Exhibit 99.1

2006 Analyst Day Event
Realizing Our Dream

Forward Looking Statements
Statements used in this presentation that relate to future plans, events, financial
results or performance are forward-looking statements that are subject to certain
risks and uncertainties including, among others, such factors as our ability to
continue to successfully execute our strategic initiatives and growth strategy; the
efficiency and effectiveness of our advertising and marketing programs; consumer
acceptance of our products, new product offerings and brand image; our ability to
execute our retail store distribution strategy; our ability to execute our wholesale
distribution strategy; our ability to maintain cost-effective sales, production and
delivery of our products; inflationary pressures caused by rising fuel and
commodity costs; the impact of outstanding litigation claims, including the potential
impact of any adverse publicity; competitive trends in the bedding industry;
uncertainties arising from general economic conditions, consumer confidence and
global events, as well as the risk factors listed from time to time in the company’s
filings with the SEC, including the company’s Annual Report on Form 10-K and
other periodic reports filed with the SEC.
1

Chairman and Chief Executive Officer
Bill McLaughlin
Reinvented a commodity product,
dramatically enhancing quality and service…
Built a vertically integrated supply chain to
ensure consistent quality…
Focused on company-owned stores to deliver
a distinctive retail experience…
Created a brand experience worthy of a
premium price
Starbucks’ Story
3
Old line industry leaders, highly recognizable
brand names, but not strong brand
Premium price of mass market products
Huge markets, growth only in premium
segments
Strong gross margins
Growth accelerated by word of mouth
Strong management teams
Industry skepticism high in early years
Other Similarities
4
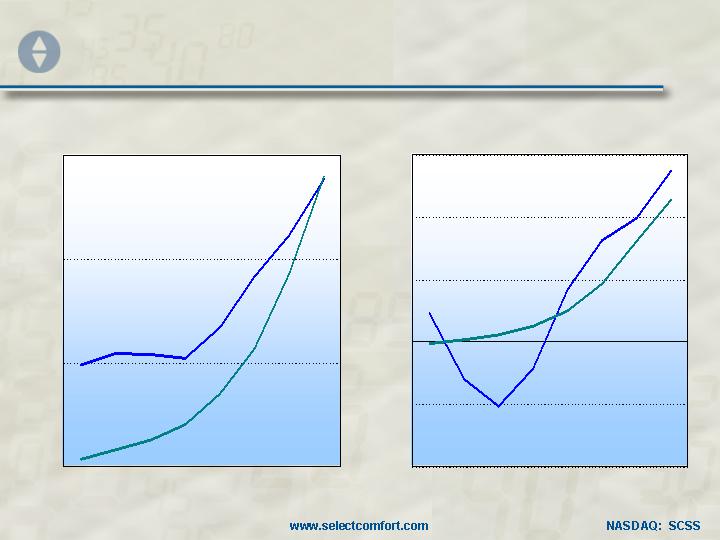
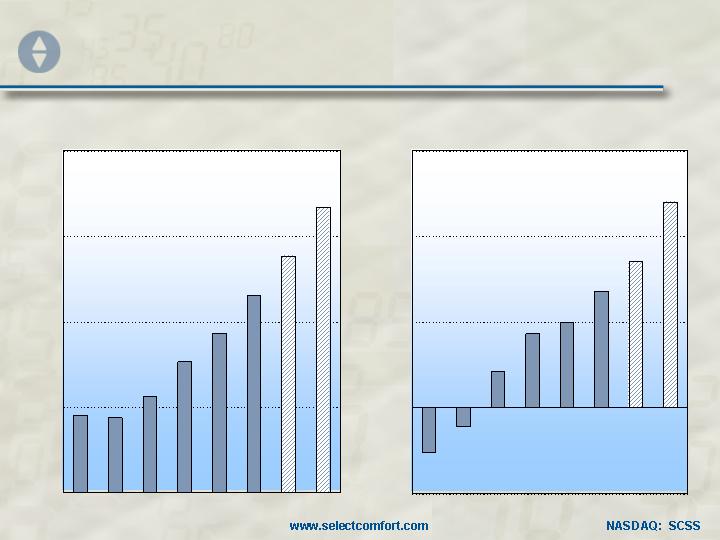
Similar Financial Performance
Net Operating Profit
($ in millions)
$75
$(50)
0
1996
2005
Revenue
($ in millions)
$750
0
SBUX 1989
SCSS 1998
SBUX
SCSS
1996
2005
SBUX 1989
SCSS 1998
SBUX
SCSS
5
SBUX Circa ’96 Closely
Resembles SCSS Circa ‘05
SBUX
SCSS
1996
2005
698
691
57
69
42
44
11%
37%
~3%
~6%
Sales
Operating Income
Net Income
ROE
U.S. Market Share
6
Essentially the Same Story!
Select Comfort’s Story
Reinvented a commodity product, dramatically
enhancing quality and service…
Focused on company-owned stores to deliver
a distinctive retail experience…
Built a vertically integrated supply chain to
ensure consistent quality…
Created a brand experience worthy of a
premium price
7
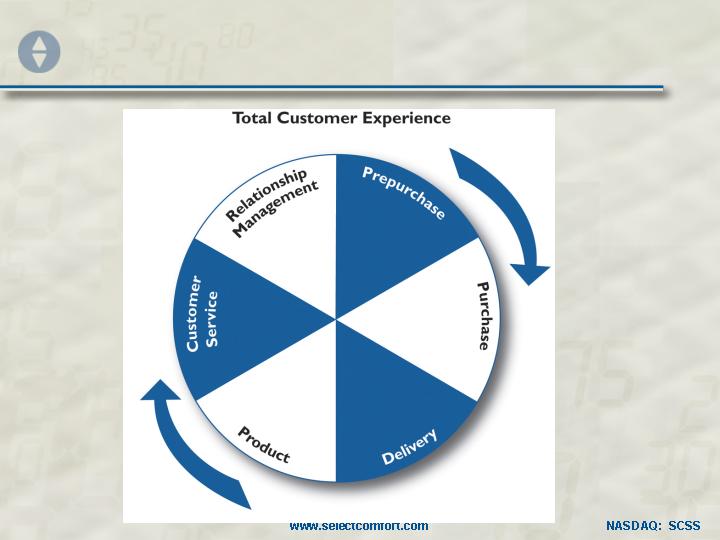
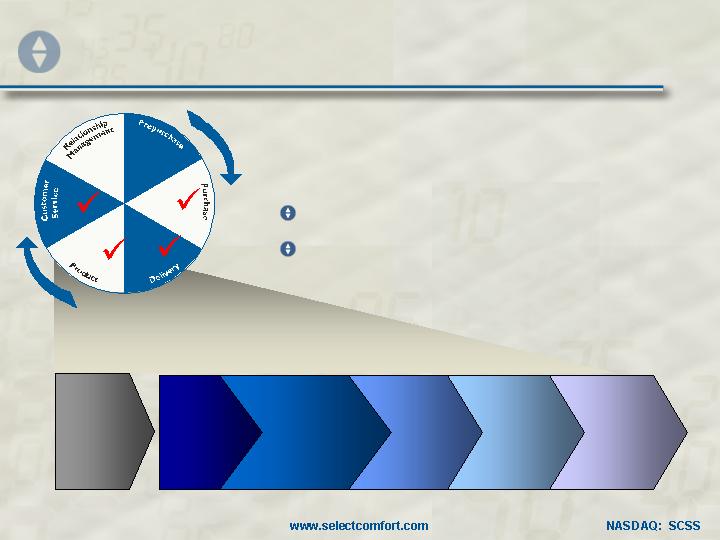
Consumer Loyalty Experience
8

Starts with Differentiated
Product/Service
9
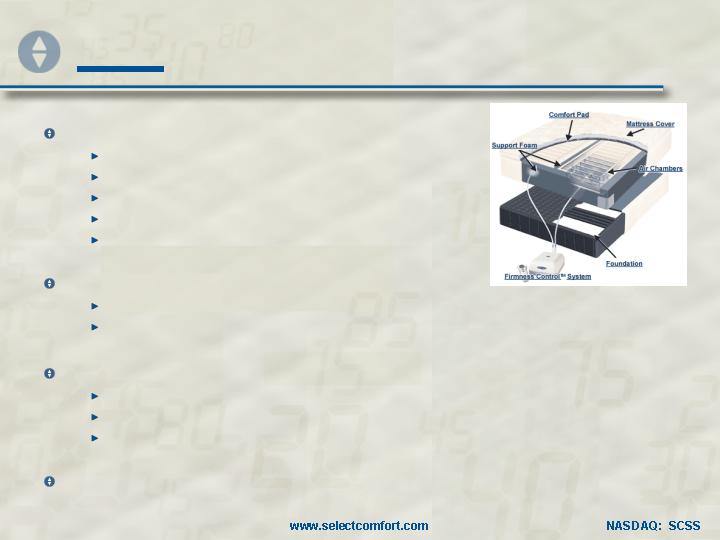
Why Our Business Model?
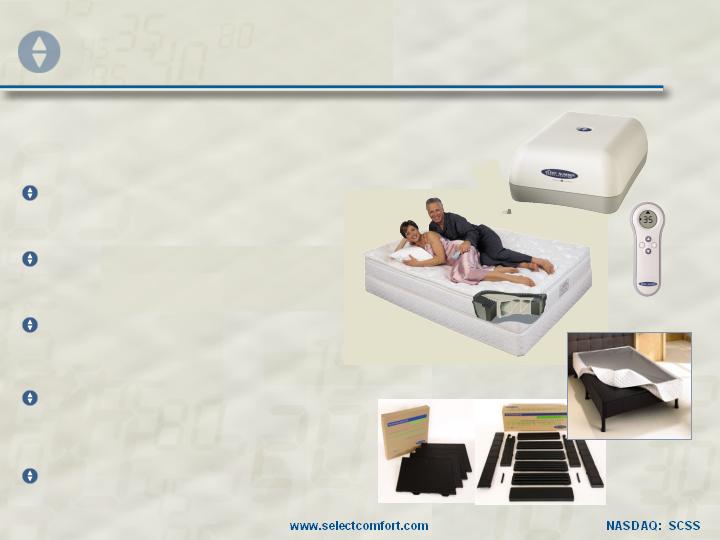
Differentiated Product that’s Complex
Air Control System
Chambers
Sewing
Daily Use
10-20 Years
Marketing and Sales Challenge
Consumers—low interest, long purchase cycle, skeptical
Selling—longer process, more Q&A, confidence
High Cost of Customer Acquisition—“Razor Blade” for Leverage
Referral
Repeat
Accessories
Total Experience of Customer Satisfaction
10
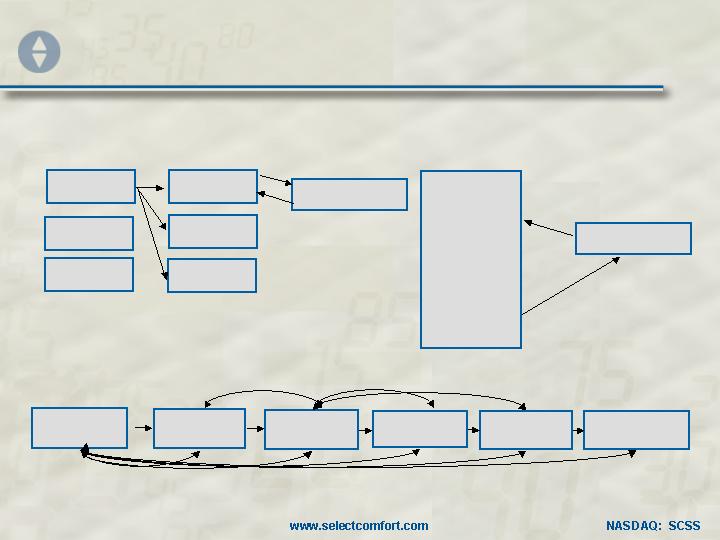
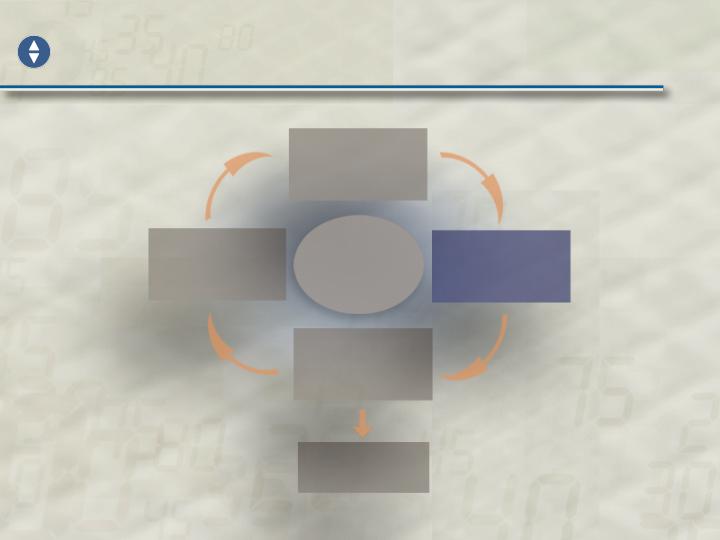
Business Model
Industry
Select Comfort
Brand
Sell
Make
Deliver
Service
Relationship
Mfg 1
Mfg 2
Mfg 3
Retail 3
Retail 2
Retail 1
Retail
Mfg
Delivery
Service
Customer
Customer
11
Awareness
Distribution
Innovation
Leverage
People
&
Systems
Expand
Strategies
12

Awareness
Distribution
Innovation
Leverage
People
&
Systems
Expand
Strategies/Competitive Advantages
1. Product Design
2. Brand
3. Quality, Cost,
Flexibility, Service
5. Balance Sheet and
Cash
4. Controlled
Distribution
6. People & Culture
13
Realizing Our Dream
Revenue
($ in billions)
$1.2
0
$150
$(50)
0
Net Operating Profit
($ in millions)
2000
2007E
2000
2007E
2005
2005
14

Doug
Awareness
Keith
Distribution
Doug
Innovation
Kathy
Leverage
People
&
Systems
Expand
Agenda
15
Awareness
Distribution
Innovation
Leverage
People
&
Systems
Expand
16
SVP, Chief Marketing Officer
Doug Collier
Chief Marketing Officer
Doug Collier
17
Agenda
Market Opportunity
Strong Starting Platform
Opportunities to Enhance and Advance
18
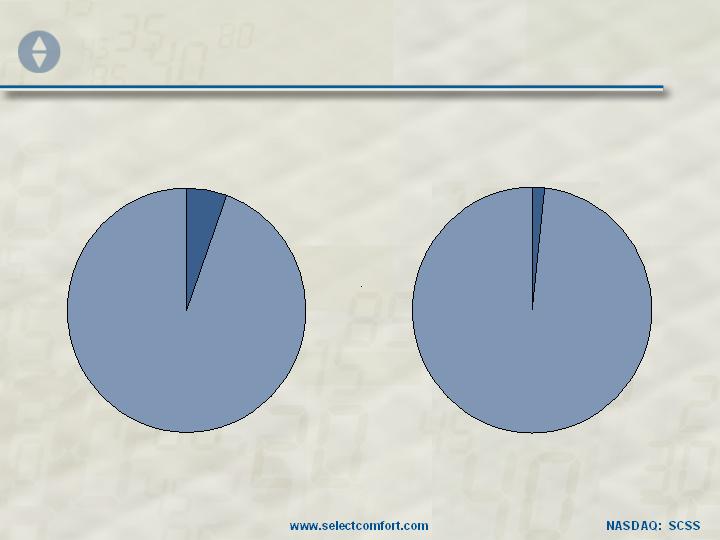
The Size of Our Opportunity
5.5%
1.6%
2005E U.S. Mattress Industry
Source: International Sleep Products Association (ISPA) and company information.
Wholesale
$6.3 billion
Units
22 million
19
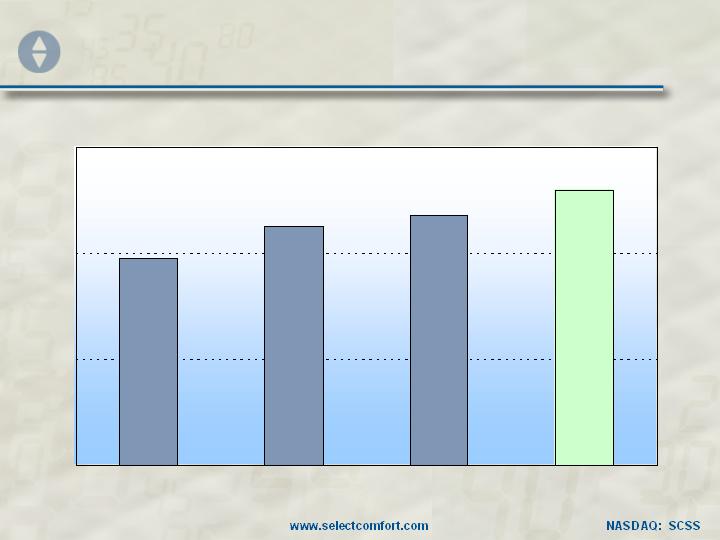
2002
2005E
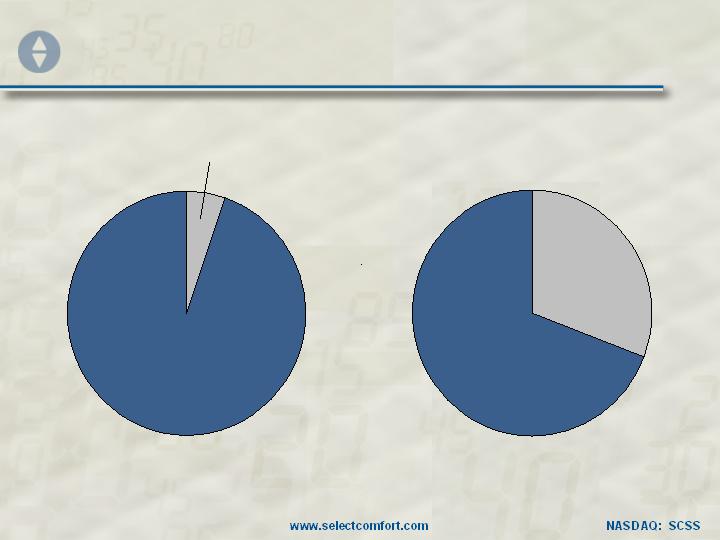
The Size of Our Opportunity
75%
40%
$500+ Price Point Segment - Queen Sets
69%
Source: International Sleep Products Association (ISPA) and company information.
20
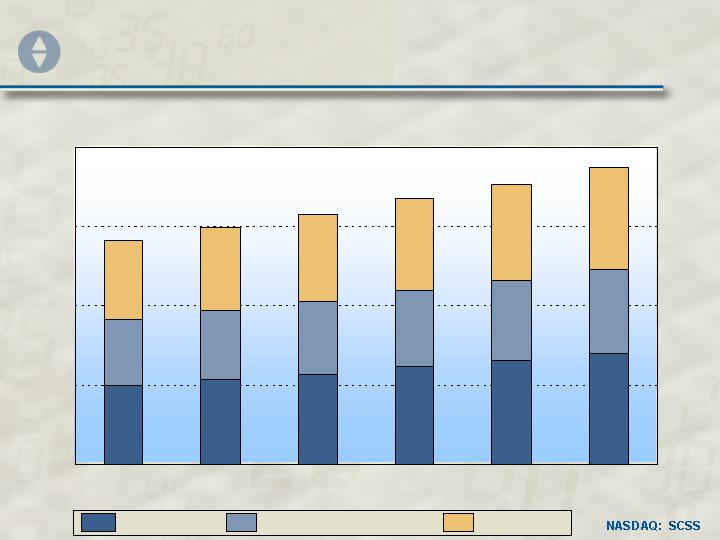
2005E
2010E
The Size of Our Opportunity
$35B
$40B
0
U.S. Mattress
U.S. Bedding Accessories
Int’l Mattress
Estimated Retail Market
Source: International Sleep Products Association (ISPA), CSIL Milano and company information.
21
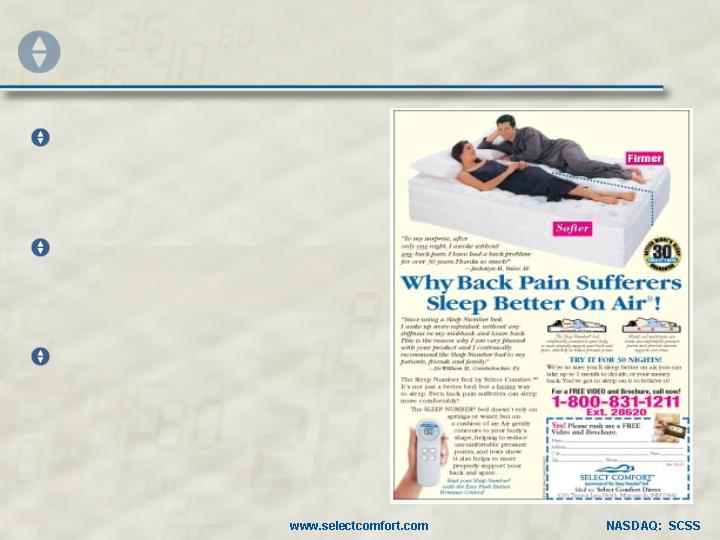
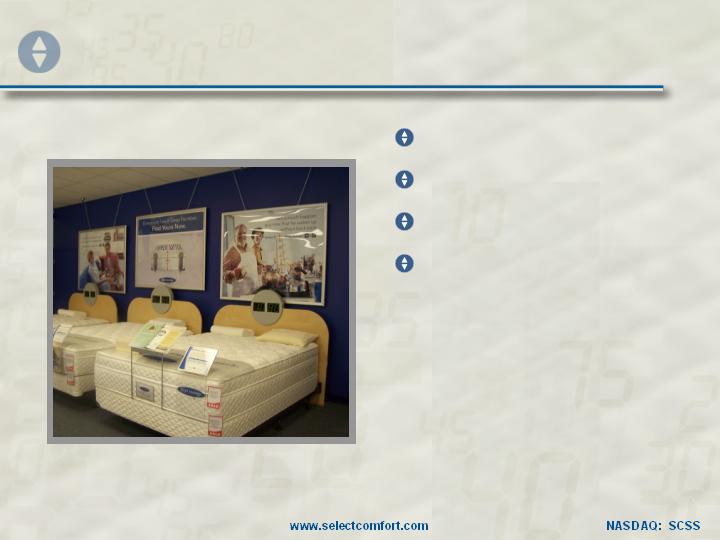
Situation in 2000
Low awareness…
number one barrier to
growth
Air bed had negative
connotations…and not
proprietary
Dominated by company’s
direct-marketing heritage
22
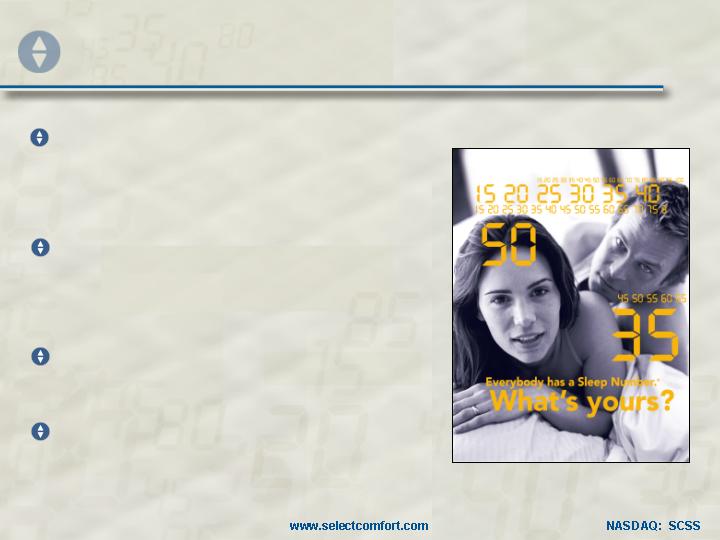
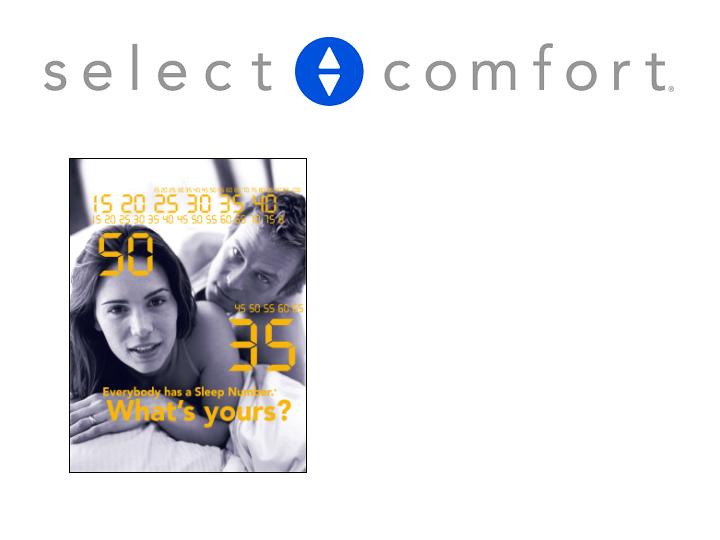
Our Marketing Model
Broad appeal of Sleep
Number® concept and
advertising campaign
Focus on unique product
feature of personalized
comfort
Message strongly integrated
across all brand touchpoints
Major investment in media
to drive awareness
23
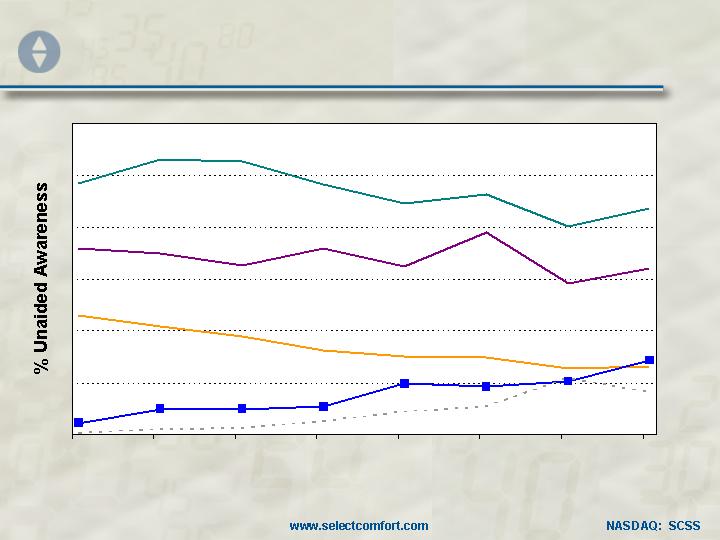
National Unaided Brand Awareness
Jan-02
Jul-02
Jan-03
Jul-03
Jan-04
Jul-04
Jan-05
Jul-05
Sealy
Sealy
Simmons
SCSS
TPX
Source: Third-party research.
13%
60%
0%
24
Moving the Model Forward
Compelling
Creative
Media
Investment
Differentiated
Product
In-Store
Experience
Consumer
Loyalty
25
Moving the Model Forward
Compelling
Creative
Media
Investment
Differentiated
Product
In-Store
Experience
Consumer
Loyalty
New Sleep Number®
campaign…leverage across
all touchpoints
New web-site
Communicate store
experience
26
27
Moving the Model Forward
Compelling
Creative
Media
Investment
Differentiated
Product
In-Store
Experience
Consumer
Loyalty
Continue increasing media
investment…efficiently
28
2000
2006E
Media Spending
$120
0
15%
7%
29
Moving the Model Forward
Compelling
Creative
Media
Investment
Differentiated
Product
In-Store
Experience
Consumer
Loyalty
Continue increasing media
investment…efficiently
Increase on-line spending 4X
Increased use of retail
activation tools
30
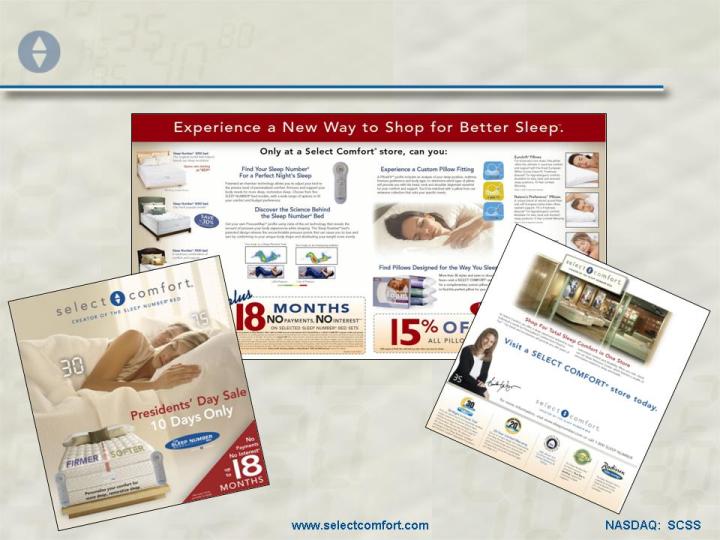
New Tools – Sunday Inserts
31
Moving the Model Forward
Compelling
Creative
Media
Investment
Differentiated
Product
In-Store
Experience
Consumer
Loyalty
R&D investment up 2X
…build pipeline of
innovation
Accessories growth…new
products, unique features
32
Moving the Model Forward
Compelling
Creative
Media
Investment
Differentiated
Product
In-Store
Experience
Consumer
Loyalty
New in-store and lease line
tools to drive traffic and
brand
Advance store design and
in-store experience
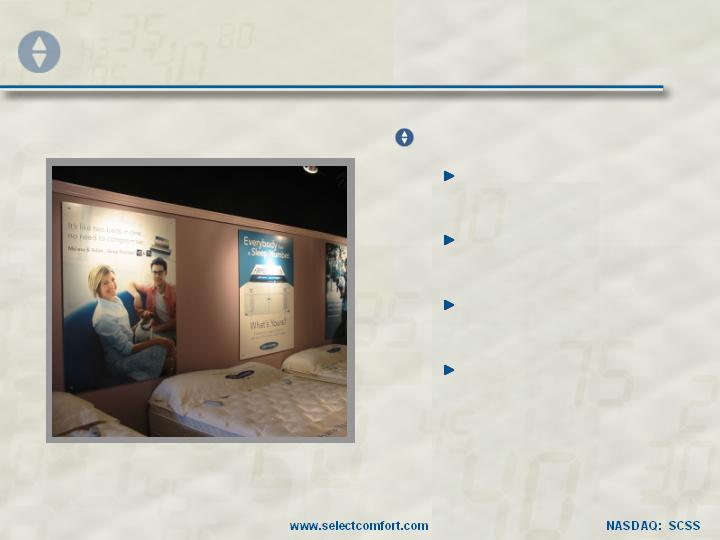
33
Moving the Model Forward
Compelling
Creative
Media
Investment
Differentiated
Product
In-Store
Experience
Consumer
Loyalty
Redesign loyalty program
…drive referrals and repeat
purchase
Consumer insight…refine
and customize message
34
Summary
Strong and Expanding Market Opportunity
Strong Starting Marketing Platform
Opportunities to Enhance and Advance
35
Awareness
Distribution
Innovation
Leverage
People
&
Systems
Expand
Keith Spurgeon
SVP, GM - Consumer Channels
36
Senior Vice President and
General Manager,
Consumer Channels
Keith Spurgeon
37

Integrating Sales and Marketing
Compelling
Creative
Media
Investment
Differentiated
Product
In-Store
Experience
Consumer
Loyalty
Differentiation and Sustainable
Competitive Advantage
Maximize Revenue and
Operating Leverage
Improve Distribution and
Sales Experience
Increase Awareness and
Traffic
38
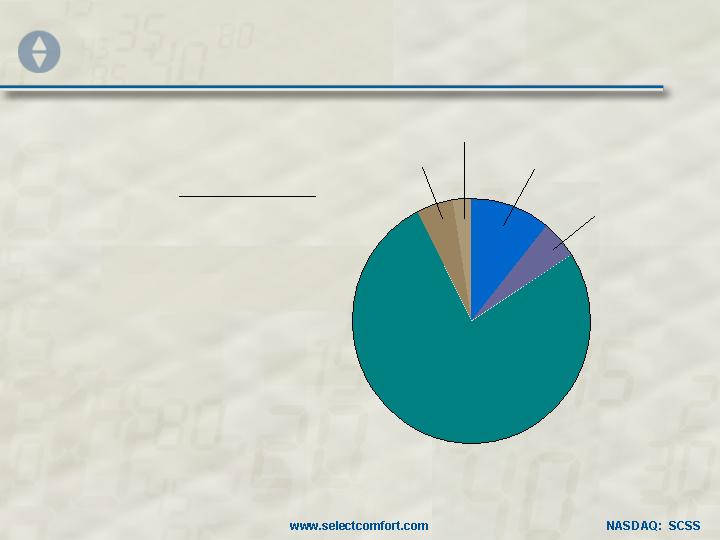
Advantaged Distribution
Retail
Direct
eCommerce
Retail Partners
Other
Total
Retail Stores - 77%
Direct – 11%
eCommerce – 5%
Retail Partners – 3%
2005 Revenue Mix
Other – 4%
2000-2005
20%
9%
34%
NM
NM
20%
CAGR
39
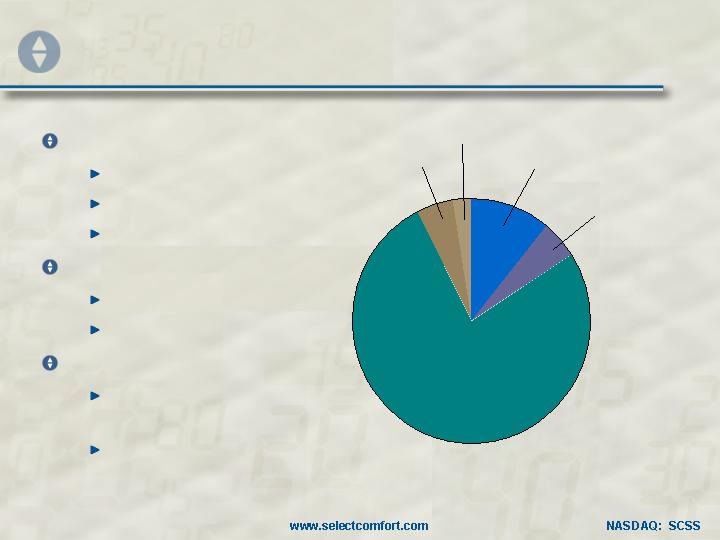
Advantaged Distribution
Control
Brand
Distribution
Selling Process
Focus
Personnel
Product
Customer Loyalty
Be Where the
Customer is
Lifetime Customer
Relationship
Retail Stores - 77%
Direct – 11%
eCommerce – 5%
Retail Partners – 3%
2005 Revenue Mix
Other – 4%
40
Sustainable Growth
Same Store
New Stores
Retail
Partners
New
Channels
Continued
Organic
Growth
5% - 10%
Annual Store
Count Growth
Increasing
Share of Retail
Partners’
Business
Incremental
Opportunities
41
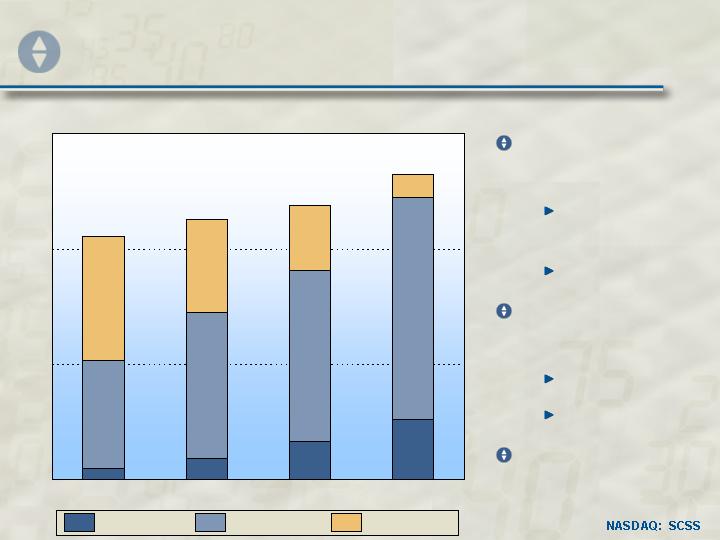
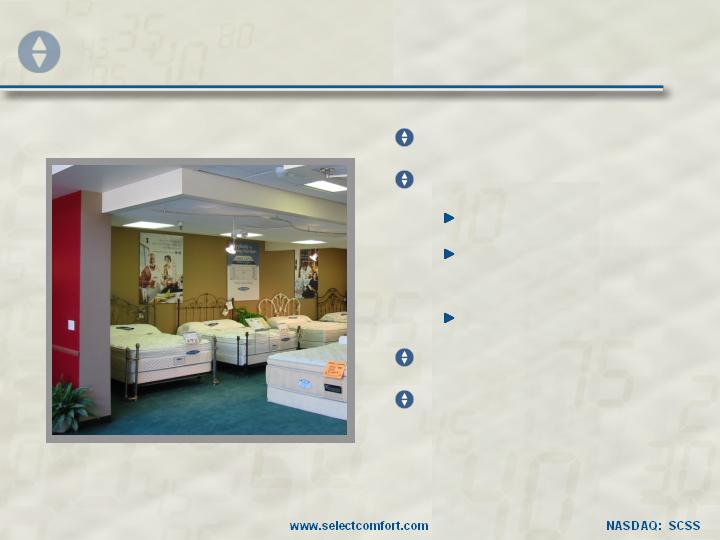
The Store is the Core
Growing
Revenues
Same Store
Sales
New Stores
Consumer-
Driven Mix
Bedding
Accessories
Compelling
Store Model
2003
2004
2005
2006E
49%
64%
77%
90%
0
8%
14%
20%
Stores >$2M
Stores >$1M
Stores <$1M
450
Stores Open > 12 Months
42
Targeted New Store Economics ($000)
~12 months
Payback
$200+
Store Investment
22%
Profit Margin
$200
First Year Profit
$900
First Year Sales
The Store is the Core
43
The Store is the Core
600-650 Stores
Non-Mall
396 Stores
Mall-Based
Locations
Mall-Based
Locations
Non-Mall
44
The Store is the Core
Store Locations
Promotions
People
Compensation & Incentives
In-Store Tools
Store Experience
Retention /
Stability
Traffic /
Higher Conversion
Customer Satisfaction
45
Retail Partner Strategy
Objectives
Principles
Criteria
Preferred Partners
Healthy Back
46
Retail Partner Strategy
Objectives
Leverage
Advertising
Increase Market
Share
First Choice of
Retail Partners
Pre-empt
Competition
Better Bedding
47
Retail Partner Strategy
Objectives
Principles
Semi-Exclusive
Controlled
Program
Incremental
Criteria
Preferred Partners
Sleep Train
48
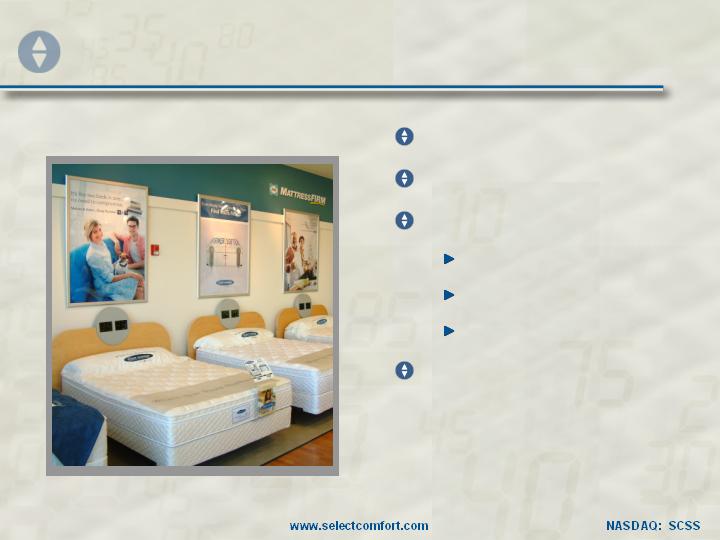
Retail Partner Strategy
Objectives
Principles
Criteria
Dominant Player
Quality Success
Brand Building
Preferred Partners
Mattress Firm
49
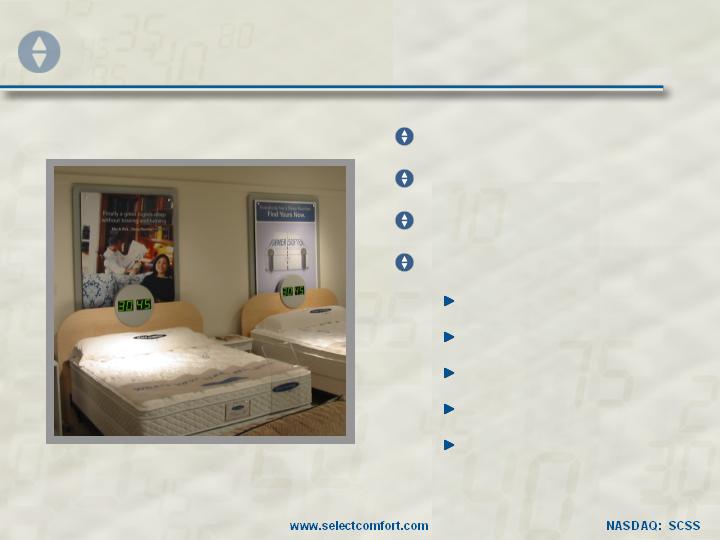
Retail Partner Strategy
Objectives
Principles
Criteria
Preferred Partners
Exclusivity
Brand Strength
Product Quality
Service & Support
Dedicated
Trainers
50
Leading Bedding Retailers
Source: Furniture|Today, Aug. 1, 2005
# Stores
370
318
314
108
Select Comfort
Sleepy’s
Mattress Firm
The Sleep Train
2004
Sales Rank
# 1
# 2
# 3
# 8
51
Integrating Sales and Marketing
Compelling
Creative
Media
Investment
Differentiated
Product
In-Store
Experience
Consumer
Loyalty
Differentiation and Sustainable
Competitive Advantage
Maximize Revenue and
Operating Leverage
Improve Distribution and
Sales Experience
Increase Awareness and
Traffic
52
Awareness
Distribution
Innovation
Leverage
People
&
Systems
Expand
SVP, Global Operations
Kathy Roedel
53

Senior Vice President,
Global Operations
Kathy Roedel
54

Introducing Global Operations
Sourcing
Logistics
Home
Delivery
Customer
Service
Manufacturing
Product
Design
Secret Weapon…
55
Delivering competitive advantage
Driving customer loyalty
Keys to Advantage & Loyalty
Complex product – history and scale
Flexible JIT supply chain – quality, cost, cash
Integrated, company owned Service
People & culture
56
Complex, Differentiated Product
More than a bed…a “sleep system”
User Interface - Controls
Service 7 days/week
20 Year Durability
Modularity
Air Control System
57
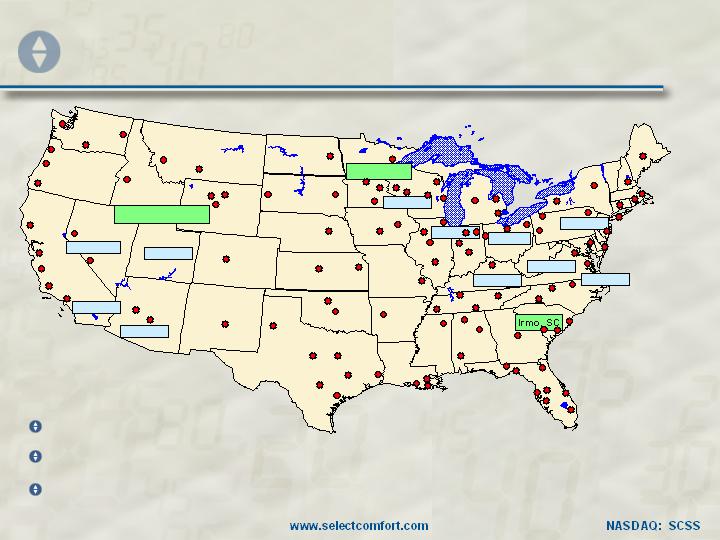
Salt Lake City UT
Minneapolis
Key Operations Locations
Foundations
Fabric
Foam
Foam
Foam
Foundations
Foundations
Foam
Foundations
Foundations
Foundations
2 Manufacturing Locations + HQ (Partner Fulfillment)
Global & Local Suppliers
Home Delivery thru 100+ cross docks
58
Keys to Advantage & Loyalty
Complex product – history and scale
Flexible JIT supply chain – quality, cost, cash
Integrated, company owned Service
People & culture
59
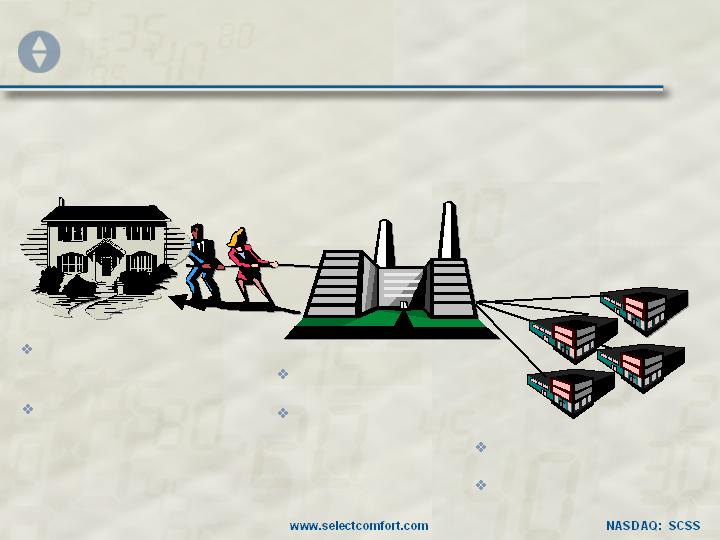
Just In Time – Flexibility & Cash
Select Comfort
Manufacturing
Customer’s
Home
Suppliers
Build to Order
Ship < 48 hours
No warehouse
…no inventory
Short supply lines
Hrs –> Days Raw Mat’l
Customer sees
“out of box” quality
60
Quality…Zero Defect Culture
Designed for manufacture & service-ability
Suppliers… qualified, certified, audited,
selectively exclusive
Mistake Proofed Processes
Quality Built In – “Do / Check”
Rapid Response – daily customer pulse
61
Keys to Advantage & Loyalty
Complex product – history and scale
Flexible JIT supply chain – quality, cost, cash
Integrated, company owned Service
People & culture
62
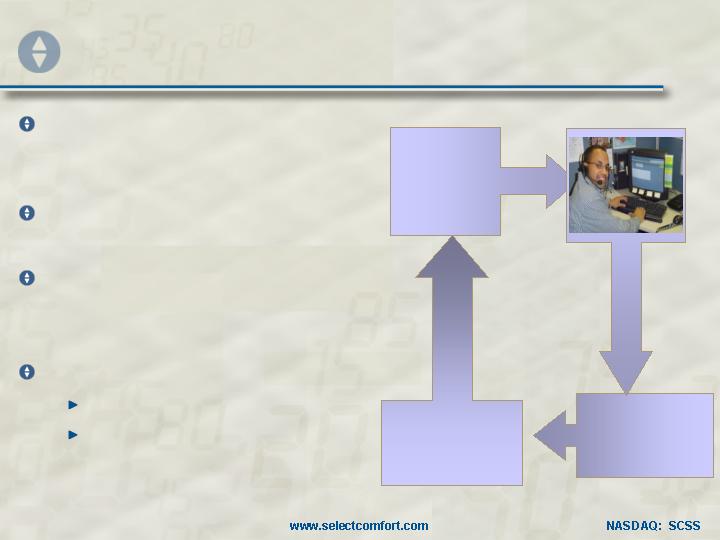
Select Customer Service
Customer care specialists
…Sleep Number bed owners!
Continuous Improvement
Closed loop process
Rapid response
Zero
Defect
Culture
Customer Data
Root Cause
Analysis
Design & Mfg
Improvements
Great
Customer
Service
All Channels, 7 days/week
Metrics & Incentives
63
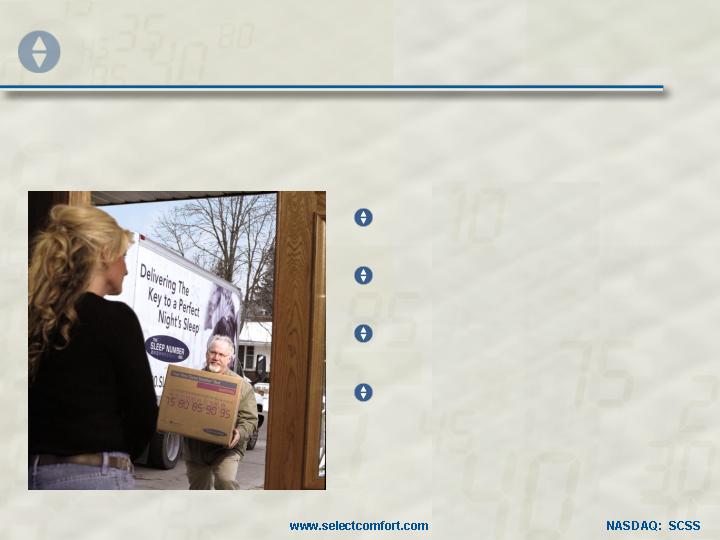
Home Delivery Service
Select Comfort controls the entire customer experience
…right into their bedroom!
Centralized Scheduling
White Glove Treatment
Great Feedback
Seals the deal…best
bed buying decision!
64
Product
Design
Productivity
“JIT”
Supply Chain
Flexibility
& Cost
Co.-owned
Service
Faster
Order Delivery
Building on Success
People &
Culture
Even deeper
bench
Refined design for mfg
Six Sigma pilots
Dual sourcing strategy
2010 capacity plan
Pilot new network design
Continuous optimization
Training and staffing
65

Keys to Advantage & Loyalty
Complex product – history and scale
Flexible JIT supply chain – quality, cost, cash
Integrated, company owned Service
People & culture
66
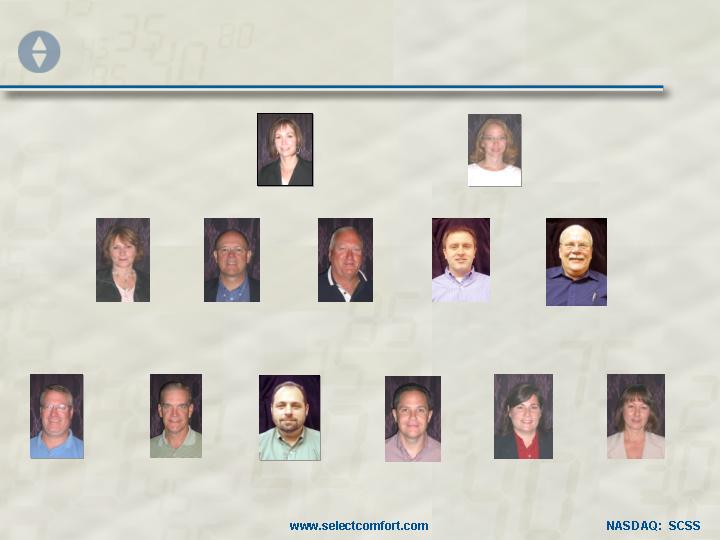
Operations Leadership Team
Kathy Roedel
Global Operations
4/4/05
Joy Grant
Administrative Support
3/31/92
Mark Sponsler
Home Delivery
3/1/05
Darrell Olson
Logistics
11/7/95
Kathleen Graber
Supply Chain
5/31/95
Dave Menssen
Cust. Service
8/3/98
Don Hancock
Mfg – SLC, UT
5/24/99
Ron McCoy
Mfg – Irmo, SC
12/6/04
Todd Dockter
Capacity Programs
1/5/98
Hunter Saklad
Finance
10/1/04
Alix Colehour
Human Resources
8/30/04
Junell Erickson
Info Systems
2/25/02
Justin Revak
Mfg – Mpls, MN
10/2/05
67
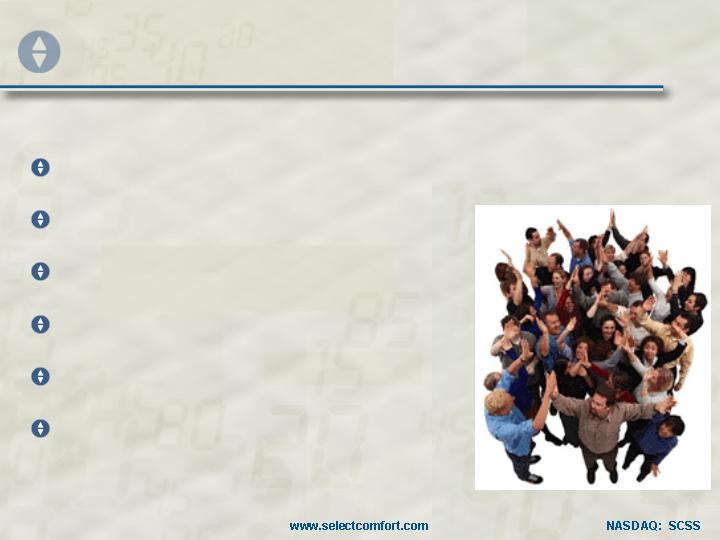
Winning Team & Culture
Passion for customers and results
100% bonus participation
Innovation mindset
Community commitment
Proud of accomplishments
Bullish on our future!
68
Global Operations
Sourcing
Logistics
Home
Delivery
Customer
Service
Manufacturing
Product
Design
Secret Weapon…
Delivering competitive advantage
Driving customer loyalty
69
Chief Financial Officer
Jim Raabe
70
Sustainable Growth
Multiple Sources of Growth
Multiple Sources of Leverage
Internally Funded
71
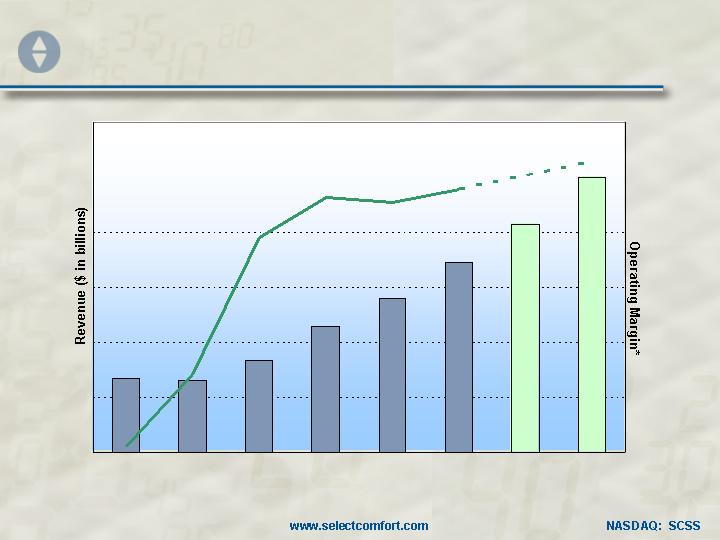
2000
2001
2002
2003
2004
2005
2006E
2007E
$1.0B
$0
15%
-10%
12%
*Note: Before stock option expense
Realizing Our Dream
72
Multiple Sources of Growth
Operating Margin
G&A
Media
Selling Margin (Ex-Media)
Gross Margin
Sales
Total
Wholesale
Company-
owned
*Including Radisson sales
92%
62%
31%
8%
34%*
26%*
100%
59%
31%
13%
8%
10%
73
Consistent Revenue Growth
+
Hospitality - year 2
Int’l - initial investment
QVC/RV
New Channels
15% - 20%
2 - 3%
100% more doors
10% 20% share of floor
Retail Partner
4 - 6%
45 - 50 Stores
New stores
9 - 11%
7-12% Target
Media + 15%
30 store relocations
e-Commerce/Direct
Same store growth
Consolidated Sales
74
Consistent Margin Growth to ‘07
~ 0.5 ppt
G&A
~ 1.0 ppt
Selling
~ 0.5 ppt
Marketing
- -
Gross Margin
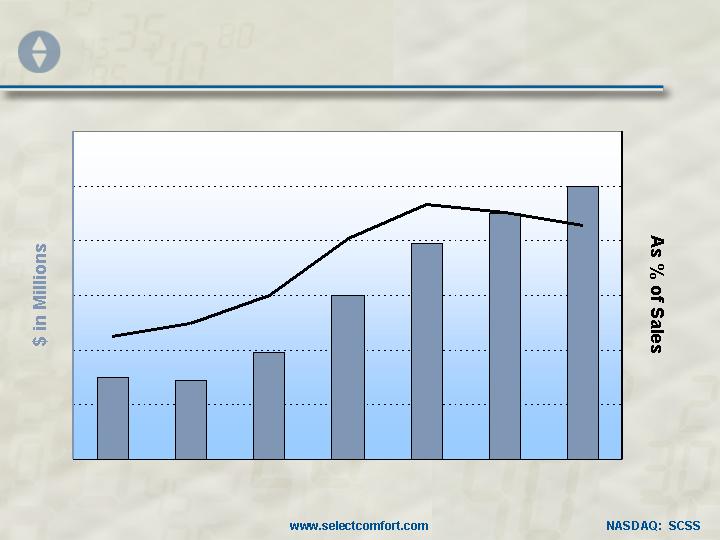
75

Cash from Operations: Funds Growth
2002
2003
2004
2005
2006E
2007E
110
0
Free
Cash
Flow
Capital
76
THANK YOU!
Demonstrated Performance
Proven Strategies
Multiple Sources of Growth
Competitive Advantages
Strong Culture
Depth of Management
77