
| Analyst Day September 10, 2003 |

| Bill McLaughlin President and Chief Executive Officer |
| Forward Looking Statements |

| Vision Revolutionize Sleep Leader Mission Improve peoples lives, by providing best sleep possible with innovative products Values Consumer Quality Performance Positive Culture Profitable Growth |
| Strategic Opportunity |
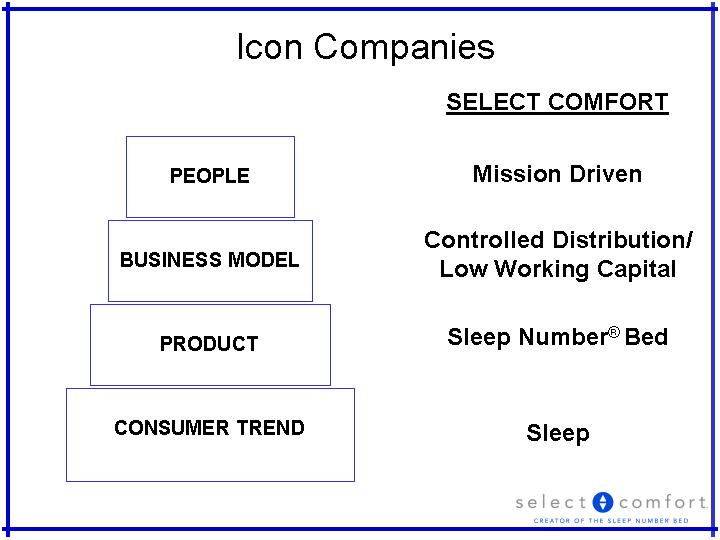
| Icon Companies CONSUMER TREND PRODUCT BUSINESS MODEL PEOPLE SELECT COMFORT Controlled Distribution/ Low Working Capital Sleep Number(r) Bed Sleep Mission Driven |
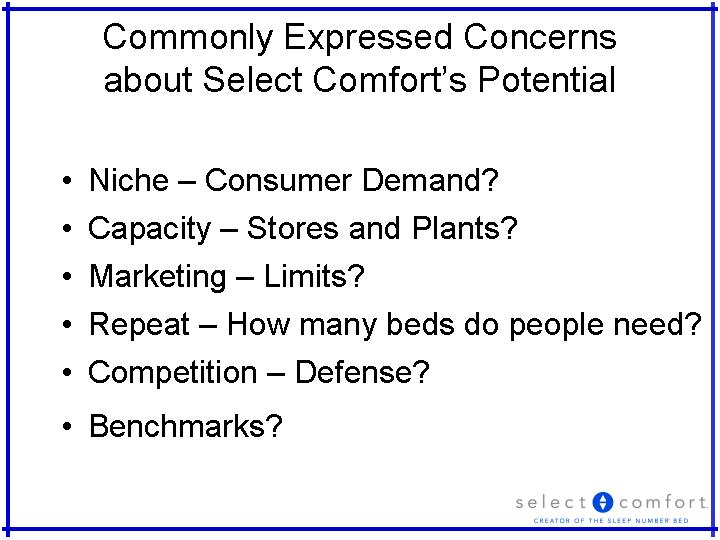
| Commonly Expressed Concerns about Select Comfort's Potential Niche - Consumer Demand? Capacity - Stores and Plants? Marketing - Limits? Repeat - How many beds do people need? Competition - Defense? Benchmarks? |
| Limited consumer demand for revolutionary, premium products? Radial Tires CD's Nike Starbucks |
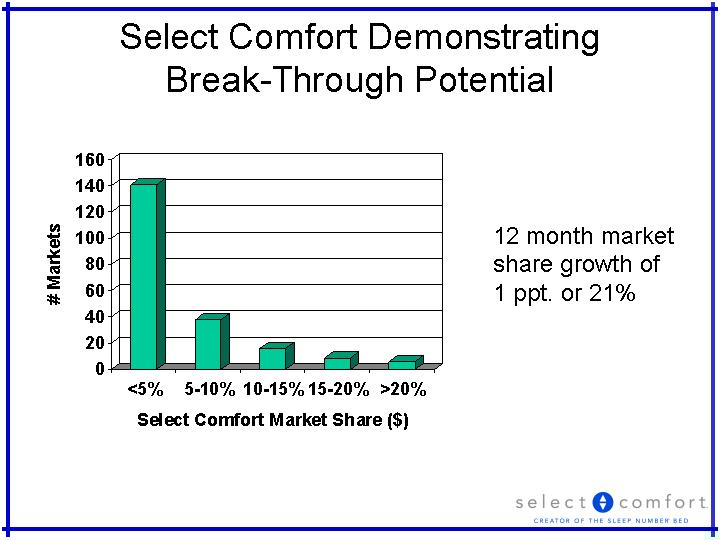
| Select Comfort Demonstrating Break-Through Potential <5% 5-10% 10-15% 15-20% >20% East 141 38 16 9 6 12 month market share growth of 1 ppt. or 21% |
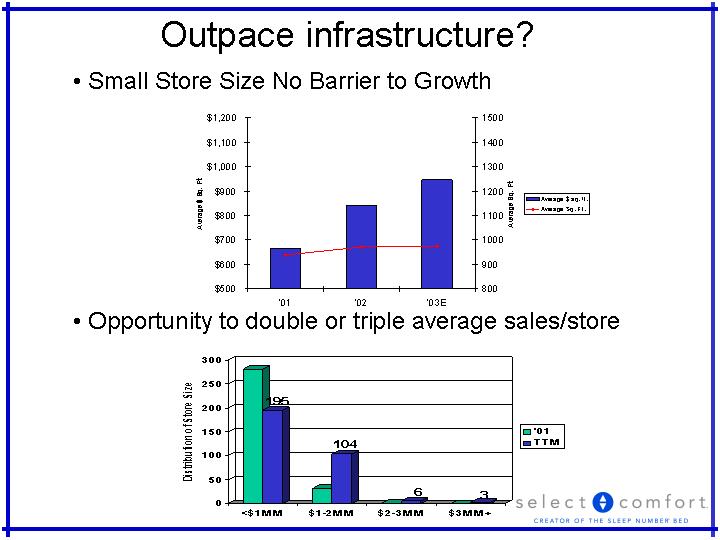
| Outpace infrastructure? Small Store Size No Barrier to Growth Opportunity to double or triple average sales/store <$1MM $1-2MM $2-3MM $3MM+ '01 281 32 1 0 TTM 195 104 6 3 '01 '02 '03E Average $ sq. ft. 666 841 946 Average Sq. Ft. 939 972 977 |

| Potential Distribution Points Sealy 7,000+ # A and B Malls 1,290 1 store per 200K pop. (metro) 922 stores Select Comfort today With Partners 416 Retail only 342 Opportunity to double or triple points of distribution Select Comfort Goal 600 - 800 |
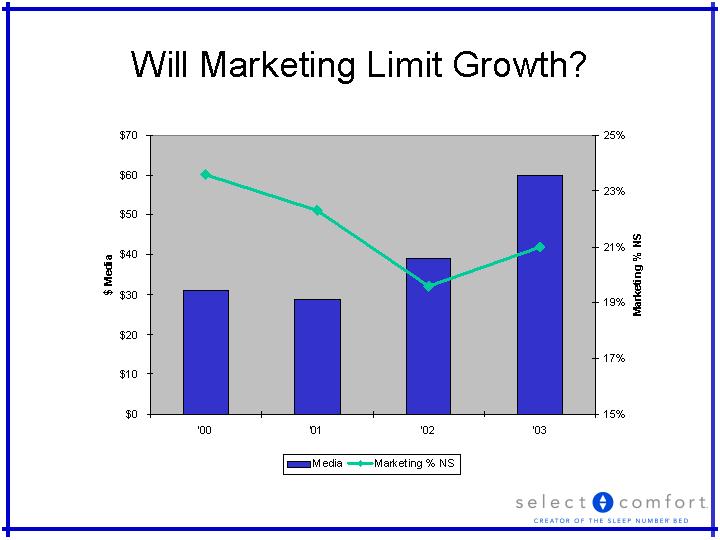
| Will Marketing Limit Growth? '00 '01 '02 '03 Media 31 29 39 60 Marketing % NS 0.236 0.223 0.196 0.21 |
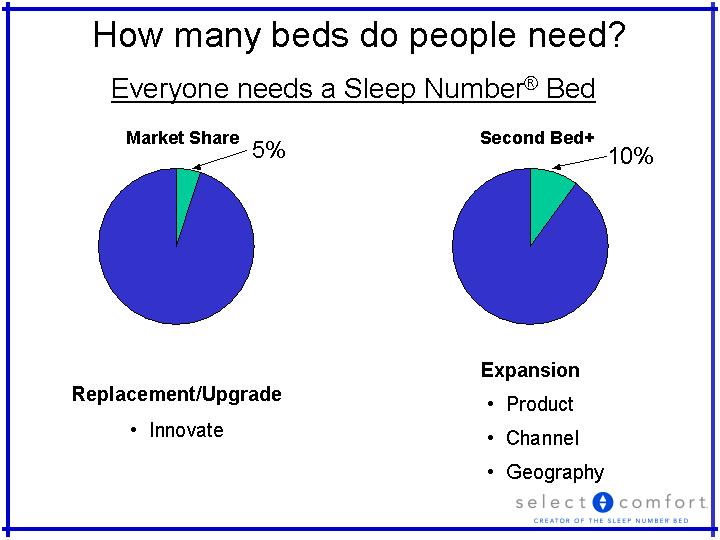
| How many beds do people need? 2nd Qtr 3rd Qtr 4th Qtr East 0.05 0.95 Everyone needs a Sleep Number(r) Bed 5% 2nd Qtr 3rd Qtr 4th Qtr East 0.1 0.9 10% Replacement/Upgrade Innovate Expansion Product Channel Geography |
| Select Comfort's Strong Offense... Competition's dilemma Product Brand Controlled Distribution Customer Experience & Satisfaction Competition's Strategic Challenges Fixed assets, infrastructure Distribution |
| Starbucks' Story Reinvented a commodity product, dramatically enhancing quality and service... Built a vertically integrated supply chain to ensure consistent quality... Focused on company-owned stores to deliver a distinctive retail experience... Created a brand experience worthy of a premium price |
| Select Comfort's Story Reinvented a commodity product, dramatically enhancing quality and service... Built a vertically integrated supply chain to ensure consistent quality... Focused on company-owned stores to deliver a distinctive retail experience... Created a brand experience worthy of a premium price Essentially the Same Story! |
| Other Similarities Old line industry leaders, highly recognizable brand names, but not strong brand Premium price of mass market products Huge markets, growth only in premium segments Strong gross margins Growth accelerated by word of mouth Strong management teams Industry skepticism high in early years |
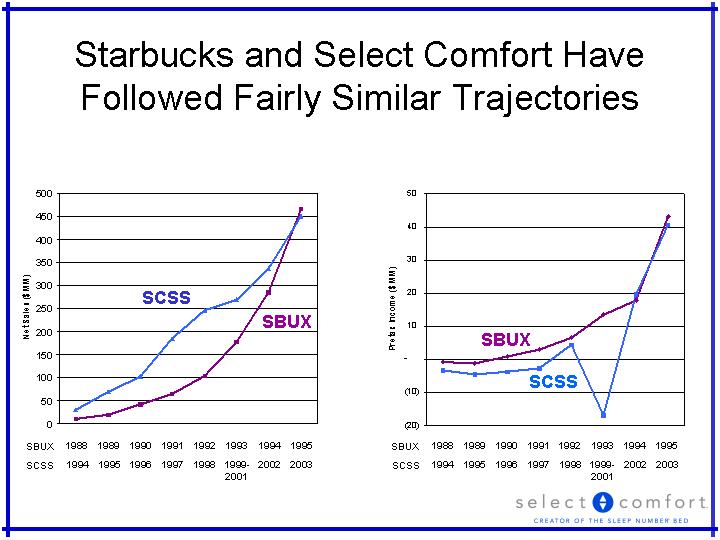
| Starbucks and Select Comfort Have Followed Fairly Similar Trajectories Sales Pretax Income SCSS SBUX SBUX SCSS 1988 1989 1990 1991 1992 1993 1994 1995 SBUX 1994 1995 1996 1997 1998 1999- 2001 2002 2003 SCSS 1988 1989 1990 1991 1992 1993 1994 1995 SBUX 1994 1995 1996 1997 1998 1999- 2001 2002 2003 SCSS |
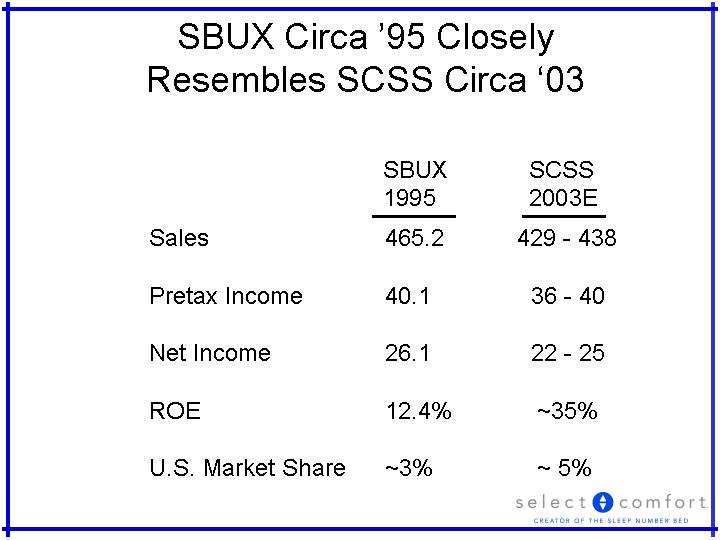
| SBUX Circa '95 Closely Resembles SCSS Circa '03 Sales Pretax Income Net Income ROE U.S. Market Share 465.2 40.1 26.1 12.4% ~3% 429 - 438 36 - 40 22 - 25 ~35% ~ 5% SBUX 1995 SCSS 2003E |
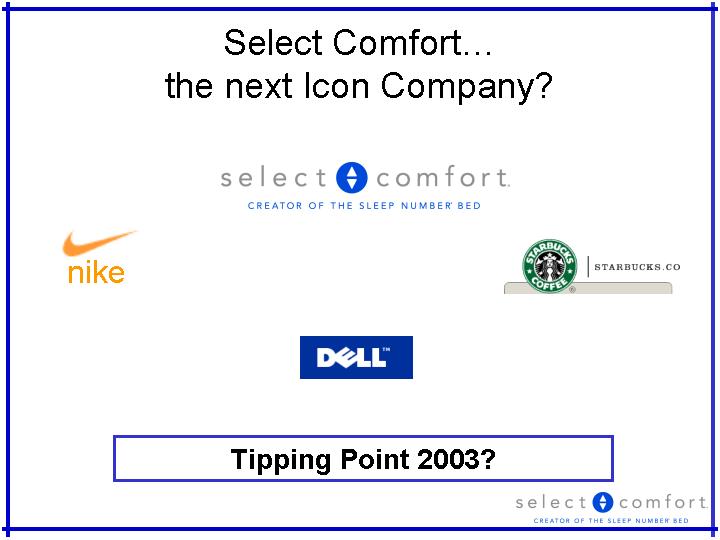
| Select Comfort... the next Icon Company? Tipping Point 2003? nike |
| Marketing Noel Schenker Sr. Vice President, Marketing & New Business Development |

| Integrated Growth Consumer Product Company and Retailer |
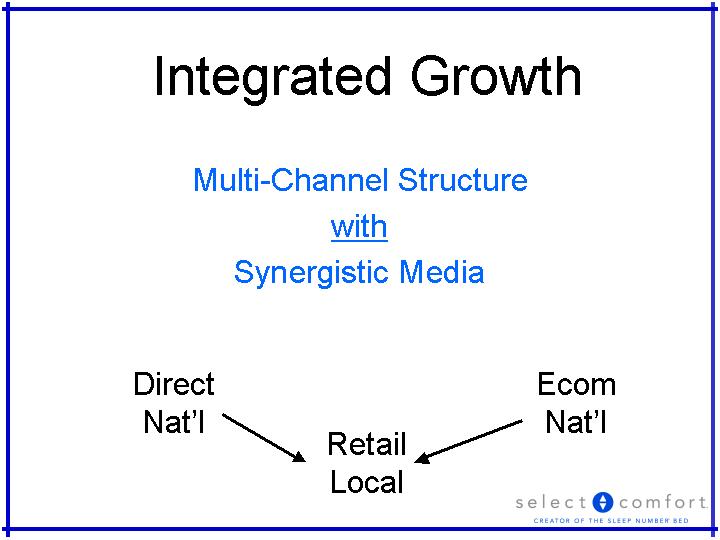
| Integrated Growth Multi-Channel Structure with Synergistic Media Direct Nat'l Retail Local Ecom Nat'l |
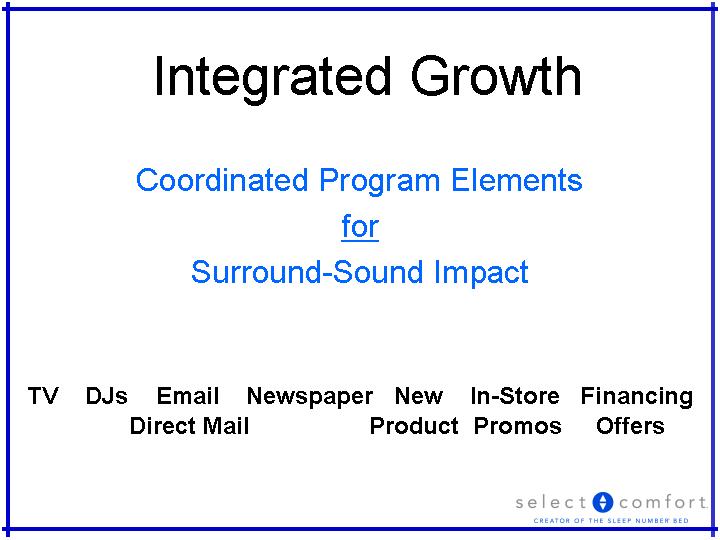
| Integrated Growth Coordinated Program Elements for Surround-Sound Impact TV DJs Email Newspaper New In-Store Financing Direct Mail Product Promos Offers |
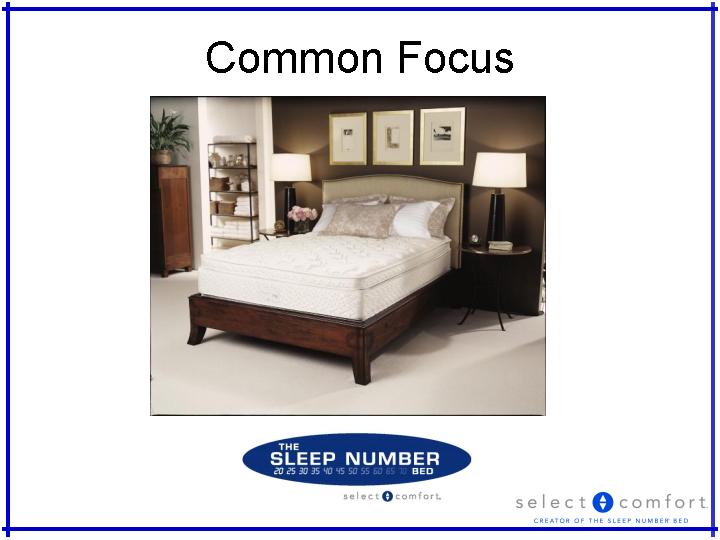
| Common Focus |
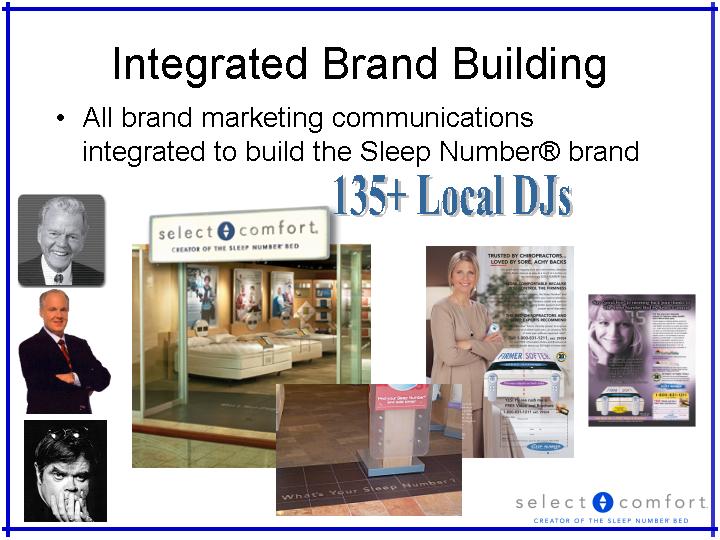
| Integrated Brand Building All brand marketing communications integrated to build the Sleep Number(r) brand 135+ Local DJs |
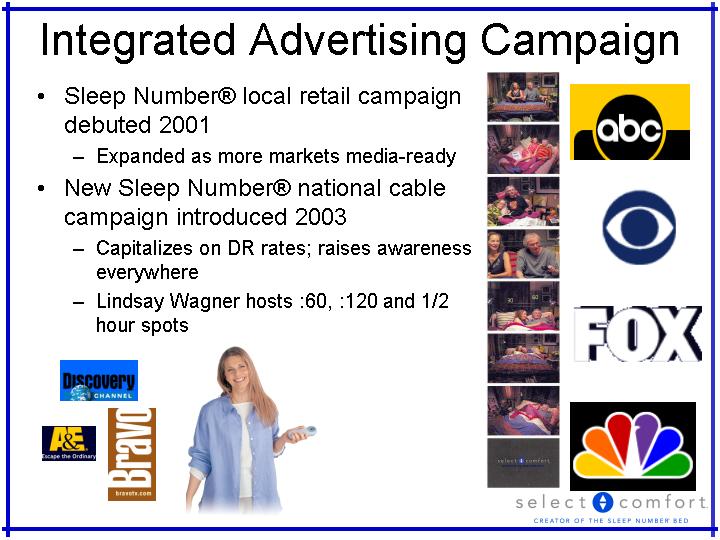
| Integrated Advertising Campaign Sleep Number(r) local retail campaign debuted 2001 Expanded as more markets media-ready New Sleep Number(r) national cable campaign introduced 2003 Capitalizes on DR rates; raises awareness everywhere Lindsay Wagner hosts :60, :120 and 1/2 hour spots |

| 2000 2001 2002 2003 Est. 2004 Total Media 30.3 29.4 39.5 60.9 79 Total Media Spending by Year ($MMs) |

| Media Spending Growth ($MMs) National Print 7.3 8.0 10% Television 11.4 21.0 84% Radio 4.8 5.6 17% Local Media Markets 10.0 17.7 77% DJs 4.1 6.1 49% Other/Internet 1.8 2.6 44% Total 39.4 61.0 55% Total Mktg % GS 27.4% 27.9% ----- % +/-? 2002 2003 |
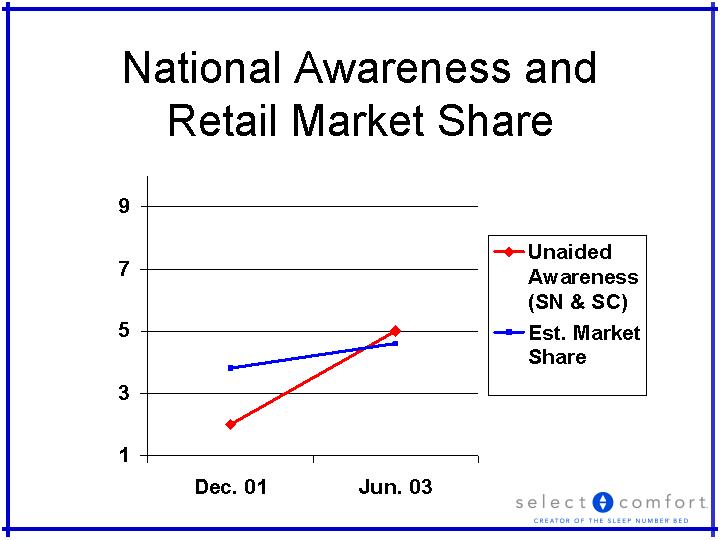
| National Awareness and Retail Market Share 1st Qtr 2nd Qtr 3rd Qtr 4th Qtr East 20.4 27.4 90 20.4 West 30.6 38.6 34.6 31.6 North 45.9 46.9 45 43.9 Dec. 01 Jun. 03 Unaided Awareness (SN & SC) 2 5 Est. Market Share 3.8 4.6 |
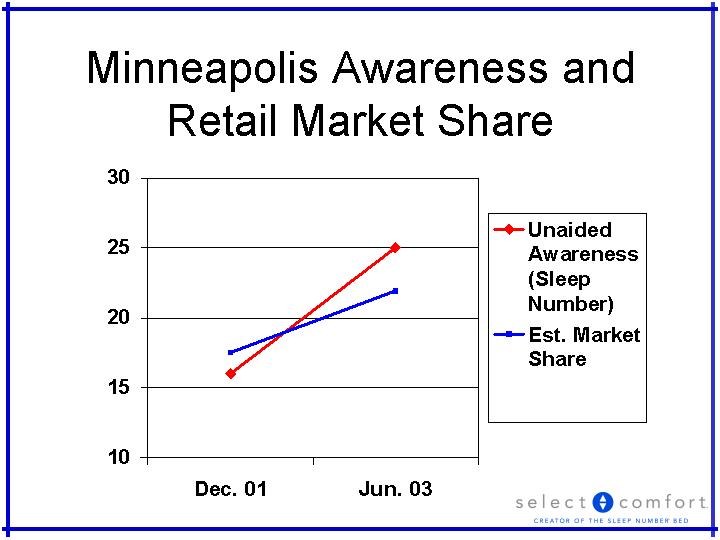
| Minneapolis Awareness and Retail Market Share 1st Qtr 2nd Qtr 3rd Qtr 4th Qtr East 20.4 27.4 90 20.4 West 30.6 38.6 34.6 31.6 North 45.9 46.9 45 43.9 Dec. 01 Jun. 03 Unaided Awareness (Sleep Number) 16 25 Est. Market Share 17.5 21.9 |
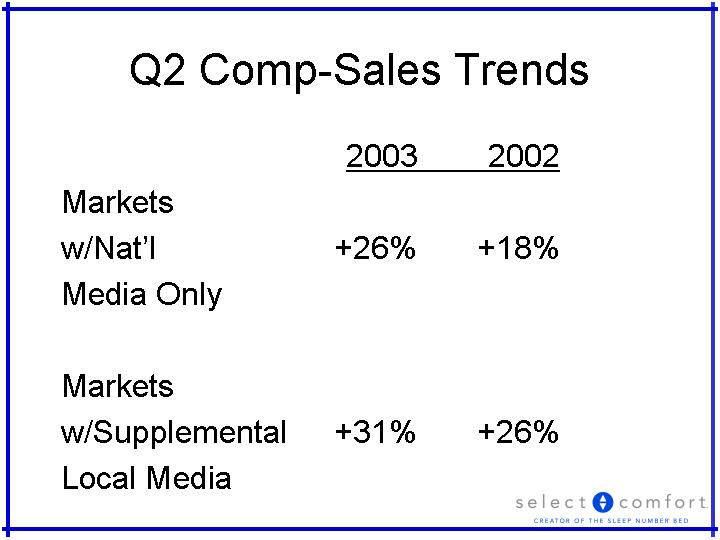
| Q2 Comp-Sales Trends 2003 2002 Markets w/Nat'l +26% +18% Media Only Markets w/Supplemental +31% +26% Local Media |
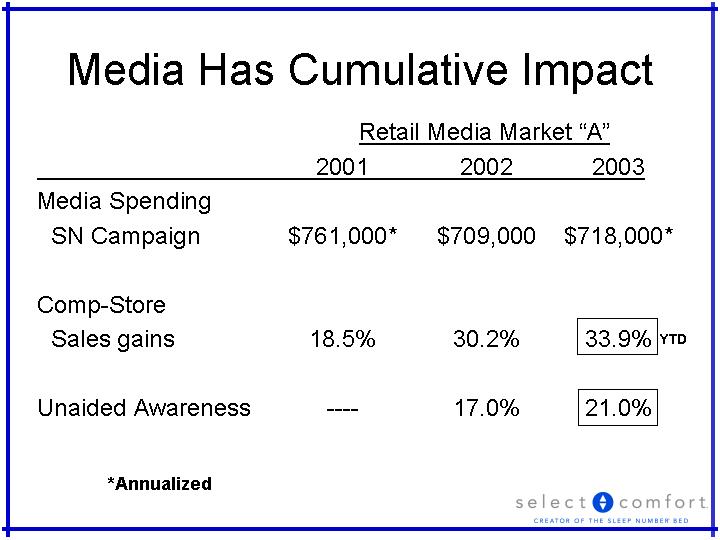
| Media Has Cumulative Impact 2001 2002 2003 Media Spending SN Campaign $761,000* $709,000 $718,000* Comp-Store Sales gains 18.5% 30.2% 33.9% Unaided Awareness ---- 17.0% 21.0% *Annualized Retail Media Market "A" YTD |
| Large Future Growth Opportunity Still a moderate advertiser Significant room to increase Nat'l cable Lifts all markets Stronger awareness and sales qualify more markets for local media Existing local campaigns expand through "Farm League" approach Local DJ program expands to 2-3/market |
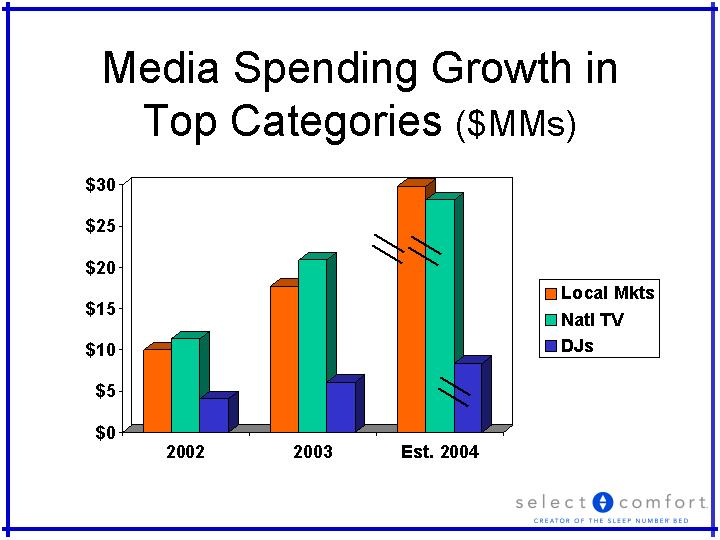
| Media Spending Growth in Top Categories ($MMs) 2002 2003 Est. 2004 Local Mkts 10 17.7 29.8 Natl TV 11.4 20.9 28.2 DJs 4.1 6.1 8.4 |
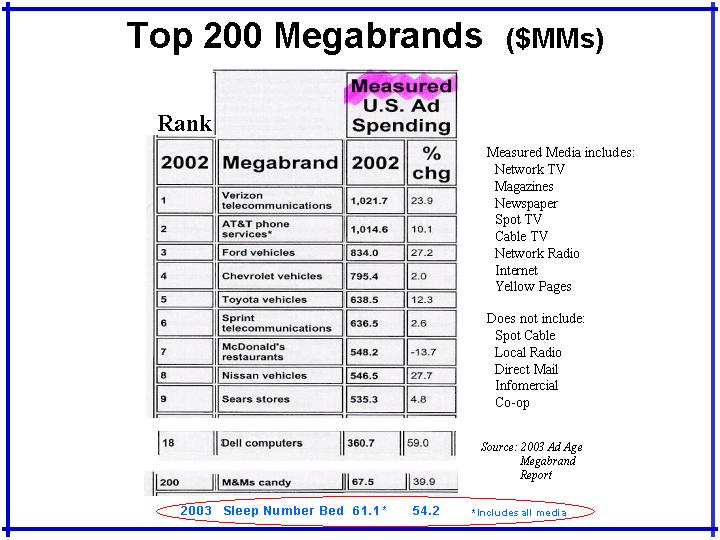
| Top 200 Megabrands ($MMs) Measured Media includes: Network TV Magazines Newspaper Spot TV Cable TV Network Radio Internet Yellow Pages Does not include: Spot Cable Local Radio Direct Mail Infomercial Co-op Source: 2003 Ad Age Megabrand Report 2003 Sleep Number Bed 61.1* 54.2 Rank *Includes all media |
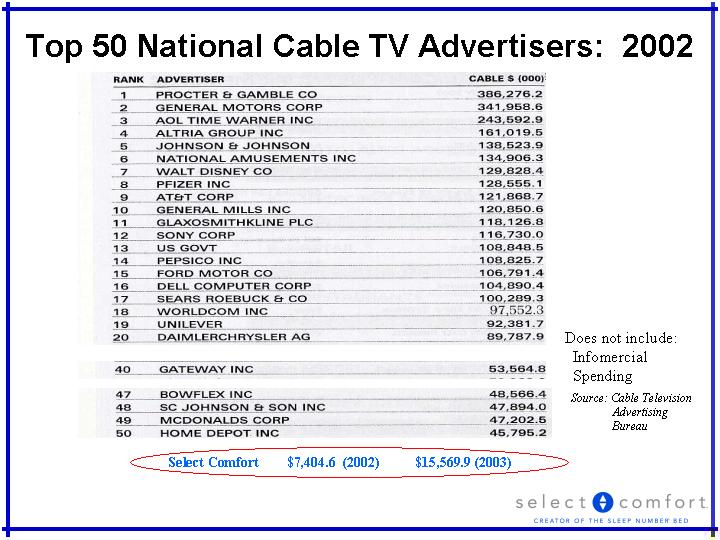
| Top 50 National Cable TV Advertisers: 2002 Select Comfort $7,404.6 (2002) $15,569.9 (2003) Source: Cable Television Advertising Bureau Does not include: Infomercial Spending |
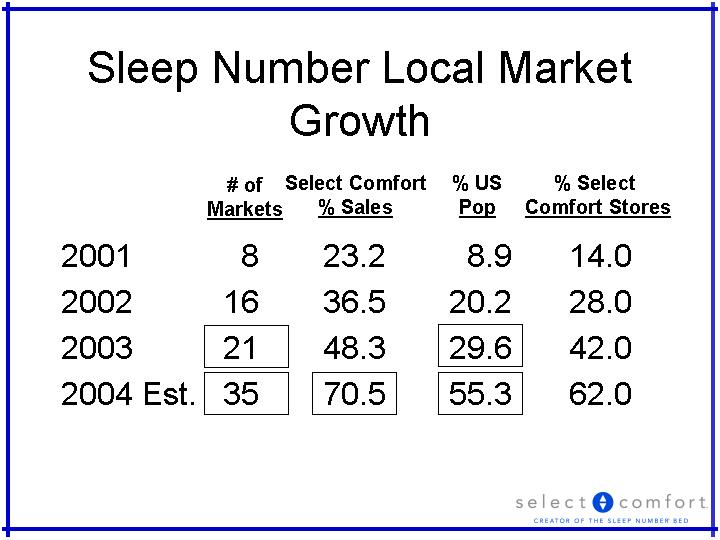
| Sleep Number Local Market Growth 2001 8 23.2 8.9 14.0 2002 16 36.5 20.2 28.0 2003 21 48.3 29.6 42.0 2004 Est. 35 70.5 55.3 62.0 # of Markets Select Comfort % Sales % US Pop % Select Comfort Stores |
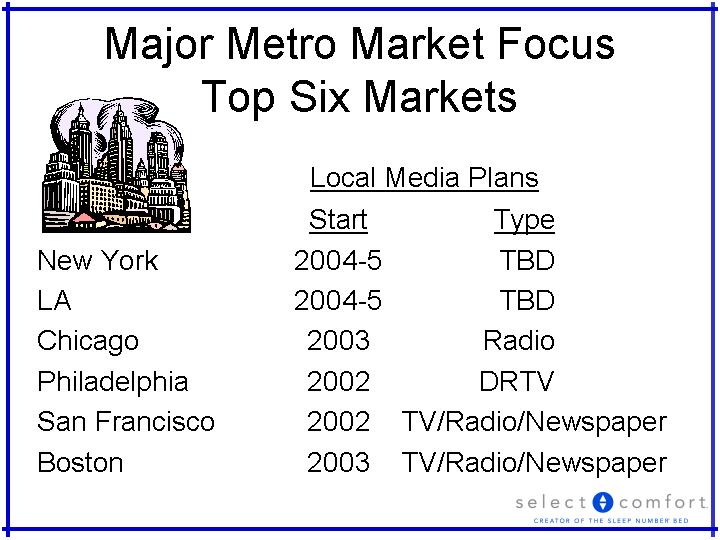
| Major Metro Market Focus Top Six Markets Start Type New York 2004-5 TBD LA 2004-5 TBD Chicago 2003 Radio Philadelphia 2002 DRTV San Francisco 2002 TV/Radio/Newspaper Boston 2003 TV/Radio/Newspaper Local Media Plans |
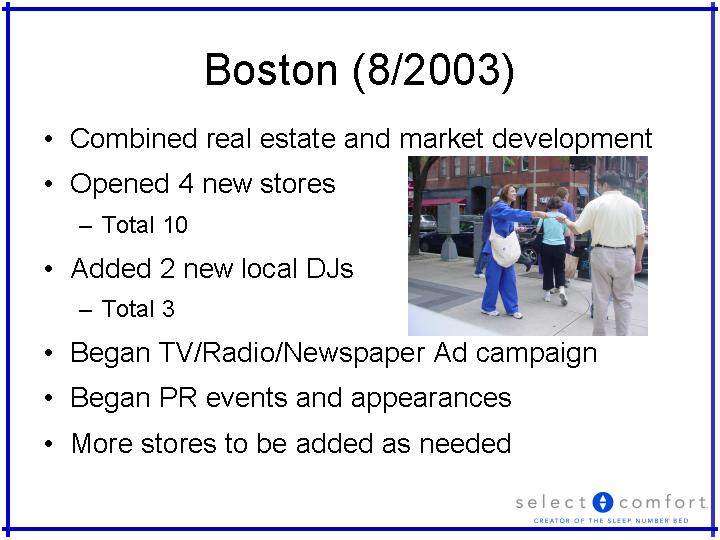
| Boston (8/2003) Combined real estate and market development Opened 4 new stores Total 10 Added 2 new local DJs Total 3 Began TV/Radio/Newspaper Ad campaign Began PR events and appearances More stores to be added as needed |
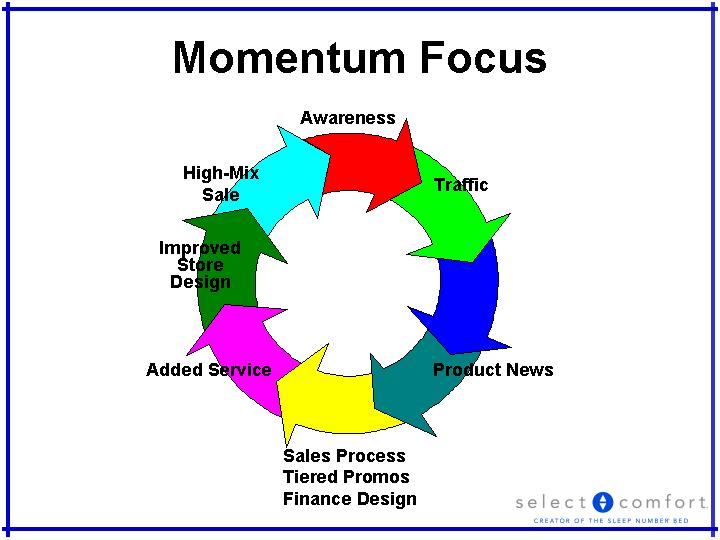
| Momentum Focus Awareness Traffic Product News Sales Process Tiered Promos Finance Design High-Mix Sale Added Service Improved Store Design |

| Distribution Growth Strategy Keith Spurgeon Senior Vice President, Sales |
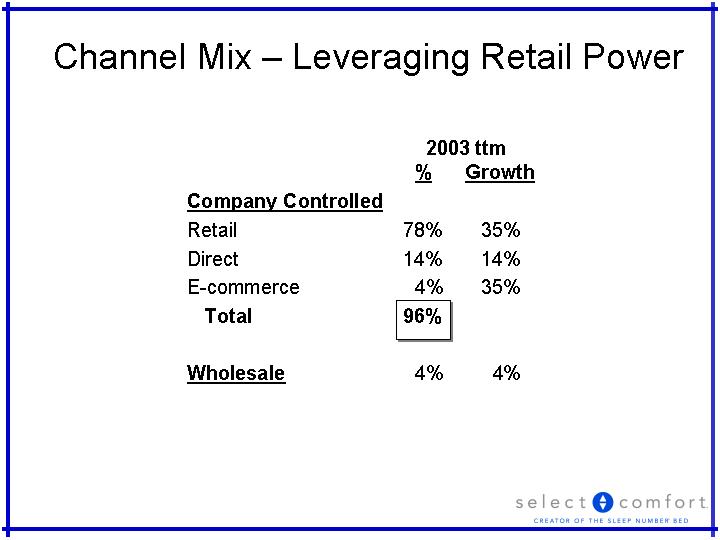
| Channel Mix - Leveraging Retail Power 2003 ttm % Growth Company Controlled Retail 78% 35% Direct 14% 14% E-commerce 4% 35% Total 96% Wholesale 4% 4% |
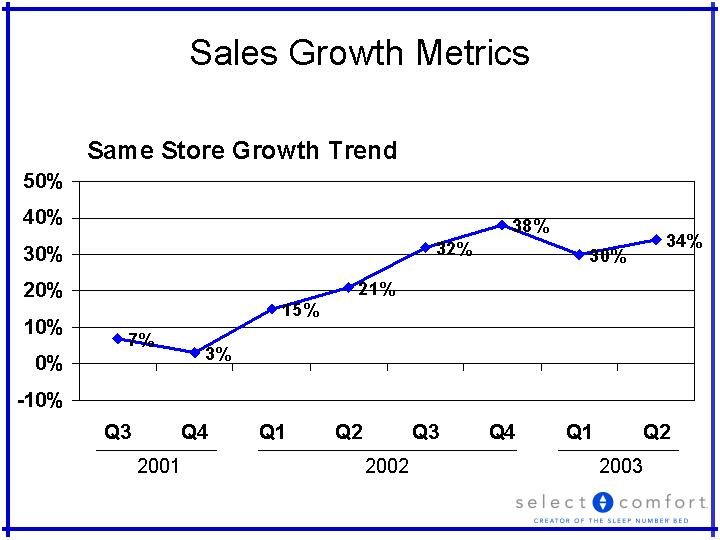
| Sales Growth Metrics Q3 Q4 Q1 Q2 Q3 Q4 Q1 Q2 0.07 0.03 0.15 0.21 0.32 0.38 0.3 0.34 2001 2002 2003 |
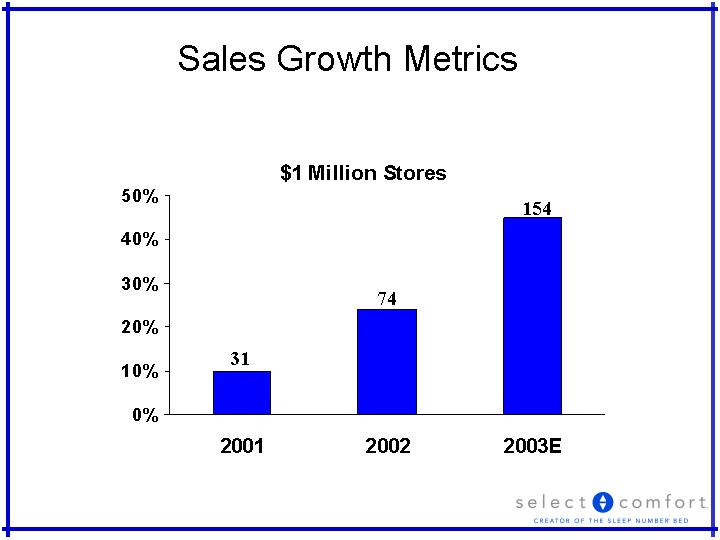
| Sales Growth Metrics 2001 2002 2003E 0.098 0.241 0.45 31 74 154 |
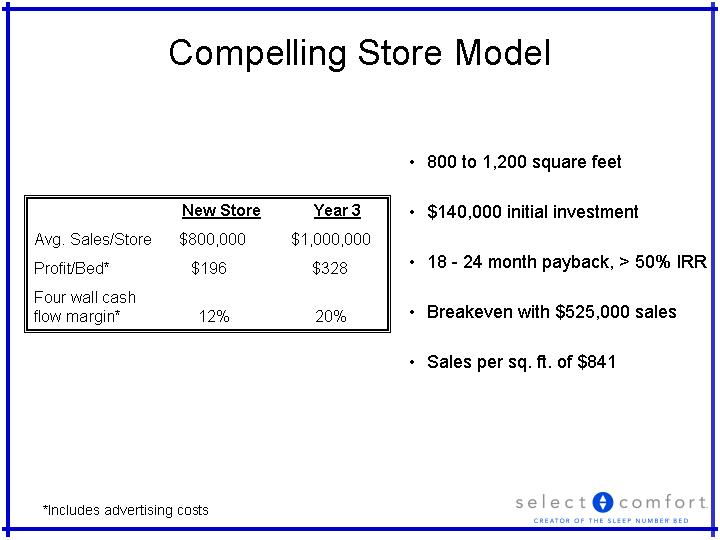
| Compelling Store Model New Store Year 3 Avg. Sales/Store $800,000 $1,000,000 Profit/Bed* $196 $328 Four wall cash flow margin* 12% 20% *Includes advertising costs 800 to 1,200 square feet $140,000 initial investment 18 - 24 month payback, > 50% IRR Breakeven with $525,000 sales Sales per sq. ft. of $841 |
| Store Selection Process Internal Success Model Marketing Support Model Rifle vs. Shotgun |

| SFO-2 LA-2 Minn-1 KC-1 St. Louis-2 Richmond-1 Atl-1 Tampa-1 Indianapolis-1 Boston-4 Columbus-1 Phoenix-2 Clev.-2 Houston-1 Dallas-1 Chicago-1 Pitts.-1 WDC-1 |

| Advertising Advertising Pop per Store Pop per Store Market Local Supplement National Only Before After Houston X 328 287 Cleveland X 406 271 DC X 383 298 Dallas X 301 271 Pittsburgh X 233 195 Chicago X 406 338 Phoenix X 243 189 Columbus X 462 308 Boston X 455 273 LA X 354 321 Indianapolis X 371 278 Tampa X 248 186 Atlanta X 358 313 Richmond X 505 252 St. Louis X 208 156 San Francisco X 394 315 Minneapolis X 182 166 Kansas City X 234 187 |
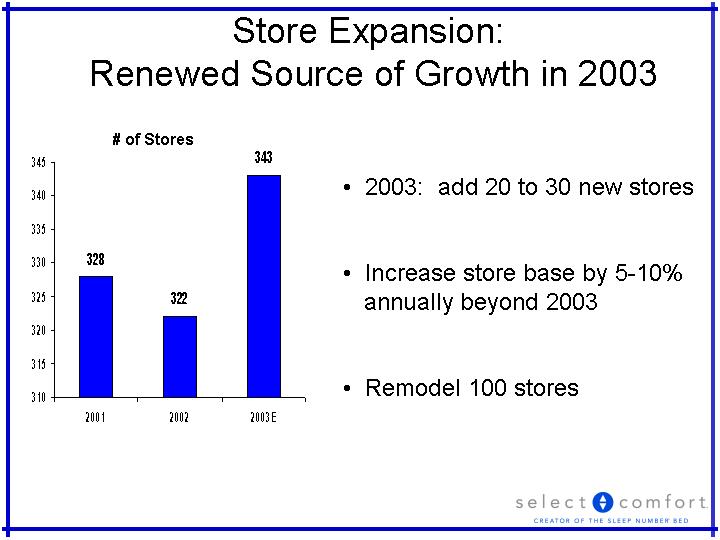
| Store Expansion: Renewed Source of Growth in 2003 # of Stores 2001 2002 2003E East 328 322 343 2003: add 20 to 30 new stores Increase store base by 5-10% annually beyond 2003 Remodel 100 stores |
| Wholesale QVC OEM Future Institutional Hospitality International |
| Retail Partners Current Partners Gabberts Benchmark Sleep Train Sleep America 1+1 > 2 |
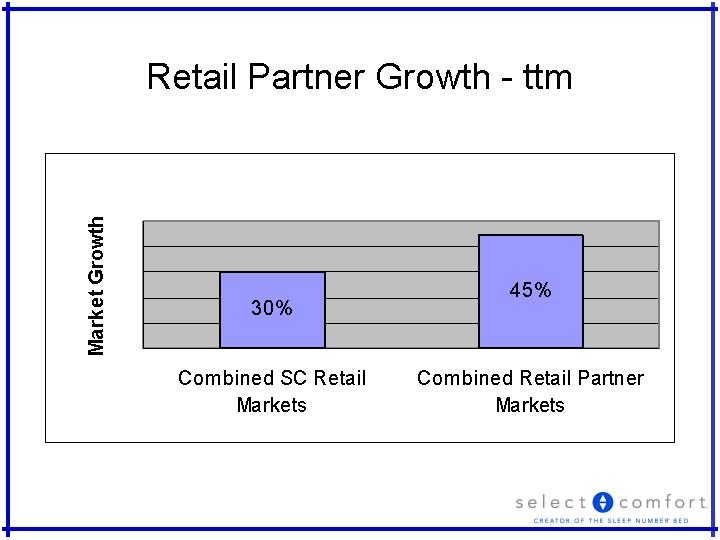
| Retail Partner Growth - ttm |
| Disciplined Growth Strategy Stores Wholesale Retail Partners |

| Jim Raabe Chief Financial Officer |
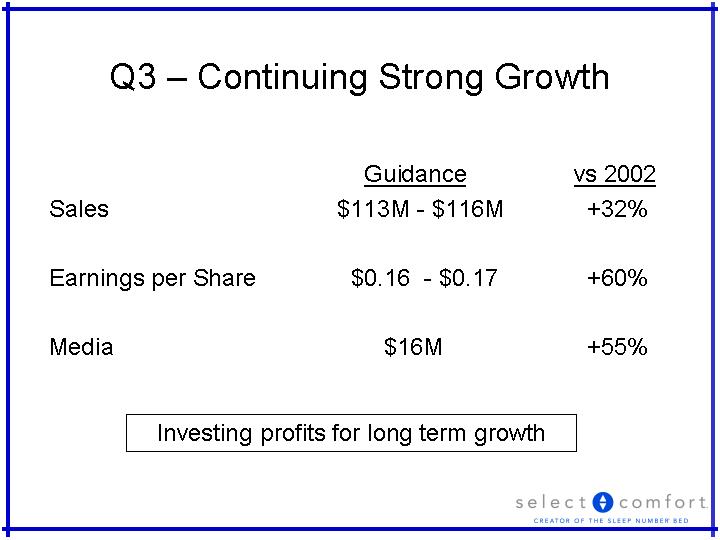
| Q3 - Continuing Strong Growth Guidance vs 2002 Sales $113M - $116M +32% Earnings per Share $0.16 - $0.17 +60% Media $16M +55% Investing profits for long term growth |
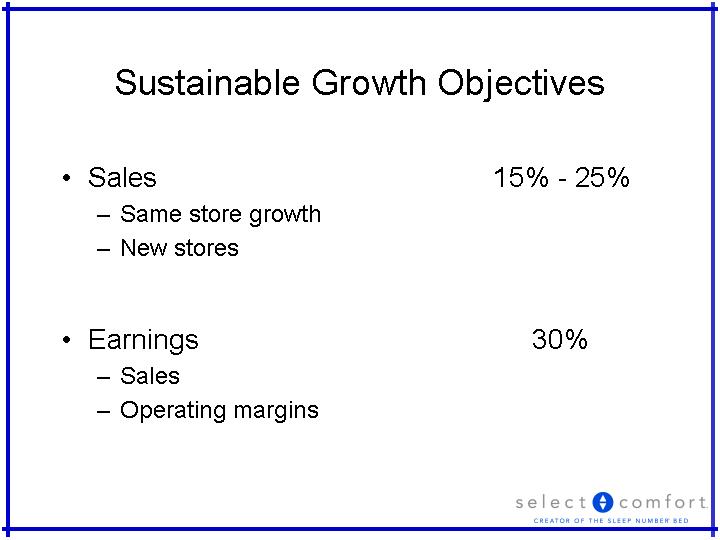
| Sustainable Growth Objectives Sales 15% - 25% Same store growth New stores Earnings 30% Sales Operating margins |
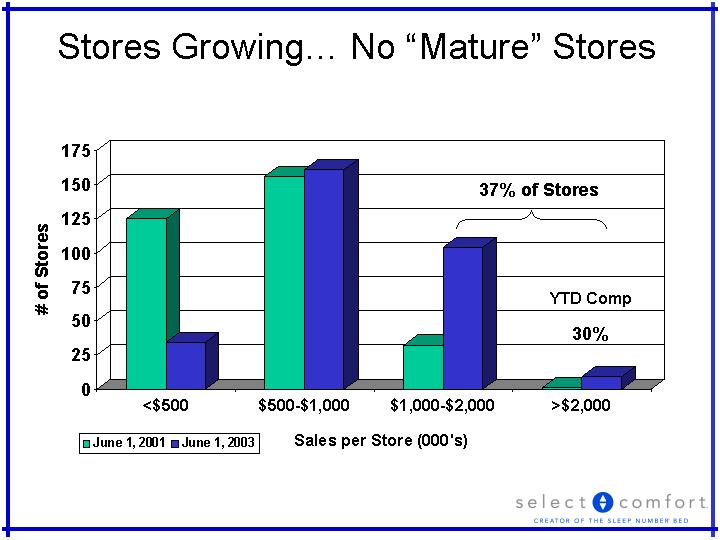
| Stores Growing... No "Mature" Stores <$500 $500-$1,000 $1,000-$2,000 >$2,000 6/1/2001 125 156 32 1 6/1/2003 34 161 104 9 30% YTD Comp 37% of Stores |

| More Mature Markets Growing Opportunity in Undeveloped Markets 5%-10% Share >10% Share 5% Share 0.3 0.12 0.58 58% of U.S. Population 28% Comp % of U.S. Population by Select Comfort Market Share |
| New Stores Provide Additional Growth No markets are currently fully stored Generate 7%-10% annual sales growth 25 to 35 new stores in 2004 Earnings positive first twelve months |
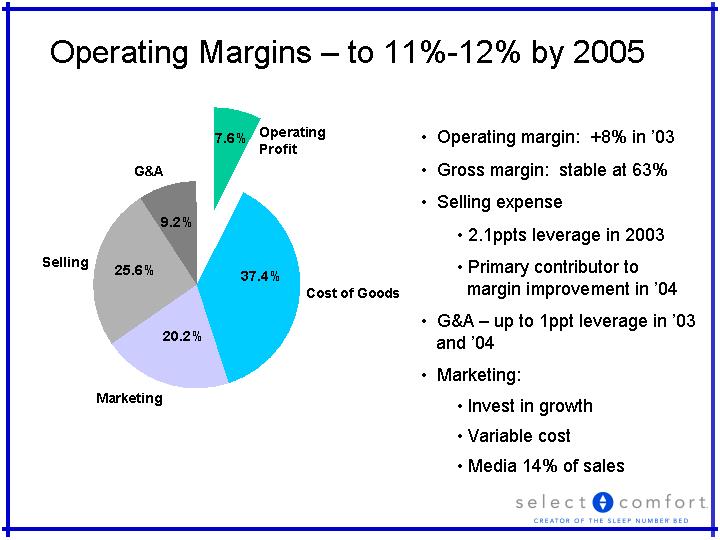
| Operating Margins - to 11%-12% by 2005 Operating Profit Cost of Goods Marketing Selling G&A East 0.076 0.374 0.202 0.256 0.092 Operating margin: +8% in '03 Gross margin: stable at 63% Selling expense 2.1ppts leverage in 2003 Primary contributor to margin improvement in '04 G&A - up to 1ppt leverage in '03 and '04 Marketing: Invest in growth Variable cost Media 14% of sales Operating Profit 37.4% 20.2% 25.6% 9.2% 7.6% |
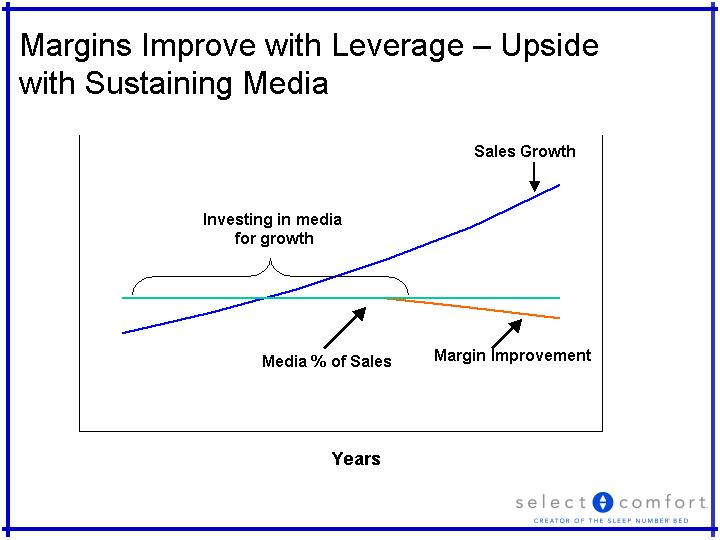
| Margins Improve with Leverage - Upside with Sustaining Media Years Media % of Sales Sales Growth Investing in media for growth Margin Improvement |

| Advantaged Model... Supports Internal Funding of Growth Priorities Growth Productivity Stock Repurchase Dividend '00 '01 '02 June '03 5.4 16.4 39.3 47.4 '00 '01 '02 June '03 (ttm) East -22.4 -4.4 28.3 26.9 |