Exhibit 99.1

| select comfort CREATOR OF THE SLEEP NUMBER BED |

| Forward Looking Statements Cautionary statements Certain risks on forward looking information Statements used in this presentation that relate to future plans, events, financial results or performance are forward-looking statements that are subject to certain risks and uncertainties including, among others, such factors as general and industry economic trends, uncertainties arising from global events, consumer confidence, effectiveness of our advertising and promotional efforts, our ability to secure suitable retail locations, our ability to attract and retain qualified sales professionals and other key employees, consumer acceptance of our products and product innovation, our ability to continue to expand and improve our product line, industry competition, warranty expenses, California wage and hour litigation, our dependence on significant suppliers, and the vulnerability of any suppliers to recessionary pressures, labor negotiations, liquidity concerns or other factors, increasing government regulations, including possible new flammability standards for the bedding industry, as well as the risk factors listed from time to time in the company's filings with the SEC, including the company's Annual Report on Form 10-K and other periodic reports filed with the SEC. |

| Select Comfort - Sales $450 million, Market Cap $850 million Sleep and bed experts Consumer Product Company Leading national retailer of beds $7.6 billion industry... growing consumer trend Advantaged product and business model Proven strategies - profitable growth Revolutionizing an Industry |

| Profitable growth Product, brand and national distribution National - 6% share Lead markets 15% - 20% share Unique business model Customer satisfaction Profit and cash leverage Growth opportunities: geography, product, channel Proven management team/ performance culture 2001 2002 2003 Sales 262 336 458 2001 2002 2003 Est. East -12.1 19.7 43.4 1.1 2002 2003 0.27 0.31 0.28 0.36 Total Same store ($11) $21 $41-$43 |

| Video In Progress |

| Adjustable firmness (air technology) Personal Comfort Better Sleep Clinically proven Low pressure points Reduced back pain 1.5 million owners/50K Testimonials Priced for broad consumer market Queen mattress $800 - $2,500 Company advantage: Starts with a Better Mattress Innerspring Sleep Number(r) Bed |

| Positive consumer trends Premium segment leading growth Active, affluent, aging Personalization, trading up Select Comfort National Market Share ($): 6% Consumers Increasingly Appreciating Quality Sleep '91 '92 '93 '94 '95 '96 '97 '98 '99 '00 '01 '02 '03 East 2.38 2.56 2.76 3.02 3.18 3.35 3.62 4.02 4.37 4.61 4.59 4.77 5.04 Nutrition Exercise Sleep Health |

| Broad Consumer Market Better Sleep 25-45 Years TV, Radio Proprietary Everybody has a Sleep Number(r) - What's Yours? Key driver of revenue growth - Brand awareness |

| Video In Progress |

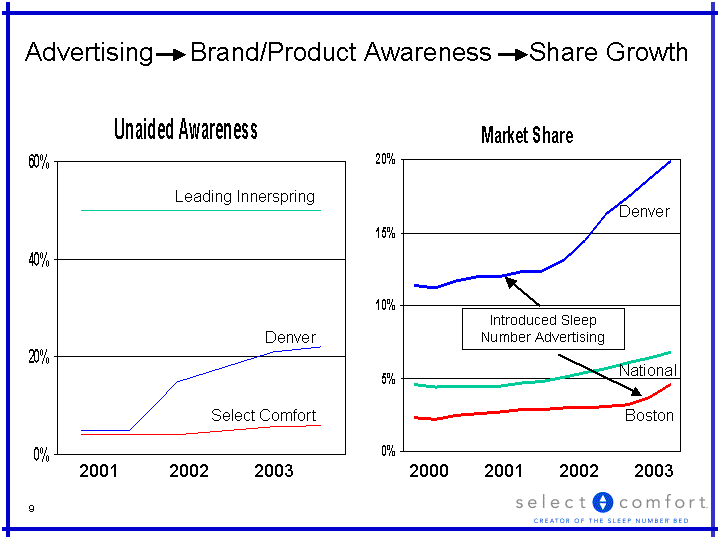
| Advertising Brand/Product Awareness Share Growth 2001 2002 2003 Sealy & Stearns 0.5 0.5 0.5 0.5 0.5 0.5 Denver 0.05 0.05 0.15 0.18 0.21 0.22 National SC 0.04 0.04 0.04 0.048 0.058 0.06 Leading Innerspring Denver Select Comfort 2000 2001 2002 2003 National 0.046 0.044 0.045 0.045 0.045 0.047 0.048 0.051 0.054 0.057 0.061 0.064 0.068 Boston 0.023 0.022 0.025 0.026 0.027 0.029 0.029 0.03 0.03 0.031 0.032 0.037 0.046 Denver 0.114 0.112 0.117 0.12 0.12 0.123 0.124 0.131 0.145 0.163 0.174 0.187 0.199 Denver National Boston Introduced Sleep Number Advertising 2001 2002 2003 2000 2001 2002 2003 |

| Product Development Sales Service/ Home Delivery Customer Service Customer Satisfaction further enhanced by Controlled Sales and Distribution 2003 Sales % of Total Growth Retail 79% 40% Direct 13% 25% E Commerce 4% 37% Wholesale 4% 23% |

| Advantage: Business Model Advantage: Business Model National Brand Controlled Sales Stores as showroom Low inventory Store capacity - $1M to $4M sales with same footprint Cash at time of order Build to Order Manufacturing 50% Excess plant capacity Proprietary supply chain Strong investment return Negative cash conversion cycle 2003 Operating free cash flow $31 million ROA +15% ROE +30% X X |

| Sustainable Growth Expectations Revenue 15% - 25% Earnings 30% Q3 Q4 Q1 Q2 Q3 Q4 Q1 Q2 Q3 Q4 East 0.6 1.7 3.4 3 5.8 8.8 6.6 7.6 11.5 14 4 4.27 4.56 4.87 5.2 5.55 5.93 6.33 6.76 7.22 Guidance Actual 2001 2002 2003 Q3 Q4 Q1 Q2 Q3 Q4 Q1 Q2 Q3 Q4 East 64.1 69.3 81.2 77.3 85.1 92.3 102 102 117.4 137.1 75 78.5 82.15 85.98 89.99 94.18 98.57 103.16 107.97 113 2001 2002 2003 30% 20% |

| Growth Formula Revenue Growth '02 '03 '04 Retail: Same store: Units 11% 14% 15% ASP 16% 17% 5% 27% 31% ^20% New stores 0% 7% ^5% Total Retail 27% 38% ^25% Total Growth 28% 36% ^20% Profit - % of Sales Est. '02 '03 '04 Gross Margin 63% nc nc Marketing 20% nc +1pt Selling 27% -2ppts -2ppts G&A 10% -1pt -1pt Op. Margin 6% 9% 10%-11% |

| Investing in our Future - National and Local '01 '02 '03 '04 Est. National 19.2 25.4 36 44 Local 10.3 14 24 36 $29 $39 $60 $80+ Local Market Development Markets % US HH % SC Stores 2001 8 10% 16% 2002 16 20% 29% 2003 21 29% 41% 2004 34 54% 67% Major metro expansion: 2002 - San Francisco 2003 - Chicago, Boston, D.C. 2004 - New York, Los Angeles |

| Increasing Awareness allows Profitable Distribution Expansion # of Stores 2001 2002 2003 2004E East 328 322 344 367 Focus: Leveraging media expansion New Stores Media Markets '03 '04 '01-'02 10 5 '03 8 8 '04 5 12 Other 4 4 27 29 |

| Compelling Store Model 2001 2002 2003 0.098 0.241 0.49 New Stores 1,000 to 1,400 square feet $160,000 initial investment $800,000+ first year sales Year 1 operating cash flow positive 18 - 24 month payback 10% 24% 49% Retail Operating 4% 12% 15% Margin $1 Million Stores |

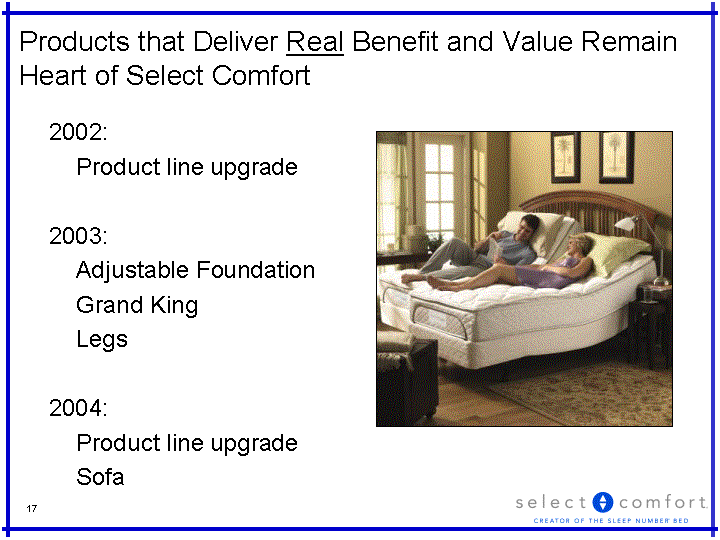
| Products that Deliver Real Benefit and Value Remain Heart of Select Comfort 2002: Product line upgrade 2003: Adjustable Foundation Grand King Legs 2004: Product line upgrade Sofa |

| People & Culture Developing Source of Long-Term Advantage Average SCSS Tenure = 4 Years |

| 2003 Outlook ($MM) (1) Millions of shares: 39.3 in Q4 and 2003, 41.5 in 2004 (2) 2002 Proforma comparison after tax EPS at 38% estimated rate Q4 2003 2003 2004 Net Sales +/- Same store sales $137 +49% +28% $458 +36% +31% $535 - $565 +20% +18%-22% EPS (1)(2) $.26 - $.28 +70% $0.67 - $0.69 +80% $0.84 - $0.90 +30% Operating Margin ^ 9% 10% - 11% Capital Expenditures $18 ^$25 Free Cash Flow $31 >$20 (as of Oct. 2003) |

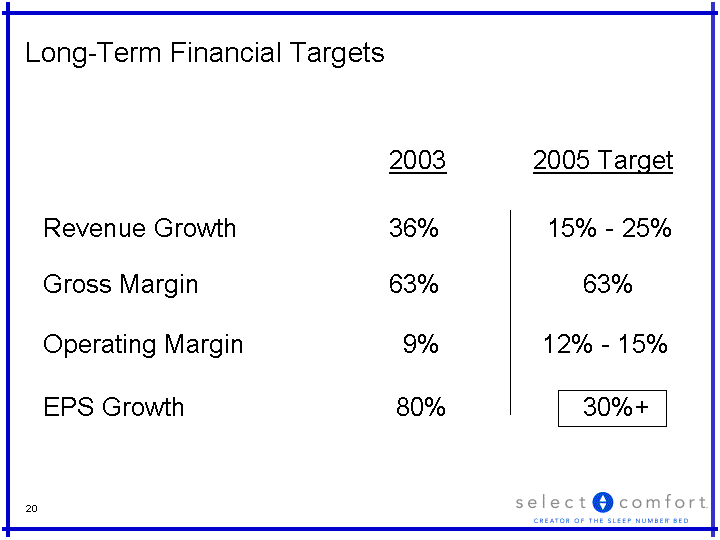
| Long-Term Financial Targets 2003 2005 Target Revenue Growth 36% 15% - 25% Gross Margin 63% 63% Operating Margin 9% 12% - 15% EPS Growth 80% 30%+ |

| Strong Balance Sheet ($MM) December 2003 Cash $75 Working Capital $50 Total Debt --- Shareholder's Equity $89 |

| Long-Term Growth & Competitive Advantage Unique product features and long-term consumer appreciation? Exposure to competition? Price pressure Distribution security & effectiveness Expansion opportunities? People and culture? |

| Select Comfort - Uniquely Positioned for Continued Growth Strong Consumer Trend - personal comfort, importance of sleep Differentiated Product and Brand Controlled Sales and Distribution Advantaged Business Model - profit and cash People and Culture Expansion opportunity Product Channel Geography |

| Mission: Improving Lives Vision: Leader in Sleep |