Forward Looking Statements Cautionary statements Certain risks on forward looking information Statements used in this presentation that relate to future plans, events, financial results or performance are forward-looking statements that are subject to certain risks and uncertainties including, among others, such factors as general and industry economic trends, uncertainties arising from global events, consumer confidence, effectiveness of our advertising and promotional efforts, our ability to secure suitable retail locations, our ability to attract and retain qualified sales professionals and other key employees, consumer acceptance of our products and product innovation, our ability to continue to expand and improve our product line, industry competition, warranty expenses, the outcome of pending litigation, including consumer claim's, California wage and hour litigation, rising regulatory and commodity costs, our dependence on significant suppliers, and the vulnerability of any suppliers to inflationary pressures, labor negotiations, liquidity concerns or other factors, increasing government regulations, including new flammability standards for the bedding industry, as well as the risk factors listed from time to time in the company's filings with the SEC, including the company's Annual Report on Form 10-K and other periodic reports filed with the SEC. |
Select Comfort: Sleep and Bed Experts NASDAQ: SCSS Consumer Product Company Vertically integrated Just in time supply chain #1 U.S. retailer of beds Revolutionizing an $8.0 billion industry - Share expansion: 5% National 20% Regional Self-funding growth 29% 3 year sales CAGR $25 million+ annual free cash flow |
Competitive Advantage Adjustable firmness, 90% share Better value Queens starting at $800, average $1,600 Durability, 20 year life Proprietary brand Clinically proven Superior customer satisfaction: 92% of owners recommend Controlled distribution Make to order, negative working capital Margin expansion potential Better Bed Better Sleep Better Business Model |
Proven Performance: Early Stage Growth 2001 2002 2003 2004 262 336 458 558 0 0.28 0.33 0.24 2001 2002 2003 2004E EPS -0.41 0.37 0.69 0.8 Operating Margin -0.041 0.063 0.093 Revenue 1 1 Pro forma to reflect tax expense Profit |
Sources of Sustained Growth '01 '02 '03 'Q3 '04 0.1 0.24 0.49 0.6 0.626 0.817 1.101 1.223 '01 '02 '03 '04 328 322 344 370 594 771 937 958 North 45.9 46.9 45 43.9 '01 '02 '03 '04 9.7 15.6 19.2 32.6 '01 '02 '03 'YTD Q3 '04 1298 1461 1686 1839 Established Stores Growing Growing Store Base with Greater Productivity New Channels Add to Core Growth (Sales in millions) Product Innovation Drives Avg. Ticket (Per mattress sales) $1.2 Million 60% 370 $958 |
New health component Premium segment growing Active, affluent, aging Personalization, trading up Select Comfort National Market Share ($): 5% Positive Consumer Trend, Large Growing Market Nutrition Exercise Sleep '91 '92 '93 '94 '95 '96 '97 '98 '99 '00 '01 '02 '03 '04E '05E East 2.38 2.56 2.76 3.02 3.18 3.35 3.62 4.02 4.37 4.61 4.59 4.77 5.04 5.5 5.94 Wholesale sales (>$8 billion at retail) |
Strategies: Building Sustainable Advantage Awareness Distribution Innovation Cost Leverage People/Culture |
Awareness: Building a Brand 2001 2002 2003 2004 Aided 4 9 21 44 Unaided 1 2 4 6 2001 2002 2003 2004 East 29 39 60 79 Media Investment Awareness Grows Sleep Number Dual Adjustability Location Find Your Sleep Number |
VIDEO IN PROGRESS |
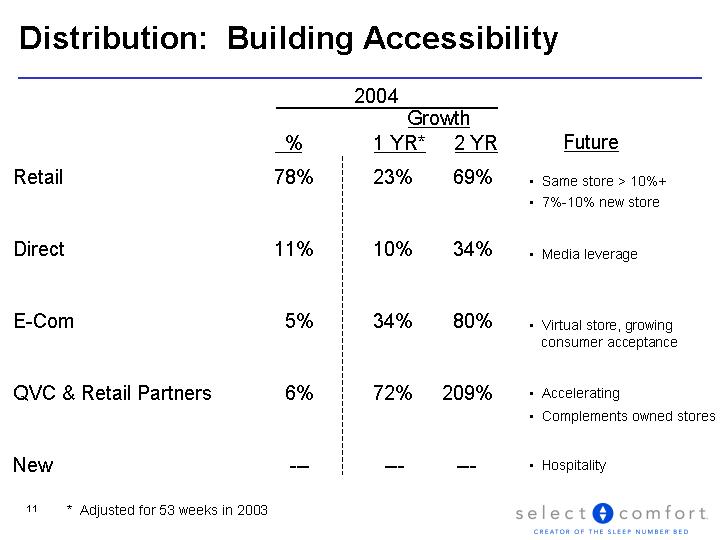
Distribution: Building Accessibility * Adjusted for 53 weeks in 2003 2004 Growth % 1 YR* 2 YR Retail 78% 23% 69% Direct 11% 10% 34% E-Com 5% 34% 80% QVC & Retail Partners 6% 72% 209% New --- --- --- Future Same store > 10%+ 7%-10% new store Media leverage Virtual store, growing consumer acceptance Accelerating Complements owned stores Hospitality |
Distribution: New Store Economics 2001 2002 2003 Q3 2004 0.098 0.241 0.49 0.6 New Stores 1,000 to 1,400 square feet $180,000 initial investment $800,000+ first year sales Year 1 operating cash flow positive 18 - 24 month payback 10% 24% 49% Operating Margins +19% $1 Million Stores 60% |
Innovation: Building Product Advantage 2002 Line upgrade Home Delivery 2003 Adjustable Foundation 2004 Line upgrade New model (9000) 2005 Sofa launch 4000 model reintroduction |
Building Cost Advantage '02 '03 '04 Q3 0.625 0.627 0.611 Opportunity Plant leverage, 65% utilized Home delivery start-up Productivity gains in existing store base Investing in new markets Future leverage opportunity Systems Scale '02 '03 '04 Q3 0.268 0.245 0.232 '02 '03 '04 Q3 0.118 0.13 0.141 '02 '03 '04 Q3 0.098 0.084 0.076 |
Long-Term Targets: $1 Billion by 2007 3-5 Year Opportunity Revenue Growth 15% - 25% Gross Margin 60% - 62% Operating Margin 12% - 15% EPS Growth 20% - 30% |
Mission: Improving Lives Vision: Leader in Sleep |