Exhibit 13

2
| Building the
foundation for
future growth
Dear Shareholders,
I came to Select Comfort five years ago, impressed by the company’s innovative product, its high level of customer satisfaction, and its unique business model. Back in 2000, I viewed these elements as building blocks for future growth, and saw significant opportunity in overcoming the challenges we then faced of low brand awareness and unprofitable operations. Looking back on 2004 and looking beyond to the next decade, I recognize that challenges are ever-present, but that our company is young and our opportunities ahead are great. I believe our product, people and business model will continue to provide us meaningful competitive advantage, allowing us to successfully build long-term growth and excellence for Select Comfort. |
The true test of a company is not how it manages success but rather how it emerges from challenge. In 2004, Select Comfort met various challenges, such as an unpredictable consumer economy and rising fuel costs, and emerged stronger as a result. We proved we can grow in less-than-perfect conditions, and we demonstrated that we have the ability to respond quickly and make course corrections when faced with obstacles.
Building on core strengths
Leadership is at the heart of Select Comfort, and I believe our leadership talent at all job levels remains unmatched nationwide. While I have great confidence in the strength and integrity of our management team, some of the most impressive leaders I’ve met at Select Comfort are on the front line selling, manufacturing and delivering beds, giving us a solid competitive advantage and cementing the strength of our direct-to-consumer business model. In 2004, our sales force demonstrated this leadership by delivering 22 percent sales growth – an enviable figure in a year when many major retailers struggled for growth.
The Sleep Number® brand also plays a pivotal role in solidifying our foundation. For any innovative product, a key to success is building awareness, understanding and interest among consumers. Since 2001 – when we launched the Sleep Number® brand and advertising campaign – we have helped more consumers each year discover the benefits of the Sleep Number® bed by broadening both our media reach and our distribution base. In 2004, we made major strides in increasing brand awareness by extending our national advertising, growing distribution and expanding our local Sleep Number® retail advertising campaign into 34 markets, now reaching more than 55 percent of the U.S. population.
Our differentiated business model provides a solid base for building our future success. Because we directly design, manufacture, market, sell, deliver and service the Sleep Number® bed, our vertically integrated business provides us with advantages no competitor can easily match. In addition to allowing us to comprehensively serve our customers, our business model provides us with strong profit leverage and cash generation potential. For example, we ended 2004 with $92 million in cash and marketable securities, with no debt, and during the year we repurchased approximately $21 million of company stock. | 
|
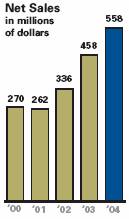
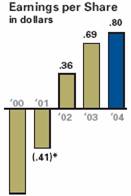
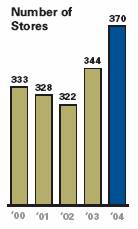
During 2004, we achieved profitable growth with record sales of $558 million – our third consecutive year with sales growth in excess of 20 percent. We also grew earnings per share by 16 percent and generated $52 million in net cash from operating activities. We opened 31 new stores to finish the year with 370. We launched a partnership with Radisson Hotels & Resorts®, with plans to replace a majority of its 90,000 beds over the next several years. And we increased national unaided awareness of our Sleep Number® brand from eight percent to ten percent by the end of the year.
4
Building unmatched innovation
Select Comfort’s spirit of innovation dates back to 1987, when Bob Walker created the Sleep Number® bed. Today, this differentiated and superior alternative to innerspring and other mattresses remains at the heart of Select Comfort’s competitive advantage and growth potential.
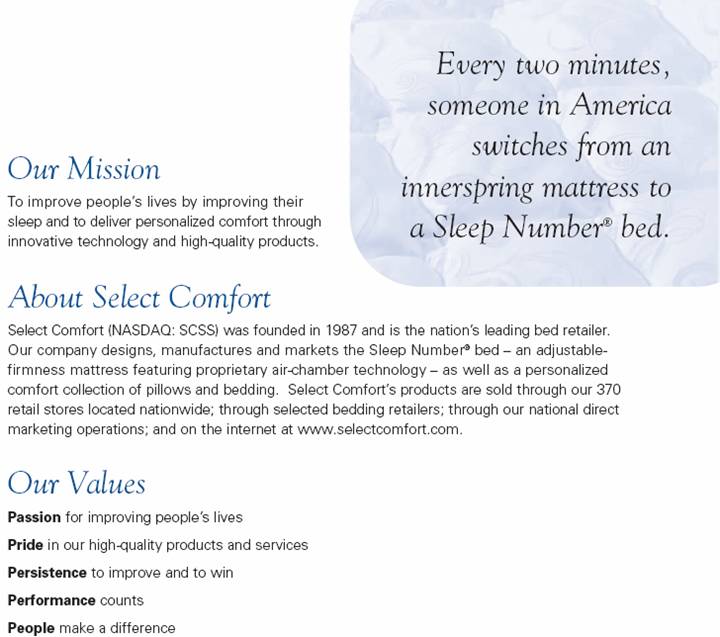
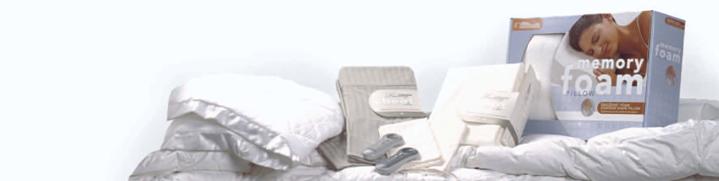
Our mission is to improve people’s lives by improving their sleep and to deliver personalized comfort through innovative technology and high-quality sleep products. We made tremendous strides in 2004 in achieving this mission and augmenting our growth with the introduction of one of the most advanced and luxurious beds ever offered – the Sleep Number® 9000 model. We also introduced the Sleep Number® SofaBed™ , which combines the comfort, support and dual adjustability of a Sleep Number® bed with the beauty of a custom-designed sofa. Further, we updated or enhanced our bed models at all price points to reflect the latest innovations in comfort and technology.
Further extending our commitment to innovation, we refined our customer service and home delivery processes in 2004 to allow a higher level of service for our customers. Recognizing this as a top priority in ensuring long-term customer loyalty, we invested in related system improvements last year and anticipate further investment in 2005. Sleep Number® bed owners are our greatest asset, and we believe that investing in their satisfaction will yield rewards for years to come.
While not without challenges, 2004 was a year of solid growth, market expansion and innovative product design, making Select Comfort stronger, larger and more profitable, positioning us for growth in 2005 and beyond.

| | Building for long-term growth
In 2005, we plan to continue building on our core strengths and investing in our people, processes and infrastructure to leverage our growth potential moving forward. Major metro markets are still under-penetrated, for example, and present a significant opportunity to increase brand awareness and expand distribution.
We plan to increase our advertising investment to approximately $88 million, to open 30-40 new company-owned stores, and to accelerate our retail partnership program to increase the availability of Sleep Number® beds nationwide. Our partnership with Radisson Hotels and Resorts® also will provide a unique opportunity for consumers to experience the benefits of a Sleep Number® bed prior to purchase, giving us even greater potential to deliver upon our mission. |
5
Building confidence
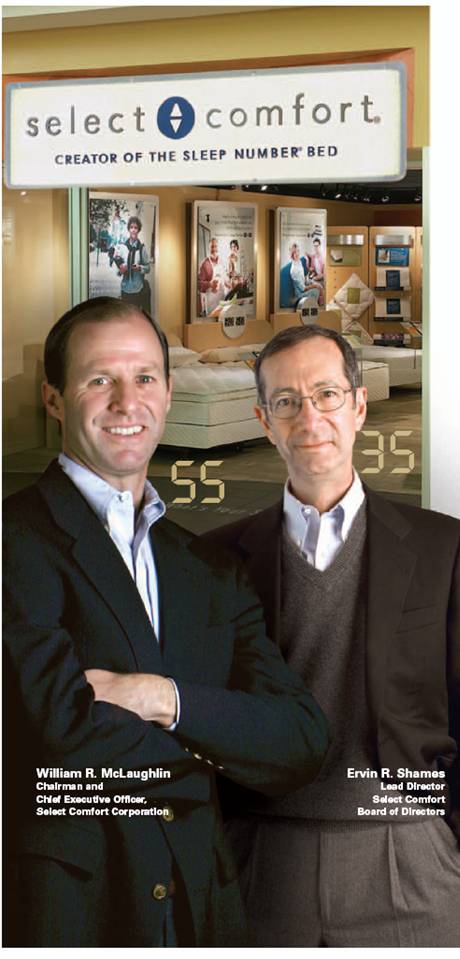
While it may go without saying, integrity, honesty and values are at the center of all we do at Select Comfort and certainly provide the fiber with which our business was built. In 2004, our Board of Directors made a formal move to enhance our high governance standards by appointing Erv Shames as lead director. Erv’s long tenure on Select Comfort’s board has been invaluable, and I appreciate the wise and consistent counsel he provides. He holds us and himself to exacting standards, drawing from his distinguished career leading consumer businesses, and he is a strong asset to Select Comfort.
We also appointed Christine Day, president of Starbucks Coffee International’s Asia Pacific Group, to our Board of Directors late last year. The experience that Christine brings to our company will be integral in helping Select Comfort establish a firm platform for continued growth, and in planning for future systems improvements and international expansion.
My five years at Select Comfort have been the most rewarding of my career – both professionally and personally. During this time, our revenues have doubled, earnings have increased dramatically and our cash and marketable securities have grown to more than $90 million. More importantly, we have doubled the number of satisfied Sleep Number® bed owners, effectively improving the lives of more than three million Americans. We have also faced many new challenges – ones we couldn’t have foreseen five years back – yet we learned and emerged stronger, faster and more responsive as a result, strengthening our foundation and positioning ourselves better than ever for long-term profitable growth.
With diligence and consistency, we are adding new building blocks of growth every day at Select Comfort. We are continuing along our journey, preparing to break through to $1 billion in sales, to increase margins and improve cash generation, and to strengthen our winning team.
Sleep well,

| |
| |
Bill McLaughlin |
As a fast-growing, mid-sized company, I believe we have only scratched the surface of what we can achieve, and the next three to five years promise to be our most exciting and demanding. In this next stage, our goal is to:
• Achieve at least 15-20 percent annual sales growth
• Reach $1 billion in sales by 2007
• Grow earnings at 20-25 percent annually
We are well leveraged to accomplish this through:
• A unique product that is clinically proven to improve sleep
• A focused distribution strategy that includes both company-owned stores and selected retail partners
• Targeted brand awareness campaigns, especially in large metropolitan markets where opportunities are the greatest
• A differentiated business model that positions us for strong profit leverage and cash generation potential
• A powerful pipeline of talented employees
6

Building awareness and distribution
Over the past four years, our integrated, cross-channel marketing initiatives have helped us build Sleep Number® brand awareness and drive retail store traffic. The Sleep Number® brand was launched in 2001, and national unaided awareness already has increased to 10 percent, placing our young brand fifth in the industry. An impressive achievement, yet one that clearly demonstrates additional opportunity for growth moving forward.
Market expansion is the core of our growth strategy, and in 2004 we significantly broadened our advertising, awareness and market share in the nation’s leading major metropolitan markets. Building on our national media and brand awareness, we launched our most aggressive local market expansion program yet, opening additional stores and launching supplemental advertising and public relations campaigns in high-population cities like Los Angeles, New York, Boston and Chicago. | | Percent of Stores at
$1 million or more in sales

The company achieved double-digit comparable store sales growth again in 2004, with same-store sales increasing 16 percent. |
| |
With these major metro initiatives, the local Sleep Number® advertising campaign now runs in 34 retail markets. More and more Americans are realizing the benefits of the Sleep Number® bed, with unaided brand awareness growing to 32 percent in our five lead advertising markets. | |
| |
In order to leverage the company’s media investment, we’re concentrating on increasing store density to align with the population base in key markets. We made great strides during 2004, successfully opening 31 new stores, including two stores in Manhattan, two additional stores in Los Angeles and three more in Chicago. This brings the total number of company-owned stores to 370 – with nearly 35 percent located in America’s top 10 markets. | |
We also signed retail distribution agreements to make the Sleep Number® bed available through retailers in Alaska and Hawaii for the first time in 2004. Over the next three to five years, our goal is to increase distribution outlets to more than 1,000 through a combination of company stores and retail partnerships, making it easier than ever for consumers to experience the benefits of the Sleep Number® bed.

8
Building innovation
Select Comfort was born from innovation, and it continues to be the foundation on which the company is built. At no time has this innovation been more evident than today – having just completed our most aggressive round of product research and development to date. This new strength across our product line provides a unique opportunity to build market share at all price points and across all channels moving forward.
All of our product development efforts are rooted firmly in the science of sleep and focused squarely on delivering upon our mission. In 2004, we introduced the state-of-the-art Sleep Number® 9000 model, featuring an advanced digital remote control and a seasonal Duvet-style pillowtop for personalized comfort. The Sleep Number® SofaBed™ was introduced on a pilot basis, and we expanded its availability to 71 stores in 28 markets by the end of the year. We also upgraded and enhanced all bed models in our line during 2004. | 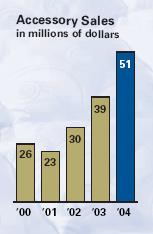
|
|
Accessories also played a key role in expanding our product offerings this year, giving consumers added personalized comfort choices and improving the company’s incremental revenue. Highlights included the introduction of a one-of-a-kind blanket with Thinsulate® Insulation, developed in partnership with 3M; new Dream Fit® sheets available in 300- or 420-thread count styles; and a new and exclusive GridZone™ Memory Foam Pillow. |
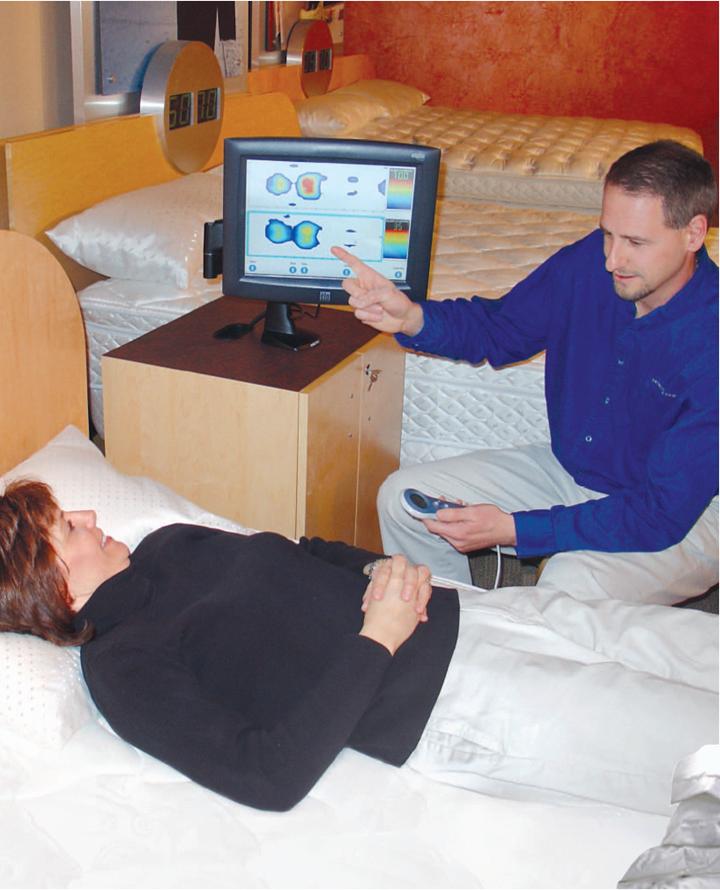
Sleep innovation also was extended to our stores during the year with PressureMapSM technology, which uses a computerized, high-precision sensor pad to measure the pressure created between the body and a sleep surface. This new technology adds science to finding a person’s Sleep Number® by quickly pinpointing the areas where sleepers need the most support. Pilot testing was so well received by customers that pressure mapping is being rolled out to all Select Comfort stores during 2005.
Another key initiative that drives innovation and sharpens our focus on sleep science is our Sleep Advisory Board™, an interdisciplinary group of leading clinicians and scientists with expertise in the relationship between sleep and health. Members of our Sleep Advisory Board have been published in prominent medical journals for their ground-breaking research in the area of sleep, and they provide valuable insight and guidance to our company on issues related to the science and practice of better sleep.
10

Building the customer experience
Every two minutes, someone switches from an innerspring mattress to a Sleep Number® bed, bringing the total number of Sleep Number® bed owners to more than three million in 2004. This foundation of loyal customers will continue to grow as consumers place an increasingly greater value on sleep and continue to invest in innovative, high-quality products to improve their lives.
As our loyal customer base grows, so too does the impact of Select Comfort’s differentiated, vertically integrated business model. It is this direct contact with our bed owners through every aspect of the business that provides us valuable, real-time consumer insight and information, allowing us to increase customer satisfaction and to identify new opportunities for innovation and growth. | | 
|
| |
Satisfied customers are loyal customers, and loyal customers are critical to a company’s future growth. At Select Comfort, we value customer loyalty and satisfaction above all else, and we are continually refining and enhancing our customer service and home delivery models to ensure our customers are receiving a level of service that is unparalleled in our industry. | |
Another way we are enhancing the customer experience is by increasing consumer trials of the Sleep Number® bed. Through our partnership with Radisson Hotels and Resorts®, millions of travelers each year will be able to experience the benefits of adjustable firmness on a Sleep Number® bed at Radisson properties throughout North America and the Caribbean.
Select Comfort’s home delivery, assembly and mattress removal service also has contributed to improving the overall customer experience. Our home delivery technicians are Sleep Number® bed owners who can articulate the benefits of the bed, reinforcing the sales process and ensuring satisfied customers. The total number of beds delivered through our full-service home delivery team was 136,000 in 2004, representing 43 percent of total beds sold. This growth doesn’t come without learning, however. We know that there is still room for improvement to help meet our expanded sales goals in 2005, and we plan to make the necessary investments in home delivery systems, scheduling and personnel to ensure continued success.

12

13
Building a progressive company
At Select Comfort, we’ve built a strong company by developing our people, giving back to the community and remaining true to our values. Values that include passion for improving people’s lives; pride in Select Comfort’s high-quality products and services; persistence to improve and to win; performance that counts and people who make a difference.
By staying true to these values, our nearly 2,500 employees bring our mission to life, each and every day. Many companies say that employees are their most valuable and irreplaceable asset. At Select Comfort, we prove it. We have well established systems for recruiting and retaining the very best and brightest people, giving us the talent and resources we need to build our bench to capture ongoing and future growth opportunities. | | 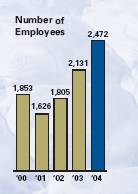
|
| |
By implementing programs such as leadership development training for our front-line managers throughout the country, we’re providing the knowledge and tools these managers need to provide effective leadership and to maximize their own and their staffs’ potential. We also have established communication and awards programs, allowing us to celebrate our success when appropriate, reward our employees and communicate our vision, values, goals and progress on a frequent, first-hand basis. | |
Select Comfort strives to be a great place to work and build a long-term career. One reason our employees take pride in their company is because of our commitment to Ronald McDonald House Charities® and our support of its efforts to help families when they need it the most. Ronald McDonald House® provides housing and support for families whose children are undergoing medical treatment at area hospitals. Select Comfort and its employees donate time, money and beds to Ronald McDonald Houses nationwide, providing better sleep to families under stress. The company is more than halfway toward meeting our goal of filling more than 4,000 Ronald McDonald House® bedrooms with Sleep Number® beds.

14
Selected Consolidated Financial Data
(in thousands, except per share and selected operating data, unless otherwise indicated)
The data presented below have been derived from our Consolidated Financial Statements and should be read in conjunction with “Management’s Discussion and Analysis of Financial Condition and Results of Operations” and our Consolidated Financial Statements and Notes thereto included in this Annual Report:
| | 2004 | | 2003(1) | | 2002 | | 2001 | | 2000 | |
Consolidated Statements of Operations Data: | | | | | | | | | | | |
Net sales | | $ | 557,639 | | $ | 458,489 | | $ | 335,795 | | $ | 261,687 | | $ | 270,077 | |
Gross profit | | 340,674 | | 287,326 | | 209,999 | | 154,477 | | 154,476 | |
Operating expenses: | | | | | | | | | | | |
Sales and marketing | | 249,925 | | 206,248 | | 155,848 | | 138,417 | | 149,272 | |
General and administrative | | 41,218 | | 38,423 | | 32,854 | | 25,296 | | 29,211 | |
Store closings and asset impairments | | — | | 71 | | 233 | | 1,366 | | 1,952 | |
Operating income (loss) | | 49,531 | | 42,584 | | 21,064 | | (10,602 | ) | (25,959 | ) |
Net income (loss) | | $ | 31,555 | | $ | 27,102 | | $ | 37,466 | | $ | (12,066 | ) | $ | (37,203 | ) |
Pro forma net income (loss) (2) | | $ | 31,555 | | $ | 27,102 | | $ | 11,969 | | $ | (7,481 | ) | $ | (15,866 | ) |
Net income (loss) per share: | | | | | | | | | | | |
Basic | | $ | 0.87 | | $ | 0.82 | | $ | 1.53 | | $ | (0.66 | ) | $ | (2.08 | ) |
Diluted | | $ | 0.80 | | $ | 0.69 | | $ | 1.10 | | $ | (0.66 | ) | $ | (2.08 | ) |
Pro forma (2) | | $ | 0.80 | | $ | 0.69 | | $ | 0.36 | | $ | (0.41 | ) | $ | (0.89 | ) |
Shares used in calculation of net income (loss) per share: | | | | | | | | | | | |
Basic | | 36,158 | | 32,856 | | 24,549 | | 18,157 | | 17,848 | |
Diluted and pro forma (2) | | 39,683 | | 39,277 | | 34,532 | | 18,157 | | 17,848 | |
| | | | | | | | | | | |
Consolidated Balance Sheet Data: | | | | | | | | | | | |
Cash, cash equivalents and marketable securities | | $ | 91,743 | | $ | 75,118 | | $ | 40,824 | | $ | 16,375 | | $ | 5,448 | |
Working capital | | 26,445 | | 54,315 | | 27,064 | | (3,739 | ) | (12,431 | ) |
Total assets | | 191,813 | | 153,506 | | 108,633 | | 67,436 | | 64,672 | |
Long-term debt, less current maturities | | — | | — | | 2,991 | | 17,109 | | 2,322 | |
Total shareholders’ equity | | 114,344 | | 92,201 | | 54,024 | | 5,937 | | 15,765 | |
| | | | | | | | | | | |
Selected Operating Data: | | | | | | | | | | | |
Stores open at period-end (3) | | 370 | | 344 | | 322 | | 328 | | 333 | |
Stores opened during period | | 31 | | 27 | | 15 | | 11 | | 19 | |
Stores closed during period | | 5 | | 5 | | 21 | | 16 | | 27 | |
Average net sales per store (000’s) (4) | | $ | 1,247 | | $ | 1,101 | | $ | 817 | | $ | 626 | | $ | 636 | |
Percentage of stores with more than $1.0 million in net sales (4) | | 64 | % | 49 | % | 24 | % | 10 | % | 12 | % |
Comparable store sales increase (decrease) (5) | | 16 | % | 31 | % | 27 | % | (4 | )% | — | |
Average square footage per store open during period (4) | | 1,032 | | 990 | | 972 | | 941 | | 913 | |
Net sales per square foot (4) | | $ | 1,208 | | $ | 1,113 | | $ | 841 | | $ | 666 | | $ | 697 | |
Average store age (in months at period end) | | 75 | | 70 | | 61 | | 51 | | 41 | |
Operating free cash flow (000’s) (6) | | $ | 31,083 | | $ | 30,839 | | $ | 28,342 | | $ | (4,445 | ) | $ | (22,370 | ) |
15
(1) Fiscal year 2003 had 53 weeks. All other fiscal years presented had 52 weeks.
(2) Pro forma net income (loss) per share reflects the effect on net income from the recognition of an income tax benefit (provision) for years where a regular tax provision, at a rate of 38%, was not recorded. Generally accepted accounting principles (GAAP) did not allow us to reduce net income for income tax expense in 2002 or to provide an income tax benefit in 2001 or 2000. Because we have recorded income tax expense in 2003 and 2004, and we expect to continue recording income tax in future periods, we believe pro forma net income (loss) per share provides a more meaningful comparison than GAAP net income (loss) per share for 2002, 2001 and 2000.
A reconciliation of net income (loss) and net income (loss) per diluted share (as determined in accordance with GAAP) to pro forma net income (loss) and pro forma net income (loss) per diluted share is as follows:
| | 2002 | | 2001 | | 2000 | |
| | | | | | | |
GAAP net income (loss) | | $ | 37,466 | | $ | (12,066 | ) | $ | (37,203 | ) |
Effect of: | | | | | | | |
Income tax (provision) benefit at 38% of income before tax | | (7,501 | ) | 4,585 | | 9,736 | |
(Restoration) write-off of deferred tax asset | | (17,996 | ) | — | | 11,601 | |
Pro forma net income (loss) | | $ | 11,969 | | $ | (7,481 | ) | $ | (15,866 | ) |
| | 2002 | | 2001 | | 2000 | |
| | | | | | | |
GAAP net income (loss) per diluted share | | $ | 1.10 | | $ | (0.66 | ) | $ | (2.08 | ) |
Effect of: | | | | | | | |
Income tax (provision) benefit at 38% of income before tax | | (0.22 | ) | 0.25 | | 0.55 | |
(Restoration) write-off of deferred tax asset | | (0.52 | ) | — | | 0.64 | |
Pro forma net income (loss) per diluted share | | $ | 0.36 | | $ | (0.41 | ) | $ | (0.89 | ) |
(3) Includes stores operated in leased departments within other retail stores (13, 13, 13, 22 and 25 at the end of 2004, 2003, 2002, 2001, and 2000, respectively).
(4) For stores open during the entire period indicated.
(5) Stores enter the comparable store calculation in the 13th full month of operation. Stores that have been remodeled or relocated within the same shopping center remain in the comparable store base. The number of comparable stores used to calculate such data was 339, 316, 307, 317 and 314 for 2004, 2003, 2002, 2001 and 2000, respectively. Our 2004 and 2003 comparable store sales increase reflects adjustments for an additional week of sales in 2003. Without adjusting for the additional week, comparable store sales would have been 14% for 2004 and 34% for 2003.
(6) Operating free cash flow (OFCF) is a key financial measure but should not be construed as an alternative to operating income or net cash provided by (used in) operating activities (as determined in accordance with GAAP). We believe that OFCF is a useful supplement to cash flow data in understanding cash flows generated from operations after reductions for capital expenditures. A reconciliation of net cash provided by (used in) operating activities to operating free cash flow for each of the fiscal years indicated is as follows:
| | 2004 | | 2003 | | 2002 | | 2001 | | 2000 | |
�� | | | | | | | | | | | |
Net cash provided by (used in) operating activities | | $ | 52,482 | | $ | 49,203 | | $ | 36,144 | | $ | 414 | | $ | (10,286 | ) |
Purchases of property and equipment | | (21,399 | ) | (18,364 | ) | (7,802 | ) | (4,859 | ) | (12,084 | ) |
Operating free cash flow (OFCF) | | $ | 331,083 | | $ | 30,839 | | $ | 28,342 | | $ | (4,445 | ) | $ | (22,370 | ) |
16
Management’s Discussion and Analysis of Financial Condition and Results of Operations
FORWARD-LOOKING STATEMENTS
The discussion in this Annual Report contains certain forward-looking statements that relate to future plans, events, financial results or performance. You can identify forward-looking statements by those that are not historical in nature, particularly those that use terminology such as “may,” “will,” “should,” “could,” “expect,” “anticipate,” “believe,” “estimate,” “plan,” “project,” “predict,” “intend,” “potential,” “continue” or the negative of these or similar terms. These statements are subject to certain risks and uncertainties that could cause actual results to differ materially from our historical experience and our present expectations or projections. These risks and uncertainties include, among others, such factors as general and industry economic trends; uncertainties arising from global events, consumer confidence, effectiveness of our advertising and promotional efforts; our ability to secure suitable retail locations; our ability to attract and retain qualified sales professionals and other key employees; consumer acceptance of our products, product quality, innovation and brand image; our ability to continue to expand and improve our product line; industry competition; warranty expenses; the outcome of pending litigation, including consumer class action litigation; our dependence on significant suppliers, and the vulnerability of any suppliers to recessionary pressures, labor negotiations, liquidity concerns or other factors; rising commodity costs; and increasing government regulations, including new flammability standards for the bedding industry. Additional information concerning these and other risks and uncertainties is contained in our filings with the Securities and Exchange Commission, including our Annual Report on Form 10-K and other periodic reports filed with the SEC.
OVERVIEW
Select Comfort is the leading developer, manufacturer and marketer of premium-quality, adjustable-firmness beds. The air chamber technology of our proprietary Sleep Number® bed allows adjustable firmness on each side of the mattress and provides a sleep surface that is clinically proven to provide better sleep quality and greater relief of back pain compared to traditional mattress products. In addition, we market and sell accessories and other sleep related products which focus on providing personalized comfort to complement the Sleep Number® bed and provide a better night’s sleep to the consumer.
We generate revenue by selling our products through four complementary distribution channels. Three of these channels: retail, direct marketing and e-commerce, are company-controlled and sell directly to consumers. Our wholesale channel sells to leading home furnishings retailers, specialty bedding retailers, the QVC shopping channel and to several end users such as Radisson Hotels and Resorts®.
The proportion of our total net sales, by dollar volume, from each of our channels during the last three years is summarized as follows:
| | 2004 | | 2003 | | 2002 | |
Retail | | 78.1 | % | 78.5 | % | 76.8 | % |
Direct marketing | | 11.5 | % | 13.0 | % | 14.2 | % |
E-commerce | | 4.6 | % | 4.3 | % | 4.3 | % |
Wholesale | | 5.8 | % | 4.2 | % | 4.7 | % |
Total | | 100 | % | 100 | % | 100 | % |
The components of sales growth, including comparable store sales increases, are as follows:
| | 2004* | | 2003* | | 2002 | |
| | Channel Increase | | Channel Increase | | Channel Increase | |
Retail: | | | | | | | |
Comp. store sales increase | | 16 | % | 31 | % | 27 | % |
New/closed stores, net | | 8 | % | 7 | % | 1 | % |
Retail total | | 24 | % | 38 | % | 27 | % |
Direct marketing | | 10 | % | 23 | % | 20 | % |
E-commerce | | 34 | % | 35 | % | 59 | % |
Wholesale | | 73 | % | 21 | % | 61 | % |
* There were 52 weeks in fiscal 2004 and 2002 and 53 weeks in fiscal 2003. Comparable store sales and sales growth rates have been adjusted and reported as if each year had the same number of weeks.
The number of company-operated retail locations during the last three years, including leased departments within 13 Bed, Bath & Beyond stores, is summarized as follows:
| | 2004 | | 2003 | | 2002 | |
Beginning of year | | 344 | | 322 | | 328 | |
Opened | | 31 | | 27 | | 15 | |
Closed | | (5 | ) | (5 | ) | (21 | ) |
End of year | | 370 | | 344 | | 322 | |
We anticipate opening 30 to 40 new retail stores and expect to close approximately 5 mall-based stores in 2005. In addition, we plan to reassess our leased department program in 2005.
Our growth plans are centered on increasing the awareness of our products and stores through expansion of media, increasing distribution - primarily through new retail store openings and supplemented with sales through other mattress retailers, and through improvement and expansion of our product lines. Our primary market consists of the sale of products directly to consumers in the U.S. domestic market. We believe that opportunities exist longer term for sales internationally and to commercial markets.
Increases in sales, along with controlling costs, has provided significant increases to operating income and operating margin. The majority of operating margin improvement has been generated through leverage in selling expenses (increased sales through the existing store base) and leverage of our existing infrastructure (general and administrative expenses). We expect any future improvements in operating margin to be derived from similar sources. Our target is to sustain annual sales growth rates of 15% to 20% and annual earnings growth rates of approximately 20% to 25%.
17
RESULTS OF OPERATIONS
The following table sets forth, for the periods indicated, our results of operations expressed as dollars and percentages of net sales. Figures are in millions except percentages and earnings per share amounts.
| | 2004 | | 2003 | | 2002 | |
| | $ | | % of
Net Sales | | $ | | % of
Net Sales | | $ | | % of
Net Sales | |
| | | | | | | | | | | | | |
Net sales | | $ | 557.6 | | 100.0 | % | $ | 458.5 | | 100.0 | % | $ | 335.8 | | 100.0 | % |
Cost of sales | | 217.0 | | 38.9 | | 171.2 | | 37.3 | | 125.8 | | 37.5 | |
Gross profit | | 340.6 | | 61.1 | | 287.3 | | 62.7 | | 210.0 | | 62.5 | |
Operating expenses: | | | | | | | | | | | | | |
Sales and marketing | | 249.9 | | 44.8 | | 206.2 | | 45.0 | | 155.8 | | 46.4 | |
General and administrative | | 41.2 | | 7.4 | | 38.4 | | 8.4 | | 32.9 | | 9.8 | |
Store closings and asset impairments | | 0.0 | | 0.0 | | 0.1 | | 0.0 | | 0.2 | | 0.1 | |
Total operating expenses | | 291.1 | | 52.2 | | 244.7 | | 53.4 | | 188.9 | | 56.3 | |
Operating income | | 49.5 | | 8.9 | | 42.6 | | 9.3 | | 21.1 | | 6.3 | |
Other income (expense), net | | 1.4 | | 0.3 | | 0.4 | | 0.1 | | (1.7 | ) | (0.5 | ) |
Income before income taxes | | 50.9 | | 9.2 | | 43.0 | | 9.4 | | 19.4 | | 5.8 | |
Income tax (expense) benefit | | (19.4 | ) | (3.5 | ) | (15.9 | ) | (3.5 | ) | 18.1 | | 5.4 | |
Net income | | $ | 31.6 | | 5.7 | % | $ | 27.1 | | 5.9 | % | $ | 37.5 | | 11.2 | % |
| | | | | | | | | | | | | |
Pro forma net income (loss) | | $ | 31.6 | | 5.7 | % | $ | 27.1 | | 5.9 | % | $ | 12.0 | | 3.6 | % |
| | 2004 | | 2003 | | 2002 | |
Net income per share: | | | | | | | |
Basic | | $ | 0.87 | | $ | 0.82 | | $ | 1.53 | |
Diluted | | 0.80 | | 0.69 | | 1.10 | |
Pro forma | | 0.80 | | 0.69 | | 0.36 | |
Weighted-average number of common shares: | | | | | | | |
Basic | | 36.2 | | 32.9 | | 24.5 | |
Diluted and pro forma | | 39.7 | | 39.3 | | 34.5 | |
| | | | | | | | | | |
Pro forma net income per share reflects the effects on net income from specific non-recurring items and from the recognition of an income tax benefit (provision) for years where a regular tax provision, at a rate of 38%, was not recorded. Generally accepted accounting principles (GAAP) did not allow us to reduce net income for income tax expense in 2002. Because we have recorded income tax expense in 2003 and 2004, and we expect to continue recording income tax in future periods, we believe pro forma net income per share provides a more meaningful comparison than GAAP net income per share for 2002.
A reconciliation of net income and net income per diluted share (as determined in accordance with GAAP) to pro forma net income and pro forma net income per diluted share is as follows:
| | 2002 | | 2002 | |
| | Net Income | | Earnings per Share | |
| | | | | |
GAAP net income | | $ | 37,466 | | $ | 1.10 | |
Effect of: | | | | | |
Income tax (provision) benefit at 38% of income before tax | | (7,501 | ) | (0.22 | ) |
(Restoration) write-off of deferred tax asset | | (17,996 | ) | (0.52 | ) |
Pro forma net income | | $ | 11,969 | | $ | 0.36 | |
18
Net Sales
We record revenue at the time product is shipped to our customer, except when beds are delivered and set up by our home delivery employees, in which case revenue for products and home delivery services is recorded at the time the bed is delivered and set up in the home. We reduce sales at the time revenue is recognized for estimated returns. This estimate is based on historical return rates, which are reasonably consistent from period to period. If actual returns vary from expected rates, revenue in future periods is adjusted, which could have a material adverse effect on future results of operations. Historically, we have not experienced material adjustments to the financial statements due to changes to these estimates.
Cost of Sales
Cost of sales includes costs associated with purchasing materials, manufacturing costs and costs to deliver our products to our customers. Cost of sales also includes estimated costs to service warranty claims of customers. This estimate is based on historical claim rates experienced during the warranty period. Because this estimate covers an extended period of time, a revision of estimated claim rates could result in a significant adjustment of estimated future costs of fulfilling warranty commitments and could have a material adverse effect on future results of operations. Historically, we have not experienced material adjustments to our consolidated statements due to changes in these estimates. However, as we announced early in October 2004, we did record a one-time warranty charge of $1.2 million (pre-tax) to allow for broader flexibility to satisfy future warranty claims after modifying our customer service practices.
Gross Profit
Our gross profit margin is dependent on a number of factors and may fluctuate from quarter to quarter. These factors include the mix of products sold, the level at which we offer promotional discounts to purchase our products, the cost of materials, delivery and manufacturing and the mix of sales between wholesale and company-controlled distribution channels. Sales of products manufactured by third parties, such as accessories and our adjustable foundation, generate lower gross margins. Similarly, sales directly to consumers through company-controlled channels generally generate higher gross margins than sales through our wholesale channels because we capture both the manufacturer’s and retailer’s margin.
Sales and Marketing Expenses
Sales and marketing expenses include advertising and media production, other marketing and selling materials such as brochures, videos, customer mailings and in-store signage, sales compensation, store occupancy costs and customer service. We expense all store opening and advertising costs as incurred.
Advertising expense was $78.5 million in 2004, $59.5 million in 2003 and $39.5 million in 2002. Future advertising expenditures will depend on the effectiveness and efficiency of the advertising in creating awareness of our products and brand name, generating consumer inquiries and driving consumer traffic to our points of sale. We anticipate that full year advertising expenditures in 2005 will be approximately $88 million.
General and Administrative Expenses
General and administrative expenses include costs associated with management of functional areas, including information technology, human resources, finance, sales and marketing administration, investor relations, risk management and research and development. Costs include salaries, bonus and benefits, information hardware, software and maintenance, office facilities, insurance, shareholder relations costs and other overhead.
Store Closings and Asset Impairments
Store closing and asset impairment expenses include charges made against operating expenses for store related or other capital assets that have been written-off when a store is underperforming and generating negative cash flows. We evaluate our long-lived assets, including leaseholds and fixtures in existing stores and stores expected to be remodeled, based on expected cash flows through the remainder of the lease term after considering the potential impact of planned operational improvements and marketing programs. Expected cash flows may not be realized, which could cause long-lived assets to become impaired in future periods and could have a material adverse effect on future results of operations. Store assets are written off when we believe these costs will not be recovered through future operations.
Quarterly and Annual Results
Quarterly and annual operating results may fluctuate significantly as a result of a variety of factors, including increases or decreases in comparable store sales, the timing, amount and effectiveness of advertising expenditures, any changes in sales return rates or warranty experience, the timing of new store openings and related expenses, net sales contributed by new stores, the timing of promotional offerings, competitive factors, rising commodity costs, any disruptions in supplies or third-party services, seasonality of retail sales, timing of QVC shows and wholesale sales, consumer confidence, and general economic conditions. Furthermore, a substantial portion of net sales is often realized in the last month of a quarter, due in part to our promotional schedule and commission structure. As a result, we may be unable to adjust spending in a timely manner, and our business, financial condition and operating results may be significantly harmed. Our historical results of operations may not be indicative of the results that may be achieved for any future period.
Future Accounting Requirements
In December 2004, the Financial Accounting Standards Board issued SFAS No. 123 (revised 2004), “Share-Based Payment” (“SFAS 123R”), which replaces SFAS No. 123, “Accounting for Stock-Based Compensation,” (SFAS123). SFAS 123R requires all share-based payments to employees, including grants of employee stock options, to be recognized in the financial statements based on their fair value beginning with the first interim or annual period after June 15, 2005. The pro forma disclosures we have previously made as permitted under SFAS 123 no longer will be an alternative to financial statement recognition. We are required to adopt SFAS 123R by the third quarter of fiscal 2005, beginning July 3, 2005. Under SFAS 123R, we must determine the appropriate fair value model to be used for valuing share-based payments, the amortization method for compensation cost, and the transition method to be used at date of adoption. We are evaluating the requirements of SFAS 123R and expect that the adoption of SFAS 123R will have a material impact on our
19
consolidated results of operations and earnings per share. Our pro forma disclosures have historically reported an annual impact to diluted earnings per share of $0.06 to $0.11. We have not yet determined the method of adoption or the effect of adopting SFAS 123R, and have not determined whether the adoption will result in amounts that are similar to our current pro forma disclosures under SFAS 123.
COMPARISON OF 2004 AND 2003
Net Sales
Net sales in 2004 increased 22% to $557.6 million from $458.5 million in 2003, due to a 10% increase in mattress unit sales and higher average selling prices. The additional week in fiscal 2003 reduced sales growth in 2004 by approximately 2%. The average selling price per bed in our company controlled channels was $1,906, an increase of approximately 13% from 2003. The higher average selling price resulted primarily from growth in unit sales at higher price points following the introduction of a new luxury mattress model at the upper end of our model line-up. We expect the growth rate of average selling price to slow somewhat in 2005, even though we have taken price increases in 2005 to offset cost pressure.
The increase in net sales by sales channel was attributable to (i) a $75.1 million increase in sales from our retail stores, including an increase in comparable store sales of $56.4 million , an estimated $7.6 million reduction in sales due to a 53rd week in 2003 and an increase of $26.3 million from new stores, net of stores closed, (ii) a $4.5 million increase in direct marketing sales, (iii) a $6.1 million increase in sales from our e-commerce channel and (iv) a $13.4 million increase in sales from our wholesale channel.
Gross Profit
Gross profit decreased to 61.1% in 2004 from 62.7% in 2003, primarily due to channel mix (i.e. increased percentage of our total net sales from our lower margin wholesale channel), a one-time warranty charge of $1.2 million (pre-tax) to allow for broader flexibility to satisfy future warranty claims after modifying our customer service practices, increased utilization of our home delivery services and increased sales of adjustable foundations which are not manufactured by us and result in lower gross margins.
Sales and Marketing Expenses
Sales and marketing expenses in 2004 increased 21% to $249.9 million from $206.2 million in 2003 and decreased as a percentage of net sales to 44.8% from 45.0% for the comparable prior-year period. The $43.7 million increase was primarily due to additional media investments, sales-based incentive compensation, and increased number of stores. The decrease as a percentage of net sales was comprised primarily of a 1.1 percentage point (ppt) increase in media investments offset by a 0.9 ppt leverage of fixed costs (occupancy, base sales compensation and certain marketing expenses) over higher sales. With additional sales growth, we expect sales and marketing expenses as a percentage of net sales to decline in 2005 as we achieve greater leverage from our base sales compensation and occupancy costs.
General and Administrative Expenses
General and administrative (G&A) expenses in 2004 increased 7% to $41.2 million from $38.4 million in 2003 but decreased as a percentage of net sales to 7.4% from 8.4% for the comparable prior-year period. The dollar increase in G&A was primarily due to higher headcount-related expenditures of $4.5 million, increased professional fees of $3.2 million, and $1.6 million in additional depreciation and maintenance expense from information technology infrastructure investments, offset by a reduction in management incentive compensation expense of $7.0 million. We expect G&A growth rates to continue to be lower than the rate of sales growth due to leveraging the fixed component of G&A expenses across a higher sales base, although we anticipate no leverage in 2005 assuming incentive compensation returns to historical levels.
Other Income (Expense), Net
Other income increased $1.0 million to $1.4 million in 2004 from $0.4 million in 2003. The improvement is primarily due to increased interest income resulting from higher average balances of invested cash and higher interest rates.
Income Tax Expense (Benefit)
Income tax expense increased $3.4 million to $19.4 million in 2004 from $16.0 million in 2003 due to higher pre-tax income and effective tax rates. The effective tax rate was 38.1% in 2004 and 37.0% in 2003. We expect an effective income tax rate of 38.8% in 2005.
COMPARISON OF 2003 AND 2002
Net Sales
Net sales in 2003 increased 37% to $458.5 million from $335.8 million in 2002 due to a 19% increase in mattress unit sales and higher average selling prices. The additional week in fiscal 2003 contributed approximately 2% to sales growth company-wide. The average selling price per bed set in our company-controlled channels for 2003 was $1,686, an increase of approximately 15% from 2002. The higher average selling prices resulted primarily from improvements in product mix and lower return rates.
The increase in net sales by sales channel was attributable to (i) a $102.1 million increase in sales from company-controlled retail stores, including an increase in comparable store sales of $77.7 million, an estimated $7.4 million of additional sales due to a 53rd week in 2003 and an increase of $17.0 million from new stores opened in 2003, net of stores closed in 2003, (ii) an $11.8 million increase in direct marketing sales, (iii) a $5.3 million increase in salesfrom our e-commerce channel and (iv) a $3.5 million increase in sales from our wholesale channel.
Gross Profit
Gross profit margin increased to 62.7% in 2003 from 62.5% in 2002 primarily due to improved product sales mix, partially offset by increased product delivery costs.
Sales and Marketing Expenses
Sales and marketing expenses in 2003 increased 32% to $206.2 million from $155.8 million in 2002, but decreased as a percentage of net sales to 45.0% in 2003 from 46.4% in 2002. The $50.4 million increase was primarily due to additional media investments, sales-based incentive compensation, and increased occupancy and financing costs. The decrease as a percentage of net sales was comprised of a 1.2 percentage point (ppt) increase in media investments offset by a 1.2 ppt decrease in occupancy
20
costs, a 0.5 ppt decrease in sales compensation costs, 0.5 ppt decrease in field management and support costs and 0.4 ppt decrease in other marketing costs.
General and Administrative Expenses
General and administrative (G&A) expenses in 2003 increased 17% to $38.4 million from $32.9 million in 2002 but decreased as a percentage of net sales to 8.4% from 9.8% for the comparable period. The dollar increase in general and administrative expenses was comprised primarily of $3.5 million from increased compensation expenses related to additional headcount, $1.0 million from increased incentive compensation expense resulting from improved company performance and $0.4 million from increased investments in research and development activities.
Store Closing and Asset Impairment Expenses
Store closing and asset impairment expenses in 2003 were $0.1 million compared to $0.2 million in 2002. In 2003 and 2002, the entire amount represented impairments related to store closures.
Other Income (Expense), Net
Other income (expense) changed by $1.7 million to income of $0.4 million in 2003 compared to an expense of $1.3 million in 2002. The improvement is primarily due to reduced interest expense following the elimination of $16 million of debt in 2002 and increased interest income reflecting higher balances of invested cash in 2003.
Income Tax Expense (Benefit)
Income tax expense (benefit) changed $34.1 million to an income tax expense of $16.0 million in 2003 compared to $18.1 million in income tax benefit in 2002. The increase in income tax expense was due to recording income tax expense at a rate of 37% in 2003. The $18.1 million income tax benefit for 2002 was the result of recording a non-recurring, non-operating, non-cash addition to earnings due to the expected realization of tax benefits from net operating loss carryforwards and other deferred tax assets.
LIQUIDITY AND CAPITAL RESOURCES
As of January 1, 2005, we had cash, cash equivalents and marketable securities of $91.7 million, of which $50.8 million is classified as a current asset. As of January 3, 2004, cash, cash equivalents and marketable securities totaled $75.1 million, of which $74.0 million is classified as current. Working capital totaled $26.4 million at the end of 2004 compared to $54.3 million at year-end 2003. The decrease in working capital was due primarily to a shift to longer-term investments which are reported as non-current assets. The $16.6 million improvement in cash and marketable securities balances was the result of generating $31.1 million of operating free cash flow ($52.5 million of cash provided by operating activities, reduced by $21.4 million of capital expenditures), offset by $14.5 million of cash used in financing activities. We expect to continue to generate positive cash flows from operations in the future, while not anticipating any significant additional working capital requirements.
We generated cash from operations of $52.5 million in 2004 and $49.2 million in 2003. The $3.3 million year-to-year improvement in cash from operations resulted primarily from improved net income of $4.5 million, reductions in net operating assets and liabilities of $5.8 million, and higher noncash depreciation expense of $2.5 million, offset by an increase in deferred taxes of $9.6 million, reflecting the utilization of substantially all net operating loss carryforwards in 2003.
Capital expenditures amounted to $21.4 million in 2004, compared to $18.4 million in 2003. In both periods our capital expenditures related primarily to new and remodeled retail stores and investments in information technology. In 2004, we opened 31 retail stores and completed the marquee and design upgrade of approximately 130 stores, while in 2003 we opened 27 stores and remodeled approximately 100 stores. We anticipate opening 30 to 40 new stores in 2005. We will fund the investment in new and upgraded stores with cash on hand and cash generated from operations. We expect our new stores to be cash flow positive within the first 12 months of operations and, as a result, do not anticipate a negative effect on net cash provided by operations. Management expects capital expenditures in fiscal 2005 to total $30 million. Additional capital expenditures may be required for expanded manufacturing capacity if new fire retardancy standards are introduced on a nationwide basis by the Consumer Product Safety Commission.
Net cash used in financing activities totaled $14.5 million in 2004, compared to $3.5 million net cash provided by financing activities in 2003. The $18.0 million decrease in cash from financing activities was comprised of a $19.0 million increase in repurchases of common stock under our board-authorized common stock repurchase program, offset by an increase of $1.1 million received for exercises of stock options and warrants and for employee purchases of common stock. Additional purchases of Select Comfort stock may be made from time-to-time, subject to market conditions and at prevailing market prices, through open market purchases. Repurchased shares will be retired and may be reissued in the future for general corporate or other purposes. Total outstanding authorization as of March 4, 2005, was $14.0 million. We may terminate or limit the stock repurchase program at any time.
Cash generated from operations should be a sufficient source of liquidity for the short- and long- term and should provide adequate funding for capital expenditures and common stock repurchases, if any. In addition, our business model, which can operate with minimal working capital, does not require significant additional capital to fund operations. In 2003, we obtained a $15 million bank revolving line ofcredit to provide additional cash flexibility in the case of unexpected significant external or internal developments. The line of credit is a three-year senior secured revolving facility. The interest rate on borrowings is calculated using LIBOR plus 1.50% to 2.25% with the incremental rate dependent on our leverage ratio, as defined by the lender. We are subject to certain financial covenants under the agreement, principally consisting of minimum liquidity requirements, working capital and leverage ratios. We have remained and expect to remain in the foreseeable future in full compliance with the financial covenants. We currently have no borrowings outstanding under this credit agreement.
21
The table below represents the scheduled maturities of our long-term contractual obligations as of January 1, 2005 (in thousands):
| | Payments Due by Period | |
| | Total | | <1
Year | | 1-3
Years | | 3-5
Years | | >5
Years | |
| | | | | | | | | | | |
Operating leases | | $ | 102,651 | | 21,808 | | 39,019 | | 27,409 | | 14,415 | |
Inventory purchase Commitments | | 86,500 | | 62,500 | | 24,000 | | — | | — | |
Total | | $ | 189,151 | | 84,308 | | 63,019 | | 27,409 | | 14,415 | |
CRITICAL ACCOUNTING POLICIES AND ESTIMATES
The preparation of financial statements in conformity with U.S. generally accepted accounting principles requires management to make estimates and assumptions. Predicting future events is inherently an imprecise activity and as such requires the use of judgment. Actual results may vary from estimates in amounts that may be material to the financial statements. The accounting policies discussed below are considered critical because changes to certain judgments and assumptions inherent in these policies could materially affect the financial statements.
Our critical accounting policies relate to stock-based compensation, revenue recognition, accrued sales returns, accrued warranty costs, and store closing and long-lived asset impairment expenses.
In certain instances, U.S. generally accepted accounting principles allow for the selection of alternative accounting methods. One such significant accounting policy involves the selection from alternative methods of accounting for stock options.
Stock-Based Compensation
Two alternative methods currently exist for accounting for stock options: the intrinsic value method and the fair value method. We use the intrinsic value method of accounting for stock options, and accordingly, no compensation expense has been recognized in the financial statements for options granted to employees, or for the discount feature of our employee stock purchase plan. Recently, the FASB issued SFAS 123R, which will require the Company to change its accounting practice for stock options to the fair value method by the third quarter of fiscal 2005, beginning July 3, 2005.
Revenue Recognition
We record revenue at the time product is shipped to our customer, except when beds are delivered and set up by our home delivery employees, in which case revenue is recorded at the time the bed is delivered and set up in the home.
Accrued Sales Returns
We reduce sales at the time revenue is recognized for estimated returns. This estimate is based on historical return rates, which are reasonably consistent from period to period. If actual returns vary from expected rates, revenue in future periods is adjusted, which could have a material adverse effect on future results of operations.
Accrued Warranty Costs
The estimated costs to service customer warranty claims is included in cost of sales. This estimate is based on historical claim rates during the warranty period. Because this estimate covers an extended period of time, a revision of estimated claim rates could result in a significant adjustment of estimated future costs of fulfilling warranty commitments and could have a material adverse effect on future results of operations. Historically, we have not experienced material adjustments to our consolidated statements due to changes in these estimates. However, as we announced early in October 2004, we did record a one-time warranty charge of $1.2 million (pre-tax) to allow for broader flexibility to satisfy future warranty claims after modifying our customer service practices.
Store Closing and Asset Impairment Expenses
We evaluate our long-lived assets, including leaseholds and fixtures in existing stores, based on expected cash flows through the remainder of the lease term after considering the potential impact of planned operational improvements and marketing programs. Expected cash flows may not be realized, which could cause long-lived assets to become impaired in future periods and could have a material adverse effect on future results of operations. Store assets are written off when we believe these costs will not be recovered through future operations.
22
MANAGEMENT'S REPORT
Management’s Responsibility for Financial Information
Select Comfort’s management is responsible for the preparation, integrity and objectivity of the consolidated financial statements and other financial information presented in this Annual Report. The accompanying financial statements have been prepared in accordance with U.S. generally accepted accounting principles.
KPMG LLP, an independent registered public accounting firm, is retained to audit Select Comfort’s consolidated financial statements and management’s assessment of, and the effective operation of, the company’s internal control over financial reporting. Its accompanying reports are based on audits conducted in accordance with the standards of the Public Company Accounting Oversight Board.
The Audit Committee of the Board of Directors is composed solely of independent, non-management directors, and is responsible for recommending to the Board the independent registered public accounting firm to be retained for the coming year, subject to stockholder ratification. The Audit Committee meets periodically and privately with the independent registered public accounting firm, with the company’s internal auditors, as well as with Select Comfort’s management, to review accounting, auditing, internal control structure and financial reporting matters.
Management's Report on Internal Control Over Financial Reporting
Our management is responsible for establishing and maintaining adequate internal control over financial reporting, as such term is defined in Exchange Act Rule 13a-15(f). Our internal control over financial reporting is a process designed to provide reasonable assurance regarding the reliability of financial reporting and the preparation of financial statements for external purposes in accordance with generally accepted accounting principles. Our internal control over financial reporting includes those policies and procedures that (1) pertain to the maintenance of records that, in reasonable detail, accurately and fairly reflect the transactions and dispositions of the assets of the company; (2) provide reasonable assurance that transactions are recorded as necessary to permit preparation of financial statements in accordance with generally accepted accounting principles, and that receipts and expenditures of the company are being made only in accordance with authorizations of management and directors of the company; and (3) provide reasonable assurance regarding prevention or timely detection of unauthorized acquisition, use, or disposition of the company's assets that could have a material effect on the financial statements.
Because of its inherent limitations, internal control over financial reporting may not prevent or detect misstatements. Also, projections of any evaluation of effectiveness to future periods are subject to the risk that controls may become inadequate because of changes in conditions, or that the degree of compliance with the policies or procedures may deteriorate.
Our management, with the participation of our chief executive officer and chief financial officer, evaluated the effectiveness of our internal control over financial reporting based on the framework in Internal Control - Integrated Framework issued by the Committee of Sponsoring Organizations of the Treadway Commission. Based on this evaluation under these criteria, our management concluded that our internal control over financial reporting was effective as of January 1, 2005. Our management's assessment of the effectiveness of our internal control over financial reporting as of January 1, 2005, has been audited by KPMG LLP, an independent registered public accounting firm, as stated by its report, which is included herein.

| | 
|
William R. McLaughlin | | James C. Raabe |
President and Chief | | Chief Financial Officer |
Executive Officer | | |
23
REPORT OF INDEPENDENT REGISTERED PUBLIC ACCOUNTING FIRM ON INTERNAL CONTROL OVER FINANCIAL REPORTING
The Board of Directors and Shareholders of Select Comfort Corporation:
We have audited management’s assessment, included in the accompanying Management’s Report on Internal Control Over Financial Reporting that Select Comfort Corporation maintained effective internal control over financial reporting as of January 1, 2005, based on criteria established in Internal Control—Integrated Framework issued by the Committee of Sponsoring Organizations of the Treadway Commission (COSO). The Company’s management is responsible for maintaining effective internal control over financial reporting and for its assessment of the effectiveness of internal control over financial reporting. Our responsibility is to express an opinion on management’s assessment and an opinion on the effectiveness of the Company’s internal control over financial reporting based on our audit.
We conducted our audit in accordance with the standards of the Public Company Accounting Oversight Board (United States). Those standards require that we plan and perform the audit to obtain reasonable assurance about whether effective internal control over financial reporting was maintained in all material respects. Our audit included obtaining an understanding of internal control over financial reporting, evaluating management’s assessment, testing and evaluating the design and operating effectiveness of internal control, and performing such other procedures as we considered necessary in the circumstances. We believe that our audit provides a reasonable basis for our opinion.
A company’s internal control over financial reporting is a process designed to provide reasonable assurance regarding the reliability of financial reporting and the preparation of financial statements for external purposes in accordance with generally accepted accounting principles. A company’s internal control over financial reporting includes those policies and procedures that (1) pertain to the maintenance of records that, in reasonable detail, accurately and fairly reflect the transactions and dispositions of the assets of the company; (2) provide reasonable assurance that transactions are recorded as necessary to permit preparation of financial statements in accordance with generally accepted accounting principles, and that receipts and expenditures of the company are being made only in accordance with authorizations of management and directors of the company; and (3) provide reasonable assurance regarding prevention or timely detection of unauthorized acquisition, use, or disposition of the company’s assets that could have a material effect on the financial statements.
Because of its inherent limitations, internal control over financial reporting may not prevent or detect misstatements. Also, projections of any evaluation of effectiveness to future periods are subject to the risk that controls may become inadequate because of changes in conditions, or that the degree of compliance with the policies or procedures may deteriorate.
In our opinion, management’s assessment that Select Comfort Corporation maintained effective internal control over financial reporting as of January 1, 2005, is fairly stated, in all material respects, based on criteria established in Internal Control—Integrated Framework issued by the Committee of SponsoringOrganizations of the Treadway Commission (COSO). Also, in our opinion, Select Comfort Corporation maintained, in all material respects, effective internal control over financial reporting as of January 1, 2005, based on criteria established in Internal Control—Integrated Framework issued by the Committee of SponsoringOrganizations of the Treadway Commission (COSO).
We also have audited, in accordance with the standards of the Public Company Accounting Oversight Board (United States), the consolidated balance sheets of Select Comfort Corporation and subsidiaries as of January 1, 2005 and January 3, 2004, and the related consolidated statements of operations, shareholders’ equity, and cash flows for each of the years in the three-year period ended January 1, 2005 and our report dated March 8, 2005, expressed an unqualified opinion on those consolidated financial statements.

|
Minneapolis, Minnesota |
March 8, 2005 |
REPORT OF INDEPENDENT REGISTERED PUBLIC ACCOUNTING FIRM ON CONSOLIDATED FINANCIAL STATEMENTS
The Board of Directors and Shareholders of Select Comfort Corporation:
We have audited the accompanying consolidated balance sheets of Select Comfort Corporation and subsidiaries as of January 1, 2005 and January 3, 2004, and the related consolidated statements of operations, shareholders’ equity, and cash flows for each of the years in the three-year period ended January 1, 2005. These consolidated financial statements are the responsibility of the Company’s management. Our responsibility is to express an opinion on these consolidated financial statements based on our audits.
We conducted our audits in accordance with the standards of the Public Company Accounting Oversight Board (United States). Those standards require that we plan and perform the audit to obtain reasonable assurance about whether the financial statements are free of material misstatement. An audit includes examining, on a test basis, evidence supporting the amounts and disclosures in the financial statements. An audit also includes assessing the accounting principles used and significant estimates made by management, as well as evaluating the overall financial statement presentation. We believe that our audits provide a reasonable basis for our opinion.
In our opinion, the consolidated financial statements referred to above present fairly, in all material respects, the financial position of Select Comfort Corporation and subsidiaries as of January 1, 2005 and January 3, 2004, and the results of their operations and their cash flows for each of the years in the three-year period ended January 1, 2005, in conformity with U.S. generally accepted accounting principles.
We also have audited, in accordance with the standards of the Public Company Accounting Oversight Board (United States), the effectiveness of Select Comfort Corporation’s internal control over financial reporting as of January 1, 2005, based on criteria established in Internal Control—Integrated Framework issued by the Committee of Sponsoring Organizations of the Treadway Commission (COSO), and our report dated March 8, 2005 expressed an unqualified opinion on management’s assessment of, and the effective operation of, internal control over financial reporting.
|
Minneapolis, Minnesota |
March 8, 2005 |
24
Consolidated Balance Sheets
January 1, 2005, and January 3, 2004
(in thousands, except share and per share amounts)
| | 2004 | | 2003 | |
Assets | | | | | |
Current assets: | | | | | |
Cash and cash equivalents | | $ | 15,066 | | $ | 24,725 | |
Marketable securities — current (note 2) | | 35,747 | | 49,322 | |
Accounts receivable, net of allowance for doubtful
accounts of $685 and $619, respectively | | 8,644 | | 6,823 | |
Inventories (note 3) | | 20,481 | | 14,110 | |
Prepaid expenses | | 7,375 | | 5,968 | |
Deferred tax assets (note 8) | | 8,253 | | 6,382 | |
Total current assets | | 95,566 | | 107,330 | |
Marketable securities — non-current (note 2) | | 40,930 | | 1,071 | |
Property and equipment, net (note 4) | | 43,911 | | 36,134 | |
Deferred tax assets (note 8) | | 7,789 | | 5,628 | |
Other assets | | 3,617 | | 3,343 | |
Total assets | | $ | 191,813 | | $ | 153,506 | |
| | | | | |
Liabilities and Shareholders’ Equity | | | | | |
Current liabilities: | | | | | |
Accounts payable | | $ | 26,267 | | $ | 16,502 | |
Consumer prepayments | | 9,368 | | 5,970 | |
Accruals: | | | | | |
Sales returns | | 5,038 | | 3,469 | |
Compensation and benefits | | 13,913 | | 17,303 | |
Taxes and withholding | | 6,392 | | 3,661 | |
Other | | 8,143 | | 6,110 | |
Total current liabilities | | 69,121 | | 53,015 | |
| | | | | |
Long-term liabilities | | 8,348 | | 8,290 | |
Total liabilities | | 77,469 | | 61,305 | |
| | | | | |
Shareholders’ equity (notes 6, 7 and 10): | | | | | |
Undesignated preferred stock; 5,000,000 shares authorized,
no shares issued and outstanding | | — | | — | |
Common stock, $0.01 par value; 95,000,000 shares authorized,
35,828,222 and 35,769,606 shares issued and outstanding, respectively | | 358 | | 358 | |
Additional paid-in capital | | 95,548 | | 104,085 | |
Unearned compensation | | (1,752 | ) | (877 | ) |
Retained earnings (accumulated deficit) | | 20,190 | | (11,365 | ) |
Total shareholders’ equity | | 114,344 | | 92,201 | |
Commitments and contingencies (notes 5 and 11): | | | | | |
Total liabilities and shareholders’ equity | | $ | 191,813 | | $ | 153,506 | |
| | | | | | | | | |
See accompanying notes to consolidated financial statements.
25
Consolidated Statements of Operations
Years ended January 1, 2005, January 3, 2004, and December 28, 2002
(in thousands, except per share amounts)
| | 2004 | | 2003* | | 2002 | |
Net sales | | $ | 557,639 | | $ | 458,489 | | $ | 335,795 | |
Cost of sales | | 216,965 | | 171,163 | | 125,796 | |
Gross profit | | 340,674 | | 287,326 | | 209,999 | |
Operating expenses: | | | | | | | |
Sales and marketing (note 1) | | 249,925 | | 206,248 | | 155,848 | |
General and administrative | | 41,218 | | 38,423 | | 32,854 | |
Store closings and asset impairments | | — | | 71 | | 233 | |
Total operating expenses | | 291,143 | | 244,742 | | 188,935 | |
Operating income | | 49,531 | | 42,584 | | 21,064 | |
Other income (expense): | | | | | | | |
Interest income | | 1,414 | | 612 | | 571 | |
Interest expense | | — | | (170 | ) | (2,035 | ) |
Other, net | | — | | — | | (198 | ) |
Other income (expense), net | | 1,414 | | 442 | | (1,662 | ) |
Income before income taxes | | 50,945 | | 43,026 | | 19,402 | |
Income tax (expense) benefit (note 8) | | (19,390 | ) | (15,924 | ) | 18,064 | |
Net income | | $ | 31,555 | | $ | 27,102 | | $ | 37,466 | |
| | | | | | | |
Basic net income per share (note 9): | | | | | | | |
Net income per share — basic | | $ | 0.87 | | $ | 0.82 | | $ | 1.53 | |
Weighted average common shares — basic | | 36,158 | | 32,856 | | 24,549 | |
Diluted net income per share (note 9): | | | | | | | |
Net income per share — diluted | | $ | 0.80 | | $ | 0.69 | | $ | 1.10 | |
Weighted average common shares — diluted | | 39,683 | | 39,277 | | 34,532 | |
See accompanying notes to consolidated financial statements.
* Fiscal year 2003 had 53 weeks. All other fiscal years presented had 52 weeks.
26
Consolidated Statements of Shareholders’ Equity
Years ended January 1, 2005, January 3, 2004, and December 28, 2002
(in thousands, except share amounts)
| | | | Additional
Paid-in
Capital | | Unearned
Compensation | | Retained Earnings/
(Accumulated
Deficit) | | Total | |
Common Stock |
Shares | | Amount |
Balance at December 29, 2001 | | 18,302,307 | | $ | 183 | | $ | 81,687 | | $ | — | | $ | (75,933 | ) | $ | 5,937 | |
| | | | | | | | | | | | | |
Exercise of common stock options (note 7) | | 166,238 | | 2 | | 279 | | — | | — | | 281 | |
Exercise of common stock warrants | | 1,046,344 | | 10 | | (10 | ) | — | | — | | — | |
Conversion of convertible debt | | 11,000,000 | | 110 | | 9,382 | | — | | — | | 9,492 | |
Employee stock purchases and 401K match (note 10) | | 212,212 | | 2 | | 846 | | — | | — | | 848 | |
Net income | | — | | — | | — | | — | | 37,466 | | 37,466 | |
Balance at December 28, 2002 | | 30,727,101 | | 307 | | 92,184 | | — | | (38,467 | ) | 54,024 | |
| | | | | | | | | | | | | |
Exercise of common stock options (note 7) | | 1,007,841 | | 10 | | 7,411 | | — | | — | | 7,421 | |
Exercise of common stock warrants | | 3,232,205 | | 32 | | 405 | | — | | — | | 437 | |
Repurchase of common stock | | (200,100 | ) | (2 | ) | (1,832 | ) | — | | — | | (1,834 | ) |
Conversion of convertible debt | | 727,272 | | 7 | | 2,834 | | — | | — | | 2,841 | |
Issuance of restricted stock (note 7) | | 102,000 | | 2 | | 950 | | (877 | ) | — | | 75 | |
Employee stock purchases and 401(k) match (note 10) | | 173,287 | | 2 | | 2,133 | | — | | — | | 2,135 | |
Net income | | — | | — | | — | | — | | 27,102 | | 27,102 | |
Balance at January 3, 2004 | | 35,769,606 | | 358 | | 104,085 | | (877 | ) | (11,365 | ) | 92,201 | |
| | | | | | | | | | | | | |
Exercise of common stock options (note 7) | | 1,017,212 | | 10 | | 9,074 | | — | | — | | 9,084 | |
Exercise of common stock warrants | | 35,480 | | — | | 5 | | — | | — | | 5 | |
Repurchase of common stock | | (1,137,631 | ) | (11 | ) | (20,842 | ) | — | | — | | (20,853 | ) |
Issuance of restricted stock (note 7) | | 51,500 | | — | | 1,280 | | (875 | ) | — | | 405 | |
Employee stock purchases and 401(k) match (note 10) | | 92,055 | | 1 | | 1,946 | | — | | — | | 1,947 | |
Net income | | — | | — | | — | | — | | 31,555 | | 31,555 | |
Balance at January 1, 2005 | | 35,828,222 | | $ | 358 | | $ | 95,548 | | $ | (1,752 | ) | $ | 20,190 | | $ | 114,344 | |
See accompanying notes to consolidated financial statements.
27
Consolidated Statements of Cash Flows
Years ended January 1, 2005, January 3, 2004, and December 28, 2002
(in thousands)
| | 2004 | | 2003 | | 2002 | |
Cash flows from operating activities: | | | | | | | |
Net income | | $ | 31,555 | | $ | 27,102 | | $ | 37,466 | |
Adjustments to reconcile net income to net cash provided by operating activities: | | | | | | | |
Depreciation and amortization | | 13,643 | | 11,145 | | 9,194 | |
Amortization of debt discount and deferred finance fees | | — | | 130 | | 1,279 | |
Non-cash compensation | | 405 | | 75 | | — | |
Loss on disposal of assets and impaired assets | | 11 | | 96 | | 548 | |
Deferred tax (benefit) expense | | (4,032 | ) | 5,599 | | (17,609 | ) |
Change in operating assets and liabilities: | | | | | | | |
Accounts receivable | | (1,821 | ) | (3,553 | ) | (647 | ) |
Inventories | | (6,371 | ) | (5,130 | ) | (894 | ) |
Prepaid expenses | | (1,407 | ) | (501 | ) | (1,879 | ) |
Other assets | | (306 | ) | 129 | | 1,441 | |
Accounts payable | | 9,765 | | (6 | ) | 1,292 | |
Customer prepayments | | 3,398 | | 4,006 | | 701 | |
Accrued sales returns | | 1,569 | | 288 | | (443 | ) |
Accrued compensation and benefits | | (3,390 | ) | 3,637 | | 6,487 | |
Accrued taxes and withholding | | 7,372 | | 5,295 | | (253 | ) |
Other accruals and liabilities | | 2,091 | | 891 | | (539 | ) |
Net cash provided by operating activities | | 52,482 | | 49,203 | | 36,144 | |
Cash flows from investing activities: | | | | | | | |
Purchases of property and equipment | | (21,399 | ) | (18,364 | ) | (7,802 | ) |
Investments in marketable securities | | (72,540 | ) | (55,717 | ) | (24,780 | ) |
Proceeds from maturity of marketable securities | | 46,256 | | 18,972 | | 11,132 | |
Net cash used in investing activities | | (47,683 | ) | (55,109 | ) | (21,450 | ) |
Cash flows from financing activities: | | | | | | | |
Principal payments on long-term debt | | — | | (11 | ) | (5,022 | ) |
Repurchase of common stock | | (20,853 | ) | (1,834 | ) | — | |
Proceeds from issuance of shares from option and warrant exercises | | 4,448 | | 3,445 | | 280 | |
Proceeds from issuance of ESPP shares and other equity transactions | | 1,947 | | 1,855 | | 849 | |
Net cash (used in) provided by financing activities | | (14,458 | ) | 3,455 | | (3,893 | ) |
(Decrease) increase in cash and cash equivalents | | (9,659 | ) | (2,451 | ) | 10,801 | |
Cash and cash equivalents, at beginning of year | | 24,725 | | 27,176 | | 16,375 | |
Cash and cash equivalents, at end of year | | $ | 15,066 | | $ | 24,725 | | $ | 27,176 | |
| | | | | | | |
Supplemental Disclosure of Cash Flow Information | | | | | | | |
Cash paid during the year for: | | | | | | | |
Interest | | $ | — | | $ | 39 | | $ | 1,494 | |
Income taxes | | 16,842 | | 5,917 | | 495 | |
Non-cash impact of conversion of debt to equity | | — | | 3,121 | | 9,492 | |
Tax benefit from disqualifying option dispositions | | 4,641 | | 4,413 | | — | |
| | | | | | | |
See accompanying notes to consolidated financial statements.
28
Notes to Consolidated Financial Statements
(1) BUSINESS AND SUMMARY OF SIGNIFICANT ACCOUNTING POLICIES
Business
Select Comfort Corporation and its wholly owned subsidiaries (the Company) develops, manufactures and markets premium quality, adjustable-firmness beds.
Financial Statement Presentation
Certain prior-year amounts have been reclassified to conform to the current-year presentation. The Company’s fiscal year ends on the Saturday closest to December 31. Fiscal years and their respective fiscal year ends are as follows: fiscal year 2004 ended January 1, 2005; fiscal year 2003 ended January 3, 2004 and fiscal year 2002 ended December 28, 2002. Fiscal year 2003 had 53 weeks. Fiscal years 2004 and 2002 each had 52 weeks.
Principles of Consolidation
The consolidated financial statements include the accounts of Select Comfort Corporation and its subsidiaries. All significant intercompany balances and transactions have been eliminated in consolidation.
Cash and Cash Equivalents
Cash and cash equivalents include highly liquid investments with original maturities of three months or less.
Marketable Securities
Marketable securities include highly liquid investment grade debt instruments issued by the U.S. government and related agencies, municipalities and corporations and commercial paper issued by companies with investment grade ratings.
The Company’s investments have an original maturity of up to 36 months. Investments with an original maturity of greater than 90 days are classified as marketable securities. Marketable securities with a remaining maturity of greater than one year are classified as long-term. Investments are classified as held-to-maturity and carried at amortized cost.
Inventories
Inventories include material, labor and overhead and are stated at the lower of cost or market. Cost is determined by the first-in, first-out method.
Property and Equipment
Property and equipment, carried at cost, are depreciated using the straight-line method over the estimated useful lives of the assets, which range from three to seven years. Leasehold improvements are depreciated over the shorter of the term of the lease (generally 7 years), without consideration of renewal option or the period through the date a store remodel is expected to be completed.
Other Assets
Other assets include security deposits, patents, trademarks, and goodwill. Patents and trademarks are amortized using the straight-line method over periods ranging from 10 to 17 years.
Fair Value of Financial Instruments
The carrying value of cash and cash equivalents and accounts receivable approximate fair value because of the short-term maturity of those instruments.
Research and Development Costs
Costs incurred in connection with research and development are charged to expense as incurred. Research and development expense was $1,853,000, $1,295,000 and $936,000 in 2004, 2003 and 2002, respectively.
Operating Leases
Rent expense is recognized on a straight-line basis over the lease term, after consideration of rent escalations and rent holidays. The lease term for purposes of the calculation is the earlier of the lease commencement date or the date the Company takes possession of the property. Leasehold improvements that are funded by landlord incentives or allowances under an operating lease are recorded as deferred rent and amortized as reductions to lease expense over the lease term.
In prior-year financial statements, the Company had excluded the build-out periods from its straight-line calculation. Prior year financial statements have been adjusted, reflecting nominal net income additions (reductions) of $(70,000) and $344,000 for the years 2003 and 2002, respectively.
Pre-opening Costs
Costs associated with the start up and promotion of new store openings are expensed as incurred.
Advertising Costs
The Company incurs advertising costs associated with print and broadcast advertisements. Such costs are charged to expense the first time the advertisement airs. Advertising expense was $78,532,000, $59,547,000 and $39,477,000 in 2004, 2003 and 2002, respectively.
Income Taxes
The Company recognizes deferred tax assets and liabilities for the future tax consequences attributable to temporary differences between the financial statement carrying amounts of existing assets and liabilities and their respective tax bases. Deferred tax assets and liabilities are measured using enacted tax rates expected to apply to taxable income in the years in which those temporary differences are expected to be recovered or settled. The effect on deferred tax assets and liabilities of a change in tax rates is recognized in income in the period that includes the enactment date. A valuation allowance is recognized against any portion of deferred tax assets when realization of the deferred tax asset is not considered more likely than not.
29
Earnings Per Share
Basic earnings per share excludes dilution and is computed by dividing the net income attributable to common shareholders by the weighted average number of common shares during the period. Diluted earnings per share includes potentially dilutive common shares consisting of stock options and warrants determined by the treasury stock method and dilutive convertible securities.
Accounting Estimates and Critical Accounting Policies
The preparation of consolidated financial statements in conformity with U.S. generally accepted accounting principles requires management to make estimates and assumptions that affect the reported amounts of assets and liabilities, disclosure of contingent assets and liabilities at the date of the consolidated financial statements and the reported amounts of revenues and expenses during the reporting period. Actual results could differ from those estimates. Critical accounting policies consist of stock-based compensation, revenue recognition, store closing and long-lived asset impairment expenses, accrued warranty costs and accrued sales returns.
In certain instances, U.S. generally accepted accounting principles allow for the selection of alternative accounting methods. One such significant accounting policy involves the selection from alternative methods of accounting for stock options.
Stock Compensation
The Company records compensation expense for option grants under its stock option plan if the current market value of the underlying stock at the grant date exceeds the stock option exercise price. If the Company issues options to non-employees, compensation expense is recognized based on the fair market value method. When the Company issues options to employees, two alternative methods exist for accounting for the options: the intrinsic value method and the fair value method. The Company uses the intrinsic value method of accounting for stock options, and accordingly, no compensation cost has been recognized in the consolidated financial statements for employee stock option grants or the discount feature of the Company’s employee stock purchase plan. Had the Company determined compensation cost based on the fair value at the grant date for its stock options and employee stock purchase plan under an alternative accounting method, the Company’s net income would have been adjusted as outlined below (in thousands, except per share amounts):
| | 2004 | | 2003 | | 2002 | |
Net income, as reported | | $ | 31,555 | | $ | 27,102 | | $ | 37,466 | |
Deduct: Total stock-based employee compensation expense determined under fair value based method for all awards, net of related tax effects | | (4,247 | ) | (2,591 | ) | (2,336 | ) |
Pro forma net income | | $ | 27,308 | | $ | 24,511 | | $ | 35,130 | |
| | | | | | | |
Net income per share | | | | | | | |
Basic – as reported | | $ | 0.87 | | $ | 0.82 | | $ | 1.53 | |
Basic – pro forma | | $ | 0.76 | | $ | 0.75 | | $ | 1.43 | |
| | | | | | | |
Diluted – as reported | | $ | 0.80 | | $ | 0.69 | | $ | 1.10 | |
Diluted – pro forma | | $ | 0.69 | | $ | 0.63 | | $ | 1.03 | |
For purposes of this pro forma presentation, the fair value of each option grant is estimated on the date of grant using the Black-Scholes option pricing model with the following assumptions:
| | 2004 | | 2003 | | 2002 | |
Expected dividend yield | | 0 | % | 0 | % | 0 | % |
Expected stock price volatility | | 55 | % | 90 | % | 90 | % |
Risk-free interest rate | | 2.0 | % | 2.0 | % | 2.0 | % |
Expected life in years | | 3.6 | | 3.6 | | 3.6 | |
Weighted-average fair value at grant date | | $ | 10.19 | | $ | 7.31 | | $ | 2.02 | |
| | | | | | | | | | |
Revenue Recognition
Revenue is recognized at the time of shipment to customers for products delivered by third party carriers. Revenue is recognized at the time products are delivered to customers through our company-controlled home delivery system. In both cases, revenue is recognized net of estimated returns.
Store Closing and Asset Impairment Expenses
The Company reviews its long-lived assets and certain identifiable intangibles for impairment whenever events or changes in circumstances indicate that the carrying amount of an asset may not be recoverable. Recoverability of assets to be held and used is measured by a comparison of the carrying amount of an asset to future net undiscounted cash flows expected to be generated by the asset. If such assets are considered to be impaired, the impairment to be recognized is measured by the amount by which the carrying amount of the assets exceeds the fair value of the assets. Assets to be disposed of are reported at the lower of the carrying amount or fair value less costs to sell.
The Company reviews store assets for possible impairment considering such factors as estimated store cash flows, lease termination provisions, and opportunities to impact future store operating results.
The test for goodwill impairment is a two-step process, and is performed at least annually. The first step is a comparison of the fair value of the reporting unit with its carrying amount, including goodwill. If this step reflects impairment, then the loss would be measured as the excess of recorded goodwill over its implied fair value. Implied fair value is the excess of fair value of the reporting unit over the fair value of all identified assets and liabilities. The carrying value of goodwill as of January 1, 2005, and January 3, 2004, was $2,850,000.
30
Accrued Warranty Costs
The Company provides a 20-year warranty on its adjustable-firmness beds. The customer participates over the last 18 years of the warranty period by paying a portion of the retail value of replacement parts. Estimated warranty costs are expensed at the time of sale based on historical claims incurred by the Company. Actual warranty claim costs could differ from these estimates. The Company classifies as noncurrent those estimated warranty costs expected to be paid out in greater than one year.
As of January 1, 2005, $1,845,000 of the accrued warranty costs was classified as a long-term liability. The activity in the accrued warranty liability account is as follows (in thousands):
| | Balance at
Beginning
of Year | | Additions
Charged to
Costs and
Expenses | | Deductions
from
Reserves | | Balance at
End of Year | |
| | | | | | | | | |
2004 | | $ | 4,262 | | $ | 7,839 | | $ | 8,257 | | $ | 3,844 | |
2003 | | 5,180 | | 4,378 | | 5,296 | | 4,262 | |
2002 | | 6,287 | | | 2,433 | | | 3,540 | | | 5,180 | |
| | | | | | | | | | | | | |
Accrued Sales Returns
Estimated sales returns are provided at the time of sale based upon historical sales returns. Returns are allowed by the Company for 30 nights following the sale.
New Accounting Pronouncements
In December 2004, the Financial Accounting Standards Board revised SFAS No. 123, “Share-Based Payment” (“SFAS 123R”), which replaces SFAS No. 123, “Accounting for Stock-Based Compensation,” (SFAS123) and supercedes APB Opinion No. 25, “Accounting for Stock Issued to Employees.” SFAS 123R requires all share-based payments to employees, including grants of employee stock options, to be recognized in the financial statements based on their fair value beginning with the first interim or annual period after June 15, 2005, with early adoption encouraged. The pro forma disclosures previously permitted under SFAS 123 no longer will be an alternative to financial statement recognition. The Company is required to adopt SFAS 123R by the third quarter of fiscal 2005, beginning July 3, 2005. Under SFAS 123R, the Company must determine the appropriate fair value model to be used for valuing share-based payments, the amortization method for compensation cost, and the transition method to be used at date of adoption. The transition methods include prospective and retroactive adoption options. Under the retroactive option, prior periods may be restated either as of the beginning of the year of adoption or for all periods presented. The prospective method requires that compensation expense be recorded for all unvested stock options at the beginning of the first quarter of adoption of SFAS 123R, while the retroactive methods would record compensation expense for all unvested options beginning with the first period restated. The Company is evaluating the requirements of SFAS 123R and expects that the adoption of SFAS 123R will have a material impact on our consolidated results of operations and earnings per share. The Company has not yet determined the method of adoption or the effect of adopting SFAS 123R, and has not determined whether the adoption will result in amounts that are similar to the current pro forma disclosures under SFAS 123.
(2) MARKETABLE SECURITIES
Marketable securities are summarized as follows (in thousands):
January 1, 2005 | | Effective
Interest Rate | | Amortized
Cost | | Fair
Value | |
| | | | | | | |
Corporate securities | | 1.9 | % | $ | 5,621 | | $ | 5,547 | |
U.S. government agencies | | 1.9 | | 52,864 | | 52,385 | |
Municipal securities | | 2.1 | | 18,192 | | 18,135 | |
| | | | $ | 76,677 | | $ | 76,067 | |
January 3, 2004 | | Effective
Interest Rate | | Amortized
Cost | | Fair
Value | |
| | | | | | | |
Corporate securities | | 1.8 | % | $ | 1,072 | | $ | 1,071 | |
U.S. government agencies | | 1.4 | | 44,724 | | 44,769 | |
Commercial paper | | 1.1 | | 4,597 | | 4,597 | |
| | | | $ | 50,393 | | $ | 50,437 | |
As of January 1, 2005, the contractual maturities were as follows (in thousands):
| | Amortized
Cost | | Fair
Value | |
| | | | | |
4-12 Months | | $ | 35,747 | | $ | 35,507 | |
13-24 Months | | 22,508 | | 22,245 | |
25-36 Months | | 18,422 | | 18,315 | |
| | $ | 76,677 | | $ | 76,067 | |
(3) INVENTORIES
Inventories consist of the following (in thousands):
| | January 1,
2005 | | January 3,
2004 | |
| | | | | |
Raw materials | | $ | 8,498 | | $ | 5,444 | |
Work in progress | | 170 | | 123 | |
Finished goods | | 11,813 | | 8,543 | |
| | $ | 20,481 | | $ | 14,110 | |
The Company’s finished goods inventory, as of January 1, 2005, was comprised of $4.3 million of finished beds, including retail display beds and deliveries in transit to those customers who have selected to utilize home delivery services, $4.6 million of finished components that are ready for assembly for the completion of beds, and $2.9 million of retail accessories.
The Company’s finished goods inventory, as of January 3, 2004, was comprised of $3.0 million of finished beds, including retail display beds and deliveries in transit to those customers who have selected to utilize home delivery services, $3.3 million of finished components that are ready for assembly for the completion of beds, and $2.2 million of retail accessories.
31
(4) PROPERTY AND EQUIPMENT
Property and equipment are summarized as follows (in thousands):
| | January 1,
2005 | | January 3,
2004 | |
| | | | | |
Leasehold improvements | | $ | 54,133 | | $ | 45,588 | |
| | | | | |
Office furniture and equipment | | 3,664 | | 3,785 | |
| | | | | |
Production machinery, computer equipment and software | | 43,352 | | 32,904 | |
| | | | | |
Less accumulated depreciation and amortization | | (57,238 | ) | (46,143 | ) |
| | $ | 43,911 | | $ | 36,134 | |
Store closings and write-off expense was $0, $71,000 and $233,000 in 2004, 2003 and 2002, respectively.
(5) LEASES
The Company rents office and manufacturing space under five operating leases which, in addition to the minimum lease payments, require payment of a proportionate share of the real estate taxes and certain building operating expenses. The Company also rents retail space under operating leases which, in addition to the minimum lease payments, require payment of percentage rents based upon sales levels and require payment of a proportionate share of the real estate taxes and certain building operating expenses. The Company also leases delivery trucks associated with its home delivery service, which in addition to the minimum lease payments, require payment of a management fee and contain certain residual value guarantee provisions that would become due at the expiration of the operating agreement if the fair value of the leased vehicles is less than the guaranteed residual value. The guaranteed residual value at lease expiration is approximately $1,514,000. We believe the likelihood of funding the guarantee obligation under any provision of the operating lease is remote. Rent expense was as follows (in thousands):
| | 2004 | | 2003 | | 2002 | |
| | | | | | | |
Minimum rents | | $ | 20,050 | | $ | 17,376 | | $ | 16,171 | |
Percentage rents | | 6,112 | | 5,036 | | 3,085 | |
Total | | $ | 26,162 | | $ | 22,412 | | $ | 19,256 | |
Equipment rent | | $ | 3,644 | | $ | 03,023 | | $ | 1,913 | |
The aggregate minimum rental commitments under operating leases for subsequent years are as follows (in thousands):
2005 | | $ | 21,808 | |
2006 | | 20,972 | |
2007 | | 18,047 | |
2008 | | 15,643 | |
2009 | | 11,766 | |
Thereafter | | 14,415 | |
| | $ | 102,651 | |
(6) LONG-TERM DEBT
In 2003, the Company entered into an agreement with Bank of America, N.A. for a $15 million three-year senior secured revolving credit facility. The interest rate on borrowings is calculated using LIBOR plus 1.5% to 2.25%. The rate that is incremental to LIBOR is determined based on the Company’s leverage ratio. The Company is subject to certain financial covenants under the agreement, principally consisting of minimum liquidity requirements, working capital and leverage ratios. The Company has remained in full compliance with the financial covenants from the origination of the agreement through January 1, 2005. The Company has had no borrowings against the credit facility.
32
(7) SHAREHOLDERS’ EQUITY
Stock Options
The Board of Directors has reserved 12,300,000 shares of common stock for options that may be granted to key employees, directors or others under the Company’s stock option plans. Shares available for grant at January 1, 2005, were 2,890,500.
A summary of the changes in the Company’s stock option plans for each of the years in the three-year period ended January 1, 2005, is as follows (in thousands, except per share amounts):
| | Shares | | Weighted
Average
Exercise Price | |
Outstanding at December 29, 2001 | | | | | | |
(including 2,035 shares exercisable) | | 4,657 | | $ | 5.32 | |
Granted | | 953 | | 3.26 | |
Exercised | | (166 | ) | 1.69 | |
Canceled | | (124 | ) | 3.97 | |
| | | | | |
Outstanding at December 28, 2002 | | | | | |
(including 2,981 shares exercisable) | | 5,320 | | 5.09 | |
Granted | | 730 | | 11.79 | |
Exercised | | (1,008 | ) | 2.98 | |
Canceled | | (53 | ) | 6.07 | |
| | | | | |
Outstanding at January 3, 2004 | | | | | |
(including 3,278 shares exercisable) | | | | | |
Granted | | 4,989 | | 6.49 | |
Exercised | | (1,017 | ) | 4.40 | |
Canceled | | (60 | ) | 15.05 | |
| | | | | |
Outstanding at January 1, 2005 | | | | | |
(including 3,285 shares exercisable) | | 4,505 | | 9.19 | |
The following table summarizes information about options outstanding at January 1, 2005 (in thousands, except per share amounts):
Options Outstanding | | Options Exercisable | |
| | | | Average | | Weighted | | | | Weighted | |
Range of | | | | Remaining | | Average | | | | Average | |
Exercise | | | | Contractual | | Exercise | | | | Exercise | |
Price | | Shares | | Life (Years) | | Price | | Shares | | Price | |
| | | | | | | | | | | |
$ | 0.56–2.30 | | 805 | | 6.38 | | $ | 1.12 | | 805 | | $ | 1.12 | |
2.31–5.25 | | 986 | | 5.83 | | 3.49 | | 960 | | 3.50 | |
5.26–8.50 | | 835 | | 5.17 | | 6.22 | | 676 | | 6.29 | |
8.51–15.45 | | 1,044 | | 6.45 | | 11.93 | | 682 | | 13.13 | |
15.46–28.73 | | 835 | | 8.28 | | 23.24 | | 162 | | 21.50 | |
$ | 0.56–28.73 | | 4,505 | | 6.40 | | $ | 9.19 | | 3,285 | | $ | 6.38 | |
Warrants
The Company has issued warrants to various holders with outstanding issuances at January 1, 2005, summarized below (in thousands, except per share amounts):
| | Exercise | | Warrants | | Expiration | |
Warrant Type | | Price | | Outstanding | | Date | |
| | | | | | | |
2001 Senior Secured Convertible Notes Financing | | $ | 1.00 | | 1,220 | | 6/6/06 | |
Miscellaneous other warrants | | 1.20–5.56 | | 174 | | 3/6/05–3/27/07 | |
| | $ | 1.00–5.56 | | 1,394 | | 3/6/05–3/27/07 | |
The warrants issued in conjunction with the 2001 Senior Secured Convertible Notes were valued at $1,100,000 and were reflected in additional paid-in capital in the statement of shareholders’ equity.
Miscellaneous other warrants consist of warrants issued to various parties in lieu of cash payments. The value of these warrants was recognized as compensation expense with an offset to shareholders’ equity utilizing the Black-Scholes pricing model with assumptions reflecting the market rates at the time of warrant issuance.
Restricted Stock
The Company issues restricted stock awards to certain employees in conjunction with its stock-based compensation plan. The shares vest over five or ten years based on continued employment. Compensation expense related to restricted stock awards is based upon the market price at date of grant and is charged to earnings on a straight-line basis over the vesting period. There were 153,500 shares of restricted stock outstanding as of January 1, 2005. Total compensation expense related to restricted stock was $405,000 for the year ended January 1, 2005, and $75,000 for the year ended January 3, 2004. There were no share issuances or related compensation expense recognized for the year ended December 28, 2002.
(8) INCOME TAXES
The (provision) benefit for income taxes consists of the following (in thousands):
| | 2004 | | 2003 | | 2002 | |
| | | | | | | |
Current: | | | | | | | |
Federal | | $ | (20,494 | ) | $ | (8,749 | ) | $ | — | |
State | | (2,928 | ) | (1,576 | ) | 340 | |
| | (23,422 | ) | (10,325 | ) | 340 | |
Deferred: | | | | | | | |
Federal | | 3,679 | | (5,512 | ) | 13,017 | |
State | | 353 | | (87 | ) | 4,707 | |
| | 4,032 | | (5,599 | ) | 17,724 | |
Income tax (expense) benefit | | $ | (19,390 | ) | $ | (15,924 | ) | $ | 18,064 | |
33
Effective tax rates differ from statutory federal income tax rates as follows:
| | 2004 | | 2003 | | 2002 | |
| | | | | | | |
Statutory federal income tax rate | | 35.0 | % | 35.0 | % | 35.0 | % |
Change in valuation allowance | | — | | — | | (124.6 | ) |
State income taxes, net of federal benefit | | 3.1 | | 3.1 | | (1.8 | ) |
Other | | — | | (1.1 | ) | 0.1 | |
| | 38.1 | % | 37.0 | % | (91.3 | )% |
The tax effects of temporary differences that give rise to deferred tax assets are as follows (in thousands):
Deferred tax assets: | | 2004 | | 2003 | |
Current: | | | | | |
Inventory, warranty and returns reserves | | $ | 3,474 | | $ | 2,994 | |
Allowance for doubtful accounts | | 266 | | 188 | |
Other | | 4,855 | | 3,512 | |
Long term: | | | | | |
Net operating and capital loss carryforwards | | 845 | | 1,046 | |
Depreciation | | 7,075 | | 4,882 | |
Other | | 187 | | 29 | |
Total gross deferred tax assets | | 16,702 | | 12,651 | |
Valuation allowance | | (660 | ) | (641 | |
Total net deferred tax assets | | $ | 16,042 | | $ | 12,010 | |
At January 1, 2005, the Company had net operating loss carryforwards for federal income tax purposes of approximately $52,000 which will expire between 2005 and 2006. The Company also had net operating loss carryforwards for state income tax purposes of approximately $2,656,000 which will expire between 2007 and 2016.
The Company believes that it is more likely than not that it will generate sufficient taxable income to utilize its deferred tax assets, including net operating loss carryforwards, within any applicable carryover periods.
The Company has recorded a valuation allowance of $660,000 for a capital loss carryforward that likely will not be utilized within its applicable carryforward period.
(9) NET INCOME PER COMMON SHARE
The following computations reconcile net income per share-basic with net income per share-diluted (in thousands, except per share amounts):
2004 | | Net
Income | | Shares | | Per Share
Amount | |
| | | | | | | |
Basic EPS | | | | | | | |
Net income: | | $ | 31,555 | | 36,158 | | $ | 0.87 | |
| | | | | | | |
Effect of Dilutive Securities | | | | | | | |
Options | | — | | 2,186 | | | |
Common stock warrants | | — | | 1,339 | | | |
| | | | | | | |
Diluted EPS | | | | | | | |
Net income plus assumed conversions | | $ | 31,555 | | 39,683 | | $ | 0.80 | |
2003 | | Net
Income | | Shares | | Per Share
Amount | |
| | | | | | | |
Basic EPS | | | | | | | |
Net income: | | $ | 27,102 | | 32,856 | | $ | 0.82 | |
| | | | | | | |
Effect of Dilutive Securities | | | | | | | |
Options | | — | | 2,823 | | | |
Common stock warrants | | — | | 3,331 | | | |
Convertible debt | | 81 | | 267 | | | |
| | | | | | | |
Diluted EPS | | | | | | | |
Net income plus assumed conversions | | $ | 27,183 | | 39,277 | | $ | 0.69 | |
2002 | | Net
Income | | Shares | | Per Share
Amount | |
| | | | | | | |
Basic EPS | | | | | | | |
Net income: | | $ | 37,466 | | 24,549 | | $ | 1.53 | |
| | | | | | | |
Effect of Dilutive Securities | | | | | | | |
Options | | — | | 1,883 | | | |
Common stock warrants | | — | | 2,886 | | | |
Convertible debt | | 563 | | 5,214 | | | |
| | | | | | | |
Diluted EPS | | | | | | | |
Net income plus assumed conversions | | $ | 38,029 | | 34,532 | | $ | 1.10 | |
The following is a summary of those securities outstanding during the respective periods which have been excluded from the calculations because the effect on net income per common share would not have been dilutive (in thousands):
| | 2004 | | 2003 | | 2002 | |
| | | | | | | |
Options | | 630 | | 210 | | 1,870 | |
Common stock warrants | | — | | — | | 40 | |
Convertible debt | | — | | — | | 727 | |
34
(10) EMPLOYEE BENEFIT PLANS
Profit Sharing and 401(k) Plan
Under the Company’s profit sharing and 401(k) plan, eligible employees may defer up to 15% of their compensation on a pre-tax basis. Each year, the Company may make a discretionary contribution equal to a percentage of the employee’s contribution. During 2004, 2003 and 2002, the Company expensed $1,828,000, $1,066,000 and $485,000, respectively, relating to its contribution to the 401(k) plan. During 2004, 2003 and 2002, the Company issued 11,225, 79,305 and 81,778 shares, respectively, for some or all of its discretionary contribution.
Employee Stock Purchase Plan
Under the Company’s Employee Stock Purchase Plan, employees can purchase Company common stock at a discount of 15% based on the average price of the stock on the last business day of the offering period (calendar-quarter.) The Company issued 80,830, 93,982 and 145,434 shares during 2004, 2003 and 2002, respectively.
(11) COMMITMENTS AND CONTINGENCIES
In August 2003, a lawsuit was filed against the Company in Superior Court of the State of California, County of Ventura. This suit was filed by two former store managers alleging misclassification of employment position and seeking class certification. The plaintiffs have sought judgment for unpaid overtime compensation for store managers and lost meal and break times for store managers and other store personnel alleged to exceed $1.0 million, together with related penalties, restitution, attorneys’ fees and costs. In January 2005, the Company agreed to settle all of the alleged claims for an aggregate sum of $750,000. This settlement is subject to the approval of the court, which the Company plans to pursue over the next several months. The cost of this settlement was accrued in our fiscal 2004 results of operations.
In October 2004, a lawsuit was filed against the Company in Hennepin County District Court in the State of Minnesota by one of our customers alleging deceptive trade practices, fraud and breach of warranty related to the alleged propensity of the Company’s products to develop mold. The complaint seeks class certification and various forms of legal and equitable relief, including without limitation rescission and/or actual damages in an amount to be determined at trial, including interest, costs and attorney’s fees. In December 2004, the Company filed a motion to dismiss the claims in their entirety. The Court’s decision on this motion is pending. The Company believes that the complaint is without merit and intends to vigorously defend the claims. As this case is in the early stages and discovery has not yet commenced, the financial impact to the Company, if any, cannot be predicted.
The Company is involved in various other claims and legal actions arising in the ordinary course of business. In the opinion of management, any losses that may occur from these other matters are adequately covered by insurance or are provided for in the consolidated financial statements, and the ultimate outcome of these other matters will not have a material effect on the consolidated financial position or results of operations of the Company.
(12) SUMMARY OF QUARTERLY FINANCIAL DATA (UNAUDITED)
The following is a condensed summary of actual quarterly results for 2004 and 2003 (in thousands, except per share amounts):
2004 | | December | | September | | June | | March | |
| | | | | | | | | |
Net sales | | $ | 148,608 | | $ | 144,348 | | $ | 124,720 | | $ | 139,963 | |
Gross profit | | 90,744 | | 86,982 | | 76,914 | | 86,034 | |
Operating income | | 16,148 | | 12,706 | | 9,059 | | 11,618 | |
Net income | | 10,438 | | 8,049 | | 5,735 | | 7,333 | |
Net income per share—diluted | | 0.27 | | 0.20 | | 0.14 | | 0.18 | |
| | | | | | | | | | | | | |
2003 | | December | | September | | June | | March | |
| | | | | | | | | |
Net sales | | $ | 137,138 | | $ | 117,400 | | $ | 101,993 | | $ | 101,958 | |
Gross profit | | 85,399 | | 74,953 | | 63,073 | | 63,901 | |
Operating income | | 17,001 | | 11,461 | | 7,578 | | 6,544 | |
Net income | | 11,092 | | 7,179 | | 4,756 | | 4,075 | |
Net income per share—diluted | | 0.28 | | 0.18 | | 0.12 | | 0.11 | |
| | | | | | | | | | | | | |
As discussed in Note 1, the Company made immaterial adjustments to historical financial statements to record the impact of changes to lease accounting. Such adjustments are reflected above.
35
QUANTITATIVE AND QUALITATIVE DISCLOSURE ABOUT MARKET RISK
Financial instruments that potentially subject us to concentrations of credit risk consist principally of investments. The counterparties to the agreements consist of government agencies and various major corporations of investment grade credit standing. We do not believe we are exposed to significant risk of non-performance by these counterparties because we limit the amount of credit exposure to any one financial institution and any one type of investment.
COMMON STOCK
Out common stock trades on the Nasdaq Stock Market under the symbol “SCSS.” The following table sets forth the quarterly high and low sales prices per share of our common stock as reported by the Nasdaq National Market for the two most recent fiscal years. These quotations reflect inter-dealer prices, without retail mark-up, mark-down or commission, and may not necessarily represent actual transactions.
| | Fourth | | Third | | Second | | First | |
| | Quarter | | Quarter | | Quarter | | Quarter | |
Fiscal 2004 | | | | | | | | | |
High | | $ | 20.70 | | $ | 27.81 | | $ | 30.23 | | $ | 28.55 | |
Low | | $ | 14.75 | | $ | 13.14 | | $ | 22.09 | | $ | 21.40 | |
Fiscal 2003 | | | | | | | | | |
High | | $ | 32.32 | | $ | 29.16 | | $ | 18.06 | | $ | 12.13 | |
Low | | $ | 21.61 | | $ | 15.57 | | $ | 9.85 | | $ | 8.55 | |
36
Information for our investors
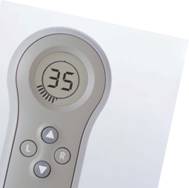
| Board of Directors | | Executive Officers/ |
Ervin R. Shames (Lead Director) | | Management Team |
Sleep Number® 35 | | |
Independent Management Consultant | | William R. McLaughlin |
| | Sleep Number® 55 |
William R. McLaughlin (Chairman) | | Chairman and |
Sleep Number® 55 | | Chief Executive Officer |
Chairman and | | |
Chief Executive Officer, | | Mark A. Kimball |
Select Comfort Corporation | | Sleep Number® 35 |
| | Senior Vice President, |
Thomas J. Albani | | Legal, General Counsel |
Sleep Number® 90 | | and Secretary |
Former President and CEO, | | |
Electrolux Corporation | | Gregory T. Kliner |
| | Sleep Number® 35 |
Christine M. Day | | Senior Vice President, |
Sleep Number® 45 | | Operations |
President, Asia Pacific Group | | |
Starbucks Coffee International | | Scott F. Peterson |
| | Sleep Number® 45 |
Patrick A. Hopf | | Senior Vice President, |
Sleep Number® 35 | | Human Resources |
Chairman, | | |
Better Life Media | | James C. Raabe |
| | Sleep Number® 25 |
Christopher P. Kirchen | | Senior Vice President, |
Sleep Number® 35 | | Chief Financial Officer |
Managing General Partner, | | |
BEV Capital | | Noel F. Schenker |
| | Sleep Number® 35 |
David T. Kollat | | Senior Vice President, |
Sleep Number® 40 | | Marketing and |
President, 22 Inc. | | New Business Development |
| | |
Brenda J. Lauderback | | Keith C. Spurgeon |
Sleep Number® 45 | | Sleep Number® 90 |
Former Group President, | | Senior Vice President, Sales |
Nine West Group | | |
| | Michael J. Thyken |
Michael A. Peel | | Sleep Number® 45 |
Sleep Number® 45 | | Senior Vice President, |
Senior Vice President, | | Chief Information Officer |
Human Resources | | |
and Corporate Services, | | |
General Mills | | |
| | |
Jean-Michel Valette | | |
Sleep Number® 35 | | |
Chairman, | | |
Peet’s Coffee & Tea, Inc. | | |