UNITED STATES
SECURITIES AND EXCHANGE COMMISSION
Washington, D.C. 20549
SCHEDULE 14A
Proxy Statement Pursuant to Section 14(a)
of the Securities Exchange Act of 1934
(Amendment No. )
| | |
Filed by the Registrant | þ |
Filed by a party other than the Registrant | o |
Check the appropriate box: | |
o | Preliminary Proxy Statement |
o | Confidential, for Use of the Commission Only (as permitted by Rule 14a-6(e)(2)) |
o | Definitive Proxy Statement |
þ | Definitive Additional Materials |
o | Soliciting Material under Rule 14a-12 |
| | |
| | |
SELECT COMFORT CORPORATION |
(Name of Registrant as Specified In Its Charter) |
| | |
| | |
(Name of Person(s) Filing Proxy Statement, if other than the Registrant) |
| | |
| | | |
Payment of Filing Fee (Check the appropriate box): |
þ | No fee required. |
o | Fee computed on table below per Exchange Act Rules 14a-6(i)(1) and 0-11. |
| (1) | Title of each class of securities to which transaction applies: |
| | | |
| | | |
| (2) | Aggregate number of securities to which transaction applies: |
| | | |
| | | |
| (3) | Per unit price or other underlying value of transaction computed pursuant to Exchange Act Rule 0-11 (set forth the amount on which the filing fee is calculated and state how it was determined): |
| | | |
| | | |
| (4) | Proposed maximum aggregate value of transaction: |
| | | |
| | | |
| (5) | Total fee paid: |
| | | |
| | | |
o | Fee paid previously with preliminary materials. |
o | Check box if any part of the fee is offset as provided by Exchange Act Rule 0-11(a)(2) and identify the filing for which the offsetting fee was paid previously. Identify the previous filing by registration statement number, or the Form or Schedule and the date of its filing. |
| (1) | Amount Previously Paid: |
| | | |
| | | |
| (2) | Form, Schedule or Registration Statement No.: |
| | | |
| | | |
| (3) | Filing Party: |
| | | |
| | | |
| (4) | Date Filed: |
| | | |
Select Comfort: SCSS
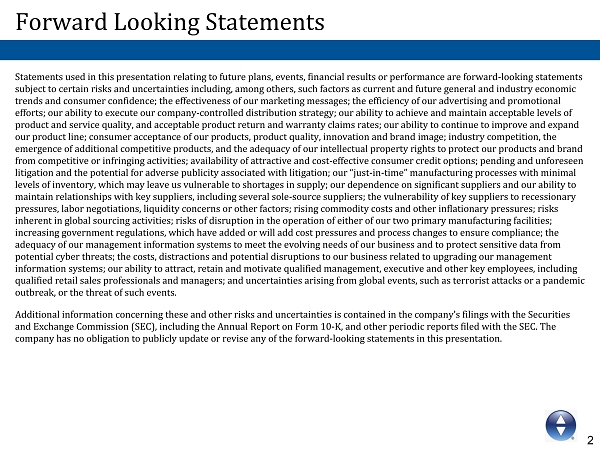
2 0 82 150 0 174 239 Forward Looking Statements Statements used in this presentation relating to future plans, events, financial results or performance are forward-looking statements subject to certain risks and uncertainties including, among others, such factors as current and future general and industry economic trends and consumer confidence; the effectiveness of our marketing messages; the efficiency of our advertising and promotional efforts; our ability to execute our company-controlled distribution strategy; our ability to achieve and maintain acceptable levels of product and service quality, and acceptable product return and warranty claims rates; our ability to continue to improve and expand our product line; consumer acceptance of our products, product quality, innovation and brand image; industry competition, the emergence of additional competitive products, and the adequacy of our intellectual property rights to protect our products and brand from competitive or infringing activities; availability of attractive and cost-effective consumer credit options; pending and unforeseen litigation and the potential for adverse publicity associated with litigation; our “just-in-time”manufacturing processes with minimal levels of inventory, which may leave us vulnerable to shortages in supply; our dependence on significant suppliers and our ability to maintain relationships with key suppliers, including several sole-source suppliers; the vulnerability of key suppliers to recessionary pressures, labor negotiations, liquidity concerns or other factors; rising commodity costs and other inflationary pressures; risks inherent in global sourcing activities; risks of disruption in the operation of either of our two primary manufacturing facilities; increasing government regulations, which have added or will add cost pressures and process changes to ensure compliance; the adequacy of our management information systems to meet the evolving needs of our business and to protect sensitive data from potential cyber threats; the costs, distractions and potential disruptions to our business related to upgrading our management information systems; our ability to attract, retain and motivatequalified management, executive and other key employees, including qualified retail sales professionals and managers; and uncertainties arising from global events, such as terrorist attacks or a pandemic outbreak, or the threat of such events. Additional information concerning these and other risks and uncertainties is contained in the company’s filings with the Securities and Exchange Commission (SEC), including the Annual Report on Form 10-K, and other periodic reports filed with the SEC. The company has no obligation to publicly update or revise any of the forward-looking statements in this presentation.
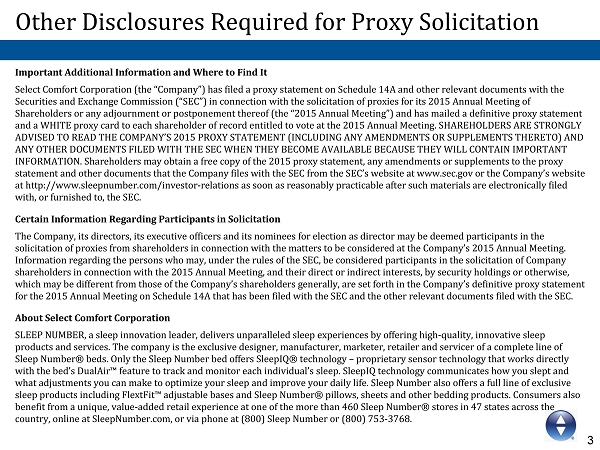
3 0 82 150 0 174 239 Other Disclosures Required for Proxy Solicitation Important Additional Information and Where to Find It Select Comfort Corporation (the “Company”) has filed a proxy statement on Schedule 14A and other relevantdocuments with the Securities and Exchange Commission (“SEC”) in connection with the solicitation of proxies for its 2015 Annual Meeting of Shareholders or any adjournment or postponement thereof (the “2015 Annual Meeting”) and has mailed a definitive proxy statement and a WHITE proxy card to each shareholder of record entitled tovote at the 2015 Annual Meeting. SHAREHOLDERS ARE STRONGLY ADVISED TO READ THE COMPANY’S 2015 PROXY STATEMENT (INCLUDING ANY AMENDMENTS OR SUPPLEMENTS THERETO) AND ANY OTHER DOCUMENTS FILED WITH THE SEC WHEN THEY BECOME AVAILABLE BECAUSE THEY WILL CONTAIN IMPORTANT INFORMATION. Shareholders may obtain a free copy of the 2015 proxy statement, any amendments or supplements to the proxy statement and other documents that the Company files with the SEC from the SEC’s website at www.sec.gov or the Company’s website at http://www.sleepnumber.com/investor-relations as soon as reasonably practicable after such materialsare electronically filed with, or furnished to, the SEC. Certain Information Regarding Participants in Solicitation The Company, its directors, its executive officers and its nominees for election as director may be deemed participants in the solicitation of proxies from shareholders in connection with thematters to be considered at the Company’s 2015 Annual Meeting. Information regarding the persons who may, under the rules of the SEC, be considered participants in the solicitation of Company shareholders in connection with the 2015 Annual Meeting, and their direct or indirect interests, by security holdings or otherwise, which may be different from those of the Company’s shareholders generally, are set forth in the Company’s definitive proxy statement for the 2015 Annual Meeting on Schedule 14A that has been filed with the SEC and the other relevant documents filed with the SEC. About Select Comfort Corporation SLEEP NUMBER, a sleep innovation leader, delivers unparalleled sleep experiences by offering high-quality, innovative sleep products and services. The company is the exclusive designer, manufacturer, marketer, retailer and servicer of a complete line of Sleep Number®beds. Only the Sleep Number bed offers SleepIQ®technology –proprietary sensor technology that works directly with the bed’s DualAir™feature to track and monitor each individual’s sleep. SleepIQ technology communicates how you slept and what adjustments you can make to optimize your sleep and improveyour daily life. Sleep Number also offers a full line of exclusive sleep products including FlextFit™adjustable bases and Sleep Number®pillows, sheets and other bedding products. Consumers also benefit from a unique, value-added retail experience at one of the more than 460 Sleep Number®stores in 47 states across the country, online at SleepNumber.com, or via phone at (800) Sleep Number or (800) 753-3768.
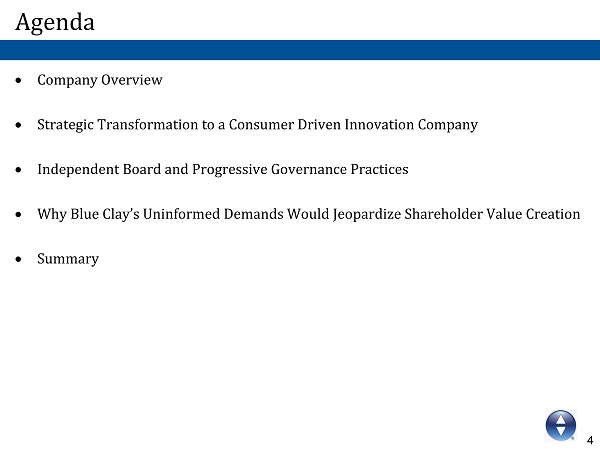
4 0 82 150 0 174 239 Agenda • Company Overview • Strategic Transformation to a Consumer Driven Innovation Company • Independent Board and Progressive Governance Practices • Why Blue Clay’s Uninformed Demands Would Jeopardize Shareholder Value Creation • Summary
5 0 82 150 0 174 239 Company Overview
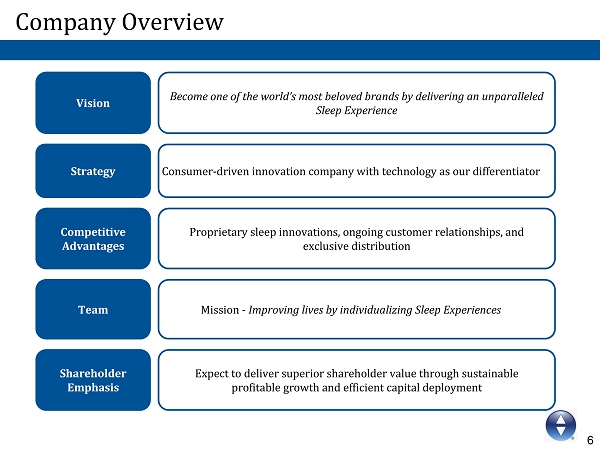
6 0 82 150 0 174 239 Company Overview Vision Become one of the world’s most beloved brands by delivering an unparalleled Sleep Experience Competitive Advantages Proprietary sleep innovations, ongoing customer relationships, and exclusive distribution Team Mission -Improving lives by individualizing Sleep Experiences Shareholder Emphasis Expect to deliver superior shareholder value through sustainable profitable growth and efficient capital deployment Strategy Consumer-driven innovation company with technology as our differentiator
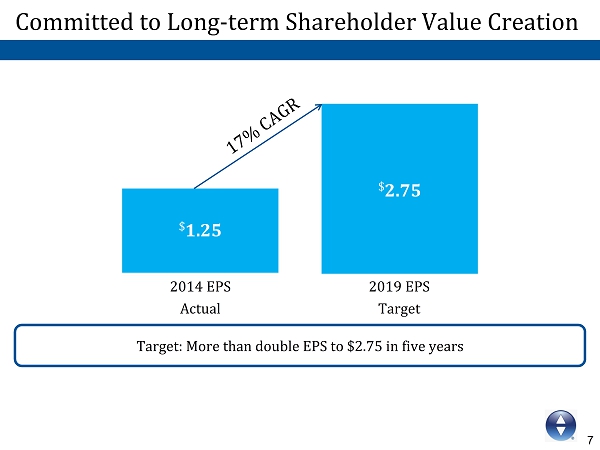
7 0 82 150 0 174 239 Target: More than double EPS to $2.75 in five years 2019 EPS Target 2014 EPS Actual $ 2.75 $ 1.25 Committed to Long-term Shareholder Value Creation 17% CAGR
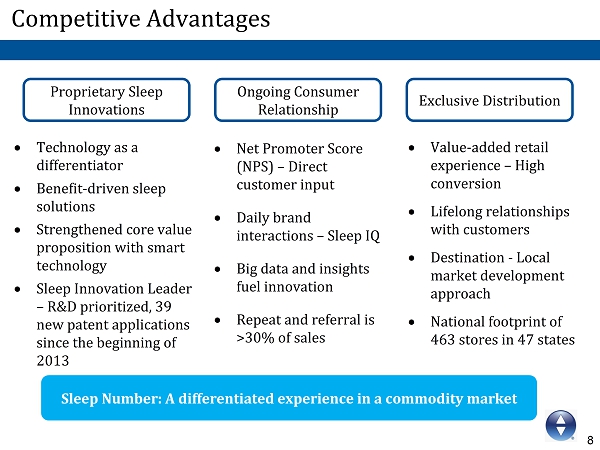
8 0 82 150 0 174 239 Competitive Advantages Proprietary Sleep Innovations • Technology as a differentiator • Benefit-driven sleep solutions • Strengthened core value proposition with smart technology • Sleep Innovation Leader –R&D prioritized, 39 new patent applications since the beginning of 2013 Ongoing Consumer Relationship Exclusive Distribution • Net Promoter Score (NPS) –Direct customer input • Daily brand interactions –Sleep IQ • Big data and insights fuel innovation • Repeat and referral is >30% of sales • Value-added retail experience –High conversion • Lifelong relationships with customers • Destination -Local market development approach • National footprint of 463 stores in 47 states Sleep Number: A differentiated experience in a commodity market
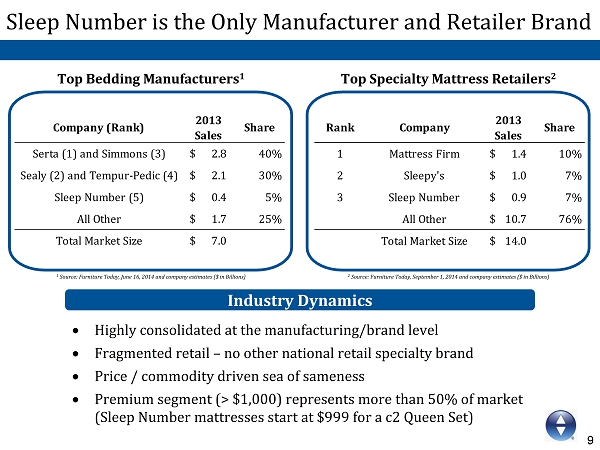
9 0 82 150 0 174 239 Sleep Number is the Only Manufacturer and Retailer Brand Company (Rank) 2013 Sales Share Serta (1) and Simmons (3) 2.8$ 40% Sealy (2) and Tempur-Pedic (4) 2.1$ 30% Sleep Number (5) 0.4$ 5% All Other 1.7$ 25% Total Market Size 7.0$ Rank Company 2013 Sales Share 1 Mattress Firm 1.4$ 10% 2 Sleepy's 1.0$ 7% 3 Sleep Number 0.9$ 7% All Other 10.7$ 76% Total Market Size 14.0$ Industry Dynamics • Highly consolidated at the manufacturing/brand level • Fragmented retail –no other national retail specialty brand • Price / commodity driven sea of sameness • Premium segment (> $1,000) represents more than 50% of market (Sleep Number mattresses start at $999 for a c2 Queen Set) 2 Source: Furniture Today, September 1, 2014 and company estimates ($ in Billions) Top Bedding Manufacturers 1 Top Specialty Mattress Retailers 2 1 Source: Furniture Today, June 16, 2014 and company estimates ($in Billions)
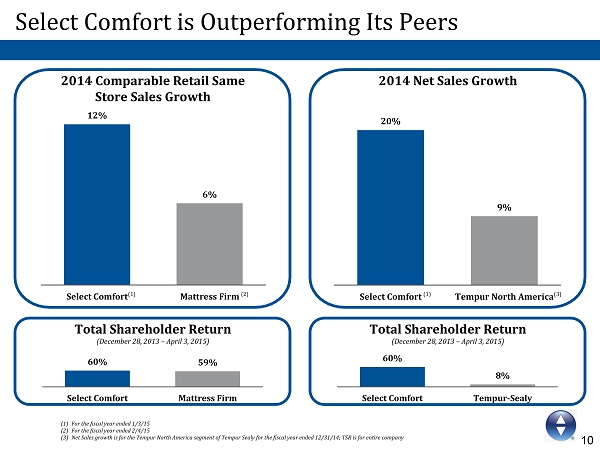
10 0 82 150 0 174 239 Select Comfort is Outperforming Its Peers 2014 Comparable Retail Same Store Sales Growth 2014 Net Sales Growth 12% 6% Select Comfort Mattress Firm 20% 9% Select Comfort Tempur North America 60% 59% Select Comfort Mattress Firm 60% 8% Select Comfort Tempur-Sealy Total Shareholder Return (December 28, 2013 –April 3, 2015) Total Shareholder Return (December 28, 2013 –April 3, 2015) (1)For the fiscal year ended 1/3/15 (2)For the fiscal year ended 2/4/15 (3)Net Sales growth is for the Tempur North America segment of Tempur Sealy for the fiscal year ended 12/31/14; TSR is for entire company (1) (1)(2) (3)
11 0 82 150 0 174 239 Strategic Transformation to a Consumer Driven Innovation Company
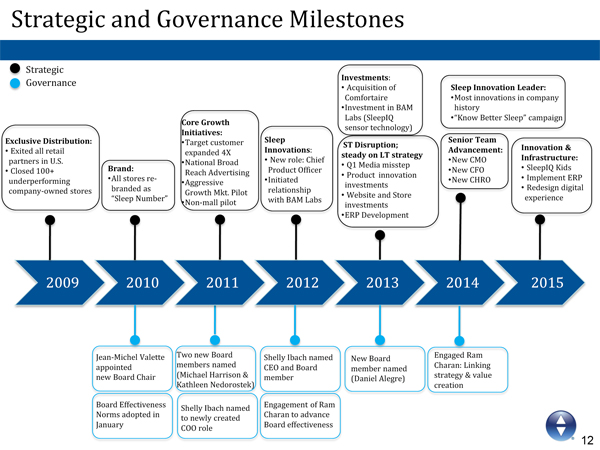
12 0 82 150 0 174 239 Strategic and Governance Milestones 2009 2010 2011 2012 2013 2014 2015 Governance Strategic Jean-Michel Valette appointed new Board Chair Two new Board members named (Michael Harrison & Kathleen Nedorostek) Shelly Ibach named to newly created COO role Shelly Ibach named CEO and Board member New Board member named (Daniel Alegre) Brand: •All stores re- branded as “Sleep Number” Core Growth Initiatives: •Target customer expanded 4X •National Broad Reach Advertising •Aggressive Growth Mkt. Pilot •Non-mall pilot Sleep Innovations: •New role: Chief Product Officer •Initiated relationship with BAM Labs Exclusive Distribution: •Exited all retail partners in U.S. •Closed 100+ underperforming company-owned stores ST Disruption; steady on LT strategy •Q1 Media misstep •Product innovation investments •Website and Store investments •ERP Development Sleep Innovation Leader: •Most innovations in company history •“Know Better Sleep”campaign Innovation & Infrastructure: •SleepIQ Kids •Implement ERP •Redesign digital experience Investments: •Acquisition of Comfortaire •Investment in BAM Labs (SleepIQ sensor technology) Board Effectiveness Norms adopted in January Senior Team Advancement: •New CMO •New CFO •New CHRO Engagement of Ram Charan to advance Board effectiveness Engaged Ram Charan: Linking strategy & value creation
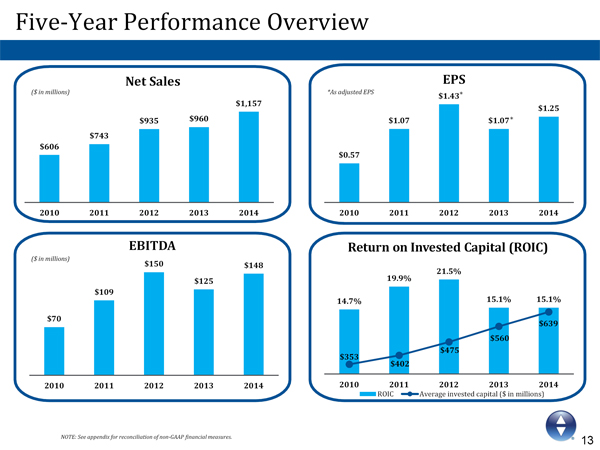
13 0 82 150 0 174 239 $0.57 $1.07 $1.43 $1.07 $1.25 2010 2011 2012 2013 2014 Five-Year Performance Overview EBITDA ($ in millions) Net Sales *As adjusted EPS NOTE: See appendix for reconciliation of non-GAAP financial measures. ($ in millions) Return on Invested Capital (ROIC) * * EPS 14.7% 19.9% 21.5% 15.1% 15.1% $353 $402 $475 $560 $639 2010 2011 2012 2013 2014 ROIC Average invested capital ($ in millions) $606 $743 $935 $960 $1,157 2010 2011 2012 2013 2014 $70 $109 $150 $125 $148 2010 2011 2012 2013 2014
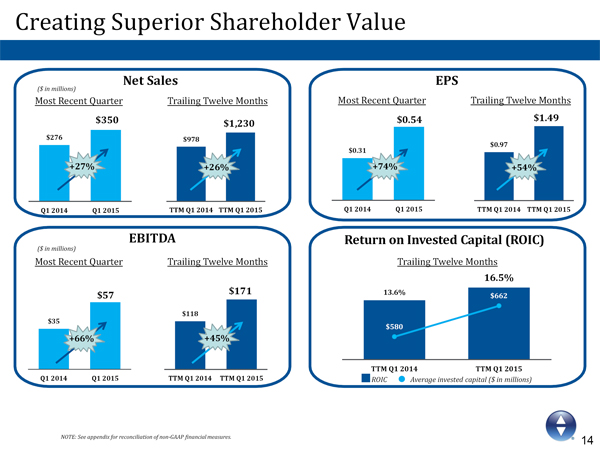
14 0 82 150 0 174 239 $978 $1,230 TTM Q1 2014 TTM Q1 2015 NOTE: See appendix for reconciliation of non-GAAP financial measures. EBITDA ($ in millions) Creating Superior Shareholder Value Return on Invested Capital (ROIC) Net Sales ($ in millions) EPS ROIC Average invested capital ($ in millions) $276 $350 Q1 2014 Q1 2015 Most Recent Quarter Trailing Twelve Months $35 $57 Q1 2014 Q1 2015 $118 $171 TTM Q1 2014 TTM Q1 2015 Most Recent Quarter Trailing Twelve Months Trailing Twelve Months $0.31 $0.54 Q1 2014 Q1 2015 $0.97 $1.49 TTM Q1 2014 TTM Q1 2015 Most Recent Quarter Trailing Twelve Months +14% 13.6% 16.5% $580 $662 TTM Q1 2014 TTM Q1 2015 16.5% $1.49 $1,230 $171 +26% +27% +66% +45% +74% +54% $350 $57 $0.54
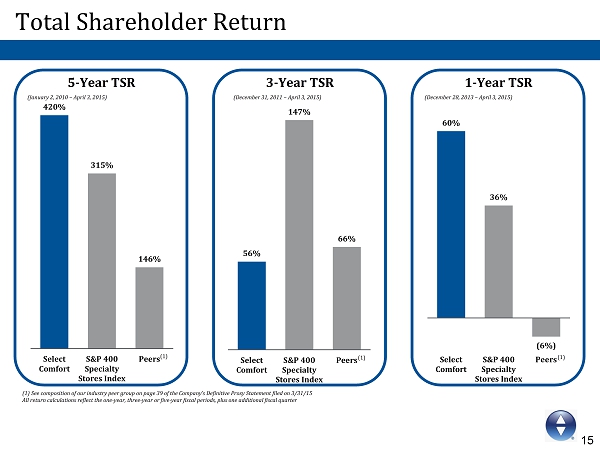
15 0 82 150 0 174 239 60% 36% (6%) Select Comfort S&P 400 Specialty Stores Index Peers Total Shareholder Return 5-Year TSR (January 2, 2010 –April 3, 2015) 3-Year TSR (December 31, 2011 –April 3, 2015) 1-Year TSR (December 28, 2013 –April 3, 2015) 420% 315% 146% Select Comfort S&P 400 Specialty Stores Index Peers 56% 147% 66% Select Comfort S&P 400 Specialty Stores Index Peers (1) See composition of our industry peer group on page 39 of theCompany’s Definitive Proxy Statement filed on 3/31/15 All return calculations reflect the one-year, three-year or five-year fiscal periods, plus one additional fiscal quarter (1) (1) (1)
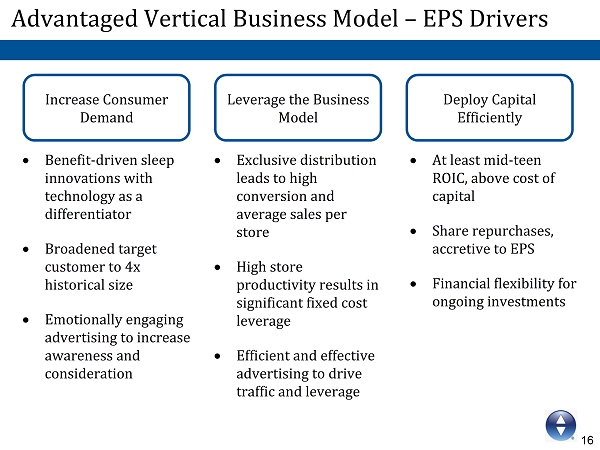
16 0 82 150 0 174 239 Advantaged Vertical Business Model –EPS Drivers Increase Consumer Demand • Benefit-driven sleep innovations with technology as a differentiator • Broadened target customer to 4x historical size • Emotionally engaging advertising to increase awareness and consideration Leverage the Business Model Deploy Capital Efficiently • Exclusive distribution leads to high conversion and average sales per store • High store productivity results in significant fixed cost leverage • Efficient and effective advertising to drive traffic and leverage • At least mid-teen ROIC, above cost of capital • Share repurchases, accretive to EPS • Financial flexibility for ongoing investments
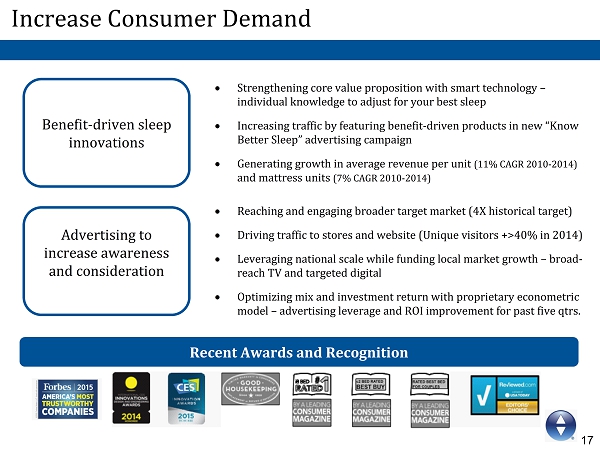
17 0 82 150 0 174 239 Increase Consumer Demand Benefit-driven sleep innovations • Reaching and engaging broader target market (4X historical target) • Driving traffic to stores and website (Unique visitors +>40% in 2014) • Leveraging national scale while funding local market growth –broad- reach TV and targeted digital • Optimizing mix and investment return with proprietary econometric model –advertising leverage and ROI improvement for past five qtrs. Advertising to increase awareness and consideration • Strengthening core value proposition with smart technology – individual knowledge to adjust for your best sleep • Increasing traffic by featuring benefit-driven products in new “Know Better Sleep”advertising campaign • Generating growth in average revenue per unit (11% CAGR 2010-2014) and mattress units (7% CAGR 2010-2014) Recent Awards and Recognition

18 0 82 150 0 174 239 Leveraging the Business Model Exclusive Distribution is the Foundation for Sustainable Profitable Growth • Gross margin expansion o Supply chain transformation o Manufacturing and sourcing leverage • Operating expense productivity o Higher sales per store drives 4-wall profit leverage o Deliberate and methodical 5-7% store growth CAGR with targeted $3M average sales per store o National media and distribution leverage Operating Efficiency • Sleep Innovation Leader • Retail expansion –Stores and digital • ERP platform enables growth, agility & scale o Replaces 20-year old legacy systems o Simplified supply chain and customer experience o Enables agility and profitability across the enterprise Investing to Grow
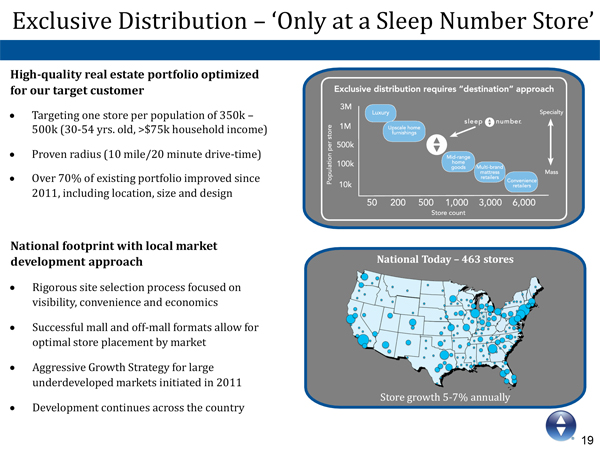
19 0 82 150 0 174 239 Exclusive Distribution –‘Only at a Sleep Number Store’ High-quality real estate portfolio optimized for our target customer •Targeting one store per population of 350k –500k (30-54 yrs. old, >$75k household income) •Proven radius (10 mile/20 minute drive-time) •Over 70% of existing portfolio improved since 2011, including location, size and design National footprint with local market development approach •Rigorous site selection process focused on visibility, convenience and economics •Successful mall and off-mall formats allow for optimal store placement by market •Aggressive Growth Strategy for large underdeveloped markets initiated in 2011 •Development continues across the country National Today –463 stores Store growth 5-7% annually
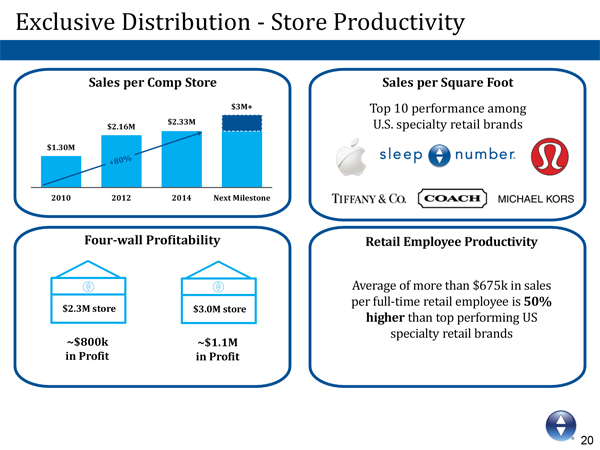
20 0 82 150 0 174 239 $1.30M $2.16M $2.33M $3M+ 2010 2012 2014 Next Milestone Exclusive Distribution -Store Productivity Four-wall Profitability Retail Employee Productivity Sales per Comp Store Sales per Square Foot Top 10 performance among U.S. specialty retail brands +80% ~$800k in Profit $2.3M store ~$1.1M in Profit $3.0M store Average of more than $675k in sales per full-time retail employee is 50% higherthan top performing US specialty retail brands

21 0 82 150 0 174 239 Aggressive Growth Markets 2010 2014 $13m DMA Sales $39m $1.5m Sales/Store $3.2m $450k Profit/Store $1.1m 9 # of Stores 12 4% Market Share 9% • Focused strategy initiated in 2011 to grow market share in 13 large and underpenetrated markets representing one-third of U.S. bedding sales o Objective: Double market share in three years and sustain ongoing growth o Heavy-up local media and real estate optimization o First nine markets all delivering as planned; 10 th market initiated in 2015 o Elements deployed in all markets as we grow share nationwide • Continuously refined and paced with ‘test and learn’approach to optimize results –factors are market specific • Integral part of national distribution strategy Actual Market Example 2010 (pre launch) 2014
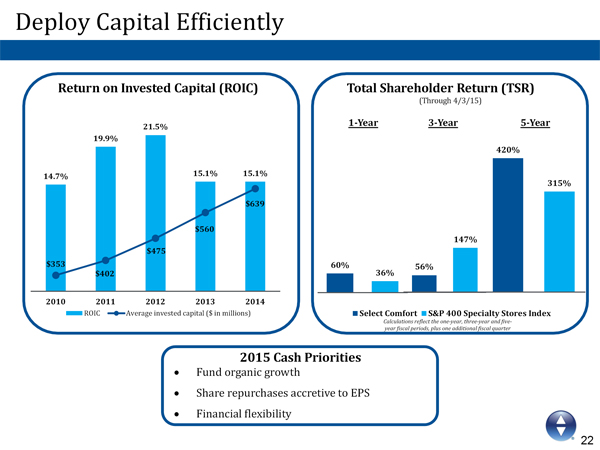
22 0 82 150 0 174 239 Deploy Capital Efficiently Return on Invested Capital (ROIC) Total Shareholder Return (TSR) (Through 4/3/15) 1-Year 3-Year 5-Year 2015 Cash Priorities • Fund organic growth • Share repurchases accretive to EPS • Financial flexibility 420% 315% 56% 147% Select Comfort S&P 400 Specialty Stores Index 60% 36% 14.7% 19.9% 21.5% 15.1% 15.1% $353 $402 $475 $560 $639 2010 2011 2012 2013 2014 ROIC Average invested capital ($ in millions) Calculations reflect the one-year, three-year and five- year fiscal periods, plus one additional fiscal quarter
23 0 82 150 0 174 239 Independent Board and Progressive Governance Practices
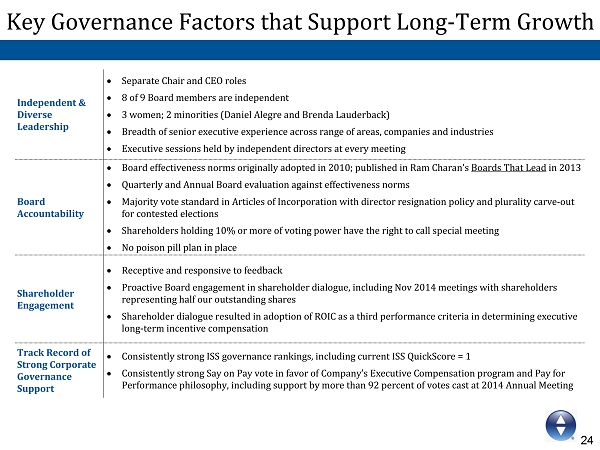
24 0 82 150 0 174 239 Key Governance Factors that Support Long-Term Growth Independent & Diverse Leadership • Separate Chair and CEO roles • 8 of 9 Board members are independent • 3 women; 2 minorities (Daniel Alegre and Brenda Lauderback) • Breadth of senior executive experience across range of areas, companies and industries • Executive sessions held by independent directors at every meeting Board Accountability • Board effectiveness norms originally adopted in 2010; published in Ram Charan’s Boards That Leadin 2013 • Quarterly and Annual Board evaluation against effectiveness norms • Majority vote standard in Articles of Incorporation with director resignation policy and plurality carve-out for contested elections • Shareholders holding 10% or more of voting power have the right to call special meeting • No poison pill plan in place Shareholder Engagement • Receptive and responsive to feedback • Proactive Board engagement in shareholder dialogue, including Nov 2014 meetings with shareholders representing half our outstanding shares • Shareholder dialogue resulted in adoption of ROIC as a third performance criteria in determining executive long-term incentive compensation Track Record of Strong Corporate Governance Support • Consistently strong ISS governance rankings, including current ISS QuickScore = 1 • Consistently strong Say on Pay vote in favor of Company’s Executive Compensation program and Pay for Performance philosophy, including support by more than 92 percent of votes cast at 2014 Annual Meeting
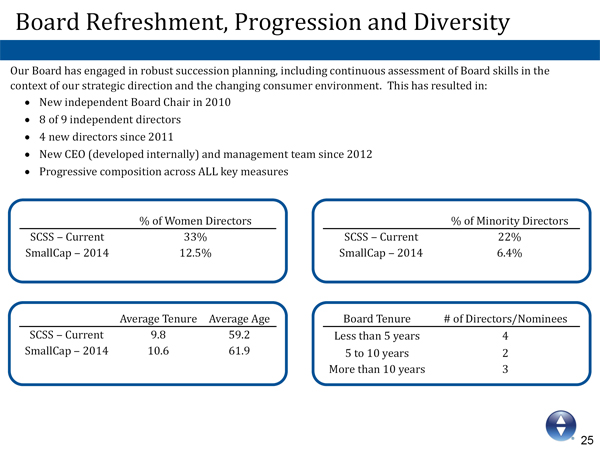
25 0 82 150 0 174 239 Board Refreshment, Progression and Diversity Our Board has engaged in robust succession planning, including continuous assessment of Board skills in the context of our strategic direction and the changing consumer environment. This has resulted in: •New independent Board Chair in 2010 •8 of 9 independent directors •4 new directors since 2011 •New CEO (developed internally) and management team since 2012 •Progressive composition across ALL key measures % of Minority Directors SCSS ‒Current 22% SmallCap ‒2014 6.4% % of Women Directors SCSS ‒Current 33% SmallCap ‒2014 12.5% Average Tenure Average Age SCSS ‒Current 9.8 59.2 SmallCap ‒2014 10.6 61.9 Board Tenure # of Directors/Nominees Less than 5 years 4 5 to 10 years 2 More than 10 years 3
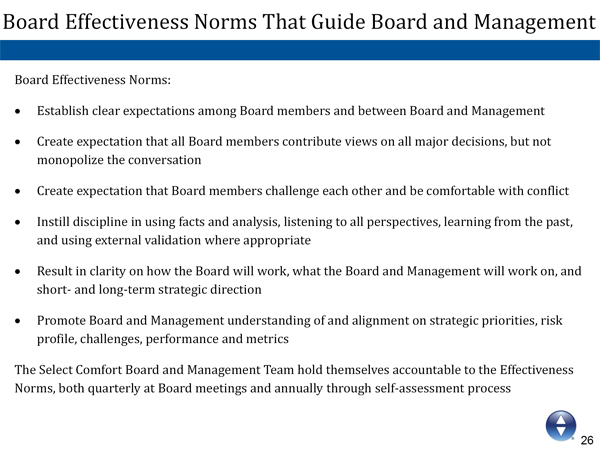
26 0 82 150 0 174 239 Board Effectiveness Norms That Guide Board and Management Board Effectiveness Norms: •Establish clear expectations among Board members and between Board and Management •Create expectation that all Board members contribute views on all major decisions, but not monopolize the conversation •Create expectation that Board members challenge each other and be comfortable with conflict •Instill discipline in using facts and analysis, listening to allperspectives, learning from the past, and using external validation where appropriate •Result in clarity on how the Board will work, what the Board andManagement will work on, and short-and long-term strategic direction •Promote Board and Management understanding of and alignment on strategic priorities, risk profile, challenges, performance and metrics The Select Comfort Board and Management Team hold themselves accountable to the Effectiveness Norms, both quarterly at Board meetings and annually through self-assessment process
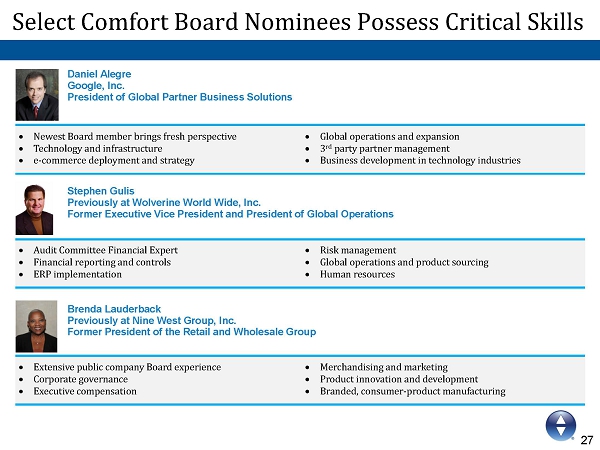
27 0 82 150 0 174 239 Select Comfort Board Nominees Possess Critical Skills Daniel Alegre Google, Inc. President of Global Partner Business Solutions Stephen Gulis Previously at Wolverine World Wide, Inc. Former Executive Vice President and President of Global Operations Brenda Lauderback Previously at Nine West Group, Inc. Former President of the Retail and Wholesale Group
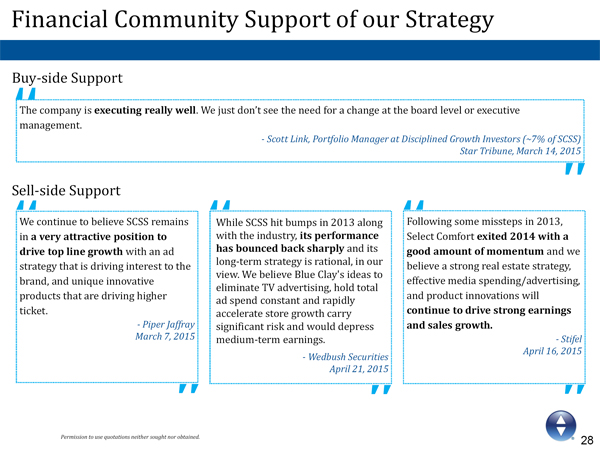
28 0 82 150 0 174 239 Financial Community Support of our Strategy Buy-side Support Sell-side Support The company is executing really well. We just don’t see the need for a change at the board level or executive management. -Scott Link, Portfolio Manager at Disciplined Growth Investors (~7% of SCSS) Star Tribune, March 14, 2015 We continue to believe SCSS remains in a very attractive position to drive top line growthwith an ad strategy that is driving interest to the brand, and unique innovative products that are driving higher ticket. -Piper Jaffray March 7, 2015 -Wedbush Securities April 21, 2015 Following some missteps in 2013, Select Comfort exited 2014 with a good amount of momentumand we believe a strong real estate strategy, effective media spending/advertising, and product innovations will continue to drive strong earnings and sales growth. -Stifel April 16, 2015 Permission to use quotations neither sought nor obtained. While SCSS hit bumps in 2013 along with the industry,its performance has bounced back sharply and its long-term strategy is rational, in our view. We believe Blue Clay's ideas to eliminate TV advertising, hold total ad spend constant and rapidly accelerate store growth carry significant risk and would depress medium-term earnings.
29 0 82 150 0 174 239 Blue Clay’s Demands
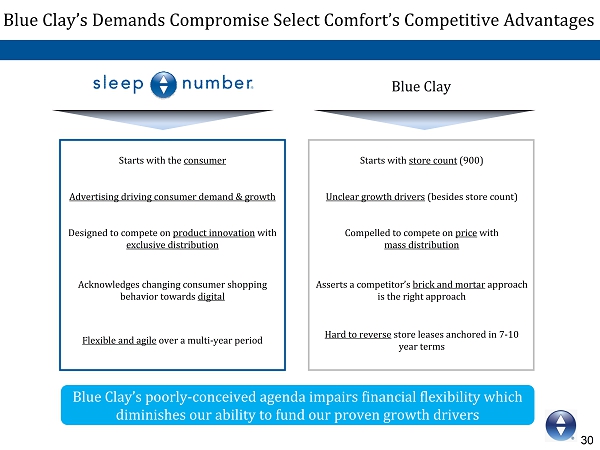
30 0 82 150 0 174 239 Blue Clay’s Demands Compromise Select Comfort’s Competitive Advantages Blue Clay Starts with the consumer Designed to compete on product innovationwith exclusive distribution Advertising driving consumer demand & growth Acknowledges changing consumer shopping behavior towards digital Flexible and agileover a multi-year period Starts with store count(900) Compelled to compete on pricewith mass distribution Unclear growth drivers(besides store count) Asserts a competitor’s brick and mortarapproach is the right approach Hard to reversestore leases anchored in 7-10 year terms Blue Clay’s poorly-conceived agenda impairs financial flexibility which diminishes our ability to fund our proven growth drivers
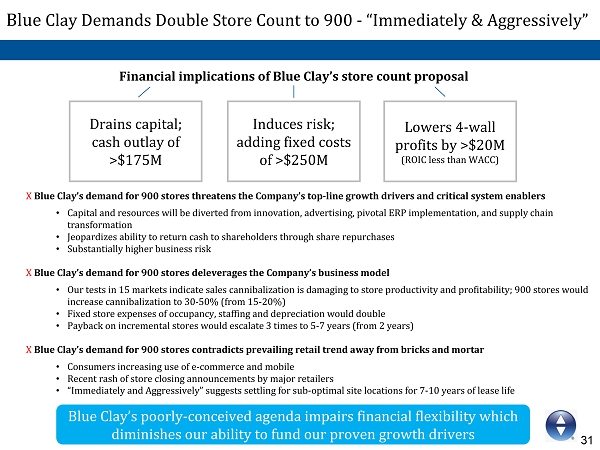
31 0 82 150 0 174 239 BlueClay Demands Double Store Count to 900 -“Immediately & Aggressively” Blue Clay’s poorly-conceived agenda impairs financial flexibility which diminishes our ability to fund our proven growth drivers Drains capital; cash outlay of >$175M Induces risk; adding fixed costs of >$250M Lowers 4-wall profits by >$20M (ROIC less than WACC) Financial implications of Blue Clay’s store count proposal XBlue Clay’s demand for 900 stores threatens the Company’s top-line growth drivers and critical system enablers • Capital and resources will be diverted from innovation, advertising, pivotal ERP implementation, and supply chain transformation • Jeopardizes ability to return cash to shareholders through sharerepurchases • Substantially higher business risk X Blue Clay’s demand for 900 stores deleverages the Company’s business model • Our tests in 15 markets indicate sales cannibalization is damaging to store productivity and profitability; 900 stores would increase cannibalization to 30-50% (from 15-20%) • Fixed store expenses of occupancy, staffing and depreciation would double • Payback on incremental stores would escalate 3 times to 5-7 years (from 2 years) XBlue Clay’s demand for 900 stores contradicts prevailing retail trend awayfrom bricks and mortar • Consumers increasing use of e-commerce and mobile • Recent rash of store closing announcements by major retailers • “Immediately and Aggressively”suggests settling for sub-optimal site locations for 7-10 years of lease life
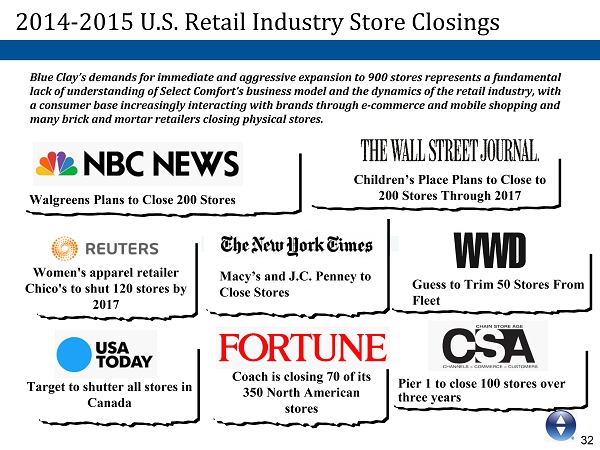
32 0 82 150 0 174 239 2014-2015 U.S. Retail Industry Store Closings Walgreens Plans to Close 200 Stores Pier 1 to close 100 stores over three years Women's apparel retailer Chico's to shut 120 stores by 2017 Macy’s and J.C. Penney to Close Stores Children’s Place Plans to Close to 200 Stores Through 2017 Guess to Trim 50 Stores From Fleet Coach is closing 70 of its 350 North American stores Blue Clay’s demands for immediate and aggressive expansion to 900 stores represents a fundamental lack of understanding of Select Comfort’s business model and the dynamics of the retail industry, with a consumer base increasingly interacting with brands through e-commerce and mobile shopping and many brick and mortar retailers closing physical stores. Target to shutter all stores in Canada
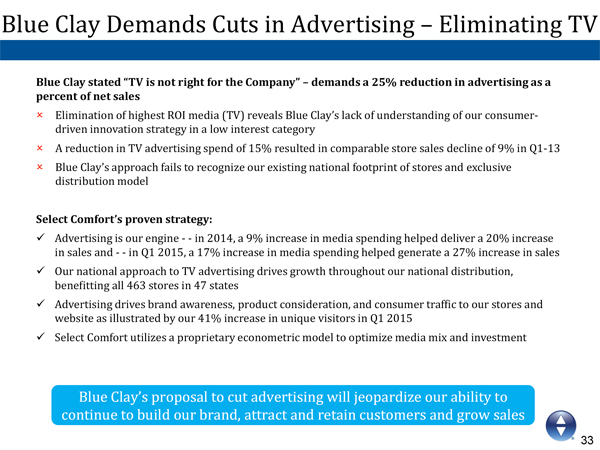
33 0 82 150 0 174 239 Blue Clay stated “TV is not right for the Company”–demands a 25% reduction in advertising as a percent of net sales •Elimination of highest ROI media (TV) reveals Blue Clay’s lack of understanding of our consumer-driven innovation strategy in a low interest category •A reduction in TV advertising spend of 15% resulted in comparable store sales decline of 9% in Q1-13 •Blue Clay’s approach fails to recognize our existing national footprint ofstores and exclusive distribution model Select Comfort’s proven strategy: xAdvertising is our engine --in 2014, a 9% increase in media spending helped deliver a 20% increase in sales and --in Q1 2015, a 17% increase in media spending helped generate a 27% increase in sales xOur national approach to TV advertising drives growth throughoutour national distribution, benefitting all 463 stores in 47 states xAdvertising drives brand awareness, product consideration, and consumer traffic to our stores and website as illustrated by our 41% increase in unique visitors inQ1 2015 xSelect Comfort utilizes a proprietary econometric model to optimize media mix and investment Blue Clay Demands Cuts in Advertising –Eliminating TV Blue Clay’s proposal to cut advertising will jeopardize our ability to continue to build our brand, attract and retain customers and grow sales
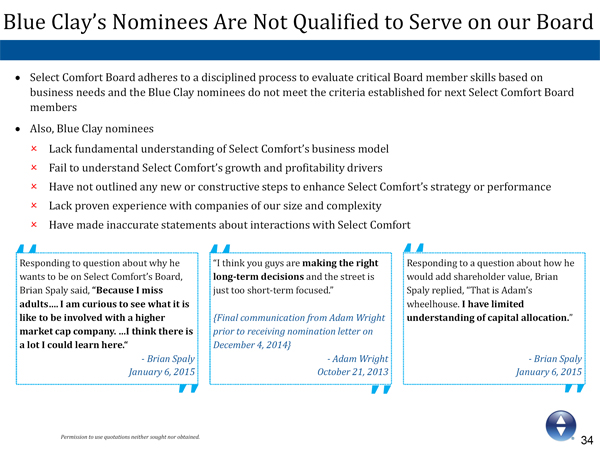
34 0 82 150 0 174 239 Blue Clay’s Nominees Are Not Qualified to Serve on our Board • Select Comfort Board adheres to a disciplined process to evaluate critical Board member skills based on business needs and the Blue Clay nominees do not meet the criteria established for next Select Comfort Board members • Also, Blue Clay nominees • Lack fundamental understanding of Select Comfort’s business model • Fail to understand Select Comfort’s growth and profitability drivers • Have not outlined any new or constructive steps to enhance Select Comfort’s strategy or performance • Lack proven experience with companies of our size and complexity • Have made inaccurate statements about interactions with Select Comfort Responding to question about why he wants to be on Select Comfort’s Board, Brian Spaly said, “Because I miss adults…. I am curious to see what it is like to be involved with a higher market cap company. …I think there is a lot I could learn here.“ -Brian Spaly January 6, 2015 “I think you guys are making the right long-term decisionsand the street is just too short-term focused.” {Final communication from Adam Wright prior to receiving nomination letter on December 4, 2014} -Adam Wright October 21, 2013 Responding to a question about how he would add shareholder value, Brian Spaly replied, “That is Adam’s wheelhouse. I have limited understanding of capital allocation.” -Brian Spaly January 6, 2015 Permission to use quotations neither sought nor obtained.

35 0 82 150 0 174 239 Summary
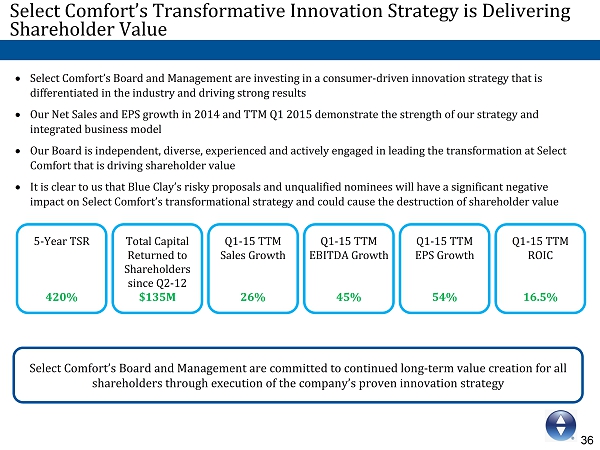
36 0 82 150 0 174 239 Select Comfort’s Transformative Innovation Strategy is Delivering Shareholder Value • Select Comfort’s Board and Management are investing in a consumer-driven innovation strategy that is differentiated in the industry and driving strong results • Our Net Sales and EPS growth in 2014 and TTM Q1 2015 demonstratethe strength of our strategy and integrated business model • Our Board is independent, diverse, experienced and actively engaged in leading the transformation at Select Comfort that is driving shareholder value • It is clear to us that Blue Clay’s risky proposals and unqualified nominees will have a significant negative impact on Select Comfort’s transformational strategy and could cause the destruction of shareholder value 5-Year TSR 420% Q1-15 TTM EPS Growth 54% Total Capital Returned to Shareholders since Q2-12 $135M Q1-15 TTM Sales Growth 26% Q1-15 TTM EBITDA Growth 45% Q1-15 TTM ROIC 16.5% Select Comfort’s Board and Management are committed to continued long-term value creation for all shareholders through execution of the company’s proven innovation strategy

37 0 82 150 0 174 239 Strategic and Governance Milestones 2009 2010 2011 2012 2013 2014 2015 Governance Strategic Jean-Michel Valette appointed new Board Chair Two new Board members named (Michael Harrison & Kathleen Nedorostek) Shelly Ibach named to newly created COO role Shelly Ibach named CEO and Board member New Board member named (Daniel Alegre) Brand: •All stores re- branded as “Sleep Number” Core Growth Initiatives: •Target customer expanded 4X •National Broad Reach Advertising •Aggressive Growth Mkt. Pilot •Non-mall pilot Sleep Innovations: •New role: Chief Product Officer •Initiated relationship with BAM Labs Exclusive Distribution: •Exited all retail partners in U.S. •Closed 100+ underperforming company-owned stores ST Disruption; steady on LT strategy •Q1 media misstep •Product innovation investments •Website and Store investments •ERP Development Sleep Innovation Leader: •Most innovations in company history •“Know Better Sleep”campaign Innovation & Infrastructure: •SleepIQ Kids •Implement ERP •Redesign digital experience Investments: •Acquisition of Comfortaire •Investment in BAM Labs (SleepIQ sensor technology) Board Effectiveness Norms adopted in January Senior Team Advancement: •New CMO •New CFO •New CHRO Engagement of Ram Charan to advance Board effectiveness Engaged Ram Charan: Linking strategy & value creation
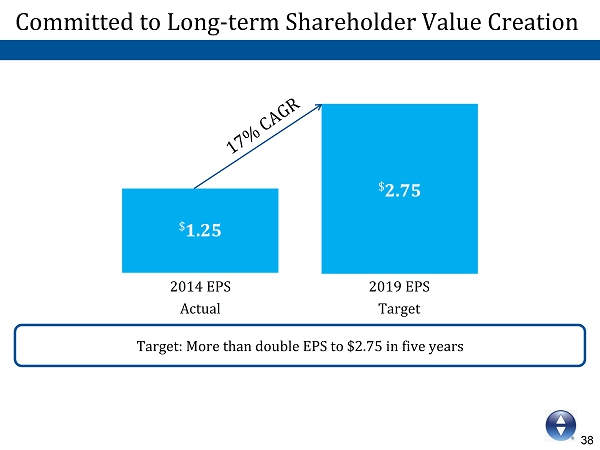
38 0 82 150 0 174 239 Target: More than double EPS to $2.75 in five years 2019 EPS Target 2014 EPS Actual $ 2.75 $ 1.25 Committed to Long-term Shareholder Value Creation 17% CAGR

39 0 82 150 0 174 239 Appendix
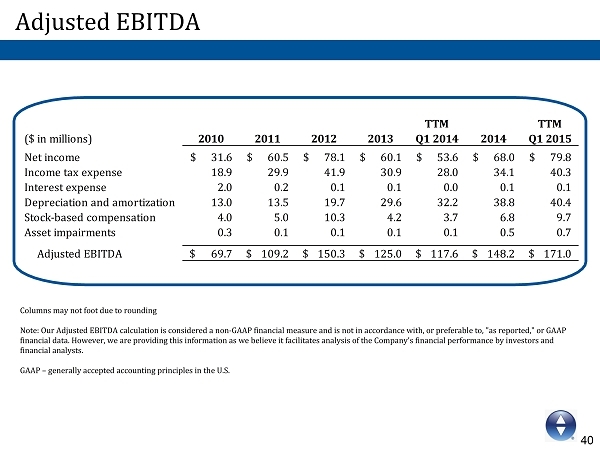
41 0 82 150 0 174 239 Adjusted EBITDA Columns may not foot due to rounding Note: Our Adjusted EBITDA calculation is considered a non-GAAP financial measure and is not in accordance with, or preferable to, "as reported," or GAAP financial data. However, we are providing this information as webelieve it facilitates analysis of the Company's financial performance by investors and financial analysts. GAAP –generally accepted accounting principles in the U.S. TTM TTM ($ in millions) 2010 2011 2012 2013 Q1 2014 2014 Q1 2015 Net income 31.6$ 60.5$ 78.1$ 60.1$ 53.6$ 68.0$ 79.8$ Income tax expense 18.9 29.9 41.9 30.9 28.0 34.1 40.3 Interest expense 2.0 0.2 0.1 0.1 0.0 0.1 0.1 Depreciation and amortization 13.0 13.5 19.7 29.6 32.2 38.8 40.4 Stock-based compensation 4.0 5.0 10.3 4.2 3.7 6.8 9.7 Asset impairments 0.3 0.1 0.1 0.1 0.1 0.5 0.7 Adjusted EBITDA 69.7$ 109.2$ 150.3$ 125.0$ 117.6$ 148.2$ 171.0$
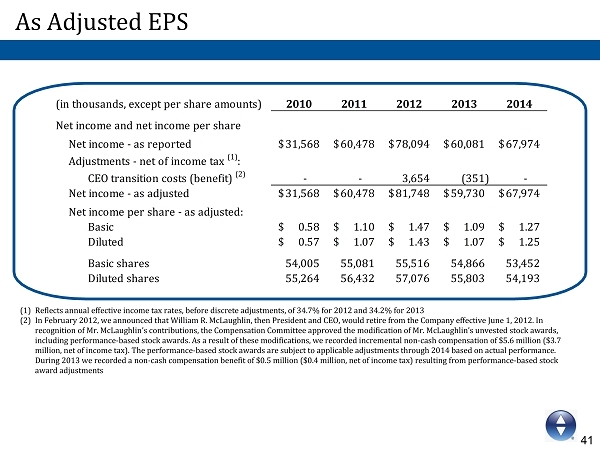
40 0 82 150 0 174 239 (in thousands, except per share amounts) 2010 2011 2012 2013 2014 Net income and net income per share Net income - as reported 31,568$ 60,478$ 78,094$ 60,081$ 67,974$ Adjustments - net of income tax (1) : CEO transition costs (benefit) (2) - - 3,654 (351) - Net income - as adjusted 31,568$ 60,478$ 81,748$ 59,730$ 67,974$ Net income per share - as adjusted: Basic 0.58$ 1.10$ 1.47$ 1.09$ 1.27$ Diluted 0.57$ 1.07$ 1.43$ 1.07$ 1.25$ Basic shares 54,005 55,081 55,516 54,866 53,452 Diluted shares 55,264 56,432 57,076 55,803 54,193 (1)Reflects annual effective income tax rates, before discrete adjustments, of 34.7% for 2012 and 34.2% for 2013 (2)In February 2012, we announced that William R. McLaughlin, then President and CEO, would retire from the Company effective June 1, 2012. In recognition of Mr. McLaughlin’s contributions, the Compensation Committee approved the modification of Mr. McLaughlin’s unvested stock awards, including performance-based stock awards. As a result of these modifications, we recorded incremental non-cash compensation of $5.6 million ($3.7 million, net of income tax). The performance-based stock awards are subject to applicable adjustments through2014 based on actual performance. During 2013 we recorded a non-cash compensation benefit of $0.5 million ($0.4 million, net of income tax) resulting from performance-based stock award adjustments As Adjusted EPS
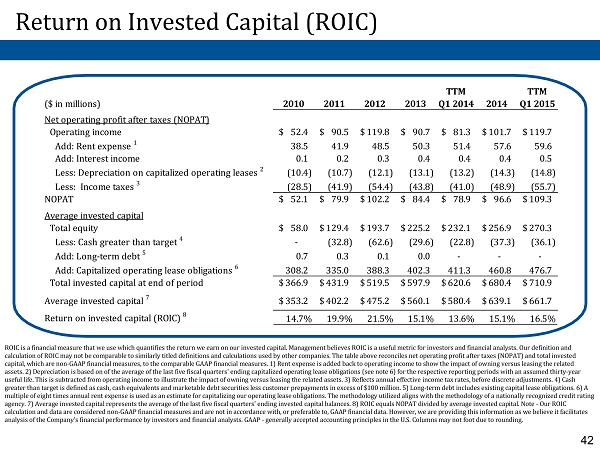
42 0 82 150 0 174 239 Return on Invested Capital (ROIC) ROIC is a financial measure that we use which quantifies the return we earn on our invested capital. Management believes ROIC isa useful metric for investors and financial analysts. Our definition and calculation of ROIC may not be comparable to similarly titled definitions and calculations used by other companies. The table above reconciles net operating profit after taxes (NOPAT) and total invested capital, which are non-GAAP financial measures, to the comparable GAAP financial measures. 1) Rent expense is added back to operating income to show the impact of owning versus leasing the related assets. 2) Depreciation is based on of the average of the last five fiscal quarters' ending capitalized operating lease obligations (see note 6) for the respective reporting periods with an assumed thirty-year useful life. This is subtracted from operating income to illustrate the impact of owning versus leasing the related assets. 3) Reflects annual effective income tax rates, before discrete adjustments. 4) Cash greater than target is defined as cash, cash equivalents and marketable debt securities less customer prepayments in excess of $100 million. 5) Long-term debt includes existing capital lease obligations. 6) A multiple of eight times annual rent expense is used as an estimate for capitalizing our operating lease obligations. The methodology utilized aligns with the methodology of a nationally recognized credit rating agency. 7) Average invested capital represents the average of the last five fiscal quarters' ending invested capital balances. 8) ROIC equals NOPAT divided by average invested capital. Note -Our ROIC calculation and data are considered non-GAAP financial measures and are not in accordance with, or preferable to, GAAP financial data. However, we are providing this information as we believe it facilitates analysis of the Company's financial performance by investors andfinancial analysts. GAAP -generally accepted accounting principles in the U.S. Columns may not foot due to rounding. ($ in millions) 2010 2011 2012 2013 TTM Q1 2014 2014 TTM Q1 2015 Net operating profit after taxes (NOPAT) Operating income 52.4$ 90.5$ 119.8$ 90.7$ 81.3$ 101.7$ 119.7$ Add: Rent expense 1 38.5 41.9 48.5 50.3 51.4 57.6 59.6 Add: Interest income 0.1 0.2 0.3 0.4 0.4 0.4 0.5 Less: Depreciation on capitalized operating leases 2 (10.4) (10.7) (12.1) (13.1) (13.2) (14.3) (14.8) Less: Income taxes 3 (28.5) (41.9) (54.4) (43.8) (41.0) (48.9) (55.7) NOPAT 52.1$ 79.9$ 102.2$ 84.4$ 78.9$ 96.6$ 109.3$ Average invested capital Total equity 58.0$ 129.4$ 193.7$ 225.2$ 232.1$ 256.9$ 270.3$ Less: Cash greater than target 4 - (32.8) (62.6) (29.6) (22.8) (37.3) (36.1) Add: Long-term debt 5 0.7 0.3 0.1 0.0 - - - Add: Capitalized operating lease obligations 6 308.2 335.0 388.3 402.3 411.3 460.8 476.7 Total invested capital at end of period 366.9$ 431.9$ 519.5$ 597.9$ 620.6$ 680.4$ 710.9$ Average invested capital 7 353.2$ 402.2$ 475.2$ 560.1$ 580.4$ 639.1$ 661.7$ Return on invested capital (ROIC) 8 14.7% 19.9% 21.5% 15.1% 13.6% 15.1% 16.5%