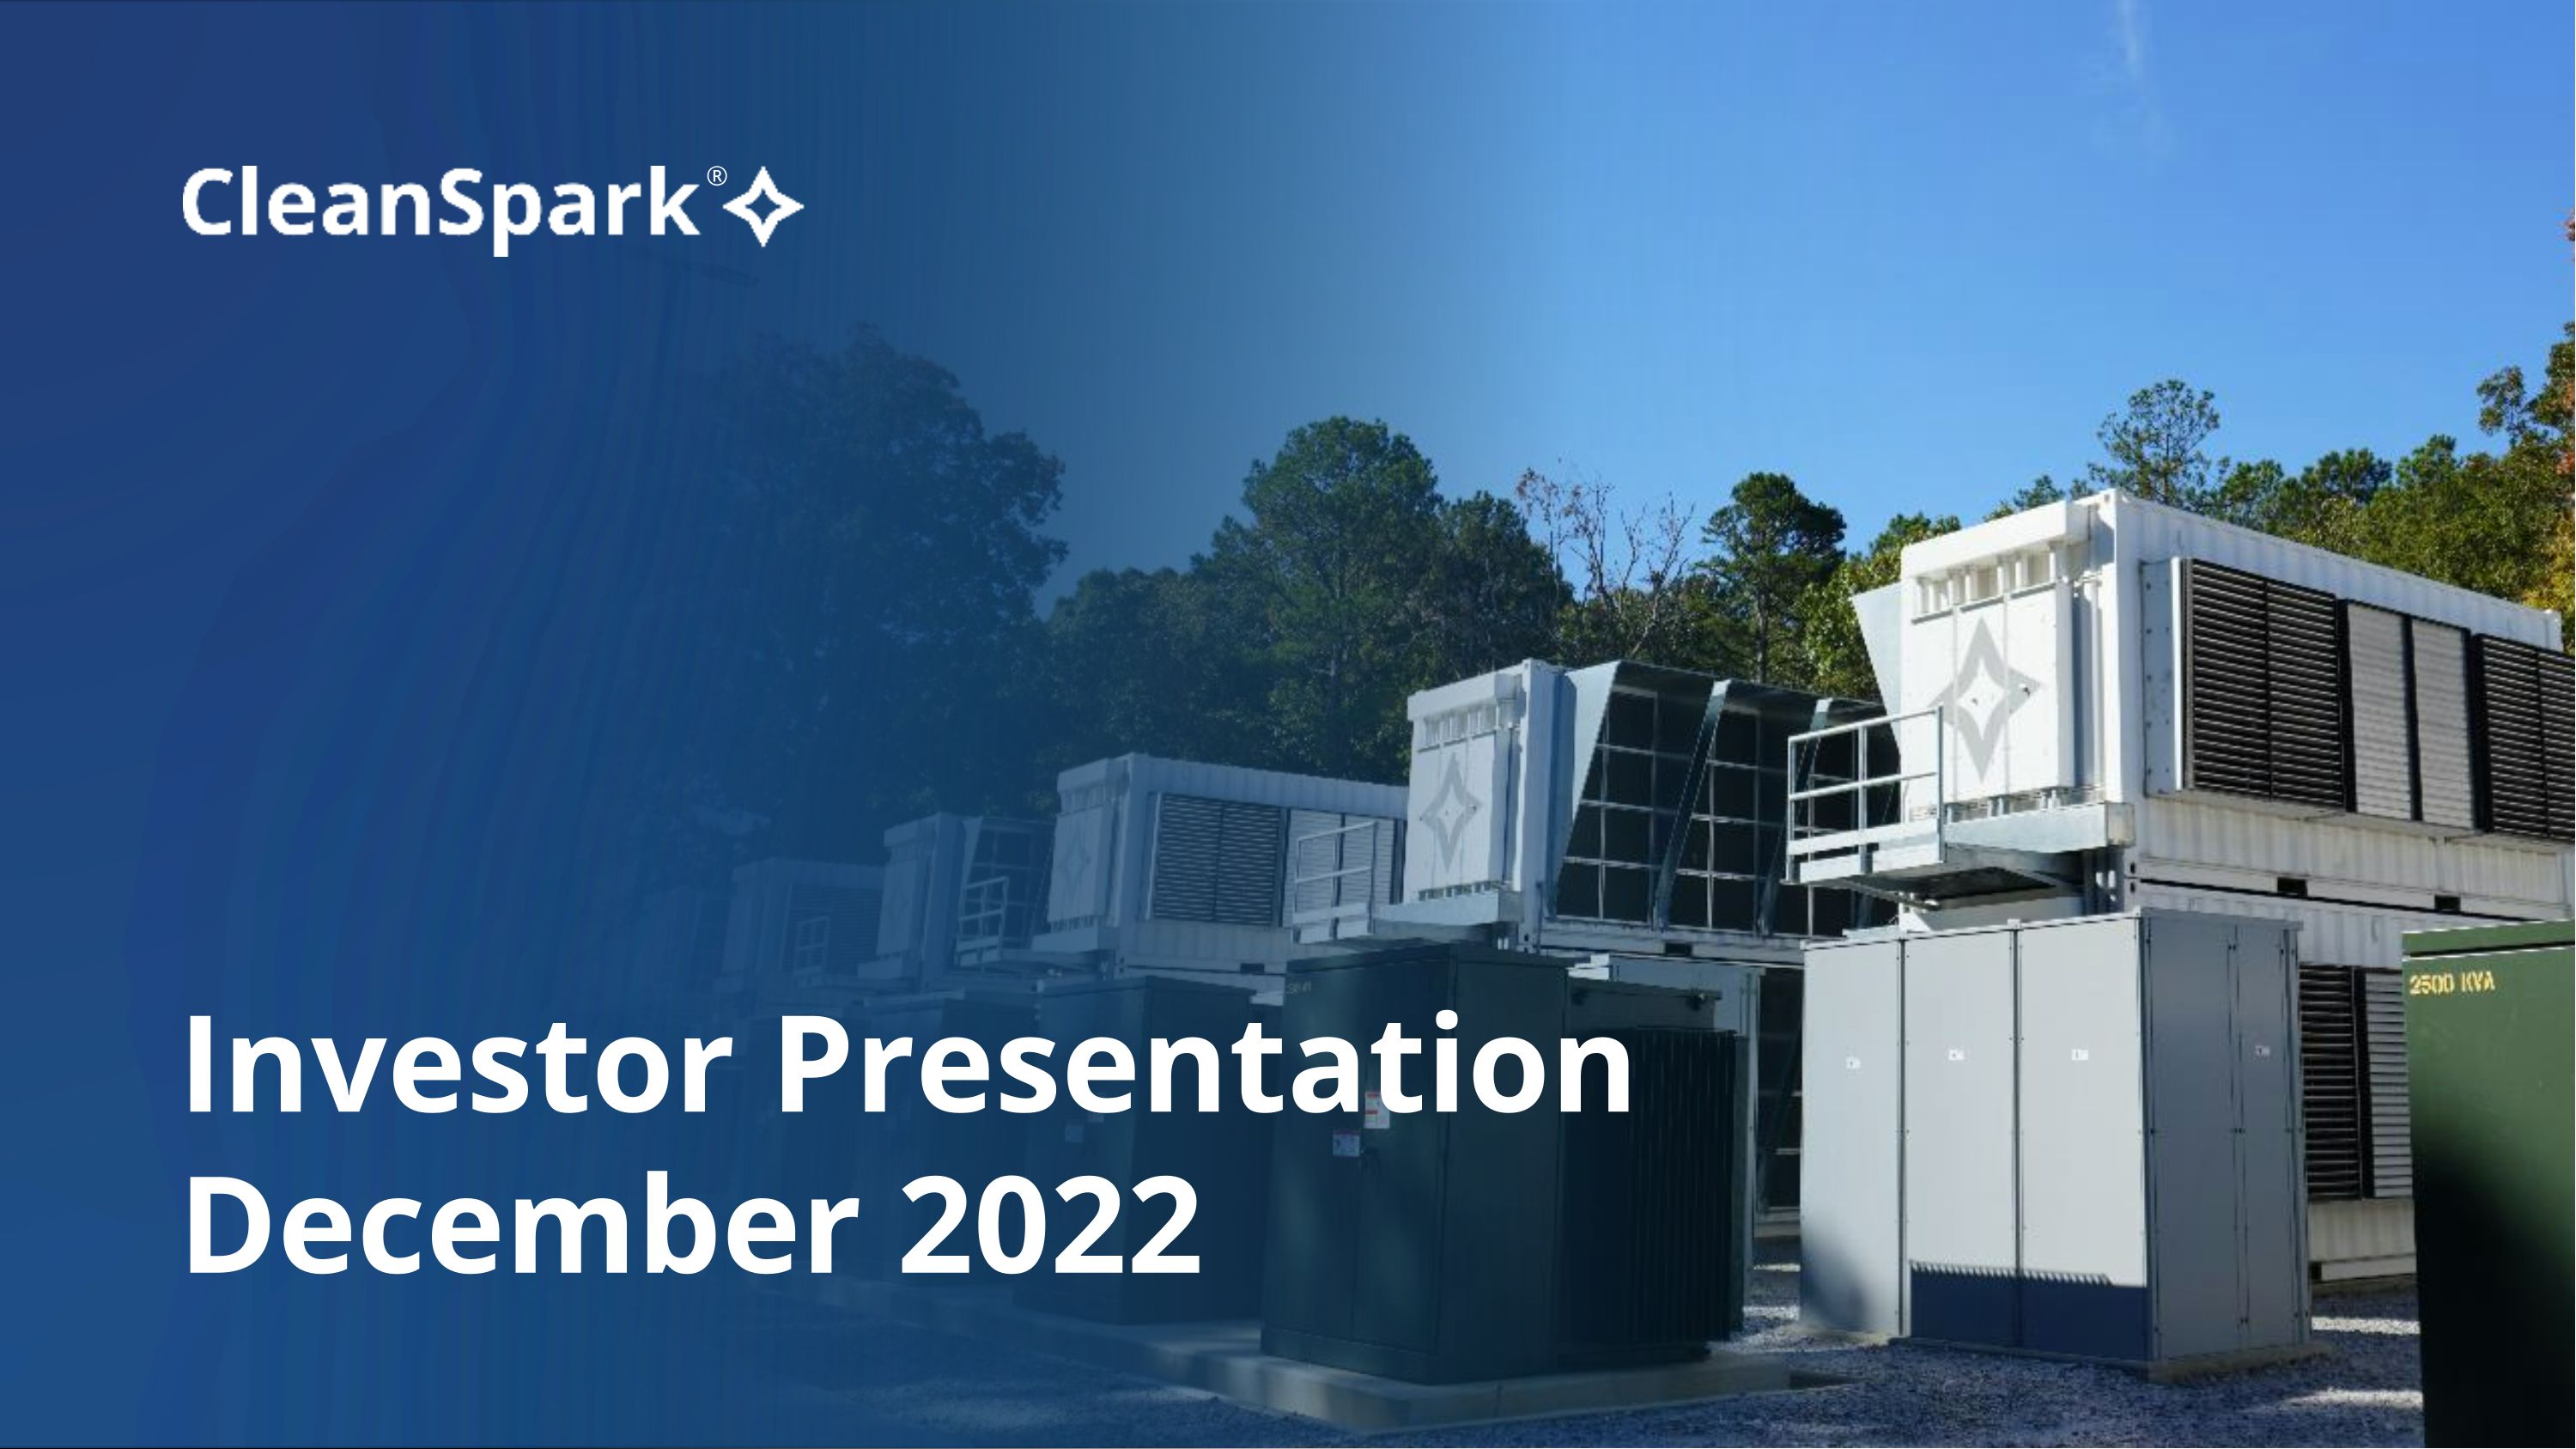
Investor Presentation December 2022 ®
CleanSpark cautions you that statements in this presentation that are not a description of historical facts are forward-looking statements. These statements are based on CleanSpark’s current beliefs and expectations. The inclusion of forward-looking statements should not be regarded as a representation by CleanSpark that any of our plans will be achieved. Actual results may differ from those set forth in this presentation due to the risk and uncertainties inherent in our business, including, without limitation: known and unknown risks, uncertainties and other important factors that may cause our actual results, performance or achievements to be materially different from any future results, performance or achievements expressed or implied by the forward-looking statements, including, but not limited to: the success of its digital currency mining activities; the volatile and unpredictable cycles in the emerging and evolving industries in which we operate; the timely completion of mining facilities or expansions thereof; recognizing the full benefits of immersion cooling; increasing difficulty rates for bitcoin mining; future hashrate growth; bitcoin halving; new or additional governmental regulation; the anticipated delivery dates of new miners; the ability to successfully deploy new miners; the dependency on utility rate structures and government incentive programs; the expectations of future revenue growth may not be realized; the impact of global pandemics (including COVID-19) on logistics and shipping and the demand for our products and services; and other risks described in the Company's prior press releases and in its filings with the Securities and Exchange Commission (SEC), including under the heading "Risk Factors" in the Company's Annual Report on Form 10-K and any subsequent filings with the SEC. The forward-looking statements in this presentation are based upon information available to us as of the date it is given, and while we believe such information forms a reasonable basis for such statements, such information may be limited or incomplete, and our statements should not be read to indicate that we have conducted an exhaustive inquiry into, or review of, all potentially available relevant information. You are cautioned not to place undue reliance on these forward-looking statements, which speak only as of the date hereof, and we undertake no obligation to revise or update this presentation to reflect events or circumstances after the date hereof. All forward-looking statements are qualified in their entirety by this cautionary statement, which is made under the safe harbor provisions of the Private Securities Litigation Reform Act of 1995. This presentation also contains aspirational statements regarding our efforts to source renewable and clean energy. Our sustainable energy strategy includes the use of renewable energy certificates as well as other strategies and efforts we may employ from time to time to mitigate or change our energy mix. Our sustainable energy strategy is at least in part dependent on the ability of certain third parties with which we contract to supply renewable and clean energy, and we do not control or independently review or audit their efforts or data. Disclaimer
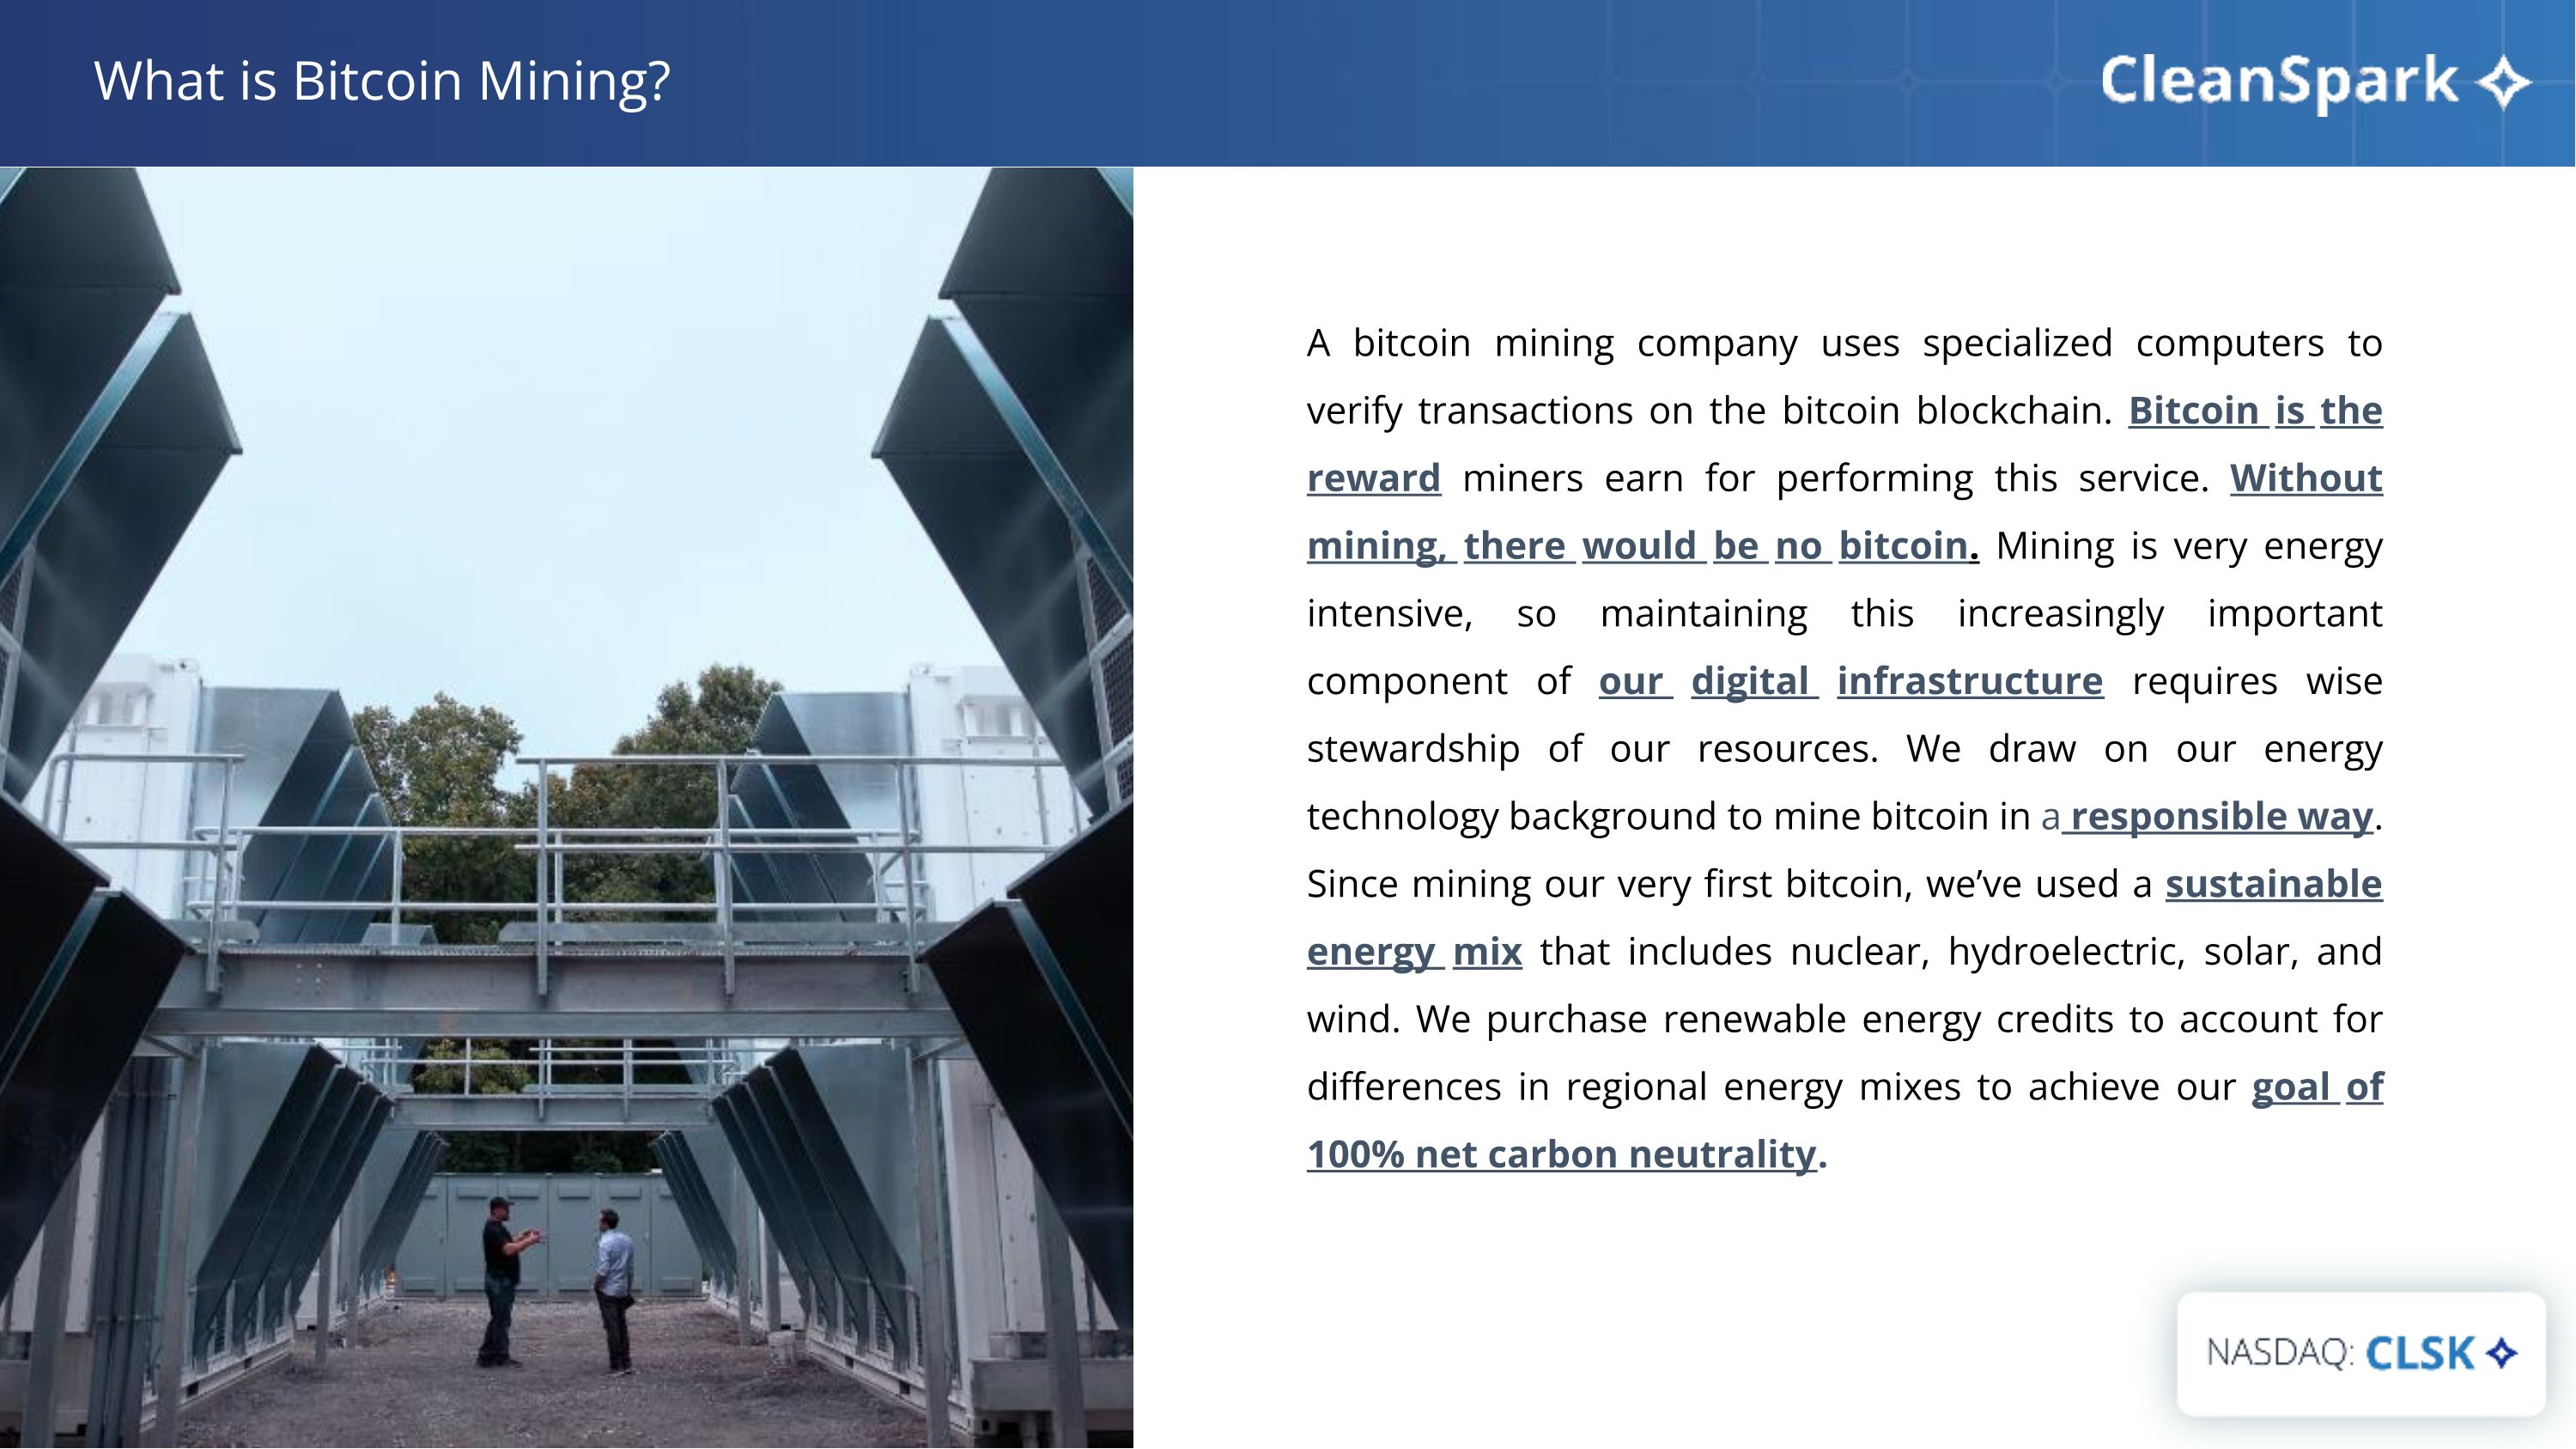
v What is Bitcoin Mining? A bitcoin mining company uses specialized computers to verify transactions on the bitcoin blockchain. Bitcoin is the reward miners earn for performing this service. Without mining, there would be no bitcoin. Mining is very energy intensive, so maintaining this increasingly important component of our digital infrastructure requires wise stewardship of our resources. We draw on our energy technology background to mine bitcoin in a responsible way. Since mining our very first bitcoin, we’ve used a sustainable energy mix that includes nuclear, hydroelectric, solar, and wind. We purchase renewable energy credits to account for differences in regional energy mixes to achieve our goal of 100% net carbon neutrality.
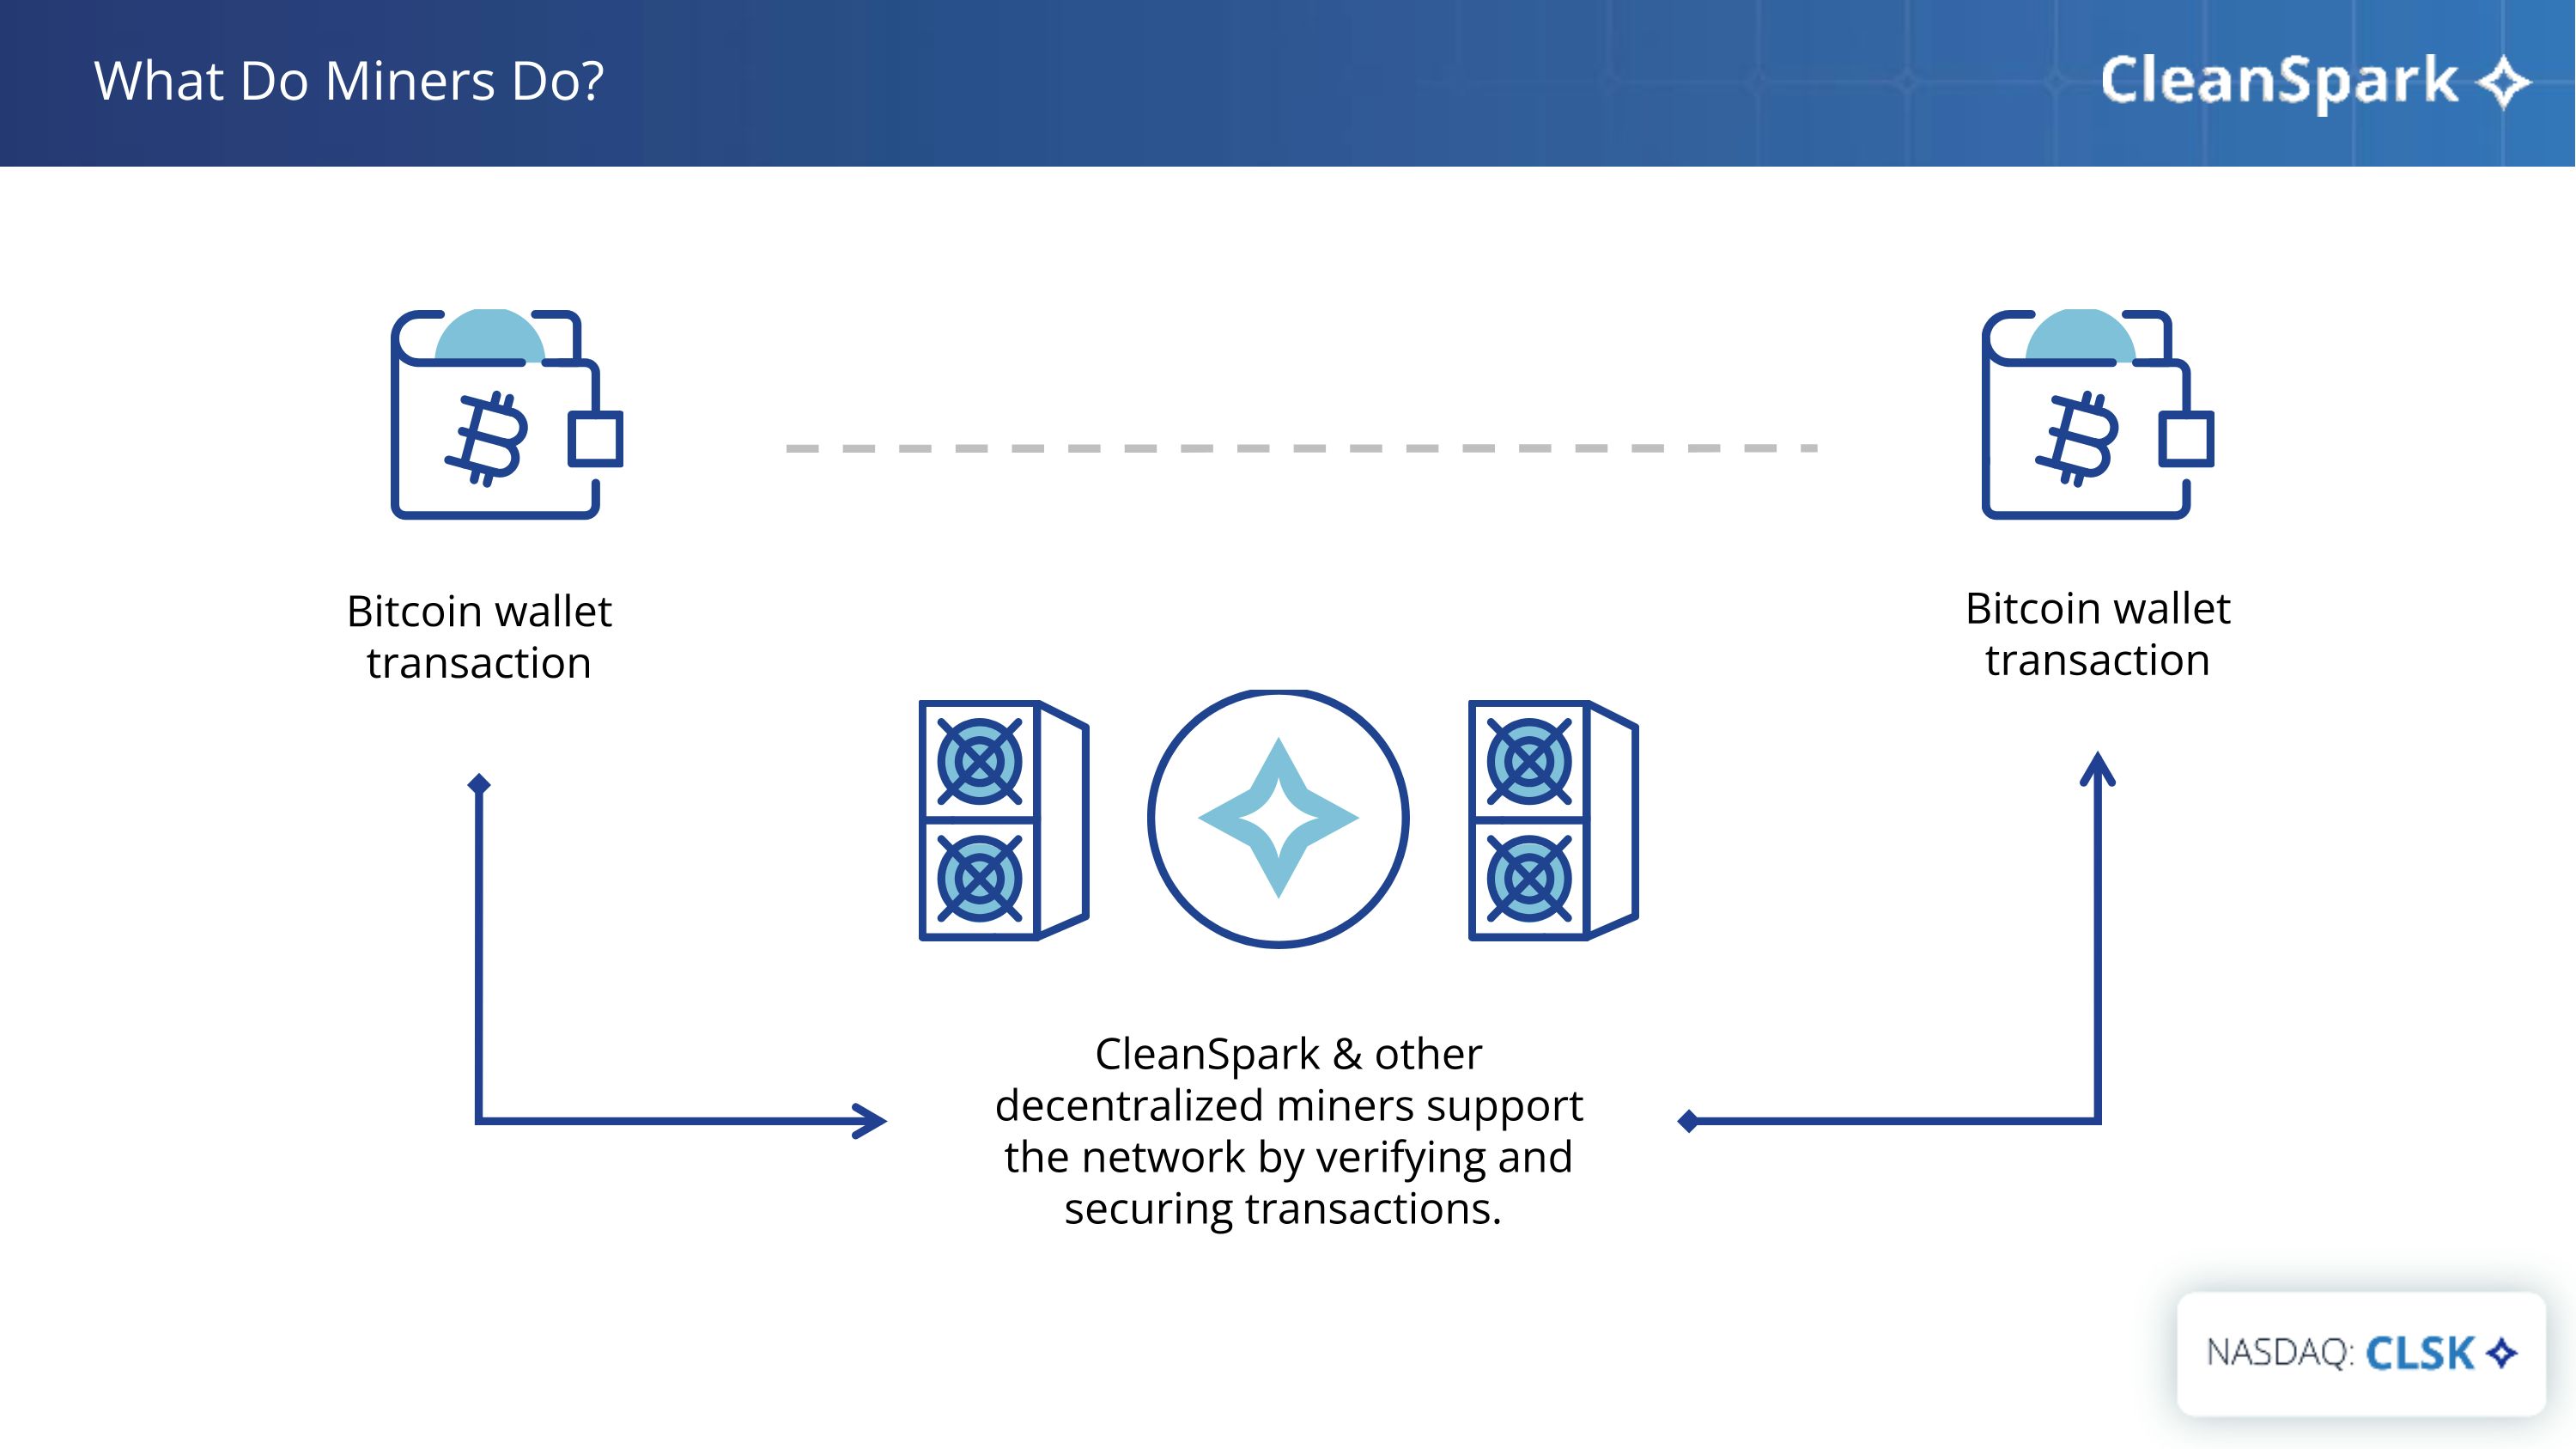
Bitcoin wallet transaction CleanSpark & other decentralized miners support the network by verifying and securing transactions. Bitcoin wallet transaction What Do Miners Do?
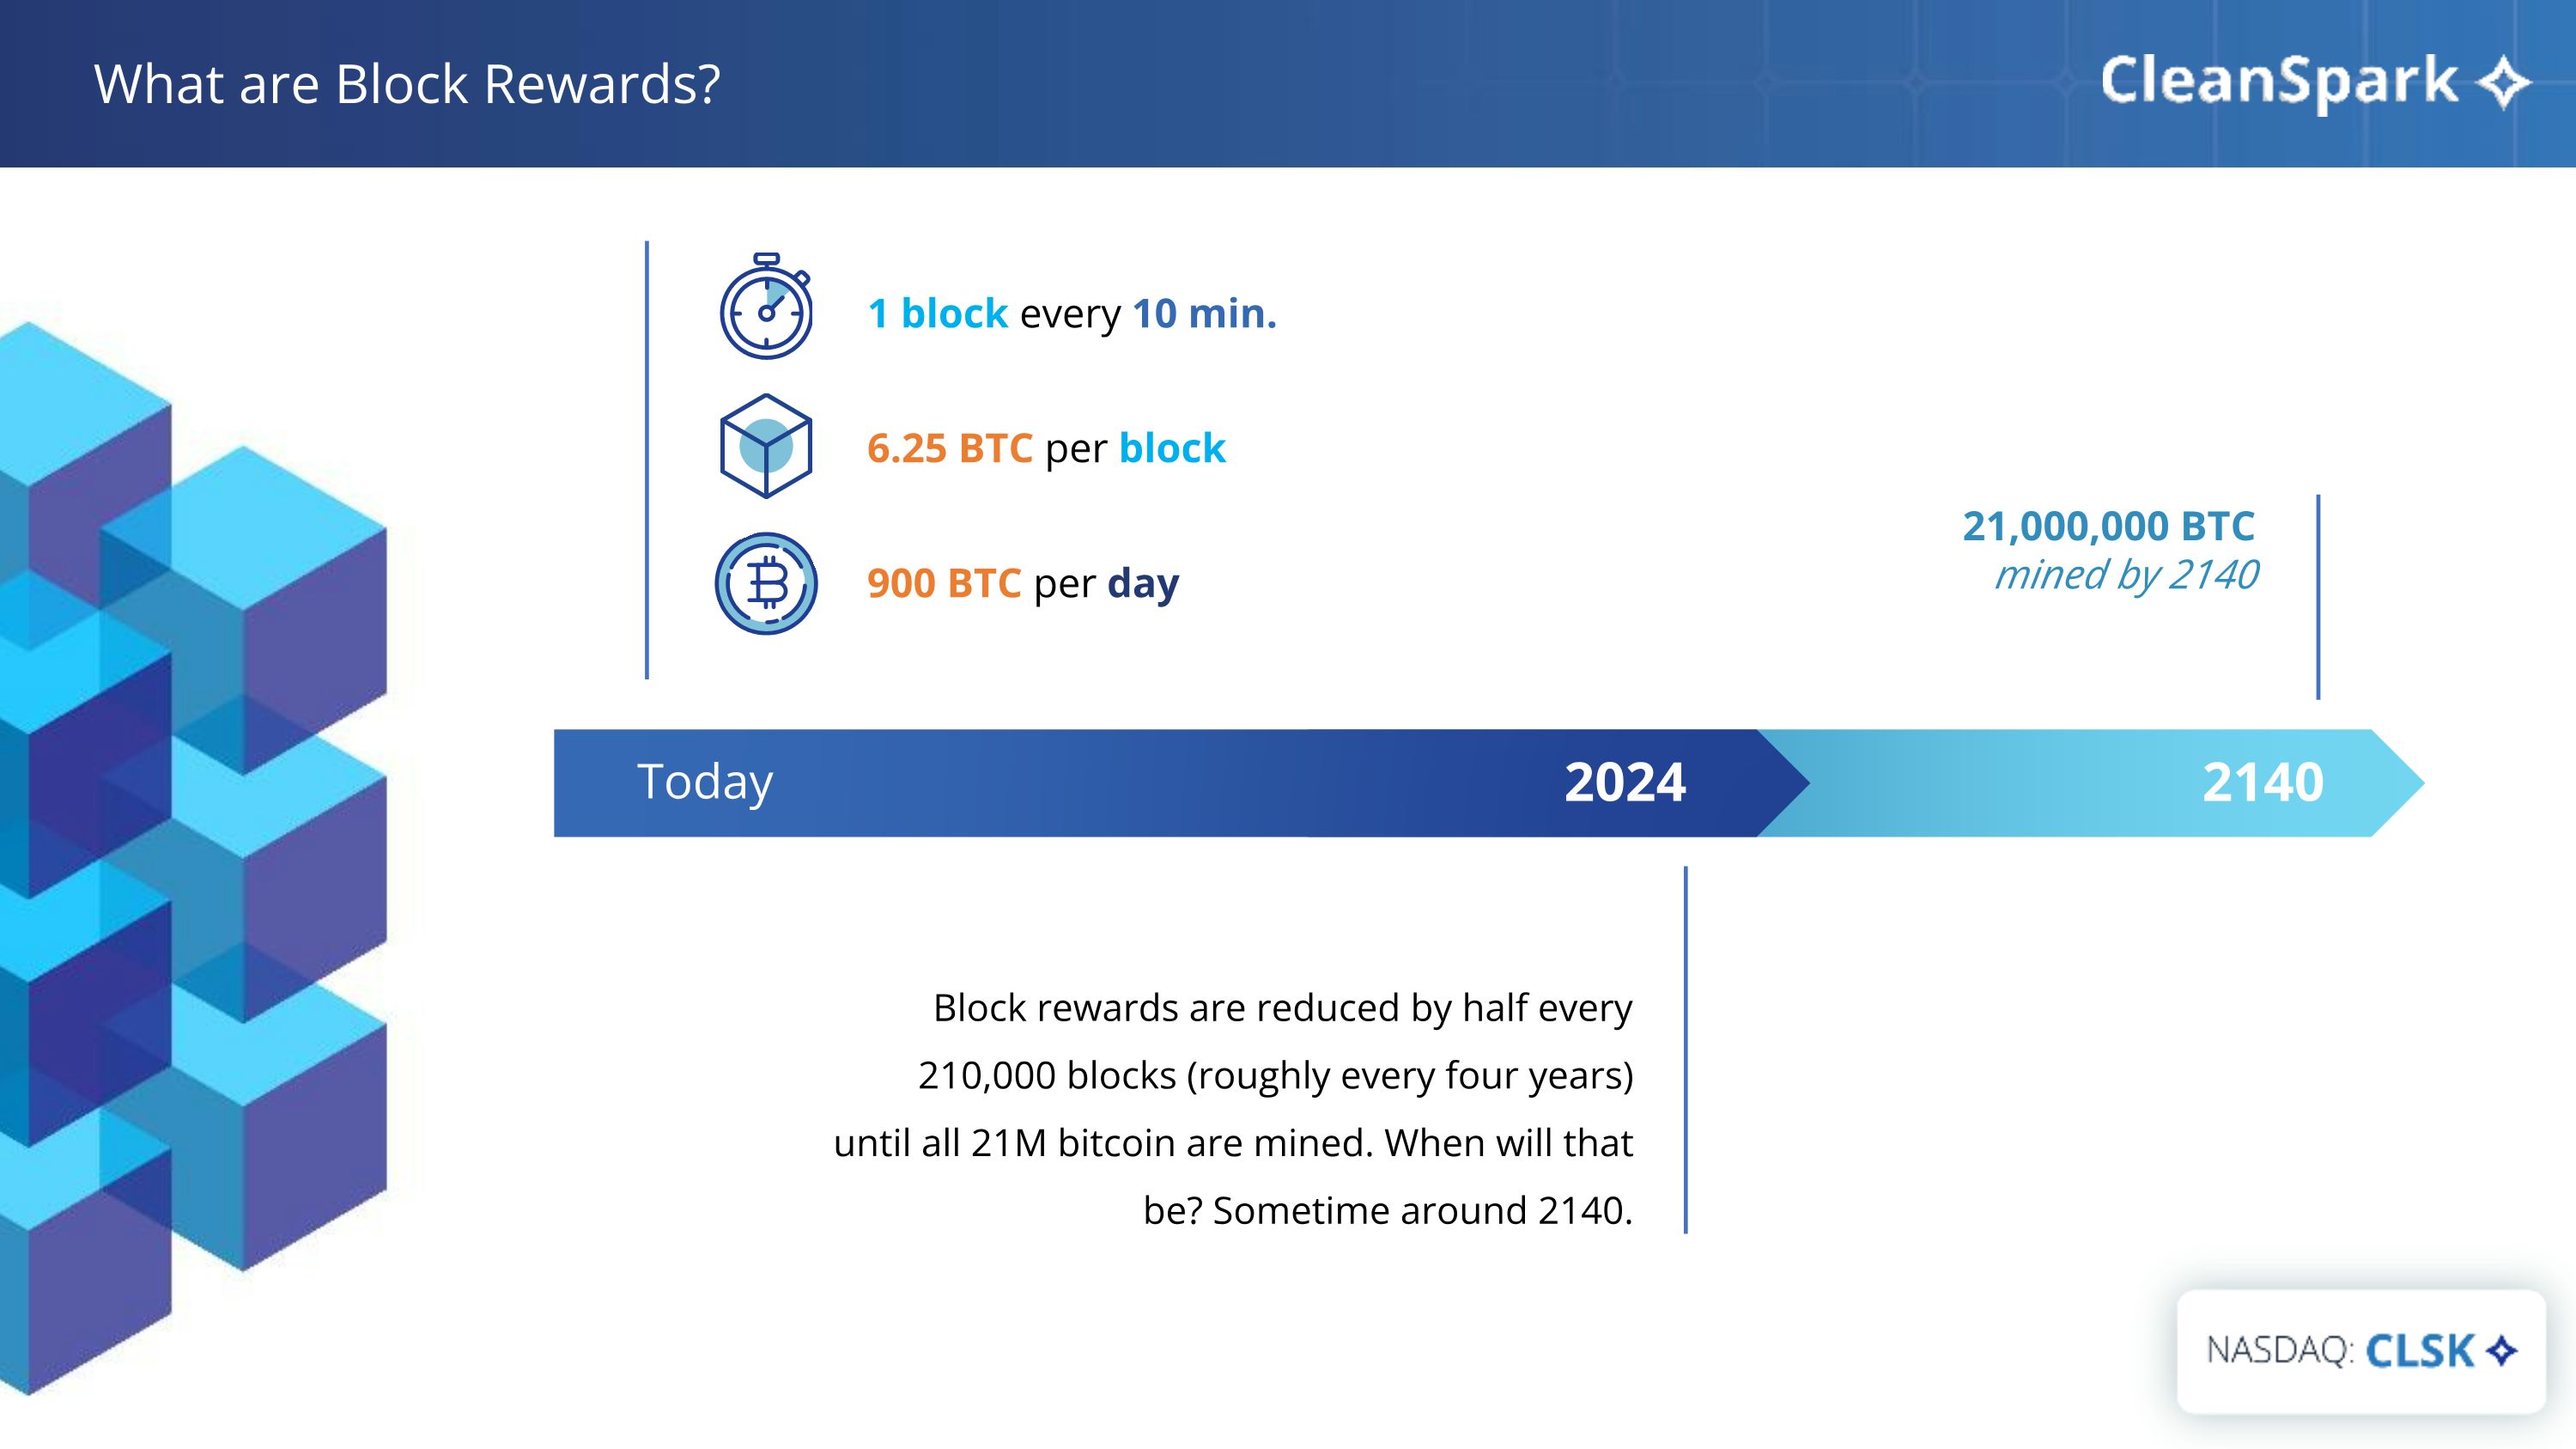
What are Block Rewards? 21,000,000 BTC mined by 2140 Block rewards are reduced by half every 210,000 blocks (roughly every four years) until all 21M bitcoin are mined. When will that be? Sometime around 2140. 1 block every 10 min. 2140 2024 6.25 BTC per block 900 BTC per day Today
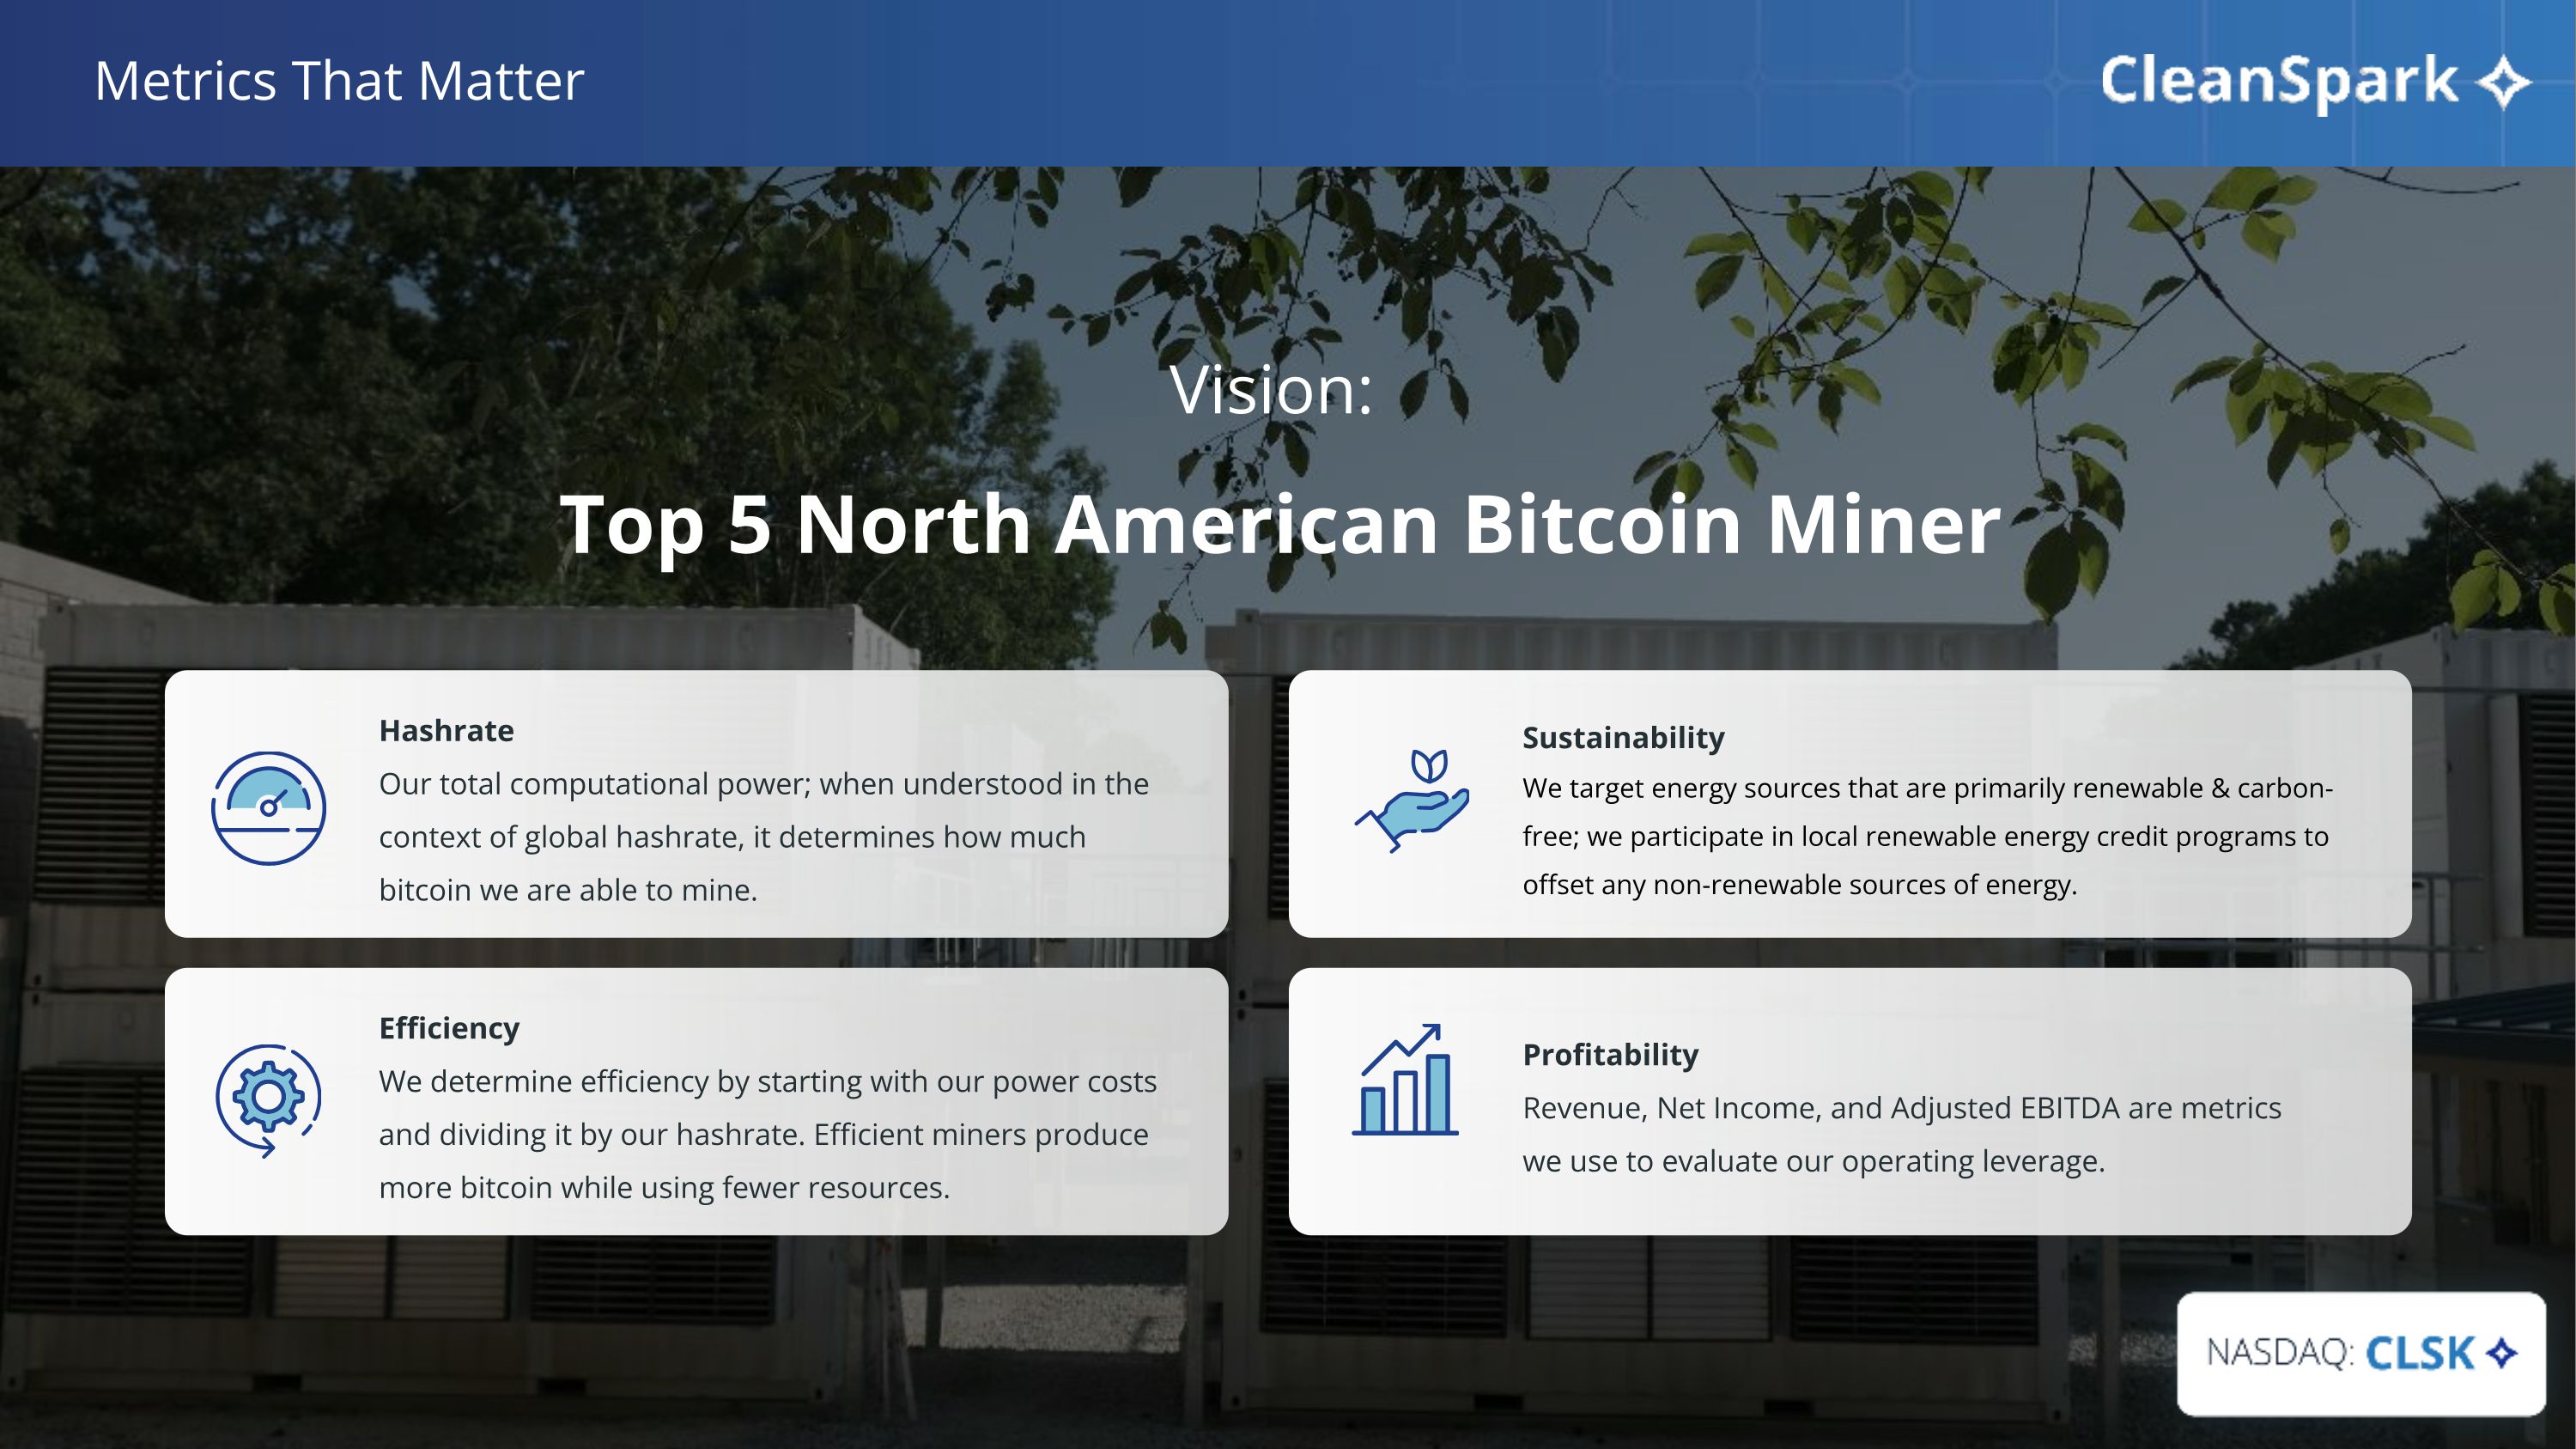
Vision: Top 5 North American Bitcoin Miner Hashrate Our total computational power; when understood in the context of global hashrate, it determines how much bitcoin we are able to mine. Efficiency We determine efficiency by starting with our power costs and dividing it by our hashrate. Efficient miners produce more bitcoin while using fewer resources. Profitability Revenue, Net Income, and Adjusted EBITDA are metrics we use to evaluate our operating leverage. Sustainability We target energy sources that are primarily renewable & carbon-free; we participate in local renewable energy credit programs to offset any non-renewable sources of energy. Metrics That Matter
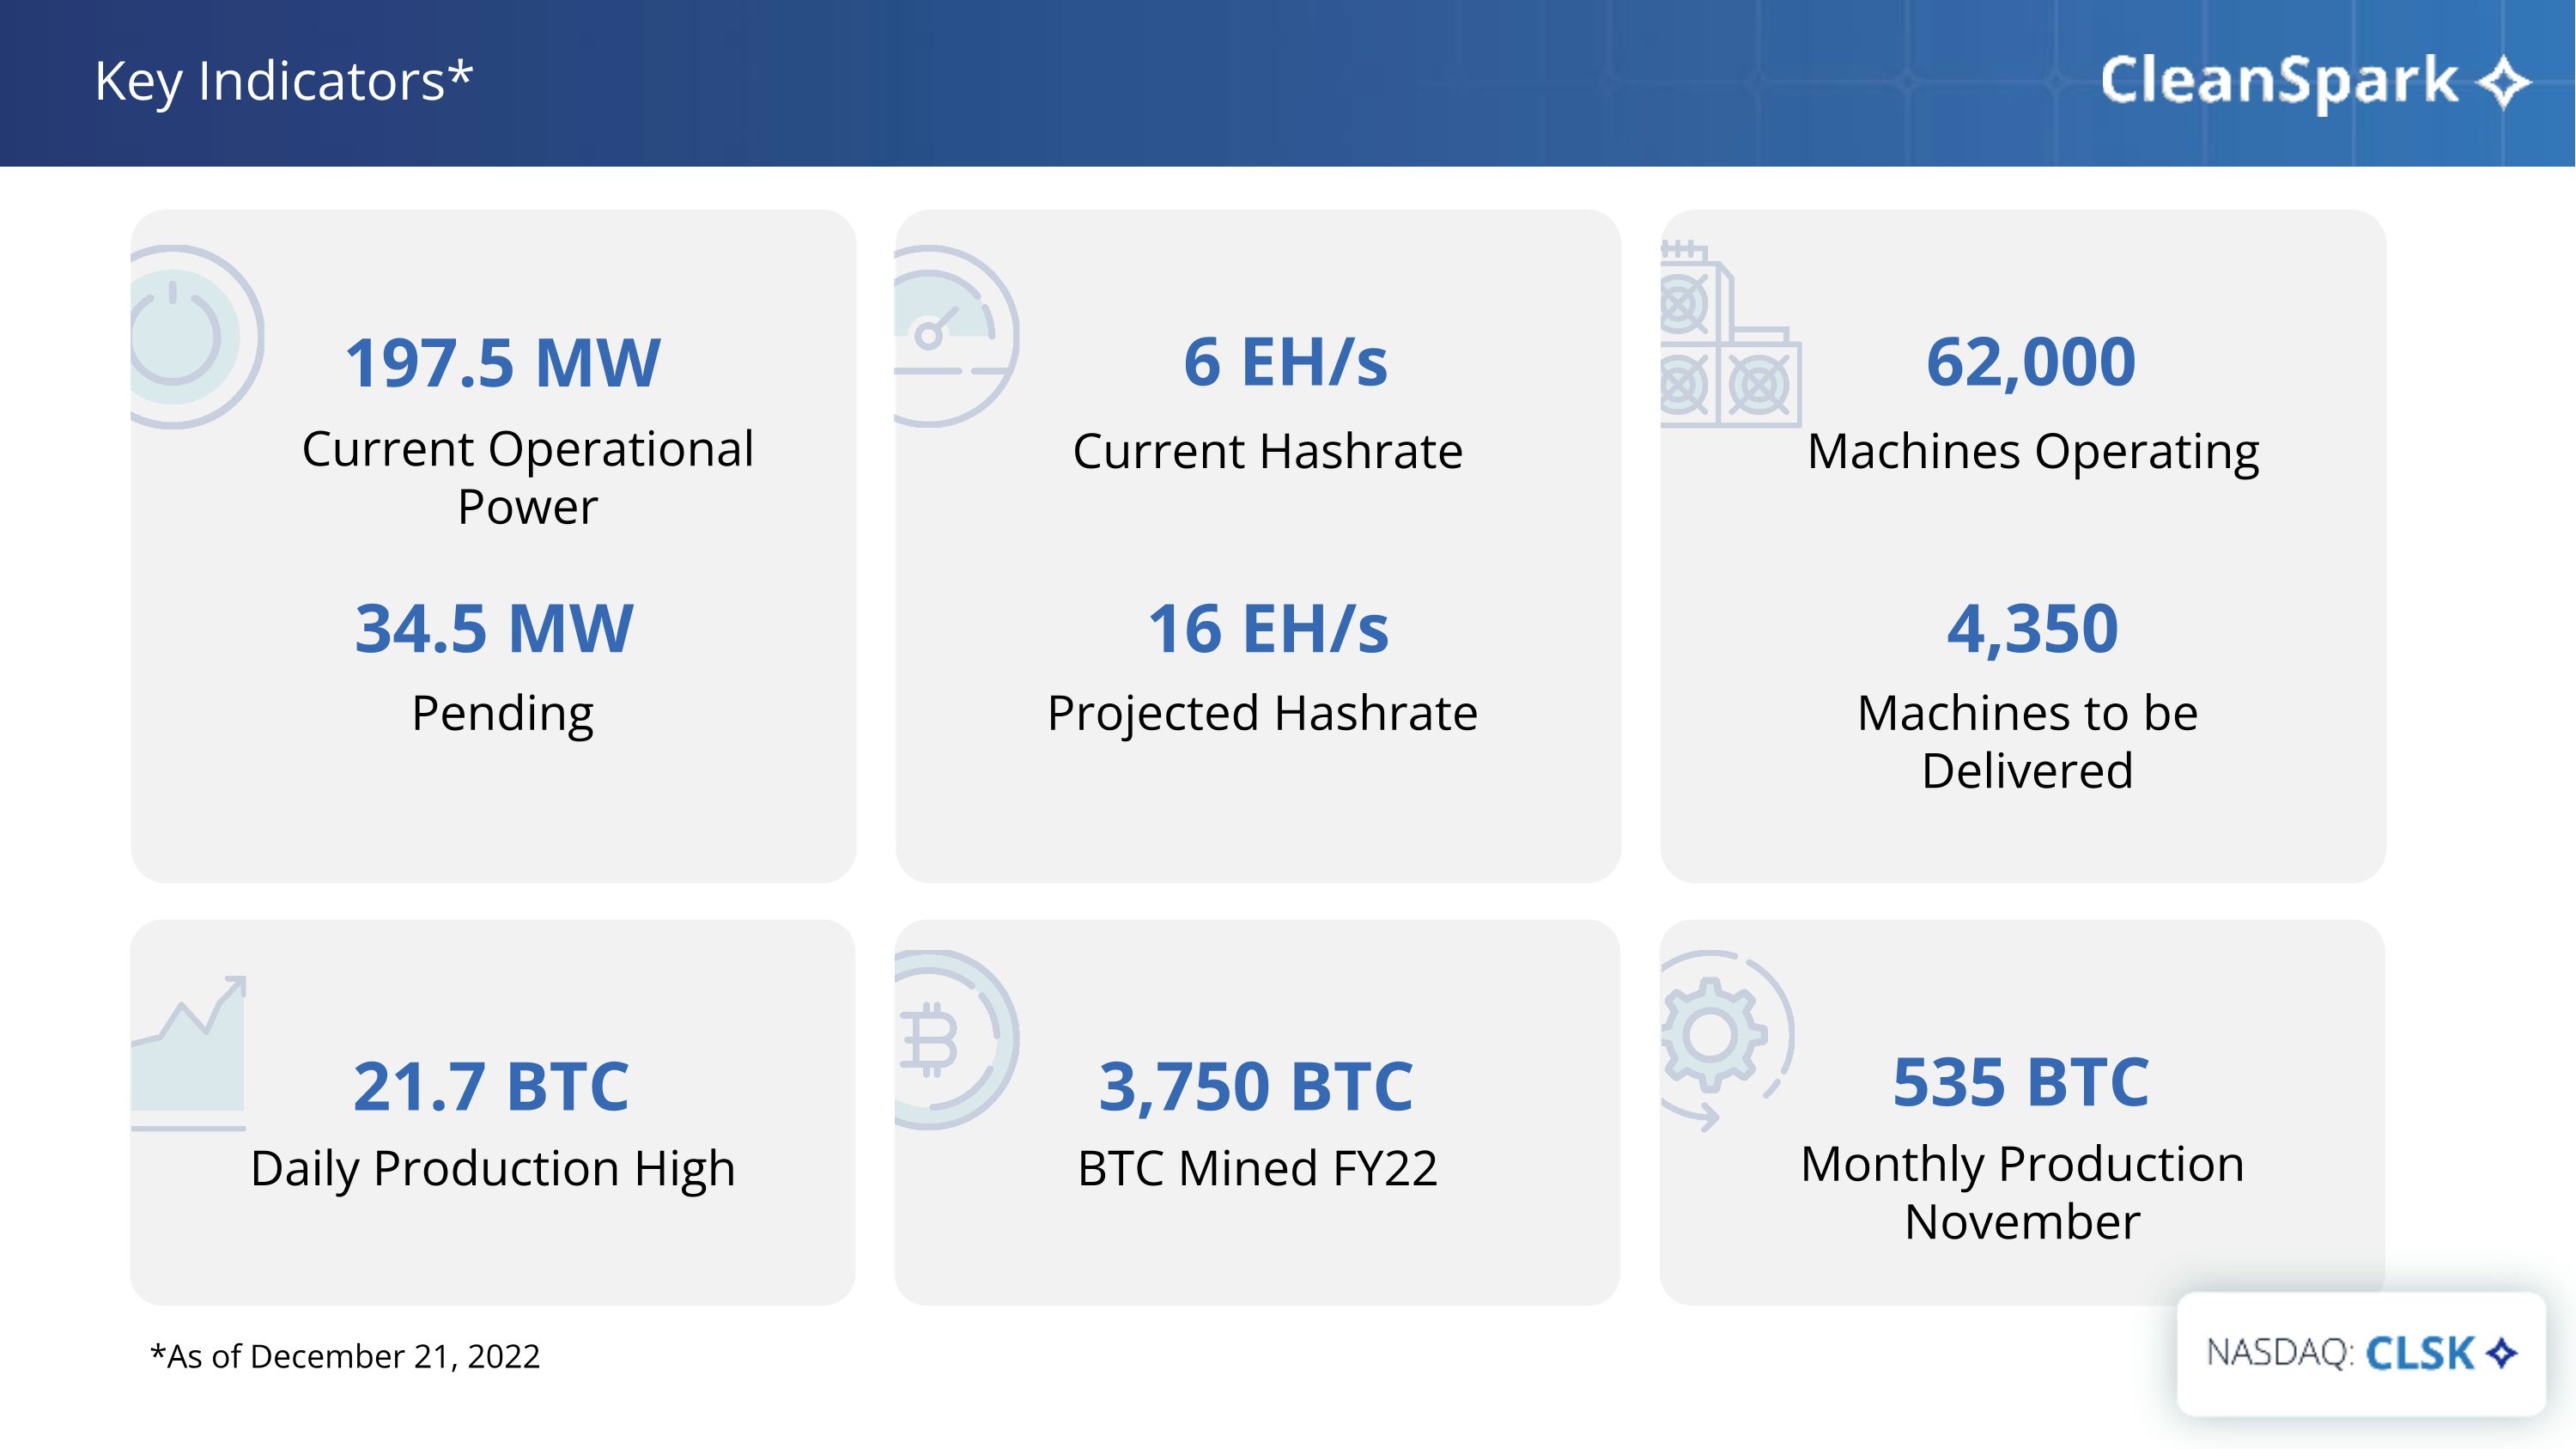
Monthly Production November 535 BTC Key Indicators* Current Operational Power 197.5 MW Daily Production High 21.7 BTC Projected Hashrate Current Hashrate 6 EH/s 16 EH/s BTC Mined FY22 3,750 BTC Machines to be Delivered Machines Operating 62,000 4,350 *As of December 21, 2022 34.5 MW Pending
What Makes CleanSpark Different? Leave the world better�than we found it. Build the infrastructure of the future. Value growth for the greater good.
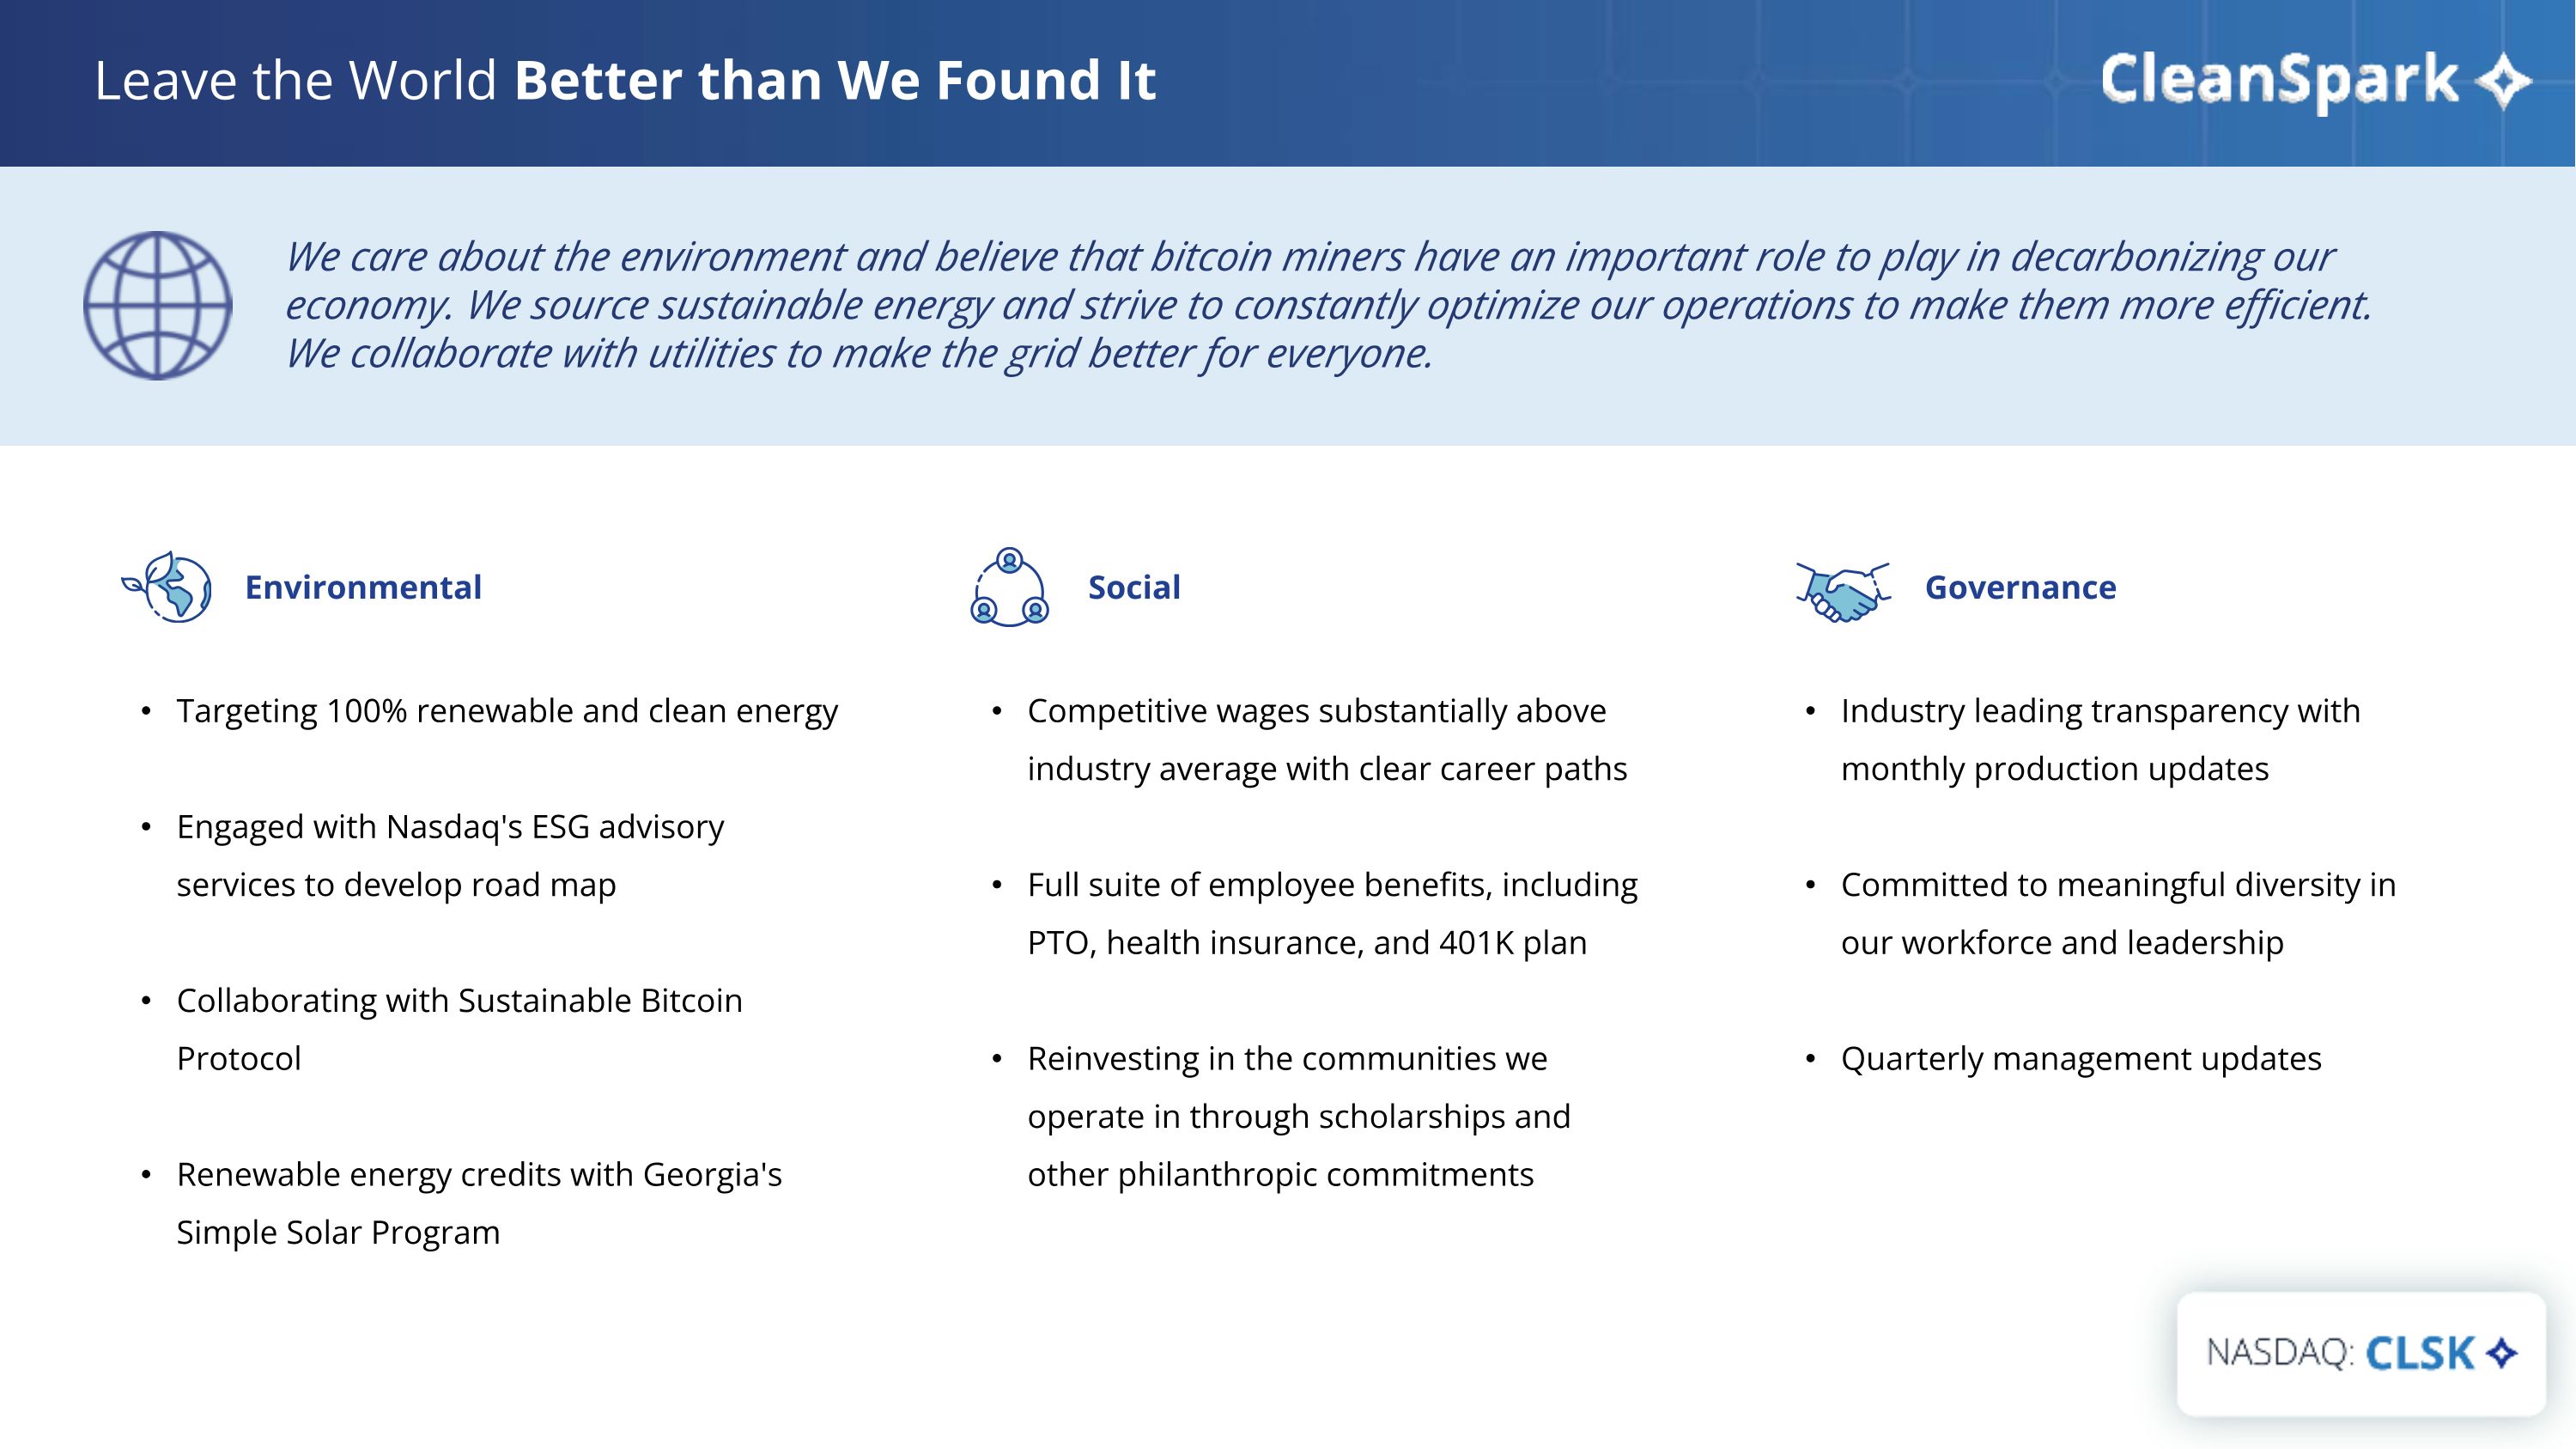
Competitive wages substantially above industry average with clear career paths Full suite of employee benefits, including PTO, health insurance, and 401K plan Reinvesting in the communities we operate in through scholarships and other philanthropic commitments Targeting 100% renewable and clean energy Engaged with Nasdaq's ESG advisory services to develop road map Collaborating with Sustainable Bitcoin Protocol Renewable energy credits with Georgia's Simple Solar Program Industry leading transparency with monthly production updates Committed to meaningful diversity in our workforce and leadership Quarterly management updates Environmental Social Governance We care about the environment and believe that bitcoin miners have an important role to play in decarbonizing our economy. We source sustainable energy and strive to constantly optimize our operations to make them more efficient. We collaborate with utilities to make the grid better for everyone. Leave the World Better than We Found It
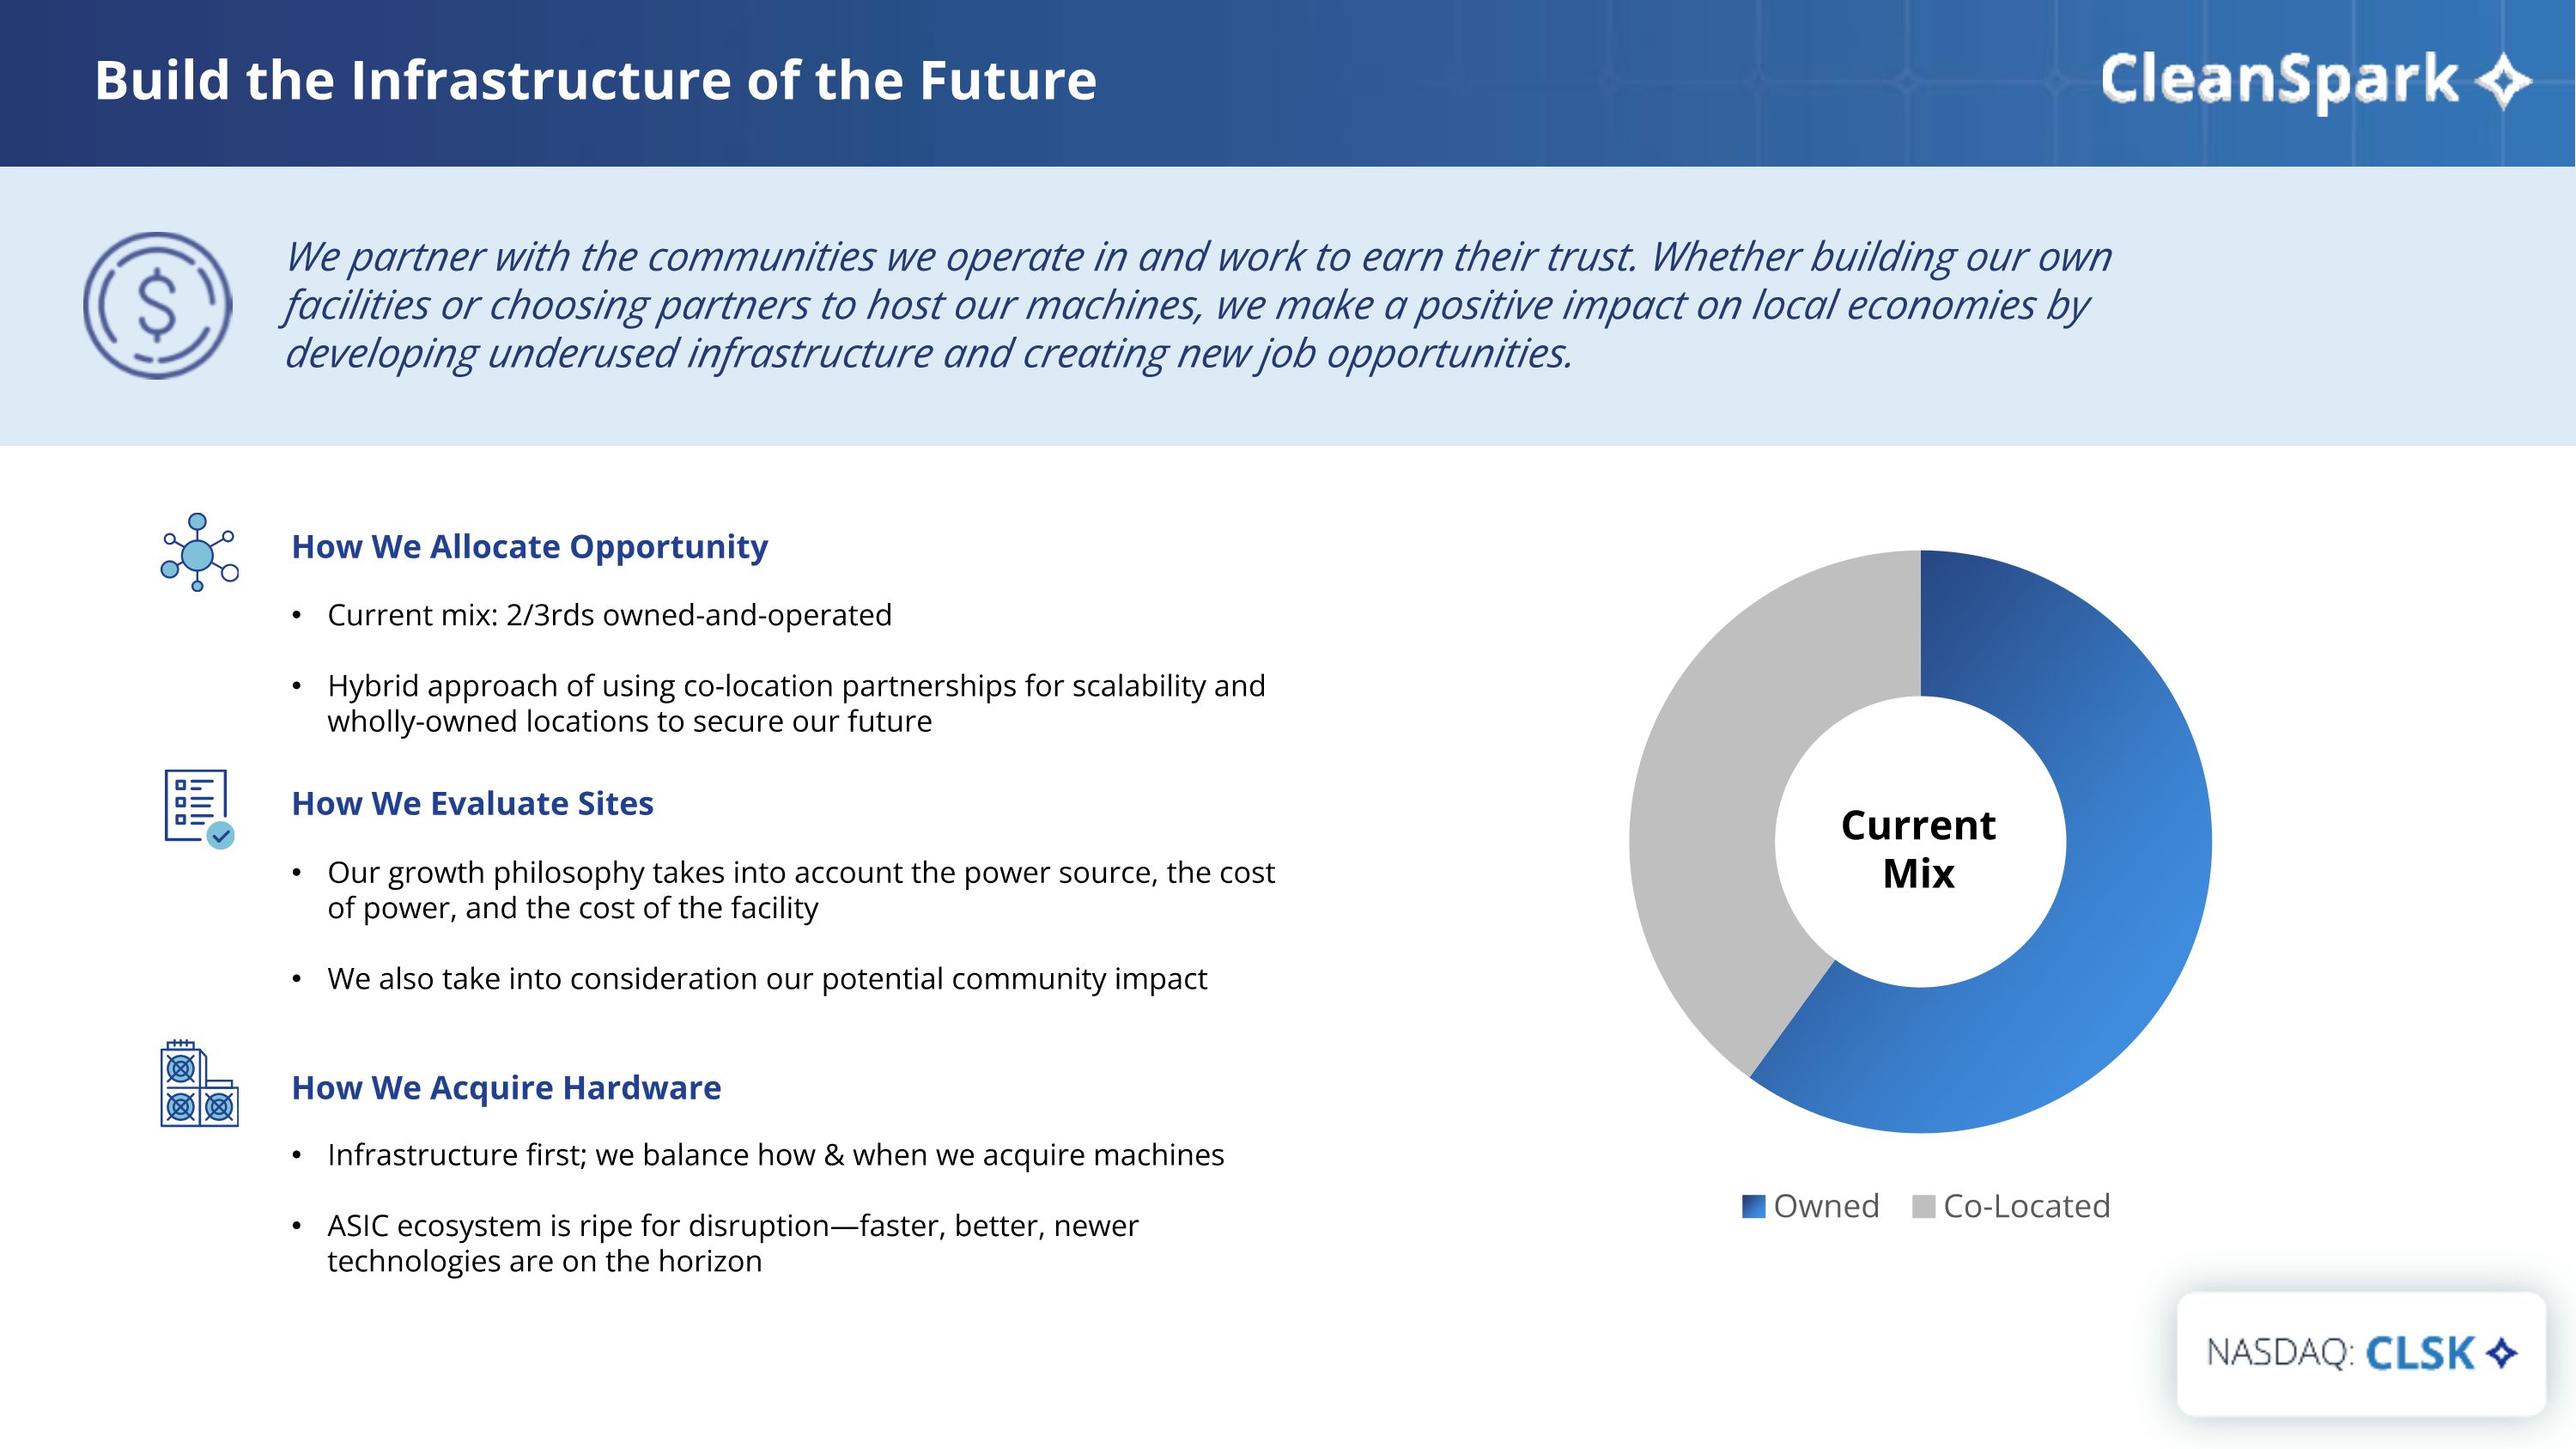
How We Allocate Opportunity Current mix: 2/3rds owned-and-operated Hybrid approach of using co-location partnerships for scalability and wholly-owned locations to secure our future Infrastructure first; we balance how & when we acquire machines ASIC ecosystem is ripe for disruption—faster, better, newer technologies are on the horizon How We Acquire Hardware Current Mix How We Evaluate Sites Our growth philosophy takes into account the power source, the cost of power, and the cost of the facility We also take into consideration our potential community impact We partner with the communities we operate in and work to earn their trust. Whether building our own facilities or choosing partners to host our machines, we make a positive impact on local economies by developing underused infrastructure and creating new job opportunities. Build the Infrastructure of the Future
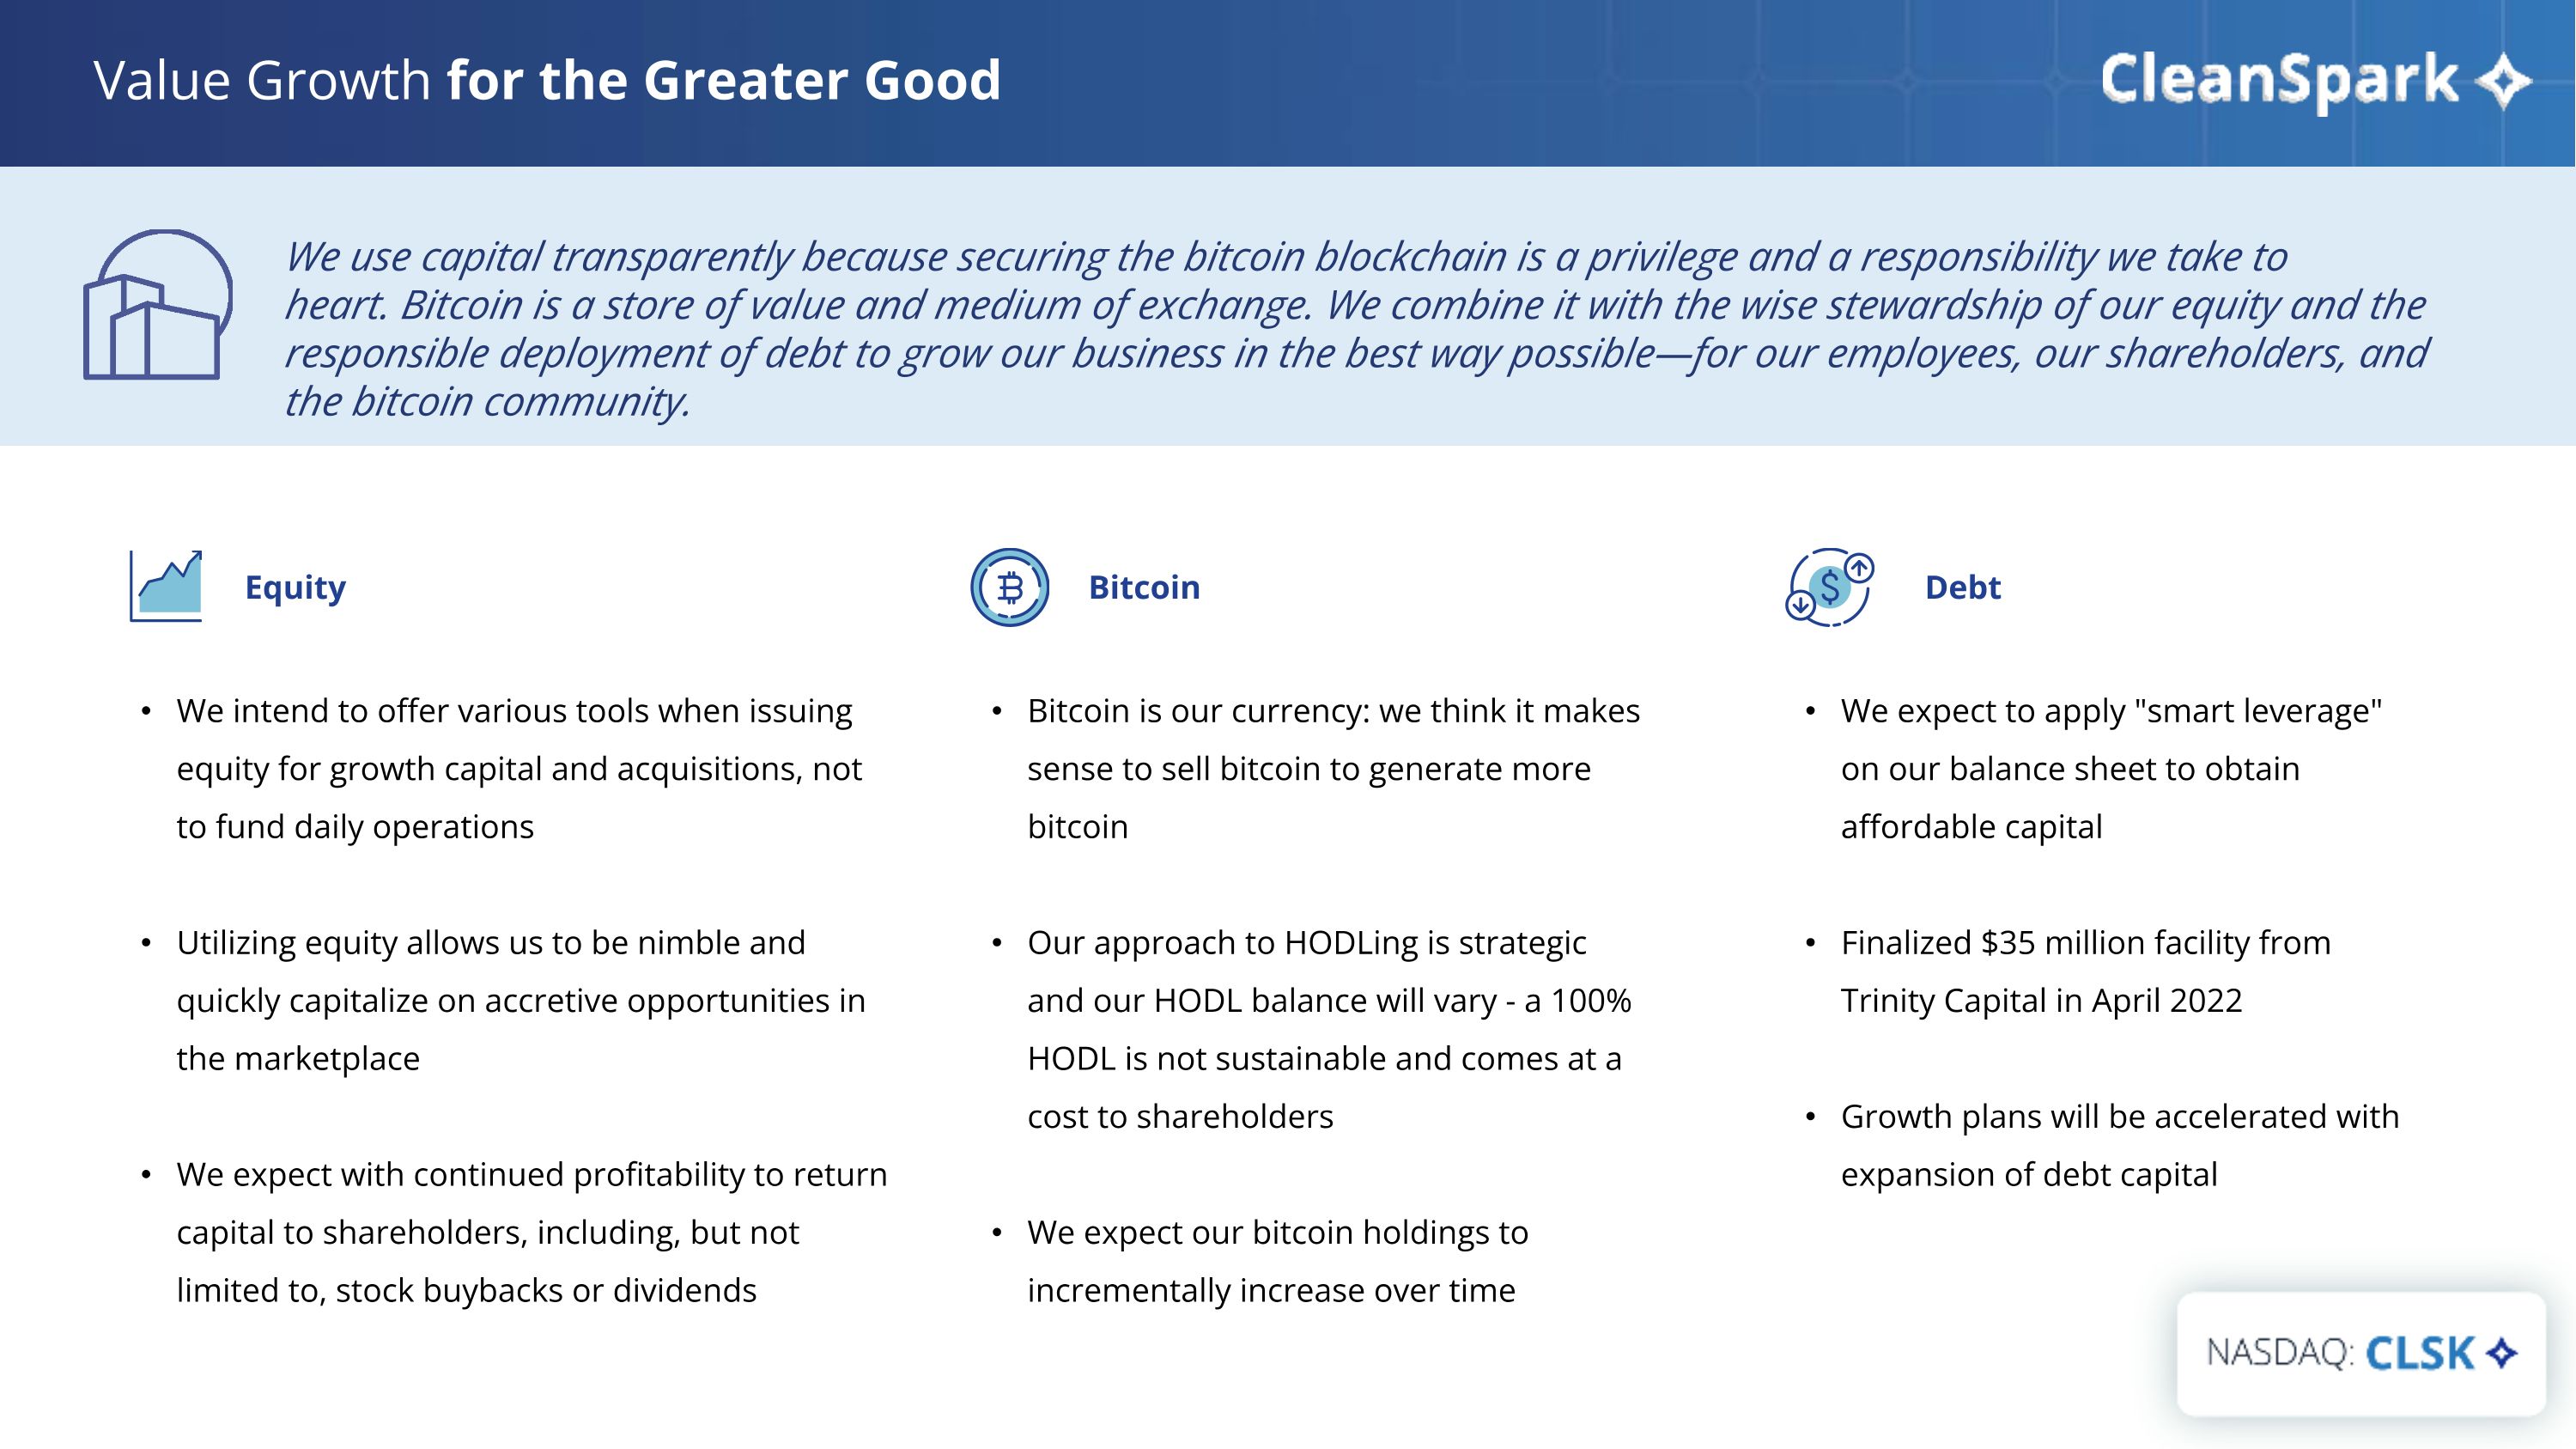
We use capital transparently because securing the bitcoin blockchain is a privilege and a responsibility we take to heart. Bitcoin is a store of value and medium of exchange. We combine it with the wise stewardship of our equity and the responsible deployment of debt to grow our business in the best way possible—for our employees, our shareholders, and the bitcoin community. Value Growth for the Greater Good Bitcoin is our currency: we think it makes sense to sell bitcoin to generate more bitcoin Our approach to HODLing is strategic and our HODL balance will vary - a 100% HODL is not sustainable and comes at a cost to shareholders We expect our bitcoin holdings to incrementally increase over time We intend to offer various tools when issuing equity for growth capital and acquisitions, not to fund daily operations Utilizing equity allows us to be nimble and quickly capitalize on accretive opportunities in the marketplace We expect with continued profitability to return capital to shareholders, including, but not limited to, stock buybacks or dividends We expect to apply "smart leverage" on our balance sheet to obtain affordable capital Finalized $35 million facility from Trinity Capital in April 2022 Growth plans will be accelerated with expansion of debt capital Equity Bitcoin Debt
Current and Future Performance
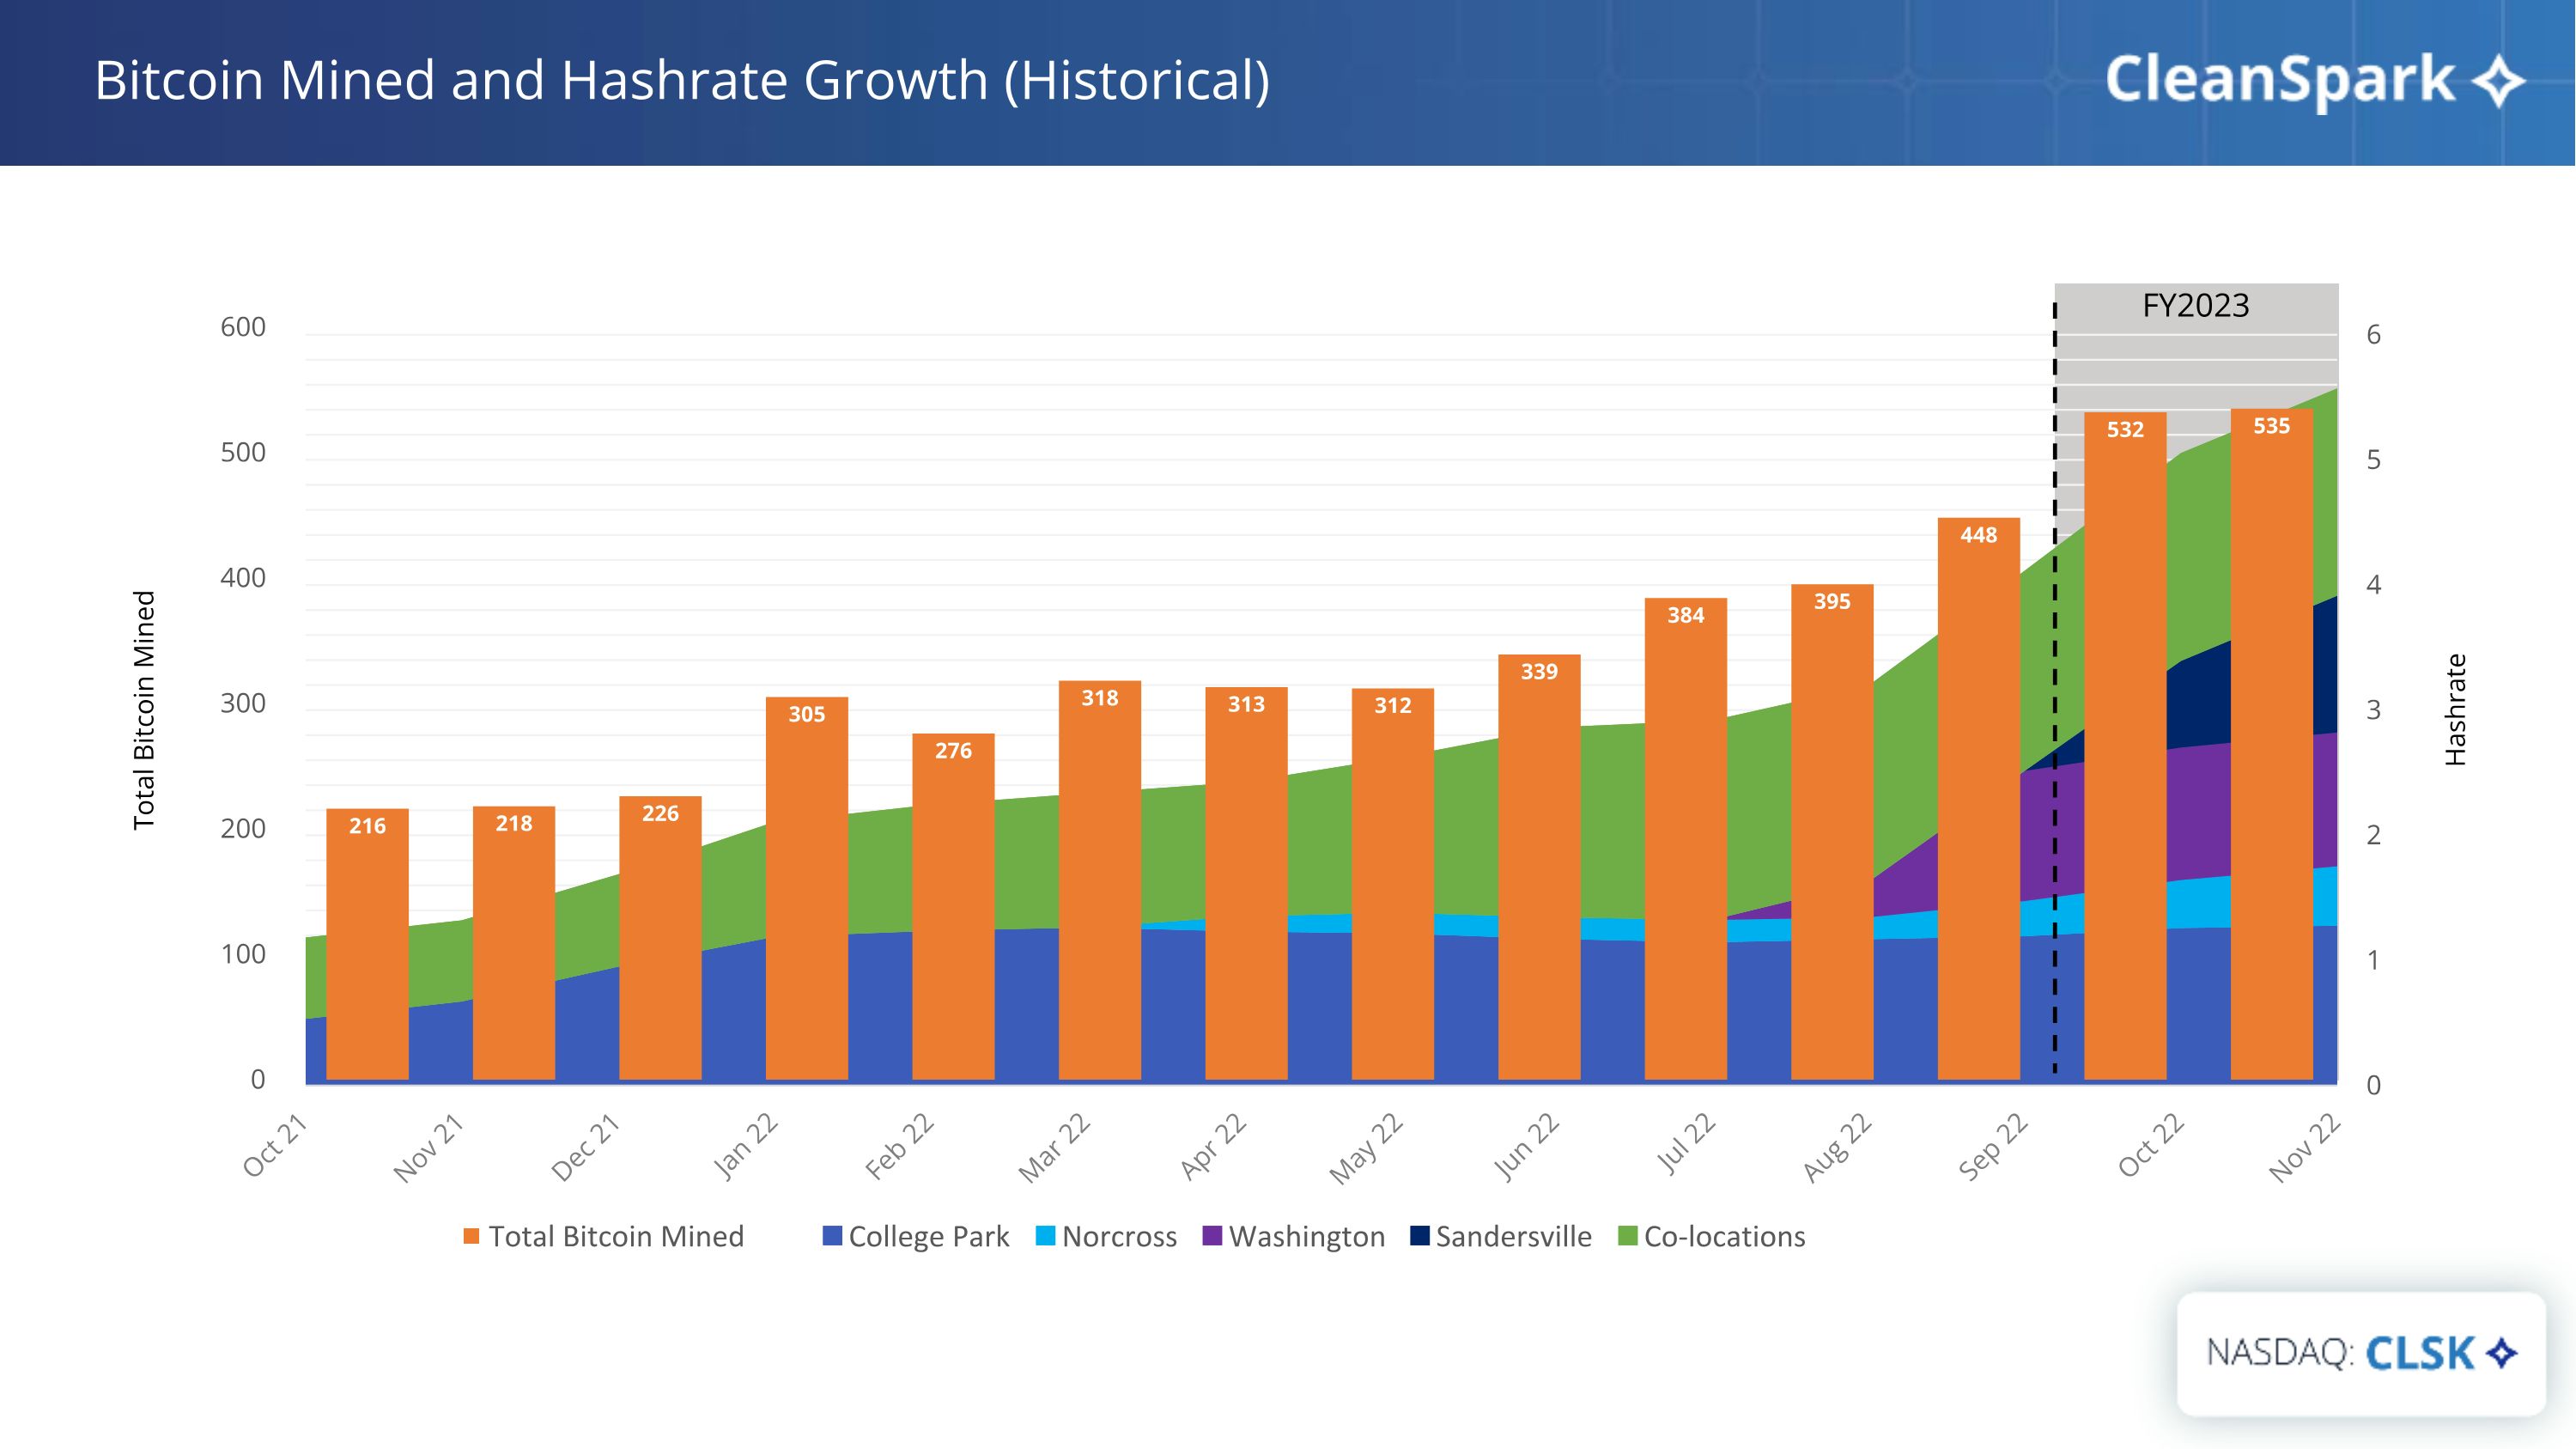
Hashrate Total Bitcoin Mined Total Bitcoin Mined Bitcoin Mined and Hashrate Growth (Historical) FY2023
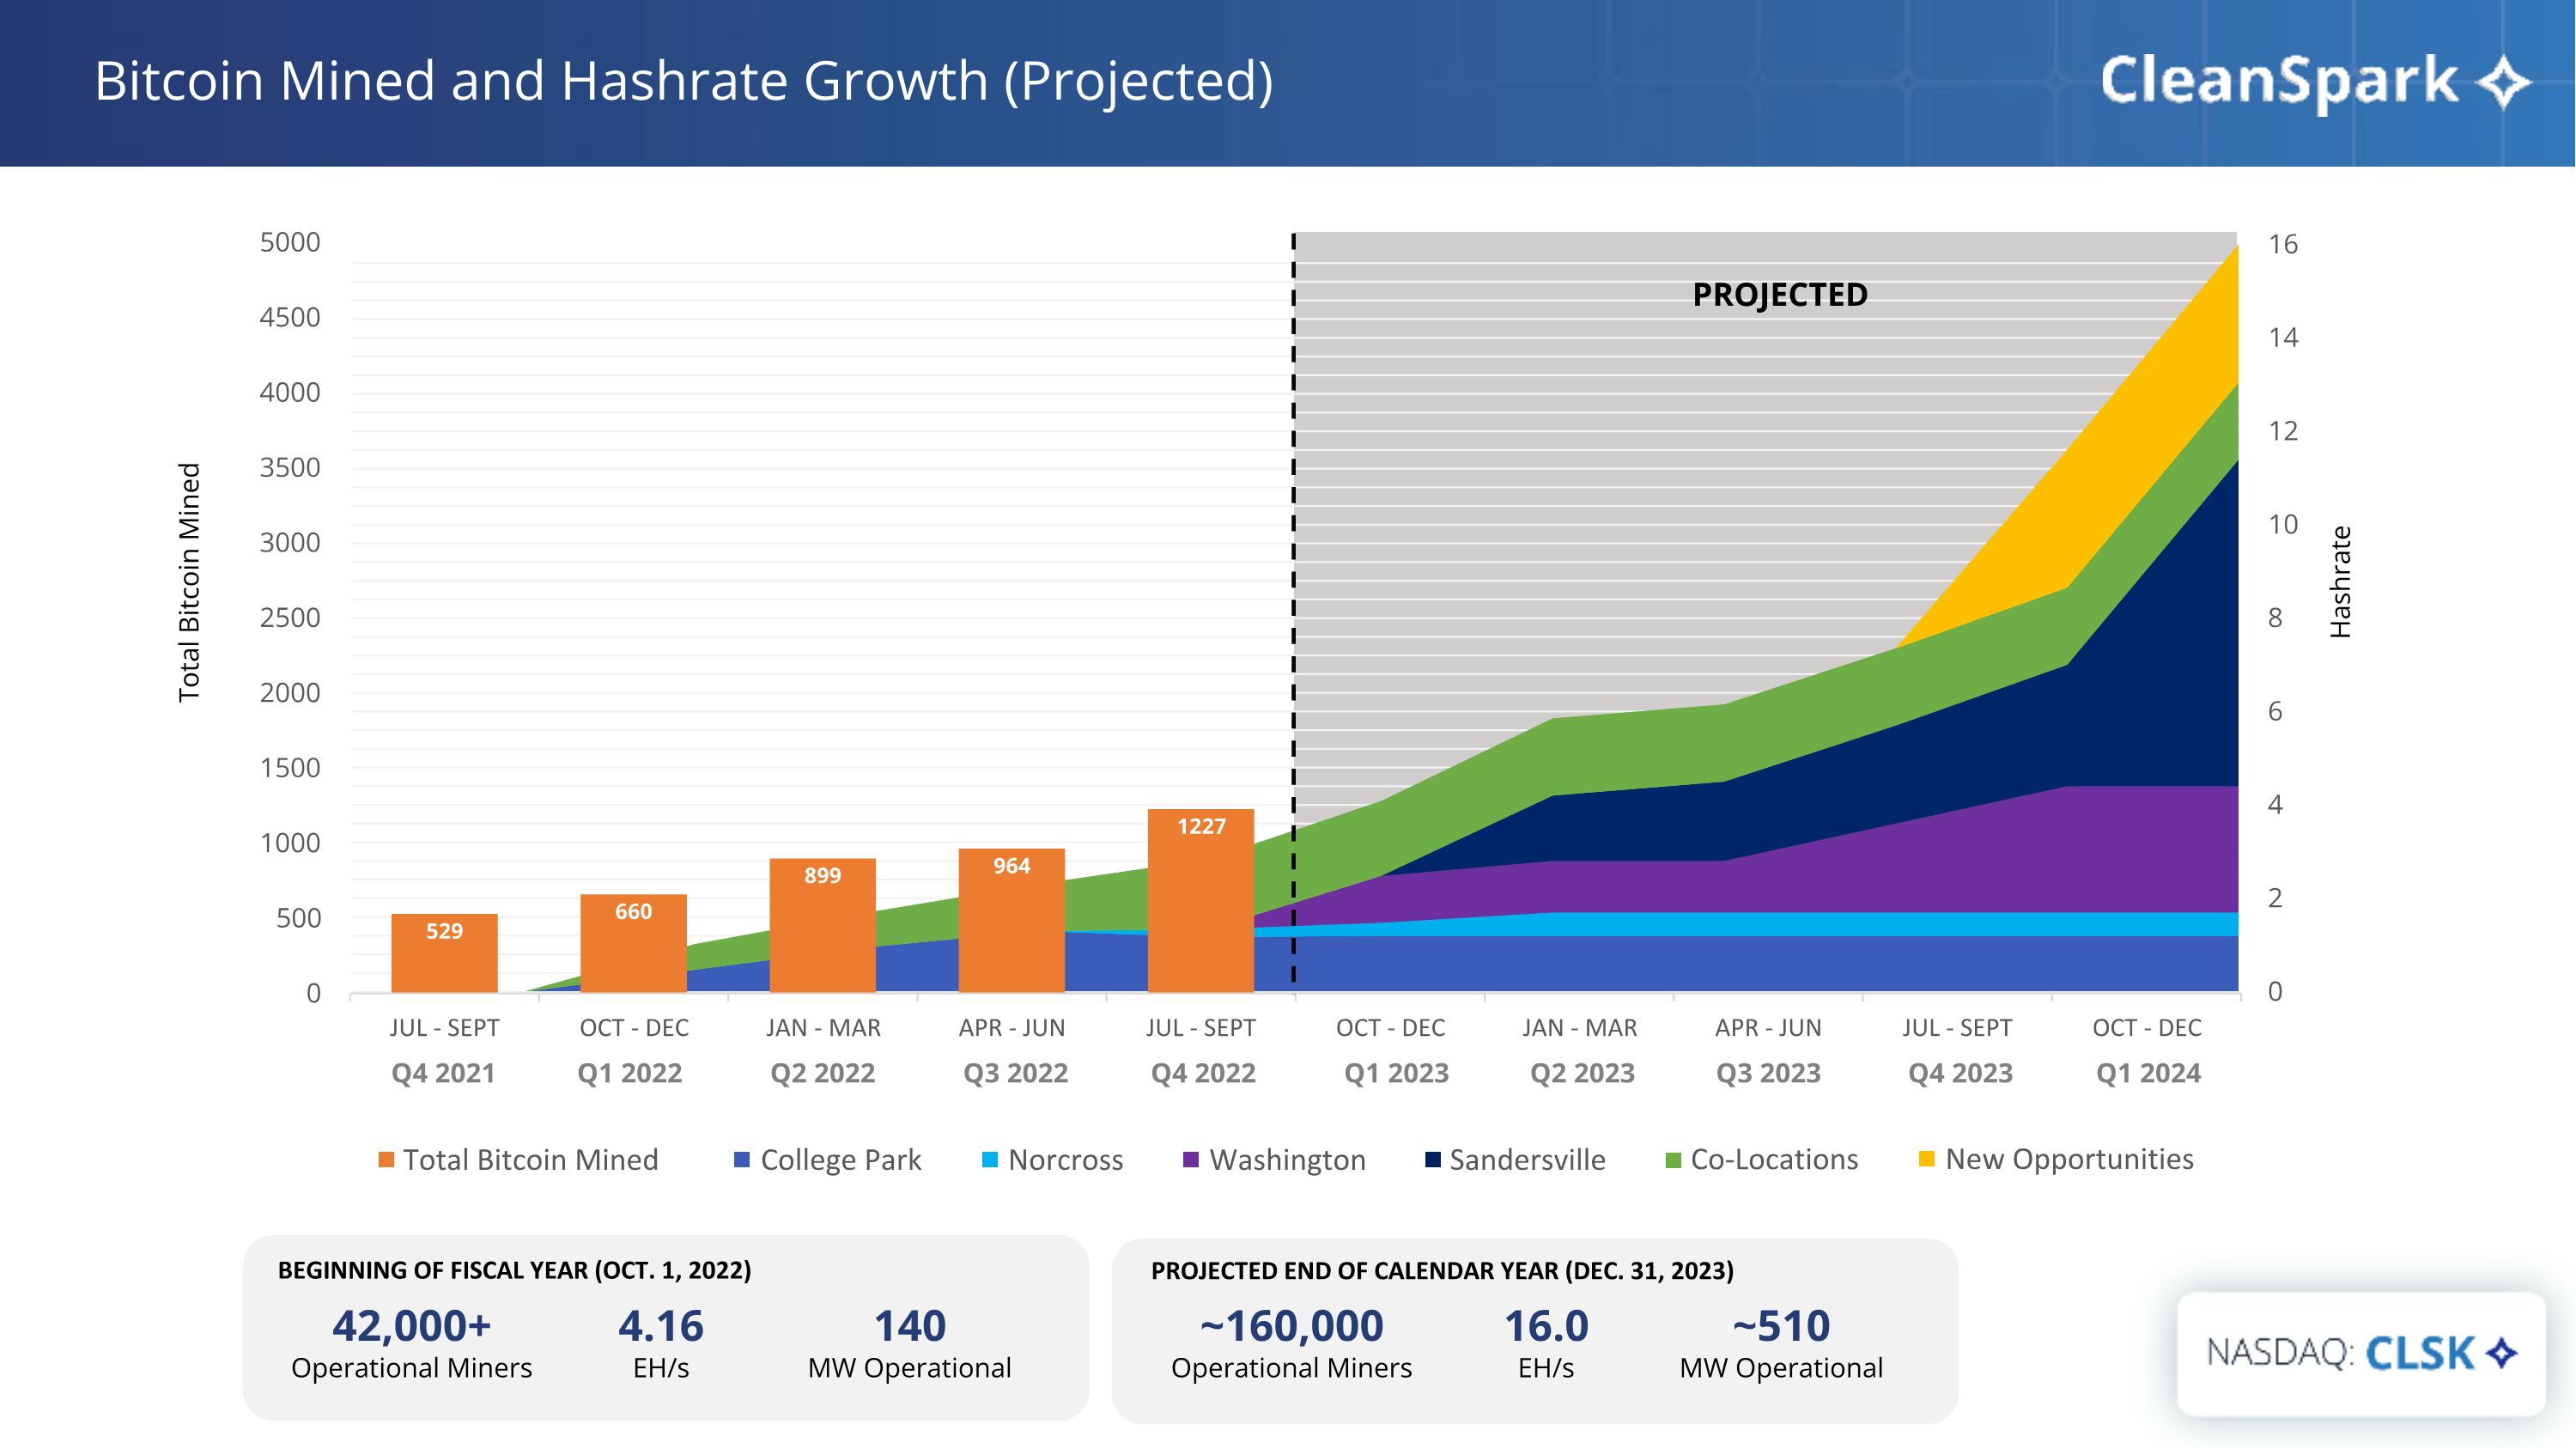
Bitcoin Mined and Hashrate Growth (Projected) Hashrate Total Bitcoin Mined PROJECTED BEGINNING OF FISCAL YEAR (OCT. 1, 2022) 42,000+ Operational Miners 4.16 EH/s 140 MW Operational ~160,000 Operational Miners 16.0 EH/s ~510 MW Operational PROJECTED END OF CALENDAR YEAR (DEC. 31, 2023) Total Bitcoin Mined College Park Norcross Washington Sandersville Co-Locations Q4 2021 Q1 2022 Q2 2022 Q3 2022 Q4 2022 Q1 2023 Q2 2023 Q3 2023 Q4 2023 Q1 2024 New Opportunities
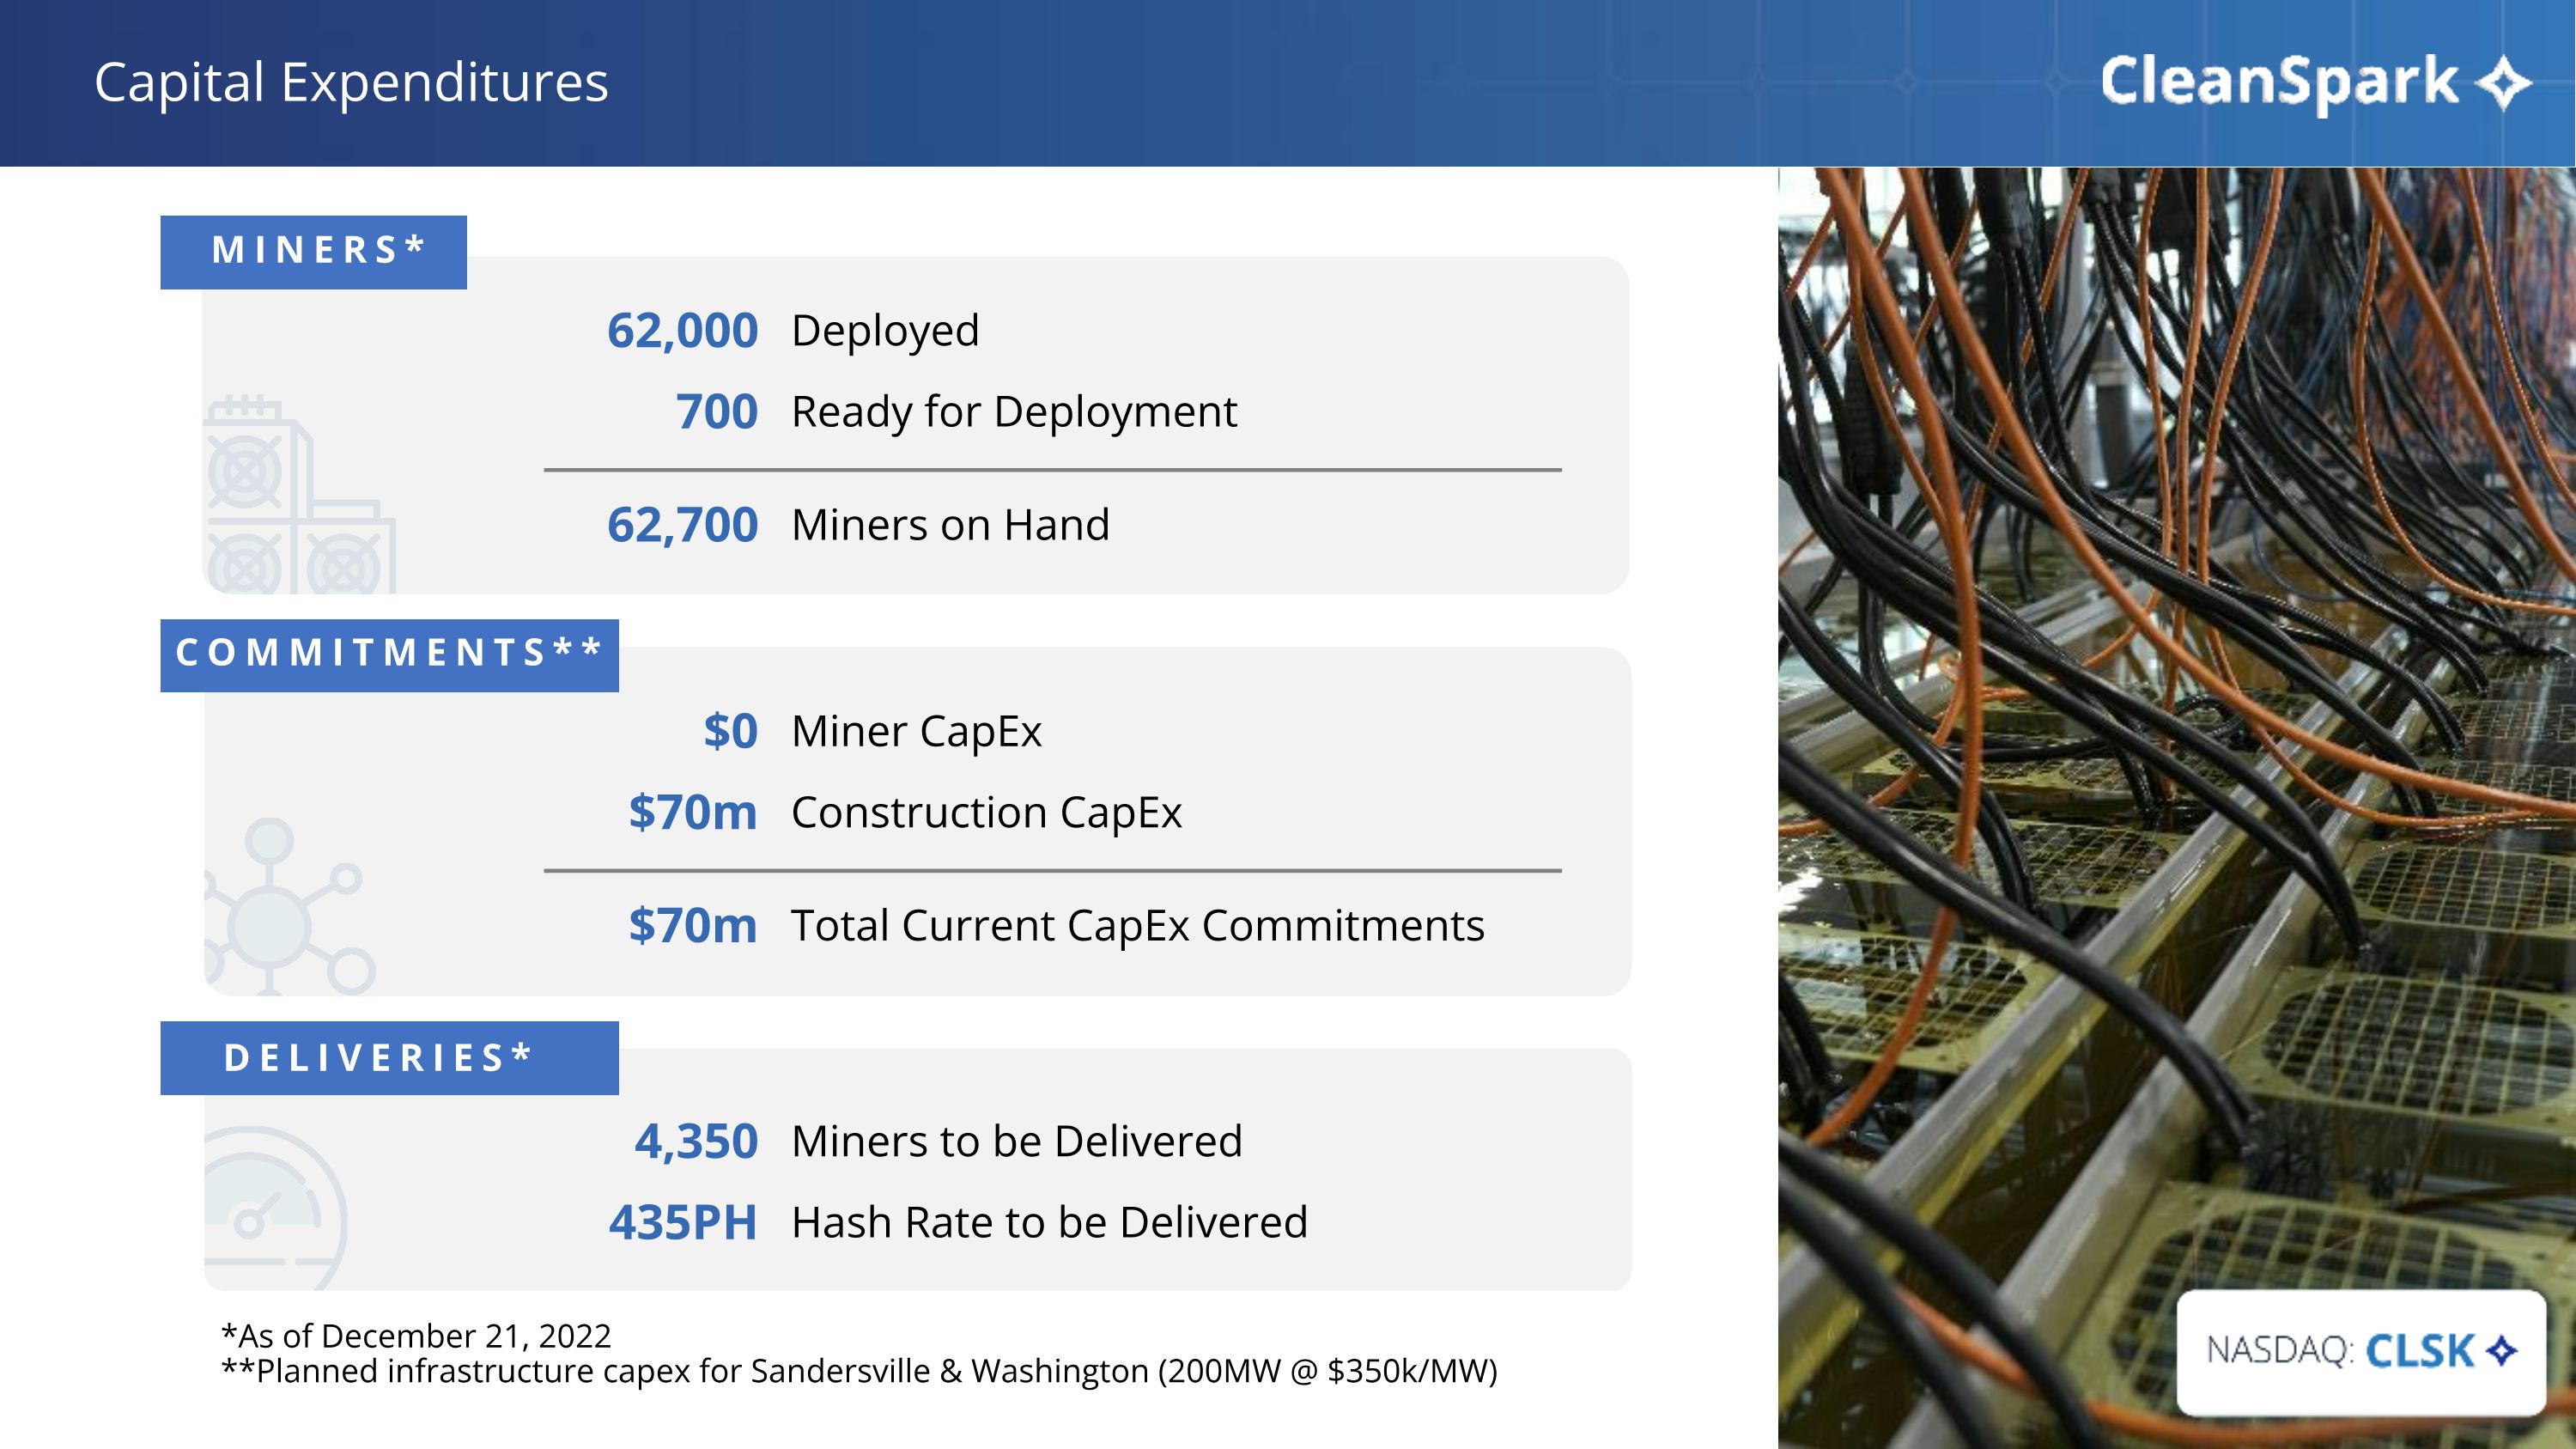
Capital Expenditures *As of December 21, 2022 **Planned infrastructure capex for Sandersville & Washington (200MW @ $350k/MW) Deployed 62,000 Ready for Deployment Miners on Hand 700 62,700 Miners to be Delivered 4,350 Hash Rate to be Delivered 435PH Miner CapEx $0 Construction CapEx Total Current CapEx Commitments $70m $70m MINERS* COMMITMENTS** DELIVERIES*
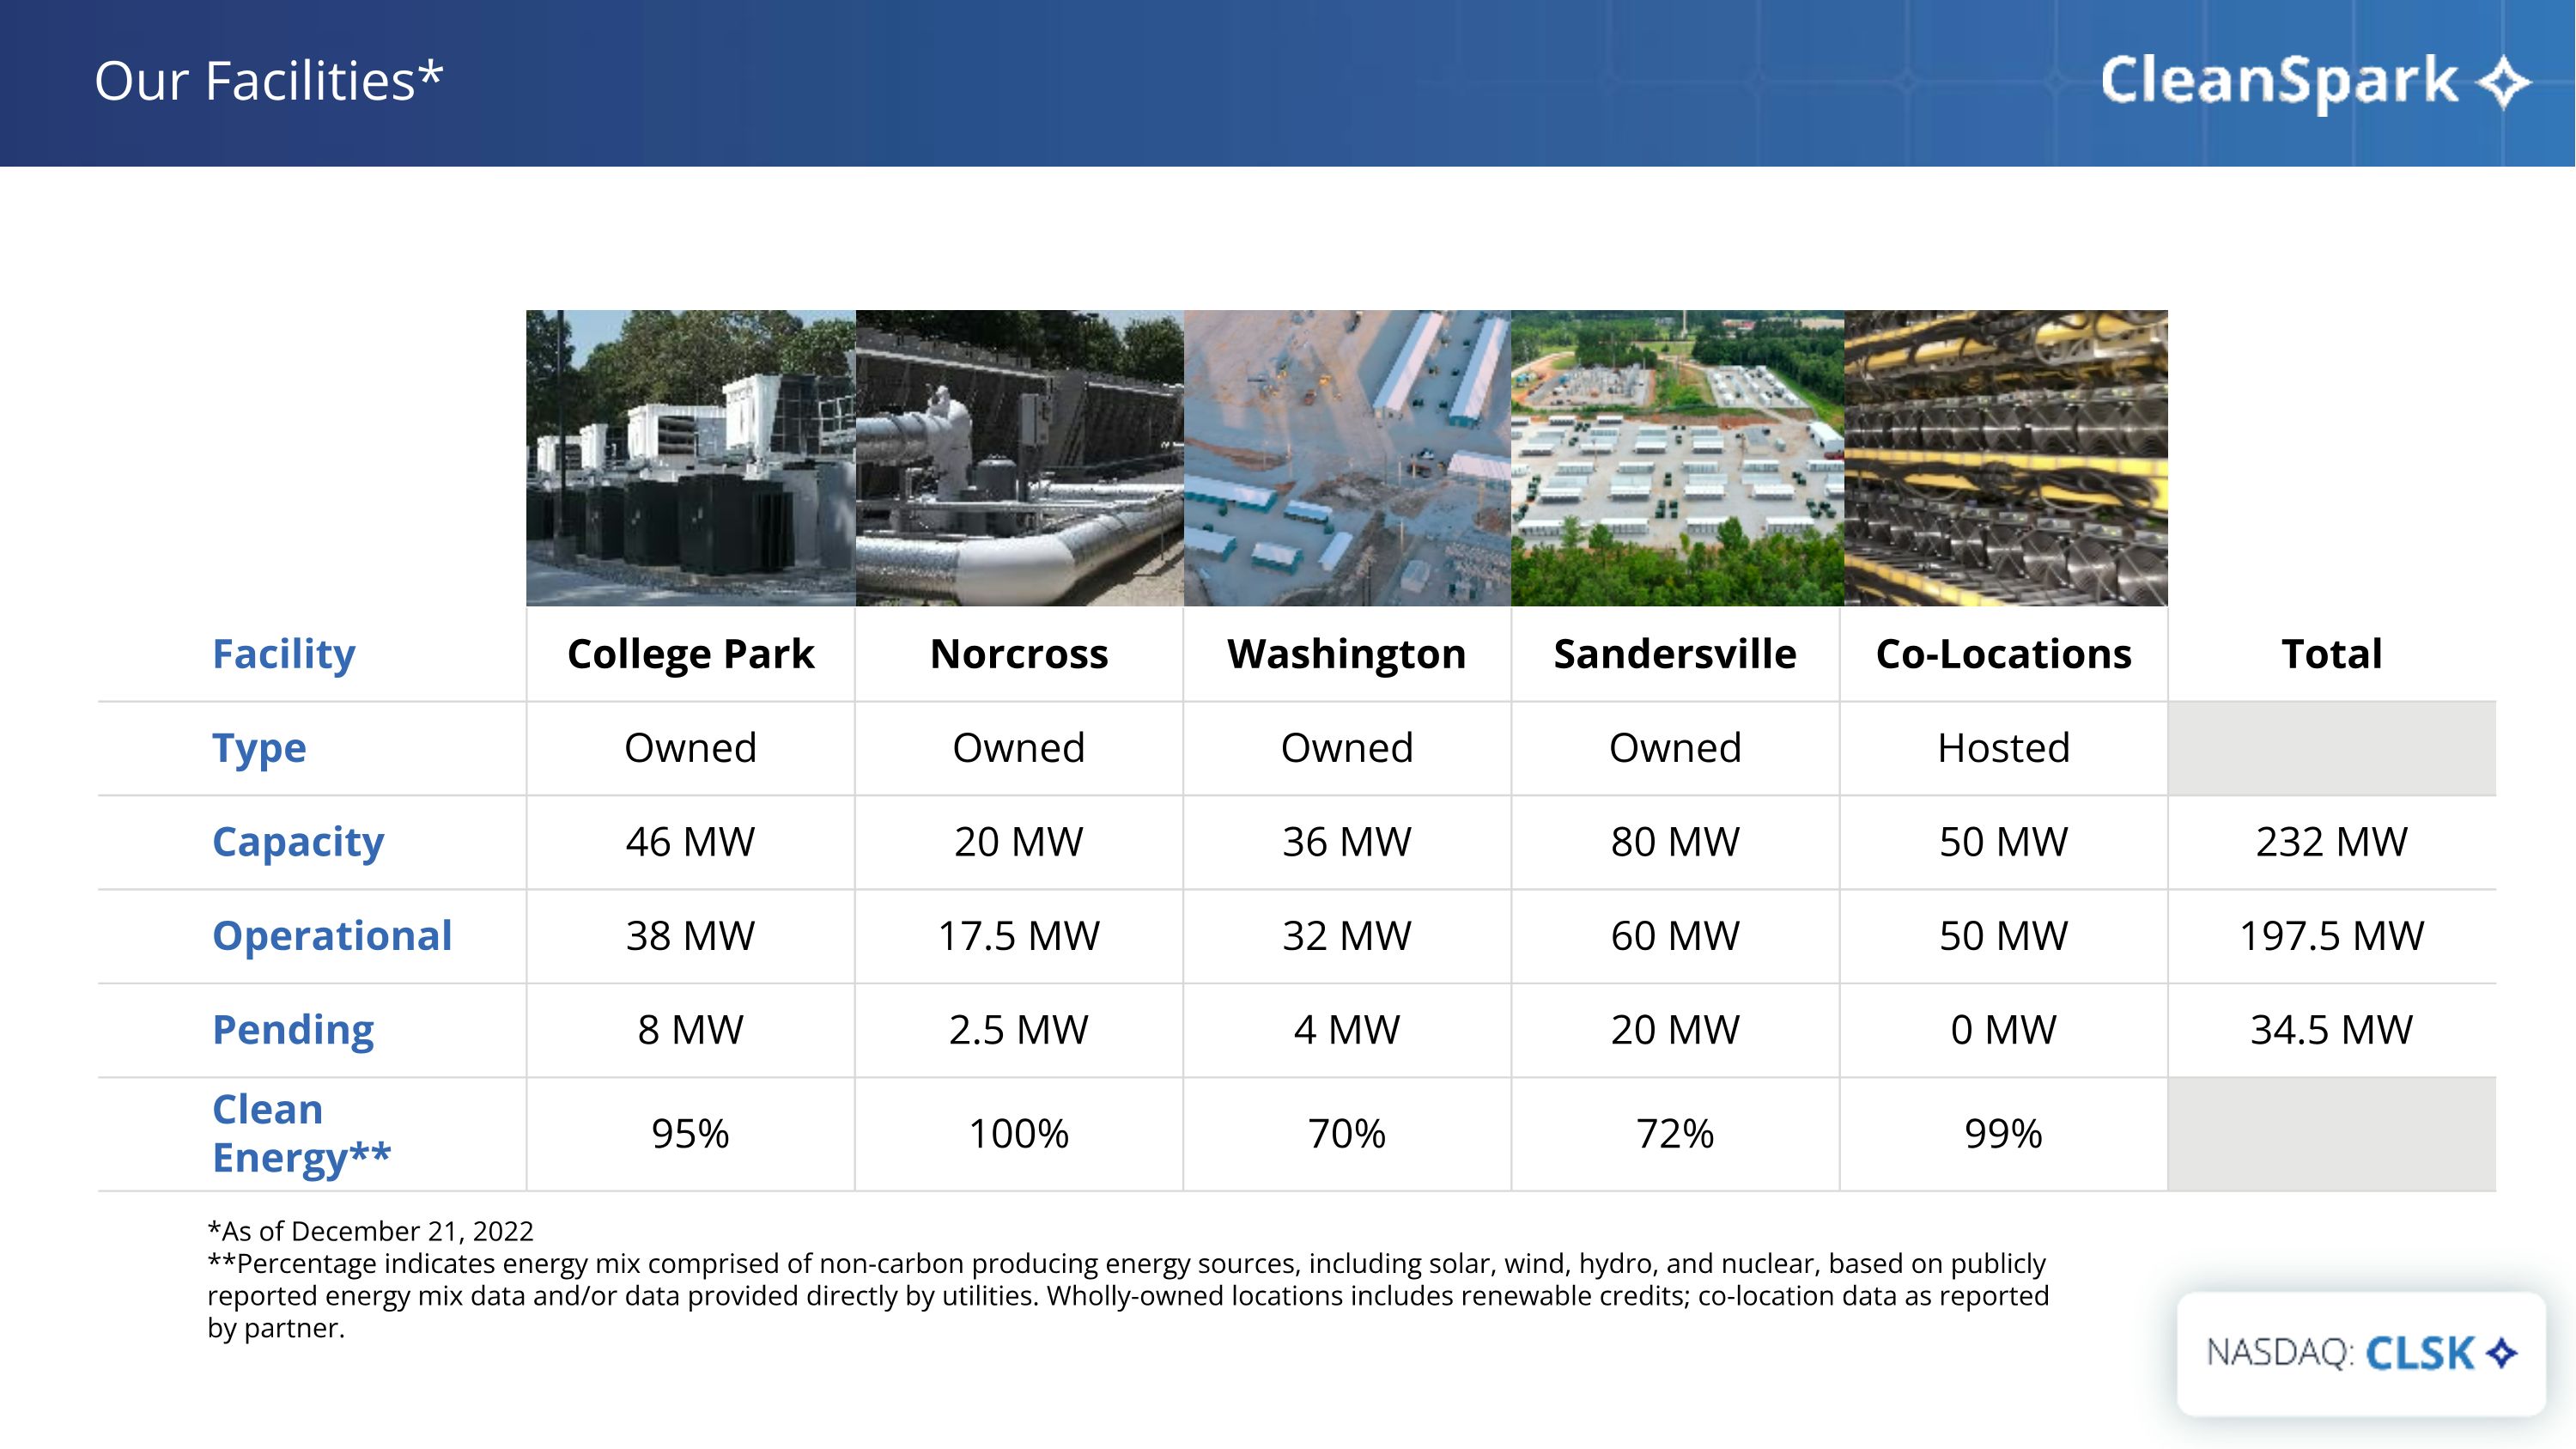
*As of December 21, 2022 **Percentage indicates energy mix comprised of non-carbon producing energy sources, including solar, wind, hydro, and nuclear, based on publicly reported energy mix data and/or data provided directly by utilities. Wholly-owned locations includes renewable credits; co-location data as reported by partner. Facility College Park Norcross Washington Sandersville Co-Locations Total Type Owned Owned Owned Owned Hosted Capacity 46 MW 20 MW 36 MW 80 MW 50 MW 232 MW Operational 38 MW 17.5 MW 32 MW 60 MW 50 MW 197.5 MW Pending 8 MW 2.5 MW 4 MW 20 MW 0 MW 34.5 MW Clean Energy** 95% 100% 70% 72% 99% Our Facilities*
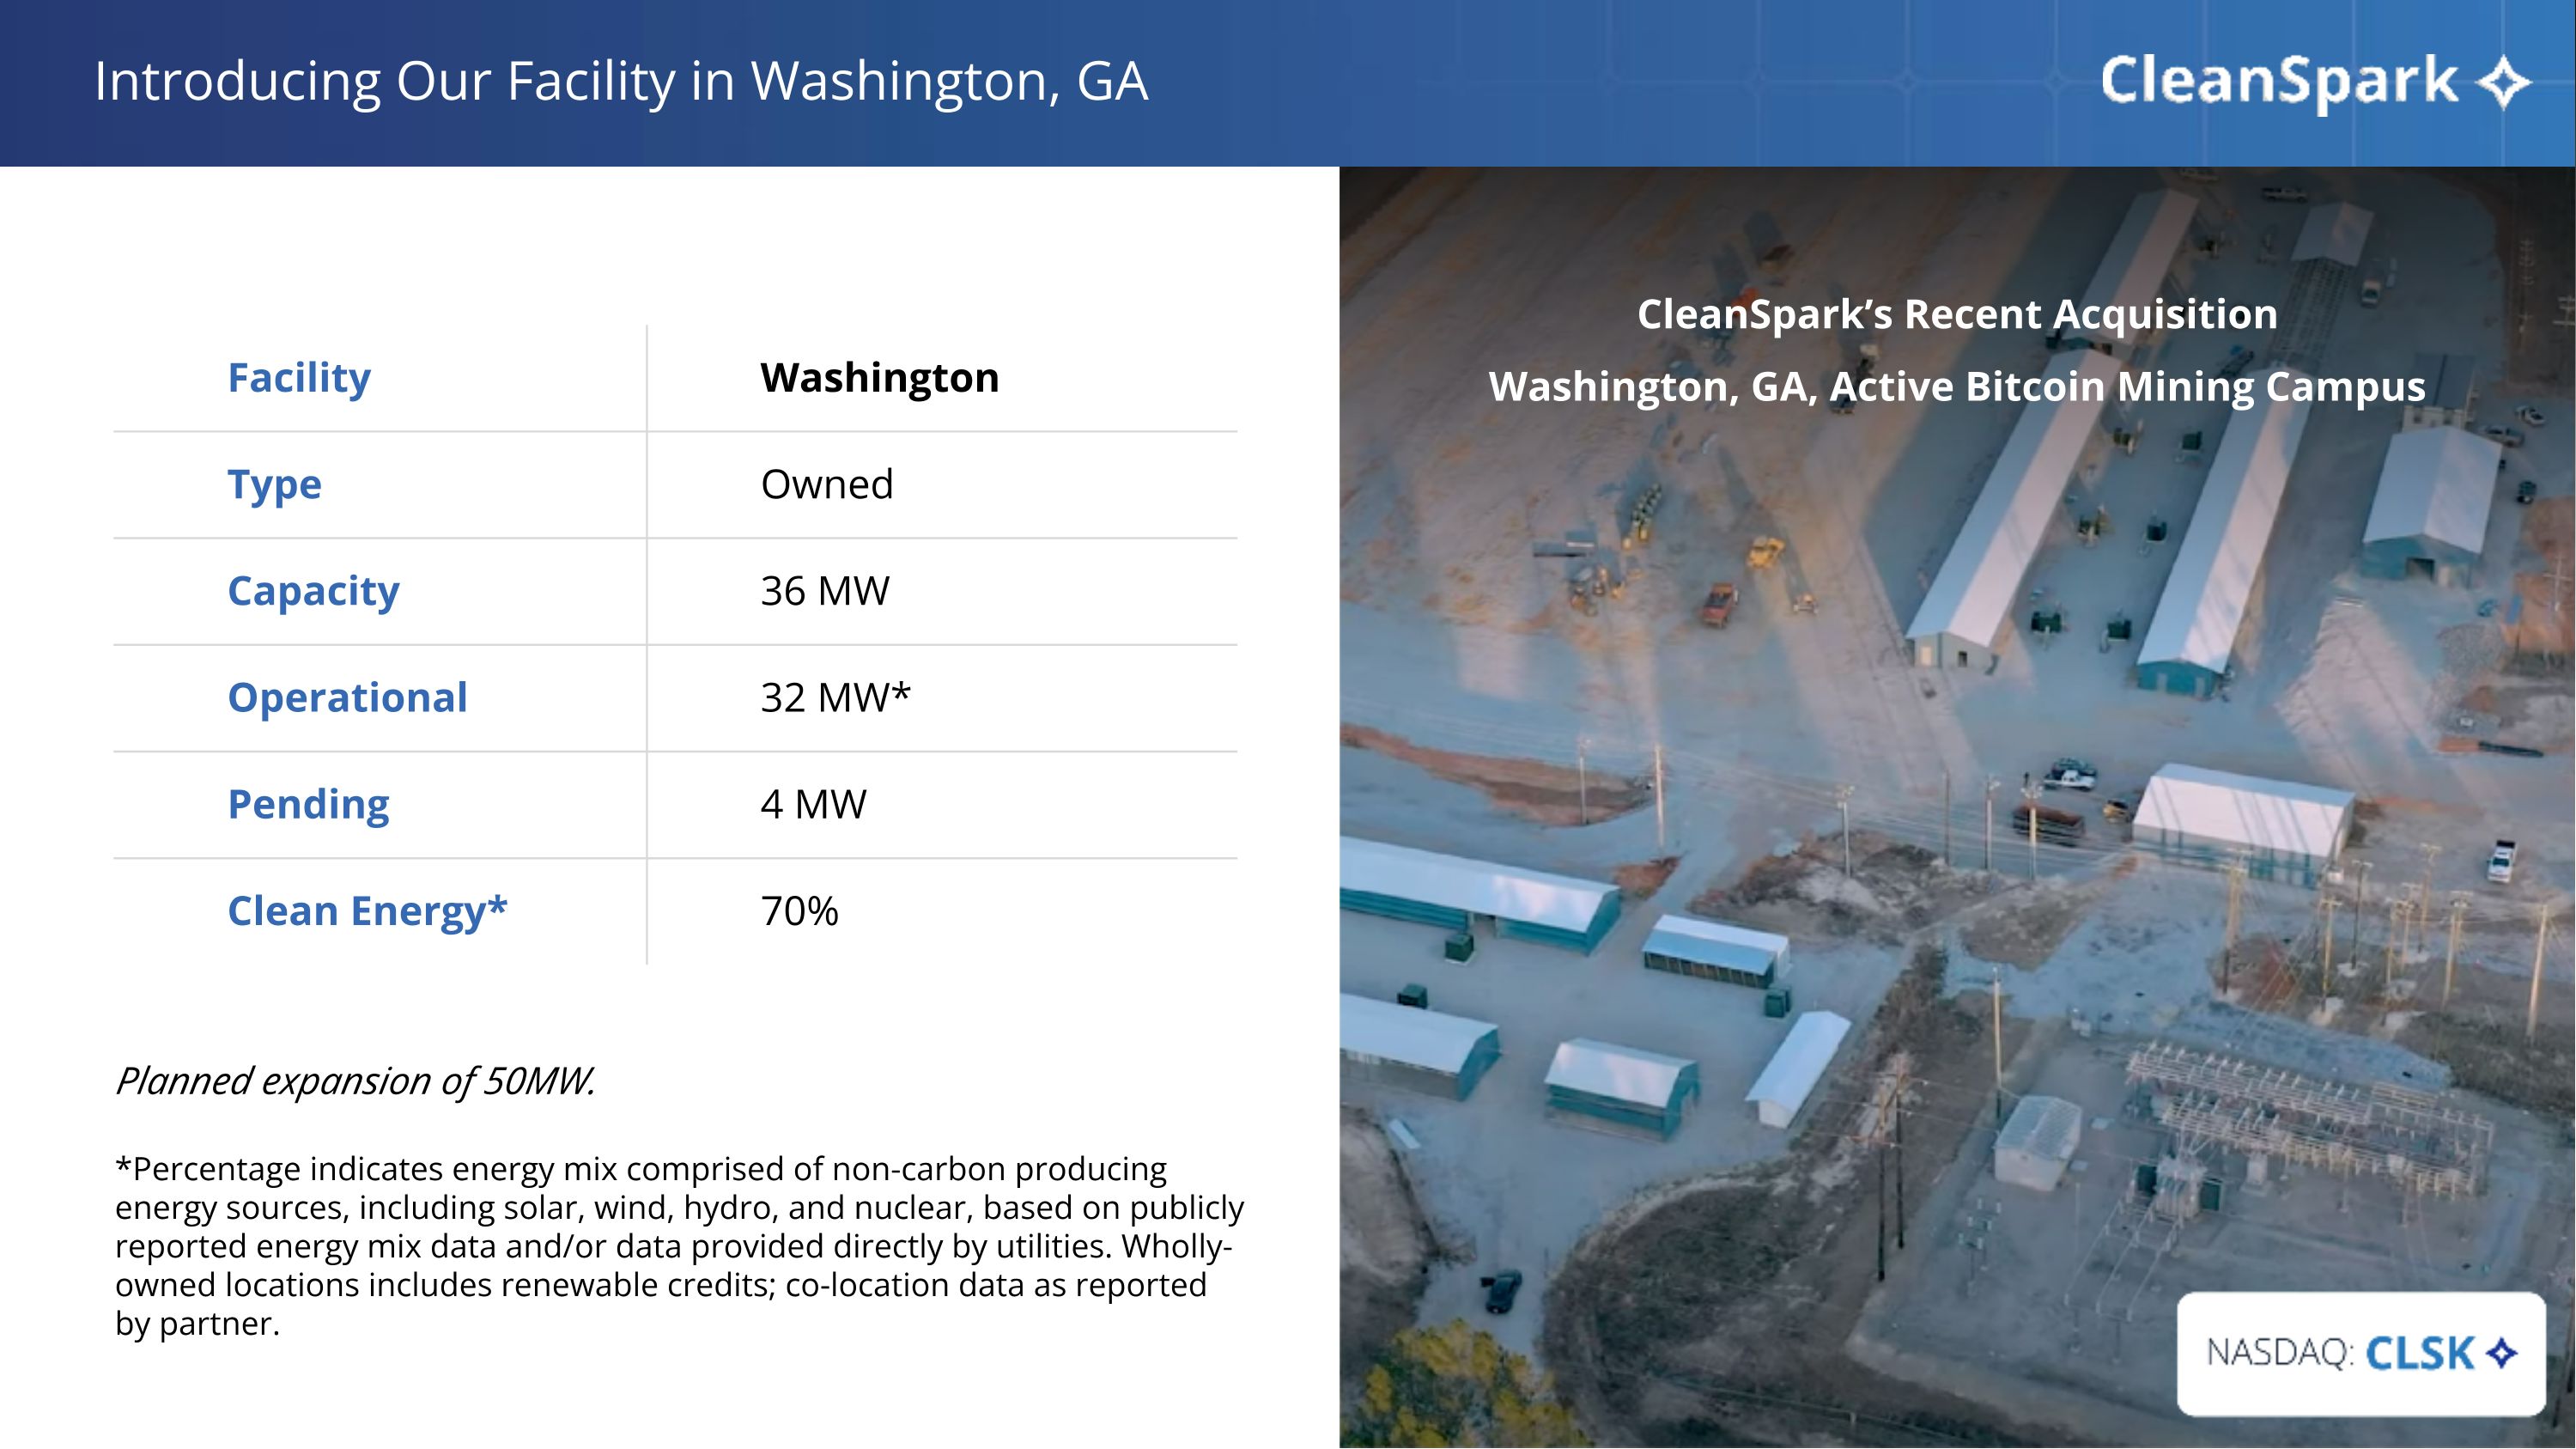
Introducing Our Facility in Washington, GA Facility Washington Type Owned Capacity 36 MW Operational 32 MW* Pending 4 MW Clean Energy* 70% *Percentage indicates energy mix comprised of non-carbon producing energy sources, including solar, wind, hydro, and nuclear, based on publicly reported energy mix data and/or data provided directly by utilities. Wholly-owned locations includes renewable credits; co-location data as reported by partner. Planned expansion of 50MW. CleanSpark’s Recent Acquisition Washington, GA, Active Bitcoin Mining Campus
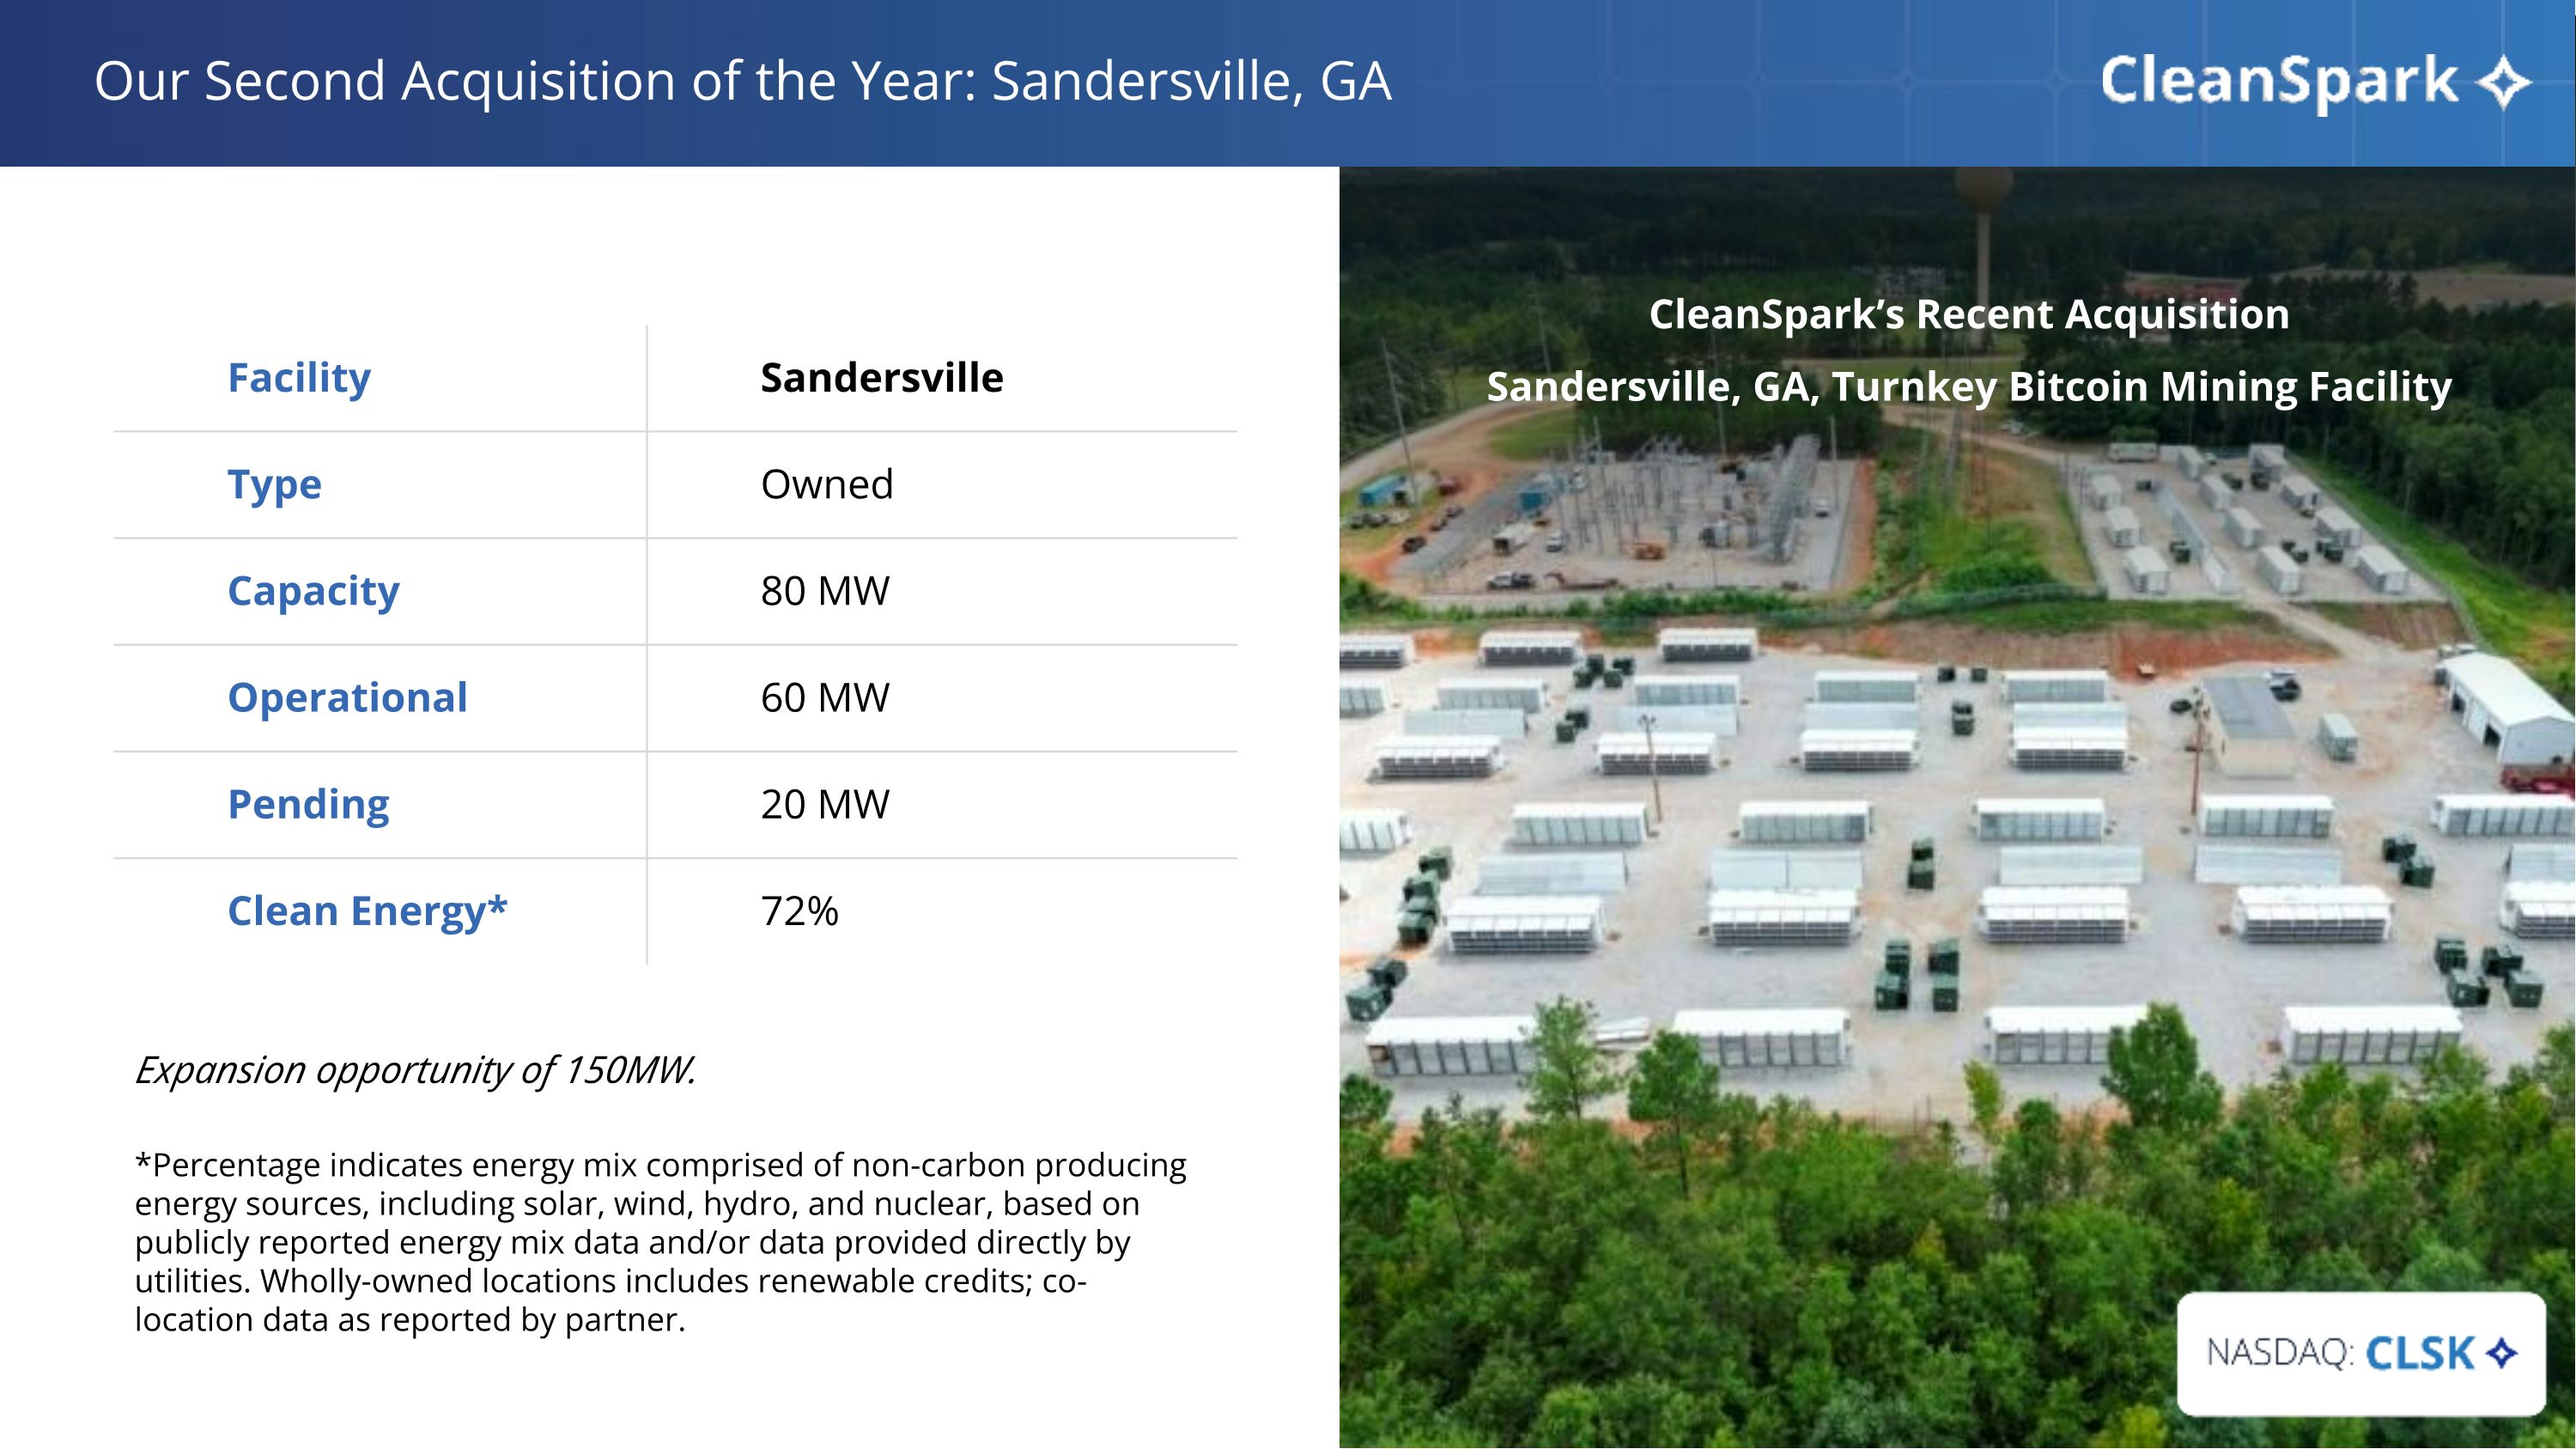
Our Second Acquisition of the Year: Sandersville, GA Facility Sandersville Type Owned Capacity 80 MW Operational 60 MW Pending 20 MW Clean Energy* 72% *Percentage indicates energy mix comprised of non-carbon producing energy sources, including solar, wind, hydro, and nuclear, based on publicly reported energy mix data and/or data provided directly by utilities. Wholly-owned locations includes renewable credits; co-location data as reported by partner. Expansion opportunity of 150MW. CleanSpark’s Recent Acquisition Sandersville, GA, Turnkey Bitcoin Mining Facility
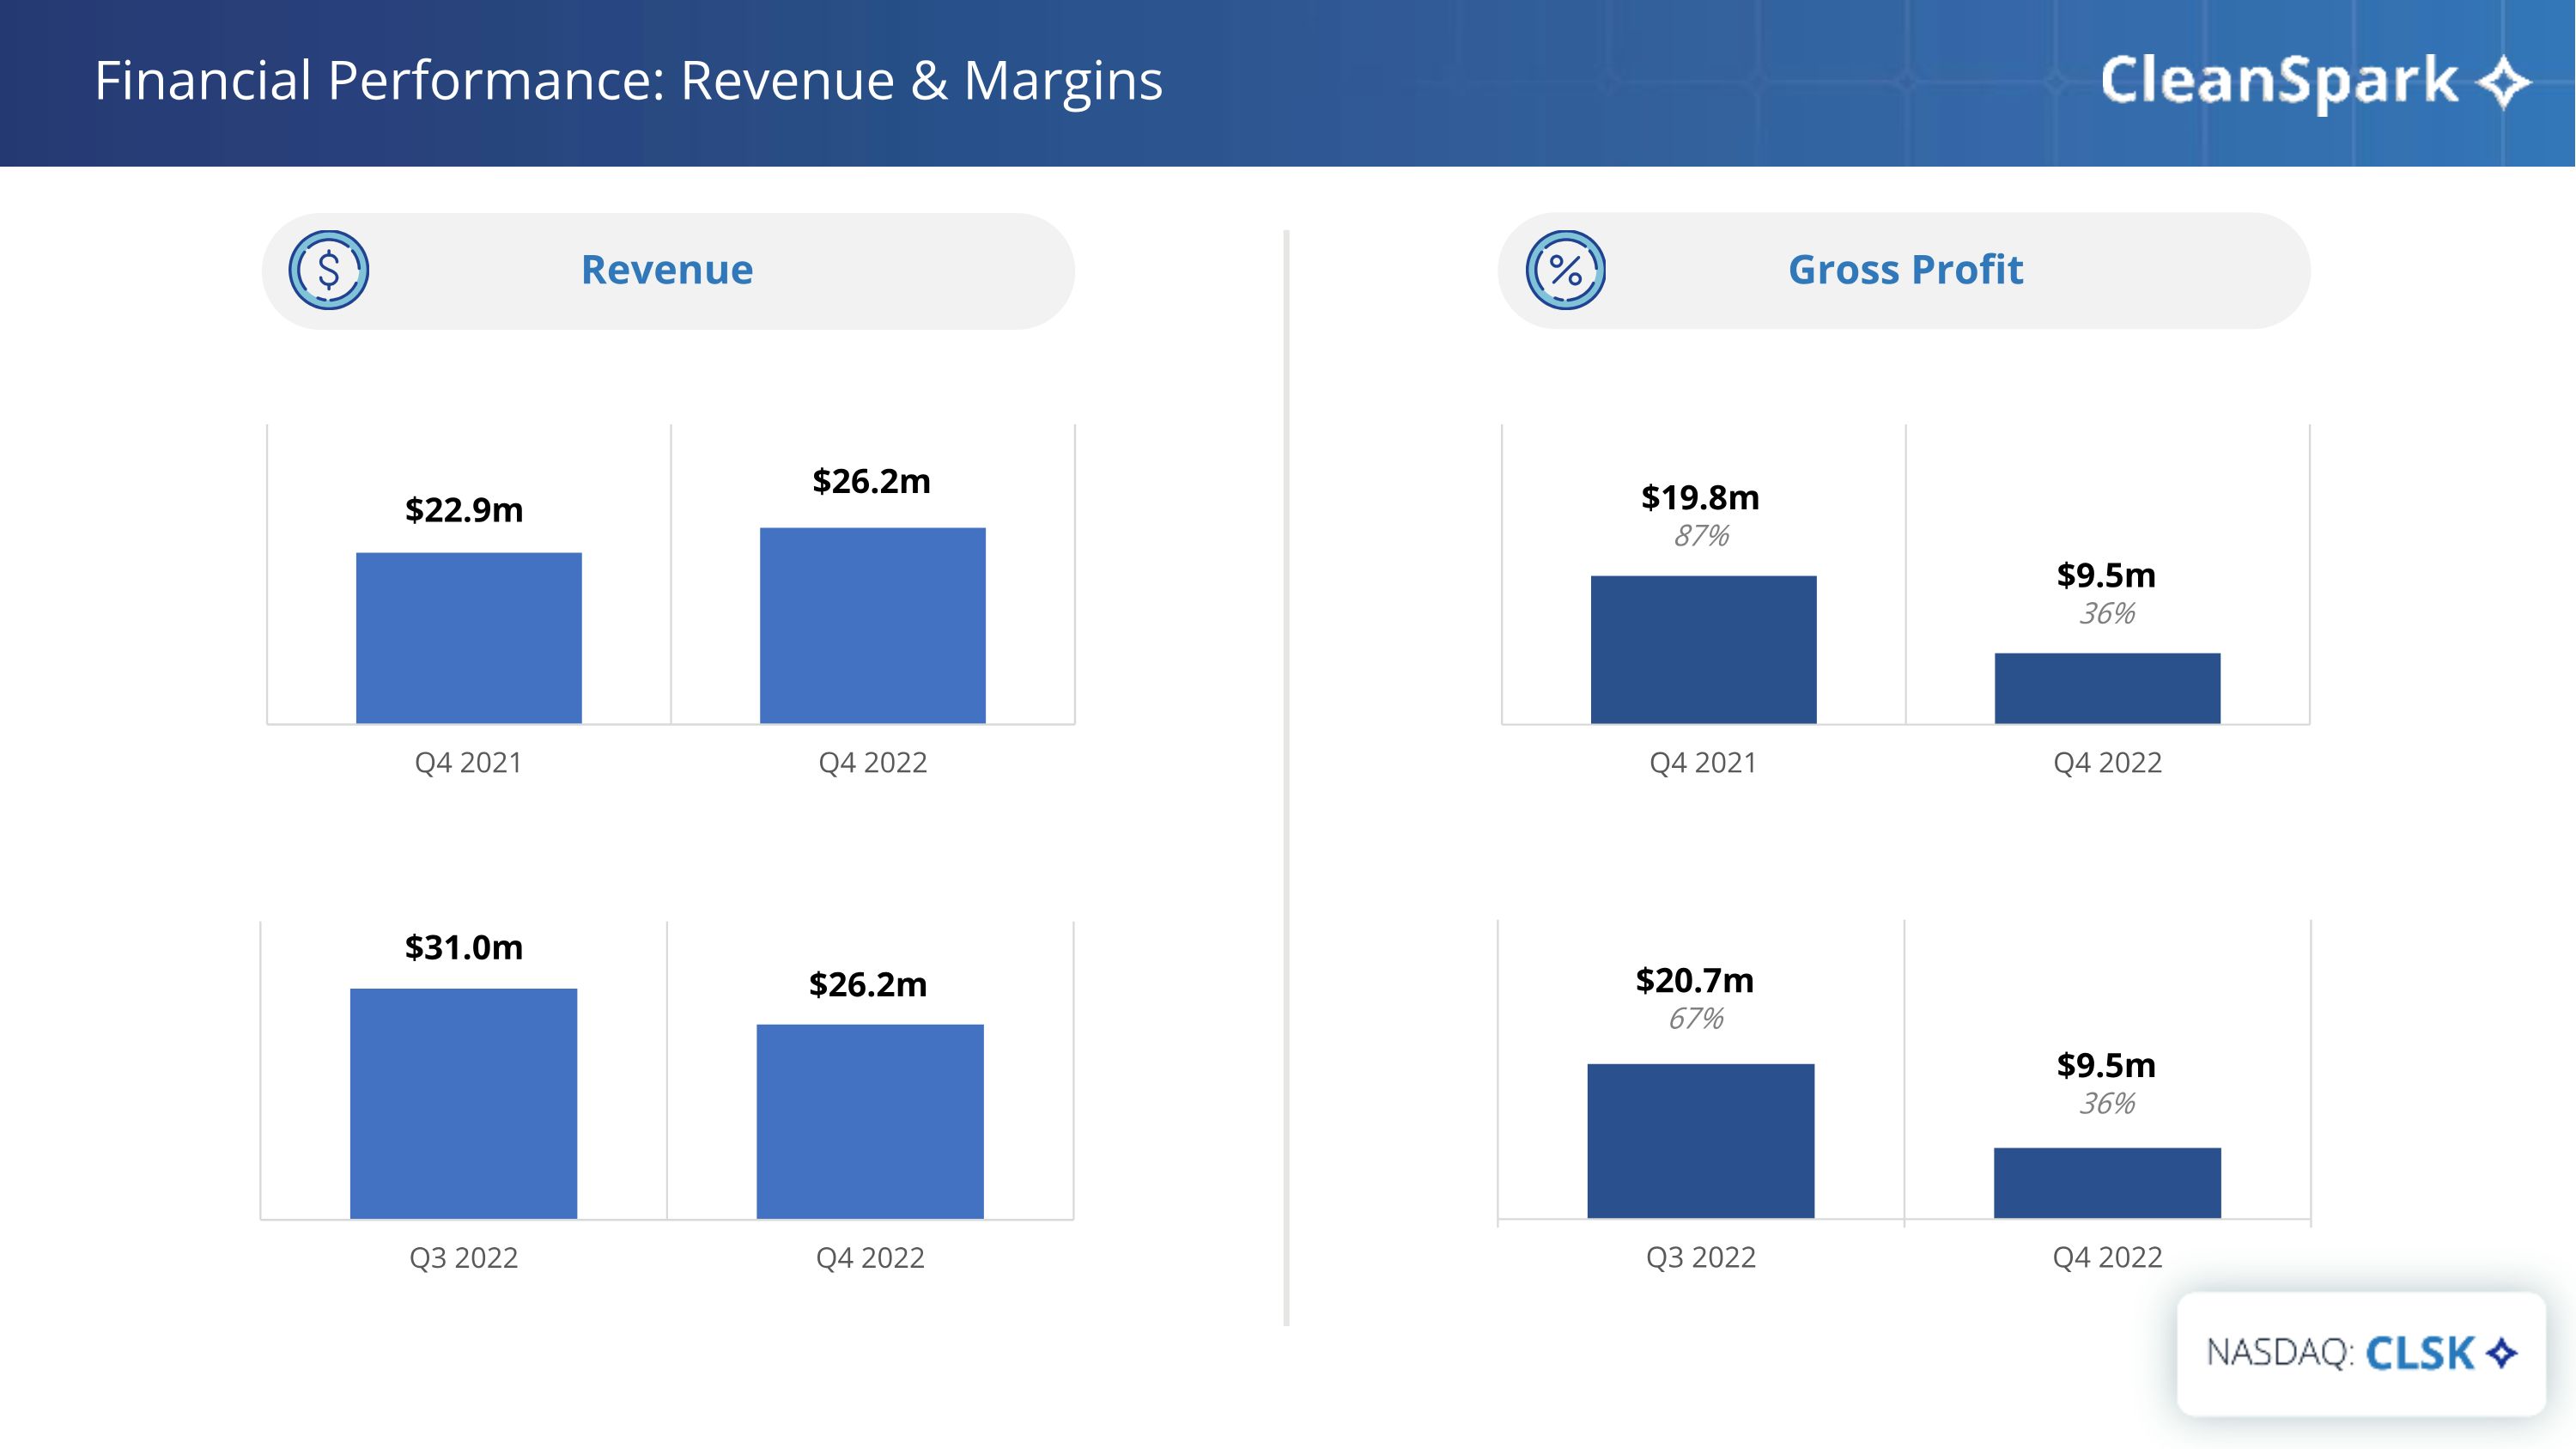
NASDAQ: CLSK Financial Performance: Revenue & Margins Gross Profit $26.2m $31.0m $26.2m $22.9m $9.5m 36% $20.7m 67% $9.5m 36% $19.8m 87% Revenue

Financial Performance: Profitability $2.9m 11% $15.1m 49% ($42.3m) ($29.3m) ($42.3m) ($5.4m) $10.6m 46% Adjusted EBITDA Net Income/Loss $2.9m 11%

Key Indicators Year-over-year Comparison (FY21 & FY22) 892 BTC 3,750 BTC FY2021 FY2022 Bitcoin Mined $49.4M $131.5M FY2021 FY2022 Revenue 10,161 42,000+ FY2021 FY2022 Machines Operating 1.01 EH/s 4.16 EH/s FY2021 FY2022 Hashrate 33MW 140MW FY2021 FY2022 MW Operational 2 4 FY2021 FY2022 Facilities Owned & Operated
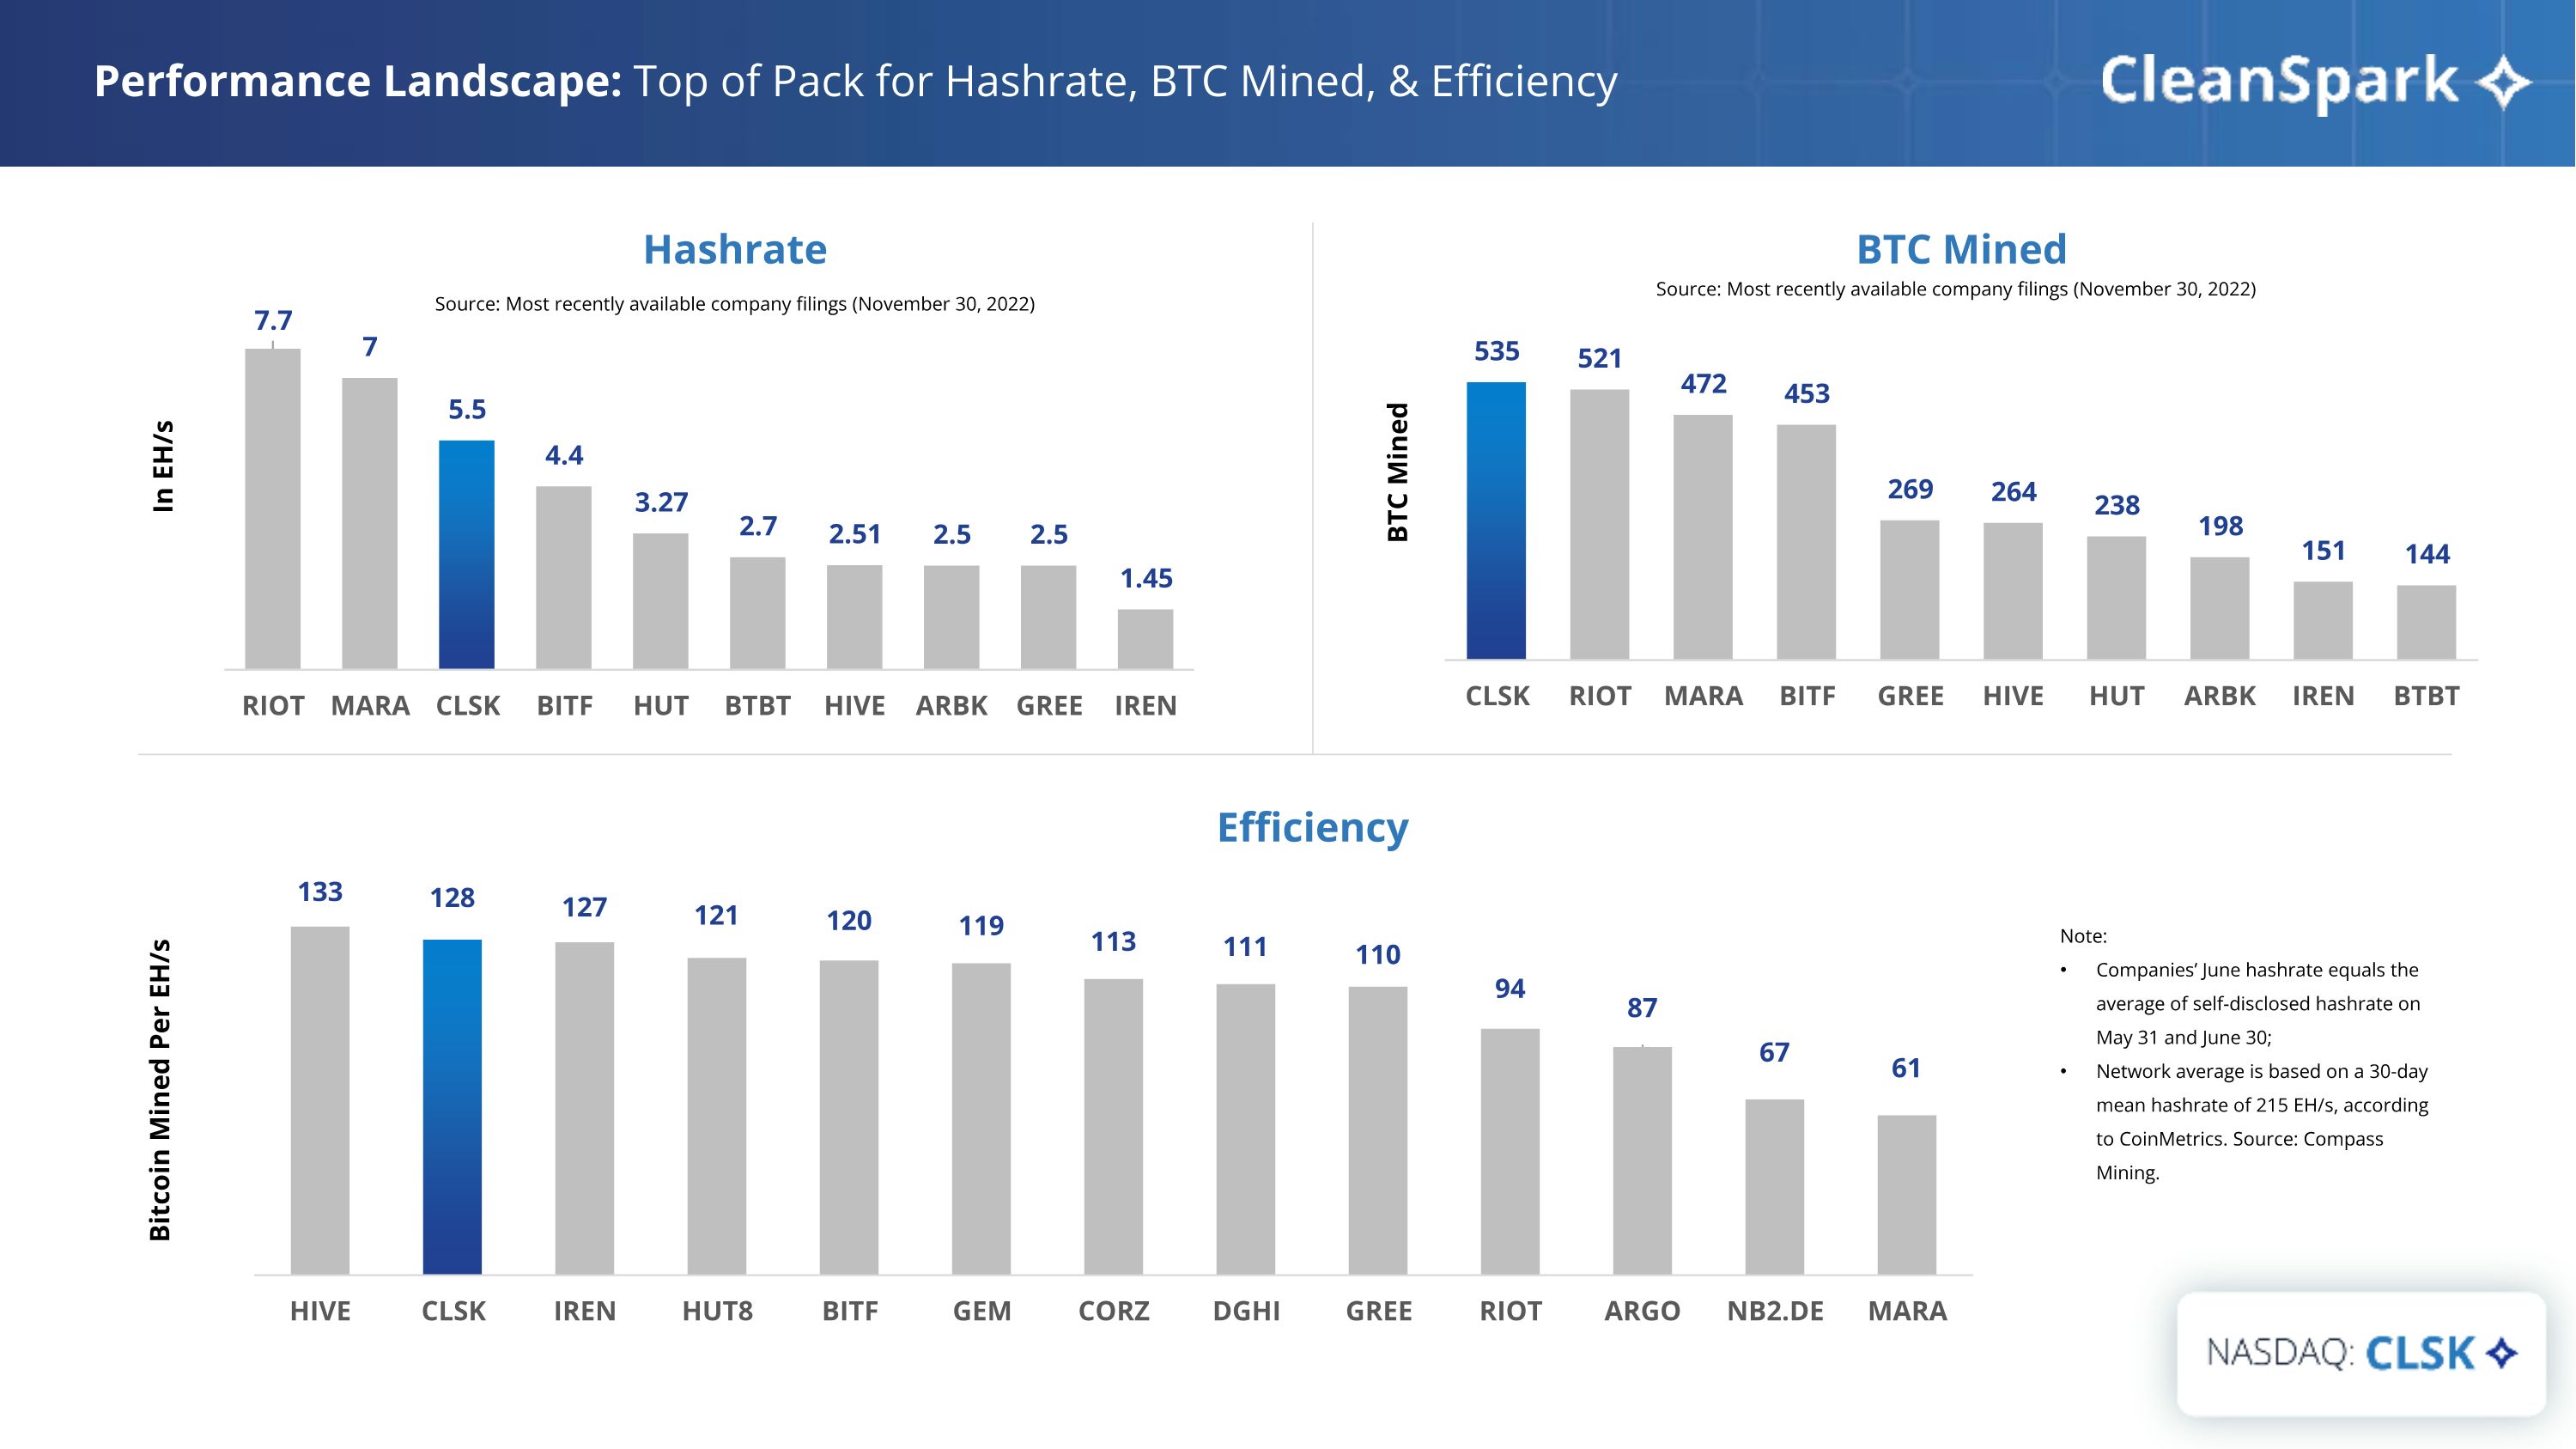
Performance Landscape: Top of Pack for Hashrate, BTC Mined, & Efficiency BTC Mined In EH/s BTC Mined Hashrate Efficiency Source: Most recently available company filings (November 30, 2022) Source: Most recently available company filings (November 30, 2022) Note: Companies’ June hashrate equals the average of self-disclosed hashrate on May 31 and June 30; Network average is based on a 30-day mean hashrate of 215 EH/s, according to CoinMetrics. Source: Compass Mining. Bitcoin Mined Per EH/s
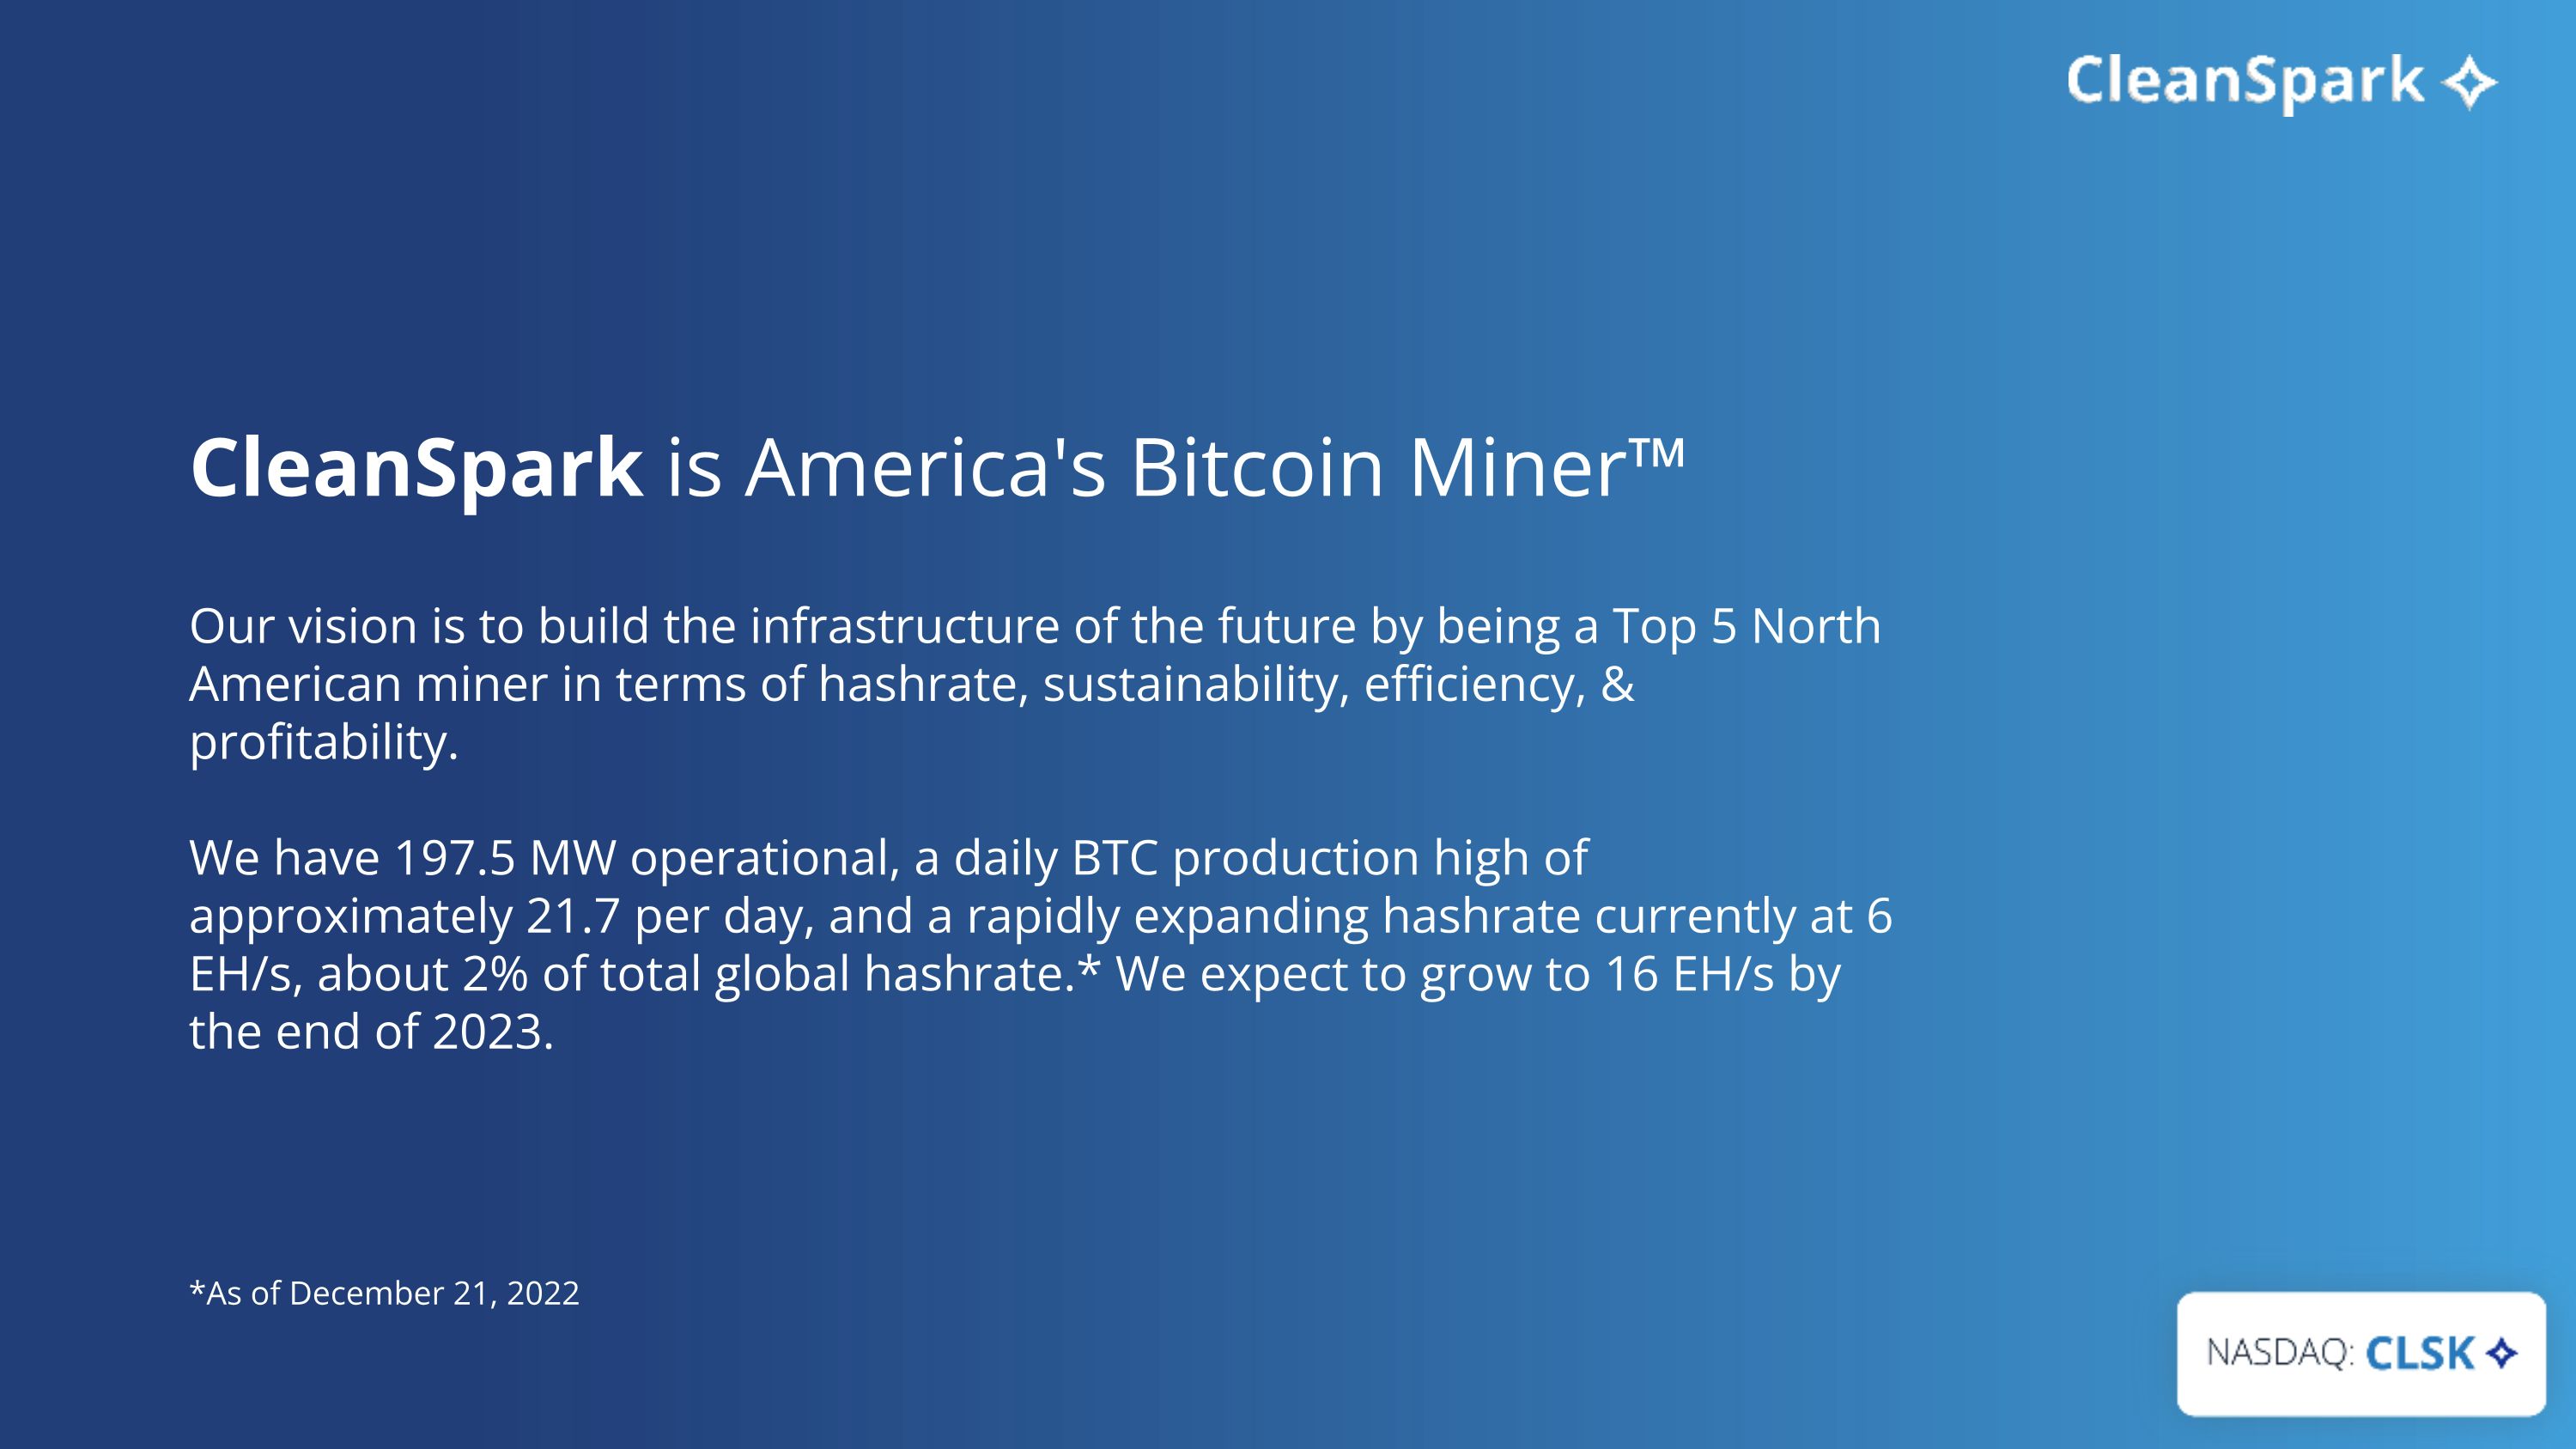
CleanSpark is America's Bitcoin Miner™��Our vision is to build the infrastructure of the future by being a Top 5 North American miner in terms of hashrate, sustainability, efficiency, & profitability. ��We have 197.5 MW operational, a daily BTC production high of approximately 21.7 per day, and a rapidly expanding hashrate currently at 6 EH/s, about 2% of total global hashrate.* We expect to grow to 16 EH/s by the end of 2023. *As of December 21, 2022
Appendix
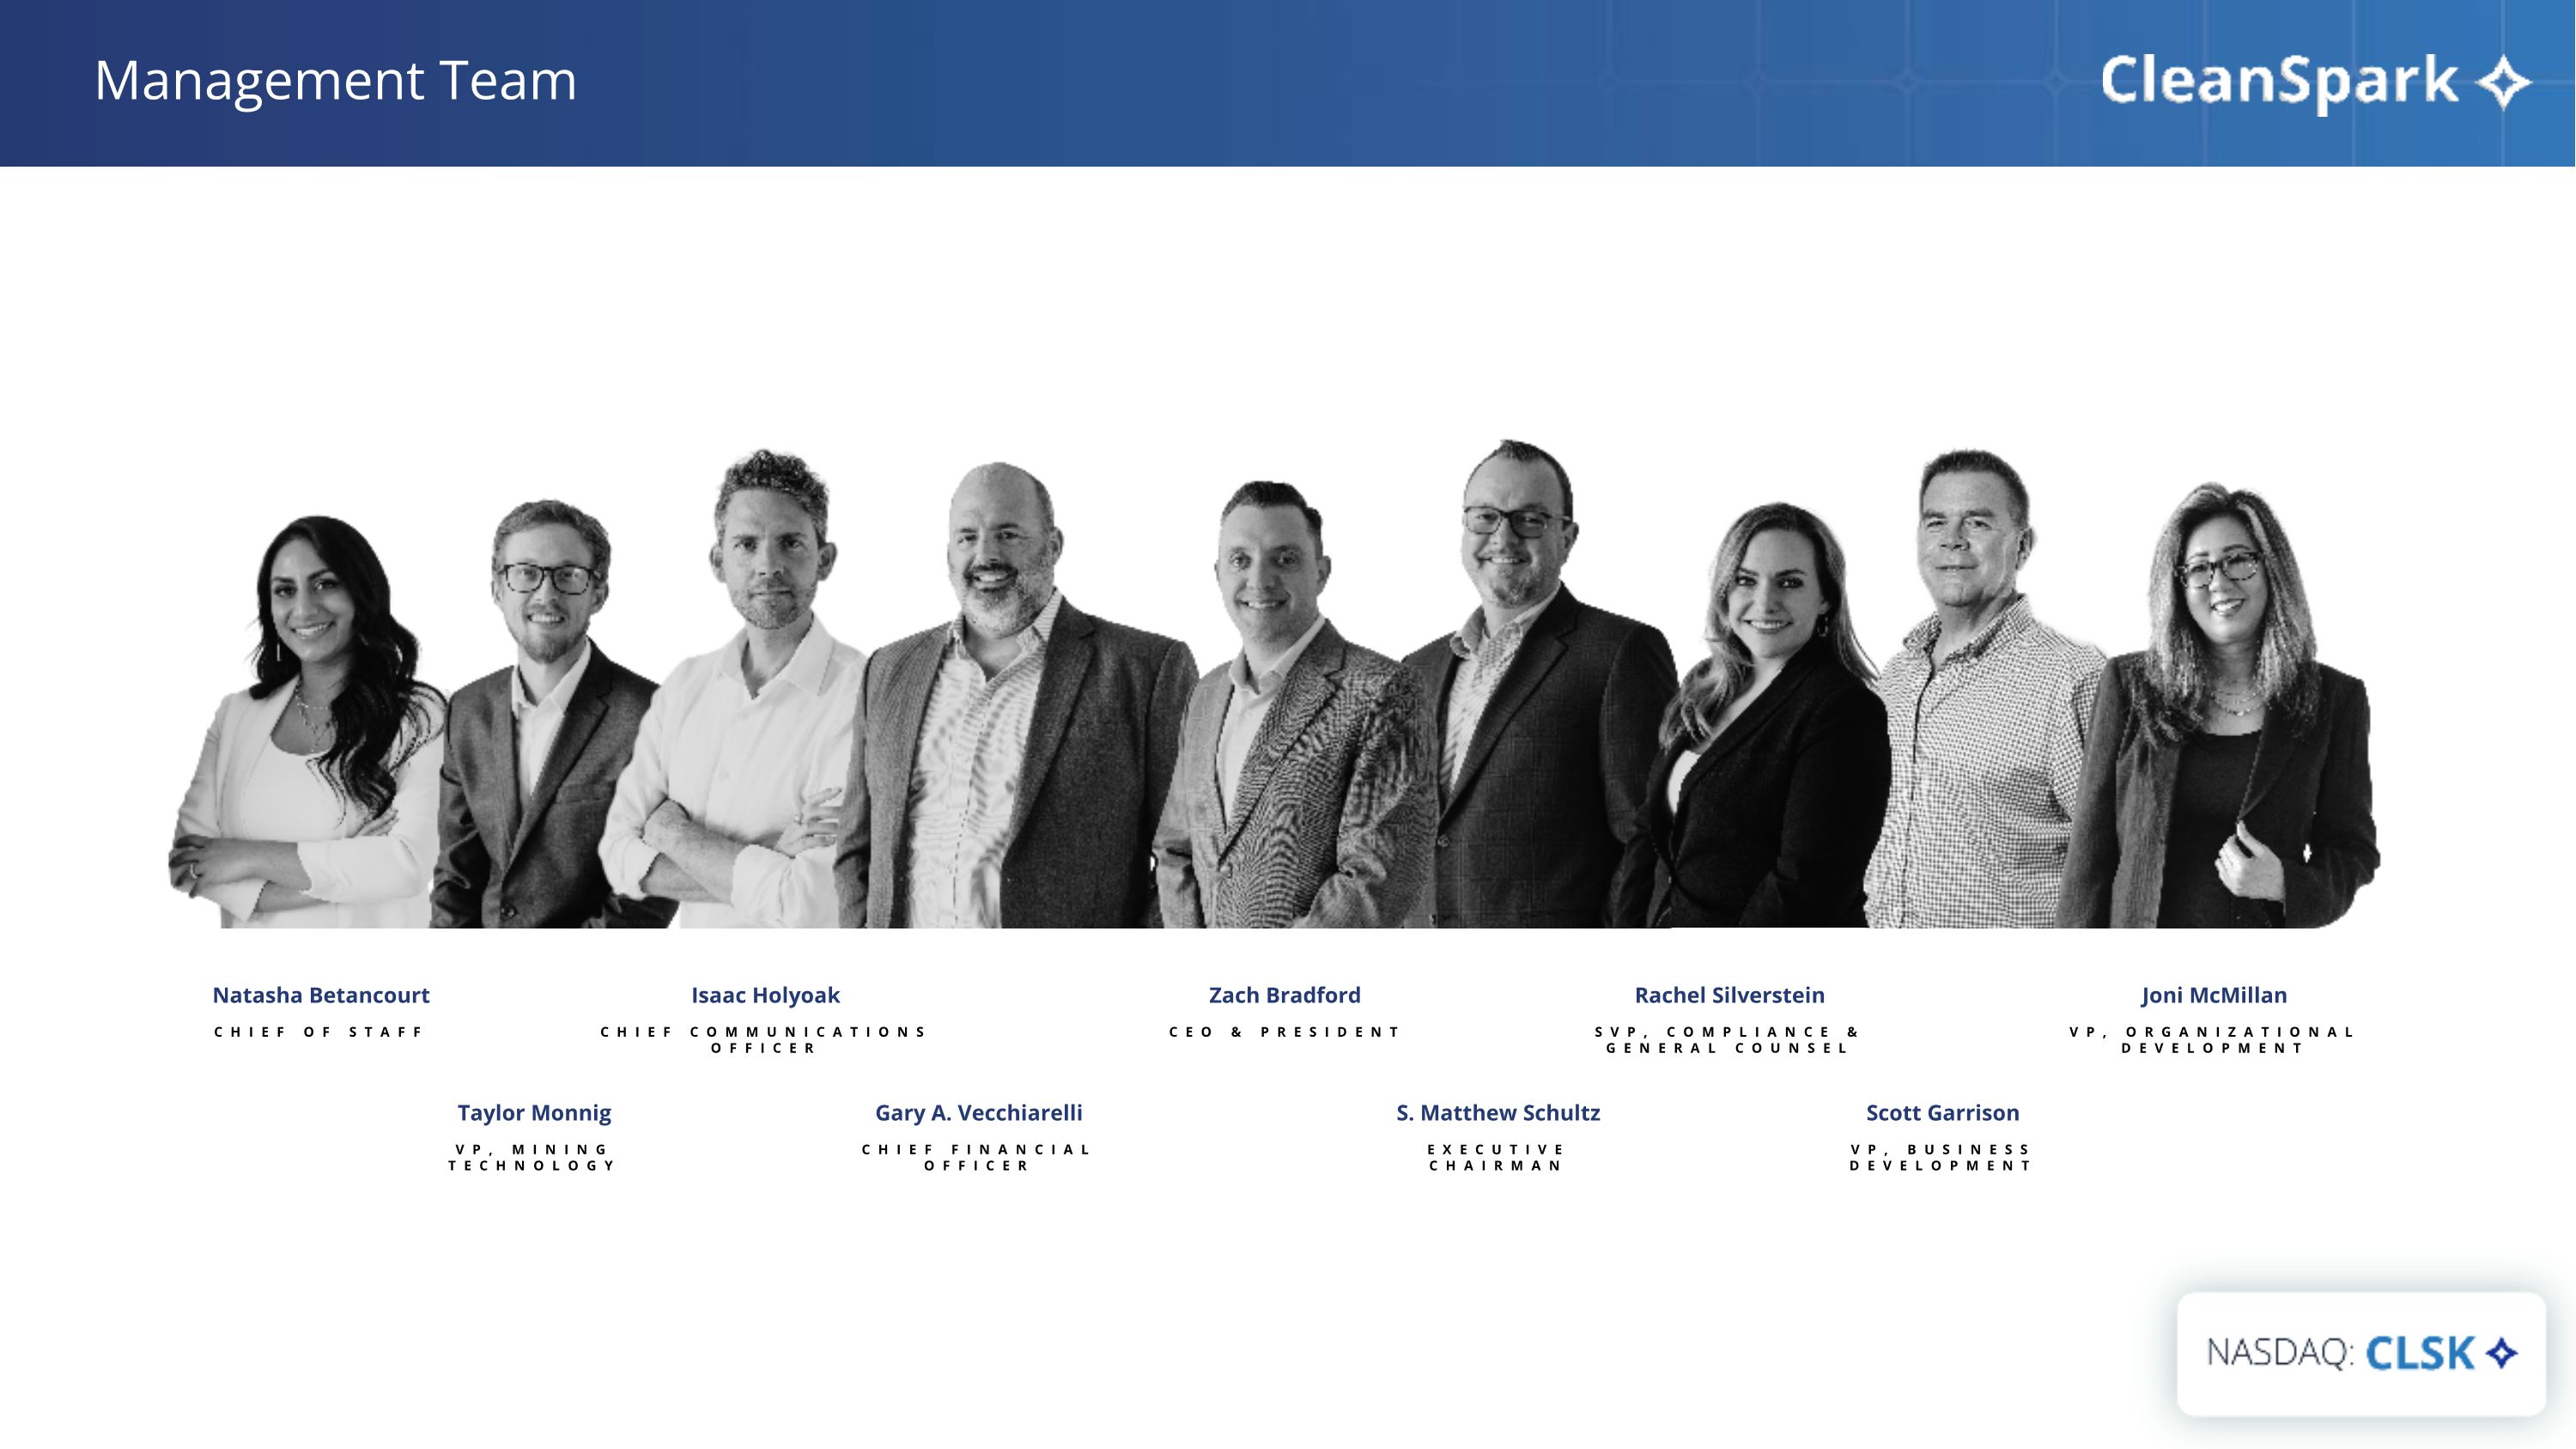
Management Team Natasha Betancourt CHIEF OF STAFF Taylor Monnig VP, MINING TECHNOLOGY Isaac Holyoak CHIEF COMMUNICATIONS OFFICER Gary A. Vecchiarelli CHIEF FINANCIAL OFFICER Zach Bradford CEO & PRESIDENT S. Matthew Schultz EXECUTIVE CHAIRMAN Rachel Silverstein SVP, COMPLIANCE & GENERAL COUNSEL Scott Garrison VP, BUSINESS DEVELOPMENT Joni McMillan VP, ORGANIZATIONAL DEVELOPMENT
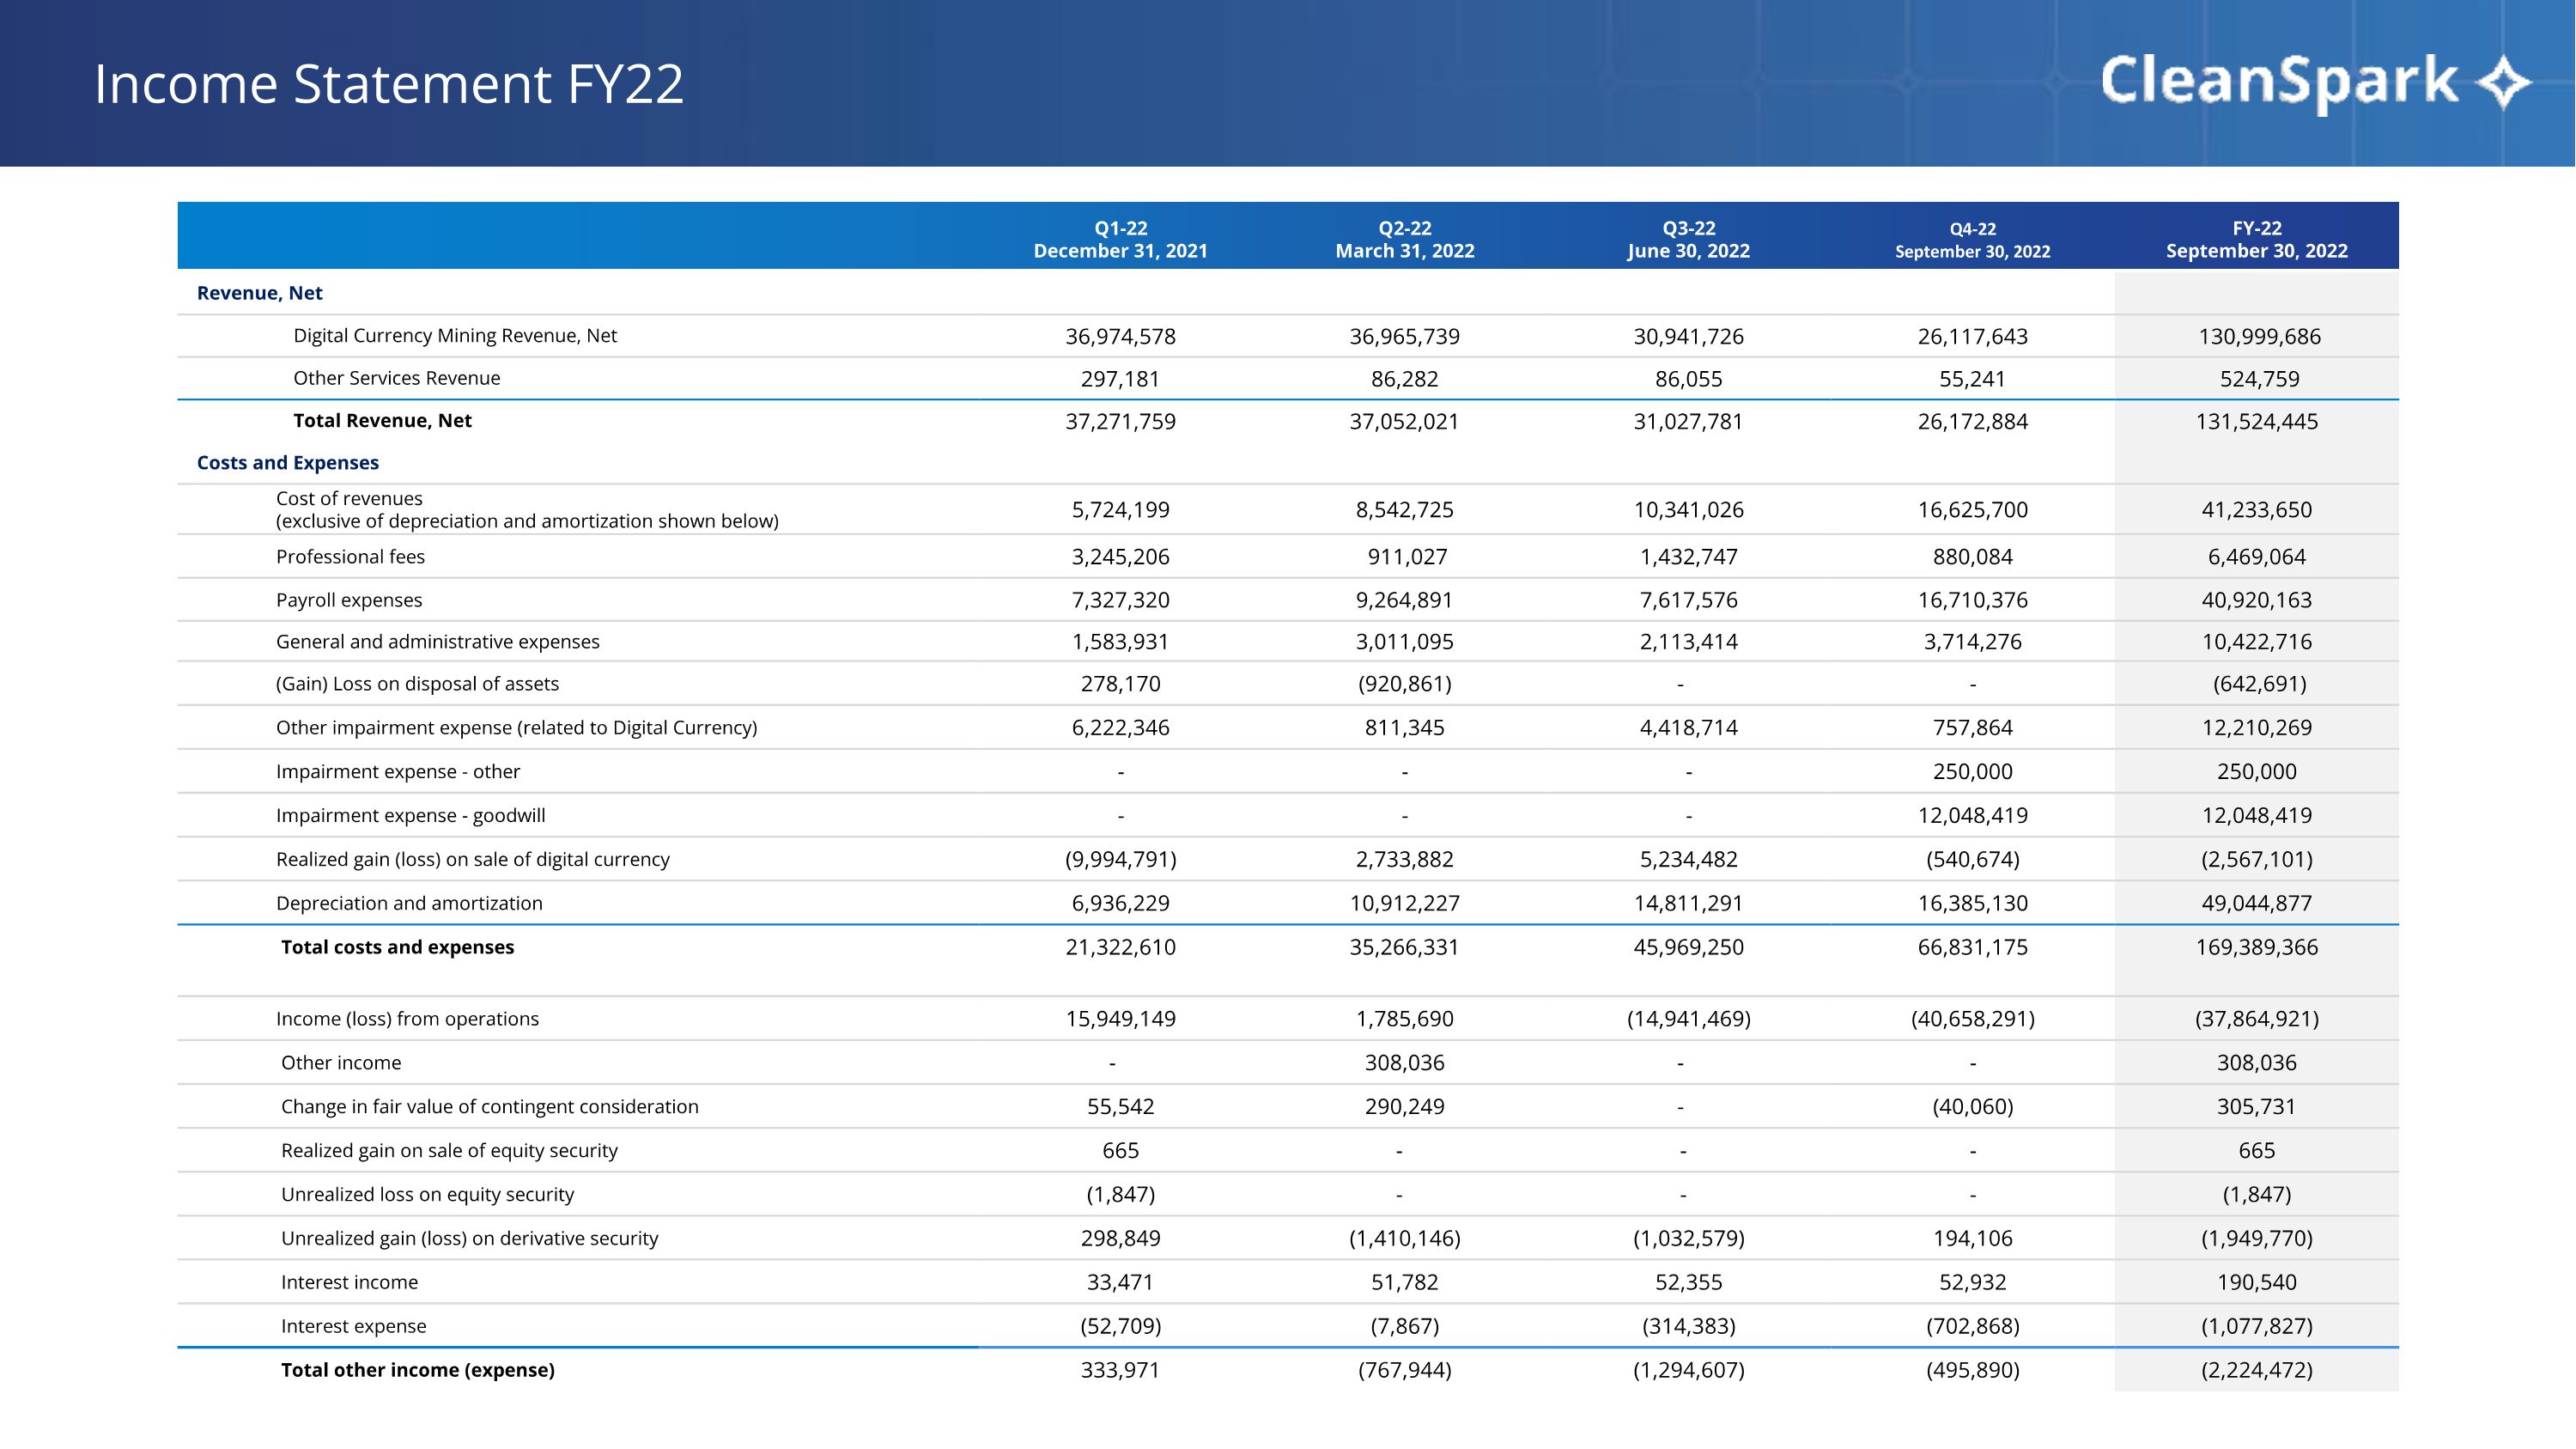
Q1-22 December 31, 2021 Q2-22 March 31, 2022 Q3-22 June 30, 2022 Q4-22 September 30, 2022 FY-22 September 30, 2022 Revenue, Net Digital Currency Mining Revenue, Net 36,974,578 36,965,739 30,941,726 26,117,643 130,999,686 Other Services Revenue 297,181 86,282 86,055 55,241 524,759 Total Revenue, Net 37,271,759 37,052,021 31,027,781 26,172,884 131,524,445 Costs and Expenses Cost of revenues (exclusive of depreciation and amortization shown below) 5,724,199 8,542,725 10,341,026 16,625,700 41,233,650 Professional fees 3,245,206 911,027 1,432,747 880,084 6,469,064 Payroll expenses 7,327,320 9,264,891 7,617,576 16,710,376 40,920,163 General and administrative expenses 1,583,931 3,011,095 2,113,414 3,714,276 10,422,716 (Gain) Loss on disposal of assets 278,170 (920,861) - - (642,691) Other impairment expense (related to Digital Currency) 6,222,346 811,345 4,418,714 757,864 12,210,269 Impairment expense - other - - - 250,000 250,000 Impairment expense - goodwill - - - 12,048,419 12,048,419 Realized gain (loss) on sale of digital currency (9,994,791) 2,733,882 5,234,482 (540,674) (2,567,101) Depreciation and amortization 6,936,229 10,912,227 14,811,291 16,385,130 49,044,877 Total costs and expenses 21,322,610 35,266,331 45,969,250 66,831,175 169,389,366 Income (loss) from operations 15,949,149 1,785,690 (14,941,469) (40,658,291) (37,864,921) Other income - 308,036 - - 308,036 Change in fair value of contingent consideration 55,542 290,249 - (40,060) 305,731 Realized gain on sale of equity security 665 - - - 665 Unrealized loss on equity security (1,847) - - - (1,847) Unrealized gain (loss) on derivative security 298,849 (1,410,146) (1,032,579) 194,106 (1,949,770) Interest income 33,471 51,782 52,355 52,932 190,540 Interest expense (52,709) (7,867) (314,383) (702,868) (1,077,827) Total other income (expense) 333,971 (767,944) (1,294,607) (495,890) (2,224,472) Income Statement FY22
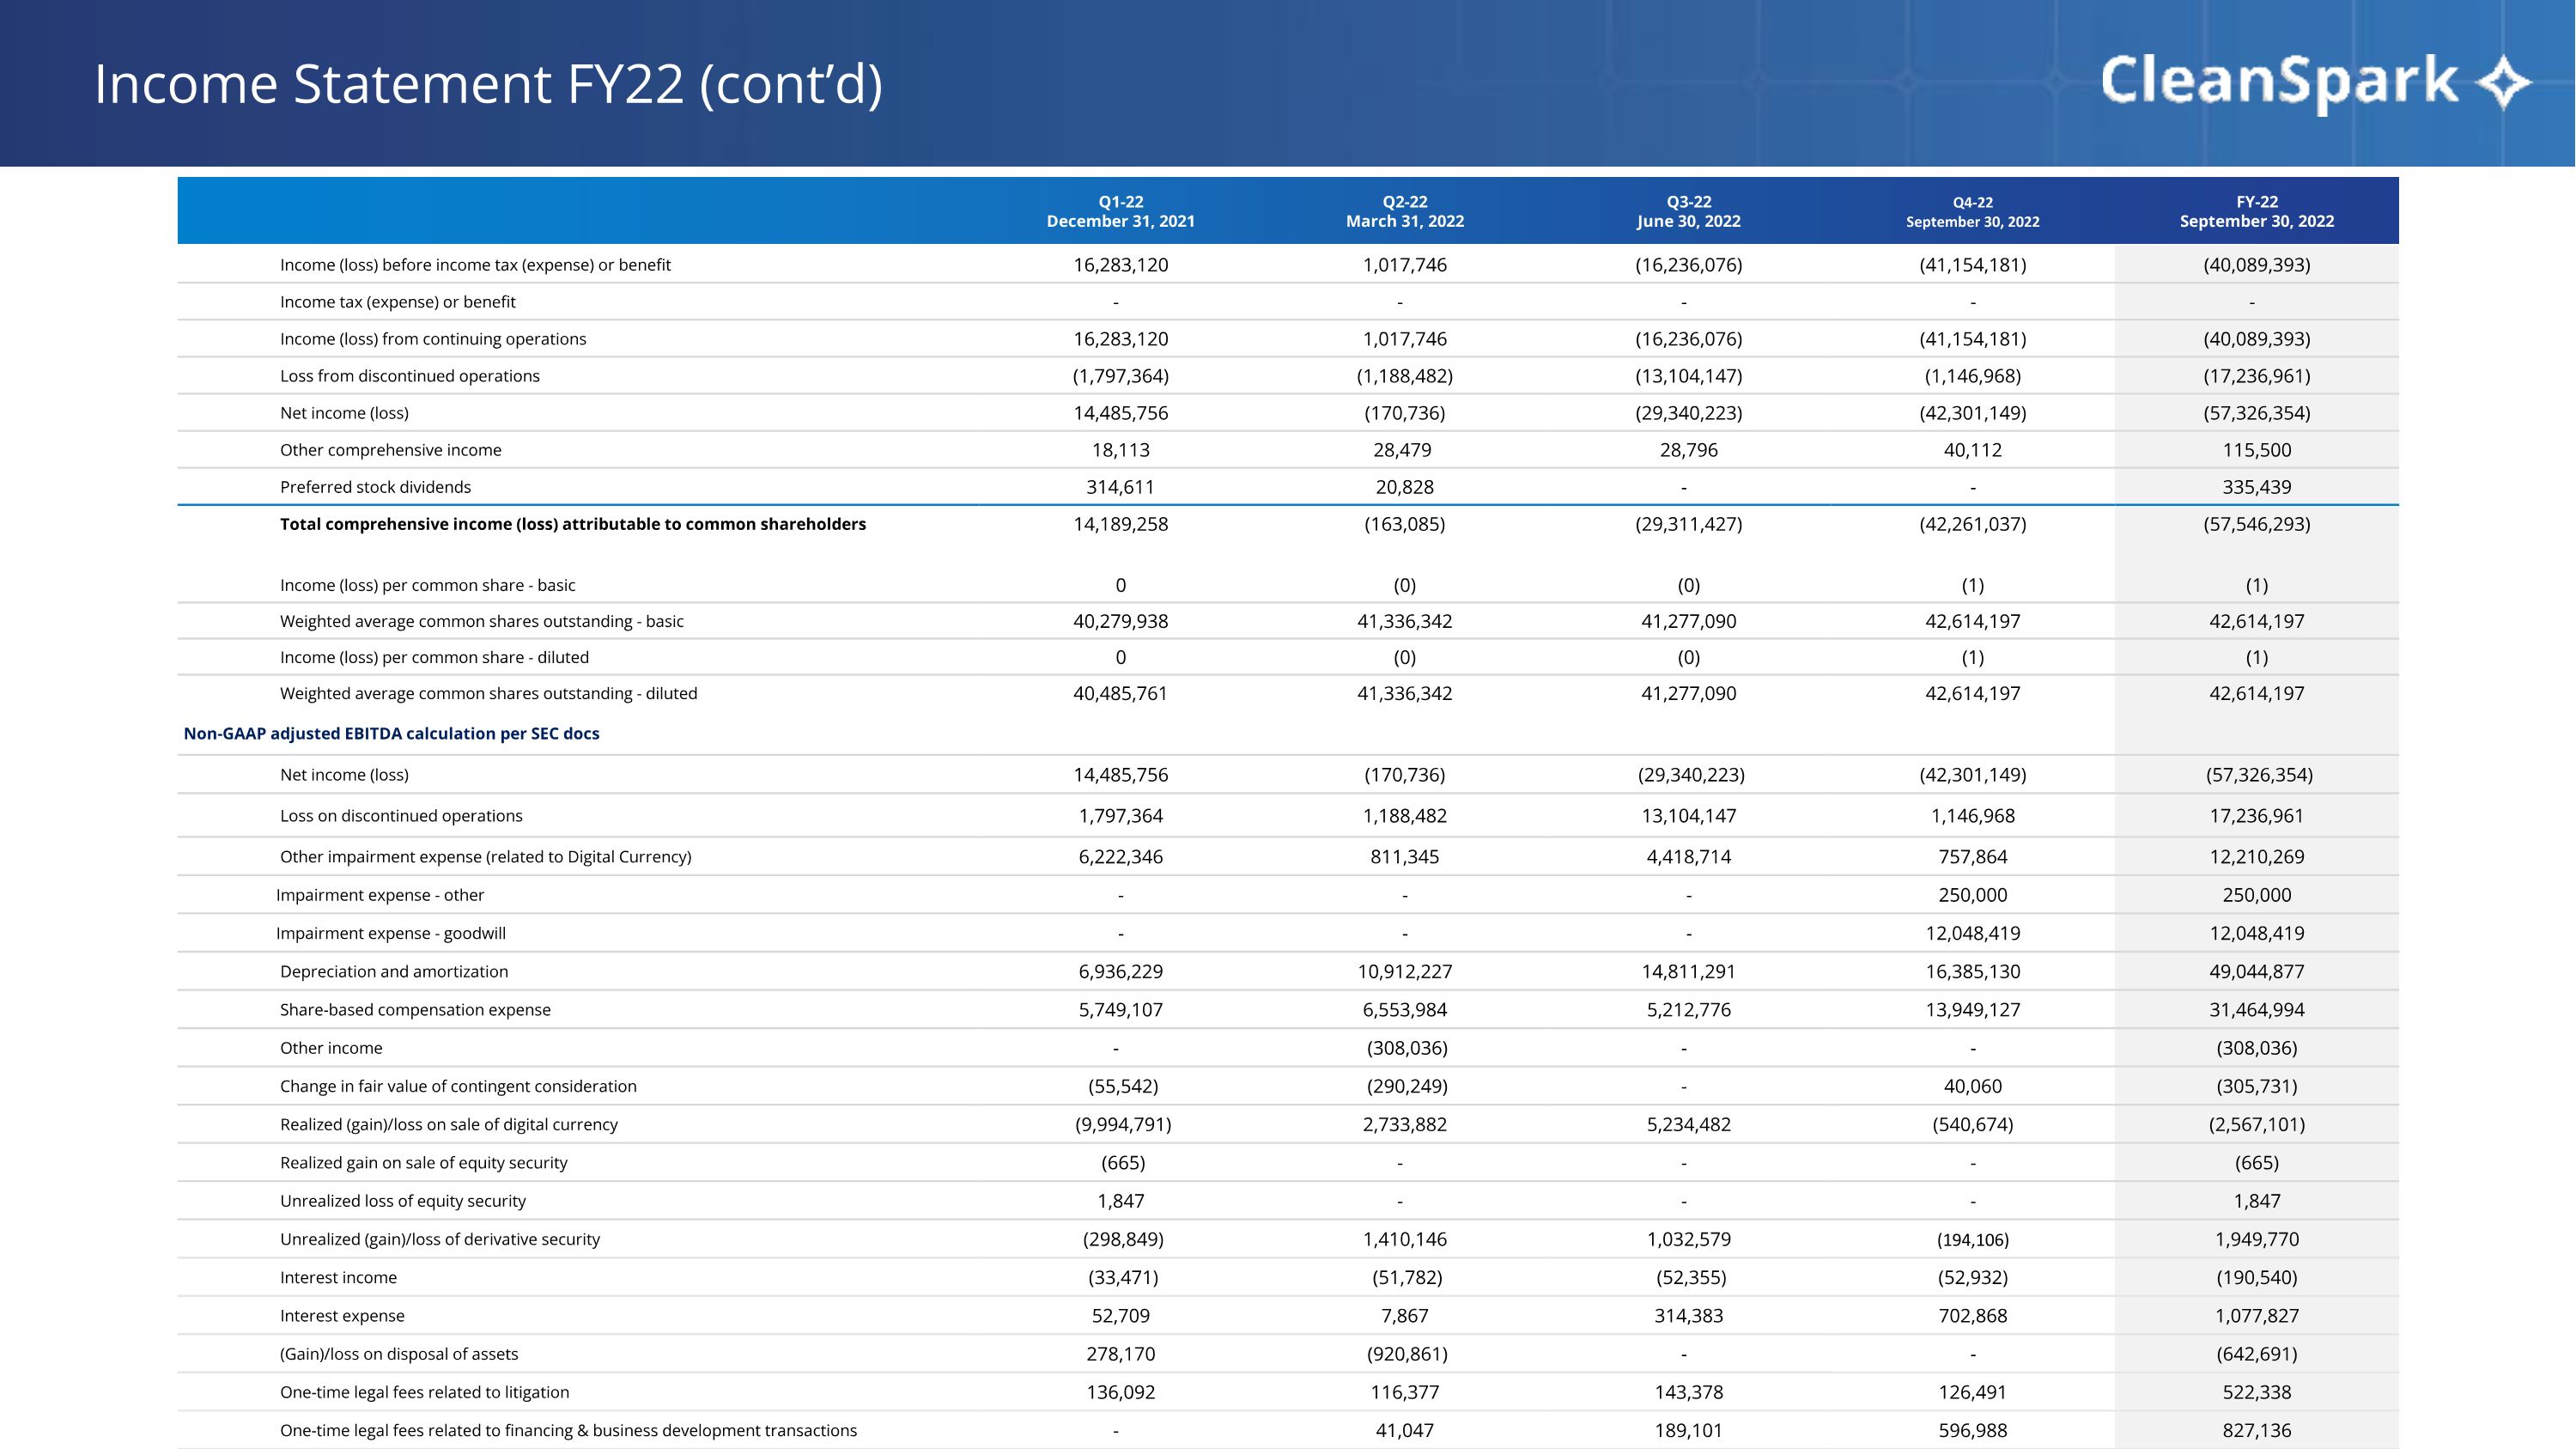
Q1-22 December 31, 2021 Q2-22 March 31, 2022 Q3-22 June 30, 2022 Q4-22 September 30, 2022 FY-22 September 30, 2022 Income (loss) before income tax (expense) or benefit 16,283,120 1,017,746 (16,236,076) (41,154,181) (40,089,393) Income tax (expense) or benefit - - - - - Income (loss) from continuing operations 16,283,120 1,017,746 (16,236,076) (41,154,181) (40,089,393) Loss from discontinued operations (1,797,364) (1,188,482) (13,104,147) (1,146,968) (17,236,961) Net income (loss) 14,485,756 (170,736) (29,340,223) (42,301,149) (57,326,354) Other comprehensive income 18,113 28,479 28,796 40,112 115,500 Preferred stock dividends 314,611 20,828 - - 335,439 Total comprehensive income (loss) attributable to common shareholders 14,189,258 (163,085) (29,311,427) (42,261,037) (57,546,293) Income (loss) per common share - basic 0 (0) (0) (1) (1) Weighted average common shares outstanding - basic 40,279,938 41,336,342 41,277,090 42,614,197 42,614,197 Income (loss) per common share - diluted 0 (0) (0) (1) (1) Weighted average common shares outstanding - diluted 40,485,761 41,336,342 41,277,090 42,614,197 42,614,197 Non-GAAP adjusted EBITDA calculation per SEC docs Net income (loss) 14,485,756 (170,736) (29,340,223) (42,301,149) (57,326,354) Loss on discontinued operations 1,797,364 1,188,482 13,104,147 1,146,968 17,236,961 Other impairment expense (related to Digital Currency) 6,222,346 811,345 4,418,714 757,864 12,210,269 Impairment expense - other - - - 250,000 250,000 Impairment expense - goodwill - - - 12,048,419 12,048,419 Depreciation and amortization 6,936,229 10,912,227 14,811,291 16,385,130 49,044,877 Share-based compensation expense 5,749,107 6,553,984 5,212,776 13,949,127 31,464,994 Other income - (308,036) - - (308,036) Change in fair value of contingent consideration (55,542) (290,249) - 40,060 (305,731) Realized (gain)/loss on sale of digital currency (9,994,791) 2,733,882 5,234,482 (540,674) (2,567,101) Realized gain on sale of equity security (665) - - - (665) Unrealized loss of equity security 1,847 - - - 1,847 Unrealized (gain)/loss of derivative security (298,849) 1,410,146 1,032,579 (194,106) 1,949,770 Interest income (33,471) (51,782) (52,355) (52,932) (190,540) Interest expense 52,709 7,867 314,383 702,868 1,077,827 (Gain)/loss on disposal of assets 278,170 (920,861) - - (642,691) One-time legal fees related to litigation 136,092 116,377 143,378 126,491 522,338 One-time legal fees related to financing & business development transactions - 41,047 189,101 596,988 827,136 Severance expenses - 288,588 102,117 14,044 404,749 Non-GAAP adjusted EBITDA 25,276,302 22,382,279 15,170,390 2,929,098 65,698,069 Income Statement FY22 (cont’d)
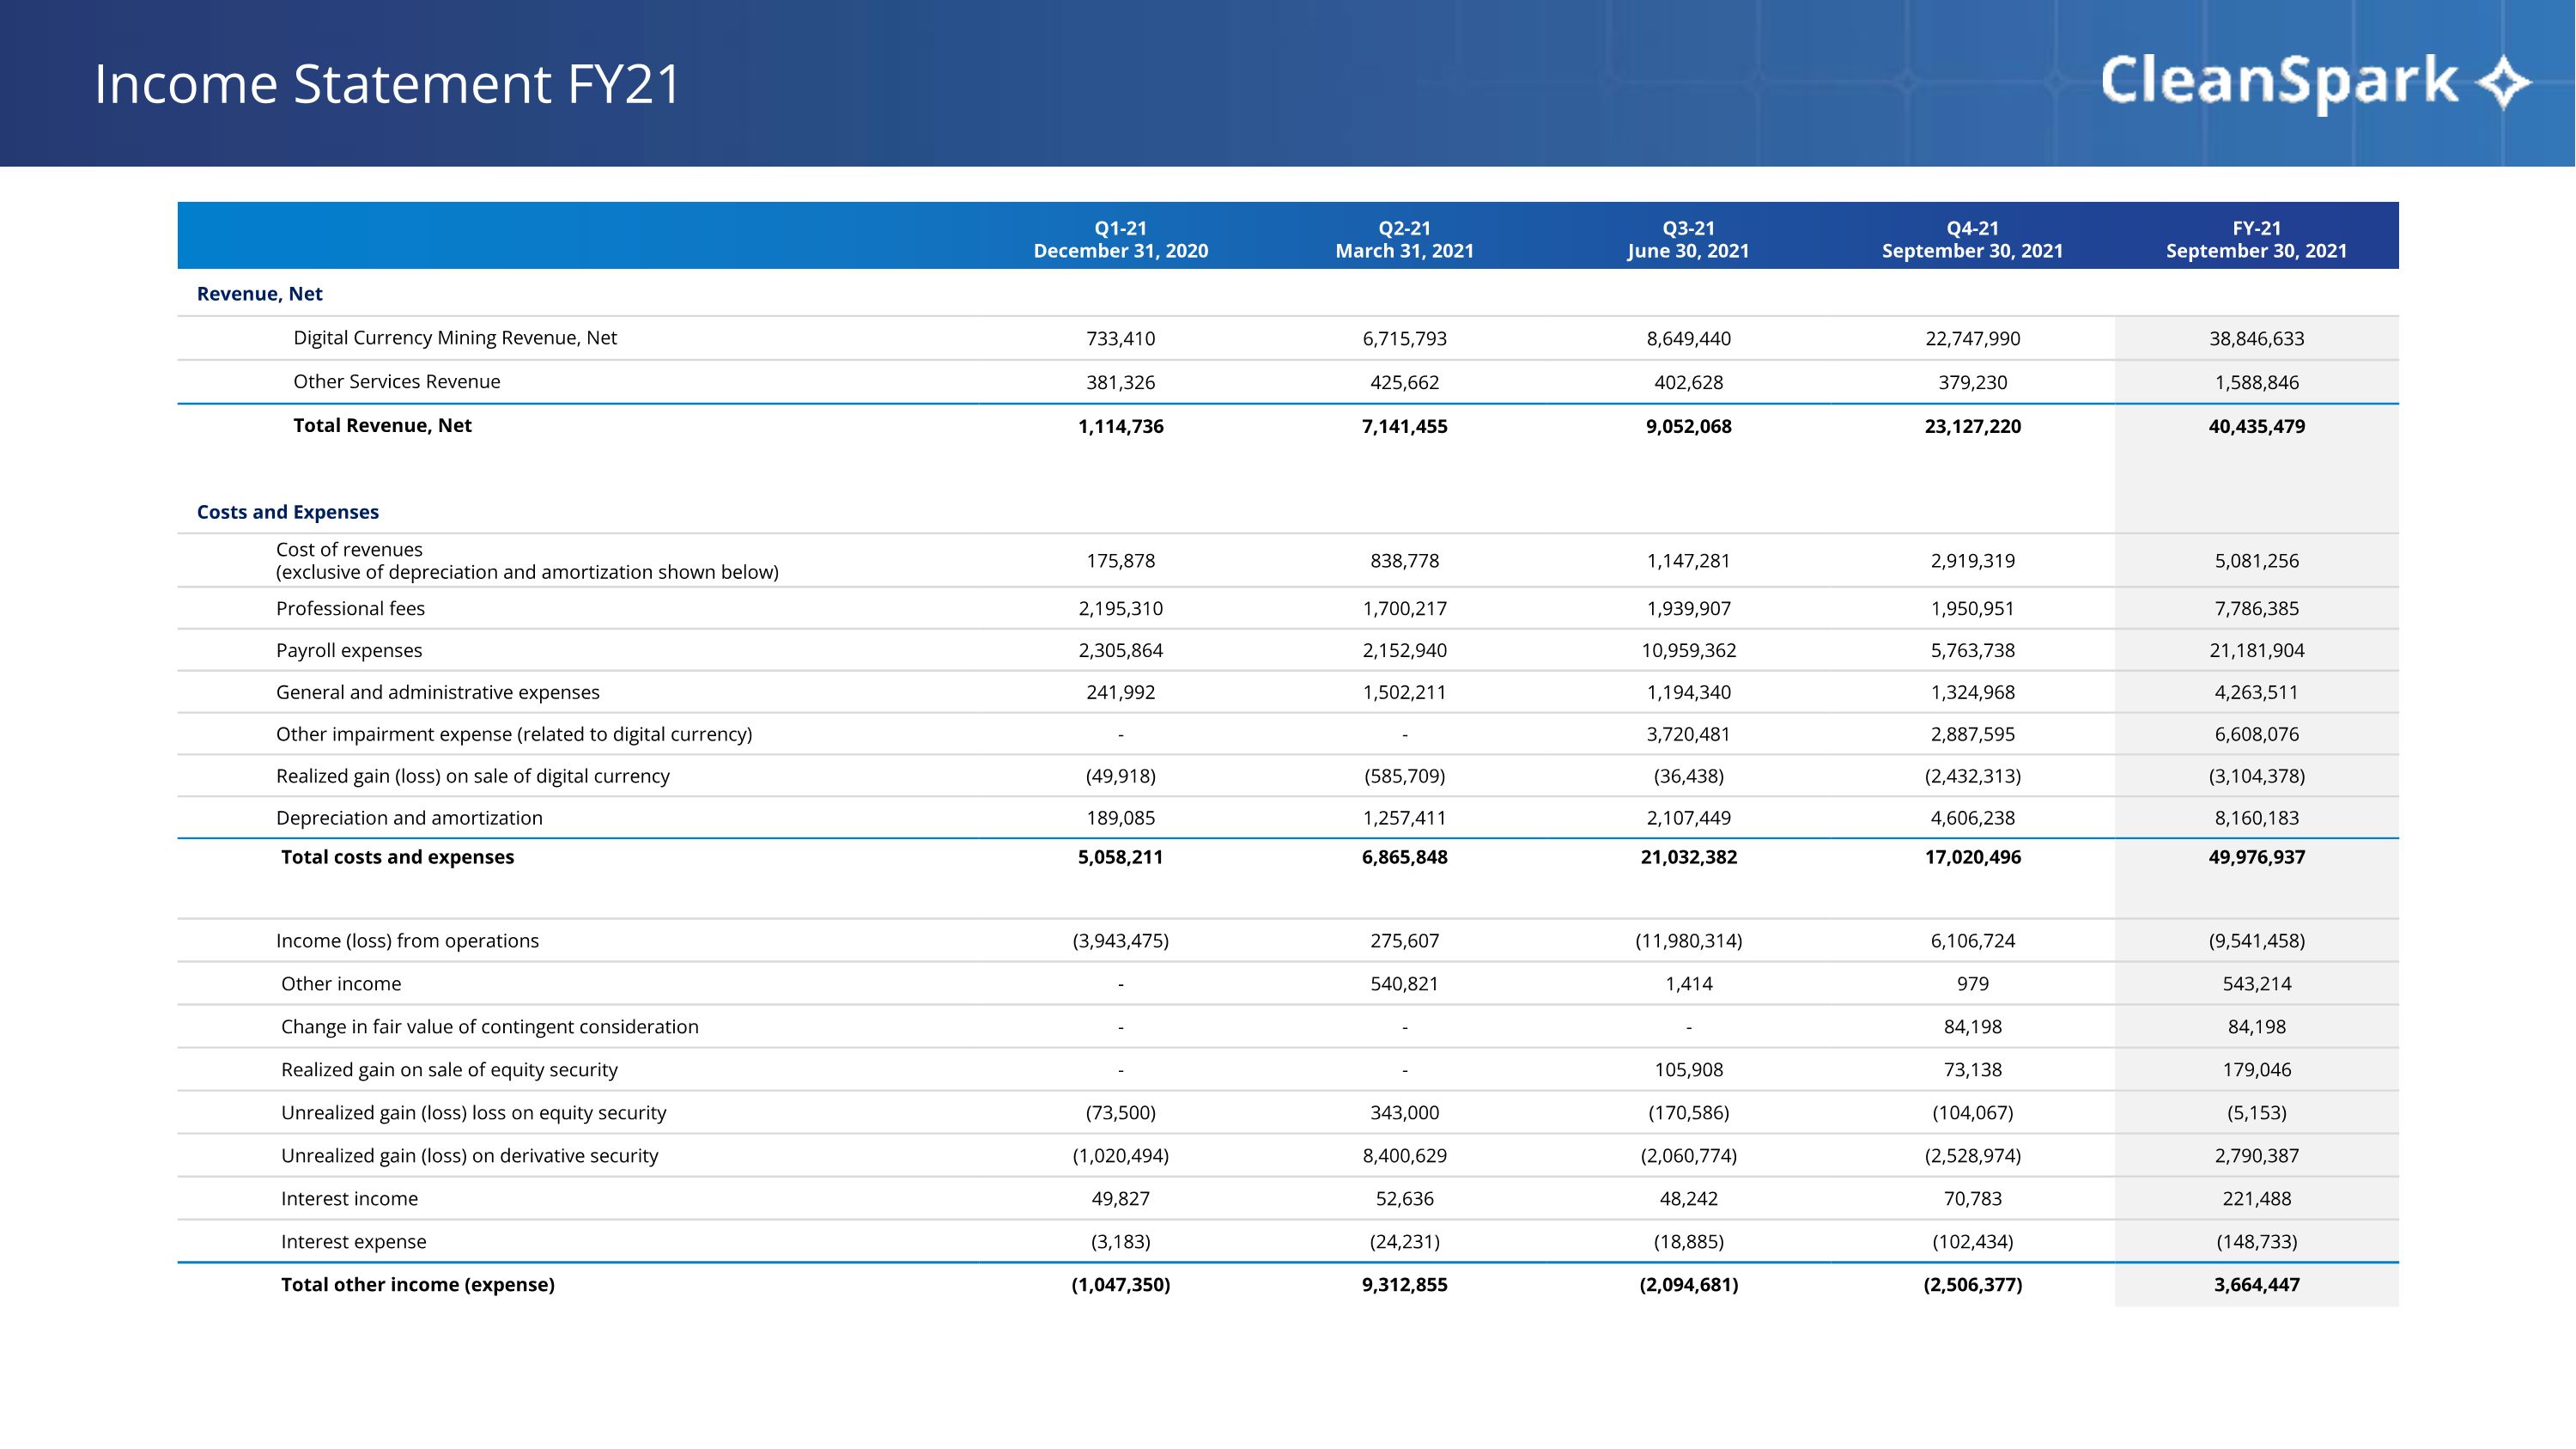
Income Statement FY21 Q1-21 December 31, 2020 Q2-21 March 31, 2021 Q3-21 June 30, 2021 Q4-21 September 30, 2021 FY-21 September 30, 2021 Revenue, Net Digital Currency Mining Revenue, Net 733,410 6,715,793 8,649,440 22,747,990 38,846,633 Other Services Revenue 381,326 425,662 402,628 379,230 1,588,846 Total Revenue, Net 1,114,736 7,141,455 9,052,068 23,127,220 40,435,479 Costs and Expenses Cost of revenues (exclusive of depreciation and amortization shown below) 175,878 838,778 1,147,281 2,919,319 5,081,256 Professional fees 2,195,310 1,700,217 1,939,907 1,950,951 7,786,385 Payroll expenses 2,305,864 2,152,940 10,959,362 5,763,738 21,181,904 General and administrative expenses 241,992 1,502,211 1,194,340 1,324,968 4,263,511 Other impairment expense (related to digital currency) - - 3,720,481 2,887,595 6,608,076 Realized gain (loss) on sale of digital currency (49,918) (585,709) (36,438) (2,432,313) (3,104,378) Depreciation and amortization 189,085 1,257,411 2,107,449 4,606,238 8,160,183 Total costs and expenses 5,058,211 6,865,848 21,032,382 17,020,496 49,976,937 Income (loss) from operations (3,943,475) 275,607 (11,980,314) 6,106,724 (9,541,458) Other income - 540,821 1,414 979 543,214 Change in fair value of contingent consideration - - - 84,198 84,198 Realized gain on sale of equity security - - 105,908 73,138 179,046 Unrealized gain (loss) loss on equity security (73,500) 343,000 (170,586) (104,067) (5,153) Unrealized gain (loss) on derivative security (1,020,494) 8,400,629 (2,060,774) (2,528,974) 2,790,387 Interest income 49,827 52,636 48,242 70,783 221,488 Interest expense (3,183) (24,231) (18,885) (102,434) (148,733) Total other income (expense) (1,047,350) 9,312,855 (2,094,681) (2,506,377) 3,664,447
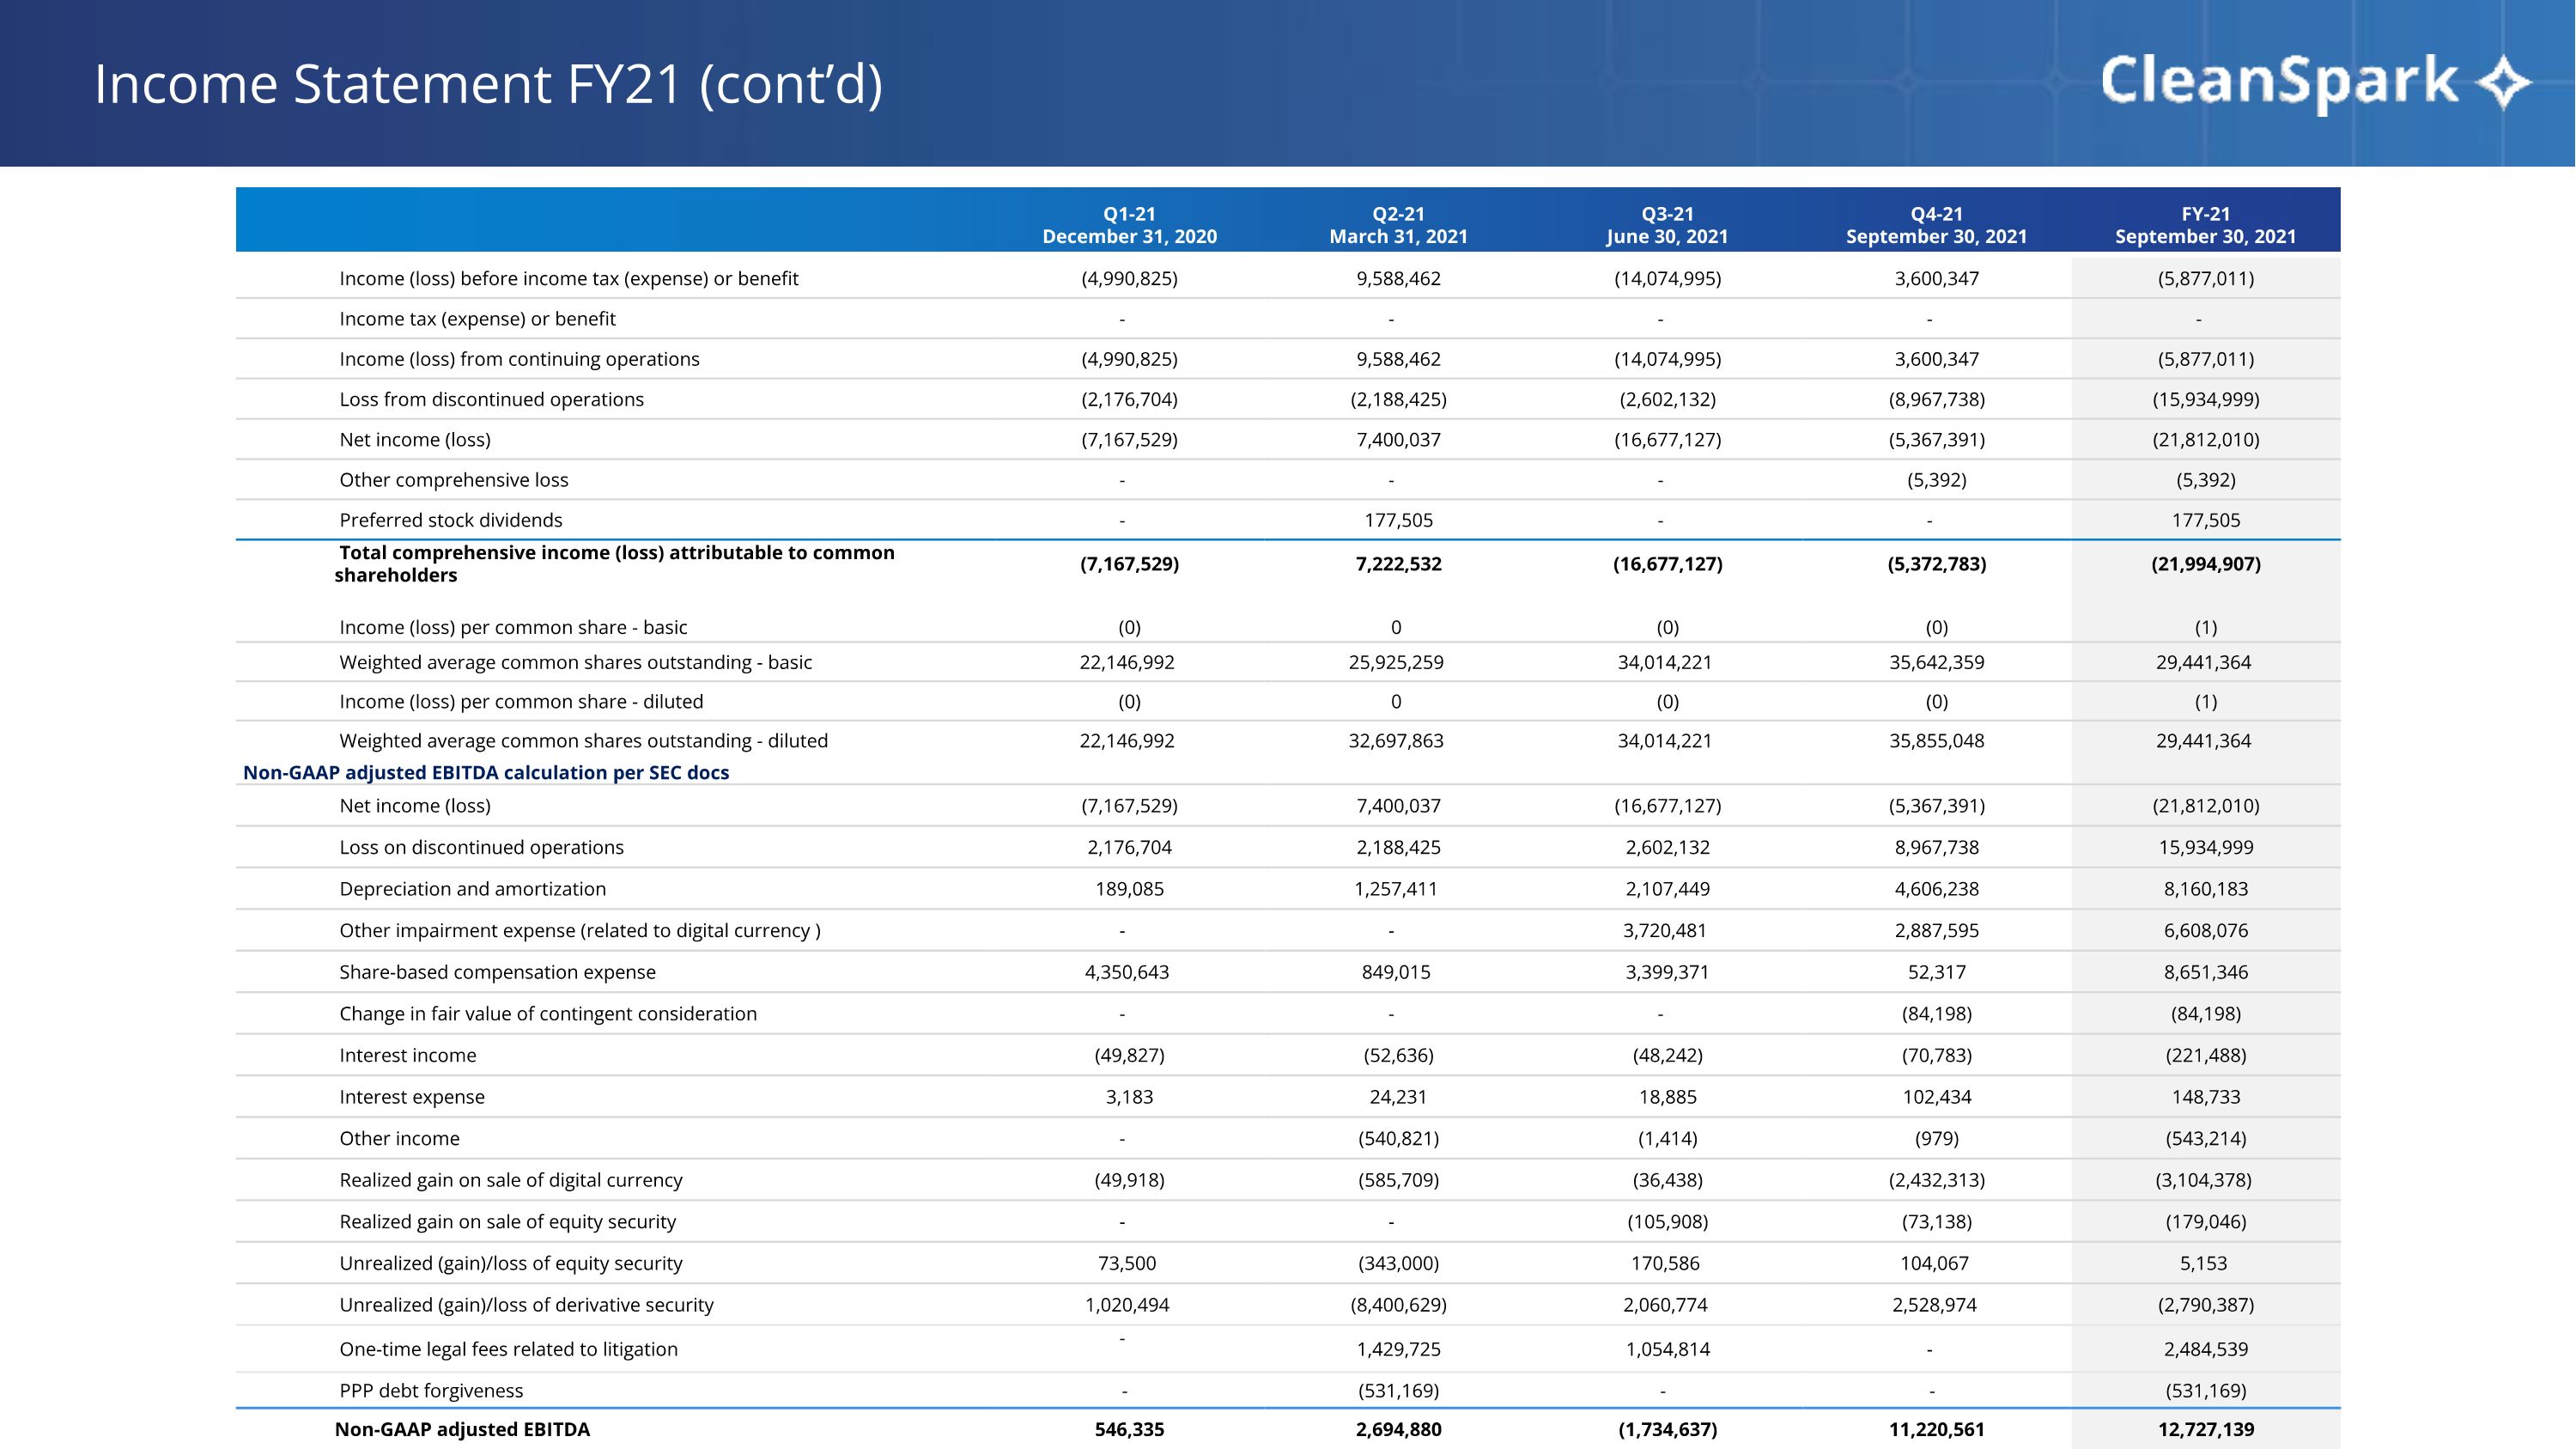
Q1-21 December 31, 2020 Q2-21 March 31, 2021 Q3-21 June 30, 2021 Q4-21 September 30, 2021 FY-21 September 30, 2021 Income (loss) before income tax (expense) or benefit (4,990,825) 9,588,462 (14,074,995) 3,600,347 (5,877,011) Income tax (expense) or benefit - - - - - Income (loss) from continuing operations (4,990,825) 9,588,462 (14,074,995) 3,600,347 (5,877,011) Loss from discontinued operations (2,176,704) (2,188,425) (2,602,132) (8,967,738) (15,934,999) Net income (loss) (7,167,529) 7,400,037 (16,677,127) (5,367,391) (21,812,010) Other comprehensive loss - - - (5,392) (5,392) Preferred stock dividends - 177,505 - - 177,505 Total comprehensive income (loss) attributable to common shareholders (7,167,529) 7,222,532 (16,677,127) (5,372,783) (21,994,907) Income (loss) per common share - basic (0) 0 (0) (0) (1) Weighted average common shares outstanding - basic 22,146,992 25,925,259 34,014,221 35,642,359 29,441,364 Income (loss) per common share - diluted (0) 0 (0) (0) (1) Weighted average common shares outstanding - diluted 22,146,992 32,697,863 34,014,221 35,855,048 29,441,364 Non-GAAP adjusted EBITDA calculation per SEC docs Net income (loss) (7,167,529) 7,400,037 (16,677,127) (5,367,391) (21,812,010) Loss on discontinued operations 2,176,704 2,188,425 2,602,132 8,967,738 15,934,999 Depreciation and amortization 189,085 1,257,411 2,107,449 4,606,238 8,160,183 Other impairment expense (related to digital currency ) - - 3,720,481 2,887,595 6,608,076 Share-based compensation expense 4,350,643 849,015 3,399,371 52,317 8,651,346 Change in fair value of contingent consideration - - - (84,198) (84,198) Interest income (49,827) (52,636) (48,242) (70,783) (221,488) Interest expense 3,183 24,231 18,885 102,434 148,733 Other income - (540,821) (1,414) (979) (543,214) Realized gain on sale of digital currency (49,918) (585,709) (36,438) (2,432,313) (3,104,378) Realized gain on sale of equity security - - (105,908) (73,138) (179,046) Unrealized (gain)/loss of equity security 73,500 (343,000) 170,586 104,067 5,153 Unrealized (gain)/loss of derivative security 1,020,494 (8,400,629) 2,060,774 2,528,974 (2,790,387) One-time legal fees related to litigation - 1,429,725 1,054,814 - 2,484,539 PPP debt forgiveness - (531,169) - - (531,169) Non-GAAP adjusted EBITDA 546,335 2,694,880 (1,734,637) 11,220,561 12,727,139 Income Statement FY21 (cont’d)
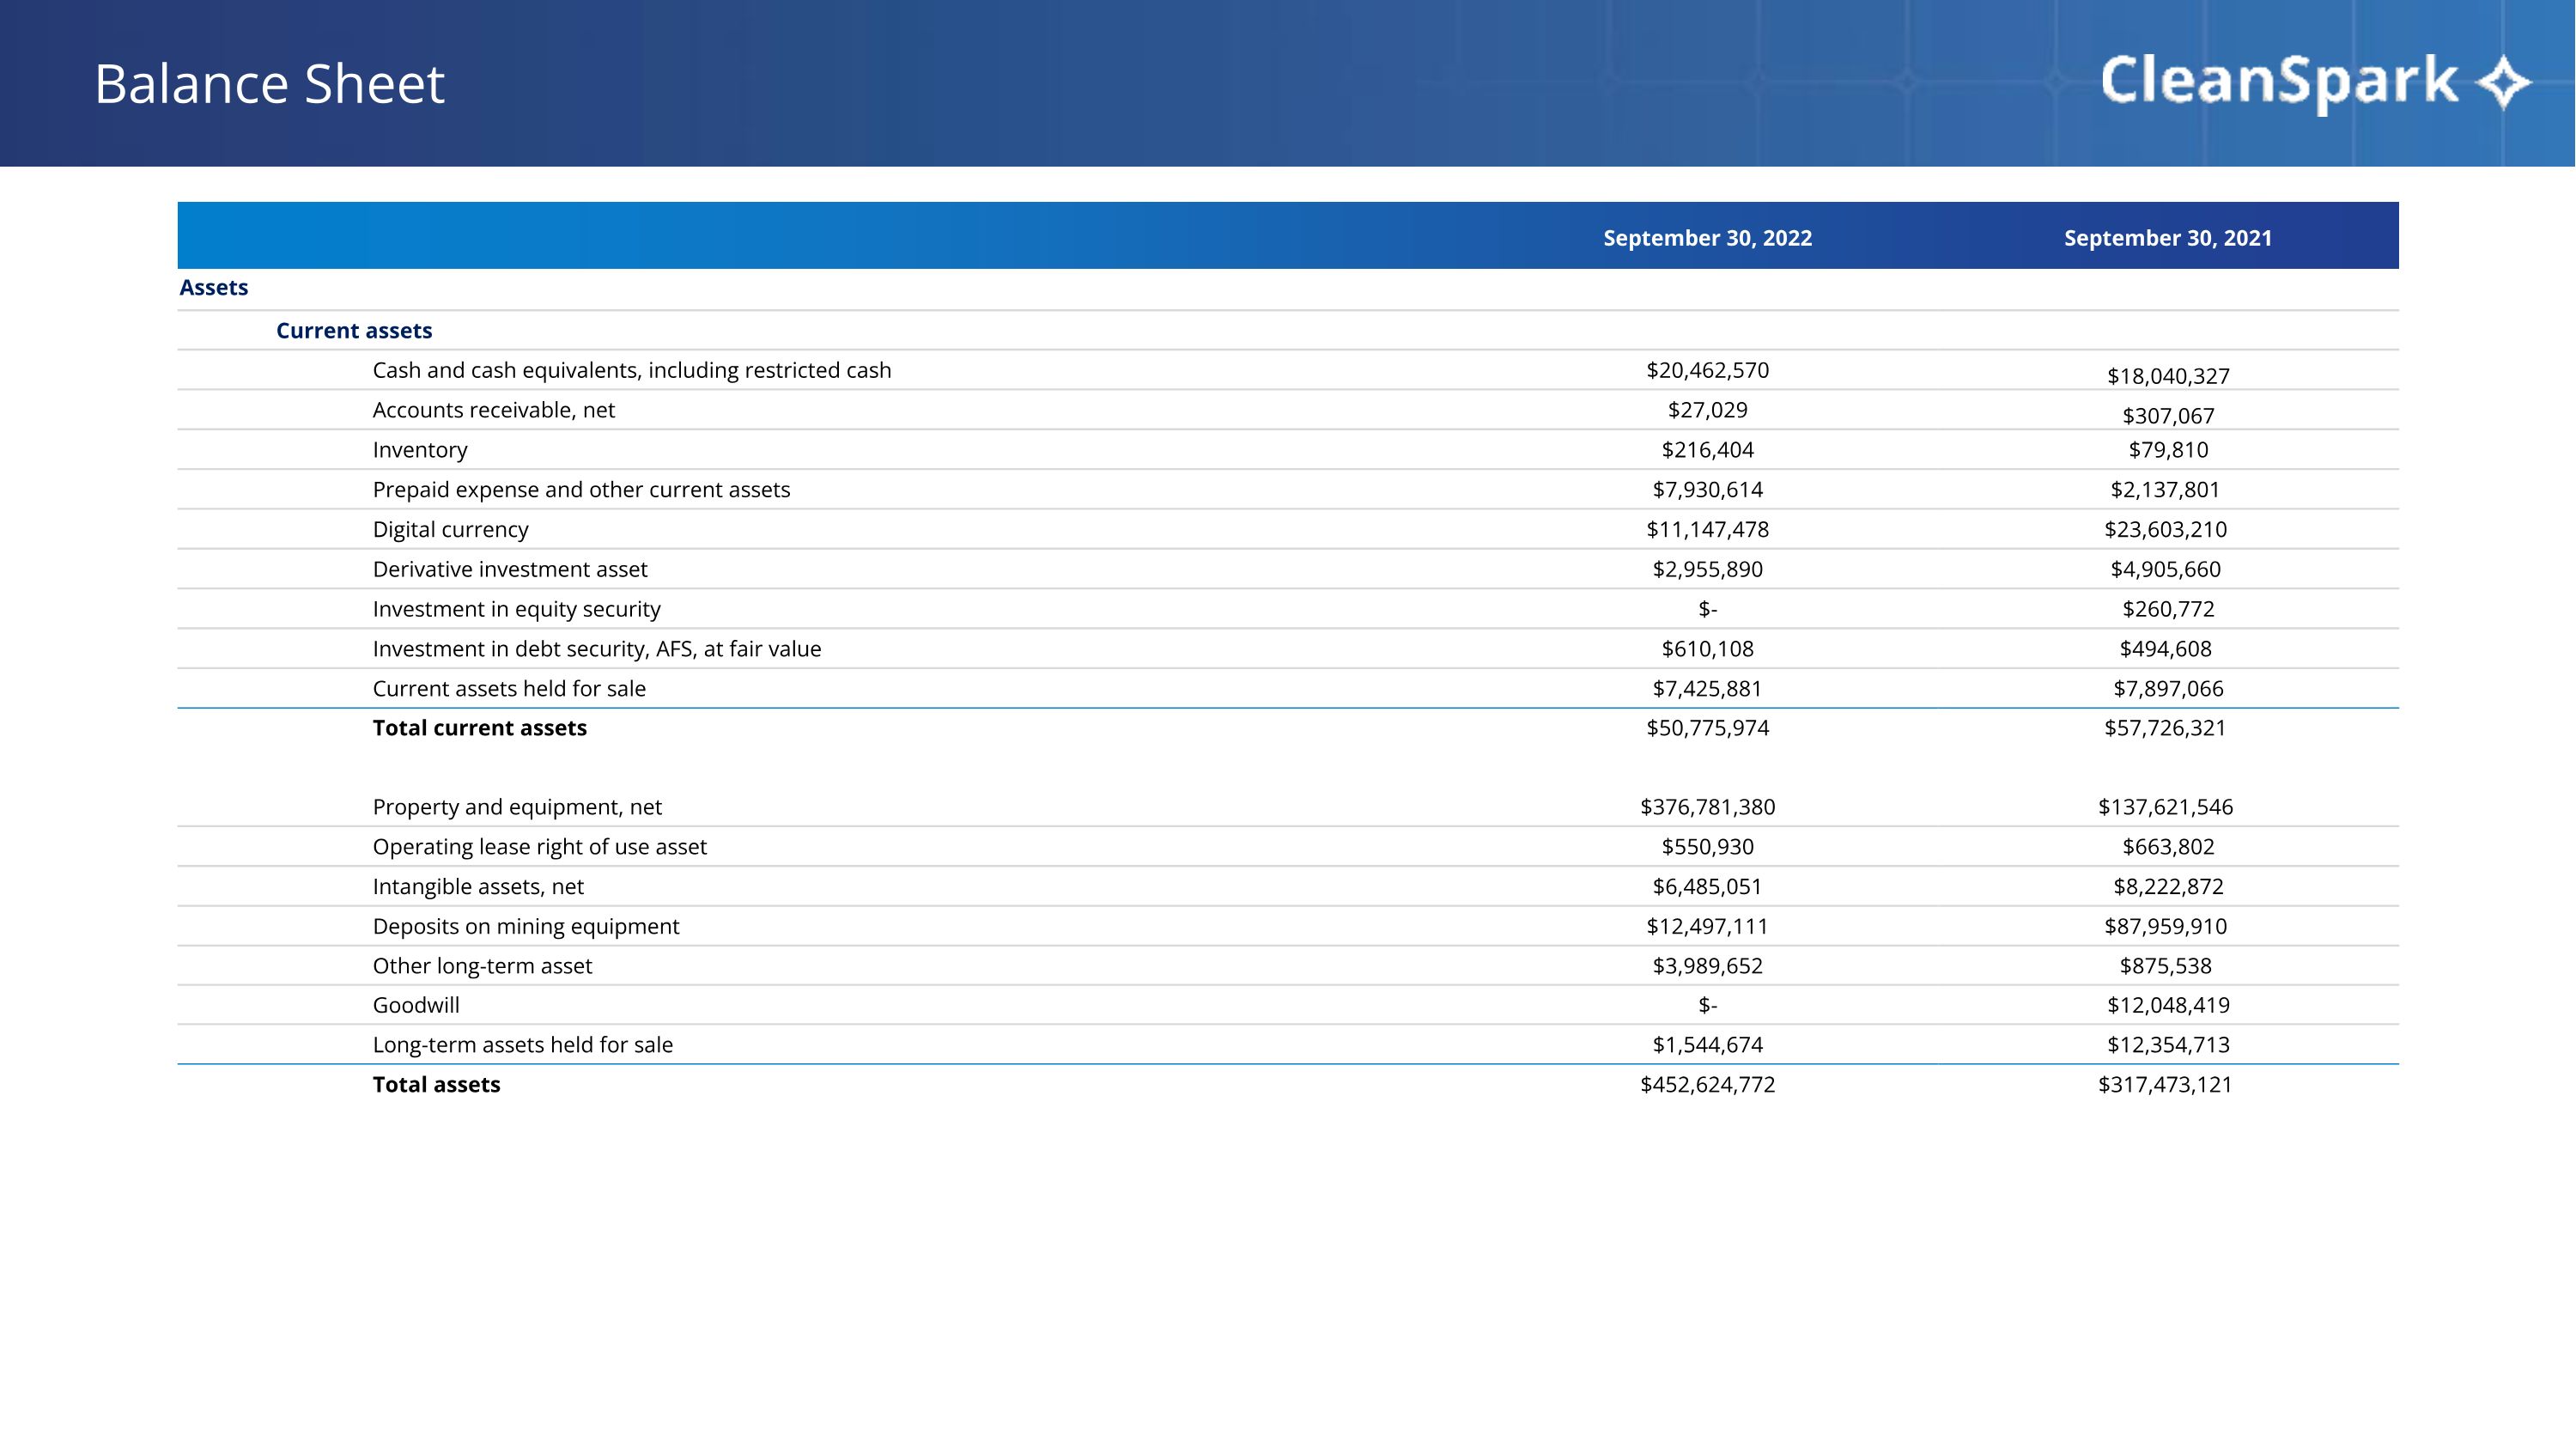
Balance Sheet September 30, 2022 September 30, 2021 Assets Current assets Cash and cash equivalents, including restricted cash $20,462,570 $18,040,327 Accounts receivable, net $27,029 $307,067 Inventory $216,404 $79,810 Prepaid expense and other current assets $7,930,614 $2,137,801 Digital currency $11,147,478 $23,603,210 Derivative investment asset $2,955,890 $4,905,660 Investment in equity security $- $260,772 Investment in debt security, AFS, at fair value $610,108 $494,608 Current assets held for sale $7,425,881 $7,897,066 Total current assets $50,775,974 $57,726,321 Property and equipment, net $376,781,380 $137,621,546 Operating lease right of use asset $550,930 $663,802 Intangible assets, net $6,485,051 $8,222,872 Deposits on mining equipment $12,497,111 $87,959,910 Other long-term asset $3,989,652 $875,538 Goodwill $- $12,048,419 Long-term assets held for sale $1,544,674 $12,354,713 Total assets $452,624,772 $317,473,121
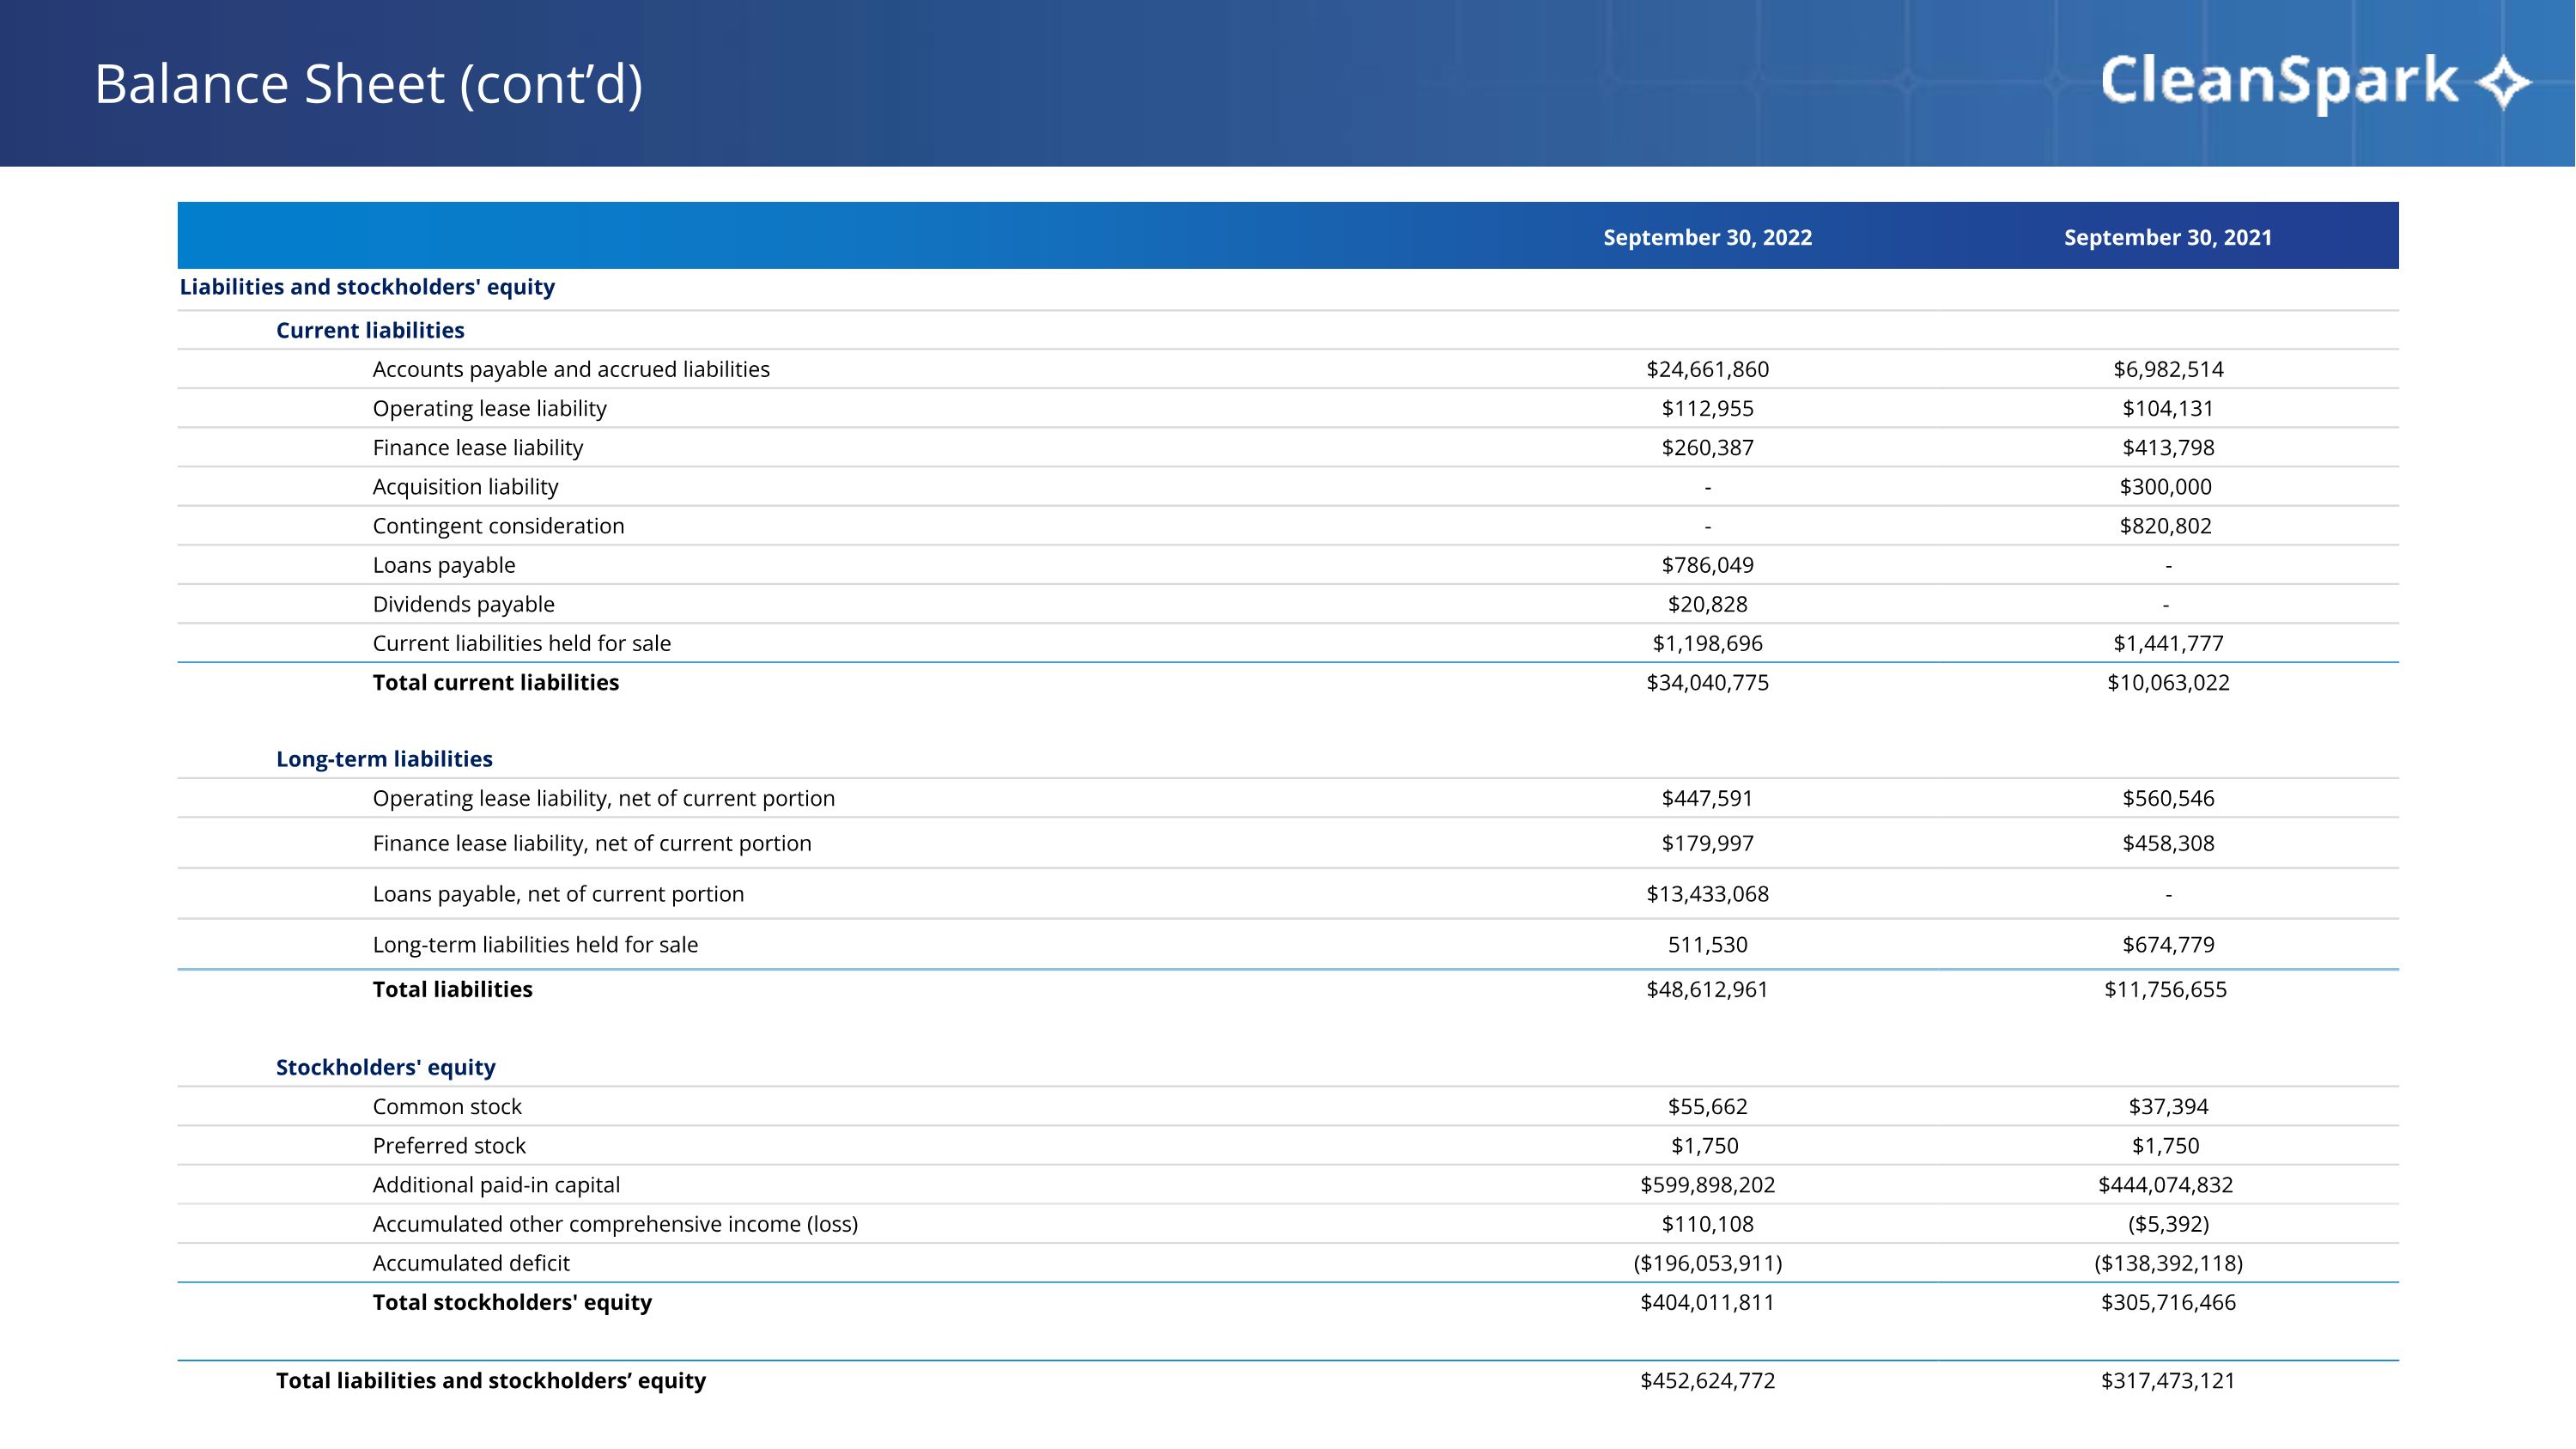
Balance Sheet (cont’d) September 30, 2022 September 30, 2021 Liabilities and stockholders' equity Current liabilities Accounts payable and accrued liabilities $24,661,860 $6,982,514 Operating lease liability $112,955 $104,131 Finance lease liability $260,387 $413,798 Acquisition liability - $300,000 Contingent consideration - $820,802 Loans payable $786,049 - Dividends payable $20,828 - Current liabilities held for sale $1,198,696 $1,441,777 Total current liabilities $34,040,775 $10,063,022 Long-term liabilities Operating lease liability, net of current portion $447,591 $560,546 Finance lease liability, net of current portion $179,997 $458,308 Loans payable, net of current portion $13,433,068 - Long-term liabilities held for sale 511,530 $674,779 Total liabilities $48,612,961 $11,756,655 Stockholders' equity Common stock $55,662 $37,394 Preferred stock $1,750 $1,750 Additional paid-in capital $599,898,202 $444,074,832 Accumulated other comprehensive income (loss) $110,108 ($5,392) Accumulated deficit ($196,053,911) ($138,392,118) Total stockholders' equity $404,011,811 $305,716,466 Total liabilities and stockholders’ equity $452,624,772 $317,473,121
Non-GAAP Measures Adjusted EBITDA is not a measurement of financial performance under generally accepted accounting principles in the United States (“GAAP”). Because of varying available valuation methodologies, subjective assumptions and the variety of equity instruments that can impact a company's non-cash operating expenses, CleanSpark management believes that providing a non-GAAP financial measure that excludes non-cash and non-recurring expenses allows for meaningful comparisons between the Company's core business operating results and those of other companies, as well as providing the Company with an important tool for financial and operational decision making and for evaluating its own core business operating results over different periods of time. The Company's Adjusted EBITDA measure may not provide information that is directly comparable to that provided by other companies in its industry, as other companies in its industry may calculate non-GAAP financial results differently, particularly related to non-recurring, unusual items. The Company's Adjusted EBITDA is not a measurement of financial performance under GAAP and should not be considered as an alternative to operating income or as an indication of operating performance or any other measure of performance derived in accordance with GAAP. Our management does not consider Adjusted EBITDA to be a substitute for, or superior to, the information provided by GAAP financial results. We are providing supplemental financial measures for non-GAAP adjusted earnings before interest, taxes, depreciation and amortization (“Adjusted EBITDA”) that excludes the impact of interest, taxes, depreciation, amortization, our share-based compensation expense, and impairment of assets, unrealized gains/losses on securities, certain financing costs, other non-cash items, certain non-recurring expenses, and impacts related to discontinued operations. These supplemental financial measures are not measurements of financial performance under GAAP and, as a result, these supplemental financial measures may not be comparable to similarly titled measures of other companies. Management uses these non-GAAP financial measures internally to help understand, manage, and evaluate our business performance and to help make operating decisions. We believe that these non-GAAP financial measures are also useful to investors and analysts in comparing our performance across reporting periods on a consistent basis. Adjusted EBITDA excludes (i) impacts of interest, taxes, and depreciation; (ii) significant non-cash expenses such as our share-based compensation expense, unrealized gains/losses on securities, certain financing costs, other non-cash items that we believe are not reflective of our general business performance, and for which the accounting requires management judgment, and the resulting expenses could vary significantly in comparison to other companies; (iii) significant impairment losses related to long-lived and digital assets, which include our bitcoin for which the accounting requires significant estimates and judgment, and the resulting expenses could vary significantly in comparison to other companies; and (iv) and impacts related to discontinued operations that would not be applicable to our future business activities. Non-GAAP financial measures are subject to material limitations as they are not in accordance with, or a substitute for, measurements prepared in accordance with GAAP. For example, we expect that share-based compensation expense, which is excluded from Adjusted EBITDA, will continue to be a significant recurring expense over the coming years and is an important part of the compensation provided to certain employees, officers, and directors. We have also excluded impairment losses on assets, including impairments of our digital currency our non-GAAP financial measures, which may continue to occur in future periods as a result of our continued holdings of significant amounts of bitcoin. Our non-GAAP financial measures are not meant to be considered in isolation and should be read only in conjunction with our Consolidated Financial Statements, which have been prepared in accordance with GAAP. We rely primarily on such Consolidated Financial Statements to understand, manage, and evaluate our business performance and use the non-GAAP financial measures only supplementally.
America’s Bitcoin Miner™


