|
| OMB APPROVAL | ||
|
| OMB Number: | 3235-0570 | |
|
| Expires: | October 31, 2006 | |
| UNITED STATES | Estimated average burden hours per response. . . . . . . . . . . . . . . . .19.3 | ||
| SECURITIES AND EXCHANGE COMMISSION |
| ||
| Washington, D.C. 20549 |
| ||
FORM N-CSR
CERTIFIED SHAREHOLDER REPORT OF REGISTERED
MANAGEMENT INVESTMENT COMPANIES
Investment Company Act file number | 811-5451 | ||||||||
| |||||||||
USLICO Series Fund | |||||||||
(Exact name of registrant as specified in charter) | |||||||||
| |||||||||
7337 E. Doubletree Ranch Rd., Scottsdale, AZ |
| 85258 | |||||||
(Address of principal executive offices) |
| (Zip code) | |||||||
| |||||||||
CT Corporation System, 101 Federal Street, Boston, MA 02110 | |||||||||
(Name and address of agent for service) | |||||||||
| |||||||||
Registrant’s telephone number, including area code: | 1-800-992-0180 |
| |||||||
| |||||||||
Date of fiscal year end: | December 31 |
| |||||||
| |||||||||
Date of reporting period: | January 1, 2005 to June 30, 2005 |
| |||||||
ITEM 1. REPORTS TO STOCKHOLDERS.
The following is a copy of the report transmitted to stockholders pursuant to Rule 30e-1 under the Act (17 CFR 270.30e-1):

Semi-Annual Report
June 30, 2005
USLICO Series Fund
§ | The Asset Allocation Portfolio |
|
|
§ | The Bond Portfolio |
|
|
§ | The Money Market Portfolio |
|
|
§ | The Stock Portfolio |
|
|
This report is submitted for general information to shareholders of the ING Funds. It is not authorized for distribution to prospective shareholders unless accompanied or preceded by a prospectus which includes details regarding the funds’ investment objectives, risks, charges, expenses and other information. This information should be read carefully. |
|
|
TABLE OF CONTENTS
PROXY VOTING INFORMATION
A description of the policies and procedures that the Registrant uses to determine how to vote proxies related to portfolio securities is available (1) without charge, upon request, by calling Shareholder Services toll-free at 800-992-0180; (2) on the Registrant’s website at www.ingfunds.com and (3) on the SEC’s website at www.sec.gov. Information regarding how the Registrant voted proxies related to portfolio securities during the most recent 12-month period ended June 30 is available without charge on the Registrant’s website at www.ingfunds.com and on the SEC’s website at www.sec.gov.
QUARTERLY PORTFOLIO HOLDINGS
The Registrant files its complete schedule of portfolio holdings with the Commission for the first and third quarters of each fiscal year on Form N-Q. The Registrant’s Forms N-Q are available on the SEC’s website at www.sec.gov. The Registrant’s Forms N-Q may be reviewed and copied at the Commission’s Public Reference Room in Washington, DC, and information on the operation of the Public Reference Room may be obtained by calling 1-800-SEC-0330; and is available upon request from the Registrant by calling Shareholder Services toll-free at 800-992-0180.
(THIS PAGE INTENTIONALLY LEFT BLANK)
| Dear Shareholder, |
We are in the midst of an exciting time here at ING Funds. We began the year by introducing a new ING global fund that gave investors an opportunity to invest in global companies with a history of attractive dividend yields. | |
The new fund was a bold and innovative opportunity and it captured the attention of investors. When the fund’s initial offering period closed, it proved to be one of the five largest unleveraged closed-end funds in history. | |
The success of the new fund offering illustrates what ING Funds is really all about: fresh thinking in financial services. The fund’s offering success also confirmed something else that we have long believed; namely, that investors are excited about opportunities beyond our shores. | |
As globalization grows, investment opportunities grow as well. In 1970, only about one-third of equity market capitalization was located abroad; by 2004, that number had jumped to 50 percent1. It is often said that the world is becoming ever more complicated. This is undoubtedly true in the world of investments where the range of asset classes and investment techniques has never been wider. To take advantage of the opportunities that are now available, it is essential to seek investment partners who have the required breadth and depth of experience — on a global basis. | |
Our goal at ING Funds is to deliver innovative investment products that help you, the investor, to achieve your financial dreams. We have also long been committed to uncovering opportunities worldwide. | |
We will continue to bring you opportunities — wherever they occur. With access to more than 700 ING investment management professionals who are located around the world and who, in our consideration, deliver exceptional insight into markets in Europe, the Americas and the Asia-Pacific region, we believe we are in a unique position to help you take advantage of the opportunities that the world has to offer. | |
On behalf of everyone here at ING Funds, I thank you for your continued support and loyalty. We look forward to serving you in the future. | |
Sincerely, | |
| |
| |
| |
James M. Hennessy | |
President | |
ING Funds | |
July 27, 2005 | |


1 Morgan Stanley Capital International
International investing does pose special risks including currency fluctuation, economic and political risks not found in investments that are solely domestic.
The views expressed in the President’s Letter reflect those of the President as of the date of the letter. Any such views are subject to change at any time based upon market or other conditions and ING Funds disclaims any responsibility to update such views. These views may not be relied on as investment advice and because investment decisions for an ING Fund are based on numerous factors, may not be relied on as an indication of investment intent on behalf of any ING Fund. Reference to specific company securities should not be construed as recommendations or investment advice.
1
Global stocks posted mixed results in the first half of 2005 with the U.S market finally succumbing to inflation and interest rate fears while many international stocks advanced. As a whole, global equities lost 0.7%, according to the Morgan Stanley Capital International (“MSCI”) World Index(1) in dollars, including net reinvested dividends, dragged down by a resurgent dollar, boosted by strong Gross Domestic Product (“GDP”) growth, and rising short-term interest rates. The euro was further buffeted by the defeat of a proposal for a European constitution, followed by acrimonious stalemate on a European budget. For the six months, the U.S. dollar rose 11.9% against the euro, 7.1% against the pound and 8.1% against the oil price sensitive yen.
Trends in investment grade U.S. fixed income securities had been dominated since the middle of 2004 by the flattening of the Treasury yield curve as ten-year yields fell even as the Federal Open Market Committee (“FOMC”) raised short-term interest rates five times in 2004 and then twice more in February and March of 2005. The trend had been temporarily broken in the last few weeks of the first quarter as risk appetites soured, but not for long. From April 1, evidence of slowing activity and firming inflation mounted. May saw the curve-flattening trend sustained by the eighth FOMC rate rise. Then Dallas Federal Reserve President Fisher said that the FOMC, after eight rate increases, was in the “eighth inning” of the tightening cycle, sending the ten-year Treasury yield plunging through 4%, squeezing the spread over the 90-day Bill on June 27th to 0.87%, a new low since April of 2001. But on the last day of the quarter the FOMC raised the Federal Funds rate for the ninth time, to 3.25%, and made it perfectly clear that extra innings were about to be played. For the six months, the yield on U.S. 10-year Treasury Notes fell by 0.27% to 3.95%, while the yield on 13-week Treasury Bills rose 0.88% to 3.06%. The return on the broader Lehman Brothers Aggregate Bond Index(2) was 2.5%, and the recovery of investors’ risk appetites helped the Lehman Brothers High Yield Bond Index(3) add 1.1%.
The U.S. equities market in the form of the Standard & Poor’s (“S&P”) 500 Index(4), lost 0.8% in the first half of 2005 including dividends. At this point the market was trading at a price-to-earnings level of about 15.75 times earnings for the current fiscal year. An early retreat was relieved by encouraging elections in Iraq, an upsurge in merger and acquisition activity and generally better than expected company earnings. A solid employment report on March 4 propelled the S&P 500 Index to its best close of the quarter the next day. But the sell off was swift amid concerns about inflation and a slowing economy. Investors keenly watched the swirling crosscurrents in the fixed income markets. Falling bond yields make stocks relatively more attractive and have encouraged mortgage refinancing on a massive scale. The funds raised have tended not to stay long in the wallets of American consumers, keeping expansion strong. However, inexorably rising short-term rates dampen demand and profit margins. Little wonder then that Mr. Fisher’s remarks encouraged the market to make a run in June from the previous March 7 high. Although, it was tripped up by the other major influence on stocks in recent quarters: the surging price of oil, which is potentially inflationary through costs and deflationary since it acts like a tax. The price of a barrel of oil for July delivery reached a new record on June 17, stopping the stock market rally in its tracks. June ended on a down note when the FOMC indicated that the tightening game was far from over.
Japan equities fell 5.8%, based on the MSCI Japan Index(5) plus net dividends in dollars, but rose 1.8% in local currency. By month end the broad market was trading at about 15.5 times current fiscal year earnings. The period saw the familiar raft of macro-economic disappointments, but from May the news improved. GDP growth was estimated at 4.9% after three weak quarters. Profits are growing in Japan, by 15.8% in the first quarter, and the banks’ bad loan crisis appears to be over.
European ex UK markets jumped 11.3% in local currencies during the first six months of 2005, repeatedly reaching three-year high levels, but fell 1.1% in dollars, according to the MSCI Europe ex UK Index(6) including net dividends. Markets were trading on average at about 13.5 times earnings for the current fiscal year. Such bullish performance belied bearish economic conditions with high unemployment and barely growing economies. This and the political setbacks referred to above served only to depress the euro. Stock markets cheered the weaker currency, while corporate profits held up and merger and acquisition activity revived, allowing stocks to rise in the face of record low bond yields.
The UK market gained 8.1% in sterling, based on the MSCI UK Index(7) including net dividends, making new four-year highs, but only 0.9% in dollars. It was then trading at just under 13 times current fiscal year
2
MARKET PERSPECTIVE: SIX MONTHS ENDED JUNE 30, 2005
earnings. The UK economy as a whole has been healthy, with 3.2% growth in 2004 and low unemployment. However, over-stretched consumers and soaring real estate prices held growth in check. Five interest rate increases through August 2004 eventually took their toll. By the end of June, house prices were falling, manufacturing was in decline and GDP growth slowed. The next move in interest rates, in our opinion, clearly is a decrease and it was this expectation, plus a weaker pound that boosted a fairly inexpensive stock market.
(1) The MSCI World Index is an unmanaged index that measures the performance of over 1,400 securities listed on exchanges in the U.S., Europe, Canada, Australia, New Zealand and the Far East.
(2) The Lehman Brothers Aggregate Bond Index is a widely recognized, unmanaged index of publicly issued investment grade U.S. Government, mortgage-backed, asset-backed and corporate debt securities.
(3) The Lehman Brothers High Yield Bond Index is an unmanaged index that measures the performance of fixed-income securities generally representative of corporate bonds rated below investment-grade.
(4) The Standard & Poor’s 500 Index is an unmanaged index that measures the performance of securities of approximately 500 large-capitalization companies whose securities are traded on major U.S. stock markets.
(5) The MSCI Japan Index is a free float-adjusted market capitalization index that is designed to measure developed market equity performance in Japan.
(6) The MSCI Europe ex UK Index is a free float-adjusted market capitalization index that is designed to measure developed market equity performance in Europe, excluding the UK.
(7) The MSCI UK Index is a free float-adjusted market capitalization index that is designed to measure developed market equity performance in the UK.
All indices are unmanaged and investors cannot invest directly in an index.
Past performance does not guarantee future results. The performance quoted represents past performance. Investment return and principal value of an investment will fluctuate, and shares, when redeemed, may be worth more or less than their original cost. The Funds’ performance is subject to change since the period’s end and may be lower or higher than the performance data shown. Please call (800) 992-0180 or log on to www.ingfunds.com to obtain performance data current to the most recent month end.
Market Perspective reflects the views of the Chief Investment Risk Officer only through the end of the period, and is subject to change based on market and other conditions.
3
As a shareholder of a Fund, you incur two types of costs: (1) transaction costs, including sales charges (loads) on purchase payments, reinvested dividends, or other distributions; redemption fees; and exchange fees; and (2) ongoing costs, including management fees; distribution [and/or service] (12b-1) fees; and other Fund expenses. These Examples are intended to help you understand your ongoing costs (in dollars) of investing in a Fund and to compare these costs with the ongoing costs of investing in other mutual funds.
The Examples are based on an investment of $1,000 invested at the beginning of the period and held for the entire period from January 1, 2005 to June 30, 2005.
Actual Expenses
The first section of the table shown, “Actual Fund Return”, provides information about actual account values and actual expenses. You may use the information in this section, together with the amount you invested, to estimate the expenses that you paid over the period. Simply divide your account value by $1,000 (for example, an $8,600 account value divided by $1,000 = 8.6), then multiply the result by the number in the first section under the heading entitled “Expenses Paid During Period” to estimate the expenses you paid on your account during this period.
Hypothetical Example for Comparison Purposes
The second section of the table shown, “Hypothetical 5% Return”, provides information about hypothetical account values and hypothetical expenses based on the Fund’s actual expense ratio and an assumed rate of return of 5% per year before expenses, which is not the Fund’s actual return. The hypothetical account values and expenses may not be used to estimate the actual ending account balance or expenses you paid for the period. You may use this information to compare the ongoing costs of investing in the Fund and other funds. To do so, compare this 5% hypothetical example with the 5% hypothetical examples that appear in the shareholder reports of the other funds.
Please note that the expenses shown in the table are meant to highlight your ongoing costs only and do not reflect any transactional costs, such as sales charges (loads), redemption fees, or exchange fees. Therefore, the hypothetical lines of the table are useful in comparing ongoing costs only, and will not help you determine the relative total costs of owning different funds. In addition, if these transactional costs were included, your costs would have been higher.
USLICO Series Fund |
| Beginning |
| Ending |
|
|
| Expenses Paid |
| ||||
| Account |
| Account |
| Annualized |
| During the Six |
| |||||
| Value |
| Value |
| Expense |
| Months Ended |
| |||||
| January 1, 2005 |
| June 30, 2005 |
| Ratio |
| June 30, 2005* |
| |||||
|
|
|
|
|
|
|
|
|
| ||||
Actual Fund Return |
|
|
|
|
|
|
|
|
| ||||
Asset Allocation Portfolio |
| $1,000.00 |
|
| $1,004.10 |
|
| 0.90 | % |
| $4.47 |
|
|
Bond Portfolio |
| 1,000.00 |
|
| 1,026.40 |
|
| 0.90 |
|
| 4.52 |
|
|
Money Market Portfolio |
| 1,000.00 |
|
| 1,010.50 |
|
| 0.70 |
|
| 3.49 |
|
|
Stock Portfolio |
| 1,000.00 |
|
| 986.60 |
|
| 0.90 |
|
| 4.43 |
|
|
Hypothetical (5% return before expenses) |
|
|
|
|
|
|
|
|
|
|
|
|
|
Asset Allocation Portfolio |
| $1,000.00 |
|
| $1,020.33 |
|
| 0.90 | % |
| $4.51 |
|
|
Bond Portfolio |
| 1,000.00 |
|
| 1,020.33 |
|
| 0.90 |
|
| 4.51 |
|
|
Money Market Portfolio |
| 1,000.00 |
|
| 1,021.32 |
|
| 0.70 |
|
| 3.51 |
|
|
Stock Portfolio |
| 1,000.00 |
|
| 1,020.33 |
|
| 0.90 |
|
| 4.51 |
|
|
* Expenses are equal to each Portfolio’s respective annualized expense ratios multiplied by the average account value over the period, multiplied by 181/365 (to reflect the one-half year period).
4
|
| The |
| The |
| The |
| The |
| |||||
| Asset Allocation | Bond | Money Market | Stock |
| |||||||||
|
| Portfolio |
| Portfolio |
| Portfolio |
| Portfolio |
| |||||
ASSETS: |
|
|
|
|
|
|
|
|
| |||||
Investments in securities at value* |
| $ | 12,388,397 |
| $ | 2,826,920 |
| $ | — |
| $ | 14,984,081 |
| |
Short-term investments at amortized cost |
| — |
| — |
| 5,227,093 |
| — |
| |||||
Repurchase agreement |
| 1,768,000 |
| 727,000 |
| 846,000 |
| 1,239,000 |
| |||||
Cash |
| 241 |
| 753 |
| 331 |
| 257 |
| |||||
Receivables: |
|
|
|
|
|
|
|
|
| |||||
Investment securities sold |
| 44,637 |
| 22,034 |
| — |
| — |
| |||||
Dividends and interest |
| 38,313 |
| 16,790 |
| 19,760 |
| 11,965 |
| |||||
Prepaid expenses |
| 207 |
| 49 |
| 96 |
| 251 |
| |||||
Reimbursement due from manager |
| 156 |
| 5,604 |
| 2,550 |
| — |
| |||||
Total assets |
| 14,239,951 |
| 3,599,150 |
| 6,095,830 |
| 16,235,554 |
| |||||
LIABILITIES: |
|
|
|
|
|
|
|
|
| |||||
Payable for investment securities purchased |
| 1,228,148 |
| 713,295 |
| — |
| — |
| |||||
Income distribution payable |
| — |
| — |
| 12,040 |
| — |
| |||||
Payable to affiliates |
| 3,786 |
| 828 |
| 1,694 |
| 9,571 |
| |||||
Payable for trustee fees |
| 546 |
| 1,916 |
| 2,099 |
| 2,284 |
| |||||
Other accrued expenses and liabilities |
| 34,834 |
| 3,690 |
| 16,589 |
| 29,874 |
| |||||
Total liabilities |
| 1,267,314 |
| 719,729 |
| 32,422 |
| 41,729 |
| |||||
NET ASSETS |
| $ | 12,972,637 |
| $ | 2,879,421 |
| $ | 6,063,408 |
| $ | 16,193,825 |
| |
NET ASSETS WERE COMPRISED OF: |
|
|
|
|
|
|
|
|
| |||||
Paid-in capital |
| $ | 16,545,169 |
| $ | 2,900,693 |
| $ | 6,063,986 |
| $ | 29,156,501 |
| |
Undistributed net investment income |
|
|
|
|
|
|
|
|
| |||||
(accumulated net investment loss) |
| 60,729 |
| 22,496 |
| (1 | ) | 19,845 |
| |||||
Accumulated net realized loss on investments |
| (4,445,344 | ) | (52,605 | ) | (577 | ) | (14,383,372 | ) | |||||
Net unrealized appreciation on investments |
| 812,083 |
| 8,837 |
| — |
| 1,400,851 |
| |||||
NET ASSETS |
| $ | 12,972,637 |
| $ | 2,879,421 |
| $ | 6,063,408 |
| $ | 16,193,825 |
| |
*Cost of investments in securities |
| $ | 11,576,314 |
| $ | 2,818,083 |
| $ | — |
| $ | 13,583,230 |
|
Net assets |
| $ | 12,972,637 |
| $ | 2,879,421 |
| $ | 6,063,408 |
| $ | 16,193,825 |
|
Shares authorized |
| unlimited |
| unlimited |
| unlimited |
| unlimited |
| ||||
Par value |
| $ | 0.001 |
| $ | 0.001 |
| $ | 0.001 |
| $ | 0.001 |
|
Shares outstanding |
| 1,365,606 |
| 285,231 |
| 6,064,055 |
| 2,200,089 |
| ||||
Net asset value and redemption price per share |
| $ | 9.50 |
| $ | 10.10 |
| $ | 1.00 |
| $ | 7.36 |
|
See Accompanying Notes to Financial Statements
5
STATEMENTS OF OPERATIONS FOR THE SIX MONTHS ENDED JUNE 30, 2005 (UNAUDITED)
|
| The |
| The |
| The |
| The |
| ||||
| Asset Allocation | Bond | Money Market | Stock |
| ||||||||
|
| Portfolio |
| Portfolio |
| Portfolio |
| Portfolio |
| ||||
INVESTMENT INCOME: |
|
|
|
|
|
|
|
|
| ||||
Dividends, net foreign taxes withheld* |
| $ | 51,489 |
| $ | 487 |
| $ | — |
| $ | 97,560 |
|
Interest |
| 120,363 |
| 59,950 |
| 81,782 |
| 15,198 |
| ||||
Total investment income |
| 171,852 |
| 60,437 |
| 81,782 |
| 112,758 |
| ||||
EXPENSES: |
|
|
|
|
|
|
|
|
| ||||
Investment management fees |
| 32,114 |
| 7,104 |
| 14,533 |
| 39,754 |
| ||||
Transfer agent fees |
| 56 |
| 358 |
| 358 |
| 56 |
| ||||
Administrative service fees |
| 6,423 |
| 1,421 |
| 2,907 |
| 7,950 |
| ||||
Shareholder reporting expense |
| 10,709 |
| 1,835 |
| 3,033 |
| 10,668 |
| ||||
Professional fees |
| 12,830 |
| 3,050 |
| 6,528 |
| 10,426 |
| ||||
Custody and accounting expense |
| 11,765 |
| 4,623 |
| 3,760 |
| 3,807 |
| ||||
Trustee fees |
| 897 |
| 362 |
| 1,083 |
| 514 |
| ||||
Miscellaneous expense |
| 467 |
| 875 |
| 272 |
| 788 |
| ||||
Total expenses |
| 75,261 |
| 19,629 |
| 32,474 |
| 73,963 |
| ||||
Net waived and reimbursed fees |
| (17,407 | ) | (7,457 | ) | (12,110 | ) | (2,544 | ) | ||||
Net expenses |
| 57,854 |
| 12,172 |
| 20,364 |
| 71,419 |
| ||||
Net investment income |
| 113,998 |
| 48,266 |
| 61,418 |
| 41,339 |
| ||||
REALIZED AND UNREALIZED GAIN (LOSS) ON INVESTMENTS: |
|
|
|
|
|
|
|
|
| ||||
Net realized gain on investments |
| 329,078 |
| 19,261 |
| 67 |
| 507,462 |
| ||||
Net change in unrealized appreciation or |
|
|
|
|
|
|
|
|
| ||||
depreciation on investments |
| (386,639 | ) | 4,792 |
| — |
| (768,081 | ) | ||||
Net realized and unrealized gain (loss) on investments |
| (57,561 | ) | 24,053 |
| 67 |
| (260,619 | ) | ||||
Increase (decrease) in net assets resulting from operations |
| $ | 56,437 |
| $ | 72,319 |
| $ | 61,485 |
| $ | (219,280 | ) |
|
|
|
|
|
|
|
|
|
|
|
|
|
|
*Foreign taxes withheld |
| $ | 93 |
| $ | — |
| $ | — |
| $ | 194 |
|
See Accompanying Notes to Financial Statements
6
|
| The Asset Allocation Portfolio |
| The Bond Portfolio |
| ||||||||
|
| Six Months |
| Year |
| Six Months |
| Year |
| ||||
|
| Ended |
| Ended |
| Ended |
| Ended |
| ||||
|
| June 30, |
| December 31, |
| June 30, |
| December 31, |
| ||||
|
| 2005 |
| 2004 |
| 2005 |
| 2004 |
| ||||
FROM OPERATIONS: |
|
|
|
|
|
|
|
|
| ||||
Net investment income |
| $ | 113,998 |
| $ | 206,897 |
| $ | 48,266 |
| $ | 88,744 |
|
Net realized gain on investments |
| 329,078 |
| 1,107,793 |
| 19,261 |
| 65,226 |
| ||||
Net change in unrealized appreciation or depreciation on |
|
|
|
|
|
|
|
|
| ||||
investments |
| (386,639 | ) | (256,489 | ) | 4,792 |
| (32,155 | ) | ||||
Net increase in net assets resulting from operations |
| 56,437 |
| 1,058,201 |
| 72,319 |
| 121,815 |
| ||||
FROM DISTRIBUTIONS TO SHAREHOLDERS: |
|
|
|
|
|
|
|
|
| ||||
Net investment income |
| (53,269 | ) | (221,813 | ) | (26,063 | ) | (95,495 | ) | ||||
Total distributions |
| (53,269 | ) | (221,813 | ) | (26,063 | ) | (95,495 | ) | ||||
FROM CAPITAL SHARE TRANSACTIONS: |
|
|
|
|
|
|
|
|
| ||||
Net proceeds from sale of shares |
| 67,542 |
| 57,686 |
| 1,054 |
| — |
| ||||
Dividends reinvested |
| 53,269 |
| 221,813 |
| 26,063 |
| 95,495 |
| ||||
|
| 120,811 |
| 279,499 |
| 27,117 |
| 95,495 |
| ||||
Cost of shares redeemed |
| (179,684 | ) | (1,238,181 | ) | (60,518 | ) | (246,394 | ) | ||||
Net decrease in net assets resulting from capital share |
|
|
|
|
|
|
|
|
| ||||
transactions |
| (58,873 | ) | (958,682 | ) | (33,401 | ) | (150,899 | ) | ||||
Net increase (decrease) in net assets |
| (55,705 | ) | (122,294 | ) | 12,855 |
| (124,579 | ) | ||||
NET ASSETS: |
|
|
|
|
|
|
|
|
| ||||
Beginning of period |
| 13,028,342 |
| 13,150,636 |
| 2,866,566 |
| 2,991,145 |
| ||||
End of period |
| $ | 12,972,637 |
| $ | 13,028,342 |
| $ | 2,879,421 |
| $ | 2,866,566 |
|
Undistributed net investment income at end of period |
| $ | 60,729 |
| $ | — |
| $ | 22,496 |
| $ | 293 |
|
See Accompanying Notes to Financial Statements
7
STATEMENTS OF CHANGES IN NET ASSETS (UNAUDITED)
|
| The Money Market Portfolio |
| The Stock Portfolio |
| ||||||||||
|
| Six Months |
| Year |
| Six Months |
| Year |
| ||||||
|
| Ended |
| Ended |
| Ended |
| Ended |
| ||||||
|
| June 30, |
| December 31, |
| June 30, |
| December 31, |
| ||||||
|
| 2005 |
| 2004 |
| 2005 |
| 2004 |
| ||||||
FROM OPERATIONS: |
|
|
|
|
|
|
|
|
| ||||||
Net investment income |
| $ | 61,418 |
| $ | 34,108 |
| $ | 41,339 |
| $ | 46,861 |
| ||
Net realized gain (loss) on investments |
| 67 |
| (644 | ) | 507,462 |
| 2,198,605 |
| ||||||
Net change in unrealized appreciation or depreciation on |
|
|
|
|
|
|
|
|
| ||||||
investments |
| — |
| — |
| (768,081 | ) | (675,185 | ) | ||||||
Net increase (decrease) in net assets resulting |
|
|
|
|
|
|
|
|
| ||||||
from operations |
| 61,485 |
| 33,464 |
| (219,280 | ) | 1,570,281 |
| ||||||
FROM DISTRIBUTIONS TO SHAREHOLDERS: |
|
|
|
|
|
|
|
|
| ||||||
Net investment income |
| (61,427 | ) | (34,100 | ) | (21,494 | ) | (46,861 | ) | ||||||
Return of capital |
| — |
| — |
| — |
| (33,220 | ) | ||||||
Total distributions |
| (61,427 | ) | (34,100 | ) | (21,494 | ) | (80,081 | ) | ||||||
FROM CAPITAL SHARE TRANSACTIONS: |
|
|
|
|
|
|
|
|
| ||||||
Net proceeds from sale of shares |
| 176,177 |
| 17,915 |
| 129,457 |
| 536,541 |
| ||||||
Dividends reinvested |
| 56,351 |
| 28,447 |
| 21,494 |
| 80,081 |
| ||||||
|
| 232,528 |
| 46,362 |
| 150,951 |
| 616,622 |
| ||||||
Cost of shares redeemed |
| (12,203 | ) | (387,653 | ) | (35,200 | ) | (70,495 | ) | ||||||
Net increase in net assets resulting from capital share |
|
|
|
|
|
|
|
|
| ||||||
transactions |
| 220,325 |
| (341,291 | ) | 115,751 |
| 546,127 |
| ||||||
Net increase (decrease) in net assets |
| 220,383 |
| (341,927 | ) | (125,023 | ) | 2,036,327 |
| ||||||
NET ASSETS: |
|
|
|
|
|
|
|
|
| ||||||
Beginning of period |
| 5,843,025 |
| 6,184,952 |
| 16,318,848 |
| 14,282,521 |
| ||||||
End of period |
| $ | 6,063,408 |
| $ | 5,843,025 |
| $ | 16,193,825 |
| $ | 16,318,848 |
| ||
Undistributed net investment income (distributions in excess of net investment income) at end of period |
| $ | (1 | ) | $ | 8 |
| $ | 19,845 |
| $ | — |
| ||
See Accompanying Notes to Financial Statements
8
THE USLICO ASSET ALLOCATION PORTFOLIO (UNAUDITED) |
|
Selected data for a share of beneficial interest outstanding throughout each period.
| Six Months |
|
|
|
|
|
|
|
|
|
| |||||||
|
| Ended |
|
|
|
|
|
|
|
|
|
|
| |||||
|
|
| Year Ended December 31, |
| ||||||||||||||
|
|
| 2004 |
| 2003 |
| 2002 |
| 2001(1) |
| 2000 |
| ||||||
Per Share Operating Performance: |
|
|
|
|
|
|
|
|
|
|
|
|
|
| ||||
Net asset value, beginning of period | $ |
| 9.50 |
| 8.90 |
| 7.64 |
| 8.64 |
| 11.04 |
| 12.68 |
| ||||
Income (loss) from investment operations: |
|
|
|
|
|
|
|
|
|
|
|
|
|
| ||||
Net investment income | $ |
| 0.08 |
| 0.15 |
| 0.15 |
| 0.19 |
| 0.22 |
| 0.18 |
| ||||
Net realized and unrealized gain (loss) on investments | $ |
| (0.04 | ) | 0.61 |
| 1.25 |
| (0.94 | ) | (2.43 | ) | (1.41 | ) | ||||
Total from investment operations | $ |
| 0.04 |
| 0.76 |
| 1.40 |
| (0.75 | ) | (2.21 | ) | (1.23 | ) | ||||
Less distributions from: |
|
|
|
|
|
|
|
|
|
|
|
|
|
| ||||
Net investment income | $ |
| 0.04 |
| 0.16 |
| 0.14 |
| 0.25 |
| 0.19 |
| 0.18 |
| ||||
Net realized gain on investments | $ |
| — |
| — |
| — |
| — |
| — |
| 0.23 |
| ||||
Total distributions | $ |
| 0.04 |
| 0.16 |
| 0.14 |
| 0.25 |
| 0.19 |
| 0.41 |
| ||||
Net asset value, end of period | $ |
| 9.50 |
| 9.50 |
| 8.90 |
| 7.64 |
| 8.64 |
| 11.04 |
| ||||
Total Return(2) | % |
| 0.41 |
| 8.61 |
| 18.54 |
| (8.72 | ) | (20.09 | ) | (9.80 | ) | ||||
Ratios and Supplemental Data: |
|
|
|
|
|
|
|
|
|
|
|
|
|
| ||||
Net assets, end of period (000’s) | $ |
| 12,973 |
| 13,028 |
| 13,151 |
| 11,603 |
| 12,752 |
| 15,591 |
| ||||
Ratios to average net assets: |
|
|
|
|
|
|
|
|
|
|
|
|
|
| ||||
Net expenses after expense reimbursement(3)(4) | % |
| 0.90 |
| 0.90 |
| 0.91 |
| 0.90 |
| 0.90 |
| 0.90 |
| ||||
Gross expenses prior to expense reimbursement(3) | % |
| 1.17 |
| 1.09 |
| 1.07 |
| 1.34 |
| 1.76 |
| 1.18 |
| ||||
Net investment income after expense reimbursement(3)(4) | % |
| 1.77 |
| 1.60 |
| 1.81 |
| 2.42 |
| 2.37 | * | 1.44 |
| ||||
Portfolio turnover rate | % |
| 134 |
| 252 |
| 210 |
| 258 |
| 354 |
| 243 |
| ||||
(1) Effective May 11, 2001, ING Investments, LLC ceased serving as the Sub-Adviser to the Portfolio and began serving as Investment Manager to the Portfolio.
(2) Total return is calculated assuming reinvestment of all dividends and capital gain distributions at net asset value. Total returns for periods less than one year are not annualized.
(3) The Investment Manager has agreed to limit expenses, (excluding interest, taxes, brokerage and extraordinary expenses) subject to possible recoupment by ING Investments, LLC within three years.
(4) Annualized for periods less than one year.
* Had the Portfolio not amortized premiums and accreted discounts the ratio of net investment income to average net assets would have been 2.09%.
See Accompanying Notes to Financial Statements
9
THE USLICO BOND PORTFOLIO (UNAUDITED) |
| FINANCIAL HIGHLIGHTS |
Selected data for a share of beneficial interest outstanding throughout each period.
| Six Months |
|
|
|
|
|
|
|
|
|
| |||||||||
|
| Ended |
|
|
|
|
|
|
|
|
|
|
| |||||||
|
|
| Year Ended December 31, |
| ||||||||||||||||
|
|
| 2004 |
| 2003 |
| 2002 |
| 2001(1) |
| 2000 |
| ||||||||
Per Share Operating Performance: |
|
|
|
|
|
|
|
|
|
|
|
|
|
| ||||||
Net asset value, beginning of period | $ |
| 9.93 |
| 9.84 |
| 9.75 |
| 9.41 |
| 9.21 |
| 9.01 |
| ||||||
Income from investment operations: |
|
|
|
|
|
|
|
|
|
|
|
|
|
| ||||||
Net investment income | $ |
| 0.17 |
| 0.30 |
| 0.36 |
| 0.39 |
| 0.48 |
| 0.40 |
| ||||||
Net realized and unrealized gain on investments | $ |
| 0.09 |
| 0.12 |
| 0.08 |
| 0.35 |
| 0.11 |
| 0.20 |
| ||||||
Total from investment operations | $ |
| 0.26 |
| 0.42 |
| 0.44 |
| 0.74 |
| 0.59 |
| 0.60 |
| ||||||
Less distributions from: |
|
|
|
|
|
|
|
|
|
|
|
|
|
| ||||||
Net investment income | $ |
| 0.09 |
| 0.33 |
| 0.35 |
| 0.40 |
| 0.39 |
| 0.40 |
| ||||||
Total distributions | $ |
| 0.09 |
| 0.33 |
| 0.35 |
| 0.40 |
| 0.39 |
| 0.40 |
| ||||||
Net asset value, end of period | $ |
| 10.10 |
| 9.93 |
| 9.84 |
| 9.75 |
| 9.41 |
| 9.21 |
| ||||||
Total Return(2) | % |
| 2.64 |
| 4.29 |
| 4.57 |
| 8.07 |
| 6.47 |
| 6.74 |
| ||||||
Ratios and Supplemental Data: |
|
|
|
|
|
|
|
|
|
|
|
|
|
| ||||||
Net assets, end of period (000’s) | $ |
| 2,880 |
| 2,867 |
| 2,991 |
| 3,086 |
| 2,846 |
| 2,881 |
| ||||||
Ratios to average net assets: |
|
|
|
|
|
|
|
|
|
|
|
|
|
| ||||||
Net expenses after expense reimbursement(3)(4) | % |
| 0.90 |
| 0.90 |
| 0.91 |
| 0.89 |
| 0.90 |
| 0.90 |
| ||||||
Gross expenses prior to expense reimbursement(3) | % |
| 1.38 |
| 1.25 |
| 1.52 |
| 1.37 |
| 2.15 |
| 1.83 |
| ||||||
Net investment income after expense reimbursement(3)(4) | % |
| 3.46 |
| 3.01 |
| 3.65 |
| 4.20 |
| 5.02 | * | 4.30 |
| ||||||
Portfolio turnover rate | % |
| 265 |
| 463 |
| 368 |
| 159 |
| 215 |
| 49 |
| ||||||
(1) Effective May 11, 2001, ING Investments, LLC ceased serving as the Sub-Adviser to the Portfolio and began serving as Investment Manager to the Portfolio.
(2) Total return is calculated assuming reinvestment of all dividends and capital gain distributions at net asset value. Total returns for periods less than one year are not annualized.
(3) The Investment Manager has agreed to limit expenses, (excluding interest, taxes, brokerage and extraordinary expenses) subject to possible recoupment by ING Investments, LLC within three years.
(4) Annualized for periods less than one year.
* Had the Portfolio not amortized premiums and accreted discounts the ratio of net investment income to average net assets would have been 4.56%.
See Accompanying Notes to Financial Statements
10
THE USLICO MONEY MARKET PORTFOLIO (UNAUDITED) |
| FINANCIAL HIGHLIGHTS |
Selected data for a share of beneficial interest outstanding throughout each period.
| Six Months |
|
|
|
|
|
|
|
|
|
| |||||||||
|
| Ended |
|
|
|
|
|
|
|
|
|
|
| |||||||
|
|
| Year Ended December 31, |
| ||||||||||||||||
|
|
| 2004 |
| 2003 |
| 2002 |
| 2001(1) |
| 2000 |
| ||||||||
Per Share Operating Performance: |
|
|
|
|
|
|
|
|
|
|
|
|
|
| ||||||
Net asset value, beginning of period | $ |
| 1.00 |
| 1.00 |
| 1.00 |
| 1.00 |
| 1.00 |
| 1.00 |
| ||||||
Income from investment operations: |
|
|
|
|
|
|
|
|
|
|
|
|
|
| ||||||
Net investment income | $ |
| 0.01 |
| 0.01 |
| 0.00 | * | 0.01 |
| 0.03 |
| 0.05 |
| ||||||
Total from investment operations | $ |
| 0.01 |
| 0.01 |
| 0.00 | * | 0.01 |
| 0.03 |
| 0.05 |
| ||||||
Less distributions from: |
|
|
|
|
|
|
|
|
|
|
|
|
|
| ||||||
Net investment income | $ |
| 0.01 |
| 0.01 |
| 0.00 | * | 0.01 |
| 0.03 |
| 0.05 |
| ||||||
Total distributions | $ |
| 0.01 |
| 0.01 |
| 0.00 | * | 0.01 |
| 0.03 |
| 0.05 |
| ||||||
Net asset value, end of period | $ |
| 1.00 |
| 1.00 |
| 1.00 |
| 1.00 |
| 1.00 |
| 1.00 |
| ||||||
Total Return(2) | % |
| 1.05 |
| 0.57 |
| 0.28 |
| 0.88 |
| 3.14 |
| 5.59 |
| ||||||
Ratios and Supplemental Data: |
|
|
|
|
|
|
|
|
|
|
|
|
|
| ||||||
Net assets, end of period (000’s) | $ |
| 6,063 |
| 5,843 |
| 6,185 |
| 6,450 |
| 6,400 |
| 6,331 |
| ||||||
Ratios to average net assets: |
|
|
|
|
|
|
|
|
|
|
|
|
|
| ||||||
Net expenses after expense reimbursement(3)(4) | % |
| 0.70 |
| 0.88 |
| 0.90 |
| 0.78 |
| 0.90 |
| 0.90 |
| ||||||
Gross expenses prior to expense reimbursement(3) | % |
| 1.12 |
| 1.22 |
| 1.11 |
| 1.03 |
| 1.63 |
| 1.34 |
| ||||||
Net investment income after expense reimbursement(3)(4) | % |
| 2.11 |
| 0.57 |
| 0.28 |
| 0.97 |
| 3.13 |
| 5.45 |
| ||||||
(1) Effective May 11, 2001, ING Investments, LLC ceased serving as the Sub-Adviser to the Portfolio and began serving as Investment Manager to the Portfolio.
(2) Total return is calculated assuming reinvestment of all dividends and capital gain distributions at net asset value. Total returns for periods less than one year are not annualized.
(3) The Investment Manager has agreed to limit expenses, (excluding interest, taxes, brokerage and extraordinary expenses) subject to possible recoupment by ING Investments, LLC within three years.
(4) Annualized for periods less than one year.
* Amount is less than $0.01 per share.
See Accompanying Notes to Financial Statements
11
THE USLICO STOCK PORTFOLIO (UNAUDITED) |
| FINANCIAL HIGHLIGHTS |
Selected data for a share of beneficial interest outstanding throughout each period.
| Six Months |
|
|
|
|
|
|
|
|
|
| |||
|
| Ended |
|
|
|
|
|
|
|
|
|
|
| |
|
|
| Year Ended December 31, |
| ||||||||||
|
|
| 2004 |
| 2003 |
| 2002 |
| 2001(1) |
| 2000 |
| ||
Per Share Operating Performance: |
|
|
|
|
|
|
|
|
|
|
|
|
|
|
Net asset value, beginning of period | $ |
| 7.47 |
| 6.77 |
| 4.96 |
| 7.32 |
| 12.42 |
| 16.06 |
|
Income (loss) from investment operations: |
|
|
|
|
|
|
|
|
|
|
|
|
|
|
Net investment income (loss) | $ |
| 0.03 |
| 0.02 |
| (0.01 | ) | (0.04 | ) | (0.05 | ) | (0.02 | ) |
Net realized and unrealized gain (loss) on investments | $ |
| (0.12 | ) | 0.72 |
| 1.82 |
| (2.32 | ) | (5.05 | ) | (3.18 | ) |
Total from investment operations | $ |
| (0.09 | ) | 0.74 |
| 1.81 |
| (2.36 | ) | (5.10 | ) | (3.20 | ) |
Less distributions from: |
|
|
|
|
|
|
|
|
|
|
|
|
|
|
Net investment income | $ |
| 0.02 |
| 0.02 |
| — |
| — |
| — |
| — |
|
Net realized gain on investments | $ |
| — |
| — |
| — |
| — |
| — |
| 0.44 |
|
Return of capital | $ |
| — |
| 0.02 |
| — |
| — |
| — |
| — |
|
Total distributions | $ |
| 0.02 |
| 0.04 |
| — |
| — |
| — |
| 0.44 |
|
Net asset value, end of period | $ |
| 7.36 |
| 7.47 |
| 6.77 |
| 4.96 |
| 7.32 |
| 12.42 |
|
Total Return(2) | % |
| (1.34 | ) | 10.90 |
| 36.49 |
| (32.24 | ) | (41.06 | ) | (19.94 | ) |
Ratios and Supplemental Data: |
|
|
|
|
|
|
|
|
|
|
|
|
|
|
Net assets, end of period (000’s) | $ |
| 16,194 |
| 16,319 |
| 14,283 |
| 10,140 |
| 14,972 |
| 26,513 |
|
Ratios to average net assets: |
|
|
|
|
|
|
|
|
|
|
|
|
|
|
Net expenses after expense reimbursement/recoupment(3)(4) | % |
| 0.90 |
| 0.90 |
| 0.90 |
| 0.90 |
| 0.90 |
| 0.62 |
|
Gross expenses prior to expense reimbursement/recoupment(3) | % |
| 0.93 |
| 0.81 |
| 1.08 |
| 1.47 |
| 1.42 |
| 0.87 |
|
Net investment income (loss) after expense |
|
|
|
|
|
|
|
|
|
|
|
|
|
|
reimbursement/recoupment(3)(4) | % |
| 0.52 |
| 0.31 |
| (0.24 | ) | (0.59 | ) | (0.61 | ) | (0.11 | ) |
Portfolio turnover rate | % |
| 39 |
| 110 |
| 189 |
| 418 |
| 510 |
| 365 |
|
(1) Effective May 11, 2001, ING Investments, LLC began serving as Investment Manager to the Portfolio.
(2) Total return is calculated assuming reinvestment of all dividends and capital gain distributions at net asset value. Total returns for periods less than one year are not annualized.
(3) The Investment Manager has agreed to limit expenses, (excluding interest, taxes, brokerage and extraordinary expenses) subject to possible recoupment by ING Investments, LLC within three years.
(4) Annualized for periods less than one year.
See Accompanying Notes to Financial Statements
12
NOTE 1 — ORGANIZATION
Organization. USLICO Series Fund (the “Fund”) is an open-end, diversified management investment company registered under the Investment Company Act of 1940 and consists of four separate portfolios. The four portfolios of the Fund are as follows: The Asset Allocation Portfolio (“Asset Allocation Portfolio”), The Bond Portfolio (“Bond Portfolio”), The Money Market Portfolio (“Money Market Portfolio”) and The Stock Portfolio (“Stock Portfolio”). Each Portfolio has its own investment objectives and policies which are detailed in the Prospectus.
The following is a brief description of each Portfolio’s investment objective:
• Asset Allocation Portfolio seeks to obtain high total return with reduced risk over the long term by allocating its assets among stocks, bonds, and short-term instruments;
• Bond Portfolio seeks a high level of income consistent with prudent risk and the preservation of capital;
• Money Market Portfolio seeks maximum current income consistent with preservation of capital and maintenance of liquidity; and
• Stock Portfolio seeks intermediate and long-term growth of capital.
The Fund was organized as a business trust under the laws of Massachusetts on January 19, 1988. Shares of the Portfolio are sold only to separate accounts of ReliaStar Life Insurance Company (ReliaStar Life) and ReliaStar Life Insurance Company of New York (ReliaStar Life of New York, a wholly-owned subsidiary of ReliaStar Life) to serve as the investment medium for variable life insurance policies issued by these companies. The separate accounts invest in shares of one or more of the Portfolios, in accordance with allocation instructions received from policyowners. Each Portfolio share outstanding represents a beneficial interest in the respective Portfolio.
ING Investments, LLC (“ING Investments’’), an Arizona limited liability company, serves as the Investment Manager to the Portfolios. ING Investments has engaged ING Investment Management Co. (“ING IM’’), a Connecticut corporation, to serve as the Sub-Adviser to the Portfolios. ING Funds Distributor, LLC (the “Distributor”) is the principal underwriter of the Portfolios. ING Funds Services, LLC serves as the administrator to each Portfolio. ING Investments, ING IM, the Distributor and ING Funds Services, LLC are indirect, wholly-owned subsidiaries of ING Groep N.V. (“ING Groep”). ING Groep is one of the largest financial services organizations in the world, and offers an array of banking, insurance and asset management services to both individuals and institutional investors.
NOTE 2 — SIGNIFICANT ACCOUNTING POLICIES
The following significant accounting policies are consistently followed by the Portfolios in the preparation of their financial statements. Such policies are in conformity with accounting principles generally accepted in the United States of America for investment companies.
A. Security Valuation. Investments in equity securities traded on a national securities exchange are valued at the last reported sale price. Securities reported by NASDAQ are valued at the NASDAQ official closing prices. Securities traded on an exchange or NASDAQ for which there has been no sale and securities traded in the over-the-counter-market are valued at the mean between the last reported bid and ask prices. All investments quoted in foreign currencies will be valued daily in U.S. dollars on the basis of the foreign currency exchange rates prevailing at that time. Debt securities are valued at prices obtained from independent services or from one or more dealers making markets in the securities and may be adjusted based on the Portfolios’ valuation procedures. U.S. Government obligations are valued by using market quotations or independent pricing services that use prices provided by market-makers or estimates of market values obtained from yield data relating to instruments or securities with similar characteristics.
Securities and assets for which market quotations are not readily available (which may include certain restricted securities which are subject to limitations as to their sale) are valued at their fair values as determined in good faith by or under the supervision of the Board of Trustees (“Board”), in accordance with methods that are specifically authorized by the Board. Securities traded on exchanges, including foreign exchanges, which close earlier than the time that a Portfolio calculates its net asset value may also be valued at their fair values as determined in good faith by or under the supervision of the Board, in accordance with methods that are specifically authorized by the Board. If an event occurs after the time at which the market for foreign securities held by the Portfolio closes but before the time that the Portfolio’s NAV is calculated, such event may cause
13
NOTES TO FINANCIAL STATEMENTS AS OF JUNE 30, 2005 (UNAUDITED) (CONTINUED)
NOTE 2 — SIGNIFICANT ACCOUNTING POLICIES (continued)
the closing price on the foreign exchange to not represent a readily available reliable market value quotation for such securities at the time the Portfolio determines its NAV. In such a case, the Portfolio will use the fair value of such securities as determined under the Portfolio’s valuation procedures. Events after the close of trading on a foreign market that could require the Portfolio to fair value some or all of its foreign securities include, among others, securities trading in the U.S. and other markets, corporate announcements, natural and other disasters, and political and other events. Among other elements of analysis in the determination of a security’s fair value, the Board has authorized the use of one or more independent research services to assist with such determinations. An independent research service may use statistical analyses and quantitative models to help determine fair value as of the time a Portfolio calculates its NAV. There can be no assurance that such models accurately reflect the behavior of the applicable markets or the effect of the behavior of such markets on the fair value of securities, or that such markets will continue to behave in a fashion that is consistent with such models. Unlike the closing price of a security on an exchange, fair value determinations employ elements of judgment. Consequently, the fair value assigned to a security may not represent the actual value that the Portfolio could obtain if it were to sell the security at the time of the close of the NYSE. Pursuant to procedures adopted by the Board, the Portfolio is not obligated to use the fair valuations suggested by any research service, and valuation recommendations provided by such research services may be overridden if other events have occurred or if other fair valuations are determined in good faith to be more accurate. Unless an event is such that it causes the Portfolio to determine that the closing prices for one or more securities do not represent readily available reliable market value quotations at the time the Portfolio determines its NAV, events that occur between the time of the close of the foreign market on which they are traded and the close of regular trading on the NYSE will not be reflected in the Portfolio’s NAV. Investments in securities maturing in 60 days or less, as well as all securities in the Money Market Portfolio, are valued at amortized cost, which, when combined with accrued interest, approximates market value.
B. Security Transactions and Revenue Recognition. Securities transactions are accounted for on the trade date. Realized gains and losses are reported on the basis of identified cost of securities sold. Interest income is recorded on an accrual basis. Dividend income is recorded on the ex-dividend date, or for certain foreign securities, when the information becomes available to the Portfolios. Premium amortization and discount accretion are determined by the effective yield method.
C. Purchases and Sales. Purchases and sales of Portfolio shares are made on the basis of the net asset value per share prevailing at the close of business on the preceding business day.
D. Distributions to Shareholders. The Portfolios record distributions to their shareholders on ex-dividend date. Dividends from net investment income and capital gains, if any, are declared and paid annually by the Portfolios. The Portfolios may make distributions on a more frequent basis to comply with the distribution requirements of the Internal Revenue Code. The characteristics of income and gains to be distributed are determined in accordance with income tax regulations, which may differ from accounting principles generally accepted in the United States of America for investment companies.
E. Federal Income Taxes. It is the policy of the Portfolios to comply with subchapter M of the Internal Revenue Code and related excise tax provisions applicable to regulated investment companies and to distribute substantially all of their net investment income and any net realized capital gains to their shareholders. Therefore, no federal income tax provision is required. No capital gain distributions shall be made until any capital loss carryforwards have been fully utilized or expired.
F. Use of Estimates. Management of the Portfolios has made certain estimates and assumptions relating to the reporting of assets, liabilities, income, and expenses to prepare these financial statements in conformity with accounting principles generally accepted in the United States of America for investment companies. Actual results could differ from these estimates.
G. Repurchase Agreements. Each Portfolio may invest in repurchase agreements only with government securities dealers recognized by the Board of Governors of the Federal Reserve System. Under such agreements, the seller of the security agrees to repurchase it at a mutually agreed upon time and price. The resale price is in excess of the purchase price and reflects an agreed upon
14
NOTES TO FINANCIAL STATEMENTS AS OF JUNE 30, 2005 (UNAUDITED) (CONTINUED)
NOTE 2 — SIGNIFICANT ACCOUNTING POLICIES (continued)
interest rate for the period of time the agreement is outstanding. The period of the repurchase agreements is usually short, from overnight to one week, while the underlying securities generally have longer maturities. Each Portfolio will receive as collateral securities acceptable to it whose market value is equal to at least 100% of the carrying amount of the repurchase agreements, plus accrued interest, being invested by the Portfolio. The underlying collateral is valued daily on a mark to market basis to assure that the value, including accrued interest is at least equal to the repurchase price. There would be potential loss to the Portfolio in the event the Portfolio is delayed or prevented from exercising its right to dispose of the collateral, and it might incur disposition costs in liquidating the collateral.
H. Illiquid and Restricted Securities. The Portfolios may not invest more than 10% of their net assets in illiquid securities. Illiquid securities are not readily marketable. Disposing of illiquid investments may involve time-consuming negotiation and legal expenses, and it may be difficult or impossible for the Portfolios to sell them promptly at an acceptable price. Each Portfolio may also invest in restricted securities, which include those sold under Rule 144A of the Securities Act of 1933 (“1933 Act”) or securities offered pursuant to Section 4(2) of the 1933 Act, and/or are subject to legal or contractual restrictions on resale and may not be publicly sold without registration under the 1933 Act. Certain restricted securities may be considered liquid pursuant to procedures adopted by the Board or may be deemed to be illiquid because they may not be readily marketable. Illiquid and restricted securities are valued using market quotations when readily available. In the absence of market quotations, the securities are valued based upon their fair value determined under procedures approved by the Board.
I. Delayed Delivery Transactions. The Portfolios may purchase or sell securities on a when-issued or forward commitment basis. The price of the underlying securities and date when the securities will be delivered and paid for are fixed at the time the transaction is negotiated. The market value of such is identified in each Portfolio’s Portfolio of Investments. Losses may arise due to changes in the market value of the securities or from the inability of counterparties to meet the terms of the contract. In connection with such purchases, the Portfolios are required to segregate liquid assets sufficient to cover the purchase price.
J. Mortgage Dollar Roll Transactions. In connection with a Portfolio’s ability to purchase or sell securities on a when-issued basis, the Portfolios may engage in dollar roll transactions with respect to mortgage-backed securities issued by Government National Mortgage Association, Federal National Mortgage Association and Federal Home Loan Mortgage Corp. In a dollar roll transaction, a Portfolio sells a mortgage-backed security to a financial institution, such as a bank or broker/dealer, and simultaneously agrees to repurchase a substantially similar (i.e., same type, coupon, and maturity) security from the institution on a delayed delivery basis an agreed upon price. The mortgage-backed securities that are repurchased will bear the same interest rate as those sold, but generally will be collateralized by different pools of mortgages with different prepayment histories. The Portfolios account for dollar roll transactions as purchases and sales.
K. Options Contracts. Stock and Asset Allocation Portfolios may purchase put and call options and may write (sell) call options on debt and other securities in standardized contracts traded on national securities exchanges or boards of trade. Option contracts are valued daily and unrealized gains or losses are recorded based upon the last sales price on the principal exchange on which the options are traded. The Portfolios will realize a gain or loss upon the expiration or closing of the option contract. When an option is exercised, the proceeds on sales of the underlying security for a written call option, the purchase cost of the security for a written put option, or the cost of the security for a purchased put or call option is adjusted by the amount of premium received or paid. Realized and unrealized gains or losses on option contracts are reflected in the accompanying financial statements. The risk in writing a call option is that the Portfolios give up the opportunity for profit if the market price of the security increases and the option is exercised. The risk in writing a put option is that the Portfolios may incur a loss if the market price of the security decreases and the option is exercised. The risk in buying an option is that the Portfolios pay a premium whether or not the option is exercised. Risks may also arise from an illiquid secondary market or from the inability of counterparties to meet the terms of the contract.
15
NOTES TO FINANCIAL STATEMENTS AS OF JUNE 30, 2005 (UNAUDITED) (CONTINUED)
NOTE 3 — INVESTMENT TRANSACTIONS
For the six months ended June 30, 2005, the cost of purchases and the proceeds from the sales of securities, excluding short-term securities, were as follows:
|
| Purchases |
| Sales |
|
Asset Allocation Portfolio |
| $4,247,112 |
| $4,670,631 |
|
Bond Portfolio |
| 856,646 |
| 970,164 |
|
Stock Portfolio |
| 5,920,045 |
| 6,407,211 |
|
U.S. Government securities not included above were as follows:
|
| Purchases |
| Sales |
|
Asset Allocation Portfolio |
| $12,248,383 |
| $11,960,970 |
|
Bond Portfolio |
| 6,421,092 |
| 6,381,210 |
|
NOTE 4 — INVESTMENT MANAGEMENT AND ADMINISTRATIVE FEES
The Portfolios have entered into an Investment Management Agreement with ING Investments (the “Investment Manager”). The Investment Management Agreement compensates the Investment Manager with a fee, computed daily and payable monthly, based on the average daily net assets of each Portfolio, at the annual percentage rate of 0.50% on the first $100 million of average daily net assets and 0.45% of average daily net assets in excess thereof.
The Investment Manager entered into a Sub-Advisory Agreement with ING IM. Subject to such policies as the Board or the Investment Manager may determine, ING IM manages the Portfolios’ assets in accordance with the Portfolios’ investment objectives, policies, and limitations.
The Investment Manager has contractually agreed to limit management fees charged to each of the Portfolios to the extent they exceed 0.25% of the average daily net assets of each Portfolio. The insurance companies pay any management fees above that amount. The Investment Manager has also agreed to limit expenses of each Portfolio, excluding management fees, interest, taxes, brokerage and extraordinary expenses, that are subject to the limitation, to 0.65% of the average net assets of each Portfolio.
The Investment Manager may at a later date recoup from a Portfolio for management fees waived and other expenses assumed by the Investment Manager during the previous 36 months, but only if, after such reimbursement, the Portfolios’ expense ratio does not exceed the percentage described above. Waived and reimbursed fees net of any recoupment by the Investment Manager of such waived and reimbursed fees are reflected on the accompanying Statements of Operations.
As of June 30, 2005, the amounts of waived and reimbursed fees that are subject to possible recoupment by the Investment Manager and the related expiration dates are as follows:
|
| June 30, 2005, |
|
|
| ||||
|
| 2006 |
| 2007 |
| 2008 |
| Total |
|
Asset Allocation |
|
|
|
|
|
|
|
|
|
Portfolio |
| $16,730 |
| $ 9,644 |
| $1,350 |
| $29,576 |
|
Bond Portfolio |
| 8,271 |
| 15,651 |
| 5,654 |
| 27,724 |
|
Money Market |
|
|
|
|
|
|
|
|
|
Portfolio |
| 2,167 |
| 16,482 |
| 496 |
| 19,145 |
|
The Expense Limitation Agreement is contractual and shall renew automatically for one-year terms unless ING Investments provides written notice of the termination of the Expense Limitation Agreement within 90 days of the end of the then current term.
Effective January 1, 2005, pursuant to a side agreement, the Investment Manager has lowered the expense limit, exclusive of management fees, to 0.45% for the Money Market Portfolio through at least December 31, 2005. There is no guarantee that the side agreement will continue after that date. The side agreement will only renew if the Investment Manager elects to renew it. If after December 31, 2005, the Investment Manager elects not to renew the side agreement, the expense limit will revert to the limitation under the Money Market Portfolio’s current expense limitation agreement of 0.65%. Any fees waived pursuant to the side agreement shall not be eligible for recoupment.
Pursuant to an Administration Agreement, ING Funds Services, LLC (“IFS”) serves as administrator and provides certain administrative and shareholder services necessary for Portfolio operations and is responsible for the supervision of other service providers. IFS is entitled to receive from each Portfolio a fee at an annual rate of 0.10% of each Portfolio’s average daily net assets.
ING Funds Distributor, LLC serves as Distributor of the Portfolios. No fees are charged to the Portfolios for distribution services.
NOTE 5 — OTHER TRANSACTIONS WITH AFFILIATED AND RELATED PARTIES
At June 30, 2005, the Portfolios had the following amounts recorded in payable to affiliates on the accompanying Statements of Assets and Liabilities (see Note 4):
|
| Accrued |
| Accrued |
| Accrued |
| Total |
| ||||
Asset Allocation |
|
|
|
|
|
|
|
|
|
|
|
|
|
Portfolio |
| $2,704 |
|
| $1,082 |
|
| $ — |
|
| $3,786 |
|
|
Bond Portfolio |
| 591 |
|
| 237 |
|
| — |
|
| 828 |
|
|
Money Market |
|
|
|
|
|
|
|
|
|
|
|
|
|
Portfolio |
| 1,210 |
|
| 484 |
|
| — |
|
| 1,694 |
|
|
Stock Portfolio |
| 3,346 |
|
| 1,338 |
|
| 4,887 |
|
| 9,571 |
|
|
Each Portfolio has adopted a Retirement Policy covering all independent trustees of the Portfolio who will have served as an independent trustee for at least five years at the time of retirement. Benefits under this plan are based on an annual rate as defined in the plan agreement.
16
NOTES TO FINANCIAL STATEMENTS AS OF JUNE 30, 2005 (UNAUDITED) (CONTINUED)
NOTE 6 — OTHER ACCRUED EXPENSES AND LIABILITIES
At June 30, 2005, the Portfolios had the following payables included in Other Accrued Expenses and Liabilities that exceeded 5% of total liabilities on the Statements of Assets and Liabilities:
|
| Payable for |
| Payable for |
| Payable for |
| Payable for |
| ||||
Money Market |
|
|
|
|
|
|
|
|
|
|
|
|
|
Portfolio |
| $3,013 |
|
| $ 9,637 |
|
| $ 2,622 |
|
| $2,099 |
|
|
Stock Portfolio |
| 2,195 |
|
| 12,997 |
|
| 14,035 |
|
| 2,284 |
|
|
NOTE 7 — LINE OF CREDIT
The Portfolios, in addition to certain other funds managed by the Investment Manager, have entered into an unsecured committed revolving line of credit agreement (the “Credit Agreement”) with The Bank of New York for an aggregate amount of $125,000,000. The proceeds may be used to: (1) temporarily finance the purchase and sale of securities; (2) finance the redemption of shares of an investor in the funds; and (3) enable the funds to meet other emergency expenses as defined in the Credit Agreement. The funds to which the line of credit is available pay a commitment fee equal to 0.09% per annum on the daily unused portion of the committed line amount payable quarterly in arrears. During the six months ended June 30, 2005, the Portfolios did not utilize the line of credit.
NOTE 8 — CAPITAL SHARE TRANSACTIONS
Transactions in capital shares and dollars were as follows:
|
| Asset Allocation Portfolio |
| Bond Portfolio |
| ||||||||||||
|
| Six Months |
| Year |
| Six Months |
| Year |
| ||||||||
|
| Ended |
| Ended |
| Ended |
| Ended |
| ||||||||
|
| June 30, |
| December 31, |
| June 30, |
| December 31, |
| ||||||||
|
| 2005 |
| 2004 |
| 2005 |
| 2004 |
| ||||||||
(Number of Shares) |
|
|
|
|
|
|
|
|
|
|
|
|
| ||||
Shares sold |
| 7,208 |
|
| 6,072 |
|
| 105 |
|
| — |
|
| ||||
Dividends reinvested |
| 5,728 |
|
| 24,078 |
|
| 2,648 |
|
| 9,686 |
|
| ||||
Shares redeemed |
| (18,893 | ) |
| (136,003 | ) |
| (6,088 | ) |
| (25,175 | ) |
| ||||
Net decrease in shares outstanding |
| (5,957 | ) |
| (105,853 | ) |
| (3,335 | ) |
| (15,489 | ) |
| ||||
|
|
|
|
|
|
|
|
|
|
|
|
|
| ||||
($) |
|
|
|
|
|
|
|
|
|
|
|
|
| ||||
Shares sold |
| $ | 67,542 |
|
| $ | 57,686 |
|
| $ | 1,054 |
|
| $ | — |
|
|
Dividends reinvested |
| 53,269 |
|
| 221,813 |
|
| 26,063 |
|
| 95,495 |
|
| ||||
Shares redeemed |
| (179,684 | ) |
| (1,238,181 | ) |
| (60,518 | ) |
| (246,394 | ) |
| ||||
Net decrease |
| $ | (58,873 | ) |
| $ | (958,682 | ) |
| $ | (33,401 | ) |
| $ | (150,899 | ) |
|
|
|
|
|
|
|
|
|
|
|
|
|
|
| ||||
|
| Money Market Portfolio |
|
| Stock Portfolio |
|
| ||||||||||
|
| Six Months |
|
| Year |
|
| Six Months |
|
| Year |
|
| ||||
|
| Ended |
|
| Ended |
|
| Ended |
|
| Ended |
|
| ||||
|
| June 30, |
|
| December 31, |
|
| June 30, |
|
| December 31, |
|
| ||||
|
| 2005 |
|
| 2004 |
|
| 2005 |
|
| 2004 |
|
| ||||
(Number of Shares) |
|
|
|
|
|
|
|
|
|
|
|
|
| ||||
Shares sold |
| 176,177 |
|
| 17,915 |
|
| 17,645 |
|
| 75,289 |
|
| ||||
Shares reinvested |
| 56,351 |
|
| 28,447 |
|
| 2,969 |
|
| 11,004 |
|
| ||||
Shares redeemed |
| (12,203 | ) |
| (387,653 | ) |
| (4,790 | ) |
| (10,367 | ) |
| ||||
Net increase (decrease) in shares outstanding |
| 220,325 |
|
| (341,291 | ) |
| 15,824 |
|
| 75,926 |
|
| ||||
|
|
|
|
|
|
|
|
|
|
|
|
|
| ||||
($) |
|
|
|
|
|
|
|
|
|
|
|
|
| ||||
Shares sold |
| $ | 176,177 |
|
| $ | 17,915 |
|
| $ | 129,457 |
|
| $ | 536,541 |
|
|
Shares reinvested |
| 56,351 |
|
| 28,447 |
|
| 21,494 |
|
| 80,081 |
|
| ||||
Shares redeemed |
| (12,203 | ) |
| (387,653 | ) |
| (35,200 | ) |
| (70,495 | ) |
| ||||
Net increase (decrease) |
| $ | 220,325 |
|
| $ | (341,291 | ) |
| $ | 115,751 |
|
| $ | 546,127 |
|
|
NOTE 9 — FEDERAL INCOME TAXES
The amount of distributions from net investment income and net realized capital gains are determined in accordance with federal income tax regulations, which may differ from accounting principles generally accepted in the United States of America for investment companies. These book/tax differences may be either temporary or permanent. Permanent differences are reclassified within the capital accounts based on their federal tax-basis
17
NOTES TO FINANCIAL STATEMENTS AS OF JUNE 30, 2005 (UNAUDITED) (CONTINUED)
NOTE 9 — FEDERAL INCOME TAXES (continued)
treatment; temporary differences are not reclassified. Key differences include the treatment of short-term capital gains, foreign currency transactions, and wash sale deferrals. Distributions in excess of available earnings and profits, current and accumulated, for tax purposes are reported as distributions of paid-in capital.
The tax composition of dividends and distributions to shareholders was as follows:
|
| Six Months |
|
|
|
|
| |||
|
| Ended |
| Year Ended |
| |||||
|
| June 30, 2005 |
| December 31, 2004 |
| |||||
|
| Ordinary Income |
| Ordinary Income |
| Return of Capital |
| |||
Asset Allocation Portfolio |
| $53,269 |
|
| $221,813 |
|
| $ — |
|
|
Bond Portfolio |
| 26,063 |
|
| 95,495 |
|
| — |
|
|
Money Market Portfolio |
| 61,427 |
|
| 34,100 |
|
| — |
|
|
Stock Portfolio |
| 21,494 |
|
| 46,861 |
|
| 33,220 |
|
|
The tax-basis components of distributable earnings and the expiration dates of the capital loss carryforwards which may be used to offset future realized capital gains for federal income tax purposes as of December 31, 2004 were as follows:
|
| Undistributed |
| Undistributed |
| Unrealized |
| Post October |
| Capital |
|
|
| |||||
|
| Ordinary |
| Long-term |
| Appreciation |
| Capital Losses |
| Loss |
| Expiration |
| |||||
|
| Income |
| Capital Gain |
| (Depreciation) |
| Deferred |
| Carryforwards |
| Dates |
| |||||
Asset Allocation Portfolio |
| $ — |
|
| $— |
|
| $ 1,191,614 |
| $— |
|
| $ | (3,474,216 | ) | 2009 |
| |
|
|
|
|
|
|
|
|
|
|
|
|
| (1,293,099 | ) | 2010 |
| ||
|
|
|
|
|
|
|
|
|
|
|
|
| $ | (4,767,315 | ) |
|
| |
Bond Portfolio |
| 293 |
|
| — |
|
| 3,200 |
| — |
|
| $ | (56,771 | ) | 2009 |
| |
|
|
|
|
|
|
|
|
|
|
|
|
| (14,250 | ) | 2010 |
| ||
|
|
|
|
|
|
|
|
|
|
|
|
| $ | (71,021 | ) |
|
| |
Money Market Portfolio |
| 6,972 |
|
| — |
|
| — |
| — |
|
| $ | (69 | ) | 2011 |
| |
|
|
|
|
|
|
|
|
|
|
|
|
| (644 | ) | 2012 |
| ||
|
|
|
|
|
|
|
|
|
|
|
|
| $ | (713 | ) |
|
| |
Stock Portfolio |
| — |
|
| — |
|
| 2,147,146 |
| — |
|
| $ | (11,325,965 | ) | 2009 |
| |
|
|
|
|
|
|
|
|
|
|
|
|
| (3,543,083 | ) | 2010 |
| ||
|
|
|
|
|
|
|
|
|
|
|
|
| $ | (14,869,048 | ) |
|
| |
NOTE 10 — ILLIQUID SECURITIES
Pursuant to guidelines adopted by the Portfolios’ Board, the following securities have been deemed to be illiquid. The Portfolios currently limit investment in illiquid securities to 10% of the Portfolios’ net assets, at market value, at time of purchase. Fair value for these securities was determined by ING Funds Valuation Committee appointed by the Portfolio’s Board of Directors/Trustees.
|
|
|
|
|
| Initial |
|
|
|
|
| Percent |
| ||
|
|
|
| Principal |
| Acquisition |
|
|
|
|
| of Net |
| ||
Portfolio |
| Security |
| Amount |
| Portfolio |
| Cost |
| Value |
| Assets |
| ||
Asset Allocation |
|
|
|
|
|
|
|
|
|
|
|
|
| ||
Portfolio |
| United Cos. Financial Corp., 0.000%, |
|
|
|
|
|
|
|
|
|
|
| ||
|
| due 11/02/99 |
| $200,000 |
| 11/07/01 |
| $ | — |
| $ | — |
| 0.0 | % |
|
|
|
|
|
|
|
| $ | — |
| $ | — |
| 0.0 | % |
Bond Portfolio |
| Federal National Mortgage Association, |
|
|
|
|
|
|
|
|
|
|
| ||
|
| 3.583%, due 07/01/27 |
| $1,321 |
| 10/02/97 |
| $ | 1,340 |
| $ | 1,359 |
| 0.0 | % |
|
| United Cos. Financial Corp., 0.000%, |
|
|
|
|
|
|
|
|
|
|
| ||
|
| due 11/02/99 |
| 100,000 |
| 11/07/01 |
| — |
| — |
| 0.0 | % | ||
|
|
|
|
|
|
|
| $ | 1,340 |
| $ | 1,359 |
| 0.0 | % |
18
NOTES TO FINANCIAL STATEMENTS AS OF JUNE 30, 2005 (UNAUDITED) (CONTINUED)
NOTE 11 — INFORMATION REGARDING TRADING OF ING’S U.S. MUTUAL FUNDS
ING Investments, LLC (“Investments”), the adviser to the ING Funds, has reported to the Boards of Directors/Trustees (the “Board”) of the ING Funds that, like many U.S. financial services companies, Investments and certain of its U.S. affiliates have received informal and formal requests for information since September 2003 from various governmental and self-regulatory agencies in connection with investigations related to mutual funds and variable insurance products. Investments has advised the Board that it and its affiliates have cooperated fully with each request.
In addition to responding to regulatory and governmental requests, Investments reported that management of U.S. affiliates of ING Groep N.V., including Investments (collectively, “ING”), on their own initiative, have conducted, through independent special counsel and a national accounting firm, an extensive internal review of trading in ING insurance, retirement, and mutual fund products. The goal of this review was to identify any instances of inappropriate trading in those products by third parties or by ING investment professionals and other ING personnel. ING’s internal review related to mutual fund trading is now substantially completed. ING has reported that, of the millions of customer relationships that ING maintains, the internal review identified several isolated arrangements allowing third parties to engage in frequent trading of mutual funds within ING’s variable insurance and mutual fund products, and identified other circumstances where frequent trading occurred, despite measures taken by ING intended to combat market timing. ING further reported that each of these arrangements has been terminated and fully disclosed to regulators. The results of the internal review were also reported to the independent members of the Board.
Investments has advised the Board that most of the identified arrangements were initiated prior to ING’s acquisition of the businesses in question in the U.S. Investments further reported that the companies in question did not receive special benefits in return for any of these arrangements, which have all been terminated.
Based on the internal review, Investments has advised the Board that the identified arrangements do not represent a systemic problem in any of the companies that were involved.
More specifically, Investments reported to the Board that, at this time, these instances include the following:
• ING has identified three arrangements, dating from 1995, 1996 and 1998, under which the administrator to the then-Pilgrim Funds, which subsequently became part of the ING Funds, entered formal and informal arrangements that permitted frequent trading. ING Funds Distributor, LLC (“IFD”) has received a notice from the staff of the NASD informing IFD that it has made a preliminary determination to recommend that disciplinary action be brought against IFD and one of its registered persons for violations of the NASD Conduct Rules and certain provisions of the federal securities laws in connection with these arrangements.
• Aeltus Investment Management, Inc. (a predecessor entity to ING Investment Management Co.) has identified two investment professionals who engaged in extensive frequent trading in certain ING Funds. One was subsequently terminated for cause and incurred substantial financial penalties in connection with this conduct and the second has been disciplined.
• ReliaStar Life Insurance Company (“ReliaStar”) entered into agreements seven years ago permitting the owner of policies issued by the insurer to engage in frequent trading and to submit orders until 4pm Central Time. In 2001 ReliaStar also entered into a selling agreement with a broker-dealer that engaged in frequent trading. Employees of ING affiliates were terminated and/or disciplined in connection with these matters.
• In 1998, Golden American Life Insurance Company entered into arrangements permitting a broker-dealer to frequently trade up to certain specific limits in a fund available in an ING variable annuity product. No employee responsible for this arrangement remains at the company.
For additional information regarding these matters, you may consult the Form 8-K for each of four life insurance companies, ING USA Annuity and Life Insurance Company, ING Life Insurance and Annuity Company, ING Insurance Company of America, and ReliaStar Life Insurance Company of New York, each filed with the Securities and Exchange Commission (the “SEC”) on September 9, 2004. These Forms 8-K can be accessed
19
NOTES TO FINANCIAL STATEMENTS AS OF JUNE 30, 2005 (UNAUDITED) (CONTINUED)
NOTE 11 — INFORMATION REGARDING TRADING OF ING’S U.S. MUTUAL FUNDS (continued)
through the SEC’s Web site at http://www.sec.gov. Despite the extensive internal review conducted through independent special counsel and a national accounting firm, there can be no assurance that the instances of inappropriate trading reported to the Board are the only instances of such trading respecting the ING Funds. Investments reported to the Board that ING is committed to conducting its business with the highest standards of ethical conduct with zero tolerance for noncompliance.
Accordingly, Investments advised the Board that ING management was disappointed that its voluntary internal review identified these situations. Viewed in the context of the breadth and magnitude of its U.S. business as a whole, ING management does not believe that ING’s acquired companies had systemic ethical or compliance issues in these areas. Nonetheless, Investments reported that given ING’s refusal to tolerate any lapses, it has taken the steps noted below, and will continue to seek opportunities to further strengthen the internal controls of its affiliates.
• ING has agreed with the ING Funds to indemnify and hold harmless the ING Funds from all damages resulting from wrongful conduct by ING or its employees or from ING’s internal investigation, any investigations conducted by any governmental or self-regulatory agencies, litigation or other formal proceedings, including any proceedings by the Securities and Exchange Commission. Investments reported to the Board that ING management believes that the total amount of any indemnification obligations will not be material to ING or its U.S. business.
• ING updated its Code of Conduct for employees reinforcing its employees’ obligation to conduct personal trading activity consistent with the law, disclosed limits, and other requirements.
• The ING Funds, upon a recommendation from ING, updated their respective Codes of Ethics applicable to investment professionals with ING entities and certain other fund personnel, requiring such personnel to pre-clear any purchases or sales of ING Funds that are not systematic in nature (i.e., dividend reinvestment), and imposing minimum holding periods for shares of ING Funds.
• ING instituted excessive trading policies for all customers in its variable insurance and retirement products and for shareholders of the ING Funds sold to the public through financial intermediaries. ING does not make exceptions to these policies.
• ING reorganized and expanded its U.S. Compliance Department, and created an Enterprise Compliance team to enhance controls and consistency in regulatory compliance.
NOTE 12 — SUBSEQUENT EVENTS
Dividends: Subsequent to June 30, 2005, the Portfolios declared dividends and distributions of:
|
| Per Share Amount |
|
|
|
|
|
|
| Net Investment |
|
|
|
|
|
|
| Income |
| Payable Date |
| Record Date |
|
Asset Allocation |
|
|
|
|
|
|
|
Portfolio |
| $0.0438 |
| July 6, 2005 |
| June 30, 2005 |
|
Bond Portfolio |
| $0.0766 |
| July 6, 2005 |
| June 30, 2005 |
|
Money Market |
|
|
|
|
|
|
|
Portfolio |
| $0.0022 |
| August 1, 2005 |
| Daily |
|
Stock Portfolio |
| $0.0120 |
| July 6, 2005 |
| June 30, 2005 |
|
20
|
| |
THE USLICO ASSET ALLOCATION PORTFOLIO | AS OF JUNE 30, 2005 (UNAUDITED) |
|
Investment Types*
as of June 30, 2005
(as a percent of net assets)
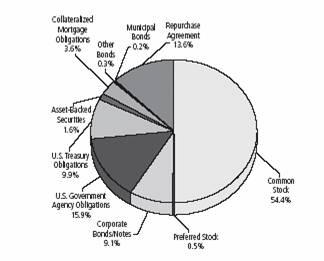
* Excludes other assets and liabilities of -9.1% of net assets.
Portfolio holdings are subject to change daily.
Shares |
|
|
|
|
| Value |
| |
|
|
|
| |||||
COMMON STOCK: 54.4% |
|
|
| |||||
|
|
|
| Aerospace/Defense: 1.9% |
|
|
| |
915 |
|
|
| Boeing Co. |
| $ | 60,390 |
|
825 |
|
|
| General Dynamics Corp. |
| 90,371 |
| |
1,810 |
|
|
| United Technologies Corp. |
| 92,943 |
| |
|
|
|
|
|
| 243,704 |
| |
|
|
|
| Agriculture: 0.6% |
|
|
| |
1,285 |
|
|
| Altria Group, Inc. |
| 83,088 |
| |
|
|
|
|
|
| 83,088 |
| |
|
|
|
| Banks: 2.1% |
|
|
| |
1,835 |
|
|
| Bank of America Corp. |
| 83,694 |
| |
2,690 |
|
|
| U.S. Bancorp |
| 78,548 |
| |
1,810 |
|
|
| Wells Fargo & Co. |
| 111,460 |
| |
|
|
|
|
|
| 273,702 |
| |
|
|
|
| Beverages: 0.9% |
|
|
| |
800 |
|
|
| Anheuser-Busch Cos., Inc. |
| 36,600 |
| |
1,565 |
|
|
| PepsiCo, Inc. |
| 84,400 |
| |
|
|
|
|
|
| 121,000 |
| |
|
|
|
| Biotechnology: 0.9% |
|
|
| |
1,015 |
| @ |
| Amgen, Inc. |
| 61,367 |
| |
1,465 |
| @ |
| Celgene Corp. |
| 59,728 |
| |
|
|
|
|
|
| 121,095 |
| |
|
|
|
| Chemicals: 2.4% |
|
|
| |
1,210 |
|
|
| Air Products & Chemicals, Inc. |
| 72,963 |
| |
1,515 |
|
|
| Dow Chemical Co. |
| 67,463 |
| |
2,200 |
|
|
| E.I. du Pont EI de Nemours & Co. |
| 94,622 |
| |
1,650 |
|
|
| Praxair, Inc. |
| 76,890 |
| |
|
|
|
|
|
| 311,938 |
| |
|
|
|
| Computers: 2.4% |
|
|
| |
2,250 |
| @ |
| Dell, Inc. |
| $ | 88,898 |
|
7,410 |
| @ |
| EMC Corp. |
| 101,591 |
| |
1,565 |
|
|
| International Business |
|
|
| |
|
|
|
| Machines Corp. |
| 116,123 |
| |
|
|
|
|
|
| 306,612 |
| |
|
|
|
| Cosmetics/Personal Care: 0.6% |
|
|
| |
1,400 |
|
|
| Procter & Gamble Co. |
| 73,850 |
| |
|
|
|
|
|
| 73,850 |
| |
|
|
|
| Diversified Financial Services: 4.4% |
|
|
| |
4,375 |
|
|
| Citigroup, Inc. |
| 202,256 |
| |
1,650 |
|
|
| Goldman Sachs Group, Inc. |
| 168,333 |
| |
1,600 |
|
|
| Lehman Brothers Holdings, Inc. |
| 158,848 |
| |
770 |
|
|
| Morgan Stanley |
| 40,402 |
| |
|
|
|
|
|
| 569,839 |
| |
|
|
|
| Electric: 0.8% |
|
|
| |
2,195 |
|
|
| Consolidated Edison, Inc. |
| 102,814 |
| |
|
|
|
|
|
| 102,814 |
| |
|
|
|
| Electronics: 0.3% |
|
|
| |
1,575 |
| @ |
| Agilent Technologies, Inc. |
| 36,257 |
| |
|
|
|
|
|
| 36,257 |
| |
|
|
|
| Healthcare-Products: 3.8% |
|
|
| |
3,000 |
|
|
| Baxter Intl., Inc. |
| 111,300 |
| |
1,755 |
| @ |
| Inamed Corp. |
| 117,532 |
| |
2,085 |
|
|
| Johnson & Johnson |
| 135,526 |
| |
1,060 |
|
|
| Medtronic, Inc. |
| 54,897 |
| |
966 |
| @ |
| Zimmer Holdings, Inc. |
| 73,580 |
| |
|
|
|
|
|
| 492,835 |
| |
|
|
|
| Healthcare-Services: 0.7% |
|
|
| |
1,230 |
| @ |
| WellPoint, Inc. |
| 85,657 |
| |
|
|
|
|
|
| 85,657 |
| |
|
|
|
| Insurance: 1.2% |
|
|
| |
2,780 |
|
|
| American Intl. Group, Inc. |
| 161,518 |
| |
|
|
|
|
|
| 161,518 |
| |
|
|
|
| Internet: 1.5% |
|
|
| |
5,735 |
| @ |
| Yahoo!, Inc. |
| 198,718 |
| |
|
|
|
|
|
| 198,718 |
| |
|
|
|
| Investment Companies: 1.0% |
|
|
| |
2,470 |
|
|
| iShares Goldman Sachs |
|
|
| |
|
|
|
| Semiconductor Index Fund |
| 130,218 |
| |
|
|
|
|
|
| 130,218 |
| |
|
|
|
| Leisure Time: 0.9% |
|
|
| |
2,085 |
| @@ |
| Carnival Corp. |
| 113,737 |
| |
|
|
|
|
|
| 113,737 |
| |
|
|
|
| Lodging: 1.3% |
|
|
| |
1,650 |
|
|
| Marriott Intl., Inc. |
| 112,563 |
| |
965 |
|
|
| Starwood Hotels & Resorts |
|
|
| |
|
|
|
| Worldwide, Inc. |
| 56,520 |
| |
|
|
|
|
|
| 169,083 |
| |
|
|
|
| Media: 1.5% |
|
|
| |
1,400 |
| @ |
| Cablevision Systems Corp. |
| 45,080 |
| |
4,400 |
| @ |
| Time Warner, Inc. |
| 73,524 |
| |
See Accompanying Notes to Financial Statements
21
| PORTFOLIO OF INVESTMENTS |
|
THE USLICO ASSET ALLOCATION PORTFOLIO | AS OF JUNE 30, 2005 (UNAUDITED) (CONTINUED) |
|
Shares |
|
|
|
|
| Value |
| |
|
|
|
| Media (continued) |
|
|
| |
2,935 |
|
|
| Walt Disney Co. |
| $ | 73,903 |
|
|
|
|
|
|
| 192,507 |
| |
|
|
|
| Mining: 0.8% |
|
|
| |
4,035 |
|
|
| Alcoa, Inc. |
| 105,435 |
| |
|
|
|
|
|
| 105,435 |
| |
|
|
|
| Miscellaneous Manufacturing: 3.8% |
|
|
| |
855 |
|
|
| 3M Co. |
| 61,817 |
| |
1,500 |
|
|
| Danaher Corp. |
| 78,510 |
| |
8,015 |
|
|
| General Electric Co. |
| 277,719 |
| |
2,600 |
| @@ |
| Tyco Intl. Ltd. |
| 75,920 |
| |
|
|
|
|
|
| 493,966 |
| |
|
|
|
| Oil and Gas: 4.5% |
|
|
| |
2,100 |
|
|
| ChevronTexaco Corp. |
| 117,432 |
| |
3,900 |
|
|
| Exxon Mobil Corp. |
| 224,133 |
| |
4,085 |
| @,@@ |
| Nabors Industries, Ltd. |
| 247,633 |
| |
|
|
|
|
|
| 589,198 |
| |
|
|
|
| Oil and Gas Services: 0.6% |
|
|
| |
1,511 |
|
|
| Baker Hughes, Inc. |
| 77,303 |
| |
|
|
|
|
|
| 77,303 |
| |
|
|
|
| Pharmaceuticals: 5.8% |
|
|
| |
885 |
|
|
| Allergan, Inc. |
| 75,437 |
| |
2,250 |
| @ |
| Barr Laboratories, Inc. |
| 109,665 |
| |
905 |
|
|
| Eli Lilly & Co. |
| 50,418 |
| |
2,580 |
| @ |
| Gilead Sciences, Inc. |
| 113,494 |
| |
5,130 |
|
|
| Pfizer, Inc. |
| 141,484 |
| |
4,490 |
| @@ |
| Teva Pharmaceutical |
|
|
| |
|
|
|
| Industries Ltd. ADR |
| 139,819 |
| |
2,710 |
|
|
| Wyeth |
| 120,595 |
| |
|
|
|
|
|
| 750,912 |
| |
|
|
|
| Retail: 4.7% |
|
|
| |
1,095 |
|
|
| Best Buy Co., Inc. |
| 75,062 |
| |
3,880 |
|
|
| CVS Corp. |
| 112,792 |
| |
1,915 |
|
|
| Dollar General Corp. |
| 38,989 |
| |
1,895 |
|
|
| Nordstrom, Inc. |
| 128,803 |
| |
1,675 |
|
|
| Target Corp. |
| 91,137 |
| |
3,485 |
|
|
| Wal-Mart Stores, Inc. |
| 167,976 |
| |
|
|
|
|
|
| 614,759 |
| |
|
|
|
| Semiconductors: 2.1% |
|
|
| |
4,555 |
|
|
| Intel Corp. |
| 118,703 |
| |
975 |
| @,@@ |
| Marvell Technology Group Ltd. |
| 37,089 |
| |
2,955 |
|
|
| Maxim Integrated Products, Inc. |
| 112,911 |
| |
|
|
|
|
|
| 268,703 |
| |
|
|
|
| Software: 1.3% |
|
|
| |
6,725 |
|
|
| Microsoft Corp. |
| 167,049 |
| |
|
|
|
|
|
| 167,049 |
| |
|
|
|
| Telecommunications: 1.6% |
|
|
| |
2,910 |
| @ |
| Cisco Systems, Inc. |
| 55,610 |
| |
2,200 |
|
|
| QUALCOMM, Inc. |
| 72,622 |
| |
3,245 |
|
|
| SBC Communications, Inc. |
| 77,069 |
| |
|
|
|
|
|
| 205,301 |
| |
|
|
|
| Total Common Stock |
|
|
| |
|
|
|
| (Cost $6,276,606) |
| 7,060,798 |
| |
|
|
|
| |||||
PREFERRED STOCK: 0.5% |
|
|
| |||||
|
|
|
| |||||
|
|
|
| Banks: 0.2% |
|
|
| |
3 |
| @,#,C |
| DG Funding Trust |
| $ | 32,269 |
|
|
|
|
|
|
| 32,269 |
| |
|
|
|
| Diversified Financial Services: 0.1% |
|
|
| |
325 |
| @,C |
| National Rural Utilities |
|
|
| |
|
|
|
| Cooperative Finance Corp. |
| 8,054 |
| |
|
|
|
|
|
| 8,054 |
| |
|
|
|
| Electric: 0.0% |
|
|
| |
200 |
| @ |
| TECO Energy, Inc. |
| 5,108 |
| |
|
|
|
|
|
| 5,108 |
| |
|
|
|
| Insurance: 0.2% |
|
|
| |
960 |
| @,@@ |
| Aegon NV |
| 24,259 |
| |
|
|
|
|
|
| 24,259 |
| |
|
|
|
| Total Preferred Stock |
|
|
| |
|
|
|
| (Cost $69,845) |
| 69,690 |
| |
Principal |
|
|
|
|
| Value |
| |
|
|
|
| |||||
CORPORATE BONDS/NOTES: 9.1% |
|
|
| |||||
|
|
|
| |||||
|
|
|
| Agriculture: 0.0% |
|
|
| |
$ | 5,000 |
| # |
| R.J. Reynolds Tobacco |
|
|
|
|
|
|
| Holdings, Inc., |
|
|
| |
|
|
|
| 6.500%, due 07/15/10 |
| 5,013 |
| |
|
|
|
|
|
| 5,013 |
| |
|
|
|
| Auto Manufacturers: 0.0% |
|
|
| |
2,000 |
|
|
| Ford Motor Co., |
|
|
| |
|
|
|
| 7.450%, due 07/16/31 |
| 1,674 |
| |
3,000 |
|
|
| General Motors Corp., |
|
|
| |
|
|
|
| 7.400%, due 09/01/25 |
| 2,317 |
| |
|
|
|
|
|
| 3,991 |
| |
|
|
|
| Banks: 2.3% |
|
|
| |
10,000 |
| @@,C |
| Australia & New Zealand |
|
|
| |
|
|
|
| Banking Group Ltd., |
|
|
| |
|
|
|
| 3.556%, due 10/29/49 |
| 8,605 |
| |
10,000 |
| @@,# |
| Banco Santander Santiago |
|
|
| |
|
|
|
| Chile SA, 3.720%, due 12/09/09 |
| 10,032 |
| |
13,000 |
| @@ |
| Banco Santander Santiago |
|
|
| |
|
|
|
| Chile SA, 7.375%, due 07/18/12 |
| 15,008 |
| |
10,000 |
| @@,C |
| Bank of Ireland, 3.689%, |
|
|
| |
|
|
|
| due 12/29/49 |
| 8,789 |
| |
10,000 |
| @@ |
| Bank of Nova Scotia, 2.318%, |
|
|
| |
|
|
|
| due 08/31/85 |
| 8,528 |
| |
13,000 |
|
|
| BankAmerica Capital II, 8.000%, |
|
|
| |
|
|
|
| due 12/15/26 |
| 14,059 |
| |
7,000 |
| @@,# |
| Chuo Mitsui Trust & Banking |
|
|
| |
|
|
|
| Co., Ltd., 5.506%, due 04/15/49 |
| 6,890 |
| |
8,000 |
| @@,#,C |
| Danske Bank A/S, 5.914%, |
|
|
| |
|
|
|
| due 12/29/49 |
| 8,626 |
| |
10,000 |
| @@,C |
| Den Norske Bank ASA, 3.250%, |
|
|
| |
|
|
|
| due 08/29/49 |
| 8,350 |
| |
9,000 |
| @@,#,C |
| First Citizens St. Lucia Ltd., 5.460%, |
|
|
| |
|
|
|
| due 02/01/12 |
| 9,145 |
| |
9,000 |
| @@,#,C |
| HBOS Capital Funding LP, 6.071%, |
|
|
| |
|
|
|
| due 06/30/49 |
| 9,732 |
| |
30,000 |
| @@,C |
| HSBC Bank PLC, 3.788%, |
|
|
| |
|
|
|
| due 06/29/49 |
| 26,670 |
| |
See Accompanying Notes to Financial Statements
22
| PORTFOLIO OF INVESTMENTS |
|
THE USLICO ASSET ALLOCATION PORTFOLIO | AS OF JUNE 30, 2005 (UNAUDITED) (CONTINUED) |
|
Principal |
|
|
|
|
| Value |
| ||
|
|
|
| Banks (continued) |
|
|
| ||
$ | 20,000 |
| @@,C |
| Lloyds TSB Bank PLC, 3.230%, |
|
|
| |
|
|
|
| due 08/29/49 |
| $ | 17,380 |
| |
14,000 |
| #,C |
| M&T Bank Corp., 3.850%, |
|
|
| ||
|
|
|
| due 04/01/13 |
| 13,843 |
| ||
10,000 |
| C |
| Mellon Capital I, 7.720%, |
|
|
| ||
|
|
|
| due 12/01/26 |
| 10,743 |
| ||
20,000 |
| @@,C |
| National Australia Bank Ltd., |
|
|
| ||
|
|
|
| 3.514%, due 10/29/49 |
| 17,856 |
| ||
5,000 |
| C |
| NB Capital Trust, 7.830%, |
|
|
| ||
|
|
|
| due 12/15/26 |
| 5,393 |
| ||
4,000 |
| C |
| NB Capital Trust IV, 8.250%, |
|
|
| ||
|
|
|
| due 04/15/27 |
| 4,376 |
| ||
11,000 |
|
|
| PNC Funding Corp., 4.500%, |
|
|
| ||
|
|
|
| due 03/10/10 |
| 11,071 |
| ||
19,000 |
| #,C |
| Rabobank Capital Funding II, |
|
|
| ||
|
|
|
| 5.260%, due 12/29/49 |
| 19,580 |
| ||
20,000 |
| @@ |
| Royal Bank of Scotland |
|
|
| ||
|
|
|
| Group PLC, 3.813%, |
|
|
| ||
|
|
|
| due 12/29/49 |
| 17,643 |
| ||
10,000 |
| @@,C |
| Societe Generale, 3.625%, |
|
|
| ||
|
|
|
| due 11/29/49 |
| 8,815 |
| ||
30,000 |
| @@,C |
| Standard Chartered PLC, |
|
|
| ||
|
|
|
| 3.750%, due 11/29/49 |
| 23,925 |
| ||
10,000 |
| @@,C |
| Standard Chartered PLC, |
|
|
| ||
|
|
|
| 3.813%, due 07/29/49 |
| 8,025 |
| ||
200,000 |
| #,I,X,** |
| United Companies |
|
|
| ||
|
|
|
| Financial Corp., 0.000%, |
|
|
| ||
|
|
|
| due 11/02/99 |
| — |
| ||
10,000 |
| @@,C |
| Westpac Banking Corp., 3.556%, |
|
|
| ||
|
|
|
| due 09/30/49 |
| 8,678 |
| ||
|
|
|
|
|
| 301,762 |
| ||
|
|
|
| Beverages: 0.2% |
|
|
| ||
10,000 |
| @@ |
| Cia Brasileira de Bebidas, |
|
|
| ||
|
|
|
| 8.750%, due 09/15/13 |
| 11,613 |
| ||
8,000 |
| @@ |
| Cia Brasileira de Bebidas, |
|
|
| ||
|
|
|
| 10.500%, due 12/15/11 |
| 9,920 |
| ||
|
|
|
|
|
| 21,533 |
| ||
|
|
|
| Chemicals: 0.2% |
|
|
| ||
4,000 |
| @@,# |
| Sociedad Quimica y Minera de |
|
|
| ||
|
|
|
| Chile SA, 7.700%, due 09/15/06 |
| 4,078 |
| ||
21,000 |
|
|
| Union Carbide Corp., |
|
|
| ||
|
|
|
| 7.750%, due 10/01/96 |
| 23,121 |
| ||
|
|
|
|
|
| 27,199 |
| ||
|
|
|
| Diversified Financial Services: 1.6% |
|
|
| ||
3,670 |
| @@,#,C |
| Arcel Finance Ltd., 5.984%, |
|
|
| ||
|
|
|
| due 02/01/09 |
| 3,770 |
| ||
9,000 |
| @@,# |
| Arcel Finance Ltd., 6.361%, |
|
|
| ||
|
|
|
| due 05/01/12 |
| 9,042 |
| ||
9,000 |
| @@,#,C |
| Arcel Finance Ltd., 7.048%, |
|
|
| ||
|
|
|
| due 09/01/11 |
| 9,347 |
| ||
22,000 |
| @@,# |
| Brazilian Merchant Voucher |
|
|
| ||
|
|
|
| Receivables Ltd., 5.911%, |
|
|
| ||
|
|
|
| due 06/15/11 |
| 22,330 |
| ||
9,000 |
| C |
| Citigroup Capital II, 7.750%, |
|
|
| ||
|
|
|
| due 12/01/36 |
| 9,638 |
| ||
18,000 |
| #,C |
| Corestates Capital Trust I, |
|
|
| ||
|
|
|
| 8.000%, due 12/15/26 |
| 19,503 |
| ||
5,000 |
| @@,C |
| Financiere CSFB NV, 3.625%, |
|
|
| ||
|
|
|
| due 03/29/49 |
| 4,295 |
| ||
3,000 |
|
|
| Ford Motor Credit Co., 7.875%, |
|
|
| ||
|
|
|
| due 06/15/10 |
| 2,968 |
| ||
$ | 3,000 |
|
|
| General Motors Acceptance Corp., |
|
|
| |
|
|
|
| 7.250%, due 03/02/11 |
| $ | 2,816 |
| |
11,000 |
|
|
| Goldman Sachs Group, Inc., |
|
|
| ||
|
|
|
| 3.538%, due 03/02/10 |
| 10,992 |
| ||
10,000 |
|
|
| HSBC Finance Corp., 5.000%, |
|
|
| ||
|
|
|
| due 06/30/15 |
| 10,098 |
| ||
9,000 |
| # |
| HVB Funding Trust I, 8.741%, |
|
|
| ||
|
|
|
| due 06/30/31 |
| 12,341 |
| ||
4,000 |
| # |
| HVB Funding Trust III, 9.000%, |
|
|
| ||
|
|
|
| due 10/22/31 |
| 5,629 |
| ||
5,000 |
|
|
| International Lease Finance Corp., |
|
|
| ||
|
|
|
| 5.000%, due 04/15/10 |
| 5,104 |
| ||
10,000 |
| C |
| JPM Capital Trust I, 7.540%, |
|
|
| ||
|
|
|
| due 01/15/27 |
| 10,777 |
| ||
11,000 |
| C |
| JPM Capital Trust II, 7.950%, |
|
|
| ||
|
|
|
| due 02/01/27 |
| 11,955 |
| ||
15,000 |
| #,C |
| Mangrove Bay Pass-Through |
|
|
| ||
|
|
|
| Trust, 6.102%, due 07/15/33 |
| 15,465 |
| ||
10,000 |
| @@ |
| Paribas, 3.555%, due 12/31/49 |
| 8,904 |
| ||
23,401 |
| @@,C,# |
| PF Export Receivables Master |
|
|
| ||
|
|
|
| Trust, 6.436%, due 06/01/15 |
| 24,010 |
| ||
7,000 |
| @@,C |
| UFJ Finance Aruba AEC, 8.750%, |
|
|
| ||
|
|
|
| due 11/29/49 |
| 7,747 |
| ||
|
|
|
|
|
| 206,731 |
| ||
|
|
|
| Electric: 1.2% |
|
|
| ||
18,000 |
| C |
| Consumers Energy Co., 4.250%, |
|
|
| ||
|
|
|
| due 04/15/08 |
| 17,988 |
| ||
4,000 |
| C |
| Consumers Energy Co., 5.150%, |
|
|
| ||
|
|
|
| due 02/15/17 |
| 4,045 |
| ||
1,000 |
| @@,# |
| Empresa Nacional de Electricidad |
|
|
| ||
|
|
|
| SA/Chile, 8.500%, due 04/01/09 |
| 1,113 |
| ||
12,000 |
| @@,# |
| Empresa Nacional de Electricidad |
|
|
| ||
|
|
|
| SA/Chile, 8.625%, due 08/01/15 |
| 14,370 |
| ||
12,000 |
| C |
| Enterprise Capital Trust II, 4.710%, |
|
|
| ||
|
|
|
| due 06/30/28 |
| 11,900 |
| ||
12,000 |
| C |
| FirstEnergy Corp., 6.450%, |
|
|
| ||
|
|
|
| due 11/15/11 |
| 13,129 |
| ||
20,000 |
| C |
| FirstEnergy Corp., 7.375%, |
|
|
| ||
|
|
|
| due 11/15/31 |
| 24,527 |
| ||
7,000 |
| #,C |
| Juniper Generation, LLC, 6.790%, |
|
|
| ||
|
|
|
| due 12/31/14 |
| 6,980 |
| ||
4,000 |
| # |
| NorthWestern Corp., 5.875%, |
|
|
| ||
|
|
|
| due 11/01/14 |
| 4,120 |
| ||
3,000 |
| C |
| Pacific Gas & Electric Co., 6.050%, |
|
|
| ||
|
|
|
| due 03/01/34 |
| 3,318 |
| ||
8,000 |
| # |
| Pinnacle West Energy Corp., |
|
|
| ||
|
|
|
| 3.630%, due 04/01/07 |
| 8,005 |
| ||
9,000 |
| C |
| Potomac Edison Co., 5.000%, |
|
|
| ||
|
|
|
| due 11/01/06 |
| 9,073 |
| ||
1,788 |
| # |
| Power Contract Financing, LLC, |
|
|
| ||
|
|
|
| 5.200%, due 02/01/06 |
| 1,800 |
| ||
7,000 |
| # |
| Power Contract Financing, LLC, |
|
|
| ||
|
|
|
| 6.256%, due 02/01/10 |
| 7,269 |
| ||
3,290 |
|
|
| PPL Montana, LLC, 8.903%, |
|
|
| ||
|
|
|
| due 07/02/20 |
| 3,720 |
| ||
4,000 |
|
|
| Sierra Pacific Power Co., 6.250%, |
|
|
| ||
|
|
|
| due 04/15/12 |
| 4,130 |
| ||
8,000 |
| # |
| TECO Energy Inc., 6.750%, |
|
|
| ||
|
|
|
| due 05/01/15 |
| 8,520 |
| ||
5,899 |
| # |
| Tenaska Virginia Partners, LP, |
|
|
| ||
|
|
|
| 6.119%, due 03/30/24 |
| 6,314 |
| ||
11,000 |
|
|
| TXU Corp., 4.446%, due 11/16/06 |
| 11,045 |
| ||
|
|
|
|
|
| 161,366 |
| ||
See Accompanying Notes to Financial Statements
23
| PORTFOLIO OF INVESTMENTS |
|
THE USLICO ASSET ALLOCATION PORTFOLIO | AS OF JUNE 30, 2005 (UNAUDITED) (CONTINUED) |
|
Principal |
|
|
|
|
| Value |
| ||
|
|
|
| Food: 0.3% |
|
|
| ||
$ | 3,000 |
|
|
| Delhaize America, Inc., |
|
|
| |
|
|
|
| 8.050%, due 04/15/27 |
| $ | 3,304 |
| |
5,000 |
|
|
| Delhaize America, Inc., |
|
|
| ||
|
|
|
| 8.125%, due 04/15/11 |
| 5,633 |
| ||
3,000 |
|
|
| Delhaize America, Inc., |
|
|
| ||
|
|
|
| 9.000%, due 04/15/31 |
| 3,760 |
| ||
13,000 |
| C |
| Safeway, Inc., |
|
|
| ||
|
|
|
| 4.800%, due 07/16/07 |
| 13,103 |
| ||
18,000 |
| C |
| Tyson Foods, Inc., |
|
|
| ||
|
|
|
| 7.250%, due 10/01/06 |
| 18,664 |
| ||
|
|
|
|
|
| 44,464 |
| ||
|
|
|
| Gas: 0.1% |
|
|
| ||
13,000 |
| #,C |
| Williams Gas Pipelines |
|
|
| ||
|
|
|
| Central, Inc., 7.375%, |
|
|
| ||
|
|
|
| due 11/15/06 |
| 13,574 |
| ||
|
|
|
|
|
| 13,574 |
| ||
|
|
|
| Home Builders: 0.1% |
|
|
| ||
17,000 |
|
|
| KB Home, 6.250%, due 06/15/15 |
| 17,368 |
| ||
1,000 |
| C |
| Technical Olympic USA, Inc., |
|
|
| ||
|
|
|
| 9.000%, due 07/01/10 |
| 1,034 |
| ||
|
|
|
|
|
| 18,402 |
| ||
|
|
|
| Insurance: 0.5% |
|
|
| ||
5,000 |
| # |
| AIG SunAmerica Global |
|
|
| ||
|
|
|
| Financing X, 6.900%, |
|
|
| ||
|
|
|
| due 03/15/32 |
| 6,173 |
| ||
17,000 |
|
|
| Aon Corp., 8.205%, due 01/01/27 |
| 19,970 |
| ||
3,000 |
|
|
| GE Global Insurance Holding Corp., |
|
|
| ||
|
|
|
| 7.000%, due 02/15/26 |
| 3,224 |
| ||
9,000 |
|
|
| Prudential Financial, Inc., |
|
|
| ||
|
|
|
| 4.104%, due 11/15/06 |
| 9,028 |
| ||
20,000 |
| #,C |
| Zurich Capital Trust I, 8.376%, |
|
|
| ||
|
|
|
| due 06/01/37 |
| 22,127 |
| ||
|
|
|
|
|
| 60,522 |
| ||
|
|
|
| Lodging: 0.1% |
|
|
| ||
8,000 |
|
|
| MGM Mirage, 5.875%, |
|
|
| ||
|
|
|
| due 02/27/14 |
| 7,810 |
| ||
|
|
|
|
|
| 7,810 |
| ||
|
|
|
| Media: 0.3% |
|
|
| ||
3,000 |
|
|
| AOL Time Warner, Inc., |
|
|
| ||
|
|
|
| 7.625%, due 04/15/31 |
| 3,759 |
| ||
1,000 |
|
|
| Clear Channel Communications, |
|
|
| ||
|
|
|
| Inc., 3.125%, due 02/01/07 |
| 974 |
| ||
9,000 |
| C |
| COX Communications, Inc., |
|
|
| ||
|
|
|
| 6.850%, due 01/15/18 |
| 9,871 |
| ||
7,000 |
|
|
| COX Communications, Inc., |
|
|
| ||
|
|
|
| 7.125%, due 10/01/12 |
| 7,861 |
| ||
8,000 |
|
|
| Time Warner, Inc., |
|
|
| ||
|
|
|
| 7.700%, due 05/01/32 |
| 10,153 |
| ||
|
|
|
|
|
| 32,618 |
| ||
|
|
|
| Mining: 0.0% |
|
|
| ||
3,000 |
| @@ |
| Vale Overseas Ltd., 8.250%, |
|
|
| ||
|
|
|
| due 01/17/34 |
| 3,315 |
| ||
|
|
|
|
|
| 3,315 |
| ||
|
|
|
| Oil and Gas: 0.7% |
|
|
| ||
9,000 |
|
|
| Amerada Hess Corp., 6.650%, |
|
|
| ||
|
|
|
| due 08/15/11 |
| 9,916 |
| ||
$ | 10,000 |
| @@,#,C |
| Empresa Nacional de Petroleo, |
|
|
| |
|
|
|
| 4.875%, due 03/15/14 |
| $ | 9,833 |
| |
6,000 |
| @@ |
| Empresa Nacional de |
|
|
| ||
|
|
|
| Petroleo ENAP, 6.750%, |
|
|
| ||
|
|
|
| due 11/15/12 |
| 6,673 |
| ||
14,000 |
|
|
| Enterprise Products Operating, LP, |
|
|
| ||
|
|
|
| 4.950%, due 06/01/10 |
| 14,081 |
| ||
10,000 |
|
|
| Kerr-McGee Corp., 6.950%, |
|
|
| ||
|
|
|
| due 07/01/24 |
| 10,383 |
| ||
5,000 |
| @@,C |
| Nexen, Inc., 5.875%, due 03/10/35 |
| 5,100 |
| ||
20,000 |
| # |
| Pemex Project Funding Master |
|
|
| ||
|
|
|
| Trust, 4.710%, due 06/15/10 |
| 20,680 |
| ||
8,000 |
| @@,# |
| Tengizchevroil Finance Co. SARL, |
|
|
| ||
|
|
|
| 6.124%, due 11/15/14 |
| 8,220 |
| ||
7,000 |
|
|
| Valero Energy Corp., 7.500%, |
|
|
| ||
|
|
|
| due 04/15/32 |
| 8,668 |
| ||
|
|
|
|
|
| 93,554 |
| ||
|
|
|
| Pipelines: 0.1% |
|
|
| ||
8,000 |
| C |
| KN Capital Trust III, 7.630%, |
|
|
| ||
|
|
|
| due 04/15/28 |
| 9,391 |
| ||
|
|
|
|
|
| 9,391 |
| ||
|
|
|
| Real Estate: 0.3% |
|
|
| ||
14,000 |
| C |
| EOP Operating, LP, |
|
|
| ||
|
|
|
| 7.750%, due 11/15/07 |
| 15,041 |
| ||
3,000 |
| C |
| Liberty Property, LP, |
|
|
| ||
|
|
|
| 6.375%, due 08/15/12 |
| 3,291 |
| ||
1,000 |
|
|
| Liberty Property, LP, |
|
|
| ||
|
|
|
| 6.950%, due 12/01/06 |
| 1,037 |
| ||
12,000 |
| C |
| Liberty Property, LP, |
|
|
| ||
|
|
|
| 7.750%, due 04/15/09 |
| 13,295 |
| ||
|
|
|
|
|
| 32,664 |
| ||
|
|
|
| Real Estate Investment Trusts: 0.2% |
|
|
| ||
10,000 |
| C |
| Simon Property Group, LP, |
|
|
| ||
|
|
|
| 4.875%, due 03/18/10 |
| 10,186 |
| ||
18,000 |
| C |
| Simon Property Group, LP, |
|
|
| ||
|
|
|
| 6.375%, due 11/15/07 |
| 18,802 |
| ||
|
|
|
|
|
| 28,988 |
| ||
|
|
|
| Retail: 0.1% |
|
|
| ||
14,000 |
| C |
| May Department Stores Co., |
|
|
| ||
|
|
|
| 3.950%, due 07/15/07 |
| 13,910 |
| ||
|
|
|
|
|
| 13,910 |
| ||
|
|
|
| Savings and Loans: 0.1% |
|
|
| ||
10,000 |
| C |
| Great Western Financial, |
|
|
| ||
|
|
|
| 8.206%, due 02/01/27 |
| 10,867 |
| ||
|
|
|
|
|
| 10,867 |
| ||
|
|
|
| Telecommunications: 0.7% |
|
|
| ||
8,000 |
| C |
| AT&T Corp., 9.750%, due 11/15/31 |
| 10,450 |
| ||
12,000 |
| C |
| BellSouth Corp., 4.200%, |
|
|
| ||
|
|
|
| due 09/15/09 |
| 11,969 |
| ||
8,000 |
| @@ |
| British Telecommunications PLC, |
|
|
| ||
|
|
|
| 8.875%, due 12/15/30 |
| 11,328 |
| ||
7,000 |
| @@,+ |
| Deutsche Telekom Intl. Finance BV, |
|
|
| ||
|
|
|
| 8.500%, due 06/15/10 |
| 8,121 |
| ||
3,000 |
|
|
| New Cingular Wireless |
|
|
| ||
|
|
|
| Services, Inc., 8.125%, |
|
|
| ||
|
|
|
| due 05/01/12 |
| 3,599 |
| ||
7,000 |
|
|
| SBC Communications, Inc., |
|
|
| ||
|
|
|
| 6.150%, due 09/15/34 |
| 7,609 |
| ||
See Accompanying Notes to Financial Statements
24
| PORTFOLIO OF INVESTMENTS |
|
THE USLICO ASSET ALLOCATION PORTFOLIO | AS OF JUNE 30, 2005 (UNAUDITED) (CONTINUED) |
|
Principal |
|
|
|
|
| Value |
| ||
|
|
|
| Telecommunications (continued) |
|
|
| ||
$ | 8,000 |
| + |
| Sprint Capital Corp., 4.780%, |
|
|
| |
|
|
|
| due 08/17/06 |
| $ | 8,061 |
| |
7,000 |
| C |
| Sprint Capital Corp., 8.375%, |
|
|
| ||
|
|
|
| due 03/15/12 |
| 8,431 |
| ||
8,000 |
| @@,# |
| Telecom Italia Capital SA, 6.000%, |
|
|
| ||
|
|
|
| due 09/30/34 |
| 8,196 |
| ||
9,000 |
| @@,# |
| Telefonos de Mexico SA de CV, |
|
|
| ||
|
|
|
| 4.750%, due 01/27/10 |
| 9,037 |
| ||
|
|
|
|
|
| 86,801 |
| ||
|
|
|
| Total Corporate Bonds/Notes |
|
|
| ||
|
|
|
| (Cost $1,170,105) |
| 1,184,475 |
| ||
|
|
|
| ||||||
U.S. GOVERNMENT AGENCY OBLIGATIONS: 15.9% |
|
|
| ||||||
|
|
|
| ||||||
|
|
|
| Federal Home Loan Bank: 0.4% |
|
|
| ||
50,000 |
|
|
| 3.250%, due 12/17/07 |
| 49,320 |
| ||
|
|
|
|
|
| 49,320 |
| ||
|
|
|
| Federal Home Loan Mortgage |
|
|
| ||
|
|
|
| Corporation: 4.9% |
|
|
| ||
105,000 |
| C |
| 2.700%, due 03/16/07 |
| 103,044 |
| ||
25,000 |
|
|
| 3.875%, due 06/15/08 |
| 25,022 |
| ||
26,987 |
|
|
| 4.330%, due 12/01/26 |
| 27,236 |
| ||
22,234 |
|
|
| 4.500%, due 12/15/16 |
| 22,290 |
| ||
9,316 |
|
|
| 4.500%, due 06/15/17 |
| 9,342 |
| ||
25,000 |
|
|
| 4.500%, due 02/15/20 |
| 24,474 |
| ||
11,000 |
|
|
| 5.000%, due 05/15/20 |
| 11,233 |
| ||
29,735 |
|
|
| 5.000%, due 08/15/21 |
| 29,921 |
| ||
23,000 |
|
|
| 5.000%, due 04/15/23 |
| 23,407 |
| ||
5,996 |
|
|
| 5.052%, due 04/01/35 |
| 6,016 |
| ||
19,000 |
|
|
| 5.214%, due 06/01/35 |
| 19,148 |
| ||
32,400 |
|
|
| 5.500%, due 11/15/18 |
| 33,228 |
| ||
113,000 |
|
|
| 5.500%, due 07/15/34 |
| 114,590 |
| ||
18,000 |
|
|
| 5.875%, due 03/21/11 |
| 19,432 |
| ||
67,578 |
| C |
| 6.000%, due 01/15/29 |
| 70,408 |
| ||
98,473 |
|
|
| 6.500%, due 12/01/31 |
| 102,186 |
| ||
|
|
|
|
|
| 640,977 |
| ||
|
|
|
| Federal National Mortgage |
|
|
| ||
|
|
|
| Association: 10.6% |
|
|
| ||
60,000 |
| C |
| 2.875%, due 05/19/08 |
| 58,391 |
| ||
6,607 |
|
|
| 3.583%, due 07/01/27 |
| 6,798 |
| ||
28,959 |
|
|
| 3.680%, due 07/01/27 |
| 29,998 |
| ||
10,284 |
|
|
| 4.500%, due 09/25/16 |
| 10,299 |
| ||
54,000 |
|
|
| 4.500%, due 07/15/19 |
| 53,764 |
| ||
9,000 |
|
|
| 4.500%, due 07/15/35 |
| 8,803 |
| ||
25,000 |
| C |
| 4.750%, due 12/25/42 |
| 25,101 |
| ||
12,032 |
|
|
| 4.837%, due 11/01/34 |
| 12,177 |
| ||
21,965 |
|
|
| 4.947%, due 01/01/35 |
| 22,176 |
| ||
52,000 |
|
|
| 5.000%, due 07/01/18 |
| 52,585 |
| ||
360,000 |
|
|
| 5.000%, due 07/15/34 |
| 360,112 |
| ||
30,000 |
|
|
| 5.250%, due 08/01/12 |
| 31,668 |
| ||
64,440 |
|
|
| 5.500%, due 07/15/19 |
| 66,152 |
| ||
25,485 |
|
|
| 5.500%, due 11/01/33 |
| 25,872 |
| ||
202,000 |
|
|
| 5.500%, due 07/15/34 |
| 204,778 |
| ||
61,969 |
|
|
| 6.000%, due 07/25/29 |
| 64,934 |
| ||
27,082 |
|
|
| 6.000%, due 04/25/31 |
| 28,398 |
| ||
147,000 |
|
|
| 6.000%, due 07/15/34 |
| 150,721 |
| ||
82,000 |
|
|
| 6.500%, due 07/15/33 |
| 84,870 |
| ||
23,000 |
|
|
| 6.625%, due 11/15/10 |
| 25,866 |
| ||
23,238 |
|
|
| 7.500%, due 11/01/29 |
| 24,850 |
| ||
$ | 8,912 |
| C |
| 7.500%, due 06/25/32 |
| $ | 9,438 |
|
12,467 |
| C |
| 7.500%, due 01/25/48 |
| 13,237 |
| ||
|
|
|
|
|
| 1,370,988 |
| ||
|
|
|
| Total U.S. Government |
|
|
| ||
|
|
|
| Agency Obligations |
|
|
| ||
|
|
|
| (Cost $2,050,499) |
| 2,061,285 |
| ||
|
|
|
| ||||||
U.S. TREASURY OBLIGATIONS: 9.9% |
|
|
| ||||||
|
|
|
| ||||||
|
|
|
| U.S. Treasury Bonds: 3.5% |
|
|
| ||
50,000 |
|
|
| 2.000%, due 01/15/14 |
| 54,257 |
| ||
76,000 |
|
|
| 5.375%, due 02/15/31 |
| 89,704 |
| ||
160,000 |
|
|
| 6.250%, due 08/15/23 |
| 199,444 |
| ||
35,000 |
|
|
| 8.750%, due 08/15/20 |
| 52,675 |
| ||
42,000 |
| C |
| 10.375%, due 11/15/12 |
| 48,321 |
| ||
|
|
|
|
|
| 444,401 |
| ||
|
|
|
| U.S. Treasury Notes: 6.1% |
|
|
| ||
75,000 |
|
|
| 1.625%, due 10/31/05 |
| 74,619 |
| ||
324,000 |
|
|
| 3.500%, due 05/31/07 |
| 323,115 |
| ||
9,000 |
|
|
| 3.500%, due 02/15/10 |
| 8,912 |
| ||
50,000 |
|
|
| 3.625%, due 06/30/07 |
| 49,988 |
| ||
29,000 |
|
|
| 3.625%, due 06/15/10 |
| 28,859 |
| ||
59,000 |
|
|
| 3.750%, due 05/15/08 |
| 59,148 |
| ||
27,000 |
|
|
| 4.000%, due 04/15/10 |
| 27,332 |
| ||
218,000 |
| W |
| 4.125%, due 05/15/15 |
| 221,253 |
| ||
|
|
|
|
|
| 793,222 |
| ||
|
|
|
| U.S. Treasury STRIP: 0.3% |
|
|
| ||
63,000 |
|
|
| 4.180%, due 05/15/16 |
| 40,351 |
| ||
|
|
|
|
|
| 40,351 |
| ||
|
|
|
| Total U.S. Treasury Obligations |
|
|
| ||
|
|
|
| (Cost $1,262,726) |
| 1,277,974 |
| ||
|
|
|
| ||||||
ASSET-BACKED SECURITIES: 1.6% |
|
|
| ||||||
|
|
|
| ||||||
|
|
|
| Automobile Asset-Backed |
|
|
| ||
|
|
|
| Securities: 0.3% |
|
|
| ||
2,000 |
|
|
| Honda Auto Receivables |
|
|
| ||
|
|
|
| Owner Trust, 2.790%, |
|
|
| ||
|
|
|
| due 03/16/09 |
| 1,966 |
| ||
5,000 |
|
|
| Honda Auto Receivables |
|
|
| ||
|
|
|
| Owner Trust, 3.820%, |
|
|
| ||
|
|
|
| due 05/21/10 |
| 4,970 |
| ||
35,000 |
|
|
| USAA Auto Owner Trust, |
|
|
| ||
|
|
|
| 2.040%, due 02/16/10 |
| 34,396 |
| ||
|
|
|
|
|
| 41,332 |
| ||
|
|
|
| Credit Card Asset-Backed |
|
|
| ||
|
|
|
| Securities: 0.6% |
|
|
| ||
12,000 |
|
|
| Bank One Issuance Trust, |
|
|
| ||
|
|
|
| 4.540%, due 09/15/10 |
| 12,086 |
| ||
11,000 |
|
|
| Capital One Master Trust, |
|
|
| ||
|
|
|
| 4.900%, due 03/15/10 |
| 11,195 |
| ||
36,000 |
| C |
| Citibank Credit Card Issuance |
|
|
| ||
|
|
|
| Trust, 5.650%, due 06/16/08 |
| 36,597 |
| ||
3,000 |
|
|
| Citibank Credit Card Master |
|
|
| ||
|
|
|
| Trust I, 5.875%, due 03/10/11 |
| 3,186 |
| ||
12,000 |
|
|
| MBNA Credit Card Master Note |
|
|
| ||
|
|
|
| Trust, 4.950%, due 06/15/09 |
| 12,208 |
| ||
3,000 |
|
|
| MBNA Master Credit Card Trust |
|
|
| ||
|
|
|
| USA, 5.900%, due 08/15/11 |
| 3,193 |
| ||
|
|
|
|
|
| 78,465 |
| ||
See Accompanying Notes to Financial Statements
25
| PORTFOLIO OF INVESTMENTS |
|
THE USLICO ASSET ALLOCATION PORTFOLIO | AS OF JUNE 30, 2005 (UNAUDITED) (CONTINUED) |
|
Principal |
|
|
|
|
| Value |
| ||
|
|
|
| Home Equity Asset-Backed |
|
|
| ||
|
|
|
| Securities: 0.3% |
|
|
| ||
$ | 43,000 |
|
|
| GSAA Trust, 5.242%, |
|
|
| |
|
|
|
| due 05/25/35 |
| $ | 43,275 |
| |
1,000 |
|
|
| Renaissance Home Equity Loan |
|
|
| ||
|
|
|
| Trust, 4.456%, due 05/25/35 |
| 1,000 |
| ||
|
|
|
|
|
| 44,275 |
| ||
|
|
|
| Other Asset-Backed Securities: 0.4% |
|
|
| ||
9,759 |
| C |
| Chase Funding Mortgage Loan |
|
|
| ||
|
|
|
| Asset-Backed Certificates, |
|
|
| ||
|
|
|
| 2.734%, due 09/25/24 |
| 9,696 |
| ||
5,000 |
| C |
| Chase Funding Mortgage |
|
|
| ||
|
|
|
| Loan Asset-Backed Certificates, |
|
|
| ||
|
|
|
| 4.045%, due 05/25/33 |
| 4,976 |
| ||
8,000 |
|
|
| Popular ABS Mortgage |
|
|
| ||
|
|
|
| Pass-Through Trust, 3.735%, |
|
|
| ||
|
|
|
| due 12/25/34 |
| 7,930 |
| ||
8,000 |
|
|
| Popular ABS Mortgage |
|
|
| ||
|
|
|
| Pass-Through Trust, 4.000%, |
|
|
| ||
|
|
|
| due 12/25/34 |
| 7,930 |
| ||
10,052 |
| C |
| Residential Asset Mortgage |
|
|
| ||
|
|
|
| Products, Inc., 2.140%, |
|
|
| ||
|
|
|
| due 02/25/30 |
| 9,997 |
| ||
|
|
|
|
|
| 40,529 |
| ||
|
|
|
| Total Asset-Backed Securities |
|
|
| ||
|
|
|
| (Cost $208,178) |
| 204,601 |
| ||
|
|
|
| ||||||
COLLATERALIZED MORTGAGE OBLIGATIONS: 3.6% |
|
|
| ||||||
|
|
|
| ||||||
|
|
|
| Commercial Mortgage-Backed |
|
|
| ||
|
|
|
| Securities: 2.2% |
|
|
| ||
10,000 |
|
|
| Banc of America Commercial |
|
|
| ||
|
|
|
| Mortgage, Inc., 4.877%, due |
| 10,231 |
| ||
7000 |
|
|
| Bear Stearns Commercial |
|
|
| ||
|
|
|
| Mortgage Securities, 3.880%, |
|
|
| ||
|
|
|
| due 08/13/39 |
| 6,898 |
| ||
1,000 |
| C |
| Bear Stearns Commercial |
|
|
| ||
|
|
|
| Mortgage Securities, 4.030%, |
|
|
| ||
|
|
|
| due 02/13/46 |
| 990 |
| ||
15,000 |
| C |
| Bear Stearns Commercial |
|
|
| ||
|
|
|
| Mortgage Securities, 4.170%, |
|
|
| ||
|
|
|
| due 01/12/41 |
| 15,008 |
| ||
1,000 |
|
|
| Capco America Securitization |
|
|
| ||
|
|
|
| Corp., 6.460%, due 10/15/30 |
| 1,071 |
| ||
15,000 |
| C |
| Commercial Mortgage |
|
|
| ||
|
|
|
| Pass-Through Certificates, |
|
|
| ||
|
|
|
| 3.600%, due 03/10/39 |
| 14,702 |
| ||
32,000 |
| C |
| CS First Boston Mortgage |
|
|
| ||
|
|
|
| Securities Corp., 3.861%, |
|
|
| ||
|
|
|
| due 03/15/36 |
| 31,794 |
| ||
8,000 |
| C |
| CS First Boston Mortgage |
|
|
| ||
|
|
|
| Securities Corp., 7.777%, |
|
|
| ||
|
|
|
| due 04/14/62 |
| 9,158 |
| ||
41,000 |
| C |
| DLJ Commercial Mortgage Corp., |
|
|
| ||
|
|
|
| 6.240%, due 11/12/31 |
| 43,464 |
| ||
10,000 |
| C |
| DLJ Commercial Mortgage Corp., |
|
|
| ||
|
|
|
| 6.460%, due 03/10/32 |
| 10,702 |
| ||
115,000 |
| C |
| DLJ Commercial Mortgage Corp., |
|
|
| ||
|
|
|
| 7.300%, due 06/10/32 |
| 127,220 |
| ||
1,000 |
| C |
| GE Capital Commercial |
|
|
| ||
|
|
|
| Mortgage Corp., 4.865%, |
|
|
| ||
|
|
|
| due 07/10/39 |
| 1,023 |
| ||
$ | 15,000 |
| C |
| JP Morgan Chase Commercial |
|
|
| |
|
|
|
| Mortgage Securities Corp., |
|
|
| ||
|
|
|
| 4.223%, due 01/15/42 |
| $ | 14,989 |
| |
1,000 |
| C |
| LB-UBS Commercial |
|
|
| ||
|
|
|
| Mortgage Trust, 4.567%, |
|
|
| ||
|
|
|
| due 06/15/29 |
| 1,012 |
| ||
|
|
|
|
|
| 288,262 |
| ||
|
|
|
| Whole Loan Collateral PAC: 0.1% |
|
|
| ||
14,069 |
| C |
| MASTR Alternative Loans Trust, |
|
|
| ||
|
|
|
| 8.500%, due 05/25/33 |
| 14,552 |
| ||
|
|
|
|
|
| 14,552 |
| ||
|
|
|
| Whole Loan Collateralized |
|
|
| ||
|
|
|
| Mortgage Obligations: 1.2% |
|
|
| ||
11,492 |
| C |
| Bank of America Mortgage |
|
|
| ||
|
|
|
| Securities, 5.250%, |
|
|
| ||
|
|
|
| due 11/25/19 |
| 11,656 |
| ||
18,131 |
| C |
| Countrywide Home Loan |
|
|
| ||
|
|
|
| Mortgage Pass Through Trust, |
|
|
| ||
|
|
|
| 5.000%, due 11/25/18 |
| 18,245 |
| ||
54,000 |
| C |
| CS First Boston Mortgage |
|
|
| ||
|
|
|
| Securities Corp., 4.080%, |
|
|
| ||
|
|
|
| due 10/25/33 |
| 54,421 |
| ||
28,729 |
| C |
| MASTR Alternative Loans Trust, |
|
|
| ||
|
|
|
| 5.500%, due 01/25/20 |
| 29,422 |
| ||
13,000 |
|
|
| Structured Adjustable Rate |
|
|
| ||
|
|
|
| Mortgage Loan Trust, 3.624%, |
|
|
| ||
|
|
|
| due 07/25/35 |
| 13,000 |
| ||
9,000 |
|
|
| Structured Adjustable Rate |
|
|
| ||
|
|
|
| Mortgage Loan Trust, 3.674%, |
|
|
| ||
|
|
|
| due 05/25/35 |
| 9,000 |
| ||
21,875 |
| C |
| Washington Mutual, 6.000%, |
|
|
| ||
|
|
|
| due 06/25/34 |
| 22,286 |
| ||
|
|
|
|
|
| 158,030 |
| ||
|
|
|
| Whole Loan Collateralized |
|
|
| ||
|
|
|
| Support CMO: 0.1% |
|
|
| ||
5,536 |
|
|
| Bank of America Mortgage |
|
|
| ||
|
|
|
| Securities, 5.500%, |
|
|
| ||
|
|
|
| due 11/25/33 |
| 5,614 |
| ||
|
|
|
|
|
| 5,614 |
| ||
|
|
|
| Total Collateralized |
|
|
| ||
|
|
|
| Mortgage Obligations |
|
|
| ||
|
|
|
| (Cost $480,182) |
| 466,458 |
| ||
|
|
|
| ||||||
MUNICIPAL BONDS: 0.2% |
|
|
| ||||||
|
|
|
| ||||||
|
|
|
| Municipal: 0.2% |
|
|
| ||
5,000 |
|
|
| City of New York, |
|
|
| ||
|
|
|
| 5.000%, due 11/01/08 |
| 5,309 |
| ||
5,000 |
|
|
| City of New York, |
|
|
| ||
|
|
|
| 5.000%, due 11/01/11 |
| 5,457 |
| ||
5,000 |
| C |
| City of New York, |
|
|
| ||
|
|
|
| 5.000%, due 11/01/15 |
| 5,512 |
| ||
5,000 |
|
|
| City of New York, |
|
|
| ||
|
|
|
| 5.000%, due 04/01/35 |
| 5,284 |
| ||
|
|
|
| Total Municipal Bonds |
|
|
| ||
|
|
|
| (Cost $21,435) |
| 21,562 |
| ||
See Accompanying Notes to Financial Statements
26
| PORTFOLIO OF INVESTMENTS |
|
THE USLICO ASSET ALLOCATION PORTFOLIO | AS OF JUNE 30, 2005 (UNAUDITED) (CONTINUED) |
|
Principal |
|
|
|
|
| Value |
| |||||
OTHER BONDS: 0.3% |
|
|
| |||||||||
|
|
|
| |||||||||
|
|
|
| Sovereign: 0.3% |
|
|
| |||||
$ | 13,000 |
| @@ |
| Dominican Republic |
|
|
| ||||
|
|
|
| International Bond, |
|
|
| |||||
|
|
|
| 0.370%, due 01/23/18 |
| $ | 13,622 |
| ||||
|
| @@ |
| Mexico Government |
| 12,000 |
| |||||
|
|
|
| Intl. Bond, 6.625%, |
|
|
| |||||
|
|
|
| due 03/03/15 |
| 13,236 |
| |||||
|
| @@,# |
| Uruguay Government |
| 10,169 |
| |||||
|
|
|
| Intl. Bond, 10.500%, |
|
|
| |||||
|
|
|
| due 10/20/06 |
| 14,696 |
| |||||
|
|
|
| Total Other Bonds |
|
|
| |||||
|
|
|
| (Cost $36,738) |
| 41,554 |
| |||||
|
|
|
| Total Long-Term Investments |
|
|
| |||||
|
|
|
| (Cost $11,576,314) |
| 12,388,397 |
| |||||
|
|
|
| |||||||||
SHORT-TERM INVESTMENTS: 13.6% |
|
|
| |||||||||
|
|
|
| |||||||||
|
|
|
| Repurchase Agreement: 13.6% |
|
|
| |||||
|
| S |
| Morgan Stanley Repurchase |
|
|
| |||||
|
|
|
| Agreement dated 06/30/05, |
|
|
| |||||
|
|
|
| 3.350%, due 07/01/05, |
|
|
| |||||
|
|
|
| $1,768,165 to be received |
|
|
| |||||
|
|
|
| upon repurchase |
|
|
| |||||
|
|
|
| (Collateralized by $5,735,000 |
|
|
| |||||
|
|
|
| Federal National |
|
|
| |||||
|
|
|
| Mortgage Association, |
|
|
| |||||
|
|
|
| 7.250%, Market Value plus |
|
|
| |||||
|
|
|
| accrued $1,805,779, |
|
|
| |||||
|
|
|
| due 05/15/30) |
| 1,768,000 |
| |||||
|
|
|
| Total Short-Term Investments |
|
|
| |||||
|
|
|
| (Cost $1,768,000) |
| 1,768,000 |
| |||||
|
|
|
| Total Investments In |
|
|
| |||||
|
|
|
| Securities (Cost |
|
|
|
|
| |||
|
|
|
| $13,344,314)* | 109.1 | % |
| $ | 14,156,397 |
| ||
|
|
|
| Other Assets and |
|
|
|
|
| |||
|
|
|
| Liabilities-Net | (9.1 | ) |
| (1,183,760 | ) | |||
|
|
|
| Net Assets | 100.0 | % |
| $ | 12,972,637 |
| ||
@ | Non-income producing security | |||
@@ | Foreign issuer | |||
ADR | American Depositary Receipt | |||
STRIP | Separate Trading of Registered Interest and Principal of Securities | |||
+ | Step-up basis bonds. Interest rates shown reflect current coupon rates. | |||
# | Securities with purchases pursuant to Rule 144A, under the Securities Act of 1933 and may not be resold subject to that rule except to qualified institutional buyers. These securities have been determined to be liquid under the guidelines established by the Funds’ Board of Directors/Trustees. | |||
C | Bond may be called prior to maturity date. | |||
S | Segregated securities for futures, when-issued or delayed delivery securities held at June 30, 2005. | |||
W | When-issued or delayed delivery security. | |||
I | Illiquid security | |||
** | Defaulted security | |||
X | Fair value determined by ING Funds Valuation Committee appointed by the Funds’ Board of Directors/Trustees. | |||
* | Cost for federal income tax purposes is $13,352,784 Net unrealized appreciation consists of: | |||
| Gross Unrealized Appreciation | $ | 955,243 |
|
| Gross Unrealized Depreciation | (151,630 | ) | |
| Net Unrealized Appreciation | $ | 803,613 |
|
See Accompanying Notes to Financial Statements
27
| PORTFOLIO OF INVESTMENTS |
|
THE USLICO BOND PORTFOLIO | AS OF JUNE 30, 2005 (UNAUDITED) |
|
Investment Types*
as of June 30, 2005
(as a percent of net assets)
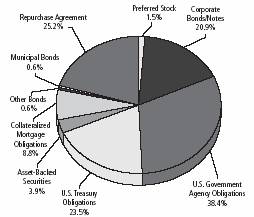
* Excludes other assets and liabilities of -23.4% of net assets.
Portfolio holdings are subject to change daily.
Principal |
|
|
|
|
| Value |
| ||
CORPORATE BONDS/NOTES: 20.9% | |||||||||
| |||||||||
|
|
|
| Agriculture: 0.1% |
|
|
| ||
$ | 3,000 |
|
|
| R.J. Reynolds Tobacco |
|
|
| |
|
|
|
| Holdings, Inc., 6.500%, |
|
|
| ||
|
|
|
| due 07/15/10 |
| $ | 3,008 |
| |
|
|
|
|
|
| 3,008 |
| ||
|
|
|
| Auto Manufacturers: 0.1% |
|
|
| ||
1,000 |
|
|
| Ford Motor Co., 7.450%, |
|
|
| ||
|
|
|
| due 07/16/31 |
| 836 |
| ||
1,000 |
|
|
| General Motors Corp., 7.400%, |
|
|
| ||
|
|
|
| due 09/01/25 |
| 773 |
| ||
|
|
|
|
|
| 1,609 |
| ||
|
|
|
| Banks: 4.7% |
|
|
| ||
6,000 |
| @@ |
| Banco Santander Chile |
|
|
| ||
|
|
|
| 3.720%, due 12/09/09 |
| 6,019 |
| ||
7,000 |
| @@ |
| Banco Santander Santiago Chile SA, |
|
|
| ||
|
|
|
| 7.375%, due 07/18/12 |
| 8,081 |
| ||
7,000 |
|
|
| BankAmerica Capital II, 8.000%, |
|
|
| ||
|
|
|
| due 12/15/26 |
| 7,570 |
| ||
4,000 |
|
|
| Chuo Mitsui Trust & Banking Co Ltd/ |
|
|
| ||
|
|
|
| The, 5.506%, due 04/15/49 |
| 3,937 |
| ||
5,000 |
| @@,#,C |
| Danske Bank A/S, 5.914%, |
|
|
| ||
|
|
|
| due 12/29/49 |
| 5,391 |
| ||
10,000 |
| @@,C |
| Den Norske Bank ASA, 3.250%, |
|
|
| ||
|
|
|
| due 08/29/49 |
| 8,350 |
| ||
5,000 |
| @@,#,C |
| First Citizens St. Lucia Ltd., 5.460%, |
|
|
| ||
|
|
|
| due 02/01/12 |
| 5,081 |
| ||
$ | 5,000 |
| @@,# |
| HBOS Capital Funding LP, 6.071%, |
|
|
| |
|
|
|
| due 06/30/49 |
| $ | 5,407 |
| |
10,000 |
| @@,C |
| HSBC Bank PLC, 3.788%, |
|
|
| ||
|
|
|
| due 06/29/49 |
| 8,890 |
| ||
10,000 |
| @@,C |
| Lloyds TSB Bank PLC, 3.230%, |
|
|
| ||
|
|
|
| due 08/29/49 |
| 8,690 |
| ||
8,000 |
| #,C |
| M&T Bank Corp., |
|
|
| ||
|
|
|
| 3.850%, due 04/01/13 |
| 7,910 |
| ||
6,000 |
|
|
| Mellon Capital I, 7.720%, |
|
|
| ||
|
|
|
| due 12/01/26 |
| 6,446 |
| ||
10,000 |
| @@,C |
| National Australia Bank Ltd., 3.514%, |
|
|
| ||
|
|
|
| due 10/29/49 |
| 8,928 |
| ||
2,000 |
| C |
| NB Capital Trust, 7.830%, |
|
|
| ||
|
|
|
| due 12/15/26 |
| 2,157 |
| ||
2,000 |
| C |
| NB Capital Trust IV, 8.250%, |
|
|
| ||
|
|
|
| due 04/15/27 |
| 2,188 |
| ||
6,000 |
|
|
| PNC Funding Corp., 4.500%, |
|
|
| ||
|
|
|
| due 03/10/10 |
| 6,039 |
| ||
10,000 |
| #,C |
| Rabobank Capital Funding II, 5.260%, |
|
|
| ||
|
|
|
| due 12/29/49 |
| 10,306 |
| ||
10,000 |
| @@ |
| Royal Bank of Scotland Group PLC, |
|
|
| ||
|
|
|
| 3.813%, due 12/29/49 |
| 8,822 |
| ||
10,000 |
| @@,C |
| Societe Generale, 3.625%, |
|
|
| ||
|
|
|
| due 11/29/49 |
| 8,815 |
| ||
10,000 |
| @@,C |
| Standard Chartered PLC, 3.750%, |
|
|
| ||
|
|
|
| due 11/29/49 |
| 7,975 |
| ||
100,000 |
| #,I,X,** |
| United Companies Financial Corp., |
|
|
| ||
|
|
|
| 0.000%, due 11/02/99 |
| — |
| ||
|
|
|
|
|
| 137,002 |
| ||
|
|
|
| Beverages: 0.4% |
|
|
| ||
5,000 |
| @@ |
| Cia Brasileira de Bebidas, 8.750%, |
|
|
| ||
|
|
|
| due 09/15/13 |
| 5,806 |
| ||
4,000 |
| @@ |
| Cia Brasileira de Bebidas, 10.500%, |
|
|
| ||
|
|
|
| due 12/15/11 |
| 4,960 |
| ||
|
|
|
|
|
| 10,766 |
| ||
|
|
|
| Chemicals: 0.5% |
|
|
| ||
2,000 |
| @@,# |
| Sociedad Quimica y Minera de |
|
|
| ||
|
|
|
| Chile SA, 7.700%, due 09/15/06 |
| 2,039 |
| ||
11,000 |
|
|
| Union Carbide Corp., 7.750%, |
|
|
| ||
|
|
|
| due 10/01/96 |
| 12,111 |
| ||
|
|
|
|
|
| 14,150 |
| ||
|
|
|
| Diversified Financial Services: 3.9% |
|
|
| ||
2,202 |
| @@,#,C |
| Arcel Finance Ltd., 5.984%, |
|
|
| ||
|
|
|
| due 02/01/09 |
| 2,262 |
| ||
5,000 |
| @@,# |
| Arcel Finance Ltd., 6.361%, |
|
|
| ||
|
|
|
| due 05/01/12 |
| 5,023 |
| ||
5,000 |
| @@,#,C |
| Arcel Finance Ltd., 7.048%, |
|
|
| ||
|
|
|
| due 09/01/11 |
| 5,193 |
| ||
12,000 |
| @@,# |
| Brazilian Merchant Voucher |
|
|
| ||
|
|
|
| Receivables Ltd., 5.911%, |
|
|
| ||
|
|
|
| due 6/15/11 |
| 12,181 |
| ||
5,000 |
| C |
| Citigroup Capital II, 7.750%, |
|
|
| ||
|
|
|
| due 12/01/36 |
| 5,354 |
| ||
10,000 |
| #,C |
| Corestates Capital Trust I, 8.000%, |
|
|
| ||
|
|
|
| due 12/15/26 |
| 10,835 |
| ||
5,000 |
| @@,C |
| Financiere CSFB NV, 3.625%, |
|
|
| ||
|
|
|
| due 03/29/49 |
| 4,295 |
| ||
1,000 |
|
|
| Ford Motor Credit Co., 7.875%, |
|
|
| ||
|
|
|
| due 06/15/10 |
| 989 |
| ||
2,000 |
|
|
| General Motors Acceptance Corp., |
|
|
| ||
|
|
|
| 7.250%, due 03/02/11 |
| 1,877 |
| ||
See Accompanying Notes to Financial Statements
28
| PORTFOLIO OF INVESTMENTS |
|
THE USLICO BOND PORTFOLIO | AS OF JUNE 30, 2005 (UNAUDITED) (CONTINUED) |
|
Principal |
|
|
|
|
| Value |
| ||
|
|
|
| Diversified Financial Services (continued) |
|
|
| ||
$ | 6,000 |
|
|
| Goldman Sachs Group, Inc., 3.538%, |
|
|
| |
|
|
|
| due 03/02/10 |
| $ | 5,996 |
| |
5,000 |
|
|
| HSBC Finance Corp, 5.000%, |
|
|
| ||
|
|
|
| due 06/30/15 |
| 5,049 |
| ||
5,000 |
| # |
| HVB Funding Trust I, 8.741%, |
|
|
| ||
|
|
|
| due 06/30/31 |
| 6,856 |
| ||
2,000 |
| # |
| HVB Funding Trust III, 9.000%, |
|
|
| ||
|
|
|
| due 10/22/31 |
| 2,814 |
| ||
3,000 |
|
|
| International Lease Finance Corp, |
|
|
| ||
|
|
|
| 5.000%, due 04/15/10 |
| 3,062 |
| ||
5,000 |
| C |
| JPM Capital Trust I, 7.540%, |
|
|
| ||
|
|
|
| due 01/15/27 |
| 5,389 |
| ||
6,000 |
| C |
| JPM Capital Trust II, 7.950%, |
|
|
| ||
|
|
|
| due 02/01/27 |
| 6,521 |
| ||
8,000 |
| #,C |
| Mangrove Bay Pass-Through Trust, |
|
|
| ||
|
|
|
| 6.102%, due 07/15/33 |
| 8,248 |
| ||
5,000 |
| @@ |
| Paribas, 3.555%, due 12/31/49 |
| 4,452 |
| ||
12,104 |
| @@,#,C |
| PF Export Receivables Master Trust, |
|
|
| ||
|
|
|
| 6.436%, due 06/01/15 |
| 12,420 |
| ||
4,000 |
| @@,C |
| UFJ Finance Aruba AEC, 8.750%, |
|
|
| ||
|
|
|
| due 11/29/49 |
| 4,427 |
| ||
|
|
|
|
|
| 113,243 |
| ||
|
|
|
| Electric: 2.9% |
|
|
| ||
9,000 |
| C |
| Consumers Energy Co., 4.250%, |
|
|
| ||
|
|
|
| due 04/15/08 |
| 8,994 |
| ||
2,000 |
| C |
| Consumers Energy Co., 5.150%, |
|
|
| ||
|
|
|
| due 02/15/17 |
| 2,023 |
| ||
6,000 |
| @@,# |
| Empresa Nacional de |
|
|
| ||
|
|
|
| Electricidad SA/Chile, 8.625%, |
|
|
| ||
|
|
|
| due 08/01/15 |
| 7,185 |
| ||
6,000 |
| C |
| Enterprise Capital Trust II, 4.710%, |
|
|
| ||
|
|
|
| due 06/30/28 |
| 5,950 |
| ||
6,000 |
| C |
| FirstEnergy Corp., 6.450%, |
|
|
| ||
|
|
|
| due 11/15/11 |
| 6,564 |
| ||
11,000 |
| C |
| FirstEnergy Corp., 7.375%, |
|
|
| ||
|
|
|
| due 11/15/31 |
| 13,490 |
| ||
4,000 |
| #,C |
| Juniper Generation, LLC, 6.790%, |
|
|
| ||
|
|
|
| due 12/31/14 |
| 3,989 |
| ||
2,000 |
| # |
| NorthWestern Corp, 5.875%, |
|
|
| ||
|
|
|
| due 11/01/14 |
| 2,060 |
| ||
2,000 |
| C |
| Pacific Gas & Electric Co., 6.050%, |
|
|
| ||
|
|
|
| due 03/01/34 |
| 2,212 |
| ||
4,000 |
| # |
| Pinnacle West Energy Corp, 3.630%, |
|
|
| ||
|
|
|
| due 04/01/07 |
| 4,003 |
| ||
5,000 |
| C |
| Potomac Edison Co., 5.000%, |
|
|
| ||
|
|
|
| due 11/01/06 |
| 5,040 |
| ||
894 |
| # |
| Power Contract Financing, LLC, |
|
|
| ||
|
|
|
| 5.200%, due 02/01/06 |
| 900 |
| ||
4,000 |
| # |
| Power Contract Financing, LLC, |
|
|
| ||
|
|
|
| 6.256%, due 02/01/10 |
| 4,154 |
| ||
1,645 |
|
|
| PPL Montana, LLC, 8.903%, |
|
|
| ||
|
|
|
| due 07/02/20 |
| 1,860 |
| ||
2,000 |
|
|
| Sierra Pacific Power Co, 6.250%, |
|
|
| ||
|
|
|
| due 04/15/12 |
| 2,065 |
| ||
4,000 |
| # |
| TECO Energy Inc., 6.750%, |
|
|
| ||
|
|
|
| due 05/01/15 |
| 4,260 |
| ||
2,950 |
| # |
| Tenaska Virginia Partners LP, 6.119%, |
|
|
| ||
|
|
|
| due 03/30/24 |
| 3,157 |
| ||
6,000 |
|
|
| TXU Corp., 4.446%, due 11/16/06 |
| 6,024 |
| ||
|
|
|
|
|
| 83,930 |
| ||
|
|
|
| Food: 0.7% |
|
|
| ||
$ | 1,000 |
|
|
| Delhaize America, Inc., 8.050%, |
|
|
| |
|
|
|
| due 04/15/27 |
| $ | 1,101 |
| |
2,000 |
|
|
| Delhaize America, Inc., 8.125%, |
|
|
| ||
|
|
|
| due 04/15/11 |
| 2,253 |
| ||
1,000 |
|
|
| Delhaize America, Inc., 9.000%, |
|
|
| ||
|
|
|
| due 04/15/31 |
| 1,253 |
| ||
7,000 |
| C |
| Safeway, Inc., 4.800%, due 07/16/07 |
| 7,056 |
| ||
9,000 |
| C |
| Tyson Foods, Inc., 7.250%, |
|
|
| ||
|
|
|
| due 10/01/06 |
| 9,332 |
| ||
|
|
|
|
|
| 20,995 |
| ||
|
|
|
| Gas: 0.3% |
|
|
| ||
7,000 |
| #,C |
| Williams Gas Pipelines Central, Inc., |
|
|
| ||
|
|
|
| 7.375%, due 11/15/06 |
| 7,309 |
| ||
|
|
|
|
|
| 7,309 |
| ||
|
|
|
| Home Builders: 0.4% |
|
|
| ||
9,000 |
|
|
| KB Home, 6.250%, due 06/15/15 |
| 9,195 |
| ||
1,000 |
| C |
| Technical Olympic USA, Inc., 9.000%, |
|
|
| ||
|
|
|
| due 07/01/10 |
| 1,034 |
| ||
|
|
|
|
|
| 10,229 |
| ||
|
|
|
| Insurance: 1.1% |
|
|
| ||
2,000 |
| # |
| AIG SunAmerica Global Financing X, |
|
|
| ||
|
|
|
| 6.900%, due 03/15/32 |
| 2,469 |
| ||
9,000 |
|
|
| Aon Corp., 8.205%, due 01/01/27 |
| 10,572 |
| ||
2,000 |
|
|
| GE Global Insurance Holding Corp., |
|
|
| ||
|
|
|
| 7.000%, due 02/15/26 |
| 2,150 |
| ||
5,000 |
|
|
| Prudential Financial, Inc., 4.104%, |
|
|
| ||
|
|
|
| due 11/15/06 |
| 5,016 |
| ||
11,000 |
| #,C |
| Zurich Capital Trust I, 8.376%, |
|
|
| ||
|
|
|
| due 06/01/37 |
| 12,169 |
| ||
|
|
|
|
|
| 32,376 |
| ||
|
|
|
| Lodging: 0.1% |
|
|
| ||
4,000 |
|
|
| MGM Mirage, 5.875%, due 02/27/14 |
| 3,905 |
| ||
|
|
|
|
|
| 3,905 |
| ||
|
|
|
| Media: 0.6% |
|
|
| ||
2,000 |
|
|
| AOL Time Warner, Inc., 7.625%, |
|
|
| ||
|
|
|
| due 04/15/31 |
| 2,506 |
| ||
1,000 |
|
|
| Clear Channel Communications, Inc., |
|
|
| ||
|
|
|
| 3.125%, due 02/01/07 |
| 974 |
| ||
5,000 |
| C |
| COX Communications, Inc., 6.850%, |
|
|
| ||
|
|
|
| due 01/15/18 |
| 5,484 |
| ||
3,000 |
|
|
| COX Communications, Inc., 7.125%, |
|
|
| ||
|
|
|
| due 10/01/12 |
| 3,369 |
| ||
4,000 |
|
|
| Time Warner, Inc., 7.700%, |
|
|
| ||
|
|
|
| due 05/01/32 |
| 5,076 |
| ||
|
|
|
|
|
| 17,409 |
| ||
|
|
|
| Oil and Gas: 1.7% |
|
|
| ||
4,000 |
|
|
| Amerada Hess Corp., 6.650%, |
|
|
| ||
|
|
|
| due 08/15/11 |
| 4,407 |
| ||
5,000 |
| @@,#,C |
| Empresa Nacional de Petroleo, |
|
|
| ||
|
|
|
| 4.875%, due 03/15/14 |
| 4,917 |
| ||
3,000 |
| @@ |
| Empresa Nacional de Petroleo ENAP, |
|
|
| ||
|
|
|
| 6.750%, due 11/15/12 |
| 3,336 |
| ||
7,000 |
|
|
| Enterprise Products Operating, LP, |
|
|
| ||
|
|
|
| 4.950%, due 06/01/10 |
| 7,041 |
| ||
5,000 |
|
|
| Kerr-McGee Corp, 6.950%, |
|
|
| ||
|
|
|
| due 07/01/24 |
| 5,191 |
| ||
3,000 |
| @@,C |
| Nexen, Inc., 5.875%, due 03/10/35 |
| 3,060 |
| ||
See Accompanying Notes to Financial Statements
29
| PORTFOLIO OF INVESTMENTS |
|
THE USLICO BOND PORTFOLIO | AS OF JUNE 30, 2005 (UNAUDITED) (CONTINUED) |
|
Principal |
|
|
|
|
| Value |
| ||
|
|
|
| Oil and Gas (continued) |
|
|
| ||
$ | 11,000 |
| # |
| Pemex Project Funding Master Trust, |
|
|
| |
|
|
|
| 4.710%, due 06/15/10 |
| $ | 11,374 |
| |
4,000 |
| @@,# |
| Tengizchevroil Finance Co. SARL, |
|
|
| ||
|
|
|
| 6.124%, due 11/15/14 |
| 4,110 |
| ||
4,000 |
|
|
| Valero Energy Corp, 7.500%, |
|
|
| ||
|
|
|
| due 04/15/32 |
| 4,953 |
| ||
|
|
|
|
|
| 48,389 |
| ||
|
|
|
| Pipelines: 0.2% |
|
|
| ||
4,000 |
|
|
| KN Capital Trust III, 7.630%, |
|
|
| ||
|
|
|
| due 04/15/28 |
| 4,696 |
| ||
|
|
|
|
|
| 4,696 |
| ||
|
|
|
| Real Estate: 0.6% |
|
|
| ||
7,000 |
| C |
| EOP Operating, LP, 7.750%, |
|
|
| ||
|
|
|
| due 11/15/07 |
| 7,520 |
| ||
2,000 |
| C |
| Liberty Property, LP, 6.375%, |
|
|
| ||
|
|
|
| due 08/15/12 |
| 2,194 |
| ||
1,000 |
|
|
| Liberty Property, LP, 6.950%, |
|
|
| ||
|
|
|
| due 12/01/06 |
| 1,037 |
| ||
7,000 |
| C |
| Liberty Property, LP, 7.750%, |
|
|
| ||
|
|
|
| due 04/15/09 |
| 7,756 |
| ||
|
|
|
|
|
| 18,507 |
| ||
|
|
|
| Real Estate Investment Trusts: 0.6% |
|
|
| ||
10,000 |
| C |
| Simon Property Group LP, 6.375%, |
|
|
| ||
|
|
|
| due 11/15/07 |
| 10,445 |
| ||
6,000 |
| C |
| Simon Property Group, LP, 4.875%, |
|
|
| ||
|
|
|
| due 03/18/10 |
| 6,112 |
| ||
|
|
|
|
|
| 16,557 |
| ||
|
|
|
| Retail: 0.3% |
|
|
| ||
8,000 |
| C |
| May Department Stores Co., 3.950%, |
|
|
| ||
|
|
|
| due 07/15/07 |
| 7,949 |
| ||
|
|
|
|
|
| 7,949 |
| ||
|
|
|
| Savings and Loans: 0.2% |
|
|
| ||
5,000 |
| C |
| Great Western Financial, 8.206%, |
|
|
| ||
|
|
|
| due 02/01/27 |
| 5,433 |
| ||
|
|
|
|
|
| 5,433 |
| ||
|
|
|
| Telecommunications: 1.5% |
|
|
| ||
4,000 |
| C |
| AT&T Corp., 9.750%, due 11/15/31 |
| 5,226 |
| ||
6,000 |
| C |
| BellSouth Corp., 4.200%, due 09/15/09 |
| 5,984 |
| ||
4,000 |
| @@ |
| British Telecommunications PLC, |
|
|
| ||
|
|
|
| 8.875%, due 12/15/30 |
| 5,664 |
| ||
4,000 |
| @@,+ |
| Deutsche Telekom International |
|
|
| ||
|
|
|
| Finance BV, 8.500%, due |
| 4,641 |
| ||
2,000 |
|
|
| New Cingular Wireless Services Inc, |
|
|
| ||
|
|
|
| 8.125%, due 05/01/12 |
| 2,400 |
| ||
4,000 |
|
|
| SBC Communications, Inc., 6.150%, |
|
|
| ||
|
|
|
| due 09/15/34 |
| 4,348 |
| ||
4,000 |
| + |
| Sprint Capital Corp., 4.780%, |
|
|
| ||
|
|
|
| due 08/17/06 |
| 4,030 |
| ||
3,000 |
| C |
| Sprint Capital Corp., 8.375%, |
|
|
| ||
|
|
|
| due 03/15/12 |
| 3,613 |
| ||
4,000 |
| @@,# |
| Telecom Italia Capital SA, 6.000%, |
|
|
| ||
|
|
|
| due 09/30/34 |
| 4,098 |
| ||
4,000 |
| @@,# |
| Telefonos de Mexico SA de CV, |
|
|
| ||
|
|
|
| 4.750%, due 01/27/10 |
| 4,017 |
| ||
|
|
|
|
|
| 44,021 |
| ||
|
|
|
| Total Corporate Bonds/Notes |
|
|
| ||
|
|
|
| (Cost $594,115) |
| 601,483 |
| ||
|
|
|
| ||||||
U.S. GOVERNMENT AGENCY OBLIGATIONS: 38.4% |
|
|
| ||||||
|
|
|
| ||||||
|
|
|
| Federal Home Loan Bank: 1.0% |
|
|
| ||
$ | 30,000 |
|
|
| 3.250%, due 12/17/07 |
| $ | 29,592 |
|
|
|
|
|
|
| 29,592 |
| ||
|
|
|
| Federal Home Loan Mortgage |
|
|
| ||
|
|
|
| Corporation: 7.9% |
|
|
| ||
60,000 |
| C |
| 2.700%, due 03/16/07 |
| 58,883 |
| ||
14,000 |
|
|
| 3.875%, due 06/15/08 |
| 14,012 |
| ||
10,319 |
|
|
| 4.330%, due 12/01/26 |
| 10,414 |
| ||
2,998 |
|
|
| 5.052%, due 04/01/35 |
| 3,008 |
| ||
9,000 |
|
|
| 5.214%, due 06/01/35 |
| 9,070 |
| ||
42,000 |
|
|
| 5.500%, due 07/15/34 |
| 42,591 |
| ||
10,000 |
|
|
| 5.875%, due 03/21/11 |
| 10,795 |
| ||
35,023 |
| C |
| 6.000%, due 01/15/29 |
| 36,491 |
| ||
40,000 |
|
|
| 6.500%, due 07/15/34 |
| 41,412 |
| ||
|
|
|
|
|
| 226,676 |
| ||
|
|
|
| Federal National Mortgage |
|
|
| ||
|
|
|
| Association: 29.5% |
|
|
| ||
30,000 |
|
|
| 2.875%, due 05/19/08 |
| 29,196 |
| ||
1,321 |
| C,I |
| 3.583%, due 07/01/27 |
| 1,359 |
| ||
10,887 |
|
|
| 3.583%, due 07/01/27 |
| 11,277 |
| ||
6,856 |
|
|
| 4.500%, due 09/25/16 |
| 6,866 |
| ||
13,961 |
|
|
| 4.500%, due 12/15/16 |
| 13,996 |
| ||
5,767 |
|
|
| 4.500%, due 06/15/17 |
| 5,783 |
| ||
28,000 |
|
|
| 4.500%, due 07/15/19 |
| 27,878 |
| ||
12,000 |
|
|
| 4.500%, due 02/15/20 |
| 11,748 |
| ||
5,000 |
|
|
| 4.500%, due 07/15/35 |
| 4,891 |
| ||
14,000 |
| C |
| 4.750%, due 12/25/42 |
| 14,057 |
| ||
6,684 |
|
|
| 4.837%, due 11/01/34 |
| 6,764 |
| ||
12,203 |
|
|
| 4.947%, due 01/01/35 |
| 12,320 |
| ||
117,000 |
|
|
| 5.000%, due 07/01/18 |
| 118,316 |
| ||
6,000 |
|
|
| 5.000%, due 05/15/20 |
| 6,127 |
| ||
16,307 |
|
|
| 5.000%, due 08/15/21 |
| 16,408 |
| ||
12,000 |
|
|
| 5.000%, due 04/15/23 |
| 12,212 |
| ||
197,000 |
|
|
| 5.000%, due 07/15/34 |
| 197,061 |
| ||
15,000 |
|
|
| 5.250%, due 08/01/12 |
| 15,834 |
| ||
17,673 |
|
|
| 5.500%, due 11/15/18 |
| 18,124 |
| ||
64,000 |
|
|
| 5.500%, due 07/15/19 |
| 65,700 |
| ||
14,703 |
|
|
| 5.500%, due 11/01/33 |
| 14,926 |
| ||
113,000 |
|
|
| 5.500%, due 07/15/34 |
| 114,554 |
| ||
30,985 |
|
|
| 6.000%, due 07/25/29 |
| 32,467 |
| ||
14,186 |
|
|
| 6.000%, due 04/25/31 |
| 14,875 |
| ||
27,000 |
|
|
| 6.000%, due 07/15/34 |
| 27,683 |
| ||
12,000 |
|
|
| 6.625%, due 11/15/10 |
| 13,495 |
| ||
23,238 |
|
|
| 7.500%, due 11/01/29 |
| 24,850 |
| ||
4,951 |
| C |
| 7.500%, due 06/25/32 |
| 5,244 |
| ||
6,402 |
| C |
| 7.500%, due 01/25/48 |
| 6,798 |
| ||
|
|
|
|
|
| 850,809 |
| ||
|
|
|
| Total U.S. Government |
|
|
| ||
|
|
|
| Agency Obligations |
|
|
| ||
|
|
|
| (Cost $1,102,555) |
| 1,107,077 |
| ||
|
|
|
| ||||||
U.S. TREASURY OBLIGATIONS: 23.5% |
|
|
| ||||||
|
|
|
| ||||||
|
|
|
| U.S. Treasury Bonds: 9.5% |
|
|
| ||
25,000 |
|
|
| 2.000%, due 01/15/14 |
| 27,129 |
| ||
40,000 |
|
|
| 5.375%, due 02/15/31 |
| 47,213 |
| ||
83,000 |
|
|
| 6.250%, due 08/15/23 |
| 103,461 |
| ||
20,000 |
|
|
| 8.750%, due 08/15/20 |
| 30,100 |
| ||
23,000 |
|
|
| 10.375%, due 11/15/12 |
| 26,462 |
| ||
30,000 |
|
|
| 13.250%, due 05/15/14 |
| 40,208 |
| ||
|
|
|
|
|
| 274,573 |
| ||
See Accompanying Notes to Financial Statements
30
| PORTFOLIO OF INVESTMENTS |
|
THE USLICO BOND PORTFOLIO | AS OF JUNE 30, 2005 (UNAUDITED) (CONTINUED) |
|
Principal |
|
|
|
|
| Value |
| ||
|
|
|
| U.S. Treasury Notes: 13.3% |
|
|
| ||
$ | 85,000 |
|
|
| 1.625%, due 10/31/05 |
| $ | 84,568 |
|
5,000 |
|
|
| 3.500%, due 02/15/10 |
| 4,951 |
| ||
118,000 |
|
|
| 3.500%, due 05/31/07 |
| 117,678 |
| ||
25,000 |
|
|
| 3.625%, due 06/30/07 |
| 24,994 |
| ||
14,000 |
|
|
| 3.625%, due 06/15/10 |
| 13,930 |
| ||
20,000 |
|
|
| 3.750%, due 05/15/08 |
| 20,050 |
| ||
14,000 |
|
|
| 4.000%, due 04/15/10 |
| 14,172 |
| ||
98,000 |
| W |
| 4.125%, due 05/15/15 |
| 99,487 |
| ||
|
|
|
|
|
| 379,830 |
| ||
|
|
|
| U.S. Treasury STRIP: 0.8% |
|
|
| ||
34,000 |
|
|
| 4.180%, due 05/15/16 |
| 21,777 |
| ||
|
|
|
|
|
| 21,777 |
| ||
|
|
|
| Total U.S. Treasury Obligations |
|
|
| ||
|
|
|
| (Cost $671,233) |
| 676,180 |
| ||
|
|
|
|
|
|
|
| ||
ASSET-BACKED SECURITIES: 3.9% |
|
|
| ||||||
|
|
|
| ||||||
|
|
|
| Automobile Asset-Backed |
|
|
| ||
|
|
|
| Securities: 0.9% |
|
|
| ||
2,000 |
|
|
| Honda Auto Receivables Owner Trust, |
|
|
| ||
|
|
|
| 2.790%, due 03/16/09 |
| 1,966 |
| ||
3,000 |
|
|
| Honda Auto Receivables Owner Trust, |
|
|
| ||
|
|
|
| 3.820%, due 05/21/10 |
| 2,982 |
| ||
20,000 |
|
|
| USAA Auto Owner Trust, 2.040%, |
|
|
| ||
|
|
|
| due 02/16/10 |
| 19,654 |
| ||
|
|
|
|
|
| 24,602 |
| ||
|
|
|
| Credit Card Asset-Backed |
|
|
| ||
|
|
|
| Securities: 1.5% |
|
|
| ||
6,000 |
|
|
| Bank One Issuance Trust, 4.540%, |
|
|
| ||
|
|
|
| due 09/15/10 |
| 6,043 |
| ||
6,000 |
|
|
| Capital One Master Trust, 4.900%, |
|
|
| ||
|
|
|
| due 03/15/10 |
| 6,106 |
| ||
19,000 |
|
|
| Citibank Credit Card Issuance Trust, |
|
|
| ||
|
|
|
| 5.650%, due 06/16/08 |
| 19,316 |
| ||
1,000 |
|
|
| Citibank Credit Card Master Trust I, |
|
|
| ||
|
|
|
| 5.875%, due 03/10/11 |
| 1,062 |
| ||
8,000 |
|
|
| MBNA Credit Card Master Note Trust, |
|
|
| ||
|
|
|
| 4.950%, due 06/15/09 |
| 8,138 |
| ||
2,000 |
|
|
| MBNA Master Credit Card Trust USA, |
|
|
| ||
|
|
|
| 5.900%, due 08/15/11 |
| 2,129 |
| ||
|
|
|
|
|
| 42,794 |
| ||
|
|
|
| Home Equity Asset-Backed |
|
|
| ||
|
|
|
| Securities: 0.8% |
|
|
| ||
24,000 |
|
|
| GSAA Trust, 5.242%, due 05/25/35 |
| 24,154 |
| ||
|
|
|
|
|
| 24,154 |
| ||
|
|
|
| Other Asset-Backed Securities: 0.7% |
|
|
| ||
5,855 |
|
|
| Chase Funding Mortgage Loan |
|
|
| ||
|
|
|
| Asset-Backed Certificates, 2.734%, |
|
|
| ||
|
|
|
| due 09/25/24 |
| 5,817 |
| ||
4,000 |
|
|
| Chase Funding Mortgage Loan |
|
|
| ||
|
|
|
| Asset-Backed Certificates, 4.045%, |
|
|
| ||
|
|
|
| due 05/25/33 |
| 3,981 |
| ||
3,000 |
|
|
| Popular ABS Mortgage Pass-Through |
|
|
| ||
|
|
|
| Trust, 3.735%, due 12/25/34 |
| 2,974 |
| ||
3,000 |
|
|
| Popular ABS Mortgage Pass-Through |
|
|
| ||
|
|
|
| Trust, 4.000%, due 12/25/34 |
| 2,974 |
| ||
4,691 |
|
|
| Residential Asset Mortgage Products, |
|
|
| ||
|
|
|
| Inc., 2.140%, due 02/25/30 |
| 4,665 |
| ||
|
|
|
|
|
| 20,411 |
| ||
|
|
|
| Total Asset-Backed Securities |
|
|
| ||
|
|
|
| (Cost $113,928) |
| 111,961 |
| ||
|
|
|
|
|
|
|
| ||
COLLATERALIZED MORTGAGE OBLIGATIONS: 8.8% | |||||||||
| |||||||||
|
|
|
| Commercial Mortgage-Backed |
|
|
| ||
|
|
|
| Securities: 5.3% |
|
|
| ||
$ | 3000 |
|
|
| Bear Stearns Commercial Mortgage |
|
|
| |
|
|
|
| Securities, 3.880%, due 08/13/39 |
| $ | 2,956 |
| |
8,000 |
| C |
| Bear Stearns Commercial Mortgage |
|
|
| ||
|
|
|
| Securities, 4.170%, due 01/12/41 |
| 8,004 |
| ||
8,000 |
|
|
| COMM, 3.600%, due 03/10/39 |
| 7,841 |
| ||
17,000 |
| C |
| CS First Boston Mortgage Securities |
|
|
| ||
|
|
|
| Corp., 3.861%, due 03/15/36 |
| 16,891 |
| ||
4,000 |
| C |
| CS First Boston Mortgage Securities |
|
|
| ||
|
|
|
| Corp., 7.777%, due 04/14/62 |
| 4,579 |
| ||
22,000 |
| C |
| DLJ Commercial Mortgage Corp., |
|
|
| ||
|
|
|
| 6.240%, due 11/12/31 |
| 23,322 |
| ||
5,000 |
| C |
| DLJ Commercial Mortgage Corp., |
|
|
| ||
|
|
|
| 6.460%, due 03/10/32 |
| 5,351 |
| ||
63,000 |
| C |
| DLJ Commercial Mortgage Corp., |
|
|
| ||
|
|
|
| 7.300%, due 06/10/32 |
| 69,696 |
| ||
5,309 |
| C |
| GE Capital Commercial Mortgage |
|
|
| ||
|
|
|
| Corp., 3.752%, due 07/10/39 |
| 5,262 |
| ||
10,000 |
| C |
| JP Morgan Chase Commercial |
|
|
| ||
|
|
|
| Mortgage Securities Corp., |
|
|
| ||
|
|
|
| 4.223%, due 01/15/42 |
| 9,992 |
| ||
|
|
|
|
|
| 153,894 |
| ||
|
|
|
| Whole Loan Collateral PAC: 0.3% |
|
|
| ||
7,689 |
| C |
| MASTR Alternative Loans Trust, |
|
|
| ||
|
|
|
| 8.500%, due 05/25/33 |
| 7,953 |
| ||
|
|
|
|
|
| 7,953 |
| ||
|
|
|
| Whole Loan Collateralized |
|
|
| ||
|
|
|
| Mortgage Obligations: 3.1% |
|
|
| ||
6,188 |
| C |
| Bank of America Mortgage Securities, |
|
|
| ||
|
|
|
| 5.250%, due 11/25/19 |
| 6,276 |
| ||
10,153 |
| C |
| Countrywide Home Loan Mortgage |
|
|
| ||
|
|
|
| Pass Through Trust, 5.000%, |
|
|
| ||
|
|
|
| due 11/25/18 |
| 10,217 |
| ||
31,000 |
| C |
| CS First Boston Mortgage |
|
|
| ||
|
|
|
| Securities Corp., 4.080%, |
|
|
| ||
|
|
|
| due 10/25/33 |
| 31,241 |
| ||
16,280 |
| C |
| MASTR Alternative Loans Trust, |
|
|
| ||
|
|
|
| 5.500%, due 01/25/20 |
| 16,673 |
| ||
8,000 |
|
|
| Structured Adjustable Rate |
|
|
| ||
|
|
|
| Mortgage Loan Trust, 3.624%, |
|
|
| ||
|
|
|
| due 07/25/35 |
| 8,000 |
| ||
5,000 |
|
|
| Structured Adjustable Rate |
|
|
| ||
|
|
|
| Mortgage Loan Trust, 3.674%, |
|
|
| ||
|
|
|
| due 05/25/35 |
| 5,000 |
| ||
12,069 |
| C |
| Washington Mutual, 6.000%, |
|
|
| ||
|
|
|
| due 06/25/34 |
| 12,296 |
| ||
|
|
|
|
|
| 89,703 |
| ||
|
|
|
| Whole Loan Collateralized |
|
|
| ||
|
|
|
| Support CMO: 0.1% |
|
|
| ||
2,373 |
|
|
| Bank of America Mortgage Securities, |
|
|
| ||
|
|
|
| 5.500%, due 11/25/33 |
| 2,406 |
| ||
|
|
|
|
|
| 2,406 |
| ||
|
|
|
| Total Collateralized |
|
|
| ||
|
|
|
| Mortgage Obligations |
|
|
| ||
|
|
|
| (Cost $258,563) |
| 253,956 |
| ||
See Accompanying Notes to Financial Statements
31
| PORTFOLIO OF INVESTMENTS |
|
THE USLICO BOND PORTFOLIO | AS OF JUNE 30, 2005 (UNAUDITED) (CONTINUED) |
|
Principal |
|
|
|
|
| Value |
| ||
MUNICIPAL BONDS: 0.6% |
|
|
| ||||||
|
|
|
| ||||||
|
|
|
| Municipal: 0.6% |
|
|
| ||
$ | 5,000 |
|
|
| City of New York NY, |
|
|
| |
|
|
|
| 5.000%, due 11/01/08 |
| $ | 5,309 |
| |
5,000 |
|
|
| City of New York NY, |
|
|
| ||
|
|
|
| 5.000%, due 11/01/11 |
| 5,457 |
| ||
5,000 |
| C |
| City of New York NY, |
|
|
| ||
|
|
|
| 5.000%, due 11/01/15 |
| 5,512 |
| ||
|
|
|
| Total Municipal Bonds |
|
|
| ||
|
|
|
| (Cost $16,318) |
| 16,278 |
| ||
|
|
|
| ||||||
OTHER BONDS: 0.6% |
|
|
| ||||||
|
|
|
| Sovereign: 0.6% |
|
|
| ||
6,000 |
|
|
| Dominican Republic Intl. Bond |
|
|
| ||
|
|
|
| 0.370%, due 01/23/18 |
| 6,287 |
| ||
6,000 |
| @@ |
| Mexico Government Intl. Bond, |
|
|
| ||
|
|
|
| 6.625%, due 03/03/15 |
| 6,618 |
| ||
3,390 |
| @@,# |
| Uruguay Government Intl. Bond, |
|
|
| ||
|
|
|
| 10.500%, due 10/20/06 |
| 4,899 |
| ||
|
|
|
| Total Other Bonds |
|
|
| ||
|
|
|
| (Cost $16,093) |
| 17,804 |
| ||
|
|
|
|
|
|
|
| ||
Shares |
|
|
|
|
| Value |
| ||
PREFERRED STOCK: 1.5% |
|
|
| ||||||
|
|
|
| Banks: 0.7% |
|
|
| ||
2 |
| @,#,C |
| DG Funding Trust |
| 21,511 |
| ||
|
|
|
|
|
| 21,511 |
| ||
|
|
|
| Diversified Financial Services: 0.2% |
|
|
| ||
175 |
| @,C |
| National Rural Utilities |
|
|
| ||
|
|
|
| Cooperative Finance Corp. |
| 4,337 |
| ||
|
|
|
|
|
| 4,337 |
| ||
|
|
|
| Electric: 0.1% |
|
|
| ||
125 |
| @ |
| TECO Energy, Inc. |
| 3,192 |
| ||
|
|
|
|
|
| 3,192 |
| ||
|
|
|
| Insurance: 0.5% |
|
|
| ||
520 |
| @,@@ |
| Aegon NV |
| 13,140 |
| ||
|
|
|
|
|
| 13,140 |
| ||
|
|
|
| Total Preferred Stock |
|
|
| ||
|
|
|
| (Cost $42,321) |
| 42,180 |
| ||
|
|
|
| Total Long-Term Investments |
|
|
| ||
|
|
|
| (Cost $2,818,083) |
| 2,826,920 |
| ||
Principal |
|
|
|
|
| Value |
| |||
SHORT-TERM INVESTMENTS: 25.2% |
|
|
| |||||||
|
|
|
| Repurchase Agreement: 25.2% |
|
|
| |||
$ | 727,000 |
| S |
| Morgan Stanley Repurchase |
|
|
| ||
|
|
|
| Agreement dated 06/30/05, |
|
|
| |||
|
|
|
| 3.350%, due 07/01/05, |
|
|
| |||
|
|
|
| $727,068 to be received upon |
|
|
| |||
|
|
|
| repurchase (Collateralized by |
|
|
| |||
|
|
|
| $2,360,000 Federal National |
|
|
| |||
|
|
|
| Mortgage Association 7.250%, |
|
|
| |||
|
|
|
| Market Value plus accrued interest |
|
|
| |||
|
|
|
| $743,093, due 05/15/30) |
| $ 727,000 |
| |||
|
|
|
| Total Short-Term Investments |
|
|
| |||
|
|
|
| (Cost $727,000) |
| 727,000 |
| |||
|
|
|
| Total Investments In |
|
|
| |||
|
|
|
| Securities (Cost |
|
|
| |||
|
|
|
| $3,545,083)* | 123.4 | % |
| $3,553,920 |
| |
|
|
|
| Other Assets and |
|
|
|
|
| |
|
|
|
| Liabilities-Net | (23.4 | ) |
| (674,499 | ) | |
|
|
|
| Net Assets | 100.0 | % |
| $2,879,421 |
| |
@ | Non-income producing security | |||
@@ | Foreign issuer | |||
STRIP | Separate Trading of Registered Interest and Principal of Securities | |||
+ | Step-up basis bonds. Interest rates shown reflect current coupon rates. | |||
# | Securities with purchases pursuant to Rule 144A, under the Securities Act of 1933 and may not be resold subject to that rule except to qualified institutional buyers. These securities have been determined to be liquid under the guidelines established by the Funds’ Board of Directors/Trustees. | |||
C | Bond may be called prior to maturity date. | |||
S | Segregated securities for futures, when-issued or delayed delivery securities held at June 30, 2005 | |||
I | Illiquid security | |||
W | When-issued or delayed delivery security. | |||
** | Defaulted security | |||
X | Fair value determined by ING Funds Valuation Committee appointed by the Fund’s Board of Directors/Trustees. | |||
* | Cost for federal income tax purposes is $3,546,054. Net unrealized appreciation consists of: | |||
| Gross Unrealized Appreciation |
| $ 29,106 |
|
| Gross Unrealized Depreciation |
| (21,240 | ) |
| Net Unrealized Appreciation |
| $ 7,866 |
|
See Accompanying Notes to Financial Statements
32
| PORTFOLIO OF INVESTMENTS |
|
THE USLICO MONEY MARKET PORTFOLIO(1) | AS OF JUNE 30, 2005 (UNAUDITED) |
|
Investment Types*
as of June 30, 2005
(as a percent of net assets)
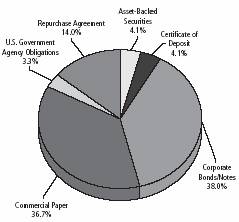
* Excludes other assets and liabilities of -0.2% of net assets.
Portfolio holdings are subject to change daily.
Principal |
|
|
|
|
| Value |
| ||
CERTIFICATE OF DEPOSIT: 4.1% |
|
|
| ||||||
$ | 250,000 |
|
|
| Barclays Bank PLC/NY, 3.275%, |
|
|
| |
|
|
|
| due 09/02/05 |
| $ | 249,939 |
| |
|
|
|
| Total Certificate of Deposit |
|
|
| ||
|
|
|
| (Cost $249,939) |
| 249,939 |
| ||
|
|
|
| ||||||
ASSET-BACKED SECURITY: 4.1% |
|
|
| ||||||
250,000 |
|
|
| Whitehawk CDO Funding Ltd., |
|
|
| ||
|
|
|
| 3.420%, due 09/15/05 |
| 250,000 |
| ||
|
|
|
| Total Asset-Backed Security |
|
|
| ||
|
|
|
| (Cost $250,000) |
| 250,000 |
| ||
|
|
|
|
|
|
|
| ||
COMMERCIAL PAPER: 36.7% |
|
|
| ||||||
250,000 |
|
|
| American Express Bank, 3.196%, |
|
|
| ||
|
|
|
| due 03/16/06 |
| 250,001 |
| ||
24,000 |
|
|
| American General Finance Corp., |
|
|
| ||
|
|
|
| 5.875%, due 07/14/06 |
| 24,451 |
| ||
250,000 |
|
|
| Concord Minutemen Cap, 3.160%, |
|
|
| ||
|
|
|
| due 07/07/06 |
| 249,997 |
| ||
250,000 |
|
|
| Master Funding LLC, 3.000%, |
|
|
| ||
|
|
|
| due 07/12/05 |
| 249,750 |
| ||
250,000 |
|
|
| Monument Gardens, 2.970%, |
|
|
| ||
|
|
|
| due 07/14/05 |
| 249,711 |
| ||
100,000 |
|
|
| Morgan Stanley, 3.340%, |
|
|
| ||
|
|
|
| due 08/15/05 |
| 100,018 |
| ||
50,000 |
|
|
| Morgan Stanley Group, Inc., |
|
|
| ||
|
|
|
| 3.750%, due 03/27/06 |
| 50,097 |
| ||
250,000 |
|
|
| Saint Germain Holdings, 2.870%, |
|
|
| ||
|
|
|
| due 07/12/05 |
| 249,761 |
| ||
250,000 |
|
|
| Three Pillars Funding, 2.760%, |
|
|
| ||
|
|
|
| due 07/08/05 |
| 249,847 |
| ||
$ | 100,000 |
|
|
| UBS Finance, 2.760%, |
|
|
| |
|
|
|
| due 07/08/05 |
| $ | 99,939 |
| |
200,000 |
|
|
| Washington Mutual Bank FA, |
|
|
| ||
|
|
|
| 3.140%, due 05/31/06 |
| 200,000 |
| ||
250,000 |
|
|
| Yorktown Capital, 2.730%, |
|
|
| ||
|
|
|
| due 07/07/05 |
| 249,868 |
| ||
|
|
|
| Total Commercial Paper |
|
|
| ||
|
|
|
| (Cost $2,123,422) |
| 2,223,440 |
| ||
|
|
|
| ||||||
CORPORATE BONDS/NOTES: 38.0% |
|
|
| ||||||
|
|
|
| ||||||
100,000 |
| # |
| American General Financial Corp., |
|
|
| ||
|
|
|
| 3.220%, due 07/14/06 |
| 100,000 |
| ||
240,000 |
|
|
| Bank One Corp., 7.625%, |
|
|
| ||
|
|
|
| due 08/01/05 |
| 241,042 |
| ||
100,000 |
|
|
| Bear Stearns Cos., Inc., 3.170%, |
|
|
| ||
|
|
|
| due 07/05/06 |
| 100,000 |
| ||
100,000 |
|
|
| Bear Stearns Cos., Inc., 3.330%, |
|
|
| ||
|
|
|
| due 07/28/06 |
| 100,000 |
| ||
250,000 |
|
|
| Crown Point Capital Co., 3.100%, |
|
|
| ||
|
|
|
| due 08/08/05 |
| 249,993 |
| ||
100,000 |
|
|
| Fannie Mae, 3.297%, due 10/07/05 |
| 100,029 |
| ||
250,000 |
|
|
| General Electric Capital Corp., |
|
|
| ||
|
|
|
| 3.410%, due 02/03/06 |
| 250,353 |
| ||
250,000 |
| # |
| Goldman Sachs Group LP, 3.210%, |
|
|
| ||
|
|
|
| due 07/17/06 |
| 250,000 |
| ||
100,000 |
|
|
| HSBC Finance Corp., 7.125%, |
|
|
| ||
|
|
|
| due 09/01/05 |
| 100,664 |
| ||
250,000 |
|
|
| PNC Bank NA, 3.210%, due 03/21/06 |
| 249,890 |
| ||
210,000 |
|
|
| Royal Bank of Scotland/New York, |
|
|
| ||
|
|
|
| 3.246%, due 09/29/05 |
| 209,930 |
| ||
50,000 |
|
|
| Societe Generale/New York, |
|
|
| ||
|
|
|
| 3.260%, due 03/30/06 |
| 49,988 |
| ||
245,000 |
|
|
| Verizon Global Funding Corp., |
|
|
| ||
|
|
|
| 6.750%, due 12/01/05 |
| 248,935 |
| ||
50,000 |
|
|
| Wachovia Corp., 7.550%, |
|
|
| ||
|
|
|
| due 08/18/05 |
| 50,270 |
| ||
|
|
|
| Total Corporate Bonds/Notes |
|
|
| ||
|
|
|
| (Cost $2,401,112) |
| 2,301,094 |
| ||
|
|
|
| ||||||
U.S. GOVERNMENT AGENCY OBLIGATIONS: 3.3% |
|
|
| ||||||
|
|
|
| ||||||
|
|
|
| Federal National Mortgage |
|
|
| ||
|
|
|
| Association: 3.3% |
|
|
| ||
200,000 |
|
|
| 6.000%, due 12/15/05 |
| 202,620 |
| ||
|
|
|
| Total U.S. Government |
|
|
| ||
|
|
|
| Agency Obligations |
|
|
| ||
|
|
|
| (Cost $202,620) |
| 202,620 |
| ||
See Accompanying Notes to Financial Statements
33
| PORTFOLIO OF INVESTMENTS |
|
THE USLICO MONEY MARKET PORTFOLIO(1) | AS OF JUNE 30, 2005 (UNAUDITED) (CONTINUED) |
|
Principal |
|
|
|
|
| Value |
| ||||
REPURCHASE AGREEMENT: 14.0% |
|
|
| ||||||||
$ | 846,000 |
|
|
| Morgan Stanley Repurchase |
|
|
| |||
|
|
|
| Agreement dated 06/30/05, 3.350%, |
|
|
| ||||
|
|
|
| due 07/01/05, $846,079 to be |
|
|
| ||||
|
|
|
| received upon repurchase |
|
|
| ||||
|
|
|
| (Collateralized by $2,745,000 |
|
|
| ||||
|
|
|
| Federal National Mortgage |
|
|
| ||||
|
|
|
| Association 7.250%, Market Value |
|
|
| ||||
|
|
|
| plus accrued interest $864,318, |
|
|
| ||||
|
|
|
| due 05/15/30) |
| $ | 846,000 |
| |||
|
|
|
| Total Repurchase Agreement |
|
|
| ||||
|
|
|
| (Cost $846,000) |
| 846,000 |
| ||||
|
|
|
| Total Investments In |
|
|
| ||||
|
|
|
| Securities (Cost |
|
|
|
|
| ||
|
|
|
| $6,073,093)* | 100.2 | % |
| $ | 6,073,093 |
| |
|
|
|
| Other Assets and |
|
|
|
|
| ||
|
|
|
| Liabilities-Net | (0.2 | ) |
| (9,685 | ) | ||
|
|
|
| Net Assets | 100.0 | % |
| $ | 6,063,408 |
| |
(1) All securities with a maturity date greater than 13 months have either a variable rate, demand feature, prerefunded, optional or mandatory put resulting in an effective maturity of one year or less. Rate shown reflects current rate.
# Securities with purchases pursuant to Rule 144A, under the Securities Act of 1933 and may not be resold subject to that rule except to qualified institutional buyers. These securities have been determined to be liquid under the guidelines established by the Funds’ Board of Directors/Trustees.
See Accompanying Notes to Financial Statements
34
| PORTFOLIO OF INVESTMENTS |
|
THE Uslico STOCK PORTFOLIO | AS OF JUNE 30, 2005 (UNAUDITED) |
|
Industry Allocation*
as of June 30, 2005
(as a percent of net assets)
* Excludes other assets and liabilities of 0.2% of net assets.
Portfolio holdings are subject to change daily.
Shares |
|
|
|
|
| Value |
| |
|
|
|
|
|
|
|
| |
COMMON STOCK: 92.5% |
|
|
| |||||
|
|
|
| |||||
|
|
|
| Aerospace/Defense: 3.1% |
|
|
| |
1,975 |
|
|
| Boeing Co. |
| $ | 130,350 |
|
1,735 |
|
|
| General Dynamics Corp. |
| 190,052 |
| |
3,680 |
|
|
| United Technologies Corp. |
| 188,968 |
| |
|
|
|
|
|
| 509,370 |
| |
|
|
|
| Agriculture: 1.0% |
|
|
| |
2,605 |
|
|
| Altria Group, Inc. |
| 168,439 |
| |
|
|
|
|
|
| 168,439 |
| |
|
|
|
| Banks: 3.5% |
|
|
| |
3,740 |
|
|
| Bank of America Corp. |
| 170,581 |
| |
5,650 |
|
|
| U.S. Bancorp |
| 164,980 |
| |
3,715 |
|
|
| Wells Fargo & Co. |
| 228,770 |
| |
|
|
|
|
|
| 564,331 |
| |
|
|
|
| Beverages: 1.6% |
|
|
| |
1,700 |
|
|
| Anheuser-Busch Cos., Inc. |
| 77,775 |
| |
3,455 |
|
|
| PepsiCo, Inc. |
| 186,328 |
| |
|
|
|
|
|
| 264,103 |
| |
|
|
|
| Biotechnology: 1.6% |
|
|
| |
2,170 |
| @ |
| Amgen, Inc. |
| 131,198 |
| |
3,135 |
| @ |
| Celgene Corp. |
| 127,814 |
| |
|
|
|
|
|
| 259,012 |
| |
|
|
|
| Chemicals: 4.1% |
|
|
| |
2,630 |
|
|
| Air Products & Chemicals, Inc. |
| 158,589 |
| |
3,270 |
|
|
| Dow Chemical Co. |
| 145,613 |
| |
4,600 |
|
|
| E.I. du Pont de Nemours & Co. |
| 197,846 |
| |
3,510 |
|
|
| Praxair, Inc. |
| 163,566 |
| |
|
|
|
|
|
| 665,614 |
| |
|
|
|
| Computers: 4.0% |
|
|
| |
4,635 |
| @ |
| Dell, Inc. |
| $ | 183,129 |
|
15,710 |
| @ |
| EMC Corp. |
| 215,384 |
| |
3,300 |
|
|
| International Business Machines |
|
|
| |
|
|
|
| Corp. |
| 244,860 |
| |
|
|
|
|
|
| 643,373 |
| |
|
|
|
| Cosmetics/Personal Care: 0.9% |
|
|
| |
2,900 |
|
|
| Procter & Gamble Co. |
| 152,975 |
| |
|
|
|
|
|
| 152,975 |
| |
|
|
|
| Diversified Financial Services: 7.7% |
|
|
| |
9,100 |
|
|
| Citigroup, Inc. |
| 420,693 |
| |
3,715 |
|
|
| Goldman Sachs Group, Inc. |
| 379,004 |
| |
3,615 |
|
|
| Lehman Brothers Holdings, Inc. |
| 358,897 |
| |
1,610 |
|
|
| Morgan Stanley |
| 84,477 |
| |
|
|
|
|
|
| 1,243,071 |
| |
|
|
|
| Electronics: 0.5% |
|
|
| |
3,305 |
| @ |
| Agilent Technologies, Inc. |
| 76,081 |
| |
|
|
|
|
|
| 76,081 |
| |
|
|
|
| Healthcare-Products: 6.7% |
|
|
| |
6,310 |
|
|
| Baxter Intl., Inc. |
| 234,101 |
| |
4,185 |
| @ |
| Inamed Corp. |
| 280,269 |
| |
4,485 |
|
|
| Johnson & Johnson |
| 291,525 |
| |
2,230 |
|
|
| Medtronic, Inc. |
| 115,492 |
| |
2,031 |
| @ |
| Zimmer Holdings, Inc. |
| 154,701 |
| |
|
|
|
|
|
| 1,076,088 |
| |
|
|
|
| Healthcare-Services: 1.1% |
|
|
| |
2,586 |
| @ |
| WellPoint, Inc. |
| 180,089 |
| |
|
|
|
|
|
| 180,089 |
| |
|
|
|
| Insurance: 2.0% |
|
|
| |
5,635 |
|
|
| American Intl. Group, Inc. |
| 327,394 |
| |
|
|
|
|
|
| 327,394 |
| |
|
|
|
| Internet: 2.8% |
|
|
| |
12,855 |
| @ |
| Yahoo!, Inc. |
| 445,426 |
| |
|
|
|
|
|
| 445,426 |
| |
|
|
|
| Investment Companies: 1.7% |
|
|
| |
5,185 |
|
|
| iShares Goldman Sachs |
|
|
| |
|
|
|
| Semiconductor Index Fund |
| 273,353 |
| |
|
|
|
|
|
| 273,353 |
| |
|
|
|
| Leisure Time: 1.7% |
|
|
| |
4,945 |
| @@ |
| Carnival Corp. |
| 269,750 |
| |
|
|
|
|
|
| 269,750 |
| |
|
|
|
| Lodging: 2.3% |
|
|
| |
3,600 |
|
|
| Marriott Intl., Inc. |
| 245,592 |
| |
2,145 |
|
|
| Starwood Hotels & Resorts |
|
|
| |
|
|
|
| Worldwide, Inc. |
| 125,633 |
| |
|
|
|
|
|
| 371,225 |
| |
|
|
|
| Media: 2.5% |
|
|
| |
3,000 |
| @ |
| Cablevision Systems Corp. |
| 96,600 |
| |
9,200 |
| @ |
| Time Warner, Inc. |
| 153,732 |
| |
6,175 |
|
|
| Walt Disney Co. |
| 155,487 |
| |
|
|
|
|
|
| 405,819 |
| |
See Accompanying Notes to Financial Statements
35
| PORTFOLIO OF INVESTMENTS |
|
THE Uslico STOCK PORTFOLIO | AS OF JUNE 30, 2005 (UNAUDITED) (CONTINUED) |
|
Shares |
|
|
|
|
| Value |
| |
|
|
|
| Mining: 1.3% |
|
|
| |
8,170 |
|
|
| Alcoa, Inc. |
| $ | 213,482 |
|
|
|
|
|
|
| 213,482 |
| |
|
|
|
| Miscellaneous Manufacturing: 6.9% |
|
|
| |
1,835 |
|
|
| 3M Co. |
| 132,671 |
| |
3,100 |
|
|
| Danaher Corp. |
| 162,254 |
| |
17,000 |
|
|
| General Electric Co. |
| 589,050 |
| |
8,080 |
| @@ |
| Tyco Intl. Ltd. |
| 235,936 |
| |
|
|
|
|
|
| 1,119,911 |
| |
|
|
|
| Oil and Gas: 7.7% |
|
|
| |
4,400 |
|
|
| ChevronTexaco Corp. |
| 246,048 |
| |
8,200 |
|
|
| Exxon Mobil Corp. |
| 471,254 |
| |
8,785 |
| @,@@ |
| Nabors Industries, Ltd. |
| 532,547 |
| |
|
|
|
|
|
| 1,249,849 |
| |
|
|
|
| Oil and Gas Services: 1.0% |
|
|
| |
3,178 |
|
|
| Baker Hughes, Inc. |
| 162,586 |
| |
|
|
|
|
|
| 162,586 |
| |
|
|
|
| Pharmaceuticals: 9.9% |
|
|
| |
1,935 |
|
|
| Allergan, Inc. |
| 164,939 |
| |
4,700 |
| @ |
| Barr Pharmaceuticals, Inc. |
| 229,078 |
| |
1,925 |
|
|
| Eli Lilly & Co. |
| 107,242 |
| |
5,825 |
| @ |
| Gilead Sciences, Inc. |
| 256,242 |
| |
10,995 |
|
|
| Pfizer, Inc. |
| 303,242 |
| |
9,415 |
| @@ |
| Teva Pharmaceutical |
|
|
| |
|
|
|
| Industries Ltd. ADR |
| 293,183 |
| |
5,700 |
|
|
| Wyeth |
| 253,650 |
| |
|
|
|
|
|
| 1,607,576 |
| |
|
|
|
| Retail: 8.2% |
|
|
| |
2,305 |
|
|
| Best Buy Co., Inc. |
| 158,008 |
| |
8,140 |
|
|
| CVS Corp. |
| 236,630 |
| |
4,025 |
|
|
| Dollar General Corp. |
| 81,949 |
| |
3,955 |
|
|
| Nordstrom, Inc. |
| 268,821 |
| |
3,510 |
|
|
| Target Corp. |
| 190,979 |
| |
8,100 |
|
|
| Wal-Mart Stores, Inc. |
| 390,420 |
| |
|
|
|
|
|
| 1,326,807 |
| |
|
|
|
| Semiconductors: 3.6% |
|
|
| |
10,380 |
|
|
| Intel Corp. |
| 270,503 |
| |
2,045 |
| @,@@ |
| Marvell Technology Group Ltd. |
| 77,792 |
| |
6,210 |
|
|
| Maxim Integrated Products, Inc. |
| 237,284 |
| |
|
|
|
|
|
| 585,579 |
| |
|
|
|
| Software: 2.4% |
|
|
| |
15,435 |
|
|
| Microsoft Corp. |
| 383,405 |
| |
|
|
|
|
|
| 383,405 |
| |
|
|
|
| Telecommunications: 2.7% |
|
|
| |
6,780 |
| @ |
| Cisco Systems, Inc. |
| 129,566 |
| |
4,500 |
|
|
| QUALCOMM, Inc. |
| 148,545 |
| |
6,790 |
|
|
| SBC Communications, Inc. |
| 161,262 |
| |
|
|
|
|
|
| 439,373 |
| |
|
|
|
| Total Common Stock |
| 14,984,081 |
| |
Principal |
|
|
|
|
| Value |
| ||||||
|
|
|
|
|
|
|
| ||||||
SHORT-TERM INVESTMENTS: 7.7% |
|
|
| ||||||||||
|
|
|
| Repurchase Agreement: 7.7% |
|
|
| ||||||
$ | 1,239,000 |
|
|
| Morgan Stanley Repurchase |
| $ | 1,239,000 |
| ||||
|
|
|
|
|
|
|
| ||||||
|
|
|
| Total Short-Term Investments |
| 1,239,000 |
| ||||||
|
|
|
| Total Investments In |
| 100.2 | % |
| $ | 16,223,081 |
| ||
|
|
|
| Other Assets and |
| (0.2 | ) |
| (29,256 | ) | |||
|
|
|
| Net Assets |
| 100.0 | % |
| $ | 16,193,825 |
| ||
|
|
|
|
|
| ||||||||
@ |
| Non-income producing security |
|
|
| ||||||||
@@ |
| Foreign issuer |
|
|
| ||||||||
ADR |
| American Depositary Receipt |
|
|
| ||||||||
* |
| Cost for federal income tax purposes is $14,842,696. Net unrealized appreciation consists of: |
|
|
| ||||||||
|
| Gross Unrealized Appreciation |
| $ | 1,631,515 |
| |||||||
|
| Gross Unrealized Depreciation |
| (251,130 | ) | ||||||||
|
| Net Unrealized Appreciation |
| $ | 1,380,385 |
| |||||||
See Accompanying Notes to Financial Statements
36
(THIS PAGE INTENTIONALLY LEFT BLANK)
(THIS PAGE INTENTIONALLY LEFT BLANK)
Investment Manager ING Investments, LLC |
| Transfer Agent DST Systems, Inc. |
|
|
|
Administrator ING Funds Services, LLC |
| Custodian The Bank of New York |
|
|
|
Distributor ING Funds Distributor, LLC |
| Legal Counsel Dechert LLP |
Before investing, carefully consider the investment objectives, risks, charges and expenses of the variable annuity contract and the underlying variable investment options. This and other information is contained in the prospectus for the variable annuity contract and the underlying variable investment options. Obtain these prospectuses from your agent/registered representative and read them carefully before investing.
|
|
| VPSAR-UUSLICO (0605-081705) |

ITEM 2. CODE OF ETHICS.
Not required for semi-annual filing.
ITEM 3. AUDIT COMMITTEE FINANCIAL EXPERT.
Not required for semi-annual filing.
ITEM 4. PRINCIPAL ACCOUNTANT FEES AND SERVICES.
Not required for semi-annual filing.
ITEM 5. AUDIT COMMITTEE OF LISTED REGISTRANTS.
Not required for semi-annual filing.
ITEM 6. SCHEDULE OF INVESTMENTS.
Schedule is included as part of the report to shareholders filed under Item 1 of
this Form.
ITEM 7. DISCLOSURE OF PROXY VOTING POLICIES AND PROCEDURES FOR CLOSED-END MANAGEMENT INVESTMENT COMPANIES.
Not applicable.
ITEM 8. PORTFOLIO MANAGERS OF CLOSED-END MANAGEMENT INVESTMENT COMPANIES.
Not applicable.
ITEM 9. PURCHASES OF EQUITY SECURITIES BY CLOSED-END MANAGEMENT INVESTMENT COMPANY AND AFFILIATED PURCHASERS.
Not applicable.
ITEM 10. SUBMISSION OF MATTERS TO A VOTE OF SECURITY HOLDERS.
The Board has a Nominating Committee for the purpose of considering and presenting to the Board candidates it proposes for nomination to fill Independent Trustee vacancies on the Board. The Committee currently consists of all Independent Trustees of the Board (6 individuals). The Nominating Committee operates pursuant to a Charter approved by the Board. The primary purpose of the Nominating Committee is to consider and present to the Board the candidates it proposes for nomination to fill vacancies on the Board. In evaluating candidates, the Nominating Committee may consider a variety of factors, but it has not at this time set any specific minimum qualifications that must be met. Specific qualifications of candidates for Board membership will be based on the needs of the Board at the time of nomination.
The Nominating Committee is willing to consider nominations received from shareholders and shall assess shareholder nominees in the same manner as it reviews its own nominees. A shareholder nominee for director should be submitted in writing to the Fund’s Secretary. Any such shareholder nomination should include at a minimum the following information as to each individual proposed for nomination as trustee: such individual’s written consent to be named in the proxy statement as a nominee (if nominated) and to serve as a trustee (if elected), and all information relating to such individual that is required to be disclosed in the solicitation of proxies for election of trustees, or is otherwise required, in each case under applicable federal securities laws, rules and regulations.
The Secretary shall submit all nominations received in a timely manner to the Nominating Committee. To be timely, any such submission must be delivered to the Fund’s Secretary not earlier than the 90th day prior to such meeting and not later than the close of business on the later of the 60th day prior to such meeting or the 10th day following the day on which public announcement of the date of the meeting is first made, by either disclosure in a press release or in a document publicly filed by the Fund with the Securities and Exchange Commission.
ITEM 11. CONTROLS AND PROCEDURES.
(a) Based on our evaluation conducted within 90 days of the filing date, hereof, the design and operation of the registrant’s disclosure controls and procedures are effective to ensure that material information relating to the registrant is made known to the certifying officers by others within the appropriate entities, particularly during the period in which Forms N-CSR are being prepared, and the registrant’s disclosure controls and procedures allow timely preparation and review of the information for the registrant’s Form N-CSR and the officer certifications of such Form N-CSR.
(b) There were no significant changes in the registrant’s internal controls that occurred during the second fiscal quarter of the period covered by this report that has materially affected, or is reasonably likely to materially affect, the registrant’s internal control over financial reporting.
ITEM 12. EXHIBITS.
(a)(1) The Code of Ethics is not required for the semi-annual filing.
(a)(2) A separate certification for each principal executive officer and principal financial officer of the registrant as required by Rule 30a-2 under the Act (17 CFR 270.30a-2) is attached hereto as EX-99.CERT.
(a)(3) Not required for semi-annual filing.
(b) The officer certifications required by Section 906 of the Sarbanes-Oxley Act of 2002 are attached hereto as EX-99.906CERT
SIGNATURES
Pursuant to the requirements of the Securities Exchange Act of 1934 and the Investment Company Act of 1940, the registrant has duly caused this report to be signed on its behalf by the undersigned, thereunto duly authorized.
(Registrant): USLICO Series Fund
By | /s/ | James M. Hennessy |
| |
|
| James M. Hennessy | ||
|
| President and Chief Executive Officer | ||
|
| |||
|
| |||
Date: | August 25, 2005 |
| ||
Pursuant to the requirements of the Securities Exchange Act of 1934 and the Investment Company Act of 1940, this report has been signed below by the following persons on behalf of the registrant and in the capacities and on the dates indicated.
By | /s/ | James M. Hennessy |
| |||
|
| James M. Hennessy | ||||
|
| President and Chief Executive Officer | ||||
|
| |||||
Date: | August 25, 2005 |
| ||||
|
| |||||
|
| |||||
By | /s/ | Todd Modic |
| |||
|
| Todd Modic | ||||
|
| Senior Vice President and Chief Financial Officer | ||||
|
| |||||
|
| |||||
Date: | August 25, 2005 |
| ||||