UNITED STATES
SECURITIES AND EXCHANGE COMMISSION
Washington, D.C. 20549
FORM N-CSR
CERTIFIED SHAREHOLDER REPORT OF REGISTERED MANAGEMENT
INVESTMENT COMPANIES
Investment Company Act file number | 811-05454 |
| |
| Dreyfus New Jersey Municipal Bond Fund, Inc. | |
| (Exact name of Registrant as specified in charter) | |
| | |
| c/o The Dreyfus Corporation 200 Park Avenue New York, New York 10166 | |
| (Address of principal executive offices) (Zip code) | |
| | |
| Bennett A. MacDougall, Esq. 200 Park Avenue New York, New York 10166 | |
| (Name and address of agent for service) | |
|
Registrant's telephone number, including area code: | (212) 922-6400 |
| |
Date of fiscal year end: | 12/31 | |
Date of reporting period: | 12/31/2018 | |
| | | | | | | |
FORM N-CSR
Item 1. Reports to Stockholders.
Dreyfus New Jersey Municipal Bond Fund, Inc.
| | | |

| | ANNUAL REPORT December 31, 2018 |
| |
Save time. Save paper. View your next shareholder report online as soon as it’s available. Log into www.dreyfus.com and sign up for Dreyfus eCommunications. It’s simple and only takes a few minutes. |
| |
The views expressed in this report reflect those of the portfolio manager(s) only through the end of the period covered and do not necessarily represent the views of Dreyfus or any other person in the Dreyfus organization. Any such views are subject to change at any time based upon market or other conditions and Dreyfus disclaims any responsibility to update such views. These views may not be relied on as investment advice and, because investment decisions for a Dreyfus fund are based on numerous factors, may not be relied on as an indication of trading intent on behalf of any Dreyfus fund. |
| |
Not FDIC-Insured • Not Bank-Guaranteed • May Lose Value |
Contents
THE FUND
FOR MORE INFORMATION
Back Cover
| | | | |
| |
Dreyfus New Jersey Municipal Bond Fund, Inc.
| | The Fund |
A LETTER FROM THE PRESIDENT OF DREYFUS
Dear Shareholder:
We are pleased to present this annual report for Dreyfus New Jersey Municipal Bond Fund, Inc., covering the 12-month period from January 1, 2018 through December 31, 2018. For information about how the fund performed during the reporting period, as well as general market perspectives, we provide a Discussion of Fund Performance on the pages that follow.
The reporting period began with major global economies achieving above-trend growth. In the United States, a robust economy and strong labor market encouraged the Federal Reserve to continue moving away from its accommodative monetary policy while other major central banks began to consider monetary tightening. Both U.S. and non-U.S. equity markets remained on an uptrend. Interest rates rose across the yield curve, putting pressure on bond prices.
A few months into the reporting period, global growth trends began to diverge and market volatility returned. While the U.S. economy continued to grow at a healthy rate, other developed markets began to weaken. However, robust growth and strong corporate earnings continued to support U.S. stock returns while other developed markets declined throughout the summer. In the fall, a broad sell-off occurred, partially offsetting earlier U.S. gains. Emerging markets remained under pressure as weakness in their currencies relative to the U.S. dollar added to investors’ uneasiness. Global equities continued their general decline through the end of the period.
Fixed income markets struggled during the first half of the period as interest rates rose and favorable U.S. equity markets fed investor risk appetites. However, in autumn volatility crept in, the yield curve began a flattening trend that continued through the end of December. As long-term debt yields fell, prices rose for many bonds, leading to moderately positive returns for several fixed income market sectors.
Despite continuing political variables, U.S. inflationary pressures and flagging growth rates, we are optimistic that the U.S. economy will remain strong in the near term. However, we remain attentive to signs that point to potential changes on the horizon. As always, we encourage you to discuss the risks and opportunities in today’s investment environment with your financial advisor.
Thank you for your continued confidence and support.
Sincerely,

Renee Laroche-Morris
President
The Dreyfus Corporation
January 15, 2019
2
DISCUSSION OF FUND PERFORMANCE(Unaudited)
For the period from January 1, 2018 through December 31, 2018, as provided by Daniel Barton and Jeffrey Burger, Portfolio Managers
Market and Fund Performance Overview
For the 12-month period ended December 31, 2018, Dreyfus New Jersey Municipal Bond Fund, Inc.’s Class A shares produced a total return of 1.17%, Class C shares returned 0.34%, Class I shares returned 1.36%, Class Y shares returned 1.50%, and Class Z shares returned 1.31%.1 In comparison, the Bloomberg Barclays U.S. Municipal Bond Index (the “Index”), the fund’s benchmark index, which is composed of bonds issued nationally and not solely within New Jersey, produced a total return of 1.28% for the same period.2
Municipal bonds during the reporting period encountered bouts of volatility stemming from rising interest rates and shifting supply-and-demand dynamics in the municipal securities market. The fund’s Class I, Y, and Z shares outperformed the Index in part due to above-average results from New Jersey securities.
The Fund’s Investment Approach
The fund seeks as high a level of current income exempt from federal and New Jersey state income taxes as is consistent with the preservation of capital. To pursue its goal, the fund normally invests at least 80% of its net assets, plus any borrowings for investment purposes, in municipal bonds that provide income exempt from federal and New Jersey state income taxes. The fund invests at least 80% of its net assets in municipal bonds rated, at the time of purchase, investment grade (i.e., Baa/BBB or higher) or the unrated equivalent as determined by The Dreyfus Corporation. The fund may invest up to 20% of its assets in municipal bonds rated below investment grade (“high yield” or “junk” bonds) or the unrated equivalent as determined by The Dreyfus Corporation. The dollar-weighted average maturity of the fund’s portfolio normally exceeds 10 years, but the fund may invest without regard to maturity.
The portfolio managers focus on identifying undervalued sectors and securities and minimize the use of interest-rate forecasting. To select municipal bonds for the fund, the portfolio managers use fundamental credit analysis to estimate the relative value and attractiveness of various sectors and securities and actively trade among various sectors based on their apparent relative values. Although the fund seeks to provide income exempt from federal and New Jersey state income taxes, interest from some of the fund’s holdings may be subject to the federal alternative minimum tax.
Supply-and-Demand Dynamics and Interest-Rate Volatility Drove Municipal Bonds
Market weakness abated early in the reporting period as municipal bonds rebounded, supported by strong seasonal reinvestment demand and very manageable new-issue supply levels. Demand from individuals was strong as personal income tax rates remained relatively high, making tax-exempt bonds an attractive shelter from taxes. Also, newly imposed tax-reform restrictions on state and local tax deductions provided a
3
DISCUSSION OF FUND PERFORMANCE(Unaudited) (continued)
catalyst for individual demand for tax-exempt bonds. Conversely, tax cuts to corporations have softened institutional demand for municipal bonds, particularly from banks and property and casualty insurance companies, as these companies perceive less of a need to seek out tax-advantaged investments in the wake of lower tax rates. Strong credit fundamental quality, reflecting the positive impact of a growing economy on tax revenues, also appealed to investors.
Inflationary pressures grew during the reporting period. In late August, rates rose across the curve and volatility reentered the picture, creating a headwind for many areas of the fixed income market, particularly higher-duration securities. In September, technical factors offered less support for the municipal bond market as coupon and maturity reinvestment trended lower, in keeping with typical seasonal patterns. Fundamentally, growing investor concern over tightening employment markets and increasing inflation weighed on the market. In October, the yield curve shifted upward on the back of continued economic strength, and volatility continued to increase as midterm elections and trade concerns caused uncertainty within the markets. At the end of the year, weakening economic indicators, concerns over corporate leverage and uncertainty about future Federal Reserve rate hikes roiled the markets. Municipal bonds and other high-quality U.S. bonds benefited from the resulting flight to quality and rebounded during late November and December.
New Jersey bonds outperformed national averages during the period. It is considered a riskier state given its lagging economy and heavy pension liabilities. However, New Jersey recently has seen progress in raising its credit-rating profile. It is adhering to its pension funding schedule and the election of a Democratic governor is expected to reduce political gridlock, leading to additional budget reforms.
New Jersey Bonds Outperformed National Averages
The fund’s relative performance was supported by its focus on New Jersey municipal bonds, which outperformed national averages. In addition, an emphasis on lower-rated securities, such as A and BBB rated bonds, helped relative returns. From a yield curve positioning perspective, an overweight in the 10-year part of the curve enhanced results. The fund also received contributions from bonds backed by hospitals and New Jersey’s settlement of litigation with U.S. tobacco companies.
A market-neutral to slightly long average duration had no material impact on relative results. Underweighted exposure to the five-year portion of the yield curve weighed to a degree on the fund’s performance. In addition, overweighted positions in the education and transportation sectors detracted, as did an emphasis on revenue bonds versus general obligation or pre-funded bonds. General obligation and pre-funded bonds outperformed during the year. Our relative lack of exposure was not beneficial to results.
Investment Posture Heading Into 2019
We expect interest rates to continue to rise next year. We expect the supply-and-demand dynamics to somewhat support the price of municipal bonds due to the investment of
4
semiannual coupon payments. Higher interest rates could also foster more retail investment demand. Furthermore, municipal bonds are relatively attractive compared to Treasuries on a yield-ratio basis, which should also provide price support going forward. These demand factors should mitigate the effects of declining institutional demand from banks and property and casualty companies.
Given this environment, we will maintain the fund’s average duration close to the benchmark and seek opportunities in attractive segments of the yield curve. We will continue to emphasize revenue bonds that provide attractive incremental yield with the potential of either price appreciation or spread tightening. We will also capitalize on any periods of volatility and spread widening to strategically add to our A and BBB rated bonds possessing strong fundamental credit characteristics.
January 15, 2019
1 Total return includes reinvestment of dividends and any capital gains paid, and does not take into consideration the maximum initial sales charge in the case of Class A shares or the applicable contingent deferred sales charge imposed on redemptions in the case of Class C shares. Had these charges been reflected, returns would have been lower. Class I, Class Y, and Class Z shares are not subject to any initial or deferred sales charge. Past performance is no guarantee of future results. Share price, yield, and investment return fluctuate such that upon redemption, fund shares may be worth more or less than their original cost. Income may be subject to state and local taxes for non-New Jersey residents, and some income may be subject to the federal alternative minimum tax (AMT) for certain investors. Capital gains, if any, are fully taxable. Return figures reflect the absorption of certain fund expenses pursuant to an agreement by The Dreyfus Corporation which may be terminated after May 1, 2019. Had these expenses not been absorbed, the returns would have been lower.
2 Source: Lipper Inc. — The Bloomberg Barclays U.S. Municipal Bond Index covers the U.S. dollar-denominated, long-term, tax-exempt bond market. Investors cannot invest directly in any index.
Bonds are subject generally to interest-rate, credit, liquidity, and market risks, to varying degrees, all of which are more fully described in the fund’s prospectus. Generally, all other factors being equal, bond prices are inversely related to interest-rate changes, and rate increases can cause price declines.
High yield bonds are subject to increased credit risk and are considered speculative in terms of the issuer’s perceived ability to continue making interest payments on a timely basis and to repay principal upon maturity.
5
FUND PERFORMANCE(Unaudited)
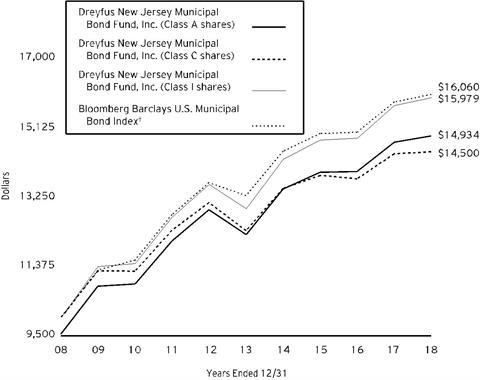
Comparison of change in value of a $10,000 investment in Class A shares, Class C shares and Class I shares ofDreyfus New Jersey Municipal Bond Fund, Inc. with a hypothetical investment of $10,000 in theBloomberg Barclays U.S. Municipal Bond Index (the “Index”)
† Source: Lipper Inc.
Past performance is not predictive of future performance.
The line graphs above compares a hypothetical $10,000 investment made in Class A, Class C and Class I shares of Dreyfus New Jersey Municipal Bond Fund, Inc. on 12/31/08 to a hypothetical investment of $10,000 made in the Index on that date. All dividends and capital gain distributions are reinvested.
The fund invests primarily in New Jersey municipal securities and its performance shown in the line graph above takes into account the maximum initial sales charge on Class A shares and all other applicable fees and expenses of the applicable classes. Performance for Class Z shares will vary from the performance of Class A, Class C and Class I shares shown above due to differences in charges and expenses. The Index is not limited to investments in New Jersey municipal obligations. The Index covers the U.S. dollar-denominated long-term tax-exempt bond market. Unlike a mutual fund, the Index is not subject to charges, fees and other expenses. Investors cannot invest directly in any index. Further information relating to fund performance, including expense reimbursements, if applicable, is contained in the Financial Highlights section of the prospectus and elsewhere in this report.
6
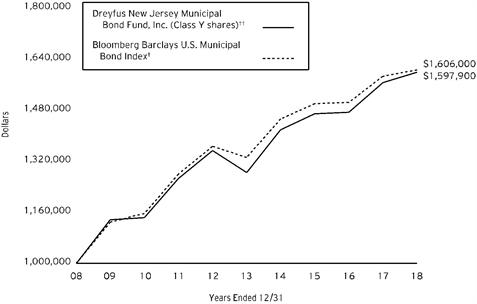
Comparison of change in value of $1,000,000 investment in Class Y shares ofDreyfus New Jersey Municipal Bond Fund, Inc. with a hypothetical investment of $1,000,000 in theBloomberg Barclays U.S. Municipal Bond Index (the “Index”)
† Source: Lipper Inc.
†† The total return figures presented for Class Y shares of the fund reflect the performance of the fund’s Class A shares for the period prior to 7/1/13 (the inception date for Class Y shares).
The line graphs above compares a $1,000,000 investment made in Class Y shares of Dreyfus New Jersey Municipal Bond Fund, Inc. on 12/31/08 to a hypothetical investment of $1,000,000 made in the Index on that date. All dividends and capital gain distributions are reinvested.
The fund’s performance shown in the line graph above takes into account the all applicable fees and expenses of the fund’s Class Y shares. Performance for Class Z shares will vary from the performance of Class Y shares shown above due to differences in charges and expenses. The Index is not limited to investments in New Jersey municipal obligations. The Index covers the U.S. dollar-denominated long-term tax-exempt bond market. Unlike a mutual fund, the Index is not subject to charges, fees and other expenses. Investors cannot invest directly in any index. Further information relating to fund performance, including expense reimbursements, if applicable, is contained in the Financial Highlights section of the prospectus and elsewhere in this report.
7
FUND PERFORMANCE(Unaudited) (continued)
| | | | | |
Average Annual Total Returns as of 12/31/18 | | |
| Inception
Date | 1 Year | 5 Years | 10 Years |
Class A shares | | | | |
with maximum sales charge (4.5%) | 11/6/87 | -3.39% | 3.08% | 4.09% |
without sales charge | 11/6/87 | 1.17% | 4.03% | 4.57% |
Class C shares | | | | |
with applicable redemption charge† | 1/7/03 | -0.63% | 3.24% | 3.79% |
without redemption | 1/7/03 | 0.34% | 3.24% | 3.79% |
Class I shares | 12/15/08 | 1.36% | 4.28% | 4.80% |
Class Y shares | 7/1/13 | 1.50% | 4.35% | 4.75%†† |
Class Z shares | 6/7/07 | 1.31% | 4.22% | 4.73% |
Bloomberg Barclays U.S.
Municipal Bond Index | | 1.28% | 3.82% | 4.85% |
† The maximum contingent deferred sales charge for Class C shares is 1% for shares redeemed within one year of the date of purchase.
†† The total return performance figures presented for Class Y shares of the fund reflect the performance of the fund’s Class A shares for the period prior to 7/1/13 (the inception date for Class Y shares), not reflecting the applicable sales charges for Class A shares.
The performance data quoted represents past performance, which is no guarantee of future results. Share price and investment return fluctuate and an investor’s shares may be worth more or less than original cost upon redemption. Current performance may be lower or higher than the performance quoted. Go to dreyfus.com for the fund’s most recent month-end returns.
The fund’s performance shown in the graphs and table does not reflect the deduction of taxes that a shareholder would pay on fund distributions or the redemption of fund shares. In addition to the performance of Class A shares shown with and without a maximum sales charge, the fund’s performance shown in the table takes into account all other applicable fees and expenses on all classes.
8
UNDERSTANDING YOUR FUND’S EXPENSES(Unaudited)
As a mutual fund investor, you pay ongoing expenses, such as management fees and other expenses. Using the information below, you can estimate how these expenses affect your investment and compare them with the expenses of other funds. You also may pay one-time transaction expenses, including sales charges (loads) and redemption fees, which are not shown in this section and would have resulted in higher total expenses. For more information, see your fund’s prospectus or talk to your financial adviser.
Review your fund’s expenses
The table below shows the expenses you would have paid on a $1,000 investment in Dreyfus New Jersey Municipal Bond Fund, Inc. from July 1, 2018 to December 31, 2018. It also shows how much a $1,000 investment would be worth at the close of the period, assuming actual returns and expenses.
| | | | | | | | | | | |
Expenses and Value of a $1,000 Investment |
assuming actual returns for the six months ended December 31, 2018 |
| | Class A | Class C | Class I | Class Y | Class Z |
Expenses paid per $1,000† | | $4.31 | | $8.09 | | $3.04 | | $3.04 | | $3.30 |
Ending value (after expenses) | | $1,011.30 | | $1,006.80 | | $1,012.80 | | $1,013.30 | | $1,012.60 |
COMPARING YOUR FUND’S EXPENSES
WITH THOSE OF OTHER FUNDS(Unaudited)
Using the SEC’s method to compare expenses
The Securities and Exchange Commission (“SEC”) has established guidelines to help investors assess fund expenses. Per these guidelines, the table below shows your fund’s expenses based on a $1,000 investment, assuming a hypothetical 5% annualized return. You can use this information to compare the ongoing expenses (but not transaction expenses or total cost) of investing in the fund with those of other funds. All mutual fund shareholder reports will provide this information to help you make this comparison. Please note that you cannot use this information to estimate your actual ending account balance and expenses paid during the period.
| | | | | | | | | | | |
Expenses and Value of a $1,000 Investment |
assuming a hypothetical 5% annualized return for the six months ended December 31, 2018 |
| | Class A | Class C | Class I | Class Y | Class Z |
Expenses paid per $1,000† | | $4.33 | | $8.13 | | $3.06 | | $3.06 | | $3.31 |
Ending value (after expenses) | | $1,020.92 | | $1,017.14 | | $1,022.18 | | $1,022.18 | | $1,021.93 |
† Expenses are equal to the fund’s annualized expense ratio of .85% for Class A, 1.60% for Class C, .60% for Class I, .60% for Class Y and .65% for Class Z, multiplied by the average account value over the period, multiplied by 184/365 (to reflect the one-half year period).
9
STATEMENT OF INVESTMENTS
December 31, 2018
| | | | | | | | | | |
| |
Description | Coupon
Rate (%) | | Maturity
Date | | Principal
Amount ($) | | Value ($) | |
Long-Term Municipal Investments - 98.8% | | | | | |
New Jersey - 85.4% | | | | | |
Atlantic County Improvement Authority,
Stockton University GO, LR (Atlantic City Campus Project) (Insured; Assured Guaranty Municipal Corp.) | | 5.00 | | 7/1/2048 | | 3,000,000 | | 3,296,460 | |
Bayonne,
General Improvement GO (Insured; Build America Mutual Assurance Company) | | 5.00 | | 7/1/2039 | | 1,000,000 | | 1,098,820 | |
Camden County Improvement Authority,
County Guaranteed Loan Revenue Bonds (County Capital Program) | | 5.00 | | 1/15/2032 | | 2,695,000 | | 3,095,207 | |
Camden County Improvement Authority,
County Guaranteed Loan Revenue Bonds (County Capital Program) | | 5.00 | | 1/15/2031 | | 3,000,000 | | 3,464,220 | |
Camden County Improvement Authority,
Health Care Redevelopment Project Revenue Bonds (The Cooper Health System Obligated Group Issue) | | 5.00 | | 2/15/2034 | | 1,000,000 | | 1,073,070 | |
Camden County Improvement Authority,
Health Care Redevelopment Project Revenue Bonds (The Cooper Health System Obligated Group Issue) | | 5.75 | | 2/15/2042 | | 5,000,000 | | 5,403,700 | |
East Orange Board of Education,
COP, LR (Insured; Assured Guaranty Municipal Corp.) | | 0.00 | | 2/1/2028 | | 2,345,000 | a | 1,764,144 | |
East Orange Board of Education,
COP, LR (Insured; Assured Guaranty Municipal Corp.) | | 0.00 | | 2/1/2026 | | 745,000 | a | 605,536 | |
East Orange Board of Education,
COP, LR (Insured; Assured Guaranty Municipal Corp.) | | 0.00 | | 2/1/2021 | | 685,000 | a | 651,736 | |
Essex County Improvement Authority,
SWDR (Covanta Project) | | 5.25 | | 7/1/2045 | | 2,500,000 | b | 2,509,250 | |
Garden State Preservation Trust,
Revenue Bonds (Open Space and Farmland Preservation Bonds) (Insured; Assured Guaranty Municipal Corp.) | | 5.75 | | 11/1/2028 | | 10,000,000 | | 11,907,500 | |
10
| | | | | | | | | | |
| |
Description | Coupon
Rate (%) | | Maturity
Date | | Principal
Amount ($) | | Value ($) | |
Long-Term Municipal Investments - 98.8% (continued) | | | | | |
New Jersey - 85.4% (continued) | | | | | |
Gloucester County Improvement Authority,
Revenue Bonds (Rowan University Project) (Insured; Assured Guaranty Municipal Corporation) | | 5.00 | | 11/1/2030 | | 1,000,000 | | 1,147,590 | |
Gloucester County Pollution Control Financing Authority,
PCR (Logan Project) | | 5.00 | | 12/1/2024 | | 1,000,000 | | 1,059,160 | |
Hudson County Improvement Authority,
County Secured LR (Hudson County Vocational-Technical Schools Project) | | 5.00 | | 5/1/2046 | | 2,500,000 | | 2,790,025 | |
Hudson County Improvement Authority,
Harrison Stadium Land Acquisition Special Obligation Revenue Bonds (Harrison Redevelopment Project) (Insured; National Public Finance Guarantee Corp.) | | 0.00 | | 12/15/2034 | | 3,000,000 | a | 1,746,720 | |
Irvington Township,
GO (Fiscal Year Adjustment Bonds and General Improvement Bonds) (Insured; Assured Guaranty Municipal Corp.) | | 5.00 | | 7/15/2032 | | 2,000,000 | | 2,228,420 | |
Jersey City,
GO | | 5.00 | | 11/1/2033 | | 400,000 | | 461,960 | |
Mercer County Improvement Authority,
County Secured Open Space Revenue Bonds (Insured; National Public Finance Guarantee Corp.) | | 5.00 | | 8/1/2040 | | 3,290,000 | | 3,298,587 | |
Middletown Township Board of Education,
GO | | 5.00 | | 8/1/2026 | | 2,935,000 | | 3,072,916 | |
Middletown Township Board of Education,
GO | | 5.00 | | 8/1/2025 | | 1,000,000 | | 1,046,990 | |
Monmouth County Improvement Authority,
Governmental Pooled Loan Revenue Bonds | | 5.00 | | 2/15/2032 | | 500,000 | | 586,090 | |
Monmouth County Improvement Authority,
Governmental Pooled Loan Revenue Bonds | | 5.00 | | 2/15/2031 | | 625,000 | | 736,106 | |
Monroe Township Board of Education,
School District GO | | 5.00 | | 3/1/2034 | | 1,250,000 | | 1,405,338 | |
11
STATEMENT OF INVESTMENTS (continued)
| | | | | | | | | | |
| |
Description | Coupon
Rate (%) | | Maturity
Date | | Principal
Amount ($) | | Value ($) | |
Long-Term Municipal Investments - 98.8% (continued) | | | | | |
New Jersey - 85.4% (continued) | | | | | |
New Brunswick Parking Authority,
City Guaranteed Parking Revenue Bonds (Insured; Build America Mutual Assurance Company) | | 5.00 | | 9/1/2035 | | 2,000,000 | | 2,273,360 | |
New Jersey Economic Development Authority,
Cigarette Tax Revenue Bonds | | 5.00 | | 6/15/2024 | | 3,000,000 | | 3,214,560 | |
New Jersey Economic Development Authority,
Cigarette Tax Revenue Bonds | | 5.00 | | 6/15/2028 | | 3,625,000 | | 3,837,679 | |
New Jersey Economic Development Authority,
Department of Human Services Composite Revenue Bonds (Division of Developmental Disabilities) | | 6.25 | | 7/1/2024 | | 490,000 | | 491,303 | |
New Jersey Economic Development Authority,
Motor Vehicle Surcharge Revenue Bonds (Insured; National Public Finance Guarantee Corp.) | | 0.00 | | 7/1/2020 | | 3,350,000 | a | 3,223,604 | |
New Jersey Economic Development Authority,
Motor Vehicle Surcharge Revenue Bonds (Insured; National Public Finance Guarantee Corp.) | | 0.00 | | 7/1/2021 | | 2,620,000 | a | 2,450,460 | |
New Jersey Economic Development Authority,
Motor Vehicle Surcharge Revenue Bonds, Refunding, Ser. 2017. A | | 5.00 | | 7/1/2033 | | 1,000,000 | | 1,078,890 | |
New Jersey Economic Development Authority,
Private Activity Revenue Bonds (The Goethals Bridge Replacement Project) | | 5.38 | | 1/1/2043 | | 3,500,000 | | 3,753,540 | |
New Jersey Economic Development Authority,
Revenue Bonds (Hillcrest Health Service System Project) (Insured; AMBAC) | | 0.00 | | 1/1/2022 | | 6,000,000 | a | 5,550,120 | |
New Jersey Economic Development Authority,
Revenue Bonds (Hillcrest Health Service System Project) (Insured; AMBAC) | | 0.00 | | 1/1/2020 | | 6,500,000 | a | 6,351,345 | |
New Jersey Economic Development Authority,
Revenue Bonds (Provident Group - Rowan Properties L.L.C. - Rowan University Student Housing Project) | | 5.00 | | 1/1/2035 | | 1,000,000 | | 1,058,840 | |
12
| | | | | | | | | | |
| |
Description | Coupon
Rate (%) | | Maturity
Date | | PrincipalAmount ($)
| | Value ($) | |
Long-Term Municipal Investments - 98.8% (continued) | | | | | |
New Jersey - 85.4% (continued) | | | | | |
New Jersey Economic Development Authority,
Revenue Bonds (Provident Group-Kean Properties L.L.C. - Kean University Student Housing Project) | | 5.00 | | 7/1/2047 | | 1,000,000 | | 1,054,540 | |
New Jersey Economic Development Authority,
Revenue Bonds (Provident Group-Kean Properties L.L.C. - Kean University Student Housing Project) | | 5.00 | | 7/1/2037 | | 650,000 | | 691,353 | |
New Jersey Economic Development Authority,
Revenue Bonds, Refunding | | 5.00 | | 1/1/2049 | | 2,000,000 | | 2,114,440 | |
New Jersey Economic Development Authority,
Revenue Bonds, Refunding (Provident Group-Montclair Properties-State University Student Housing Project) (Insured; Assured Guaranty Municipal Corporation) | | 5.00 | | 6/1/2042 | | 1,000,000 | | 1,092,440 | |
New Jersey Economic Development Authority,
School Facilities Construction Revenue Bonds | | 5.75 | | 3/1/2021 | | 1,380,000 | c | 1,491,325 | |
New Jersey Economic Development Authority,
School Facilities Construction Revenue Bonds | | 5.75 | | 9/1/2023 | | 385,000 | | 409,725 | |
New Jersey Economic Development Authority,
School Facilities Construction Revenue Bonds (Insured; National Public Finance Guarantee Corp.) | | 5.50 | | 9/1/2027 | | 10,000,000 | | 11,818,700 | |
New Jersey Economic Development Authority,
School Revenue Bonds (Charter Foundation Academy Charter School Project) | | 5.00 | | 7/1/2050 | | 1,000,000 | | 1,042,660 | |
New Jersey Economic Development Authority,
Special Facility Revenue Bonds (Continental Airlines, Inc. Project) | | 5.25 | | 9/15/2029 | | 8,050,000 | | 8,705,914 | |
New Jersey Economic Development Authority,
Special Facility Revenue Bonds, Refunding (Port Newark Container Terminal LLC Project) | | 5.00 | | 10/1/2047 | | 7,500,000 | | 7,895,550 | |
13
STATEMENT OF INVESTMENTS (continued)
| | | | | | | | | | |
| |
Description | Coupon
Rate (%) | | Maturity
Date | | Principal
Amount ($) | | Value ($) | |
Long-Term Municipal Investments - 98.8% (continued) | | | | | |
New Jersey - 85.4% (continued) | | | | | |
New Jersey Economic Development Authority,
Water Facilities Revenue Bonds (New Jersey - American Water Company, Inc. Project) | | 5.10 | | 6/1/2023 | | 3,000,000 | | 3,104,880 | |
New Jersey Economic Development Authority,
Water Facilities Revenue Bonds (New Jersey - American Water Company, Inc. Project) | | 5.60 | | 11/1/2034 | | 6,600,000 | | 6,852,978 | |
New Jersey Economic Development Authority,
Water Facilities Revenue Bonds (New Jersey - American Water Company, Inc. Project) | | 5.70 | | 10/1/2039 | | 5,000,000 | | 5,114,050 | |
New Jersey Educational Facilities Authority,
Revenue Bonds (New Jersey Institute of Technology Issue) | | 5.00 | | 7/1/2031 | | 2,000,000 | | 2,082,480 | |
New Jersey Educational Facilities Authority,
Revenue Bonds (Princeton Theological Seminary Issue) | | 5.00 | | 7/1/2020 | | 1,800,000 | c | 1,885,104 | |
New Jersey Educational Facilities Authority,
Revenue Bonds (Princeton University) | | 5.00 | | 7/1/2034 | | 1,000,000 | | 1,184,380 | |
New Jersey Educational Facilities Authority,
Revenue Bonds (Princeton University) | | 5.00 | | 7/1/2034 | | 2,000,000 | | 2,368,760 | |
New Jersey Educational Facilities Authority,
Revenue Bonds (Ramapo College of New Jersey Issue) | | 5.00 | | 7/1/2042 | | 3,000,000 | | 3,229,650 | |
New Jersey Educational Facilities Authority,
Revenue Bonds (Ramapo College of New Jersey) (Insured; Assured Guaranty Municipal Corporation) | | 5.00 | | 7/1/2034 | | 2,000,000 | | 2,288,300 | |
New Jersey Educational Facilities Authority,
Revenue Bonds (Stockton University Issue) (Insured; Assured Guaranty Municipal Corp.) | | 5.00 | | 7/1/2035 | | 1,600,000 | | 1,788,304 | |
New Jersey Educational Facilities Authority,
Revenue Bonds (The College of New Jersey Issue) | | 4.00 | | 7/1/2035 | | 1,750,000 | | 1,827,193 | |
14
| | | | | | | | | | |
| |
Description | Coupon
Rate (%) | | Maturity
Date | | PrincipalAmount ($)
| | Value ($) | |
Long-Term Municipal Investments - 98.8% (continued) | | | | | |
New Jersey - 85.4% (continued) | | | | | |
New Jersey Educational Facilities Authority,
Revenue Bonds (The William Paterson University of New Jersey Issue) | | 5.00 | | 7/1/2029 | | 2,130,000 | | 2,414,611 | |
New Jersey Educational Facilities Authority,
Revenue Bonds (The William Paterson University of New Jersey Issue) | | 5.00 | | 7/1/2022 | | 2,165,000 | | 2,360,196 | |
New Jersey Educational Facilities Authority,
Revenue Bonds (The William Paterson University of New Jersey Issue) | | 5.00 | | 7/1/2030 | | 2,255,000 | | 2,550,585 | |
New Jersey Educational Facilities Authority,
Revenue Bonds (The William Paterson University of New Jersey Issue) (Insured; Assured Guaranty Corp.) | | 5.00 | | 7/1/2038 | | 225,000 | | 225,455 | |
New Jersey Educational Facilities Authority,
Revenue Bonds (The William Paterson University of New Jersey Issue) (Insured; Build America Mutual Assurance Company) | | 5.00 | | 7/1/2030 | | 2,025,000 | | 2,308,135 | |
New Jersey Health Care Facilities Financing Authority,
Revenue Bonds (AHS Hospital Corporation Issue) | | 4.00 | | 7/1/2041 | | 7,500,000 | | 7,607,775 | |
New Jersey Health Care Facilities Financing Authority,
Revenue Bonds (Atlantic Health System Hospital Corporation Issue) | | 5.00 | | 7/1/2027 | | 350,000 | | 350,952 | |
New Jersey Health Care Facilities Financing Authority,
Revenue Bonds (Barnabas Health Issue) | | 5.63 | | 7/1/2021 | | 3,000,000 | c | 3,270,990 | |
New Jersey Health Care Facilities Financing Authority,
Revenue Bonds (General Hospital Center at Passaic, Inc. Obligated Group Issue) (Insured; Assured Guaranty Municipal Corp.) (Escrowed to Maturity) | | 6.75 | | 7/1/2019 | | 110,000 | | 112,707 | |
New Jersey Health Care Facilities Financing Authority,
Revenue Bonds (Hackensack Meridian Health) | | 5.00 | | 7/1/2039 | | 1,500,000 | | 1,688,745 | |
15
STATEMENT OF INVESTMENTS (continued)
| | | | | | | | | | |
| |
Description | Coupon
Rate (%) | | Maturity
Date | | Principal
Amount ($) | | Value ($) | |
Long-Term Municipal Investments - 98.8% (continued) | | | | | |
New Jersey - 85.4% (continued) | | | | | |
New Jersey Health Care Facilities Financing Authority,
Revenue Bonds (Inspira Health Obligated Group Issue) | | 4.00 | | 7/1/2041 | | 3,250,000 | | 3,309,052 | |
New Jersey Health Care Facilities Financing Authority,
Revenue Bonds (Inspira Health Obligated Group Issue) | | 5.00 | | 7/1/2046 | | 3,000,000 | | 3,288,180 | |
New Jersey Health Care Facilities Financing Authority,
Revenue Bonds (Inspira Health Obligated Group) | | 5.00 | | 7/1/2042 | | 3,500,000 | | 3,891,055 | |
New Jersey Health Care Facilities Financing Authority,
Revenue Bonds (Kennedy Health System Obligated Group Issue) | | 5.00 | | 7/1/2022 | | 1,525,000 | c | 1,681,389 | |
New Jersey Health Care Facilities Financing Authority,
Revenue Bonds (Meridian Health System Obligated Group Issue) | | 5.00 | | 7/1/2026 | | 1,000,000 | | 1,095,800 | |
New Jersey Health Care Facilities Financing Authority,
Revenue Bonds (Meridian Health System Obligated Group Issue) | | 5.00 | | 7/1/2023 | | 2,500,000 | | 2,751,925 | |
New Jersey Health Care Facilities Financing Authority,
Revenue Bonds (Princeton HealthCare System Issue) | | 5.00 | | 7/1/2039 | | 2,000,000 | | 2,222,720 | |
New Jersey Health Care Facilities Financing Authority,
Revenue Bonds (Robert Wood Johnson Barnabas Health Obligated Group Issue) | | 5.00 | | 7/1/2043 | | 3,500,000 | | 3,924,270 | |
New Jersey Health Care Facilities Financing Authority,
Revenue Bonds (Saint Barnabas Health Care System Issue) (Insured; National Public Finance Guarantee Corp.) (Escrowed to Maturity) | | 0.00 | | 7/1/2023 | | 2,280,000 | a | 2,060,960 | |
New Jersey Health Care Facilities Financing Authority,
Revenue Bonds (Saint Joseph's Healthcare System Obligated Group Issue) | | 5.00 | | 7/1/2041 | | 1,000,000 | | 1,064,200 | |
New Jersey Health Care Facilities Financing Authority,
Revenue Bonds (St. Joseph's Healthcare Systems Obligation Group) | | 5.00 | | 7/1/2036 | | 2,790,000 | | 3,008,457 | |
16
| | | | | | | | | | |
| |
Description | Coupon
Rate (%) | | Maturity
Date | | Principal
Amount ($) | | Value ($) | |
Long-Term Municipal Investments - 98.8% (continued) | | | | | |
New Jersey - 85.4% (continued) | | | | | |
New Jersey Health Care Facilities Financing Authority,
Revenue Bonds (University Hospital Issue) (Insured; Assured Guaranty Municipal Corp.) | | 5.00 | | 7/1/2046 | | 2,000,000 | | 2,185,080 | |
New Jersey Health Care Facilities Financing Authority,
Revenue Bonds (Virtua Health Issue) (Insured; Assured Guaranty Corp.) | | 5.50 | | 7/1/2038 | | 5,000,000 | | 5,089,150 | |
New Jersey Health Care Facilities Financing Authority,
Revenue Bonds, Refunding (Hackensack University Medical Center) Ser. 2010. B | | 5.00 | | 1/1/2020 | | 1,720,000 | c | 1,773,320 | |
New Jersey Health Care Facilities Financing Authority,
Revenue Bonds, Refunding (Hackensack University Medical Center) Ser. 2010. B | | 5.00 | | 1/1/2020 | | 1,060,000 | c | 1,093,390 | |
New Jersey Higher Education Student Assistance Authority,
Senior Student Loan Revenue Bonds | | 5.00 | | 12/1/2021 | | 1,800,000 | | 1,924,506 | |
New Jersey Higher Education Student Assistance Authority,
Student Loan Revenue Bonds | | 5.00 | | 12/1/2026 | | 1,075,000 | | 1,100,510 | |
New Jersey Higher Education Student Assistance Authority,
Student Loan Revenue Bonds | | 5.00 | | 12/1/2027 | | 1,000,000 | | 1,136,880 | |
New Jersey Higher Education Student Assistance Authority,
Student Loan Revenue Bonds | | 5.00 | | 12/1/2025 | | 425,000 | | 435,085 | |
New Jersey Higher Education Student Assistance Authority,
Student Loan Revenue Bonds, Ser. 2018. A | | 3.35 | | 12/1/2029 | | 7,000,000 | | 7,084,630 | |
New Jersey Housing and Mortgage Finance Agency,
Multi-Family Revenue Bonds | | 4.95 | | 5/1/2041 | | 7,000,000 | | 7,087,500 | |
New Jersey Housing and Mortgage Finance Agency,
SFHR | | 5.20 | | 10/1/2025 | | 3,265,000 | | 3,280,998 | |
New Jersey Institute of Technology,
GO | | 5.00 | | 7/1/2031 | | 3,385,000 | | 3,841,603 | |
New Jersey Institute of Technology,
Revenue Bonds | | 5.00 | | 7/1/2032 | | 695,000 | | 752,553 | |
New Jersey Institute of Technology,
Revenue Bonds | | 5.00 | | 7/1/2022 | | 305,000 | c | 337,367 | |
17
STATEMENT OF INVESTMENTS (continued)
| | | | | | | | | | |
| |
Description | Coupon
Rate (%) | | Maturity
Date | | Principal
Amount ($) | | Value ($) | |
Long-Term Municipal Investments - 98.8% (continued) | | | | | |
New Jersey - 85.4% (continued) | | | | | |
New Jersey Tobacco Settlement Financing Corp.,
Revenue Bonds, Refunding, Ser. B | | 3.20 | | 6/1/2027 | | 11,000,000 | | 11,015,950 | |
New Jersey Tobacco Settlement Financing Corp.,
Revenue Bonds, Refunding, Ser. B | | 5.00 | | 6/1/2046 | | 11,500,000 | | 11,606,145 | |
New Jersey Transportation Trust Fund Authority,
(Transportation System) | | 5.50 | | 12/15/2023 | | 7,000,000 | | 7,843,780 | |
New Jersey Transportation Trust Fund Authority,
(Transportation System) | | 5.50 | | 6/15/2031 | | 2,500,000 | | 2,645,325 | |
New Jersey Transportation Trust Fund Authority,
(Transportation System) (Insured; AMBAC) | | 0.00 | | 12/15/2024 | | 1,000,000 | a | 816,330 | |
New Jersey Transportation Trust Fund Authority,
(Transportation System) (Insured; AMBAC) | | 5.25 | | 12/15/2022 | | 5,000,000 | | 5,490,350 | |
New Jersey Transportation Trust Fund Authority,
Revenue Bonds (Build America Bond) Ser. A | | 0.00 | | 12/15/2028 | | 12,000,000 | a | 8,373,000 | |
New Jersey Transportation Trust Fund Authority,
Revenue Bonds (Build America Bond) Ser. A | | 0.00 | | 12/15/2038 | | 6,330,000 | a | 2,719,495 | |
New Jersey Turnpike Authority,
Revenue Bonds | | 5.00 | | 1/1/2035 | | 1,500,000 | | 1,712,985 | |
New Jersey Turnpike Authority,
Revenue Bonds | | 5.00 | | 1/1/2031 | | 2,500,000 | | 2,901,225 | |
New Jersey Turnpike Authority,
Revenue Bonds, Refunding | | 5.00 | | 1/1/2040 | | 1,000,000 | | 1,133,030 | |
New Jersey Turnpike Authority,
Turnpike Revenue Bonds | | 5.00 | | 1/1/2023 | | 2,000,000 | | 2,225,980 | |
New Jersey Turnpike Authority,
Turnpike Revenue Bonds | | 5.00 | | 1/1/2045 | | 4,000,000 | | 4,371,640 | |
New Jersey Turnpike Authority,
Turnpike Revenue Bonds | | 5.00 | | 1/1/2026 | | 2,000,000 | | 2,204,160 | |
New Jersey Turnpike Authority,
Turnpike Revenue Bonds | | 5.00 | | 1/1/2034 | | 2,000,000 | | 2,224,780 | |
New Jersey Turnpike Authority,
Turnpike Revenue Bonds | | 5.00 | | 1/1/2025 | | 2,000,000 | | 2,312,880 | |
New Jersey Turnpike Authority,
Turnpike Revenue Bonds | | 5.00 | | 1/1/2022 | | 3,000,000 | c | 3,277,710 | |
18
| | | | | | | | | | |
| |
Description | Coupon
Rate (%) | | Maturity
Date | | Principal
Amount ($) | | Value ($) | |
Long-Term Municipal Investments - 98.8% (continued) | | | | | |
New Jersey - 85.4% (continued) | | | | | |
New Jersey Turnpike Authority,
Turnpike Revenue Bonds (Insured; Assured Guaranty Municipal Corp.) | | 5.25 | | 1/1/2027 | | 3,000,000 | | 3,633,150 | |
New Jersey Turnpike Authority,
Turnpike Revenue Bonds, Refunding | | 5.00 | | 1/1/2031 | | 2,500,000 | | 2,941,175 | |
New Jersey Turnpike Authority,
Turnpike Revenue Bonds, Refunding | | 5.00 | | 1/1/2035 | | 1,000,000 | | 1,154,080 | |
North Hudson Sewerage Authority,
Gross Revenue Bonds Senior Lien Lease Certificates (Master Lease Agreement) | | 5.00 | | 6/1/2024 | | 520,000 | | 564,907 | |
North Hudson Sewerage Authority,
Gross Revenue Bonds Senior Lien Lease Certificates (Master Lease Agreement) | | 5.00 | | 6/1/2022 | | 480,000 | c | 528,245 | |
North Hudson Sewerage Authority,
Revenue Bonds, Refunding, Ser. A | | 5.00 | | 6/1/2042 | | 9,735,000 | | 10,423,654 | |
North Hudson Sewerage Authority,
Revenue Bonds, Refunding, Ser. A | | 5.00 | | 6/1/2022 | | 585,000 | c | 643,798 | |
North Jersey District Water Supply Commission,
Sewer Revenue Bonds (Wanaque South Project) (Insured; National Public Finance Guarantee Corp.) (Escrowed to Maturity) | | 6.00 | | 7/1/2019 | | 255,000 | | 260,414 | |
Rahway Valley Sewerage Authority,
Sewer Revenue Bonds (Insured; National Public Finance Guarantee Corp.) | | 0.00 | | 9/1/2030 | | 7,550,000 | a | 5,298,514 | |
Rutgers, The State University,
GO | | 5.00 | | 5/1/2034 | | 1,600,000 | | 1,829,392 | |
Rutgers, The State University,
GO | | 5.00 | | 5/1/2026 | | 5,000,000 | | 5,585,750 | |
Salem County Pollution Control Financing Authority,
PCR (Chambers Project) | | 5.00 | | 12/1/2023 | | 1,000,000 | | 1,050,520 | |
South Jersey Port Corporation,
Marine Terminal Revenue Bonds | | 5.75 | | 1/1/2023 | | 4,000,000 | | 4,122,120 | |
South Jersey Port Subordinated Marine Terminal,
Revenue Bonds, Ser. B | | 5.00 | | 1/1/2048 | | 2,830,000 | | 3,013,412 | |
South Jersey Port Subordinated Marine Terminal,
Revenue Bonds, Ser. B | | 5.00 | | 1/1/2042 | | 1,500,000 | | 1,605,360 | |
South Jersey Transportation Authority,
Transportation System Revenue Bonds | | 5.00 | | 11/1/2023 | | 4,250,000 | | 4,582,180 | |
| | 364,198,139 | |
19
STATEMENT OF INVESTMENTS (continued)
| | | | | | | | | | |
| |
Description | Coupon
Rate (%) | | Maturity
Date | | Principal
Amount ($) | | Value ($) | |
Long-Term Municipal Investments - 98.8% (continued) | | | | | |
New York - 10.8% | | | | | |
Port Authority of New York and New Jersey,
(Consolidated Revenue Bonds, 167th Series) | | 5.00 | | 9/15/2024 | | 2,400,000 | | 2,538,696 | |
Port Authority of New York and New Jersey,
(Consolidated Revenue Bonds, 167th Series) | | 5.50 | | 9/15/2026 | | 7,600,000 | | 8,116,876 | |
Port Authority of New York and New Jersey,
(Consolidated Revenue Bonds, 172nd Series) | | 5.00 | | 10/1/2033 | | 5,000,000 | | 5,387,050 | |
Port Authority of New York and New Jersey,
(Consolidated Revenue Bonds, 178th Series) | | 5.00 | | 12/1/2024 | | 2,000,000 | | 2,242,460 | |
Port Authority of New York and New Jersey,
(Consolidated Revenue Bonds, 184th Series) | | 5.00 | | 9/1/2032 | | 3,000,000 | | 3,386,760 | |
Port Authority of New York and New Jersey,
(Consolidated Revenue Bonds, 185th Series) | | 5.00 | | 9/1/2031 | | 2,270,000 | | 2,532,208 | |
Port Authority of New York and New Jersey,
(Consolidated Revenue Bonds, 186th Series) | | 5.00 | | 10/15/2021 | | 1,555,000 | | 1,679,322 | |
Port Authority of New York and New Jersey,
(Consolidated Revenue Bonds, 186th Series) | | 5.00 | | 10/15/2044 | | 9,730,000 | | 10,530,001 | |
Port Authority of New York and New Jersey,
(Consolidated Revenue Bonds, 195th Series) | | 5.00 | | 10/1/2035 | | 4,295,000 | | 4,830,801 | |
Port Authority of New York and New Jersey,
(Consolidated Revenue Bonds, 93rd Series) | | 6.13 | | 6/1/2094 | | 3,000,000 | | 3,533,820 | |
Port Authority of New York and New Jersey,
Special Project Revenue Bonds (JFK International Air Terminal LLC Project) | | 5.00 | | 12/1/2020 | | 1,370,000 | | 1,428,417 | |
| | 46,206,411 | |
20
| | | | | | | | | | |
| |
Description | Coupon
Rate (%) | | Maturity
Date | | Principal
Amount ($) | | Value ($) | |
Long-Term Municipal Investments - 98.8% (continued) | | | | | |
Pennsylvania - 1.8% | | | | | |
Delaware River Joint Toll Bridge Commission,
Bridge System Revenue Bonds | | 5.00 | | 7/1/2037 | | 2,500,000 | | 2,850,350 | |
Delaware River Port Authority,
Revenue Bonds | | 5.00 | | 1/1/2038 | | 1,200,000 | | 1,387,968 | |
Delaware River Port Authority,
Revenue Bonds | | 5.00 | | 1/1/2020 | | 3,500,000 | c | 3,608,500 | |
| | 7,846,818 | |
U.S. Related - .8% | | | | | |
Puerto Rico Highway & Transportation Authority,
Highway Revenue Bonds, Refunding (Insured; Assured Guaranty Municipal Corporation) Ser. 2007. CC | | 5.25 | | 7/1/2034 | | 3,000,000 | | 3,238,620 | |
Total Investments(cost $409,122,840) | | 98.8% | 421,489,988 | |
Cash and Receivables (Net) | | 1.2% | 5,220,099 | |
Net Assets | | 100.0% | 426,710,087 | |
a Security issued with a zero coupon. Income is recognized through the accretion of discount.
b Security exempt from registration pursuant to Rule 144A under the Securities Act of 1933. These securities may be resold in transactions exempt from registration, normally to qualified institutional buyers. At December 31, 2018, these securities were valued at $2,509,250 or .59% of net assets.
c These securities are prerefunded; the date shown represents the prerefunded date. Bonds which are prerefunded are collateralized by U.S. Government securities which are held in escrow and are used to pay principal and interest on the municipal issue and to retire the bonds in full at the earliest refunding date.
21
STATEMENT OF INVESTMENTS (continued)
| | |
Portfolio Summary (Unaudited)† | Value (%) |
Transportation | 31.3 |
Education | 15.2 |
Medical | 14.2 |
General | 11.7 |
Tobacco Settlement | 5.3 |
Water | 4.9 |
Prerefunded | 4.4 |
General Obligation | 2.3 |
Special Tax | 2.3 |
Multifamily Housing | 1.7 |
Development | 1.5 |
Housing | 1.4 |
Pollution | .8 |
Single Family Housing | .8 |
Facilities | .5 |
Nursing Homes | .5 |
| | 98.8 |
† Based on net assets.
See notes to financial statements.
22
| | | | |
| |
Summary of Abbreviations(Unaudited) |
| |
ABAG | Association of Bay Area
Governments | ACA | American Capital Access |
AGC | ACE Guaranty Corporation | AGIC | Asset Guaranty Insurance Company |
AMBAC | American Municipal Bond
Assurance Corporation | ARRN | Adjustable Rate
Receipt Notes |
BAN | Bond Anticipation Notes | BPA | Bond Purchase Agreement |
CIFG | CDC Ixis Financial Guaranty | COP | Certificate of Participation |
CP | Commercial Paper | DRIVERS | Derivative Inverse
Tax-Exempt Receipts |
EDR | Economic Development
Revenue | EIR | Environmental Improvement
Revenue |
FGIC | Financial Guaranty
Insurance Company | FHA | Federal Housing Administration |
FHLB | Federal Home
Loan Bank | FHLMC | Federal Home Loan Mortgage
Corporation |
FNMA | Federal National
Mortgage Association | GAN | Grant Anticipation Notes |
GIC | Guaranteed Investment
Contract | GNMA | Government National Mortgage
Association |
GO | General Obligation | HR | Hospital Revenue |
IDB | Industrial Development Board | IDC | Industrial Development Corporation |
IDR | Industrial Development
Revenue | LIFERS | Long Inverse Floating
Exempt Receipts |
LOC | Letter of Credit | LOR | Limited Obligation Revenue |
LR | Lease Revenue | MERLOTS | Municipal Exempt Receipts
Liquidity Option Tender |
MFHR | Multi-Family Housing Revenue | MFMR | Multi-Family Mortgage Revenue |
PCR | Pollution Control Revenue | PILOT | Payment in Lieu of Taxes |
P-FLOATS | Puttable Floating Option
Tax-Exempt Receipts | PUTTERS | Puttable Tax-Exempt Receipts |
RAC | Revenue Anticipation Certificates | RAN | Revenue Anticipation Notes |
RAW | Revenue Anticipation Warrants | RIB | Residual Interest Bonds |
ROCS | Reset Options Certificates | RRR | Resources Recovery Revenue |
SAAN | State Aid Anticipation Notes | SBPA | Standby Bond Purchase Agreement |
SFHR | Single Family Housing Revenue | SFMR | Single Family Mortgage Revenue |
SONYMA | State of New York
Mortgage Agency | SPEARS | Short Puttable Exempt
Adjustable Receipts |
SWDR | Solid Waste Disposal Revenue | TAN | Tax Anticipation Notes |
TAW | Tax Anticipation Warrants | TRAN | Tax and Revenue Anticipation Notes |
XLCA | XL Capital Assurance | | |
See notes to financial statements.
23
STATEMENT OF ASSETS AND LIABILITIES
December 31, 2018
| | | | | | | |
| | | | | | |
| | | Cost | | Value | |
Assets ($): | | | | |
Investments in securities—See Statement of Investments | 409,122,840 | | 421,489,988 | |
Cash | | | | | 731,097 | |
Interest receivable | | 5,535,176 | |
Receivable for shares of Common Stock subscribed | | 291,905 | |
Prepaid expenses | | | | | 29,902 | |
| | | | | 428,078,068 | |
Liabilities ($): | | | | |
Due to The Dreyfus Corporation and affiliates—Note 3(c) | | | | 309,444 | |
Payable for shares of Common Stock redeemed | | 990,166 | |
Directors fees and expenses payable | | 3,761 | |
Accrued expenses | | | | | 64,610 | |
| | | | | 1,367,981 | |
Net Assets ($) | | | 426,710,087 | |
Composition of Net Assets ($): | | | | |
Paid-in capital | | | | | 413,319,856 | |
Total distributable earnings (loss) | | | | | 13,390,231 | |
Net Assets ($) | | | 426,710,087 | |
| | | | | | | |
Net Asset Value Per Share | Class A | Class C | Class I | Class Y | Class Z | |
Net Assets ($) | 317,887,935 | 4,493,227 | 12,576,170 | 105,094 | 91,647,661 | |
Shares Outstanding | 25,379,099 | 359,109 | 1,003,984 | 8,356 | 7,315,711 | |
Net Asset Value Per Share ($) | 12.53 | 12.51 | 12.53 | 12.58 | 12.53 | |
| | | | | | | |
See notes to financial statements. | | | | | | |
24
STATEMENT OF OPERATIONS
Year Ended December 31, 2018
| | | | | | | |
| | | | | | |
| | | | | | |
Investment Income ($): | | | | |
Interest Income | | | 17,517,669 | |
Expenses: | | | | |
Management fee—Note 3(a) | | | 2,667,887 | |
Shareholder servicing costs—Note 3(c) | | | 1,036,341 | |
Professional fees | | | 92,077 | |
Registration fees | | | 67,679 | |
Distribution fees—Note 3(b) | | | 40,872 | |
Directors’ fees and expenses—Note 3(d) | | | 37,905 | |
Custodian fees—Note 3(c) | | | 20,039 | |
Prospectus and shareholders’ reports | | | 14,529 | |
Loan commitment fees—Note 2 | | | 8,910 | |
Miscellaneous | | | 52,749 | |
Total Expenses | | | 4,038,988 | |
Less—reduction in expenses due to undertaking—Note 3(a) | | | (454,600) | |
Less—reduction in fees due to earnings credits—Note 3(c) | | | (17,289) | |
Net Expenses | | | 3,567,099 | |
Investment Income—Net | | | 13,950,570 | |
Realized and Unrealized Gain (Loss) on Investments—Note 4 ($): | | |
Net realized gain (loss) on investments | 5,214,164 | |
Net unrealized appreciation (depreciation) on investments | | | (14,453,566) | |
Net Realized and Unrealized Gain (Loss) on Investments | | | (9,239,402) | |
Net Increase in Net Assets Resulting from Operations | | 4,711,168 | |
| | | | | | | |
See notes to financial statements. | | | | | |
25
STATEMENT OF CHANGES IN NET ASSETS
| | | | | | | | | | |
| | | | Year Ended December 31, |
| | | | 2018 | | 2017 | a |
Operations ($): | | | | | | | | |
Investment income—net | | | 13,950,570 | | | | 15,176,071 | |
Net realized gain (loss) on investments | | 5,214,164 | | | | 3,261,348 | |
Net unrealized appreciation (depreciation)
on investments | | (14,453,566) | | | | 7,885,568 | |
Net Increase (Decrease) in Net Assets
Resulting from Operations | 4,711,168 | | | | 26,322,987 | |
Distributions ($): | |
Distributions to shareholders: | | | | | | | | |
Class A | | | (14,169,822) | | | | (10,752,728) | |
Class C | | | (186,553) | | | | (209,424) | |
Class I | | | (649,692) | | | | (527,736) | |
Class Y | | | (3,739) | | | | (4,680) | |
Class Z | | | (4,441,097) | | | | (3,453,130) | |
Total Distributions | | | (19,450,903) | | | | (14,947,698) | |
Capital Stock Transactions ($): | |
Net proceeds from shares sold: | | | | | | | | |
Class A | | | 14,990,091 | | | | 12,153,360 | |
Class C | | | 396,876 | | | | 422,036 | |
Class I | | | 4,612,938 | | | | 11,199,345 | |
Class Y | | | 90,000 | | | | - | |
Class Z | | | 2,326,001 | | | | 3,070,162 | |
Distributions reinvested: | | | | | | | | |
Class A | | | 11,097,145 | | | | 8,109,390 | |
Class C | | | 138,929 | | | | 146,141 | |
Class I | | | 627,353 | | | | 497,008 | |
Class Y | | | 3,693 | | | | 399 | |
Class Z | | | 3,730,509 | | | | 2,837,674 | |
Cost of shares redeemed: | | | | | | | | |
Class A | | | (35,786,651) | | | | (36,976,317) | |
Class C | | | (2,153,896) | | | | (4,994,722) | |
Class I | | | (9,431,576) | | | | (2,942,755) | |
Class Y | | | - | | | | (227,951) | |
Class Z | | | (13,959,078) | | | | (11,023,406) | |
Increase (Decrease) in Net Assets
from Capital Stock Transactions | (23,317,666) | | | | (17,729,636) | |
Total Increase (Decrease) in Net Assets | (38,057,401) | | | | (6,354,347) | |
Net Assets ($): | |
Beginning of Period | | | 464,767,488 | | | | 471,121,835 | |
End of Period | | | 426,710,087 | | | | 464,767,488 | |
26
| | | | | | | | | | |
| | | | Year Ended December 31, |
| | | | 2018 | | 2017 | a |
Capital Share Transactions (Shares): | |
Class Ab,c | | | | | | | | |
Shares sold | | | 1,182,371 | | | | 944,389 | |
Shares issued for distributions reinvested | | | 878,494 | | | | 631,014 | |
Shares redeemed | | | (2,823,067) | | | | (2,881,219) | |
Net Increase (Decrease) in Shares Outstanding | (762,202) | | | | (1,305,816) | |
Class Cb | | | | | | | | |
Shares sold | | | 31,287 | | | | 33,051 | |
Shares issued for distributions reinvested | | | 11,009 | | | | 11,390 | |
Shares redeemed | | | (170,393) | | | | (388,045) | |
Net Increase (Decrease) in Shares Outstanding | (128,097) | | | | (343,604) | |
Class I | | | | | | | | |
Shares sold | | | 363,523 | | | | 876,624 | |
Shares issued for distributions reinvested | | | 49,627 | | | | 38,622 | |
Shares redeemed | | | (742,893) | | | | (228,113) | |
Net Increase (Decrease) in Shares Outstanding | (329,743) | | | | 687,133 | |
Class Y | | | | | | | | |
Shares sold | | | 7,058 | | | | - | |
Shares issued for distributions reinvested | | | 292 | | | | 31 | |
Shares redeemed | | | - | | | | (17,712) | |
Net Increase (Decrease) in Shares Outstanding | 7,350 | | | | (17,681) | |
Class Zc | | | | | | | | |
Shares sold | | | 183,321 | | | | 239,133 | |
Shares issued for distributions reinvested | | | 295,168 | | | | 220,738 | |
Shares redeemed | | | (1,099,971) | | | | (861,823) | |
Net Increase (Decrease) in Shares Outstanding | (621,482) | | | | (401,952) | |
| | | | | | | | | | |
a Distributions to shareholders include $10,626,756 Class A, $205,786 Class C, $522,186 Class I, $4,592 Class Y and $3,415,289 Class Z distributions from net investment income and $125,972 Class A, $3,638 Class C, $5,550 Class I, $88 Class Y and $37,841 Class Z distributions from net realized gains. Undistributed investment income—net was $78,628 in 2017 and is no longer presented as a result of the adoption of SEC’s Disclosure Update and Simplification Rule. | |
b During the period ended December 31, 2017, 3,437 Class C shares representing $44,484 were automatically converted to 3,438 Class A shares. | |
c During the period ended December 31, 2017, 405 Class A shares representing $5,253 were converted to 405 Class Z shares. | |
See notes to financial statements.
| | | | | | | | |
27
FINANCIAL HIGHLIGHTS
The following tables describe the performance for each share class for the fiscal periods indicated. All information (except portfolio turnover rate) reflects financial results for a single fund share. Total return shows how much your investment in the fund would have increased (or decreased) during each period, assuming you had reinvested all dividends and distributions. These figures have been derived from the fund’s financial statements.
| | | | | | | |
| | |
| | | Year Ended December 31, |
Class A Shares | | 2018 | 2017 | 2016 | 2015 | 2014 |
Per Share Data ($): | | | | | | |
Net asset value, beginning of period | | 12.95 | 12.64 | 13.03 | 13.04 | 12.27 |
Investment Operations: | | | | | | |
Investment income—neta | | .39 | .41 | .43 | .45 | .46 |
Net realized and unrealized
gain (loss) on investments | | (.25) | .31 | (.40) | (.02) | .76 |
Total from Investment Operations | | .14 | .72 | .03 | .43 | 1.22 |
Distributions: | | | | | | |
Dividends from
investment income—net | | (.39) | (.40) | (.42) | (.44) | (.45) |
Dividends from net realized
gain on investments | | (.17) | (.01) | - | - | (.00)b |
Total Distributions | | (.56) | (.41) | (.42) | (.44) | (.45) |
Net asset value, end of period | | 12.53 | 12.95 | 12.64 | 13.03 | 13.04 |
Total Return (%)c | | 1.17 | 5.64 | .17 | 3.38 | 10.11 |
Ratios/Supplemental Data (%): | | | | | | |
Ratio of total expenses to
average net assets | | .95 | .95 | .95 | .95 | .95 |
Ratio of net expenses to
average net assets | | .85 | .85 | .85 | .85 | .85 |
Ratio of interest and expense
related to floating rate notes
issued to average net assets | | - | - | - | - | .00d |
Ratio of net investment income
to average net assets | | 3.09 | 3.20 | 3.27 | 3.45 | 3.59 |
Portfolio Turnover Rate | | 13.71 | 11.13 | 13.81 | 8.41 | 10.18 |
Net Assets, end of period ($ x 1,000) | | 317,888 | 338,412 | 346,829 | 364,755 | 383,670 |
a Based on average shares outstanding.
b Amount represents less than $.01 per share.
c Exclusive of sales charge.
d Amount represents less than .01%.
See notes to financial statements.
28
| | | | | | | |
| | | |
| | | Year Ended December 31, |
Class C Shares | | 2018 | 2017 | 2016 | 2015 | 2014 |
Per Share Data ($): | | | | | | |
Net asset value, beginning of period | | 12.93 | 12.62 | 13.02 | 13.03 | 12.26 |
Investment Operations: | | | | | | |
Investment income—neta | | .30 | .32 | .33 | .35 | .36 |
Net realized and unrealized
gain (loss) on investments | | (.26) | .30 | (.41) | (.02) | .77 |
Total from Investment Operations | | .04 | .62 | (.08) | .33 | 1.13 |
Distributions: | | | | | | |
Dividends from
investment income—net | | (.29) | (.30) | (.32) | (.34) | (.36) |
Dividends from net realized
gain on investments | | (.17) | (.01) | - | - | (.00)b |
Total Distributions | | (.46) | (.31) | (.32) | (.34) | (.36) |
Net asset value, end of period | | 12.51 | 12.93 | 12.62 | 13.02 | 13.03 |
Total Return (%)c | | .34 | 4.94 | (.66) | 2.61 | 9.29 |
Ratios/Supplemental Data (%): | | | | | | |
Ratio of total expenses to
average net assets | | 1.75 | 1.73 | 1.72 | 1.71 | 1.72 |
Ratio of net expenses to
average net assets | | 1.60 | 1.60 | 1.60 | 1.60 | 1.60 |
Ratio of interest and expense
related to floating rate notes
issued to average net assets | | - | - | - | - | .00d |
Ratio of net investment income
to average net assets | | 2.35 | 2.46 | 2.51 | 2.71 | 2.82 |
Portfolio Turnover Rate | | 13.71 | 11.13 | 13.81 | 8.41 | 10.18 |
Net Assets, end of period ($ x 1,000) | | 4,493 | 6,301 | 10,488 | 9,690 | 10,808 |
a Based on average shares outstanding.
b Amount represents less than $.01 per share.
c Exclusive of sales charge.
d Amount represents less than .01%.
See notes to financial statements.
29
FINANCIAL HIGHLIGHTS (continued)
| | | | | | | |
| | | |
| | | Year Ended December 31, |
Class I Shares | | 2018 | 2017 | 2016 | 2015 | 2014 |
Per Share Data ($): | | | | | | |
Net asset value, beginning of period | | 12.95 | 12.64 | 13.04 | 13.05 | 12.28 |
Investment Operations: | | | | | | |
Investment income—neta | | .42 | .45 | .47 | .48 | .49 |
Net realized and unrealized
gain (loss) on investments | | (.25) | .30 | (.42) | (.02) | .77 |
Total from Investment Operations | | .17 | .75 | .05 | .46 | 1.26 |
Distributions: | | | | | | |
Dividends from
investment income—net | | (.42) | (.43) | (.45) | (.47) | (.49) |
Dividends from net realized
gain on investments | | (.17) | (.01) | - | - | (.00)b |
Total Distributions | | (.59) | (.44) | (.45) | (.47) | (.49) |
Net asset value, end of period | | 12.53 | 12.95 | 12.64 | 13.04 | 13.05 |
Total Return (%) | | 1.36 | 5.99 | .34 | 3.63 | 10.38 |
Ratios/Supplemental Data (%): | | | | | | |
Ratio of total expenses to
average net assets | | .72 | .71 | .71 | .71 | .72 |
Ratio of net expenses to
average net assets | | .60 | .60 | .60 | .60 | .60 |
Ratio of interest and expense
related to floating rate notes
issued to average net assets | | - | - | - | - | .00c |
Ratio of net investment income
to average net assets | | 3.35 | 3.44 | 3.51 | 3.70 | 3.82 |
Portfolio Turnover Rate | | 13.71 | 11.13 | 13.81 | 8.41 | 10.18 |
Net Assets, end of period ($ x 1,000) | | 12,576 | 17,269 | 8,172 | 8,080 | 4,837 |
a Based on average shares outstanding.
b Amount represents less than $.01 per share.
c Amount represents less than .01%.
See notes to financial statements.
30
| | | | | | | |
| | | |
| | | Year Ended December 31, |
Class Y Share | | 2018 | 2017 | 2016 | 2015 | 2014 |
Per Share Data ($): | | | | | | |
Net asset value, beginning of period | | 12.99 | 12.64 | 13.03 | 13.05 | 12.27 |
Investment Operations: | | | | | | |
Investment income—neta | | .43 | .44 | .46 | .48 | .38 |
Net realized and unrealized
gain (loss) on investments | | (.25) | .35 | (.40) | (.03) | .87 |
Total from Investment Operations | | .18 | .79 | .06 | .45 | 1.25 |
Distributions: | | | | | | |
Dividends from
investment income—net | | (.42) | (.43) | (.45) | (.47) | (.47) |
Dividends from net realized
gain on investments | | (.17) | (.01) | - | - | (.00)b |
Total Distributions | | (.59) | (.44) | (.45) | (.47) | (.47) |
Net asset value, end of period | | 12.58 | 12.99 | 12.64 | 13.03 | 13.05 |
Total Return (%) | | 1.50 | 6.32 | .34 | 3.56 | 10.37 |
Ratios/Supplemental Data (%): | | | | | | |
Ratio of total expenses to
average net assets | | .75 | .67 | .72 | .71 | .76 |
Ratio of net expenses to
average net assets | | .60 | .60 | .60 | .60 | .63 |
Ratio of interest and expense
related to floating rate notes
issued to average net assets | | - | - | - | - | .00c |
Ratio of net investment income
to average net assets | | 3.30 | 3.52 | 3.53 | 3.71 | 3.59 |
Portfolio Turnover Rate | | 13.71 | 11.13 | 13.81 | 8.41 | 10.18 |
Net Assets, end of period ($ x 1,000) | | 105 | 13 | 236 | 306 | 614 |
a Based on average shares outstanding.
b Amount represents less than $.01 per share.
c Amount represents less than .01%.
See notes to financial statements.
31
FINANCIAL HIGHLIGHTS (continued)
| | | | | | | |
| | |
| | | Year Ended December 31, |
Class Z Shares | | 2018 | 2017 | 2016 | 2015 | 2014 |
Per Share Data ($): | | | | | | |
Net asset value, beginning of period | | 12.95 | 12.64 | 13.03 | 13.05 | 12.28 |
Investment Operations: | | | | | | |
Investment income—neta | | .42 | .44 | .46 | .47 | .48 |
Net realized and unrealized
gain (loss) on investments | | (.25) | .31 | (.40) | (.03) | .77 |
Total from Investment Operations | | .17 | .75 | .06 | .44 | 1.25 |
Distributions: | | | | | | |
Dividends from
investment income—net | | (.42) | (.43) | (.45) | (.46) | (.48) |
Dividends from net realized
gain on investments | | (.17) | (.01) | - | - | (.00)b |
Total Distributions | | (.59) | (.44) | (.45) | (.46) | (.48) |
Net asset value, end of period | | 12.53 | 12.95 | 12.64 | 13.03 | 13.05 |
Total Return (%) | | 1.31 | 5.94 | .36 | 3.49 | 10.31 |
Ratios/Supplemental Data (%): | | | | | | |
Ratio of total expenses to
average net assets | | .76 | .76 | .76 | .77 | .77 |
Ratio of net expenses to
average net assets | | .65 | .65 | .65 | .66 | .66 |
Ratio of interest and expense
related to floating rate notes
issued to average net assets | | - | - | - | - | .00c |
Ratio of net investment income
to average net assets | | 3.31 | 3.40 | 3.47 | 3.64 | 3.78 |
Portfolio Turnover Rate | | 13.71 | 11.13 | 13.81 | 8.41 | 10.18 |
Net Assets, end of period ($ x 1,000) | | 91,648 | 102,772 | 105,396 | 113,663 | 120,340 |
a Based on average shares outstanding.
b Amount represents less than $.01 per share.
c Amount represents less than .01%.
See notes to financial statements.
32
NOTES TO FINANCIAL STATEMENTS
NOTE 1—Significant Accounting Policies:
Dreyfus New Jersey Municipal Bond Fund, Inc. (the “fund”) is registered under the Investment Company Act of 1940, as amended (the “Act”), as a non-diversified open-end management investment company. The fund’s investment objective is to seek as high a level of current income exempt from federal and New Jersey income taxes as is consistent with the preservation of capital. The Dreyfus Corporation (the “Manager” or “Dreyfus”), a wholly-owned subsidiary of The Bank of New York Mellon Corporation (“BNY Mellon”), serves as the fund’s investment adviser.
MBSC Securities Corporation (the “Distributor”), a wholly-owned subsidiary of Dreyfus, is the distributor of the fund’s shares. The fund is authorized to issue 775 million shares of $.001 par value Common Stock. The fund currently has authorized six classes of shares: Class A (200 million shares authorized), Class C (150 million shares authorized), Class I (150 million shares authorized), Class T (100 million shares authorized), Class Y (150 million shares authorized) and Class Z (25 million shares authorized). Class A and Class T shares generally are subject to a sales charge imposed at the time of purchase. Class C shares are subject to a contingent deferred sales charge (“CDSC”) imposed on Class C shares redeemed within one year of purchase. Class C shares automatically convert to Class A shares ten years after the date of purchase, without the imposition of a sales charge. Class I and Class Y shares are sold at net asset value per share generally to institutional investors. Class Z shares are sold at net asset value per share to certain shareholders of the fund. Class Z shares generally are not available for new accounts. As of the date of this report, the fund did not offer Class T shares for purchase. Other differences between the classes include the services offered to and the expenses borne by each class, the allocation of certain transfer agency costs and certain voting rights. Income, expenses (other than expenses attributable to a specific class), and realized and unrealized gains or losses on investments are allocated to each class of shares based on its relative net assets.
The Financial Accounting Standards Board (“FASB”) Accounting Standards Codification is the exclusive reference of authoritative U.S. generally accepted accounting principles (“GAAP”) recognized by the FASB to be applied by nongovernmental entities. Rules and interpretive releases of the Securities and Exchange Commission (“SEC”) under authority of federal laws are also sources of authoritative GAAP for SEC registrants. The fund’s financial statements are prepared in accordance with GAAP, which may require the use of management estimates and assumptions. Actual results could differ from those estimates.
33
NOTES TO FINANCIAL STATEMENTS(continued)
The fundenters into contracts that contain a variety of indemnifications. The fund’s maximum exposure under these arrangements is unknown. The fund does not anticipate recognizing any loss related to these arrangements.
(a) Portfolio valuation: The fair value of a financial instrument is the amount that would be received to sell an asset or paid to transfer a liability in an orderly transaction between market participants at the measurement date (i.e., the exit price). GAAP establishes a fair value hierarchy that prioritizes the inputs of valuation techniques used to measure fair value. This hierarchy gives the highest priority to unadjusted quoted prices in active markets for identical assets or liabilities (Level 1 measurements) and the lowest priority to unobservable inputs (Level 3 measurements).
Additionally, GAAP provides guidance on determining whether the volume and activity in a market has decreased significantly and whether such a decrease in activity results in transactions that are not orderly. GAAP requires enhanced disclosures around valuation inputs and techniques used during annual and interim periods.
Various inputs are used in determining the value of the fund’s investments relating to fair value measurements. These inputs are summarized in the three broad levels listed below:
Level 1—unadjusted quoted prices in active markets for identical investments.
Level 2—other significant observable inputs (including quoted prices for similar investments, interest rates, prepayment speeds, credit risk, etc.).
Level 3—significant unobservable inputs (including the fund’s own assumptions in determining the fair value of investments).
The inputs or methodology used for valuing securities are not necessarily an indication of the risk associated with investing in those securities.
Changes in valuation techniques may result in transfers in or out of an assigned level within the disclosure hierarchy. Valuation techniques used to value the fund’s investments are as follows:
Investments in securities are valued each business day by an independent pricing service (the “Service”) approved by the fund’s Board of Directors (the “Board”). Investments for which quoted bid prices are readily available and are representative of the bid side of the market in the judgment of the Service are valued at the mean between the quoted bid prices (as obtained by the Service from dealers in such securities) and
34
asked prices (as calculated by the Service based upon its evaluation of the market for such securities). Other investments (which constitute a majority of the portfolio securities) are carried at fair value as determined by the Service, based on methods which include consideration of the following: yields or prices of municipal securities of comparable quality, coupon, maturity and type; indications as to values from dealers; and general market conditions. All of the preceding securities are generally categorized within Level 2 of the fair value hierarchy.
The Service is engaged under the general supervision of the Board.
When market quotations or official closing prices are not readily available, or are determined not to accurately reflect fair value, such as when the value of a security has been significantly affected by events after the close of the exchange or market on which the security is principally traded, but before the fund calculates its net asset value, the fund may value these investments at fair value as determined in accordance with the procedures approved by the Board. Certain factors may be considered when fair valuing investments such as: fundamental analytical data, the nature and duration of restrictions on disposition, an evaluation of the forces that influence the market in which the securities are purchased and sold, and public trading in similar securities of the issuer or comparable issuers. These securities are either categorized within Level 2 or 3 of the fair value hierarchy depending on the relevant inputs used.
For restricted securities where observable inputs are limited, assumptions about market activity and risk are used and such securities are generally categorized within Level 3 of the fair value hierarchy.
The following is a summary of the inputs used as of December 31, 2018in valuing the fund’s investments:
| | | | | |
| | Level 1 - Unadjusted Quoted Prices | Level 2 - Other Significant Observable Inputs | Level 3 -Significant Unobservable Inputs | Total |
Assets ($) | | | | |
Investments in Securities: | | | | |
Municipal Bonds† | — | 421,489,988 | — | 421,489,988 |
† See Statement of Investments for additional detailed categorizations.
At December 31, 2018, there were no transfers between levels of the fair value hierarchy. It is the fund’s policy to recognize transfers between levels at the end of the reporting period.
(b) Securities transactions and investment income: Securities transactions are recorded on a trade date basis. Realized gains and losses
35
NOTES TO FINANCIAL STATEMENTS(continued)
from securities transactions are recorded on the identified cost basis. Interest income, adjusted for accretion of discount and amortization of premium on investments, is earned from settlement date and recognized on the accrual basis. Securities purchased or sold on a when issued or delayed delivery basis may be settled a month or more after the trade date.
The fund follows an investment policy of investing primarily in municipal obligations of one state. Economic changes affecting the state and certain of its public bodies and municipalities may affect the ability of issuers within the state to pay interest on, or repay principal of, municipal obligations held by the fund.
(c) Dividends and distributions to shareholders:It is the policy of the fund to declare dividends daily from investment income-net. Such dividends are paid monthly. Dividends from net realized capital gains, if any, are normally declared and paid annually, but the fund may make distributions on a more frequent basis to comply with the distribution requirements of the Internal Revenue Code of 1986, as amended (the “Code”). To the extent that net realized capital gains can be offset by capital loss carryovers, it is the policy of the fund not to distribute such gains. Income and capital gain distributions are determined in accordance with income tax regulations, which may differ from GAAP.
(d) Federal income taxes: It is the policy of the fund to continue to qualify as a regulated investment company, which can distribute tax-exempt dividends, by complying with the applicable provisions of the Code, and to make distributions of income and net realized capital gain sufficient to relieve it from substantially all federal income and excise taxes.
As of and during the period ended December 31, 2018, the fund did not have any liabilities for any uncertain tax positions. The fund recognizes interest and penalties, if any, related to uncertain tax positions as income tax expense in the Statement of Operations. During the period ended December 31, 2018, the fund did not incur any interest or penalties.
Each tax year in the four-year period ended December 31, 2018 remains subject to examination by the Internal Revenue Service and state taxing authorities.
At December 31, 2018, the components of accumulated earnings on a tax basis were as follows: undistributed tax-exempt income $1,054,595, undistributed ordinary income $607,642, undistributed capital gains $146,331 and unrealized appreciation $12,636,258.
The tax character of distributions paid to shareholders during the fiscal periods ended December 31, 2018 and December 31, 2017 were as
36
follows: tax-exempt income $13,827,322 and $14,774,609, ordinary income $250,600 and $173,089 and long term capital gains $5,372,981 and $0, respectively.
During the period ended December 31, 2018, as a result of permanent book to tax differences, primarily due to the tax treatment for amortization adjustments, the fund decreased total distributable earnings (loss) by $123,714 and increased paid-in capital by the same amount. Net assets and net asset value per share were not affected by this reclassification.
NOTE 2—Bank Lines of Credit:
The fund participates with other Dreyfus-managed long-term open-end funds in a $1.030 billion unsecured credit facility led by Citibank, N.A. (the “Citibank Credit Facility”) and a $300 million unsecured credit facility provided by The Bank of New York Mellon (the “BNYM Credit Facility”), a subsidiary of BNY Mellon and an affiliate of Dreyfus, each to be utilized primarily for temporary or emergency purposes, including the financing of redemptions (each, a “Facility”). The Citibank Credit Facility is available in two tranches: (i) Tranche A is in an amount equal to $830 million and is available to all long-term open-ended funds, including the fund, and (ii) Tranche B is in amount equal to $200 million and is available only to the Dreyfus Floating Rate Income Fund, a series of The Dreyfus/Laurel Funds, Inc. Prior to October 3, 2018, the unsecured credit facility with Citibank, N.A. was $830 million. In connection therewith, the fund has agreed to pay its pro rata portion of commitment fees for Tranche A of the Citibank Credit Facility and the BNYM Credit Facility. Interest is charged to the fund based on rates determined pursuant to the terms of the respective Facility at the time of borrowing. During the period ended December 31, 2018 the fund did not borrow under the Facilities.
NOTE 3—Management Fee and Other Transactions with Affiliates:
(a)Pursuant to a management agreement with Dreyfus, the management fee is computed at the annual rate of .60% of the value of the fund’s average daily net assets and is payable monthly. Dreyfus has contractually agreed, from January 1, 2018 through May 1, 2019, to waive receipt of its fees and/or assume the direct expenses of the fund, so that the expenses of none of the classes (excluding Rule 12b-1 Distribution Plan fees, Shareholder Services Plan fees, taxes, interest expense, brokerage commissions, commitment fees on borrowings and extraordinary expenses) exceed .60% of the value of the fund’s average daily net assets. On or after May 1, 2019, Dreyfus may terminate this expense limitation agreement at any time. The reduction in expenses, pursuant to the
37
NOTES TO FINANCIAL STATEMENTS(continued)
undertaking, amounted to $454,600 during the period ended December 31, 2018.
During the period ended December 31, 2018, the Distributor retained $2,534 from commissions earned on sales of the fund’s Class A shares and $99 from CDSC fees on redemptions of the fund’s Class C shares.
(b) Under the Distribution Plan adopted pursuant to Rule 12b-1 under the Act, Class C shares pay the Distributor for distributing its shares at an annual rate of .75% of the value of its average daily net assets. During the period ended December 31, 2018, Class C shares were charged $40,872 pursuant to the Distribution Plan.
(c)Under the Shareholder Services Plan, Class A and Class C shares pay the Distributor at an annual rate of .25% of the value of their average daily net assets for the provision of certain services. The services provided may include personal services relating to shareholder accounts, such as answering shareholder inquiries regarding the fund and providing reports and other information, and services related to the maintenance of shareholder accounts. The Distributor may make payments to Service Agents (securities dealers, financial institutions or other industry professionals) with respect to these services. The Distributor determines the amounts to be paid to Service Agents. During the period ended December 31, 2018, Class A and Class C shares were charged $815,168and $13,624, respectively, pursuant to the Shareholder Services Plan.
Under the Shareholder Services Plan, Class Z shares reimburse the Distributor at an amount not to exceed an annual rate of .25% of the value of Class Z shares’ average daily net assets for the provision of certain services. The services provided may include personal services relating to shareholder accounts, such as answering shareholder inquiries regarding Class Z shares and providing reports and other information, and services related to the maintenance of shareholder accounts. During the period ended December 31, 2018,Class Z shares were charged $52,646 pursuant to the Shareholder Services Plan.
The fund has arrangements with the transfer agent and the custodian whereby the fund may receive earnings credits when positive cash balances are maintained, which are used to offset transfer agency and custody fees. For financial reporting purposes, the fund includes net earnings credits, if any, as an expense offset in the Statement of Operations.
The fund compensates Dreyfus Transfer, Inc., a wholly-owned subsidiary of Dreyfus, under a transfer agency agreement for providing transfer agency and cash management services for the fund. The majority of transfer agency fees are comprised of amounts paid on a per account basis,
38
while cash management fees are related to fund subscriptions and redemptions. During the period ended December 31, 2018, the fund was charged $109,701 for transfer agency services. These fees are included in Shareholder servicing costs in the Statement of Operations.
The fund compensates The Bank of New York Mellon under a custody agreement for providing custodial services for the fund. These fees are determined based on net assets, geographic region and transaction activity. During the period ended December 31, 2018, the fund was charged $20,039 pursuant to the custody agreement. These fees were offset by earnings credits of $17,276.
The fund compensates The Bank of New York Mellon under a shareholder redemption draft processing agreement for providing certain services related to the fund’s check writing privilege. During the period ended December 31, 2018, the fund was charged $4,967 pursuant to the agreement, which is included in Shareholder servicing costs in the Statement of Operations. These fees were partially offset by earnings credits of $13.
During the period ended December 31, 2018, the fund was charged $12,774 for services performed by the Chief Compliance Officer and his staff. These fees are included in Miscellaneous in the Statement of Operations.
The components of “Due to The Dreyfus Corporation and affiliates” in the Statement of Assets and Liabilities consist of: management fees $220,673, Distribution Plan fees $2,852, Shareholder Services Plan fees $66,042, custodian fees $1,690, Chief Compliance Officer fees $6,289 and transfer agency fees $16,027, which are offset against an expense reimbursement currently in effect in the amount of $4,129.
(d) Each Board member also serves as a Board member of other funds within the Dreyfus complex. Annual retainer fees and attendance fees are allocated to each fund based on net assets.
NOTE 4—Securities Transactions:
The aggregate amount of purchases and sales of investment securities, excluding short-term securities, during the period ended December 31, 2018, amounted to $60,251,624 and $86,933,495, respectively.
At December 31, 2018, the cost of investments for federal income tax purposes was $408,853,730; accordingly, accumulated net unrealized appreciation on investments was $12,636,258, consisting of $14,209,258 gross unrealized appreciation and $1,573,000 gross unrealized depreciation.
39
REPORT OF INDEPENDENT REGISTERED PUBLIC ACCOUNTING FIRM
To the Shareholders and the Board of Directors of Dreyfus New Jersey Municipal Bond Fund, Inc.
Opinion on the Financial Statements
We have audited the accompanying statement of assets and liabilities of Dreyfus New Jersey Municipal Bond Fund, Inc. (the “Fund”), including the statement of investments, as of December 31, 2018, and the related statement of operations for the year then ended, the statements of changes in net assets for each of the two years in the period then ended, the financial highlights for each of the five years in the period then ended and the related notes (collectively referred to as the “financial statements”). In our opinion, the financial statements present fairly, in all material respects, the financial position of the Fund at December 31, 2018, the results of its operations for the year then ended, the changes in its net assets for each of the two years in the period then ended and its financial highlights for each of the five years in the period then ended, in conformity with U.S. generally accepted accounting principles.
Basis for Opinion
These financial statements are the responsibility of the Fund’s management. Our responsibility is to express an opinion on the Fund’s financial statements based on our audits. We are a public accounting firm registered with the Public Company Accounting Oversight Board (United States) (“PCAOB”) and are required to be independent with respect to the Fund in accordance with the U.S. federal securities laws and the applicable rules and regulations of the Securities and Exchange Commission and the PCAOB.
We conducted our audits in accordance with the standards of the PCAOB. Those standards require that we plan and perform the audit to obtain reasonable assurance about whether the financial statements are free of material misstatement, whether due to error or fraud. The Fund is not required to have, nor were we engaged to perform, an audit of the Fund’s internal control over financial reporting. As part of our audits, we are required to obtain an understanding of internal control over financial reporting, but not for the purpose of expressing an opinion on the effectiveness of the Fund’s internal control over financial reporting. Accordingly, we express no such opinion.
Our audits included performing procedures to assess the risks of material misstatement of the financial statements, whether due to error or fraud, and performing procedures that respond to those risks. Such procedures included examining, on a test basis, evidence regarding the amounts and disclosures in the financial statements. Our procedures included confirmation of securities owned as of December 31, 2018, by correspondence with the custodian and others or by other appropriate auditing procedures where replies from others were not received. Our audits also included evaluating the accounting principles used and significant estimates made by management, as well as evaluating the overall presentation of the financial statements. We believe that our audits provide a reasonable basis for our opinion.

We have served as the auditor of one or more Dreyfus investment companies since at least 1957, but we are unable to determine the specific year.
New York, New York
February 27, 2019
40
IMPORTANT TAX INFORMATION(Unaudited)
In accordance with federal tax law, the fund hereby reports all the dividends paid from investment income-net during the fiscal year ended December 31, 2018 as “exempt-interest dividends” (not subject to regular federal and, for individuals who are New Jersey residents, New Jersey personal income taxes). Where required by federal tax law rules, shareholders will receive notification of their portion of the fund’s taxable ordinary dividends (if any), capital gains distributions (if any) and tax-exempt dividends paid for the 2018 calendar year on Form 1099-DIV, which will be mailed in early 2019. Also, the fund hereby reports $.0071 per share as a short-term capital gain distribution paid on March 19, 2018 and the fund also reports $.1594 per share as a long-term capital gain distribution paid on December 28, 2018.
41
BOARD MEMBERS INFORMATION(Unaudited)
INDEPENDENT BOARD MEMBERS
Joseph S. DiMartino (75)
Chairman of the Board (1995)
Principal Occupation During Past 5 Years:
· Corporate Director and Trustee (1995-present)
Other Public Company Board Memberships During Past 5 Years:
· CBIZ (formerly, Century Business Services, Inc.), a provider of outsourcing functions for small and medium size companies, Director (1997-present)
No. of Portfolios for which Board Member Serves:122
———————
Peggy C. Davis (75)
Board Member (2006)
Principal Occupation During Past 5 Years:
· Shad Professor of Law, New York University School of Law (1983-present)
No. of Portfolios for which Board Member Serves: 45
———————
David P. Feldman (79)
Board Member (1994)
Principal Occupation During Past 5 Years:
· Corporate Director and Trustee (1985-present)
Other Public Company Board Memberships During Past 5 Years:
· BBH Mutual Funds Group (5 registered mutual funds), Director (1992-2014)
No. of Portfolios for which Board Member Serves:31
———————
Joan Gulley (71)
Board Member (2017)
Principal Occupation During Past 5 Years:
· PNC Financial Services Group, Inc.(1993-2014), Executive Vice President and Chief Human Resources Officer and Executive Committee Member (2008-2014)
No. of Portfolios for which Board Member Serves:52
———————
42
Ehud Houminer (78)
Board Member (2006)
Principal Occupation During Past 5 Years:
· Board of Overseers at the Columbia Business School, Columbia University (1992-present)
· Trustee, Ben Gurion University
No. of Portfolios for which Board Member Serves: 52
———————
Lynn Martin (79)
Board Member (2012)
Principal Occupation During Past 5 Years:
· President of The Martin Hall Group LLC, a human resources consulting firm (2005-2012)
No. of Portfolios for which Board Member Serves:31
———————
Robin A. Melvin (55)
Board Member (2012)
Principal Occupation During Past 5 Years:
· Co-chairman, Illinois Mentoring Partnership, non-profit organization dedicated to increasing the quantity and quality of mentoring services in Illinois; (2014-present; board member since 2013)
No. of Portfolios for which Board Member Serves:99
———————
Dr. Martin Peretz (79)
Board Member (1990)
Principal Occupation During Past 5 Years:
· Editor-in-Chief Emeritus of The New Republic Magazine (2011-2012) (previously,
Editor-in-Chief, 1974-2011)
· Lecturer at Harvard University (1968-2010)
No. of Portfolios for which Board Member Serves:31
———————
Once elected all Board Members serve for an indefinite term, but achieve Emeritus status upon reaching age 80. The address of the Board Members and Officers is c/o The Dreyfus Corporation, 200 Park Avenue, New York, New York 10166. Additional information about the Board Members is available in the fund’s Statement of Additional Information which can be obtained from Dreyfus free of charge by calling this toll free number: 1-800-DREYFUS.
James F. Henry, Emeritus Board Member
Philip L. Toia, Emeritus Board Member
43
OFFICERS OF THE FUND(Unaudited)
BRADLEY J. SKAPYAK, President since January 2010.
Chief Operating Officer and a director of the Manager since June 2009, Chairman of Dreyfus Transfer, Inc., an affiliate of the Manager and the transfer agent of the funds, since May 2011 and Chief Executive Officer of MBSC Securities Corporation since August 2016. He is an officer of 62 investment companies (comprised of 122 portfolios) managed by the Manager. He is 60 years old and has been an employee of the Manager since February 1988.
BENNETT A. MACDOUGALL, Chief Legal Officer since October 2015.
Chief Legal Officer of the Manager and Associate General Counsel and Managing Director of BNY Mellon since June 2015; from June 2005 to June 2015, he served in various capacities with Deutsche Bank – Asset & Wealth Management Division, including as Director and Associate General Counsel, and Chief Legal Officer of Deutsche Investment Management Americas Inc. from June 2012 to May 2015. He is an officer of 63 investment companies (comprised of 147 portfolios) managed by the Manager. He is 47 years old and has been an employee of the Manager since June 2015.
JAMES BITETTO, Vice President since August 2005 and Secretary since February 2018.
Managing Counsel of BNY Mellon and Secretary of the Manager, and an officer of 63 investment companies (comprised of 147 portfolios) managed by the Manager. He is 52 years old and has been an employee of the Manager since December 1996.
SONALEE CROSS, Vice President and Assistant Secretary since March 2018.
Counsel of BNY Mellon since October 2016; Associate at Proskauer Rose LLP from April 2016 to September 2016; Attorney at EnTrust Capital from August 2015 to February 2016; Associate at Sidley Austin LLP from September 2013 until August 2015. She is an officer of 63 investment companies (comprised of 147 portfolios) managed by Dreyfus. She is 31 years old and has been an employee of the Manager since October 2016.
SARAH S. KELLEHER, Vice President and Assistant Secretary since April 2014.
Managing Counsel of BNY Mellon since December 2017, from March 2013 to December 2017, Senior Counsel of BNY Mellon. She is an officer of 63 investment companies (comprised of 147 portfolios) managed by the Manager. She is 43 years old and has been an employee of the Manager since March 2013.
JEFF PRUSNOFSKY, Vice President and Assistant Secretary since August 2005.
Senior Managing Counsel of BNY Mellon, and an officer of 63 investment companies (comprised of 147 portfolios) managed by the Manager. He is 53 years old and has been an employee of the Manager since October 1990.
NATALYA ZELENSKY, Vice President and Assistant Secretary since March 2017.
Counsel of BNY Mellon since May 2016; Attorney at Wildermuth Endowment Strategy Fund/Wildermuth Advisory, LLC from November 2015 until May 2016; Assistant General Counsel at RCS Advisory Services from July 2014 until November 2015; Associate at Sutherland, Asbill & Brennan from January 2013 until January 2014. She is an officer of 63 investment companies (comprised of 147 portfolios) managed by Dreyfus. She is 33 years old and has been an employee of the Manager since May 2016.
JAMES WINDELS, Treasurer since November 2001.
Director – Mutual Fund Accounting of the Manager, and an officer of 63 investment companies (comprised of 147 portfolios) managed by the Manager. He is 60 years old and has been an employee of the Manager since April 1985.
GAVIN C. REILLY, Assistant Treasurer since December 2005.
Tax Manager of the Investment Accounting and Support Department of the Manager, and an officer of 63 investment companies (comprised of 147 portfolios) managed by the Manager. He is 50 years old and has been an employee of the Manager since April 1991.
ROBERT S. ROBOL, Assistant Treasurer since August 2005.
Senior Accounting Manager – Dreyfus Financial Reporting of the Manager, and an officer of 63 investment companies (comprised of 147 portfolios) managed by the Manager. He is 54 years old and has been an employee of the Manager since October 1988.
44
ROBERT SALVIOLO, Assistant Treasurer since July 2007.
Senior Accounting Manager – Equity Funds of the Manager, and an officer of 63 investment companies (comprised of 147 portfolios) managed by the Manager. He is 51 years old and has been an employee of the Manager since June 1989.
ROBERT SVAGNA, Assistant Treasurer since August 2002.
Senior Accounting Manager – Fixed Income and Equity Funds of the Manager, and an officer of 63 investment companies (comprised of 147 portfolios) managed by the Manager. He is 51 years old and has been an employee of the Manager since November 1990.
JOSEPH W. CONNOLLY, Chief Compliance Officer since October 2004.
Chief Compliance Officer of the Manager, the Dreyfus Family of Funds and BNY Mellon Funds Trust (63 investment companies, comprised of 147 portfolios). He is 61 years old and has served in various capacities with the Manager since 1980, including manager of the firm’s Fund Accounting Department from 1997 through October 2001.
CARIDAD M. CAROSELLA, Anti-Money Laundering Compliance Officer since January 2016.
Anti-Money Laundering Compliance Officer of the Dreyfus Family of Funds and BNY Mellon Funds Trust since January 2016; from May 2015 to December 2015, Interim Anti-Money Laundering Compliance Officer of the Dreyfus Family of Funds and BNY Mellon Funds Trust and the Distributor; from January 2012 to May 2015, AML Surveillance Officer of the Distributor and from 2007 to December 2011, Financial Processing Manager of the Distributor. She is an officer of 57 investment companies (comprised of 141 portfolios) managed by the Manager. She is 50 years old and has been an employee of the Distributor since 1997.
45
Dreyfus New Jersey Municipal Bond Fund, Inc.
200 Park Avenue
New York, NY 10166
Manager
The Dreyfus Corporation
200 Park Avenue
New York, NY 10166
Custodian
The Bank of New York Mellon
240 Greenwich Street
New York, NY 10286
Transfer Agent &
Dividend Disbursing Agent
Dreyfus Transfer, Inc.
200 Park Avenue
New York, NY 10166
Distributor
MBSC Securities Corporation
200 Park Avenue
New York, NY 10166
| | |
Ticker Symbols: | Class A: DRNJX Class C: DCNJX Class I: DNMIX Class Y: DNJYX Class Z: DZNJX |
Telephone Call your financial representative or 1-800-DREYFUS
Mail The Dreyfus Family of Funds, 144 Glenn Curtiss Boulevard, Uniondale, NY 11556-0144
E-mailSend your request toinfo@dreyfus.com
InternetInformation can be viewed online or downloaded atwww.dreyfus.com
The fund files its complete schedule of portfolio holdings with the Securities and Exchange Commission (“SEC”) for the first and third quarters of each fiscal year on Form N-Q. The fund’s Forms N-Q are available on the SEC’s website atwww.sec.gov.
A description of the policies and procedures that the fund uses to determine how to vote proxies relating to portfolio securities and information regarding how the fund voted these proxies for the most recent 12-month period ended June 30 is available atwww.dreyfus.com and on the SEC’s website atwww.sec.gov and without charge, upon request, by calling 1-800-DREYFUS.
| | |
© 2019 MBSC Securities Corporation
0750AR1218 | 
|
Item 2. Code of Ethics.
The Registrant has adopted a code of ethics that applies to the Registrant's principal executive officer, principal financial officer, principal accounting officer or controller, or persons performing similar functions. There have been no amendments to, or waivers in connection with, the Code of Ethics during the period covered by this Report.
Item 3. Audit Committee Financial Expert.
The Registrant's Board has determined that David P. Feldman, a member of the Audit Committee of the Board, is an audit committee financial expert as defined by the Securities and Exchange Commission (the "SEC"). Mr. Feldman is "independent" as defined by the SEC for purposes of audit committee financial expert determinations.
Item 4. Principal Accountant Fees and Services.
(a) Audit Fees. The aggregate fees billed for each of the last two fiscal years (the "Reporting Periods") for professional services rendered by the Registrant's principal accountant (the "Auditor") for the audit of the Registrant's annual financial statements or services that are normally provided by the Auditor in connection with the statutory and regulatory filings or engagements for the Reporting Periods, were $35,313 in 2017 and $35,843 in 2018.
(b) Audit-Related Fees. The aggregate fees billed in the Reporting Periods for assurance and related services by the Auditor that are reasonably related to the performance of the audit of the Registrant's financial statements and are not reported under paragraph (a) of this Item 4 were $16,913 in 2017 and $10,658 in 2018. These services consisted of one or more of the following: (i) agreed upon procedures related to compliance with Internal Revenue Code section 817(h), (ii) security counts required by Rule 17f-2 under the Investment Company Act of 1940, as amended, (iii) advisory services as to the accounting or disclosure treatment of Registrant transactions or events and (iv) advisory services to the accounting or disclosure treatment of the actual or potential impact to the Registrant of final or proposed rules, standards or interpretations by the Securities and Exchange Commission, the Financial Accounting Standards Boards or other regulatory or standard-setting bodies.
The aggregate fees billed in the Reporting Periods for non-audit assurance and related services by the Auditor to the Registrant's investment adviser (not including any sub-investment adviser whose role is primarily portfolio management and is subcontracted with or overseen by another investment adviser), and any entity controlling, controlled by or under common control with the investment adviser that provides ongoing services to the Registrant ("Service Affiliates"), that were reasonably related to the performance of the annual audit of the Service Affiliate, which required pre-approval by the Audit Committee were $0 in 2017 and $0 in 2018.
(c) Tax Fees. The aggregate fees billed in the Reporting Periods for professional services rendered by the Auditor for tax compliance, tax advice, and tax planning ("Tax Services") were $3,503 in 2017 and $4,482 in 2018. These services consisted of: (i) review or preparation of U.S. federal, state, local and excise tax returns; (ii) U.S. federal, state and local tax planning, advice and assistance regarding statutory, regulatory or administrative developments; and (iii) tax advice regarding tax qualification matters and/or treatment of various financial instruments held or proposed to be acquired or held. The aggregate fees billed in the Reporting Periods for Tax Services by the Auditor to Service Affiliates, which required pre-approval by the Audit Committee were $0 in 2017 and $0 in 2018.
(d) All Other Fees. The aggregate fees billed in the Reporting Periods for products and services provided by the Auditor, other than the services reported in paragraphs (a) through (c) of this Item, were $1,249 in 2017 and $1,273 in 2018. These services consisted of a review of the Registrant's anti-money laundering program.
The aggregate fees billed in the Reporting Periods for Non-Audit Services by the Auditor to Service Affiliates, other than the services reported in paragraphs (b) through (c) of this Item, which required pre-approval by the Audit Committee, were $0 in 2017 and $0 in 2018.
(e)(1) Audit Committee Pre-Approval Policies and Procedures. The Registrant's Audit Committee has established policies and procedures (the "Policy") for pre-approval (within specified fee limits) of the Auditor's engagements for non-audit services to the Registrant and Service Affiliates without specific case-by-case consideration. The pre-approved services in the Policy can include pre-approved audit services, pre-approved audit-related services, pre-approved tax services and pre-approved all other services. Pre-approval considerations include whether the proposed services are compatible with maintaining the Auditor's independence. Pre-approvals pursuant to the Policy are considered annually.
(e)(2) Note. None of the services described in paragraphs (b) through (d) of this Item 4 were approved by the Audit Committee pursuant to paragraph (c)(7)(i)(C) of Rule 2-01 of Regulation S-X.
(f) None of the hours expended on the principal accountant's engagement to audit the registrant's financial statements for the most recent fiscal year were attributed to work performed by persons other than the principal account's full-time, permanent employees.
Non-Audit Fees. The aggregate non-audit fees billed by the Auditor for services rendered to the Registrant, and rendered to Service Affiliates, for the Reporting Periods were $31,379,272 in 2017 and $53,294,289 in 2018.
Auditor Independence. The Registrant's Audit Committee has considered whether the provision of non-audit services that were rendered to Service Affiliates, which were not pre-approved (not requiring pre-approval), is compatible with maintaining the Auditor's independence.
Item 5. Audit Committee of Listed Registrants.
Not applicable.
Item 6. Investments.
(a) Not applicable.
Item 7. Disclosure of Proxy Voting Policies and Procedures for Closed-End Management Investment Companies.
Not applicable.
Item 8. Portfolio Managers of Closed-End Management Investment Companies.
Not applicable.
Item 9. Purchases of Equity Securities by Closed-End Management Investment Companies and Affiliated Purchasers.
Not applicable.
Item 10. Submission of Matters to a Vote of Security Holders.
There have been no material changes to the procedures applicable to Item 10.
Item 11. Controls and Procedures.
(a) The Registrant's principal executive and principal financial officers have concluded, based on their evaluation of the Registrant's disclosure controls and procedures as of a date within 90 days of the filing date of this report, that the Registrant's disclosure controls and procedures are reasonably designed to ensure that information required to be disclosed by the Registrant on Form N-CSR is recorded, processed, summarized and reported within the required time periods and that information required to be disclosed by the Registrant in the reports that it files or submits on Form N-CSR is accumulated and communicated to the Registrant's management, including its principal executive and principal financial officers, as appropriate to allow timely decisions regarding required disclosure.
(b) There were no changes to the Registrant's internal control over financial reporting that occurred during the second fiscal quarter of the period covered by this report that have materially affected, or are reasonably likely to materially affect, the Registrant's internal control over financial reporting.
Item 12. Disclosure of Securities Lending Activities for Closed-End Management Investment Companies.
Not applicable.
Item 13. Exhibits.
(a)(1) Code of ethics referred to in Item 2.
(a)(2) Certifications of principal executive and principal financial officers as required by Rule 30a-2(a) under the Investment Company Act of 1940.
(a)(3) Not applicable.
(b) Certification of principal executive and principal financial officers as required by Rule 30a-2(b) under the Investment Company Act of 1940.
SIGNATURES
Pursuant to the requirements of the Securities Exchange Act of 1934 and the Investment Company Act of 1940, the Registrant has duly caused this Report to be signed on its behalf by the undersigned, thereunto duly authorized.
Dreyfus New Jersey Municipal Bond Fund, Inc.
By: /s/ Bradley J. Skapyak
Bradley J. Skapyak
President
Date: February 25, 2019
Pursuant to the requirements of the Securities Exchange Act of 1934 and the Investment Company Act of 1940, this Report has been signed below by the following persons on behalf of the Registrant and in the capacities and on the dates indicated.
By: /s/ Bradley J. Skapyak
Bradley J. Skapyak
President
Date: February 25, 2019
By: /s/ James Windels
James Windels
Treasurer
Date: February 25, 2019
EXHIBIT INDEX
(a)(1) Code of ethics referred to in Item 2.
(a)(2) Certifications of principal executive and principal financial officers as required by Rule 30a-2(a) under the Investment Company Act of 1940. (EX-99.CERT)
(b) Certification of principal executive and principal financial officers as required by Rule 30a-2(b) under the Investment Company Act of 1940. (EX-99.906CERT)
