UNITED STATES
SECURITIES AND EXCHANGE COMMISSION
Washington, D.C. 20549
FORM N-CSR
CERTIFIED SHAREHOLDER REPORT OF REGISTERED MANAGEMENT
INVESTMENT COMPANIES
Investment Company Act file number | 811-5454 |
| |
| Dreyfus New Jersey Municipal Bond Fund, Inc. | |
| (Exact name of Registrant as specified in charter) | |
| | |
| c/o The Dreyfus Corporation 200 Park Avenue New York, New York 10166 | |
| (Address of principal executive offices) (Zip code) | |
| | |
| Janette E. Farragher, Esq. 200 Park Avenue New York, New York 10166 | |
| (Name and address of agent for service) | |
|
Registrant's telephone number, including area code: | (212) 922-6000 |
| |
Date of fiscal year end: | 12/31 | |
Date of reporting period: | 6/30/12 | |
| | | | | | | |
FORM N-CSR
Item 1. Reports to Stockholders.
Save time. Save paper. View your next shareholder report online as soon as it’s available. Log into www.dreyfus.com and sign up for Dreyfus eCommunications. It’s simple and only takes a few minutes.
The views expressed in this report reflect those of the portfolio manager only through the end of the period covered and do not necessarily represent the views of Dreyfus or any other person in the Dreyfus organization. Any such views are subject to change at any time based upon market or other conditions and Dreyfus disclaims any responsibility to update such views.These views may not be relied on as investment advice and, because investment decisions for a Dreyfus fund are based on numerous factors, may not be relied on as an indication of trading intent on behalf of any Dreyfus fund.
Not FDIC-Insured • Not Bank-Guaranteed • May Lose Value
| | Contents |
| | THE FUND |
| 2 | A Letter from the Chairman and CEO |
| 3 | Discussion of Fund Performance |
| 6 | Understanding Your Fund’s Expenses |
| 6 | Comparing Your Fund’s Expenses With Those of Other Funds |
| 7 | Statement of Investments |
| 22 | Statement of Assets and Liabilities |
| 23 | Statement of Operations |
| 24 | Statement of Changes in Net Assets |
| 26 | Financial Highlights |
| 30 | Notes to Financial Statements |
| 42 | Information About the Renewal of the Fund’s Management Agreement |
| | FOR MORE INFORMATION |
| | Back Cover |
Dreyfus
New Jersey Municipal
Bond Fund, Inc.
The Fund

A LETTER FROM THE CHAIRMAN AND CEO
Dear Shareholder:
We are pleased to present this semiannual report for Dreyfus New Jersey Municipal Bond Fund, Inc., covering the six-month period from January 1, 2012, through June 30, 2012. For information about how the fund performed during the reporting period, as well as general market perspectives, we provide a Discussion of Fund Performance on the pages that follow.
Economic optimism and favorable supply-and-demand dynamics helped drive municipal bond prices higher during the reporting period. In early 2012, investors responded positively to improving U.S. employment trends and efforts by states and municipalities to rein in spending and generate greater revenues.Although U.S. economic data weakened in the spring amid intensifying concerns emanating from Europe and the emerging markets, municipal bonds were supported by robust demand from individual and institutional investors. Consequently, municipal bonds were among the better performing asset classes over the first half of the year.
Despite the recent downturn in economic sentiment, we believe the U.S. and global economies are likely to remain on mildly upward trajectories. In our judgment, current sluggishness is at least partly due to the lagging effects of tighter monetary policies in some areas of the world, and we expect stronger growth when a shift to more accommodative policies begins to have an impact on global economic activity. In addition, the adjustment among U.S. exporters to weaker European demand and slower economic growth in certain emerging markets should be largely completed later this year, potentially setting the stage for a stronger economic rebound in 2013.
As always, we encourage you to discuss our observations with your financial advisor.
Thank you for your continued confidence and support.

Jonathan R. Baum
Chairman and Chief Executive Officer
The Dreyfus Corporation
July 16, 2012
2

DISCUSSION OF FUND PERFORMANCE
For the period of January 1, 2012, through June 30, 2012, as provided by Daniel Barton and Jeffrey Burger Portfolio Managers
Fund and Market Performance Overview
For the six-month period ended June 30, 2012, Dreyfus New Jersey Municipal Bond Fund’s Class A shares produced a total return of 3.97%, Class C shares returned 3.59%, Class I shares returned 4.04% and Class Z shares returned 4.09%.1 In comparison, the Barclays Capital Municipal Bond Index (the “Index”), the fund’s benchmark, achieved a total return of 3.66% for the same period.2 Falling long-term interest rates and favorable supply-and-demand dynamics supported municipal bond prices over the first half of 2012. The fund’s returns generally were higher than its benchmark, chiefly due to a relatively long average duration and an emphasis on revenue-backed bonds.
The Fund’s Investment Approach
To pursue its goal, the fund seeks as high a level of current income exempt from federal and New Jersey state income taxes as is consistent with the preservation of capital.The fund normally invests at least 80% of its assets in municipal bonds that provide income exempt from federal and New Jersey personal income taxes.The fund invests at least 80% of its assets in investment-grade municipal bonds or the unrated equivalent as determined by Dreyfus.The fund may invest up to 20% of its assets in municipal bonds rated below investment grade (“high yield” or “junk” bonds) or the unrated equivalent as determined by Dreyfus.The dollar-weighted average maturity of the fund’s portfolio normally exceeds 10 years.
We focus on identifying undervalued sectors and securities and minimize the use of interest rate forecasting. We select municipal bonds for the fund’s portfolio by:
Using fundamental credit analysis to estimate the relative value and attractiveness of various sectors and securities and to exploit pricing inefficiencies in the municipal bond market; and
Actively trading among various sectors, such as pre-refunded, general obligation and revenue, based on their apparent relative values.The fund seeks to invest in several of these sectors.
DISCUSSION OF FUND PERFORMANCE (continued)
Municipal Bonds Rallied as Economic Concerns Eased
2012 began in the midst of improving market sentiment as better macroeconomic news encouraged investors to take more risks, including reaching for higher levels of income from riskier credit-rating categories. As a result, municipal bonds that had been punished during a downturn in 2011 led the market rebound, while higher-quality bonds generally lagged market averages. Although stronger economic growth typically would support higher interest rates, longer term interest rates remained low due to Operation Twist, a stimulative program from the Federal Reserve Board involving massive purchases of U.S.Treasury securities.
Positive supply-and-demand forces also proved beneficial over the first half of 2012. New issuance volumes remained relatively low as political pressure led to less borrowing for capital projects. Meanwhile, demand was robust from individual and institutional investors seeking competitive after-tax yields in a low interest-rate environment.
As a result of these fundamental and technical factors, New Jersey municipal bonds sometimes offered higher nominal yields than comparable U.S.Treasury securities during the reporting period.
From a credit-quality perspective, New Jersey’s tax revenues have increased modestly, but the state has continued to struggle with rising retiree benefits costs, a relatively slow economic recovery, and depleted reserve fund balances.
Longer Maturities Buoyed Relative Performance
The search by investors for competitive yields led them to focus on longer-term municipal bonds, boosting prices in a segment of the market’s maturity spectrum that we had regarded as undervalued. In addition, the fund generally favored better performing revenue-backed securities, including those issued on behalf of hospitals, industrial development projects and the state’s settlement of litigation with U.S. tobacco companies.The fund’s holdings of municipal bonds issued by Puerto Rico, which are exempt from New Jersey state income taxes, also fared well during the reporting period.The fund further benefited from overweighted exposure to municipal bonds at the lower end of the investment-grade range when yield differences narrowed along the market’s quality spectrum. Finally, we successfully implemented a strategy using swap options in anticipation of narrower yield differences between municipal bonds and U.S.Treasury securities.
4
Detractors from the fund’s relative performance included higher-quality bonds, particularly those backed by revenues from municipal water and sewer facilities.We increased the fund’s holdings of such bonds in order to upgrade its overall credit profile, but this strategy did detract from performance as lower quality bonds continued to rally.
Prepared for a Changing Market Environment
We have been encouraged by recently improved data, but the U.S. economy remains vulnerable to unexpected shocks and uncertainty regarding future monetary and fiscal policies. In addition, higher yielding and longer-maturity bonds have become more richly valued after recent rallies. Consequently, while we have continued to favor revenue-backed municipal bonds over their general obligation counterparts, we expect to trim some positions and add to holdings of higher quality bonds.
July 16, 2012
| |
| | Bond funds are subject generally to interest rate, credit, liquidity and market risks, to varying |
| | degrees, all of which are more fully described in the fund’s prospectus. Generally, all other factors |
| | being equal, bond prices are inversely related to interest-rate changes, and rate increases can cause |
| | price declines. |
| | High yield bonds are subject to increased credit risk and are considered speculative in terms of the |
| | issuer’s perceived ability to continue making interest payments on a timely basis and to repay |
| | principal upon maturity. |
| 1 | Total return includes reinvestment of dividends and any capital gains paid and does not take into |
| | consideration the maximum initial sales charge in the case of Class A shares or the applicable |
| | contingent deferred sales charges imposed on redemptions in the case of Class C shares. Had these |
| | charges been reflected, returns would have been lower. Class I and Class Z shares are not subject |
| | to any initial or deferred sales charge. Past performance is no guarantee of future results. Share |
| | price, yield and investment return fluctuate such that upon redemption, fund shares may be worth |
| | more or less than their original cost. Income may be subject to state and local taxes for non-New |
| | Jersey residents, and some income may be subject to the federal alternative minimum tax (AMT) |
| | for certain investors. Capital gains, if any, are fully taxable. Return figures provided for Class A |
| | and C shares reflect the absorption of certain fund expenses pursuant to an agreement by The |
| | Dreyfus Corporation which may be terminated after May 1, 2013, upon 90 days’ notice to |
| | shareholders. Return figures for Class I shares, reflect the absorption of certain fund expenses by |
| | The Dreyfus Corporation and may be terminated at any time. Had these expenses not been |
| | absorbed, the fund’s returns would have been lower. |
| 2 | SOURCE: LIPPER INC. — Reflects reinvestment of dividends and, where applicable, capital |
| | gain distributions.The Barclays Capital Municipal Bond Index is a widely accepted, unmanaged |
| | total return performance benchmark for the long-term, investment-grade, tax-exempt bond market. |
| | Index returns do not reflect fees and expenses associated with operating a mutual fund. Investors |
| | cannot invest directly in any index. |
UNDERSTANDING YOUR FUND’S EXPENSES (Unaudited)
As a mutual fund investor, you pay ongoing expenses, such as management fees and other expenses. Using the information below, you can estimate how these expenses affect your investment and compare them with the expenses of other funds.You also may pay one-time transaction expenses, including sales charges (loads) and redemption fees, which are not shown in this section and would have resulted in higher total expenses. For more information, see your fund’s prospectus or talk to your financial adviser.
Review your fund’s expenses
The table below shows the expenses you would have paid on a $1,000 investment in Dreyfus New Jersey Municipal Bond Fund, Inc. from January 1, 2012 to June 30, 2012. It also shows how much a $1,000 investment would be worth at the close of the period, assuming actual returns and expenses.
| | | | | | | | |
| Expenses and Value of a $1,000 Investment | | | | | | |
| assuming actual returns for the six months ended June 30, 2012 | | | | |
| | | Class A | | Class C | | Class I | | Class Z |
| Expenses paid per $1,000† | $ | 4.31 | $ | 8.10 | $ | 3.55 | $ | 3.96 |
| Ending value (after expenses) | $ | 1,039.70 | $ | 1,035.90 | $ | 1,040.40 | $ | 1,040.90 |
|
| COMPARING YOUR FUND’S EXPENSES |
| WITH THOSE OF OTHER FUNDS (Unaudited) |
Using the SEC’s method to compare expenses
The Securities and Exchange Commission (SEC) has established guidelines to help investors assess fund expenses. Per these guidelines, the table below shows your fund’s expenses based on a $1,000 investment, assuming a hypothetical 5% annualized return. You can use this information to compare the ongoing expenses (but not transaction expenses or total cost) of investing in the fund with those of other funds.All mutual fund shareholder reports will provide this information to help you make this comparison. Please note that you cannot use this information to estimate your actual ending account balance and expenses paid during the period.
| | | | | | | | |
| Expenses and Value of a $1,000 Investment | | | | | | |
| assuming a hypothetical 5% annualized return for the six months ended June 30, 2012 |
| | | Class A | | Class C | | Class F | | Class I |
| Expenses paid per $1,000† | $ | 4.27 | $ | 8.02 | $ | 3.52 | $ | 3.92 |
| Ending value (after expenses) | $ | 1,020.64 | $ | 1,016.91 | $ | 1,021.38 | $ | 1,020.98 |
† Expenses are equal to the fund’s annualized expense ratio of .85% for Class A, 1.60% for Class C, .70% for Class I and .78% for Class Z, multiplied by the average account value over the period, multiplied by 182/366 (to reflect the one-half year period).
6
|
| STATEMENT OF INVESTMENTS |
| June 30, 2012 (Unaudited) |
| | | | | |
| Long-Term Municipal | Coupon | Maturity | Principal | | |
| Investments—97.7% | Rate (%) | Date | Amount ($) | | Value ($) |
| New Jersey—85.6% | | | | | |
| Atlantic County Utilities | | | | | |
| Authority, Solid Waste | | | | | |
| System Revenue | 7.13 | 3/1/16 | 7,540,000 | | 7,561,414 |
| Burlington County Bridge | | | | | |
| Commission, EDR (The | | | | | |
| Evergreens Project) | 5.63 | 1/1/38 | 5,500,000 | | 5,615,940 |
| Camden County Improvement | | | | | |
| Authority, Health Care | | | | | |
| Redevelopment Project Revenue | | | | | |
| (The Cooper Health System | | | | | |
| Obligated Group Issue) | 5.25 | 2/15/20 | 4,545,000 | | 4,832,562 |
| Camden County Improvement | | | | | |
| Authority, Health Care | | | | | |
| Redevelopment Project Revenue | | | | | |
| (The Cooper Health System | | | | | |
| Obligated Group Issue) | 5.25 | 2/15/20 | 2,000,000 | | 2,126,540 |
| Delaware River Port Authority, | | | | | |
| Revenue | 5.00 | 1/1/30 | 3,500,000 | | 3,857,245 |
| Delaware River Port Authority, | | | | | |
| Revenue | 5.00 | 1/1/35 | 3,500,000 | | 3,799,390 |
| East Orange Board of Education, | | | | | |
| COP, LR (Insured; Assured | | | | | |
| Guaranty Municipal Corp.) | 0.00 | 2/1/21 | 685,000 | a | 497,269 |
| East Orange Board of Education, | | | | | |
| COP, LR (Insured; Assured | | | | | |
| Guaranty Municipal Corp.) | 0.00 | 2/1/26 | 745,000 | a | 404,513 |
| East Orange Board of Education, | | | | | |
| COP, LR (Insured; Assured | | | | | |
| Guaranty Municipal Corp.) | 0.00 | 2/1/28 | 2,345,000 | a | 1,130,595 |
| Essex County, | | | | | |
| GO (General Improvement) | 5.00 | 8/1/23 | 15,200,000 | | 17,885,384 |
| Garden State Preservation Trust, | | | | | |
| Revenue (Open Space and | | | | | |
| Farmland Preservation Bonds) | | | | | |
| (Insured; Assured Guaranty | | | | | |
| Municipal Corp.) | 5.75 | 11/1/28 | 5,000,000 | | 6,587,400 |
| Gloucester County Improvement | | | | | |
| Authority, County Guaranteed | | | | | |
| Loan Revenue (County | | | | | |
| Capital Program) | 5.00 | 4/1/38 | 7,000,000 | | 7,582,540 |
STATEMENT OF INVESTMENTS (Unaudited) (continued)
| | | | | |
| Long-Term Municipal | Coupon | Maturity | Principal | | |
| Investments (continued) | Rate (%) | Date | Amount ($) | | Value ($) |
| New Jersey (continued) | | | | | |
| Gloucester Township Municipal | | | | | |
| Utilities Authority, Sewer | | | | | |
| Revenue (Insured; AMBAC) | 5.65 | 3/1/18 | 1,825,000 | | 2,054,165 |
| Higher Education Student | | | | | |
| Assistance Authority of | | | | | |
| New Jersey, Student | | | | | |
| Loan Revenue (Insured; | | | | | |
| National Public Finance | | | | | |
| Guarantee Corp.) | 6.13 | 6/1/17 | 280,000 | | 280,902 |
| Hudson County Improvement | | | | | |
| Authority, Harrison Stadium | | | | | |
| Land Acquisition Special | | | | | |
| Obligation Revenue (Harrison | | | | | |
| Redevelopment Project) | | | | | |
| (Insured; National Public | | | | | |
| Finance Guarantee Corp.) | 0.00 | 12/15/34 | 3,000,000 | a | 970,740 |
| Mercer County Improvement | | | | | |
| Authority, County Secured | | | | | |
| Open Space Revenue (Insured; | | | | | |
| National Public Finance | | | | | |
| Guarantee Corp.) | 5.00 | 8/1/40 | 3,290,000 | | 3,436,635 |
| Middletown Township Board of | | | | | |
| Education, GO | 5.00 | 8/1/25 | 4,140,000 | | 4,821,775 |
| Middletown Township Board of | | | | | |
| Education, GO | 5.00 | 8/1/26 | 2,935,000 | | 3,393,652 |
| New Jersey Economic | | | | | |
| Development Authority, | | | | | |
| Cigarette Tax Revenue | 5.00 | 6/15/28 | 2,000,000 | | 2,163,820 |
| New Jersey Economic Development | | | | | |
| Authority, Cigarette Tax | | | | | |
| Revenue (Prerefunded) | 5.75 | 6/15/14 | 2,000,000 | b | 2,210,760 |
| New Jersey Economic Development | | | | | |
| Authority, Department of | | | | | |
| Human Services Composite | | | | | |
| Revenue (Division of | | | | | |
| Developmental Disabilities) | 6.25 | 7/1/24 | 1,240,000 | | 1,242,815 |
| New Jersey Economic Development | | | | | |
| Authority, Department of | | | | | |
| Human Services Composite | | | | | |
| Revenue (Division of Mental | | | | | |
| Health Services) | 6.10 | 7/1/17 | 1,540,000 | | 1,544,682 |
8
| | | | | |
| Long-Term Municipal | Coupon | Maturity | Principal | | |
| Investments (continued) | Rate (%) | Date | Amount ($) | | Value ($) |
| New Jersey (continued) | | | | | |
| New Jersey Economic Development | | | | | |
| Authority, EDR (Masonic | | | | | |
| Charity Foundation of | | | | | |
| New Jersey Project) | 5.00 | 6/1/18 | 1,365,000 | | 1,418,194 |
| New Jersey Economic Development | | | | | |
| Authority, Gas Facilities Revenue | | | | | |
| (NUI Corporation Project) | 5.25 | 11/1/33 | 2,780,000 | | 2,781,640 |
| New Jersey Economic Development | | | | | |
| Authority, Motor Vehicle | | | | | |
| Surcharge Revenue (Insured; | | | | | |
| National Public Finance | | | | | |
| Guarantee Corp.) | 0.00 | 7/1/20 | 3,350,000 | a | 2,543,521 |
| New Jersey Economic Development | | | | | |
| Authority, Motor Vehicle | | | | | |
| Surcharge Revenue (Insured; | | | | | |
| National Public Finance | | | | | |
| Guarantee Corp.) | 0.00 | 7/1/21 | 2,620,000 | a | 1,890,775 |
| New Jersey Economic Development | | | | | |
| Authority, Revenue (Hillcrest | | | | | |
| Health Service System Project) | | | | | |
| (Insured; AMBAC) | 0.00 | 1/1/13 | 1,000,000 | a | 981,300 |
| New Jersey Economic Development | | | | | |
| Authority, Revenue (Hillcrest | | | | | |
| Health Service System Project) | | | | | |
| (Insured; AMBAC) | 0.00 | 1/1/15 | 3,250,000 | a | 2,936,472 |
| New Jersey Economic Development | | | | | |
| Authority, Revenue (Hillcrest | | | | | |
| Health Service System Project) | | | | | |
| (Insured; AMBAC) | 0.00 | 1/1/17 | 5,000,000 | a | 4,135,100 |
| New Jersey Economic Development | | | | | |
| Authority, Revenue (Hillcrest | | | | | |
| Health Service System Project) | | | | | |
| (Insured; AMBAC) | 0.00 | 1/1/18 | 2,500,000 | a | 1,954,650 |
| New Jersey Economic Development | | | | | |
| Authority, Revenue (Hillcrest | | | | | |
| Health Service System Project) | | | | | |
| (Insured; AMBAC) | 0.00 | 1/1/20 | 6,500,000 | a | 4,546,360 |
| New Jersey Economic Development | | | | | |
| Authority, Revenue (Hillcrest | | | | | |
| Health Service System Project) | | | | | |
| (Insured; AMBAC) | 0.00 | 1/1/22 | 6,000,000 | a | 3,707,160 |
STATEMENT OF INVESTMENTS (Unaudited) (continued)
| | | | |
| Long-Term Municipal | Coupon | Maturity | Principal | |
| Investments (continued) | Rate (%) | Date | Amount ($) | Value ($) |
| New Jersey (continued) | | | | |
| New Jersey Economic Development | | | | |
| Authority, School Facilities | | | | |
| Construction Revenue | 5.00 | 9/1/18 | 2,265,000 | 2,691,658 |
| New Jersey Economic Development | | | | |
| Authority, School Facilities | | | | |
| Construction Revenue | 5.75 | 9/1/23 | 3,765,000 | 4,621,914 |
| New Jersey Economic Development | | | | |
| Authority, School Facilities | | | | |
| Construction Revenue | | | | |
| (Insured; AMBAC) | 5.50 | 9/1/24 | 10,000,000 | 12,442,900 |
| New Jersey Economic Development | | | | |
| Authority, School Facilities | | | | |
| Construction Revenue (Insured; | | | | |
| National Public Finance | | | | |
| Guarantee Corp.) | 5.50 | 9/1/27 | 10,000,000 | 12,657,000 |
| New Jersey Economic Development | | | | |
| Authority, Water Facilities | | | | |
| Revenue (New Jersey—American | | | | |
| Water Company, Inc. Project) | 5.10 | 6/1/23 | 3,000,000 | 3,382,590 |
| New Jersey Economic Development | | | | |
| Authority, Water Facilities | | | | |
| Revenue (New Jersey—American | | | | |
| Water Company, Inc. Project) | 5.60 | 11/1/34 | 6,600,000 | 7,410,348 |
| New Jersey Economic Development | | | | |
| Authority, Water Facilities | | | | |
| Revenue (New Jersey—American | | | | |
| Water Company, Inc. Project) | 5.70 | 10/1/39 | 5,000,000 | 5,519,450 |
| New Jersey Educational Facilities | | | | |
| Authority, Revenue (Fairleigh | | | | |
| Dickenson University Issue) | 6.00 | 7/1/20 | 4,535,000 | 4,790,638 |
| New Jersey Educational Facilities | | | | |
| Authority, Revenue (Kean | | | | |
| University Issue) | 5.00 | 9/1/21 | 1,500,000 | 1,734,645 |
| New Jersey Educational Facilities | | | | |
| Authority, Revenue (Montclair | | | | |
| State University Issue) | 5.25 | 7/1/38 | 2,000,000 | 2,173,980 |
| New Jersey Educational Facilities | | | | |
| Authority, Revenue (New Jersey | | | | |
| City University Issue) (Insured; | | | | |
| Assured Guaranty Municipal Corp.) | 5.00 | 7/1/35 | 12,165,000 | 13,142,214 |
10
| | | | | |
| Long-Term Municipal | Coupon | Maturity | Principal | | |
| Investments (continued) | Rate (%) | Date | Amount ($) | | Value ($) |
| New Jersey (continued) | | | | | |
| New Jersey Educational Facilities | | | | | |
| Authority, Revenue (New Jersey | | | | | |
| Institute of Technology Issue) | 5.00 | 7/1/31 | 2,000,000 | | 2,191,060 |
| New Jersey Educational Facilities | | | | | |
| Authority, Revenue (Princeton | | | | | |
| Theological Seminary Issue) | 5.00 | 7/1/29 | 5,000,000 | | 5,919,750 |
| New Jersey Educational Facilities | | | | | |
| Authority, Revenue (Princeton | | | | | |
| University) (Prerefunded) | 5.00 | 7/1/15 | 120,000 | b | 136,224 |
| New Jersey Educational Facilities | | | | | |
| Authority, Revenue (Public | | | | | |
| Library Project Grant Program | | | | | |
| Issue) (Insured; AMBAC) | 5.50 | 9/1/17 | 1,500,000 | | 1,512,585 |
| New Jersey Educational Facilities | | | | | |
| Authority, Revenue (Ramapo | | | | | |
| College of New Jersey Issue) | 5.00 | 7/1/42 | 3,000,000 | | 3,288,150 |
| New Jersey Educational Facilities | | | | | |
| Authority, Revenue (Seton Hall | | | | | |
| University Issue) | 6.25 | 7/1/37 | 5,000,000 | | 5,868,050 |
| New Jersey Educational Facilities | | | | | |
| Authority, Revenue (Stevens | | | | | |
| Institute of Technology Issue) | 5.00 | 7/1/27 | 5,000,000 | | 5,298,050 |
| New Jersey Educational Facilities | | | | | |
| Authority, Revenue (Stevens | | | | | |
| Institute of Technology Issue) | 5.00 | 7/1/34 | 7,655,000 | | 7,983,246 |
| New Jersey Educational Facilities | | | | | |
| Authority, Revenue (Stevens | | | | | |
| Institute of Technology Issue) | | | | | |
| (Prerefunded) | 5.38 | 7/1/14 | 2,500,000 | b | 2,749,000 |
| New Jersey Educational Facilities | | | | | |
| Authority, Revenue (The | | | | | |
| College of New Jersey Issue) | | | | | |
| (Insured; Assured Guaranty | | | | | |
| Municipal Corp.) | 5.00 | 7/1/35 | 7,910,000 | | 8,549,840 |
| New Jersey Educational Facilities | | | | | |
| Authority, Revenue (The William | | | | | |
| Paterson University of New Jersey | | | | | |
| Issue) (Insured; Assured | | | | | |
| Guaranty Municipal Corp.) | 5.00 | 7/1/38 | 3,745,000 | | 4,022,767 |
STATEMENT OF INVESTMENTS (Unaudited) (continued)
| | | | | |
| Long-Term Municipal | Coupon | Maturity | Principal | | |
| Investments (continued) | Rate (%) | Date | Amount ($) | | Value ($) |
| New Jersey (continued) | | | | | |
| New Jersey Environmental | | | | | |
| Infrastructure Trust, | | | | | |
| Environmental | | | | | |
| Infrastructure Bonds | 5.00 | 9/1/17 | 4,165,000 | | 5,026,530 |
| New Jersey Environmental | | | | | |
| Infrastructure Trust, | | | | | |
| Environmental | | | | | |
| Infrastructure Bonds | 5.00 | 9/1/18 | 5,200,000 | | 6,385,288 |
| New Jersey Health Care Facilities | | | | | |
| Financing Authority, Revenue | | | | | |
| (AHS Hospital Corporation Issue) | 5.00 | 7/1/27 | 5,400,000 | | 5,765,958 |
| New Jersey Health Care Facilities | | | | | |
| Financing Authority, Revenue | | | | | |
| (Atlantic City Medical | | | | | |
| Center Issue) | 6.00 | 7/1/12 | 1,670,000 | | 1,670,384 |
| New Jersey Health Care Facilities | | | | | |
| Financing Authority, Revenue | | | | | |
| (Atlantic City Medical | | | | | |
| Center Issue) | 6.25 | 7/1/17 | 2,730,000 | | 2,730,901 |
| New Jersey Health Care Facilities | | | | | |
| Financing Authority, Revenue | | | | | |
| (AtlantiCare Regional Medical | | | | | |
| Center Issue) | 5.00 | 7/1/22 | 3,975,000 | | 4,332,313 |
| New Jersey Health Care Facilities | | | | | |
| Financing Authority, Revenue | | | | | |
| (Barnabas Health Issue) | 5.63 | 7/1/32 | 3,000,000 | | 3,248,790 |
| New Jersey Health Care Facilities | | | | | |
| Financing Authority, Revenue | | | | | |
| (Capital Health System Obligated | | | | | |
| Group Issue) (Prerefunded) | 5.75 | 7/1/13 | 3,000,000 | b | 3,161,370 |
| New Jersey Health Care Facilities | | | | | |
| Financing Authority, Revenue | | | | | |
| (General Hospital Center at | | | | | |
| Passaic, Inc. Obligated Group | | | | | |
| Issue) (Insured; Assured | | | | | |
| Guaranty Municipal Corp.) | 6.75 | 7/1/19 | 550,000 | | 691,075 |
| New Jersey Health Care Facilities | | | | | |
| Financing Authority, Revenue | | | | | |
| (Hackensack University Medical | | | | | |
| Center Issue) | 5.00 | 1/1/28 | 2,780,000 | | 2,917,332 |
12
| | | | | |
| Long-Term Municipal | Coupon | Maturity | Principal | | |
| Investments (continued) | Rate (%) | Date | Amount ($) | | Value ($) |
| New Jersey (continued) | | | | | |
| New Jersey Health Care Facilities | | | | | |
| Financing Authority, Revenue | | | | | |
| (Hackensack University Medical | | | | | |
| Center Issue) (Insured; Assured | | | | | |
| Guaranty Municipal Corp.) | 5.25 | 1/1/36 | 2,900,000 | | 3,093,024 |
| New Jersey Health Care Facilities | | | | | |
| Financing Authority, Revenue | | | | | |
| (Holy Name Medical Center Issue) | 5.00 | 7/1/15 | 3,410,000 | | 3,653,815 |
| New Jersey Health Care Facilities | | | | | |
| Financing Authority, Revenue | | | | | |
| (Meridian Health System | | | | | |
| Obligated Group Issue) | 5.00 | 7/1/23 | 2,500,000 | | 2,868,850 |
| New Jersey Health Care Facilities | | | | | |
| Financing Authority, Revenue | | | | | |
| (Meridian Health System | | | | | |
| Obligated Group Issue) | 5.00 | 7/1/26 | 1,000,000 | | 1,105,680 |
| New Jersey Health Care Facilities | | | | | |
| Financing Authority, Revenue | | | | | |
| (Meridian Health System | | | | | |
| Obligated Group Issue) | | | | | |
| (Insured; Assured Guaranty | | | | | |
| Municipal Corp.) | 5.00 | 7/1/38 | 4,965,000 | | 5,239,962 |
| New Jersey Health Care Facilities | | | | | |
| Financing Authority, Revenue | | | | | |
| (Robert Wood Johnson | | | | | |
| University Hospital Issue) | 5.00 | 7/1/31 | 4,950,000 | | 5,376,789 |
| New Jersey Health Care Facilities | | | | | |
| Financing Authority, Revenue | | | | | |
| (Saint Barnabas Health Care | | | | | |
| System Issue) (Insured; | | | | | |
| National Public Finance | | | | | |
| Guarantee Corp.) | 0.00 | 7/1/23 | 2,280,000 | a | 1,734,533 |
| New Jersey Health Care Facilities | | | | | |
| Financing Authority, Revenue | | | | | |
| (South Jersey Hospital Issue) | 6.00 | 7/1/12 | 655,000 | | 655,098 |
| New Jersey Health Care Facilities | | | | | |
| Financing Authority, Revenue | | | | | |
| (Virtua Health Issue) | | | | | |
| (Insured; Assured Guaranty | | | | | |
| Municipal Corp.) | 5.50 | 7/1/38 | 5,000,000 | | 5,475,050 |
STATEMENT OF INVESTMENTS (Unaudited) (continued)
| | | | |
| Long-Term Municipal | Coupon | Maturity | Principal | |
| Investments (continued) | Rate (%) | Date | Amount ($) | Value ($) |
| New Jersey (continued) | | | | |
| New Jersey Health Care Facilities | | | | |
| Financing Authority, State | | | | |
| Contract Revenue (Hospital | | | | |
| Asset Transformation Program) | 5.25 | 10/1/38 | 13,595,000 | 14,608,099 |
| New Jersey Higher Education | | | | |
| Student Assistance Authority, | | | | |
| Student Loan Revenue | 5.00 | 12/1/25 | 1,000,000 | 1,081,580 |
| New Jersey Higher Education | | | | |
| Student Assistance Authority, | | | | |
| Student Loan Revenue | 5.00 | 12/1/26 | 2,330,000 | 2,513,651 |
| New Jersey Higher Education | | | | |
| Student Assistance Authority, | | | | |
| Student Loan Revenue (Insured; | | | | |
| Assured Guaranty Municipal Corp.) | 5.88 | 6/1/21 | 5,805,000 | 6,505,199 |
| New Jersey Highway Authority, | | | | |
| Revenue (Garden State Parkway) | 6.00 | 1/1/19 | 6,645,000 | 8,277,676 |
| New Jersey Housing and Mortgage | | | | |
| Finance Agency, MFHR (Insured: | | | | |
| AMBAC and FHA) | 5.65 | 5/1/40 | 4,480,000 | 4,483,539 |
| New Jersey Housing and Mortgage | | | | |
| Finance Agency, MFHR (Insured; | | | | |
| Assured Guaranty Municipal Corp.) | 5.70 | 5/1/20 | 2,180,000 | 2,184,905 |
| New Jersey Housing and | | | | |
| Mortgage Finance Agency, | | | | |
| Multi-Family Revenue | 4.95 | 5/1/41 | 7,000,000 | 7,391,580 |
| New Jersey Housing and Mortgage | | | | |
| Finance Agency, SFHR | 5.20 | 10/1/25 | 5,740,000 | 6,230,540 |
| New Jersey Housing and Mortgage | | | | |
| Finance Agency, SFHR | 6.38 | 10/1/28 | 4,980,000 | 5,577,899 |
| New Jersey Housing and Mortgage | | | | |
| Finance Agency, SFHR | 5.25 | 10/1/37 | 1,020,000 | 1,077,457 |
| New Jersey Institute of | | | | |
| Technology, GO | 5.00 | 7/1/32 | 1,000,000 | 1,141,570 |
| New Jersey Transportation | | | | |
| Trust Fund Authority | | | | |
| (Transportation System) | 5.00 | 6/15/20 | 4,000,000 | 4,345,240 |
| New Jersey Transportation | | | | |
| Trust Fund Authority | | | | |
| (Transportation System) | 5.50 | 12/15/23 | 7,000,000 | 8,763,020 |
14
| | | | | |
| Long-Term Municipal | Coupon | Maturity | Principal | | |
| Investments (continued) | Rate (%) | Date | Amount ($) | | Value ($) |
| New Jersey (continued) | | | | | |
| New Jersey Transportation | | | | | |
| Trust Fund Authority | | | | | |
| (Transportation System) | 5.50 | 6/15/31 | 2,500,000 | | 2,903,625 |
| New Jersey Transportation | | | | | |
| Trust Fund Authority | | | | | |
| (Transportation System) | 6.00 | 12/15/38 | 6,565,000 | | 7,599,053 |
| New Jersey Transportation Trust | | | | | |
| Fund Authority (Transportation | | | | | |
| System) (Insured; AMBAC) | 0.00 | 12/15/24 | 1,000,000 | a | 602,840 |
| New Jersey Transportation Trust | | | | | |
| Fund Authority (Transportation | | | | | |
| System) (Insured; AMBAC) | 5.00 | 12/15/32 | 8,000,000 | | 8,975,440 |
| New Jersey Transportation Trust | | | | | |
| Fund Authority (Transportation | | | | | |
| System) (Prerefunded) | 6.00 | 12/15/18 | 3,435,000 | b | 4,497,205 |
| New Jersey Turnpike Authority, | | | | | |
| Turnpike Revenue | 6.50 | 1/1/16 | 60,000 | | 70,760 |
| New Jersey Turnpike Authority, | | | | | |
| Turnpike Revenue | 6.50 | 1/1/16 | 120,000 | | 132,580 |
| New Jersey Turnpike Authority, | | | | | |
| Turnpike Revenue | 5.00 | 1/1/35 | 3,000,000 | | 3,378,000 |
| New Jersey Turnpike Authority, | | | | | |
| Turnpike Revenue | 5.25 | 1/1/40 | 5,420,000 | | 6,005,794 |
| New Jersey Turnpike Authority, | | | | | |
| Turnpike Revenue (Insured; | | | | | |
| Assured Guaranty | | | | | |
| Municipal Corp.) | 6.50 | 1/1/16 | 655,000 | | 723,664 |
| New Jersey Turnpike Authority, | | | | | |
| Turnpike Revenue (Insured; | | | | | |
| Assured Guaranty | | | | | |
| Municipal Corp.) | 6.50 | 1/1/16 | 165,000 | | 195,276 |
| New Jersey Turnpike Authority, | | | | | |
| Turnpike Revenue (Insured; | | | | | |
| Assured Guaranty | | | | | |
| Municipal Corp.) | 5.25 | 1/1/27 | 3,000,000 | | 3,699,390 |
| New Jersey Turnpike Authority, | | | | | |
| Turnpike Revenue (Insured; | | | | | |
| National Public Finance | | | | | |
| Guarantee Corp.) | 6.50 | 1/1/16 | 3,520,000 | | 4,151,242 |
STATEMENT OF INVESTMENTS (Unaudited) (continued)
| | | | | |
| Long-Term Municipal | Coupon | Maturity | Principal | | |
| Investments (continued) | Rate (%) | Date | Amount ($) | | Value ($) |
| New Jersey (continued) | | | | | |
| North Hudson Sewerage Authority, | | | | | |
| Gross Revenue Senior Lien | | | | | |
| Lease Certificates (Master | | | | | |
| Lease Agreement) | 5.00 | 6/1/42 | 10,320,000 | | 11,202,979 |
| North Jersey District Water Supply | | | | | |
| Commission, Sewer Revenue | | | | | |
| (Wanaque South Project) | | | | | |
| (Insured; National Public | | | | | |
| Finance Guarantee Corp.) | 6.00 | 7/1/19 | 1,690,000 | | 1,996,143 |
| Port Authority of New York and | | | | | |
| New Jersey (Consolidated Bonds, | | | | | |
| 93rd Series) | 6.13 | 6/1/94 | 3,000,000 | | 3,678,180 |
| Port Authority of New York and | | | | | |
| New Jersey (Consolidated Bonds, | | | | | |
| 139th Series) (Insured; | | | | | |
| National Public Finance | | | | | |
| Guarantee Corp.) | 5.00 | 10/1/18 | 11,235,000 | | 12,437,257 |
| Port Authority of New York and | | | | | |
| New Jersey (Consolidated Bonds, | | | | | |
| 167th Series) | 5.00 | 9/15/24 | 3,675,000 | | 4,213,388 |
| Port Authority of New York and | | | | | |
| New Jersey (Consolidated Bonds, | | | | | |
| 167th Series) | 5.50 | 9/15/26 | 7,600,000 | | 8,935,168 |
| Port Authority of New York and | | | | | |
| New Jersey, Special Obligation | | | | | |
| Revenue (JFK International Air | | | | | |
| Terminal LLC Project) | | | | | |
| (Insured; National Public | | | | | |
| Finance Guarantee Corp.) | 6.25 | 12/1/15 | 5,000,000 | | 5,528,600 |
| Port Authority of New York and | | | | | |
| New Jersey, Special Project | | | | | |
| Revenue (JFK International Air | | | | | |
| Terminal LLC Project) | 5.00 | 12/1/20 | 2,500,000 | | 2,726,650 |
| Rahway Valley Sewerage Authority, | | | | | |
| Sewer Revenue (Insured; | | | | | |
| National Public Finance | | | | | |
| Guarantee Corp.) | 0.00 | 9/1/30 | 7,550,000 | a | 3,305,617 |
| Rutgers, The State University, | | | | | |
| GO | 5.00 | 5/1/39 | 3,450,000 | | 3,780,855 |
| South Jersey Port Corporation, | | | | | |
| Marine Terminal Revenue | 5.75 | 1/1/23 | 4,000,000 | | 4,798,280 |
16
| | | | | |
| Long-Term Municipal | Coupon | Maturity | Principal | | |
| Investments (continued) | Rate (%) | Date | Amount ($) | | Value ($) |
| New Jersey (continued) | | | | | |
| South Jersey Port Corporation, | | | | | |
| Marine Terminal Revenue | | | | | |
| (Insured; Assured Guaranty | | | | | |
| Municipal Corp.) | 5.75 | 1/1/34 | 2,900,000 | | 3,279,407 |
| South Jersey Port Corporation, | | | | | |
| Marine Terminal Revenue | | | | | |
| (Insured; Assured Guaranty | | | | | |
| Municipal Corp.) | 5.88 | 1/1/39 | 6,000,000 | | 6,787,260 |
| Tobacco Settlement Financing | | | | | |
| Corporation of New Jersey, | | | | | |
| Tobacco Settlement | | | | | |
| Asset-Backed Bonds | 4.50 | 6/1/23 | 2,480,000 | | 2,330,704 |
| Tobacco Settlement Financing | | | | | |
| Corporation of New Jersey, | | | | | |
| Tobacco Settlement | | | | | |
| Asset-Backed Bonds | 4.63 | 6/1/26 | 3,000,000 | | 2,666,280 |
| Tobacco Settlement Financing | | | | | |
| Corporation of New Jersey, | | | | | |
| Tobacco Settlement | | | | | |
| Asset-Backed Bonds | 4.75 | 6/1/34 | 2,800,000 | | 2,169,104 |
| Tobacco Settlement Financing | | | | | |
| Corporation of New Jersey, | | | | | |
| Tobacco Settlement | | | | | |
| Asset-Backed Bonds | 5.00 | 6/1/41 | 4,000,000 | | 3,123,120 |
| Tobacco Settlement Financing | | | | | |
| Corporation of New Jersey, | | | | | |
| Tobacco Settlement Asset-Backed | | | | | |
| Bonds (Prerefunded) | 6.75 | 6/1/13 | 1,790,000 | b | 1,897,543 |
| Tobacco Settlement Financing | | | | | |
| Corporation of New Jersey, | | | | | |
| Tobacco Settlement Asset-Backed | | | | | |
| Bonds (Prerefunded) | 7.00 | 6/1/13 | 10,630,000 | b | 11,297,883 |
| University of Medicine and | | | | | |
| Dentistry of New Jersey, GO | | | | | |
| (Insured; AMBAC) | 5.50 | 12/1/27 | 15,425,000 | | 15,663,625 |
| U.S. Related—12.1% | | | | | |
| Guam, | | | | | |
| Business Privilege Tax Revenue | 5.00 | 1/1/42 | 2,000,000 | | 2,133,220 |
| Guam Power Authority, | | | | | |
| Revenue | 5.50 | 10/1/30 | 2,250,000 | | 2,356,133 |
STATEMENT OF INVESTMENTS (Unaudited) (continued)
| | | | | |
| Long-Term Municipal | Coupon | Maturity | Principal | | |
| Investments (continued) | Rate (%) | Date | Amount ($) | | Value ($) |
| U.S. Related (continued) | | | | | |
| Guam Waterworks Authority, | | | | | |
| Water and Wastewater | | | | | |
| System Revenue | 6.00 | 7/1/25 | 1,000,000 | | 1,028,710 |
| Puerto Rico Aqueduct and Sewer | | | | | |
| Authority, Senior Lien Revenue | 5.13 | 7/1/37 | 2,000,000 | | 1,997,200 |
| Puerto Rico Commonwealth, | | | | | |
| Public Improvement GO | 5.50 | 7/1/39 | 6,000,000 | | 6,169,680 |
| Puerto Rico Electric Power | | | | | |
| Authority, Power Revenue | 5.25 | 7/1/22 | 5,000,000 | | 5,556,550 |
| Puerto Rico Electric Power | | | | | |
| Authority, Power Revenue | 5.50 | 7/1/38 | 10,445,000 | | 10,919,412 |
| Puerto Rico Electric Power | | | | | |
| Authority, Power Revenue | | | | | |
| (Insured; National Public | | | | | |
| Finance Guarantee Corp.) | 5.25 | 7/1/30 | 5,000,000 | | 5,391,800 |
| Puerto Rico Infrastructure | | | | | |
| Financing Authority, Special | | | | | |
| Tax Revenue (Insured; AMBAC) | 5.50 | 7/1/27 | 4,715,000 | | 5,184,755 |
| Puerto Rico Public Buildings | | | | | |
| Authority, Government | | | | | |
| Facilities Revenue | 6.25 | 7/1/22 | 2,000,000 | | 2,308,440 |
| Puerto Rico Sales Tax Financing | | | | | |
| Corporation, Sales Tax Revenue | | | | | |
| (First Subordinate Series) | 5.75 | 8/1/37 | 2,990,000 | | 3,287,834 |
| Puerto Rico Sales Tax Financing | | | | | |
| Corporation, Sales Tax Revenue | | | | | |
| (First Subordinate Series) | 6.00 | 8/1/39 | 2,230,000 | | 2,510,110 |
| Puerto Rico Sales Tax Financing | | | | | |
| Corporation, Sales Tax Revenue | | | | | |
| (First Subordinate Series) | 6.00 | 8/1/42 | 9,000,000 | | 10,062,900 |
| Puerto Rico Sales Tax Financing | | | | | |
| Corporation, Sales Tax Revenue | | | | | |
| (Insured; Berkshire Hathaway | | | | | |
| Assurance Corporation) | 0.00 | 8/1/54 | 21,100,000 | a | 2,340,834 |
| Puerto Rico Sales Tax Financing | | | | | |
| Corporation, Sales Tax Revenue | | | | | |
| (Insured; National Public | | | | | |
| Finance Guarantee Corp.) | 0.00 | 8/1/43 | 18,000,000 | a | 3,067,020 |
18
| | | | | |
| Long-Term Municipal | Coupon | Maturity | Principal | | |
| Investments (continued) | Rate (%) | Date | Amount ($) | | Value ($) |
| U.S. Related (continued) | | | | | |
| Virgin Islands Public Finance | | | | | |
| Authority, Revenue (Virgin | | | | | |
| Islands Gross Receipts Taxes | | | | | |
| Loan Note) | 6.38 | 10/1/19 | 1,825,000 | | 1,831,132 |
| Virgin Islands Public Finance | | | | | |
| Authority, Revenue (Virgin Islands | | | | | |
| Matching Fund Loan Note) | 5.00 | 10/1/25 | 5,000,000 | | 5,441,800 |
| Virgin Islands Public Finance | | | | | |
| Authority, Revenue (Virgin Islands | | | | | |
| Matching Fund Loan Notes) | 5.00 | 10/1/25 | 2,000,000 | | 2,158,060 |
| Total Long-Term Municipal Investments | | | | |
| (cost $547,430,156) | | | | | 596,795,168 |
| |
| Short-Term Municipal | | | | | |
| Investment—.8% | | | | | |
| New Jersey; | | | | | |
| New Jersey Health Care Facilities | | | | | |
| Financing Authority, Revenue | | | | | |
| (Virtua Health Issue) (LOC; | | | | | |
| JPMorgan Chase Bank) | | | | | |
| (cost $4,600,000) | 0.17 | 7/1/12 | 4,600,000 | c | 4,600,000 |
| |
| Total Investments (cost $552,030,156) | | | 98.5 | % | 601,395,168 |
| Cash and Receivables (Net) | | | 1.5 | % | 8,975,364 |
| Net Assets | | | 100.0 | % | 610,370,532 |
|
| a Security issued with a zero coupon. Income is recognized through the accretion of discount. |
| b These securities are prerefunded; the date shown represents the prerefunded date. Bonds which are prerefunded are |
| collateralized by U.S. Government securities which are held in escrow and are used to pay principal and interest on |
| the municipal issue and to retire the bonds in full at the earliest refunding date. |
| c Variable rate demand note—rate shown is the interest rate in effect at June 30, 2012. Maturity date represents the |
| next demand date, or the ultimate maturity date if earlier. |
STATEMENT OF INVESTMENTS (Unaudited) (continued)
| | | |
| Summary of Abbreviations | | |
| |
| ABAG | Association of Bay Area | ACA | American Capital Access |
| | Governments | | |
| AGC | ACE Guaranty Corporation | AGIC | Asset Guaranty Insurance Company |
| AMBAC | American Municipal Bond | ARRN | Adjustable Rate |
| | Assurance Corporation | | Receipt Notes |
| BAN | Bond Anticipation Notes | BPA | Bond Purchase Agreement |
| CIFG | CDC Ixis Financial Guaranty | COP | Certificate of Participation |
| CP | Commercial Paper | DRIVERS | Derivative Inverse |
| | | | Tax-Exempt Receipts |
| EDR | Economic Development | EIR | Environmental Improvement |
| | Revenue | | Revenue |
| FGIC | Financial Guaranty | FHA | Federal Housing |
| | Insurance Company | | Administration |
| FHLB | Federal Home | FHLMC | Federal Home Loan Mortgage |
| | Loan Bank | | Corporation |
| FNMA | Federal National | GAN | Grant Anticipation Notes |
| | Mortgage Association | | |
| GIC | Guaranteed Investment | GNMA | Government National Mortgage |
| | Contract | | Association |
| GO | General Obligation | HR | Hospital Revenue |
| IDB | Industrial Development Board | IDC | Industrial Development Corporation |
| IDR | Industrial Development | LIFERS | Long Inverse Floating |
| | Revenue | | Exempt Receipts |
| LOC | Letter of Credit | LOR | Limited Obligation Revenue |
| LR | Lease Revenue | MERLOTS | Municipal Exempt Receipt |
| | | | Liquidity Option Tender |
| MFHR | Multi-Family Housing Revenue | MFMR | Multi-Family Mortgage Revenue |
| PCR | Pollution Control Revenue | PILOT | Payment in Lieu of Taxes |
| P-FLOATS | Puttable Floating Option | PUTTERS | Puttable Tax-Exempt Receipts |
| | Tax-Exempt Receipts | | |
| RAC | Revenue Anticipation Certificates | RAN | Revenue Anticipation Notes |
| RAW | Revenue Anticipation Warrants | ROCS | Reset Options Certificates |
| RRR | Resources Recovery Revenue | SAAN | State Aid Anticipation Notes |
| SBPA | Standby Bond Purchase Agreement | SFHR | Single Family Housing Revenue |
| SFMR | Single Family Mortgage Revenue | SONYMA | State of New York Mortgage Agency |
| SPEARS | Short Puttable Exempt | SWDR | Solid Waste Disposal Revenue |
| | Adjustable Receipts | | |
| TAN | Tax Anticipation Notes | TAW | Tax Anticipation Warrants |
| TRAN | Tax and Revenue Anticipation Notes | XLCA | XL Capital Assurance |
20
| | | | | |
| Summary of Combined Ratings (Unaudited) | |
| |
| Fitch | or | Moody’s | or | Standard & Poor’s | Value (%)† |
| AAA | | Aaa | | AAA | 8.7 |
| AA | | Aa | | AA | 27.3 |
| A | | A | | A | 42.0 |
| BBB | | Baa | | BBB | 17.8 |
| BB | | Ba | | BB | .2 |
| B | | B | | B | 1.7 |
| F1 | | MIG1/P1 | | SP1/A1 | .7 |
| Not Ratedd | | Not Ratedd | | Not Ratedd | 1.6 |
| | | | | | 100.0 |
| |
| † | Based on total investments. |
| d | Securities which, while not rated by Fitch, Moody’s and Standard & Poor’s, have been determined by the Manager to |
| | be of comparable quality to those rated securities in which the fund may invest. |
| See notes to financial statements. |
|
| STATEMENT OF ASSETS AND LIABILITIES |
| June 30, 2012 (Unaudited) |
| | | | | |
| | | | Cost | Value |
| Assets ($): | | | | |
| Investments in securities—See Statement of Investments | | 552,030,156 | 601,395,168 |
| Cash | | | | 460,838 |
| Interest receivable | | | | 8,728,103 |
| Unrealized appreciation on swap contracts—Note 4 | | | 170,685 |
| Receivable for shares of Common Stock subscribed | | | 127,500 |
| Prepaid expenses | | | | 34,097 |
| | | | | 610,916,391 |
| Liabilities ($): | | | | |
| Due to The Dreyfus Corporation and affiliates—Note 3(c) | | | 423,690 |
| Payable for shares of Common Stock redeemed | | | 18,936 |
| Accrued expenses | | | | 103,233 |
| | | | | 545,859 |
| Net Assets ($) | | | | 610,370,532 |
| Composition of Net Assets ($): | | | | |
| Paid-in capital | | | | 570,116,880 |
| Accumulated undistributed investment income—net | | | 174,395 |
| Accumulated net realized gain (loss) on investments | | | (9,456,440) |
| Accumulated net unrealized appreciation (depreciation) | | | |
| on investments and swap transactions | | | 49,535,697 |
| Net Assets ($) | | | | 610,370,532 |
| |
| |
| Net Asset Value Per Share | | | | |
| | Class A | Class C | Class I | Class Z |
| Net Assets ($) | 456,511,409 | 9,736,798 | 3,953,047 | 140,169,278 |
| Shares Outstanding | 34,362,399 | 733,594 | 297,499 | 10,548,837 |
| Net Asset Value Per Share ($) | 13.29 | 13.27 | 13.29 | 13.29 |
| |
| See notes to financial statements. | | | | |
22
|
| STATEMENT OF OPERATIONS |
| Six Months Ended June 30, 2012 (Unaudited) |
| | |
| Investment Income ($): | |
| Interest Income | 13,953,493 |
| Expenses: | |
| Management fee—Note 3(a) | 1,808,166 |
| Shareholder servicing costs—Note 3(c) | 764,770 |
| Directors’ fees and expenses—Note 3(d) | 47,461 |
| Professional fees | 44,656 |
| Distribution fees—Note 3(b) | 35,236 |
| Registration fees | 31,004 |
| Custodian fees—Note 3(c) | 25,794 |
| Prospectus and shareholders’ reports | 21,707 |
| Loan commitment fees—Note 2 | 2,058 |
| Miscellaneous | 33,925 |
| Total Expenses | 2,814,777 |
| Less—reduction in expenses due to undertaking—Note 3(a) | (264,256) |
| Less—reduction in fees due to earnings credits—Note 3(c) | (320) |
| Net Expenses | 2,550,201 |
| Investment Income—Net | 11,403,292 |
| Realized and Unrealized Gain (Loss) on Investments—Note 4 ($): | |
| Net realized gain (loss) on investments | 1,471,328 |
| Net unrealized appreciation (depreciation) on investments | 10,616,556 |
| Net unrealized appreciation (depreciation) on swap transactions | 170,685 |
| Net Unrealized Appreciation (Depreciation) | 10,787,241 |
| Net Realized and Unrealized Gain (Loss) on Investments | 12,258,569 |
| Net Increase in Net Assets Resulting from Operations | 23,661,861 |
| |
| See notes to financial statements. | |
STATEMENT OF CHANGES IN NET ASSETS
| | | | |
| | Six Months Ended | |
| | June 30, 2012 | Year Ended |
| | (Unaudited)a | December 31, 2011 |
| Operations ($): | | |
| Investment income—net | 11,403,292 | 24,238,697 |
| Net realized gain (loss) on investments | 1,471,328 | (2,528,365) |
| Net unrealized appreciation | | |
| (depreciation) on investments | 10,787,241 | 36,597,601 |
| Net Increase (Decrease) in Net Assets | | |
| Resulting from Operations | 23,661,861 | 58,307,933 |
| Dividends to Shareholders from ($): | | |
| Investment income—net: | | |
| Class A Shares | (8,397,165) | (17,916,454) |
| Class B Shares | (412) | (11,078) |
| Class C Shares | (139,256) | (291,501) |
| Class I Shares | (55,453) | (100,906) |
| Class Z Shares | (2,636,611) | (5,633,078) |
| Total Dividends | (11,228,897) | (23,953,017) |
| Capital Stock Transactions ($): | | |
| Net proceeds from shares sold: | | |
| Class A Shares | 16,202,500 | 28,763,272 |
| Class B Shares | 138 | 2,102 |
| Class C Shares | 1,355,146 | 1,591,464 |
| Class I Shares | 2,557,927 | 834,997 |
| Class Z Shares | 3,307,907 | 4,012,360 |
| Dividends reinvested: | | |
| Class A Shares | 6,264,579 | 13,306,484 |
| Class B Shares | 262 | 7,868 |
| Class C Shares | 71,850 | 150,423 |
| Class I Shares | 36,098 | 63,443 |
| Class Z Shares | 2,140,621 | 4,545,138 |
| Cost of shares redeemed: | | |
| Class A Shares | (19,141,450) | (59,475,244) |
| Class B Shares | (217,906) | (298,762) |
| Class C Shares | (919,764) | (2,287,276) |
| Class I Shares | (1,285,503) | (710,540) |
| Class Z Shares | (5,705,400) | (14,941,227) |
| Increase (Decrease) in Net Assets | | |
| from Capital Stock Transactions | 4,667,005 | (24,435,498) |
| Total Increase (Decrease) in Net Assets | 17,099,969 | 9,919,418 |
| Net Assets ($): | | |
| Beginning of Period | 593,270,563 | 583,351,145 |
| End of Period | 610,370,532 | 593,270,563 |
| Undistributed investment income—net | 174,395 | — |
24
| | | | |
| | Six Months Ended | |
| | June 30, 2012 | Year Ended |
| | (Unaudited)a | December 31, 2011 |
| Capital Share Transactions: | | |
| Class Ab | | |
| Shares sold | 1,223,857 | 2,296,610 |
| Shares issued for dividends reinvested | 471,771 | 1,064,904 |
| Shares redeemed | (1,445,417) | (4,801,204) |
| Net Increase (Decrease) in Shares Outstanding | 250,211 | (1,439,690) |
| Class Bb | | |
| Shares sold | 10 | 169 |
| Shares issued for dividends reinvested | 20 | 633 |
| Shares redeemed | (16,545) | (24,189) |
| Net Increase (Decrease) in Shares Outstanding | (16,515) | (23,387) |
| Class C | | |
| Shares sold | 102,331 | 127,862 |
| Shares issued for dividends reinvested | 5,416 | 12,066 |
| Shares redeemed | (69,155) | (186,803) |
| Net Increase (Decrease) in Shares Outstanding | 38,592 | (46,875) |
| Class I | | |
| Shares sold | 193,085 | 67,258 |
| Shares issued for dividends reinvested | 2,718 | 5,065 |
| Shares redeemed | (97,008) | (57,453) |
| Net Increase (Decrease) in Shares Outstanding | 98,795 | 14,870 |
| Class Z | | |
| Shares sold | 249,546 | 320,272 |
| Shares issued for dividends reinvested | 161,203 | 363,730 |
| Shares redeemed | (430,798) | (1,212,600) |
| Net Increase (Decrease) in Shares Outstanding | (20,049) | (528,598) |
| |
| a | Effective as of the close of business on March 13, 2012, the fund no longer offers Class B shares. |
| b | During the period ended June 30, 2012, 1,079 Class B shares representing $14,086 were automatically converted |
| | to 1,078 Class A shares and during the period ended December 31, 2011, 7,796 Class B shares representing |
| | $97,746 were automatically converted to 7,788 Class A shares. |
| See notes to financial statements. |
FINANCIAL HIGHLIGHTS
The following tables describe the performance for each share class for the fiscal periods indicated.All information (except portfolio turnover rate) reflects financial results for a single fund share.Total return shows how much your investment in the fund would have increased (or decreased) during each period, assuming you had reinvested all dividends and distributions.These figures have been derived from the fund’s financial statements.
| | | | | | | | | | | | |
| Six Months Ended | | | | | |
| June 30, 2012 | | Year Ended December 31, | |
| Class A Shares | (Unaudited) | 2011 | 2010 | 2009 | 2008 | 2007 |
| Per Share Data ($): | | | | | | |
| Net asset value, | | | | | | |
| beginning of period | 13.01 | 12.25 | 12.70 | 11.67 | 12.79 | 13.07 |
| Investment Operations: | | | | | | |
| Investment income—neta | .25 | .53 | .54 | .55 | .55 | .54 |
| Net realized and unrealized | | | | | | |
| gain (loss) on investments | .28 | .75 | (.46) | 1.02 | (1.12) | (.28) |
| Total from Investment Operations | .53 | 1.28 | .08 | 1.57 | (.57) | .26 |
| Distributions: | | | | | | |
| Dividends from | | | | | | |
| investment income—net | (.25) | (.52) | (.53) | (.54) | (.55) | (.54) |
| Net asset value, end of period | 13.29 | 13.01 | 12.25 | 12.70 | 11.67 | 12.79 |
| Total Return (%)b | 3.97c | 10.72 | .56 | 13.65 | (4.61) | 2.05 |
| Ratios/Supplemental Data (%): | | | | | | |
| Ratio of total expenses | | | | | | |
| to average net assets | .96d | .96 | .95 | .96 | 1.00 | 1.10 |
| Ratio of net expenses | | | | | | |
| to average net assets | .85d | .85 | .85 | .85 | .90 | 1.00 |
| Ratio of interest and expense | | | | | | |
| related to floating rate notes | | | | | | |
| issued to average net assets | — | — | — | — | .05 | .13 |
| Ratio of net investment income | | | | | | |
| to average net assets | 3.78d | 4.23 | 4.22 | 4.40 | 4.45 | 4.21 |
| Portfolio Turnover Rate | 6.80c | 9.58 | 18.88 | 17.17 | 50.33 | 36.63 |
| Net Assets, end of period | | | | | | |
| ($ x 1,000) | 456,511 | 443,882 | 435,549 | 458,014 | 403,333 | 439,752 |
| |
| a | Based on average shares outstanding at each month end. |
| b | Exclusive of sales charge. |
| c | Not annualized. |
| d | Annualized. |
| See notes to financial statements. |
26
| | | | | | | | | | | | |
| Six Months Ended | | | | | |
| June 30, 2012 | | Year Ended December 31, | |
| Class C Shares | (Unaudited) | 2011 | 2010 | 2009 | 2008 | 2007 |
| Per Share Data ($): | | | | | | |
| Net asset value, | | | | | | |
| beginning of period | 13.00 | 12.24 | 12.68 | 11.66 | 12.78 | 13.06 |
| Investment Operations: | | | | | | |
| Investment income—neta | .20 | .43 | .45 | .45 | .45 | .45 |
| Net realized and unrealized | | | | | | |
| gain (loss) on investments | .27 | .76 | (.45) | 1.02 | (1.12) | (.29) |
| Total from Investment Operations | .47 | 1.19 | — | 1.47 | (.67) | .16 |
| Distributions: | | | | | | |
| Dividends from | | | | | | |
| investment income—net | (.20) | (.43) | (.44) | (.45) | (.45) | (.44) |
| Net asset value, end of period | 13.27 | 13.00 | 12.24 | 12.68 | 11.66 | 12.78 |
| Total Return (%)b | 3.59c | 9.90 | (.13) | 12.71 | (5.34) | 1.28 |
| Ratios/Supplemental Data (%): | | | | | | |
| Ratio of total expenses | | | | | | |
| to average net assets | 1.74d | 1.73 | 1.72 | 1.72 | 1.77 | 1.87 |
| Ratio of net expenses | | | | | | |
| to average net assets | 1.60d | 1.60 | 1.60 | 1.60 | 1.64 | 1.75 |
| Ratio of interest and expense | | | | | | |
| related to floating rate notes | | | | | | |
| issued to average net assets | — | — | — | — | .05 | .13 |
| Ratio of net investment income | | | | | | |
| to average net assets | 3.02d | 3.48 | 3.45 | 3.61 | 3.69 | 3.44 |
| Portfolio Turnover Rate | 6.80c | 9.58 | 18.88 | 17.17 | 50.33 | 38.63 |
| Net Assets, end of period | | | | | | |
| ($ x 1,000) | 9,737 | 9,035 | 9,080 | 9,008 | 4,714 | 3,749 |
| |
| a | Based on average shares outstanding at each month end. |
| b | Exclusive of sales charge. |
| c | Not annualized. |
| d | Annualized. |
| See notes to financial statements. |
FINANCIAL HIGHLIGHTS (continued)
| | | | | | | | | | |
| Six Months Ended |
| | June 30, 2012 | Year Ended December 31, | |
| Class I Shares | (Unaudited) | 2011 | 2010 | 2009 | 2008a |
| Per Share Data ($): | | | | | |
| Net asset value, beginning of period | 13.02 | 12.25 | 12.70 | 11.66 | 11.28 |
| Investment Operations: | | | | | |
| Investment income—netb | .24 | .54 | .57 | .56 | .03 |
| Net realized and unrealized | | | | | |
| gain (loss) on investments | .28 | .77 | (.47) | 1.04 | .38 |
| Total from Investment Operations | .52 | 1.31 | .10 | 1.60 | .41 |
| Distributions: | | | | | |
| Dividends from investment income—net | (.25) | (.54) | (.55) | (.56) | (.03) |
| Net asset value, end of period | 13.29 | 13.02 | 12.25 | 12.70 | 11.66 |
| Total Return (%) | 4.04c | 10.97 | .70 | 13.91 | 3.61c |
| Ratios/Supplemental Data (%): | | | | | |
| Ratio of total expenses to average net assets | .75d | .76 | .72 | .78 | .76d |
| Ratio of net expenses to average net assets | .70d | .70 | .70 | .70 | .70d |
| Ratio of net investment income | | | | | |
| to average net assets | 3.91d | 4.36 | 4.34 | 4.55 | 5.03d |
| Portfolio Turnover Rate | 6.80c | 9.58 | 18.88 | 17.17 | 50.33 |
| Net Assets, end of period ($ x 1,000) | 3,953 | 2,586 | 2,252 | 958 | 10 |
| |
| a | From December 15, 2008 (commencement of initial offering) to December 31, 2008. |
| b | Based on average shares outstanding at each month end. |
| c | Not annualized. |
| d | Annualized. |
| See notes to financial statements. |
28
| | | | | | | | | | | | |
| Six Months Ended | | | | | |
| June 30, 2012 | | Year Ended December 31, | |
| Class Z Shares | (Unaudited) | 2011 | 2010 | 2009 | 2008 | 2007a |
| Per Share Data ($): | | | | | | |
| Net asset value, | | | | | | |
| beginning of period | 13.01 | 12.25 | 12.70 | 11.67 | 12.79 | 12.84 |
| Investment Operations: | | | | | | |
| Investment income—netb | .25 | .54 | .55 | .56 | .56 | .31 |
| Net realized and unrealized | | | | | | |
| gain (loss) on investments | .28 | .75 | (.46) | 1.02 | (1.12) | (.05) |
| Total from Investment Operations | .53 | 1.29 | .09 | 1.58 | (.56) | .26 |
| Distributions: | | | | | | |
| Dividends from | | | | | | |
| investment income—net | (.25) | (.53) | (.54) | (.55) | (.56) | (.31) |
| Net asset value, end of period | 13.29 | 13.01 | 12.25 | 12.70 | 11.67 | 12.79 |
| Total Return (%) | 4.09c | 10.80 | .65 | 13.72 | (4.56) | 2.03c |
| Ratios/Supplemental Data (%): | | | | | | |
| Ratio of total expenses | | | | | | |
| to average net assets | .78d | .78 | .77 | .79 | .85 | .91d |
| Ratio of net expenses | | | | | | |
| to average net assets | .78d | .78 | .77 | .78 | .85 | .91d |
| Ratio of interest and expense | | | | | | |
| related to floating rate notes | | | | | | |
| issued to average net assets | — | — | — | — | .05 | .13d |
| Ratio of net investment income | | | | | | |
| to average net assets | 3.85d | 4.30 | 4.31 | 4.47 | 4.50 | 4.26d |
| Portfolio Turnover Rate | 6.80c | 9.58 | 18.88 | 17.17 | 50.33 | 36.63 |
| Net Assets, end of period | | | | | | |
| ($ x 1,000) | 140,169 | 137,552 | 135,981 | 148,768 | 140,950 | 163,869 |
| |
| a | From June 7, 2007 (commencement of initial offering) to December 31, 2007. |
| b | Based on average shares outstanding at each month end. |
| c | Not annualized. |
| d | Annualized. |
| See notes to financial statements. |
NOTES TO FINANCIAL STATEMENTS (Unaudited)
NOTE 1—Significant Accounting Policies:
Dreyfus New Jersey Municipal Bond Fund, Inc. (the “fund”) is registered under the Investment Company Act of 1940, as amended (the “Act”), as a non-diversified open-end management investment company. The fund’s investment objective is to seek as high a level of current income exempt from federal and New Jersey income taxes as is consistent with the preservation of capital. The Dreyfus Corporation (the “Manager” or “Dreyfus”), a wholly-owned subsidiary of The Bank of New York Mellon Corporation (“BNY Mellon”), serves as the fund’s investment adviser.
MBSC Securities Corporation (the “Distributor”), a wholly-owned subsidiary of the Manager, is the distributor of the fund’s shares. The fund is authorized to issue 675 million shares of $.001 par value Common Stock.The fund currently offers four classes of shares: Class A (350 million shares authorized), Class C (150 million shares authorized), Class I (150 million shares authorized) and Class Z (25 million shares authorized). Class A shares are subject to a sales charge imposed at the time of purchase. Class C shares are subject to a contingent deferred sales charge (“CDSC”) imposed on Class C shares redeemed within one year of purchase. Class I shares are sold at net asset value per share only to institutional investors. Class Z shares generally are not available for new accounts. The fund’s Board of Directors approved effective as of the close of business on March 13, 2012, the transfer of shares authorized from Class B to Class A shares. Class B shares were subject to a CDSC imposed on Class B share redemptions made within six years of purchase and automatically converted to Class A shares after six years.The fund no longer offers Class B shares. Effective March 13, 2012, all outstanding Class B shares were automatically converted to Class A shares. Other differences between the classes include the services offered to and the expenses borne by each class, the allocation of certain transfer agency costs and certain voting rights. Income, expenses
30
(other than expenses attributable to a specific class), and realized and unrealized gains or losses on investments are allocated to each class of shares based on its relative net assets.
The Financial Accounting Standards Board (“FASB”) Accounting Standards Codification is the exclusive reference of authoritative U.S. generally accepted accounting principles (“GAAP”) recognized by the FASB to be applied by nongovernmental entities. Rules and interpretive releases of the Securities and Exchange Commission (“SEC”) under authority of federal laws are also sources of authoritative GAAP for SEC registrants. The fund’s financial statements are prepared in accordance with GAAP, which may require the use of management estimates and assumptions.Actual results could differ from those estimates.
The fund enters into contracts that contain a variety of indemnifications. The fund’s maximum exposure under these arrangements is unknown.The fund does not anticipate recognizing any loss related to these arrangements.
(a) Portfolio valuation: The fair value of a financial instrument is the amount that would be received to sell an asset or paid to transfer a liability in an orderly transaction between market participants at the measurement date (i.e., the exit price). GAAP establishes a fair value hierarchy that prioritizes the inputs of valuation techniques used to measure fair value.This hierarchy gives the highest priority to unadjusted quoted prices in active markets for identical assets or liabilities (Level 1 measurements) and the lowest priority to unobservable inputs (Level 3 measurements).
Additionally, GAAP provides guidance on determining whether the volume and activity in a market has decreased significantly and whether such a decrease in activity results in transactions that are not orderly. GAAP requires enhanced disclosures around valuation inputs and techniques used during annual and interim periods.
NOTES TO FINANCIAL STATEMENTS (Unaudited) (continued)
Various inputs are used in determining the value of the fund’s investments relating to fair value measurements.These inputs are summarized in the three broad levels listed below:
Level 1—unadjusted quoted prices in active markets for identical investments.
Level 2—other significant observable inputs (including quoted prices for similar investments, interest rates, prepayment speeds, credit risk, etc.).
Level 3—significant unobservable inputs (including the fund’s own assumptions in determining the fair value of investments).
The inputs or methodology used for valuing securities are not necessarily an indication of the risk associated with investing in those securities.
Changes in valuation techniques may result in transfers in or out of an assigned level within the disclosure hierarchy. Valuation techniques used to value the fund’s investments are as follows:
Investments in securities are valued each business day by an independent pricing service (the “Service”) approved by the fund’s Board of Directors. Investments for which quoted bid prices are readily available and are representative of the bid side of the market in the judgment of the Service are valued at the mean between the quoted bid prices (as obtained by the Service from dealers in such securities) and asked prices (as calculated by the Service based upon its evaluation of the market for such securities). Other investments (which constitute a majority of the portfolio securities) are carried at fair value as determined by the Service, based on methods which include consideration of the following: yields or prices of municipal securities of comparable quality, coupon, maturity and type; indications as to values from dealers; and general market conditions.All of the preceding securities are categorized within Level 2 of the fair value hierarchy.
The Service’s procedures are reviewed by Dreyfus under the general supervision of the fund’s Board of Directors.
When market quotations or official closing prices are not readily available, or are determined not to reflect accurately fair value, such as
32
when the value of a security has been significantly affected by events after the close of the exchange or market on which the security is principally traded, but before the fund calculates its net asset value, the fund may value these investments at fair value as determined in accordance with the procedures approved by the fund’s Board of Directors. Certain factors may be considered when fair valuing investments such as: fundamental analytical data, the nature and duration of restrictions on disposition, an evaluation of the forces that influence the market in which the securities are purchased and sold, and public trading in similar securities of the issuer or comparable issuers. These securities are either categorized as Level 2 or 3 depending on the relevant inputs used.
For restricted securities where observable inputs are limited, assumptions about market activity and risk are used and are categorized within Level 3 of the fair value hierarchy.
Swaps are valued by the Service by using a swap pricing model which incorporates among other factors, default probabilities, recovery rates, credit curves of the underlying issuer and swap spreads on interest rates.These securities are generally categorized within Level 2 of the fair value hierarchy.
The following is a summary of the inputs used as of June 30, 2012 in valuing the fund’s investments:
| | | | |
| | | Level 2—Other | Level 3— | |
| | Level 1— | Significant | Significant | |
| | Unadjusted | Observable | Unobservable | |
| | Quoted Prices | Inputs | Inputs | Total |
| Assets ($) | | | | |
| Investments in Securities: | | | |
| Municipal Bonds | — | 601,395,168 | — | 601,395,168 |
| Other Financial | | | | |
| Instruments: | | | | |
| Swaps† | — | 170,685 | — | 170,685 |
| † Amount shown represents unrealized appreciation at period end. | |
NOTES TO FINANCIAL STATEMENTS (Unaudited) (continued)
For the period ended June 30, 2012, there were no transfers of municipal bonds or swaps between Level 1 and Level 2 of the fair value hierarchy.
(b) Securities transactions and investment income: Securities transactions are recorded on a trade date basis. Realized gains and losses from securities transactions are recorded on the identified cost basis. Interest income, adjusted for accretion of discount and amortization of premium on investments, is earned from settlement date and recognized on the accrual basis. Securities purchased or sold on a when issued or delayed delivery basis may be settled a month or more after the trade date.
The fund follows an investment policy of investing primarily in municipal obligations of one state. Economic changes affecting the state and certain of its public bodies or municipalities may affect the ability of issuers within the state to pay interest on, or repay principal of, municipal obligations held by the fund.
(c) Dividends to shareholders: It is the policy of the fund to declare dividends from investment income-net on each business day. Such dividends are paid monthly. Dividends from net realized capital gains, if any, are normally declared and paid annually, but the fund may make distributions on a more frequent basis to comply with the distribution requirements of the Internal Revenue Code of 1986, as amended (the “Code”).To the extent that net realized capital gains can be offset by capital loss carryovers, it is the policy of the fund not to distribute such gains. Income and capital gain distributions are determined in accordance with income tax regulations, which may differ from GAAP.
(d) Federal income taxes: It is the policy of the fund to continue to qualify as a regulated investment company, which can distribute tax exempt dividends, by complying with the applicable provisions of the Code, and to make distributions of income and net realized capital gains sufficient to relieve it from substantially all federal income and excise taxes.
34
As of and during the period ended June 30, 2012, the fund did not have any liabilities for any uncertain tax positions.The fund recognizes interest and penalties, if any, related to uncertain tax positions as income tax expense in the Statement of Operations. During the period, the fund did not incur any interest or penalties.
Each of the tax years in the three-year period ended December 31, 2011 remains subject to examination by the Internal Revenue Service and state taxing authorities.
Under the Regulated Investment Company Modernization Act of 2010 (the “2010 Act”), the fund is permitted to carry forward capital losses incurred in taxable years beginning after December 22, 2010 (“post-enactment losses”) for an unlimited period. Furthermore, post-enactment capital loss carryovers retain their character as either short-term or long-term capital losses rather than short-term as they were under previous statute.The 2010 Act requires post-enactment losses to be utilized before the utilization of losses incurred in taxable years prior to the effective date of the 2010 Act (“pre-enactment losses”).As a result of this ordering rule, pre-enactment losses may be more likely to expire unused.
The fund has an unused capital loss carryover of $11,713,579 available for federal income tax purposes to be applied against future net realized capital gains, if any, realized subsequent to December 31, 2011. If not applied, $97,441 of the carryover expires in fiscal year 2014, $822,282 expires in fiscal year 2015, $1,125,950 expires in fiscal year 2016, $6,969,933 expires in fiscal year 2017 and $1,186,692 of post-enactment short-term losses and $1,511,281 of post-enactment long-term losses which can be carried forward for an unlimited period.
The tax character of distributions paid to shareholders during the fiscal year ended December 31, 2011 was as follows: tax exempt income $23,788,452 and ordinary income $164,565.The tax character of current year distributions will be determined at the end of the current year.
NOTES TO FINANCIAL STATEMENTS (Unaudited) (continued)
NOTE 2—Bank Lines of Credit:
The fund participates with other Dreyfus-managed funds in a $225 million unsecured credit facility led by Citibank, N.A. and a $300 million unsecured credit facility provided by The Bank of New York Mellon, a subsidiary of BNY Mellon and an affiliate of Dreyfus (each, a “Facility”), each to be utilized primarily for temporary or emergency purposes, including the financing of redemptions. In connection therewith, the fund has agreed to pay its pro rata portion of commitment fees for each Facility. Interest is charged to the fund based on rates determined pursuant to the terms of the respective Facility at the time of borrowing. During the period ended June 30, 2012, the fund did not borrow under the Facilities.
NOTE 3—Management Fee and Other Transactions With Affiliates:
(a) Pursuant to a management agreement with the Manager, the management fee is computed at the annual rate of .60% of the value of the fund’s average daily net assets and is payable monthly.The Manager has agreed until May 1, 2013, to limit the fund’s Class A and Class C and Class B until February 29, 2012 expenses (exclusive of taxes, brokerage commissions, interest expense, commitment fees on borrowings, shareholder services plan fees, Rule 12b-1 distribution plan fees and extraordinary expenses) to .60% of the value of the fund’s average daily net assets for Class A and Class C shares. The reduction in expenses, pursuant to the undertaking, for Class A and Class C shares amounted to $263,545 during the period ended June 30, 2012.This agreement may be terminated after May 1, 2013, upon 90 days notice to shareholders.
The Manager had undertaken until June 30, 2012, to limit the fund’s operating expenses or assume all or part of the expenses of the fund, if the aggregate expenses of the fund (exclusive of taxes, brokerage commissions, interest expense, commitment fees on borrowings, and extraordinary expenses) exceeded .70% of the value of the fund’s
36
average daily net assets for Class I shares.The reduction in expenses, pursuant to the undertaking for Class I shares, amounted to $711 during the period ended June 30, 2012.
During the period ended June 30, 2012, the Distributor retained $5,908 from commissions earned on sales of the fund’s Class A shares and $170 from CDSCs on redemptions of the fund’s Class C shares.
(b) Under the Distribution Plan (the “Plan”) adopted pursuant to Rule 12b-1 under the Act, Class B shares paid and Class C shares pay the Distributor for distributing their shares at an annual rate of .50% of the value of the average daily net assets of Class B shares and .75% of the value of the average daily net assets of Class C shares. During the period ended June 30, 2012, Class B and Class C shares were charged $57 and $35,179, respectively, pursuant to the Plan.
(c) Under the Shareholder Services Plan, Class A and Class C shares pay and Class B shares paid the Distributor at an annual rate of .25% of the value of their average daily net assets for the provision of certain services.The services provided may include personal services relating to shareholder accounts, such as answering shareholder inquiries regarding the fund and providing reports and other information, and services related to the maintenance of shareholder accounts. The Distributor may make payments to Service Agents (a securities dealers, financial institutions or other industry professionals) in respect of these services. The Distributor determines the amounts to be paid to Service Agents. During the period ended June 30, 2012, Class A, Class B and Class C shares were charged $564,193, $29 and $11,726, respectively, pursuant to the Shareholder Services Plan.
Under the Shareholder Services Plan, Class Z shares reimburse the Distributor an amount not to exceed an annual rate of .25% of the value of Class Z shares’ average daily net assets for certain allocated expenses of providing personal services and/or maintaining share-
NOTES TO FINANCIAL STATEMENTS (Unaudited) (continued)
holder accounts.The services provided may include personal services relating to shareholder accounts, such as answering shareholder inquiries regarding Class Z shares and providing reports and other information, and services related to the maintenance of shareholder accounts. During the period ended June 30, 2012, Class Z shares were charged $40,102 pursuant to the Shareholder Services Plan.
The fund compensates Dreyfus Transfer, Inc. (“DTI”), a wholly-owned subsidiary of the Manager, under a transfer agency agreement for providing personnel and facilities to perform transfer agency services for the fund. Since May 29, 2012, DTI has also provided certain cash management services for the fund. During the period ended June 30, 2012, the fund was charged $76,316 pursuant to the transfer agency agreement, which is included in Shareholder servicing costs in the Statement of Operations.
The fund compensatesThe Bank of NewYork Mellon under a custody agreement for providing custodial services for the fund. During the period ended June 30, 2012, the fund was charged $25,794 pursuant to the custody agreement.
The fund has arrangements with the transfer agent and the custodian whereby the fund may receive earnings credits when positive cash balances are maintained, which are used to offset transfer agency and custody fees. For financial reporting purposes, the fund includes net earnings credits as an expense offset in the Statement of Operations.
Prior to May 29, 2012, the fund compensated The Bank of NewYork Mellon under a cash management agreement for performing cash management services related to fund subscriptions and redemptions. During the period ended June 30, 2012, the fund was charged $6,677 pursuant to the cash management agreements, which is included in Shareholder servicing costs in the Statement of Operations.These fees were partially offset by earnings credits of $320.
During the period ended June 30, 2012, the fund was charged $3,183 for services performed by the Chief Compliance Officer and his staff.
38
The components of “Due to The Dreyfus Corporation and affiliates” in the Statement of Assets and Liabilities consist of: management fees $300,025, Plan fees $5,857, Shareholder Services Plan fees $95,686, custodian fees $12,904, Chief Compliance Officer fees $3,183 and transfer agency per account fees $51,774, which are offset against an expense reimbursement currently in effect in the amount of $45,739.
(d) Each Board member also serves as a Board member of other funds within the Dreyfus complex. Annual retainer fees and attendance fees are allocated to each fund based on net assets.
NOTE 4—Securities Transactions:
The aggregate amount of purchases and sales of investment securities and swap transactions, excluding short-term securities, during the period ended June 30, 2012, amounted to $46,623,474 and $40,403,833, respectively.
Swap Transactions:The fund enters into swap agreements to exchange the interest rate on, or return generated by, one nominal instrument for the return generated by another nominal instrument.The fund enters into these agreements to hedge certain market or interest rate risks, to manage the interest rate sensitivity (sometimes called duration) of fixed income securities, to provide a substitute for purchasing or selling particular securities or to increase potential returns.
The fund accrues for the interim payments on swap contracts on a daily basis, with the net amount recorded within unrealized appreciation (depreciation) on swap contracts in the Statement of Assets and Liabilities. Once the interim payments are settled in cash, the net amount is recorded as a realized gain (loss) on swaps, in addition to realized gain (loss) recorded upon the termination of swap contracts in the Statement of Operations. Upfront payments made and/or received by the fund, are recorded as an asset and/or liability in the Statement of Assets and Liabilities and are recorded as a realized gain or loss ratably over the contract’s term/event with the exception of forward
NOTES TO FINANCIAL STATEMENTS (Unaudited) (continued)
starting interest rate swaps which are recorded as realized gains or losses on the termination date. Fluctuations in the value of swap contracts are recorded for financial statement purposes as unrealized appreciation or depreciation on swap transactions.
Interest Rate Swaps: Interest rate swaps involve the exchange of commitments to pay and receive interest based on a notional principal amount. The fund may elect to pay a fixed rate and receive a floating rate, or receive a fixed rate and pay a floating rate on a notional principal amount.The net interest received or paid on interest rate swap agreements is included within unrealized appreciation (depreciation) on swap contracts in the Statement of Assets and Liabilities. Interest rate swaps are valued daily and the change, if any, is recorded as an unrealized gain or loss in the Statement of Operations.When a swap contract is terminated early, the fund records a realized gain or loss equal to the difference between the current realized value and the expected cash flows.
The fund’s maximum risk of loss from counterparty credit risk is the discounted net value of the cash flows to be received from the coun-terparty over the contract’s remaining life, to the extent that the amount is positive. This risk is mitigated by having a master netting arrangement between the fund and the counterparty and by the posting of collateral by the counterparty to the fund to cover the fund’s exposure to the counterparty.The following summarizes open interest rate swaps entered into by the fund at June 30, 2012:
| | | | | | |
| Notional | Reference | | (Pay)/Receive | | | Unrealized |
| Amount ($) | Entity | Counterparty | Fixed Rate (%) | | Expiration | Appreciation ($) |
| |
| 17,000,000 | USD—6 Month | | | | | |
| | Libor | Barclays | (1.73 | ) | 9/7/2022 | 170,685 |
40
The following summarizes the average notional value of swap contracts outstanding during the period ended June 30, 2012:
| |
| | Average Notional Value ($) |
| Interest rate swap contracts | 2,428,571 |
At June 30, 2012, accumulated net unrealized appreciation on investments was $49,365,012, consisting of $49,429,164 gross unrealized appreciation and $64,152 gross unrealized depreciation.
At June 30, 2012, the cost of investments for federal income tax purposes was substantially the same as the cost for financial reporting purposes (see the Statement of Investments).
|
| INFORMATION ABOUT THE RENEWAL OF THE |
| FUND’S MANAGEMENT AGREEMENT (Unaudited) |
At a meeting of the fund’s Board of Directors held on June 28, 2012, the Board considered the renewal of the fund’s Management Agreement pursuant to which Dreyfus provides the fund with investment advisory and administrative services (the “Agreement”). The Board members, none of whom are “interested persons” (as defined in the Investment Company Act of 1940, as amended) of the fund, were assisted in their review by independent legal counsel and met with counsel in executive session separate from Dreyfus representatives. In considering the renewal of the Agreement, the Board considered all factors that it believed to be relevant, including those discussed below.The Board did not identify any one factor as dispositive, and each Board member may have attributed different weights to the factors considered.
Analysis of Nature, Extent, and Quality of Services Provided to the Fund.The Board considered information previously provided to them in presentations from Dreyfus representatives regarding the nature, extent, and quality of the services provided to funds in the Dreyfus fund complex, and Dreyfus representatives confirmed that there had been no material changes in this information. Dreyfus provided the number of open accounts in the fund, the fund’s asset size and the allocation of fund assets among distribution channels. Dreyfus also had previously provided information regarding the diverse intermediary relationships and distribution channels of funds in the Dreyfus fund complex (such as retail direct or intermediary, in which intermediaries typically are paid by the fund and/or Dreyfus) and Dreyfus’ corresponding need for broad, deep, and diverse resources to be able to provide ongoing shareholder services to each intermediary or distribution channel, as applicable to the fund.
The Board also considered research support available to, and portfolio management capabilities of, the fund’s portfolio management personnel and that Dreyfus also provides oversight of day-to-day fund operations, including fund accounting and administration and assistance in meeting legal and regulatory requirements.The Board also considered Dreyfus’ extensive administrative, accounting, and compliance infrastructures.
42
Comparative Analysis of the Fund’s Performance and Management Fee and Expense Ratio.The Board reviewed reports prepared by Lipper, Inc. (“Lipper”), an independent provider of investment company data, which included information comparing (1) the fund’s performance with the performance of a group of comparable funds (the “Performance Group”) and with a broader group of funds (the “Performance Universe”), all for various periods ended May 31, 2012, and (2) the fund’s actual and contractual management fees and total expenses with those of a group of comparable funds (the “Expense Group”) and with a broader group of funds (the “Expense Universe”), the information for which was derived in part from fund financial statements available to Lipper as of the date of its analysis. Dreyfus previously had furnished the Board with a description of the methodology Lipper used to select the Performance Group and Performance Universe and the Expense Group and Expense Universe.
Dreyfus representatives stated that the usefulness of performance comparisons may be affected by a number of factors, including different investment limitations that may be applicable to the fund and comparison funds.The Board discussed the results of the comparisons and noted that the fund’s total return performance was generally below the Performance Group and Performance Universe medians, ranking in the fourth quartile of the Performance Group for most of the periods. The Board noted, however, the proximity of the fund’s returns to the Performance Group medians.The Board also noted that the fund’s yield performance was at or above the Performance Group and Performance Universe medians for seven and nine of the ten one-year periods, respectively, ended May 31st. Dreyfus also provided a comparison of the fund’s calendar year total returns to the returns of the fund’s Lipper category average and noted that the fund’s return was above the average in six of the ten years.
|
| INFORMATION ABOUT THE RENEWAL OF THE FUND’S |
| MANAGEMENT AGREEMENT (Unaudited) (continued) |
The Board also reviewed the range of actual and contractual management fees and total expenses of the Expense Group and Expense Universe funds and discussed the results of the comparisons.The Board noted that the fund’s contractual management fee was above the Expense Group median, the fund’s actual management fee was below the Expense Group median and above the Expense Universe median and the fund’s total expenses were above the Expense Group and Expense Universe medians.
Dreyfus representatives noted that Dreyfus has agreed to limit the fund’s Class A and Class C expenses, exclusive of taxes, brokerage commissions, extraordinary expenses, interest expenses, commitment fees on borrowings, shareholder servicing fees and Rule 12b-1 fees, but including the management fee, to .60 of the value of the fund’s average daily net assets and that this agreement may be terminated after May 1, 2013, upon 90 days’ notice to shareholders. They also noted that Dreyfus currently is limiting the fund’s operating expenses or assuming all or part of the expenses of the fund so that the direct expenses do not exceed .70%.They noted that this expense limitation is voluntary, not contractual, and may be terminated at any time.
Dreyfus representatives reviewed with the Board the management or investment advisory fees (1) paid by funds advised or administered by Dreyfus that are in the same Lipper category as the fund and (2) paid to Dreyfus or the Dreyfus-affiliated primary employer of the fund’s primary portfolio manager(s) for advising any separate accounts and/or other types of client portfolios that are considered to have similar investment strategies and policies as the fund (the “Similar Clients”), and explained the nature of the Similar Clients. They discussed differences in fees paid and the relationship of the fees paid in light of any differences in the services provided and other relevant factors. The Board considered the relevance of the fee information provided for the Similar Clients to evaluate the appropriateness and reasonableness of the fund’s management fee.
44
Analysis of Profitability and Economies of Scale. Dreyfus representatives reviewed the expenses allocated and profit received by Dreyfus and the resulting profitability percentage for managing the fund, and the method used to determine the expenses and profit. The Board concluded that the profitability results were not unreasonable, given the services rendered and service levels provided by Dreyfus.The Board also noted the expense limitation arrangement and its effect on Dreyfus’ profitability.The Board previously had been provided with information prepared by an independent consulting firm regarding Dreyfus’ approach to allocating costs to, and determining the profitability of, individual funds and the entire Dreyfus fund complex.The consulting firm also had analyzed where any economies of scale might emerge in connection with the management of a fund.
The Board’s counsel stated that the Board should consider the profitability analysis (1) as part of the evaluation of whether the fees under the Agreement bear a reasonable relationship to the mix of services provided by Dreyfus, including the nature, extent and quality of such services, and (2) in light of the relevant circumstances for the fund and the extent to which economies of scale would be realized if the fund grows and whether fee levels reflect these economies of scale for the benefit of fund shareholders. Dreyfus representatives also noted that, as a result of shared and allocated costs among funds in the Dreyfus fund complex, the extent of economies of scale could depend substantially on the level of assets in the complex as a whole, so that increases and decreases in complex-wide assets can affect potential economies of scale in a manner that is disproportionate to, or even in the opposite direction from, changes in the fund’s asset level.The Board also considered potential benefits to Dreyfus from acting as investment adviser and noted that there were no soft dollar arrangements in effect for trading the fund’s investments.
At a special Board meeting held on April 23, 2012, the Board approved consolidating the fund’s Board with the boards of certain other funds in The Dreyfus Family of Funds, effective September 1, 2012, subject
|
| INFORMATION ABOUT THE RENEWAL OF THE FUND’S |
| MANAGEMENT AGREEMENT (Unaudited) (continued) |
to the election of the new Board members by shareholders of the fund (the “Board Consolidation”). It was noted that, to align the renewal dates of the Management Agreements of the funds involved in the Board Consolidation, management recommended changing the fund’s Management Agreement renewal date to March 30th, subject to shareholder election of the new Board members for the fund.
At the conclusion of these discussions, the Board agreed that it had been furnished with sufficient information to make an informed business decision with respect to the renewal of the Agreement. Based on the discussions and considerations as described above, the Board concluded and determined as follows.
The Board concluded that the nature, extent and quality of the services provided by Dreyfus are adequate and appropriate.
The Board generally was satisfied with the fund’s overall performance.
The Board concluded that the fee paid to Dreyfus was reasonable in light of the considerations described above.
The Board determined that the economies of scale which may accrue to Dreyfus and its affiliates in connection with the management of the fund had been adequately considered by Dreyfus in connection with the fee rate charged to the fund pursuant to the Agreement and that, to the extent in the future it were determined that material economies of scale had not been shared with the fund, the Board would seek to have those economies of scale shared with the fund.
In evaluating the Agreement, the Board considered these conclusions and determinations and also relied on its previous knowledge, gained through meetings and other interactions with Dreyfus and its affiliates, of the fund and the services provided to the fund by Dreyfus.The Board also relied on information received on a routine and regular basis
46
throughout the year relating to the operations of the fund and the investment management and other services provided under the Agreement, including information on the investment performance of the fund in comparison to similar mutual funds and benchmark performance indices; general market outlook as applicable to the fund; and compliance reports. In addition, it should be noted that the Board’s consideration of the contractual fee arrangements for this fund had the benefit of a number of years of reviews of prior or similar agreements during which lengthy discussions took place between the Board and Dreyfus representatives. Certain aspects of the arrangements may receive greater scrutiny in some years than in others, and the Board’s conclusions may be based, in part, on their consideration of the same or similar arrangements in prior years.The Board determined that renewal of the Agreement through March 30, 2013, subject to shareholder approval of the Board Consolidation as described above, was in the best interests of the fund and its shareholders.
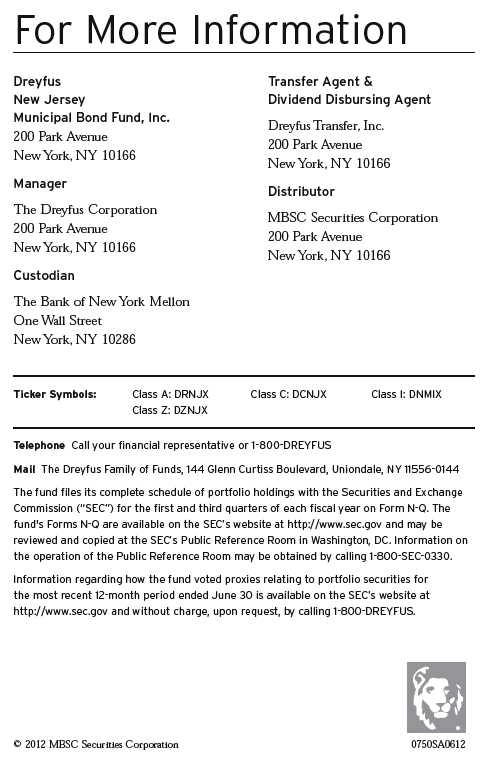
Item 2. Code of Ethics.
Not applicable.
Item 3. Audit Committee Financial Expert.
Not applicable.
Item 4. Principal Accountant Fees and Services.
Not applicable.
Item 5. Audit Committee of Listed Registrants.
Not applicable.
Item 6. Investments.
(a) Not applicable.
Item 7. Disclosure of Proxy Voting Policies and Procedures for Closed-End Management Investment Companies.
Not applicable.
Item 8. Portfolio Managers of Closed-End Management Investment Companies.
Not applicable.
Item 9. Purchases of Equity Securities by Closed-End Management Investment Companies and Affiliated Purchasers.
Not applicable. [CLOSED END FUNDS ONLY]
Item 10. Submission of Matters to a Vote of Security Holders.
There have been no material changes to the procedures applicable to Item 10.
Item 11. Controls and Procedures.
(a) The Registrant's principal executive and principal financial officers have concluded, based on their evaluation of the Registrant's disclosure controls and procedures as of a date within 90 days of the filing date of this report, that the Registrant's disclosure controls and procedures are reasonably designed to ensure that information required to be disclosed by the Registrant on Form N-CSR is recorded, processed, summarized and reported within the required time periods and that information required to be disclosed by the Registrant in the reports that it files or submits on Form N-CSR is accumulated and communicated to the Registrant's management, including its principal executive and principal financial officers, as appropriate to allow timely decisions regarding required disclosure.
(b) There were no changes to the Registrant's internal control over financial reporting that occurred during the second fiscal quarter of the period covered by this report that have materially affected, or are reasonably likely to materially affect, the Registrant's internal control over financial reporting.
Item 12. Exhibits.
(a)(1) Not applicable.
(a)(2) Certifications of principal executive and principal financial officers as required by Rule 30a-2(a) under the Investment Company Act of 1940.
(a)(3) Not applicable.
(b) Certification of principal executive and principal financial officers as required by Rule 30a-2(b) under the Investment Company Act of 1940.
SIGNATURES
Pursuant to the requirements of the Securities Exchange Act of 1934 and the Investment Company Act of 1940, the Registrant has duly caused this Report to be signed on its behalf by the undersigned, thereunto duly authorized.
Dreyfus New Jersey Municipal Bond Fund, Inc.
By: /s/Bradley J. Skapyak |
Bradley J. Skapyak, President |
Date: | August 20, 2012 |
|
Pursuant to the requirements of the Securities Exchange Act of 1934 and the Investment Company Act of 1940, this Report has been signed below by the following persons on behalf of the Registrant and in the capacities and on the dates indicated. |
|
By: /s/Bradley J. Skapyak |
Bradley J. Skapyak, President |
Date: | August 20, 2012 |
|
By: /s/James Windels |
James Windels, Treasurer |
Date: | August 20, 2012 |
|
EXHIBIT INDEX
(a)(2) Certifications of principal executive and principal financial officers as required by Rule 30a-2(a) under the Investment Company Act of 1940. (EX-99.CERT)
(b) Certification of principal executive and principal financial officers as required by Rule 30a-2(b) under the Investment Company Act of 1940. (EX-99.906CERT)