Exhibit 99.1
N E W S R E L E A S E |
Contact: |
| Suzy W. Taylor |
|
| 866-652-1810 |

FirstCity Financial Reports Fourth Quarter and Full Year 2007 Results
Waco, Texas March 17, 2008……….
Highlights:
· FirstCity reported 4th quarter 2007 loss of $1.4 million or ($.12) per diluted share. Earnings for the year 2007 were $2,185,000 or $0.19 per diluted share.
· FirstCity’s total investment level nears $150.0 million for 2007.
· FirstCity liquidity is solid with additional borrowing capacity of $146 million.
Components of the quarterly results are detailed below (dollars in thousands except per share data):
|
| Three Months Ended |
| Year Ended |
| ||||||||
|
| December 31, |
| December 31, |
| ||||||||
|
| 2007 |
| 2006 |
| 2007 |
| 2006 |
| ||||
|
| (unaudited) |
| (unaudited) |
| ||||||||
Portfolio Asset Acquisition and Resolution |
| $ | 569 |
| $ | 3,009 |
| $ | 11,432 |
| $ | 15,104 |
|
Corporate overhead * |
| (1,929 | ) | (1,459 | ) | (9,247 | ) | (5,227 | ) | ||||
Earnings (loss) from continuing operations |
| (1,360 | ) | 1,550 |
| 2,185 |
| 9,877 |
| ||||
Loss from discontinued operations, net of taxes |
| — |
| — |
| — |
| (75 | ) | ||||
Net earnings (loss) to common stockholders |
| $ | (1,360 | ) | $ | 1,550 |
| $ | 2,185 |
| $ | 9,802 |
|
Diluted earnings (loss) per common share |
| $ | (0.12 | ) | $ | 0.13 |
| $ | 0.19 |
| $ | 0.83 |
|
* Corporate overhead includes expenses related to the independent audit committee investigation of $2.2 million in 2007 – comprised of $1.2 million in the first quarter, $0.8 million in the second quarter and $0.2 million in the third quarter. The independent investigation concluded in 2007.
James T. Sartain, President and CEO of FirstCity, said, “While we are disappointed in our 2007 results, FirstCity is well positioned to take advantage of the growing investment opportunities we are seeing in the marketplace. We have liquidity, a well-rounded franchise and talented, seasoned asset managers to create significant value for FirstCity. These are the times we look for, where the growing supply of distressed assets translates into attractive margins. I am enthusiastic about the opportunities I see in 2008.”
Portfolio Asset Acquisition and Resolution
The Company invested $19.4 million in portfolio acquisitions and other investments during the quarter. Earning assets totaled $243.6 million at quarter end.
(more)
Portfolio purchases are detailed below (in millions):
|
| Portfolio Purchases |
| FirstCity |
|
|
| ||||||||||||||||
|
|
|
|
|
| Latin |
|
|
| FirstCity |
| Investment |
|
|
| ||||||||
|
| Domestic |
| Europe |
| America |
| Total |
| Investment |
| in Other |
| Total |
| ||||||||
2007 |
|
|
|
|
|
|
|
|
|
|
|
|
|
|
| ||||||||
4th Quarter |
| $ | 5.3 |
| $ | 14.7 |
| $ | 4.4 |
| $ | 24.4 |
| $ | 15.7 |
| $ | 3.7 |
| $ | 19.4 |
| |
3rd Quarter |
| 17.4 |
| 2.3 |
| — |
| 19.7 |
| 16.3 |
| 6.3 |
| 22.6 |
| ||||||||
2nd Quarter |
| 27.4 |
| 2.4 |
| 61.6 |
| 91.4 |
| 25.2 |
| 4.2 |
| 29.4 |
| ||||||||
1st Quarter |
| 71.6 |
| 3.8 |
| 3.4 |
| 78.8 |
| 69.5 |
| 7.8 |
| 77.3 |
| ||||||||
YTD 2007 |
| $ | 121.7 |
| $ | 23.2 |
| $ | 69.4 |
| $ | 214.3 |
| $ | 126.7 |
| $ | 22.0 |
| $ | 148.7 |
| |
2006 |
|
|
|
|
|
|
|
|
|
|
|
|
|
|
| ||||||||
4th Quarter |
| $ | 34.6 |
| $ | 101.2 |
| $ | 2.1 |
| $ | 137.9 |
| $ | 70.2 |
| $ | 16.8 |
| $ | 87.0 |
| |
3rd Quarter |
| 35.4 |
| — |
| 56.1 |
| 91.5 |
| 31.5 |
| 3.7 |
| 35.2 |
| ||||||||
2nd Quarter |
| 24.2 |
| 1.0 |
| — |
| 25.2 |
| 19.0 |
| 7.0 |
| 26.0 |
| ||||||||
1st Quarter |
| 42.4 |
| — |
| — |
| 42.4 |
| 23.3 |
| 0.7 |
| 24.0 |
| ||||||||
Total Year 2006 |
| $ | 136.6 |
| $ | 102.2 |
| $ | 58.2 |
| $ | 297.0 |
| $ | 144.0 |
| $ | 28.2 |
| $ | 172.2 |
| |
Total Year 2005 |
| $ | 93.4 |
| $ | 37.2 |
| $ | 16.0 |
| $ | 146.6 |
| $ | 71.4 |
| $ | 3.2 |
| $ | 74.6 |
| |
Total Year 2004 |
| $ | 91.2 |
| $ | 9.8 |
| $ | 73.1 |
| $ | 174.1 |
| $ | 59.8 |
| $ | — |
| $ | 59.8 |
| |
For the fourth quarter 2007, operating contribution from the Portfolio Asset Acquisition business was $0.6 million. The earnings were comprised primarily of $10.9 million in revenues, $2.6 million in equity in earnings of investments, and $13.0 million of expenses. The business generated 56% of the revenues (including equity in earnings of investments) from domestic investments, 26% from investments in Latin America, 18% from investments in Europe and less than 1% from investments in Canada.
The revenues for the fourth quarter were positively impacted by continued income streams from Portfolio Assets of $6.3 million, equity in earnings of investments of $2.6 million, servicing fees of $2.4 million, and interest income from loans receivable of $0.9 million.
Fourth quarter earnings were negatively impacted by $3.2 million of net provisions – comprised of $1.1 million of provisions recorded to our wholly-owned domestic portfolios, and $2.1 million recorded to portfolio assets held in our partnerships ($1.6 million of net provisions in domestic partnerships and $0.5 million in Latin American partnerships). For the full year, net provisions were $6.4 million – comprised of $2.1 million recorded to our wholly-owned portfolios and $4.3 million to portfolio assets held in our partnerships. The fourth quarter provisions reflected delays and declines in the expected cash flows of certain loan portfolios and real estate assets. Management regularly evaluates the collectibility of the Company’s portfolio assets and may increase or decrease those values in future periods as the cash flows expected from those assets change.
Considering the recent deterioration of credit quality experienced by many banks, management believes that acquisition opportunities at attractive margins are on the rise. FirstCity’s total investment level approximated $150.0 million in 2007, and the Company is currently evaluating 27 different transactions representing over $1.8 billion in face value of assets, although there can be no assurance that FirstCity will be able to consummate any of these transactions on acceptable terms.
2
The following tables detail the impact of net foreign currency gains (losses) on corporate earnings:
|
| Three Months Ended |
| Year Ended |
| ||||||||
Illustration of the Effects of Currency |
| December 31, |
| December 31, |
| ||||||||
Fluctuations (dollars in thousands) |
| 2007 |
| 2006 |
| 2007 |
| 2006 |
| ||||
|
| (unaudited) |
| (unaudited) |
| ||||||||
Net earnings (loss) to Common Stockholders |
| $ | (1,360 | ) | $ | 1,550 |
| $ | 2,185 |
| $ | 9,802 |
|
Foreign currency gains (losses): |
|
|
|
|
|
|
|
|
| ||||
Euro |
| 97 |
| 287 |
| 882 |
| 1,068 |
| ||||
Mexican Peso |
| 127 |
| (274 | ) | (63 | ) | (585 | ) | ||||
Argentine Peso |
| (14 | ) | 29 |
| (38 | ) | (30 | ) | ||||
Canadian Dollar |
| 4 |
| (106 | ) | 247 |
| (112 | ) | ||||
Chilean Peso |
| 32 |
| — |
| 60 |
| — |
| ||||
|
|
|
|
|
|
|
|
|
| ||||
Exchange rate at valuation date: |
|
|
|
|
|
|
|
|
| ||||
Euro |
| 0.68 |
| 0.76 |
|
|
|
|
| ||||
Mexican Peso |
| 10.87 |
| 10.88 |
|
|
|
|
| ||||
Argentine Peso |
| 3.15 |
| 3.07 |
|
|
|
|
| ||||
Canadian Dollar |
| 0.98 |
| 1.17 |
|
|
|
|
| ||||
Chilean Peso |
| 497.70 |
| 532.6 |
|
|
|
|
| ||||
Other Corporate Matters
Share Repurchase Program
FirstCity initiated a stock repurchase program in 2006 providing for the repurchase of up to 1,000,000 shares of its common stock. Recently, the program was increased by 500,000 shares. To date, the Company has purchased 845,030 shares at an average cost of $9.60 per share (including 40,400 shares repurchased during the fourth quarter of 2007 and 264,530 shares repurchased since
year-end). Share repurchases continue and signify management’s assessment that the shares are undervalued in the market and represent a good investment alternative to enhance long term shareholder value.
Liquidity
FirstCity’s ability to obtain financing for investment opportunities is strong and remains unhindered by the negative conditions witnessed recently in the financial services sector, as evidenced by FirstCity’s ability to secure $125.0 million of total increases in its Bank of Scotland credit facilities during 2007. Management believes that the prospects for continued growth are strong based on existing acquisition opportunities and the stability of the Company’s credit providers and availability under its lines of credit.
3
Conference Call
A conference call will be held on Monday, March 17, 2008 at 9:00 a.m. Central Time to discuss fourth quarter and fiscal year 2007 results. A question and answer session will follow the prepared remarks. Details to access the call and webcast are as follows:
Event: |
| FirstCity Financial Corporation Fourth Quarter 2007 Conference Call | |||
Date: |
| Monday, March 17, 2008 | |||
Time: |
| 9:00 a.m. Central Time | |||
Host: |
| James T. Sartain, FirstCity’s President and Chief Executive Officer | |||
|
|
| |||
|
|
| |||
Web Access: |
| FirstCity’s web page- |
| www.fcfc.com/invest.htm or, | |
|
| CCBN’s Investor websites- |
| www.streetevents.com and, | |
|
|
|
| www.fulldisclosure.com | |
Dial In Access: |
| Domestic |
| 800-329-9097 |
|
| International |
| 617-614-4929 |
|
|
|
|
|
|
| Pass code |
| 63177991 |
|
|
|
|
|
Replay |
| Available on FirstCity’s web page (www.fcfc.com/invest.htm) | ||
Forward Looking Statements
Certain statements in this press release, which are not historical in fact, including, but not limited to, statements relating to future performance, may be deemed to be forward-looking statements under the Private Securities Litigation Reform Act of 1995, Section 27A of the Securities Act of 1933, as amended, and Section 21E of the Securities Exchange Act of 1934, as amended. Forward-looking statements include, without limitation, statements based on management’s expectations and statements regarding revenues, earnings guidance and future projected cash collections, as well as any statement that may project, indicate or imply future results, performance or achievements, and may contain the words “expect,” “intend,” “plan,” “estimate,” “believe,” “will be,” “will continue,” “will likely result,” “indication” and similar expressions. Such statements inherently are subject to a variety of risks and uncertainties that could cause actual results to differ materially from those projected. There are many important factors that could cause the Company’s actual results to differ materially.
These factors include, but are not limited to, the performance of the Company’s subsidiaries and affiliates; availability of portfolio assets and other investment opportunities; the Company’s ability to consummate portfolio acquisitions ad other investment transactions on acceptable terms; assumptions underlying portfolio asset performance; risks associated with start up of new businesses and entry into new foreign markets, risks associated with foreign operations; currency exchange rate fluctuations; interest rate risk; credit risk; risks of declining value of loans, collateral or assets; the degree to which the Company is leveraged; the Company’s continued need for financing; availability of the Company’s credit facilities; ability to obtain additional financing from the Bank of Scotland or any other lender; the impact of certain covenants in loan agreements of the Company and its subsidiaries; the ability of the Company to utilize net operating loss carry forwards; general economic, business and market conditions; foreign social and economic conditions; changes (legislative and otherwise) in the asset securitization industry; regulatory and accounting changes; fluctuation in residential and commercial real estate values; capital markets conditions, including the markets for asset-backed securities; uncertainties of any litigation arising from discontinued operations; factors more fully discussed and identified under Item 7, “Management’s Discussion and Analysis of Financial Condition and Results of Operations;” and risk factors and other risks identified in the Company’s Annual Report on Form 10-K for the year ended December 31, 2007, filed with the SEC on March 17, 2008, as well as in the Company’s other filings with the SEC.
Many of these factors are beyond the Company’s control. In addition, it should be noted that past financial and operational performance of the Company is not necessarily indicative of future financial and operational performance. Given these risks and uncertainties, investors should not place undue reliance on forward-looking statements.
The forward-looking statements in this release speak only as of the date of this release. The Company expressly disclaims any obligation or undertaking to release publicly any updates or revisions to any forward-looking statement to reflect any change in the Company’s expectations with regard thereto or any change in events, conditions or circumstances on which any forward-looking statement is based.
The Company is a diversified financial services company with operations dedicated to portfolio asset acquisition and resolution with offices in the U.S. and with affiliate organizations in Europe and Latin America. Its common stock is listed on the NASDAQ Global Select Market under the symbol “FCFC.”
4
FirstCity Financial Corporation |
Summary of Operations |
(In thousands, except per share data) |
(Unaudited) |
|
| Three Months Ended |
| Year Ended |
| |||||||||
|
| December 31, |
| December 31, |
| |||||||||
|
| 2007 |
| 2006 |
| 2007 |
| 2006 |
| |||||
Revenues: |
|
|
|
|
|
|
|
|
| |||||
Servicing fees |
| $ | 2,382 |
| $ | 2,724 |
| $ | 10,390 |
| $ | 12,906 |
| |
Income from Portfolio Assets |
| 6,291 |
| 3,436 |
| 22,754 |
| 10,987 |
| |||||
Gain on sale of SBA loans held for sale, net |
| 65 |
| — |
| 723 |
| — |
| |||||
Interest income from SBA loans |
| 474 |
| — |
| 2,140 |
| — |
| |||||
Interest income from affiliates |
| 147 |
| 309 |
| 560 |
| 1,498 |
| |||||
Interest income from loans receivable - other |
| 306 |
| 559 |
| 3,822 |
| 576 |
| |||||
Other income |
| 1,367 |
| 574 |
| 3,267 |
| 2,420 |
| |||||
Total revenues |
| 11,032 |
| 7,602 |
| 43,656 |
| 28,387 |
| |||||
Expenses: |
|
|
|
|
|
|
|
|
| |||||
Interest and fees on notes payable - other |
| 4,394 |
| 2,856 |
| 18,060 |
| 8,289 |
| |||||
Interest and fees on notes payable to affiliates |
| — |
| — |
| — |
| 22 |
| |||||
Salaries and benefits |
| 4,629 |
| 3,721 |
| 16,932 |
| 14,831 |
| |||||
Provision (recovery) for loan and impairment losses |
| 1,125 |
| 170 |
| 2,061 |
| 271 |
| |||||
Occupancy, data processing, property protection and other |
| 4,249 |
| 3,043 |
| 14,789 |
| 9,236 |
| |||||
Total expenses |
| 14,397 |
| 9,790 |
| 51,842 |
| 32,649 |
| |||||
Equity in earnings of investments |
| 2,629 |
| 3,712 |
| 10,944 |
| 11,756 |
| |||||
Gain on sale of subsidiaries and equity investments |
| — |
| 54 |
| 207 |
| 2,459 |
| |||||
Earnings (loss) from continuing operations before income taxes and minority interest |
| (736 | ) | 1,578 |
| 2,965 |
| 9,953 |
| |||||
Income taxes |
| (415 | ) | (61 | ) | (781 | ) | (173 | ) | |||||
Minority interest |
| (209 | ) | 33 |
| 1 |
| 97 |
| |||||
Earnings (loss) from continuing operations |
| (1,360 | ) | 1,550 |
| 2,185 |
| 9,877 |
| |||||
Discontinued operations |
|
|
|
|
|
|
|
|
| |||||
Loss from operations of discontinued components |
| — |
| — |
| — |
| (75 | ) | |||||
Income taxes |
| — |
| — |
| — |
| — |
| |||||
Loss from discontinued operations |
| — |
| — |
| — |
| (75 | ) | |||||
Net earnings |
| $ | (1,360 | ) | $ | 1,550 |
| $ | 2,185 |
| $ | 9,802 |
| |
|
|
|
|
|
|
|
|
|
| |||||
Basic earnings per common share are as follows: |
|
|
|
|
|
|
|
|
| |||||
Earnings (loss) from continuing operations |
| $ | (0.14 | ) | $ | 0.14 |
| $ | 0.20 |
| $ | 0.89 |
| |
Discontinued operations |
| $ | — |
| $ | — |
| $ | — |
| $ | (0.01 | ) | |
Net earnings (loss) per common share |
| $ | (0.14 | ) | $ | 0.14 |
| $ | 0.20 |
| $ | 0.88 |
| |
Wtd. avg. common shares outstanding |
| 10,778 |
| 10,787 |
| 10,786 |
| 11,125 |
| |||||
|
|
|
|
|
|
|
|
|
| |||||
Diluted earnings per common share are as follows: |
|
|
|
|
|
|
|
|
| |||||
Earnings (loss) from continuing operations |
| $ | (0.12 | ) | $ | 0.13 |
| $ | 0.19 |
| $ | 0.84 |
| |
Discontinued operations |
| $ | — |
| $ | — |
| $ | — |
| $ | (0.01 | ) | |
Net earnings (loss) per common share |
| $ | (0.12 | ) | $ | 0.13 |
| $ | 0.19 |
| $ | 0.83 |
| |
Wtd. avg. common shares outstanding |
| 11,362 |
| 11,415 |
| 11,392 |
| 11,759 |
| |||||
|
|
|
|
| ||||||||||
Selected Unaudited Balance Sheet Data |
|
|
|
| ||||||||||
|
|
|
|
| ||||||||||
|
| December 31, |
| December 31, |
|
|
|
|
|
| ||||
|
| 2007 |
| 2006 |
|
|
|
|
|
| ||||
Cash |
| $ | 23,546 |
| $ | 18,472 |
|
|
|
|
|
| ||
Earning Assets: |
|
|
|
|
|
|
|
|
|
| ||||
Portfolio Assets, net |
| 122,001 |
| 108,696 |
|
|
|
|
|
| ||||
Loans and interest receivable |
| 26,574 |
| 29,311 |
|
|
|
|
|
| ||||
Equity investments |
| 87,622 |
| 112,357 |
|
|
|
|
|
| ||||
Railroad assets |
| 7,403 |
| — |
|
|
|
|
|
| ||||
Deferred tax asset, net |
| 20,101 |
| 20,101 |
|
|
|
|
|
| ||||
Service fees receivable and other assets |
| 10,872 |
| 8,726 |
|
|
|
|
|
| ||||
Total assets |
| $ | 298,119 |
| $ | 297,663 |
|
|
|
|
|
| ||
|
|
|
|
|
|
|
|
|
|
| ||||
Notes payable - other |
| $ | 177,329 |
| $ | 187,811 |
|
|
|
|
|
| ||
Minority interest and other liabilities |
| 13,967 |
| 5,959 |
|
|
|
|
|
| ||||
Total liabilities |
| 191,296 |
| 193,770 |
|
|
|
|
|
| ||||
Total equity |
| 106,823 |
| 103,893 |
|
|
|
|
|
| ||||
Total liabilities and equity |
| $ | 298,119 |
| $ | 297,663 |
|
|
|
|
|
| ||
5
FirstCity Financial Corporation |
Supplemental Information |
(Dollars in thousands) |
(Unaudited) |
|
| Three Months Ended |
| Year Ended |
| ||||||||
|
| December 31, |
| December 31, |
| ||||||||
|
| 2007 |
| 2006 |
| 2007 |
| 2006 |
| ||||
Portfolio Asset Acquisition and Resolution: |
|
|
|
|
|
|
|
|
| ||||
Summary Operating Statement Data |
|
|
|
|
|
|
|
|
| ||||
Revenues |
| $ | 10,945 |
| $ | 7,470 |
| $ | 43,217 |
| $ | 27,522 |
|
Equity in earnings of investments |
| 2,629 |
| 3,712 |
| 10,944 |
| 11,756 |
| ||||
Gain on sale of subsidiaries and equity investments |
| — |
| 54 |
| 207 |
| 2,459 |
| ||||
Expenses |
| (11,880 | ) | (8,057 | ) | (40,875 | ) | (26,362 | ) | ||||
Operating contribution before provision for loan and impairment losses |
| 1,694 |
| 3,179 |
| 13,493 |
| 15,375 |
| ||||
Provision for loan and impairment losses |
| 1,125 |
| 170 |
| 2,061 |
| 271 |
| ||||
Operating contribution, net of direct taxes |
| $ | 569 |
| $ | 3,009 |
| $ | 11,432 |
| $ | 15,104 |
|
|
|
|
|
|
|
|
|
|
| ||||
Aggregate purchase price of portfolios acquired: |
|
|
|
|
|
|
|
|
| ||||
Acquisition partnerships |
|
|
|
|
|
|
|
|
| ||||
Domestic |
| $ | 5,309 |
| $ | 34,653 |
| $ | 121,679 |
| $ | 136,596 |
|
Latin America |
| 4,496 |
| 2,132 |
| 69,455 |
| 58,236 |
| ||||
Europe |
| 14,661 |
| 101,132 |
| 23,199 |
| 102,158 |
| ||||
Total |
| $ | 24,466 |
| $ | 137,917 |
| $ | 214,333 |
| $ | 296,990 |
|
|
| Purchase |
| FirstCity’s |
|
|
|
|
|
| ||
|
| Price |
| Investment |
|
|
|
|
|
| ||
Historical Acquisitions - Annual: |
|
|
|
|
|
|
|
|
|
| ||
2007 |
| $ | 214,333 |
| $ | 126,714 |
|
|
|
|
|
|
2006 |
| 296,990 |
| 144,048 |
|
|
|
|
|
| ||
2005 |
| 146,581 |
| 71,405 |
|
|
|
|
|
| ||
2004 |
| 174,139 |
| 59,762 |
|
|
|
|
|
| ||
2003 |
| 129,192 |
| 22,944 |
|
|
|
|
|
| ||
|
| December 31, |
| December 31, |
|
|
|
|
|
| ||
|
| 2007 |
| 2006 |
|
|
|
|
|
| ||
Portfolio acquisition and resolution assets by region: |
|
|
|
|
|
|
|
|
|
| ||
Domestic |
| $ | 163,078 |
| $ | 158,147 |
|
|
|
|
|
|
Latin America |
| 33,450 |
| 28,883 |
|
|
|
|
|
| ||
Europe |
| 46,701 |
| 61,062 |
|
|
|
|
|
| ||
Canada |
| 371 |
| 2,272 |
|
|
|
|
|
| ||
Total |
| $ | 243,600 |
| $ | 250,364 |
|
|
|
|
|
|
|
| Three Months Ended |
| Year Ended |
| ||||||||
|
| December 31, |
| December 31, |
| ||||||||
|
| 2007 |
| 2006 |
| 2007 |
| 2006 |
| ||||
Revenues and equity in earnings of investments by region: |
|
|
|
|
|
|
|
|
| ||||
Domestic |
| $ | 7,632 |
| $ | 5,719 |
| $ | 33,850 |
| $ | 22,063 |
|
Latin America |
| 3,540 |
| 3,289 |
| 12,068 |
| 11,191 |
| ||||
Europe |
| 2,388 |
| 2,080 |
| 8,055 |
| 5,913 |
| ||||
Canada |
| 14 |
| 94 |
| 188 |
| 111 |
| ||||
Total |
| $ | 13,574 |
| $ | 11,182 |
| $ | 54,161 |
| $ | 39,278 |
|
|
|
|
|
|
|
|
|
|
| ||||
Revenues and equity in earnings of investments by source: |
|
|
|
|
|
|
|
|
| ||||
Equity earnings |
| $ | 2,629 |
| $ | 3,712 |
| $ | 10,944 |
| $ | 11,756 |
|
Income from Portfolio Assets |
| 6,291 |
| 3,436 |
| 22,754 |
| 10,987 |
| ||||
Servicing fees |
| 2,382 |
| 2,724 |
| 10,390 |
| 12,906 |
| ||||
Gain on sale of SBA loans held for sale, net |
| 65 |
| — |
| 723 |
| — |
| ||||
Interest income from SBA loans |
| 474 |
| — |
| 2,140 |
| — |
| ||||
Interest income from affiliates |
| 147 |
| 309 |
| 560 |
| 1,498 |
| ||||
Interest income from loans receivable - other |
| 306 |
| 559 |
| 3,822 |
| 576 |
| ||||
Other |
| 1,280 |
| 442 |
| 2,828 |
| 1,555 |
| ||||
Total |
| $ | 13,574 |
| $ | 11,182 |
| $ | 54,161 |
| $ | 39,278 |
|
6
FirstCity Financial Corporation
Supplemental Information
(Dollars in thousands)
(Unaudited)
|
| Three Months Ended |
| Year Ended |
| ||||||||
|
| December 31, |
| December 31, |
| ||||||||
|
| 2007 |
| 2006 |
| 2007 |
| 2006 |
| ||||
Analysis of Equity Investments |
|
|
|
|
|
|
|
|
| ||||
FirstCity’s average investment |
|
|
|
|
|
|
|
|
| ||||
Domestic |
| $ | 29,693 |
| $ | 38,697 |
| $ | 33,573 |
| $ | 45,479 |
|
Latin America |
| 21,827 |
| 19,148 |
| 20,960 |
| 10,897 |
| ||||
Europe |
| 29,025 |
| 30,801 |
| 40,405 |
| 22,774 |
| ||||
Europe-Servicing subsidiaries |
| 6,465 |
| 5,738 |
| 6,018 |
| 5,594 |
| ||||
Latin America-Servicing subsidiaries |
| 4,453 |
| 282 |
| 3,588 |
| 233 |
| ||||
Total |
| $ | 91,463 |
| $ | 94,666 |
| $ | 104,544 |
| $ | 84,977 |
|
|
|
|
|
|
|
|
|
|
| ||||
FirstCity share of equity earnings: |
|
|
|
|
|
|
|
|
| ||||
Domestic |
| $ | (144 | ) | $ | 1,366 |
| $ | 2,284 |
| $ | 6,502 |
|
Latin America |
| 495 |
| 127 |
| 1,310 |
| (189 | ) | ||||
Europe |
| 1,653 |
| 1,623 |
| 5,948 |
| 4,614 |
| ||||
Europe-Servicing subsidiaries |
| 421 |
| 317 |
| 1,152 |
| 750 |
| ||||
Latin America-Servicing subsidiaries |
| 204 |
| 279 |
| 250 |
| 79 |
| ||||
Total |
| $ | 2,629 |
| $ | 3,712 |
| $ | 10,944 |
| $ | 11,756 |
|
|
|
|
|
|
|
|
|
|
| ||||
Selected Other Data: |
|
|
|
|
|
|
|
|
| ||||
Average investment in wholly owned portfolio assets and loans receivable: |
|
|
|
|
|
|
|
|
| ||||
Domestic |
| $ | 139,469 |
| $ | 95,629 |
| $ | 147,545 |
| $ | 66,381 |
|
Latin America |
| 6,714 |
| 8,962 |
| 7,952 |
| 12,479 |
| ||||
Europe |
| 5,628 |
| 3,500 |
| 4,431 |
| 2,475 |
| ||||
Canada |
| 369 |
| 2,286 |
| 1,255 |
| 703 |
| ||||
Total |
| $ | 152,180 |
| $ | 110,377 |
| $ | 161,183 |
| $ | 82,038 |
|
|
|
|
|
|
|
|
|
|
| ||||
Income from wholly owned portfolio assets and loans receivable: |
|
|
|
|
|
|
|
|
| ||||
Domestic |
| $ | 6,686 |
| $ | 3,595 |
| $ | 27,452 |
| $ | 11,392 |
|
Latin America |
| 479 |
| 543 |
| 1,990 |
| 1,377 |
| ||||
Europe |
| 104 |
| 72 |
| 369 |
| 181 |
| ||||
Canada |
| 14 |
| 94 |
| 188 |
| 111 |
| ||||
Total |
| $ | 7,283 |
| $ | 4,304 |
| $ | 29,999 |
| $ | 13,061 |
|
|
|
|
|
|
|
|
|
|
| ||||
Servicing fee revenues: |
|
|
|
|
|
|
|
|
| ||||
Domestic partnerships: |
|
|
|
|
|
|
|
|
| ||||
Servicing fee revenue |
| $ | 316 |
| $ | 600 |
| $ | 2,429 |
| $ | 3,398 |
|
Average servicing fee % |
| 3.4 | % | 3.1 | % | 3.7 | % | 3.0 | % | ||||
Latin American partnerships: |
|
|
|
|
|
|
|
|
| ||||
Servicing fee revenue |
| $ | 2,041 |
| $ | 2,044 |
| $ | 7,782 |
| $ | 7,287 |
|
Average servicing fee % |
| 14.5 | % | 12.8 | % | 13.6 | % | 9.9 | % | ||||
Incentive service fees |
| $ | — |
| $ | 80 |
| $ | — |
| $ | 2,221 |
|
Total Service Fees-Portfolio Assets: |
|
|
|
|
|
|
|
|
| ||||
Servicing fee revenue |
| $ | 2,357 |
| $ | 2,724 |
| $ | 10,211 |
| $ | 12,906 |
|
Average servicing fee % |
| 10.0 | % | 7.7 | % | 8.3 | % | 6.9 | % | ||||
Service Fees-SBA loans: |
| $ | 25 |
| $ | — |
| $ | 179 |
| $ | — |
|
Total Service Fees |
| $ | 2,382 |
| $ | 2,724 |
| $ | 10,390 |
| $ | 12,906 |
|
|
|
|
|
|
|
|
|
|
| ||||
Collections: |
|
|
|
|
|
|
|
|
| ||||
Domestic |
| $ | 9,389 |
| $ | 19,241 |
| $ | 66,063 |
| $ | 114,248 |
|
Latin America |
| 14,090 |
| 16,003 |
| 57,283 |
| 73,781 |
| ||||
Europe |
| 21,329 |
| 12,184 |
| 91,422 |
| 52,348 |
| ||||
Subtotal |
| 44,808 |
| 47,428 |
| 214,768 |
| 240,377 |
| ||||
Wholly-owned |
| 25,071 |
| 17,146 |
| 85,888 |
| 48,116 |
| ||||
Total |
| $ | 69,879 |
| $ | 64,574 |
| $ | 300,656 |
| $ | 288,493 |
|
|
|
|
|
|
|
|
|
|
| ||||
Servicing portfolio (face value): |
|
|
|
|
|
|
|
|
| ||||
Domestic |
| $ | 564,828 |
| $ | 552,925 |
|
|
|
|
| ||
Latin America |
| 1,053,299 |
| 1,694,649 |
|
|
|
|
| ||||
Europe |
| 1,125,168 |
| 1,062,886 |
|
|
|
|
| ||||
Total |
| $ | 2,743,295 |
| $ | 3,310,460 |
|
|
|
|
| ||
|
|
|
|
|
|
|
|
|
| ||||
Number of personnel at period end: |
|
|
|
|
|
|
|
|
| ||||
Domestic |
| 88 |
| 57 |
|
|
|
|
| ||||
Latin America |
| 118 |
| 119 |
|
|
|
|
| ||||
Corporate |
| 35 |
| 32 |
|
|
|
|
| ||||
Total personnel |
| 241 |
| 208 |
|
|
|
|
| ||||
7
FirstCity Financial Corporation
Schedule of Unrealized Gross Profit
As of December 31, 2007
(Unaudited)
|
| Book Value of Portfolio Assets (1) |
| |||||
($ in 000’s) |
| 12/31/2005 |
| 12/31/2006 |
| 12/31/2007 |
| |
Domestic |
| $ | 115,081 |
| 161,670 |
| 151,802 |
|
Europe |
| 19,112 |
| 46,204 |
| 40,340 |
| |
Latin America |
| 18,949 |
| 13,826 |
| 26,844 |
| |
Total |
| $ | 153,141 |
| 221,700 |
| 218,987 |
|
|
| Estimated Remaining Collections (2) |
| |||||
|
| 12/31/2005 |
| 12/31/2006 |
| 12/31/2007 |
| |
Domestic |
| $ | 170,153 |
| 215,987 |
| 195,845 |
|
Europe |
| 28,185 |
| 61,081 |
| 52,617 |
| |
Latin America |
| 34,556 |
| 50,866 |
| 68,900 |
| |
Total |
| $ | 232,895 |
| 327,934 |
| 317,363 |
|
|
| Unrealized Gross Profit (3) |
| |||||
|
| 12/31/2005 |
| 12/31/2006 |
| 12/31/2007 |
| |
Domestic |
| $ | 55,073 |
| 54,317 |
| 44,043 |
|
Europe |
| 9,073 |
| 14,877 |
| 12,278 |
| |
Latin America |
| 15,608 |
| 37,040 |
| 42,056 |
| |
Total |
| $ | 79,754 |
| 106,234 |
| 98,376 |
|
|
| Gross Profit% |
| ||||
|
| 12/31/2005 |
| 12/31/2006 |
| 12/31/2007 |
|
Domestic |
| 32.4 | % | 29.1 | % | 22.5 | % |
Europe |
| 32.2 | % | 24.4 | % | 23.3 | % |
Latin America |
| 45.2 | % | 56.0 | % | 61.0 | % |
Total |
| 34.2 | % | 32.4 | % | 31.0 | % |
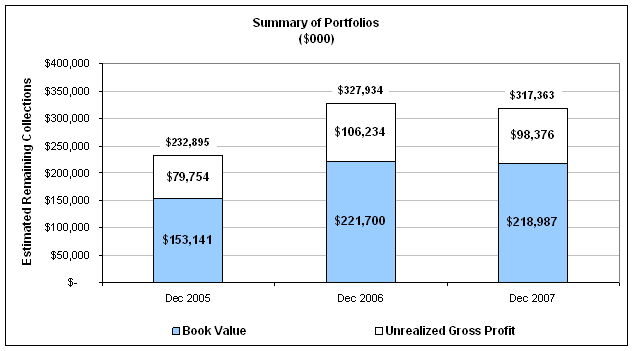
This schedule represents statistical information related to the Company’s ownership in portfolio assets and is provided for informational purposes to give an indication of the future Unrealized Gross Profit attributable to those pools. These are estimates and will change each period based upon review and judgment of management and individual facts and circumstances surrounding each asset in the portfolios.
(1) Book Value of Portfolio Assets represents FirstCity’s share of the unamortized purchase price of the portfolios held by the various acquisition entities that hold the portfolio some of which are consolidated and some are held through equity investments in partnership or similar arrangements.
(2) Estimated Remaining Collections represents the sum of all future projected cash collections expected from the owned portfolios net of certain expenses.
(3) Unrealized Gross Profit represents the excess difference between the Estimated Remaining Collections and the Book Value of Portfolio Assets.
8