Exhibit 99.1
N E W S R E L E A S E
Contact: | Suzy W. Taylor |
| 866-652-1810 |

FirstCity Financial Reports Third Quarter 2008 Results and Other Activities
Waco, Texas November 10, 2008
Highlights:
· FirstCity reported 3rd quarter 2008 loss of $1.8 million or ($0.17) per diluted share – which includes $2.1 million of net provisions.
· FirstCity invested $9.3 million in portfolio acquisitions and other investments during the quarter.
· FirstCity purchased 439,170 shares of its common stock since June 30, 2008, completing the 1,500,000 share repurchase authorized under its stock repurchase plan.
Components of the quarterly results are detailed below (dollars in thousands except per share data):
|
| Three Months Ended |
| Nine Months Ended |
| ||||||||
|
| September 30, |
| September 30, |
| ||||||||
|
| 2008 |
| 2007 |
| 2008 |
| 2007 |
| ||||
|
| (unaudited) |
| (unaudited) |
| ||||||||
Portfolio Asset Acquisition and Resolution |
| $ | (510 | ) | $ | 4,680 |
| $ | (7,131 | ) | $ | 10,863 |
|
Corporate overhead * |
| (1,241 | ) | (2,026 | ) | (4,592 | ) | (7,318 | ) | ||||
Earnings (loss) from continuing operations |
| (1,751 | ) | 2,654 |
| (11,723 | ) | 3,545 |
| ||||
Loss from discontinued operations, net of taxes |
| (4 | ) | — |
| (145 | ) | — |
| ||||
Net earnings (loss) to common stockholders |
| $ | (1,755 | ) | $ | 2,654 |
| $ | (11,868 | ) | $ | 3,545 |
|
Diluted earnings (loss) per common share |
| $ | (0.17 | ) | $ | 0.23 |
| $ | (1.14 | ) | $ | 0.31 |
|
* Corporate overhead includes $0.2 million and $2.2 million of expenses related to the independent investigation for the three-month and nine-month periods ended September 30, 2007, respectively.
Portfolio Asset Acquisition and Resolution
For the third quarter 2008, the operating contribution from the Portfolio Asset Acquisition business resulted in a $0.5 million loss. The loss was comprised primarily of $12.6 million in revenues, $2.2 million in equity in earnings of investments, and $15.3 million of expenses. The business generated 57% of the revenues (including equity in earnings of investments) from domestic investments, 30% from investments in Latin America, and 13% from investments in Europe.
Earnings for the third quarter were positively impacted by continued revenue streams from Portfolio Assets of $5.2 million; equity in earnings of investments of $2.2 million; servicing fees of $3.8 million; interest income of $1.8 million from loan investments; and $0.8 million from our majority-owned domestic railroad operation. However, third quarter earnings were negatively impacted by net impairment provisions, declining collections, and asset-level expenses attributed primarily to the Company’s consolidated and non-consolidated domestic portfolios; and foreign currency exchange losses.
(more)
Portfolio Asset Acquisition and Resolution (Continued)
Net Impairment Provisions, Declining Collections and Asset-Level Expenses
FirstCity recorded $2.1 million of net impairment provisions in third quarter 2008 – comprised of $1.1 million of net provisions recorded to our consolidated portfolios, and $1.0 million as our share of net impairment provisions recorded to portfolio assets held in our partnership interests. The global distribution of the $2.1 million of net impairment provisions recorded by the Company in third quarter 2008 includes $1.2 million in the United States, $0.3 million in Europe, and $0.6 million in Latin America. The impairment provisions in third quarter 2008 were attributed primarily to declines in values of loan collateral and real estate assets in our domestic portfolios, and additional delays in the timing of collections of expected cash flows on domestic loan portfolios. Collections on the Company’s consolidated domestic portfolios decreased to $14.5 million in third quarter 2008 from $18.3 million in third quarter 2007, and aggregate collections on portfolios held in our non-consolidated domestic partnerships decreased to $13.2 million in third quarter 2008 from $14.2 million in third quarter 2007. FirstCity also recorded $1.2 million of asset-level costs (i.e. property taxes, insurance, repairs and legal costs) in third quarter 2008 related to consolidated domestic portfolios to protect the Company’s security interests in its loan collateral and to support foreclosed properties until they are sold. These asset-level costs are attributed primarily to increased levels of delinquent property tax and insurance payments by the borrowers and increased loan foreclosures over the past twelve months. Management believes that declines in real estate values, delayed collections, and rising asset-level costs are the resulting adverse effects from the subprime mortgage crisis that began in the United States in 2007 (i.e. rising loan defaults and foreclosures on loan collateral because borrowers cannot refinance their loans and/or continue to make payments, and significant declines in real estate values attributed primarily to excess building inventories). The impairment provisions were identified in connection with management’s quarterly evaluation of the collectability of the Company’s Portfolio Assets. Management’s evaluation is inherently subjective as it requires estimates that are susceptible to revision in future periods as more information becomes available. Given current market conditions, we cannot provide assurance that we will not incur additional provisions in the future.
Foreign Currency Transaction Losses
The combined impact of foreign currency transactions from the Company’s consolidated and non-consolidated foreign operations resulted in a $0.4 million foreign currency exchange loss in third quarter 2008 (compared to a combined impact of $0.9 million in foreign currency exchange gains in third quarter 2007). The global distribution of the Company’s combined foreign currency exchange loss in third quarter 2008 was comprised of $0.5 million of exchange losses from European operations and $0.1 million of exchange gains from Latin American operations.
The following tables detail the impact of net foreign currency gains (losses) on corporate earnings:
|
| Three Months Ended |
| Nine Months Ended |
| ||||||||
Illustration of the Effects of Currency |
| September 30, |
| September 30, |
| ||||||||
Fluctuations (dollars in thousands) |
| 2008 |
| 2007 |
| 2008 |
| 2007 |
| ||||
|
| (unaudited) |
| (unaudited) |
| ||||||||
Net earnings (loss) to Common Stockholders |
| $ | (1,755 | ) | $ | 2,654 |
| $ | (11,868 | ) | $ | 3,545 |
|
Foreign currency gains (losses): |
|
|
|
|
|
|
|
|
| ||||
Euro |
| (550 | ) | 1,231 |
| (512 | ) | 785 |
| ||||
Mexican Peso |
| 325 |
| (349 | ) | 1,019 |
| (190 | ) | ||||
Argentine Peso |
| (33 | ) | (22 | ) | (2 | ) | (24 | ) | ||||
Canadian Dollar |
| (8 | ) | 23 |
| (20 | ) | 243 |
| ||||
Chilean Peso |
| (182 | ) | 5 |
| (129 | ) | 28 |
| ||||
|
|
|
|
|
|
|
|
|
| ||||
Exchange rate at valuation date: |
|
|
|
|
|
|
|
|
| ||||
Euro |
| 0.69 |
| 0.70 |
|
|
|
|
| ||||
Mexican Peso |
| 10.79 |
| 10.92 |
|
|
|
|
| ||||
Argentine Peso |
| 3.13 |
| 3.15 |
|
|
|
|
| ||||
Canadian Dollar |
| 1.04 |
| 0.99 |
|
|
|
|
| ||||
Chilean Peso |
| 550.59 |
| 511.20 |
|
|
|
|
| ||||
2
Portfolio Asset Acquisition and Resolution (Continued)
The Company was involved in acquiring $4.5 million of portfolio investments with a face value of approximately $78.1 million in the third quarter 2008 – of which FirstCity’s investment share was $3.2 million. FirstCity’s global distribution of its third quarter 2008 investments includes $2.9 million in the United States and $0.3 million in Latin America. In addition to its portfolio acquisitions in third quarter 2008, FirstCity invested $4.2 million in the form of SBA loan originations and advances; and $1.8 million in equity interest investments. For the nine months ended September 30, 2008, FirstCity was involved in acquiring $61.1 million of portfolio investments with a face value of approximately $716.2 million (of which FirstCity’s investment share was $45.1 million), and $39.7 million of additional portfolio investments, debt financing arrangements, SBA loan originations and advances, and equity interest investments. At September 30, 2008, FirstCity’s earning assets (Portfolio Assets, equity investments, loans receivable and entity-level earning assets) totaled $301.7 million, and the global distribution of such earning assets (at carrying value) included $194.3 million in the United States; $54.7 million in Europe; and $52.7 million in Latin America.
Portfolio purchases are detailed below (in millions):
|
| Portfolio Purchases |
| FirstCity |
|
|
| |||||||||||||||
|
|
|
|
|
| Latin |
|
|
| FirstCity |
| Investment |
|
|
| |||||||
|
| Domestic |
| Europe |
| America |
| Total |
| Investment |
| in Other |
| Total |
| |||||||
2008 |
|
|
|
|
|
|
|
|
|
|
|
|
|
|
| |||||||
3rd Quarter |
| $ | 2.9 |
| $ | — |
| $ | 1.6 |
| $ | 4.5 |
| $ | 3.2 |
| $ | 6.0 |
| $ | 9.2 |
|
2nd Quarter |
| 28.4 |
| — |
| 8.3 |
| 36.7 |
| 33.5 |
| 32.2 |
| 65.7 |
| |||||||
1st Quarter |
| 6.7 |
| — |
| 13.2 |
| 19.9 |
| 8.4 |
| 1.5 |
| 9.9 |
| |||||||
YTD 2008 |
| $ | 38.0 |
| $ | — |
| $ | 23.1 |
| $ | 61.1 |
| $ | 45.1 |
| $ | 39.7 |
| $ | 84.8 |
|
2007 |
|
|
|
|
|
|
|
|
|
|
|
|
|
|
| |||||||
4th Quarter |
| $ | 5.3 |
| $ | 14.7 |
| $ | 4.4 |
| $ | 24.4 |
| $ | 15.7 |
| $ | 3.7 |
| $ | 19.4 |
|
3rd Quarter |
| 17.4 |
| 2.3 |
| — |
| 19.7 |
| 16.3 |
| 6.3 |
| 22.6 |
| |||||||
2nd Quarter |
| 27.4 |
| 2.4 |
| 61.6 |
| 91.4 |
| 25.2 |
| 4.2 |
| 29.4 |
| |||||||
1st Quarter |
| 71.6 |
| 3.8 |
| 3.4 |
| 78.8 |
| 69.5 |
| 7.8 |
| 77.3 |
| |||||||
YTD 2007 |
| $ | 121.7 |
| $ | 23.2 |
| $ | 69.4 |
| $ | 214.3 |
| $ | 126.7 |
| $ | 22.0 |
| $ | 148.7 |
|
Total Year 2006 |
| $ | 136.6 |
| $ | 102.2 |
| $ | 58.2 |
| $ | 297.0 |
| $ | 144.0 |
| $ | 28.2 |
| $ | 172.2 |
|
Total Year 2005 |
| $ | 93.4 |
| $ | 37.2 |
| $ | 16.0 |
| $ | 146.6 |
| $ | 71.4 |
| $ | 3.2 |
| $ | 74.6 |
|
Management believes that current market conditions have created tremendous opportunities for FirstCity to expand its business, and that asset acquisition opportunities at attractive margins are available. These opportunities are showing up in FirstCity’s current pipeline as the Company is currently evaluating 29 different transactions representing approximately $7.2 billion in face value of assets, of which $6 billion is in the U.S., $347 million in Europe and $817 million in Latin America. This is in contrast to the pipeline at the end of the fourth quarter 2007 with $1.8 billion in face value, of which only $398 million was in the U.S. While FirstCity is very encouraged with the prospects, most of these transactions are subject to competitive bidding and negotiations, and there can be no assurance as to the ultimate execution of any one transaction.
Other Corporate Matters
Liquidity
FirstCity has $350.0 million of credit facility commitments available to finance its portfolio and asset purchases and equity investments in new ventures, and to provide for working capital loans. At September 30, 2008, FirstCity’s maximum borrowing capacity under these credit commitments was approximately $145.0 million (subject to borrowing base requirements of the respective credit facilities). These credit facilities are available to FirstCity through their maturity in November 2010, at which time management expects to negotiate for a maturity date extension. At September 30, 2008, FirstCity was in compliance with all material covenants and requirements set forth in the underlying credit agreements for these credit facilities.
3
Other Corporate Matters (Continued)
Share Repurchase Program
The Company completed the purchase of 1,500,000 shares of its common stock under its stock repurchase plan by purchasing an additional 439,170 shares since June 30, 2008 for $1.7 million (including 102,800 shares purchased in third quarter 2008 for $0.6 million). To date, the Company has purchased 1,500,000 shares of its common stock pursuant to the stock repurchase plan for an aggregate purchase price of $10.9 million from August 2006 to October 2008.
Conference Call
A conference call will be held on Monday, November 10, 2008 at 9:00 a.m. Central Time to discuss third quarter results. A question and answer session will follow the prepared remarks. Details to access the call and webcast are as follows:
| Event: | FirstCity Financial Corporation Third Quarter 2008 Conference Call | ||
| Date: | Monday, November 10, 2008 | ||
| Time: | 9:00 a.m. Central Time | ||
| Host: | James T. Sartain, FirstCity’s President and Chief Executive Officer | ||
|
|
| ||
| Web Access: | FirstCity’s web page - | www.fcfc.com/invest.htm or, | |
|
| CCBN’s Investor websites - | www.streetevents.com and, | |
|
|
| www.earnings.com | |
|
|
| ||
| Dial In Access: | Domestic | 866-713-8565 | |
|
| International | 617-597-5324 | |
|
|
|
| |
|
| Pass code | 59236678 | |
Replay Available on FirstCity’s web page (www.fcfc.com/invest.htm)
FirstCity Financial Corporation is a diversified financial services company with operations dedicated to portfolio asset acquisition and resolution with offices in the U.S. and with affiliate organizations in Europe and Latin America. FirstCity common stock is listed on the NASDAQ Global Select Market (NASDAQ: FCFC).
4
Forward-Looking Statements
FirstCity may from time to time make written or oral forward-looking statements, including statements contained in this press release, FirstCity’s filings with the SEC, in its reports to stockholders and in other FirstCity communications. These statements relate to the Company’s strategic objectives and future performance, which are not historical facts, and may be deemed to be forward-looking statements under the Private Securities Litigation Reform Act of 1995, Section 27A of the Securities Act of 1933, as amended, and Section 21E of the Securities Exchange Act of 1934, as amended (“Exchange Act”). Forward-looking statements include, without limitation, statements regarding our future financial position, business strategy, and plans and objectives of management for future operations, as well as any statement that may project, indicate or imply future results, performance or achievements, and may contain the words “expect,” “intend,” “plan,” “anticipate,” “estimate,” “believe,” “may,” “could,” “would,” “should,” “will likely result,” “indication,” “outlook,” “projects” and similar expressions. Forward-looking statements are not guarantees of future performance and involve certain risks, uncertainties and assumptions that are difficult to predict. Actual results and outcomes may differ materially from those expressed in, or implied by, our forward-looking statements.
There are many important factors that could cause the Company’s actual results to differ materially from those indicated in the forward-looking statements. Such factors include, but are not limited to, changes in general economic conditions in the United States and local economic conditions in the geographic regions and industries in which the Company operates; foreign social and economic conditions; performance of the Company’s subsidiaries and affiliates; availability of investments and investment opportunities; the Company’s ability to project future cash receipts and develop critical assumptions and estimates underlying asset performance; increased competition in the business in which we operate; the Company’s ability to consummate portfolio acquisitions and other investment transactions on acceptable terms; credit risk associated with our borrowers’ ability to repay their loans; level of nonperforming assets, charge-offs and impairment provisions; risks associated with foreign operations; currency exchange rate fluctuations; risks associated with start-up of new businesses and entry into new markets; changes in the interest rate environment and market liquidity; fluctuations in residential and commercial real estate values; adverse movements and volatility in equity capital markets; the degree to which the Company is leveraged; the Company’s continued need for financing; availability of the Company’s credit facilities; ability to obtain additional financing from the Bank of Scotland or any other lender; the impact of certain covenants in loan agreements of the Company and its subsidiaries; risks of declining value of loans, collateral or assets; the ability of the Company to utilize NOLs; liabilities resulting from litigation and regulatory investigations that might arise from continuing and discontinued operations, including costs, expenses, settlements and judgments; changes (legislative and otherwise) in the asset securitization industry; changes in domestic or foreign tax laws, rules and regulations as well as court, Internal Revenue Service or other governmental agencies’ interpretations thereof; changes in accounting standards, rules and interpretations; and factors more fully discussed and identified in the Company’s Annual Report on Form 10-K, for the year ended December 31, 2007, filed with the SEC on March 17, 2008 (including those discussed under “Item 7. Management’s Discussion and Analysis of Financial Condition and Results of Operations”), as well as in other SEC filings of the Company. Many of these factors are beyond the Company’s control. In addition, it should be noted that past financial and operational performance of the Company is not necessarily indicative of future financial and operational performance. Given these risks and uncertainties, investors should not place undue reliance on forward-looking statements. The forward-looking statements in this Quarterly Report on Form 10-Q represent beliefs and assumptions only as of the date of this Quarterly Report on Form 10-Q. Except as required by applicable law, the Company expressly disclaims any obligation or intention to release publicly any updates or revisions to any forward-looking statement to reflect any change in the Company’s expectations with regard thereto or any change in future events, conditions or circumstances on which any forward-looking statement is based.
The forward-looking statements in this release speak only as of the date of this release. The Company expressly disclaims any obligation or undertaking to release publicly any updates or revisions to any forward-looking statement to reflect any change in the Company’s expectations with regard thereto or any change in events, conditions or circumstances on which any forward-looking statement is based.
5
FirstCity Financial Corporation
Summary of Operations
(In thousands, except per share data)
(Unaudited)
|
| Three Months Ended |
| Nine Months Ended |
| |||||||||
|
| September 30, |
| September 30, |
| |||||||||
|
| 2008 |
| 2007 |
| 2008 |
| 2007 |
| |||||
Revenues: |
|
|
|
|
|
|
|
|
| |||||
Servicing fees |
| $ | 3,842 |
| $ | 2,426 |
| $ | 8,748 |
| $ | 8,008 |
| |
Income from Portfolio Assets |
| 5,229 |
| 5,743 |
| 15,786 |
| 16,463 |
| |||||
Gain on sale of SBA loans held for sale, net |
| 85 |
| 34 |
| 227 |
| 658 |
| |||||
Interest income from SBA loans |
| 368 |
| 752 |
| 1,210 |
| 1,666 |
| |||||
Interest income from affiliates |
| 875 |
| 147 |
| 1,508 |
| 413 |
| |||||
Interest income from loans receivable - other |
| 541 |
| 1,627 |
| 1,171 |
| 3,516 |
| |||||
Revenue from railroad operations |
| 810 |
| 302 |
| 2,474 |
| 302 |
| |||||
Other income |
| 939 |
| 601 |
| 2,558 |
| 1,598 |
| |||||
Total revenues |
| 12,689 |
| 11,632 |
| 33,682 |
| 32,624 |
| |||||
Expenses: |
|
|
|
|
|
|
|
|
| |||||
Interest and fees on notes payable to banks |
| 4,249 |
| 4,747 |
| 11,690 |
| 13,666 |
| |||||
Interest and fees on notes payable to affiliates |
| 322 |
| — |
| 322 |
| — |
| |||||
Salaries and benefits |
| 5,655 |
| 4,446 |
| 15,982 |
| 12,303 |
| |||||
Provision for loan and impairment losses |
| 1,123 |
| (136 | ) | 11,243 |
| 936 |
| |||||
Property protection |
| 1,307 |
| 781 |
| 4,661 |
| 1,950 |
| |||||
Occupancy, data processing and other |
| 3,774 |
| 1,438 |
| 9,025 |
| 8,590 |
| |||||
Total expenses |
| 16,430 |
| 11,276 |
| 52,923 |
| 37,445 |
| |||||
Equity in earnings of investments |
| 2,170 |
| 2,157 |
| 8,018 |
| 8,315 |
| |||||
Gain on sale of subsidiaries and equity investments |
| — |
| 207 |
| — |
| 207 |
| |||||
Earnings (loss) from continuing operations before income taxes and minority interest |
| (1,571 | ) | 2,720 |
| (11,223 | ) | 3,701 |
| |||||
Income taxes |
| 44 |
| (153 | ) | (245 | ) | (366 | ) | |||||
Minority interest |
| (224 | ) | 87 |
| (255 | ) | 210 |
| |||||
Earnings (loss) from continuing operations |
| (1,751 | ) | 2,654 |
| (11,723 | ) | 3,545 |
| |||||
Discontinued operations |
|
|
|
|
|
|
|
|
| |||||
Loss from discontinued operations |
| (4 | ) | — |
| (145 | ) | — |
| |||||
Net earnings (loss) |
| $ | (1,755 | ) | $ | 2,654 |
| $ | (11,868 | ) | $ | 3,545 |
| |
|
|
|
|
|
|
|
|
|
| |||||
Basic earnings (loss) per common share are as follows: |
|
|
|
|
|
|
|
|
| |||||
Earnings (loss) from continuing operations |
| $ | (0.17 | ) | $ | 0.25 |
| $ | (1.13 | ) | $ | 0.33 |
| |
Discontinued operations |
| $ | — |
| $ | — |
| $ | (0.01 | ) | $ | — |
| |
Net earnings (loss) per common share |
| $ | (0.17 | ) | $ | 0.25 |
| $ | (1.14 | ) | $ | 0.33 |
| |
Weighted average common shares outstanding |
| 10,232 |
| 10,790 |
| 10,391 |
| 10,789 |
| |||||
|
|
|
|
|
|
|
|
|
| |||||
Diluted earnings (loss) per common share are as follows: |
|
|
|
|
|
|
|
|
| |||||
Earnings (loss) from continuing operations |
| $ | (0.17 | ) | $ | 0.23 |
| $ | (1.13 | ) | $ | 0.31 |
| |
Discontinued operations |
| $ | — |
| $ | — |
| $ | (0.01 | ) | $ | — |
| |
Net earnings (loss) per common share |
| $ | (0.17 | ) | $ | 0.23 |
| $ | (1.14 | ) | $ | 0.31 |
| |
Wtd. avg. common shares outstanding |
| 10,232 |
| 11,379 |
| 10,391 |
| 11,402 |
| |||||
|
|
|
|
|
|
|
|
|
| |||||
Selected Unaudited Balance Sheet Data | ||||||||||||||
|
|
|
|
|
|
|
|
|
| |||||
|
|
| September 30, |
| December 31, |
|
|
|
|
| ||||
|
|
| 2008 |
| 2007 |
|
|
|
|
| ||||
| Cash and cash equivalents |
| $ | 12,984 |
| $ | 23,037 |
|
|
|
|
| ||
| Restricted cash |
| 1,124 |
| 509 |
|
|
|
|
| ||||
| Earning Assets: |
|
|
|
|
|
|
|
|
| ||||
| Portfolio Assets, net |
| 141,153 |
| 122,001 |
|
|
|
|
| ||||
| Loans and interest receivable |
| 59,009 |
| 26,574 |
|
|
|
|
| ||||
| Equity investments |
| 93,287 |
| 87,622 |
|
|
|
|
| ||||
| Railroad assets |
| 8,264 |
| 7,403 |
|
|
|
|
| ||||
| Deferred tax asset, net |
| 20,101 |
| 20,101 |
|
|
|
|
| ||||
| Service fees receivable and other assets |
| 11,008 |
| 10,872 |
|
|
|
|
| ||||
| Total assets |
| $ | 346,930 |
| $ | 298,119 |
|
|
|
|
| ||
|
|
|
|
|
|
|
|
|
|
| ||||
| Notes payable to banks |
| $ | 216,597 |
| $ | 177,329 |
|
|
|
|
| ||
| Note payable to affiliate |
| 8,658 |
| — |
|
|
|
|
| ||||
| Minority interest and other liabilities |
| 29,606 |
| 13,967 |
|
|
|
|
| ||||
| Total liabilities |
| 254,861 |
| 191,296 |
|
|
|
|
| ||||
| Total equity |
| 92,069 |
| 106,823 |
|
|
|
|
| ||||
| Total liabilities and equity |
| $ | 346,930 |
| $ | 298,119 |
|
|
|
|
| ||
6
FirstCity Financial Corporation
Supplemental Information
(Dollars in thousands)
(Unaudited)
|
| Three Months Ended |
| Nine Months Ended |
| |||||||||
|
| September 30, |
| September 30, |
| |||||||||
|
| 2008 |
| 2007 |
| 2008 |
| 2007 |
| |||||
Portfolio Asset Acquisition and Resolution: |
|
|
|
|
|
|
|
|
| |||||
Summary Operating Statement Data |
|
|
|
|
|
|
|
|
| |||||
Revenues |
| $ | 12,601 |
| $ | 11,492 |
| $ | 33,367 |
| $ | 32,272 |
| |
Equity in earnings of investments |
| 2,170 |
| 2,157 |
| 8,018 |
| 8,315 |
| |||||
Gain on sale of subsidiaries and equity investments |
| — |
| 207 |
| — |
| 207 |
| |||||
Expenses |
| (14,158 | ) | (9,312 | ) | (37,273 | ) | (28,995 | ) | |||||
Operating contribution before provision for loan and impairment losses |
| 613 |
| 4,544 |
| 4,112 |
| 11,799 |
| |||||
Provision for loan and impairment losses |
| 1,123 |
| (136 | ) | 11,243 |
| 936 |
| |||||
Operating contribution, net of direct taxes |
| $ | (510 | ) | $ | 4,680 |
| $ | (7,131 | ) | $ | 10,863 |
| |
|
|
|
|
|
|
|
|
|
| |||||
Aggregate purchase price of portfolios acquired: |
|
|
|
|
|
|
|
|
| |||||
Acquisition partnerships |
|
|
|
|
|
|
|
|
| |||||
Domestic |
| $ | 2,912 |
| $ | 17,338 |
| $ | 38,031 |
| $ | 116,370 |
| |
Latin America |
| 1,576 |
| — |
| 23,097 |
| 64,959 |
| |||||
Europe |
| — |
| 2,327 |
| — |
| 8,538 |
| |||||
Total |
| $ | 4,488 |
| $ | 19,665 |
| $ | 61,128 |
| $ | 189,867 |
| |
|
|
|
|
|
|
|
|
|
| |||||
|
| Purchase |
| FirstCity’s |
|
|
|
|
| |||||
|
| Price |
| Investment |
|
|
|
|
| |||||
Historical Acquisitions - Annual: |
|
|
|
|
|
|
|
|
| |||||
Nine months ended September 30, 2008 |
| $ | 61,128 |
| $ | 45,124 |
|
|
|
|
| |||
2007 |
| 214,333 |
| 126,714 |
|
|
|
|
| |||||
2006 |
| 296,990 |
| 144,048 |
|
|
|
|
| |||||
2005 |
| 146,581 |
| 71,405 |
|
|
|
|
| |||||
2004 |
| 174,139 |
| 59,762 |
|
|
|
|
| |||||
|
|
|
|
|
|
|
|
|
| |||||
|
| September 30, |
| December 31, |
|
|
|
|
| |||||
|
| 2008 |
| 2007 |
|
|
|
|
| |||||
Portfolio acquisition and resolution assets by region: |
|
|
|
|
|
|
|
|
| |||||
Domestic |
| $ | 194,051 |
| $ | 163,078 |
|
|
|
|
| |||
Latin America |
| 52,698 |
| 33,450 |
|
|
|
|
| |||||
Europe |
| 54,692 |
| 46,701 |
|
|
|
|
| |||||
Canada |
| 272 |
| 371 |
|
|
|
|
| |||||
Total |
| $ | 301,713 |
| $ | 243,600 |
|
|
|
|
| |||
|
|
|
|
|
| |||||||||
|
| Three Months Ended |
| Nine Months Ended |
| |||||||||
|
| September 30, |
| September 30, |
| |||||||||
|
| 2008 |
| 2007 |
| 2008 |
| 2007 |
| |||||
Revenues and equity in earnings of investments by region: |
|
|
|
|
|
|
|
|
| |||||
Domestic |
| $ | 8,373 |
| $ | 9,869 |
| $ | 22,340 |
| $ | 26,218 |
| |
Latin America |
| 4,433 |
| 2,303 |
| 11,321 |
| 8,528 |
| |||||
Europe |
| 1,955 |
| 1,462 |
| 7,690 |
| 5,667 |
| |||||
Canada |
| 10 |
| 15 |
| 34 |
| 174 |
| |||||
Total |
| $ | 14,771 |
| $ | 13,649 |
| $ | 41,385 |
| $ | 40,587 |
| |
|
|
|
|
|
|
|
|
|
| |||||
Revenues and equity in earnings of investments by source: |
|
|
|
|
|
|
|
|
| |||||
Equity earnings |
| $ | 2,170 |
| $ | 2,157 |
| $ | 8,018 |
| $ | 8,315 |
| |
Income from Portfolio Assets |
| 5,229 |
| 5,743 |
| 15,786 |
| 16,463 |
| |||||
Servicing fees |
| 3,842 |
| 2,426 |
| 8,748 |
| 8,008 |
| |||||
Gain on sale of SBA loans held for sale, net |
| 85 |
| 34 |
| 227 |
| 658 |
| |||||
Interest income from SBA loans |
| 368 |
| 752 |
| 1,210 |
| 1,666 |
| |||||
Interest income from affiliates |
| 875 |
| 147 |
| 1,508 |
| 413 |
| |||||
Interest income from loans receivable - other |
| 541 |
| 1,627 |
| 1,171 |
| 3,516 |
| |||||
Revenue from railroad operations |
| 810 |
| 302 |
| 2,474 |
| 302 |
| |||||
Other |
| 851 |
| 461 |
| 2,243 |
| 1,246 |
| |||||
Total |
| $ | 14,771 |
| $ | 13,649 |
| $ | 41,385 |
| $ | 40,587 |
| |
7
FirstCity Financial Corporation
Supplemental Information
(Dollars in thousands)
(Unaudited)
|
| Three Months Ended |
| Nine Months Ended |
| ||||||||
|
| September 30, |
| September 30, |
| ||||||||
|
| 2008 |
| 2007 |
| 2008 |
| 2007 |
| ||||
Analysis of Equity Investments |
|
|
|
|
|
|
|
|
| ||||
FirstCity’s average investment: |
|
|
|
|
|
|
|
|
| ||||
Domestic |
| $ | 20,728 |
| $ | 36,114 |
| $ | 22,202 |
| $ | 35,207 |
|
Latin America |
| 24,238 |
| 21,980 |
| 23,610 |
| 20,670 |
| ||||
Europe |
| 27,757 |
| 39,398 |
| 29,569 |
| 43,587 |
| ||||
Europe-Servicing subsidiaries |
| 11,531 |
| 5,923 |
| 8,887 |
| 5,869 |
| ||||
Latin America-Servicing subsidiaries |
| 4,798 |
| 4,578 |
| 4,960 |
| 3,315 |
| ||||
Domestic-Operating subsidiaries |
| 34 |
| — |
| 5 |
| — |
| ||||
Total |
| $ | 89,086 |
| $ | 107,993 |
| $ | 89,233 |
| $ | 108,648 |
|
|
|
|
|
|
|
|
|
|
| ||||
FirstCity’s share of equity earnings (losses): |
|
|
|
|
|
|
|
|
| ||||
Domestic |
| $ | (448 | ) | $ | 1,064 |
| $ | (294 | ) | $ | 2,428 |
|
Latin America |
| 405 |
| (62 | ) | 1,509 |
| 815 |
| ||||
Europe |
| 1,625 |
| 1,082 |
| 5,705 |
| 4,295 |
| ||||
Europe-Servicing subsidiaries |
| (161 | ) | 168 |
| 649 |
| 731 |
| ||||
Latin America-Servicing subsidiaries |
| (183 | ) | (95 | ) | (127 | ) | 46 |
| ||||
Domestic-Operating subsidiaries |
| 932 |
| — |
| 576 |
| — |
| ||||
Total |
| $ | 2,170 |
| $ | 2,157 |
| $ | 8,018 |
| $ | 8,315 |
|
|
|
|
|
|
|
|
|
|
| ||||
Selected Other Data: |
|
|
|
|
|
|
|
|
| ||||
Average investment in consolidated portfolio assets and loans receivable: |
|
|
|
|
|
|
|
|
| ||||
Domestic |
| $ | 167,781 |
| $ | 158,039 |
| $ | 147,149 |
| $ | 151,906 |
|
Latin America |
| 19,653 |
| 7,335 |
| 12,030 |
| 8,327 |
| ||||
Europe |
| 9,463 |
| 4,328 |
| 9,293 |
| 3,976 |
| ||||
Canada |
| 272 |
| 351 |
| 305 |
| 1,522 |
| ||||
Total |
| $ | 197,169 |
| $ | 170,053 |
| $ | 168,777 |
| $ | 165,731 |
|
|
|
|
|
|
|
|
|
|
| ||||
Income from consolidated portfolio assets and loans receivable: |
|
|
|
|
|
|
|
|
| ||||
Domestic |
| $ | 5,528 |
| $ | 7,723 |
| $ | 17,002 |
| $ | 20,766 |
|
Latin America |
| 1,123 |
| 465 |
| 1,826 |
| 1,511 |
| ||||
Europe |
| 437 |
| 100 |
| 1,040 |
| 265 |
| ||||
Canada |
| 10 |
| 15 |
| 34 |
| 174 |
| ||||
Total |
| $ | 7,098 |
| $ | 8,303 |
| $ | 19,902 |
| $ | 22,716 |
|
|
|
|
|
|
|
|
|
|
| ||||
Servicing fee revenues: |
|
|
|
|
|
|
|
|
| ||||
Domestic partnerships: |
|
|
|
|
|
|
|
|
| ||||
Servicing fee revenue |
| $ | 1,157 |
| $ | 435 |
| $ | 1,865 |
| $ | 2,114 |
|
Average servicing fee % |
| 8.8 | % | 3.1 | % | 6.1 | % | 3.7 | % | ||||
Latin American partnerships: |
|
|
|
|
|
|
|
|
| ||||
Servicing fee revenue |
| $ | 2,615 |
| $ | 1,874 |
| $ | 6,744 |
| $ | 5,741 |
|
Average servicing fee % |
| 25.7 | % | 23.0 | % | 22.1 | % | 24.9 | % | ||||
Total Service Fees-Portfolio Assets: |
|
|
|
|
|
|
|
|
| ||||
Servicing fee revenue |
| $ | 3,772 |
| $ | 2,309 |
| $ | 8,609 |
| $ | 7,855 |
|
Average servicing fee % |
| 16.2 | % | 10.3 | % | 14.1 | % | 9.9 | % | ||||
Service Fees-SBA loans: |
| $ | 70 |
| $ | 117 |
| $ | 139 |
| $ | 153 |
|
Total Service Fees |
| $ | 3,842 |
| $ | 2,426 |
| $ | 8,748 |
| $ | 8,008 |
|
|
|
|
|
|
|
|
|
|
| ||||
Collections: |
|
|
|
|
|
|
|
|
| ||||
Domestic partnerships |
| $ | 13,161 |
| $ | 14,190 |
| $ | 30,736 |
| $ | 56,674 |
|
Latin American partnerships |
| 16,384 |
| 14,827 |
| 56,900 |
| 42,068 |
| ||||
European partnerships |
| 17,028 |
| 22,254 |
| 50,149 |
| 70,093 |
| ||||
Subtotal |
| 46,573 |
| 51,271 |
| 137,785 |
| 168,835 |
| ||||
Consolidated portfolio assets |
| 15,608 |
| 19,733 |
| 46,523 |
| 60,817 |
| ||||
Total |
| $ | 62,181 |
| $ | 71,004 |
| $ | 184,308 |
| $ | 229,652 |
|
|
|
|
|
|
|
|
|
|
| ||||
Servicing portfolio (face value) at period end: |
|
|
|
|
|
|
|
|
| ||||
Domestic |
| $ | 593,898 |
| $ | 601,119 |
|
|
|
|
| ||
Latin America |
| 1,582,654 |
| 1,129,681 |
|
|
|
|
| ||||
Europe |
| 1,362,008 |
| 1,065,638 |
|
|
|
|
| ||||
Total |
| $ | 3,538,560 |
| $ | 2,796,438 |
|
|
|
|
| ||
|
|
|
|
|
|
|
|
|
| ||||
Number of personnel at period end: |
|
|
|
|
|
|
|
|
| ||||
Domestic |
| 96 |
| 84 |
|
|
|
|
| ||||
Latin America |
| 132 |
| 116 |
|
|
|
|
| ||||
Corporate |
| 32 |
| 35 |
|
|
|
|
| ||||
Total personnel |
| 260 |
| 235 |
|
|
|
|
| ||||
8
FirstCity Financial Corporation
Schedule of Unrealized Gross Profit
September 30, 2008
(Unaudited)
|
| Basis in Portfolio Assets (1) |
| |||||
($ in 000’s) |
| 12/31/2006 |
| 12/31/2007 |
| 9/30/2008 |
| |
Domestic |
| $ | 153,118 |
| 151,802 |
| 145,393 |
|
Europe |
| 46,204 |
| 40,340 |
| 35,489 |
| |
Latin America |
| 22,378 |
| 26,844 |
| 40,679 |
| |
Total (4) |
| $ | 221,700 |
| 218,987 |
| 221,561 |
|
|
| Estimated Remaining Collections (2) |
| |||||
|
| 12/31/2006 |
| 12/31/2007 |
| 9/30/2008 |
| |
Domestic |
| $ | 215,987 |
| 195,845 |
| 202,769 |
|
Europe |
| 61,081 |
| 52,617 |
| 46,333 |
| |
Latin America |
| 50,866 |
| 68,900 |
| 90,174 |
| |
Total |
| $ | 327,934 |
| 317,363 |
| 339,276 |
|
|
| Unrealized Gross Profit (3) |
| |||||
|
| 12/31/2006 |
| 12/31/2007 |
| 9/30/2008 |
| |
Domestic |
| $ | 62,869 |
| 44,043 |
| 57,376 |
|
Europe |
| 14,877 |
| 12,278 |
| 10,845 |
| |
Latin America |
| 28,488 |
| 42,056 |
| 49,495 |
| |
Total |
| $ | 106,234 |
| 98,376 |
| 117,716 |
|
|
| Unrealized Gross Profit % |
| ||||
|
| 12/31/2006 |
| 12/31/2007 |
| 9/30/2008 |
|
Domestic |
| 29.1 | % | 22.5 | % | 28.3 | % |
Europe |
| 24.4 | % | 23.3 | % | 23.4 | % |
Latin America |
| 56.0 | % | 61.0 | % | 54.9 | % |
Total |
| 32.4 | % | 31.0 | % | 34.7 | % |
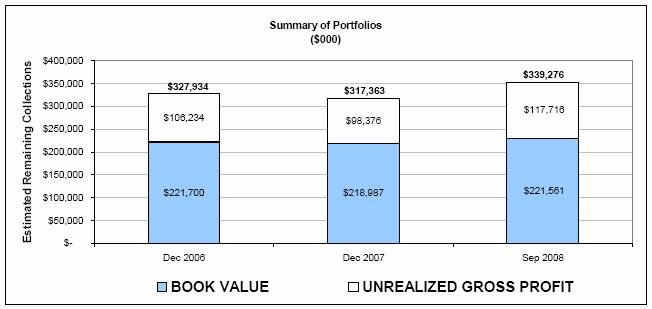
This schedule represents information related to the Company’s ownership interests in consolidated and non-consolidated Portfolio Assets and is provided for informational purposes to give an indication of the future potential Unrealized Gross Profit attributable to those portfolios. These are estimates and will change each period based upon management’s review and evaluation of the individual facts and circumstances surrounding the underlying assets and pools in the Portfolios.
(1) Basis in Portfolio Assets represents FirstCity’s share of the unamortized purchase price of the Portfolios held by the various acquisition entities, some of which are consolidated by FirstCity and others held through equity investments in partnership or similar arrangements.
(2) Estimated Remaining Collections represents FirstCity’s share of future projected cash collections expected from the Portfolios, net of expenses.
(3) Unrealized Gross Profit represents the excess difference between the Estimated Remaining Collections and the Basis in Portfolio Assets.
(4) FirstCity considers Basis in Portfolio Assets a useful measurement of the Company’s underlying holdings and interests in Portfolio Assets. As FirstCity’s share of Basis in Portfolio Assets is considered a non-GAAP measure, the following reconciliation is provided:
|
| 12/31/2006 |
| 12/31/2007 |
| 9/30/2008 |
| |
FirstCity’s consolidated Portfolio Assets (as reported in “Portfolio Assets” on the financial statement of the respective Form 10-K or 10-Q) |
| $ | 108,696 |
| 122,001 |
| 147,840 |
|
Minority ownership interests in FirstCity’s consolidated Portfolio Assets (component of “Minority interest” liability on the financial statement of the respective Form 10-K or 10-Q) |
| (2,005 | ) | (4,474 | ) | (11,914 | ) | |
FirstCity’s interests in Portfolio Assets held by Acquisition Partnerships (a component of “Assets” as reported in the “Condensed Combined Balance Sheets” tabular disclosure under the “Equity Investments” footnote of the respective Form 10-K or 10-Q) |
| 115,009 |
| 101,460 |
| 85,635 |
| |
FirstCity’s basis in consolidated and non-consolidated Portfolio Assets |
| $ | 221,700 |
| 218,987 |
| 221,561 |
|
9