Exhibit 99.1
NEWS RELEASE
Contact: | Suzy W. Taylor |
| 866-652-1810 |

FirstCity Financial Corporation Reports Second Quarter 2009 Results and Activities
Waco, Texas August 12, 2009……….
Highlights:
· FirstCity reported second quarter 2009 earnings of $7.7 million or $0.76 per diluted share.
· FirstCity invested $70.9 million in domestic portfolio acquisitions and other investments during the quarter.
· FirstCity reported continued earning asset growth of $37.0 million for the second quarter of 2009 — as total earning assets grew to $383.2 million at June 30, 2009.
· FirstCity has invested $21.3 million in domestic portfolio acquisitions and other investments subsequent to the second quarter of 2009.
Second Quarter 2009 and Business Outlook
FirstCity generated net earnings of $7.7 million for the second quarter of 2009, which is a $14.2 million increase over the $6.5 million net loss reported for the second quarter of 2008. The diluted net income per common share was $0.76 in the second quarter of 2009, compared to a diluted net loss per common share of $0.63 for the same period last year. The earnings improvement was a result of (1) increased revenues directly associated with higher domestic collections in the second quarter of 2009 compared to the same period last year; (2) a $6.5 million decline in FirstCity’s combined share of impairment in the second quarter of 2009 compared to 2008; and (3) a $2.0 million increase in the combined impact of foreign currency exchange gains from FirstCity’s foreign investments in the second quarter of 2009 compared to the same period last year.
Jim Sartain, Chief Executive Officer, said, “We are very pleased with our strong earnings performance in the second quarter. The current economic environment has presented numerous investment opportunities for each of our business segments. These investments in turn have provided positive cash flows, allowing us to leverage our long-time expertise and continue to take advantage of the opportunities in the current market.”
FirstCity’s investments of $70.9 million during the second quarter included $48.6 million of domestic portfolio assets with a face value of $117.8 million acquired primarily from the FDIC; $7.9 million of SBA loan advances and originations; and $14.4 million of debt and equity investments. In addition, subsequent to June 30, 2009, the Company was involved in acquiring $36.4 million of Portfolio Assets with a face value of approximately $52.1 million — of which FirstCity’s investment share was $18.3 million. FirstCity also funded $3.0 million of additional loan investments after quarter-end.
(more)
The Company continues to experience positive growth with the unrealized future gross profit associated with its core portfolio asset business. At the end of June 2009, the unrealized future gross profit on these assets increased to $155.5 million, which is up from $122.3 million at the end of December 2008. Unrealized future gross profit is a non-GAAP measure. Refer to the Schedule of Estimated Unrealized Gross Profit from Portfolio Assets on page 10 of this release for a reconciliation of this measure with the most directly comparable financial measure calculated and presented in accordance with U.S. generally accepted accounting principles.
FirstCity has $350.0 million of credit facility commitments available to finance its portfolio and asset purchases, capital investments in new ventures, and to provide for working capital to support our growth. At June 30, 2009, FirstCity’s maximum borrowing capacity under these credit commitments approximated $74.4 million (subject to borrowing base requirements of the respective credit facilities). These credit facilities are available to FirstCity through their maturity in November 2010. FirstCity is in compliance with all covenants and requirements set forth in the underlying credit agreements for these credit facilities.
Items impacting comparability of results for the second quarter of 2009 are as follows:
Total assets at the end of second quarter 2009 expanded to $421.3 million compared to $378.2 million at the end of first quarter 2009 as a result of FirstCity’s loan portfolio acquisitions and other investments during the quarter. The Company’s earning assets experienced a corresponding increase to $383.2 million at the end of June 2009 compared to $346.2 million at the end of March 2009.
Revenues in the second quarter of 2009 increased to $20.7 million compared to $11.5 million in the second quarter last year. The Company’s earnings in the second quarter of 2009 included $14.1 million of income and gains from Portfolio Assets, $1.6 million of interest income from loans receivable, and $2.4 million of fee income attributable to our loan servicing platform. Increased revenue in the second quarter of 2009 is a result of increased collections on consolidated portfolios to $51.7 million in the second quarter of 2009 compared to $11.4 million in the same period a year ago, and FirstCity’s increased holdings in earning assets ($383.2 million at the end of June 2009 compared to $296.3 million at the end of June 2008).
The Company recorded net provisions for loss of $2.0 million during the second quarter of 2009 compared to $8.5 million in the second quarter of 2008. The provisions in second quarter of 2009 were recorded to reflect declines in values of loan collateral and real estate assets. The global distribution of the $2.0 million of net impairment provisions in the second quarter of 2009 includes $2.9 million for domestic assets, $0.2 million related to Latin American assets, and $1.1 million of net recoveries related to European assets. The net provisions were allocated between consolidated portfolios ($0.7 million) and non-consolidated subsidiaries ($1.3 million) in the second quarter 2009.
Foreign currency exchange gains of $2.2 million were recorded during the second quarter of 2009 compared to $0.2 million of foreign currency exchange gains for the same period in 2008. In the second quarter of 2009, $1.8 million of the Company’s foreign currency exchange gains were attributable to the strengthening of the Mexican peso against the U.S. dollar.
In the second quarter of 2009, the Company also recorded a $1.5 million gain attributable to a transaction in which the Company acquired a controlling financial interest in certain French Acquisition Partnerships. The Company owned a noncontrolling equity interest in these entities prior to the transaction. Under the new business acquisition accounting standards (SFAS 141R), the Company’s previously-held noncontrolling interests in the entities were remeasured to fair value on the acquisition date (May 2009) — which resulted in the Company’s recognition of the gain.
2
Equity in earnings of unconsolidated subsidiaries was $1.2 million in the second quarter of 2009 compared to $3.0 million of net earnings for the same period a year ago. The decline was caused primarily by a decrease in Acquisition Partnership collections to $22.0 million in the second quarter of 2009 from $55.5 million for the same period last year — which corresponds to a decrease in the Acquisition Partnerships’ portfolio asset holdings (i.e. earning assets) to $276.5 million at June 2009 from $412.8 million at June 2008. FirstCity’s average investment in equity-method investments (including Acquisition Partnerships) decreased to $71.2 million for the second quarter of 2009 compared to $89.1 million for the second quarter of 2008. Since a majority of FirstCity’s portfolio acquisitions over the past twelve months were acquired through consolidated Portfolios instead of equity investments in Acquisition Partnerships, the Company expects income from consolidated investments to off-set the decline in equity earnings.
Selected financial data for the second quarter of 2009:
The Company’s total operating expenses (excluding provision, interest and income tax expenses) experienced a modest decline to $9.6 million for the second quarter of 2009 from $10.0 million in the second quarter of 2008 — attributed primarily to $0.9 million of consolidated foreign exchange gains recorded in the second quarter 2009 compared to $0.4 of foreign exchange losses in the same period a year ago. This favorable impact was off-set partially by a $0.7 million increase in salaries for the second quarter 2009 compared to the same quarter last year.
Total interest expense decreased to $3.6 million in the second quarter of 2009 from $3.8 million for the same period in 2008 (even though FirstCity’s second quarter average debt holdings increased to $302.5 million in 2009 from $197.6 million in 2008). The interest expense decrease is attributable to the Company’s lower average cost of funds of 4.8% during the second quarter of 2009 compared to 7.6% from the same period in 2008 due to a decline in market interest rates over the past twelve months.
Conference Call
A conference call will be held on Wednesday, August 12, 2009 at 9:00 a.m. Central Time to discuss second quarter results. A question and answer session will follow the prepared remarks. Details to access the call and webcast are as follows:
Event: | FirstCity Financial Corporation Second Quarter 2009 Conference Call | ||
Date: | Wednesday, August 12, 2009 | ||
Time: | 9:00 a.m. Central Time | ||
Host: | James T. Sartain, FirstCity’s President and Chief Executive Officer | ||
|
|
| |
Web Access: | FirstCity’s web page - | www.fcfc.com/invest.htm or, | |
| CCBN’s Investor websites - | www.streetevents.com and, | |
|
| www.earnings.com | |
|
|
| |
Dial In Access: | Domestic | 866-730-5763 | |
| International | 857-350-1587 | |
|
|
| |
| Pass code | 62900092 | |
Replay available on FirstCity’s web page (www.fcfc.com/invest.htm)
3
FirstCity Financial Corporation is a diversified financial services company with operations dedicated primarily to distressed asset acquisitions and special situations investments. FirstCity has offices in the U.S. and affiliate organizations in Europe and Latin America. FirstCity common stock is listed on the NASDAQ Global Select Market (NASDAQ: FCFC).
Forward-Looking Statements
FirstCity may from time to time make written or oral forward-looking statements, including statements contained in this press release, FirstCity’s filings with the Securities and Exchange Commission (“SEC”), in its reports to stockholders and in other FirstCity communications. These statements relate to FirstCity’s or management’s intentions, hopes, beliefs, expectations, representations, projections, plans or predictions of the future and may be deemed to be forward-looking statements under the Private Securities Litigation Reform Act of 1995, Section 27A of the Securities Act of 1933, as amended, and Section 21E of the Securities Exchange Act of 1934. The forward-looking statements in this press release are based upon management’s beliefs, assumptions and expectations of the Company’s future operations and economic performance, taking into account currently available information. These statements are not statements of historical fact. Forward-looking statements involve risks and uncertainties, some of which are not currently known to us. Actual events or results may differ from those expressed or implied in any such forward-looking statements as a result of various factors, including the risk factors and other risks that are described from time to time in the Company’s filings with the SEC including but not limited to its annual reports on Form 10-K, its quarterly reports on Form 10-Q, and its current reports on Form 8-K, filed with the SEC and available through the Company’s website, which contain a more detailed discussion of the Company’s business, including risks and uncertainties that may affect future results. Due to such uncertainties and risks, readers are cautioned not to place undue reliance on such forward-looking statements, which speak only as of the date hereof. Information in this press release may be superseded by more recent information or statements, which may be disclosed in later press releases, subsequent filings with the SEC or otherwise. The Company expressly disclaims any obligation or undertaking to release publicly any updates or revisions to any forward-looking statements contained herein to reflect any change in the Company’s expectations with regard thereto or to reflect any change in events, conditions or circumstances on which any such f orward-looking statements are based, in whole or in part.
4
FirstCity Financial Corporation
Summary of Operations
(In thousands, except per share data)
(Unaudited)
|
| Three Months Ended |
| Six Months Ended |
| ||||||||
|
| June 30, |
| June 30, |
| ||||||||
|
| 2009 |
| 2008 |
| 2009 |
| 2008 |
| ||||
Revenues: |
|
|
|
|
|
|
|
|
| ||||
Servicing fees |
| $ | 2,403 |
| $ | 2,706 |
| $ | 4,795 |
| $ | 4,906 |
|
Income from Portfolio Assets |
| 14,077 |
| 5,622 |
| 23,120 |
| 10,557 |
| ||||
Gain on sale of SBA loans held for sale, net |
| 610 |
| 133 |
| 610 |
| 142 |
| ||||
Interest income from SBA loans |
| 295 |
| 366 |
| 641 |
| 842 |
| ||||
Interest income from loans receivable - affiliates |
| 939 |
| 483 |
| 1,862 |
| 633 |
| ||||
Interest income from loans receivable - other |
| 364 |
| 355 |
| 793 |
| 630 |
| ||||
Revenue from railroad operations |
| 705 |
| 859 |
| 1,452 |
| 1,664 |
| ||||
Other income |
| 1,268 |
| 965 |
| 3,069 |
| 1,619 |
| ||||
Total revenues |
| 20,661 |
| 11,489 |
| 36,342 |
| 20,993 |
| ||||
Expenses: |
|
|
|
|
|
|
|
|
| ||||
Interest and fees on notes payable to banks |
| 3,145 |
| 3,758 |
| 6,189 |
| 7,441 |
| ||||
Interest and fees on notes payable to affiliates |
| 444 |
| — |
| 877 |
| — |
| ||||
Salaries and benefits |
| 6,032 |
| 5,297 |
| 11,086 |
| 10,327 |
| ||||
Provision for loan and impairment losses |
| 677 |
| 7,090 |
| 1,783 |
| 10,120 |
| ||||
Asset-level expenses |
| 1,417 |
| 1,427 |
| 2,654 |
| 2,988 |
| ||||
Occupancy, data processing and other |
| 2,182 |
| 3,303 |
| 5,588 |
| 5,758 |
| ||||
Total expenses |
| 13,897 |
| 20,875 |
| 28,177 |
| 36,634 |
| ||||
Equity in net earnings of subsidiaries |
| 1,198 |
| 3,008 |
| 1,052 |
| 5,848 |
| ||||
Step acquisition gain from business combination |
| 1,455 |
| — |
| 1,455 |
| — |
| ||||
Earnings (loss) before income taxes |
| 9,417 |
| (6,378 | ) | 10,672 |
| (9,793 | ) | ||||
Income taxes |
| (440 | ) | (98 | ) | (703 | ) | (289 | ) | ||||
Net earnings (loss) |
| 8,977 |
| (6,476 | ) | 9,969 |
| (10,082 | ) | ||||
Less: net income attributable to noncontrolling interests |
| 1,231 |
| 53 |
| 1,579 |
| 31 |
| ||||
Net earnings (loss) attributable to FirstCity |
| $ | 7,746 |
| $ | (6,529 | ) | $ | 8,390 |
| $ | (10,113 | ) |
|
|
|
|
|
|
|
|
|
| ||||
Basic earnings (loss) per common share are as follows: |
|
|
|
|
|
|
|
|
| ||||
Net earnings (loss) attributable to FirstCity stockholders |
| $ | 0.79 |
| $ | (0.63 | ) | $ | 0.85 |
| $ | (0.97 | ) |
Weighted average common shares outstanding |
| 9,832 |
| 10,357 |
| 9,832 |
| 10,471 |
| ||||
|
|
|
|
|
|
|
|
|
| ||||
Diluted earnings (loss) per common share are as follows: |
|
|
|
|
|
|
|
|
| ||||
Net earnings (loss) attributable to FirstCity stockholders |
| $ | 0.76 |
| $ | (0.63 | ) | $ | 0.84 |
| $ | (0.97 | ) |
Weighted average common shares outstanding |
| 10,135 |
| 10,357 |
| 9,983 |
| 10,471 |
| ||||
Selected Unaudited Balance Sheet Data | |||||||
| |||||||
|
| June 30, |
| December 31, |
| ||
|
| 2009 |
| 2008 |
| ||
Cash and cash equivalents |
| $ | 25,521 |
| $ | 19,103 |
|
Restricted cash |
| 1,115 |
| 1,217 |
| ||
Earning assets: |
|
|
|
|
| ||
Portfolio acquisition and resolution assets: |
|
|
|
|
| ||
Domestic |
| 236,465 |
| 167,211 |
| ||
Latin America |
| 42,463 |
| 42,426 |
| ||
Europe |
| 63,802 |
| 48,612 |
| ||
Other |
| — |
| 228 |
| ||
Special situations platform assets |
| 40,483 |
| 37,786 |
| ||
Service fees receivable and other assets |
| 11,488 |
| 12,354 |
| ||
Total assets |
| $ | 421,337 |
| $ | 328,937 |
|
|
|
|
|
|
| ||
Notes payable to banks |
| $ | 295,975 |
| $ | 242,889 |
|
Note payable to affiliate |
| 8,658 |
| 8,658 |
| ||
Other liabilities |
| 17,585 |
| 11,515 |
| ||
Total liabilities |
| 322,218 |
| 263,062 |
| ||
Total equity |
| 99,119 |
| 65,875 |
| ||
Total liabilities and equity |
| $ | 421,337 |
| $ | 328,937 |
|
5
FirstCity Financial Corporation
Supplemental Information
(Dollars in thousands)
(Unaudited)
|
| Three Months Ended |
| Six Months Ended |
| ||||||||
|
| June 30, |
| June 30, |
| ||||||||
|
| 2009 |
| 2008 |
| 2009 |
| 2008 |
| ||||
Summary Operating Statement Data for Each Segment |
|
|
|
|
|
|
|
|
| ||||
Portfolio Asset Acquisition and Resolution segment: |
|
|
|
|
|
|
|
|
| ||||
Revenues |
| $ | 18,969 |
| $ | 10,017 |
| $ | 32,266 |
| $ | 18,250 |
|
Equity in net earnings of subsidiaries |
| 1,840 |
| 3,364 |
| 855 |
| 6,204 |
| ||||
Step acquisition gain from business combination |
| 1,455 |
| — |
| 1,455 |
| — |
| ||||
Expenses |
| (9,805 | ) | (11,231 | ) | (20,178 | ) | (21,368 | ) | ||||
Operating contribution before provision for loan and impairment losses |
| 12,459 |
| 2,150 |
| 14,398 |
| 3,086 |
| ||||
Provision for loan and impairment losses |
| (290 | ) | 7,090 |
| 816 |
| 10,120 |
| ||||
Net income attributable to noncontrolling interests |
| (1,611 | ) | (67 | ) | (1,528 | ) | (38 | ) | ||||
Operating contribution (loss), net of taxes |
| $ | 11,138 |
| $ | (5,007 | ) | $ | 12,054 |
| $ | (7,072 | ) |
|
|
|
|
|
|
|
|
|
| ||||
Special Situations Platform segment: |
|
|
|
|
|
|
|
|
| ||||
Revenues |
| $ | 1,575 |
| $ | 1,427 |
| $ | 3,913 |
| $ | 2,516 |
|
Equity in net earnings (loss) of subsidiaries |
| (642 | ) | (356 | ) | 197 |
| (356 | ) | ||||
Expenses |
| (1,478 | ) | (899 | ) | (2,887 | ) | (1,716 | ) | ||||
Operating contribution (loss) before provision for loan and impairment losses |
| (545 | ) | 172 |
| 1,223 |
| 444 |
| ||||
Provision for loan and impairment losses |
| 967 |
| — |
| 967 |
| — |
| ||||
Net loss (income) attributable to noncontrolling interests |
| 380 |
| 14 |
| (51 | ) | 7 |
| ||||
Operating contribution (loss), net of taxes |
| $ | (1,132 | ) | $ | 186 |
| $ | 205 |
| $ | 451 |
|
|
|
|
|
|
|
|
|
|
| ||||
|
| Three Months Ended |
| Six Months Ended |
| ||||||||
|
| June 30, |
| June 30, |
| ||||||||
|
| 2009 |
| 2008 |
| 2009 |
| 2008 |
| ||||
Portfolio Asset Acquisition and Resolution segment: |
|
|
|
|
|
|
|
|
| ||||
Revenues and equity in earnings of investments by region: |
|
|
|
|
|
|
|
|
| ||||
Domestic |
| $ | 15,785 |
| $ | 6,177 |
| $ | 25,518 |
| $ | 11,807 |
|
Latin America |
| 4,355 |
| 3,853 |
| 5,274 |
| 6,888 |
| ||||
Europe |
| 661 |
| 3,340 |
| 2,313 |
| 5,735 |
| ||||
Canada |
| 8 |
| 11 |
| 16 |
| 24 |
| ||||
Total |
| $ | 20,809 |
| $ | 13,381 |
| $ | 33,121 |
| $ | 24,454 |
|
|
|
|
|
|
|
|
|
|
| ||||
Revenues and equity in earnings of investments by source: |
|
|
|
|
|
|
|
|
| ||||
Equity in net earnings of subsidiaries |
| $ | 1,840 |
| $ | 3,364 |
| $ | 855 |
| $ | 6,204 |
|
Income from Portfolio Assets |
| 14,077 |
| 5,622 |
| 23,120 |
| 10,557 |
| ||||
Servicing fees |
| 2,403 |
| 2,706 |
| 4,795 |
| 4,906 |
| ||||
Gain on sale of SBA loans held for sale, net |
| 610 |
| 133 |
| 610 |
| 142 |
| ||||
Interest income from SBA loans |
| 295 |
| 366 |
| 641 |
| 842 |
| ||||
Interest income from affiliates |
| 553 |
| 147 |
| 1,089 |
| 297 |
| ||||
Interest income from loans receivable - other |
| 207 |
| 123 |
| 414 |
| 136 |
| ||||
Other |
| 824 |
| 920 |
| 1,597 |
| 1,370 |
| ||||
Total |
| $ | 20,809 |
| $ | 13,381 |
| $ | 33,121 |
| $ | 24,454 |
|
|
|
|
|
|
|
|
|
|
| ||||
Special Situations Platform segment: |
|
|
|
|
|
|
|
|
| ||||
Revenues and equity in earnings of investments by source: |
|
|
|
|
|
|
|
|
| ||||
Equity in net earnings (loss) of subsidiaries |
| $ | (642 | ) | $ | (356 | ) | $ | 197 |
| $ | (356 | ) |
Interest income from loans receivable - affiliates |
| 386 |
| 336 |
| 773 |
| 336 |
| ||||
Interest income from loans receivable - other |
| 158 |
| 232 |
| 379 |
| 494 |
| ||||
Revenue from railroad operations |
| 705 |
| 859 |
| 1,452 |
| 1,664 |
| ||||
Other |
| 326 |
| — |
| 1,309 |
| 22 |
| ||||
Total |
| $ | 933 |
| $ | 1,071 |
| $ | 4,110 |
| $ | 2,160 |
|
|
|
|
|
|
|
|
|
|
| ||||
Number of personnel at period end: |
|
|
|
|
|
|
|
|
| ||||
Domestic, Portfolio Asset Acquisition and Resolution segment |
| 82 |
| 77 |
|
|
|
|
| ||||
Domestic, Special Situations Platform segment |
| 25 |
| 24 |
|
|
|
|
| ||||
Latin America |
| 127 |
| 127 |
|
|
|
|
| ||||
Corporate |
| 31 |
| 35 |
|
|
|
|
| ||||
Total personnel |
| 265 |
| 263 |
|
|
|
|
| ||||
6
FirstCity Financial Corporation
Supplemental Information
(Dollars in thousands)
(Unaudited)
Portfolio Purchases and Other Investments:
|
|
|
|
|
|
|
|
|
|
|
|
|
| FirstCity |
|
|
| ||||||||
|
| Portfolio Purchases |
|
|
| FirstCity |
| Investment |
|
|
| ||||||||||||||
|
|
|
|
|
| Latin |
|
|
| FirstCity |
| Investment |
| in Special |
|
|
| ||||||||
|
| Domestic |
| Europe |
| America |
| Total |
| Investment |
| in Other |
| Situations |
| Total |
| ||||||||
2009 |
|
|
|
|
|
|
|
|
|
|
|
|
|
|
|
|
| ||||||||
2nd Quarter |
| $ | 67,085 |
| $ | — |
| $ | — |
| $ | 67,085 |
| $ | 48,559 |
| $ | 19,149 |
| $ | 3,164 |
| $ | 70,872 |
|
1st Quarter |
| 70,238 |
| — |
| — |
| 70,238 |
| 64,907 |
| 6,418 |
| 2,400 |
| 73,725 |
| ||||||||
Total Year 2009 |
| $ | 137,323 |
| $ | — |
| $ | — |
| $ | 137,323 |
| $ | 113,466 |
| $ | 25,567 |
| $ | 5,564 |
| $ | 144,597 |
|
2008 |
|
|
|
|
|
|
|
|
|
|
|
|
|
|
|
|
| ||||||||
4th Quarter |
| $ | 26,363 |
| $ | 1,823 |
| $ | — |
| $ | 28,186 |
| $ | 27,183 |
| $ | 10,071 |
| $ | 3,150 |
| $ | 40,404 |
|
3rd Quarter |
| 2,912 |
| — |
| 1,576 |
| 4,488 |
| 3,241 |
| 6,040 |
| — |
| 9,281 |
| ||||||||
2nd Quarter |
| 28,427 |
| — |
| 8,314 |
| 36,741 |
| 33,448 |
| 15,443 |
| 16,756 |
| 65,647 |
| ||||||||
1st Quarter |
| 6,692 |
| — |
| 13,207 |
| 19,899 |
| 8,435 |
| 1,453 |
| — |
| 9,888 |
| ||||||||
Total Year 2008 |
| $ | 64,394 |
| $ | 1,823 |
| $ | 23,097 |
| $ | 89,314 |
| $ | 72,307 |
| $ | 33,007 |
| $ | 19,906 |
| $ | 125,220 |
|
Total Year 2007 |
| $ | 121,679 |
| $ | 23,199 |
| $ | 69,455 |
| $ | 214,333 |
| $ | 126,714 |
| $ | 10,476 |
| $ | 11,530 |
| $ | 148,720 |
|
Total Year 2006 |
| $ | 136,596 |
| $ | 102,158 |
| $ | 58,236 |
| $ | 296,990 |
| $ | 144,048 |
| $ | 28,181 |
| $ | — |
| $ | 172,229 |
|
Portfolio Asset Acquisition and Resolution segment:
|
| Three Months Ended |
| Six Months Ended |
| ||||||||
|
| June 30, |
| June 30, |
| ||||||||
|
| 2009 |
| 2008 |
| 2009 |
| 2008 |
| ||||
Aggregate purchase price of portfolios acquired: |
|
|
|
|
|
|
|
|
| ||||
Acquisition partnerships |
|
|
|
|
|
|
|
|
| ||||
Domestic |
| $ | 67,085 |
| $ | 28,426 |
| $ | 137,323 |
| $ | 35,119 |
|
Latin America |
| — |
| 8,314 |
| — |
| 21,521 |
| ||||
Europe |
| — |
| — |
| — |
| — |
| ||||
Total |
| $ | 67,085 |
| $ | 36,740 |
| $ | 137,323 |
| $ | 56,640 |
|
|
| Purchase |
| FirstCity’s |
| ||
|
| Price |
| Investment |
| ||
Historical Acquisitions of Portfolios - Annual: |
|
|
|
|
| ||
Six months ended June 30, 2009 |
| $ | 137,323 |
| $ | 113,466 |
|
2008 |
| 89,314 |
| 72,307 |
| ||
2007 |
| 214,333 |
| 126,714 |
| ||
2006 |
| 296,990 |
| 144,048 |
| ||
2005 |
| 146,581 |
| 71,405 |
| ||
2004 |
| 174,139 |
| 59,762 |
| ||
|
| June 30, |
| December 31, |
| ||
|
| 2009 |
| 2008 |
| ||
Portfolio acquisition and resolution assets by region: |
|
|
|
|
| ||
Domestic |
| $ | 236,465 |
| $ | 167,211 |
|
Latin America |
| 42,463 |
| 42,426 |
| ||
Europe |
| 63,802 |
| 48,612 |
| ||
Canada |
| — |
| 228 |
| ||
Total |
| $ | 342,730 |
| $ | 258,477 |
|
Special Situations Platform segment:
|
| Total |
| FirstCity Denver’s Investment |
| ||||||||
|
| Investment |
| Debt |
| Equity |
| Total |
| ||||
Historical Investments - Annual: |
|
|
|
|
|
|
|
|
| ||||
Six months ended June 30, 2009 |
| $ | 6,310 |
| $ | 5,177 |
| $ | 387 |
| $ | 5,564 |
|
2008 |
| 28,750 |
| 16,650 |
| 3,256 |
| 19,906 |
| ||||
2007 |
| 22,314 |
| 5,630 |
| 5,900 |
| 11,530 |
| ||||
7
FirstCity Financial Corporation
Supplemental Information
(Dollars in thousands)
(Unaudited)
|
| Three Months Ended |
| Six Months Ended |
| ||||||||
|
| June 30, |
| June 30, |
| ||||||||
|
| 2009 |
| 2008 |
| 2009 |
| 2008 |
| ||||
Analysis of Equity Investments |
|
|
|
|
|
|
|
|
| ||||
FirstCity’s average investment: |
|
|
|
|
|
|
|
|
| ||||
Domestic, Portfolio Asset Acquisition and Resolution segment |
| $ | 13,928 |
| $ | 21,812 |
| $ | 14,366 |
| $ | 22,903 |
|
Domestic, Special Situations Platform segment |
| 1,529 |
| (110 | ) | 1,329 |
| (63 | ) | ||||
Latin America |
| 17,484 |
| 23,798 |
| 17,783 |
| 23,311 |
| ||||
Europe |
| 12,754 |
| 31,163 |
| 12,989 |
| 30,793 |
| ||||
Europe-Servicing subsidiaries |
| 22,596 |
| 7,189 |
| 22,356 |
| 7,084 |
| ||||
Latin America-Servicing subsidiaries |
| 2,929 |
| 5,271 |
| 2,960 |
| 5,059 |
| ||||
Total |
| $ | 71,220 |
| $ | 89,123 |
| $ | 71,783 |
| $ | 89,087 |
|
|
|
|
|
|
|
|
|
|
| ||||
FirstCity’s share of equity earnings (losses): |
|
|
|
|
|
|
|
|
| ||||
Domestic, Portfolio Asset Acquisition and Resolution segment |
| $ | 515 |
| $ | (112 | ) | $ | 516 |
| $ | 154 |
|
Domestic, Special Situations Platform segment |
| (642 | ) | (356 | ) | 197 |
| (356 | ) | ||||
Latin America |
| 1,391 |
| 735 |
| (253 | ) | 1,104 |
| ||||
Europe |
| 227 |
| 2,394 |
| 979 |
| 4,080 |
| ||||
Europe-Servicing subsidiaries |
| (89 | ) | 494 |
| 80 |
| 810 |
| ||||
Latin America-Servicing subsidiaries |
| (204 | ) | (147 | ) | (467 | ) | 56 |
| ||||
Total |
| $ | 1,198 |
| $ | 3,008 |
| $ | 1,052 |
| $ | 5,848 |
|
|
|
|
|
|
|
|
|
|
| ||||
Selected Other Data: |
|
|
|
|
|
|
|
|
| ||||
Average investment in consolidated portfolio assets and loans receivable: |
|
|
|
|
|
|
|
|
| ||||
Domestic, Portfolio Asset Acquisition and Resolution segment |
| $ | 213,933 |
| $ | 129,338 |
| $ | 190,798 |
| $ | 126,342 |
|
Domestic, Special Situations Platform segment |
| 30,344 |
| 18,366 |
| 29,557 |
| 12,906 |
| ||||
Latin America |
| 19,183 |
| 9,031 |
| 19,413 |
| 8,176 |
| ||||
Europe |
| 15,644 |
| 9,219 |
| 14,196 |
| 9,158 |
| ||||
Canada |
| 175 |
| 295 |
| 196 |
| 321 |
| ||||
Total |
| $ | 279,279 |
| $ | 166,249 |
| $ | 254,160 |
| $ | 156,903 |
|
|
|
|
|
|
|
|
|
|
| ||||
Income from consolidated portfolio assets and loans receivable: |
|
|
|
|
|
|
|
|
| ||||
Domestic, Portfolio Asset Acquisition and Resolution segment |
| $ | 14,218 |
| $ | 5,671 |
| $ | 22,990 |
| $ | 10,644 |
|
Domestic, Special Situations Platform segment |
| 544 |
| 568 |
| 1,152 |
| 830 |
| ||||
Latin America |
| 1,111 |
| 382 |
| 1,887 |
| 703 |
| ||||
Europe |
| 405 |
| 327 |
| 981 |
| 603 |
| ||||
Canada |
| 8 |
| 11 |
| 16 |
| 24 |
| ||||
Total |
| $ | 16,286 |
| $ | 6,959 |
| $ | 27,026 |
| $ | 12,804 |
|
|
|
|
|
|
|
|
|
|
| ||||
Servicing fee revenues: |
|
|
|
|
|
|
|
|
| ||||
Domestic partnerships: |
|
|
|
|
|
|
|
|
| ||||
Servicing fee revenue |
| $ | 606 |
| $ | 347 |
| $ | 1,188 |
| $ | 709 |
|
Average servicing fee % |
| 6.1 | % | 5.4 | % | 8.3 | % | 4.0 | % | ||||
Latin American partnerships: |
|
|
|
|
|
|
|
|
| ||||
Servicing fee revenue |
| $ | 1,722 |
| $ | 2,281 |
| $ | 3,458 |
| $ | 4,129 |
|
Average servicing fee % |
| 43.7 | % | 25.2 | % | 41.9 | % | 20.3 | % | ||||
Total Service Fees-Portfolio Assets: |
|
|
|
|
|
|
|
|
| ||||
Servicing fee revenue |
| $ | 2,328 |
| $ | 2,628 |
| $ | 4,646 |
| $ | 4,838 |
|
Average servicing fee % |
| 16.8 | % | 17.0 | % | 20.5 | % | 12.8 | % | ||||
Service Fees-SBA loans: |
| $ | 75 |
| $ | 78 |
| $ | 149 |
| $ | 68 |
|
Total Service Fees |
| $ | 2,403 |
| $ | 2,706 |
| $ | 4,795 |
| $ | 4,906 |
|
|
|
|
|
|
|
|
|
|
| ||||
Collections: |
|
|
|
|
|
|
|
|
| ||||
Domestic partnerships |
| $ | 9,928 |
| $ | 6,378 |
| $ | 14,375 |
| $ | 17,575 |
|
Latin American partnerships |
| 5,772 |
| 28,752 |
| 11,862 |
| 40,516 |
| ||||
European partnerships |
| 6,314 |
| 20,353 |
| 15,378 |
| 33,121 |
| ||||
Partnership collections |
| 22,014 |
| 55,483 |
| 41,615 |
| 91,212 |
| ||||
Domestic consolidated |
| 50,329 |
| 10,315 |
| 79,194 |
| 28,857 |
| ||||
Latin American consolidated |
| 899 |
| 543 |
| 1,336 |
| 1,029 |
| ||||
European consolidated |
| 462 |
| 568 |
| 1,624 |
| 1,029 |
| ||||
Consolidated collections |
| 51,690 |
| 11,426 |
| 82,154 |
| 30,915 |
| ||||
Total collections |
| $ | 73,704 |
| $ | 66,909 |
| $ | 123,769 |
| $ | 122,127 |
|
|
|
|
|
|
|
|
|
|
| ||||
Servicing portfolio (face value) at period end: |
|
|
|
|
|
|
|
|
| ||||
Domestic |
| $ | 775,307 |
| $ | 601,576 |
|
|
|
|
| ||
Latin America |
| 1,019,685 |
| 1,614,533 |
|
|
|
|
| ||||
Europe |
| 1,698,442 |
| 1,154,890 |
|
|
|
|
| ||||
Total |
| $ | 3,493,434 |
| $ | 3,370,999 |
|
|
|
|
| ||
8
FirstCity Financial Corporation
Supplemental Information
(Dollars in thousands)
(Unaudited)
|
| Three Months Ended |
| Six Months Ended |
| ||||||||
Illustration of the Effects of Foreign |
| June 30, |
| June 30, |
| ||||||||
Currency Fluctuations |
| 2009 |
| 2008 |
| 2009 |
| 2008 |
| ||||
Net earnings (loss) to common stockholders |
| $ | 7,746 |
| $ | (6,529 | ) | $ | 8,390 |
| $ | (10,113 | ) |
Foreign currency gains (losses), net: |
|
|
|
|
|
|
|
|
| ||||
Euro |
| 381 |
| (187 | ) | (60 | ) | 38 |
| ||||
Mexican Peso |
| 1,762 |
| 448 |
| 311 |
| 694 |
| ||||
Argentine Peso |
| (8 | ) | 25 |
| (49 | ) | 22 |
| ||||
Canadian Dollar |
| 15 |
| 3 |
| 10 |
| (12 | ) | ||||
Chilean Peso |
| 79 |
| (42 | ) | 203 |
| 62 |
| ||||
|
|
|
|
|
|
|
|
|
| ||||
Exchange rate at valuation date: |
|
|
|
|
|
|
|
|
| ||||
Euro |
| 0.71 |
| 0.63 |
|
|
|
|
| ||||
Mexican Peso |
| 13.20 |
| 10.28 |
|
|
|
|
| ||||
Argentine Peso |
| 3.80 |
| 3.02 |
|
|
|
|
| ||||
Canadian Dollar |
| 1.16 |
| 1.01 |
|
|
|
|
| ||||
Chilean Peso |
| 539.98 |
| 513.20 |
|
|
|
|
| ||||
9
FirstCity Financial Corporation
Schedule of Estimated Unrealized Gross Profit from Portfolio Assets
June 30, 2009
(Unaudited)
|
| Basis in Portfolio Assets (1), (4) |
| |||||
($ in 000’s) |
| 12/31/2007 |
| 12/31/2008 |
| 6/30/2009 |
| |
Domestic |
| 151,802 |
| 153,148 |
| 203,434 |
| |
Europe |
| 40,340 |
| 29,555 |
| 42,680 |
| |
Latin America |
| 26,844 |
| 29,867 |
| 29,138 |
| |
Total |
| $ | 218,987 |
| 212,570 |
| 275,252 |
|
|
| Estimated Remaining Collections (2) |
| |||||
|
| 12/31/2007 |
| 12/31/2008 |
| 6/30/2009 |
| |
Domestic |
| $ | 195,845 |
| 217,347 |
| 298,447 |
|
Europe |
| 52,617 |
| 39,341 |
| 59,692 |
| |
Latin America |
| 68,900 |
| 78,211 |
| 72,656 |
| |
Total |
| $ | 317,363 |
| 334,899 |
| 430,795 |
|
|
| Estimated Unrealized Gross Profit (3) |
| |||||
|
| 12/31/2007 |
| 12/31/2008 |
| 6/30/2009 |
| |
Domestic |
| $ | 44,043 |
| 64,199 |
| 95,013 |
|
Europe |
| 12,278 |
| 9,787 |
| 17,012 |
| |
Latin America |
| 42,056 |
| 48,344 |
| 43,518 |
| |
Total |
| $ | 98,376 |
| 122,329 |
| 155,543 |
|
|
| Estimated Unrealized Gross Profit % |
| ||||
|
| 12/31/2007 |
| 12/31/2008 |
| 6/30/2009 |
|
Domestic |
| 22.49 | % | 29.54 | % | 31.84 | % |
Europe |
| 23.33 | % | 24.88 | % | 28.50 | % |
Latin America |
| 61.04 | % | 61.81 | % | 59.90 | % |
Total |
| 31.00 | % | 36.53 | % | 36.11 | % |
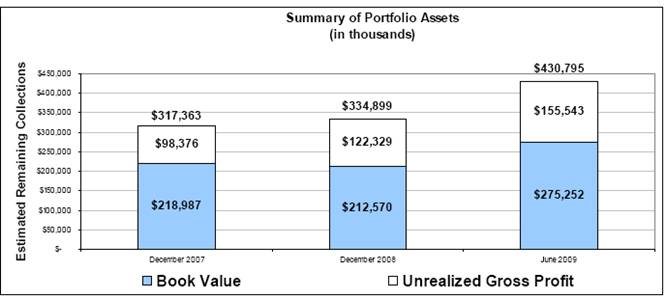
This schedule provides selected information related to the Company’s ownership interests in consolidated and non-consolidated Portfolio Assets and is provided for informational purposes to provide an indication of the future potential unrealized gross profit attributable to those portfolios. In preparing this schedule, management was required to make certain estimates and assumptions surrounding the underlying assets in the Portfolios that impact the reported amounts. Such estimates and assumptions could change in the future, as more information becomes known, which could impact the reported amounts. As future events and their effects cannot be determined with precision, actual results could differ significantly from these estimates.
(1) Basis in Portfolio Assets represents FirstCity’s share of the unamortized purchase price of the Portfolios held by the various acquisition entities, some of which are consolidated by FirstCity and others held through equity investments in unconsolidated partnerships.
(2) Estimated Remaining Collections represents FirstCity’s share of future projected net cash collections expected from the Portfolios Assets.
(3) Unrealized Gross Profit represents the excess difference between the Estimated Remaining Collections and the Basis in Portfolio Assets.
(4) FirstCity considers Basis in Portfolio Assets a useful measurement of the Company’s underlying holdings and interests in Portfolio Assets. As FirstCity’s share of Basis in Portfolio Assets is considered a non-GAAP measure, the following reconciliation is provided:
|
| 12/31/2007 |
| 12/31/2008 |
| 6/30/2009 |
| |
FirstCity’s consolidated Portfolio Assets (as reported in “Total Portfolio Assets” on the balance sheet of the respective Form 10-K or 10-Q) |
| $ | 122,001 |
| 148,213 |
| 237,426 |
|
Noncontrolling interests in FirstCity’s consolidated Portfolio Assets (component of “Non-controlling interests” on the balance sheet of the respective Form 10-K or 10-Q) |
| (4,474 | ) | (11,460 | ) | (38,482 | ) | |
FirstCity’s interest in Portfolio Assets held by Acquisition Partnerships (a component of “Assets” as reported in the “Condensed Combined Balance Sheets” tabular disclosure under the “Equity Investments” footnote of the respective Form 10-K or 10-Q) |
| 101,460 |
| 75,817 |
| 76,308 |
| |
FirstCity’s basis in consolidated and non-consolidated Portfolio Assets |
| $ | 218,987 |
| 212,570 |
| 275,252 |
|
10