GSI Commerce, Inc.
(Nasdaq: GSIC)
August 2004
Safe Harbor Statement
All statements made in this presentation, other than statements of historical fact, are or will be forward-looking statements. The words “anticipate,” “believe,” “estimate,” “expect,” “intend,” “may,” “plan,” “will,” “would,” “should,” “guidance,” “potential,” “continue,” “project,” “forecast,” “confident,” “prospects,” and similar expressions typically are used to identify forward-looking statements. Forward-looking statements are based on the then-current expectations, beliefs, assumptions, estimates and forecasts about the business of GSI Commerce and the industries and markets in which GSI Commerce operates. These statements are not guarantees of future performance and involve risks, uncertainties and assumptions, which are difficult to predict. Therefore, actual outcomes and results may differ materially from what is expressed or implied by these forward-looking statements. Factors which may affect GSI Commerce’s business, financial condition and operating results include the effects of changes in the economy, consumer spending, the financial markets and the industries in which GSI Commerce and its partners operate, changes affecting the Internet and e-commerce, the ability of GSI Commerce to develop and maintain relationships with strategic partners and suppliers and the timing of its establishment or extension of its relationships with strategic partners, the ability of GSI Commerce to timely and successfully develop, maintain and protect its technology and product and service offerings and execute operationally, the ability of GSI Commerce to attract and retain qualified personnel, the ability of GSI Commerce to successfully integrate its acquisitions of other businesses, if any, and the performance of acquired businesses. More information about potential factors that could affect GSI Commerce can be found in its most recent Form 10-K, Form 10-Q and other reports and statements filed by GSI Commerce with the Securities and Exchange Commission. GSI Commerce expressly disclaims any intent or obligation to update these forward-looking statements, except as otherwise specifically stated by GSI Commerce.
2
Non-GAAP Financial Measures
This presentation contains adjusted EBITDA, net merchandise sales and certain ratios that use net merchandise sales. Net merchandise sales represent the retail value of all sales transactions, inclusive of freight charges and net of allowances for returns and discounts, which flow through the GSI Commerce platform, whether or not the company is the seller of the merchandise or records the full amount of such sales on its financial statements. Adjusted EBITDA represents earnings (or losses) before interest income/expense, taxes, depreciation, amortization, and stock-based compensation. GSI Commerce uses adjusted EBITDA as a means to evaluate its performance period to period without taking into account certain expenses, particularly stock-based compensation expense, which may fluctuate materially due to fluctuations in the price of GSI Commerce’s common stock both on a quarterly and annual basis, and does not consistently reflect GSI Commerce’s results from its core business activities. GSI Commerce also uses net merchandise sales as a metric for operating its business. Variable costs such as fulfillment and customer service labor expense, order processing costs such as credit card and bank processing fees and business management costs such as marketing department staffing levels are related to the amount of sales made through GSI Commerce’s platform, whether or not GSI Commerce records the revenue from such sales. GSI Commerce believes that investors will have a more thorough understanding of its historical expenses and expense trends if they have visibility to both GAAP net revenue as well as the non-GAAP financial measure of net merchandise sales and the percentages that such expenses bear to net revenues and net merchandise sales. These financial measures should be considered in addition to, and not as a substitute for, or superior to, other measures of financial performance prepared in accordance with GAAP. The non-GAAP financial measures included in this presentation have been reconciled to the nearest GAAP measures, as is required under SEC rules, in Appendices A, A-1, B and B-1. A reconciliation of these financial measures with GAAP information can also be found in our SEC filings as well as in our press releases, which can be found in the press room section on our Web site at gsicommerce.com. As used in herein, “GAAP” refers to accounting principle generally accepted in the United States of America.
3

Presentation Agenda
GSI Commerce . . . A Snapshot The Market Opportunity Our Solution Compelling Value & Growth Strategy Financials
4
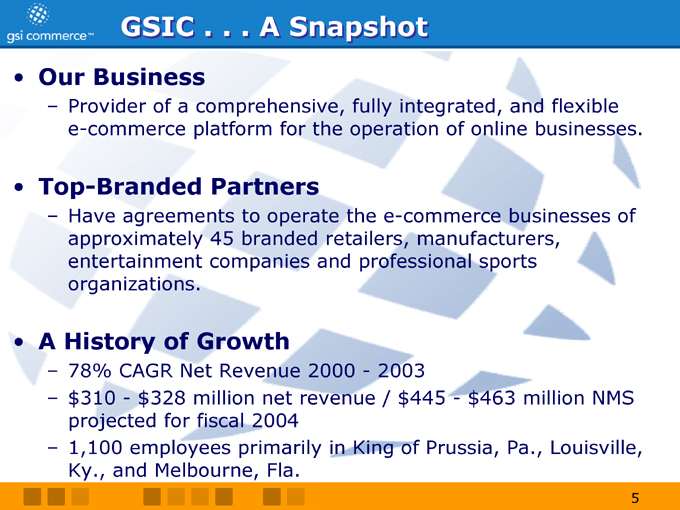
GSIC . . . A Snapshot
Our Business
Provider of a comprehensive, fully integrated, and flexible e-commerce platform for the operation of online businesses.
Top-Branded Partners
Have agreements to operate the e-commerce businesses of approximately 45 branded retailers, manufacturers, entertainment companies and professional sports organizations.
A History of Growth
78% CAGR Net Revenue 2000—2003 $310—$328 million net revenue / $445—$463 million NMS projected for fiscal 2004 1,100 employees primarily in King of Prussia, Pa., Louisville, Ky., and Melbourne, Fla.
5
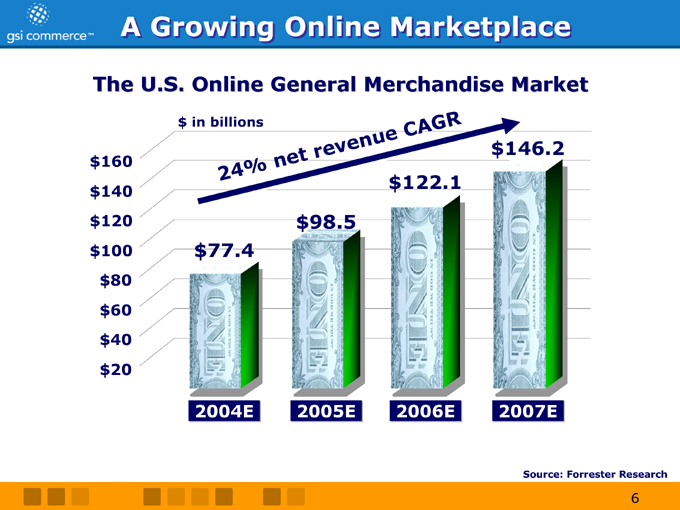
A Growing Online Marketplace
24% net revenue CAGR
The U.S. Online General Merchandise Market $ in billions $160 $140 $120 $100 $80 $60 $40 $20
2004E 2005E 2006E 2007E $77.4 $98.5 $122.1 $146.2
Source: Forrester Research
6
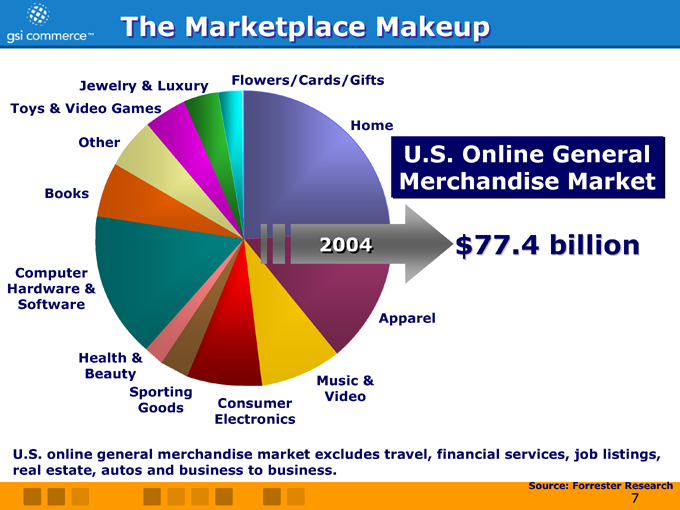
The Marketplace Makeup
Jewelry & Luxury
Flowers/Cards/Gifts
Toys & Video Games
Other
Books
Computer Hardware & Software
Home
Health & Beauty
Sporting Goods
Consumer Electronics
Music & Video
Apparel
2004 $77.4 billion
U.S. Online General Merchandise Market
U.S. online general merchandise market excludes travel, financial services, job listings, real estate, autos and business to business.
Source: Forrester Research
7
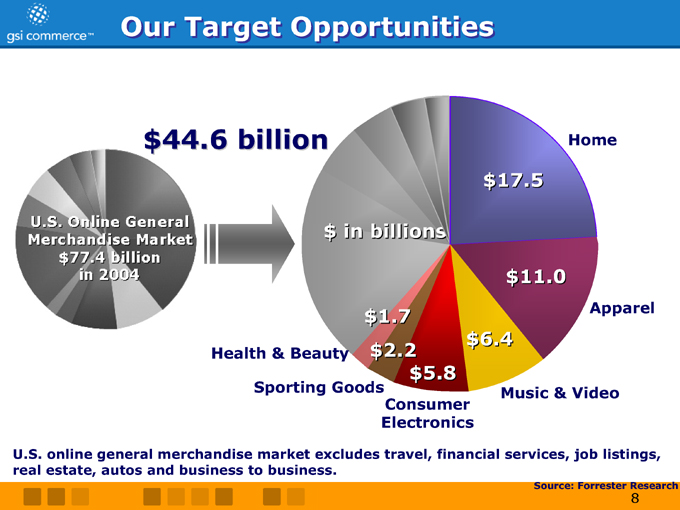
Our Target Opportunities $44.6 billion
$ in billions $17.5
U.S. Online General Merchandise Market $77.4 billion in 2004
$11.0 $1.7
Home
Health & Beauty
Sporting Goods $2.2
$6.4 $5.8
Apparel
Music & Video
Consumer Electronics
U.S. online general merchandise market excludes travel, financial services, job listings, real estate, autos and business to business.
Source: Forrester Research
8
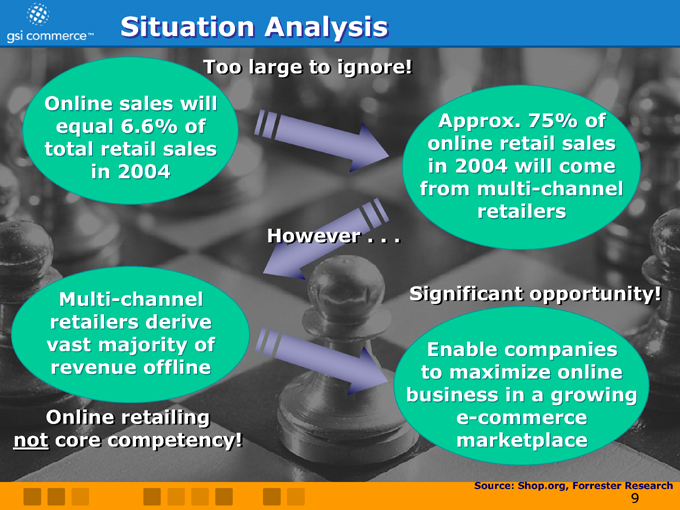
Situation Analysis
Too large to ignore!
Online sales will equal 6.6% of total retail sales in 2004
Approx. 75% of online retail sales in 2004 will come from multi-channel retailers
However . . .
Multi-channel retailers derive vast majority of revenue offline
Significant opportunity!
Enable companies to maximize online business in a growing e-commerce marketplace
Online retailing not core competency!
Source: Shop.org, Forrester Research
9
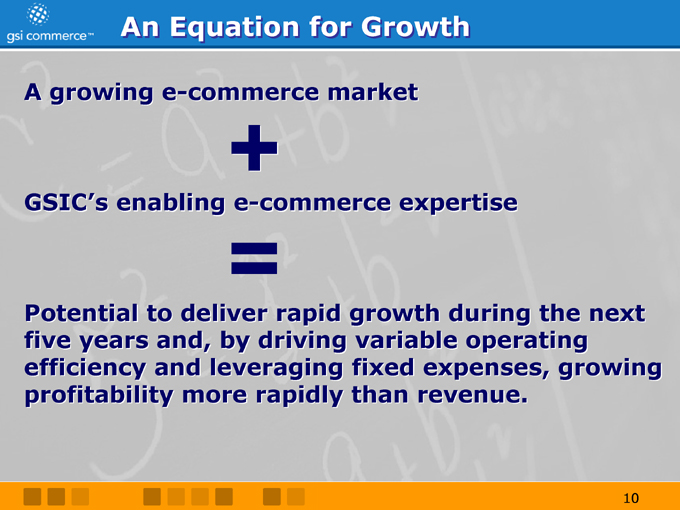
An Equation for Growth
+
A growing e-commerce market
GSIC’s enabling e-commerce expertise
=
Potential to deliver rapid growth during the next five years and, by driving variable operating efficiency and leveraging fixed expenses, growing profitability more rapidly than revenue.
10
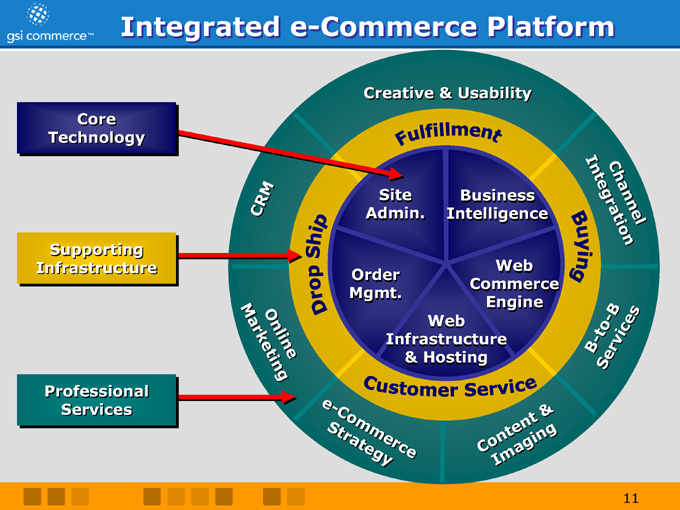
Integrated e-Commerce Platform
Creative & Usability
Site Admin.
Business Intelligence
Order Mgmt.
Web Commerce Engine
Web Infrastructure & Hosting
Channel Integration
B-to-B Services
Content & Imaging
e-Commerce Strategy
Online Marketing
CRM
Buying
Drop Ship
Fulfillment
Customer service
Core Technology
Supporting Infrastructure
Professional Services
11
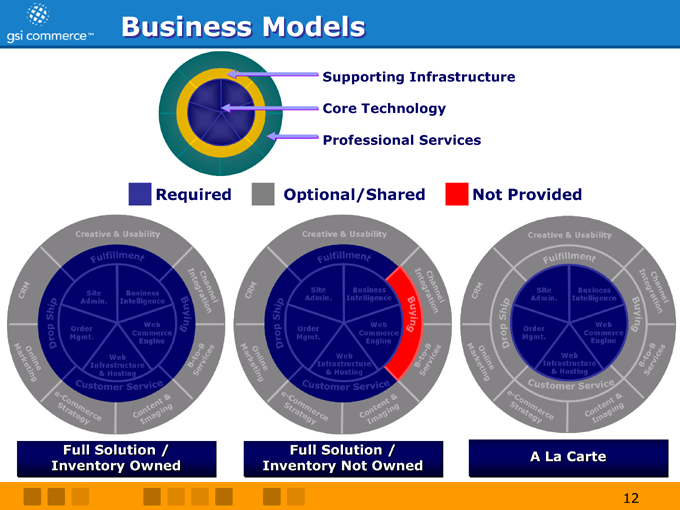
Business Models
Supporting Infrastructure Core Technology Professional Services
Required
Creative & Usability
Channel Integration
B-to-B Services
Content & Imaging
e-Commerce Strategy
Online Marketing
CRM
Buying
Drop Ship
Fulfillment
Customer service
Site Admin.
Business Intelligence
Web Commerce Engine
Web Infrastructure
Order Mgmt,
Optional/Shared
Not Provided
Full Solution / Inventory Owned
Full Solution / Inventory Not Owned
A La Carte
12

Partnering with Top Brands
Apparel & Footwear
Electronics, Home, & GM
Sports Organizations
Sporting Goods
Beauty
Media & Entertainment
13
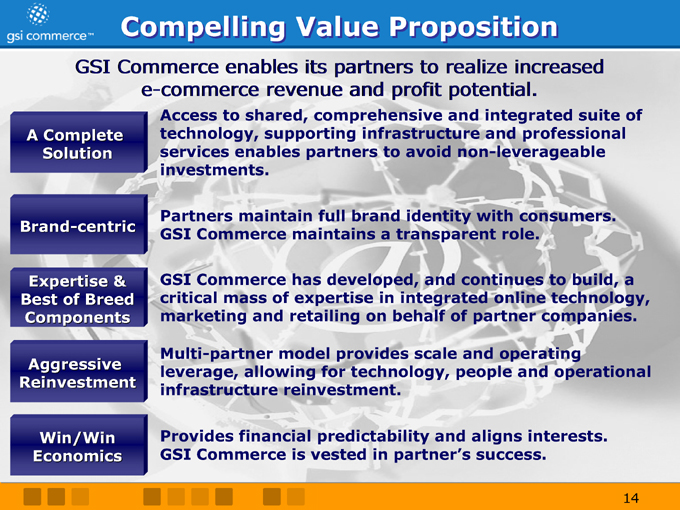
Compelling Value Proposition
GSI Commerce enables its partners to realize increased e-commerce revenue and profit potential.
A Complete Solution
Access to shared, comprehensive and integrated suite of technology, supporting infrastructure and professional services enables partners to avoid non-leverageable investments.
Brand-centric
Partners maintain full brand identity with consumers. GSI Commerce maintains a transparent role.
Expertise & Best of Breed Components
GSI Commerce has developed, and continues to build, a critical mass of expertise in integrated online technology, marketing and retailing on behalf of partner companies.
Aggressive Reinvestment
Multi-partner model provides scale and operating leverage, allowing for technology, people and operational infrastructure reinvestment.
Win/Win Economics
Provides financial predictability and aligns interests. GSI Commerce is vested in partner’s success.
14
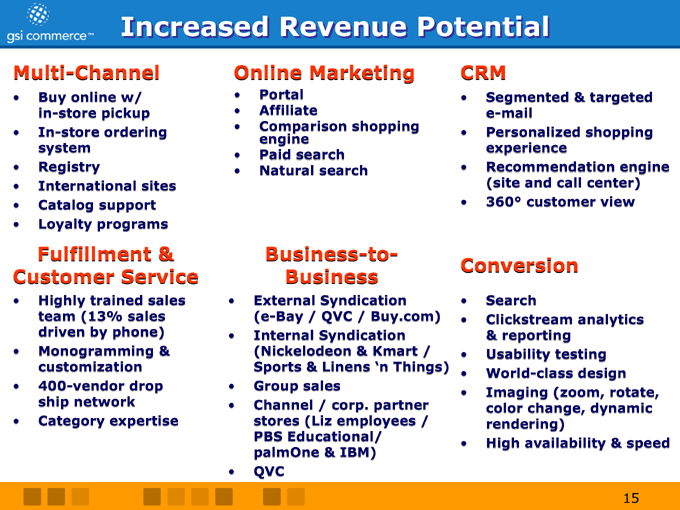
Increased Revenue Potential
Multi-Channel
Buy online w/ in-store pickup In-store ordering system Registry International sites Catalog support Loyalty programs
Online Marketing
Portal Affiliate
Comparison shopping engine Paid search Natural search
CRM
Segmented & targeted e-mail Personalized shopping experience Recommendation engine (site and call center) 360° customer view
Fulfillment &
Customer Service
Highly trained sales team (13% sales driven by phone) Monogramming & customization 400-vendor drop ship network Category expertise
Business-to-
Business
External Syndication (e-Bay / QVC / Buy.com) Internal Syndication (Nickelodeon & Kmart / Sports & Linens ‘n Things) Group sales Channel / corp. partner stores (Liz employees / PBS Educational/ palmOne & IBM) QVC
Conversion
Search
Clickstream analytics & reporting Usability testing World-class design Imaging (zoom, rotate, color change, dynamic rendering) High availability & speed
15
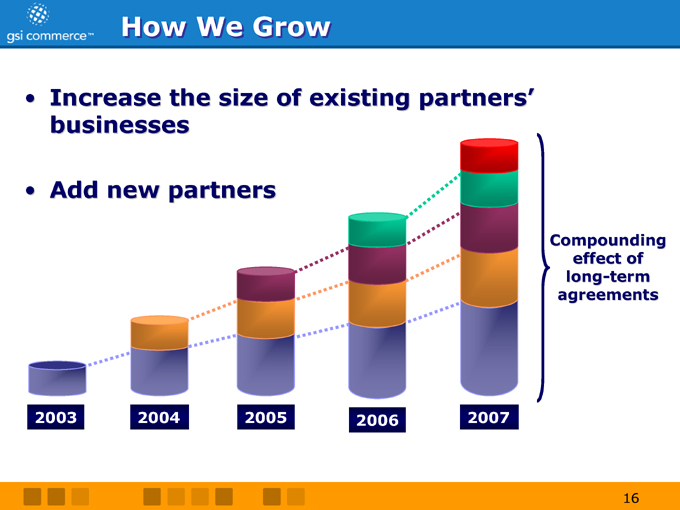
How We Grow
Increase the size of existing partners’ businesses
Add new partners
Compounding effect of long-term agreements
2003
2004
2005
2006
2007
16
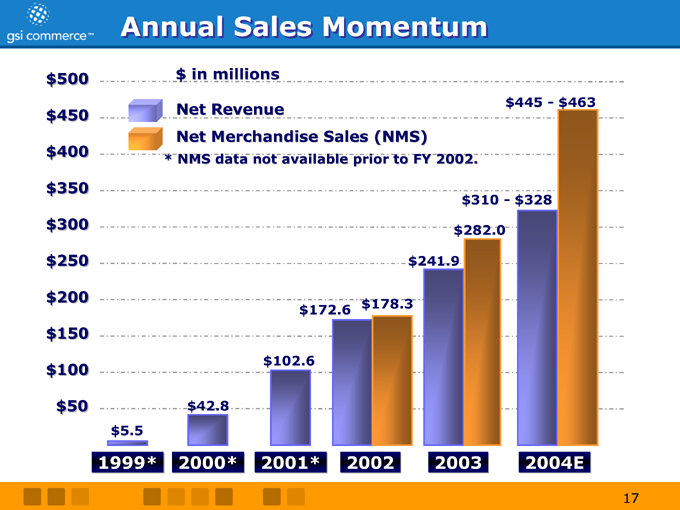
Annual Sales Momentum $500 $450 $400 $350 $300 $250 $200 $150 $100 $50
1999* 2000* 2001* 2002 2003 2004E $ in millions
Net Revenue
* Net Merchandise Sales (NMS)
NMS data not available prior to FY 2002.
$5.5 $42.8 $102.6 $172.6 $178.3 $241.9 $282.0 $310—$328 $445—$463
17
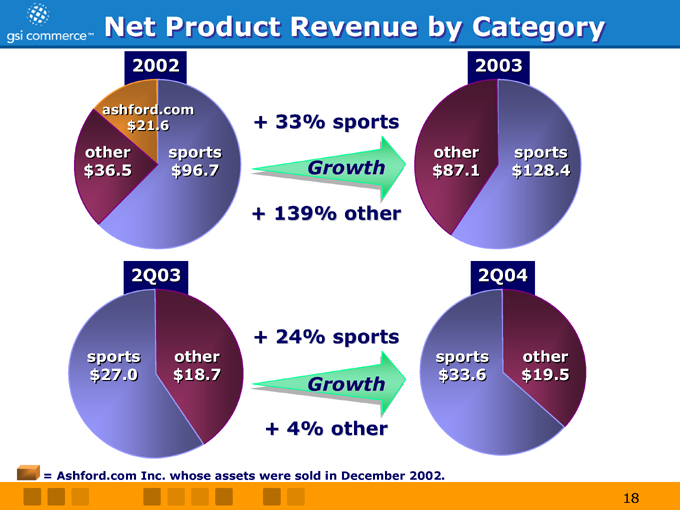
Net Product Revenue by Category
2002 ashford.com $21.6 other $36.5 sports $96.7
2003 other $87.1 sports $128.4
+ 33% sports
Growth
+ 139% other
2Q03 sports $27.0 other $18.7
+ 24% sports
Growth
+ 4% other
2Q04 sports $33.6 other $19.5
= Ashford.com Inc. whose assets were sold in December 2002.
18
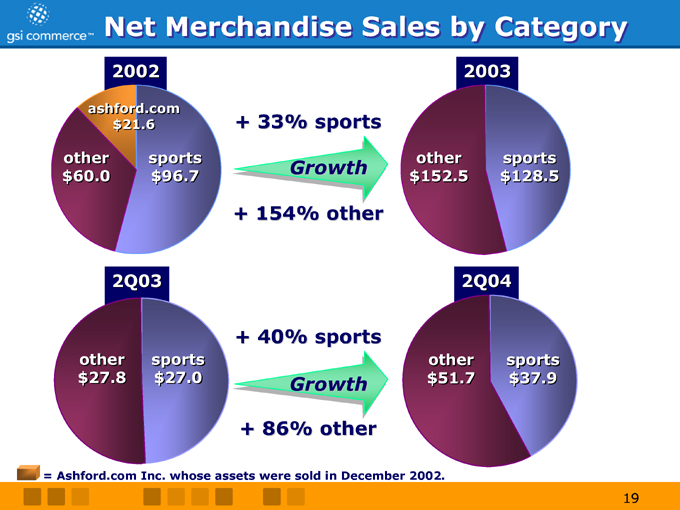
Net Merchandise Sales by Category
2002 ashford.com $21.6 other $60.0 sports $96.7
+ 33% sports
Growth
+ 154% other
2003 other $152.5 sports $128.5
2Q03 other $27.8 sports $27.0
+ 40% sports
Growth
+ 86% other
2Q04 other $51.7 sports $37.9
= Ashford.com Inc. whose assets were sold in December 2002.
19
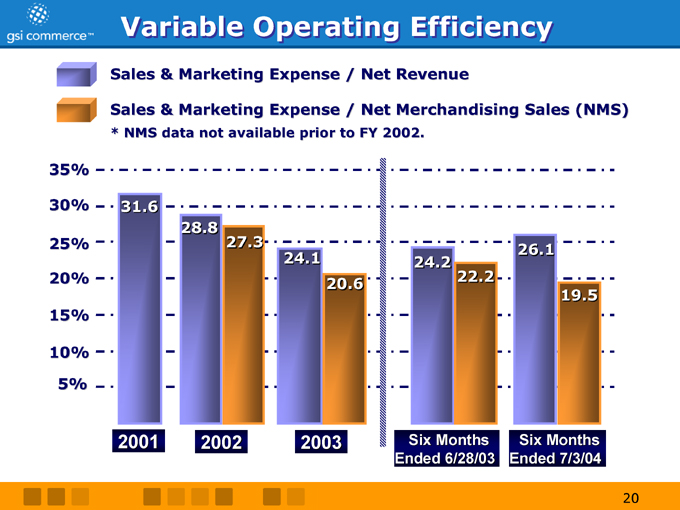
Variable Operating Efficiency
Sales & Marketing Expense / Net Revenue
Sales & Marketing Expense / Net Merchandising Sales (NMS)
* NMS data not available prior to FY 2002.
35% 30% 25% 20% 15% 10% 5%
2001 2002 2003
31.6
28.8
27.3
24.1
20.6
24.2
22.2
26.1
19.5
Six Months Ended 6/28/03
Six Months Ended 7/3/04
20
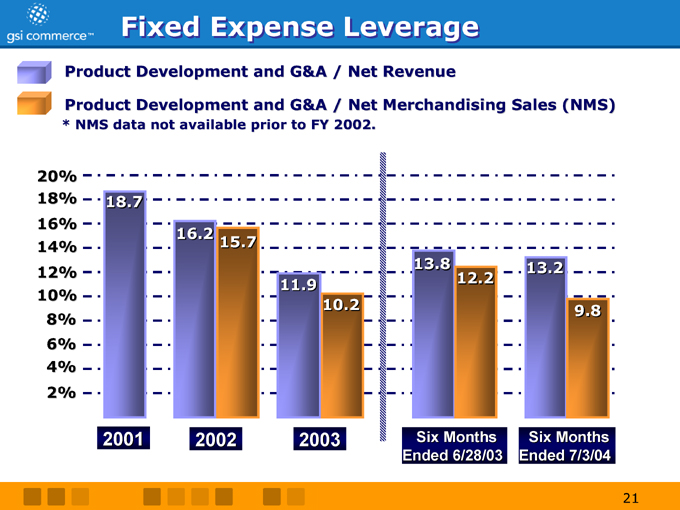
Fixed Expense Leverage
Product Development and G&A / Net Revenue
Product Development and G&A / Net Merchandising Sales (NMS)
* NMS data not available prior to FY 2002.
20% 18% 16% 14% 12% 10% 8% 6% 4% 2%
18.7
16.2
15.7
11.9
10.2
2001 2002 2003
13.8
12.2
13.2
9.8
Six Months Ended 6/28/03
Six Months Ended 7/3/04
21
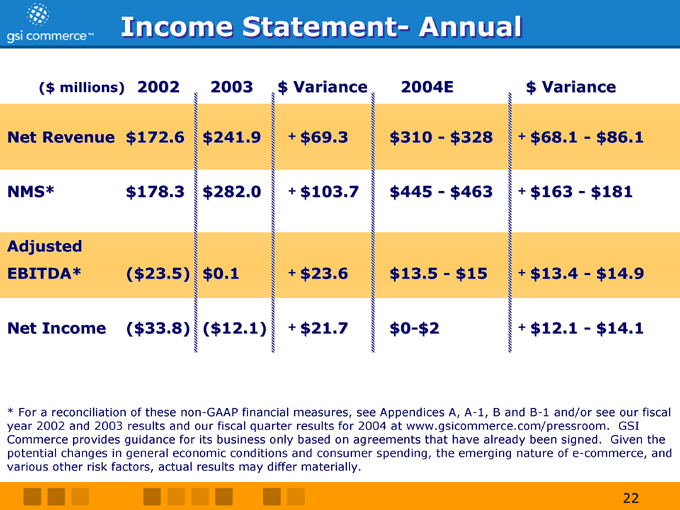
Income Statement- Annual
($ millions) 2002 2003 $ Variance 2004E $ Variance Net Revenue $172.6 $241.9 + $69.3 $310 - $328 + $68.1 - $86.1 NMS* $178.3 $282.0
+ $103.7 $445 - $463 + $163 - $181
Adjusted
EBITDA* ($23.5) $0.1 + $23.6 $13.5 - $15 + $13.4 - $14.9
Net Income ($33.8) ($12.1) + $21.7 $0-$2 + $12.1 - $14.1
* For a reconciliation of these non-GAAP financial measures, see Appendices A, A-1, B and B-1 and/or see our fiscal year 2002 and 2003 results and our fiscal quarter results for 2004 at www.gsicommerce.com/pressroom. GSI Commerce provides guidance for its business only based on agreements that have already been signed. Given the potential changes in general economic conditions and consumer spending, the emerging nature of e-commerce, and various other risk factors, actual results may differ materially.
22
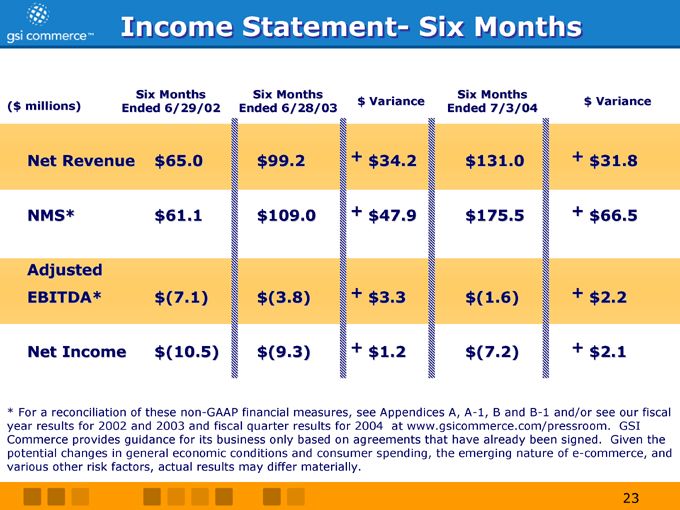
Income Statement- Six Months
($ millions)
Six Months Ended 6/29/02
Six Months Ended 6/28/03 $ Variance
Six Months Ended 7/3/04 $ Variance
Net Revenue $65.0 $99.2 + $34.2 $131.0 + $31.8
NMS* $61.1 $109.0 + $47.9 $175.5 + $66.5
Adjusted
EBITDA* $(7.1) $(3.8) + $3.3 $(1.6) + $2.2
Net Income $(10.5) $(9.3) + $1.2 $(7.2) + $2.1
* For a reconciliation of these non-GAAP financial measures, see Appendices A, A-1, B and B-1 and/or see our fiscal year results for 2002 and 2003 and fiscal quarter results for 2004 at www.gsicommerce.com/pressroom. GSI Commerce provides guidance for its business only based on agreements that have already been signed. Given the potential changes in general economic conditions and consumer spending, the emerging nature of e-commerce, and various other risk factors, actual results may differ materially.
23
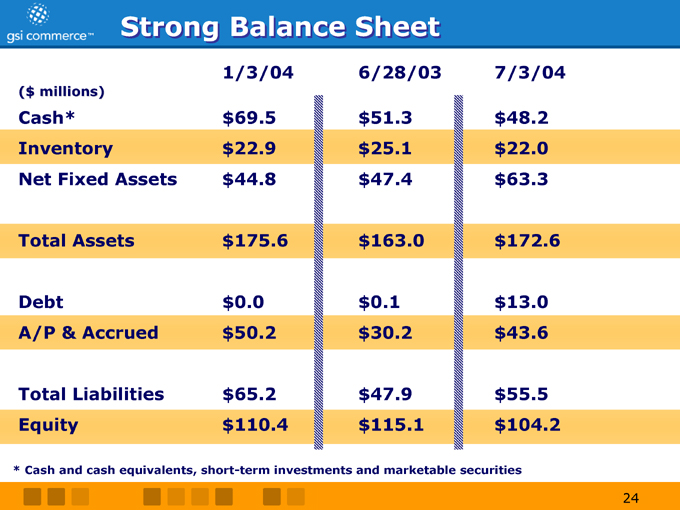
Strong Balance Sheet
1/3/04 6/28/03 7/3/04
($ millions)
Cash* $69.5 $51.3 $48.2 Inventory $22.9 $25.1 $22.0 Net Fixed Assets $44.8 $47.4 $63.3
Total Assets $175.6 $163.0 $172.6
Debt $0.0 $0.1 $13.0 A/P & Accrued $50.2 $30.2 $43.6
Total Liabilities $65.2 $47.9 $55.5 Equity $110.4 $115.1 $104.2
* Cash and cash equivalents, short-term investments and marketable securities
24

GSIC . . . e-Commerce Expertise
25
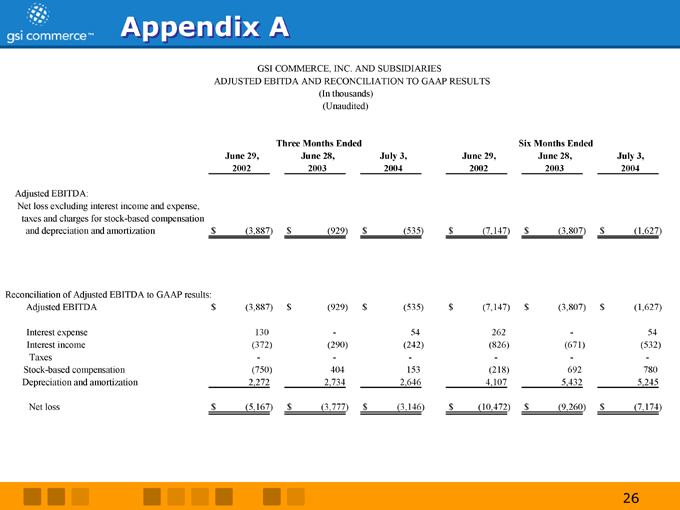
Appendix A
GSI COMMERCE, INC. AND SUBSIDIARIES
ADJUSTED EBITDA AND RECONCILIATION TO GAAP RESULTS
(In thousands) (Unaudited)
June 29, 2002
Three Months Ended June 28, 2003
July 3, 2004
June 29, 2002
Six Months Ended June 28, 2003
July 3, 2004
Adjusted EBITDA:
Net loss excluding interest income and expense, taxes and charges for stock-based compensation and depreciation and amortization $ (3,887) $ (929) $ (535) $ (7,147) $ (3,807) $ (1,627)
Reconciliation of Adjusted EBITDA to GAAP results:
Adjusted EBITDA $ (3,887) $ (929) $ (535) $ (7,147) $ (3,807) $ (1,627)
Interest expense 130 - 54 262 - 54
Interest income (372) (290) (242) (826) (671) (532)
Taxes - - - - - -
Stock-based compensation (750) 404 153 (218) 692 780 Depreciation and amortization 2,272 2,734 2,646 4,107 5,432 5,245
Net loss $ (5,167) $ (3,777) $ (3,146) $ (10,472) $ (9,260) $ (7,174)
26
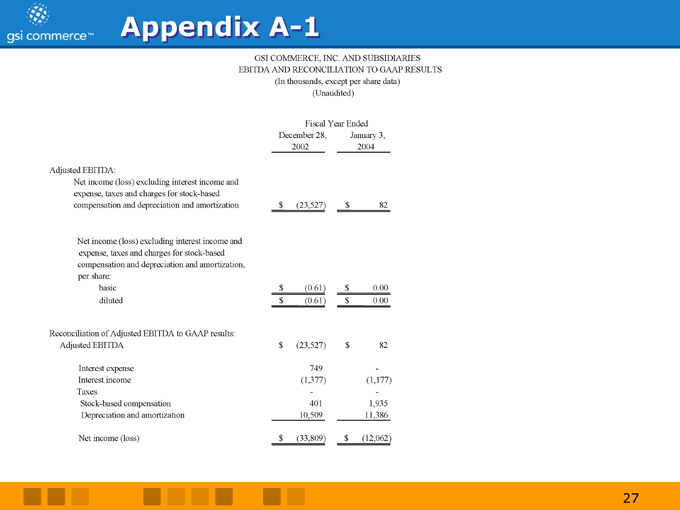
Appendix A-1
GSI COMMERCE, INC. AND SUBSIDIARIES EBITDA AND RECONCILIATION TO GAAP RESULTS
(In thousands, except per share data) (Unaudited)
Fiscal Year Ended
December 28, 2002
January 3, 2004
Adjusted EBITDA:
Net income (loss) excluding interest income and expense, taxes and charges for stock-based compensation and depreciation and amortization $ (23,527) $ 82
Net income (loss) excluding interest income and expense, taxes and charges for stock-based compensation and depreciation and amortization, per share: basic $ (0.61) $ 0.00 diluted $ (0.61) $ 0.00
Reconciliation of Adjusted EBITDA to GAAP results:
Adjusted EBITDA $ (23,527) $ 82
Interest expense 749 -
Interest income (1,377) (1,177)
Taxes - -
Stock-based compensation 401 1,935
Depreciation and amortization 10,509 11,386
Net income (loss) $ (33,809) $ (12,062)
27
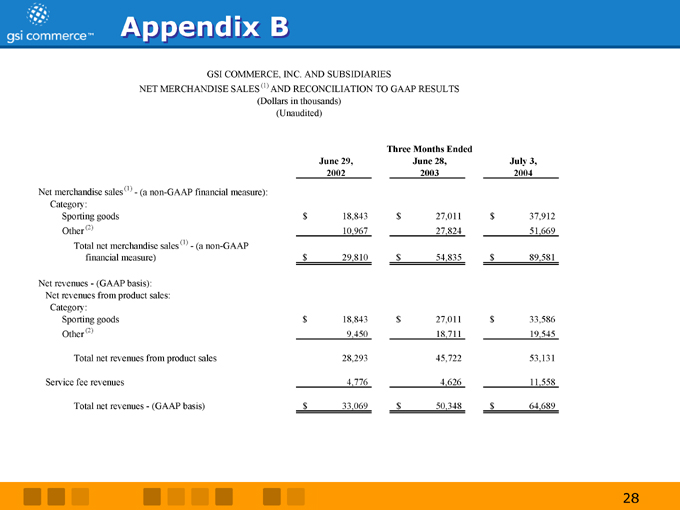
Appendix B
GSI COMMERCE, INC. AND SUBSIDIARIES
NET MERCHANDISE SALES (1) AND RECONCILIATION TO GAAP RESULTS
(Dollars in thousands) (Unaudited)
June 29, 2002
Three Months Ended
June 28, 2003
July 3, 2004
Net merchandise sales (1) - (a non-GAAP financial measure): Category:
Sporting goods $ 18,843 $ 27,011 $ 37,912 Other (2) 10,967 27,824 51,669 Total net merchandise sales (1) - (a non-GAAP financial measure) $ 29,810 $ 54,835 $ 89,581
Net revenues—(GAAP basis): Net revenues from product sales: Category:
Sporting goods $ 18,843 $ 27,011 $ 33,586 Other (2) 9,450 18,711 19,545
Total net revenues from product sales 28,293 45,722 53,131 Service fee revenues 4,776 4,626 11,558 Total net revenues—(GAAP basis) $ 33,069 $ 50,348 $ 64,689
28
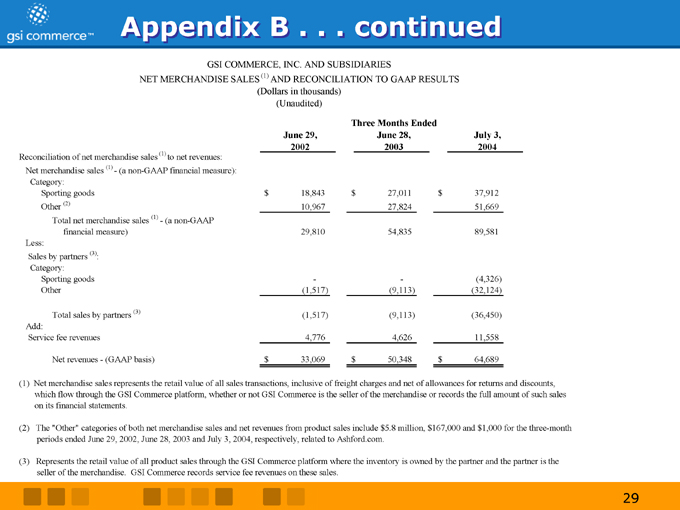
Appendix B . . . continued
GSI COMMERCE, INC. AND SUBSIDIARIES
NET MERCHANDISE SALES (1) AND RECONCILIATION TO GAAP RESULTS
(Dollars in thousands) (Unaudited)
Three Months Ended
June 29, 2002
June 28, 2003
July 3, 2004
Reconciliation of net merchandise sales (1) to net revenues: Net merchandise sales (1) - (a non-GAAP financial measure): Category:
Sporting goods $ 18,843 $ 27,011 $ 37,912 Other (2) 10,967 27,824 51,669 Total net merchandise sales (1)—(a non-GAAP financial measure) 29,810 54,835 89,581 Less: Sales by partners (3): Category: Sporting goods - - (4,326) Other (1,517) (9,113) (32,124)
Total sales by partners (3) (1,517) (9,113) (36,450) Add: Service fee revenues 4,776 4,626 11,558
Net revenues—(GAAP basis) $ 33,069 $ 50,348 $ 64,689
(1) Net merchandise sales represents the retail value of all sales transactions, inclusive of freight charges and net of allowances for returns and discounts, which flow through the GSI Commerce platform, whether or not GSI Commerce is the seller of the merchandise or records the full amount of such sales on its financial statements.
(2) The “Other” categories of both net merchandise sales and net revenues from product sales include $5.8 million, $167,000 and $1,000 for the three-month periods ended June 29, 2002, June 28, 2003 and July 3, 2004, respectively, related to Ashford.com.
(3) Represents the retail value of all product sales through the GSI Commerce platform where the inventory is owned by the partner and the partner is the seller of the merchandise. GSI Commerce records service fee revenues on these sales.
29
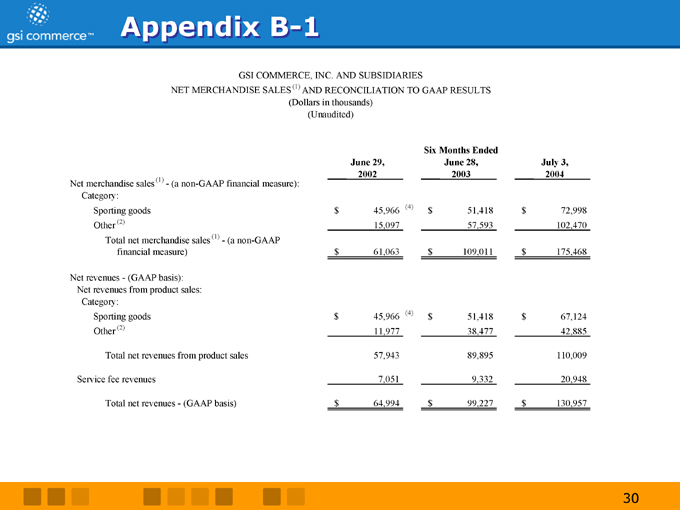
Appendix B-1
GSI COMMERCE, INC. AND SUBSIDIARIES
NET MERCHANDISE SALES (1) AND RECONCILIATION TO GAAP RESULTS
(Dollars in thousands) (Unaudited)
Six Months Ended
June 29, 2002
June 28, 2003
July 3, 2004
Net merchandise sales (1) - (a non-GAAP financial measure): Category:
Sporting goods $ 45,966 (4) $ 51,418 $ 72,998 Other (2) 15,097 57,593 102,470 Total net merchandise sales (1) - (a non-GAAP financial measure) $ 61,063 $ 109,011 $ 175,468
Net revenues—(GAAP basis): Net revenues from product sales: Category:
Sporting goods $ 45,966 (4) $ 51,418 $ 67,124 Other (2) 11,977 38,477 42,885
Total net revenues from product sales 57,943 89,895 110,009 Service fee revenues 7,051 9,332 20,948 Total net revenues—(GAAP basis) $ 64,994 $ 99,227 $ 130,957
30
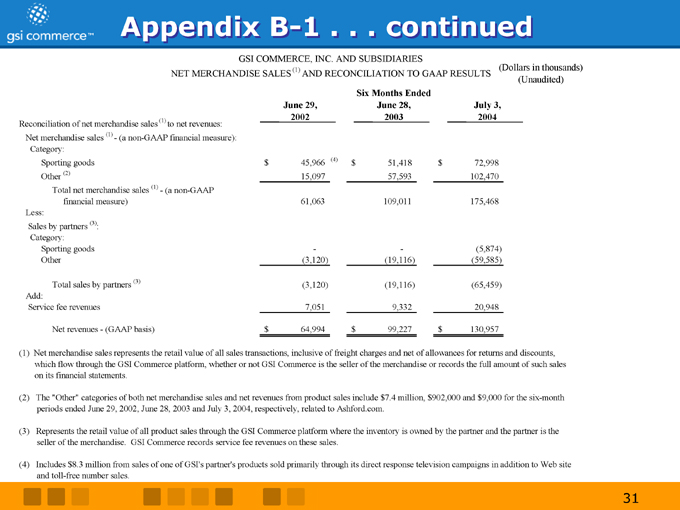
Appendix B-1 . . . continued
GSI COMMERCE, INC. AND SUBSIDIARIES
NET MERCHANDISE SALES (1) AND RECONCILIATION TO GAAP RESULTS
(Dollars in thousands) (Unaudited)
June 29, 2002
June 28, 2003
July 3, 2004
Six Months Ended
Reconciliation of net merchandise sales (1) to net revenues: Net merchandise sales (1) - (a non-GAAP financial measure): Category:
Sporting goods $ 45,966 (4) $ 51,418 $ 72,998 Other (2) 15,097 57,593 102,470 Total net merchandise sales (1)—(a non-GAAP financial measure) 61,063 109,011 175,468 Less: Sales by partners (3): Category: Sporting goods - - (5,874) Other (3,120) (19,116) (59,585)
Total sales by partners (3) (3,120) (19,116) (65,459) Add: Service fee revenues 7,051 9,332 20,948
Net revenues—(GAAP basis) $ 64,994 $ 99,227 $ 130,957
(1) Net merchandise sales represents the retail value of all sales transactions, inclusive of freight charges and net of allowances for returns and discounts, which flow through the GSI Commerce platform, whether or not GSI Commerce is the seller of the merchandise or records the full amount of such sales on its financial statements.
(2) The “Other” categories of both net merchandise sales and net revenues from product sales include $7.4 million, $902,000 and $9,000 for the six-month periods ended June 29, 2002, June 28, 2003 and July 3, 2004, respectively, related to Ashford.com.
(3) Represents the retail value of all product sales through the GSI Commerce platform where the inventory is owned by the partner and the partner is the seller of the merchandise. GSI Commerce records service fee revenues on these sales.
(4) Includes $8.3 million from sales of one of GSI’s partner’s products sold primarily through its direct response television campaigns in addition to Web site and toll-free number sales.
31
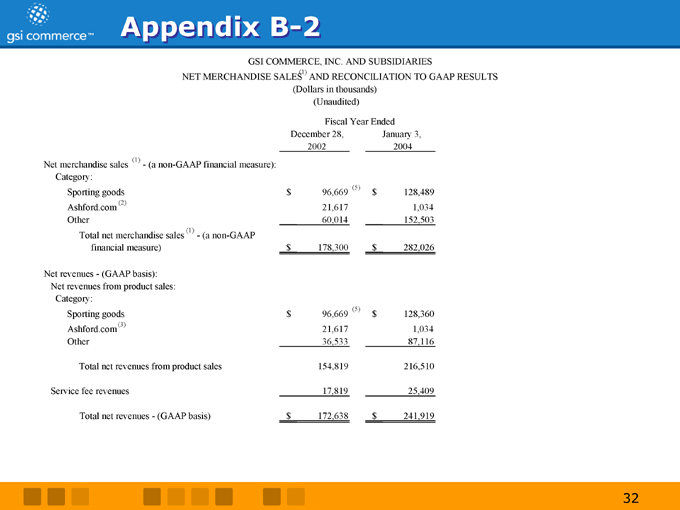
Appendix B-2
GSI COMMERCE, INC. AND SUBSIDIARIES
NET MERCHANDISE SALES(1) AND RECONCILIATION TO GAAP RESULTS
(Dollars in thousands) (Unaudited)
Fiscal Year Ended
December 28, 2002
January 3, 2004
Net merchandise sales (1) - (a non-GAAP financial measure): Category:
Sporting goods $ 96,669 (5) $ 128,489 Ashford.com (2) 21,617 1,034 Other 60,014 152,503 Total net merchandise sales (1) - (a non-GAAP financial measure) $ 178,300 $ 282,026
Net revenues - (GAAP basis): Net revenues from product sales: Category:
Sporting goods $ 96,669 (5) $ 128,360 Ashford.com(3) 21,617 1,034 Other 36,533 87,116
Total net revenues from product sales 154,819 216,510 Service fee revenues 17,819 25,409 Total net revenues—(GAAP basis) $ 172,638 $ 241,919
32
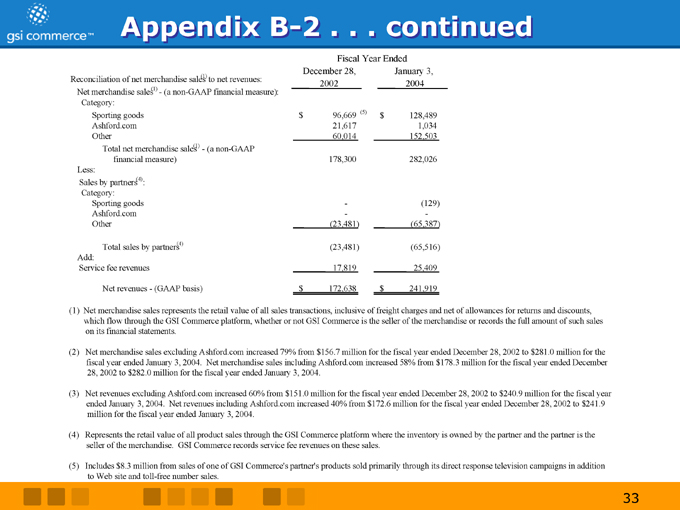
Appendix B-2 . . . continued
Fiscal Year Ended
December 28, 2002
January 3, 2004
Reconciliation of net merchandise sales (1) to net revenues: Net merchandise sales(1) - (a non-GAAP financial measure): Category:
Sporting goods $ 96,669 (5) $ 128,489 Ashford.com 21,617 1,034 Other 60,014 152,503 Total net merchandise sales(1) - (a non-GAAP financial measure) 178,300 282,026 Less: Sales by partners(4): Category: Sporting goods - (129) Ashford.com - - Other (23,481) (65,387)
Total sales by partners(4) (23,481) (65,516) Add: Service fee revenues 17,819 25,409
Net revenues—(GAAP basis) $ 172,638 $ 241,919
(1) Net merchandise sales represents the retail value of all sales transactions, inclusive of freight charges and net of allowances for returns and discounts, which flow through the GSI Commerce platform, whether or not GSI Commerce is the seller of the merchandise or records the full amount of such sales on its financial statements.
(2) Net merchandise sales excluding Ashford.com increased 79% from $156.7 million for the fiscal year ended December 28, 2002 to $281.0 million for the fiscal year ended January 3, 2004. Net merchandise sales including Ashford.com increased 58% from $178.3 million for the fiscal year ended December 28, 2002 to $282.0 million for the fiscal year ended January 3, 2004.
(3) Net revenues excluding Ashford.com increased 60% from $151.0 million for the fiscal year ended December 28, 2002 to $240.9 million for the fiscal year ended January 3, 2004. Net revenues including Ashford.com increased 40% from $172.6 million for the fiscal year ended December 28, 2002 to $241.9 million for the fiscal year ended January 3, 2004.
(4) Represents the retail value of all product sales through the GSI Commerce platform where the inventory is owned by the partner and the partner is the seller of the merchandise. GSI Commerce records service fee revenues on these sales.
(5) Includes $8.3 million from sales of one of GSI Commerce’s partner’s products sold primarily through its direct response television campaigns in addition to Web site and toll-free number sales.
33