 © Copyright 2007 – GSI Commerce GSI Commerce First Quarter 2007 Exhibit 99.1 |
 2 Safe Harbor Statement All statements made in this presentation, other than statements of historical fact, are forward-looking statements. The words “anticipate,” “believe,” “estimate,” “expect,” “intend,” “may,” “plan,” “will,” “would,” “should,” “guidance,” “potential,” “continue,” “project,” “forecast,” “confident,” “prospects,” “schedule” and similar expressions typically are used to identify forward-looking statements. Forward-looking statements are based on the then-current expectations, beliefs, assumptions, estimates and forecasts about the business of GSI Commerce. These statements are not guarantees of future performance and involve risks, uncertainties and assumptions which are difficult to predict. Therefore, actual outcomes and results may differ materially from what is expressed or implied by these forward- looking statements. Factors which may affect GSI Commerce’s business, financial condition and operating results include the effects of changes in the economy, consumer spending, the financial markets and the industries in which GSI Commerce and its partners operate, changes affecting the Internet and e-commerce, the ability of GSI Commerce to develop and maintain relationships with strategic partners and suppliers and the timing of its establishment, extension or termination of its relationships with strategic partners, the ability of GSI Commerce to timely and successfully develop, maintain and protect its technology, confidential and proprietary information, and product and service offerings, the ability of GSI Commerce to execute operationally and attract and retain qualified personnel, the ability of GSI Commerce to successfully integrate its acquisitions of other businesses, if any, the performance of any acquired businesses and the impact of SFAS 123(R). More information about potential factors that could affect GSI Commerce can be found in its most recent Form 10-K, Form 10-Q and other reports and statements filed by GSI Commerce with the SEC. GSI Commerce expressly disclaims any intent or obligation to update these forward-looking statements. |
 3 Non-GAAP Financial Measures This presentation contains or may mention the non-GAAP measures merchandise sales, adjusted EBITDA, non-GAAP net income, free cash flow and certain ratios that use those measures. Merchandise sales – Merchandise sales represent the retail value of all sales transactions, inclusive of freight charges and net of allowances for returns and discounts, which flow through the GSI Commerce platform, whether or not the company is the seller of the merchandise or records the full amount of such sales on its financial statements. GSI uses merchandise sales as a metric for operating its business. Variable costs such as fulfillment and customer service labor expense, order processing costs such as credit card and bank processing fees and organizational costs such as business management are related to the amount of sales made through GSI’s platform, whether or not GSI records the revenue from such sales. GSI believes that investors will have a more thorough understanding of its historical expenses and expense trends if they have visibility to GAAP net revenue as well as the non-GAAP financial measure merchandise sales and the percentages that such expenses bear to net revenues and merchandise sales. Adjusted EBITDA – GSI defines adjusted EBITDA as income from operations excluding stock-based compensation and depreciation and amortization expenses. Although we previously defined adjusted EBITDA by reference to net income, there is no material difference in the resulting adjusted EBITDA calculation. We consider adjusted EBITDA to be a useful metric for management and investors because it excludes certain non-cash items. We believe that given the recent adoption of SFAS 123R, it is difficult for investors to evaluate our income from operations relative to prior periods because our income from operations prior to fiscal 2006 calculated our stock-based compensation expense in a manner differently than required under SFAS 123R. Non-GAAP Net Income – GSI defines non-GAAP net income as net income excluding stock-based compensation expense, amortization of acquisition-related intangibles, cumulative effect of change in accounting principle related to the adoption of SFAS 123R and income tax benefits related to the release of the company’s valuation allowances. Free Cash Flow – GSI defines free cash flow as net cash provided by operating activities minus capital expenditures, including capitalized software development. We consider free cash flow to be a liquidity measure that provides useful information to management and investors about the amount of cash generated by the business that, after the acquisition of property and equipment, including information technology infrastructure, can be used for strategic opportunities, including investing in the business, making strategic acquisitions and strengthening the balance sheet. These financial measures should be considered in addition to, and not as a substitute for, or superior to, other measures of financial performance prepared in accordance with GAAP. The non-GAAP financial measures included in this presentation have been reconciled to the nearest GAAP measures as required under Securities and Exchange Commission rules and can be found in the appendices of this presentation. |
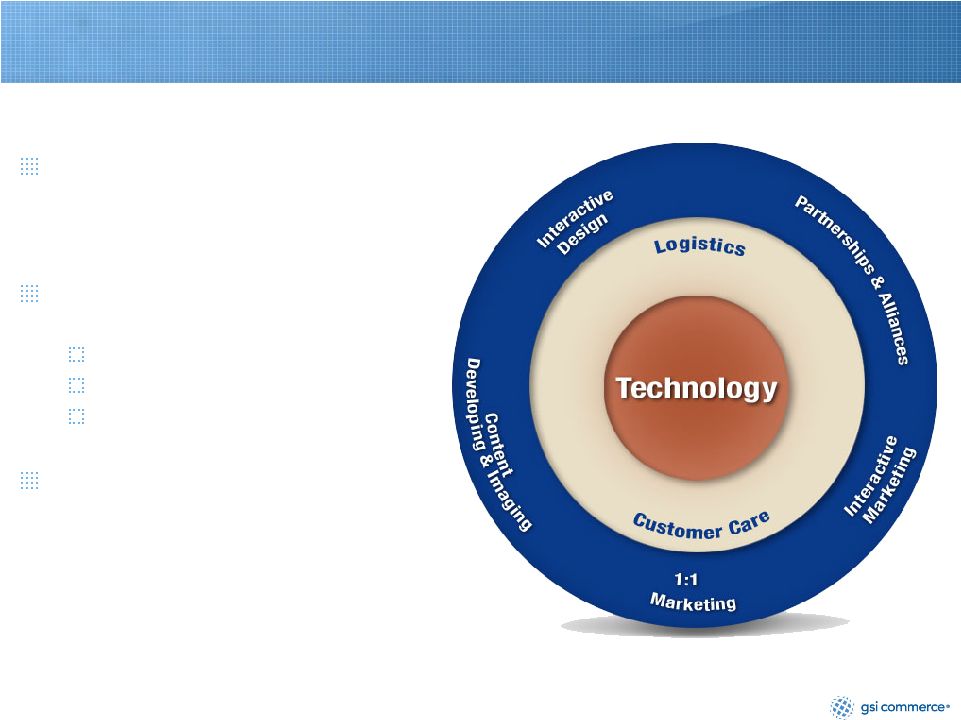 4 Leading Platform for Outsourced e-Commerce Approximately 60 major retailers & brands, 11 merchandise categories * and an international offering End-to-end e-commerce platform Technology Logistics and customer care Marketing services Delivers customized solutions to partners through platform Marketing Services Marketing Services * Target retail categories include apparel, accessories & footwear, appliances & tools, baby products, consumer electronics, cosmetics & fragrances, home furnishings, jewelry, music & videos, personal care, sporting goods & apparel, toys & video games as reported in the “US e-Commerce: Five-Year Forecast and Data Overview” published by Forrester Research, Inc., Oct. 2006. |
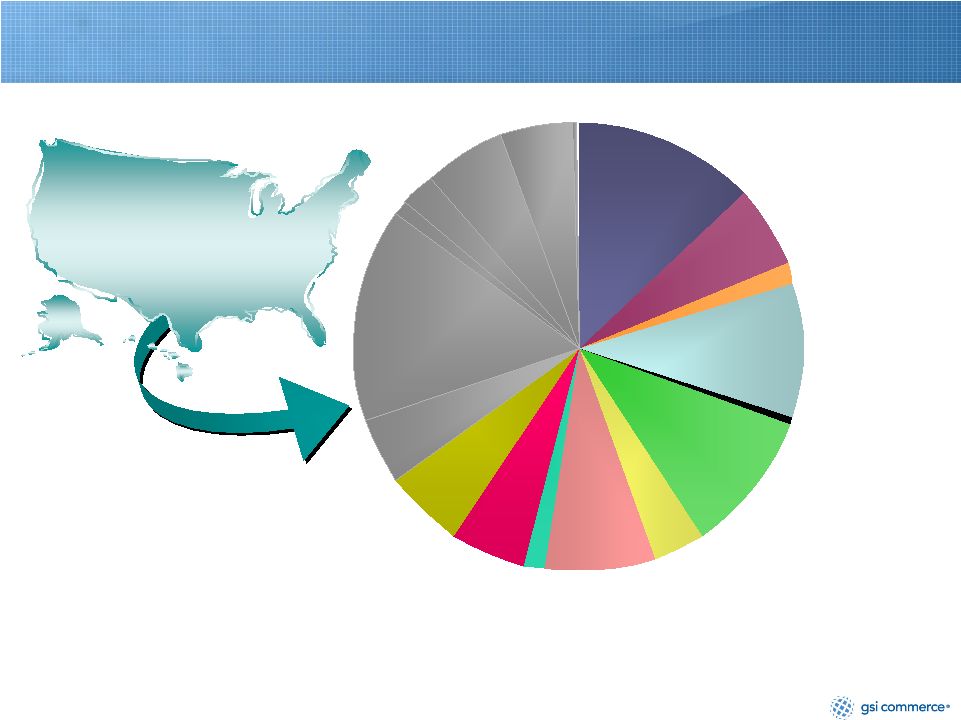 5 Large Addressable Domestic Market 2007 U.S. Online General 2007 U.S. Online General Merchandise Market * Merchandise Market * $124.5 billion $124.5 billion * GSI Commerce excludes automobiles and parts, food, beverage, grocery, travel, and event and movie tickets, when discussing the U.S. online general merchandise market. Source: “US e-Commerce: Five-Year Forecast and Data Overview,” Forrester Research, Inc., Oct. 2006. $ in billions $ in billions Baby Products Baby Products Apparel, Accessories & Footwear Apparel, Accessories & Footwear Consumer Consumer Electronics Electronics Music & Music & Video Video Personal Personal Care Care Jewelry Jewelry Cosmetics & Cosmetics & Fragrances Fragrances Toys & Video Games Toys & Video Games Appliances & Tools Appliances & Tools Home Home Furnishings Furnishings Sporting Goods & Apparel Sporting Goods & Apparel $16.4 $16.4 $7.0 $7.0 $1.9 $1.9 $11.9 $11.9 $12.5 $12.5 $1.0 $1.0 $4.8 $4.8 $9.9 $9.9 $1.6 $1.6 $7.0 $7.0 $6.8 $6.8 2007 Estimated Target Categories Worth $80.8 billion 2007 Estimated Target Categories Worth $80.8 billion |
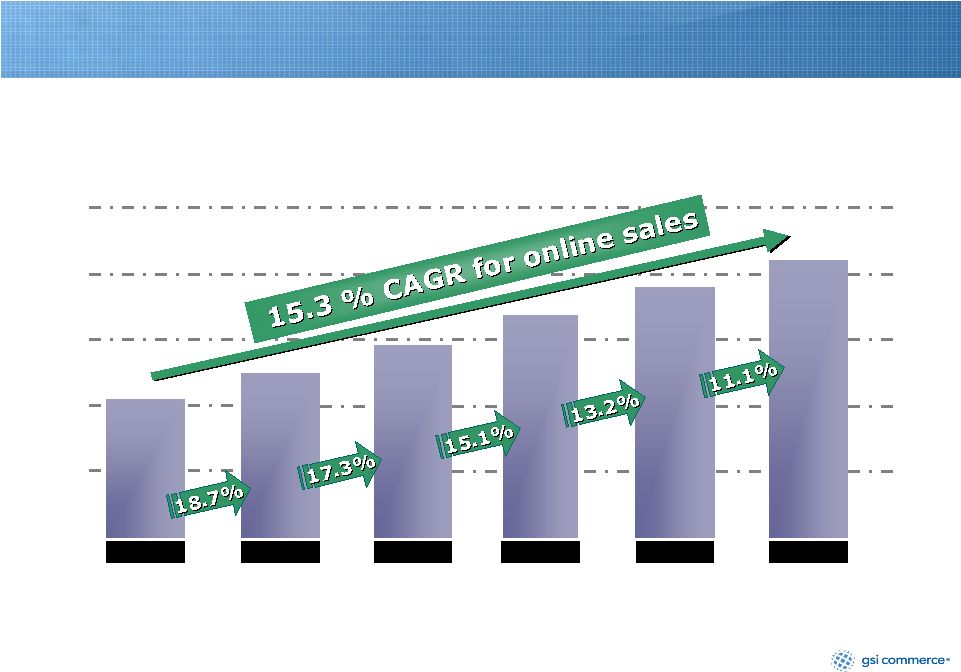 6 The U.S. Online General Merchandise Market * The U.S. Online General Merchandise Market * The U.S. Online General Merchandise Market * $ in billions $ in billions $ in billions Strong Growth Projected for e-Commerce * GSI Commerce excludes automobiles and parts, food, beverage, grocery, travel, and event and movie tickets, when discussing the U.S. online general merchandise market. Source: “US e-Commerce: Five-Year Forecast and Data Overview,”Forrester Research, Inc., Oct. 2006. $50 $100 $150 $200 $250 2011E $211.3 $211.3 2010E $190.2 $190.2 2009E $168 $168 2008E $146 $146 2007E $124.5 $124.5 2006E $104.9 $104.9 |
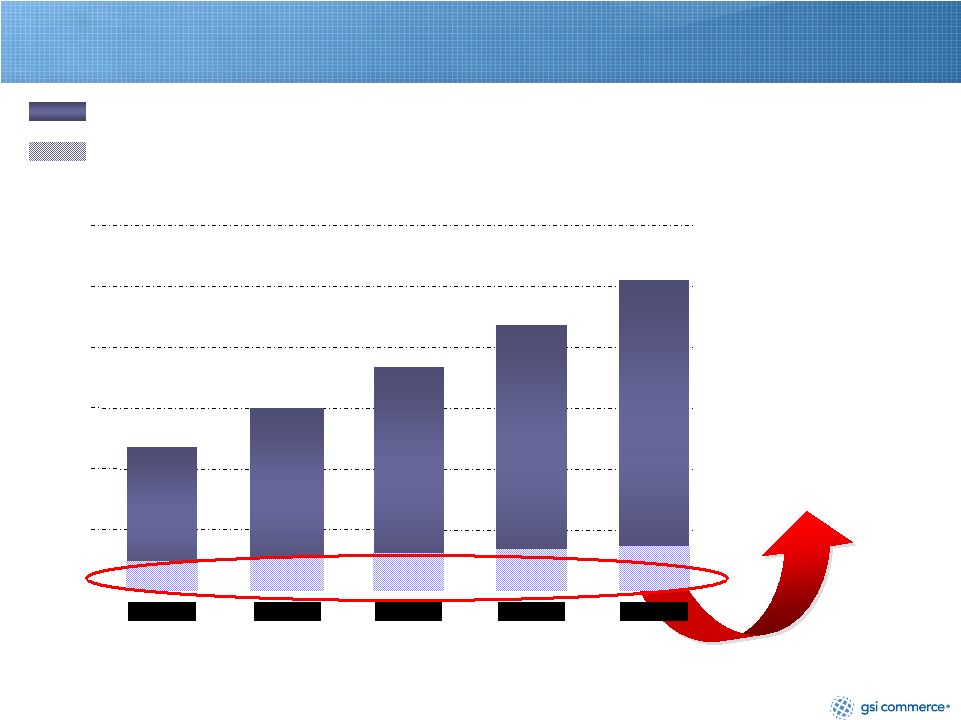 7 Compelling Reason for Prospects to Outsource Online business is too large to ignore, but not large enough to justify the investment required to achieve in-house competency for multi- channel e-commerce. Total estimated sales of retail categories* targeted by GSI Commerce Estimated online sales of retail categories targeted by GSI Commerce expressed as a % of total sales of the same categories $ billions $ billions 2007E 2008E 2009E 2010E 2011E $1,004.2 $1,004.2 * Target retail categories include apparel, accessories & footwear, appliances & tools, baby products, consumer electronics, cosmetics & fragrances, home furnishings, jewelry, music & videos, personal care, sporting goods & apparel, toys & video games. For GSI Commerce partners, online sales generally average 3% to 4% of total sales. Source: “US e-Commerce: Five-Year Forecast and Data Overview,” Forrester Research, Inc., Oct. 2006. 800 850 900 950 1,000 1,050 9.3% 9.3% 10.7% 10.7% 12.0% 12.0% 13.2% 13.2% 14.4% 14.4% $967.8 $967.8 $933.2 $933.2 $900.3 $900.3 $868.9 $868.9 |
 8 GSI Offers a Strong Value Proposition A Complete Solution Increased efficiency – one vendor Improved integration – built to work together 360° understanding of business GSI Commerce is Invisible to Consumers Uncompromised Not in conflict with partner’s business Scale & Operating Leverage with Enterprise Focus Platform expertise Premium quality components Focus on Growth and Innovation International platform Marketing services New/enhanced functionality (e.g., parametric search / alternative payments / express shop & mini cart ) Win/Win Economics Financial predictability and aligned interests through long-term contracts |
 9 Platform Enables E-Commerce for Top Brands 1. Apparel, Accessories & 1. Apparel, Accessories & Footwear Footwear 2. Consumer Electronics 2. Consumer Electronics 6. Cosmetics & Fragrances 6. Cosmetics & Fragrances 7. Personal Care 7. Personal Care 5. Sporting Goods & 5. Sporting Goods & Apparel Apparel 8. Music & Video 8. Music & Video 3. Home Furnishings 3. Home Furnishings 4. Appliances & Tools 4. Appliances & Tools 9. Jewelry 9. Jewelry 10. Toys & Video Games 10. Toys & Video Games 11. Baby Products 11. Baby Products |
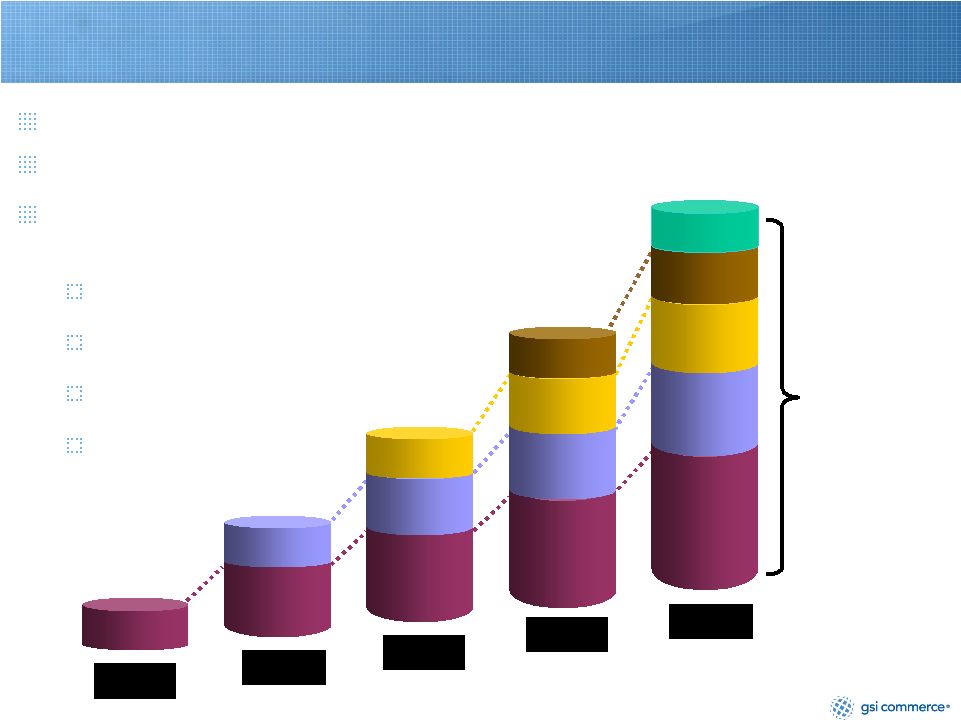 10 Growth Strategy Compounding effect of long-term agreements Yr. 5 Yr. 4 Yr. 3 Yr. 2 Yr. 1 Add new partners Grow transaction revenues from each partner Develop incremental revenue streams from each partner Marketing & design services International Multichannel capabilities Site enhancements |
 11 Competition Web Platform IBM, ATG, Microsoft, Amazon Services Customer/Web Analytics /CRM Siebel, WebSideStory, Coremetrics Order Processing /Warehouse Mgmt. /Merchandising Systems SAP, Yantra, Manhattan Assoc. Fulfillment and Logistics DHL/Exel, UPS, Accretive Commerce Design aQuantive/Razorfish, AKQA, Blast Radius, Digitas E-mail Management Experian/CheetahMail, DoubleClick/Performics, Epsilon Interactive Online Marketing aQuantive, Digitas, Grey Interactive, LinkShare Strategic Consulting McKinsey & Co., Boston Consulting Group, Accenture System Integrator Accenture, IBM, BearingPoint, EDS, Sapient Call Center West, Convergys |
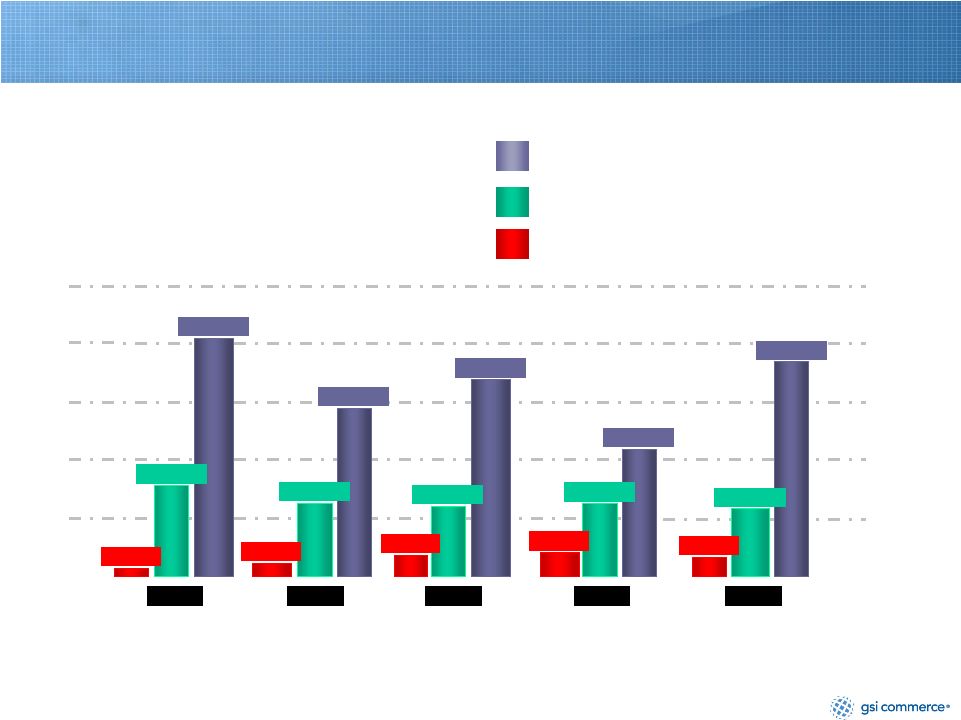 12 Growing Faster than the Industry GSI Commerce Merchandise Sales ** E-Commerce Sales Total Retail Sales Percent Growth Y/Y * Percent Growth Y/Y * * E-commerce Sales and Total Retail Sales Source: Census Bureau, U.S. Department of Commerce. ** For a reconciliation of non-GAAP financial measures, see Appendices A thru B-1 and/or see our results for fiscal years 2002 - 2006 at www.gsicommerce.com/news. 2005 20% 40% 60% 80% 100% 2002 81.3% 31.0% 2.3% 2003 58.2% 24.7% 4.2% 2004 68.0% 24.3% 7.1% 44.0% 24.6% 7.7% 2006 74.0% 23.5% 5.8% |
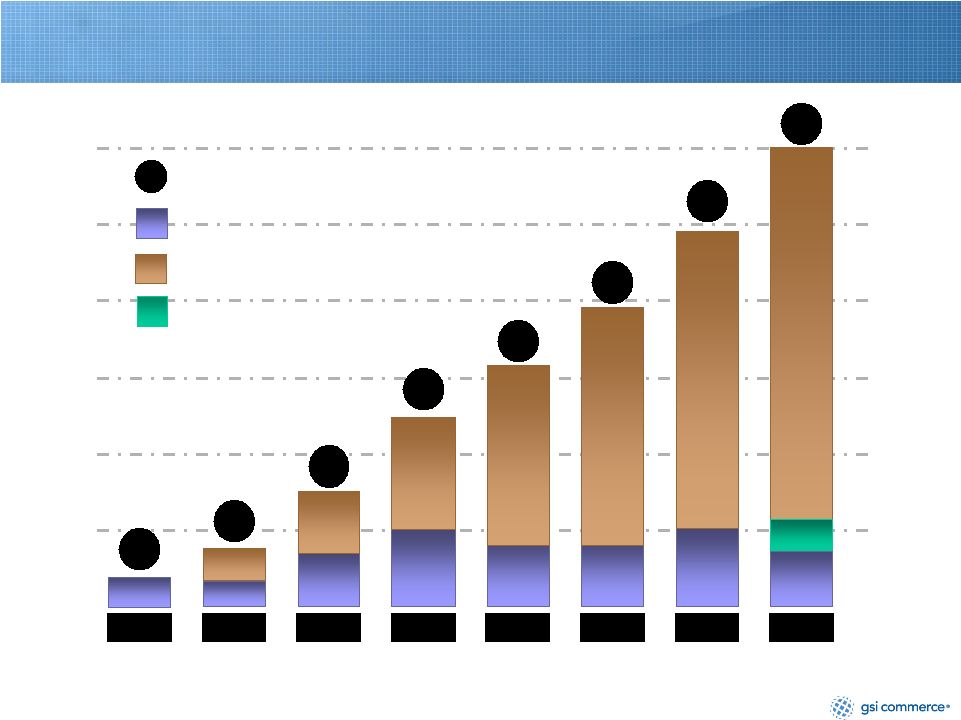 13 Category & Geographic Expansion Partner Growth 10 10 20 20 1999 4 4 1 1 2000 3 3 7 7 1 1 30 30 2001 6 6 13 13 1 1 2002 10 10 23 23 4 4 2003 8 8 31 31 6 6 2004 8 8 39 39 7 7 2005 10 10 49 49 9 9 2006 60 60 6 6 5 5 11 11 GSI Commerce participates in 11 retail categories as defined by Forrester Research: apparel, accessories & footwear, appliances & tools, baby products, consumer electronics, cosmetics & fragrances, home furnishings, jewelry, music & videos, personal care, sporting goods & apparel, toys & video games. Total domestic partners Current partners that launched or will launch with GSI Commerce during that year 40 40 50 50 60 60 International partners Number of Categories |
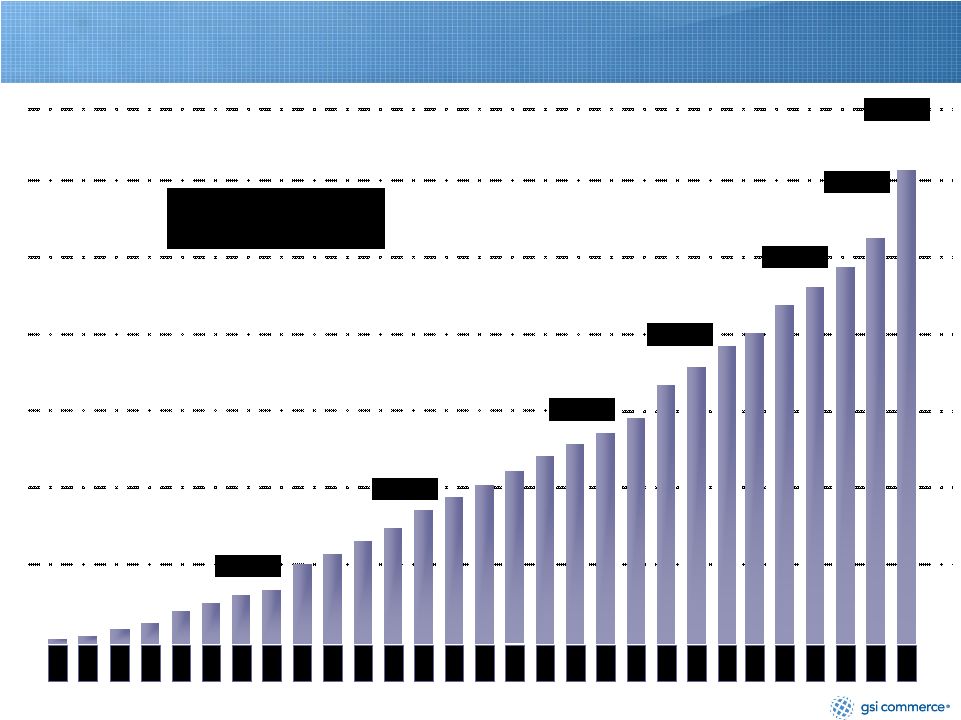 14 Net Revenues – Trailing Four Quarters Net Revenue $ in millions 4Q 99 1Q 00 2Q 00 3Q 00 4Q 00 1Q 01 2Q 01 3Q 01 4Q 01 1Q 02 2Q 02 3Q 02 4Q 02 1Q 03 2Q 03 3Q 03 4Q 03 1Q 04 2Q 04 3Q 04 4Q 04 1Q 05 2Q 05 3Q 05 4Q 05 1Q 06 2Q 06 $100 $100 $600 $200 $300 $400 $500 3Q 06 4Q 06 $700 |
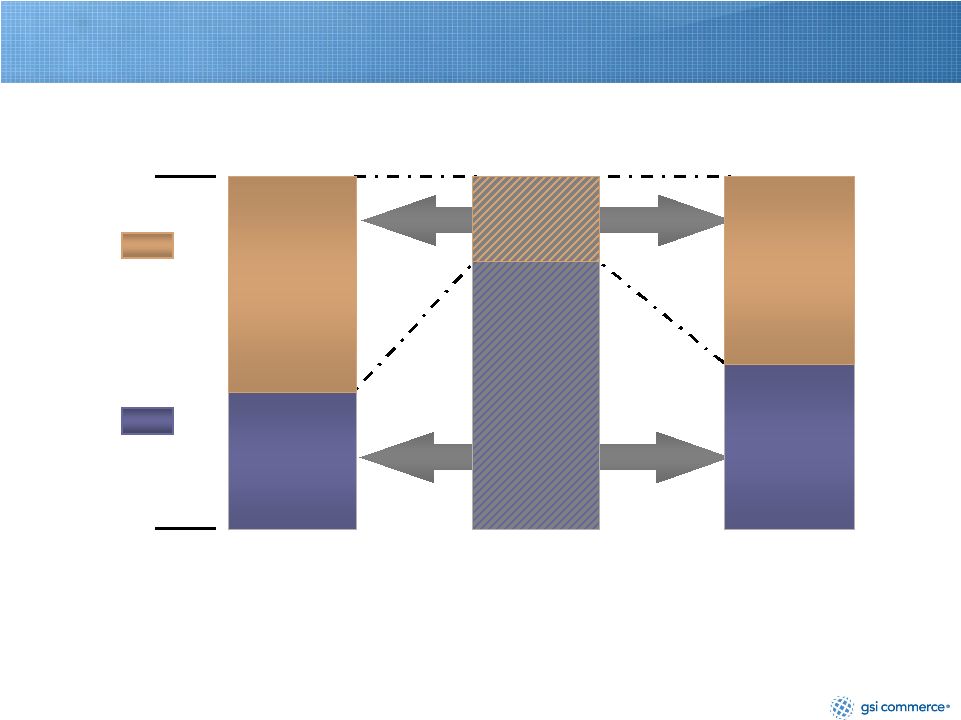 15 Business Models Provide Balanced Gross Profit Contribution Owned Owned Inventory Inventory Non-Owned Inventory 100% 100% 2006 2006 Merchandise Sales Merchandise Sales 0% 0% $1,187.8 $1,187.8 61% $726.6 61% $726.6 2006 2006 Gross Profit Gross Profit $278.3 $278.3 53% $148.4 53% $148.4 47% $129.9 47% $129.9 2006 2006 Net Revenue Net Revenue $609.6 $609.6 76% $461.2 76% $461.2 $ in millions $ in millions 24% $148.4 24% $148.4 39% $461.2 39% $461.2 For a reconciliation of non-GAAP financial measures, see Appendices A thru B-1 and/or see our results for fiscal years 2001 - 2006 at www.gsicommerce.com/news/news.jsp. |
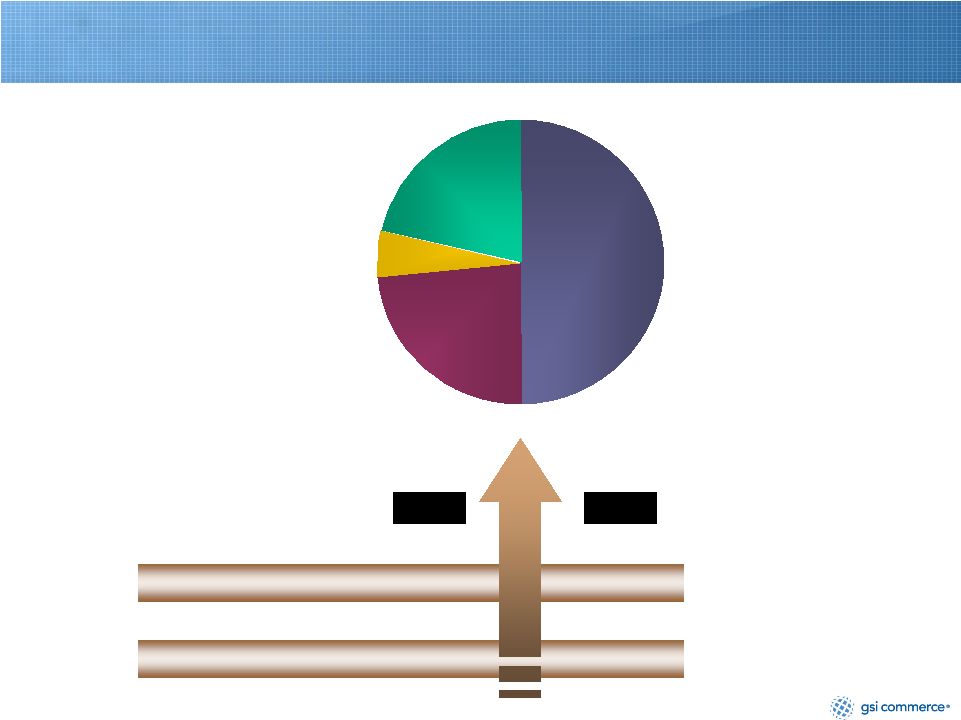
 16 2006 Expense Breakdown - - Fulfillment Fulfillment - - Credit card proc. Credit card proc. - - Customer care Customer care - - Revenue share Revenue share - - Business mgmt. Business mgmt. - - Marketing services Marketing services - - Technology Technology - - HR HR - - Legal Legal - - Finance Finance - - Business development Business development For a reconciliation of non-GAAP financial measures, see Appendices A thru B-1 and/or see our results for fiscal years 2001 - 2006 at www.gsicommerce.com/news/news.jsp. Expense lines and adjusted EBITDA exclude stock-based compensation. Gross Gross Profit Profit Adjusted Adjusted EBITDA EBITDA $38.5 M $38.5 M Product Product Development Development $44.4 M $44.4 M General General & Admin. & Admin. $33.1 M $33.1 M $278.3 M $278.3 M Sales & Sales & Marketing Marketing $162.3 M $162.3 M |
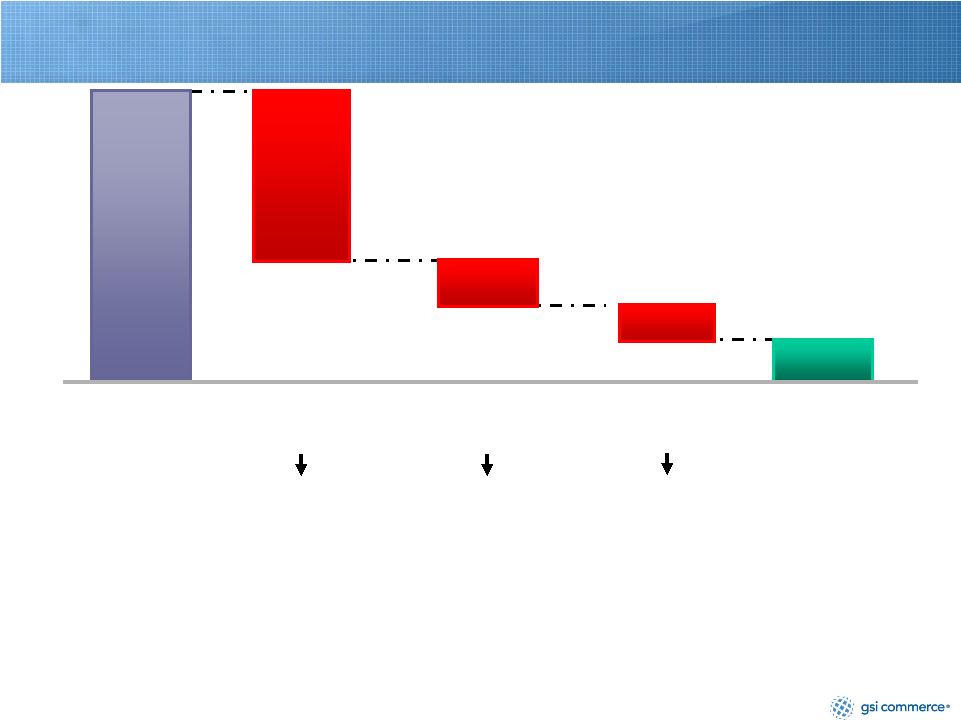
 17 Multiple Drivers of Margin Expansion Gross Margin Gross Margin Sales & Marketing Sales & Marketing Product Development Product Development General & Admin. General & Admin. Gross Profit Gross Profit 35.2% 35.2% 45.7% 45.7% Sales & Marketing Sales & Marketing 31.6% 31.6% 26.6% 26.6% Product Develop. Product Develop. 8.4% 8.4% 7.3% 7.3% G&A G&A 9.9% 9.9% 5.4% 5.4% 2001 2006 As a % of As a % of net revenues net revenues +2,110 basis points +2,110 basis points 1,050 bp 1,050 bp 500 bp 500 bp 110 bp 110 bp 450 bp 450 bp |
 18 Cash * Cash * $156.7 $156.7 $184.5 $184.5 Inventory Inventory $34.6 $34.6 $46.8 $46.8 Net Fixed Assets Net Fixed Assets $87.9 $87.9 $106.2 $106.2 Total Assets Total Assets $332.6 $332.6 $463.6 $463.6 Debt Debt $71.2 $71.2 $70.9 $70.9 A/P & Accrued A/P & Accrued $101.7 $101.7 $149.3 $149.3 Total Liabilities Total Liabilities $179.5 $179.5 $235.9 $235.9 Equity Equity $153.2 $153.2 $227.7 $227.7 * Cash and cash equivalents and marketable securities. Strong Balance Sheet ($ millions) ($ millions) Dec. 31, 2005 Dec. 30, 2006 |
 19 Appendix A December 31, December 30, December 31, December 30, 2005 2006 2005 2006 Reconciliation of GAAP Income from operations to Adjusted EBITDA: GAAP Income from operations 12,287 $ 23,462 $ 2,878 $ 9,647 $ Stock-based compensation 1,231 1,692 3,805 7,578 Depreciation and amortization 4,203 6,385 14,635 21,297 Adjusted EBITDA 17,721 $ 31,539 $ 21,318 $ 38,522 $ (1) Adjusted EBITDA no longer includes other income (expense) as a reconciling item between Adjusted EBITDA and GAAP results. Twelve Months Ended Three Months Ended GSI COMMERCE, INC. AND SUBSIDIARIES ADJUSTED EBITDA (1) AND RECONCILIATION TO GAAP RESULTS (In thousands) (Unaudited) |
 20 January 3, January 1, 2004 2005 Merchandise sales (1) - (a non-GAAP financial measure): Category: Sporting goods 128,489 $ 200,394 $ Other (2) 153,537 274,586 Total merchandise sales (1) - (a non-GAAP financial measure) 282,026 $ 474,980 $ Net revenues - (GAAP basis): Net revenues from product sales: Category: Sporting goods 128,360 $ 164,530 $ Other (2) 88,150 110,458 Total net revenues from product sales 216,510 274,988 Service fee revenues 25,409 60,116 Total net revenues - (GAAP basis) 241,919 $ 335,104 $ GSI COMMERCE, INC. AND SUBSIDIARIES MERCHANDISE SALES (1) AND RECONCILIATION TO GAAP RESULTS (Dollars in thousands) (Unaudited) Appendix B December 28, 2002 96,669 $ 81,631 178,300 $ 96,669 $ 58,150 154,819 17,819 172,638 $ Fiscal Year 2004 Fiscal Year 2003 Fiscal Year 2002 Year Ended December 31, 2005 261,568 $ 420,429 681,997 $ 212,932 $ 142,442 355,374 85,018 440,392 $ Fiscal Year 2005 385,950 $ 801,849 1,187,799 $ 314,696 $ 146,487 461,183 148,370 609,553 $ December 30, 2006 Fiscal Year 2006 |
 21 Appendix B . . . continued January 3, January 1, 2004 2005 Year Ended GSI COMMERCE, INC. AND SUBSIDIARIES MERCHANDISE SALES (1) AND RECONCILIATION TO GAAP RESULTS (Dollars in thousands) (Unaudited) Reconciliation of merchandise sales (1) to net revenues: Merchandise sales (1) - (a non-GAAP financial measure): Category: Sporting goods 128,489 $ 200,394 $ Other (2) 153,537 274,586 Total merchandise sales (1) - (a non-GAAP financial measure) 282,026 474,980 Less: Sales by partners (3) : Category: Sporting goods (129) (35,864) Other (65,387) (164,128) Total sales by partners (3) (65,516) (199,992) Add: Service fee revenues 25,409 60,116 Net revenues - (GAAP basis) 241,919 $ 335,104 $ (1) Merchandise sales represents the retail value of all sales transactions, inclusive of freight charges and net of allowances for returns and discounts, which flow through the GSI Commerce platform, whether or not GSI Commerce is the seller of the merchandise or records the full amount of such sales on its financial statements. (2) The "Other" categories of both merchandise sales and net revenues from product sales include $1,034 and $10 for the year ended January 3, 2004 and January 1, 2005, respectively, related to Ashford.com. (3) Represents the retail value of all product sales through the GSI Commerce platform where the inventory is owned by the partner and the partner is the seller of the merchandise. GSI Commerce records service fee revenues on these sales. December 28, 2002 96,669 $ 81,631 178,300 -- (23,481) (23,481) 17,819 172,638 $ Fiscal Year 2004 Fiscal Year 2003 Fiscal Year 2002 December 31, 2005 Fiscal Year 2005 261,568 $ 420,429 681,997 (48,636) (277,987) (326,623) 85,018 440,392 $ 385,950 $ 801,849 1,187,799 (71,254) (655,362) (726,616) 148,370 609,553 $ December 30, 2006 Fiscal Year 2006 |