 investor presentation Exhibit 99.1 |
 2 safe harbor statement All statements made in this presentation, other than statements of historical fact, are forward-looking statements. This presentation contains forward-looking statements within the meaning of the Private Securities Litigation Reform Act of 1995. The words “look forward to,” “anticipate,” “believe,” “estimate,” “expect,” “intend,” “may,” “plan,” “will,” “would,” “should,” “could,” “guidance,” “potential,” “opportunity,” “continue,” “project,” “forecast,” “confident,” “prospects,” “schedule,” “designed,” “future” and similar expressions typically are used to identify forward-looking statements. Forward-looking statements are based on the then-current expectations, beliefs, assumptions, estimates and forecasts about the business of GSI Commerce. These statements are not guarantees of future performance and involve risks, uncertainties and assumptions which are difficult to predict. Therefore, actual outcomes and results may differ materially from what is expressed or implied by these forward-looking statements. Factors which may affect GSI Commerce’s business, financial condition and operating results include the effects of changes in the economy, consumer spending, the financial markets and the industries in which GSI Commerce and its partners operate, changes affecting the Internet and e-commerce, the ability of GSI Commerce to develop and maintain relationships with strategic partners and suppliers and the timing of the establishment, extension or termination of its relationships with strategic partners, the ability of GSI Commerce to timely and successfully develop, maintain and protect its technology, confidential and proprietary information and product and service offerings and execute operationally, the ability of GSI Commerce to attract and retain qualified personnel, the ability of GSI Commerce to successfully integrate its acquisitions of other businesses, if any, and the performance of acquired businesses. More information about potential factors that could affect GSI Commerce can be found in its most recent Form 10-K, Form 10-Q and other reports and statements filed by GSI Commerce with the SEC. GSI Commerce expressly disclaims any intent or obligation to update these forward-looking statements. |
 3 non-GAAP financial measures This presentation contains or may mention the non-GAAP measures merchandise sales, adjusted EBITDA, non-GAAP net income, free cash flow and certain ratios that use those measures. GSI’s consolidated financial statements are prepared and presented in accordance with GAAP. To supplement our consolidated financial statements, in this release and on the conference call, we use the non-GAAP financial measures of merchandise sales, adjusted EBITDA, non-GAAP net income and free cash flow. We also discuss certain ratios that use those measures. The non-GAAP measures and ratios presented are not intended to be considered in isolation of, as a substitute for or superior to our GAAP financial information. We have included reconciliations later in this presentation of the non-GAAP measures to the nearest GAAP measure. We use these non-GAAP financial measures for financial and operational decision making and as a means to evaluate our performance. In our opinion, these non-GAAP measures provide meaningful supplemental information regarding our performance. We believe that both management and investors benefit from referring to these non-GAAP financial measures in assessing our performance and when planning, forecasting and analyzing future periods. These non-GAAP financial measures also facilitate management’s internal comparisons to our historical performance and liquidity as well as to the operating results of comparable companies. We believe these non-GAAP financial measures are useful to investors both because (1) they allow for greater transparency with respect to key metrics used by management in its financial and operational decision making and (2) they are used by institutional investors and the analyst community to help them analyze the health of our business. Merchandise sales. We define merchandise sales as the retail value of all sales transactions, inclusive of freight charges and net of allowances for returns and discounts, which flow through our platform, whether we record the full amount of such transaction as a product sale or a percentage of such transaction as a service fee on our financial statements. Merchandise sales exclude the retail value of all sales transactions from partners acquired through the acquisition of Accretive Commerce as such sales do not flow through our platform. Merchandise sales do, however, include the value of freight services sold by Accretive Commerce to its partners. We consider merchandise sales to be a useful metric for management and investors because a significant portion of our sales and marketing expenses, including fulfillment and customer service labor expense, order processing costs such as credit card and bank processing fees and organizational costs such as business management, are related to the amount of sales made through our platform, whether or not we record the revenue from such sales. As a result, we use this metric as part of our revenue and expense forecasting process and for capacity planning purposes. We monitor this metric on a daily basis and consider it to be a critical measure of the health of our business. Adjusted EBITDA. We have defined adjusted EBITDA as income from operations excluding stock-based compensation and depreciation and amortization expenses. Beginning with this release we are also excluding acquisition-related integration expenses. We consider adjusted EBITDA to be a useful metric for management and investors because it excludes certain non-cash and non-operating items. Because of varying available valuation methodologies, subjective assumptions and the variety of award types that companies can use when valuing equity awards under SFAS 123R, we believe that viewing income from operations excluding stock-based compensation expense allows investors to make meaningful comparisons between our operating performance and those of other businesses. Because we are growing rapidly and operate in an emerging and rapidly changing industry, we believe that our level of capital expenditures and consequently the level of depreciation and amortization expense relative to our revenues could be meaningfully greater today than it will be over time. As a result, we believe it is useful supplemental information to view income from operations excluding depreciation and amortization expense as it provides a potential indicator of the future operating margin potential of the business. We believe the exclusion of acquisition-related integration expenses permits evaluation and a comparison of results for on-going business operations, and it is on this basis that management internally assesses the company's performance. Non-GAAP net income. We have defined non-GAAP net income as net income plus stock-based compensation expense and amortization of acquisition-related intangibles minus cumulative effect of change in accounting principle related to the adoption of SFAS 123R and plus/minus the provision/benefit for income taxes. Beginning with this release, we are also adding back acquisition-related integrated expenses to net income. This figure is then taxed at our current annual effective tax rate to arrive at non-GAAP net income. We believe it is useful to exclude stock-based compensation expense and acquisition-related integration expenses from non-GAAP net income for the same reasons we exclude them from adjusted EBITDA. We believe it is useful to exclude amortization of acquisition-related intangibles because in our opinion the benefits of these assets could exceed the amortization period and this supplemental view enables management and investors to measure the business without this potential effect. The gain we recorded from the cumulative effect of change in accounting principle related to the adoption of SFAS 123R is an item we view as non-recurring in nature. We believe it is useful to view net income without the benefit of this non- recurring item. We exclude the GAAP income tax provision in order to compute the non-GAAP pre-tax income. The non-GAAP pre-tax income is then taxed at our current annual effective tax rate to arrive at non-GAAP net income. Free cash flow. We define free cash flow as net cash provided by operating activities minus cash paid for fixed assets, including capitalized software development. We consider free cash flow to be a liquidity measure that provides useful information to management and investors about the amount of cash generated by the business that, after the acquisition of property and equipment, including information technology infrastructure, can be used for strategic opportunities, including investing in the business, making strategic acquisitions and strengthening the balance sheet. Analysis of free cash flow also facilitates management’s comparisons of our operating results to the operating results of comparable companies. A limitation of using free cash flow as a means for evaluating our performance is that free cash flow reflects changes in working capital which is impacted by short-term changes in cash flow and the seasonality of our business which may not be indicative of long-term performance. Another limitation of free cash flow is that it excludes fixed assets purchased and placed in service but not paid for during the applicable period. Our management compensates for this limitation by providing information about capital expenditures on the face of the cash flow statement and in supplemental disclosures in our Forms 10-K and 10-Q. |
 4 agenda core domestic business emerging growth opportunities marketing services – gsi interactive SM gsi international SM financials agenda core domestic business emerging growth opportunities financials |
 5 technology fulfillment customer care premium e-commerce solutions end-to-end or modular integrated components customized ~ 80 major retailers / brands 13 retail categories ~ 3,400 employees $672 million in trailing 12-month net revenues ended sept. 29, 2007 core domestic business agenda core domestic business emerging growth opportunities financials |
 6 Acquisition of Accretive Commerce expands domestic market position announced aug. 16 / closed sept. 11 integration targeted for completion during second half 2008 adds 14 marquee partners more depth added in key apparel, home, health & beauty and specialty foods categories opportunity to provide new partners with services and platform options increases scale and infrastructure adds ~ 1 million sq. ft. of fulfillment space adds 600 call center seats enhances long-term growth $83.6 million in 12-months trailing net revenues ended June 2007 opportunity for additional services / platform options including marketing and international agenda core domestic business emerging growth opportunities financials |
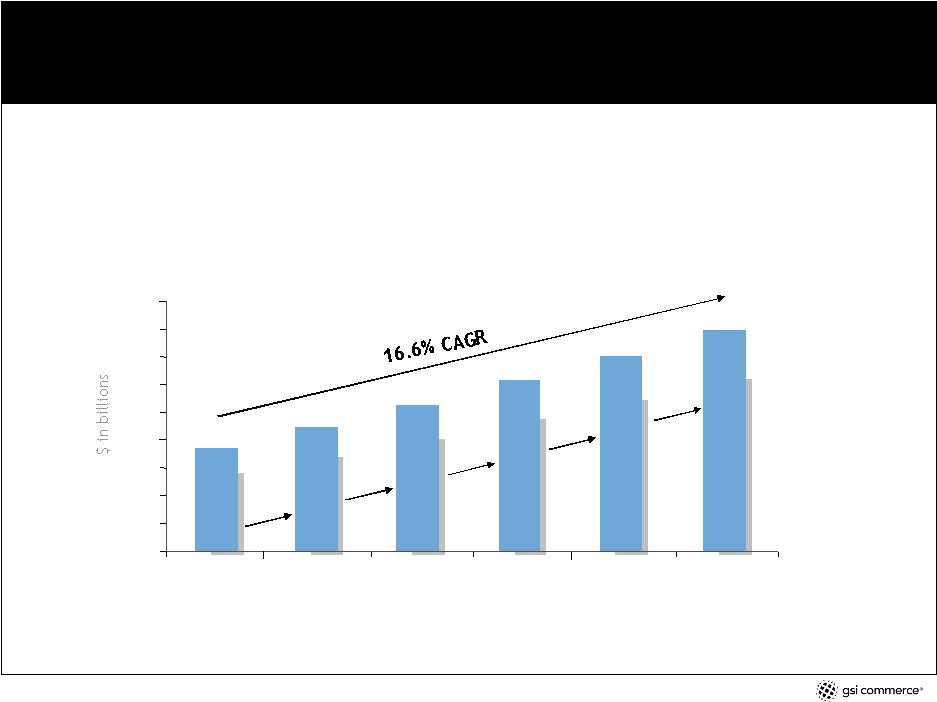 7 healthy and growing U.S. e-commerce market agenda core domestic business emerging growth opportunities financials “The channel continues to move full steam ahead while capturing a larger share of total retail sales ( ~ 7%). This strong growth is an indication that the online retail channel is still years away from reaching its saturation level and still has several years of double- digit growth ahead.” The State of Retailing Online 2007 – a Shop.org study conducted by Forrester Research * GSI Commerce excludes automobiles and parts, travel, and event and movie tickets, when discussing the U.S. online general merchandise market. GSI target retail categories include apparel, accessories & footwear, appliances & tools, baby products, consumer electronics, cosmetics & fragrances, home furnishings; jewelry; music & videos (media entertainment); personal care; sporting goods & apparel; toys & video games; food, beverages and groceries (gifting / specialty foods) and pet supplies as reported in the “US e-Commerce: Five-Year Forecast and Data Overview” published by Forrester Research Inc., Oct. 2006. current categories total $88.7 billion in 2007 * 0 $20 $40 $60 $80 $100 $120 $140 $160 $180 2006 2007 2008 2009 2010 2011 $73.9 $88.7 $105.3 $122.6 $140.3 $159 20.3% 18.7% 16.4% 14.4% 13.3% |
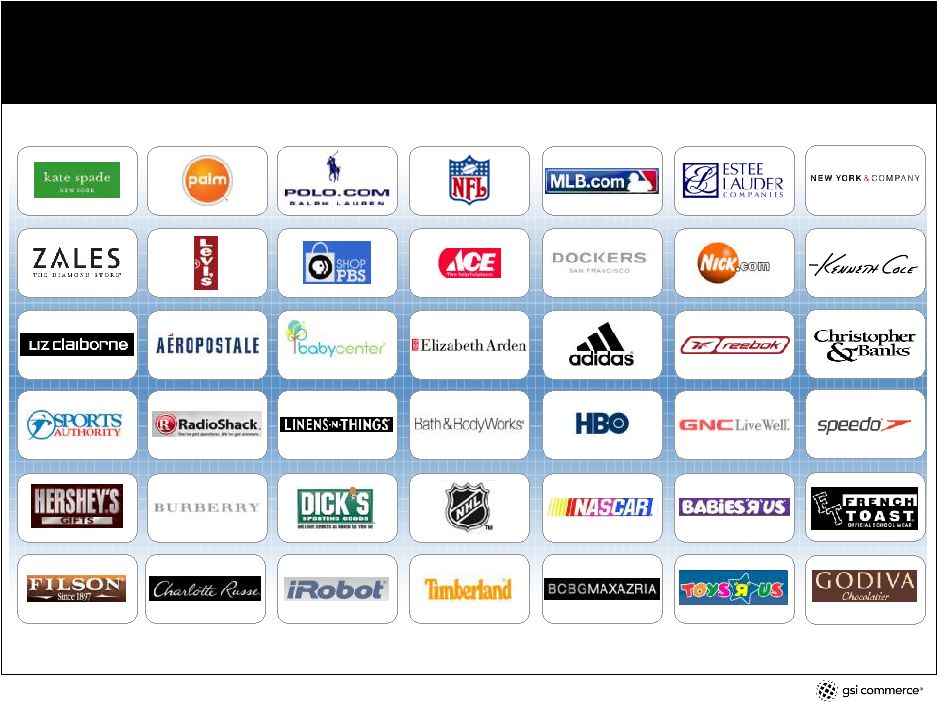 8 ~ 80 leading retailers and brands * Slide shows selected partners. agenda core domestic business emerging growth opportunities financials |
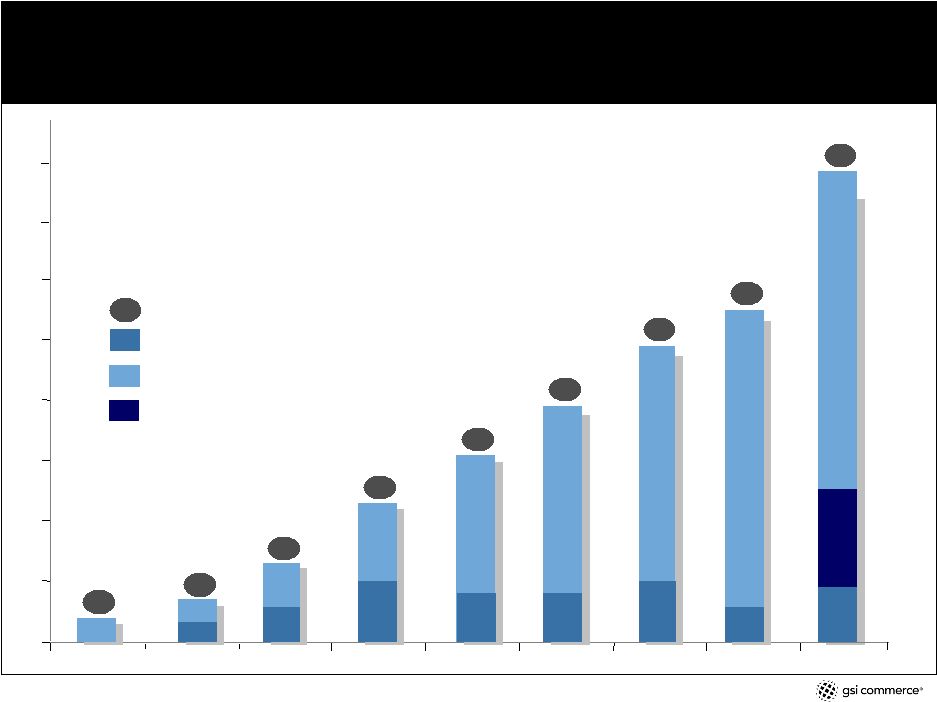 9 adding 5 to 10 new partners and 1 to 2 categories per year total domestic partners current partners that launched or are expected to launch with GSI during that year number of categories 23 31 39 49 55 4 4 6 6 7 7 9 9 11 11 1999 2000 2001 2002 2003 2004 2005 2006 4 0 10 20 30 40 50 60 6 8 8 10 6 1 1 7 1 1 13 1 1 3 10 78 13 13 2007 70 9 acquisition partners 80 14 agenda core domestic business emerging growth opportunities financials |
 10 2007 partner renewals agenda core domestic business emerging growth opportunities financials partner since 2004; multiyear extension partner since 1999; 10-year extension partner since 2005; multiyear extension and international expansion partner since 2003; multiyear extension partner since 2003; FY 2016 extension partner since 2004; FY 2014 extension partner since 2006; FY 2012 extension |
 11 value proposition complete solution enterprise scale & scope focus on partner’s growth, brand and customer experience agenda core domestic business emerging growth opportunities financials |
 12 value proposition – complete premium solution end-to-end, integrated, multichannel, e-commerce platform shared infrastructure and customized solutions increased efficiency – one vendor proven integration – built to work together e-commerce expertise - 360°understanding of business agenda core domestic business emerging growth opportunities financials technology fulfillment customer care |
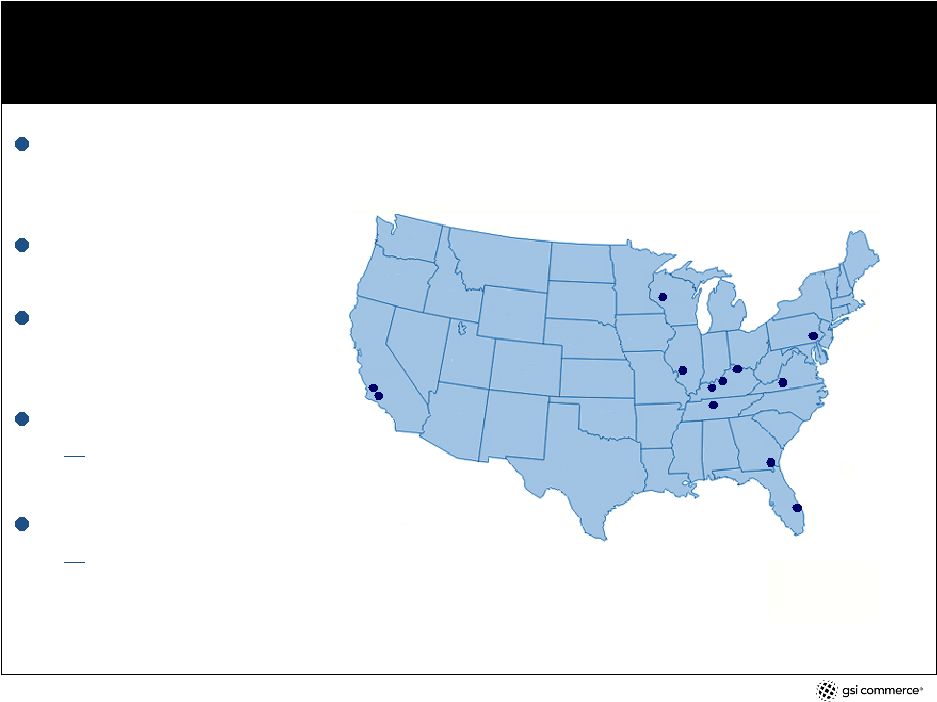 13 value proposition – enterprise scale & scope not partner core competency – e-commerce ~ 2% to 4% of total sales ~ 3,400 employees redundant, geographically separate data centers 4 customer care facilities ~ 1,600 seats 6 primary fulfillment centers 2.7 million sq. ft. agenda core domestic business emerging growth opportunities financials Edwardsville, Ill. Louisville, Ky. Shepherdsville, Ky. Richwood, Ky. Los Angeles, Calif. Pacoima, Calif. Martinsville, Va. Nashville, Ten. Melbourne, Fla. Eau Claire, Wis. Brunswick, Ga. King of Prussia, Pa. |
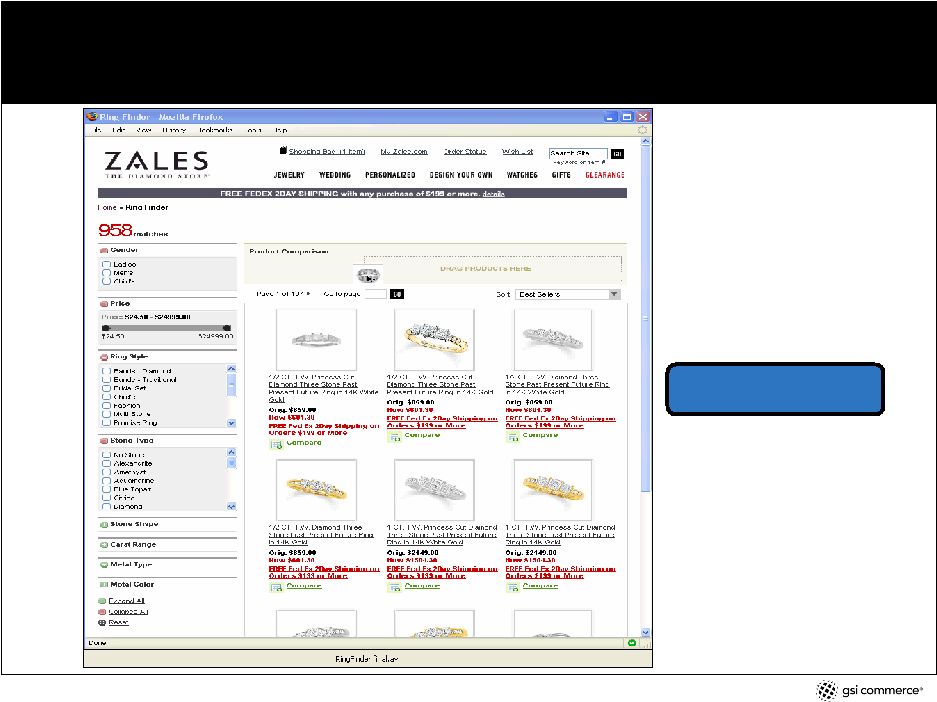 14 value proposition – focus on partner growth, brand and customer experience agenda core domestic business emerging growth opportunities financials decision wizards |
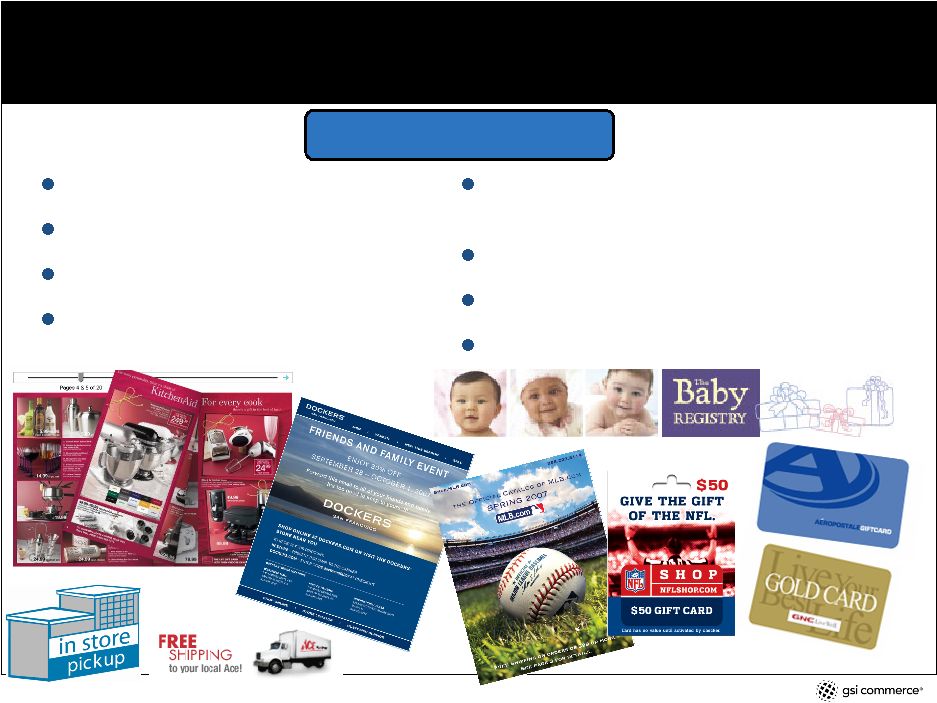 15 value proposition – focus on partner growth, brand and customer experience buy online, pick up in store buy online, ship to store buy online, return to store digital versions of print media (e.g. catalogs, circulars) online/offline gift card redemption and purchase online/offline loyalty program integration online/offline private label credit card integrated registries agenda core domestic business emerging growth opportunities financials multichannel capabilities |
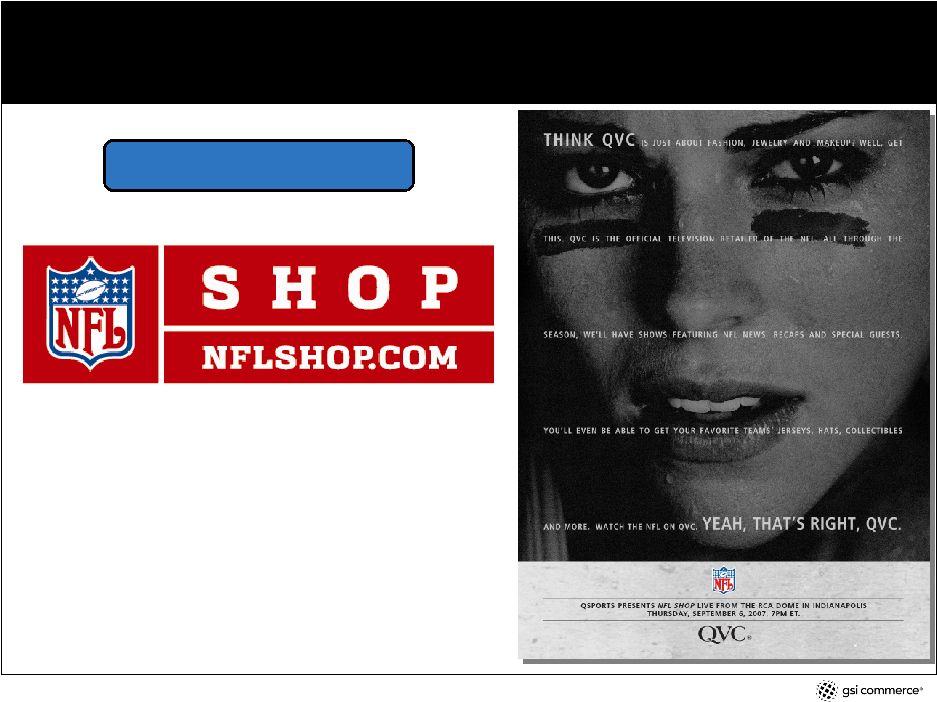 16 value proposition – focus on partner growth, brand and customer experience agenda core domestic business emerging growth opportunities financials leveraging relationships |
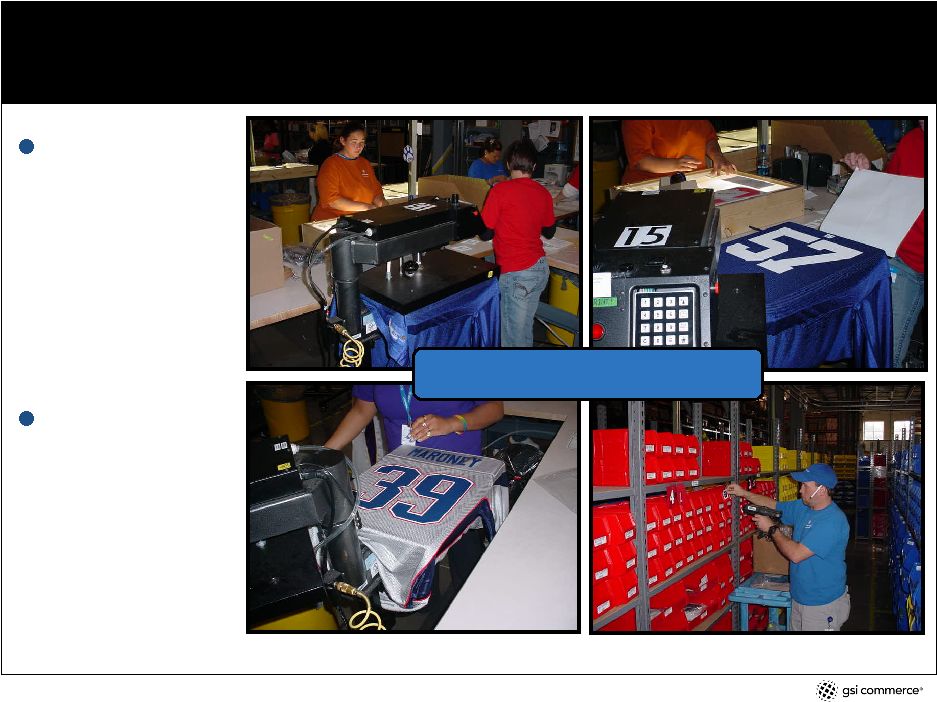 17 value proposition – focus on partner growth, brand and customer experience More than 100,000 NFL jerseys decorated in-house by GSI July – Dec. 2006 More than 9,000 customized NFL team jerseys were ordered on QVC.com in a single day. agenda core domestic business emerging growth opportunities financials customization / personalization |
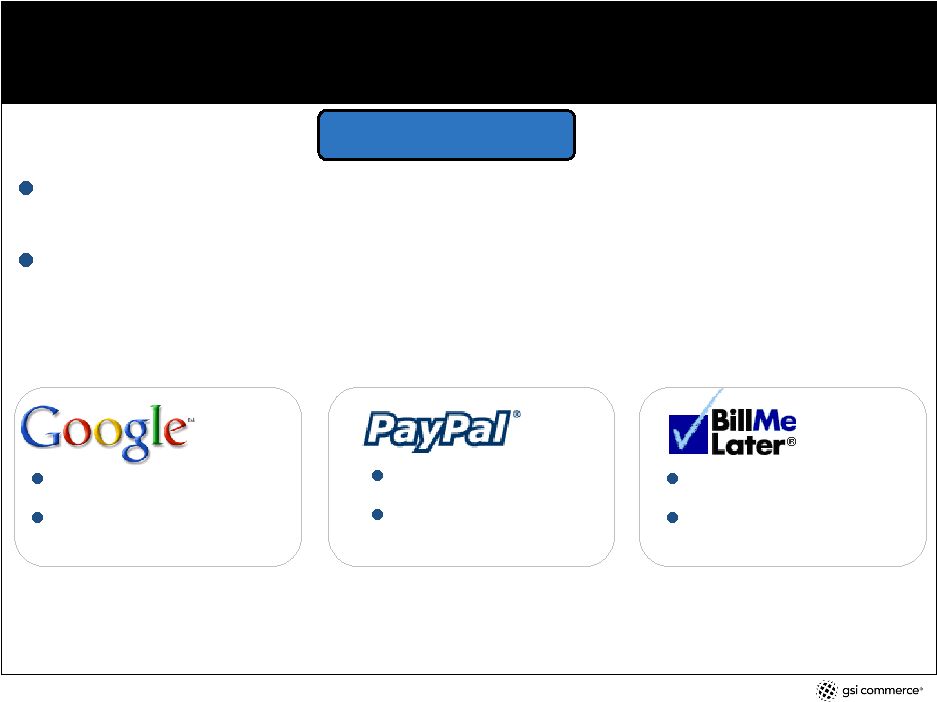 18 value proposition – focus on partner growth, brand and customer experience ~ 41 partner web stores use one or more alternative payment methods black friday thru cyber monday, 2006 – Bill Me Later, Google Checkout and PayPal accounted for more than 18% of purchases made on GSI Commerce’s partner sites using those services 1x login & account set up track all order & shipping info. in one account virtual wallet extensive network quick, easy credit “90 days same as cash” agenda core domestic business emerging growth opportunities financials alternative payments |
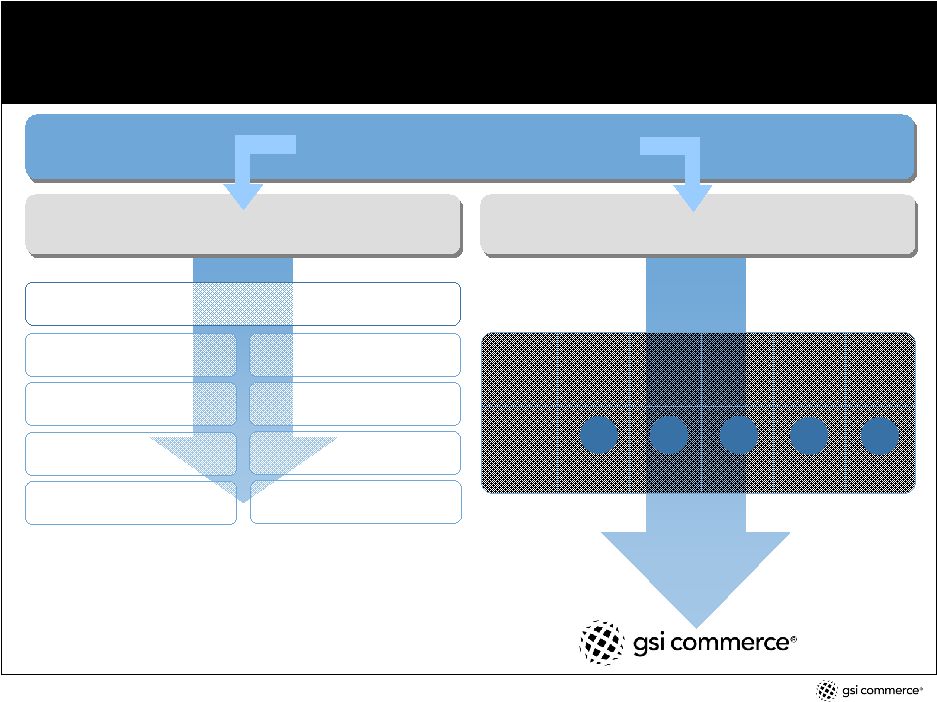   19 competition outsource insource web platform IBM, ATG, Microsoft customer care West, Convergys fulfillment /logistics DHL, UPS design aQuantive, Grey Interactive online marketing aQuantive, ValueClick strategy/sys. integrators McKinsey, Accenture order proc/merch systems SAP, Yantra e-mail mgmt. Experian, epsilon retailer e-commerce decision GSI web platform custom solutions marketing services fulfillment /logistics customer care one-stop, full-service solution provider agenda core domestic business emerging growth opportunities financials |
 20 marketing services agenda core domestic business emerging growth opportunities financials |
 21 marketing services full-service, interactive marketing services creative – user experience & site design online marketing (search, affiliate, comparison shopping engines, display) e-mail content development & digital photography catalog services provides services to ~ 50 partners 155 staff and growing complementary acquisitions possible agenda core domestic business emerging growth opportunities financials |
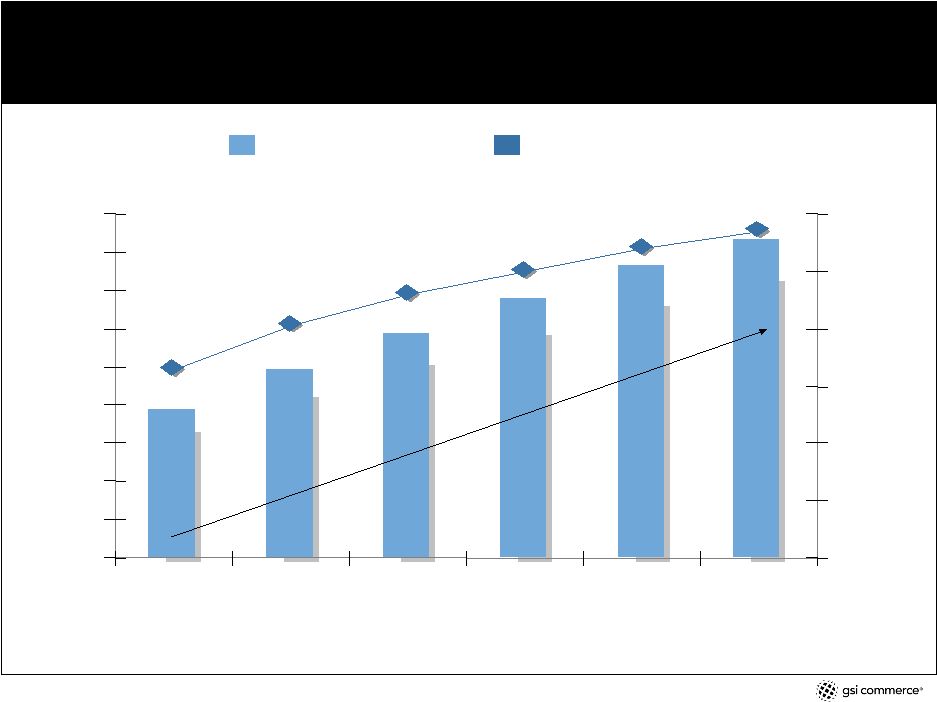 22 marketing services – online advertising market estimated U.S. online advertising as % of total U.S. advertising spend estimated U.S. online advertising revenues 2006 2007 2008 2009 2010 2011 $0 $5 $10 $15 $20 $25 $30 $35 $40 $45 0% 2% 4% 6% 8% 10% 12% $19.3 $24.7 $29.5 $34.0 6.6% 8.1% 9.2% 11.4% 10.0% 10.8% $38.2 $42.0 16.9% CAGR Source: Piper Jaffray, U.S. Online Advertising Forecast. $ in millions agenda core domestic business emerging growth opportunities financials |
 23 marketing services – a multichannel requirement almost $400 billion of store sales – or 16% of total retail sales – were directly influenced by the Web (cross-channel sales) in 2006. This will grow at a 17% CAGR over the next five years resulting in cross-channel sales by consumers of more than $1 trillion by 2012 * 51% of online consumers have researched and then purchased offline * 45% of online consumers buy additional products once inside an offline store * main reason consumers purchased offline: wanted product immediately * $0 $500 $1,000 $1,500 $2,000 $2,500 $3,000 $3,500 2006 2007 2008 2009 2010 2011 2012 16% 20% 24% 28% 32% 35% 38% $2,481 $2,552 $2,627 $2,705 $2,787 $2,873 $2,954 total cross-channel sales - % * total retail sales, excluding travel * CAGR = 17% * Source: Forrester Research Inc., “The Web’s Impact on In-Store Sales: U.S. Cross-Channel Sales Forecast, 2006 to 2012.”, May 7, 2007. $ in millions agenda core domestic business emerging growth opportunities financials |
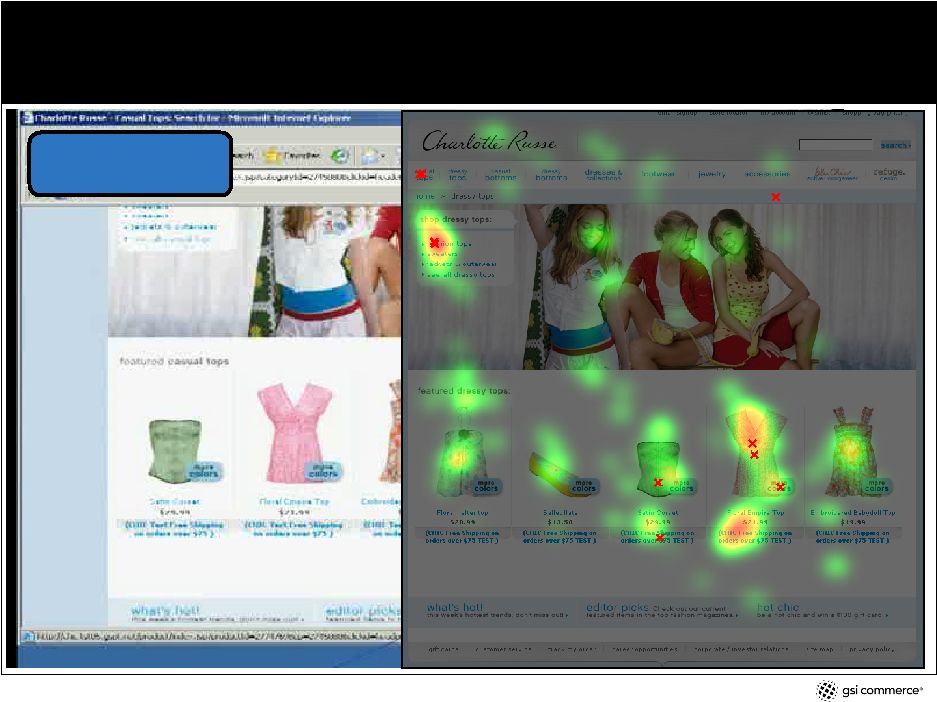 24 marketing services – enhancing the customer experience agenda core domestic business emerging growth opportunities financials usability lab |
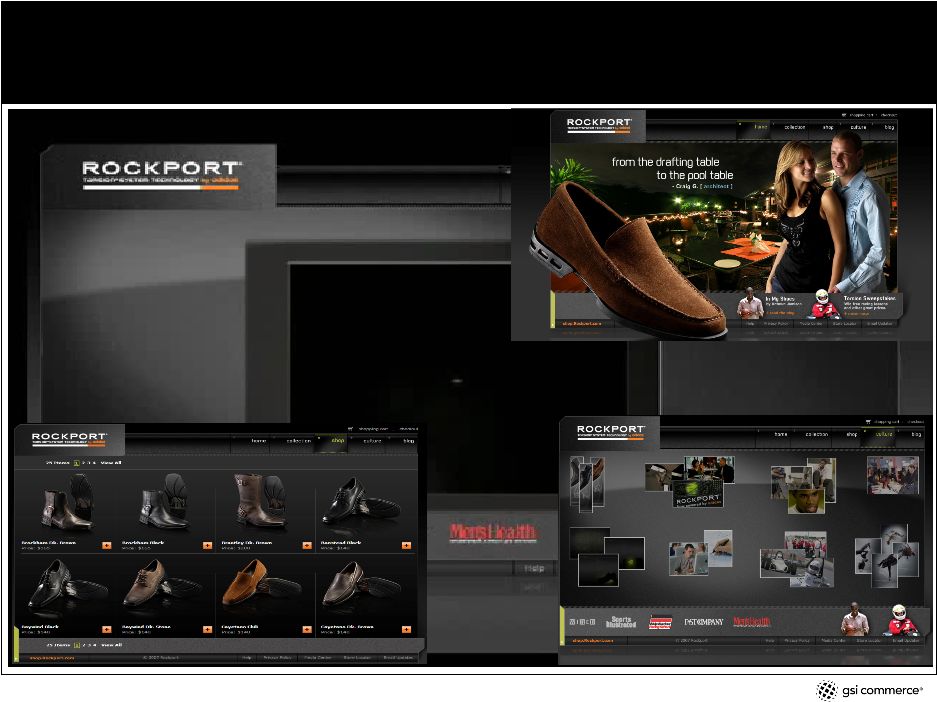 25 marketing services – brand integration agenda core domestic business emerging growth opportunities financials |
 26 international agenda core domestic business emerging growth opportunities financials |
 27 international executive presence in Barcelona, Spain senior executive relocated in August leveraging 2006 acquisition of Aspherio and incrementally developing core platform europe followed by asia size of the market, current Barcelona presence, and fewer language & cultural challenges interest of domestic partners ability to gain traction with new partners buy / build assets to assemble end-to-end solution an end-to-end solution is strategic differentiator two international deals signed in 2007 for 2008 launches iRobot -- launching in three countries in 2008 Unnamed men’s apparel partner -- launching two stores each in six countries in 2008 agenda core domestic business emerging growth opportunities financials |
 28 international – european e-commerce market * Includes the following European countries: United Kingdom, Germany, France, Italy, Spain, Netherlandds, Belgium, Luxembourg, Norway, Sweden, Denmark, Finland, Austria, Switzerland, Ireland, Portugal and Greece. Source: Forrester Research Inc., “Europe’s e-Commerce Forecast: 2006 to 2011,” June 29, 2006. Euros were converted to U.S. dollars for this presentation. As of 5/10/07 that rate was 1 Euro = $1.354 projected growth of european online sales european online population expected to grow from 189 million in 2006 to 242 million in 2011, or from 58% to 74% of the adult population. * in 2003, 19% of europe’s online population shopped online -- that number is expected to grow to 54% by 2011. * 2006 2007 2008 2009 2010 2011 $ in billions $309.9 $138.9 $177.2 $219.3 $264.0 $356.1 $0 $50 $100 $150 $200 $250 $300 $350 $400 23.7% 20.4% 17.4% 14.9% 27.5% agenda core domestic business emerging growth opportunities financials |
 29 financials agenda core domestic business emerging growth opportunities financials |
 30 growth strategy for the business core enterprise market add new partners (5 – 10 per year) – long-term, exclusive deals grow annuity transaction volume increase incremental revenue – technology & multichannel projects renew / extend agreements emerging growth opportunities marketing services - gsi interactive SM international – gsi international SM agenda core domestic business emerging growth opportunities financials |
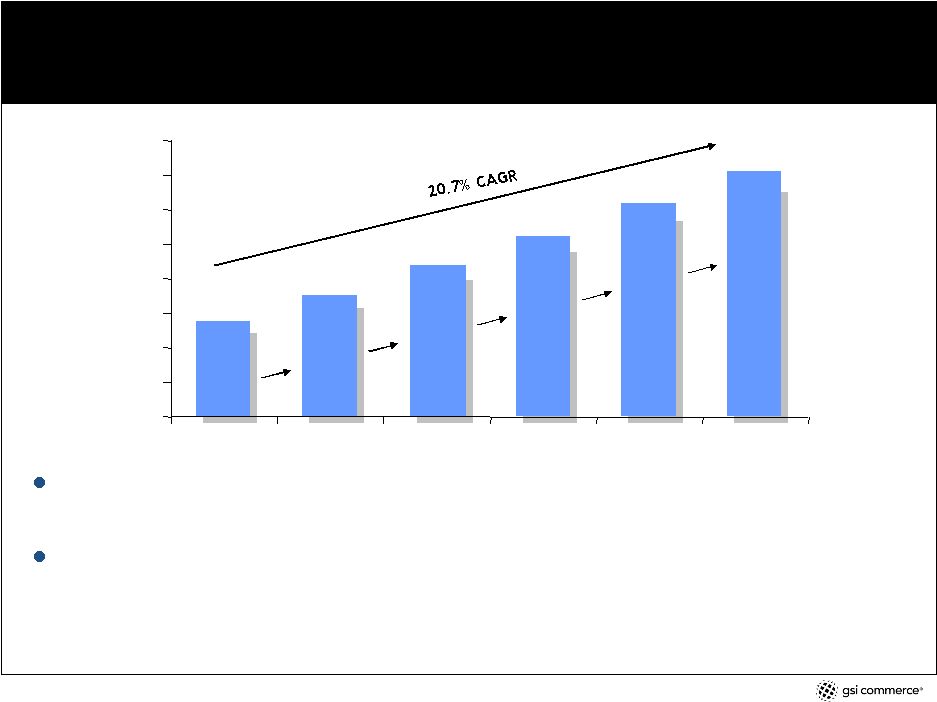
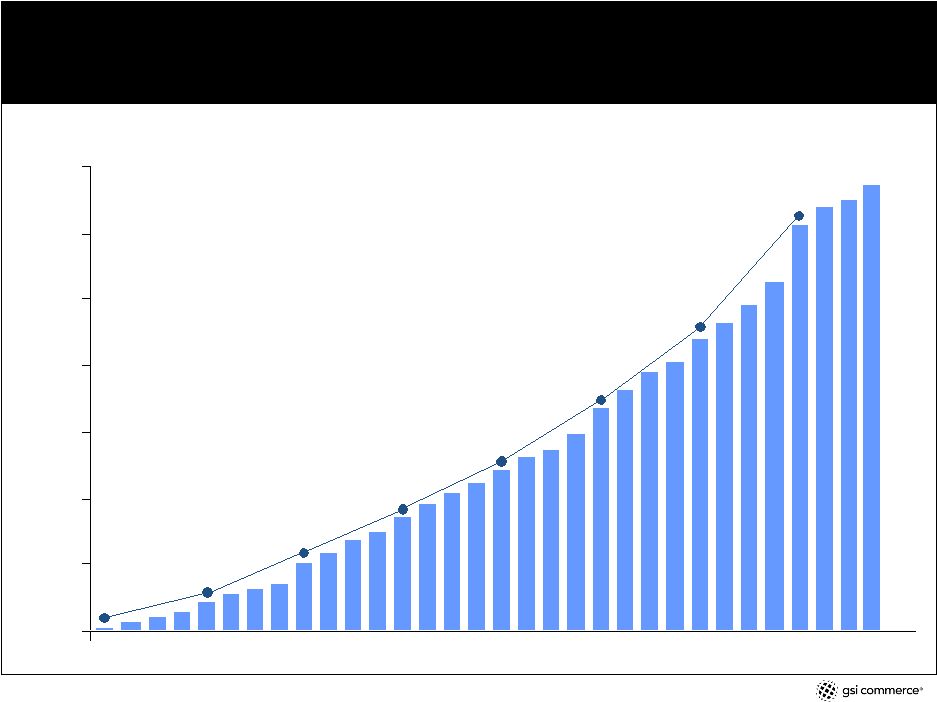 31 net revenues – trailing four quarters $0 $100 $200 $300 $400 $500 $600 $700 $5.5 FY99 $42.8 FY00 $102.6 FY01 $172.6 FY02 $241.9 FY03 $335.1 FY04 $440.4 FY05 $609.6 FY06 $ in millions agenda core domestic business emerging growth opportunities financials |
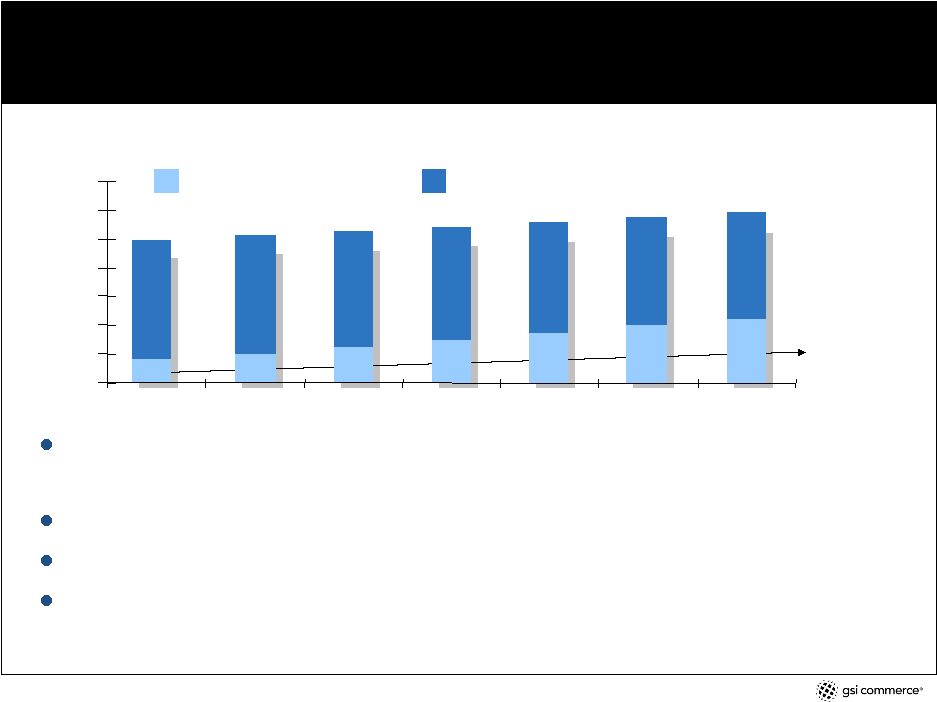
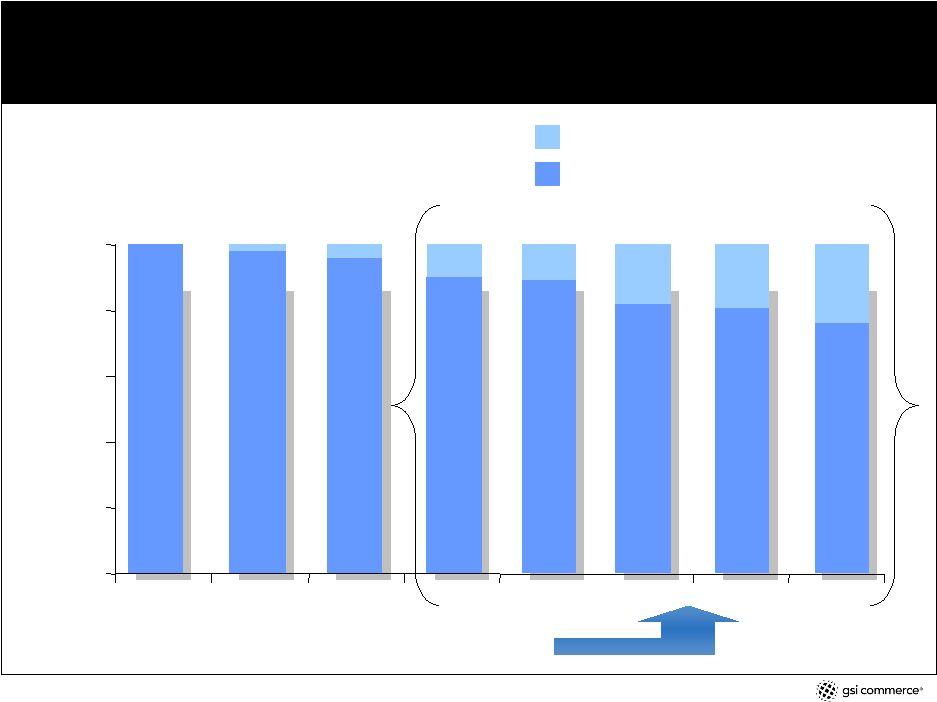 32 changing revenue mix . . . product sales % contribution to net revenue service fees % contribution to net revenue % net revenue 0% 20% 40% 60% 80% 100% 1999 2000 2001 2002 2003 2004 2005 2006 100% 97.7% 95.8% 89.7% 89.5% 82.0% 80.7% 75.7% 2.3% 4.2% 10.3% 10.5% 18.0% 19.3% 24.3% service fees compounded annual growth rate from 2002 – 2006 = 70% product sales compounded annual growth rate from 2002 – 2006 = 31.4% agenda core domestic business emerging growth opportunities financials |
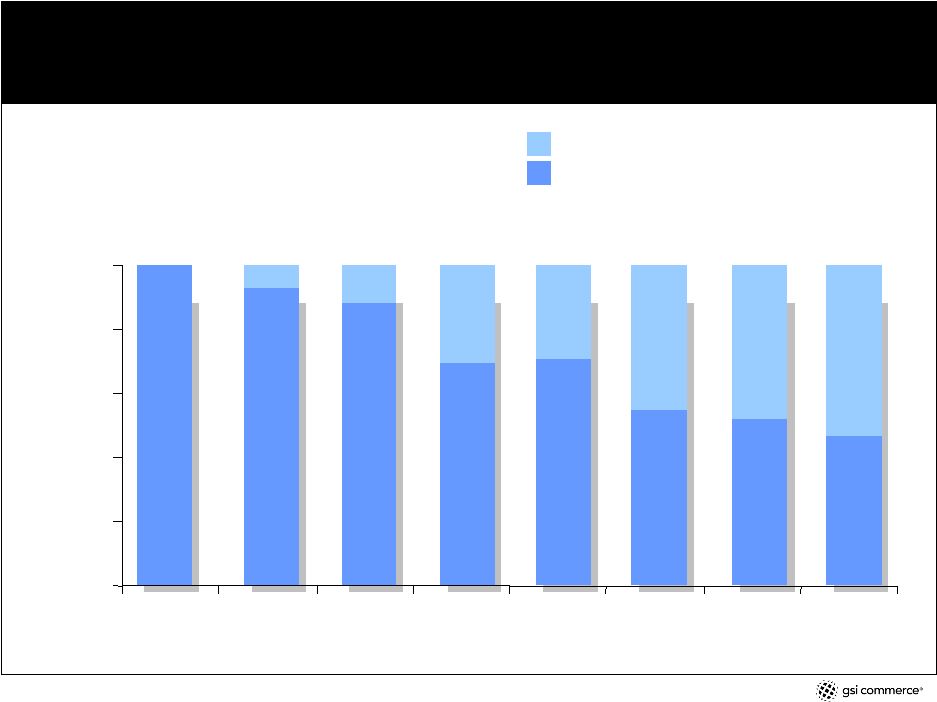 33 . . . more fully impacts gross profit contribution product sales % contribution to gross profit service fees % contribution to gross profit 0% 20% 40% 60% 80% 100% 1999 2000 2001 2002 2003 2004 2005 2006 % gross profit 100% 92.4% 87.7% 69.5% 70.9% 54.5% 51.9% 46.7% 7.6% 12.3% 30.5% 29.1% 45.5% 48.1% 53.3% agenda core domestic business emerging growth opportunities financials |
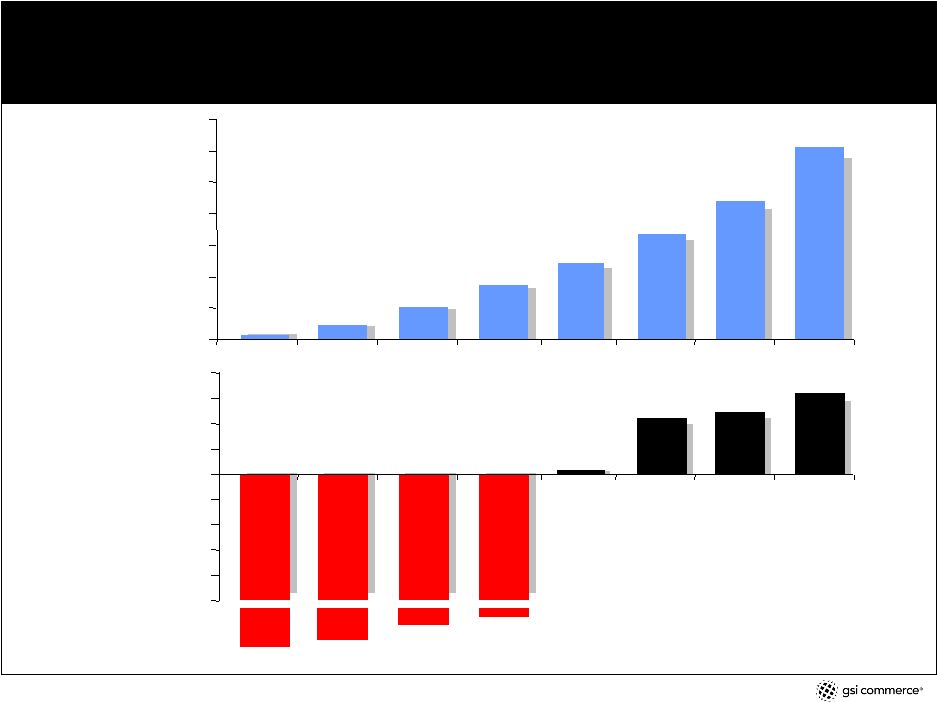 34 Delivering revenue growth & margin expansion For a reconciliation of non-GAAP financial measures, see Appendices A thru D and/or see our results for fiscal years 2001 - 2006 at www.gsicommerce.com/news/news.jsp . net revenue $ in millions adjusted EBITDA -467.3% $0 $100 $200 $300 $400 $500 $600 $700 1999 2000 2001 2002 2003 2004 2005 2006 $5.5 $42.8 $102.6 $172.6 $241.9 $335.1 $440.4 $609.6 0.1% 4.4% 4.9% 6.4% -10% -8% -6% -4% -2% 0% 2% 4% 6% 8% -95.4% -16.2% -11.3% agenda core domestic business emerging growth opportunities financials |
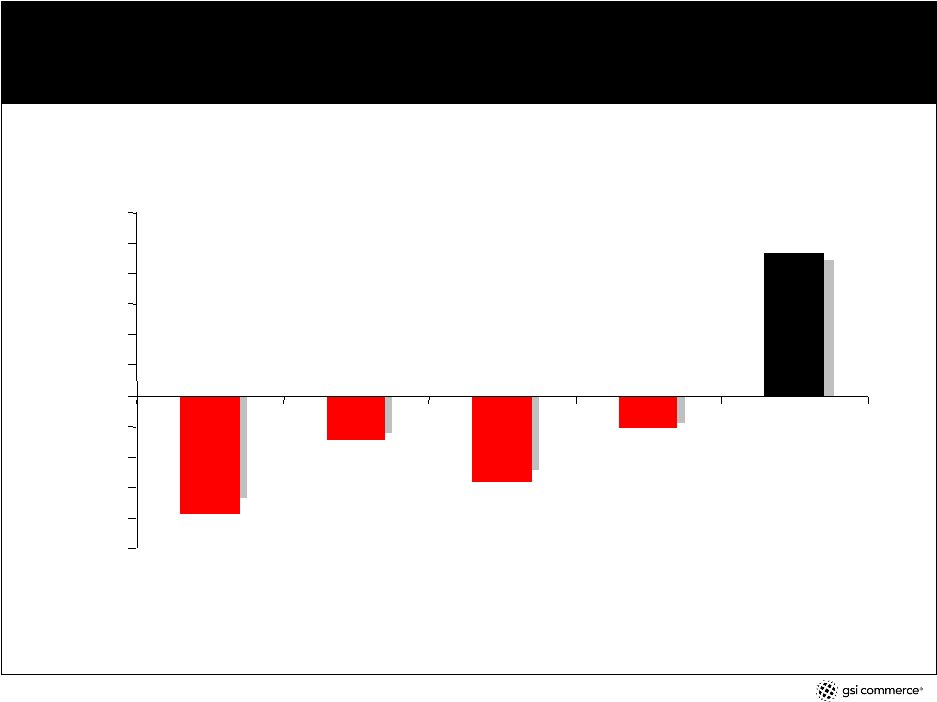 35 annual free cash flow – 2006 positive milestone $ in millions -$25 -$20 -$15 -$10 -$5 $0 $5 $10 $15 $20 $25 $30 2002 2003 2004 2005 2006 -$19.4 -$7.5 -$13.6 -$5.3 $23.5 For a reconciliation of non-GAAP financial measures, see Appendices A thru D and/or see our results for fiscal years 2001 - 2006 at www.gsicommerce.com/news/news.jsp . agenda core domestic business emerging growth opportunities financials |
 36 strong balance sheet cash * $103.5 $184.5 $166.2 inventory $43.3 $46.8 $52.8 net fixed assets $96.7 $106.2 $148.3 total assets $308.4 $463.6 $608.5 debt $70.8 $70.9 $236.8 a/p & accrued expenses $74.7 $149.3 $127.3 total liabilities $157.7 $235.9 $383.7 stockholders’ equity $153.2 $227.7 $224.8 * cash and cash equivalents and marketable securities. ($ millions) sept. 30, 2006 dec. 30, 2006 sept. 29, 2007 agenda core domestic business emerging growth opportunities financials |
 37 appendices |
 38 appendix a January 1, December 30, December 29, December 28, January 3, January 1, January 3, January 1, 2000 2000 2001 2002 2004 2005 2005 2006 (29,083) $ (53,557) $ (32,497) $ (34,437) $ (13,064) $ (401) $ 2,878 $ 9,647 $ 2,655 4,983 10,282 401 1,935 3,576 3,805 7,578 728 8,074 6,662 10,509 11,386 10,944 14,635 21,297 (25,700) $ (40,500) $ (15,553) $ (23,527) $ 257 $ 14,119 $ 21,318 $ 38,522 $ Twelve Months Ended GSI COMMERCE, INC. AND SUBSIDIARIES ADJUSTED EBITDA (1) AND RECONCILIATION TO GAAP RESULTS (In thousands) (Unaudited) FY1999 FY2000 FY2001 FY2002 FY2003 FY2004 FY2005 FY2006 Reconciliation of GAAP Income from operations to Adjusted EBITDA: GAAP Income from operations Stock-based compensation Depreciation and amortization Adjusted EBITDA (1) Adjusted EBITDA no longer includes other income (expense) as a reconciling item between Adjusted EBITDA and GAAP results. |
 39 appendix b GSI COMMERCE, INC. AND SUBSIDIARIES MERCHANDISE SALES (1) AND RECONCILIATION TO GAAP RESULTS (Dollars in thousands) (Unaudited) January 3, January 1, 2004 2005 Merchandise sales (1) - (a non-GAAP financial measure): Category: Sporting goods 128,489 $ 200,394 $ Other (2) 153,537 274,586 Total merchandise sales (1) - (a non-GAAP financial measure) 282,026 $ 474,980 $ Net revenues - (GAAP basis): Net revenues from product sales: Category: Sporting goods 128,360 $ 164,530 $ Other (2) 88,150 110,458 Total net revenues from product sales 216,510 274,988 Service fee revenues 25,409 60,116 Total net revenues - (GAAP basis) 241,919 $ 335,104 $ December 28, 2002 96,669 $ 81,631 178,300 $ 96,669 $ 58,150 154,819 17,819 172,638 $ Fiscal Year 2004 Fiscal Year 2003 Fiscal Year 2002 Year Ended December 31, 2005 261,568 $ 420,429 681,997 $ 212,932 $ 142,442 355,374 85,018 440,392 $ Fiscal Year 2005 385,950 $ 801,849 1,187,799 $ 314,696 $ 146,487 461,183 148,370 609,553 $ December 30, 2006 Fiscal Year 2006 |
 40 appendix b . . . continued January 3, January 1, 2004 2005 Year Ended GSI COMMERCE, INC. AND SUBSIDIARIES MERCHANDISE SALES (1) AND RECONCILIATION TO GAAP RESULTS (Dollars in thousands) (Unaudited) Reconciliation of merchandise salesto net revenues: (1) Merchandise sales - (1) (a non-GAAP financial measure): Category: Sporting goods 128,489 $ 200,394 $ Other (2) 153,537 274,586 Total merchandise sales (1) - (a non-GAAP financial measure) 282,026 474,980 Less: Sales by partners : (3) Category: Sporting goods (129) (35,864) Other (65,387) (164,128) Total sales by partners (3) (65,516) (199,992) Add: Service fee revenues 25,409 60,116 Net revenues - (GAAP basis) 241,919 $ 335,104 $ (1) Merchandise sales represents the retail value of all sales transactions, inclusive of freight charges and net of allowances for returns and discounts, which flow through the GSI Commerce platform, whether or not GSI Commerce is the seller of the merchandise or records the full amount of such sales on its financial statements. (2) The "Other" categories of both merchandise sales and net revenues from product sales include $1,034 and $10 for the year ended January 3, 2004 and January 1, 2005, respectively, related to Ashford.com. (3) Represents the retail value of all product sales through the GSI Commerce platform where the inventory is owned by the partner and the partner is the seller of the merchandise. GSI Commerce records service fee revenues on these sales. December 28, 2002 96,669 $ 81,631 178,300 -- (23,481) (23,481) 17,819 172,638 $ Fiscal Year 2004 Fiscal Year 2003 Fiscal Year 2002 December 31, 2005 Fiscal Year 2005 261,568 $ 420,429 681,997 (48,636) (277,987) (326,623) 85,018 440,392 $ 385,950 $ 801,849 1,187,799 (71,254) (655,362) (726,616) 148,370 609,553 $ December 30, 2006 Fiscal Year 2006 |
 41 appendix c December 28, January 3, January 1, December 31, December 30, 2002 2004 2005 2005 2006 Reconciliation of GAAP operating cash flow to free cash flow GAAP cash flow from operating activities 10,041 $ 475 $ 21,094 $ 24,285 $ 66,077 $ Cash paid for fixed assets, including capitalized software development (29,480) (7,999) (34,717) (29,551) (42,621) Free Cash Flow (19,439) $ (7,524) $ (13,623) $ (5,266) $ 23,456 $ Twelve Months Ended GSI COMMERCE, INC. AND SUBSIDIARIES FREE CASH FLOW AND RECONCILIATION TO GAAP OPERATING CASH FLOW (In thousands) (Unaudited) |