UNITED STATES
SECURITIES AND EXCHANGE COMMISSION
Washington, DC 20549
FORMN-CSRS
CERTIFIED SHAREHOLDER REPORT OF REGISTERED
MANAGEMENT INVESTMENT COMPANIES
Investment Company Act file number811-05459
Templeton Global Income Fund
(Exact name of registrant as specified in charter)
|
| 300 S.E. 2nd Street, Fort Lauderdale, FL 33301-1923 |
| (Address of principal executive offices) (Zip code) |
Craig S. Tyle, One Franklin Parkway, San Mateo, CA 94403-1906
(Name and address of agent for service)
Registrant’s telephone number, including area code: (954)527-7500
Date of fiscal year end: 12/31
Date of reporting period: 6/30/19
Item 1. Reports to Stockholders.
Internet Delivery of Fund Reports Unless You Request Paper Copies:Effective January 1, 2021, as permitted by the SEC, paper copies of the Fund’s shareholder reports will no longer be sent by mail, unless you specifically request them from the Fund or your financial intermediary. Instead, the reports will be made available on a website, and you will be notified by mail each time a report is posted and provided with a website link to access the report.
If you already elected to receive shareholder reports electronically, you will not be affected by this change and you need not take any action. If you have not signed up for electronic delivery, we would encourage you to join fellow shareholders who have. You may elect to receive shareholder reports and other communications electronically from the Fund by calling (800)416-5585 or by contacting your financial intermediary.
You may elect to continue to receive paper copies of all your future shareholder reports free of charge by contacting your financial intermediary or, if you invest directly with a Fund, calling (800)416-5585 to let the Fund know of your request. Your election to receive reports in paper will apply to all funds held in your account.
FRANKLIN TEMPLETON
Successful investing begins with ambition. And achievement only comes when you reach for it. That’s why we continually strive to deliver better outcomes for investors. No matter what your goals are, our deep, global investment expertise allows us to offer solutions that can help.
During our more than 70 years of experience, we’ve managed through all kinds of markets—up, down and those in between. We’re always preparing for what may come next. It’s because of this, combined with our strength as one of the world’s largest asset managers that we’ve earned the trust of millions of investors around the world.
Contents
Semiannual Report
|
Visitfranklintempleton.com/investor/investments-and-solutions/investment-
options/closed-end-funds/for fund |
| updates, to access your account, or to find helpful financial planning tools. |
| | |
| | Not FDIC Insured | May Lose Value | No Bank Guarantee |
| | | | |
| | | |
| franklintempleton.com | | Not part of the semiannual report | | 1 |
SEMIANNUAL REPORT
Templeton Global Income Fund
Dear Shareholder:
This semiannual report for Templeton Global Income Fund covers the period ended June 30, 2019.
Your Fund’s Goal and Main Investments
The Fund seeks high, current income, with a secondary goal of capital appreciation. Under normal market conditions, the Fund invests at least 80% of its net assets in income-producing securities, including debt securities of U.S. and foreign issuers, including emerging markets.
Performance Overview
For the six months under review, the Fund posted cumulative total returns of +9.21% based on market price and +3.46% based on net asset value. For comparison, the global government bond market, as measured by the J.P.Morgan (JPM) Global Government Bond Index (GGBI), posted a cumulative total return of +5.37% in U.S. dollar terms for the same period.1 You can find the Fund’s long-term performance data in the Performance Summary on page 6.
Performance data represent past performance, which does not guarantee future results. Investment return and principal value will fluctuate, and you may have a gain or loss when you sell your shares. Current performance may differ from figures shown.
Economic and Market Overview
Global financial markets began thesix-month period on a positive note, significantly recovering from the heightened volatility in December 2018. Some of the strongest rallies in January were seen across emerging markets, notably in Latin America. Most global currencies initially strengthened against a broadly weaker U.S. dollar before the trends reversed in February, March, April and May. However, weakness in the U.S. dollar returned in June, resulting in positive appreciations for a number of currencies against the U.S. dollar over the fullsix-month period. Additionally, risk assets around the world largely rallied during the period as a whole despite intermittent periods of volatility, with credit
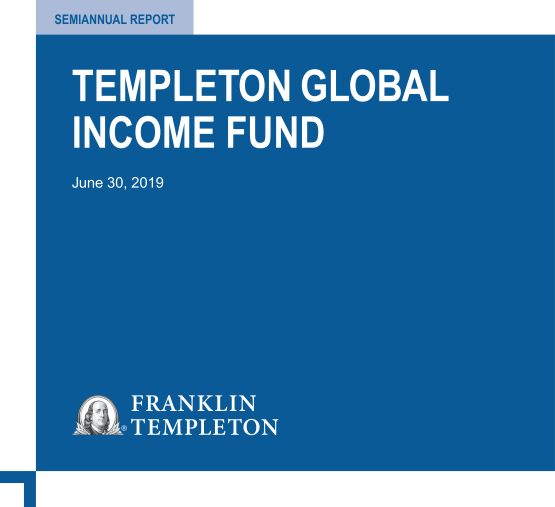
Portfolio Composition*
Based on Total Net Assets as of 6/30/19
*Figures represent the net Fund exposure and include certain derivatives held in the portfolio (or their underlying reference assets) and may not total 100% or may be negative due to rounding, use of any derivatives or other factors.
**Includes U.S. and foreign government and agency securities, money market funds and other net assets (including derivatives).
spreads broadly tightening across much of the global fixed income markets.
The Federal Open Market Committee (FOMC) shifted its policy stance at its January 2019 meeting, keeping rates unchanged, but removing its prior statement that “some further gradual increases in the target range for the federal funds rate” would be warranted. By March, the U.S. Federal Reserve (Fed) dropped its projected rate hikes for 2019 to zero, from the previous projections for two. In June, the FOMC shifted forward guidance further into dovish territory, notably removing its prior statement on being “patient…on future adjustments” and replacing it with a declaration that it “will act as appropriate to sustain the expansion.” Fed Chair Jay Powell indicated that several FOMC members saw a strengthening case for rate cuts.
In Europe, the European Central Bank (ECB) kept its policy rate unchanged at its January, March, April and June meetings, but moved increasingly into dovish territory throughout the period. ECB President Mario Draghi indicated the central bank was prepared to “use all the instruments in its toolbox” to support economic conditions and move inflation closer to its 2.0% target, specifically including the possibility for rate cuts and quantitative easing.
1. Source: Morningstar.
The index is unmanaged and includes reinvestment of any income or distributions. It does not reflect any fees, expenses or sales charges. One cannot invest directly in an index, and an index is not representative of the Fund’s portfolio.
See www.franklintempletondatasources.com for additional data provider information.
The dollar value, number of shares or principal amount, and names of all portfolio holdings are listed in the Fund’s Statement of Investments (SOI).
The SOI begins on page 10.
| | | | |
| 2 | | Semiannual Report | | franklintempleton.com |
TEMPLETON GLOBAL INCOME FUND
Trade tensions between the U.S. and China presented risks to economic continuity and market sentiment during the period. Negotiations appeared to deteriorate throughout May, but not to a point that we believed would trigger an imminent recession or require acute monetary accommodation. The impasse appeared to thaw at the end of June, as President Trump resumed trade talks with Chinese President Xi Jinping at the G20 summit in Osaka, Japan. Our baseline view was for trade agreements to be reached in the second half of 2019, though the tail risks for“no-deal” scenarios and ongoing tariff tensions remained elevated.
Sovereign bond yields around the world declined during thesix-month period, with the yield on the10-year U.S. Treasury (UST) note finishing 0.68% lower at 2.01%, its lowest level since November 2016, and the yield on the10-year German Bund dropping 0.57% to finish at 0.33%, its lowest level on record. The UST yield curve inverted with the spread between three-month and10-year USTs reaching a low of-0.25% in early June, its lowest level since 2007. In our view, markets were overvaluing longer-term USTs during the period and overstating the probabilities for a near-term contraction in the U.S. economy. The probability for slower growth in the second half of 2019 increased during the period, but the likelihood for a recession still remained quite low, in our assessment.
On the whole, duration and credit exposures around the world rallied during the period. Additionally, a number of global currencies appreciated against a weakened U.S. dollar, with some notable exceptions including the euro, the Australian dollar, the Argentine peso and the Ghanaian cedi. Overall, long-duration exposures and select currency exposures across global fixed income markets were key drivers of investment returns during the period.
Investment Strategy
We invest selectively in bonds around the world to generate income for the Fund, seeking opportunities while monitoring changes in interest rates, currency exchange rates and credit risks. We seek to manage the Fund’s exposure to various currencies and may use currency forward contracts.
Manager’s Discussion
During the period, we held duration exposures in select local-currency markets, notably including Brazil, Colombia, Ghana, India and Indonesia. We held short-term local-currency bonds in Mexico, Argentina and South Korea. We also continued to hold anet-negative position in the euro, through currency forward contracts, as a macro hedge against a broadly strengthening U.S. dollar and as a
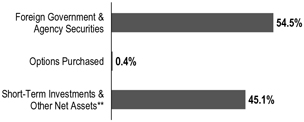
Geographic Composition*
Based on Total Net Assets as of 6/30/19
*Figures reflect certain derivatives held in the portfolio (or their underlying reference assets) and may not total 100% or may be negative due to rounding, use of any derivatives, unsettled trades or other factors.
**The Fund’s supranational investment was denominated in the Mexican peso.
directional view on the currency. We expected the euro to weaken based on rate differentials and growth divergence between Europe and the U.S. The ECB has shifted back toward ongoing stimulus with intentions to not raise rates above the 0% main refinancing rate through at least the first half of 2020. Our short euro position was also designed to hedge against eurosceptic political risks and unresolved structural risks across Europe. We also continued to holdnet-negative positioning in the Australian dollar, also through currency forward contracts, based on the Reserve Bank of Australia’s continued rate accommodation, and as a partial hedge against potential trade risks and tail risks associated with China’s economy. The short Australian dollar position is intended to hedge broad-based beta risk across emerging markets. In May, we closed ournet-negative position in the Japanese yen, formerly achieved through currency forward contracts, and transitioned toward a positive exposure to the yen, as our expectations shifted to a positive outlook for yen strength. We continued to hedge our exposures to the Indian rupee and South Korean won but maintained our positions in the local-currency bonds. In credit markets, we continued to see areas of value in some specific sovereign credits. However, we largely preferred the risk-adjusted returns in specific areas of the local-currency bond markets over the more fully valued credit markets. We remained positioned for rising yields by maintaining low overall portfolio duration and holding negative duration exposure to USTs through interest-rate swaps. During the period, we used forward currency exchange contracts to actively manage currencies. We also used interest-rate swaps to tactically manage duration exposures.
| | | | | | |
| | | |
franklintempleton.com | | Semiannual Report | | | 3 | |
TEMPLETON GLOBAL INCOME FUND
What is duration?
Duration is a measure of a bond’s price sensitivity to interest-rate changes. In general, a portfolio of securities with a lower duration can be expected to be less sensitive to interest-rate changes than a portfolio with a higher duration.
What is a currency forward contract?
A currency forward contract is an agreement between the Fund and a counterparty to buy or sell a foreign currency in exchange for another currency at a specific exchange rate on a future date. Currency forward contracts are privately traded in the interbank market, not on a centralized exchange.
What is an interest-rate swap?
An interest-rate swap is an agreement between two parties to exchange interest-rate payment obligations, generally one based on an interest rate fixed to maturity and the other based on an interest rate that changes in accordance with changes in a designated benchmark (for example, LIBOR, prime, commercial paper or other benchmarks).
| | | | |
| Currency Composition* | | | |
| 6/30/19 | | | |
| |
| | | % of Total
Net Assets | |
| |
Americas | | | 121.0% | |
| |
U.S. Dollar | | | 84.0% | |
| |
Mexican Peso | | | 18.4% | |
| |
Brazilian Real | | | 13.4% | |
| |
Argentine Peso | | | 3.6% | |
| |
Colombian Peso | | | 1.6% | |
| |
Asia Pacific | | | 15.4% | |
| |
Japanese Yen | | | 18.2% | |
| |
Indonesian Rupiah | | | 8.2% | |
| |
Indian Rupee | | | 0.2% | |
| |
Philippine Peso | | | 0.0% | ** |
| |
South Korean Won | | | 0.0% | ** |
| |
Australian Dollar | | | -11.2% | |
| |
Middle East & Africa | | | 1.4% | |
| |
Ghanaian Cedi | | | 1.4% | |
| |
Europe | | | -37.8% | |
| |
Euro | | | -37.8% | |
| |
*Figures represent the net Fund exposure and include certain derivatives held in the portfolio (or their underlying reference assets) and may not total 100% or may be negative due to rounding, use of any derivatives or other factors.
**Rounds to less than 0.1%.
During the period, the strategy’s positive absolute performance was primarily attributable to currency positions.
Interest-rate strategies detracted from absolute return, while sovereign credit exposures had a largely neutral effect. Among currencies, the Fund’snet-negative positions in the euro and the Japanese yen contributed to absolute performance. Its position in the Mexican peso also contributed to absolute results, while its position in the Argentine peso detracted. The Fund maintained a defensive approach regarding interest rates in developed markets, while holding duration exposures in select emerging markets. Negative duration exposure to USTs detracted from absolute performance. However, select duration exposures in Asiaex-Japan contributed to absolute results, as did duration exposure in Brazil.
On a relative basis, the strategy’s underperformance during the period was primarily due to interest-rate strategies. Currency positions contributed to relative results, while sovereign credit exposures had a largely neutral effect. Underweighted duration exposures in the U.S. and Japan detracted from relative performance, as did select underweighted duration exposures in Europe. However, overweighted duration exposure in Brazil contributed to relative results. Among currencies, the Fund’s underweighted positions in the euro and the Japanese yen contributed to relative performance. Its overweighted position in the Mexican peso also contributed to relative results, while its overweighted position in the Argentine peso detracted.
Thank you for your continued participation in Templeton Global Income Fund. We look forward to serving your future investment needs.
Sincerely,
| | |

| |  |
| | Michael Hasenstab, Ph.D. Lead Portfolio Manager |
| | |
 | |  |
| | Calvin Ho Portfolio Manager |
| | | | |
| | | |
4 | | Semiannual Report | | franklintempleton.com |
TEMPLETON GLOBAL INCOME FUND
|
The foregoing information reflects our analysis, opinions and portfolio holdings as of June 30, 2019, the end of the reporting period. The way we implement our main investment strategies and the resulting portfolio holdings may change depending on factors such as market and economic conditions. These opinions may not be relied upon as investment advice or an offer for a particular security. The information is not a complete analysis of every aspect of any market, country, industry, security or the Fund. Statements of fact are from sources considered reliable, but the investment manager makes no representation or warranty as to their completeness or accuracy. Although historical performance is no guarantee of future results, these insights may help you understand our investment management philosophy. |
| | | | | | |
| | | |
franklintempleton.com | | Semiannual Report | | | 5 | |
TEMPLETON GLOBAL INCOME FUND
Performance Summary as of June 30, 2019
Total return reflects reinvestment of the Fund’s dividends and capital gain distributions, if any, and any unrealized gains or losses. Total returns do not reflect any sales charges paid at inception or brokerage commissions paid on secondary market purchases. The performance table does not reflect any taxes that a shareholder would pay on Fund dividends, capital gain distributions, if any, or any realized gains on the sale of Fund shares. Your dividend income will vary depending on dividends or interest paid by securities in the Fund’s portfolio, adjusted for operating expenses. Capital gain distributions are net profits realized from the sale of portfolio securities.
Performance as of 6/30/191
| | | | | | | | | | | | | | | | | | | | |
| | | |
| | | Cumulative Total Return2 | | | | | | Average Annual Total Return2 | |
| | | | | | | | | | | | |
| | | Based on
NAV3 | | | Based on
market price4 | | | | | | Based on NAV3 | | | Based on
market price4 | |
| |
6-Month | | | +3.46% | | | | +9.21% | | | | | | | | +3.46% | | | | +9.21% | |
| |
1-Year | | | +6.52% | | | | +10.76% | | | | | | | | +6.52% | | | | +10.76% | |
| |
5-Year | | | +5.46% | | | | +2.96% | | | | | | | | +1.07% | | | | +0.59% | |
| |
10-Year | | | +69.70% | | | | +56.62% | | | | | | | | +5.43% | | | | +4.59% | |
| |
Performance data represent past performance, which does not guarantee future results. Investment return and principal value will fluctuate, and you may have a gain or loss when you sell your shares. Current performance may differ from figures shown.
Distributions(1/1/19–6/30/19)
| | |
Net Investment
Income | | |
$0.2222 | | |
See page 7 for Performance Summary footnotes.
| | | | |
| | | |
6 | | Semiannual Report | | franklintempleton.com |
TEMPLETON GLOBAL INCOME FUND
PERFORMANCE SUMMARY
All investments involve risks, including possible loss of principal. Changes in interest rates will affect the value of the Fund’s portfolio value, share price and yield. Bond prices generally move in the opposite direction of interest rates. As prices of bonds in the Fund adjust to a rise in interest rates, the Fund’s share price may decline. Special risks are associated with foreign investing, including currency fluctuations, economic instability and political developments of countries where the Fund invests. Investments in developing markets involve heightened risks related to the same factors, in addition to those associated with their relatively small size and lesser liquidity. Sovereign debt securities are subject to various risks in addition to those relating to debt securities and foreign securities generally, including, but not limited to, the risk that a government entity may be unwilling or unable to pay interest and repay principal on its sovereign debt, or otherwise meet its obligations when due. The markets for particular securities or types of securities are or may become relatively illiquid. Reduced liquidity will have an adverse impact on the security’s value and on the Fund’s ability to sell such securities when necessary to meet the Fund’s liquidity needs or in response to a specific market event. Derivatives, including currency management strategies, involve costs and can create economic leverage in the portfolio that may result in significant volatility and cause the Fund to participate in losses on an amount that exceeds the Fund’s initial investment. The Fund may not achieve the anticipated benefits and may realize losses when a counterparty fails to perform as promised. As a nondiversified investment company, the Fund may invest in a relatively small number of issuers and, as a result, be subject to a greater risk of loss with respect to its portfolio securities. The Fund is actively managed but there is no guarantee that the manager’s investment decisions will produce the desired results.
The Fund may invest in China Interbank bonds traded on the China Interbank Bond Market (“CIBM”) through the China – Hong Kong Bond Connect program (“Bond Connect”). In China, the Hong Kong Monetary Authority Central Money Markets Unit holds Bond Connect securities on behalf of ultimate investors (such as the Fund) in accounts maintained with a China-based custodian (either the China Central Depository & Clearing Co. or the Shanghai Clearing House). This recordkeeping system subjects the Fund to various risks, including the risk that the Fund may have a limited ability to enforce rights as a bondholder and the risks of settlement delays and counterparty default of the Hong Kongsub-custodian. In addition, enforcing the ownership rights of a beneficial holder of Bond Connect securities is untested and courts in China have limited experience in applying the concept of beneficial ownership. Bond Connect uses the trading infrastructure of both Hong Kong and China and is not available on trading holidays in Hong Kong. As a result, prices of securities purchased through Bond Connect may fluctuate at times when a Fund is unable to add to or exit its position. Securities offered through Bond Connect may lose their eligibility for trading through the program at any time. If Bond Connect securities lose their eligibility for trading through the program, they may be sold but can no longer be purchased through Bond Connect.
Bond Connect is subject to regulation by both Hong Kong and China and there can be no assurance that further regulations will not affect the availability of securities in the program, the frequency of redemptions or other limitations. Bond Connect trades are settled in Chinese currency, the renminbi (“RMB”). It cannot be guaranteed that investors will have timely access to a reliable supply of RMB in Hong Kong. Bond Connect is relatively new and its effects on the Chinese interbank bond market are uncertain. In addition, the trading, settlement and IT systems required fornon-Chinese investors in Bond Connect are relatively new. In the event of systems malfunctions, trading via Bond Connect could be disrupted. In addition, the Bond Connect program may be subject to further interpretation and guidance. There can be no assurance as to the program’s continued existence or whether future developments regarding the program may restrict or adversely affect the Fund’s investments or returns. Finally, uncertainties in China tax rules governing taxation of income and gains from investments via Bond Connect could result in unexpected tax liabilities for a Fund.
The application and interpretation of the laws and regulations of Hong Kong and China, and the rules, policies or guidelines published or applied by relevant regulators and exchanges in respect of the Bond Connect program, are uncertain, and may have a detrimental effect on the Fund’s investments and returns.
1. The Fund has a fee waiver associated with any investment it makes in a Franklin Templeton money fund and/or other Franklin Templeton fund, contractually guaranteed through 2/29/20. Fund investment results reflect the fee waiver; without this waiver, the results would have been lower.
2. Total return calculations represent the cumulative and average annual changes in value of an investment over the periods indicated. Return for less than one year, if any, has not been annualized.
3. Assumes reinvestment of distributions based on net asset value.
4. Assumes reinvestment of distributions based on the dividend reinvestment and cash purchase plan.
| | | | | | |
franklintempleton.com | | Semiannual Report | | | 7 | |
TEMPLETON GLOBAL INCOME FUND
Important Notice to Shareholders
Share Repurchase Program
The Fund’s Board previously authorized the Fund to repurchase up to 10% of the Fund’s outstanding shares in open-market transactions, at the discretion of management. This authorization remains in effect.
In exercising its discretion consistent with its portfolio management responsibilities, the investment manager will take into account various other factors, including, but not limited to, the level of the discount, the Fund’s performance, portfolio holdings, dividend history, market conditions, cash on hand, the availability of other attractive investments and whether the sale of certain portfolio securities would be undesirable because of liquidity concerns or because the sale might subject the Fund to adverse tax consequences. Any repurchases would be made on a national securities exchange at the prevailing market price, subject to exchange requirements, Federal securities laws and rules that restrict repurchases, and the terms of any outstanding leverage or borrowing of the Fund. If and when the Fund’s 10% threshold is reached, no further repurchases could be completed until authorized by the Board. Until the 10% threshold is reached, Fund management will have the flexibility to commence share repurchases if and when it is determined to be appropriate in light of prevailing circumstances.
In the Notes to Financial Statements section, please see note 2 (Shares of Beneficial Interest) for additional information regarding shares repurchased.
Fund Use of Currency Options
For purposes of pursuing its investment goals, the Fund may use currency options as a hedging technique or to implement a currency investment strategy, which could expose a large amount of the Fund’s assets to obligations under these instruments. The Fund uses options to express macroeconomic and market views and to hedge foreign exchange and market risks on portfolio exposures, using the full suite ofover-the-counter options products in strategies that both buy and sell options. The Fund is permitted to invest up to 25% of its net assets in currency options for hedging purposes and to invest up to 10% of its net assets in currency options for investment purposes. Additionally, the Fund is permitted to sell currency options up to 25% of its net assets.
Currency management strategies may substantially change the Fund’s exposure to currency exchange rates and could result in losses to the Fund if currencies do not perform as the investment manager expects. In addition, currency management strategies, to the extent that they reduce the Fund’s exposure to currency risks, may also reduce the Fund’s ability to benefit from favorable changes in currency exchange rates. Using currency management strategies for purposes other than hedging further increases the Fund’s exposure to foreign investment losses. Currency markets generally are not as regulated as securities markets. In addition, currency rates may fluctuate significantly over short periods of time, and can reduce returns.
| | | | |
| 8 | | Semiannual Report | | franklintempleton.com |
TEMPLETON GLOBAL INCOME FUND
Financial Highlights
| | | | | | | | | | | | | | | | | | | | | | | | | | | | |
| | | Six Months Ended
June 30, 2019 (unaudited) | | | | | | | | | | | | | | | | | | | |
| | | Year Ended December 31, | | | Year Ended August 31, | |
| | | | |
| | | 2018 | | | 2017 | | | 2016a | | | 2016 | | | 2015 | | | 2014 | |
| |
|
Per share operating performance (for a share outstanding throughout the period) | |
Net asset value, beginning of period | | | $ 7.04 | | | | $ 7.25 | | | | $ 7.34 | | | | $ 7.09 | | | | $ 7.38 | | | | $ 8.72 | | | | $ 8.38 | |
| | | | |
Income from investment operations: | | | | | | | | | | | | | | | | | | | | | | | | | | | | |
Net investment incomeb | | | 0.21 | | | | 0.37 | | | | 0.36 | | | | 0.10 | | | | 0.31 | | | | 0.33 | | | | 0.35 | |
Net realized and unrealized gains (losses) | | | 0.03 | | | | (0.23 | ) | | | (0.16 | ) | | | 0.25 | | | | (0.30 | ) | | | (1.04 | ) | | | 0.61 | |
| | | | |
Total from investment operations | | | 0.24 | | | | 0.14 | | | | 0.20 | | | | 0.35 | | | | 0.01 | | | | (0.71 | ) | | | 0.96 | |
| | | | |
Less distributions from: | | | | | | | | | | | | | | | | | | | | | | | | | | | | |
Net investment income and net foreign currency gains | | | (0.22 | ) | | | (0.26 | ) | | | (0.29 | ) | | | — | | | | (0.11 | ) | | | (0.63 | ) | | | (0.62 | ) |
Net realized gains | | | — | | | | — | | | | — | | | | — | | | | (0.02 | ) | | | (— | )c | | | (— | )c |
Tax return of capital | | | — | | | | (0.09 | ) | | | — | | | | (0.10 | ) | | | (0.17 | ) | | | — | | | | — | |
| | | | |
Total distributions | | | (0.22 | ) | | | (0.35 | ) | | | (0.29 | ) | | | (0.10 | ) | | | (0.30 | ) | | | (0.63 | ) | | | (0.62 | ) |
| | | | |
Net asset value, end of period | | | $ 7.06 | | | | $ 7.04 | | | | $ 7.25 | | | | $ 7.34 | | | | $ 7.09 | | | | $ 7.38 | | | | $ 8.72 | |
| | | | |
Market value, end of periodd | | | $ 6.36 | | | | $ 6.03 | | | | $ 6.46 | | | | $ 6.48 | | | | $ 6.43 | | | | $ 6.22 | | | | $ 7.96 | |
| | | | |
| | | | | | | |
Total return (based on market value per share)e | | | 9.21% | | | | (1.24)% | | | | 4.10% | | | | 2.38% | | | | 8.35% | | | | (14.76)% | | | | 7.04% | |
|
Ratios to average net assetsf | |
Expenses before waiver and payments by affiliates and expense reduction | | | 0.77% | | | | 0.79% | | | | 0.76% | | | | 0.73% | | | | 0.76% | | | | 0.74% | | | | 0.73% | |
Expenses net of waiver and payments by affiliates | | | 0.68% | | | | 0.71% | | | | 0.70% | | | | 0.69% | | | | 0.73% | | | | 0.73% | | | | 0.73% | |
Expenses net of waiver and payments by affiliates and expense reduction | | | 0.68% | | | | 0.71%g | | | | 0.69% | | | | 0.68% | | | | 0.73%g | | | | 0.73% | | | | 0.73% | g,h |
Net investment income | | | 5.95% | | | | 5.18% | | | | 4.84% | | | | 4.31% | | | | 4.38% | | | | 4.14% | | | | 4.05% | |
| | | | | | | |
Supplemental data | | | | | | | | | | | | | | | | | | | | | | | | | | | | |
Net assets, end of period (000’s) | | | $946,580 | | | | $944,988 | | | | $972,791 | | | | $984,355 | | | | $951,191 | | | | $989,595 | | | | $1,169,318 | |
Portfolio turnover rate | | | 5.55% | | | | 35.47% | | | | 42.34% | | | | 25.94% | | | | 46.03% | | | | 35.51% | | | | 45.61% | |
aFor the period September 1, 2016 to December 31, 2016.
bBased on average daily shares outstanding.
cAmount rounds to less than $0.01 per share.
dBased on the last sale on the New York Stock Exchange.
eTotal return is not annualized for periods less than one year.
fRatios are annualized for periods less than one year.
gBenefit of expense reduction rounds to less than 0.01%.
hBenefit of waiver and payments by affiliates rounds to less than 0.01%.
| | | | | | |
| | | |
franklintempleton.com | | The accompanying notes are an integral part of these financial statements. | Semiannual Report | | | 9 | |
TEMPLETON GLOBAL INCOME FUND
Statement of Investments, June 30, 2019 (unaudited)
| | | | | | | | | | | | |
| | | Principal Amount* | | | | | | Value | |
| | | |
Foreign Government and Agency Securities 54.5% | | | | | | | | | | | | |
Argentina 2.4% | | | | | | | | | | | | |
Argentina Treasury Bill, | | | | | | | | | | | | |
Strip, 4/30/20 | | | 68,265,000 | | | | ARS | | | $ | 1,826,545 | |
Strip, 7/31/20 | | | 13,797,000 | | | | ARS | | | | 314,505 | |
Argentine Bonos del Tesoro, | | | | | | | | | | | | |
18.20%, 10/03/21 | | | 252,627,000 | | | | ARS | | | | 4,040,965 | |
16.00%, 10/17/23 | | | 283,431,000 | | | | ARS | | | | 4,801,191 | |
senior note, 15.50%, 10/17/26 | | | 512,895,000 | | | | ARS | | | | 8,450,553 | |
Government of Argentina, | | | | | | | | | | | | |
aFRN, 68.466%, (ARPP7DRR), 6/21/20 | | | 3,380,000 | | | | ARS | | | | 77,547 | |
aFRN, 52.006%, (ARS Badlar + 2.00%), 4/03/22 | | | 20,588,000 | | | | ARS | | | | 416,360 | |
bIndex Linked, 4.00%, 3/06/20 | | | 1,274,000 | | | | ARS | | | | 41,112 | |
senior note, 4.50%, 2/13/20 | | | 2,821,000 | | | | | | | | 2,440,165 | |
| | | | | | | | | | | | |
| | | |
| | | | | | | | | | | 22,408,943 | |
| | | | | | | | | | | | |
Brazil 13.4% | | | | | | | | | | | | |
Letra Tesouro Nacional, | | | | | | | | | | | | |
Strip, 7/01/20 | | | 70,870c | | | | BRL | | | | 17,417,796 | |
Strip, 7/01/21 | | | 74,890c | | | | BRL | | | | 17,311,414 | |
Nota do Tesouro Nacional, | | | | | | | | | | | | |
10.00%, 1/01/21 | | | 73,235c | | | | BRL | | | | 20,107,580 | |
10.00%, 1/01/23 | | | 6,218c | | | | BRL | | | | 1,779,398 | |
10.00%, 1/01/25 | | | 75,193c | | | | BRL | | | | 22,088,335 | |
10.00%, 1/01/27 | | | 162,730c | | | | BRL | | | | 48,604,022 | |
| | | | | | | | | | | | |
| | | |
| | | | | | | | | | | 127,308,545 | |
| | | | | | | | | | | | |
Colombia 1.6% | | | | | | | | | | | | |
Government of Colombia, | | | | | | | | | | | | |
senior bond, 7.75%, 4/14/21 | | | 983,000,000 | | | | COP | | | | 320,186 | |
senior bond, 4.375%, 3/21/23 | | | 149,000,000 | | | | COP | | | | 45,056 | |
senior bond, 9.85%, 6/28/27 | | | 237,000,000 | | | | COP | | | | 93,082 | |
Titulos de Tesoreria, | | | | | | | | | | | | |
B, 7.75%, 9/18/30 | | | 1,645,700,000 | | | | COP | | | | 577,096 | |
senior bond, B, 11.00%, 7/24/20 | | | 1,144,000,000 | | | | COP | | | | 380,393 | |
senior bond, B, 7.00%, 5/04/22 | | | 3,111,000,000 | | | | COP | | | | 1,021,581 | |
senior bond, B, 10.00%, 7/24/24 | | | 12,183,000,000 | | | | COP | | | | 4,590,371 | |
senior bond, B, 7.50%, 8/26/26 | | | 9,469,300,000 | | | | COP | | | | 3,265,435 | |
senior bond, B, 6.00%, 4/28/28 | | | 13,320,000,000 | | | | COP | | | | 4,163,712 | |
senior note, B, 7.00%, 9/11/19 | | | 1,258,000,000 | | | | COP | | | | 393,547 | |
| | | | | | | | | | | | |
| | | |
| | | | | | | | | | | 14,850,459 | |
| | | | | | | | | | | | |
Ghana 1.4% | | | | | | | | | | | | |
Government of Ghana, | | | | | | | | | | | | |
24.75%, 3/01/21 | | | 220,000 | | | | GHS | | | | 43,579 | |
16.25%, 5/17/21 | | | 2,040,000 | | | | GHS | | | | 358,815 | |
24.50%, 6/21/21 | | | 50,000 | | | | GHS | | | | 9,986 | |
24.75%, 7/19/21 | | | 360,000 | | | | GHS | | | | 72,330 | |
18.75%, 1/24/22 | | | 8,520,000 | | | | GHS | | | | 1,546,811 | |
17.60%, 11/28/22 | | | 100,000 | | | | GHS | | | | 17,907 | |
19.75%, 3/25/24 | | | 8,520,000 | | | | GHS | | | | 1,591,164 | |
19.00%, 11/02/26 | | | 25,560,000 | | | | GHS | | | | 4,631,867 | |
| | | | |
| | | |
10 | | Semiannual Report | | franklintempleton.com |
TEMPLETON GLOBAL INCOME FUND
STATEMENT OF INVESTMENTS (UNAUDITED)
| | | | | | | | | | | | |
| | | Principal Amount* | | | | | | Value | |
| | | |
Foreign Government and Agency Securities(continued) | | | | | | | | | | | | |
Ghana(continued) | | | | | | | | | | | | |
Government of Ghana, (continued) | | | | | | | | | | | | |
senior bond, 19.75%, 3/15/32 | | | 25,560,000 | | | | GHS | | | $ | 4,657,498 | |
senior note, 21.50%, 3/09/20 | | | 370,000 | | | | GHS | | | | 69,551 | |
senior note, 18.50%, 6/01/20 | | | 140,000 | | | | GHS | | | | 25,716 | |
senior note, 18.25%, 9/21/20 | | | 140,000 | | | | GHS | | | | 25,621 | |
senior note, 16.50%, 3/22/21 | | | 490,000 | | | | GHS | | | | 86,777 | |
| | | | | | | | | | | | |
| | | |
| | | | | | | | | | | 13,137,622 | |
| | | | | | | | | | | | |
India 8.9% | | | | | | | | | | | | |
Government of India, | | | | | | | | | | | | |
senior bond, 8.20%, 2/15/22 | | | 282,000,000 | | | | INR | | | | 4,257,648 | |
senior bond, 8.35%, 5/14/22 | | | 68,200,000 | | | | INR | | | | 1,036,828 | |
senior bond, 8.08%, 8/02/22 | | | 549,000,000 | | | | INR | | | | 8,298,619 | |
senior bond, 8.13%, 9/21/22 | | | 15,000,000 | | | | INR | | | | 227,585 | |
senior bond, 9.15%, 11/14/24 | | | 387,000,000 | | | | INR | | | | 6,161,860 | |
senior note, 8.27%, 6/09/20 | | | 476,000,000 | | | | INR | | | | 7,036,481 | |
senior note, 7.80%, 4/11/21 | | | 697,700,000 | | | | INR | | | | 10,369,117 | |
senior note, 8.79%, 11/08/21 | | | 225,000,000 | | | | INR | | | | 3,428,582 | |
senior note, 8.15%, 6/11/22 | | | 540,000,000 | | | | INR | | | | 8,175,890 | |
senior note, 6.84%, 12/19/22 | | | 111,000,000 | | | | INR | | | | 1,622,564 | |
senior note, 7.16%, 5/20/23 | | | 42,900,000 | | | | INR | | | | 631,230 | |
senior note, 8.83%, 11/25/23 | | | 966,400,000 | | | | INR | | | | 15,126,998 | |
senior note, 7.68%, 12/15/23 | | | 730,000,000 | | | | INR | | | | 11,003,678 | |
senior note, 6.79%, 5/15/27 | | | 492,800,000 | | | | INR | | | | 7,055,125 | |
| | | | | | | | | | | | |
| | | |
| | | | | | | | | | | 84,432,205 | |
| | | | | | | | | | | | |
Indonesia 8.2% | | | | | | | | | | | | |
Government of Indonesia, | | | | | | | | | | | | |
senior bond, FR31, 11.00%, 11/15/20 | | | 145,557,000,000 | | | | IDR | | | | 10,923,340 | |
senior bond, FR34, 12.80%, 6/15/21 | | | 64,492,000,000 | | | | IDR | | | | 5,082,215 | |
senior bond, FR35, 12.90%, 6/15/22 | | | 42,438,000,000 | | | | IDR | | | | 3,488,463 | |
senior bond, FR36, 11.50%, 9/15/19 | | | 32,651,000,000 | | | | IDR | | | | 2,340,979 | |
senior bond, FR39, 11.75%, 8/15/23 | | | 2,703,000,000 | | | | IDR | | | | 224,132 | |
senior bond, FR42, 10.25%, 7/15/27 | | | 3,595,000,000 | | | | IDR | | | | 296,685 | |
senior bond, FR43, 10.25%, 7/15/22 | | | 4,826,000,000 | | | | IDR | | | | 373,833 | |
senior bond, FR44, 10.00%, 9/15/24 | | | 1,618,000,000 | | | | IDR | | | | 129,096 | |
senior bond, FR46, 9.50%, 7/15/23 | | | 11,430,000,000 | | | | IDR | | | | 881,795 | |
senior bond, FR47, 10.00%, 2/15/28 | | | 1,052,000,000 | | | | IDR | | | | 86,245 | |
senior bond, FR52, 10.50%, 8/15/30 | | | 3,390,000,000 | | | | IDR | | | | 292,364 | |
senior bond, FR53, 8.25%, 7/15/21 | | | 144,200,000,000 | | | | IDR | | | | 10,508,157 | |
senior bond, FR56, 8.375%, 9/15/26 | | | 292,968,000,000 | | | | IDR | | | | 22,052,170 | |
senior bond, FR61, 7.00%, 5/15/22 | | | 18,449,000,000 | | | | IDR | | | | 1,315,622 | |
senior bond, FR63, 5.625%, 5/15/23 | | | 16,137,000,000 | | | | IDR | | | | 1,100,206 | |
senior bond, FR64, 6.125%, 5/15/28 | | | 3,157,000,000 | | | | IDR | | | | 206,817 | |
senior bond, FR70, 8.375%, 3/15/24 | | | 149,967,000,000 | | | | IDR | | | | 11,256,418 | |
senior bond, FR71, 9.00%, 3/15/29 | | | 45,298,000,000 | | | | IDR | | | | 3,548,170 | |
senior bond, FR73, 8.75%, 5/15/31 | | | 41,805,000,000 | | | | IDR | | | | 3,217,304 | |
| | | | | | | | | | | | |
| | | |
| | | | | | | | | | | 77,324,011 | |
| | | | | | | | | | | | |
| | | | | | |
| | | |
franklintempleton.com | | Semiannual Report | | | 11 | |
TEMPLETON GLOBAL INCOME FUND
STATEMENT OF INVESTMENTS (UNAUDITED)
| | | | | | | | | | | | | | | | |
| | | | | | Principal Amount* | | | | | | Value | |
| |
Foreign Government and Agency Securities(continued) | | | | | | | | | | | | | | | | |
Mexico 15.8% | | | | | | | | | | | | | | | | |
Government of Mexico, | | | | | | | | | | | | | | | | |
senior bond, M, 8.00%, 6/11/20 | | | | | | | 1,881,620d | | | | MXN | | | $ | 9,817,367 | |
senior bond, M, 6.50%, 6/10/21 | | | | | | | 18,789,460d | | | | MXN | | | | 96,069,980 | |
senior bond, M, 6.50%, 6/09/22 | | | | | | | 2,244,600d | | | | MXN | | | | 11,406,739 | |
senior bond, M, 8.00%, 12/07/23 | | | | | | | 16,500d | | | | MXN | | | | 87,847 | |
senior note, M, 5.00%, 12/11/19 | | | | | | | 3,370,500d | | | | MXN | | | | 17,314,709 | |
senior note, M, 7.25%, 12/09/21 | | | | | | | 2,763,800d | | | | MXN | | | | 14,338,762 | |
eMexican Udibonos, Index Linked, 2.50%, 12/10/20 | | | | | | | 114,411f | | | | MXN | | | | 588,732 | |
| | | | | | | | | | | | | | | | |
| | | | |
| | | | | | | | | | | | | | | 149,624,136 | |
| | | | | | | | | | | | | | | | |
Philippines 0.0%† | | | | | | | | | | | | | | | | |
Government of the Philippines, senior note, 3.375%, 8/20/20 | | | | | | | 9,870,000 | | | | PHP | | | | 190,191 | |
| | | | | | | | | | | | | | | | |
South Korea 1.8% | | | | | | | | | | | | | | | | |
Korea Monetary Stabilization Bond, senior note, 2.06%, 12/02/19 | | | | | | | 20,034,000,000 | | | | KRW | | | | 17,352,854 | |
| | | | | | | | | | | | | | | | |
gSupranational 1.0% | | | | | | | | | | | | | | | | |
Inter-American Development Bank, senior bond, 7.50%, 12/05/24 | | | | | | | 185,000,000 | | | | MXN | | | | 9,596,997 | |
| | | | | | | | | | | | | | | | |
Total Foreign Government and Agency Securities
(Cost $559,477,972) | | | | | | | | | | | | | | | 516,225,963 | |
| | | | | | | | | | | | | | | | |
| | | | |
| | | Number of
Contracts | | | Notional Amount* | | | | | | | |
| | | | | | | | | | | | | | | | |
Options Purchased 0.4% | | | | | | | | | | | | | | | | |
Calls -Over-the-Counter | | | | | | | | | | | | | | | | |
Currency Options 0.3% | | | | | | | | | | | | | | | | |
AUD/JPY, Counterparty CITI, February Strike Price 82.35 JPY, Expires 2/12/20 | | | 1 | | | | 869,000 | | | | AUD | | | | 1,241 | |
AUD/JPY, Counterparty CITI, May Strike Price 84.00 JPY, Expires 5/06/20 | | | 1 | | | | 3,864,000 | | | | AUD | | | | 6,021 | |
AUD/JPY, Counterparty CITI, May Strike Price 86.63 JPY, Expires 5/06/20 | | | 1 | | | | 4,250,000 | | | | AUD | | | | 3,768 | |
AUD/JPY, Counterparty CITI, May Strike Price 85.50 JPY, Expires 5/07/20 | | | 1 | | | | 15,455,000 | | | | AUD | | | | 16,707 | |
AUD/JPY, Counterparty CITI, November Strike Price 84.33 JPY, Expires 11/12/20 | | | 1 | | | | 2,898,000 | | | | AUD | | | | 9,079 | |
AUD/USD, Counterparty HSBK, April Strike Price $0.77, Expires 4/30/20 | | | 1 | | | | 4,830,000 | | | | AUD | | | | 11,093 | |
AUD/USD, Counterparty HSBK, May Strike Price $0.77, Expires 5/04/20 | | | 1 | | | | 6,086,000 | | | | AUD | | | | 15,606 | |
AUD/USD, Counterparty HSBK, May Strike Price $0.77, Expires 5/07/20 | | | 1 | | | | 3,864,000 | | | | AUD | | | | 8,229 | |
USD/MXN, Counterparty CITI, November Strike Price 20.00 MXN, Expires 11/07/19 | | | 1 | | | | 3,778,000 | | | | | | | | 67,668 | |
USD/MXN, Counterparty CITI, December Strike Price 20.50 MXN, Expires 12/05/19 | | | 1 | | | | 11,688,000 | | | | | | | | 177,167 | |
USD/MXN, Counterparty CITI, May Strike Price 20.50 MXN, Expires 5/11/20 | | | 1 | | | | 21,158,000 | | | | | | | | 775,547 | |
USD/MXN, Counterparty CITI, May Strike Price 20.92 MXN, Expires 5/12/20 | | | 1 | | | | 12,594,000 | | | | | | | | 379,722 | |
USD/MXN, Counterparty CITI, May Strike Price 20.87 MXN, Expires 5/14/20 | | | 1 | | | | 14,206,000 | | | | | | | | 443,866 | |
USD/MXN, Counterparty JPHQ, October Strike Price 20.25 MXN, Expires 10/17/19 | | | 1 | | | | 10,682,000 | | | | | | | | 123,345 | |
USD/MXN, Counterparty JPHQ, October Strike Price 21.92 MXN, Expires 10/17/19 | | | 1 | | | | 5,341,000 | | | | | | | | 16,194 | |
USD/MXN, Counterparty JPHQ, November Strike Price 20.11 MXN, Expires 11/14/19 | | | 1 | | | | 7,103,000 | | | | | | | | 123,194 | |
USD/MXN, Counterparty JPHQ, November Strike Price 20.11 MXN, Expires 11/14/19 | | | 1 | | | | 7,103,000 | | | | | | | | 123,194 | |
USD/MXN, Counterparty JPHQ, November Strike Price 22.35 MXN, Expires 11/14/19 | | | 1 | | | | 7,103,000 | | | | | | | | 25,017 | |
| | | | |
| | | |
12 | | Semiannual Report | | franklintempleton.com |
TEMPLETON GLOBAL INCOME FUND
STATEMENT OF INVESTMENTS (UNAUDITED)
| | | | | | | | | | | | | | | | |
| | | Number of
Contracts | | | Notional Amount* | | | | | | Value | |
Options Purchased(continued) | | | | | | | | | | | | | | | | |
Calls -Over-the-Counter(continued) | | | | | | | | | | | | | | | | |
Currency Options(continued) | | | | | | | | | | | | | | | | |
USD/MXN, Counterparty JPHQ, December Strike Price 20.14 MXN, Expires 12/19/19 | | | 1 | | | | 2,670,000 | | | | | | | $ | 58,996 | |
USD/MXN, Counterparty JPHQ, May Strike Price 20.93 MXN, Expires 5/13/20 | | | 1 | | | | 8,118,000 | | | | | | | | 244,806 | |
| | | | | | | | | | | | | | | | |
| | | | |
| | | | | | | | | | | | | | | 2,630,460 | |
| | | | | | | | | | | | | | | | |
Puts -Over-the-Counter | | | | | | | | | | | | | | | | |
Currency Options 0.1% | | | | | | | | | | | | | | | | |
AUD/JPY, Counterparty CITI, May Strike Price 69.54 JPY, Expires 5/06/20 | | | 1 | | | | 3,091,000 | | | | AUD | | | | 23,583 | |
AUD/JPY, Counterparty CITI, May Strike Price 70.65 JPY, Expires 5/06/20 | | | 1 | | | | 1,932,000 | | | | AUD | | | | 17,657 | |
AUD/JPY, Counterparty CITI, May Strike Price 74.48 JPY, Expires 5/06/20 | | | 1 | | | | 14,296,000 | | | | AUD | | | | 245,900 | |
AUD/JPY, Counterparty CITI, May Strike Price 75.50 JPY, Expires 5/06/20 | | | 1 | | | | 5,796,000 | | | | AUD | | | | 109,573 | |
AUD/JPY, Counterparty CITI, May Strike Price 65.55 JPY, Expires 5/07/20 | | | 1 | | | | 7,728,000 | | | | AUD | | | | 31,555 | |
AUD/JPY, Counterparty CITI, May Strike Price 73.25 JPY, Expires 5/07/20 | | | 1 | | | | 7,728,000 | | | | AUD | | | | 108,721 | |
AUD/JPY, Counterparty CITI, November Strike Price 66.78 JPY, Expires 11/12/20 | | | 1 | | | | 1,449,000 | | | | AUD | | | | 13,442 | |
AUD/JPY, Counterparty CITI, November Strike Price 69.18 JPY, Expires 11/12/20 | | | 1 | | | | 869,000 | | | | AUD | | | | 10,873 | |
AUD/JPY, Counterparty CITI, November Strike Price 72.78 JPY, Expires 11/12/20 | | | 1 | | | | 3,622,000 | | | | AUD | | | | 71,586 | |
AUD/JPY, Counterparty CITI, November Strike Price 74.00 JPY, Expires 11/12/20 | | | 1 | | | | 2,608,000 | | | | AUD | | | | 60,195 | |
AUD/USD, Counterparty HSBK, April Strike Price $0.66, Expires 4/30/20 | | | 1 | | | | 12,880,000 | | | | AUD | | | | 56,814 | |
AUD/USD, Counterparty HSBK, April Strike Price $0.68, Expires 4/30/20 | | | 1 | | | | 6,440,000 | | | | AUD | | | | 49,414 | |
AUD/USD, Counterparty HSBK, May Strike Price $0.65, Expires 5/04/20 | | | 1 | | | | 16,228,000 | | | | AUD | | | | 42,432 | |
AUD/USD, Counterparty HSBK, May Strike Price $0.68, Expires 5/04/20 | | | 1 | | | | 8,050,000 | | | | AUD | | | | 56,756 | |
AUD/USD, Counterparty HSBK, May Strike Price $0.66, Expires 5/05/20 | | | 1 | | | | 6,440,000 | | | | AUD | | | | 34,844 | |
AUD/USD, Counterparty HSBK, May Strike Price $0.65, Expires 5/07/20 | | | 1 | | | | 7,728,000 | | | | AUD | | | | 31,713 | |
AUD/USD, Counterparty HSBK, May Strike Price $0.68, Expires 5/07/20 | | | 1 | | | | 3,864,000 | | | | AUD | | | | 28,216 | |
AUD/USD, Counterparty MSCO, November Strike Price $0.67, Expires 11/14/19 | | | 1 | | | | 14,000 | | | | AUD | | | | 40 | |
USD/MXN, Counterparty CITI, October Strike Price 18.25 MXN, Expires 10/08/19 | | | 1 | | | | 5,844,000 | | | | | | | | 14,575 | |
USD/MXN, Counterparty CITI, November Strike Price 18.28 MXN, Expires 11/07/19 | | | 1 | | | | 3,778,000 | | | | | | | | 13,091 | |
USD/MXN, Counterparty CITI, May Strike Price 18.31 MXN, Expires 5/14/20 | | | 1 | | | | 3,552,000 | | | | | | | | 29,290 | |
USD/MXN, Counterparty JPHQ, December Strike Price 18.85 MXN, Expires 12/03/19 | | | 1 | | | | 5,341,000 | | | | | | | | 52,566 | |
USD/MXN, Counterparty JPHQ, December Strike Price 20.34 MXN, Expires 12/03/19 | | | 1 | | | | 5,341,000 | | | | | | | | 263,167 | |
| | | | | | | | | | | | | | | | |
| | | | |
| | | | | | | | | | | | | | | 1,366,003 | |
| | | | | | | | | | | | | | | | |
Total Options Purchased
(Cost $5,283,129) | | | | | | | | | | | | | | | 3,996,463 | |
| | | | | | | | | | | | | | | | |
| | | | |
Total Investments before Short Term Investments
(Cost $564,761,101) | | | | | | | | | | | | | | | 520,222,426 | |
| | | | | | | | | | | | | | | | |
| | | | | | |
| | | |
franklintempleton.com | | Semiannual Report | | | 13 | |
TEMPLETON GLOBAL INCOME FUND
STATEMENT OF INVESTMENTS (UNAUDITED)
| | | | | | | | | | | | | | | | |
| | | | | | Principal Amount* | | | | | | Value | |
| | | | |
Short Term Investments 40.8% | | | | | | | | | | | | | | | | |
| | | |
Foreign Government and Agency Securities 5.5% | | | | | | | | | | | | | |
Argentina 1.4% | | | | | | | | | | | | | | | | |
h Argentina Treasury Bill, 7/19/19 - 2/28/20 | | | | | | | 454,305,500 | | | | ARS | | | $ | 13,442,794 | |
Mexico 1.6% | | | | | | | | | | | | | | | | |
hMexico Treasury Bill, 7/04/19 - 2/27/20 | | | | | | | 29,736,520 | i | | | MXN | | | | 15,080,265 | |
South Korea 2.5% | | | | | | | | | | | | | | | | |
Korea Monetary Stabilization Bond, | | | | | | | | | | | | | | | | |
senior note, 1.80%, 9/09/19 | | | | | | | 10,158,000,000 | | | | KRW | | | | 8,784,044 | |
senior note, 1.85%, 10/02/19 | | | | | | | 17,190,000,000 | | | | KRW | | | | 14,869,245 | |
| | | | |
| | | | | | | | | | | | | | | 23,653,289 | |
| | | | |
Total Foreign Government and Agency Securities
(Cost $54,164,138) | | | | | | | | | | | | | | | 52,176,348 | |
U.S. Government and Agency Securities 10.3% | | | | | | | | | | | | | | | | |
United States 10.3% | | | | | | | | | | | | | | | | |
h U.S. Treasury Bill, | | | | | | | | | | | | | | | | |
9/05/19 | | | | | | | 10,148,000 | | | | | | | | 10,109,251 | |
9/12/19 | | | | | | | 27,100,000 | | | | | | | | 26,986,783 | |
10/24/19 | | | | | | | 16,300,000 | | | | | | | | 16,197,024 | |
11/07/19 | | | | | | | 13,600,000 | | | | | | | | 13,500,218 | |
11/29/19 | | | | | | | 10,148,000 | | | | | | | | 10,060,784 | |
7/18/19 - 12/05/19 | | | | | | | 20,269,000 | | | | | | | | 20,174,903 | |
| | | | |
Total U.S. Government and Agency Securities
(Cost $96,943,608) | | | | | | | | | | | | | | | 97,028,963 | |
| | | | |
Total Investments before Money Market Funds
(Cost $715,868,847) | | | | | | | | | | | | | | | 669,427,737 | |
| | | | |
| | | | | | Shares | | | | | | | |
| | | | |
Money Market Funds (Cost $236,752,680) 25.0% | | | | | | | | | | | | | | | | |
United States 25.0% | | | | | | | | | | | | | | | | |
j,kInstitutional Fiduciary Trust Money Market Portfolio, 2.05% | | | | | | | 236,752,680 | | | | | | | | 236,752,680 | |
| | | | |
Total Investments (Cost $952,621,527) 95.7% | | | | | | | | | | | | | | | 906,180,417 | |
Options Written (0.4)% | | | | | | | | | | | | | | | (3,343,796 | ) |
Other Assets, less Liabilities 4.7% | | | | | | | | | | | | | | | 43,743,797 | |
| | | | |
Net Assets 100.0% | | | | | | | | | | | | | | $ | 946,580,418 | |
| | | | |
| | | Number of
Contracts | | | Notional
Amount* | | | | | | | |
Options Written (0.4)% | | | | | | | | | | | | | | | | |
Calls -Over-the-Counter | | | | | | | | | | | | | | | | |
Currency Options (0.2)% | | | | | | | | | | | | | | | | |
AUD/JPY, Counterparty CITI, November Strike Price 79.77 JPY, Expires 11/06/19 | | | 1 | | | | 9,273,000 | | | | AUD | | | | (15,095 | ) |
AUD/JPY, Counterparty CITI, November Strike Price 80.15 JPY, Expires 11/06/19 | | | 1 | | | | 3,864,000 | | | | AUD | | | | (5,262 | ) |
AUD/JPY, Counterparty CITI, November Strike Price 80.60 JPY, Expires 11/08/19 | | | 1 | | | | 7,728,000 | | | | AUD | | | | (8,707 | ) |
AUD/JPY, Counterparty CITI, February Strike Price 77.28 JPY, Expires 2/12/20 | | | 1 | | | | 2,898,000 | | | | AUD | | | | (22,023 | ) |
| | | | |
| | | |
14 | | Semiannual Report | | franklintempleton.com |
TEMPLETON GLOBAL INCOME FUND
STATEMENT OF INVESTMENTS (UNAUDITED)
| | | | | | | | | | | | | | | | |
| | | Number of
Contracts | | | Notional Amount* | | | | | | Value | |
Options Written(continued) | | | | | | | | | | | | | | | | |
Calls -Over-the-Counter(continued) | | | | | | | | | | | | | | | | |
Currency Options(continued) | | | | | | | | | | | | | | | | |
AUD/JPY, Counterparty CITI, February Strike Price 78.18 JPY, Expires 2/12/20 | | | 1 | | | | 1,739,000 | | | | AUD | | | $ | (9,968 | ) |
AUD/JPY, Counterparty CITI, February Strike Price 79.45 JPY, Expires 2/12/20 | | | 1 | | | | 2,608,000 | | | | AUD | | | | (9,844 | ) |
AUD/JPY, Counterparty CITI, February Strike Price 80.32 JPY, Expires 2/12/20 | | | 1 | | | | 2,898,000 | | | | AUD | | | | (8,159 | ) |
AUD/JPY, Counterparty CITI, May Strike Price 78.60 JPY, Expires 5/06/20 | | | 1 | | | | 6,182,000 | | | | AUD | | | | (41,494 | ) |
AUD/JPY, Counterparty CITI, May Strike Price 79.10 JPY, Expires 5/06/20 | | | 1 | | | | 3,864,000 | | | | AUD | | | | (22,664 | ) |
AUD/JPY, Counterparty CITI, May Strike Price 77.35 JPY, Expires 5/07/20 | | | 1 | | | | 15,455,000 | | | | AUD | | | | (144,189 | ) |
AUD/USD, Counterparty HSBK, April Strike Price $0.71, Expires 4/30/20 | | | 1 | | | | 4,830,000 | | | | AUD | | | | (65,432 | ) |
AUD/USD, Counterparty HSBK, May Strike Price $0.71, Expires 5/04/20 | | | 1 | | | | 6,086,000 | | | | AUD | | | | (90,756 | ) |
AUD/USD, Counterparty HSBK, November Strike Price $0.71, Expires 11/05/20 | | | 1 | | | | 3,864,000 | | | | AUD | | | | (69,040 | ) |
AUD/USD, Counterparty HSBK, November Strike Price $0.80, Expires 11/05/20 | | | 1 | | | | 7,728,000 | | | | AUD | | | | (22,350 | ) |
AUD/USD, Counterparty HSBK, April Strike Price $0.81, Expires 4/29/21 | | | 1 | | | | 9,660,000 | | | | AUD | | | | (39,478 | ) |
AUD/USD, Counterparty HSBK, May Strike Price $0.80, Expires 5/04/21 | | | 1 | | | | 12,172,000 | | | | AUD | | | | (56,844 | ) |
AUD/USD, Counterparty HSBK, May Strike Price $0.78, Expires 5/05/21 | | | 1 | | | | 6,440,000 | | | | AUD | | | | (48,162 | ) |
AUD/USD, Counterparty MSCO, November Strike Price $0.72, Expires 11/14/19 | | | 1 | | | | 14,000 | | | | AUD | | | | (73 | ) |
USD/MXN, Counterparty CITI, December Strike Price 21.90 MXN, Expires 12/05/19 | | | 1 | | | | 11,688,000 | | | | | | | | (67,779 | ) |
USD/MXN, Counterparty CITI, May Strike Price 19.55 MXN, Expires 5/11/20 | | | 1 | | | | 7,053,000 | | | | | | | | (408,869 | ) |
USD/MXN, Counterparty CITI, May Strike Price 22.55 MXN, Expires 5/11/20 | | | 1 | | | | 7,053,000 | | | | | | | | (103,869 | ) |
USD/MXN, Counterparty CITI, May Strike Price 19.82 MXN, Expires 5/12/20 | | | 1 | | | | 5,038,000 | | | | | | | | (257,291 | ) |
USD/MXN, Counterparty CITI, May Strike Price 23.85 MXN, Expires 5/12/20 | | | 1 | | | | 5,038,000 | | | | | | | | (45,775 | ) |
USD/MXN, Counterparty CITI, May Strike Price 22.85 MXN, Expires 5/14/20 | | | 1 | | | | 7,103,000 | | | | | | | | (94,548 | ) |
USD/MXN, Counterparty JPHQ, October Strike Price 19.18 MXN, Expires 10/17/19 | | | 1 | | | | 5,341,000 | | | | | | | | (171,959 | ) |
USD/MXN, Counterparty JPHQ, October Strike Price 22.48 MXN, Expires 10/17/19 | | | 1 | | | | 5,341,000 | | | | | | | | (11,227 | ) |
USD/MXN, Counterparty JPHQ, November Strike Price 21.00 MXN, Expires 11/14/19 | | | 1 | | | | 14,207,000 | | | | | | | | (122,393 | ) |
USD/MXN, Counterparty JPHQ, May Strike Price 23.76 MXN, Expires 5/13/20 | | | 1 | | | | 4,059,000 | | | | | | | | (38,256 | ) |
| | | | | | | | | | | | | | | (2,001,506 | ) |
Puts -Over-the-Counter | | | | | | | | | | | | | | | | |
Currency Options (0.2)% | | | | | | | | | | | | | | | | |
USD/MXN, Counterparty CITI, October Strike Price 18.66 MXN, Expires 10/08/19 | | | 1 | | | | 5,843,000 | | | | | | | | (31,675 | ) |
USD/MXN, Counterparty CITI, October Strike Price 19.60 MXN, Expires 10/08/19 | | | 1 | | | | 4,383,000 | | | | | | | | (48,152 | ) |
USD/MXN, Counterparty CITI, November Strike Price 18.74 MXN, Expires 11/07/19 | | | 1 | | | | 7,556,000 | | | | | | | | (55,726 | ) |
USD/MXN, Counterparty CITI, May Strike Price 19.55 MXN, Expires 5/11/20 | | | 1 | | | | 7,053,000 | | | | | | | | (183,272 | ) |
USD/MXN, Counterparty CITI, May Strike Price 19.69 MXN, Expires 5/12/20 | | | 1 | | | | 2,519,000 | | | | | | | | (73,179 | ) |
USD/MXN, Counterparty CITI, May Strike Price 19.24 MXN, Expires 5/14/20 | | | 1 | | | | 10,655,000 | | | | | | | | (213,452 | ) |
USD/MXN, Counterparty JPHQ, October Strike Price 19.18 MXN, Expires 10/17/19 | | | 1 | | | | 5,341,000 | | | | | | | | (72,365 | ) |
USD/MXN, Counterparty JPHQ, November Strike Price 19.44 MXN, Expires 11/13/19 | | | 1 | | | | 4,059,000 | | | | | | | | (82,637 | ) |
USD/MXN, Counterparty JPHQ, November Strike Price 19.36 MXN, Expires 11/14/19 | | | 1 | | | | 7,103,000 | | | | | | | | (129,353 | ) |
USD/MXN, Counterparty JPHQ, December Strike Price 20.10 MXN, Expires 12/03/19 | | | 1 | | | | 10,682,000 | | | | | | | | (400,660 | ) |
| | | | | | |
| | | |
franklintempleton.com | | Semiannual Report | | | 15 | |
TEMPLETON GLOBAL INCOME FUND
STATEMENT OF INVESTMENTS (UNAUDITED)
| | | | | | | | | | | | | | | | |
| | | Number of
Contracts | | | Notional
Amount* | | | | | | Value | |
Options Written(continued) | | | | | | | | | | | | | | | | |
Currency Options(continued) | | | | | | | | | | | | | | | | |
USD/MXN, Counterparty JPHQ, December Strike Price 19.36 MXN, Expires 12/19/19 | | | 1 | | | | 2,670,000 | | | | | | | $ | (51,819 | ) |
| | | | | | | | | | | | | | | (1,342,290 | ) |
Total Options Written (Premiums received $4,208,014) | | | | | | | | | | | | | | | (3,343,796 | ) |
†Rounds to less than 0.1% of net assets.
*The principal/notional amount is stated in U.S. dollars unless otherwise indicated.
aThe coupon rate shown represents the rate at period end.
bRedemption price at maturity and coupon payment are adjusted for inflation. See Note 1(f).
cPrincipal amount is stated in 1,000 Brazilian Real Units.
dPrincipal amount is stated in 100 Mexican Peso Units.
ePrincipal amount of security is adjusted for inflation. See Note 1(f).
fPrincipal amount is stated in 100 Unidad de Inversion Units.
gA supranational organization is an entity formed by two or more central governments through international treaties.
hThe security was issued on a discount basis with no stated coupon rate.
iPrincipal amount is stated in 10 Mexican Peso Units.
jSee Note 3(c) regarding investments in affiliated management investment companies.
kThe rate shown is the annualizedseven-day effective yield at period end.
At June 30, 2019, the Fund had the following forward exchange contracts outstanding. See Note 1(c).
Forward Exchange Contracts
| | | | | | | | | | | | | | | | | | | | | | | | | | | | | | | | |
| Currency | | Counterpartya | | | Type | | | Quantity | | | Contract
Amount* | | | | | | Settlement
Date | | | Unrealized
Appreciation | | | Unrealized
Depreciation | |
OTC Forward Exchange Contracts | |
Indian Rupee | | | BNDP | | | | Sell | | | | 363,139,700 | | | | 5,185,525 | | | | | | | | 7/05/19 | | | $ | — | | | $ | (76,289 | ) |
Indian Rupee | | | HSBK | | | | Buy | | | | 309,946,000 | | | | 4,497,185 | | | | | | | | 7/05/19 | | | | — | | | | (6,136 | ) |
Indian Rupee | | | HSBK | | | | Sell | | | | 309,946,000 | | | | 4,446,858 | | | | | | | | 7/05/19 | | | | — | | | | (44,190 | ) |
Indonesian Rupiah | | | JPHQ | | | | Buy | | | | 111,570,000,000 | | | | 10,785,963 | | | | AUD | | | | 7/10/19 | | | | 312,050 | | | | — | |
Indonesian Rupiah | | | JPHQ | | | | Sell | | | | 111,570,000,000 | | | | 10,908,291 | | | | AUD | | | | 7/10/19 | | | | — | | | | (226,145 | ) |
Indian Rupee | | | HSBK | | | | Sell | | | | 674,825,628 | | | | 9,576,609 | | | | | | | | 7/11/19 | | | | — | | | | (193,680 | ) |
Australian Dollar | | | JPHQ | | | | Sell | | | | 10,311,000 | | | | 7,376,902 | | | | | | | | 7/15/19 | | | | 134,656 | | | | — | |
Indian Rupee | | | CITI | | | | Sell | | | | 449,892,000 | | | | 6,370,197 | | | | | | | | 7/15/19 | | | | — | | | | (139,991 | ) |
Japanese Yen | | | CITI | | | | Buy | | | | 352,860,667 | | | | 3,212,977 | | | | | | | | 7/16/19 | | | | 64,413 | | | | — | |
Japanese Yen | | | CITI | | | | Sell | | | | 352,860,667 | | | | 3,187,106 | | | | | | | | 7/16/19 | | | | — | | | | (90,285 | ) |
Japanese Yen | | | JPHQ | | | | Buy | | | | 102,242,000 | | | | 929,181 | | | | | | | | 7/16/19 | | | | 20,448 | | | | — | |
Japanese Yen | | | JPHQ | | | | Sell | | | | 102,242,000 | | | | 925,250 | | | | | | | | 7/16/19 | | | | — | | | | (24,379 | ) |
Japanese Yen | | | DBAB | | | | Buy | | | | 490,271,000 | | | | 4,457,965 | | | | | | | | 7/17/19 | | | | 96,064 | | | | — | |
Japanese Yen | | | DBAB | | | | Sell | | | | 490,271,000 | | | | 4,407,327 | | | | | | | | 7/17/19 | | | | — | | | | (146,703 | ) |
Japanese Yen | | | GSCO | | | | Buy | | | | 133,889,518 | | | | 1,216,857 | | | | | | | | 7/17/19 | | | | 26,816 | | | | — | |
Japanese Yen | | | GSCO | | | | Sell | | | | 133,889,518 | | | | 1,203,501 | | | | | | | | 7/17/19 | | | | — | | | | (40,172 | ) |
Japanese Yen | | | HSBK | | | | Buy | | | | 372,780,000 | | | | 3,384,534 | | | | | | | | 7/17/19 | | | | 78,145 | | | | — | |
Japanese Yen | | | HSBK | | | | Sell | | | | 372,780,000 | | | | 3,352,353 | | | | | | | | 7/17/19 | | | | — | | | | (110,326 | ) |
Japanese Yen | | | MSCO | | | | Buy | | | | 245,000,000 | | | | 2,231,472 | | | | | | | | 7/17/19 | | | | 44,284 | | | | — | |
Japanese Yen | | | MSCO | | | | Sell | | | | 245,000,000 | | | | 2,203,277 | | | | | | | | 7/17/19 | | | | — | | | | (72,479 | ) |
Japanese Yen | | | CITI | | | | Buy | | | | 207,460,000 | | | | 1,887,100 | | | | | | | | 7/18/19 | | | | 40,109 | | | | — | |
Japanese Yen | | | CITI | | | | Sell | | | | 207,460,000 | | | | 1,865,649 | | | | | | | | 7/18/19 | | | | — | | | | (61,559 | ) |
| | | | |
| | | |
16 | | Semiannual Report | | franklintempleton.com |
TEMPLETON GLOBAL INCOME FUND
STATEMENT OF INVESTMENTS (UNAUDITED)
Forward Exchange Contracts(continued)
| | | | | | | | | | | | | | | | | | | | | | | | | | | | | | | | |
| Currency | | Counterpartya | | | Type | | | Quantity | | | Contract
Amount* | | | | | | Settlement
Date | | | Unrealized
Appreciation | | | Unrealized
Depreciation | |
OTC Forward Exchange Contracts(continued) | |
Japanese Yen | | | HSBK | | | | Buy | | | | 93,560,000 | | | | 849,513 | | | | | | | | 7/18/19 | | | $ | 19,617 | | | $ | — | |
Japanese Yen | | | HSBK | | | | Sell | | | | 93,560,000 | | | | 841,369 | | | | | | | | 7/18/19 | | | | — | | | | (27,760 | ) |
Japanese Yen | | | JPHQ | | | | Buy | | | | 1,459,049,000 | | | | 13,262,980 | | | | | | | | 7/19/19 | | | | 292,000 | | | | — | |
Japanese Yen | | | JPHQ | | | | Sell | | | | 1,459,049,000 | | | | 13,122,915 | | | | | | | | 7/19/19 | | | | — | | | | (432,065 | ) |
Indian Rupee | | | HSBK | | | | Sell | | | | 553,716,000 | | | | 7,698,869 | | | | | | | | 7/22/19 | | | | — | | | | (306,278 | ) |
Indian Rupee | | | JPHQ | | | | Sell | | | | 466,711,000 | | | | 6,581,737 | | | | | | | | 7/22/19 | | | | — | | | | (165,566 | ) |
Japanese Yen | | | HSBK | | | | Buy | | | | 707,007,200 | | | | 6,421,500 | | | | | | | | 7/22/19 | | | | 148,373 | | | | — | |
Japanese Yen | | | HSBK | | | | Sell | | | | 707,007,200 | | | | 6,357,978 | | | | | | | | 7/22/19 | | | | — | | | | (211,895 | ) |
Japanese Yen | | | JPHQ | | | | Buy | | | | 753,194,000 | | | | 6,849,781 | | | | | | | | 7/25/19 | | | | 150,963 | | | | — | |
Japanese Yen | | | JPHQ | | | | Sell | | | | 753,194,000 | | | | 6,778,936 | | | | | | | | 7/25/19 | | | | — | | | | (221,808 | ) |
South Korean Won | | | HSBK | | | | Sell | | | | 12,970,000,000 | | | | 11,304,803 | | | | | | | | 7/30/19 | | | | 84,109 | | | | — | |
Euro | | | BZWS | | | | Sell | | | | 2,175,778 | | | | 2,443,877 | | | | | | | | 7/31/19 | | | | — | | | | (36,631 | ) |
Japanese Yen | | | BZWS | | | | Buy | | | | 125,158,380 | | | | 1,141,092 | | | | | | | | 7/31/19 | | | | 22,756 | | | | — | |
Japanese Yen | | | BZWS | | | | Sell | | | | 125,158,380 | | | | 1,127,594 | | | | | | | | 7/31/19 | | | | — | | | | (36,254 | ) |
Japanese Yen | | | CITI | | | | Buy | | | | 220,552,000 | | | | 2,008,187 | | | | | | | | 7/31/19 | | | | 42,725 | | | | — | |
Japanese Yen | | | CITI | | | | Sell | | | | 220,552,000 | | | | 1,986,892 | | | | | | | | 7/31/19 | | | | — | | | | (64,020 | ) |
Japanese Yen | | | DBAB | | | | Buy | | | | 93,580,000 | | | | 858,573 | | | | | | | | 7/31/19 | | | | 11,627 | | | | — | |
Japanese Yen | | | DBAB | | | | Sell | | | | 93,580,000 | | | | 843,147 | | | | | | | | 7/31/19 | | | | — | | | | (27,054 | ) |
Euro | | | JPHQ | | | | Sell | | | | 893,000 | | | | 1,003,878 | | | | | | | | 8/02/19 | | | | — | | | | (14,353 | ) |
Euro | | | JPHQ | | | | Sell | | | | 3,156,669 | | | | 3,575,844 | | | | | | | | 8/13/19 | | | | — | | | | (26,650 | ) |
Indian Rupee | | | HSBK | | | | Sell | | | | 425,413,000 | | | | 6,089,943 | | | | | | | | 8/14/19 | | | | — | | | | (40,869 | ) |
South Korean Won | | | DBAB | | | | Sell | | | | 5,870,000,000 | | | | 4,959,865 | | | | | | | | 8/16/19 | | | | — | | | | (120,297 | ) |
South Korean Won | | | HSBK | | | | Sell | | | | 7,321,000,000 | | | | 6,552,403 | | | | | | | | 8/19/19 | | | | 216,069 | | | | — | |
Indian Rupee | | | JPHQ | | | | Sell | | | | 299,959,000 | | | | 4,210,630 | | | | | | | | 8/20/19 | | | | — | | | | (108,599 | ) |
Euro | | | JPHQ | | | | Sell | | | | 12,683,779 | | | | 14,263,607 | | | | | | | | 8/21/19 | | | | — | | | | (220,734 | ) |
Euro | | | SCNY | | | | Sell | | | | 3,955,000 | | | | 4,452,262 | | | | | | | | 8/21/19 | | | | — | | | | (64,181 | ) |
South Korean Won | | | CITI | | | | Sell | | | | 6,847,000,000 | | | | 5,769,539 | | | | | | | | 8/21/19 | | | | — | | | | (156,804 | ) |
Indian Rupee | | | BNDP | | | | Sell | | | | 366,171,300 | | | | 5,175,347 | | | | | | | | 9/06/19 | | | | — | | | | (85,357 | ) |
Indian Rupee | | | HSBK | | | | Sell | | | | 308,587,000 | | | | 4,374,328 | | | | | | | | 9/06/19 | | | | — | | | | (59,074 | ) |
Japanese Yen | | | HSBK | | | | Buy | | | | 520,970,840 | | | | 4,846,844 | | | | | | | | 9/06/19 | | | | 10,594 | | | | — | |
Japanese Yen | | | JPHQ | | | | Buy | | | | 447,587,520 | | | | 4,168,532 | | | | | | | | 9/06/19 | | | | 4,694 | | | | — | |
South Korean Won | | | DBAB | | | | Sell | | | | 5,874,000,000 | | | | 4,985,571 | | | | | | | | 9/10/19 | | | | — | | | | (101,626 | ) |
Indian Rupee | | | HSBK | | | | Sell | | | | 424,992,790 | | | | 6,011,639 | | | | | | | | 9/11/19 | | | | — | | | | (90,196 | ) |
Australian Dollar | | | JPHQ | | | | Sell | | | | 6,470,000 | | | | 486,795,607 | | | | JPY | | | | 9/12/19 | | | | — | | | | (11,560 | ) |
Indian Rupee | | | BNDP | | | | Sell | | | | 102,165,000 | | | | 1,459,104 | | | | | | | | 9/12/19 | | | | — | | | | (7,541 | ) |
Indian Rupee | | | CITI | | | | Sell | | | | 343,270,000 | | | | 4,890,931 | | | | | | | | 9/16/19 | | | | — | | | | (34,386 | ) |
Indian Rupee | | | HSBK | | | | Sell | | | | 213,251,757 | | | | 3,036,909 | | | | | | | | 9/16/19 | | | | — | | | | (22,877 | ) |
Indian Rupee | | | JPHQ | | | | Sell | | | | 559,573,000 | | | | 7,945,095 | | | | | | | | 9/18/19 | | | | — | | | | (81,716 | ) |
Euro | | | JPHQ | | | | Sell | | | | 32,400,000 | | | | 37,352,664 | | | | | | | | 9/20/19 | | | | 270,759 | | | | — | |
South Korean Won | | | CITI | | | | Sell | | | | 2,579,000,000 | | | | 2,291,487 | | | | | | | | 9/20/19 | | | | 57,194 | | | | — | |
Euro | | | GSCO | | | | Sell | | | | 1,285,078 | | | | 1,481,913 | | | | | | | | 9/23/19 | | | | 10,815 | | | | — | |
Euro | | | DBAB | | | | Sell | | | | 14,148,265 | | | | 16,370,957 | | | | | | | | 9/25/19 | | | | 172,313 | | | | — | |
Euro | | | JPHQ | | | | Sell | | | | 6,359,037 | | | | 7,220,496 | | | | | | | | 9/25/19 | | | | — | | | | (60,099 | ) |
Euro | | | BZWS | | | | Sell | | | | 1,087,889 | | | | 1,248,238 | | | | | | | | 9/30/19 | | | | 2,215 | | | | — | |
Euro | | | SCNY | | | | Sell | | | | 4,385,600 | | | | 5,008,926 | | | | | | | | 9/30/19 | | | | — | | | | (14,160 | ) |
Euro | | | HSBK | | | | Sell | | | | 2,972,000 | | | | 3,386,743 | | | | | | | | 10/01/19 | | | | — | | | | (17,527 | ) |
Indian Rupee | | | HSBK | | | | Sell | | | | 309,946,000 | | | | 4,441,442 | | | | | | | | 10/03/19 | | | | 3,907 | | | | — | |
Euro | | | GSCO | | | | Sell | | | | 2,676,375 | | | | 3,044,751 | | | | | | | | 10/04/19 | | | | — | | | | (21,607 | ) |
| | | | | | |
| | | |
franklintempleton.com | | Semiannual Report | | | 17 | |
TEMPLETON GLOBAL INCOME FUND
STATEMENT OF INVESTMENTS (UNAUDITED)
Forward Exchange Contracts(continued)
| | | | | | | | | | | | | | | | | | | | | | | | | | | | | | | | |
| Currency | | Counterpartya | | | Type | | | Quantity | | | Contract
Amount* | | | | | | Settlement
Date | | | Unrealized
Appreciation | | | Unrealized
Depreciation | |
OTC Forward Exchange Contracts(continued) | |
Australian Dollar | | | CITI | | | | Sell | | | | 2,549,800 | | | | 1,820,455 | | | | | | | | 10/08/19 | | | $ | 25,336 | | | $ | — | |
Euro | | | BOFA | | | | Sell | | | | 1,257,588 | | | | 1,431,927 | | | | | | | | 10/08/19 | | | | — | | | | (9,354 | ) |
Euro | | | UBSW | | | | Sell | | | | 13,525,000 | | | | 15,405,043 | | | | | | | | 10/09/19 | | | | — | | | | (96,727 | ) |
Australian Dollar | | | JPHQ | | | | Sell | | | | 6,321,500 | | | | 4,536,877 | | | | | | | | 10/11/19 | | | | 86,091 | | | | — | |
Euro | | | BZWS | | | | Sell | | | | 4,094,000 | | | | 4,687,978 | | | | | | | | 10/11/19 | | | | — | | | | (5,114 | ) |
Euro | | | HSBK | | | | Sell | | | | 13,422,375 | | | | 15,368,485 | | | | | | | | 10/11/19 | | | | — | | | | (18,042 | ) |
Euro | | | JPHQ | | | | Sell | | | | 7,083,554 | | | | 8,112,865 | | | | | | | | 10/11/19 | | | | — | | | | (7,255 | ) |
Australian Dollar | | | CITI | | | | Sell | | | | 5,634,533 | | | | 4,038,045 | | | | | | | | 10/15/19 | | | | 70,572 | | | | — | |
Australian Dollar | | | JPHQ | | | | Sell | | | | 10,311,000 | | | | 7,390,564 | | | | | | | | 10/15/19 | | | | 130,227 | | | | — | |
Euro | | | GSCO | | | | Sell | | | | 748,727 | | | | 856,012 | | | | | | | | 10/15/19 | | | | — | | | | (2,545 | ) |
Euro | | | BOFA | | | | Sell | | | | 6,265,500 | | | | 7,201,566 | | | | | | | | 10/16/19 | | | | 16,428 | | | | — | |
Euro | | | GSCO | | | | Sell | | | | 1,183,000 | | | | 1,359,657 | | | | | | | | 10/16/19 | | | | 3,019 | | | | — | |
Euro | | | SCNY | | | | Sell | | | | 6,873,000 | | | | 7,894,259 | | | | | | | | 10/17/19 | | | | 11,843 | | | | — | |
South Korean Won | | | CITI | | | | Sell | | | | 616,384,000 | | | | 542,592 | | | | | | | | 10/17/19 | | | | 8,114 | | | | — | |
Japanese Yen | | | HSBK | | | | Buy | | | | 1,305,707,190 | | | | 12,171,837 | | | | | | | | 10/21/19 | | | | 43,505 | | | | — | |
Japanese Yen | | | JPHQ | | | | Buy | | | | 822,634,530 | | | | 7,662,749 | | | | | | | | 10/21/19 | | | | 33,281 | | | | — | |
Euro | | | GSCO | | | | Sell | | | | 1,285,391 | | | | 1,474,793 | | | | | | | | 10/23/19 | | | | — | | | | (64 | ) |
Euro | | | JPHQ | | | | Sell | | | | 11,085,000 | | | | 12,722,809 | | | | | | | | 10/23/19 | | | | 3,879 | | | | — | |
Euro | | | UBSW | | | | Sell | | | | 5,829,129 | | | | 6,696,387 | | | | | | | | 10/23/19 | | | | 8,044 | | | | — | |
Euro | | | UBSW | | | | Sell | | | | 1,228,000 | | | | 1,410,229 | | | | | | | | 10/24/19 | | | | 1,113 | | | | — | |
Euro | | | BOFA | | | | Sell | | | | 8,723,695 | | | | 9,871,297 | | | | | | | | 10/29/19 | | | | — | | | | (142,927 | ) |
Euro | | | GSCO | | | | Sell | | | | 451,231 | | | | 510,613 | | | | | | | | 10/29/19 | | | | — | | | | (7,370 | ) |
Euro | | | JPHQ | | | | Sell | | | | 33,330 | | | | 37,706 | | | | | | | | 10/29/19 | | | | — | | | | (555 | ) |
Euro | | | SCNY | | | | Sell | | | | 4,300,311 | | | | 4,866,236 | | | | | | | | 10/29/19 | | | | — | | | | (70,237 | ) |
Euro | | | BOFA | | | | Sell | | | | 8,723,695 | | | | 9,864,144 | | | | | | | | 10/31/19 | | | | — | | | | (151,634 | ) |
Euro | | | GSCO | | | | Sell | | | | 1,784,250 | | | | 2,016,854 | | | | | | | | 10/31/19 | | | | — | | | | (31,665 | ) |
Euro | | | JPHQ | | | | Sell | | | | 4,312,000 | | | | 4,896,664 | | | | | | | | 11/08/19 | | | | — | | | | (57,067 | ) |
Australian Dollar | | | CITI | | | | Sell | | | | 5,614,733 | | | | 3,929,190 | | | | | | | | 11/13/19 | | | | — | | | | (26,941 | ) |
Australian Dollar | | | JPHQ | | | | Sell | | | | 6,321,500 | | | | 4,429,949 | | | | | | | | 11/13/19 | | | | — | | | | (24,168 | ) |
Australian Dollar | | | JPHQ | | | | Sell | | | | 14,547,500 | | | | 10,217,437 | | | | | | | | 11/14/19 | | | | — | | | | (32,938 | ) |
Euro | | | HSBK | | | | Sell | | | | 7,662,000 | | | | 8,738,434 | | | | | | | | 11/14/19 | | | | — | | | | (67,958 | ) |
Australian Dollar | | | CITI | | | | Sell | | | | 5,614,733 | | | | 3,933,121 | | | | | | | | 11/15/19 | | | | — | | | | (23,190 | ) |
Australian Dollar | | | JPHQ | | | | Sell | | | | 7,979,000 | | | | 5,589,688 | | | | | | | | 11/15/19 | | | | — | | | | (32,556 | ) |
Euro | | | CITI | | | | Sell | | | | 1,417,000 | | | | 1,619,489 | | | | | | | | 11/15/19 | | | | — | | | | (9,280 | ) |
Euro | | | JPHQ | | | | Sell | | | | 932,604 | | | | 1,066,041 | | | | | | | | 11/15/19 | | | | — | | | | (5,940 | ) |
South Korean Won | | | CITI | | | | Sell | | | | 5,173,000,000 | | | | 4,427,422 | | | | | | | | 11/15/19 | | | | — | | | | (62,510 | ) |
Australian Dollar | | | JPHQ | | | | Sell | | | | 4,614,000 | | | | 3,198,909 | | | | | | | | 11/20/19 | | | | — | | | | (52,623 | ) |
Euro | | | BOFA | | | | Sell | | | | 13,098,580 | | | | 14,865,055 | | | | | | | | 11/20/19 | | | | — | | | | (196,937 | ) |
Euro | | | GSCO | | | | Sell | | | | 3,105,000 | | | | 3,522,157 | | | | | | | | 11/20/19 | | | | — | | | | (48,267 | ) |
Euro | | | JPHQ | | | | Sell | | | | 36,690,814 | | | | 41,663,336 | | | | | | | | 11/20/19 | | | | — | | | | (527,248 | ) |
Australian Dollar | | | JPHQ | | | | Sell | | | | 3,926,000 | | | | 2,711,335 | | | | | | | | 11/21/19 | | | | — | | | | (55,420 | ) |
Euro | | | GSCO | | | | Sell | | | | 1,285,078 | | | | 1,457,471 | | | | | | | | 11/21/19 | | | | — | | | | (20,348 | ) |
Euro | | | JPHQ | | | | Sell | | | | 12,683,779 | | | | 14,369,326 | | | | | | | | 11/21/19 | | | | — | | | | (216,821 | ) |
Euro | | | UBSW | | | | Sell | | | | 6,199,607 | | | | 7,026,263 | | | | | | | | 11/21/19 | | | | — | | | | (103,188 | ) |
Euro | | | BZWS | | | | Sell | | | | 1,087,889 | | | | 1,230,076 | | | | | | | | 11/29/19 | | | | — | | | | (21,757 | ) |
Euro | | | GSCO | | | | Sell | | | | 1,348,769 | | | | 1,525,828 | | | | | | | | 11/29/19 | | | | — | | | | (26,199 | ) |
Euro | | | MSCO | | | | Sell | | | | 4,545,000 | | | | 5,140,486 | | | | | | | | 11/29/19 | | | | — | | | | (89,442 | ) |
Australian Dollar | | | CITI | | | | Sell | | | | 2,549,800 | | | | 1,774,941 | | | | | | | | 12/03/19 | | | | — | | | | (22,459 | ) |
| | | | |
| | | |
18 | | Semiannual Report | | franklintempleton.com |
TEMPLETON GLOBAL INCOME FUND
STATEMENT OF INVESTMENTS (UNAUDITED)
Forward Exchange Contracts(continued)
| | | | | | | | | | | | | | | | | | | | | | | | | | | | | | | | |
| Currency | | Counterpartya | | | Type | | | Quantity | | | Contract
Amount* | | | | | | Settlement
Date | | | Unrealized
Appreciation | | | Unrealized
Depreciation | |
OTC Forward Exchange Contracts(continued) | |
Australian Dollar | | | GSCO | | | | Sell | | | | 26,618,090 | | | | 18,553,075 | | | | | | | | 12/04/19 | | | $ | — | | | $ | (210,920 | ) |
Euro | | | BOFA | | | | Sell | | | | 7,200,930 | | | | 8,157,033 | | | | | | | | 12/04/19 | | | | — | | | | (132,292 | ) |
Euro | | | GSCO | | | | Sell | | | | 2,676,375 | | | | 3,034,260 | | | | | | | | 12/04/19 | | | | — | | | | (46,640 | ) |
Euro | | | HSBK | | | | Sell | | | | 4,550,000 | | | | 5,155,241 | | | | | | | | 12/04/19 | | | | — | | | | (82,476 | ) |
Euro | | | JPHQ | | | | Sell | | | | 6,016,524 | | | | 6,832,515 | | | | | | | | 12/05/19 | | | | — | | | | (93,924 | ) |
Euro | | | SCNY | | | | Sell | | | | 1,325,806 | | | | 1,505,558 | | | | | | | | 12/05/19 | | | | — | | | | (20,757 | ) |
Japanese Yen | | | JPHQ | | | | Buy | | | | 432,810,070 | | | | 4,056,132 | | | | | | | | 12/05/19 | | | | 7,376 | | | | — | |
Japanese Yen | | | HSBK | | | | Buy | | | | 1,329,338,880 | | | | 12,463,433 | | | | | | | | 12/06/19 | | | | 18,270 | | | | — | |
Japanese Yen | | | JPHQ | | | | Buy | | | | 450,247,630 | | | | 4,220,606 | | | | | | | | 12/06/19 | | | | 6,952 | | | | — | |
Euro | | | BOFA | | | | Sell | | | | 1,258,386 | | | | 1,440,009 | | | | | | | | 12/09/19 | | | | — | | | | (9,141 | ) |
Australian Dollar | | | HSBK | | | | Sell | | | | 2,560,000 | | | | 191,644,160 | | | | JPY | | | | 12/12/19 | | | | — | | | | (4,679 | ) |
Australian Dollar | | | HSBK | | | | Sell | | | | 7,320,000 | | | | 549,658,800 | | | | JPY | | | | 12/12/19 | | | | 2,368 | | | | — | |
Australian Dollar | | | JPHQ | | | | Sell | | | | 4,480,000 | | | | 335,794,368 | | | | JPY | | | | 12/12/19 | | | | — | | | | (4,270 | ) |
Euro | | | BOFA | | | | Sell | | | | 6,549,290 | | | | 7,466,191 | | | | | | | | 12/18/19 | | | | — | | | | (81,217 | ) |
Euro | | | GSCO | | | | Sell | | | | 748,727 | | | | 852,650 | | | | | | | | 12/18/19 | | | | — | | | | (10,183 | ) |
Japanese Yen | | | HSBK | | | | Buy | | | | 1,356,630,000 | | | | 12,660,717 | | | | | | | | 12/19/19 | | | | 90,353 | | | | — | |
Japanese Yen | | | JPHQ | | | | Buy | | | | 666,398,580 | | | | 6,222,534 | | | | | | | | 12/20/19 | | | | 41,493 | | | | — | |
Japanese Yen | | | HSBK | | | | Buy | | | | 520,970,830 | | | | 4,910,576 | | | | | | | | 3/06/20 | | | | 9,687 | | | | — | |
Japanese Yen | | | JPHQ | | | | Buy | | | | 494,791,690 | | | | 4,668,862 | | | | | | | | 3/06/20 | | | | 4,154 | | | | — | |
Australian Dollar | | | JPHQ | | | | Sell | | | | 5,850,000 | | | | 436,559,526 | | | | JPY | | | | 3/12/20 | | | | — | | | | (7,386 | ) |
Australian Dollar | | | HSBK | | | | Sell | | | | 2,520,000 | | | | 187,363,260 | | | | JPY | | | | 3/13/20 | | | | — | | | | (9,657 | ) |
Japanese Yen | | | HSBK | | | | Buy | | | | 1,966,726,540 | | | | 18,509,745 | | | | | | | | 3/23/20 | | | | 83,906 | | | | — | |
Japanese Yen | | | JPHQ | | | | Buy | | | | 1,331,363,580 | | | | 12,520,037 | | | | | | | | 3/23/20 | | | | 66,822 | | | | — | |
Japanese Yen | | | JPHQ | | | | Buy | | | | 345,545,070 | | | | 3,280,374 | | | | | | | | 3/24/20 | | | | — | | | | (13,355 | ) |
Japanese Yen | | | HSBK | | | | Buy | | | | 520,970,850 | | | | 4,939,067 | | | | | | | | 6/08/20 | | | | 9,319 | | �� | | — | |
Japanese Yen | | | JPHQ | | | | Buy | | | | 494,791,690 | | | | 4,696,337 | | | | | | | | 6/08/20 | | | | 3,389 | | | | — | |
Australian Dollar | | | HSBK | | | | Sell | | | | 2,560,000 | | | | 189,807,360 | | | | JPY | | | | 6/12/20 | | | | — | | | | (7,608 | ) |
Australian Dollar | | | JPHQ | | | | Sell | | | | 6,990,000 | | | | 518,468,537 | | | | JPY | | | | 6/12/20 | | | | — | | | | (18,822 | ) |
Euro | | | JPHQ | | | | Sell | | | | 916,524 | | | | 1,065,111 | | | | | | | | 6/15/20 | | | | — | | | | (3,952 | ) |
Japanese Yen | | | JPHQ | | | | Buy | | | | 666,398,580 | | | | 6,301,528 | | | | | | | | 6/22/20 | | | | 33,583 | | | | — | |
Japanese Yen | | | BNDP | | | | Buy | | | | 1,684,055,930 | | | | 16,084,717 | | | | | | | | 6/24/20 | | | | — | | | | (73,307 | ) |
| | | | | | | | | | | | | | | | | | | | | | | | | | | | |
| | | | | | | |
Total Forward Exchange Contracts | | | | | | | | | | | | | | | | | | | | | | | $ | 3,156,839 | | | $ | (7,219,210) | |
| | | | | | | | | | | | | | | | | | | | | | | | | | | | |
| | | | | |
Net unrealized appreciation (depreciation) | | | | | | | | | | | | | | | | | | | $ | (4,062,371) | |
| | | | | | | | | | | | | | | | | | | | | | | | | | | | | | | | |
*In U.S. dollars unless otherwise indicated.
aMay be comprised of multiple contracts with the same counterparty, currency and settlement date.
At June 30, 2019, the Fund had the following interest rate swap contracts outstanding. See Note 1(c).
Interest Rate Swap Contracts
| | | | | | | | | | | | | | | | |
| Description | | Payment
Frequency | | | Maturity
Date | | | Notional
Amount | | | Value/
Unrealized
Appreciation
(Depreciation) | |
|
Centrally Cleared Swap Contracts | |
Receive Floating3-month USD LIBOR
Pay Fixed 1.914% | |
| Quarterly
Semi-Annual |
| | | 1/22/25 | | | $ | 35,260,000 | | | | $(363,488) | |
| | | | | | |
| | | |
franklintempleton.com | | Semiannual Report | | | 19 | |
TEMPLETON GLOBAL INCOME FUND
STATEMENT OF INVESTMENTS (UNAUDITED)
Interest Rate Swap Contracts(continued)
| | | | | | | | | | | | | | | | |
| Description | | Payment
Frequency | | | Maturity
Date | | | Notional
Amount | | | Value/
Unrealized
Appreciation
(Depreciation) | |
|
Centrally Cleared Swap Contracts(continued) | |
Receive Floating3-month USD LIBOR
Pay Fixed 1.97% | |
| Quarterly
Semi-Annual |
| | | 1/23/25 | | | | $17,628,000 | | | | $ (237,987 | ) |
Receive Floating3-month USD LIBOR
Pay Fixed 1.973% | |
| Quarterly
Semi-Annual |
| | | 1/27/25 | | | | 10,404,000 | | | | (143,795 | ) |
Receive Floating3-month USD LIBOR
Pay Fixed 1.942% | |
| Quarterly
Semi-Annual |
| | | 1/30/25 | | | | 5,500,000 | | | | (65,729 | ) |
Receive Floating3-month USD LIBOR
Pay Fixed 1.978% | |
| Quarterly
Semi-Annual |
| | | 3/27/25 | | | | 800,000 | | | | (12,275 | ) |
Receive Floating3-month USD LIBOR
Pay Fixed 1.985% | |
| Quarterly
Semi-Annual |
| | | 3/27/25 | | | | 800,000 | | | | (12,610 | ) |
Receive Floating3-month USD LIBOR
Pay Fixed 2.449% | |
| Quarterly
Semi-Annual |
| | | 7/02/25 | | | | 6,340,000 | | | | (271,360 | ) |
Receive Floating3-month USD LIBOR
Pay Fixed 2.31% | |
| Quarterly
Semi-Annual |
| | | 7/29/25 | | | | 16,220,000 | | | | (558,527 | ) |
Receive Floating3-month USD LIBOR
Pay Fixed 2.752% | |
| Quarterly
Semi-Annual |
| | | 7/29/45 | | | | 23,960,000 | | | | (2,839,100 | ) |
Receive Floating3-month USD LIBOR
Pay Fixed 2.378% | |
| Quarterly
Semi-Annual |
| | | 11/18/46 | | | | 56,100,000 | | | | (1,955,742 | ) |
Receive Floating3-month USD LIBOR
Pay Fixed 2.794% | |
| Quarterly
Semi-Annual |
| | | 3/13/47 | | | | 10,100,000 | | | | (1,328,997 | ) |
Receive Floating3-month USD LIBOR
Pay Fixed 2.537% | |
| Quarterly
Semi-Annual |
| | | 4/13/47 | | | | 12,300,000 | | | | (854,820 | ) |
Receive Floating3-month USD LIBOR
Pay Fixed 2.98% | |
| Quarterly
Semi-Annual |
| | | 2/20/48 | | | | 12,196,000 | | | | (2,146,066 | ) |
Receive Floating3-month USD LIBOR
Pay Fixed 3.002% | |
| Quarterly
Semi-Annual |
| | | 2/22/48 | | | | 12,196,000 | | | | (2,206,665 | ) |
Receive Floating3-month USD LIBOR
Pay Fixed 3.019% | |
| Quarterly
Semi-Annual |
| | | 2/23/48 | | | | 12,196,000 | | | | (2,250,635 | ) |
| | | | | | | | | | | | | | | | |
| | | | |
Total Interest Rate Swap Contracts | | | | | | | | | | | | | | | $(15,247,796 | ) |
| | | | | | | | | | | | | | | | |
See Note 9 regarding other derivative information.
See Abbreviations on page 34.
| | | | | | |
| | | | |
20 | | Semiannual Report | | | The accompanying notes are an integral part of these financial statements. | | franklintempleton.com |
TEMPLETON GLOBAL INCOME FUND
FINANCIAL STATEMENTS
Statement of Assets and Liabilities
June 30, 2019 (unaudited)
| | | | |
Assets: | | | | |
Investments in securities: | | | | |
Cost - Unaffiliated issuers | | | $ 715,868,847 | |
Cost -Non-controlled affiliates (Note 3c) | | | 236,752,680 | |
| | | | |
Value - Unaffiliated issuers | | | $ 669,427,737 | |
Value -Non-controlled affiliates (Note 3c) | | | 236,752,680 | |
Cash | | | 16,382,751 | |
Restricted cash for OTC derivative contracts (Note 1d) | | | 796,000 | |
Foreign currency, at value (cost $2,516,163) | | | 2,518,645 | |
Receivables: | | | | |
Investment securities sold | | | 135,134 | |
Interest | | | 9,835,178 | |
Deposits with brokers for: | | | | |
OTC derivative contracts | | | 2,722,000 | |
Centrally cleared swap contracts | | | 16,816,614 | |
Variation margin on centrally cleared swap contracts | | | 729,165 | |
Unrealized appreciation on OTC forward exchange contracts | | | 3,156,839 | |
Other assets | | | 1,259 | |
| | | | |
| |
Total assets | | | 959,274,002 | |
| | | | |
Liabilities: | | | | |
Payables: | | | | |
Management fees | | | 432,614 | |
Deposits from brokers for: | | | | |
OTC derivative contracts | | | 796,000 | |
Options written, at value (premiums received $4,208,014) | | | 3,343,796 | |
Unrealized depreciation on OTC forward exchange contracts | | | 7,219,210 | |
Deferred tax | | | 560,305 | |
Accrued expenses and other liabilities | | | 341,659 | |
| | | | |
| |
Total liabilities | | | 12,693,584 | |
| | | | |
| |
Net assets, at value | | | $ 946,580,418 | |
| | | | |
Net assets consist of: | | | | |
Paid-in capital | | | $1,016,013,989 | |
Total distributable earnings (loss) | | | (69,433,571 | ) |
| | | | |
| |
Net assets, at value | | | $ 946,580,418 | |
| | | | |
| |
Shares outstanding | | | 134,144,158 | |
| | | | |
Net asset value per share | | | $7.06 | |
| | | | |
| | | | | | |
| | | |
franklintempleton.com | | The accompanying notes are an integral part of these financial statements. | Semiannual Report | | | 21 | |
TEMPLETON GLOBAL INCOME FUND
FINANCIAL STATEMENTS
Statement of Operations
for the six months ended June 30, 2019 (unaudited)
| | | | |
Investment income: | | | | |
Dividends: | | | | |
Non-controlled affiliates (Note 3c) | | | $ 2,425,222 | |
Interest: (net of foreign taxes)~ | | | | |
Unaffiliated issuers | | | 29,009,457 | |
| | | | |
Total investment income | | | 31,434,679 | |
| | | | |
Expenses: | | | | |
Management fees (Note 3a) | | | 3,027,495 | |
Transfer agent fees | | | 85,482 | |
Custodian fees (Note 4) | | | 193,729 | |
Reports to shareholders | | | 33,337 | |
Registration and filing fees | | | 66,493 | |
Professional fees | | | 45,212 | |
Trustees’ fees and expenses | | | 74,407 | |
Other | | | 114,694 | |
| | | | |
Total expenses | | | 3,640,849 | |
Expenses waived/paid by affiliates (Note 3c) | | | (409,870 | ) |
| | | | |
Net expenses | | | 3,230,979 | |
| | | | |
Net investment income | | | 28,203,700 | |
| | | | |
Realized and unrealized gains (losses): | | | | |
Net realized gain (loss) from: | | | | |
Investments:# | | | | |
Unaffiliated issuers | | | (262,546 | ) |
Written options | | | (87,244 | ) |
Foreign currency transactions | | | (2,760 | ) |
Forward exchange contracts | | | 15,234,276 | |
Swap contracts | | | 343,348 | |
| | | | |
Net realized gain (loss) | | | 15,225,074 | |
| | | | |
Net change in unrealized appreciation (depreciation) on: | | | | |
Investments: | | | | |
Unaffiliated issuers | | | 10,577,035 | |
Translation of other assets and liabilities denominated in foreign currencies | | | 65,671 | |
Forward exchange contracts | | | (1,150,434 | ) |
Written options | | | 864,218 | |
Swap contracts | | | (22,524,300 | ) |
Change in deferred taxes on unrealized appreciation | | | 138,517 | |
| | | | |
Net change in unrealized appreciation (depreciation) | | | (12,029,293 | ) |
| | | | |
Net realized and unrealized gain (loss) | | | 3,195,781 | |
| | | | |
Net increase (decrease) in net assets resulting from operations | | | $ 31,399,481 | |
| | | | |
| |
| | | | |
~Foreign taxes withheld on interest | | | $ 663,629 | |
#Net of foreign taxes | | | $ 98,979 | |
| | | | |
| | | |
22 | | Semiannual Report | The accompanying notes are an integral part of these financial statements. | | franklintempleton.com |
TEMPLETON GLOBAL INCOME FUND
FINANCIAL STATEMENTS
Statements of Changes in Net Assets
| | | | | | | | |
| | | Six Months Ended
June 30, 2019
(unaudited) | | | Year Ended
December 31, 2018 | |
| | |
Increase (decrease) in net assets: | | | | | | | | |
Operations: | | | | | | | | |
Net investment income | | | $ 28,203,700 | | | | $ 49,777,751 | |
Net realized gain (loss) | | | 15,225,074 | | | | 4,033,496 | |
Net change in unrealized appreciation (depreciation) | | | (12,029,293 | ) | | | (34,650,969 | ) |
| | | | |
| | |
Net increase (decrease) in net assets resulting from operations | | | 31,399,481 | | | | 19,160,278 | |
| | | | |
| | |
Distributions to shareholders | | | (29,806,832 | ) | | | (34,604,129 | ) |
Distributions to shareholders from tax return of capital | | | — | | | | (12,359,741 | ) |
| | | | |
| | |
Total distributions to shareholders | | | (29,806,832 | ) | | | (46,963,870 | ) |
| | | | |
| | |
Net increase (decrease) in net assets | | | 1,592,649 | | | | (27,803,592 | ) |
Net assets: | | | | | | | | |
Beginning of period | | | 944,987,769 | | | | 972,791,361 | |
| | | | |
| | |
End of period | | | $946,580,418 | | | | $944,987,769 | |
| | | | |
| | | | | | |
| | | |
franklintempleton.com | | The accompanying notes are an integral part of these financial statements. | Semiannual Report | | | 23 | |
TEMPLETON GLOBAL INCOME FUND
Notes to Financial Statements (unaudited)
1. Organization and Significant Accounting Policies
Templeton Global Income Fund (Fund) is registered under the Investment Company Act of 1940 (1940 Act) as aclosed-end management investment company and applies the specialized accounting and reporting guidance in U.S. Generally Accepted Accounting Principles (U.S. GAAP).
The following summarizes the Fund’s significant accounting policies.
a. Financial Instrument Valuation
The Fund’s investments in financial instruments are carried at fair value daily. Fair value is the price that would be received to sell an asset or paid to transfer a liability in an orderly transaction between market participants on the measurement date. The Fund calculates the net asset value (NAV) per share each business day as of 4 p.m. Eastern time or the regularly scheduled close of the New York Stock Exchange (NYSE), whichever is earlier. Under compliance policies and procedures approved by the Fund’s Board of Trustees (the Board), the Fund’s administrator has responsibility for oversight of valuation, including leading the cross-functional Valuation Committee (VC). The Fund may utilize independent pricing services, quotations from securities and financial instrument dealers, and other market sources to determine fair value.
Debt securities generally trade in theover-the-counter (OTC) market rather than on a securities exchange. The Fund’s pricing services use multiple valuation techniques to determine fair value. In instances where sufficient market activity exists, the pricing services may utilize a market-based approach through which quotes from market makers are used to determine fair value. In instances where sufficient market activity may not exist or is limited, the pricing services also utilize proprietary valuation models which may consider market characteristics such as benchmark yield curves, credit spreads, estimated default rates, anticipated market interest rate volatility, coupon rates, anticipated timing of principal repayments, underlying collateral, and other unique security features in order to estimate the relevant cash flows, which are then discounted to calculate the fair value. Securities denominated in a foreign currency are converted into their U.S. dollar equivalent at the foreign exchange rate in effect at 4 p.m. Eastern time on the date that the values of the foreign debt securities are determined.
Investments inopen-end mutual funds are valued at the closing NAV.
Certain derivative financial instruments are centrally cleared or trade in the OTC market. The Fund’s pricing services use various techniques including industry standard option pricing models and proprietary discounted cash flow models to determine the fair value of those instruments. The Fund’s net benefit or obligation under the derivative contract, as measured by the fair value of the contract, is included in net assets.
The Fund has procedures to determine the fair value of financial instruments for which market prices are not reliable or readily available. Under these procedures, the Fund primarily employs a market-based approach which may use related or comparable assets or liabilities, recent transactions, market multiples, book values, and other relevant information for the investment to determine the fair value of the investment. An income-based valuation approach may also be used in which the anticipated future cash flows of the investment are discounted to calculate fair value. Discounts may also be applied due to the nature or duration of any restrictions on the disposition of the investments. Due to the inherent uncertainty of valuations of such investments, the fair values may differ significantly from the values that would have been used had an active market existed.
b. Foreign Currency Translation
Portfolio securities and other assets and liabilities denominated in foreign currencies are translated into U.S. dollars based on the exchange rate of such currencies against U.S. dollars on the date of valuation. The Fund may enter into foreign currency exchange contracts to facilitate transactions denominated in a foreign currency. Purchases and sales of securities, income and expense items denominated in foreign currencies are translated into U.S. dollars at the exchange rate in effect on the transaction date. Portfolio securities and assets and liabilities denominated in foreign currencies contain risks that those currencies will decline in value relative to the U.S. dollar. Occasionally, events may impact the availability or reliability of foreign exchange rates used to convert the U.S. dollar equivalent value. If such an event occurs, the foreign exchange rate will be valued at fair value using procedures established and approved by the Board.
| | | | |
| | | |
24 | | Semiannual Report | | franklintempleton.com |
TEMPLETON GLOBAL INCOME FUND
NOTES TO FINANCIAL STATEMENTS (UNAUDITED)
The Fund does not separately report the effect of changes in foreign exchange rates from changes in market prices on securities held. Such changes are included in net realized and unrealized gain or loss from investments in the Statement of Operations.
Realized foreign exchange gains or losses arise from sales of foreign currencies, currency gains or losses realized between the trade and settlement dates on securities transactions and the difference between the recorded amounts of dividends, interest, and foreign withholding taxes and the U.S. dollar equivalent of the amounts actually received or paid. Net unrealized foreign exchange gains and losses arise from changes in foreign exchange rates on foreign denominated assets and liabilities other than investments in securities held at the end of the reporting period.
c. Derivative Financial Instruments
The Fund invested in derivative financial instruments in order to manage risk or gain exposure to various other investments or markets. Derivatives are financial contracts based on an underlying or notional amount, require no initial investment or an initial net investment that is smaller than would normally be required to have a similar response to changes in market factors, and require or permit net settlement. Derivatives contain various risks including the potential inability of the counterparty to fulfill their obligations under the terms of the contract, the potential for an illiquid secondary market, and/or the potential for market movements which expose the Fund to gains or losses in excess of the amounts shown in the Statement of Assets and Liabilities. Realized gain and loss and unrealized appreciation and depreciation on these contracts for the period are included in the Statement of Operations.
Derivative counterparty credit risk is managed through a formal evaluation of the creditworthiness of all potential counterparties. The Fund attempts to reduce its exposure to counterparty credit risk on OTC derivatives, whenever possible, by entering into International Swaps and Derivatives Association (ISDA) master agreements with certain counterparties. These agreements contain various provisions, including but not limited to collateral requirements, events of default, or early termination. Termination events applicable to the counterparty include certain deteriorations in the credit quality of the counterparty. Termination events applicable to the Fund include failure of the Fund to maintain certain net asset levels and/or limit the decline in net assets over various
periods of time. In the event of default or early termination, the ISDA master agreement gives thenon-defaulting party the right to net andclose-out all transactions traded, whether or not arising under the ISDA agreement, to one net amount payable by one counterparty to the other. However, absent an event of default or early termination, OTC derivative assets and liabilities are presented gross and not offset in the Statement of Assets and Liabilities. Early termination by the counterparty may result in an immediate payment by the Fund of any net liability owed to that counterparty under the ISDA agreement.
Collateral requirements differ by type of derivative. Collateral or initial margin requirements are set by the broker or exchange clearing house for exchange traded and centrally cleared derivatives. Initial margin deposited is held at the exchange and can be in the form of cash and/or securities. For OTC derivatives traded under an ISDA master agreement, posting of collateral is required by either the Fund or the applicable counterparty if the total net exposure of all OTC derivatives with the applicable counterparty exceeds the minimum transfer amount, which typically ranges from $100,000 to $250,000, and can vary depending on the counterparty and the type of the agreement. Generally, collateral is determined at the close of Fund business each day and any additional collateral required due to changes in derivative values may be delivered by the Fund or the counterparty the next business day, or within a few business days. Collateral pledged and/or received by the Fund for OTC derivatives, if any, is held in segregated accounts with the Fund’s custodian/counterparty broker and can be in the form of cash and/or securities. Unrestricted cash may be invested according to the Fund’s investment objectives. To the extent that the amounts due to the Fund from its counterparties are not subject to collateralization or are not fully collateralized, the Fund bears the risk of loss from counterpartynon-performance.
The Fund entered into OTC forward exchange contracts primarily to manage and/or gain exposure to certain foreign currencies. A forward exchange contract is an agreement between the Fund and a counterparty to buy or sell a foreign currency at a specific exchange rate on a future date.
The Fund entered into interest rate swap contracts primarily to manage interest rate risk. An interest rate swap is an agreement between the Fund and a counterparty to exchange cash flows based on the difference between two interest rates, applied to a notional amount. These
| | | | | | |
| | | |
franklintempleton.com | | Semiannual Report | | | 25 | |
TEMPLETON GLOBAL INCOME FUND
NOTES TO FINANCIAL STATEMENTS (UNAUDITED)
1. Organization and Significant Accounting Policies(continued)
c. Derivative Financial Instruments(continued)
agreements may be privately negotiated in theover-the-counter market (OTC interest rate swaps) or may be executed on a registered exchange (centrally cleared interest rate swaps). For centrally cleared interest rate swaps, required initial margins are pledged by the Fund, and the daily change in fair value is accounted for as a variation margin payable or receivable in the Statement of Assets and Liabilities. Over the term of the contract, contractually required payments to be paid and to be received are accrued daily and recorded as unrealized depreciation and appreciation until the payments are made, at which time they are realized.
The Fund purchased or wrote OTC option contracts primarily to manage and/or gain exposure to foreign exchange rate risk. An option is a contract entitling the holder to purchase or sell a specific amount of shares or units of an asset or notional amount of a swap (swaption), at a specified price. When an option is purchased or written, an amount equal to the premium paid or received is recorded as an asset or liability, respectively. Upon exercise of an option, the acquisition cost or sales proceeds of the underlying investment is adjusted by any premium received or paid. Upon expiration of an option, any premium received or paid is recorded as a realized gain or loss. Upon closing an option other than through expiration or exercise, the difference between the premium received or paid and the cost to close the position is recorded as a realized gain or loss.
The Fund invests in value recovery instruments (VRI) primarily to gain exposure to economic growth. Periodic payments from VRI are dependent on established benchmarks for underlying variables. VRI has a notional amount, which is used to calculate amounts of payments to holders. Payments are recorded upon receipt as realized gains in the Statement of Operations. The risks of investing in VRI include growth risk, liquidity, and the potential loss of investment.
See Note 9 regarding other derivative information.
d. Restricted Cash
At June 30, 2019, the Fund held restricted cash in connection with investments in certain derivative securities. Restricted cash is held in a segregated account with the Fund’s custodian and is reflected in the Statement of Assets and Liabilities.
e. Income and Deferred Taxes
It is the Fund’s policy to qualify as a regulated investment company under the Internal Revenue Code. The Fund intends to distribute to shareholders substantially all of its taxable income and net realized gains to relieve it from federal income and excise taxes. As a result, no provision for U.S. federal income taxes is required.
The Fund may be subject to foreign taxation related to income received, capital gains on the sale of securities and certain foreign currency transactions in the foreign jurisdictions in which it invests. Foreign taxes, if any, are recorded based on the tax regulations and rates that exist in the foreign markets in which the Fund invests. When a capital gain tax is determined to apply, the Fund records an estimated deferred tax liability in an amount that would be payable if the securities were disposed of on the valuation date.
The Fund may recognize an income tax liability related to its uncertain tax positions under U.S. GAAP when the uncertain tax position has a less than 50% probability that it will be sustained upon examination by the tax authorities based on its technical merits. As of June 30, 2019, the Fund has determined that no tax liability is required in its financial statements related to uncertain tax positions for any open tax years (or expected to be taken in future tax years). Open tax years are those that remain subject to examination and are based on the statute of limitations in each jurisdiction in which the Fund invests.
f. Security Transactions, Investment Income, Expenses and Distributions
Security transactions are accounted for on trade date. Realized gains and losses on security transactions are determined on a specific identification basis. Interest income and estimated expenses are accrued daily. Amortization of premium and accretion of discount on debt securities are included in interest income. Dividend income is recorded on theex-dividend date. Distributions to shareholders are recorded on theex-dividend date. Distributable earnings are
| | | | |
| | | |
26 | | Semiannual Report | | franklintempleton.com |
TEMPLETON GLOBAL INCOME FUND
NOTES TO FINANCIAL STATEMENTS (UNAUDITED)
determined according to income tax regulations (tax basis) and may differ from earnings recorded in accordance with U.S. GAAP. These differences may be permanent or temporary. Permanent differences are reclassified among capital accounts to reflect their tax character. These reclassifications have no impact on net assets or the results of operations. Temporary differences are not reclassified, as they may reverse in subsequent periods.
Inflation-indexed bonds are adjusted for inflation through periodic increases or decreases in the security’s interest accruals, face amount, or principal redemption value, by amounts corresponding to the rate of inflation as measured by an index. Any increase or decrease in the face amount or principal redemption value will be included as interest income in the Statement of Operations.
g. Accounting Estimates
The preparation of financial statements in accordance with U.S. GAAP requires management to make estimates and assumptions that affect the reported amounts of assets and
liabilities at the date of the financial statements and the amounts of income and expenses during the reporting period. Actual results could differ from those estimates.
h. Guarantees and Indemnifications
Under the Fund’s organizational documents, its officers and trustees are indemnified by the Fund against certain liabilities arising out of the performance of their duties to the Fund. Additionally, in the normal course of business, the Fund enters into contracts with service providers that contain general indemnification clauses. The Fund’s maximum exposure under these arrangements is unknown as this would involve future claims that may be made against the Fund that have not yet occurred. Currently, the Fund expects the risk of loss to be remote.
2. Shares of Beneficial Interest
At June 30, 2019, there were an unlimited number of shares authorized (without par value). During the period ended June 30, 2019 and year ended December 31, 2018 there were no shares issued; all reinvested distributions were satisfied with previously issued shares purchased in the open market.
Under the Board approved open-market share repurchase program, the Fund may purchase, from time to time, Fund shares in open-market transactions, at the discretion of management. Since the inception of the program, the Fund has repurchased a total of 11,210,400 shares. During the period ended June 30, 2019 and year ended December 31, 2018, there were no shares repurchased.
3. Transactions with Affiliates
Franklin Resources, Inc. is the holding company for various subsidiaries that together are referred to as Franklin Templeton. Certain officers and trustees of the Fund are also officers and/or directors of the following subsidiaries:
| | |
| |
| Subsidiary | | Affiliation |
Franklin Advisers, Inc. (Advisers) | | Investment manager |
Franklin Templeton Services, LLC (FT Services) | | Administrative manager |
| | | | | | |
| | | |
franklintempleton.com | | Semiannual Report | | | 27 | |
TEMPLETON GLOBAL INCOME FUND
NOTES TO FINANCIAL STATEMENTS (UNAUDITED)
3. Transactions with Affiliates(continued)
a. Management Fees
The Fund pays an investment management fee to Advisers based on the average daily net assets of the Fund as follows:
| | |
| |
| Annualized Fee Rate | | Net Assets |
0.700% | | Up to and including $200 million |
0.635% | | Over $200 million, up to and including $700 million |
0.600% | | Over $700 million, up to and including $1 billion |
0.580% | | Over $1 billion, up to and including $5 billion |
0.560% | | Over $5 billion, up to and including $10 billion |
0.540% | | Over $10 billion, up to and including $15 billion |
0.520% | | Over $15 billion, up to and including $20 billion |
0.500% | | In excess of $20 billion |
For the period ended June 30, 2019, the annualized gross effective investment management fee rate was 0.639% of the Fund’s average daily net assets.
b. Administrative Fees
Under an agreement with Advisers, FT Services provides administrative services to the Fund. The fee is paid by Advisers based on Fund’s average daily net assets, and is not an additional expense of the Fund.
c. Investments in Affiliated Management Investment Companies
The Fund invests in one or more affiliated management investment companies for purposes other than exercising a controlling influence over the management or policies. Management fees paid by the Fund are waived on assets invested in the affiliated management investment companies, as noted in the Statement of Operations, in an amount not to exceed the management and administrative fees paid directly or indirectly by each affiliate. During the period ended June 30, 2019, the Fund held investments in affiliated management investment companies as follows:
| | | | | | | | | | | | | | | | | | | | | | | | | | | | | | | | |
| | | | | | | | |
| | | Value at
Beginning
of Period | | | Purchases | | | Sales | | | Realized
Gain (Loss) | | | Net Change in
Unrealized
Appreciation
(Depreciation) | | | Value at
End of
Period | | | Number of
Shares
Held at End
of Period | | | Dividend
Income | |
| | |
| Non-Controlled Affiliates | | | | | | | | | |
Institutional Fiduciary Trust Money Market Portfolio, 2.05% | | $ | 236,712,686 | | | $ | 36,352,942 | | | $ | (36,312,948 | ) | | | $ — | | | | $ — | | | | $236,752,680 | | | | 236,752,680 | | | | $2,425,222 | |
4. Expense Offset Arrangement
The Fund has entered into an arrangement with its custodian whereby credits realized as a result of uninvested cash balances are used to reduce a portion of the Fund’s custodian expenses. During the period ended June 30, 2019, there were no credits earned.
5. Income Taxes
For tax purposes, capital losses may be carried over to offset future capital gains.
| | | | |
| | | |
28 | | Semiannual Report | | franklintempleton.com |
TEMPLETON GLOBAL INCOME FUND
NOTES TO FINANCIAL STATEMENTS (UNAUDITED)
At December 31, 2018, the capital loss carryforwards were as follows:
| | | | |
Capital loss carryforwards not subject to expiration: | | | | |
Short term | | $ | 5,765,789 | |
For tax purposes, the Fund may elect to defer any portion of a post-October capital loss or late-year ordinary loss to the first day of the following fiscal year. At December 31, 2018, the Fund deferred late-year ordinary losses of $11,087,367.
At June 30, 2019, the cost of investments, net unrealized appreciation (depreciation) for income tax purposes were as follows:
| | | | |
Cost of investments | | $ | 958,299,592 | |
| |
Unrealized appreciation | | $ | 33,207,709 | |
Unrealized depreciation | | | (98,710,842 | ) |
| |
Net unrealized appreciation (depreciation) | | $ | (65,503,133 | ) |
Differences between income and/or capital gains as determined on a book basis and a tax basis are primarily due to differing treatments of foreign currency transactions, bond discounts and premiums, and inflation related adjustments on foreign securities.
6. Investment Transactions
Purchases and sales of investments (excluding short term securities) for the period ended June 30, 2019, aggregated $29,378,843 and $37,559,568, respectively.
7. Credit Risk
At June 30, 2019, the Fund had 19.5% of its portfolio invested in high yield securities, or other securities rated below investment grade and unrated securities, if any. These securities may be more sensitive to economic conditions causing greater price volatility and are potentially subject to a greater risk of loss due to default than higher rated securities.
8. Concentration of Risk
Investing in foreign securities may include certain risks and considerations not typically associated with investing in U.S. securities, such as fluctuating currency values and changing local and regional economic, political and social conditions, which may result in greater market volatility. Current political and financial uncertainty surrounding the European Union may increase market volatility and the economic risk of investing in securities in Europe. In addition, certain foreign securities may not be as liquid as U.S. securities.
| | | | | | |
| | | |
franklintempleton.com | | Semiannual Report | | | 29 | |
TEMPLETON GLOBAL INCOME FUND
NOTES TO FINANCIAL STATEMENTS (UNAUDITED)
9. Other Derivative Information
At June 30, 2019, investments in derivative contracts are reflected in the Statement of Assets and Liabilities as follows:
| | | | | | | | | | | | | | |
| | | |
| | | Asset Derivatives | | | | | Liability Derivatives | |
| | | | | |
Derivative Contracts
Not Accounted for as
Hedging Instruments | | Statement of
Assets and Liabilities
Location | | Fair Value | | | | | Statement of
Assets and Liabilities
Location | | Fair Value | |
| | | | | |
Interest rate contracts | | Variation margin on centrally
cleared swap contracts | | | $ — | | | | | Variation margin on centrally
cleared swap contracts | |
| $15,247,796
| a
|
Foreign exchange contracts | | Investments in securities, at value | | | 3,996,463 | b | | | | Options written, at value | | | 3,343,796 | |
| | Unrealized appreciation on OTC forward exchange contracts | | | 3,156,839 | | | | | Unrealized depreciation on OTC forward exchange contracts | | | 7,219,210 | |
| | | | | | | | | | | | | | |
| Totals | | | | | $7,153,302 | | | | | | | | $25,810,802 | |
| | | | | | | | | | | | | | |
aThis amount reflects the cumulative appreciation (depreciation) of centrally cleared swap contracts as reported in the Statement of Investments. Only the variation margin receivable/payable at period end is separately reported within the Statement of Assets and Liabilities. Prior variation margin movements were recorded to cash upon receipt or payment.
bPurchased option contracts are included in investments in securities, at value in the Statement of Assets and Liabilities.
For the period ended June 30, 2019, the effect of derivative contracts in the Statement of Operations was as follows:
| | | | | | | | | | | | | | |
| | | | | |
Derivative Contracts
Not Accounted for as
Hedging Instruments | | Statement of
Operations Location | | Net Realized
Gain (Loss) for
the Period | | | | | Statement of
Operations Location | | Net Change in
Unrealized
Appreciation
(Depreciation)
for the Period | |
| | | | | |
| | Net realized gain (loss) from: | | | | | | | | Net change in unrealized appreciation (depreciation) on: | | | | |
Interest rate contracts | | Swap contracts | | | $ 343,348 | | | | | Swap contracts | | | $(22,524,300) | |
Foreign exchange contracts | | Investments | | | 203,417 | a | | | | Investments | | | (1,286,666) | a |
| | Written options | | | (87,244 | ) | | | | Written options | | | 864,218 | |
| | Forward exchange contracts | | | 15,234,276 | | | | | Forward exchange contracts | | | (1,150,434) | |
Value recovery instruments | | Investments | | | 1,541,568 | a | | | | Investments | | | (1,271,357) | a |
| | | | | | | | | | | | | | |
Totals | | | | | $17,235,365 | | | | | | | | $(25,368,539) | |
| | | | | | | | | | | | | | |
aPurchased option contracts and VRI are included in net realized gain (loss) from investments and net change in unrealized appreciation (depreciation) on investments in the Statement of Operations.
For the period ended June 30, 2019, the average month end notional amount of options and swap contracts, the average month end contract value for forward exchange contracts, and average month end fair value of VRI, were as follows:
| | | | |
Options | | $ | 125,150,239 | |
Swap contracts | | $ | 232,000,000 | |
Forward exchange contracts | | $ | 948,237,801 | |
VRI | | $ | 2,672,355 | |
| | | | |
| | | |
30 | | Semiannual Report | | franklintempleton.com |
TEMPLETON GLOBAL INCOME FUND
NOTES TO FINANCIAL STATEMENTS (UNAUDITED)
At June 30, 2019, OTC derivative assets and liabilities are as follows:
| | | | | | | | |
| |
| | | Gross Amounts of
Assets and Liabilities Presented
in the Statement of Assets and Liabilities | |
| | |
| | | Assetsa | | | Liabilitiesa | |
| | |
| Derivatives | | | | | | | | |
Forward exchange contracts | | | $3,156,839 | | | | $ 7,219,210 | |
Options purchased | | | 3,996,463 | | | | — | |
Options written | | | — | | | | 3,343,796 | |
| | |
Total | | | $7,153,302 | | | | $10,563,006 | |
aAbsent an event of default or early termination, OTC derivative assets and liabilities are presented gross and not offset in the Statement of Assets and Liabilities.
At June 30, 2019, OTC derivative assets, which may be offset against OTC derivative liabilities and collateral received from the counterparty, are as follows:
| | | | | | | | | | | | | | | | | | | | |
| | |
| | | | Amounts Not Offset in the
Statement of Assets and Liabilities | | | | |
| | | | | |
| | | Gross
Amounts of
Assets Presented in
the Statement of
Assets and Liabilities | | | Financial
Instruments
Available for
Offset | | | Financial
Instruments
Collateral
Receiveda | | | Cash
Collateral
Receivedb
| | | Net Amount
(Not less
than zero) | |
Counterparty | | | | | | | | | | | | | | | | | | | | |
BNDP | | | $ — | | | | $ — | | | | $ — | | | | $ — | | | | $ — | |
BOFA | | | 16,428 | | | | (16,428) | | | | — | | | | — | | | | — | |
BZWS | | | 24,971 | | | | (24,971) | | | | — | | | | — | | | | — | |
CITI | | | 2,939,290 | | | | (2,562,416) | | | | (303) | | | | (376,571) | | | | — | |
DBAB | | | 280,004 | | | | (280,004) | | | | — | | | | — | | | | — | |
GSCO | | | 40,650 | | | | (40,650) | | | | — | | | | — | | | | — | |
HSBK | | | 1,153,339 | | | | (1,153,339) | | | | — | | | | — | | | | — | |
JPHQ | | | 2,633,296 | | | | (2,633,296) | | | | — | | | | — | | | | — | |
MSCO | | | 44,324 | | | | (44,324) | | | | — | | | | — | | | | — | |
SCNY | | | 11,843 | | | | (11,843) | | | | — | | | | — | | | | — | |
UBSW | | | 9,157 | | | | (9,157) | | | | — | | | | — | | | | — | |
| | | | |
| | | | | |
Total | | | $7,153,302 | | | | $(6,776,428) | | | | $(303) | | | | $(376,571) | | | | $ — | |
| | | | |
| | | | | | |
| | | |
franklintempleton.com | | Semiannual Report | | | 31 | |
TEMPLETON GLOBAL INCOME FUND
NOTES TO FINANCIAL STATEMENTS (UNAUDITED)
9. Other Derivative Information(continued)
At June 30, 2019, OTC derivative liabilities, which may be offset against OTC derivative assets and collateral pledged to the counterparty, are as follows:
| | | | | | | | | | | | | | | | | | | | |
| | |
| | | | Amounts Not Offset in the
Statement of Assets and Liabilities | | | | |
| | | | | |
| | | Gross
Amounts of Liabilities Presented in
the Statement of
Assets and Liabilities | | | Financial
Instruments
Available for
Offset | | | Financial
Instruments
Collateral
Pledged | | | Cash
Collateral
Pledgedb | | | Net Amount
(Not less
than zero) | |
| | | | | |
| Counterparty | | | | | | | | | | | | | | | | | | | | |
BNDP | | | $242,494 | | | | $ — | | | | $ — | | | | $(10,000) | | | | $232,494 | |
BOFA | | | 723,502 | | | | (16,428) | | | | — | | | | (707,074) | | | | — | |
BZWS | | | 99,756 | | | | (24,971) | | | | — | | | | — | | | | 74,785 | |
CITI | | | 2,562,416 | | | | (2,562,416) | | | | — | | | | — | | | | — | |
DBAB | | | 395,680 | | | | (280,004) | | | | — | | | | (115,676) | | | | — | |
GSCO | | | 465,980 | | | | (40,650) | | | | — | | | | (330,000) | | | | 95,330 | |
HSBK | | | 1,713,291 | | | | (1,153,339) | | | | — | | | | (411,000) | | | | 148,952 | |
JPHQ | | | 3,828,643 | | | | (2,633,296) | | | | — | | | | (750,000) | | | | 445,347 | |
MSCO | | | 161,994 | | | | (44,324) | | | | — | | | | — | | | | 117,670 | |
SCNY | | | 169,335 | | | | (11,843) | | | | — | | | | — | | | | 157,492 | |
UBSW | | | 199,915 | | | | (9,157) | | | | — | | | | (190,758) | | | | — | |
| | | | |
| | | | | |
Total | | | $10,563,006 | | | | $(6,776,428) | | | | $ — | | | | $(2,514,508) | | | | $1,272,070 | |
| | | | |
aAt June 30, 2019, the Fund received U.S. Treasury Bonds and Notes as collateral for derivatives.
bIn some instances, the collateral amounts disclosed in the table above were adjusted due to the requirement to limit collateral amounts to avoid the effect of overcollateralization. Actual collateral received and/or pledged may be more than the amounts disclosed herein.
See Note 1(c) regarding derivative financial instruments.
See Abbreviations on page 34.
10. Fair Value Measurements
The Fund follows a fair value hierarchy that distinguishes between market data obtained from independent sources (observable inputs) and the Fund’s own market assumptions (unobservable inputs). These inputs are used in determining the value of the Fund’s financial instruments and are summarized in the following fair value hierarchy:
| | • | | Level 1 – quoted prices in active markets for identical financial instruments |
| | • | | Level 2 – other significant observable inputs (including quoted prices for similar financial instruments, interest rates, prepayment speed, credit risk, etc.) |
| | • | | Level 3 – significant unobservable inputs (including the Fund’s own assumptions in determining the fair value of financial instruments) |
The input levels are not necessarily an indication of the risk or liquidity associated with financial instruments at that level.
| | | | |
| | | |
32 | | Semiannual Report | | franklintempleton.com |
TEMPLETON GLOBAL INCOME FUND
NOTES TO FINANCIAL STATEMENTS (UNAUDITED)
A summary of inputs used as of June 30, 2019, in valuing the Fund’s assets and liabilities carried at fair value, is as follows:
| | | | | | | | | | | | | | | | |
| | | | |
| | | Level 1 | | | Level 2 | | | Level 3 | | | Total | |
| | | | |
| Assets: | | | | | | | | | | | | | | | | |
Investments in Securities:a | | | | | | | | | | | | | | | | |
Foreign Government and Agency Securities | | $ | — | | | $ | 516,225,963 | | | $ | — | | | $ | 516,225,963 | |
Options Purchased | | | — | | | | 3,996,463 | | | | — | | | | 3,996,463 | |
Short Term Investments | | | 333,781,643 | | | | 52,176,348 | | | | — | | | | 385,957,991 | |
| | | | |
| | | | |
Total Investments in Securities | | $ | 333,781,643 | | | $ | 572,398,774 | | | $ | — | | | $ | 906,180,417 | |
| | | | |
| | | | |
Other Financial Instruments: | | | | | | | | | | | | | | | | |
Forward Exchange Contracts | | $ | — | | | $ | 3,156,839 | | | $ | — | | | $ | 3,156,839 | |
| | | | |
| | | | |
| Liabilities: | | | | | | | | | | | | | | | | |
Other Financial Instruments: | | | | | | | | | | | | | | | | |
Options Written | | $ | — | | | $ | 3,343,796 | | | $ | — | | | $ | 3,343,796 | |
Forward Exchange Contracts | | | — | | | | 7,219,210 | | | | — | | | | 7,219,210 | |
Swap Contracts. | | | — | | | | 15,247,796 | | | | — | | | | 15,247,796 | |
| | | | |
| | | | |
Total Other Financial Instruments | | $ | — | | | $ | 25,810,802 | | | $ | — | | | $ | 25,810,802 | |
| | | | |
aFor detailed categories, see the accompanying Statement of Investments.
11. Subsequent Events
The Fund has evaluated subsequent events through the issuance of the financial statements and determined that no events have occurred that require disclosure.
| | | | | | |
| | | |
franklintempleton.com | | Semiannual Report | | | 33 | |
TEMPLETON GLOBAL INCOME FUND
NOTES TO FINANCIAL STATEMENTS (UNAUDITED)
Abbreviations
| | | | | | | | | | |
| Counterparty | | Currency | | Selected Portfolio |
| | | | | |
| BNDP | | BNP Paribas | | ARS | | Argentine Peso | | ARPP7DRR | | Argentina Central Bank 7 Day Repo Rate |
| BOFA | | Bank of America Corp. | | AUD | | Australian Dollar | | BADLAR | | Argentina Deposit Rates Badlar Private |
| BZWS | | Barclays Bank PLC | | BRL | | Brazilian Real | | FRN | | Floating Rate Note |
| CITI | | Citigroup, Inc. | | COP | | Colombian Peso | | GDP | | Gross Domestic Product |
| DBAB | | Deutsche Bank AG | | EUR | | Euro | | LIBOR | | London InterBank Offered Rate |
| GSCO | | The Goldman Sachs Group, Inc. | | GHS | | Ghanaian Cedi | | VRI | | Value Recovery Instruments |
| HSBK | | HSBC Bank PLC | | IDR | | Indonesian Rupiah | | | | |
| JPHQ | | JP Morgan Chase & Co. | | INR | | Indian Rupee | | | | |
| MSCO | | Morgan Stanley | | JPY | | Japanese Yen | | | | |
| SCNY | | Standard Chartered Bank | | KRW | | South Korean Won | | | | |
| UBSW | | UBS AG | | MXN | | Mexican Peso | | | | |
| | | | PHP | | Philippine Peso | | | | |
| | | | USD | | United States Dollar | | | | |
| | | | |
| | | |
34 | | Semiannual Report | | franklintempleton.com |
TEMPLETON GLOBAL INCOME FUND
Tax Information (unaudited)
At December 31, 2018, more than 50% of the Fund’s total assets were invested in securities of foreign issuers. In most instances, foreign taxes were withheld from income paid to the Fund on these investments. As shown in the table below, the Fund hereby reports to shareholders the foreign source income and foreign taxes paid, pursuant to Section 853 of the Internal Revenue Code. This written statement will allow shareholders of record on January 15, 2019, to treat their proportionate share of foreign taxes paid by the Fund as having been paid directly by them. The shareholder shall consider these amounts as foreign taxes paid in the tax year in which they receive the Fund distribution.
The following table provides a detailed analysis of foreign tax paid and foreign source income as reported by the Fund to shareholders of record.
| | | | | | | | | | | | |
| | | |
| | | Foreign Tax Paid
Per Share | | | Foreign Source
Income Per Share | | | Foreign Source Qualified
Dividends Per Share | |
| | | |
| | | $0.0133 | | | | $0.3835 | | | | $ — | |
Foreign Tax Paid Per Share is the amount per share available to you, as a tax credit (assuming you held your shares in the Fund for a minimum of 16 days during the31-day period beginning 15 days before theex-dividend date of the Fund’s distribution to which the foreign taxes relate), or, as a tax deduction.
Foreign Source Income Per Share is the amount per share of income dividends attributable to foreign securities held by the Fund, plus any foreign taxes withheld on these dividends. The amounts reported include foreign source qualified dividends that have not been adjusted for the rate differential applicable to such dividend income.1
Foreign Source Qualified Dividends Per Share is the amount per share of foreign source qualified dividends plus any foreign taxes withheld on these dividends. These amounts represent the portion of the Foreign Source Income Per Share that were derived from qualified foreign securities held by the Fund.1
At the beginning of each calendar year, shareholders will receive Form 1099-DIV which will include their share of taxes paid and foreign source income distributed during the prior calendar year. The Foreign Source Income reported on Form1099-DIV has not been adjusted for the rate differential on foreign source qualified dividend income. Shareholders are advised to check with their tax advisors for information on the treatment of these amounts on their individual income tax returns.
1. Qualified dividends are taxed at reduced long term capital gains tax rates. In determining the amount of foreign tax credit that may be applied against the U.S. tax liability of individuals receiving foreign source qualified dividends, adjustments may be required to the foreign tax credit limitation calculation to reflect the rate differential applicable to such dividend income. The rules however permit certain individuals to elect not to apply the rate differential adjustments for capital gains and/or dividends for any taxable year. Please consult your tax advisor and the instructions to Form 1116 for more information.
| | | | | | |
| | | |
franklintempleton.com | | Semiannual Report | | | 35 | |
TEMPLETON GLOBAL INCOME FUND
Annual Meeting of Shareholders May 30, 2019 (unaudited)
The Annual Meeting of Shareholders of Templeton Global Income Fund (the “Fund”) was held at the Fund’s offices, 300 S.E. 2nd Street, Fort Lauderdale, Florida, on May 30, 2019. The purpose of the meeting was to elect four Trustees of the Fund and to ratify the selection of PricewaterhouseCoopers LLP as the independent registered public accounting firm for the Fund for the fiscal year ending December 31, 2019. At the meeting, the following persons were elected by the shareholders to serve as Trustees of the Fund: Mary C. Choksi, Larry D. Thompson, Rupert H. Johnson, Jr. and Gregory E. Johnson.* Shareholders also ratified the selection of PricewaterhouseCoopers LLP as the independent registered public accounting firm for the Fund for the fiscal year ending December 31, 2019. No other business was transacted at the meeting with respect to the Fund
The results of the voting at the Annual Meeting are as follows:
1. Election of four Trustees:
| | | | | | | | | | | | | | | | | | | | | | | | |
| | | | | | |
| Term Expiring 2022 | | For | | | % of
Outstanding
Shares | | | % of Shares
Present | | | Withheld | | | % of
Outstanding
Shares | | | % of Shares
Present | |
| |
| | | | | | |
Mary C. Choksi | | | 119,332,134 | | | | 88.96% | | | | 98.03% | | | | 2,401,989 | | | | 1.79% | | | | 1.97% | |
| |
Larry D. Thompson | | | 119,091,491 | | | | 88.78% | | | | 97.83% | | | | 2,642,632 | | | | 1.97% | | | | 2.17% | |
| |
Rupert H. Johnson, Jr. | | | 118,706,852 | | | | 88.49% | | | | 97.51% | | | | 3,027,271 | | | | 2.26% | | | | 2.49% | |
| |
Gregory E. Johnson | | | 119,052,450 | | | | 88.75% | | | | 97.80% | | | | 2,681,673 | | | | 2.00% | | | | 2.20% | |
| |
There were no brokernon-votes received with respect to this item.
2. Ratification of the selection of PricewaterhouseCoopers LLP as the independent registered public accounting firm for the Fund for the fiscal year ending December 31, 2019:
| | | | | | | | | | | | |
| | | |
| | | Shares
Voted | | | % of
Outstanding
Shares | | | % of Shares
Present | |
| | | |
For | | | 118,242,688 | | | | 88.15% | | | | 97.13% | |
| |
Against | | | 2,554,501 | | | | 1.90% | | | | 2.10% | |
| |
Abstain | | | 936,922 | | | | 0.70% | | | | 0.77% | |
| |
| | | | |
| | | |
36 | | Semiannual Report | | franklintempleton.com |
TEMPLETON GLOBAL INCOME FUND
Dividend Reinvestment and Cash Purchase Plan
The Fund offers a Dividend Reinvestment and Cash Purchase Plan (the “Plan”) with the following features:
Shareholders must affirmatively elect to participate in the Plan. If you decide to use this service, dividends and capital gains distributions will be reinvested automatically in shares of the Fund for your account.
Whenever the Fund declares dividends in either cash or shares of the Fund, if the market price is equal to or exceeds net asset value at the valuation date, the participant will receive the dividends entirely in new shares at a price equal to the net asset value, but not less than 95% of the then current market price of the Fund’s shares. If the market price is lower than net asset value or if dividends and/or capital gains distributions are payable only in cash, the participant will receive shares purchased on the New York Stock Exchange or otherwise on the open market.
A participant has the option of submitting additional cash payments to the Plan Administrator, in any amounts of at least $100, up to a maximum of $5,000 per month, for the purchase of Fund shares for his or her account. These payments can be made by check payable to American Stock Transfer and Trust Company LLC (the “Plan Administrator”) and sent to American Stock Transfer and Trust Company LLC, P.O. Box 922, Wall Street Station, New York, NY 10269-0560, Attention: Templeton Global Income Fund. The Plan Administrator will apply such payments (less a $5.00 service charge and less a pro rata share of trading fees) to purchases of Fund shares on the open market.
The automatic reinvestment of dividends and/or capital gains does not relieve the participant of any income tax that may be payable on dividends or distributions.
Whenever shares are purchased on the New York Stock Exchange or otherwise on the open market, each participant will pay a pro rata portion of trading fees. Trading fees will be deducted from amounts to be invested. The Plan Administrator’s fee for a sale of shares through the Plan is $15.00 per transaction plus a $0.12 per share trading fee.
A participant may withdraw from the Plan without penalty at any time by written notice to the Plan Administrator sent to American Stock Transfer and Trust Company LLC, P.O. Box 922, Wall Street Station, New York, NY 10269-0560. Upon withdrawal, the participant will receive, without charge, share certificates issued in the participant’s name for all full shares held by the Plan Administrator; or, if the participant wishes, the Plan Administrator will sell the participant’s shares and send the proceeds to the participant, less a service charge of $15.00 and less trading fees of $0.12 per share. The Plan Administrator will convert any fractional shares held at the time of withdrawal to cash at current market price and send a check to the participant for the net proceeds.
For more information, please see the Plan’s Terms and Conditions located at the back of this report.
| | | | | | |
| | | |
franklintempleton.com | | Semiannual Report | | | 37 | |
TEMPLETON GLOBAL INCOME FUND
DIVIDEND REINVESTMENT AND CASH PURCHASE PLAN
Transfer Agent
American Stock Transfer and Trust Company LLC
P.O. Box 922, Wall Street Station
New York, NY 10269-0560
(800)416-5585
www.astfinancial.com
Direct Deposit Service for Registered Shareholders
Cash distributions can now be electronically credited to a checking or savings account at any financial institution that participates in the Automated Clearing House (“ACH”) system. The Direct Deposit service is provided for registered shareholders at no charge. To enroll in the service, access your account online by going www.amstock.com or dial (800)416-5585 (toll free) and follow the instructions. Direct Deposit will begin with the next scheduled distribution payment date following enrollment in the service.
Direct Registration
If you are a registered shareholder of the Fund, purchases of shares of the Fund can be electronically credited to your Fund account at American Stock Transfer and Trust Company LLC through Direct Registration. This service provides shareholders with a convenient way to keep track of shares through book-entry transactions, electronically move book-entry shares between broker-dealers, transfer agents and DRS eligible issuers, and eliminate the possibility of lost certificates. For additional information, please contact American Stock Transfer and Trust Company LLC at (800)416-5585.
Shareholder Information
Shares of Templeton Global Income Fund are traded on the New York Stock Exchange under the symbol “GIM.” Information about the net asset value and the market price is available at franklintempleton.com.
For current information about distributions and shareholder accounts, call (800)416-5585. Registered shareholders can access their Fund accounton-line. For information go to American Stock Transfer and Trust Company LLC’s web site at www.astfinancial.com and follow the instructions.
The daily closing net asset value as of the previous business day may be obtained when available by calling Franklin Templeton Fund Information after 7 a.m. Pacific time any business day at (800) DIALBEN/342-5236. The Fund’s net asset value and dividends are also listed on the NASDAQ Stock Market, Inc.’s Mutual Fund Quotation Service (“NASDAQ MFQS”).
Shareholders not receiving copies of reports to shareholders because their shares are registered in the name of a broker or a custodian can request that they be added to the Fund’s mailing list by writing Templeton Global Income Fund, 100 Fountain Parkway, P.O. Box 33030, St. Petersburg, FL, 33733-8030.
| | | | |
| | | |
38 | | Semiannual Report | | franklintempleton.com |
TEMPLETON GLOBAL INCOME FUND
Shareholder Information
Board Approval of Investment Management Agreements
TEMPLETON GLOBAL INCOME FUND
(Fund)
At anin-person meeting held on May 21, 2019 (Meeting), the Board of Trustees (Board) of the Fund, including a majority of the trustees who are not “interested persons” as defined in the Investment Company Act of 1940 (Independent Trustees), reviewed and approved the continuance of the investment management agreement between Franklin Advisers, Inc. (Manager) and the Fund (Management Agreement) for an additionalone-year period. The Independent Trustees received advice from and met separately with Independent Trustee counsel in considering whether to approve the continuation of the Management Agreement.
In considering the continuation of the Management Agreement, the Board reviewed and considered information provided by the Manager at the Meeting and throughout the year at meetings of the Board and its committees. The Board also reviewed and considered information provided in response to a detailed set of requests for information submitted to the Manager by Independent Trustee counsel on behalf of the Independent Trustees in connection with the annual contract renewal process. In addition, prior to the Meeting, the Independent Trustees held a telephonic contract renewal meeting at which the Independent Trustees conferred amongst themselves and Independent Trustee counsel about contract renewal matters. The Board reviewed and considered all of the factors it deemed relevant in approving the continuance of the Management Agreement, including, but not limited to: (i) the nature, extent and quality of the services provided by the Manager; (ii) the investment performance of the Fund; (iii) the costs of the services provided and profits realized by the Manager and its affiliates from the relationship with the Fund; (iv) the extent to which economies of scale are realized as the Fund grows; and (v) whether fee levels reflect these economies of scale for the benefit of Fund investors.
In approving the continuance of the Management Agreement, the Board, including a majority of the Independent Trustees, determined that the terms of the Management Agreement are fair and reasonable and that the continuance of such Management Agreement is in the interests of the Fund and its shareholders. While attention was given to all information furnished, the following
discusses some primary factors relevant to the Board’s determination.
Nature, Extent and Quality of Services
The Board reviewed and considered information regarding the nature, extent and quality of investment management services provided by the Manager and its affiliates to the Fund and its shareholders. This information included, among other things, the qualifications, background and experience of the senior management and investment personnel of the Manager; the structure of investment personnel compensation; oversight ofthird-party service providers; investment performance reports and related financial information for the Fund (including its share price discount to net asset value); reports on expenses and shareholder services; legal and compliance matters; risk controls; pricing and other services provided by the Manager and its affiliates; and management fees charged by the Manager and its affiliates to US funds and other accounts, including management’s explanation of differences among accounts where relevant. The Board noted management’s continuing efforts and expenditures in establishing effective business continuity plans and developing strategies to address areas of heightened concern in the mutual fund industry, such as cybersecurity and liquidity risk management.
The Board also reviewed and considered the benefits provided to Fund shareholders of investing in a fund that is part of the Franklin Templeton family of funds. The Board noted the financial position of Franklin Resources, Inc. (FRI), the Manager’s parent, and its commitment to the mutual fund business as evidenced by its continued introduction of new funds, reassessment of the fund offerings in response to the market environment and project initiatives and capital investments relating to the services provided to the Fund by the Franklin Templeton Investments (FT) organization.
Following consideration of such information, the Board was satisfied with the nature, extent and quality of services provided by the Manager and its affiliates to the Fund and its shareholders.
Fund Performance
The Board reviewed and considered the performance results of the Fund over various time periods ended February 28, 2019. The Board considered the performance returns for the Fund in comparison to the performance returns of mutual funds deemed comparable to the Fund included in a universe (Performance Universe) selected by Broadridge Financial Solutions, Inc. (Broadridge), an independent provider of investment company data. The Board received a
| | | | | | |
| | | |
franklintempleton.com | | Semiannual Report | | | 39 | |
TEMPLETON GLOBAL INCOME FUND
SHAREHOLDER INFORMATION
description of the methodology used by Broadridge to select the mutual funds included in a Performance Universe. The Board also reviewed and considered Fund performance reports provided and discussions that occurred with portfolio managers at Board meetings throughout the year. A summary of the Fund’s performance results is below. Such results are based on net asset value without regard to market discounts or premiums.
The Performance Universe for the Fund included the Fund and all leveraged andnon-leveragedclosed-end global income funds. The Board noted that the Fund’s annualized income return for theone-, three-, five- and10-year periods was below the median of its Performance Universe. The Board also noted that the Fund’s annualized total return for the three-, five-, and10-year periods was below the median of its Performance Universe, but for theone-year period was above the median of its Performance Universe. The Broadridge report also contained a performance supplement, provided at the request of the Manager, with a Performance Universe that included the Fund and all retail and institutional global income funds. The Board noted management’s belief that the Performance Universe first noted above was not an appropriate comparison universe for the Fund as such Performance Universe included funds with multisector or specific sector/regional focused strategies that used leverage, whereas the Fund has a global bond strategy and does not use leverage. The Board observed that the Fund’s annualized total return for theone-, three-, five- and10-year periods was above the median and in the first (best) and second quintile of its supplemental Performance Universe. The Board also noted that the Fund’s annualized income return and annualized total return were positive for all periods and for theone-year period exceeded 5.6% and 4.7%, respectively. The Board further noted management’s explanation that the Fund underperformed its peer group over the three- and five-year periods primarily due to underweighted developed market duration exposures. The Board also noted management’s further explanation that management has strong convictions for the Fund’s current positioning, highlighting that the Fund continues to maintain low portfolio duration while aiming at a negative correlation with U.S. Treasury returns. The Board concluded that the Fund’s performance was satisfactory, noting the Fund’s annualized total return for theone-year period was above the median and in the second quintile of its Performance Universe.
Comparative Fees and Expenses
The Board reviewed and considered information regarding
the Fund’s actual total expense ratio and its various components, including, as applicable, management fees; underlying fund expenses; investment-related expenses; and othernon-management fees. The Board considered the actual total expense ratio and, separately, the contractual management fee rate, without the effect of fee waivers, if any (Management Rate) of the Fund in comparison to the median expense ratio and median Management Rate, respectively, of other mutual funds deemed comparable to and with a similar expense structure to the Fund selected by Broadridge (Expense Group). Broadridge fee and expense data is based upon information taken from each fund’s most recent annual report, which reflects historical asset levels. While recognizing such inherent limitation and the fact that expense ratios and Management Rates generally increase as assets decline and decrease as assets grow, the Board believed the independent analysis conducted by Broadridge to be an appropriate measure of comparative fees and expenses. The Broadridge Management Rate includes administrative charges. The Board received a description of the methodology used by Broadridge to select the mutual funds included in the Expense Group.
The Expense Group for the Fund included the Fund and six other leveraged andnon-leveragedclosed-end global income funds. The Board noted that the Management Rate and actual total expense ratio for the Fund were below the medians and in the first quintile (best) of its Expense Group. The Board concluded that the Management Rate charged to the Fund is reasonable.
Profitability
The Board reviewed and considered information regarding the profits realized by the Manager and its affiliates in connection with the operation of the Fund. In this respect, the Board considered the Fund profitability analysis provided by the Manager that addresses the overall profitability of FT’s US fund business, as well as its profits in providing investment management and other services to each of the individual funds during the12-month period ended September 30, 2018, being the most recent fiscalyear-end for FRI. The Board noted that although management continually makes refinements to its methodologies used in calculating profitability in response to organizational and product-related changes, the overall methodology has remained consistent with that used in the Fund’s profitability report presentations from prior years. Additionally, PricewaterhouseCoopers LLP, auditor to FRI and certain Franklin Templeton funds, has been engaged by the Manager to periodically review and assess the allocation
| | | | |
| | | |
40 | | Semiannual Report | | franklintempleton.com |
TEMPLETON GLOBAL INCOME FUND
SHAREHOLDER INFORMATION
methodologies to be used solely by the Fund’s Board with respect to the profitability analysis.
The Board noted management’s belief that costs incurred in establishing the infrastructure necessary for the type of mutual fund operations conducted by the Manager and its affiliates may not be fully reflected in the expenses allocated to the Fund in determining its profitability, as well as the fact that the level of profits, to a certain extent, reflected operational cost savings and efficiencies initiated by management. The Board also noted management’s expenditures in improving shareholder services provided to the Fund, as well as the need to implement systems and meet additional regulatory and compliance requirements resulting from recent SEC and other regulatory requirements.
The Board also considered the extent to which the Manager and its affiliates might derive ancillary benefits from fund operations, potential benefits resulting from personnel and systems enhancements necessitated by fund growth, as well as increased leverage with service providers and counterparties. Based upon its consideration of all these factors, the Board concluded that the level of profits realized by the Manager and its affiliates from providing services to the Fund was not excessive in view of the nature, extent and quality of services provided to the Fund.
Economies of Scale
The Board reviewed and considered the extent to which the Manager may realize economies of scale, if any, as the Fund grows larger and whether the Fund’s management fee structure reflects any economies of scale for the benefit of shareholders. The Board believes that the Manager’s ability to realize economies of scale and the sharing of such benefit is a more relevant consideration in the case of anopen-end fund whose size increases as a result of the continuous sale of its shares. Aclosed-end fund such as the Fund does not continuously offer shares, and growth following its initial public offering will primarily result from market appreciation, which benefits its shareholders. While believing economies of scale to be less of a factor in the context of aclosed-end fund, the Board believes at some point an increase in size may lead to economies of scale that would be shared with the Fund and its shareholders. The Board noted the existence of management fee breakpoints, which operate generally to share any economies of scale with the Fund’s shareholders by reducing the Fund’s effective management fees as the Fund grows in size. The Board considered the Manager’s view that
any analyses of potential economies of scale in managing a particular fund are inherently limited in light of the joint and common costs and investments the Manager incurs across the Franklin Templeton family of funds as a whole. The Board concluded that to the extent economies of scale may be realized by the Manager and its affiliates, the Fund’s management fee structure provided a sharing of benefits with the Fund and its shareholders as the Fund grows.
Conclusion
Based on its review, consideration and evaluation of all factors it believed relevant, including the above-described factors and conclusions, the Board unanimously approved the continuation of the Management Agreement for an additionalone-year period.
Proxy Voting Policies and Procedures
The Fund’s investment manager has established Proxy Voting Policies and Procedures (Policies) that the Fund uses to determine how to vote proxies relating to portfolio securities. Shareholders may view the Fund’s complete Policies online at franklintempleton.com. Alternatively, shareholders may request copies of the Policies free of charge by calling the Proxy Group collect at (954)527-7678 or by sending a written request to: Franklin Templeton Companies, LLC, 300 S.E. 2nd Street, Fort Lauderdale, FL 33301, Attention: Proxy Group. Copies of the Fund’s proxy voting records are also made available online at franklintempleton.com and posted on the U.S. Securities and Exchange Commission’s website at sec.gov and reflect the most recent12-month period ended June 30.
Quarterly Statement of Investments
The Fund files a complete statement of investments with the U.S. Securities and Exchange Commission for the first and third quarters for each fiscal year as an exhibit to its report on FormN-PORT. Shareholders may view the filed FormN-PORT by visiting the Commission’s website at sec.gov. The filed form may also be viewed and copied at the Commission’s Public Reference Room in Washington, DC. Information regarding the operations of the Public Reference Room may be obtained by calling(800) SEC-0330.
| | | | | | |
| | | |
franklintempleton.com | | Semiannual Report | | | 41 | |
TERMS AND CONDITIONS OF DIVIDEND REINVESTMENT AND CASH PURCHASE PLAN
1. American Stock Transfer and Trust Company LLC (“AST”), will act as Plan Administrator and will open an account for participating shareholders (“participant”) under the Dividend Reinvestment and Cash Purchase Plan (the “Plan”) in the same name as that in which the participant’s present shares are registered, and put the Plan into effect as of the first record date for a dividend or capital gains distribution after AST receives the authorization duly executed by such participant.
2. Whenever Templeton Global Income Fund (the “Fund”) declares a distribution from capital gains or an income dividend payable in either cash or shares of the Fund (“Fund shares”), if the market price per share on the valuation date equals or exceeds the net asset value per share, participants will receive such dividend or distribution entirely in Fund shares, and AST shall automatically receive such Fund shares for participant accounts including aggregate fractions. The number of additional Fund shares to be credited to participant accounts shall be determined by dividing the equivalent dollar amount of the capital gains distribution or dividend payable to participants by the Fund’s net asset value per share of the Fund shares on the valuation date, provided that the Fund shall not issue such shares at a price lower than 95% of the current market price per share. The valuation date will be the payable date for such distribution or dividend.
3. Whenever the Fund declares a distribution from capital gains or an income dividend payable only in cash, or if the Fund’s net asset value per share exceeds the market price per share on the valuation date, AST shall apply the amount of such dividend or distribution payable to participants to the purchase of Fund shares on the open market (less their pro rata share of trading fees incurred with respect to open market purchases in connection with the reinvestment of such dividend or distribution). If, before AST has completed its purchases, the market price exceeds the net asset value per share, the average per share purchase price paid by AST may exceed the net asset value of the Fund’s shares, resulting in the acquisition of fewer shares than if the dividend or capital gains distribution had been paid in shares issued by the Fund at net asset value per share. Such purchases will be made promptly after the payable date for such dividend or distribution, and in no event later than five business days prior to the record date for the next dividend or distribution except where temporary curtailment or suspension of purchase is necessary to comply with applicable provisions of the Federal securities laws.
4. A participant has the option of submitting additional payments to AST, in any amounts of at least $100, up to a maximum of $5,000 per month, for the purchase of Fund shares for his or her account. These payments may be made electronically through AST at www.amstock.com or by check payable to “American Stock Transfer and Trust Company LLC” and sent to American Stock Transfer and Trust Company LLC, P.O. Box 922, Wall Street Station, New York, NY 10269-0560, Attention: Templeton Global Income Fund. AST shall apply such payments (less a $5.00 service charge and less a pro rata share of trading fees) to purchases of Fund shares on the open market, as discussed below in paragraph 6. AST shall make such purchases promptly beginning on the dividend payment date, which is usually the last business day of each month, or, in the event that there is no dividend or distribution paid in a month, AST shall make such purchases on the last business day of that month, and in no event more than 30 days after receipt, except where necessary to comply with provisions of the Federal securities laws. Any voluntary payment received less than two business days before an investment
date shall be invested during the following month unless there are more than 30 days until the next investment date, in which case such payment will be returned to the participant. AST shall return to the participant his or her entire voluntary cash payment upon written notice of withdrawal received by AST not less than 48 hours before such payment is to be invested. Such written notice shall be sent to AST by the participant, as discussed below in paragraph 14.
5. For all purposes of the Plan: (a) the market price of the Fund’s shares on a particular date shall be the last sale price on the New York Stock Exchange on that date if a business day and if not, on the preceding business day, or if there is no sale on such Exchange on such date, then the mean between the closing bid and asked quotations for such shares on such Exchange on such date, and (b) net asset value per share of the Fund’s shares on a particular date shall be as determined by or on behalf of the Fund.
6. Open market purchases provided for above may be made on any securities exchange where Fund shares are traded, in theover-the-counter market or in negotiated transactions and may be on such terms as to price, delivery and otherwise as AST shall determine. Participant funds held by AST uninvested will not bear interest, and it is understood that, in any event, AST shall have no liability in connection with any inability to purchase Fund shares within five business days prior to the record date for the next dividend or distribution as herein provided, or with the timing of any purchases effected. AST shall have no responsibility as to the value of the Fund shares acquired for participant accounts. For the purposes of purchases on the open market, AST may aggregate purchases with those of other participants, and the average price (including trading fees) of all shares purchased by AST shall be the price per share allocable to all participants.
7. AST will hold shares acquired pursuant to this Plan, together with the shares of other participants acquired pursuant to this Plan, in its name or that of its nominee. AST will forward to participants any proxy solicitation material and will vote any shares so held for participants only in accordance with the proxies returned by participants to the Fund. Upon written request, AST will deliver to participants, without charge, a certificate or certificates for all or a portion of the full shares held by AST.
8. AST will confirm to participants each acquisition made for an account as soon as practicable but not later than ten business days after the date thereof. AST will send to participants a detailed account statement showing total dividends and distributions, date of investment, shares acquired and price per share, and total shares of record for the account. Although participants may from time to time have an undivided fractional interest (computed to three decimal places) in a share of the Fund, no certificates for a fractional share will be issued. However, dividends and distributions on fractional shares will be credited to participant accounts. In the event of termination of an account under the Plan, AST will adjust for any such undivided fractional interest in cash at the market price of the Fund’s shares on the date of termination.
9. Any share dividends or split shares distributed by the Fund on shares held by AST for participants will be credited to participant accounts. In the event that the Fund makes available to its shareholders transferable rights to purchase additional Fund shares or other securities, AST will sell such rights and apply the proceeds of the sale to the purchase of additional Fund shares for the participant accounts. The shares held for participants under the Plan
| | | | |
| | | |
42 | | Not part of the semiannual report | | franklintempleton.com |
TERMS AND CONDITIONS OF DIVIDEND REINVESTMENT AND CASH PURCHASE PLAN(continued)
will be added to underlying shares held by participants in calculating the number of rights to be issued.
10. AST’s service charge for capital gains or income dividend purchases will be paid by the Fund when shares are issued by the Fund or purchased on the open market. AST will deduct a $5.00 service charge from each voluntary cash payment. Participants will be charged a pro rata share of trading fees on all open market purchases.
11. Participants may withdraw shares from such participant’s account or terminate their participation under the Plan by notifying AST in writing. Such withdrawal or termination will be effective immediately if notice is received by AST not less than two days prior to any dividend or distribution record date; otherwise such withdrawal or termination will be effective after the investment of any current dividend or distribution or voluntary cash payment. The Plan may be terminated by AST or the Fund upon 90 days’ notice in writing mailed to participants. Upon any withdrawal or termination, AST will cause a certificate or certificates for the full shares held by AST for participants and cash adjustment for any fractional shares (valued at the market value of the shares at the time of withdrawal or termination) to be delivered to participants, less any trading fees. Alternatively, a participant may elect by written notice to AST to have AST sell part or all of the shares held for him and to remit the proceeds to him. AST is authorized to deduct a $15.00 service charge and a $0.12 per share trading fee for this transaction from the proceeds. If a participant disposes of all shares registered in his name on the books of the Fund, AST may, at its option, terminate the participant’s account or determine from the participant whether he wishes to continue his participation in the Plan.
12. These terms and conditions may be amended or supplemented by AST or the Fund at any time or times, except when necessary or appropriate to comply with applicable law or the rules or policies of the U.S. Securities and Exchange Commission or any other regulatory authority, only by mailing to participants appropriate written notice at least 90 days prior to the effective date thereof. The amendment or supplement shall be deemed to be accepted by participants unless, prior to the effective date thereof, AST receives written notice of the termination of a participant account under the Plan. Any such amendment may include an appointment by AST in its place and stead of a successor Plan Administrator under these terms and conditions, with full power and authority to perform all or any of the acts to be performed by AST under these terms and conditions. Upon any such appointment of a Plan Administrator for the purpose of receiving dividends and distributions, the Fund will be authorized to pay to such successor Plan Administrator, for a participant’s account, all dividends and distributions payable on Fund shares held in a participant’s name or under the Plan for retention or application by such successor Plan Administrator as provided in these terms and conditions.
13. AST shall at all times act in good faith and agree to use its best efforts within reasonable limits to ensure the accuracy of all services performed under this Agreement and to comply with applicable law, but shall assume no responsibility and shall not be liable for loss or damage due to errors unless such error is caused by AST’s negligence, bad faith or willful misconduct or that of its employees.
14. Any notice, instruction, request or election which by any provision of the Plan is required or permitted to be given or made by the participant to AST shall be in writing addressed to American
Stock Transfer and Trust Company LLC, P.O. Box 922, Wall Street Station, New York, NY 10269-0560, or www.amstock.com or such other address as AST shall furnish to the participant, and shall have been deemed to be given or made when received by AST.
15. Any notice or other communication which by any provision of the Plan is required to be given by AST to the participant shall be in writing and shall be deemed to have been sufficiently given for all purposes by being deposited postage prepaid in a post office letter box addressed to the participant at his or her address as it shall last appear on AST’s records. The participant agrees to notify AST promptly of any change of address.
16. These terms and conditions shall be governed by and construed in accordance with the laws of the State of New York and the rules and regulations of the U.S. Securities and Exchange Commission, as they may be amended from time to time.
| | | | | | |
| | | |
franklintempleton.com | | Not part of the semiannual report | | | 43 | |
This page intentionally left blank.
Investors should be aware that the value of investments made for the Fund may go down as well as up. Like any investment in securities, the value of the Fund’s portfolio will be subject to the risk of loss from market, currency, economic, political and other factors. The Fund and its investors are not protected from such losses by the investment manager. Therefore, investors who cannot accept this risk should not invest in shares of the Fund.
To help ensure we provide you with quality service, all calls to and from our service areas are monitored and/or recorded.
| | | | | | |
 | | Semiannual Report | | |
| | Templeton Global Income Fund | | |
| | Investment Manager | | Transfer Agent | | Fund Information |
| | Franklin Advisers, Inc. | | American Stock Transfer & Trust Co., LLC | | (800) DIAL BEN® / 342-5236 |
| | | | 6201 15th Avenue | | |
| | | | Brooklyn, NY 11219 | | |
| | | | Toll Free Number: (800)416-5585 | | |
| | | | Hearing Impaired Number: (866)703-9077 | | |
| | | | International Phone Number: (718) 921-8124 | | |
| | | | www.astfinancial.com | | |
| | | |
| © 2019 Franklin Templeton Investments. All rights reserved. | | | | | | TLGIM S 08/19 |
Item 2. Code of Ethics.
| (a) | The Registrant has adopted a code of ethics that applies to its principal executive officers and principal financial and accounting officer. |
| (f) | Pursuant to Item 13(a) (1), the Registrant is attaching as an exhibit a copy of its code of ethics that applies to its principal executive officers and principal financial and accounting officer. |
Item 3. Audit Committee Financial Expert.
| | |
| (a) (1) | | The Registrant has an audit committee financial expert serving on its audit committee. |
| |
| (2) | | The audit committee financial experts are Ann Torre Bates and David W. Niemiec and they are “independent” as defined under the relevant Securities and Exchange Commission Rules and Releases. |
Item 4. Principal Accountant Fees and Services. N/A
Item 5. Audit Committee of Listed Registrants
Members of the Audit Committee are: David W. Niemiec, Ann Torre Bates and Constantine D. Tseretopoulos.
Item 6. Schedule of Investments. N/A
Item 7. Disclosure of Proxy Voting Policies and Procedures forClosed-End Management Investment Companies.
The board of trustees of the Fund has delegated the authority to vote proxies related to the portfolio securities held by the Fund to the Fund’s investment manager Franklin Advisers, Inc. in accordance with the Proxy Voting Policies and Procedures (Policies) adopted by the investment manager.
The investment manager has delegated its administrative duties with respect to the voting of proxies for securities to the Proxy Group within Franklin Templeton Companies, LLC (Proxy Group), an affiliate and wholly owned subsidiary of Franklin Resources, Inc. All proxies received by the Proxy Group will be voted based upon the investment manager’s instructions and/or policies. The investment manager votes proxies solely in the best interests of the Fund and its shareholders.
To assist it in analyzing proxies of equity securities, the investment manager subscribes to Institutional Shareholder Services, Inc. (ISS), an unaffiliated third-party corporate governance research service that providesin-depth analyses of shareholder meeting agendas, vote recommendations, vote execution
services, ballot reconciliation services, recordkeeping and vote disclosure services. In addition, the investment manager subscribes to Glass, Lewis & Co., LLC (Glass Lewis), an unaffiliated third-party analytical research firm, to receive analyses and vote recommendations on the shareholder meetings of publicly held U.S. companies, as well as a limited subscription to its international research. Also, the investment manager has a supplemental subscription to Egan-Jones Proxy Services (Egan-Jones), an unaffiliated third party proxy advisory firm, to receive analyses and vote recommendations. Although analyses provided by ISS, Glass Lewis, Egan-Jones, and/or another independent third party proxy service provider (each a “Proxy Service”) are thoroughly reviewed and considered in making a final voting decision, the investment manager does not consider recommendations from a Proxy Service or any third party to be determinative of the investment manager’s ultimate decision. Rather, the investment manager exercises its independent judgment in making voting decisions. For most proxy proposals, the investment manager’s evaluation should result in the same position being taken for all Funds. In some cases, however, the evaluation may result in a Fund voting differently, depending upon the nature and objective of the Fund, the composition of its portfolio and other factors. As a matter of policy, the officers, directors/trustees and employees of the investment manager and the Proxy Group will not be influenced by outside sources whose interests conflict with the interests of the Fund and its shareholders. Efforts are made to resolve all conflicts in the best interests of the investment manager’s clients. Material conflicts of interest are identified by the Proxy Group based upon analyses of client, distributor, broker-dealer and vendor lists, information periodically gathered from directors and officers, and information derived from other sources, including public filings. In situations where a material conflict of interest is identified, the Proxy Group may vote consistent with the voting recommendation of a Proxy Service; or send the proxy directly to the Fund’s board or a committee of the board with the investment manager’s recommendation regarding the vote for approval.
Where a material conflict of interest has been identified, but the items on which the investment manager’s vote recommendations differ from a Proxy Service and relate specifically to (1) shareholder proposals regarding social or environmental issues, (2) “Other Business” without describing the matters that might be considered, or (3) items the investment manager wishes to vote in opposition to the recommendations of an issuer’s management, the Proxy Group may defer to the vote recommendations of the investment manager rather than sending the proxy directly to the Fund’s board or a board committee for approval.
To avoid certain potential conflicts of interest, the investment manager will employ echo voting or pass-through voting, if possible, in the following instances: (1) when the Fund invests in an underlying fund in reliance on any one of Sections 12(d) (1) (F), or (G) of the 1940 Act, the rules thereunder, or pursuant to a SEC exemptive order thereunder; (2) when the Fund invests uninvested cash in affiliated money market funds pursuant to the rules under the 1940 Act or any exemptive orders thereunder (“cash sweep arrangement”); or (3) when required pursuant to the Fund’s governing documents or applicable law. Echo voting means that the investment manager will vote the shares in the same proportion as the vote of all of the other holders of the underlying fund’s shares. With respect to instances when a Franklin Templeton U.S. registered investment company invests in an underlying fund in reliance on any one of Sections 12(d)(1)(F) or (G) of the 1940 Act, the rules thereunder, or pursuant to an SEC exemptive order thereunder, and there are no other unaffiliated shareholders also invested in the underlying fund, the Investment Manager will
vote in accordance with the recommendation of such investment company’s board of trustees or directors. In addition, to avoid certain potential conflicts of interest, and where required under a fund’s governing documents or applicable law, the Investment Manager will employ pass-through voting when a Franklin Templeton U.S. registered investment company invests in an underlying fund in reliance on Section 12(d)(1)(E) of the 1940 Act, the rules thereunder, or pursuant to an SEC exemptive order thereunder. In “pass-through voting,” a feeder fund will solicit voting instructions from its shareholders as to how to vote on the master fund’s proposals.
The recommendation of management on any issue is a factor that the investment manager considers in determining how proxies should be voted. However, the investment manager does not consider recommendations from management to be determinative of the investment manager’s ultimate decision. As a matter of practice, the votes with respect to most issues are cast in accordance with the position of the company’s management. Each issue, however, is considered on its own merits, and the investment manager will not support the position of the company’s management in any situation where it deems that the ratification of management’s position would adversely affect the investment merits of owning that company’s shares.
Engagement with issuers. The investment manager believes that engagement with issuers is important to good corporate governance and to assist in making proxy voting decisions. The investment manager may engage with issuers to discuss specific ballot items to be voted on in advance of an annual or special meeting to obtain further information or clarification on the proposals. The investment manager may also engage with management on a range of environmental, social or corporate governance issues throughout the year.
Investment manager’s proxy voting policies and principles The investment manager has adopted general proxy voting guidelines, which are summarized below. These guidelines are not an exhaustive list of all the issues that may arise and the investment manager cannot anticipate all future situations. In all cases, each proxy and proposal (including both management and shareholder proposals) will be considered based on the relevant facts and circumstances on acase-by-case basis.
Board of directors. The investment manager supports an independent, diverse board of directors, and prefers that key committees such as audit, nominating, and compensation committees be comprised of independent directors. The investment manager supports boards with strong risk management oversight. The investment manager will generally vote against management efforts to classify a board and will generally support proposals to declassify the board of directors. The investment manager will consider withholding votes from directors who have attended less than 75% of meetings without a valid reason. While generally in favor of separating Chairman and CEO positions, the investment manager will review this issue as well as proposals to restore or provide for cumulative voting on acase-by-case basis, taking into consideration factors such as the company’s corporate governance guidelines or provisions and performance. The investment manager generally will supportnon-binding shareholder proposals to require a majority vote standard for the election of directors; however, if these proposals are binding, the investment manager will give careful review on acase-by-case basis of the potential ramifications of such implementation.
In the event of a contested election, the investment manager will review a number of factors in making a decision including management’s track record, the
company’s financial performance, qualifications of candidates on both slates, and the strategic plan of the dissidents and/or shareholder nominees.
Ratification of auditors of portfolio companies. The investment manager will closely scrutinize the independence, role and performance of auditors. On acase-by-case basis, the investment manager will examine proposals relating tonon-audit relationships andnon-audit fees. The investment manager will also consider, on acase-by-case basis, proposals to rotate auditors, and will vote against the ratification of auditors when there is clear and compelling evidence of a lack of independence, accounting irregularities or negligence. The investment manager may also consider whether the ratification of auditors has been approved by an appropriate audit committee that meets applicable composition and independence requirements.
Management and director compensation. A company’s equity-based compensation plan should be in alignment with the shareholders’ long-term interests. The investment manager believes that executive compensation should be directly linked to the performance of the company. The investment manager evaluates plans on acase-by-case basis by considering several factors to determine whether the plan is fair and reasonable, including the ISS quantitative model utilized to assess such plans and/or the Glass Lewis evaluation of the plans. The investment manager will generally oppose plans that have the potential to be excessively dilutive, and will almost always oppose plans that are structured to allow the repricing of underwater options, or plans that have an automatic share replenishment “evergreen” feature. The investment manager will generally support employee stock option plans in which the purchase price is at least 85% of fair market value, and when potential dilution is 10% or less.
Severance compensation arrangements will be reviewed on acase-by-case basis, although the investment manager will generally oppose “golden parachutes” that are considered to be excessive. The investment manager will normally support proposals that require a percentage of directors’ compensation to be in the form of common stock, as it aligns their interests with those of shareholders.
The investment manager will reviewnon-bindingsay-on-pay proposals on acase-by-case basis, and will generally vote in favor of such proposals unless compensation is misaligned with performance and/or shareholders’ interests, the company has not provided reasonably clear disclosure regarding its compensation practices, or there are concerns with the company’s remuneration practices.
Anti-takeover mechanisms and related issues. The investment manager generally opposes anti-takeover measures since they tend to reduce shareholder rights. However, as with all proxy issues, the investment manager conducts an independent review of each anti-takeover proposal. On occasion, the investment manager may vote with management when the research analyst has concluded that the proposal is not onerous and would not harm the Fund or its shareholders’ interests. The investment manager generally supports proposals that require shareholder rights’ plans (“poison pills”) to be subject to a shareholder vote and will closely evaluate such plans on acase-by-case basis to determine whether or not they warrant support. In addition, the investment manager will generally vote against any proposal to issue stock that has unequal or subordinate voting rights. The investment manager generally opposes any supermajority voting requirements as well as the payment of “greenmail.” The investment manager generally supports “fair price” provisions and confidential voting. The investment manager will review a company’s proposal to reincorporate to a different state or country on acase-by-case basis taking into consideration financial benefits such as tax treatment as well as
comparing corporate governance provisions and general business laws that may result from the change in domicile.
Changes to capital structure. The investment manager realizes that a company’s financing decisions have a significant impact on its shareholders, particularly when they involve the issuance of additional shares of common or preferred stock or the assumption of additional debt. The investment manager will review, on acase-by-case basis, proposals by companies to increase authorized shares and the purpose for the increase. The investment manager will generally not vote in favor of dual-class capital structures to increase the number of authorized shares where that class of stock would have superior voting rights. The investment manager will generally vote in favor of the issuance of preferred stock in cases where the company specifies the voting, dividend, conversion and other rights of such stock and the terms of the preferred stock issuance are deemed reasonable. The investment manager will review proposals seeking preemptive rights on acase-by-case basis.
Mergers and corporate restructuring. Mergers and acquisitions will be subject to careful review by the research analyst to determine whether they would be beneficial to shareholders. The investment manager will analyze various economic and strategic factors in making the final decision on a merger or acquisition. Corporate restructuring proposals are also subject to a thorough examination on acase-by-case basis.
Environmental and social issues. The investment manager considers environmental and social issues alongside traditional financial measures to provide a more comprehensive view of the value, risk and return potential of an investment. Companies may face significant financial, legal and reputational risks resulting from poor environmental and social practices, or negligent oversight of environmental or social issues. Franklin Templeton’s “Responsible Investment Principles and Policies” describes the investment manager’s approach to consideration of environmental, social and governance issues within the investment manager’s processes and ownership practices.
The investment manager will review shareholder proposals on acase-by-case basis and may support those that serve to enhance value or mitigate risk, are drafted appropriately, and do not disrupt the course of business or require a disproportionate or inappropriate use of company resources. In the investment manager’s experience, those companies that are managed well are often effective in dealing with the relevant environmental and social issues that pertain to their business. As such, the investment manager will generally give management discretion with regard to environmental and social issues. However, in cases where management and the board have not demonstrated adequate efforts to mitigate material environmental or social risks, have engaged in inappropriate or illegal conduct, or have failed to adequately address current or emergent risks that threaten shareholder value, the investment manager may choose to support well-crafted shareholder proposals that serve to promote or protect shareholder value. This may include seeking appropriate disclosure regarding material environmental and social issues.
The investment manager will consider supporting a shareholder proposal seeking disclosure and greater board oversight of lobbying and corporate political contributions if the investment manager believes that there is evidence of inadequate oversight by the company’s board, if the company’s current disclosure is significantly deficient, or if the disclosure is notably lacking in comparison to the company’s peers.
Governance matters. The investment manager generally supports the right of shareholders to call special meetings and act by written consent. However, the investment manager will review such shareholder proposals on acase-by-case basis in an effort to ensure that such proposals do not disrupt the course of business or require a disproportionate or inappropriate use of company resources.
Proxy access. In cases where the investment manager is satisfied with company performance and the responsiveness of management, it will generally vote against shareholder proxy access proposals not supported by management. In other instances, the investment manager will consider such proposals on acase-by-case basis, taking into account factors such as the size of the company, ownership thresholds and holding periods, nomination limits (e.g., number of candidates that can be nominated), the intentions of the shareholder proponent, and shareholder base.
Global corporate governance. Many of the tenets discussed above are applied to the investment manager’s proxy voting decisions for international investments. However, the investment manager must be flexible in these worldwide markets. Principles of good corporate governance may vary by country, given the constraints of a country’s laws and acceptable practices in the markets. As a result, it is on occasion difficult to apply a consistent set of governance practices to all issuers. As experienced money managers, the investment manager’s analysts are skilled in understanding the complexities of the regions in which they specialize and are trained to analyze proxy issues germane to their regions.
The investment manager will generally attempt to process every proxy it receives for all domestic and foreign securities. However, there may be situations in which the investment manager may be unable to successfully vote a proxy, or may choose not to vote a proxy, such as where: (i) a proxy ballot was not received from the custodian bank; (ii) a meeting notice was received too late; (iii) there are fees imposed upon the exercise of a vote and it is determined that such fees outweigh the benefit of voting; (iv) there are legal encumbrances to voting, including blocking restrictions in certain markets that preclude the ability to dispose of a security if the investment manager votes a proxy or where the investment manager is prohibited from voting by applicable law, economic or other sanctions, or other regulatory or market requirements, including but not limited to, effective Powers of Attorney; (v) additional documentation or the disclosure of beneficial owner details is required; (vi) the investment manager held shares on the record date but has sold them prior to the meeting date; (vii) a proxy voting service is not offered by the custodian in the market; (viii) due to either system error or human error, the investment manager’s intended vote is not correctly submitted; (ix) the investment manager believes it is not in the best interest of the Fund or its shareholders to vote the proxy for any other reason not enumerated herein; or (x) a security is subject to a securities lending or similar program that has transferred legal title to the security to another person.
In somenon-U.S. jurisdictions, even if the investment manager uses reasonable efforts to vote a proxy on behalf of the Fund, such vote or proxy may be rejected because of (a) operational or procedural issues experienced by one or more third parties involved in voting proxies in such jurisdictions; (b) changes in the process or agenda for the meeting by the issuer for which the investment manager does not have sufficient notice; or (c) the exercise by the issuer of its discretion to reject the vote of the investment manager. In addition, despite the best efforts of the Proxy Group and its agents, there may
be situations where the investment manager’s votes are not received, or properly tabulated, by an issuer or the issuer’s agent.
The investment manager or its affiliates may, on behalf of one or more of the proprietary registered investment companies advised by the investment manager or its affiliates, determine to use its best efforts to recall any security on loan where the investment manager or its affiliates (a) learn of a vote on a material event that may affect a security on loan and (b) determine that it is in the best interests of such proprietary registered investment companies to recall the security for voting purposes.
Procedures for meetings involving fixed income securities & privately held issuers. From time to time, certain custodians may process events for fixed income securities through their proxy voting channels rather than corporate action channels for administrative convenience. In such cases, the Proxy Group will receive ballots for such events on the ISS voting platform. The Proxy Group will solicit voting instructions from the investment manager for each Fund involved. If the Proxy Group does not receive voting instructions from the investment manager, the Proxy Group will take no action on the event. The investment manager may be unable to vote a proxy for a fixed income security, or may choose not to vote a proxy, for the reasons described above.
The Proxy Group will monitor such meetings involving fixed income securities or privately held issuers for conflicts of interest in accordance with these procedures. If a fixed income or privately held issuer is flagged as a potential conflict of interest, the investment manager may nonetheless vote as it deems in the best interests of the Fund. The investment manager will report such decisions on an annual basis to the Fund board as may be required.
In the rare instance where there is a vote for a privately held issuer, the decision will generally be made by the relevant portfolio managers or research analysts.
Shareholders may view the complete Policies online at franklintempleton.com. Alternatively, shareholders may request copies of the Policies free of charge by calling the Proxy Group collect at (954)527-7678 or by sending a written request to: Franklin Templeton Companies, LLC, 300 S.E. 2nd Street, Fort Lauderdale, FL 33301-1923, Attention: Proxy Group. Copies of the Fund’s proxy voting records are available online at franklintempleton.com and posted on the SEC website at www.sec.gov. The proxy voting records are updated each year by August 31 to reflect the most recent12-month period ended June 30.
Item 8. Portfolio Managers ofClosed-End Management Investment Companies. N/A
Item 9. Purchases of Equity Securities byClosed-End Management Investment Company and Affiliated Purchasers. N/A
Item 10. Submission of Matters to a Vote of Security Holders.
There have been no changes to the procedures by which shareholders may recommend nominees to the Registrant’s Board of Trustees that would require disclosure herein.
Item 11. Controls and Procedures.
(a)Evaluation of Disclosure Controls and Procedures. The Registrant maintains disclosure controls and procedures that are designed to provide reasonable assurance that information required to be disclosed in the Registrant’s filings under the Securities Exchange Act of 1934, as amended, and the Investment Company Act of 1940 is recorded, processed, summarized and reported within the periods specified in the rules and forms of the Securities and Exchange Commission. Such information is accumulated and communicated to the Registrant’s management, including its principal executive officer and principal financial officer, as appropriate, to allow timely decisions regarding required disclosure. The Registrant’s management, including the principal executive officer and the principal financial officer, recognizes that any set of controls and procedures, no matter how well designed and operated, can provide only reasonable assurance of achieving the desired control objectives.
Within 90 days prior to the filing date of this Shareholder Report on FormN-CSRS, the Registrant had carried out an evaluation, under the supervision and with the participation of the Registrant’s management, including the Registrant’s principal executive officer and the Registrant’s principal financial officer, of the effectiveness of the design and operation of the Registrant’s disclosure controls and procedures. Based on such evaluation, the Registrant’s principal executive officer and principal financial officer concluded that the Registrant’s disclosure controls and procedures are effective.
(b)Changes in Internal Controls. There have been no changes in the Registrant’s internal control over financial reporting that occurred during the period covered by this report that has materially affected, or is reasonably likely to materially affect the internal control over financial reporting.
Item 12. Disclosure of Securities Lending Activities forClosed-End Management Investment Company. N/A
Item 13. Exhibits.
(a) (1)Code of Ethics
(a) (2) Certifications pursuant to Section 302 of the Sarbanes-Oxley Act of 2002 of Matthew T. Hinkle, Chief Executive Officer - Finance and Administration, and Robert G. Kubilis, Chief Financial Officer and Chief Accounting Officer
(b) Certifications pursuant to Section 906 of the Sarbanes-Oxley Act of 2002 of Matthew T. Hinkle, Chief Executive Officer - Finance and Administration, and Robert G. Kubilis, Chief Financial Officer and Chief Accounting Officer
SIGNATURES
Pursuant to the requirements of the Securities Exchange Act of 1934 and the Investment Company Act of 1940, the registrant has duly caused this report to be signed on its behalf by the undersigned, thereunto duly authorized.
TEMPLETON GLOBAL INCOME FUND
| | |
| By | | S\MATTHEW T. HINKLE |
| | Matthew T. Hinkle |
| | Chief Executive Officer – Finance and Administration |
| | Date August 30, 2019 |
Pursuant to the requirements of the Securities Exchange Act of 1934 and the Investment Company Act of 1940, this report has been signed below by the following persons on behalf of the registrant and in the capacities and on the dates indicated.
| | |
| By | | S\MATTHEW T. HINKLE |
| | Matthew T. Hinkle |
| | Chief Executive Officer – Finance and Administration |
| | Date August 30, 2019 |
| |
| By | | S\ROBERT G. KUBILIS |
| | Robert G. Kubilis |
| | Chief Financial Officer and Chief Accounting Officer |
| | Date August 30, 2019 |