General. In 2007, no single property accounted for more than 1.8% of our total assets or 1.4% of gross revenues. The five largest properties, in the aggregate, represented approximately 6.4% of our gross revenues for the year ended December 31, 2007; otherwise, none of the remaining properties accounted for more than 1.1% of our gross revenues during the same period. The weighted average occupancy rate for all of our improved properties as of December 31, 2007 was 94.4% compared to 94.1% as of December 31, 2006.
Substantially all of our properties are owned directly by us (subject in some cases to mortgages), although our interests in some properties are held indirectly through interests in real estate joint ventures or under long-term leases. In our opinion, our properties are well maintained and in good repair, suitable for their intended uses, and adequately covered by insurance.
We participate in 65 real estate joint ventures or partnerships that hold 116 of our properties. Our ownership interest ranges from 7.8% to 99%; we are normally the managing or operating partner and receive a fee for acting in this capacity.
We may use a DownREIT operating partnership structure in the acquisition of some real estate properties. In these transactions, a fair value purchase price is agreed upon between us, as general partner of the DownREIT, and the seller where the seller receives operating partnership units in exchange for some or all of its ownership interest in the property. Each operating partnership unit is the equivalent of one of our common shares of beneficial interest. These units generally allow our partners the right to put their limited partnership units interest to us on or after the first anniversary of the entity’s formation. We may acquire these limited partnership units for either cash or a fixed number of our common shares of beneficial interest at our discretion.
Shopping Centers. At December 31, 2007, we owned or operated under long-term leases, either directly or through our interest in real estate joint ventures or partnerships, a total of 303 developed income-producing properties and 32 properties under various stages of construction and development, which are located in 22 states spanning the USA from coast to coast.
Our shopping centers are primarily neighborhood and community shopping centers that typically range in size from 100,000 to 600,000 square feet of building area, as distinguished from large regional enclosed malls and small strip centers, which generally contain 5,000 to 25,000 square feet. Almost none of the centers have climatized common areas, but are designed to allow retail customers to park their automobiles in close proximity to any retailer in the center. Our centers are customarily constructed of masonry, steel and glass, and all have lighted, paved parking areas, which are typically landscaped with berms, trees and shrubs. They are generally located at major intersections in close proximity to neighborhoods that have existing populations sufficient to support retail activities of the types conducted in our centers.
We have approximately 7,500 separate leases with 5,700 different tenants. Included among our top revenue-producing tenants are: The Kroger Co., T.J.X. Companies, Safeway, Ross Stores, Publix, Home Depot, Office Depot, Blockbuster Video, Barnes & Noble and Gap. The diversity of our tenant base is also evidenced by the fact that our largest tenant accounted for only 2.9% of rental revenues during 2007.
In the ordinary course of business, we have tenants who cease making payments under their leases or who file for bankruptcy protection. We are unable to predict or forecast the timing of store closings or unexpected vacancies. While we believe the effect of this will not have a material impact on our financial position, results of operations, or liquidity due to the significant diversification of our tenant base, the uncertainty in the commercial credit markets could result in a negative impact.
Our shopping center leases have lease terms generally ranging from three to five years for tenant space under 5,000 square feet and from 10 to 25 years for tenant space over 10,000 square feet. Leases with primary lease terms in excess of 10 years, generally for anchor and out-parcels, frequently contain renewal options which allow the tenant to extend the term of the lease for one or more additional periods, with each of these periods generally being of a shorter duration than the primary lease term. The rental rates paid during a renewal period are generally based upon the rental rate for the primary term; sometimes adjusted for inflation, market conditions or an amount of the tenant's sales during the primary term.
Most of our leases provide for the monthly payment in advance of fixed minimum rentals, the tenants' prorata share of ad valorem taxes, insurance (including fire and extended coverage, rent insurance and liability insurance) and common area maintenance for the center (based on estimates of the costs for these items). They also provide for the payment of additional rentals based on a percentage of the tenants' sales. Utilities are generally paid directly by tenants except where common metering exists with respect to a center. In this case we make payments for the utilities, and the tenants on a monthly basis reimburse us. Generally, our leases prohibit the tenant from assigning or subletting its space. They also require the tenant to use its space for the purpose designated in its lease agreement and to operate its business on a continuous basis. Some of the lease agreements with major tenants contain modifications of these basic provisions in view of the financial condition, stability or desirability of those tenants. Where a tenant is granted the right to assign its space, the lease agreement generally provides that the original lessee will remain liable for the payment of the lease obligations under that lease agreement.
During 2007, we invested approximately $458.4 million in the acquisition of operating retail properties. Approximately $417.3 million was invested in 13 shopping centers and $41.1 million was invested in four unconsolidated joint ventures to acquire seven retail properties.
A portfolio of six retail properties was purchased in January and March 2007, including five properties in Tucson, Arizona and one in Scottsdale, Arizona. The centers are leased to a diverse mix of national retailers including Wal-Mart, Safeway, Walgreens, Kohl’s, Home Depot, PetSmart and Circuit City. This acquisition added 801,551 square feet to our portfolio and represented a total investment of $140 million. This purchase transaction includes an earnout provision of approximately $29 million that is contingent upon the subsequent development of space by the property seller. This contingency agreement expires in 2010.
Cherokee Plaza, acquired in January 2007, is a 98,553 square foot grocery-anchored neighborhood center located in the prestigious Buckhead area in Atlanta, Georgia. The 100% occupied property is anchored by a 57,000 square foot Kroger.
Sunrise West Shopping Center, acquired in January 2007, is a 76,321 square foot grocery-anchored neighborhood center located in Sunrise (Miami), Florida. This property is anchored by a 44,000 square foot Publix. Cole Park Plaza, acquired in February 2007, is an 82,258 square foot retail development located in Chapel Hill (Durham), North Carolina next to our existing Chatham Crossing shopping center. Both Sunrise and Cole Park were acquired through an existing unconsolidated joint venture with AEW Capital Management.
Oak Grove Market Center, acquired in June 2007, is a 97,207 square foot grocery-anchored shopping center located in Portland, Oregon. The center is anchored by a 53,000 square foot Safeway.
In July 2007, we acquired a portfolio of five retail power centers, adding 1.4 million square feet to our portfolio under management. Three of the retail power centers in Florida, Georgia and Texas were acquired through a new unconsolidated real estate joint venture with PNC Realty Investors on behalf of its institutional client, AFL-CIO Building Investment Trust (the “BIT”). We own 20% of this joint venture with the BIT owning 80%. The remaining two centers, one in Atlanta, Georgia and the other in Chicago, Illinois, were wholly acquired by us.
Countryside Centre, a 242,123 square foot community center located in the St. Petersburg/Clearwater Area of Florida, was also acquired in July 2007. This center is anchored by Albertson’s, TJ Maxx, Home Goods and Shoe Carnival.
Stella Link Shopping Center is a 28,510 square foot shopping center located in Houston, Texas, which was acquired in August 2007. This retail center is adjacent to one of our operating properties, which is anchored by Sellers Brothers and Burke’s Outlet.
The Shoppes at South Semoran is a 101,535 square foot shopping center located in suburban Orlando, Florida, which was acquired in September 2007. This 100% occupied center is anchored by a 57,000 square foot Winn Dixie.
In September 2007, we acquired a 10% interest in Tully Corners Shopping Center through a tenancy-in-common arrangement. This 115,992 square foot grocery-anchored shopping center, located in San Jose, California, is anchored by Save Mart, Petco and Party City.
In October 2007, we acquired a 10% interest in Paradise Key Shopping Center through a tenancy-in-common arrangement. This 271,777 square foot grocery-anchored shopping center is located in Destin, Florida.
In December 2007, we acquired our partner’s 50% interest in Tropicana Beltway located in Las Vegas, Nevada. The center is anchored by Lowe’s and Wal-Mart.
In 2007, we sold 17 shopping centers totaling 1.8 million square feet of building area, of which nine were located in Texas, three in Louisiana, two each in Colorado and Illinois and one in Georgia. Sales proceeds from these dispositions totaled $243.2 million and generated gains of $80.9 million. Three of these shopping centers were each held in a 50% consolidated real estate joint venture. These real estate joint ventures are consolidated in our financial statements because we exercise financial and operating control.
In December 2007, a retail center in Highland Ranch, Colorado was sold. This property was held in a 40%-owned unconsolidated real estate joint venture, and our share of the sales proceeds and gain generated was $11.2 million and $2.2 million, respectively.
Industrial Properties. At December 31, 2007, we owned, either directly or through our interest in real estate joint ventures or partnerships, 77 industrial projects and three other operating properties totaling approximately 17.3 million square feet of building area. Our industrial properties consist of bulk warehouse, business distribution and office-service center assets ranging in size from 13,000 to 727,000 square feet. Similar to our shopping centers, these properties are customarily constructed of masonry, steel and glass, and have lighted, concrete parking areas and are well landscaped. The national and regional tenants in our industrial centers include Hitachi Transport Systems, Sears Logistics, Publix, Shell, Rooms to Go, UPS Supply Chain Solutions, Sanderson Industries, Stone Container, General Electric Company, G.E. Polymershapes, Inc., Interline Brands, Inc., Constar International, Inc., Rooftop Systems Inc., Wells Fargo Bank and Iron Mountain. Our properties are located in California, Florida, Georgia, Tennessee, Texas and Virginia. During 2007, we invested approximately $85.8 million in the acquisition of seven industrial properties and one office building, and $21.2 million was invested in an unconsolidated real estate joint venture to acquire seven industrial properties.
Lakeland Business Park, acquired in January 2007, is a 100% leased 168,400 square foot industrial business center located in Lakeland (Tampa), Florida.
In April and May 2007, we acquired a portfolio of 10 high quality industrial buildings located in Richmond, Virginia for a purchase price of $136 million, including $6 million that is contingent upon the lease up of vacant space by the property seller. This contingency agreement expires in 2009. Eight of the buildings were acquired through an existing 20%-owned unconsolidated joint venture with PNC Realty Investors on behalf of its institutional client the BIT. The remaining two buildings were acquired directly by us. This portfolio added 2.4 million square feet under management.
Town & Country Commerce Center, acquired in June 2007, is a 206,000 square foot industrial distribution center located in Houston, Texas. The property is 100% leased to Arizona Tile and Seitel Solution Tech Center.
Riverview Distribution Center, acquired in August 2007, is a 265,200 square foot industrial center located in Atlanta, Georgia. It is anchored by 109,000 square foot CHEP USA.
In October 2007, we acquired Westlake Industrial Centre, a 154,464 square foot industrial building, and Southpark Industrial Centre, a 234,525 square foot industrial center, both of which are located in Atlanta, Georgia.
In 2007, we sold an industrial distribution center totaling 152,000 square feet and an industrial building totaling 90,000 square feet. Both of these properties are located in Texas. Sales proceeds from these dispositions totaled $10.7 million and generated gains of $3.7 million.
Unimproved Land. At December 31, 2007, we owned 19 parcels of unimproved land consisting of approximately 9.9 million square feet of land area located in Arizona, Louisiana, North Carolina and Texas. These properties include approximately 1.6 million square feet of land adjacent to certain of our existing developed properties, which may be used for expansion of these developments, as well as approximately 8.3 million square feet of land, which may be used for new development. Most of these unimproved properties are served by roads and utilities and are suitable for development as shopping centers or industrial projects, and we intend to emphasize the development of these parcels for such purpose.
New Development Properties. At December 31, 2007, we had 32 projects under construction or in preconstruction stages with an estimated final square footage of approximately 9.1 million. These properties are slated to be completed over the next one to five years.
In 2007, under our merchant development program, we sold two vacant industrial buildings in San Diego, California; one shopping center in Phoenix, Arizona, the River Pointe apartments in Conroe, Texas and 17 parcels of land, of which 11 were located in Texas, three in Arizona and one each in Florida, Louisiana and Tennessee. Sales proceeds from these dispositions totaled $103.0 million and generated gains of $16.4 million. At a 50%-owned unconsolidated joint venture, a land parcel was sold in Liberty Lakes, Washington. Our share of the sales proceeds and the gain generated totaled $1.5 million and $.6 million, respectively.
We are involved in various matters of litigation arising in the normal course of business. While we are unable to predict with certainty the amounts involved, our management and counsel believe that when such litigation is resolved, our resulting liability, if any, will not have a material adverse effect on our consolidated financial statements.
None.
PART II
Our common shares of beneficial interest are listed and traded on the New York Stock Exchange under the symbol "WRI." The number of holders of record of our common shares of beneficial interest as of January 31, 2008 was 3,305. The closing high and low sale prices per common share as reported on the New York Stock Exchange, and dividends per share paid for the fiscal quarters indicated were as follows:
| | | High | | | Low | | | Dividends | |
| | | | | | | | | | |
| 2007: | | | | | | | | | |
| Fourth | | $ | 44.82 | | | $ | 31.44 | | | $ | .495 | |
| Third | | | 42.15 | | | | 36.34 | | | | .495 | |
| Second | | | 49.00 | | | | 40.84 | | | | .495 | |
| First | | | 52.16 | | | | 46.06 | | | | .495 | |
| | | | | | | | | | | | | |
| 2006: | | | | | | | | | | | | |
| Fourth | | $ | 47.83 | | | $ | 42.72 | | | $ | .465 | |
| Third | | | 43.26 | | | | 38.19 | | | | .465 | |
| Second | | | 40.56 | | | | 37.10 | | | | .465 | |
| First | | | 41.76 | | | | 38.66 | | | | .465 | |
The following table summarizes the equity compensation plans under which our common shares of beneficial interest may be issued as of December 31, 2007:
| | | Number of shares to | | Weighted average | | |
| | | be issued upon exercise | | exercise price of | | Number of shares |
| | | of outstanding options, | | outstanding options, | | remaining available |
| Plan category | | warrants and rights | | warrants and rights | | for future issuance |
| | | | | | | |
| Equity compensation plans approved by shareholders | | 2,840,290 | | $ 32.66 | | 2,626,360 |
| | | | | | | |
| Equity compensation plans not approved by shareholders | | ― | | ― | | ― |
| | | | | | | |
| Total | | 2,840,290 | | $ 32.66 | | 2,626,360 |
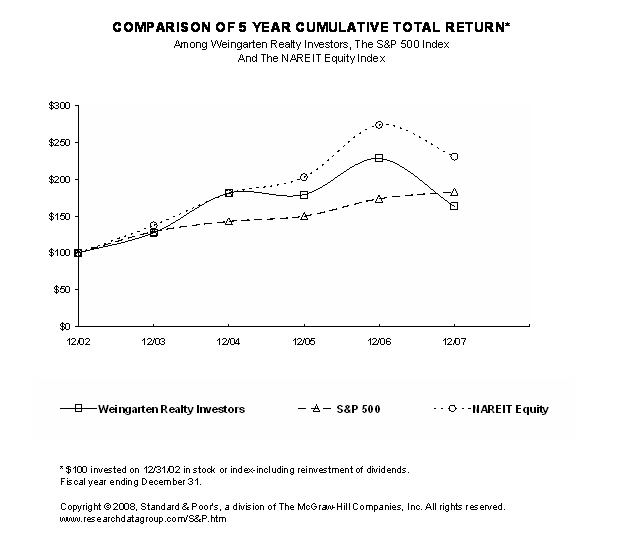
Performance Graph
The graph below provides an indicator of cumulative total shareholder returns for us as compared with the S&P 500 Stock Index and the NAREIT All Equity Index, weighted by market value at each measurement point. The graph assumes that $100 was invested on December 31, 2002 in our common shares of beneficial interest and that all dividends were reinvested by the shareholder.
Comparison of Five Year Cumulative Return
| | | 2003 | | | 2004 | | | 2005 | | | 2006 | | | 2007 | |
| | | | | | | | | | | | | | | | |
| Weingarten | | | 127.19 | | | | 181.08 | | | | 178.82 | | | | 227.97 | | | | 163.05 | |
| S&P 500 Index | | | 128.68 | | | | 142.69 | | | | 149.70 | | | | 173.34 | | | | 182.87 | |
| The NAREIT All Equity Index | | | 137.13 | | | | 180.44 | | | | 202.38 | | | | 273.34 | | | | 230.45 | |
There can be no assurance that our share performance will continue into the future with the same or similar trends depicted in the graph above. We will not make or endorse any predications as to future share performance.
In July 2007, our Board of Trust Managers authorized a common share repurchase program as part of our ongoing investment strategy. Under the terms of the program, we may purchase up to a maximum value of $300 million of our common shares of beneficial interest during the next two years. Share repurchases may be made in the open market or in privately negotiated transactions at the discretion of management and as market conditions warrant. We anticipate funding the repurchase of shares primarily through the proceeds received from our property disposition program, as well as from general corporate funds.
Repurchases of our common shares of beneficial interest for the quarter ended December 31, 2007 are as follows:
| | | (a) | | | (b) | | | (c) | | | (d) | |
| | | Total | | | Average | | | Total Number of | | | Maximum Dollar | |
| | | Number | | | Price | | | Shares Purchased | | | Value of Shares that | |
| | | of Shares | | | Paid per | | | as Part of Publicly | | | May Yet be Purchased | |
| Period | | Purchased | | | Share | | | Announced Program | | | Under the Program | |
| November 1, 2007 to November 30, 2007 | | | 1,370,073 | | | $ | 36.47 | | | | 1,370,073 | | | $ | 196,715,648 | |
| | | | | | | | | | | | | | | | | |
The following table sets forth our selected consolidated financial data and should be read in conjunction with "Item 7. Management's Discussion and Analysis of Financial Condition and Results of Operations," the Consolidated Financial Statements and accompanying Notes in "Item 8. Financial Statements and Supplementary Data" and the financial schedules included elsewhere in this Form 10-K.
| | | (Amounts in thousands, except per share amounts) | |
| | | Year Ended December 31, | |
| | | 2007 | | | 2006 | | | 2005 | | | 2004 | | | 2003 | |
| | | | | | | | | | | | | | | | |
| Revenues (primarily real estate rentals) | | $ | 599,054 | | | $ | 538,194 | | | $ | 487,856 | | | $ | 441,144 | | | $ | 361,757 | |
| Expenses: | | | | | | | | | | | | | | | | | | | | |
| Depreciation and amortization | | | 131,708 | | | | 121,471 | | | | 110,956 | | | | 98,727 | | | | 78,139 | |
| Other | | | 201,798 | | | | 174,471 | | | | 146,778 | | | | 137,674 | | | | 110,360 | |
| Total | | | 333,506 | | | | 295,942 | | | | 257,734 | | | | 236,401 | | | | 188,499 | |
| Operating Income | | | 265,548 | | | | 242,252 | | | | 230,122 | | | | 204,743 | | | | 173,258 | |
| Interest Expense | | | (148,829 | ) | | | (145,374 | ) | | | (129,160 | ) | | | (116,142 | ) | | | (90,214 | ) |
| Interest and Other Income | | | 8,486 | | | | 9,044 | | | | 2,860 | | | | 1,389 | | | | 1,562 | |
| Loss on Redemption of Preferred Shares | | | | | | | | | | | | | | | (3,566 | ) | | | (2,739 | ) |
Equity in Earnings of Real Estate Joint Ventures and Partnerships, net | | | 19,853 | | | | 14,655 | | | | 6,610 | | | | 5,384 | | | | 4,681 | |
| Income Allocated to Minority Interests | | | (10,237 | ) | | | (6,414 | ) | | | (6,060 | ) | | | (4,928 | ) | | | (2,723 | ) |
| Gain on Land and Merchant Development Sales | | | 16,385 | | | | 7,166 | | | | 804 | | | | | | | | | |
| Gain on Sale of Properties | | | 4,086 | | | | 22,493 | | | | 22,306 | | | | 1,562 | | | | 667 | |
| Provision for Income Taxes | | | (4,073 | ) | | | (1,366 | ) | | | | | | | | | | | | |
| Income from Continuing Operations | | | 151,219 | | | | 142,456 | | | | 127,482 | | | | 88,442 | | | | 84,492 | |
| Income from Discontinued Operations (1) | | | 86,798 | | | | 162,554 | | | | 92,171 | | | | 52,939 | | | | 31,788 | |
| Net Income | | $ | 238,017 | | | $ | 305,010 | | | $ | 219,653 | | | $ | 141,381 | | | $ | 116,280 | |
| | | | | | | | | | | | | | | | | | | | | |
| Net Income Available to Common Shareholders | | $ | 212,642 | | | $ | 294,909 | | | $ | 209,552 | | | $ | 133,911 | | | $ | 97,880 | |
| Per Share Data - Basic: | | | | | | | | | | | | | | | | | | | | |
| Income from Continuing Operations | | $ | 1.47 | | | $ | 1.51 | | | $ | 1.32 | | | $ | 0.94 | | | $ | 0.84 | |
| Net Income | | $ | 2.49 | | | $ | 3.36 | | | $ | 2.35 | | | $ | 1.55 | | | $ | 1.24 | |
| Weighted Average Number of Shares | | | 85,504 | | | | 87,719 | | | | 89,224 | | | | 86,171 | | | | 78,800 | |
| Per Share Data - Diluted: | | | | | | | | | | | | | | | | | | | | |
| Income from Continuing Operations | | $ | 1.46 | | | $ | 1.50 | | | $ | 1.32 | | | $ | 0.94 | | | $ | 0.84 | |
| Net Income | | $ | 2.44 | | | $ | 3.27 | | | $ | 2.31 | | | $ | 1.54 | | | $ | 1.24 | |
| Weighted Average Number of Shares | | | 88,893 | | | | 91,779 | | | | 93,166 | | | | 89,511 | | | | 81,574 | |
| | | | | | | | | | | | | | | | | | | | | |
| Property (at cost) | | $ | 4,972,344 | | | $ | 4,445,888 | | | $ | 4,033,579 | | | $ | 3,751,607 | | | $ | 3,200,091 | |
| Total Assets | | $ | 4,993,343 | | | $ | 4,373,887 | | | $ | 3,737,741 | | | $ | 3,470,318 | | | $ | 2,923,094 | |
| Debt | | $ | 3,165,059 | | | $ | 2,941,039 | | | $ | 2,348,504 | | | $ | 2,138,842 | | | $ | 1,835,126 | |
| | | | | | | | | | | | | | | | | | | | | |
| Other Data: | | | | | | | | | | | | | | | | | | | | |
| Cash Flows from Operating Activities | | $ | 223,309 | | | $ | 242,592 | | | $ | 200,525 | | | $ | 203,886 | | | $ | 162,316 | |
| Cash Flows from Investing Activities | | $ | (480,630 | ) | | $ | (314,686 | ) | | $ | (105,459 | ) | | $ | (349,654 | ) | | $ | (331,503 | ) |
| Cash Flows from Financing Activities | | $ | 252,095 | | | $ | 100,407 | | | $ | (97,791 | ) | | $ | 170,928 | | | $ | 168,623 | |
| Cash Dividends per Common Share | | $ | 1.98 | | | $ | 1.86 | | | $ | 1.76 | | | $ | 1.66 | | | $ | 1.56 | |
| | | | | | | | | | | | | | | | | | | | | |
| Funds from Operations: (2) | | | | | | | | | | | | | | | | | | | | |
| Net Income Available to Common Shareholders | | $ | 212,642 | | | $ | 294,909 | | | $ | 209,552 | | | $ | 133,911 | | | $ | 97,880 | |
| Depreciation and Amortization | | | 141,150 | | | | 131,792 | | | | 125,742 | | | | 114,342 | | | | 90,367 | |
| Gain on Sale of Properties | | | (86,076 | ) | | | (172,056 | ) | | | (87,561 | ) | | | (26,316 | ) | | | (7,273 | ) |
| Total | | $ | 267,716 | | | $ | 254,645 | | | $ | 247,733 | | | $ | 221,937 | | | $ | 180,974 | |
| (1) | SFAS No. 144, "Accounting for the Impairment or Disposal of Long-Lived Assets" requires the operating results and gain (loss) on the sale of operating properties to be reported as discontinued operations for all periods presented. |
| (2) | The National Association of Real Estate Investment Trusts defines funds from operations (“FFO”) as net income (loss) available to common shareholders computed in accordance with generally accepted accounting principles, excluding gains or losses from sales of operating real estate assets and extraordinary items, plus depreciation and amortization of operating properties, including our share of unconsolidated real estate joint ventures and partnerships. We calculate FFO in a manner consistent with the NAREIT definition. Management uses FFO as a supplemental measure to conduct and evaluate our business because there are certain limitations associated with using GAAP net income by itself as the primary measure of our operating performance. Historical cost accounting for real estate assets in accordance with GAAP implicitly assumes that the value of real estate assets diminishes predictably over time. Since real estate values instead have historically risen or fallen with market conditions, management believes that the presentation of operating results for real estate companies that uses historical cost accounting is insufficient by itself. There can be no assurance that FFO presented by us is comparable to similarly titled measures of other REITs. FFO should not be considered as an alternative to net income or other measurements under GAAP as an indicator of our operating performance or to cash flows from operating, investing or financing activities as a measure of liquidity. FFO does not reflect working capital changes, cash expenditures for capital improvements or principal payments on indebtedness. |
The following discussion should be read in conjunction with the consolidated financial statements and notes thereto and the comparative summary of selected financial data appearing elsewhere in this report. Historical results and trends which might appear should not be taken as indicative of future operations. Our results of operations and financial condition, as reflected in the accompanying consolidated financial statements and related footnotes, are subject to management's evaluation and interpretation of business conditions, retailer performance, changing capital market conditions and other factors which could affect the ongoing viability of our tenants.
Executive Overview
Weingarten Realty Investors is a real estate investment trust (“REIT”) organized under the Texas Real Estate Investment Trust Act. We, and our predecessor entity, began the ownership and development of shopping centers and other commercial real estate in 1948. Our primary business is leasing space to tenants in the shopping and industrial centers we own or lease. We also manage centers for joint ventures in which we are partners or for other outside owners for which we charge fees.
We operate a portfolio of rental properties which includes neighborhood and community shopping centers and industrial properties of approximately 72.8 million square feet. We have a diversified tenant base with our largest tenant comprising only 2.9% of total rental revenues during 2007.
We focus on increasing funds from operations (“FFO”) and growing dividend payments to our common shareholders. We do this through hands-on leasing, management and selected redevelopment of the existing portfolio of properties, through disciplined growth from selective acquisitions and new developments, and through the disposition of assets that no longer meet our ownership criteria. We do this while remaining committed to maintaining a conservative balance sheet, a well-staggered debt maturity schedule and strong credit agency ratings.
We continue to maintain a strong, conservative capital structure, which provides ready access to a variety of attractive capital sources. We carefully balance obtaining low cost financing with minimizing exposure to interest rate movements and matching long-term liabilities with the long-term assets acquired or developed. The turmoil in the current capital markets has adversely affected both the pricing and the availability of certain financial instruments. However, based on our business plan for the upcoming year, we believe that asset dispositions, joint venture relationships and existing capital resources such as our revolving credit facilities will provide adequate capital to execute our business plan.
At December 31, 2007, we owned or operated under long-term leases, either directly or through our interest in real estate joint ventures or partnerships, a total of 383 developed income-producing properties and 32 properties under various stages of construction and development. The total number of centers includes 335 neighborhood and community shopping centers, 77 industrial projects and three other operating properties located in 23 states spanning the country from coast to coast.
We also owned interests in 19 parcels of unimproved land held for future development that totaled approximately 9.9 million square feet.
We had approximately 7,500 leases with 5,700 different tenants at December 31, 2007.
Leases for our properties range from less than a year for smaller spaces to over 25 years for larger tenants. Rental revenues generally include minimum lease payments, which often increase over the lease term, reimbursements of property operating expenses, including ad valorem taxes, and additional rent payments based on a percentage of the tenants' sales. The majority of our anchor tenants are supermarkets, value-oriented apparel/discount stores and other retailers or service providers who generally sell basic necessity-type goods and services. We believe stability of our anchor tenants, combined with convenient locations, attractive and well-maintained properties, high quality retailers and a strong tenant mix, should ensure the long-term success of our merchants and the viability of our portfolio.
In assessing the performance of our properties, management carefully tracks the occupancy of the portfolio. Occupancy for the total portfolio was 94.4% at December 31, 2007 compared to 94.1% at December 31, 2006. Historically, occupancy for the total portfolio has never fallen below 90.0%. We expect our existing portfolio occupancy to continue at this level due to our tenant diversification and a strong tenant anchor base in 2008. Another important indicator of performance is the spread in rental rates on a same-space basis as we complete new leases and renew existing leases. We completed 1,261 new leases or renewals during 2007 totaling 7.0 million square feet, increasing rental rates an average of 10.3% on a cash basis.
In the first quarter of 2006, we articulated a new long-term growth strategy with a planned three-year implementation. The key elements of this strategy are as follows:
| | · | A much greater focus on new development, including merchant development, with $300 million in annual new development completions beginning in 2009. |
| | · | Increased use of joint ventures for acquisitions including the recapitalization (or partial sale) of existing assets, which provide the opportunity to further increase returns on investment through the generation of fee income from leasing and management services we will provide to the venture. |
| | · | Further recycling capital through the active disposition of non-core properties and reinvesting the proceeds into properties with barriers to entry within high growth metropolitan markets. This, combined with our continuous focus on our assets, produces a higher quality portfolio with higher occupancy rates and much stronger internal revenue growth. |
During 2007 and 2006, we made excellent progress in the execution of this long-term growth strategy as described in the following sections on new development, acquisitions and joint ventures and dispositions.
New Development
At December 31, 2007, we had 32 properties in various stages of development, including our merchant development program, which is up from 26 properties under development a year ago. We have invested $341.0 million to-date on these projects and, at completion we estimate our total investment to be $628.7 million. These properties are slated to open over the next one to five years with a projected return on investment of approximately 9% when completed.
In addition to these projects, we have a development pipeline with eight development sites under contract, which will represent a projected investment of approximately $178 million. Due to current economic factors, obtaining new projects over the next year may prove challenging as potential retail anchors are delaying their expansion plans due to the softening of the economy. We will continue to seek opportunities and monitor this market closely.
Merchant development is a new program in which we develop a project with the objective of selling all or part of it, instead of retaining it in our portfolio on a long-term basis. Also, disposition of land parcels and non-operating properties are included in this program. We generated gains of approximately $16.4 million from this program during 2007. We expect to generate similar gains in 2008 and throughout future years.
Acquisitions and Joint Ventures
During 2007, we acquired 20 shopping centers, 14 industrial properties, our partner’s 50% interest in a retail center and one other operating property for a purchase price of approximately $565 million. Included in that total were seven retail properties and seven industrial properties purchased as part of unconsolidated real estate joint ventures. It is possible that, consistent with our strategy, some of the other acquired properties will also be contributed to future joint ventures.
Acquisitions are a key component of our strategy. However, the turmoil in the credit markets has significantly reduced transactions in the marketplace and, therefore, created uncertainty with respect to pricing. Partnering with institutional investors through joint ventures enables us to acquire high quality assets in our target markets while also meeting our financial return objectives. We benefit from access to lower-cost capital, as well as leveraging our expertise to provide fee-based services such as the acquisition, leasing and management of properties, to the joint ventures.
Joint venture fee income for 2007 was approximately $8.2 million or an increase of $5.7 million over 2006. This is a direct result of our strategy initiative to develop new joint venture relationships. We expect continued strong growth in joint venture income during the upcoming year.
Dispositions
During 2007, we sold 17 shopping centers, one industrial distribution center and one industrial building for $253.9 million. Also, one shopping center in an unconsolidated joint venture was sold, of which our share of the sales proceeds totaled $11.2 million. Although lenders for prospective acquirers have tightened their underwriting criteria, we expect to continue to dispose of non-core properties during the coming year as opportunities present themselves. Dispositions are part of an ongoing portfolio management process where we prune our portfolio of properties that do not meet our geographic or growth targets and provide capital to recycle into properties that have barrier-to-entry locations within high growth metropolitan markets. Over time, we expect this to produce a portfolio with higher occupancy rates and much stronger internal revenue growth.
Summary of Critical Accounting Policies
Our discussion and analysis of financial condition and results of operations is based on our consolidated financial statements, which have been prepared in accordance with accounting principles generally accepted in the United States of America. The preparation of these financial statements requires us to make estimates and judgments that affect the reported amounts of assets, liabilities and contingencies as of the date of the financial statements and the reported amounts of revenues and expenses during the reporting periods. We evaluate our assumptions and estimates on an ongoing basis. We base our estimates on historical experience and on various other assumptions that we believe to be reasonable under the circumstances, the results of which form the basis for making judgments about the carrying values of assets and liabilities that are not readily apparent from other sources. Actual results may differ from these estimates under different assumptions or conditions. We believe the following critical accounting policies affect our more significant judgments and estimates used in the preparation of our consolidated financial statements.
Revenue Recognition
Rental revenue is generally recognized on a straight-line basis over the life of the lease, which begins the date the leasehold improvements are substantially complete, if owned by us, or the date the tenant takes control of the space, if the leasehold improvements are owned by the tenant. Revenue from tenant reimbursements of taxes, maintenance expenses and insurance is recognized in the period the related expense is recognized. Revenue based on a percentage of tenants' sales is recognized only after the tenant exceeds their sales breakpoint. In addition, in circumstances where we would provide a tenant improvement allowance for improvements that are owned by the tenant, we would recognize the allowance as a reduction of rental revenue on a straight-line basis over the term of the lease. Other revenue is income from contractual agreements with third parties, tenants or partially owned real estate joint ventures or partnerships, which is recognized as the related services are performed under the respective agreements.
Real Estate Joint Ventures and Partnerships
To determine the method of accounting for partially owned real estate joint ventures and partnerships, we first apply the guidelines set forth in Financial Accounting Standards Board (“FASB”) Interpretation No. 46R, "Consolidation of Variable Interest Entities." Based upon our analysis, we have determined that we have no interests in variable interest entities.
Partially owned real estate joint ventures and partnerships over which we exercise financial and operating control are consolidated in our financial statements. In determining if we exercise financial and operating control, we consider factors such as ownership interest, authority to make decisions, kick-out rights and substantive participating rights. Partially owned real estate joint ventures and partnerships where we have the ability to exercise significant influence, but do not exercise financial and operating control, are accounted for using the equity method.
Our investments in partially owned real estate joint ventures and partnerships are reviewed for impairment, periodically, if events or circumstances change indicating that the carrying amount of our investments may not be recoverable. The ultimate realization of our investments in partially owned real estate joint ventures and partnerships is dependent on a number of factors, including the performance of each investment and market conditions. We will record an impairment charge if we determine that a decline in the value of an investment is other than temporary.
Property
Real estate assets are stated at cost less accumulated depreciation, which, in the opinion of management, is not in excess of the individual property's estimated undiscounted future cash flows, including estimated proceeds from disposition. Depreciation is computed using the straight-line method, generally over estimated useful lives of 18-40 years for buildings and 10-20 years for parking lot surfacing and equipment. Major replacements where the betterment extends the useful life of the asset are capitalized, and the replaced asset and corresponding accumulated depreciation are removed from the accounts. All other maintenance and repair items are charged to expense as incurred. If we do not allocate these costs appropriately or incorrectly estimate the useful lives of our real estate, depreciation expense may be misstated.
Acquisitions of properties are accounted for utilizing the purchase method and, accordingly, the results of operations of an acquired property are included in our results of operations from the date of acquisition. We have used estimates of future cash flows and other valuation techniques to allocate the purchase price of acquired property among land, buildings on an "as if vacant" basis, tenant improvements and other identifiable intangibles. Current economic and operational property conditions, known trends and changes expected in current market conditions are considered in the estimates of future cash flows used for purchase price allocation purposes. Other identifiable intangible assets and liabilities include the effect of out-of-market leases, the value of having leases in place (“as is” versus “as if vacant” and absorption costs), out-of-market assumed mortgages and tenant relationships. Depreciation and amortization is computed using the straight-line method, generally over estimated useful lives of 40 years for buildings and one to 25 years for other identifiable intangible assets. The impact of these estimates could result in significant differences related to the purchased assets, liabilities and resulting depreciation or amortization. Initial valuations are subject to change until such information is finalized, no later than 12 months from the acquisition date. The impact of incorrect estimates in connection with acquisition asset values and related estimated useful lives could be material to our consolidated financial statements.
Property also includes costs incurred in the development of new operating properties and properties in our merchant development program. Merchant development is a new program in which we develop a project with the objective of selling all or part of it, instead of retaining it in our portfolio on a long-term basis. Also, disposition of land parcels and non-operating properties are included in this program. These properties are carried at cost and no depreciation is recorded on these assets until the commencement of rental revenue or no later than one year from the completion of major construction. These costs include pre-acquisition costs directly identifiable with the specific project, development and construction costs, interest and real estate taxes. Indirect development costs, including salaries and benefits, travel and other related costs that are directly attributable to the development of the property, are also capitalized. The capitalization of such costs ceases at the earlier of one year from the completion of major construction or when the property, or any completed portion, becomes available for occupancy.
Property also includes costs for tenant improvements paid by us, including reimbursements to tenants for improvements that are owned by us and will remain our property after the lease expires.
Our properties are reviewed for impairment if events or changes in circumstances indicate that the carrying amount of the property, including any identifiable intangible assets, may not be recoverable. In such an event, a comparison is made of the current and projected operating cash flows of each such property into the foreseeable future on an undiscounted basis to the carrying amount of such property. Our overall future plans for a property and our views on current market and economic conditions may have a significant impact on the resulting estimated future cash flows of a property that are analyzed for these purposes. The property carrying amount is adjusted, if necessary, to the estimated fair value to reflect an impairment in the value of the asset.
Interest Capitalization
Interest is capitalized on land under development and buildings under construction based on rates applicable to borrowings outstanding during the period and the weighted average balance of qualified assets under development/construction during the period. Differences in methodologies to calculate applicable interest rates and the cost of qualified assets can yield significant differences in the amounts capitalized and, as a result, the amount of depreciation recognized.
Deferred Charges
Debt and lease costs are amortized primarily on a straight-line basis, which approximates the effective interest method, over the terms of the debt and over the lives of leases, respectively. Lease costs represent the initial direct costs incurred in origination, negotiation and processing of a lease agreement. Such costs include outside broker commissions and other independent third party costs, as well as salaries and benefits, travel and other internal costs directly related to completing the leases. Costs related to supervision, administration, unsuccessful origination efforts and other activities not directly related to completed lease agreements are charged to expense as incurred. Differences in methodologies to calculate and defer these costs can yield differences in the amounts deferred and, accordingly, the amount of amortization recognized.
Sales of Real Estate
Sales of real estate include the sale of shopping center pads, property adjacent to shopping centers, shopping center properties, merchant development properties, investments in real estate joint ventures and partnerships and partial sales to real estate joint ventures and partnerships in which we participate.
We recognize profit on sales of real estate, including merchant development sales, in accordance with FASB’s Statement of Financial Accounting Standards (“SFAS”) No. 66 (“SFAS 66”), “Accounting for Sales of Real Estate.” Profits are not recognized until (a) a sale is consummated; (b) the buyer’s initial and continuing investments are adequate to demonstrate a commitment to pay; (c) the seller’s receivable is not subject to future subordination; and (d) we have transferred to the buyer the usual risks and rewards of ownership in the transaction, and we do not have a substantial continuing involvement with the property.
We recognize gains on the sale of real estate to joint ventures and partnerships in which we participate to the extent we receive cash from the joint venture or partnership, if it meets the sales criteria in accordance with SFAS 66 and we do not have a commitment to support the operations of the real estate joint venture or partnership to an extent greater than our proportionate interest in the real estate joint venture or partnership..
Accrued Rent and Accounts Receivable
Receivable balances outstanding include base rents, tenant reimbursements and receivables attributable to the straight-lining of rental commitments. An allowance for the uncollectible portion of accrued rents and accounts receivable is determined based upon an analysis of balances outstanding, historical bad debt levels, tenant credit worthiness and current economic trends. Additionally, estimates of the expected recovery of pre-petition and post-petition claims with respect to tenants in bankruptcy are considered in assessing the collectibility of the related receivables. As these factors change, the allowance is subject to revision and may impact the results of operations.
Income Taxes
We have elected to be treated as a REIT under the Internal Revenue Code of 1986, as amended. As a REIT, we generally will not be subject to corporate level federal income tax on taxable income we distribute to our shareholders. To be taxed as a REIT, we must meet a number of requirements including defined percentage tests concerning the amount of our assets and revenues that come from, or are attributable to, real estate operations. As long as we distribute at least 90% of the taxable income of the REIT to our shareholders as dividends, we will not be taxed on the portion of our income we distribute as dividends unless we have ineligible transactions.
The Tax Relief Extension Act of 1999 gave REITs the ability to conduct activities which a REIT was previously precluded from doing as long as such activities are performed in entities which have elected to be treated as taxable REIT subsidiaries under the IRS code. These activities include buying or developing properties with the express purpose of selling them. We conduct certain of these activities in taxable REIT subsidiaries that we have created. We calculate and record income taxes in our consolidated financial statements based on the activities in those entities. We also record deferred taxes for the temporary tax differences that have resulted from those activities as required under SFAS No. 109, “Accounting for Income Taxes.” We use estimates in preparing our deferred tax amounts and if revised, these estimates could impact our results of operations.
Results of Operations
Comparison of the Year Ended December 31, 2007 to the Year Ended December 31, 2006
Revenues
Total revenues were $599.1 million for the year ended 2007 versus $538.2 million for the year ended 2006, an increase of $60.9 million or 11.3%. This increase resulted primarily from an increase in rental revenues of $54.4 million and other income of $6.5 million.
Property acquisitions and new development activity contributed $56.6 million of the rental income increase with $5.3 million resulting from 1,261 renewals and new leases, comprising 7.0 million square feet at an average rental rate increase of 10.3%. Offsetting these rental income increases was a decrease of $7.5 million, which resulted from the sale of an 80% interest in five industrial centers in the third quarter of 2006.
Occupancy (leased space) of the portfolio as compared to the prior year was as follows:
| | | December 31, | |
| | | 2007 | | | 2006 | |
| | | | | | | |
| Shopping Centers | | | 95.1 | % | | | 95.0 | % |
| Industrial | | | 92.0 | % | | | 91.2 | % |
| Total | | | 94.4 | % | | | 94.1 | % |
Other income increased by $6.5 million from the prior year. This increase resulted primarily from the increase in joint venture fee income of $5.7 million and miscellaneous tenant revenue of $.8 million.
Expenses
Total expenses for 2007 were $333.5 million versus $295.9 million in 2006, an increase of $37.6 million or 12.7%.
The increases in 2007 for depreciation and amortization expense ($10.2 million), operating expenses ($18.3 million), ad valorem taxes ($5.9 million) and general and administrative expenses ($3.2 million) were primarily a result of the properties acquired and developed during the year, an increase in property insurance expenses as a result of the hurricanes experienced in 2005, and increases associated with additional headcount needed to achieve growth in the portfolio. Overall, direct operating costs and expenses (operating and ad valorem tax expense) of operating our properties as a percentage of rental revenues were 29.8% in 2007 and 28.4% in 2006.
Interest Expense
Interest expense totaled $148.8 million for 2007, up $3.5 million or 2.4% from 2006. The components of interest expense were as follows (in thousands):
| | | Year Ended December 31, | |
| | | 2007 | | | 2006 | |
| | | | | | | |
| Gross interest expense | | $ | 180,612 | | | $ | 160,454 | |
| Over-market mortgage adjustment of acquired properties | | | (6,758 | ) | | | (7,464 | ) |
| Capitalized interest | | | (25,025 | ) | | | (7,616 | ) |
| | | | | | | | | |
| Total | | $ | 148,829 | | | $ | 145,374 | |
Gross interest expense totaled $180.6 million in 2007, up $20.2 million or 12.6% from 2006. The increase in gross interest expense was due to an increase in the average debt outstanding from $2.5 billion in 2006 to $3.0 billion in 2007 at a weighted average interest rate of 5.9% in 2007 and 6.0% for 2006. Capitalized interest increased $17.4 million due to an increase in new development activity, and the over-market mortgage adjustment decreased by $.7 million.
Equity in Earnings of Real Estate Joint Ventures and Partnerships, net
Our equity in earnings of real estate joint ventures and partnerships was $19.9 million in 2007 versus $14.7 million in 2006, an increase of $5.2 million or 35.4%. This increase was attributable primarily to our incremental income from our investments in newly formed joint ventures for the acquisition and development of retail and industrial properties.
Income Allocated to Minority Interests
Income allocated to minority interests was $10.2 million in 2007 versus $6.4 million in 2006, an increase of $3.8 million or 59.4%. This increase resulted primarily from the gain on sale of three shopping centers that were each held in a 50%-owned consolidated entity. .
Gain on Sale of Properties
The decrease in gain on sale of properties of $18.4 million resulted primarily from the sale of an 80% interest in five industrial properties in the San Diego, Memphis and Atlanta markets in 2006.
Gain on Land and Merchant Development Sales
Gain on land and merchant development sales totaled $16.4 million in 2007. We sold two vacant industrial buildings in San Diego, California; one shopping center in Phoenix, Arizona, the River Pointe apartments in Conroe, Texas and 17 parcels of land, of which 11 are located in Texas, three in Arizona and one each in Florida, Louisiana and Tennessee. The activity in 2006 of $7.1 million resulted from the disposition of the Timber Springs shopping center in Orlando, Florida and the sale of three parcels of land in Arizona (1) and Texas (2).
Provision for Income Taxes
The increase is attributable to an increase of $1.9 million in the Texas margin tax, which was enacted in the second quarter of 2006 and an increase of $.8 million at our taxable REIT subsidiary.
Income from Discontinued Operations
Income from discontinued operations was $86.8 million in 2007 versus $162.6 million in 2006, a decrease of $75.8 million or 46.6%. This decrease was due primarily to the decrease in gain on sale of 17 properties in 2007 as compared to the gain on sale of 23 properties in 2006. Also, the income from discontinued operations for 2006 includes the operating results of the properties disposed of in 2007.
Results of Operations
Comparison of the Year Ended December 31, 2006 to the Year Ended December 31, 2005
Revenues
Total revenues increased by $50.3 million or 10.3% in 2006 ($538.2 million in 2006 versus $487.9 million in 2005). This increase resulted primarily from the increase in rental revenues of $49.8 million or 10.3%.
Property acquisitions and new development activity contributed $35.6 million of the rental income increase. The remaining increase of $14.2 million resulted from 1,264 renewals and new leases, comprising 6.1 million square feet at an average rental rate increase of 7.5%.
Occupancy (leased space) of the portfolio as compared to the prior year was as follows:
| | | December 31, | |
| | | 2006 | | | 2005 | |
| | | | | | | |
| Shopping Centers | | | 95.0 | % | | | 94.6 | % |
| Industrial | | | 91.2 | % | | | 93.1 | % |
| Total | | | 94.1 | % | | | 94.2 | % |
Expenses
Total expenses increased by $38.2 million or 14.8% in 2006 ($295.9 million in 2006 versus $257.7 million in 2005).
The increases in 2006 for depreciation and amortization expense ($10.5 million), operating expenses ($14.8 million) and ad valorem taxes ($6.5 million) and general and administrative expense ($6.4 million) were primarily a result of the properties acquired and developed during the year, an increase in property insurance expenses as a result of the hurricanes experienced in 2005 and increases associated with headcount increases to support the growth of the portfolio. Overall, direct operating costs and expenses (operating and ad valorem tax expense) of operating our properties as a percentage of rental revenues were 28.4% in 2006 and 26.9% in 2005.
Interest Expense
Interest expense totaled $145.4 million for 2006, up $16.2 million or 12.6% from 2005. The components of interest expense were as follows (in thousands):
| | | Year Ended December 31, | |
| | | 2006 | | | 2005 | |
| | | | | | | |
| Gross interest expense | | $ | 160,454 | | | $ | 138,845 | |
| Over-market mortgage adjustment of acquired properties | | | (7,464 | ) | | | (7,056 | ) |
| Capitalized interest | | | (7,616 | ) | | | (2,629 | ) |
| | | | | | | | | |
| Total | | $ | 145,374 | | | $ | 129,160 | |
Gross interest expense totaled $160.5 million in 2006, up $21.6 million or 15.6% from 2005. The increase in gross interest expense was due to an increase in the average debt outstanding from $2.2 billion in 2005 to $2.5 billion in 2006 at a weighted average interest rate of 6.0% in 2006 and 6.1% for 2005. Capitalized interest increased $5.0 million due to an increase in new development activity, and the over-market mortgage adjustment increased by $.4 million.
Interest and Other Income
Interest and other income was $9.0 million in 2006 versus $2.9 million in 2005, an increase of $6.1 million or 210.3%. This increase was attributable to interest earned from a qualified escrow account for the purposes of completing like-kind exchanges, construction loans associated with our new development activities, excess proceeds from our $575 million Convertible Debt Offering and assets held in a grantor trust related to our deferred compensation plan.
Equity in Earnings of Real Estate Joint Ventures and Partnerships, net
Equity in earnings of real estate joint ventures and partnerships increased by $8.1 million or 122.7% in 2006 ($14.7 million in 2006 versus $6.6 million in 2005). This increase was attributable primarily to our share of the gains generated from the disposition of two shopping centers in Texas totaling $4.0 million, a gain of $1.1 million associated with land and merchant development activities in Texas and Washington and incremental income from our investments in newly formed joint ventures in 2005 and 2006 for the acquisition and development of retail and industrial properties.
Gain on Sale of Properties
The gain of $22.5 million and $22.3 million in 2006 and 2005, respectively, resulted primarily from the sale of an 80% interest in five industrial properties in the San Diego, Memphis and Atlanta markets and two retail centers in Louisiana, respectively, in which we retained a continuing 20% operating interest.
Gain on Land and Merchant Development Sales
Gain on land and merchant development sales of $7.1 million in 2006 resulted from the gain from the sale of the Timber Springs shopping center in Orlando, Florida and the sale of three parcels of land in Arizona (1) and Texas (2). The activity in 2005 resulted from the sale of a parcel of land in Orlando, Florida.
Provision for Income Taxes
The amount reported in 2006 includes the tax expense in our taxable REIT subsidiary and the deferred tax impact attributable to the Texas margin tax enacted in the second quarter of 2006.
Income from Discontinued Operations
Income from discontinued operations increased by $70.4 million ($162.6 million in 2006 versus $92.2 million in 2005). This increase was due to the disposition of 23 properties totaling 3.5 million square feet that provided sales proceeds of $308.2 million and generated gains of $145.5 million. The 2005 caption includes the operating results of properties disposed in 2007 and 2006 plus the disposition of 16 properties and a vacant building totaling 1.3 million square feet in 2005. The 2005 dispositions provided sales proceeds of $133.8 million and generated gains of $65.5 million.
Effects of Inflation
We have structured our leases in such a way as to remain largely unaffected should significant inflation occur. Most of the leases contain percentage rent provisions whereby we receive increased rentals based on the tenants' gross sales. Many leases provide for increasing minimum rentals during the terms of the leases through escalation provisions. In addition, many of our leases are for terms of less than 10 years, which allow us to adjust rental rates to changing market conditions when the leases expire. Most of our leases also require the tenants to pay their proportionate share of operating expenses and ad valorem taxes. As a result of these lease provisions, increases due to inflation, as well as ad valorem tax rate increases, generally do not have a significant adverse effect upon our operating results as they are absorbed by our tenants.
Capital Resources and Liquidity
Our primary liquidity needs are payment of our common and preferred dividends, maintaining and operating our existing properties, payment of our debt service costs and funding planned growth. We anticipate that cash flows from operating activities will continue to provide adequate capital for all common and preferred dividend payments and debt service costs, as well as the capital necessary to maintain and operate our existing properties. We do not anticipate that the current turmoil in the capital markets will have a significant effect on our ability to obtain capital or to execute our business plan. We believe that asset dispositions, real estate joint venture relationships and existing capital resources such as our revolving credit facilities will provide adequate capital. Our most restrictive debt covenants limit the amount of additional leverage we can add, however, we believe the sources of capital described above are adequate to execute our current business plan and remain in compliance with our debt covenants.
Primary sources of capital for funding our acquisitions and new development programs are our revolving credit facilities, cash generated from sales of properties, transactions with venture partners, cash flow generated by our operating properties and proceeds from capital issuances as needed. Amounts outstanding under the revolving credit agreement are retired as needed with proceeds from the issuance of long-term debt, common and preferred equity, cash generated from dispositions of properties and cash flow generated by our operating properties. As of December 31, 2007, the balance outstanding under our $575 million revolving credit facility was $255.0 million, and no amounts were outstanding under our $30 million credit facility, which we use for cash management purposes.
Our capital structure also includes non-recourse secured debt that we assume in conjunction with our acquisitions program. We also have non-recourse debt secured by acquired or developed properties held in several of our real estate joint ventures and partnerships. We hedge the future cash flows of certain debt transactions, as well as changes in the fair value of our debt instruments, principally through interest rate swaps with major financial institutions. We generally have the right to sell or otherwise dispose of our assets except in certain cases where we are required to obtain a third party consent, such as assets held in entities in which we have less than 100% ownership.
Investing Activities:
Acquisitions
Retail Properties.
A portfolio of six retail properties was purchased in January and March 2007, including five properties in Tucson, Arizona and one in Scottsdale, Arizona. The centers are leased to a diverse mix of national retailers including Wal-Mart, Safeway, Walgreens, Kohl’s, Home Depot, PetSmart and Circuit City. This acquisition added 801,551 square feet to our portfolio and represented a total investment of $140 million. This purchase transaction includes an earnout provision of approximately $29 million that is contingent upon the subsequent development of space by the property seller. This contingency agreement expires in 2010.
Cherokee Plaza, acquired in January 2007, is a 98,553 square foot grocery-anchored neighborhood center located in the prestigious Buckhead area in Atlanta, Georgia. The 100% occupied property is anchored by a 57,000 square foot Kroger.
Sunrise West Shopping Center, acquired in January 2007, is a 76,321 square foot grocery-anchored neighborhood center located in Sunrise (Miami), Florida. This property is anchored by a 44,000 square foot Publix. Cole Park Plaza, acquired in February 2007, is an 82,258 square foot retail development located in Chapel Hill (Durham), North Carolina next to our existing Chatham Crossing shopping center. Both Sunrise and Cole Park were acquired through an existing unconsolidated joint venture with AEW Capital Management.
Oak Grove Market Center, acquired in June 2007, is a 97,207 square foot grocery-anchored shopping center located in Portland, Oregon. The center is anchored by a 53,000 square foot Safeway.
In July 2007, we acquired a portfolio of five retail power centers, adding 1.4 million square feet to our portfolio under management. Three of the retail power centers in Florida, Georgia and Texas were acquired through a new unconsolidated real estate joint venture with PNC Realty Investors on behalf of its institutional client, AFL-CIO Building Investment Trust (the “BIT”). We own 20% of this joint venture with the BIT owning 80%. The remaining two centers, one in Atlanta, Georgia and the other in Chicago, Illinois, were wholly acquired by us.
Countryside Centre, a 242,123 square foot community center located in the St. Petersburg/Clearwater Area of Florida, was also acquired in July 2007. This center is anchored by Albertson’s, TJ Maxx, Home Goods and Shoe Carnival.
Stella Link Shopping Center is a 28,510 square foot shopping center located in Houston, Texas, which was acquired in August 2007. This retail center is adjacent to one of our operating properties, which is anchored by Sellers Brothers and Burke’s Outlet.
The Shoppes at South Semoran is a 101,535 square foot shopping center located in suburban Orlando, Florida, which was acquired in September 2007. This 100% occupied center is anchored by a 57,000 square foot Winn Dixie.
In September 2007, we acquired a 10% interest in Tully Corners Shopping Center through a tenancy-in-common arrangement. This 115,992 square foot grocery-anchored shopping center, located in San Jose, California, is anchored by Save Mart, Petco and Party City.
In October 2007, we acquired a 10% interest in Paradise Key Shopping Center through a tenancy-in-common arrangement. This 271,777 square foot grocery-anchored shopping center is located in Destin, Florida.
In December 2007, we acquired our partner’s 50% interest in Tropicana Beltway located in Las Vegas, Nevada. The center is anchored by Lowe’s and Wal-Mart.
Industrial Properties.
Lakeland Business Park, acquired in January 2007, is a 100% leased 168,400 square foot industrial business center located in Lakeland (Tampa), Florida.
In April and May 2007, we acquired a portfolio of 10 high quality industrial buildings located in Richmond, Virginia for a purchase price of $136 million, including $6 million that is contingent upon the lease up of vacant space by the property seller. This contingency agreement expires in 2009. Eight of the buildings were acquired through an existing 20%-owned unconsolidated joint venture with PNC Realty Investors on behalf of its institutional client the BIT. The remaining two buildings were acquired directly by us. This portfolio added 2.4 million square feet under management.
Town & Country Commerce Center, acquired in June 2007, is a 206,000 square foot industrial distribution center located in Houston, Texas. The property is 100% leased to Arizona Tile and Seitel Solution Tech Center.
Riverview Distribution Center, acquired in August 2007, is a 265,200 square foot industrial center located in Atlanta, Georgia. It is anchored by 109,000 square foot CHEP USA.
In October 2007, we acquired Westlake Industrial Centre, a 154,464 square foot industrial building, and Southpark Industrial Centre, a 234,525 square foot industrial center, both of which are located in Atlanta, Georgia.
The cash requirements for these acquisitions were initially financed under our revolving credit facilities, using available cash generated from dispositions of properties or using cash flow generated by our operating properties.
Dispositions
Retail Properties.
In 2007, we sold 17 shopping centers totaling 1.8 million square feet of building area, of which nine were located in Texas, three in Louisiana, two each in Colorado and Illinois and one in Georgia. Sales proceeds from these dispositions totaled $243.2 million and generated gains of $80.9 million. Three of these shopping centers were each held in a 50% consolidated real estate joint venture. These real estate joint ventures are consolidated in our financial statements because we exercise financial and operating control.
In December 2007, a retail center in Highland Ranch, Colorado was sold. This property was held in a 40%-owned unconsolidated joint venture, and our share of the sales proceeds and the gain generated was $11.2 million and $2.2 million, respectively.
Industrial Properties.
In 2007, we sold an industrial distribution center totaling 152,000 square feet and an industrial building totaling 90,000 square feet. Both of these properties are located in Texas. Sales proceeds from these dispositions totaled $10.7 million and generated gains of $3.7 million.
New Development and Capital Expenditures
At December 31, 2007, we had 32 projects under construction or in preconstruction stages with an estimated final square footage of approximately 9.1 million. These properties are slated to be completed over the next one to five years.
In 2007, under our merchant development program, we sold two vacant industrial buildings in San Diego, California; one shopping center in Phoenix, Arizona, the River Pointe apartments in Conroe, Texas and 17 parcels of land, of which 11 are located in Texas, three in Arizona and one each in Florida, Louisiana and Tennessee. Sales proceeds from these dispositions totaled $103.0 million and generated gains of $16.4 million. At a 50%-owned unconsolidated joint venture, a land parcel was sold in Liberty Lakes, Washington. Our share of the sales proceeds and the gain generated totaled $1.5 million and $.6 million, respectively.
Our new development projects are financed initially under our revolving credit facilities, using available cash generated from dispositions of properties or using cash flow generated by our operating properties.
Capital expenditures for additions to the existing portfolio, acquisitions, new development and our share of investments in unconsolidated real estate joint ventures and partnerships totaled $1.1 billion in both 2007 and 2006 and $455.1 million in 2005. We expect to invest approximately $127.0 million in 2008, $100.5 million in 2009, $53.3 million in 2010, $7.8 million in 2011 and $1.4 million in 2012 to complete construction of 32 properties under various stages of development. We also expect to invest $8.3 million to acquire projects in 2008 and $1.8 in 2009.
Financing Activities:
Debt
Total debt outstanding increased to $3.2 billion at December 31, 2007 from $2.9 billion at December 31, 2006. Total debt at December 31, 2007 included $2.8 billion of which interest rates are fixed and $321.7 million, including the effect of $50 million of interest rate swaps, that bears interest at variable rates. Additionally, debt totaling $1.1 billion was secured by operating properties while the remaining $2.1 billion was unsecured.
In November 2007, we increased our revolving credit facility from $400 million to $575 million and amended certain covenants of this facility. This unsecured revolving credit facility held by a syndicate of banks expires in February 2010 and provides a one-year extension option available at our request. Borrowing rates under this facility float at a margin over LIBOR, plus a facility fee. The borrowing margin and facility fee, which are currently 42.5 and 15.0 basis points, respectively, are priced off a grid that is tied to our senior unsecured credit rating. This facility includes a competitive bid feature where we are allowed to request bids for borrowings up to $287.5 million from the syndicate banks. As of February 15, 2008, there was $380.0 million outstanding under this facility. We also maintain a $30 million unsecured and uncommitted overnight facility that is used for cash management purposes, and as of February 15, 2008, there was no outstanding balance under this facility. The available balance under our revolving credit agreement was $184.6 million at February 15, 2008, which is reduced by amounts outstanding for letters of credit and our overnight facility. We are in full compliance with the covenants of our unsecured revolving credit facilities as of December 31, 2007.
In January 2008, we elected to repay at par a fixed rate 8.33% mortgage totaling $121.8 million that was secured by 19 supermarket-anchored shopping centers in California originally acquired in April 2001.
In August 2006, we issued $575 million of 3.95% convertible senior unsecured notes due 2026. The net proceeds from the sale of the debentures, after repurchasing 4.3 million of our common shares of beneficial interest, were used for general business purposes and to reduce amounts outstanding under our revolving credit facility. The debentures are convertible under certain circumstances for our common shares of beneficial interest at an initial conversion rate of 20.3770 common shares of beneficial interest per $1,000 of principal amount of debentures (an initial conversion price of $49.075). Upon the conversion of debentures, we will deliver cash for the principal return, as defined, and cash or common shares of beneficial interest, at our option, for the excess of the conversion value, as defined, over the principal return. The debentures are redeemable for cash at our option beginning in 2011 for the principal amount plus accrued and unpaid interest. Holders of the debentures have the right to require us to repurchase their debentures for cash equal to the principal of the debentures plus accrued and unpaid interest in 2011, 2016 and 2021 and in the event of a change in control.
In December 2006, we issued $75 million of 10-year unsecured fixed rate medium term notes at 6.1% including the effect of an interest rate swap that had hedged the transaction. Proceeds from this issuance were used to repay balances under our revolving credit facilities, to cash settle a forward hedge and for general business purposes.
In May 2006, we entered into a forward-starting interest rate swap with a notional amount of $74.0 million. In December 2006, we terminated this interest rate swap in conjunction with the issuance of the $75.0 million of medium term notes. The termination fee of $4.1 million is being amortized over the life of the medium term note.
At December 31, 2007, we had two interest rate swap contracts designated as fair value hedges with an aggregate notional amount of $50.0 million that convert fixed rate interest payments at rates of 4.2% to variable interest payments. Also, at December 31, 2007, we had two forward-starting interest rate swap contracts with an aggregate notional amount of $118.6 million. These contracts have been designated as cash flow hedges and mitigate the risk of increasing interest rates on forecasted long-term debt issuances over a maximum period of two years. We could be exposed to losses in the event of nonperformance by the counter-parties; however, management believes the likelihood of such nonperformance is remote.
In July, November and December 2007, swaps of $10 million, $5 million and $10 million, respectively, matured in conjunction with the maturity of the associated medium term notes. These hedge contracts were designated as a fair value hedges.
In conjunction with acquisitions completed during 2007, we assumed $99.4 million of non-recourse debt secured by the related properties. A capital lease obligation totaling $12.9 million was assumed and subsequently settled in 2007. As of December 31, 2006, the balance of non-recourse secured debt that was assumed in conjunction with 2006 acquisitions was $140.7 million.
In conjunction with the disposition of properties completed during 2007, we incurred a net loss of $.4 million on the early extinguishment of three loans totaling $22.2 million.
Equity
Common and preferred dividends increased to $194.5 million in 2007, compared to $173.0 million in 2006. The dividend rate for our common shares of beneficial interest increased for each quarter of 2007 to $.495 compared to $.465 for the same period of 2006. Our dividend payout ratio on common equity for 2007, 2006 and 2005 approximated 63.2%, 64.0% and 63.4%, respectively, based on basic funds from operations for the respective periods.
In July 2007, our Board of Trust Managers authorized a common share repurchase program as part of our ongoing investment strategy. Under the terms of the program, we may purchase up to a maximum value of $300 million of our common shares of beneficial interest during the next two years. Share repurchases may be made in the open market or in privately negotiated transactions at the discretion of management and as market conditions warrant. We anticipate funding the repurchase of shares primarily through the proceeds received from our property disposition program, as well as from general corporate funds.
During 2007, we have repurchased and cancelled 1.4 million common shares of beneficial interest at an average share price of $37.75. At December 31, 2007, a total of 1.4 million common shares of beneficial interest were outstanding that were purchased at an average share price of $36.47. These shares were subsequently retired on January 11, 2008.
In July 2006, our Board of Trust Managers authorized the repurchase of our common shares of beneficial interest to a total of $207 million, and we used $167.6 million of the net proceeds from the $575 million debt offering to purchase 4.3 million common shares of beneficial interest at $39.26 per share.
On September 25, 2007, we issued $200 million of depositary shares in a private placement, and the net proceeds of $193.6 million were used to repay amounts outstanding under our credit facilities. Each depositary share represents one-hundredth of a Series G Cumulative Redeemable Preferred Share. The depositary shares are redeemable, in whole or in part on or after September 25, 2007 at our option, at a redemption price of $25 multiplied by a graded rate per depositary share based on the date of redemption plus any accrued and unpaid dividends thereon. The depositary shares are not convertible or exchangeable for any of our other property or securities. The Series G Preferred Shares pay a variable-rate quarterly dividend through September 2008 and then a variable-rate monthly dividend and have a liquidation preference of $2,500 per share. The variable-rate dividend is calculated on the period’s three-month LIBOR rate plus a percentage determined by the number of days outstanding. Further, the rate may vary if any of our outstanding preferred shares are downgraded. The variable-rate dividend is not to exceed 20%.
On January 30, 2007, we issued $200 million of depositary shares. Each depositary share represents one-hundredth of a 6.5% Series F Cumulative Redeemable Preferred Share. The depositary shares are redeemable, in whole or in part, on or after January 30, 2012 at our option, at a redemption price of $25 per depositary share, plus any accrued and unpaid dividends thereon. The depositary shares are not convertible or exchangeable for any of our other property or securities. The Series F Preferred Shares pay a 6.5% annual dividend and have a liquidation preference of $2,500 per share. Net proceeds of $194.0 million were used to repay amounts outstanding under our credit facilities and for general business purposes.
In September 2004, the SEC declared effective two additional shelf registration statements totaling $1.55 billion, of which $1.35 billion was available as of February 15, 2008. In addition, we have $85.4 million available as of February 15, 2008 under our $1 billion shelf registration statement, which became effective in April 2003. We will continue to closely monitor both the debt and equity markets and carefully consider our available financing alternatives, including both public and private placements.
Contractual Obligations
The following table summarizes our primary contractual obligations as of December 31, 2007 (in thousands):
| | | 2008 | | | 2009 | | | 2010 | | | 2011 | | | 2012 | | | Thereafter | | | Total | |
Mortgages and Notes Payable:(1) | | | | | | | | | | | | | | | | | | | | | |
| Unsecured Debt | | $ | 156,400 | | | $ | 123,522 | | | $ | 394,810 | | | $ | 860,566 | | | $ | 242,216 | | | $ | 797,690 | | | $ | 2,575,204 | |
| Secured Debt | | | 249,818 | | | | 134,079 | | | | 116,324 | | | | 141,532 | | | | 167,306 | | | | 555,800 | | | | 1,364,859 | |
| | | | | | | | | | | | | | | | | | | | | | | | | | | | | |
| Ground Lease Payments | | | 2,436 | | | | 2,961 | | | | 2,917 | | | | 2,862 | | | | 2,821 | | | | 113,568 | | | | 127,565 | |
| | | | | | | | | | | | | | | | | | | | | | | | | | | | | |
Obligations to Acquire Projects | | | 8,306 | | | | 1,824 | | | | | | | | | | | | | | | | | | | | 10,130 | |
| | | | | | | | | | | | | | | | | | | | | | | | | | | | | |
| Obligations to Develop Projects | | | 126,957 | | | | 100,583 | | | | 53,284 | | | | 7,799 | | | | 1,370 | | | | | | | | 289,993 | |
| | | | | | | | | | | | | | | | | | | | | | | | | | | | | |
| Total Contractual Obligations | | $ | 543,917 | | | $ | 362,969 | | | $ | 567,335 | | | $ | 1,012,759 | | | $ | 413,713 | | | $ | 1,467,058 | | | $ | 4,367,751 | |
_______________ (1) Includes principal and interest with interest on variable-rate debt calculated using rates at December 31, 2007 excluding the effect of interest rate swaps.
Off Balance Sheet Arrangements
As of December 31, 2007 and December 31, 2006, none of our off-balance sheet arrangements had a material affect on our liquidity or availability of, or requirement for, our capital resources. Letters of credit totaling $9.2 million and $10.1 million were outstanding under the revolving credit facility at December 31, 2007 and 2006, respectively.
Related to our investment in a redevelopment project in Sheridan, Colorado that is held in an unconsolidated real estate joint venture, we, our joint venture partner and the joint venture have each provided a guarantee for the payment of any annual sinking fund requirement shortfalls on bonds issued in connection with the project. The Sheridan Redevelopment Agency issued $97 million of Series A bonds used for an urban renewal project. The bonds are to be repaid with incremental sales and property taxes and a public improvement fee (“PIF”) to be assessed on future retail sales. The incremental taxes and PIF are to remain intact until the bond liability has been paid in full, including any amounts we may have to provide. We have evaluated and determined that the fair value of the guarantee is nominal. However, due to the guarantee, a liability has been recorded by the joint venture equal to amounts funded under the bonds.
Funds from Operations
The National Association of Real Estate Investment Trusts defines FFO as net income (loss) available to common shareholders computed in accordance with generally accepted accounting principles, excluding gains or losses from sales of operating real estate assets and extraordinary items, plus depreciation and amortization of operating properties, including our share of unconsolidated real estate joint ventures and partnerships. We calculate FFO in a manner consistent with the NAREIT definition.
Management uses FFO as a supplemental measure to conduct and evaluate our business because there are certain limitations associated with using GAAP net income by itself as the primary measure of our operating performance. Historical cost accounting for real estate assets in accordance with GAAP implicitly assumes that the value of real estate assets diminishes predictably over time. Since real estate values instead have historically risen or fallen with market conditions, management believes that the presentation of operating results for real estate companies that uses historical cost accounting is insufficient by itself. There can be no assurance that FFO presented by us is comparable to similarly titled measures of other REITs.
FFO should not be considered as an alternative to net income or other measurements under GAAP as an indicator of our operating performance or to cash flows from operating, investing or financing activities as a measure of liquidity. FFO does not reflect working capital changes, cash expenditures for capital improvements or principal payments on indebtedness.
FFO is calculated as follows (in thousands):
| | | Year Ended December 31, | |
| | | 2007 | | | 2006 | | | 2005 | |
| | | | | | | | | | |
| Net income available to common shareholders | | $ | 212,642 | | | $ | 294,909 | | | $ | 209,552 | |
| Depreciation and amortization | | | 129,946 | | | | 126,713 | | | | 122,203 | |
| Depreciation and amortization of unconsolidated joint ventures | | | 11,204 | | | | 5,079 | | | | 3,539 | |
| Gain on sale of properties | | | (83,907 | ) | | | (168,004 | ) | | | (87,569 | ) |
| (Gain) loss on sale of properties of unconsolidated joint ventures | | | (2,169 | ) | | | (4,052 | ) | | | 8 | |
| Funds from operations | | | 267,716 | | | | 254,645 | | | | 247,733 | |
| Funds from operations attributable to operating partnership units | | | 4,407 | | | | 5,453 | | | | 5,218 | |
| Funds from operations assuming conversion of OP units | | $ | 272,123 | | | $ | 260,098 | | | $ | 252,951 | |
| | | | | | | | | | | | | |
| Weighted average shares outstanding - basic | | | 85,504 | | | | 87,719 | | | | 89,224 | |
| Effect of dilutive securities: | | | | | | | | | | | | |
| Share options and awards | | | 891 | | | | 926 | | | | 860 | |
| Operating partnership units | | | 2,498 | | | | 3,134 | | | | 3,082 | |
| Weighted average shares outstanding - diluted | | | 88,893 | | | | 91,779 | | | | 93,166 | |
Newly Issued Accounting Pronouncements
In June 2006, the FASB issued FASB Interpretation No. 48 (“FIN 48”), “Accounting for Uncertainty in Income Taxes-an interpretation of FASB Statement No. 109.” FIN 48 clarifies the accounting for uncertainty in income taxes recognized in the financial statements. The interpretation prescribes a recognition threshold and measurement attribute for the financial statement recognition of a tax position taken, or expected to be taken, in a tax return. A tax position may only be recognized in the financial statements if it is more likely than not that the tax position will be sustained upon examination. There are also several disclosure requirements. We adopted FIN 48 as of January 1, 2007, and its adoption did not have a material effect on our consolidated financial statements.
In September 2006, the FASB issued SFAS No. 157 (“SFAS 157”), “Fair Value Measurements.” This statement defines fair value and establishes a framework for measuring fair value in generally accepted accounting principles and expands disclosures about fair value measurements. The key changes to current practice are (1) the definition of fair value, which focuses on an exit price rather than an entry price; (2) the methods used to measure fair value, such as emphasis that fair value is a market-based measurement, not an entity-specific measurement, as well as the inclusion of an adjustment for risk, restrictions and credit standing and (3) the expanded disclosures about fair value measurements. This statement does not require any new fair value measurements.
We are required to adopt SFAS 157 in the first quarter of 2008 regarding our financial assets and liabilities. The FASB has issued FSP FAS 157-2, “Effective Date of FASB Statement No. 157,” to defer the provisions of SFAS 157 relating to nonfinancial assets and liabilities that delays implementation by us until January 1, 2009. SFAS 157 is not expected to materially affect how we determine fair value, but may result in certain additional disclosures.
In September 2006, the FASB issued SFAS No. 158 (“SFAS 158”), “Employers’ Accounting for Defined Benefit Pension and Other Postretirement Plans – An Amendment of FASB Statements No. 87, 88, 106, and 132R.” This new standard requires an employer to: (a) recognize in its statement of financial position an asset for a plan’s overfunded status or a liability for a plan’s underfunded status; (b) measure a plan’s assets and its obligations that determine its funded status as of the end of the employer’s fiscal year (with limited exceptions); and (c) recognize changes in the funded status of a defined benefit postretirement plan in the year in which the changes occur. These changes will be reported in comprehensive income. The requirement to recognize the funded status of a benefit plan and the disclosure requirements were effective for us as of December 31, 2006, and as a result we recognized an additional liability of $803,000. The requirement to measure plan assets and benefit obligations as of the date of the employer’s fiscal year-end statement of financial position (the “Measurement Provision”) is effective for fiscal years ending after December 15, 2008. We have assessed the potential impact of the Measurement Provision of SFAS 158 and concluded that its adoption will not have a material effect on our consolidated financial statements.
In February 2007, the FASB issued SFAS No. 159 (“SFAS 159”), “The Fair Value Option for Financial Assets and Financial Liabilities.” SFAS 159 expands opportunities to use fair value measurement in financial reporting and permits entities to choose to measure many financial instruments and certain other items at fair value. This statement is effective for us on January 1, 2008. We are currently evaluating the impact that the adoption of SFAS 159 will have on our consolidated financial statements.
In December 2007, the FASB issued SFAS No. 141 (revised 2007) (“SFAS 141R”), “Business Combinations.” SFAS 141R expands the original guidance’s definition of a business. It broadens the fair value measurement and recognition to all assets acquired, liabilities assumed and interests transferred as a result of business combinations. SFAS 141R requires expanded disclosures to improve the ability to evaluate the nature and financial effects of business combinations. SFAS 141R is effective for us for business combinations made on or after January 1, 2009. While we have not formally quantified the effect, we expect the adoption of SFAS 141R to have a material effect on our consolidated financial statements if our property acquisitions fall under the definition of a business.
In December 2007, the FASB issued SFAS No. 160 (“SFAS 160”), “Noncontrolling Interests in Consolidated Financial Statements—an amendment of ARB No. 51”. SFAS 160 requires that a noncontrolling interest in an unconsolidated entity be reported as equity and any losses in excess of an unconsolidated entity’s equity interest will be recorded to the noncontrolling interest. The statement requires fair value measurement of any noncontrolling equity investment retained in a deconsolidation. SFAS 160 is effective on January 1, 2009 and most provisions will be applied retrospectively. We are currently evaluating the impact SFAS 160 will have on our consolidated financial statements.
On August 31, 2007, the FASB authorized a proposed FASB Staff Position (the “proposed FSP”) that, if issued, would affect the accounting for our convertible and exchangeable senior debentures. If issued in the form expected, the proposed FSP would require that the initial debt proceeds from the sale of our convertible and exchangeable senior debentures be allocated between a liability component and an equity component. The resulting debt discount would be amortized using the effective interest method over the period the debt is expected to be outstanding as additional interest expense. The proposed FSP has not been issued, but the FASB has indicated that it is expected to be effective for fiscal years beginning after December 15, 2007 and requires retroactive application. Upon the adoption of the proposed FSP on January 1, 2008, we have estimated the unamortized debt discount (as of December 31, 2007) to be approximately $34.5 million to be included as a reduction of Debt and approximately $46.3 million as Accumulated Additional Paid-In Capital in our condensed consolidated balance sheet. We have estimated incremental Interest Expense to be approximately $8.4 million and $3.4 million for the years ended December 31, 2007 and 2006.
We use fixed and floating-rate debt to finance our capital requirements. These transactions expose us to market risk related to changes in interest rates. Derivative financial instruments are used to manage a portion of this risk, primarily interest rate swap agreements with major financial institutions. These swap agreements expose us to credit risk in the event of non-performance by the counter-parties to the swaps. We do not engage in the trading of derivative financial instruments in the normal course of business. At December 31, 2007, we had fixed-rate debt of $2.8 billion and variable-rate debt of $321.7 million, after adjusting for the net effect of $50 million notional amount of interest rate swaps. At December 31, 2006, we had fixed-rate debt of $2.8 billion and variable-rate debt of $115.4 million, after adjusting for the net effect of $75.0 million notional amount of interest rate swaps. In the event interest rates were to increase 100 basis points, annual net income and cash flows would decrease by $3.2 million and $1.2 million based upon the variable-rate debt and notes receivable outstanding at December 31, 2007 and 2006, respectively, and the fair value of fixed-rate debt at December 31, 2007 and 2006 would decrease by $204.8 million and $200.7 million, respectively.
REPORT OF INDEPENDENT REGISTERED PUBLIC ACCOUNTING FIRM
To the Board of Trust Managers and Shareholders of
Weingarten Realty Investors
Houston, Texas
We have audited the accompanying consolidated balance sheets of Weingarten Realty Investors and subsidiaries (the "Company") as of December 31, 2007 and 2006, and the related consolidated statements of income and comprehensive income, shareholders' equity, and cash flows for each of the three years in the period ended December 31, 2007. These financial statements are the responsibility of the Company's management. Our responsibility is to express an opinion on these financial statements based on our audits.
We conducted our audits in accordance with the standards of the Public Company Accounting Oversight Board (United States). Those standards require that we plan and perform the audit to obtain reasonable assurance about whether the financial statements are free of material misstatement. An audit includes examining, on a test basis, evidence supporting the amounts and disclosures in the financial statements. An audit also includes assessing the accounting principles used and significant estimates made by management, as well as evaluating the overall financial statement presentation. We believe that our audits provide a reasonable basis for our opinion.
In our opinion, such consolidated financial statements present fairly, in all material respects, the financial position of Weingarten Realty Investors and subsidiaries as of December 31, 2007 and 2006, and the results of their operations and their cash flows for each of the three years in the period ended December 31, 2007, in conformity with accounting principles generally accepted in the United States of America.
We have also audited, in accordance with the standards of the Public Company Accounting Oversight Board (United States), the Company's internal control over financial reporting as of December 31, 2007, based on the criteria established in Internal Control—Integrated Framework issued by the Committee of Sponsoring Organizations of the Treadway Commission and our report dated February 29, 2008 expressed an unqualified opinion on the Company’s internal control over financial reporting.
/s/Deloitte & Touche LLP
Houston, Texas
February 29, 2008
(In thousands, except per share amounts)
| | | Year Ended December 31, | |
| | | 2007 | | | 2006 | | | 2005 | |
| | | | | | | | | | |
| Revenues: | | | | | | | | | |
| Rentals | | $ | 585,702 | | | $ | 531,353 | | | $ | 481,628 | |
| Other | | | 13,352 | | | | 6,841 | | | | 6,228 | |
| | | | | | | | | | | | | |
| Total | | | 599,054 | | | | 538,194 | | | | 487,856 | |
| | | | | | | | | | | | | |
| Expenses: | | | | | | | | | | | | |
| Depreciation and amortization | | | 131,708 | | | | 121,471 | | | | 110,956 | |
| Operating | | | 106,259 | | | | 88,018 | | | | 73,218 | |
| Ad valorem taxes | | | 68,560 | | | | 62,652 | | | | 56,181 | |
| General and administrative | | | 26,979 | | | | 23,801 | | | | 17,379 | |
| | | | | | | | | | | | | |
| Total | | | 333,506 | | | | 295,942 | | | | 257,734 | |
| | | | | | | | | | | | | |
| Operating Income | | | 265,548 | | | | 242,252 | | | | 230,122 | |
| Interest Expense | | | (148,829 | ) | | | (145,374 | ) | | | (129,160 | ) |
| Interest and Other Income | | | 8,486 | | | | 9,044 | | | | 2,860 | |
Equity in Earnings of Real Estate Joint Ventures and Partnerships, net | | | 19,853 | | | | 14,655 | | | | 6,610 | |
| Income Allocated to Minority Interests | | | (10,237 | ) | | | (6,414 | ) | | | (6,060 | ) |
| Gain on Sale of Properties | | | 4,086 | | | | 22,493 | | | | 22,306 | |
| Gain on Land and Merchant Development Sales | | | 16,385 | | | | 7,166 | | | | 804 | |
| Provision for Income Taxes | | | (4,073 | ) | | | (1,366 | ) | | | | |
| Income from Continuing Operations | | | 151,219 | | | | 142,456 | | | | 127,482 | |
| Operating Income from Discontinued Operations | | | 3,139 | | | | 17,060 | | | | 26,712 | |
| Gain on Sale of Properties from Discontinued Operations | | | 83,659 | | | | 145,494 | | | | 65,459 | |
| Income from Discontinued Operations | | | 86,798 | | | | 162,554 | | | | 92,171 | |
| Net Income | | | 238,017 | | | | 305,010 | | | | 219,653 | |
| | | | | | | | | | | | | |
| Dividends on Preferred Shares | | | (25,375 | ) | | | (10,101 | ) | | | (10,101 | ) |
| Net Income Available to Common Shareholders | | $ | 212,642 | | | $ | 294,909 | | | $ | 209,552 | |
| | | | | | | | | | | | | |
| Net Income Per Common Share - Basic: | | | | | | | | | | | | |
| Income from Continuing Operations | | $ | 1.47 | | | $ | 1.51 | | | $ | 1.32 | |
| Income from Discontinued Operations | | | 1.02 | | | | 1.85 | | | | 1.03 | |
| Net Income | | $ | 2.49 | | | $ | 3.36 | | | $ | 2.35 | |
| | | | | | | | | | | | | |
| Net Income Per Common Share - Diluted: | | | | | | | | | | | | |
| Income from Continuing Operations | | $ | 1.46 | | | $ | 1.50 | | | $ | 1.32 | |
| Income from Discontinued Operations | | | .98 | | | | 1.77 | | | | .99 | |
| Net Income | | $ | 2.44 | | | $ | 3.27 | | | $ | 2.31 | |
| | | | | | | | | | | | | |
| Comprehensive Income: | | | | | | | | | | | | |
| Net Income | | $ | 238,017 | | | $ | 305,010 | | | $ | 219,653 | |
| Other Comprehensive Loss: | | | | | | | | | | | | |
| Unrealized loss on derivatives | | | (5,014 | ) | | | (2,861 | ) | | | (1,943 | ) |
| Amortization of loss on derivatives | | | 878 | | | | 364 | | | | 340 | |
| Minimum pension liability adjustment | | | 1,161 | | | | (1,150 | ) | | | (1,704 | ) |
| Other Comprehensive Loss | | | (2,975 | ) | | | (3,647 | ) | | | (3,307 | ) |
| | | | | | | | | | | | | |
| Comprehensive Income | | $ | 235,042 | | | $ | 301,363 | | | $ | 216,346 | |
See Notes to Consolidated Financial Statements.
| |
| (In thousands, except per share amounts) | |
| | | | | | | |
| | | | | | | |
| | | December 31, | | | December 31, | |
| | | 2007 | | | 2006 | |
| | | | | | | |
| ASSETS | | | | | | |
| Property | | $ | 4,972,344 | | | $ | 4,445,888 | |
| Accumulated Depreciation | | | (774,321 | ) | | | (707,005 | ) |
| Property, net | | | 4,198,023 | | | | 3,738,883 | |
| Investment in Real Estate Joint Ventures and Partnerships | | | 300,756 | | | | 203,839 | |
| Total | | | 4,498,779 | | | | 3,942,722 | |
| Notes Receivable from Real Estate Joint Ventures and Partnerships | | | 81,818 | | | | 3,971 | |
| Unamortized Debt and Lease Costs | | | 114,969 | | | | 112,873 | |
Accrued Rent and Accounts Receivable (net of allowance for doubtful accounts of $8,721 in 2007 and $5,995 in 2006) | | | 94,607 | | | | 78,893 | |
| Cash and Cash Equivalents | | | 65,777 | | | | 71,003 | |
| Restricted Deposits and Mortgage Escrows | | | 38,884 | | | | 94,466 | |
| Other | | | 98,509 | | | | 69,959 | |
| Total | | $ | 4,993,343 | | | $ | 4,373,887 | |
| | | | | | | | | |
| LIABILITIES AND SHAREHOLDERS' EQUITY | | | | | | | | |
| Debt | | $ | 3,165,059 | | | $ | 2,941,039 | |
| Accounts Payable and Accrued Expenses | | | 155,137 | | | | 132,821 | |
| Other | | | 104,439 | | | | 86,566 | |
| Total | | | 3,424,635 | | | | 3,160,426 | |
| Minority Interest | | | 96,885 | | | | 87,680 | |
| | | | | | | | | |
| Commitments and Contingencies | | | | | | | | |
| | | | | | | | | |
| Shareholders' Equity: | | | | | | | | |
Preferred Shares of Beneficial Interest - par value, $.03 per share; shares authorized: 10,000 | | | | | | | | |
6.75% Series D cumulative redeemable preferred shares of beneficial interest; 100 shares issued and outstanding in 2007 and 2006; aggregate liquidation preference $75,000 | | | 3 | | | | 3 | |
6.95% Series E cumulative redeemable preferred shares of beneficial interest; 29 shares issued and outstanding in 2007 and 2006; aggregate liquidation preference $72,500 | | | 1 | | | | 1 | |
6.5% Series F cumulative redeemable preferred shares of beneficial interest; 80 shares issued and outstanding in 2007; aggregate liquidation preference $200,000 | | | 2 | | | | | |
Variable-rate Series G cumulative redeemable preferred shares of beneficial interest, 80 shares issued and outstanding in 2007; aggregate liquidation preference $200,000 | | | 2 | | | | | |
Common Shares of Beneficial Interest - par value, $.03 per share; shares authorized: 150,000; shares issued and outstanding: 85,146 in 2007 and 85,765 in 2006 | | | 2,565 | | | | 2,582 | |
Treasury Shares of Beneficial Interest - par value, $.03 per share; 1,370 shares outstanding in 2007 | | | (41 | ) | | | | |
| Accumulated Additional Paid-In Capital | | | 1,442,027 | | | | 1,136,481 | |
| Net Income in Excess of (Less Than) Accumulated Dividends | | | 42,739 | | | | (786 | ) |
| Accumulated Other Comprehensive Loss | | | (15,475 | ) | | | (12,500 | ) |
| Shareholders' Equity | | | 1,471,823 | | | | 1,125,781 | |
| Total | | $ | 4,993,343 | | | $ | 4,373,887 | |
| | | | | | | | | |
| See Notes to Consolidated Financial Statements. | |
| |
| (In thousands) | |
| | | | | | | | | | |
| | | | | | | | | | |
| | | Year Ended December 31, | |
| | | 2007 | | | 2006 | | | 2005 | |
| Cash Flows from Operating Activities: | | | | | | | | | |
| Net Income | | $ | 238,017 | | | $ | 305,010 | | | $ | 219,653 | |
Adjustments to reconcile net income to net cash provided by operating activities: | | | | | | | | | | | | |
| Depreciation and amortization | | | 134,676 | | | | 131,992 | | | | 128,573 | |
| Equity in earnings of real estate joint ventures and partnerships, net | | | (19,853 | ) | | | (14,655 | ) | | | (6,681 | ) |
| Income allocated to minority interests | | | 10,237 | | | | 6,414 | | | | 6,060 | |
| Gain on land and merchant development sales | | | (16,385 | ) | | | (7,166 | ) | | | (804 | ) |
| Gain on sales of properties | | | (87,745 | ) | | | (167,987 | ) | | | (87,765 | ) |
Distributions of income from real estate joint ventures and partnerships | | | 6,251 | | | | 2,524 | | | | 2,603 | |
| Changes in accrued rent and accounts receivable | | | (22,276 | ) | | | (18,056 | ) | | | (3,281 | ) |
| Changes in other assets | | | (26,813 | ) | | | (37,607 | ) | | | (30,769 | ) |
| Changes in accounts payable and accrued expenses | | | 4,852 | | | | 43,641 | | | | (27,964 | ) |
| Other, net | | | 2,348 | | | | (1,518 | ) | | | 900 | |
| Net cash provided by operating activities | | | 223,309 | | | | 242,592 | | | | 200,525 | |
| | | | | | | | | | | | | |
| Cash Flows from Investing Activities: | | | | | | | | | | | | |
| Investment in property | | | (753,462 | ) | | | (880,471 | ) | | | (259,730 | ) |
| Proceeds from sales and disposition of property, net | | | 341,383 | | | | 661,175 | | | | 201,363 | |
| Change in restricted deposits and mortgage escrows | | | 56,331 | | | | (79,737 | ) | | | 1,764 | |
Mortgage bonds and notes receivable from real estate joint ventures and partnerships: | | | | | | | | | | | | |
| Advances | | | (145,735 | ) | | | (54,800 | ) | | | (30,852 | ) |
| Collections | | | 82,852 | | | | 47,617 | | | | 5,278 | |
| Real estate joint ventures and partnerships: | | | | | | | | | | | | |
| Investments | | | (78,794 | ) | | | (21,547 | ) | | | (29,233 | ) |
| Distributions of capital | | | 16,795 | | | | 13,077 | | | | 5,951 | |
| Net cash used in investing activities | | | (480,630 | ) | | | (314,686 | ) | | | (105,459 | ) |
| | | | | | | | | | | | | |
| Cash Flows from Financing Activities: | | | | | | | | | | | | |
| Proceeds from issuance of: | | | | | | | | | | | | |
| Debt | | | 270,092 | | | | 780,782 | | | | 148,347 | |
| Common shares of beneficial interest | | | 4,010 | | | | 4,570 | | | | 2,829 | |
| Preferred shares of beneficial interest, net | | | 387,678 | | | | | | | | | |
Purchase of marketable securities in connection with the legal defeasance of mortgage notes payable | | | (22,536 | ) | | | | | | | | |
| Repurchase of common shares of beneficial interest, net | | | (103,366 | ) | | | (167,573 | ) | | | | |
| Principal payments of debt | | | (89,419 | ) | | | (327,601 | ) | | | (82,810 | ) |
| Common and preferred dividends paid | | | (194,492 | ) | | | (173,010 | ) | | | (167,196 | ) |
| Debt issuance cost paid | | | (1,451 | ) | | | (13,681 | ) | | | | |
| Other, net | | | 1,579 | | | | (3,080 | ) | | | 1,039 | |
| Net cash provided by (used in) financing activities | | | 252,095 | | | | 100,407 | | | | (97,791 | ) |
| | | | | | | | | | | | | |
| Net (decrease) increase in cash and cash equivalents | | | (5,226 | ) | | | 28,313 | | | | (2,725 | ) |
| Cash and cash equivalents at January 1 | | | 71,003 | | | | 42,690 | | | | 45,415 | |
| Cash and cash equivalents at December 31 | | $ | 65,777 | | | $ | 71,003 | | | $ | 42,690 | |
| | | | | | | | | | | | | |
| See Notes to Consolidated Financial Statements. | |
(In thousands, except per share amounts)
Year Ended December 31, 2007, 2006, and 2005
| | | | | | | | | | | | | | | Net | | | | | | | |
| | | Preferred | | | Common | | | Treasury | | | | | | Income in | | | | | | | |
| | | Shares | | | Shares | | | Shares | | | Accumulated | | | Excess of | | | Accumulated | | | | |
| | | of | | | of | | | of | | | Additional | | | (Less Than) | | | Other | | | | |
| | | Beneficial | | | Beneficial | | | Beneficial | | | Paid-In | | | Accumulated | | | Comprehensive | | | | |
| | | Interest | | | Interest | | | Interest | | | Capital | | | Dividends | | | Loss | | | Total | |
| | | | | | | | | | | | | | | | | | | | | | |
| Balance, January 1, 2005 | | $ | 4 | | | $ | 2,672 | | | | | | $ | 1,283,270 | | | $ | (185,243 | ) | | $ | (4,743 | ) | | $ | 1,095,960 | |
| Net income | | | | | | | | | | | | | | | | | | 219,653 | | | | | | | | 219,653 | |
| Shares issued in exchange for interests in limited partnerships | | | | | | | 1 | | | | | | | 1,302 | | | | | | | | | | | | 1,303 | |
| Valuation adjustment on shares issued in exchange for interests in limited partnerships | | | | | | | | | | | | | | 550 | | | | | | | | | | | | 550 | |
| Shares issued under benefit plans | | | | | | | 13 | | | | | | | 3,310 | | | | | | | | | | | | 3,323 | |
| Dividends declared – common shares (1) | | | | | | | | | | | | | | | | | | (157,095 | ) | | | | | | | (157,095 | ) |
| Dividends declared – preferred shares (2) | | | | | | | | | | | | | | | | | | (10,101 | ) | | | | | | | (10,101 | ) |
| Other comprehensive loss | | | | | | | | | | | | | | | | | | | | | | (3,307 | ) | | | (3,307 | ) |
| Balance, December 31, 2005 | | | 4 | | | | 2,686 | | | | | | | 1,288,432 | | | | (132,786 | ) | | | (8,050 | ) | | | 1,150,286 | |
| Net income | | | | | | | | | | | | | | | | | | 305,010 | | | | | | | | 305,010 | |
| Shares issued in exchange for interests in limited partnerships | | | | | | | 7 | | | | | | | 7,988 | | | | | | | | | | | | 7,995 | |
| Shares cancelled | | | | | | | (128 | ) | | | | | | (167,445 | ) | | | | | | | | | | | (167,573 | ) |
| Shares issued under benefit plans | | | | | | | 17 | | | | | | | 7,506 | | | | | | | | | | | | 7,523 | |
| Dividends declared – common shares (1) | | | | | | | | | | | | | | | | | | (162,909 | ) | | | | | | | (162,909 | ) |
| Dividends declared – preferred shares (2) | | | | | | | | | | | | | | | | | | (10,101 | ) | | | | | | | (10,101 | ) |
| Adjustment to initially apply FASB Statement No. 158 | | | | | | | | | | | | | | | | | | | | | | (803 | ) | | | (803 | ) |
| Other comprehensive loss | | | | | | | | | | | | | | | | | | | | | | (3,647 | ) | | | (3,647 | ) |
| Balance, December 31, 2006 | | | 4 | | | | 2,582 | | | | | | | 1,136,481 | | | | (786 | ) | | | (12,500 | ) | | | 1,125,781 | |
| Net income | | | | | | | | | | | | | | | | | | 238,017 | | | | | | | | 238,017 | |
| Issuance of Series F preferred shares | | | 2 | | | | | | | | | | | 193,972 | | | | | | | | | | | | 193,974 | |
| Issuance of Series G preferred shares | | | 2 | | | | | | | | | | | 193,548 | | | | | | | | | | | | 193,550 | |
| Shares issued in exchange for interests in limited partnerships | | | | | | | 17 | | | | | | | 13,562 | | | | | | | | | | | | 13,579 | |
| Shares repurchased (4) | | | | | | | | | | $ | (41 | ) | | | (49,966 | ) | | | | | | | | | | | (50,007 | ) |
| Shares repurchased and cancelled | | | | | | | (42 | ) | | | | | | | (53,317 | ) | | | | | | | | | | | (53,359 | ) |
| Shares issued under benefit plans | | | | | | | 8 | | | | | | | | 7,747 | | | | | | | | | | | | 7,755 | |
| Dividends declared – common shares (1) | | | | | | | | | | | | | | | | | | | (169,117 | ) | | | | | | | (169,117 | ) |
| Dividends declared – preferred shares (3) | | | | | | | | | | | | | | | | | | | (25,375 | ) | | | | | | | (25,375 | ) |
| Other comprehensive loss | | | | | | | | | | | | | | | | | | | | | | | (2,975 | ) | | | (2,975 | ) |
| Balance, December 31, 2007 | | $ | 8 | | | $ | 2,565 | | | $ | (41 | ) | | $ | 1,442,027 | | | $ | 42,739 | | | $ | (15,475 | ) | | $ | 1,471,823 | |
| (1) | Common dividends per share were $1.98, $1.86 and $1.76 for the year ended December 31, 2007, 2006 and 2005, respectively. |
| (2) | Series D and Series E preferred dividends per share were $50.63 and $173.75, respectively, for both the year ended December 31, 2006 and 2005. |
| (3) | Series D, E, F and G preferred dividends per share were $50.63, $173.75, $142.64 and $34.88, respectively, for the year ended December 31, 2007. |
| (4) | A total of 1.4 million common shares of beneficial interest were purchased in 2007 and subsequently retired on January 11, 2008. |
See Notes to Consolidated Financial Statements.
Note 1. Summary of Significant Accounting Policies
Business
Weingarten Realty Investors is a real estate investment trust organized under the Texas Real Estate Investment Trust Act. We, and our predecessor entity, began the ownership and development of shopping centers and other commercial real estate in 1948. Our primary business is leasing space to tenants in the shopping and industrial centers we own or lease. We also manage centers for joint ventures in which we are partners or for other outside owners for which we charge fees.
We operate a portfolio of properties that include neighborhood and community shopping centers and industrial properties of approximately 72.8 million square feet. We have a diversified tenant base with our largest tenant comprising only 2.9% of total rental revenues during 2007.
We currently operate, and intend to operate in the future, as a real estate investment trust (“REIT”).
Basis of Presentation
Our consolidated financial statements include the accounts of our subsidiaries and certain partially owned real estate joint ventures or partnerships which meet the guidelines for consolidation. All significant intercompany balances and transactions have been eliminated.
Our financial statements are prepared in accordance with accounting principles generally accepted in the United States. Such statements require management to make estimates and assumptions that affect the reported amounts on our consolidated financial statements. Actual results could differ from these estimates
Revenue Recognition
Rental revenue is generally recognized on a straight-line basis over the life of the lease, which begins the date the leasehold improvements are substantially complete, if owned by us, or the date the tenant takes control of the space, if the leasehold improvements are owned by the tenant. Revenue from tenant reimbursements of taxes, maintenance expenses and insurance is recognized in the period the related expense is recognized. Revenue based on a percentage of tenants' sales is recognized only after the tenant exceeds their sales breakpoint. In addition, in circumstances where we would provide a tenant improvement allowance for improvements that are owned by the tenant, we would recognize the allowance as a reduction of rental revenue on a straight-line basis over the term of the lease. Other revenue is income from contractual agreements with third parties, tenants or partially owned real estate joint ventures or partnerships, which is recognized as the related services are performed under the respective agreements.
Real Estate Joint Ventures and Partnerships
To determine the method of accounting for partially owned real estate joint ventures and partnerships, we first apply the guidelines set forth in Financial Accounting Standards Board (“FASB”) Interpretation No. 46R, “Consolidation of Variable Interest Entities.” Based upon our analysis, we have determined that we have no interests in variable interest entities.
Partially owned real estate joint ventures and partnerships over which we exercise financial and operating control are consolidated in our financial statements. In determining if we exercise financial and operating control, we consider factors such as ownership interest, authority to make decisions, kick-out rights and substantive participating rights. Partially owned real estate joint ventures and partnerships where we have the ability to exercise significant influence, but do not exercise financial and operating control, are accounted for using the equity method.
Our investments in partially owned real estate joint ventures and partnerships are reviewed for impairment, periodically, if events or circumstances change indicating that the carrying amount of our investments may not be recoverable. The ultimate realization of our investments in partially owned real estate joint ventures and partnerships is dependent on a number of factors, including the performance of each investment and market conditions. We will record an impairment charge if we determine that a decline in the value of an investment is other than temporary. No impairment was recorded for the years ended December 31, 2007, 2006 and 2005.
Property
Real estate assets are stated at cost less accumulated depreciation, which, in the opinion of management, is not in excess of the individual property's estimated undiscounted future cash flows, including estimated proceeds from disposition. Depreciation is computed using the straight-line method, generally over estimated useful lives of 18-40 years for buildings and 10-20 years for parking lot surfacing and equipment. Major replacements where the betterment extends the useful life of the asset are capitalized and the replaced asset and corresponding accumulated depreciation are removed from the accounts. All other maintenance and repair items are charged to expense as incurred.
Acquisitions of properties are accounted for utilizing the purchase method and, accordingly, the results of operations of an acquired property are included in our results of operations from the date of acquisition. We have used estimates of future cash flows and other valuation techniques to allocate the purchase price of acquired property among land, buildings on an "as if vacant" basis, tenant improvements and other identifiable intangibles. Other identifiable intangible assets and liabilities include the effect of out-of-market leases, the value of having leases in place (“as is” versus “as vacant” basis and absorption costs), out-of-market assumed mortgages and tenant relationships. Depreciation and amortization is computed using the straight-line method, generally over estimated useful lives of 40 years for buildings and one to 25 years for other identifiable intangible assets. Initial valuations are subject to change until such information is finalized, no later than 12 months from the acquisition date.
Property also includes costs incurred in the development of new operating properties and properties in our merchant development program. Merchant development is a new program in which we develop a project with the objective of selling all or part of it, instead of retaining it in our portfolio on a long-term basis. Also, disposition of land parcels and non-operating properties are included in this program. These properties are carried at cost and no depreciation is recorded on these assets until the commencement of rental revenue or no later than one year from the completion of major construction. These costs include preacquisition costs directly identifiable with the specific project, development and construction costs, interest and real estate taxes. Indirect development costs, including salaries and benefits, travel and other related costs that are directly attributable to the development of the property, are also capitalized. The capitalization of such costs ceases at the earlier of one year from the completion of major construction or when the property, or any completed portion, becomes available for occupancy.
Property also includes costs for tenant improvements paid by us, including reimbursements to tenants for improvements that are owned by us and will remain our property after the lease expires.
Our properties are reviewed for impairment if events or changes in circumstances indicate that the carrying amount of the property, including any identifiable intangible assets, may not be recoverable. In such an event, a comparison is made of the current and projected operating cash flows of each such property into the foreseeable future on an undiscounted basis to the carrying amount of such property. Such carrying amount is adjusted, if necessary, to the estimated fair value to reflect an impairment in the value of the asset. No impairment was recorded for the years ended December 31, 2007, 2006 and 2005.
Some of our properties are held in single purpose entities. A single purpose entity is a legal entity typically established at the request of a lender solely for the purpose of owning a property or group of properties subject to a mortgage. There may be restrictions limiting the entity’s ability to engage in an activity other than owning or operating the property, assuming or guaranteeing the debt of any other entity, or dissolving itself or declaring bankruptcy before the debt has been repaid. Most of our single purpose entities are 100% owned by us and are consolidated in our financial statements.
Interest Capitalization
Interest is capitalized on land under development and buildings under construction based on rates applicable to borrowings outstanding during the period and the weighted average balance of qualified assets under development/construction during the period.
Deferred Charges
Debt and lease costs are amortized primarily on a straight-line basis, which approximates the effective interest method, over the terms of the debt and over the lives of leases, respectively. Lease costs represent the initial direct costs incurred in origination, negotiation and processing of a lease agreement. Such costs include outside broker commissions and other independent third party costs, as well as salaries and benefits, travel and other internal costs directly related to completing the leases. Costs related to supervision, administration, unsuccessful origination efforts and other activities not directly related to completed lease agreements are charged to expense as incurred.
Sales of Real Estate
Sales of real estate include the sale of shopping center pads, property adjacent to shopping centers, shopping center properties, merchant development properties, investments in real estate joint ventures and partnerships and partial sales to real estate joint ventures and partnerships in which we participate.
We recognize profit on sales of real estate, including merchant development sales, in accordance with FASB’s Statement of Financial Accounting Standards (“SFAS”) No. 66 (“SFAS 66”), “Accounting for Sales of Real Estate.” Profits are not recognized until (a) a sale is consummated; (b) the buyer’s initial and continuing investments are adequate to demonstrate a commitment to pay; (c) the seller’s receivable is not subject to future subordination; and (d) we have transferred to the buyer the usual risks and rewards of ownership in the transaction, and we do not have a substantial continuing involvement with the property.
We recognize gains on the sale of real estate to joint ventures and partnerships in which we participate to the extent we receive cash from the joint venture or partnership, if it meets the sales criteria in accordance with SFAS 66 and we do not have a commitment to support the operations of the real estate joint venture or partnership to an extent greater than our proportionate interest in the real estate joint venture or partnership.
Accrued Rent and Accounts Receivable
Receivable balances outstanding include base rents, tenant reimbursements and receivables attributable to the straight-lining of rental commitments. An allowance for the uncollectible portion of accrued rents and accounts receivable is determined based upon an analysis of balances outstanding, historical bad debt levels, tenant credit worthiness and current economic trends. Additionally, estimates of the expected recovery of pre-petition and post-petition claims with respect to tenants in bankruptcy are considered in assessing the collectibility of the related receivables.
Restricted Deposits and Mortgage Escrows
Restricted deposits and mortgage escrows consist of escrow deposits held by lenders primarily for property taxes, insurance and replacement reserves and restricted cash that is held in a qualified escrow account for the purposes of completing like-kind exchange transactions. At December 31, 2007 and December 31, 2006, we had $21.3 million and $79.4 million held for like-kind exchange transactions, respectively, and $17.6 million and $15.1 million held in escrow related to our mortgages, respectively.
Other Assets
Other assets in our consolidated financial statements include investments held in grantor trusts, prepaid expenses, the value of above-market leases and the related accumulated amortization, deferred tax assets and other miscellaneous receivables. Investments held in grantor trusts are adjusted to fair value at each period end with changes included in our Statements of Consolidated Income and Comprehensive Income. Above-market leases are amortized over terms of the acquired leases.
Per Share Data
Net income per common share - basic is computed using net income available to common shareholders and the weighted average shares outstanding. Net income per common share - diluted includes the effect of potentially dilutive securities for the periods indicated as follows (in thousands):
| | | Year Ended December 31, | |
| | | 2007 | | | 2006 | | | 2005 | |
| | | | | | | | | | |
| Numerator: | | | | | | | | | |
| Net income available to common shareholders – basic | | $ | 212,642 | | | $ | 294,909 | | | $ | 209,552 | |
| Income attributable to operating partnership units | | | 4,407 | | | | 5,453 | | | | 5,218 | |
| Net income available to common shareholders – diluted | | $ | 217,049 | | | $ | 300,362 | | | $ | 214,770 | |
| | | | | | | | | | | | | |
| Denominator: | | | | | | | | | | | | |
| Weighted average shares outstanding – basic | | | 85,504 | | | | 87,719 | | | | 89,224 | |
| Effect of dilutive securities: | | | | | | | | | | | | |
| Share options and awards | | | 891 | | | | 926 | | | | 860 | |
| Operating partnership units | | | 2,498 | | | | 3,134 | | | | 3,082 | |
| Weighted average shares outstanding - diluted | | | 88,893 | | | | 91,779 | | | | 93,166 | |
Options to purchase common shares of beneficial interest of .5 million in both 2007 and 2006 and .9 million in 2005, respectively, were not included in the calculation of net income per common share - diluted as the exercise prices were greater than the average market price for the year.
Income Taxes
We have elected to be treated as a REIT under the Internal Revenue Code of 1986, as amended. As a REIT, we generally will not be subject to corporate level federal income tax on taxable income we distribute to our shareholders. To be taxed as a REIT, we must meet a number of requirements including defined percentage tests concerning the amount of our assets and revenues that come from, or are attributable to, real estate operations. As long as we distribute at least 90% of the taxable income of the REIT to our shareholders as dividends, we will not be taxed on the portion of our income we distribute as dividends unless we have ineligible transactions.
The Tax Relief Extension Act of 1999 gave REITs the ability to conduct activities which a REIT was previously precluded from doing as long as such activities are performed in entities which have elected to be treated as taxable REIT subsidiaries under the IRS code. These activities include buying or developing properties with the express purpose of selling them. We conduct certain of these activities in taxable REIT subsidiaries that we have created. We calculate and record income taxes in our consolidated financial statements based on the activities in those entities. We also record deferred taxes for the temporary tax differences that have resulted from those activities as required under SFAS No. 109, “Accounting for Income Taxes.”
Cash Flow Information
All highly liquid investments with original maturities of three months or less are considered cash equivalents. We issued common shares of beneficial interest valued at $13.6 million, $8.0 million and $1.3 million during 2007, 2006 and 2005, respectively, in exchange for interests in real estate joint ventures and partnerships, which had been formed to acquire properties. We also accrued $15.5 million, $6.5 million and $4.9 million during 2007, 2006 and 2005, respectively, associated with the construction of property. Cash payments for interest on debt, net of amounts capitalized, of $153.2 million, $139.1 million and $135.4 million were made during 2007, 2006 and 2005, respectively. A cash payment of $.8 million and $.6 million for federal income taxes was made during 2007 and 2006, respectively.
In association with property acquisitions and investments in unconsolidated real estate joint ventures, items assumed were as follows (in thousands):
| | | Year Ended December 31, | |
| | | 2007 | | | 2006 | | | 2005 | |
| | | | | | | | | | |
| Debt | | $ | 99,428 | | | $ | 140,740 | | | $ | 135,330 | |
| Obligations Under Capital Leases | | | 12,888 | | | | | | | | | |
| Minority Interest | | | 27,932 | | | | 15,816 | | | | 6,871 | |
| Net Assets and Liabilities | | | 14,322 | | | | 21,597 | | | | 31,983 | |
In conjunction with the disposition of properties completed during 2007, we defeased three mortgage loans totaling $22.2 million and transferred marketable securities totaling $22.5 million in connection with the legal defeasance of these three loans. Also, we settled a $12.9 million capital lease obligation. Net assets and liabilities were reduced by $59.8 million during 2007 from the reorganization of three joint ventures, two of which were previously consolidated, to tenancy-in-common arrangements where we have a 50% interest. This net reduction from the reorganization of three joint ventures was offset by the assumption of debt totaling $33.2 million.
In connection with the sale of an 80% interest in 12 properties in 2006 and two properties in 2005, we retained a 20% unconsolidated investment of $90.6 million and $14.7 million, respectively. In connection with the sale of improved properties, we received notes receivable totaling $2.6 million in 2006. In 2005, a $15.5 million capital lease obligation was settled, and debt of $11.1 million was assumed.
Reclassifications
The reclassification of prior years’ operating results for certain properties to discontinued operations was made to conform to the current year presentation. We also reclassified the net balance of our below-market assumed mortgages from Other Liabilities to Debt and our above-market assumed mortgages from Other Assets to Debt. For additional information see Note 9, “Discontinued Operations” and Note 16, “Identified Intangible Assets and Liabilities,” respectively. These reclassifications had no impact on previously reported net income, net income per share, shareholders’ equity or cash flows.
Note 2. Newly Issued Accounting Pronouncements
In June 2006, the FASB issued FASB Interpretation No. 48 (“FIN 48”), “Accounting for Uncertainty in Income Taxes-an interpretation of FASB Statement No. 109.” FIN 48 clarifies the accounting for uncertainty in income taxes recognized in the financial statements. The interpretation prescribes a recognition threshold and measurement attribute for the financial statement recognition of a tax position taken, or expected to be taken, in a tax return. A tax position may only be recognized in the financial statements if it is more likely than not that the tax position will be sustained upon examination. There are also several disclosure requirements. We adopted FIN 48 as of January 1, 2007, and its adoption did not have a material effect on our consolidated financial statements.
In September 2006, the FASB issued SFAS No. 157 (“SFAS 157”), “Fair Value Measurements.” This statement defines fair value and establishes a framework for measuring fair value in generally accepted accounting principles and expands disclosures about fair value measurements. The key changes to current practice are (1) the definition of fair value, which focuses on an exit price rather than an entry price; (2) the methods used to measure fair value, such as emphasis that fair value is a market-based measurement, not an entity-specific measurement, as well as the inclusion of an adjustment for risk, restrictions and credit standing and (3) the expanded disclosures about fair value measurements. This statement does not require any new fair value measurements.
We are required to adopt SFAS 157 in the first quarter of 2008 regarding our financial assets and liabilities. The FASB has issued FSP FAS 157-2, “Effective Date of FASB Statement No. 157,” to defer the provisions of SFAS 157 relating to nonfinancial assets and liabilities that delays implementation by us until January 1, 2009. SFAS 157 is not expected to materially affect how we determine fair value, but may result in certain additional disclosures.
In September 2006, the FASB issued SFAS No. 158 (“SFAS 158”), “Employers’ Accounting for Defined Benefit Pension and Other Postretirement Plans – An Amendment of FASB Statements No. 87, 88, 106, and 132R.” This new standard requires an employer to: (a) recognize in its statement of financial position an asset for a plan’s overfunded status or a liability for a plan’s underfunded status; (b) measure a plan’s assets and its obligations that determine its funded status as of the end of the employer’s fiscal year (with limited exceptions); and (c) recognize changes in the funded status of a defined benefit postretirement plan in the year in which the changes occur. These changes will be reported in comprehensive income. The requirement to recognize the funded status of a benefit plan and the disclosure requirements were effective for us as of December 31, 2006, and as a result we recognized an additional liability of $803,000. The requirement to measure plan assets and benefit obligations as of the date of the employer’s fiscal year-end statement of financial position (the “Measurement Provision”) is effective for fiscal years ending after December 15, 2008. We have assessed the potential impact of the Measurement Provision of SFAS 158 and concluded that its adoption will not have a material effect on our consolidated financial statements.
In February 2007, the FASB issued SFAS No. 159 (“SFAS 159”), “The Fair Value Option for Financial Assets and Financial Liabilities.” SFAS 159 expands opportunities to use fair value measurement in financial reporting and permits entities to choose to measure many financial instruments and certain other items at fair value. This statement is effective for us on January 1, 2008. We are currently evaluating the impact that the adoption of SFAS 159 will have on our consolidated financial statements.
In December 2007, the FASB issued SFAS No. 141 (revised 2007) (“SFAS 141R”), “Business Combinations.” SFAS 141R expands the original guidance’s definition of a business. It broadens the fair value measurement and recognition to all assets acquired, liabilities assumed and interests transferred as a result of business combinations. SFAS 141R requires expanded disclosures to improve the ability to evaluate the nature and financial effects of business combinations. SFAS 141R is effective for us for business combinations made on or after January 1, 2009. We expect the adoption of SFAS 141R to have a material effect on our consolidated financial statements. While we have not formally quantified the effect, we expect the adoption of SFAS 141R to have a material effect on our consolidated financial statements if our property acquisitions fall under the definition of a business.
In December 2007, the FASB issued SFAS No. 160 (“SFAS 160”), “Noncontrolling Interests in Consolidated Financial Statements—an amendment of ARB No. 51”. SFAS 160 requires that a noncontrolling interest in an unconsolidated entity be reported as equity and any losses in excess of an unconsolidated entity’s equity interest will be recorded to the noncontrolling interest. The statement requires fair value measurement of any noncontrolling equity investment retained in a deconsolidation. SFAS 160 is effective on January 1, 2009 and most provisions will be applied retrospectively. We are currently evaluating the impact SFAS 160 will have on our consolidated financial statements.
On August 31, 2007, the FASB authorized a proposed FASB Staff Position (the “proposed FSP”) that, if issued, would affect the accounting for our convertible and exchangeable senior debentures. If issued in the form expected, the proposed FSP would require that the initial debt proceeds from the sale of our convertible and exchangeable senior debentures be allocated between a liability component and an equity component. The resulting debt discount would be amortized using the effective interest method over the period the debt is expected to be outstanding as additional interest expense. The proposed FSP has not been issued, but the FASB has indicated that it is expected to be effective for fiscal years beginning after December 15, 2007 and requires retroactive application. Upon the adoption of the proposed FSP on January 1, 2008, we have estimated the unamortized debt discount (as of December 31, 2007) to be approximately $34.5 million to be included as a reduction of Debt and approximately $46.3 million as Accumulated Additional Paid-In Capital on our condensed consolidated balance sheet. We have estimated incremental Interest Expense to be approximately $8.4 million and $3.4 million for the years ended December 31, 2007 and 2006.
Note 3. Derivatives and Hedging
We occasionally hedge the future cash flows of our debt transactions, as well as changes in the fair value of our debt instruments, principally through interest rate swaps with major financial institutions. At December 31, 2007, we had two interest rate swap contracts designated as fair value hedges with an aggregate notional amount of $50.0 million that convert fixed interest payments at rates of 4.2% to variable interest payments. We have determined that they are highly effective in limiting our risk of changes in the fair value of fixed-rate notes attributable to changes in variable interest rates. Also, at December 31, 2007, we had two forward-starting interest rate swap contracts with an aggregate notional amount of $118.6 million, which lock the swap rate at 5.2% effective through January 2018. The purpose of these forward-starting swaps, which are designated as cash flow hedges, is to mitigate the risk of future fluctuations in interest rates on forecasted issuances of long-term debt. We have determined that they are highly effective in offsetting future variable interest cash flows on anticipated long-term debt issuances.
In July, November and December 2007, swaps of $10 million, $5 million and $10 million, respectively, matured in conjunction with the maturity of the associated medium term notes. These hedge contracts were designated as fair value hedges.
Changes in the fair value of fair value hedges, as well as changes in the fair value of the hedged item attributable to the hedge risk, are recorded in earnings each reporting period. For the twelve months ended December 31, 2007 and 2006, these changes in fair value offset through earnings. At December 31, 2007, we had no derivative instruments reported in Other Assets. The derivative instruments at December 31, 2006 were reported at their fair values in Other Assets, net of accrued interest, of $.1 million, and as Other Liabilities, net of accrued interest, of $5.8 million and $3.2 million at December 31, 2007 and December 31, 2006, respectively.
As of December 31, 2007 and December 31, 2006, the balance in Accumulated Other Comprehensive Loss relating to derivatives was $11.8 million and $7.6 million, respectively, and amounts amortized to Interest Expense were $.9 million in 2007, $.4 million in 2006 and $.3 million in 2005. Within the next 12 months, approximately $.9 million of the balance in Accumulated Other Comprehensive Loss is expected to be amortized to Interest Expense.
The interest rate swaps increased interest expense and decreased net income by $.6 million, $.5 million and $1.3 million in 2007, 2006 and 2005, respectively, and increased the average interest rate of our debt by .02% in 2007 and 2006 and .1% in 2005. We could be exposed to losses in the event of nonperformance by the counter-parties; however, management believes the likelihood of such nonperformance is remote.
Note 4. Debt
Our debt consists of the following (in thousands):
| | | December 31, | |
| | | 2007 | | | 2006 | |
| | | | | | | |
| Debt payable to 2030 at 4.5% to 8.8% | | $ | 2,876,445 | | | $ | 2,888,892 | |
| Unsecured notes payable under revolving credit agreements | | | 255,000 | | | | 18,000 | |
| Obligations under capital leases | | | 29,725 | | | | 29,725 | |
| Industrial revenue bonds payable to 2015 at 3.5% to 5.4% | | | 3,889 | | | | 4,422 | |
| | | | | | | | | |
| Total | | $ | 3,165,059 | | | $ | 2,941,039 | |
The grouping of total debt between fixed and variable-rate as well as between secured and unsecured is summarized below (in thousands):
| | | December 31, | |
| | | 2007 | | | 2006 | |
| | | | | | | |
| As to interest rate (including the effects of interest rate swaps): | | | | | | |
| Fixed-rate debt | | $ | 2,843,320 | | | $ | 2,825,640 | |
| Variable-rate debt | | | 321,739 | | | | 115,399 | |
| | | | | | | | | |
| Total | | $ | 3,165,059 | | | $ | 2,941,039 | |
| | | | | | | | | |
| As to collateralization: | | | | | | | | |
| Unsecured debt | | $ | 2,095,506 | | | $ | 1,910,216 | |
| Secured debt | | | 1,069,553 | | | | 1,030,823 | |
| | | | | | | | | |
| Total | | $ | 3,165,059 | | | $ | 2,941,039 | |
In November 2007, we increased our revolving credit facility from $400 million to $575 million and amended certain covenants of this facility. This unsecured revolving credit facility held by a syndicate of banks expires in February 2010 and provides a one-year extension option available at our request. Borrowing rates under this facility float at a margin over LIBOR, plus a facility fee. The borrowing margin and facility fee, which are currently 42.5 and 15.0 basis points, respectively, are priced off a grid that is tied to our senior unsecured credit ratings. This facility retains a competitive bid feature that allows us to request bids for amounts up to $287.5 million from each of the syndicate banks, allowing us an opportunity to obtain pricing below what we would pay using the pricing grid.
At December 31, 2007 and December 31, 2006, the balance outstanding under the revolving credit facility was $255 million at a variable interest rate of 5.4% and $18 million at a variable interest rate of 5.8%, respectively. We also have an agreement for an unsecured and uncommitted overnight facility totaling $30 million as of December 31, 2007 and $20 million at December 31, 2006 with a bank that we use for cash management purposes, of which no amounts were outstanding at each respective date. Letters of credit totaling $9.2 million and $10.1 million were outstanding under the revolving credit facility at December 31, 2007 and 2006, respectively. The available balance under our revolving credit agreement was $310.8 million and $371.9 million at December 31, 2007 and December 31, 2006, respectively. During 2007, the maximum balance and weighted average balance outstanding under both facilities combined were $312.4 million and $96.7 million, respectively, at a weighted average interest rate of 6.1%. During 2006, the maximum balance and weighted average balance outstanding under both facilities combined were $368.2 million and $179.1 million, respectively, at a weighted average interest rate of 5.5%.
In January 2008, we elected to repay at par a fixed rate 8.33% mortgage totaling $121.8 million that was secured by 19 supermarket-anchored shopping centers in California originally acquired in April 2001.
In conjunction with acquisitions completed during 2007, we assumed $99.4 million of nonrecourse debt secured by the related properties. A capital lease obligation totaling $12.9 million was assumed and subsequently settled in 2007. As of December 31, 2006, the balance of secured debt that was assumed in conjunction with 2006 acquisitions was $140.7 million.
In conjunction with the disposition of properties completed 2007, we incurred a net loss of $.4 million on the early extinguishment of three loans totaling $22.2 million. These defeasance costs were recognized as Interest Expense and have been reclassified and reported as discontinued operations in the Statements of Consolidated Income and Comprehensive Income in accordance with SFAS No. 144, "Accounting for the Impairment or Disposal of Long-Lived Assets."
Various leases and properties, and current and future rentals from those lease and properties, collateralize certain debt. At December 31, 2007 and 2006, the carrying value of such property aggregated $1.9 billion and $1.8 billion, respectively.
Scheduled principal payments on our debt (excluding $255.0 million due under our revolving credit agreements, $21.0 million of certain capital leases, ($.4) million fair value of interest rate swaps and $29.7 million of non-cash debt-related items) are due during the following years (in thousands):
| 2008 | | $ | 254,509 | |
| 2009 | | | 113,506 | |
| 2010 | | | 119,183 | |
| 2011 | | | 890,314 | |
| 2012 | | | 333,112 | |
| 2013 | | | 283,412 | |
| 2014 | | | 373,787 | |
| 2015 | | | 200,596 | |
| 2016 | | | 142,667 | |
| Thereafter | | | 148,616 | |
Our various debt agreements contain restrictive covenants, including minimum interest and fixed charge coverage ratios, minimum unencumbered interest coverage ratios and minimum net worth requirements and maximum total debt levels. We are in compliance with all restrictive covenants as of December 31, 2007.
In December 2006, we issued $75 million of 10-year unsecured fixed rate medium term notes at 6.1% including the effect of an interest rate swap that had hedged the transaction. Proceeds from this issuance were used to repay balances under our revolving credit facilities, to cash settle a forward hedge and for general business purposes.
In July 2006, we priced an offering of $575 million of 3.95% convertible senior unsecured notes due 2026, which closed on August 2, 2006. Interest is payable semi-annually in arrears on February 1 and August 1 of each year, beginning February 1, 2007. The net proceeds of $395.9 million from the sale of the debentures, after repurchasing 4.3 million of our common shares of beneficial interest, were used for general business purposes and to reduce amounts outstanding under our revolving credit facility. The debentures are convertible under certain circumstances for our common shares of beneficial interest at an initial conversion rate of 20.3770 common shares of beneficial interest per $1,000 of principal amount of debentures (an initial conversion price of $49.075). In addition, the conversion rate may be adjusted if certain change in control transactions or other specified events occur on or prior to August 4, 2011. Upon the conversion of debentures, we will deliver cash for the principal return, as defined, and cash or common shares of beneficial interest, at our option, for the excess of the conversion value, as defined, over the principal return. The debentures are redeemable for cash at our option beginning in 2011 for the principal amount plus accrued and unpaid interest. Holders of the debentures have the right to require us to repurchase their debentures for cash equal to the principal of the debentures plus accrued and unpaid interest in 2011, 2016 and 2021 and in the event of a change in control.
In connection with the issuance of these debentures, we filed a shelf registration statement related to the resale of the debentures and the common shares of beneficial interest issuable upon the conversion of the debentures. This registration statement has been declared effective by the SEC.
Note 5. Preferred Shares
On September 25, 2007, we issued $200 million of depositary shares in a private placement, and the net proceeds of $193.6 million were used to repay amounts outstanding under our credit facilities. Each depositary share represents one-hundredth of a Series G Cumulative Redeemable Preferred Share. The depositary shares are redeemable, in whole or in part at our option, at a redemption price of $25 multiplied by a graded rate per depositary share based on the date of redemption plus any accrued and unpaid dividends thereon. The depositary shares are not convertible or exchangeable for any of our other property or securities. The Series G Preferred Shares pay a variable-rate quarterly dividend through September 2008 and then a variable-rate monthly dividend and have a liquidation preference of $2,500 per share. The variable-rate dividend is calculated on the period’s three-month LIBOR rate plus a percentage determined by the number of days outstanding. Further, the rate may vary if any of our outstanding preferred shares are downgraded. The variable-rate dividend is not to exceed 20%. At December 31, 2007, the variable-rate dividend was 5.9%.
On January 30, 2007, we issued $200 million of depositary shares. Each depositary share represents one-hundredth of a Series F Cumulative Redeemable Preferred Share. The depositary shares are redeemable, in whole or in part, on or after January 30, 2012 at our option, at a redemption price of $25 per depositary share, plus any accrued and unpaid dividends thereon. The depositary shares are not convertible or exchangeable for any of our other property or securities. The Series F Preferred Shares pay a 6.5% annual dividend and have a liquidation preference of $2,500 per share. Net proceeds of $194.0 million were used to repay amounts outstanding under our credit facilities and for general business purposes.
In July 2004, we issued $72.5 million of depositary shares with each share representing one-hundredth of a Series E Cumulative Redeemable Preferred Share. The depositary shares are redeemable, in whole or in part, for cash on or after July 8, 2009 at our option, at a redemption price of $25 per depositary share, plus any accrued and unpaid dividends thereon. The depositary shares are not convertible or exchangeable for any of our other property or securities. The Series E preferred shares pay a 6.95% annual dividend and have a liquidation preference of $2,500 per share.
In April 2003, $75 million of depositary shares were issued with each share representing one-thirtieth of a Series D Cumulative Redeemable Preferred Share. The depositary shares are redeemable, in whole or in part, for cash on or after April 30, 2008 at our option, at a redemption price of $25 per depositary share, plus any accrued and unpaid dividends thereon. The depositary shares are not convertible or exchangeable for any of our property or securities. The Series D preferred shares pay a 6.75% annual dividend and have a liquidation preference of $750 per share.
Note 6. Common Shares of Beneficial Interest
In July 2007, our Board of Trust Managers authorized a common share repurchase program as part of our ongoing investment strategy. Under the terms of the program, we may purchase up to a maximum value of $300 million of our common shares of beneficial interest during the next two years. Share repurchases may be made in the open market or in privately negotiated transactions at the discretion of management and as market conditions warrant. We anticipate funding the repurchase of shares primarily through the proceeds received from our property disposition program, as well as from general corporate funds.
During 2007, we have repurchased and cancelled 1.4 million common shares of beneficial interest at an average share price of $37.75.
In July 2006, our Board of Trust Managers authorized the repurchase of our common shares of beneficial interest to a total of $207 million, and we used $167.6 million of the net proceeds from the $575 million debt offering to purchase 4.3 million common shares of beneficial interest at $39.26 per share. For additional information see Note 4, “Debt.”
Note 7. Treasury Shares of Beneficial Interest
At December 31, 2007, a total of 1.4 million common shares of beneficial interest were outstanding that were purchased at an average share price of $36.47. These shares were subsequently retired on January 11, 2008.
Note 8. Property
Our property consisted of the following (in thousands):
| | | December 31, | |
| | | 2007 | | | 2006 | |
| | | | | | | |
| Land | | $ | 974,145 | | | $ | 847,295 | |
| Land held for development | | | 62,033 | | | | 21,405 | |
| Land under development | | | 223,827 | | | | 146,990 | |
| Buildings and improvements | | | 3,533,037 | | | | 3,339,074 | |
| Construction in-progress | | | 179,302 | | | | 91,124 | |
| | | | | | | | | |
| Total | | $ | 4,972,344 | | | $ | 4,445,888 | |
The following carrying charges were capitalized (in thousands):
| | | Year Ended December 31, | |
| | | 2007 | | | 2006 | | | 2005 | |
| | | | | | | | | | |
| Interest | | $ | 25,025 | | | $ | 7,616 | | | $ | 2,629 | |
| Ad valorem taxes | | | 1,985 | | | | 780 | | | | 293 | |
| | | | | | | | | | | | | |
| Total | | $ | 27,010 | | | $ | 8,396 | | | $ | 2,922 | |
During 2007, we invested $503.1 million in the acquisition of operating properties. We completed the acquisition of 13 shopping centers, one office building and seven industrial properties that are located in Arizona, Florida, Georgia, Illinois, Oregon, Texas and Virginia. We also acquired our partner’s 50% interest in a shopping center in Las Vegas, Nevada. Of this total, $417.3 million was invested in shopping centers, and $85.8 million was invested in industrial properties and the office building.
During 2007, we invested $243.1 million in 28 new developments projects. We commenced 13 new development projects located in Arizona, Florida, Georgia, Nevada, North Carolina and Texas during 2007. Of these, six represent interests in consolidated joint ventures in which we have ownership interests ranging from 50% to 55%.
Note 9. Discontinued Operations
During 2007, we sold 17 shopping centers and one industrial center, 10 of which were located in Texas, three in Louisiana, two each in Colorado and Illinois, and one in Georgia. In 2006, we sold 19 shopping centers and four industrial properties, 10 of which were located in Texas, three in Kansas, two each in Arkansas, Oklahoma and Tennessee, and one each in Arizona, Missouri, New Mexico and Colorado. The operating results of these properties have been reclassified and reported as discontinued operations in the Statements of Consolidated Income and Comprehensive Income in accordance with SFAS No. 144, "Accounting for the Impairment or Disposal of Long-Lived Assets," as well as any gains on the respective disposition for all periods presented. Revenues recorded in Operating Income from Discontinued Operations totaled $10.9 million in 2007, $40.8 million in 2006, and $61.5 million in 2005. Included in the Consolidated Balance Sheet at December 31, 2006 were $180.1 million of Property, $30.4 million of Accumulated Depreciation and $22.4 million of Debt related to properties sold during 2007.
In 2007, we incurred a net loss of $.4 million on the defeasance of three loans totaling $22.2 million that were required to be settled upon their disposition. These defeasance costs were recognized as Interest Expense and have been reclassified and reported as operating income from discontinued operations.
The discontinued operations reported in 2006 had no debt that was required to be repaid upon their disposition.
We elected not to allocate other consolidated interest to discontinued operations because the interest savings to be realized from the proceeds of the sale of these operations was not material.
Note 10. Notes Receivable from Real Estate Joint Ventures and Partnerships
We have ownership interests in a number of real estate joint ventures and partnerships. Notes receivable from these entities bear interest ranging from 5.7% to 10% at December 31, 2007 and 6.0% to 10% at December 31, 2006. These notes are due at various dates through 2028 and are generally secured by real estate assets. We recognized interest income on these notes as follows, in millions: $1.5 in 2007 and $1.3 in both 2006 and 2005.
Note 11. Related Parties
In 2007, we acquired our partner’s 50% interest in a shopping center in Las Vegas, Nevada. As part of this transaction, our $22.2 million note receivable from this partner was settled.
In 2007, we sold a 12.6% interest in a shopping center located in Lafayette, Louisiana to our outside partner. Sales proceeds and the gain generated totaled $4.4 million and $.8 million, respectively.
Note 12. Investment in Real Estate Joint Ventures and Partnerships
We own interests in real estate joint ventures or limited partnerships and have tenancy-in-common interests in which we exercise significant influence, but do not have financial and operating control. We account for these investments using the equity method, and our interests range from 7.8% to 75%. Combined condensed unaudited financial information of these ventures (at 100%) is summarized as follows (in thousands):
| | | December 31, | |
| | | 2007 | | | 2006 | |
| | | | | | | |
| Combined Condensed Balance Sheets | | | | | | |
| | | | | | | |
| Property | | $ | 1,660,915 | | | $ | 1,123,600 | |
| Accumulated depreciation | | | (71,998 | ) | | | (41,305 | ) |
| Property – net | | | 1,588,917 | | | | 1,082,295 | |
| | | | | | | | | |
| Other assets | | | 238,166 | | | | 117,594 | |
| | | | | | | | | |
| Total | | $ | 1,827,083 | | | $ | 1,199,889 | |
| | | | | | | | | |
| | | | | | | | | |
| | | | | | | | | |
| Debt (primarily mortgage payable) | | $ | 378,206 | | | $ | 327,460 | |
| Notes and accounts payable to Weingarten Realty Investors | | | 87,191 | | | | 22,657 | |
| Other liabilities | | | 138,150 | | | | 39,154 | |
| Accumulated equity | | | 1,223,536 | | | | 810,618 | |
| | | | | | | | | |
| Total | | $ | 1,827,083 | | | $ | 1,199,889 | |
| | | Year Ended December 31, | |
| | | 2007 | | | 2006 | | | 2005 | |
| | | | | | | | | | |
| Combined Condensed Statements of Income | | | | | | | | | |
| | | | | | | | | | |
| Revenues | | $ | 146,642 | | | $ | 65,002 | | | $ | 41,059 | |
| | | | | | | | | | | | | |
| Expenses: | | | | | | | | | | | | |
| Depreciation and amortization | | | 38,574 | | | | 15,390 | | | | 9,322 | |
| Interest | | | 23,093 | | | | 17,398 | | | | 10,565 | |
| Operating | | | 22,396 | | | | 8,750 | | | | 5,480 | |
| Ad valorem taxes | | | 15,767 | | | | 6,187 | | | | 4,756 | |
| General and administrative | | | 1,243 | | | | 783 | | | | 301 | |
| | | | | | | | | | | | | |
| Total | | | 101,073 | | | | 48,508 | | | | 30,424 | |
| | | | | | | | | | | | | |
| Gain on land and merchant development sales | | | 1,295 | | | | 1,938 | | | | 170 | |
| Gain (loss) on sale of properties | | | 5,422 | | | | 5,991 | | | | (20 | ) |
| Net income | | $ | 52,286 | | | $ | 24,423 | | | $ | 10,785 | |
Our investment in real estate joint ventures and partnerships, as reported on our Consolidated Balance Sheets, differs from our proportionate share of the entities' underlying net assets due to basis differentials, which arose upon the transfer of assets to the joint ventures. The basis differentials, which totaled $15.8 million and $20.1 million at December 31, 2007 and December 31, 2006, respectively, are generally amortized over the useful lives of the related assets.
Fees earned by us for the management of these real estate joint ventures and partnerships totaled $5.0 million in 2007, $1.9 million in 2006, and $.8 million in 2005.
During 2007, a 25%-owned unconsolidated real estate joint venture acquired two shopping centers. Cole Park Plaza is located in Chapel Hill, North Carolina, and Sunrise West is located in Sunrise, Florida. A 50%-owned unconsolidated real estate joint venture was formed for the purpose of developing a retail shopping center. A 20%-owned unconsolidated real estate joint venture acquired seven industrial properties, one each in Ashland and Chester, Virginia, two in Colonial Heights, Virginia and three in Richmond, Virginia. We invested in a 20%-owned unconsolidated real estate joint venture, which acquired three retail power centers: Pineapple Commons located in Stuart, Florida; Mansell Crossing located in Alpharetta, Georgia; and Preston Shepard Place located in Plano, Texas. We acquired a 10% interest in two retail shopping centers each through a tenancy-in-common arrangement that are located in San Jose, California and Destin, Florida.
In March 2007, three joint ventures, two of which were previously consolidated, were reorganized and our 50% interest in each of these properties is now held in a tenancy-in-common arrangement.
In November 2007, we sold a 12.6% interest in a shopping center located in Lafayette, Louisiana to our outside partner. Sales proceeds and the gain generated totaled $4.4 million and $.8 million, respectively.
In December 2007, we acquired our partner’s 50% interest in a shopping center located in Las Vegas, Nevada, which was previously held in an unconsolidated real estate joint venture.
In December 2007, a retail center in Highland Ranch, Colorado was sold. This property was held in a 40%-owned unconsolidated real estate joint venture, and our share of the sales proceeds and the gain generated was $11.2 million and $2.2 million, respectively. Also, a land parcel was sold in Liberty Lakes, Washington, which was held in a 50%-owned unconsolidated real estate joint venture. Our share of the sales proceeds and the gain generated totaled $1.5 million and $.6 million, respectively.
During 2006, we invested in a 25%-owned unconsolidated real estate joint venture, which acquired five shopping centers. Fresh Market Shoppes is located in Hilton Head, South Carolina; Shoppes at Paradise Isle is located in Destin, Florida; Indian Harbor Place is located in Melbourne, Florida, and both Quesada Commons and Shoppes of Port Charlotte are located in Port Charlotte, Florida. Two 50%-owned real estate joint ventures commenced development of a retail center each located in Mission, Texas and Apple Valley, California. Also, two shopping centers, one each in Crosby and Dickinson, Texas, were sold. Our share of the sales proceeds totaled $8.1 million and generated a gain of $4.1 million. Associated with our land and merchant development activities, two parcels of land in Houston, Texas and Liberty Lake, Washington were sold in a 75%-owned and a 50%-owned real estate joint venture, respectively, of which our share of the gain totaled $1.1 million. We also acquired our partner’s share of Heritage Station, which is located in Wake Forest, North Carolina. Heritage Station is a 62,000 square foot shopping center that is anchored by Harris Teeter.
During the third quarter of 2006, we formed a strategic joint venture with PNC Realty Investors (“PNC”) to acquire and operate industrial properties within target markets across the United States. PNC served as investment advisor to the AFL-CIO Building Investment Trust (“BIT”). The joint venture is 80% owned by BIT and 20% by us. The partners plan to invest $500 million in total capital over the next two years including leverage targeted at approximately 50% of total capital. As part of this transaction, we contributed 16 buildings at five properties with a total value of $123 million and aggregating more than two million square feet. The sale of an 80% interest in these properties resulted in a gain to us of $21.6 million, and due to our continuing involvement with these properties, the operating results have not been reclassified and reported in discontinued operations. The properties are located in the San Diego, Memphis and Atlanta markets.
During the fourth quarter of 2006, two new strategic joint ventures were formed with TIAA-CREF Global Real Estate and AEW Capital Management on behalf of its institutional clients, of which we own 20%. We contributed to the TIAA-CREF Global Real Estate joint venture seven recently purchased neighborhood/community shopping centers in South Florida with a total value of $325 million and aggregating more than 1.3 million square feet. The AEW Capital Management joint venture acquired four grocery-anchored centers and two power centers located in Oregon and Washington.
Note 13. Federal Income Tax Considerations
We qualify as a REIT under the provisions of the Internal Revenue Code, and therefore, no tax is imposed on our taxable income distributed to shareholders. To maintain our REIT status, we must distribute at least 90% of our ordinary taxable income to our shareholders and meet certain income source and investment restriction requirements. Our shareholders must report their share of income distributed in the form of dividends.
Taxable income differs from net income for financial reporting purposes principally because of differences in the timing of recognition of depreciation, rental revenue, compensation expense and gain from sales of property. As a result of these differences, the book value of our net fixed assets exceeds the tax basis by $275 million at December 31, 2007 and $70.8 million at December 31, 2006.
The following table reconciles net income to REIT taxable income for the year ended December 31, 2007, 2006 and 2005 (in thousands):
| | | 2007 | | | 2006 | | | 2005 | |
| | | | | | | | | | |
| Net Income | | $ | 238,017 | | | $ | 305,010 | | | $ | 219,653 | |
| Net income of taxable REIT subsidiaries included above | | | (6,352 | ) | | | (4,264 | ) | | | (923 | ) |
| Net Income from REIT operations | | | 231,665 | | | | 300,746 | | | | 218,730 | |
| Book depreciation and amortization including discontinued operations | | | 134,676 | | | | 131,992 | | | | 126,930 | |
| Tax depreciation and amortization | | | (98,238 | ) | | | (86,002 | ) | | | (80,922 | ) |
| Book/tax difference on gains/losses from capital transactions | | | (76,054 | ) | | | (128,628 | ) | | | (69,885 | ) |
| Other book/tax differences, net | | | 2,698 | | | | (22,534 | ) | | | (32,336 | ) |
| REIT taxable income | | | 194,747 | | | | 195,574 | | | | 162,517 | |
| Dividends paid deduction | | | (194,747 | ) | | | (195,574 | ) | | | (167,196 | ) |
| Dividends paid in excess of taxable income | | $ | - | | | $ | - | | | $ | (4,679 | ) |
The dividends paid deduction in 2007 and 2006 includes designated dividends of $10.9 million from 2008 and $10.2 million from 2007.
For federal income tax purposes, the cash dividends distributed to common shareholders are characterized as follows:
| | | 2007 | | | 2006 | | | 2005 | |
| | | | | | | | | | |
| Ordinary income | | | 85.6 | % | | | 76.2 | % | | | 81.2 | % |
| Capital gain distributions | | | 14.4 | | | | 23.8 | | | | 9.7 | |
| Return of capital (generally nontaxable) | | | | | | | | | | | 9.1 | |
| | | | | | | | | | | | | |
| Total | | | 100.0 | % | | | 100.0 | % | | | 100.0 | % |
Our taxable REIT subsidiary is subject to federal, state and local income taxes. We have recorded a federal income tax provision of $2.1 million, $1.3 million and zero for the years ended December 31, 2007, 2006 and 2005, respectively. Our deferred tax assets at December 31, 2007 and 2006 were $1.1 million and $.3 million, respectively, with the deferred tax liabilities totaling $1.4 million and $1.6 million, respectively. Also, a current tax obligation of $2.3 million has been recorded at December 31, 2007 in association with this tax.
We have reviewed our tax positions under FIN 48. FIN 48 clarifies the accounting for uncertainty in income taxes recognized in the financial statements. The interpretation prescribes a recognition threshold and measurement attribute for the financial statement recognition of a tax position taken, or expected to be taken, in a tax return. A tax position may only be recognized in the financial statements if it is more likely than not that the tax position will be sustained upon examination. We believe it is more likely than not that our tax positions will be sustained in any tax examinations.
In May 2006, the State of Texas enacted a new business tax (the “Revised Texas Franchise Tax”) that replaces its existing franchise tax. In general, legal entities that do business in Texas are subject to the Revised Texas Franchise Tax. Most REITs are subject to the Revised Franchise Tax, whereas they were previously exempt. The Revised Texas Franchise Tax becomes effective for franchise tax reports due on or after January 1, 2008 and will be based on revenues earned during the 2007 fiscal year.
Because the Revised Texas Franchise Tax is determined by applying a tax rate to a base that considers both revenues and expenses, it is considered an income tax and is accounted for in accordance with the provisions of SFAS No. 109, “Accounting for Income Taxes.”
For the years ended December 31, 2007 and 2006, we recorded a provision for the Revised Texas Franchise Tax of $2.0 million and $.1 million, respectively. The deferred tax assets and deferred tax liability associated with this tax each totaled $.1 million as of December 31, 2007 and 2006. Also, a current tax obligation of $2.0 million has been recorded at December 31, 2007 in association with this tax.
Note 14. Leasing Operations
The terms of our leases range from less than one year for smaller tenant spaces to over 25 years for larger tenant spaces. In addition to minimum lease payments, most of the leases provide for contingent rentals (payments for taxes, maintenance and insurance by lessees and an amount based on a percentage of the tenants' sales). Future minimum rental income from non-cancelable tenant leases at December 31, 2007, in millions, is: $445.2 in 2008; $392.3 in 2009; $329.8 in 2010; $257.7 in 2011; $193.5 in 2012; and $797.6 thereafter. The future minimum rental amounts do not include estimates for contingent rentals. Such contingent rentals, in millions, aggregated $126.3 in 2007, $119.0 in 2006 and $108.8 in 2005.
Note 15. Commitments and Contingencies
We are engaged in the operations of shopping centers, which are either owned or, with respect to certain shopping centers, operated under long-term ground leases. These ground leases expire at various dates through 2075, with renewal options. Space in our shopping centers is leased to tenants pursuant to agreements that provide for terms ranging generally from one month to 25 years and, in some cases, for annual rentals subject to upward adjustments based on operating expense levels, sales volume, or contractual increases as defined in the lease agreements.
Scheduled minimum rental payments under the terms of all non-cancelable operating leases in which we are the lessee, principally for shopping center ground leases, for the subsequent five years and thereafter ending December 31, are as follows (in thousands):
| 2008 | | $ | 2,436 | |
| 2009 | | | 2,961 | |
| 2010 | | | 2,917 | |
| 2011 | | | 2,862 | |
| 2012 | | | 2,821 | |
| Thereafter | | | 113,568 | |
| | | $ | 127,565 | |
Rental expense (including insignificant amounts for contingent rentals) for operating leases was, in millions: $3.4 in 2007; $3.2 in 2006 and $2.9 in 2005.
The scheduled future minimum revenues under subleases, applicable to the ground lease rentals above, under the terms of all non-cancelable tenant leases, assuming no new or renegotiated leases or option extensions for the subsequent five years and thereafter ending December 31, are as follows (in thousands):
| 2008 | | $ | 32,356 | |
| 2009 | | | 28,028 | |
| 2010 | | | 23,814 | |
| 2011 | | | 20,022 | |
| 2012 | | | 16,222 | |
| Thereafter | | | 68,544 | |
| | | $ | 188,986 | |
Property under capital leases, consisting of four shopping centers at both December 31, 2007 and 2006 aggregated $29.1 million, and is included in buildings and improvements. Amortization of property under capital leases is included in depreciation and amortization expense, and the balance of accumulated depreciation associated with these capital leases at December 31, 2007 and 2006 was $14.2 million and $13.1 million, respectively. Future minimum lease payments under these capital leases total $50.1 million, with annual payments due, in millions, of $1.9 in 2008; $2.0 in each of 2009 and 2010; $2.1 in each of 2011 and 2012; and $40.0 thereafter. The amount of these total payments representing interest is $20.4 million. Accordingly, the present value of the net minimum lease payments was $29.7 million at December 31, 2007.
We participate in six real estate ventures structured as DownREIT partnerships that have properties in Arkansas, California, Georgia, North Carolina, Texas and Utah. As a general partner, we have operating and financial control over these ventures and consolidate their operations in our consolidated financial statements. These ventures allow the outside limited partners to put their interest to the partnership for our common shares of beneficial interest or an equivalent amount in cash. We may acquire any limited partnership interests that are put to the partnership, and we have the option to redeem the interest in cash or a fixed number of our common shares of beneficial interest, at our discretion. We also participate in two real estate ventures that have properties in Florida and Texas that allow their outside partners to put operating partnership units to us for our common shares of beneficial interest or an equivalent amount of cash. We have the option to redeem these units in cash or a fixed number of our common shares of beneficial interest, at our discretion. In 2007 and 2006 we issued common shares of beneficial interest valued at $13.6 million and $8.0, million, respectively, in exchange for certain of these limited partnership interests or operating partnership units. The aggregate redemption value of the operating partnership units was approximately $76 million and $139 million as of December 31, 2007 and 2006, respectively.
In January 2007, two retail properties were purchased in Arizona. This purchase transaction includes an earnout provision of approximately $29 million that is contingent upon the subsequent development of space by the property seller. This contingency agreement expires in 2010. As of December 31, 2007, $5.2 million has been paid and $4.2 million has been accrued. Amounts paid or accrued under such earnouts are treated as additional purchase price and capitalized to the related property.
In April 2007, we acquired an industrial building located in Virginia. This purchase transaction includes an earnout provision of approximately $6 million that is contingent upon the lease up of vacant space by the property seller. This contingency agreement expires in 2009. As of December 31, 2007, $5.6 million has been accrued. Amounts paid or accrued under such earnouts are treated as additional purchase price and capitalized to the related property.
In August 2006, we purchased a portfolio of properties from North American Properties. The purchase agreement allows for the subsequent development and leasing of an additional phase of Brookwood Marketplace by the property seller. If the terms of the purchase agreement are met by the seller, the purchase price would be increased by approximately $6.9 million. This agreement expires in August 2008. We have no obligation for this contingency as of December 31, 2007.
We expect to invest approximately $127.0 million in 2008, $100.5 million in 2009, $53.3 million in 2010, $7.8 million in 2011 and $1.4 million in 2012 to complete construction of 32 properties under various stages of development. We also expect to invest $8.3 million to acquire projects in 2008 and $1.8 in 2009.
We are subject to numerous federal, state and local environmental laws, ordinances and regulations in the areas where we own or operate properties. We are not aware of any material contamination, which may have been caused by us or any of our tenants that would have a material effect on our consolidated financial statements.
As part of our risk management activities, we have applied and been accepted into state sponsored environmental programs which will limit our expenses if contaminants need to be remediated. We also have an environmental insurance policy that covers us against third party liabilities and remediation costs.
While we believe that we do not have any material exposure to environmental remediation costs, we cannot give absolute assurance that changes in the law or new discoveries of contamination will not result in increased liabilities to us.
Related to our investment in a redevelopment project in Sheridan, Colorado that is held in an unconsolidated real estate joint venture, we, our joint venture partner and the joint venture have each provided a guarantee for the payment of any annual sinking fund requirement shortfalls on bonds issued in connection with the project. The Sheridan Redevelopment Agency issued $97 million of Series A bonds used for an urban renewal project. The bonds are to be repaid with incremental sales and property taxes and a public improvement fee (“PIF”) to be assessed on future retail sales. The incremental taxes and PIF are to remain intact until the bond liability has been paid in full, including any amounts we may have to provide. We have evaluated and determined that the fair value of the guarantee is nominal. However, due to the guarantee, a liability has been recorded by the joint venture equal to amounts funded under the bonds.
We are involved in various matters of litigation arising in the normal course of business. While we are unable to predict with certainty the amounts involved, our management and counsel are of the opinion that, when such litigation is resolved, our resulting liability, if any, will not have a material effect on our consolidated financial statements.
Note 16. Identified Intangible Assets and Liabilities
Identified intangible assets and liabilities associated with our property acquisitions are as follows (in thousands):
| | | December 31, | | | December 31, | |
| | | 2007 | | | 2006 | |
| | | | | | | |
| Identified Intangible Assets: | | | | | | |
| Above-Market Leases (included in Other Assets) | | $ | 18,590 | | | $ | 14,686 | |
| Above-Market Leases – Accumulated Amortization | | | (7,323 | ) | | | (5,277 | ) |
| Below-Market Assumed Mortgages (included in Debt) | | | 2,072 | | | | 1,653 | |
| Below-Market Assumed Mortgages – Accumulated Amortization | | | (246 | ) | | | | |
| Valuation of In Place Leases (included in Unamortized Debt and Lease Cost) | | | 59,498 | | | | 52,878 | |
| Valuation of In Place Leases – Accumulated Amortization | | | (22,308 | ) | | | (16,297 | ) |
| | | | | | | | | |
| | | $ | 50,283 | | | $ | 47,643 | |
| | | | | | | | | |
| Identified Intangible Liabilities: | | | | | | | | |
| Below-Market Leases (included in Other Liabilities) | | $ | 39,141 | | | $ | 24,602 | |
| Below-Market Leases – Accumulated Amortization | | | (11,949 | ) | | | (6,569 | ) |
| Above-Market Assumed Mortgages (included in Debt) | | | 58,414 | | | | 59,863 | |
| Above-Market Assumed Mortgages – Accumulated Amortization | | | (24,517 | ) | | | (18,123 | ) |
| | | | | | | | | |
| | | $ | 61,089 | | | $ | 59,773 | |
These identified intangible assets and liabilities are amortized over the terms of the acquired leases or the remaining lives of the assumed mortgages.
The net amortization of above-market and below-market leases increased rental revenues by $3.2 million, $1.3 million, and $.3 million in 2007, 2006, and 2005, respectively. The estimated net amortization of these intangible assets and liabilities will increase rental revenues for each of the next five years as follows (in thousands):
| 2008 | | $ | 3,321 | |
| 2009 | | | 2,771 | |
| 2010 | | | 1,940 | |
| 2011 | | | 1,369 | |
| 2012 | | | 1,115 | |
The amortization of the in place lease intangible recorded in depreciation and amortization, was $8.3 million, $7.6 million, and $6.2 million in 2007, 2006, and 2005, respectively. The estimated amortization of this intangible asset will increase depreciation and amortization for each of the next five years as follows (in thousands):
| 2008 | | $ | 7,187 | |
| 2009 | | | 6,255 | |
| 2010 | | | 5,227 | |
| 2011 | | | 4,042 | |
| 2012 | | | 3,229 | |
The amortization of above-market and below-market assumed mortgages decreased interest expense by $6.7 million, $7.3 million and $6.9 million in 2007, 2006, and 2005, respectively. The estimated amortization of these intangible assets and liabilities will decrease interest expense for each of the next five years as follows (in thousands):
| 2008 | | $ | 5,804 | |
| 2009 | | | 4,476 | |
| 2010 | | | 3,823 | |
| 2011 | | | 2,526 | |
| 2012 | | | 1,355 | |
Note 17. Fair Value of Financial Instruments
The fair value of our financial instruments was determined using available market information and appropriate valuation methodologies as of December 31, 2007. Unless otherwise described below, all other financial instruments are carried at amounts which approximate their fair values.
Based on rates currently available to us for debt with similar terms and average maturities, fixed-rate debt with carrying values of $2.8 billion at both December 31, 2007 and 2006, have fair values of approximately $2.9 billion and $2.7 billion, respectively. The fair value of our variable-rate debt approximates its carrying values of $321.7 million and $115.4 million as of December 31, 2007 and 2006, respectively.
Note 18. Share Options and Awards
On January 1, 2006, we adopted SFAS No. 123(R), “Share-Based Payment,” which established accounting standards for all transactions in which an entity exchanges its equity instruments for goods and services. This accounting standard focuses primarily on equity transactions with employees. We began recording compensation expense on any unvested awards granted during the remaining vesting periods.
In 1988, we adopted a Share Option Plan that provided for the issuance of options and share awards up to a maximum of 1.6 million common shares of beneficial interest. This plan expired in December 1997, and no awards remain outstanding at December 31, 2007.
In 1992, we adopted the Employee Share Option Plan that grants 100 share options to every employee, excluding officers, upon completion of each five-year interval of service. This plan expires in 2012 and provides options for a maximum of 225,000 common shares of beneficial interest, of which .2 million is available for future grant of options or awards at December 31, 2007. Options granted under this plan are exercisable immediately.
In 1993, we adopted the Incentive Share Option Plan that provided for the issuance of up to 3.9 million common shares of beneficial interest, either in the form of restricted shares or share options. This plan expired in 2002, but some awards made pursuant to it remain outstanding as of December 31, 2007. The share options granted to non-officers vest over a three-year period beginning after the grant date, and for officers vest over a seven-year period beginning two years after the grant date. Restricted shares under this plan have multiple vesting periods. Prior to 2000, restricted shares generally vested over a 10 year period. Effective in 2000, the vesting period became five years. In addition, the vesting period for these restricted shares can be accelerated based on appreciation in the market share price. All restricted shares related to this plan vested prior to 2005.
In 2001, we adopted the Long-term Incentive Plan for the issuance of options and share awards. In 2006, the maximum number of common shares of beneficial interest issuable under this plan was increased to 4.8 million common shares of beneficial interest, of which 2.6 million is available for the future grant of options or awards at December 31, 2007. This plan expires in 2011. The share options granted to non-officers vest over a three-year period beginning after the grant date, and share options and restricted shares for officers vest over a five-year period after the grant date. Restricted shares granted to trust managers and options or awards granted to retirement eligible employees are expensed immediately.
The grant price for the Employee Share Option Plan is equal to the closing price of our common shares of beneficial interest on the date of grant. The grant price of the Long-term Incentive Plan is calculated as an average of the high and low of the quoted fair value of our common shares of beneficial interest on the date of grant. In both plans, these options expire upon termination of employment or 10 years from the date of grant. In the Long-term Incentive Plan, restricted shares for officers and trust managers are granted at no purchase price. Our policy is to recognize compensation expense for equity awards ratably over the vesting period, except for retirement eligible amounts. Compensation expense, net of forfeitures, associated with share options and restricted shares totaled $5.1 million in 2007, $4.9 million in 2006 and $1.7 million in 2005, of which $1.3 million in both 2007 and 2006 and $.5 million in 2005 was capitalized.
The fair value of share options and restricted shares is estimated on the date of grant using the Black-Scholes option pricing method based on the expected weighted average assumptions in the following table. The dividend yield is an average of the historical yields at each record date over the estimated expected life. We estimate volatility using our historical volatility data for a period of 10 years, and the expected life is based on historical data from an option valuation model of employee exercises and terminations. The risk-free rate is based on the U.S. Treasury yield curve in effect at the time of grant. The fair value and weighted average assumptions are as follows:
| | | Year Ended December 31, | |
| | | 2007 | | | 2006 | | | 2005 | |
| | | | | | | | | | |
| Fair value per share option | | $ | 4.29 | | | $ | 4.97 | | | $ | 3.02 | |
| Dividend yield | | | 5.5 | % | | | 5.7 | % | | | 6.3 | % |
| Expected volatility | | | 18.1 | % | | | 18.2 | % | | | 16.8 | % |
| Expected life (in years) | | | 6.0 | | | | 5.9 | | | | 6.7 | |
| Risk-free interest rate | | | 4.1 | % | | | 4.4 | % | | | 4.4 | % |
Following is a summary of the option activity for the three years ended December 31, 2007:
| | | | | | Weighted | |
| | | Shares | | | Average | |
| | | Under | | | Exercise | |
| | | Option | | | Price | |
| | | | | | | |
| Outstanding, January 1, 2005 | | | 3,011,790 | | | $ | 24.77 | |
| Granted | | | 537,319 | | | | 37.40 | |
| Forfeited or expired | | | (30,797 | ) | | | 28.10 | |
| Exercised | | | (338,666 | ) | | | 19.17 | |
| Outstanding, December 31, 2005 | | | 3,179,646 | | | | 27.47 | |
| Granted | | | 544,346 | | | | 47.41 | |
| Forfeited or expired | | | (65,996 | ) | | | 28.63 | |
| Exercised | | | (510,843 | ) | | | 20.73 | |
| Outstanding, December 31, 2006 | | | 3,147,153 | | | | 31.99 | |
| Granted | | | 7,821 | | | | 42.63 | |
| Forfeited or expired | | | (73,156 | ) | | | 35.78 | |
| Exercised | | | (241,528 | ) | | | 23.24 | |
| Outstanding, December 31, 2007 | | | 2,840,290 | | | $ | 32.66 | |
The total intrinsic value of options exercised was $5.0 million in 2007, $10.3 million in 2006 and $6.4 million in 2005. As of December 31, 2007 and 2006, there was approximately $3.3 million and $4.9 million, respectively, of total unrecognized compensation cost related to unvested share options, which is expected to be amortized over a weighted average of 2.0 years and 3.0 years, respectively.
The following table summarizes information about share options outstanding and exercisable at December 31, 2007:
| | | | Outstanding | | | Exercisable | |
| | | | | | Weighted | | | | | | | | | | | | | Weighted | | | |
| | | | | | Average | | Weighted | | | Aggregate | | | | | | Weighted | | Average | | Aggregate | |
| | | | | | Remaining | | Average | | | Intrinsic | | | | | | Average | | Remaining | | Intrinsic | |
| Range of | | | | | Contractual | | Exercise | | | Value | | | | | | Exercise | | Contractual | | Value | |
| Exercise Prices | | | Number | | Life | | Price | | | | (000’s) | | | Number | | | Price | | Life | | | (000’s) | |
| | | | | | | | | | | | | | | | | | | | | | | | |
| $ | 17.89 - $26.83 | | | | 1,059,744 | | 4.0 years | | $ | 21.95 | | | | | | | | 860,045 | | | $ | 21.55 | | 3.8 years | | | | |
| | | | | | | | | | | | | | | | | | | | | | | | | | | | | |
| $ | 26.84 - $40.26 | | | | 1,262,966 | | 7.0 years | | $ | 35.58 | | | | | | | | 818,749 | | | $ | 34.91 | | 6.8 years | | | | |
| | | | | | | | | | | | | | | | | | | | | | | | | | | | | |
| $ | 40.27 - $49.62 | | | | 517,580 | | 8.9 years | | $ | 47.47 | | | | | | | | 113,702 | | | $ | 47.46 | | 8.9 years | | | | |
| | | | | | | | | | | | | | | | | | | | | | | | | | | | | |
| Total | | | | 2,840,290 | | 6.2 years | | $ | 32.66 | | | $ | - | | | | 1,792,496 | | | $ | 29.30 | | 5.5 years | | $ | 3,836 | |
A summary of the status of unvested restricted shares for the ended December 31, 2007 is as follows:
| | | Unvested | | | Weighted | |
| | | Restricted | | | Average Grant | |
| | | Shares | | | Date Fair Value | |
| | | | | | | |
| Outstanding, January 1, 2007 | | | 172,255 | | | $ | 40.80 | |
| Granted | | | 10,412 | | | | 48.43 | |
| Vested | | | (55,841 | ) | | | 40.63 | |
| Forfeited | | | (9,287 | ) | | | 42.04 | |
| Outstanding, December 31, 2007 | | | 117,539 | | | $ | 41.45 | |
As of December 31, 2007 and 2006, there was approximately $4.4 million and $6.1 million, respectively, of total unrecognized compensation cost related to unvested restricted shares, which is expected to be amortized over a weighted average of 2.7 years and 3.7 years, respectively.
Note 19. Employee Benefit Plans
We have a Savings and Investment Plan pursuant to which eligible employees may elect to contribute from 1% of their salaries to the maximum amount established annually by the Internal Revenue Service. Employee contributions are matched by us at the rate of $.50 per $1.00 for the first 6% of the employee's salary. The employees vest in the employer contributions ratably over a six-year period. Compensation expense related to the plan was $1.0 million in 2007, $.8 million in 2006 and $.7 million in 2005.
We also have an Employee Share Purchase Plan under which .6 million of our common shares of beneficial interest have been authorized. These shares, as well as common shares of beneficial interest purchased by us on the open market, are made available for sale to employees at a discount of 15% from the quoted market price on the purchase date. Shares purchased by the employee under the plan are restricted from being sold for two years from the date of purchase or until termination of employment. A total of 30,437, 24,181 and 22,717 shares were purchased by employees at an average price of $33.49, $35.38 and $30.89 during 2007, 2006 and 2005, respectively.
Effective April 1, 2002, we converted a noncontributory pension plan to a noncontributory cash balance retirement plan ("Retirement Plan") under which each participant received an actuarially determined opening balance. Annual additions to each participant's account include a service credit ranging from 3-5% of compensation, depending on years of service, and an interest credit based on the ten-year US Treasury Bill rate. Vesting generally occurs after five years of service. Certain participants were grandfathered under the prior pension plan formula. In addition to the plan described above, effective September 1, 2002, we established two separate and independent nonqualified supplemental retirement plans ("SRP") for certain employees, the assets of which are held in a grantor trust. These unfunded plans provide benefits in excess of the statutory limits of our noncontributory cash balance retirement plan. Annual additions to each participant's account include a service credit ranging from 3-5% of compensation, depending on years of service, and an interest credit of 7.5%. Vesting generally occurs after five years of service. We have elected to use the actuarial present value of the vested benefits to which the participant is entitled if the participant separates immediately for the SRP, as defined in EITF 88-1, "Determination of Vested Benefit Obligation for a Defined Benefit Pension Plan."
At December 31, 2006, we adopted SFAS No. 158, “Employers’ Accounting for Defined Benefit Pension and Other Postretirement Plans.” As a result of the adoption we recognized additional minimum liability directly to accumulated other comprehensive income of $803,000.
The estimated net loss, prior service cost, and transition obligation that will be amortized from accumulated other comprehensive income into net periodic benefit cost over the next fiscal year are $183,000, ($117,000) and zero, respectively.
The following tables summarize changes in the benefit obligation, the plan assets and the funded status of our pension plans as well as the components of net periodic benefit costs, including key assumptions. The measurement dates for plan assets and obligations were December 31, 2007 and 2006.
| | | Fiscal Year End | |
| | | 2007 | | | 2006 | |
| Change in Projected Benefit Obligation: | | | | | | |
| Benefit obligation at beginning of year | | $ | 38,997 | | | $ | 32,456 | |
| Service cost | | | 3,846 | | | | 3,090 | |
| Interest cost | | | 2,175 | | | | 2,309 | |
| Plan amendments | | | | | | | 63 | |
| Actuarial (gains) losses | | | (1,325 | ) | | | 1,882 | |
| Benefit payments | | | (2,610 | ) | | | (803 | ) |
| Benefit obligation at end of year | | $ | 41,083 | | | $ | 38,997 | |
| | | | | | | | | |
| Change in Plan Assets: | | | | | | | | |
| Fair value of plan assets at beginning of year | | $ | 17,933 | | | $ | 15,213 | |
| Actual return on plan assets | | | 1,185 | | | | 1,901 | |
| Employer contributions | | | 3,926 | | | | 1,622 | |
| Benefit payments | | | (2,610 | ) | | | (803 | ) |
| Fair value of plan assets at end of year | | $ | 20,434 | | | $ | 17,933 | |
| | | | | | | | | |
| Unfunded Status at End of Year: | | $ | 20,649 | | | $ | 21,064 | |
| | | | | | | | | |
| Accumulated benefit obligation | | $ | 40,101 | | | $ | 38,194 | |
| | | | | | | | | |
| Amounts recognized in accumulated other comprehensive loss consist of: | | | | | | | | |
| Net loss | | $ | 4,287 | | | $ | 5,565 | |
| Prior service credit | | | (587 | ) | | | (704 | ) |
| Total amount recognized | | $ | 3,700 | | | $ | 4,861 | |
The following is the required information for plans with an accumulated benefit obligation in excess of plan assets at each year end:
| | | 2007 | | | 2006 | |
| | | | | | | | | |
| Projected benefit obligation | | $ | 41,083 | | | $ | 38,997 | |
| Accumulated benefit obligation | | | 40,101 | | | | 38,194 | |
| Fair value of plan assets | | | 20,434 | | | | 17,933 | |
At December 31, 2007 and 2006, the Retirement Plan was underfunded by $2.7 million and $4.8 million, respectively, and the SRP was underfunded by $17.9 million and $16.3 million, respectively.
The following is the required information for other changes in plan assets and benefit obligations recognized in other comprehensive income:
| | | 2007 | | | 2006 | | | 2005 | |
| | | | | | | | | | |
| Net gain | | $ | (925 | ) | | | N/A | | | | N/A | |
| Amortization of net gain | | | (353 | ) | | | N/A | | | | N/A | |
| Amortization of prior service cost | | | 117 | | | | N/A | | | | N/A | |
| | | | | | | | | | | | | |
| Total recognized in other comprehensive income | | $ | (1,161 | ) | | | N/A | | | | N/A | |
| | | | | | | | | | | | | |
| Total recognized in net periodic benefit costs and other comprehensive income | | $ | 3,511 | | | | N/A | | | | N/A | |
The components of net periodic benefit cost for both plans are as follows (in thousands):
| | | 2007 | | | 2006 | | | 2005 | |
| | | | | | | | | | |
| Service cost | | $ | 3,846 | | | $ | 3,090 | | | $ | 2,641 | |
| Interest cost | | | 2,175 | | | | 2,309 | | | | 1,724 | |
| Expected return on plan assets | | | (1,500 | ) | | | (1,385 | ) | | | (1,192 | ) |
| Prior service cost | | | (117 | ) | | | (128 | ) | | | (128 | ) |
| Recognized loss | | | 269 | | | | 407 | | | | 159 | |
| | | | | | | | | | | | | |
| Total | | $ | 4,673 | | | $ | 4,293 | | | $ | 3,204 | |
The assumptions used to develop periodic expense for both plans are shown below:
| | | 2007 | | | 2006 | | | 2005 | |
| | | | | | | | | | |
| Discount rate – Retirement Plan | | | 5.75 | % | | | 5.75 | % | | | 6.00 | % |
| Salary scale increases – Retirement Plan | | | 4.00 | % | | | 4.00 | % | | | 4.00 | % |
| Salary scale increases – SRP | | | 5.00 | % | | | 5.00 | % | | | 5.00 | % |
| Long-term rate of return on assets – Retirement Plan | | | 8.50 | % | | | 8.50 | % | | | 8.50 | % |
The selection of the discount rate follows the guidance provided in SFAS No. 87, "Employers' Accounting for Pensions." The selection of the discount rate is made annually after comparison to yields based on high quality fixed-income investments. The salary scale is the composite rate which reflects anticipated inflation, merit increases, and promotions for the group of covered participants. The long-term rate of return is a composite rate for the trust. It is derived as the sum of the percentages invested in each principal asset class included in the portfolio multiplied by their respective expected rates of return. We considered the historical returns and the future expectations for returns for each asset class, as well as the target asset allocation of the pension portfolio. This analysis resulted in the selection of 8.50% as the long-term rate of return assumption for 2007.
The assumptions used to develop the actuarial present value of the benefit obligations at year-end for both plans are shown below:
| | | 2007 | | | 2006 | | | 2005 | |
| | | | | | | | | | |
| Discount rate – Retirement Plan | | | 6.25 | % | | | 5.75 | % | | | 5.75 | % |
| Salary scale increases – Retirement Plan | | | 4.00 | % | | | 4.00 | % | | | 4.00 | % |
| Salary scale increases – SRP | | | 5.00 | % | | | 5.00 | % | | | 5.00 | % |
The expected contribution to be paid for both plans by us during 2008 is approximately $5.5 million, of which $2.5 million relates to the Retirement Plan. The expected benefit payments for the next ten years for both plans are as follows, in millions: $.7 in 2008; $7.0 in 2009; $.8 in 2010; $.8 in 2011, $2.5 in 2012 and $9.3 in 2013 through 2017.
The participant data used in determining the liabilities and costs was collected as of January 1, 2007.
The allocation of the fair value of plan assets as provided by the plan trustee was as follows (in thousands):
| | | December 31, | |
| | | 2007 | | | 2006 | |
| | | | | | | |
| Cash and short-term investments | | | 3 | % | | | 3 | % |
| Mutual funds – equity | | | 69 | % | | | 69 | % |
| Mutual funds – fixed income | | | 28 | % | | | 28 | % |
| | | | | | | | | |
| Total | | | 100 | % | | | 100 | % |
Our investment policy and strategy for plan assets require that plan assets be allocated based on a "Broad Market Diversification" model. Approximately 70% of plan assets are allocated to equity investments and 30% to fixed income investments. On a quarterly basis, the plan assets are reviewed in an effort to maintain this asset allocation. Selected investment funds are monitored as reasonably necessary to permit our Investment Committee to evaluate any material changes to the investment fund's performance.
We also have a deferred compensation plan for eligible employees allowing them to defer portions of their current cash salary or share-based compensation. Deferred amounts are deposited in a grantor trust, which are included in Other Assets, and are reported as compensation expense in the year service is rendered. Cash deferrals are invested based on the employee’s investment selections from a mix of assets based on a “Broad Market Diversification” model. Deferred share-based compensation cannot be diversified, and distributions from this plan are made in the same form as the original deferral.
Note 20. Segment Information
The reportable segments presented are the segments for which separate financial information is available, and for which operating performance is evaluated regularly by senior management in deciding how to allocate resources and in assessing performance. We evaluate the performance of the reportable segments based on net operating income, defined as total revenues less operating expenses and ad valorem taxes. Management does not consider the effect of gains or losses from the sale of property in evaluating segment operating performance.
The shopping center segment is engaged in the acquisition, development and management of real estate, primarily anchored neighborhood and community shopping centers located in Arizona, Arkansas, California, Colorado, Florida, Illinois, Georgia, Kansas, Kentucky, Louisiana, Maine, Missouri, Nevada, New Mexico, North Carolina, Oklahoma, Oregon, South Carolina, Tennessee, Texas, Utah and Washington. The customer base includes supermarkets, discount retailers, drugstores and other retailers who generally sell basic necessity-type commodities. The industrial segment is engaged in the acquisition, development and management of bulk warehouses and office/service centers. Its properties are located in California, Florida, Georgia, Tennessee, Texas and Virginia, and the customer base is diverse. Included in "Other" are corporate-related items, insignificant operations and costs that are not allocated to the reportable segments.
Information concerning our reportable segments is as follows (in thousands):
| | | Shopping | | | | | | | | | | |
| | | Center | | | Industrial | | | Other | | | Total | |
| | | | | | | | | | | | | |
| Year Ended December 31, 2007: | | | | | | | | | | | | |
| Revenues | | $ | 533,815 | | | $ | 54,355 | | | $ | 10,884 | | | $ | 599,054 | |
| Net Operating Income | | | 382,092 | | | | 37,610 | | | | 4,533 | | | | 424,235 | |
| Equity in Earnings of Real Estate Joint Ventures and Partnerships, net | | | 18,309 | | | | 1,348 | | | | 196 | | | | 19,853 | |
| Capital Expenditures | | | 771,590 | | | | 91,881 | | | | 24,874 | | | | 888,345 | |
| | | | | | | | | | | | | | | | | |
| Year Ended December 31, 2006: | | | | | | | | | | | | | | | | |
| Revenues | | $ | 481,388 | | | $ | 54,118 | | | $ | 2,688 | | | $ | 538,194 | |
| Net Operating Income (Loss) | | | 350,145 | | | | 37,784 | | | | (405 | ) | | | 387,524 | |
| Equity in Earnings of Real Estate Joint Ventures and Partnerships, net | | | 13,713 | | | | 377 | | | | 565 | | | | 14,655 | |
| Capital Expenditures | | | 920,017 | | | | 96,504 | | | | 5,582 | | | | 1,022,103 | |
| | | | | | | | | | | | | | | | | |
| Year Ended December 31, 2005: | | | | | | | | | | | | | | | | |
| Revenues | | $ | 439,005 | | | $ | 46,715 | | | $ | 2,136 | | | $ | 487,856 | |
| Net Operating Income | | | 323,861 | | | | 33,711 | | | | 885 | | | | 358,457 | |
| Equity in Earnings (Loss) of Real Estate Joint Ventures and Partnerships, net | | | 6,533 | | | | 87 | | | | (10 | ) | | | 6,610 | |
| Capital Expenditures | | | 339,328 | | | | 89,066 | | | | 646 | | | | 429,040 | |
| | | | | | | | | | | | | | | | | |
| As of December 31, 2007: | | | | | | | | | | | | | | | | |
| Investment in Real Estate Joint Ventures and Partnerships | | $ | 261,293 | | | $ | 35,103 | | | $ | 4,360 | | | $ | 300,756 | |
| Total Assets | | | 3,908,105 | | | | 353,157 | | | | 732,081 | | | | 4,993,343 | |
| | | | | | | | | | | | | | | | | |
| As of December 31, 2006: | | | | | | | | | | | | | | | | |
| Investment in Real Estate Joint Ventures and Partnerships | | $ | 174,587 | | | $ | 25,156 | | | $ | 4,096 | | | $ | 203,839 | |
| Total Assets | | | 3,516,080 | | | | 324,343 | | | | 533,464 | | | | 4,373,887 | |
| | | | | | | | | | | | | | | | | |
| As of December 31, 2005 | | | | | | | | | | | | | | | | |
| Investment in Real Estate Joint Ventures and Partnerships | | $ | 82,092 | | | $ | 480 | | | $ | 1,776 | | | $ | 84,348 | |
| Total Assets | | | 3,035,964 | | | | 355,848 | | | | 345,929 | | | | 3,737,741 | |
Net operating income reconciles to Income from Continuing Operations as shown on the Statements of Consolidated Income and Comprehensive Income as follows (in thousands):
| | | 2007 | | | 2006 | | | 2005 | |
| | | | | | | | | | |
| Total Segment Net Operating Income | | $ | 424,235 | | | $ | 387,524 | | | $ | 358,457 | |
| Depreciation and Amortization | | | (131,708 | ) | | | (121,471 | ) | | | (110,956 | ) |
| General and Administrative | | | (26,979 | ) | | | (23,801 | ) | | | (17,379 | ) |
| Interest Expense | | | (148,829 | ) | | | (145,374 | ) | | | (129,160 | ) |
| Interest and Other Income | | | 8,486 | | | | 9,044 | | | | 2,860 | |
Equity in Earnings of Real Estate Joint Ventures and Partnerships, net | | | 19,853 | | | | 14,655 | | | | 6,610 | |
| Income Allocated to Minority Interests | | | (10,237 | ) | | | (6,414 | ) | | | (6,060 | ) |
| Gain on Land and Merchant Development Sales | | | 16,385 | | | | 7,166 | | | | 804 | |
| Gain on Sale of Properties | | | 4,086 | | | | 22,493 | | | | 22,306 | |
| Provision for Income Taxes | | | (4,073 | ) | | | (1,366 | ) | | | | |
| Income from Continuing Operations | | $ | 151,219 | | | $ | 142,456 | | | $ | 127,482 | |
Note 21. Quarterly Financial Data (Unaudited)
Summarized quarterly financial data is as follows (in thousands):
| | | First | | Second | | | | Third | | | | Fourth | | | |
| | | | | | | | | | | | | | | | |
| 2007: | | | | | | | | | | | | | | | |
| Revenues (2) | | $ | 143,507 | | $ | 145,027 | | | | $ | 156,116 | | | | $ | 154,404 | | | |
| Net income available to common shareholders | | | 46,657 | | | 70,002 | | (1) | | | 38,281 | | | | | 57,702 | | (1) | |
| Net income per common share – basic | | | 0.61 | | | 0.81 | | (1) | | | 0.45 | | | | | 0.68 | | (1) | |
| Net income per common share – diluted | | | 0.53 | | | 0.79 | | (1) | | | 0.44 | | | | | 0.67 | | (1) | |
| | | | | | | | | | | | | | | | | | | | |
| 2006: | | | | | | | | | | | | | | | | | | | |
| Revenues (2) | | $ | 128,300 | | $ | 130,621 | | | | $ | 138,557 | | | | $ | 140,716 | | | |
| Net income available to common shareholders | | | 52,084 | | | 87,741 | | (1) | | | 103,223 | | (1) | | | 51,861 | | | |
| Net income per common share – basic | | | 0.58 | | | 0.98 | | (1) | | | 1.19 | | (1) | | | 0.61 | | | |
| Net income per common share – diluted | | | 0.57 | | | 0.95 | | (1) | | | 1.15 | | (1) | | | 0.59 | | | |
| | (1) | The quarter results include gains on the sale of properties. |
| | (2) | Revenues from the sale of operating properties have been reclassified and reported as operating income from discontinued operations for all periods presented. |
****
Not applicable
Under the supervision and with the participation of our principal executive officer and principal financial officer, management has evaluated the effectiveness of the design and operation of our disclosure controls and procedures (as defined in Rule 13a-15(e) and 15d-15(e) of the Securities Exchange Act of 1934) as of December 31, 2007. Based on that evaluation, our principal executive officer and our principal financial officer have concluded that our disclosure controls and procedures were effective as of December 31, 2007.
There has been no change to our internal control over financial reporting during the quarter ended December 31, 2007 that has materially affected, or is reasonably likely to materially affect, our internal control over financial reporting.
MANAGEMENT'S REPORT ON INTERNAL CONTROL OVER FINANCIAL REPORTING
Weingarten Realty Investors and its subsidiaries ("WRI") maintain a system of internal control over financial reporting, as defined in Rules 13a-15(f) and 15d-15(f) under the Securities Exchange Act, which is a process designed under the supervision of the WRI's principal executive officer and principal financial officer and effected by WRI's Board of Trust Managers, management and other personnel, to provide reasonable assurance regarding the reliability of financial reporting and the preparation of financial statements for external purposes in accordance with generally accepted accounting principles.
WRI's internal control over financial reporting includes those policies and procedures that:
§ Pertain to the maintenance of records that in reasonable detail accurately and fairly reflect the transactions and dispositions of WRI's assets;
§ Provide reasonable assurance that transactions are recorded as necessary to permit preparation of financial statements in accordance with generally accepted accounting principles, and that receipts and expenditures of WRI are being made only in accordance with authorizations of management and trust managers of WRI; and
§ Provide reasonable assurance regarding prevention or timely detection of unauthorized acquisition, use or disposition of WRI's assets that could have a material effect on the financial statements.
WRI's management has responsibility for establishing and maintaining adequate internal control over financial reporting for WRI. Management, with the participation of WRI's Chief Executive Officer and Chief Financial Officer, conducted an evaluation of the effectiveness of WRI's internal control over financial reporting as of December 31, 2007 based on the framework in Internal Control—Integrated Framework issued by the Committee of Sponsoring Organizations of the Treadway Commission.
Based on their evaluation of WRI's internal control over financial reporting, WRI's management along with the Chief Executive and Chief Financial Officers believe that WRI's internal control over financial reporting is effective as of December 31, 2007.
Deloitte & Touche LLP, WRI's independent registered public accounting firm that audited the consolidated financial statements and financial statement schedules included in this Form 10-K, has issued an attestation report on the effectiveness of WRI's internal control over financial reporting.
February 29, 2008
REPORT OF INDEPENDENT REGISTERED PUBLIC ACCOUNTING FIRM
To the Board of Trust Managers and Shareholders of
Weingarten Realty Investors
Houston, Texas
We have audited the internal control over financial reporting of Weingarten Realty Investors and subsidiaries (the "Company") as of December 31, 2007, based on criteria established in Internal Control — Integrated Framework issued by the Committee of Sponsoring Organizations of the Treadway Commission. The Company's management is responsible for maintaining effective internal control over financial reporting and for its assessment of the effectiveness of internal control over financial reporting, included in the accompanying Management’s Report On Internal Control Over Financial Reporting. Our responsibility is to express an opinion on the Company's internal control over financial reporting based on our audit.
We conducted our audit in accordance with the standards of the Public Company Accounting Oversight Board (United States). Those standards require that we plan and perform the audit to obtain reasonable assurance about whether effective internal control over financial reporting was maintained in all material respects. Our audit included obtaining an understanding of internal control over financial reporting, assessing the risk that a material weakness exists, testing and evaluating the design and operating effectiveness of internal control based on the assessed risk, and performing such other procedures as we considered necessary in the circumstances. We believe that our audit provides a reasonable basis for our opinion.
A company's internal control over financial reporting is a process designed by, or under the supervision of, the company's principal executive and principal financial officers, or persons performing similar functions, and effected by the company's board of directors, management, and other personnel to provide reasonable assurance regarding the reliability of financial reporting and the preparation of financial statements for external purposes in accordance with generally accepted accounting principles. A company's internal control over financial reporting includes those policies and procedures that (1) pertain to the maintenance of records that, in reasonable detail, accurately and fairly reflect the transactions and dispositions of the assets of the company; (2) provide reasonable assurance that transactions are recorded as necessary to permit preparation of financial statements in accordance with generally accepted accounting principles, and that receipts and expenditures of the company are being made only in accordance with authorizations of management and directors of the company; and (3) provide reasonable assurance regarding prevention or timely detection of unauthorized acquisition, use, or disposition of the company's assets that could have a material effect on the financial statements.
Because of the inherent limitations of internal control over financial reporting, including the possibility of collusion or improper management override of controls, material misstatements due to error or fraud may not be prevented or detected on a timely basis. Also, projections of any evaluation of the effectiveness of the internal control over financial reporting to future periods are subject to the risk that the controls may become inadequate because of changes in conditions, or that the degree of compliance with the policies or procedures may deteriorate.
In our opinion, the Company maintained, in all material respects, effective internal control over financial reporting as of December 31, 2007, based on the criteria established in Internal Control — Integrated Framework issued by the Committee of Sponsoring Organizations of the Treadway Commission.
We have also audited, in accordance with the standards of the Public Company Accounting Oversight Board (United States), the consolidated financial statements and consolidated financial statement schedules as of and for the year ended December 31, 2007 of the Company and our reports dated February 29, 2008 expressed unqualified opinions on those financial statements and financial statement schedules.
/s/Deloitte & Touche LLP
Houston, Texas
February 29, 2008
Not applicable.
PART III
Information with respect to our trust managers and executive officers is incorporated herein by reference to the "Election of Trust Managers," "Executive Officers" and “Share Ownership of Certain Beneficial Owners and Management—Section 16(a) Beneficial Ownership Reporting Compliance” sections of our definitive Proxy Statement for the Annual Meeting of Shareholders to be held May 7, 2008.
Code of Ethics
We have adopted a code of business and ethics for trust managers, officers and employees, known as the Code of Conduct and Ethics. The Code of Conduct and Ethics is available on our website at www.weingarten.com. Shareholders may request a free copy of the Code of Conduct and Ethics from:
Weingarten Realty Investors
Attention: Investor Relations
2600 Citadel Plaza Drive, Suite 300
Houston, Texas 77008
(713) 866-6000
www.weingarten.com
We have also adopted a Code of Conduct for Financial Managers setting forth a code of ethics applicable to our principal executive officer, principal financial officer and financial managers, which is available on our website at www.weingarten.com. Shareholders may request a free copy of the Code of Conduct for Financial Managers from the address and phone number set forth above.
Governance Guidelines
We have adopted Trust Managers Governance Guidelines, which are available on our website at www.weingarten.com. Shareholders may request a free copy of the Trust Managers Governance Guidelines from the address and phone number set forth above under "—Code of Ethics."
Information with respect to executive compensation is incorporated herein by reference to the “Executive Compensation”, “Election of Trust Managers”, “Trust Manager Compensation Table” and “Compensation Committee Report” sections of our definitive Proxy Statement for the Annual Meeting of Shareholders to be held May 7, 2008.
The "Share Ownership of Certain Beneficial Owners and Management" section of our definitive Proxy Statement for the Annual Meeting of Shareholders to be held May 7, 2008 is incorporated herein by reference.
The following table summarizes the equity compensation plans under which our common shares of beneficial interest may be issued as of December 31, 2007:
| | | Number of shares to | | Weighted average | | |
| | | be issued upon exercise | | exercise price of | | Number of shares |
| | | of outstanding options, | | outstanding options, | | remaining available |
| Plan category | | warrants and rights | | warrants and rights | | for future issuance |
| | | | | | | |
| Equity compensation plans approved by shareholders | | 2,840,290 | | $ 32.66 | | 2,626,360 |
| | | | | | | |
| Equity compensation plans not approved by shareholders | | ― | | ― | | ― |
| | | | | | | |
| Total | | 2,840,290 | | $ 32.66 | | 2,626,360 |
The “Corporate Governance – Independence of Trust Managers and Committee Members”, “Compensation Committee Interlocks and Insider Participation" and “Certain Transactions” sections of our definitive Proxy Statement for the Annual Meeting of Shareholders to be held May 7, 2008 are incorporated herein by reference.
The "Independent Registered Public Accounting Firm Fees" section within “Proposal Two –Ratification of Independent Registered Public Accounting Firm” of our definitive Proxy Statement for the Annual Meeting of Shareholders to be held May 7, 2008 is incorporated herein by reference.
PART IV
| (a) | | Financial Statements and Financial Statement Schedules: | Page |
| | | | | |
| | (1) | (A) | | 49 |
| | | (B) | Financial Statements | |
| | | | (i) | | 50 |
| | | | (ii) | | 51 |
| | | | (iii) | | 52 |
| | | | (iv) | | 53 |
| | | | (v) | | 54 |
| | (2) | Financial Statement Schedules: |
| | | | | |
| | | | 91 |
| | | Schedule | |
| | | |
| | | | II | | 92 |
| | | | III | | 93 |
| | | | IV | | 95 |
All other schedules are omitted since the required information is not present or is not present in amounts sufficient to require submission of the schedule or because the information required is included in the consolidated financial statements and notes hereto.
| | | |
| (b) | | Exhibits: |
| | | |
| 3.1 | — | Restated Declaration of Trust (filed as Exhibit 3.1 to WRI's Registration Statement on Form 8-A dated January 19, 1999 and incorporated herein by reference). |
| 3.2 | — | Amendment of the Restated Declaration of Trust (filed as Exhibit 3.2 to WRI's Registration Statement on Form 8-A dated January 19, 1999 and incorporated herein by reference). |
| 3.3 | — | Second Amendment of the Restated Declaration of Trust (filed as Exhibit 3.3 to WRI's Registration Statement on Form 8-A dated January 19, 1999 and incorporated herein by reference). |
| 3.4 | — | Third Amendment of the Restated Declaration of Trust (filed as Exhibit 3.4 to WRI's Registration Statement on Form 8-A dated January 19, 1999 and incorporated herein by reference). |
| 3.5 | — | Fourth Amendment of the Restated Declaration of Trust dated April 28, 1999 (filed as Exhibit 3.5 to WRI's Annual Report on Form 10-K for the year ended December 31, 2001 and incorporated herein by reference). |
| 3.6 | — | Fifth Amendment of the Restated Declaration of Trust dated April 20, 2001 (filed as Exhibit 3.6 to WRI's Annual Report on Form 10-K for the year ended December 31, 2001 and incorporated herein by reference). |
| 3.7 | — | Amended and Restated Bylaws of WRI (filed as Exhibit 99.2 to WRI's Registration Statement on Form 8-A dated February 23, 1998 and incorporated herein by reference). |
| 3.8 | — | Amendment of Bylaws-Direct Registration System, Section 7.2(a) dated May 3, 2007 (filed as Exhibit 3.8 to WRI’s Form 10-Q for the quarter ended June 30, 2007 and incorporated herein by reference). |
| 4.1 | — | Subordinated Indenture dated as of May 1, 1995 between WRI and Chase Bank of Texas, National Association (formerly, Texas Commerce Bank National Association) (filed as Exhibit 4(a) to WRI's Registration Statement on Form S-3 (No. 33-57659) and incorporated herein by reference). |
| 4.2 | — | Subordinated Indenture dated as of May 1, 1995 between WRI and Chase Bank of Texas, National Association (formerly, Texas Commerce Bank National Association) (filed as Exhibit 4(b) to WRI's Registration Statement on Form S-3 (No. 33-57659) and incorporated herein by reference). |
| 4.3 | — | Form of Fixed Rate Senior Medium Term Note (filed as Exhibit 4.19 to WRI’s Annual Report on Form 10-K for the year ended December 31, 1998 and incorporated herein by reference). |
| 4.4 | — | Form of Floating Rate Senior Medium Term Note (filed as Exhibit 4.20 to WRI’s Annual Report on Form 10-K for the year ended December 31, 1998 and incorporated herein by reference). |
| 4.5 | — | Form of Fixed Rate Subordinated Medium Term Note (filed as Exhibit 4.21 to WRI’s Annual Report on Form 10-K for the year ended December 31, 1998 and incorporated herein by reference). |
| 4.6 | — | Form of Floating Rate Subordinated Medium Term Note (filed as Exhibit 4.22 to WRI’s Annual Report on Form 10-K for the year ended December 31, 1998 and incorporated herein by reference). |
| 4.7 | — | Statement of Designation of 6.75% Series D Cumulative Redeemable Preferred Shares (filed as Exhibit 3.1 to WRI’s Registration Statement on Form 8-A dated April 17, 2003 and incorporated herein by reference). |
| 4.8 | — | Statement of Designation of 6.95% Series E Cumulative Redeemable Preferred Shares (filed as Exhibit 3.1 to WRI’s Registration Statement on Form 8-A dated July 8, 2004 and incorporated herein by reference). |
| 4.9 | — | Statement of Designation of 6.50% Series F Cumulative Redeemable Preferred Shares (filed as Exhibit 3.1 to WRI’s Registration Statement on Form 8-A dated January 29, 2007 and incorporated herein by reference). |
| 4.10 | — | Statement of Designation of Adjustable Rate Series G Cumulative Redeemable Preferred Shares (filed as Exhibit 3.1 to WRI’s Form 8-K dated September 25, 2007 and incorporated herein by reference). |
| 4.11 | — | 6.75% Series D Cumulative Redeemable Preferred Share Certificate (filed as Exhibit 4.2 to WRI’s Registration Statement on Form 8-A dated April 17, 2003 and incorporated herein by reference). |
| 4.12 | — | 6.95% Series E Cumulative Redeemable Preferred Share Certificate (filed as Exhibit 4.2 to WRI’s Registration Statement on Form 8-A dated July 8, 2004 and incorporated herein by reference). |
| 4.13 | — | 6.50% Series F Cumulative Redeemable Preferred Share Certificate (filed as Exhibit 4.2 to WRI’s Registration Statement on Form 8-A dated January 29, 2007 and incorporated herein by reference). |
| 4.14 | — | Form of Receipt for Depositary Shares, each representing 1/30 of a share of 6.75% Series D Cumulative Redeemable Preferred Shares, par value $.03 per share (filed as Exhibit 4.3 to WRI’s Registration Statement on Form 8-A dated April 17, 2003 and incorporated herein by reference). |
| 4.15 | — | Form of Receipt for Depositary Shares, each representing 1/100 of a share of 6.95% Series E Cumulative Redeemable Preferred Shares, par value $.03 per share (filed as Exhibit 4.3 to WRI’s Registration Statement on Form 8-A dated July 8, 2004 and incorporated herein by reference). |
| 4.16 | — | Form of Receipt for Depositary Shares, each representing 1/100 of a share of 6.50% Series F Cumulative Redeemable Preferred Shares, par value $.03 per share (filed as Exhibit 4.3 to WRI’s Registration Statement on Form 8-A dated January 29, 2007 and incorporated herein by reference). |
| 4.17 | — | Purchase Agreement for Depositary Shares, each representing 1/100 of a share of Adjustable Rate Series G Cumulative Redeemable Preferred Shares, par value $.03 per share (filed as Exhibit 10.1 to WRI’s Form 8-K dated September 25, 2007 and incorporated herein by reference). |
| 4.18 | — | Form of 7% Notes due 2011 (filed as Exhibit 4.17 to WRI’s Annual Report on Form 10-K for the year ended December 31, 2001 and incorporated herein by reference). |
| 4.19 | — | Form of 3.95% Convertible Senior Notes due 2026 (filed as Exhibit 4.2 to WRI’s Form 8-K on August 2, 2006 and incorporated herein by reference). |
| 10.1† | — | 1988 Share Option Plan of WRI, as amended (filed as Exhibit 10.1 to WRI’s Annual Report on Form 10-K for the year ended December 31, 1990 and incorporated herein by reference). |
| 10.2† | — | The Savings and Investment Plan for Employees of Weingarten Realty Investors dated December 17, 2003 (filed as Exhibit 10.34 on WRI’s Annual Report on Form 10-K for the year ended December 31, 2005 and incorporated herein by reference). |
| 10.3† | — | The Savings and Investment Plan for Employees of WRI, as amended (filed as Exhibit 4.1 to WRI’s Registration Statement on Form S-8 (No. 33-25581) and incorporated herein by reference). |
| 10.4† | — | First Amendment to the Savings and Investment Plan for Employees of Weingarten Realty Investors dated August 1, 2005 (filed as Exhibit 10.25 on WRI’s Form 10-Q for the quarter ended September 30, 2005 and incorporated herein by reference). |
| 10.5† | — | The Fifth Amendment to Savings and Investment Plan for Employees of WRI (filed as Exhibit 4.1.1 to WRI’s Post-Effective Amendment No. 1 to Registration Statement on Form S-8 (No. 33-25581) and incorporated herein by reference). |
| 10.6† | — | Mandatory Distribution Amendment for the Savings and Investment Plan for Employees of Weingarten Realty Investors dated August 1, 2005 (filed as Exhibit 10.26 on WRI’s Form 10-Q for the quarter ended September 30, 2005 and incorporated herein by reference). |
| 10.7† | — | The 1993 Incentive Share Plan of WRI (filed as Exhibit 4.1 to WRI’s Registration Statement on Form S-8 (No. 33-52473) and incorporated herein by reference). |
| 10.8† | — | 1999 WRI Employee Share Purchase Plan (filed as Exhibit 10.6 to WRI’s Annual Report on Form 10-K for the year ended December 31, 1999 and incorporated herein by reference). |
| 10.9† | — | 2001 Long Term Incentive Plan (filed as Exhibit 10.7 to WRI’s Annual Report on Form 10-K for the year ended December 31, 2001 and incorporated herein by reference). |
| 10.10 | — | Master Promissory Note in the amount of $20,000,000 between WRI, as payee, and Chase Bank of Texas, National Association (formerly, Texas Commerce Bank National Association), as maker, effective December 30, 1998 (filed as Exhibit 4.15 to WRI’s Annual Report on Form 10-K for the year ended December 31, 1999 and incorporated herein by reference). |
| 10.11† | — | Weingarten Realty Retirement Plan restated effective April 1, 2002 (filed as Exhibit 10.29 on WRI’s Annual Report on Form 10-K for the year ended December 31, 2005 and incorporated herein by reference). |
| 10.12† | — | First Amendment to the Weingarten Realty Retirement Plan, dated December 31, 2003 (filed as Exhibit 10.33 on WRI’s Annual Report on Form 10-K for the year ended December 31, 2005 and incorporated herein by reference). |
| 10.13† | — | First Amendment to the Weingarten Realty Pension Plan, dated August 1, 2005 (filed as Exhibit 10.27 on WRI’s Form 10-Q for the quarter ended September 30, 2005 and incorporated herein by reference). |
| 10.14† | — | Mandatory Distribution Amendment for the Weingarten Realty Retirement Plan dated August 1, 2005 (filed as Exhibit 10.28 on WRI’s Form 10-Q for the quarter ended September 30, 2005 and incorporated herein by reference). |
| 10.15† | — | Weingarten Realty Investors Supplemental Executive Retirement Plan amended and restated effective September 1, 2002 (filed as Exhibit 10.10 on WRI’s Form 10-Q for the quarter ended June 30, 2005 and incorporated herein by reference). |
| 10.16† | — | First Amendment to the Weingarten Realty Investors Supplemental Executive Retirement Plan amended on November 3, 2003 (filed as Exhibit 10.11 on WRI’s Form 10-Q for the quarter ended June 30, 2005 and incorporated herein by reference). |
| 10.17† | — | Second Amendment to the Weingarten Realty Investors Supplemental Executive Retirement Plan amended October 22, 2004 (filed as Exhibit 10.12 on WRI’s Form 10-Q for the quarter ended June 30, 2005 and incorporated herein by reference). |
| 10.18† | — | Third Amendment to the Weingarten Realty Investors Supplemental Executive Retirement Plan amended October 22, 2004 (filed as Exhibit 10.13 on WRI’s Form 10-Q for the quarter ended June 30, 2005 and incorporated herein by reference). |
| 10.19† | — | Weingarten Realty Investors Retirement Benefit Restoration Plan adopted effective September 1, 2002 (filed as Exhibit 10.14 on WRI’s Form 10-Q for the quarter ended June 30, 2005 and incorporated herein by reference). |
| 10.20† | — | First Amendment to the Weingarten Realty Investors Retirement Benefit Restoration Plan amended on November 3, 2003 (filed as Exhibit 10.15 on WRI’s Form 10-Q for the quarter ended June 30, 2005 and incorporated herein by reference). |
| 10.21† | — | Second Amendment to the Weingarten Realty Investors Retirement Benefit Restoration Plan amended October 22, 2004 (filed as Exhibit 10.16 on WRI’s Form 10-Q for the quarter ended June 30, 2005 and incorporated herein by reference). |
| 10.22† | — | Third Amendment to the Weingarten Realty Pension Plan dated December 23, 2005 (filed as Exhibit 10.30 on WRI’s Annual Report on Form 10-K for the year ended December 31, 2005 and incorporated herein by reference). |
| 10.23† | — | Weingarten Realty Investors Deferred Compensation Plan amended and restated as a separate and independent plan effective September 1, 2002 (filed as Exhibit 10.17 on WRI’s Form 10-Q for the quarter ended June 30, 2005 and incorporated herein by reference). |
| 10.24† | — | Supplement to the Weingarten Realty Investors Deferred Compensation Plan amended on April 25, 2003 (filed as Exhibit 10.18 on WRI’s Form 10-Q for the quarter ended June 30, 2005 and incorporated herein by reference). |
| 10.25† | — | First Amendment to the Weingarten Realty Investors Deferred Compensation Plan amended on November 3, 2003 (filed as Exhibit 10.19 on WRI’s Form 10-Q for the quarter ended June 30, 2005 and incorporated herein by reference). |
| 10.26† | — | Second Amendment to the Weingarten Realty Investors Deferred Compensation Plan, as amended, dated October 13, 2005 (filed as Exhibit 10.29 on WRI’s Form 10-Q for the quarter ended September 30, 2005 and incorporated herein by reference). |
| 10.27† | — | Trust Under the Weingarten Realty Investors Deferred Compensation Plan amended and restated effective October 21, 2003 (filed as Exhibit 10.21 on WRI’s Form 10-Q for the quarter ended June 30, 2005 and incorporated herein by reference). |
| 10.28† | — | Fourth Amendment to the Weingarten Realty Investors Deferred Compensation Plan, dated December 23, 2005 (filed as Exhibit 10.31 on WRI’s Annual Report on Form 10-K for the year ended December 31, 2005 and incorporated herein by reference). |
| 10.29† | — | Trust Under the Weingarten Realty Investors Retirement Benefit Restoration Plan amended and restated effective October 21, 2003 (filed as Exhibit 10.22 on WRI’s Form 10-Q for the quarter ended June 30, 2005 and incorporated herein by reference). |
| 10.30† | — | Trust Under the Weingarten Realty Investors Supplemental Executive Retirement Plan amended and restated effective October 21, 2003 (filed as Exhibit 10.23 on WRI’s Form 10-Q for the quarter ended June 30, 2005 and incorporated herein by reference). |
| 10.31† | — | First Amendment to the Trust Under the Weingarten Realty Investors Deferred Compensation Plan, Supplemental Executive Retirement Plan, and Retirement Benefit Restoration Plan amended on March 16, 2004 (filed as Exhibit 10.24 on WRI’s Form 10-Q for the quarter ended June 30, 2005 and incorporated herein by reference). |
| 10.32† | — | Third Amendment to the Weingarten Realty Investors Deferred Compensation Plan dated August 1, 2005 (filed as Exhibit 10.30 on WRI’s Form 10-Q for the quarter ended September 30, 2005 and incorporated herein by reference). |
| 10.33 | — | Amended and Restated Credit Agreement dated February 22, 2006 among Weingarten Realty Investors, the Lenders Party Hereto and JPMorgan Chase Bank, N.A., as Administrative Agent (filed as Exhibit 10.32 on WRI’s Form 10-K for the year ended December 31, 2005 and incorporated by reference). |
| 10.34 | — | Amendment Agreement dated November 7, 2007 to the Amended and Restated Credit Agreement (filed as Exhibit 10.34 on WRI’s Form 10-Q for the quarter ended September 30, 2007 and incorporated herein by reference). |
| 10.35† | — | Fifth Amendment to the Weingarten Realty Investors Deferred Compensation Plan (filed as Exhibit 10.34 to WRI’s Form 10-Q for quarter ended June 30, 2006 and incorporated herein by reference). |
| 10.36† | — | Restatement of the Weingarten Realty Investors Supplemental Executive Retirement Plan dated August 4, 2006 (filed as Exhibit 10.35 to WRI’s Form 10-Q for the quarter ended September 30, 2006 and incorporated herein by reference). |
| 10.37† | — | Restatement of the Weingarten Realty Investors Deferred Compensation Plan dated August 4, 2006 (filed as Exhibit 10.36 to WRI’s Form 10-Q for the quarter ended September 30, 2006 and incorporated herein by reference). |
| 10.38† | — | Restatement of the Weingarten Realty Investors Retirement Benefit Restoration Plan dated August 4, 2006 (filed as Exhibit 10.37 to WRI’s Form 10-Q for the quarter ended September 30, 2006 and incorporated herein by reference). |
| 10.39† | — | Amendment No. 1 to the Weingarten Realty Investors Supplemental Executive Retirement Plan dated December 15, 2006 (filed as Exhibit 10.38 on WRI’s Form 10-K for the year ended December 31, 2006 and incorporated by reference). |
| 10.40† | — | Amendment No. 1 to the Weingarten Realty Investors Retirement Benefit Restoration Plan dated December 15, 2006 (filed as Exhibit 10.39 on WRI’s Form 10-K for the year ended December 31, 2006 and incorporated by reference). |
| 10.41† | — | Amendment No. 1 to the Weingarten Realty Investors Deferred Compensation Plan dated December 15, 2006 (filed as Exhibit 10.40 on WRI’s Form 10-K for the year ended December 31, 2006 and incorporated by reference). |
| 10.42† | — | Final 401(k)/401(m) Regulations Amendment dated December 15, 2006 (filed as Exhibit 10.41 on WRI’s Form 10-K for the year ended December 31, 2006 and incorporated by reference). |
| 10.43†* | — | |
| 10.44†* | — | |
| 10.45†* | — | |
| 10.46†* | — | |
| 10.47†* | — | |
| 12.1* | — | |
| 14.1 | — | Code of Ethical Conduct for Senior Financial Officers – Andrew M. Alexander (filed as Exhibit 14.1 to WRI’s Annual Report on Form 10-K for the year ended December 31, 2003 and incorporated herein by reference). |
| 14.2 | — | Code of Ethical Conduct for Senior Financial Officers – Stephen C. Richter (filed as Exhibit 14.2 to WRI’s Annual Report on Form 10-K for the year ended December 31, 2003 and incorporated herein by reference). |
| 14.3 | — | Code of Ethical Conduct for Senior Financial Officers – Joe D. Shafer (filed as Exhibit 14.3 to WRI’s Annual Report on Form 10-K for the year ended December 31, 2003 and incorporated herein by reference). |
| 23.1* | — | |
| 31.1* | — | |
| 31.2* | — | |
| 32.1** | — | |
| 32.2** | — | |
_______________
| ** | Furnished with this report. |
| † | Management contract or compensation plan or arrangement. |
Pursuant to the requirements of Section 13 or 15(d) of the Securities and Exchange Act of 1934, the Registrant has duly caused this report to be signed on its behalf by the undersigned, thereunto duly authorized.
| | WEINGARTEN REALTY INVESTORS |
| | | |
| | | |
| | By: | /s/ Andrew M. Alexander |
| | | Andrew M. Alexander |
| | | Chief Executive Officer |
Date: February 29, 2008
POWER OF ATTORNEY
KNOW ALL MEN BY THESE PRESENTS that each of Weingarten Realty Investors, a real estate investment trust organized under the Texas Real Estate Investment Trust Act, and the undersigned trust managers and officers of Weingarten Realty Investors hereby constitutes and appoints Andrew M. Alexander, Stanford Alexander, Martin Debrovner, Stephen C. Richter and Joe D. Shafer or any one of them, its or his true and lawful attorney-in-fact and agent, for it or him and in its or his name, place and stead, in any and all capacities, with full power to act alone, to sign any and all amendments to this Report, and to file each such amendment to the Report, with all exhibits thereto, and any and all other documents in connection therewith, with the Securities and Exchange Commission, hereby granting unto said attorney-in-fact and agent full power and authority to do and perform any and all acts and things requisite and necessary to be done in and about the premises as fully to all intents and purposes as it or he might or could do in person, hereby ratifying and confirming all that said attorney-in-fact and agent may lawfully do or cause to be done by virtue hereof.
Pursuant to the requirement of the Securities and Exchange Act of 1934, this report has been signed below by the following persons on behalf of the Registrant and in the capacities and on the dates indicated:
| | Signature | Title | Date |
| | | | |
| | | | |
| | | | |
| By: | /s/ Stanford Alexander | Chairman | February 29, 2008 |
| | Stanford Alexander | and Trust Manager | |
| | | | |
| By: | /s/ Andrew M. Alexander | Chief Executive Officer, | February 29, 2008 |
| | Andrew M. Alexander | President and Trust Manager | |
| | | | |
| By: | /s/ James W. Crownover | Trust Manager | February 29, 2008 |
| | James W. Crownover | | |
| | | | |
| By: | /s/ Robert J. Cruikshank | Trust Manager | February 29, 2008 |
| | Robert J. Cruikshank | | |
| | | | |
| By: | /s/ Martin Debrovner | Vice Chairman | February 29, 2008 |
| | Martin Debrovner | | |
| By: | /s/ Melvin Dow | Trust Manager | February 29, 2008 |
| | Melvin Dow | | |
| | | | |
| By: | /s/ Stephen A. Lasher | Trust Manager | February 29, 2008 |
| | Stephen A. Lasher | | |
| | | | |
| By: | /s/ Stephen C. Richter | Executive Vice President and | February 29, 2008 |
| | Stephen C. Richter | Chief Financial Officer | |
| | | | |
| By: | /s/ Douglas W. Schnitzer | Trust Manager | February 29, 2008 |
| | Douglas W. Schnitzer | | |
| | | | |
| By: | /s/ Joe D. Shafer | Vice President/Chief Accounting Officer | February 29, 2008 |
| | Joe D. Shafer | (Principal Accounting Officer) | |
| | | | |
| By: | /s/ C. Park Shaper | Trust Manager | February 29, 2008 |
| | C. Park Shaper | | |
| | | | |
| By: | /s/ Marc J. Shapiro | Trust Manager | February 29, 2008 |
| | Marc J. Shapiro | | |
| | | | |
To the Board of Trust Managers and Shareholders of
Weingarten Realty Investors
Houston, Texas
We have audited the consolidated financial statements of Weingarten Realty Investors and subsidiaries (the "Company") as of December 31, 2007 and 2006, and for each of the three years in the period ended December 31, 2007, and the Company's internal control over financial reporting as of December 31, 2007, and have issued our reports thereon dated February 29, 2008; such reports are included elsewhere in this Form 10-K. Our audits also included the consolidated financial statement schedules of the Company listed in Item 15. These consolidated financial statement schedules are the responsibility of the Company's management. Our responsibility is to express an opinion based on our audits. In our opinion, such consolidated financial statement schedules, when considered in relation to the basic consolidated financial statements taken as a whole, present fairly, in all material respects, the information set forth therein.
/s/Deloitte & Touche LLP
Houston, Texas
February 29, 2008
Schedule II
WEINGARTEN REALTY INVESTORS
December 31, 2007, 2006, and 2005
(Amounts in thousands)
| | | | | | Charged | | | | | | | |
| | | Balance at | | | to costs | | | | | | Balance | |
| | | beginning | | | and | | | Deductions | | | at end of | |
| Description | | of period | | | expenses | | | (A) | | | period | |
| | | | | | | | | | | | | |
| 2007 | | | | | | | | | | | | |
| Allowance for Doubtful Accounts | | $ | 5,995 | | | $ | 5,929 | | | $ | 3,203 | | | $ | 8,721 | |
| 2006 | | | | | | | | | | | | | | | | |
| Allowance for Doubtful Accounts | | $ | 4,673 | | | $ | 3,917 | | | $ | 2,595 | | | $ | 5,995 | |
| 2005 | | | | | | | | | | | | | | | | |
| Allowance for Doubtful Accounts | | $ | 4,205 | | | $ | 3,720 | | | $ | 3,252 | | | $ | 4,673 | |
_______________
Note A - Write-offs of accounts receivable previously reserved.
Schedule III
WEINGARTEN REALTY INVESTORS
DECEMBER 31, 2007
(Amounts in thousands)
| | | | | | | | | | | | | |
| | | | | | Buildings | | | Projects | | | Total | | | | | | | |
| | | | | | and | | | Under | | | Cost | | | Accumulated | | | Encumbrances | |
| | | Land | | | Improvements | | | Development | | | (B) | | | Depreciation | | | (A) | |
| | | | | | | | | | | | | | | | | | | |
| SHOPPING CENTERS: | | | | | | | | | | | | | | | | | | |
| Texas | | $ | 180,711 | | | $ | 804,127 | | | | | | $ | 984,838 | | | $ | 333,815 | | | $ | 82,906 | |
| Other States | | | 711,702 | | | | 2,315,769 | | | | | | | 3,027,471 | | | | 341,921 | | | | 860,244 | |
| Total Shopping Centers | | | 892,413 | | | | 3,119,896 | | | | | | | 4,012,309 | | | | 675,736 | | | | 943,150 | |
| INDUSTRIAL: | | | | | | | | | | | | | | | | | | | | | | | |
| Texas | | | 47,185 | | | | 225,438 | | | | | | | 272,623 | | | | 65,442 | | | | | |
| Other States | | | 30,905 | | | | 131,816 | | | | | | | 162,721 | | | | 8,173 | | | | 16,083 | |
| Total Industrial | | | 78,090 | | | | 357,254 | | | | | | | 435,344 | | | | 73,615 | | | | 16,083 | |
| OTHER: | | | | | | | | | | | | | | | | | | | | | | | |
| Texas | | | 1,871 | | | | 23,600 | | | | | | | 25,471 | | | | 10,647 | | | | | |
| Other States | | | 1,771 | | | | 3,233 | | | | | | | 5,004 | | | | 74 | | | | | |
| Total Other | | | 3,642 | | | | 26,833 | | | | | | | 30,475 | | | | 10,721 | | | | | |
| | | | | | | | | | | | | | | | | | | | | | | | |
| Total Improved Properties | | | 974,145 | | | | 3,503,983 | | | | | | | 4,478,128 | | | | 760,072 | | | | 959,233 | |
| LAND UNDER DEVELOPMENT OR HELD FOR DEVELOPMENT: | | | | | | | | | | | | | | | | | | | | | | | |
| Texas | | | | | | | | | | $ | 118,106 | | | $ | 118,106 | | | | | | | | | |
| Other States | | | | | | | | | | | 167,754 | | | | 167,754 | | | | | | | | | |
| Total Land Under Development or Held for Development | | | | | | | | | | | 285,860 | | | | 285,860 | | | | | | | | | |
| SHOPPING CENTERS UNDER CAPITAL LEASE: | | | | | | | | | | | | | | | | | | | | | | | | |
| Other States | | | | | | | 29,054 | | | | | | | | 29,054 | | | | 14,249 | | | | 8,732 | |
| Total Leased Property Under Capital Lease | | | | | | | 29,054 | | | | | | | | 29,054 | | | | 14,249 | | | | 8,732 | |
| CONSTRUCTION IN PROGRESS: | | | | | | | | | | | | | | | | | | | | | | | | |
| Texas | | | | | | | | | | | 57,721 | | | | 57,721 | | | | | | | | | |
| Other States | | | | | | | | | | | 121,581 | | | | 121,581 | | | | | | | | | |
| Total Construction in Progress | | | | | | | | | | | 179,302 | | | | 179,302 | | | | | | | | | |
| | | | | | | | | | | | | | | | | | | | | | | | | |
| TOTAL OF ALL PROPERTIES | | $ | 974,145 | | | $ | 3,533,037 | | | $ | 465,162 | | | $ | 4,972,344 | | | $ | 774,321 | | | $ | 967,965 | |
| Note A - | Encumbrances do not include $15.7 million outstanding under a $30 million 20-year term loan, payable to a group of insurance companies secured by a property collateral pool including two shopping centers. |
| Note B - | The book value of our net fixed asset exceeds the tax basis by $275 million at December 31, 2007. |
Schedule III
(Continued)
The changes in total cost of the properties for the years ended December 31, 2007, 2006 and 2005 were as follows:
| | | 2007 | | | 2006 | | | 2005 | |
| | | | | | | | | | |
| Balance at beginning of year | | $ | 4,445,888 | | | $ | 4,033,579 | | | $ | 3,751,607 | |
| Additions at cost | | | 888,345 | | | | 1,022,103 | | | | 429,040 | |
| Retirements or sales | | | (361,889 | ) | | | (609,794 | ) | | | (147,068 | ) |
| | | | | | | | | | | | | |
| Balance at end of year | | $ | 4,972,344 | | | $ | 4,445,888 | | | $ | 4,033,579 | |
The changes in accumulated depreciation for the years ended December 31, 2007, 2006 and 2005 were as follows:
| | | 2007 | | | 2006 | | | 2005 | |
| | | | | | | | | | |
| Balance at beginning of year | | $ | 707,005 | | | $ | 679,642 | | | $ | 609,772 | |
| Additions at cost | | | 114,956 | | | | 110,406 | | | | 107,901 | |
| Retirements or sales | | | (47,640 | ) | | | (83,043 | ) | | | (38,031 | ) |
| | | | | | | | | | | | | |
| Balance at end of year | | $ | 774,321 | | | $ | 707,005 | | | $ | 679,642 | |
Schedule IV
WEINGARTEN REALTY INVESTORS
DECEMBER 31, 2007
(Amounts in thousands)
| | | | | Final | | Periodic | | Face | | Carrying |
| | | Interest | | Maturity | | Payment | | Amount of | | Amount of |
| | | Rate | | Date | | Terms | | Mortgages | | Mortgages(A) |
| | | | | | | | | | | |
| SHOPPING CENTERS: | | | | | | | | | | |
| FIRST MORTGAGES: | | | | | | | | | | |
| Eastex Venture | | | | | | | | | | |
| Beaumont, TX | | 8.00% | | 10-31-09 | | $317 Annual P & I | | $ 1,145 | | $ 1,145 |
| | | | | | | | | | | |
| 363-410 Burma, LLC | | 6.50% | | 07-01-11 | | $212 Annual P & I | | 2,563 | | 2,563 |
| | | | | | | | | | | |
| WRI-SRP Cole Park Plaza, LLC | | | | | | | | | | |
| Chappel Hill, NC | | 5.66% | | 02-01-12 | | At Maturity | | 6,200 | | 6,200 |
| | | | | | | | | | | |
| SHOPPING CENTERS: | | | | | | | | | | |
| CONSTRUCTION LOANS: | | | | | | | | | | |
| Shary Retail, Ltd. | | 6.75% | | 11-14-08 | | At Maturity | | 17,111 | | 17,111 |
| | | | | | | | | | | |
| WRI Alliance Riley Venture | | 7.50% | | 02-28-08 | | At Maturity | | 17,054 | | 17,054 |
| | | | | | | | | | | |
| WRI Alliance Riley Venture III | | 7.50% | | 02-28-08 | | At Maturity | | 613 | | 613 |
| | | | | | | | | | | |
| Weingarten Sheridan, LLC | | 6.75% | | 12-15-10 | | At Maturity | | 35,212 | | 35,212 |
| | | | | | | | | | | |
| TOTAL MORTGAGE LOANS ON REAL ESTATE | | | | | | | | $ 79,898 | | $ 79,898 |
| Note A - | The aggregate cost at December 31, 2007 for federal income tax purposes is $79,898. |
| Note B - | Changes in mortgage loans for the years ended December 31, 2007, 2006, and 2005 are summarized below. |
| | | 2007 | | | 2006 | | | 2005 | |
| | | | | | | | | | |
| Balance, Beginning of Year | | $ | 5,308 | | | $ | 2,791 | | | $ | 3,057 | |
| Additions to Existing Loans | | | 155,855 | | | | 3,347 | | | | 339 | |
| Collections of Principal | | | (81,265 | ) | | | (830 | ) | | | (605 | ) |
| | | | | | | | | | | | | |
| Balance, End of Year | | $ | 79,898 | | | $ | 5,308 | | | $ | 2,791 | |
95