Exhibit 99.1 WSFS Financial Corporation Q2 2019 Investor Update August 2, 2019
Forward Looking Statements This presentation contains estimates, predictions, opinions, projections and other "forward-looking statements" as that phrase is defined in the Private Securities Litigation Reform Act of 1995. Such statements include, without limitation, references to the Company's predictions or expectations of future business or financial performance as well as its goals and objectives for future operations, financial and business trends, business prospects, and management's outlook or expectations for earnings, revenues, expenses, capital levels, liquidity levels, asset quality or other future financial or business performance, strategies or expectations. The words “believe,” “expect,” “anticipate,” “plan,” “estimate,” “target,” “project” and similar expressions, among others, generally identify forward-looking statements. Such forward-looking statements are based on various assumptions (some of which may be beyond the Company's control) and are subject to risks and uncertainties (which change over time) and other factors which could cause actual results to differ materially from those currently anticipated. Such risks and uncertainties include, but are not limited to, those related to difficult market conditions and unfavorable economic trends in the United States generally, and particularly in the markets in which the Company operates and in which its loans are concentrated, including the effects of declines in housing markets, an increase in unemployment levels and slowdowns in economic growth; the Company's level of nonperforming assets and the costs associated with resolving problem loans including litigation and other costs; possible additional loan losses and impairment of the collectability of loans; changes in market interest rates which may increase funding costs and reduce earning asset yields and thus reduce margin; the impact of changes in interest rates and the credit quality and strength of underlying collateral and the effect of such changes on the market value of the Company's investment securities portfolio; the credit risk associated with the substantial amount of commercial real estate, construction and land development, and commercial and industrial loans in our loan portfolio; the extensive federal and state regulation, supervision and examination governing almost every aspect of the Company's operations including the Dodd-Frank Wall Street Reform and Consumer Protection Act (the Dodd-Frank Act) the Economic Growth, Regulatory Relief, and Consumer Protection Act (which amended the Dodd-Frank Act), and the rules and regulations issued in accordance therewith and potential expenses associated with complying with such regulations; the Company's ability to comply with applicable capital and liquidity requirements (including the finalized Basel III capital standards), including our ability to generate liquidity internally or raise capital on favorable terms; possible changes in trade, monetary and fiscal policies, laws and regulations and other activities of governments, agencies, and similar organizations; any impairment of the Company's goodwill or other intangible assets; failure of the financial and operational controls of the Company's Cash Connect® division; conditions in the financial markets that may limit the Company's access to additional funding to meet its liquidity needs; the success of the Company's growth plans, including the successful integration of past and future acquisitions, including the acquisition of Beneficial Bancorp, Inc. (“Beneficial” or “BNCL”); the Company's ability to fully realize the cost savings and other benefits of its acquisitions, manage risks related to business disruption following those acquisitions, and post-acquisition customer acceptance of the Company's products and services and related Customer disintermediation; negative perceptions or publicity with respect to the Company's trust and wealth management business; adverse judgments or other resolution of pending and future legal proceedings, and cost incurred in defending such proceedings; system failure or cybersecurity incidents or other breaches of the Company's network security; the Company's ability to recruit and retain key employees; the effects of problems encountered by other financial institutions that adversely affect the Company or the banking industry generally; the effects of weather and natural disasters such as floods, droughts, wind, tornadoes and hurricanes as well as effects from geopolitical instability and man-made disasters including terrorist attacks; possible changes in the speed of loan prepayments by the Company's customers and loan origination or sales volumes; possible changes in the speed of prepayments of mortgage-backed securities due to changes in the interest rate environment, and the related acceleration of premium amortization on prepayments in the event that prepayments accelerate; regulatory limits on the Company's ability to receive dividends from its subsidiaries and pay dividends to its stockholders; the effects of any reputation, credit, interest rate, market, operational, legal, liquidity, regulatory and compliance risk resulting from developments related to any of the risks discussed above; and the costs associated with resolving any problem loans, litigation, and other risks and uncertainties, including those discussed in the Company's Form 10-K for the year ended December 31, 2018 and other documents filed by the Company with the Securities and Exchange Commission from time to time. We caution readers not to place undue reliance on any such forward-looking statements, which speak only as of the date on which they are made, and the Company disclaims any duty to revise or update any forward-looking statement, whether written or oral, that may be made from time to time by or on behalf of the Company for any reason, except as specifically required by law. As used in this presentation, the terms "WSFS", "the Company", "registrant", "we", "us", and "our" mean WSFS Financial Corporation and its subsidiaries, on a consolidated basis, unless the context indicates otherwise. 2

Non-GAAP Information This presentation contains financial information and performance measures determined by methods other than in accordance with accounting principles generally accepted in the United States (“GAAP”). The Company’s management believes that these non-GAAP measures provide a greater understanding of ongoing operations, enhance comparability of results of operations with prior periods and show the effects of significant gains and charges in the periods presented. The Company’s management believes that investors may use these non-GAAP measures to analyze the Company’s financial performance without the impact of unusual items or events that may obscure trends in the Company’s underlying performance. This non-GAAP data should be considered in addition to results prepared in accordance with GAAP, and is not a substitute for, or superior to, GAAP results. For a reconciliation of these non-GAAP measures to their comparable GAAP measures, see Appendix 2. The following are the non-GAAP measures used in this presentation: • Core net income (non-GAAP) is a non-GAAP measure that adjusts net income determined in accordance with GAAP to exclude the impact of securities gains, unrealized gains, recovery of/provision for fraud loss and corporate development costs • Core noninterest income, also called core fee income, is a non-GAAP measure that adjusts noninterest income as determined in accordance with GAAP to exclude the impact of securities gains (losses) and unrealized gains • Core earnings per share (“EPS”) is a non-GAAP measure that divides (i) core net income (non-GAAP) by (ii) weighted average shares of common stock outstanding for the applicable period • Core net revenue is a non-GAAP measure that is determined by adding core net interest income plus core noninterest income • Core noninterest expense is a non-GAAP measure that adjusts noninterest expense as determined in accordance with GAAP to exclude corporate development expenses, and recovery of provision for fraud loss • Core efficiency ratio is a non-GAAP measure that is determined by dividing core noninterest expense by the sum of core interest income and core noninterest income • Core fee income to total revenue is a non-GAAP measure that divides (i) core non interest income by (ii) (tax equivalent) core net interest income and core noninterest income • Core return on average assets (“ROA”) is a non-GAAP measure that divides (i) core net income (non-GAAP) by (ii) average assets for the applicable period • Core operating leverage is a non-GAAP measure that subtracts (i) periodic change in core noninterest expense growth from (ii) periodic change in core net revenue growth • Tangible common equity (“TCE”) is a non-GAAP measure and is defined as total average stockholders’ equity less goodwill, other intangible assets. Return on average tangible common equity (“ROTCE” or “ROATCE”) is a non-GAAP measure and is defined as net income allocable to common stockholders divided by tangible common equity • Tangible common book value per share is a non-GAAP measure that is equal to common equity less goodwill and intangible assets, divided by total shares outstanding 3

Table of Contents •2Q 2019 Results Page 5 •Net Interest Margin Page 8 •Outlook Page 9 •Beneficial Update Page 11 •The WSFS Franchise Page 15 •Selected Financial Information Page 20 •Appendix 1 – Management Team Page 32 •Appendix 2 – Non-GAAP Financial Information Page 34 4

2Q 2019 Reported Financial Results First full quarter combined with Beneficial 2Q 2019 Reported Results: • EPS $0.68 • NIM 4.68% • ROA 1.20 % • Fee Income / Total Revenue 25.8% • ROTCE (1) 12.46% • Efficiency Ratio 64.8% • Net revenue (which includes net interest income and noninterest income) was $166.1 million for 2Q 2019, an increase of $70.1 million, or 73%, from 2Q 2018 • Net interest income was $123.2 million, an increase of $62.2 million, or 102%, from 2Q 2018 and net interest margin for 2Q 2019 was 4.68%, a 58 bps increase compared to 2Q 2018 • Two legacy WSFS Commercial and Industrial (“C&I”) loans, which were classified as nonperforming for an extended period of time, experienced significant credit events resulting in higher levels of provision for loan losses and concurrent charge-offs during the quarter. Leading 2Q 2019 credit metrics demonstrate consistent trends in both the originated and acquired loan portfolios. • Fee income (noninterest income) was $42.9 million, an increase of $7.9 million, or 23%, from 2Q 2018, due to our mortgage banking business, Cash Connect division, our Wealth Management and traditional banking businesses • Noninterest expenses were $107.8 million in 2Q 2019, an increase of $50.0 million, or 87%, from 2Q 2018, which included $15.8 million (pre-tax), or $0.22 per share (after-tax), of restructuring and corporate development costs in 2Q 2019 related to our acquisition of Beneficial (1) This is a non-GAAP financial measure and should be considered along with results prepared in accordance with GAAP, and not as a substitute for GAAP results. See Appendix 2 for a reconciliation to GAAP financial information. 5
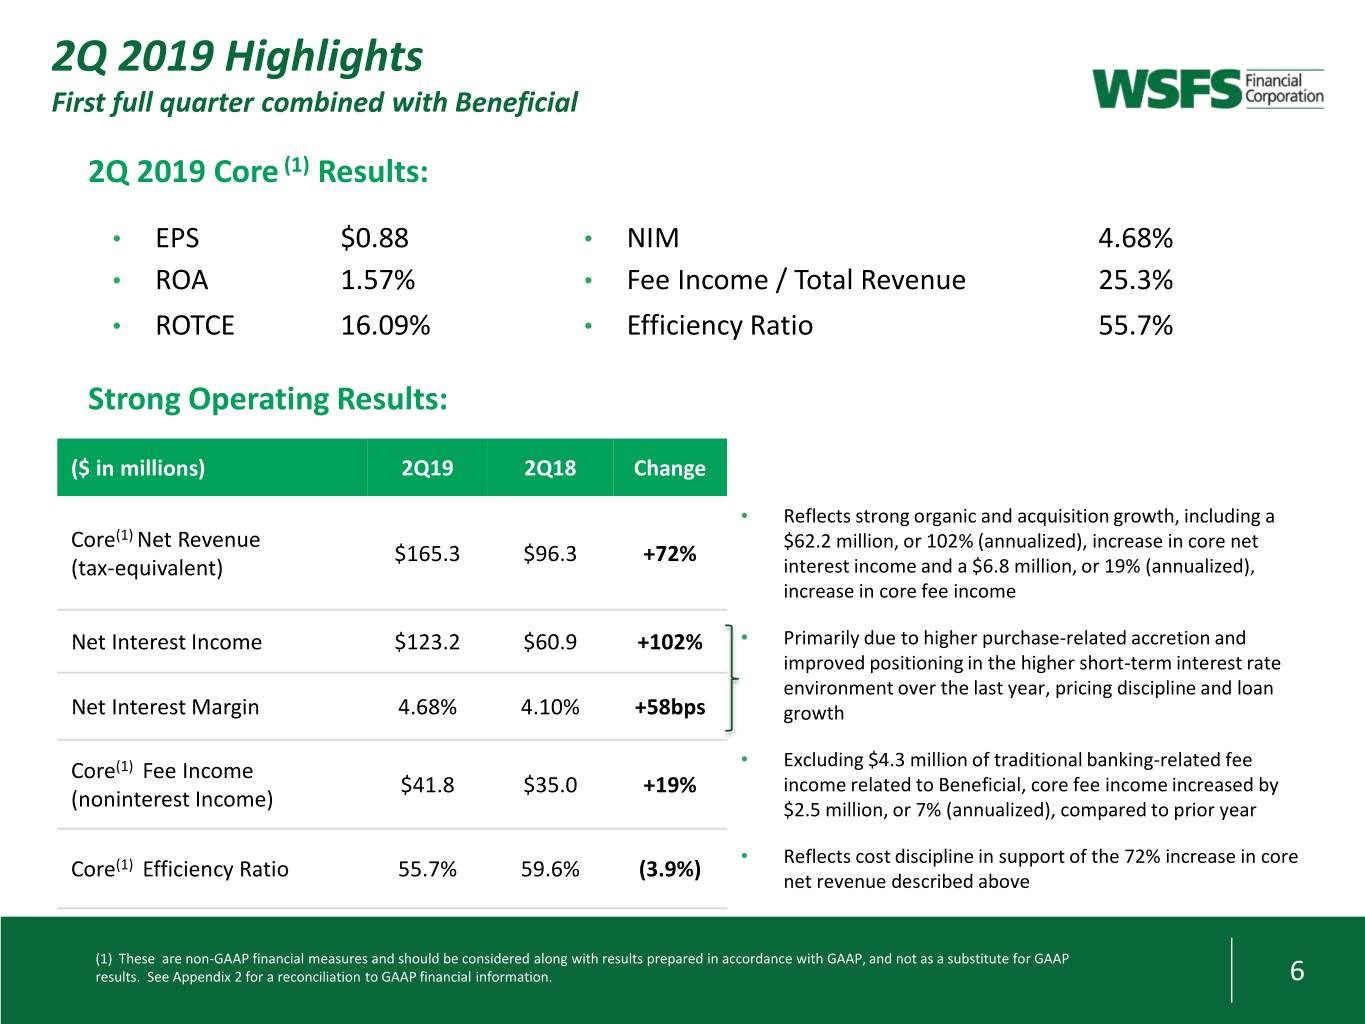
2Q 2019 Highlights First full quarter combined with Beneficial 2Q 2019 Core (1) Results: • EPS $0.88 • NIM 4.68% • ROA 1.57% • Fee Income / Total Revenue 25.3% • ROTCE 16.09% • Efficiency Ratio 55.7% Strong Operating Results: ($ in millions) 2Q19 2Q18 Change • Reflects strong organic and acquisition growth, including a Core(1) Net Revenue $62.2 million, or 102% (annualized), increase in core net $165.3 $96.3 +72% (tax-equivalent) interest income and a $6.8 million, or 19% (annualized), increase in core fee income Net Interest Income $123.2 $60.9 +102% • Primarily due to higher purchase-related accretion and improved positioning in the higher short-term interest rate environment over the last year, pricing discipline and loan Net Interest Margin 4.68% 4.10% +58bps growth Core(1) Fee Income • Excluding $4.3 million of traditional banking-related fee $41.8 $35.0 +19% income related to Beneficial, core fee income increased by (noninterest Income) $2.5 million, or 7% (annualized), compared to prior year • Reflects cost discipline in support of the 72% increase in core Core(1) Efficiency Ratio 55.7% 59.6% (3.9%) net revenue described above (1) These are non-GAAP financial measures and should be considered along with results prepared in accordance with GAAP, and not as a substitute for GAAP results. See Appendix 2 for a reconciliation to GAAP financial information. 6
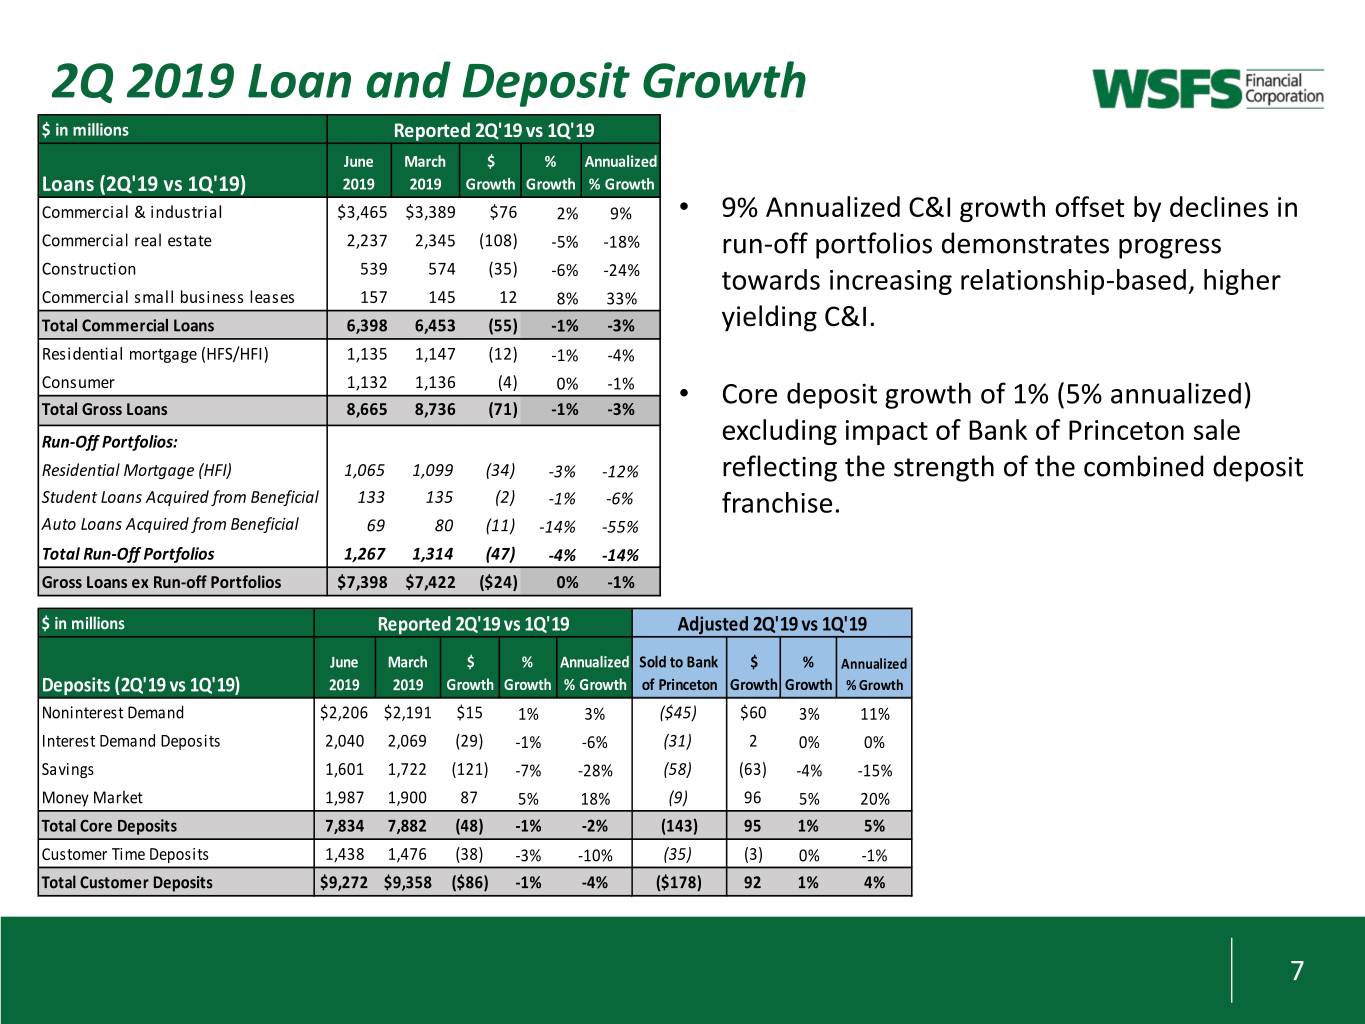
2Q 2019 Loan and Deposit Growth $ in millions Reported 2Q'19 vs 1Q'19 June March $ % Annualized Loans (2Q'19 vs 1Q'19) 2019 2019 Growth Growth % Growth Commercial & industrial $3,465 $3,389 $76 2% 9% • 9% Annualized C&I growth offset by declines in Commercial real estate 2,237 2,345 (108) -5% -18% run-off portfolios demonstrates progress Construction 539 574 (35) -6% -24% towards increasing relationship-based, higher Commercial small business leases 157 145 12 8% 33% Total Commercial Loans 6,398 6,453 (55) -1% -3% yielding C&I. Residential mortgage (HFS/HFI) 1,135 1,147 (12) -1% -4% Consumer 1,132 1,136 (4) 0% -1% Total Gross Loans 8,665 8,736 (71) -1% -3% • Core deposit growth of 1% (5% annualized) Run-Off Portfolios: excluding impact of Bank of Princeton sale Residential Mortgage (HFI) 1,065 1,099 (34) -3% -12% reflecting the strength of the combined deposit Student Loans Acquired from Beneficial 133 135 (2) -1% -6% franchise. Auto Loans Acquired from Beneficial 69 80 (11) -14% -55% Total Run-Off Portfolios 1,267 1,314 (47) -4% -14% Gross Loans ex Run-off Portfolios $7,398 $7,422 ($24) 0% -1% $ in millions Reported 2Q'19 vs 1Q'19 Adjusted 2Q'19 vs 1Q'19 June March $ % Annualized Sold to Bank $ % Annualized Deposits (2Q'19 vs 1Q'19) 2019 2019 Growth Growth % Growth of Princeton Growth Growth % Growth Noninterest Demand $2,206 $2,191 $15 1% 3% ($45) $60 3% 11% Interest Demand Deposits 2,040 2,069 (29) -1% -6% (31) 2 0% 0% Savings 1,601 1,722 (121) -7% -28% (58) (63) -4% -15% Money Market 1,987 1,900 87 5% 18% (9) 96 5% 20% Total Core Deposits 7,834 7,882 (48) -1% -2% (143) 95 1% 5% Customer Time Deposits 1,438 1,476 (38) -3% -10% (35) (3) 0% -1% Total Customer Deposits $9,272 $9,358 ($86) -1% -4% ($178) 92 1% 4% 7
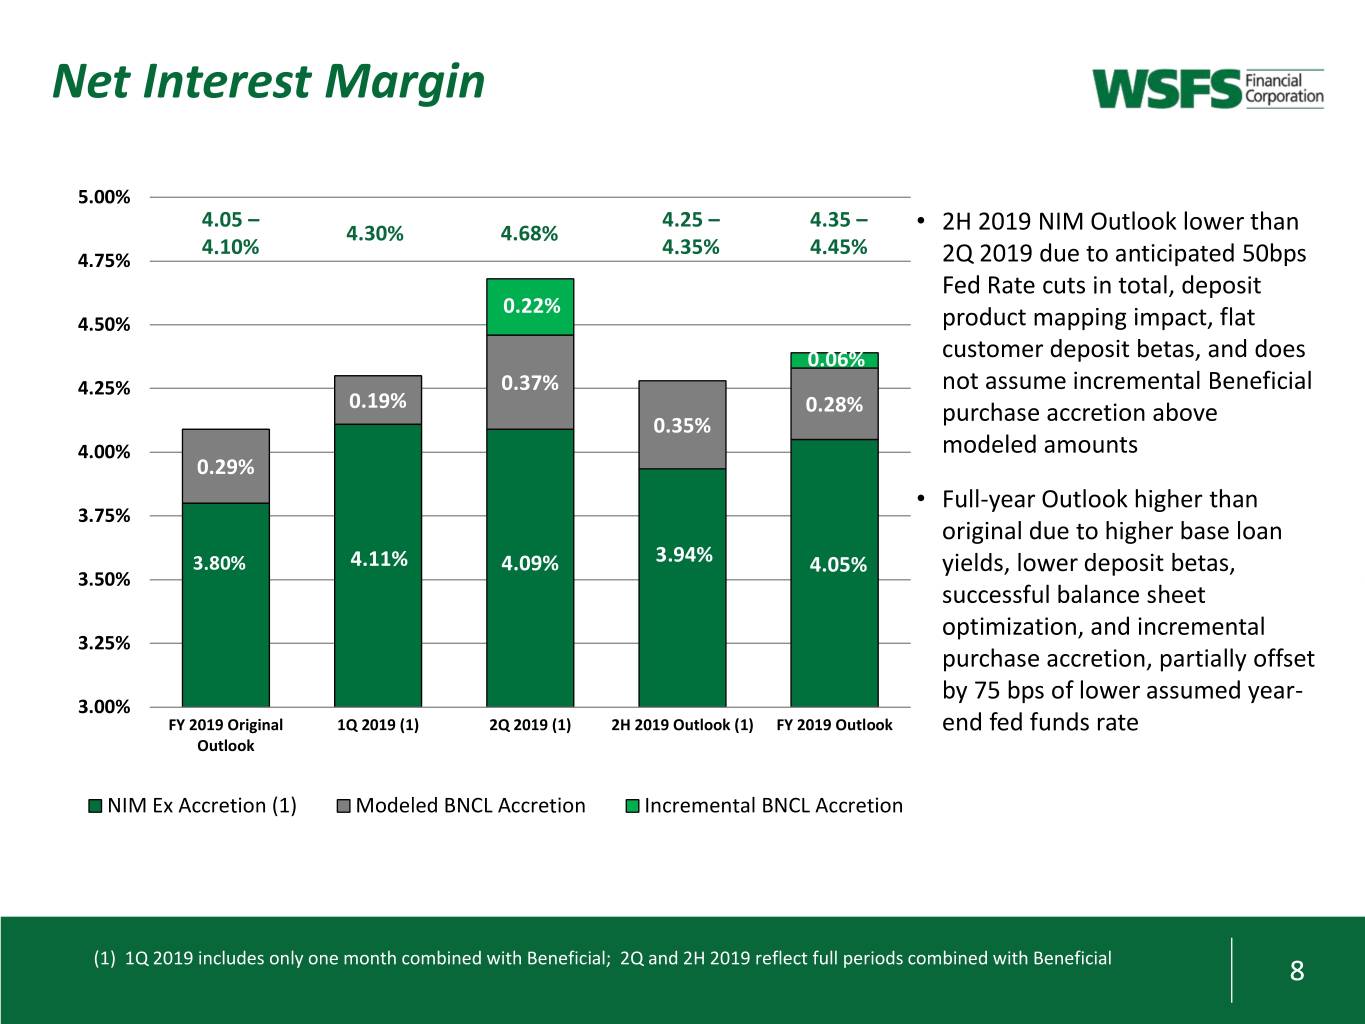
Net Interest Margin 5.00% 4.05 – 4.25 – 4.35 – 4.30% 4.68% • 2H 2019 NIM Outlook lower than 4.10% 4.35% 4.45% 4.75% 2Q 2019 due to anticipated 50bps Fed Rate cuts in total, deposit 0.22% 4.50% product mapping impact, flat 0.06% customer deposit betas, and does 4.25% 0.37% not assume incremental Beneficial 0.19% 0.28% purchase accretion above 0.35% 4.00% modeled amounts 0.29% • Full-year Outlook higher than 3.75% original due to higher base loan 3.80% 4.11% 4.09% 3.94% 4.05% yields, lower deposit betas, 3.50% successful balance sheet optimization, and incremental 3.25% purchase accretion, partially offset by 75 bps of lower assumed year- 3.00% FY 2019 Original 1Q 2019 (1) 2Q 2019 (1) 2H 2019 Outlook (1) FY 2019 Outlook end fed funds rate Outlook NIM Ex Accretion (1) Modeled BNCL Accretion Incremental BNCL Accretion (1) 1Q 2019 includes only one month combined with Beneficial; 2Q and 2H 2019 reflect full periods combined with Beneficial 8
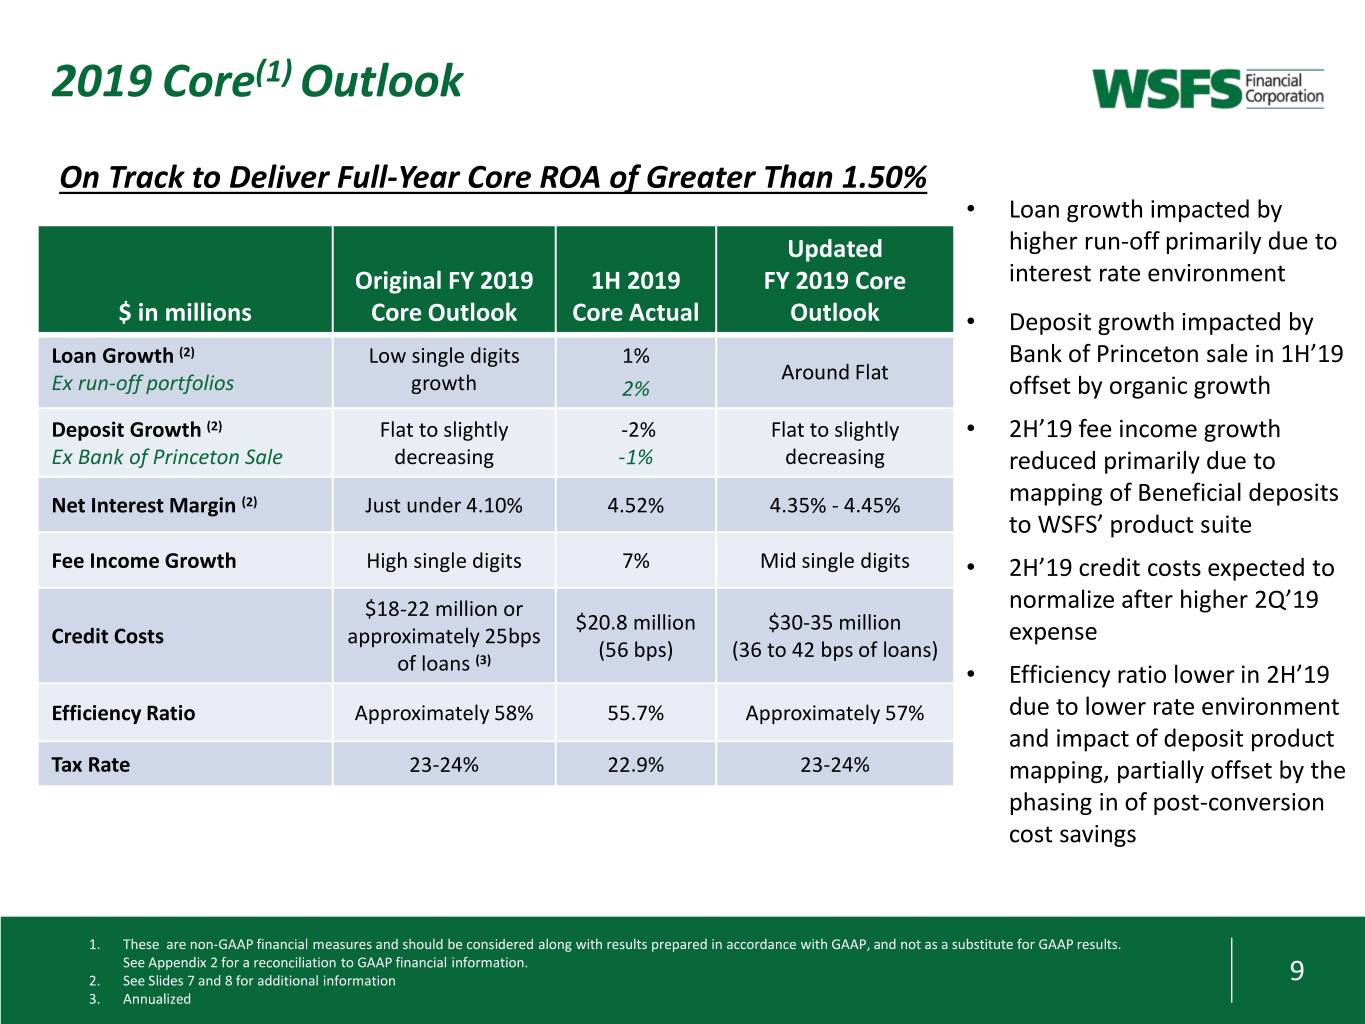
2019 Core(1) Outlook On Track to Deliver Full-Year Core ROA of Greater Than 1.50% • Loan growth impacted by Updated higher run-off primarily due to Original FY 2019 1H 2019 FY 2019 Core interest rate environment $ in millions Core Outlook Core Actual Outlook • Deposit growth impacted by Loan Growth (2) Low single digits 1% Bank of Princeton sale in 1H’19 Around Flat Ex run-off portfolios growth 2% offset by organic growth Deposit Growth (2) Flat to slightly -2% Flat to slightly • 2H’19 fee income growth Ex Bank of Princeton Sale decreasing -1% decreasing reduced primarily due to Net Interest Margin (2) Just under 4.10% 4.52% 4.35% - 4.45% mapping of Beneficial deposits to WSFS’ product suite Fee Income Growth High single digits 7% Mid single digits • 2H’19 credit costs expected to $18-22 million or normalize after higher 2Q’19 $20.8 million $30-35 million Credit Costs approximately 25bps expense (3) (56 bps) (36 to 42 bps of loans) of loans • Efficiency ratio lower in 2H’19 Efficiency Ratio Approximately 58% 55.7% Approximately 57% due to lower rate environment and impact of deposit product Tax Rate 23-24% 22.9% 23-24% mapping, partially offset by the phasing in of post-conversion cost savings 1. These are non-GAAP financial measures and should be considered along with results prepared in accordance with GAAP, and not as a substitute for GAAP results. See Appendix 2 for a reconciliation to GAAP financial information. 2. See Slides 7 and 8 for additional information 9 3. Annualized
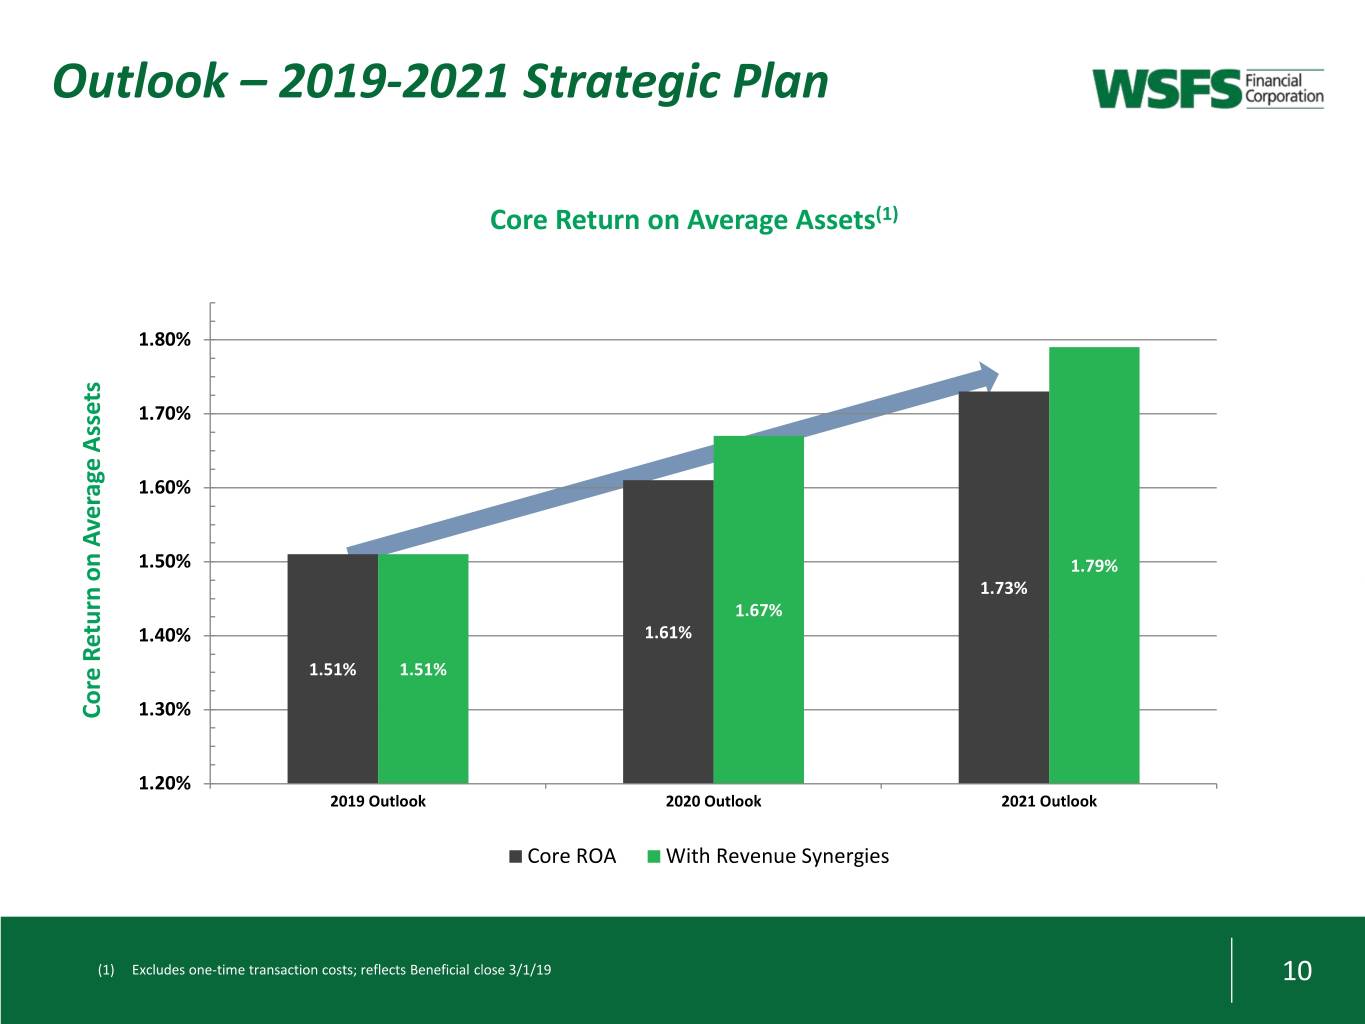
Outlook – 2019-2021 Strategic Plan Core Return on Average Assets(1) 1.80% 1.70% 1.60% 1.50% 1.79% 1.73% 1.67% 1.40% 1.61% 1.51% 1.51% Core Return on Average Assets on Average Return Core 1.30% 1.20% 2019 Outlook 2020 Outlook 2021 Outlook Core ROA With Revenue Synergies (1) Excludes one-time transaction costs; reflects Beneficial close 3/1/19 10
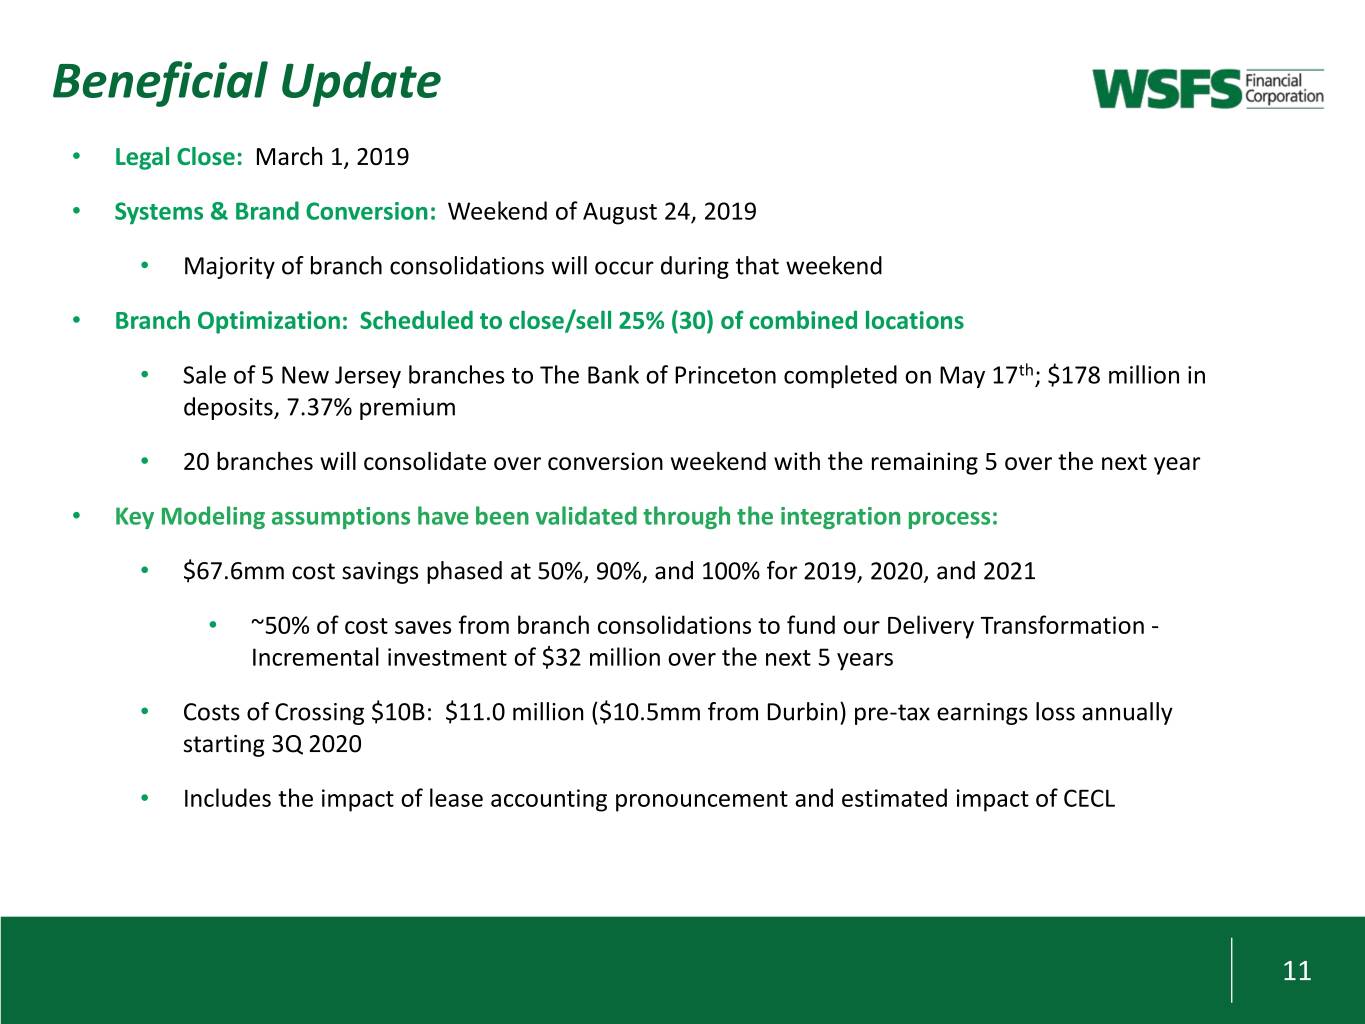
Beneficial Update • Legal Close: March 1, 2019 • Systems & Brand Conversion: Weekend of August 24, 2019 • Majority of branch consolidations will occur during that weekend • Branch Optimization: Scheduled to close/sell 25% (30) of combined locations • Sale of 5 New Jersey branches to The Bank of Princeton completed on May 17th; $178 million in deposits, 7.37% premium • 20 branches will consolidate over conversion weekend with the remaining 5 over the next year • Key Modeling assumptions have been validated through the integration process: • $67.6mm cost savings phased at 50%, 90%, and 100% for 2019, 2020, and 2021 • ~50% of cost saves from branch consolidations to fund our Delivery Transformation - Incremental investment of $32 million over the next 5 years • Costs of Crossing $10B: $11.0 million ($10.5mm from Durbin) pre-tax earnings loss annually starting 3Q 2020 • Includes the impact of lease accounting pronouncement and estimated impact of CECL 11
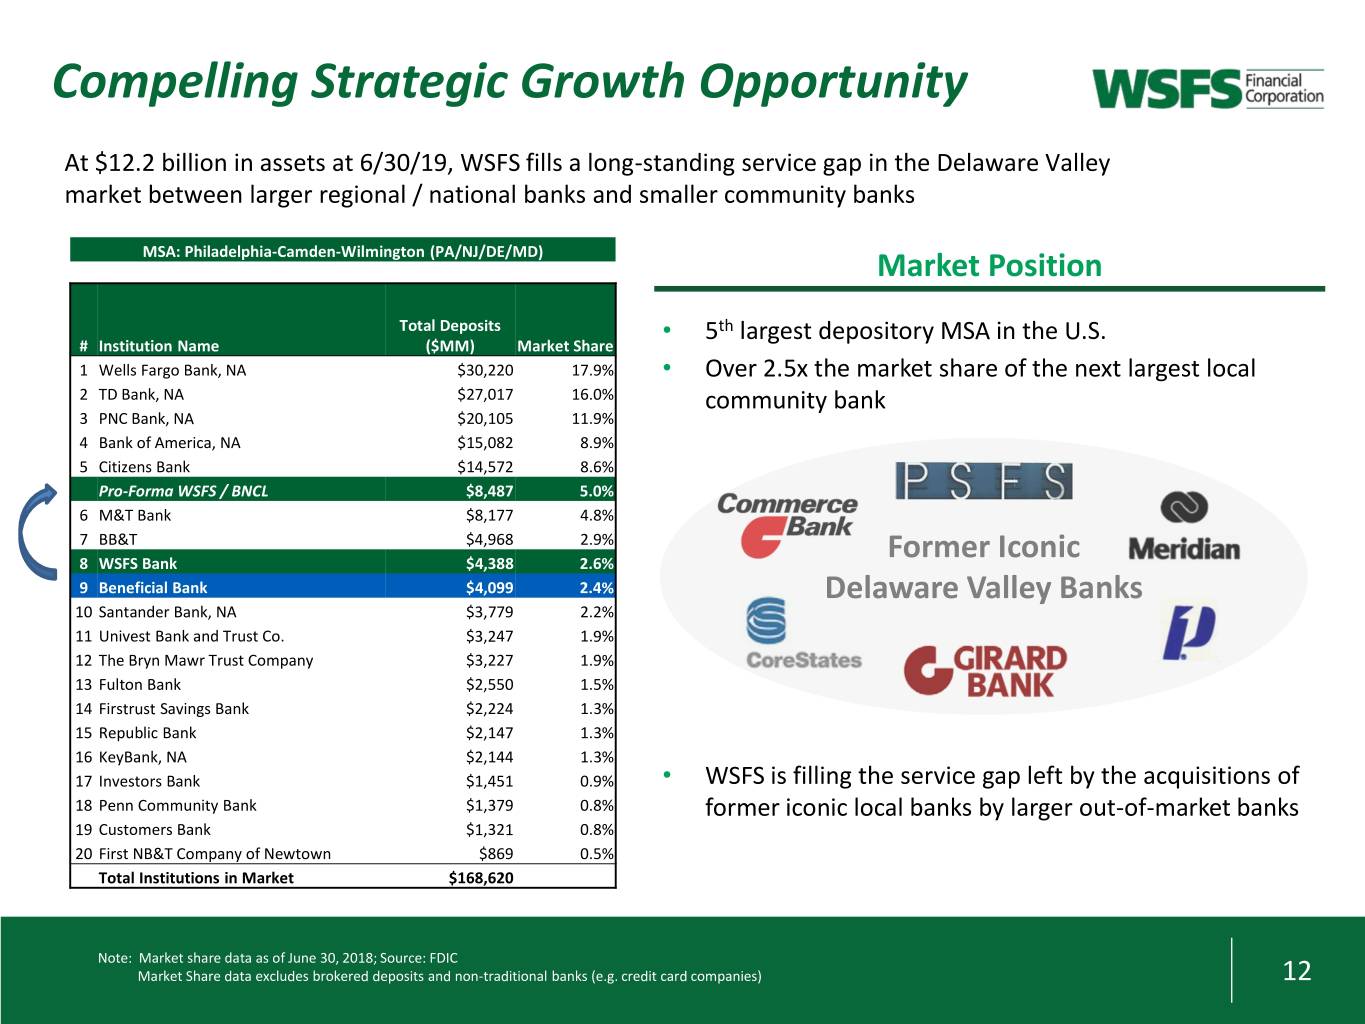
Compelling Strategic Growth Opportunity At $12.2 billion in assets at 6/30/19, WSFS fills a long-standing service gap in the Delaware Valley market between larger regional / national banks and smaller community banks MSA: Philadelphia-Camden-Wilmington (PA/NJ/DE/MD) Market Position Total Deposits • 5th largest depository MSA in the U.S. # Institution Name ($MM) Market Share 1 Wells Fargo Bank, NA $30,220 17.9% • Over 2.5x the market share of the next largest local 2 TD Bank, NA $27,017 16.0% community bank 3 PNC Bank, NA $20,105 11.9% 4 Bank of America, NA $15,082 8.9% 5 Citizens Bank $14,572 8.6% Pro-Forma WSFS / BNCL $8,487 5.0% 6 M&T Bank $8,177 4.8% 7 BB&T $4,968 2.9% 8 WSFS Bank $4,388 2.6% Former Iconic 9 Beneficial Bank $4,099 2.4% Delaware Valley Banks 10 Santander Bank, NA $3,779 2.2% 11 Univest Bank and Trust Co. $3,247 1.9% 12 The Bryn Mawr Trust Company $3,227 1.9% 13 Fulton Bank $2,550 1.5% 14 Firstrust Savings Bank $2,224 1.3% 15 Republic Bank $2,147 1.3% 16 KeyBank, NA $2,144 1.3% 17 Investors Bank $1,451 0.9% • WSFS is filling the service gap left by the acquisitions of 18 Penn Community Bank $1,379 0.8% former iconic local banks by larger out-of-market banks 19 Customers Bank $1,321 0.8% 20 First NB&T Company of Newtown $869 0.5% Total Institutions in Market $168,620 Note: Market share data as of June 30, 2018; Source: FDIC Market Share data excludes brokered deposits and non-traditional banks (e.g. credit card companies) 12
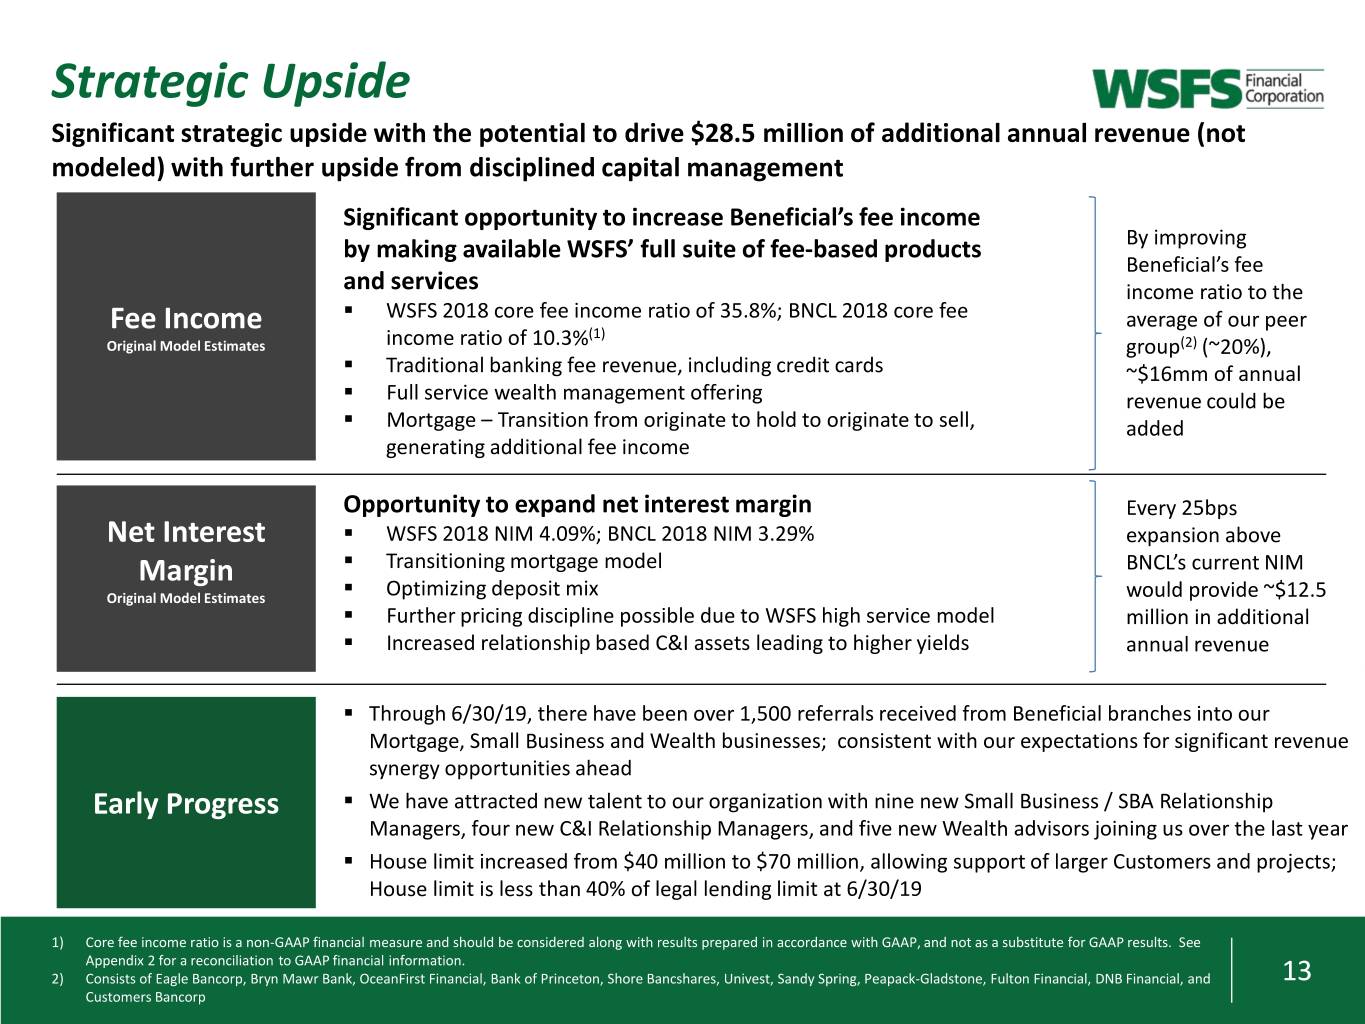
Strategic Upside Significant strategic upside with the potential to drive $28.5 million of additional annual revenue (not modeled) with further upside from disciplined capital management Significant opportunity to increase Beneficial’s fee income by making available WSFS’ full suite of fee-based products By improving Beneficial’s fee and services income ratio to the . WSFS 2018 core fee income ratio of 35.8%; BNCL 2018 core fee average of our peer Fee Income (1) Original Model Estimates income ratio of 10.3% group(2) (~20%), . Traditional banking fee revenue, including credit cards ~$16mm of annual . Full service wealth management offering revenue could be . Mortgage – Transition from originate to hold to originate to sell, added generating additional fee income Opportunity to expand net interest margin Every 25bps Net Interest . WSFS 2018 NIM 4.09%; BNCL 2018 NIM 3.29% expansion above . Transitioning mortgage model BNCL’s current NIM Margin . Original Model Estimates Optimizing deposit mix would provide ~$12.5 . Further pricing discipline possible due to WSFS high service model million in additional . Increased relationship based C&I assets leading to higher yields annual revenue . Through 6/30/19, there have been over 1,500 referrals received from Beneficial branches into our Mortgage, Small Business and Wealth businesses; consistent with our expectations for significant revenue synergy opportunities ahead Early Progress . We have attracted new talent to our organization with nine new Small Business / SBA Relationship Managers, four new C&I Relationship Managers, and five new Wealth advisors joining us over the last year . House limit increased from $40 million to $70 million, allowing support of larger Customers and projects; House limit is less than 40% of legal lending limit at 6/30/19 1) Core fee income ratio is a non-GAAP financial measure and should be considered along with results prepared in accordance with GAAP, and not as a substitute for GAAP results. See Appendix 2 for a reconciliation to GAAP financial information. 2) Consists of Eagle Bancorp, Bryn Mawr Bank, OceanFirst Financial, Bank of Princeton, Shore Bancshares, Univest, Sandy Spring, Peapack-Gladstone, Fulton Financial, DNB Financial, and 13 Customers Bancorp

Delivery Transformation • Focused on melding physical and digital delivery, consistent with our brand, by enabling our Associates with the latest technology and actionable data to better serve our Customers • ~50% of cost savings from branch consolidations to fund a Delivery Transformation - Incremental investment of $32 million over the next 5 years • Below are two examples that are expected to go live in 2019: Humanizing the Digital Experience - Highly- Guided Conversations Platform – Engagement engine designed to personalized messaging application that securely facilitate conversations in the branch. By providing our Associates connects WSFS Customers to their own live with customizable data-driven questions, we can effectively Personal Banker. address Customers’ needs and match them with ideal solutions. 14

The WSFS Franchise
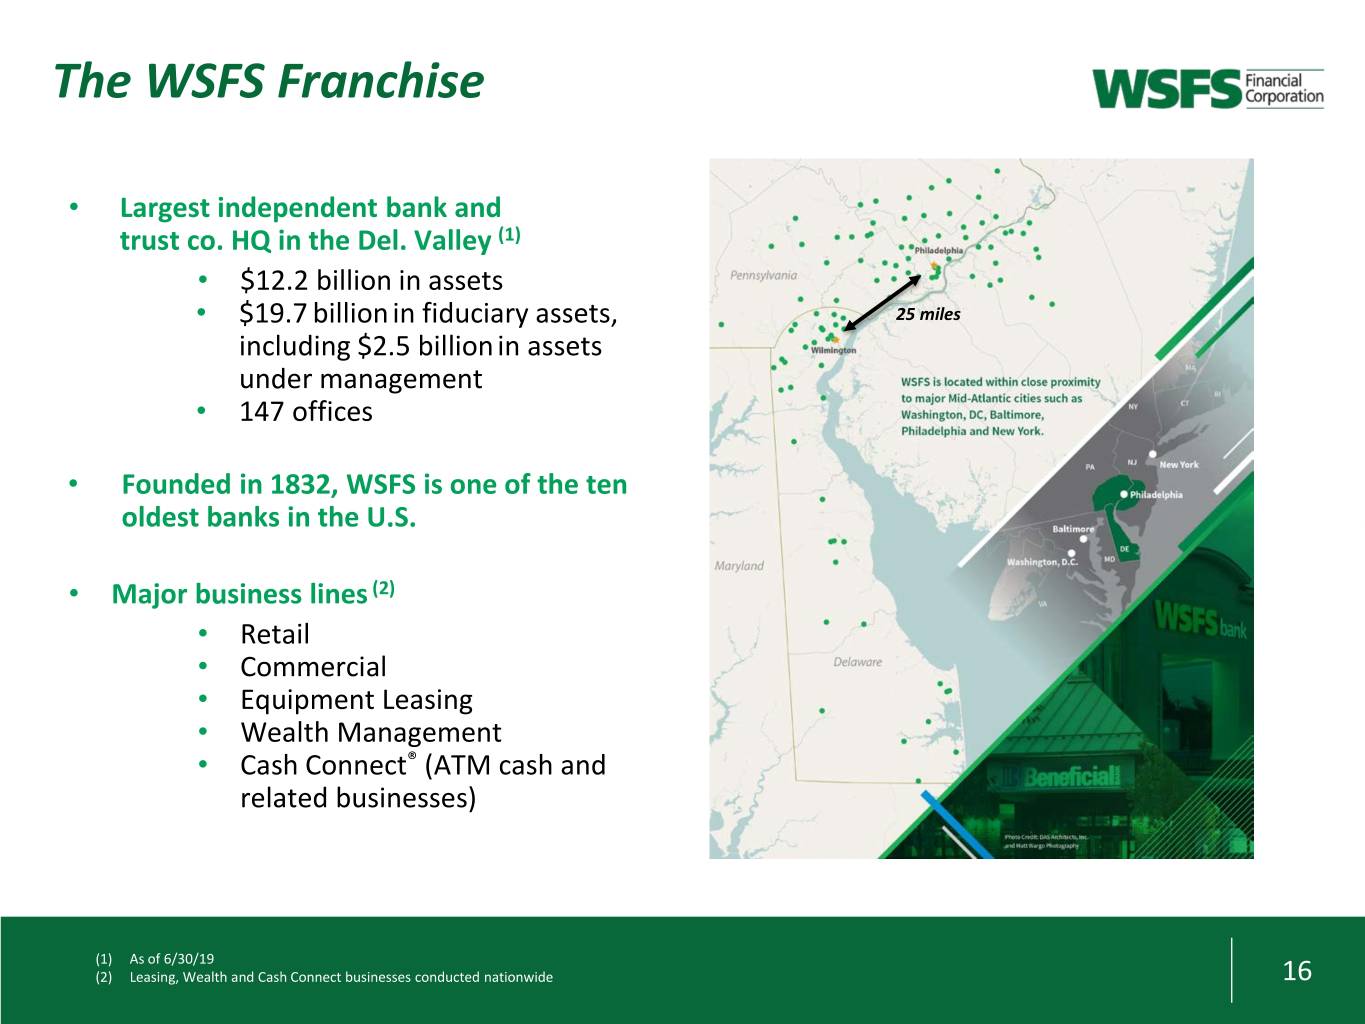
The WSFS Franchise • Largest independent bank and trust co. HQ in the Del. Valley (1) • $12.2 billion in assets • $19.7 billionin fiduciary assets, 25 miles including $2.5 billionin assets under management • 147 offices • Founded in 1832, WSFS is one of the ten oldest banks in the U.S. • Major business lines (2) • Retail • Commercial • Equipment Leasing • Wealth Management • Cash Connect® (ATM cash and related businesses) (1) As of 6/30/19 (2) Leasing, Wealth and Cash Connect businesses conducted nationwide 16
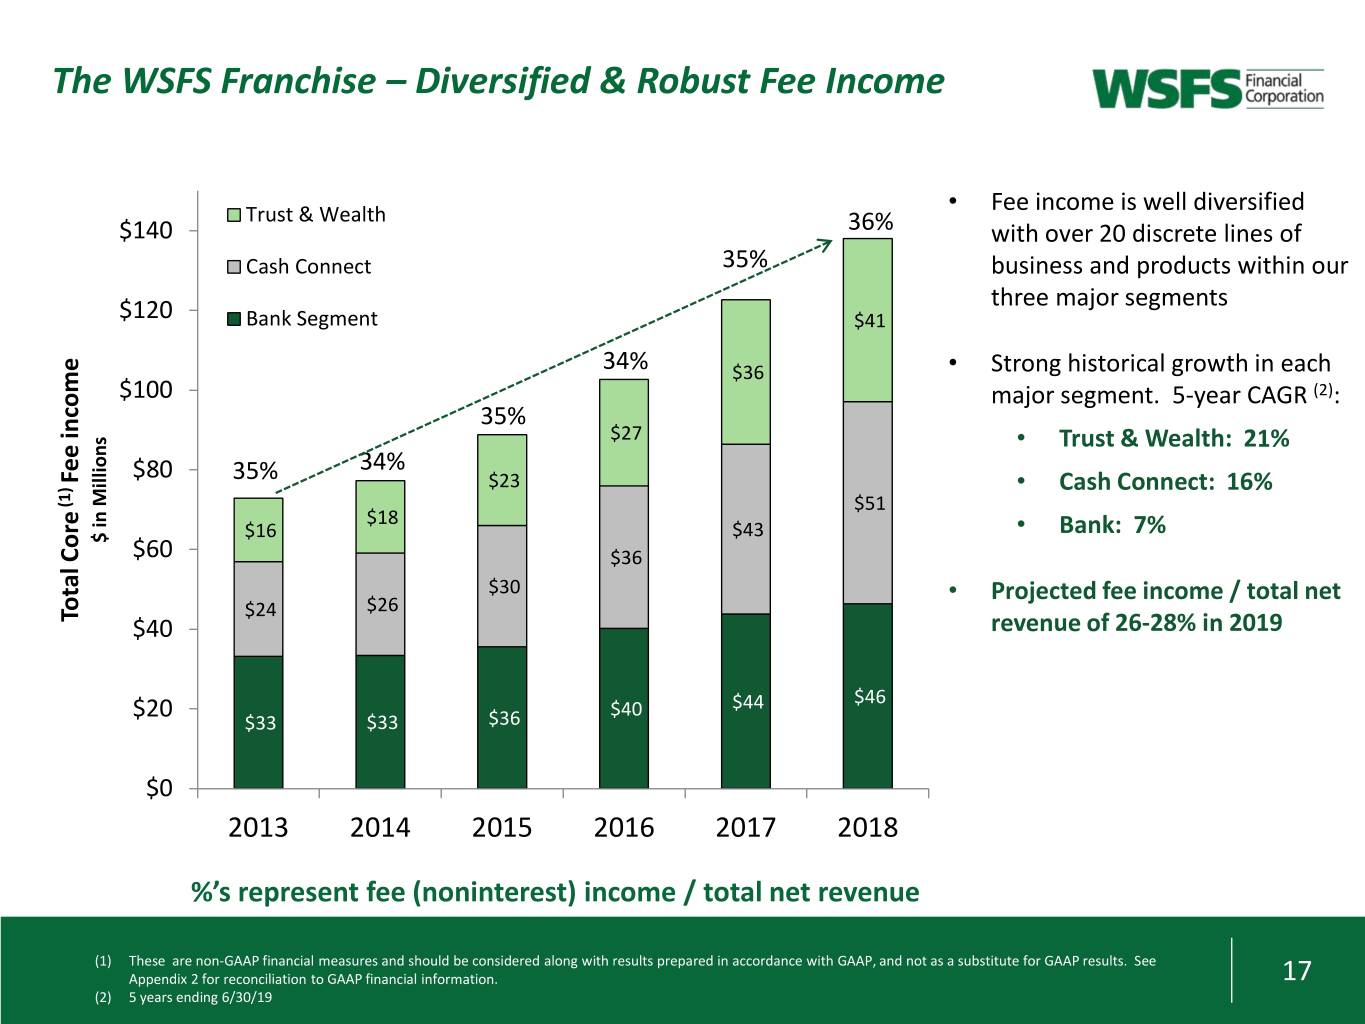
The WSFS Franchise – Diversified & Robust Fee Income Trust & Wealth • Fee income is well diversified $140 36% with over 20 discrete lines of Cash Connect 35% business and products within our three major segments $120 Bank Segment $41 34% $36 • Strong historical growth in each $100 major segment. 5-year CAGR (2): 35% $27 • Trust & Wealth: 21% 34% Fee income Fee $80 35% $23 • Cash Connect: 16% (1) $51 $18 $43 • Bank: 7% $ in Millions $ in Millions $16 $60 $36 $30 $26 • Projected fee income / total net Total Core Total $24 $40 revenue of 26-28% in 2019 $46 $20 $40 $44 $33 $33 $36 $0 2013 2014 2015 2016 2017 2018 %’s represent fee (noninterest) income / total net revenue (1) These are non-GAAP financial measures and should be considered along with results prepared in accordance with GAAP, and not as a substitute for GAAP results. See Appendix 2 for reconciliation to GAAP financial information. 17 (2) 5 years ending 6/30/19
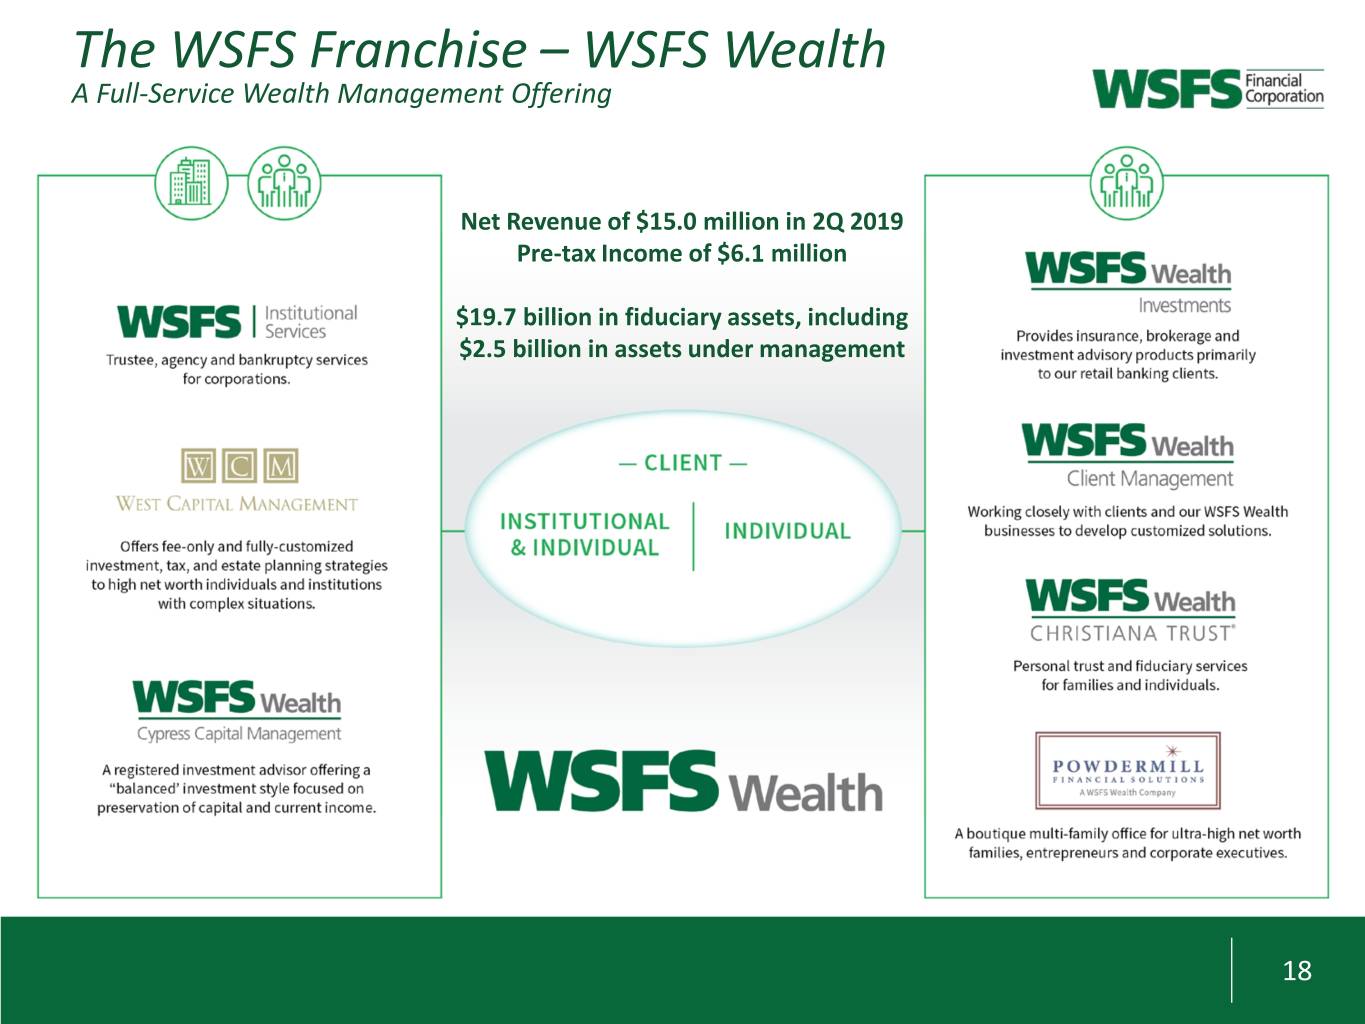
The WSFS Franchise – WSFS Wealth A Full-Service Wealth Management Offering Net Revenue of $15.0 million in 2Q 2019 Pre-tax Income of $6.1 million $19.7 billion in fiduciary assets, including $2.5 billion in assets under management 18
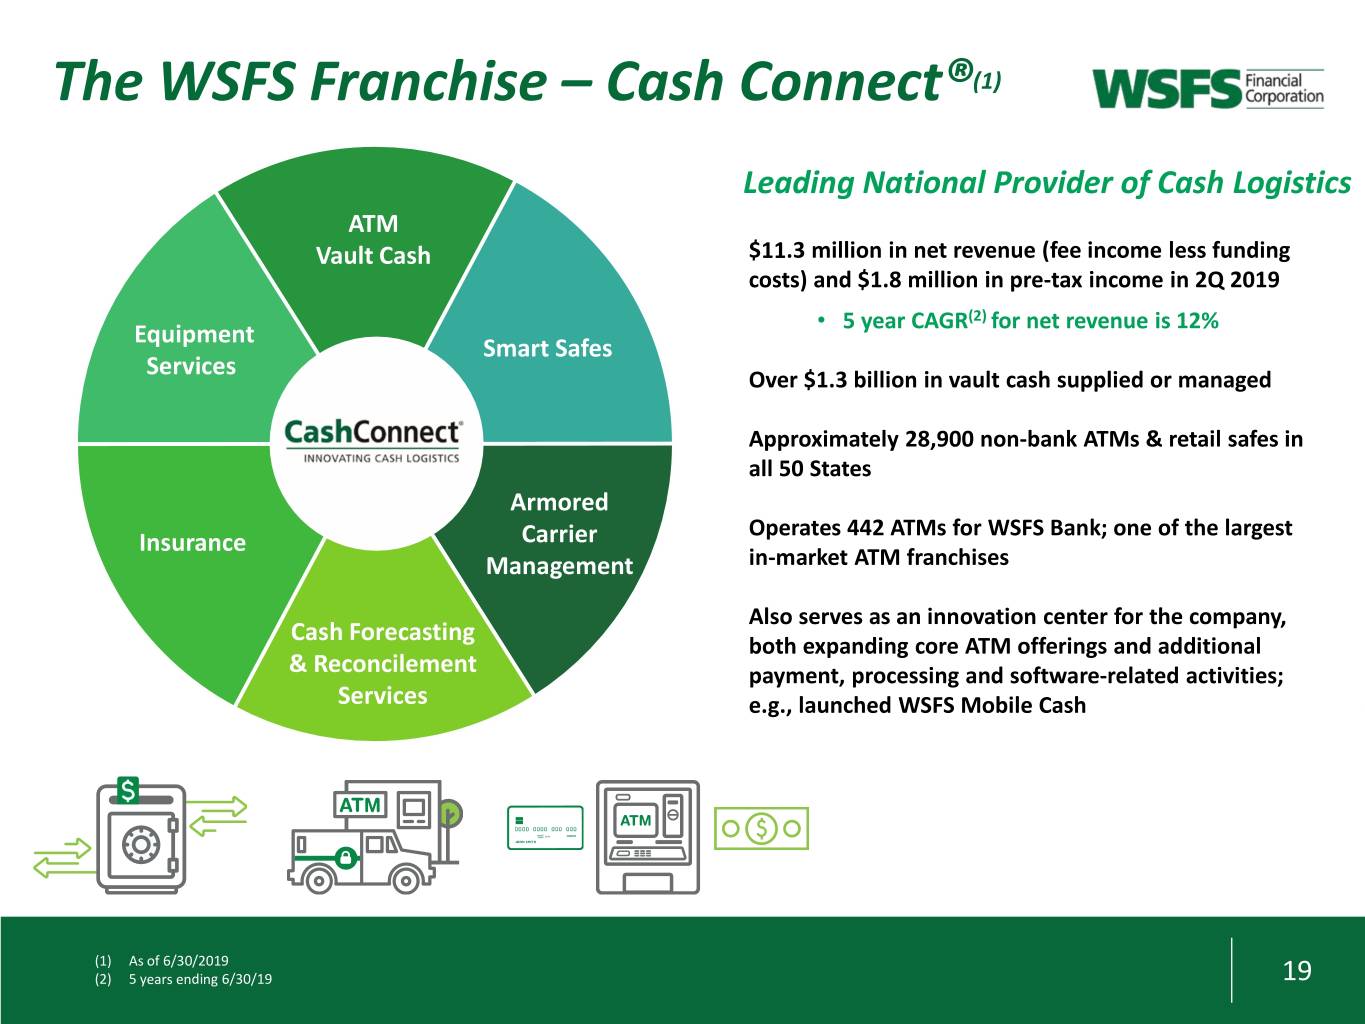
The WSFS Franchise – Cash Connect®(1) Leading National Provider of Cash Logistics ATM Vault Cash $11.3 million in net revenue (fee income less funding costs) and $1.8 million in pre-tax income in 2Q 2019 • 5 year CAGR(2) for net revenue is 12% Equipment Smart Safes Services Over $1.3 billion in vault cash supplied or managed Approximately 28,900 non-bank ATMs & retail safes in all 50 States Armored Operates 442 ATMs for WSFS Bank; one of the largest Insurance Carrier Management in-market ATM franchises Also serves as an innovation center for the company, Cash Forecasting both expanding core ATM offerings and additional & Reconcilement payment, processing and software-related activities; Services e.g., launched WSFS Mobile Cash (1) As of 6/30/2019 (2) 5 years ending 6/30/19 19
Selected Financial Information
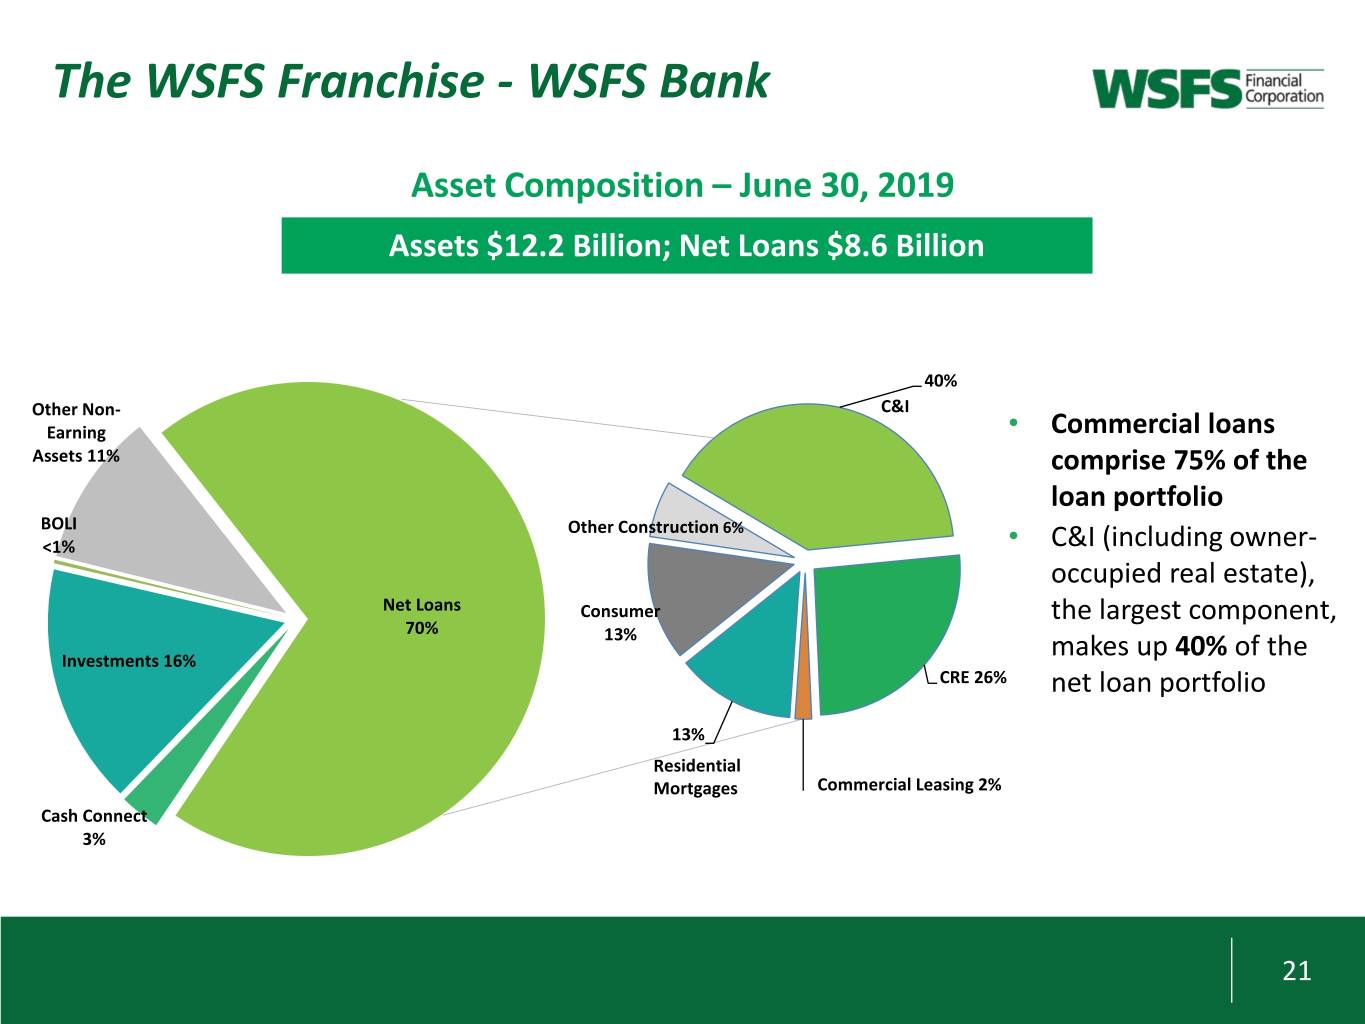
The WSFS Franchise - WSFS Bank Asset Composition – June 30, 2019 Assets $12.2 Billion; Net Loans $8.6 Billion 40% Other Non- C&I Earning • Commercial loans Assets 11% comprise 75% of the loan portfolio BOLI Other Construction 6% <1% • C&I (including owner- occupied real estate), Net Loans Consumer the largest component, 70% 13% Investments 16% makes up 40% of the CRE 26% net loan portfolio 13% Residential Mortgages Commercial Leasing 2% Cash Connect 3% 21
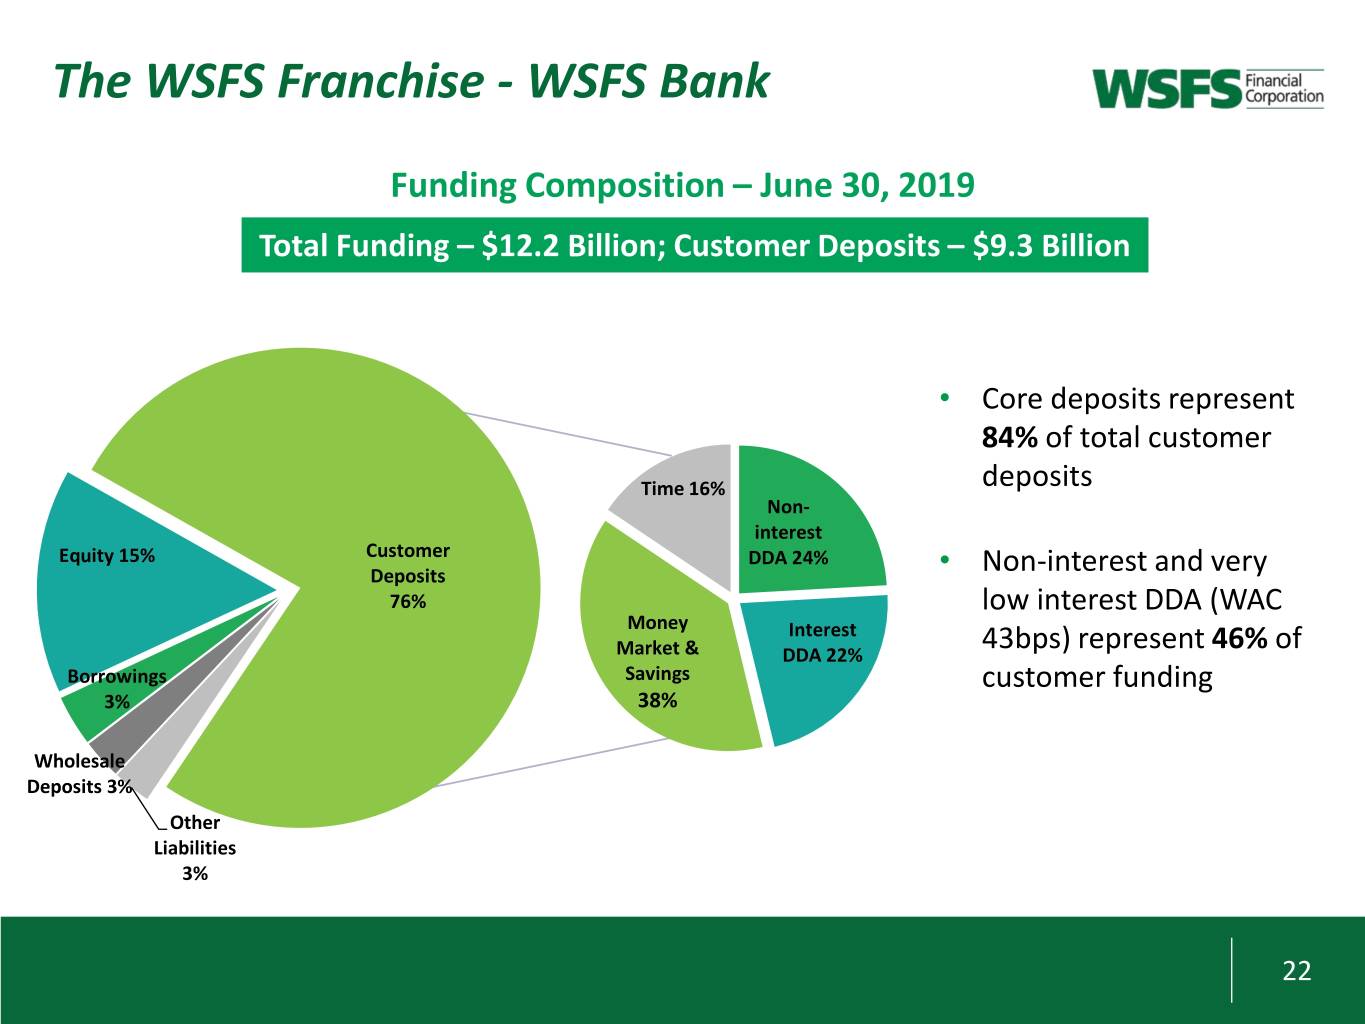
The WSFS Franchise - WSFS Bank Funding Composition – June 30, 2019 Total Funding – $12.2 Billion; Customer Deposits – $9.3 Billion • Core deposits represent 84% of total customer Time 16% deposits Non- interest Equity 15% Customer DDA 24% Deposits • Non-interest and very 76% low interest DDA (WAC Money Interest 43bps) represent of Market & DDA 22% 46% Borrowings Savings customer funding 3% 38% Wholesale Deposits 3% Other Liabilities 3% 22
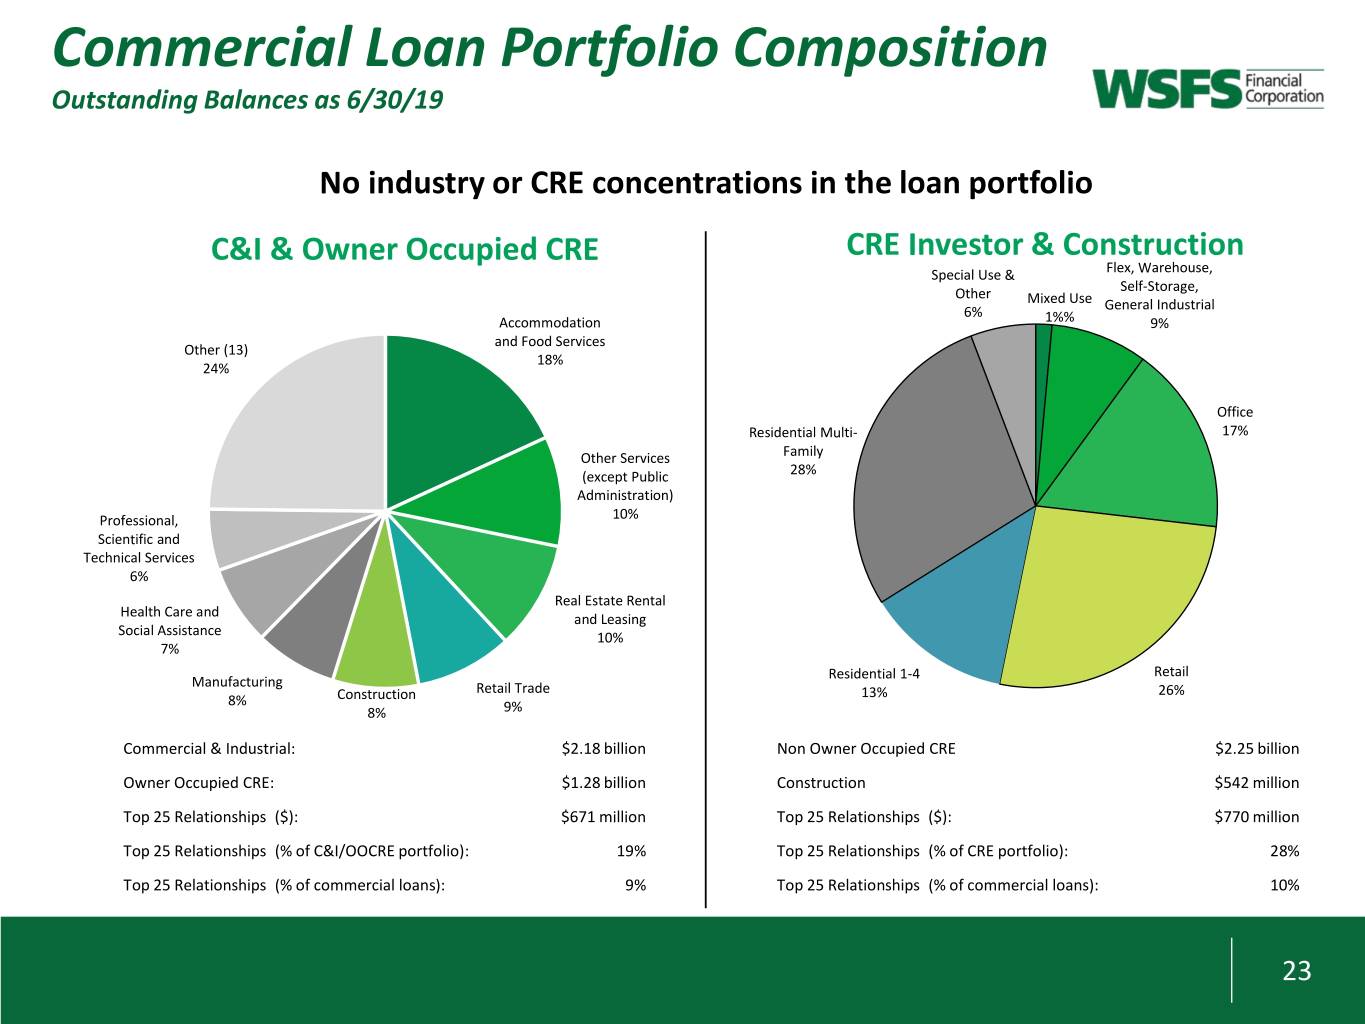
Commercial Loan Portfolio Composition Outstanding Balances as 6/30/19 No industry or CRE concentrations in the loan portfolio C&I & Owner Occupied CRE CRE Investor & Construction Special Use & Flex, Warehouse, Self-Storage, Other Mixed Use 6% General Industrial Accommodation 1%% 9% and Food Services Other (13) 18% 24% Office Residential Multi- 17% Other Services Family (except Public 28% Administration) Professional, 10% Scientific and Technical Services 6% Real Estate Rental Health Care and and Leasing Social Assistance 10% 7% Residential 1-4 Retail Manufacturing Retail Trade 13% 26% 8% Construction 8% 9% Commercial & Industrial: $2.18 billion Non Owner Occupied CRE $2.25 billion Owner Occupied CRE: $1.28 billion Construction $542 million Top 25 Relationships ($): $671 million Top 25 Relationships ($): $770 million Top 25 Relationships (% of C&I/OOCRE portfolio): 19% Top 25 Relationships (% of CRE portfolio): 28% Top 25 Relationships (% of commercial loans): 9% Top 25 Relationships (% of commercial loans): 10% 23
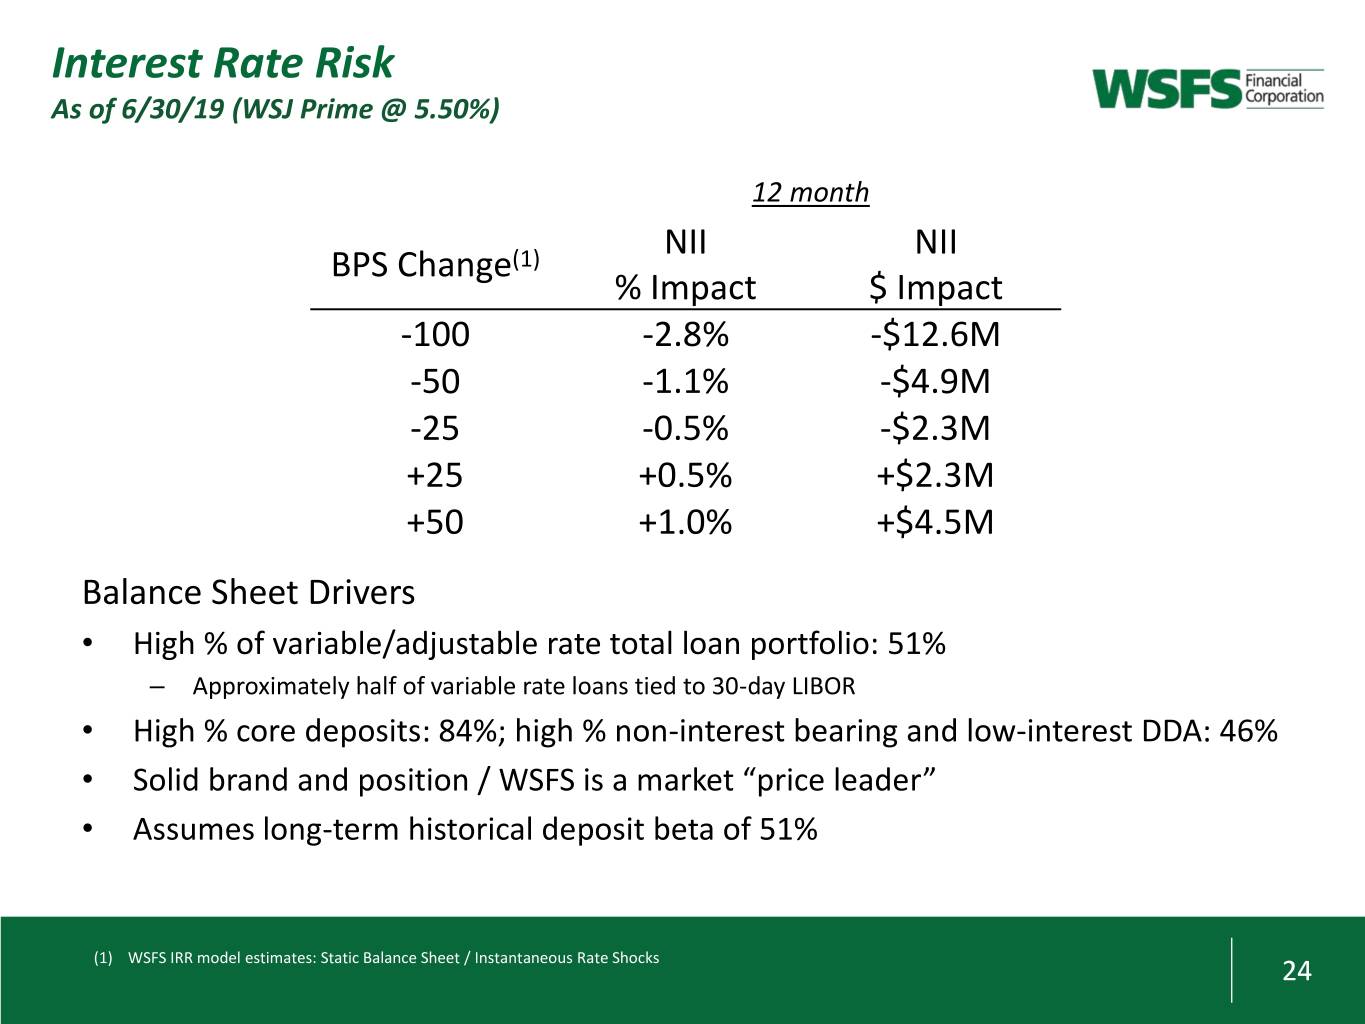
Interest Rate Risk As of 6/30/19 (WSJ Prime @ 5.50%) 12 month NII NII BPS Change(1) % Impact $ Impact -100 -2.8% -$12.6M -50 -1.1% -$4.9M -25 -0.5% -$2.3M +25 +0.5% +$2.3M +50 +1.0% +$4.5M Balance Sheet Drivers • High % of variable/adjustable rate total loan portfolio: 51% – Approximately half of variable rate loans tied to 30-day LIBOR • High % core deposits: 84%; high % non-interest bearing and low-interest DDA: 46% • Solid brand and position / WSFS is a market “price leader” • Assumes long-term historical deposit beta of 51% (1) WSFS IRR model estimates: Static Balance Sheet / Instantaneous Rate Shocks 24

Overall Credit Trends Remain Stable Criticized & Classified Loans / Tier-1 + ALLL Delinquencies (1) / Gross Loans 50% 2.00% High point during the cycle 1.80% High point during 45% of: 1.60% the cycle of 3.03% 40% Criticized: 105.6% in 1Q10 in 1Q12 1.40% 35% Classified: 70.5% in 3Q09 1.20% 30% 1.00% 0.78% 25% 0.80% 16.78% 20% 0.60% 15% 0.40% 13.77% 10% 0.20% 1Q13 2Q13 3Q13 4Q13 1Q14 2Q14 3Q14 4Q14 1Q15 2Q15 3Q15 4Q15 1Q16 2Q16 3Q16 4Q16 1Q17 2Q17 3Q17 4Q17 1Q18 2Q18 3Q18 4Q18 1Q19 2Q19 1Q13 2Q13 3Q13 4Q13 1Q14 2Q14 3Q14 4Q14 1Q15 2Q15 3Q15 4Q15 1Q16 2Q16 3Q16 4Q16 1Q17 2Q17 3Q17 4Q17 1Q18 2Q18 3Q18 4Q18 1Q19 2Q19 Classified Loans Criticized Loans Delinquencies Large Relationship (2) NPAs / Total Assets Net Charge-Offs (3) 2.20% 1.00% High point during 1.70% 0.80% the cycle of 2.61% 0.61% in 3Q09 0.60% 1.20% 0.40% 0.70% 0.46% 0.20% 0.20% 0.00% 1Q13 2Q13 3Q13 4Q13 1Q14 2Q14 3Q14 4Q14 1Q15 2Q15 3Q15 4Q15 1Q16 2Q16 3Q16 4Q16 1Q17 2Q17 3Q17 4Q17 1Q18 2Q18 3Q18 4Q18 1Q19 2Q19 1Q13 2Q13 3Q13 4Q13 1Q14 2Q14 3Q14 4Q14 1Q15 2Q15 3Q15 4Q15 1Q16 2Q16 3Q16 4Q16 1Q17 2Q17 3Q17 4Q17 1Q18 2Q18 3Q18 4Q18 1Q19 2Q19 (1) Includes non-accruing loans (2) One large $15.4 million, highly-seasonal relationship that was exited in 3Q 2016 (3) Ratio of quarterly net charge-offs to average gross loans 25
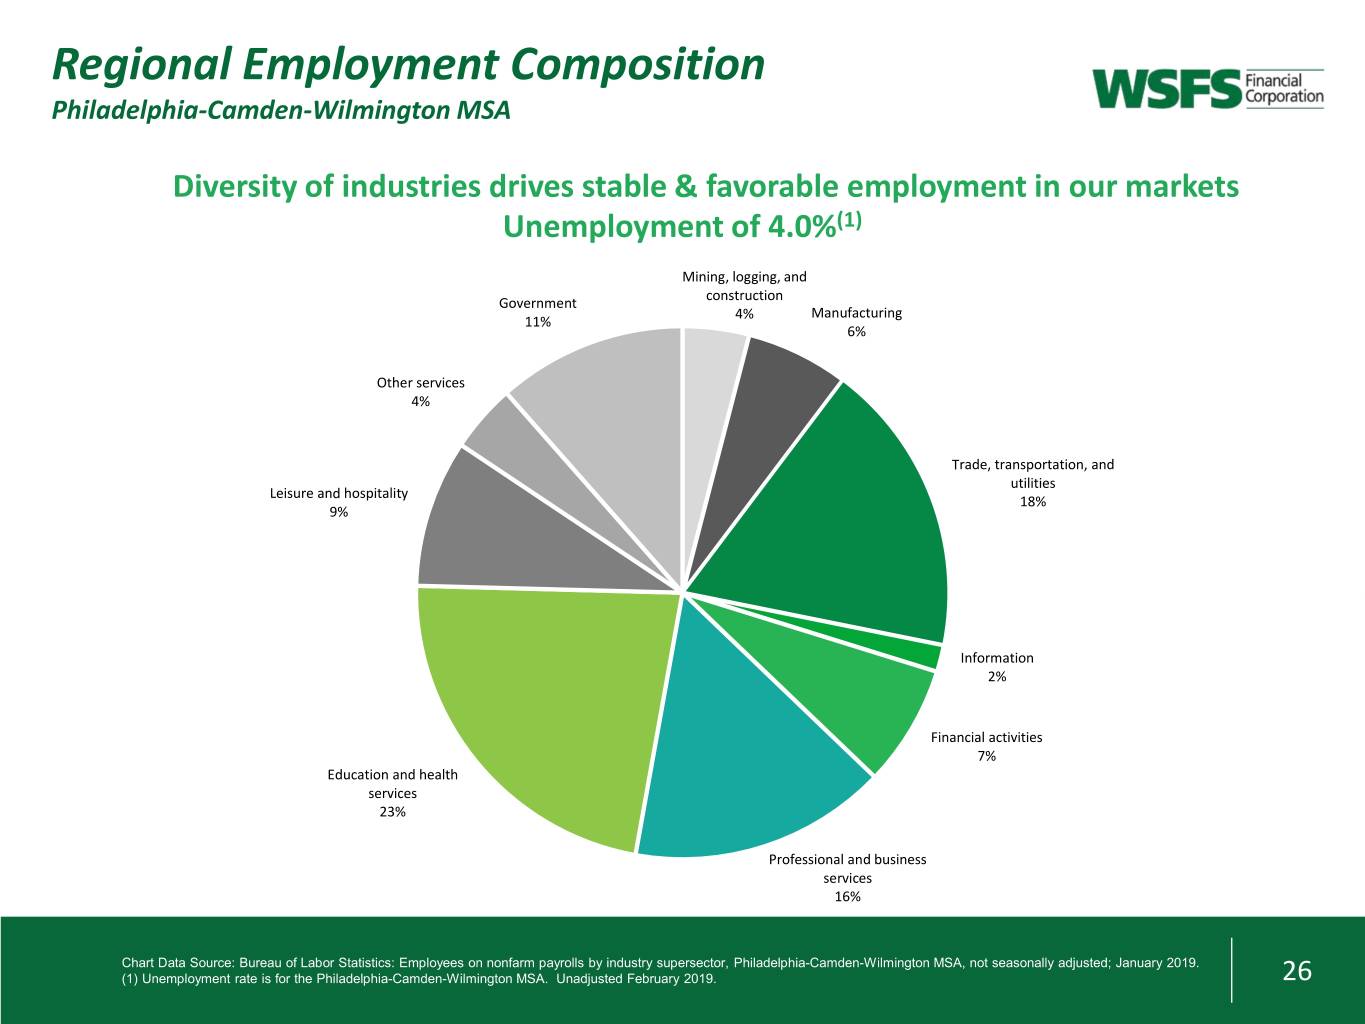
Regional Employment Composition Philadelphia-Camden-Wilmington MSA Diversity of industries drives stable & favorable employment in our markets Unemployment of 4.0%(1) Mining, logging, and construction Government 4% Manufacturing 11% 6% Other services 4% Trade, transportation, and utilities Leisure and hospitality 18% 9% Information 2% Financial activities 7% Education and health services 23% Professional and business services 16% Chart Data Source: Bureau of Labor Statistics: Employees on nonfarm payrolls by industry supersector, Philadelphia-Camden-Wilmington MSA, not seasonally adjusted; January 2019. (1) Unemployment rate is for the Philadelphia-Camden-Wilmington MSA. Unadjusted February 2019. 26
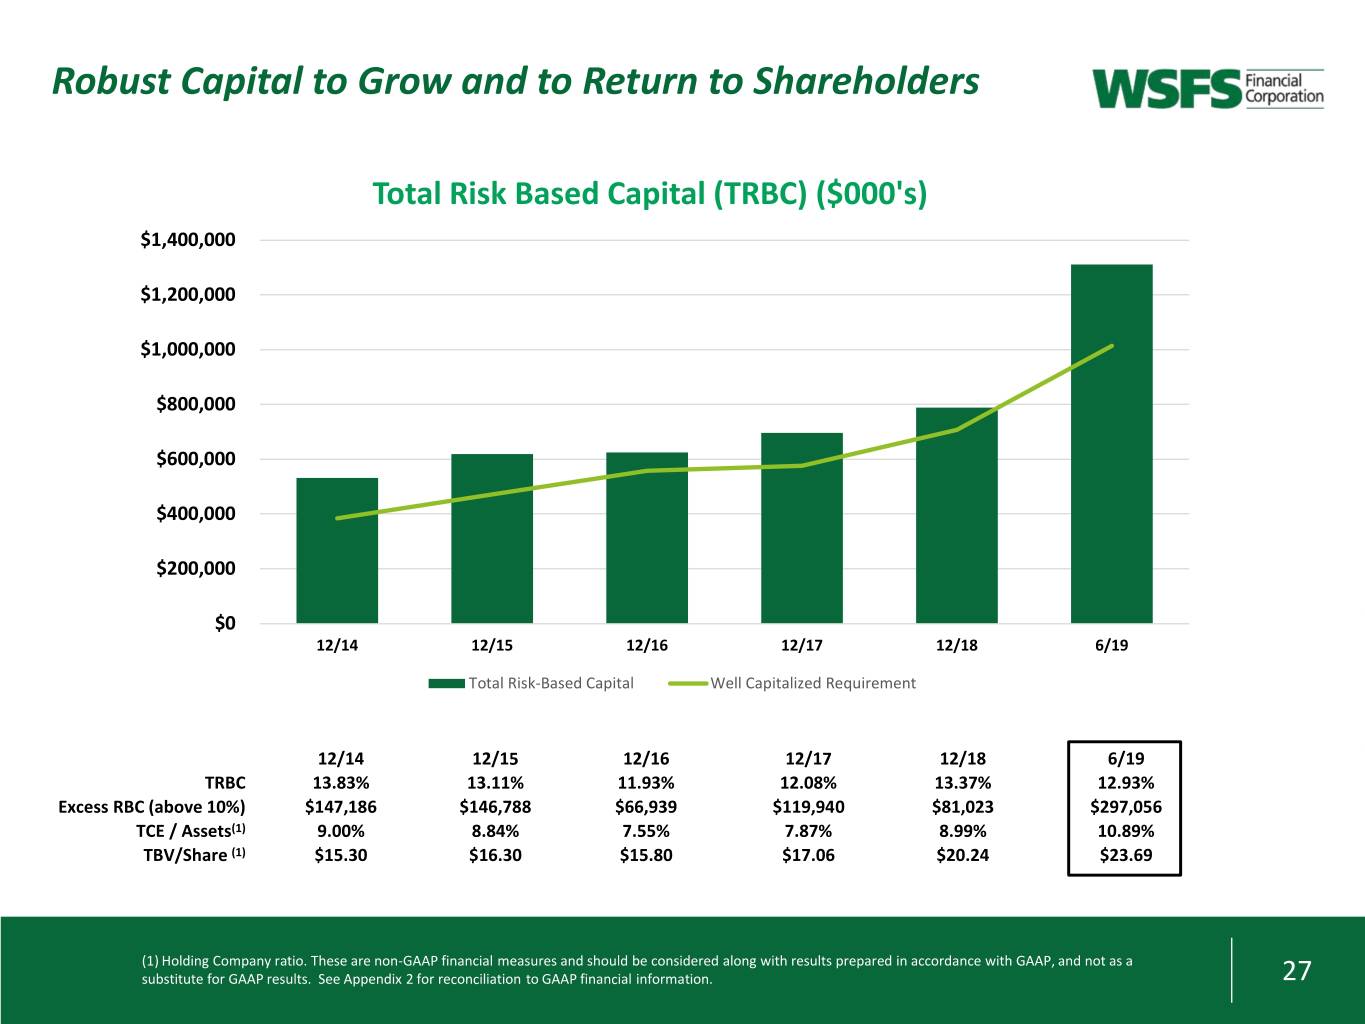
Robust Capital to Grow and to Return to Shareholders Total Risk Based Capital (TRBC) ($000's) $1,400,000 $1,200,000 $1,000,000 $800,000 $600,000 $400,000 $200,000 $0 12/14 12/15 12/16 12/17 12/18 6/19 Total Risk-Based Capital Well Capitalized Requirement 12/14 12/15 12/16 12/17 12/18 6/19 TRBC 13.83% 13.11% 11.93% 12.08% 13.37% 12.93% Excess RBC (above 10%) $147,186 $146,788 $66,939 $119,940 $81,023 $297,056 TCE / Assets(1) 9.00% 8.84% 7.55% 7.87% 8.99% 10.89% TBV/Share (1) $15.30 $16.30 $15.80 $17.06 $20.24 $23.69 (1) Holding Company ratio. These are non-GAAP financial measures and should be considered along with results prepared in accordance with GAAP, and not as a substitute for GAAP results. See Appendix 2 for reconciliation to GAAP financial information. 27
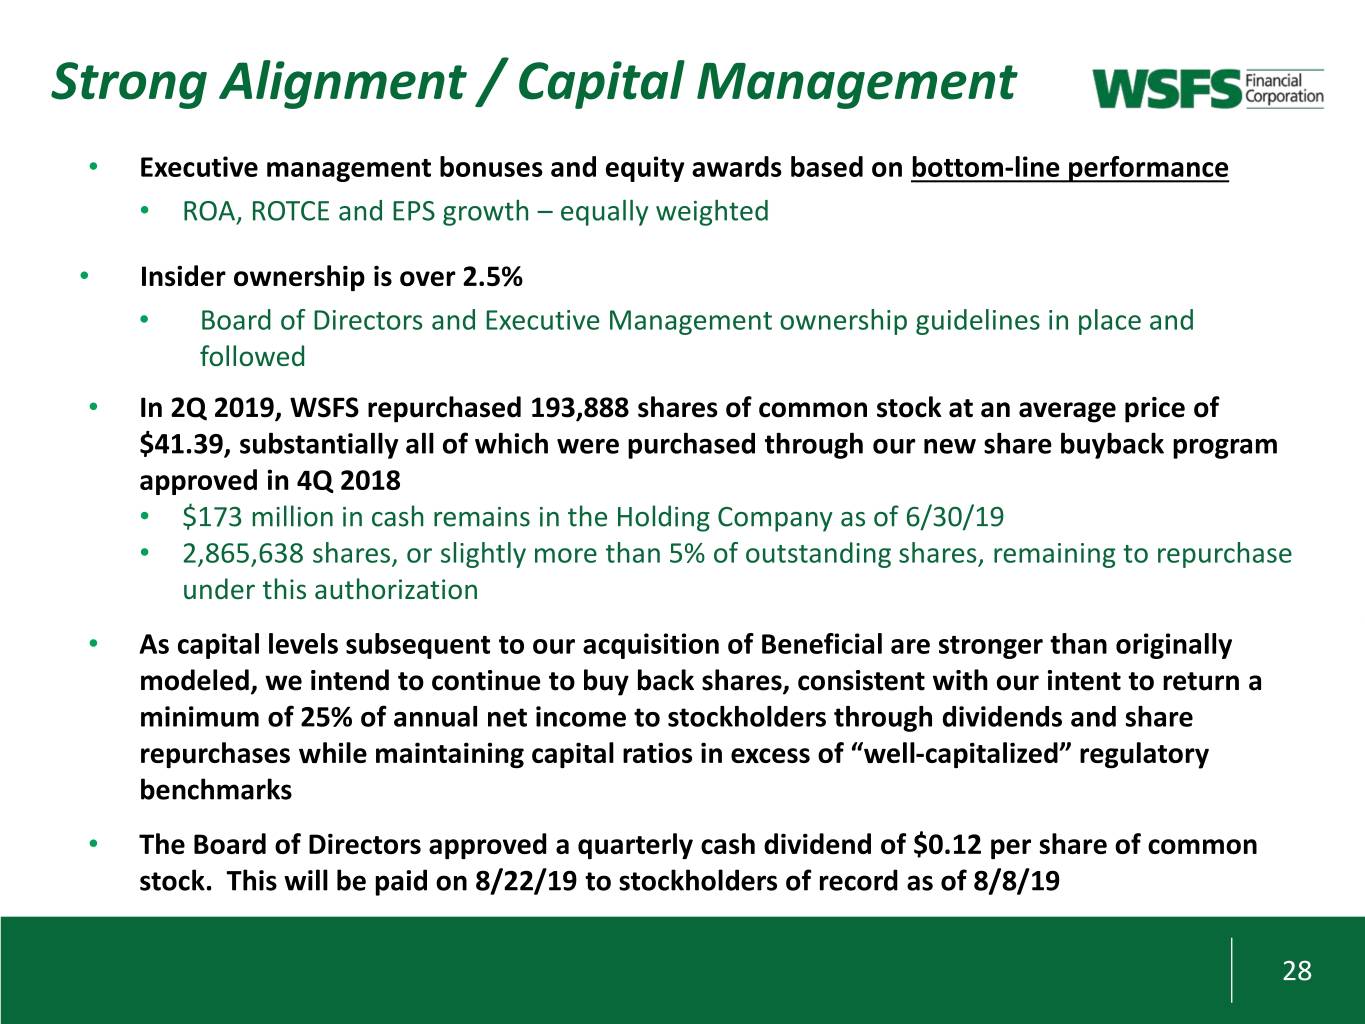
Strong Alignment / Capital Management • Executive management bonuses and equity awards based on bottom-line performance • ROA, ROTCE and EPS growth – equally weighted • Insider ownership is over 2.5% • Board of Directors and Executive Management ownership guidelines in place and followed • In 2Q 2019, WSFS repurchased 193,888 shares of common stock at an average price of $41.39, substantially all of which were purchased through our new share buyback program approved in 4Q 2018 • $173 million in cash remains in the Holding Company as of 6/30/19 • 2,865,638 shares, or slightly more than 5% of outstanding shares, remaining to repurchase under this authorization • As capital levels subsequent to our acquisition of Beneficial are stronger than originally modeled, we intend to continue to buy back shares, consistent with our intent to return a minimum of 25% of annual net income to stockholders through dividends and share repurchases while maintaining capital ratios in excess of “well-capitalized” regulatory benchmarks • The Board of Directors approved a quarterly cash dividend of $0.12 per share of common stock. This will be paid on 8/22/19 to stockholders of record as of 8/8/19 28
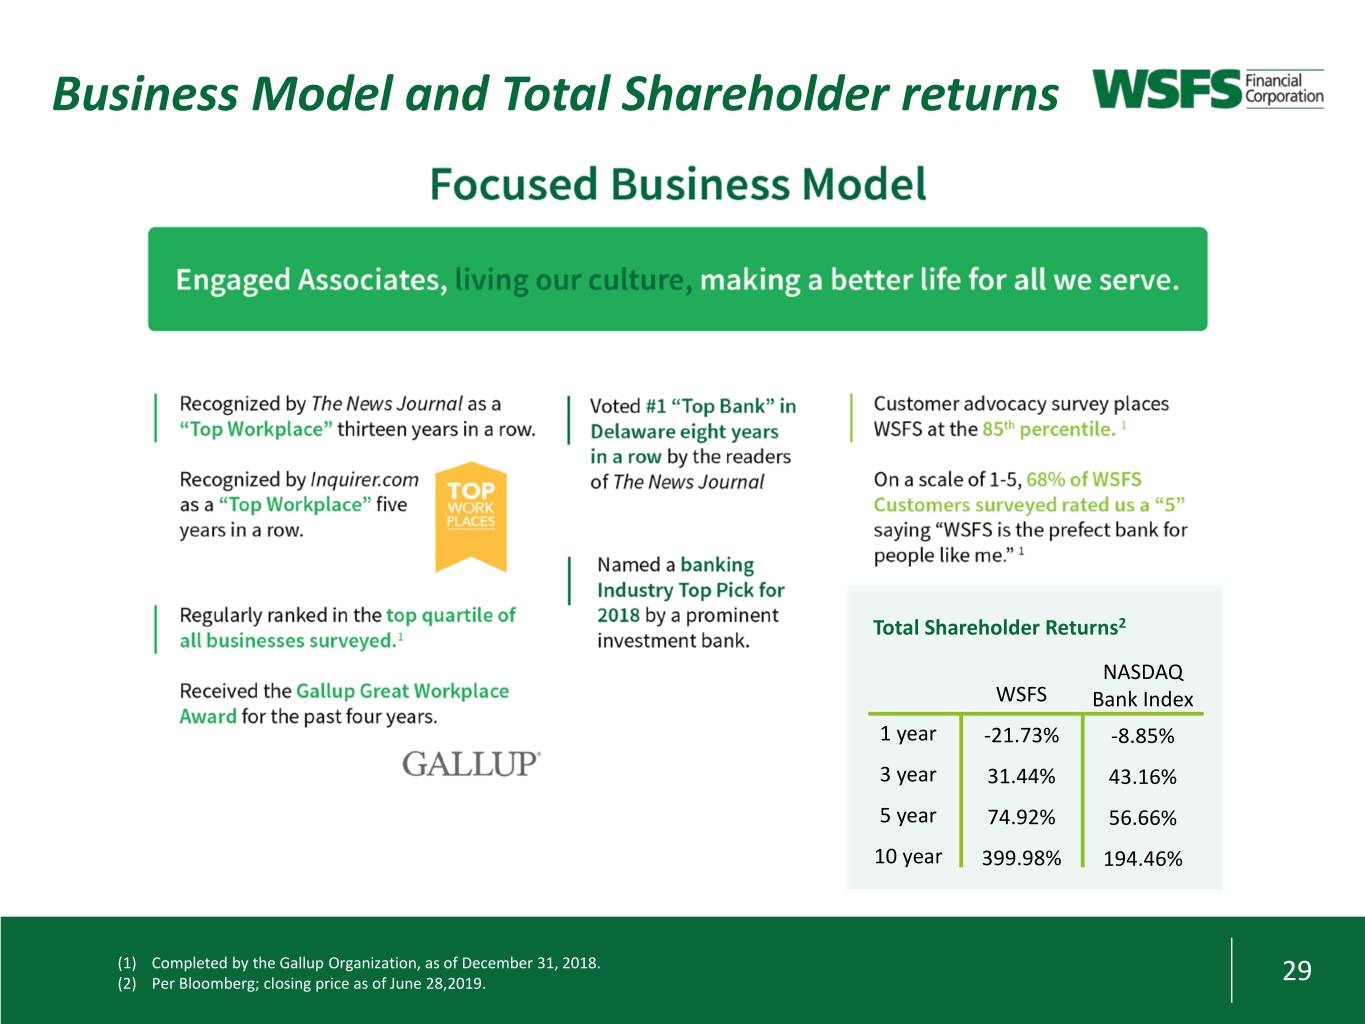
Business Model and Total Shareholder returns Total Shareholder Returns2 NASDAQ WSFS Bank Index 1 year -21.73% -8.85% 3 year 31.44% 43.16% 5 year 74.92% 56.66% 10 year 399.98% 194.46% (1) Completed by the Gallup Organization, as of December 31, 2018. (2) Per Bloomberg; closing price as of June 28,2019. 29
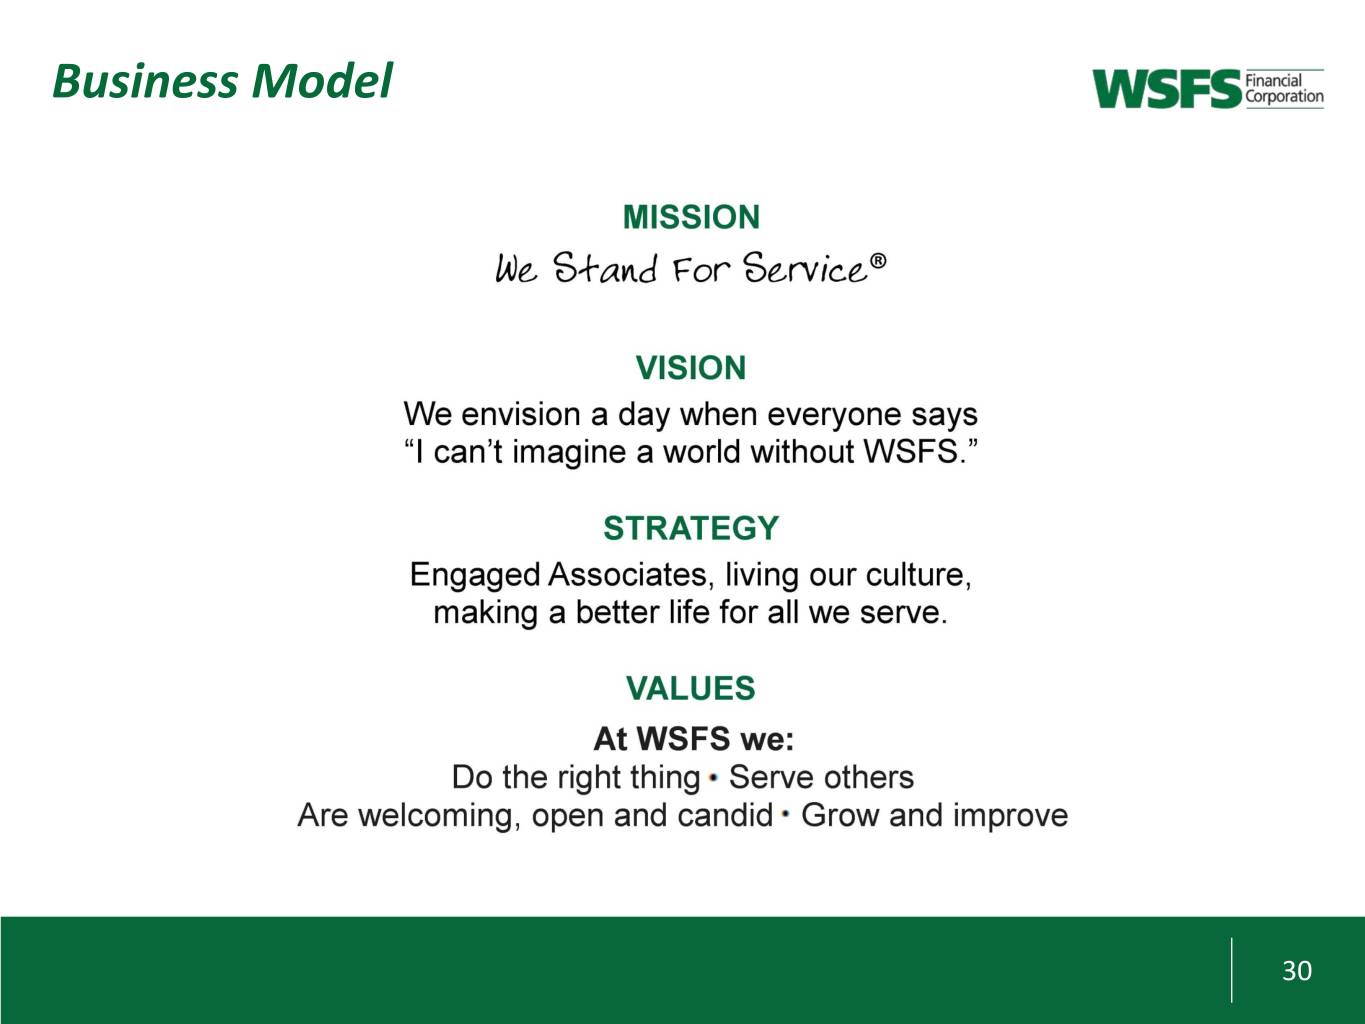
Business Model 30
Appendices
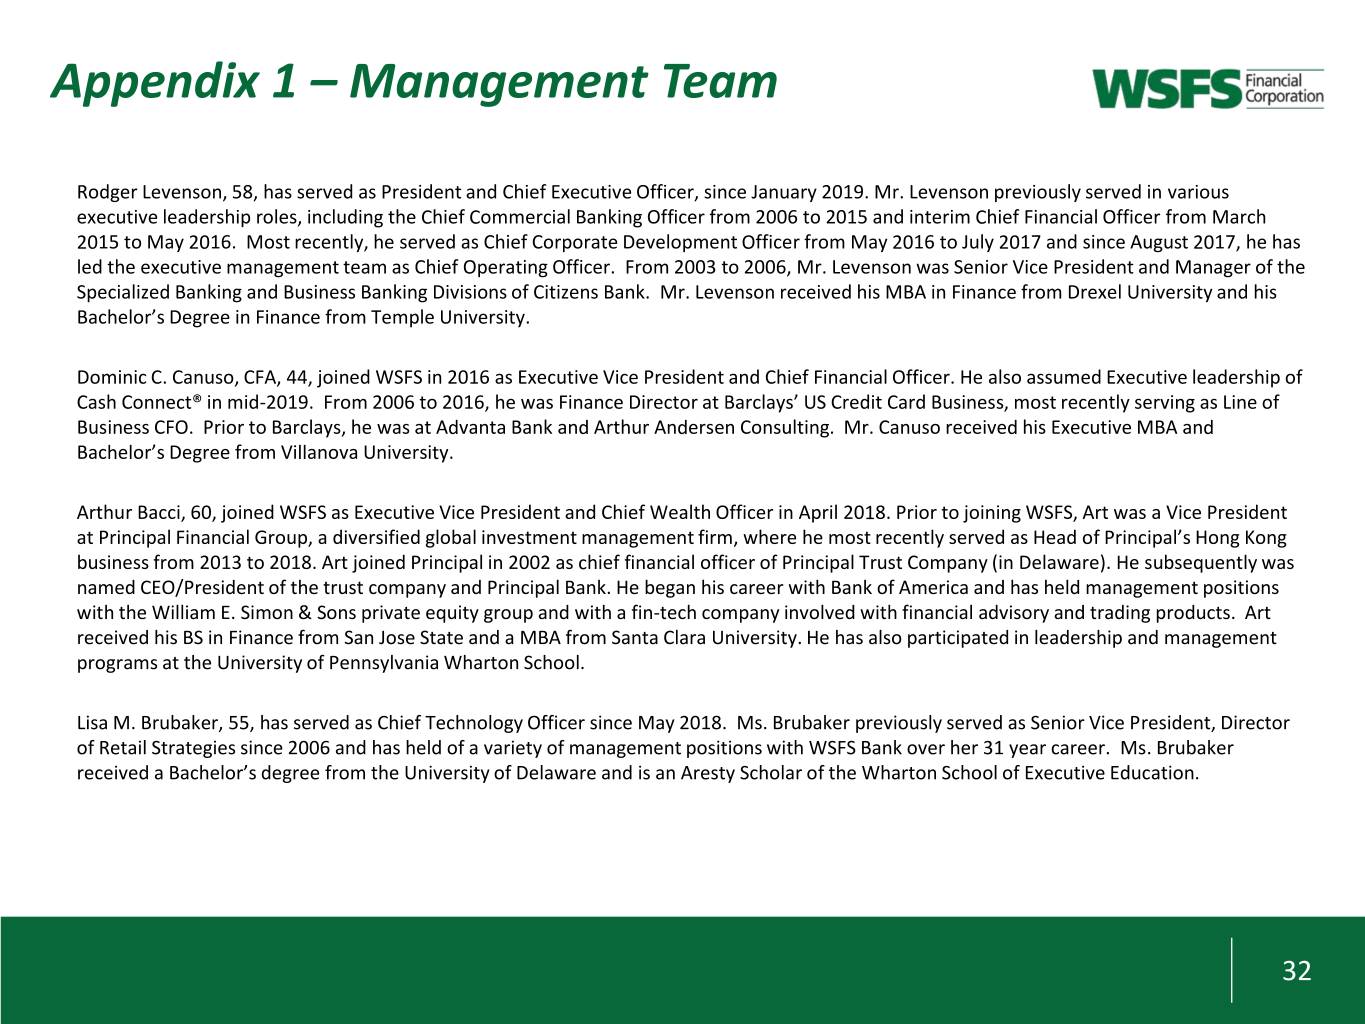
Appendix 1 – Management Team Rodger Levenson, 58, has served as President and Chief Executive Officer, since January 2019. Mr. Levenson previously served in various executive leadership roles, including the Chief Commercial Banking Officer from 2006 to 2015 and interim Chief Financial Officer from March 2015 to May 2016. Most recently, he served as Chief Corporate Development Officer from May 2016 to July 2017 and since August 2017, he has led the executive management team as Chief Operating Officer. From 2003 to 2006, Mr. Levenson was Senior Vice President and Manager of the Specialized Banking and Business Banking Divisions of Citizens Bank. Mr. Levenson received his MBA in Finance from Drexel University and his Bachelor’s Degree in Finance from Temple University. Dominic C. Canuso, CFA, 44, joined WSFS in 2016 as Executive Vice President and Chief Financial Officer. He also assumed Executive leadership of Cash Connect® in mid-2019. From 2006 to 2016, he was Finance Director at Barclays’ US Credit Card Business, most recently serving as Line of Business CFO. Prior to Barclays, he was at Advanta Bank and Arthur Andersen Consulting. Mr. Canuso received his Executive MBA and Bachelor’s Degree from Villanova University. Arthur Bacci, 60, joined WSFS as Executive Vice President and Chief Wealth Officer in April 2018. Prior to joining WSFS, Art was a Vice President at Principal Financial Group, a diversified global investment management firm, where he most recently served as Head of Principal’s Hong Kong business from 2013 to 2018. Art joined Principal in 2002 as chief financial officer of Principal Trust Company (in Delaware). He subsequently was named CEO/President of the trust company and Principal Bank. He began his career with Bank of America and has held management positions with the William E. Simon & Sons private equity group and with a fin-tech company involved with financial advisory and trading products. Art received his BS in Finance from San Jose State and a MBA from Santa Clara University. He has also participated in leadership and management programs at the University of Pennsylvania Wharton School. Lisa M. Brubaker, 55, has served as Chief Technology Officer since May 2018. Ms. Brubaker previously served as Senior Vice President, Director of Retail Strategies since 2006 and has held of a variety of management positions with WSFS Bank over her 31 year career. Ms. Brubaker received a Bachelor’s degree from the University of Delaware and is an Aresty Scholar of the Wharton School of Executive Education. 32

Appendix 1 – Management Team Steve Clark, 61, joined WSFS Bank in 2002 and has served as Executive Vice President and Chief Commercial Banking Officer since May 2016. From 2002 thru 2006, Mr. Clark led and managed the establishment of the Middle Market lending unit, and in 2007 became Division Manager of the Business Banking and Middle Market Divisions. Prior to 2002, he spent 23 years in various commercial banking positions at PNC Bank and its predecessor companies. Mr. Clark received his MBA in Finance from Widener University and his Bachelor’s Degree in Business Administration (Marketing) from the University of Delaware. Paul S. Greenplate, 61, Executive Vice President and Chief Risk Officer, joined WSFS in 1999 and prior to his leadership role in the Risk Division, he served as Senior Vice President and Treasurer. As Executive Vice President and Chief Risk Officer, Mr. Greenplate oversees all independent Risk Management functions including, Credit Risk Management, Real Estate Services, Asset Recovery, Enterprise Risk Management, Legal, Internal Audit, Loan Review and Regulatory Compliance. Mr. Greenplate graduated from the University of Delaware with a Bachelor’s Degree in Economics. Peggy H. Eddens, 63, Executive Vice President, Chief Associate and Customer Experience Officer, joined WSFS Bank in 2007. From 2003 to 2007 she was Senior Vice President for Human Resources and Development for NexTier Bank, Butler PA. Ms. Eddens received a Master of Science Degree in Human Resource Management from La Roche College and her Bachelor’s Degree in Business Administration with minors in Management and Psychology from Robert Morris University. Patrick J. Ward, 63, joined WSFS in August 2016 as Executive Vice President, Pennsylvania Market President. He also serves on the Board of Directors of WSFS Financial Corporation. Mr. Ward has over 32 years of banking industry experience and previously served as Chairman and CEO of Penn Liberty Bank. He was an EVP of Citizens Bank of Pennsylvania from January 2003 until January 2004. Prior thereto, Mr. Ward served as President and CEO of Commonwealth Bancorp, Inc., the holding company for Commonwealth Bank, until its acquisition by Citizens Bank in January 2003. Mr. Ward is a graduate of Carnegie Mellon University with a Bachelor’s Degree in Economics and earned an MBA from the University of Notre Dame. Richard M. Wright, 66, Executive Vice President and Chief Retail Banking Officer since 2006. From 2003 to 2006, Mr. Wright was Executive Vice President, Retail Banking and Marketing for DNB First in Downingtown, PA. Mr. Wright received his MBA in Management Decision Systems from the University of Southern California and his Bachelor’s Degree in Marketing and Economics from California State University. 33
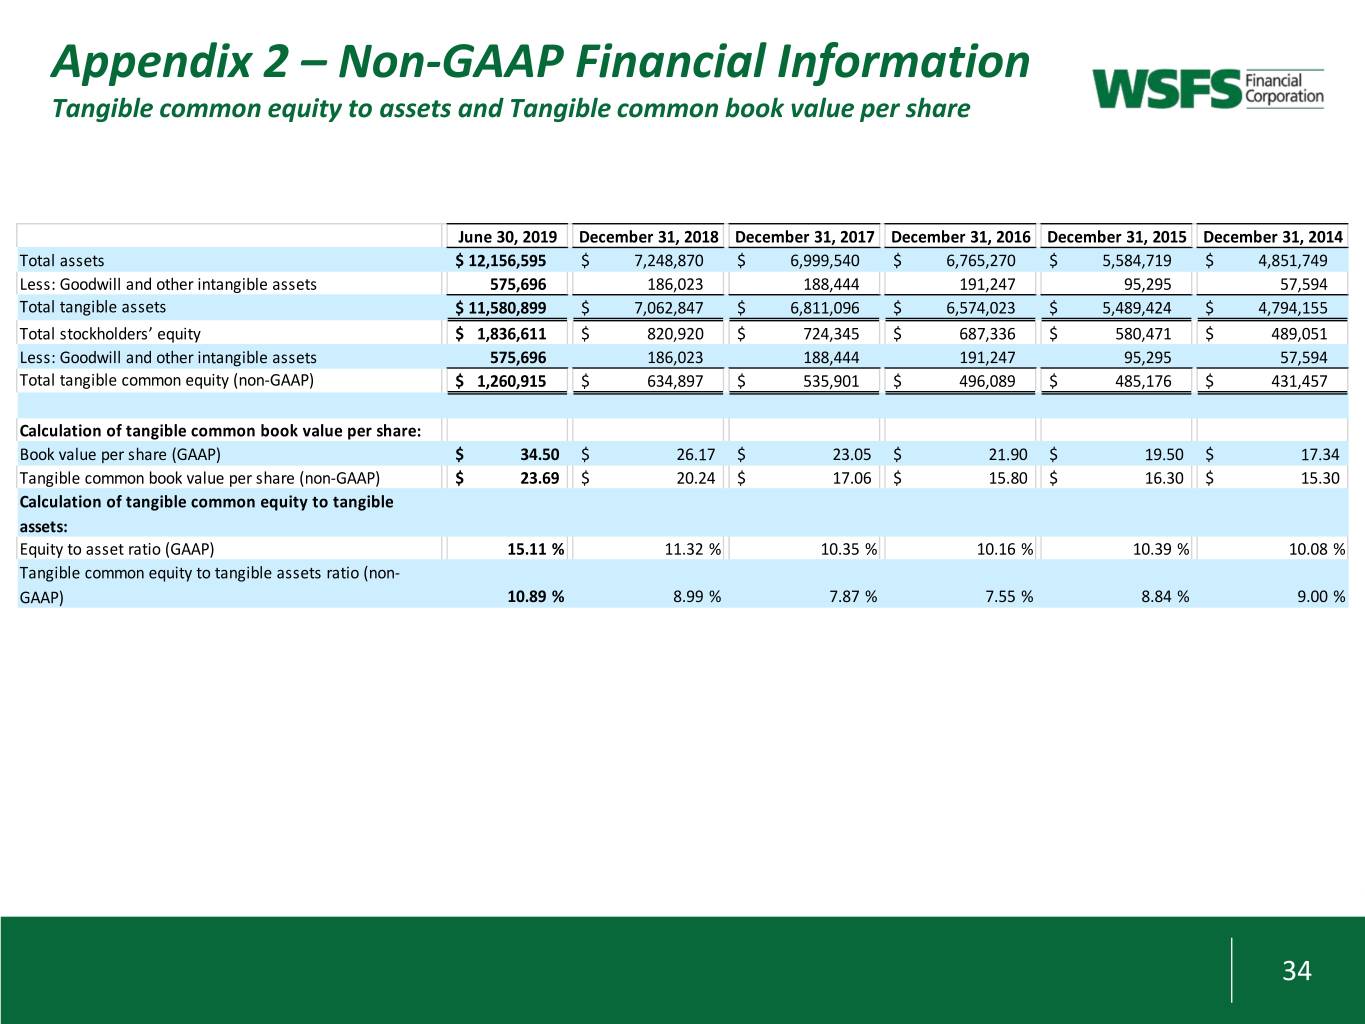
Appendix 2 – Non-GAAP Financial Information Tangible common equity to assets and Tangible common book value per share June 30, 2019 December 31, 2018 December 31, 2017 December 31, 2016 December 31, 2015 December 31, 2014 Total assets $ 12,156,595 $ 7,248,870 $ 6,999,540 $ 6,765,270 $ 5,584,719 $ 4,851,749 Less: Goodwill and other intangible assets 575,696 186,023 188,444 191,247 95,295 57,594 Total tangible assets $ 11,580,899 $ 7,062,847 $ 6,811,096 $ 6,574,023 $ 5,489,424 $ 4,794,155 Total stockholders’ equity $ 1,836,611 $ 820,920 $ 724,345 $ 687,336 $ 580,471 $ 489,051 Less: Goodwill and other intangible assets 575,696 186,023 188,444 191,247 95,295 57,594 Total tangible common equity (non-GAAP) $ 1,260,915 $ 634,897 $ 535,901 $ 496,089 $ 485,176 $ 431,457 Calculation of tangible common book value per share: Book value per share (GAAP) $ 34.50 $ 26.17 $ 23.05 $ 21.90 $ 19.50 $ 17.34 Tangible common book value per share (non-GAAP) $ 23.69 $ 20.24 $ 17.06 $ 15.80 $ 16.30 $ 15.30 Calculation of tangible common equity to tangible assets: Equity to asset ratio (GAAP) 15.11 % 11.32 % 10.35 % 10.16 % 10.39 % 10.08 % Tangible common equity to tangible assets ratio (non- GAAP) 10.89 % 8.99 % 7.87 % 7.55 % 8.84 % 9.00 % 34
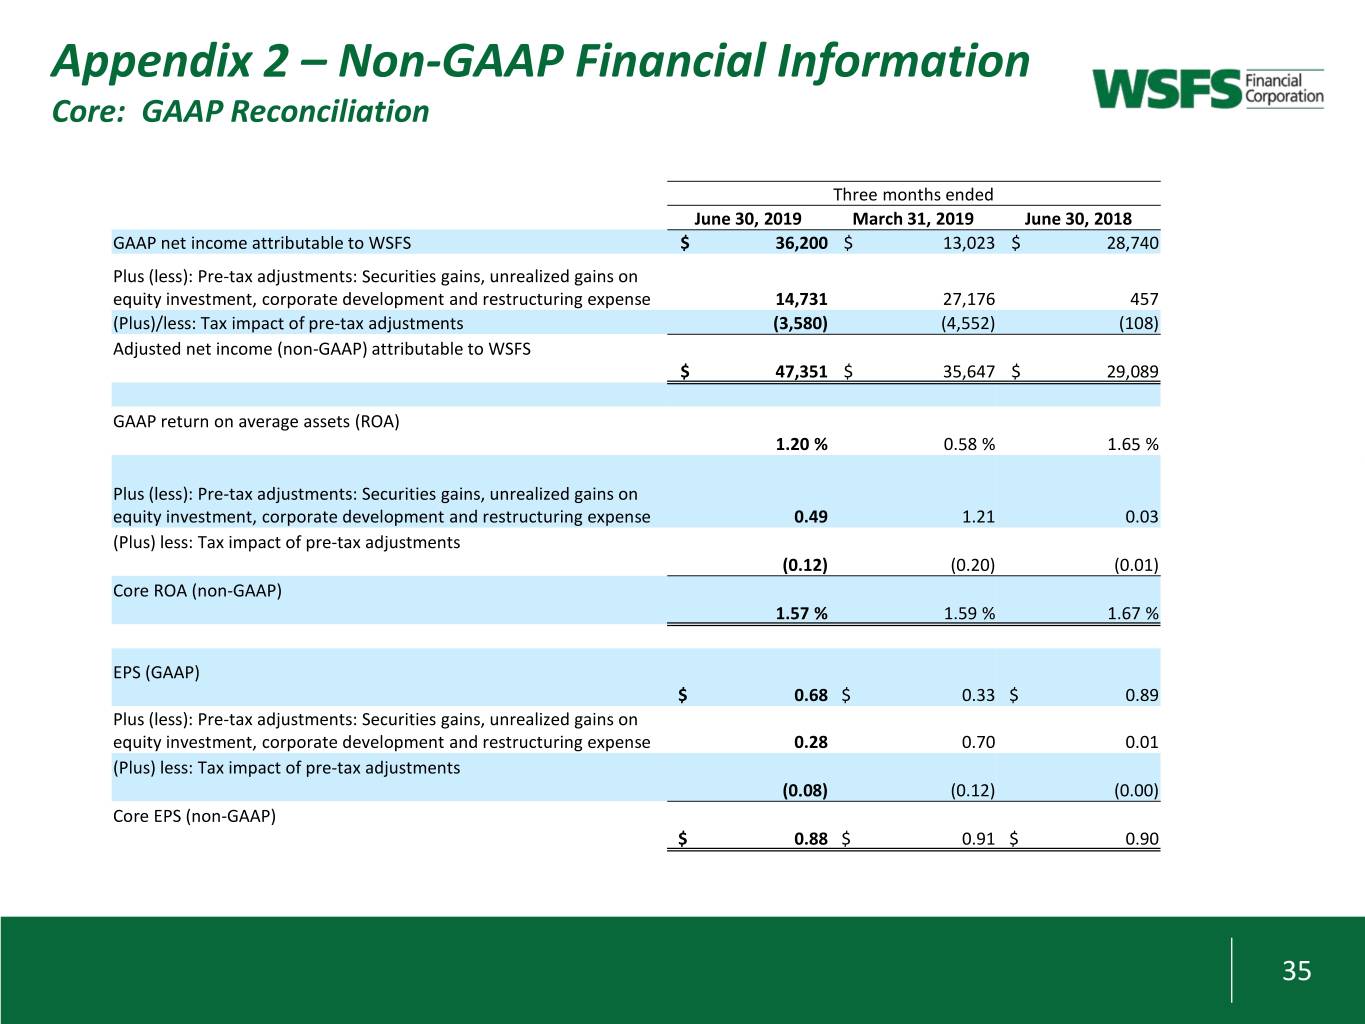
Appendix 2 – Non-GAAP Financial Information Core: GAAP Reconciliation Three months ended June 30, 2019 March 31, 2019 June 30, 2018 GAAP net income attributable to WSFS $ 36,200 $ 13,023 $ 28,740 Plus (less): Pre-tax adjustments: Securities gains, unrealized gains on equity investment, corporate development and restructuring expense 14,731 27,176 457 (Plus)/less: Tax impact of pre-tax adjustments (3,580) (4,552) (108) Adjusted net income (non-GAAP) attributable to WSFS $ 47,351 $ 35,647 $ 29,089 GAAP return on average assets (ROA) 1.20 % 0.58 % 1.65 % Plus (less): Pre-tax adjustments: Securities gains, unrealized gains on equity investment, corporate development and restructuring expense 0.49 1.21 0.03 (Plus) less: Tax impact of pre-tax adjustments (0.12) (0.20) (0.01) Core ROA (non-GAAP) 1.57 % 1.59 % 1.67 % EPS (GAAP) $ 0.68 $ 0.33 $ 0.89 Plus (less): Pre-tax adjustments: Securities gains, unrealized gains on equity investment, corporate development and restructuring expense 0.28 0.70 0.01 (Plus) less: Tax impact of pre-tax adjustments (0.08) (0.12) (0.00) Core EPS (non-GAAP) $ 0.88 $ 0.91 $ 0.90 35
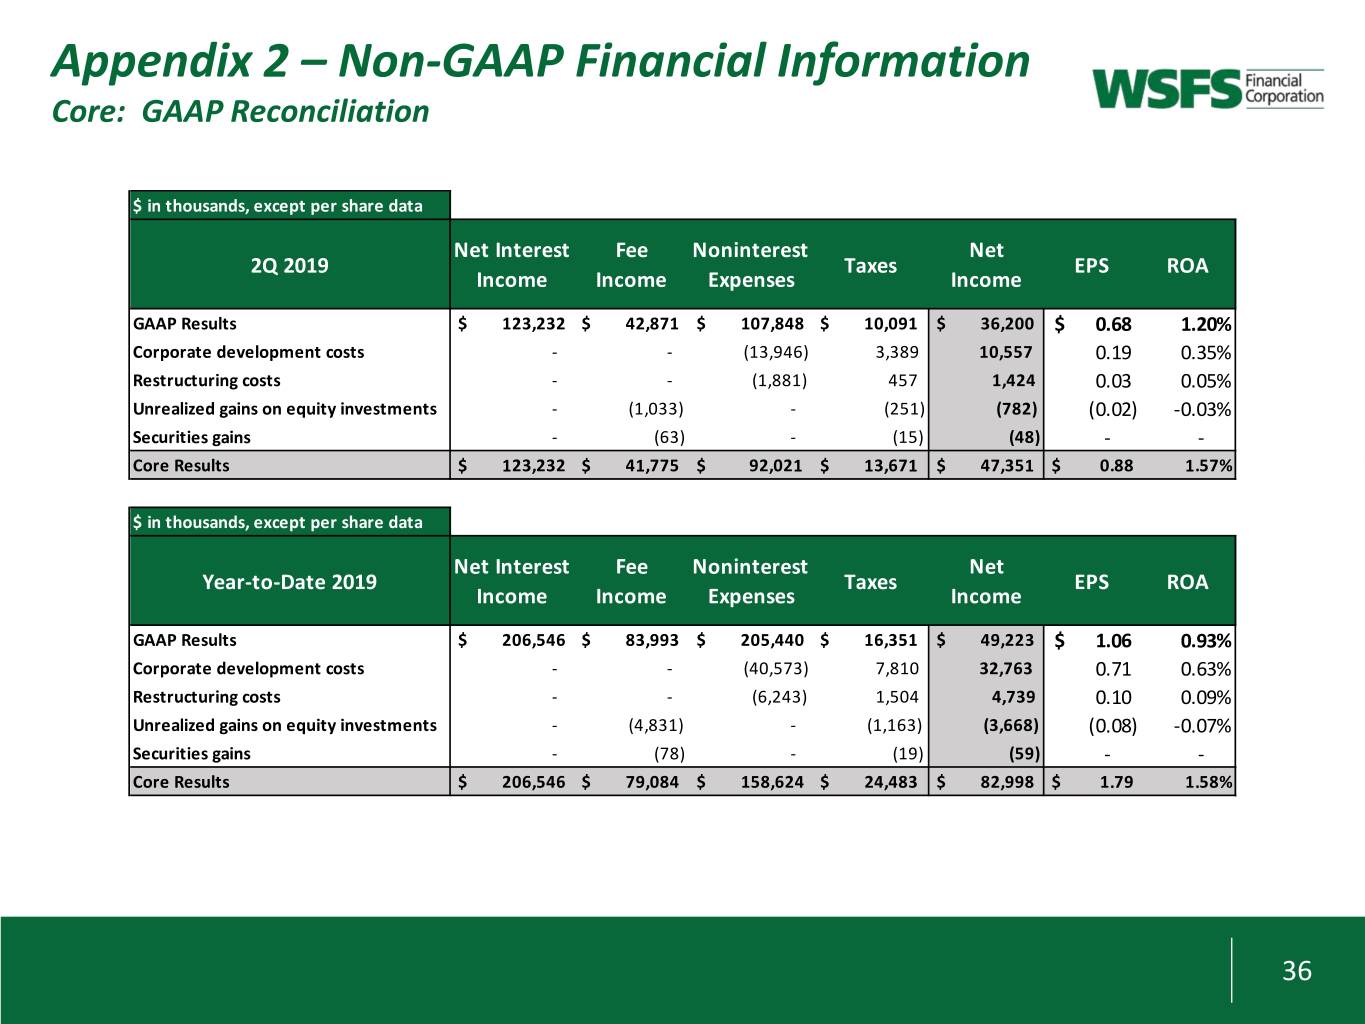
Appendix 2 – Non-GAAP Financial Information Core: GAAP Reconciliation $ in thousands, except per share data Net Interest Fee Noninterest Net 2Q 2019 Taxes EPS ROA Income Income Expenses Income GAAP Results $ 123,232 $ 42,871 $ 107,848 $ 10,091 $ 36,200 $ 0.68 1.20% Corporate development costs - - (13,946) 3,389 10,557 0.19 0.35% Restructuring costs - - (1,881) 457 1,424 0.03 0.05% Unrealized gains on equity investments - (1,033) - (251) (782) (0.02) -0.03% Securities gains - (63) - (15) (48) - - Core Results $ 123,232 $ 41,775 $ 92,021 $ 13,671 $ 47,351 $ 0.88 1.57% $ in thousands, except per share data Net Interest Fee Noninterest Net Year-to-Date 2019 Taxes EPS ROA Income Income Expenses Income GAAP Results $ 206,546 $ 83,993 $ 205,440 $ 16,351 $ 49,223 $ 1.06 0.93% Corporate development costs - - (40,573) 7,810 32,763 0.71 0.63% Restructuring costs - - (6,243) 1,504 4,739 0.10 0.09% Unrealized gains on equity investments - (4,831) - (1,163) (3,668) (0.08) -0.07% Securities gains - (78) - (19) (59) - - Core Results $ 206,546 $ 79,084 $ 158,624 $ 24,483 $ 82,998 $ 1.79 1.58% 36
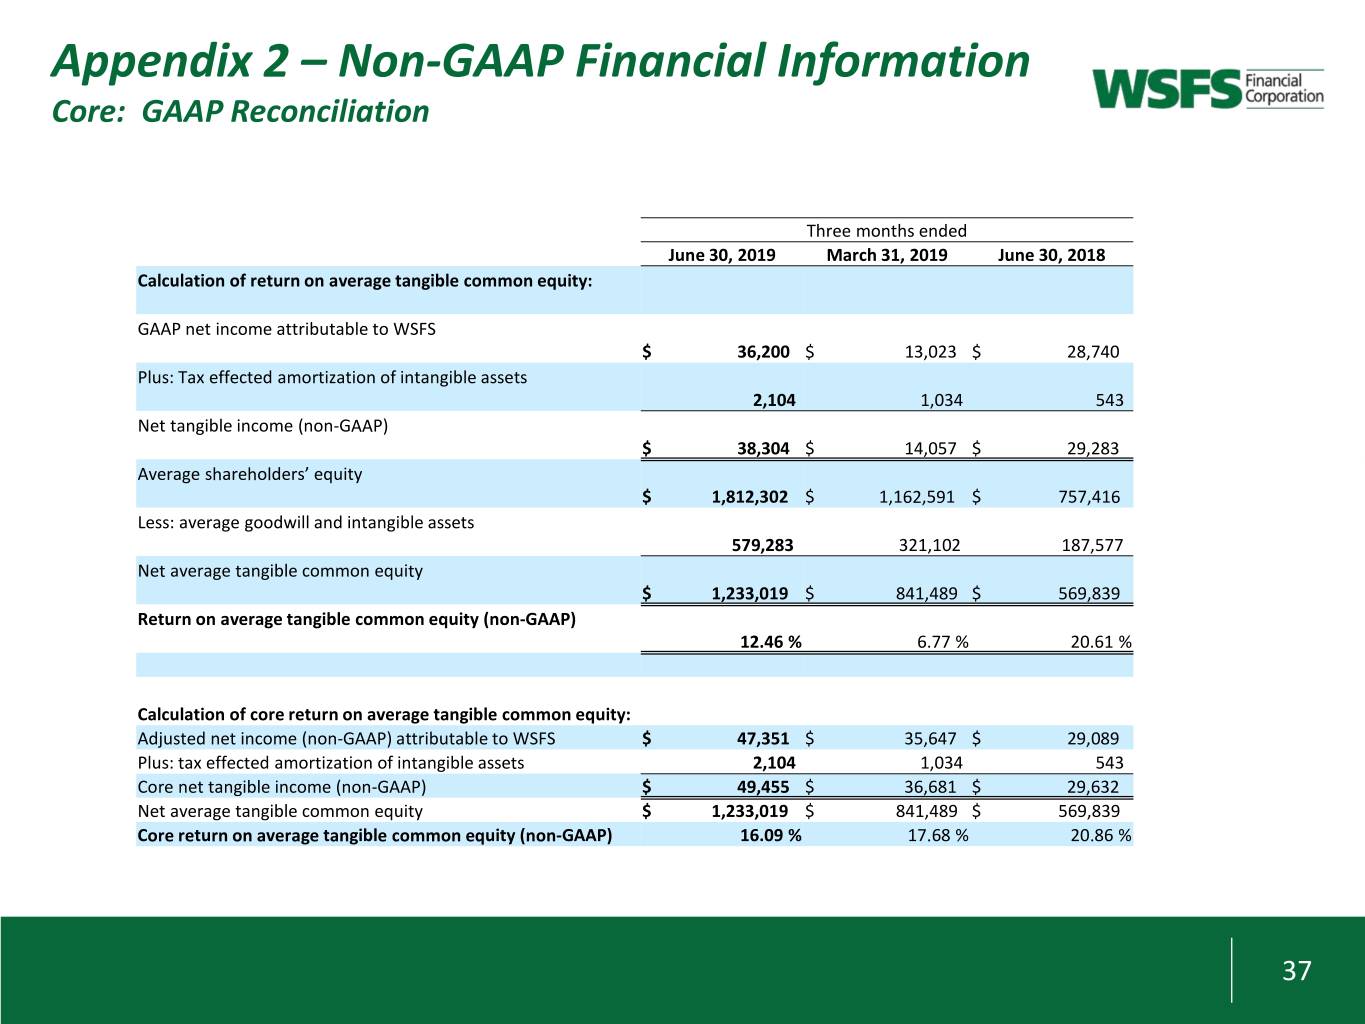
Appendix 2 – Non-GAAP Financial Information Core: GAAP Reconciliation Three months ended June 30, 2019 March 31, 2019 June 30, 2018 Calculation of return on average tangible common equity: GAAP net income attributable to WSFS $ 36,200 $ 13,023 $ 28,740 Plus: Tax effected amortization of intangible assets 2,104 1,034 543 Net tangible income (non-GAAP) $ 38,304 $ 14,057 $ 29,283 Average shareholders’ equity $ 1,812,302 $ 1,162,591 $ 757,416 Less: average goodwill and intangible assets 579,283 321,102 187,577 Net average tangible common equity $ 1,233,019 $ 841,489 $ 569,839 Return on average tangible common equity (non-GAAP) 12.46 % 6.77 % 20.61 % Calculation of core return on average tangible common equity: Adjusted net income (non-GAAP) attributable to WSFS $ 47,351 $ 35,647 $ 29,089 Plus: tax effected amortization of intangible assets 2,104 1,034 543 Core net tangible income (non-GAAP) $ 49,455 $ 36,681 $ 29,632 Net average tangible common equity $ 1,233,019 $ 841,489 $ 569,839 Core return on average tangible common equity (non-GAAP) 16.09 % 17.68 % 20.86 % 37
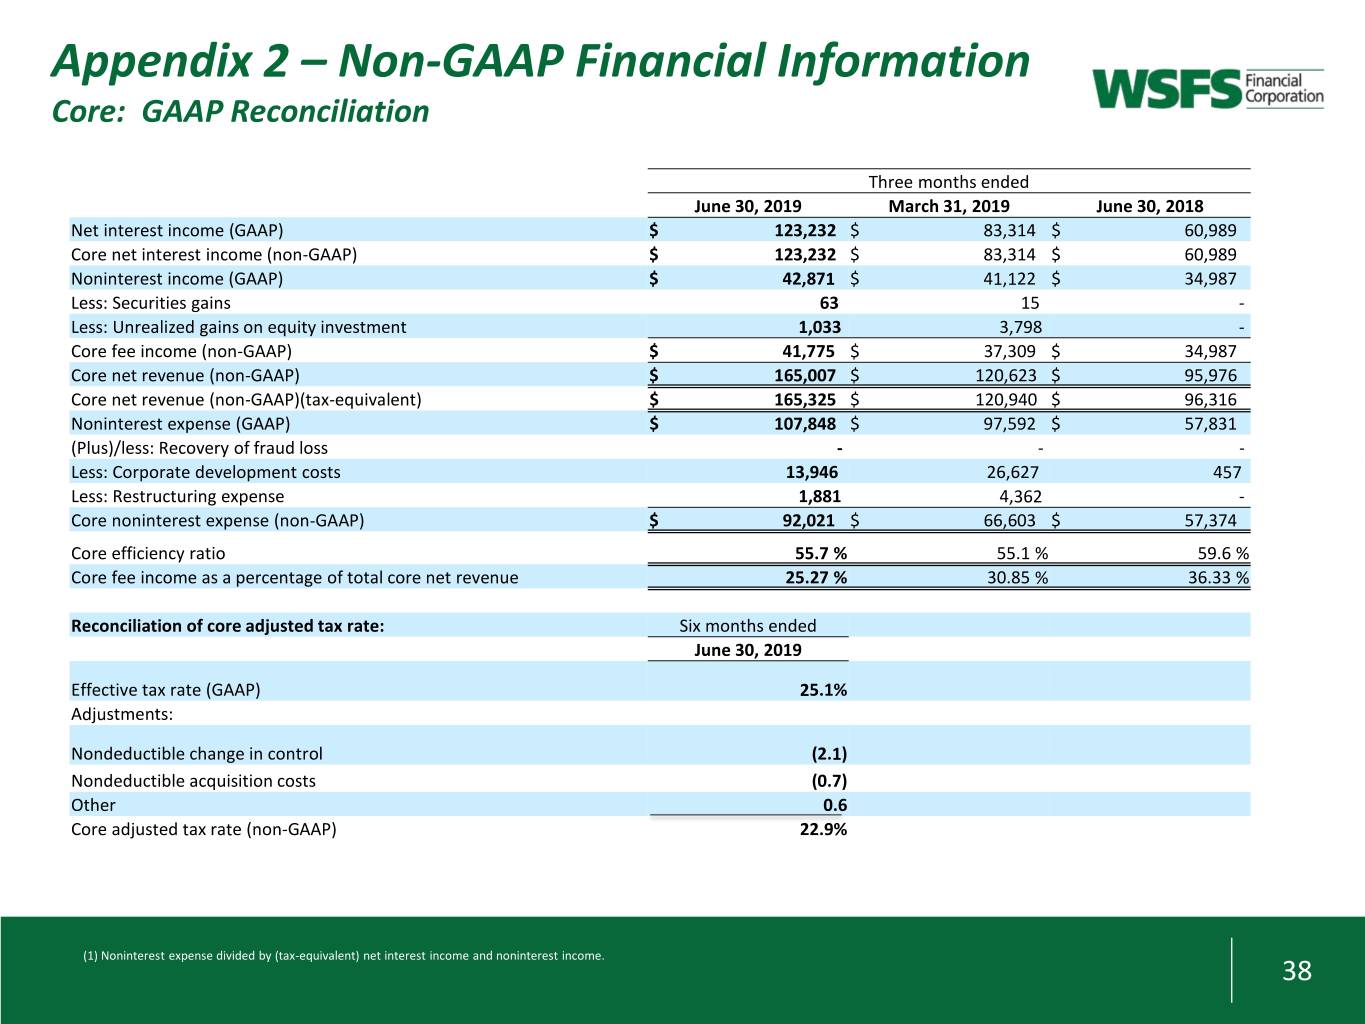
Appendix 2 – Non-GAAP Financial Information Core: GAAP Reconciliation Three months ended June 30, 2019 March 31, 2019 June 30, 2018 Net interest income (GAAP) $ 123,232 $ 83,314 $ 60,989 Core net interest income (non-GAAP) $ 123,232 $ 83,314 $ 60,989 Noninterest income (GAAP) $ 42,871 $ 41,122 $ 34,987 Less: Securities gains 63 15 - Less: Unrealized gains on equity investment 1,033 3,798 - Core fee income (non-GAAP) $ 41,775 $ 37,309 $ 34,987 Core net revenue (non-GAAP) $ 165,007 $ 120,623 $ 95,976 Core net revenue (non-GAAP)(tax-equivalent) $ 165,325 $ 120,940 $ 96,316 Noninterest expense (GAAP) $ 107,848 $ 97,592 $ 57,831 (Plus)/less: Recovery of fraud loss - - - Less: Corporate development costs 13,946 26,627 457 Less: Restructuring expense 1,881 4,362 - Core noninterest expense (non-GAAP) $ 92,021 $ 66,603 $ 57,374 Core efficiency ratio 55.7 % 55.1 % 59.6 % Core fee income as a percentage of total core net revenue 25.27 % 30.85 % 36.33 % Reconciliation of core adjusted tax rate: Six months ended June 30, 2019 Effective tax rate (GAAP) 25.1% Adjustments: Nondeductible change in control (2.1) Nondeductible acquisition costs (0.7) Other 0.6 Core adjusted tax rate (non-GAAP) 22.9% (1) Noninterest expense divided by (tax-equivalent) net interest income and noninterest income. 38
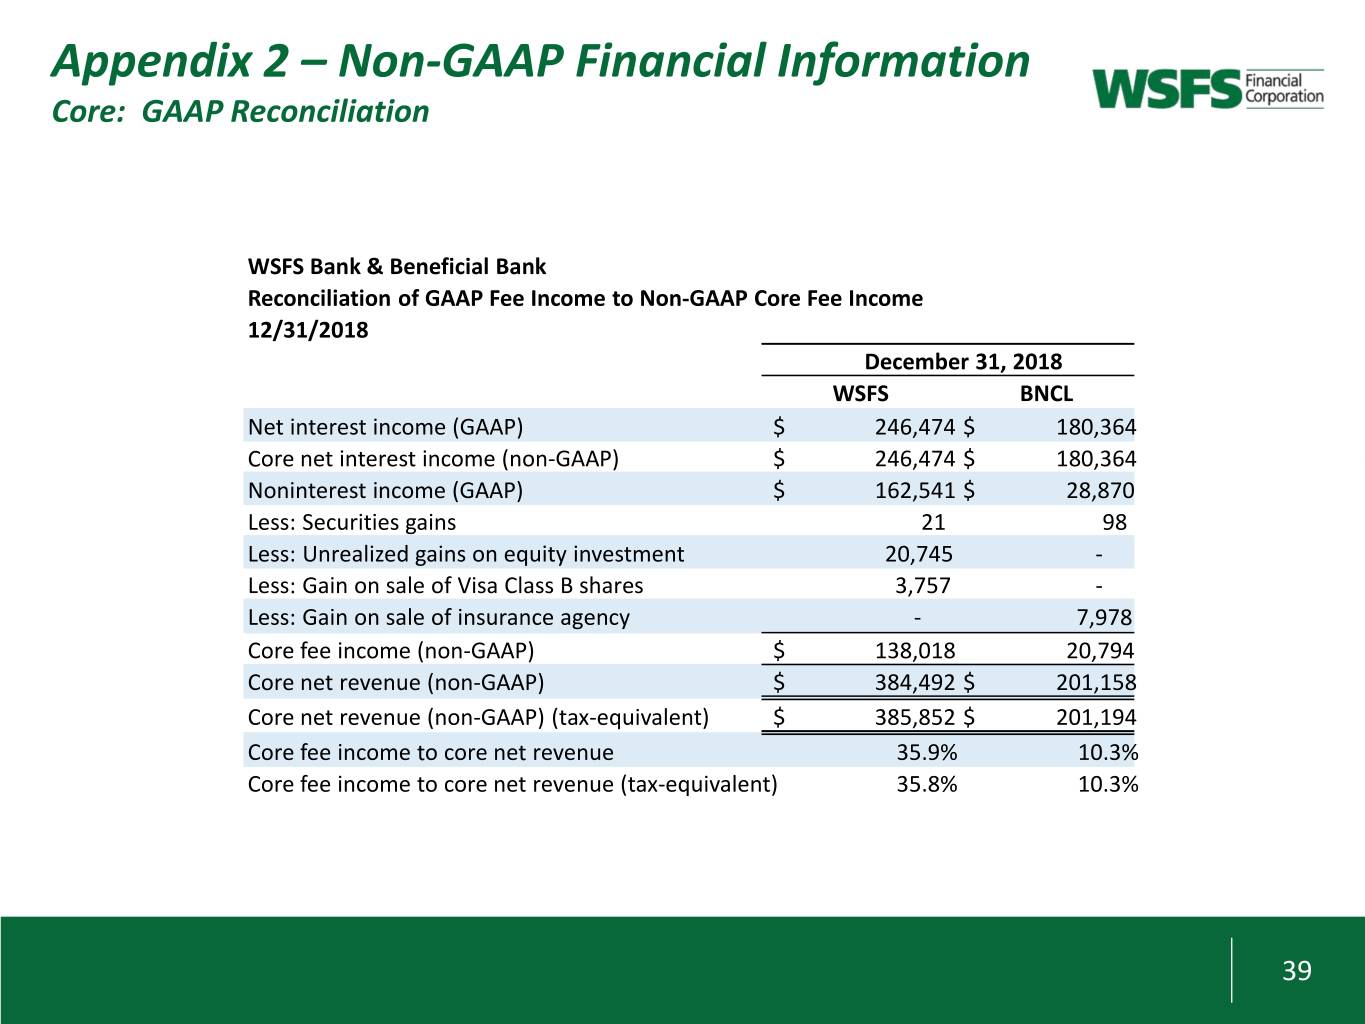
Appendix 2 – Non-GAAP Financial Information Core: GAAP Reconciliation WSFS Bank & Beneficial Bank Reconciliation of GAAP Fee Income to Non-GAAP Core Fee Income 12/31/2018 December 31, 2018 WSFS BNCL Net interest income (GAAP) $ 246,474 $ 180,364 Core net interest income (non-GAAP) $ 246,474 $ 180,364 Noninterest income (GAAP) $ 162,541 $ 28,870 Less: Securities gains 21 98 Less: Unrealized gains on equity investment 20,745 - Less: Gain on sale of Visa Class B shares 3,757 - Less: Gain on sale of insurance agency - 7,978 Core fee income (non-GAAP) $ 138,018 20,794 Core net revenue (non-GAAP) $ 384,492 $ 201,158 Core net revenue (non-GAAP) (tax-equivalent) $ 385,852 $ 201,194 Core fee income to core net revenue 35.9% 10.3% Core fee income to core net revenue (tax-equivalent) 35.8% 10.3% 39

Stockholders or others seeking information regarding the Company may call or write: WSFS Financial Corporation Investor Relations WSFS Bank Center 500 Delaware Avenue Wilmington, DE 19801 302-792-6009 stockholderrelations@wsfsbank.com www.wsfsbank.com Rodger Levenson Dominic C. Canuso President and CEO Chief Financial Officer 302-571-7296 302-571-6833 rlevenson@wsfsbank.com dcanuso@wsfsbank.com 40


