 WSFS Financial Corporation Exhibit 99.2 |
 Stockholders or others seeking information regarding the Company may call or write: WSFS Financial Corporation Investor Relations WSFS Bank Center 500 Delaware Avenue Wilmington, DE 19801 302-571-7264 bsellers@wsfsbank.com www.wsfsbank.com 2 Mark A. Turner President and CEO 302-571-7160 mturner@wsfsbank.com Stephen A. Fowle Chief Financial Officer 302-571-6833 sfowle@wsfsbank.com Rodger Levenson Chief Commercial Banking Officer 302-571-7296 rlevenson@wsfsbank.com |
 This presentation contains estimates, predictions, opinions, projections and other “forward-looking statements” as that phrase is defined in the Private Securities Litigation Reform Act of 1995. Such statements include, without limitation, references to the Company’s financial goals, management’s plans and objectives for future operations, financial and business trends, business prospects, and management’s outlook or expectations for earnings, revenues, expenses, capital levels, liquidity levels, asset quality or other future financial or business performance, strategies or expectations. Such forward-looking statements are based on various assumptions (some of which may be beyond the Company’s control) and are subject to risks and uncertainties (which change over time) and other factors which could cause actual results to differ materially from those currently anticipated. Such risks and uncertainties include, but are not limited to, those related to the economic environment, particularly in the market areas in which the Company operates, including an increase in unemployment levels; the volatility of the financial and securities markets, including changes with respect to the market value of financial assets; changes in market interest rates may increase funding costs and reduce earning asset yields thus reducing margin; increases in benchmark rates would increase debt service requirements for customers whose terms include a variable interest rate, which may negatively impact the ability of borrowers to pay as contractually obligated; changes in government regulation affecting financial institutions, including the Dodd-Frank Wall Street Reform and Consumer Protection Act and the rules being issued in accordance with this statute and potential expenses and elevated capital levels associated therewith; possible additional loan losses and impairment of the collectability of loans; seasonality, which may impact customer, such as construction-related businesses, the availability of public funds, and certain types of the Company’s fee revenue, such as mortgage originations; possible changes in trade, monetary and fiscal policies, laws and regulations and other activities of governments, agencies, and similar organizations, may have an adverse effect on business; possible rules and regulations issued by the Consumer Financial Protection Bureau or other regulators which might adversely impact our business model or products and services; possible stresses in the real estate markets, including possible continued deterioration in property values that affect the collateral value of underlying real estate loans; the Company’s ability to expand into new markets, develop competitive new products and services in a timely manner and to maintain profit margins in the face of competitive pressures; possible changes in consumer and business spending and savings habits could affect the Company’s ability to increase assets and to attract deposits; the Company’s ability to effectively manage credit risk, interest rate risk market risk, operational risk, legal risk, liquidity risk, reputational risk, and regulatory and compliance risk; the effects of increased competition from both banks and non-banks; the effects of geopolitical instability and risks such as terrorist attacks; the effects of weather and natural disasters such as floods, droughts, wind, tornadoes and hurricanes, and the effects of man-made disasters; possible changes in the speed of loan prepayments by the Company’s customers and loan origination or sales volumes; possible acceleration of prepayments of mortgage-backed securities due to low interest rates, and the related acceleration of premium amortization on prepayments on mortgage-backed securities due to low interest rates; the Company’s ability to timely integrate any businesses it may acquire and realize any anticipated cost savings from those acquisitions; and the costs associated with resolving any problem loans, litigation and other risks and uncertainties, discussed in the Company’s Form 10-K for the year ended December 31, 2013 and other documents filed by the Company with the Securities and Exchange Commission from time to time. Forward looking statements are as of the date they are made, and the Company does not undertake to update any forward-looking statement, whether written or oral, that may be made from time to time by or on behalf of the Company. 3 Forward-Looking Statements |
 Quarter Highlights • 4Q 2014 results reflect continued core revenue growth • Core revenues increased $4.5 million or 8% over 4Q 2013 • Net interest income improved $3.7 million or 11% over 4Q 2013 • • Reported ROA was 1.07%; ROTCE was 12.04% • Core ROA of 1.15% increased 6% from 1.08% in 4Q 2013 • Reported EPS was $1.32 compared to $1.33 in 4Q 2013 • Core EPS of $1.43 up 8% from core EPS of $1.32 in 4Q 2013 • Balance Sheet growth includes First National Bank of Wyoming Acquisition • Total loan growth was $248.7 million or 9% over 4Q 2013 • Commercial growth of $228.2 million or 9%; Consumer growth of $25.4 million or 8% • Core deposit account growth of $401.2 million or an increase of 16% from 4Q 2013 • Core deposit accounts are 85% of total customer funding • Includes year end temporary trust–related deposits of $188.5 million 4 Review of 4Q 2014 Results Core noninterest income increased $793,000 or 4% over 4Q 2013; stands at a robust 35% of total revenue |
 • Capital levels remain strong, boosted by earnings and investment appreciation • Tangible common book value per share improved 3% to $45.89 and tangible common equity increased 15 basis points to 9.00% • Tier 1 leverage ratio was 10.25%, Tier 1 risk-based capital ratio was 12.79% and total risk-based capital ratio was 13.83% at quarter-end • All substantially above “well capitalized” levels • In September 2014, the Board of Directors approved a 25% increase to the cash dividend and authorized a 5% stock repurchase plan • Credit quality metrics continued favorable trends • Delinquency decreased to 0.55% of total loans (includes nonperforming loans) • Charge offs are $624,000 for the 4Q 2014 or 8 basis points (annualized) of gross loans • Total credit costs (provision for loan losses, loan workout expenses, OREO expenses and other credit reserves), were $991,000 during 4Q 2014 a decrease from $2.2 million in 4Q 2013 • NPLs decreased $2.4 million to $24.1 million, or 0.75% of net loans at December 31, 2014 Quarter Highlights 5 |
 6 Strategic Rationale: Consistent with WSFS’s strategic growth plan Size: Assets of $421MM; Loans $310MM; Deposits of $345MM; 8 Branches Enhances franchise in Delaware County and Chester County – from #22 to #9 (pro forma) in Delaware County, PA Provides appealing cross-sell opportunities for WSFS products and services, including Array Financial ,Treasury Management, Mobile Banking and Wealth Management Compatible Culture; client focused community banking model Platform for future growth in Southeastern PA Accretive in 1 st full year (excluding integration costs) with IRR of 17% Purchase Price: Approximately $92.0 million in aggregate 70% Stock / 30% Cash Tangible Book Value of 138.4% Expected Closing: Fourth quarter 2015; pending shareholder and regulatory approvals Pending combination with Alliance Bancorp, Inc. |
 7 Recently completed combination with FNB of Wyoming (DE) Strategic Rationale: Consistent with WSFS’s strategic growth plan Size: Assets of $285MM; Loans $176MM; Deposits of $229MM; 6 Branches Enhances franchise in Kent County – from #6 to #2 (pro forma) in market share Diversifies revenue stream and improves core funding and liquidity; The First National Bank of Wyoming is ranked 2nd in SBA lending in Delaware Low risk in-market transaction and plain balance sheet; business lines are easily integrated Attractive financial returns; opportunity for significant cost savings Accretive in 1 st full year (excluding integration costs) with IRR well in excess of 20% Purchase Price: Approximately $65.0 million in aggregate Tangible Book Value of 129% 50% Stock / 50% Cash Closing: September 5, 2014. Completed successful integration |
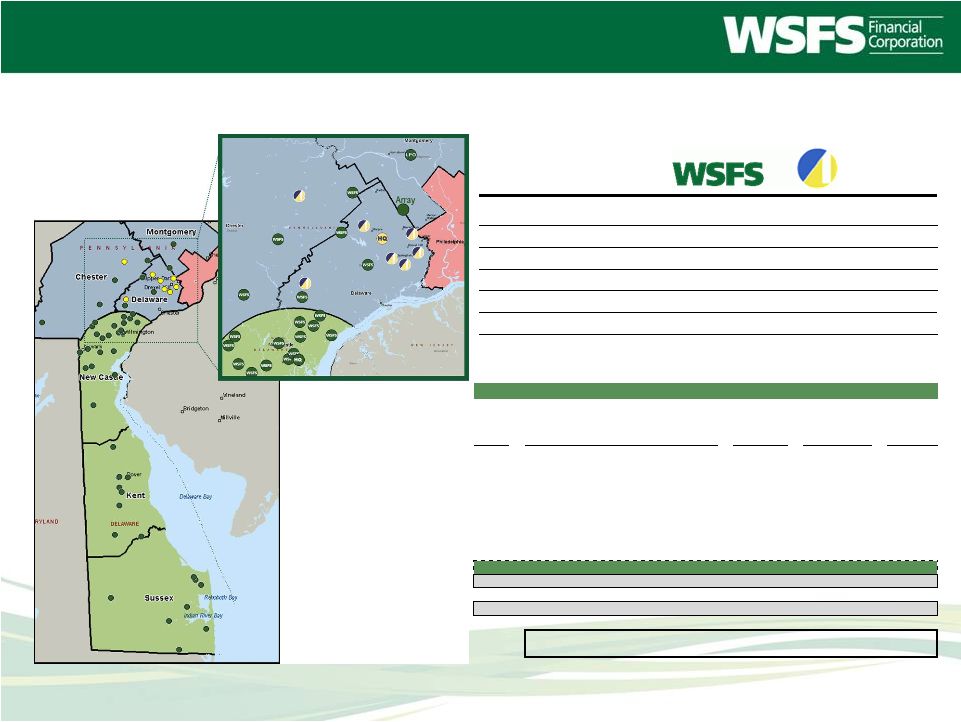
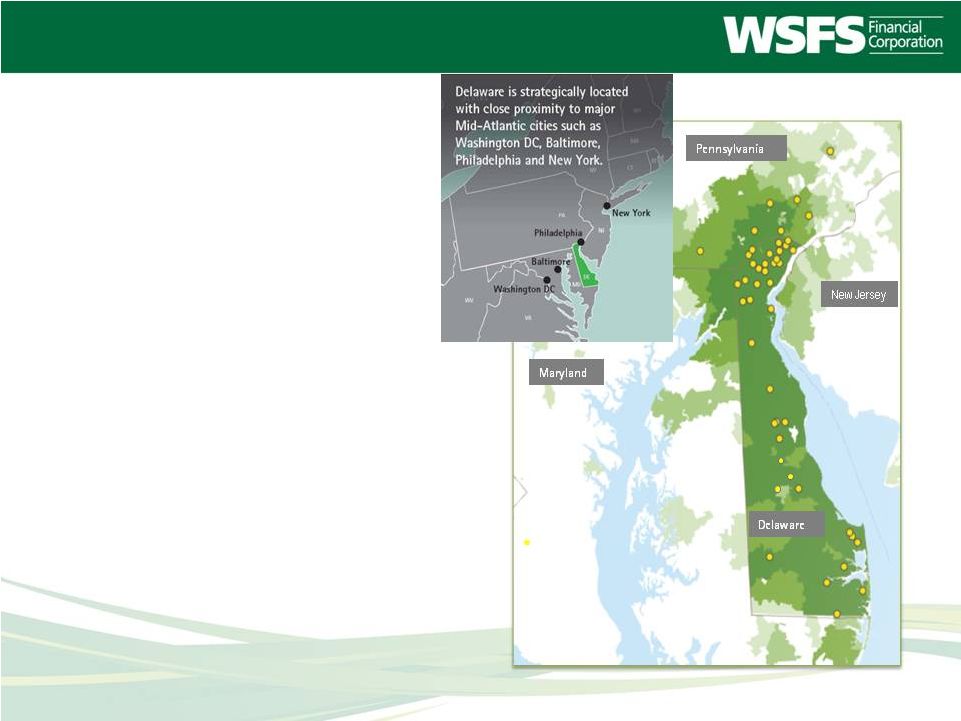 8 The WSFS Franchise • Largest independent bank and trust co. in the Delaware Valley • $4.9 billion in assets • 55 offices • Major business lines • Retail • Commercial • Wealth Management Indicates WSFS branch office and LPO locations Not shown on map: Annandale, VA (LPO) & Las Vegas, NV (Wealth Management Office) • $9.9 billion in fiduciary assets, includes $1.2 billion in assets under management • Founded in 1832, WSFS is one of the ten oldest banks in the U.S. • Cash Connect ® (ATM cash and related businesses) Note: the varying shades of green represent the intensity of the number of Customers we serve in our regional footprint |
 WSFS Bank Deposits of Traditional Banks in Delaware June 30, 2014* Rank Institution Branch Count Total Deposits in Market Total Market Share CAGR ‘08-’14 1 M&T Bancorp (NY) 41 5,672,018 29.41% 3.58% 2 PNC Financial Services Group (PA) 41 3,932,958 20.40% 10.11% 3 WSFS (DE)¹ 37 3,090,816 16.03% 11.52% 4 Wells Fargo & Company (CA) 19 2,188,755 11.35% -7.54% 5 TD Bank (Canada)² 13 2,062,985 10.70% 11.67% 6 Citizens (RBS -Scotland) 23 943,384 4.89% -1.67% 7 Artisan’s Bank (DE) 12 440,888 2.29% -2.98% 8 Fulton Financial Corp. (PA) 11 416,159 2.16% 9.65% 9 County Bank (DE) 7 295,014 1.53% 0.51% 10 Bank of America (NC) 4 239,917 1.24% 47.09% Top 10 Delaware Banks³ 208 $19,282,894 100.00% 4.42% 9 *Most recently available FDIC data (1) WSFS deposits are restated year over year to include First National Bank of Wyoming and its surviving branches (2) Excludes estimated out-of-market deposits of TD Bank (3) Top 10 Delaware Banks house 96% of all traditional deposits in the state |
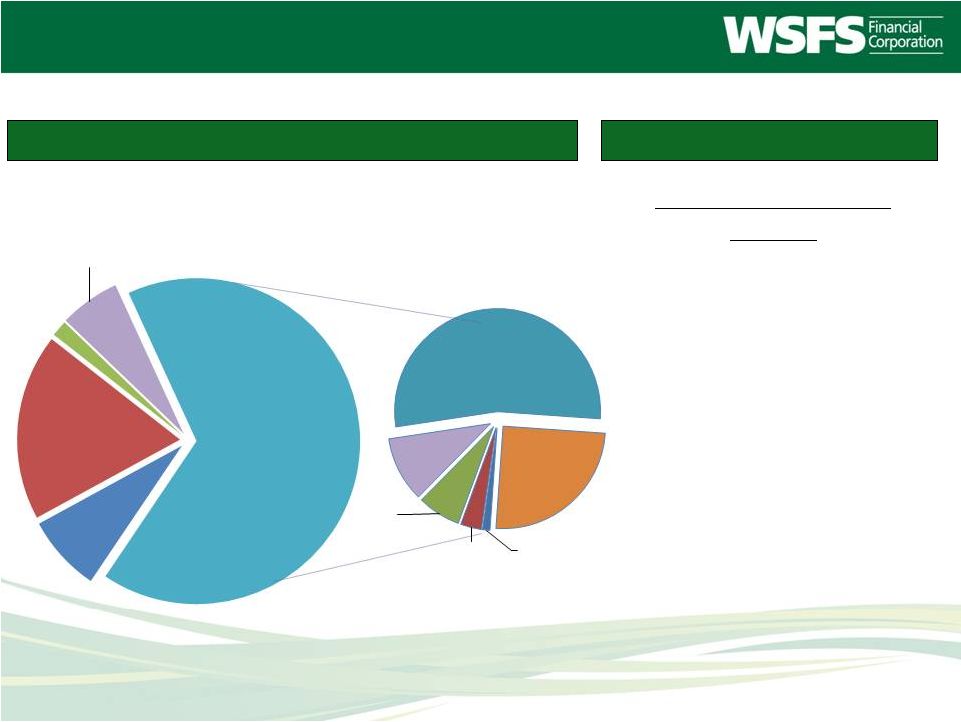 Commercial Bank Assets 4Q 2014: • • C&I (including owner-occupied real estate), the largest component, makes up 54% of all loans • • Commercial loans grew 9% • Consumer loans grew 8% • Reflects FNBW acquisition Comments Assets $4.9 Billion; Net Loans $3.2 Billion Asset Composition-December 31, 2014 WSFS Bank – Balance Sheet 10 RCLC = Residential Construction & Land Development CCLC = Commercial Construction & and Land Development Cash Connect 8% Investments 18% BOLI 2% Non- Earning Assets 6% Net Loans 66% 1%CCLD 3% 7% 10% 54% 25% CRE C&I Residential Mortgages Consumer RCLD Commercial loans comprise 83% of the loan portfolio Net loans grew 9% from 4Q 2013 |
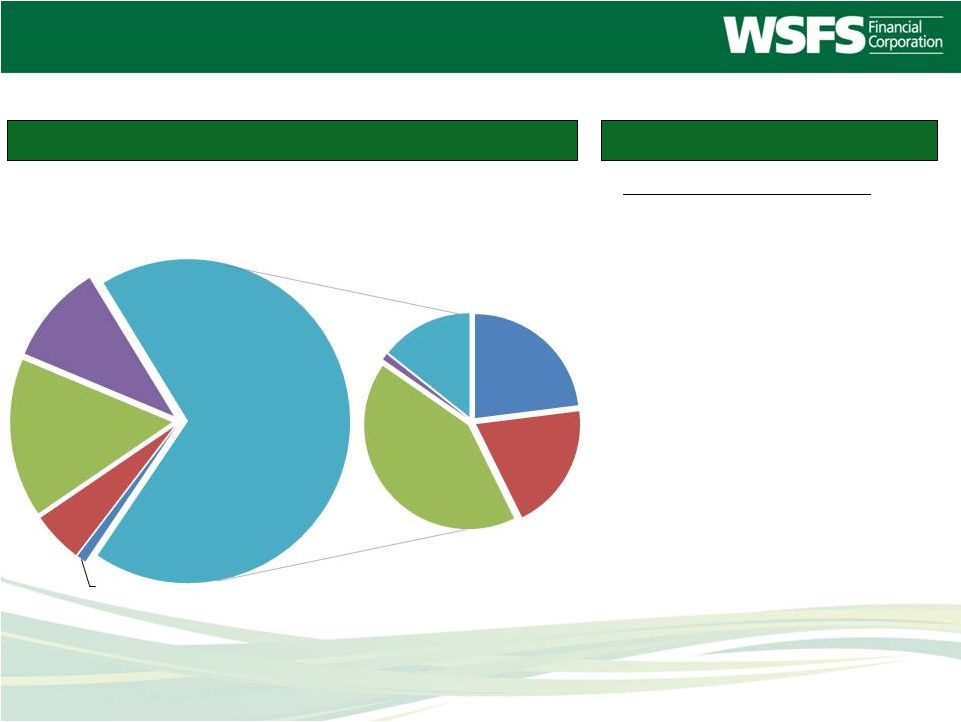 Comments Customer Funding - $3.5 billion Funding Composition-December 31, 2014 WSFS Bank – Balance Sheet 11 • • Non-interest and very low interest DDA (WAC 9bps) stands at 43% of total customer funding • Customer funding up 8% from December 31, 2013 driven by $401.2 million or 16% growth in core deposits • 4% core deposit growth, excluding FNBW acquired deposits and temporary increases in Trust-related money market over prior year. At December 31, 2014, we held $188.5 million in temporary trust-related money market deposits • • Down from a high of 140% prior to the beginning of the economic cycle Other Liabilities 1% Wholesale Deposits 5% Borrowings 16% Equity 10% Customer Funding 68% Non interest DDA 23% Interest DDA 20% Money Market & Savings 42% Sweeps 1% Time 14% Loan to customer funding ratio is at 92% Core customer funding comprises 85% of total customer funding Heavy Bias Towards Core: |
 • Fiduciary and investment services • Services to personal trust clients as well as trustee, agency, custodial and commercial domicile services to corporate and institutional clients • $3.4 million revenue in 4Q 2014 • $526 million in assets under management and $8.8 billion assets under administration • Ranked sixth among all U.S. corporate trustees in the ABS/MBS industry for 2014 (1) Wealth Management WSFS Private Banking WSFS Wealth Investments • Offers insurance and brokerage products • Focus on retail banking clients • $469,000 revenue in 4Q 2014 • Offers credit and deposit products • Focus on high net worth individuals • Partners/refers to other wealth units • $2.1 million revenue in 4Q 2014 • Registered investment advisor offering a “balanced’ investment style focused on preservation of capital and current income • Focus on high net worth individuals • $661 million + assets under management • $563,000 revenue in 4Q 2014 (1) Per the January 2015 issue of Asset-Backed Alert 12 CYPRESS CAPITAL MANAGEMENT, LLC |
 Cash Connect ® 13 • Leading provider of ATM vault cash, armored carrier management, cash forecasting services, insurance and equipment services • Adding ATM settlement services to existing managed service offering • Expanding ATM managed services from ISO market to FI market sector • Services non-bank ATM owners • More than $486 million in vault cash • Nearly 15,000 non-bank ATMs nationwide • $6.5 million net revenue (fee income less funding costs) and $1.9 million in pre-tax profitability in 4Q 2014 • 5 year CAGR for net revenue is 13.4% • Also serves as an innovation center for the company, both expanding core ATM offerings and additional payment-, processing- and software-related activities • Launched Smart Safe cash services in 2Q 2014. Currently 51 safes; projecting 400 by EOY 2015 • Operates more than 465 ATMs for WSFS Bank; largest in-market ATM franchise |
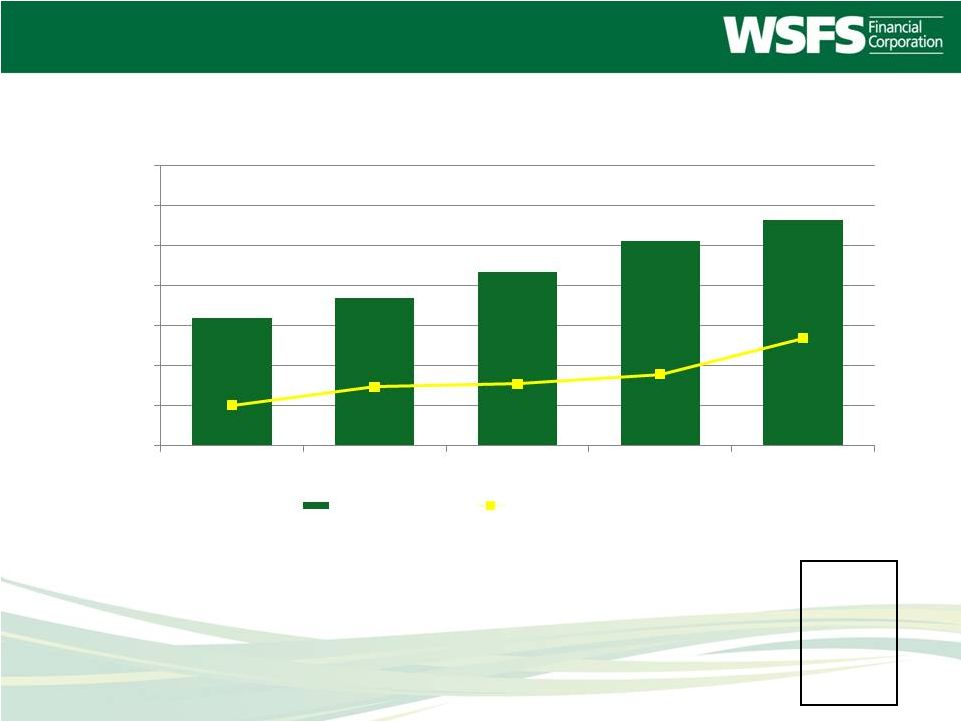
 Fee Income Businesses 14 Significant Growth in Fee Businesses * Excludes security gains, reverse mortgage consolidation gains and BOLI gain 35% of Total Revenues* $0 $10 $20 $30 $40 $50 $60 $70 $80 2010 2011 2012 2013 2014 WSFS Bank* Cash Connect Wealth |
 15 • Focus on increasing operating leverage and earnings • Continued credit quality improvement • Managing capital prudently and thoughtfully • Continuing strong alignment of management and owners • Goal – become solidly high performing (top quintile of peers in ROA, ROTCE and EPS growth), supporting above-peer Total Shareholder Returns • On a path to high performing status; see analysis on page 23 The WSFS Franchise Organizational Focus • Generating above-peer Total Shareholder Returns over 3, 5, and 10 year time frames, see analysis on page 24 |
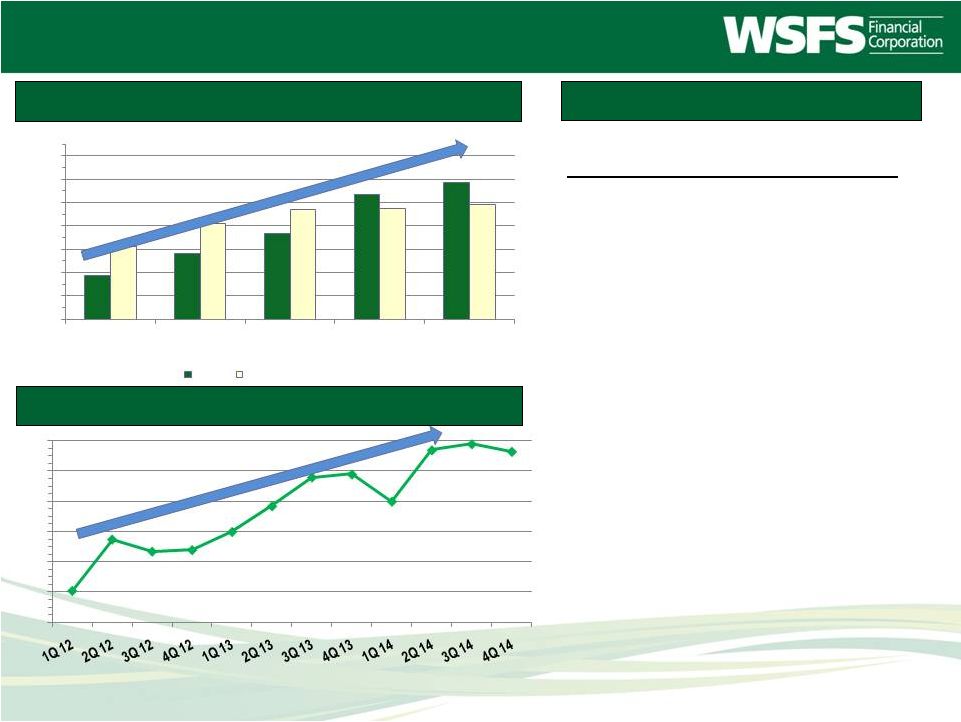 Comments Building Bottom Line Performance: • • 4Q 2014 Core ROA of 1.15% ahead of 1.08% in 4Q 2013 • Goal of 1.20% -1.30% by end of 4Q 2015 • Normalized EPS growth momentum • Increased 8% from 4Q 2013 reflecting success in building market share Increasing Earnings 16 (1) Peer group ROA reflects 97% reporting for December 31, 2014 (2) Represents normalization for securities gain/losses, non-routine BOLI income, bulk sale provision, OREO impact and debt extinguishment loss. Please see Appendix 3 Non-GAAP Financial Information for details ROA Progression (1) Normalized EPS Trend (2) ROA trend has consistently improved from a break-even year in 2009 0.00% 0.20% 0.40% 0.60% 0.80% 1.00% 1.20% 1.40% 2010 2011 2012 2013 2014 WSFS $2 -$10B Peer Median(1) $0.30 $0.50 $0.70 $0.90 $1.10 $1.30 $1.50 |
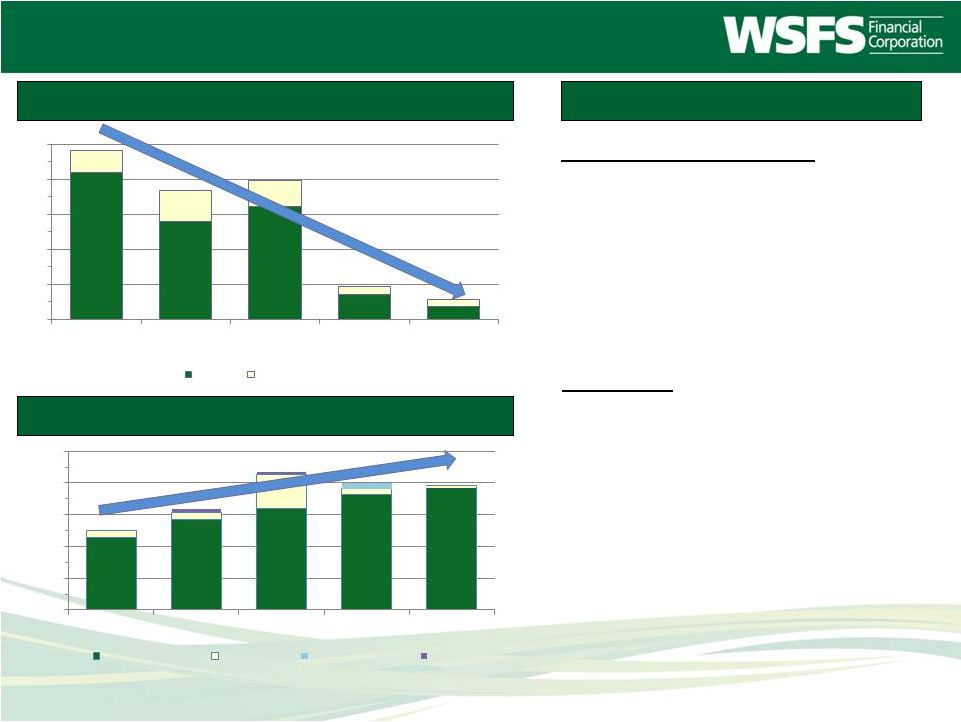 Increasing Earnings 35.6% Provision and Credit Costs • • Fee Income • • • Wealth Management fee income increased 24% from 4Q 2013 • Cash Connect net revenue increased 6% from 4Q 2013 17 Percentages represent normalized fee income as a percentage of total revenues Comments Core Fee Income Reflects Improved Credit Quality Decreased significantly, reflecting long term trend in asset quality improvement and lower charge offs in 4Q 2014. Total Problem loans reduced significantly to 25.97% of Tier I Capital plus ALLL Increased focus on fee income growth, 35% of revenues in 2014 Fee income increased $793,000 million or 4% from 4Q 2013 reflecting growth in most segments of the business $0 $20 $40 $60 $80 $100 2010 2011 2012 2013 2014 27.3% 31.0% 33.6% 35.0% $0 $10 $20 $30 $40 $50 2010 2011 2012 2013 2014 Provision Other Credit Cost Fee Income Normalized Securities Gains Rev Mtg Consol Gain BOLI Gain |
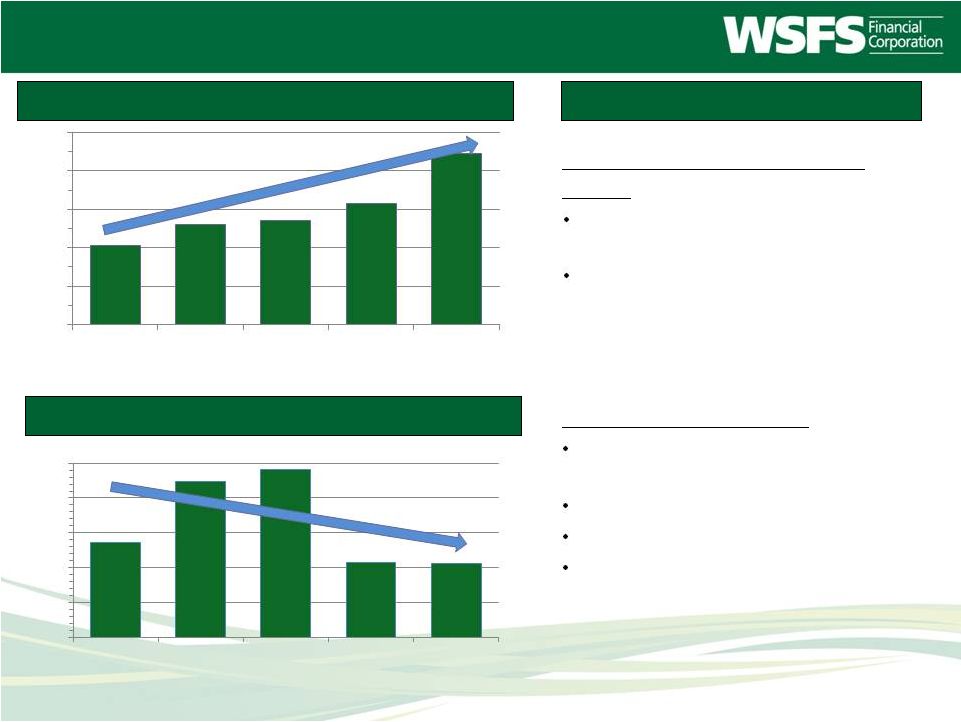 Increasing Earnings Net Interest Margin / Net Interest Income Improving Efficiency Ratio 18 Comments Improving Efficiency Ratio (1) Improved Net Interest Income (1) Excludes pro forma items listed on page 29 $100 $110 $120 $130 $140 $150 2010 2011 2012 2013 2014 60.0% 62.0% 64.0% 66.0% 68.0% 70.0% 2010 2011 2012 2013 2014 Strong revenue growth across all business lines Improving credit costs Moderating core expenses Increased operating leverage Net interest income increased $3.7 million or 11% over 4Q 2013 Net Interest Margin of 3.78% improved 10 basis points over 4Q 2013 |
 What happens when Rates go up? Balance Sheet Drivers • +100 Model results reflects impact of loan floors and WSFS prime • High % of variable/adjustable rate total loan portfolio: 66% • High % core deposits: 88% • High % non-interest bearing deposits: 26% • Solid brand and position / “Price Leader” • * Static Balance Sheet / Instantaneous Rate Shocks 19 NII NII BPS Change* % Impact $ Impact +100 (1)% $ (1.6) mm +200 2% $ +2.2 mm +300 4% $ +6.2 mm +400 7% $ +9.9 mm Recent strategy: shortening duration of investment portfolio and lengthening duration of FHLB advances |
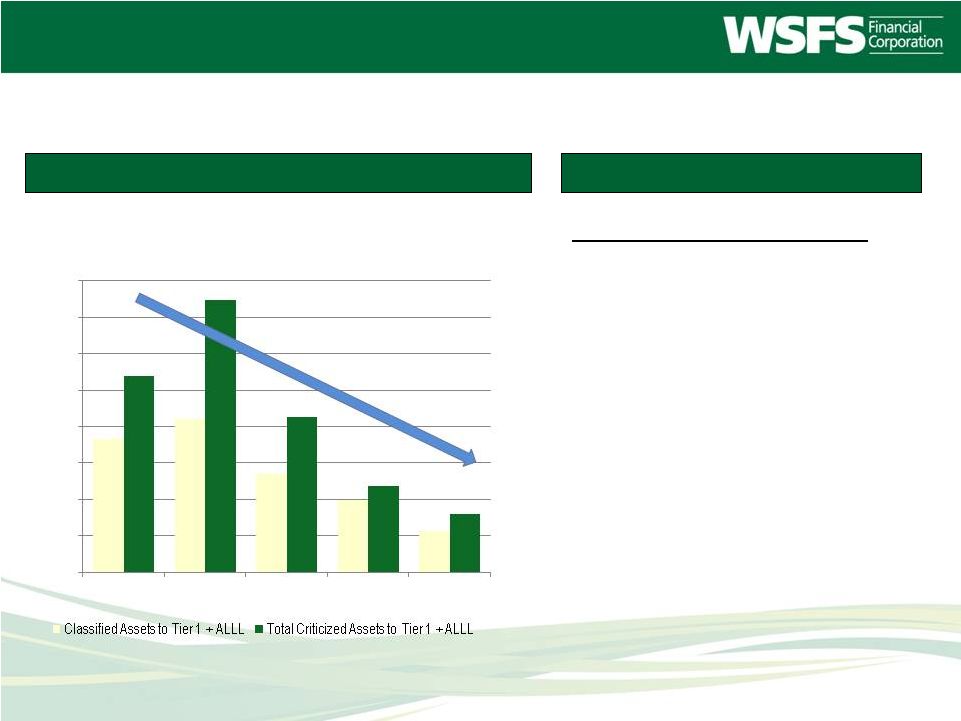 Asset Quality Metrics Improving credit quality trends: • • • From a cycle–high of over 70% • • 20 Comments Problem Loan Key Ratios Credit Quality Continues to Improve Adjusted for FNBW acquired loans, ALLL Ratio is 1.30% NPAs were 1.08% of total assets at December 31, 2014 Classified loans decreased to 21.3% of Tier 1 Capital + ALLL ALLL remains at a strong 1.23% of loans* Coverage ratio stands at 164% of non-performing loans at December 31, 2014 46.6% 52.2% 36.8% 29.7% 21.3% 63.9% 84.8% 52.5% 33.6% 26.0% 10.0% 20.0% 30.0% 40.0% 50.0% 60.0% 70.0% 80.0% 90.0% 2010 2011 2012 2013 2014 |
 21 Bank-Level Capital Ratios (thousands) Total Risk-Based Capital 13.62% 13.43% 14.29% 14.36% 13.83% Tier 1 Capital 12.36% 12.18% 13.04% 13.16% 12.79% Excess RBC (above 10%) $108,611 $110,940 $140,117 $153,542 $147,186 Tangible Common Equity 7.18% 7.18% 7.72% 7.69% 9.00% Tangible Common Book Value $33.03 $35.96 $38.21 $38.68 $45.89 Managing Capital $409,034 $434,301 $466,925 $505,354 $531,208 $250,000 $300,000 $350,000 $400,000 $450,000 $500,000 $550,000 $600,000 12/10 12/11 12/12 12/13 12/14 Total Risk-Based Capital Well Capitalized Requirement |
 Strong Alignment • Insider ownership is nearly 8% * • Board of Directors and Executive Management ownership guidelines in place • Executive management bonuses and equity awards based on bottom-line performance • ROA, ROTCE and EPS growth • 5% stock buyback authorization in place; repurchased 1% or 116,421 common share equivalents in 4Q 2014 • $54.3 million in cash remains in the Holding Co. as of December 31, 2014 to so support the buyback and other company cash needs. • The Board of Directors approved a 25% increase of the quarterly cash dividend to $0.15 per share of common stock in September 2014 22 * As defined in our most recent proxy, adjusted for options approved by shareholders and awarded to the CEO and EVP’s in April 2013. |
 Path to High Performing – 2015 Goal Item Action Plan Planned Impact + Possible Impact LTD Improvements NII (Goal: 3.60 – 3.75%) Planned: 2012 deleverage strategy, municipal investment, fixed rate loan growth, balance sheet mix. Possible: Rate environment 15 bp + 6 bp 18 bp Fee income (Goal: 36 – 40%) Planned: Low double digit growth in Cash Connect, high single digit growth in Wealth Division fees, intro of new banking solutions 20 bp + 0 bp 4 bp Efficiency ratio (Goal: low 60s%) Planned: Reduction in regulatory costs from release of MOU, higher 1Q seasonal costs. Possible: Contain expense growth to 2% in 2013, 5% in later year 8 bp + 1 bp 2 bp Credit costs (Goal: 0.27%) Planned: Reduced credit costs to industry median (35 bps of loans 2012). Possible: Further improvement possible in stronger economy 5 bp + 3 bp 8 bp Tax rate Planned: Tax impact of muni investment 2 bp + 0 bp 3 bp Total 50 bp + 10 bp 35 bp (1Q 2013 Normalized) 0.70% ROA 11 10 (1Q 2013 Normalized + Planned Impacts) 1.20% 0.91% (as Reported) 1.30% (with Possible) 6 3 5 2 12 1 20 Credit Costs Security Gains 8 15 (4Q 2014 Normalized) 1.05% % ROA * 1.05% normalized ROA for 4Q 2014 adjusted includes credit costs at long term expectations for the industry (-11bps), the impact of securities gains, and one-time identifiable expenses related to corporate development activities and retirement benefit charge (+9bps) 1.07% (Reported) 2* 0.00% 0.20% 0.40% 0.60% 0.80% 1.00% 1.20% 1.40% Q4 2014 Results Goal Tax rate Credit costs Efficiency ratio Fee income growth Net interest income 1Q 2013 Baseline |
 Business Model and Total Shareholder Returns 24 * Completed by the Gallup Organization, as of December 31, 2013 ** Per Bloomberg; closing price as of December 31, 2014 Focused Business Model • Gallup survey showed WSFS best among top players in market at delivering service * • Consistently ranked in the top quintile of all businesses surveyed * • WSFS has been recog- nized by The Wilmington News Journal as a “Top Workplace Award” winner nine years in a row; “Top 3” the last 5 years running • Customer advocacy survey places WSFS at the 89th percentile* • On a scale of 1-5, 44% of WSFS customers rated us a “5” (“strongly agree”) saying “I can’t imagine a world without WSFS” * • Voted “Top Bank” in Delaware 4 years running (The News Journal) • Builds sustainable real profit growth • Leads to increased shareholder value • Total Shareholder Returns** WSFS Nasdaq Bank Index 1 year (.12)% 4.91% 3 year 70.76% 49.52% 5 year 216.23% 80.25% 10 year 41.15% 5.64% |
 Appendices |
 Appendix – Table of Contents Section Page # • Appendix 1 – Management Team 27-28 • Appendix 2 – Business Model 29 • Appendix 3 – Non-GAAP Financial Information 30-31 • Appendix 4 – Alliance Bancorp, Inc. presentation 32-41 26 |
 Appendix 1 – Management Team • Mark A. Turner, 52, has served as President and Chief Executive Officer since 2007. Mr. Turner was previously Chief Operating Officer and the Chief Financial Officer for WSFS. Prior to joining WSFS, his experience includes working at CoreStates Bank and Meridian Bancorp. Mr. Turner started his career at the international professional services firm of KPMG, LLP. He received his MBA from the Wharton School of the University of Pennsylvania, his Masters Degree in Executive Leadership from the University of Nebraska and his Bachelor’s Degree in Accounting and Management from LaSalle University. • Peggy H. Eddens, 59, Executive Vice President, Chief Human Capital Officer since 2007. From 2003 to 2007 she was Senior Vice President for Human Resources and Development for NexTier Bank, Butler PA. Ms. Eddens received a Master of Science Degree in Human Resource Management from La Roche College and her Bachelor of Science Degree in Business Administration with minors in Management and Psychology from Robert Morris University. • Stephen A. Fowle, 49, Executive Vice President and Chief Financial Officer since 2005. From 2000 to 2004, he was Chief Financial Officer at Third Federal Savings and Loan Association of Cleveland. Mr. Fowle received his Masters of Management, Finance and Marketing from Northwestern University and his Bachelor’s Degree in Chemistry from Stanford University. • Paul D. Geraghty, 61, Executive Vice President and Chief Wealth Officer since 2011. From 2007 to 2010, he was Chief Executive Officer at Harleysville National Corporation, Harleysville, PA. Mr. Geraghty received his Bachelor of Science in Accounting from Villanova University and pursued graduate study in business at Lehigh University. 27 |
 Appendix 1 – Management Team • Thomas W. Kearney, 67, Executive Vice President and Chief Risk Officer has been with WSFS since 1998. Mr. Kearney holds a Bachelor’s degree in Business Administration (Finance and Accounting) from Drexel University. He also holds the professional designations of Certified Bank Auditor (CBA) and Certified Financial Services Auditor (CFSA). As Chief Risk Officer, Mr. Kearney’s primary responsibility is to manage and direct the various oversight functions throughout the Company. These oversight functions include Enterprise Risk Management, Loan Review, In-house Counsel, Security/Fraud Investigations, Regulatory Compliance, Internal Control/Audit and Credit Administration. • Rodger Levenson, 53, Executive Vice President and Chief Commercial Banking Officer since 2006. From 2003 to 2006, Mr. Levenson was Senior Vice President and Manager of the Specialized Banking and Business Banking Divisions of Citizens Bank. Mr. Levenson received his MBA in Finance from Drexel University and his Bachelor’s Degree in Finance from Temple University. • S. James Mazarakis, 58, Executive Vice President and Chief Technology Officer since 2010. Mr. Mazarakis served in a senior leadership role as Chief Information Officer for T. Rowe Price, and Managing Director and Divisional CIO at JP Morgan Investment Asset Management. He received his Master of Science degree in Management of Technology from Polytechnic Institute of New York University. • Thomas Stevenson, 62, has served as President of Cash Connect Division since 2003. Mr. Stevenson joined WSFS in 1996 as Executive Vice President and Chief Information Officer. Prior to joining WSFS, Mr. Stevenson was the Manager of Quality Assurance at Electronic Payment Services. Mr. Stevenson attended Wayne State University and the Banking and Financial Services program at the University of Michigan’s Graduate School of Business Administration. • Richard M. Wright, 62, Executive Vice President and Chief Retail Banking Officer since 2006. From 2003 to 2006, Mr. Wright was Executive Vice President, Retail Banking and Marketing for DNB First in Downingtown, PA. Mr. Wright received his MBA in Management Decision Systems from the University of Southern California and his Bachelor’s Degree in Marketing and Economics from California State University. 28 |
 Appendix 2 – Business Model 29 |
 Appendix 3 – Non-GAAP Financial Information Rev Mtg Securities Non-Routine Debt Consolidation Corporate Fraud/ (Gains) BOLI Bulk Extinguishment Gain / Tax Development Litigation PRBO Proforma EPS Losses Income Sale Loss Benefit Costs Costs Adj. EPS 4th Quarter 2011 0.63 (0.14) 0.49 1st Quarter 2012 0.66 (0.15) 0.51 2nd Quarter 2012 0.76 (0.95) 1.04 0.85 3rd Quarter 2012 1.06 (0.18) (0.11) 0.77 4th Quarter 2012 0.78 (0.27) 0.27 0.78 1st Quarter 2013 1.02 (0.12) 0.90 2nd Quarter 2013 1.16 (0.07) 1.09 3rd Quarter 2013 1.54 (0.02) (0.27) 0.01 1.26 4th Quarter 2013 1.33 (0.05) 0.04 1.32 1st Quarter 2014 1.85 (0.04) (0.73) 0.02 1.10 2nd Quarter 2014 1.39 (0.03) 0.02 0.06 1.44 3rd Quarter 2014 1.23 (0.00) 0.18 0.07 1.48 4th Quarter 2014 1.32 (0.00) 0.07 0.04 1.43 30 |
  End of Period December 31, September 30, December 31, 2014 2014 2013 Total assets $ 4,853,320 $ 4,782,728 $ 4,442,656 Less: Goodwill and other intangible assets (57,593) (58,176) (39,541) Total tangible assets $ 4,795,727 $ 4,724,552 $ 4,403,115 Total Stockholders' equity $ 489,051 $ 476,324 $ 373,951 Less: Goodwill and other intangible assets (57,693) (58,176) (39,541) Total tangible common equity $ 431,358 $ 418,148 $ 334,410 Calculation of tangible common book value: Book Value (GAAP) $ 52.01 $ 50.70 $ 43.06 Tangible book value (non-GAAP) 45.89 44.50 38.68 Tangible common book value (non-GAAP) 45.89 44.50 36.68 Calculation of tangible common equity to assets: Equity to asset ratio (GAAP) 10.08% 9.96% 8.48% Tangible equity to asset ratio (non-GAAP) 9.00% 8.85% 7.69% Tangible common equity to asset ratio (non-GAAP) 9.00% 8.85% 7.69% Appendix 3 – Non-GAAP Financial Information Tangible common book value and equity to assets 31 |
 WSFS Financial Corporation to acquire Alliance Bancorp, Inc. of Pennsylvania March 3, 2015 Appendix 4 32 |
 Forward-Looking Statement Disclaimer 33 This presentation contains estimates, predictions, opinions, projections and other “forward-looking statements” as that phrase is defined in the Private Securities Litigation Reform Act of 1995. Such statements include, without limitation, references to the Company’s financial goals, management’s plans and objectives for future operations, financial and business trends, business prospects, and management’s outlook or expectations for earnings, revenues, expenses, capital levels, liquidity levels, asset quality or other future financial or business performance, strategies or expectations. Such forward-looking statements are based on various assumptions (some of which may be beyond the Company’s control) and are subject to risks and uncertainties (which change over time) and other factors which could cause actual results to differ materially from those currently anticipated. Such risks and uncertainties include, but are not limited to, those related to the economic environment, particularly in the market areas in which the Company operates, including an increase in unemployment levels; the volatility of the financial and securities markets, including changes with respect to the market value of financial assets; changes in market interest rates may increase funding costs and reduce earning asset yields thus reducing margin; increases in benchmark rates would increase debt service requirements for customers whose terms include a variable interest rate, which may negatively impact the ability of borrowers to pay as contractually obligated; changes in government regulation affecting financial institutions, including the Dodd-Frank Wall Street Reform and Consumer Protection Act and the rules being issued in accordance with this statute and potential expenses and elevated capital levels associated therewith; possible additional loan losses and impairment of the collectability of loans; seasonality, which may impact customer, such as construction-related businesses, the availability of public funds, and certain types of the Company’s fee revenue, such as mortgage originations; possible changes in trade, monetary and fiscal policies, laws and regulations and other activities of governments, agencies, and similar organizations, may have an adverse effect on business; possible rules and regulations issued by the Consumer Financial Protection Bureau or other regulators which might adversely impact our business model or products and services; possible stresses in the real estate markets, including possible continued deterioration in property values that affect the collateral value of underlying real estate loans; the Company’s ability to expand into new markets, develop competitive new products and services in a timely manner and to maintain profit margins in the face of competitive pressures; possible changes in consumer and business spending and savings habits could affect the Company’s ability to increase assets and to attract deposits; the Company’s ability to effectively manage credit risk, interest rate risk market risk, operational risk, legal risk, liquidity risk, reputational risk, and regulatory and compliance risk; the effects of increased competition from both banks and non-banks; the effects of geopolitical instability and risks such as terrorist attacks; the effects of weather and natural disasters such as floods, droughts, wind, tornadoes and hurricanes, and the effects of man-made disasters; possible changes in the speed of loan prepayments by the Company’s customers and loan origination or sales volumes; possible acceleration of prepayments of mortgage-backed securities due to low interest rates, and the related acceleration of premium amortization on prepayments on mortgage-backed securities due to low interest rates; and the costs associated with resolving any problem loans, litigation and other risks and uncertainties, discussed in the Company’s Form 10-K for the year ended December 31, 2013 and other documents filed by the Company with the Securities and Exchange Commission from time to time. Forward looking statements are as of the date they are made, and the Company does not undertake to update any forward-looking statement, whether written or oral, that may be made from time to time by or on behalf of the Company. This presentation speaks only as of its date, and WSFS disclaims any duty to update the information herein. |
 34 IMPORTANT ADDITIONAL INFORMATION AND WHERE TO FIND IT In connection with the proposed merger, WSFS will file with the SEC a Registration Statement on Form S-4 that will include a proxy statement of Alliance and a prospectus of WSFS, as well as other relevant documents concerning the proposed transaction. This communication does not constitute an offer to sell or the solicitation of an offer to buy any securities or a solicitation of any vote or approval. SHAREHOLDERS OF ALLIANCE ARE URGED TO READ THE REGISTRATION STATEMENT AND THE PROXY STATEMENT/PROSPECTUS REGARDING THE MERGER WHEN IT BECOMES AVAILABLE AND ANY OTHER RELEVANT DOCUMENTS FILED WITH THE SEC, AS WELL AS ANY AMENDMENTS OR SUPPLEMENTS TO THOSE DOCUMENTS, BECAUSE THEY WILL CONTAIN IMPORTANT INFORMATION. A free copy of the Proxy Statement/Prospectus, as well as other filings containing information about WSFS and Alliance, may be obtained at the SEC’s Internet site (http://www.sec.gov), when they are filed. You will also be able to obtain these documents, when they are filed, free of charge, from WSFS at www.wsfsbank.com under the heading “About WSFS” and then under the heading “Investor Relations” and then under “SEC Filings” or from Alliance by accessing Alliance’s website at www.allianceanytime.com under the heading “Stockholder Information” and then under “Corporate and Market Information”. Copies of the Proxy Statement/Prospectus can also be obtained, when it becomes available, free of charge, by directing a request to WSFS Financial Corporation, WSFS Bank Center, 500 Delaware Avenue, Wilmington, Delaware 19801, Attention: Corporate Secretary, Telephone: (302) 792-6000 or to Alliance Bancorp, Inc. of Pennsylvania, 541 Lawrence Road, Broomall, Pennsylvania 19008, Attention: Corporate Secretary, Telephone: (610) 353-2900. PARTICIPANTS IN THE SOLICITATION Alliance and certain of its directors and executive officers may be deemed to be participants in the solicitation of proxies from the shareholders of Alliance in connection with the proposed merger. Information about the directors and executive officers of Alliance and their ownership of Alliance common stock is set forth in the proxy statement for Alliance’s 2014 annual meeting of shareholders, as filed with the SEC on Schedule 14A on March 19, 2014. Additional information regarding the interests of those participants and other persons who may be deemed participants in the transaction may be obtained by reading the Proxy Statement/Prospectus regarding the proposed merger when it becomes available. Free copies of this document may be obtained as described in the section above. |
 Strategic Rationale Strategic Rationale Financially Attractive 35 Consistent with WSFS’s strategic growth plan in Southeastern PA Only remaining independent community bank of scale headquartered in attractive Delaware County market Favorable demographics, similar to WSFS core markets 8 offices in overlapping and adjacent market; WSFS will have 17 locations in Southeastern PA at close Alliance - Assets of $421mm; Loans $310mm; Deposits of $345mm Alliance customer base provides appealing cross-sell opportunities for WSFS products and services including Array Financial (residential mortgages), Treasury Management, Mobile Banking, and Wealth Management. Platform for future growth in Southeastern PA Compatible culture; client focused community banking model Accretive to first full year earnings per share excluding one-time costs Slight dilution to tangible book value earned back in 4.7 years WSFS pro forma capital ratios well in excess of “well-capitalized” guidelines following close 17% anticipated IRR Pro forma ownership by Alliance shareholders in WSFS – 8.0% |
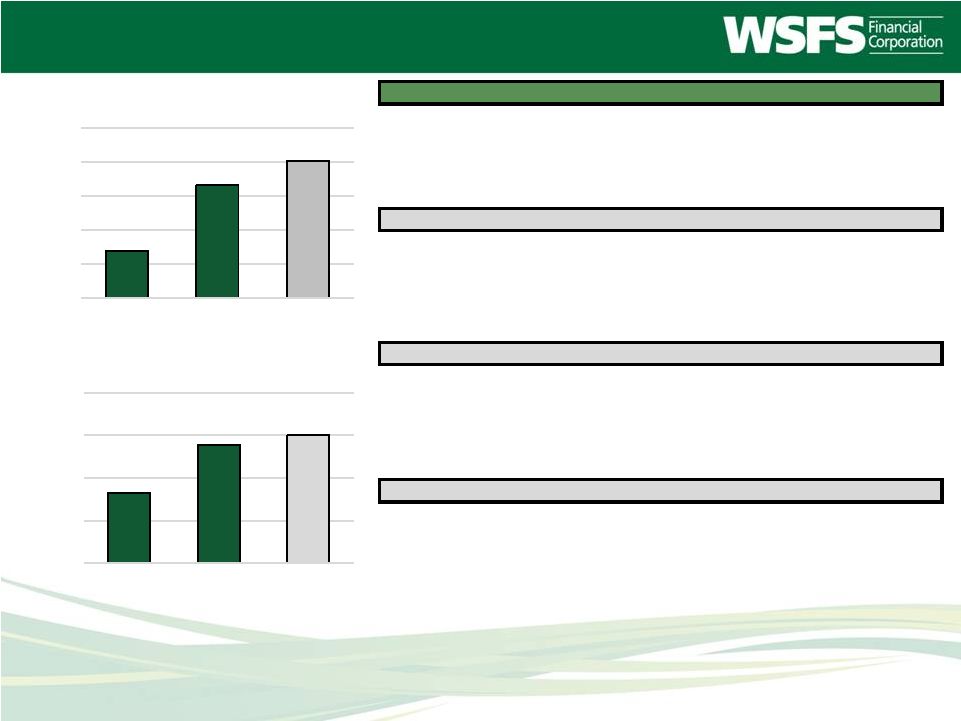 Overview of Alliance Bancorp, Inc. 1) Represents bank level (Alliance Bank) financial data as of and for the year ended December 31, 2014. Source: SNL Financial and Company provided information. As of 12/31/14 36 $284 $303 $310 $270 $280 $290 $300 $310 $320 2012 2013 2014 Total Gross Loans ($mm) 76% 88% 90% 60% 70% 80% 90% 100% 2012 2013 2014 Loan / Deposits (%) Financial Highlights Total Assets ($mm) 420.8 Gross Loans ($mm) 310.2 Total Deposits ($mm) 344.8 Loans / Deposits 89.98% Capital Ratios Tangible Equity ($mm) 66.5 Tangible Equity / Tangible Assets 15.79% Total Risk-Based Ratio 1 23.19% Leverage Ratio 1 14.39% Asset Quality Metrics NPAs / Total Assets 1 1.72% NPAs Ex. TDRs / Total Assets 1 0.60% LLR / Gross Loans 1.44% NCOs / Avg. Loans¹ 0.07% Profitability Metrics Net Income ($mm) 2.6 Return on Average Assets 0.60% Return on Average Equity 3.74% Net Interest Margin¹ 3.61% |
 Attractive Combined Franchise 37 (1) Does not include purchase accounting adjustments. (2) Based on 20 Day Average WSFS share price as of 2/26/2015 of $77.77. Source: SNL Financial and Company provided information. Deposit Market Share (Delaware County) as of 6/30/2014 Rank Institution Branches Deposits ($mm) Market Share (%) 1 Toronto-Dominion Bank 15 2,354 19.8% 2 Wells Fargo & Co. (CA) 23 2,333 19.6% 3 Royal Bank of Scotland Group 21 1,625 13.7% 4 PNC Financial Services Group (PA) 11 1,111 9.4% 5 Banco Santander 13 832 7.0% 6 Bryn Mawr Bank Corp. (PA) 14 589 5.0% 7 Beneficial Bancorp Inc (PA) 6 413 3.5% 8 Bank of America Corp. (NC) 9 404 3.4% Pro Forma 10 388 3.3% 9 Alliance Bancorp of Penn (PA) 7 342 2.9% 10 M&T Bank Corp. (NY) 9 261 2.2% 22 WSFS Financial Corp. (DE) 3 46 0.4% Total (1-10) 128 10,263 86.4% Total (1-31) 169 11,881 100.0% ($mm) 12/31/2014 Combined (1) Assets: 4,853 421 5,274 Gross Loans: 3,225 310 3,535 Deposits: 3,649 345 3,994 Market Cap (2) : 731 - 794 Offices: 55 8 63 Assets Under Management: 1,187 - 1,187 Assets Under Administration: 9,416 - 9,416 The combination creates the largest, most diversified, community bank headquartered in the Delaware Valley (Philadelphia-Camden -Wilmington MSA). |
 Market Demographics Delaware Pennsylvania New Castle Kent Sussex Delaware Chester County County County County County Total Population 551,010 171,028 207,614 562,633 511,036 Median Household Income $66,757 $52,489 $56,481 $61,896 $80,383 % of Household Income > $100k 30.6% 16.5% 21.6% 28.5% 39.3% Median Home Value $254,448 $199,798 $245,039 $240,250 $324,247 Current Unemployment Rate 4.4% 4.6% 5.1% 4.5% 3.4% WSFS Offices (3) 28 9 8 4 / 11 (1) 4 (2) / 5 (1) Distance from WSFS HQ to Alliance HQ 25 miles 25 miles (1) Pro Forma for Alliance. (2) Pro Forma including new WSFS Devon, PA office opening March 2015 (3) WSFS offices in Nevada, Virginia, and Montgomery County, PA are not included in this chart. Source: SNL Financial. 38 Alliance operates in a contiguous market with similar demographics to WSFS’s home market, where we have had success for 183 years. |
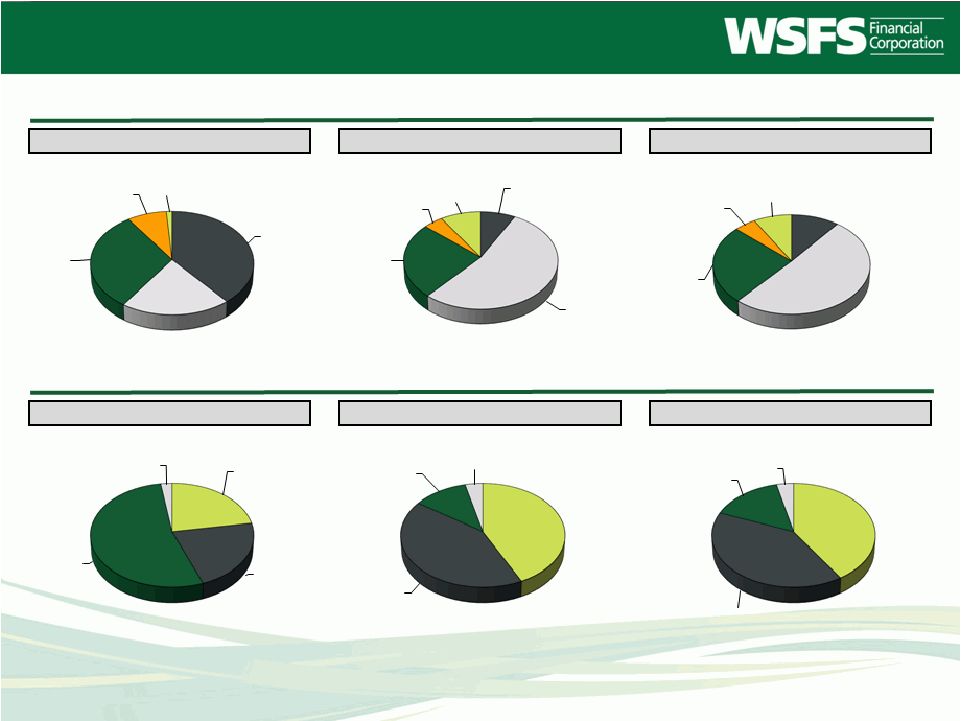 Pro Forma Loans and Deposits Note: Financial data as of 12/31/2014. No purchase accounting assumptions are incorporated in the pro forma loan and deposit composition. Owner occupied CRE is classified as C&I. Source: SNL Financial and Company provided information. ALLB: $310.2 mm WSFS: $3,224.6 mm Pro Forma: $3,534.8 mm ALLB: $344.8 mm WSFS: $3,649.2 mm Pro Forma: $3,994.0 mm Pro Forma Loan Composition Pro Forma Deposit Composition 39 Transaction 22% MMDA & Savings 22% Retail CDs 54% Jumbo CDs 2% Transaction 43% MMDA & Savings 42% Retail CDs 11% Jumbo CDs 4% Transaction 41% MMDA & Savings 40% Retail CDs 15% Jumbo CDs 4% 1-4 Family 10% C&I 51% CRE & Multi Family 26% Constr. and Dev. 5% Other Loans 8% 1-4 Family 8% C&I 54% CRE & Multi Family 25% Constr. and Dev. 4% Other Loans 9% 1-4 Family 39% C&I 20% CRE & Multi Family 31% Constr. and Dev. 8% Other Loans 1% |
 • Approximately $92.0 million transaction value • 70% common stock / 30% cash • 0.28955 shares of WSFS or $22.00 in cash • Price / Tangible Book Value of 138.4% • Anticipated closing date in early Q4 2015, subject to completion of standard closing conditions, shareholder and regulatory approvals. Transaction Overview and Financial Impact Transaction Structure • Assumptions based on comprehensive due diligence • One-time pre-tax transaction costs of $9.3 million • Cost savings of ~40% of Alliance’s non-interest expense base • Substantial credit diligence undertaken; expected credit mark of 3.5% • No revenue synergies are modeled, but they are expected. Assumptions • 3.2% accretive to first full year earnings per share excluding one-time costs • Tangible book value dilution of 1.8%, earned back in 4.7 years • 17% anticipated IRR • WSFS pro forma capital ratios well in excess of “well-capitalized” guidelines following close Financial Impact 40 |
 For more information please contact: Investor Relations: Stephen Fowle (302) 571-6833 or sfowle@wsfsbank.com www.wsfsbank.com Corporate Headquarters 500 Delaware Avenue Wilmington, DE 19801 41 |