WSFS Financial Corporation 4Q 2016 Investor Update February 7, 2017 Exhibit 99.2
Stockholders or others seeking information regarding the Company may call or write: WSFS Financial Corporation Investor Relations WSFS Bank Center 500 Delaware Avenue Wilmington, DE 19801 302-571-7264 stockholderrelations@wsfsbank.com www.wsfsbank.com Mark A. Turner President and CEO 302-571-7160 mturner@wsfsbank.com Rodger Levenson Chief Corporate Development Officer 302-571-7296 rlevenson@wsfsbank.com Dominic Canuso Chief Financial Officer 302-571-6833 dcanuso@wsfsbank.com
Table of Contents Forward-Looking Statements / Non-GAAP Information 2017 Outlook & 2016 – 2018 Strategic Plan The WSFS Franchise Page 4 Page 9 Page 13 4Q 2016 Highlights Page 6 Selected Financial Information Page 22 Appendix 1 – Management Team Page 31 Appendix 2 – Business Model Page 33 Appendix 3 – Non-GAAP Financial Information Page 34
Forward-Looking Statements This presentation contains estimates, predictions, opinions, projections and other "forward-looking statements" as that phrase is defined in the Private Securities Litigation Reform Act of 1995. Such statements include, without limitation, references to the Company's predictions or expectations of future business or financial performance as well as its goals and objectives for future operations, financial and business trends, business prospects, and management's outlook or expectations for earnings, revenues, expenses, capital levels, liquidity levels, asset quality or other future financial or business performance, strategies or expectations. Such forward-looking statements are based on various assumptions (some of which may be beyond the Company's control) and are subject to risks and uncertainties (which change over time) and other factors which could cause actual results to differ materially from those currently anticipated. Such risks and uncertainties include, but are not limited to, those related to difficult market conditions and unfavorable economic trends in the United States generally, and particularly in the market areas in which the Company operates and in which its loans are concentrated, including the effects of declines in housing markets, an increase in unemployment levels and slowdowns in economic growth; the Company's level of nonperforming assets and the costs associated with resolving any problem loans including litigation and other costs; changes in market interest rates may increase funding costs and reduce earning asset yields thus reducing margin; the impact of changes in interest rates and the credit quality and strength of underlying collateral and the effect of such changes on the market value of the Company's investment securities portfolio; the credit risk associated with the substantial amount of commercial real estate, construction and land development, and commercial and industrial loans in our loan portfolio; the extensive federal and state regulation, supervision and examination governing almost every aspect of the Company's operations including changes in regulations affecting financial institutions, including the Dodd-Frank Wall Street Reform and Consumer Protection Act and the rules and regulations being issued in accordance with this statute and potential expenses associated with complying with such regulations; possible additional loan losses and impairment of the collectability of loans; the Company's ability to comply with applicable capital and liquidity requirements (including the finalized Basel III capital standards), including our ability to generate liquidity internally or raise capital on favorable terms; possible changes in trade, monetary and fiscal policies, laws and regulations and other activities of governments, agencies, and similar organizations; any impairment of the Company's goodwill or other intangible assets; failure of the financial and operational controls of the Company's Cash Connect division; conditions in the financial markets that may limit the Company's access to additional funding to meet its liquidity needs; the success of the Company's growth plans, including the successful integration of past and future acquisitions; negative perceptions or publicity with respect to the Company's trust and wealth management business; system failure or cybersecurity breaches of the Company's network security; the Company's ability to recruit and retain key employees; the effects of problems encountered by other financial institutions that adversely affect the Company or the banking industry generally; the effects of weather and natural disasters such as floods, droughts, wind, tornadoes and hurricanes as well as effects from geopolitical instability and manmade disasters including terrorist attacks; possible changes in the speed of loan prepayments by the Company's customers and loan origination or sales volumes; possible acceleration of prepayments of mortgage-backed securities due to low interest rates, and the related acceleration of premium amortization on prepayments on mortgage-backed securities due to low interest rates; regulatory limits on the Company's ability to receive dividends from its subsidiaries and pay dividends to its shareholders; the effects of any reputational, credit, interest rate, market, operational, legal, liquidity, regulatory and compliance risk resulting from developments related to any of the risks discussed above; and the costs associated with resolving any problem loans, litigation and other risks and uncertainties, discussed in the Company's Form 10-K for the year ended December 31, 2015 and other documents filed by the Company with the Securities and Exchange Commission from time to time. Forward-looking statements are as of the date they are made, and the Company does not undertake to update any forward-looking statement, whether written or oral, that may be made from time to time by or on behalf of the Company.
Non-GAAP Information This presentation contains financial information and performance measures determined by methods other than in accordance with accounting principles generally accepted in the United States (“GAAP”). The Company’s management uses these non-GAAP measures to measure the Company’s performance and believes that these non-GAAP measures provide a greater understanding of ongoing operations, enhance comparability of results of operations with prior periods and show the effects of significant gains and charges in the periods presented. The Company’s management believes that investors may use these non-GAAP measures to analyze the Company’s financial performance without the impact of unusual items or events that may obscure trends in the Company’s underlying performance. These disclosures should not be viewed as a substitute for financial measures determined in accordance with GAAP. For a reconciliation of these non-GAAP to their comparable GAAP measures, see Appendix 3. The following are the non-GAAP measures used in this presentation: Core ROA is a non-GAAP measure that divides (i) net income determined in accordance with GAAP and excluding the impact of securities gains (losses), corporate development expenses, debt extinguishment costs, and other extraordinary items by (ii) average assets Core and Sustainable ROA is a non-GAAP measure that divides (i) net income determined in accordance with GAAP and adjusting it by taking core net income and normalizing for long-term credit costs, non-recurring accretion from purchased credit impaired loans (“PCI”), and a normal tax rate by (ii) average assets Tangible common equity is a non-GAAP measure and is defined as total average stockholders’ equity less goodwill, other intangible assets and preferred stock. Return on average tangible common equity is a non-GAAP measure and is defined as net income allocable to common stockholders divided by tangible common equity. Core net interest income is a non-GAAP measure that adjusts net interest income as determined in accordance with GAAP to exclude the impact of extraordinary items such as special dividends Core noninterest income, also called core fee income, is a non-GAAP measure that adjusts noninterest income as determined in accordance with GAAP to exclude the impact of securities gains (losses) Core noninterest expense is a non-GAAP measure that adjusts noninterest expense as determined in accordance with GAAP to exclude corporate development expenses and debt extinguishment costs Core efficiency ratio is a non-GAAP measure that is determined by dividing core noninterest expense by the sum of core interest income and core noninterest income Core fee income to total revenue is a non-GAAP measure that divides (i) core non interest income by (ii) (tax equivalent) core net interest income and core noninterest income Core net revenue is a non-GAAP measure that is determined by adding core net interest income plus core noninterest Income Core net income is a non-GAAP measure that adjusts net income determined in accordance with GAAP to exclude the impact of securities gains (losses), corporate development expenses, debt extinguishment costs, and other extraordinary items Core EPS is a non-GAAP measure that divides (i) net income determined in accordance with GAAP and excluding the impact of securities gains (losses), corporate development expenses, debt extinguishment costs, and other extraordinary items by (ii) weighted average shares of common stock outstanding
4Q 2016 Highlights
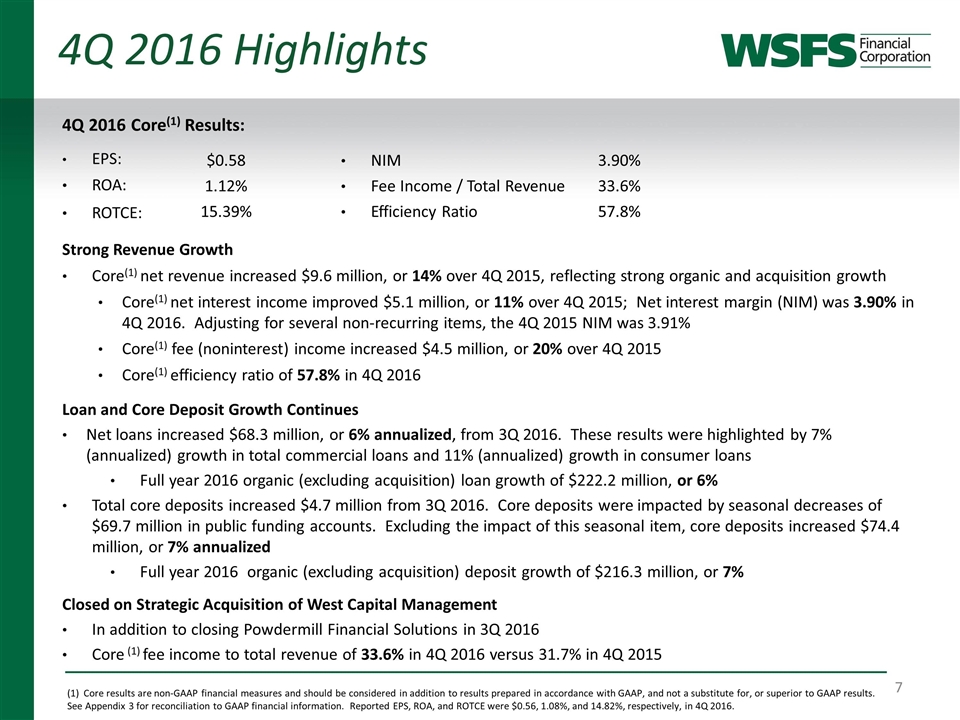
4Q 2016 Core(1) Results: EPS: ROA: ROTCE: Strong Revenue Growth Core(1) net revenue increased $9.6 million, or 14% over 4Q 2015, reflecting strong organic and acquisition growth Core(1) net interest income improved $5.1 million, or 11% over 4Q 2015; Net interest margin (NIM) was 3.90% in 4Q 2016. Adjusting for several non-recurring items, the 4Q 2015 NIM was 3.91% Core(1) fee (noninterest) income increased $4.5 million, or 20% over 4Q 2015 Core(1) efficiency ratio of 57.8% in 4Q 2016 Loan and Core Deposit Growth Continues Net loans increased $68.3 million, or 6% annualized, from 3Q 2016. These results were highlighted by 7% (annualized) growth in total commercial loans and 11% (annualized) growth in consumer loans Full year 2016 organic (excluding acquisition) loan growth of $222.2 million, or 6% Total core deposits increased $4.7 million from 3Q 2016. Core deposits were impacted by seasonal decreases of $69.7 million in public funding accounts. Excluding the impact of this seasonal item, core deposits increased $74.4 million, or 7% annualized Full year 2016 organic (excluding acquisition) deposit growth of $216.3 million, or 7% Closed on Strategic Acquisition of West Capital Management In addition to closing Powdermill Financial Solutions in 3Q 2016 Core (1) fee income to total revenue of 33.6% in 4Q 2016 versus 31.7% in 4Q 2015 $0.58 NIM 3.90% 1.12% Fee Income / Total Revenue 33.6% 15.39% Efficiency Ratio 57.8% 4Q 2016 Highlights (1) Core results are non-GAAP financial measures and should be considered in addition to results prepared in accordance with GAAP, and not a substitute for, or superior to GAAP results. See Appendix 3 for reconciliation to GAAP financial information. Reported EPS, ROA, and ROTCE were $0.56, 1.08%, and 14.82%, respectively, in 4Q 2016.
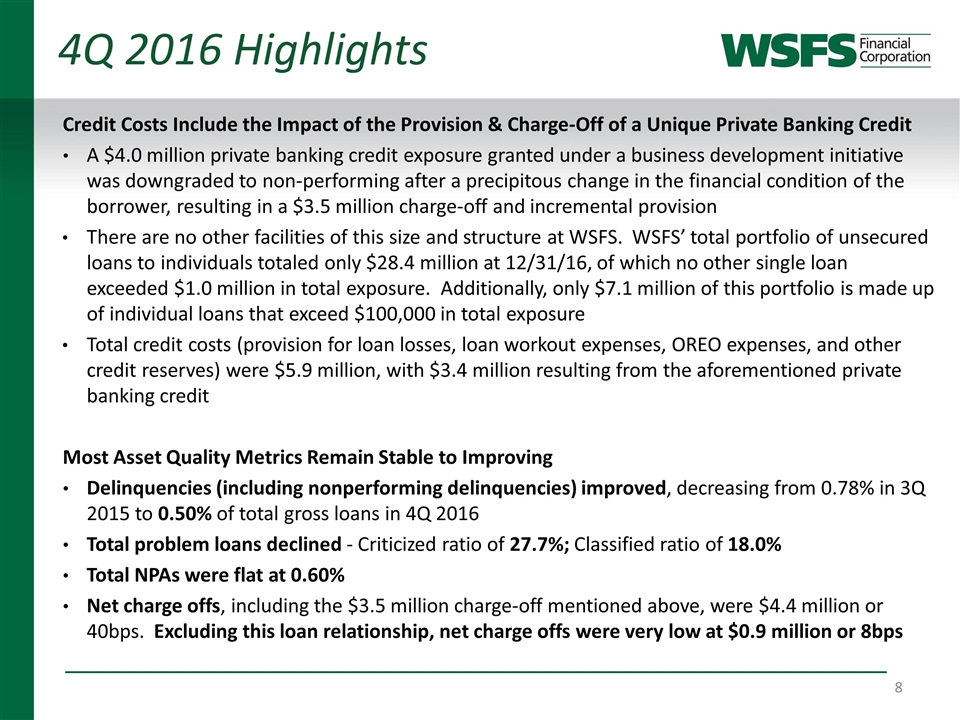
4Q 2016 Highlights Credit Costs Include the Impact of the Provision & Charge-Off of a Unique Private Banking Credit A $4.0 million private banking credit exposure granted under a business development initiative was downgraded to non-performing after a precipitous change in the financial condition of the borrower, resulting in a $3.5 million charge-off and incremental provision There are no other facilities of this size and structure at WSFS. WSFS’ total portfolio of unsecured loans to individuals totaled only $28.4 million at 12/31/16, of which no other single loan exceeded $1.0 million in total exposure. Additionally, only $7.1 million of this portfolio is made up of individual loans that exceed $100,000 in total exposure Total credit costs (provision for loan losses, loan workout expenses, OREO expenses, and other credit reserves) were $5.9 million, with $3.4 million resulting from the aforementioned private banking credit Most Asset Quality Metrics Remain Stable to Improving Delinquencies (including nonperforming delinquencies) improved, decreasing from 0.78% in 3Q 2015 to 0.50% of total gross loans in 4Q 2016 Total problem loans declined - Criticized ratio of 27.7%; Classified ratio of 18.0% Total NPAs were flat at 0.60% Net charge offs, including the $3.5 million charge-off mentioned above, were $4.4 million or 40bps. Excluding this loan relationship, net charge offs were very low at $0.9 million or 8bps
2017 Outlook & 2016-2018 Strategic Plan
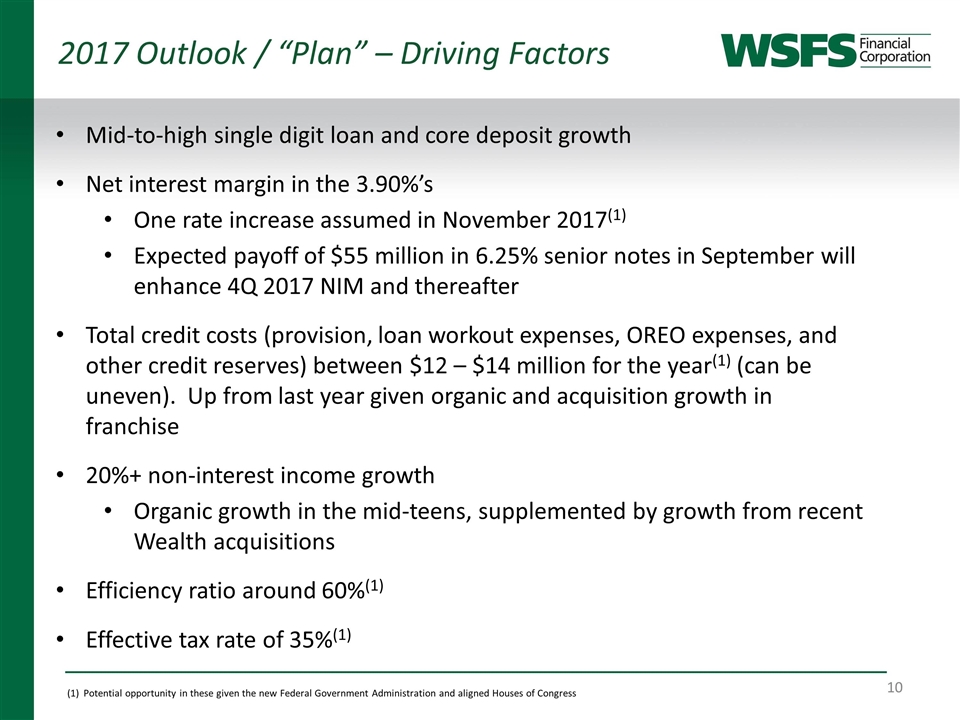
2017 Outlook / “Plan” – Driving Factors Mid-to-high single digit loan and core deposit growth Net interest margin in the 3.90%’s One rate increase assumed in November 2017(1) Expected payoff of $55 million in 6.25% senior notes in September will enhance 4Q 2017 NIM and thereafter Total credit costs (provision, loan workout expenses, OREO expenses, and other credit reserves) between $12 – $14 million for the year(1) (can be uneven). Up from last year given organic and acquisition growth in franchise 20%+ non-interest income growth Organic growth in the mid-teens, supplemented by growth from recent Wealth acquisitions Efficiency ratio around 60%(1) Effective tax rate of 35%(1) (1) Potential opportunity in these given the new Federal Government Administration and aligned Houses of Congress
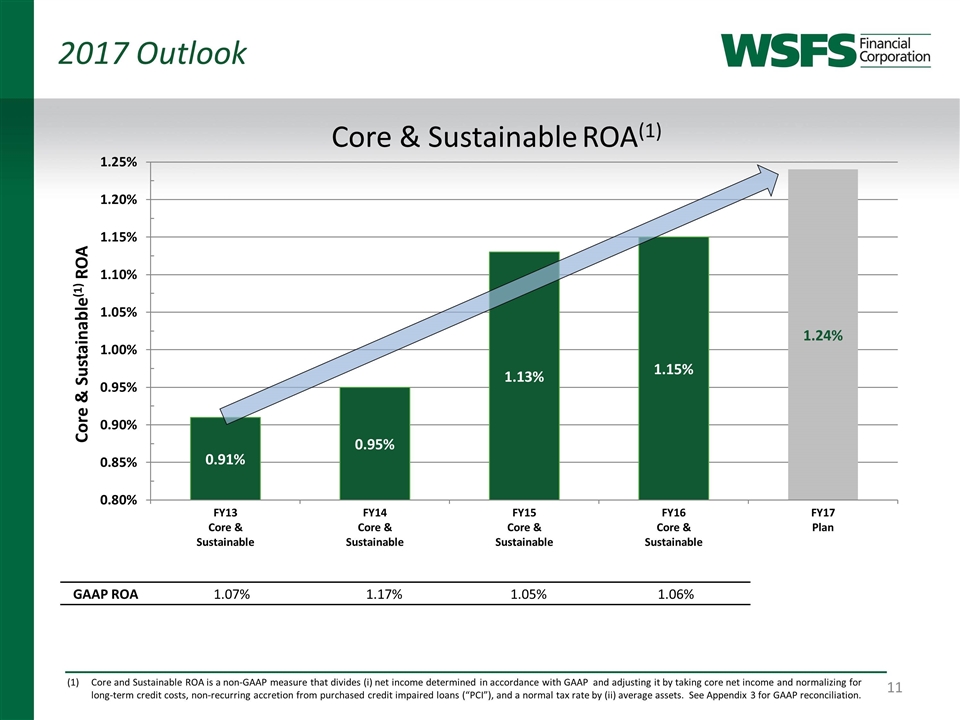
Core & Sustainable(1) ROA Core & Sustainable ROA(1) GAAP ROA 1.07% 1.17% 1.05% 1.06% 2017 Outlook Core and Sustainable ROA is a non-GAAP measure that divides (i) net income determined in accordance with GAAP and adjusting it by taking core net income and normalizing for long-term credit costs, non-recurring accretion from purchased credit impaired loans (“PCI”), and a normal tax rate by (ii) average assets. See Appendix 3 for GAAP reconciliation.
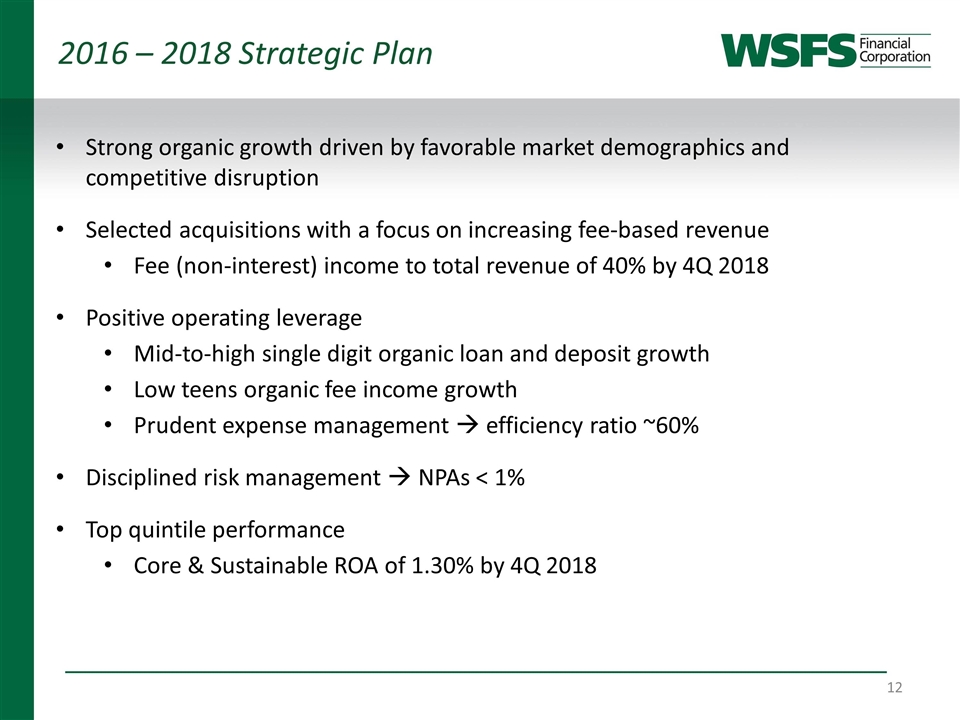
2016 – 2018 Strategic Plan Strong organic growth driven by favorable market demographics and competitive disruption Selected acquisitions with a focus on increasing fee-based revenue Fee (non-interest) income to total revenue of 40% by 4Q 2018 Positive operating leverage Mid-to-high single digit organic loan and deposit growth Low teens organic fee income growth Prudent expense management à efficiency ratio ~60% Disciplined risk management à NPAs < 1% Top quintile performance Core & Sustainable ROA of 1.30% by 4Q 2018
The WSFS Franchise
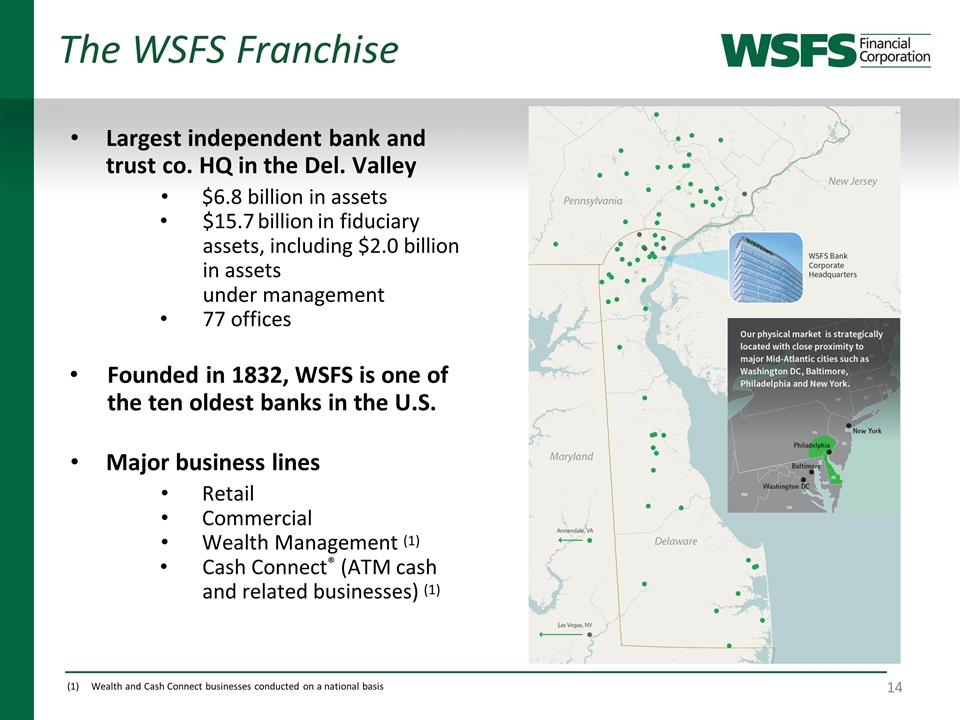
Largest independent bank and trust co. HQ in the Del. Valley $6.8 billion in assets $15.7 billion in fiduciary assets, including $2.0 billion in assets under management 77 offices Founded in 1832, WSFS is one of the ten oldest banks in the U.S. Major business lines Retail Commercial Wealth Management (1) Cash Connect® (ATM cash and related businesses) (1) The WSFS Franchise Wealth and Cash Connect businesses conducted on a national basis
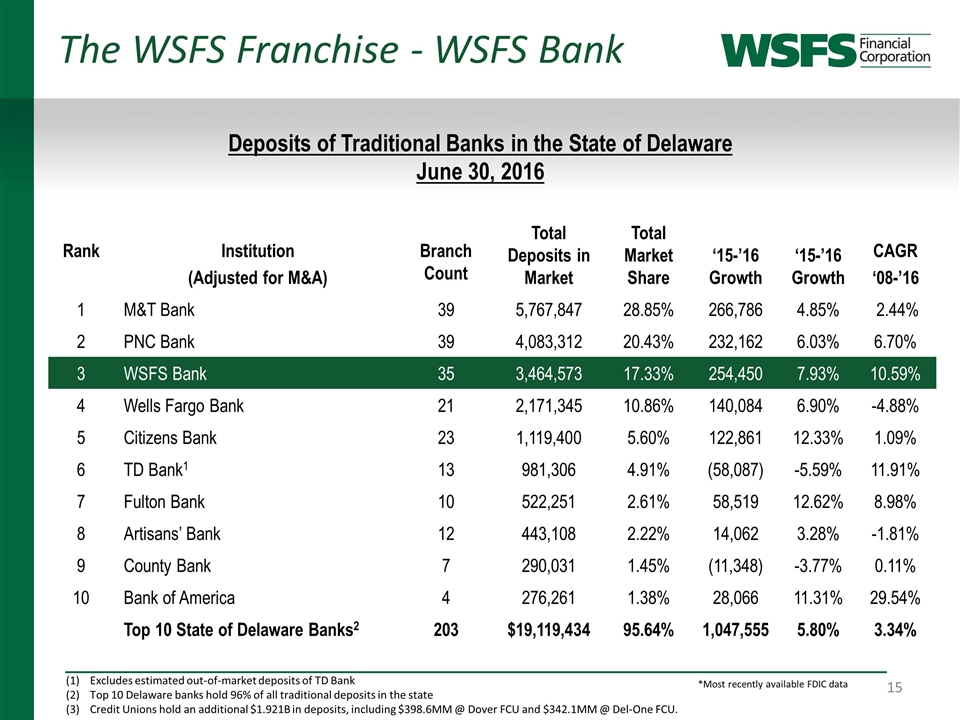
*Most recently available FDIC data The WSFS Franchise - WSFS Bank Deposits of Traditional Banks in the State of Delaware June 30, 2016 Rank Institution (Adjusted for M&A) Branch Count Total Deposits in Market Total Market Share ‘15-’16 Growth ‘15-’16 Growth CAGR ‘08-’16 1 M&T Bank 39 5,767,847 28.85% 266,786 4.85% 2.44% 2 PNC Bank 39 4,083,312 20.43% 232,162 6.03% 6.70% 3 WSFS Bank 35 3,464,573 17.33% 254,450 7.93% 10.59% 4 Wells Fargo Bank 21 2,171,345 10.86% 140,084 6.90% -4.88% 5 Citizens Bank 23 1,119,400 5.60% 122,861 12.33% 1.09% 6 TD Bank1 13 981,306 4.91% (58,087) -5.59% 11.91% 7 Fulton Bank 10 522,251 2.61% 58,519 12.62% 8.98% 8 Artisans’ Bank 12 443,108 2.22% 14,062 3.28% -1.81% 9 County Bank 7 290,031 1.45% (11,348) -3.77% 0.11% 10 Bank of America 4 276,261 1.38% 28,066 11.31% 29.54% Top 10 State of Delaware Banks2 203 $19,119,434 95.64% 1,047,555 5.80% 3.34% Excludes estimated out-of-market deposits of TD Bank Top 10 Delaware banks hold 96% of all traditional deposits in the state Credit Unions hold an additional $1.921B in deposits, including $398.6MM @ Dover FCU and $342.1MM @ Del-One FCU.
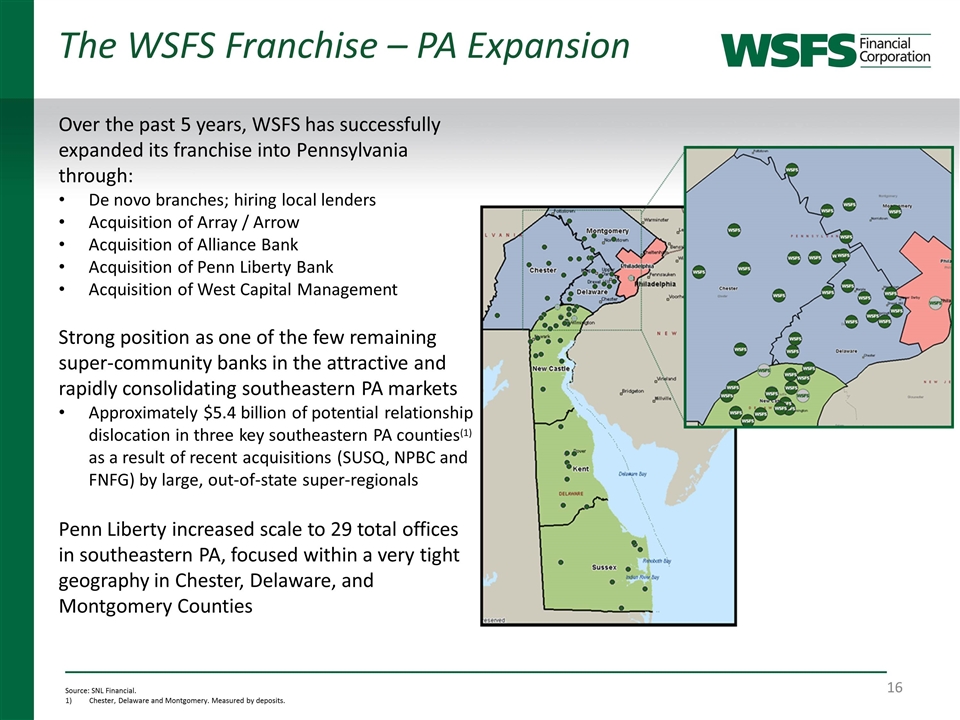
The WSFS Franchise – PA Expansion Over the past 5 years, WSFS has successfully expanded its franchise into Pennsylvania through: De novo branches; hiring local lenders Acquisition of Array / Arrow Acquisition of Alliance Bank Acquisition of Penn Liberty Bank Acquisition of West Capital Management Strong position as one of the few remaining super-community banks in the attractive and rapidly consolidating southeastern PA markets Approximately $5.4 billion of potential relationship dislocation in three key southeastern PA counties(1) as a result of recent acquisitions (SUSQ, NPBC and FNFG) by large, out-of-state super-regionals Penn Liberty increased scale to 29 total offices in southeastern PA, focused within a very tight geography in Chester, Delaware, and Montgomery Counties Source: SNL Financial. Chester, Delaware and Montgomery. Measured by deposits.
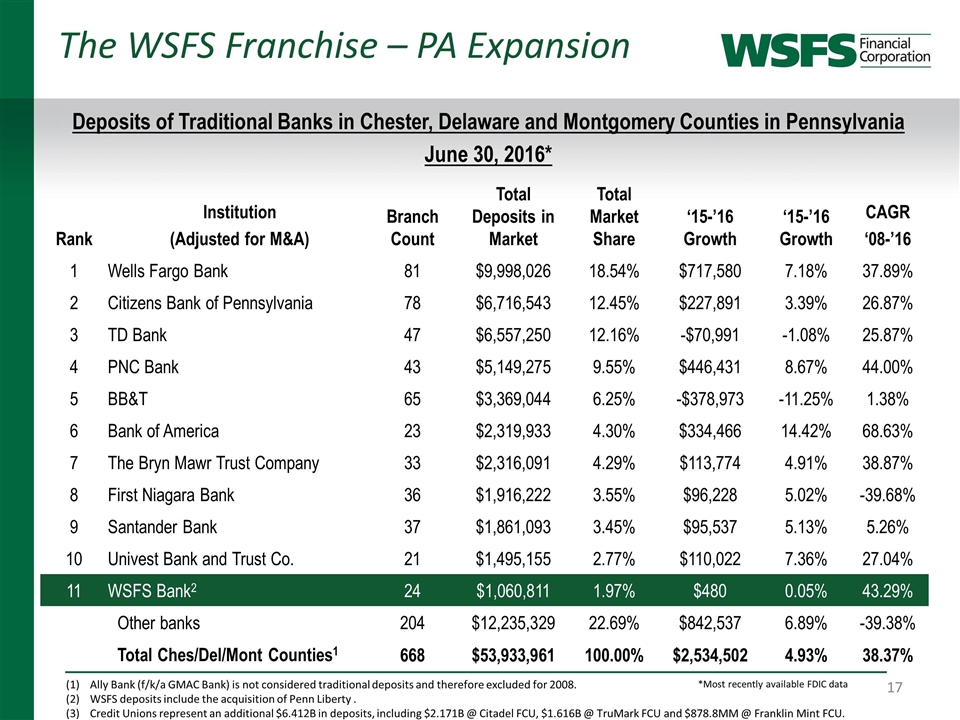
*Most recently available FDIC data Ally Bank (f/k/a GMAC Bank) is not considered traditional deposits and therefore excluded for 2008. WSFS deposits include the acquisition of Penn Liberty . Credit Unions represent an additional $6.412B in deposits, including $2.171B @ Citadel FCU, $1.616B @ TruMark FCU and $878.8MM @ Franklin Mint FCU. Deposits of Traditional Banks in Chester, Delaware and Montgomery Counties in Pennsylvania June 30, 2016* Rank Institution (Adjusted for M&A) Branch Count Total Deposits in Market Total Market Share ‘15-’16 Growth ‘15-’16 Growth CAGR ‘08-’16 1 Wells Fargo Bank 81 $9,998,026 18.54% $717,580 7.18% 37.89% 2 Citizens Bank of Pennsylvania 78 $6,716,543 12.45% $227,891 3.39% 26.87% 3 TD Bank 47 $6,557,250 12.16% -$70,991 -1.08% 25.87% 4 PNC Bank 43 $5,149,275 9.55% $446,431 8.67% 44.00% 5 BB&T 65 $3,369,044 6.25% -$378,973 -11.25% 1.38% 6 Bank of America 23 $2,319,933 4.30% $334,466 14.42% 68.63% 7 The Bryn Mawr Trust Company 33 $2,316,091 4.29% $113,774 4.91% 38.87% 8 First Niagara Bank 36 $1,916,222 3.55% $96,228 5.02% -39.68% 9 Santander Bank 37 $1,861,093 3.45% $95,537 5.13% 5.26% 10 Univest Bank and Trust Co. 21 $1,495,155 2.77% $110,022 7.36% 27.04% 11 WSFS Bank2 24 $1,060,811 1.97% $480 0.05% 43.29% Other banks 204 $12,235,329 22.69% $842,537 6.89% -39.38% Total Ches/Del/Mont Counties1 668 $53,933,961 100.00% $2,534,502 4.93% 38.37% The WSFS Franchise – PA Expansion
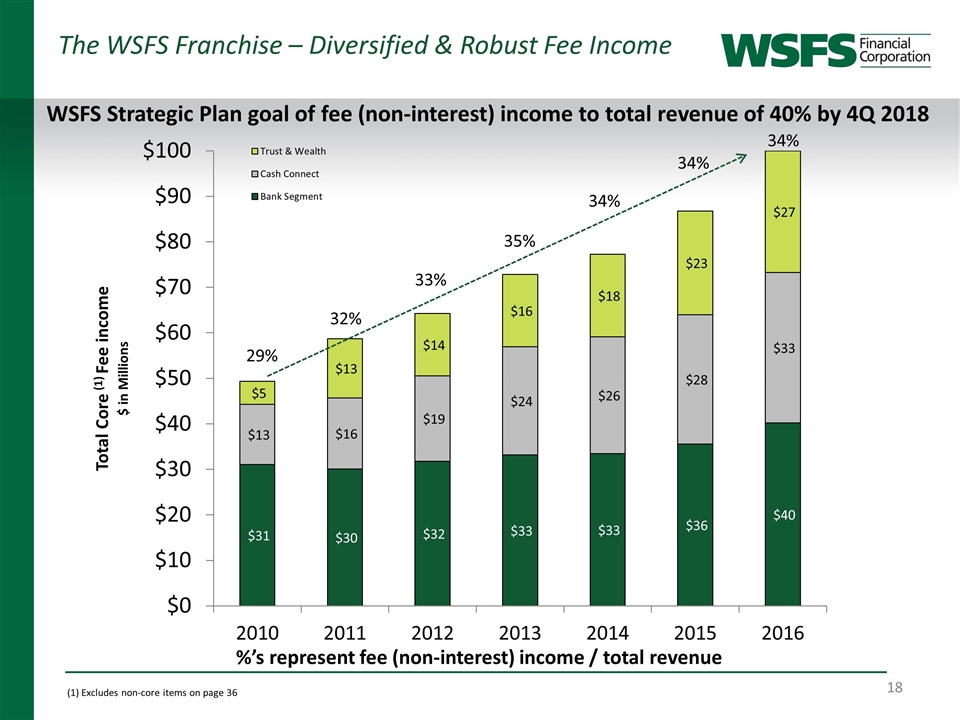
WSFS Strategic Plan goal of fee (non-interest) income to total revenue of 40% by 4Q 2018 The WSFS Franchise – Diversified & Robust Fee Income %’s represent fee (non-interest) income / total revenue (1) Excludes non-core items on page 36
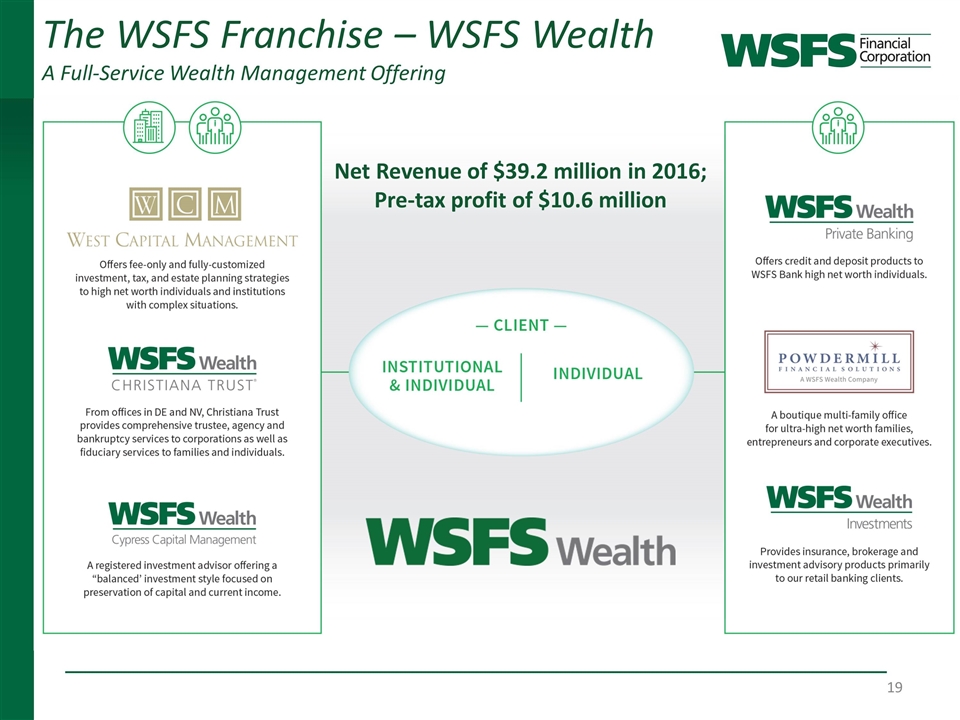
The WSFS Franchise – WSFS Wealth A Full-Service Wealth Management Offering Net Revenue of $39.2 million in 2016; Pre-tax profit of $10.6 million
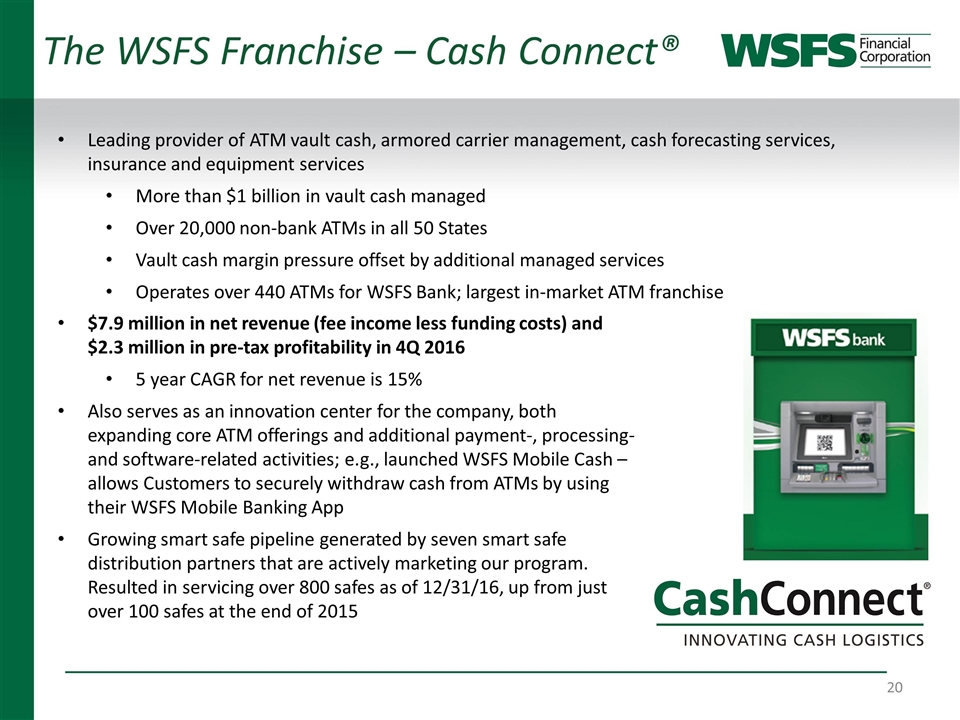
The WSFS Franchise – Cash Connect® Leading provider of ATM vault cash, armored carrier management, cash forecasting services, insurance and equipment services More than $1 billion in vault cash managed Over 20,000 non-bank ATMs in all 50 States Vault cash margin pressure offset by additional managed services Operates over 440 ATMs for WSFS Bank; largest in-market ATM franchise $7.9 million in net revenue (fee income less funding costs) and $2.3 million in pre-tax profitability in 4Q 2016 5 year CAGR for net revenue is 15% Also serves as an innovation center for the company, both expanding core ATM offerings and additional payment-, processing- and software-related activities; e.g., launched WSFS Mobile Cash – allows Customers to securely withdraw cash from ATMs by using their WSFS Mobile Banking App Growing smart safe pipeline generated by seven smart safe distribution partners that are actively marketing our program. Resulted in servicing over 800 safes as of 12/31/16, up from just over 100 safes at the end of 2015
Embracing Innovation as a Catalyst for Growth
Selected Financial Information
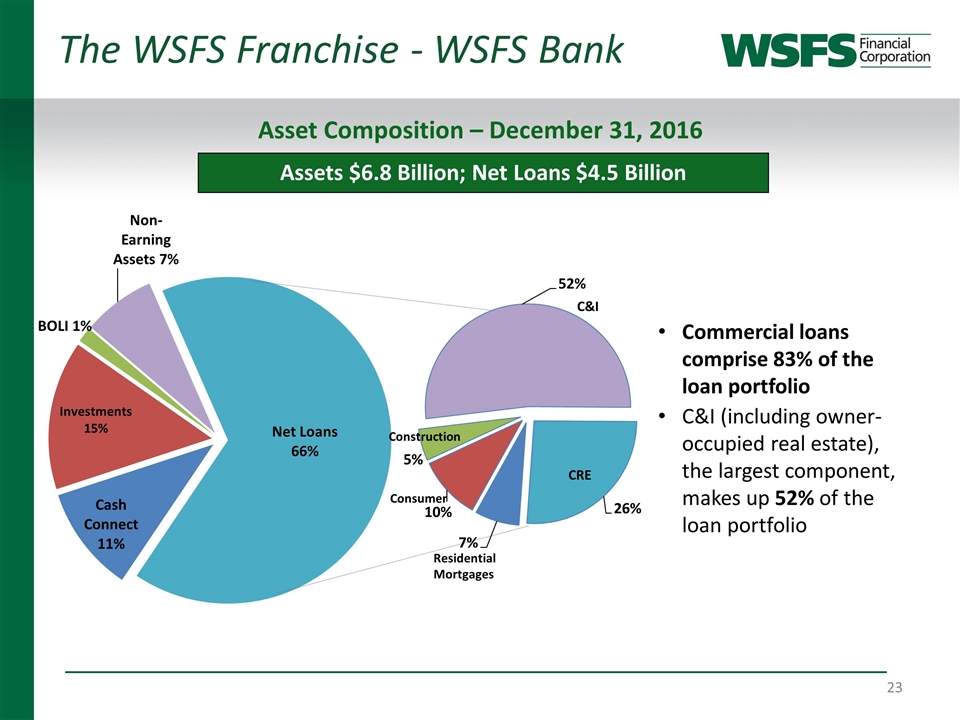
The WSFS Franchise - WSFS Bank Assets $6.8 Billion; Net Loans $4.5 Billion Asset Composition – December 31, 2016 Commercial loans comprise 83% of the loan portfolio C&I (including owner-occupied real estate), the largest component, makes up 52% of the loan portfolio
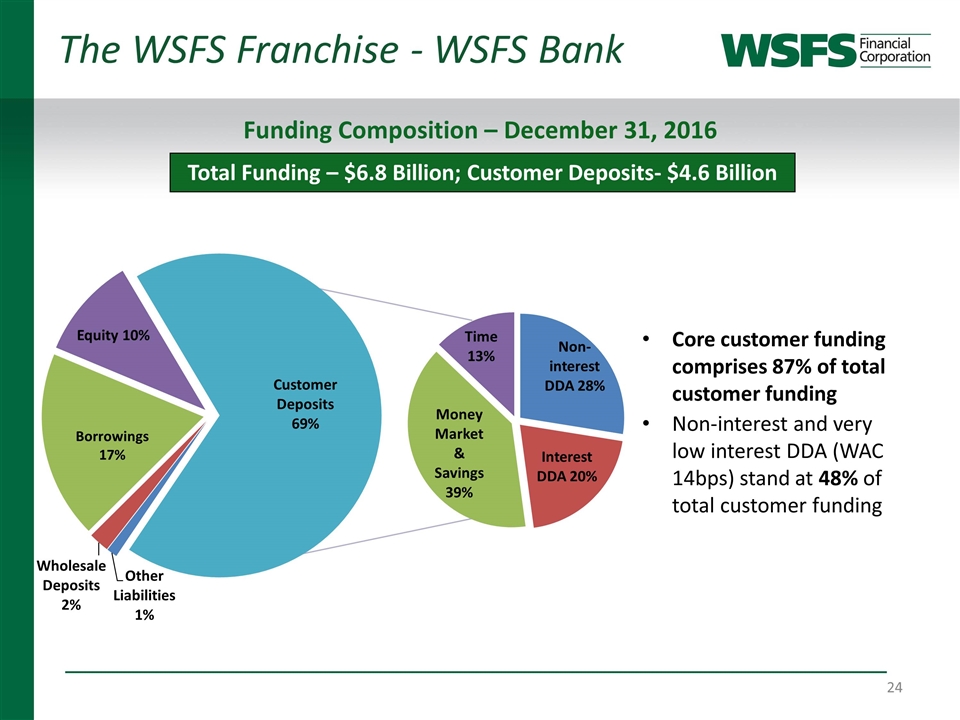
Total Funding – $6.8 Billion; Customer Deposits- $4.6 Billion Funding Composition – December 31, 2016 Core customer funding comprises 87% of total customer funding Non-interest and very low interest DDA (WAC 14bps) stand at 48% of total customer funding The WSFS Franchise - WSFS Bank
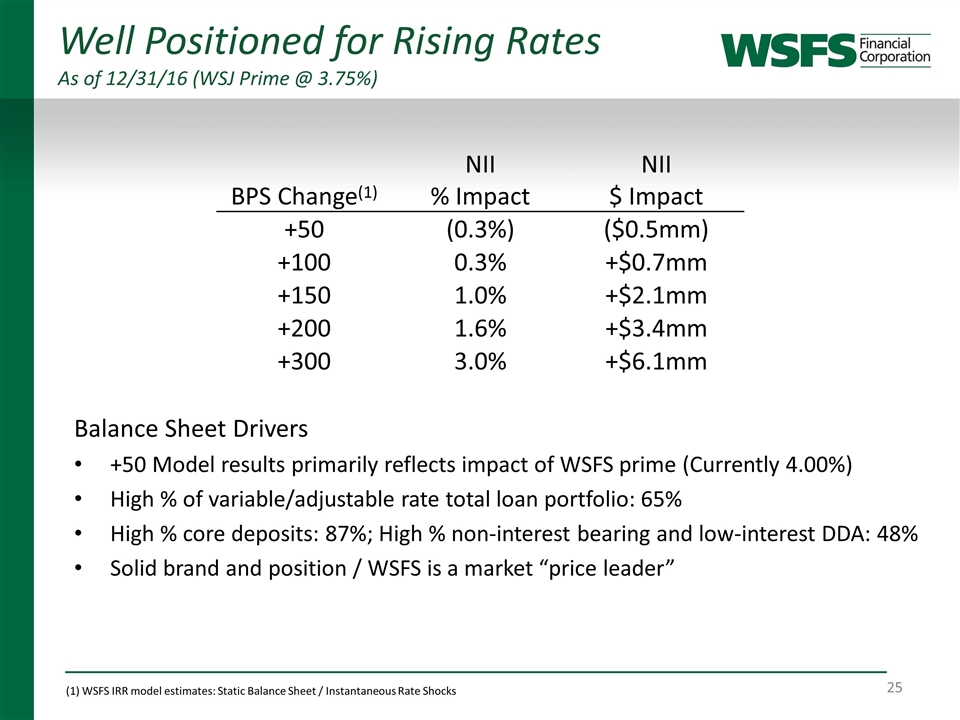
Well Positioned for Rising Rates As of 12/31/16 (WSJ Prime @ 3.75%) BPS Change(1) NII % Impact NII $ Impact +50 (0.3%) ($0.5mm) +100 0.3% +$0.7mm +150 1.0% +$2.1mm +200 1.6% +$3.4mm +300 3.0% +$6.1mm Balance Sheet Drivers +50 Model results primarily reflects impact of WSFS prime (Currently 4.00%) High % of variable/adjustable rate total loan portfolio: 65% High % core deposits: 87%; High % non-interest bearing and low-interest DDA: 48% Solid brand and position / WSFS is a market “price leader” (1) WSFS IRR model estimates: Static Balance Sheet / Instantaneous Rate Shocks
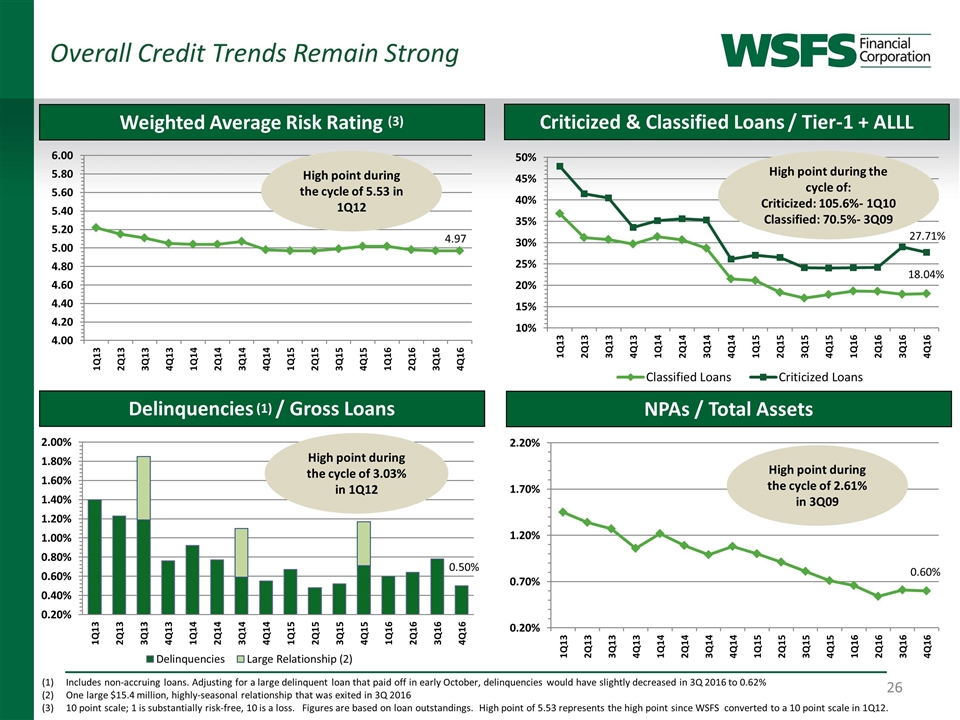
Overall Credit Trends Remain Strong Delinquencies (1) / Gross Loans Weighted Average Risk Rating (3) Includes non-accruing loans. Adjusting for a large delinquent loan that paid off in early October, delinquencies would have slightly decreased in 3Q 2016 to 0.62% One large $15.4 million, highly-seasonal relationship that was exited in 3Q 2016 10 point scale; 1 is substantially risk-free, 10 is a loss. Figures are based on loan outstandings. High point of 5.53 represents the high point since WSFS converted to a 10 point scale in 1Q12. Criticized & Classified Loans / Tier-1 + ALLL NPAs / Total Assets High point during the cycle of 3.03% in 1Q12 High point during the cycle of 2.61% in 3Q09 High point during the cycle of 5.53 in 1Q12 High point during the cycle of: Criticized: 105.6%- 1Q10 Classified: 70.5%- 3Q09
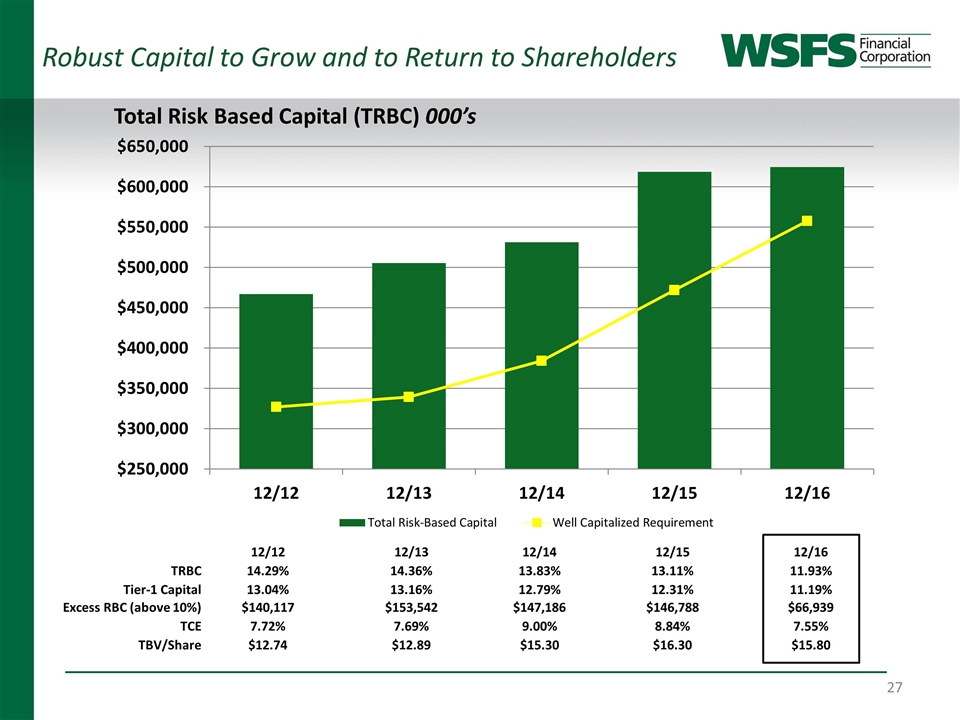
12/12 12/13 12/14 12/15 12/16 TRBC 14.29% 14.36% 13.83% 13.11% 11.93% Tier-1 Capital 13.04% 13.16% 12.79% 12.31% 11.19% Excess RBC (above 10%) $140,117 $153,542 $147,186 $146,788 $66,939 TCE 7.72% 7.69% 9.00% 8.84% 7.55% TBV/Share $12.74 $12.89 $15.30 $16.30 $15.80 Robust Capital to Grow and to Return to Shareholders Total Risk Based Capital (TRBC) 000’s
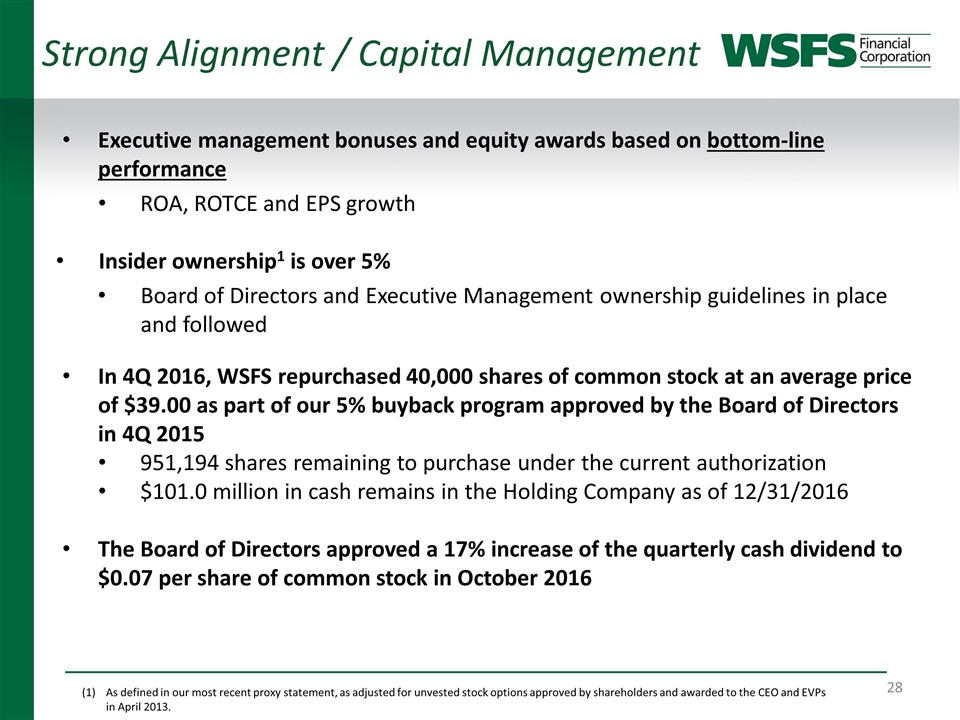
Strong Alignment / Capital Management Executive management bonuses and equity awards based on bottom-line performance ROA, ROTCE and EPS growth Insider ownership1 is over 5% Board of Directors and Executive Management ownership guidelines in place and followed In 4Q 2016, WSFS repurchased 40,000 shares of common stock at an average price of $39.00 as part of our 5% buyback program approved by the Board of Directors in 4Q 2015 951,194 shares remaining to purchase under the current authorization $101.0 million in cash remains in the Holding Company as of 12/31/2016 The Board of Directors approved a 17% increase of the quarterly cash dividend to $0.07 per share of common stock in October 2016 As defined in our most recent proxy statement, as adjusted for unvested stock options approved by shareholders and awarded to the CEO and EVPs in April 2013.
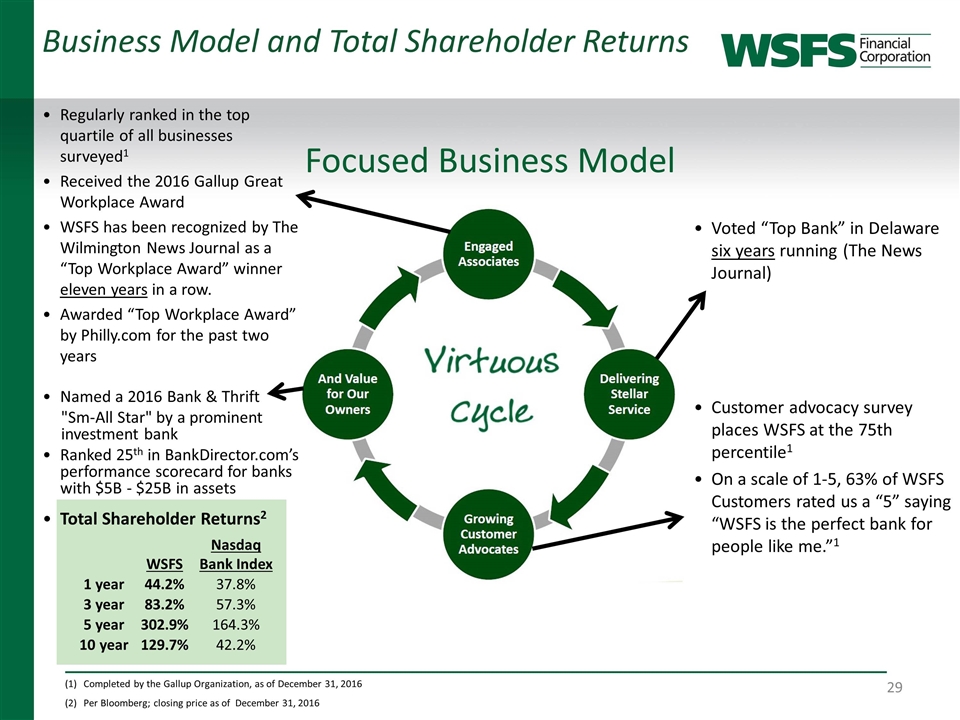
Business Model and Total Shareholder Returns (1) Completed by the Gallup Organization, as of December 31, 2016 (2) Per Bloomberg; closing price as of December 31, 2016 Focused Business Model Regularly ranked in the top quartile of all businesses surveyed1 Received the 2016 Gallup Great Workplace Award WSFS has been recognized by The Wilmington News Journal as a “Top Workplace Award” winner eleven years in a row. Awarded “Top Workplace Award” by Philly.com for the past two years Voted “Top Bank” in Delaware six years running (The News Journal) Customer advocacy survey places WSFS at the 75th percentile1 On a scale of 1-5, 63% of WSFS Customers rated us a “5” saying “WSFS is the perfect bank for people like me.”1 Named a 2016 Bank & Thrift "Sm-All Star" by a prominent investment bank Ranked 25th in BankDirector.com’s performance scorecard for banks with $5B - $25B in assets Total Shareholder Returns2 WSFS Nasdaq Bank Index 1 year 44.2% 37.8% 3 year 83.2% 57.3% 5 year 302.9% 164.3% 10 year 129.7% 42.2%
Appendices
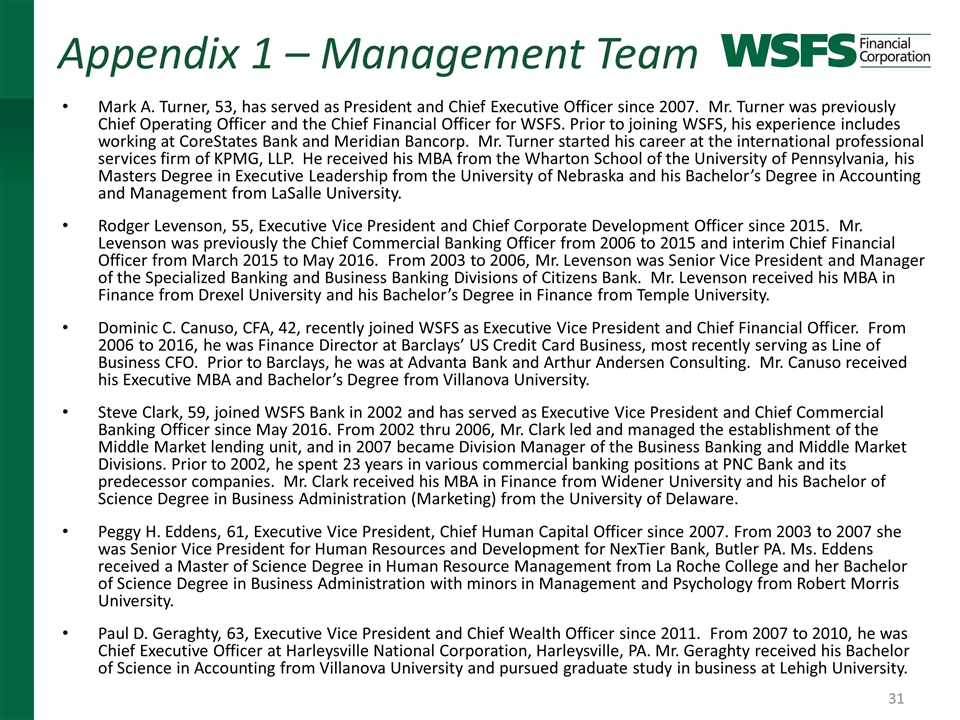
Appendix 1 – Management Team Mark A. Turner, 53, has served as President and Chief Executive Officer since 2007. Mr. Turner was previously Chief Operating Officer and the Chief Financial Officer for WSFS. Prior to joining WSFS, his experience includes working at CoreStates Bank and Meridian Bancorp. Mr. Turner started his career at the international professional services firm of KPMG, LLP. He received his MBA from the Wharton School of the University of Pennsylvania, his Masters Degree in Executive Leadership from the University of Nebraska and his Bachelor’s Degree in Accounting and Management from LaSalle University. Rodger Levenson, 55, Executive Vice President and Chief Corporate Development Officer since 2015. Mr. Levenson was previously the Chief Commercial Banking Officer from 2006 to 2015 and interim Chief Financial Officer from March 2015 to May 2016. From 2003 to 2006, Mr. Levenson was Senior Vice President and Manager of the Specialized Banking and Business Banking Divisions of Citizens Bank. Mr. Levenson received his MBA in Finance from Drexel University and his Bachelor’s Degree in Finance from Temple University. Dominic C. Canuso, CFA, 42, recently joined WSFS as Executive Vice President and Chief Financial Officer. From 2006 to 2016, he was Finance Director at Barclays’ US Credit Card Business, most recently serving as Line of Business CFO. Prior to Barclays, he was at Advanta Bank and Arthur Andersen Consulting. Mr. Canuso received his Executive MBA and Bachelor’s Degree from Villanova University. Steve Clark, 59, joined WSFS Bank in 2002 and has served as Executive Vice President and Chief Commercial Banking Officer since May 2016. From 2002 thru 2006, Mr. Clark led and managed the establishment of the Middle Market lending unit, and in 2007 became Division Manager of the Business Banking and Middle Market Divisions. Prior to 2002, he spent 23 years in various commercial banking positions at PNC Bank and its predecessor companies. Mr. Clark received his MBA in Finance from Widener University and his Bachelor of Science Degree in Business Administration (Marketing) from the University of Delaware. Peggy H. Eddens, 61, Executive Vice President, Chief Human Capital Officer since 2007. From 2003 to 2007 she was Senior Vice President for Human Resources and Development for NexTier Bank, Butler PA. Ms. Eddens received a Master of Science Degree in Human Resource Management from La Roche College and her Bachelor of Science Degree in Business Administration with minors in Management and Psychology from Robert Morris University. Paul D. Geraghty, 63, Executive Vice President and Chief Wealth Officer since 2011. From 2007 to 2010, he was Chief Executive Officer at Harleysville National Corporation, Harleysville, PA. Mr. Geraghty received his Bachelor of Science in Accounting from Villanova University and pursued graduate study in business at Lehigh University.
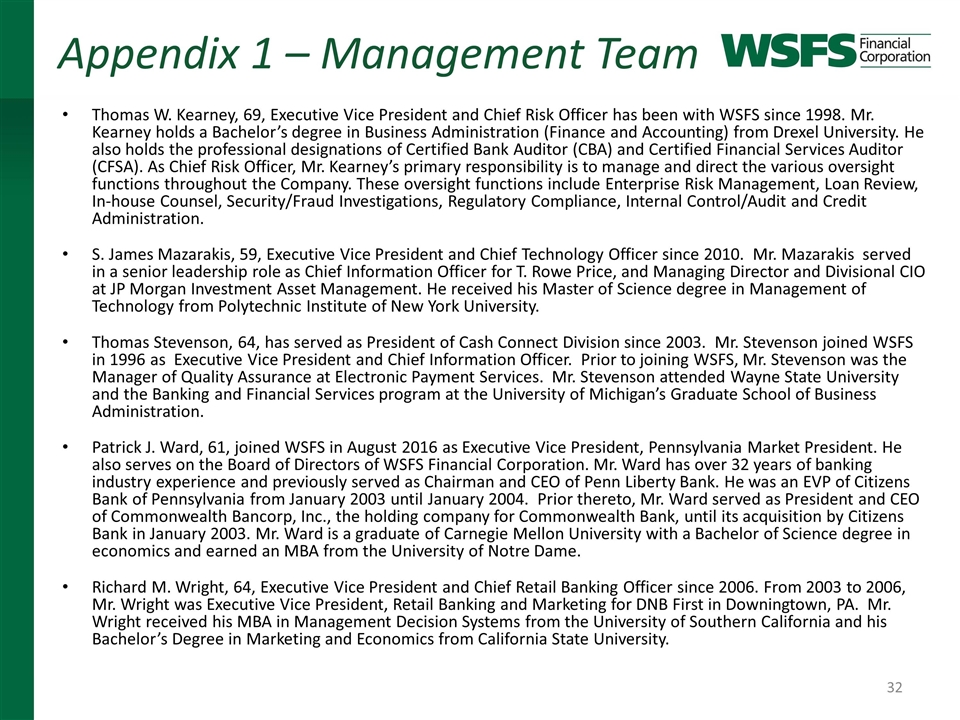
Appendix 1 – Management Team Thomas W. Kearney, 69, Executive Vice President and Chief Risk Officer has been with WSFS since 1998. Mr. Kearney holds a Bachelor’s degree in Business Administration (Finance and Accounting) from Drexel University. He also holds the professional designations of Certified Bank Auditor (CBA) and Certified Financial Services Auditor (CFSA). As Chief Risk Officer, Mr. Kearney’s primary responsibility is to manage and direct the various oversight functions throughout the Company. These oversight functions include Enterprise Risk Management, Loan Review, In-house Counsel, Security/Fraud Investigations, Regulatory Compliance, Internal Control/Audit and Credit Administration. S. James Mazarakis, 59, Executive Vice President and Chief Technology Officer since 2010. Mr. Mazarakis served in a senior leadership role as Chief Information Officer for T. Rowe Price, and Managing Director and Divisional CIO at JP Morgan Investment Asset Management. He received his Master of Science degree in Management of Technology from Polytechnic Institute of New York University. Thomas Stevenson, 64, has served as President of Cash Connect Division since 2003. Mr. Stevenson joined WSFS in 1996 as Executive Vice President and Chief Information Officer. Prior to joining WSFS, Mr. Stevenson was the Manager of Quality Assurance at Electronic Payment Services. Mr. Stevenson attended Wayne State University and the Banking and Financial Services program at the University of Michigan’s Graduate School of Business Administration. Patrick J. Ward, 61, joined WSFS in August 2016 as Executive Vice President, Pennsylvania Market President. He also serves on the Board of Directors of WSFS Financial Corporation. Mr. Ward has over 32 years of banking industry experience and previously served as Chairman and CEO of Penn Liberty Bank. He was an EVP of Citizens Bank of Pennsylvania from January 2003 until January 2004. Prior thereto, Mr. Ward served as President and CEO of Commonwealth Bancorp, Inc., the holding company for Commonwealth Bank, until its acquisition by Citizens Bank in January 2003. Mr. Ward is a graduate of Carnegie Mellon University with a Bachelor of Science degree in economics and earned an MBA from the University of Notre Dame. Richard M. Wright, 64, Executive Vice President and Chief Retail Banking Officer since 2006. From 2003 to 2006, Mr. Wright was Executive Vice President, Retail Banking and Marketing for DNB First in Downingtown, PA. Mr. Wright received his MBA in Management Decision Systems from the University of Southern California and his Bachelor’s Degree in Marketing and Economics from California State University.
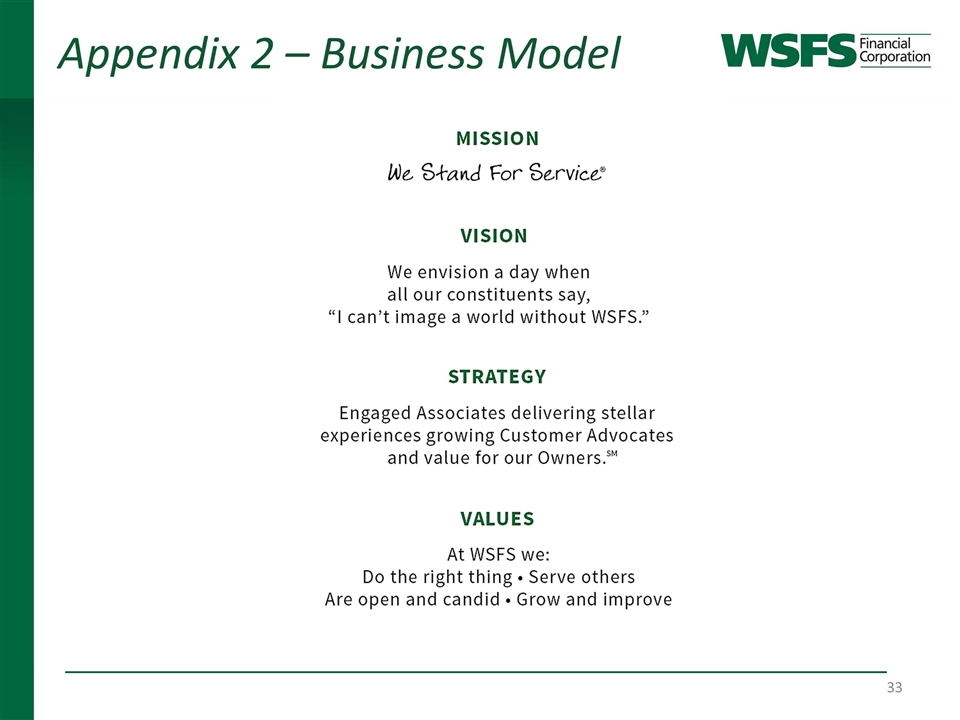
Appendix 2 – Business Model
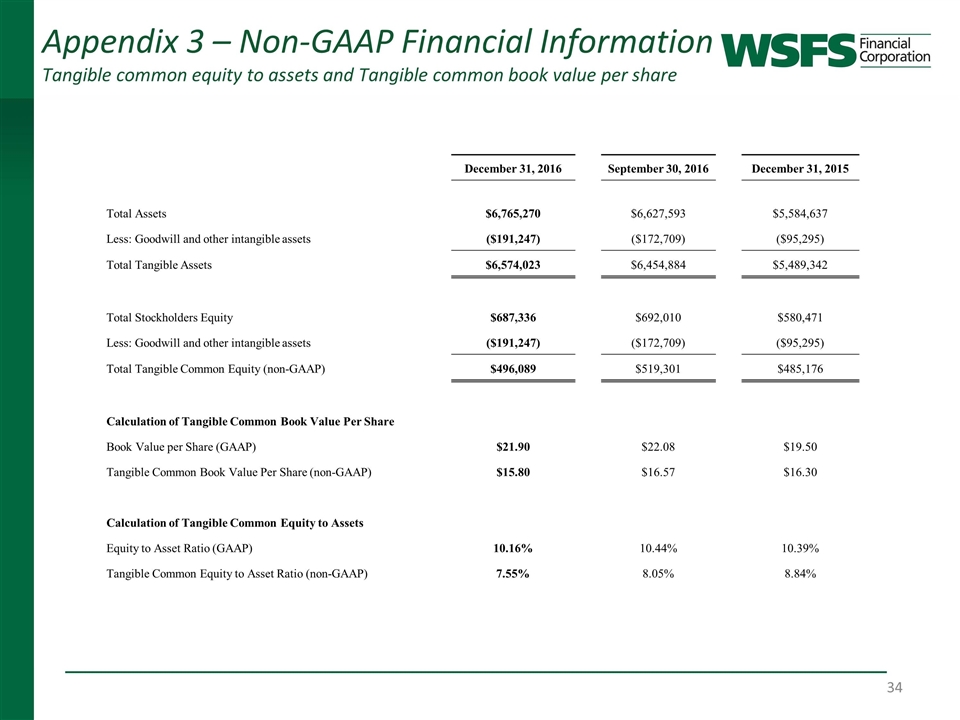
Appendix 3 – Non-GAAP Financial Information Tangible common equity to assets and Tangible common book value per share December 31, 2016 September 30, 2016 December 31, 2015 Total Assets $6,765,270 $6,627,593 $5,584,637 Less: Goodwill and other intangible assets ($191,247) ($172,709) ($95,295) Total Tangible Assets $6,574,023 $6,454,884 $5,489,342 Total Stockholders Equity $687,336 $692,010 $580,471 Less: Goodwill and other intangible assets ($191,247) ($172,709) ($95,295) Total Tangible Common Equity (non-GAAP) $496,089 $519,301 $485,176 Calculation of Tangible Common Book Value Per Share Book Value per Share (GAAP) $21.90 $22.08 $19.50 Tangible Common Book Value Per Share (non-GAAP) $15.80 $16.57 $16.30 Calculation of Tangible Common Equity to Assets Equity to Asset Ratio (GAAP) 10.16% 10.44% 10.39% Tangible Common Equity to Asset Ratio (non-GAAP) 7.55% 8.05% 8.84%
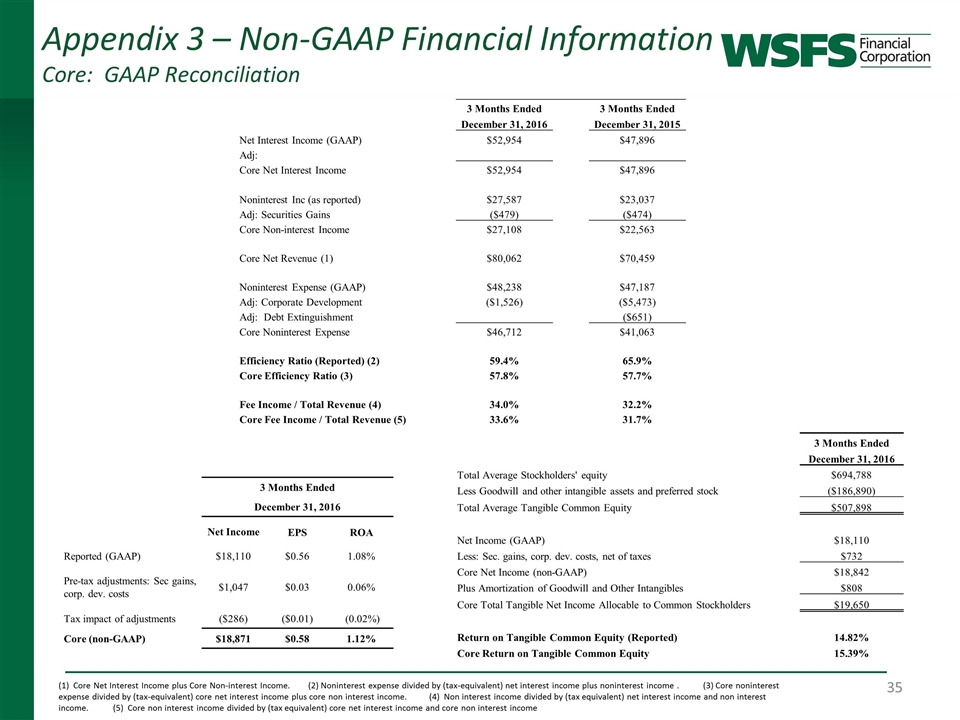
Appendix 3 – Non-GAAP Financial Information Core: GAAP Reconciliation (1) Core Net Interest Income plus Core Non-interest Income. (2) Noninterest expense divided by (tax-equivalent) net interest income plus noninterest income . (3) Core noninterest expense divided by (tax-equivalent) core net interest income plus core non interest income. (4) Non interest income divided by (tax equivalent) net interest income and non interest income. (5) Core non interest income divided by (tax equivalent) core net interest income and core non interest income 3 Months Ended December 31, 2016 Net Income EPS ROA Reported (GAAP) $18,110 $0.56 1.08% Pre-tax adjustments: Sec gains, corp. dev. costs $1,047 $0.03 0.06% Tax impact of adjustments ($286) ($0.01) (0.02%) Core (non-GAAP) $18,871 $0.58 1.12% 3 Months Ended December 31, 2016 Total Average Stockholders' equity $694,788 Less Goodwill and other intangible assets and preferred stock ($186,890) Total Average Tangible Common Equity $507,898 Net Income (GAAP) $18,110 Less: Sec. gains, corp. dev. costs, net of taxes $732 Core Net Income (non-GAAP) $18,842 Plus Amortization of Goodwill and Other Intangibles $808 Core Total Tangible Net Income Allocable to Common Stockholders $19,650 Return on Tangible Common Equity (Reported) 14.82% Core Return on Tangible Common Equity 15.39% 3 Months Ended 3 Months Ended December 31, 2016 December 31, 2015 Net Interest Income (GAAP) $52,954 $47,896 Adj: Core Net Interest Income $52,954 $47,896 Noninterest Inc (as reported) $27,587 $23,037 Adj: Securities Gains ($479) ($474) Core Non-interest Income $27,108 $22,563 Core Net Revenue (1) $80,062 $70,459 Noninterest Expense (GAAP) $48,238 $47,187 Adj: Corporate Development ($1,526) ($5,473) Adj: Debt Extinguishment ($651) Core Noninterest Expense $46,712 $41,063 Efficiency Ratio (Reported) (2) 59.4% 65.9% Core Efficiency Ratio (3) 57.8% 57.7% Fee Income / Total Revenue (4) 34.0% 32.2% Core Fee Income / Total Revenue (5) 33.6% 31.7%
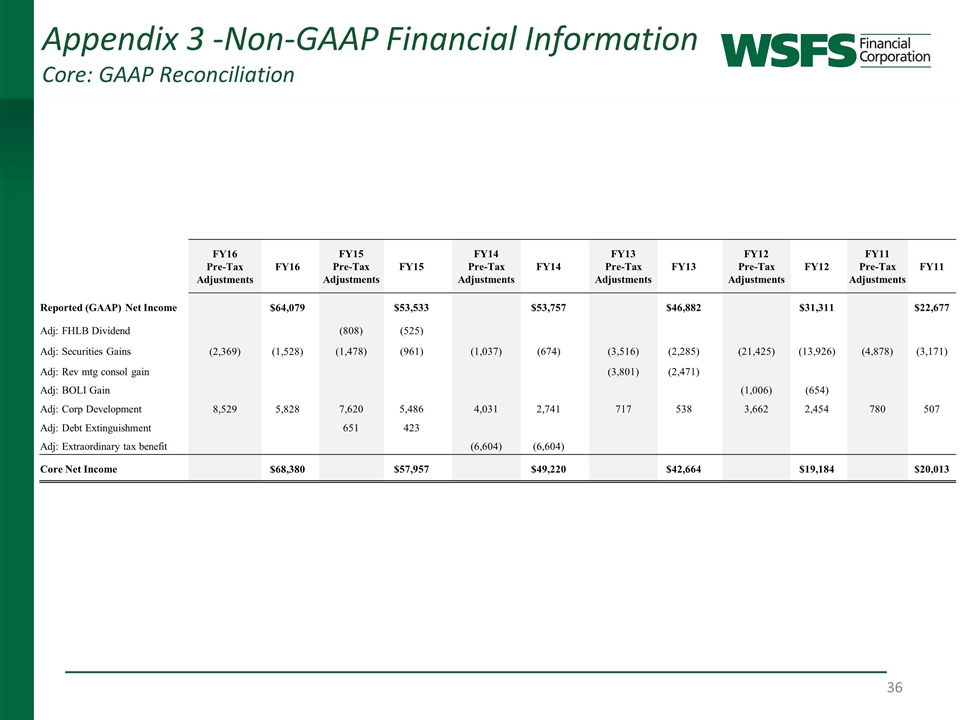
Appendix 3 -Non-GAAP Financial Information Core: GAAP Reconciliation FY16 Pre-Tax Adjustments FY16 FY15 Pre-Tax Adjustments FY15 FY14 Pre-Tax Adjustments FY14 FY13 Pre-Tax Adjustments FY13 FY12 Pre-Tax Adjustments FY12 FY11 Pre-Tax Adjustments FY11 Reported (GAAP) Net Income $64,079 $53,533 $53,757 $46,882 $31,311 $22,677 Adj: FHLB Dividend (808) (525) Adj: Securities Gains (2,369) (1,528) (1,478) (961) (1,037) (674) (3,516) (2,285) (21,425) (13,926) (4,878) (3,171) Adj: Rev mtg consol gain (3,801) (2,471) Adj: BOLI Gain (1,006) (654) Adj: Corp Development 8,529 5,828 7,620 5,486 4,031 2,741 717 538 3,662 2,454 780 507 Adj: Debt Extinguishment 651 423 Adj: Extraordinary tax benefit (6,604) (6,604) Core Net Income $68,380 $57,957 $49,220 $42,664 $19,184 $20,013
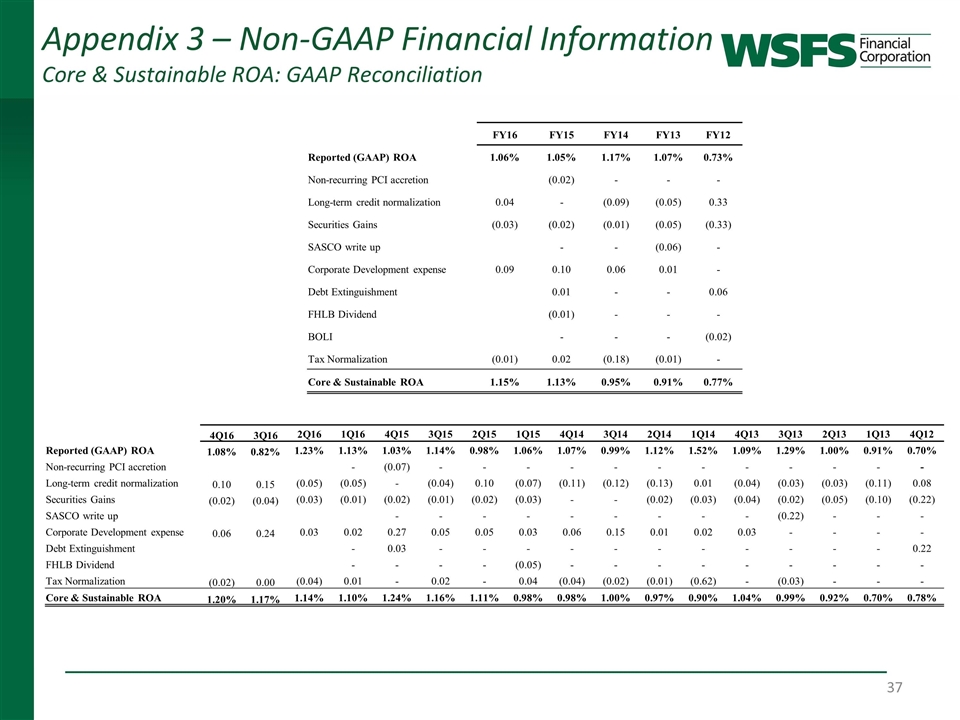
Appendix 3 – Non-GAAP Financial Information Core & Sustainable ROA: GAAP Reconciliation FY16 FY15 FY14 FY13 FY12 Reported (GAAP) ROA 1.06% 1.05% 1.17% 1.07% 0.73% Non-recurring PCI accretion (0.02) - - - Long-term credit normalization 0.04 - (0.09) (0.05) 0.33 Securities Gains (0.03) (0.02) (0.01) (0.05) (0.33) SASCO write up - - (0.06) - Corporate Development expense 0.09 0.10 0.06 0.01 - Debt Extinguishment 0.01 - - 0.06 FHLB Dividend (0.01) - - - BOLI - - - (0.02) Tax Normalization (0.01) 0.02 (0.18) (0.01) - Core & Sustainable ROA 1.15% 1.13% 0.95% 0.91% 0.77% 4Q16 3Q16 2Q16 1Q16 4Q15 3Q15 2Q15 1Q15 4Q14 3Q14 2Q14 1Q14 4Q13 3Q13 2Q13 1Q13 4Q12 Reported (GAAP) ROA 1.08% 0.82% 1.23% 1.13% 1.03% 1.14% 0.98% 1.06% 1.07% 0.99% 1.12% 1.52% 1.09% 1.29% 1.00% 0.91% 0.70% Non-recurring PCI accretion - (0.07) - - - - - - - - - - - - Long-term credit normalization 0.10 0.15 (0.05) (0.05) - (0.04) 0.10 (0.07) (0.11) (0.12) (0.13) 0.01 (0.04) (0.03) (0.03) (0.11) 0.08 Securities Gains (0.02) (0.04) (0.03) (0.01) (0.02) (0.01) (0.02) (0.03) - - (0.02) (0.03) (0.04) (0.02) (0.05) (0.10) (0.22) SASCO write up - - - - - - - - - (0.22) - - - Corporate Development expense 0.06 0.24 0.03 0.02 0.27 0.05 0.05 0.03 0.06 0.15 0.01 0.02 0.03 - - - - Debt Extinguishment - 0.03 - - - - - - - - - - - 0.22 FHLB Dividend - - - - (0.05) - - - - - - - - - Tax Normalization (0.02) 0.00 (0.04) 0.01 - 0.02 - 0.04 (0.04) (0.02) (0.01) (0.62) - (0.03) - - - Core & Sustainable ROA 1.20% 1.17% 1.14% 1.10% 1.24% 1.16% 1.11% 0.98% 0.98% 1.00% 0.97% 0.90% 1.04% 0.99% 0.92% 0.70% 0.78%
For more information please contact: Investor Relations: Dominic Canuso (302) 571-6833 or dcanuso@wsfsbank.com www.wsfsbank.com Corporate Headquarters 500 Delaware Avenue Wilmington, DE 19801


