
1 WSFS Financial Corporation 3Q 2022 Earnings Release Supplement October 2022
2 Forward Looking Statements & Non-GAAP Forward Looking Statements: This presentation contains estimates, predictions, opinions, projections and other "forward-looking statements" as that phrase is defined in the Private Securities Litigation Reform Act of 1995. Such statements include, without limitation, references to the Company's predictions or expectations of future business or financial performance as well as its goals and objectives for future operations, financial and business trends, business prospects, and management's outlook or expectations for earnings, revenues, expenses, capital levels, liquidity levels, asset quality or other future financial or business performance, strategies or expectations. The words “believe,” “expect,” “anticipate,” “plan,” “estimate,” “target,” “project” and similar expressions, among others, generally identify forward-looking statements. Such forward-looking statements are based on various assumptions (some of which may be beyond the Company's control) and are subject to significant risks and uncertainties (which change over time) and other factors, including ability to successfully integrate and fully realize the cost savings and other benefits of our recent acquisition of Bryn Mawr Bank Corporation (“BMT”) and the uncertain effects of the COVID-19 pandemic and actions taken in response thereto on our business, results of operations, capital and liquidity, which could cause actual results to differ materially from those currently anticipated. Such risks and uncertainties are discussed in detail in the Company's Form 10-K for the year ended December 31, 2021, Form 10-Q for the quarter ended March 31, 2022, Form 10-Q for the quarter ended June 30, 2022, and other documents filed by the Company with the Securities and Exchange Commission from time to time. We caution readers not to place undue reliance on any such forward-looking statements, which speak only as of the date on which they are made, and the Company disclaims any duty to revise or update any forward-looking statement, whether written or oral, that may be made from time to time by or on behalf of the Company for any reason, except as specifically required by law. As used in this presentation, the terms "WSFS", "the Company", "registrant", "we", "us", and "our" mean WSFS Financial Corporation and its subsidiaries, on a consolidated basis, unless the context indicates otherwise. Non-GAAP Financial Measures: This presentation contains financial measures determined by methods other than in accordance with accounting principles generally accepted in the United States (“GAAP”). These non-GAAP measures include core earnings per share (“EPS”), core EPS, core net income, core return on equity (“ROE”), core efficiency ratio, pre-provision net revenue (“PPNR”), core PPNR, PPNR to average assets ratio, core PPNR to average assets ratio, core return on assets (“ROA”), core ROA, core net interest income, core net interest margin (“NIM”), tangible common equity (“TCE”), tangible assets, tangible equity, return on tangible common equity (“ROTCE”), core ROTCE, core fee revenue and core fee revenue as a percentage of total core net revenue. The Company’s management believes that these non-GAAP measures provide a greater understanding of ongoing operations, enhance comparability of results of operations with prior periods and show the effects of significant gains and charges in the periods presented. The Company’s management believes that investors may use these non-GAAP measures to analyze the Company’s financial performance without the impact of unusual items or events that may obscure trends in the Company’s underlying performance. This non-GAAP data should be considered in addition to results prepared in accordance with GAAP, and is not a substitute for, or superior to, GAAP results. For a reconciliation of these non-GAAP measures to their comparable GAAP measures, see the Appendix. Trade names, trademarks and service marks of other companies appearing in this presentation are the property of their respective holders.
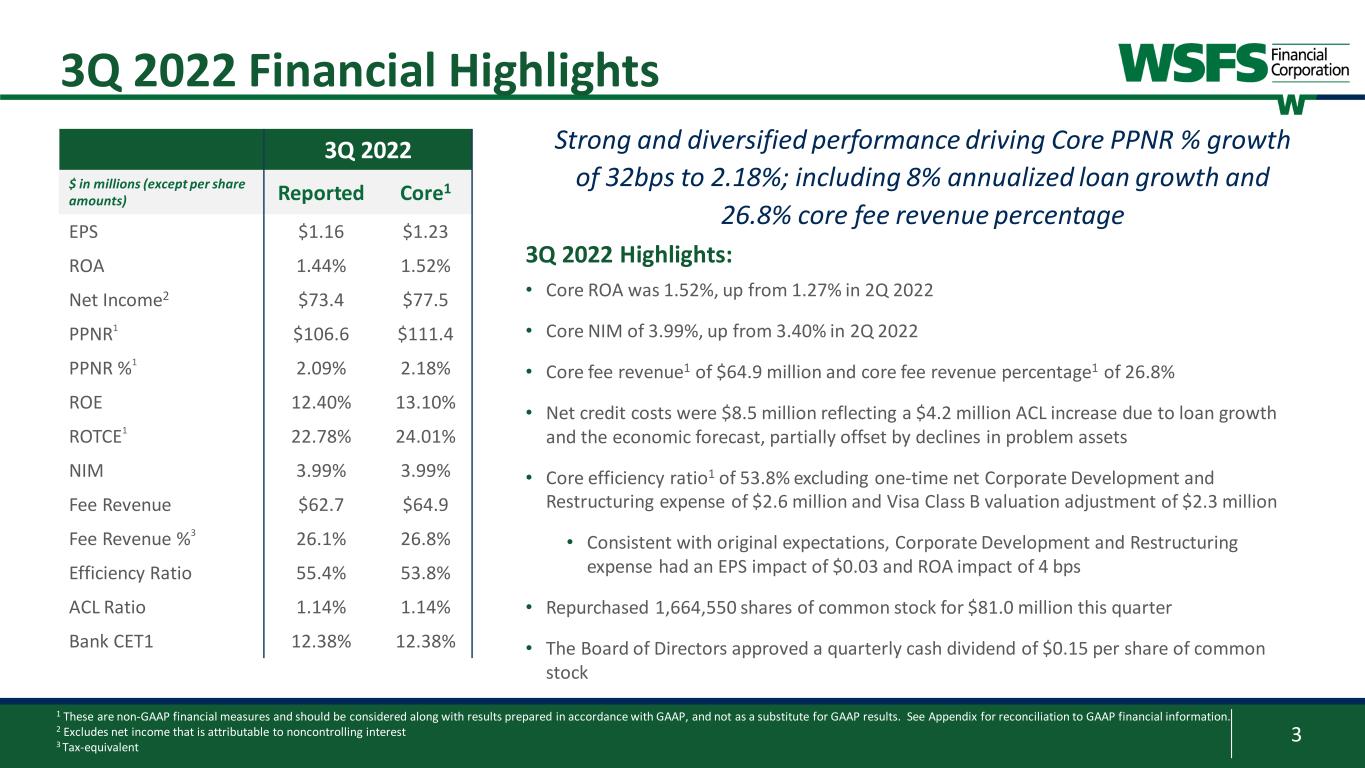
3 3Q 2022 Financial Highlights Strong and diversified performance driving Core PPNR % growth of 32bps to 2.18%; including 8% annualized loan growth and 26.8% core fee revenue percentage 3Q 2022 $ in millions (except per share amounts) Reported Core1 EPS $1.16 $1.23 ROA 1.44% 1.52% Net Income2 $73.4 $77.5 PPNR1 $106.6 $111.4 PPNR %1 2.09% 2.18% ROE 12.40% 13.10% ROTCE1 22.78% 24.01% NIM 3.99% 3.99% Fee Revenue $62.7 $64.9 Fee Revenue %3 26.1% 26.8% Efficiency Ratio 55.4% 53.8% ACL Ratio 1.14% 1.14% Bank CET1 12.38% 12.38% 3Q 2022 Highlights: • Core ROA was 1.52%, up from 1.27% in 2Q 2022 • Core NIM of 3.99%, up from 3.40% in 2Q 2022 • Core fee revenue1 of $64.9 million and core fee revenue percentage1 of 26.8% • Net credit costs were $8.5 million reflecting a $4.2 million ACL increase due to loan growth and the economic forecast, partially offset by declines in problem assets • Core efficiency ratio1 of 53.8% excluding one-time net Corporate Development and Restructuring expense of $2.6 million and Visa Class B valuation adjustment of $2.3 million • Consistent with original expectations, Corporate Development and Restructuring expense had an EPS impact of $0.03 and ROA impact of 4 bps • Repurchased 1,664,550 shares of common stock for $81.0 million this quarter • The Board of Directors approved a quarterly cash dividend of $0.15 per share of common stock 1 These are non-GAAP financial measures and should be considered along with results prepared in accordance with GAAP, and not as a substitute for GAAP results. See Appendix for reconciliation to GAAP financial information. 2 Excludes net income that is attributable to noncontrolling interest 3 Tax-equivalent
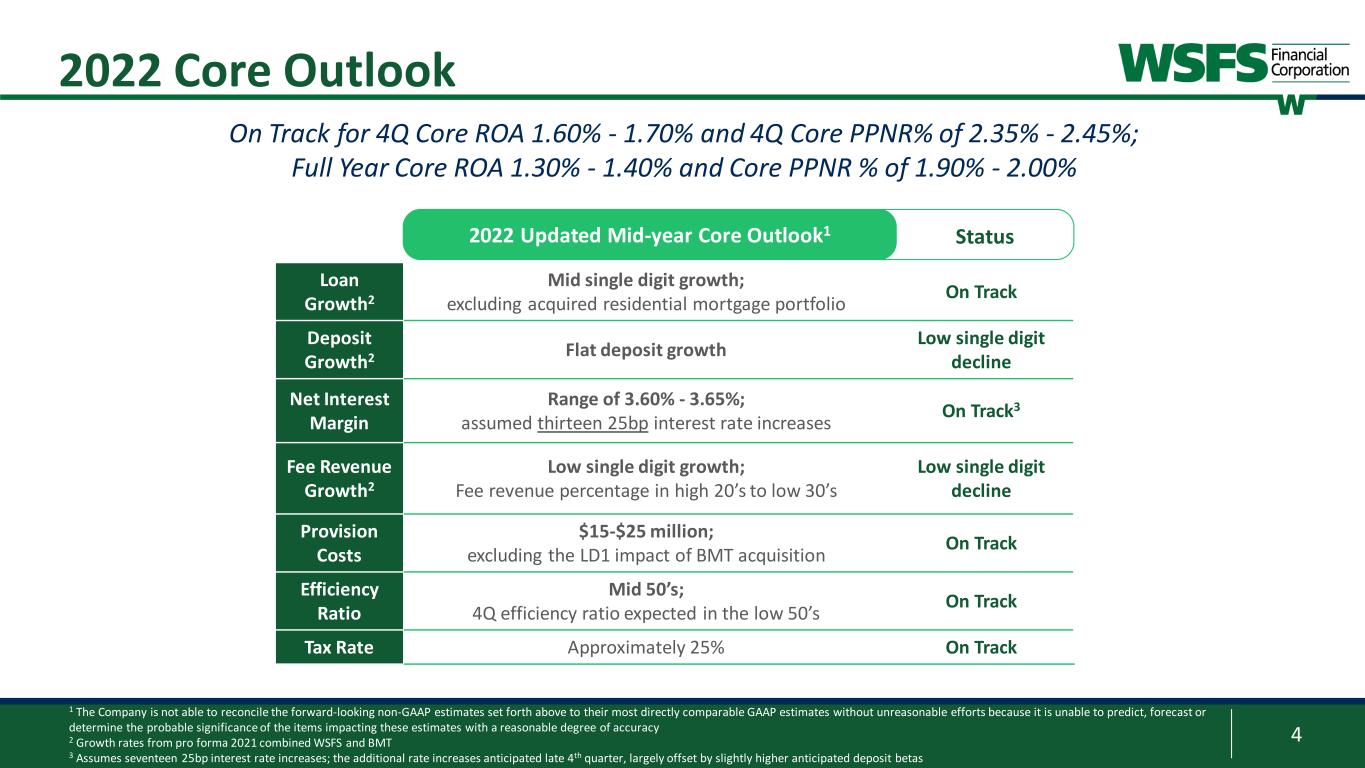
4 Status 3 2022 Core Outlook Loan Growth2 Mid single digit growth; excluding acquired residential mortgage portfolio On Track Deposit Growth2 Flat deposit growth Low single digit decline Net Interest Margin Range of 3.60% - 3.65%; assumed thirteen 25bp interest rate increases On Track3 Fee Revenue Growth2 Low single digit growth; Fee revenue percentage in high 20’s to low 30’s Low single digit decline Provision Costs $15-$25 million; excluding the LD1 impact of BMT acquisition On Track Efficiency Ratio Mid 50’s; 4Q efficiency ratio expected in the low 50’s On Track Tax Rate Approximately 25% On Track 1 The Company is not able to reconcile the forward-looking non-GAAP estimates set forth above to their most directly comparable GAAP estimates without unreasonable efforts because it is unable to predict, forecast or determine the probable significance of the items impacting these estimates with a reasonable degree of accuracy 2 Growth rates from pro forma 2021 combined WSFS and BMT 3 Assumes seventeen 25bp interest rate increases; the additional rate increases anticipated late 4th quarter, largely offset by slightly higher anticipated deposit betas 2022 Updated Mid-year Core Outlook1 On Track for 4Q Core ROA 1.60% - 1.70% and 4Q Core PPNR% of 2.35% - 2.45%; Full Year Core ROA 1.30% - 1.40% and Core PPNR % of 1.90% - 2.00%

5 Loan and Deposit Growth • Customer deposit decline of $545 million, or 13% annualized, primarily due to declines in transactional trust deposits and Customer liquidity run-off across most lines of business • 55% of Customer deposits are in Wealth and Trust, Commercial, and Small Business portfolios • Total gross loan growth excluding acquired residential mortgage portfolio is 9% annualized • Commercial loan growth of $75 million, or 3% annualized • Growth driven by Construction Loans and Commercial Leases • Strong Consumer loan growth of $155 million primarily due to SpringEQ and Upstart partnership products Consumer 44% Wealth and Trust 12% Commercial 25% Small Business 18% Other 1% 3Q 2022 Customer Deposits By LOB Diversified deposit base and strong loan-to-deposit ratio of 70% positioned well for organic loan growth ($ in millions) Sep 2022 Jun 2022 Sep 2021 3Q22 $ Growth % Growth Annualized % Growth C & I Loans $4,445 $4,444 $3,261 $1 0% 0% Commercial Mortgages $3,280 $3,322 $1,988 ($42) (1%) (5%) Construction Loans $1,028 $934 $763 $94 10% 40% Commercial Leases $535 $513 $317 $22 4% 17% Total Commercial Loans $9,288 $9,213 $6,329 $75 1% 3% Residential Mortgage (HFS/HFI) $802 $808 $654 ($6) (1%) (3%) Consumer Loans $1,677 $1,522 $1,118 $155 10% 40% Total Gross Loans $11,767 $11,543 $8,101 $224 2% 8% Acquired HFI Resi Mortgage $595 $618 $424 ($23) (4%) (15%) Gross Loans ex Acquired HFI Resi Portfolio $11,172 $10,925 $7,677 $247 2% 9% Loans - 3Q 2022 vs 2Q 2022 ($ in millions) Sep 2022 Jun 2022 Sep 2021 3Q22 $ Growth % Growth Annualized % Growth Noninterest Demand $6,171 $6,552 $4,134 ($381) (6%) (23%) Interest Demand Deposits $3,462 $3,396 $2,845 $66 2% 8% Savings $2,266 $2,313 $1,942 ($47) (2%) (8%) Money Market $3,740 $3,882 $2,772 ($142) (4%) (15%) Total Core Deposits $15,639 $16,143 $11,693 ($504) (3%) (12%) Customer Time Deposits $1,063 $1,104 $1,035 ($41) (4%) (15%) Total Customer Deposits $16,702 $17,247 $12,728 ($545) (3%) (13%) Deposits - 3Q 2022 vs 2Q 2022
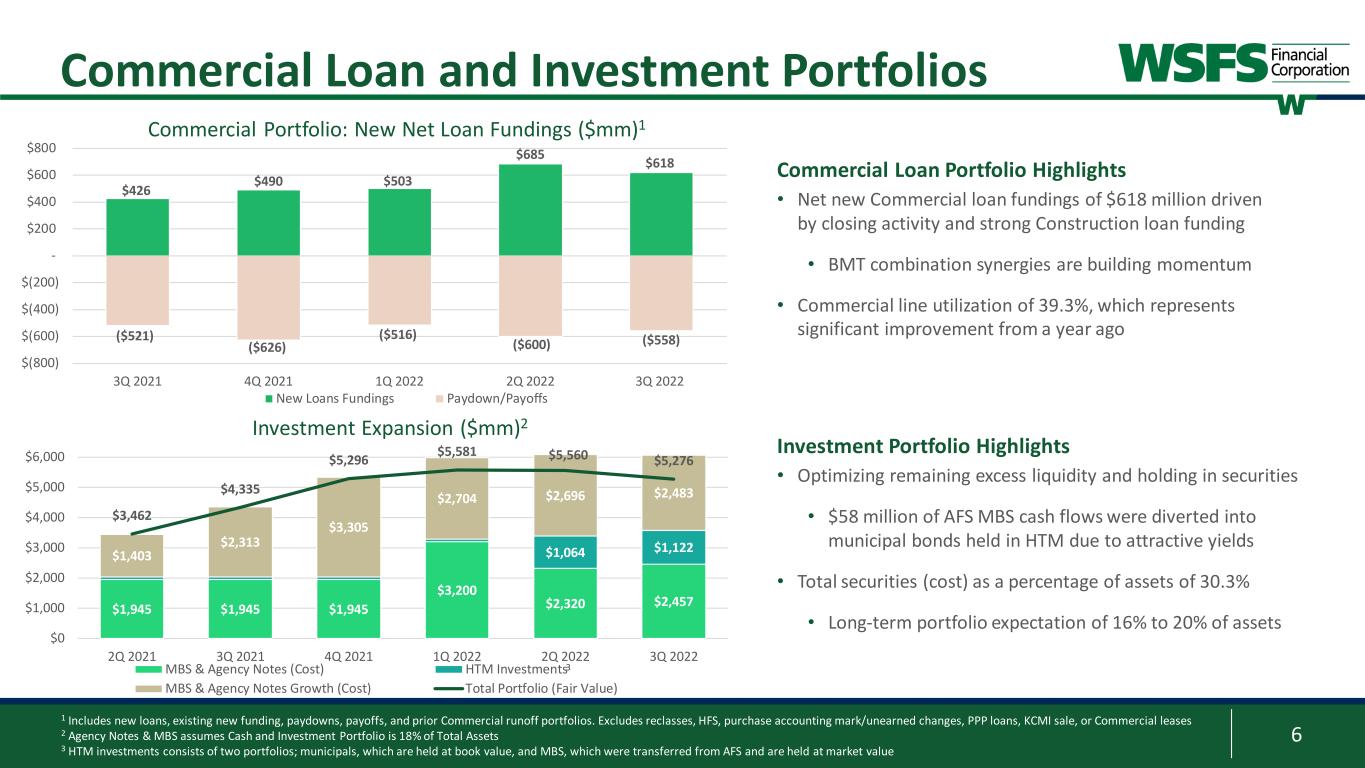
6 $426 $490 $503 $685 $618 ($521) ($626) ($516) ($600) ($558) $(800) $(600) $(400) $(200) - $200 $400 $600 $800 3Q 2021 4Q 2021 1Q 2022 2Q 2022 3Q 2022 Commercial Portfolio: New Net Loan Fundings ($mm)1 New Loans Fundings Paydown/Payoffs Commercial Loan and Investment Portfolios Investment Portfolio Highlights • Optimizing remaining excess liquidity and holding in securities • $58 million of AFS MBS cash flows were diverted into municipal bonds held in HTM due to attractive yields • Total securities (cost) as a percentage of assets of 30.3% • Long-term portfolio expectation of 16% to 20% of assets 1 Includes new loans, existing new funding, paydowns, payoffs, and prior Commercial runoff portfolios. Excludes reclasses, HFS, purchase accounting mark/unearned changes, PPP loans, KCMI sale, or Commercial leases 2 Agency Notes & MBS assumes Cash and Investment Portfolio is 18% of Total Assets 3 HTM investments consists of two portfolios; municipals, which are held at book value, and MBS, which were transferred from AFS and are held at market value Commercial Loan Portfolio Highlights • Net new Commercial loan fundings of $618 million driven by closing activity and strong Construction loan funding • BMT combination synergies are building momentum • Commercial line utilization of 39.3%, which represents significant improvement from a year ago $1,945 $1,945 $1,945 $3,200 $2,320 $2,457 $1,064 $1,122$1,403 $2,313 $3,305 $2,704 $2,696 $2,483 $3,462 $4,335 $5,296 $5,581 $5,560 $5,276 $0 $1,000 $2,000 $3,000 $4,000 $5,000 $6,000 2Q 2021 3Q 2021 4Q 2021 1Q 2022 2Q 2022 3Q 2022 Investment Expansion ($mm)2 MBS & Agency Notes (Cost) HTM Investments MBS & Agency Notes Growth (Cost) Total Portfolio (Fair Value) 3
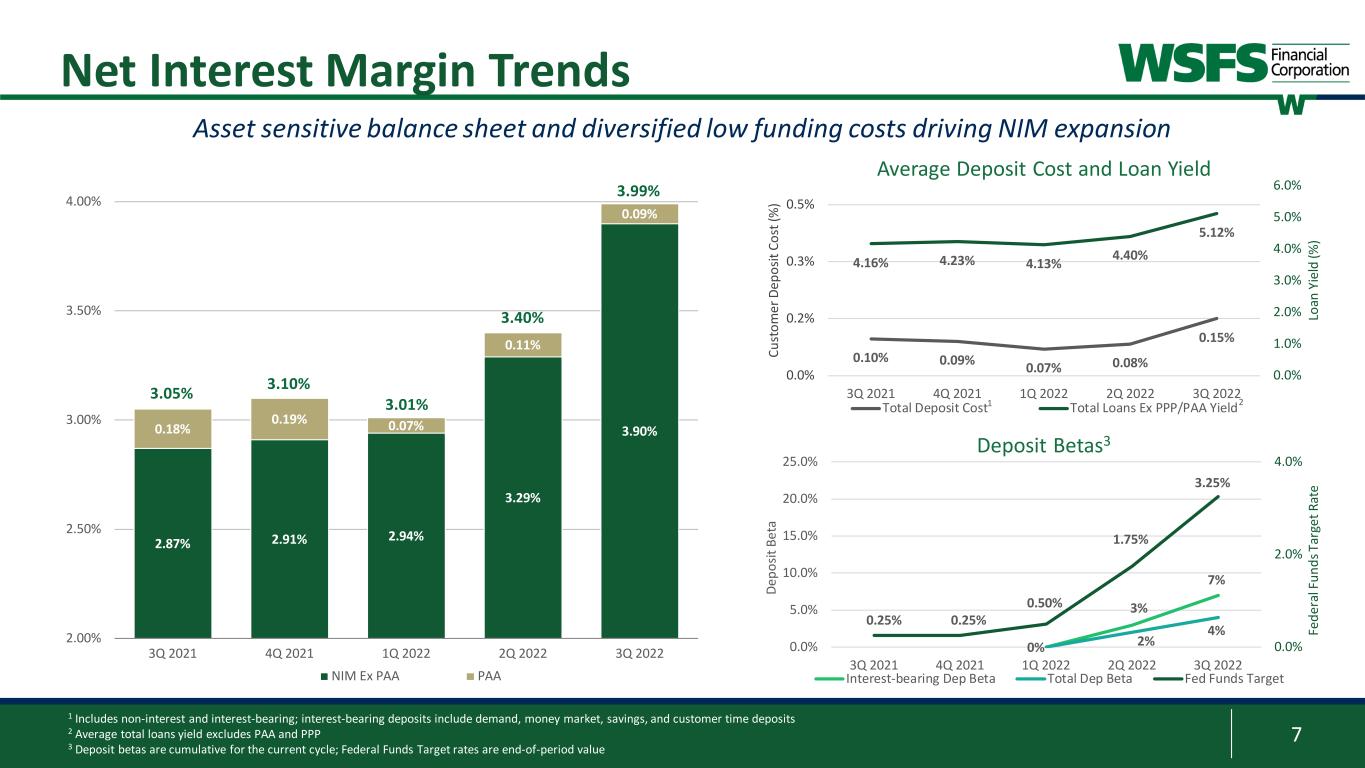
7 0.10% 0.09% 0.07% 0.08% 0.15% 4.16% 4.23% 4.13% 4.40% 5.12% 0.0% 1.0% 2.0% 3.0% 4.0% 5.0% 6.0% 0.0% 0.2% 0.3% 0.5% 3Q 2021 4Q 2021 1Q 2022 2Q 2022 3Q 2022 Lo an Y ie ld (% ) Cu st om er D ep os it Co st (% ) Total Deposit Cost Total Loans Ex PPP/PAA Yield 2.87% 2.91% 2.94% 3.29% 3.90%0.18% 0.19% 0.07% 0.11% 0.09% 2.00% 2.50% 3.00% 3.50% 4.00% 3Q 2021 4Q 2021 1Q 2022 2Q 2022 3Q 2022 NIM Ex PAA PAA Deposit Betas3 Net Interest Margin Trends Asset sensitive balance sheet and diversified low funding costs driving NIM expansion Average Deposit Cost and Loan Yield 1 Includes non-interest and interest-bearing; interest-bearing deposits include demand, money market, savings, and customer time deposits 2 Average total loans yield excludes PAA and PPP 3 Deposit betas are cumulative for the current cycle; Federal Funds Target rates are end-of-period value 21 3.05% 3.10% 3% 7% 0% 2% 4% 0.25% 0.25% 0.50% 1.75% 3.25% 0.0% 2.0% 4.0% 0.0% 5.0% 10.0% 15.0% 20.0% 25.0% 3Q 2021 4Q 2021 1Q 2022 2Q 2022 3Q 2022 Fe de ra l F un ds T ar ge t R at e De po sit B et a Interest-bearing Dep Beta Total Dep Beta Fed Funds Target 3.01% 3.40% 3.99%
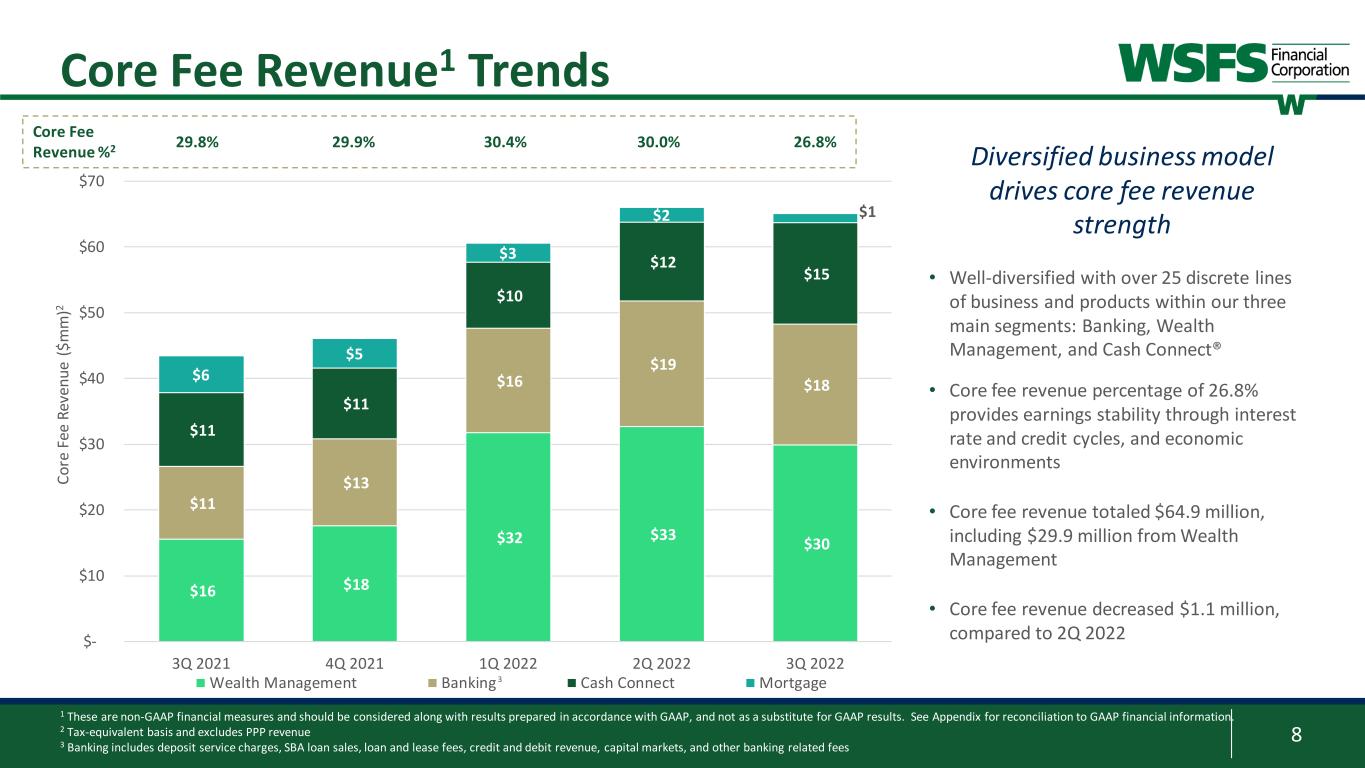
8 $16 $18 $32 $33 $30 $11 $13 $16 $19 $18 $11 $11 $10 $12 $15 $6 $5 $3 $2 $1 $- $10 $20 $30 $40 $50 $60 $70 3Q 2021 4Q 2021 1Q 2022 2Q 2022 3Q 2022 Co re F ee R ev en ue ( $m m )2 Wealth Management Banking Cash Connect Mortgage 1 These are non-GAAP financial measures and should be considered along with results prepared in accordance with GAAP, and not as a substitute for GAAP results. See Appendix for reconciliation to GAAP financial information. 2 Tax-equivalent basis and excludes PPP revenue 3 Banking includes deposit service charges, SBA loan sales, loan and lease fees, credit and debit revenue, capital markets, and other banking related fees • Well-diversified with over 25 discrete lines of business and products within our three main segments: Banking, Wealth Management, and Cash Connect® • Core fee revenue percentage of 26.8% provides earnings stability through interest rate and credit cycles, and economic environments • Core fee revenue totaled $64.9 million, including $29.9 million from Wealth Management • Core fee revenue decreased $1.1 million, compared to 2Q 2022 Core Fee Revenue1 Trends Diversified business model drives core fee revenue strength 3 Core Fee Revenue %2 29.8% 29.9% 30.4% 30.0% 26.8%

9 $60 $80 $100 $120 $140 $160 $180 6/30/2022 Economic Impact Net Loan Growth Migration Other 9/30/2022 0% 1% 2% 3% 4% 5% 1Q22 2Q22 3Q22 4Q22 1Q23 2Q23 3Q23 4Q23 2Q22 Forecast 3Q22 Forecast Coverage Ratio 1 Source: Oxford Economics as of September 2022 2 Hotel loan balances are included in the C&I and Construction segments ACL Overview ACL by Segment Full-Year GDP forecast of 1.7% in 2022 and flat in 20231 Full-Year Unemployment forecast of 3.7% in 2022 and 4.4% in 20231 3Q 2022 ACL Commentary 1.13% 1.14% GDP Growth by Quarter Unemployment by Quarter • Coverage ratio of 1.14% and 1.40% including estimated remaining credit mark on the acquired loan portfolio • ACL increased $4.2 million in 3Q 2022 driven by: • Loan growth in Commercial and Consumer portfolios and economic forecast model • Offset by favorable migration in criticized and classified loans 3Q 2022 ACL ($mm)-2% -1% 0% 1% 2% 3% 4% 1Q22 2Q22 3Q22 4Q22 1Q23 2Q23 3Q23 4Q23 2Q22 Forecast 3Q22 Forecast $6 $142 ($6) $146 ($5)$9 ($ millions) $ % $ % $ % C&I2 $59.3 3.22% $54.3 2.10% $51.9 1.97% Owner Occupied $4.9 0.37% $5.5 0.30% $6.0 0.63% CRE Investor $13.2 0.67% $23.7 0.71% $21.5 0.66% Construction2 $2.1 0.28% $5.1 0.54% $6.5 0.34% Mortgage $3.0 0.52% $5.0 0.65% $4.8 0.64% Leases $6.6 2.07% $6.5 1.25% $8.0 1.49% HELOC & HEIL $4.6 1.04% $5.4 0.94% $7.0 1.24% Consumer Partnerships $8.0 1.70% $31.2 4.50% $36.4 4.40% Other $3.2 1.07% $5.3 0.41% $4.1 0.29% TOTAL $104.9 1.30% $142.0 1.13% $146.2 1.14% September 30, 2021 June 30, 2022 September 30, 2022
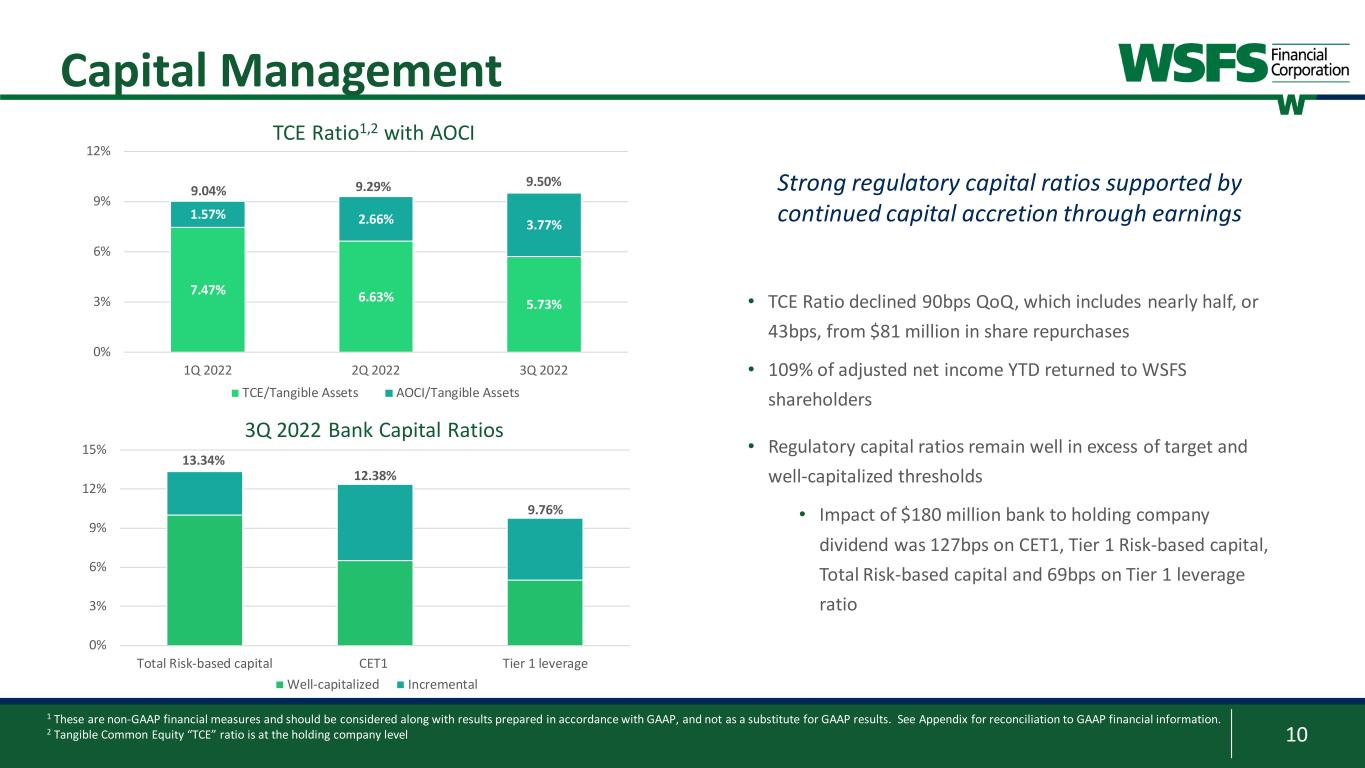
10 Capital Management TCE Ratio1,2 with AOCI 3Q 2022 Bank Capital Ratios 7.47% 6.63% 5.73% 1.57% 2.66% 3.77% 9.04% 9.29% 9.50% 0% 3% 6% 9% 12% 1Q 2022 2Q 2022 3Q 2022 TCE/Tangible Assets AOCI/Tangible Assets • TCE Ratio declined 90bps QoQ, which includes nearly half, or 43bps, from $81 million in share repurchases • 109% of adjusted net income YTD returned to WSFS shareholders • Regulatory capital ratios remain well in excess of target and well-capitalized thresholds • Impact of $180 million bank to holding company dividend was 127bps on CET1, Tier 1 Risk-based capital, Total Risk-based capital and 69bps on Tier 1 leverage ratio 1 These are non-GAAP financial measures and should be considered along with results prepared in accordance with GAAP, and not as a substitute for GAAP results. See Appendix for reconciliation to GAAP financial information. 2 Tangible Common Equity “TCE” ratio is at the holding company level 13.34% 12.38% 9.76% 0% 3% 6% 9% 12% 15% Total Risk-based capital CET1 Tier 1 leverage Well-capitalized Incremental Strong regulatory capital ratios supported by continued capital accretion through earnings
11 Non-GAAP Financial Information Appendix:
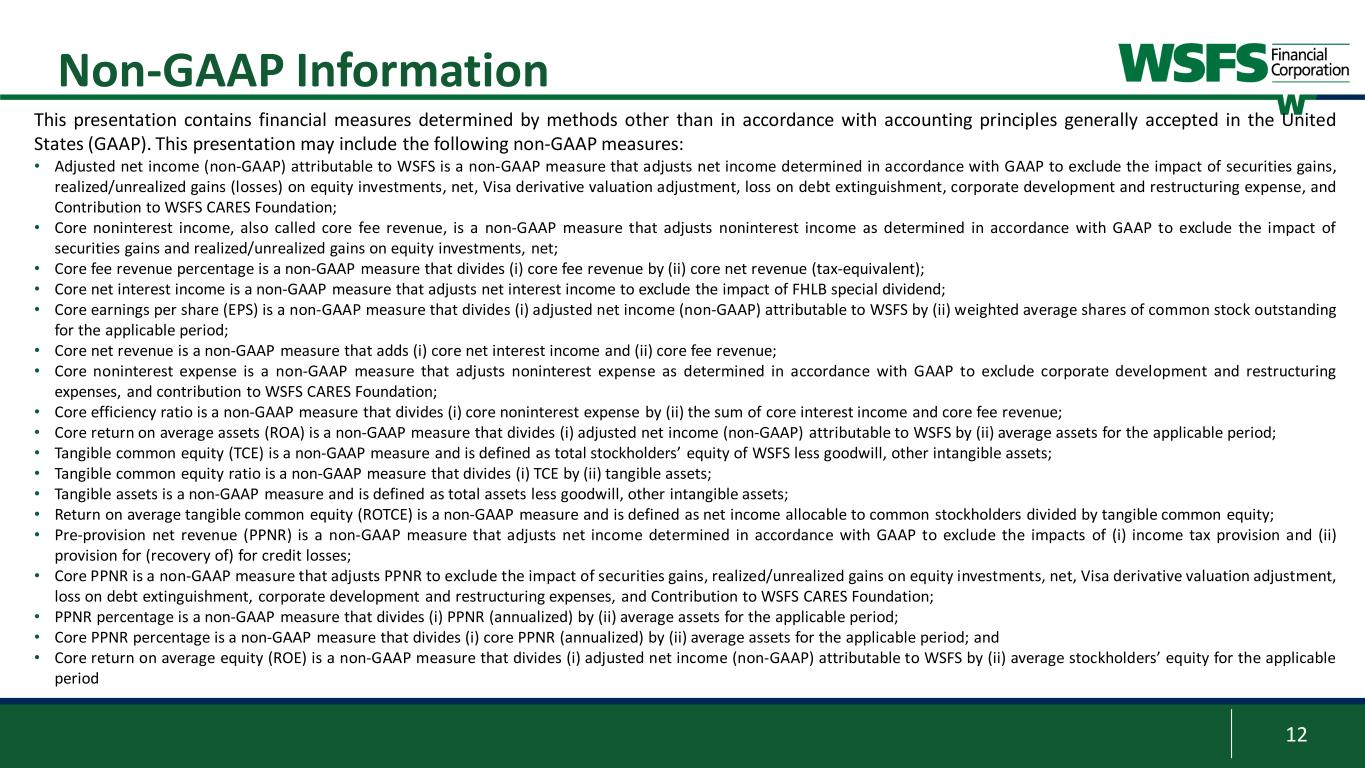
12 Non-GAAP Information This presentation contains financial measures determined by methods other than in accordance with accounting principles generally accepted in the United States (GAAP). This presentation may include the following non-GAAP measures: • Adjusted net income (non-GAAP) attributable to WSFS is a non-GAAP measure that adjusts net income determined in accordance with GAAP to exclude the impact of securities gains, realized/unrealized gains (losses) on equity investments, net, Visa derivative valuation adjustment, loss on debt extinguishment, corporate development and restructuring expense, and Contribution to WSFS CARES Foundation; • Core noninterest income, also called core fee revenue, is a non-GAAP measure that adjusts noninterest income as determined in accordance with GAAP to exclude the impact of securities gains and realized/unrealized gains on equity investments, net; • Core fee revenue percentage is a non-GAAP measure that divides (i) core fee revenue by (ii) core net revenue (tax-equivalent); • Core net interest income is a non-GAAP measure that adjusts net interest income to exclude the impact of FHLB special dividend; • Core earnings per share (EPS) is a non-GAAP measure that divides (i) adjusted net income (non-GAAP) attributable to WSFS by (ii) weighted average shares of common stock outstanding for the applicable period; • Core net revenue is a non-GAAP measure that adds (i) core net interest income and (ii) core fee revenue; • Core noninterest expense is a non-GAAP measure that adjusts noninterest expense as determined in accordance with GAAP to exclude corporate development and restructuring expenses, and contribution to WSFS CARES Foundation; • Core efficiency ratio is a non-GAAP measure that divides (i) core noninterest expense by (ii) the sum of core interest income and core fee revenue; • Core return on average assets (ROA) is a non-GAAP measure that divides (i) adjusted net income (non-GAAP) attributable to WSFS by (ii) average assets for the applicable period; • Tangible common equity (TCE) is a non-GAAP measure and is defined as total stockholders’ equity of WSFS less goodwill, other intangible assets; • Tangible common equity ratio is a non-GAAP measure that divides (i) TCE by (ii) tangible assets; • Tangible assets is a non-GAAP measure and is defined as total assets less goodwill, other intangible assets; • Return on average tangible common equity (ROTCE) is a non-GAAP measure and is defined as net income allocable to common stockholders divided by tangible common equity; • Pre-provision net revenue (PPNR) is a non-GAAP measure that adjusts net income determined in accordance with GAAP to exclude the impacts of (i) income tax provision and (ii) provision for (recovery of) for credit losses; • Core PPNR is a non-GAAP measure that adjusts PPNR to exclude the impact of securities gains, realized/unrealized gains on equity investments, net, Visa derivative valuation adjustment, loss on debt extinguishment, corporate development and restructuring expenses, and Contribution to WSFS CARES Foundation; • PPNR percentage is a non-GAAP measure that divides (i) PPNR (annualized) by (ii) average assets for the applicable period; • Core PPNR percentage is a non-GAAP measure that divides (i) core PPNR (annualized) by (ii) average assets for the applicable period; and • Core return on average equity (ROE) is a non-GAAP measure that divides (i) adjusted net income (non-GAAP) attributable to WSFS by (ii) average stockholders’ equity for the applicable period

13 Appendix: Non-GAAP Financial Information Three Months Ended (dollars in thousands) September 30, 2022 June 30, 2022 September 30, 2021 Net interest income (GAAP) $ 176,831 $ 153,615 $ 104,491 Core net interest income (non-GAAP) $ 176,831 $ 153,615 $ 104,491 Noninterest income (GAAP) $ 62,651 $ 72,029 $ 42,613 Less: Securities gains — — 2 Less/(Plus): Unrealized gain (loss) on equity investments, net — 5,991 (120) Plus: Realized loss on sale of equity investment — — (706) Plus: Visa B Valuation Adjustment (2,285) — — Core fee revenue (non-GAAP) $ 64,936 $ 66,038 $ 43,437 Core net revenue (non-GAAP) $ 241,767 $ 219,653 $ 147,928 Core net revenue (non-GAAP) (tax-equivalent) $ 242,327 $ 220,095 $ 148,167 Noninterest expense (GAAP) $ 132,917 $ 134,049 $ 96,446 Less: Corporate development expense 1,248 6,393 2,049 Less: Restructuring expense 1,344 3,934 — Core noninterest expense (non-GAAP) $ 130,325 $ 123,722 $ 94,397 Core efficiency ratio (non-GAAP) 53.8% 56.2% 63.7% Core fee revenue as a percentage of total core net revenue (non-GAAP)(tax-equivalent) 26.8% 30.0% 29.3% Three Months Ended (dollars in thousands, except per share data) September 30, 2022 June 30, 2022 September 30, 2021 GAAP net income attributable to WSFS $ 73,382 $ 60,740 $ 54,406 Plus/(less): Pre-tax adjustments1 4,877 4,336 2,873 (Plus)/less: Tax impact of pre-tax adjustments (750) 334 (619) Adjusted net income (non-GAAP) attributable to WSFS$ 77,509 $ 65,410 $ 56,660 Net income (GAAP) $ 73,344 $ 60,902 $ 54,452 Plus: Income tax provision 25,767 22,425 17,516 Less: Provision for (recovery of) credit losses 7,454 8,268 (21,310) PPNR (Non-GAAP) $ 106,565 $ 91,595 $ 50,658 Plus/(less): Pre-tax adjustments1 4,877 4,336 2,873 Core PPNR (Non-GAAP) $ 111,442 $ 95,931 $ 53,531 Average Assets $ 20,235,749 $ 20,737,889 $ 15,137,572 PPNR % (Non-GAAP) 2.09% 1.77% 1.33% Core PPNR % (Non-GAAP) 2.18% 1.86% 1.40% GAAP return on average assets (ROA) 1.44% 1.17% 1.43% Plus/(less): Pre-tax adjustments1 0.10 0.08 0.08 (Plus)/less: Tax impact of pre-tax adjustments (0.02) 0.02 (0.03) Core ROA (non-GAAP) 1.52% 1.27% 1.48% Earnings per share (GAAP) $ 1.16 $ 0.94 $ 1.14 Plus/(less): Pre-tax adjustments1 0.08 0.07 0.06 (Plus)/less: Tax impact of pre-tax adjustments (0.01) 0.01 (0.01) Core earnings per share (non-GAAP) $ 1.23 $ 1.02 $ 1.19 1 Pre-tax adjustments include securities gains, realized/unrealized gains (losses) on equity investments, Visa derivative valuation adjustment, loss on debt extinguishment, corporate development and restructuring expense, and contribution to WSFS CARES Foundation

14 Appendix: Non-GAAP Financial Information Three Months Ended (dollars in thousands) September 30, 2022 June 30, 2022 September 30, 2021 Calculation of return on average tangible common equity: GAAP net income attributable to WSFS $ 73,382 $ 60,740 $ 54,406 Plus: Tax effected amortization of intangible assets 2,906 2,940 2,006 Net tangible income (non-GAAP) $ 76,288 $ 63,680 $ 56,412 Average stockholders' equity of WSFS $ 2,347,178 $ 2,404,262 $ 1,907,868 Less: average goodwill and intangible assets 1,018,592 1,032,131 550,923 Net average tangible common equity $ 1,328,586 $ 1,372,131 $ 1,356,945 Return on average common equity (GAAP) 12.40% 10.13% 11.31% Return on average tangible common equity (non-GAAP) 22.78% 18.61% 16.49% Calculation of core return on average tangible common equity: Adjusted net income (non-GAAP) attributable to WSFS $ 77,509 $ 65,410 $ 56,660 Plus: Tax effected amortization of intangible assets 2,906 2,940 2,006 Core net tangible income (non-GAAP) $ 80,415 $ 68,350 $ 58,666 Net average tangible common equity $ 1,328,586 $ 1,372,131 $ 1,356,945 Core return on average common equity (non-GAAP) 13.10% 10.91% 11.78% Core return on average tangible common equity (non-GAAP) 24.01% 19.98% 17.15% For the year ended December 31, (dollars in thousands) 2010 2011 2012 2013 Net Income (GAAP) $ 14,117 $ 22,677 $ 31,311 $ 46,882 Adj: Plus/(less) core (after-tax)1 420 (2,664) (11,546) (4,290) Adjusted net income (non-GAAP) $ 14,537 $ 20,013 $ 19,765 $ 42,592 Average Assets $ 3,796,166 $ 4,070,896 $ 4,267,358 $ 4,365,389 GAAP ROA 0.37% 0.56% 0.73% 1.07% Core ROA (non-GAAP) 0.38% 0.49% 0.46% 0.98% For the year ended December 31, (dollars in thousands) 2014 2015 2016 2017 Net Income (GAAP) $ 53,757 $ 53,533 $ 64,080 $ 50,244 Adj: Plus/(less) core (after-tax)1 (4,632) 4,407 4,323 32,597 Adjusted net income (non-GAAP) $ 49,125 $ 57,940 $ 68,403 $ 82,841 Average Assets $ 4,598,121 $ 5,074,129 $ 6,042,824 $ 6,820,471 GAAP ROA 1.17% 1.05% 1.06% 0.74% Core ROA (non-GAAP) 1.07% 1.14% 1.13% 1.21% For the year ended December 31, (dollars in thousands) 2018 2019 2020 2021 Net Income (GAAP) $ 134,743 $ 148,809 $ 114,774 $ 271,442 Adj: Plus/(less) core (after-tax)1 (20,436) 36,295 (18,126) (2,893) Adjusted net income (non-GAAP) $ 114,307 $ 185,104 $ 96,648 $ 268,549 Average Assets $ 7,014,447 $ 11,477,856 $ 13,148,317 $ 14,903,920 GAAP ROA 1.92% 1.30% 0.87% 1.82% Core ROA (non-GAAP) 1.63% 1.61% 0.74% 1.80% 1 For details on our core adjustments for full-year 2010 through 2021 refer to each years’ respective fourth quarter Earnings Release filed at Exhibit 99.1 on Form 8-K
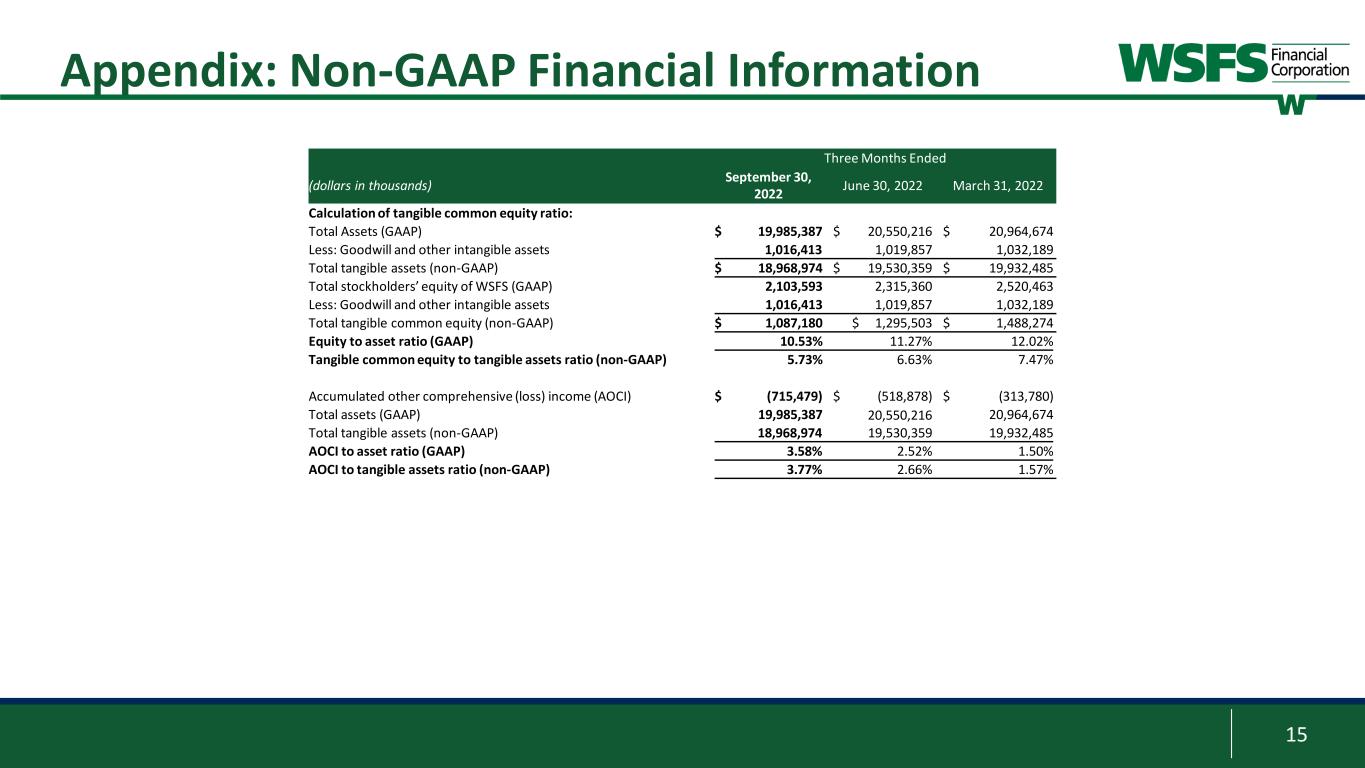
15 Appendix: Non-GAAP Financial Information Three Months Ended (dollars in thousands) September 30, 2022 June 30, 2022 March 31, 2022 Calculation of tangible common equity ratio: Total Assets (GAAP) $ 19,985,387 $ 20,550,216 $ 20,964,674 Less: Goodwill and other intangible assets 1,016,413 1,019,857 1,032,189 Total tangible assets (non-GAAP) $ 18,968,974 $ 19,530,359 $ 19,932,485 Total stockholders’ equity of WSFS (GAAP) 2,103,593 2,315,360 2,520,463 Less: Goodwill and other intangible assets 1,016,413 1,019,857 1,032,189 Total tangible common equity (non-GAAP) $ 1,087,180 $ 1,295,503 $ 1,488,274 Equity to asset ratio (GAAP) 10.53% 11.27% 12.02% Tangible common equity to tangible assets ratio (non-GAAP) 5.73% 6.63% 7.47% Accumulated other comprehensive (loss) income (AOCI) $ (715,479) $ (518,878) $ (313,780) Total assets (GAAP) 19,985,387 20,550,216 20,964,674 Total tangible assets (non-GAAP) 18,968,974 19,530,359 19,932,485 AOCI to asset ratio (GAAP) 3.58% 2.52% 1.50% AOCI to tangible assets ratio (non-GAAP) 3.77% 2.66% 1.57%

16 Appendix: Non-GAAP Financial Information 1 Completed on a fully tax-equivalent basis For the year ended December 31, (dollars in thousands) 2017 2018 2019 2020 2021 Net interest income (as reported) $ 221,271 $ 246,474 $ 444,948 $ 465,955 $ 433,649 Adj: Tax-equivalent income 2,991 1,360 1,215 1,151 1,000 Core net interest income1 (non-GAAP) $ 224,262 $ 247,834 $ 446,163 $ 467,106 $ 434,649 Average Interest-Earning Assets $ 5,684,724 $ 6,052,145 $ 10,057,074 $ 11,804,926 $ 13,443,701 Net interest margin 3.95% 4.09% 4.44% 3.96% 3.23% Core net interest margin (non-GAAP) 3.95% 4.09% 4.44% 3.96% 3.23% Noninterest income (as reported) $ 124,644 $ 162,541 $ 188,109 $ 201,025 $ 185,480 Adj: Securities gains (1,984) (21) (333) (9,076) (331) Adj: Realized (gain) loss on sale of equity investment, net - (3,757) - (22,052) 706 Adj: Unrealized gain on equity investment, net - (20,745) (26,175) (761) (5,141) Core fee revenue (non-GAAP) $ 122,660 $ 138,018 $ 161,601 $ 169,136 $ 180,714 Core net revenue (non-GAAP) $ 343,931 $ 384,492 $ 606,549 $ 635,091 $ 614,363 Core net revenue (non-GAAP)(tax-equivalent) $ 346,922 $ 385,852 $ 607,764 $ 636,242 $ 615,363 Core fee revenue % (non-GAAP) 35.7% 35.9% 26.6% 26.6% 29.4% Core fee revenue % (non-GAAP)(tax-equivalent) 35.4% 35.8% 26.6% 26.6% 29.4% Three Months Ended (dollars in thousands) September 30, 2022 June 30, 2022 March 31, 2022 December 31, 2021 September 30, 2021 Core fee revenue (non-GAAP) $ 64,936 $ 66,038 $ 60,577 $ 46,027 $ 43,437 PPP fee income - - - (63) (3) Core fee income excl. PPP $ 64,936 $ 66,038 $ 60,577 $ 46,090 $ 43,440 Core net revenue (non-GAAP)(tax-equivalent) $ 242,327 $ 220,095 $ 199,349 $ 154,499 $ 148,167 PPP income - - 170 608 2,628 Core net revenue excl. PPP $ 242,327 $ 220,095 $ 199,179 $ 153,891 $ 145,539 Core fee revenue as a percentage of core net revenue excl. PPP (non-GAAP) 26.8% 30.0% 30.4% 29.9% 29.8%
17 Stockholders or others seeking information regarding the Company may call or write: WSFS Financial Corporation Investor Relations WSFS Bank Center 500 Delaware Avenue Wilmington, DE 19801 302-504-9857 stockholderrelations@wsfsbank.com www.wsfsbank.com Rodger Levenson Chairman, President and CEO 302-571-7296 rlevenson@wsfsbank.com Dominic C. Canuso Chief Financial Officer 302-571-6833 dcanuso@wsfsbank.com


