1 WSFS Financial Corporation 4Q 2022 Investor Update February 2023 Exhibit 99.1
2 Forward Looking Statements & Non-GAAP Forward Looking Statements: This presentation contains estimates, predictions, opinions, projections and other "forward-looking statements" as that phrase is defined in the Private Securities Litigation Reform Act of 1995. Such statements include, without limitation, references to the Company's predictions or expectations of future business or financial performance as well as its goals and objectives for future operations, financial and business trends, business prospects, and management's outlook or expectations for earnings, revenues, expenses, capital levels, liquidity levels, asset quality or other future financial or business performance, strategies or expectations. The words “believe,” “expect,” “anticipate,” “plan,” “estimate,” “target,” “project” and similar expressions, among others, generally identify forward-looking statements. Such forward-looking statements are based on various assumptions (some of which may be beyond the Company's control) and are subject to significant risks and uncertainties (which change over time) and other factors, including ability to successfully integrate and fully realize the cost savings and other benefits of our recent acquisition of Bryn Mawr Bank Corporation (“BMT”), the uncertain effects of the COVID-19 pandemic, inflation, interest rates and actions taken in response thereto on our business, results of operations, capital and liquidity, which could cause actual results to differ materially from those currently anticipated. Such risks and uncertainties are discussed in detail in the Company's Form 10-K for the year ended December 31, 2021, Form 10-Q for the quarter ended March 31, 2022, Form 10-Q for the quarter ended June 30, 2022, Form 10-Q for the quarter ended September 30, 2022, and other documents filed by the Company with the Securities and Exchange Commission from time to time. We caution readers not to place undue reliance on any such forward-looking statements, which speak only as of the date on which they are made, and the Company disclaims any duty to revise or update any forward-looking statement, whether written or oral, that may be made from time to time by or on behalf of the Company for any reason, except as specifically required by law. As used in this presentation, the terms "WSFS", "the Company", "registrant", "we", "us", and "our" mean WSFS Financial Corporation and its subsidiaries, on a consolidated basis, unless the context indicates otherwise. Non-GAAP Financial Measures: This presentation contains financial measures determined by methods other than in accordance with accounting principles generally accepted in the United States (“GAAP”). These non-GAAP measures include Core Earnings Per Share (“EPS”), Core EPS, Core Net Income, Core Return on Equity (“ROE”), Core Efficiency %, Pre-provision Net Revenue (“PPNR”), Core PPNR, PPNR to average assets ratio, Core PPNR to average assets ratio, Core Return on Assets (“ROA”), Core ROA, core net interest income, Core Net Interest Margin (“NIM”), Tangible Common Equity (“TCE”), tangible assets, tangible equity, Return on Tangible Common Equity (“ROTCE”), Core ROTCE, Core Fee Revenue and Core Fee Revenue as a percentage of total core net revenue. The Company’s management believes that these non-GAAP measures provide a greater understanding of ongoing operations, enhance comparability of results of operations with prior periods and show the effects of significant gains and charges in the periods presented. The Company’s management believes that investors may use these non-GAAP measures to analyze the Company’s financial performance without the impact of unusual items or events that may obscure trends in the Company’s underlying performance. This non-GAAP data should be considered in addition to results prepared in accordance with GAAP, and is not a substitute for, or superior to, GAAP results. For a reconciliation of these non-GAAP measures to their comparable GAAP measures, see the Appendix. Trade names, trademarks and service marks of other companies appearing in this presentation are the property of their respective holders.
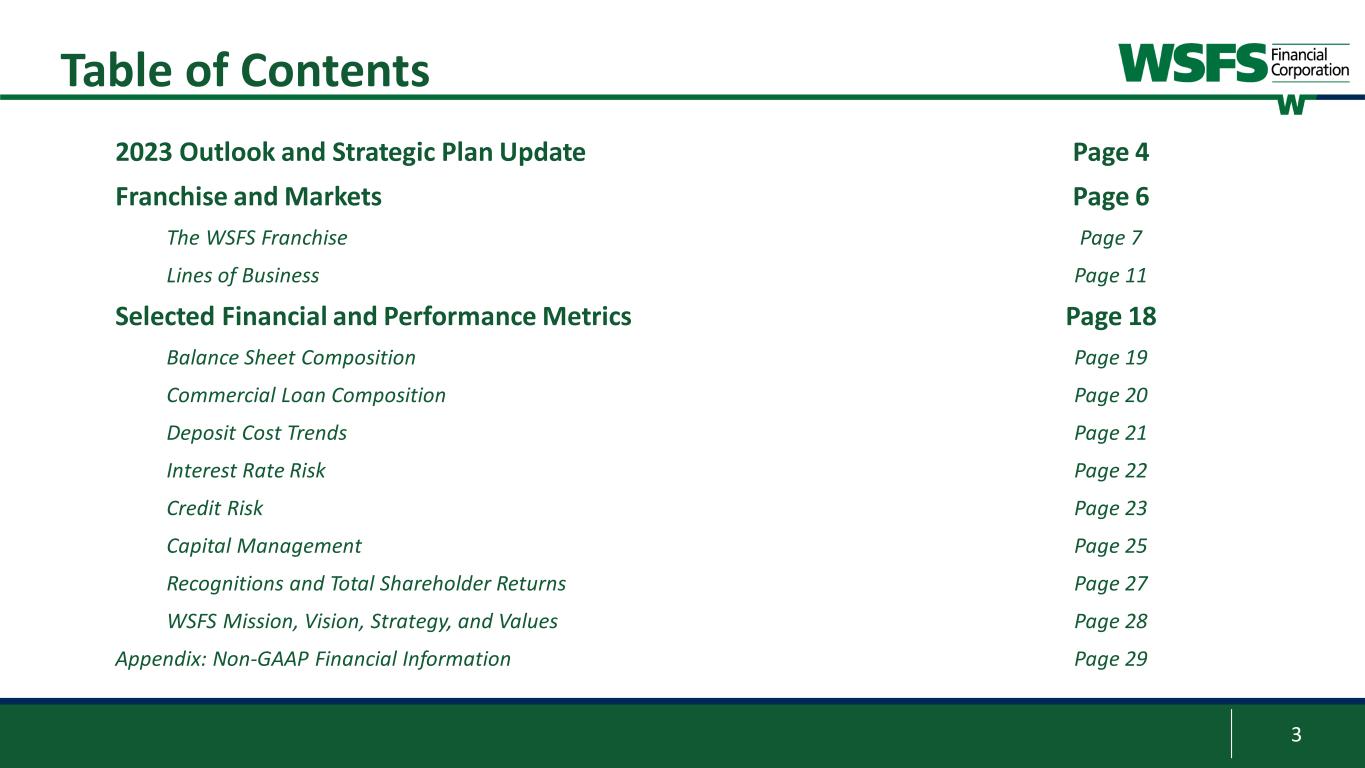
3 Table of Contents 2023 Outlook and Strategic Plan Update Page 4 Franchise and Markets Page 6 The WSFS Franchise Page 7 Lines of Business Page 11 Selected Financial and Performance Metrics Page 18 Balance Sheet Composition Page 19 Commercial Loan Composition Page 20 Deposit Cost Trends Page 21 Interest Rate Risk Page 22 Credit Risk Page 23 Capital Management Page 25 Recognitions and Total Shareholder Returns Page 27 WSFS Mission, Vision, Strategy, and Values Page 28 Appendix: Non-GAAP Financial Information Page 29
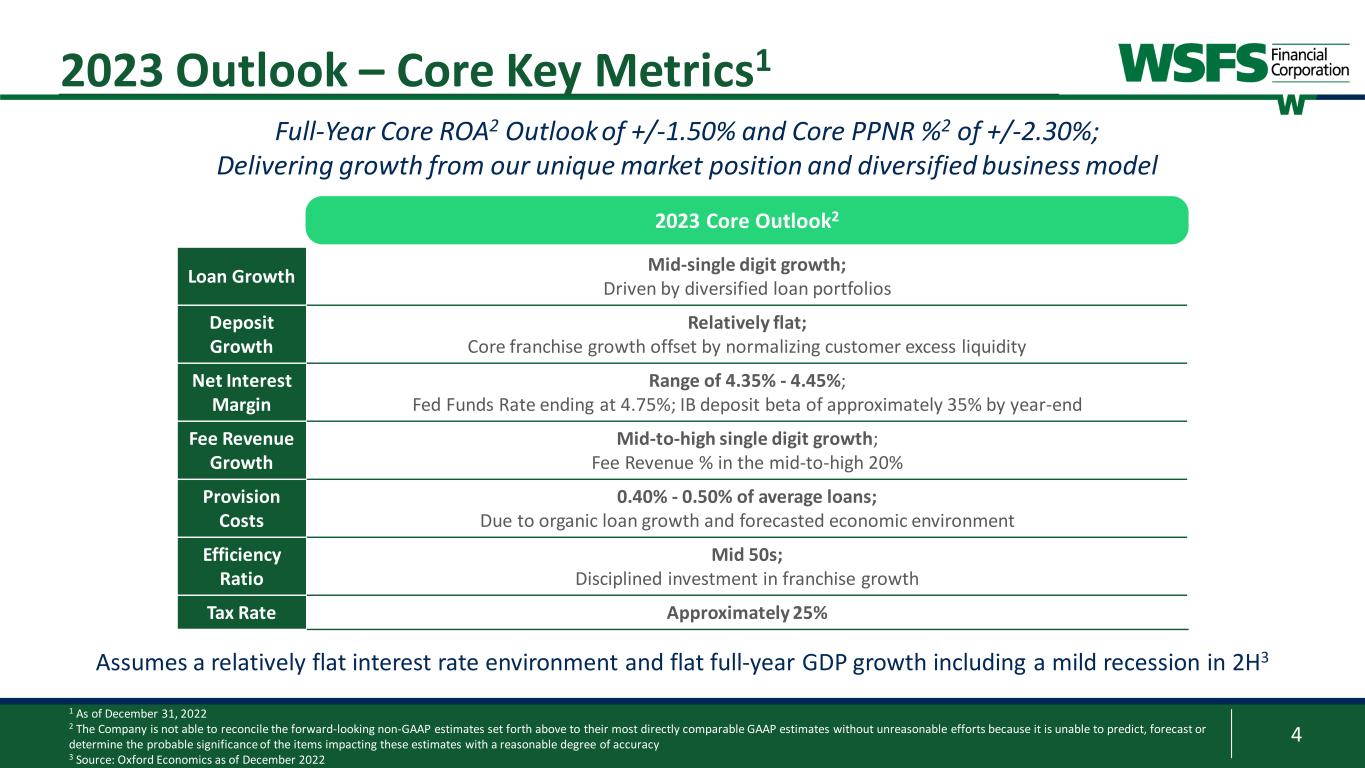
4 3 2023 Outlook – Core Key Metrics1 Loan Growth Mid-single digit growth; Driven by diversified loan portfolios Deposit Growth Relatively flat; Core franchise growth offset by normalizing customer excess liquidity Net Interest Margin Range of 4.35% - 4.45%; Fed Funds Rate ending at 4.75%; IB deposit beta of approximately 35% by year-end Fee Revenue Growth Mid-to-high single digit growth; Fee Revenue % in the mid-to-high 20% Provision Costs 0.40% - 0.50% of average loans; Due to organic loan growth and forecasted economic environment Efficiency Ratio Mid 50s; Disciplined investment in franchise growth Tax Rate Approximately 25% Full-Year Core ROA2 Outlook of +/-1.50% and Core PPNR %2 of +/-2.30%; Delivering growth from our unique market position and diversified business model 1 As of December 31, 2022 2 The Company is not able to reconcile the forward-looking non-GAAP estimates set forth above to their most directly comparable GAAP estimates without unreasonable efforts because it is unable to predict, forecast or determine the probable significance of the items impacting these estimates with a reasonable degree of accuracy 3 Source: Oxford Economics as of December 2022 2023 Core Outlook2 Assumes a relatively flat interest rate environment and flat full-year GDP growth including a mild recession in 2H3
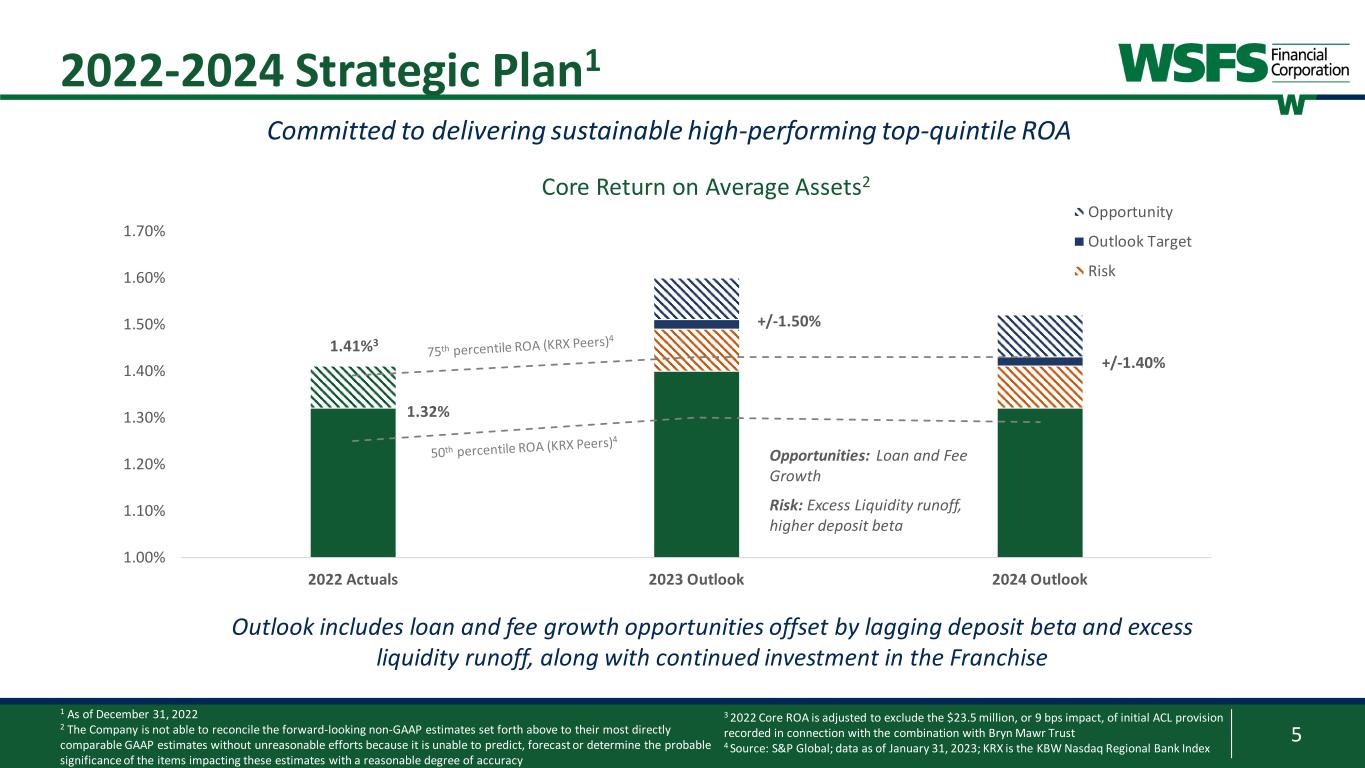
5 1.00% 1.10% 1.20% 1.30% 1.40% 1.50% 1.60% 1.70% 2022 Actuals 2023 Outlook 2024 Outlook Opportunity Outlook Target Risk 1.41%3 1.32% +/-1.50% +/-1.40% 3 2022-2024 Strategic Plan1 Core Return on Average Assets2 Committed to delivering sustainable high-performing top-quintile ROA 1 As of December 31, 2022 2 The Company is not able to reconcile the forward-looking non-GAAP estimates set forth above to their most directly comparable GAAP estimates without unreasonable efforts because it is unable to predict, forecast or determine the probable significance of the items impacting these estimates with a reasonable degree of accuracy Outlook includes loan and fee growth opportunities offset by lagging deposit beta and excess liquidity runoff, along with continued investment in the Franchise Opportunities: Loan and Fee Growth Risk: Excess Liquidity runoff, higher deposit beta 3 2022 Core ROA is adjusted to exclude the $23.5 million, or 9 bps impact, of initial ACL provision recorded in connection with the combination with Bryn Mawr Trust 4 Source: S&P Global; data as of January 31, 2023; KRX is the KBW Nasdaq Regional Bank Index
6 Franchise and Markets
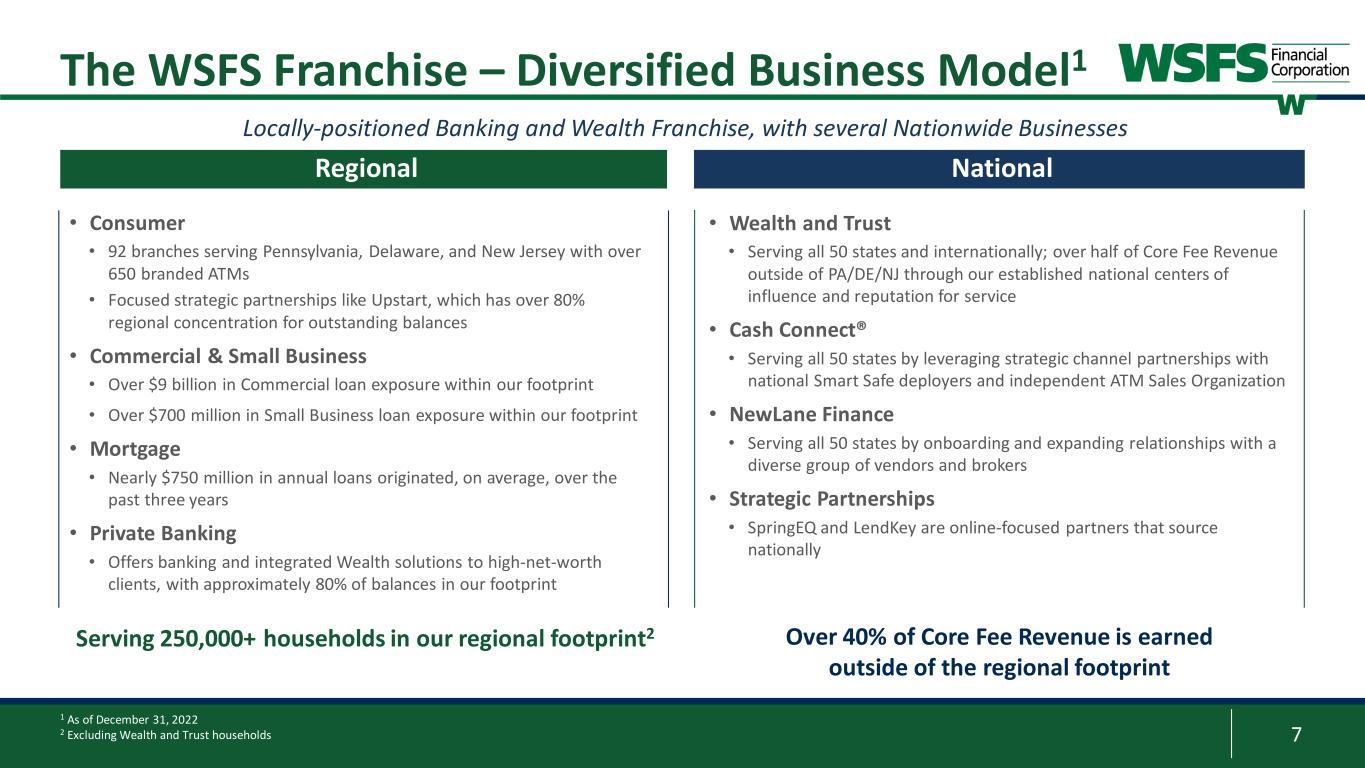
7 • Consumer • 92 branches serving Pennsylvania, Delaware, and New Jersey with over 650 branded ATMs • Focused strategic partnerships like Upstart, which has over 80% regional concentration for outstanding balances • Commercial & Small Business • Over $9 billion in Commercial loan exposure within our footprint • Over $700 million in Small Business loan exposure within our footprint • Mortgage • Nearly $750 million in annual loans originated, on average, over the past three years • Private Banking • Offers banking and integrated Wealth solutions to high-net-worth clients, with approximately 80% of balances in our footprint • Wealth and Trust • Serving all 50 states and internationally; over half of Core Fee Revenue outside of PA/DE/NJ through our established national centers of influence and reputation for service • Cash Connect® • Serving all 50 states by leveraging strategic channel partnerships with national Smart Safe deployers and independent ATM Sales Organization • NewLane Finance • Serving all 50 states by onboarding and expanding relationships with a diverse group of vendors and brokers • Strategic Partnerships • SpringEQ and LendKey are online-focused partners that source nationally Regional National The WSFS Franchise – Diversified Business Model1 Locally-positioned Banking and Wealth Franchise, with several Nationwide Businesses 1 As of December 31, 2022 2 Excluding Wealth and Trust households Over 40% of Core Fee Revenue is earned outside of the regional footprint Serving 250,000+ households in our regional footprint2
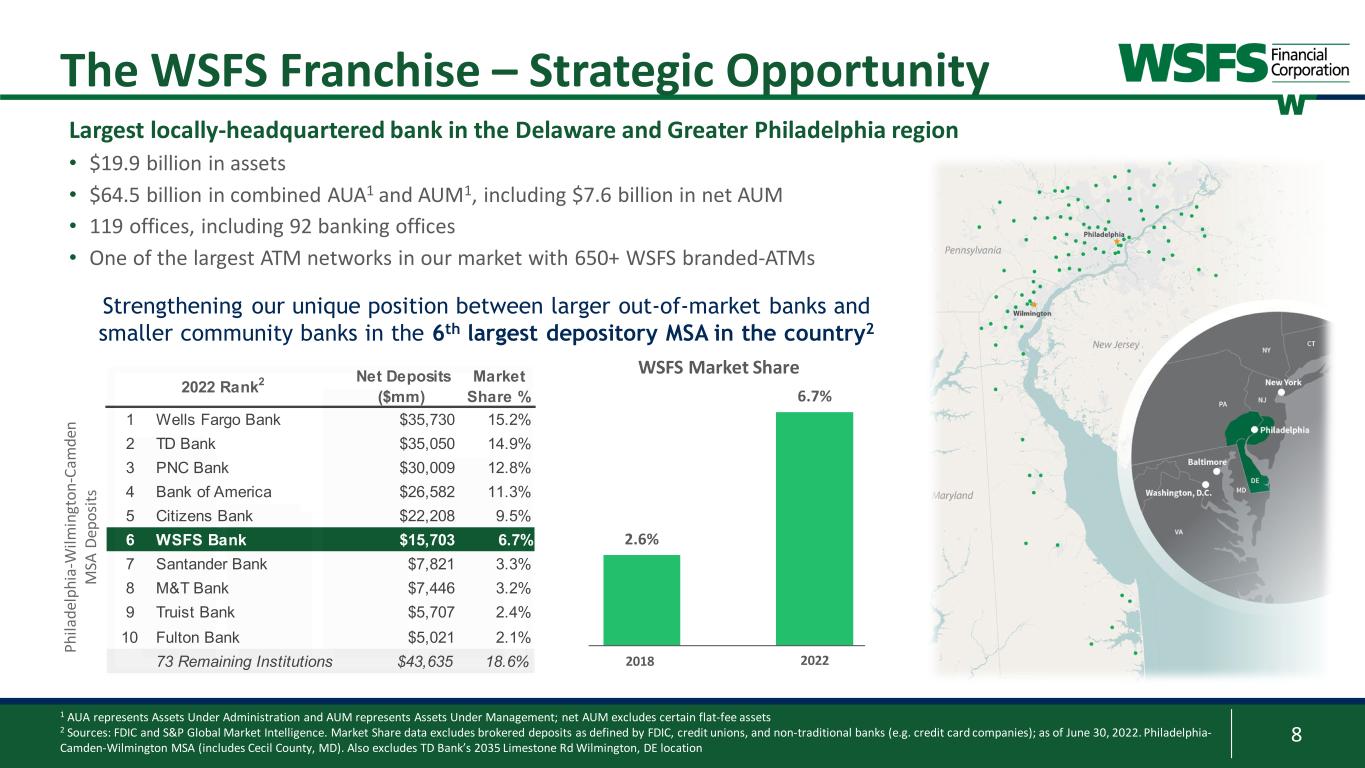
8 2.6% 6.7% WSFS Market Share 2018 2022 1 AUA represents Assets Under Administration and AUM represents Assets Under Management; net AUM excludes certain flat-fee assets 2 Sources: FDIC and S&P Global Market Intelligence. Market Share data excludes brokered deposits as defined by FDIC, credit unions, and non-traditional banks (e.g. credit card companies); as of June 30, 2022. Philadelphia- Camden-Wilmington MSA (includes Cecil County, MD). Also excludes TD Bank’s 2035 Limestone Rd Wilmington, DE location The WSFS Franchise – Strategic Opportunity Strengthening our unique position between larger out-of-market banks and smaller community banks in the 6th largest depository MSA in the country2 Largest locally-headquartered bank in the Delaware and Greater Philadelphia region • $19.9 billion in assets • $64.5 billion in combined AUA1 and AUM1, including $7.6 billion in net AUM • 119 offices, including 92 banking offices • One of the largest ATM networks in our market with 650+ WSFS branded-ATMs Net Deposits ($mm) Market Share % 1 Wells Fargo Bank $35,730 15.2% 2 TD Bank $35,050 14.9% 3 PNC Bank $30,009 12.8% 4 Bank of America $26,582 11.3% 5 Citizens Bank $22,208 9.5% 6 WSFS Bank $15,703 6.7% 7 Santander Bank $7,821 3.3% 8 M&T Bank $7,446 3.2% 9 Truist Bank $5,707 2.4% 10 Fulton Bank $5,021 2.1% 73 Remaining Institutions $43,635 18.6% 2022 Rank2 Ph ila de lp hi a- W ilm in gt on -C am de n M SA D ep os its

9 The WSFS Franchise – Diversified Fee Revenue 1 This is a non-GAAP financial measure and should be considered along with results prepared in accordance with GAAP, and not as a substitute for GAAP results. See Appendix for reconciliation to GAAP financial information. 2 %s represent Core Fee (noninterest) Revenue / Total Core Net Revenue (tax-equivalent) 3 Banking includes deposit service charges, SBA loan sales, loan and lease fees, credit and debit revenue, capital markets, and other banking related fees Note: GAAP Fee Revenue is the following: 2020 - $201.0mm, 2021 - $185.5mm, and 2022 - $260.1mm; GAAP Fee Revenue/Total Net Revenue is the following: 2020 – 30%, 2021 – 30%, and 2022 – 28% $41 $44 $50 $63 $125$40 $55 $48 $52 $69 $51 $51 $41 $43 $56 $6 $11 $30 $23 $7 $138 $161 $169 $181 $257 $0 $30 $60 $90 $120 $150 $180 $210 $240 $270 2018 2019 2020 2021 2022 Co re F ee R ev en ue ( $m m )1 Wealth Management Banking Cash Connect Mortgage 27%227%236%2 29%2 28%2 • Well-diversified with over 25 discrete lines of business and products within our three main segments: Banking, Wealth Management, and Cash Connect® • 2022 Core Fee Revenue percentage of 28%; strong Core Fee Revenue provides earnings stability through interest rate and credit cycles, and economic environments 3
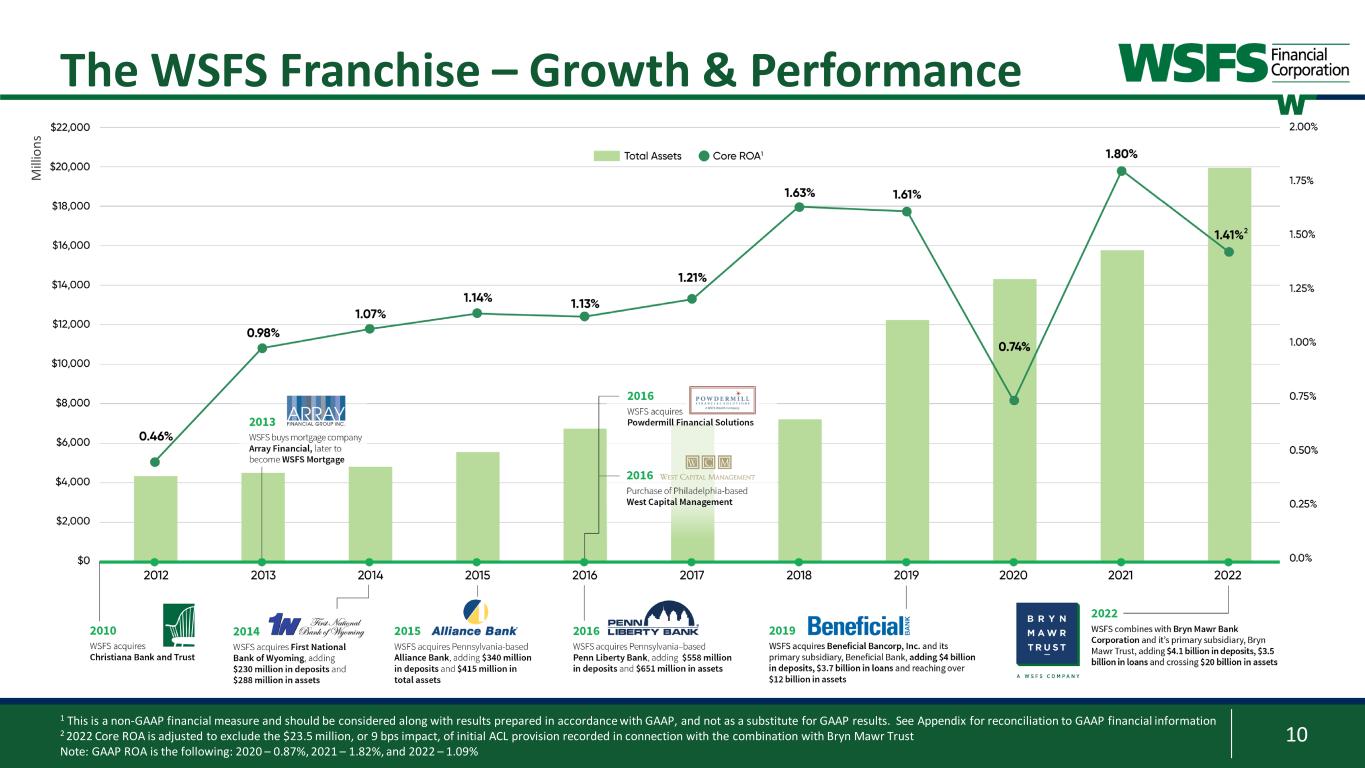
10 1 This is a non-GAAP financial measure and should be considered along with results prepared in accordance with GAAP, and not as a substitute for GAAP results. See Appendix for reconciliation to GAAP financial information 2 2022 Core ROA is adjusted to exclude the $23.5 million, or 9 bps impact, of initial ACL provision recorded in connection with the combination with Bryn Mawr Trust Note: GAAP ROA is the following: 2020 – 0.87%, 2021 – 1.82%, and 2022 – 1.09% The WSFS Franchise – Growth & Performance M ill io ns
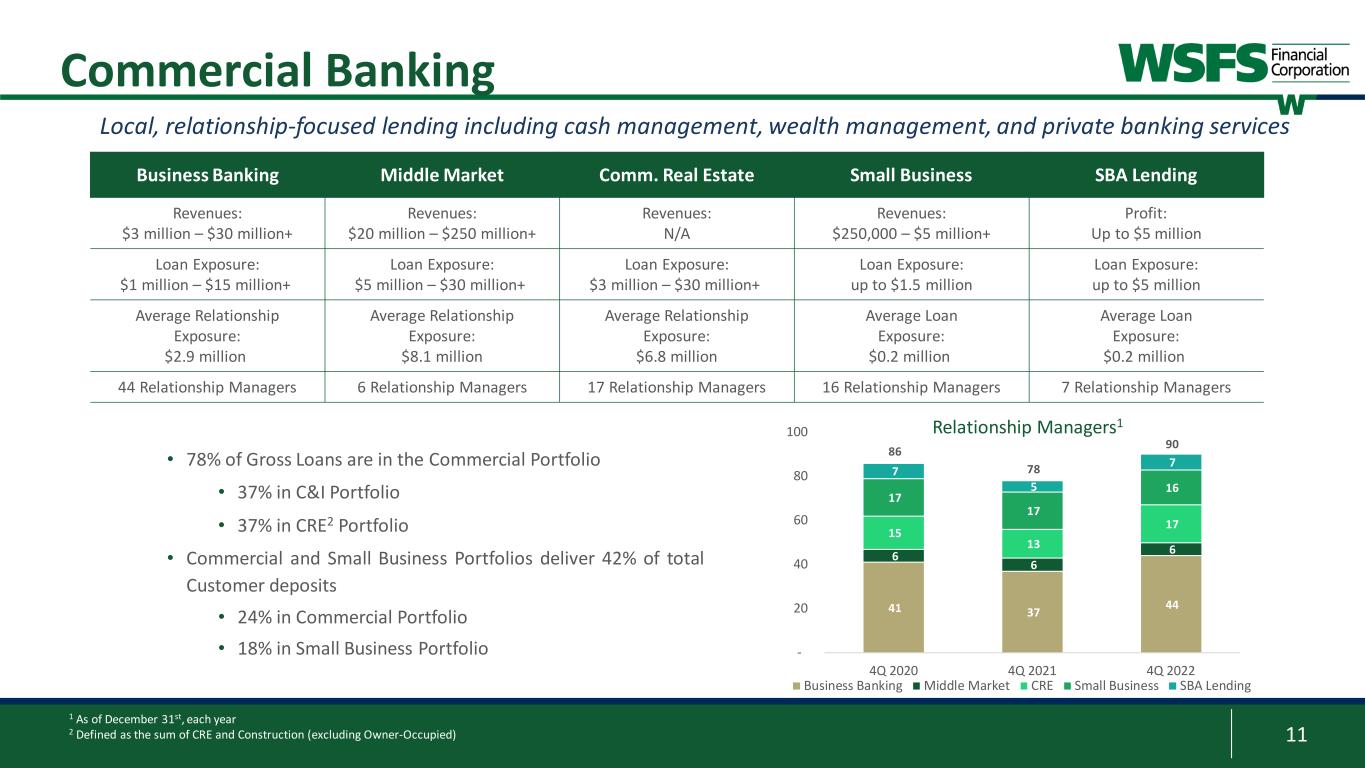
11 41 37 44 6 6 6 15 13 17 17 17 16 7 5 7 86 78 90 - 20 40 60 80 100 4Q 2020 4Q 2021 4Q 2022 Relationship Managers1 Business Banking Middle Market CRE Small Business SBA Lending Business Banking Middle Market Comm. Real Estate Small Business SBA Lending Revenues: $3 million – $30 million+ Revenues: $20 million – $250 million+ Revenues: N/A Revenues: $250,000 – $5 million+ Profit: Up to $5 million Loan Exposure: $1 million – $15 million+ Loan Exposure: $5 million – $30 million+ Loan Exposure: $3 million – $30 million+ Loan Exposure: up to $1.5 million Loan Exposure: up to $5 million Average Relationship Exposure: $2.9 million Average Relationship Exposure: $8.1 million Average Relationship Exposure: $6.8 million Average Loan Exposure: $0.2 million Average Loan Exposure: $0.2 million 44 Relationship Managers 6 Relationship Managers 17 Relationship Managers 16 Relationship Managers 7 Relationship Managers Local, relationship-focused lending including cash management, wealth management, and private banking services 1 As of December 31st, each year 2 Defined as the sum of CRE and Construction (excluding Owner-Occupied) Commercial Banking • 78% of Gross Loans are in the Commercial Portfolio • 37% in C&I Portfolio • 37% in CRE2 Portfolio • Commercial and Small Business Portfolios deliver 42% of total Customer deposits • 24% in Commercial Portfolio • 18% in Small Business Portfolio
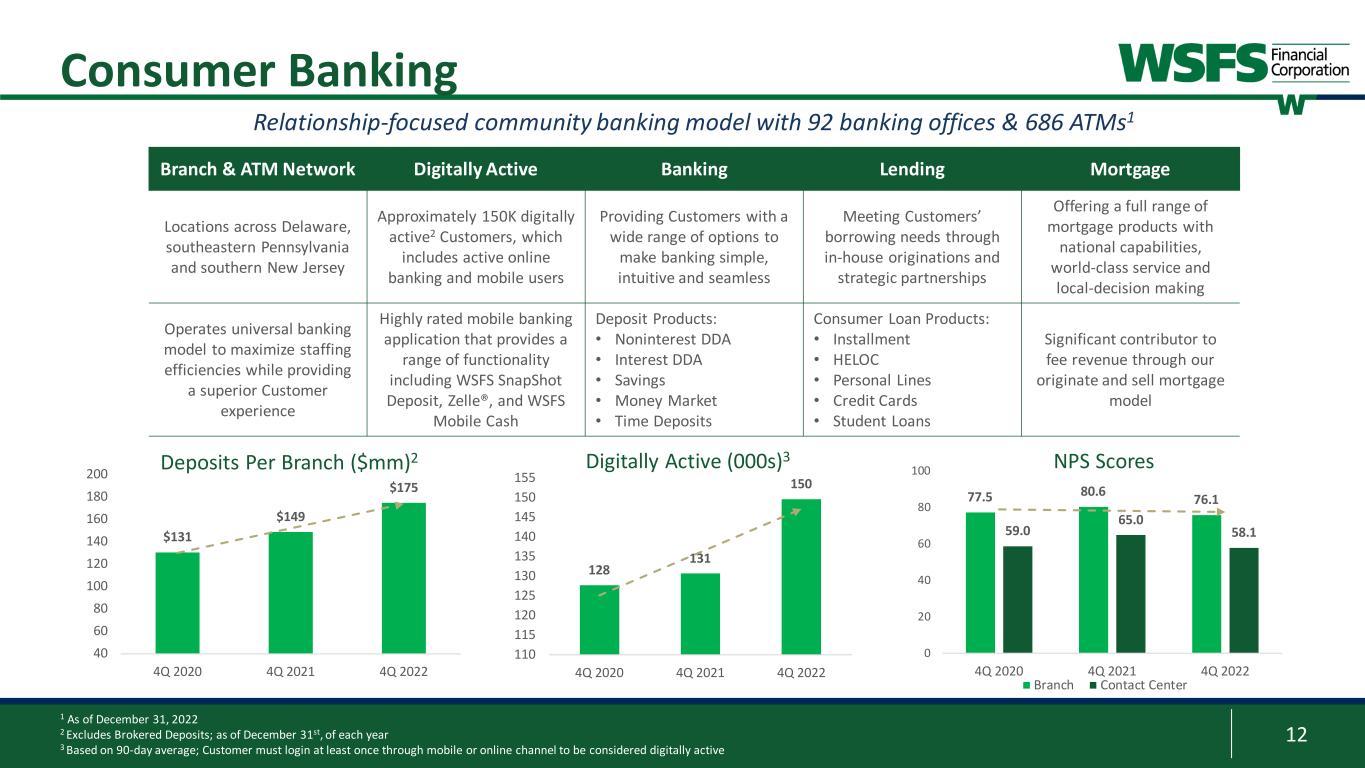
12 Branch & ATM Network Digitally Active Banking Lending Mortgage Locations across Delaware, southeastern Pennsylvania and southern New Jersey Approximately 150K digitally active2 Customers, which includes active online banking and mobile users Providing Customers with a wide range of options to make banking simple, intuitive and seamless Meeting Customers’ borrowing needs through in-house originations and strategic partnerships Offering a full range of mortgage products with national capabilities, world-class service and local-decision making Operates universal banking model to maximize staffing efficiencies while providing a superior Customer experience Highly rated mobile banking application that provides a range of functionality including WSFS SnapShot Deposit, Zelle®, and WSFS Mobile Cash Deposit Products: • Noninterest DDA • Interest DDA • Savings • Money Market • Time Deposits Consumer Loan Products: • Installment • HELOC • Personal Lines • Credit Cards • Student Loans Significant contributor to fee revenue through our originate and sell mortgage model 1 As of December 31, 2022 2 Excludes Brokered Deposits; as of December 31st, of each year 3 Based on 90-day average; Customer must login at least once through mobile or online channel to be considered digitally active Relationship-focused community banking model with 92 banking offices & 686 ATMs1 Consumer Banking $131 $149 $175 40 60 80 100 120 140 160 180 200 4Q 2020 4Q 2021 4Q 2022 Deposits Per Branch ($mm)2 128 131 150 110 115 120 125 130 135 140 145 150 155 4Q 2020 4Q 2021 4Q 2022 Digitally Active (000s)3 77.5 80.6 76.1 59.0 65.0 58.1 0 20 40 60 80 100 4Q 2020 4Q 2021 4Q 2022 NPS Scores Branch Contact Center
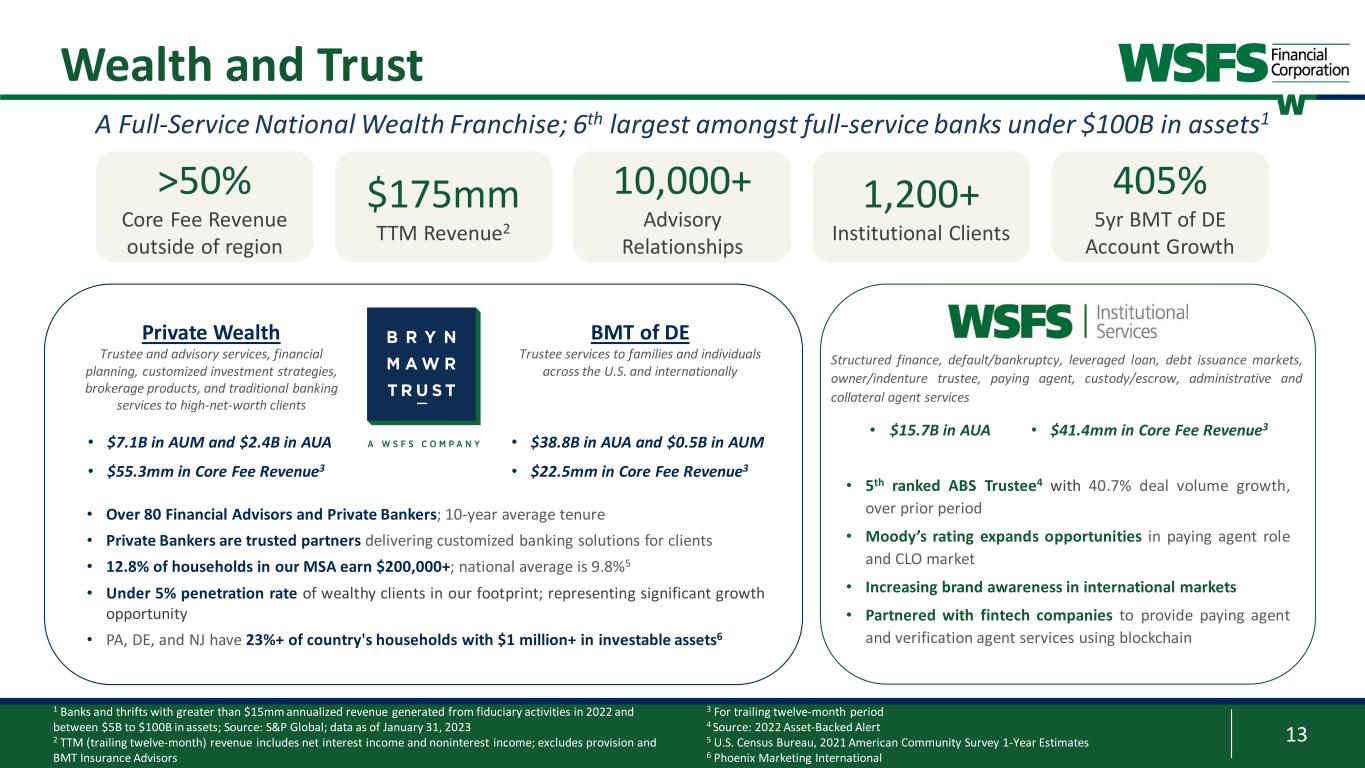
13 1 Banks and thrifts with greater than $15mm annualized revenue generated from fiduciary activities in 2022 and between $5B to $100B in assets; Source: S&P Global; data as of January 31, 2023 2 TTM (trailing twelve-month) revenue includes net interest income and noninterest income; excludes provision and BMT Insurance Advisors Wealth and Trust A Full-Service National Wealth Franchise; 6th largest amongst full-service banks under $100B in assets1 • Over 80 Financial Advisors and Private Bankers; 10-year average tenure • Private Bankers are trusted partners delivering customized banking solutions for clients • 12.8% of households in our MSA earn $200,000+; national average is 9.8%5 • Under 5% penetration rate of wealthy clients in our footprint; representing significant growth opportunity • PA, DE, and NJ have 23%+ of country's households with $1 million+ in investable assets6 Private Wealth Trustee and advisory services, financial planning, customized investment strategies, brokerage products, and traditional banking services to high-net-worth clients • 5th ranked ABS Trustee4 with 40.7% deal volume growth, over prior period • Moody’s rating expands opportunities in paying agent role and CLO market • Increasing brand awareness in international markets • Partnered with fintech companies to provide paying agent and verification agent services using blockchain 1,200+ Institutional Clients 10,000+ Advisory Relationships $175mm TTM Revenue2 >50% Core Fee Revenue outside of region 405% 5yr BMT of DE Account Growth BMT of DE Trustee services to families and individuals across the U.S. and internationally • $15.7B in AUA • $41.4mm in Core Fee Revenue3 Structured finance, default/bankruptcy, leveraged loan, debt issuance markets, owner/indenture trustee, paying agent, custody/escrow, administrative and collateral agent services 3 For trailing twelve-month period 4 Source: 2022 Asset-Backed Alert 5 U.S. Census Bureau, 2021 American Community Survey 1-Year Estimates 6 Phoenix Marketing International • $7.1B in AUM and $2.4B in AUA • $55.3mm in Core Fee Revenue3 • $38.8B in AUA and $0.5B in AUM • $22.5mm in Core Fee Revenue3
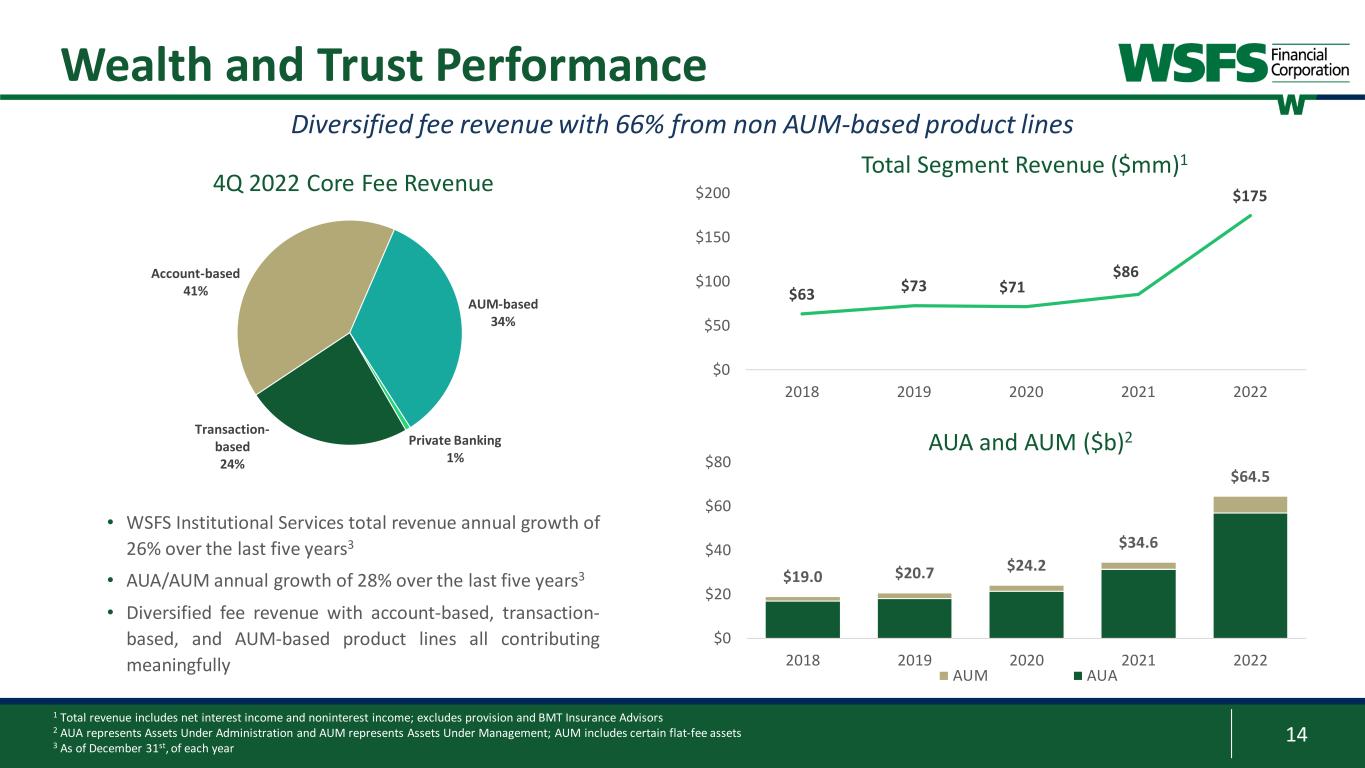
14 Transaction- based 24% Account-based 41% AUM-based 34% Private Banking 1% 4Q 2022 Core Fee Revenue $19.0 $20.7 $24.2 $34.6 $64.5 $0 $20 $40 $60 $80 2018 2019 2020 2021 2022 AUM AUA AUA and AUM ($b)2 1 Total revenue includes net interest income and noninterest income; excludes provision and BMT Insurance Advisors 2 AUA represents Assets Under Administration and AUM represents Assets Under Management; AUM includes certain flat-fee assets 3 As of December 31st, of each year Wealth and Trust Performance Total Segment Revenue ($mm)1 $63 $73 $71 $86 $175 $0 $50 $100 $150 $200 2018 2019 2020 2021 2022 • WSFS Institutional Services total revenue annual growth of 26% over the last five years3 • AUA/AUM annual growth of 28% over the last five years3 • Diversified fee revenue with account-based, transaction- based, and AUM-based product lines all contributing meaningfully Diversified fee revenue with 66% from non AUM-based product lines
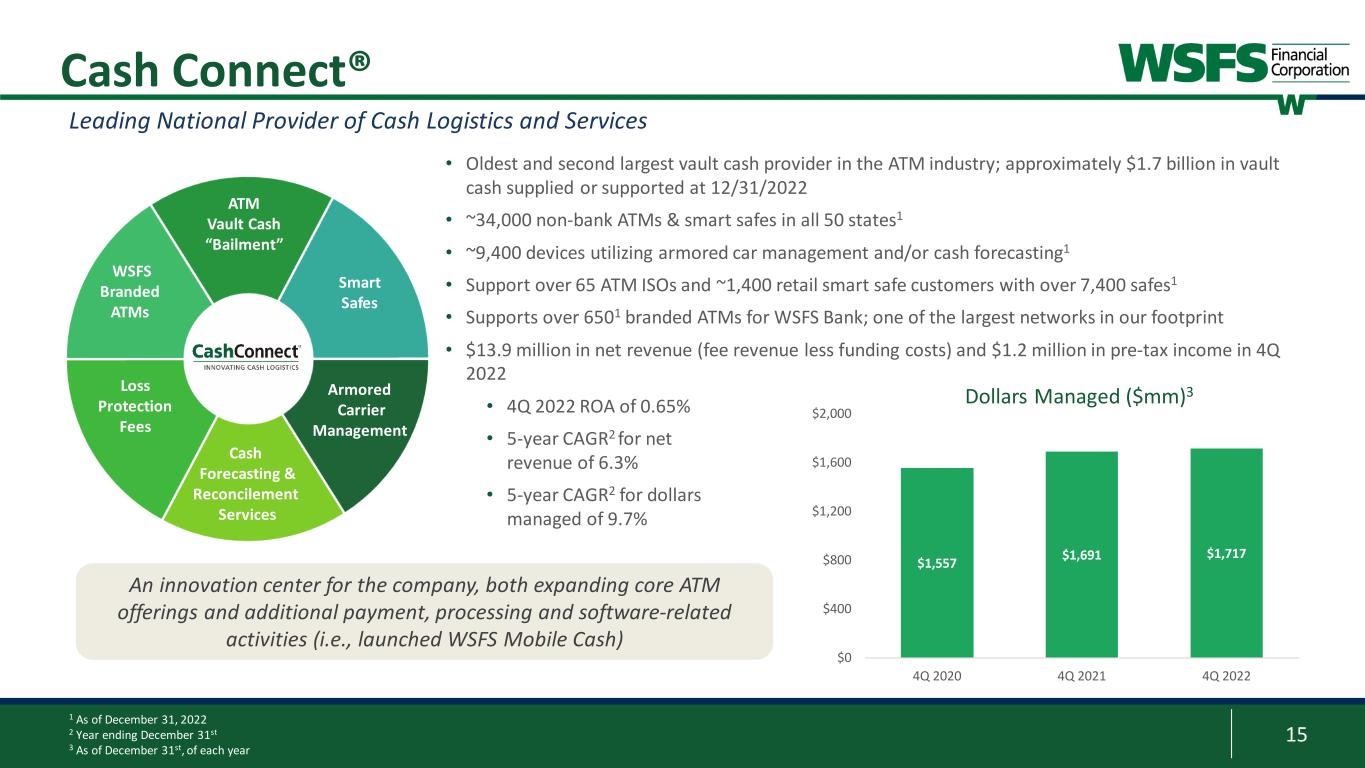
15 • Oldest and second largest vault cash provider in the ATM industry; approximately $1.7 billion in vault cash supplied or supported at 12/31/2022 • ~34,000 non-bank ATMs & smart safes in all 50 states1 • ~9,400 devices utilizing armored car management and/or cash forecasting1 • Support over 65 ATM ISOs and ~1,400 retail smart safe customers with over 7,400 safes1 • Supports over 6501 branded ATMs for WSFS Bank; one of the largest networks in our footprint • $13.9 million in net revenue (fee revenue less funding costs) and $1.2 million in pre-tax income in 4Q 2022 • 4Q 2022 ROA of 0.65% • 5-year CAGR2 for net revenue of 6.3% • 5-year CAGR2 for dollars managed of 9.7% 1 As of December 31, 2022 2 Year ending December 31st 3 As of December 31st, of each year ATM Vault Cash “Bailment” Smart Safes Armored Carrier Management Cash Forecasting & Reconcilement Services Loss Protection Fees WSFS Branded ATMs Leading National Provider of Cash Logistics and Services Cash Connect® An innovation center for the company, both expanding core ATM offerings and additional payment, processing and software-related activities (i.e., launched WSFS Mobile Cash) Dollars Managed ($mm)3 $1,557 $1,691 $1,717 $0 $400 $800 $1,200 $1,600 $2,000 4Q 2020 4Q 2021 4Q 2022
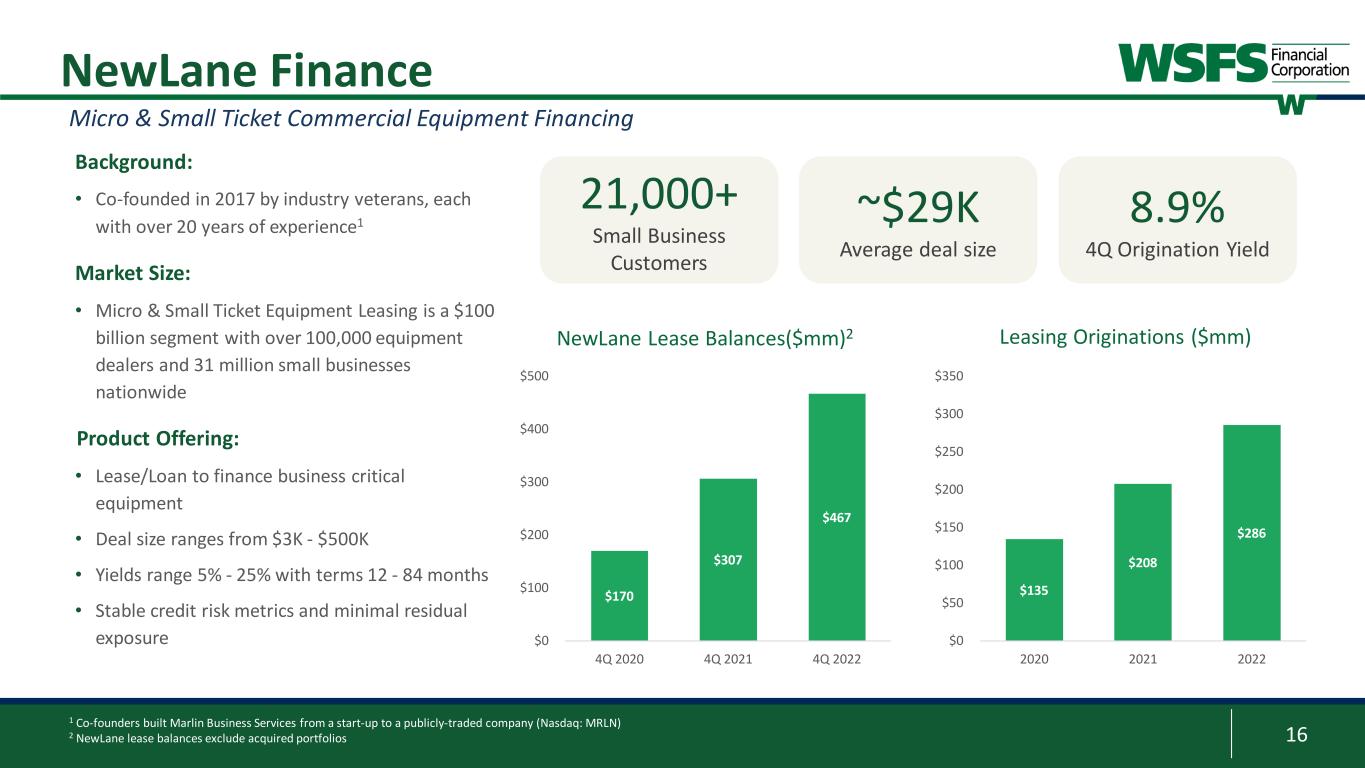
16 NewLane Finance Background: • Co-founded in 2017 by industry veterans, each with over 20 years of experience1 Market Size: • Micro & Small Ticket Equipment Leasing is a $100 billion segment with over 100,000 equipment dealers and 31 million small businesses nationwide Product Offering: • Lease/Loan to finance business critical equipment • Deal size ranges from $3K - $500K • Yields range 5% - 25% with terms 12 - 84 months • Stable credit risk metrics and minimal residual exposure Micro & Small Ticket Commercial Equipment Financing 1 Co-founders built Marlin Business Services from a start-up to a publicly-traded company (Nasdaq: MRLN) 2 NewLane lease balances exclude acquired portfolios $135 $208 $286 $0 $50 $100 $150 $200 $250 $300 $350 2020 2021 2022 Leasing Originations ($mm) $170 $307 $467 $0 $100 $200 $300 $400 $500 4Q 2020 4Q 2021 4Q 2022 NewLane Lease Balances($mm)2 8.9% 4Q Origination Yield 21,000+ Small Business Customers ~$29K Average deal size
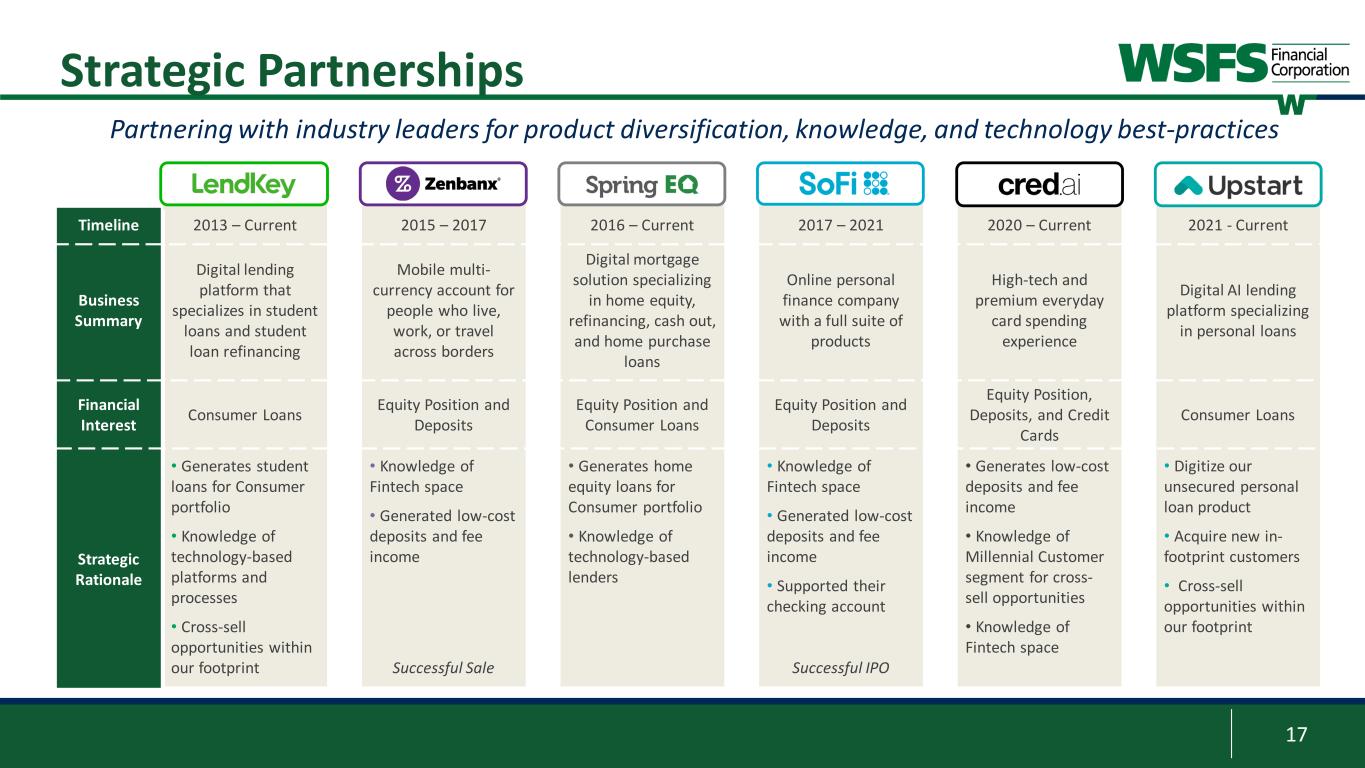
17 Timeline 2013 – Current 2015 – 2017 2016 – Current 2017 – 2021 2020 – Current 2021 - Current Business Summary Digital lending platform that specializes in student loans and student loan refinancing Mobile multi- currency account for people who live, work, or travel across borders Digital mortgage solution specializing in home equity, refinancing, cash out, and home purchase loans Online personal finance company with a full suite of products High-tech and premium everyday card spending experience Digital AI lending platform specializing in personal loans Financial Interest Consumer Loans Equity Position and Deposits Equity Position and Consumer Loans Equity Position and Deposits Equity Position, Deposits, and Credit Cards Consumer Loans Strategic Rationale • Generates student loans for Consumer portfolio • Knowledge of technology-based platforms and processes • Cross-sell opportunities within our footprint • Knowledge of Fintech space • Generated low-cost deposits and fee income Successful Sale • Generates home equity loans for Consumer portfolio • Knowledge of technology-based lenders • Knowledge of Fintech space • Generated low-cost deposits and fee income • Supported their checking account Successful IPO • Generates low-cost deposits and fee income • Knowledge of Millennial Customer segment for cross- sell opportunities • Knowledge of Fintech space • Digitize our unsecured personal loan product • Acquire new in- footprint customers • Cross-sell opportunities within our footprint Partnering with industry leaders for product diversification, knowledge, and technology best-practices Strategic Partnerships
18 Selected Financial and Performance Metrics
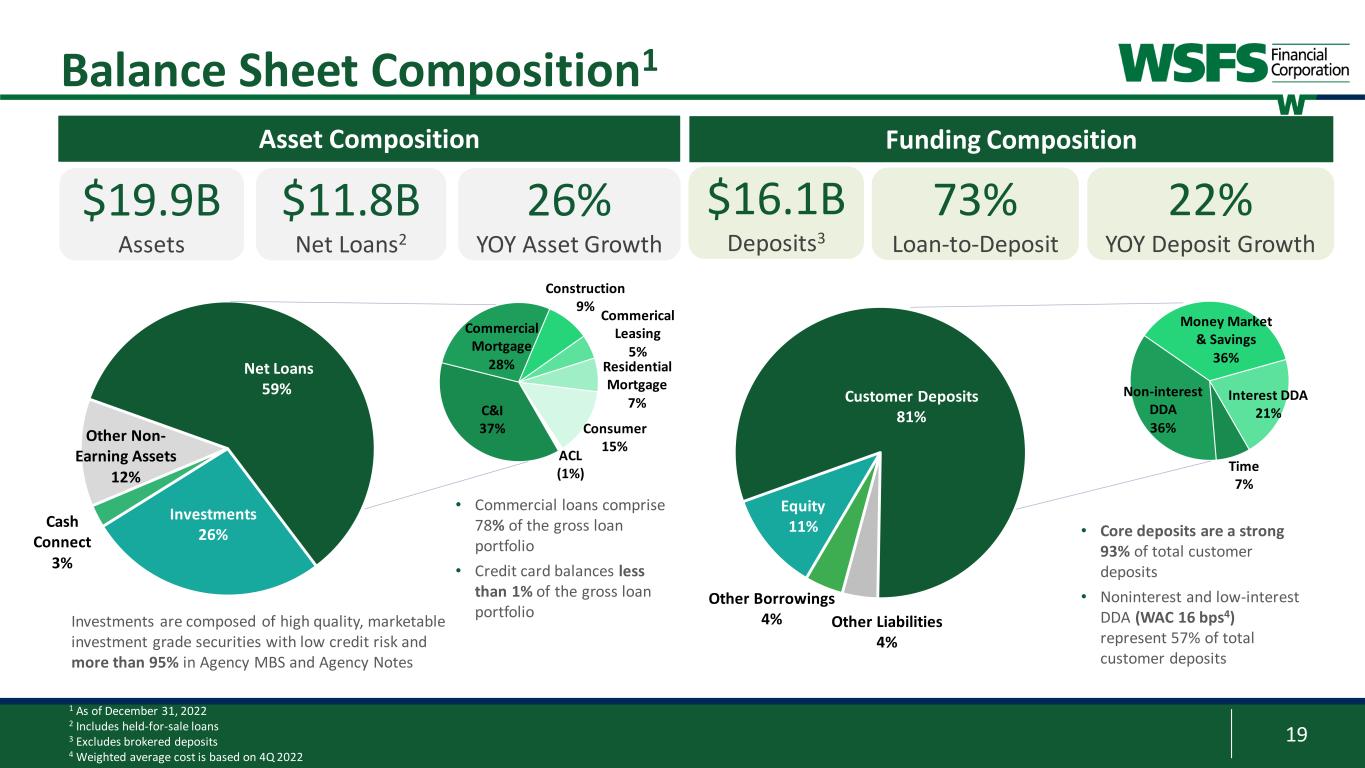
19 Time 7% Non-interest DDA 36% Money Market & Savings 36% Interest DDA 21% Balance Sheet Composition1 C&I 37% Commercial Mortgage 28% Construction 9% Commerical Leasing 5% Residential Mortgage 7% Consumer 15%ACL (1%) Investments 26% Cash Connect 3% Other Non- Earning Assets 12% Net Loans 59% • Commercial loans comprise 78% of the gross loan portfolio • Credit card balances less than 1% of the gross loan portfolio Equity 11% Customer Deposits 81% Investments are composed of high quality, marketable investment grade securities with low credit risk and more than 95% in Agency MBS and Agency Notes $19.9B Assets $11.8B Net Loans2 Asset Composition 26% YOY Asset Growth Funding Composition $16.1B Deposits3 73% Loan-to-Deposit 22% YOY Deposit Growth Other Borrowings 4% Other Liabilities 4% 1 As of December 31, 2022 2 Includes held-for-sale loans 3 Excludes brokered deposits 4 Weighted average cost is based on 4Q 2022 • Core deposits are a strong 93% of total customer deposits • Noninterest and low-interest DDA (WAC 16 bps4) represent 57% of total customer deposits

20 3 Commercial Loan Composition Hotels, 13% Other Serv excl. Public Admin, 10% Healthcare & Social Assist., 9%Construction, 8% Manufacturing, 8% Real Estate & Rental, 8% Retail Trade, 7% Finance & Insurance, 7% Food Services, 5% Professional, Science & Tech, 4% Wholesale, 4% Other, 17% C&I and Owner-Occupied - $4.4 billion CRE Investor and Construction - $4.4 billion Flex, Warehouse, Self-Storage, General Industrial, 9% Medical Office, 2% Office, 14% Residential 1-4, 14% Residential Multi- Family, 27% Retail, 25% Special Use & Other, 9% Note: As defined by the North American Industry Classification System (NAICS) Granular C&I, CRE, and Construction Portfolios

21 $3.7 $6.5 $7.6 $8.4 $10.7 $1.5 $2.2 $2.8 $4.0 $6.4 0.65% 0.82% 0.47% 0.16% 0.26% 0.47% 0.62% 0.35% 0.11% 0.17% 0.0% 0.1% 0.2% 0.3% 0.4% 0.5% 0.6% 0.7% 0.8% $0 $2 $4 $6 $8 $10 $12 $14 $16 $18 2018 2019 2020 2021 2022 Av er ag e Cu st om er D ep os it Co st (% ) Av er ag e Cu st om er D ep os it ($ b) Interest-bearing Noninterest-bearing Interest-bearing cost Total deposit cost Deposit Cost Trends 1 Interest-bearing deposits include demand, money market, savings, and customer time deposits • Well-diversified deposit base with more than 50% of our deposits outside of Consumer banking • $2 billion coming from Wealth Management • 36% of total customer deposits are noninterest-bearing deposits • Competitive and prudent in our deposit pricing through economic cycles 1 1
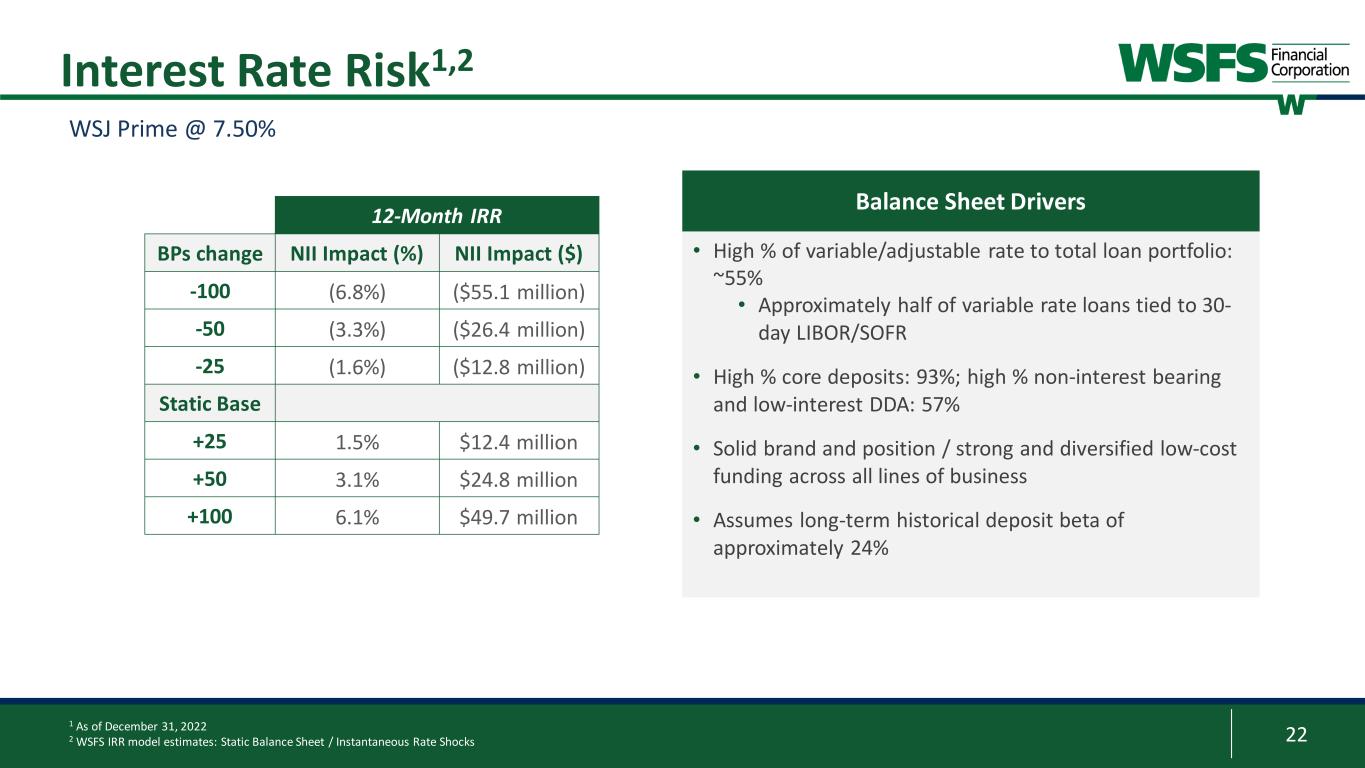
22 1 As of December 31, 2022 2 WSFS IRR model estimates: Static Balance Sheet / Instantaneous Rate Shocks • High % of variable/adjustable rate to total loan portfolio: ~55% • Approximately half of variable rate loans tied to 30- day LIBOR/SOFR • High % core deposits: 93%; high % non-interest bearing and low-interest DDA: 57% • Solid brand and position / strong and diversified low-cost funding across all lines of business • Assumes long-term historical deposit beta of approximately 24% Interest Rate Risk1,2 WSJ Prime @ 7.50% Balance Sheet Drivers12-Month IRR BPs change NII Impact (%) NII Impact ($) -100 (6.8%) ($55.1 million) -50 (3.3%) ($26.4 million) -25 (1.6%) ($12.8 million) Static Base +25 1.5% $12.4 million +50 3.1% $24.8 million +100 6.1% $49.7 million
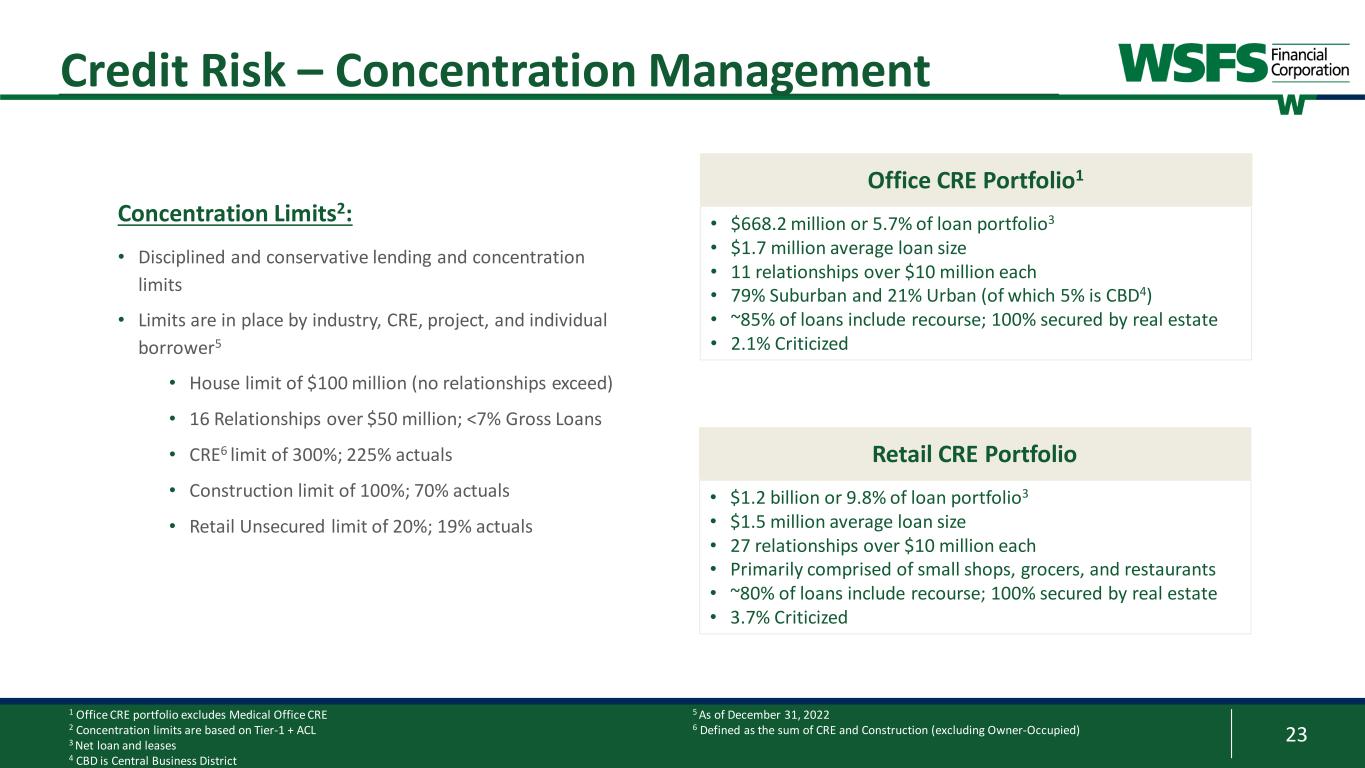
23 3 Credit Risk – Concentration Management 1 Office CRE portfolio excludes Medical Office CRE 2 Concentration limits are based on Tier-1 + ACL 3 Net loan and leases 4 CBD is Central Business District • $668.2 million or 5.7% of loan portfolio3 • $1.7 million average loan size • 11 relationships over $10 million each • 79% Suburban and 21% Urban (of which 5% is CBD4) • ~85% of loans include recourse; 100% secured by real estate • 2.1% Criticized • $1.2 billion or 9.8% of loan portfolio3 • $1.5 million average loan size • 27 relationships over $10 million each • Primarily comprised of small shops, grocers, and restaurants • ~80% of loans include recourse; 100% secured by real estate • 3.7% Criticized Office CRE Portfolio1 Retail CRE Portfolio Concentration Limits2: • Disciplined and conservative lending and concentration limits • Limits are in place by industry, CRE, project, and individual borrower5 • House limit of $100 million (no relationships exceed) • 16 Relationships over $50 million; <7% Gross Loans • CRE6 limit of 300%; 225% actuals • Construction limit of 100%; 70% actuals • Retail Unsecured limit of 20%; 19% actuals 5 As of December 31, 2022 6 Defined as the sum of CRE and Construction (excluding Owner-Occupied)
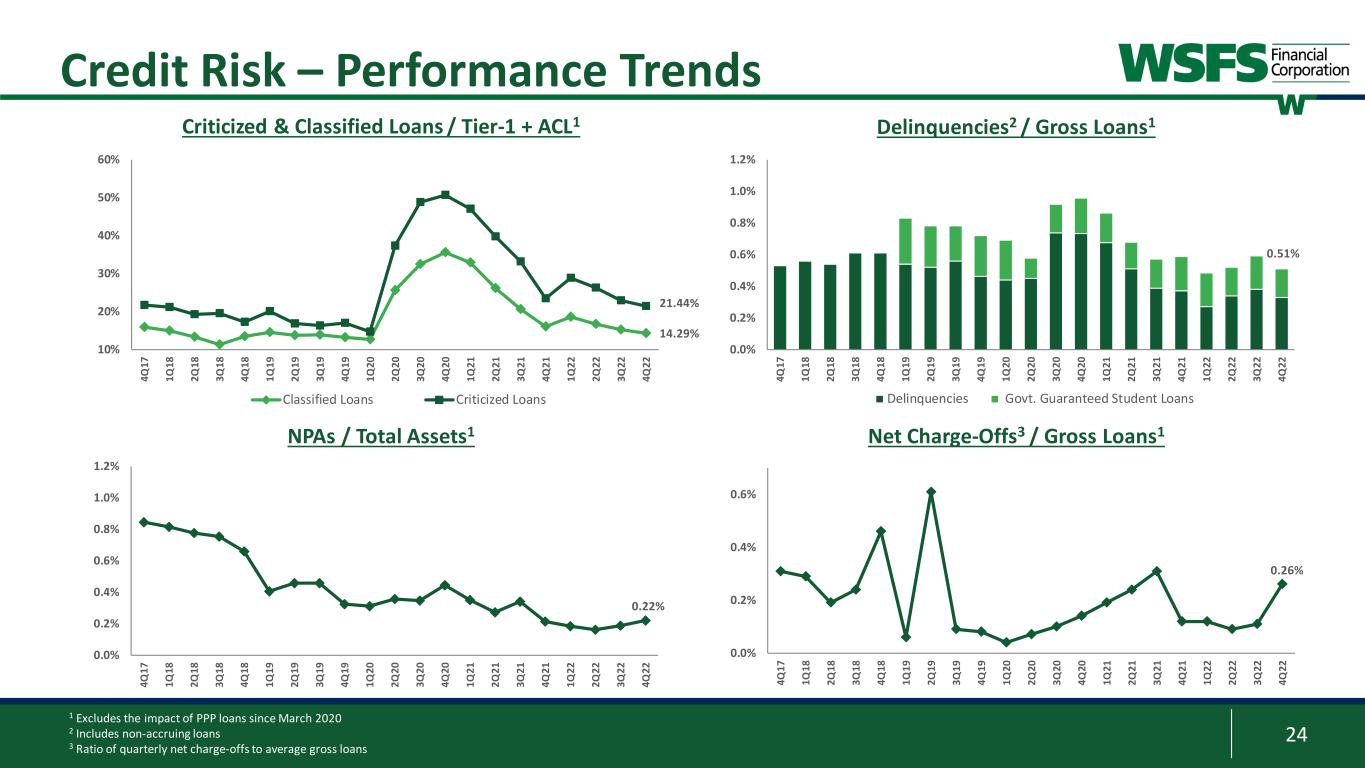
24 0.0% 0.2% 0.4% 0.6% 0.8% 1.0% 1.2% 4Q 17 1Q 18 2Q 18 3Q 18 4Q 18 1Q 19 2Q 19 3Q 19 4Q 19 1Q 20 2Q 20 3Q 20 4Q 20 1Q 21 2Q 21 3Q 21 4Q 21 1Q 22 2Q 22 3Q 22 4Q 22 Delinquencies Govt. Guaranteed Student Loans 0.51% 0.0% 0.2% 0.4% 0.6% 0.8% 1.0% 1.2% 4Q 17 1Q 18 2Q 18 3Q 18 4Q 18 1Q 19 2Q 19 3Q 19 4Q 19 1Q 20 2Q 20 3Q 20 4Q 20 1Q 21 2Q 21 3Q 21 4Q 21 1Q 22 2Q 22 3Q 22 4Q 22 0.0% 0.2% 0.4% 0.6% 4Q 17 1Q 18 2Q 18 3Q 18 4Q 18 1Q 19 2Q 19 3Q 19 4Q 19 1Q 20 2Q 20 3Q 20 4Q 20 1Q 21 2Q 21 3Q 21 4Q 21 1Q 22 2Q 22 3Q 22 4Q 22 10% 20% 30% 40% 50% 60% 4Q 17 1Q 18 2Q 18 3Q 18 4Q 18 1Q 19 2Q 19 3Q 19 4Q 19 1Q 20 2Q 20 3Q 20 4Q 20 1Q 21 2Q 21 3Q 21 4Q 21 1Q 22 2Q 22 3Q 22 4Q 22 Classified Loans Criticized Loans Delinquencies2 / Gross Loans1 Net Charge-Offs3 / Gross Loans1 1 Excludes the impact of PPP loans since March 2020 2 Includes non-accruing loans 3 Ratio of quarterly net charge-offs to average gross loans Criticized & Classified Loans / Tier-1 + ACL1 NPAs / Total Assets1 0.22% 0.26% Credit Risk – Performance Trends 21.44% 14.29%
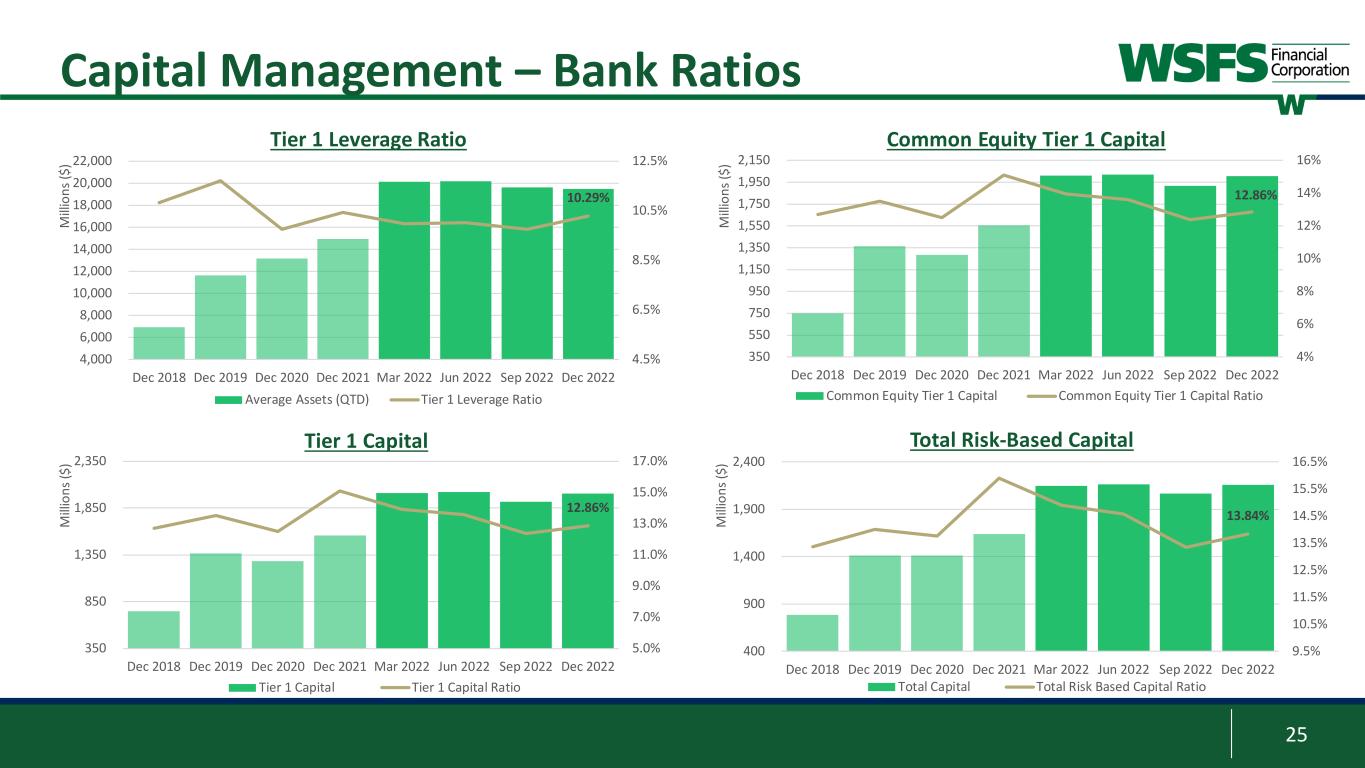
25 10.29% 4.5% 6.5% 8.5% 10.5% 12.5% 4,000 6,000 8,000 10,000 12,000 14,000 16,000 18,000 20,000 22,000 Dec 2018 Dec 2019 Dec 2020 Dec 2021 Mar 2022 Jun 2022 Sep 2022 Dec 2022 Average Assets (QTD) Tier 1 Leverage Ratio 13.84% 9.5% 10.5% 11.5% 12.5% 13.5% 14.5% 15.5% 16.5% 400 900 1,400 1,900 2,400 Dec 2018 Dec 2019 Dec 2020 Dec 2021 Mar 2022 Jun 2022 Sep 2022 Dec 2022 Total Capital Total Risk Based Capital Ratio 12.86% 5.0% 7.0% 9.0% 11.0% 13.0% 15.0% 17.0% 350 850 1,350 1,850 2,350 Dec 2018 Dec 2019 Dec 2020 Dec 2021 Mar 2022 Jun 2022 Sep 2022 Dec 2022 Tier 1 Capital Tier 1 Capital Ratio Capital Management – Bank Ratios Tier 1 Leverage Ratio Common Equity Tier 1 Capital Tier 1 Capital Total Risk-Based Capital M ill io ns ($ ) M ill io ns M ill io ns ($ ) M ill io ns ($ ) 12.86% 4% 6% 8% 10% 12% 14% 16% 350 550 750 950 1,150 1,350 1,550 1,750 1,950 2,150 Dec 2018 Dec 2019 Dec 2020 Dec 2021 Mar 2022 Jun 2022 Sep 2022 Dec 2022 Common Equity Tier 1 Capital Common Equity Tier 1 Capital Ratio M ill io ns ($ )

26 1 As discussed in our most recent proxy statement filed March 28, 2022 2 As of December 31, 2022 3 Board authorizations in 2Q 2020 and 2Q 2022 (dollars in 000s) 2018 2019 2020 2021 20222 Total Capital Returned $44,451 $113,795 $179,451 $36,263 $229,927 Total Shares Repurchased 691,742 2,132,390 3,950,855 267,309 4,151,117 $0.30 $0.42 $0.47 $0.48 $0.52 $0.56 $- $0.10 $0.20 $0.30 $0.40 $0.50 $0.60 $- $50,000 $100,000 $150,000 $200,000 $250,000 2017 2018 2019 2020 2021 2022 An nu al D iv id en ds P ai d pe r S ha re Ca pi ta l R et ur ne d ($ in 0 00 s) Dividends Routine buybacks Incremental buybacks Annual Dividend Per Share Capital Management – Ownership Alignment • Executive management incentive compensation and equity awards aligned with shareholder performance • Insider ownership1 is approximately 1.7% Board of Directors and Executive Management ownership guidelines in place and followed • Repurchased 0.4 million shares or 1% of common shares outstanding in 4Q 2022 Approximately 11% of common shares outstanding2 are available for repurchase under the Board authorizations3 • The Board of Directors approved a quarterly cash dividend of $0.15 per share of common stock which will be paid in February 2023
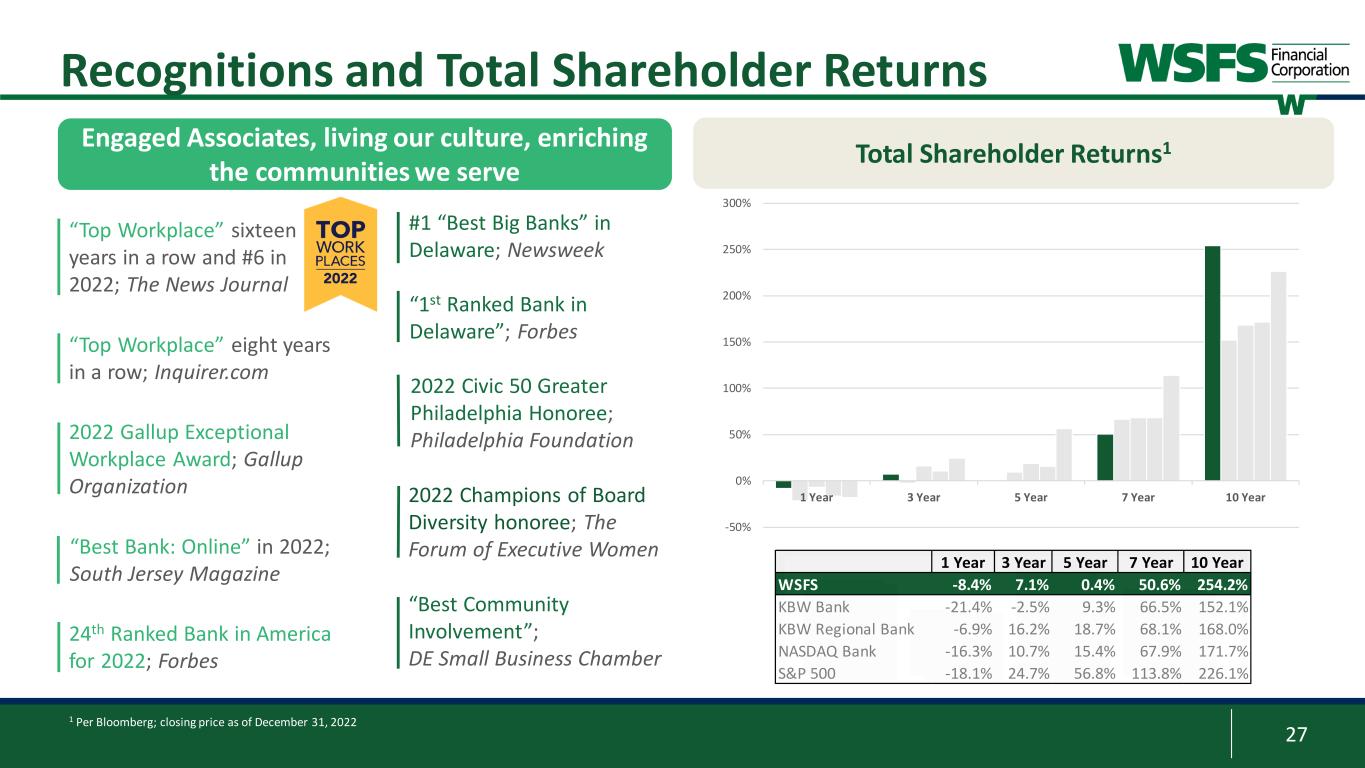
27 “Best Community Involvement”; DE Small Business Chamber 2022 Champions of Board Diversity honoree; The Forum of Executive Women 2022 Civic 50 Greater Philadelphia Honoree; Philadelphia Foundation #1 “Best Big Banks” in Delaware; Newsweek “1st Ranked Bank in Delaware”; Forbes 1 Per Bloomberg; closing price as of December 31, 2022 Recognitions and Total Shareholder Returns “Top Workplace” sixteen years in a row and #6 in 2022; The News Journal “Top Workplace” eight years in a row; Inquirer.com 24th Ranked Bank in America for 2022; Forbes 2022 Gallup Exceptional Workplace Award; Gallup Organization Engaged Associates, living our culture, enriching the communities we serve Total Shareholder Returns1 “Best Bank: Online” in 2022; South Jersey Magazine -50% 0% 50% 100% 150% 200% 250% 300% 1 Year 3 Year 5 Year 7 Year 10 Year 1 Year 3 Year 5 Year 7 Year 10 Year WSFS -8.4% 7.1% 0.4% 50.6% 254.2% KBW Bank -21.4% -2.5% 9.3% 66.5% 152.1% KBW Regional Bank -6.9% 16.2% 18.7% 68.1% 168.0% NASDAQ Bank -16.3% 10.7% 15.4% 67.9% 171.7% S&P 500 -18.1% 24.7% 56.8% 113.8% 226.1%
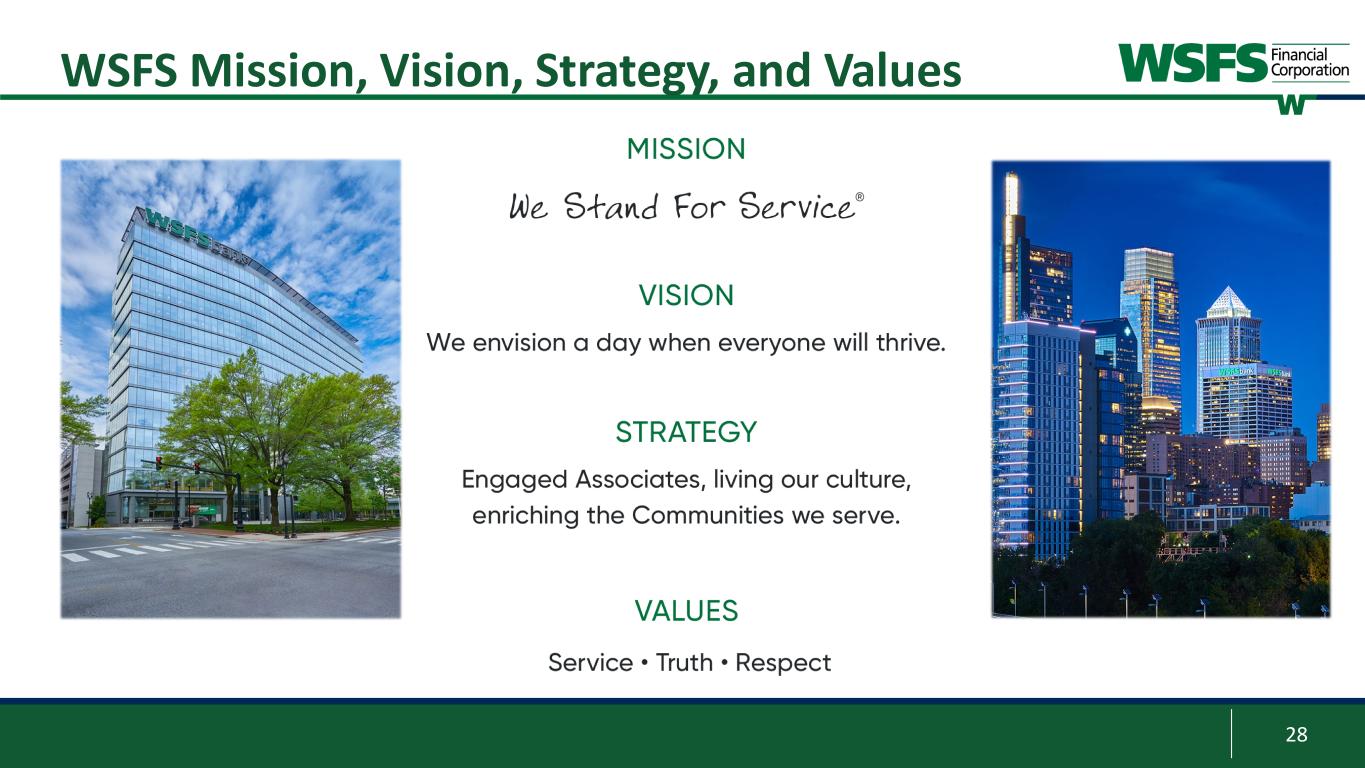
28 WSFS Mission, Vision, Strategy, and Values
29 Non-GAAP Financial Information Appendix:
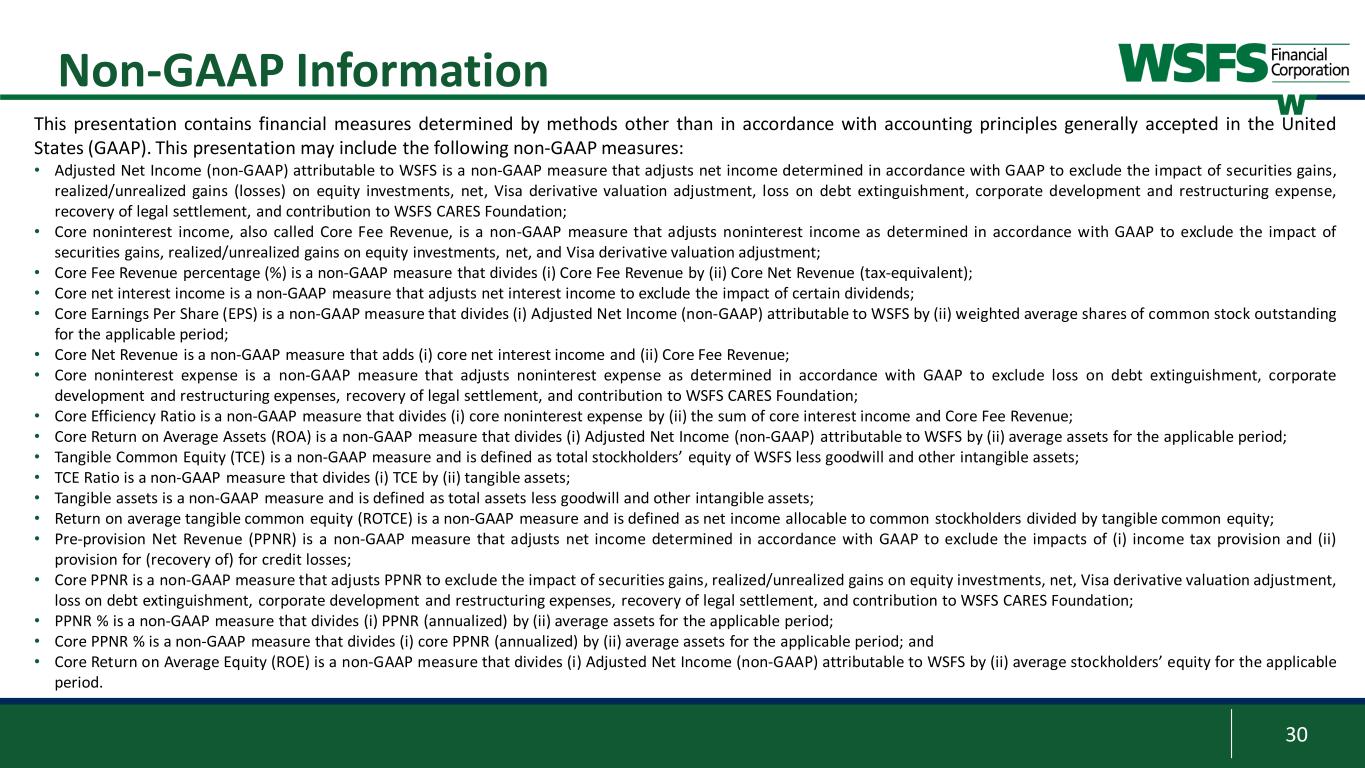
30 Non-GAAP Information This presentation contains financial measures determined by methods other than in accordance with accounting principles generally accepted in the United States (GAAP). This presentation may include the following non-GAAP measures: • Adjusted Net Income (non-GAAP) attributable to WSFS is a non-GAAP measure that adjusts net income determined in accordance with GAAP to exclude the impact of securities gains, realized/unrealized gains (losses) on equity investments, net, Visa derivative valuation adjustment, loss on debt extinguishment, corporate development and restructuring expense, recovery of legal settlement, and contribution to WSFS CARES Foundation; • Core noninterest income, also called Core Fee Revenue, is a non-GAAP measure that adjusts noninterest income as determined in accordance with GAAP to exclude the impact of securities gains, realized/unrealized gains on equity investments, net, and Visa derivative valuation adjustment; • Core Fee Revenue percentage (%) is a non-GAAP measure that divides (i) Core Fee Revenue by (ii) Core Net Revenue (tax-equivalent); • Core net interest income is a non-GAAP measure that adjusts net interest income to exclude the impact of certain dividends; • Core Earnings Per Share (EPS) is a non-GAAP measure that divides (i) Adjusted Net Income (non-GAAP) attributable to WSFS by (ii) weighted average shares of common stock outstanding for the applicable period; • Core Net Revenue is a non-GAAP measure that adds (i) core net interest income and (ii) Core Fee Revenue; • Core noninterest expense is a non-GAAP measure that adjusts noninterest expense as determined in accordance with GAAP to exclude loss on debt extinguishment, corporate development and restructuring expenses, recovery of legal settlement, and contribution to WSFS CARES Foundation; • Core Efficiency Ratio is a non-GAAP measure that divides (i) core noninterest expense by (ii) the sum of core interest income and Core Fee Revenue; • Core Return on Average Assets (ROA) is a non-GAAP measure that divides (i) Adjusted Net Income (non-GAAP) attributable to WSFS by (ii) average assets for the applicable period; • Tangible Common Equity (TCE) is a non-GAAP measure and is defined as total stockholders’ equity of WSFS less goodwill and other intangible assets; • TCE Ratio is a non-GAAP measure that divides (i) TCE by (ii) tangible assets; • Tangible assets is a non-GAAP measure and is defined as total assets less goodwill and other intangible assets; • Return on average tangible common equity (ROTCE) is a non-GAAP measure and is defined as net income allocable to common stockholders divided by tangible common equity; • Pre-provision Net Revenue (PPNR) is a non-GAAP measure that adjusts net income determined in accordance with GAAP to exclude the impacts of (i) income tax provision and (ii) provision for (recovery of) for credit losses; • Core PPNR is a non-GAAP measure that adjusts PPNR to exclude the impact of securities gains, realized/unrealized gains on equity investments, net, Visa derivative valuation adjustment, loss on debt extinguishment, corporate development and restructuring expenses, recovery of legal settlement, and contribution to WSFS CARES Foundation; • PPNR % is a non-GAAP measure that divides (i) PPNR (annualized) by (ii) average assets for the applicable period; • Core PPNR % is a non-GAAP measure that divides (i) core PPNR (annualized) by (ii) average assets for the applicable period; and • Core Return on Average Equity (ROE) is a non-GAAP measure that divides (i) Adjusted Net Income (non-GAAP) attributable to WSFS by (ii) average stockholders’ equity for the applicable period.

31 Appendix: Non-GAAP Financial Information For the year ended December 31, (dollars in thousands) 2012 2013 2014 2015 Net Income (GAAP) $ 31,311 $ 46,882 $ 53,757 $ 53,533 Adj: Plus/(less) core (after-tax)1 (11,546) (4,290) (4,632) 4,407 Adjusted net income (non-GAAP) $ 19,765 $ 42,592 $ 49,125 $ 57,940 Average Assets $4,267,358 $ 4,365,389 $ 4,598,121 $ 5,074,129 GAAP ROA 0.73% 1.07% 1.17% 1.05% Core ROA (non-GAAP) 0.46% 0.98% 1.07% 1.14% For the year ended December 31, (dollars in thousands) 2016 2017 2018 2019 Net Income (GAAP) $ 64,080 $ 50,244 $ 134,743 $ 148,809 Adj: Plus/(less) core (after-tax)1 4,323 32,597 (20,436) 36,295 Adjusted net income (non-GAAP) $ 68,403 $ 82,841 $ 114,307 $ 185,104 Average Assets $6,042,824 $ 6,820,471 $ 7,014,447 $ 11,477,856 GAAP ROA 1.06% 0.74% 1.92% 1.30% Core ROA (non-GAAP) 1.13% 1.21% 1.63% 1.61% For the year ended December 31, (dollars in thousands) 2020 2021 2022 Net Income (GAAP) $ 114,774 $ 271,442 $ 222,375 Adj: Plus/(less) core (after-tax)1 (18,126) (2,893) 48,310 Adj: Plus BMT LD1 initial provision (after-tax) - - 17,565 Adjusted net income (non-GAAP) $ 96,648 $ 268,549 $ 288,250 Average Assets $ 13,148,317 $14,903,920 $20,463,695 GAAP ROA 0.87% 1.82% 1.09% Core ROA (non-GAAP) 0.74% 1.80% 1.41% For the year ended December 31, (dollars in thousands) 2018 2019 2020 2021 2022 Net interest income (as reported) $ 246,474 $ 444,948 $ 465,955 $ 433,649 $ 662,890 Core net interest income1 (non-GAAP) 246,474 444,948 465,955 433,649 662,890 Tax-equivalent income 1,360 1,215 1,151 1,000 1,908 Noninterest income (as reported) $ 162,541 $ 188,109 $ 201,025 $ 185,480 $ 260,134 Adj: Securities gains (21) (333) (9,076) (331) - Adj: Realized (gain) loss on sale of equity investment, net (3,757) - (22,052) 706 - Adj: Unrealized gain on equity investment, net (20,745) (26,175) (761) (5,141) (5,980) Adj. Visa B valuation adjustment - - - - 2,877 Core fee revenue (non-GAAP) $ 138,018 $ 161,601 $ 169,136 $ 180,714 $ 257,031 Core net revenue (non-GAAP) $ 384,492 $ 606,549 $ 635,091 $ 614,363 $ 919,921 Core net revenue (non-GAAP)(tax- equivalent) $ 385,852 $ 607,764 $ 636,242 $ 615,363 $ 921,829 Core fee revenue % (non-GAAP) 35.9% 26.6% 26.6% 29.4% 27.9% Core fee revenue % (non-GAAP)(tax- equivalent) 35.8% 26.6% 26.6% 29.4% 27.9% 1 For details on our core adjustments for full-year 2012 through 2022 refer to each years’ respective fourth quarter Earnings Release filed at Exhibit 99.1 on Form 8-K

32 Appendix: Non-GAAP Financial Information Three Months Ended Twelve Months Ended (dollars in thousands, except per share data) December 31, 2022 September 30, 2022 December 31, 2021 December 31, 2022 GAAP return on average assets (ROA) 1.69% 1.44% 1.45% 1.09% Plus/(less): Pre-tax adjustments1 0.03 0.10 (0.21) 0.30 (Plus)/less: Tax impact of pre-tax adjustments (0.01) (0.02) 0.04 (0.07) Core ROA (non-GAAP) 1.71% 1.52% 1.28% 1.32% 1 Pre-tax adjustments include unrealized (loss) gain on equity investments, net, Visa derivative valuation adjustment, corporate development and restructuring expense, and recovery of legal settlement
33 Stockholders or others seeking information regarding the Company may call or write: WSFS Financial Corporation Investor Relations WSFS Bank Center 500 Delaware Avenue Wilmington, DE 19801 302-504-9857 stockholderrelations@wsfsbank.com www.wsfsbank.com Rodger Levenson Chairman, President and CEO 302-571-7296 rlevenson@wsfsbank.com Dominic C. Canuso Chief Financial Officer 302-571-6833 dcanuso@wsfsbank.com


