UNITED STATES
SECURITIES AND EXCHANGE COMMISSION
Washington, D.C. 20549
FORM N-CSR
CERTIFIED SHAREHOLDER REPORT OF REGISTERED
MANAGEMENT INVESTMENT COMPANIES
Investment Company Act file number | 811-05476 |
|
LORD ABBETT GLOBAL FUND, INC. |
(Exact name of registrant as specified in charter) |
|
90 Hudson Street, Jersey City, NJ | | 07302 |
(Address of principal executive offices) | | (Zip code) |
|
Thomas R. Phillips, Vice President & Assistant Secretary 90 Hudson Street, Jersey City, NJ 07302 |
(Name and address of agent for service) |
|
Registrant’s telephone number, including area code: | (800) 201-6984 | |
|
Date of fiscal year end: | 12/31 | |
|
Date of reporting period: | 12/31/2007 | |
| | | | | | | | |
Item 1: Reports to Stockholders.
2007
LORD ABBETT ANNUAL REPORT

Lord Abbett
Global Equity Fund
Developing Local Markets Fund
For the fiscal year ended December 31, 2007

Lord Abbett Global Fund
Annual Report
For the fiscal year ended December 31, 2007
Dear Shareholders: We are pleased to provide you with this overview of the performance of the Lord Abbett Global Equity Fund and the Lord Abbett Developing Local Markets Fund (formerly the Lord Abbett Global Income Fund) for the year ended December 31, 2007. On this and the following pages, we discuss the major factors that influenced performance. For detailed and more timely information about the Funds, please visit our Website at www.lordabbett.com, where you also can access the quarterly commentaries of the Funds' portfolio managers.
General information about Lord Abbett mutual funds, as well as in-depth discussion of market trends and investment strategies, is also provided in Lord Abbett Insights, a newsletter accompanying your quarterly account statements. We also encourage you to call Lord Abbett at 888-522-2388 and speak to one of our professionals if you would like more information.
Thank you for investing in Lord Abbett mutual funds. We value the trust that you place in us and look forward to serving your investment needs in the years to come.
Best regards,

Robert S. Dow
Chairman

From left to right: Robert S. Dow, Director and Chairman of the Lord Abbett Funds; E. Thayer Bigelow, Independent Lead Director of the Lord Abbett Funds; and Daria L. Foster, Director and President of the Lord Abbett Funds.
Q: What were the overall market conditions during the year ended December 31, 2007?
A: International equity markets posted strong returns for the 12-month period ended December 31, 2007. The MSCI EAFE® Index with Net Dividends,1 primarily a large company index, rose 11.17% (in U.S. dollar terms), and the S&P/Citigroup Extended Market World ex-U.S. Index,2 primarily a small company index, rose 7.32% (in U.S. dollar terms), outperforming the U.S. equity markets, as measured by the S&P 500® Index,3 which rose 5.49% (in U.S. dollar terms). Developed markets, including Europe, which made up 70% of the MSCI EAFE Index as of December 31, 2007, had a strong 12-month period with positive
1
returns posted by developed market indexes. Emerging markets also performed well, as the MSCI Emerging Markets Index with Net Dividends4 returned 39.39% (in U.S. dollar terms) over the period.
While markets outside the U.S. performed well during the 12-month period, the performance belies the volatility experienced during the year owing to concerns about rising oil prices, the U.S. subprime market, and the subsequent deterioration in credit markets. As a result, financial stocks were hit hardest globally. The U.S. Federal Reserve Board (the Fed) reacted by cutting the discount rate by 50 basis points (bps) on September 18 in an attempt to allow banks access to funding. This provided a brief respite for global markets, but bank/financial stocks began to falter again as third quarter earnings disappointed. By the end of October, bank/financial stocks rallied in anticipation of the Fed's rate cut of 25 bps on October 31. However, the last two months of the year proved to be volatile as renewed credit worries sapped confidence.
Oil prices for most of the year were quite volatile owing to geopolitical concerns. At the beginning of the year, oil was trading at below $60 per barrel, which contrasts with its sharp increase over the subsequent 12 months, when it reached its all-time high of almost $100 per barrel.
Emerging equity markets finished the year quite strongly, reflecting the strong economic fundamentals in developing economies. Global demand for commodity exports from countries like Brazil and Chile remained strong, although prices in some commodities, like Chilean copper, seemed to stabilize. Latin America and Asia, in particular, significantly outperformed the developed markets. The U.S. dollar lost ground in global currency markets during much of the year.
Lord Abbett Global Equity Fund
Q: How did the Global Equity Fund perform during the year ended December 31, 2007?
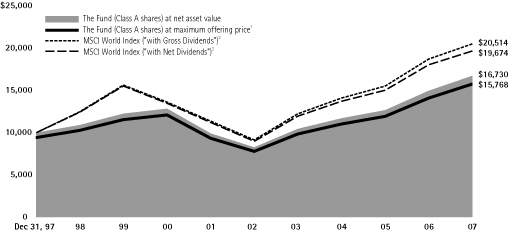
A: The Fund returned 11.82%, reflecting performance at the net asset value (NAV) of Class A shares with all distributions reinvested, compared to its benchmark, the MSCI World Index with Gross Dividends,5 which returned 9.57% over the same period.
Q: What were the most significant factors affecting performance?
A: The greatest contributors to the Fund's performance relative to its benchmark for the one-year period were the financials sector (owing to an underweight position), the materials sector, and the healthcare sector.
Among the individual holdings that contributed to performance were materials holdings Monsanto Co. (the Fund's number-one contributor), a
2
provider of technology-based solutions and agricultural products for growers and downstream customers in the agricultural markets, and Alcan Inc., a multinational aluminum industry company; financials holdings National Bank of Greece S.A., an international provider of retail and corporate banking services, and Agile Property Holdings Ltd., a developer of properties in the Guangdong province, China; and consumer discretionary holding GameStop Corp., an operator of specialty electronic game and PC entertainment software stores.
The worst detractors from the Fund's performance were the energy sector and the consumer discretionary sector.
Among the individual holdings that detracted from performance were energy holding Electromagnetic GeoServices AS (the Fund's number-one detractor), a specialist in seabed logging, a technique used in the search for offshore hydrocarbons; and four financials holdings: Citigroup Inc., a worldwide provider of a broad range of financial services, Orix Corp., a worldwide provider of comprehensive financial services, The Royal Bank of Scotland Group plc, a provider of banking, insurance, and finance-related activities, and Sumitomo Mitsui Financial Group, Inc., a Japanese supplier of commercial banking and a variety of financial services.
The Fund's portfolio is actively managed and, therefore, its holdings and weightings of a particular issuer or particular sector as a percentage of portfolio assets are subject to change. Sectors may include many industries.
Lord Abbett Developing Local Markets Fund
(Prior to June 29, 2007, the Lord Abbett Developing Local Markets Fund was known as the Lord Abbett Global Income Fund. Performance commentary in this report is divided into two components of six months each. The first six months of the calendar year reflect the Fund's investment strategy and benchmark as a global bond fund. Effective June 29, 2007, the Fund adopted a new investment objective, investment strategy, and benchmark. Since that date, the Fund seeks high total return through investing primarily in instruments that provide investment exposure to the currencies of, and in fixed-income instruments denominated in the currencies of, developing markets. Developing markets include countries in Asia, Africa, the Middle East, Latin America, and Europe. Accordingly, the performance discussed for the second six–month period of the calendar year reflects this new strategy.)
3
Q: How did the Developing Local Markets Fund perform during the year ended December 31, 2007?
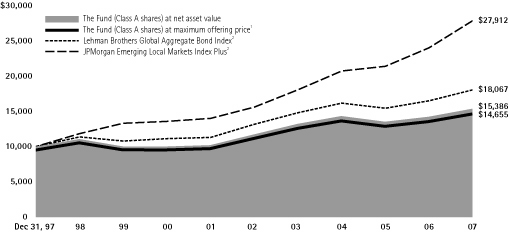
A: The Fund returned 7.98%, reflecting performance at the net asset value (NAV) of Class A shares with all distributions reinvested, compared to its benchmark, the Lehman Brothers Global Aggregate Bond Index,6 which returned 9.41% over the same period. The Fund's new benchmark, the JPMorgan Emerging Local Markets Index Plus,7 returned 9.33% for the six-month period ended December 31, 2007.
Q: What were the most significant factors affecting performance?
A: The Fund was managed as a global bond fund in the first six months of the calendar year. The following performance discussion reflects the global bond fund strategy from January 1, 2007, through June 28, 2007. Performance is relative to the Lehman Brothers Global Aggregate Bond Index6. Detracting from performance relative to its benchmark was the portfolio's overweight position in mortgage-backed securities, particularly commercial mortgage-backed securities, which were negatively affected by the distress in the U.S. subprime mortgage market. Spreads between mortgages and U.S. Treasuries widened in the period.
Contributing to performance relative to its benchmark were the portfolio's holdings in Brazilian and Mexican bonds, both of which were bought and then sold during the period. In the currency market, the portfolio's underweight position in the U.S. dollar and overweight in euro and British pound added to performance as the Bank of England and the European Central Bank raised rates. Also helping performance was the portfolio's overweight position in long–term European bonds and an underweight position in intermediate-term bonds. An underweight position in investment-grade bonds aided performance as spreads between that sector and U.S. Treasuries widened.
The Fund was managed as a developing local markets currency fund in the second half of the year. The following performance discussion reflects the local developing markets strategy from June 29, 2007, through December 31, 2007. Performance is relative to the JPMorgan Emerging Local Markets Index Plus7. A key strategy employed by the Fund was to overweight currencies of countries that are benefiting from high commodity prices, such as the Brazilian real and Chilean peso. The portfolio was overweight in both currencies in the calendar year. The portfolio also had an overweight position in the Turkish lira, as that currency benefited from that nation's continuing economic strength. Also contributing to performance in the period was the portfolio's underweight in lower-yielding Asian currencies, such as the Taiwan and Hong Kong dollars. Detracting from performance during the calendar year was the portfolio's overweight in the Indonesi an rupiah.
The Fund's portfolio is actively managed and, therefore, its holdings and weightings of a particular issuer or particular sector as a percentage of portfolio assets are subject to change. Sectors may include many industries.
4
A prospectus contains important information about a fund, including its investment objectives, risks, charges, and ongoing expenses, which an investor should carefully consider before investing. To obtain a prospectus on any Lord Abbett mutual fund, please contact your investment professional or Lord Abbett Distributor LLC at 888-522-2388 or visit our Website at www.lordabbett.com. Read the prospectus carefully before investing.
1 The MSCI EAFE® Index with Net Dividends—The MSCI Europe, Australasia, and Far East (EAFE)® Index includes stocks traded on 21 exchanges in Europe, Australasia, and the Far East. It is an unmanaged capitalization index representing the industry composition and a sampling of small, medium, and large capitalization companies from the aforementioned global markets.
2 The S&P/Citigroup Global Equity Index System and the names of each of the indexes and subindexes that it comprises (each an "Index" and collectively, the "Indexes") are service marks of Citigroup. The S&P/Citigroup EMI World ex-U.S. Index is a subset of the Global Citigroup Extended Market Index (EMI). The World ex-U.S. composite includes all developed countries except the United States.
3 The S&P 500® Index is widely regarded as the standard for measuring large-cap U.S. stock market performance and includes a representative sample of leading companies in leading industries.
4 The MSCI Emerging Markets Index with Net Dividends is a free float-adjusted market capitalization index that is designed to measure equity market performance in the global emerging markets. As of June 2007, the MSCI Emerging Markets Index consisted of the following 25 emerging market country indexes: Argentina, Brazil, Chile, China, Colombia, Czech Republic, Egypt, Hungary, India, Indonesia, Israel, Jordan, Korea, Malaysia, Mexico, Morocco, Pakistan, Peru, Philippines, Poland, Russia, South Africa, Taiwan, Thailand, and Turkey.
5 The MSCI World Index with Gross Dividends is an unmanaged capitalization index representing the industry composition and a sampling of small, medium and large capitalization companies from global markets. It is a Morgan Stanley International Index that includes stocks traded on 21 exchanges in Europe, Australasia, and the Far East.
6 The Lehman Brothers Global Aggregate Bond Index is a broad-based measure of the global investment-grade, fixed income markets. The three major components of this index are the U.S. Aggregate, the Pan-European Aggregate, and the Asian-Pacific Aggregate Indexes. The index also includes eurodollar and euro/yen corporate bonds, Canadian government securities, and U.S. dollar investment-grade 144A securities.
7 The JPMorgan Emerging Local Markets Index Plus (ELMI+) tracks total returns for emerging markets local-currency-denominated money market instruments. The benchmark instrument of the index is FX forward contracts, and these are laddered with maturities ranging from one to three months. Country weights are based on a trade-weighted allocation, with maximum weight of 10% for countries with convertible currencies and 2% for countries with nonconvertible currencies.
Indexes are unmanaged, do not reflect the deduction of fees or expenses, and are not available for direct investment.
Important Performance and Other Information
Performance data quoted reflect past performance and are no guarantee of future results. Current performance may be higher or lower than the performance quoted. The investment return and principal value of an investment in the Funds will fluctuate so that shares, on any given day or when redeemed, may be worth more or less than their original cost. You can obtain performance data current to the most recent month-end by calling Lord Abbett at 888-522-2388 or referring to our Website at www.lordabbett.com.
Except where noted, comparative Fund performance does not account for the deduction of sales charges and would be different if sales charges were included. Each Fund offers additional classes of shares with distinct pricing options. For a full description of the differences in pricing alternatives, please see the Funds' prospectuses.
During certain periods shown, expense reimbursements were in place. Without such expense reimbursements, the Funds' returns would have been lower.
The views of the Funds' management and the portfolio holdings described in this report are as of December 31, 2007; these views and portfolio holdings may have changed subsequent to this date, and they do not guarantee the future performance of the markets or the Funds. Information provided in this report should not be considered a recommendation to purchase or sell securities.
A Note about Risk: See Notes to Financial Statements for a discussion of investment risks. For a more detailed discussion of the risks associated with the Funds, please see the Funds' prospectuses.
Mutual funds are not insured by the FDIC, are not deposits or other obligations of, or guaranteed by banks, and are subject to investment risks including possible loss of principal amount invested.
5
Global Equity Fund
Investment Comparison
Below is a comparison of a $10,000 investment in Class A shares with the same investment in the Morgan Stanley Capital International (MSCI) World Index ("With Gross Dividends") and the MSCI World Index ("With Net Dividends"), assuming reinvestment of all dividends and distributions. "With Net Dividends" reflects a reduction in dividends after taking into account withholding of taxes by certain foreign countries represented in the MSCI World Index. The performance of the other classes will be greater than or less than the performance shown in the graph below due to different sales loads and expenses applicable to such classes. The graph and performance table below do not reflect the deduction of taxes that a shareholder would pay on Fund distributions or the redemption of Fund shares. Past performance is no guarantee of future results.
Average Annual Total Return at Maximum Applicable
Sales Charge for the Periods Ended December 31, 2007
| | | 1 Year | | 5 Years | | 10 Years | | Life of Class | |
| Class A3 | | | 5.41 | % | | | 13.77 | % | | | 4.65 | % | | | — | | |
| Class B4 | | | 7.13 | % | | | 14.27 | % | | | 4.59 | % | | | — | | |
| Class C5 | | | 11.14 | % | | | 14.40 | % | | | 4.59 | % | | | — | | |
| Class F6 | | | — | | | | — | | | | — | | | | - | 1.67%* | |
| Class I7 | | | 12.25 | % | | | — | | | | — | | | | 16.09 | % | |
1 Reflects the deduction of the maximum initial sales charge of 5.75%.
2 Performance for each unmanaged index does not reflect transaction costs, management fees or sales charges. The performance of the indexes is not necessarily representative of the Fund's performance.
3 Total return, which is the percent change in net asset value, after deduction of the maximum initial sales charge of 5.75% applicable to Class A shares, with all distributions reinvested for the periods shown ending December 31, 2007, is calculated using the SEC-required uniform method to compute such return.
4 Performance reflects the deduction of a CDSC of 4% for 1 year, 1% for 5 years and 0% for 10 years.
5 The 1% CDSC for Class C shares normally applies before the first anniversary of the purchase date. Performance is at net asset value.
6 Class F shares commenced operations on September 28, 2007. The SEC effective date was September 14, 2007. Performance for the Class began September 28, 2007. Performance is at net asset value.
7 Effective September 28, 2007, Class Y was renamed Class I. Class I shares were first offered on October 19, 2004. Performance is at net asset value.
* Because Class F shares have existed for less than one year, average annual returns are not provided.
6
Developing Local Markets
Investment Comparison
Below is a comparison of a $10,000 investment in Class A shares with the same investment in the Lehman Brothers Global Aggregate Bond Index and the JPMorgan Emerging Local Markets Index Plus, assuming reinvestment of all dividends and distributions. The Fund believes that the JPMorgan Emerging Local Markets Index Plus is a more appropriate benchmark for the Fund as a measure of the Fund's performance, and therefore will remove Lehman Brothers Global Aggregate Bond Index in its 2008 Annual Report. The performance of the other classes will be greater than or less than the performance shown in the graph below due to different sales loads and expenses applicable to such classes. The graph and performance table below do not reflect the deduction of taxes that a shareholder would pay on Fund distributions or the redemption of Fund shares. Past performance is no guarantee of future results.
Average Annual Total Return at Maximum Applicable
Sales Charge for the Periods Ended December 31, 2007
| | | 1 Year | | 5 Years | | 10 Years | | Life of Class | |
| Class A3 | | | 2.87 | % | | | 4.56 | % | | | 3.90 | % | | | — | | |
| Class B4 | | | 3.33 | % | | | 4.73 | % | | | 3.74 | % | | | — | | |
| Class C5 | | | 7.27 | % | | | 4.93 | % | | | 3.77 | % | | | — | | |
| Class F6 | | | — | | | | — | | | | — | | | | 3.56 | %* | |
| Class I7 | | | 8.20 | % | | | — | | | | — | | | | 4.36 | % | |
| Class P8 | | | 7.96 | % | | | 5.38 | % | | | — | | | | 4.12 | % | |
| Class R29 | | | — | | | | — | | | | — | | | | 3.45 | %* | |
| Class R310 | | | — | | | | — | | | | — | | | | 3.48 | %* | |
1 Reflects the deduction of the maximum initial sales charge of 4.75%.
2 Performance for each unmanaged index does not reflect transaction costs, management fees or sales charges. The performance of the indexes is not necessarily representative of the Fund's performance.
3 Total return, which is the percent change in net asset value, after deduction of the maximum initial sales charge of 4.75% applicable to Class A shares, with all dividends and distributions reinvested for the periods shown ending December 31, 2007, is calculated using the SEC-required uniform method to compute such return.
4 Performance reflects the deduction of a CDSC of 4% for 1 year, 1% for 5 years and 0% for 10 years.
5 The 1% CDSC for Class C shares normally applies before the first anniversary of the purchase date. Performance is at net asset value.
6 Class F shares commenced operations on September 28, 2007. The SEC effective date was September 14, 2007. Performance for the Class began September 28, 2007. Performance is at net asset value.
7 Effective September 28, 2007, Class Y was renamed Class I. Class I shares were first offered on October 19, 2004. Performance is at net asset value.
8 Class P shares were first offered on March 4, 1999. Performance is at net asset value.
9 Class R2 shares commenced operations on September 28, 2007. The SEC effective date was September 14, 2007. Performance for the Class began September 28, 2007. Performance is at net asset value.
10 Class R3 shares commenced operations on September 28, 2007. The SEC effective date was September 14, 2007. Performance for the Class began September 28, 2007. Performance is at net asset value.
* Because Class F, R2 and R3 shares have existed for less than one year, average annual returns are not provided.
7
Expense Example
As a shareholder of a Fund, you incur two types of costs: (1) transaction costs, including sales charges on purchase payments (these charges vary among the share classes); and (2) ongoing costs, including management fees; distribution and service (12b-1) fees (these charges vary among the share classes); and other Fund expenses. This Example is intended to help you understand your ongoing costs (in dollars) of investing in each Fund and to compare these costs with the ongoing costs of investing in other mutual funds.
The Example is based on an investment of $1,000 invested at the beginning of the period and held for the entire period (July 1, 2007 through December 31, 2007).
Actual Expenses
For each class of each Fund, the first line of the table on the following pages provides information about actual account values and actual expenses. You may use the information in this line, together with the amount you invested, to estimate the expenses that you paid over the period. Simply divide your account value by $1,000 (for example, an $8,600 account value divided by $1,000 = 8.6), then multiply the result by the number in the first line under the heading entitled "Expenses Paid During the Period 7/1/07 – 12/31/07" to estimate the expenses you paid on your account during this period.
Hypothetical Example for Comparison Purposes
For each class of each Fund, the second line of the table on the following pages provides information about hypothetical account values and hypothetical expenses based on the Fund's actual expense ratio and an assumed rate of return of 5% per year before expenses, which is not the Fund's actual return. The hypothetical account values and expenses may not be used to estimate the actual ending account balance or expenses you paid for the period. You may use this information to compare the ongoing costs of investing in each Fund and other funds. To do so, compare this 5% hypothetical example with the 5% hypothetical examples that appear in the shareholder reports of the other funds.
8
Global Equity Fund
Please note that the expenses shown in the table are meant to highlight your ongoing costs only and do not reflect any transactional costs, such as sales charges. Therefore, the second line of the table is useful in comparing ongoing costs only, and will not help you determine the relative total costs of owning different funds. In addition, if these transactional costs were included, your costs would have been higher.
| | | Beginning
Account
Value | | Ending
Account
Value | | Expenses
Paid During
Period† | |
| | | 7/1/07 | | 12/31/07 | | 7/1/07 –
12/31/07 | |
| Class A | |
| Actual | | $ | 1,000.00 | | | $ | 1,022.00 | | | $ | 8.15 | | |
| Hypothetical (5% Return Before Expenses) | | $ | 1,000.00 | | | $ | 1,017.14 | | | $ | 8.13 | | |
| Class B | |
| Actual | | $ | 1,000.00 | | | $ | 1,018.20 | | | $ | 11.45 | | |
| Hypothetical (5% Return Before Expenses) | | $ | 1,000.00 | | | $ | 1,013.86 | | | $ | 11.42 | | |
| Class C | |
| Actual | | $ | 1,000.00 | | | $ | 1,018.90 | | | $ | 11.45 | | |
| Hypothetical (5% Return Before Expenses) | | $ | 1,000.00 | | | $ | 1,013.86 | | | $ | 11.42 | | |
| Class F | |
| Actual | | $ | 1,000.00 | | | $ | 983.30 | | | $ | 2.99 | | |
| Hypothetical (5% Return Before Expenses) | | $ | 1,000.00 | | | $ | 1,022.18 | | | $ | 3.05 | | |
| Class I | |
| Actual | | $ | 1,000.00 | | | $ | 1,023.90 | | | $ | 6.38 | | |
| Hypothetical (5% Return Before Expenses) | | $ | 1,000.00 | | | $ | 1,018.91 | | | $ | 6.36 | | |
† For each class of the Fund, expenses are equal to the annualized expense ratio for such class (1.60% for Class A, 2.25% for Classes B and C, 1.16% for Class F and 1.25% for Class I) multiplied by the average value the period, multiplied by 184/365 for Class A, B, C and I (to reflect one-half year period) and multiplied by 95/365 for Class F (to reflect the period September 28, 2007, commencement of investment operations, to December 31, 2007).
Portfolio Holdings Presented by Sector
December 31, 2007
| Sector* | | %** | |
| Consumer Discretionary | | | 6.47 | % | |
| Consumer Staples | | | 14.56 | % | |
| Energy | | | 6.90 | % | |
| Financials | | | 15.80 | % | |
| Health Care | | | 11.00 | % | |
| Industrials | | | 10.71 | % | |
| Information Technology | | | 11.89 | % | |
| Materials | | | 6.11 | % | |
| Telecommunication Services | | | 6.91 | % | |
| Utilities | | | 5.89 | % | |
| Short-Term Investments | | | 3.76 | % | |
| Total | | | 100.00 | % | |
* A sector may comprise several industries.
** Represents percent of total investments.
9
Developing Local Markets Fund
Please note that the expenses shown in the table are meant to highlight your ongoing costs only and do not reflect any transactional costs, such as sales charges. Therefore, the second line of the table is useful in comparing ongoing costs only, and will not help you determine the relative total costs of owning different funds. In addition, if these transactional costs were included, your costs would have been higher.
| | | Beginning
Account
Value | | Ending
Account
Value | | Expenses
Paid During
Period† | |
| | | 7/1/07 | | 12/31/07 | | 7/1/07 –
12/31/07 | |
| Class A | |
| Actual | | $ | 1,000.00 | | | $ | 1,080.70 | | | $ | 5.09 | | |
| Hypothetical (5% Return Before Expenses) | | $ | 1,000.00 | | | $ | 1,020.33 | | | $ | 4.94 | | |
| Class B | |
| Actual | | $ | 1,000.00 | | | $ | 1,077.10 | | | $ | 8.48 | | |
| Hypothetical (5% Return Before Expenses) | | $ | 1,000.00 | | | $ | 1,017.06 | | | $ | 8.24 | | |
| Class C | |
| Actual | | $ | 1,000.00 | | | $ | 1,077.10 | | | $ | 8.48 | | |
| Hypothetical (5% Return Before Expenses) | | $ | 1,000.00 | | | $ | 1,017.06 | | | $ | 8.24 | | |
| Class F | |
| Actual | | $ | 1,000.00 | | | $ | 1,035.10 | | | $ | 1.69 | | |
| Hypothetical (5% Return Before Expenses) | | $ | 1,000.00 | | | $ | 1,023.54 | | | $ | 1.69 | | |
| Class I | |
| Actual | | $ | 1,000.00 | | | $ | 1,081.00 | | | $ | 3.15 | | |
| Hypothetical (5% Return Before Expenses) | | $ | 1,000.00 | | | $ | 1,022.16 | | | $ | 3.06 | | |
| Class P | |
| Actual | | $ | 1,000.00 | | | $ | 1,080.70 | | | $ | 5.40 | | |
| Hypothetical (5% Return Before Expenses) | | $ | 1,000.00 | | | $ | 1,020.00 | | | $ | 5.24 | | |
| Class R2 | |
| Actual | | $ | 1,000.00 | | | $ | 1,034.00 | | | $ | 2.70 | | |
| Hypothetical (5% Return Before Expenses) | | $ | 1,000.00 | | | $ | 1,022.56 | | | $ | 2.68 | | |
| Class R3 | |
| Actual | | $ | 1,000.00 | | | $ | 1,034.20 | | | $ | 2.49 | | |
| Hypothetical (5% Return Before Expenses) | | $ | 1,000.00 | | | $ | 1,022.75 | | | $ | 2.47 | | |
† For each class of the Fund, expenses are equal to the annualized expense ratio for such class (0.97% for Class A, 1.62% for Classes B and C, 0.64% for Class F, 0.60% for Class I, 1.03% for Class P, 1.02% for Class R2 and 0.94% for Class R3) multiplied by the average account value over the period, multiplied by 184/365 for Class A, B, C, I and P (to reflect one-half year period) and mutiplied by 95/365 for Class F, R2 and R3 (to reflect the period September 28, 2007, commencement of investment operations, to December 31, 2007).
Portfolio Holdings Presented by Sector
| December 31, 2007 | |
| Sector* | | %** | |
| Agency | | | 0.64 | % | |
| Asset Backed | | | 47.31 | % | |
| Banking | | | 13.56 | % | |
| Basic Industry | | | 0.05 | % | |
| Consumer Cyclical | | | 0.04 | % | |
| Consumer Non-Cyclical | | | 0.13 | % | |
| Finance & Investment | | | 6.19 | % | |
| Government Guaranteed | | | 0.25 | % | |
| Sector* | | %** | |
| Media | | | 0.80 | % | |
| Mortgage Backed | | | 21.61 | % | |
| Services Cyclical | | | 0.09 | % | |
| Sovereign | | | 6.12 | % | |
| Telecommunications | | | 1.93 | % | |
| Short-Term Investments | | | 1.28 | % | |
| Total | | | 100.00 | % | |
* A sector may comprise several industries.
** Represents percent of total investments.
10
Schedule of Investments
GLOBAL EQUITY FUND December 31, 2007
| Investments | | Shares | | U.S. $
Value
(000) | |
| LONG-TERM INVESTMENTS 96.94% | |
| COMMON STOCKS 96.63% | |
| Australia 0.78% | |
| Boart Longyear Group* | | | 234,682 | | | $ | 484 | | |
| Sonic Healthcare Ltd. | | | 33,086 | | | | 486 | | |
| Total | | | 970 | | |
| Belgium 1.21% | |
| Delhaize Group | | | 9,431 | | | | 830 | | |
| KBC Group NV | | | 4,768 | | | | 671 | | |
| Total | | | 1,501 | | |
| Brazil 1.13% | |
| Bovespa Holding S.A.* | | | 28,700 | | | | 553 | | |
| EDP-Energias do Brasil S.A. | | | 20,100 | | | | 326 | | |
| Rossi Residencial S.A. | | | 6,400 | | | | 164 | | |
| Souza Cruz S.A. | | | 13,100 | | | | 355 | | |
| Total | | | 1,398 | | |
| Canada 3.12% | |
| Addax Petroleum Corp. | | | 28,650 | | | | 1,247 | | |
| Barrick Gold Corp. | | | 27,506 | | | | 1,157 | | |
| Equinox Minerals Ltd.* | | | 135,400 | | | | 749 | | |
| OPTI Canada Inc.* | | | 15,490 | | | | 260 | | |
| Teck Cominco Ltd. Class B | | | 12,504 | | | | 449 | | |
| Total | | | 3,862 | | |
| China 0.67% | |
Guangzhou R&F Properties
Co., Ltd. | | | 93,600 | | | | 334 | | |
Yanzhou Coal Mining
Co., Ltd. | | | 253,000 | | | | 501 | | |
| Total | | | 835 | | |
| Czech Republic 0.23% | |
| CEZ, a.s. | | | 3,834 | | | | 285 | | |
| Egypt 0.81% | |
Orascom Telecom Holding
(S.A.E.) GDR | | | 12,100 | | | | 1,004 | | |
| Investments | | Shares | | U.S. $
Value
(000) | |
| Finland 0.81% | |
| Nokia Oyj ADR | | | 26,100 | | | $ | 1,002 | | |
| France 4.30% | |
| AXA | | | 12,977 | | | | 520 | | |
| BNP Paribas S.A. | | | 10,518 | | | | 1,141 | | |
Casino Guichard-Perrachon
S.A. | | | 7,332 | | | | 797 | | |
| Schneider Electric S.A. | | | 7,025 | | | | 952 | | |
| SUEZ S.A. | | | 13,990 | | | | 953 | | |
| Vivendi S.A. | | | 20,949 | | | | 961 | | |
| Total | | | 5,324 | | |
| Germany 6.25% | |
Bayerische Motoren
Werke AG | | | 10,654 | | | | 661 | | |
Deutsche Telekom AG
Registered Shares | | | 42,537 | | | | 936 | | |
| E. On AG | | | 4,928 | | | | 1,048 | | |
Fresenius Medical Care
AG & Co. KGaA | | | 23,614 | | | | 1,268 | | |
| Henkel KGaA | | | 20,308 | | | | 1,038 | | |
| Linde AG | | | 7,268 | | | | 963 | | |
| Merck KGaA | | | 3,973 | | | | 514 | | |
| Siemens AG | | | 5,463 | | | | 868 | | |
| Symrise GmbH & Co. AG* | | | 15,731 | | | | 444 | | |
| Total | | | 7,740 | | |
| Greece 1.98% | |
| Folli-Follie S.A. | | | 6,609 | | | | 247 | | |
Hellenic Telecomn
Organization S.A. | | | 13,742 | | | | 506 | | |
National Bank of
Greece S.A. | | | 24,738 | | | | 1,699 | | |
| Total | | | 2,452 | | |
| Hong Kong 1.52% | |
BOC Hong Kong
(Holdings) Ltd. | | | 282,500 | | | | 792 | | |
| China Unicom Ltd. | | | 164,860 | | | | 378 | | |
Galaxy Entertainment
Group Ltd.* | | | 558,000 | | | | 525 | | |
See Notes to Financial Statements.
11
Schedule of Investments (continued)
GLOBAL EQUITY FUND December 31, 2007
| Investments | | Shares | | U.S. $
Value
(000) | |
| Hong Kong (continued) | |
REXCAPITAL Financial
Holdings Ltd.* | | | 950,000 | | | $ | 181 | | |
| Total | | | 1,876 | | |
| India 0.50% | |
Tata Consultancy
Services Ltd. | | | 22,714 | | | | 621 | | |
| Indonesia 0.59% | |
| Indosat tbk PT | | | 805,500 | | | | 735 | | |
| Italy 1.36% | |
| Finmeccanica S.p.A. | | | 23,781 | | | | 763 | | |
| Telecom Italia S.p.A. | | | 298,609 | | | | 926 | | |
| Total | | | 1,689 | | |
| Japan 6.17% | |
| Capcom Co., Ltd. | | | 12,200 | | | | 311 | | |
| Don Quijote Co., Ltd. | | | 18,100 | | | | 356 | | |
| East Japan Railway Co. | | | 109 | | | | 897 | | |
| Nintendo Co., Ltd. | | | 1,000 | | | | 587 | | |
Nippon Commercial
Investment REIT | | | 199 | | | | 878 | | |
| NSK Ltd. | | | 85,000 | | | | 871 | | |
| NTT DoCoMo, Inc. | | | 292 | | | | 481 | | |
| Ricoh Co., Ltd. | | | 49,600 | | | | 905 | | |
| Sumitomo Corp. | | | 53,100 | | | | 743 | | |
| Tokyo Tatemono Co., Ltd. | | | 71,000 | | | | 666 | | |
| Yamada Denki Co., Ltd. | | | 8,410 | | | | 949 | | |
| Total | | | 7,644 | | |
| Mexico 0.41% | |
Desarrolladora Homex,
S.A. de C.V. ADR* | | | 10,300 | | | | 509 | | |
| Netherlands 1.37% | |
| ING Groep N.V. CVA | | | 12,577 | | | | 492 | | |
| Koninklijke Ahold N.V.* | | | 22,759 | | | | 317 | | |
| Schlumberger Ltd. | | | 9,046 | | | | 890 | | |
| Total | | | 1,699 | | |
| Investments | | Shares | | U.S. $
Value
(000) | |
| Norway 1.29% | |
Electromagnetic
Geo-Services ASA* | | | 30,800 | | | $ | 287 | | |
Petroleum
Geo-Services ASA* | | | 45,290 | | | | 1,304 | | |
| Total | | | 1,591 | | |
| Philippines 0.21% | |
| Manila Electric Co. | | | 129,800 | | | | 256 | | |
| Portugal 0.51% | |
EDP-Electricidade De
Portugal, S.A. | | | 97,456 | | | | 637 | | |
| South Africa 1.13% | |
Impala Platinum
Holdings Ltd. | | | 25,425 | | | | 882 | | |
| MTN Group Ltd. | | | 27,898 | | | | 523 | | |
| Total | | | 1,405 | | |
| South Korea 1.20% | |
| Kookmin Bank* | | | 8,150 | | | | 601 | | |
| Pusan Bank* | | | 18,760 | | | | 312 | | |
Samsung Electronics
Co., Ltd. | | | 982 | | | | 578 | | |
| Total | | | 1,491 | | |
| Switzerland 3.28% | |
| Credit Suisse Group | | | 6,800 | | | | 409 | | |
Julius Baer Holding AG
Registered Shares | | | 12,645 | | | | 1,038 | | |
Lonza Group Ltd. AG
Registered Shares | | | 3,743 | | | | 453 | | |
Nestle S.A.
Registered Shares | | | 2,386 | | | | 1,096 | | |
| Roche Holding Ltd. AG | | | 6,179 | | | | 1,068 | | |
| Total | | | 4,064 | | |
| Taiwan 1.09% | |
| Acer Inc. | | | 342,830 | | | | 671 | | |
Taiwan Semiconductor
Manufacturing Co.,
Ltd. ADR | | | 67,924 | | | | 677 | | |
| Total | | | 1,348 | | |
See Notes to Financial Statements.
12
Schedule of Investments (continued)
GLOBAL EQUITY FUND December 31, 2007
| Investments | | Shares | | U.S. $
Value
(000) | |
| United Kingdom 10.20% | |
| Aegis Group plc | | | 237,279 | | | $ | 553 | | |
| Aviva plc | | | 23,820 | | | | 319 | | |
| BAE Systems plc | | | 146,880 | | | | 1,456 | | |
BlueBay Asset
Management plc | | | 48,669 | | | | 344 | | |
British American
Tobacco plc | | | 19,850 | | | | 776 | | |
| Diageo plc | | | 36,769 | | | | 790 | | |
| Diageo plc ADR | | | 3,537 | | | | 304 | | |
| easyJet plc* | | | 52,749 | | | | 644 | | |
| National Grid plc | | | 62,009 | | | | 1,029 | | |
| Prudential plc | | | 60,868 | | | | 863 | | |
| Reckitt Benckiser plc | | | 8,233 | | | | 478 | | |
| Reed Elsevier Group plc | | | 75,843 | | | | 1,026 | | |
| SABMiller plc | | | 35,555 | | | | 1,002 | | |
| Shire plc | | | 19,846 | | | | 454 | | |
| Tesco plc | | | 59,521 | | | | 565 | | |
| Tullow Oil plc | | | 59,220 | | | | 768 | | |
| Vodafone Group plc | | | 337,468 | | | | 1,262 | | |
| Total | | | 12,633 | | |
| United States 44.51% | |
| Abbott Laboratories | | | 23,100 | | | | 1,297 | | |
| Activision, Inc.* | | | 10,664 | | | | 317 | | |
| Adobe Systems Inc.* | | | 10,933 | | | | 467 | | |
Advanced Micro
Devices, Inc.* | | | 2,500 | | | | 19 | | |
| Agilent Technologies, Inc.* | | | 11,100 | | | | 408 | | |
| Altria Group, Inc. | | | 5,900 | | | | 446 | | |
| American Express Co. | | | 2,803 | | | | 146 | | |
American International
Group, Inc. | | | 7,199 | | | | 420 | | |
| Amgen Inc.* | | | 10,500 | | | | 488 | | |
Amylin Pharmaceuticals,
Inc.* | | | 5,100 | | | | 189 | | |
| Anheuser-Busch Cos., Inc. | | | 4,200 | | | | 220 | | |
| Aon Corp. | | | 12,200 | | | | 582 | | |
| Archer Daniels Midland Co. | | | 20,500 | | | | 952 | | |
| Investments | | Shares | | U.S. $
Value
(000) | |
| AT&T Inc. | | | 38,310 | | | $ | 1,592 | | |
| Baker Hughes, Inc. | | | 4,088 | | | | 332 | | |
| Bank of America Corp. | | | 11,164 | | | | 461 | | |
Bank of New York
Mellon Corp. | | | 20,205 | | | | 985 | | |
| Baxter International, Inc. | | | 8,183 | | | | 475 | | |
| Best Buy Co., Inc. | | | 8,500 | | | | 448 | | |
| Boeing Co. (The) | | | 7,500 | | | | 656 | | |
| Bristol-Myers Squibb Co. | | | 10,700 | | | | 284 | | |
| Campbell Soup Co. | | | 11,500 | | | | 411 | | |
| Caterpillar Inc. | | | 2,258 | | | | 164 | | |
| Celgene Corp.* | | | 12,100 | | | | 559 | | |
| Chevron Corp. | | | 9,671 | | | | 903 | | |
| Cisco Systems, Inc.* | | | 31,800 | | | | 861 | | |
| Citigroup, Inc. | | | 11,444 | | | | 337 | | |
| Coach, Inc.* | | | 6,200 | | | | 190 | | |
| Coca-Cola Co. (The) | | | 20,600 | | | | 1,264 | | |
| Colgate-Palmolive Co. | | | 10,167 | | | | 793 | | |
| Comcast Corp. Class A* | | | 6,837 | | | | 124 | | |
| ConocoPhillips | | | 3,658 | | | | 323 | | |
| Corning, Inc. | | | 20,754 | | | | 498 | | |
| CVS Caremark Corp. | | | 23,952 | | | | 952 | | |
| Dominion Resources, Inc. | | | 12,700 | | | | 603 | | |
| Electronic Arts Inc.* | | | 17,100 | | | | 999 | | |
| Eli Lilly & Co. | | | 8,600 | | | | 459 | | |
| Emerson Electric Co. | | | 9,620 | | | | 545 | | |
| Express Scripts, Inc.* | | | 12,100 | | | | 883 | | |
| ExxonMobil Corp. | | | 18,842 | | | | 1,765 | | |
| FannieMae | | | 10,800 | | | | 432 | | |
| FPL Group, Inc. | | | 7,500 | | | | 508 | | |
Freeport-McMoRan
Copper & Gold Inc. | | | 1,005 | | | | 103 | | |
| GameStop Corp.* | | | 11,900 | | | | 739 | | |
| General Dynamics Corp. | | | 4,606 | | | | 410 | | |
| General Electric Co. | | | 32,756 | | | | 1,214 | | |
| Genzyme Corp.* | | | 6,800 | | | | 506 | | |
| Gilead Sciences, Inc.* | | | 13,056 | | | | 601 | | |
See Notes to Financial Statements.
13
Schedule of Investments (continued)
GLOBAL EQUITY FUND December 31, 2007
| Investments | | Shares | | U.S. $
Value
(000) | |
| United States (continued) | |
| Harris Corp. | | | 2,400 | | | $ | 150 | | |
Hartford Financial Group,
Inc. (The) | | | 3,451 | | | | 301 | | |
| Hewlett-Packard Co. | | | 20,190 | | | | 1,019 | | |
| Honeywell International, Inc. | | | 6,358 | | | | 391 | | |
| ImClone Systems Inc.* | | | 6,878 | | | | 296 | | |
| Intel Corp. | | | 35,388 | | | | 943 | | |
International Business
Machines Corp. | | | 6,700 | | | | 724 | | |
| Johnson & Johnson | | | 7,060 | | | | 471 | | |
| JPMorgan Chase & Co. | | | 13,723 | | | | 599 | | |
| Kellogg Co. | | | 8,700 | | | | 456 | | |
| Kohl's Corp.* | | | 8,000 | | | | 366 | | |
| Kraft Foods, Inc. Class A | | | 22,830 | | | | 745 | | |
| Kroger Co. (The) | | | 8,963 | | | | 239 | | |
| Lockheed Martin Corp. | | | 5,500 | | | | 579 | | |
| Macy's, Inc. | | | 4,100 | | | | 106 | | |
| Marathon Oil Corp. | | | 500 | | | | 30 | | |
| Marshall & Ilsley Corp. (The) | | | 3,799 | | | | 101 | | |
Medco Health
Solutions, Inc.* | | | 3,117 | | | | 316 | | |
| Medtronic, Inc. | | | 6,000 | | | | 302 | | |
| Merck & Co., Inc. | | | 15,500 | | | | 901 | | |
| Merrill Lynch & Co., Inc. | | | 5,700 | | | | 306 | | |
| MetLife, Inc. | | | 4,400 | | | | 271 | | |
| Microsoft Corp. | | | 27,470 | | | | 978 | | |
| Monsanto Co. | | | 14,450 | | | | 1,614 | | |
| Morgan Stanley | | | 7,300 | | | | 388 | | |
| Northeast Utilities | | | 9,400 | | | | 294 | | |
| NVIDIA Corp.* | | | 6,300 | | | | 214 | | |
| Occidental Petroleum Corp. | | | 400 | | | | 31 | | |
| Oracle Corp.* | | | 25,926 | | | | 585 | | |
| PepsiCo, Inc. | | | 9,839 | | | | 747 | | |
| Pfizer, Inc. | | | 14,349 | | | | 326 | | |
| PG&E Corp. | | | 12,913 | | | | 556 | | |
PNC Financial Services
Group, Inc. (The) | | | 9,200 | | | | 604 | | |
| Investments | | Shares | | U.S. $
Value
(000) | |
| Polo Ralph Lauren Corp. | | | 900 | | | $ | 56 | | |
| Praxair, Inc. | | | 8,599 | | | | 763 | | |
| Procter & Gamble Co. (The) | | | 24,590 | | | | 1,805 | | |
| Progress Energy, Inc. | | | 9,651 | | | | 467 | | |
| QUALCOMM Inc. | | | 22,096 | | | | 869 | | |
| Quest Diagnostics, Inc. | | | 8,226 | | | | 435 | | |
| Raytheon Co. | | | 9,333 | | | | 567 | | |
| Safeco Corp. | | | 901 | | | | 50 | | |
| Schering-Plough Corp. | | | 8,300 | | | | 221 | | |
| Sprint Nextel Corp. | | | 5,040 | | | | 66 | | |
| St. Jude Medical, Inc.* | | | 11,600 | | | | 471 | | |
| SunTrust Banks, Inc. | | | 3,000 | | | | 187 | | |
| Target Corp. | | | 7,000 | | | | 350 | | |
| Texas Instruments Inc. | | | 6,861 | | | | 229 | | |
| Tiffany & Co. | | | 1,100 | | | | 51 | | |
| Time Warner Inc. | | | 9,400 | | | | 155 | | |
| U.S. Bancorp | | | 9,800 | | | | 311 | | |
United Parcel Service, Inc.
Class B | | | 5,210 | | | | 368 | | |
| United Technologies Corp. | | | 10,400 | | | | 796 | | |
| Valero Energy Corp. | | | 5,200 | | | | 364 | | |
| Verizon Communications, Inc. | | | 5,012 | | | | 219 | | |
| Wachovia Corp. | | | 3,785 | | | | 144 | | |
| Walgreen Co. | | | 2,644 | | | | 101 | | |
| Wal-Mart Stores, Inc. | | | 7,202 | | | | 342 | | |
| Walt Disney Co. (The) | | | 6,462 | | | | 209 | | |
WebMD Health Corp.
Class A* | | | 200 | | | | 8 | | |
| Wells Fargo & Co. | | | 14,364 | | | | 434 | | |
| Western Union Co. (The) | | | 7,500 | | | | 182 | | |
| Wm. Wrigley Jr. Co. | | | 6,000 | | | | 351 | | |
| XTO Energy, Inc. | | | 1,980 | | | | 102 | | |
| Yahoo! Inc.* | | | 8,300 | | | | 193 | | |
| Total | | | 55,145 | | |
Total Common Stocks
(cost $106,097,879) | | | 119,716 | | |
See Notes to Financial Statements.
14
Schedule of Investments (concluded)
GLOBAL EQUITY FUND December 31, 2007
| Investments | | Shares | | U.S. $
Value
(000) | |
| FOREIGN PREFERRED STOCKS 0.31% | |
| Brazil 0.31% | |
Cia Energetica Minas Gerais
(cost $384,135) | | | 21,090 | | | $ | 385 | | |
Total Long-Term Investments
(cost $106,482,014) | | $ | 120,101 | | |
| | | Principal
Amount
(000) | | | |
| SHORT-TERM INVESTMENT 3.79% | |
| Repurchase Agreement | |
Repurchase Agreement
dated 12/31/2007,
3.38% due 1/2/2008
with State Street
Bank & Trust Co.
collateralized by
$4,725,000 of U.S.
Treasury Notes at 4.75%
due 12/31/2008;
value: $4,789,969;
proceeds: $4,692,848
(cost $4,691,966) | | $ | 4,692 | | | | 4,692 | | |
Total Investments in
Securities 100.73%
(cost $111,173,980) | | | 124,793 | | |
Liabilities in Excess of
Foreign Cash and
Other Assets (0.73%) | | | (900 | ) | |
| Net Assets 100.00% | | $ | 123,893 | | |
ADR American Depositary Receipt.
GDR Global Depositary Receipt.
REIT Real Estate Investment Trust.
* Non-income producing security.
Industry classifications have not been audited by Deloitte & Touche LLP.
See Notes to Financial Statements.
15
Schedule of Investments
DEVELOPING LOCAL MARKETS FUND December 31, 2007
| Investments | | Interest
Rate | | Maturity
Date | | Principal
Amount
(000) | | Value | |
| LONG-TERM INVESTMENTS 94.62% | |
| ASSET-BACKED SECURITIES 39.62% | |
| Automobile 16.95% | |
BMW Vehicle Owner Trust
Series 2005-A Class A4 | | | 4.28 | % | | 2/25/2010 | | $ | 1,135 | | | $ | 1,132,496 | | |
BMW Vehicle Owner Trust
Series 2006-A Class A3 | | | 5.13 | % | | 9/27/2010 | | | 610 | | | | 611,679 | | |
Capital Auto Receivables Asset Trust
Series 2006-1 Class A4 | | | 5.04 | % | | 5/17/2010 | | | 830 | | | | 833,849 | | |
| Capital One Prime Auto 2006-1 A3 | | | 4.99 | % | | 9/15/2010 | | | 1,061 | | | | 1,063,318 | | |
Daimler Chrysler Auto Trust
Series 2005-A Class A4 | | | 3.74 | % | | 2/8/2010 | | | 819 | | | | 816,025 | | |
Daimler Chrysler Auto Trust
Series 2005-B Class A4 | | | 4.20 | % | | 7/8/2010 | | | 850 | | | | 847,454 | | |
Daimler Chrysler Auto Trust
Series 2006-B Class A3 | | | 5.33 | % | | 8/8/2010 | | | 437 | | | | 438,671 | | |
Ford Credit Auto Owner Trust
Series 2005-A Class A4 | | | 3.72 | % | | 10/15/2009 | | | 1,095 | | | | 1,089,673 | | |
Ford Credit Auto Owner Trust
Series 2005-B Class A4 | | | 4.38 | % | | 1/15/2010 | | | 517 | | | | 516,188 | | |
Ford Credit Auto Owner Trust
Series 2005-B Class B | | | 4.64 | % | | 4/15/2010 | | | 530 | | | | 530,113 | | |
Honda Auto Receivables Owner Trust
Series 2005-3 Class A3 | | | 3.87 | % | | 4/20/2009 | | | 473 | | | | 472,000 | | |
USAA Auto Owner Trust
Series 2005-4 Class A3 | | | 4.83 | % | | 4/15/2010 | | | 540 | | | | 539,825 | | |
USAA Auto Owner Trust
Series 2006-2 Class A3 | | | 5.32 | % | | 9/15/2010 | | | 317 | | | | 317,997 | | |
| Total | | | 9,209,288 | | |
| Credit Cards 21.68% | |
American Express Credit Master Trust
Series 2001-5 Class A | | | 5.208 | %# | | 11/15/2010 | | | 1,400 | | | | 1,400,780 | | |
American Express Credit Master Trust
Series 2004-4 Class A | | | 5.118 | %# | | 3/15/2012 | | | 600 | | | | 599,135 | | |
Chase Credit Card Master Trust
Series 2003-3 Class A | | | 5.138 | %# | | 10/15/2010 | | | 400 | | | | 400,132 | | |
Chase Credit Card Master Trust
Series 2003-5 Class A | | | 5.148 | %# | | 1/17/2011 | | | 1,000 | | | | 1,000,151 | | |
| Chase Issuance Trust 2005-A3 Class A | | | 5.048 | %# | | 10/17/2011 | | | 600 | | | | 598,965 | | |
Citibank Credit Card Issuance Trust
Series 2001-A1 Class A1 | | | 5.045 | %# | | 2/7/2010 | | | 350 | | | | 350,094 | | |
See Notes to Financial Statements.
16
Schedule of Investments (continued)
DEVELOPING LOCAL MARKETS FUND December 31, 2007
| Investments | | Interest
Rate | | Maturity
Date | | Principal
Amount
(000) | | Value | |
| Credit Cards (continued) | |
Citibank Credit Card Issuance Trust
Series 2003-A3 Class A3 | | | 3.10 | % | | 3/10/2010 | | $ | 270 | | | $ | 269,220 | | |
Citibank Credit Card Issuance Trust
Series 2003-A6 Class A6 | | | 2.90 | % | | 5/17/2010 | | | 1,085 | | | | 1,077,753 | | |
Citibank Credit Card Issuance Trust
Series 2006-A2 Class A2 | | | 4.85 | % | | 2/10/2011 | | | 605 | | | | 608,761 | | |
Discover Card Master Trust I
Series 2003-4 Class A1 | | | 5.138 | %# | | 5/15/2011 | | | 975 | | | | 974,732 | | |
First USA Credit Card Master Trust
Series 1998-6 Class A | | | 5.156 | %# | | 4/18/2011 | | | 1,600 | | | | 1,600,759 | | |
Household Affinity Credit Card Master Trust
Series 2003-1 Class A | | | 5.148 | %# | | 2/15/2010 | | | 400 | | | | 400,111 | | |
MBNA Credit Card Master Note Trust
Series 2003-A3 Class A3 | | | 5.148 | %# | | 8/16/2010 | | | 600 | | | | 600,207 | | |
MBNA Credit Card Master Note Trust
Series 2003-A7 Class A7 | | | 2.65 | % | | 11/15/2010 | | | 505 | | | | 500,468 | | |
MBNA Credit Card Master Note Trust
Series 2005-A1 Class A1 | | | 4.20 | % | | 9/15/2010 | | | 1,400 | | | | 1,397,981 | | |
| Total | | | 11,779,249 | | |
| Home Equity 0.99% | |
Bank One Issuance Trust
Series 2003-A6 Class A6 | | | 5.138 | %# | | 2/15/2011 | | | 540 | | | | 540,178 | | |
| Total Asset-Backed Securities (cost $21,427,937) | | | 21,528,715 | | |
| CORPORATE BONDS 3.99% | |
| Auto Loans 0.04% | |
| General Motors Acceptance Corp. LLC | | | 6.75 | % | | 12/1/2014 | | | 25 | | | | 20,190 | | |
| Banking 0.53% | |
| Citigroup, Inc. | | | 7.25 | % | | 10/1/2010 | | | 275 | | | | 291,036 | | |
| Food - Wholesale 0.13% | |
| Corn Products International, Inc. | | | 8.45 | % | | 8/15/2009 | | | 65 | | | | 69,354 | | |
Investments & Miscellaneous
Financial Services 0.55% | |
| Goldman Sachs Group, Inc. | | | 4.50 | % | | 6/15/2010 | | | 300 | | | | 299,185 | | |
| Media - Broadcast 0.24% | |
| Cox Communications, Inc. | | | 7.75 | % | | 11/1/2010 | | | 125 | | | | 133,415 | | |
See Notes to Financial Statements.
17
Schedule of Investments (continued)
DEVELOPING LOCAL MARKETS FUND December 31, 2007
| Investments | | Interest
Rate | | Maturity
Date | | Principal
Amount
(000) | | Value | |
| Media-Cable 0.52% | |
| Comcast Corp. | | | 5.85 | % | | 1/15/2010 | | $ | 275 | | | $ | 281,678 | | |
| Steel Producers/Products 0.05% | |
| Allegheny Technologies Inc. | | | 8.375 | % | | 12/15/2011 | | | 25 | | | | 26,750 | | |
| Support-Services 0.08% | |
| Corrections Corp. of America | | | 7.50 | % | | 5/1/2011 | | | 45 | | | | 45,787 | | |
| Telecommunications-Integrated/Services 1.85% | |
Deutsche Telekom International
Finance B.V. (Netherlands)(a) | | | 8.00 | % | | 6/15/2010 | | | 275 | | | | 293,751 | | |
| France Telecom S.A. (France)(a) | | | 7.75 | % | | 3/1/2011 | | | 275 | | | | 295,784 | | |
| SBC Communications, Inc. | | | 5.30 | % | | 11/15/2010 | | | 275 | | | | 280,072 | | |
| Telefonica Europe B.V. (Netherlands)(a) | | | 7.75 | % | | 9/15/2010 | | | 125 | | | | 133,876 | | |
| Total | | | 1,003,483 | | |
| Total Corporate Bonds (cost $2,136,238) | | | 2,170,878 | | |
| FOREIGN BONDS 5.86% | |
| Nigeria 1.34% | |
| Nigeria Treasury(b) | | | 12.50 | % | | 2/24/2009 | | | 81,000 | | | | 726,355 | | |
| Poland 2.57% | |
| Poland Government(b) | | | 5.75 | % | | 6/24/2008 | | | 3,435 | | | | 1,396,190 | | |
| South Africa 1.95% | |
| Republic of South Africa(b) | | | 10.00 | % | | 2/28/2008 | | | 7,250 | | | | 1,060,075 | | |
| Total Foreign Bonds (cost $2,973,454) | | | 3,182,620 | | |
GOVERNMENT SPONSORED ENTERPRISES
PASS-THROUGHS 4.51% | |
| Federal Home Loan Mortgage Corp. | | | 4.198 | %# | | 1/1/2034 | | | 695 | | | | 703,113 | | |
| Federal Home Loan Mortgage Corp. | | | 7.00 | % | | 2/1/2032 | | | 59 | | | | 61,435 | | |
| Federal National Mortgage Assoc. | | | 3.494 | %# | | 8/1/2033 | | | 198 | | | | 199,320 | | |
| Federal National Mortgage Assoc. | | | 4.51 | %# | | 7/1/2035 | | | 213 | | | | 212,475 | | |
| Federal National Mortgage Assoc. | | | 5.475 | %# | | 4/1/2036 | | | 307 | | | | 311,076 | | |
| Federal National Mortgage Assoc. | | | 5.505 | %# | | 4/1/2036 | | | 152 | | | | 153,531 | | |
| Federal National Mortgage Assoc. | | | 5.654 | %# | | 8/1/2036 | | | 533 | | | | 539,305 | | |
| Federal National Mortgage Assoc. | | | 5.936 | %# | | 5/1/2036 | | | 264 | | | | 270,192 | | |
| Total Government Sponsored Enterprises Pass-Throughs (cost $2,418,592) | | | 2,450,447 | | |
See Notes to Financial Statements.
18
Schedule of Investments (continued)
DEVELOPING LOCAL MARKETS FUND December 31, 2007
| Investments | | Interest
Rate | | Maturity
Date | | Principal
Amount
(000) | | Value | |
NON-AGENCY COMMERCIAL
MORTGAGE-BACKED SECURITIES 40.64% | |
Banc of America Commercial Mortgage Inc.
Series 2004-2 Class A2 | | | 3.52 | % | | 11/10/2038 | | $ | 912 | | | $ | 900,181 | | |
Banc of America Commercial Mortgage Inc.
Series 2004-4 Class A3 | | | 4.128 | % | | 7/10/2042 | | | 970 | | | | 962,547 | | |
Banc of America Commercial Mortgage Inc.
Series 2005-3 Class A2 | | | 4.501 | % | | 7/10/2043 | | | 1,382 | | | | 1,365,848 | | |
Bear Stearns Commercial Mortgage
Series 2006-PW11 Class A1 | | | 5.266 | % | | 3/11/2039 | | | 820 | | | | 824,011 | | |
Bear Stearns Commercial Mortgage
Series 2004-PWR4 Class A1 | | | 4.361 | % | | 6/11/2041 | | | 279 | | | | 277,346 | | |
Bear Stearns Commercial Mortgage
Series 2004-PWR6 Class A2 | | | 4.133 | % | | 11/11/2041 | | | 1,300 | | | | 1,290,301 | | |
Bear Stearns Commercial Mortgage
Series 2005-PWR8 Class A1 | | | 4.212 | % | | 6/11/2041 | | | 102 | | | | 101,092 | | |
Bear Stearns Commercial Mortgage
Series 2005-PW10 Class A2 | | | 5.27 | % | | 12/11/2040 | | | 1,200 | | | | 1,206,534 | | |
Citigroup/Deutsche Bank Commercial
Mortgage Trust 2006-CD2 Class AAB | | | 5.392 | %# | | 1/15/2046 | | | 920 | | | | 928,228 | | |
Credit Suisse First Boston Mortgage Corp.
Series 2004-C3 Class A2 | | | 3.913 | % | | 7/15/2036 | | | 775 | | | | 767,293 | | |
Credit Suisse First Boston Mortgage Corp.
Series 2004-C5 Class A2 | | | 4.183 | % | | 11/15/2037 | | | 500 | | | | 496,288 | | |
Credit Suisse Mortgage
Capital Series 2005-C6 Class A1 | | | 4.938 | % | | 12/15/2040 | | | 898 | | | | 894,907 | | |
CS First Boston Mortgage
Securities Corp. Series 2005-C1 Class A2 | | | 4.609 | % | | 2/15/2038 | | | 500 | | | | 495,920 | | |
GE Capital Commercial
Mortgage Corp. Series 2004-C2 Class A2 | | | 4.119 | % | | 3/10/2040 | | | 400 | | | | 396,469 | | |
GE Capital Commercial
Mortgage Corp. Series 2004-C3 Class A2 | | | 4.433 | % | | 7/10/2039 | | | 500 | | | | 498,263 | | |
GMAC Commercial Mortgage Securities Inc.
Series 2003-C2 Class A1 | | | 4.576 | % | | 5/10/2040 | | | 453 | | | | 452,714 | | |
JPMorgan Chase Commercial
Mortgage Series 2005-LDP1 Class A1 | | | 4.116 | % | | 3/15/2046 | | | 807 | | | | 799,134 | | |
JPMorgan Chase Commercial
Mortgage Series 2006-LDP6 Class ASB | | | 5.49 | %# | | 4/15/2043 | | | 990 | | | | 1,001,367 | | |
LB-UBS Commercial Mortgage Trust
Series 2003-C8 Class A2 | | | 4.207 | % | | 11/15/2027 | | | 600 | | | | 596,317 | | |
LB-UBS Commercial Mortgage Trust
Series 2004-C1 Class A1 | | | 2.964 | % | | 1/15/2029 | | | 1,274 | | | | 1,257,177 | | |
See Notes to Financial Statements.
19
Schedule of Investments (continued)
DEVELOPING LOCAL MARKETS FUND December 31, 2007
| Investments | | Interest
Rate | | Maturity
Date | | Principal
Amount
(000) | | Value | |
NON-AGENCY COMMERCIAL
MORTGAGE-BACKED SECURITIES (continued) | |
LB-UBS Commercial Mortgage Trust
Series 2004-C6 Class A2 | | | 4.187 | % | | 8/15/2029 | | $ | 1,000 | | | $ | 993,263 | | |
Merrill Lynch Mortgage Trust Series
2005-CKI1 Class A1 | | | 5.077 | % | | 11/12/2037 | | | 776 | | | | 776,447 | | |
Merrill Lynch Mortgage Trust Series
2005-LC1 Class ASB | | | 5.282 | %# | | 1/12/2044 | | | 70 | | | | 70,353 | | |
Merrill Lynch Mortgage Trust Series
2006-C1 Class A2 | | | 5.614 | %# | | 5/12/2039 | | | 1,080 | | | | 1,098,074 | | |
Morgan Stanley Capital I Series
2004-HQ3 Class A2 | | | 4.05 | % | | 1/13/2041 | | | 1,000 | | | | 990,432 | | |
Morgan Stanley Capital I Series
2004-IQ7 Class A1 | | | 4.03 | % | | 6/15/2038 | | | 407 | | | | 404,365 | | |
Morgan Stanley Capital I Series
2004-T15 Class A2 | | | 4.69 | % | | 6/13/2041 | | | 600 | | | | 600,716 | | |
Morgan Stanley Capital I Series
2006-T23 Class A1 | | | 5.682 | % | | 8/12/2041 | | | 138 | | | | 139,977 | | |
Wachovia Bank Commercial Mortgage
Trust Series 2004-C14 Class A2 | | | 4.368 | % | | 8/15/2041 | | | 1,500 | | | | 1,492,780 | | |
| Total Non-Agency Commercial Mortgage-Backed Securities (cost $21,746,152) | | | 22,078,344 | | |
| Total Long-Term Investments (cost $50,702,373) | | | 51,411,004 | | |
| SHORT-TERM INVESTMENT 1.23% | |
| Repurchase Agreement | |
Repurchase Agreement dated 12/31/2007,
3.38% due 1/2/2008 with State Street
Bank & Trust Co. collateralized by
$655,000 of U.S. Treasury Notes at
4.625% due 7/31/2009; value: $683,094;
proceeds: $665,146 (cost $665,021) | | | | | | | | | 665 | | | | 665,021 | | |
| Total Investments in Securities 95.85% (cost $51,367,394) | | | 52,076,025 | | |
| Cash, Foreign Cash and Other Assets in Excess of Liabilities(c) 4.15% | | | 2,256,241 | | |
| Net Assets 100.00% | | $ | 54,332,266 | | |
# Variable rate security. The interest rate represents the rate at December 31, 2007.
(a) Foreign security traded in U.S. dollars.
(b) Investment in non-U.S. dollar denominated securities.
(c) Cash, Foreign Cash and Other Assets in Excess of Liabilities include net unrealized appreciation (depreciation) on futures contracts and forward currency exchange contracts, as follows:
See Notes to Financial Statements.
20
Schedule of Investments (continued)
DEVELOPING LOCAL MARKETS FUND December 31, 2007
| Open Futures Contracts at December 31, 2007: | |
| Type | | Expiration | | Contracts | | Position | | Market Value | | Unrealized
Depreciation | |
| U.S. 5-Year Treasury Note | | March 2008 | | | 134 | | | Short | | $ | (14,777,688 | ) | | $ | (79,970 | ) | |
| Forward Foreign Currency Contracts Open as of December 31, 2007: | |
Forward
Foreign Currency
Contracts | | Transaction
Type | | Expiration
Date | | Foreign
Currency | | U.S. $ Cost on
Origination
Date | | U.S. $
Current
Value | | Unrealized
Appreciation/
(Depreciation) | |
| Argentine Peso | | Buy | | 1/11/2008 | | | 1,400,000 | | | $ | 436,477 | | | $ | 444,019 | | | $ | 7,542 | | |
| Argentine Peso | | Buy | | 2/1/2008 | | | 1,850,000 | | | | 584,519 | | | | 585,664 | | | | 1,145 | | |
| Brazilian Real | | Buy | | 1/11/2008 | | | 600,000 | | | | 322,840 | | | | 336,508 | | | | 13,668 | | |
| Brazilian Real | | Buy | | 2/1/2008 | | | 2,290,000 | | | | 1,290,672 | | | | 1,280,211 | | | | (10,461 | ) | |
| Brazilian Real | | Buy | | 4/1/2008 | | | 1,100,000 | | | | 587,607 | | | | 610,337 | | | | 22,730 | | |
| Chilean Peso | | Buy | | 1/11/2008 | | | 520,000,000 | | | | 1,033,788 | | | | 1,044,006 | | | | 10,218 | | |
| Chilean Peso | | Buy | | 2/1/2008 | | | 477,000,000 | | | | 926,483 | | | | 957,194 | | | | 30,711 | | |
| Chilean Peso | | Buy | | 3/4/2008 | | | 500,000,000 | | | | 973,520 | | | | 1,002,657 | | | | 29,137 | | |
| Colombian Peso | | Buy | | 1/11/2008 | | | 2,200,000,000 | | | | 1,092,353 | | | | 1,088,583 | | | | (3,770 | ) | |
| Colombian Peso | | Buy | | 2/1/2008 | | | 1,100,000,000 | | | | 541,213 | | | | 542,409 | | | | 1,196 | | |
| Czech Koruna | | Buy | | 1/11/2008 | | | 41,000,000 | | | | 2,109,053 | | | | 2,255,041 | | | | 145,988 | | |
| Czech Koruna | | Buy | | 2/1/2008 | | | 20,500,000 | | | | 1,109,415 | | | | 1,128,067 | | | | 18,652 | | |
| Czech Koruna | | Buy | | 4/1/2008 | | | 12,000,000 | | | | 642,077 | | | | 660,977 | | | | 18,900 | | |
| Hong Kong Dollar | | Buy | | 1/11/2008 | | | 22,000,000 | | | | 2,836,148 | | | | 2,822,686 | | | | (13,462 | ) | |
| Hong Kong Dollar | | Buy | | 2/1/2008 | | | 5,700,000 | | | | 736,082 | | | | 731,941 | | | | (4,141 | ) | |
| Hong Kong Dollar | | Buy | | 3/3/2008 | | | 5,536,400 | | | | 713,316 | | | | 711,744 | | | | (1,572 | ) | |
| Hong Kong Dollar | | Sell | | 1/11/2008 | | | 4,500,000 | | | | 577,886 | | | | 577,367 | | | | 519 | | |
| Hungarian Forint | | Buy | | 1/11/2008 | | | 280,000,000 | | | | 1,578,007 | | | | 1,617,997 | | | | 39,990 | | |
| Hungarian Forint | | Buy | | 3/4/2008 | | | 270,000,000 | | | | 1,564,764 | | | | 1,554,261 | | | | (10,503 | ) | |
| Indian Rupee | | Buy | | 1/11/2008 | | | 48,500,000 | | | | 1,217,675 | | | | 1,229,610 | | | | 11,935 | | |
| Indian Rupee | | Buy | | 3/14/2008 | | | 22,000,000 | | | | 557,145 | | | | 556,318 | | | | (827 | ) | |
| Indonesian Rupiah | | Buy | | 2/1/2008 | | | 7,300,000,000 | | | | 800,614 | | | | 776,220 | | | | (24,394 | ) | |
| Indonesian Rupiah | | Buy | | 3/4/2008 | | | 12,380,000,000 | | | | 1,324,678 | | | | 1,313,640 | | | | (11,038 | ) | |
| Israeli Shekel | | Buy | | 1/11/2008 | | | 4,000,000 | | | | 998,303 | | | | 1,039,269 | | | | 40,966 | | |
| Israeli Shekel | | Buy | | 3/4/2008 | | | 4,100,000 | | | | 1,075,692 | | | | 1,065,303 | | | | (10,389 | ) | |
| Malaysian Ringgit | | Buy | | 1/11/2008 | | | 2,545,500 | | | | 747,577 | | | | 769,966 | | | | 22,389 | | |
| Malaysian Ringgit | | Buy | | 2/4/2008 | | | 800,000 | | | | 239,106 | | | | 242,147 | | | | 3,041 | | |
| Malaysian Ringgit | | Sell | | 1/11/2008 | | | 2,545,500 | | | | 764,644 | | | | 769,966 | | | | (5,322 | ) | |
| Mexican Peso | | Buy | | 1/11/2008 | | | 16,300,000 | | | | 1,482,074 | | | | 1,492,325 | | | | 10,251 | | |
| Mexican Peso | | Buy | | 2/1/2008 | | | 8,100,000 | | | | 752,158 | | | | 740,519 | | | | (11,639 | ) | |
| Mexican Peso | | Buy | | 3/4/2008 | | | 20,695,000 | | | | 1,884,876 | | | | 1,887,879 | | | | 3,003 | | |
| Mexican Peso | | Buy | | 3/14/2008 | | | 6,000,000 | | | | 550,055 | | | | 546,909 | | | | (3,146 | ) | |
| New Romania Leu | | Buy | | 1/11/2008 | | | 2,100,000 | | | | 889,039 | | | | 854,801 | | | | (34,238 | ) | |
| New Romania Leu | | Buy | | 3/4/2008 | | | 2,200,000 | | | | 911,501 | | | | 891,365 | | | | (20,136 | ) | |
| New Romania Leu | | Sell | | 3/14/2008 | | | 1,500,000 | | | | 620,091 | | | | 607,230 | | | | 12,861 | | |
See Notes to Financial Statements.
21
Schedule of Investments (concluded)
DEVELOPING LOCAL MARKETS FUND December 31, 2007
Forward
Foreign Currency
Contracts | | Transaction
Type | | Expiration
Date | | Foreign
Currency | | U.S. $ Cost on
Origination
Date | | U.S. $
Current
Value | | Unrealized
Appreciation/
(Depreciation) | |
| New Turkish Lira | | Buy | | 1/11/2008 | | | 3,000,000 | | | $ | 2,401,922 | | | $ | 2,549,912 | | | $ | 147,990 | | |
| New Turkish Lira | | Buy | | 2/1/2008 | | | 1,500,000 | | | | 1,222,992 | | | | 1,266,229 | | | | 43,237 | | |
| New Turkish Lira | | Buy | | 3/4/2008 | | | 2,375,000 | | | | 1,959,086 | | | | 1,985,756 | | | | 26,670 | | |
| Philippines Peso | | Buy | | 1/11/2008 | | | 27,000,000 | | | | 596,421 | | | | 653,876 | | | | 57,455 | | |
| Philippines Peso | | Buy | | 2/1/2008 | | | 24,000,000 | | | | 559,963 | | | | 580,762 | | | | 20,799 | | |
| Philippines Peso | | Buy | | 3/4/2008 | | | 22,655,000 | | | | 531,583 | | | | 547,568 | | | | 15,985 | | |
| Philippines Peso | | Sell | | 2/1/2008 | | | 24,000,000 | | | | 578,871 | | | | 580,762 | | | | (1,891 | ) | |
| Polish Zloty | | Buy | | 1/11/2008 | | | 4,300,000 | | | | 1,622,642 | | | | 1,748,029 | | | | 125,387 | | |
| Polish Zloty | | Buy | | 2/1/2008 | | | 3,800,000 | | | | 1,507,279 | | | | 1,544,094 | | | | 36,815 | | |
| Polish Zloty | | Buy | | 3/4/2008 | | | 2,400,000 | | | | 977,597 | | | | 974,570 | | | | (3,027 | ) | |
| Russian Ruble | | Buy | | 1/10/2008 | | | 28,000,000 | | | | 1,087,028 | | | | 1,141,032 | | | | 54,004 | | |
| Russian Ruble | | Buy | | 3/6/2008 | | | 15,000,000 | | | | 612,182 | | | | 610,944 | | | | (1,238 | ) | |
| Singapore Dollar | | Buy | | 1/11/2008 | | | 3,900,000 | | | | 2,661,003 | | | | 2,711,608 | | | | 50,605 | | |
| Singapore Dollar | | Buy | | 2/1/2008 | | | 1,300,000 | | | | 892,796 | | | | 905,284 | | | | 12,488 | | |
| Singapore Dollar | | Buy | | 3/4/2008 | | | 1,425,000 | | | | 992,616 | | | | 994,202 | | | | 1,586 | | |
| Slovakian Koruna | | Buy | | 1/11/2008 | | | 34,000,000 | | | | 1,420,811 | | | | 1,479,523 | | | | 58,712 | | |
| Slovakian Koruna | | Buy | | 2/1/2008 | | | 17,300,000 | | | | 738,244 | | | | 753,017 | | | | 14,773 | | |
| Slovakian Koruna | | Sell | | 2/1/2008 | | | 14,000,000 | | | | 620,898 | | | | 609,378 | | | | 11,520 | | |
| Slovakian Koruna | | Sell | | 3/14/2008 | | | 14,000,000 | | | | 620,832 | | | | 609,952 | | | | 10,880 | | |
| South African Rand | | Buy | | 1/11/2008 | | | 6,700,000 | | | | 1,004,558 | | | | 978,386 | | | | (26,172 | ) | |
| South African Rand | | Buy | | 2/1/2008 | | | 5,400,000 | | | | 810,993 | | | | 785,553 | | | | (25,440 | ) | |
| South African Rand | | Buy | | 3/4/2008 | | | 3,000,000 | | | | 435,603 | | | | 433,813 | | | | (1,790 | ) | |
| Taiwan Dollar | | Buy | | 2/1/2008 | | | 23,500,000 | | | | 728,231 | | | | 728,595 | | | | 364 | | |
| Taiwan Dollar | | Sell | | 2/1/2008 | | | 23,500,000 | | | | 731,631 | | | | 728,594 | | | | 3,037 | | |
Net Unrealized Appreciation on Forward Foreign Currency
Contracts | | | | | | | | | | | | | | | | | | $ | 912,553 | | |
Industry classifications have not been audited by Deloitte & Touche LLP.
See Notes to Financial Statements.
22
Statements of Assets and Liabilities
December 31, 2007
| | | Global
Equity Fund | | Developing Local
Markets Fund | |
| ASSETS: | |
| Investment in securities, at cost | | $ | 111,173,980 | | | $ | 51,367,394 | | |
| Investment in securities, at value | | $ | 124,792,567 | | | $ | 52,076,025 | | |
| Cash | | | – | | | | 6,172 | | |
| Foreign cash, at value (cost $342,223 and $1,489,415, respectively) | | | 346,591 | | | | 1,476,424 | | |
| Deposits with brokers for futures collateral | | | – | | | | 100,500 | | |
| Receivables: | |
| Interest and dividends | | | 158,504 | | | | 296,120 | | |
| Investment securities sold | | | 9,543 | | | | – | | |
| Capital shares sold | | | 449,598 | | | | 31,678 | | |
| From advisor (See Note 3) | | | 17,846 | | | | – | | |
| Unrealized appreciation on forward foreign currency contracts | | | – | | | | 1,137,149 | | |
| Prepaid expenses and other assets | | | 21,946 | | | | 40,032 | | |
| Total assets | | | 125,796,595 | | | | 55,164,100 | | |
| LIABILITIES: | |
| Payables: | |
| Investment securities purchased | | | 1,146,070 | | | | – | | |
| Capital shares reacquired | | | 434,665 | | | | 90,419 | | |
| Management fees | | | 75,988 | | | | 23,493 | | |
| 12b-1 distribution fees | | | 55,142 | | | | 29,031 | | |
| Fund administration | | | 4,068 | | | | 1,887 | | |
| Directors' fees | | | 28,845 | | | | 44,676 | | |
| Variation margin on future contracts | | | – | | | | 35,997 | | |
| Unrealized depreciation on forward foreign currency contracts | | | – | | | | 224,596 | | |
| Distributions payable | | | – | | | | 151,532 | | |
| Accrued expenses and other liabilities | | | 159,306 | | | | 230,203 | | |
| Total liabilities | | | 1,904,084 | | | | 831,834 | | |
| NET ASSETS | | $ | 123,892,511 | | | $ | 54,332,266 | | |
| COMPOSITION OF NET ASSETS: | |
| Paid-in capital | | $ | 108,727,139 | | | $ | 59,960,515 | | |
| Undistributed (distributions in excess of) net investment income | | | (47,960 | ) | | | 1,510,528 | | |
Accumulated net realized gain (loss) on investments,
futures contracts and foreign currency related transactions | | | 1,592,688 | | | | (8,674,837 | ) | |
Net unrealized appreciation on investments,
futures contracts and translation of assets and liabilities
denominated in foreign currencies | | | 13,620,644 | | | | 1,536,060 | | |
| Net Assets | | $ | 123,892,511 | | | $ | 54,332,266 | | |
See Notes to Financial Statements.
23
Statements of Assets and Liabilities (concluded)
December 31, 2007
| | | Global
Equity Fund | | Developing Local
Markets Fund | |
| Net assets by class: | |
| Class A Shares | | $ | 94,321,487 | | | $ | 44,148,379 | | |
| Class B Shares | | $ | 12,653,427 | | | $ | 3,302,777 | | |
| Class C Shares | | $ | 16,103,883 | | | $ | 5,952,403 | | |
| Class F Shares | | $ | 9,861 | | | $ | 10,337 | | |
| Class I Shares | | $ | 803,853 | | | $ | 888,280 | | |
| Class P Shares | | | – | | | $ | 9,454 | | |
| Class R2 Shares | | | – | | | $ | 10,317 | | |
| Class R3 Shares | | | – | | | $ | 10,319 | | |
| Outstanding shares by class: | |
| Class A Shares (430 million and 415 million shares of common stock | |
| authorized respectively, $.001 par value) | | | 7,173,148 | | | | 6,559,097 | | |
| Class B Shares (15 million and 30 million shares of common stock | |
| authorized respectively, $.001 par value) | | | 1,032,710 | | | | 489,909 | | |
| Class C Shares (20 million and 20 million shares of common stock | |
| authorized respectively, $.001 par value) | | | 1,311,677 | | | | 881,736 | | |
| Class F Shares (20 million and 20 million shares of common stock | |
| authorized respectively, $.001 par value) | | | 751.470 | | | | 1,536 | | |
| Class I Shares (15 million and 15 million shares of common stock | |
| authorized respectively, $.001 par value) | | | 61,008 | | | | 131,920 | | |
| Class P Shares (20 million and 20 million shares of common stock | |
| authorized respectively, $.001 par value) | | | – | | | | 1,409 | | |
| Class R2 Shares (20 million and 20 million shares of common stock | |
| authorized respectively, $.001 par value) | | | – | | | | 1,533 | | |
| Class R3 Shares (20 million and 20 million shares of common stock | |
| authorized respectively, $.001 par value) | | | – | | | | 1,534 | | |
Net asset value, offering and redemption price per share
(Net assets divided by outstanding shares): | | | |
| Class A Shares–Net asset value | | $ | 13.15 | | | $ | 6.73 | | |
| Class A Shares–Maximum offering price | |
| (Net asset value plus sales charge of 5.75% and 4.75%, respectively) | | $ | 13.95 | | | $ | 7.07 | | |
| Class B Shares–Net asset value | | $ | 12.25 | | | $ | 6.74 | | |
| Class C Shares–Net asset value | | $ | 12.28 | | | $ | 6.75 | | |
| Class F Shares–Net asset value | | $ | 13.12 | | | $ | 6.73 | | |
| Class I Shares–Net asset value | | $ | 13.18 | | | $ | 6.73 | | |
| Class P Shares–Net asset value | | | – | | | $ | 6.71 | | |
| Class R2 Shares–Net asset value | | | – | | | $ | 6.73 | | |
| Class R3 Shares–Net asset value | | | – | | | $ | 6.73 | | |
See Notes to Financial Statements.
24
Statements of Operations
For the Year Ended December 31, 2007
| | | Global
Equity Fund | | Developing Local
Markets Fund | |
| Investment income: | |
| Dividends (net of foreign witholding taxes of $113,793) | | $ | 2,241,643 | | | $ | – | | |
Interest (net of foreign witholding taxes of $0 and
$2,252, respectively) | | | 166,357 | | | | 2,578,603 | | |
| Total investment income | | | 2,408,000 | | | | 2,578,603 | | |
| Expenses: | |
| Management fees | | | 881,275 | | | | 293,741 | | |
| 12b-1 distribution plan–Class A | | | 313,690 | | | | 167,576 | | |
| 12b-1 distribution plan–Class B | | | 123,273 | | | | 36,127 | | |
| 12b-1 distribution plan–Class C | | | 148,966 | | | | 62,510 | | |
| 12b-1 distribution plan–Class F | | | 3 | | | | 3 | | |
| 12b-1 distribution plan–Class P | | | – | | | | 36 | | |
| 12b-1 distribution plan–Class R2 | | | – | | | | 16 | | |
| 12b-1 distribution plan–Class R3 | | | – | | | | 13 | | |
| Shareholder servicing | | | 371,223 | | | | 147,893 | | |
| Professional | | | 56,046 | | | | 164,954 | | |
| Reports to shareholders | | | 98,267 | | | | 114,209 | | |
| Fund administration | | | 47,001 | | | | 23,499 | | |
| Custody | | | 74,250 | | | | 29,150 | | |
| Interest expense (See Note 2(n)) | | | - | | | | 4,387 | | |
| Directors' fees | | | 4,281 | | | | 2,184 | | |
| Registration | | | 62,341 | | | | 71,651 | | |
| Other | | | 5,548 | | | | 18,216 | | |
| Gross expenses | | | 2,186,164 | | | | 1,136,165 | | |
| Expense reductions (See Note 7) | | | (3,788 | ) | | | (4,144 | ) | |
| Expenses assumed by advisor (See Note 3) | | | (127,651 | ) | | | (402,608 | ) | |
| Net expenses | | | 2,054,725 | | | | 729,413 | | |
| Net investment income | | | 353,275 | | | | 1,849,190 | | |
| Net realized and unrealized gain: | |
Net realized gain on investments, futures contracts and
foreign currency related transactions
(net of foreign capital gains tax) | | | 12,750,606 | | | | 2,395,847 | | |
Net change in unrealized appreciation on investments,
futures contracts and translation of assets and liabilities
denominated in foreign currencies | | | (350,004 | ) | | | (49,255 | ) | |
| Net realized and unrealized gain | | | 12,400,602 | | | | 2,346,592 | | |
| Net Increase in Net Assets Resulting From Operations | | $ | 12,753,877 | | | $ | 4,195,782 | | |
See Notes to Financial Statements.
25
Statements of Changes in Net Assets
| | | Global Equity Fund | |
| INCREASE IN NET ASSETS | | For the Year Ended
December 31, 2007 | | For the Year Ended
December 31, 2006 | |
| Operations: | |
| Net investment income | | $ | 353,275 | | | $ | 212,791 | | |
Net realized gain on investments and foreign currency
related transactions (net of foreign capital gains tax) | | | 12,750,606 | | | | 10,002,322 | | |
Net change in unrealized appreciation on investments
and translation of assets and liabilities
denominated in foreign currencies | | | (350,004 | ) | | | 5,744,858 | | |
| Net increase in net assets resulting from operations | | | 12,753,877 | | | | 15,959,971 | | |
| Distributions to shareholders from: | |
| Net investment income | |
| Class A | | | (188,552 | ) | | | (254,181 | ) | |
| Class B | | | – | | | | (10,226 | ) | |
| Class C | | | – | | | | (10,477 | ) | |
| Class F | | | (47 | ) | | | - | | |
| Class I | | | (4,225 | ) | | | (3,566 | ) | |
| Net realized gain | |
| Class A | | | (9,949,992 | ) | | | (7,029,455 | ) | |
| Class B | | | (1,436,997 | ) | | | (1,008,862 | ) | |
| Class C | | | (1,803,400 | ) | | | (1,109,269 | ) | |
| Class F | | | (868 | ) | | | - | | |
| Class I | | | (81,544 | ) | | | (48,203 | ) | |
| Total distributions to shareholders | | | (13,465,625 | ) | | | (9,474,239 | ) | |
| Capital share transactions (Net of share conversions) (See Note 11): | |
| Net proceeds from sales of shares | | | 26,278,759 | | | | 22,199,929 | | |
| Reinvestment of distributions | | | 12,889,477 | | | | 9,138,075 | | |
| Cost of shares reacquired | | | (22,396,093 | ) | | | (16,331,879 | ) | |
Net increase in net assets resulting
from capital share transactions | | | 16,772,143 | | | | 15,006,125 | | |
| Net increase in net assets | | | 16,060,395 | | | | 21,491,857 | | |
| NET ASSETS: | |
| Beginning of year | | $ | 107,832,116 | | | $ | 86,340,259 | | |
| End of year | | $ | 123,892,511 | | | $ | 107,832,116 | | |
| Distributions in excess of net investment income | | $ | (47,960 | ) | | $ | (103,581 | ) | |
See Notes to Financial Statements.
26
Statements of Changes in Net Assets
| | | Developing Local Markets Fund | |
| DECREASE IN NET ASSETS | | For the Year Ended
December 31, 2007 | | For the Year Ended
December 31, 2006 | |
| Operations: | |
| Net investment income | | $ | 1,849,190 | | | $ | 1,599,187 | | |
Net realized gain on investments, futures contracts
and foreign currency related transactions | | | 2,395,847 | | | | 345,362 | | |
Net change in unrealized appreciation on investments,
futures contracts and translation of assets
and liabilities denominated in foreign currencies | | | (49,255 | ) | | | 1,192,278 | | |
| Net increase in net assets resulting from operations | | | 4,195,782 | | | | 3,136,827 | | |
| Distributions to shareholders from: | |
| Net investment income | |
| Class A | | | (4,222,377 | ) | | | (2,256,611 | ) | |
| Class B | | | (292,105 | ) | | | (170,118 | ) | |
| Class C | | | (517,997 | ) | | | (265,929 | ) | |
| Class F | | | (630 | ) | | | – | | |
| Class I | | | (88,523 | ) | | | (38,156 | ) | |
| Class P | | | (799 | ) | | | (92 | ) | |
| Class R2 | | | (618 | ) | | | – | | |
| Class R3 | | | (621 | ) | | | – | | |
| Total distributions to shareholders | | | (5,123,670 | ) | | | (2,730,906 | ) | |
| Capital share transactions (Net of share conversions) (See Note 11): | |
| Net proceeds from sales of shares | | | 9,551,552 | | | | 13,789,852 | | |
| Reinvestment of distributions | | | 4,343,294 | | | | 2,239,902 | | |
| Cost of shares reacquired | | | (20,867,881 | ) | | | (18,683,726 | ) | |
Net decrease in net assets resulting
from capital share transactions | | | (6,973,035 | ) | | | (2,653,972 | ) | |
| Net decrease in net assets | | | (7,900,923 | ) | | | (2,248,051 | ) | |
| NET ASSETS: | |
| Beginning of year | | $ | 62,233,189 | | | $ | 64,481,240 | | |
| End of year | | $ | 54,332,266 | | | $ | 62,233,189 | | |
| Undistributed net investment income | | $ | 1,510,528 | | | $ | 1,003,915 | | |
See Notes to Financial Statements.
27
Financial Highlights
GLOBAL EQUITY FUND
| | | Class A Shares | |
| | | Year Ended 12/31 | |
| | | 2007 | | 2006 | | 2005 | | 2004 | | 2003 | |
| Per Share Operating Performance | |
| Net asset value, beginning of year | | $ | 13.17 | | | $ | 12.23 | | | $ | 11.75 | | | $ | 10.51 | | | $ | 8.33 | | |
| Investment operations: | |
| Net investment income (loss)(a) | | | .06 | | | | .05 | | | | .05 | | | | (.01 | ) | | | .04 | | |
| Net realized and unrealized gain | | | 1.48 | | | | 2.13 | | | | .91 | | | | 1.27 | | | | 2.16 | | |
| Total from investment operations | | | 1.54 | | | | 2.18 | | | | .96 | | | | 1.26 | | | | 2.20 | | |
| Distributions to shareholders from: | |
| Net investment income | | | (.03 | ) | | | (.04 | ) | | | (.05 | ) | | | (.02 | ) | | | (.02 | ) | |
| Net realized gain | | | (1.53 | ) | | | (1.20 | ) | | | (.43 | ) | | | – | | | | – | | |
| Total distributions | | | (1.56 | ) | | | (1.24 | ) | | | (.48 | ) | | | (.02 | ) | | | (.02 | ) | |
| Net asset value, end of year | | $ | 13.15 | | | $ | 13.17 | | | $ | 12.23 | | | $ | 11.75 | | | $ | 10.51 | | |
| Total Return(b) | | | 11.82 | % | | | 18.12 | % | | | 8.21 | % | | | 11.99 | % | | | 26.38 | % | |
| Ratios to Average Net Assets: | |
Expenses, excluding expense reductions
and including expenses assumed | | | 1.60 | % | | | 1.60 | % | | | 1.60 | % | | | 2.05 | % | | | 1.95 | % | |
Expenses, including expense reductions
and expenses assumed | | | 1.60 | % | | | 1.60 | % | | | 1.60 | % | �� | | 2.05 | % | | | 1.95 | % | |
Expenses, excluding expense reductions
and expenses assumed | | | 1.71 | % | | | 1.83 | % | | | 1.94 | % | | | 2.05 | % | | | 1.95 | % | |
| Net investment income (loss) | | | .45 | % | | | .36 | % | | | .43 | % | | | (.11 | )% | | | .45 | % | |
| Supplemental Data: | |
| Net assets, end of year (000) | | $ | 94,321 | | | $ | 83,067 | | | $ | 67,807 | | | $ | 59,915 | | | $ | 52,828 | | |
| Portfolio turnover rate | | | 87.01 | % | | | 95.23 | % | | | 97.65 | % | | | 170.93 | % | | | 56.26 | % | |
(a) Calculated using average shares outstanding during the period.
(b) Total return does not consider the effects of sales loads and assumes the reinvestment of all distributions.
See Notes to Financial Statements.
28
Financial Highlights (continued)
GLOBAL EQUITY FUND
| | | Class B Shares | |
| | | Year Ended 12/31 | |
| | | 2007 | | 2006 | | 2005 | | 2004 | | 2003 | |
| Per Share Operating Performance | |
| Net asset value, beginning of year | | $ | 12.42 | | | $ | 11.65 | | | $ | 11.24 | | | $ | 10.10 | | | $ | 8.04 | | |
| Investment operations: | |
| Net investment loss(a) | | | (.03 | ) | | | (.04 | ) | | | (.02 | ) | | | (.08 | ) | | | (.02 | ) | |
| Net realized and unrealized gain | | | 1.39 | | | | 2.02 | | | | .86 | | | | 1.22 | | | | 2.08 | | |
| Total from investment operations | | | 1.36 | | | | 1.98 | | | | .84 | | | | 1.14 | | | | 2.06 | | |
| Distributions to shareholders from: | |
| Net investment income | | | – | | | | (.01 | ) | | | – | | | | – | | | | – | | |
| Net realized gain | | | (1.53 | ) | | | (1.20 | ) | | | (.43 | ) | | | – | | | | – | | |
| Total distributions | | | (1.53 | ) | | | (1.21 | ) | | | (.43 | ) | | | – | | | | – | | |
| Net asset value, end of year | | $ | 12.25 | | | $ | 12.42 | | | $ | 11.65 | | | $ | 11.24 | | | $ | 10.10 | | |
| Total Return(b) | | | 11.08 | % | | | 17.28 | % | | | 7.52 | % | | | 11.29 | % | | | 25.62 | % | |
| Ratios to Average Net Assets: | |
Expenses, excluding expense reductions
and including expenses assumed | | | 2.25 | % | | | 2.25 | % | | | 2.25 | % | | | 2.69 | % | | | 2.61 | % | |
Expenses, including expense reductions
and expenses assumed | | | 2.25 | % | | | 2.25 | % | | | 2.25 | % | | | 2.69 | % | | | 2.61 | % | |
Expenses, excluding expense reductions
and expenses assumed | | | 2.36 | % | | | 2.48 | % | | | 2.58 | % | | | 2.69 | % | | | 2.61 | % | |
| Net investment loss | | | (.20 | )% | | | (.29 | )% | | | (.22 | )% | | | (.75 | )% | | | (.21 | )% | |
| Supplemental Data: | |
| Net assets, end of year (000) | | $ | 12,653 | | | $ | 11,502 | | | $ | 9,064 | | | $ | 7,818 | | | $ | 6,033 | | |
| Portfolio turnover rate | | | 87.01 | % | | | 95.23 | % | | | 97.65 | % | | | 170.93 | % | | | 56.26 | % | |
(a) Calculated using average shares outstanding during the period.
(b) Total return does not consider the effects of sales loads and assumes the reinvestment of all distributions.
See Notes to Financial Statements.
29
Financial Highlights (continued)
GLOBAL EQUITY FUND
| | | Class C Shares | |
| | | Year Ended 12/31 | |
| | | 2007 | | 2006 | | 2005 | | 2004 | | 2003 | |
| Per Share Operating Performance | |
| Net asset value, beginning of year | | $ | 12.44 | | | $ | 11.67 | | | $ | 11.25 | | | $ | 10.11 | | | $ | 8.06 | | |
| Investment operations: | |
| Net investment loss(a) | | | (.03 | ) | | | (.04 | ) | | | (.02 | ) | | | (.08 | ) | | | (.02 | ) | |
| Net realized and unrealized gain | | | 1.40 | | | | 2.02 | | | | .87 | | | | 1.22 | | | | 2.07 | | |
| Total from investment operations | | | 1.37 | | | | 1.98 | | | | .85 | | | | 1.14 | | | | 2.05 | | |
| Distributions to shareholders from: | |
| Net investment income | | | – | | | | (.01 | ) | | | – | | | | – | | | | – | | |
| Net realized gain | | | (1.53 | ) | | | (1.20 | ) | | | (.43 | ) | | | – | | | | – | | |
| Total distributions | | | (1.53 | ) | | | (1.21 | ) | | | (.43 | ) | | | – | | | | – | | |
| Net asset value, end of year | | $ | 12.28 | | | $ | 12.44 | | | $ | 11.67 | | | $ | 11.25 | | | $ | 10.11 | | |
| Total Return(b) | | | 11.14 | % | | | 17.25 | % | | | 7.61 | % | | | 11.28 | % | | | 25.59 | % | |
| Ratios to Average Net Assets: | |
Expenses, excluding expense reductions
and including expenses assumed | | | 2.25 | % | | | 2.25 | % | | | 2.25 | % | | | 2.69 | % | | | 2.61 | % | |
Expenses, including expense reductions
and expenses assumed | | | 2.25 | % | | | 2.25 | % | | | 2.25 | % | | | 2.69 | % | | | 2.61 | % | |
Expenses, excluding expense reductions
and expenses assumed | | | 2.36 | % | | | 2.48 | % | | | 2.58 | % | | | 2.69 | % | | | 2.61 | % | |
| Net investment loss | | | (.20 | )% | | | (.30 | )% | | | (.22 | )% | | | (.75 | )% | | | (.29 | )% | |
| Supplemental Data: | |
| Net assets, end of year (000) | | $ | 16,104 | | | $ | 12,681 | | | $ | 8,991 | | | $ | 7,158 | | | $ | 4,111 | | |
| Portfolio turnover rate | | | 87.01 | % | | | 95.23 | % | | | 97.65 | % | | | 170.93 | % | | | 56.26 | % | |
(a) Calculated using average shares outstanding during the period.
(b) Total return does not consider the effects of sales loads and assumes the reinvestment of all distributions.
See Notes to Financial Statements.
30
Financial Highlights (continued)
GLOBAL EQUITY FUND
| | | Class F Shares | |
| | | 9/28/2007(a)
to
12/31/2007 | |
| Per Share Operating Performance | |
| Net asset value, beginning of period | | $ | 14.71 | | |
| Investment operations: | |
| Net investment income(b) | | | .01 | | |
| Net realized and unrealized loss | | | (.26 | ) | |
| Total from investment operations | | | (.25 | ) | |
| Distributions to shareholders from: | |
| Net investment income | | | (.07 | ) | |
| Net realized gain | | | (1.27 | ) | |
| Total distributions | | | (1.34 | ) | |
| Net asset value, end of period | | $ | 13.12 | | |
| Total Return(c) | | | (1.67 | )%(d) | |
| Ratios to Average Net Assets: | |
| Expenses, excluding expense reductions and including expenses assumed | | | .30 | %(d) | |
| Expenses, including expense reductions and expenses assumed | | | .30 | %(d) | |
| Expenses, excluding expense reductions and expenses assumed | | | .39 | %(d) | |
| Net investment income | | | .04 | %(d) | |
| Supplemental Data: | |
| Net assets, end of period (000) | | $ | 10 | | |
| Portfolio turnover rate | | | 87.01 | % | |
(a) Commencement of investment operations was September 28, 2007; SEC effective date was September 14, 2007 and date shares first became available to the public was October 1, 2007.
(b) Calculated using average shares outstanding during the period.
(c) Total return does not consider the effects of sales loads and assumes the reinvestment of all distributions.
(d) Not annualized.
See Notes to Financial Statements.
31
Financial Highlights (concluded)
GLOBAL EQUITY FUND
| | | Class I Shares | |
| | | Year Ended 12/31 | | 10/19/2004(a)
to | |
| | | 2007 | | 2006 | | 2005 | | 12/31/2004 | |
| Per Share Operating Performance | |
| Net asset value, beginning of period | | $ | 13.19 | | | $ | 12.25 | | | $ | 11.76 | | | $ | 10.54 | | |
| Investment operations: | |
| Net investment income(b) | | | .11 | | | | .09 | | | | .09 | | | | – | (d) | |
| Net realized and unrealized gain | | | 1.49 | | | | 2.14 | | | | .92 | | | | 1.22 | | |
| Total from investment operations | | | 1.60 | | | | 2.23 | | | | 1.01 | | | | 1.22 | | |
| Distributions to shareholders from: | |
| Net investment income | | | (.08 | ) | | | (.09 | ) | | | (.09 | ) | | | – | | |
| Net realized gain | | | (1.53 | ) | | | (1.20 | ) | | | (.43 | ) | | | – | | |
| Total distributions | | | (1.61 | ) | | | (1.29 | ) | | | (.52 | ) | | | – | | |
| Net asset value, end of period | | $ | 13.18 | | | $ | 13.19 | | | $ | 12.25 | | | $ | 11.76 | | |
| Total Return(c) | | | 12.25 | % | | | 18.46 | % | | | 8.64 | % | | | 11.57 | %(e) | |
| Ratios to Average Net Assets: | |
Expenses, excluding expense reductions
and including expenses assumed | | | 1.25 | % | | | 1.25 | % | | | 1.25 | % | | | .33 | %(e) | |
Expenses, including expense reductions
and expenses assumed | | | 1.25 | % | | | 1.25 | % | | | 1.25 | % | | | .33 | %(e) | |
Expenses, excluding expense reductions
and expenses assumed | | | 1.36 | % | | | 1.48 | % | | | 1.58 | % | | | .33 | %(e) | |
| Net investment income | | | .78 | % | | | .70 | % | | | .77 | % | | | .02 | %(e) | |
| Supplemental Data: | |
| Net assets, end of period (000) | | $ | 804 | | | $ | 582 | | | $ | 478 | | | $ | 460 | | |
| Portfolio turnover rate | | | 87.01 | % | | | 95.23 | % | | | 97.65 | % | | | 170.93 | %(e) | |
(a) Commencement of offering of class shares.
(b) Calculated using average shares outstanding during the period.
(c) Total return does not consider the effects of sales loads and assumes the reinvestment of all distributions.
(d) Amount is less than $.01.
(e) Not annualized.
See Notes to Financial Statements.
32
Financial Highlights
DEVELOPING LOCAL MARKETS FUND
| | | Class A Shares | |
| | | Year Ended 12/31 | |
| | | 2007 | | 2006 | | 2005 | | 2004 | | 2003 | |
| Per Share Operating Performance | |
| Net asset value, beginning of year | | $ | 6.84 | | | $ | 6.80 | | | $ | 7.66 | | | $ | 7.43 | | | $ | 6.91 | | |
| Investment operations: | |
| Net investment income(a) | | | .22 | | | | .18 | | | | .17 | | | | .17 | | | | .18 | | |
| Net realized and unrealized gain (loss) | | | .31 | | | | .17 | | | | (.59 | ) | | | .43 | | | | .68 | | |
| Total from investment operations | | | .53 | | | | .35 | | | | (.42 | ) | | | .60 | | | | .86 | | |
| Distributions to shareholders from: | |
| Net investment income | | | (.64 | ) | | | (.31 | ) | | | (.44 | ) | | | (.37 | ) | | | (.34 | ) | |
| Net asset value, end of year | | $ | 6.73 | | | $ | 6.84 | | | $ | 6.80 | | | $ | 7.66 | | | $ | 7.43 | | |
| Total Return(b) | | | 7.98 | % | | | 5.22 | % | | | (5.61 | )% | | | 8.40 | % | | | 12.79 | % | |
| Ratios to Average Net Assets: | |
Expenses, excluding expense reductions
and including expenses assumed | | | 1.14 | % | | | 1.30 | % | | | 1.30 | % | | | 1.40 | % | | | 1.35 | % | |
Expenses, excluding interest expense,
including expense reductions and
expenses assumed | | | 1.14 | % | | | 1.30 | % | | | 1.30 | % | | | 1.40 | % | | | 1.35 | % | |
Expenses, excluding expense reductions
and expenses assumed | | | 1.83 | % | | | 1.43 | % | | | 1.38 | % | | | 1.40 | % | | | 1.35 | % | |
| Net investment income | | | 3.25 | % | | | 2.70 | % | | | 2.36 | % | | | 2.33 | % | | | 2.43 | % | |
| Supplemental Data: | |
| Net assets, end of year (000) | | $ | 44,148 | | | $ | 50,398 | | | $ | 52,275 | | | $ | 55,821 | | | $ | 56,386 | | |
| Portfolio turnover rate | | | 301.30 | % | | | 271.35 | % | | | 194.12 | % | | | 260.11 | % | | | 239.18 | % | |
(a) Calculated using average shares outstanding during the period.
(b) Total return does not consider the effects of sales loads and assumes the reinvestment of all distributions.
See Notes to Financial Statements.
33
Financial Highlights (continued)
DEVELOPING LOCAL MARKETS FUND
| | | Class B Shares | |
| | | Year Ended 12/31 | |
| | | 2007 | | 2006 | | 2005 | | 2004 | | 2003 | |
| Per Share Operating Performance | |
| Net asset value, beginning of year | | $ | 6.85 | | | $ | 6.80 | | | $ | 7.67 | | | $ | 7.45 | | | $ | 6.92 | | |
| Investment operations: | |
| Net investment income(a) | | | .18 | | | | .14 | | | | .12 | | | | .12 | | | | .13 | | |
| Net realized and unrealized gain (loss) | | | .28 | | | | .17 | | | | (.60 | ) | | | .43 | | | | .70 | | |
| Total from investment operations | | | .46 | | | | .31 | | | | (.48 | ) | | | .55 | | | | .83 | | |
| Distributions to shareholders from: | |
| Net investment income | | | (.57 | ) | | | (.26 | ) | | | (.39 | ) | | | (.33 | ) | | | (.30 | ) | |
| Net asset value, end of year | | $ | 6.74 | | | $ | 6.85 | | | $ | 6.80 | | | $ | 7.67 | | | $ | 7.45 | | |
| Total Return(b) | | | 7.26 | % | | | 4.67 | % | | | (6.34 | )% | | | 7.58 | % | | | 12.22 | % | |
| Ratios to Average Net Assets: | |
Expenses, excluding expense reductions
and including expenses assumed | | | 1.79 | % | | | 1.95 | % | | | 1.95 | % | | | 2.04 | % | | | 1.99 | % | |
Expenses, excluding interest expense,
including expense reductions and
expenses assumed | | | 1.79 | % | | | 1.95 | % | | | 1.95 | % | | | 2.04 | % | | | 1.99 | % | |
Expenses, excluding expense reductions
and expenses assumed | | | 2.46 | % | | | 2.08 | % | | | 2.03 | % | | | 2.04 | % | | | 1.99 | % | |
| Net investment income | | | 2.58 | % | | | 2.05 | % | | | 1.71 | % | | | 1.69 | % | | | 1.79 | % | |
| Supplemental Data: | |
| Net assets, end of year (000) | | $ | 3,303 | | | $ | 4,184 | | | $ | 4,636 | | | $ | 5,291 | | | $ | 3,719 | | |
| Portfolio turnover rate | | | 301.30 | % | | | 271.35 | % | | | 194.12 | % | | | 260.11 | % | | | 239.18 | % | |
(a) Calculated using average shares outstanding during the period.
(b) Total return does not consider the effects of sales loads and assumes the reinvestment of all distributions.
See Notes to Financial Statements.
34
Financial Highlights (continued)
DEVELOPING LOCAL MARKETS FUND
| | | Class C Shares | |
| | | Year Ended 12/31 | |
| | | 2007 | | 2006 | | 2005 | | 2004 | | 2003 | |
| Per Share Operating Performance | |
| Net asset value, beginning of year | | $ | 6.86 | | | $ | 6.81 | | | $ | 7.67 | | | $ | 7.45 | | | $ | 6.92 | | |
| Investment operations: | |
| Net investment income(a) | | | .18 | | | | .14 | | | | .12 | | | | .12 | | | | .13 | | |
| Net realized and unrealized gain (loss) | | | .30 | | | | .17 | | | | (.59 | ) | | | .43 | | | | .70 | | |
| Total from investment operations | | | .48 | | | | .31 | | | | (.47 | ) | | | .55 | | | | .83 | | |
| Distributions to shareholders from: | |
| Net investment income | | | (.59 | ) | | | (.26 | ) | | | (.39 | ) | | | (.33 | ) | | | (.30 | ) | |
| Net asset value, end of year | | $ | 6.75 | | | $ | 6.86 | | | $ | 6.81 | | | $ | 7.67 | | | $ | 7.45 | | |
| Total Return(b) | | | 7.27 | % | | | 4.66 | % | | | (6.20 | )% | | | 7.59 | % | | | 12.29 | % | |
| Ratios to Average Net Assets: | |
Expenses, excluding expense reductions
and including expenses assumed | | | 1.79 | % | | | 1.95 | % | | | 1.95 | % | | | 2.04 | % | | | 1.99 | % | |
Expenses, excluding interest expense,
including expense reductions and
expenses assumed | | | 1.79 | % | | | 1.95 | % | | | 1.95 | % | | | 2.04 | % | | | 1.99 | % | |
Expenses, excluding expense reductions
and expenses assumed | | | 2.47 | % | | | 2.08 | % | | | 2.02 | % | | | 2.04 | % | | | 1.99 | % | |
| Net investment income | | | 2.60 | % | | | 2.05 | % | | | 1.70 | % | | | 1.69 | % | | | 1.79 | % | |
| Supplemental Data: | |
| Net assets, end of year (000) | | $ | 5,952 | | | $ | 6,608 | | | $ | 7,004 | | | $ | 6,235 | | | $ | 5,212 | | |
| Portfolio turnover rate | | | 301.30 | % | | | 271.35 | % | | | 194.12 | % | | | 260.11 | % | | | 239.18 | % | |
(a) Calculated using average shares outstanding during the period.
(b) Total return does not consider the effects of sales loads and assumes the reinvestment of all distributions.
See Notes to Financial Statements.
35
Financial Highlights (continued)
DEVELOPING LOCAL MARKETS FUND
| | | Class F Shares | |
| | | 9/28/2007(a)
to
12/31/2007 | |
| Per Share Operating Performance | |
| Net asset value, beginning of period | | $ | 6.92 | | |
| Investment operations: | |
| Net investment income(b) | | | .07 | | |
| Net realized and unrealized gain | | | .17 | | |
| Total from investment operations | | | .24 | | |
| Distributions to shareholders from: | |
| Net investment income | | | (.43 | ) | |
| Net asset value, end of period | | $ | 6.73 | | |
| Total Return(c) | | | 3.56 | %(d) | |
| Ratios to Average Net Assets: | |
| Expenses, excluding expense reductions and including expenses assumed | | | .16 | %(d) | |
| Expenses, excluding interest expense, including expense reductions and expenses assumed | | | .16 | %(d) | |
| Expenses, excluding expense reductions and expenses assumed | | | .17 | %(d) | |
| Net investment income | | | 1.02 | %(d) | |
| Supplemental Data: | |
| Net assets, end of period (000) | | $ | 10 | | |
| Portfolio turnover rate | | | 301.30 | % | |
(a) Commencement of investment operations was September 28, 2007; SEC effective date was September 14, 2007 and date shares first became available to the public was October 1, 2007.
(b) Calculated using average shares outstanding during the period.
(c) Total return does not consider the effects of sales loads and assumes the reinvestment of all distributions.
(d) Not annualized.
See Notes to Financial Statements.
36
Financial Highlights (continued)
DEVELOPING LOCAL MARKETS FUND
| | | Class I Shares | |
| | | Year Ended 12/31 | | 10/19/2004(a)
to | |
| | | 2007 | | 2006 | | 2005 | | 12/31/2004 | |
| Per Share Operating Performance | |
| Net asset value, beginning of period | | $ | 6.85 | | | $ | 6.80 | | | $ | 7.66 | | | $ | 7.38 | | |
| Investment operations: | |
| Net investment income(b) | | | .25 | | | | .21 | | | | .20 | | | | .04 | | |
| Net realized and unrealized gain (loss) | | | .29 | | | | .17 | | | | (.60 | ) | | | .37 | | |
| Total from investment operations | | | .54 | | | | .38 | | | | (.40 | ) | | | .41 | | |
| Distributions to shareholders from: | |
| Net investment income | | | (.66 | ) | | | (.33 | ) | | | (.46 | ) | | | (.13 | ) | |
| Net asset value, end of period | | $ | 6.73 | | | $ | 6.85 | | | $ | 6.80 | | | $ | 7.66 | | |
| Total Return(c) | | | 8.20 | % | | | 5.75 | % | | | (5.28 | )% | | | 5.79 | %(d) | |
| Ratios to Average Net Assets: | |
Expenses, excluding expense reductions
and including expenses assumed | | | .77 | % | | | .95 | % | | | .95 | % | | | .21 | %(d) | |
Expenses, excluding interest expense,
including expense reductions
and expenses assumed | | | .77 | % | | | .95 | % | | | .95 | % | | | .21 | %(d) | |
Expenses, excluding expense
reductions and expenses assumed | | | 1.45 | % | | | 1.08 | % | | | 1.03 | % | | | .21 | %(d) | |
| Net investment income | | | 3.64 | % | | | 3.03 | % | | | 2.71 | % | | | .57 | %(d) | |
| Supplemental Data: | |
| Net assets, end of period (000) | | $ | 888 | | | $ | 1,041 | | | $ | 564 | | | $ | 577 | | |
| Portfolio turnover rate | | | 301.30 | % | | | 271.35 | % | | | 194.12 | % | | | 260.11 | %(d) | |
(a) Commencement of offering of class shares.
(b) Calculated using average shares outstanding during the period.
(c) Total return does not consider the effects of sales loads and assumes the reinvestment of all distributions.
(d) Not annualized.
See Notes to Financial Statements.
37
Financial Highlights (continued)
DEVELOPING LOCAL MARKETS FUND
| | | Class P Shares | |
| | | Year Ended 12/31 | |
| | | 2007 | | 2006 | | 2005 | | 2004 | | 2003 | |
| Per Share Operating Performance | |
| Net asset value, beginning of year | | $ | 6.82 | | | $ | 6.77 | | | $ | 7.59 | | | $ | 7.39 | | | $ | 6.87 | | |
| Investment operations: | |
| Net investment income(a) | | | .22 | | | | .18 | | | | .16 | | | | .16 | | | | .17 | | |
| Net realized and unrealized gain (loss) | | | .30 | | | | .17 | | | | (.58 | ) | | | .36 | | | | .69 | | |
| Total from investment operations | | | .52 | | | | .35 | | | | (.42 | ) | | | .52 | | | | .86 | | |
| Distributions to shareholders from: | |
| Net investment income | | | (.63 | ) | | | (.30 | ) | | | (.40 | ) | | | (.32 | ) | | | (.34 | ) | |
| Net asset value, end of year | | $ | 6.71 | | | $ | 6.82 | | | $ | 6.77 | | | $ | 7.59 | | | $ | 7.39 | | |
| Total Return(b) | | | 7.96 | % | | | 5.34 | % | | | (5.60 | )% | | | 7.34 | % | | | 12.78 | % | |
| Ratios to Average Net Assets: | |
Expenses, excluding expense reductions
and including expenses assumed | | | 1.17 | % | | | 1.22 | % | | | 1.38 | % | | | 1.49 | % | | | 1.44 | % | |
Expenses, excluding interest expense,
including expense reductions
and expenses assumed | | | 1.17 | % | | | 1.22 | % | | | 1.38 | % | | | 1.49 | % | | | 1.44 | % | |
Expenses, excluding expense
reductions and expenses assumed | | | 1.93 | % | | | 1.50 | % | | | 1.39 | % | | | 1.49 | % | | | 1.44 | % | |
| Net investment income | | | 3.30 | % | | | 2.60 | % | | | 2.20 | % | | | 2.24 | % | | | 2.34 | % | |
| Supplemental Data: | |
| Net assets, end of year (000) | | $ | 9 | | | $ | 2 | | | $ | 2 | | | $ | 2 | | | $ | 1,904 | | |
| Portfolio turnover rate | | | 301.30 | % | | | 271.35 | % | | | 194.12 | % | | | 260.11 | % | | | 239.18 | % | |
(a) Calculated using average shares outstanding during the period.
(b) Total return does not consider the effects of sales loads and assumes the reinvestment of all distributions.
See Notes to Financial Statements.
38
Financial Highlights (continued)
DEVELOPING LOCAL MARKETS FUND
| | | Class R2 Shares | |
| | | 9/28/2007(a)
to
12/31/2007 | |
| Per Share Operating Performance | |
| Net asset value, beginning of period | | $ | 6.92 | | |
| Investment operations: | |
| Net investment income(b) | | | .06 | | |
| Net realized and unrealized gain | | | .17 | | |
| Total from investment operations | | | .23 | | |
| Distributions to shareholders from: | |
| Net investment income | | | (.42 | ) | |
| Net asset value, end of period | | $ | 6.73 | | |
| Total Return(c) | | | 3.45 | %(d) | |
| Ratios to Average Net Assets: | |
| Expenses, excluding expense reductions and including expenses assumed | | | .27 | %(d) | |
| Expenses, excluding interest expense, including expense reductions and expenses assumed | | | .27 | %(d) | |
| Expenses, excluding expense reductions and expenses assumed | | | .28 | %(d) | |
| Net investment income | | | .92 | %(d) | |
| Supplemental Data: | |
| Net assets, end of period (000) | | $ | 10 | | |
| Portfolio turnover rate | | | 301.30 | % | |
(a) Commencement of investment operations was September 28, 2007; SEC effective date was September 14, 2007 and date shares first became available to the public was October 1, 2007.
(b) Calculated using average shares outstanding during the period.
(c) Total return does not consider the effects of sales loads and assumes the reinvestment of all distributions.
(d) Not annualized.
See Notes to Financial Statements.
39
Financial Highlights (concluded)
DEVELOPING LOCAL MARKETS FUND
| | | Class R3 Shares | |
| | | 9/28/2007(a)
to
12/31/2007 | |
| Per Share Operating Performance | |
| Net asset value, beginning of period | | $ | 6.92 | | |
| Investment operations: | |
| Net investment income(b) | | | .07 | | |
| Net realized and unrealized gain | | | .17 | | |
| Total from investment operations | | | .24 | | |
| Distributions to shareholders from: | |
| Net investment income | | | (.43 | ) | |
| Net asset value, end of period | | $ | 6.73 | | |
| Total Return(c) | | | 3.48 | %(d) | |
| Ratios to Average Net Assets: | |
| Expenses, excluding expense reductions and including expenses assumed | | | .25 | %(d) | |
| Expenses, excluding interest expense, including expense reductions and expenses assumed | | | .25 | %(d) | |
| Expenses, excluding expense reductions and expenses assumed | | | .25 | %(d) | |
| Net investment income | | | .95 | %(d) | |
| Supplemental Data: | |
| Net assets, end of period (000) | | $ | 10 | | |
| Portfolio turnover rate | | | 301.30 | % | |
(a) Commencement of investment operations was September 28, 2007; SEC effective date was September 14, 2007 and date shares first became available to the public was October 1, 2007.
(b) Calculated using average shares outstanding during the period.
(c) Total return does not consider the effects of sales loads and assumes the reinvestment of all distributions.
(d) Not annualized.
See Notes to Financial Statements.
40
Notes to Financial Statements
1. ORGANIZATION
Lord Abbett Global Fund, Inc. (the "Company") is registered under the Investment Company Act of 1940 (the "Act") as an open-end management investment company incorporated under Maryland law on February 23, 1988. The Company consists of the following two portfolios (the "Funds") and their respective classes: Equity Series ("Global Equity Fund") and Lord Abbett Developing Local Markets Fund ("Developing Local Markets Fund"; formerly named the "Global Income Fund"), Classes A, B, C, F, I, P, R2 and R3 shares. As of the date of this report, no P, R2 or R3 shares have been issued for Global Equity Fund. Global Equity Fund is diversified as defined under the Act and the Developing Local Markets Fund is non-diversified. Effective September 28, 2007, Class Y was renamed Class I. As of October 1, 2007, the Fund's Class P shares were closed to substantially all new retirement and benefit plans and fee-based programs, with certain exceptions as set for th in the Funds' Prospectus.
Global Equity Fund's investment objective is long-term growth of capital and income consistent with reasonable risk. The production of current income is a secondary consideration. Developing Local Markets Fund's investment objective is to seek high total return. Each class of shares has different expenses and dividends. A front-end sales charge is normally added to the Net Asset Value ("NAV") for Class A shares. There is no front-end sales charge in the case of the Classes B, C, F, I, P, R2 and R3 shares, although there may be a contingent deferred sales charge ("CDSC") as follows: certain redemptions of Class A shares made within 12 months following certain purchases made without a sales charge; Class B shares redeemed before the sixth anniversary of purchase; and Class C shares redeemed before the first anniversary of purchase. Class B shares will convert to Class A shares on the eighth anniversary of an original purchase of Class B shares .
The preparation of financial statements in conformity with accounting principles generally accepted in the United States of America requires management to make certain estimates and assumptions that affect the reported amounts of assets and liabilities and disclosure of contingent assets and liabilities at the date of the financial statements and the reported amounts of increases and decreases in net assets from operations during the reporting period. Actual results could differ from those estimates.
2. SIGNIFICANT ACCOUNTING POLICIES
(a) Investment Valuation–Securities traded on any recognized U.S. or non-U.S. exchange or on The NASDAQ Stock Market LLC are valued at the last sale price or official closing price on the exchange or system on which they are principally traded. Events occurring after the close of trading on non-U.S. exchanges may result in adjustments to the valuation of foreign securities to more accurately reflect their fair value as of the close of regular trading on the New York Stock Exchange. The Funds may rely on an independent fair valuation service in adjusting the valuations of foreign securities. Unlisted equity securities are valued at the last quoted sale price or, if no sale price is available, at the mean between the most recently quoted bid and asked prices. Fixed income securit ies are valued at the mean between the bid and asked prices on the basis of prices supplied by independent pricing services, which reflect broker/dealer supplied valuations and electronic data processing techniques. Exchange-traded options and futures contracts are valued at the last sale price in the market where they are principally traded. If no sale has occurred, the mean between the most recently quoted bid and asked prices is used. Securities for which market quotations are not
41
Notes to Financial Statements (continued)
readily available are valued at fair value as determined by management and approved in good faith by the Board of Directors. Short-term securities with 60 days or less remaining to maturity are valued using the amortized cost method, which approximates current market value.
(b) Security Transactions–Security transactions are recorded as of the date that the securities are purchased or sold (trade date). Realized gains and losses on sales of portfolio securities are calculated using the identified-cost method. Realized and unrealized gains (losses) are allocated to each class of shares based upon the relative proportion of net assets at the beginning of the day.
(c) Investment Income–Dividend income is recorded on the ex-dividend date. Interest income is recorded on the accrual basis. Discounts are accreted and premiums are amortized using the effective interest method. Withholding taxes on foreign dividends have been provided for in accordance with the Funds' understanding of the applicable country's tax rules and rates. Investment income is allocated to each class of shares based upon the relative proportion of net assets at the beginning of the day.
(d) Federal Taxes–It is the policy of each Fund to meet the requirements of Subchapter M of the Internal Revenue Code applicable to regulated investment companies and to distribute substantially all taxable income and capital gains to its shareholders. Therefore, no Federal income tax provision is required.
(e) Expenses–Expenses incurred by the Company that do not specifically relate to an individual fund are generally allocated to the Funds within the Company on a pro rata basis. Expenses, excluding class specific expenses, are allocated to each class of shares based upon the relative proportion of net assets at the beginning of the day. Class A, B, C, F, P, R2 and R3 shares bear their class specific share of all expenses and fees relating to the Funds' 12b-1 Distribution Plan.
(f) Foreign Transactions–The books and records of the Funds are maintained in U.S. dollars and transactions denominated in foreign currencies are recorded in each Fund's records at the rate prevailing when earned or recorded. Asset and liability accounts that are denominated in foreign currencies are adjusted to reflect current exchange rates. The resultant exchange gains and losses are included in Net realized gain on investments, futures contracts and foreign currency related transactions on each Fund's Statement of Operations. Each Fund does not isolate that portion of the results of operations arising as a result of changes in the foreign exchange rates from the changes in market prices of the securities.
(g) Commitments–At December 31, 2007, Global Equity Fund had entered into foreign exchange contracts, under which it had agreed to purchase and sell various foreign currencies with approximate values of $814,552 and $10,415, respectively.
(h) Forward Foreign Currency Exchange Contracts–The Developing Local Markets Fund may invest substantially in forward foreign currency contracts or other derivatives, such as options, futures contracts, and swap agreements. U.S. fixed income instruments are used to "cover" the Developing Local Markets Fund's net exposure under forward contracts and other instruments that provide investment exposure to the currencies of developing markets. The Global Equity Fund may enter into forward foreign currency exchange contracts in order to reduce its exposure to changes in foreign currency exchange rates on its foreign portfolio holdings and to lock in the U.S. dollar cost of firm purchase and sale commitments for
42
Notes to Financial Statements (continued)
securities denominated in foreign currencies. A forward foreign currency exchange contract is a commitment to purchase or sell a foreign currency at a future date at a negotiated rate. Forward contracts may also be structured for cash settlement rather than physical delivery. The contracts are valued daily at forward exchange rates and any unrealized gain (loss) is included in Net change in unrealized appreciation on investments, futures contracts and translation of assets and liabilities denominated in foreign currencies on each Fund's Statement of Operations. The gain (loss) arising from the difference between the U.S. dollar cost of the original contract and the value of the foreign currency in U.S. dollars upon closing of such contracts is included in Net realized gain on investments, futures contracts and foreign currency related transactions on the Statement of Operations.
(i) Futures Contracts–Each Fund may purchase and sell futures contracts for bona fide hedging purposes including hedging against changes in interest rates and securities prices. At the time of entering into a futures transaction, an investor is required to deposit and maintain a specified amount of cash or eligible securities called "initial margin." Subsequent payments called "variation margin" are made on a daily basis as the market price of the futures contract fluctuates. The Funds will record an unrealized gain (loss) based on the amount of variation margin. When a contract is closed, a realized gain (loss) is recorded equal to the difference between the opening and closing value of the contract. Generally, open futures contracts are marked to market for Federal income tax purposes at fiscal year-end. As of December 31, 2007, only Developing Local Markets Fund had open futures contracts.
(j) When-Issued or Forward Transactions–Each Fund may purchase securities on a when-issued or forward basis. When-issued, forward transactions or to-be-announced ("TBA") transactions involve a commitment by a fund to purchase securities, with payment and delivery ("settlement") to take place in the future, in order to secure what is considered to be an advantageous price or yield at the time of entering into the transaction. During the period between purchase and settlement, the value of the securities will fluctuate and assets consisting of cash and/or marketable securities (normally short-term U.S. Government or U.S. Government sponsored enterprise securities) marked to market daily in an amount sufficient to make payment at settlement will be segregated at each Fund's custod ian in order to pay for the commitment. At the time each Fund makes the commitment to purchase a security on a when-issued basis, it will record the transaction and reflect the liability for the purchase and value of the security in determining its net asset value. Each Fund, generally, has the ability to close out a purchase obligation on or before the settlement date rather than take delivery of the security. Under no circumstances will settlement for such securities take place more than 120 days after the purchase date.
(k) TBA Sale Commitments–Developing Local Markets Fund may enter into TBA sale commitments to hedge its positions or to sell mortgage-backed securities it owns under delayed delivery arrangements. Proceeds of TBA sale commitments are not received until the contractual settlement date. During the time a TBA sale commitment is outstanding, equivalent deliverable securities, or an offsetting TBA purchase commitment deliverable on or before the sale commitment date, are held as "cover" for the transaction. Unsettled TBA sale commitments are valued at the current market value of the underlying securities, according to the procedures described under "Investment Valuation" above. The contract is adjusted to market value daily and the change in market value is recorded by the Fund as u nrealized appreciation (depreciation). If the TBA sale (purchase) commitment is closed
43
Notes to Financial Statements (continued)
through the acquisition of an offsetting purchase (sale) commitment, the Fund realizes a gain or loss from the sale of the securities based upon the unit price established at the date the commitment was entered into.
(l) Mortgage Dollar Rolls–Developing Local Markets Fund may sell mortgage-backed securities for delivery in the current month and simultaneously contract to repurchase substantially similar (same type, coupon and maturity) securities on a specific future date. During the roll period, the Fund loses the right to receive principal (including prepayments of principal) and interest paid on the securities sold.
(m) Repurchase Agreements–Each Fund may enter into repurchase agreements with respect to securities. A repurchase agreement is a transaction in which a Fund acquires a security and simultaneously commits to resell that security to the seller (a bank or securities dealer) at an agreed-upon price on an agreed-upon date. Each Fund requires at all times that the repurchase agreement be collateralized by cash, or by securities of the U.S. Government, its agencies, its instrumentalities, or U.S. Government sponsored enterprises having a value equal to, or in excess of, the value of the repurchase agreement (including accrued interest). If the seller of the agreement defaults on its obligation to repurchase the underlying securities at a time when the value of these securities has dec lined, the Funds may incur a loss upon disposition of the securities.
(n) Reverse Repurchase Agreements–Developing Local Markets Fund may enter into reverse repurchase agreements. In a reverse repurchase agreement, a Fund sells a security to a securities dealer or bank for cash and agrees to repurchase the same security at an agreed-upon later date at an agreed-upon price. The interest payments associated with such transactions are included in interest expense in the Statement of Operations. Reverse repurchase agreements expose a Fund to credit risk, but this risk is reduced because each Fund maintains collateral equal to at least 100% of the market value of the securities sold. As of December 31, 2007, Developing Local Markets Fund did not have any open reverse repurchase agreements.
The average balance of reverse repurchase agreements outstanding and the weighted-average interest rate during the year ended December 31, 2007, was as follows:
| | | Weighted Average
Daily Balance | | Weighted Average
Interest Rate | |
| Developing Local Markets Fund | | $ | 95,902 | | | | 4.51 | % | |
The maximum balance of reverse repurchase agreements outstanding during the year was $3,899,520 which was 6.64% of average daily net assets of Developing Local Markets Fund.
(o) Short Sales–Each Fund may sell a security it does not own in anticipation of a decline in the fair value of that security. When a Fund sells a security short, it must borrow the security sold short and deliver it to the broker-dealer through which it made the short sale. A gain, limited to the price at which the Fund sold the security short, or a loss, unlimited in size, will be realized upon the termination of a short sale. As of December 31, 2007, the Funds did not have any open short sales.
44
Notes to Financial Statements (continued)
3. MANAGEMENT FEES AND OTHER TRANSACTIONS WITH AFFILIATES
Management Fees
The Company has a management agreement with Lord, Abbett & Co. LLC ("Lord Abbett") pursuant to which Lord Abbett supplies each Fund with investment management services and executive and other personnel, pays the remuneration of officers, provides office space and pays for ordinary and necessary office and clerical expenses relating to research and statistical work and supervision of each Fund's investment portfolio.
The management fees are based on average daily net assets at the following annual rates:
| Global Equity Fund: | |
| First $1 billion | | | .75 | % | |
| Next $1 billion | | | .70 | % | |
| Over $2 billion | | | .65 | % | |
| Developing Local Markets Fund: | |
| First $1 billion | | | .50 | % | |
| Over $1 billion | | | .45 | % | |
For the year ended December 31, 2007, the effective management fees paid to Lord Abbett were at the following annualized rates:
| | | Management Fees | |
| Global Equity Fund | | | .75 | % | |
| Developing Local Markets Fund | | | .50 | % | |
For the period January 1, 2007 through April 30, 2008, Lord Abbett has contractually agreed to reimburse each Fund to the extent necessary so that each class' total annual operating expenses (excluding interest expense for Developing Local Markets Fund only) do not exceed the following annual rates:
Global Equity Fund
| Class | | % of Average
Daily Net Assets | |
| A | | | 1.60 | % | |
| B | | | 2.25 | % | |
| C | | | 2.25 | % | |
| F | | | 1.35 | %(1) | |
| I | | | 1.25 | % | |
| P | | | 1.70 | % | |
| R2 | | | 1.85 | %(1) | |
| R3 | | | 1.75 | %(1) | |
(1) The contractual expense reimbursement agreement for Class F, R2 and R3 shares began on September 14, 2007.
Developing Local Markets Fund
| Class | | % of Average
Daily Net Assets | |
| A | | | 1.30 | % | |
| B | | | 1.95 | % | |
| C | | | 1.95 | % | |
| F | | | 1.05 | %(1) | |
| I | | | .95 | % | |
| P | | | 1.40 | % | |
| R2 | | | 1.55 | %(1) | |
| R3 | | | 1.45 | %(1) | |
(1) The contractual expense reimbursement agreement for Class F, R2 and R3 shares began on September 14, 2007.
For the fiscal year ended December 31, 2007, Lord Abbett voluntarily reimbursed approximately an additional $97,000 of expenses for Developing Local Markets Fund.
45
Notes to Financial Statements (continued)
Lord Abbett provides certain administrative services to the Funds pursuant to an Administrative Services Agreement at an annual rate of .04% of each Fund's average daily net assets.
12b-1 Distribution Plan
Each Fund has adopted a distribution plan with respect to Class A, B, C, F, P, R2 and R3 shares pursuant to Rule 12b-1 under the Act, which provides for the payment of ongoing distribution and service fees to Lord Abbett Distributor LLC ("Distributor"), an affiliate of Lord Abbett. The fees are accrued daily at annual rates based upon average daily net assets as follows:
| Fees* | | Class A | | Class B | | Class C | | Class F | | Class P | | Class R2 | | Class R3 | |
| Service | | | .25 | % | | | .25 | % | | | .25 | % | | | - | | | | .20 | % | | | .25 | % | | | .25 | % | |
| Distribution | | | .10 | % | | | .75 | % | | | .75 | % | | | .10 | % | | | .25 | % | | | .35 | % | | | .25 | % | |
* The Fund may designate a portion of the aggregate fee as attributable to service activities for purposes of calculating Financial Industry Regulatory Authority ("FINRA") sales charge limitations.
Class I does not have a distribution plan.
Commissions
Distributor received the following commissions on sales of shares of the Funds, after concessions were paid to authorized dealers, for the year ended December 31, 2007:
| | | Distributor
Commissions | | Dealers'
Concessions | |
| Global Equity Fund | | $ | 47,561 | | | $ | 251,298 | | |
| Developing Local Markets Fund | | | 15,871 | | | | 78,896 | | |
Distributor received the following amount of CDSCs for the year ended December 31, 2007:
| | | Class A | | Class C | |
| Global Equity Fund | | $ | 319 | | | $ | 1,478 | | |
| Developing Local Markets Fund | | | 999 | | | | 79 | | |
Two Directors and certain of the Fund's officers have an interest in Lord Abbett.
4. DISTRIBUTIONS AND CAPITAL LOSS CARRYFORWARDS
Dividends from net investment income, if any, are declared and paid semiannually for Global Equity Fund, and declared daily and paid monthly for Developing Local Markets. Taxable net realized gains from investment transactions, reduced by capital loss carryforwards, if any, are declared and distributed to shareholders at least annually. The capital loss carryforward amount, if any, is available to offset future net capital gains. Dividends and distributions to shareholders are recorded on the ex-dividend date. The amount of dividends and distributions from net investment income and net realized capital gains are determined in accordance with Federal income tax regulations which may differ from accounting principles generally accepted in the United States of America. These book/tax differences are either considered temporary or permanent in nature. To the extent these differences are permanent in nature, such amounts are reclassified within t he components of net assets based on their federal tax basis treatment; temporary differences do not require reclassification. Dividends and distributions, which exceed earnings and profits for tax purposes, are reported as a tax return of capital.
46
Notes to Financial Statements (continued)
The tax character of distributions paid during the fiscal years ended December 31, 2007 and 2006 are as follows:
| | | Global Equity Fund | | Developing Local
Markets Fund | |
| | | 12/31/2007 | | 12/31/2006 | | 12/31/2007 | | 12/31/2006 | |
| Distributions paid from: | |
| Ordinary income | | $ | 7,402,846 | | | $ | 4,483,162 | | | $ | 5,123,670 | | | $ | 2,730,906 | | |
| Net long-term capital gains | | | 6,062,779 | | | | 4,991,077 | | | | - | | | | - | | |
| Total distributions paid | | $ | 13,465,625 | | | $ | 9,474,239 | | | $ | 5,123,670 | | | $ | 2,730,906 | | |
As of December 31, 2007, the components of accumulated earnings (losses) on a tax-basis are as follows:
| | | Global Equity Fund | | Developing Local
Markets Fund | |
| Undistributed ordinary income – net | | $ | 660,051 | | | $ | 1,979,179 | | |
| Undistributed long-term capital gains | | | 1,127,195 | | | | - | | |
| Total undistributed earnings | | $ | 1,787,246 | | | $ | 1,979,179 | | |
| Capital loss carryforward* | | | - | | | | (8,389,515 | ) | |
| Temporary differences | | | (47,960 | ) | | | (393,334 | ) | |
| Unrealized gains – net | | | 13,426,086 | | | | 1,175,421 | | |
| Total accumulated earnings (losses) – net | | $ | 15,165,372 | | | $ | (5,628,249 | ) | |
* As of December 31, 2007, the capital loss carryforwards, along with the related expiration dates, are as follows:
| | | 2008 | | 2010 | | 2014 | | 2015 | | Total | |
| Developing Local Markets Fund | | $ | 2,677,712 | | | $ | 3,056,190 | | | $ | 1,173,526 | | | $ | 1,482,087 | | | $ | 8,389,515 | | |
Certain losses incurred after October 31 ("Post-October Losses"), within the taxable year are deemed to arise on the first business day of the Fund's next taxable year. Each fund incurred and will elect to defer net losses during fiscal 2007 as follows:
| | | Ordinary | | Capital | |
| Global Equity Fund | | $ | 19,115 | | | $ | – | | |
| Developing Local Markets Fund | | | – | | | | 348,658 | | |
As of December 31, 2007, the aggregate unrealized security gains and losses based on cost for U.S. Federal income tax purposes are as follows:
| | | Global Equity Fund | | Developing Local
Markets Fund | |
| Tax cost | | $ | 111,368,538 | | | $ | 51,384,028 | | |
| Gross unrealized gain | | | 17,554,754 | | | | 703,152 | | |
| Gross unrealized loss | | | (4,130,725 | ) | | | (11,155 | ) | |
| Net unrealized security gain | | $ | 13,424,029 | | | $ | 691,997 | | |
The difference between book-basis and tax-basis unrealized gains (losses) is attributable to wash sales and amortization.
47
Notes to Financial Statements (continued)
Permanent items identified during the fiscal year ended December 31, 2007 have been reclassified among the components of net assets based on their tax basis treatment as follows:
| | | Undistributed
(Distributions
in Excess of)
Net Investment
Income | | Accumulated
Net Realized
Gain (Loss) | | Paid-in
Capital | |
| Global Equity Fund | | $ | (104,830 | ) | | $ | 101,572 | | | $ | 3,258 | | |
| Developing Local Markets Fund | | | 3,781,093 | | | | (2,307,867 | ) | | | (1,473,226 | ) | |
The permanent differences are attributable to the tax treatment of amortization, foreign currency transactions, certain securities, certain distributions, paydown gains and losses and the expiration of capital loss carryforwards.
5. PORTFOLIO SECURITIES TRANSACTIONS
Purchases and sales of investment securities (excluding short-term and mortgage dollar roll investments) for the fiscal year ended December 31, 2007 are as follows:
| | | U.S.
Government
Purchases* | | Non-U.S.
Government
Purchases | | U.S.
Government
Sales* | | Non-U.S.
Government
Sales | |
| Global Equity Fund | | $ | - | | | $ | 101,935,265 | | | $ | - | | | $ | 98,969,907 | | |
Developing Local
Markets Fund | | | 65,920,856 | �� | | | 86,880,767 | | | | 82,426,941 | | | | 78,085,850 | | |
* Includes U.S. Government sponsored enterprises securities.
6. DIRECTORS' REMUNERATION
The Company's officers and the two Directors who are associated with Lord Abbett do not receive any compensation from the Company for serving in such capacities. Outside Directors' fees are allocated among all Lord Abbett-sponsored funds based on the net assets of each fund. There is an equity based plan available to all outside Directors under which outside Directors must defer receipt of a portion of, and may elect to defer receipt of an additional portion of, Directors' fees. The deferred amounts are treated as though equivalent dollar amounts have been invested in the funds. Such amounts and earnings accrued thereon are included in Directors' fees on the Statement of Operations and in Directors' fees payable on the Statement of Assets and Liabilities and are not deductible for U.S. Federal income tax purposes until such amounts are paid.
7. EXPENSE REDUCTIONS
The Company has entered into arrangements with the Funds' transfer agent and custodian, whereby credits realized as a result of uninvested cash balances are used to reduce a portion of each Fund's expenses.
8. LINE OF CREDIT
Global Equity Fund, along with certain other funds managed by Lord Abbett, has available a $250,000,000 unsecured revolving credit facility ("Facility") from a consortium of banks, to be
48
Notes to Financial Statements (continued)
used for temporary or emergency purposes as an additional source of liquidity to fund redemptions of investor shares. Any borrowings under this Facility will bear interest at current market rates as defined in the agreement. The fee for this Facility is at an annual rate of .08%. As of December 31, 2007, there were no loans outstanding pursuant to this Facility nor was the Facility utilized at any time during the year ended December 31, 2007.
9. CUSTODIAN AND ACCOUNTING AGENT
State Street Bank & Trust Company ("SSB") is the Company's custodian and accounting agent. SSB performs custodial, accounting and recordkeeping functions relating to portfolio transactions and calculating each Fund's NAV.
10. INVESTMENT RISKS
Each Fund is subject to the risks of investing in securities that are issued by non-U.S. entities, the risks of investing in derivatives, liquidity risk, and the risks from leverage.
Foreign securities may pose greater risks than domestic securities, including greater price fluctuations, less government regulation, and higher transaction costs. Foreign investments also may be affected by changes in currency rates or currency controls.
Derivatives are subject to risks such as liquidity risk, leveraging risk, interest rate risk, market risk, and credit risk. Derivatives also involve the risk of mispricing or improper valuation and the risk that changes in the value of the derivative may not correlate perfectly with the value of the underlying asset, rate, or index.
Illiquid securities may lower a Fund's returns since the Fund may be unable to sell these securities at its desired time or price.
Leverage, including borrowing, may increase volatility in a Fund by magnifying the effect of changes in the value of the Fund's holdings. The use of leverage may cause investors in a Fund to lose more money in adverse environments than would be the case in the absence of leverage.
The Global Equity Fund is subject to the general risks and considerations associated with equity investing. The value of an investment will fluctuate in response to movements in the stock market in general and to the changing prospects of individual companies in which the Global Equity Fund invests. Although certain companies in which the Global Equity Fund may invest may exhibit earnings and revenue growth above the market trend, the stocks of these companies may be more volatile and may drop in value if earnings and revenue growth do not meet expectations. With respect to foreign currency transactions in which the Fund may engage, there is no guarantee that these transactions will be successful. They may lower the Fund's return or result in significant losses.
The Developing Local Markets Fund is subject to the general risks and considerations associated with investing in debt securities, including interest rate risk. When interest rates rise, the prices of debt securities and an investment in the Developing Local Markets Fund are likely to decline. In times of economic uncertainty, high-yield debt securities (or "junk bonds") may decline in price, even when interest rates are falling. There is also the risk that an issuer of a debt security will fail to make timely payments of principal or interest to the Developing Local Markets Fund, a risk that is greater with junk bonds.
49
Notes to Financial Statements (continued)
Foreign currency exchange rates may fluctuate significantly over short periods of time. The Developing Local Markets Fund's use of currency-related transactions involves the risk that Lord Abbett will not accurately predict currency movements, and the Fund's returns could be reduced as a result. A decline in the value of foreign currencies relative to the U.S. dollar will reduce the value of securities held by the Developing Local Markets Fund that are denominated in those currencies.
The securities markets of developing or emerging countries tend to be less liquid, are especially subject to greater price volatility, have a smaller market capitalization, have less government regulation and may not be subject to as extensive and frequent accounting, financial, and other reporting requirements as securities issued in more developed countries.
The Developing Local Markets Fund believes that its investment strategies with respect to foreign currencies will generate qualifying income under current U.S. federal income tax law. However, there can be no assurance that the U.S. Treasury Department will not issue regulations in the future (possibly with retroactive effect) that would treat some or all of the Fund's foreign currency gains as nonqualifying income.
These factors can affect each Fund's performance.
50
Notes to Financial Statements (continued)
11. SUMMARY OF CAPITAL TRANSACTIONS
Transactions in shares of capital stock are as follows:
GLOBAL EQUITY FUND
| | | Year Ended
December 31, 2007 | | Year Ended
December 31, 2006 | |
| Class A Shares* | | Shares | | Amount | | Shares | | Amount | |
| Shares sold | | | 1,215,912 | | | $ | 17,010,004 | | | | 1,078,514 | | | $ | 14,088,599 | | |
| Converted from Class B** | | | 41,894 | | | | 583,098 | | | | 35,395 | | | | 461,107 | | |
| Reinvestment of distributions | | | 737,648 | | | | 9,775,524 | | | | 541,251 | | | | 7,067,107 | | |
| Shares reacquired | | | (1,131,751 | ) | | | (15,846,193 | ) | | | (888,030 | ) | | | (11,626,679 | ) | |
| Increase | | | 863,703 | | | $ | 11,522,433 | | | | 767,130 | | | $ | 9,990,134 | | |
| Class B Shares* | |
| Shares sold | | | 235,633 | | | $ | 3,090,432 | | | | 277,264 | | | $ | 3,439,964 | | |
| Reinvestment of distributions | | | 109,940 | | | | 1,359,027 | | | | 78,319 | | | | 965,721 | | |
| Shares reacquired | | | (194,549 | ) | | | (2,548,549 | ) | | | (170,104 | ) | | | (2,107,530 | ) | |
| Converted to Class A** | | | (44,611 | ) | | | (583,098 | ) | | | (37,307 | ) | | | (461,107 | ) | |
| Increase | | | 106,413 | | | $ | 1,317,812 | | | | 148,172 | | | $ | 1,837,048 | | |
| Class C Shares | |
| Shares sold | | | 454,896 | | | $ | 5,944,096 | | | | 368,984 | | | $ | 4,583,770 | | |
| Reinvestment of distributions | | | 134,683 | | | | 1,668,249 | | | | 85,286 | | | | 1,053,482 | | |
| Shares reacquired | | | (297,396 | ) | | | (3,924,128 | ) | | | (205,409 | ) | | | (2,528,410 | ) | |
| Increase | | | 292,183 | | | $ | 3,688,217 | | | | 248,861 | | | $ | 3,108,842 | | |
| | | Period Ended
December 31, 2007† | |
| Class F Shares | | Shares | | Amount | |
| Shares sold | | | 681.810 | | | $ | 10,029 | | |
| Reinvestment of distributions | | | 69.660 | | | | 913 | | |
| Increase | | | 751.470 | | | $ | 10,942 | | |
| | | Year Ended
December 31, 2007 | | Year Ended
December 31, 2006 | |
| Class I Shares | | Shares | | Amount | | Shares | | Amount | |
| Shares sold | | | 15,746 | | | $ | 224,198 | | | | 6,548 | | | $ | 87,596 | | |
| Reinvestment of distributions | | | 6,473 | | | | 85,764 | | | | 3,955 | | | | 51,765 | | |
| Shares reacquired | | | (5,368 | ) | | | (77,223 | ) | | | (5,407 | ) | | | (69,260 | ) | |
| Increase | | | 16,851 | | | $ | 232,739 | | | | 5,096 | | | $ | 70,101 | | |
* Amounts for the year ended December 31, 2006 have been reclassified to conform with current presentation.
** Automatic conversion of Class B shares occurs approximately eight years after the initial purchase date.
† For the period September 28, 2007 (commencement of investment operations) to December 31, 2007.
51
Notes to Financial Statements (continued)
DEVELOPING LOCAL MARKETS FUND
| | | Year Ended
December 31, 2007 | | Year Ended
December 31, 2006 | |
| Class A Shares* | | Shares | | Amount | | Shares | | Amount | |
| Shares sold | | | 1,022,043 | | | $ | 6,984,852 | | | | 1,379,703 | | | $ | 9,411,239 | | |
| Converted from Class B** | | | 48,852 | | | | 331,700 | | | | 17,250 | | | | 116,509 | | |
| Reinvestment of distributions | | | 536,642 | | | | 3,617,915 | | | | 275,165 | | | | 1,878,649 | | |
| Shares reacquired | | | (2,411,351 | ) | | | (16,429,458 | ) | | | (2,001,261 | ) | | | (13,619,285 | ) | |
| Decrease | | | (803,814 | ) | | $ | (5,494,991 | ) | | | (329,143 | ) | | $ | (2,212,888 | ) | |
| Class B Shares* | |
| Shares sold | | | 97,913 | | | $ | 672,860 | | | | 186,956 | | | $ | 1,276,467 | | |
| Reinvestment of distributions | | | 34,457 | | | | 232,444 | | | | 18,847 | | | | 128,814 | | |
| Shares reacquired | | | (204,168 | ) | | | (1,398,703 | ) | | | (259,532 | ) | | | (1,764,197 | ) | |
| Converted to Class A** | | | (48,780 | ) | | | (331,700 | ) | | | (17,225 | ) | | | (116,509 | ) | |
| Decrease | | | (120,578 | ) | | $ | (825,099 | ) | | | (70,954 | ) | | $ | (475,425 | ) | |
| Class C Shares | |
| Shares sold | | | 238,003 | | | $ | 1,631,457 | | | | 389,363 | | | $ | 2,664,042 | | |
| Reinvestment of distributions | | | 59,659 | | | | 402,838 | | | | 28,634 | | | | 195,916 | | |
| Shares reacquired | | | (378,495 | ) | | | (2,583,706 | ) | | | (484,564 | ) | | | (3,295,752 | ) | |
| Decrease | | | (80,833 | ) | | $ | (549,411 | ) | | | (66,567 | ) | | $ | (435,794 | ) | |
| | | Period Ended
December 31, 2007† | | | |
| Class F Shares | | Shares | | Amount | | | | | |
| Shares sold | | | 1,447 | | | $ | 10,014 | | | | | | | | | | |
| Reinvestment of distributions | | | 89 | | | | 599 | | | | | | | | | | |
| Increase | | | 1,536 | | | $ | 10,613 | | | | | | | | | | |
| | | Year Ended
December 31, 2006 | | Year Ended
December 31, 2006 | |
| Class I Shares | | Shares | | Amount | | Shares | | Amount | |
| Shares sold | | | 32,388 | | | $ | 224,542 | | | | 64,192 | | | $ | 437,607 | | |
| Reinvestment of distributions | | | 13,079 | | | | 88,309 | | | | 5,342 | | | | 36,521 | | |
| Shares reacquired | | | (65,395 | ) | | | (455,424 | ) | | | (643 | ) | | | (4,391 | ) | |
| Increase(decrease) | | | (19,928 | ) | | $ | (142,573 | ) | | | 68,891 | | | $ | 469,737 | | |
| Class P Shares | |
| Shares sold | | | 1,147 | | | $ | 7,827 | | | | 73.29 | | | $ | 497 | | |
| Reinvestment of distributions | | | 1 | | | | 6 | | | | 0.28 | | | | 2 | | |
| Shares reacquired | | | (85 | ) | | | (590 | ) | | | (14.82 | ) | | | (101 | ) | |
| Increase | | | 1,063 | | | $ | 7,243 | | | | 58.75 | | | $ | 398 | | |
| | | Period Ended
December 31, 2007† | | | |
| Class R2 Shares | | Shares | | Amount | | | | | |
| Shares sold | | | 1,445 | | | $ | 10,000 | | | | | | | | | | |
| Reinvestment of distributions | | | 88 | | | | 591 | | | | | | | | | | |
| Increase | | | 1,533 | | | $ | 10,591 | | | | | | | | | | |
| Class R3 Shares | |
| Shares sold | | | 1,445 | | | $ | 10,000 | | | | | | | | | | |
| Reinvestment of distributions | | | 89 | | | | 592 | | | | | | | | | | |
| Increase | | | 1,534 | | | $ | 10,592 | | | | | | | | | | |
* Amounts for the year ended December 31, 2006 have been reclassified to conform with current presentation.
** Automatic conversion of Class B shares occurs approximately eight years after the initial purchase date.
† For the period September 28, 2007 (commencement of investment operations) to December 31, 2007.
52
Notes to Financial Statements (concluded)
12. RECENT ACCOUNTING PRONOUNCEMENTS
In June 2006, the Financial Accounting Standards Board (FASB) issued Interpretation 48, Accounting for Uncertainty in Income Taxes—an interpretation of FASB Statement 109 (FIN 48). FIN 48 clarifies the accounting for income taxes by prescribing the minimum recognition threshold a tax position must meet before being recognized in the financial statements. Effective June 29, 2007, the Funds have adopted FIN 48. The adoption of FIN 48 has not resulted in a material impact on the Funds' net assets, results of operations and financial statement disclosures. The Funds file U.S. Federal and various state tax returns. No income tax returns are currently under examination. The Funds' tax returns remain open for examination for the years ended December 31, 2004 through December 31, 2007.
In September 2006, Statement of Financial Accounting Standards No. 157, Fair Value Measurements (SFAS 157), was issued and is effective for fiscal years beginning after November 15, 2007. SFAS 157 defines fair value, establishes a framework for measuring fair value and expands disclosures about fair value measurements. Management is currently evaluating the impact the adoption of SFAS 157 will have on each Fund's financial statement disclosures.
53
Report of Independent Registered Public Accounting Firm
The Board of Directors and Shareholders,
Lord Abbett Global Fund, Inc.:
We have audited the accompanying statements of assets and liabilities, including the schedules of investments, of Lord Abbett Global Fund, Inc. (the "Funds") comprising Equity Series and Lord Abbett Developing Local Markets Fund (formerly Income Series) as of December 31, 2007, and the related statements of operations for the year then ended, the statements of changes in net assets for each of the two years in the period then ended, and the financial highlights for each of the periods presented. These financial statements and financial highlights are the responsibility of the Funds' management. Our responsibility is to express an opinion on these financial statements and financial highlights based on our audits.
We conducted our audits in accordance with standards of the Public Company Accounting Oversight Board (United States). Those standards require that we plan and perform the audit to obtain reasonable assurance about whether the financial statements and financial highlights are free of material misstatement. The Funds are not required to have, nor were we engaged to perform, an audit of their internal control over financial reporting. Our audits included consideration of internal control over financial reporting as a basis for designing audit procedures that are appropriate in the circumstances, but not for the purpose of expressing an opinion on the effectiveness of the Funds' internal control over financial reporting. Accordingly, we express no such opinion. An audit also includes examining, on a test basis, evidence supporting the amounts and disclosures in the financial statements, assessing the accounting principles used and significant e stimates made by management, as well as evaluating the overall financial statement presentation. Our procedures included confirmation of securities owned as of December 31, 2007 by correspondence with the custodian and brokers; where replies were not received from brokers, we performed other auditing procedures. We believe that our audits provide a reasonable basis for our opinion.
In our opinion, the financial statements and financial highlights referred to above present fairly, in all material respects, the financial position of each of the portfolios constituting the Lord Abbett Global Fund, Inc. as of December 31, 2007, the results of their operations for the year then ended, the changes in their net assets for each of the two years in the period then ended, and the financial highlights for each of the periods presented, in conformity with accounting principles generally accepted in the United States of America.
DELOITTE & TOUCHE LLP
New York, New York
February 25, 2008
54
Basic Information About Management
The Board of Directors (the "Board") is responsible for the management of the business and affairs of the Company in accordance with the laws of the State of Maryland. The Board appoints officers who are responsible for the day-to-day operations of the Company and who execute policies authorized by the Board. The Board also approves an investment adviser to the Company and continues to monitor the cost and quality of the services provided by the investment adviser, and annually considers whether to renew the contract with the adviser. Generally, each Director holds office until his/her successor is elected and qualified or until his/her earlier resignation or removal, as provided in the Company's organizational documents.
Lord, Abbett & Co. LLC ("Lord Abbett"), a Delaware limited liability company, is the Company's investment adviser.
Interested Directors
The following Directors are Partners of Lord Abbett and are "interested persons" of the Company as defined in the Act. Mr. Dow and Ms. Foster are officers, directors, or trustees of each of the fourteen Lord Abbett-sponsored funds, which consist of 51 portfolios or series.
Name, Address and
Year of Birth | | Current Position
Length of Service
with Company | | Principal Occupation
During Past Five Years | | Other
Directorships | |
Robert S. Dow
Lord, Abbett & Co. LLC
90 Hudson Street
Jersey City, NJ 07302 (1945) | | Director since 1995; Chairman since 1996 | | Senior Partner since 2007 and Chief Executive Officer of Lord Abbett since 1996; formerly Managing Partner of Lord Abbett (1996 - 2007). | | N/A | |
|
Daria L. Foster
Lord, Abbett & Co. LLC
90 Hudson Street
Jersey City, NJ 07302 (1954) | | Director since 2006 | | Managing Partner since 2007; formerly Director of Marketing and Client Service of Lord Abbett (1990 - 2007). | | N/A | |
|
Independent Directors
The following independent or outside Directors ("Independent Directors") are also directors or trustees of each of the fourteen Lord Abbett-sponsored funds, which consist of 51 portfolios or series.
Name, Address and
Year of Birth | | Current Position
Length of Service
with Company | | Principal Occupation
During Past Five Years | | Other
Directorships | |
E. Thayer Bigelow
Lord, Abbett & Co. LLC
c/o Legal Dept.
90 Hudson Street
Jersey City, NJ 07302 (1941) | | Director since 1994 | | Managing General Partner, Bigelow Media, LLC (since 2000); Senior Adviser, Time Warner Inc. (1998 - 2000); Acting Chief Executive Officer of Courtroom Television Network (1997 - 1998); President and Chief Executive Officer of Time Warner Cable Programming, Inc. (1991 - 1997). | | Currently serves as director of Crane Co. and Huttig Building Products Inc. | |
|
55
Basic Information About Management (continued)
Name, Address and
Year of Birth | | Current Position
Length of Service
with Company | | Principal Occupation
During Past Five Years | | Other
Directorships | |
William H.T. Bush
Lord, Abbett & Co. LLC
c/o Legal Dept.
90 Hudson Street
Jersey City, NJ 07302 (1938) | | Director since 1998 | | Co-founder and Chairman of the Board of the financial advisory firm of Bush-O'Donnell & Company (since 1986). | | Currently serves as director of WellPoint, Inc. (since 2002). | |
|
Robert B. Calhoun, Jr. Lord, Abbett & Co. LLC c/o Legal Dept.
90 Hudson Street
Jersey City, NJ 07302 (1942) | | Director since 1998 | | Managing Director of Monitor Clipper Partners (since 1997) and President of Clipper Asset Management Corp. (since 1991), both private equity investment funds. | | Currently serves as director of Avondale, Inc. and Interstate Bakeries Corp. | |
|
Julie A. Hill
Lord, Abbett & Co. LLC
c/o Legal Dept.
90 Hudson Street
Jersey City, NJ 07302 (1946) | | Director since 2004 | | Owner and CEO of The Hill Company, a business consulting firm (since 1998); Founder, President and Owner of the Hiram-Hill and Hillsdale Development Company, a residential real estate development firm (1998 - 2000). | | Currently serves as director of WellPoint, Inc. since 1994 and Lend Lease Corporation Limited since 2005. | |
|
Franklin W. Hobbs
Lord, Abbett & Co. LLC c/o Legal Dept.
90 Hudson Street
Jersey City, NJ 07302 (1947) | | Director since 2000 | | Advisor of One Equity Partners, a private equity firm (since 2004); Chief Executive Officer of Houlihan Lokey Howard & Zukin, an investment bank (2002 - 2003); Chairman of Warburg Dillon Read, an investment bank (1999 - 2001); Global Head of Corporate Finance of SBC Warburg Dillon Read (1997 - 1999); Chief Executive Officer of Dillon, Read & Co. (1994 - 1997). | | Currently serves as director of Molson Coors Brewing Company. | |
|
Thomas J. Neff
Lord, Abbett & Co. LLC
c/o Legal Dept.
90 Hudson Street
Jersey City, NJ 07302 (1937) | | Director since 1988 | | Chairman of Spencer Stuart (U.S.), an executive search consulting firm (since 1996); President of Spencer Stuart (1979 - 1996). | | Currently serves as director of Ace, Ltd. (since 1997) and Hewitt Associates, Inc. | |
|
James L.L. Tullis
Lord, Abbett & Co. LLC
c/o Legal Dept.
90 Hudson Street
Jersey City, NJ 07302 (1947) | | Director since 2006 | | CEO of Tullis-Dickerson and Co. Inc, a venture capital management firm (since 1990). | | Currently serves as director of Crane Co. (since 1998). | |
|
56
Basic Information About Management (continued)
Officers
None of the officers listed below have received compensation from the Company. All the officers of the Company may also be officers of the other Lord Abbett-sponsored funds and maintain offices at 90 Hudson Street, Jersey City, NJ 07302.
Name and
Year of Birth | | Current Position
with Company | | Length of Service
of Current Position | | Principal Occupation
During Past Five Years | |
Robert S. Dow
(1945) | | Chief Executive Officer and Chairman | | Elected in 1995 | | Senior Partner since 2007 and Chief Executive Officer of Lord Abbett since 1996; formerly Managing Partner of Lord Abbett (1996 - 2007). | |
|
Daria L. Foster
(1954) | | President | | Elected in 2006 | | Managing Partner since 2007; formerly Director of Marketing and Client Service of Lord Abbett (1990 - 2007). | |
|
Daniel H. Frascarelli
(1954) | | Executive Vice President | | Elected in 2005 | | Partner and Director of Large Cap Core Equity, joined Lord Abbett in 1990. | |
|
Robert I. Gerber
(1954) | | Executive Vice President | | Elected in 2001 | | Partner and Chief Investment Officer; formerly Director of Taxable Fixed Income Management, joined Lord Abbett in 1997. | |
|
Jerald M. Lanzotti
(1967) | | Executive Vice President | | Elected in 1997 | | Partner and Portfolio Manager of International Fixed Income, joined Lord Abbett in 1996. | |
|
Harold E. Sharon
(1960) | | Executive Vice President | | Elected in 2003 | | Partner and Director of International Core Equity Investments, joined Lord Abbett in 2003; Financial Industry Consultant for venture capitalist (2001 - 2003). | |
|
James Bernaiche
(1956) | | Chief Compliance Officer | | Elected in 2004 | | Chief Compliance Officer, joined Lord Abbett in 2001. | |
|
Joan A. Binstock
(1954) | | Chief Financial Officer and Vice President | | Elected in 1999 | | Partner and Chief Operations Officer, joined Lord Abbett in 1999. | |
|
57
Basic Information About Management (concluded)
Name and
Year of Birth | | Current Position
with Company | | Length of Service
of Current Position | | Principal Occupation
During Past Five Years | |
John K. Forst
(1960) | | Vice President and Assistant Secretary | | Elected in 2005 | | Deputy General Counsel, joined Lord Abbett in 2004; Managing Director and Associate General Counsel at New York Life Investment Management LLC (2002 - 2003). | |
|
Lawrence H. Kaplan
(1957) | | Vice President and Secretary | | Elected in 1997 | | Partner and General Counsel, joined Lord Abbett in 1997. | |
|
| A. Edward Oberhaus, III (1959) | | Vice President | | Elected in 1996 | | Partner and Manager of Equity Trading, joined Lord Abbett in 1983. | |
|
Lawrence B. Stoller
(1963) | | Vice President and Assistant Secretary | | Elected in 2007 | | Senior Deputy General Counsel; joined Lord Abbett in 2007; formerly, Executive Vice President and General Counsel at Cohen & Steers Capital Management, Inc. | |
|
Bernard J. Grzelak
(1971) | | Treasurer | | Elected in 2003 | | Director of Fund Administration, joined Lord Abbett in 2003; formerly Vice President, Lazard Asset Management LLC. | |
|
58
Approval of Advisory Contracts
At meetings held on December 12 and 13, 2007, the Board, including all of the Directors who are not interested persons of either Fund or Lord Abbett, considered whether to approve the continuation of the existing management agreement between each of the Funds and Lord Abbett. In addition to the materials the Board had reviewed throughout the course of the year, the Board received materials relating to the management agreement before the meeting and had the opportunity to ask questions and request further information in connection with its consideration. The Board also took into account its familiarity with Lord Abbett gained through its previous meetings and discussions, and the examination of the portfolio management teams conducted by members of the Contracts Committee during the year.
The materials received by the Board as to each Fund included, but were not limited to, (1) information provided by Lipper Analytical Services, Inc. regarding the investment performance of the Fund compared to the investment performance of one or more groups of funds with substantially similar investment objectives (the "performance universe") and to the investment performance of an appropriate securities index (if such an index existed), for various time periods each ended September 30, 2007, (2) information on the effective management fee rates and expense ratios for one or more groups of funds with similar objectives and of similar size (the "peer expense group"), (3) sales and redemption information for the Fund, (4) information regarding Lord Abbett's financial condition, (5) an analysis of the relative profitability of the management agreement to Lord Abbett, (6) information regarding the distribution arrangements of the Fund, and (7) i nformation regarding the personnel and other resources devoted by Lord Abbett to managing the Fund.
The specific considerations for each Fund are set forth below.
Global Equity Fund
Investment Management Services Generally. The Board considered the investment management services provided by Lord Abbett to the Fund, including investment research, portfolio management, and trading, and Lord Abbett's commitment to compliance with all relevant legal requirements. The Board also observed that Lord Abbett was solely engaged in the investment management business and accordingly did not experience the conflicts of interest resulting from being engaged in other lines of business. The Board noted that Lord Abbett did not use brokerage commissions to purchase third-party research. The Board considered the investment advisory services provided by Lord Abbett to other clients, the fees charged for the services, and the differences in the nature of the services provided to the Fund and other Lord Abbett Funds, on the one hand, and the services provided to other clients, on the other.
Investment Performance and Compliance. The Board reviewed the Fund's investment performance in relation to that of the performance universe, both in terms of total return and in terms of other statistical measures. The Board observed that the investment performance of the Class A shares of the Fund was in the fourth quintile of its performance universe for the nine-month, one-year, three-year and five-year periods, and in the fifth quintile for the ten-year period. The Board also observed that the Fund's investment performance was above that of the Lipper Global Large-Cap Core Index for the nine-month, three-year, and five-year periods and below that of the Index for the one-year and ten-year periods.
Lord Abbett's Personnel and Methods. The Board considered the qualifications of the personnel providing investment management services to the Fund, in light of its investment
59
objective and discipline. Among other things, the Board considered the size, experience, and turnover rates of Lord Abbett's investment management staff, Lord Abbett's investment methodology and philosophy, and Lord Abbett's approach to recruiting, training, and retaining investment management personnel. The Board determined that Lord Abbett had the expertise and resources to manage the Fund effectively.
Nature and Quality of Other Services. The Board considered the nature, quality, costs, and extent of compliance, administrative, and other services performed by Lord Abbett and Lord Abbett Distributor and the nature and extent of Lord Abbett's supervision of third party service providers, including the Fund's transfer agent and custodian.
Expenses. The Board considered the expense levels of the Fund and the expense levels of the peer expense group. It also considered the amount and nature of the fees paid by shareholders. The Board noted that it and Lord Abbett had agreed to an expense reimbursement agreement that limited the total expense ratio of Class A to not more than 1.60%, the total expense ratios of Class B and Class C to not more than 2.25%, the total expense ratio of Class F to not more than 1.35%, the total expense ratio of Class I to not more than 1.25%, the total expense ratio of Class P to not more than 1.70%, the total expense ratio of Class R2 to not more than 1.85%, and the total expense ratio of Class R3 to not more than 1.75%, and that Lord Abbett proposed to enter into a new expense reimbursement agreement with the same terms. The Board observed that the contractual and actual m anagement and administrative services fees were approximately eight basis points below the median of the peer group. The Board observed that at September 30, 2007 the total expense ratio of Class A was approximately one basis points below the median of the peer group, the total expense ratio of Class B and Class C were approximately two basis points above the median of the peer group, the total expense ratio of Class F was approximately six basis points below the median of the peer group, the total expense ratio of Class I was approximately twenty basis points above the median of the peer group, the total expense ratio of Class R2 was approximately fifteen basis points above the median of the peer group, and the total expense ratio of Class R3 was approximately five basis points above the median of the peer group. The Board also observed that the Fund continued to have a relatively high level of transfer agent and shareholder servicing costs, due to its relatively small average account size.
Profitability. The Board considered the level of Lord Abbett's profits in managing the Fund, including a review of Lord Abbett's methodology for allocating its costs to its management of the Fund. The Board concluded that the allocation methodology had a reasonable basis and was appropriate. It considered the profits realized by Lord Abbett in connection with the operation of the Fund and whether the amount of profit was fair for the management of the Fund. The Board also considered the profits realized from other businesses of Lord Abbett, which may benefit from or be related to the Fund's business. The Board considered Lord Abbett's profit margins in comparison with available industry data, both accounting for and ignoring marketing and distribution expenses, and how those profit margins could affect Lord Abbett's ability to recruit and retain investment personn el. The Board recognized that Lord Abbett's profitability was a factor in enabling it to attract and retain qualified investment management personnel to provide services to the Fund. The Board noted that Lord Abbett's profitability had increased in recent years, in part due to an increase in assets under management, but concluded that Lord Abbett's profitability overall and as to the Fund was not excessive.
Economies of Scale. The Board considered whether there had been any economies of scale in managing the Fund, whether the Fund had appropriately benefited from any such economies of
60
scale, and whether there was potential for realization of any further economies of scale. The Board concluded that the existing advisory fee schedule, with its breakpoints in the level of the advisory fee, adequately addressed any economies of scale in managing the Fund.
Other Benefits to Lord Abbett. The Board considered the character and amount of fees paid by the Fund and the Fund's shareholders to Lord Abbett and Lord Abbett Distributor for services other than investment advisory services. The Board also considered the revenues and profitability of Lord Abbett's investment advisory business apart from its mutual fund business, and the intangible benefits enjoyed by Lord Abbett by virtue of its relationship with the Fund. The Board observed that Lord Abbett Distributor receives 12b-1 fees from certain of the Lord Abbett Funds as to shares held in accounts for which there is no other broker of record, may retain a portion of the 12b-1 fees from the Funds, and receives a portion of the sales charges on sales and redemptions of some classes of shares. In addition, the Board observed that Lord Abbett accrues certain benefits for it s business of providing investment advice to clients other than the Lord Abbett Funds, but that that business also benefits the Funds. The Board also noted that Lord Abbett, as disclosed in the prospectuses of the Funds, has entered into revenue sharing arrangements with certain entities that distribute shares of the Funds.
Alternative Arrangements. The Board considered whether, instead of approving the continuation of the management agreement, it might be in the best interests of the Fund to implement one or more alternative arrangements, such as continuing to employ Lord Abbett, but on different terms. The Board noted that Lord Abbett was considering recommending changes to the operations of the Fund, including considering recommending that it be restructured to invest in other Lord Abbett Funds, and that the Board would have the opportunity to consider any recommendation in 2008.
In considering whether to approve the continuation of the management agreement, the Board did not identify any single factor as paramount or controlling. This summary does not discuss in detail all matters considered. After considering all of the relevant factors, the Board unanimously found that continuation of the existing management agreement was in the best interests of the Fund and its shareholders and voted unanimously to approve the continuation of the management agreement.
Developing Local Markets Fund
Investment Management Services Generally. The Board considered the investment management services provided by Lord Abbett to the Fund, including investment research, portfolio management, and trading, and Lord Abbett's commitment to compliance with all relevant legal requirements. The Board also observed that Lord Abbett was solely engaged in the investment management business and accordingly did not experience the conflicts of interest resulting from being engaged in other lines of business. The Board noted that Lord Abbett did not use brokerage commissions to purchase third-party research. The Board considered the investment advisory services provided by Lord Abbett to other clients, the fees charged for the services, and the differences in the nature of the services provided to the Fund and other Lord Abbett Funds, on the one hand, and the services provided to other clients, on the other.
Investment Performance and Compliance. The Board reviewed the Fund's investment performance in relation to that of the performance universe, both in terms of total return and in terms of other statistical measures. The Board noted that shareholders had approved a change in the Fund's current investment objective from seeking high current income consistent with reasonable risk, with capital appreciation as a secondary consideration, to seeking high total
61
return, and a change in the Fund's principal investment strategy from investing primarily in high-quality and investment grade debt securities of domestic and foreign companies, to investing primarily in currencies of, and in fixed income instruments denominated in currencies of, developing markets. The Board noted that these changes had resulted in Lipper changing the classification of the Fund from global income to international income. Accordingly, the Board considered the operations of the Fund in relationship to two different performance universes and expense peer groups, the first being global income and the second being international income. The Board observed that the investment performance of the Class A shares of the Fund was in the fourth quintile of the first performance universe for the nine-month, one-year, and five-year periods and in the fifth quintile for the three-year and ten-year periods. The Board also observed that the Fund's investment performance was below that of the Lipper Global Income Fund Index for each of those periods. The Board observed that the investment performance of the Class A shares of the Fund was in the fourth quintile of the second performance universe and below that of the Lipper International Income Fund Index for each of those periods.
Lord Abbett's Personnel and Methods. The Board considered the qualifications of the personnel providing investment management services to the Fund, in light of its investment objective and discipline. Among other things, the Board considered the size, experience, and turnover rates of Lord Abbett's investment management staff, Lord Abbett's investment methodology and philosophy, and Lord Abbett's approach to recruiting, training, and retaining investment management personnel. The Board determined that Lord Abbett had the expertise and resources to manage the Fund effectively.
Nature and Quality of Other Services. The Board considered the nature, quality, costs, and extent of compliance, administrative, and other services performed by Lord Abbett and Lord Abbett Distributor and the nature and extent of Lord Abbett's supervision of third party service providers, including the Fund's transfer agent and custodian.
Expenses. The Board considered the expense levels of the Fund and the expense levels of peer expense groups, the first peer group consisting of global income funds and the second consisting of international income funds. It also considered the amount and nature of the fees paid by shareholders. The Board observed that Lord Abbett had implemented an expense reimbursement agreement for the Fund that limited the total expense ratio of Class A to not more than 1.30%, the total expense ratios of Class B and Class C to not more than 1.95%, the total expense ratio of Class P to not more than 1.40%, and the total expense ratio of Class I to not more than 0.95%, and that the Board and Lord Abbett had agreed to a new expense reimbursement agreement with the same terms. The Board observed that the contractual and actual management and administrative services fees were approx imately two basis points below the median of the peer group. The Board observed that the total expense ratio of Class A was approximately five basis points above the median of the peer group, the total expense ratios of Class B and Class C were approximately the same as the median of the peer group, the total expense ratio of Class P was approximately twenty-one basis points above the median of the peer group, and the total expense ratio of Class I was approximately five basis points above the median of the peer group. As to the second peer group, the Board observed that the contractual and actual management and administrative services fees were approximately eleven basis points below the median of the peer group. The Board observed that the total expense ratio of Class A was approximately six basis points above the median of the peer group, the total expense ratios of Class B and Class C were approximately the same as the median of the peer group, the total expense ratio of Class F was approximately two bas is points below the median of the peer group, the total expense ratio of Class I was approximately one basis point below the median of the peer group, the total
62
expense ratio of Class P was approximately four basis points below the median of the peer group, the total expense ratio of Class R2 was approximately eleven basis points above the median of the peer group, and the total expense ratio of Class R3 was approximately one basis point above the median of the peer group.
Profitability. The Board considered the level of Lord Abbett's profits in managing the Fund, including a review of Lord Abbett's methodology for allocating its costs to its management of the Fund. The Board concluded that the allocation methodology had a reasonable basis and was appropriate. It considered the profits realized by Lord Abbett in connection with the operation of the Fund and whether the amount of profit was fair for the management of the Fund. The Board also considered the profits realized from other businesses of Lord Abbett, which may benefit from or be related to the Fund's business. The Board considered Lord Abbett's profit margins in comparison with available industry data, both accounting for and ignoring marketing and distribution expenses, and how those profit margins could affect Lord Abbett's ability to recruit and retain investment personn el. The Board recognized that Lord Abbett's profitability was a factor in enabling it to attract and retain qualified investment management personnel to provide services to the Fund. The Board noted that Lord Abbett's profitability had increased in recent years, in part due to an increase in assets under management, but concluded that Lord Abbett's profitability overall and as to the Fund was not excessive.
Economies of Scale. The Board considered whether there had been any economies of scale in managing the Fund, whether the Fund had appropriately benefited from any such economies of scale, and whether there was potential for realization of any further economies of scale. The Board concluded that the existing advisory fee schedule, with its breakpoints in the level of the advisory fee, adequately addressed any economies of scale in managing the Fund.
Other Benefits to Lord Abbett. The Board considered the character and amount of fees paid by the Fund and the Fund's shareholders to Lord Abbett and Lord Abbett Distributor for services other than investment advisory services. The Board also considered the revenues and profitability of Lord Abbett's investment advisory business apart from its mutual fund business, and the intangible benefits enjoyed by Lord Abbett by virtue of its relationship with the Fund. The Board observed that Lord Abbett Distributor receives 12b-1 fees from certain of the Lord Abbett Funds as to shares held in accounts for which there is no other broker of record, may retain a portion of the 12b-1 fees from the Funds, and receives a portion of the sales charges on sales and redemptions of some classes of shares. The Board observed that, in addition, Lord Abbett accrues certain benefits for i ts business of providing investment advice to clients other than the Lord Abbett Funds, but that that business also benefits the Funds. The Board also noted that Lord Abbett, as disclosed in the prospectuses of the Funds, has entered into revenue sharing arrangements with certain entities that distribute shares of the Funds.
Alternative Arrangements. The Board considered whether, instead of approving the continuation of the management agreement, it might be in the best interests of the Fund to implement one or more alternative arrangements, such as continuing to employ Lord Abbett, but on different terms.
In considering whether to approve the continuation of the management agreement, the Board did not identify any single factor as paramount or controlling. This summary does not discuss in detail all matters considered. After considering all of the relevant factors, the Board unanimously found that continuation of the existing management agreement was in the best interests of the Fund and its shareholders and voted unanimously to approve the continuation of the management agreement.
63
Householding
The Company has adopted a policy that allows it to send only one copy of the Funds' Prospectuses, proxy material, annual report and semiannual report to certain shareholders residing at the same "household." This reduces Fund expenses, which benefits you and other shareholders. If you need additional copies or do not want your mailings to be "householded," please call Lord Abbett at 888-522-2388 or send a written request with your name, the name of your fund or funds and your account number or numbers to Lord Abbett Family of Funds, P.O. Box 219336, Kansas City, MO 64121.
Proxy Voting Policies, Procedures and Record
A description of the policies and procedures that Lord Abbett uses to vote proxies related to each Funds' portfolio securities, and information on how Lord Abbett voted each Fund's proxies during the 12-month period ended June 30 are available without charge, upon request, (i) by calling 888-522-2388; (ii) on Lord Abbett's website at www.LordAbbett.com; and (iii) on the Securities and Exchange Commission's ("SEC") website at www.sec.gov.
Shareholder Reports and Quarterly Portfolio Disclosure
The Funds are required to file their complete schedule of portfolio holdings with the SEC for its first and third fiscal quarters on Form N-Q. Copies of the filings are available without charge, upon request on the SEC's website at www.sec.gov and may be available by calling Lord Abbett at 888-522-2388. You can also obtain copies of Form N-Q by (i) visiting the SEC's Public Reference Room in Washington, DC (information on the operation of the Public Reference Room may be obtained by calling 800-SEC-0330); (ii) sending your request and duplicating fee to the SEC's Public Reference Room, Washington, DC 20549-0102; or (iii) sending your request electronically to publicinfo@sec.gov.
Tax Information
30.42% of the ordinary income distributions paid by the Global Equity Fund during fiscal 2007 is qualified dividend income. For corporate shareholders, 12.95% of the Global Equity Fund's ordinary income distributions qualified for the dividends received deduction.
Additionally, of the distributions paid by Global Equity Fund to shareholders during the fiscal year ended December 31, 2007, $7,233,860 and $6,066,037, respectively, represent short-term and long-term capital gains.
For foreign shareholders, the percentages below reflect the portion of the ordinary income distributions paid by the Funds during the fiscal year ended December 31, 2007 that represent interest-related dividends:
| Fund Name | |
| Global Equity Fund | | | 0.17 | % | |
| Developing Local Markets Fund | | | 47.67 | % | |
64
LAGF-2-1207
(02/08)
Lord Abbett Global Fund, Inc.
Equity Series
Lord Abbett Developing Local Markets Fund

This report, when not used for the general information
of shareholders of the Fund, is to be distributed only if
preceded or accompanied by a current fund prospectus.
Lord Abbett Mutual Fund shares are distributed by LORD ABBETT DISTRIBUTOR LLC.
Item 2: | | Code of Ethics. | | |
| | | | |
| (a) | In accordance with applicable requirements, the Registrant adopted a Sarbanes-Oxley Code of Ethics on June 19, 2003 that applies to the principal executive officer and senior financial officers of the Registrant (“Code of Ethics”). The Code of Ethics was in effect during the fiscal year ended December 31, 2007 (the “Period”). |
| | | | |
| (b) | Not applicable. |
| | | | |
| (c) | The Registrant has not amended the Code of Ethics as described in Form N-CSR during the Period. |
| | | | |
| (d) | The Registrant has not granted any waiver, including an implicit waiver, from a provision of the Code of Ethics as described in Form N-CSR during the Period. |
| | | | |
| (e) | Not applicable. |
| | | | |
| (f) | See Item 12(a)(1) concerning the filing of the Code of Ethics. The Registrant will provide a copy of the Code of Ethics to any person without charge, upon request. To obtain a copy, please call Lord Abbett at 888-522-2388. |
| | | | |
Item 3: | | Audit Committee Financial Expert. | |
| | | | |
| | The Registrant’s board of directors has determined that each of the following independent directors who are members of the audit committee are audit committee financial experts: E. Thayer Bigelow, Robert B. Calhoun, Franklin W. Hobbs and James L.L. Tullis. Each of these persons is independent within the meaning of the Form N-CSR. |
| | | | |
Item 4: | | Principal Accountant Fees and Services. | |
| | | | |
| | In response to sections (a), (b), (c) and (d) of Item 4, the aggregate fees billed to the Registrant for the fiscal years ended December 31, 2007 and 2006 by the Registrant’s principal accounting firm, Deloitte & Touche LLP, the member firms of Deloitte Touche Tohmatsu and their respective affiliates (collectively, “Deloitte”) were as follows: |
| | Fiscal year ended: | |
| | 2007 | | 2006 | |
Audit Fees {a} | | $ | 79,000 | | $ | 75,000 | |
Audit-Related Fees {b} | | 0 | | 15 | |
Total audit and audit-related fees | | 79,000 | | 75,015 | |
| | | | | |
Tax Fees {c} | | 15,151 | | 14,719 | |
All Other Fees {d} | | 0 | | 0 | |
| | | | | |
Total Fees | | $ | 94,151 | | $ | 89,734 | |
{a} Consists of fees for audits of the Registrant’s annual financial statements.
{b} Consists of the Registrant’s proportionate share of fees for performing certain agreed-upon procedures regarding compliance with the provisions of Rule 17a-7 of the Investment Company Act of 1940 and related Board approved procedures.
{c} Fees for the fiscal year ended December 31, 2007 and 2006 consist of fees for preparing the U.S. Income Tax Return for Regulated Investment Companies, New Jersey Corporation Business Tax Return, New Jersey Annual Report Form, U.S. Return of Excise Tax on Undistributed Income of Investment Companies, IRS Forms 1099-MISC and 1096 Annual Summary and Transmittal of U.S. Information Returns.
{d} There were no other fees in the years ended December 31, 2007 and 2006.
(e) (1) Pursuant to Rule 2-01(c) (7) of Regulation S-X, the Registrant’s Audit Committee has adopted pre-approval policies and procedures. Such policies and procedures generally provide that the Audit Committee must pre-approve:
· any audit, audit-related, tax, and other services to be provided to the Lord Abbett Funds, including the Registrant, and
· any audit-related, tax, and other services to be provided to the Registrant’s investment adviser and any entity controlling, controlled by or under common control with the investment adviser that provides ongoing services to one or more Funds comprising the Registrant if the engagement relates directly to operations and financial reporting of a Fund, by the independent auditor to assure that the provision of such services does not impair the auditor’s independence.
The Audit Committee has delegated pre-approval authority to its Chairman, subject to a fee limit of $10,000 per event, and not to exceed $25,000 annually. The Chairman will report any pre-approval decisions to the Audit Committee at its next scheduled meeting. Unless a type of service to be provided by the independent auditor has received general pre-approval, it must be pre-approved by the Audit Committee. Any proposed services exceeding pre-approved cost levels will require specific pre-approval by the Audit Committee.
(e) (2) The Registrant’s Audit Committee has approved 100% of the services described in this Item 4 (b) through (d).
(f) Not applicable.
(g) The aggregate non-audit fees billed by Deloitte for services rendered to the Registrant are shown above in the response to Item 4 (a), (b), (c) and (d) as “All Other Fees”.
The aggregate non-audit fees billed by Deloitte for services rendered to the Registrant’s investment adviser, Lord, Abbett & Co. LLC (“Lord Abbett”), for the fiscal years ended December 31, 2007 and 2006 were:
| | Fiscal year ended: | |
| | 2007 | | 2006 | |
All Other Fees {a} | | $ | 137,700 | | $ | 100,000 | |
| | | | | | | |
{a} Consist of fees for Independent Services Auditors’ Report on Controls Placed in Operation and Tests of Operating Effectiveness related to Lord Abbett’s Asset Management Services (“SAS 70 Report”).
The aggregate non-audit fees billed by Deloitte for services rendered to entities under the common control of Lord Abbett (i.e., Lord Abbett Distributor LLC, the Registrant’s principal underwriter) for the fiscal years ended December 31, 2007 and 2006 were:
| | Fiscal year ended: | |
| | 2007 | | 2006 | |
All Other Fees | | $ | 0 | | $ | 0 | |
| | | | | | | |
(h) The Registrant’s Audit Committee has considered the provision of non-audit services that were rendered to the Registrant’s investment adviser, and any entity controlling, controlled by or under common control with the investment adviser that provides ongoing services to the Registrant, that were not pre-approved pursuant to Rule 2-01 (c)(7)(ii) of Regulation S-X and has determined that the provision of such services is compatible with maintaining Deloitte’s independence.
Item 5: | | Audit Committee of Listed Registrants. |
| | |
| | Not applicable. |
| | |
Item 6: | | Schedule of Investments. |
| | |
| | Not applicable. |
| | |
Item 7: | | Disclosure of Proxy Voting Policies and Procedures for Closed-End Management Investment Companies. |
| | |
| | Not applicable. |
| | |
Item 8: | | Portfolio Managers of Closed-End Management Investment Companies. |
| | |
| | Not applicable. |
Item 9: | | Purchases of Equity Securities by Closed-End Management Investment Company and Affiliated Purchasers. |
| | |
| | Not applicable. |
| | |
Item 10: | | Submission of Matters to a Vote of Security Holders. |
| | |
| | Not applicable. |
| | |
Item 11: | | Controls and Procedures. |
| | |
(a) | | Based on their evaluation of the Registrant’s disclosure controls and procedures (as defined in Rule 30a-3(c) under the Investment Company Act of 1940) as of a date within 90 days prior to the filing date of this report, the Chief Executive Officer and Chief Financial Officer of the Registrant have concluded that such disclosure controls and procedures are reasonably designed and effective to ensure that material information relating to the Registrant, including its consolidated subsidiaries, is made known to them by others within those entities. |
| | |
(b) | | There were no significant changes in the Registrant’s internal control over financial reporting (as defined in Rule 30a-3(d) under the Investment Company Act of 1940) that occurred during the second fiscal quarter of the period covered by this report that have materially affected, or are reasonably likely to materially affect, the Registrant’s internal control over financial reporting. |
| | |
Item 12: | | Exhibits. |
| | |
(a) | (1) | Amendments to Code of Ethics – Not applicable. |
| | |
(a) | (2) | Certification of each principal executive officer and principal financial officer of the Registrant as required by Rule 30a-2 under the Investment Company Act of 1940 is attached hereto as a part of EX-99.CERT. |
| | |
(a) | (3) | Not applicable. |
| | |
(b) | | Certification of each principal executive officer and principal financial officer of the Registrant as required by Section 906 of the Sarbanes-Oxley Act of 2002 is provided as a part of EX-99.906CERT. |
| | | |
SIGNATURES
Pursuant to the requirements of the Securities Exchange Act of 1934 and the Investment Company Act of 1940, the Registrant has duly caused this report to be signed on its behalf by the undersigned, thereunto duly authorized.
| LORD ABBETT GLOBAL FUND, INC. |
| |
| |
| /s/ Robert S. Dow |
| Robert S. Dow |
| Chief Executive Officer and Chairman |
| |
| |
| /s/ Joan A. Binstock |
| Joan A. Binstock |
| Chief Financial Officer and Vice President |
Date: February 25, 2008
Pursuant to the requirements of the Securities Exchange Act of 1934 and the Investment Company Act of 1940, this report has been signed below by the following persons on behalf of the Registrant and in the capacities and on the dates indicated.
| LORD ABBETT GLOBAL FUND, INC. |
| |
| |
| /s/ Robert S. Dow |
| Robert S. Dow |
| Chief Executive Officer and Chairman |
| |
| |
| /s/ Joan A. Binstock |
| Joan A. Binstock |
| Chief Financial Officer and Vice President |
Date: February 25, 2008