
PICO Holdings, Inc. Annual Meeting of Shareholders May 3, 2019 1

FORWARD LOOKING STATEMENTS SAFE HARBOR This presentation contains forward-looking statements made pursuant to the “safe harbor” provisions of the Private Securities Litigation Reform Act of 1995. All statements, other than statements of historical or current fact, are statements that could be deemed forward-looking statements; these include, without limitation, any projections or guidance regarding earnings, earnings per share, revenues, cash flows, dividends, capital expenditures or other financial items; and any statements concerning plans, strategy and management objectives for future operations, as well as statements regarding future economic, industry, or company conditions or performance and any statements of belief and any statement of assumptions underlying any of the foregoing. Forward-looking statements often address current expected future business and financial performance, including the demand and pricing for PICO’s real estate and water assets, the completion of proposed monetization transactions, the return of proceeds to shareholders, and the reduction of costs. Forward-looking statements may contain words such as “expects,” “estimates,” “anticipates,” “intends,” “plans, “projects,” “believes,” “seeks,” or “will.” All forward-looking statements included in this presentation are based on information available to PICO as of the date hereof; PICO specifically disclaims and assumes no obligation to update any forward-looking statements. Actual results could, and likely will, differ materially from those described in the forward-looking statements. Forward-looking statements involve risks and uncertainties, outside of our control, including, but not limited to, economic, competitive and governmental actions that may cause our business, industry, strategy or actual results to differ materially from the forward- looking statements. Factors that could cause or contribute to such differences include, but are not limited to, those discussed in detail under the heading “Risk Factors” in PICO periodic reports filed with the U.S. Securities and Exchange Commission. This presentation should be reviewed in connection with, and is qualified by, PICO’s Annual Report on Form 10-K filed for the period ending December 31, 2018, and PICO’s quarterly report on Form 10-Q filed for the period ended March 31, 2019. A number of the slides in the presentation contain information from public sources that PICO has not independently verified. 22
Business Plan • Creatively monetize existing assets at maximum possible present value • Return proceeds to our shareholders (we may occasionally use proceeds to enhance existing assets) • Reduce costs 33
Accomplishments in 2018 and First Quarter 2019 • Sold 511 acre – feet of water rights in Lyon County, NV for $10.3 million in 2018 • Sold 77 acre – feet of Fish Spring Ranch water rights for $2.7 million in 2018 and 86 acre – feet of Fish Springs Ranch water rights for $3 million in Q1 2019 • Sold 1,064 acres and 18 acre – feet of water rights at Dodge Flat, NV for $8.9 million in Q1 2019 • Repurchased approximately 2.5 million shares on the open market for $27.7 million in 2018 and a further 420,394 shares for $4.3 million in Q1 2019. • Closed the La Jolla, CA office and transitioned our finance and accounting functions to our new headquarters in Carson City, NV 44

Net Assets: March 31, 2019 $17.2 million Real Estate, Water Assets & Other Net Assets / Liabilities Unrestricted Cash Total: $179 million $161.8 million 20,305,710 shares outstanding at March 31, 2019. 55

EPIC Report Update: Northern Nevada Study Area EPIC Study Area Actual Population Tracking: Dec-14 to Feb-19 (EPIC Forecast Period: 2019-2023) Dec 2014 Feb 2019 # Change % Change Actual 598,639 640,565 41,926 7.0% EPIC (Original & New) 598,639 639,713 41,074 6.9% Note: Light pink area denotes “New EPIC” forecast period. Sources: EPIC Committee, RCG Economics, NV State Demographer, TMRPA, Woods & Poole, TMWA, EMSI, BLS, Census. 66

EPIC Report Update: Northern Nevada Study Area EPIC Study Area Actual Employment Tracking: Dec-14 to Feb-19 (EPIC Forecast Period: 2019-2023) Dec 2014 Feb 2019 # Change % Change Actual 353,140 416,624 63,484 18.0% EPIC (Original & New) 353,140 414,812 61,672 17.5% Note: Light pink area denotes “New EPIC” forecast period. Sources: EPIC Committee, RCG Economics, NV State Demographer, TMRPA, Woods & Poole, TMWA, EMSI, BLS, Census. 77
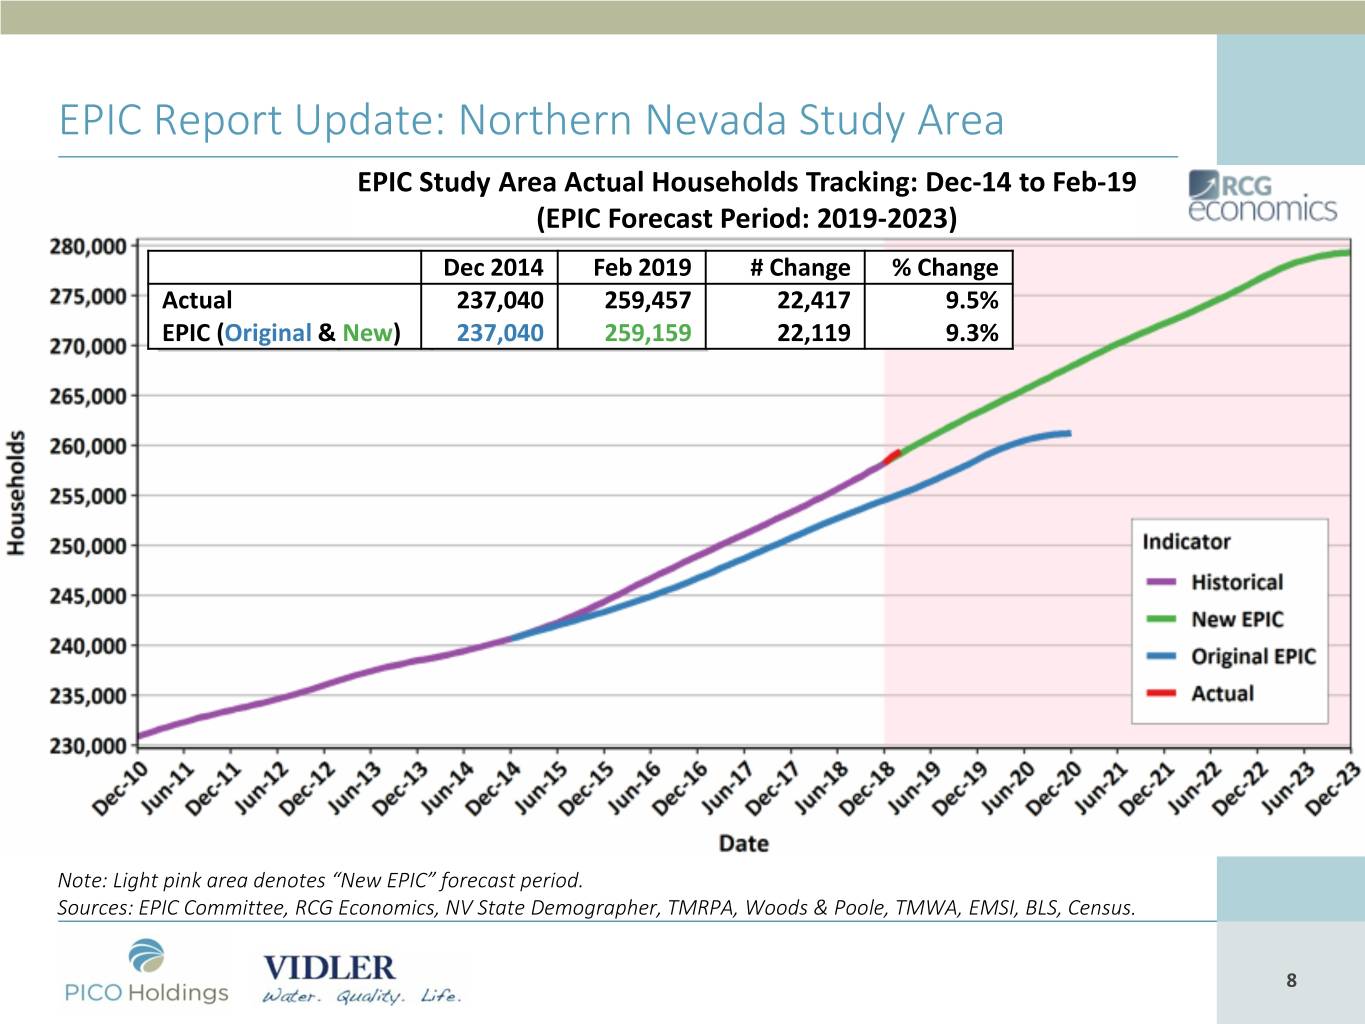
EPIC Report Update: Northern Nevada Study Area EPIC Study Area Actual Households Tracking: Dec-14 to Feb-19 (EPIC Forecast Period: 2019-2023) Dec 2014 Feb 2019 # Change % Change Actual 237,040 259,457 22,417 9.5% EPIC (Original & New) 237,040 259,159 22,119 9.3% Note: Light pink area denotes “New EPIC” forecast period. Sources: EPIC Committee, RCG Economics, NV State Demographer, TMRPA, Woods & Poole, TMWA, EMSI, BLS, Census. 88
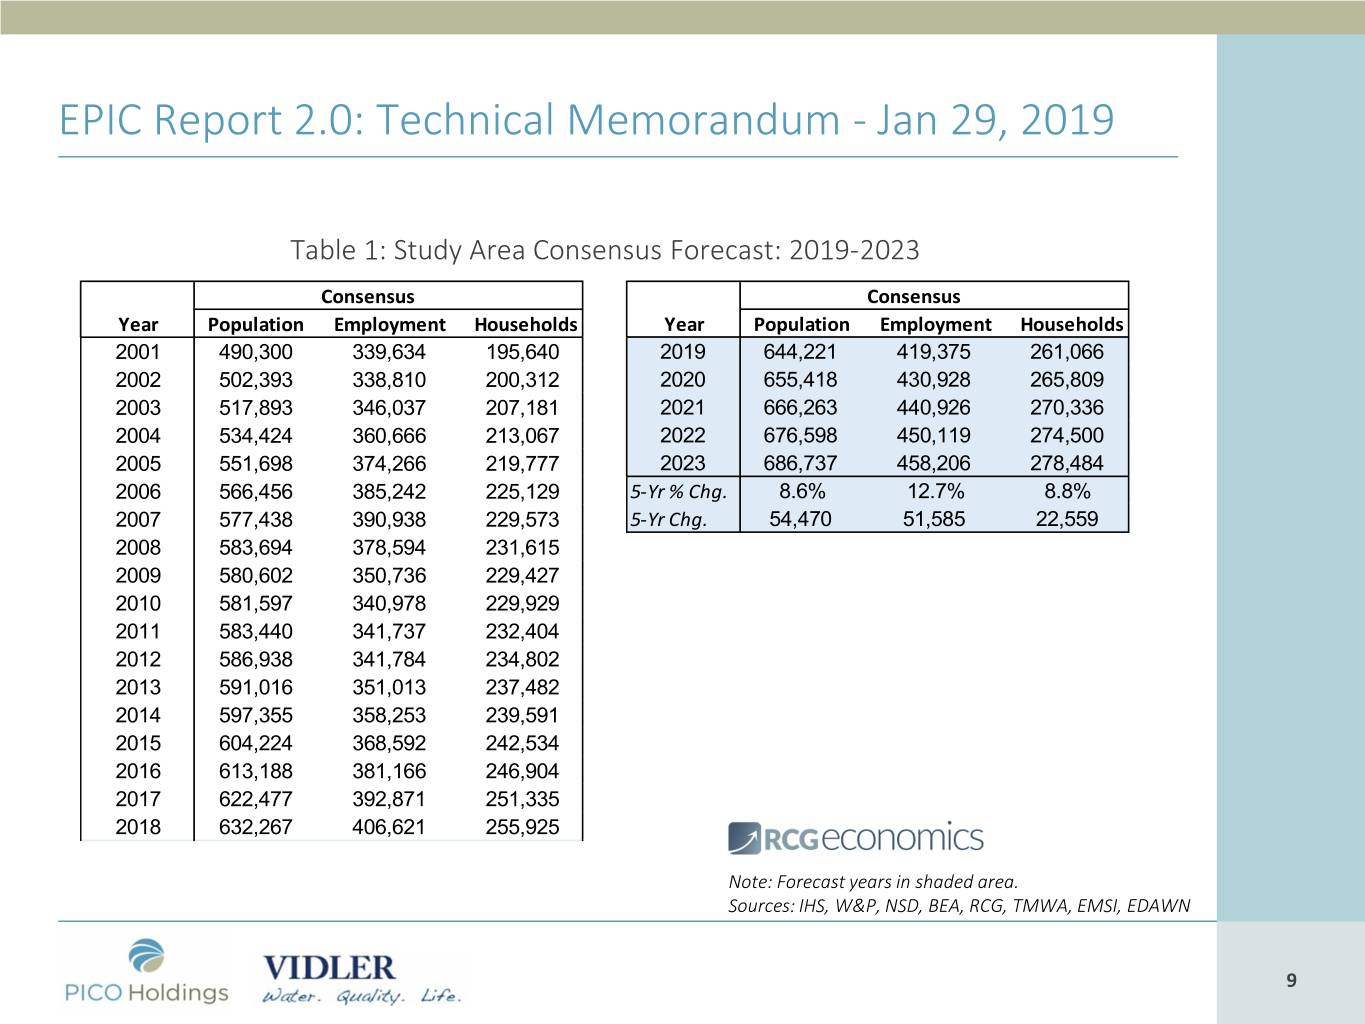
EPIC Report 2.0: Technical Memorandum - Jan 29, 2019 Table 1: Study Area Consensus Forecast: 2019-2023 Consensus Consensus Year Population Employment Households Year Population Employment Households 2001 490,300 339,634 195,640 2019 644,221 419,375 261,066 2002 502,393 338,810 200,312 2020 655,418 430,928 265,809 2003 517,893 346,037 207,181 2021 666,263 440,926 270,336 2004 534,424 360,666 213,067 2022 676,598 450,119 274,500 2005 551,698 374,266 219,777 2023 686,737 458,206 278,484 2006 566,456 385,242 225,129 5-Yr % Chg. 8.6% 12.7% 8.8% 2007 577,438 390,938 229,573 5-Yr Chg. 54,470 51,585 22,559 2008 583,694 378,594 231,615 2009 580,602 350,736 229,427 2010 581,597 340,978 229,929 2011 583,440 341,737 232,404 2012 586,938 341,784 234,802 2013 591,016 351,013 237,482 2014 597,355 358,253 239,591 2015 604,224 368,592 242,534 2016 613,188 381,166 246,904 2017 622,477 392,871 251,335 2018 632,267 406,621 255,925 Note: Forecast years in shaded area. Sources: IHS, W&P, NSD, BEA, RCG, TMWA, EMSI, EDAWN 99

EPIC Report 2.0: Technical Memorandum - Jan 29, 2019 Figure 1: Study Area Total Consensus Historical Estimates & Forecast: 2019-2023 Note: Forecast years in shaded area. Sources: IHS, W&P, NSD, BEA, RCG, TMWA, EMSI, EDAWN 1010
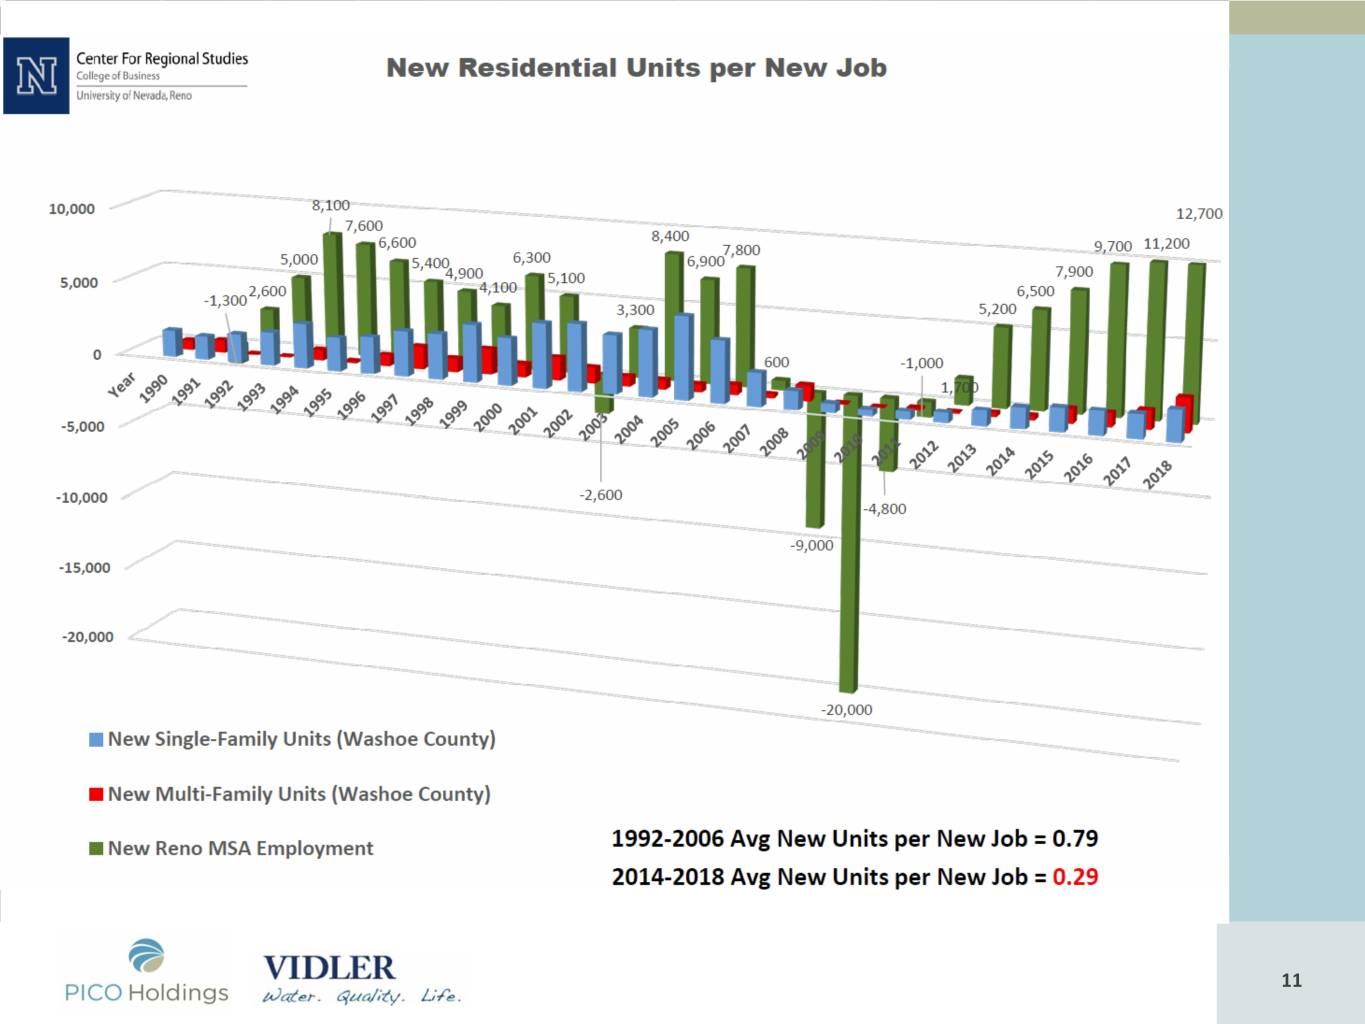
Sources: Washoe County Assessor and Department of Employment, Training, & Rehabilitation (CES data) 1111
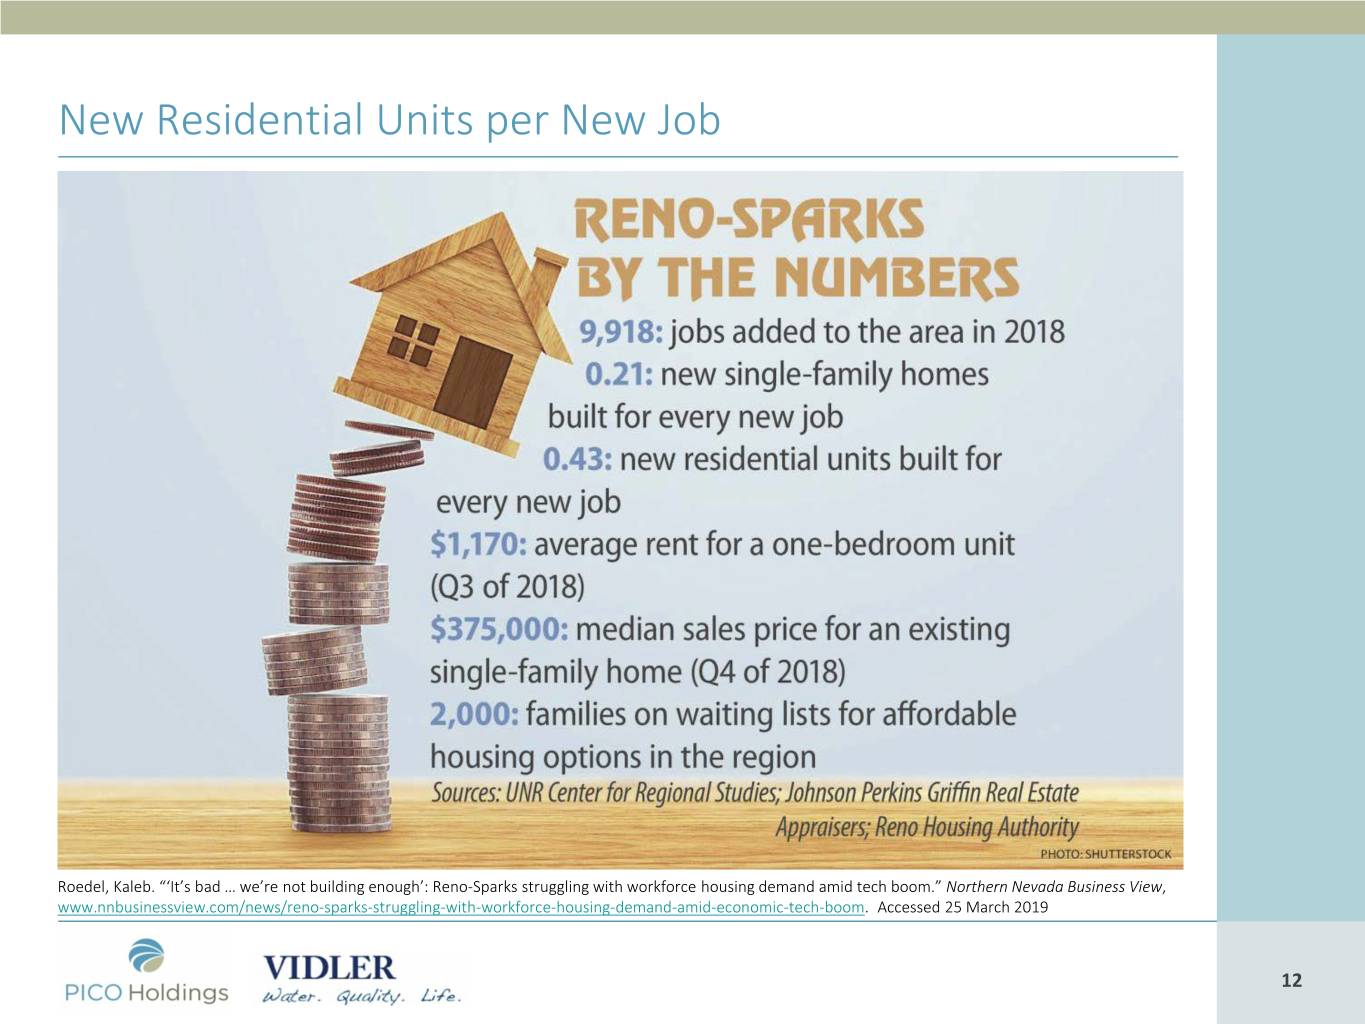
New Residential Units per New Job Roedel, Kaleb. “‘It’s bad … we’re not building enough’: Reno-Sparks struggling with workforce housing demand amid tech boom.” Northern Nevada Business View, www.nnbusinessview.com/news/reno-sparks-struggling-with-workforce-housing-demand-amid-economic-tech-boom. Accessed 25 March 2019 1212

Source: Washoe County Assessor RENO-SPARKS REGIONAL ECONOMY – MARCH 2019 1313
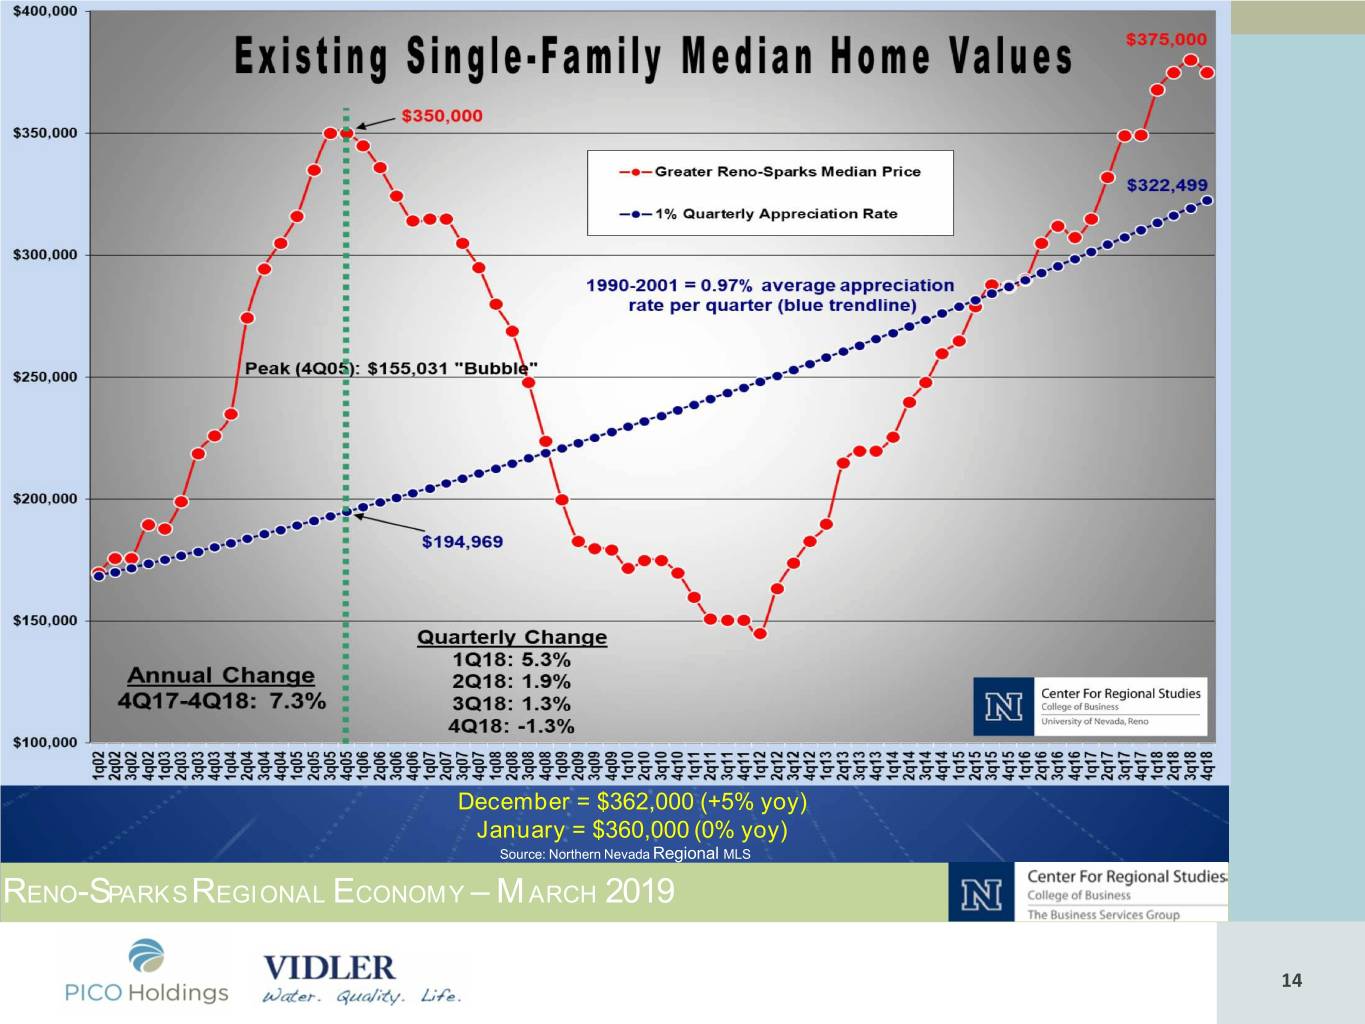
December = $362,000 (+5% yoy) January = $360,000 (0% yoy) Source: Northern Nevada Regional MLS RENO-SPARKS REGIONAL ECONOMY – MARCH 2019 1414
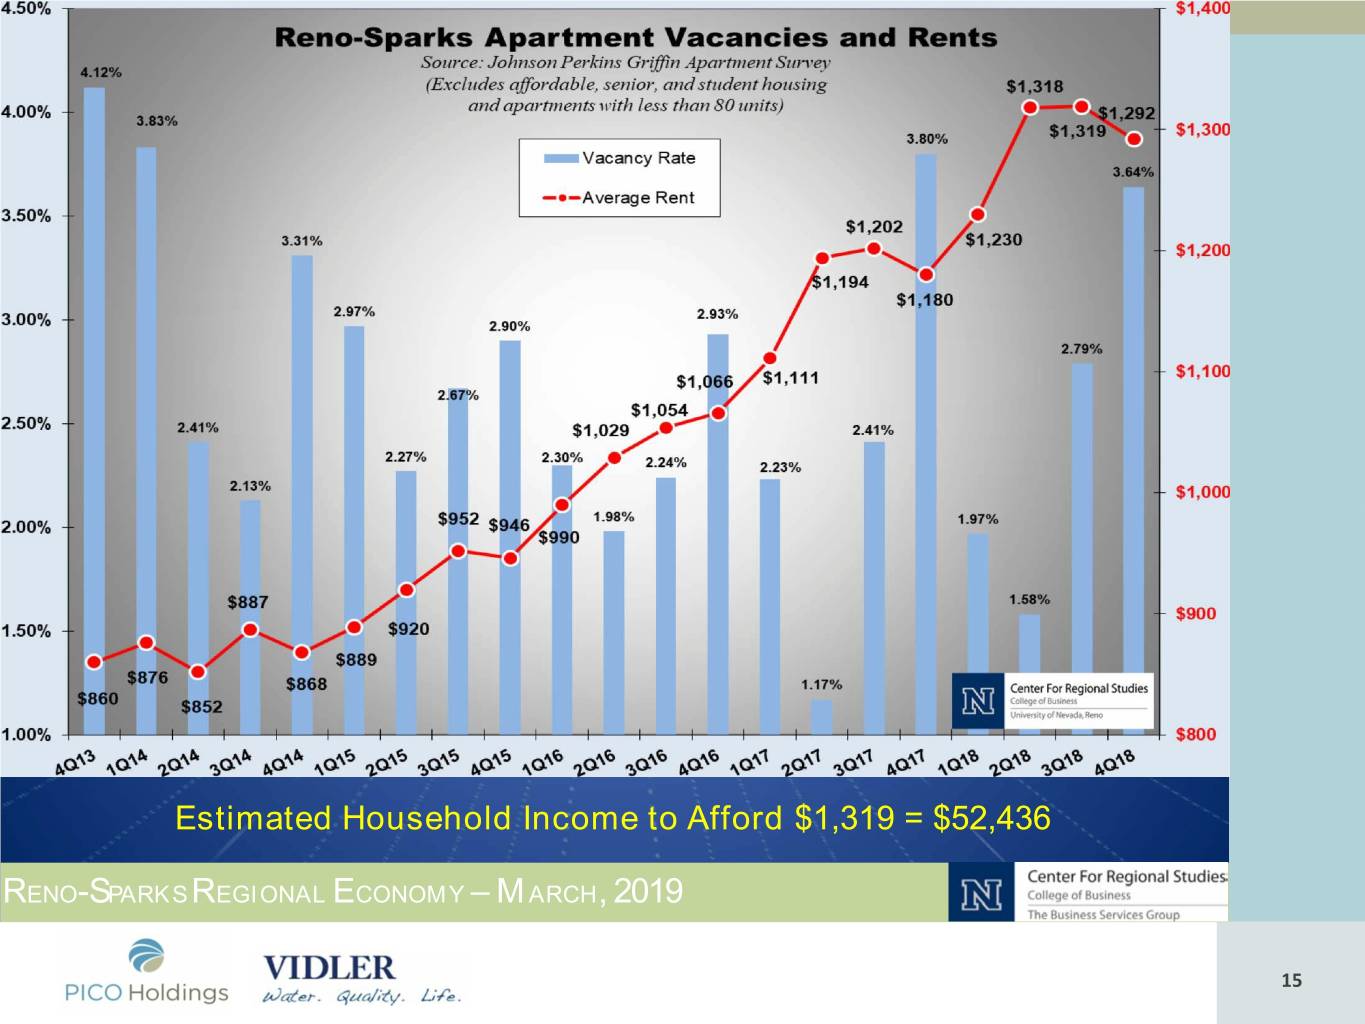
Source: Johnson-Perkins-Griffin Apartment Survey Apartment Units Under Construction = 3,762 Apartment Units Approved = 8,329 Estimated Household Income to Afford $1,319 = $52,436 RENO-SPARKS REGIONAL ECONOMY – MARCH, 2019 1515

Regional Residential Activity 2018 Summary Source: American Community Survey, US Census Bureau RENO-SPARKS REGIONAL ECONOMY – MARCH 2019 1616
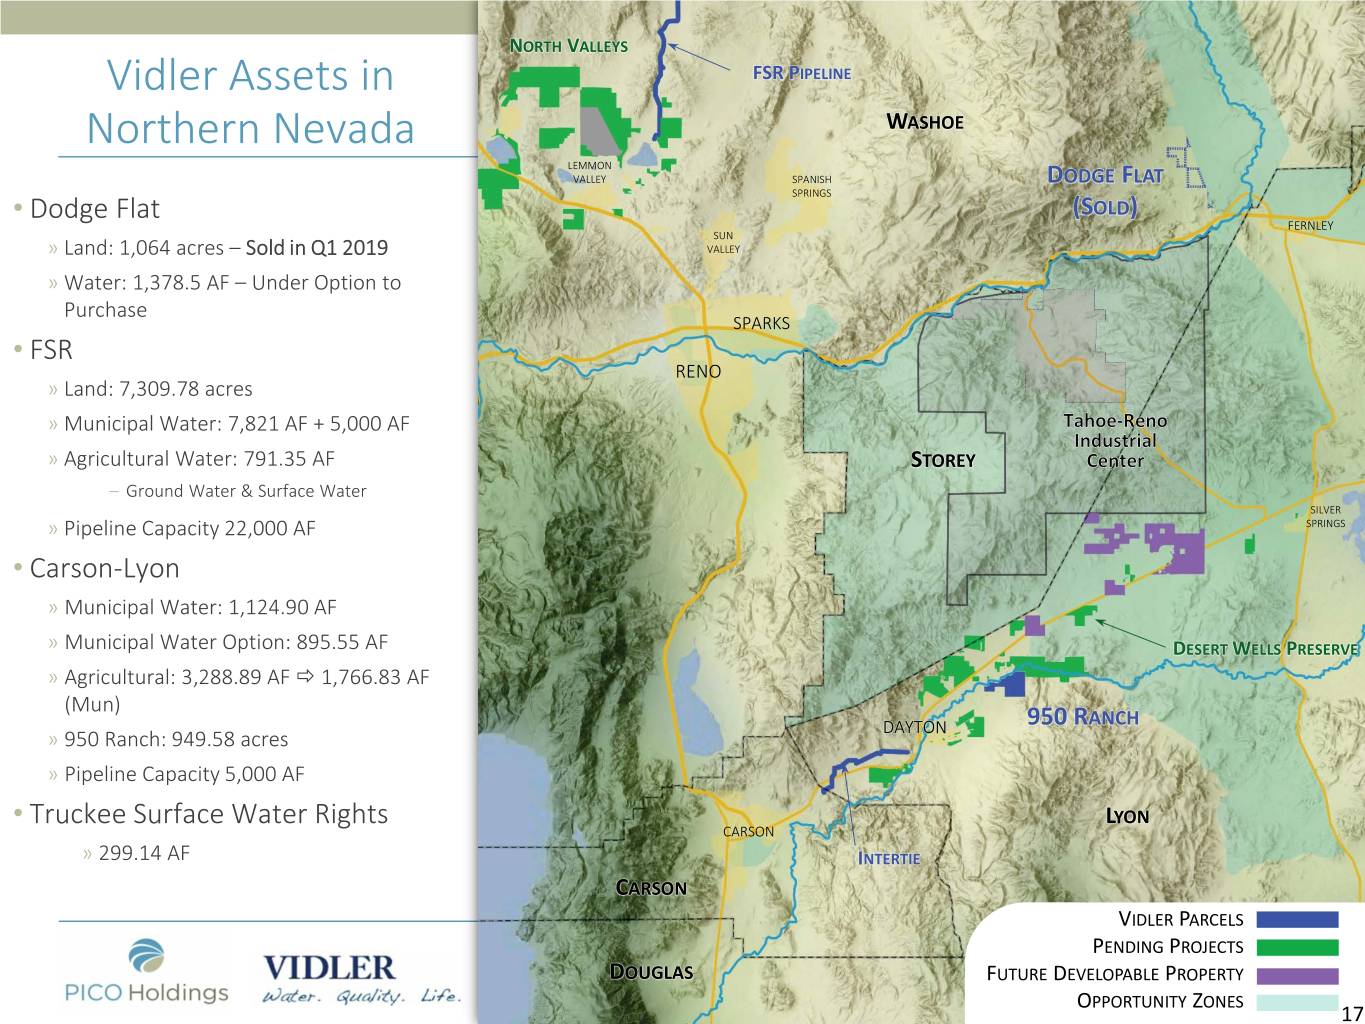
NORTH VALLEYS Vidler Assets in FSR PIPELINE Northern Nevada WASHOE LEMMON VALLEY SPANISH DODGE FLAT SPRINGS Dodge Flat (SOLD) • FERNLEY SUN » Land: 1,064 acres – Sold in Q1 2019 VALLEY » Water: 1,378.5 AF – Under Option to Purchase SPARKS • FSR RENO » Land: 7,309.78 acres » Municipal Water: 7,821 AF + 5,000 AF » Agricultural Water: 791.35 AF STOREY – Ground Water & Surface Water SILVER » Pipeline Capacity 22,000 AF SPRINGS • Carson-Lyon » Municipal Water: 1,124.90 AF » Municipal Water Option: 895.55 AF DESERT WELLS PRESERVE » Agricultural: 3,288.89 AF 1,766.83 AF (Mun) DAYTON 950 RANCH » 950 Ranch: 949.58 acres » Pipeline Capacity 5,000 AF Truckee Surface Water Rights LYON • CARSON » 299.14 AF INTERTIE CARSON VIDLER PARCELS PENDING PROJECTS DOUGLAS FUTURE DEVELOPABLE PROPERTY 1717 OPPORTUNITY ZONES 17
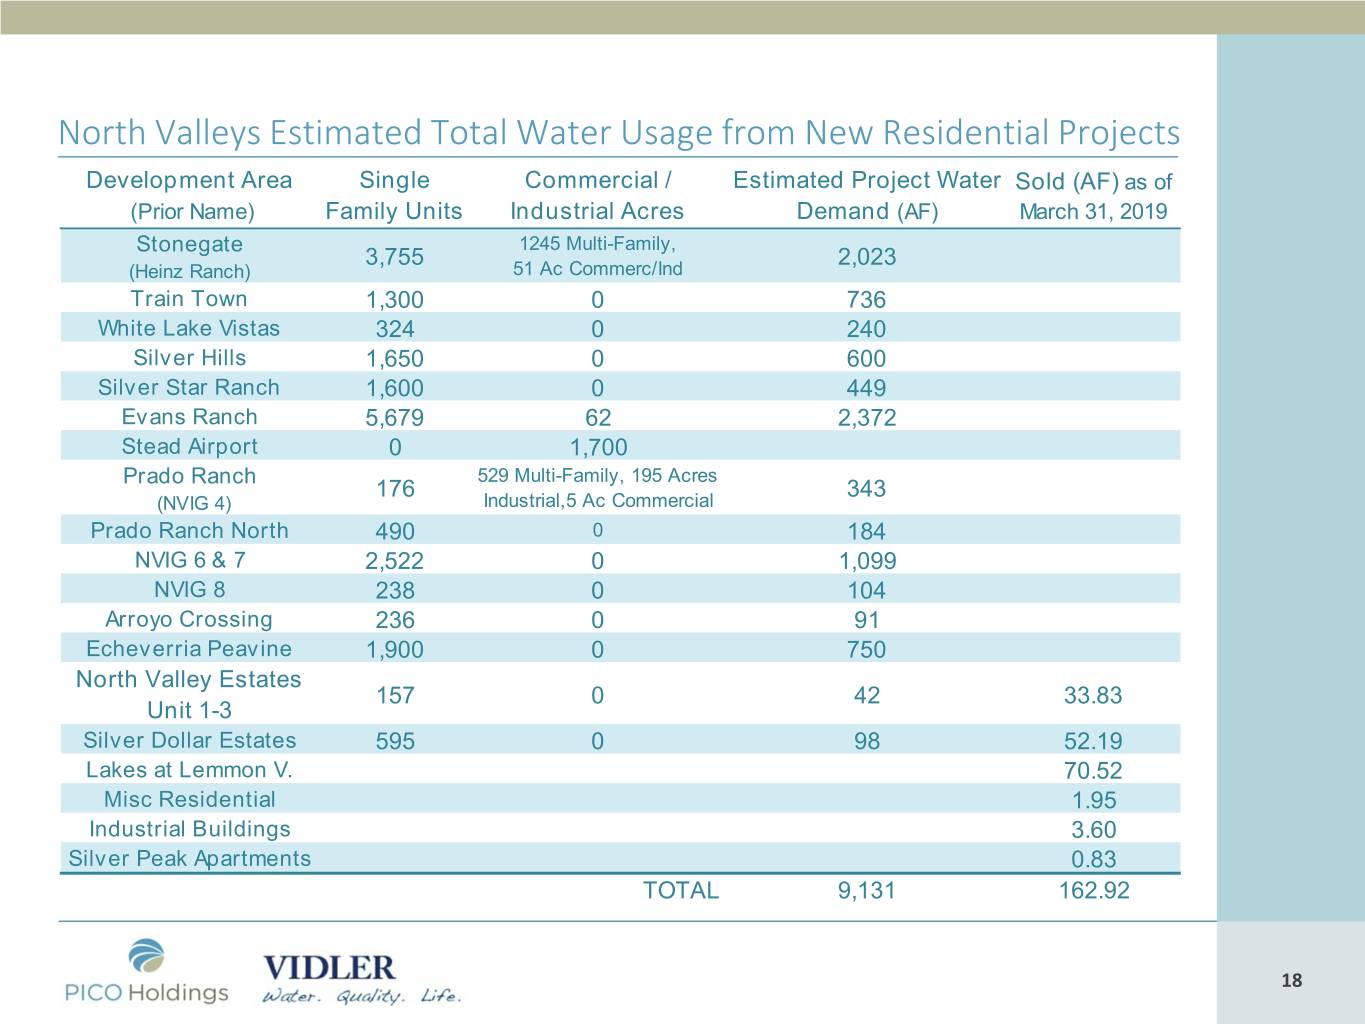
North Valleys Estimated Total Water Usage from New Residential Projects Development Area Single Commercial / Estimated Project Water Sold (AF) as of (Prior Name) Family Units Industrial Acres Demand (AF) March 31, 2019 Stonegate 1245 Multi-Family, 3,755 2,023 (Heinz Ranch) 51 Ac Commerc/Ind Train Town 1,300 0 736 White Lake Vistas 324 0 240 Silver Hills 1,650 0 600 Silver Star Ranch 1,600 0 449 Evans Ranch 5,679 62 2,372 Stead Airport 0 1,700 Prado Ranch 529 Multi-Family, 195 Acres 176 343 (NVIG 4) Industrial,5 Ac Commercial Prado Ranch North 490 0 184 NVIG 6 & 7 2,522 0 1,099 NVIG 8 238 0 104 Arroyo Crossing 236 0 91 Echeverria Peavine 1,900 0 750 North Valley Estates 157 0 42 33.83 Unit 1-3 Silver Dollar Estates 595 0 98 52.19 Lakes at Lemmon V. 70.52 Misc Residential 1.95 Industrial Buildings 3.60 Silver Peak Apartments 0.83 TOTAL 9,131 162.92 1818
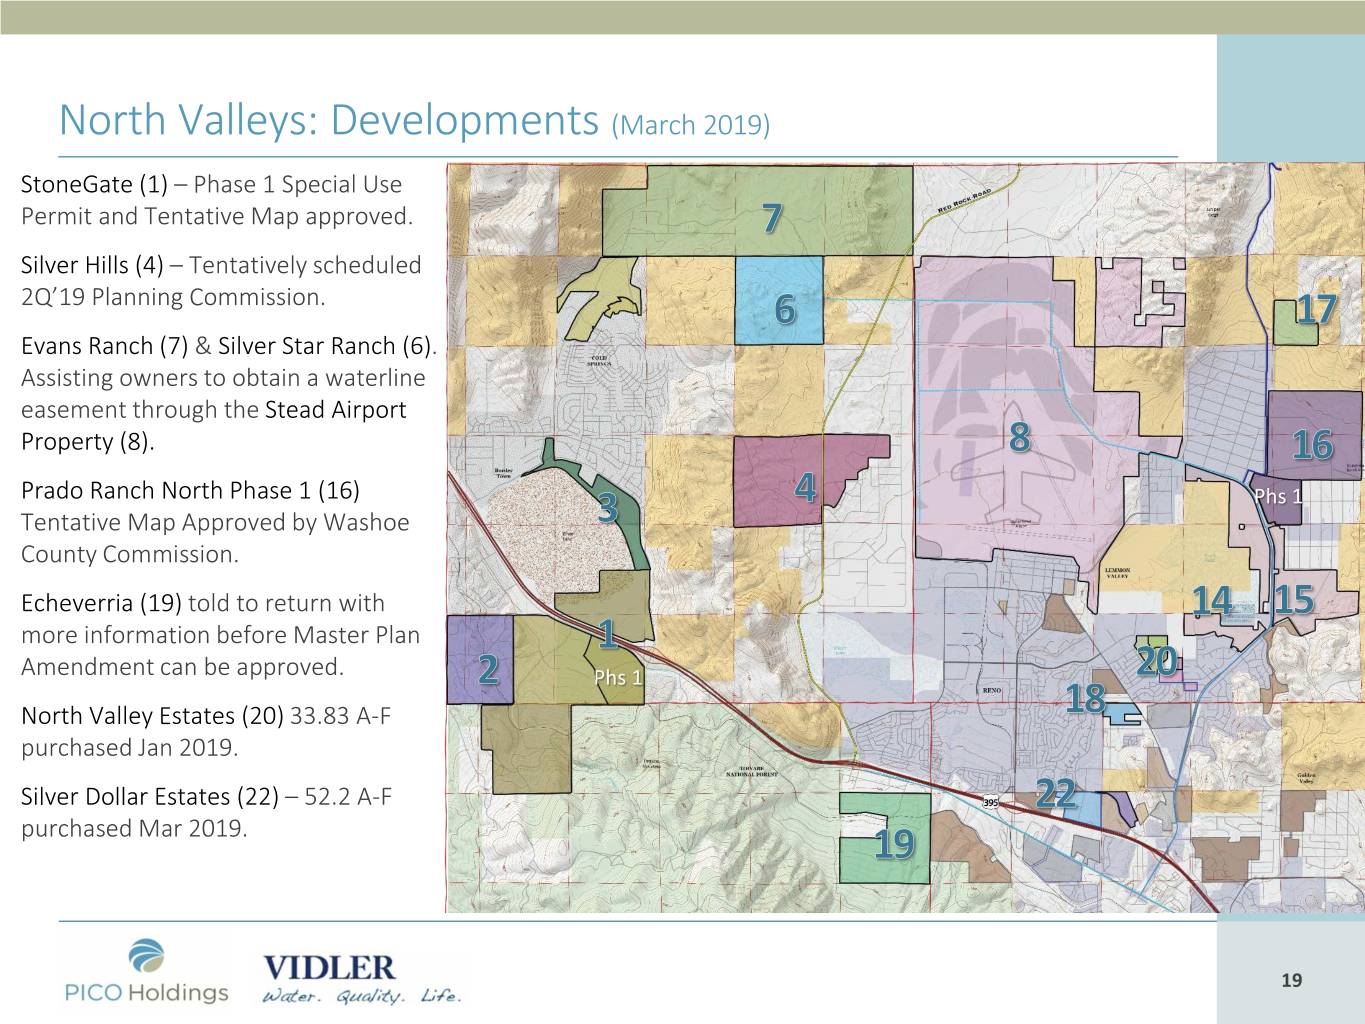
North Valleys: Developments (March 2019) StoneGate (1) – Phase 1 Special Use Permit and Tentative Map approved. Silver Hills (4) – Tentatively scheduled 2Q’19 Planning Commission. Evans Ranch (7) & Silver Star Ranch (6). Assisting owners to obtain a waterline easement through the Stead Airport Property (8). Prado Ranch North Phase 1 (16) Phs 1 Tentative Map Approved by Washoe County Commission. Echeverria (19) told to return with more information before Master Plan Amendment can be approved. Phs 1 North Valley Estates (20) 33.83 A-F purchased Jan 2019. Silver Dollar Estates (22) – 52.2 A-F purchased Mar 2019. 1919
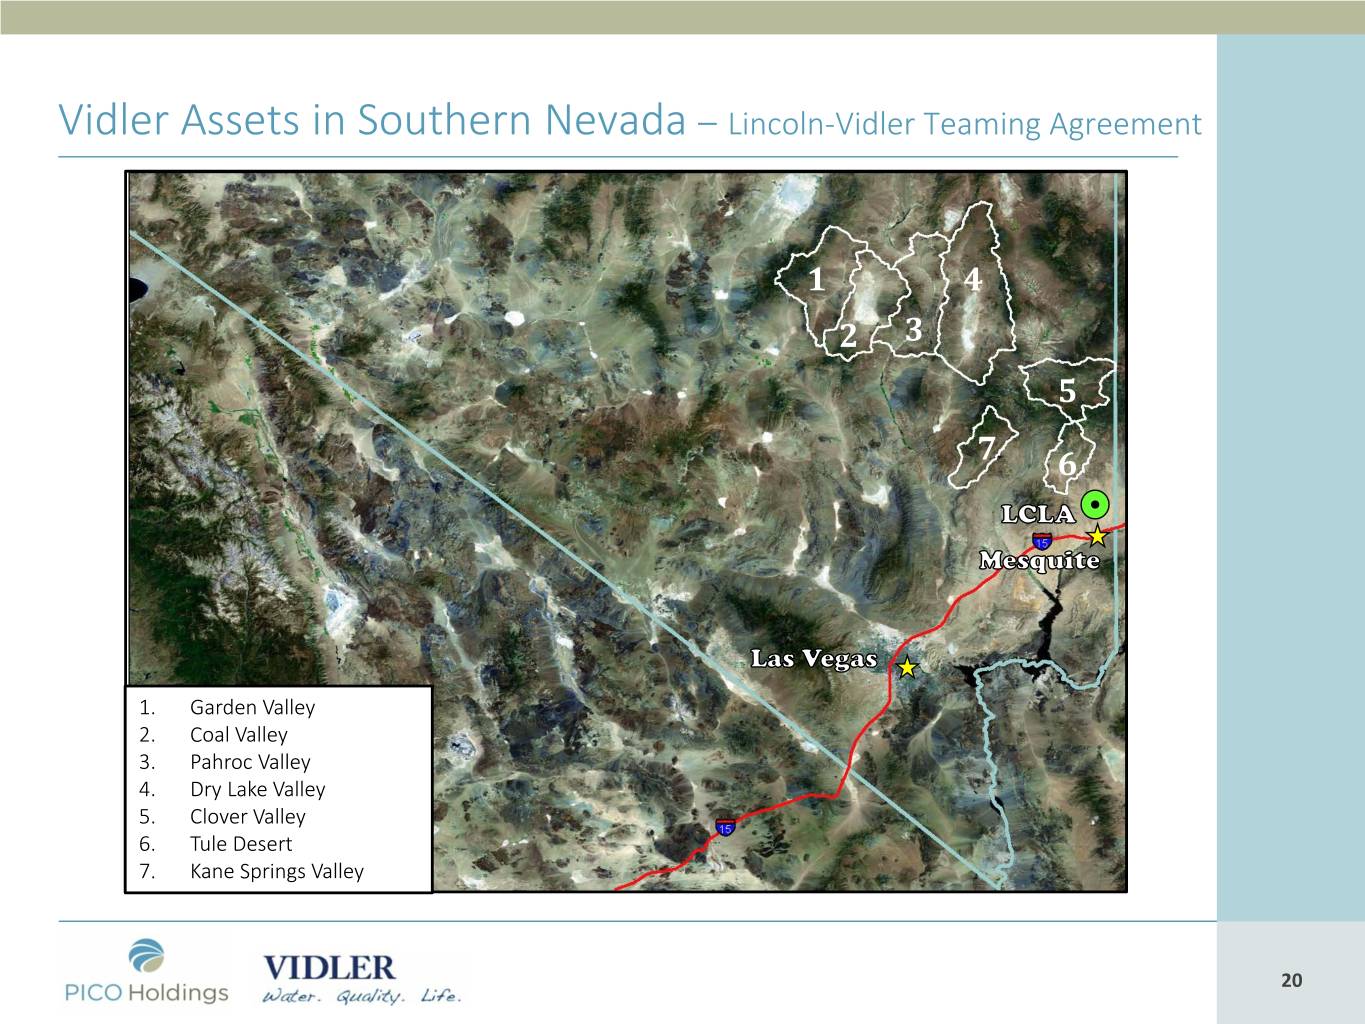
Vidler Assets in Southern Nevada – Lincoln-Vidler Teaming Agreement 1 4 2 3 5 7 6 1. Garden Valley 2. Coal Valley 3. Pahroc Valley 4. Dry Lake Valley 5. Clover Valley 6. Tule Desert 7. Kane Springs Valley 2020
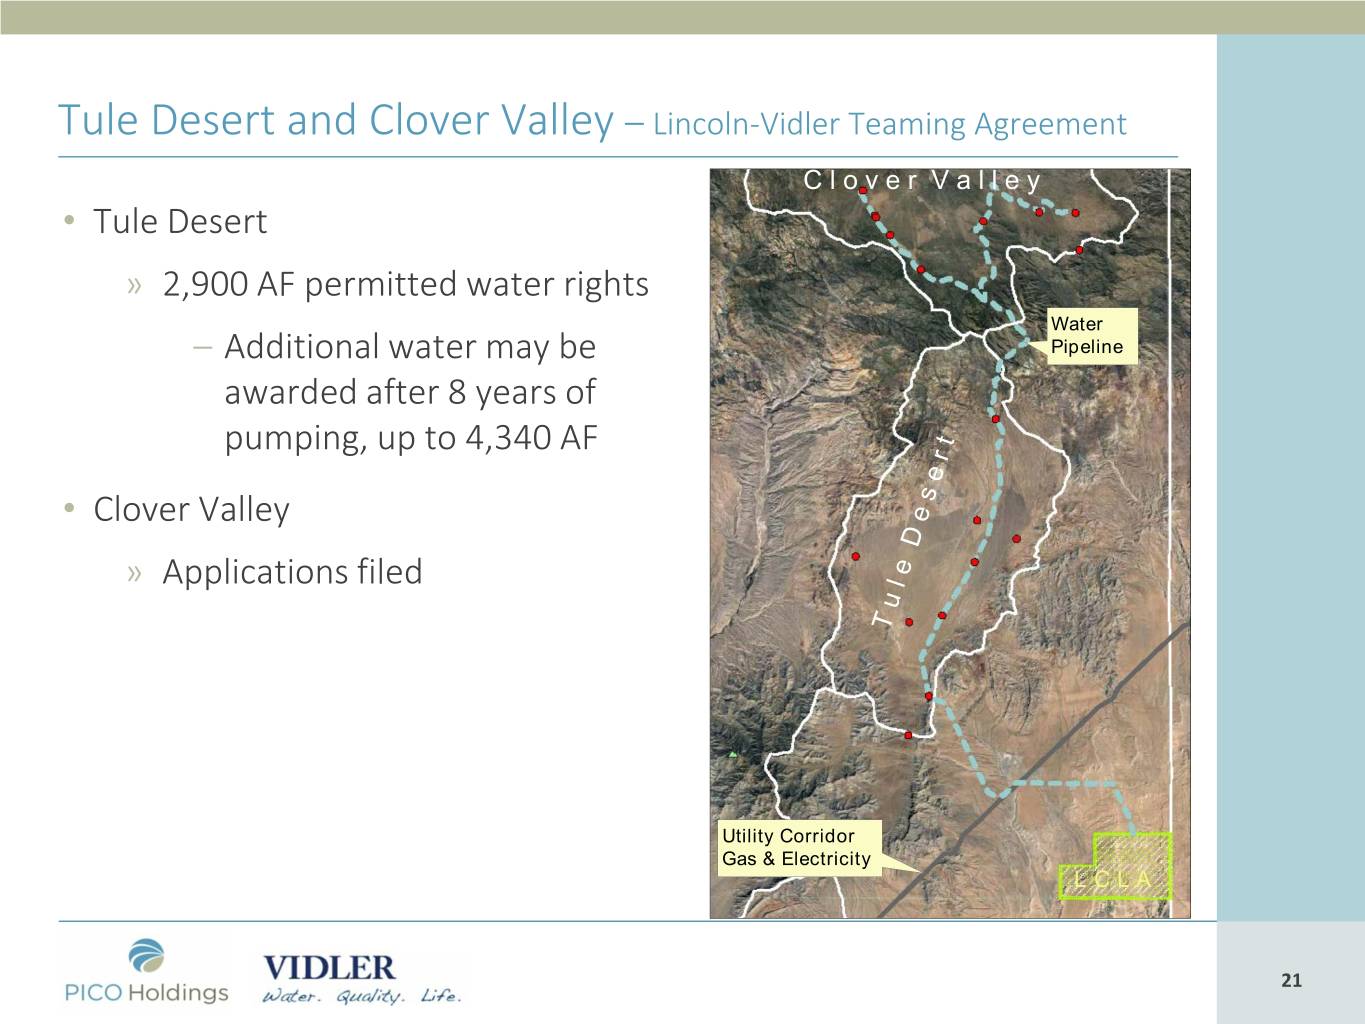
Tule Desert and Clover Valley – Lincoln-Vidler Teaming Agreement C l o v e r V a l l e y • Tule Desert » 2,900 AF permitted water rights Water – Additional water may be Pipeline awarded after 8 years of pumping, up to 4,340 AF • Clover Valley » Applications filed Utility Corridor Gas & Electricity L C L A 2121

Kane Springs Valley – Lincoln-Vidler Teaming Agreement • Kane Springs Valley » 500 AF permitted water rights, Vidler option with Coyote Springs » Additional applications filed 2222

Dry Lake Valley – Lincoln-Vidler Teaming Agreement • Dry Lake Valley » 1,009 AF certificated agricultural water rights » 600 acre parcel located within BLM-designated solar energy development zone 2323
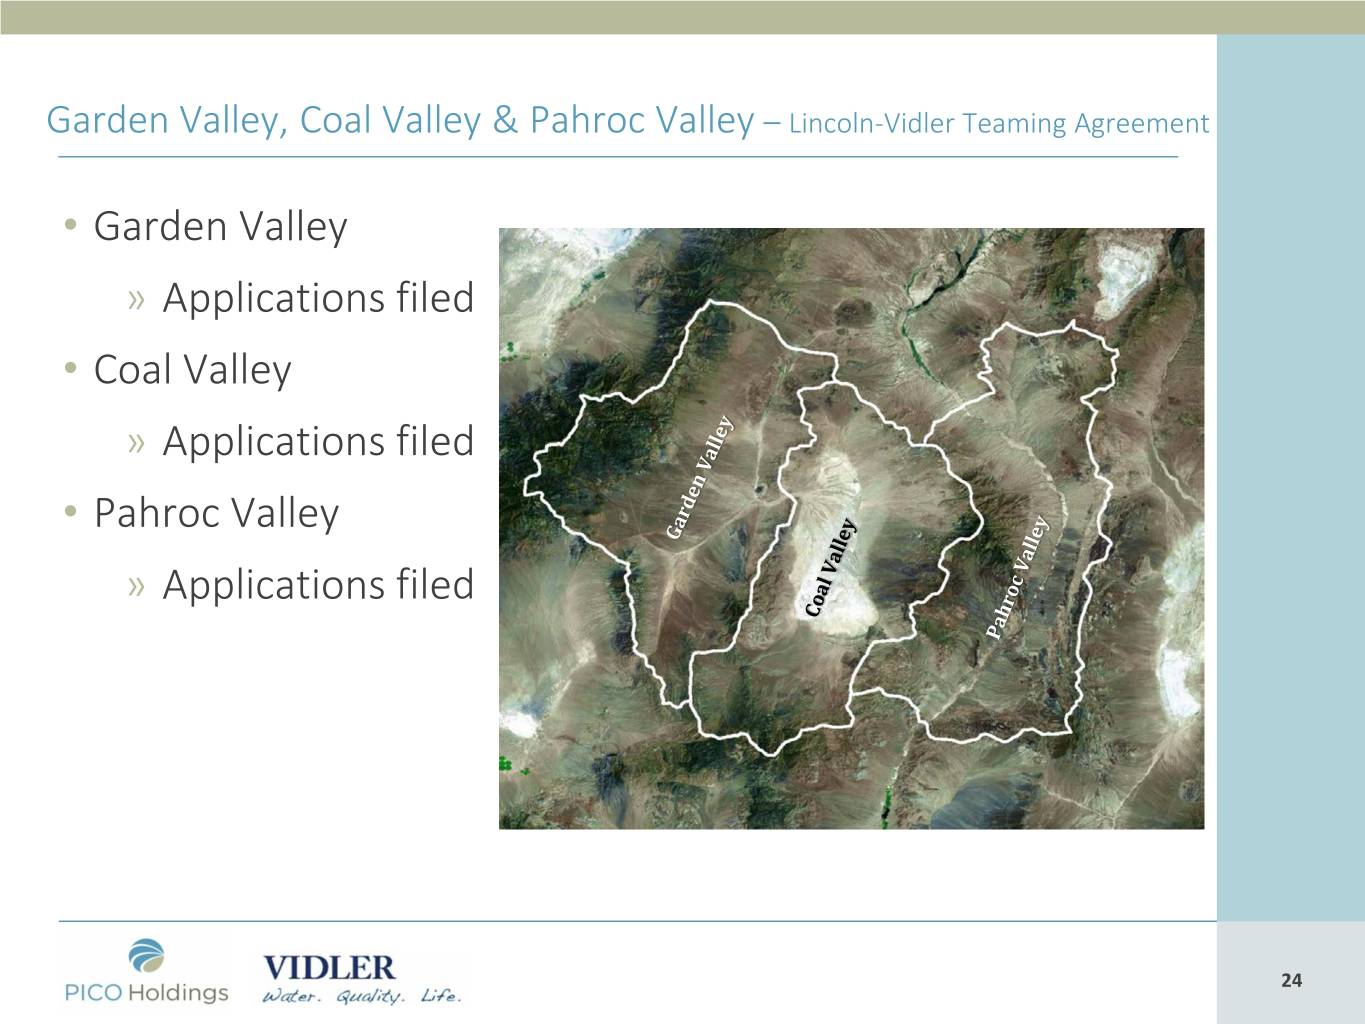
Garden Valley, Coal Valley & Pahroc Valley – Lincoln-Vidler Teaming Agreement • Garden Valley » Applications filed • Coal Valley » Applications filed • Pahroc Valley » Applications filed 2424

Vidler Assets in Arizona, Long-Term Storage Credits Location LTSC (AF) Utah Colorado Harquahala INA 250,682.53 Nevada Current Phoenix AMA 53,551.69 Under Contract / Option -13,300.00 Total Phoenix AMA 40,251.69 Grand Total 290,934.22 California New Harquahala INA Mexico Phoenix AMA 2525
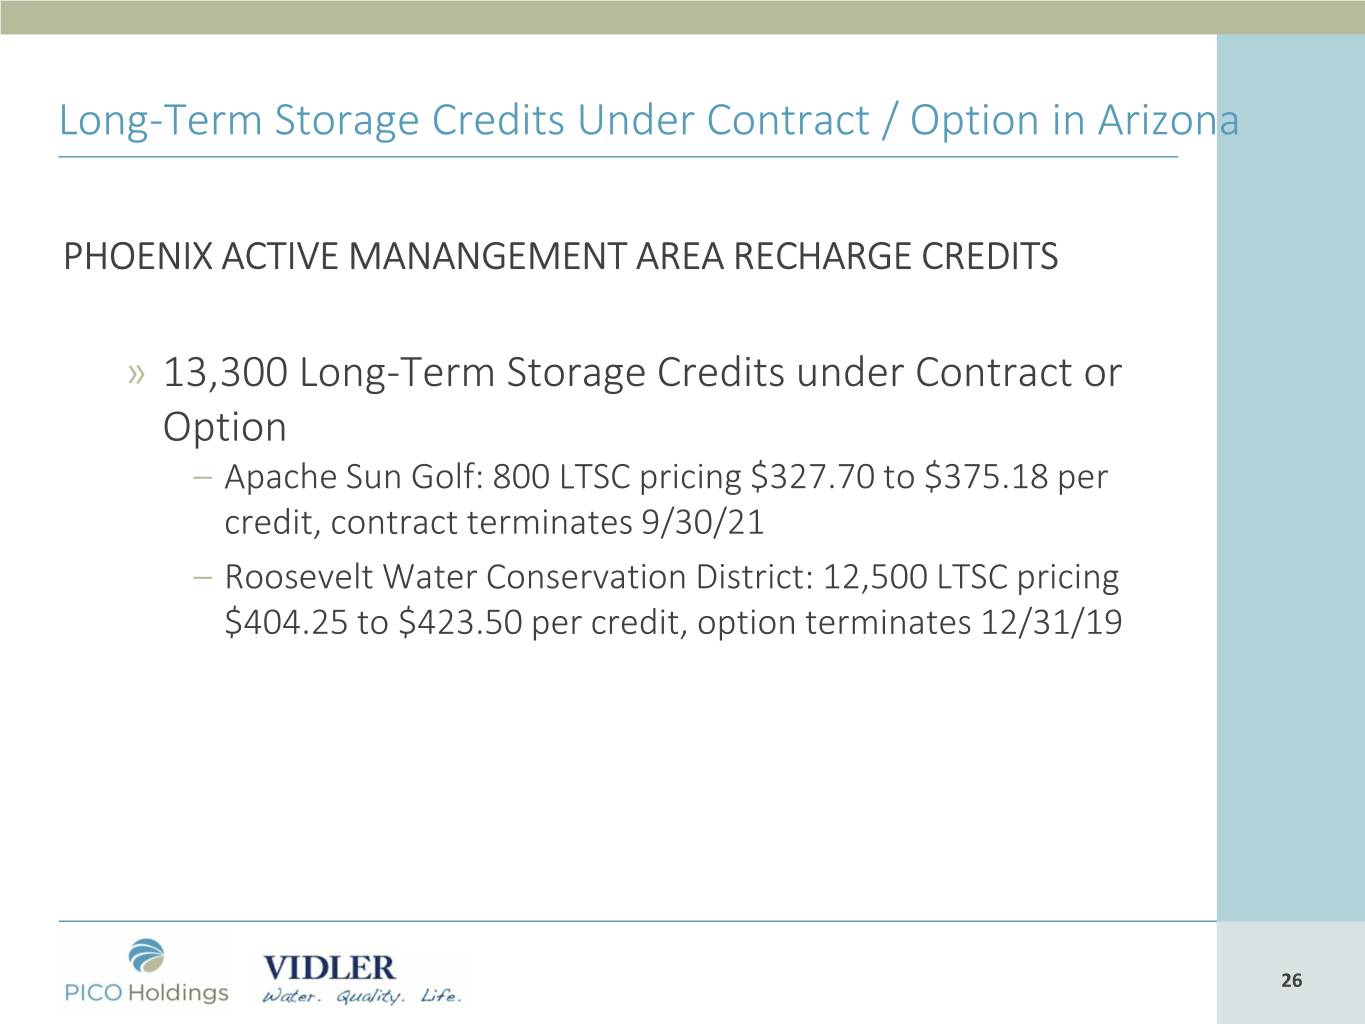
Long-Term Storage Credits Under Contract / Option in Arizona PHOENIX ACTIVE MANANGEMENT AREA RECHARGE CREDITS » 13,300 Long-Term Storage Credits under Contract or Option – Apache Sun Golf: 800 LTSC pricing $327.70 to $375.18 per credit, contract terminates 9/30/21 – Roosevelt Water Conservation District: 12,500 LTSC pricing $404.25 to $423.50 per credit, option terminates 12/31/19 2626

Harquahala Recharge Site, La Paz County, Arizona Our Recharge site is located in La Paz County and is in a recently designated federal Opportunity Zone. Opportunity Zone Hatching 27 27

Colorado River Basin Water Supply Forecast: (Source: March 24, 2019 US Bureau of Reclamation, data provided by NRCS) • Snowpack conditions throughout the Colorado River Basin as a whole is approximately 130% of median snow water equivalent (SWE). • This means the BOR NOT likely to declare shortage for 2020. • President Trump signed bill codifying DCP plan thereby increasing the volume of water left in Lake Mead in case of shortage. » Arizona’s contributions to the DCP are governed by the following: – At or below 1,090’ and above 1,075’ – 192,000 AF (DCP) – At or below 1,075’ and at or above 1,050’ – 512,000 AF (combined DCP & 2007 Shortage Guidelines) – Below 1,050’ and above 1,045’ – 592,000 AF (combined DCP & 2007 Shortage Guidelines) » And it gets worse as the lake level declines… 2828
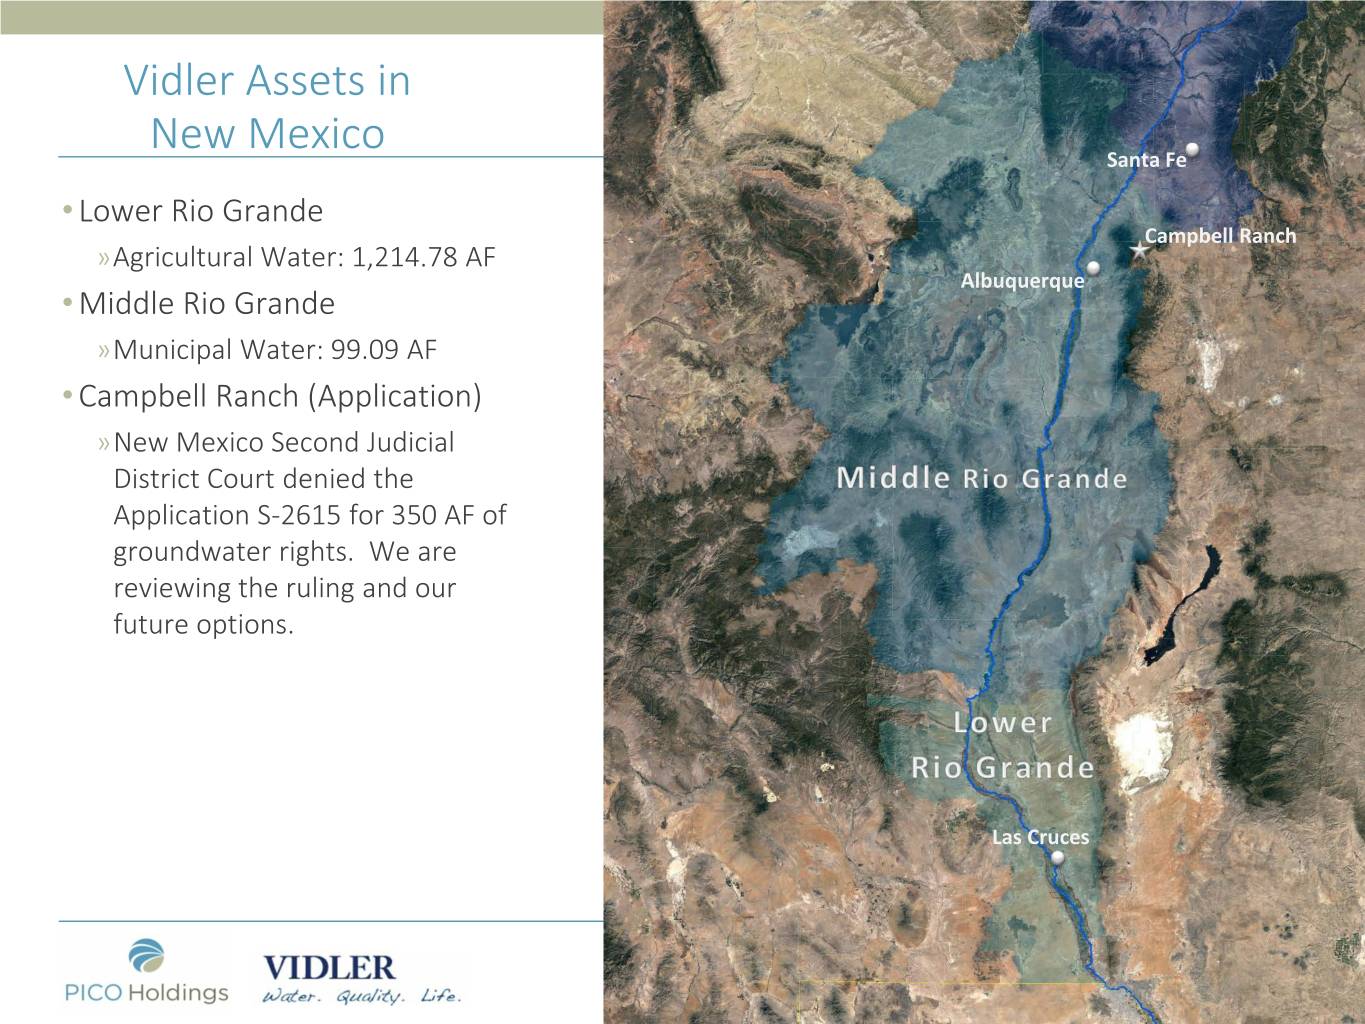
Vidler Assets in New Mexico Santa Fe • Lower Rio Grande Campbell Ranch »Agricultural Water: 1,214.78 AF Albuquerque • Middle Rio Grande »Municipal Water: 99.09 AF • Campbell Ranch (Application) »New Mexico Second Judicial District Court denied the Application S-2615 for 350 AF of groundwater rights. We are reviewing the ruling and our future options. Las Cruces 2929
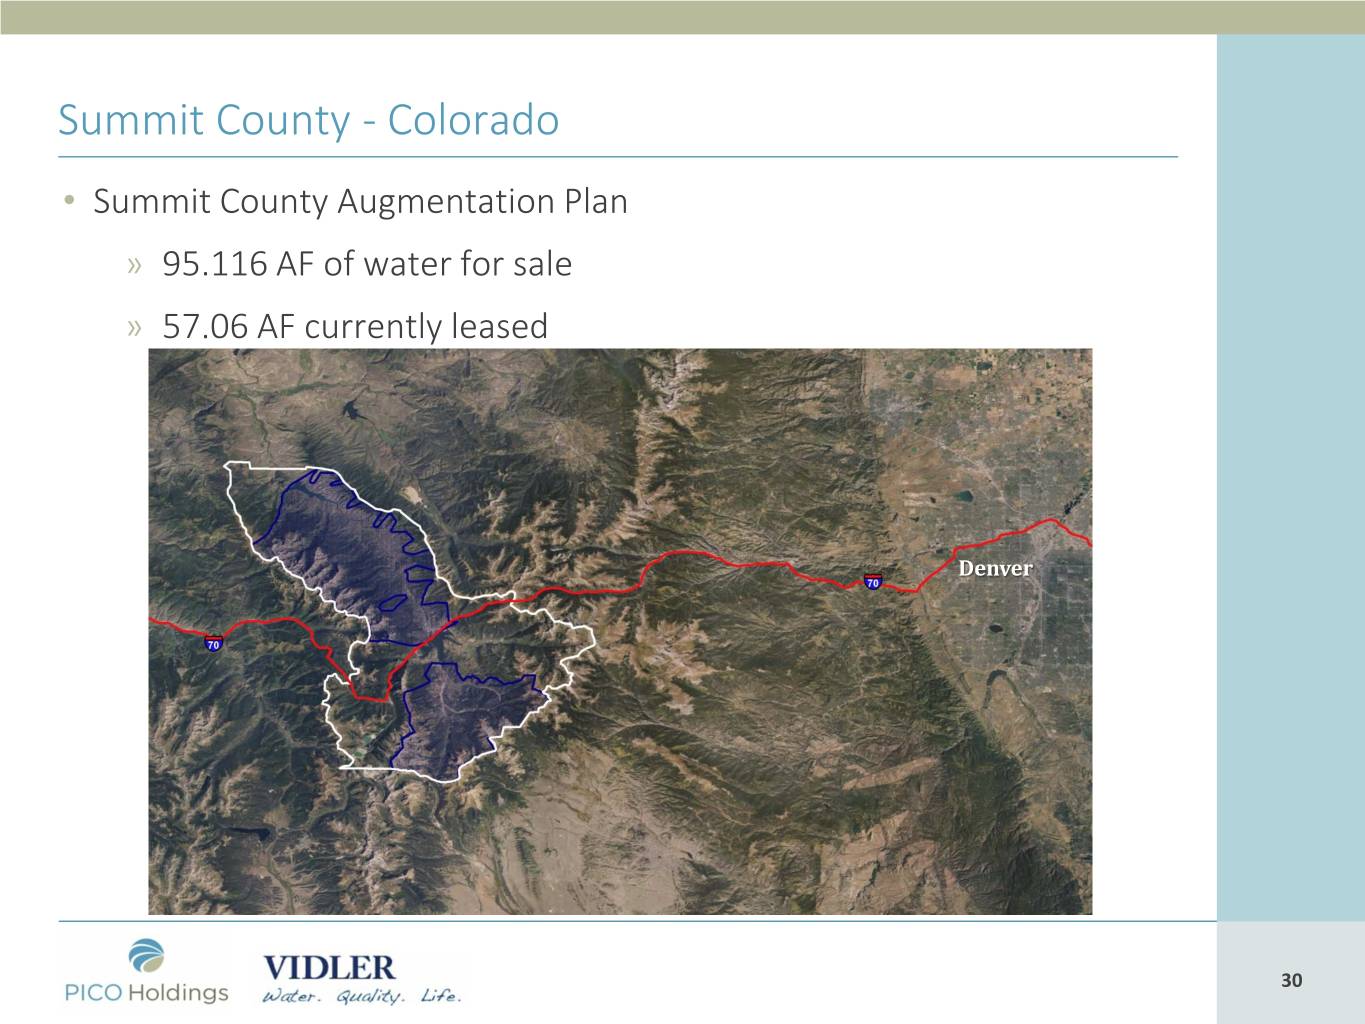
Summit County - Colorado • Summit County Augmentation Plan » 95.116 AF of water for sale » 57.06 AF currently leased Denver 3030
Vidler’s Major Assets: Summary Arizona Long-Term Storage Credits » Resource driven: Demand exists in AZ for LTSCs due to the Colorado River Lower Basin structural deficit, the drought contingency plan and the needs of new development. Northern Nevada Assets (North Valleys, Reno and Dayton corridor areas) » Market driven: Pent-up demand due to housing shortages and lack of available water in the North Valleys and Dayton corridor: BUT actual monetization and timing of sales is highly dependent on new residential and commercial demand and issuance of building permits occurring as part of the “Reno/ Northern Nevada Growth” story. 3131
Return of Monetization Proceeds to Shareholders to Date • Special Dividend (tax-free return of capital) of $5 per share (approximately $115.9 million) • Open market repurchases of stock: approximately 2.9 million shares repurchased through March 31, 2019 for total cost of $32.7 million (average cost $11.19 per share) • Any significant additional monetization proceeds anticipated to be returned to shareholders through tender offer, and/or open market repurchases, and/or special dividends depending on facts and circumstances existing at the time of monetization 3232
Reducing Net Costs • We have closed the La Jolla, CA office: The transition and migration of all functions (treasury, accounting, financial reporting, corporate administration, IT & HR) to Vidler’s existing Carson City office is now complete • Vidler’s existing Carson City office has become the new headquarters of PICO Holdings, Inc. • Total transition costs, including severance and retention costs, estimated to be approximately $1.6 million (majority of costs booked in 2018) • Corporate simplification is also complete and PICO’s only holding is Vidler’s water resource development operations • From May 2019 (post transition costs) we anticipate that net annual cash expenditures, before any asset monetizations, will be approximately $5.5 million 33 33
Water Rights Acquisition: Lyon County, NV • In the Second Quarter 2019 we closed on acquiring 266.67 acre – feet of groundwater rights and entering in to options for a further 402.60 acre – feet of groundwater rights in Lyon County, NV • Lyon County is a water short area; residential, commercial and industrial development is projected along the Hwy 50 corridor from Stagecoach to Silver Springs. These properties have limited water resources and will need to purchase additional water rights. The properties are desirable for development due to their proximity to the Tahoe Reno Industrial Center as well as being located within an Opportunity Zone. • We compared the estimated return on capital of this acquisition to re-purchasing shares and we determined this estimated return on capital is an appropriate investment. 3434
Future Direction • Over the past 15 months, we have repurchased approximately 2.9 million shares • If we continue repurchasing shares at the same pace it is possible this would leave us on the cusp of losing representation in the Russell small cap index in June 2020 due to reduced market cap (threshold in 2018 was $159.2mn) » Our current top 10 shareholders at December 31, 2018 (Source: Bloomberg) Credit Agricole Group 2,604,553 First Foundation Advisors LLC 993,934 BlackRock Inc 1,380,443 River Road Asset Management LLC 921,020 Dimensional Fund Advisors LP 1,182,544 Vanguard Group Inc 822,428 Royce & Associates LP 1,052,551 NFC Investments LLC 469,718 Bandera Partners 1,014,443 State Street Corp 418,035 • If our equity continues to be withdrawn, this may lead to a revised shareholder base Request for Information • We have started to assess a potential turnover in our ownership » We are contemplating hiring an advisor to help us with an analysis of the shareholder registry as we asses scenarios of shareholder turnover, number of owners, number of shares, optimal trading venues, etc » We would greatly appreciate shareholder assistance in any information gathering exercise - in particular by informing us of the number of shares owned and any index restrictions 3535
Q. & A. 3636


