| Investment Company Act file number | 811-05488 |
| Registrant’s telephone number, including area code: | (312) 917-7700 |
| Date of fiscal year end: | October 31 |
| Date of reporting period: | October 31, 2023 |
| ITEM 1. | REPORTS TO STOCKHOLDERS. |
 | Closed-End Funds | October 31, 2023 | ||||
| Nuveen Municipal Value Fund, Inc. | NUV | |
| Nuveen AMT-Free Municipal Value Fund | NUW | |
| Nuveen Municipal Income Fund, Inc. | NMI | |
| 3 | ||||
| 4 | ||||
| 5 | ||||
| 9 | ||||
| 11 | ||||
| 12 | ||||
| 18 | ||||
| 19 | ||||
| 20 | ||||
| 71 | ||||
| 72 | ||||
| 73 | ||||
| 76 | ||||
| 80 | ||||
| 92 | ||||
| 117 | ||||
| 118 | ||||
| 119 | ||||
| 120 | ||||
| 127 | ||||
 | Dear Shareholders, Financial markets spent the past year focused on the direction of inflation and whether policy makers would be able to deliver a soft landing in their economies. After more than a year and a half of interest rate increases by the U.S. Federal Reserve (Fed) and other central banks, financial conditions have tightened and inflation rates have cooled considerably. The Fed increased the target fed funds rate from near zero in March 2022 to a range of 5.25% to 5.50% as of November 2023, with pauses in June 2023, September 2023 and November 2023. But current inflation rates remain above central banks’ targets, and the trajectory from here is difficult to predict given that monetary policy acts on the economy with long and variable lags. Surprisingly, economies were relatively resilient for much of 2023. By year-end, the “most predicted recession” had yet to materialize in the U.S., while U.K. and European economic growth was just beginning to show signs of stagnation or decline. U.S. gross domestic product rose 5.2% in the third quarter of 2023, 2.1% in the second quarter of 2023 and 2.0% in the first quarter of 2023, after growing 2.1% in 2022 overall compared to 2021. Much of the growth was driven by a relatively strong jobs market, which kept consumer sentiment and spending elevated despite long-term interest rates nearing multi-year highs, a series of U.S. regional bank failures and shocks from flaring geopolitical tensions.While central banks are likely nearing the end of this interest rate hiking cycle, there are still upside risks to inflation and downside risks to the economy. Some labor market and consumer indicators are softening. Government funding and deficits remain a concern, especially as the U.S. election year gets underway. The markets will continue to try to anticipate monetary policy shifts as the Fed evaluates incoming data and adjusts its rate setting activity on a meeting-by-meeting On behalf of the other members of the Nuveen Fund Board, we look forward to continuing to earn your trust in the months and years ahead.  Terence J. Toth Chair of the Board December 22, 2023 |
Per Common Share Amounts | ||||||
Monthly Distributions (Ex-Dividend Date) | NUV | NUW | NMI | |||
| November | $0.0280 | $0.0390 | $0.0300 | |||
| December | 0.0280 | 0.0390 | 0.0300 | |||
| January | 0.0280 | 0.0390 | 0.0300 | |||
| February | 0.0280 | 0.0390 | 0.0300 | |||
| March | 0.0280 | 0.0390 | 0.0300 | |||
| April | 0.0280 | 0.0405 | 0.0300 | |||
| May | 0.0280 | 0.0405 | 0.0300 | |||
| June | 0.0280 | 0.0405 | 0.0300 | |||
| July | 0.0280 | 0.0405 | 0.0315 | |||
| August | 0.0280 | 0.0405 | 0.0315 | |||
| September | 0.0280 | 0.0405 | 0.0315 | |||
| October | 0.0290 | 0.0425 | 0.0315 | |||
Total Distributions from Net Investment Income | $0.3370 | $0.4805 | $0.3660 | |||
Yields | NUV | NUW | NMI | |||
Market Yield 1 | 4.36% | 4.05% | 4.53% | |||
Taxable-Equivalent Yield 1 | 7.34% | 6.84% | 7.65% | |||
| 1 | Market Yield is based on the Fund’s current annualized monthly dividend divided by the Fund’s current market price as of the end of the reporting period. Taxable-Equivalent Yield represents the yield that must be earned on a fully taxable investment in order to equal the yield of the Fund on an after-tax basis. It is based on a federal income tax rate of 40.8%. Your actual federal income tax rate may differ from the assumed rate. The Taxable-Equivalent Yield also takes into account the percentage of the Fund’s income generated and paid by the Fund (based on payments made during the previous calendar year) that was not exempt from federal income tax. Separately, if the comparison were instead to investments that generate qualified dividend income, which is taxable at a rate lower than an individual’s ordinary graduated tax rate, the fund’s Taxable-Equivalent Yield would be lower. |
NMI | ||
| Additional authorized common shares | 2,000,000 |
NMI | ||
| Common shares sold through shelf offering | 4,954 | |
| Weighted average premium to NAV per common share sold | 1.11% |
NUV | NUW | NMI | ||||
| Common shares cumulatively repurchased and retired | 0 | 0 | 0 | |||
| Common shares authorized for repurchase | 20,750,000 | 1,795,000 | 1,005,000 |
NUV | NUW | NMI | ||||
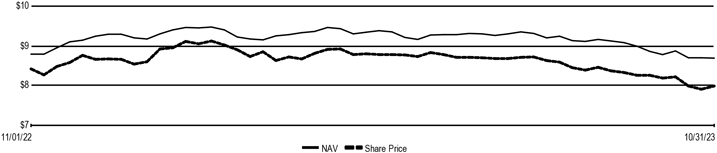
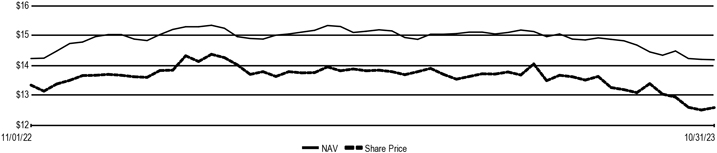
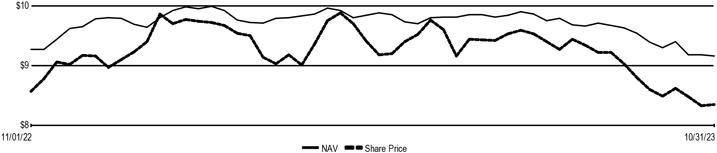
| Common share NAV | $ 8.69 | $ 14.20 | $ 9.16 | |||
| Common share price | $ 7.99 | $ 12.60 | $ 8.35 | |||
| Premium/(Discount) to NAV | (8.06)% | (11.27)% | (8.84)% | |||
| Average premium/(discount) to NAV | (6.03)% | (8.73)% | (4.55)% |
| NUV | Nuveen Municipal Value Fund, Inc. Performance Overview and Holding Summaries as of October 31, 2023 |
Total Returns as of October 31, 2023 | ||||||||||||||||
Average Annual | ||||||||||||||||
Inception Date | 1-Year | 5-Year | 10-Year | |||||||||||||
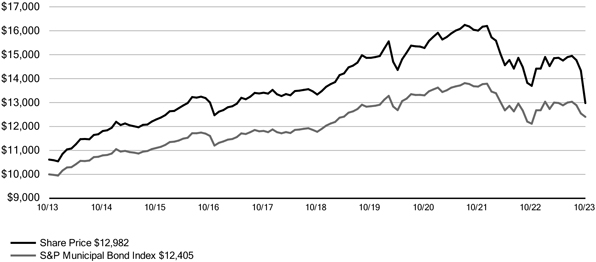
| NUV at Common Share NAV | 6/17/87 | 2.79% | 1.04% | 2.77% | ||||||||||||
| NUV at Common Share Price | 6/17/87 | (0.52)% | 0.84% | 2.64% | ||||||||||||
| S&P Municipal Bond Index | – | 2.36% | 1.04% | 2.18% | ||||||||||||
Fund Allocation | ||||
(% of net assets) | ||||
| Municipal Bonds | 99.5% | |||
| Other Assets & Liabilities, Net | 1.7% | |||
| Floating Rate Obligations | (1.2)% | |||
Net Assets | 100% | |||
Bond Credit Quality | ||||
(% of total investment exposure) | ||||
| U.S. Guaranteed | 4.2% | |||
| AAA | 7.6% | |||
| AA | 40.4% | |||
| A | 28.4% | |||
| BBB | 11.2% | |||
| BB or Lower | 2.3% | |||
| N/R (not rated) | 5.9% | |||
Total | 100% | |||
Portfolio Composition | ||||
(% of total investments) | ||||
| Tax Obligation/Limited | 28.4% | |||
| Transportation | 20.6% | |||
| Tax Obligation/General | 14.4% | |||
| Utilities | 14.2% | |||
| Health Care | 7.6% | |||
| Education and Civic Organizations | 4.8% | |||
| U.S. Guaranteed | 4.7% | |||
| Other | 5.3% | |||
Total | 100% | |||
States and Territories 1 | ||||
(% of total municipal bonds) | ||||
| Texas | 13.1% | |||
| Illinois | 11.0% | |||
| New York | 7.6% | |||
| California | 6.5% | |||
| Colorado | 6.4% | |||
| Florida | 5.7% | |||
| New Jersey | 4.5% | |||
| Ohio | 4.0% | |||
| Washington | 4.0% | |||
| Georgia | 4.0% | |||
| Michigan | 3.0% | |||
| Nevada | 2.7% | |||
| South Carolina | 2.4% | |||
| Pennsylvania | 2.1% | |||
| Kentucky | 1.8% | |||
| Puerto Rico | 1.8% | |||
| District of Columbia | 1.7% | |||
| Tennessee | 1.5% | |||
| Oklahoma | 1.4% | |||
| Utah | 1.4% | |||
| Other | 13.4% | |||
Total | 100% | |||
| 1 | See the Portfolio of Investments for the remaining states comprising “Other” and not listed in the table above. |
| NUW | Nuveen AMT-Free Municipal Value Fund Performance Overview and Holding Summaries as of October 31, 2023 |
Total Returns as of October 31, 2023 | ||||||||||||||||
Average Annual | ||||||||||||||||
Inception Date | 1-Year | 5-Year | 10-Year | |||||||||||||
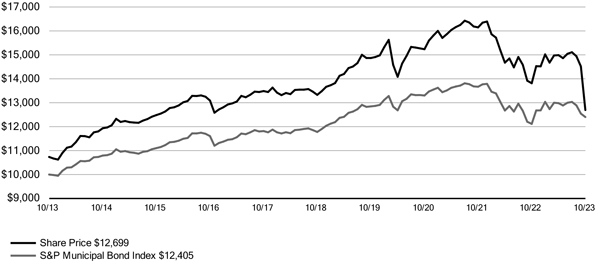
| NUW at Common Share NAV | 2/25/09 | 3.27% | 1.24% | 2.79% | ||||||||||||
| NUW at Common Share Price | 2/25/09 | (1.08)% | 1.04% | 2.42% | ||||||||||||
| S&P Municipal Bond Index | – | 2.36% | 1.04% | 2.18% | ||||||||||||
Fund Allocation | ||||
(% of net assets) | ||||
| Municipal Bonds | 98.5% | |||
| Common Stocks | 0.5% | |||
| Other Assets & Liabilities, Net | 1.8% | |||
| Floating Rate Obligations | (0.8)% | |||
Net Assets | 100% | |||
Bond Credit Quality | ||||
(% of total investment exposure) | ||||
| U.S. Guaranteed | 1.6% | |||
| AAA | 7.7% | |||
| AA | 40.8% | |||
| A | 29.6% | |||
| BBB | 11.7% | |||
| BB or Lower | 2.0% | |||
| N/R (not rated) | 6.1% | |||
| N/A (not applicable) | 0.5% | |||
Total | 100% | |||
Portfolio Composition | ||||
(% of total investments) | ||||
| Tax Obligation/Limited | 24.2% | |||
| Utilities | 20.2% | |||
| Tax Obligation/General | 16.9% | |||
| Transportation | 10.5% | |||
| Health Care | 9.5% | |||
| Education and Civic Organizations | 7.2% | |||
| Consumer Staples | 4.4% | |||
| Other | 6.6% | |||
| Common Stocks | 0.5% | |||
Total | 100% | |||
States and Territories 1 | ||||
(% of total municipal bonds) | ||||
| California | 11.5% | |||
| Illinois | 10.4% | |||
| Texas | 9.6% | |||
| New York | 6.9% | |||
| New Jersey | 6.9% | |||
| Nevada | 5.6% | |||
| Pennsylvania | 4.4% | |||
| Ohio | 4.2% | |||
| Colorado | 4.1% | |||
| Florida | 3.8% | |||
| Tennessee | 3.8% | |||
| Washington | 3.5% | |||
| Kentucky | 3.4% | |||
| Maryland | 3.2% | |||
| Puerto Rico | 3.0% | |||
| Georgia | 2.6% | |||
| South Carolina | 1.7% | |||
| West Virginia | 1.5% | |||
| Arizona | 1.3% | |||
| Minnesota | 1.2% | |||
| Other | 7.4% | |||
Total | 100% | |||
| 1 | See the Portfolio of Investments for the remaining states comprising “Other” and not listed in the table above. |
| NMI | Nuveen Municipal Income Fund, Inc. | |
Performance Overview and Holding Summaries as of October 31, 2023 |
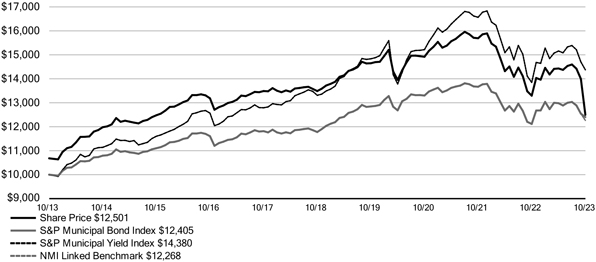
Total Returns as of October 31, 2023 | ||||||||||||||||
Average Annual | ||||||||||||||||
Inception Date | 1-Year | 5-Year | 10-Year | |||||||||||||
| NMI at Common Share NAV | 4/20/88 | 2.94% | 0.24% | 2.47% | ||||||||||||
| NMI at Common Share Price | 4/20/88 | 1.80% | 0.05% | 2.26% | ||||||||||||
| S&P Municipal Bond Index | – | 2.36% | 1.04% | 2.18% | ||||||||||||
| S&P Municipal Yield Index | – | 3.80% | 1.55% | 3.70% | ||||||||||||
| NMI Linked Benchmark | – | 1.23% | 0.81% | 2.06% | ||||||||||||
Fund Allocation (% of net assets) | ||||
| Municipal Bonds | 96.6% | |||
| Short-Term Municipal Bonds | 2.9% | |||
| Other Assets & Liabilities, Net | 0.5% | |||
Net Assets | 100% | |||
Bond Credit Quality (% of total investment exposure) | ||||
| U.S. Guaranteed | 3.7% | |||
| AAA | 2.1% | |||
| AA | 29.0 | |||
| A | 30.3% | |||
| BBB | 11.0% | |||
| BB or Lower | 6.1% | |||
| N/R (not rated) | 17.8% | |||
Total | 100% | |||
Portfolio Composition (% of total investments) | ||||
| Transportation | 21.2% | |||
| Health Care | 21.0% | |||
| Tax Obligation/Limited | 18.0% | |||
| Education and Civic Organizations | 10.5% | |||
| Utilities | 8.7% | |||
| Tax Obligation/General | 7.4% | |||
| Long-Term Care | 3.8% | |||
| Other | 9.4% | |||
Total | 100% | |||
States and Territories 1 (% of total municipal bonds) | ||||
| Colorado | 15.0% | |||
| Illinois | 12.6% | |||
| Texas | 10.2% | |||
| Florida | 5.6% | |||
| Arizona | 4.9% | |||
| Missouri | 4.2% | |||
| New York | 3.8% | |||
| Wisconsin | 3.8% | |||
| Indiana | 2.8% | |||
| North Carolina | 2.8% | |||
| California | 2.7% | |||
| New Jersey | 2.6% | |||
| Louisiana | 2.3% | |||
| Pennsylvania | 2.3% | |||
| Alabama | 2.3% | |||
| Georgia | 2.2% | |||
| Virginia | 2.0% | |||
| Hawaii | 1.8% | |||
| Minnesota | 1.8% | |||
| Ohio | 1.8% | |||
| Other | 12.5% | |||
Total | 100% | |||
| 1 | See the Portfolio of Investments for the remaining states comprising “Other” and not listed in the table above. |
NUV | NUW | NMI | ||||||||||
| Common Shares | Common Shares | Common Shares | ||||||||||
Approval of the Board Members was reached as follows: | ||||||||||||
| Amy B.R. Lancellotta | ||||||||||||
| For | 167,611,770 | 14,293,466 | 7,951,418 | |||||||||
| Withhold | 4,342,613 | 1,752,981 | 364,554 | |||||||||
| Total | 171,954,383 | 16,046,447 | 8,315,972 | |||||||||
| John K. Nelson | ||||||||||||
| For | 167,524,604 | 14,153,422 | 7,922,811 | |||||||||
| Withhold | 4,429,779 | 1,893,025 | 393,161 | |||||||||
| Total | 171,954,383 | 16,046,447 | 8,315,972 | |||||||||
| Terence J. Toth | ||||||||||||
| For | 167,333,902 | 14,162,033 | 7,896,658 | |||||||||
| Withhold | 4,620,481 | 1,884,414 | 419,314 | |||||||||
| Total | 171,954,383 | 16,046,447 | 8,315,972 | |||||||||
| Robert L. Young | ||||||||||||
| For | 167,700,960 | 14,153,629 | 7,966,792 | |||||||||
| Withhold | 4,253,423 | 1,892,818 | 349,180 | |||||||||
| Total | 171,954,383 | 16,046,447 | 8,315,972 | |||||||||
| NUV | Nuveen Municipal Value Fund, Inc. | |
Portfolio of Investments October 31, 2023 |
Principal Amount (000) | Description (a) | Optional Call Provisions (b) | Value | |||||||||||
LONG-TERM INVESTMENTS - 99.5% | ||||||||||||||
MUNICIPAL BONDS - 99.5% | ||||||||||||||
Alabama - 0.2% | ||||||||||||||
| Birmingham Airport Authority, Alabama, Airport Revenue Bonds, Series 2020: | ||||||||||||||
| $ | 255 | 4.000%, 7/01/39 - BAM Insured | 7/30 at 100.00 | $ | 232,507 | |||||||||
| 225 | 4.000%, 7/01/40 - BAM Insured | 7/30 at 100.00 | 203,945 | |||||||||||
| 3,805 | (c) | Homewood, Alabama, General Obligation Warrants, Series 2016, 5.000%, 9/01/36, (Pre-refunded 9/01/26) | 9/26 at 100.00 | 3,938,059 | ||||||||||
| Total Alabama | 4,374,511 | |||||||||||||
Alaska - 0.4% | ||||||||||||||
| 9,750 | Anchorage, Alaska, Solid Waste Services Revenue Bonds, Refunding Series 2022A, 4.000%, 11/01/52 | 11/32 at 100.00 | 8,021,167 | |||||||||||
| 110 | Northern Tobacco Securitization Corporation, Alaska, Tobacco Settlement Asset-Backed Bonds, Senior Series 2021A Class 1, 4.000%, 6/01/50 | 6/31 at 100.00 | 88,132 | |||||||||||
| Total Alaska | 8,109,299 | |||||||||||||
Arizona - 1.0% | ||||||||||||||
| 1,915 | Chandler Industrial Development Authority, Arizona, Industrial Development Revenue Bonds, Intel Corporation Project, Series 2019, 5.000%, 6/01/49, (AMT), (Mandatory Put 6/03/24) | 6/24 at 100.00 | 1,914,386 | |||||||||||
| 2,935 | Phoenix Civic Improvement Corporation, Arizona, Airport Revenue Bonds, Senior Lien Series 2017A, 5.000%, 7/01/35 | 7/27 at 100.00 | 3,010,385 | |||||||||||
| 780 | Phoenix Civic Improvement Corporation, Arizona, Excise Tax Revenue Bonds, Subordinate Lien Series 2020A, 4.000%, 7/01/45 | 7/30 at 100.00 | 669,283 | |||||||||||
| 2,590 | Phoenix Civic Improvement Corporation, Arizona, Water System Revenue Bonds, Junior Lien Series 2021A, 5.000%, 7/01/45 | 7/31 at 100.00 | 2,645,395 | |||||||||||
| 2,175 | Pima County Industrial Development Authority, Arizona, Revenue Bonds, Tucson Medical Center, Series 2021A, 4.000%, 4/01/46 | 4/31 at 100.00 | 1,728,821 | |||||||||||
| 5,600 | Salt Verde Financial Corporation, Arizona, Senior Gas Revenue Bonds, Citigroup Energy Inc Prepay Contract Obligations, Series 2007, 5.000%, 12/01/37 | No Opt. Call | 5,436,116 | |||||||||||
| Tucson, Arizona, Water System Revenue Bonds, Refunding Series 2017: | ||||||||||||||
| 1,000 | 5.000%, 7/01/34 | 7/27 at 100.00 | 1,034,891 | |||||||||||
| 750 | 5.000%, 7/01/35 | 7/27 at 100.00 | 774,102 | |||||||||||
| Total Arizona | 17,213,379 | |||||||||||||
California - 6.5% | ||||||||||||||
| 405 | California County Tobacco Securitization Agency, Tobacco Settlement Asset-Backed Bonds, Los Angeles County Securitization Corporation, Series 2020A, 4.000%, 6/01/49 | 6/30 at 100.00 | 329,753 | |||||||||||
| 1,250 | California County Tobacco Securitization Agency, Tobacco Settlement Asset-Backed Bonds, Sonoma County Tobacco Securitization Corporation, Series 2020A, 4.000%, 6/01/49 | 12/30 at 100.00 | 1,017,757 | |||||||||||
| 4,080 | (c) | California Health Facilities Financing Authority, California, Revenue Bonds, Sutter Health, Refunding Series 2016B, 5.000%, 11/15/46, (Pre-refunded 11/15/26) | 11/26 at 100.00 | 4,250,951 | ||||||||||
| 5,920 | California Health Facilities Financing Authority, California, Revenue Bonds, Sutter Health, Series 2018A, 5.000%, 11/15/48 | 11/27 at 100.00 | 5,836,000 | |||||||||||
Principal Amount (000) | Description (a) | Optional Call Provisions (b) | Value | |||||||||||
California | ||||||||||||||
| $ | 1,650 | California Health Facilities Financing Authority, Revenue Bonds, Children’s Hospital Los Angeles, Series 2017A, 5.000%, 8/15/35 | 8/27 at 100.00 | $ | 1,660,904 | |||||||||
| California Municipal Finance Authority, Revenue Bonds, Linxs APM Project, Senior Lien Series 2018A: | ||||||||||||||
| 1,635 | 5.000%, 12/31/43, (AMT) | 6/28 at 100.00 | 1,547,046 | |||||||||||
| 3,495 | 5.000%, 12/31/47, (AMT) | 6/28 at 100.00 | 3,273,156 | |||||||||||
| 1,000 | California Municipal Finance Authority, Revenue Bonds, Linxs APM Project, Senior Lien Series 2018B, 5.000%, 6/01/48, (AMT) | 6/28 at 100.00 | 933,003 | |||||||||||
| 2,290 | California Pollution Control Financing Authority, Water Furnishing Revenue Bonds, San Diego County Water Authoriity Desalination Project Pipeline, Refunding Series 2019, 5.000%, 7/01/39, 144A | 1/29 at 100.00 | 2,260,481 | |||||||||||
| 1,625 | (c) | California State Public Works Board, Lease Revenue Bonds, Various Capital Projects, Series 2013I, 5.000%, 11/01/38, (Pre-refunded 1/02/24) | 1/24 at 100.00 | 1,628,422 | ||||||||||
| 3,500 | California Statewide Communities Development Authority, California, Revenue Bonds, Loma Linda University Medical Center, Series 2016A, 5.000%, 12/01/46, 144A | 6/26 at 100.00 | 3,092,843 | |||||||||||
| 4,505 | Covina-Valley Unified School District, Los Angeles County, California, General Obligation Bonds, Series 2003B, 0.000%, 6/01/28 - FGIC Insured | No Opt. Call | 3,683,488 | |||||||||||
| 5,700 | East Bay Municipal Utility District, Alameda and Contra Costa Counties, California, Water System Revenue Bonds, Green Series 2017A, 5.000%, 6/01/45 | 6/27 at 100.00 | 5,806,107 | |||||||||||
| 2,180 | (d) | Foothill/Eastern Transportation Corridor Agency, California, Toll Road Revenue Bonds, Refunding Series 2013A, 0.000%, 1/15/42 | 1/31 at 100.00 | 2,456,142 | ||||||||||
| Fresno, California, Airport Revenue Bonds, Series 2023A: | ||||||||||||||
| 1,000 | 5.000%, 7/01/48 - BAM Insured, (AMT) | 7/33 at 100.00 | 960,234 | |||||||||||
| 1,000 | 5.000%, 7/01/53 - BAM Insured, (AMT) | 7/33 at 100.00 | 947,968 | |||||||||||
| 49,020 | Golden State Tobacco Securitization Corporation, California, Tobacco Settlement Asset-Backed Bonds, Capital Appreciation Series 2021B-2, 0.000%, 6/01/66 | 12/31 at 27.75 | 4,020,733 | |||||||||||
| 345 | Golden State Tobacco Securitization Corporation, California, Tobacco Settlement Asset-Backed Revenue Bonds, Series 2022A-1, 5.000%, 6/01/51 | | 12/31 at 100.00 | | 344,986 | |||||||||
| 2,780 | Los Angeles Department of Airports, California, Revenue Bonds, Los Angeles International Airport, Refunding Subordinate Series 2022I, 5.000%, 5/15/48 | | 11/31 at 100.00 | | 2,835,235 | |||||||||
| 2,725 | Los Angeles Department of Water and Power, California, Water System Revenue Bonds, Series 2023A, 5.250%, 7/01/53 | 7/33 at 100.00 | 2,870,152 | |||||||||||
| 2,555 | Merced Union High School District, Merced County, California, General Obligation Bonds, Series 1999A, 0.000%, 8/01/24 - FGIC Insured | No Opt. Call | 2,475,750 | |||||||||||
| 2,365 | Montebello Unified School District, Los Angeles County, California, General Obligation Bonds, Election 1998 Series 2004, 0.000%, 8/01/27 - FGIC Insured | No Opt. Call | 1,998,822 | |||||||||||
| Mount San Antonio Community College District, Los Angeles County, California, General Obligation Bonds, Election of 2008, Series 2013A: | ||||||||||||||
| 3,060 | 5.875%, 8/01/28 | 2/28 at 100.00 | 3,345,619 | |||||||||||
| 2,315 | (d) | 0.000%, 8/01/43 | 8/35 at 100.00 | 2,015,947 | ||||||||||
| 3,550 | M-S-R | No Opt. Call | 3,998,479 | |||||||||||
| 10,150 | Placer Union High School District, Placer County, California, General Obligation Bonds, Series 2004C, 0.000%, 8/01/33 - AGM Insured | No Opt. Call | 6,651,087 | |||||||||||
| NUV | Nuveen Municipal Value Fund, Inc. (continued) Portfolio of Investments October 31, 2023 |
Principal Amount (000) | Description (a) | Optional Call Provisions (b) | Value | |||||||||||
California | ||||||||||||||
| San Bruno Park School District, San Mateo County, California, General Obligation Bonds, Series 2000B: | ||||||||||||||
| $ | 2,575 | 0.000%, 8/01/24 - FGIC Insured | No Opt. Call | $ | 2,494,948 | |||||||||
| 2,660 | 0.000%, 8/01/25 - FGIC Insured | No Opt. Call | 2,458,372 | |||||||||||
| 230 | San Diego Tobacco Settlement Revenue Funding Corporation, California, Tobacco Settlement Bonds, Subordinate Series 2018C, 4.000%, 6/01/32 | 6/28 at 100.00 | 218,107 | |||||||||||
| San Francisco Airports Commission, California, Revenue Bonds, San Francisco International Airport, Refunding Second Series 2019D: | ||||||||||||||
| 6,000 | 5.000%, 5/01/36 | 5/29 at 100.00 | 6,294,364 | |||||||||||
| 4,000 | 5.000%, 5/01/39 | 5/29 at 100.00 | 4,128,381 | |||||||||||
| San Joaquin Hills Transportation Corridor Agency, Orange County, California, Refunding Senior Lien Toll Road Revenue Bonds, Series 2021A: | ||||||||||||||
| 315 | 4.000%, 1/15/39 | 1/32 at 100.00 | 286,816 | |||||||||||
| 525 | 4.000%, 1/15/41 | 1/32 at 100.00 | 468,947 | |||||||||||
| 550 | 4.000%, 1/15/43 | 1/32 at 100.00 | 483,070 | |||||||||||
| 200 | 4.000%, 1/15/44 | 1/32 at 100.00 | 174,275 | |||||||||||
| 12,095 | San Joaquin Hills Transportation Corridor Agency, Orange County, California, Toll Road Revenue Bonds, Refunding Series 1997A, 0.000%, 1/15/25 - NPFG Insured | No Opt. Call | 11,478,042 | |||||||||||
| 13,220 | San Mateo County Community College District, California, General Obligation Bonds, Series 2006A, 0.000%, 9/01/28 - NPFG Insured | No Opt. Call | 10,897,830 | |||||||||||
| 5,000 | San Mateo Union High School District, San Mateo County, California, General Obligation Bonds, Election of 2000, Series 2002B, 0.000%, 9/01/24 - FGIC Insured | No Opt. Call | 4,839,719 | |||||||||||
| 5,815 | San Ysidro School District, San Diego County, California, General Obligation Bonds, Refunding Series 2015, 0.000%, 8/01/48 | 8/25 at 29.16 | 1,511,170 | |||||||||||
| 440 | Tobacco Securitization Authority of Northern California, Tobacco Settlement Asset-Backed Bonds, Refunding Sacramento County Tobacco Securitization Corporation Series 2021B Class 2, 4.000%, 6/01/49 | 12/30 at 100.00 | 411,201 | |||||||||||
| 575 | Vernon, California, Electric System Revenue Bonds, Series 2021A, 5.000%, 4/01/28 | No Opt. Call | 576,362 | |||||||||||
| Total California | 116,962,669 | |||||||||||||
Colorado - 6.4% | ||||||||||||||
| 7,500 | Arapahoe County School District 6, Littleton, Colorado, General Obligation Bonds, Series 2019A, 5.500%, 12/01/43 | 12/28 at 100.00 | 7,814,660 | |||||||||||
| 4,155 | Colorado Health Facilities Authority, Colorado, Revenue Bonds, CommonSpirit Health, Series 2019A-2, 4.000%, 8/01/49 | 8/29 at 100.00 | 3,214,185 | |||||||||||
| 1,255 | Colorado High Performance Transportation Enterprise, C-470 Express Lanes Revenue Bonds, Senior Lien Series 2017, 5.000%, 12/31/56 | 12/24 at 100.00 | 1,129,825 | |||||||||||
| 7,070 | Colorado Mountain College, Colorado, Certificates of Participation, Series 2021, 4.000%, 12/01/46 | 12/31 at 100.00 | 6,050,473 | |||||||||||
| 4,500 | Colorado State, Building Excellent Schools Today, Certificates of Participation, Series 2018N, 5.000%, 3/15/37 | 3/28 at 100.00 | 4,595,851 | |||||||||||
| 1,000 | Colorado State, Building Excellent Schools Today, Certificates of Participation, Series 2020R, 4.000%, 3/15/45 | 3/30 at 100.00 | 848,900 | |||||||||||
| Colorado State, Certificates of Participation, Lease Purchase Financing Program, National Western Center, Series 2018A: | ||||||||||||||
| 1,250 | 5.000%, 9/01/30 | 3/28 at 100.00 | 1,298,374 | |||||||||||
| 2,000 | 5.000%, 9/01/31 | 3/28 at 100.00 | 2,078,299 | |||||||||||
| 1,260 | 5.000%, 9/01/32 | 3/28 at 100.00 | 1,309,262 | |||||||||||
| 620 | 5.000%, 9/01/33 | 3/28 at 100.00 | 643,548 | |||||||||||
Principal Amount (000) | Description (a) | Optional Call Provisions (b) | Value | |||||||||||
Colorado | ||||||||||||||
| $ | 3,790 | Colorado State, Certificates of Participation, Rural Series 2018A, 5.000%, 12/15/37 | 12/28 at 100.00 | $ | 3,899,785 | |||||||||
| 3,400 | Denver City and County, Colorado, Airport System Revenue Bonds, Series 2022B, 5.250%, 11/15/53 | 11/32 at 100.00 | 3,485,620 | |||||||||||
| 5,160 | Denver City and County, Colorado, Airport System Revenue Bonds, Subordinate Lien Series 2013B, 5.000%, 11/15/43 | 12/23 at 100.00 | 5,094,277 | |||||||||||
| 2,000 | Denver Convention Center Hotel Authority, Colorado, Revenue Bonds, Convention Center Hotel, Refunding Senior Lien Series 2016, 5.000%, 12/01/35 | 12/26 at 100.00 | 1,932,059 | |||||||||||
E-470 Public Highway Authority, Colorado, Senior Revenue Bonds, Series 2000B: | ||||||||||||||
| 9,660 | 0.000%, 9/01/29 - NPFG Insured | No Opt. Call | 7,533,150 | |||||||||||
| 24,200 | 0.000%, 9/01/31 - NPFG Insured | No Opt. Call | 17,175,948 | |||||||||||
| 17,000 | 0.000%, 9/01/32 - NPFG Insured | No Opt. Call | 11,496,168 | |||||||||||
| 2,905 | E-470 Public Highway Authority, Colorado, Senior Revenue Bonds, Series 2020A, 5.000%, 9/01/40 | 9/24 at 100.00 | 2,913,126 | |||||||||||
| 7,600 | E-470 Public Highway Authority, Colorado, Toll Revenue Bonds, Refunding Series 2006B, 0.000%, 9/01/39 - NPFG Insured | 9/26 at 52.09 | 3,347,302 | |||||||||||
| 8,000 | Public Authority for Colorado Energy, Natural Gas Purchase Revenue Bonds, Colorado Springs Utilities, Series 2008, 6.500%, 11/15/38 | No Opt. Call | 8,847,450 | |||||||||||
| 1,400 | Regional Transportation District, Colorado, Private Activity Bonds, Denver Transit Partners Eagle P3 Project, Series 2020A, 4.000%, 7/15/34 | 1/31 at 100.00 | 1,315,697 | |||||||||||
| 4,945 | Regional Transportation District, Colorado, Sales Tax Revenue Bonds, Fastracks Project, Series 2017A, 5.000%, 11/01/40 | 11/26 at 100.00 | 5,010,552 | |||||||||||
| State of Colorado, Rural Colorado, Certificates of Participation, Series 2022: | ||||||||||||||
| 5,355 | 6.000%, 12/15/38 | 12/32 at 100.00 | 6,023,467 | |||||||||||
| 3,000 | 6.000%, 12/15/41 | 12/32 at 100.00 | 3,336,461 | |||||||||||
| 4,250 | (c) | University of Colorado, Enterprise System Revenue Bonds, Series 2018B, 5.000%, 6/01/43, (Pre-refunded 6/01/28) | 6/28 at 100.00 | 4,493,031 | ||||||||||
| Total Colorado | 114,887,470 | |||||||||||||
Connecticut - 0.9% | ||||||||||||||
| 2,125 | Connecticut Health and Educational Facilities Authority, Revenue Bonds, Connecticut Children’s Medical Center and Subsidiaries, Series 2023E, 5.250%, 7/15/48 | 1/33 at 100.00 | 2,128,961 | |||||||||||
| 8,440 | Connecticut State, General Obligation Bonds, Series 2015E, 5.000%, 8/01/29 | 8/25 at 100.00 | 8,559,357 | |||||||||||
| 5,000 | Connecticut State, General Obligation Bonds, Series 2015F, 5.000%, 11/15/33 | 11/25 at 100.00 | 5,041,008 | |||||||||||
| Total Connecticut | 15,729,326 | |||||||||||||
Delaware - 0.1% | ||||||||||||||
| 1,270 | Delaware River and Bay Authority, Delaware and New Jersey, Revenue Bonds, Series 2021, 4.000%, 1/01/46 | 1/32 at 100.00 | 1,053,404 | |||||||||||
| Total Delaware | 1,053,404 | |||||||||||||
District of Columbia - 1.7% | ||||||||||||||
| 15,000 | District of Columbia Tobacco Settlement Corporation, Tobacco Settlement Asset-Backed Bonds, Series 2006A, 0.000%, 6/15/46 | 12/23 at 24.98 | 3,219,247 | |||||||||||
| 5,390 | District of Columbia Water and Sewer Authority, Public Utility Revenue Bonds, Senior Lien Series 2018B, 5.000%, 10/01/43 | 4/28 at 100.00 | 5,457,912 | |||||||||||
| NUV | Nuveen Municipal Value Fund, Inc. (continued) Portfolio of Investments October 31, 2023 |
Principal Amount (000) | Description (a) | Optional Call Provisions (b) | Value | |||||||||||
District of Columbia | ||||||||||||||
| $ | 3,865 | Metropolitan Washington Airports Authority, District of Columbia, Dulles Toll Road Revenue Bonds, Dulles Metrorail & Capital improvement Projects, Refunding & Subordinate Lien Series 2019B, 5.000%, 10/01/47 | 10/29 at 100.00 | $ | 3,640,642 | |||||||||
| 10,000 | Metropolitan Washington Airports Authority, District of Columbia, Dulles Toll Road Revenue Bonds, Dulles Metrorail Capital Appreciation, Second Senior Lien Series 2010B, 6.500%, 10/01/44 | 10/28 at 100.00 | 10,552,364 | |||||||||||
| Washington Convention and Sports Authority, Washington D.C., Dedicated Tax Revenue Bonds, Refunding Senior Lien Series 2021A: | ||||||||||||||
| 670 | 4.000%, 10/01/36 | 10/30 at 100.00 | 618,304 | |||||||||||
| 1,060 | 4.000%, 10/01/38 | 10/30 at 100.00 | 937,905 | |||||||||||
| 1,265 | 4.000%, 10/01/39 | 10/30 at 100.00 | 1,099,361 | |||||||||||
| 1,745 | Washington Convention and Sports Authority, Washington D.C., Dedicated Tax Revenue Bonds, Refunding Senior Lien Series 2021B, 4.000%, 10/01/38 | 10/30 at 100.00 | 1,544,005 | |||||||||||
| Washington Metropolitan Area Transit Authority, District of Columbia, Dedicated Revenue Bonds, Series 2020A: | ||||||||||||||
| 2,390 | 4.000%, 7/15/45 | 7/30 at 100.00 | 2,071,607 | |||||||||||
| 1,775 | 5.000%, 7/15/45 | 7/30 at 100.00 | 1,798,242 | |||||||||||
| Total District of Columbia | 30,939,589 | |||||||||||||
Florida - 5.7% | ||||||||||||||
| 1,000 | Babcock Ranch Community Independent Special District, Charlotte County, Florida, Special Assessment Bonds, 2022 Project Series 2022, 5.000%, 5/01/53 | 5/32 at 100.00 | 839,332 | |||||||||||
| 1,240 | Broward County, Florida, Half-Cent Sales Tax Revenue Bonds, Refunding Series 2020, 4.000%, 10/01/40 | 10/30 at 100.00 | 1,114,288 | |||||||||||
| 23,000 | Broward County, Florida, Tourist Development Tax Revenue Bonds, Convention Center Expansion Project, Series 2021, 4.000%, 9/01/51 | 9/31 at 100.00 | 18,513,854 | |||||||||||
| 565 | Florida Development Finance Corporation, Educational Facilities Revenue Bonds, Renaissance Charter School Income Projects, Series 2015A, 6.000%, 6/15/35, 144A | 6/25 at 100.00 | 553,863 | |||||||||||
| Florida Development Finance Corporation, Healthcare Facilities Revenue Bonds, UF Health - Jacksonville Project, Series 2022A: | ||||||||||||||
| 1,800 | 4.000%, 2/01/41 - AGM Insured | 2/32 at 100.00 | 1,547,243 | |||||||||||
| 1,875 | 4.000%, 2/01/42 - AGM Insured | 2/32 at 100.00 | 1,590,838 | |||||||||||
| 15,000 | Florida Development Finance Corporation, Revenue Bonds, Brightline Passenger Rail Expansion Project, Series 2023C, 8.000%, 7/01/57, (AMT), (Mandatory Put 4/01/24), 144A | 11/23 at 100.00 | 15,106,023 | |||||||||||
| 4,000 | Gainesville, Florida, Utilities System Revenue Bonds, Series 2017A, 5.000%, 10/01/36 | 10/27 at 100.00 | 4,111,804 | |||||||||||
| 3,500 | Gainesville, Florida, Utilities System Revenue Bonds, Series 2019A, 5.000%, 10/01/47 | 10/29 at 100.00 | 3,504,410 | |||||||||||
| 2,290 | (c) | Hillsborough County Aviation Authority, Florida, Revenue Bonds, Tampa International Airport, Subordinate Lien Series 2015B, 5.000%, 10/01/40, (Pre-refunded 10/01/24) | 10/24 at 100.00 | 2,312,736 | ||||||||||
| 1,000 | Lakeland, Florida, Energy System Revenue Bonds, Series 2021, 4.000%, 10/01/40 | 10/31 at 100.00 | 892,326 | |||||||||||
| 2,735 | Miami Beach Health Facilities Authority, Florida, Hospital Revenue Bonds, Mount Sinai Medical Center of Florida Project, Series 2021B, 4.000%, 11/15/46 | 11/31 at 100.00 | 2,193,202 | |||||||||||
| 5,090 | Miami-Dade County Expressway Authority, Florida, Toll System Revenue Bonds, Series 2010A, 5.000%, 7/01/40 | 12/23 at 100.00 | 4,925,809 | |||||||||||
Principal Amount (000) | Description (a) | Optional Call Provisions (b) | Value | |||||||||||
Florida | ||||||||||||||
| $ | 2,000 | Miami-Dade County, Florida, Aviation Revenue Bonds, Miami International Airport, Refunding Series 2014B, 5.000%, 10/01/37 | 10/24 at 100.00 | $ | 1,978,370 | |||||||||
| 3,000 | Miami-Dade County, Florida, Transit System Sales Surtax Revenue Bonds, Series 2022, 5.000%, 7/01/51 | 7/32 at 100.00 | 2,971,608 | |||||||||||
| 5,330 | Orange County Health Facilities Authority, Florida, Hospital Revenue Bonds, Orlando Health Obligated Group, Inc., Series 2022, 4.000%, 10/01/52 | 4/32 at 100.00 | 4,291,452 | |||||||||||
| Orlando Utilities Commission, Florida, Utility System Revenue Bonds, Series 2018A: | ||||||||||||||
| 3,500 | 5.000%, 10/01/36 | 10/27 at 100.00 | 3,595,286 | |||||||||||
| 3,780 | 5.000%, 10/01/37 | 10/27 at 100.00 | 3,877,217 | |||||||||||
| 1,120 | 5.000%, 10/01/38 | 10/27 at 100.00 | 1,147,482 | |||||||||||
| 10,725 | (c) | Orlando, Florida, Contract Tourist Development Tax Payments Revenue Bonds, Series 2014A, 5.000%, 11/01/44, (Pre-refunded 5/01/24) | 5/24 at 100.00 | 10,782,252 | ||||||||||
Osceola County, Florida, Transportation Revenue Bonds, Osceola Parkway, Refunding & Improvement Capital Appreciation Series 2019A-2: | ||||||||||||||
| 3,500 | 0.000%, 10/01/43 | 10/29 at 61.27 | 1,054,195 | |||||||||||
| 3,575 | 0.000%, 10/01/44 | 10/29 at 59.08 | 998,525 | |||||||||||
| 4,000 | 0.000%, 10/01/45 | 10/29 at 56.95 | 1,043,743 | |||||||||||
| 750 | 0.000%, 10/01/49 | 10/29 at 49.08 | 146,948 | |||||||||||
| 5,000 | 0.000%, 10/01/50 | 10/29 at 47.17 | 917,534 | |||||||||||
| 11,000 | 0.000%, 10/01/53 | 10/29 at 41.97 | 1,651,703 | |||||||||||
| 4,000 | Pembroke Pines, Florida, Capital Improvement Revenue Bonds, Series 2019A, 4.000%, 7/01/38 | 7/29 at 100.00 | 3,617,332 | |||||||||||
| 1,020 | Putnam County Development Authority, Florida, Pollution Control Revenue Bonds, Seminole Electric Cooperatice, Inc. Project, Refunding Series 2018B, 5.000%, 3/15/42 | 5/28 at 100.00 | 981,774 | |||||||||||
| 6,865 | South Broward Hospital District, Florida, Hospital Revenue Bonds, Refunding Series 2015, 4.000%, 5/01/34 | 5/25 at 100.00 | 6,561,876 | |||||||||||
| Total Florida | 102,823,025 | |||||||||||||
Georgia - 4.0% | ||||||||||||||
| 3,325 | Atlanta, Georgia, Water and Wastewater Revenue Bonds, Refunding Series 2015, 5.000%, 11/01/40 | 5/25 at 100.00 | 3,308,774 | |||||||||||
| 2,290 | Fulton County Development Authority, Georgia, Hospital Revenue Bonds, Wellstar Health System, Inc Project, Series 2017A, 5.000%, 4/01/47 | 4/27 at 100.00 | 2,177,199 | |||||||||||
| Gainesville and Hall County Hospital Authority, Georgia, Revenue Anticipation Certificates, Northeast Georgia Health Services Inc., Series 2017B: | ||||||||||||||
| 3,500 | 5.500%, 2/15/42 | 2/27 at 100.00 | 3,573,444 | |||||||||||
| 2,500 | 5.250%, 2/15/45 | 2/27 at 100.00 | 2,524,736 | |||||||||||
| 1,500 | Geo. L. Smith II Georgia World Congress Center Authority, Georgia, Convention Center Hotel Revenue Bonds, First Tier Series 2021A, 4.000%, 1/01/54 | 1/31 at 100.00 | 1,123,986 | |||||||||||
| 10,500 | Georgia Ports Authority, Revenue Bonds, Series 2022, 5.250%, 7/01/52 | 7/32 at 100.00 | 10,786,511 | |||||||||||
| 17,010 | Municipal Electric Authority of Georgia, Plant Vogtle Units 3 & 4 Project J Bonds, Series 2019A, 5.000%, 1/01/49 - BAM Insured | 7/28 at 100.00 | 16,558,946 | |||||||||||
| 4,025 | Municipal Electric Authority of Georgia, Plant Vogtle Units 3 & 4 Project M Bonds, Series 19A, 5.000%, 1/01/59 - AGM Insured | 7/28 at 100.00 | 3,881,895 | |||||||||||
| 17,350 | Municipal Electric Authority of Georgia, Plant Vogtle Units 3 & 4 Project M Bonds, Series 2022A, 5.000%, 7/01/52 - AGM Insured | 7/32 at 100.00 | 16,836,263 | |||||||||||
| 2,415 | Municipal Electric Authority of Georgia, Project One Revenue Bonds, Subordinate Lien Series 2015A, 5.000%, 1/01/35 | 1/25 at 100.00 | 2,402,505 | |||||||||||
| NUV | Nuveen Municipal Value Fund, Inc. (continued) Portfolio of Investments October 31, 2023 |
Principal Amount (000) | Description (a) | Optional Call Provisions (b) | Value | |||||||||||
Georgia | ||||||||||||||
| Municipal Electric Authority of Georgia, Project One Revenue Bonds, Subordinate Lien Series 2020A: | ||||||||||||||
| $ | 1,000 | 5.000%, 1/01/45 | 1/31 at 100.00 | $ | 974,987 | |||||||||
| 5,500 | 5.000%, 1/01/50 | 1/31 at 100.00 | 5,241,823 | |||||||||||
| 2,000 | Private Colleges and Universities Authority, Georgia, Revenue Bonds, Emory University, Refunding Series 2016A, 5.000%, 10/01/46 | 10/26 at 100.00 | 1,997,392 | |||||||||||
| Total Georgia | 71,388,461 | |||||||||||||
Hawaii - 0.4% | ||||||||||||||
| 4,830 | Honolulu City and County, Hawaii, General Obligation Bonds, Series 2018A, 5.000%, 9/01/40 | 9/28 at 100.00 | 4,924,272 | |||||||||||
| 3,000 | Honolulu City and County, Hawaii, Wastewater System Revenue Bonds, First Bond Resolution, Senior Series 2018A, 5.000%, 7/01/37 | 1/28 at 100.00 | 3,077,872 | |||||||||||
| Total Hawaii | 8,002,144 | |||||||||||||
Idaho - 0.1% | ||||||||||||||
| 1,550 | University of Idaho, General Revenue Bonds, Refunding Series 2022A, 4.000%, 4/01/45 - BAM Insured | 4/32 at 100.00 | 1,325,564 | |||||||||||
| Total Idaho | 1,325,564 | |||||||||||||
Illinois - 10.9% | ||||||||||||||
| 5,000 | Chicago Board of Education, Illinois, Dedicated Capital Improvement Tax Revenue Bonds, Series 2016, 6.000%, 4/01/46 | 4/27 at 100.00 | 5,030,084 | |||||||||||
| 5,000 | Chicago Board of Education, Illinois, General Obligation Bonds, Dedicated Revenues, Series 2016A, 7.000%, 12/01/44 | 12/25 at 100.00 | 5,109,996 | |||||||||||
| 2,945 | Chicago Board of Education, Illinois, General Obligation Bonds, Dedicated Revenues, Series 2016B, 6.500%, 12/01/46 | 12/26 at 100.00 | 2,991,683 | |||||||||||
| 4,710 | Chicago Board of Education, Illinois, General Obligation Bonds, Dedicated Revenues, Series 2017A, 7.000%, 12/01/46, 144A | 12/27 at 100.00 | 4,890,423 | |||||||||||
| 17,775 | Chicago Board of Education, Illinois, Unlimited Tax General Obligation Bonds, Dedicated Tax Revenues, Series 1998B-1, 0.000%, 12/01/24 - FGIC Insured | No Opt. Call | 16,850,776 | |||||||||||
| 7,495 | Chicago Board of Education, Illinois, Unlimited Tax General Obligation Bonds, Dedicated Tax Revenues, Series 1999A, 0.000%, 12/01/31 - NPFG Insured | No Opt. Call | 4,962,649 | |||||||||||
| Chicago Greater Metropolitan Water Reclamation District, Illinois, General Obligation Bonds, Limited Tax Capital Improvement Green Series 2021A: | ||||||||||||||
| 2,325 | 4.000%, 12/01/46 | 12/31 at 100.00 | 1,942,933 | |||||||||||
| 4,000 | 4.000%, 12/01/51 | 12/31 at 100.00 | 3,248,303 | |||||||||||
| 1,960 | Chicago Transit Authority, Illinois, Capital Grant Receipts Revenue Bonds, Federal Transit Administration Section 5307 Urbanized Area Formula Funds, Refunding Series 2021, 5.000%, 6/01/27 | No Opt. Call | 2,008,182 | |||||||||||
| 5,000 | Chicago Transit Authority, Illinois, Sales Tax Receipts Revenue Bonds, Second Lien Series 2022A, 5.000%, 12/01/46 - BAM Insured | 12/31 at 100.00 | 5,108,621 | |||||||||||
| 5,100 | Chicago Transit Authority, Illinois, Sales Tax Receipts Revenue Bonds, Series 2014, 5.000%, 12/01/44 | 12/24 at 100.00 | 4,868,181 | |||||||||||
| 1,000 | Cook County, Illinois, General Obligation Bonds, Refunding Series 2018, 5.000%, 11/15/35 | 11/26 at 100.00 | 1,013,395 | |||||||||||
| 1,500 | Cook County, Illinois, General Obligation Bonds, Refunding Series 2021A, 5.000%, 11/15/32 | 11/30 at 100.00 | 1,562,992 | |||||||||||
| 2,040 | Cook County, Illinois, Sales Tax Revenue Bonds, Series 2021A: 4.000%, 11/15/40 | 11/30 at 100.00 | 1,780,056 | |||||||||||
Principal Amount (000) | Description (a) | Optional Call Provisions (b) | Value | |||||||||||
Illinois | ||||||||||||||
| $ | 1,000 | 4.000%, 11/15/41 | 11/30 at 100.00 | $ | 862,224 | |||||||||
| 1,300 | Illinois Finance Authority, Revenue Bonds, Rush University Medical Center Obligated Group, Series 2015A, 5.000%, 11/15/38 | 5/25 at 100.00 | 1,268,968 | |||||||||||
| 3,700 | Illinois Finance Authority, Revenue Bonds, Rush University Medical Center Obligated Group, Series 2015B, 5.000%, 11/15/39 | 5/25 at 100.00 | 3,604,409 | |||||||||||
| Illinois Finance Authority, Revenue Bonds, Silver Cross Hospital and Medical Centers, Refunding Series 2015C: | ||||||||||||||
| 560 | 5.000%, 8/15/35 | 8/25 at 100.00 | 537,079 | |||||||||||
| 825 | 5.000%, 8/15/44 | 8/25 at 100.00 | 775,949 | |||||||||||
| 5,125 | Illinois State, General Obligation Bonds, November Series 2017C, 5.000%, 11/01/29 | 11/27 at 100.00 | 5,230,657 | |||||||||||
| 1,755 | Illinois State, General Obligation Bonds, October Series 2016, 5.000%, 2/01/27 | No Opt. Call | 1,791,320 | |||||||||||
| 5,590 | Illinois Toll Highway Authority, Toll Highway Revenue Bonds, Senior Lien Series 2013A, 5.000%, 1/01/38 | 12/23 at 100.00 | 5,589,539 | |||||||||||
| 4,000 | Illinois Toll Highway Authority, Toll Highway Revenue Bonds, Senior Lien Series 2016B, 5.000%, 1/01/41 | 7/26 at 100.00 | 4,013,350 | |||||||||||
| 5,000 | Illinois Toll Highway Authority, Toll Highway Revenue Bonds, Senior Lien Series 2020A, 5.000%, 1/01/45 | 1/31 at 100.00 | 4,996,838 | |||||||||||
| 9,015 | Metropolitan Pier and Exposition Authority, Illinois, McCormick Place Expansion Project Bonds, Refunding Series 2020A, 4.000%, 6/15/50 | 12/29 at 100.00 | 7,017,744 | |||||||||||
| Metropolitan Pier and Exposition Authority, Illinois, Revenue Bonds, McCormick Place Expansion Project, Series 1994B: | ||||||||||||||
| 5,245 | 0.000%, 6/15/28 - NPFG Insured | No Opt. Call | 4,227,904 | |||||||||||
| 11,675 | 0.000%, 6/15/29 - FGIC Insured | No Opt. Call | 8,955,363 | |||||||||||
| Metropolitan Pier and Exposition Authority, Illinois, Revenue Bonds, McCormick Place Expansion Project, Series 2002A: | ||||||||||||||
| 4,950 | 0.000%, 12/15/32 - NPFG Insured | No Opt. Call | 3,200,019 | |||||||||||
| 21,375 | 0.000%, 6/15/34 - NPFG Insured | No Opt. Call | 12,811,382 | |||||||||||
| 21,000 | 0.000%, 12/15/35 - NPFG Insured | No Opt. Call | 11,539,922 | |||||||||||
| 21,970 | 0.000%, 6/15/36 - NPFG Insured | No Opt. Call | 11,671,833 | |||||||||||
| 10,375 | 0.000%, 12/15/36 - NPFG Insured | No Opt. Call | 5,325,783 | |||||||||||
| 10,000 | 0.000%, 12/15/37 - NPFG Insured | No Opt. Call | 4,790,922 | |||||||||||
| 25,825 | 0.000%, 6/15/39 - NPFG Insured | No Opt. Call | 11,222,737 | |||||||||||
| 6,095 | Regional Transportation Authority, Cook, DuPage, Kane, Lake, McHenry and Will Counties, Illinois, General Obligation Bonds, Series 2002A, 6.000%, 7/01/32 - NPFG Insured | No Opt. Call | 6,970,578 | |||||||||||
| 8,000 | Regional Transportation Authority, Cook, DuPage, Kane, Lake, McHenry and Will Counties, Illinois, General Obligation Bonds, Series 2003A, 6.000%, 7/01/33 - NPFG Insured | No Opt. Call | 9,041,732 | |||||||||||
| 5,000 | (c) | Regional Transportation Authority, Cook, DuPage, Kane, Lake, McHenry and Will Counties, Illinois, General Obligation Bonds, Series 2014A, 5.000%, 6/01/44, (Pre-refunded 6/01/24) | 6/24 at 100.00 | 5,034,006 | ||||||||||
| Southwestern Illinois Development Authority, Local Government Revenue Bonds, Edwardsville Community Unit School District 7 Project, Series 2007: | ||||||||||||||
| 2,645 | 0.000%, 12/01/23 - AGM Insured | No Opt. Call | 2,636,249 | |||||||||||
| 2,375 | 0.000%, 12/01/23 - AGM Insured | No Opt. Call | 2,366,230 | |||||||||||
| Total Illinois | 196,851,011 | |||||||||||||
| NUV | Nuveen Municipal Value Fund, Inc. (continued) Portfolio of Investments October 31, 2023 |
Principal Amount (000) | Description (a) | Optional Call Provisions (b) | Value | |||||||||||
Indiana - 1.3% | ||||||||||||||
| $ | 2,250 | Indiana Finance Authority, Hospital Revenue Bonds, Indiana Unversity Health Obligation Group, Refunding 2015A, 4.000%, 12/01/40 | 6/25 at 100.00 | $ | 1,994,051 | |||||||||
| 2,000 | Indiana Municipal Power Agency Power Supply System Revenue Bonds, Refunding Series 2016A, 5.000%, 1/01/42 | 7/26 at 100.00 | 1,993,210 | |||||||||||
| 4,250 | Indianapolis Local Public Improvement Bond Bank, Indiana, Community Justice Campus Bonds, Courthouse & Jail Project, Series 2019A, 5.000%, 2/01/54 | 2/29 at 100.00 | 4,183,586 | |||||||||||
| Indianapolis Local Public Improvement Bond Bank, Indiana, Series 1999E: | ||||||||||||||
| 2,400 | 0.000%, 2/01/25 - AMBAC Insured | No Opt. Call | 2,273,477 | |||||||||||
| 14,595 | 0.000%, 2/01/27 - AMBAC Insured | No Opt. Call | 12,681,648 | |||||||||||
| Total Indiana | 23,125,972 | |||||||||||||
Kentucky - 1.8% | ||||||||||||||
| Kenton County Airport Board, Kentucky, Airport Revenue Bonds, Cincinnati/Northern Kentucky International Airport, Refunding Series 2016: | ||||||||||||||
| 1,530 | 5.000%, 1/01/27 | 1/26 at 100.00 | 1,560,682 | |||||||||||
| 1,600 | 5.000%, 1/01/28 | 1/26 at 100.00 | 1,627,546 | |||||||||||
| Kentucky Bond Development Corporation, Transient Room Tax Revenue Bonds, Lexington Center Corporation Project, Series 2018A: | ||||||||||||||
| 1,280 | 5.000%, 9/01/37 | 9/28 at 100.00 | 1,303,306 | |||||||||||
| 1,435 | 5.000%, 9/01/38 | 9/28 at 100.00 | 1,445,183 | |||||||||||
| 4,000 | 5.000%, 9/01/43 | 9/28 at 100.00 | 3,781,877 | |||||||||||
| 2,000 | 5.000%, 9/01/48 | 9/28 at 100.00 | 1,887,386 | |||||||||||
| 1,000 | Kentucky Economic Development Finance Authority, Louisville Arena Project Revenue Bonds, Louisville Arena Authority, Inc., Series 2017A, 5.000%, 12/01/45 - AGM Insured | 12/27 at 100.00 | 998,797 | |||||||||||
| 8,935 | Kentucky Economic Development Finance Authority, Revenue Bonds, Next Generation Kentucky Information Highway Project, Senior Series 2015A, 5.000%, 1/01/45 | 7/25 at 100.00 | 8,111,734 | |||||||||||
| 6,000 | Kentucky Public Transportation Infrastructure Authority, Toll Revenue Bonds, Downtown Crossing Project, Convertible Capital Appreciation First Tier Series 2013C, 6.600%, 7/01/39 | 7/31 at 100.00 | 6,557,237 | |||||||||||
| 5,000 | Kentucky State Property and Buildings Commission, Revenue Bonds, Project 115, Series 2017, 5.000%, 4/01/30 | 4/27 at 100.00 | 5,105,084 | |||||||||||
| Total Kentucky | 32,378,832 | |||||||||||||
Louisiana - 0.6% | ||||||||||||||
| 1,335 | East Baton Rouge Sewerage Commission, Louisiana, Revenue Bonds, Refunding Series 2019A, 4.000%, 2/01/45 | 2/29 at 100.00 | 1,123,932 | |||||||||||
| 9,040 | New Orleans Aviation Board, Louisiana, General Airport Revenue Bonds, North Terminal Project, Series 2017A, 5.000%, 1/01/48 - AGM Insured | 1/27 at 100.00 | 8,756,010 | |||||||||||
| 1,470 | New Orleans Aviation Board, Louisiana, Special Facility Revenue Bonds, Parking Facilities Corporation Consolidated Garage System, Series 2018A, 5.000%, 10/01/43 - AGM Insured | 10/28 at 100.00 | 1,455,220 | |||||||||||
| Total Louisiana | 11,335,162 | |||||||||||||
Maine - 0.9% | ||||||||||||||
| Maine Health and Higher Educational Facilities Authority Revenue Bonds, MaineHealth Issue, Series 2018A: | ||||||||||||||
| 5,125 | 5.000%, 7/01/43 | 7/28 at 100.00 | 4,993,823 | |||||||||||
| 2,005 | 5.000%, 7/01/48 | 7/28 at 100.00 | 1,925,573 | |||||||||||
Principal Amount (000) | Description (a) | Optional Call Provisions (b) | Value | |||||||||||
Maine | ||||||||||||||
| $ | 1,805 | Maine Turnpike Authority, Turnpike Revenue Bonds, Series 2020, 5.000%, 7/01/50 | 7/30 at 100.00 | $ | 1,806,963 | |||||||||
| 7,990 | University of Maine, System Revenue Bonds, Series 2022, 5.000%, 3/01/47 | 3/32 at 100.00 | 7,817,418 | |||||||||||
| Total Maine | 16,543,777 | |||||||||||||
Maryland - 1.2% | ||||||||||||||
| Baltimore, Maryland, Convention Center Hotel Revenue Bonds, Refunding Series 2017: | ||||||||||||||
| 1,140 | 5.000%, 9/01/29 | 9/27 at 100.00 | 1,092,022 | |||||||||||
| 630 | 5.000%, 9/01/31 | 9/27 at 100.00 | 595,307 | |||||||||||
| 1,945 | 5.000%, 9/01/32 | 9/27 at 100.00 | 1,825,759 | |||||||||||
| 385 | 5.000%, 9/01/34 | 9/27 at 100.00 | 356,124 | |||||||||||
| 2,750 | 5.000%, 9/01/35 | 9/27 at 100.00 | 2,512,932 | |||||||||||
| 2,550 | 5.000%, 9/01/42 | 9/27 at 100.00 | 2,120,207 | |||||||||||
| 6,665 | 5.000%, 9/01/46 | 9/27 at 100.00 | 5,374,480 | |||||||||||
| 1,050 | Maryland Health and Higher Educational Facilities Authority, Maryland, Revenue Bonds, Meritus Medical Center, Series 2015, 5.000%, 7/01/40 | 7/25 at 100.00 | 1,013,875 | |||||||||||
| Maryland Stadium Authority, Revenue Bonds, Baltimore City Public Schools Construction & Revitalization Program, Series 2018A: | ||||||||||||||
| 4,375 | 5.000%, 5/01/47 | 5/28 at 100.00 | 4,384,364 | |||||||||||
| 2,260 | (c) | 5.000%, 5/01/47, (Pre-refunded 5/01/28) | 5/28 at 100.00 | 2,377,281 | ||||||||||
| Total Maryland | 21,652,351 | |||||||||||||
Massachusetts - 0.5% | ||||||||||||||
| 1,000 | Massachusetts Department of Transportation, Metropolitan Highway System Revenue Bonds, Refunding Senior Lien Series 2019A, 5.000%, 1/01/37 | 1/29 at 100.00 | 1,030,928 | |||||||||||
| 2,905 | Massachusetts Development Finance Agency, Revenue Bonds, Boston Medical Center Issue, Green Bonds, Series 2015D, 5.000%, 7/01/44 | 7/25 at 100.00 | 2,703,809 | |||||||||||
| 1,500 | Massachusetts Development Finance Agency, Revenue Bonds, Boston Medical Center Issue, Series 2016E, 5.000%, 7/01/35 | 7/26 at 100.00 | 1,506,424 | |||||||||||
| 2,765 | Massachusetts Development Finance Agency, Revenue Bonds, Dana- Farber Cancer Institute Issue, Series 2016N, 5.000%, 12/01/46 | 12/26 at 100.00 | 2,657,467 | |||||||||||
| 980 | Massachusetts Turnpike Authority, Metropolitan Highway System Revenue Bonds, Senior Series 1997A, 0.000%, 1/01/29 - NPFG Insured | No Opt. Call | 780,247 | |||||||||||
| Total Massachusetts | 8,678,875 | |||||||||||||
Michigan - 2.9% | ||||||||||||||
| Bloomfield Hills Schools, Oakland County, Michigan, General Obligation Bonds, School Building & Site Series 2023: | ||||||||||||||
| 1,475 | 5.000%, 5/01/44 | 5/33 at 100.00 | 1,493,918 | |||||||||||
| 625 | 5.000%, 5/01/48 | 5/33 at 100.00 | 628,757 | |||||||||||
| 820 | 5.000%, 5/01/50 | 5/33 at 100.00 | 822,807 | |||||||||||
| Detroit Academy of Arts and Sciences, Michigan, Public School Academy Revenue Bonds, Refunding Series 2013: | ||||||||||||||
| 1,405 | 6.000%, 10/01/33 | 12/23 at 100.00 | 1,273,915 | |||||||||||
| 2,520 | 6.000%, 10/01/43 | 12/23 at 100.00 | 2,120,713 | |||||||||||
| 15 | Detroit, Michigan, Second Lien Sewerage Disposal System Revenue Bonds, Series 2005A, 4.500%, 7/01/35 - NPFG Insured | 12/23 at 100.00 | 15,001 | |||||||||||
| 2,925 | Detroit, Michigan, Senior Lien Sewerage Disposal System Revenue Bonds, Series 2001B, 5.500%, 7/01/29 - NPFG Insured | No Opt. Call | 2,982,513 | |||||||||||
| 5 | Detroit, Michigan, Water Supply System Revenue Bonds, Second Lien Series 2003B, 5.000%, 7/01/34 - NPFG Insured | 12/23 at 100.00 | 5,005 | |||||||||||
| NUV | Nuveen Municipal Value Fund, Inc. (continued) Portfolio of Investments October 31, 2023 |
Principal Amount (000) | Description (a) | Optional Call Provisions (b) | Value | |||||||||||
Michigan | ||||||||||||||
| $ | 5 | Detroit, Michigan, Water Supply System Revenue Bonds, Senior Lien Series 2003A, 5.000%, 7/01/34 - NPFG Insured | 12/23 at 100.00 | $ | 5,005 | |||||||||
| 4,000 | Kalamazoo County, Michigan, General Obligation Bonds, Limitied Tax Series 2022, 4.000%, 5/01/45 | 5/31 at 100.00 | 3,382,301 | |||||||||||
| 3,315 | Michigan Finance Authority, Distributable State Aid Revenue Bonds, Charter County of Wayne Criminal Justice Center Project, Senior Lien Series 2018, 5.000%, 11/01/43 | 11/28 at 100.00 | 3,340,900 | |||||||||||
| 1,565 | Michigan Finance Authority, Tobacco Settlement Asset- Backed Bonds, 2007 Sold Tobacco Receipts, Series 2020B-1-CL2, | 12/30 at 100.00 | 1,533,944 | |||||||||||
| 6,000 | Michigan Hospital Finance Authority, Revenue Bonds, Ascension Health Senior Credit Group, Refunding & Project Series 2010F-6, 4.000%, 11/15/47 | 11/26 at 100.00 | 4,941,875 | |||||||||||
Michigan State Building Authority, Revenue Bonds, Facilities Program, Refunding Series 2015-I: | ||||||||||||||
| 9,565 | 5.000%, 4/15/30 | 10/25 at 100.00 | 9,722,733 | |||||||||||
| 435 | (c) | 5.000%, 4/15/30, (Pre-refunded 10/15/25) | 10/25 at 100.00 | 443,850 | ||||||||||
| 2,100 | Michigan State Building Authority, Revenue Bonds, Facilities Program, Refunding Series 2023II, 4.000%, 10/15/43 | 10/33 at 100.00 | 1,832,016 | |||||||||||
| Michigan State, Trunk Line Fund Bonds, Rebuilding Michigan Program, Series 2021A: | ||||||||||||||
| 3,020 | 4.000%, 11/15/37 | 11/31 at 100.00 | 2,801,340 | |||||||||||
| 6,510 | 4.000%, 11/15/38 | 11/31 at 100.00 | 6,006,252 | |||||||||||
| Michigan Technological University, General Revenue Bonds, Series 2023A: | ||||||||||||||
| 1,515 | 5.000%, 10/01/47 - AGM Insured | 10/31 at 100.00 | 1,476,914 | |||||||||||
| 675 | 5.250%, 10/01/52 - AGM Insured | 10/31 at 100.00 | 673,129 | |||||||||||
| 1,800 | Northern Michigan University, General Revenue Bonds, Series 2021, 4.000%, 6/01/46 | 6/31 at 100.00 | 1,414,200 | |||||||||||
| 1,100 | Wayne County Airport Authority, Michigan, Revenue Bonds, Detroit Metropolitan Wayne County Airport, Series 2015D, 5.000%, 12/01/45 | 12/25 at 100.00 | 1,080,378 | |||||||||||
| 5,000 | Wayne County Airport Authority, Michigan, Revenue Bonds, Detroit Metropolitan Wayne County Airport, Series 2023A, 5.250%, 12/01/48 - AGM Insured | 12/33 at 100.00 | 5,093,859 | |||||||||||
| Total Michigan | 53,091,325 | |||||||||||||
Minnesota - 0.3% | ||||||||||||||
| 3,200 | Rochester, Minnesota, Health Care Facilities Revenue Bonds, Mayo Clinic, Refunding Series 2016B, 5.000%, 11/15/34 | No Opt. Call | 3,516,356 | |||||||||||
| 1,480 | University of Minnesota, General Obligation Bonds, Series 2016A, 5.000%, 4/01/41 | 4/26 at 100.00 | 1,489,724 | |||||||||||
| Total Minnesota | 5,006,080 | |||||||||||||
Missouri - 0.2% | ||||||||||||||
| 3,465 | Missouri Health and Educational Facilities Authority, Health Facilities Revenue Bonds, CoxHealth, Series 2013A, 5.000%, 11/15/48 | 12/23 at 100.00 | 3,253,280 | |||||||||||
| Total Missouri | 3,253,280 | |||||||||||||
Montana - 0.6% | ||||||||||||||
| 1,115 | Billings, Montana, Sewer System Revenue Bonds, Series 2017, 5.000%, 7/01/33 | 7/27 at 100.00 | 1,149,299 | |||||||||||
| Montana Facility Finance Authority, Healthcare Facility Revenue Bonds, Kalispell Regional Medical Center, Series 2018B: | ||||||||||||||
| 1,340 | 5.000%, 7/01/30 | 7/28 at 100.00 | 1,340,540 | |||||||||||
Principal Amount (000) | Description (a) | Optional Call Provisions (b) | Value | |||||||||||
Montana | ||||||||||||||
| $ | 1,415 | 5.000%, 7/01/31 | 7/28 at 100.00 | $ | 1,412,652 | |||||||||
| 1,980 | 5.000%, 7/01/32 | 7/28 at 100.00 | 1,971,729 | |||||||||||
| 2,135 | 5.000%, 7/01/33 | 7/28 at 100.00 | 2,119,199 | |||||||||||
| 3,045 | Montana Facility Finance Authority, Revenue Bonds, Billings Clinic Obligated Group, Series 2018A, 5.000%, 8/15/48 | 8/28 at 100.00 | 2,921,528 | |||||||||||
| Total Montana | 10,914,947 | |||||||||||||
Nebraska - 0.2% | ||||||||||||||
| Central Plains Energy Project, Nebraska, Gas Project 3 Revenue Bonds, Refunding Crossover Series 2017A: | ||||||||||||||
| 1,710 | 5.000%, 9/01/35 | No Opt. Call | 1,690,546 | |||||||||||
| 1,500 | 5.000%, 9/01/42 | No Opt. Call | 1,410,523 | |||||||||||
| 1,400 | Douglas County Hospital Authority 3, Nebraska, Health Facilities Revenue Bonds, Nebraska Methodist Health System, Refunding Series 2015, 5.000%, 11/01/45 | 11/25 at 100.00 | 1,353,630 | |||||||||||
| Total Nebraska | 4,454,699 | |||||||||||||
Nevada - 2.7% | ||||||||||||||
| 490 | Clark County School District, Nevada, General Obligation Bonds, Limited Tax Building Series 2020A, 4.000%, 6/15/40 - AGM Insured | 6/30 at 100.00 | 429,671 | |||||||||||
| Clark County, Nevada, General Obligation Bonds, Transportation Improvement, Limited Tax, Additionally Secured by Pledged Revenue Series 2018B: | ||||||||||||||
| 2,000 | 5.000%, 12/01/33 | 12/28 at 100.00 | 2,092,440 | |||||||||||
| 5,000 | 5.000%, 12/01/35 | 12/28 at 100.00 | 5,197,967 | |||||||||||
| 5,000 | Las Vegas Convention and Visitors Authority, Nevada, Convention Center Expansion Revenue Bonds, Series 2018B, 5.000%, 7/01/43 | 7/28 at 100.00 | 5,023,269 | |||||||||||
| 8,500 | Las Vegas Convention and Visitors Authority, Nevada, Revenue Bonds, Series 2018C, 5.250%, 7/01/43 | 7/28 at 100.00 | 8,627,207 | |||||||||||
| Las Vegas Valley Water District, Nevada, General Obligation Bonds, Refunding Series 2015: | ||||||||||||||
| 5,220 | 5.000%, 6/01/33 | 12/24 at 100.00 | 5,271,977 | |||||||||||
| 10,000 | 5.000%, 6/01/34 | 12/24 at 100.00 | 10,097,462 | |||||||||||
| 9,000 | 5.000%, 6/01/39 | 12/24 at 100.00 | 9,039,473 | |||||||||||
| 1,205 | Las Vegas Valley Water District, Nevada, General Obligation Bonds, Refunding Water Improvement Series 2016A, 5.000%, 6/01/41 | 6/26 at 100.00 | 1,213,645 | |||||||||||
| 2,000 | Reno, Nevada, Subordinate Lien Sales Tax Revenue Refunding Bonds, ReTrac-Reno Transporation Rail Access Corridor Project, Series 2018A, 5.000%, 6/01/48 | 12/28 at 100.00 | 1,867,447 | |||||||||||
| 250 | Reno, Nevada, Subordinate Lien Sales Tax Revenue Refunding Bonds, ReTrac-Reno Transporation Rail Access Corridor Project, Series 2018B, 5.000%, 6/01/33 - AGM Insured | 12/28 at 100.00 | 257,514 | |||||||||||
| Total Nevada | 49,118,072 | |||||||||||||
New Jersey - 4.4% | ||||||||||||||
| 2,500 | Delaware River Port Authority, New Jersey and Pennsylvania, Revenue Bonds, Series 2018A, 5.000%, 1/01/36 | 1/29 at 100.00 | 2,602,084 | |||||||||||
| 930 | New Jersey Economic Development Authority, Private Activity Bonds, The Goethals Bridge Replacement Project, Series 2013, 5.125%, 1/01/39 - AGM Insured, (AMT) | 1/24 at 100.00 | 930,181 | |||||||||||
| 6,000 | (c) | New Jersey Economic Development Authority, School Facilities Construction Bonds, Refunding Series 2016BBB, 5.500%, 6/15/31, (Pre- refunded 12/15/26) | 12/26 at 100.00 | 6,303,208 | ||||||||||
| NUV | Nuveen Municipal Value Fund, Inc. (continued) Portfolio of Investments October 31, 2023 |
Principal Amount (000) | Description (a) | Optional Call Provisions (b) | Value | |||||||||||
New Jersey | ||||||||||||||
| $ | 5,990 | New Jersey Economic Development Authority, School Facilities Construction Bonds, Series 2005N-1, 5.500%, 9/01/25 - AGM Insured | No Opt. Call | $ | 6,149,035 | |||||||||
| 3,380 | New Jersey Transportation Trust Fund Authority, Transportation Program Bonds, Series 2022BB, 4.000%, 6/15/46 | 12/31 at 100.00 | 2,882,131 | |||||||||||
| 9,420 | New Jersey Transportation Trust Fund Authority, Transportation System Bonds, Capital Appreciation Series 2010A, 0.000%, 12/15/31 | No Opt. Call | 6,471,304 | |||||||||||
| New Jersey Transportation Trust Fund Authority, Transportation System Bonds, Refunding Series 2006C: | ||||||||||||||
| 30,000 | 0.000%, 12/15/30 - FGIC Insured | No Opt. Call | 21,760,968 | |||||||||||
| 27,000 | 0.000%, 12/15/32 - AGM Insured | No Opt. Call | 17,943,520 | |||||||||||
| New Jersey Transportation Trust Fund Authority, Transportation System Bonds, Series 2015AA: | ||||||||||||||
| 2,750 | 5.250%, 6/15/32 | 6/25 at 100.00 | 2,777,862 | |||||||||||
| 2,150 | 5.250%, 6/15/34 | 6/25 at 100.00 | 2,167,144 | |||||||||||
| 1,220 | New Jersey Transportation Trust Fund Authority, Transportation System Bonds, Series 2020AA, 4.000%, 6/15/50 | 12/30 at 100.00 | 1,014,323 | |||||||||||
| 2,000 | New Jersey Turnpike Authority, Revenue Bonds, Series 2017B, 5.000%, 1/01/40 | 1/28 at 100.00 | 2,024,821 | |||||||||||
| 3,760 | New Jersey Turnpike Authority, Turnpike Revenue Bonds, Series 2017G, 4.000%, 1/01/43 | 1/28 at 100.00 | 3,337,050 | |||||||||||
| 1,455 | South Jersey Transportation Authority, New Jersey, Transportation System Revenue Bonds, Series 2020A, 5.000%, 11/01/41 - BAM Insured | 11/30 at 100.00 | 1,453,788 | |||||||||||
| 2,535 | Tobacco Settlement Financing Corporation, New Jersey, Tobacco Settlement Asset-Backed Bonds, Series 2018B, 5.000%, 6/01/46 | 6/28 at 100.00 | 2,353,567 | |||||||||||
| Total New Jersey | 80,170,986 | |||||||||||||
New York - 7.6% | ||||||||||||||
| 4,200 | Dormitory Authority of the State of New York, State Personal Income Tax Revenue Bonds, General Purpose, Series 2021B, 4.000%, 3/15/47 | 3/31 at 100.00 | 3,616,080 | |||||||||||
| Dormitory Authority of the State of New York, Lease Revenue Bonds, State University Dormitory Facilities, Series 2017A: | ||||||||||||||
| 2,970 | 5.000%, 7/01/42 | 7/27 at 100.00 | 2,997,246 | |||||||||||
| 780 | (c) | 5.000%, 7/01/42, (Pre-refunded 7/01/27) | 7/27 at 100.00 | 813,979 | ||||||||||
| 1,950 | Long Island Power Authority, New York, Electric System General Revenue Bonds, Series 2018, 5.000%, 9/01/39 | 9/28 at 100.00 | 1,984,378 | |||||||||||
| Long Island Power Authority, New York, Electric System General Revenue Bonds, Series 2021A: | ||||||||||||||
| 1,000 | 4.000%, 9/01/39 | 9/31 at 100.00 | 887,562 | |||||||||||
| 2,100 | 4.000%, 9/01/41 | 9/31 at 100.00 | 1,828,233 | |||||||||||
Metropolitan Transportation Authority, New York, Transportation Revenue Bonds, Green Climate Bond Certified Series 2020C-1: | ||||||||||||||
| 3,100 | 4.750%, 11/15/45 | 5/30 at 100.00 | 2,853,357 | |||||||||||
| 8,325 | 5.000%, 11/15/50 | 5/30 at 100.00 | 7,929,126 | |||||||||||
| MTA Hudson Rail Yards Trust Obligations, New York, MTA Financing Agreement Payable by the Metropolitan Transportation Authority, Series 2016A: | ||||||||||||||
| 3,135 | 5.000%, 11/15/51 | 11/23 at 100.00 | 2,955,701 | |||||||||||
| 7,380 | 5.000%, 11/15/56 | 11/23 at 100.00 | 6,872,100 | |||||||||||
| New York City Industrial Development Agency, New York, PILOT Payment in Lieu of Taxes Revenue Bonds, Queens Baseball Stadium Project, Refunding Series 2021A: | ||||||||||||||
| 1,500 | 5.000%, 1/01/29 - AGM Insured | No Opt. Call | 1,556,992 | |||||||||||
Principal Amount (000) | Description (a) | Optional Call Provisions (b) | Value | |||||||||||
New York | ||||||||||||||
| $ | 1,750 | 5.000%, 1/01/30 - AGM Insured | No Opt. Call | $ | 1,823,684 | |||||||||
| 4,000 | New York City Municipal Water Finance Authority, New York, Water and Sewer System Second General Resolution Revenue Bonds, Fiscal 2019 Series FF-2, 4.000%, 6/15/37 | 6/29 at 100.00 | 3,733,725 | |||||||||||
| 17,425 | New York City Transitional Finance Authority, New York, Building Aid Revenue Bonds, Fiscal 2019 Subseries S-3A, 5.000%, 7/15/37 | 7/28 at 100.00 | 17,774,840 | |||||||||||
| 5,000 | New York City Transitional Finance Authority, New York, Future Tax Secured Bonds, Subordinate Fiscal 2022 Subseries F-1, 5.000%, 2/01/51 | 2/32 at 100.00 | 4,971,614 | |||||||||||
| 3,465 | New York City, New York, General Obligation Bonds, Fiscal 2021 Series C, 5.000%, 8/01/42 | 8/30 at 100.00 | 3,511,767 | |||||||||||
| 11,755 | New York Liberty Development Corporation, New York, Liberty Revenue Bonds, 3 World Trade Center Project, Class 1 Series 2014, 5.000%, 11/15/44, 144A | 11/24 at 100.00 | 10,528,369 | |||||||||||
| 3,180 | New York Liberty Development Corporation, New York, Liberty Revenue Bonds, Secured by Port Authority Consolidated Bonds, Refunding Series 1WTC-2021, 4.000%, 2/15/43 - BAM Insured | 2/30 at 100.00 | 2,698,174 | |||||||||||
| 4,000 | New York State Power Authority, General Revenue Bonds, Series 2020A, 4.000%, 11/15/50 | 5/30 at 100.00 | 3,314,312 | |||||||||||
| 1,000 | New York State Thruway Authority, State Personal Income Tax Revenue Bonds, Bidding Group 1 Series 2022A, 4.000%, 3/15/49 | 9/32 at 100.00 | 856,085 | |||||||||||
| 8,270 | New York Transportation Development Corporation, New York, Special Facilities Bonds, LaGuardia Airport Terminal B Redevelopment Project, Series 2016A, 5.000%, 7/01/41, (AMT) | 7/24 at 100.00 | 7,853,322 | |||||||||||
| 5,000 | New York Transportation Development Corporation, New York, Special Facility Revenue Bonds, Terminal 4 John F Kennedy International Airport Project, Series 2022, 5.000%, 12/01/40, (AMT) | 12/32 at 100.00 | 4,809,173 | |||||||||||
| New York Transportation Development Corporation, Special Facility Revenue Bonds, Delta Air Lines, Inc. - LaGuardia Airport Terminals C&D Redevelopment Project, Series 2018: | ||||||||||||||
| 3,250 | 5.000%, 1/01/34, (AMT) | 1/28 at 100.00 | 3,136,290 | |||||||||||
| 5,250 | 5.000%, 1/01/36, (AMT) | 1/28 at 100.00 | 4,974,126 | |||||||||||
| 4,500 | Suffolk Tobacco Asset Securitization Corporation, New York, Tobacco Settlement Asset-Backed Bonds, Senior Series 2021A-2, 4.000%, 6/01/50 | 6/31 at 100.00 | 3,616,212 | |||||||||||
| 8,000 | Triborough Bridge and Tunnel Authority, New York, General Purpose Revenue Bonds, MTA Bridges & Tunnels, Series 2017A, 5.000%, 11/15/37 | 5/27 at 100.00 | 8,154,460 | |||||||||||
| 3,000 | Triborough Bridge and Tunnel Authority, New York, General Purpose Revenue Bonds, Refunding Series 2015A, 5.000%, 11/15/50 | 5/25 at 100.00 | 2,967,058 | |||||||||||
| 7,000 | Triborough Bridge and Tunnel Authority, New York, Payroll Mobility Tax Bonds, Senior Lien Green Bonds, Series 2022D-2, 4.500%, 5/15/52 | 11/32 at 100.00 | 6,446,789 | |||||||||||
| 5,000 | Triborough Bridge and Tunnel Authority, New York, Payroll Mobility Tax Bonds, Senior Lien Subseries 2021A-1, 5.000%, 5/15/51 | 5/31 at 100.00 | 4,957,045 | |||||||||||
| 6,000 | Triborough Bridge and Tunnel Authority, New York, Sales Tax Revenue Bonds, MTA Bridges & Tunnels, TBTA Capital Lockbox-City Sales Tax, Series 2022A, 5.250%, 5/15/57 | 11/32 at 100.00 | 6,120,359 | |||||||||||
| 650 | TSASC Inc., New York, Tobacco Settlement Asset-Backed Bonds, Fiscal 2017 Series B, 5.000%, 6/01/24 | No Opt. Call | 646,613 | |||||||||||
| Total New York | 137,188,771 | |||||||||||||
North Carolina - 1.0% | ||||||||||||||
| 1,520 | North Carolina Capital Facilities Finance Agency, Revenue Bonds, Duke University Project, Refunding Series 2016B, 5.000%, 10/01/44 | 10/26 at 100.00 | 1,523,786 | |||||||||||
| NUV | Nuveen Municipal Value Fund, Inc. (continued) Portfolio of Investments October 31, 2023 |
Principal Amount (000) | Description (a) | Optional Call Provisions (b) | Value | |||||||||||
North Carolina | ||||||||||||||
North Carolina Department of Transportation, Private Activity Revenue Bonds, I-77 Hot Lanes Project, Series 2015: | ||||||||||||||
| $ | 2,155 | 5.000%, 12/31/37, (AMT) | 6/25 at 100.00 | $ | 2,077,798 | |||||||||
| 4,175 | 5.000%, 6/30/54, (AMT) | 6/25 at 100.00 | 3,758,243 | |||||||||||
| 2,995 | North Carolina Turnpike Authority, Monroe Expressway Toll Revenue Bonds, Series 2017A, 5.000%, 7/01/54 | 7/26 at 100.00 | 2,786,029 | |||||||||||
| North Carolina Turnpike Authority, Triangle Expressway System Revenue Bonds, Capital Appreciation Series 2019: | ||||||||||||||
| 2,000 | 0.000%, 1/01/41 | 1/30 at 71.45 | 820,768 | |||||||||||
| 1,500 | 0.000%, 1/01/42 | 1/30 at 68.97 | 577,723 | |||||||||||
| 14,500 | 0.000%, 1/01/49 | 1/30 at 54.10 | 3,595,143 | |||||||||||
| North Carolina Turnpike Authority, Triangle Expressway System Revenue Bonds, Refunding Senior Lien Series 2017: | ||||||||||||||
| 1,625 | 5.000%, 1/01/30 | 1/27 at 100.00 | 1,648,800 | |||||||||||
| 1,850 | 5.000%, 1/01/32 | 1/27 at 100.00 | 1,875,895 | |||||||||||
| Total North Carolina | 18,664,185 | |||||||||||||
North Dakota - 0.1% | ||||||||||||||
| 1,840 | Grand Forks, North Dakota, Health Care System Revenue Bonds, Altru Health System Obligated Group, Series 2017A, 5.000%, 12/01/42 | 12/27 at 100.00 | 1,648,362 | |||||||||||
| Total North Dakota | 1,648,362 | |||||||||||||
Ohio - 4.0% | ||||||||||||||
| 4,710 | Buckeye Tobacco Settlement Financing Authority, Ohio, Tobacco Settlement Asset-Backed Revenue Bonds, Refunding Senior Lien Series 2020A-2 Class 1, 4.000%, 6/01/48 | 6/30 at 100.00 | 3,769,657 | |||||||||||
| 44,200 | Buckeye Tobacco Settlement Financing Authority, Ohio, Tobacco Settlement Asset-Backed Revenue Bonds, Refunding Senior Lien Series 2020B-2 Class 2, 5.000%, 6/01/55 | 6/30 at 100.00 | 36,208,406 | |||||||||||
| 4,975 | Central Ohio Transit Authority, Ohio, General Obligation Bonds, Capital Facilities Limited Tax Series 2023, 5.000%, 12/01/53 | 12/33 at 100.00 | 4,985,961 | |||||||||||
| 1,195 | Franklin County, Ohio, Hospital Revenue Bonds, Nationwide Children’s Hospital Project, Refunding & Improvement Series 2017A, 5.000%, 11/01/32 | 11/27 at 100.00 | 1,241,427 | |||||||||||
| 3,485 | Franklin County, Ohio, Revenue Bonds, Trinity Health Credit Group, Series 2017OH, 4.000%, 12/01/46 | 6/27 at 100.00 | 2,904,570 | |||||||||||
| 5,000 | Franklin County, Ohio, Sales Tax Revenue Bonds, Various Purpose Series 2018, 5.000%, 6/01/43 | 6/28 at 100.00 | 5,061,014 | |||||||||||
| 14,500 | Ohio Air Quality Development Authority, Ohio, Pollution Control Revenue Bonds, FirstEnergy Generation Corporation Project, Refunding Series 2009D, 3.375%, 8/01/29, (Mandatory Put 9/15/21) | No Opt. Call | 12,774,236 | |||||||||||
| 4,110 | Ohio State, Private Activity Bonds, Portsmouth Gateway Group, LLC - Borrower, Portsmouth Bypass Project, Series 2015, 5.000%, 12/31/39 - AGM Insured, (AMT) | 6/25 at 100.00 | 3,870,372 | |||||||||||
| 1,940 | Port of Greater Cincinnati Development Authority, Ohio, Public Improvement TOT Revenue Bonds, Series 2021, 4.250%, 12/01/50, 144A | 12/28 at 100.00 | 1,420,326 | |||||||||||
| Total Ohio | 72,235,969 | |||||||||||||
Oklahoma - 1.4% | ||||||||||||||
| 4,000 | (c) | Oklahoma City Water Utilities Trust, Oklahoma, Water and Sewer Revenue Bonds, Refunding Series 2016, 5.000%, 7/01/36, (Pre-refunded 7/01/26) | 7/26 at 100.00 | 4,120,361 | ||||||||||
Principal Amount (000) | Description (a) | Optional Call Provisions (b) | Value | |||||||||||
Oklahoma | ||||||||||||||
| Oklahoma Development Finance Authority, Health System Revenue Bonds, Integris Baptist Medical Center, Refunding Series 2015A: | ||||||||||||||
| $ | 1,590 | 5.000%, 8/15/27 | 8/25 at 100.00 | $ | 1,590,077 | |||||||||
| 1,250 | 5.000%, 8/15/29 | 8/25 at 100.00 | 1,236,967 | |||||||||||
| Oklahoma Development Finance Authority, Health System Revenue Bonds, OU Medicine Project, Series 2018B: | ||||||||||||||
| 1,790 | 5.250%, 8/15/43 | 8/28 at 100.00 | 1,562,093 | |||||||||||
| 7,040 | 5.500%, 8/15/57 | 8/28 at 100.00 | 6,020,583 | |||||||||||
| 1,000 | Oklahoma Development Finance Authority, Health System Revenue Bonds, OU Medicine Project, Taxable Series 2022, 5.500%, 8/15/37 | 8/32 at 100.00 | 906,240 | |||||||||||
| 10,000 | Oklahoma State Turnpike Authority, Turnpike System Revenue Bonds, Second Senior Series 2017A, 5.000%, 1/01/42 | 1/26 at 100.00 | 9,893,641 | |||||||||||
| Total Oklahoma | 25,329,962 | |||||||||||||
Oregon - 1.3% | ||||||||||||||
| 2,500 | Oregon Health and Science University, Revenue Bonds, Green Series 2021A, 4.000%, 7/01/44 | 1/32 at 100.00 | 2,140,124 | |||||||||||
| 6,585 | Oregon State Department of Transportation, Highway User Tax Revenue Bonds, Refunding Senior Lien Series 2017B, 5.000%, 11/15/28 | 5/27 at 100.00 | 6,885,214 | |||||||||||
| 2,000 | Oregon State, General Obligation Bonds, Article XI-Q State Projects Series 2021A, 4.000%, 5/01/40 | 5/31 at 100.00 | 1,798,170 | |||||||||||
| 7,500 | Portland, Oregon, Sewer System Revenue Bonds, Second Lien Refunding Series 2023A, 5.000%, 12/01/47 | 6/33 at 100.00 | 7,598,698 | |||||||||||
| 5,330 | University of Oregon, General Revenue Bonds, Series 2018A, 5.000%, 4/01/48 | 4/28 at 100.00 | 5,338,917 | |||||||||||
| Total Oregon | 23,761,123 | |||||||||||||
Pennsylvania - 2.1% | ||||||||||||||
| 3,155 | Geisinger Authority, Montour County, Pennsylvania, Health System Revenue Bonds, Geisinger Health System, Series 2017A-1, 5.000%, 2/15/45 | 2/27 at 100.00 | 3,043,537 | |||||||||||
| 3,035 | Montgomery County Higher Education and Health Authority, Pennsylvania, Revenue Bonds, Thomas Jefferson University, Series 2022B, 4.000%, 5/01/52 | 5/32 at 100.00 | 2,346,227 | |||||||||||
| 2,000 | Pennsylvania State University, Revenue Bonds, Refunding Series 2016A, 5.000%, 9/01/41 | 9/26 at 100.00 | 2,026,219 | |||||||||||
| 20,000 | Pennsylvania State University, Revenue Bonds, Series 2023, 5.250%, 9/01/53 | 9/33 at 100.00 | 20,663,448 | |||||||||||
| 1,250 | Pennsylvania Turnpike Commission, Motor License Fund-Enhanced Turnpike Special Revenue Bonds, Subordinate Series 2014A, 4.750%, 12/01/37 | 12/26 at 100.00 | 1,251,445 | |||||||||||
| 3,000 | Pennsylvania Turnpike Commission, Turnpike Revenue Bonds, Series 2018A-2, 5.000%, 12/01/48 | 12/28 at 100.00 | 2,973,762 | |||||||||||
| 1,025 | Pennsylvania Turnpike Commission, Turnpike Revenue Bonds, Subordinate Series 2019A, 4.000%, 12/01/49 | 12/29 at 100.00 | 834,060 | |||||||||||
| 2,620 | Pennsylvania Turnpike Commission, Turnpike Revenue Bonds, Subordinate Series 2021A, 4.000%, 12/01/50 | 12/30 at 100.00 | 2,127,571 | |||||||||||
| 570 | Pittsburgh Water and Sewer Authority, Pennsylvania, Water and Sewer System Revenue Bonds, Refunding Subordinate Series 2019B, 4.000%, 9/01/34 - AGM Insured | 9/29 at 100.00 | 534,644 | |||||||||||
| 1,350 | Susquehanna Area Regional Airport Authority, Pennsylvania, Airport System Revenue Bonds, Series 2017, 5.000%, 1/01/38, (AMT) | 1/28 at 100.00 | 1,261,640 | |||||||||||
| Total Pennsylvania | 37,062,553 | |||||||||||||
| NUV | Nuveen Municipal Value Fund, Inc. (continued) Portfolio of Investments October 31, 2023 |
Principal Amount (000) | Description (a) | Optional Call Provisions (b) | Value | |||||||||||
Puerto Rico - 1.8% | ||||||||||||||
Puerto Rico Sales Tax Financing Corporation, Sales Tax Revenue Bonds, Restructured 2018A-1: | ||||||||||||||
| $ | 10,046 | 0.000%, 7/01/33 | 7/28 at 86.06 | $ | 6,292,458 | |||||||||
| 5,985 | 4.500%, 7/01/34 | 7/25 at 100.00 | 5,715,764 | |||||||||||
| 5,125 | 5.000%, 7/01/58 | 7/28 at 100.00 | 4,486,978 | |||||||||||
| 5,320 | Puerto Rico Sales Tax Financing Corporation, Sales Tax Revenue Bonds, Restructured Cofina Project Series 2019A-2A, 4.550%, 7/01/40 | 7/28 at 100.00 | 4,735,414 | |||||||||||
| 12,119 | Puerto Rico Sales Tax Financing Corporation, Sales Tax Revenue Bonds, Taxable Restructured Cofina Project Series 2019A-2, 4.329%, 7/01/40 | 7/28 at 100.00 | 10,498,999 | |||||||||||
| Total Puerto Rico | 31,729,613 | |||||||||||||
South Carolina - 2.4% | ||||||||||||||
| Patriots Energy Group, South Carolina, Gas System Revenue Bonds, Improvement and Refunding Series 2021A: | ||||||||||||||
| 3,750 | 4.000%, 6/01/46 | 6/31 at 100.00 | 3,034,979 | |||||||||||
| 1,500 | 4.000%, 6/01/51 | 6/31 at 100.00 | 1,174,667 | |||||||||||
Piedmont Municipal Power Agency, South Carolina, Electric Revenue Bonds, Series 2004A-2: | ||||||||||||||
| 12,760 | 0.000%, 1/01/28 - AGC Insured | No Opt. Call | 10,534,170 | |||||||||||
| 9,535 | 0.000%, 1/01/29 - AGC Insured | No Opt. Call | 7,507,633 | |||||||||||
| 4,000 | South Carolina Public Service Authority, Santee Cooper Revenue Obligations, Refunding & Improvement Series 2020A, 4.000%, 12/01/39 | 12/30 at 100.00 | 3,461,535 | |||||||||||
| South Carolina Public Service Authority, Santee Cooper Revenue Obligations, Refunding Series 2016B: | ||||||||||||||
| 5,500 | 5.000%, 12/01/46 | 12/26 at 100.00 | 5,245,353 | |||||||||||
| 8,000 | 5.000%, 12/01/56 | 12/26 at 100.00 | 7,425,938 | |||||||||||
| 1,500 | South Carolina Public Service Authority, Santee Cooper Revenue Obligations, Refunding Series 2022A, 5.000%, 12/01/55 | 6/32 at 100.00 | 1,393,565 | |||||||||||
| 3,455 | South Carolina Public Service Authority, Santee Cooper Revenue Obligations, Series 2014A, 5.500%, 12/01/54 | 6/24 at 100.00 | 3,373,686 | |||||||||||
| Total South Carolina | 43,151,526 | |||||||||||||
South Dakota - 0.1% | ||||||||||||||
| 2,630 | Baltic School District No. 49-1, South Dakota, General Obligation Bonds, Series 2022, 5.250%, 12/01/47 - AGM Insured | 12/31 at 100.00 | 2,671,699 | |||||||||||
| Total South Dakota | 2,671,699 | |||||||||||||
Tennessee - 1.5% | ||||||||||||||
| Hallsdale-Powell Utility District, Knox County, Tennessee, Water and Sewer Revenue Bonds, Refunding & Improvement Series 2022A: | ||||||||||||||
| 760 | 4.000%, 4/01/37 | 4/31 at 100.00 | 707,682 | |||||||||||
| 1,305 | 4.000%, 4/01/40 | 4/31 at 100.00 | 1,182,160 | |||||||||||
| Loudon, Tennessee, Water and Sewer Revenue Bonds, Series 2023: | ||||||||||||||
| 1,000 | 5.000%, 3/01/40 | 3/33 at 100.00 | 1,019,881 | |||||||||||
| 1,000 | 5.000%, 3/01/41 | 3/33 at 100.00 | 1,015,808 | |||||||||||
| 1,495 | 5.000%, 3/01/42 | 3/33 at 100.00 | 1,511,295 | |||||||||||
| 4,250 | 4.375%, 3/01/48 | 3/33 at 100.00 | 3,623,295 | |||||||||||
| 1,450 | Memphis, Tennessee, Sanitary Sewerage System Revenue Bonds, Refunding Series 2020B, 5.000%, 10/01/45 | 10/30 at 100.00 | 1,474,024 | |||||||||||
| 2,260 | Metropolitan Government of Nashville-Davidson County, Tennessee, Water and Sewerage Revenue Bonds, Green Series 2017A, 5.000%, 7/01/42 | 7/27 at 100.00 | 2,253,742 | |||||||||||
Principal Amount (000) | Description (a) | Optional Call Provisions (b) | Value | |||||||||||
Tennessee | ||||||||||||||
| $ | 2,000 | Metropolitan Nashville Airport Authority, Tennessee, Airport Improvement Revenue Bonds, Series 2022A, 5.250%, 7/01/47 | 7/32 at 100.00 | $ | 2,016,988 | |||||||||
| 1,375 | New Memphis Arena Public Building Authority, Memphis and Shelby County, Tennessee, Local Government Public Improvement Bonds, Capital Appreciation Series 2021, 0.000%, 4/01/40 | 4/31 at 81.47 | 548,070 | |||||||||||
| 3,000 | Tennessee State School Bond Authority, Higher Educational Facilities Second Program Bonds, Series 2017A, 5.000%, 11/01/42 | 11/27 at 100.00 | 3,013,735 | |||||||||||
| 5,000 | Tennessee State, General Obligation Bonds, Series 2023A, 5.000%, 5/01/40 | 5/33 at 100.00 | 5,221,722 | |||||||||||
| 3,240 | West Wilson Utility District, Wilson County, Tennessee, Water Revenue Bonds, Improvement Series 2022, 4.000%, 6/01/52 | 6/32 at 100.00 | 2,723,491 | |||||||||||
| Total Tennessee | 26,311,893 | |||||||||||||
Texas - 13.0% | ||||||||||||||
| 240 | Baytown Municipal Development District, Texas, Hotel Revenue Bonds, Baytown Convention Center Hotel, First-Lien Series 2021A, 4.000%, 10/01/50 | 10/31 at 100.00 | 170,943 | |||||||||||
| 14,355 | (e) | Bexar County Hospital District, Texas, Certificates of Obligation, Series 2018, 4.000%, 2/15/43, (UB) | 2/27 at 100.00 | 12,372,986 | ||||||||||
| 4,750 | Bexar County Hospital District, Texas, Certificates of Obligation, Series 2023, 5.000%, 2/15/48 | 8/32 at 100.00 | 4,785,493 | |||||||||||
| 710 | Central Texas Regional Mobility Authority, Revenue Bonds, Senior Lien Series 2020A, 5.000%, 1/01/39 | 1/30 at 100.00 | 716,041 | |||||||||||
| 240 | Decatur Hospital Authority, Texas, Revenue Bonds, Wise Regional Health System, Series 2014A, 5.250%, 9/01/44 | 9/24 at 100.00 | 221,144 | |||||||||||
| 5,000 | El Paso County Hospital District, Texas, General Obligtion Bonds, Certificates of Obligation Series 2013, 5.000%, 8/15/39 | 12/23 at 100.00 | 4,504,587 | |||||||||||
| Fort Bend County Municipal Utility District 50, Texas, General Obligation Bonds, Series 2018A: | ||||||||||||||
| 2,600 | 4.000%, 9/01/46 - AGM Insured | 12/23 at 100.00 | 2,068,642 | |||||||||||
| 5,500 | 4.000%, 9/01/48 - AGM Insured | 12/23 at 100.00 | 4,296,252 | |||||||||||
| 2,845 | Harris County Cultural Education Facilities Finance Corporation, Texas, Revenue Bonds, Houston Methodist Hospital System, Series 2015, 4.000%, 12/01/45 | 6/25 at 100.00 | 2,304,640 | |||||||||||
| 7,295 | Harris County-Houston Sports Authority, Texas, Revenue Bonds, Capital Appreciation Refunding Senior Lien Series 2014A, 0.000%, 11/15/50 - AGM Insured | 11/31 at 39.79 | 1,435,475 | |||||||||||
| Harris County-Houston Sports Authority, Texas, Revenue Bonds, Junior Lien Series 2001H: | ||||||||||||||
| 11,055 | 0.000%, 11/15/27 | No Opt. Call | 9,046,029 | |||||||||||
| 845 | (c) | 0.000%, 11/15/27, (ETM) | No Opt. Call | 708,235 | ||||||||||
| Harris County-Houston Sports Authority, Texas, Revenue Bonds, Refunding Second Lien Series 2014C: | ||||||||||||||
| 425 | 5.000%, 11/15/23 | No Opt. Call | 425,034 | |||||||||||
| 1,565 | 5.000%, 11/15/31 | 11/24 at 100.00 | 1,566,251 | |||||||||||
| 14,905 | Harris County-Houston Sports Authority, Texas, Revenue Bonds, Third Lien Series 2004A-3, 0.000%, 11/15/33 - NPFG Insured | 11/24 at 59.10 | 8,232,872 | |||||||||||
| 1,000 | Hidalgo County Regional Mobility Authority, Texas, Toll and Vehicle Registration Fee Revenue Bonds, Senior Lien Series 2022A, 4.000%, 12/01/40 | 12/31 at 100.00 | 832,002 | |||||||||||
| NUV | Nuveen Municipal Value Fund, Inc. (continued) Portfolio of Investments October 31, 2023 |
Principal Amount (000) | Description (a) | Optional Call Provisions (b) | Value | |||||||||||
Texas | ||||||||||||||
| Houston, Texas, Airport System Revenue Bonds, Refunding & Subordinate Lien Series 2018B: | ||||||||||||||
| $ | 1,590 | 5.000%, 7/01/43 | 7/28 at 100.00 | $ | 1,581,606 | |||||||||
| 2,290 | 5.000%, 7/01/48 | 7/28 at 100.00 | 2,226,598 | |||||||||||
| Houston, Texas, Hotel Occupancy Tax and Special Revenue Bonds, Convention and Entertainment Project, Series 2001B: | ||||||||||||||
| 24,755 | 0.000%, 9/01/29 - AMBAC Insured | No Opt. Call | 18,977,178 | |||||||||||
| 12,940 | 0.000%, 9/01/30 - AMBAC Insured | No Opt. Call | 9,440,851 | |||||||||||
| 10,000 | 0.000%, 9/01/31 - AMBAC Insured | No Opt. Call | 6,936,354 | |||||||||||
| 19,500 | 0.000%, 9/01/32 - AMBAC Insured | No Opt. Call | 12,849,726 | |||||||||||
| 5,120 | Leander Independent School District, Williamson and Travis Counties, Texas, General Obligation Bonds, Refunding Series 2015A, 5.000%, 8/15/39 | 8/25 at 100.00 | 5,151,147 | |||||||||||
| 4,510 | Leander Independent School District, Williamson and Travis Counties, Texas, General Obligation Bonds, Refunding Series 2016A, 5.000%, 8/15/49 | 8/26 at 100.00 | 4,537,931 | |||||||||||
| 1,705 | Love Field Airport Modernization Corporation, Texas, Special Facilities Revenue Bonds, Southwest Airlines Company - Love Field Modernization Program Project, Series 2012, 5.000%, 11/01/28, (AMT) | 12/23 at 100.00 | 1,685,737 | |||||||||||
| 3,570 | Lower Colorado River Authority, Texas, Transmission Contract Revenue Bonds, LCRA Transmission Services Corporation Project, Refunding Series 2021A, 5.000%, 5/15/51 | 5/31 at 100.00 | 3,409,853 | |||||||||||
| Lubbock, Texas, Electric Light and Power System Revenue Bonds, Series 2018: | ||||||||||||||
| 2,170 | 5.000%, 4/15/40 | 4/28 at 100.00 | 2,129,934 | |||||||||||
| 3,930 | 5.000%, 4/15/43 | 4/28 at 100.00 | 3,782,896 | |||||||||||
| North Texas Tollway Authority, System Revenue Bonds, Refunding First Tier Capital Appreciation Series 2008I: | ||||||||||||||
| 30,000 | (c) | 6.200%, 1/01/42, (Pre-refunded 1/01/25) - AGC Insured | 1/25 at 100.00 | 30,758,016 | ||||||||||
| 5,220 | (c) | 6.500%, 1/01/43, (Pre-refunded 1/01/25) | 1/25 at 100.00 | 5,366,517 | ||||||||||
| 15,450 | North Texas Tollway Authority, System Revenue Bonds, Refunding First Tier, Series 2008D, 0.000%, 1/01/36 - AGC Insured | No Opt. Call | 8,637,676 | |||||||||||
| 5,000 | North Texas Tollway Authority, System Revenue Bonds, Refunding First Tier, Series 2017A, 4.000%, 1/01/43 | 1/28 at 100.00 | 4,196,241 | |||||||||||
| 8,000 | North Texas Tollway Authority, System Revenue Bonds, Refunding Second Tier Series 2017B, 5.000%, 1/01/43 | 1/27 at 100.00 | 8,004,671 | |||||||||||
| 9,100 | North Texas Tollway Authority, System Revenue Bonds, Refunding Second Tier, Series 2015A, 5.000%, 1/01/32 | 1/25 at 100.00 | 9,128,811 | |||||||||||
| 1,750 | Tarrant County Cultural Education Facilities Finance Corporation, Texas, Revenue Bonds, Texas Health Resources System, Series 2016A, 5.000%, 2/15/41 | 8/26 at 100.00 | 1,732,073 | |||||||||||
| 5,000 | Temple, Texas, General Obligation Bonds, Combination Tax and Revenue Series 2022B, 4.000%, 8/01/47 | 8/31 at 100.00 | 4,133,296 | |||||||||||
| 3,990 | Texas Municipal Gas Acquisition and Supply Corporation I, Gas Supply Revenue Bonds, Senior Lien Series 2008D, 6.250%, 12/15/26 | No Opt. Call | 4,067,548 | |||||||||||
| 5,400 | Texas Private Activity Bond Surface Transporation Corporation, Revenue Bonds, NTE Mobility Partners LLC North Tarrant Express Managed Lanes Project, Refunding Senior Lien Series 2019A, 5.000%, 12/31/35 | 12/29 at 100.00 | 5,480,304 | |||||||||||
| 3,000 | Texas Transportation Commission, Central Texas Turnpike System Revenue Bonds, Refunding First Tier Series 2015B, 5.000%, 8/15/37 | 8/24 at 100.00 | 2,979,319 | |||||||||||
| 1,750 | Texas Transportation Commission, Central Texas Turnpike System Revenue Bonds, Refunding Second Tier Series 2015C, 5.000%, 8/15/33 | 8/24 at 100.00 | 1,719,553 | |||||||||||
Principal Amount (000) | Description (a) | Optional Call Provisions (b) | Value | |||||||||||
Texas | ||||||||||||||
| $ | 5,500 | Texas Turnpike Authority, Central Texas Turnpike System Revenue Bonds, First Tier Series 2002A, 0.000%, 8/15/25 - AMBAC Insured | No Opt. Call | $ | 5,094,062 | |||||||||
| Texas Water Development Board, State Water Implementation Revenue Fund Bonds, Master Trust Series 2017A: | ||||||||||||||
| 12,500 | (e) | 4.000%, 10/15/42, (UB) | 10/27 at 100.00 | 10,993,433 | ||||||||||
| 1,500 | 5.000%, 10/15/42 | 10/27 at 100.00 | 1,512,807 | |||||||||||
| 5,000 | Texas Water Development Board, State Water Implementation Revenue Fund Bonds, Master Trust Series 2018B, 5.000%, 10/15/38 | 10/28 at 100.00 | 5,097,591 | |||||||||||
| Total Texas | 235,298,355 | |||||||||||||
Utah - 1.4% | ||||||||||||||
| 5,345 | Salt Lake City, Utah, Airport Revenue Bonds, International Airport Series 2017B, 5.000%, 7/01/42 | 7/27 at 100.00 | 5,279,207 | |||||||||||
| 3,500 | Salt Lake City, Utah, Airport Revenue Bonds, International Airport Series 2018B, 5.000%, 7/01/43 | 7/28 at 100.00 | 3,455,734 | |||||||||||
| 9,550 | Salt Lake City, Utah, Airport Revenue Bonds, International Airport Series 2023A, 5.250%, 7/01/48, (AMT) | 7/33 at 100.00 | 9,380,832 | |||||||||||
| Salt Lake County, Utah, Sales Tax Revenue Bonds, TRCC Series 2017: | ||||||||||||||
| 695 | 5.000%, 2/01/36 | 2/27 at 100.00 | 713,162 | |||||||||||
| 1,150 | 5.000%, 2/01/37 | 2/27 at 100.00 | 1,175,489 | |||||||||||
| Utah Associated Municipal Power Systems, Revenue Bonds, Horse Butte Wind Project, Refunding Series 2017A: | ||||||||||||||
| 1,250 | 5.000%, 9/01/29 | 3/28 at 100.00 | 1,299,468 | |||||||||||
| 1,000 | 5.000%, 9/01/30 | 3/28 at 100.00 | 1,037,557 | |||||||||||
| 1,250 | 5.000%, 9/01/31 | 3/28 at 100.00 | 1,293,572 | |||||||||||
| 660 | 5.000%, 9/01/32 | 3/28 at 100.00 | 681,826 | |||||||||||
| 540 | Utah Water Finance Agency, Revenue Bonds, Pooled Loan Financing Program, Series 2017A, 5.000%, 3/01/37 | 3/27 at 100.00 | 549,419 | |||||||||||
| Total Utah | 24,866,266 | |||||||||||||
Virginia - 0.5% | ||||||||||||||
| 1,805 | Chesapeake Bay Bridge and Tunnel District, Virginia, General Resolution Revenue Bonds, First Tier Series 2016, 5.000%, 7/01/51 | 7/26 at 100.00 | 1,677,834 | |||||||||||
| 4,355 | Tobacco Settlement Financing Corporation of Virginia, Tobacco Settlement Asset Backed Bonds, Series 2007B1, 5.000%, 6/01/47 | 11/23 at 100.00 | 3,735,581 | |||||||||||
| 4,100 | Virginia Small Business Financing Authority, Private Activity Revenue Bonds, Transform 66 P3 Project, Senior Lien Series 2017, 5.000%, 12/31/49, (AMT) | 6/27 at 100.00 | 3,838,603 | |||||||||||
| Total Virginia | 9,252,018 | |||||||||||||
Washington - 4.0% | ||||||||||||||
| 8,825 | Central Puget Sound Regional Transit Authority, Washington, Sales Tax and Motor Vehicle Excise Tax Bonds, Refunding & Improvement, Green Series 2021S-1, 4.000%, 11/01/46 | 11/31 at 100.00 | 7,473,395 | |||||||||||
| 2,235 | Pierce County School District 10, Tacoma, Washington, General Obligation Bonds, Series 2020B, 4.000%, 12/01/43 | 12/30 at 100.00 | 1,942,115 | |||||||||||
| Port of Seattle, Washington, Revenue Bonds, Refunding Intermediate Lien Series 2016: | ||||||||||||||
| 1,930 | 5.000%, 2/01/29 | 2/26 at 100.00 | 1,966,634 | |||||||||||
| 1,000 | 5.000%, 2/01/30 | 2/26 at 100.00 | 1,016,616 | |||||||||||
| Spokane Public Facilities District, Washington, Hotel, Motel, and Sales Use Tax Revenue Bonds, Series 2017: | ||||||||||||||
| 1,175 | 5.000%, 12/01/38 | 6/27 at 100.00 | 1,150,121 | |||||||||||
| NUV | Nuveen Municipal Value Fund, Inc. (continued) Portfolio of Investments October 31, 2023 |
Principal Amount (000) | Description (a) | Optional Call Provisions (b) | Value | |||||||||||
Washington | ||||||||||||||
| $ | 5,000 | 5.000%, 12/01/41 | 6/27 at 100.00 | $ | 4,962,944 | |||||||||
| 1,390 | Washington Health Care Facilities Authority, Revenue Bonds, CommonSpirit Health, Series 2019A-1, 4.000%, 8/01/44 | 8/29 at 100.00 | 1,120,404 | |||||||||||
| 12,000 | Washington Health Care Facilities Authority, Revenue Bonds, Providence Health & Services, Refunding Series 2012A, 5.000%, 10/01/33 | 12/23 at 100.00 | 12,000,745 | |||||||||||
| 1,310 | Washington Health Care Facilities Authority, Revenue Bonds, Virginia Mason Medical Center, Series 2017, 5.000%, 8/15/30 | 8/27 at 100.00 | 1,321,172 | |||||||||||
| 6,030 | Washington State Convention Center Public Facilities District, Lodging Tax Revenue Bonds, Refunding Series2021B. Exchange Purchase, 4.000%, 7/01/37 | 7/31 at 100.00 | 5,369,469 | |||||||||||
| Washington State Convention Center Public Facilities District, Lodging Tax Revenue Bonds, Refunding Subordinate Series 2021B. Exchange Purchase: | ||||||||||||||
| 4,615 | 4.000%, 7/01/43 | 7/31 at 100.00 | 3,822,156 | |||||||||||
| 7,830 | 3.000%, 7/01/48 | 7/31 at 100.00 | 4,920,305 | |||||||||||
| Washington State Convention Center Public Facilities District, Lodging Tax Revenue Bonds, Series 2018: | ||||||||||||||
| 3,240 | 4.000%, 7/01/58 | 7/28 at 100.00 | 2,442,044 | |||||||||||
| 3,000 | 5.000%, 7/01/58 | 7/28 at 100.00 | 2,776,721 | |||||||||||
Washington State, Motor Vehicle Fuel Tax General Obligation Bonds, Series 2002-03C: | ||||||||||||||
| 9,100 | 0.000%, 6/01/29 - NPFG Insured | No Opt. Call | 7,321,760 | |||||||||||
| 16,195 | 0.000%, 6/01/30 - NPFG Insured | No Opt. Call | 12,480,881 | |||||||||||
| Total Washington | 72,087,482 | |||||||||||||
West Virginia - 0.7% | ||||||||||||||
| 1,830 | West Virginia Hospital Finance Authority, Hospital Revenue Bonds, Cabell Huntington Hospital, Inc. Project, Refunding & Improvement Series 2018A, 5.000%, 1/01/34 | 1/29 at 100.00 | 1,817,186 | |||||||||||
| 2,750 | West Virginia Hospital Finance Authority, Hospital Revenue Bonds, Charleston Area Medical Center, Refunding & Improvement Series 2019A, 5.000%, 9/01/38 | 9/29 at 100.00 | 2,590,859 | |||||||||||
| 3,570 | West Virginia Parkways Authority, Turnpike Toll Revenue Bonds, Senior Lien Series 2018, 5.000%, 6/01/43 | 6/28 at 100.00 | 3,596,869 | |||||||||||
| 4,135 | West Virginia Parkways Authority, Turnpike Toll Revenue Bonds, Senior Lien Series 2021, 5.000%, 6/01/47 | 6/31 at 100.00 | 4,182,683 | |||||||||||
| Total West Virginia | 12,187,597 | |||||||||||||
Wisconsin - 0.7% | ||||||||||||||
| 5,000 | Public Finance Authority Wisconsin, Tax Exempt Pooled Securities, Class A Social Impact Certificates, Series 2023-1, 4.000%, 8/01/59, (Mandatory Put 7/01/26) | No Opt. Call | 4,850,862 | |||||||||||
| 4,410 | Wisconsin Health and Educational Facilities Authority, Revenue Bonds, Mercy Alliance, Inc., Series 2012, 5.000%, 6/01/39 | 12/23 at 100.00 | 4,198,879 | |||||||||||
| Wisconsin Health and Educational Facilities Authority, Wisconsin, Revenue Bonds, Ascension Health Alliance Senior Credit Group, Series 2016A: | ||||||||||||||
| 2,870 | 4.000%, 11/15/46 | 5/26 at 100.00 | 2,406,393 | |||||||||||
Principal Amount (000) | Description (a) | Optional Call Provisions (b) | Value | |||||||||||
Wisconsin | ||||||||||||||
| $ | 935 | (c) | 4.000%, 11/15/46, (Pre-refunded 5/15/26) | 5/26 at 100.00 | $ | 933,573 | ||||||||
| Total Wisconsin | 12,389,707 | |||||||||||||
Total Municipal Bonds (cost $1,882,403,978) | 1,795,221,291 | |||||||||||||
Total Long-Term Investments (cost $1,882,403,978) | 1,795,221,291 | |||||||||||||
Floating Rate Obligations - (1.2)% | (21,480,000 | ) | ||||||||||||
Other Assets & Liabilities, Net - 1.7% | 30,712,131 | |||||||||||||
Net Assets Applicable to Common Shares - 100% | $ | 1,804,453,422 | ||||||||||||
| (a) | All percentages shown in the Portfolio of Investments are based on net assets applicable to common shares unless otherwise noted. |
| (b) | Optional Call Provisions: Dates (month and year) and prices of the earliest optional call or redemption. There may be other call provisions at varying prices at later dates. Certain mortgage-backed securities may be subject to periodic principal paydowns. Optional Call Provisions are not covered by the report of independent registered public accounting firm. |
| (c) | Backed by an escrow or trust containing sufficient U.S. Government or U.S. Government agency securities, which ensure the timely payment of principal and interest. |
| (d) | Step-up coupon bond, a bond with a coupon that increases (“steps up”), usually at regular intervals, while the bond is outstanding. The rate shown is the coupon as of the end of the reporting period. |
| (e) | Investment, or portion of investment, has been pledged to collateralize the net payment obligations for investments in inverse floating rate transactions. |
| 144A | Investment is exempt from registration under Rule 144A of the Securities Act of 1933, as amended. These investments may only be resold in transactions exempt from registration, which are normally those transactions with qualified institutional buyers. |
| AMT | Alternative Minimum Tax |
| ETM | Escrowed to maturity |
| UB | Underlying bond of an inverse floating rate trust reflected as a financing transaction. |
| NUW | Nuveen AMT-Free Municipal Value Fund Portfolio of Investments October 31, 2023 |
Principal Amount (000) | Description (a) | Optional Call Provisions (b) | Value | |||||||||||
LONG-TERM INVESTMENTS - 99.0% | ||||||||||||||
MUNICIPAL BONDS - 98.5% | ||||||||||||||
Alaska - 0.3% | ||||||||||||||
| $ | 800 | Northern Tobacco Securitization Corporation, Alaska, Tobacco Settlement Asset-Backed Bonds, Senior Series 2021A Class 1, 5.000%, 6/01/31 | No Opt. Call | $ | 837,169 | |||||||||
| Total Alaska | 837,169 | |||||||||||||
Arizona - 1.3% | ||||||||||||||
| 345 | Phoenix Civic Improvement Corporation, Arizona, Excise Tax Revenue Bonds, Subordinate Lien Series 2020A, 4.000%, 7/01/45 | 7/30 at 100.00 | 296,029 | |||||||||||
| 3,045 | Salt Verde Financial Corporation, Arizona, Senior Gas Revenue Bonds, Citigroup Energy Inc Prepay Contract Obligations, Series 2007, 5.000%, 12/01/37 | No Opt. Call | 2,955,888 | |||||||||||
| Total Arizona | 3,251,917 | |||||||||||||
California - 11.3% | ||||||||||||||
| 1,730 | Anaheim Public Financing Authority, California, Lease Revenue Bonds, Public Improvement Project, Series 1997C, 0.000%, 9/01/30 - AGM Insured | No Opt. Call | 1,277,102 | |||||||||||
| 45 | California County Tobacco Securitization Agency, Tobacco Settlement Asset-Backed Bonds, Los Angeles County Securitization Corporation, Series 2020A, 4.000%, 6/01/49 | 6/30 at 100.00 | 36,639 | |||||||||||
| 340 | California Pollution Control Financing Authority, Water Furnishing Revenue Bonds, San Diego County Water Authoriity Desalination Project Pipeline, Refunding Series 2019, 5.000%, 7/01/39, 144A | 1/29 at 100.00 | 335,617 | |||||||||||
| Los Angeles Department of Airports, California, Revenue Bonds, Los Angeles International Airport, Private Activity/Non AMT Refunding Subordinate Series 2019C: | ||||||||||||||
| 1,280 | (c) | 5.000%, 5/15/30, (Pre-refunded 5/15/29) | 5/29 at 100.00 | 1,378,384 | ||||||||||
| 760 | 5.000%, 5/15/30 | 5/29 at 100.00 | 816,203 | |||||||||||
| 450 | M-S-R Energy Authority, California, Gas Revenue Bonds, Citigroup Prepay Contracts, Series 2009A, 6.500%, 11/01/39 | No Opt. Call | 506,850 | |||||||||||
| 10,200 | Palomar Pomerado Health, California, General Obligation Bonds, Series 2009A, 7.000%, 8/01/38 - AGC Insured | 8/29 at 100.00 | 11,277,824 | |||||||||||
| 1,030 | Poway Unified School District, San Diego County, California, General Obligation Bonds, School Facilities Improvement District 2007-1, Series 2011A, 0.000%, 8/01/35 | No Opt. Call | 610,569 | |||||||||||
| 2,470 | San Francisco Airports Commission, California, Revenue Bonds, San Francisco International Airport, Governmental Purpose Second Series 2017B, 5.000%, 5/01/47 | 5/27 at 100.00 | 2,470,286 | |||||||||||
| 12,955 | San Ysidro School District, San Diego County, California, General Obligation Bonds, 1997 Election Series 2012G, 0.000%, 8/01/35 - AGM Insured | No Opt. Call | 7,530,609 | |||||||||||
| 5,185 | San Ysidro School District, San Diego County, California, General Obligation Bonds, Refunding Series 2015, 0.000%, 8/01/44 | 8/25 at 36.88 | 1,712,417 | |||||||||||
| 115 | Vernon, California, Electric System Revenue Bonds, Series 2021A, 5.000%, 4/01/28 | No Opt. Call | 115,272 | |||||||||||
| 700 | Victor Elementary School District, San Bernardino County, California, General Obligation Bonds, Series 2002A, 0.000%, 8/01/24 - FGIC Insured | No Opt. Call | 677,941 | |||||||||||
| Total California | 28,745,713 | |||||||||||||
Principal Amount (000) | Description (a) | Optional Call Provisions (b) | Value | |||||||||||
Colorado - 4.0% | ||||||||||||||
| Denver Convention Center Hotel Authority, Colorado, Revenue Bonds, Convention Center Hotel, Refunding Senior Lien Series 2016: | ||||||||||||||
| $ | 1,000 | 5.000%, 12/01/30 | 12/26 at 100.00 | $ | 995,788 | |||||||||
| 1,500 | 5.000%, 12/01/36 | 12/26 at 100.00 | 1,423,611 | |||||||||||
| Denver Health and Hospitals Authority, Colorado, Healthcare Revenue Bonds, Series 2019A: | ||||||||||||||
| 1,750 | 4.000%, 12/01/38 | 12/29 at 100.00 | 1,448,830 | |||||||||||
| 2,000 | 4.000%, 12/01/39 | 12/29 at 100.00 | 1,630,836 | |||||||||||
| 5,885 | E-470 Public Highway Authority, Colorado, Toll Revenue Bonds, Series 2004A, 0.000%, 9/01/34 - NPFG Insured | No Opt. Call | 3,592,948 | |||||||||||
| 1,000 | Public Authority for Colorado Energy, Natural Gas Purchase Revenue Bonds, Colorado Springs Utilities, Series 2008, 6.500%, 11/15/38 | No Opt. Call | 1,105,931 | |||||||||||
| Total Colorado | 10,197,944 | |||||||||||||
Delaware - 0.2% | ||||||||||||||
| Delaware River and Bay Authority, Delaware and New Jersey, Revenue Bonds, Series 2014A: | ||||||||||||||
| 150 | 4.125%, 1/01/39 | 1/24 at 100.00 | 134,677 | |||||||||||
| 200 | 5.000%, 1/01/44 | 1/24 at 100.00 | 200,106 | |||||||||||
| 130 | Delaware River and Bay Authority, Delaware and New Jersey, Revenue Bonds, Series 2019, 4.000%, 1/01/44 | 1/29 at 100.00 | 109,049 | |||||||||||
| Total Delaware | 443,832 | |||||||||||||
District of Columbia - 0.9% | ||||||||||||||
| 1,735 | Metropolitan Washington Airports Authority, District of Columbia, Dulles Toll Road Revenue Bonds, Dulles Metrorail & Capital improvement Projects, Refunding & Subordinate Lien Series 2019B, 5.000%, 10/01/47 | 10/29 at 100.00 | 1,634,286 | |||||||||||
| 725 | Washington Metropolitan Area Transit Authority, District of Columbia, Dedicated Revenue Bonds, Series 2020A, 5.000%, 7/15/45 | 7/30 at 100.00 | 734,493 | |||||||||||
| Total District of Columbia | 2,368,779 | |||||||||||||
Florida - 3.8% | ||||||||||||||
| 1,655 | Fort Myers, Florida, Utility System Revenue Bonds, Refunding Series 2019A, 4.000%, 10/01/49 | 10/28 at 100.00 | 1,356,795 | |||||||||||
| 500 | Gainesville, Florida, Utilities System Revenue Bonds, Series 2017A, 5.000%, 10/01/36 | 10/27 at 100.00 | 513,975 | |||||||||||
| 1,000 | JEA, Florida, Water and Sewer System Revenue Bonds, Series 2020A, 5.000%, 10/01/34 | 4/30 at 100.00 | 1,062,371 | |||||||||||
| 1,605 | Lakeland, Florida, Hospital System Revenue Bonds, Lakeland Regional Health, Series 2015, 5.000%, 11/15/45 | 11/24 at 100.00 | 1,503,727 | |||||||||||
| 535 | Miami Beach Redevelopment Agency, Florida, Tax Increment Revenue Bonds, City Center/Historic Convention Village, Series 2015A, 5.000%, 2/01/44 - AGM Insured | 2/24 at 100.00 | 535,017 | |||||||||||
| 3,350 | Miami-Dade County, Florida, Water and Sewer System Revenue Bonds, Refunding Series 2017B, 5.000%, 10/01/32 | 10/25 at 100.00 | 3,391,033 | |||||||||||
| 510 | Putnam County Development Authority, Florida, Pollution Control Revenue Bonds, Seminole Electric Cooperatice, Inc. Project, Refunding Series 2018B, 5.000%, 3/15/42 | 5/28 at 100.00 | 490,887 | |||||||||||
| 805 | (d) | Tolomato Community Development District, Florida, Special Assessment Bonds, Refunding Series 2015-2, 0.000%, 5/01/40 | 12/23 at 100.00 | 749,123 | ||||||||||
| 880 | (e) | Tolomato Community Development District, Florida, Special Assessment Bonds, Refunding Series 2015-3, 6.610%, 5/01/40 | 12/23 at 100.00 | 9 | ||||||||||
| Total Florida | 9,602,937 | |||||||||||||
| NUW | Nuveen AMT-Free Municipal Value Fund (continued) Portfolio of Investments October 31, 2023 |
Principal Amount (000) | Description (a) | Optional Call Provisions (b) | Value | |||||||||||
Georgia - 2.6% | ||||||||||||||
| $ | 2,000 | Gainesville and Hall County Hospital Authority, Georgia, Revenue Anticipation Certificates, Northeast Georgia Health Services Inc., Series 2017B, 5.250%, 2/15/45 | 2/27 at 100.00 | $ | 2,019,789 | |||||||||
| 1,470 | Municipal Electric Authority of Georgia, Plant Vogtle Units 3 & 4 Project J Bonds, Series 2019A, 5.000%, 1/01/49 - BAM Insured | 7/28 at 100.00 | 1,431,020 | |||||||||||
| Municipal Electric Authority of Georgia, Project One Revenue Bonds, Subordinate Lien Series 2015A: | ||||||||||||||
| 1,790 | 0.000%, 1/01/32 | No Opt. Call | 1,179,963 | |||||||||||
| 2,000 | 5.000%, 1/01/35 | 1/25 at 100.00 | 1,989,652 | |||||||||||
| Total Georgia | 6,620,424 | |||||||||||||
Illinois - 10.2% | ||||||||||||||
| 2,000 | Chicago Board of Education, Illinois, Dedicated Capital Improvement Tax Revenue Bonds, Series 2016, 6.000%, 4/01/46 | 4/27 at 100.00 | 2,012,033 | |||||||||||
| 2,000 | Cook County, Illinois, Sales Tax Revenue Bonds, Series 2017, 5.000%, 11/15/38 | 11/27 at 100.00 | 2,012,185 | |||||||||||
| 1,800 | Evanston, Cook County, Illinois, General Obligation Bonds, Corporate Purpose Series 2019A, 5.000%, 12/01/43 | 12/29 at 100.00 | 1,794,392 | |||||||||||
| 7,500 | Illinois Finance Authority, Revenue Bonds, University of Chicago, Series 2023A, 5.250%, 5/15/54 | 5/33 at 100.00 | 7,708,613 | |||||||||||
| Illinois Finance Authority, State of Illinois Clean Water Initiative Revolving Fund Revenue Bonds, Series 2017: | ||||||||||||||
| 3,125 | 5.000%, 7/01/37 | 1/27 at 100.00 | 3,204,935 | |||||||||||
| 375 | (c) | 5.000%, 7/01/37, (Pre-refunded 1/01/27) | 1/27 at 100.00 | 387,594 | ||||||||||
| 1,500 | Illinois State, General Obligation Bonds, November Series 2017D, 5.000%, 11/01/27 | No Opt. Call | 1,537,373 | |||||||||||
| 525 | Illinois State, General Obligation Bonds, October Series 2016, 5.000%, 2/01/27 | No Opt. Call | 535,865 | |||||||||||
| 495 | Metropolitan Pier and Exposition Authority, Illinois, McCormick Place Expansion Project Bonds, Refunding Series 2020A, 4.000%, 6/15/50 | 12/29 at 100.00 | 385,334 | |||||||||||
| 11,420 | Metropolitan Pier and Exposition Authority, Illinois, Revenue Bonds, McCormick Place Expansion Project, Series 2002A, 0.000%, 12/15/37 - NPFG Insured | No Opt. Call | 5,471,233 | |||||||||||
| Will County Community Unit School District 201-U Crete-Monee, Illinois, General Obligation Bonds, Capital Appreciation Series 2004: | ||||||||||||||
| 340 | (c) | 0.000%, 11/01/23 - NPFG Insured, (ETM) | No Opt. Call | 340,000 | ||||||||||
| 330 | 0.000%, 11/01/23 - NPFG Insured | No Opt. Call | 330,000 | |||||||||||
| 300 | (c) | 0.000%, 11/01/23 - NPFG Insured, (ETM) | No Opt. Call | 300,000 | ||||||||||
| 50 | (c) | 0.000%, 11/01/23 - NPFG Insured, (ETM) | No Opt. Call | 50,000 | ||||||||||
| 25 | (c) | 0.000%, 11/01/23 - NPFG Insured, (ETM) | No Opt. Call | 25,000 | ||||||||||
| Total Illinois | 26,094,557 | |||||||||||||
Indiana - 0.6% | ||||||||||||||
| 1,500 | Indianapolis Local Public Improvement Bond Bank, Indiana, Series 1999E, 0.000%, 2/01/25 - AMBAC Insured | No Opt. Call | 1,420,923 | |||||||||||
| Total Indiana | 1,420,923 | |||||||||||||
Kentucky - 3.3% | ||||||||||||||
| 1,150 | Kenton County Airport Board, Kentucky, Airport Revenue Bonds, Cincinnati/Northern Kentucky International Airport, Refunding Series 2016, 5.000%, 1/01/29 | 1/26 at 100.00 | 1,167,985 | |||||||||||
Principal Amount (000) | Description (a) | Optional Call Provisions (b) | Value | |||||||||||
Kentucky | ||||||||||||||
| $ | 1,000 | Kentucky Bond Development Corporation, Transient Room Tax Revenue Bonds, Lexington Center Corporation Project, Series 2018A, 5.000%, 9/01/43 | 9/28 at 100.00 | $ | 945,469 | |||||||||
| 1,185 | Kentucky Economic Development Finance Authority, Louisville Arena Project Revenue Bonds, Louisville Arena Authority, Inc., Series 2017A, 5.000%, 12/01/47 - AGM Insured | 12/23 at 100.00 | 1,128,196 | |||||||||||
| 1,000 | Kentucky Economic Development Finance Authority, Revenue Bonds, CommonSpirit Health, Series 2019A-1, 5.000%, 8/01/32 | 8/29 at 100.00 | 1,023,256 | |||||||||||
| 3,750 | Kentucky Economic Development Finance Authority, Revenue Bonds, Next Generation Kentucky Information Highway Project, Senior Series 2015A, 5.000%, 1/01/45 | 7/25 at 100.00 | 3,404,477 | |||||||||||
| 1,080 | Kentucky Public Transportation Infrastructure Authority, Toll Revenue Bonds, Downtown Crossing Project, Refunding First Tier Series 2021B, 4.000%, 7/01/53 - AGM Insured | 7/31 at 100.00 | 839,270 | |||||||||||
| Total Kentucky | 8,508,653 | |||||||||||||
Maine - 0.9% | ||||||||||||||
| 2,425 | University of Maine, System Revenue Bonds, Series 2022, 5.000%, 3/01/47 | 3/32 at 100.00 | 2,372,621 | |||||||||||
| Total Maine | 2,372,621 | |||||||||||||
Maryland - 3.2% | ||||||||||||||
| 3,420 | Baltimore, Maryland, Convention Center Hotel Revenue Bonds, Refunding Series 2017, 5.000%, 9/01/33 | 9/27 at 100.00 | 3,190,451 | |||||||||||
| 5,000 | Maryland Health and Higher Educational Facilities Authority, Revenue Bonds, MedStar Health Issue, Series 2017A, 5.000%, 5/15/45 | 5/27 at 100.00 | 4,861,899 | |||||||||||
| Total Maryland | 8,052,350 | |||||||||||||
Michigan - 0.7% | ||||||||||||||
| 1,000 | Michigan Finance Authority, Distributable State Aid Revenue Bonds, Charter County of Wayne Criminal Justice Center Project, Senior Lien Series 2018, 5.000%, 11/01/43 | 11/28 at 100.00 | 1,007,813 | |||||||||||
| 850 | Michigan Finance Authority, Tobacco Settlement Asset- Backed Bonds, 2007 Sold Tobacco Receipts, Series 2020B-1-CL2, 5.000%, 6/01/49 | 12/30 at 100.00 | 833,133 | |||||||||||
| Total Michigan | 1,840,946 | |||||||||||||
Minnesota - 1.1% | ||||||||||||||
| 1,145 | Rochester, Minnesota, Electric Utility Revenue Bonds, Refunding Series 2017A, 5.000%, 12/01/47 | 12/26 at 100.00 | 1,131,002 | |||||||||||
| 700 | Southern Minnesota Municipal Power Agency, Badger Coulee Project Revenue Bonds, Series 2019A, 5.000%, 1/01/32 | 1/30 at 100.00 | 746,074 | |||||||||||
| 1,000 | University of Minnesota, General Obligation Bonds, Series 2017A, 5.000%, 9/01/36 | 9/27 at 100.00 | 1,028,233 | |||||||||||
| Total Minnesota | 2,905,309 | |||||||||||||
Montana - 0.8% | ||||||||||||||
| Montana Facility Finance Authority, Montana, Health Facilities Reveue Bonds, Bozeman Deaconess Health Services Obligated Group, Series 2021A: | ||||||||||||||
| 500 | 5.000%, 6/01/31 | No Opt. Call | 512,832 | |||||||||||
| 640 | 4.000%, 6/01/38 | 6/31 at 100.00 | 559,073 | |||||||||||
| 1,245 | 4.000%, 6/01/40 | 6/31 at 100.00 | 1,064,153 | |||||||||||
| Total Montana | 2,136,058 | |||||||||||||
| NUW | Nuveen AMT-Free Municipal Value Fund (continued) Portfolio of Investments October 31, 2023 |
Principal Amount (000) | Description (a) | Optional Call Provisions (b) | Value | |||||||||||
Nevada - 5.5% | ||||||||||||||
| $ | 3,000 | Clark County, Nevada, General Obligation Bonds, Transportation Improvement, Limited Tax, Additionally Secured by Pledged Revenue Series 2018B, 5.000%, 12/01/33 | 12/28 at 100.00 | $ | 3,138,660 | |||||||||
| 4,000 | Las Vegas Convention and Visitors Authority, Nevada, Revenue Bonds, Series 2018C, 5.250%, 7/01/43 | 7/28 at 100.00 | 4,059,862 | |||||||||||
| Las Vegas Convention and Visitors Authority, Nevada, Revenue Bonds, Series 2019B: | ||||||||||||||
| 3,015 | 5.000%, 7/01/36 | 7/29 at 100.00 | 3,116,101 | |||||||||||
| 1,665 | 5.000%, 7/01/37 | 7/29 at 100.00 | 1,707,725 | |||||||||||
| 2,000 | Las Vegas Valley Water District, Nevada, General Obligation Bonds, Refunding Series 2015, 5.000%, 6/01/39 | 12/24 at 100.00 | 2,008,772 | |||||||||||
| 60 | Sparks, Nevada, Sales Tax Revenue Bonds, Tourism Improvement District 1 Legends at Sparks Marina, Refunding Senior Series 2019A, 2.750%, 6/15/28, 144A | No Opt. Call | 54,440 | |||||||||||
| Total Nevada | 14,085,560 | |||||||||||||
New Jersey - 6.8% | ||||||||||||||
| Camden County Improvement Authority, New Jersey, Health Care Redevelopment Revenue Bonds, Cooper Health System Obligated Group Issue, Refunding Series 2014A: | ||||||||||||||
| 105 | (c) | 5.000%, 2/15/25, (Pre-refunded 2/15/24) | 2/24 at 100.00 | 105,250 | ||||||||||
| 100 | (c) | 5.000%, 2/15/34, (Pre-refunded 2/15/24) | 2/24 at 100.00 | 100,238 | ||||||||||
| 110 | Camden County Improvement Authority, New Jersey, Lease Revenue Bonds, Rowan University School of Osteopathic Medicine Project, Refunding Series 2013A, 5.000%, 12/01/32 | 12/23 at 100.00 | 108,491 | |||||||||||
| 80 | Cumberland County Improvement Authority, New Jersey, Guaranteed Lease Revenue Bonds, County Correctional Facility Project, Series 2018, 4.000%, 10/01/43 - BAM Insured | 10/28 at 100.00 | 68,133 | |||||||||||
| Delaware River Port Authority, New Jersey and Pennsylvania, Revenue Bonds, Series 2018A: | ||||||||||||||
| 175 | 5.000%, 1/01/37 | 1/29 at 100.00 | 180,794 | |||||||||||
| 125 | 5.000%, 1/01/38 | 1/29 at 100.00 | 128,035 | |||||||||||
| 245 | Garden State Preservation Trust, New Jersey, Open Space and Farmland Preservation Bonds, Series 2005A, 5.750%, 11/01/28 - AGM Insured | No Opt. Call | 255,754 | |||||||||||
| Harrison, New Jersey, General Obligation Bonds, Parking Utility Series 2018: | ||||||||||||||
| 35 | 3.125%, 3/01/31 - BAM Insured | 3/28 at 100.00 | 31,671 | |||||||||||
| 30 | 3.250%, 3/01/32 - BAM Insured | 3/28 at 100.00 | 27,041 | |||||||||||
| 50 | 3.500%, 3/01/36 - BAM Insured | 3/28 at 100.00 | 43,635 | |||||||||||
| 150 | Hudson County Improvement Authority, New Jersey, County Secured Lease Revenue Bonds, Hudson County Vocational Technical Schools Project, Series 2016, 5.250%, 5/01/51 | 5/26 at 100.00 | 150,970 | |||||||||||
| 100 | Jersey City, New Jersey, General Obligation Bonds, Refunding General Improvement Series 2017A, 5.000%, 11/01/29 | 11/27 at 100.00 | 104,203 | |||||||||||
| 100 | (e) | Middlesex County Improvement Authority, New Jersey, Senior Revenue Bonds, Heldrich Center Hotel/Conference Center Project, Series 2005A, 5.000%, 1/01/32 | 12/23 at 100.00 | 69,607 | ||||||||||
| 125 | Middlesex County, New Jersey, General Obligation Bonds, Refunding Redevelopment Series 2017, 5.000%, 1/15/27 | No Opt. Call | 129,983 | |||||||||||
| 20 | Montclair Township, Essex County, New Jersey, General Obligation Bonds, Refunding Parking Utility Series 2014A, 5.000%, 1/01/37 | 1/24 at 100.00 | 20,016 | |||||||||||
Principal Amount (000) | Description (a) | Optional Call Provisions (b) | Value | |||||||||||
New Jersey | ||||||||||||||
| $ | 100 | Montclair Township, Essex County, New Jersey, General Obligation Bonds, Refunding School Series 2017B, 4.000%, 3/01/25 | No Opt. Call | $ | 100,281 | |||||||||
| New Brunswick Parking Authority, Middlesex County, New Jersey, Guaranteed Parking Revenue Bonds, Refunding Series 2016A: | ||||||||||||||
| 300 | 5.000%, 9/01/32 - BAM Insured | 9/26 at 100.00 | 305,633 | |||||||||||
| 140 | 5.000%, 9/01/39 - BAM Insured | 9/26 at 100.00 | 140,298 | |||||||||||
| 25 | New Jersey Economic Development Authority, Charter School Revenue Bonds, Foundation Academy Charter School, Series 2018A, 5.000%, 7/01/38 | 1/28 at 100.00 | 23,209 | |||||||||||
| New Jersey Economic Development Authority, Charter School Revenue Bonds, North Star Academy Charter School of Newark, Series 2017: | ||||||||||||||
| 220 | 4.000%, 7/15/37 | 7/27 at 100.00 | 191,990 | |||||||||||
| 25 | 5.000%, 7/15/47 | 7/27 at 100.00 | 22,779 | |||||||||||
| 100 | New Jersey Economic Development Authority, Charter School Revenue Bonds, Teaneck Community Charter School, Series 2017A, 5.125%, 9/01/52, 144A | 9/27 at 100.00 | 82,406 | |||||||||||
| 35 | New Jersey Economic Development Authority, Fixed Rate Revenue Bonds, Lions Gate Project, Series 2014, 5.250%, 1/01/44 | 1/24 at 100.00 | 30,014 | |||||||||||
| 100 | New Jersey Economic Development Authority, Lease Revenue Bonds, State House Project, Series 2017B, 4.500%, 6/15/40 | 12/28 at 100.00 | 93,367 | |||||||||||
| 215 | New Jersey Economic Development Authority, Natural Gas Facilities Revenue Bonds, New Jersey Natural Gas Company Project, Refunding Series 2011A, 2.750%, 8/01/39 | 8/24 at 100.00 | 153,158 | |||||||||||
| 125 | New Jersey Economic Development Authority, Revenue Bonds, Motor Vehicle Surcharge, Refunding Subordinate Series 2017A, 3.375%, 7/01/30 | 7/27 at 100.00 | 112,630 | |||||||||||
| 55 | New Jersey Economic Development Authority, Revenue Bonds, Provident Group - Kean Properties LLC - Kean University Student Housing Project, Series 2017A, 5.000%, 7/01/47 | 1/27 at 100.00 | 46,800 | |||||||||||
| 100 | New Jersey Economic Development Authority, Revenue Bonds, Provident Group - Rowan Properties LLC - Rowan University Student Housing Project, Series 2015A, 5.000%, 1/01/48 | 1/25 at 100.00 | 83,749 | |||||||||||
| 115 | New Jersey Economic Development Authority, Revenue Bonds, The Seeing Eye Inc., Refunding Series 2015, 5.000%, 3/01/25 | No Opt. Call | 116,383 | |||||||||||
| New Jersey Economic Development Authority, Revenue Bonds, The Seeing Eye Inc., Refunding Series 2017: | ||||||||||||||
| 20 | 3.000%, 6/01/32 | 12/27 at 100.00 | 17,334 | |||||||||||
| 15 | 5.000%, 6/01/32 | 12/27 at 100.00 | 15,203 | |||||||||||
| 40 | (c) | New Jersey Economic Development Authority, Revenue Bonds, United Methodist Homes of New Jersey Obligated Group Issue, Refunding Series 2014A, 5.000%, 7/01/29, (Pre-refunded 7/01/24) | 7/24 at 100.00 | 40,154 | ||||||||||
| 155 | New Jersey Economic Development Authority, Revenue Bonds, West Campus Housing LLC - New Jersey City University Student Housing Project, Series 2015, 5.000%, 7/01/47 | 7/25 at 100.00 | 119,246 | |||||||||||
| 100 | New Jersey Economic Development Authority, Revenue Bonds, White Horse HMT Urban Renewal LLC Project, Series 2020, 5.000%, 1/01/40, 144A | 1/28 at 102.00 | 66,445 | |||||||||||
| 935 | New Jersey Economic Development Authority, School Facilities Construction Bonds, Series 2005N-1, 5.500%, 9/01/27 - NPFG Insured | No Opt. Call | 986,216 | |||||||||||
| 15 | New Jersey Economic Development Authority, School Facilities Construction Bonds, Social Series 2021QQQ, 4.000%, 6/15/50 | 12/30 at 100.00 | 12,340 | |||||||||||
| 145 | New Jersey Educational Facilities Authority, Revenue Bonds, College of New Jersey, Refunding Series 2016F, 3.000%, 7/01/40 | 7/26 at 100.00 | 104,148 | |||||||||||
| NUW | Nuveen AMT-Free Municipal Value Fund (continued) Portfolio of Investments October 31, 2023 |
Principal Amount (000) | Description (a) | Optional Call Provisions (b) | Value | |||||||||||
New Jersey | ||||||||||||||
| $ | 100 | New Jersey Educational Facilities Authority, Revenue Bonds, Kean University, Refunding Series 2015H, 4.000%, 7/01/39 - AGM Insured | 7/25 at 100.00 | $ | 86,470 | |||||||||
| 50 | New Jersey Educational Facilities Authority, Revenue Bonds, Montclair State University, Series 2014A, 5.000%, 7/01/44 | 7/24 at 100.00 | 48,677 | |||||||||||
| New Jersey Educational Facilities Authority, Revenue Bonds, Rider University, Series 2017F: | ||||||||||||||
| 5 | 3.750%, 7/01/37 | 7/27 at 100.00 | 3,613 | |||||||||||
| 100 | 4.000%, 7/01/42 | 7/27 at 100.00 | 68,601 | |||||||||||
| 100 | 5.000%, 7/01/47 | 7/27 at 100.00 | 76,933 | |||||||||||
| 75 | New Jersey Educational Facilities Authority, Revenue Bonds, Seton Hall University, Series 2013D, 5.000%, 7/01/38 | 12/23 at 100.00 | 73,711 | |||||||||||
| New Jersey Educational Facilities Authority, Revenue Bonds, Seton Hall University, Series 2016C: | ||||||||||||||
| 435 | 3.000%, 7/01/41 | 7/26 at 100.00 | 299,324 | |||||||||||
| 50 | 3.000%, 7/01/46 | 7/26 at 100.00 | 31,674 | |||||||||||
| 25 | 4.000%, 7/01/46 | 7/26 at 100.00 | 19,412 | |||||||||||
| New Jersey Educational Facilities Authority, Revenue Bonds, Stevens Institute of Technology, Series 2017A: | ||||||||||||||
| 200 | 4.000%, 7/01/47 | 7/27 at 100.00 | 155,113 | |||||||||||
| 30 | 5.000%, 7/01/47 | 7/27 at 100.00 | 27,483 | |||||||||||
| 25 | New Jersey Educational Facilities Authority, Revenue Bonds, The College of Saint Elizabeth, Series 2016D, 5.000%, 7/01/46 | 7/26 at 100.00 | 20,379 | |||||||||||
| 80 | New Jersey Health Care Facilities Financing Authority, Revenue Bonds, AHS Hospital Corporation, Refunding Series 2016, 4.000%, 7/01/41 | 1/27 at 100.00 | 72,084 | |||||||||||
| 230 | New Jersey Health Care Facilities Financing Authority, Revenue Bonds, Barnabas Health, Refunding Series 2014A, 5.000%, 7/01/44 | 7/24 at 100.00 | 225,055 | |||||||||||
| New Jersey Health Care Facilities Financing Authority, Revenue Bonds, Hackensack Meridian Health Obligated Group, Refunding Series 2017A: | ||||||||||||||
| 150 | 5.000%, 7/01/28 | 7/27 at 100.00 | 155,834 | |||||||||||
| 150 | 5.000%, 7/01/57 | 7/27 at 100.00 | 141,581 | |||||||||||
| 110 | New Jersey Health Care Facilities Financing Authority, Revenue Bonds, Hunterdon Medical Center, Refunding Series 2014A, 4.000%, 7/01/45 | 7/24 at 100.00 | 89,097 | |||||||||||
| 50 | New Jersey Health Care Facilities Financing Authority, Revenue Bonds, Inspira Health Obligated Group Issue, Refunding Series 2016A, 4.000%, 7/01/41 | 7/26 at 100.00 | 42,068 | |||||||||||
| 360 | New Jersey Health Care Facilities Financing Authority, Revenue Bonds, Inspira Health Obligated Group Issue, Series 2017A, 5.000%, 7/01/42 | 7/27 at 100.00 | 348,066 | |||||||||||
| New Jersey Health Care Facilities Financing Authority, Revenue Bonds, Princeton HealthCare System, Series 2016A: | ||||||||||||||
| 25 | 5.000%, 7/01/32 | 7/26 at 100.00 | 25,521 | |||||||||||
| 40 | 5.000%, 7/01/33 | 7/26 at 100.00 | 40,796 | |||||||||||
| 30 | 5.000%, 7/01/34 | 7/26 at 100.00 | 30,554 | |||||||||||
| 130 | New Jersey Health Care Facilities Financing Authority, Revenue Bonds, Robert Wood Johnson University Hospital Issue, Series 2014A, 5.000%, 7/01/39 | 7/24 at 100.00 | 128,773 | |||||||||||
| 110 | New Jersey Health Care Facilities Financing Authority, Revenue Bonds, Robert Wood Johnson University Hospital, Series 2013A, 5.500%, 7/01/43 | 12/23 at 100.00 | 110,010 | |||||||||||
| 125 | New Jersey Health Care Facilities Financing Authority, Revenue Bonds, RWJ Barnabas Health Obligated Group, Refunding Series 2016A, 5.000%, 7/01/43 | 7/26 at 100.00 | 123,671 | |||||||||||
Principal Amount (000) | Description (a) | Optional Call Provisions (b) | Value | |||||||||||
New Jersey | ||||||||||||||
| New Jersey Health Care Facilities Financing Authority, Revenue Bonds, Saint Joseph’s Healthcare System Obligated Group Issue, Refunding Series 2016: | ||||||||||||||
| $ | 10 | 3.000%, 7/01/32 | 7/26 at 100.00 | $ | 8,093 | |||||||||
| 405 | 4.000%, 7/01/48 | 7/26 at 100.00 | 313,052 | |||||||||||
| New Jersey Health Care Facilities Financing Authority, Revenue Bonds, University Hospital Issue, Refunding Series 2015A: | ||||||||||||||
| 130 | 4.125%, 7/01/38 - AGM Insured | 7/25 at 100.00 | 121,770 | |||||||||||
| 110 | 5.000%, 7/01/46 - AGM Insured | 7/25 at 100.00 | 108,214 | |||||||||||
| New Jersey Health Care Facilities Financing Authority, Revenue Bonds, Valley Health System Obligated Group, Series 2019: | ||||||||||||||
| 50 | 4.000%, 7/01/44 | 7/29 at 100.00 | 40,696 | |||||||||||
| 205 | 3.000%, 7/01/49 | 7/29 at 100.00 | 133,022 | |||||||||||
| 50 | (e) | New Jersey Health Care Facilities Financing Authority, Revenue Bonds, Village Drive Healthcare Urban Renewal LLC, Series 2018, 5.750%, 10/01/38, 144A | 10/26 at 102.00 | 36,212 | ||||||||||
| 120 | New Jersey Housing and Mortgage Finance Agency, Multifamily Revenue Bonds, Series 2015A, 4.000%, 11/01/45 | 11/24 at 100.00 | 96,724 | |||||||||||
| 270 | New Jersey Housing and Mortgage Finance Agency, Multifamily Revenue Bonds, Series 2016B, 3.600%, 11/01/40 | 11/25 at 100.00 | 222,623 | |||||||||||
| 435 | New Jersey Housing and Mortgage Finance Agency, Multifamily Revenue Bonds, Series 2018A, 3.875%, 11/01/38 | 11/27 at 100.00 | 368,674 | |||||||||||
| 100 | New Jersey Housing and Mortgage Finance Agency, Multifamily Revenue Bonds, Series 2019A, 2.900%, 11/01/39 | 11/28 at 100.00 | 74,708 | |||||||||||
| New Jersey Housing and Mortgage Finance Agency, Single Family Housing Revenue Bonds, Series 2018A: | ||||||||||||||
| 125 | 3.600%, 4/01/33 | 10/27 at 100.00 | 116,310 | |||||||||||
| 75 | 3.750%, 10/01/35 | 10/27 at 100.00 | 66,331 | |||||||||||
| 665 | New Jersey Housing and Mortgage Finance Agency, Single Family Housing Revenue Bonds, Series 2019C, 3.950%, 10/01/44 | 4/28 at 100.00 | 551,004 | |||||||||||
| 235 | New Jersey Housing and Mortgage Finance Agency, Single Family Housing Revenue Bonds, Series 2020E, 2.250%, 10/01/40 | 4/29 at 100.00 | 157,564 | |||||||||||
| 200 | New Jersey Institute of Technology, New Jersey, General Obligation Bonds, Series 2015A, 5.000%, 7/01/45 | 7/25 at 100.00 | 200,519 | |||||||||||
| 70 | New Jersey State, General Obligation Bonds, Covid-19 Emergency Series 2020A, 4.000%, 6/01/32 | No Opt. Call | 69,401 | |||||||||||
| 100 | New Jersey State, General Obligation Bonds, Various Purpose Series 2020, 2.250%, 6/01/35 | 12/27 at 100.00 | 74,695 | |||||||||||
| 5,020 | New Jersey Transportation Trust Fund Authority, Transportation System Bonds, Capital Appreciation Series 2010A, 0.000%, 12/15/31 | No Opt. Call | 3,448,614 | |||||||||||
| 2,170 | New Jersey Transportation Trust Fund Authority, Transportation System Bonds, Series 2009A, 0.000%, 12/15/39 | No Opt. Call | 916,749 | |||||||||||
| 255 | New Jersey Transportation Trust Fund Authority, Transportation System Bonds, Series 2015AA, 5.250%, 6/15/41 | 6/25 at 100.00 | 255,207 | |||||||||||
| 50 | New Jersey Transportation Trust Fund Authority, Transportation System Bonds, Series 2019A, 4.000%, 12/15/39 | 12/29 at 100.00 | 44,745 | |||||||||||
| New Jersey Transportation Trust Fund Authority, Transportation System Bonds, Series 2019BB: | ||||||||||||||
| 225 | 3.500%, 6/15/46 | 12/28 at 100.00 | 173,091 | |||||||||||
| 100 | 4.000%, 6/15/50 | 12/28 at 100.00 | 83,141 | |||||||||||
| NUW | Nuveen AMT-Free Municipal Value Fund (continued) Portfolio of Investments October 31, 2023 |
Principal Amount (000) | Description (a) | Optional Call Provisions (b) | Value | |||||||||||
New Jersey | ||||||||||||||
| New Jersey Transportation Trust Fund Authority, Transportation System Bonds, Series 2020AA: | ||||||||||||||
| $ | 40 | 3.000%, 6/15/50 | 12/30 at 100.00 | $ | 26,206 | |||||||||
| 30 | 4.000%, 6/15/50 | 12/30 at 100.00 | 24,942 | |||||||||||
| 70 | 5.000%, 6/15/50 | 12/30 at 100.00 | 68,243 | |||||||||||
| 255 | New Jersey Turnpike Authority, Revenue Bonds, Refunding Series 2015E, 5.000%, 1/01/45 | 1/25 at 100.00 | 247,708 | |||||||||||
| 200 | Ocean City, New Jersey, General Obligation Bonds, General Improvement Series 2019, 2.250%, 9/15/33 | 9/26 at 100.00 | 157,485 | |||||||||||
| 300 | Salem County Pollution Control Financing Authority, New Jersey, Revenue Bonds, Atlantic City Electric Company Project, Refunding Series 2020, 2.250%, 6/01/29 | No Opt. Call | 255,279 | |||||||||||
| 250 | South Jersey Transportation Authority, New Jersey, Transportation System Revenue Bonds, Refunding Series 2019A, 5.000%, 11/01/31 - AGM Insured | 11/29 at 100.00 | 258,127 | |||||||||||
| 30 | South Jersey Transportation Authority, New Jersey, Transportation System Revenue Bonds, Series 2020A, 5.000%, 11/01/45 | 11/30 at 100.00 | 28,482 | |||||||||||
| 125 | Sussex County, New Jersey, General Obligation Bonds, Series 2019, 3.000%, 6/01/27 | 6/26 at 100.00 | 119,512 | |||||||||||
| Tobacco Settlement Financing Corporation, New Jersey, Tobacco Settlement Asset-Backed Bonds, Series 2018A: | ||||||||||||||
| 215 | 4.000%, 6/01/37 | 6/28 at 100.00 | 200,370 | |||||||||||
| 305 | 5.250%, 6/01/46 | 6/28 at 100.00 | 299,838 | |||||||||||
| 450 | Tobacco Settlement Financing Corporation, New Jersey, Tobacco Settlement Asset-Backed Bonds, Series 2018B, 5.000%, 6/01/46 | 6/28 at 100.00 | 417,793 | |||||||||||
| 535 | Union County Improvement Authority, New Jersey, General Obligation Lease Bonds, Juvenile Detention Center Facility Project, Refunding Series 2015A, 5.500%, 5/01/30 | No Opt. Call | 588,294 | |||||||||||
| 170 | Union County Utilities Authority, New Jersey, Solid Waste System County Deficiency Revenue Bonds, Series 2011A, 5.000%, 6/15/41 | 12/23 at 100.00 | 170,025 | |||||||||||
| Total New Jersey | 17,375,567 | |||||||||||||
New York - 6.8% | ||||||||||||||
| 500 | Dormitory Authority of the State of New York, Revenue Bonds, School Districts Financing Program, Series 2021A, 5.000%, 10/01/32 - AGM Insured | 10/29 at 100.00 | 527,170 | |||||||||||
| 3,000 | Liberty Development Corporation, New York, Goldman Sachs Headquarters Revenue Bonds Series 2007, 5.500%, 10/01/37 | No Opt. Call | 3,118,661 | |||||||||||
| 1,500 | Long Island Power Authority, New York, Electric System General Revenue Bonds, Series 2017, 5.000%, 9/01/42 | 9/27 at 100.00 | 1,502,876 | |||||||||||
| 2,050 | Long Island Power Authority, New York, Electric System General Revenue Bonds, Series 2018, 5.000%, 9/01/39 | 9/28 at 100.00 | 2,086,141 | |||||||||||
| 1,390 | Metropolitan Transportation Authority, New York, Transportation Revenue Bonds, Green Climate Bond Certified Series 2020C-1, 5.000%, 11/15/50 | 5/30 at 100.00 | 1,323,902 | |||||||||||
| 750 | Metropolitan Transportation Authority, New York, Transportation Revenue Bonds, Refunding Green Climate Certified Series 2020E, 5.000%, 11/15/30 | No Opt. Call | 770,695 | |||||||||||
| New York City Transitional Finance Authority, New York, Future Tax Secured Bonds, Subordinate Fiscal Series 2024A-1: | ||||||||||||||
| 1,450 | 4.000%, 5/01/53 | 5/33 at 100.00 | 1,203,166 | |||||||||||
| 1,510 | 5.000%, 5/01/53 | 5/33 at 100.00 | 1,498,156 | |||||||||||
Principal Amount (000) | Description (a) | Optional Call Provisions (b) | Value | |||||||||||
New York | ||||||||||||||
| $ | 1,230 | New York City, New York, General Obligation Bonds, Fiscal 2021 Series C, 5.000%, 8/01/42 | 8/30 at 100.00 | $ | 1,246,601 | |||||||||
| 315 | Port Authority of New York and New Jersey, Consolidated Revenue Bonds, One Hundred Seventy Ninth Series 2013, 5.000%, 12/01/43 | 12/23 at 100.00 | 315,371 | |||||||||||
| 1,000 | Suffolk Tobacco Asset Securitization Corporation, New York, Tobacco Settlement Asset-Backed Bonds, Senior Series 2021A-2, 5.000%, 6/01/31 | No Opt. Call | 1,045,762 | |||||||||||
| 3,000 | Triborough Bridge and Tunnel Authority, New York, Payroll Mobility Tax Bonds, Senior Lien Subseries 2021A-1, 2.000%, 5/15/45, (Mandatory Put 5/15/26) | No Opt. Call | 2,793,487 | |||||||||||
| Total New York | 17,431,988 | |||||||||||||
North Carolina - 1.1% | ||||||||||||||
| 1,000 | North Carolina Capital Facilities Finance Agency, Revenue Bonds, Duke University Project, Refunding Series 2016B, 5.000%, 7/01/42 | 10/26 at 100.00 | 1,004,106 | |||||||||||
| North Carolina Turnpike Authority, Triangle Expressway System Revenue Bonds, Refunding Senior Lien Series 2017: | ||||||||||||||
| 1,095 | 5.000%, 1/01/31 - AGM Insured | 1/27 at 100.00 | 1,123,530 | |||||||||||
| 700 | 5.000%, 1/01/32 | 1/27 at 100.00 | 709,798 | |||||||||||
| Total North Carolina | 2,837,434 | |||||||||||||
Ohio - 4.2% | ||||||||||||||
| 570 | Buckeye Tobacco Settlement Financing Authority, Ohio, Tobacco Settlement Asset-Backed Revenue Bonds, Refunding Senior Lien Series 2020A-2 Class 1, 4.000%, 6/01/48 | 6/30 at 100.00 | 456,201 | |||||||||||
| 8,580 | Buckeye Tobacco Settlement Financing Authority, Ohio, Tobacco Settlement Asset-Backed Revenue Bonds, Refunding Senior Lien Series 2020B-2 Class 2, 5.000%, 6/01/55 | 6/30 at 100.00 | 7,028,690 | |||||||||||
| 3,095 | Central Ohio Transit Authority, Ohio, General Obligation Bonds, Capital Facilities Limited Tax Series 2023, 5.000%, 12/01/48 | 12/33 at 100.00 | 3,119,268 | |||||||||||
| Total Ohio | 10,604,159 | |||||||||||||
Oklahoma - 0.2% | ||||||||||||||
| 500 | Oklahoma Development Finance Authority, Health System Revenue Bonds, OU Medicine Project, Series 2018B, 5.500%, 8/15/57 | 8/28 at 100.00 | 427,598 | |||||||||||
| Total Oklahoma | 427,598 | |||||||||||||
Pennsylvania - 4.3% | ||||||||||||||
| 160 | Adams County, Pennsylvania, General Obligation Bonds, Series 2017B, 2.500%, 11/15/29 | 11/25 at 100.00 | 141,196 | |||||||||||
| 50 | Allegheny County Higher Education Building Authority, Pennsylvania, Revenue Bonds, Robert Morris University, Series 2017, 5.000%, 10/15/37 | 10/27 at 100.00 | 45,473 | |||||||||||
| 465 | Allegheny County Hospital Development Authority, Pennsylvania, Revenue Bonds, Allegheny Health Network Obligated Group Issue, Series 2018A, 4.000%, 4/01/44 | 4/28 at 100.00 | 365,212 | |||||||||||
| 115 | Allegheny County Hospital Development Authority, Pennsylvania, Revenue Bonds, University of Pittsburgh Medical Center, Series 2019A, 4.000%, 7/15/35 | 7/29 at 100.00 | 108,118 | |||||||||||
| 220 | (c) | Allegheny County, Pennsylvania, General Obligation Bonds, Series 2013C-72, 5.250%, 12/01/32,(Pre-refunded 12/01/23) | 12/23 at 100.00 | 220,239 | ||||||||||
| 230 | Allentown Neighborhood Improvement Zone Development Authority, Pennsylvania, Tax Revenue Bonds, City Center Refunding Project, Series 2017, 5.000%, 5/01/42, 144A | 5/27 at 100.00 | 210,758 | |||||||||||
| 105 | Avon Grove School District, Chester County, Pennsylvania, General Obligation Bonds, Series 2021A, 4.000%, 11/15/37 | 5/29 at 100.00 | 94,820 | |||||||||||
| NUW | Nuveen AMT-Free Municipal Value Fund (continued) Portfolio of Investments October 31, 2023 |
Principal Amount (000) | Description (a) | Optional Call Provisions (b) | Value | |||||||||||
Pennsylvania | ||||||||||||||
| $ | 380 | Berks County Industrial Development Authority, Pennsylvania, Health System Revenue Bonds, Tower Health Project, Series 2017, 5.000%, 11/01/50 | 11/27 at 100.00 | $ | 207,306 | |||||||||
| 155 | Berks County Industrial Development Authority, Pennsylvania, Healthcare Facilities Revenue Bonds, Highlands at Wyomissing, Series 2017A, 5.000%, 5/15/42 | 5/27 at 100.00 | 133,293 | |||||||||||
| 15 | Berks County Municipal Authority, Pennsylvania, Revenue Bonds, Alvernia University Project, Series 2020, 5.000%, 10/01/39 | 10/29 at 100.00 | 13,098 | |||||||||||
| 125 | Bethel Park School District, Allegheny County, Pennsylvania, General Obligation Bonds, Refunding Series 2016, 4.000%, 8/01/33 | 8/26 at 100.00 | 123,006 | |||||||||||
| 45 | Boyertown Area School District, Berks and Montgomery Counties, Pennsylvania, General Obligation Bonds, Series 2015, 5.000%, 10/01/38 | 4/24 at 100.00 | 45,140 | |||||||||||
| 155 | Bucks County Industrial Development Authority, Pennsylvania, Hospital Revenue Bonds, Saint Luke’s University Health Network Project, Series 2021, 3.000%, 8/15/53 | 8/30 at 100.00 | 91,009 | |||||||||||
| 70 | Bucks County Industrial Development Authority, Pennsylvania, Revenue Bonds, School Lane Charter School Project, Series 2016, 5.125%, 3/15/36 | 3/27 at 100.00 | 67,733 | |||||||||||
| 20 | Bucks County Water and Sewer Authority, Pennsylvania, Water System Revenue Bonds, Series 2020, 2.125%, 12/01/45 | 12/28 at 100.00 | 11,204 | |||||||||||
| 115 | Canon-McMillan School District, Washington County, Pennsylvania, General Obligation Bonds, Series 2014D, 5.000%, 12/15/39 | 12/24 at 100.00 | 115,184 | |||||||||||
| 100 | (c) | Centre County Hospital Authority, Pennsylvania, Hospital Revenue Bonds, Mount Nittany Medical Center Project, Series 2016A, 5.000%, 11/15/46, (Pre-refunded 11/15/25) | 11/25 at 100.00 | 102,220 | ||||||||||
| 75 | Chester County Health and Education Facilities Authority, Pennsylvania, Health System Revenue Bonds, Main Line Health System, Series 2017A, 4.000%, 10/01/37 | 10/27 at 100.00 | 66,376 | |||||||||||
| 190 | Chester County Health and Education Facilities Authority, Pennsylvania, Health System Revenue Bonds, Main Line Health System, Series 2020A, 4.000%, 9/01/50 | 9/30 at 100.00 | 151,794 | |||||||||||
| 35 | Chester County Health and Education Facilities Authority, Pennsylvania, Revenue Bonds, Simpson Senior Services Project, Series 2019, 5.000%, 12/01/51 | 12/25 at 103.00 | 22,661 | |||||||||||
| 20 | Chester County Industrial Development Authority, Pennsylvania, Avon Grove Charter School Revenue Bonds, Series 2017A, 5.000%, 12/15/47 | 12/27 at 100.00 | 17,001 | |||||||||||
| 15 | Chester County Industrial Development Authority, Pennsylvania, Student Housing Revenue Bonds, University Student Housing, LLC Project at West Chester University Series 2013A, 5.000%, 8/01/45 | 12/23 at 100.00 | 12,945 | |||||||||||
| 35 | Clarion County Industrial Development Authority, Pennsylvania, Revenue Bonds, Clarion University Foundation Inc. Student Housing Project at Clarion University, Series 2014A, 5.000%, 7/01/45 | 7/24 at 100.00 | 33,370 | |||||||||||
| 100 | Colonial School District, Montgomery County, Pennsylvania, General Obligation Bonds, Series 2020, 5.000%, 2/15/44 | 2/27 at 100.00 | 101,626 | |||||||||||
| Commonwealth Financing Authority, Pennsylvania, State Appropriation Lease Bonds, Master Settlement, Series 2018: | ||||||||||||||
| 40 | 5.000%, 6/01/33 | 6/28 at 100.00 | 40,924 | |||||||||||
| 355 | 4.000%, 6/01/39 - AGM Insured | 6/28 at 100.00 | 318,037 | |||||||||||
| 70 | Cumberland County Municipal Authority, Pennsylvania, Revenue Bonds, Asbury Pennsylvania Obligated Group, Refunding Series 2019, 5.000%, 1/01/45 | 1/25 at 104.00 | 54,914 | |||||||||||
Principal Amount (000) | Description (a) | Optional Call Provisions (b) | Value | |||||||||||
Pennsylvania | ||||||||||||||
| Cumberland County Municipal Authority, Pennsylvania, Revenue Bonds, Diakon Lutheran Social Ministries Project, Series 2015: | ||||||||||||||
| $ | 60 | (c) | 4.000%, 1/01/33, (Pre-refunded 1/01/25) | 1/25 at 100.00 | $ | 59,983 | ||||||||
| 45 | 4.000%, 1/01/33 | 1/25 at 100.00 | 40,309 | |||||||||||
| 20 | (c) | 4.000%, 1/01/33, (Pre-refunded 1/01/25) | 1/25 at 100.00 | 19,994 | ||||||||||
| 65 | 5.000%, 1/01/38 | 1/25 at 100.00 | 61,155 | |||||||||||
| 55 | (c) | 5.000%, 1/01/38, (Pre-refunded 1/01/25) | 1/25 at 100.00 | 55,603 | ||||||||||
| 15 | (c) | 5.000%, 1/01/38, (Pre-refunded 1/01/25) | 1/25 at 100.00 | 15,165 | ||||||||||
| 100 | Cumberland County Municipal Authority, Pennsylvania, Revenue Bonds, Diakon Lutheran Social Ministries Project, Series 2016, 5.000%, 1/01/29 | 1/26 at 100.00 | 99,053 | |||||||||||
| Cumberland County Municipal Authority, Pennsylvania, Revenue Bonds, Diakon Lutheran Social Ministries Project, Series 2019A: | ||||||||||||||
| 25 | 4.125%, 1/01/38 | 1/29 at 100.00 | 21,185 | |||||||||||
| 20 | (c) | 5.000%, 1/01/39, (Pre-refunded 1/01/29) | 1/29 at 100.00 | 21,092 | ||||||||||
| 5 | (c) | 5.000%, 1/01/39, (Pre-refunded 1/01/29) | 1/29 at 100.00 | 5,273 | ||||||||||
| 5 | 5.000%, 1/01/39 | 1/29 at 100.00 | 4,605 | |||||||||||
| 100 | Cumberland County Municipal Authority, Pennsylvania, Revenue Bonds, Dickinson College Project, Second Series 2017A, 5.000%, 11/01/39 | 11/27 at 100.00 | 101,454 | |||||||||||
| 200 | Cumberland County Municipal Authority, Pennsylvania, Revenue Bonds, Penn State Health, Series 2019, 4.000%, 11/01/44 | 11/29 at 100.00 | 163,775 | |||||||||||
| 30 | Dallas Area Municipal Authority, Pennsylvania, Revenue Bonds, Misericordia University Project, Series 2019, 5.000%, 5/01/48 | 5/29 at 100.00 | 24,490 | |||||||||||
| 30 | Dallas Area Municipal Authority, Pennsylvania, Revenue Bonds, Misericordia University, Series 2014, 5.000%, 5/01/37 | 5/24 at 100.00 | 27,301 | |||||||||||
| 55 | Dauphin County General Authority, Pennsylvania, Health System Revenue Bonds, Pinnacle Health System Project, Refunding Series 2016A, 5.000%, 6/01/35 | 6/26 at 100.00 | 55,372 | |||||||||||
| Delaware River Joint Toll Bridge Commission, New Jersey and Pennsylvania, Bridge System Revenue Bonds, Series 2017: | ||||||||||||||
| 245 | 5.000%, 7/01/42 | 7/27 at 100.00 | 247,179 | |||||||||||
| 540 | 5.000%, 7/01/47 | 7/27 at 100.00 | 538,621 | |||||||||||
| 295 | Delaware River Joint Toll Bridge Commission, New Jersey and Pennsylvania, Bridge System Revenue Bonds, Series 2019A, 5.000%, 7/01/28 | No Opt. Call | 308,829 | |||||||||||
| Doylestown Hospital Authority, Pennsylvania, Hospital Revenue Bonds, Series 2016A: | ||||||||||||||
| 185 | 5.000%, 7/01/41 | No Opt. Call | 155,912 | |||||||||||
| 40 | 5.000%, 7/01/41 | No Opt. Call | 41,102 | |||||||||||
| 25 | Doylestown Hospital Authority, Pennsylvania, Hospital Revenue Bonds, Series 2019A, 4.000%, 7/01/45 | No Opt. Call | 17,406 | |||||||||||
| 150 | Dubois Hospital Authority, Pennsylvania, Hospital Revenue Bonds, Penn Highlands Healthcare, Series 2018, 5.000%, 7/15/48 | 1/28 at 100.00 | 137,046 | |||||||||||
| 30 | (c) | East Hempfield Township Industrial Development Authority, Pennsylvania, Student Services Inc - Student Housing Project at Millersville University, Series 2014, 5.000%, 7/01/46, (Pre-refunded 7/01/24) | 7/24 at 100.00 | 30,174 | ||||||||||
| 100 | (c) | East Hempfield Township Industrial Development Authority, Pennsylvania, Student Services Inc - Student Housing Project at Millersville University, Series 2015, 5.000%, 7/01/47, (Pre-refunded 7/01/25) | 7/25 at 100.00 | 101,570 | ||||||||||
| 25 | Easton Area School District, Northampton County, Pennsylvania, General Obligation Bonds, Series 2020B, 5.000%, 2/01/31 | 2/28 at 100.00 | 26,180 | |||||||||||
| 60 | Erie Higher Education Building Authority, Pennsylvania, Revenue Bonds, Gannon University, Series 2016, 4.000%, 5/01/46 | 11/26 at 100.00 | 43,513 | |||||||||||
| NUW | Nuveen AMT-Free Municipal Value Fund (continued) Portfolio of Investments October 31, 2023 |
Principal Amount (000) | Description (a) | Optional Call Provisions (b) | Value | |||||||||||
Pennsylvania | ||||||||||||||
| $ | 75 | General Authority of Southcentral Pennsylvania, Revenue Bonds, AICUP Financing Program-York College of Pennsylvania, Series 2017 PP4, 3.375%, 11/01/37 | 10/27 at 100.00 | $ | 60,129 | |||||||||
| Huntingdon County General Authority, Pennsylvania, Revenue Bonds, Juniata College, Series 2016OO2: | ||||||||||||||
| 15 | 3.250%, 5/01/36 | 5/26 at 100.00 | 11,773 | |||||||||||
| 35 | 3.500%, 5/01/41 | 5/26 at 100.00 | 25,183 | |||||||||||
| 20 | Lancaster County Hospital Authority, Pennsylvania, Health Center Revenue Bonds, Masonic Villages Project, Series 2015, 5.000%, 11/01/35 | 5/25 at 100.00 | 19,869 | |||||||||||
| 40 | Lancaster County Hospital Authority, Pennsylvania, Health Center Revenue Bonds, Saint Anne’s Retirement Community, Inc., Series 2020, 5.000%, 3/01/50 | 3/27 at 102.00 | 28,938 | |||||||||||
| 100 | Lancaster County Hospital Authority, Revenue Bonds, University of Pennsylvania Health System, Refunding Series 2016B, 5.000%, 8/15/46 | 8/26 at 100.00 | 96,357 | |||||||||||
| 155 | Lancaster County Hospital Authority, Revenue Bonds, University of Pennsylvania Health System, Series 2016A, 5.000%, 8/15/42 | 8/26 at 100.00 | 153,187 | |||||||||||
| 25 | Lancaster School District, Lancaster County, Pennsylvania, General Obligation Bonds, Series 2020, 4.000%, 6/01/35 - AGM Insured | 12/28 at 100.00 | 24,001 | |||||||||||
| Lehigh County Authority, Pennsylvania, Water and Sewer Revenue Bonds, Allentown Concession, Series 2013A: | ||||||||||||||
| 105 | (c) | 5.125%, 12/01/47, (Pre-refunded 12/01/23) | 12/23 at 100.00 | 105,104 | ||||||||||
| 95 | 5.125%, 12/01/47 | 12/23 at 100.00 | 95,013 | |||||||||||
| 100 | Lehigh County General Purpose Authority, Pennsylvania, Revenue Bonds, Good Shepherd Group, Refunding Series 2016, 4.000%, 11/01/41 | 5/26 at 100.00 | 79,463 | |||||||||||
| 100 | Monroe County Industrial Development Authority, Pennsylvania, Special Obligation Revenue Bonds, Tobyhanna Township Project, Series 2014, 6.875%, 7/01/33, 144A | 7/24 at 100.00 | 94,246 | |||||||||||
| 50 | Montgomery County Higher Education and Health Authority, Pennsylvania, Revenue Bonds, Thomas Jefferson University, Series 2018A, 5.000%, 9/01/48 | 9/28 at 100.00 | 46,925 | |||||||||||
| Montgomery County Higher Education and Health Authority, Pennsylvania, Revenue Bonds, Thomas Jefferson University, Series 2019: | ||||||||||||||
| 50 | 4.000%, 9/01/44 | 9/29 at 100.00 | 41,948 | |||||||||||
| 25 | 4.000%, 9/01/49 | 9/29 at 100.00 | 19,929 | |||||||||||
| 200 | (c) | Montgomery County Industrial Development Authority, Pennsylvania, Health System Revenue Bonds, Albert Einstein Healthcare Network Issue, Series 2015A, 5.250%, 1/15/45, (Pre-refunded 1/15/25) | 1/25 at 100.00 | 203,080 | ||||||||||
| 200 | Montgomery County Industrial Development Authority, Pennsylvania, Revenue Bonds, ACTS Retirement-Life Communities, Inc. Obligated Group, Series 2016, 5.000%, 11/15/36 | 11/26 at 100.00 | 192,758 | |||||||||||
| 90 | Northampton County General Purpose Authority, Pennsylvania, Revenue Bonds, Lafayette College, Refunding Series 2018, 4.000%, 11/01/38 | 11/28 at 100.00 | 79,644 | |||||||||||
| 55 | Northampton County Industrial Development Authority, Pennsylvania, Revenue Bonds, Morningstar Senior Living, Inc., Series 2019, 5.000%, 11/01/44 | 11/26 at 103.00 | 43,861 | |||||||||||
| 140 | Pennsylvania Economic Development Financing Authority, Parking System Revenue Bonds, Capitol Region Parking System, Series 2013A, 5.250%, 1/01/44 - AGM Insured | 1/24 at 100.00 | 140,091 | |||||||||||
| 250 | Pennsylvania Economic Development Financing Authority, Revenue Bonds, Pennsylvania-American Water Company, Refunding Series 2019, 3.000%, 4/01/39 | 10/29 at 100.00 | 186,255 | |||||||||||
Principal Amount (000) | Description (a) | Optional Call Provisions (b) | Value | |||||||||||
Pennsylvania | ||||||||||||||
| Pennsylvania Higher Educational Facilities Authority, Revenue Bonds, University of the Sciences in Philadelphia, Series 2012: | ||||||||||||||
| $ | 35 | 4.000%, 11/01/39 | 12/23 at 100.00 | $ | 27,894 | |||||||||
| 60 | 5.000%, 11/01/42 | 12/23 at 100.00 | 55,740 | |||||||||||
| 300 | Pennsylvania Higher Educational Facilities Authority, Revenue Bonds, University Properties Inc. Student Housing Project at East Stroudsburg University of Pennsylvania, Series 2016A, 5.000%, 7/01/35 | 7/26 at 100.00 | 280,634 | |||||||||||
| 45 | Pennsylvania Housing Finance Agency, Single Family Mortgage Revenue Bonds, Series 2016-119, 3.500%, 10/01/36 | 4/25 at 100.00 | 38,578 | |||||||||||
| 350 | Pennsylvania Housing Finance Agency, Single Family Mortgage Revenue Bonds, Series 2016-120, 3.200%, 4/01/40 | 10/25 at 100.00 | 275,153 | |||||||||||
| 450 | Pennsylvania Housing Finance Agency, Single Family Mortgage Revenue Bonds, Series 2016-121, 3.200%, 10/01/41 | 10/25 at 100.00 | 343,597 | |||||||||||
| 65 | Pennsylvania Housing Finance Agency, Single Family Mortgage Revenue Bonds, Series 2017-123B, 3.450%, 10/01/32 | 10/26 at 100.00 | 59,293 | |||||||||||
| 45 | Pennsylvania Housing Finance Agency, Single Family Mortgage Revenue Bonds, Series 2017-125B, 3.700%, 10/01/47 | 4/27 at 100.00 | 38,666 | |||||||||||
| 250 | Pennsylvania Housing Finance Agency, Single Family Mortgage Revenue Bonds, Series 2019-129, 3.350%, 10/01/45 | 10/28 at 100.00 | 183,477 | |||||||||||
| 125 | Pennsylvania Housing Finance Agency, Single Family Mortgage Revenue Bonds, Series 2019-130A, 3.000%, 10/01/46 | 10/28 at 100.00 | 81,889 | |||||||||||
| 45 | Pennsylvania Housing Finance Agency, Single Family Mortgage Revenue Bonds, Series 2020-133, 2.500%, 10/01/45 | 10/29 at 100.00 | 27,614 | |||||||||||
| 100 | Pennsylvania Turnpike Commission, Motor License Fund-Enhanced Turnpike Special Revenue Bonds, Subordinate Series 2014A, 4.750%, 12/01/37 | 12/26 at 100.00 | 100,116 | |||||||||||
| 100 | Pennsylvania Turnpike Commission, Oil Franchise Tax Revenue Bonds, Subordinate Series 2018B, 5.000%, 12/01/48 | 12/28 at 100.00 | 95,437 | |||||||||||
| 585 | Pennsylvania Turnpike Commission, Turnpike Revenue Bonds, Series 2015B, 5.000%, 12/01/45 | 12/25 at 100.00 | 575,155 | |||||||||||
| 50 | Pennsylvania Turnpike Commission, Turnpike Revenue Bonds, Subordinate Series 2019A, 4.000%, 12/01/49 | 12/29 at 100.00 | 40,686 | |||||||||||
| 25 | Philadelphia Authority for Industrial Development, Pennsylvania, Charter School Revenue Bonds, Philadelphia Performing Arts: A String Theory Charter School, Series 2020, 5.000%, 6/15/50, 144A | 6/28 at 100.00 | 20,970 | |||||||||||
| 70 | Philadelphia Authority for Industrial Development, Pennsylvania, Revenue Bonds, La Salle University, Series 2017, 3.625%, 5/01/35 | 11/27 at 100.00 | 53,261 | |||||||||||
| Philadelphia Authority for Industrial Development, Pennsylvania, Revenue Bonds, University of the Arts, Series 2017: | ||||||||||||||
| 45 | 5.000%, 3/15/45, 144A | 3/28 at 100.00 | 35,153 | |||||||||||
| 5 | (c) | 5.000%, 3/15/45, (Pre-refunded 3/15/28), 144A | 3/28 at 100.00 | 5,261 | ||||||||||
| 150 | Philadelphia Gas Works, Pennsylvania, Revenue Bonds, 1998 General Ordinance, Fifteenth Series 2017, 5.000%, 8/01/47 | 8/27 at 100.00 | 142,201 | |||||||||||
| 105 | Philadelphia Gas Works, Pennsylvania, Revenue Bonds, 1998 General Ordinance, Sixteenth Series 2020A, 5.000%, 8/01/50 - AGM Insured | 8/30 at 100.00 | 103,609 | |||||||||||
| 125 | Philadelphia Gas Works, Pennsylvania, Revenue Bonds, Refunding Thirteenth Series 2015, 5.000%, 8/01/30 | 8/25 at 100.00 | 125,811 | |||||||||||
| 100 | Philadelphia Hospitals and Higher Education Facilities Authority, Pennsylvania, Hospital Revenue Bonds, Temple University Health System Obligated Group, Series of 2017, 5.000%, 7/01/30 | 7/27 at 100.00 | 99,889 | |||||||||||
| NUW | Nuveen AMT-Free Municipal Value Fund (continued) Portfolio of Investments October 31, 2023 |
Principal Amount (000) | Description (a) | Optional Call Provisions (b) | Value | |||||||||||
Pennsylvania | ||||||||||||||
| $ | 100 | Pittsburgh and Allegheny County Sports and Exhibition Authority, Pennsylvania, Parking Revenue Bonds, Series 2017, 5.000%, 12/15/34 | 12/27 at 100.00 | $ | 101,596 | |||||||||
| 20 | Pittsburgh Water and Sewer Authority, Pennsylvania, Water and Sewer System Revenue Bonds, First Lien Series 2020B, 4.000%, 9/01/45 - AGM Insured | 9/30 at 100.00 | 17,105 | |||||||||||
| 25 | Pittsburgh Water and Sewer Authority, Pennsylvania, Water and Sewer System Revenue Bonds, Refunding Subordinate Series 2019B, 4.000%, 9/01/34 - AGM Insured | 9/29 at 100.00 | 23,449 | |||||||||||
| 200 | Pottsville Hospital Authority, Pennsylvania, Hospital Revenue Bonds, Lehigh Valley Health Network, Series 2016B, 5.000%, 7/01/45 | 1/27 at 100.00 | 186,054 | |||||||||||
| 35 | Rostraver Township, Westmoreland County, Pennsylvania, General Obligation Bonds, Series 2018, 3.500%, 9/01/34 - AGM Insured | 9/25 at 100.00 | 31,130 | |||||||||||
| 80 | Scranton, Lackawanna County, Pennsylvania, General Obligation Notes, Series 2016, 5.000%, 11/15/32 | 5/24 at 100.00 | 74,690 | |||||||||||
| 100 | Scranton-Lackawanna Health and Welfare Authority, Pennsylvania, University Revenue Bonds, Marywood University, Series 2016, 5.000%, 6/01/46 | 6/26 at 100.00 | 80,946 | |||||||||||
| 210 | Southcentral Pennsylvania General Authority, Revenue Bonds, Wellspan Health Obligated Group, Series 2019A, 5.000%, 6/01/49 | 6/29 at 100.00 | 201,183 | |||||||||||
| 10 | The Redevelopment Authority of the City of Scranton, Lackawanna county, Pennsylvania, Guaranteed Lease Revenue Bonds, Series 2016A, 5.000%, 11/15/28 | 5/24 at 100.00 | 9,757 | |||||||||||
| 40 | Upper Allegheny Joint Sanitary Authority, Allegheny County, Pennsylvania, Sewer Revenue Bonds, Refunding Series 2019A, 3.000%, 9/01/44 - AGM Insured | 9/29 at 100.00 | 27,671 | |||||||||||
| 100 | Upper Dublin School District, Montgomery County, Pennsylvania, General Obligation Bonds, Series 2021A, 4.000%, 9/15/38 | 3/29 at 100.00 | 90,884 | |||||||||||
| 145 | Washington County Industrial Development Authority, Pennsylvania, College Revenue Bonds, AICUP Financing Program-Washington and Jefferson College Project, Series 2017-PP5, 3.375%, 11/01/36 | 11/27 at 100.00 | 116,529 | |||||||||||
| 15 | Washington County Redevelopment Authority, Pennsylvania, Tanger Outlet Victory Center Tax Increment Bonds, Series 2018, 5.000%, 7/01/35 | 1/28 at 100.00 | 13,884 | |||||||||||
| 15 | Westmoreland County Industrial Development Authority, Pennsylvania, Revenue Bonds, Excela Health Project, Series 2020A, 4.000%, 7/01/37 | 1/31 at 100.00 | 12,495 | |||||||||||
| Williamsport Sanitary Authority, Lycoming County, Pennsylvania, Sewer Revenue Bonds, Series 2021.: | ||||||||||||||
| 100 | 5.000%, 1/01/25 - BAM Insured | No Opt. Call | 101,199 | |||||||||||
| 25 | 5.000%, 1/01/28 - BAM Insured | No Opt. Call | 26,225 | |||||||||||
| Total Pennsylvania | 11,010,633 | |||||||||||||
Puerto Rico - 3.0% | ||||||||||||||
Puerto Rico Sales Tax Financing Corporation, Sales Tax Revenue Bonds, Restructured 2018A-1: | ||||||||||||||
| 1,170 | 0.000%, 7/01/33 | 7/28 at 86.06 | 732,847 | |||||||||||
| 1,739 | 4.500%, 7/01/34 | 7/25 at 100.00 | 1,660,771 | |||||||||||
| 3,812 | 5.000%, 7/01/58 | 7/28 at 100.00 | 3,337,436 | |||||||||||
| 710 | Puerto Rico Sales Tax Financing Corporation, Sales Tax Revenue Bonds, Restructured Cofina Project Series 2019A-2A, 4.550%, 7/01/40 | 7/28 at 100.00 | 631,982 | |||||||||||
Puerto Rico Sales Tax Financing Corporation, Sales Tax Revenue Bonds, Taxable Restructured Cofina Project Series 2019A-2: | ||||||||||||||
| 1,360 | 4.329%, 7/01/40 | 7/28 at 100.00 | 1,178,203 | |||||||||||
| 10 | 4.329%, 7/01/40 | 7/28 at 100.00 | 8,663 | |||||||||||
Principal Amount (000) | Description (a) | Optional Call Provisions (b) | Value | |||||||||||
Puerto Rico | ||||||||||||||
| $ | 49 | 4.784%, 7/01/58 | 7/28 at 100.00 | $ | 41,214 | |||||||||
| Total Puerto Rico | 7,591,116 | |||||||||||||
South Carolina - 1.7% | ||||||||||||||
| 5,435 | Piedmont Municipal Power Agency, South Carolina, Electric Revenue Bonds, Series 2004A-2, 0.000%, 1/01/29 - AGC Insured | No Opt. Call | 4,279,390 | |||||||||||
| Total South Carolina | 4,279,390 | |||||||||||||
Tennessee - 3.7% | ||||||||||||||
| 3,090 | Chattanooga Health, Educational and Housing Facility Board, Tennessee, Revenue Bonds, CommonSpirit Health, Series 2019A-2, 5.000%, 8/01/44 | 8/29 at 100.00 | 2,921,656 | |||||||||||
| 135 | Metropolitan Government of Nashville-Davidson County Health and Educational Facilities Board, Tennessee, Revenue Bonds, Vanderbilt University Medical Center, Series 2016A, 5.000%, 7/01/46 | 7/26 at 100.00 | 130,903 | |||||||||||
| 605 | Metropolitan Government of Nashville-Davidson County, Tennessee, Water and Sewerage Revenue Bonds, Green Series 2017A, 5.000%, 7/01/42 | 7/27 at 100.00 | 603,325 | |||||||||||
| 4,000 | The Tennessee Energy Acquisition Corporation, Gas Revenue Bonds, Series 2006B, 5.625%, 9/01/26 | No Opt. Call | 4,000,608 | |||||||||||
| 2,160 | West Wilson Utility District, Wilson County, Tennessee, Water Revenue Bonds, Improvement Series 2022, 4.000%, 6/01/47 | 6/32 at 100.00 | 1,856,061 | |||||||||||
| Total Tennessee | 9,512,553 | |||||||||||||
Texas - 9.5% | ||||||||||||||
| 1,000 | Austin Community College District Public Facility Corporation, Texas, Lease Revenue Bonds, Highland Campus - Building 3000 Project, Series 2018A, 5.000%, 8/01/42 | 8/27 at 100.00 | 1,010,422 | |||||||||||
| 1,000 | Austin, Texas, Electric Utility System Revenue Bonds, Refunding Series 2017, 5.000%, 11/15/35 | 11/26 at 100.00 | 1,017,146 | |||||||||||
| 500 | Bexar County Hospital District, Texas, Certificates of Obligation, Series 2020, 5.000%, 2/15/45 | 2/29 at 100.00 | 503,710 | |||||||||||
| 1,000 | Bexar County Hospital District, Texas, Certificates of Obligation, Series 2023, 5.000%, 2/15/48 | 8/32 at 100.00 | 1,007,472 | |||||||||||
| 745 | Central Texas Regional Mobility Authority, Revenue Bonds, Senior Lien Series 2020A, 5.000%, 1/01/40 | 1/30 at 100.00 | 748,752 | |||||||||||
| Houston, Texas, Hotel Occupancy Tax and Special Revenue Bonds, Convention and Entertainment Project, Series 2001B: | ||||||||||||||
| 3,000 | 0.000%, 9/01/32 - AMBAC Insured | No Opt. Call | 1,976,881 | |||||||||||
| 7,935 | 0.000%, 9/01/33 - AMBAC Insured | No Opt. Call | 4,959,299 | |||||||||||
| 1,430 | Lower Colorado River Authority, Texas, Transmission Contract Revenue Bonds, LCRA Transmission Services Corporation Project, Refunding Series 2021A, 5.000%, 5/15/51 | 5/31 at 100.00 | 1,365,852 | |||||||||||
| 915 | North Texas Tollway Authority, System Revenue Bonds, Refunding First Tier, Series 2015B, 5.000%, 1/01/45 | 1/25 at 100.00 | 906,172 | |||||||||||
| 250 | Tarrant County Cultural Education Facilities Finance Corporation, Texas, Revenue Bonds, Texas Health Resources System, Series 2016A, 5.000%, 2/15/41 | 8/26 at 100.00 | 247,439 | |||||||||||
| 1,600 | Texas Private Activity Bond Surface Transporation Corporation, Revenue Bonds, NTE Mobility Partners LLC North Tarrant Express Managed Lanes Project, Refunding Senior Lien Series 2019A, 5.000%, 12/31/35 | 12/29 at 100.00 | 1,623,794 | |||||||||||
| 7,635 | Texas Water Development Board, State Water Implementation Revenue Fund Bonds, Master Trust Series 2016, 4.000%, 10/15/41 | 10/26 at 100.00 | 6,675,762 | |||||||||||
| NUW | Nuveen AMT-Free Municipal Value Fund (continued) Portfolio of Investments October 31, 2023 |
Principal Amount (000) | Description (a) | Optional Call Provisions (b) | Value | |||||||||||
Texas | ||||||||||||||
| $ | 2,500 | (f) | Texas Water Development Board, State Water Implementation Revenue Fund Bonds, Master Trust Series 2017A, 4.000%, 10/15/42, (UB) | 10/27 at 100.00 | $ | 2,198,686 | ||||||||
| Total Texas | 24,241,387 | |||||||||||||
Utah - 0.6% | ||||||||||||||
| 1,500 | Salt Lake City, Utah, Airport Revenue Bonds, International Airport Series 2017B, 5.000%, 7/01/47 | 7/27 at 100.00 | 1,474,096 | |||||||||||
| Total Utah | 1,474,096 | |||||||||||||
Virginia - 1.0% | ||||||||||||||
| 1,160 | Chesapeake Bay Bridge and Tunnel District, Virginia, General Resolution Revenue Bonds, First Tier Series 2016, 5.000%, 7/01/51 | 7/26 at 100.00 | 1,078,276 | |||||||||||
| 1,400 | Chesapeake, Virginia, Transportation System Senior Toll Road Revenue Bonds, Capital Appreciation Series 2012B, 4.875%, 7/15/40 | 7/28 at 100.00 | 1,346,028 | |||||||||||
| Total Virginia | 2,424,304 | |||||||||||||
Washington - 3.5% | ||||||||||||||
| 3,330 | Chelan County Public Utility District 1, Washington, Columbia River-Rock Island Hydro-Electric System Revenue Refunding Bonds, Series 1997A, 0.000%, 6/01/29 - NPFG Insured | No Opt. Call | 2,635,682 | |||||||||||
| 690 | Washington Health Care Facilities Authority, Revenue Bonds, Virginia Mason Medical Center, Series 2017, 5.000%, 8/15/30 | 8/27 at 100.00 | 695,884 | |||||||||||
| Washington State Convention Center Public Facilities District, Lodging Tax Revenue Bonds, Refunding Series2021B. Exchange Purchase: | ||||||||||||||
| 2,165 | 4.000%, 7/01/37 | 7/31 at 100.00 | 1,927,844 | |||||||||||
| 2,140 | 4.000%, 7/01/43 | 7/31 at 100.00 | 1,783,734 | |||||||||||
| 2,000 | Washington State Convention Center Public Facilities District, Lodging Tax Revenue Bonds, Series 2018, 5.000%, 7/01/58 | 7/28 at 100.00 | 1,851,148 | |||||||||||
| Total Washington | 8,894,292 | |||||||||||||
West Virginia - 1.4% | ||||||||||||||
| 530 | West Virginia Hospital Finance Authority, Hospital Revenue Bonds, Cabell Huntington Hospital, Inc. Project, Refunding & Improvement Series 2018A, 5.000%, 1/01/34 | 1/29 at 100.00 | 526,289 | |||||||||||
| 1,800 | West Virginia Hospital Finance Authority, Hospital Revenue Bonds, Charleston Area Medical Center, Refunding & Improvement Series 2019A, 5.000%, 9/01/38 | 9/29 at 100.00 | 1,695,835 | |||||||||||
| 1,430 | West Virginia Parkways Authority, Turnpike Toll Revenue Bonds, Senior Lien Series 2018, 5.000%, 6/01/43 | 6/28 at 100.00 | 1,440,763 | |||||||||||
| Total West Virginia | 3,662,887 | |||||||||||||
Total Municipal Bonds (cost $265,679,392) | 251,253,096 | |||||||||||||
Shares | Description (a) | Value | ||||||||||||
COMMON STOCKS - 0.5% | ||||||||||||||
Utilities - 0.5% | ||||||||||||||
| 14,686 | (g),(h) | Energy Harbor Corp | $ | 1,166,318 | ||||||||||
| 977 | (h),(i) | Talen Energy Supply LLC | 51,049 | |||||||||||
| Total Utilities | 1,217,367 | |||||||||||||
Total Common Stocks (cost $439,065) | 1,217,367 | |||||||||||||
Total Long-Term Investments (cost $266,118,457) | 252,470,463 | |||||||||||||
Floating Rate Obligations - (0.8)% | (2,000,000) | |||||||||||||
Other Assets & Liabilities, Net -1.8% | 4,490,033 | |||||||||||||
Net Assets Applicable to Common Shares - 100% | $ | 254,960,496 | ||||||||||||
Description | Number of Contracts | Expiration Date | Notional Amount | Value | Unrealized Appreciation (Depreciation) | |||||
U.S. Treasury 10-Year Note | (159) | 12/23 | $(17,536,172) | $(16,881,328) | $654,844 |
| (a) | All percentages shown in the Portfolio of Investments are based on net assets applicable to common shares unless otherwise noted. |
| (b) | Optional Call Provisions: Dates (month and year) and prices of the earliest optional call or redemption. There may be other call provisions at varying prices at later dates. Certain mortgage-backed securities may be subject to periodic principal paydowns. Optional Call Provisions are not covered by the report of independent registered public accounting firm. |
| (c) | Backed by an escrow or trust containing sufficient U.S. Government or U.S. Government agency securities, which ensure the timely payment of principal and interest. |
| (d) | Step-up coupon bond, a bond with a coupon that increases (“steps up”), usually at regular intervals, while the bond is outstanding. The rate shown is the coupon as of the end of the reporting period. |
| (e) | Defaulted security. A security whose issuer has failed to fully pay principal and/or interest when due, or is under the protection of bankruptcy. |
| (f) | Investment, or portion of investment, has been pledged to collateralize the net payment obligations for investments in inverse floating rate transactions. |
| (g) | Energy Harbor Corp (ENGH) common stock received as part of the bankruptcy settlements during February 2020 for Beaver County Industrial Development Authority, Pennsylvania, Pollution Control Revenue Bonds, FirstEnergy Nuclear Generation Project, Refunding Series 2005A, 4.000%, 1/01/35; Beaver County Industrial Development Authority, Pennsylvania, Pollution Control Revenue Refunding Bonds, FirstEnergy Nuclear Generation Project, Series 2006A, 4.375%, 1/01/35; Beaver County Industrial Development Authority, Pennsylvania, Pollution Control Revenue Refunding Bonds, FirstEnergy Nuclear Generation Project, Series 2006B, 3.500%, 12/01/35; and Pennsylvania Economic Development Financing Authority, Exempt Facilities Revenue Bonds, Shippingport Project, First Energy Guarantor, Series 2006A, 2.550%, 11/01/41. Various funds and accounts managed by Nuveen, including the Fund, collectively are a substantial minority holder of ENGH’s outstanding shares of common stock, and possess certain other rights with respect to the corporate governance of ENGH. Due to these facts, under the federal securities laws, the securities of ENGH held by Nuveen funds and accounts, including the Fund, cannot be sold except under limited conditions (which are not currently satisfied). The Fund is therefore unable to sell such shares in ordinary secondary market transactions at this time. On March 6, 2023 Vistra Corp. (“Vistra”) announced that it has executed a definitive agreement with Energy Harbor Corp., pursuant to which Energy Harbor will merge with and into a newly-formed subsidiary of Vistra. In connection with the transaction, Nuveen funds and accounts expect to receive a combination of cash and shares in a newly formed entity. Nuveen expects these shares to be issued in a private transaction and may have reduced secondary market liquidity. The transaction is subject to certain regulatory approvals and there can be no assurance that the transaction will close. |
| (h) | Non-income producing; issuer has not declared anex-dividend date within the past twelve months. |
| (i) | In May 2023, Talen Energy completed a Chapter 11 plan of reorganization whereby the Fund received Talen Energy Common Stock in exchange for the following portfolio holding: Pennsylvania Economic Development Financing Authority, Exempt Facilities Revenue Refunding Bonds, PPL Energy Supply, LLC Project, Series 2009A, 6.400%, 12/01/38. |
| 144A | Investment is exempt from registration under Rule 144A of the Securities Act of 1933, as amended. These investments may only be resold in transactions exempt from registration, which are normally those transactions with qualified institutional buyers. |
| ETM | Escrowed to maturity |
| UB | Underlying bond of an inverse floating rate trust reflected as a financing transaction. |
| NMI | Nuveen Municipal Income Fund, Inc. | |
Portfolio of Investments October 31, 2023 |
Principal Amount (000) | Description (a) | Optional Call Provisions (b) | Value | |||||||||||
LONG-TERM INVESTMENTS - 96.6% | ||||||||||||||
MUNICIPAL BONDS - 96.6% | ||||||||||||||
Alabama - 2.2% | ||||||||||||||
| $ | 1,000 | Southeast Energy Authority, Alabama, Commodity Supply Revenue Bonds, Project 4, Series 2022B-1, 5.000%, 5/01/53, (Mandatory Put 8/01/28) | 5/28 at 100.34 | $ | 990,715 | |||||||||
| 1,000 | Southeast Energy Authority, Alabama, Commodity Supply Revenue Bonds, Project 5, Series 2023A, 5.250%, 1/01/54, (Mandatory Put 7/01/29) | 4/29 at 100.18 | 996,954 | |||||||||||
| 100 | Tuscaloosa County Industrial Development Authority, Alabama, Gulf Opportunity Zone Bonds, Hunt Refining Project, Refunding Series 2019A, 5.250%, 5/01/44, 144A | 5/29 at 100.00 | 82,420 | |||||||||||
| Total Alabama | 2,070,089 | |||||||||||||
Arizona - 4.9% | ||||||||||||||
| 600 | Arizona Health Facilities Authority, Revenue Bonds, Scottsdale Lincoln Hospitals Project, Refunding Series 2014A, 5.000%, 12/01/39 | 12/24 at 100.00 | 566,885 | |||||||||||
| 275 | Arizona Industrial Development Authority Education Revenue Bonds, Academies of Math & Science Projects, Series 2023, 5.250%, 7/01/43 | 7/31 at 100.00 | 243,809 | |||||||||||
| 1,000 | Arizona Industrial Development Authority, Arizona, Education Revenue Bonds, Academies of Math & Science Projects, Series 2018A, 5.000%, 7/01/48 | 1/28 at 100.00 | 915,234 | |||||||||||
| 1,000 | Arizona Industrial Development Authority, Arizona, Education Revenue Bonds, KIPPC NYC Public Charter Schools - Macombs Facility Project, Series 2021A, 4.000%, 7/01/41 | 7/31 at 100.00 | 827,140 | |||||||||||
| 1,495 | Phoenix Civic Improvement Corporation, Arizona, Airport Revenue Bonds, Junior Lien Series 2019A, 5.000%, 7/01/49 | 7/29 at 100.00 | 1,448,794 | |||||||||||
| 515 | Salt Verde Financial Corporation, Arizona, Senior Gas Revenue Bonds, Citigroup Energy Inc Prepay Contract Obligations, Series 2007, 5.250%, 12/01/28 | No Opt. Call | 520,208 | |||||||||||
| Total Arizona | 4,522,070 | |||||||||||||
Arkansas - 0.4% | ||||||||||||||
| 200 | Arkansas Development Finance Authority, Arkansas, Environmental Improvement Revenue Bonds, United States Steel Corporation, Green Series 2022, 5.450%, 9/01/52, (AMT), 144A | 9/25 at 105.00 | 176,309 | |||||||||||
| 200 | Arkansas Development Finance Authority, Arkansas, Environmental Improvement Revenue Bonds, United States Steel Corporation, Green Series 2023, 5.700%, 5/01/53, (AMT) | 5/26 at 105.00 | 182,519 | |||||||||||
| Total Arkansas | 358,828 | |||||||||||||
California - 2.7% | ||||||||||||||
| 430 | California Infrastructure and Economic Development Bank, Revenue Bonds, Brightline West Passenger Rail Project, Series 2020A, 3.650%, 1/01/50, (AMT), (Mandatory Put 1/31/24) | 12/23 at 100.00 | 427,606 | |||||||||||
| 625 | California Municipal Finance Authority, Special Tax Revenue Bonds, Bold Program, Series 2023B, 5.500%, 9/01/43 | No Opt. Call | 595,100 | |||||||||||
| 365 | California Statewide Communities Development Authority, California, Revenue Bonds, Loma Linda University Medical Center, Series 2016A, 5.250%, 12/01/56, 144A | 6/26 at 100.00 | 323,368 | |||||||||||
| 275 | California Statewide Communities Development Authority, Revenue Bonds, Front Porch Communities & Services Project, Series 2017A, 4.000%, 4/01/36 | 4/27 at 100.00 | 249,433 | |||||||||||
Principal Amount (000) | Description (a) | Optional Call Provisions (b) | Value | |||||||||||
California | ||||||||||||||
| $ | 11 | (c),(d) | California Statewide Community Development Authority, Revenue Bonds, Daughters of Charity Health System, Series 2005A, 5.500%, 7/01/39 | 1/22 at 100.00 | $ | 10,994 | ||||||||
| 300 | M-S-R | No Opt. Call | 349,294 | |||||||||||
| 500 | San Joaquin Hills Transportation Corridor Agency, Orange County, California, Toll Road Revenue Bonds, Refunding Junior Lien Series 2014B, 5.250%, 1/15/44 | 1/25 at 100.00 | 501,576 | |||||||||||
| Total California | 2,457,371 | |||||||||||||
Colorado - 13.5% | ||||||||||||||
| 1,000 | Boulder Valley School District RE2, Boulder County, Colorado, General Obligation Bonds, Series 2019A, 4.000%, 12/01/48 | 6/29 at 100.00 | 847,197 | |||||||||||
| Central Platte Valley Metropolitan District, Colorado, General Obligation Bonds, Refunding Series 2013A: | ||||||||||||||
| 150 | (e) | 5.125%, 12/01/29, (Pre-refunded 12/01/23) | 12/23 at 100.00 | 150,124 | ||||||||||
| 250 | (e) | 5.375%, 12/01/33, (Pre-refunded 12/01/23) | 12/23 at 100.00 | 250,255 | ||||||||||
| 350 | (e) | Colorado Health Facilities Authority, Colorado, Health Facilities Revenue Bonds, The Evangelical Lutheran Good Samaritan Society Project, Refunding Series 2017, 5.000%, 6/01/42, (Pre-refunded 6/01/27) | 6/27 at 100.00 | 362,958 | ||||||||||
| 1,000 | Colorado Health Facilities Authority, Colorado, Revenue Bonds, AdventHealth Obligated Group, Series 2019A, 4.000%, 11/15/43 | 11/29 at 100.00 | 862,555 | |||||||||||
| 500 | Colorado Health Facilities Authority, Colorado, Revenue Bonds, Christian Living Neighborhoods Project, Refunding Series 2016, 5.000%, 1/01/37 | 1/24 at 102.00 | 452,778 | |||||||||||
| 1,000 | Colorado Health Facilities Authority, Colorado, Revenue Bonds, CommonSpirit Health, Series 2019A-2, 5.000%, 8/01/44 | 8/29 at 100.00 | 945,520 | |||||||||||
| 1,395 | Denver City and County, Colorado, Airport System Revenue Bonds, Subordinate Lien Series 2018A, 5.000%, 12/01/43, (AMT) | 12/28 at 100.00 | 1,343,250 | |||||||||||
| 700 | Erie Farm Metropolitan District, Erie, Boulder County, Colorado, General Obligation Limited Tax Bonds, Refunding & Improvement, Series 2021, 5.000%, 12/01/46 - AGM Insured | 12/31 at 100.00 | 700,730 | |||||||||||
| 700 | Falcon Area Water and Wastewater Authority (El Paso County, Colorado), Tap Fee Revenue Bonds, Series 2022A, 6.750%, 12/01/34, 144A | 9/27 at 103.00 | 649,828 | |||||||||||
| 1,000 | Lewis Pointe Metropolitan District, Thornton, Colorado, Limited Tax General Obligation Bonds, Refunding Series 2021, 4.000%, 12/01/47 - BAM Insured | 12/31 at 100.00 | 795,213 | |||||||||||
| 500 | Park Creek Metropolitan District, Colorado, Senior Limited Property Tax Supported Revenue Bonds, Series 2017A, 5.000%, 12/01/46 | 12/25 at 100.00 | 477,351 | |||||||||||
| 650 | Park Creek Metropolitan District, Colorado, Senior Limited Property Tax Supported Revenue Bonds, Series 2018A, 4.000%, 12/01/51 | 12/28 at 100.00 | 478,304 | |||||||||||
| 500 | Peak Metropolitan District 1, Colorado Springs, El Paso County, Colorado, Limited Tax General Obligation Bonds, Series 2021A, 5.000%, 12/01/41, 144A | 3/26 at 103.00 | 423,566 | |||||||||||
| 1,000 | Platte River Metropolitan District, Weld County, Colorado, General Obligation Bonds, Limited Tax Refunding Series 2023A, 6.500%, 8/01/53, 144A | 8/29 at 103.00 | 940,026 | |||||||||||
| 125 | Public Authority for Colorado Energy, Natural Gas Purchase Revenue Bonds, Colorado Springs Utilities, Series 2008, 6.125%, 11/15/23 | No Opt. Call | 125,064 | |||||||||||
| 463 | (e) | Tallyn’s Reach Metropolitan District 3, Aurora, Colorado, General Obligation Bonds, Limited Tax Convertible to Unlimited Tax, Refunding & Improvement Series 2013, 5.000%, 12/01/33, (Pre-refunded 12/01/23), 144A | 12/23 at 100.00 | 463,336 | ||||||||||
| NMI | Nuveen Municipal Income Fund, Inc. (continued) Portfolio of Investments October 31, 2023 |
Principal Amount (000) | Description (a) | Optional Call Provisions (b) | Value | |||||||||||
Colorado | ||||||||||||||
| $ | 1,275 | Ventana Metropolitan District, El Paso County, Colorado, General Obligation Bonds, Limited Tax Refunding and Improvement Series 2023A, 6.500%, 9/01/53, 144A | 12/28 at 103.00 | $ | 1,255,049 | |||||||||
| 525 | Waterview II Metropolitan District, El Paso County, Colorado, Limited Tax General Obligation Bonds, Series 2022A, 4.500%, 12/01/31 | 3/27 at 103.00 | 460,382 | |||||||||||
| 500 | West Globeville Metropolitan District 1, Denver, Colorado, General Obligation Limited Tax Bonds, Series 2022, 6.750%, 12/01/52 | 12/29 at 103.00 | 432,303 | |||||||||||
| Total Colorado | 12,415,789 | |||||||||||||
Delaware - 0.1% | ||||||||||||||
| 100 | Delaware Health Facilities Authroity, Revenue Bonds, Beebe Medical Center Project, Series 2018, 5.000%, 6/01/48 | 12/28 at 100.00 | 90,433 | |||||||||||
| Total Delaware | 90,433 | |||||||||||||
District of Columbia - 0.1% | ||||||||||||||
| 105 | Metropolitan Washington Airports Authority, District of Columbia, Dulles Toll Road Revenue Bonds, Dulles Metrorail & Capital improvement Projects, Refunding & Subordinate Lien Series 2019B, 4.000%, 10/01/49 | 10/29 at 100.00 | 82,293 | |||||||||||
| Total District of Columbia | 82,293 | |||||||||||||
Florida - 5.6% | ||||||||||||||
| 815 | Bay County, Florida, Educational Facilities Revenue Refunding Bonds, Bay Haven Charter Academy, Inc. Project, Series 2013A, 5.000%, 9/01/33 | 12/23 at 100.00 | 815,099 | |||||||||||
| 210 | Florida Development Finance Corporation, Educational Facilities Revenue Bonds, Renaissance Charter School Income Projects, Series 2023A, 6.500%, 6/15/38, 144A | 6/30 at 103.00 | 205,530 | |||||||||||
| 700 | Florida Development Finance Corporation, Florida, Surface Transportation Facility Revenue Bonds, Brightline Passenger Rail Project, Green Series 2019B, 7.375%, 1/01/49, (AMT), 144A | 1/24 at 107.00 | 682,501 | |||||||||||
| Florida Development Finance Corporation, Florida, Surface Transportation Facility Revenue Bonds, Virgin Trains USA Passenger Rail Project, Series 2019A: | ||||||||||||||
| 350 | 6.375%, 1/01/49, (AMT), (Mandatory Put 1/01/26), 144A | 12/23 at 102.00 | 333,168 | |||||||||||
| 380 | 6.500%, 1/01/49, (AMT), (Mandatory Put 1/01/29), 144A | 12/23 at 102.00 | 359,156 | |||||||||||
| 500 | Florida Development Finance Corporation, Revenue Bonds, Brightline Passenger Rail Expansion Project, Series 2023C, 8.000%, 7/01/57, (AMT), (Mandatory Put 4/01/24), 144A | 11/23 at 100.00 | 503,534 | |||||||||||
| 500 | Greater Orlando Aviation Authority, Florida, Orlando Airport Facilities Revenue Bonds, Priority Subordinated Series 2017A, 5.000%, 10/01/42, (AMT) | 10/27 at 100.00 | 484,958 | |||||||||||
| 1,145 | Hillsborough County Industrial Development Authority, Florida, Hospital Revenue Bonds, Florida Health Sciences Center Inc D/B/A Tampa General Hospital, Series 2020A, 4.000%, 8/01/55 | 2/31 at 100.00 | 868,735 | |||||||||||
| 300 | Lakewood Ranch Stewardship District, Florida, Special Assessment Revenue Bonds, Taylor Ranch Project, Series 2023, 6.125%, 5/01/43 | 5/33 at 100.00 | 293,659 | |||||||||||
| 645 | Woodsdale Community Development District, Pasco County, Florida, Revenue Bonds, Capital Improvement Series 2023, 6.125%, 11/01/43, 144A | 11/33 at 100.00 | 622,331 | |||||||||||
| Total Florida | 5,168,671 | |||||||||||||
Georgia - 2.2% | ||||||||||||||
| 455 | Atlanta Development Authority, Georgia, Revenue Bonds, New Downtown Atlanta Stadium Project, Senior Lien Series 2015A-1, 5.250%, 7/01/40 | 7/25 at 100.00 | 457,173 | |||||||||||
Principal Amount (000) | Description (a) | Optional Call Provisions (b) | Value | |||||||||||
Georgia | ||||||||||||||
| $ | 170 | Atlanta Urban Residential Finance Authority, Georgia, Multifamily Housing Revenue Bonds, Testletree Village Apartments, Series 2013A, 4.000%, 11/01/25 | 12/23 at 100.00 | $ | 159,210 | |||||||||
| 500 | Fulton County Development Authority, Georgia, Hospital Revenue Bonds, Wellstar Health System, Inc Project, Series 2017A, 4.000%, 4/01/50 | 4/30 at 100.00 | 396,989 | |||||||||||
| 1,000 | Main Street Natural Gas Inc., Georgia, Gas Supply Revenue Bonds, Series 2023B, 5.000%, 7/01/53, (Mandatory Put 3/01/30) | 12/29 at 100.31 | 993,968 | |||||||||||
| Total Georgia | 2,007,340 | |||||||||||||
Hawaii - 1.8% | ||||||||||||||
| 250 | Hawaii Department of Budget and Finance, Special Purpose Revenue Bonds, Hawaii Pacific University, Series 2013A, 6.625%, 7/01/33, 144A | 12/23 at 100.00 | 250,102 | |||||||||||
| 1,500 | Hawaii State, Airport System Revenue Bonds, Series 2022, 5.000%, 7/01/47, (AMT) | 7/32 at 100.00 | 1,420,978 | |||||||||||
| Total Hawaii | 1,671,080 | |||||||||||||
Illinois - 12.5% | ||||||||||||||
| 250 | Chicago Board of Education, Illinois, Dedicated Capital Improvement Tax Revenue Bonds, Series 2016, 6.000%, 4/01/46 | 4/27 at 100.00 | 251,504 | |||||||||||
| 500 | Chicago Board of Education, Illinois, Dedicated Capital Improvement Tax Revenue Bonds, Series 2023, 5.750%, 4/01/48 | 4/33 at 100.00 | 502,830 | |||||||||||
| 435 | Chicago Board of Education, Illinois, General Obligation Bonds, Dedicated Revenues, Refunding Series 2018D, 5.000%, 12/01/46 | 12/28 at 100.00 | 382,882 | |||||||||||
| 650 | Chicago Board of Education, Illinois, General Obligation Bonds, Dedicated Revenues, Series 2016A, 7.000%, 12/01/44 | 12/25 at 100.00 | 664,299 | |||||||||||
| 500 | Chicago Board of Education, Illinois, General Obligation Bonds, Dedicated Revenues, Series 2023A, 6.000%, 12/01/49, (WI/DD) | 12/33 at 100.00 | 499,976 | |||||||||||
| 1,000 | Chicago, Illinois, General Airport Revenue Bonds, O’Hare International Airport, Senior Lien Series 2022A, 5.500%, 1/01/55 | 1/32 at 100.00 | 998,227 | |||||||||||
| 1,000 | Illinois Educational Facilities Authority, Revenue Bonds, Field Museum of Natural History, Series 2002.RMKT, 4.500%, 11/01/36 | 11/24 at 100.00 | 972,114 | |||||||||||
| 500 | Illinois Finance Authority, Revenue Bonds, Bradley University, Refunding Series 2021A, 4.000%, 8/01/51 | 8/31 at 100.00 | 372,777 | |||||||||||
| 1,000 | Illinois Finance Authority, Revenue Bonds, Northshore - Edward-Elmhurst Health Credit Group, Series 2022A, 5.000%, 8/15/51 | 8/32 at 100.00 | 948,868 | |||||||||||
| 1,105 | Illinois Finance Authority, Revenue Bonds, OSF Healthcare System, Series 2015A, 5.000%, 11/15/45 | 11/25 at 100.00 | 1,047,432 | |||||||||||
| 200 | Illinois Finance Authority, Revenue Bonds, Silver Cross Hospital and Medical Centers, Refunding Series 2015C, 5.000%, 8/15/44 | 8/25 at 100.00 | 188,109 | |||||||||||
| 540 | Illinois State, General Obligation Bonds, June Series 2022A, 5.500%, 3/01/47 | 3/32 at 100.00 | 543,204 | |||||||||||
| 500 | Illinois State, General Obligation Bonds, March Series 2021A, 5.000%, 3/01/46 | 3/31 at 100.00 | 469,947 | |||||||||||
| 400 | Illinois State, General Obligation Bonds, May Series 2020, 5.500%, 5/01/39 | 5/30 at 100.00 | 409,437 | |||||||||||
| 1,000 | Illinois State, General Obligation Bonds, October Series 2022C, 5.500%, 10/01/41 | 10/32 at 100.00 | 1,019,385 | |||||||||||
| 1,900 | Illinois Toll Highway Authority, Toll Highway Revenue Bonds, Senior Lien Series 2019A, 5.000%, 1/01/44 | 7/29 at 100.00 | 1,900,167 | |||||||||||
| 200 | Metropolitan Pier and Exposition Authority, Illinois, McCormick Place Expansion Project Bonds, Series 2015A, 5.500%, 6/15/53 | 12/25 at 100.00 | 198,788 | |||||||||||
| NMI | Nuveen Municipal Income Fund, Inc. (continued) Portfolio of Investments October 31, 2023 |
Principal Amount (000) | Description (a) | Optional Call Provisions (b) | Value | |||||||||||
Illinois | ||||||||||||||
| $ | 205 | Metropolitan Pier and Exposition Authority, Illinois, Revenue Bonds, McCormick Place Expansion Project, Series 2002A, 0.000%, 12/15/35 - NPFG Insured | No Opt. Call | $ | 112,652 | |||||||||
| Total Illinois | 11,482,598 | |||||||||||||
Indiana - 2.8% | ||||||||||||||
| 735 | Gary Local Public Improvement Bond Bank, Indiana, Economic Development Revenue Bonds, Drexel Foundation for Educational Excellence Project, Refunding Series 2020A, 5.875%, 6/01/55, 144A | 6/30 at 100.00 | 578,545 | |||||||||||
| 1,000 | Indiana Finance Authority, Environmental Improvement Revenue Bonds, Fulcrum CenterPoint, LLC Project, Series 2022, 4.500%, 12/15/46, (AMT), (Mandatory Put 11/15/23) | 11/23 at 100.00 | 999,778 | |||||||||||
| Indiana Finance Authority, Hospital Revenue Bonds, Indiana University Health Obligation Group, Fixed Rate Series 2023A: | ||||||||||||||
| 1,000 | 5.000%, 10/01/46 | No Opt. Call | 987,679 | |||||||||||
| Total Indiana | 2,566,002 | |||||||||||||
Iowa - 0.5% | ||||||||||||||
| 500 | Iowa Finance Authority, Iowa, Midwestern Disaster Area Revenue Bonds, Iowa Fertilizer Company Project, Refunding Series 2022, 5.000%, 12/01/50 | 12/29 at 103.00 | 443,807 | |||||||||||
| Total Iowa | 443,807 | |||||||||||||
Louisiana - 2.3% | ||||||||||||||
| 1,000 | East Baton Rouge Parish Capital Improvement District, Louisiana, MOVEBR Sales Tax Revenue Bonds, Series 2019, 5.000%, 8/01/48 | 8/29 at 100.00 | 985,382 | |||||||||||
| 1,230 | Louisiana Local Government Environmental Facilities and Community Development Authority, Louisiana, Revenue Bonds, Womans Hospital Foundation Project, Refunding Series 2017A, 5.000%, 10/01/41 | 10/27 at 100.00 | 1,157,146 | |||||||||||
| Total Louisiana | 2,142,528 | |||||||||||||
Maryland - 0.5% | ||||||||||||||
| 500 | (e) | Maryland Health and Higher Educational Facilities Authority, Revenue Bonds, Peninsula Regional Medical Center Issue, Refunding Series 2015, 5.000%, 7/01/45, (Pre-refunded 7/01/24) | 7/24 at 100.00 | 502,745 | ||||||||||
| Total Maryland | 502,745 | |||||||||||||
Massachusetts - 0.1% | ||||||||||||||
| 50 | (e) | Massachusetts Development Finance Agency, Revenue Bonds, Atrius Health Issue, Series 2019A, 4.000%, 6/01/49, (Pre-refunded 6/01/29) | 6/29 at 100.00 | 50,788 | ||||||||||
| Total Massachusetts | 50,788 | |||||||||||||
Michigan - 0.9% | ||||||||||||||
| 1,000 | Michigan State University, General Revenue Bonds, Refunding Series 2019C, 4.000%, 2/15/44 | 8/29 at 100.00 | 846,997 | |||||||||||
| Total Michigan | 846,997 | |||||||||||||
Minnesota - 1.8% | ||||||||||||||
| 75 | Baytown Township, Minnesota Charter School Lease Revenue Bonds, Saint Croix Preparatory Academy, Refunding Series 2016A, 4.250%, 8/01/46 | 8/26 at 100.00 | 54,756 | |||||||||||
| 1,000 | Duluth Economic Development Authority, Minnesota, Health Care Facilities Revenue Bonds, Essentia Health Obligated Group, Series 2018A, 5.000%, 2/15/48 | 2/28 at 100.00 | 910,622 | |||||||||||
Principal Amount (000) | Description (a) | Optional Call Provisions (b) | Value | |||||||||||
Minnesota | ||||||||||||||
| $ | 555 | Saint Paul Housing & Redevelopment Authority, Minnesota, Charter School Lease Revenue Bonds, Twin Cities German Immersion School Project, Series 2019, 5.000%, 7/01/49 | 7/27 at 102.00 | $ | 444,087 | |||||||||
| 300 | Saint Paul Park, Minnesota, Senior Housing and Health Care Revenue Bonds, Presbyterian Homes Bloomington Project, Refunding Series 2017, 4.250%, 9/01/37 | 9/24 at 100.00 | 258,742 | |||||||||||
| Total Minnesota | 1,668,207 | |||||||||||||
Mississippi - 1.0% | ||||||||||||||
| 1,000 | Mississippi Hospital Equipment and Facilities Authority, Revenue Bonds, Baptist Memorial Healthcare, Series 2016A, 5.000%, 9/01/41 | 9/26 at 100.00 | 947,148 | |||||||||||
| Total Mississippi | 947,148 | |||||||||||||
Missouri - 2.5% | ||||||||||||||
| 1,000 | Missouri Health and Educational Facilities Authority, Educational Facilities Revenue Bonds, Southwest Baptist University Project, Series 2012, 5.000%, 10/01/33 | 12/23 at 100.00 | 918,332 | |||||||||||
| 1,000 | Missouri Health and Educational Facilities Authority, Health Facilities Revenue Bonds, Mosaic Health System, Series 2019A, 4.000%, 2/15/54 | 2/29 at 100.00 | 777,328 | |||||||||||
| 215 | Saint Louis County Industrial Development Authority, Missouri, Revenue Bonds, Friendship Village Saint Louis Obligated Group, Series 2018A, 5.250%, 9/01/53 | 9/25 at 103.00 | 171,777 | |||||||||||
| 335 | Saline County Industrial Development Authority, Missouri, First Mortgage Revenue Bonds, Missouri Valley College, Series 2017, 4.500%, 10/01/40 | 12/23 at 100.00 | 264,802 | |||||||||||
| 225 | Taney County Industrial Development Authority, Missouri, Sales Tax Revenue Improvement Bonds, Big Cedar Infrastructure Project Series 2023, 6.000%, 10/01/49, 144A | 10/30 at 100.00 | 202,941 | |||||||||||
| Total Missouri | 2,335,180 | |||||||||||||
Nebraska - 1.6% | ||||||||||||||
| 500 | Central Plains Energy Project, Nebraska, Gas Project 3 Revenue Bonds, Refunding Crossover Series 2017A, 5.000%, 9/01/42 | No Opt. Call | 470,174 | |||||||||||
| 1,000 | Douglas County School District 54, Ralston, Nebraska, General Obligation Bonds, Series 2023, 5.000%, 12/15/48 | 12/32 at 100.00 | 1,004,859 | |||||||||||
| Total Nebraska | 1,475,033 | |||||||||||||
New Jersey - 2.6% | ||||||||||||||
| 35 | (e) | Gloucester County Pollution Control Financing Authority, New Jersey, Pollution Control Revenue Bonds, Logan Project, Refunding Series 2014A, 5.000%, 12/01/24, (AMT), (ETM) | No Opt. Call | 35,060 | ||||||||||
| 545 | New Jersey Transportation Trust Fund Authority, Transportation System Bonds, Series 2015AA, 5.000%, 6/15/45 | 6/25 at 100.00 | 524,917 | |||||||||||
| 1,000 | New Jersey Transportation Trust Fund Authority, Transportation System Bonds, Series 2019BB, 4.000%, 6/15/44 | 12/28 at 100.00 | 856,473 | |||||||||||
| 1,000 | Tobacco Settlement Financing Corporation, New Jersey, Tobacco Settlement Asset-Backed Bonds, Series 2018A, 5.000%, 6/01/46 | 6/28 at 100.00 | 938,203 | |||||||||||
| Total New Jersey | 2,354,653 | |||||||||||||
New York - 3.8% | ||||||||||||||
| 60 | Buffalo and Erie County Industrial Land Development Corporation, New York, Revenue Bonds, Catholic Health System, Inc. Project, Series 2015, 5.250%, 7/01/35 | 7/25 at 100.00 | 49,701 | |||||||||||
| 1,500 | Dormitory Authority of the State of New York, State Personal Income Tax Revenue Bonds, General Purpose Series 2022A, 5.000%, 3/15/46 | 3/32 at 100.00 | 1,512,019 | |||||||||||
| NMI | Nuveen Municipal Income Fund, Inc. (continued) Portfolio of Investments October 31, 2023 |
Principal Amount (000) | Description (a) | Optional Call Provisions (b) | Value | |||||||||||
New York | ||||||||||||||
| $ | 250 | Genesee County Funding Corporation, New York, Revenue Bonds, Rochester Regional Health Project, Series 2022A, 5.250%, 12/01/52 | 12/32 at 100.00 | $ | 236,834 | |||||||||
| 315 | Metropolitan Transportation Authority, New York, Transportation Revenue Bonds, Green Climate Bond Certified Series 2020C-1, 5.250%, 11/15/55 | 5/30 at 100.00 | 309,858 | |||||||||||
| 500 | New York City Transitional Finance Authority, New York, Future Tax Secured Bonds, Subordinate Fiscal 2021 Subseries E-1, 4.000%, 2/01/42 | 2/31 at 100.00 | 443,130 | |||||||||||
| 500 | New York Liberty Development Corporation, New York, Liberty Revenue Bonds, 3 World Trade Center Project, Class 1 Series 2014, 5.000%, 11/15/44, 144A | 11/24 at 100.00 | 447,825 | |||||||||||
| 500 | New York Transportation Development Corporation, Special Facility Revenue Bonds, Delta Air Lines, Inc. - LaGuardia Airport Terminals C&D Redevelopment Project, Series 2023, 6.000%, 4/01/35, (AMT) | 4/31 at 100.00 | 518,093 | |||||||||||
| Total New York | 3,517,460 | |||||||||||||
North Carolina - 2.8% | ||||||||||||||
| 685 | North Carolina Medical Care Commission, Retirement Facilities First Mortgage Revenue Bonds, Southminster Project, Refunding Series 2016, 5.000%, 10/01/31 | 10/24 at 102.00 | 651,409 | |||||||||||
| 2,000 | North Carolina Turnpike Authority, Triangle Expressway System Revenue Bonds, Senior Lien Series 2019, 5.000%, 1/01/49 | 1/30 at 100.00 | 1,914,477 | |||||||||||
| Total North Carolina | 2,565,886 | |||||||||||||
North Dakota - 0.1% | ||||||||||||||
| 100 | Grand Forks, North Dakota, Senior Housing & Nursing Facilities Revenue Bonds, Valley Homes and Services Obligated Group, Series 2017, 5.000%, 12/01/36 | 12/26 at 100.00 | 84,639 | |||||||||||
| Total North Dakota | 84,639 | |||||||||||||
Ohio - 1.7% | ||||||||||||||
| 1,000 | Buckeye Tobacco Settlement Financing Authority, Ohio, Tobacco Settlement Asset-Backed Revenue Bonds, Refunding Senior Lien Series 2020B-2 Class 2, 5.000%, 6/01/55 | 6/30 at 100.00 | 819,195 | |||||||||||
| 1,000 | Cleveland-Cuyahoga County Port Authroity, Ohio, Cultural Facility Revenue Bonds, The Cleveland Museum of Natural History Project, Series 2021, 4.000%, 7/01/51 | 7/31 at 100.00 | 786,015 | |||||||||||
| Total Ohio | 1,605,210 | |||||||||||||
Oklahoma - 0.6% | ||||||||||||||
| 670 | Oklahoma Development Finance Authority, Health System Revenue Bonds, OU Medicine Project, Series 2018B, 5.500%, 8/15/52 | 8/28 at 100.00 | 580,917 | |||||||||||
| Total Oklahoma | 580,917 | |||||||||||||
Oregon - 0.1% | ||||||||||||||
| 55 | Clackamas County Hospital Facility Authority, Oregon, Revenue Bonds, Rose Villa Inc., Series 2020A, 5.250%, 11/15/50 | 11/25 at 102.00 | 45,753 | |||||||||||
| Total Oregon | 45,753 | |||||||||||||
Pennsylvania - 2.3% | ||||||||||||||
| 1,000 | Berks County Municipal Authority, Pennsylvania, Revenue Bonds, Reading Hospital & Medical Center Project, Series 2012A, 5.000%, 11/01/40 | 11/23 at 100.00 | 546,412 | |||||||||||
| 500 | Lancaster County Hospital Authority, Pennsylvania, Revenue Bonds, Penn State Health, Series 2021, 5.000%, 11/01/51 | 11/29 at 100.00 | 472,117 | |||||||||||
| 500 | Lehigh County, Pennsylvania, Revenue Bonds, Lehigh Valley Dual Language Charter School, General Purpose Authority, Series 2023, 7.000%, 6/01/53 | 6/30 at 103.00 | 488,979 | |||||||||||
Principal Amount (000) | Description (a) | Optional Call Provisions (b) | Value | |||||||||||
Pennsylvania (continued) | ||||||||||||||
| $ | 560 | (e) | Montgomery County Industrial Development Authority, Pennsylvania, Health System Revenue Bonds, Albert Einstein Healthcare Network Issue, Series 2015A, 5.250%, 1/15/36, (Pre-refunded 1/15/25) | 1/25 at 100.00 | $ | 568,624 | ||||||||
| Total Pennsylvania | 2,076,132 | |||||||||||||
Puerto Rico - 1.7% | ||||||||||||||
Puerto Rico Sales Tax Financing Corporation, Sales Tax Revenue Bonds, Restructured 2018A-1: | ||||||||||||||
| 1,760 | 0.000%, 7/01/51 | 7/28 at 30.01 | 318,141 | |||||||||||
| 500 | 4.750%, 7/01/53 | 7/28 at 100.00 | 423,560 | |||||||||||
| 745 | 5.000%, 7/01/58 | 7/28 at 100.00 | 652,254 | |||||||||||
| 200 | Puerto Rico Sales Tax Financing Corporation, Sales Tax Revenue Bonds, Taxable Restructured Cofina Project Series 2019A-2, 4.329%, 7/01/40 | 7/28 at 100.00 | 173,265 | |||||||||||
| Total Puerto Rico | 1,567,220 | |||||||||||||
South Carolina - 0.5% | ||||||||||||||
| 620 | South Carolina Jobs-Economic Development Authority, Economic Development Revenue Bonds, Bishop Gadsden Episcopal Retirement Community, Series 2019A, 4.000%, 4/01/49 | 4/26 at 103.00 | 418,625 | |||||||||||
| Total South Carolina | 418,625 | |||||||||||||
South Dakota - 1.5% | ||||||||||||||
| 100 | Sioux Falls, South Dakota, Health Facilities Revenue Bonds, Dow Rummel Village Project, Series 2017, 5.125%, 11/01/47 | 11/26 at 100.00 | 79,228 | |||||||||||
| 1,300 | South Dakota Health and Educational Facilities Authority, Revenue Bonds, Avera Health System, Series 2014, 5.000%, 7/01/44 | 7/24 at 100.00 | 1,259,217 | |||||||||||
| Total South Dakota | 1,338,445 | |||||||||||||
Tennessee - 1.1% | ||||||||||||||
| 870 | Knox County Health, Educational and Housing Facilities Board, Tennessee, Revenue Bonds, University Health System, Inc., Series 2016, 5.000%, 9/01/47 | 9/26 at 100.00 | 747,328 | |||||||||||
| 250 | Metropolitan Nashville Airport Authority, Tennessee, Airport Improvement Revenue Bonds, Series 2022B, 5.500%, 7/01/42, (AMT) | 7/32 at 100.00 | 255,115 | |||||||||||
| Total Tennessee | 1,002,443 | |||||||||||||
Texas - 10.2% | ||||||||||||||
| 250 | Bexar County Hospital District, Texas, Certificates of Obligation, Series 2023, 5.000%, 2/15/48 | 8/32 at 100.00 | 251,868 | |||||||||||
| 670 | (e) | Central Texas Regional Mobility Authority, Revenue Bonds, Senior Lien, Series 2015A, 5.000%, 1/01/40, (Pre-refunded 7/01/25) | 7/25 at 100.00 | 681,602 | ||||||||||
| 1,000 | Dallas-Fort Worth International Airport, Texas, Joint Revenue Bonds, Refunding Series 2021A, 4.000%, 11/01/46 | 11/30 at 100.00 | 844,688 | |||||||||||
| 500 | Grand Parkway Transportation Corporation, Texas, System Toll Revenue Bonds, Refunding First Tier Series 2020C, 4.000%, 10/01/45 | 4/30 at 100.00 | 412,516 | |||||||||||
| 450 | Hutto Independent School District, Williamson County, Texas, General Obligation Bonds, School Building Series 2023, 5.000%, 8/01/48 | 8/33 at 100.00 | 461,490 | |||||||||||
| 500 | Kyle, Texas, Special Assessment Revenue Bonds, Southwest Kyle Public Improvement District 1 Improvement Area 2 Project, Series 2023, 6.750%, 9/01/48, 144A, (WI/DD) | 9/33 at 100.00 | 496,365 | |||||||||||
| 500 | Lower Colorado River Authority, Texas, Transmission Contract Revenue Bonds, LCRA Transmission Services Corporation Project, Refunding Series 2015, 5.000%, 5/15/40 | 5/25 at 100.00 | 497,338 | |||||||||||
| NMI | Nuveen Municipal Income Fund, Inc. (continued) Portfolio of Investments October 31, 2023 |
Principal Amount (000) | Description (a) | Optional Call Provisions (b) | Value | |||||||||||
Texas | ||||||||||||||
| $ | 125 | Mission Economic Development Corporation, Texas, Revenue Bonds, Natgasoline Project, Senior Lien Series 2018, 4.625%, 10/01/31, (AMT), 144A | 11/23 at 103.00 | $ | 117,670 | |||||||||
| 1,000 | New Hope Cultural Education Facilities Finance Corporation, Texas, Student Housing Revenue Bonds, CHF-Collegiate Housing Foundation - College Station I LLC - Texas A&M University Project, Series 2014A, 5.000%, 4/01/46 - AGM Insured | 4/24 at 100.00 | 895,721 | |||||||||||
| 200 | (e) | North Texas Tollway Authority, Special Projects System Revenue Bonds, Convertible Capital Appreciation Series 2011C, 7.000%, 9/01/43, (Pre-refunded 9/01/31) | 9/31 at 100.00 | 235,907 | ||||||||||
| 500 | North Texas Tollway Authority, System Revenue Bonds, Refunding Second Tier, Series 2015A, 5.000%, 1/01/38 | 1/25 at 100.00 | 489,772 | |||||||||||
| 535 | Plano, Collin and Denton Counties, Texas, Special Assessment Revenue Bonds, Haggard Farm Public Improvement District Project, Area 1 Project Series 2023, 7.500%, 9/15/53, 144A, (WI/DD) | 9/33 at 100.00 | 535,282 | |||||||||||
| 240 | Reagan Hospital District of Reagan County, Texas, Limited Tax Revenue Bonds, Series 2014A, 5.000%, 2/01/34 | 2/24 at 100.00 | 235,795 | |||||||||||
| 295 | SA Energy Acquisition Public Facilities Corporation, Texas, Gas Supply Revenue Bonds, Series 2007, 5.500%, 8/01/27 | No Opt. Call | 298,353 | |||||||||||
| 1,000 | San Antonio, Texas, Water System Revenue Bonds, Refunding Junior Lien Series 2018A, 5.000%, 5/15/48 | 5/28 at 100.00 | 1,006,865 | |||||||||||
| 1,000 | Texas Private Activity Bond Surface Transporation Corporation, Senior Lien Revenue Bonds, NTE Mobility Partners Segments 3 LLC Segments 3C Project, Series 2019, 5.000%, 6/30/58, (AMT) | 6/29 at 100.00 | 915,685 | |||||||||||
| 1,000 | Texas Transportation Commission, Central Texas Turnpike System Revenue Bonds, Refunding Second Tier Series 2015C, 5.000%, 8/15/32 | 8/24 at 100.00 | 985,308 | |||||||||||
| Total Texas | 9,362,225 | |||||||||||||
Utah - 0.4% | ||||||||||||||
| 410 | Salt Lake City, Utah, Airport Revenue Bonds, International Airport Series 2023A, 5.250%, 7/01/53, (AMT) | 7/33 at 100.00 | 400,840 | |||||||||||
| Total Utah | 400,840 | |||||||||||||
Virgin Islands - 0.4% | ||||||||||||||
| 380 | Matching Fund Special Purpose Securitization Corporation, Virgin Islands, Revenue Bonds, Series 2022A, 5.000%, 10/01/32 | No Opt. Call | 373,654 | |||||||||||
| Total Virgin Islands | 373,654 | |||||||||||||
Virginia - 2.0% | ||||||||||||||
| 1,265 | Virginia Small Business Financing Authority, Private Activity Revenue Bonds, Transform 66 P3 Project, Senior Lien Series 2017, 5.000%, 12/31/56, (AMT) | 6/27 at 100.00 | 1,159,947 | |||||||||||
| 750 | Virginia Small Business Financing Authority, Revenue Bonds, 95 Express Lanes LLC Project, Refunding Senior Lien Series 2022, 5.000%, 12/31/47, (AMT) | 12/32 at 100.00 | 708,146 | |||||||||||
| Total Virginia | 1,868,093 | |||||||||||||
West Virginia - 1.0% | ||||||||||||||
| 1,000 | West Virginia Hospital Finance Authority, Revenue Bonds, West Virginia University Health System Obligated Group, Improvement Series 2017A, 5.000%, 6/01/47 | 6/27 at 100.00 | 959,062 | |||||||||||
| Total West Virginia | 959,062 | |||||||||||||
Principal Amount (000) | Description (a) | Optional Call Provisions (b) | Value | |||||||||||
Wisconsin - 3.8% | ||||||||||||||
| Public Finance Authority of Wisconsin, Conference Center and Hotel Revenue Bonds, Lombard Public Facilities Corporation, Second Tier Series 2018B: | ||||||||||||||
| $ | 4 | (c) | 0.000%, 1/01/46, 144A | No Opt. Call | $ | 79 | ||||||||
| 4 | (c) | 0.000%, 1/01/47, 144A | No Opt. Call | 72 | ||||||||||
| 4 | (c) | 0.000%, 1/01/48, 144A | No Opt. Call | 67 | ||||||||||
| 4 | (c) | 0.000%, 1/01/49, 144A | No Opt. Call | 63 | ||||||||||
| 3 | (c) | 0.000%, 1/01/50, 144A | No Opt. Call | 57 | ||||||||||
| 4 | (c) | 0.000%, 1/01/51, 144A | No Opt. Call | 59 | ||||||||||
| 98 | (c) | 1.000%, 7/01/51, 144A | 3/28 at 100.00 | 51,864 | ||||||||||
| 4 | (c) | 0.000%, 1/01/52, 144A | No Opt. Call | 54 | ||||||||||
| 4 | (c) | 0.000%, 1/01/53, 144A | No Opt. Call | 51 | ||||||||||
| 4 | (c) | 0.000%, 1/01/54, 144A | No Opt. Call | 47 | ||||||||||
| 4 | (c) | 0.000%, 1/01/55, 144A | No Opt. Call | 44 | ||||||||||
| 4 | (c) | 0.000%, 1/01/56, 144A | No Opt. Call | 41 | ||||||||||
| 4 | (c) | 0.000%, 1/01/57, 144A | No Opt. Call | 38 | ||||||||||
| 4 | (c) | 0.000%, 1/01/58, 144A | No Opt. Call | 35 | ||||||||||
| 3 | (c) | 0.000%, 1/01/59, 144A | No Opt. Call | 33 | ||||||||||
| 3 | (c) | 0.000%, 1/01/60, 144A | No Opt. Call | 31 | ||||||||||
| 3 | (c) | 0.000%, 1/01/61, 144A | No Opt. Call | 28 | ||||||||||
| 3 | (c) | 0.000%, 1/01/62, 144A | No Opt. Call | 26 | ||||||||||
| 3 | (c) | 0.000%, 1/01/63, 144A | No Opt. Call | 24 | ||||||||||
| 3 | (c) | 0.000%, 1/01/64, 144A | No Opt. Call | 23 | ||||||||||
| 3 | (c) | 0.000%, 1/01/65, 144A | No Opt. Call | 21 | ||||||||||
| 3 | (c) | 0.000%, 1/01/66, 144A | No Opt. Call | 19 | ||||||||||
| 42 | (c) | 0.000%, 1/01/67, 144A | No Opt. Call | 226 | ||||||||||
| 500 | Public Finance Authority of Wisconsin, Pollution Control Revenue Bonds, Duke Energy Progress Project, Refunding Series 2022A-2, 3.300%, 10/01/46, (Mandatory Put 10/01/26) | No Opt. Call | 487,380 | |||||||||||
| 200 | Wisconsin Health and Educational Facilities Authority, Wisconsin, Revenue Bonds, Dickson Hollow Project. Series 2014, 5.125%, 10/01/34 | 12/23 at 101.00 | 172,248 | |||||||||||
| 200 | Wisconsin Health and Educational Facilities Authority, Wisconsin, Revenue Bonds, Oakwood Lutheran Senior Ministries, Series 2021, 4.000%, 1/01/57 | 1/27 at 103.00 | 105,478 | |||||||||||
| 1,000 | Wisconsin Health and Educational Facilities Authority, Wisconsin, Revenue Bonds, PHW Oconomowoc, Inc. Project, Series 2018, 5.125%, 10/01/48 | 12/23 at 102.00 | 788,175 | |||||||||||
| 1,000 | Wisconsin Health and Educational Facilities Authority, Wisconsin, Revenue Bonds, ProHealth Care, Inc. Obligated Group, Refunding Series 2015, 5.000%, 8/15/39 | 8/24 at 100.00 | 966,744 | |||||||||||
| 1,000 | Wisconsin Health and Educational Facilities Authority, Wisconsin, Revenue Bonds, ThedaCare Inc, Series 2015, 5.000%, 12/15/44 | 12/24 at 100.00 | 932,670 | |||||||||||
| Total Wisconsin | 3,505,697 | |||||||||||||
| Total Municipal Bonds (cost $95,989,478) | 88,931,951 | |||||||||||||
Total Long-Term Investments (cost $95,989,478) | 88,931,951 | |||||||||||||
Principal Amount (000) | Description (a) | Optional Call Provisions (b) | Value | |||||||||||
SHORT-TERM INVESTMENTS - 2.9% | ||||||||||||||
MUNICIPAL BONDS - 2.9% | ||||||||||||||
Colorado - 1.3% | ||||||||||||||
| $ | 1,200 | (f) | Colorado Springs, Colorado, Utilities System Revenue Bonds, Refunding Series 2009C, 4.090%, 11/01/28, (Mandatory Put 11/7/2023) | 10/23 at 100.00 | $ | 1,200,000 | ||||||||
| Total Colorado | 1,200,000 | |||||||||||||
| NMI | Nuveen Municipal Income Fund, Inc. (continued) Portfolio of Investments October 31, 2023 |
Principal Amount (000) | Description (a) | Optional Call Provisions (b) | Value | |||||||||||
Missouri - 1.6% | ||||||||||||||
| $ | 1,480 | (f) | Missouri Health and Educational Facilities Authority, Revenue Bonds, BJC Health System, Variable Rate Demand Obligations, Series 2008C, 4.060%, 5/15/38, (Mandatory Put 11/7/2023) | 10/23 at 100.00 | $ | 1,480,000 | ||||||||
| Total Missouri | 1,480,000 | |||||||||||||
| Total Municipal Bonds (cost $2,680,000) | 2,680,000 | |||||||||||||
Total Short-Term Investments (cost $2,680,000) | 2,680,000 | |||||||||||||
Total Investments (cost $98,669,478) - 99.5% | 91,611,951 | |||||||||||||
Other Assets & Liabilities, Net - 0.5% | 505,457 | |||||||||||||
Net Assets Applicable to Common Shares - 100% | $ | 92,117,408 | ||||||||||||
| (a) | All percentages shown in the Portfolio of Investments are based on net assets applicable to common shares unless otherwise noted. |
| (b) | Optional Call Provisions: Dates (month and year) and prices of the earliest optional call or redemption. There may be other call provisions at varying prices at later dates. Certain mortgage-backed securities may be subject to periodic principal paydowns. Optional Call Provisions are not covered by the report of independent registered public accounting firm. |
| (c) | Defaulted security. A security whose issuer has failed to fully pay principal and/or interest when due, or is under the protection of bankruptcy. |
| (d) | For fair value measurement disclosure purposes, investment classified as Level 3. |
| (e) | Backed by an escrow or trust containing sufficient U.S. Government or U.S. Government agency securities, which ensure the timely payment of principal and interest. |
| (f) | Investment has a maturity of greater than one year, but has variable rate and/or demand features which qualify it as a short-term investment. The rate disclosed, as well as the reference rate and spread, where applicable, is that in effect as of the end of the reporting period. This rate changes periodically based on market conditions or a specified market index. |
| 144A | Investment is exempt from registration under Rule 144A of the Securities Act of 1933, as amended. These investments may only be resold in transactions exempt from registration, which are normally those transactions with qualified institutional buyers. |
| AMT | Alternative Minimum Tax |
| ETM | Escrowed to maturity |
| WI/DD | When-issued or delayed delivery security. |
October 31, 2023 | NUV | NUW | NMI | |||||||||
ASSETS | ||||||||||||
Long-term investments, at value † | $ | 1,795,221,291 | $ | 252,470,463 | $ | 88,931,951 | ||||||
Short-term investments, at value ◇ | – | – | 2,680,000 | |||||||||
| Cash | 12,245,560 | 1,611,440 | 849,455 | |||||||||
Cash collateral at broker for investments in futures contracts (1) | – | 318,012 | – | |||||||||
| Receivables: | ||||||||||||
| Interest | 22,675,621 | 3,279,355 | 1,348,503 | |||||||||
| Investments sold | 2,455,000 | 195,000 | 2,550,636 | |||||||||
| Variation margin on futures contracts | – | 7,453 | – | |||||||||
| Deferred offering costs | – | – | 111,370 | |||||||||
| Other | 490,160 | 14,064 | 4,259 | |||||||||
Total assets | 1,833,087,632 | 257,895,787 | 96,476,174 | |||||||||
LIABILITIES | ||||||||||||
| Floating rate obligations | 21,480,000 | 2,000,000 | – | |||||||||
| Payables: | ||||||||||||
| Dividends | 5,545,982 | 748,253 | 301,151 | |||||||||
| Interest | 117,606 | 3,919 | – | |||||||||
| Investments purchased - regular settlement | – | – | 2,465,565 | |||||||||
| Investments purchased - when-issued/delayed-delivery settlement | – | – | 1,505,466 | |||||||||
| Accrued expenses: | ||||||||||||
| Custodian fees | 117,454 | 33,546 | 15,039 | |||||||||
| Investor relations | 30,841 | 4,682 | 1,067 | |||||||||
| Management fees | 711,203 | 122,141 | 48,421 | |||||||||
| Directors/Trustees fees | 492,142 | 7,874 | 2,293 | |||||||||
| Professional fees | 10,436 | 7,454 | 3,971 | |||||||||
| Shareholder reporting expenses | 57,333 | 7,264 | 3,973 | |||||||||
| Shareholder servicing agent fees | 71,192 | 141 | 1,025 | |||||||||
| Shelf offering costs | – | – | 10,787 | |||||||||
| Other | 21 | 17 | 8 | |||||||||
Total liabilities | 28,634,210 | 2,935,291 | 4,358,766 | |||||||||
Commitments and contingencies (2) | ||||||||||||
Net assets applicable to common shares | $ | 1,804,453,422 | $ | 254,960,496 | $ | 92,117,408 | ||||||
| Common shares outstanding | 207,541,595 | 17,951,336 | 10,051,095 | |||||||||
| Net asset value (“NAV”) per common share outstanding | $ | 8.69 | $ | 14.20 | $ | 9.16 | ||||||
NET ASSETS APPLICABLE TO COMMON SHARES CONSIST OF: | ||||||||||||
| Common shares, $0.01 par value per share | $ | 2,075,416 | $ | 179,513 | $ | 100,511 | ||||||
Paid-in capital | 1,963,547,908 | 268,620,421 | 105,319,950 | |||||||||
| Total distributable earnings (loss) | (161,169,902 | ) | (13,839,438 | ) | (13,303,053 | ) | ||||||
| Net assets applicable to common shares | $ | 1,804,453,422 | $ | 254,960,496 | $ | 92,117,408 | ||||||
| Authorized shares: | ||||||||||||
| Common | 350,000,000 | Unlimited | 200,000,000 | |||||||||
† | $ | 1,882,403,978 | $ | 266,118,457 | $ | 95,989,478 | ||||||
◇ | $ | – | $ | – | $ | 2,680,000 | ||||||
| (1) | Cash pledged to collateralize the net payment obligations for investments in derivatives. |
| (2) | As disclosed in Notes to Financial Statements. |
Year Ended October 31, 2023 | NUV | NUW | NMI | |||||||||
INVESTMENT INCOME | ||||||||||||
| Interest | $ | 82,246,713 | $ | 10,677,425 | $ | 4,503,481 | ||||||
| Total investment income | 82,246,713 | 10,677,425 | 4,503,481 | |||||||||
EXPENSES | ||||||||||||
| Management fees | 8,599,863 | 1,490,583 | 595,150 | |||||||||
| Shareholder servicing agent fees | 302,074 | 316 | 5,831 | |||||||||
| Interest expense | 791,579 | 74,476 | 761 | |||||||||
| Directors/Trustees fees | 63,865 | 8,982 | 3,270 | |||||||||
| Custodian expenses, net | 53,379 | 30,179 | 14,351 | |||||||||
| Investor relations expenses | 75,177 | 10,825 | 4,293 | |||||||||
| Professional fees | 109,787 | 48,556 | 55,405 | |||||||||
| Shareholder reporting expenses | 128,425 | 23,845 | 23,381 | |||||||||
| Stock exchange listing fees | 62,551 | 7,326 | 7,789 | |||||||||
| Other | 57,854 | 585 | 11,564 | |||||||||
| Total expenses | 10,244,554 | 1,695,673 | 721,795 | |||||||||
Net investment income (loss) | 72,002,159 | 8,981,752 | 3,781,686 | |||||||||
REALIZED AND UNREALIZED GAIN (LOSS) | ||||||||||||
| Realized gain (loss) from: | ||||||||||||
| Investments | (21,685,836 | ) | (1,450,379 | ) | (1,348,719 | ) | ||||||
| Futures contracts | – | 1,687,127 | – | |||||||||
| Net realized gain (loss) | (21,685,836 | ) | 236,748 | (1,348,719 | ) | |||||||
| Change in unrealized appreciation (depreciation) on: | ||||||||||||
| Investments | 4,622,056 | 101,760 | 483,356 | |||||||||
| Futures contracts | – | (686,998 | ) | – | ||||||||
| Net change in unrealized appreciation (depreciation) | 4,622,056 | (585,238 | ) | 483,356 | ||||||||
| Net realized and unrealized gain (loss) | (17,063,780 | ) | (348,490 | ) | (865,363 | ) | ||||||
Net increase (decrease) in net assets applicable to common shares from operations | $ | 54,938,379 | $ | 8,633,262 | $ | 2,916,323 | ||||||
NUV | NUW | |||||||||||||||||||||
Year Ended 10/31/23 | Year Ended 10/31/22 | Year Ended 10/31/23 | Year Ended 10/31/22 | |||||||||||||||||||
OPERATIONS | ||||||||||||||||||||||
| Net investment income (loss) | $ | 72,002,159 | $ | 68,382,062 | $ | 8,981,752 | $ | 8,265,079 | ||||||||||||||
| Net realized gain (loss) | (21,685,836 | ) | (42,644,074 | ) | 236,748 | (953,863 | ) | |||||||||||||||
| Net change in unrealized appreciation (depreciation) | 4,622,056 | (340,070,110 | ) | (585,238 | ) | (51,604,479 | ) | |||||||||||||||
| Net increase (decrease) in net assets applicable to common shares from operations | 54,938,379 | (314,332,122 | ) | 8,633,262 | (44,293,263 | ) | ||||||||||||||||
DISTRIBUTIONS TO COMMON SHAREHOLDERS | ||||||||||||||||||||||
| Dividends | (69,941,517 | ) | (69,733,974 | ) | (8,625,617 | ) | (11,846,086 | ) | ||||||||||||||
| Total distributions | (69,941,517 | ) | (69,733,974 | ) | (8,625,617 | ) | (11,846,086 | ) | ||||||||||||||
CAPITAL SHARE TRANSACTIONS | ||||||||||||||||||||||
| Common shares: | ||||||||||||||||||||||
| Reinvestments of distributions | – | 347,096 | – | – | ||||||||||||||||||
| Net increase (decrease) applicable to common shares from capital share transactions | – | 347,096 | – | – | ||||||||||||||||||
| Net increase (decrease) in net assets applicable to common shares | (15,003,138 | ) | (383,719,000 | ) | 7,645 | (56,139,349 | ) | |||||||||||||||
| Net assets applicable to common shares at the beginning of the period | 1,819,456,560 | 2,203,175,560 | 254,952,851 | 311,092,200 | ||||||||||||||||||
Net assets applicable to common shares at the end of the period | $ | 1,804,453,422 | $ | 1,819,456,560 | $ | 254,960,496 | $ | 254,952,851 | ||||||||||||||
NMI | ||||||||||||
Year Ended 10/31/23 | Year Ended 10/31/22 | |||||||||||
OPERATIONS | ||||||||||||
| Net investment income (loss) | $ | 3,781,686 | $ | 3,444,459 | ||||||||
| Net realized gain (loss) | (1,348,719 | ) | (5,141,509 | ) | ||||||||
| Net change in unrealized appreciation (depreciation) | 483,356 | (15,433,338 | ) | |||||||||
| Net increase (decrease) in net assets applicable to common shares from operations | 2,916,323 | (17,130,388 | ) | |||||||||
DISTRIBUTIONS TO COMMON SHAREHOLDERS | ||||||||||||
| Dividends | (3,678,642 | ) | (3,259,831 | ) | ||||||||
| Total distributions | (3,678,642 | ) | (3,259,831 | ) | ||||||||
CAPITAL SHARE TRANSACTIONS | ||||||||||||
| Common shares: | ||||||||||||
| Proceeds from shelf offering, net of offering costs | 49,338 | (9,169 | ) | |||||||||
| Reinvestments of distributions | – | 38,776 | ||||||||||
| Net increase (decrease) applicable to common shares from capital share transactions | 49,338 | 29,607 | ||||||||||
| Net increase (decrease) in net assets applicable to common shares | (712,981 | ) | (20,360,612 | ) | ||||||||
| Net assets applicable to common shares at the beginning of the period | 92,830,389 | 113,191,001 | ||||||||||
Net assets applicable to common shares at the end of the period | $ | 92,117,408 | $ | 92,830,389 | ||||||||
Investment Operations | Less Distributions to Common Shareholders | Common Share | ||||||||||||||||||||||||||||||||||||||
Common Share Net Asset Value, Beginning of Period | Net Investment Income (NII) (Loss) | Net Realized/ Unrealized Gain (Loss) | Total | From NII | From Net Realized Gains | Total | Premium per Share Sold through Shelf Offering | Net Asset Value, End of Period | Share Price, End of Period | |||||||||||||||||||||||||||||||
NUV | ||||||||||||||||||||||||||||||||||||||||
| 10/31/23 | $8.77 | $0.35 | $(0.09) | $0.26 | $(0.34) | $– | $(0.34) | $– | $8.69 | $7.99 | ||||||||||||||||||||||||||||||
| 10/31/22 | 10.62 | 0.33 | (1.84) | (1.51) | (0.34) | – | (0.34) | – | 8.77 | 8.35 | ||||||||||||||||||||||||||||||
| 10/31/21 | 10.48 | 0.35 | 0.15 | 0.50 | (0.36) | – | (0.36) | – | 10.62 | 11.21 | ||||||||||||||||||||||||||||||
| 10/31/20 | 10.57 | 0.37 | (0.09) | 0.28 | (0.37) | – | (0.37) | – | 10.48 | 10.81 | ||||||||||||||||||||||||||||||
| 10/31/19 | 9.84 | 0.37 | 0.73 | 1.10 | (0.37) | – | (0.37) | – | 10.57 | 10.43 | ||||||||||||||||||||||||||||||
NUW | ||||||||||||||||||||||||||||||||||||||||
| 10/31/23 | 14.20 | 0.50 | (0.02) | 0.48 | (0.48) | – | (0.48) | – | 14.20 | 12.60 | ||||||||||||||||||||||||||||||
| 10/31/22 | 17.33 | 0.46 | (2.93) | (2.47) | (0.47) | (0.19) | (0.66) | – | 14.20 | 13.19 | ||||||||||||||||||||||||||||||
| 10/31/21 | 16.81 | 0.45 | 0.54 | 0.99 | (0.47) | – | (0.47) | –(c) | 17.33 | 16.76 | ||||||||||||||||||||||||||||||
| 10/31/20 | 16.90 | 0.47 | (0.08) | 0.39 | (0.48) | – | (0.48) | – | 16.81 | 16.21 | ||||||||||||||||||||||||||||||
| 10/31/19 | 15.88 | 0.60 | 1.16 | 1.76 | (0.65) | (0.10) | (0.75) | 0.01 | 16.90 | 16.83 | ||||||||||||||||||||||||||||||
| (a) | Percentage is not annualized. |
| (b) | The expense ratios reflect, among other things, the interest expense deemed to have been paid by the Fund on the floating rate certificates issued by the special purpose trusts for the self-deposited inverse floaters held by the Fund (as described in Notes to Financial Statements), where applicable, as follows: |
Ratios of Interest Expense to Average Net Assets Applicable to Common Shares | ||||||||
NUV | NUW | |||||||
| 10/31/23 | 0.04% | 0.03% | ||||||
| 10/31/22 | 0.01 | 0.01 | ||||||
| 10/31/21 | 0.01 | 0.01 | ||||||
| 10/31/20 | 0.02 | 0.01 | ||||||
| 10/31/19 | 0.04 | 0.07 | ||||||
Common Share Supplemental Data/ Ratios Applicable to Common Shares | ||||||||||||
Common Share Total Returns | Ratios to Average Net Assets | |||||||||||
Based on Net Asset Value(a) | Based on Share Price(a) | Net Assets, End of Period (000) | Expenses(b) | Net Investment Income (Loss) | Portfolio Turnover Rate | |||||||
| 2.79% | (0.52)% | $1,804,453 | 0.53% | 3.77% | 17% | |||||||
| (14.52) | (22.80) | 1,819,457 | 0.50 | 3.36 | 29 | |||||||
| 4.79 | 7.19 | 2,203,176 | 0.48 | 3.27 | 11 | |||||||
| 2.72 | 7.41 | 2,171,104 | 0.51 | 3.52 | 11 | |||||||
| 11.35 | 17.92 | 2,186,923 | 0.54 | 3.63 | 13 | |||||||
| 3.27 | (1.08) | 254,960 | 0.63 | 3.35 | 14 | |||||||
| (14.65) | (17.84) | 254,953 | 0.64 | 2.90 | 17 | |||||||
| 5.89 | 6.31 | 311,092 | 0.68 (d) | 2.60 (d) | 10 | |||||||
| 2.33 | (0.77) | 260,790 | 0.78 (d) | 2.79 (d) | 13 | |||||||
| 11.38 | 22.81 | 262,190 | 0.73 | 3.61 | 31 | |||||||
| (c) | Value rounded to zero. |
| (d) | During the period ended October 31, 2021 and October 31, 2020, the Adviser voluntarily reimbursed the Fund for certain expenses incurred in connection with a common shares equity shelf program. As a result, the Expenses and Net Investment Income (Loss) Ratios to Average Net Assets reflect the voluntary expense reimbursement from Adviser. The Expenses and Net Investment Income (Loss) Ratios to Average Net Assets excluding this expense reimbursement from Adviser were as follows: |
Ratios to Average Net Assets | ||||||||||||||
NUW | Expenses | NII (Loss) | ||||||||||||
| 10/31/21 | 0.68% | 2.60% | ||||||||||||
| 10/31/20 | 0.82 | 2.75 | ||||||||||||
Investment Operations | Less Distributions to Common Shareholders | Common Share | ||||||||||||||||||||||||||||||||||||||||
Common Share Net Asset Value, Beginning of Period | Net Investment Income (NII) (Loss) | Net Realized/ Unrealized Gain (Loss) | Total | From NII | From Net Realized Gains | Total | Premium per Share Sold through Shelf Offering | Net Asset Value, End of Period | Share Price, End of Period | |||||||||||||||||||||||||||||||||
NMI | ||||||||||||||||||||||||||||||||||||||||||
| 10/31/23 | $9.24 | $0.38 | $(0.09) | $0.29 | $(0.37) | $– | $(0.37) | $-(c) | $9.16 | $8.35 | ||||||||||||||||||||||||||||||||
| 10/31/22 | 11.27 | 0.34 | (2.05) | (1.71) | (0.32) | –(c) | (0.32) | – | 9.24 | 8.53 | ||||||||||||||||||||||||||||||||
| 10/31/21 | 11.08 | 0.37 | 0.20 | 0.57 | (0.38) | – | (0.38) | – | 11.27 | 11.65 | ||||||||||||||||||||||||||||||||
| 10/31/20 | 11.32 | 0.41 | (0.20) | 0.21 | (0.41) | (0.04) | (0.45) | –(c) | 11.08 | 11.31 | ||||||||||||||||||||||||||||||||
| 10/31/19 | 10.92 | 0.43 | 0.47 | 0.90 | (0.43) | (0.07) | (0.50) | –(c) | 11.32 | 11.33 | ||||||||||||||||||||||||||||||||
| (a) | Percentage is not annualized. |
Common Share Supplemental Data/ Ratios Applicable to Common Shares | ||||||||||||||||||||||||||||||||||||||||||
Common Share Total Returns | Ratios to Average Net Assets | |||||||||||||||||||||||||||||||||||||||||
Based on Net Asset Value(a) | Based on Share Price(a) | Net Assets, End of Period (000) | Expenses(b) | Net Investment Income (Loss) | Portfolio Turnover Rate | |||||||||||||||||||||||||||||||||||||
| 2.94% | 1.80% | $92,117 | 0.74% | 3.87% | 33% | |||||||||||||||||||||||||||||||||||||
| (15.39) | (24.32) | 92,830 | 0.72 | 3.29 | 61 | |||||||||||||||||||||||||||||||||||||
| 5.18 | 6.51 | 113,191 | 0.73 | 3.23 | 15 | |||||||||||||||||||||||||||||||||||||
| 1.86 | 3.87 | 101,924 | 0.74 | 3.70 | 15 | |||||||||||||||||||||||||||||||||||||
| 8.45 | 17.61 | 99,822 | 0.79 | 3.83 | 10 | |||||||||||||||||||||||||||||||||||||
| (b) | The expense ratios reflect, among other things, the interest expense deemed to have been paid by the Fund on the floating rate certificates issued by the special purpose trusts for the self-deposited inverse floaters held by the Fund (as described in Notes to Financial Statements), where applicable, as follows: |
Ratios of Interest Expense to Average Net Assets Applicable to Common Shares | ||||
NMI | ||||
| 10/31/23 | –% | |||
| 10/31/22 | – | |||
| 10/31/21 | – | |||
| 10/31/20 | – | |||
| 10/31/19 | – | |||
| (c) | Value rounded to zero. |
1. | General Information |
| · | Nuveen Municipal Value Fund, Inc. (NUV) |
| · | Nuveen AMT-Free Municipal Value Fund (NUW) |
| · | Nuveen Municipal Income Fund, Inc. (NMI) |
2. | Significant Accounting Policies |
Fund | Gross Custodian Fee Credits | |||
NUV | $ | 101,097 | ||
NUW | 13,121 | |||
NMI | 8,181 | |||
3. | Investment Valuation and Fair Value Measurements |
| Level 1 – | Inputs are unadjusted and prices are determined using quoted prices in active markets for identical securities. | |
| Level 2 – | Prices are determined using other significant observable inputs (including quoted prices for similar securities, interest rates, credit spreads, etc.). | |
| Level 3 – | Prices are determined using significant unobservable inputs (including management’s assumptions in determining the fair value of investments). | |
NUV | Level 1 | Level 2 | Level 3 | Total | ||||||||||||
| Long-Term Investments: | ||||||||||||||||
| Municipal Bonds | $ | – | $ | 1,795,221,291 | $ | – | $ | 1,795,221,291 | ||||||||
| Total | $ | – | $ | 1,795,221,291 | $ | – | $ | 1,795,221,291 | ||||||||
NUW | Level 1 | Level 2 | Level 3 | Total | ||||||||||||
| Long-Term Investments: | ||||||||||||||||
| Municipal Bonds | $ | – | $ | 251,253,096 | $ | – | $ | 251,253,096 | ||||||||
| Common Stocks | – | 1,217,367 | – | 1,217,367 | ||||||||||||
| Investments in Derivatives: | ||||||||||||||||
| Futures Contracts* | 654,844 | – | – | 654,844 | ||||||||||||
| Total | $ | 654,844 | $ | 252,470,463 | $ | – | $ | 253,125,307 | ||||||||
NMI | Level 1 | Level 2 | Level 3 | Total | ||||||||||||
| Long-Term Investments: | ||||||||||||||||
| Municipal Bonds | $ | – | $ | 88,920,957 | $ | 10,994** | $ | 88,931,951 | ||||||||
| Short-Term Investments: | ||||||||||||||||
| Municipal Bonds | – | 2,680,000 | – | 2,680,000 | ||||||||||||
| Total | $ | – | $ | 91,600,957 | $ | 10,994 | $ | 91,611,951 | ||||||||
| * | Represents net unrealized appreciation (depreciation) as reported in Fund’s Portfolio of Investments. |
| ** | Refer to the Fund’s Portfolio of Investments for securities classified as Level 3. |
4. | Portfolio Securities |
Fund | Floating Rate Obligations: Self- Deposited Inverse Floaters | Floating Rate Obligations: Externally-Deposited Inverse Floaters | Total | |||||||||
NUV | $ | 21,480,000 | $ | – | $ | 21,480,000 | ||||||
NUW | 2,000,000 | – | 2,000,000 | |||||||||
NMI | – | – | – | |||||||||
Fund | Average Floating Rate Obligations Outstanding | Average Annual Interest Rate And Fees | ||||
NUV | $ | 21,480,000 | 3.62% | |||
NUW | 2,000,000 | 3.62 | ||||
NMI | – | – | ||||
Fund | Maximum Exposure to Recourse Trusts: Self-Deposited Inverse Floaters | Maximum Exposure to Recourse Trusts: Externally-Deposited Inverse Floaters | Total | |||||||||
NUV | $ | 21,480,000 | $ | – | $ | 21,480,000 | ||||||
NUW | 2,000,000 | – | 2,000,000 | |||||||||
NMI | – | – | – | |||||||||
Fund | Non-U.S. Government Purchases | Non-U.S. Government Sales and Maturities | ||||
NUV | $ | 324,376,367 | $ 337,792,880 | |||
NUW | 36,445,858 | 36,965,435 | ||||
NMI | 34,428,539 | 30,812,843 | ||||
5. | Derivative Investments |
Fund | Average Notional Amount of Futures Contracts Outstanding * | |
NUW | $20,128,845 |
| * | The average notional amount is calculated based on the absolute aggregate notional amount of contracts outstanding at the beginning of the current fiscal period and at the end of each fiscal quarter within the current fiscal period. |
Asset Derivatives | Liability Derivatives | |||||||||||||||||
Derivative Instrument | Risk Exposure | Location | Value | Location | Value | |||||||||||||
NUW | ||||||||||||||||||
| Futures Contracts | Interest rate | | Unrealized appreciation on futures contracts * | | $654,844 | – | $– | |||||||||||
| * | The fair value presented includes cumulative gain (loss) on open futures contracts; however, the value reflected in the accompanying Statements of Assets and Liabilities is only the receivable or payable for variation margin on open futures contacts. |
Derivative Instrument | Risk Exposure | Net Realized Gain (Loss) | Change in Unrealized Appreciation (Depreciation) | |||||||||
NUW | ||||||||||||
| Futures contracts | Interest rate | $1,687,127 | $(686,998) | |||||||||
6. | Fund Shares |
NMI | ||||||
Year Ended 10/31/23 | Year Ended 10/31/22 | |||||
| Additional authorized common shares | 2,000,000* | 2,200,000 | ||||
| Common shares sold | – | – | ||||
| Offering proceeds, net of offering costs | 49,338 | (9,169) | ||||
| * | For the period September 22, 2023 through October 31, 2023. |
NUV | ||||||
Year Ended 10/31/23 | Year Ended 10/31/22 | |||||
| Common Shares: | ||||||
| Issued to shareholders due to reinvestment of distributions | – | 32,361 | ||||
| Total | – | 32,361 | ||||
NMI | ||||||
Year Ended 10/31/23 | Year Ended 10/31/22 | |||||
| Common Shares: | ||||||
| Sold through shelf offering | 4,954 | – | ||||
| Issued to shareholders due to reinvestment of distributions | – | 3,430 | ||||
| Total | 4,954 | 3,430 | ||||
| Weighted average common share: | ||||||
| Premium to NAV per shelf offering common share sold | 1.11% | –% | ||||
7. | Income Tax Information |
Fund | Tax Cost | Gross Unrealized Appreciation | Gross Unrealized (Depreciation) | Net Unrealized Appreciation (Depreciation) | ||||||||||||
NUV | $ | 1,853,279,580 | $ | 37,243,869 | $ | (116,782,158) | $ | (79,538,289) | ||||||||
NUW | 264,384,489 | 4,722,860 | (17,982,042 | ) | (13,259,182) | |||||||||||
NMI | 98,632,080 | 280,115 | (7,300,244 | ) | (7,020,129) | |||||||||||
Fund | Undistributed Tax-Exempt Income 1 | Undistributed Ordinary Income | Undistributed Long-Term Capital Gains | Unrealized Appreciation (Depreciation) | Capital Loss Carryforwards | Late-Year Loss Deferrals | Other Book-to-Tax Differences | Total | ||||||||||||||||||||||||||
NUV | $ | 8,960,607 | $ | 5,789 | $ | – | $ | (79,538,289) | $ | (84,579,303) | $ | – | $ | (6,018,706) | $ | (161,169,902) | ||||||||||||||||||
NUW | 1,387,709 | 1,864 | – | (13,259,182) | (542,698) | – | (1,427,131) | (13,839,438) | ||||||||||||||||||||||||||
NMI | 433,537 | – | – | (7,020,129) | (6,399,852) | – | (316,609) | (13,303,053) | ||||||||||||||||||||||||||
| 1 | Undistributed tax-exempt income (on a tax basis) has not been reduced for the dividend declared on October 2, 2023 and paid on November 1, 2023. |
10/31/23 | 10/31/22 | |||||||||||||||||||||||
Fund | Tax-Exempt Income 1 | Ordinary Income | Long-Term Capital Gains | Tax-Exempt Income | Ordinary Income | Long-Term Capital Gains | ||||||||||||||||||
NUV | $ | 69,485,651 | $ | 455,866 | $ | – | $ | 68,791,746 | $ | 942,228 | $ | – | ||||||||||||
NUW | 8,621,293 | 4,324 | – | 8,231,947 | 538,802 | 3,075,337 | ||||||||||||||||||
NMI | 3,678,642 | – | – | 3,254,922 | – | 4,909 | ||||||||||||||||||
| 1 | Each Fund designates these amounts paid during the period as Exempt Interest Dividends. |
Fund | Short-Term | Long-Term | Total | |||||||||
NUV | $ | 39,918,409 | $ | 44,660,894 | $ | 84,579,303 | ||||||
NUW | – | 542,698 | 542,698 | |||||||||
NMI | 3,319,863 | 3,079,989 | 6,399,852 | |||||||||
8. | Management Fees and Other Transactions with Affiliates |
NUV | ||||
Average Daily Net Assets | Fund-Level Fee Rate | |||
| For the first $500 million | 0.1500 | % | ||
| For the next $500 million | 0.1250 | |||
| For net assets over $1 billion | 0.1000 | |||
NUV | ||||
Gross Interest Income | Gross Income Fee Rate | |||
| For the first $50 million | 4.125 | % | ||
| For the next $50 million | 4.000 | |||
| For gross income over $100 million | 3.875 | |||
NUW | ||||
Average Daily Managed Assets* | Fund-Level Fee Rate | |||
| For the first $125 million | 0.4000 | % | ||
| For the next $125 million | 0.3875 | |||
| For the next $250 million | 0.3750 | |||
| For the next $500 million | 0.3625 | |||
| For the next $1 billion | 0.3500 | |||
| For the next $3 billion | 0.3250 | |||
| For managed assets over $5 billion | 0.3125 | |||
NMI | ||||
Average Daily Net Assets | Fund-Level Fee Rate | |||
| For the first $125 million | 0.4500 | % | ||
| For the next $125 million | 0.4375 | |||
| For the next $250 million | 0.4250 | |||
| For the next $500 million | 0.4125 | |||
| For the next $1 billion | 0.4000 | |||
| For the next $3 billion | 0.3750 | |||
| For net assets over $5 billion | 0.3625 | |||
Complex-Level Eligible Asset Breakpoint Level* | Effective Complex-Level Fee Rate at Breakpoint Level | |
| $55 billion | 0.2000% | |
| $56 billion | 0.1996 | |
| $57 billion | 0.1989 | |
| $60 billion | 0.1961 | |
| $63 billion | 0.1931 | |
| $66 billion | 0.1900 | |
| $71 billion | 0.1851 | |
| $76 billion | 0.1806 | |
| $80 billion | 0.1773 | |
| $91 billion | 0.1691 | |
| $125 billion | 0.1599 | |
| $200 billion | 0.1505 | |
| $250 billion | 0.1469 | |
| $300 billion | 0.1445 |
| * | For the complex-level fees, managed assets include closed-end fund assets managed by the Adviser that are attributable to certain types of leverage. For these purposes, leverage includes the funds’ use of preferred stock and borrowings and certain investments in the residual interest certificates (also called inverse floating rate securities) in tender option bond (TOB) trusts, including the portion of assets held by a TOB trust that has been effectively financed by the trust’s issuance of floating rate securities, subject to an agreement by the Adviser as to certain funds to limit the amount of such assets for determining managed assets in certain circumstances. The complex-level fee is calculated based upon the aggregate daily managed assets of all Nuveenopen-end andclosed-end funds that constitute ‘‘eligible assets.” Eligible assets do not include assets attributable to investments in other Nuveen funds or assets in excess of a determined amount (originally $2 billion) added to the Nuveen fund complex in connection with the Adviser’s assumption of the management of the former First American Funds effective January 1, 2011, but do not include certain assets of certain Nuveen funds that were reorganized into funds advised by an affiliate of the Adviser during the 2019 calendar year. As of October 31, 2023, the complex-level fee for each Fund was as follows: |
Fund | Complex-Level Fee | |||
NUV | 0.1623% | |||
NUW | 0.1623% | |||
NMI | 0.1623% | |||
Fund | Purchases | Sales | Realized Gain (Loss) | |||||||||
NUV | $ | – | $ | – | $ | – | ||||||
NUW | – | – | – | |||||||||
NMI | 4,861,068 | 6,928,503 | (452,816) | |||||||||
9. | Commitments and Contingencies |
10. | Borrowing Arrangements |
Fund | Maximum Outstanding Balance | |||
NUV | $ | 2,942,327 | ||
NUW | 296,365 | |||
NMI | 197,550 | |||
Fund | Utilization Period (Days Outstanding) | Average Daily Balance Outstanding | Average Annual Interest Rate | |||||||||
NUV | 8 | $ | 2,002,377 | 6.12% | ||||||||
NUW | 4 | 296,365 | 5.53 | |||||||||
NMI | 7 | 157,964 | 5.85 | |||||||||
11. | Inter-Fund Lending |
| ● | The Fund may invest up to 20% of its Managed Assets in municipal securities that pay interest that is taxable under the federal alternative minimum tax. |
| ● | The Fund will invest at least 80% of its Managed Assets in investment grade quality municipal securities that, at the time of investment, are rated within the four highest grades (Baa or BBB or better) by at least one nationally recognized statistical rating organization (“NRSRO”) that rate such securities, or if it is unrated but judged to be of comparable quality by the Fund’s sub-adviser. A security is considered investment grade if it is rated within the four highest letter grades by at least one NRSRO that rate such securities (even if rated lower by another), or if it is unrated but judged to be of comparable quality by the Fund’ssub-adviser (such securities are commonly referred to as split-rated securities). |
| ● | The Fund may invest up to 20% of its Managed Assets in municipal securities that at the time of investment are rated below investment grade (Ba or BB or lower) by all NRSROs or are unrated but judged to be of comparable quality by the Fund’s sub-adviser; however, the Fund may not invest more than 10% of its Managed Assets in municipal securities rated belowB3/B- by all NRSROs that rate the security or that are unrated but judged to be of comparable quality by the Fund’ssub-adviser. |
| ● | The Fund may invest up to 15% of its Managed Assets in inverse floating rate securities. |
| ● | The Fund will not invest more than 25% of its Managed Assets in municipal securities in any one industry or in any one state of origin. |
| ● | The Fund will not invest more than 10% of its Managed Assets in “tobacco settlement bonds.” |
| ● | The Fund may invest in distressed securities but may not invest in the securities of an issuer which, at the time of investment, is in default on its obligations to pay principal or interest thereon when due or that is involved in a bankruptcy proceeding (i.e., rated below C-, at the time of investment); provided, however, that the Fund’ssub-adviser may determine that it is in the best interest of shareholders in pursuing a workout arrangement with issuers of defaulted securities to make loans to the defaulted issuer or another party, or purchase a debt, equity or other interest from the defaulted issuer or another party, or take other related or similar steps involving the investment of additional monies, but only if that issuer’s securities are already held by the Fund. |
| ● | The Fund may not enter into a futures contract or related options or forward contracts if more than 30% of the Fund’s Managed Assets would be represented by futures contracts or more than 5% of the Fund’s Managed Assets would be committed to initial margin deposits and premiums on futures contracts or related options. |
| ● | The Fund will generally maintain an investment portfolio with an overall weighted average maturity of greater than 10 years. |
| ● | The Fund will invest at least 80% of its Managed Assets in investment grade quality municipal securities that, at the time of investment, are rated within the four highest grades (Baa or BBB or better) by at least one NRSRO that rate such securities, or if it is unrated but judged to be of comparable quality by the Fund’s sub-adviser. A security is considered investment grade if it is rated within the four highest letter grades by at least one NRSRO that rate such securities (even if rated lower by another), or if it is unrated but judged to be of comparable quality by the Fund’ssub-adviser (such securities are commonly referred to as split-rated securities). |
| ● | The Fund may invest up to 20% of its Managed Assets in municipal securities that at the time of investment are rated below investment grade (Ba or BB or lower) by all NRSRO or are unrated but judged to be of comparable quality by the Fund’s sub-adviser; however, the Fund may not invest more than 10% of its Managed Assets in municipal securities rated belowB3/B- by all NRSROs that rate the security or that are unrated but judged to be of comparable quality by the Fund’ssub-adviser. |
| ● | The Fund will not invest in municipal securities that pay interest that is taxable under the federal alternative minimum tax applicable to individuals. |
| ● | The Fund may invest in distressed securities but may not invest in the securities of an issuer which, at the time of investment, is in default on its obligations to pay principal or interest thereon when due or that is involved in a bankruptcy proceeding (i.e., rated below C-, at the time of investment); provided, however, that the Fund’ssub-adviser may determine that it is in the best interest of shareholders in pursuing a workout arrangement with issuers of defaulted securities to make loans to the defaulted issuer or another party, or purchase a debt, equity or other interest from the defaulted issuer or another party, or take other related or similar steps involving the investment of additional monies, but only if that issuer’s securities are already held by the Fund. |
| ● | The Fund may invest up to 15% of its Managed Assets in inverse floating rate securities. |
| ● | The Fund will not invest more than 25% of its Managed Assets in municipal securities in any one industry or in any one state of origin and no more than 5% of its Managed Assets in any one issuer. |
| ● | The Fund may not enter into a futures contract or related options or forward contracts if more than 30% of the Fund’s Managed Assets would be represented by futures contracts or more than 5% of the Fund’s Managed Assets would be committed to initial margin deposits and premiums on futures contracts or related options. |
| ● | The Fund will generally maintain an investment portfolio with an overall weighted average maturity of greater than 10 years. |
| ● | The Fund may invest up to 20% of its Managed Assets in municipal securities that pay interest that is taxable under the federal alternative minimum tax. |
| ● | The Fund may invest up to 75% of its Managed Assets in municipal securities that are rated BBB/Baa or lower by at least one NRSRO or are unrated but judged to be of comparable quality by the Fund’s sub-adviser. The Fund may not invest more than 10% of its Managed Assets in municipal securities rated belowB3/B- by any NRSROs that rate the security or that are unrated but judged to be of comparable quality by the Fund’ssub-adviser. |
| ● | The Fund may invest in the securities of an issuer which, at the time of investment, is in default on its obligations to pay principal or interest thereon when due or that is involved in a bankruptcy proceeding (i.e., rated below C- at the time of investment) (“defaulted securities”), and may invest in municipal securities that are experiencing other financial difficulties at the time of acquisition (such securities are commonly referred to as distressed securities). The Fund’ssub-adviser may determine that it is in the best interest of shareholders in pursuing a workout arrangement with issuers of defaulted securities to make loans to the defaulted issuer or another party, or purchase a debt, equity or other interest from the defaulted issuer or another party, or take other related or similar steps involving the investment of additional monies. |
| ● | The Fund may invest up to 25% of its Managed Assets in municipal securities in any one industry or in any one state of origin. |
| ● | The Fund may invest up to 15% of its Managed Assets in inverse floating rate securities. |
| ● | The Fund may not enter into a futures contract or related options or forward contracts if more than 30% of the Fund’s Managed Assets would be represented by futures contracts or more than 5% of the Fund’s Managed Assets would be committed to initial margin deposits and premiums on futures contracts or related options. |
| ● | The Fund will generally maintain an investment portfolio with an overall weighted average maturity of greater than 10 years. |
Risk | Nuveen Municipal Value Fund, Inc. (NUV) | Nuveen AMT-Free Municipal Value Fund (NUW) | Nuveen Municipal Income Fund, Inc. (NMI) | |||
Portfolio Level Risks | ||||||
| Alternative Minimum Tax Risk | X | – | X | |||
| Below Investment Grade Risk | X | X | X | |||
| Call Risk | X | X | X | |||
| Credit Risk | X | X | X | |||
| Credit Spread Risk | X | X | X | |||
| Distressed or Defaulted Securities Risk | X | X | X | |||
| Deflation Risk | X | X | X | |||
| Derivatives Risk | X | X | X | |||
| Duration Risk | X | X | X | |||
| Economic Sector Risk | X | X | X | |||
| Financial Futures and Options Risk | X | X | X | |||
| Hedging Risk | X | X | X | |||
| Illiquid Investments Risk | X | X | X | |||
| Income Risk | X | X | X | |||
| Inflation Risk | X | X | X | |||
| Insurance Risk | X | X | X | |||
| Interest Rate Risk | X | X | X | |||
| Inverse Floating Rate Securities Risk | X | X | X | |||
| Municipal Securities Market Liquidity Risk | X | X | X | |||
| Municipal Securities Market Risk | X | X | X | |||
| Other Investment Companies Risk | X | X | X | |||
| Puerto Rico Municipal Securities Market Risk | X | X | X | |||
| Reinvestment Risk | X | X | X | |||
| Special Risks Related to Certain Municipal Obligations | X | X | X | |||
| Swap Transactions Risk | X | X | X | |||
| Tax Risk | X | X | X | |||
| Taxability Risk | X | X | X | |||
| Tobacco Settlement Bond Risk | X | X | X | |||
| Unrated Securities Risk | X | X | X | |||
| Valuation Risk | X | X | X | |||
| Zero Coupon Bonds Risk | X | X | X | |||
Risk | Nuveen Municipal Value Fund, Inc. (NUV) | Nuveen AMT-Free Municipal Value Fund (NUW) | Nuveen Municipal Income Fund, Inc. (NMI) | |||
Fund Level and Other Risks | ||||||
| Anti-Takeover Provisions | X | X | X | |||
| Counterparty Risk | X | X | X | |||
| Cybersecurity Risk | X | X | X | |||
| Economic and Political Events Risk | X | X | X | |||
| Fund Tax Risk | X | X | X | |||
| Global Economic Risk | X | X | X | |||
| Investment and Market Risk | X | X | X | |||
| Legislation and Regulatory Risk | X | X | X | |||
| Leverage Risk | X | X | X | |||
| Market Discount from Net Asset Value | X | X | X | |||
| Recent Market Conditions | X | X | X | |||
| · | If the Fund has a need for cash and the securities in a special purpose trust are not actively trading due to adverse market conditions; |
| · | If special purpose trust sponsors (as a collective group or individually) experience financial hardship and consequently seek to terminate their respective outstanding special purpose trusts; and |
| · | If the value of an underlying security declines significantly and if additional collateral has not been posted by the Fund. |
Principal Risk | Fund(s) | |
| Financial Futures and Options Risk | Nuveen Municipal Value Fund, Inc. (NUV); and Nuveen Municipal Income Fund, Inc. (NMI) | |
| Illiquid Investments Risk | NMI | |
| Insurance Risk | NMI | |
| Other Investment Companies Risk | Nuveen AMT-Free Municipal Value Fund (NUW); andNMI | |
| Swap Transactions Risk | NMI | |
Prior Investment Policy | New Investment Policy | |
The Fund will invest at least 80% of its Managed Assets in investment grade quality municipal securities that, at the time of investment, are rated within the four highest | The Fund may invest up to 75% of its Managed Assets in municipal securities that are rated BBB/Baa or lower by at least one NRSRO or are unrated but judged to be of comparable quality by the fund’s sub-adviser. | |
| grades (Baa or BBB or better) by at least one NRSRO that rate such securities, or if it is unrated but judged to be of comparable quality by the Fund’s sub-adviser. A security is considered investment grade if it is rated within the four highest letter grades by at least one NRSRO that rate such securities (even if rated lower by another), or if it is unrated but judged to be of comparable quality by the Fund’ssub-adviser (such securities are commonly referred to as split-rated securities). | ||
| The Fund may invest up to 20% of its Managed Assets in municipal securities that at the time of investment are rated below investment grade (Ba or BB or lower) by all NRSRO or are unrated but judged to be of comparable quality by the Fund’s sub-adviser; however, the Fund may not invest more than 10% of its Managed Assets in municipal securities rated belowB3/B- by all NRSROs that rate the security or that are unrated but judged to be of comparable quality by the Fund’ssub-adviser. | The Fund may not invest more than 10% of its Managed Assets in municipal securities rated below B3/B- by any NRSROs that rate the security or that are unrated but judged to be of comparable quality by the fund’ssub-adviser. | |
The Fund may invest in distressed securities but may not invest in the securities of an issuer which, at the time of investment, is in default on its obligations to pay principal or interest thereon when due or that is involved in a bankruptcy proceeding (i.e., rated below | The Fund may invest in the securities of an issuer which, at the time of investment, is in default on its obligations to pay principal or interest thereon when due or that is involved in a bankruptcy proceeding (i.e., rated below C- at the time of investment) (“defaulted securities”), and may invest in municipal securities that are experiencing other financial difficulties at the time of acquisition (such securities are commonly referred to as distressed securities). The Fund’ssub-adviser may determine that it is in the best interest of shareholders in pursuing a workout arrangement with issuers of defaulted securities to make loans to the defaulted issuer or another party, or purchase a debt, equity or other interest from the defaulted issuer or another party, or take other related or similar steps involving the investment of additional monies. | |
C-, at the time of investment); provided, however, that the Fund’ssub-adviser may determine that it is in the best interest of shareholders in pursuing a workout arrangement with issuers of defaulted securities to make loans to the defaulted issuer or another party, or purchase a debt, equity or other interest from the defaulted issuer or another party, or take other relatedor similar steps involving the investment of additional monies, but only if that issuer’s securities are already held by the Fund. | ||
| N/A | In addition, the credit quality policies noted above apply only at the time of the purchase of a security, and the Fund is not required to dispose of a security in the event Moody’s, S&P or Fitch downgrades its assessment of the credit characteristics of a particular issuer, even if such downgrade causes the portfolio to exceed the 75% or 10% thresholds noted above. If at any time the Fund exceeds either the 75% or 10% threshold noted above, the Fund’s future investments will be made in a manner that will bring the Fund’s portfolio back into compliance with these policies. | |
Shareholder Transaction Expenses | ||||
| Maximum Sales Charge (as a percentage of offering price) | 4.00% (1) | |||
| Dividend Reinvestment Plan Fees (2) | $2.50 | |||
| (1) | A maximum sales charge of 4.00% applies only to offerings pursuant to a syndicated underwriting. The maximum sales charge for offerings made at-the-market |
| (2) | You will be charged a $2.50 service charge and pay brokerage charges if you direct Computershare Inc. and Computershare Trust Company, N.A., as agent for the common shareholders, to sell your Common Shares held in a dividend reinvestment account. |
Annual Expenses (As a Percentage of Net Assets Attributable to Common Shares) (1) | ||||
| Management Fees | 0.61% | |||
| Interest and Other Related Expenses (2) | 0.00% (3) | |||
| Other Expenses (4) | 0.13% | |||
| Total Annual Expenses | 0.74% | |||
| (1) | Stated as percentages of average net assets attributable to Common Shares for the fiscal year ended October 31, 2023. |
| (2) | Interest and Other Related Expenses reflect actual expenses and fees incurred by the Fund related to its temporary committed line of credit for the fiscal year ended October 31, 2023. The Fund will not leverage its capital structure by issuing senior securities such as Preferred Shares or debt instruments. However, the Fund may borrow for temporary or emergency purposes and invest in certain instruments, including inverse floating rate securities, that have the economic effect of leverage. During the fiscal year ended October 31, 2023, the Fund did not employ leverage through investments in inverse floating rate securities, but it did incur expenses related to its temporary committed line of credit as described in the Notes to Financial Statements (Note 10 – Borrowing Arrangements, Committed Line of Credit) of this annual report. “Actual Interest and Other Related Expenses” incurred in the future may be higher or lower. The Fund’s use of leverage will increase the amount of management fees paid to the Fund’s adviser and sub-advisor(s). |
| (3) | Rounds to less than 0.01% |
| (4) | Other Expenses are based on estimated amounts for the current fiscal year. Expenses attributable to the Fund’s investments, if any, in other investment companies are currently estimated not to exceed 0.01%. |
1 Year | 3 Years | 5 Years | 10 Years | |||||||||||||||||||||||||
| $17 | $33 | $51 | $101 | |||||||||||||||||||||||||
1 Year | 3 Years | 5 Years | 10 Years | |||||||||||||||||||||||||
| $47 | $63 | $80 | $128 | |||||||||||||||||||||||||
1 Year | 3 Years | 5 Years | 10 Years | |||||||||||||||||||||||||
| $8 | $24 | $41 | $92 | |||||||||||||||||||||||||
Market Price | NAV | Premium/(Discount) to NAV | ||||||||||||||||||||||||||||||||||||||||||||||
Fiscal Quarter End | High | Low | High | Low | High | Low | ||||||||||||||||||||||||||||||||||||||||||
| October 2023 | $9.75 | $8.33 | $9.84 | $9.16 | (0.91)% | (9.95)% | ||||||||||||||||||||||||||||||||||||||||||
| July 2023 | $9.99 | $9.13 | $9.90 | $9.67 | 1.94% | (7.59)% | ||||||||||||||||||||||||||||||||||||||||||
| April 2023 | $9.90 | $8.96 | $10.00 | $9.70 | (0.30)% | (8.34)% | ||||||||||||||||||||||||||||||||||||||||||
| January 2023 | $10.00 | $8.57 | $9.99 | $9.27 | 1.23% | (8.47)% | ||||||||||||||||||||||||||||||||||||||||||
| October 2022 | $9.70 | $8.46 | $10.19 | $9.19 | (4.72)% | (8.82)% | ||||||||||||||||||||||||||||||||||||||||||
| July 2022 | $9.75 | $9.03 | $10.24 | $9.72 | (4.69)% | (7.80)% | ||||||||||||||||||||||||||||||||||||||||||
| April 2022 | $10.77 | $9.42 | $11.10 | $10.13 | (2.62)% | (7.13)% | ||||||||||||||||||||||||||||||||||||||||||
| January 2022 | $12.24 | $10.75 | $11.37 | $11.03 | 7.84% | (2.63)% | ||||||||||||||||||||||||||||||||||||||||||
October 31, 2023 | ||||
| NAV per Common Share | $ 9.16 | |||
| Market Price | $ 8.35 | |||
| Percentage of Premium/(Discount) to NAV per Common Share | (8.84)% | |||
| Net Assets Attributable to Common Shares | $ 92,117,408 | |||
Fund | Net Long-Term Capital Gains | |||
NUV | $– | |||
NUW | – | |||
NMI | – | |||
| Jack B. Evans | William C. Hunter | Amy B.R. Lancellotta | Joanne T. Medero | Albin F. Moschner | John K. Nelson | |||||
| Matthew Thornton III | Terence J. Toth | Margaret L. Wolff | Robert L. Young | |||||||
Investment Adviser | Custodian | Legal Counsel | Independent Registered | Transfer Agent and | ||||
Nuveen Fund Advisors, LLC 333 West Wacker Drive | State Street Bank & Trust Company | Chapman and Cutler LLP Chicago, IL 60603 | Public Accounting Firm KPMG LLP | Shareholder Services | ||||
| Chicago, IL 60606 | One Congress Street | 200 East Randolph Street | N.A. | |||||
| Suite 1 | Chicago, IL 60601 | 150 Royall Street | ||||||
| Boston, MA 02114-2016 | Canton, MA 02021 | |||||||
| (800) 257-8787 |
NUV | NUW | NMI | ||||||||||||||||||
| Common shares repurchased | 0 | 0 | 0 | |||||||||||||||||
1. | Fees and Expenses |
2. | Comparisons with the Fees of Other Clients |
3. | Profitability of Fund Advisers |
Name, Year of Birth & Address | Position(s) Held with the Funds | Year First Elected or Appointed and Term (1) | Principal Occupation(s) Including other Directorships During Past 5 Years | Number of Portfolios in Fund Complex Overseen By Board Member | ||||||
| Independent Trustees: | ||||||||||
Terence J. Toth 1959 333 W. Wacker Drive Chicago, IL 60606 | Chair and Board Member | 2008 Class II | Formerly, a Co-Founding Partner, Promus Capital (investment advisory firm) (2008-2017); formerly, Director, Quality Control Corporation (manufacturing) (2012-2021); Chair of the Board of the Kehrein Center for the Arts (philanthropy) (since 2021); member: Catalyst Schools of Chicago Board (since 2008) and Mather Foundation Board (philanthropy) (since 2012), formerly, Chair of its Investment Committee (2017-2022); formerly, Member, Chicago Fellowship Board (philanthropy) (2005-2016); formerly, Director, Fulcrum IT Services LLC (information technology services firm to government entities) (2010-2019); formerly, Director, LogicMark LLC (health services) (2012-2016); formerly, Director, Legal & General Investment Management America, Inc. (asset management) (2008-2013); formerly, CEO and President, Northern Trust Global Investments (financial services) (2004-2007); Executive Vice President, Quantitative Management & Securities Lending (2000-2004); prior thereto, various positions with Northern Trust Company (financial services) (since 1994); formerly, Member, Northern Trust Mutual Funds Board (2005-2007), Northern Trust Global Investments Board (2004-2007), Northern Trust Japan Board (2004-2007), Northern Trust Securities Inc. Board (2003- 2007) and Northern Trust Hong Kong Board (1997-2004). | 132 | ||||||
Jack B. Evans 1948 333 W. Wacker Drive Chicago, IL 60606 | Board Member | 1999 Class III | Chairman (since 2019), formerly, President (1996-2019), The Hall-Perrine Foundation, (private philanthropic corporation); Life Trustee of Coe College and the Iowa College Foundation; formerly, Member and President Pro-Tem of the Board of Regents for the State of Iowa University System (2007- 2013); Director and Chairman (2009-2021), United Fire Group, a publicly held company; Director, Public Member, American Board of Orthopaedic Surgery (2015-2020); Director (2000-2004), Alliant Energy; Director (1996-2015), The Gazette Company (media and publishing); Director (1997- 2003), Federal Reserve Bank of Chicago; President and Chief Operating Officer (1972-1995), SCI Financial Group, Inc., (regional financial services firm). | 132 | ||||||
William C. Hunter 1948 333 W. Wacker Drive Chicago, IL 60606 | Board Member | 2003 Class I | Dean Emeritus, formerly, Dean, Tippie College of Business, University of Iowa (2006-2012); Director of Wellmark, Inc. (since 2009); past Director (2005-2015), and past President (2010- 2014) Beta Gamma Sigma, Inc., The International Business Honor Society; formerly, Director (2004-2018) of Xerox Corporation; formerly, Dean and Distinguished Professor of Finance, School of Business at the University of Connecticut (2003-2006); previously, Senior Vice President and Director of Research at the Federal Reserve Bank of Chicago (1995-2003); formerly, Director (1997-2007), Credit Research Center at Georgetown University. | 132 | ||||||
Name, Year of Birth & Address | Position(s) Held with the Funds | Year First Elected or Appointed and Term (1) | Principal Occupation(s) Including other Directorships During Past 5 Years | Number of Portfolios in Fund Complex Overseen By Board Member | ||||
Amy B. R. Lancellotta 1959 333 W. Wacker Drive Chicago, IL 60606 | Board Member | 2021 Class II | Formerly, Managing Director, Independent Directors Council (IDC) (supports the fund independent director community and is part of the Investment Company Institute (ICI), which represents regulated investment companies) (2006-2019); formerly, various positions with ICI (1989-2006); President (since 2023) and Member (since 2020) of the Board of Directors, Jewish Coalition Against Domestic Abuse (JCADA). | 132 | ||||
Joanne T. Medero 1954 333 W. Wacker Drive Chicago, IL 60606 | Board Member | 2021 Class III | Formerly, Managing Director, Government Relations and Public Policy (2009-2020) and Senior Advisor to the Vice Chairman (2018-2020), BlackRock, Inc. (global investment management firm); formerly, Managing Director, Global Head of Government Relations and Public Policy, Barclays Group (IBIM) (investment banking, investment management and wealth management businesses) (2006-2009); formerly, Managing Director, Global General Counsel and Corporate Secretary, Barclays Global Investors (global investment management firm) (1996-2006); formerly, Partner, Orrick, Herrington & Sutcliffe LLP (law firm) (1993-1995); formerly, General Counsel, Commodity Futures Trading Commission (government agency overseeing U.S. derivatives markets) (1989-1993); formerly, Deputy Associate Director/Associate Director for Legal and Financial Affairs, Office of Presidential Personnel, The White House (1986-1989); Member of the Board of Directors, Baltic-American Freedom Foundation (seeks to provide opportunities for citizens of the Baltic states to gain education and professional development through exchanges in the U.S.) (since 2019). | 132 | ||||
Albin F. Moschner 1952 333 W. Wacker Drive Chicago, IL 60606 | Board Member | 2016 Class III | Founder and Chief Executive Officer, Northcroft Partners, LLC, (management consulting) (since 2012); formerly, Chairman (2019), and Director (2012-2019), USA Technologies, Inc., (provider of solutions and services to facilitate electronic payment transactions); formerly, Director, Wintrust Financial Corporation (1996-2016); previously, held positions at Leap Wireless International, Inc. (consumer wireless services), including Consultant (2011-2012), Chief Operating Officer (2008-2011), and Chief Marketing Officer (2004-2008); formerly, President, Verizon Card Services division of Verizon Communications, Inc. (2000-2003); formerly, President, One Point Services at One Point Communications (telecommunication services) (1999-2000); formerly, Vice Chairman of the Board, Diba, Incorporated (internet technology provider) (1996-1997); formerly, various executive positions (1991-1996) including Chief Executive Officer (1995-1996) of Zenith Electronics Corporation (consumer electronics). | 132 | ||||
John K. Nelson 1962 333 W. Wacker Drive Chicago, IL 60606 | Board Member | 2013 Class II | Member of Board of Directors of Core12 LLC. (private firm which develops branding, marketing and communications strategies for clients) (since 2008); served The President’s Council of Fordham University (2010-2019) and previously a Director of the Curran Center for Catholic American Studies (2009-2018); formerly, senior external advisor to the Financial Services practice of Deloitte Consulting LLP. (2012-2014); former Chair of the Board of Trustees of Marian University (2010-2014 as trustee, 2011-2014 as Chair); formerly Chief Executive Officer of ABN AMRO Bank N.V., North America, and Global Head of the Financial Markets Division (2007-2008), with various executive leadership roles in ABN AMRO Bank N.V. between 1996 and 2007. | 132 | ||||
Name, Year of Birth & Address | Position(s) Held with the Funds | Year First Elected or Appointed and Term (1) | Principal Occupation(s) Including other Directorships During Past 5 Years | Number of Portfolios in Fund Complex Overseen By Board Member | ||||||
Matthew Thornton III 1958 333 W. Wacker Drive Chicago, IL 60606 | Board Member | 2020 Class III | Formerly, Executive Vice President and Chief Operating Officer (2018-2019), FedEx Freight Corporation, a subsidiary of FedEx Corporation (FedEx) (provider of transportation, e-commerce and business services through its portfolio of companies); formerly, Senior Vice President, U.S. Operations (2006-2018), Federal Express Corporation, a subsidiary of FedEx; formerly Member of the Board of Directors (2012-2018), Safe Kids Worldwide® (anon-profit organization dedicated to preventing childhood injuries). Member of the Board of Directors (since 2014), The Sherwin-Williams Company (develops, manufactures, distributes and sells paints, coatings and related products); Director (since 2020), Crown Castle International (provider of communications infrastructure). | 132 | ||||||
Margaret L. Wolff 1955 333 W. Wacker Drive Chicago, IL 60606 | Board Member | 2016 Class I | Formerly, member of the Board of Directors (2013-2017) of Travelers Insurance Company of Canada and The Dominion of Canada General Insurance Company (each, a part of Travelers Canada, the Canadian operation of The Travelers Companies, Inc.); formerly, Of Counsel, Skadden, Arps, Slate, Meagher & Flom LLP (Mergers & Acquisitions Group) (legal services) (2005- 2014); Member of the Board of Trustees of New York-Presbyterian Hospital (since 2005); Member (since 2004) formerly, Chair (2015- 2022) of the Board of Trustees of The John A. Hartford Foundation (a philanthropy dedicated to improving the care of older adults); formerly, Member (2005-2015) and Vice Chair (2011-2015) of the Board of Trustees of Mt. Holyoke College. | 132 | ||||||
Robert L. Young 1963 333 W. Wacker Drive Chicago, IL 60606 | Board Member | 2017 Class I | Formerly, Chief Operating Officer and Director, J.P. Morgan Investment Management Inc. (financial services) (2010-2016); formerly, President and Principal Executive Officer (2013-2016), and Senior Vice President and Chief Operating Officer (2005-2010), of J.P. Morgan Funds; formerly, Director and various officer positions for J.P. Morgan Investment Management Inc. (formerly, JPMorgan Funds Management, Inc. and formerly, One Group Administrative Services) and JPMorgan Distribution Services, Inc. (financial services) (formerly, One Group Dealer Services, Inc.) (1999-2017). | 132 | ||||||
Name, Year of Birth & Address | Position(s) Held with the Funds | Year First Elected or Appointed (2) | Principal Occupation(s) Including other Directorships During Past 5 Years | |||||||
| Officers of the Funds: | ||||||||||
David J. Lamb 1963 333 W. Wacker Drive Chicago, IL 60606 | Chief Administrative Officer | 2015 | Managing Director of Nuveen Fund Advisors, LLC (since 2019); Senior Managing Director (since 2021), formerly, Managing Director (2020-2021) of Nuveen Securities, LLC; Senior Managing Director (since 2021), formerly, Managing Director (2017-2021), Senior Vice President of Nuveen (2006-2017). | |||||||
Brett E. Black 1972 333 W. Wacker Drive Chicago, IL 60606 | Vice President and Chief Compliance Officer | 2022 | Managing Director, Chief Compliance Officer of Nuveen (since 2022); formerly, Vice President (2014-2022), Chief Compliance Officer and Anti-Money Laundering Compliance Officer (2017-2022), Deputy Chief Compliance Officer (2014-2017) of BMO Funds, Inc. | |||||||
Name, Year of Birth & Address | Position(s) Held with the Funds | Year First Elected or Appointed (2) | Principal Occupation(s) Including other Directorships During Past 5 Years | |||||
Mark J. Czarniecki 1979 901 Marquette Avenue Minneapolis, MN 55402 | Vice President and Assistant Secretary | 2013 | Managing Director (since 2022), formerly, Vice President (2016-2022), and Assistant Secretary (since 2016) of Nuveen Securities, LLC; Managing Director (since 2022), formerly, Vice President (2017-2022) and Assistant Secretary (since 2017) of Nuveen Fund Advisors, LLC; Managing Director and Associate General Counsel (since January 2022), formerly, Vice President and Associate General Counsel of Nuveen (2013-2021); Managing Director (since 2022), formerly, Vice President (2018-2022), Assistant Secretary and Associate General Counsel (since 2018) of Nuveen Asset Management, LLC; Managing Director, Associate General Counsel and Assistant Secretary of Teachers Advisors, LLC and TIAA-CREF Investment Management, LLC (since 2023). | |||||
Diana R. Gonzalez 1978 8500 Andrew Carnegie Blvd. Charlotte, NC 28262 | Vice President and Assistant Secretary | 2017 | Vice President and Assistant Secretary of Nuveen Fund Advisors, LLC (since 2017); Vice President and Associate General Counsel and Assistant Secretary of Nuveen Asset Management, LLC (since 2022); Vice President, Associate General Counsel and Assistant Secretary of Teachers Advisors, LLC and TIAA-CREF Investment Management, LLC (since 2023); Vice President and Associate General Counsel of Nuveen (since 2017); formerly, Associate General Counsel of Jackson National Asset Management (2012-2017). | |||||
Nathaniel T. Jones 1979 333 W. Wacker Drive Chicago, IL 60606 | Vice President and Treasurer | 2016 | Senior Managing Director (since 2021), formerly, Managing Director (2017-2021), Senior Vice President (2016-2017) of Nuveen; Managing Director (since 2015) of Nuveen Fund Advisors, LLC; Chartered Financial Analyst. | |||||
Brian H. Lawrence 1982 8500 Andrew Carnegie Blvd. Charlotte, NC 28262 | Vice President and Assistant Secretary | 2023 | Vice President and Associate General Counsel of Nuveen (since 2023); Vice President, Associate General Counsel and Assistant Secretary (since 2023) of Teachers Advisors, LLC and TIAA-CREF Investment Management, LLC; formerly Corporate Counsel of Franklin Templeton (2018-2022). | |||||
Tina M. Lazar 1961 333 W. Wacker Drive Chicago, IL 60606 | Vice President | 2002 | Managing Director (since 2017), formerly, Senior Vice President (2014-2017) of Nuveen Securities, LLC. | |||||
Brian J. Lockhart 1974 333 W. Wacker Drive Chicago, IL 60606 | Vice President | 2019 | Managing Director (since 2019) of Nuveen Fund Advisors, LLC; Senior Managing Director (since 2021), formerly, Managing Director (2017-2021), Vice President (2010-2017) of Nuveen; Head of Investment Oversight (since 2017), formerly, Team Leader of Manager Oversight (2015-2017); Chartered Financial Analyst and Certified Financial Risk Manager. | |||||
John M. McCann 1975 8500 Andrew Carnegie Blvd. Charlotte, NC 28262 | Vice President and Assistant Secretary | 2022 | Managing Director (since 2021), General Counsel and Secretary (since 2023), formerly, Assistant Secretary (2021-2023), of Nuveen Fund Advisors, LLC; Managing Director, Associate General Counsel and Assistant Secretary of Nuveen Asset Management, LLC (since 2021); Managing Director (since 2021) and Assistant Secretary (since 2016) of TIAA SMA Strategies LLC; Managing Director (since 2019, formerly, Vice President and Director), Associate General Counsel and Assistant Secretary of College Retirement Equities Fund, TIAA Separate Account VA-1, TIAA-CREF Funds and TIAA-CREF Life Funds; Managing Director (since 2018), formerly, Vice President and Director, Associate General Counsel and Assistant Secretary of Teachers Insurance and Annuity Association of America, Teacher Advisors LLC and TIAA-CREF Investment Management, LLC; Managing Director (since 2022), formerly, Vice President (2017-2022), Associate General Counsel and Assistant Secretary (since 2011) of Nuveen Alternative Advisors LLC; General Counsel and Assistant Secretary of Covariance Capital Management, Inc. (2014-2017). | |||||
Name, Year of Birth & Address | Position(s) Held with the Funds | Year First Elected or Appointed (2) | Principal Occupation(s) Including other Directorships During Past 5 Years | |||||
Kevin J. McCarthy 1966 333 W. Wacker Drive Chicago, IL 60606 | Vice President and Assistant Secretary | 2007 | Executive Vice President (since 2022) and Secretary and General Counsel (since 2016) of Nuveen Investments, Inc., formerly, Senior Managing Director (2017- 2022); Executive Vice President (since 2023) and Assistant Secretary (since 2008) of Nuveen Securities, LLC, formerly Senior Managing Director (2017-2023); Executive Vice President and Assistant Secretary (since 2023) of Nuveen Fund Advisors, LLC, formerly, Senior Managing Director (2017-2023), Secretary (2016-2023) and Co- General Counsel (2011-2020); Executive Vice President (since 2023) and Secretary (since 2016) of Nuveen Asset Management, LLC, formerly, Senior Managing Director (2017-2023) and Associate General Counsel (2011-2020); Executive Vice President (since 2021) and Secretary (since 2023) of Teachers Advisors, LLC, formerly, General Counsel and Assistant Secretary (2021-2023); Executive Vice President (since 2017) and Secretary (since 2023) of TIAA-CREF Investment Management, LLC, formerly General Counsel and Assistant Secretary (2017- 2023); formerly, Vice President (2007-2021) and Secretary (2016-2021), of NWQ Investment Management Company, LLC and Santa Barbara Asset Management, LLC; Vice President and Secretary of Winslow Capital Management, LLC (since 2010); Executive Vice President (since 2023) and Secretary (since 2016) of Nuveen Alternative Investments, LLC, formerly Senior Managing Director (2017-2023). | |||||
Jon Scott Meissner 1973 8500 Andrew Carnegie Blvd. Charlotte, NC 28262 | Vice President and Assistant Secretary | 2019 | Managing Director, Mutual Fund Tax and Expense Administration (since 2022), formerly, Managing Director of Mutual Fund Tax and Financial Reporting groups (2017-2022), at Nuveen; Managing Director of Nuveen Fund Advisors, LLC (since 2019); Managing Director (since 2021), formerly, Senior Director (2016-2021), of Teachers Advisors, LLC and TIAA-CREF Investment Management, LLC; Managing Director, Mutual Fund Tax and Expense Administration (since 2022), formerly, Senior Director Mutual Fund Taxation (2015-2022), to the TIAA-CREF Funds, the TIAA- CREF Life Funds, the TIAA Separate Account VA-1 and the CREF Accounts; has held various positions with TIAA since 2004. | |||||
William A. Siffermann 1975 333 W. Wacker Drive Chicago, IL 60606 | Vice President | 2017 | Managing Director (since 2017), formerly Senior Vice President (2016-2017) of Nuveen. | |||||
E. Scott Wickerham 1973 8500 Andrew Carnegie Blvd. Charlotte, NC 28262 | Vice President and Controller | 2019 | Senior Managing Director, Head of Public Investment Finance at Nuveen (since 2019), formerly, Managing Director; Senior Managing Director (since 2019) of Nuveen Fund Advisors, LLC; Senior Managing Director (since 2022) of Nuveen Asset Management, LLC; Senior Managing Director of Teachers Advisors, LLC (since 2021) and TIAA-CREF Investment Management, LLC (since 2016); Principal Financial Officer, Principal Accounting Officer and Treasurer (since 2017) of the TIAA-CREF Funds, the TIAA-CREF Life Funds, the TIAA Separate Account VA-1 and Principal Financial Officer, Principal Accounting Officer (since 2020) and Treasurer (since 2017) of the CREF Accounts; has held various positions with TIAA since 2006. | |||||
Mark L. Winget 1968 333 W. Wacker Drive Chicago, IL 60606 | Vice President and Secretary | 2008 | Vice President and Assistant Secretary of Nuveen Securities, LLC (since 2008), and Nuveen Fund Advisors, LLC (since 2019); Vice President, Associate General Counsel and Assistant Secretary of Teachers Advisors, LLC and TIAA-CREF Investment Management, LLC (since 2023) and Nuveen Asset Management, LLC (since 2020); Vice President (since 2010) and Associate General Counsel (since 2019) of Nuveen. | |||||
Rachael Zufall 1973 8500 Andrew Carnegie Blvd. Charlotte, NC 28262 | Vice President and Assistant Secretary | 2022 | Managing Director and Assistant Secretary (since 2023) of Nuveen Fund Advisors, LLC; Managing Director (since 2017), Associate General Counsel and Assistant Secretary (since 2014) of the CREF Accounts, TIAA Separate Account VA-1, TIAA- CREF Funds and TIAA-CREF Life Funds; Managing Director (since 2017), Associate General Counsel and Assistant Secretary (since 2011) of Teachers Advisors, LLC and TIAA-CREF Investment Management, LLC; Managing Director of Nuveen, LLC and of TIAA (since 2017). | |||||
| (1) | The Board of Trustees is divided into three classes, Class I, Class II, and Class III, with each being elected to serve until the third succeeding annual shareholders’ meeting subsequent to its election or thereafter in each case when its respective successors are duly elected or appointed, except two board members are elected by the holders of Preferred Shares, when applicable, to serve until the next annual shareholders’ meeting subsequent to its election or thereafter in each case when its respective successors are duly elected or appointed. The year first elected or appointed represents the year in which the board member was first elected or appointed to any fund in the Nuveen complex. |
| (2) | Officers serve indefinite terms until their successor has been duly elected and qualified, their death or their resignation or removal. The year first elected or appointed represents the year in which the Officer was first elected or appointed to any fund in the Nuveen Complex. |

| Nuveen Securities, LLC, member FINRA and SIPC | 333 West Wacker Drive | Chicago, IL 60606 | www.nuveen.com | EAN-A-1023P 3241317-INV-Y-12/24 |
| ITEM 2. | CODE OF ETHICS. |
As of the end of the period covered by this report, the registrant has adopted a code of ethics that applies to the registrant’s principal executive officer, principal financial officer, principal accounting officer or controller, or persons performing similar functions. There were no amendments to or waivers from the Code during the period covered by this report. The registrant has posted the code of ethics on its website at www.nuveen.com/fund-governance. (To view the code, click on Code of Conduct.)
| ITEM 3. | AUDIT COMMITTEE FINANCIAL EXPERT. |
As of the end of the period covered by this report, the registrant’s Board of Directors or Trustees (“Board”) determined that the registrant has at least one “audit committee financial expert” (as defined in Item 3 of Form N-CSR) serving on its Audit Committee. The registrant’s audit committee financial experts are Jack B. Evans, Albin F. Moschner, John K. Nelson and Robert L. Young, who are “independent” for purposes of Item 3 of Form N-CSR.
Mr. Evans was formerly President and Chief Operating Officer of SCI Financial Group, Inc., a full service registered broker-dealer and registered investment adviser (“SCI”). As part of his role as President and Chief Operating Officer, Mr. Evans actively supervised the Chief Financial Officer (the “CFO”) and actively supervised the CFO’s preparation of financial statements and other filings with various regulatory authorities. In such capacity, Mr. Evans was actively involved in the preparation of SCI’s financial statements and the resolution of issues raised in connection therewith. Mr. Evans has also served on the audit committee of various reporting companies. At such companies, Mr. Evans was involved in the oversight of audits, audit plans, and the preparation of financial statements. Mr. Evans also formerly chaired the audit committee of the Federal Reserve Bank of Chicago.
Mr. Moschner is a consultant in the wireless industry and, in July 2012, founded Northcroft Partners, LLC, a management consulting firm that provides operational, management and governance solutions. Prior to founding Northcroft Partners, LLC, Mr. Moschner held various positions at Leap Wireless International, Inc., a provider of wireless services, where he was as a consultant from February 2011 to July 2012, Chief Operating Officer from July 2008 to February 2011, and Chief Marketing Officer from August 2004 to June 2008. Before he joined Leap Wireless International, Inc., Mr. Moschner was President of the Verizon Card Services division of Verizon Communications, Inc. from 2000 to 2003, and President of One Point Services at One Point Communications from 1999 to 2000. Mr. Moschner also served at Zenith Electronics Corporation as Director, President and Chief Executive Officer from 1995 to 1996, and as Director, President and Chief Operating Officer from 1994 to 1995.
Mr. Nelson is on the Board of Directors of Core12, LLC. (since 2008), a private firm which develops branding, marketing, and communications strategies for clients. Mr. Nelson has extensive experience in global banking and markets, having served in several senior executive positions with ABN AMRO Holdings N.V. and its affiliated entities and predecessors, including LaSalle Bank Corporation from 1996 to 2008, ultimately serving as Chief Executive Officer of ABN AMRO N.V. North America. During his tenure at the bank, he also served as Global Head of its Financial Markets Division, which encompassed the bank’s Currency, Commodity, Fixed Income, Emerging Markets, and Derivatives businesses. He was a member of the Foreign Exchange Committee of the Federal Reserve Bank of the United States and during his tenure with ABN AMRO served as the bank’s representative on various committees of The Bank of Canada, European Central Bank, and The Bank of England. Mr. Nelson previously served as a senior, external advisor to the financial services practice of Deloitte Consulting LLP. (2012-2014).
Mr. Young has more than 30 years of experience in the investment management industry. From 1997 to 2017, he held various positions with J.P. Morgan Investment Management Inc. (“J.P. Morgan Investment”) and its affiliates (collectively, “J.P. Morgan”). Most recently, he served as Chief Operating Officer and Director of J.P. Morgan Investment (from 2010 to 2016) and as President and Principal Executive Officer of the J.P. Morgan Funds (from 2013 to 2016). As Chief Operating Officer of J.P. Morgan Investment, Mr. Young led service, administration and business platform support activities for J.P. Morgan’s domestic retail mutual fund and institutional commingled and separate account businesses, and co-led these activities for J.P. Morgan’s global retail and institutional investment management businesses. As President of the J.P. Morgan Funds, Mr. Young interacted with various service providers to these funds, facilitated the relationship between such funds and their boards, and was directly involved in establishing board agendas, addressing regulatory matters, and establishing policies and procedures. Before joining J.P. Morgan, Mr. Young, a former Certified Public Accountant (CPA), was a Senior Manager (Audit) with Deloitte & Touche LLP (formerly, Touche Ross LLP), where he was employed from 1985 to 1996. During his tenure there, he actively participated in creating, and ultimately led, the firm’s midwestern mutual fund practice.
| ITEM 4. | PRINCIPAL ACCOUNTANT FEES AND SERVICES. |
Nuveen Municipal Income Fund, Inc.
The following tables show the amount of fees that KPMG LLP, the Fund’s auditor, billed to the Fund during the Fund’s last two full fiscal years. For engagements with KPMG LLP the Audit Committee approved in advance all audit services and non-audit services that KPMG LLP provided to the Fund, except for those non-audit services that were subject to the pre-approval exception under Rule 2-01 of Regulation S-X (the “pre-approval exception”). The pre-approval exception for services provided directly to the Fund waives the pre-approval requirement for services other than audit, review or attest services if: (A) the aggregate amount of all such services provided constitutes no more than 5% of the total amount of revenues paid by the Fund to its accountant during the fiscal year in which the services are provided; (B) the Fund did not recognize the services as non-audit services at the time of the engagement; and (C) the services are promptly brought to the Audit Committee’s attention, and the Committee (or its delegate) approves the services before the audit is completed.
The Audit Committee has delegated certain pre-approval responsibilities to its Chair (or, in his absence, any other member of the Audit Committee).
SERVICES THAT THE FUND’S AUDITOR BILLED TO THE FUND
Fiscal Year Ended | Audit Fees Billed to Fund 1 | Audit-Related Fees Billed to Fund 2 | Tax Fees Billed to Fund 3 | All Other Fees Billed to Fund 4 | ||||||||||||
October 31, 2023 | $ | 28,000 | $ | 2,600 | $ | 0 | $ | 0 | ||||||||
|
|
|
|
|
|
|
| |||||||||
Percentage approved pursuant to pre-approval exception | 0 | % | 0 | % | 0 | % | 0 | % | ||||||||
|
|
|
|
|
|
|
| |||||||||
October 31, 2022 | $ | 26,220 | $ | 2,500 | $ | 0 | $ | 0 | ||||||||
|
|
|
|
|
|
|
| |||||||||
Percentage approved pursuant to pre-approval exception | 0 | % | 0 | % | 0 | % | 0 | % | ||||||||
|
|
|
|
|
|
|
| |||||||||
1 “Audit Fees” are the aggregate fees billed for professional services for the audit of the Fund’s annual financial statements and services provided in connection with statutory and regulatory filings or engagements.
2 “Audit Related Fees” are the aggregate fees billed for assurance and related services reasonably related to the performance of the audit or review of financial statements that are not reported under “Audit Fees”. These fees include offerings related to the Fund’s common shares and leverage.
3 “Tax Fees” are the aggregate fees billed for professional services for tax advice, tax compliance, and tax planning. These fees include: all global withholding tax services; excise and state tax reviews; capital gain, tax equalization and taxable basis calculation performed by the principal accountant.
4 “All Other Fees” are the aggregate fees billed for products and services other than “Audit Fees”, “Audit-Related Fees” and “Tax Fees”. These fees represent all “Agreed-Upon Procedures” engagements pertaining to the Fund’s use of leverage.
SERVICES THAT THE FUND’S AUDITOR BILLED TO THE
ADVISER AND AFFILIATED FUND SERVICE PROVIDERS
The following tables show the amount of fees billed by KPMG LLP to Nuveen Fund Advisors, LLC (formerly Nuveen Fund Advisors, Inc.) (the “Adviser”), and any entity controlling, controlled by or under common control with the Adviser that provides ongoing services to the Fund (“Affiliated Fund Service Provider”), for engagements directly related to the Fund’s operations and financial reporting, during the Fund’s last two full fiscal years.
The tables also show the percentage of fees subject to the pre-approval exception. The pre-approval exception for services provided to the Adviser and any Affiliated Fund Service Provider (other than audit, review or attest services) waives the pre-approval requirement if: (A) the aggregate amount of all such services provided constitutes no more than 5% of the total amount of revenues paid to KPMG LLP by the Fund, the Adviser and Affiliated Fund Service Providers during the fiscal year in which the services are provided that would have to be pre-approved by the Audit Committee; (B) the Fund did not recognize the services as non-audit services at the time of the engagement; and (C) the services are promptly brought to the Audit Committee’s attention, and the Committee (or its delegate) approves the services before the Fund’s audit is completed.
Fiscal Year Ended | Audit-Related Fees Billed to Adviser and Affiliated Fund Service Providers | Tax Fees Billed to Adviser and Affiliated Fund Service Providers | All Other Fees Billed to Adviser and Affiliated Fund Service Providers | |||||||||
October 31, 2023 | $ | 0 | $ | 0 | $ | 0 | ||||||
|
|
|
|
|
| |||||||
Percentage approved pursuant to pre-approval exception | 0 | % | 0 | % | 0 | % | ||||||
|
|
|
|
|
| |||||||
October 31, 2022 | $ | 0 | $ | 0 | $ | 0 | ||||||
|
|
|
|
|
| |||||||
Percentage approved pursuant to pre-approval exception | 0 | % | 0 | % | 0 | % | ||||||
|
|
|
|
|
| |||||||
NON-AUDIT SERVICES
The following table shows the amount of fees that KPMG LLP billed during the Fund’s last two full fiscal years for non-audit services. The Audit Committee is required to pre-approve non-audit services that KPMG LLP provides to the Adviser and any Affiliated Fund Services Provider, if the engagement related directly to the Fund’s operations and financial reporting (except for those subject to the pre-approval exception described above). The Audit Committee requested and received information from KPMG LLP about any non-audit services that KPMG LLP rendered during the Fund’s last fiscal year to the Adviser and any Affiliated Fund Service Provider. The Committee considered this information in evaluating KPMG LLP’s independence.
Fiscal Year Ended | Total Non-Audit Fees Billed to Fund | Total Non-Audit Fees billed to Adviser and Affiliated Fund Service Providers (engagements related directly to the operations and financial reporting of the Fund) | Total Non-Audit Fees billed to Adviser and Affiliated Fund Service Providers (all other engagements) | Total | ||||||||||||
October 31, 2023 | $ | 0 | $ | 0 | $ | 0 | $ | 0 | ||||||||
October 31, 2022 | $ | 0 | $ | 0 | $ | 0 | $ | 0 | ||||||||
“Non-Audit Fees billed to Fund” for both fiscal year ends represent “Tax Fees” and “All Other Fees” billed to Fund in their respective amounts from the previous table.
Less than 50 percent of the hours expended on the principal accountant’s engagement to audit the registrant’s financial statements for the most recent fiscal year were attributed to work performed by persons other than the principal accountant’s full-time, permanent employees.
Audit Committee Pre-Approval Policies and Procedures. Generally, the Audit Committee must approve (i) all non-audit services to be performed for the Fund by the Fund’s independent accountants and (ii) all audit and non-audit services to be performed by the Fund’s independent accountants for the Affiliated Fund Service Providers with respect to operations and financial reporting of the Fund. Regarding tax and research projects conducted by the independent accountants for the Fund and Affiliated Fund Service Providers (with respect to operations and financial reports of the Fund) such engagements will be (i) pre-approved by the Audit Committee if they are expected to be for amounts greater than $10,000; (ii) reported to the Audit Committee chair for his verbal approval prior to engagement if they are expected to be for amounts under $10,000 but greater than $5,000; and (iii) reported to the Audit Committee at the next Audit Committee meeting if they are expected to be for an amount under $5,000.
| ITEM 5. | AUDIT COMMITTEE OF LISTED REGISTRANTS. |
The registrant’s Board has a separately designated Audit Committee established in accordance with Section 3(a)(58)(A) of the Securities Exchange Act of 1934, as amended (15 U.S.C. 78c(a) (58)(A)). As of the end of the period covered by this report the members of the audit committee are Jack B. Evans, Albin F. Moschner, John K. Nelson, Chair, Margaret L. Wolff, and Robert L. Young.
| ITEM 6. | SCHEDULE OF INVESTMENTS. |
| a) | See Portfolio of Investments in Item 1. |
| b) | Not applicable. |
| ITEM 7. | DISCLOSURE OF PROXY VOTING POLICIES AND PROCEDURES FOR CLOSED-END MANAGEMENT INVESTMENT COMPANIES. |
| ITEM 8. | PORTFOLIO MANAGERS OF CLOSED-END MANAGEMENT INVESTMENT COMPANIES. |
Nuveen Fund Advisors, LLC is the registrant’s investment adviser (also referred to as the “Adviser”). The Adviser is responsible for the selection and on-going monitoring of the Fund’s investment portfolio, managing the Fund’s business affairs and providing certain clerical, bookkeeping and administrative services. The Adviser has engaged Nuveen Asset Management, LLC (“Nuveen Asset Management” or “Sub-Adviser”) as Sub-Adviser to provide discretionary investment advisory services. The following section provides information on the portfolio managers at the Sub-Adviser:
| ITEM 8(a)(1). | PORTFOLIO MANAGER BIOGRAPHIES |
As of the date of filing this report, the following individuals at the Sub-Adviser (the “Portfolio Managers”) have primary responsibility for the day-to-day implementation of the registrant’s investment strategies:
Christopher L. Drahn, CFA, Managing Director at Nuveen Asset Management, manages tax-exempt fixed income portfolios as well as mutual funds and closed-end funds. He began working in the investment industry when he joined the firm in 1980. Chris became a portfolio manager in 1988. He received a B.A. from Wartburg College and an M.B.A. in finance from the University of Minnesota. Chris holds the Chartered Financial Analyst designation and is a member of the CFA Institute, the Minnesota Society of Municipal Analysts and the CFA Society of Minnesota.
Kristen M. DeJong, CFA, Managing Director at Nuveen Asset Management, is a portfolio manager responsible for managing taxable municipal fixed income strategies for customized institutional portfolios and closed-end funds. She began her career in the financial services industry in 2005 and joined Nuveen Asset Management in 2008. Prior to her current role, she served as a research associate at Nuveen in the wealth management services area and then as a senior research analyst for Nuveen Asset Management’s municipal fixed income team before assuming portfolio management responsibilities in 2021. She received her B.S. in Business from Miami University. Ms. DeJong holds the Chartered Financial Analyst designation and is a member of the CFA Institute and the CFA Society of Chicago.
Scott R. Romans, PhD, Managing Director of Nuveen Asset Management, responsible for managing several state-specific, tax-exempt portfolios, including the California Municipal Bond, California High Yield Municipal Bond and the New York Municipal Bond strategies. He also serves as portfolio manager for a number of closed-end funds. Before moving to his portfolio management role in 2003, he was a senior research analyst in the firm’s tax-exempt fixed income department, specializing in the education sector. He holds an undergraduate degree from the University of Pennsylvania, an M.S.F. from the Illinois Institute of Technology Stuart School of Business, and an MA and PhD from the University of Chicago.
| ITEM 8(a)(2). | OTHER ACCOUNTS MANAGED BY PORTFOLIO MANAGERS |
Other Accounts Managed. In addition to managing the registrant, the Portfolio Managers are also primarily responsible for the day-to-day portfolio management of the following accounts:
Portfolio Manager | Type of Account | Number of Accounts | Assets* | |||||
Christopher L. Drahn | Registered Investment Company | 10 | $18.29 billion | |||||
Other Pooled Investment Vehicles | 0 | $0 | ||||||
Other Accounts | 1 | $152 million | ||||||
Kristen M. DeJong | Registered Investment Company | 20 | $17.78 billion | |||||
Other Pooled Investment Vehicles | 0 | $0 | ||||||
Other Accounts | 52 | $14.53 billion | ||||||
Scott R. Romans | Registered Investment Company | 17 | $15.79 billion | |||||
Other Pooled Investment Vehicles | 0 | $0 | ||||||
Other Accounts | 3 | $4.6 million | ||||||
* Assets are as of October 31, 2023. None of the assets in these accounts are subject to an advisory fee based on performance.
POTENTIAL MATERIAL CONFLICTS OF INTEREST
Actual or apparent conflicts of interest may arise when a portfolio manager has day-to-day management responsibilities with respect to more than one account. More specifically, portfolio managers who manage multiple accounts are presented a number of potential conflicts, including, among others, those discussed below.
The management of multiple accounts may result in a portfolio manager devoting unequal time and attention to the management of each account. Nuveen Asset Management seeks to manage such competing interests for the time and attention of portfolio managers by having portfolio managers focus on a particular investment discipline. Most accounts managed by a portfolio manager in a particular investment strategy are managed using the same investment models.
If a portfolio manager identifies a limited investment opportunity which may be suitable for more than one account, an account may not be able to take full advantage of that opportunity due to an allocation of filled purchase or sale orders across all eligible accounts. To deal with these situations, Nuveen Asset Management has adopted procedures for allocating limited opportunities across multiple accounts.
With respect to many of its clients’ accounts, Nuveen Asset Management determines which broker to use to execute transaction orders, consistent with its duty to seek best execution of the transaction. However, with respect to certain other accounts, Nuveen Asset Management may be limited by the client with respect to the selection of brokers or may be instructed to direct trades through a particular broker. In these cases, Nuveen Asset Management may place separate, non-simultaneous, transactions for a Fund and other accounts which may temporarily affect the market price of the security or the execution of the transaction, or both, to the detriment of the Fund or the other accounts.
Some clients are subject to different regulations. As a consequence of this difference in regulatory requirements, some clients may not be permitted to engage in all the investment techniques or transactions or to engage in these transactions to the same extent as the other accounts managed by a portfolio manager. Finally, the appearance of a conflict of interest may arise where Nuveen Asset Management has an incentive, such as a performance-based management fee, which relates to the management of some accounts, with respect to which a portfolio manager has day-to-day management responsibilities.
Conflicts of interest may also arise when the Sub-Adviser invests one or more of its client accounts in different or multiple parts of the same issuer’s capital structure, including investments in public versus private securities, debt versus equity, or senior versus junior/subordinated debt, or otherwise where there are different or inconsistent rights or benefits. Decisions or actions such as investing, trading, proxy voting, exercising, waiving or amending rights or covenants, workout activity, or serving on a board, committee or other involvement in governance may result in conflicts of interest between clients holding different securities or investments. Generally, individual portfolio managers will seek to act in a manner that they believe serves the best interest of the accounts they manage. In cases where a portfolio manager or team faces a conflict among its client accounts, it will seek to act in a manner that it believes best reflects its overall fiduciary duty, which may result in relative advantages or disadvantages for particular accounts.
Nuveen Asset Management has adopted certain compliance procedures which are designed to address these types of conflicts common among investment managers. However, there is no guarantee that such procedures will detect each and every situation in which a conflict arises.
Nuveen Asset Management or its affiliates, including TIAA, sponsor an array of financial products for retirement and other investment goals, and provide services worldwide to a diverse customer base. Accordingly, from time to time, a Fund may be restricted from purchasing or selling securities, or from engaging in other investment activities because of regulatory, legal or contractual restrictions that arise due to another client account’s investments and/or the internal policies of Nuveen Asset Management, TIAA or its affiliates designed to comply with such restrictions. As a result, there may be periods, for example, when Nuveen Asset Management will not initiate or recommend certain types of transactions in certain securities or instruments with respect to which investment limits have been reached.
The investment activities of Nuveen Asset Management or its affiliates may also limit the investment strategies and rights of the Funds. For example, in certain circumstances where the Funds invest in securities issued by companies that operate in certain regulated industries, in certain emerging or international markets, or are subject to corporate or regulatory ownership definitions, or invest in certain futures and derivative transactions, there may be limits on the aggregate amount invested by Nuveen Asset Management or its affiliates for the Funds and other client accounts that may not be exceeded without the grant of a license or other regulatory or corporate consent. If certain aggregate ownership thresholds are reached or certain transactions undertaken, the ability of Nuveen Asset Management, on behalf of the Funds or other client accounts, to purchase or dispose of investments or exercise rights or undertake business transactions may be restricted by regulation or otherwise impaired. As a result, Nuveen Asset Management, on behalf of the Funds or other client accounts, may limit purchases, sell existing investments, or otherwise restrict or limit the exercise of rights (including voting rights) when Nuveen Asset Management, in its sole discretion, deems it appropriate in light of potential regulatory or other restrictions on ownership or other consequences resulting from reaching investment thresholds.
| ITEM 8(a)(3). | FUND MANAGER COMPENSATION |
As of the most recently completed fiscal year end, the primary Portfolio Managers’ compensation is as follows:
Portfolio manager compensation consists primarily of base salary and variable components consisting of (i) a cash bonus; (ii) a long-term performance award; and (iii) participation in a profits interest plan.
Base salary. A portfolio manager’s base salary is determined based upon an analysis of the portfolio manager’s general performance, experience and market levels of base pay for such position.
Cash bonus. A portfolio manager is eligible to receive an annual cash bonus that is based on three variables: risk-adjusted investment performance relative to benchmark generally measured over the most recent one, three and five year periods (unless the portfolio manager’s tenure is shorter), ranking versus Morningstar peer funds generally measured over the most recent one, three and five year periods (unless the portfolio manager’s tenure is shorter), and management and peer reviews.
Long-term performance award. A portfolio manager is eligible to receive a long-term performance award that vests after three years. The amount of the award when granted is based on the same factors used in determining the cash bonus. The value of the award at the completion of the three-year vesting period is adjusted based on the risk-adjusted investment performance of Fund(s) managed by the portfolio manager during the vesting period and the performance of the TIAA organization as a whole.
Profits interest plan. Portfolio managers are eligible to receive profits interests in Nuveen Asset Management and its affiliate, Teachers Advisors, LLC, which vest over time and entitle their holders to a percentage of the firms’ annual profits. Profits interests are allocated to each portfolio manager based on such person’s overall contribution to the firms.
There are generally no differences between the methods used to determine compensation with respect to the Fund and the Other Accounts shown in the table above.
| ITEM 8(a)(4). | OWNERSHIP OF NMI SECURITIES AS OF OCTOBER 31, 2023 |
Name of Portfolio Manager | None | $1- $10,000 | $10,001- $50,000 | $50,001- $100,000 | $100,001- $500,000 | $500,001- $1,000,000 | Over $1,000,000 | |||||||
Christopher L. Drahn | X | |||||||||||||
Kristen M. DeJong | X | |||||||||||||
Scott R. Romans | X |
| ITEM 9. | PURCHASES OF EQUITY SECURITIES BY CLOSED-END MANAGEMENT INVESTMENT COMPANY AND AFFILIATED PURCHASERS. |
Not applicable.
| ITEM 10. | SUBMISSION OF MATTERS TO A VOTE OF SECURITY HOLDERS. |
There have been no material changes to the procedures by which shareholders may recommend nominees to the registrant’s Board implemented after the registrant last provided disclosure in response to this Item.
| ITEM 11. | CONTROLS AND PROCEDURES. |
| (a) | The registrant’s principal executive and principal financial officers, or persons performing similar functions, have concluded that the registrant’s disclosure controls and procedures (as defined in Rule 30a-3(c) under the Investment Company Act of 1940, as amended (the “1940 Act”) (17 CFR 270.30a-3(c))) are effective, as of a date within 90 days of the filing date of this report that includes the disclosure required by this paragraph, based on their evaluation of the controls and procedures required by Rule 30a-3(b) under the 1940 Act (17 CFR 270.30a-3(b)) and Rules 13a-15(b) or 15d-15(b) under the Securities Exchange Act of 1934, as amended (the “Exchange Act”) (17 CFR 240.13a-15(b) or 240.15d-15(b)). |
| (b) | There were no changes in the registrant’s internal control over financial reporting (as defined in Rule 30a-3(d) under the 1940 Act (17 CFR 270.30a-3(d)) that occurred during the period covered by this report that has materially affected, or is reasonably likely to materially affect, the registrant’s internal control over financial reporting. |
| ITEM 12. | DISCLOSURE OF SECURITIES LENDING ACTIVITIES FOR CLOSED-END MANAGEMENT INVESTMENT COMPANIES. |
Not applicable.
| ITEM 13. | EXHIBITS. |
File the exhibits listed below as part of this Form.
(a)(1) Any code of ethics, or amendment thereto, that is the subject of the disclosure required by Item 2, to the extent that the registrant intends to satisfy the Item 2 requirements through filing of an exhibit: Not applicable because the code is posted on registrant’s website at www.nuveen.com/fund-governance and there were no amendments during the period covered by this report. (To view the code, click on Code of Conduct.)
(a)(3) Any written solicitation to purchase securities under Rule 23c-1 under the 1940 Act (17 CFR 270.23c-1) sent or given during the period covered by the report by or on behalf of the registrant to 10 or more persons. Not applicable.
(a)(4) Change in the registrant’s independent public accountant. Not applicable.
(c)(4) Consent of Independent Registered Public Accounting Firm. EX99.IND PUB ACCT attached hereto.
SIGNATURES
Pursuant to the requirements of the Securities Exchange Act of 1934 and the Investment Company Act of 1940, the registrant has duly caused this report to be signed on its behalf by the undersigned, thereunto duly authorized.
(Registrant) Nuveen Municipal Income Fund, Inc.
| By (Signature and Title) | /s/ David J. Lamb | |
David J. Lamb | ||
Chief Administrative Officer |
Date: January 5, 2024
Pursuant to the requirements of the Securities Exchange Act of 1934 and the Investment Company Act of 1940, this report has been signed below by the following persons on behalf of the registrant and in the capacities and on the dates indicated.
| By (Signature and Title) | /s/ David J. Lamb | |
| David J. Lamb | ||
| Chief Administrative Officer | ||
| (principal executive officer) |
Date: January 5, 2024
| By (Signature and Title) | /s/ E. Scott Wickerham | |
| E. Scott Wickerham | ||
| Vice President and Funds Controller | ||
| (principal financial officer) |
Date: January 5, 2024