Exhibit 99.1
We make a material difference Investor Presentation February 1, 2019 NYSE American: CCF Shareholder & Investor Relations Department Phone: +1 781.332.0700 E-mail: InvestorRelations@ChaseCorp.com Website: www.ChaseCorp.com |
2 Forward-Looking Statements Certain statements in this presentation are forward-looking. These can be identified by the use of forward-looking words or phrases such as “believe”; “expect”; “anticipate”; “should”; “planned”; “estimated”; “forecasted”; “projected”; and “potential”, among others. These forward-looking statements are based on Chase Corporation’s current expectations. The Private Securities Litigation Reform Act of 1995 provides a “safe harbor” for such forward-looking statements. To comply with the terms of the safe harbor, the Company cautions investors that any forward-looking statements made by the Company are not guarantees of future performance and that a variety of factors could cause the Company's actual results and experience to differ materially from the anticipated results or other expectations expressed in the Company's forward-looking statements. The risks and uncertainties which may affect the operations, performance, development and results of the Company's business include, but are not limited to, the following: uncertainties relating to economic conditions; uncertainties relating to customer plans and commitments; the pricing and availability of equipment, materials and inventories; technological developments; performance issues with suppliers and subcontractors; economic growth; delays in testing of new products; the Company’s ability to successfully integrate acquired operations; the effectiveness of cost-reduction plans; rapid technology changes and the highly competitive environment in which the Company operates. Important factors that could cause actual results to differ materially from our expectations are disclosed under Item 1A (“Risk Factors”) in our latest Annual Report on Form 10-K filed with the U.S. Securities and Exchange Commission, and should be read together with this presentation. Readers are cautioned not to place undue reliance on these forward-looking statements, which speak only as of the date the statement was made. Further Information This presentation should be read together with “Management’s Discussion and Analysis of Financial Condition and Results of Operations” and the consolidated financial statements and the related notes thereto included in our public filings. Non-GAAP Financial Measures This presentation includes certain non‐GAAP financial measures intended to supplement, not substitute for, comparable GAAP financial measures. Reconciliations of non‐GAAP financial measures to GAAP financial measures are provided within this presentation. Investors are urged to consider carefully the comparable GAAP measures and the reconciliations to those measures provided herein. EBITDA, EBITDA Margin, Adjusted EBITDA, Segment EBITDA, Segment EBITDA Margin, Organic Revenue and Free Cash Flow are non-GAAP financial measures (“non-GAAP measures”). The Company believes that non-GAAP measures are useful performance measures which are used by its executive management team to measure operating performance, to allocate resources, to evaluate the effectiveness of its business strategies and to communicate with its board of directors and investors concerning its financial performance. The Company also believes non-GAAP measures are commonly used by financial analysts and others in the industries in which the Company operates, and thus provide useful information to investors. Please note that our definition and measurement of non-GAAP measures may be different from and therefore not directly comparable to similarly-titled measures used by other companies. Non-GAAP measures should be considered in addition to, and not as an alternative to, the Company’s reported results prepared in accordance with GAAP. See the reconciliations contained herein of these non-GAAP measures to the most comparable GAAP financial measures. Safe Harbor Statement |
3 ■ Joined Chase in August 2018 ■ VP Operations Finance and Strategy for Haemonetics Corp. (2016 – 2018) ■ Siemens A.G., most recently as Head of North America Service Sales Finance (2002 – 2016) ■ More than 25 years with the Company and its affiliates ■ CFO and Treasurer (2014 – present) ■ Director of Finance (2012 – 2014) ■ CFO of NEPTCO (1992 – 2012) Kenneth J. Feroldi Chief Financial Officer and Treasurer ■ Two decades with the Company ■ President (2008 – present) ■ Chief Executive Officer (2015 – present) ■ Chief Operating Officer (2007 – 2015) Adam P. Chase President and Chief Executive Officer Chase Corporation (“Chase” or “the Company”) is led by a highly-regarded management team with significant experience and an established track record of executing commercial and operational initiatives Leadership Team ✓ To be recognized as a leading manufacturer of protective materials for high-reliability applications ✓ Solidify Chase’s position as a trusted partner to customers by providing effective and reliable product solutions ✓ Create long-term value for our shareholders ✓ Effectively manage risk, implement sustainable business practices and continuously improve operating performance ✓ Develop an ethical corporate culture that emphasizes contributing to the community, respecting the environment and treating employees fairly Vision and Mission Christian J. Talma Chief Accounting Officer |
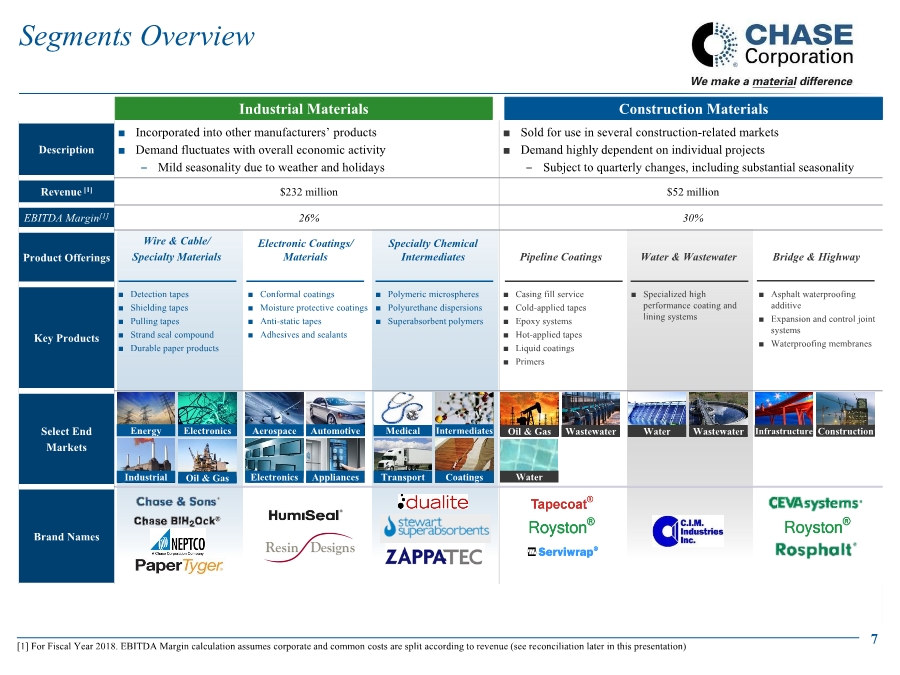
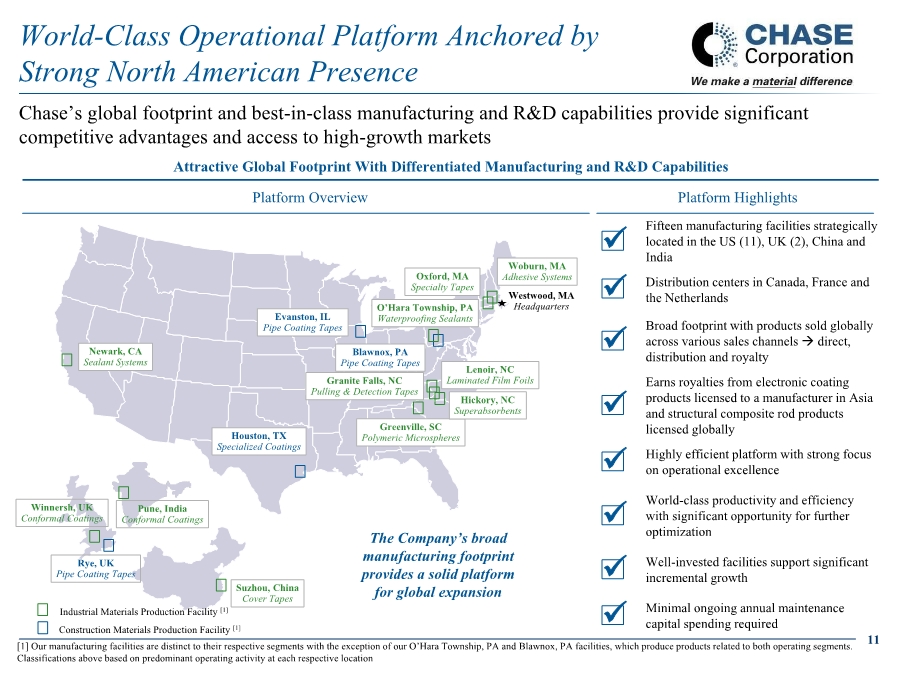
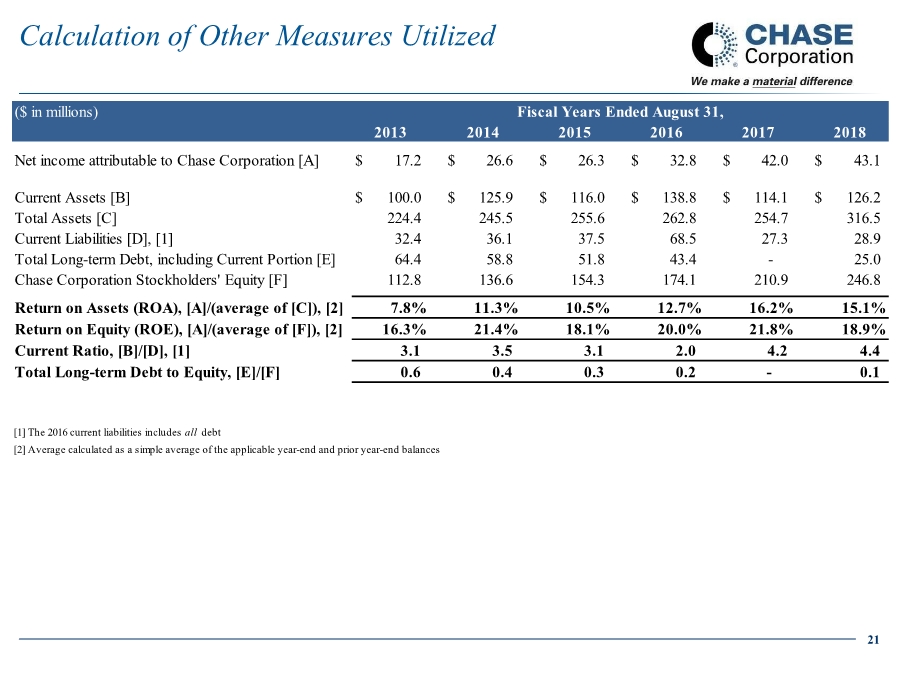
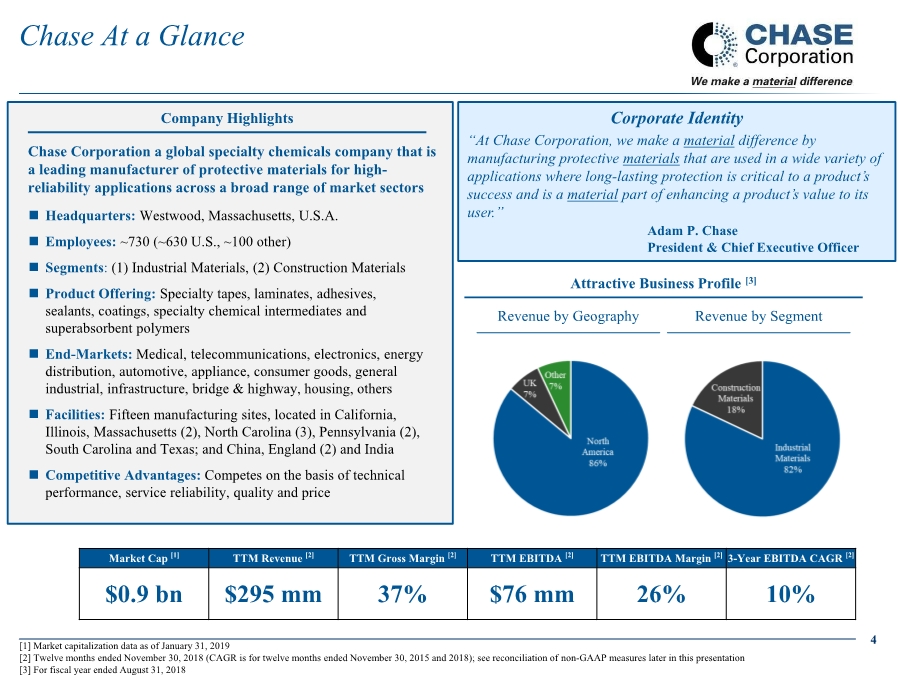
4 Chase At a Glance [1] Market capitalization data as of January 31, 2019 [2] Twelve months ended November 30, 2018 (CAGR is for twelve months ended November 30, 2015 and 2018); see reconciliation of non-GAAP measures later in this presentation [3] For fiscal year ended August 31, 2018 Chase Corporation a global specialty chemicals company that is a leading manufacturer of protective materials for high- reliability applications across a broad range of market sectors ◼ Headquarters: Westwood, Massachusetts, U.S.A. ◼ Employees: ~730 (~630 U.S., ~100 other) ◼ Segments: (1) Industrial Materials, (2) Construction Materials ◼ Product Offering: Specialty tapes, laminates, adhesives, sealants, coatings, specialty chemical intermediates and superabsorbent polymers ◼ End-Markets: Medical, telecommunications, electronics, energy distribution, automotive, appliance, consumer goods, general industrial, infrastructure, bridge & highway, housing, others ◼ Facilities: Fifteen manufacturing sites, located in California, Illinois, Massachusetts (2), North Carolina (3), Pennsylvania (2), South Carolina and Texas; and China, England (2) and India ◼ Competitive Advantages: Competes on the basis of technical performance, service reliability, quality and price Company Highlights Attractive Business Profile [3] Revenue by Geography Revenue by Segment Corporate Identity “At Chase Corporation, we make a material difference by manufacturing protective materials that are used in a wide variety of applications where long-lasting protection is critical to a product’s success and is a material part of enhancing a product’s value to its user.” Adam P. Chase President & Chief Executive Officer Market Cap [1] TTM Revenue [2] TTM Gross Margin [2] TTM EBITDA [2] TTM EBITDA Margin [2] 3-Year EBITDA CAGR [2] $0.9 bn $295 mm 37% $76 mm 26% 10% |
5 Established Wire and Cable “Roots” 1946 - 1989 ■ Continued expansion of core coatings, adhesive and sealant technologies through a related diversification approach ■ Strategically positioned for growth and margin expansion ■ Ongoing investments in facility, systems and organizational consolidation to improve performance and gain economies of scale ■ Four recent significant investments (NEPTCO, Henkel’s Specialty Chemical Intermediates product lines, Resin Designs, Stewart Superabsorbents) ■ Product offering transformation: – Product portfolio shift toward innovative, high-reliability solutions – Continued inorganic growth in core protective materials ■ Focused on growing core tapes and coatings businesses (Chase & Sons, HumiSeal and Royston) ■ Globalization and diversification through acquisitions and partnership agreements ■ Streamlined, modernized and consolidated manufacturing processes ■ Founded in 1946 as Chase & Sons ■ Reverse merger with Columbia Technical Corporation in 1970 ■ Developed the HumiSeal line of conformal coatings ■ Acquired Royston business of protective coating tapes and other protectants ■ Corporate restructuring resulted in a new leadership team and the divestiture of non-core businesses Transformation and Globalization 1990 - 2010 Reinvestment into Growth 2011 - Today Corporate Evolution |
6 ◼ Inorganic growth through attractive acquisitions and integration ◼ Consolidation and rationalization where appropriate ◼ Organic growth in select areas through market and product development ◼ Generate actionable growth strategies ◼ Develop sustainable competitive advantages ◼ Continual improvement ◼ Operate in the zone of sustainability → ethical approach to decision-making, risk management and business conduct ◼ Focus on gross margins, working capital management and free cash flow ◼ Financial discipline and flexibility → a strong balance sheet is fundamental Proven growth strategy sharply focused on building upon core businesses, and enhancing operational infrastructure and commonalities to gain competitive advantage Strategy and Philosophy Financial Discipline Strategic Drivers Business Philosophy Chase’s Core Strategy |
7 Description ■ Incorporated into other manufacturers’ products ■ Demand fluctuates with overall economic activity – Mild seasonality due to weather and holidays ■ Sold for use in several construction-related markets ■ Demand highly dependent on individual projects – Subject to quarterly changes, including substantial seasonality Revenue [1] $232 million $52 million EBITDA Margin[1] 26% 30% Product Offerings Wire & Cable/ Specialty Materials Electronic Coatings/ Materials Specialty Chemical Intermediates Pipeline Coatings Water & Wastewater Bridge & Highway Key Products ■ Detection tapes ■ Shielding tapes ■ Pulling tapes ■ Strand seal compound ■ Durable paper products ■ Conformal coatings ■ Moisture protective coatings ■ Anti-static tapes ■ Adhesives and sealants ■ Polymeric microspheres ■ Polyurethane dispersions ■ Superabsorbent polymers ■ Casing fill service ■ Cold-applied tapes ■ Epoxy systems ■ Hot-applied tapes ■ Liquid coatings ■ Primers ■ Specialized high performance coating and lining systems ■ Asphalt waterproofing additive ■ Expansion and control joint systems ■ Waterproofing membranes Select End Markets Brand Names Segment Manufacturing ocations ■ Blawnox, PA ■ Granite Falls, NC ■ Greenville, SC ■ Lenoir, NC ■ Newark, CA ■ O’Hara Township, PA ■ Oxford, MA ■ Pawtucket, RI ■ Woburn, MA ■ Pune, India ■ Suzhou, China ■ Winnersh, England ■ Blawnox, PA ■ Evanston, IL ■ Houston, TX ■ O’Hara Township, PA ■ Rye, England Construction Materials [1] For Fiscal Year 2018. EBITDA Margin calculation assumes corporate and common costs are split according to revenue (see reconciliation later in this presentation) Segments Overview Industrial Materials Energy Electronics Oil & GasIndustrial Aerospace Automotive Electronics Appliances Intermediates Transport Coatings Oil & Gas Wastewater Water Wastewater Infrastructure ConstructionMedical Water 7 |
8 Peer Group Average [1] Stock performance, including comparative Chemicals Index, information furnished by KeyBanc Capital Markets [2] Peer group consists of DB:HEN3, NYSE:FUL, TSX:ITP, NYSE:ROG and NYSE:RPM per company filings, as furnished by KeyBanc Capital Markets [3] See reconciliation of Chase’s twelve months ended November 30, 2018 EBITDA margin later in this presentation Differentiated Platform Drives Superior Results and Outsized Growth ✓ Highly Differentiated Business Attributes… ✓ ...Driving Superior Results and a Strong Foundation for Continuous Growth Broad Portfolio of Protective Material Technologies Proven Consolidator with Attractive Pipeline of Highly Accretive Targets World-Class Operational Platform Anchored by Strong North American Presence Sustainable Financial Performance With Strong Cash Flow Generation Entrenched Relationships with Diversified, High Quality Customer Base Differentiated R&D Capabilities Drive Strong Product Innovation Chase has significantly outperformed both the S&P 500 and the Chemicals Index over the past 10 years [1] (TTM EBITDA margin) [3] Industry Leading Profitability [2] |
9 Chase boasts an attractive portfolio of protective material technologies serving well-diversified end- markets poised for continued growth Broad Portfolio of Protective Material Technologies Industrial Materials DescriptionProduct Technology Construction Materials Insulating and Conducting Materials Cover Tapes Protective Pipe Coating Tapes Protectants for Bridge Decks Fluid Applied Coating and Lining Systems Joint Control Systems Moisture Protective Coatings Laminated Film Foils Laminated Durable Papers Pulling and Detection Tapes Polyurethane Dispersions Polymeric Microspheres High-performance tapes, coatings and sealants Specialty tapes used to install and locate cables and utilities Polymer products for weight and density reduction as well as sound dampening EMI/RFI shielding tapes used in communication cables Reliable anti-static tapes essential to delivering semiconductor components Water-based polyurethane dispersions utilized in various coating products Coatings for electronic circuitry found in automobiles and appliances Specialty laminated paper products primarily for envelope converters Specialty tapes used in construction and repair of water, oil and gas infrastructure Protectants for highway bridge deck metal- supported surfaces Coatings and linings used in the water and wastewater treatment industries Expansion and control joint systems for roads, bridges, stadiums and runways Water and Wastewater Cable Industry Bridge & Highway Energy Infrastructure Telecom MedicalConsumer & Packaging Telecom & UtilitiesElectronics Automotive Adhesive and Sealant Systems Custom formulated adhesives and sealants for use in electronic applications Asphalt Additives Waterproofing additive for highways, bridges and runway surfaces Superabsorbent Polymers Specialty materials for water and liquid management, remediation and protection |
10 Sold RodPack product line (Wind Energy Composite) Acquired Grace Construction Products (Pipeline Coatings) Acquired NEPTCO Inc. (Wire & Cable Materials) 2009 2010 2012 2014 2015 20172016 Chase has built a global platform through consistent organic growth and successful integration of key acquisitions ◼ Demonstrated track record of identifying, executing and integrating highly accretive and synergistic strategic acquisitions ◼ Focus on purchasing high-quality assets at attractive prices ◼ Proven ability to successfully nurture and integrate targets into Chase’s collaborative culture ◼ Ongoing discipline to rationalize product portfolio where appropriate ◼ Ideally positioned to continue undertaking strategic acquisitions → maintains a robust pipeline of acquisition targets Proven Consolidator with Attractive Pipeline of Highly Accretive Targets Proven Ability to Acquire, Integrate, Optimize and Grow Assets Acquired C.I.M. Industries (Coating & Lining Systems) Sold RWA, Inc. (Electronic Manufacturing Services) Sold Insulfab product line (Aircraft Cover Films) Acquired from Henkel Corporation (Specialty Chemical Intermediates) Acquired remaining interest in NEPTCO JV (Fiber Optic Cable Components) Acquired HumiSeal India Private Limited (Electronic Coatings) 2018 Acquired Resin Designs (Sealants & Adhesives) Sold Fiber Optic Cable Components product line Acquired Stewart Superabsorbents, LLC (Superabsorbents) Sold remaining Structural Composite Rod product lines |
11 Chase’s global footprint and best-in-class manufacturing and R&D capabilities provide significant competitive advantages and access to high-growth markets World-Class Operational Platform Anchored by Strong North American Presence Attractive Global Footprint With Differentiated Manufacturing and R&D Capabilities Platform Overview Platform Highlights Winnersh, UK Conformal Coatings Rye, UK Pipe Coating Tapes Suzhou, China Cover Tapes Construction Materials Production Facility [1] ✓■ Fifteen manufacturing facilities strategically located in the US (11), UK (2), China and India ✓■ Broad footprint with products sold globally across various sales channels → direct, distribution and royalty ✓■ Highly efficient platform with strong focus on operational excellence ✓■ Well-invested facilities support significant incremental growth ✓■ World-class productivity and efficiency with significant opportunity for further optimization ✓■ Minimal ongoing annual maintenance capital spending required Houston, TX Specialized Coatings Evanston, IL Pipe Coating Tapes O’Hara Township, PA Waterproofing Sealants Blawnox, PA Pipe Coating Tapes Greenville, SC Polymeric Microspheres Granite Falls, NC Pulling & Detection Tapes Oxford, MA Specialty Tapes Westwood, MA Headquarters ✓■ Distribution centers in Canada, France and the Netherlands ✓ ■ Earns royalties from electronic coating products licensed to a manufacturer in Asia and structural composite rod products licensed globally The Company’s broad manufacturing footprint provides a solid platform for global expansion Pune, India Conformal Coatings Woburn, MA Adhesive Systems Newark, CA Sealant Systems Industrial Materials Production Facility [1] [1] Our manufacturing facilities are distinct to their respective segments with the exception of our O’Hara Township, PA and Blawnox, PA facilities, which produce products related to both operating segments. Classifications above based on predominant operating activity at each respective location Lenoir, NC Laminated Film Foils Hickory, NC Superabsorbents |
12[1] Organic revenue defined as legacy businesses, plus revenue from acquired businesses beginning 12 months after acquisition, less revenue associated with currently divested businesses for all periods shown [2] See reconciliation later in this presentation All years are fiscal years ended August 31 Sustainable Financial Performance with Strong Cash Flow Generation Organic Growth in Revenue by Fiscal Year [1]Revenue by Fiscal Year ($ in millions) Free Cash Flow by Fiscal Year [2] ($ in millions) Adjusted EBITDA by Fiscal Year [2] ($ in millions)Construction Materials Revenue CAGR: -0.3% Industrial Materials Revenue CAGR: 7.3% Adjusted EBITDA CAGR: 13.5% Organic Revenue CAGR: 12.1% ($ in millions)Free Cash Flow CAGR: 11.1% |
13 Income Reinvested Into Business, Coupled With a Return to Shareholders [1] Net income attributable to Chase Corporation All years are fiscal years ended August 31 Net Income by Fiscal Year [1] ($ in millions) Earnings Per Diluted Share by Fiscal Year ($ per share) Cash Dividends Per Share by Fiscal Year Paid $0.10 in 2015 was a special dividend for gain from the sale of a business ($ per share) Dividends Paid as a % of Prior Year Net Income [1] Gains from sales of businesses: FY2014: $3.7 mm; FY2016: $0.7mm; FY2017: $1.4 mm; FY2018: $1.1mm Gains from sales of businesses: FY2014: $0.40; FY2016: $0.07; FY2017: $0.15; FY2018: $0.12 |
14 Expanded Global Presence Chase is well positioned to continue executing on its proven growth strategy underpinned by multiple initiatives and recent platform enhancements Multiple Growth Avenues Strategic M&A Drive Share Gains in Existing MarketsExecute on Compelling New Product and End- Market Opportunities Favorable Industry and End-Market Dynamics Improved Margin Profile through Integration and Optimization ■ Growth strategy sharply focused on building upon core competencies ■ Robust M&A pipeline provides significant revenue growth potential ■ Multiple initiatives underway focused on acquisition integration, improving operating efficiency and optimizing the platform ■ Continued expansion in new geographies to enhance capacity and product mix ■ Capitalize on expected growth in core end-markets including electronics, housing and automotive. ■ Leverage Chase’s full suite of market-leading capabilities to expand customer wallet share ■ Chase’s size, geographic footprint, industry focus and financial capacity uniquely position the Company to capture additional growth through product innovation and new market expansion |
15[1] See calculation later in this presentation All years are fiscal years ended August 31 Balance Sheet Supports an Acquisition Program ROE % and ROA % by Fiscal Year [1] Current Ratio at Fiscal Year End [1] Debt to Equity Ratio at Fiscal Year End [1] Note: Chase utilized $65 million from its revolving credit facility in December 2017 (fiscal 2018) for the acquisition of Stewart Superabsorbents, LLC. $15 million of the $65 million was still outstanding at November 30, 2018. |
16 Financial Appendix For trailing twelve months ended November 30, 2018 and fiscal years ended August 31. Please note that values and percentages may appear to not add up because of rounding. |
17 Income Statement Summary – Trailing Twelve Months ($ in millions) CAGR, TTM Nov 30, 2018 vs. Nov 30, 2013 Industrial Materials $ 55.3 $ 65.4 $ 61.6 $ 60.2 $ 242.5 8.0% Construction Materials 10.6 13.5 15.8 12.3 52.3 0.3% Revenue $ 65.9 $ 78.9 $ 77.5 $ 72.5 $ 294.8 6.3% Less: Cost of products and services sold 42.0 48.3 48.0 46.6 184.8 Gross profit $ 23.9 $ 30.7 $ 29.5 $ 25.9 $ 110.0 8.7% % of Revenue 36.3% 38.9% 38.0% 35.8% 37.3% Less: Selling, general and administrative 12.1 13.7 14.4 13.4 53.6 Less: Other operating expenses 0.4 — 1.3 0.3 1.9 Operating income $ 11.4 $ 17.0 $ 13.8 $ 12.3 $ 54.4 13.1% Plus: Gain on sale of business, real estate or license 1.1 1.5 — — 2.6 Plus: Other (expense) income, net (0.7) 0.2 0.2 (0.5) (0.8) Income before income taxes $ 11.7 $ 18.7 $ 14.0 $ 11.8 $ 56.2 10.5% Less: Income taxes 1.6 5.1 2.8 3.0 12.5 Net Income $ 10.1 $ 13.5 $ 11.2 $ 8.8 $ 43.7 14.6% Plus: Net (income) loss attrib. to noncontrolling interest — — — — — Net income attributable to Chase Corporation $ 10.1 $ 13.5 $ 11.2 $ 8.8 $ 43.7 14.2% % of Revenue 15.4% 17.2% 14.4% 12.2% 14.8% Plus: Interest exp., Income taxes, Depreciation, Amort. 6.3 10.0 8.4 7.5 32.3 EBITDA $ 16.5 $ 23.5 $ 19.6 $ 16.4 $ 75.9 10.4% % of Revenue (EBITDA Margin [1]) 25.0% 29.8% 25.3% 22.6% 25.8% Adjustments, net 0.8 (1.5) 0.1 0.5 (0.1) Adjusted EBITDA [1] $ 17.3 $ 22.0 $ 19.7 $ 16.8 $ 75.9 12.9% % of Revenue 26.3% 27.9% 25.4% 23.2% 25.7% [1] See reconciliation later in this presentation May 31, 2018 TTM Ended Feb 28, 2018 Nov 30, 2018Nov 30, 2018Aug 31, 2018 Three Months Ended |
18 Income Statement Summary – Fiscal Years ($ in millions) CAGR 2013-2018 Industrial Materials $ 163.5 $ 169.7 $ 176.5 $ 181.7 $ 203.0 $ 232.3 7.3% Construction Materials 52.6 54.3 61.5 56.4 49.6 51.9 -0.3% Revenue $ 216.1 $ 224.0 $ 238.0 $ 238.1 $ 252.6 $ 284.2 5.6% % Growth 45.1% 3.7% 6.3% 0.0% 6.1% 12.5% Less: Cost of products and services sold 146.0 145.2 149.2 144.4 146.0 175.1 Gross profit $ 70.0 $ 78.8 $ 88.8 $ 93.7 $ 106.5 $ 109.1 9.3% % of Revenue 32.4% 35.2% 37.3% 39.3% 42.2% 38.4% Less: Selling, general and administrative 43.2 42.6 46.0 44.6 47.7 52.3 Less: Other operating expenses — — 0.6 1.3 0.7 1.7 Operating income $ 26.8 $ 36.2 $ 42.2 $ 47.8 $ 58.1 $ 55.1 15.5% Plus: Gain on sale of business, real estate or licence — 5.7 — 1.0 2.9 2.6 Plus: Other (expense) income, net (1.0) (1.4) (1.0) 1.3 (0.1) (0.7) Income before income taxes $ 25.8 $ 40.5 $ 41.2 $ 50.1 $ 60.9 $ 57.0 17.2% Less: Income taxes 9.1 14.0 14.8 17.3 18.9 13.8 Net Income $ 16.7 $ 26.5 $ 26.4 $ 32.8 $ 42.0 $ 43.1 20.8% Plus: Net (income) loss attrib. to noncontrolling interest 0.5 0.1 (0.1) — — — Net income attributable to Chase Corporation $ 17.2 $ 26.6 $ 26.3 $ 32.8 $ 42.0 $ 43.1 20.2% % of Revenue 8.0% 11.9% 11.1% 13.8% 16.6% 15.2% Plus: Interest exp., Income taxes, Depreciation, Amort. 21.0 25.6 28.4 31.8 34.0 32.6 EBITDA [1] $ 38.2 $ 52.3 $ 54.8 $ 64.6 $ 76.0 $ 75.8 14.7% % of Revenue (EBITDA Margin [1]) 17.7% 23.3% 23.0% 27.1% 30.1% 26.7% Adjustments, net 1.8 (5.4) 0.8 (0.6) (2.0) (0.5) Adjusted EBITDA [1] $ 40.0 $ 46.9 $ 55.6 $ 64.0 $ 74.0 $ 75.2 13.5% % of Revenue 18.5% 20.9% 23.4% 26.9% 29.3% 26.5% [1] See reconciliation later in this presentation Values and percentages in table may not add due to rounding 20182017 Fiscal Years Ended August 31, 20162014 20152013 |
19 Reconciliation to Non-GAAP Measures (1) ($ in millions) TTM Ended Revenue [A] $ 216.1 $ 224.0 $ 238.0 $ 238.1 $ 252.6 $ 284.2 $ 294.8 Net income attributable to Chase Corporation $ 17.2 $ 26.6 $ 26.3 $ 32.8 $ 42.0 $ 43.1 $ 43.7 Interest expense 1.3 1.1 1.1 1.1 0.8 1.2 1.3 Income taxes 9.1 14.0 14.8 17.3 18.9 13.8 12.5 Depreciation expense 5.9 5.7 5.8 5.6 5.1 5.8 5.8 Amortization expense 4.8 4.8 6.8 7.8 9.1 11.8 12.6 EBITDA [1], [B] $ 38.2 $ 52.3 $ 54.8 $ 64.6 $ 76.0 $ 75.8 $ 75.9 EBITDA Margin [1], [B]/[A] 18% 23% 23% 27% 30% 27% 26% Gain on sale of license; businesses; real estate [2] — (5.7) — (1.0) (2.9) (2.6) (2.6) Pension curtailment and settlement costs [3] 1.2 0.3 0.2 0.0 0.0 — 0.2 Acquisition-related costs [4] — — 0.6 — 0.6 0.4 0.4 Cost of sale of inventory step-up [5] 0.6 — 0.1 — 0.2 1.1 1.1 Other reconciling items [6] — — — 0.4 0.1 0.6 0.9 Adjusted EBITDA [1] $ 40.0 $ 46.9 $ 55.6 $ 64.0 $ 74.0 $ 75.2 $ 75.9 Net cash provided by operating activities $ 28.2 $ 28.6 $ 41.0 $ 48.8 $ 51.9 $ 46.1 51.1 Less: Purchases of property, plant and equipment (3.0) (4.3) (2.6) (2.0) (3.2) (3.5) (3.3) Free Cash Flow [1] $ 25.1 $ 24.3 $ 38.3 $ 46.8 $ 48.7 $ 42.6 $ 47.8 2013 [5] Represents expenses related to the step-up in fair value of inventory through purchase accounting from the December 2017 acquisition of Zappa Stewart, the September 2016 acquisition of Resin Designs, the January 2015 acquisition of the specialty chemical intermediates product line, and the June 2012 acquisition of NEPTCO 2017 [2] Represents gain on sale of the structural composites rod business in FY18, gain on sale of a license in FY18; gain on sale of the fiber optic cable components business in FY17, of the RodPack wind energy business in FY16, and of the sale of the Insulfab business in FY14; gain on sale of Bridgewater MA former corporate headquarters and Paterson NJ facility in FY17 [3] Represents pension-related curtailment and settlement costs due to the timing of lump-sum distributions [4] Represents costs related to the December 2017 acquisition of Zappa Stewart, the September 2016 acquisition of Resin Designs, and the January 2015 acquisition of the specialty chemical intermediates product line [6] Includes exit costs related to Pawtucket and Randolph facilities, write-down of assets under construction incident to a sale of a business, and an annuity settlement 2018 [1] EBITDA, Adjusted EBITDA, EBITDA Margin, Segment EBITDA, Segment EBITDA Margin and Free Cash Flow are non-GAAP measures, and should not be considered in isolation or construed as an alternative to our Net income attributable to Chase Corporation, Net cash provided by operating activities, or other measures as determined in accordance with U.S. GAAP. Our measurement of EBITDA, Adjusted EBITDA, EBITDA Margin, Segment EBITDA, Segment EBITDA Margin and Free Cash Flow may not be comparable to similarly-titled measures used by other companies. Non-GAAP financial measures should be considered in addition to, and not as an alternative to, the Company’s reported results prepared in accordance with GAAP. Nov 30, 20182014 2015 2016 Fiscal Years Ended August 31, |
20 Reconciliation to Non-GAAP Measures (2) ($ in millions) Industrial Construction Corporate & Chase Materials Materials Common Corporation Revenue [A] $ 232.3 $ 51.9 $ — $ 284.2 Income (loss) before taxes $ 66.1 $ 18.2 $ (27.3) $ 57.0 Interest expense 0.9 0.2 — 1.2 Depreciation expense 4.0 0.8 1.0 5.8 Amortization expense 10.5 1.3 — 11.8 EBITDA [1] $ 81.5 $ 20.5 $ (26.3) $ 75.8 Split of Corporate & Common [2] (21.5) (4.8) 26.3 — Segment EBITDA [B] $ 60.1 $ 15.7 — $ 75.8 Segment EBITDA Margin [1], [2], [B]/[A] 26% 30% 27% [2] Corporate and Common Costs have been allocated according to revenue. [1] EBITDA, Adjusted EBITDA, EBITDA Margin, Segment EBITDA, Segment EBITDA Margin and Free Cash Flow are non-GAAP measures, and should not be considered in isolation or construed as an alternative to our Net income attributable to Chase Corporation, Net cash provided by operating activities, or other measures as determined in accordance with U.S. GAAP. Our measurement of EBITDA, Adjusted EBITDA, EBITDA Margin, Segment EBITDA, Segment EBITDA Margin and Free Cash Flow may not be comparable to similarly-titled measures used by other companies. Non-GAAP financial measures should be considered in addition to, and not as an alternative to, the Company’s reported results prepared in accordance with GAAP. Fiscal Year Ended August 31, 2018 |
21 Calculation of Other Measures Utilized ($ in millions) Net income attributable to Chase Corporation [A] $ 17.2 $ 26.6 $ 26.3 $ 32.8 $ 42.0 $ 43.1 Current Assets [B] $ 100.0 $ 125.9 $ 116.0 $ 138.8 $ 114.1 $ 126.2 Total Assets [C] 224.4 245.5 255.6 262.8 254.7 316.5 Current Liabilities [D], [1] 32.4 36.1 37.5 68.5 27.3 28.9 Total Long-term Debt, including Current Portion [E] 64.4 58.8 51.8 43.4 - 25.0 Chase Corporation Stockholders' Equity [F] 112.8 136.6 154.3 174.1 210.9 246.8 Return on Assets (ROA), [A]/(average of [C]), [2] 7.8% 11.3% 10.5% 12.7% 16.2% 15.1% Return on Equity (ROE), [A]/(average of [F]), [2] 16.3% 21.4% 18.1% 20.0% 21.8% 18.9% Current Ratio, [B]/[D], [1] 3.1 3.5 3.1 2.0 4.2 4.4 Total Long-term Debt to Equity, [E]/[F] 0.6 0.4 0.3 0.2 - 0.1 [1] The 2016 current liabilities includes all debt [2] Average calculated as a simple average of the applicable year-end and prior year-end balances 2013 2018 Fiscal Years Ended August 31, 201720162014 2015 |
22 Frequently Asked Questions Q& A from interested parties Section 1: Corporate Strategy & Risks Section 2: Capital Allocation & Investments Section 3: Acquisitions & Divestitures – Strategy Section 4: Products & Markets Section 5: Competition Section 6: Acquisitions & Divestitures – Transaction-Specific Section 7: Financials, Profitability, Trends Section 8: Organization |
23 FAQ Section 1: Corporate Strategy & Risks (1) What is the overall strategy at Chase? “Stay the course” of continued growth in markets we serve via internal and external means, staying close to our core financial principles • M&A • Consolidation • Organic growth in selected areas Given the recent trading price of CCF stock, has the Company considered the possibility of a stock split? With an increased “float” there might be a corresponding increase in investor interest in the stock. The majority of our investor base (in terms of ownership) is focused on liquidity, measured as total dollars per day in trades. Higher liquidity allows them to move quickly into and out of a position without impacting the share price. For these investors, who often take large positions in Chase (3-5% of a fund), price per share is not part of their decision-making process. Over the last 4 years our liquidity, as measured by dollars per day in trades, has increased tenfold. In 2014, we were trading approximately 8,000 shares a day on average at a price of ~$30/share, or roughly $250k/day. More recently, we are trading roughly 20,000 shares a day at a price of ~$100 or $2.0mm/day. Since there are both one-time and recurring costs to splitting the stock, the cost/benefit to Chase and its shareholders is not attractive at this time, as we do not believe that a stock split would change the total dollars traded per day. We will continue to focus on what drives shareholder value, and we believe liquidity measured in terms of dollars per day is the best way to ensure that outcome. |
24 FAQ Section 1: Corporate Strategy & Risks (2) You suggest Chase Corp is a GDP+ type business. How do you justify this? Our growth over the past few years has been focused on our specialty chemicals platforms, which provides higher returns on revenue growth than the oldest parts of our company. The oldest parts, such as cable materials, are in “harvest mode,” and provide a stable cash flow that supports our other strategic moves. |
25 FAQ Section 2: Capital Allocation & Investments (1) Please discuss your capital allocation philosophy and priorities going forward. We will continue to use free cash flow and leveraged debt as our two main sources of capital to fund strategic initiatives. It seems like there is very minimal CapEx in your business? Explicit CapEx is fairly low, since our major pieces of production equipment have long useful lives and the technology changes slowly. However, CapEx is often embedded in our M&A activity. While our reported “Purchases of property, plant and equipment” totaled $3,488, $3,199, $2,046 and $2,642 for fiscal 2018, 2017, 2016 and 2015, respectively, these do not include: • Zappa Stewart acquisition (fiscal 2018) - $1,872 in PP&E obtained • Resin Designs acquisition (fiscal 2017) - $623 in PP&E obtained • Spray Products (India) Private Limited acquisition (fiscal 2016) - $1,027 in PP&E obtained • Henkel specialty chemical intermediates acquisition (fiscal 2015) - $1,064 in PP&E obtained • NEPTCO acquisition (fiscal 2012) - $18,657 in PP&E obtained. We currently have several on-going capital projects that are important to our long-term strategic goals. Machinery and equipment will be added as needed to increase capacity or enhance operating efficiencies in our manufacturing plants. Also, we can readily increase production in our facilities through adding shifts, without needing to acquire additional equipment. |
26 FAQ Section 2: Capital Allocation & Investments (2) You refinanced your previously existing debt agreement. What was the purpose of the refinancing and what is Chase’s strategy for utilizing the revolving debt? In December 2016, we replaced our preexisting term loan with a more flexible and larger all- revolver facility with a $150 million base plus an “accordion” of an additional $50 million under the same terms and conditions. The credit agreement allows for greater flexibility in our M&A program, maintains favorable borrowing rates and allows us to convert any portion to term debt. Chase plans to utilize the new revolving debt agreement in line with its existing core strategies, including using it in part to finance the December 2017 acquisition of Zappa Stewart. What is the maximum level of leverage that you are comfortable having on your balance sheet? Our all-revolver debt agreement with BoA, Citizens Bank and JPMorgan calls for no more than a 3.25x leverage on EBITDA (defined in the credit agreement), and that is our high-end comfort level. What is Chase’s priority for use of excess cash? Our main focus is to increase shareholder value through growth initiatives where the return is greater than the cost of capital. We focus on our Mergers, Acquisitions and Divestitures program as the first priority for “excess” cash, as well as strategic market and product development efforts. Our variable debt structure allows us to pay down debt (de-lever) in times when a project is not ready for investment, and then subsequently use the debt structure to make accretive acquisitions, so debt repayment is our second priority. Our third priority is to pay out special dividends. In view of Chase’s already low float, buying back shares is not currently in our plans. |
27 FAQ Section 2: Capital Allocation & Investments (3) What was the basis for keeping the dividend the same as last year at $0.80? We base our dividend on the net income we earned in the prior fiscal year. We distribute, via a dividend, 15-20% of this amount, depending on future needs of the Company for growth, debt repayment, and other capital requirements. Our fiscal year 2018 net income was only 3% higher than in 2017, so we did not increase the dividend from its prior year level. |
28 FAQ Section 3: Acquisitions & Divestitures – Strategy (1) With regards to mergers and acquisitions, please discuss: How you source deals (i.e., bankers, sellers come to you, you approach sellers, etc.)? Yes to all. What internal resources do you have dedicated to M&A? We utilize a cross-functional team made up of senior management and outside consultants. The integration process? We expect to fully integrate all new acquisitions into our business model with centralized administrative services and inclusion in our centrally-managed ERP environment. Opportunities for cost and/or revenue synergies? Each opportunity is unique, but we always look to leverage our fixed costs. The financial hurdles or returns you seek when doing M&A? We look for any acquisition to be accretive to our overall metrics (GM %, ROI, ROE, etc.). The level of M&A to expect going forward? Mergers, acquisitions and divestitures will continue to be an important part of our strategy. |
29 FAQ Section 3: Acquisitions & Divestitures – Strategy (2) Are acquired companies folded 100% into Chase Corp, or are they run autonomously? Do you retain key executives from the acquired company? We centralize the back office and administrative functions while complying with localization requirements in non-U.S. locations. Our goal is to implement our global ERP system at each acquired location within six months. Zappa Stewart and Resin Designs, our most recent acquisitions, are already fully integrated into our single accounting and IT platform. Our preference is to retain “acquired” talent where they will assist in growing the business, and where they are willing to work in the management and controls environment of a public company. This includes not only management and technical people, but salespeople, production supervisors, and line workers. In general, we have retained key executives from each of our acquisitions. How is the M&A pipeline looking versus, say, twelve months ago? Similar in terms of opportunity, with valuations appearing to be past their peak and returning to more normal (that is, lower) multiple levels. We attribute this to the higher cost of debt capital, perhaps enhanced by a weakening of creditworthiness among potential buyers. |
30 FAQ Section 4: Products & Markets (1) Review your product mix now and how it has changed over time? Chase has grown from its wire and cable roots into a broad range of industrial and construction- related markets, specializing in protective materials for high-reliability applications with specialized properties and formulations. What end markets are your products sold into? Changes over time? Our primary markets span multiple industries (telecommunications, electronics, energy distribution, automotive, appliance, general industrial, infrastructure (water, oil, gas), bridge & highway, commercial building, housing, medical, consumer, environmental, mining/drilling, etc.). Our fiscal 2015 acquisition of our specialty chemical intermediates product line, our fiscal 2017 acquisition of Resin Designs and our fiscal 2018 acquisition of Stewart Superabsorbents/Zappa-Tec (“Zappa Stewart”) represent major immediate and long-term opportunities for growth by providing us entry into new markets and expansion in certain markets we already serve. Do you have any significant customer concentration? No. During fiscal 2018, 2017, and 2016, no one customer accounted for as much as 10% of sales. The acquisitions that we have made in recent years have expanded our customer roster and broadened our end-market reach, reducing our customer and industry concentration as a welcome side-benefit. |
31 FAQ Section 4: Products & Markets (2) Are your products a “consumable” or a one-time purchase? Industrial Materials segment includes specified products that are used in or integrated into another company’s product with demand typically dependent upon general economic conditions. These could be viewed as "consumable" in nature. Construction Materials segment comprises principally project-oriented product offerings that are primarily sold and used as “Chase”-branded products. Each project could be viewed as a one-time purchase, although some projects extend over multiple years and some give rise to follow-on projects (and purchases). What is the cost of your product as a % of the product it is being sold into? Varies by product line, but we believe it to generally be a small part of the cost of the end product or project. How critical are your products to the performance of the products that they are incorporated into? Our products are not typically the “active” part of an end product (e.g., they do not transmit a signal or energy), but rather allow the end product to perform more reliably over time, protect its warranty and increase its durability. Are your products sold direct or via distributors? Both. We sell through multiple means, depending on market and location. |
32 FAQ Section 4: Products & Markets (3) Are any of your products sold on a contract basis? Yes, many products have contracts covering price, volume, etc., but our standard terms and conditions do not include minimum purchase quantities, “take or pay” or exclusivity provisions. Can you walk through your manufacturing process? They are usually one to three steps, including coating, laminating, blending, polymerizing, mixing, weaving, printing, slitting and containerizing. How important are automotive-related sales to your current results and planned future growth? The automotive industry is important to us, as our products are used throughout current vehicles. For example, HumiSeal and Resin Designs products are utilized in engine and cabin control systems, in- dash circuitry and displays; our polyurethane dispersions are utilized in headliners, dashes and soft- touch vinyl interior components; our polymeric microspheres are utilized in adhesives and coatings for weight and density reduction, along with lining systems for sound dampening; and our cable shielding tapes, among our oldest products, have sales into automotive industry markets. The burgeoning electric vehicle market uses our materials in power/energy management systems and in charging stations. A substantial slowdown in the automotive industry would hurt our results, but no one industry is critical to our future plans. |
33 FAQ Section 4: Products & Markets (4) Which products and end-markets will drive your future organic growth? We see growth drivers in several areas using our specialty chemicals technologies: electric vehicles, IoT expansion in consumer products and appliances, broadband and 5G implementations, and in multiple industries using electronics; weight reduction from using polymeric microspheres; and broadened use of superabsorbent polymers in medical, consumer and environmental applications. How is the sales team structured? By segment, division, product, end-market, geography…? Because our products and markets are so varied, our sales organization varies as well. Product-line specialization is more important than geography for high-volume product lines, and geography is more important for low-volume ones. Providing a single point of contact for a customer is also important. We try to be easy for our customers to work with while providing cost-effective service. Would expansion into new geographical areas involve an expansion of the direct sales force, or would you rely on independent distributors? We have mostly used direct sales in our Industrial Materials segment, and both direct sales and distribution in our Construction Materials segment. We lean towards direct sales force expansion for new areas, but distribution is always considered as an alternative. There is a third option: to access India, we bought a small Indian manufacturer/distributor of industrial coatings in 2016, and we have purchased small distributors in other areas over the years. |
34 FAQ Section 4: Products & Markets (5) What are your “differentiated R&D capabilities?” We spend almost all our R&D effort in developing specific solutions to solve customer problems or extend product capability and function. We are “differentiated” in that our focus is providing products and performance in reliability and protective uses for specific customer requirements, rather than general line extensions for which we hope we can find a market. |
35 FAQ Section 5: Competition (1) What is the principal way that you compete in the marketplace (i.e., cost/price, technology/value add, brand/reputation, breadth of offering, service, etc.)? All of the above are important to different products we offer, with differing levels of importance based on the end-market. We compete principally on the basis of technical performance, service, reliability, quality and price. What do you see as your primary competitive advantages in the market? We are a reliable supplier with a long track record of producing and delivering high-quality value- added products. In certain markets, we are differentiated through our depth and breadth of proven product solutions to meet a specific need. What % of your revenue is tied to products that have patents or IP protecting them? Relatively low on legally-protected IP, but our trade secrets are important to our success. We hold various patents, but we believe that they are not material to the success of our business. Do your products have substitutes (i.e., a different material/chemical, not necessarily a competitor’s product)? Most of our products face pressure from some form of substitution, but we believe we offer both tangible and intangible value to our customers over these alternatives. Of course, there are other companies that manufacture or sell products and services similar to those made and sold by us. |
36 FAQ Section 5: Competition (2) Have there been any new entrants into the markets that you serve in the last 3-5 years? Yes, there are always new entrants, or ones that re-appear based upon exchange rates and other factors. What singular competitor do you most find yourselves competing against for sales? Would any market participant’s exit radically improve your ability to win business and improve your financial results? Given the diversified nature of Chase’s product offerings and markets served, the elimination of any one or even two competitors would not dramatically improve the results of the Company as a whole. We compete by reliably supplying our customers quality products. |
37 FAQ Section 6: Acquisitions & Divestitures – Transaction-Specific (1) Can you walk through the strategic rationale of acquiring the Resin Designs assets in September 2016? Why did Resin Designs sell the businesses to you? Resin Designs’ owners felt that the combination of their product design and Chase’s global reach was the right long-term strategy to continue to develop their business. We felt this was an excellent add-on to our business in terms of size, future potential, overlap in our distribution channels, and fit within our overall strategy. What were the EBITDA margins of the acquired Resin Designs business? We do not directly disclose product line margins, but we have provided pro forma financial information in our filings during fiscal 2017. We expect this investment to continue to grow and meet our expectations, and deliver results accretive to the Company. What was the rationale for the sale of the Fiber Optics Cable Components (FOC) business to Roblon in April 2017? The Company’s initial 50% share in the FOC business was part of our acquisition of NEPTCO in fiscal 2012 (NEPTCO JV). In fiscal 2015, we acquired the other 50% equity share owned by Owens Corning, to give us full control in managing the business. Because of its low growth and margin prospects, and a customer, supplier and equipment base separate from our other businesses, Fiber Optic Cable Components was determined to not be part of Chase’s long-term strategy. The business was worth more as an add-on to Roblon, an established player, than to Chase. Moreover, the deal allows Chase to offset certain fixed costs in our Granite Falls, NC location by providing services and leasing space to the buyer, while we plan our future uses of the facility and its workforce. |
38 FAQ Section 6: Acquisitions & Divestitures – Transaction-Specific (2) How does the acquisition of Zappa Stewart in December 2017 fit into Chase’s strategy? We see this as a continuation of our desire to invest in specialty chemical opportunities where products provide attributes of protection at a low cost and high value. While the business derives some revenue from Wire & Cable customers, the attraction was for products in diversified areas such as medical, consumer, environmental and construction applications. What synergies do you expect now that you have combined Zappa Stewart with Chase’s ongoing operations? We have not justified this investment on integration of this business into Chase, but we anticipate some logical cost savings by bringing this business onto Chase’s ERP system, support systems and shared services platform. Can you clarify what you mean by accretive to earnings? We see Zappa Stewart as increasing our earnings per share after taking into account one-time transaction costs and financing costs. Was the Zappa Stewart transaction part of an auction? This deal did not involve an auction. The principals on both sides, who have had a lengthy relationship, saw the benefits of combining strengths of each company to maximize value for both. |
39 FAQ Section 6: Acquisitions & Divestitures – Transaction-Specific (3) Why did the former owners of Zappa Stewart sell this business? There was a desire by one of the owners to scale back a portfolio of businesses as part of a retirement plan, and a desire by other owners to continue to build the business. Combining SSA and Zappa-Tec into one entity enabled an orderly exit for some and the opportunity for other members to continue to grow the business under the Chase umbrella. Can you explain how tax reform and the Tax Cuts and Jobs Act will impact the Zappa Stewart deal? Was that the reason for the December 31, 2017 close date? We justified this business under then-existing tax laws. We see the tax reform changes as being beneficial to certain aspects of this deal as well as to Chase as a whole. For example, we plan to accelerate depreciation on equipment purchased as part of the transaction. The timing of the close was dictated by our desire to observe the combination of SSA and Zappa-Tec for one full quarter to evaluate the performance of the combined business, and not by tax considerations. What was the multiple that was paid on the acquisition of Zappa Stewart? We have disclosed the Master Purchase Agreement as an exhibit to our public SEC filings. The transaction required the business to deliver a minimum EBITDA of $8.5mm, which was exceeded. On that basis, the transaction multiple, inclusive of working capital adjustment, was 8.6x. |
40 FAQ Section 6: Acquisitions & Divestitures – Transaction-Specific (4) Can you expand on the sale of the Structural Composites Rod business in April 2018? We continued our exit of the composite rod business, receiving a fair price for the business and a participation in future sales growth via a royalty agreement. Like the other businesses we have sold in the past few years, this one is outside our strategic focus area and would never get the attention from us that it will get from the buyer, for whom this is an extension of one of their key businesses. Why did you close the Pawtucket manufacturing facility? What is the savings from closing the plant? Will you continue to use the adjacent office area, or will you sell the whole property? We closed the facility to reduce fixed costs. Continued margin pressures from raw material cost increases and consolidation in our customer base made action necessary. Pawtucket was the smallest of the three plants that produced wire and cable products, and we no longer needed its floor space. We are not disclosing the anticipated amount, but it will be meaningful in future periods. We will measure the savings by comparing our actual costs in future periods with what we would have expected them to be if we had not closed the plant. We will continue to use the office area in the adjacent building to house accounting, IT, and other support functions. We have no current plans to sell the property. How will closing Pawtucket affect your future revenue? Not substantially. Most of the equipment was moved to the other two cable materials plants and is back in production. |
41 FAQ Section 7: Financials, Profitability, Trends (1) Has your historical revenue growth been driven by volume, price or a combination of the two? Primarily volume, with M&A expansion also significantly contributing to growth. Chase has also increased prices in recent periods to address rising raw material costs. What are the appropriate long-term revenue growth rates to think of for your segments/products? Are these rates being driven by volume, price, or both? We do not provide earnings guidance. We predict both volume and price will play a part in revenue growth, based upon underlying commodity pricing fluctuations. Your margins have been higher than your peer group. Why? Are they sustainable? Our focus has been and will be to follow our strategy of using our base knowledge and core competency of chemical formulation to address customer demand by providing value added protective material solutions. We believe the value we provide to a customer with an engineered solution that meets their requirements, coupled with security of supply, deserves the margins we derive. Our intent is to continue to build out this specialty chemical platform with acquisitions and organic growth and desire to sustain our margin profile. We have also sold some product lines and assets that did not meet our profitability requirements and did not fit our strategy. The revenue losses have been offset by our acquisitions, as well as organic growth in certain strategic product lines. In effect, we have replaced some low-margin business with higher-margin business, resulting in better overall margins for the Company. |
42 FAQ Section 7: Financials, Profitability, Trends (2) Why has gross margin % declined in fiscal 2019 and 2018 from fiscal 2017? Is it due to raw materials costs? As we have written in our prior issued earnings press releases, there are several reasons: • Lag in our ability to quickly pass on raw material cost increases • Increased operational costs following the exit of our Pawtucket, RI plant, which are not anticipated to be long-term additions to our production run rates • Product mix, which shifted to lower margin products We are taking necessary short- and long-term steps to regain and improve margins where price increases are not practical. What are the primary raw materials in your COGS? We purchase a wide variety of commodity items, including petroleum-based solvents, films, yarns and nonwovens; aluminum and copper foils; specialty papers; and various resins, adhesives, polymers and inks. Are you able to pass through raw material cost increases to your customers either contractually or on a spot basis? When raw material costs decline, do you typically keep some of this margin or pass it along to your customers? Short-term, we usually are able to keep the benefit from cost declines but have difficulty passing on cost increases quickly. Over the longer term, these ebbs and flows work themselves through the supply chain. |
43 FAQ Section 7: Financials, Profitability, Trends (3) What is the mix of fixed versus variable costs in your business? We do not disclose, but we are focused on leveraging and reducing fixed costs. How much room is left on the consolidation strategy and streamlining of operations? There is room for further consolidation, with multiple projects in progress and therefore different stages for each project. An active and opportunistic M&A program means that we are always thinking about how to best use our current set of facilities and equipment. For example, in June 2018 we announced that we were closing our Pawtucket, RI plant, effective August 31, 2018, and relocating its production to our plants in Oxford, MA and Lenoir, NC. The centralized office functions and personnel will remain at Pawtucket. The Pawtucket plant primarily supplied the wire and cable industry with specialty tapes. There has been extensive consolidation among our wire and cable manufacturer customers, and our tactics match the needs of the industry. Can you explain how tax reform and the Tax Cuts and Jobs Act will impact Chase going forward? Ignoring our most significant “discrete” tax items, we had a fiscal 2018 blended rate of approximately 26% (including state tax), and for fiscal 2019 we expect to be at approximately 25% (federal 21% and state 4%). These rates, which are the results of the Tax Act, are significantly below the all-in effective tax rates of 31% and 35% recognized in fiscal 2017 and 2016, respectively. Additionally, certain provisions in the Tax Act have allowed us to repatriate significant amounts of cash from our U.K. operations, without any additional tax effects. |
44 FAQ Section 7: Financials, Profitability, Trends (4) What has driven the improvement in working capital as a % of sales in recent years? Have there been specific initiatives? Are there opportunities for further improvement? We have focused attention on the age, accessibility and quality of our inventories. Including our acquired operations in our shared services environment and global ERP system has provided tools to the local managers to improve their performance, and has subjected the plants to centralized oversight and discipline. There has been a similar but smaller benefit in accounts receivable. There are always opportunities for improvement. However, our priority is cost reduction, and we will buy and carry large amounts of inventory to take advantage of temporary savings opportunities. Can you achieve further margin expansion without significant revenue growth? We believe we can improve margins on a constant-volume basis by leveraging our fixed assets. Short- term margin recovery will be achieved through price/cost passthroughs of past and future cost increases, although this will be a return to prior margin norms rather than an improvement. You say that “In a time of greater uncertainty” Chase will “pursue tactical business model changes to reduce variable cost.” What are these changes? Similar actions to those we have taken in the past: product pruning, footprint reductions, resource reallocation, divestitures, etc. |
45 FAQ Section 7: Financials, Profitability, Trends (5) What is your backlog? How has it changed over time? Our backlog is generally a little under one month of revenue, and this has been consistent over a long period. Most of our production cycles are short, and most of our products are standard, allowing us to maintain a stock of finished or semi-finished materials that we can ship quickly as customer orders are received. We have never considered our backlog to be an important metric or performance indicator. The new revenue recognition standard (ASC 606) is expected to very slightly accelerate our revenue recognition, with a corresponding very slight reduction in our backlog. |
46 FAQ Section 8: Organization Christian Talma has replaced Ken Feroldi as CFO, what is the background? Christian joined the Company in August of 2018 as Chief Accounting Officer as part of a succession plan for Ken Feroldi, who sought to reduce his workload and main duties. To ensure a seamless transition, Christian’s first focus as CAO has been in the compliance and operations portions of the Finance Function. After having successfully managed the year-end audit process and becoming oriented to the business, he will assume the CFO role in February as part of our annual shareholder meeting. Ken will continue with Chase and serve as our Treasurer with a focus on three main areas within the Finance Function: Investor Relations, Capital Structure/Finance, and M&A. [ END OF CHASE CORPORATION INVESTOR PRESENTATION ] |