Table of Contents
UNITED STATES
SECURITIES AND EXCHANGE COMMISSION
WASHINGTON, D.C. 20549
FORM N-CSR
CERTIFIED SHAREHOLDER REPORT OF REGISTERED
MANAGEMENT INVESTMENT COMPANIES
811-5514
(Investment Company Act File Number)
MTB Group of Funds
(Exact Name of Registrant as Specified in Charter)
MTB Investment Advisors, Inc.
100 East Pratt St., 17th Floor
Baltimore, MD 21202
(Address of Principal Executive Offices)
410.986.5600
(Registrant’s Telephone Number)
Gregory B. McShea
MTB Investment Advisors, Inc.
100 East Pratt St., 17th Floor
Baltimore, MD 21202
(Name and Address of Agent for Service)
(Notices should be sent to the Agent for Service)
Date of Fiscal Year End: 04/30
Date of Reporting Period: Fiscal year ended 04/30/11
Form N-CSR is to be used by management investment companies to file reports with the Commission not later than 10 days after the transmission to stockholders of any report that is required to be transmitted to stockholders under Rule 30e-1 under the Investment Company Act of 1940 (17 CFR 270.30e-1). The Commission may use the information provided on Form N-CSR in its regulatory, disclosure review, inspection, and policymaking roles.
A registrant is required to disclose the information specified by Form N-CSR, and the Commission will make this information public. A registrant is not required to respond to the collection of information contained in Form N-CSR unless the Form displays a currently valid Office of Management and Budget (“OMB”) control number. Please direct comments concerning the accuracy of the information collection burden estimate and any suggestions for reducing the burden to Secretary, Securities and Exchange Commission, 450 Fifth Street, NW, Washington, DC 20549-0609. The OMB has reviewed this collection of information under the clearance requirements of 44 U.S.C. § 3507.
Table of Contents
| ITEM 1. | REPORT(S) TO STOCKHOLDERS. |
The Trust’s annual report transmitted to shareholders pursuant to Rule 30e-1 under the Investment Company Act of 1940 is as follows:
Table of Contents

Managed by MTB Investment Advisors, Inc. — www.mtbia.com
PRESIDENT’S MESSAGE AND ANNUAL REPORT — APRIL 30, 2011
MTB Group of Funds
U.S. Treasury Money Market Fund
U.S. Government | Tax-Free Money Market Fund
Money Market Fund | Prime Money Market Fund
New York Tax-Free
Pennsylvania Tax-Free | ||

Table of Contents

| PRESIDENT’S MESSAGE | ||||
| President’s Message | i | |||
| MTB MONEY MARKET FUNDS ANNUAL REPORT | ||||
| Shareholder Expense Example | 1 | |||
| Portfolios of Investments | 3 | |||
| Notes to Portfolios of Investments | 22 | |||
| Statements of Assets and Liabilities | 24 | |||
| Statements of Operations | 26 | |||
| Statements of Changes in Net Assets | 28 | |||
| Financial Highlights | 32 | |||
| Notes to Financial Statements | 40 | |||
| Report of Independent Registered Public Accounting Firm | 44 | |||
| Board of Trustees and Trust Officers | 45 | |||
Table of Contents
I am pleased to enclose the Annual Report of the MTB Group of Funds (the “Trust”). This report covers the Trust’s fiscal year, which is the 12-month reporting period from May 1, 2010 through April 30, 2011. Inside, you will find a discussion of the factors impacting each Fund’s performance during the reporting period, as well as a complete listing of each Fund’s holdings and financial statements.
The Economy and Financial Markets in Review
MTB Investments Advisors, Inc., the advisor to the Trust, has provided the following review of the economy, bond and stock markets over the 12-month reporting period:
The Economy
During the period under review for our report, the U.S. economy avoided a double dip recession. However, the growth has been weak, with the Commerce Department’s early estimate of Gross Domestic Product (“GDP”) growth of 1.8% in the first quarter. Since the end of the “Great Recession” (second quarter of 2009); the country has averaged a 2.8% growth rate which is significantly lower than the 4.6% growth rate during economic recoveries over the past 40 years (and seven recessions). Hopes for a better first quarter in 2011, were set back by exogenous events. The tragic earthquake and tsunami in Japan and political unrest in the Middle East and North Africa had an economic impact throughout the world.
Federal Reserve (“Fed”) Chairman Bernanke noted the slow first quarter growth, but felt it was “transitory” and is expected to improve throughout the year. Some stimulus was added by the Fed’s “quantitative easing” program (“QE2”) which is expected to end in June. 1 Most economists feel the cessation of the Fed’s asset purchases will be offset by activity from the private sector.
Housing and jobs remain a concern, but over 260,000 new jobs were created in the private sector in April 2011 according to the U.S. Bureau of Labor Statistics. Consumer confidence, spending, and retail sales appeared favorable in the April 2011 reports from the U.S. Department of Commerce, and this should contribute to full-year growth.
Manufacturing reports released by the Institute for Supply Management have been favorable, with 15 out of 18 manufacturing industries reporting growth in March 2011. This marks the 20th consecutive month of manufacturing growth. Inflation talk has replaced the deflation concerns of early 2010. Price increases in the news have showcased selected commodities such as oil, precious metals, copper, cotton, corn, and wheat. These inflationary pressures are, in part, offset by lower housing prices and non-existent wage pressures.
According to the U.S. Department of Commerce, Bureau of Economic Analysis, the first quarter GDP growth is expected to be the low quarterly report for the year. On the positive side, the job picture is improving, consumers are upbeat, business investment is picking up, and corporate profits are up. Comments from Chairman Bernanke indicate that the Fed estimates economic growth of 3.3% and unemployment at 8.5% by the end of the calendar year.
The Bond Markets
The bond market has proven to be challenging over the last six months of the Funds’ fiscal year as investors allocated away from high quality bonds into “riskier” asset classes such as equities, commodities and low grade corporate bonds. As a result the U.S. Department of the Treasury reported that the yield on the 10-year treasury note has risen from 2.63% on October 31, 2010 to 3.32% on April 30, 2011, even as the Fed nears the conclusion of its second massive treasury buyback known as QE2.
While the domestic economy slowly recovers from the recession in 2008 and 2009, global geo-political events in the Middle East and North Africa and the tragic Japanese tsunami continue to influence the direction of interest rates in the United States. Standard and Poor’s put the “AAA” rating of the United States on credit watch “negative” in April 2011, implying that the U.S. has a ratings downgrade probability in the next two years of 1 in 3. Currently, Congress and the Administration are struggling with our $14.3 trillion debt limit.
We believe that the economy will continue to mend and slowly expand, QE2 will not be extended and that the Fed will raise the rate in the first quarter of 2012. With a growing economy, and some marginal increases in the Consumer Price Index (“CPI”), we look to reduce maturities in our taxable bond portfolios.
The municipal market has seen reduced supply by issuers over the last four months. We believe the supply/demand dynamics in the municipal market are favorable and feel optimistic about the prospects for this market. The municipal market has not endured substantially higher default levels predicted by some prognosticators in 2011 to date, and we continue to closely analyze our municipal credits.
PRESIDENT’S MESSAGE / April 30, 2011
Table of Contents
| ii |
For the 12-month reporting period May 1, 2010 through April 30, 2011, certain Barclays Capital indices performed as follows2:
| Barclays Capital U.S. Aggregate Bond Index3 | Barclays Capital U.S. Treasury Bond Index4 | Barclays Capital Fixed Rate Mortgage-Backed Securities Index5 | Barclays Capital U.S. Credit Bond Index6 | Barclays Capital Municipal Bond Index7 | ||||||||||||
| 5.36% | 4.64% | 4.98% | 7.03% | 2.20% | ||||||||||||
The Stock Markets
The Funds’ fiscal year ended with indexes at or near 12-month highs. The effect of the global stimulus manifested itself in higher commodity and asset prices. So much so that China, one of the big engines of global economic growth, decided to shift focus and concentrate on taming inflation. Thus the tighten cycle in China began, and through the year many other emerging economies would follow. Coupled with this tightening cycle was the revelation the some European countries may have been using currency swaps to get around conditions set forth in the Maastricht treaty. The upshot was that there were calls for the breakup of the Euro. Suffice it to say the following four months in the stock markets were quite trying. In the stock market, you are guilty until proven innocent, and the charge was a global double dip recession.
The result was a stock market correction that lasted from approximately the first of May 2010 until the Fed’s Jackson Hole meeting in late August 2010. At this meeting Chairman Bernanke suggested that the Fed would do what it takes to make sure the U.S. economy recovers. The stock market, similar to a young child, got what it wanted, QE2. It didn’t matter that we would have to wait until the next full two day meeting in late October for it to become official. The market, the forward price discounting mechanism that it is, started to move higher. The reflation trade was put back on, buy industrials, commodities, and energy, and short the dollar. The only problem is that eventually rising commodity prices slow growth, but I digress. To use an old bridge term, let’s review the bidding. From approximately May 1 to September 1, 2010, the S&P 500 corrected 14% and from September 1 to May 1, 2011, the S&P 500 appreciated by close to 30%.
What does the future hold? The theory behind QE2 is that if an economy is flooded with liquidity, and we can get inflationary expectations rising, then the velocity of money will increase, and the economy has a good chance of growing on its own. To date, leading economic indicators are starting to decline and inflationary pressures around the world are starting to intensify. A slower growth environment with declining inflation may just be what the doctor ordered.
For the 12-month reporting period May 1, 2010 through April 30, 2011, certain stock market indices performed as follows:
| S&P 500 Index8 | Dow Jones Industrial Average9 | NASDAQ Composite Index 10 | ||||||
| 17.22% | 19.33% | 17.98% | ||||||
The Trust, with assets of $7.1 billion as of April 30, 2011, gives investors access to every major asset class and sector. Whether you are looking for a comfortable retirement, to fund a child’s higher education, pursue tax-free income11, stay ahead of inflation, or keep your cash working, one or more of the Trust’s Funds can provide you with the diversification, flexibility and professional management you need.12
Sincerely,

Timothy L. Brenner
President
June 13, 2011
April 30, 2011 / PRESIDENT’S MESSAGE
Table of Contents
| iii |
For more complete information, please download the Trust’s prospectus available on www.mtbfunds.com or call 1-800-836-2211 for a copy. You should consider the Funds’ investment objectives, risks, charges, and expenses carefully before you invest. Information about these and other important subjects is in the Trust’s prospectus, which you should read carefully before investing.
Past performance is no guarantee of future results. The index performance quoted is for illustrative purposes only and is not representative of any specific investment.
An investment in money market funds is neither insured nor guaranteed by the Federal Deposit Insurance Corporation or any other government agency. Although money market funds seek to preserve the value of your investment at $1.00 per share, it is possible to lose money by investing in these funds.
| 1. | Quantitative easing is the practice of expanding a central bank’s balance sheet by buying long-term assets in an attempt to drive down long-term interest rates. |
| 2. | Bond prices are sensitive to changes in interest rates and a rise in interest rates can cause a decline in their prices. |
| 3. | Barclays Capital U.S. Aggregate Bond Index is widely used benchmark index for the domestic investment-grade bond market composed of securities from the Barclays Capital Government/Corporate Bond Index, Mortgage-Backed Securities Index and Asset-Backed Securities Index. The index typically includes fixed income securities with overall intermediate- to long-term average maturities. The index is unmanaged and investments cannot be made directly in an index. |
| 4. | Barclays Capital U. S. Treasury Bond Index is a market capitalization weighted index that includes all publicly issued, U.S. Treasury securities that have a remaining maturity of at least one year, are rated investment-grade, and have $250 million or more of outstanding face value. The index is unmanaged and investments cannot be made directly in an index. |
| 5. | Barclays Capital Fixed Rate Mortgage-Backed Securities Index is composed of all securities mortgage pools by GNMA, FNMA and the FHLMC, including GNMA graduated Payment Mortgages. The index is unmanaged and investments cannot be made directly in an index. |
| 6. | Barclays Capital U.S. Credit Bond Index tracks the performance of domestic investment-grade corporate bonds and is composed of all publicly issued, fixed-rate, nonconvertible, investment-grade corporate debt. The index is unmanaged and investments cannot be made directly in an index. |
| 7. | Barclays Capital Municipal Bond Index tracks the performance of long-term, tax-exempt, investment-grade bond market. To be included in the index, bonds must have an outstanding par balance of at least $7 million and be issued as part of a transaction of at least $75 million. The index is unmanaged and investments cannot be made directly in an index. |
| 8. | The S&P 500 Index is a capitalization-weighted index of 500 stocks designed to measure performance of the broad domestic economy through changes in the aggregate market value of 500 stocks representing all major industries. The index is unmanaged and investments cannot be made directly in an index. |
| 9. | Dow Jones Industrial Average (“DJIA”) represents share prices of selected blue chip industrial corporations as well as public utility and transportation companies. The DJIA indicates daily changes in the average prices of stocks in any of its categories. It also reports total sales for each group of industries. Because it represents the top corporations of America, the DJIA’s average movements are leading economic indicators for the stock market as a whole. The average is unmanaged and investments cannot be made directly in an average. |
| 10. | NASDAQ Composite Index measures all NASDAQ domestic and non-U.S. based common stocks listed on the NASDAQ Stock Market. The index is unmanaged and investments cannot be made directly in an index. |
| 11. | Income generated by tax-free funds may be subject to the federal alternative minimum tax and state and local taxes. |
| 12. | Diversification does not assure a profit nor protect against loss. |
PRESIDENT’S MESSAGE / April 30, 2011
Table of Contents
Managed by MTB Investment Advisors, Inc.
ANNUAL REPORT: April 30, 2011
MTB Group of Funds
U.S. Treasury Money Market Fund
U.S. Government | Tax-Free Money Market Fund
Money Market Fund | Prime Money Market Fund
New York Tax-Free
Pennsylvania Tax-Free | ||
Table of Contents
| 1 |
As a shareholder of a Fund, you incur ongoing costs, including management fees; to the extent applicable, distribution (12b-1) fees, and/or shareholder services fees; and other Fund expenses. This Example is intended to help you to understand your ongoing costs (in dollars) of investing in the Funds and to compare these costs with the ongoing costs of investing in other mutual funds. It is based on an investment of $1,000 invested at the beginning of the period and held for the entire period from November 1, 2010 to April 30, 2011.
Actual Expenses
This section of the following tables provides information about actual account values and actual expenses. You may use the information in this section, together with the amount you invested, to estimate the expenses that you incurred over the period. Simply divide your account value by $1,000 (for example, an $8,600 account value divided by $1,000 = 8.6), then multiply the result by the number in the first section under the heading entitled “Expenses Paid During Period” to estimate the expenses attributable to your investment during this period.
Hypothetical Example for Comparison Purposes
This section the following tables provides information about hypothetical account values and hypothetical expenses based on the Funds’ actual expense ratios and assumed rates of return of 5% per year before expenses, which is not the Funds’ actual returns. Thus, you should not use the hypothetical account values and expenses to estimate the actual ending account balance or your expenses for the period. Rather, these figures are required to be provided to enable you to compare the ongoing costs of investing in the Funds with other funds. To do so, compare this 5% hypothetical example with the 5% hypothetical examples that appear in the shareholder reports of the other funds.
Please note that the expenses shown in the table are meant to highlight your ongoing costs only. Therefore, the Annualized Net Expense Ratio section of the table is useful in comparing ongoing costs only, and will not help you determine the relative total costs of owning different funds.
| Beginning Account Value 11/1/10 | Ending Account Value 4/30/11 | Expenses Paid During Period1 | Annualized Net Expense Ratio | |||||||||||||
| MTB U.S. TREASURY MONEY MARKET FUND | ||||||||||||||||
Actual | ||||||||||||||||
Class A Shares | $ | 1,000.00 | $ | 1,000.00 | $ | 0.69 | 0.14 | % | ||||||||
Class S Shares | $ | 1,000.00 | $ | 1,000.00 | $ | 0.69 | 0.14 | % | ||||||||
Institutional I Shares | $ | 1,000.00 | $ | 1,000.00 | $ | 0.74 | 0.15 | % | ||||||||
Institutional II Shares | $ | 1,000.00 | $ | 1,000.00 | $ | 0.69 | 0.14 | % | ||||||||
Hypothetical (assuming a 5% return before expenses) | ||||||||||||||||
Class A Shares | $ | 1,000.00 | $ | 1,024.10 | $ | 0.70 | 0.14 | % | ||||||||
Class S Shares | $ | 1,000.00 | $ | 1,024.10 | $ | 0.70 | 0.14 | % | ||||||||
Institutional I Shares | $ | 1,000.00 | $ | 1,024.05 | $ | 0.75 | 0.15 | % | ||||||||
Institutional II Shares | $ | 1,000.00 | $ | 1,024.10 | $ | 0.70 | 0.14 | % | ||||||||
| MTB U.S. GOVERNMENT MONEY MARKET FUND | ||||||||||||||||
Actual | ||||||||||||||||
Class A Shares | $ | 1,000.00 | $ | 1,000.00 | $ | 1.04 | 0.21 | % | ||||||||
Institutional I Shares | $ | 1,000.00 | $ | 1,000.00 | $ | 1.09 | 0.22 | % | ||||||||
Institutional II Shares | $ | 1,000.00 | $ | 1,000.00 | $ | 1.04 | 0.21 | % | ||||||||
Hypothetical (assuming a 5% return before expenses) | �� | |||||||||||||||
Class A Shares | $ | 1,000.00 | $ | 1,023.75 | $ | 1.05 | 0.21 | % | ||||||||
Institutional I Shares | $ | 1,000.00 | $ | 1,023.70 | $ | 1.10 | 0.22 | % | ||||||||
Institutional II Shares | $ | 1,000.00 | $ | 1,023.75 | $ | 1.05 | 0.21 | % | ||||||||
| MTB TAX-FREE MONEY MARKET FUND | ||||||||||||||||
Actual | ||||||||||||||||
Class A Shares | $ | 1,000.00 | $ | 1,000.10 | $ | 1.98 | 0.40 | % | ||||||||
Institutional I Shares | $ | 1,000.00 | $ | 1,000.10 | $ | 1.88 | 0.38 | % | ||||||||
Institutional II Shares | $ | 1,000.00 | $ | 1,000.10 | $ | 1.93 | 0.39 | % | ||||||||
Hypothetical (assuming a 5% return before expenses) | ||||||||||||||||
Class A Shares | $ | 1,000.00 | $ | 1,022.81 | $ | 2.01 | 0.40 | % | ||||||||
Institutional I Shares | $ | 1,000.00 | $ | 1,022.91 | $ | 1.91 | 0.38 | % | ||||||||
Institutional II Shares | $ | 1,000.00 | $ | 1,022.86 | $ | 1.96 | 0.39 | % | ||||||||
ANNUAL REPORT / April 30, 2011
Table of Contents
| 2 |
| Beginning Account Value 11/1/10 | Ending Account Value 4/30/11 | Expenses Paid During Period1 | Annualized Net Expense Ratio | |||||||||||||
| MTB MONEY MARKET FUND | ||||||||||||||||
Actual | ||||||||||||||||
Class A Shares | $ | 1,000.00 | $ | 1,000.00 | $ | 1.14 | 0.23 | % | ||||||||
Class A2 Shares | $ | 1,000.00 | $ | 1,000.10 | $ | 1.14 | 0.23 | % | ||||||||
Class S Shares | $ | 1,000.00 | $ | 1,000.00 | $ | 1.14 | 0.23 | % | ||||||||
Institutional I Shares | $ | 1,000.00 | $ | 1,000.20 | $ | 1.04 | 0.21 | % | ||||||||
Institutional II Shares | $ | 1,000.00 | $ | 1,000.20 | $ | 1.04 | 0.21 | % | ||||||||
Hypothetical (assuming a 5% return before expenses) | ||||||||||||||||
Class A Shares | $ | 1,000.00 | $ | 1,023.65 | $ | 1.15 | 0.23 | % | ||||||||
Class A2 Shares | $ | 1,000.00 | $ | 1,023.65 | $ | 1.15 | 0.23 | % | ||||||||
Class S Shares | $ | 1,000.00 | $ | 1,023.65 | $ | 1.15 | 0.23 | % | ||||||||
Institutional I Shares | $ | 1,000.00 | $ | 1,023.75 | $ | 1.05 | 0.21 | % | ||||||||
Institutional II Shares | $ | 1,000.00 | $ | 1,023.75 | $ | 1.05 | 0.21 | % | ||||||||
| MTB PRIME MONEY MARKET FUND | ||||||||||||||||
Actual | ||||||||||||||||
Corporate Shares | $ | 1,000.00 | $ | 1,000.20 | $ | 0.94 | 0.19 | % | ||||||||
Hypothetical (assuming a 5% return before expenses) | ||||||||||||||||
Corporate Shares | $ | 1,000.00 | $ | 1,023.85 | $ | 0.95 | 0.19 | % | ||||||||
| MTB NEW YORK TAX-FREE MONEY MARKET FUND | ||||||||||||||||
Actual | ||||||||||||||||
Class A Shares | $ | 1,000.00 | $ | 1,000.10 | $ | 1.79 | 0.36 | % | ||||||||
Institutional I Shares | $ | 1,000.00 | $ | 1,000.10 | $ | 1.98 | 0.40 | % | ||||||||
Hypothetical (assuming a 5% return before expenses) | ||||||||||||||||
Class A Shares | $ | 1,000.00 | $ | 1,023.01 | $ | 1.81 | 0.36 | % | ||||||||
Institutional I Shares | $ | 1,000.00 | $ | 1,022.81 | $ | 2.01 | 0.40 | % | ||||||||
| MTB PENNSYLVANIA TAX-FREE MONEY MARKET FUND | ||||||||||||||||
Actual | ||||||||||||||||
Class A Shares | $ | 1,000.00 | $ | 1,000.10 | $ | 1.93 | 0.39 | % | ||||||||
Institutional I Shares | $ | 1,000.00 | $ | 1,000.10 | $ | 1.88 | 0.38 | % | ||||||||
Institutional II Shares | $ | 1,000.00 | $ | 1,000.10 | $ | 1.93 | 0.39 | % | ||||||||
Hypothetical (assuming a 5% return before expenses) | ||||||||||||||||
Class A Shares | $ | 1,000.00 | $ | 1,022.86 | $ | 1.96 | 0.39 | % | ||||||||
Institutional I Shares | $ | 1,000.00 | $ | 1,022.91 | $ | 1.91 | 0.38 | % | ||||||||
Institutional II Shares | $ | 1,000.00 | $ | 1,022.86 | $ | 1.96 | 0.39 | % | ||||||||
| (1) | Expenses are equal to the Funds’ annualized net expense ratios, multiplied by the average account value over the period, multiplied by 181/365 (to reflect the one-half year period). |
April 30, 2011 / ANNUAL REPORT
Table of Contents
| 3 |
PORTFOLIO OF INVESTMENTS SUMMARY TABLE
MTB U.S. Treasury Money Market Fund
At April 30, 2011, the Fund’s portfolio composition was as follows: (unaudited)
| Percentage of Total Net Assets | ||||
| U.S. Government Agency & Obligations | 51.4 | % | ||
| Cash Equivalents1 | 48.5 | % | ||
| Other Assets and Liabilities – Net2 | 0.1 | % | ||
| TOTAL | 100.0 | % | ||
| (1) | Cash Equivalents include investments in repurchase agreements. |
| (2) | Assets, other than investments in securities, less liabilities. See Statements of Assets and Liabilities. |
April 30, 2011
| Description | Par Value | Value | ||||||
U.S. GOVERNMENT AGENCY & OBLIGATIONS - 51.4% | ||||||||
U.S. TREASURY BILLS – 45.9% | ||||||||
20.03%, 5/19/11 | $ | 50,000,000 | $ | 49,999,375 | ||||
20.04%, 6/16/11 | 100,000,000 | 99,994,889 | ||||||
20.10%, 10/06/11 | 25,000,000 | 24,989,576 | ||||||
20.13%, 7/07/11 | 200,000,000 | 199,952,076 | ||||||
20.18%, 7/28/11 | 50,000,000 | 49,978,000 | ||||||
TOTAL U.S. TREASURY BILLS | $ | 424,913,916 | ||||||
U.S. TREASURY NOTES – 5.5% | ||||||||
0.88%, 1/31/12 | 25,000,000 | 25,113,916 | ||||||
4.63%, 10/31/11 | 25,000,000 | 25,546,268 | ||||||
TOTAL U.S. TREASURY NOTES | $ | 50,660,184 | ||||||
TOTAL U.S. GOVERNMENT AGENCY & OBLIGATIONS (COST $475,574,100) | $ | 475,574,100 | ||||||
| REPURCHASE AGREEMENTS – 48.5% | ||||||||
Barclays Capital, Inc., 0.03%, dated 04/29/11, due 05/02/11, repurchase price $207,000,518, collateralized by U.S. Treasury Securities 1.00% to 3.13%, maturing 07/15/13 to 09/30/13; total market value of $209,070,007. | 207,000,000 | 207,000,000 | ||||||
| Description | Par Value | Value | ||||||
Deutsche Bank Securities, 0.02%, dated 04/29/11, due 05/02/11, repurchase price $91,000,152, collateralized by U.S. Treasury Securities 0.00% to 0.00%, maturing 08/15/23 to 05/15/26; total market value of $91,910,000. | $ | 91,000,000 | $ | 91,000,000 | ||||
Merrill Lynch, Pierce, Fenner & Smith, Inc., 0.03%, dated 04/29/11, due 05/02/11, repurchase price $150,000,375, collateralized by U.S. Treasury Securities 0.88% to 4.50%, maturing 01/31/12 to 11/15/15; total market value of $151,500,023. | 150,000,000 | 150,000,000 | ||||||
TOTAL REPURCHASE AGREEMENTS (COST $448,000,000) | $ | 448,000,000 | ||||||
TOTAL INVESTMENTS – 99.9% (COST $923,574,100) | $ | 923,574,100 | ||||||
| OTHER ASSETS LESS LIABILITIES – 0.1% | 846,935 | |||||||
| TOTAL NET ASSETS – 100.0% | $ | 924,421,035 | ||||||
Cost of investments for Federal income tax purposes is the same as for financial statement purposes.
Various inputs are used in determining the value of the Fund’s investments. These inputs are summarized in the three broad levels listed below.
Level 1 – quoted prices in active markets for identical securities
Level 2 – other significant observable inputs (including quoted prices for similar securities, interest rates, prepayment speeds, credit risk, etc.)
Level 3 – significant unobservable inputs (including the Fund’s own assumptions in determining the fair value of investments)
(MTB U.S. Treasury Money Market Fund continued next page)
ANNUAL REPORT / April 30, 2011
Table of Contents
| 4 | PORTFOLIOS OF INVESTMENTS |
MTB U.S. Treasury Money Market Fund (concluded)
The following is a summary of the inputs used as of April 30, 2011 in valuing the Fund’s assets carried at fair value:
| Level 1 | Level 2 | Level 3 | Total | |||||||||||||
Investments in Securities | ||||||||||||||||
U.S. Government Agency & Obligations | $ | — | $ | 475,574,100 | $ | — | $ | 475,574,100 | ||||||||
Repurchase Agreements | — | 448,000,000 | — | 448,000,000 | ||||||||||||
Total | $ | — | $ | 923,574,100 | $ | — | $ | 923,574,100 | ||||||||
See Notes to Portfolios of Investments
April 30, 2011 / ANNUAL REPORT
Table of Contents
| 5 |
PORTFOLIO OF INVESTMENTS SUMMARY TABLE
MTB U.S. Government Money Market Fund
At April 30, 2011, the Fund’s portfolio composition was as follows: (unaudited)
| Percentage of Total Net Assets | ||||
| U.S. Government Agency & Obligations | 55.7 | % | ||
| Commercial Paper | 9.3 | % | ||
| Cash Equivalents1 | 35.0 | % | ||
| Other Assets and Liabilities – Net2 | 0.0 | %3 | ||
| TOTAL | 100.0 | % | ||
| (1) | Cash Equivalents include investments in repurchase agreements. |
| (2) | Assets, other than investments in securities, less liabilities. See Statements of Assets and Liabilities. |
| (3) | Represents less than 0.05%. |
PORTFOLIO OF INVESTMENTS
April 30, 2011
| Description | Par Value | Value | ||||||
| 4COMMERCIAL PAPER – 9.3% | ||||||||
ASSET BACKED SECURITIES – 9.3% | ||||||||
Straight-A Funding LLC | ||||||||
6,70.19%, 6/23/11 | $ | 50,000,000 | $ | 49,986,014 | ||||
6,70.21%, 7/01/11 | 50,000,000 | 49,982,208 | ||||||
6,70.25%, 5/03/11 | 50,000,000 | 49,999,305 | ||||||
6,70.25%, 5/05/11 | 25,000,000 | 24,999,306 | ||||||
| TOTAL COMMERCIAL PAPER (COST $174,966,833) | $ | 174,966,833 | ||||||
| U.S. GOVERNMENT AGENCY & OBLIGATIONS – 55.7% | ||||||||
FEDERAL FARM CREDIT BANK (FFCB) – 13.3% | ||||||||
10.19%, 5/02/11 | 25,000,000 | 25,000,000 | ||||||
10.19%, 5/02/11 | 100,000,000 | 99,986,730 | ||||||
10.22%, 5/02/11 | 125,000,000 | 125,000,000 | ||||||
TOTAL FEDERAL FARM CREDIT BANK (FFCB) | $ | 249,986,730 | ||||||
FEDERAL HOME LOAN BANK (FHLB) – 10.6% | ||||||||
20.08%, 7/06/11 | 50,000,000 | 49,992,392 | ||||||
10.15%, 5/09/11 | 100,000,000 | 99,987,352 | ||||||
10.19%, 5/02/11 | 50,000,000 | 50,000,000 | ||||||
TOTAL FEDERAL HOME LOAN BANK (FHLB) | $ | 199,979,744 | ||||||
FEDERAL HOME LOAN MORTGAGE CORPORATION (FHLMC) – 13.2% | ||||||||
20.14%, 6/29/11 | 100,000,000 | 99,977,055 | ||||||
20.20%, 7/15/11 | 50,000,000 | 49,979,167 | ||||||
20.21%, 7/06/11 | 100,000,000 | 99,961,500 | ||||||
TOTAL FEDERAL HOME LOAN MORTGAGE CORPORATION (FHLMC) | $ | 249,917,722 | ||||||
| Description | Par Value | Value | ||||||
FEDERAL NATIONAL MORTGAGE ASSOCIATION (FNMA) – 13.3% | ||||||||
20.13%, 7/18/11 | $ | 50,000,000 | $ | 49,985,917 | ||||
20.16%, 7/01/11 | 50,000,000 | 49,986,444 | ||||||
20.22%, 10/03/11 | 100,000,000 | 99,905,278 | ||||||
1.00%, 11/23/11 | 50,000,000 | 50,207,601 | ||||||
TOTAL FEDERAL NATIONAL MORTGAGE ASSOCIATION (FNMA) | $ | 250,085,240 | ||||||
U.S. TREASURY BILLS – 5.3% | ||||||||
20.10%, 10/06/11 | 50,000,000 | 49,979,153 | ||||||
20.30%, 12/15/11 | 50,000,000 | 49,905,000 | ||||||
TOTAL U.S. TREASURY BILLS | $ | 99,884,153 | ||||||
TOTAL U.S. GOVERNMENT AGENCY & OBLIGATIONS (COST $1,049,853,589) | $ | 1,049,853,589 | ||||||
| REPURCHASE AGREEMENTS – 35.0% | ||||||||
Barclays Capital, Inc., 0.03%, dated 04/29/11, due 05/02/11, repurchase price $274,000,685, collateralized by U.S. Treasury Securities 0.63% to 1.38%, maturing 06/30/12 to 02/15/13; total market value of $276,740,004. | 274,000,000 | 274,000,000 | ||||||
Deutsche Bank Securities, 0.03%, dated 04/29/11, due 05/02/11, repurchase price $385,000,963, collateralized by U.S. Government Securities 0.00% to 6.71%, maturing 06/24/11 to 07/28/14; total market value of $388,850,489. | 385,000,000 | 385,000,000 | ||||||
| TOTAL REPURCHASE AGREEMENTS (COST $659,000,000) | $ | 659,000,000 | ||||||
(MTB U.S. Government Money Market Fund continued next page)
ANNUAL REPORT / April 30, 2011
Table of Contents
| 6 | PORTFOLIOS OF INVESTMENTS |
MTB U.S. Government Money Market Fund (concluded)
| Description | Par Value | Value | ||||||
| TOTAL INVESTMENTS – 100.0% (COST $1,883,820,422) | $ | 1,883,820,422 | ||||||
| OTHER ASSETS LESS LIABILITIES – 0.0%** | 385,164 | |||||||
| TOTAL NET ASSETS – 100.0% | $ | 1,884,205,586 | ||||||
Cost of investments for Federal income tax purposes is the same as for financial statement purposes.
Various inputs are used in determining the value of the Fund’s investments. These inputs are summarized in the three broad levels listed below.
Level 1 – quoted prices in active markets for identical securities
Level 2 – other significant observable inputs (including quoted prices for similar securities, interest rates, prepayment speeds, credit risk, etc.)
Level 3 – significant unobservable inputs (including the Fund’s own assumptions in determining the fair value of investments)
The following is a summary of the inputs used as of April 30, 2011 in valuing the Fund’s assets carried at fair value:
| Level 1 | Level 2 | Level 3 | Total | |||||||||||||
Investments in Securities | ||||||||||||||||
Commercial Paper | $ | — | $ | 174,966,833 | $ | — | $ | 174,966,833 | ||||||||
U.S. Government Agency & Obligations | — | 1,049,853,589 | — | 1,049,853,589 | ||||||||||||
Repurchase Agreements | — | 659,000,000 | — | 659,000,000 | ||||||||||||
Total | $ | — | $ | 1,883,820,422 | $ | — | $ | 1,883,820,422 | ||||||||
See Notes to Portfolios of Investments
April 30, 2011 / ANNUAL REPORT
Table of Contents
| 7 |
PORTFOLIO OF INVESTMENTS SUMMARY TABLE
MTB Tax-Free Money Market Fund
At April 30, 2011, the Fund’s sector classifications were as follows: (unaudited)
| Percentage of Total Net Assets | ||||
| Medical | 14.1 | % | ||
| General Obligations | 12.4 | % | ||
| Higher Education | 9.9 | % | ||
| Multi-Family Housing | 9.6 | % | ||
| Water & Sewer | 9.4 | % | ||
| General Revenue | 8.4 | % | ||
| Transportation | 8.0 | % | ||
| Pollution Control | 7.7 | % | ||
| School District | 5.5 | % | ||
| Development | 4.9 | % | ||
| Asset Backed Securities | 2.9 | % | ||
| Power | 2.7 | % | ||
| Education | 2.2 | % | ||
| Facilities | 1.4 | % | ||
| Utilities | 0.7 | % | ||
| Other Assets and Liabilities – Net1 | 0.2 | % | ||
| TOTAL | 100.0 | % | ||
| (1) | Assets, other than investments in securities, less liabilities. See Statements of Assets and Liabilities. |
PORTFOLIO OF INVESTMENTS
April 30, 2011
| Description | Par Value | Value | ||||||
COMMERCIAL PAPER – 6.1% | ||||||||
NEW YORK – 6.1% | ||||||||
ASSET BACKED SECURITIES – 2.9% | ||||||||
New York State Power Authority, (JP Morgan LOC), 0.30%, 5/02/11 | $ | 4,410,000 | $ | 4,410,000 | ||||
TRANSPORTATION – 3.2% | ||||||||
Metropolitan Transportation Authority, NY, (Series D), 0.27%, 5/02/11 | 5,000,000 | 5,000,000 | ||||||
TOTAL NEW YORK | $ | 9,410,000 | ||||||
| TOTAL COMMERCIAL PAPER (COST $9,410,000) | $ | 9,410,000 | ||||||
| MUNICIPAL BONDS – 17.0% | ||||||||
MICHIGAN – 0.5% | ||||||||
SCHOOL DISTRICT – 0.5% | ||||||||
Traverse City Area Public Schools, MI, GO Unlimited Bonds, (School Building & Site), 2.00%, 5/01/11 | 750,000 | 750,000 | ||||||
TOTAL MICHIGAN | $ | 750,000 | ||||||
| Description | Par Value | Value | ||||||
NEW YORK – 8.4% | ||||||||
GENERAL OBLIGATIONS – 5.9% | ||||||||
Nassau County, NY, GO Unlimited Notes, TANs, (Series B), 2.00%, 9/15/11 | $ | 1,000,000 | $ | 1,003,160 | ||||
Nassau County, NY, GO Unlimited Notes, TANs, (Series C), 1.75%, 10/15/11 | 3,000,000 | 3,010,193 | ||||||
Rome, NY, Public Improvements, GO Unlimited, Refunding Revenue Bonds, 2.00%, 9/15/11 | 1,055,000 | 1,059,319 | ||||||
Suffolk County, NY, GO Unlimited Notes, TANs, 2.00%, 8/11/11 | 2,000,000 | 2,008,417 | ||||||
Watertown, NY, GO Unlimited, Refunding Notes, BANs, 1.50%, 4/26/12 | 2,000,000 | 2,009,759 | ||||||
TOTAL GENERAL OBLIGATIONS | $ | 9,090,848 | ||||||
HIGHER EDUCATION – 1.1% | ||||||||
New York State Dormitory Authority, Nonstate Supported Debt, Revenue Bonds, (Series A-1), (State Appropriations), 1.50%, 7/01/11 | 1,735,000 | 1,735,601 | ||||||
(MTB Tax-Free Money Market Fund continued next page)
ANNUAL REPORT / April 30, 2011
Table of Contents
| 8 | PORTFOLIOS OF INVESTMENTS |
MTB Tax-Free Money Market Fund (continued)
| Description | Par Value | Value | ||||||
SCHOOL DISTRICT – 1.4% | ||||||||
Mineola Union Free School District, NY, GO Unlimited, Refunding Notes, (State Aid Withholding), 2.00%, 6/15/11 | $ | 680,000 | $ | 681,036 | ||||
Windsor Central School District, NY, GO Unlimited Refunding Notes, BANs, (State Aid Withholding), 1.75%, 6/16/11 | 1,500,000 | 1,501,970 | ||||||
TOTAL SCHOOL DISTRICT | $ | 2,183,006 | ||||||
TOTAL NEW YORK | $ | 13,009,455 | ||||||
PENNSYLVANIA – 6.2% | ||||||||
DEVELOPMENT – 1.3% | ||||||||
Allegheny County, PA, IDA, Revenue Bonds, (Animal Friends Inc., OBG)/(PNC Bank N.A., LOC), 0.70%, 7/01/11 | 2,000,000 | 2,000,000 | ||||||
GENERAL OBLIGATIONS – 1.3% | ||||||||
Philadelphia, PA, GO Unlimited Notes, TRANs, (Series A), 2.00%, 6/30/11 | 2,000,000 | 2,004,245 | ||||||
SCHOOL DISTRICT – 3.6% | ||||||||
Otto-Eldred School District, PA, GO Unlimited Bonds, (AGM), 2.00%, 11/15/11 | 525,000 | 528,967 | ||||||
Philadelphia, PA, School District, GO Unlimited Notes, TRANs, (Series A), 2.50%, 6/30/11 | 5,000,000 | 5,012,995 | ||||||
TOTAL SCHOOL DISTRICT | $ | 5,541,962 | ||||||
TOTAL PENNSYLVANIA | $ | 9,546,207 | ||||||
WISCONSIN – 1.9% | ||||||||
GENERAL REVENUE – 1.9% | ||||||||
Sister Bay, WI, Anticipated Notes, 2.65%, 6/01/11 | 2,925,000 | 2,928,232 | ||||||
TOTAL WISCONSIN | $ | 2,928,232 | ||||||
| TOTAL MUNICIPAL BONDS (COST $26,233,894) | $ | 26,233,894 | ||||||
3SHORT-TERM MUNICIPAL BONDS – 76.7% | ||||||||
ALABAMA – 2.6% | ||||||||
TRANSPORTATION – 2.6% | ||||||||
Mobile, AL, IDB, Dock & Wharf Revenue, (Series B) Weekly VRDNs, (Holnam, Inc.)/(Wachovia Bank N.A., LOC), 0.26%, 5/04/11 | 4,000,000 | 4,000,000 | ||||||
TOTAL ALABAMA | $ | 4,000,000 | ||||||
COLORADO – 1.0% | ||||||||
FACILITIES – 1.0% | ||||||||
Colorado Educational & Cultural Facilities Authority, Revenue Bonds, (Series C-5) Daily VRDNs, (Milwaukee Jewish Foundation, Inc.)/(U.S. Bank NA, LOC), 0.27%, 5/02/11 | 1,500,000 | 1,500,000 | ||||||
TOTAL COLORADO | $ | 1,500,000 | ||||||
| Description | Par Value | Value | ||||||
CONNECTICUT – 1.1% | ||||||||
MEDICAL – 1.1% | ||||||||
Connecticut State, Health & Educational Facility Authority, Refunding Revenue Bonds, (Series B) Weekly VRDNs, (Bradley Health Care, Inc.)/(Central Connecticut Senior Care, Inc.)/(Fleet National Bank CT, LOC), 0.26%, 5/04/11 | $ | 1,700,000 | $ | 1,700,000 | ||||
TOTAL CONNECTICUT | $ | 1,700,000 | ||||||
FLORIDA – 3.3% | ||||||||
GENERAL REVENUE – 2.4% | ||||||||
Broward County School Board, FL, Certificate Participation, (Series D) Weekly VRDNs, (AGM)/(Dexia Credit Local), 0.40%, 5/05/11 | 3,800,000 | 3,800,000 | ||||||
MEDICAL – 0.9% | ||||||||
Jacksonville Economic Development Commission, FL, Health Care Facilities, Refunding Revenue Bonds, Daily VRDNs, (Methodist, OBG)/(TD Bank N.A., LOC), 0.23%, 5/02/11 | 1,345,000 | 1,345,000 | ||||||
TOTAL FLORIDA | $ | 5,145,000 | ||||||
GEORGIA – 1.7% | ||||||||
MULTI-FAMILY HOUSING – 1.7% | ||||||||
De Kalb County, GA, Winterscreek Apartments, Weekly VRDNs, (FNMA, COL), 0.27%, 5/04/11 | 2,600,000 | 2,600,000 | ||||||
TOTAL GEORGIA | $ | 2,600,000 | ||||||
MARYLAND – 2.3% | ||||||||
MEDICAL – 2.3% | ||||||||
Maryland State, Health & Higher Educational Facilities Authority, Refunding Revenue Bonds, (Series B) Weekly VRDNs, (GO of INSTN)/(JP Morgan Chase, LOC)/(Pooled Loan Program), 0.26%, 5/04/11 | 1,700,000 | 1,700,000 | ||||||
Maryland State, Health & Higher Educational Facilities Authority, Revenue Bonds, (Series D) Daily VRDNs, (University of Maryland Medical System)/(TD Bank N.A., LOC), 0.23%, 5/02/11 | 1,800,000 | 1,800,000 | ||||||
TOTAL MEDICAL | $ | 3,500,000 | ||||||
TOTAL MARYLAND | $ | 3,500,000 | ||||||
MASSACHUSETTS – 4.2% | ||||||||
WATER & SEWER – 4.2% | ||||||||
Massachusetts Water Resources Authority, Revenue Bonds, (Subseries C) Daily VRDNs, (Landesbank Hessen-Thuringen, LOC), 0.20%, 5/02/11 | 6,445,000 | 6,445,000 | ||||||
TOTAL MASSACHUSETTS | $ | 6,445,000 | ||||||
(MTB Tax-Free Money Market Fund continued next page)
April 30, 2011 / ANNUAL REPORT
Table of Contents
| PORTFOLIOS OF INVESTMENTS | 9 |
MTB Tax-Free Money Market Fund (continued)
| Description | Par Value | Value | ||||||
MISSOURI – 1.0% | ||||||||
MEDICAL – 1.0% | ||||||||
Missouri State, Health & Educational Facilities Authority, Health Revenue Bonds, (Series E) Daily VRDNs, (SSM Health Care Corp., OBG)/(PNC Bank N.A., LOC), 0.25%, 5/02/11 | $ | 1,500,000 | $ | 1,500,000 | ||||
TOTAL MISSOURI | $ | 1,500,000 | ||||||
NEVADA – 2.0% | ||||||||
MULTI-FAMILY HOUSING – 2.0% | ||||||||
5Nevada Housing Division, Multi-Unit Housing Revenue Bonds, AMT, (Series K) Weekly VRDNs, (U.S. Bank N.A./Federal Home Loan Bank, LOC), 0.30%, 5/05/11 | 3,075,000 | 3,075,000 | ||||||
TOTAL NEVADA | $ | 3,075,000 | ||||||
NEW HAMPSHIRE – 2.4% | ||||||||
HIGHER EDUCATION – 2.4% | ||||||||
New Hampshire, HEFA, Refunding Revenue Bonds, Weekly VRDNs, (Dartmouth College)/(JP Morgan Chase Bank), 0.23%, 5/04/11 | 3,700,000 | 3,700,000 | ||||||
TOTAL NEW HAMPSHIRE | $ | 3,700,000 | ||||||
NEW YORK – 16.7% | ||||||||
GENERAL OBLIGATIONS – 5.2% | ||||||||
New York City, NY, (Series H-Subseries H-2) Daily VRDNs, (MBIA Insurance Corp. INS)/(Wachovia Bank N.A., LOC), 0.27%, 5/02/11 | 3,200,000 | 3,200,000 | ||||||
New York City, NY, GO Bonds, (Series I, Subseries I-4) Weekly VRDNs, (Bank of New York, LOC), 0.24%, 5/04/11 | 1,500,000 | 1,500,000 | ||||||
New York City, NY, GO Unlimited Bonds, (Subseries H-4) Daily VRDNs, (Bank of New York, LOC), 0.21%, 5/02/11 | 3,300,000 | 3,300,000 | ||||||
TOTAL GENERAL OBLIGATIONS | $ | 8,000,000 | ||||||
GENERAL REVENUE – 3.8% | ||||||||
New York City Transitional Finance Authority, NY, Revenue Bonds, (Series 3, Subseries 3 F) Daily VRDNs, (Royal Bank of Canada, SPA), 0.23%, 5/02/11 | 2,785,000 | 2,785,000 | ||||||
New York City, NY, Transitional Finance Authority, (Series A-2) Weekly VRDNs, (Bank of Nova Scotia), 0.22%, 5/04/11 | 3,100,000 | 3,100,000 | ||||||
TOTAL GENERAL REVENUE | $ | 5,885,000 | ||||||
MEDICAL – 2.1% | ||||||||
New York State Dormitory Authority, Nonstate Supported Debt, Revenue Bonds, (Series D) Weekly VRDNs, (North Shore Long Island Jewish, OBG)/(Bank of America N.A., LOC), 0.24%, 5/04/11 | 3,300,000 | 3,300,000 | ||||||
POWER – 0.7% | ||||||||
Long Island Power Authority, NY, Electric System Revenue Bonds, (Subseries 3B) Daily VRDNs, (Westlabs AG, LOC), 0.28%, 5/02/11 | 1,000,000 | 1,000,000 | ||||||
| Description | Par Value | Value | ||||||
WATER & SEWER – 4.9% | ||||||||
New York City Municipal Water Finance Authority, NY, Water & Sewer Revenue, Refunding Bonds, (Series DD-1) Daily VRDNs, (TD Bank N.A., SPA), 0.22%, 5/02/11 | $ | 7,500,000 | $ | 7,500,000 | ||||
TOTAL NEW YORK | $ | 25,685,000 | ||||||
NORTH CAROLINA – 2.2% | ||||||||
EDUCATION – 2.2% | ||||||||
North Carolina Capital Facilities Finance Agency, Educational Facilities Revenue Bonds, Weekly VRDNs, (Peace College of Raleigh)/(Wachovia Bank N.A., LOC), 0.28%, 5/05/11 | 3,355,000 | 3,355,000 | ||||||
TOTAL NORTH CAROLINA | $ | 3,355,000 | ||||||
PENNSYLVANIA – 23.0% | ||||||||
DEVELOPMENT – 2.4% | ||||||||
Delaware County, PA, IDA, (Series G) Weekly VRDNs, (General Electric Co.(GTD)), 0.24%, 5/04/11 | 1,075,000 | 1,075,000 | ||||||
Delaware County, PA, IDA, Revenue Bonds, (Series G) Weekly VRDNs, (Resource Recovery Facility)/(General Electric Capital Corp.), 0.24%, 5/04/11 | 2,580,000 | 2,580,000 | ||||||
TOTAL DEVELOPMENT | $ | 3,655,000 | ||||||
FACILITIES – 0.4% | ||||||||
Delaware Valley, PA, Regional Financial Authority, Local Government Revenue, (Series A) Weekly VRDNs, (Bayerische Landesbank, LOC), 0.32%, 5/04/11 | 600,000 | 600,000 | ||||||
GENERAL REVENUE – 0.3% | ||||||||
Delaware Valley, PA, Regional Financial Authority, Local Government Revenue, BMTF-Mode 1, Weekly VRDNs, (Bayerische Landesbank, LOC), 0.31%, 5/04/11 | 500,000 | 500,000 | ||||||
HIGHER EDUCATION – 6.4% | ||||||||
Northampton County, PA, Higher Education Authority, Revenue Bonds, (Series A) Weekly VRDNs, (Lehigh University)/(Wachovia Bank N.A.), 0.25%, 5/05/11 | 1,400,000 | 1,400,000 | ||||||
Pennsylvania State, Higher Education Facilities Authority, Revenue Bonds, (Series B) Weekly VRDNs, (Drexel University)/(Landesbank Hessen-Thuringen, LOC), 0.26%, 5/05/11 | 5,545,000 | 5,545,000 | ||||||
Pennsylvania State, University Revenue Bonds, (Series A) Weekly VRDNs, (Pennsylvania State University)/(GO of University)/(West Deutsche Landesbank), 0.25%, 5/05/11 | 1,400,000 | 1,400,000 | ||||||
Washington County Authority, PA, Refunding Revenue Bonds, Weekly VRDNs, (University of Pennsylvania), 0.22%, 5/05/11 | 1,500,000 | 1,500,000 | ||||||
TOTAL HIGHER EDUCATION | $ | 9,845,000 | ||||||
(MTB Tax-Free Money Market Fund continued next page)
ANNUAL REPORT / April 30, 2011
Table of Contents
| 10 | PORTFOLIOS OF INVESTMENTS |
MTB Tax-Free Money Market Fund (continued)
| Description | Par Value | Value | ||||||
MEDICAL – 6.7% | ||||||||
Erie County Hospital Authority, PA, Health Facilities Revenue Bonds, (Series B) Weekly VRDNs, (St. Mary’s Home of Erie, OBG)/(Bank of America N.A., LOC), 0.30%, 5/04/11 | $ | 3,035,000 | $ | 3,035,000 | ||||
Geisinger Authority, PA, Health System Refunding Bonds, (Series A) Daily VRDNs, (Geisinger Health System Foundation)/(Bank of America N.A.), 0.19%, 5/02/11 | 1,800,000 | 1,800,000 | ||||||
Geisinger Authority, PA, Health System Revenue Bonds, Daily VRDNs, (Geisinger Health System Federation)/(Bank of America N.A., SPA), 0.23%, 5/02/11 | 1,100,000 | 1,100,000 | ||||||
Lancaster County, PA, Hospital Authority Revenue Bonds, Daily VRDNs, (Bank of America N.A., LOC)/(Lancaster General Hospital), 0.25%, 5/02/11 | 2,200,000 | 2,200,000 | ||||||
Lehigh County, PA, General Purpose Hospital Revenue, Refunding Bonds, (Series C) Daily VRDNs, (Lehigh Valley Health Network)/(Bank of America N.A., LOC), 0.25%, 5/02/11 | 1,100,000 | 1,100,000 | ||||||
Wilkins Area, PA, IDA, Refunding Revenue Bonds, (Series B) Weekly VRDNs, (Fairview Extended Care Services)/(Bank of America N.A., LOC), 0.36%, 5/09/11 | 1,000,000 | 1,000,000 | ||||||
TOTAL MEDICAL | $ | 10,235,000 | ||||||
POLLUTION CONTROL – 3.5% | ||||||||
Beaver County, PA, IDA, Pollution Control, Refunding Revenue Bonds, (Series B) Daily VRDNs, (Pennsylvania Electric Co.)/(UBS AG, LOC), 0.20%, 5/02/11 | 2,000,000 | 2,000,000 | ||||||
Beaver County, PA, IDA, Pollution Control, Revenue Bonds, (Series B) Weekly VRDNs, (Firstenergy Nuclear, OBG)/(AGMT-Firstenergy Solution, GTY)/(Citibank N.A., LOC), 0.24%, 5/04/11 | 1,000,000 | 1,000,000 | ||||||
Beaver County, PA, IDA, Refunding Revenue Bonds, Daily VRDNs, (Firstenergy Nuclear Generation)/(Barclays Bank PLC, LOC) | ||||||||
0.22%, 5/02/11 | 400,000 | 400,000 | ||||||
0.24%, 5/02/11 | 2,000,000 | 2,000,000 | ||||||
TOTAL POLLUTION CONTROL | $ | 5,400,000 | ||||||
POWER – 2.0% | ||||||||
5Pennsylvania State, Energy Development Authority, Revenue Bonds, AMT, Weekly VRDNs, (Edensburg Power Company)/(Landesbank Hessen-Thuringen, LOC), 0.30%, 5/04/11 | 3,100,000 | 3,100,000 | ||||||
TRANSPORTATION – 0.3% | ||||||||
Delaware River Joint Toll Bridge Commission, PA, Bridge Revenue Bonds, (Series B-1) Weekly VRDNs, (Dexia Credit Local, LOC), 0.80%, 5/05/11 | 500,000 | 500,000 | ||||||
| Description | Par Value | Value | ||||||
UTILITIES – 0.7% | ||||||||
Philadelphia, PA, Gas Works Revenue Bonds, (Series A2) Weekly VRDNs, (JP Morgan Chase 50%, Bank of Nova Scotia 50%, LOC), 0.24%, 5/05/11 | $ | 1,100,000 | $ | 1,100,000 | ||||
WATER & SEWER – 0.3% | ||||||||
Pittsburgh Water & Sewer Authority, PA, Revenue Bonds, (Series B-1) Weekly VRDNs, (AGM)/(JP Morgan Chase Bank, SPA), 0.50%, 5/05/11 | 500,000 | 500,000 | ||||||
TOTAL PENNSYLVANIA | $ | 35,435,000 | ||||||
TEXAS – 1.3% | ||||||||
TRANSPORTATION – 1.3% | ||||||||
Port Arthur, TX, Jefferson County, Daily VRDNs (Texaco Inc), 0.16%, 5/02/11 | 2,000,000 | 2,000,000 | ||||||
TOTAL TEXAS | $ | 2,000,000 | ||||||
UTAH – 1.2% | ||||||||
DEVELOPMENT – 1.2% | ||||||||
Emery County, UT, Pollution Control Revenue, Weekly VRDNs, (Pacificorp)/(BNP Paribus, LOC), 0.27%, 5/04/11 | 1,800,000 | 1,800,000 | ||||||
TOTAL UTAH | $ | 1,800,000 | ||||||
WASHINGTON – 0.6% | ||||||||
TRANSPORTATION – 0.6% | ||||||||
Port of Tacoma, WA, Sub Lien, (Series B) Daily VRDNs, (Bank of America N.A., LOC), 0.24%, 5/02/11 | 1,000,000 | 1,000,000 | ||||||
TOTAL WASHINGTON | $ | 1,000,000 | ||||||
WISCONSIN – 5.9% | ||||||||
MULTI-FAMILY HOUSING – 5.9% | ||||||||
Wisconsin Housing & Economic Development Authority, Revenue Bonds, (Series E) Weekly VRDNs, (AGM GO of Authority)/(Federal Home Loan Bank, SPA), 0.32%, 5/04/11 | 9,135,000 | 9,135,000 | ||||||
TOTAL WISCONSIN | $ | 9,135,000 | ||||||
WYOMING – 4.2% | ||||||||
POLLUTION CONTROL – 4.2% | ||||||||
Lincoln County, WY, Pollution Control Revenue Bonds, (Series C) Daily VRDNs, (Exxon Mobil Corporation), 0.12%, 5/02/11 | 2,400,000 | 2,400,000 | ||||||
Sublette County, WY, Pollution Control, Revenue Bonds, Daily VRDNs, (Exxon Mobil Corp., OBG), 0.18%, 5/02/11 | 4,000,000 | 4,000,000 | ||||||
TOTAL POLLUTION CONTROL | $ | 6,400,000 | ||||||
TOTAL WYOMING | $ | 6,400,000 | ||||||
TOTAL SHORT-TERM MUNICIPAL BONDS (COST $117,975,000) | $ | 117,975,000 | ||||||
TOTAL INVESTMENTS – 99.8% (COST $153,618,894) | $ | 153,618,894 | ||||||
| OTHER ASSETS LESS LIABILITIES – 0.2% | 284,484 | |||||||
| TOTAL NET ASSETS – 100.0% | $ | 153,903,378 | ||||||
(MTB Tax-Free Money Market Fund continued next page)
April 30, 2011 / ANNUAL REPORT
Table of Contents
| PORTFOLIOS OF INVESTMENTS | 11 |
MTB Tax-Free Money Market Fund (concluded)
Cost of investments for Federal income tax purposes is the same as for financial statement purposes.
Various inputs are used in determining the value of the Fund’s investments. These inputs are summarized in the three broad levels listed below.
Level 1 – quoted prices in active markets for identical securities
Level 2 – other significant observable inputs (including quoted prices for similar securities, interest rates, prepayment speeds, credit risk, etc.)
Level 3 – significant unobservable inputs (including the Fund’s own assumptions in determining the fair value of investments)
The following is a summary of the inputs used as of April 30, 2011 in valuing the Fund’s assets carried at fair value:
| Level 1 | Level 2 | Level 3 | Total | |||||||||||||
Investments in Securities | ||||||||||||||||
Commercial Paper | $ | — | $ | 9,410,000 | $ | — | $ | 9,410,000 | ||||||||
Municipal Bonds | — | 26,233,894 | — | 26,233,894 | ||||||||||||
Short-Term Municipal Bonds | — | 117,975,000 | — | 117,975,000 | ||||||||||||
Total | $ | — | $ | 153,618,894 | $ | — | $ | 153,618,894 | ||||||||
See Notes to Portfolios of Investments
ANNUAL REPORT / April 30, 2011
Table of Contents
| 12 |
PORTFOLIO OF INVESTMENTS SUMMARY TABLE
MTB Money Market Fund
At April 30, 2011, the Fund’s portfolio composition was as follows: (unaudited)
| Percentage of Total Net Assets | ||||
| Asset Backed Securities | 19.3 | % | ||
| Federal Farm Credit Bank (FFCB) | 16.7 | % | ||
| U.S. Treasury Bills | 10.3 | % | ||
| Banks | 7.3 | % | ||
| Diversified Financial Services | 6.7 | % | ||
| Finance-Auto Loans | 6.7 | % | ||
| Food | 3.9 | % | ||
| Media | 3.4 | % | ||
| Beverages | 3.3 | % | ||
| Oil & Gas | 3.3 | % | ||
| Transportation | 2.8 | % | ||
| Federal Home Loan Bank (FHLB) | 2.7 | % | ||
| Cash Equivalents1 | 13.6 | % | ||
| Other Assets and Liabilities – Net2 | (0.0 | )%3 | ||
| TOTAL | 100.0 | % | ||
| (1) | Cash Equivalents include investments in repurchase agreements. |
| (2) | Assets, other than investments in securities, less liabilities. See Statements of Assets and Liabilities. |
| (3) | Represents less than 0.05%. |
PORTFOLIO OF INVESTMENTS
April 30, 2011
| Description | Par Value | Value | ||||||
4COMMERCIAL PAPER – 56.7% | ||||||||
ASSET BACKED | ||||||||
6,7Atlantis One Funding Corp., 0.28%, 5/02/11 | $ | 65,000,000 | $ | 64,999,494 | ||||
FCAR Owner Trust Series I, 0.43%, 10/17/11 | 65,000,000 | 64,868,790 | ||||||
6,7Gemini Security Corp., LLC, 0.25%, 7/21/11 | 60,000,000 | 59,966,250 | ||||||
Straight-A Funding LLC | ||||||||
6,70.21%, 7/01/11 | 50,000,000 | 49,982,208 | ||||||
6,70.25%, 5/03/11 | 50,000,000 | 49,999,306 | ||||||
TOTAL ASSET BACKED SECURITIES | $ | 289,816,048 | ||||||
BANKS – 7.3% | ||||||||
Abbey National North America LLC, 0.41%, 6/23/11 | 50,000,000 | 49,969,819 | ||||||
Dexia Delaware LLC, 0.36%, 5/23/11 | 60,000,000 | 59,986,800 | ||||||
TOTAL BANKS | $ | 109,956,619 | ||||||
| Description | Par Value | Value | ||||||
BEVERAGES – 3.3% | ||||||||
6,7PepsiCo, Inc., 0.17%, 7/05/11 | $ | 50,000,000 | $ | 49,984,653 | ||||
DIVERSIFIED FINANCIAL SERVICES – 6.7% | ||||||||
General Electric Capital Corp., 0.19%, 7/18/11 | 50,000,000 | 49,979,417 | ||||||
HSBC Finance Corp., 0.16%, 5/25/11 | 50,000,000 | 49,994,667 | ||||||
TOTAL DIVERSIFIED FINANCIAL SERVICES | $ | 99,974,084 | ||||||
FINANCE-AUTO LOANS – 6.7% | ||||||||
American Honda Finance Corp., 0.22%, 5/16/11 | 50,000,000 | 49,995,417 | ||||||
Toyota Motor Credit Corp., 0.33%, 10/03/11 | 50,000,000 | 49,928,958 | ||||||
TOTAL FINANCE-AUTO LOANS | $ | 99,924,375 | ||||||
FOOD – 3.9% | ||||||||
6,7Nestle Capital Corp., 0.18%, 8/10/11 | 58,000,000 | 57,970,710 | ||||||
(MTB Money Market Fund continued next page)
April 30, 2011 / ANNUAL REPORT
Table of Contents
| PORTFOLIOS OF INVESTMENTS | 13 |
MTB Money Market Fund (concluded)
| Description | Par Value | Value | ||||||
MEDIA – 3.4% | ||||||||
6,7Walt Disney Co., 0.10%, 5/09/11 | $ | 50,000,000 | $ | 49,998,889 | ||||
OIL & GAS – 3.3% | ||||||||
Chevron Funding Corp., 0.09%, 5/04/11 | 50,000,000 | 49,999,646 | ||||||
TRANSPORTATION – 2.8% | ||||||||
6,7United Parcel Service, Inc., 0.04%, 5/02/11 | 42,000,000 | 41,999,953 | ||||||
| TOTAL COMMERCIAL PAPER (COST $849,624,977) | $ | 849,624,977 | ||||||
| U.S. GOVERNMENT AGENCY & OBLIGATIONS – 29.7% | ||||||||
FEDERAL FARM CREDIT BANK (FFCB) – 16.7% | ||||||||
10.19%, 5/02/11 | 50,000,000 | 49,993,365 | ||||||
10.22%, 5/02/11 | 75,000,000 | 75,000,000 | ||||||
10.25%, 5/12/11 | 50,000,000 | 50,000,000 | ||||||
2Federal Farm Credit Discount Notes, 0.26%, 10/20/11 | 75,000,000 | 74,906,833 | ||||||
TOTAL FEDERAL FARM CREDIT BANK (FFCB) | $ | 249,900,198 | ||||||
FEDERAL HOME LOAN BANK | ||||||||
10.19%, 5/02/11 | 40,000,000 | 40,000,000 | ||||||
U.S. TREASURY BILLS – 10.3% | ||||||||
20.10%, 10/06/11 | 40,000,000 | 39,983,322 | ||||||
| Description | Par Value | Value | ||||||
20.28%, 6/02/11 | $ | 75,000,000 | $ | 74,981,334 | ||||
20.30%, 12/15/11 | 40,000,000 | 39,924,000 | ||||||
TOTAL U.S. TREASURY BILLS | $ | 154,888,656 | ||||||
| TOTAL U.S. GOVERNMENT AGENCY & OBLIGATIONS (COST $444,788,854) | $ | 444,788,854 | ||||||
| REPURCHASE AGREEMENTS – 13.6% | ||||||||
Barclays Capital, Inc., 0.03%, dated 04/29/11, due 05/02/11, repurchase price $103,000,258, collateralized by U.S. Treasury Securities 0.88% to 2.63%, maturing 02/29/12 to 08/15/20; total market value of $104,030,044. | 103,000,000 | 103,000,000 | ||||||
Deutsche Bank Securities, 0.03%, dated 04/29/11, due 05/02/11, repurchase price $101,000,253, collateralized by U.S. Government Securities 0.00% to 0.00%, maturing 05/27/11 to 07/28/11; total market value of $102,010,078. | 101,000,000 | 101,000,000 | ||||||
| TOTAL REPURCHASE AGREEMENTS (COST $204,000,000) | $ | 204,000,000 | ||||||
| TOTAL INVESTMENTS – 100.0% (COST $1,498,413,831) | $ | 1,498,413,831 | ||||||
| OTHER LIABILITIES LESS ASSETS – (0.0)% | (26,821 | ) | ||||||
| TOTAL NET ASSETS – 100.0% | $ | 1,498,387,010 | ||||||
Cost of investments for Federal income tax purposes is the same as for financial statement purposes.
Various inputs are used in determining the value of the Fund’s investments. These inputs are summarized in the three broad levels listed below.
Level 1 – quoted prices in active markets for identical securities
Level 2 – other significant observable inputs (including quoted prices for similar securities, interest rates, prepayment speeds, credit risk, etc.)
Level 3 – significant unobservable inputs (including the Fund’s own assumptions in determining the fair value of investments)
The following is a summary of the inputs used as of April 30, 2011 in valuing the Fund’s assets carried at fair value:
| Level 1 | Level 2 | Level 3 | Total | |||||||||||||
Investments in Securities | ||||||||||||||||
Commercial Paper | $ | — | $ | 849,624,977 | $ | — | $ | 849,624,977 | ||||||||
U.S. Government Agency & Obligations | — | 444,788,854 | — | 444,788,854 | ||||||||||||
Repurchase Agreements | — | 204,000,000 | — | 204,000,000 | ||||||||||||
Total | $ | — | $ | 1,498,413,831 | $ | — | $ | 1,498,413,831 | ||||||||
See Notes to Portfolios of Investments
ANNUAL REPORT / April 30, 2011
Table of Contents
| 14 |
PORTFOLIO OF INVESTMENTS SUMMARY TABLE
MTB Prime Money Market Fund
At April 30, 2011, the Fund’s portfolio composition was as follows: (unaudited)
| Percentage of Total Net Assets | ||||
| Asset Backed Securities | 16.1 | % | ||
| Federal Farm Credit Bank (FFCB) | 14.6 | % | ||
| U.S. Treasury Bills | 9.0 | % | ||
| Banks | 6.0 | % | ||
| Finance-Auto Loans | 6.0 | % | ||
| Diversified Financial Services | 5.5 | % | ||
| Beverages | 3.0 | % | ||
| Media | 3.0 | % | ||
| Oil & Gas | 3.0 | % | ||
| Federal Home Loan Bank (FHLB) | 2.5 | % | ||
| Food | 2.3 | % | ||
| Transportation | 2.0 | % | ||
| Cash Equivalents1 | 26.9 | % | ||
| Other Assets and Liabilities – Net2 | 0.1 | % | ||
| TOTAL | 100.0 | % | ||
| (1) | Cash Equivalents include investments in repurchase agreements. |
| (2) | Assets, other than investments in securities, less liabilities. See Statements of Assets and Liabilities. |
PORTFOLIO OF INVESTMENTS
April 30, 2011
| Description | Par Value | Value | ||||||
4COMMERCIAL PAPER – 46.9% | ||||||||
ASSET BACKED SECURITIES – 16.1% | ||||||||
6,7Atlantis One Funding Corp., 0.28%, 5/02/11 | $ | 17,000,000 | $ | 16,999,868 | ||||
FCAR Owner Trust Series I, 0.43%, 10/17/11 | 17,000,000 | 16,965,683 | ||||||
6,7Gemini Security Corp., LLC, 0.25%, 7/21/11 | 10,000,000 | 9,994,375 | ||||||
Straight-A Funding LLC | ||||||||
6,70.21%, 7/01/11 | 10,000,000 | 9,996,442 | ||||||
6,70.25%, 5/03/11 | 10,000,000 | 9,999,861 | ||||||
TOTAL ASSET BACKED SECURITIES | $ | 63,956,229 | ||||||
BANKS – 6.0% | ||||||||
Abbey National North America LLC, 0.41%, 6/23/11 | 12,000,000 | 11,992,757 | ||||||
Dexia Delaware LLC, 0.36%, 5/23/11 | 12,000,000 | 11,997,360 | ||||||
TOTAL BANKS | $ | 23,990,117 | ||||||
BEVERAGES – 3.0% | ||||||||
6,7PepsiCo, Inc., 0.17%, 7/05/11 | 12,000,000 | 11,996,317 | ||||||
DIVERSIFIED FINANCIAL SERVICES – 5.5% | ||||||||
General Electric Capital Corp., 0.19%, 7/18/11 | 12,000,000 | 11,995,060 | ||||||
| Description | Par Value | Value | ||||||
HSBC Finance Corp., 0.16%, 5/25/11 | $ | 10,000,000 | $ | 9,998,933 | ||||
TOTAL DIVERSIFIED FINANCIAL SERVICES | $ | 21,993,993 | ||||||
FINANCE-AUTO LOANS – 6.0% | ||||||||
American Honda Finance Corp., 0.22%, 5/16/11 | 12,000,000 | 11,998,900 | ||||||
Toyota Motor Credit Corp., 0.33%, 10/03/11 | 12,000,000 | 11,982,950 | ||||||
TOTAL FINANCE-AUTO LOANS | $ | 23,981,850 | ||||||
FOOD – 2.3% | ||||||||
6,7Nestle Capital Corp., 0.18%, 8/10/11 | 9,000,000 | 8,995,455 | ||||||
MEDIA – 3.0% | ||||||||
6,7Walt Disney Co., 0.10%, 5/09/11 | 12,000,000 | 11,999,733 | ||||||
OIL & GAS – 3.0% | ||||||||
Chevron Funding Corp., 0.09%, 5/04/11 | 12,000,000 | 11,999,915 | ||||||
TRANSPORTATION – 2.0% | ||||||||
6,7United Parcel Service, Inc., 0.04%, 5/02/11 | 8,000,000 | 7,999,991 | ||||||
TOTAL COMMERCIAL PAPER (COST $186,913,600) | $ | 186,913,600 | ||||||
(MTB Prime Money Market Fund continued next page)
April 30, 2011 / ANNUAL REPORT
Table of Contents
| PORTFOLIOS OF INVESTMENTS | 15 |
MTB Prime Money Market Fund (concluded)
| Description | Par Value | Value | ||||||
| U.S. GOVERNMENT AGENCY & OBLIGATIONS –26.1% | ||||||||
FEDERAL FARM CREDIT BANK (FFCB) – 14.6% | ||||||||
10.19%, 5/02/11 | $ | 15,000,000 | $ | 14,998,009 | ||||
10.22%, 5/02/11 | 15,000,000 | 15,000,000 | ||||||
10.25%, 5/12/11 | 10,000,000 | 10,000,000 | ||||||
2Discount Notes, 0.26%, 10/20/11 | 18,000,000 | 17,977,640 | ||||||
TOTAL FEDERAL FARM CREDIT BANK (FFCB) | $ | 57,975,649 | ||||||
FEDERAL HOME LOAN BANK (FHLB) – 2.5% | ||||||||
10.19%, 5/02/11 | 10,000,000 | 10,000,000 | ||||||
U.S. TREASURY BILLS – 9.0% | ||||||||
20.10%, 10/06/11 | 10,000,000 | 9,995,831 | ||||||
20.28%, 6/02/11 | 18,000,000 | 17,995,520 | ||||||
20.30%, 12/15/11 | 8,000,000 | 7,984,800 | ||||||
TOTAL U.S. TREASURY BILLS | $ | 35,976,151 | ||||||
TOTAL U.S. GOVERNMENT AGENCY & OBLIGATIONS (COST $103,951,800) | $ | 103,951,800 | ||||||
| Description | Par Value | Value | ||||||
REPURCHASE AGREEMENTS – 26.9% | ||||||||
Barclays Capital, Inc., 0.03%, dated 04/29/11, due 05/02/11, repurchase price $54,000,135, collateralized by U.S. Treasury Securities 0.00% to 0.00%, maturing 06/09/11 to 04/05/12; total market value of $54,540,057. | $ | 54,000,000 | $ | 54,000,000 | ||||
Deutsche Bank Securities, 0.03%, dated 04/29/11, due 05/02/11, repurchase price $53,000,133, collateralized by U.S. Government Securities 0.75% to 4.50%, maturing 11/23/12 to 07/07/25; total market value of $53,530,442. | 53,000,000 | 53,000,000 | ||||||
TOTAL REPURCHASE AGREEMENTS (COST $107,000,000) | $ | 107,000,000 | ||||||
TOTAL INVESTMENTS – 99.9% (COST $397,865,400) | $ | 397,865,400 | ||||||
| OTHER ASSETS LESS LIABILITIES – 0.1% | 331,868 | |||||||
| TOTAL NET ASSETS – 100.0% | $ | 398,197,268 | ||||||
Cost of investments for Federal income tax purposes is the same as for financial statement purposes.
Various inputs are used in determining the value of the Fund’s investments. These inputs are summarized in the three broad levels listed below.
Level 1 – quoted prices in active markets for identical securities
Level 2 – other significant observable inputs (including quoted prices for similar securities, interest rates, prepayment speeds, credit risk, etc.)
Level 3 – significant unobservable inputs (including the Fund’s own assumptions in determining the fair value of investments)
The following is a summary of the inputs used as of April 30, 2011 in valuing the Fund’s assets carried at fair value:
| Level 1 | Level 2 | Level 3 | Total | |||||||||||||
Investments in Securities | ||||||||||||||||
Commercial Paper | $ | — | $ | 186,913,600 | $ | — | $ | 186,913,600 | ||||||||
U.S. Government Agency & Obligations | — | 103,951,800 | — | 103,951,800 | ||||||||||||
Repurchase Agreements | — | 107,000,000 | — | 107,000,000 | ||||||||||||
Total | $ | — | $ | 397,865,400 | $ | — | $ | 397,865,400 | ||||||||
See Notes to Portfolios of Investments
ANNUAL REPORT / April 30, 2011
Table of Contents
| 16 |
PORTFOLIO OF INVESTMENTS SUMMARY TABLE
MTB New York Tax-Free Money Market Fund
At April 30, 2011, the Fund’s sector classifications were as follows: (unaudited)
| Percentage of Total Net Assets | ||||
| General Obligations | 32.3 | % | ||
| School District | 13.8 | % | ||
| Power | 9.2 | % | ||
| Medical | 8.6 | % | ||
| Transportation | 8.5 | % | ||
| Housing | 7.4 | % | ||
| Asset Backed Securities | 5.0 | % | ||
| Water | 4.2 | % | ||
| General Revenue | 3.9 | % | ||
| Higher Education | 3.1 | % | ||
| Education | 2.2 | % | ||
| Development | 1.4 | % | ||
| Other Assets and Liabilities – Net1 | 0.4 | % | ||
| TOTAL | 100.0 | % | ||
| (1) | Assets, other than investments in securities, less liabilities. See Statements of Assets and Liabilities. |
PORTFOLIO OF INVESTMENTS
April 30, 2011
| Description | Par Value | Value | ||||||
4COMMERCIAL PAPER – 10.0% | ||||||||
NEW YORK – 10.0% | ||||||||
ASSET BACKED SECURITIES – 5.0% | ||||||||
New York State Power Authority, (JP Morgan LOC), 0.30%, 5/02/11 | $ | 5,000,000 | $ | 5,000,000 | ||||
TRANSPORTATION – 5.0% | ||||||||
Metropolitan Transportation Authority, NY, (Series D), 0.27%, 5/02/11 | 5,000,000 | 5,000,000 | ||||||
TOTAL NEW YORK | $ | 10,000,000 | ||||||
TOTAL COMMERCIAL PAPER (COST $10,000,000) | $ | 10,000,000 | ||||||
| MUNICIPAL BONDS – 29.0% | ||||||||
NEW YORK – 27.0% | ||||||||
GENERAL OBLIGATIONS – 11.3% | ||||||||
Irondequoit, NY, GO Unlimited Notes, BANs, 1.50%, 12/16/11 | 2,100,000 | 2,111,533 | ||||||
Nassau County, NY, GO Unlimited Notes, TANs, (Series B), 2.00%, 9/15/11 | 4,000,000 | 4,012,640 | ||||||
Rockland County, NY, GO Unlimited Notes, BANs, 1.25%, 9/01/11 | 2,000,000 | 2,001,530 | ||||||
Suffolk County, NY, GO Unlimited Notes, TANs, 3.00%, 8/11/11 | 2,200,000 | 2,215,440 | ||||||
| Description | Par Value | �� | Value | |||||
Watertown, NY, GO Unlimited, Refunding Notes, BANs, 1.50%, 4/26/12 | $ | 1,000,000 | $ | 1,004,880 | ||||
TOTAL GENERAL OBLIGATIONS | $ | 11,346,023 | ||||||
HIGHER EDUCATION – 1.6% | ||||||||
New York State Dormitory Authority, Non-State Supported Debt, School District Funding, Revenue Bonds, (Series A), (AGM GO of DISTS), 3.00%, 10/01/11 | 1,560,000 | 1,575,115 | ||||||
SCHOOL DISTRICT – 11.8% | ||||||||
Alexander Central School District, NY, GO Unlimited, Refunding Bonds, (AGM State Aid Withholding), 5.00%, 6/15/11 | 645,000 | 648,319 | ||||||
Brushton-Moira Central School District, NY, GO Unlimited Notes, BANs, (State Aid Withholding), 1.50%, 7/22/11 | 3,625,000 | 3,629,078 | ||||||
La Fargeville Central School District, NY, GO Unlimited Refunding Notes, BANs, (State Aid Withholding), 2.00%, 6/29/11 | 2,500,000 | 2,504,006 | ||||||
West Canada Valley Central School District, NY, GO Unlimited Notes, BANs, (State Aid Withholding), 2.00%, 6/24/11 | 3,500,000 | 3,505,638 | ||||||
Windsor Central School District, NY, GO Unlimited Refunding Notes, BANs, (State Aid Withholding), 1.75%, 6/16/11 | 1,500,000 | 1,501,970 | ||||||
TOTAL SCHOOL DISTRICT | $ | 11,789,011 | ||||||
(MTB New York Tax-Free Money Market Fund continued next page)
April 30, 2011 / ANNUAL REPORT
Table of Contents
| PORTFOLIOS OF INVESTMENTS | 17 |
MTB New York Tax-Free Money Market Fund (continued)
| Description | Par Value | Value | ||||||
TRANSPORTATION – 1.2% | ||||||||
New York State Thruway Authority, General Revenue Notes, BANs, 4.00%, 7/15/11 | $ | 1,250,000 | $ | 1,259,141 | ||||
WATER – 1.1% | ||||||||
Buffalo, NY, Sewer Authority, Revenue Bonds, (Series I), (AGM), 5.00%, 7/01/11 | 1,110,000 | 1,118,385 | ||||||
TOTAL NEW YORK | $ | 27,087,675 | ||||||
PENNSYLVANIA – 2.0% | ||||||||
SCHOOL DISTRICT – 2.0% | ||||||||
Philadelphia, PA, School District, GO Unlimited Notes, TRANs, (Series A), 2.50%, 6/30/11 | 2,025,000 | 2,031,116 | ||||||
TOTAL PENNSYLVANIA | $ | 2,031,116 | ||||||
| TOTAL MUNICIPAL BONDS (COST $29,118,791) | $ | 29,118,791 | ||||||
3SHORT-TERM MUNICIPAL BONDS – 60.6% | ||||||||
NEW YORK – 60.6% | ||||||||
DEVELOPMENT – 1.4% | ||||||||
New York City, NY, IDA, Civic Facility Revenue Bonds, Weekly VRDNs, (Casa Project)/(National Center for Addiction/Substance)/(Chase Manhattan Bank), 0.27%, 5/05/11 | 1,375,000 | 1,375,000 | ||||||
EDUCATION – 2.2% | ||||||||
Dutchess County, NY, IDA, Weekly VRDNs, (Trinity-Pawling School Corp.)/(PNC Bank, N.A., LOC), 0.28%, 5/05/11 | 2,235,000 | 2,235,000 | ||||||
GENERAL OBLIGATIONS – 21.0% | ||||||||
New York City, NY, (Series H-Subseries H-2) Daily VRDNs, (MBIA Insurance Corp. INS)/(Wachovia Bank N.A., LOC), 0.27%, 5/02/11 | 2,700,000 | 2,700,000 | ||||||
New York City, NY, GO Bonds, (Series F-4) Weekly VRDNs, (Landesbank Hessen-Thuringen, LOC), 0.26%, 5/04/11 | 1,475,000 | 1,475,000 | ||||||
New York City, NY, GO Bonds, (Series F-6) Weekly VRDNs, (Morgan Guarantee Trust, LOC), 0.26%, 5/04/11 | 1,825,000 | 1,825,000 | ||||||
New York City, NY, GO Bonds, (Series I, Subseries I-4) Weekly VRDNs, (Bank of New York, LOC), 0.24%, 5/04/11 | 2,000,000 | 2,000,000 | ||||||
New York City, NY, GO Bonds, (Subseries A-4) Daily VRDNs, (Landesbank Baden Wurttemberg, LOC), 0.28%, 5/02/11 | 2,000,000 | 2,000,000 | ||||||
New York City, NY, GO Bonds, (Subseries A-5) Weekly VRDNs, (Bank of Nova Scotia, LOC), 0.21%, 5/04/11 | 1,350,000 | 1,350,000 | ||||||
New York City, NY, GO Bonds, (Subseries A-6) Weekly VRDNs, (Landesbank Baden Wurttemberg, LOC), 0.25%, 5/04/11 | 1,300,000 | 1,300,000 | ||||||
New York City, NY, GO Bonds, (Subseries H-2) Daily VRDNs, (Dexia Credit Local, LOC), 0.35%, 5/02/11 | 1,100,000 | 1,100,000 | ||||||
New York City, NY, GO Unlimited Bonds, (Series I-Subseries I-3) Daily VRDNs, (Bank of America N.A., LOC), 0.27%, 5/02/11 | 1,550,000 | 1,550,000 | ||||||
New York City, NY, GO Unlimited Bonds, (Subseries H-4) Daily VRDNs, (Bank of New York, LOC), 0.21%, 5/02/11 | 2,000,000 | 2,000,000 | ||||||
| Description | Par Value | Value | ||||||
New York City, NY, GO Unlimited Bonds, (Subseries J-8) Daily VRDNs, (Landesbank Baden Wurttemberg, LOC), 0.31%, 5/02/11 | $ | 1,000,000 | $ | 1,000,000 | ||||
New York City, NY, GO Unlimited, (Subseries B-2) Daily VRDNs, (Morgan Guaranty Trust), 0.21%, 5/02/11 | 800,000 | 800,000 | ||||||
New York City, NY, GO Unlimited, (Subseries E2) Daily VRDNs, (JP Morgan Chase Bank, LOC), 0.23%, 5/02/11 | 2,000,000 | 2,000,000 | ||||||
| TOTAL GENERAL OBLIGATIONS | $ | 21,100,000 | ||||||
GENERAL REVENUE – 3.9% | ||||||||
New York City, NY, Transitional Finance Authority, (Series A-2) Weekly VRDNs, (Bank of Nova Scotia), 0.22%, 5/04/11 | 3,900,000 | 3,900,000 | ||||||
HIGHER EDUCATION – 1.5% | ||||||||
New York State, Dormitory Authority, Revenues Nonstate Supported Debt, Remarketable Revenue Bonds, (Series A-1) Weekly VRDNs, (University of Rochester)/(Bank of America N.A., LOC), 0.25%, 5/04/11 | 1,500,000 | 1,500,000 | ||||||
HOUSING – 7.4% | ||||||||
Albany, NY, IDA, Revenue Bonds, (Series A) Weekly VRDN’s, (South Mall Towers Albany, OBG)/(Fannie Mae)/(Fannie Mae, LOC), 0.27%, 5/05/11 | 2,400,000 | 2,400,000 | ||||||
5New York State, HFA Revenue Bond, AMT, (Series 2005-A) Weekly VRDNs, (L&M 93rd Street LLC)/(Landesbank Hessen-Thuringen, LOC), 0.26%, 5/04/11 | 5,000,000 | 5,000,000 | ||||||
TOTAL HOUSING | $ | 7,400,000 | ||||||
MEDICAL – 8.6% | ||||||||
Nassau Health Care Corp, NY, Revenue Bonds, (Subseries B-2), (Nassau County GTD)/(TD Bank N.A., LOC), 0.22%, 5/09/11 | 5,720,000 | 5,720,000 | ||||||
New York State Dormitory Authority, Nonstate Supported Debt, Revenue Bonds, (Series D) Weekly VRDNs, (North Shore Long Island Jewish, OBG)/(Bank of America N.A., LOC), 0.24%, 5/04/11 | 2,900,000 | 2,900,000 | ||||||
TOTAL MEDICAL | $ | 8,620,000 | ||||||
POWER – 9.2% | ||||||||
Long Island Power Authority, NY, Electric System Revenue Bonds, (Subseries 3B) Daily VRDNs, (Westlabs AG, LOC), 0.28%, 5/02/11 | 1,200,000 | 1,200,000 | ||||||
Long Island Power Authority, NY, Electric System, Revenue Bonds, (Subseries 1B) Daily VRDNs, (State Street B&T Co., LOC), 0.23%, 5/02/11 | 1,000,000 | 1,000,000 | ||||||
New York State, Energy Research & Development Authority, Revenue Bonds, (Subseries A-1) Weekly VRDNs, (Consolidated Edison Co.)/(Wachovia Bank N.A., LOC), 0.26%, 5/04/11 | 7,000,000 | 7,000,000 | ||||||
TOTAL POWER | $ | 9,200,000 | ||||||
(MTB New York Tax-Free Money Market Fund continued next page)
ANNUAL REPORT / April 30, 2011
Table of Contents
| 18 | PORTFOLIOS OF INVESTMENTS |
MTB New York Tax-Free Money Market Fund (concluded)
| Description | Par Value | Value | ||||||
TRANSPORTATION – 2.3% | ||||||||
Metropolitan Transportation Authority, NY, Refunding Revenue Bonds, (Series D-1) Weekly VRDNs, (FSA INS)/(Westdeutsche Landesbank), 0.40%, 5/05/11 | $ | 1,200,000 | $ | 1,200,000 | ||||
Triborough Bridge & Tunnel Authority, NY, Refunding Revenue Bonds, (Subseries B-4) Weekly VRDNs, (GO of Authority)/(Landesbank Baden Wurttemberg, LIQ), 0.26%, 5/05/11 | 1,100,000 | 1,100,000 | ||||||
TOTAL TRANSPORTATION | $ | 2,300,000 | ||||||
WATER – 3.1% | ||||||||
New York City, NY, Municipal Water Finance Authority, Water & Sewer System, Refunding Revenue Bonds, (Series F-2) Weekly VRDNs, (JP Morgan Chase Bank), 0.26%, 5/04/11 | 1,075,000 | 1,075,000 | ||||||
| Description | Par Value | Value | ||||||
New York City, NY, Municipal Water Finance Authority, Water & Sewer System, Revenue Bonds, (Series F-1) Daily VRDNs, (Dexia Credit, LOC), 0.35%, 5/02/11 | $ | 2,000,000 | $ | 2,000,000 | ||||
TOTAL WATER | $ | 3,075,000 | ||||||
TOTAL NEW YORK | $ | 60,705,000 | ||||||
| TOTAL SHORT-TERM MUNICIPAL BONDS (COST $60,705,000) | $ | 60,705,000 | ||||||
| TOTAL INVESTMENTS – 99.6% (COST $99,823,791) | $ | 99,823,791 | ||||||
| OTHER ASSETS LESS LIABILITIES – 0.4% | 361,220 | |||||||
| TOTAL NET ASSETS – 100.0% | $ | 100,185,011 | ||||||
Cost of investments for Federal income tax purposes is the same as for financial statement purposes.
Various inputs are used in determining the value of the Fund’s investments. These inputs are summarized in the three broad levels listed below.
Level 1 – quoted prices in active markets for identical securities
Level 2 – other significant observable inputs (including quoted prices for similar securities, interest rates, prepayment speeds, credit risk, etc.)
Level 3 – significant unobservable inputs (including the Fund’s own assumptions in determining the fair value of investments)
The following is a summary of the inputs used as of April 30, 2011 in valuing the Fund’s assets carried at fair value:
| Level 1 | Level 2 | Level 3 | Total | |||||||||||||
Investments in Securities | ||||||||||||||||
Commercial Paper | $ | — | $ | 10,000,000 | $ | — | $ | 10,000,000 | ||||||||
Municipal Bonds | — | 29,118,791 | — | 29,118,791 | ||||||||||||
Short-Term Municipal Bonds | — | 60,705,000 | — | 60,705,000 | ||||||||||||
Total | $ | — | $ | 99,823,791 | $ | — | $ | 99,823,791 | ||||||||
See Notes to Portfolios of Investments
April 30, 2011 / ANNUAL REPORT
Table of Contents
| 19 |
PORTFOLIO OF INVESTMENTS SUMMARY TABLE
MTB Pennsylvania Tax-Free Money Market Fund
At April 30, 2011, the Fund’s sector classifications were as follows: (unaudited)
| Percentage of Total Net Assets | ||||
| Pollution Control | 18.3 | % | ||
| Medical | 12.8 | % | ||
| Utilities | 9.2 | % | ||
| Transportation | 8.6 | % | ||
| Education | 7.0 | % | ||
| School District | 6.8 | % | ||
| General Obligations | 5.8 | % | ||
| Higher Education | 5.3 | % | ||
| Airport Development & Maintenance | 5.0 | % | ||
| Power | 5.0 | % | ||
| Nursing Homes | 5.0 | % | ||
| Facilities | 4.3 | % | ||
| Development | 4.1 | % | ||
| Water & Sewer | 2.4 | % | ||
| Other Assets and Liabilities – Net1 | 0.4 | % | ||
| TOTAL | 100.0 | % | ||
| (1) | Assets, other than investments in securities, less liabilities. See Statements of Assets and Liabilities. |
PORTFOLIO OF INVESTMENTS
April 30, 2011
| Description | Par Value | Value | ||||||
| MUNICIPAL BONDS - 25.0% | ||||||||
FLORIDA – 2.4% | ||||||||
WATER & SEWER – 2.4% | ||||||||
JEA, FL, Water & Sewer System, Revenue Bonds, (Series B), (AGM), 5.25%, 10/01/11 | $ | 600,000 | $ | 611,969 | ||||
TOTAL FLORIDA | $ | 611,969 | ||||||
NEW YORK – 3.9% | ||||||||
GENERAL OBLIGATIONS – 3.9% | ||||||||
Nassau County, NY, GO Unlimited Notes, TANs, (Series C), 1.75%, 10/15/11 | 1,000,000 | 1,003,398 | ||||||
TOTAL NEW YORK | $ | 1,003,398 | ||||||
PENNSYLVANIA – 18.7% | ||||||||
DEVELOPMENT – 3.7% | ||||||||
Allegheny County, PA, IDA, Revenue Bonds, (Animal Friends Inc., OBG)/(PNC Bank N.A., LOC), 0.70%, 7/01/11 | 955,000 | 955,000 | ||||||
GENERAL OBLIGATIONS – 1.9% | ||||||||
Allegheny County, PA, Prerefunded GO Unlimited Bonds, (Series C-53), (FGIC), (PRF 5/01/11 @100), 5.40%, 11/01/19 | 500,000 | 500,000 | ||||||
| Description | Par Value | Value | ||||||
SCHOOL DISTRICT – 6.8% | ||||||||
Philadelphia, PA, School District, GO Unlimited Notes, TRANs, (Series A), 2.50%, 6/30/11 | $ | 1,000,000 | $ | 1,002,443 | ||||
Shikellamy School District, PA, GO Unlimited Bonds, (Series A), (AGM), 1.50%, 11/15/11 | 745,000 | 748,618 | ||||||
TOTAL SCHOOL DISTRICT | $ | 1,751,061 | ||||||
TRANSPORTATION – 3.9% | ||||||||
Delaware River Joint Toll Bridge Commission, PA, Bridge Refunding Revenue Bonds, 5.25%, 7/01/11 | 1,000,000 | 1,007,517 | ||||||
UTILITIES – 2.4% | ||||||||
Lower Pottsgrove Township Authority, PA, Sewer Revenue Bonds, (Municipal Government, GTD), 2.00%, 10/15/11 | 610,000 | 614,011 | ||||||
TOTAL PENNSYLVANIA | $ | 4,827,589 | ||||||
TOTAL MUNICIPAL BONDS (COST $6,442,956) | $ | 6,442,956 | ||||||
(MTB Pennsylvania Tax-Free Money Market Fund continued next page)
ANNUAL REPORT / April 30, 2011
Table of Contents
| 20 | PORTFOLIOS OF INVESTMENTS |
MTB Pennsylvania Tax-Free Money Market Fund (continued)
| Description | Par Value | Value | ||||||
3SHORT-TERM MUNICIPAL BONDS – 74.6% | ||||||||
PENNSYLVANIA – 74.6% | ||||||||
AIRPORT DEVELOPMENT & MAINTENANCE – 5.0% | ||||||||
Delaware County, PA, IDA, Refunding Revenue Bonds, Daily VRDNs, (United Parcel Services, Inc.), 0.20%, 5/02/11 | $ | 1,300,000 | $ | 1,300,000 | ||||
DEVELOPMENT – 0.4% | ||||||||
Delaware County, PA, IDA, Refunding Revenue Bonds, (Series G) Weekly VRDNs, (Resource Recovery Facility)/(General Electric Capital Corp.), 0.24%, 5/04/11 | 100,000 | 100,000 | ||||||
EDUCATION – 7.0% | ||||||||
Allentown, PA, Commercial and IDA, Daily VRDNs, (Diocese of Allentown)/(Wachovia Bank N.A., LOC), 0.23%, 5/02/11 | 1,100,000 | 1,100,000 | ||||||
Emmaus General Authority, PA, Local Government Revenue Bonds, (Pool E, Subseries E25) Weekly VRDNs, (U.S. Bank NA, LOC), 0.25%, 5/04/11 | 700,000 | 700,000 | ||||||
TOTAL EDUCATION | $ | 1,800,000 | ||||||
FACILITIES – 4.3% | ||||||||
Delaware Valley, PA, Regional Financial Authority, Local Government Revenue, (Series A) Weekly VRDNs, (Bayerische Landesbank, LOC), 0.32%, 5/04/11 | 1,100,000 | 1,100,000 | ||||||
HIGHER EDUCATION – 5.3% | ||||||||
Pennsylvania State, Higher Education Facilities Authority, Revenue Bonds, (Series B) Weekly VRDNs, (Drexel University)/(Landesbank Hessen-Thuringen, LOC), 0.26%, 5/05/11 | 1,360,000 | 1,360,000 | ||||||
MEDICAL – 12.8% | ||||||||
Chester County, PA, HEFA, Revenue Bonds, (Series A) Weekly VRDNs, (Barclay Friends)/(Wachovia Bank N.A., LOC), 0.38%, 5/04/11 | 300,000 | 300,000 | ||||||
Geisinger Authority, PA, Health System Refunding Bonds, (Series A) Daily VRDNs, (Geisinger Health System Foundation)/(Bank of America N.A.), 0.19%, 5/02/11 | 200,000 | 200,000 | ||||||
Lehigh County, PA, General Purpose Hospital Revenue, Refunding Bonds, (Series C) Daily VRDNs, (Lehigh Valley Health Network)/(Bank of America N.A., LOC), 0.25%, 5/02/11 | 1,800,000 | 1,800,000 | ||||||
Philadelphia, PA, HEFA, Hospital Refunding Bonds, (Series A) Daily VRDNs, (Childrens Hospital Project)/(JP Morgan Chase Bank, SPA), 0.25%, 5/02/11 | 300,000 | 300,000 | ||||||
Philadelphia, PA, Hospitals & Higher Education Facilities Authority, Refunding Revenue Bonds (Series B) Daily VRDNs, (Childrens Hospital Philadelphia)/(Wachovia Bank N.A.), 0.25%, 5/02/11 | 400,000 | 400,000 | ||||||
Wilkins Area, PA, IDA, Refunding Revenue Bonds, (Series B) Weekly VRDNs, (Fairview Extended Care Services)/(Bank of America N.A., LOC), 0.36%, 5/09/11 | 300,000 | 300,000 | ||||||
TOTAL MEDICAL | $ | 3,300,000 | ||||||
| Description | Par Value | Value | ||||||
NURSING HOMES – 5.0% | ||||||||
Allegheny County, PA, IDA, Health & Housing Facilities, Refunding Revenue Bonds, (Series A) Daily VRDNs, (PNC Bank N.A., LOC), 0.25%, 5/02/11 | $ | 500,000 | $ | 500,000 | ||||
Lancaster County, PA, Hospital Authority Refunding Revenue Bonds, (Series D) Daily VRDNs, (Masonic Homes of Grand Lodge Project)/(JP Morgan Chase Bank, LOC), 0.23%, 5/02/11 | 800,000 | 800,000 | ||||||
TOTAL NURSING HOMES | $ | 1,300,000 | ||||||
POLLUTION CONTROL – 18.3% | ||||||||
Beaver County, PA, IDA, Pollution Control, Refunding Revenue Bonds, (Series B) Daily VRDNs, (Pennsylvania Electric Co.)/(UBS AG, LOC), 0.20%, 5/02/11 | 1,000,000 | 1,000,000 | ||||||
Beaver County, PA, IDA, Pollution Control, Revenue Bonds, (Series B) Weekly VRDNs, (Firstenergy Nuclear, OBG)/(AGMT-Firstenergy Solution, GTY)/(Citibank N.A., LOC), 0.24%, 5/04/11 | 900,000 | 900,000 | ||||||
Beaver County, PA, IDA, Refunding Revenue Bonds, Daily VRDNs, (Firstenergy Nuclear Generation)/(Barclays Bank PLC, LOC) 0.22%, 5/02/11 0.24%, 5/02/11 |
| 1,200,000 900,000 |
|
| 1,200,000 900,000 |
| ||
Delaware County, PA, IDA, Refunding Revenue Bonds, (Series G) Weekly VRDNs, (General Electric Capital Corp.), | 700,000 | 700,000 | ||||||
TOTAL POLLUTION CONTROL | $ | 4,700,000 | ||||||
POWER – 5.0% | ||||||||
5Pennsylvania State, Energy Development Authority, Revenue Bonds, AMT, Weekly VRDNs, (Edensburg Power Company)/(Landesbank Hessen-Thuringen, LOC), | 1,300,000 | 1,300,000 | ||||||
TRANSPORTATION – 4.7% | ||||||||
Delaware River Joint Toll Bridge Commission, PA, Bridge Revenue Bonds, (Series B-1) Weekly VRDNs, (Dexia Credit Local, LOC), 0.80%, 5/05/11 | 1,200,000 | 1,200,000 | ||||||
UTILITIES – 6.8% | ||||||||
Philadelphia, PA, Gas Works Revenue Bonds, (Series A2) Weekly VRDNs, (JP Morgan Chase 50%, Bank of Nova Scotia 50%, LOC), 0.24%, 5/05/11 | 1,750,000 | 1,750,000 | ||||||
TOTAL PENNSYLVANIA | $ | 19,210,000 | ||||||
| TOTAL SHORT-TERM MUNICIPAL BONDS (COST $19,210,000) | $ | 19,210,000 | ||||||
| TOTAL INVESTMENTS – 99.6% (COST $25,652,956) | $ | 25,652,956 | ||||||
| OTHER ASSETS LESS LIABILITIES – 0.4% | 96,036 | |||||||
| TOTAL NET ASSETS – 100.0% | $ | 25,748,992 | ||||||
(MTB Pennsylvania Tax-Free Money Market Fund continued next page)
April 30, 2011 / ANNUAL REPORT
Table of Contents
| PORTFOLIOS OF INVESTMENTS | 21 |
MTB Pennsylvania Tax-Free Money Market Fund (concluded)
Cost of investments for Federal income tax purposes is the same as for financial statement purposes.
Various inputs are used in determining the value of the Fund’s investments. These inputs are summarized in the three broad levels listed below.
Level 1 – quoted prices in active markets for identical securities
Level 2 – other significant observable inputs (including quoted prices for similar securities, interest rates, prepayment speeds, credit risk, etc.)
Level 3 – significant unobservable inputs (including the Fund’s own assumptions in determining the fair value of investments)
The following is a summary of the inputs used as of April 30, 2011 in valuing the Fund’s assets carried at fair value:
| Level 1 | Level 2 | Level 3 | Total | |||||||||||||
Investments in Securities | ||||||||||||||||
Municipal Bonds | $ | — | $ | 6,442,956 | $ | — | $ | 6,442,956 | ||||||||
Short-Term Municipal Bonds | — | 19,210,000 | — | 19,210,000 | ||||||||||||
Total | $ | — | $ | 25,652,956 | $ | — | $ | 25,652,956 | ||||||||
ANNUAL REPORT / April 30, 2011
See Notes to Portfolios of Investments
Table of Contents
| 22 | NOTES TO PORTFOLIOS OF INVESTMENTS |
| (1) | Floating rate note with current rate and next reset date shown. |
| (2) | Zero coupon security. The rate shown reflects the effective yield at purchase date. |
| (3) | Current rate and next reset date shown for Variable Rate Demand Notes. |
| (4) | Discount rate at time of purchase. |
| (5) | At April 30, 2011, the percentage of total investments at market value subject to the alternative minimum tax is as follows: |
| MTB Fund | Amount | Percentage of Total Investments | ||||||
| MTB Tax-Free Money Market Fund | $6,175,000 | 4.0% | ||||||
| MTB New York Tax-Free Money Market Fund | 5,000,000 | 5.0% | ||||||
| MTB Pennsylvania Tax-Free Money Market Fund | 1,300,000 | 5.1% | ||||||
| (6) | Denotes a restricted security that may be resold without restriction to “qualified institutional buyers” as defined in Rule 144A under the Securities Act of 1933 and that the Fund has determined to be liquid under criteria established by the Fund’s Board of Trustees. At April 30, 2011, these liquid restricted securities were as follows: |
| MTB Fund | Amount | Percentage of Total Net Assets | ||||||
| MTB U.S. Government Money Market Fund | $174,966,833 | 9.3% | ||||||
| MTB Money Market Fund | 424,901,463 | 28.4% | ||||||
| MTB Prime Money Market Fund | 87,982,042 | 22.1% | ||||||
| (7) | Denotes a restricted security that either (a) cannot be offered for public sale without first being registered, or being able to take advantage of an exemption from registration, under the Securities Act of 1933, or (b) is subject to a contractual restriction on public sales. At April 30, 2011, these restricted securities were as follows: |
| Security | Acquisition Date | Acquisition Cost | Market Value | Percentage of Total Net Assets | ||||||||||||
MTB U.S. Government Money Market Fund | ||||||||||||||||
| Straight-A Funding LLC | 04/11/2011 | $49,980,736 | $49,986,014 | |||||||||||||
| Straight-A Funding LLC | 04/05/2011 | 49,974,625 | 49,982,208 | |||||||||||||
| Straight-A Funding LLC | 02/08/2011 | 24,985,069 | 24,999,306 | |||||||||||||
| Straight-A Funding LLC | 02/02/2011 | 49,968,750 | 49,999,305 | |||||||||||||
| 174,966,833 | 9.3% | |||||||||||||||
MTB Money Market Fund | ||||||||||||||||
| Atlantis One Funding Corp. | 02/01/2011 | 64,955,006 | 64,999,494 | |||||||||||||
| Gemini Security Corp., LLC | 04/21/2011 | 49,968,403 | 49,971,875 | |||||||||||||
| Gemini Security Corp., LLC | 04/21/2011 | 9,993,681 | 9,994,375 | |||||||||||||
| Nestle Capital Corp. | 04/26/2011 | 57,969,260 | 57,970,710 | |||||||||||||
| PepsiCo, Inc. | 04/06/2011 | 49,978,750 | 49,984,653 | |||||||||||||
| Straight-A Funding LLC | 04/05/2011 | 49,974,625 | 49,982,208 | |||||||||||||
| Straight-A Funding LLC | 02/02/2011 | 49,968,750 | 49,999,306 | |||||||||||||
| United Parcel Service, Inc. | 04/26/2011 | 41,999,720 | 41,999,953 | |||||||||||||
| Walt Disney Co. | 04/04/2011 | 49,995,139 | 49,998,889 | |||||||||||||
| 424,901,463 | 28.4% | |||||||||||||||
MTB Prime Money Market Fund | ||||||||||||||||
| Atlantis One Funding Corp. | 02/01/2011 | 16,988,232 | 16,999,868 | |||||||||||||
| Gemini Security Corp., LLC | 04/21/2011 | 9,993,681 | 9,994,375 | |||||||||||||
| Nestle Capital Corp. | 04/26/2011 | 8,995,230 | 8,995,455 | |||||||||||||
| PepsiCo, Inc. | 04/06/2011 | 11,994,900 | 11,996,317 | |||||||||||||
| Straight-A Funding LLC | 04/05/2011 | 9,994,925 | 9,996,442 | |||||||||||||
| Straight-A Funding LLC | 02/02/2011 | 9,993,750 | 9,999,861 | |||||||||||||
| United Parcel Service, Inc. | 04/26/2011 | 7,999,947 | 7,999,991 | |||||||||||||
| Walt Disney Co. | 04/04/2011 | 11,998,833 | 11,999,733 | |||||||||||||
| 87,982,042 | 22.1% | |||||||||||||||
| ** | Represent less than 0.05%. |
April 30, 2011 / ANNUAL REPORT
Table of Contents
| NOTES TO PORTFOLIOS OF INVESTMENTS | 23 |
The following acronyms are used throughout this report:
AGM – Assured Guaranty Municipal
AMT – Alternative Minimum Tax (subject to)
BANs – Bond Anticipation Notes
COL – Collateralized
FGIC – Financial Guarantee Insurance Company
FSA – Financial Security Assurance Inc.
GO – General Obligation
GTD – Guaranteed
HEFA – Health & Education Facility Authority
HFA – Housing Finance Authority
IDA – Industrial Development Authority/Agency
IDB – Industrial Development Bank
INS – Insured
INSTN – Institutional
LIQ – Liquidity Agreement
LLC – Limited Liability Corporation
LOC – Letter of Credit
MBIA – Municipal Bond Investors Assurance
OBG – Obligated Group
PRF – Prerefunded
TANs – Tax Anticipation Notes
TRANs – Tax & Revenue Anticipation Notes
VRDNs – Variable Rate Demand Notes
ANNUAL REPORT / April 30, 2011
Table of Contents
| 24 | STATEMENTS OF ASSETS AND LIABILITIES |
| April 30, 2011 | MTB U.S. Treasury Money Market Fund | MTB U.S. Government Money Market Fund | MTB Tax-Free Money Market Fund | MTB Money Market Fund | MTB Prime Money Market Fund | |||||||||||||||
| ASSETS: | ||||||||||||||||||||
Investments, at identified cost | $ | 923,574,100 | $ | 1,883,820,422 | $ | 153,618,894 | $ | 1,498,413,831 | $ | 397,865,400 | ||||||||||
Investments in repurchase agreements, at value | $ | 448,000,000 | $ | 659,000,000 | $ | — | $ | 204,000,000 | $ | 107,000,000 | ||||||||||
Investments in securities, at value | 475,574,100 | 1,224,820,422 | 153,618,894 | 1,294,413,831 | 290,865,400 | |||||||||||||||
| TOTAL INVESTMENTS IN SECURITIES AND REPURCHASE AGREEMENTS | 923,574,100 | 1,883,820,422 | 153,618,894 | 1,498,413,831 | 397,865,400 | |||||||||||||||
Cash | 330,948 | 299,853 | 1,948 | 198,449 | 382,889 | |||||||||||||||
Income receivable | 636,349 | 301,522 | 340,834 | 42,672 | 10,803 | |||||||||||||||
Receivable for shares sold | 3 | — | — | 35 | — | |||||||||||||||
Other assets | 18,687 | 18,827 | — | — | 17,128 | |||||||||||||||
| TOTAL ASSETS | 924,560,087 | 1,884,440,624 | 153,961,676 | 1,498,654,987 | 398,276,220 | |||||||||||||||
| LIABILITIES: | ||||||||||||||||||||
Income distribution payable | 7,903 | 15,456 | 2,312 | 27,249 | 12,851 | |||||||||||||||
Payable for Trustees’ fees | 518 | 1,018 | 991 | 1,759 | 898 | |||||||||||||||
Payable for distribution services fee | — | — | 885 | — | — | |||||||||||||||
Payable for shareholder services fee | — | — | — | 7,145 | — | |||||||||||||||
Accrued expenses | 130,631 | 218,564 | 54,110 | 231,824 | 65,203 | |||||||||||||||
| TOTAL LIABILITIES | 139,052 | 235,038 | 58,298 | 267,977 | 78,952 | |||||||||||||||
| NET ASSETS | $ | 924,421,035 | $ | 1,884,205,586 | $ | 153,903,378 | $ | 1,498,387,010 | $ | 398,197,268 | ||||||||||
NET ASSETS CONSIST OF: | ||||||||||||||||||||
Paid-in capital | $ | 924,409,439 | $ | 1,884,221,042 | $ | 153,899,318 | $ | 1,498,408,264 | $ | 398,194,925 | ||||||||||
Undistributed (distributions in excess of) net investment income | 6,296 | (15,456 | ) | 4,060 | (21,254 | ) | (231 | ) | ||||||||||||
Accumulated net realized gain (loss) on investments | 5,300 | — | — | — | 2,574 | |||||||||||||||
| TOTAL NET ASSETS | $ | 924,421,035 | $ | 1,884,205,586 | $ | 153,903,378 | $ | 1,498,387,010 | $ | 398,197,268 | ||||||||||
| COMPUTATION OF NET ASSET VALUE AND OFFERING PRICE: | ||||||||||||||||||||
Class A Shares | ||||||||||||||||||||
Net Assets | $ | 71,928,743 | $ | 35,560,930 | $ | 11,778,855 | $ | 345,930,953 | $ | — | ||||||||||
Shares outstanding (unlimited shares authorized) | 71,932,746 | 35,565,067 | 11,779,695 | 346,053,179 | — | |||||||||||||||
Net Asset Value per share | $ | 1.00 | $ | 1.00 | $ | 1.00 | $ | 1.00 | $ | — | ||||||||||
Class A2 Shares | ||||||||||||||||||||
Net Assets | $ | — | $ | — | $ | — | $ | 217,836,376 | $ | — | ||||||||||
Shares outstanding (unlimited shares authorized) | — | — | — | 217,887,476 | — | |||||||||||||||
Net Asset Value per share | $ | — | $ | — | $ | — | $ | 1.00 | $ | — | ||||||||||
Class S Shares | ||||||||||||||||||||
Net Assets | $ | 10,627,353 | $ | — | $ | — | $ | 5,870,331 | $ | — | ||||||||||
Shares outstanding (unlimited shares authorized) | 10,627,618 | — | — | 5,875,637 | — | |||||||||||||||
Net Asset Value per share | $ | 1.00 | $ | — | $ | — | $ | 1.00 | $ | — | ||||||||||
Corporate Shares | ||||||||||||||||||||
Net Assets | $ | — | $ | — | $ | — | $ | — | $ | 398,197,268 | ||||||||||
Shares outstanding (unlimited shares authorized) | — | — | — | — | 398,197,484 | |||||||||||||||
Net Asset Value per share | $ | — | $ | — | $ | — | $ | — | $ | 1.00 | ||||||||||
Institutional I Shares | ||||||||||||||||||||
Net Assets | $ | 165,795,373 | $ | 355,505,343 | $ | 108,802,048 | $ | 512,362,747 | $ | — | ||||||||||
Shares outstanding (unlimited shares authorized) | 165,809,526 | 355,621,976 | 108,808,300 | 512,530,442 | — | |||||||||||||||
Net Asset Value per share | $ | 1.00 | $ | 1.00 | $ | 1.00 | $ | 1.00 | $ | — | ||||||||||
Institutional II Shares | ||||||||||||||||||||
Net Assets | $ | 676,069,566 | $ | 1,493,139,313 | $ | 33,322,475 | $ | 416,386,603 | $ | — | ||||||||||
Shares outstanding (unlimited shares authorized) | 676,094,431 | 1,493,344,638 | 33,324,711 | 416,487,933 | — | |||||||||||||||
Net Asset Value per share | $ | 1.00 | $ | 1.00 | $ | 1.00 | $ | 1.00 | $ | — | ||||||||||
See Notes which are an integral part of the Financial Statements
(Statements of Assets and Liabilities continued next page)
April 30, 2011 / ANNUAL REPORT
Table of Contents
| STATEMENTS OF ASSETS AND LIABILITIES (concluded) | 25 |
| April 30, 2011 | MTB New York Tax-Free Money Market Fund | MTB Pennsylvania Tax-Free Money Market Fund | ||||||
| ASSETS: | ||||||||
Investments, at identified cost | $ | 99,823,791 | $ | 25,652,956 | ||||
Investments in repurchase agreements, at value | $ | — | $ | — | ||||
Investments in securities, at value | 99,823,791 | 25,652,956 | ||||||
| TOTAL INVESTMENTS IN SECURITIES AND REPURCHASE AGREEMENTS | 99,823,791 | 25,652,956 | ||||||
Cash | 62,922 | 62,957 | ||||||
Income receivable | 346,342 | 72,973 | ||||||
Receivable for shares sold | — | — | ||||||
Other assets | — | — | ||||||
| TOTAL ASSETS | 100,233,055 | 25,788,886 | ||||||
| LIABILITIES: | ||||||||
Income distribution payable | 977 | 306 | ||||||
Payable for Trustees’ fees | 895 | 1,032 | ||||||
Payable for distribution services fee | — | — | ||||||
Payable for shareholder services fee | — | — | ||||||
Accrued expenses | 46,172 | 38,556 | ||||||
| TOTAL LIABILITIES | 48,044 | 39,894 | ||||||
| NET ASSETS | $ | 100,185,011 | $ | 25,748,992 | ||||
NET ASSETS CONSIST OF: | ||||||||
Paid-in capital | $ | 100,256,853 | $ | 25,746,108 | ||||
Undistributed net investment income | 181 | 2,884 | ||||||
Accumulated net realized gain (loss) on investments | (72,023 | ) | — | |||||
| TOTAL NET ASSETS | $ | 100,185,011 | $ | 25,748,992 | ||||
| COMPUTATION OF NET ASSET VALUE AND OFFERING PRICE: | ||||||||
Class A Shares | ||||||||
Net Assets | $ | 52,517,572 | $ | 5,293,250 | ||||
Shares outstanding (unlimited shares authorized) | 52,550,186 | 5,293,095 | ||||||
Net Asset Value per share | $ | 1.00 | $ | 1.00 | ||||
Institutional I Shares | ||||||||
Net Assets | $ | 47,667,439 | $ | 12,379,387 | ||||
Shares outstanding (unlimited shares authorized) | 47,712,354 | 12,376,694 | ||||||
Net Asset Value per share | $ | 1.00 | $ | 1.00 | ||||
Institutional II Shares | ||||||||
Net Assets | $ | — | $ | 8,076,355 | ||||
Shares outstanding (unlimited shares authorized) | — | 8,076,321 | ||||||
Net Asset Value per share | $ | — | $ | 1.00 | ||||
See Notes which are an integral part of the Financial Statements
ANNUAL REPORT / April 30, 2011
Table of Contents
| 26 | STATEMENTS OF OPERATIONS |
| Year Ended April 30, 2011 | MTB U.S. Treasury Money Market Fund | MTB U.S. Government Money Market Fund | MTB Tax-Free Money Market Fund | MTB Money Market Fund | MTB Prime Money Market Fund | |||||||||||||||
| INVESTMENT INCOME: | ||||||||||||||||||||
Interest | $ | 1,866,910 | $ | 5,544,984 | $ | 540,687 | $ | 4,641,353 | $ | 1,104,269 | ||||||||||
| TOTAL INVESTMENT INCOME | 1,866,910 | 5,544,984 | 540,687 | 4,641,353 | 1,104,269 | |||||||||||||||
| EXPENSES: | ||||||||||||||||||||
Investment advisory fee | 4,267,461 | 8,501,419 | 515,295 | 6,422,275 | 1,565,215 | |||||||||||||||
Administrative personnel and services fee | 305,322 | 608,908 | 36,939 | 460,096 | 112,151 | |||||||||||||||
Portfolio accounting, administration and custodian fees | 352,106 | 777,031 | 54,190 | 627,033 | 140,119 | |||||||||||||||
Transfer and dividend disbursing agent fees and expenses | 17,482 | 13,624 | 14,982 | 186,985 | 12,302 | |||||||||||||||
Trustees’ fees | 19,510 | 19,993 | 19,988 | 20,809 | 19,907 | |||||||||||||||
Professional fees | 47,226 | 49,804 | 53,286 | 54,376 | 48,349 | |||||||||||||||
Distribution services fee—Class A Shares | — | 85,015 | 41,602 | — | — | |||||||||||||||
Distribution services fee—Class A2 Shares | — | — | — | 562,085 | — | |||||||||||||||
Distribution services fee—Class B Shares | — | — | — | 1,351 | — | |||||||||||||||
Distribution services fee—Class S Shares | 30,759 | — | — | 28,434 | — | |||||||||||||||
Distribution services fee—Corporate Shares | — | — | — | — | 978,259 | |||||||||||||||
Distribution services fee—Institutional II Shares | 1,869,647 | 4,097,329 | 90,658 | 1,016,253 | — | |||||||||||||||
Shareholder services fee—Class A Shares | 215,607 | 85,015 | 41,602 | 1,022,485 | — | |||||||||||||||
Shareholder services fee—Class A2 Shares | — | — | — | 562,085 | — | |||||||||||||||
Shareholder services fee—Class B Shares | — | — | — | 451 | — | |||||||||||||||
Shareholder services fee—Class S Shares | 30,759 | — | — | 28,434 | — | |||||||||||||||
Shareholder services fee—Corporate Shares | — | — | — | — | 978,259 | |||||||||||||||
Shareholder services fee—Institutional I Shares | 551,150 | 1,131,043 | 189,800 | 1,384,215 | — | |||||||||||||||
Share registration costs | 36,621 | 28,119 | 31,065 | 59,880 | 16,680 | |||||||||||||||
Printing and postage | 13,009 | 16,363 | 2,848 | 46,373 | 3,467 | |||||||||||||||
Miscellaneous | 129,328 | 226,425 | 21,225 | 146,875 | 70,000 | |||||||||||||||
| TOTAL EXPENSES | 7,885,987 | 15,640,088 | 1,113,480 | 12,630,495 | 3,944,708 | |||||||||||||||
| WAIVERS AND REIMBURSEMENTS: | ||||||||||||||||||||
Waiver/reimbursement by investment advisor | (3,440,704 | ) | (4,923,950 | ) | (249,362 | ) | (3,986,871 | ) | (1,083,645 | ) | ||||||||||
Waiver of distribution services fee—Class A Shares | — | (85,015 | ) | (38,221 | ) | — | — | |||||||||||||
Waiver of distribution services fee—Class A2 Shares | — | — | — | (562,085 | ) | — | ||||||||||||||
Waiver of distribution services fee—Class B Shares | — | — | — | (1,351 | ) | — | ||||||||||||||
Waiver of distribution services fee—Class S Shares | (30,759 | ) | — | — | (28,434 | ) | — | |||||||||||||
Waiver of distribution services fee—Corporate Shares | — | — | — | — | (978,259 | ) | ||||||||||||||
Waiver of distribution services fee—Institutional II Shares | (1,869,647 | ) | (4,097,329 | ) | (89,712 | ) | (1,016,253 | ) | — | |||||||||||
Waiver of shareholder services fee—Class A Shares | (215,607 | ) | (85,015 | ) | (41,486 | ) | (906,635 | ) | — | |||||||||||
Waiver of shareholder services fee—Class A2 Shares | — | — | — | (501,036 | ) | — | ||||||||||||||
Waiver of shareholder services fee—Class B Shares | — | — | — | (398 | ) | — | ||||||||||||||
Waiver of shareholder services fee—Class S Shares | (30,759 | ) | — | — | (25,298 | ) | — | |||||||||||||
Waiver of shareholder services fee—Corporate Shares | — | — | — | — | (978,259 | ) | ||||||||||||||
Waiver of shareholder services fee—Institutional I Shares | (551,150 | ) | (1,131,043 | ) | (189,800 | ) | (1,384,215 | ) | — | |||||||||||
Reimbursement of transfer and dividend disbursing agent fees and expenses by Administrator | (1,137 | ) | (156 | ) | (312 | ) | (41,981 | ) | (219 | ) | ||||||||||
| TOTAL WAIVERS AND REIMBURSEMENTS | (6,139,763 | ) | (10,322,508 | ) | (608,893 | ) | (8,454,557 | ) | (3,040,382 | ) | ||||||||||
Net expenses | 1,746,224 | 5,317,580 | 504,587 | 4,175,938 | 904,326 | |||||||||||||||
Net investment income | 120,686 | 227,404 | 36,100 | 465,415 | 199,943 | |||||||||||||||
| REALIZED GAIN (LOSS) ON INVESTMENTS: | ||||||||||||||||||||
Net realized gain on investments | 5,300 | — | — | — | 8,001 | |||||||||||||||
Change in net assets resulting from operations | $ | 125,986 | $ | 227,404 | $ | 36,100 | $ | 465,415 | $ | 207,944 | ||||||||||
See Notes which are an integral part of the Financial Statements
(Statements of Operations continued next page)
April 30, 2011 / ANNUAL REPORT
Table of Contents
| STATEMENTS OF OPERATIONS (concluded) | 27 |
| Year Ended April 30, 2011 | MTB New York Tax-Free Money Market Fund | MTB Pennsylvania Tax-Free Money Market Fund | ||||||
| INVESTMENT INCOME: | ||||||||
Interest | $ | 432,000 | $ | 134,589 | ||||
| TOTAL INVESTMENT INCOME | 432,000 | 134,589 | ||||||
| EXPENSES: | ||||||||
Investment advisory fee | 446,242 | 128,188 | ||||||
Administrative personnel and services fee | 31,968 | 9,189 | ||||||
Portfolio accounting, administration and custodian fees | 53,635 | 19,821 | ||||||
Transfer and dividend disbursing agent fees and expenses | 26,771 | 17,859 | ||||||
Trustees’ fees | 19,778 | 20,066 | ||||||
Professional fees | 49,350 | 50,451 | ||||||
Distribution services fee—Class A Shares | — | 12,219 | ||||||
Distribution services fee—Institutional II Shares | — | 25,270 | ||||||
Shareholder services fee—Class A Shares | 149,612 | 12,219 | ||||||
Shareholder services fee—Institutional I Shares | 129,323 | 42,628 | ||||||
Share registration costs | 25,898 | 30,142 | ||||||
Printing and postage | 6,331 | 2,182 | ||||||
Miscellaneous | 17,022 | 13,361 | ||||||
| TOTAL EXPENSES | 955,930 | 383,595 | ||||||
| WAIVERS AND REIMBURSEMENTS: | ||||||||
Waiver/reimbursement by investment advisor | (262,657 | ) | (161,630 | ) | ||||
Waiver of distribution services fee—Class A Shares | — | (11,889 | ) | |||||
Waiver of distribution services fee—Institutional II Shares | — | (25,270 | ) | |||||
Waiver of shareholder services fee—Class A Shares | (147,543 | ) | (12,219 | ) | ||||
Waiver of shareholder services fee—Institutional I Shares | (129,323 | ) | (42,628 | ) | ||||
Reimbursement of transfer and dividend disbursing agent fees and expenses by Administrator | (1,671 | ) | (563 | ) | ||||
| TOTAL WAIVERS AND REIMBURSEMENTS | (541,194 | ) | (254,199 | ) | ||||
Net expenses | 414,736 | 129,396 | ||||||
Net investment income | 17,264 | 5,193 | ||||||
| REALIZED GAIN (LOSS) ON INVESTMENTS: | ||||||||
Net realized loss on investments | (2,115 | ) | — | |||||
Change in net assets resulting from operations | $ | 15,149 | $ | 5,193 | ||||
See Notes which are an integral part of the Financial Statements
ANNUAL REPORT / April 30, 2011
Table of Contents
| 28 | STATEMENTS OF CHANGES IN NET ASSETS |
| MTB U.S. Treasury Money Market Fund | MTB U.S. Government Money Market Fund | |||||||||||||||
| Year Ended April 30, 2011 | Year Ended April 30, 2010 | Year Ended April 30, 2011 | Year Ended April 30, 2010 | |||||||||||||
| OPERATIONS: | ||||||||||||||||
Net investment income | $ | 120,686 | $ | 184,349 | $ | 227,404 | $ | 446,781 | ||||||||
Net realized gain (loss) on investments | 5,300 | 1,312 | — | 16,139 | ||||||||||||
Change in net assets resulting from operations | 125,986 | 185,661 | 227,404 | 462,920 | ||||||||||||
| DISTRIBUTIONS TO SHAREHOLDERS: | ||||||||||||||||
Distributions from net investment income | ||||||||||||||||
Class A Shares | (8,642 | ) | (19,102 | ) | (3,204 | ) | (3,776 | ) | ||||||||
Class S Shares | (1,231 | ) | (1,774 | ) | – | — | ||||||||||
Institutional I Shares | (22,116 | ) | (48,026 | ) | (48,851 | ) | (94,098 | ) | ||||||||
Institutional II Shares | (74,920 | ) | (113,865 | ) | (173,078 | ) | (175,247 | ) | ||||||||
Return of Capital | ||||||||||||||||
Class A Shares | — | — | (214 | ) | (2,608 | ) | ||||||||||
Institutional I Shares | — | — | (3,264 | ) | (64,994 | ) | ||||||||||
Institutional II Shares | — | — | (11,564 | ) | (121,046 | ) | ||||||||||
Change in net assets resulting from distributions to shareholders | (106,909 | ) | (182,767 | ) | (240,175 | ) | (461,769 | ) | ||||||||
| SHARE TRANSACTIONS: | ||||||||||||||||
Proceeds from sale of shares | ||||||||||||||||
Class A Shares | 734,784,789 | 720,546,399 | 71,796,583 | 103,671,524 | ||||||||||||
Class S Shares | 42,441,571 | 73,937,677 | — | — | ||||||||||||
Institutional I Shares | 726,497,713 | 546,276,177 | 1,600,579,006 | 1,873,261,809 | ||||||||||||
Institutional II Shares | 2,682,169,766 | 1,942,550,395 | 3,046,806,667 | 3,932,313,069 | ||||||||||||
Distributions reinvested | ||||||||||||||||
Class A Shares | 7,239 | 14,668 | 3,139 | 6,257 | ||||||||||||
Class S Shares | 10 | 2 | — | — | ||||||||||||
Institutional I Shares | 388 | 438 | 1,954 | 249 | ||||||||||||
Institutional II Shares | — | — | 13 | 87 | ||||||||||||
Cost of shares redeemed | ||||||||||||||||
Class A Shares | (804,512,975 | ) | (712,668,520 | ) | (71,740,682 | ) | (110,602,863 | ) | ||||||||
Class S Shares | (42,569,468 | ) | (73,453,632 | ) | — | — | ||||||||||
Institutional I Shares | (737,173,495 | ) | (764,361,922 | ) | (1,741,077,371 | ) | (2,772,043,955 | ) | ||||||||
Institutional II Shares | (2,660,643,620 | ) | (2,040,303,699 | ) | (3,135,973,704 | ) | (3,992,129,406 | ) | ||||||||
Change in net assets resulting from share transactions | (58,998,082 | ) | (307,462,017 | ) | (229,604,395 | ) | (965,523,229 | ) | ||||||||
Change in net assets | (58,979,005 | ) | (307,459,123 | ) | (229,617,166 | ) | (965,522,078 | ) | ||||||||
| NET ASSETS: | ||||||||||||||||
Beginning of year | 983,400,040 | 1,290,859,163 | 2,113,822,752 | 3,079,344,830 | ||||||||||||
End of year | $ | 924,421,035 | $ | 983,400,040 | $ | 1,884,205,586 | $ | 2,113,822,752 | ||||||||
Undistributed (distributions in excess of) net investment income included in net assets at end of year | $ | 6,296 | $ | (7,481 | ) | $ | (15,456 | ) | $ | (17,727 | ) | |||||
| SHARES OF BENEFICIAL INTEREST: | ||||||||||||||||
Shares sold | ||||||||||||||||
Class A Shares | 734,784,789 | 720,546,399 | 71,796,583 | 103,671,524 | ||||||||||||
Class S Shares | 42,441,571 | 73,937,677 | — | — | ||||||||||||
Institutional I Shares | 726,497,713 | 546,276,177 | 1,600,579,006 | 1,873,261,809 | ||||||||||||
Institutional II Shares | 2,682,169,766 | 1,942,550,395 | 3,046,806,667 | 3,932,313,069 | ||||||||||||
Distributions reinvested | ||||||||||||||||
Class A Shares | 7,239 | 14,668 | 3,139 | 6,257 | ||||||||||||
Class S Shares | 10 | 2 | — | — | ||||||||||||
Institutional I Shares | 388 | 438 | 1,954 | 249 | ||||||||||||
Institutional II Shares | — | — | 13 | 87 | ||||||||||||
Shares redeemed | ||||||||||||||||
Class A Shares | (804,512,975 | ) | (712,668,520 | ) | (71,740,682 | ) | (110,602,863 | ) | ||||||||
Class S Shares | (42,569,468 | ) | (73,453,632 | ) | — | — | ||||||||||
Institutional I Shares | (737,173,495 | ) | (764,361,922 | ) | (1,741,077,371 | ) | (2,772,043,955 | ) | ||||||||
Institutional II Shares | (2,660,643,620 | ) | (2,040,303,699 | ) | (3,135,973,704 | ) | (3,992,129,406 | ) | ||||||||
Net change resulting from share transactions | (58,998,082 | ) | (307,462,017 | ) | (229,604,395 | ) | (965,523,229 | ) | ||||||||
See Notes which are an integral part of the Financial Statements
(Statements of Changes in Net Assets continued next page)
April 30, 2011 / ANNUAL REPORT
Table of Contents
| STATEMENTS OF CHANGES IN NET ASSETS (continued) | 29 |
| MTB Tax-Free Money Market Fund | MTB Money Market Fund | |||||||||||||||
Year Ended | Year Ended April 30, 2010 | Year Ended | Year Ended April 30, 2010 | |||||||||||||
| OPERATIONS: | ||||||||||||||||
Net investment income | $ | 36,100 | $ | 162,619 | $ | 465,415 | $ | 704,707 | ||||||||
Change in net assets resulting from operations | 36,100 | 162,619 | 465,415 | 704,707 | ||||||||||||
| �� | ||||||||||||||||
| DISTRIBUTIONS TO SHAREHOLDERS: | ||||||||||||||||
Distributions from net investment income | ||||||||||||||||
Class A Shares | (2,058 | ) | (7,515 | ) | (43,015 | ) | (116,197 | ) | ||||||||
Class A2 Shares | — | — | (23,560 | ) | (69,934 | ) | ||||||||||
Class B Shares | — | — | (19 | ) | (74 | ) | ||||||||||
Class S Shares | — | — | (1,192 | ) | (4,609 | ) | ||||||||||
Institutional I Shares | (24,011 | ) | (128,949 | ) | (225,258 | ) | (295,177 | ) | ||||||||
Institutional II Shares | (10,621 | ) | (26,202 | ) | (164,341 | ) | (154,040 | ) | ||||||||
Return of Capital | ||||||||||||||||
Class A Shares | — | — | — | (11,101 | ) | |||||||||||
Class A2 Shares | — | — | — | (6,681 | ) | |||||||||||
Class B Shares | — | — | — | (7 | ) | |||||||||||
Class S Shares | — | — | — | (440 | ) | |||||||||||
Institutional I Shares | — | — | — | (28,201 | ) | |||||||||||
Institutional II Shares | — | — | — | (14,717 | ) | |||||||||||
Change in net assets resulting from distributions to shareholders | (36,690 | ) | (162,666 | ) | (457,385 | ) | (701,178 | ) | ||||||||
| SHARE TRANSACTIONS: | ||||||||||||||||
Proceeds from sale of shares | ||||||||||||||||
Class A Shares | 37,814,367 | 41,566,010 | 1,159,756,741 | 1,449,614,626 | ||||||||||||
Class A2 Shares | — | — | 155,495,435 | 124,710,770 | ||||||||||||
Class B Shares | — | — | 48,770 | 500 | ||||||||||||
Class S Shares | — | — | 112,590,000 | 191,756,126 | ||||||||||||
Institutional I Shares | 170,176,509 | 153,583,649 | 1,116,334,940 | 1,058,237,609 | ||||||||||||
Institutional II Shares | 82,897,090 | 52,330,657 | 858,351,940 | 1,012,783,706 | ||||||||||||
Distributions reinvested | ||||||||||||||||
Class A Shares | 2,026 | 7,366 | 33,365 | 92,645 | ||||||||||||
Class A2 Shares | — | — | 23,257 | 87,198 | ||||||||||||
Class B Shares | — | — | 21 | 82 | ||||||||||||
Class S Shares | — | — | 60 | 105 | ||||||||||||
Institutional I Shares | 345 | 331 | 16,082 | 19,446 | ||||||||||||
Institutional II Shares | — | — | 10 | 11 | ||||||||||||
Cost of shares redeemed | ||||||||||||||||
Class A Shares | (44,986,161 | ) | (43,962,564 | ) | (1,273,362,600 | ) | (1,620,640,497 | ) | ||||||||
Class A2 Shares | — | — | (182,348,866 | ) | (200,383,611 | ) | ||||||||||
Class B Shares | — | — | (253,926 | ) | (213,046 | ) | ||||||||||
Class S Shares | — | — | (119,546,284 | ) | (209,353,532 | ) | ||||||||||
Institutional I Shares | (145,290,490 | ) | (250,252,322 | ) | (1,170,580,109 | ) | (1,303,759,963 | ) | ||||||||
Institutional II Shares | (86,444,854 | ) | (64,602,635 | ) | (867,066,245 | ) | (1,034,891,769 | ) | ||||||||
Change in net assets resulting from share transactions | 14,168,832 | (111,329,508 | ) | (210,507,409 | ) | (531,939,594 | ) | |||||||||
Change in net assets | 14,168,242 | (111,329,555 | ) | (210,499,379 | ) | (531,936,065 | ) | |||||||||
| NET ASSETS: | ||||||||||||||||
Beginning of year | 139,735,136 | 251,064,691 | 1,708,886,389 | 2,240,822,454 | ||||||||||||
End of year | $ | 153,903,378 | $ | 139,735,136 | $ | 1,498,387,010 | $ | 1,708,886,389 | ||||||||
Undistributed (distributions in excess of) net investment income included in net assets at end of year | $ | 4,060 | $ | 4,650 | $ | (21,254 | ) | $ | (29,284 | ) | ||||||
| SHARES OF BENEFICIAL INTEREST: | ||||||||||||||||
Shares sold | ||||||||||||||||
Class A Shares | 37,814,367 | 41,566,010 | 1,159,756,741 | 1,449,614,626 | ||||||||||||
Class A2 Shares | — | — | 155,495,435 | 124,710,770 | ||||||||||||
Class B Shares | — | — | 48,770 | 500 | ||||||||||||
Class S Shares | — | — | 112,590,000 | 191,756,106 | ||||||||||||
Institutional I Shares | 170,176,509 | 153,583,649 | 1,116,334,940 | 1,058,237,609 | ||||||||||||
Institutional II Shares | 82,897,090 | 52,330,657 | 858,351,940 | 1,012,783,706 | ||||||||||||
Distributions reinvested | ||||||||||||||||
Class A Shares | 2,026 | 7,366 | 33,365 | 92,645 | ||||||||||||
Class A2 Shares | — | — | 23,257 | 87,198 | ||||||||||||
Class B Shares | — | — | 21 | 82 | ||||||||||||
Class S Shares | — | — | 60 | 105 | ||||||||||||
Institutional I Shares | 345 | 331 | 16,082 | 19,446 | ||||||||||||
Institutional II Shares | — | — | 10 | 11 | ||||||||||||
Shares redeemed | ||||||||||||||||
Class A Shares | (44,986,161 | ) | (43,962,564 | ) | (1,273,362,600 | ) | (1,620,640,346 | ) | ||||||||
Class A2 Shares | — | — | (182,348,866 | ) | (200,383,611 | ) | ||||||||||
Class B Shares | — | — | (253,926 | ) | (213,046 | ) | ||||||||||
Class S Shares | — | — | (119,546,284 | ) | (209,353,529 | ) | ||||||||||
Institutional I Shares | (145,290,490 | ) | (250,252,322 | ) | (1,170,580,109 | ) | (1,303,759,963 | ) | ||||||||
Institutional II Shares | (86,444,854 | ) | (64,602,635 | ) | (867,066,245 | ) | (1,034,891,768 | ) | ||||||||
Net change resulting from share transactions | 14,168,832 | (111,329,508 | ) | (210,507,409 | ) | (531,939,459 | ) | |||||||||
See Notes which are an integral part of the Financial Statements
(Statements of Changes in Net Assets continued next page)
ANNUAL REPORT / April 30, 2011
Table of Contents
| 30 | STATEMENTS OF CHANGES IN NET ASSETS (continued) |
| MTB Prime Money Market Fund | MTB New York Tax-Free Money Market Fund | |||||||||||||||
Year Ended | Year Ended April 30, 2010 | Year Ended | Year Ended April 30, 2010 | |||||||||||||
| OPERATIONS: | ||||||||||||||||
Net investment income | $ | 199,943 | $ | 323,788 | $ | 17,264 | $ | 92,288 | ||||||||
Net realized gain (loss) on investments | 8,001 | — | (2,115 | ) | (63,251 | ) | ||||||||||
Change in net assets resulting from operations | 207,944 | 323,788 | 15,149 | 29,037 | ||||||||||||
| DISTRIBUTIONS TO SHAREHOLDERS: | ||||||||||||||||
Distributions from net investment income | ||||||||||||||||
Class A Shares | — | — | (6,670 | ) | (25,354 | ) | ||||||||||
Corporate Shares | (200,111 | ) | (323,835 | ) | — | — | ||||||||||
Institutional I Shares | — | — | (9,091 | ) | (66,359 | ) | ||||||||||
Distributions from net realized gain on investments | ||||||||||||||||
Corporate Shares | (2,500 | ) | — | — | — | |||||||||||
Change in net assets resulting from distributions to shareholders | (202,611 | ) | (323,835 | ) | (15,761 | ) | (91,713 | ) | ||||||||
| SHARE TRANSACTIONS: | ||||||||||||||||
Proceeds from sale of shares | ||||||||||||||||
Class A Shares | — | — | 171,744,955 | 199,048,434 | ||||||||||||
Corporate Shares | 1,192,328,824 | 1,196,398,750 | — | — | ||||||||||||
Institutional I Shares | — | — | 163,024,541 | 143,991,061 | ||||||||||||
Distributions reinvested | ||||||||||||||||
Class A Shares | — | — | 6,100 | 31,389 | ||||||||||||
Corporate Shares | 61,169 | 107,716 | — | — | ||||||||||||
Institutional I Shares | — | — | 1,204 | 9,672 | ||||||||||||
Cost of shares redeemed | ||||||||||||||||
Class A Shares | — | — | (176,961,528 | ) | (224,978,573 | ) | ||||||||||
Corporate Shares | (1,219,955,099 | ) | (1,335,283,403 | ) | — | — | ||||||||||
Institutional I Shares | — | — | (163,194,785 | ) | (209,520,671 | ) | ||||||||||
Change in net assets resulting from share transactions | (27,565,106 | ) | (138,776,937 | ) | (5,379,513 | ) | (91,418,688 | ) | ||||||||
Change in net assets | (27,559,773 | ) | (138,776,984 | ) | (5,380,125 | ) | (91,481,364 | ) | ||||||||
| NET ASSETS: | ||||||||||||||||
Beginning of year | 425,757,041 | 564,534,025 | 105,565,136 | 197,046,500 | ||||||||||||
End of year | $ | 398,197,268 | $ | 425,757,041 | $ | 100,185,011 | $ | 105,565,136 | ||||||||
Undistributed (distributions in excess of) net investment income included in net assets at end of year | $ | (231 | ) | $ | (63 | ) | $ | 181 | $ | (1,322 | ) | |||||
| SHARES OF BENEFICIAL INTEREST: | ||||||||||||||||
Shares sold | ||||||||||||||||
Class A Shares | — | — | 171,744,955 | 199,048,434 | ||||||||||||
Corporate Shares | 1,192,328,824 | 1,196,398,750 | — | — | ||||||||||||
Institutional I Shares | — | — | 163,024,541 | 143,991,061 | ||||||||||||
Distributions reinvested | ||||||||||||||||
Class A Shares | — | — | 6,100 | 31,389 | ||||||||||||
Corporate Shares | 61,169 | 107,716 | — | — | ||||||||||||
Institutional I Shares | — | — | 1,204 | 9,672 | ||||||||||||
Shares redeemed | ||||||||||||||||
Class A Shares | — | — | (176,961,528 | ) | (224,978,573 | ) | ||||||||||
Corporate Shares | (1,219,955,099 | ) | (1,335,283,403 | ) | — | — | ||||||||||
Institutional I Shares | — | — | (163,194,785 | ) | (209,520,671 | ) | ||||||||||
Net change resulting from share transactions | (27,565,106 | ) | (138,776,937 | ) | (5,379,513 | ) | (91,418,688 | ) | ||||||||
See Notes which are an integral part of the Financial Statements
(Statements of Changes in Net Assets continued next page)
April 30, 2011 / ANNUAL REPORT
Table of Contents
| STATEMENTS OF CHANGES IN NET ASSETS (concluded) | 31 |
| MTB Pennsylvania Tax-Free Money Market Fund | ||||||||
Year Ended | Year Ended April 30, 2010 | |||||||
| OPERATIONS: | ||||||||
Net investment income | $ | 5,193 | $ | 25,794 | ||||
Change in net assets resulting from operations | 5,193 | 25,794 | ||||||
| DISTRIBUTIONS TO SHAREHOLDERS: | ||||||||
Distributions from net investment income | ||||||||
Class A Shares | (541 | ) | (2,000 | ) | ||||
Institutional I Shares | (3,015 | ) | (20,607 | ) | ||||
Institutional II Shares | (1,845 | ) | (3,672 | ) | ||||
Change in net assets resulting from distributions to shareholders | (5,401 | ) | (26,279 | ) | ||||
| SHARE TRANSACTIONS: | ||||||||
Proceeds from sale of shares | ||||||||
Class A Shares | 11,034,485 | 20,834,909 | ||||||
Institutional I Shares | 47,408,136 | 49,437,783 | ||||||
Institutional II Shares | 1,368,779 | 20,093,481 | ||||||
Distributions reinvested | ||||||||
Class A Shares | 564 | 2,192 | ||||||
Institutional I Shares | 603 | 1,585 | ||||||
Institutional II Shares | — | — | ||||||
Cost of shares redeemed | ||||||||
Class A Shares | (12,986,353 | ) | (18,729,732 | ) | ||||
Institutional I Shares | (53,207,667 | ) | (80,027,020 | ) | ||||
Institutional II Shares | (7,810,178 | ) | (9,721,831 | ) | ||||
Change in net assets resulting from share transactions | (14,191,631 | ) | (18,108,633 | ) | ||||
Change in net assets | (14,191,839 | ) | (18,109,118 | ) | ||||
| NET ASSETS: | ||||||||
Beginning of year | 39,940,831 | 58,049,949 | ||||||
End of year | $ | 25,748,992 | $ | 39,940,831 | ||||
Undistributed net investment income included in net assets at end of year | $ | 2,884 | $ | 3,092 | ||||
| SHARES OF BENEFICIAL INTEREST: | ||||||||
Shares sold | ||||||||
Class A Shares | 11,034,485 | 20,834,909 | ||||||
Institutional I Shares | 47,408,136 | 49,437,783 | ||||||
Institutional II Shares | 1,368,779 | 20,093,481 | ||||||
Distributions reinvested | ||||||||
Class A Shares | 564 | 2,192 | ||||||
Institutional I Shares | 603 | 1,585 | ||||||
Institutional II Shares | — | — | ||||||
Shares redeemed | ||||||||
Class A Shares | (12,986,353 | ) | (18,729,732 | ) | ||||
Institutional I Shares | (53,207,667 | ) | (80,027,020 | ) | ||||
Institutional II Shares | (7,810,178 | ) | (9,721,831 | ) | ||||
Net change resulting from share transactions | (14,191,631 | ) | (18,108,633 | ) | ||||
See Notes which are an integral part of the Financial Statements
ANNUAL REPORT / April 30, 2011
Table of Contents
| 32 | FINANCIAL HIGHLIGHTS |
For a share outstanding throughout each year ended April 30, unless otherwise noted:
| MTB U.S. TREASURY MONEY MARKET FUND | ||||||||||||||||||||
| CLASS A SHARES | 2011 | 2010 | 2009 | 2008 | 2007 | |||||||||||||||
| Net Asset Value, Beginning of Period | $ 1.000 | $ 1.000 | $ 1.000 | $ 1.000 | $ 1.000 | |||||||||||||||
| Income (Loss) From Operations: | ||||||||||||||||||||
Net Investment Income | 0.000 | (c) | 0.000 | (c) | 0.005 | 0.033 | 0.043 | |||||||||||||
| Less Distributions From: | ||||||||||||||||||||
Net Investment Income | (0.000 | )(c) | (0.000 | )(c) | (0.005 | ) | (0.033 | ) | (0.043 | ) | ||||||||||
| Net Asset Value, End of Period | $ 1.000 | $ 1.000 | $ 1.000 | $ 1.000 | $ 1.000 | |||||||||||||||
| Total Return(a) | 0.01 | % | 0.02 | % | 0.54 | % | 3.40 | % | 4.42 | % | ||||||||||
| Net Assets, End of Period (000’s) | $71,929 | $141,648 | $133,754 | $103,488 | $108,698 | |||||||||||||||
| Ratios to Average Net Assets | ||||||||||||||||||||
Gross Expense | 0.74 | % | 0.74 | % | 0.74 | % | 0.76 | % | 0.78 | % | ||||||||||
Net Expenses(b) | 0.17 | % | 0.20 | % | 0.60 | % | 0.74 | % | 0.72 | % | ||||||||||
Net Investment Income | 0.01 | % | 0.02 | % | 0.48 | % | 3.32 | % | 4.33 | % | ||||||||||
| CLASS S SHARES | 2011 | 2010 | 2009 | 2008 | 2007 | |||||||||||||||
| Net Asset Value, Beginning of Period | $ 1.000 | $ 1.000 | $ 1.000 | $ 1.000 | $ 1.000 | |||||||||||||||
| Income (Loss) From Operations: | ||||||||||||||||||||
Net Investment Income | 0.000 | (c) | 0.000 | (c) | 0.004 | 0.031 | 0.041 | |||||||||||||
| Less Distributions From: | ||||||||||||||||||||
Net Investment Income | (0.000 | )(c) | (0.000 | )(c) | (0.004 | ) | (0.031 | ) | (0.041 | ) | ||||||||||
| Net Asset Value, End of Period | $ 1.000 | $ 1.000 | $ 1.000 | $ 1.000 | $ 1.000 | |||||||||||||||
| Total Return(a) | 0.01 | % | 0.02 | % | 0.43 | % | 3.14 | % | 4.18 | % | ||||||||||
| Net Assets, End of Period (000’s) | $10,627 | $10,755 | $10,271 | $21,153 | $27,794 | |||||||||||||||
| Ratios to Average Net Assets | ||||||||||||||||||||
Gross Expense | 0.99 | % | 0.98 | % | 0.99 | % | 1.01 | % | 1.03 | % | ||||||||||
Net Expenses(b) | 0.16 | % | 0.20 | % | 0.74 | % | 0.99 | % | 0.96 | % | ||||||||||
Net Investment Income | 0.01 | % | 0.02 | % | 0.45 | % | 3.27 | % | 4.10 | % | ||||||||||
| INSTITUTIONAL I SHARES | 2011 | 2010 | 2009 | 2008 | 2007 | |||||||||||||||
| Net Asset Value, Beginning of Period | $ 1.000 | $ 1.000 | $ 1.000 | $ 1.000 | $ 1.000 | |||||||||||||||
| Income (Loss) From Operations: | ||||||||||||||||||||
Net Investment Income | 0.000 | (c) | 0.000 | (c) | 0.007 | 0.036 | 0.046 | |||||||||||||
| Less Distributions From: | ||||||||||||||||||||
Net Investment Income | (0.000 | )(c) | (0.000 | )(c) | (0.007 | ) | (0.036 | ) | (0.046 | ) | ||||||||||
| Net Asset Value, End of Period | $ 1.000 | $ 1.000 | $ 1.000 | $ 1.000 | $ 1.000 | |||||||||||||||
| Total Return(a) | 0.01 | % | 0.02 | % | 0.68 | % | 3.66 | % | 4.66 | % | ||||||||||
| Net Assets, End of Period (000’s) | $165,795 | $176,467 | $394,550 | $565,532 | $336,470 | |||||||||||||||
| Ratios to Average Net Assets | ||||||||||||||||||||
Gross Expense | 0.74 | % | 0.74 | % | 0.74 | % | 0.75 | % | 0.77 | % | ||||||||||
Net Expenses(b) | 0.17 | % | 0.23 | % | 0.46 | % | 0.49 | % | 0.49 | % | ||||||||||
Net Investment Income | 0.01 | % | 0.02 | % | 0.64 | % | 3.64 | % | 4.57 | % | ||||||||||
| INSTITUTIONAL II SHARES | 2011 | 2010 | 2009 | 2008 | 2007 | |||||||||||||||
| Net Asset Value, Beginning of Period | $ 1.000 | $ 1.000 | $ 1.000 | $ 1.000 | $ 1.000 | |||||||||||||||
| Income (Loss) From Operations: | ||||||||||||||||||||
Net Investment Income | 0.000 | (c) | 0.000 | (c) | 0.006 | 0.035 | 0.044 | |||||||||||||
| Less Distributions From: | ||||||||||||||||||||
Net Investment Income | (0.000 | )(c) | (0.000 | )(c) | (0.006 | ) | (0.035 | ) | (0.044 | ) | ||||||||||
| Net Asset Value, End of Period | $ 1.000 | $ 1.000 | $ 1.000 | $ 1.000 | $ 1.000 | |||||||||||||||
| Total Return(a) | 0.01 | % | 0.02 | % | 0.58 | % | 3.51 | % | 4.51 | % | ||||||||||
| Net Assets, End of Period (000’s) | $676,070 | $654,530 | $752,284 | $447,430 | $382,644 | |||||||||||||||
| Ratios to Average Net Assets | ||||||||||||||||||||
Gross Expense | 0.74 | % | 0.73 | % | 0.74 | % | 0.75 | % | 0.77 | % | ||||||||||
Net Expenses(b) | 0.16 | % | 0.22 | % | 0.54 | % | 0.64 | % | 0.63 | % | ||||||||||
Net Investment Income | 0.01 | % | 0.03 | % | 0.39 | % | 3.22 | % | 4.40 | % | ||||||||||
| (a) | Total returns for periods of less than one year are not annualized. |
| (b) | The investment manager voluntarily waived a portion of its fees. |
| (c) | Represents less than $0.001. |
See Notes which are an integral part of the Financial Statements
(Financial Highlights continued next page)
April 30, 2011 / ANNUAL REPORT
Table of Contents
| FINANCIAL HIGHLIGHTS (continued) | 33 |
For a share outstanding throughout each year ended April 30, unless otherwise noted:
| MTB U.S. GOVERNMENT MONEY MARKET FUND | ||||||||||||||||||||
| CLASS A SHARES | 2011 | 2010 | 2009 | 2008 | 2007 | |||||||||||||||
| Net Asset Value, Beginning of Period | $ 1.000 | $ 1.000 | $ 1.000 | $ 1.000 | $ 1.000 | |||||||||||||||
| Income (Loss) From Operations: | ||||||||||||||||||||
Net Investment Income | 0.000 | (c) | 0.000 | (c) | 0.011 | 0.038 | 0.044 | |||||||||||||
| Less Distributions From: | ||||||||||||||||||||
Net Investment Income | (0.000 | )(c) | (0.000 | )(c) | (0.011 | ) | (0.038 | ) | (0.044 | ) | ||||||||||
Return of Capital | (0.000 | )(c) | (0.000 | )(c) | — | — | — | |||||||||||||
| Total Distributions | (0.000 | ) | (0.000 | ) | (0.011 | ) | (0.038 | ) | (0.044 | ) | ||||||||||
| Net Asset Value, End of Period | $ 1.000 | $ 1.000 | $ 1.000 | $ 1.000 | $ 1.000 | |||||||||||||||
| Total Return(a) | 0.01 | % | 0.02 | % | 1.14 | % | 3.97 | % | 4.53 | % | ||||||||||
| Net Assets, End of Period (000’s) | $35,561 | $35,502 | $42,427 | $26,789 | $23,755 | |||||||||||||||
| Ratios to Average Net Assets | ||||||||||||||||||||
Gross Expense | 0.98 | % | 1.00 | % | 0.99 | % | 0.99 | % | 1.01 | % | ||||||||||
Net Expenses(b) | 0.25 | % | 0.30 | % | 0.73 | % | 0.70 | % | 0.72 | % | ||||||||||
Net Investment Income | 0.01 | % | 0.02 | % | 0.97 | % | 3.77 | % | 4.67 | % | ||||||||||
| INSTITUTIONAL I SHARES | 2011 | 2010 | 2009 | 2008 | 2007 | |||||||||||||||
| Net Asset Value, Beginning of Period | $ 1.000 | $ 1.000 | $ 1.000 | $ 1.000 | $ 1.000 | |||||||||||||||
| Income (Loss) From Operations: | ||||||||||||||||||||
Net Investment Income | 0.000 | (c) | 0.000 | (c) | 0.013 | 0.041 | 0.047 | |||||||||||||
| Less Distributions From: | ||||||||||||||||||||
Net Investment Income | (0.000 | )(c) | (0.000 | )(c) | (0.013 | ) | (0.041 | ) | (0.047 | ) | ||||||||||
Return of Capital | (0.000 | )(c) | (0.000 | )(c) | — | — | — | |||||||||||||
| Total Distributions | (0.001 | ) | (0.000 | ) | (0.013 | ) | (0.041 | ) | (0.047 | ) | ||||||||||
| Net Asset Value, End of Period | $ 1.000 | $ 1.000 | $ 1.000 | $ 1.000 | $ 1.000 | |||||||||||||||
| Total Return(a) | 0.01 | % | 0.02 | % | 1.34 | % | 4.20 | % | 4.83 | % | ||||||||||
| Net Assets, End of Period (000’s) | $355,506 | $496,004 | $1,394,758 | $2,196,947 | $1,420,028 | |||||||||||||||
| Ratios to Average Net Assets | ||||||||||||||||||||
Gross Expense | 0.74 | % | 0.75 | % | 0.73 | % | 0.73 | % | 0.76 | % | ||||||||||
Net Expenses(b) | 0.26 | % | 0.32 | % | 0.48 | % | 0.45 | % | 0.45 | % | ||||||||||
Net Investment Income | 0.01 | % | 0.02 | % | 1.38 | % | 3.97 | % | 4.74 | % | ||||||||||
| INSTITUTIONAL II SHARES | 2011 | 2010 | 2009 | 2008 | 2007 | |||||||||||||||
| Net Asset Value, Beginning of Period | $ 1.000 | $ 1.000 | $ 1.000 | $ 1.000 | $ 1.000 | |||||||||||||||
| Income (Loss) From Operations: | ||||||||||||||||||||
Net Investment Income | 0.000 | (c) | 0.000 | (c) | 0.012 | 0.040 | 0.046 | |||||||||||||
| Less Distributions From: | ||||||||||||||||||||
Net Investment Income | (0.000 | )(c) | (0.000 | )(c) | (0.012 | ) | (0.040 | ) | (0.046 | ) | ||||||||||
Return of Capital | (0.000 | )(c) | (0.000 | )(c) | — | — | — | |||||||||||||
| Total Distributions | (0.000 | ) | (0.000 | ) | (0.012 | ) | (0.040 | ) | (0.046 | ) | ||||||||||
| Net Asset Value, End of Period | $ 1.000 | $ 1.000 | $ 1.000 | $ 1.000 | $ 1.000 | |||||||||||||||
| Total Return(a) | 0.01 | % | 0.02 | % | 1.23 | % | 4.09 | % | 4.74 | % | ||||||||||
| Net Assets, End of Period (000’s) | $1,493,139 | $1,582,317 | $1,642,160 | $1,417,435 | $1,075,679 | |||||||||||||||
| Ratios to Average Net Assets | ||||||||||||||||||||
Gross Expense | 0.73 | % | 0.74 | % | 0.73 | % | 0.73 | % | 0.76 | % | ||||||||||
Net Expenses(b) | 0.25 | % | 0.29 | % | 0.58 | % | 0.55 | % | 0.54 | % | ||||||||||
Net Investment Income | 0.01 | % | 0.02 | % | 1.17 | % | 3.88 | % | 4.63 | % | ||||||||||
| (a) | Total returns for periods of less than one year are not annualized. |
| (b) | The investment manager voluntarily waived a portion of its fees. |
| (c) | Represents less than $0.001. |
See Notes which are an integral part of the Financial Statements
(Financial Highlights continued next page)
ANNUAL REPORT /�� April 30, 2011
Table of Contents
| 34 | FINANCIAL HIGHLIGHTS (continued) |
For a share outstanding throughout each year ended April 30, unless otherwise noted:
| MTB TAX-FREE MONEY MARKET FUND | ||||||||||||||||||||
| CLASS A SHARES | 2011 | 2010 | 2009 | 2008 | 2007 | |||||||||||||||
| Net Asset Value, Beginning of Period | $ 1.000 | $ 1.000 | $ 1.000 | $ 1.000 | $ 1.000 | |||||||||||||||
| Income (Loss) From Operations: | ||||||||||||||||||||
Net Investment Income | 0.000 | (c) | 0.000 | (c) | 0.010 | 0.024 | 0.027 | |||||||||||||
Net Realized and Unrealized Gain (Loss) | — | — | — | 0.001 | — | |||||||||||||||
| Total Income (Loss) From Operations | 0.000 | 0.000 | 0.010 | 0.025 | 0.027 | |||||||||||||||
| Less Distributions From: | ||||||||||||||||||||
Net Investment Income | (0.000 | )(c) | (0.000 | )(c) | (0.010 | ) | (0.025 | ) | (0.027 | ) | ||||||||||
| Net Asset Value, End of Period | $ 1.000 | $ 1.000 | $ 1.000 | $ 1.000 | $ 1.000 | |||||||||||||||
| Total Return(a) | 0.01 | % | 0.03 | % | 1.00 | % | 2.49 | % | 2.78 | % | ||||||||||
| Net Assets, End of Period (000’s) | $11,779 | $18,949 | $21,338 | $22,194 | $19,781 | |||||||||||||||
| Ratios to Average Net Assets | ||||||||||||||||||||
Gross Expense | 1.08 | % | 1.04 | % | 1.03 | % | 1.08 | % | 1.09 | % | ||||||||||
Net Expenses(b) | 0.41 | % | 0.47 | % | 0.80 | % | 0.79 | % | 0.80 | % | ||||||||||
Net Investment Income | 0.01 | % | 0.04 | % | 0.99 | % | 2.44 | % | 2.72 | % | ||||||||||
| INSTITUTIONAL I SHARES | 2011 | 2010 | 2009 | 2008 | 2007 | |||||||||||||||
| Net Asset Value, Beginning of Period | $ 1.000 | $ 1.000 | $ 1.000 | $ 1.000 | $ 1.000 | |||||||||||||||
| Income (Loss) From Operations: | ||||||||||||||||||||
Net Investment Income | 0.000 | (c) | 0.001 | 0.014 | 0.028 | 0.031 | ||||||||||||||
Net Realized and Unrealized Gain (Loss) | — | — | — | 0.001 | — | |||||||||||||||
| Total Income (Loss) From Operations | 0.000 | 0.001 | 0.014 | 0.029 | 0.031 | |||||||||||||||
| �� | ||||||||||||||||||||
| Less Distributions From: | ||||||||||||||||||||
Net Investment Income | (0.000 | )(c) | (0.001 | ) | (0.014 | ) | (0.029 | ) | (0.031 | ) | ||||||||||
| Net Asset Value, End of Period | $ 1.000 | $ 1.000 | $ 1.000 | $ 1.000 | $ 1.000 | |||||||||||||||
| Total Return(a) | 0.03 | % | 0.09 | % | 1.40 | % | 2.88 | % | 3.19 | % | ||||||||||
| Net Assets, End of Period (000’s) | $108,802 | $83,916 | $180,584 | $70,133 | $41,617 | |||||||||||||||
| Ratios to Average Net Assets | ||||||||||||||||||||
Gross Expense | 0.83 | % | 0.78 | % | 0.78 | % | 0.90 | % | 0.84 | % | ||||||||||
Net Expenses(b) | 0.39 | % | 0.41 | % | 0.42 | % | 0.39 | % | 0.41 | % | ||||||||||
Net Investment Income | 0.03 | % | 0.10 | % | 1.14 | % | 2.75 | % | 3.13 | % | ||||||||||
| INSTITUTIONAL II SHARES | 2011 | 2010 | 2009 | 2008 | 2007 | |||||||||||||||
| Net Asset Value, Beginning of Period | $ 1.000 | $ 1.000 | $ 1.000 | $ 1.000 | $ 1.000 | |||||||||||||||
| Income (Loss) From Operations: | ||||||||||||||||||||
Net Investment Income | 0.000 | (c) | 0.001 | 0.012 | 0.026 | 0.030 | ||||||||||||||
Net Realized and Unrealized Gain (Loss) | — | — | — | 0.001 | — | |||||||||||||||
| Total Income (Loss) From Operations |
|
0.000 |
| 0.001 | 0.012 | 0.027 | 0.030 | |||||||||||||
| Less Distributions From: | ||||||||||||||||||||
Net Investment Income |
|
(0.000 |
)(c) | (0.001 | ) | (0.012 | ) | (0.027 | ) | (0.030 | ) | |||||||||
| Net Asset Value, End of Period | $ 1.000 | $ 1.000 | $ 1.000 | $ 1.000 | $ 1.000 | |||||||||||||||
| Total Return(a) | 0.03 | % | 0.06 | % | 1.25 | % | 2.74 | % | 3.04 | % | ||||||||||
| Net Assets, End of Period (000’s) | $33,322 | $36,870 | $49,143 | $39,081 | $29,292 | |||||||||||||||
| Ratios to Average Net Assets | ||||||||||||||||||||
Gross Expense | 0.83 | % | 0.78 | % | 0.78 | % | 0.82 | % | 0.84 | % | ||||||||||
Net Expenses(b) | 0.39 | % | 0.45 | % | 0.56 | % | 0.54 | % | 0.55 | % | ||||||||||
Net Investment Income | 0.03 | % | 0.06 | % | 1.21 | % | 2.64 | % | 2.98 | % | ||||||||||
| (a) | Total returns for periods of less than one year are not annualized. |
| (b) | The investment manager voluntarily waived a portion of its fees. |
| (c) | Represents less than $0.001. |
See Notes which are an integral part of the Financial Statements
(Financial Highlights continued next page)
April 30, 2011 / ANNUAL REPORT
Table of Contents
| FINANCIAL HIGHLIGHTS (continued) | 35 |
For a share outstanding throughout each year ended April 30, unless otherwise noted:
| MTB MONEY MARKET FUND | ||||||||||||||||||||
| CLASS A SHARES | 2011 | 2010 | 2009 | 2008 | 2007 | |||||||||||||||
| Net Asset Value, Beginning of Period | $ 1.000 | $ 1.000 | $ 1.000 | $ 1.000 | $ 1.000 | |||||||||||||||
| Income (Loss) From Operations: | ||||||||||||||||||||
Net Investment Income | 0.000 | (c) | 0.000 | (c) | 0.011 | 0.041 | 0.046 | |||||||||||||
| Less Distributions From: | ||||||||||||||||||||
Net Investment Income | (0.000 | )(c) | (0.000 | )(c) | (0.011 | ) | (0.041 | ) | (0.046 | ) | ||||||||||
Return of Capital | — | (0.000 | )(c) | — | — | — | ||||||||||||||
| Total Distributions | (0.000 | ) | (0.000 | ) | (0.011 | ) | (0.041 | ) | (0.046 | ) | ||||||||||
| Net Asset Value, End of Period | $ 1.000 | $ 1.000 | $ 1.000 | $ 1.000 | $ 1.000 | |||||||||||||||
| Total Return(a) | 0.01 | % | 0.02 | % | 1.13 | % | 4.14 | % | 4.72 | % | ||||||||||
| Net Assets, End of Period (000’s) | $345,931 | $459,497 | $630,429 | $837,674 | $740,486 | |||||||||||||||
| Ratios to Average Net Assets | ||||||||||||||||||||
Gross Expense | 0.75 | % | 0.77 | % | 0.76 | % | 0.75 | % | 0.78 | % | ||||||||||
Net Expenses(b) | 0.28 | % | 0.29 | % | 0.67 | % | 0.67 | % | 0.63 | % | ||||||||||
Net Investment Income | 0.01 | % | 0.02 | % | 1.20 | % | 3.97 | % | 4.62 | % | ||||||||||
| CLASS A2 SHARES(d) | 2011 | 2010 | 2009 | 2008 | 2007 | |||||||||||||||
| Net Asset Value, Beginning of Period | $ 1.000 | $ 1.000 | $ 1.000 | $ 1.000 | $ 1.000 | |||||||||||||||
| Income (Loss) From Operations: | ||||||||||||||||||||
Net Investment Income | 0.000 | (c) | 0.000 | (c) | 0.013 | 0.043 | 0.047 | |||||||||||||
| Less Distributions From: | ||||||||||||||||||||
Net Investment Income | �� | (0.000 | )(c) | (0.000 | )(c) | (0.013 | ) | (0.043 | ) | (0.047 | ) | |||||||||
Return of Capital | — | (0.000 | )(c) | — | — | — | ||||||||||||||
| Total Distributions | (0.000 | ) | (0.000 | ) | (0.013 | ) | (0.043 | ) | (0.047 | ) | ||||||||||
| Net Asset Value, End of Period | $ 1.000 | $ 1.000 | $ 1.000 | $ 1.000 | $ 1.000 | |||||||||||||||
| Total Return(a) | 0.01 | % | 0.03 | % | 1.30 | % | 4.35 | % | 4.83 | % | ||||||||||
| Net Assets, End of Period (000’s) | $217,836 | $244,661 | $320,238 | $459,544 | $156,286 | |||||||||||||||
| Ratios to Average Net Assets | ||||||||||||||||||||
Gross Expense | 1.00 | % | 1.02 | % | 1.00 | % | 0.99 | % | 1.03 | % | ||||||||||
Net Expenses(b) | 0.28 | % | 0.28 | % | 0.49 | % | 0.47 | % | 0.49 | % | ||||||||||
Net Investment Income | 0.01 | % | 0.03 | % | 1.42 | % | 3.98 | % | 4.85 | % | ||||||||||
(Financial Highlights continued next page)
ANNUAL REPORT / April 30, 2011
Table of Contents
| 36 | FINANCIAL HIGHLIGHTS (continued) |
For a share outstanding throughout each year ended April 30, unless otherwise noted:
| MTB MONEY MARKET FUND – (continued) | ||||||||||||||||||||
| CLASS S SHARES | 2011 | 2010 | 2009 | 2008 | 2007 | |||||||||||||||
| Net Asset Value, Beginning of Period | $ 1.000 | $ 1.000 | $ 1.000 | $ 1.000 | $ 1.000 | |||||||||||||||
| Income (Loss) From Operations: | ||||||||||||||||||||
Net Investment Income | 0.000 | (c) | 0.000 | (c) | 0.009 | 0.038 | 0.043 | |||||||||||||
| Less Distributions From: | ||||||||||||||||||||
Net Investment Income | (0.000 | )(c) | (0.000 | )(c) | (0.009 | ) | (0.038 | ) | (0.043 | ) | ||||||||||
Return of Capital | — | (0.000 | )(c) | — | — | — | ||||||||||||||
| Total Distributions | (0.000 | ) | (0.000 | ) | (0.009 | ) | (0.038 | ) | (0.043 | ) | ||||||||||
| Net Asset Value, End of Period | $ 1.000 | $ 1.000 | $ 1.000 | $ 1.000 | $ 1.000 | |||||||||||||||
| Total Return(a) | 0.01 | % | 0.02 | % | 0.92 | % | 3.88 | % | 4.40 | % | ||||||||||
| Net Assets, End of Period (000’s) | $5,870 | $12,826 | $30,423 | $62,025 | $61,091 | |||||||||||||||
| Ratios to Average Net Assets | ||||||||||||||||||||
Gross Expense | 1.00 | % | 1.02 | % | 1.00 | % | 1.00 | % | 1.03 | % | ||||||||||
Net Expenses(b) | 0.28 | % | 0.34 | % | 0.88 | % | 0.92 | % | 0.93 | % | ||||||||||
Net Investment Income | 0.01 | % | 0.03 | % | 1.07 | % | 3.75 | % | 4.33 | % | ||||||||||
| INSTITUTIONAL I SHARES | 2011 | 2010 | 2009 | 2008 | 2007 | |||||||||||||||
| Net Asset Value, Beginning of Period | $ 1.000 | $ 1.000 | $ 1.000 | $ 1.000 | $ 1.000 | |||||||||||||||
| Income (Loss) From Operations: | ||||||||||||||||||||
Net Investment Income | 0.000 | (c) | 0.000 | (c) | 0.013 | 0.043 | 0.048 | |||||||||||||
| Less Distributions From: | ||||||||||||||||||||
Net Investment Income | (0.000 | )(c) | (0.000 | )(c) | (0.013 | ) | (0.043 | ) | (0.048 | ) | ||||||||||
Return of Capital | — | (0.000 | )(c) | — | — | — | ||||||||||||||
| Total Distributions | (0.000 | ) | (0.000 | ) | (0.013 | ) | (0.043 | ) | (0.048 | ) | ||||||||||
| Net Asset Value, End of Period | $ 1.000 | $ 1.000 | $ 1.000 | $ 1.000 | $ 1.000 | |||||||||||||||
| Total Return(a) | 0.04 | % | 0.05 | % | 1.35 | % | 4.40 | % | 4.92 | % | ||||||||||
| Net Assets, End of Period (000’s) | $512,363 | $566,594 | $812,096 | $790,578 | $502,907 | |||||||||||||||
| Ratios to Average Net Assets | ||||||||||||||||||||
Gross Expense | 0.75 | % | 0.77 | % | 0.76 | % | 0.74 | % | 0.78 | % | ||||||||||
Net Expenses(b) | 0.25 | % | 0.26 | % | 0.45 | % | 0.42 | % | 0.43 | % | ||||||||||
Net Investment Income | 0.04 | % | 0.05 | % | 1.31 | % | 4.09 | % | 4.82 | % | ||||||||||
| INSTITUTIONAL II SHARES | 2011 | 2010 | 2009 | 2008 | 2007 | |||||||||||||||
| Net Asset Value, Beginning of Period | $ 1.000 | $ 1.000 | $ 1.000 | $ 1.000 | $ 1.000 | |||||||||||||||
| Income (Loss) From Operations: | ||||||||||||||||||||
Net Investment Income | 0.000 | (c) | 0.000 | (c) | 0.012 | 0.042 | 0.047 | |||||||||||||
| Less Distributions From: | ||||||||||||||||||||
Net Investment Income | (0.000 | )(c) | (0.000 | )(c) | (0.012 | ) | (0.042 | ) | (0.047 | ) | ||||||||||
Return of Capital | — | (0.000 | )(c) | — | — | — | ||||||||||||||
| Total Distributions | (0.000 | ) | (0.000 | ) | (0.012 | ) | (0.042 | ) | (0.047 | ) | ||||||||||
| Net Asset Value, End of Period | $ 1.000 | $ 1.000 | $ 1.000 | $ 1.000 | $ 1.000 | |||||||||||||||
| Total Return(a) | 0.04 | % | 0.04 | % | 1.25 | % | 4.29 | % | 4.82 | % | ||||||||||
| Net Assets, End of Period (000’s) | $416,387 | $425,103 | $447,219 | $1,104,416 | $555,422 | |||||||||||||||
| Ratios to Average Net Assets | ||||||||||||||||||||
Gross Expense | 0.75 | % | 0.77 | % | 0.74 | % | 0.74 | % | 0.78 | % | ||||||||||
Net Expenses(b) | 0.25 | % | 0.26 | % | 0.53 | % | 0.52 | % | 0.53 | % | ||||||||||
Net Investment Income | 0.04 | % | 0.04 | % | 1.55 | % | 3.93 | % | 4.73 | % | ||||||||||
| (a) | Total returns for periods of less than one year are not annualized. |
| (b) | The investment manager voluntarily waived a portion of its fees. |
| (c) | Represents less than $0.001. |
| (d) | Formerly Institutional Shares. |
See Notes which are an integral part of the Financial Statements
(Financial Highlights continued next page)
April 30, 2011 / ANNUAL REPORT
Table of Contents
| FINANCIAL HIGHLIGHTS (continued) | 37 |
For a share outstanding throughout each year ended April 30, unless otherwise noted:
| MTB PRIME MONEY MARKET FUND | ||||||||||||||||||||
| CORPORATE SHARES(c) | 2011 | 2010 | 2009 | 2008 | 2007 | |||||||||||||||
| Net Asset Value, Beginning of Period | $ 1.000 | $ 1.000 | $ 1.000 | $ 1.000 | $ 1.000 | |||||||||||||||
| Income (Loss) From Operations: | ||||||||||||||||||||
Net Investment Income | 0.001 | 0.001 | 0.013 | 0.043 | 0.048 | |||||||||||||||
| Less Distributions From: | ||||||||||||||||||||
Net Investment Income | (0.001 | ) | (0.001 | ) | (0.013 | ) | (0.043 | ) | (0.048 | ) | ||||||||||
| Net Asset Value, End of Period | $ 1.000 | $ 1.000 | $ 1.000 | $ 1.000 | $ 1.000 | |||||||||||||||
| Total Return(a) | 0.05 | % | 0.07 | % | 1.35 | % | 4.44 | % | 4.94 | % | ||||||||||
| Net Assets, End of Period (000’s) | $398,197 | $425,757 | $564,534 | $454,775 | $349,459 | |||||||||||||||
| Ratios to Average Net Assets | ||||||||||||||||||||
Gross Expense | 1.01 | % | 1.01 | % | 1.01 | % | 0.97 | % | 1.03 | % | ||||||||||
Net Expenses(b) | 0.23 | % | 0.24 | % | 0.39 | % | 0.37 | % | 0.40 | % | ||||||||||
Net Investment Income | 0.05 | % | 0.07 | % | 1.27 | % | 4.19 | % | 4.83 | % | ||||||||||
| (a) | Total returns for periods of less than one year are not annualized. |
| (b) | The investment manager voluntarily waived a portion of its fees. |
| (c) | Formerly Institutional Shares. |
See Notes which are an integral part of the Financial Statements
(Financial Highlights continued next page)
ANNUAL REPORT / April 30, 2011
Table of Contents
| 38 | FINANCIAL HIGHLIGHTS (continued) |
For a share outstanding throughout each year ended April 30, unless otherwise noted:
| MTB NEW YORK TAX-FREE MONEY MARKET FUND | ||||||||||||||||||||
| CLASS A SHARES | 2011 | 2010 | 2009 | 2008 | 2007 | |||||||||||||||
| Net Asset Value, Beginning of Period | $ 1.000 | $ 1.000 | $ 1.000 | $ 1.000 | $ 1.000 | |||||||||||||||
| Income (Loss) From Operations: | ||||||||||||||||||||
Net Investment Income | 0.000 | (c) | 0.000 | (c) | 0.010 | 0.024 | 0.028 | |||||||||||||
| Less Distributions From: | ||||||||||||||||||||
Net Investment Income | (0.000 | )(c) | (0.000 | )(c) | (0.010 | ) | (0.024 | ) | (0.028 | ) | ||||||||||
Net Realized Gains | — | — | (0.000 | )(c) | (0.000 | )(c) | — | |||||||||||||
| Total Distributions | (0.000 | ) | (0.000 | ) | (0.010 | ) | (0.024 | ) | (0.028 | ) | ||||||||||
| Net Asset Value, End of Period | $ 1.000 | $ 1.000 | $ 1.000 | $ 1.000 | $ 1.000 | |||||||||||||||
| Total Return(a) | 0.01 | % | 0.03 | % | 1.06 | % | 2.47 | % | 2.86 | % | ||||||||||
| Net Assets, End of Period (000’s) | $52,518 | $57,728 | $83,653 | $100,280 | $80,685 | |||||||||||||||
| Ratios to Average Net Assets | ||||||||||||||||||||
Gross Expense | 0.86 | % | 0.81 | % | 0.79 | % | 0.80 | % | 0.84 | % | ||||||||||
Net Expenses(b) | 0.37 | % | 0.52 | % | 0.75 | % | 0.74 | % | 0.72 | % | ||||||||||
Net Investment Income | 0.01 | % | 0.03 | % | 1.06 | % | 2.36 | % | 2.81 | % | ||||||||||
| INSTITUTIONAL I SHARES | 2011 | 2010 | 2009 | 2008 | 2007 | |||||||||||||||
| Net Asset Value, Beginning of Period | $ 1.000 | $ 1.000 | $ 1.000 | $ 1.000 | $ 1.000 | |||||||||||||||
| Income (Loss) From Operations: | ||||||||||||||||||||
Net Investment Income | 0.000 | (c) | 0.001 | 0.013 | 0.025 | 0.030 | ||||||||||||||
Net Realized and Unrealized Gain (Loss) | — | — | — | 0.002 | — | |||||||||||||||
| Total Income (Loss) From Operations | 0.000 | 0.001 | 0.013 | 0.027 | 0.030 | |||||||||||||||
| Less Distributions From: | ||||||||||||||||||||
Net Investment Income | (0.000 | )(c) | (0.001 | ) | (0.013 | ) | (0.027 | ) | (0.030 | ) | ||||||||||
Net Realized Gains | — | — | (0.000 | )(c) | (0.000 | )(c) | — | |||||||||||||
| Total Distributions | (0.000 | ) | (0.001 | ) | (0.013 | ) | (0.027 | ) | (0.030 | ) | ||||||||||
| Net Asset Value, End of Period | $ 1.000 | $ 1.000 | $ 1.000 | $ 1.000 | $ 1.000 | |||||||||||||||
| Total Return(a) | 0.02 | % | 0.07 | % | 1.30 | % | 2.72 | % | 3.08 | % | ||||||||||
| Net Assets, End of Period (000’s) | $47,667 | $47,838 | $113,393 | $49,637 | $30,767 | |||||||||||||||
| Ratios to Average Net Assets | ||||||||||||||||||||
Gross Expense | 0.86 | % | 0.81 | % | 0.79 | % | 0.80 | % | 0.85 | % | ||||||||||
Net Expenses(b) | 0.37 | % | 0.49 | % | 0.50 | % | 0.49 | % | 0.50 | % | ||||||||||
Net Investment Income | 0.02 | % | 0.08 | % | 1.24 | % | 2.52 | % | 3.02 | % | ||||||||||
| (a) | Total returns for periods of less than one year are not annualized. |
| (b) | The investment manager voluntarily waived a portion of its fees. |
| (c) | Represents less than $0.001. |
See Notes which are an integral part of the Financial Statements
(Financial Highlights continued next page)
April 30, 2011 / ANNUAL REPORT
Table of Contents
| FINANCIAL HIGHLIGHTS (concluded) | 39 |
For a share outstanding throughout each year ended April 30, unless otherwise noted:
| MTB PENNSYLVANIA TAX-FREE MONEY MARKET FUND | ||||||||||||||||||||
| CLASS A SHARES | 2011 | 2010 | 2009 | 2008 | 2007 | |||||||||||||||
| Net Asset Value, Beginning of Period | $ 1.000 | $ 1.000 | $ 1.000 | $ 1.000 | $ 1.000 | |||||||||||||||
| Income (Loss) From Operations: | ||||||||||||||||||||
Net Investment Income | 0.000 | (c) | 0.000 | (c) | 0.010 | 0.025 | 0.028 | |||||||||||||
| Less Distributions From: | ||||||||||||||||||||
Net Investment Income | (0.000 | )(c) | (0.000 | )(c) | (0.010 | ) | (0.025 | ) | (0.028 | ) | ||||||||||
| Net Asset Value, End of Period | $ 1.000 | $ 1.000 | $ 1.000 | $ 1.000 | $ 1.000 | |||||||||||||||
| Total Return(a) | 0.01 | % | 0.03 | % | 0.97 | % | 2.50 | % | 2.81 | % | ||||||||||
| Net Assets, End of Period (000’s) | $5,293 | $7,245 | $5,137 | $6,320 | $3,817 | |||||||||||||||
| Ratios to Average Net Assets | ||||||||||||||||||||
Gross Expense | 1.41 | % | 1.25 | % | 1.13 | % | 1.30 | % | 1.41 | % | ||||||||||
Net Expenses(b) | 0.41 | % | 0.44 | % | 0.76 | % | 0.75 | % | 0.77 | % | ||||||||||
Net Investment Income | 0.01 | % | 0.03 | % | 0.98 | % | 2.41 | % | 2.83 | % | ||||||||||
| INSTITUTIONAL I SHARES | 2011 | 2010 | 2009 | 2008 | 2007 | |||||||||||||||
| Net Asset Value, Beginning of Period | $ 1.000 | $ 1.000 | $ 1.000 | $ 1.000 | $ 1.000 | |||||||||||||||
| Income (Loss) From Operations: | ||||||||||||||||||||
Net Investment Income | 0.000 | (c) | 0.001 | 0.011 | 0.027 | 0.030 | ||||||||||||||
| Less Distributions From: | ||||||||||||||||||||
Net Investment Income | (0.000 | )(c) | (0.001 | ) | (0.011 | ) | (0.027 | ) | (0.030 | ) | ||||||||||
| Net Asset Value, End of Period | $ 1.000 | $ 1.000 | $ 1.000 | $ 1.000 | $ 1.000 | |||||||||||||||
| Total Return(a) | 0.02 | % | 0.06 | % | 1.16 | % | 2.71 | % | 3.03 | % | ||||||||||
| Net Assets, End of Period (000’s) | $12,380 | $18,178 | $48,766 | $59,232 | $15,343 | |||||||||||||||
| Ratios to Average Net Assets | ||||||||||||||||||||
Gross Expense | 1.16 | % | 0.99 | % | 0.88 | % | 1.04 | % | 1.16 | % | ||||||||||
Net Expenses(b) | 0.40 | % | 0.47 | % | 0.57 | % | 0.55 | % | 0.57 | % | ||||||||||
Net Investment Income | 0.02 | % | 0.07 | % | 1.09 | % | 2.46 | % | 2.96 | % | ||||||||||
| INSTITUTIONAL II SHARES | 2011 | 2010 | 2009 | 2008 | 2007 | |||||||||||||||
| Net Asset Value, Beginning of Period | $ 1.000 | $ 1.000 | $ 1.000 | $ 1.000 | $ 1.000 | |||||||||||||||
| Income (Loss) From Operations: | ||||||||||||||||||||
Net Investment Income | 0.000 | (c) | 0.000 | (c) | 0.011 | 0.026 | 0.029 | |||||||||||||
| Less Distributions From: | ||||||||||||||||||||
Net Investment Income | (0.000 | )(c) | (0.000 | )(c) | (0.011 | ) | (0.026 | ) | (0.029 | ) | ||||||||||
| Net Asset Value, End of Period | $ 1.000 | $ 1.000 | $ 1.000 | $ 1.000 | $ 1.000 | |||||||||||||||
| Total Return(a) | 0.02 | % | 0.04 | % | 1.06 | % | 2.61 | % | 2.97 | % | ||||||||||
| Net Assets, End of Period (000’s) | $8,076 | $14,518 | $4,146 | $3,685 | $931 | |||||||||||||||
| Ratios to Average Net Assets | ||||||||||||||||||||
Gross Expense | 1.15 | % | 1.00 | % | 0.89 | % | 1.03 | % | 1.15 | % | ||||||||||
Net Expenses(b) | 0.41 | % | 0.39 | % | 0.67 | % | 0.65 | % | 0.65 | % | ||||||||||
Net Investment Income | 0.02 | % | 0.03 | % | 0.97 | % | 2.38 | % | 2.90 | % | ||||||||||
| (a) | Total returns for periods of less than one year are not annualized. |
| (b) | The investment manager voluntarily waived a portion of its fees. |
| (c) | Represents less than $0.001. |
See Notes which are an integral part of the Financial Statements
ANNUAL REPORT / April 30, 2011
Table of Contents
| 40 | NOTES TO FINANCIAL STATEMENTS |
MTB Group of Funds
April 30, 2011
| 1. | ORGANIZATION |
MTB Group of Funds (the “Trust”) is registered under the Investment Company Act of 1940, as amended (the “Act”), as an open-end management investment company. The Trust consists of 23 portfolios, 7 of which are presented herein (individually referred
to as the “Fund” or collectively as the “Funds”). The remaining 16 funds (1 of which is only made available to variable annuity contracts) are presented in separate reports.
| Fund | Investment Goal | |
| MTB U.S. Treasury Money Market Fund (“U.S. Treasury Money Market Fund”)(d) | The Fund seeks to provide current income while maintaining liquidity and stability of principal. | |
| MTB U.S. Government Money Market Fund (“U.S. Government Money Market Fund”)(d) | The Fund seeks to provide current income while maintaining liquidity and stability of principal. | |
| MTB Tax-Free Money Market Fund (“Tax-Free Money Market Fund”)(d) | The Fund seeks to provide current income that is exempt from federal income taxes while maintaining liquidity and stability of principal. | |
| MTB Money Market Fund (“Money Market Fund”)(d) | The Fund seeks to provide current income while maintaining liquidity and stability of principal. | |
| MTB Prime Money Market Fund (“Prime Money Market Fund”)(d) | The Fund seeks to provide current income while maintaining liquidity and stability of principal. | |
| MTB New York Tax-Free Money Market Fund (“New York Tax-Free Money Market Fund”)(d) | The Fund seeks to provide current income that is exempt from both federal and New York state and local income taxes while maintaining liquidity and stability of principal. | |
| MTB Pennsylvania Tax-Free Money Market Fund (“Pennsylvania Tax-Free Money Market Fund”)(d) | The Fund seeks to provide current income that is exempt from both federal and Pennsylvania state and local income taxes while maintaining liquidity and stability of principal. | |
| (d) | Diversified |
The Trust offers 7 classes of shares: Class A Shares, Class A2 Shares (formerly Institutional Shares), Class C Shares, Class S Shares, Corporate Shares, Institutional I Shares and Institutional II Shares. All shares of the Trust have equal rights with respect to voting, except on class-specific matters.
At a meeting of the Board of Trustees (the “Board”, or the “Trustees”) of the Trust held on March 9, 2011, the Trustees approved the conversion of Class B Shares of the MTB Money Market Fund into Class A2 Shares of the same Fund. Class A2 shares are subject to the same fees and expenses as the Class B Shares of that Fund, except that Class A2 Shares have lower 12b-1 fees.
On April 1, 2011, Class B Shares of the MTB Money Market Fund were terminated after the conversion into Class A2 Shares. Class B shareholders did not incur any transaction costs and since the transaction was tax-free for federal income tax purposes, Class B shareholders will not have a taxable gain or loss on the conversion of their Class B Shares to Class A2. Class B Shares of the Fund have been closed to new investors since December 31, 2008.
The assets of each portfolio are segregated and a shareholder’s interest is limited to the portfolio in which shares are held.
| 2. | SUMMARY OF SIGNIFICANT ACCOUNTING POLICIES |
The following is a summary of significant accounting policies consistently followed by the Funds in the preparation of their financial statements. These policies are in conformity with U.S. generally accepted accounting principles (“GAAP”). The preparation of financial statements in conformity with GAAP requires management to make estimates and assumptions that affect the amounts of
assets, liabilities, expenses and revenues reported in the financial statements. Actual results could differ from those estimated.
Investment Valuation – The Funds use the amortized cost method to value their portfolio securities in accordance with Rule 2a-7 under the Act.
The Trust follows authoritative guidance for fair value measurements. The guidance establishes a framework for measuring fair value and a hierarchy for inputs used in measuring fair value that maximizes the use of observable inputs and minimizes the use of unobservable inputs by requiring that the most observable inputs be used when available. The guidance establishes three tiers of inputs that may be used to measure fair value. The three tiers of inputs are summarized at the end of each Fund’s Portfolio of Investments. The inputs or methodology used for valuing securities are not necessarily an indication of the risk associated with investing in those securities.
The Funds’ policy is to disclose significant transfers between Levels based on valuations at the beginning of the reporting period. Each portfolio may hold securities which are periodically fair valued in accordance with the Funds’ fair value procedures. This may result in movements between Levels 1, 2 and 3 throughout the period. For the year ended April 30, 2011, there were no significant transfers between Levels 1, 2 and 3 assets and liabilities.
In May 2011, the International Accounting Standards Board and the Financial Accounting Standards Board issued new guidance to improve and align fair value measurement and disclosure requirements. The guidance was issued as International Financial Reporting Standard (“IFRS”) 13, Fair Value Measurement, and Accounting Standards Update (“ASU”) No. 2011-04, Amendments to Achieve Common Fair Value Measurement and Disclosure Requirements in U.S. GAAP and IFRSs. IFRS 13 and ASU 2011-04
(continued on next page)
April 30, 2011 / ANNUAL REPORT
Table of Contents
| NOTES TO FINANCIAL STATEMENTS | 41 |
include common requirements for measurement of and disclosure about fair value between U.S. GAAP and IFRS. ASU 2011-04 will require reporting entities to make disclosures about amounts and reasons for all transfers in and out of Level 1 and Level 2 fair value measurements. In addition, ASU 2011-04 will require reporting entities to disclose the following information for fair value measurements categorized within Level 3 of the fair value hierarchy: quantitative information about the unobservable inputs used in the fair value measurement, the valuation processes used by the reporting entity and a narrative description of the sensitivity of the fair value measurement to changes in unobservable inputs and the interrelationships between those unobservable inputs. The new and revised disclosures are effective for interim and annual reporting periods beginning after December 15, 2011. Management is currently evaluating the implications of ASU No. 2011-04 and its impact on the financial statements.
Repurchase Agreements – Repurchase agreements are transactions in which a Fund buys a security from a dealer or bank and agrees to sell the security back at a mutually agreed upon time and price. The repurchase price exceeds the sale price, reflecting the Fund’s return on the transaction. It is each Fund’s policy to require the counterparty to a repurchase agreement to transfer to the Funds’ custodian or sub-custodian eligible securities or cash with a market value (after transaction costs) at least equal to the repurchase price to be paid under the repurchase agreement. The eligible securities are transferred to accounts with the custodian or sub-custodian in which the Funds hold a “securities entitlement” and exercise “control” as those terms are defined in the Uniform Commercial Code. The Funds have established procedures for monitoring the market value of the transferred securities and requiring the transfer of additional eligible securities if necessary to equal at least the repurchase price. These procedures also allow the counterparty to require securities to be transferred from the account to the extent that their market value exceeds the repurchase price or in exchange for other eligible securities of equivalent market value.
The insolvency of the counterparty or other failure to repurchase the securities may delay the disposition of the underlying securities or cause the Funds to receive less than the full repurchase price.
Investment Income, Gains and Losses, Expenses and Distributions – Interest income and expenses are accrued daily. Distributions to shareholders are recorded on the ex-dividend date. Distributions of net investment income are declared daily and paid monthly. Investment transactions are accounted for on a trade date basis for financial reporting purposes. Realized gains and losses from investment transactions are recorded on an identified cost basis. All Funds, except Prime Money Market Fund, offer multiple classes of shares. Investment income, realized gains and losses, and certain fund-level expenses are allocated to each class based on relative daily net assets, except that each class bears certain expenses unique to that class such as distribution and shareholder services fees. Distributions are declared separately for each class. No class has preferential distribution rights; differences in per share distribution rates are generally due to differences in separate class expense.
Expenses of the Trust, which are directly identifiable to a specific Fund, are applied to that Fund. Expenses which are not identifiable to a specific Fund are allocated in such a manner as deemed equitable, taking into consideration the nature and type of expenses.
Premium and Discount Amortization/Accretion – All premiums and discounts are amortized/accreted.
Federal Taxes – It is the Funds’ policy to comply with the Subchapter M provision of the Internal Revenue Code of 1986, as amended (the “Code”), and to distribute to shareholders each year substantially all of their income. Accordingly, no provisions for federal income tax are necessary.
| 3. | FEDERAL TAX INFORMATION |
The timing and character of income and capital gain distributions are determined in accordance with income tax regulations, which may differ from GAAP. These differences are due in part to differing treatments for income recognition on expiration of loss carryforwards and distribution recognition on income distribution payable.
As of April 30, 2011, there are no uncertain tax positions that would require financial statement recognition, de-recognition or disclosure. The Funds’ federal tax returns filed for the three-year periods ended April 30, 2010, 2009 and 2008, remain subject to examination by the Internal Revenue Service.
For the year ended April 30, 2011, permanent differences identified and reclassified among the components of net assets were as follows:
| Fund | Accumulated Net Realized Loss | Paid-in Capital | ||||||
Money Market Fund | 11,291 | (11,291 | ) | |||||
Net investment income (loss), net realized gain (loss), and net assets were not affected by these reclassifications.
The tax character of distributions as reported on the Statements of Changes in Net Assets for the years ended April 30, 2011 and 2010 were as follows:
| Fund | 2011 Return of Capital | 2011 Ordinary Income* | 2010 Return of Capital | 2010 Ordinary Income | ||||||||||||
| U.S. Treasury Money Market Fund | $ | — | $ | 106,909 | $ | — | $ | 182,767 | ||||||||
| U.S. Government Money Market Fund | 15,042 | 225,133 | 188,648 | 273,121 | ||||||||||||
| Tax-Free Money Market Fund | — | 36,690 | ** | — | 162,666 | *** | ||||||||||
| Money Market Fund | — | 457,385 | 61,147 | 640,031 | ||||||||||||
| Prime Money Market Fund | — | 202,611 | — | 323,835 | ||||||||||||
| New York Tax-Free Money Market Fund | — | 15,761 | ** | — | 91,713 | *** | ||||||||||
| Pennsylvania Tax-Free Money Market Fund | — | 5,401 | ** | — | 26,279 | *** | ||||||||||
| * | For tax purposes short-term capital gain distributions are considered ordinary income distributions. |
| ** | Included in this amount is tax exempt income of $36,662, $15,710 and $5,342 for the Tax-Free Money Market Fund, New York Tax-Free Money Market Fund, and Pennsylvania Tax-Free Money Market Fund, respectively. |
| *** | Included in this amount is tax exempt income of $162,631, $86,000 and $26,279 for the Tax-Free Money Market Fund, New York Tax-Free Money Market Fund, and Pennsylvania Tax-Free Money Market Fund, respectively. |
(continued on next page)
ANNUAL REPORT / April 30, 2011
Table of Contents
| 42 | NOTES TO FINANCIAL STATEMENTS |
As of April 30, 2011, the components of distributable earnings on a tax basis were as follows:
| Fund | Undistributed (Distribution in Excess of) Ordinary Income | Capital Loss Carryforward | ||||||
| U.S. Treasury Money Market Fund | $ | 11,596 | $ | — | ||||
| U.S. Government Money Market Fund | (15,456 | ) | — | |||||
| Tax-Free Money Market Fund | 4,060 | * | — | |||||
| Money Market Fund | (21,254 | ) | — | |||||
| Fund | Undistributed (Distribution in Excess of) Ordinary Income | Capital Loss Carryforward | ||||||
| Prime Money Market Fund | $ | 2,343 | $ | — | ||||
| New York Tax-Free Money Market Fund | 181 | * | (72,023 | ) | ||||
| Pennsylvania Tax-Free Money Market Fund | 2,884 | * | — | |||||
| * | Included in this amount is tax exempt income of $4,060, $181 and $2,884 for the Tax-Free Money Market Fund, New York Tax-Free Money Market Fund and Pennsylvania Tax-Free Money Market Fund, respectively. |
At April 30, 2011, the following Funds had capital loss carryforwards which will reduce each Fund’s taxable income arising from future net realized gain on investments, if any, to the extent permitted by the Code and thus will reduce the amount of distributions to shareholders which would otherwise be necessary to relieve the Fund of any liability for federal income tax. Pursuant to the Code, such capital loss carryforwards will expire as follows:
| Capital Loss Carryforward to Expire in | Total Capital Carryforwards | |||||||||||||||
| Fund | 2017 | 2018 | 2019 | |||||||||||||
| New York Tax-Free Money Market | 6,657 | 63,251 | 2,115 | 72,023 | ||||||||||||
During the year ended April 30, 2011, the Money Market Fund had a capital loss carryforward expire in the amount of $11,291.
In addition, the Prime Money Market Fund utilized $2,927 to offset taxable gains realized during the year ended April 30, 2011.
Under the recently enacted Regulated Investment Company Modernization Act of 2010, the Funds will be permitted to carry forward capital losses incurred in taxable years beginning after December 22, 2010 for an unlimited period. However, any losses incurred during those future taxable years will be required to be utilized prior to the losses incurred in pre-enactment taxable years. As a result of this ordering rule, pre-enactment capital loss carryforwards may have an increased likelihood to expire unused. Additionally, post-enactment capital losses that are carried forward will retain their character as either short-term or long-term capital losses rather than being considered all short-term as under previous law.
| 4. | ADVISORY FEES, SERVICING FEES, AND OTHER SERVICE PROVIDERS |
Investment Advisor – MTB Investment Advisors, Inc. (“MTBIA,” or the “Advisor”) receives for its services an annual investment advisory fee, accrued daily and paid daily, equal to 0.40% of each Fund’s average daily net assets. The Advisor may
voluntarily choose to waive any portion of its fee and/or reimburse certain operating expenses of the Funds. For the year ended April 30, 2011, the Advisor voluntarily agreed to waive, and/or reimburse operating expenses (excluding 12b-1 and shareholder services fees) of each Fund in order to limit each Fund’s average expenses for the year. The Advisor can modify or terminate this voluntary agreement at any time in its sole discretion.
Administrative Fee – BNY Mellon provides the Trust with fund administration, accounting, and custody services. Fees for such services are based on assets and volume of transactions. For the period September 10, 2007 through September 10, 2010, BNY Mellon agreed to limit fees payable by the Trust for fund administration, accounting and custody services to $2,679,285 per year. MTBIA in its role as co-administrator, provides the Funds with certain administrative personnel and services necessary to operate the Funds. These services were provided for at an aggregate annual fee as specified below.
Administrative personnel and services fees payable to MTBIA are calculated as follows:
| Maximum Fee | Average Aggregate Daily Net Assets of the Trust | |
0.033% | on the first $5 billion | |
0.020% | on the next $2 billion | |
0.016% | on the next $3 billion | |
0.015% | on assets in excess of $10 billion |
(continued on next page)
April 30, 2011 / ANNUAL REPORT
Table of Contents
| NOTES TO FINANCIAL STATEMENTS | 43 |
MTBIA may voluntarily choose to waive any portion of its fee. MTBIA can modify or terminate its voluntary waiver at any time in its sole discretion. For the year ended April 30, 2011, MTBIA did not waive any administrative personnel and services fee.
Distribution Services Fee – The Trust has adopted a Distribution Services Plan (the “Plan”) pursuant to Rule 12b-1 under the Act. The Plan allows the Funds, except U.S. Treasury Money Market Fund’s Class A Shares, Money Market Fund’s Class A Shares and New York Tax-Free Money Market Fund’s Class A Shares, to pay fees to financial intermediaries which may be paid through ALPS Distributors, Inc. (“ALPS”), the principal distributor, at an annual rate of up to 0.25% of the average daily net assets of the Funds’ Class A Shares, Class A2 Shares, Class S Shares, Corporate Shares and Institutional II Shares, for the sale, distribution, administration, customer servicing and recordkeeping of these Shares.
The Funds may reduce the maximum amount of distribution service fees it pays from time to time in its sole discretion. In addition, a financial intermediary (including ALPS, the Advisor or their affiliates), may voluntarily waive or reduce any fees to which they are entitled.
Shareholder Services Fee – Pursuant to a Shareholder Services Plan adopted by the Funds and administered by ALPS, the Funds may pay up to 0.25% of the average daily net assets of each Fund’s Class A Shares, Class A2 Shares, Class S Shares, Corporate Shares and Institutional I Shares to financial intermediaries (which may include ALPS, the Advisor or their affiliates) for providing shareholder services and maintaining shareholder accounts. M&T Securities, Inc. (“M&T”), an affiliate of the Advisor, has entered into a Shareholder Services Agreement with ALPS, under which it is entitled to receive up to 0.25% of the average daily net assets of each Fund’s Shares for whom M&T provides shareholder services. The Funds may reduce the maximum amount of shareholder service fees it pays from time to time at its sole discretion. In addition, a financial intermediary (including M&T) may waive or reduce any fees to which they are entitled. For the year ended April 30, 2011, M&T received a portion of the fees paid by the following Funds which are listed in the chart below:
| Fund | Shareholder Services Fee | |||
| Tax-Free Money Market Fund | $ | 168 | ||
| Money Market Fund | 166,808 | |||
| New York Tax-Free Money Market Fund | 1,029 | |||
Other Service Providers – Foreside Management Services, LLC (“FMS”) provides a Principal Executive Officer to the Trust. FMS has no role in determining the investment policies or which securities are to be sold or purchased by the Trust or its Funds.
ALPS Fund Services, Inc. provides transfer agency services to the Trust. For the period November 16, 2007 through November 16, 2010, BNY Mellon agreed to pay the excess amount of fees payable to ALPS Fund Services, Inc. for transfer agency services when the total expenses payable by the Trust exceed $1,047,803 per year. Effective October 1, 2010, BNY Mellon agreed to pay the excess amount of fees payable to ALPS Fund Services, Inc. when the total expenses payable by the Trust exceed $995,413 until
October 1, 2011. These amounts are shown as reimbursements on the Statements of Operations.
General – Certain Officers of the Trust are also Officers or employees of the above companies that provide services to the Funds, and during their terms of office, receive no compensation from the Funds. The Trust’s Statement of Additional Information includes additional information about the Trustees.
| 5. | CONCENTRATION OF RISK |
Since New York Tax-Free Money Market Fund and Pennsylvania Tax-Free Money Market Fund invest a substantial portion of their assets in issuers located in one state, they will be more susceptible to factors adversely affecting issuers of that state than would be a comparable tax-exempt mutual fund that invests nationally. Additionally, at April 30, 2011, Tax-Free Money Market Fund was invested 29.2% in Pennsylvania and 31.2% in New York State. In order to reduce the credit risk associated with such factors, at April 30, 2011, 16.3% for Tax-Free Money Market Fund, 21.9% for New York Tax-Free Money Market Fund and 9.6% for Pennsylvania Tax-Free Money Market Fund of the total market value of the securities in the portfolio of investments are backed by letters of credit or bond insurance of various financial institutions and financial guaranty assurance agencies. The largest percentage of the total market value of investments insured by or supported (backed) by a letter of credit from any one institution or agency was 8.8% for Tax-Free Money Market Fund, 11.8% for New York Tax-Free Money Market Fund and 5.3% for Pennsylvania Tax-Free Money Market Fund.
| 6. | LINE OF CREDIT |
The Trust participated in a $10,000,000 unsecured, committed revolving line of credit (“LOC”) agreement with BNY Mellon. The LOC was made available for extraordinary or emergency purposes, primarily for financing redemption payments. Borrowings are charged interest at a rate of 1.25% per annum over the greater of the Federal Funds Rate or the overnight LIBOR Rate. The LOC included a commitment fee of 0.12% per annum on the daily unused portion. In addition, an upfront commitment fee of 0.02% was paid to BNY Mellon. The termination date of this LOC is February 8, 2012. The Funds did not utilize the LOC for the year ended April 30, 2011.
| 7. | SUBSEQUENT EVENTS |
Management has evaluated events and transactions for potential recognition or disclosure in the financial statements through the date the financial statements were issued. Management has determined that, except as set forth below, there are no material events that would require disclosure in the Funds’ financial statements through this date.
On June 9, 2011, the Board approved the re-naming of the Institutional I and Institutional II Shares to Class I and Class I2 Shares, respectively. This re-naming is expected to be effective at the close of business on or about August 31, 2011.
ANNUAL REPORT / April 30, 2011
Table of Contents
| 44 |
REPORT OF INDEPENDENT REGISTERED PUBLIC ACCOUNTING FIRM
TO THE SHAREHOLDERS AND BOARD OF TRUSTEES OF MTB GROUP OF FUNDS
We have audited the accompanying statements of assets and liabilities, including the portfolios of investments, of MTB U.S. Treasury Money Market Fund, MTB U.S. Government Money Market Fund, MTB Tax-Free Money Market Fund, MTB Money Market Fund, MTB Prime Money Market Fund, MTB New York Tax-Free Money Market Fund and MTB Pennsylvania Tax-Free Money Market Fund (seven of the Funds constituting MTB Group of Funds) (the “Funds”) as of April 30, 2011, and the related statements of operations for the year then ended, the statements of changes in net assets for each of the two years in the period then ended, and the financial highlights for each of the five years in the period then ended. These financial statements and financial highlights are the responsibility of the Funds’ management. Our responsibility is to express an opinion on these financial statements and financial highlights based on our audits.
We conducted our audits in accordance with standards of the Public Company Accounting Oversight Board (United States). Those standards require that we plan and perform the audit to obtain reasonable assurance about whether the financial statements and financial highlights are free of material misstatement. We were not engaged to perform an audit of the Funds’ internal control over financial reporting. Our audits included consideration of internal control over financial reporting as a basis for designing audit procedures that are appropriate in the circumstances, but not for the purpose of expressing an opinion on the effectiveness of the Funds’ internal control over financial reporting. Accordingly, we express no such opinion. An audit also includes examining, on a test basis, evidence supporting the amounts and disclosures in the financial statements and financial highlights, assessing the accounting principles used and significant estimates made by management, and evaluating the overall financial statement presentation. Our procedures included confirmation of securities owned as of April 30, 2011, by correspondence with the custodian and brokers. We believe that our audits provide a reasonable basis for our opinion.
In our opinion, the financial statements and financial highlights referred to above present fairly, in all material respects, the financial position of the above mentioned Funds of the MTB Group of Funds at April 30, 2011, the results of their operations for the year then ended, the changes in their net assets for each of the two years in the period then ended and their financial highlights for each of the five years in the period then ended, in conformity with U.S. generally accepted accounting principles.

Philadelphia, Pennsylvania
June 29, 2011
April 30, 2011 / ANNUAL REPORT
Table of Contents
| 45 |
BOARD OF TRUSTEES AND TRUST OFFICERS
The following tables give information about each Trustee and the senior officers of the Trust. The tables separately list Trustee members who are “interested persons” of the Fund (i.e., “Interested” Trustees) and those who are not (i.e., “Independent” Trustees). The Trust is comprised of 23 funds. Unless otherwise noted, the business address of each Trustee and senior officer is 100 East Pratt Street, 17th floor, Baltimore, Maryland 21202. Each Trustee oversees all portfolios of the Trust and serves for an indefinite term. The Trust’s Statement of Additional Information includes additional information about the Trustees and is available, without charge and upon request, by calling 1-800-836-2211.
INTERESTED TRUSTEES BACKGROUND
| Name Address Birth Year Positions Held with Trust Date Service Began | Principal Occupation(s), Previous Positions and Other Directorships Held | |
Kenneth G. Thompson* Manufacturers and Traders Trust Company (“M&T Bank”) Birth year: 1964 TRUSTEE Began serving: December 2008 | Principal Occupation: Senior Vice President, M&T Bank.
Other Directorships Held: None | |
Jeffrey Durkee* Manufacturers and Traders Trust Company (“M&T Bank”) Birth year: 1958 TRUSTEE Began serving: December 2007 | Principal Occupation: President and Chief Executive Officer, MTB Investment Advisors, Inc. (3/07 to present).
Other Directorships Held: None
Previous Positions: Chairman and CEO Private Wealth Management, Mercantile Bankshares Corporation (4/06 to 3/07); Senior Vice-President and Director, Southern Division, Legg Mason Wood Walker (1998 to 4/06). | |
*Kenneth G. Thompson and Jeffrey Durkee are “interested” due to positions they hold with M&T Bank, the parent of the Funds’ Advisor.
INDEPENDENT TRUSTEES BACKGROUND
| Name Address Birth Year Positions Held with Trust Date Service Began | Principal Occupation(s), Previous Positions and Other Directorships Held | |
Joseph J. Castiglia Birth year: 1934 CHAIRMAN AND TRUSTEE Began serving: February 1988 | Principal Occupation: Retired.
Other Directorships Held: Chairman, Community Foundation for Greater Buffalo (1/05 to 12/08); Chairman and Treasurer, Buffalo Olmstead Parks Conservancy (1/05 to 12/10); Chairman, Buffalo Philharmonic Orchestra Foundation (1/06 to 12/10); Vice Chairman, Christ the King Seminary (1/05 to 12/10); Director, Baker Victory Services (1/05 to 12/08); Director, Dunn Tire Corporation (1/05 to 12/10); Director, Read to Succeed Buffalo (1/09 to 12/10).
Previous Positions: President, Chief Executive Officer and Vice Chairman, Pratt & Lambert United, Inc., manufacturer of paints and chemical specialties (12/67 to 1/96); Chairman and Director, Catholic Health Systems of Western New York (1/97 to 5/03); Chairman Blue Cross Blue Shield of Western and Central New York (5/92 to 5/07); Director, Energy East, gas and electric utility; Chairman and Director, Federal Reserve Bank of New York, Buffalo Branch. | |
ANNUAL REPORT / April 30, 2011
Table of Contents
| 46 |
| Name Address Birth Year Positions Held with Trust Date Service Began | Principal Occupation(s), Previous Positions and Other Directorships Held | |
John S. Cramer Birth year: 1942 TRUSTEE Began serving: December 2000 | Principal Occupation: Senior Consultant, Yaffe & Co., Inc., a consulting firm specializing in executive compensation and governance services (2/06 to present), Retired (2002 to 2006).
Other Directorships Held: Highmark Blue Cross Blue Shield (4/01 to present); Chek-Med Corporation (6/03 to present).
Previous Positions: President and Chief Executive Officer, PinnacleHealth Systems, a non-profit hospital and health care system in central Pennsylvania. | |
Daniel R. Gernatt, Jr. Birth year: 1940 TRUSTEE Began serving: February 1988 | Principal Occupation: CEO, Gernatt Asphalt Products, Inc. (1979 to present).
Other Directorships Held: Hilbert College (2000 to present). | |
William H. Cowie, Jr. Birth year: 1931 | Principal Occupation: Retired.
Other Directorships Held: MedStar Health Community (1972 to present).
Previous Positions: Vice Chairman of Signet Banking Corp. | |
Richard B. Seidel Birth year: 1941 | Principal Occupation: Founder, Chairman and Director, Girard Partners Ltd., a registered investment advisory firm and Broker/Dealer (1995 to present); Chairman and Director Girard Capital, LLC, registered investment advisors (3/09 to present).
Other Directorships Held: Tristate Capital Bank (9/07 to present); Surrey Services for Seniors (2002 to 2008). | |
Dr. Marguerite D. Hambleton Birth year: 1943 | Principal Occupation: President, AAA New York State Association (7/09 to present).
Other Directorships Held: AAA National Foundation for Traffic Safety (12/85 to present); Catholic Health System (2004 to 2009).
Previous Positions: President, New York Federal Reserve Board, Buffalo Branch (12/05 to 4/08); President and CEO, AAA Western and Central New York (1985 to 2005). | |
OFFICERS
| Name Address Birth Year Positions Held with Trust Date Service Began | Principal Occupation(s) and Previous Positions | |
Timothy L. Brenner Birth year: 1956 | Principal Occupation: Senior Vice President, M&T Bank, President of M&T Life Insurance Company. | |
Michael D. Daniels Birth year: 1967 CHIEF OPERATING OFFICER Began serving: June 2007 | Principal Occupation: Chief Operating Officer, MTB Group of Funds and MTB Investment Advisors, Inc.; Administrative Vice President, M&T Bank.
Previous Positions: Senior Vice President, MSD&T and MCA (2006 to 2007); Vice President, Calamos Asset Management (2004 to 2006); Vice President, JP Morgan Chase Bank (2002 to 2004). | |
April 30, 2011 / ANNUAL REPORT
Table of Contents
| 47 |
| Name Address Birth Year Positions Held with Trust Date Service Began | Principal Occupation(s) and Previous Positions | |
Jeffrey M. Seling Birth year: 1970 VICE PRESIDENT Began serving: June 2007 | Principal Occupation: Vice President, M&T Bank and MTB Investment Advisors, Inc.
Previous Positions: Vice President, MSD&T; Assistant Vice President, Wells Fargo Bank; Assistant Vice President, JP Morgan Chase Bank. | |
Bradley J. Swenson Birth year: 1972 AML COMPLIANCE OFFICER Began serving: September 2007 | Principal Occupation: Senior Vice President and Chief Compliance Officer, ALPS Distributors, Inc., ALPS Fund Services, Inc., FTAM Funds Distributor, Inc., ALPS Holdings, Inc. and ALPS Advisors, Inc.
Previous Positions: Senior Audit Manager, Janus Capital Group, Inc. | |
Gregory B. McShea Birth year: 1965 CHIEF COMPLIANCE OFFICER AND ASSISTANT SECRETARY Began serving: December 2009 | Principal Occupation: Managing Director, MTB Investment Advisors, Inc.; Chief Compliance Officer, MTB Group of Funds.
Previous Positions: General Counsel, Legg Mason Capital Management, Inc. (2007 to 2009); General Counsel, Western Asset Management Company (2003 to 2009); Associate General Counsel and Compliance Director, Legg Mason Wood Walker, Incorporated (1997 to 2003). | |
Ralph V. Partlow III 25 S. Charles St., 22nd Floor Baltimore, MD 21201 Birth year: 1957 VICE PRESIDENT Began serving: June 2010 | Principal Occupation: Administrative Vice President and Deputy General Counsel, M&T Bank (2003 to present).
Previous Positions: Vice President and Senior Counsel, Allfirst Bank (1995 to 2003). | |
Guy Nordahl 101 Barclay Street, 13E New York, NY 10286 Birth year: 1965 CHIEF FINANCIAL OFFICER AND TREASURER Began serving: September 2007 | Principal Occupation: Vice President, BNY Mellon Asset Servicing. | |
Lisa R. Grosswirth 101 Barclay Street, 13E New York, NY 10286 Birth year: 1963 SECRETARY Began serving: September 2007 | Principal Occupation: Vice President, BNY Mellon Asset Servicing (2004 to present).
Previous Positions: Supervisory Paralegal, The Dreyfus Corporation (1998 to 2004). | |
Richard J. Berthy Three Canal Plaza, Suite 100 Portland, ME 04101 Birth year: 1958 CHIEF EXECUTIVE OFFICER Began serving: September 2007 | Principal Occupation: President and Managing Partner, Foreside Financial
Previous Positions: Chief Administrative Officer, Foreside Financial Group, LLC (2005 to 2008); President and Secretary, Bainbridge Capital Management, LLC | |
Eric B. Paul Birth year: 1974 VICE PRESIDENT Began serving: June 2008 | Principal Occupation: Vice President, M&T Bank (2003 to present); Director of Proprietary Products, M&T Bank (4/08 to present). | |
ANNUAL REPORT / April 30, 2011
Table of Contents
Investment Advisor
MTB Investment Advisors, Inc.
100 E. Pratt Street
17th Floor
Baltimore, MD 21202
Distributor
ALPS Distributors, Inc.
1290 Broadway
Suite 1100
Denver, CO 80203
Co-Administrator
MTB Investment Advisors, Inc.
100 E. Pratt Street
17th Floor
Baltimore, MD 21202
Co-Administrator, Accountant and Custodian
The Bank of New York Mellon
101 Barclay Street
New York, NY 10286
Transfer Agent and Dividend
Disbursing Agent
ALPS Fund Services, Inc.
1290 Broadway
Suite 1100
Denver, CO 80203
Independent Registered Public
Accounting Firm
Ernst & Young LLP
Two Commerce Square
2001 Market Street
Suite 4000
Philadelphia, PA 19103
We are pleased to send you this Annual Report of MTB Group of Funds. The Annual Report contains important information about your investments in MTB Group of Funds.
Since we are required by law to send an Annual Report to each person listed as a shareholder, you (or your household) may receive more than one Annual Report.
(6/11)
Table of Contents
MTB FUNDS
100 EAST PRATT STREET, 17TH FLOOR
BALTIMORE, MD 21202
MTB-AR-011M-0611
1-800-836-2211 / mtbfunds.com


Table of Contents

Managed by MTB Investment Advisors, Inc. – www.mtbia.com
ANNUAL REPORT — APRIL 30, 2011
MTB Group of Funds
Short Duration Government
Short-Term Corporate Bond Fund
U.S. Government Bond Fund
New York Municipal Bond Fund
Pennsylvania Municipal Bond Fund
Maryland Municipal Bond Fund
Virginia Municipal Bond Fund
Intermediate-Term Bond Fund
Income Fund | Strategic Allocation Fund
Large Cap Value Fund
Large Cap Growth Fund
Mid Cap Growth Fund
Small Cap Growth Fund
International Equity Fund | |||

Table of Contents

| PRESIDENT’S MESSAGE | ||||
| President’s Message | i | |||
| MTB FLUCTUATING FUNDS ANNUAL REPORT | ||||
| Management’s Discussion of Fund Performance | 1 | |||
| Shareholder Expense Example | 52 | |||
| Portfolios of Investments | 55 | |||
| Notes to Portfolios of Investments | 119 | |||
| Statements of Assets and Liabilities | 122 | |||
| Statements of Operations | 125 | |||
| Statements of Changes in Net Assets | 128 | |||
| Financial Highlights | 136 | |||
| Notes to Financial Statements | 155 | |||
| Report of Independent Registered Public Accounting Firm | 168 | |||
| Board of Trustees and Trust Officers | 169 | |||
| Shareholder Proxy Results | 172 | |||
Table of Contents
I am pleased to enclose the Annual Report of the MTB Group of Funds (the “Trust”). This report covers the Trust’s fiscal year, which is the 12-month reporting period from May 1, 2010 through April 30, 2011. Inside, you will find a discussion of the factors impacting each Fund’s performance during the reporting period, as well as a complete listing of each Fund’s holdings and financial statements.
The Economy and Financial Markets in Review
MTB Investments Advisors, Inc., the advisor to the Trust, has provided the following review of the economy, bond and stock markets over the 12-month reporting period:
The Economy
During the period under review for our report, the U.S. economy avoided a double dip recession. However, the growth has been weak, with the Commerce Department’s early estimate of Gross Domestic Product (“GDP”) growth of 1.8% in the first quarter. Since the end of the “Great Recession” (second quarter of 2009); the country has averaged a 2.8% growth rate which is significantly lower than the 4.6% growth rate during economic recoveries over the past 40 years (and seven recessions). Hopes for a better first quarter in 2011, were set back by exogenous events. The tragic earthquake and tsunami in Japan and political unrest in the Middle East and North Africa had an economic impact throughout the world.
Federal Reserve (“Fed”) Chairman Bernanke noted the slow first quarter growth, but felt it was “transitory” and is expected to improve throughout the year. Some stimulus was added by the Fed’s “quantitative easing” program (“QE2”) which is expected to end in June.1 Most economists feel the cessation of the Fed’s asset purchases will be offset by activity from the private sector.
Housing and jobs remain a concern, but over 260,000 new jobs were created in the private sector in April 2011 according to the U.S. Bureau of Labor Statistics. Consumer confidence, spending, and retail sales appeared favorable in the April 2011 reports from the U.S. Department of Commerce, and this should contribute to full-year growth.
Manufacturing reports released by the Institute for Supply Management have been favorable, with 15 out of 18 manufacturing industries reporting growth in March 2011. This marks the 20th consecutive month of manufacturing growth. Inflation talk has replaced the deflation concerns of early 2010. Price increases in the news have showcased selected commodities such as oil, precious metals, copper, cotton, corn, and wheat. These inflationary pressures are, in part, offset by lower housing prices and non-existent wage pressures.
According to the U.S. Department of Commerce, Bureau of Economic Analysis, the first quarter GDP growth is expected to be the low quarterly report for the year. On the positive side, the job picture is improving, consumers are upbeat, business investment is picking up, and corporate profits are up. Comments from Chairman Bernanke indicate that the Fed estimates economic growth of 3.3% and unemployment at 8.5% by the end of the calendar year.
The Bond Markets
The bond market has proven to be challenging over the last six months of the Funds’ fiscal year as investors allocated away from high quality bonds into “riskier” asset classes such as equities, commodities and low grade corporate bonds. As a result, the U.S. Department of the Treasury reported that the yield on the 10-year treasury note has risen from 2.63% on October 31, 2010 to 3.32% on April 30, 2011, even as the Fed nears the conclusion of its second massive treasury buyback, known as QE2.
While the domestic economy slowly recovers from the recession in 2008 and 2009, global geo-political events in the Middle East and North Africa and the tragic Japanese tsunami continue to influence the direction of interest rates in the United States. Standard and Poor’s put the “AAA” rating of the United States on credit watch “negative” in April 2011, implying that the U.S. has a ratings downgrade probability in the next two years of 1 in 3. Currently, Congress and the Administration are struggling with our $14.3 trillion debt limit.
We believe that the economy will continue to mend and slowly expand, QE2 will not be extended and that the Fed will raise the rate in the first quarter of 2012. With a growing economy, and some marginal increases in the Consumer Price Index (“CPI”), we look to reduce maturities in our taxable bond portfolios.
The municipal market has seen reduced supply by issuers over the last four months. We believe the supply/demand dynamics in the municipal market are favorable and feel optimistic about the prospects for this market. The municipal market has not endured substantially higher default levels predicted by some prognosticators in 2011 to date, and we continue to closely analyze our municipal credits.
PRESIDENT’S MESSAGE / April 30, 2011
Table of Contents
| ii |
For the 12-month reporting period May 1, 2010 through April 30, 2011, certain Barclays Capital indices performed as follows2:
| Barclays Capital U.S. Aggregate Bond Index3 | Barclays Capital U.S. Treasury Bond Index4 | Barclays Capital Fixed Rate Mortgage-Backed Securities Index5 | Barclays Capital U.S. Credit Bond Index6 | Barclays Capital Municipal Bond Index7 | ||||||||||||
| 5.36% | 4.64% | 4.98% | 7.03% | 2.20% | ||||||||||||
The Stock Markets
The Funds’ fiscal year ended with indexes at or near 12-month highs. The effect of the global stimulus manifested itself in higher commodity and asset prices. So much so that China, one of the big engines of global economic growth, decided to shift focus and concentrate on taming inflation. Thus the tighten cycle in China began, and through the year many other emerging economies would follow. Coupled with this tightening cycle was the revelation the some European countries may have been using currency swaps to get around conditions set forth in the Maastricht treaty. The upshot was that there were calls for the breakup of the Euro. Suffice it to say the following four months in the stock markets were quite trying. In the stock market, you are guilty until proven innocent, and the charge was a global double dip recession.
The result was a stock market correction that lasted from approximately the first of May 2010 until the Fed’s Jackson Hole meeting in late August 2010. At this meeting, Chairman Bernanke suggested that the Fed would do what it takes to make sure the U.S. economy recovers. The stock market, similar to a young child, got what it wanted, QE2. It didn’t matter that we would have to wait until the next full two day meeting in late October for it to become official. The market, the forward price discounting mechanism that it is, started to move higher. The reflation trade was put back on, buy industrials, commodities, and energy, and short the dollar. The only problem is that eventually rising commodity prices slow growth, but I digress. To use an old bridge term, let’s review the bidding. From approximately May 1 to September 1, 2010, the S&P 500 corrected 14% and from September 1 to May 1, 2011, the S&P 500 appreciated by close to 30%.
What does the future hold? The theory behind QE2 is that if an economy is flooded with liquidity, and we can get inflationary expectations rising, then the velocity of money will increase, and the economy has a good chance of growing on its own. To date, leading economic indicators are starting to decline and inflationary pressures around the world are starting to intensify. A slower growth environment with declining inflation may just be what the doctor ordered.
For the 12-month reporting period May 1, 2010 through April 30, 2011, certain stock market indices performed as follows:
| S&P 500 Index8 | Dow Jones Industrial Average9 | NASDAQ Composite Index10 | ||||||
| 17.22% | 19.33% | 17.98% | ||||||
The Trust, with assets of $7.1 billion as of April 30, 2011, gives investors access to every major asset class and sector. Whether you are looking for a comfortable retirement, to fund a child’s higher education, pursue tax-free income11, stay ahead of inflation, or keep your cash working, one or more of the Trust’s Funds can provide you with the diversification, flexibility and professional management you need.12
Sincerely,

Timothy L. Brenner
President
June 13, 2011
April 30, 2011 / PRESIDENT’S MESSAGE
Table of Contents
| iii |
For more complete information, please download the Trust’s prospectus available on www.mtbfunds.com or call 1-800-836-2211 for a copy. You should consider the Funds’ investment objectives, risks, charges, and expenses carefully before you invest. Information about these and other important subjects is in the Trust’s prospectus, which you should read carefully before investing.
Past performance is no guarantee of future results. The index performance quoted is for illustrative purposes only and is not representative of any specific investment.
| 1. | Quantitative easing is the practice of expanding a central bank’s balance sheet by buying long-term assets in an attempt to drive down long-term interest rates. |
| 2. | Bond prices are sensitive to changes in interest rates and a rise in interest rates can cause a decline in their prices. |
| 3. | Barclays Capital U.S. Aggregate Bond Index is widely used benchmark index for the domestic investment-grade bond market composed of securities from the Barclays Capital Government/Corporate Bond Index, Mortgage-Backed Securities Index and Asset-Backed Securities Index. The index typically includes fixed income securities with overall intermediate-to long-term average maturities. The index is unmanaged and investments cannot be made directly in an index. |
| 4. | Barclays Capital U. S. Treasury Bond Index is a market capitalization weighted index that includes all publicly issued, U.S. Treasury securities that have a remaining maturity of at least one year, are rated investment-grade, and have $250 million or more of outstanding face value. The index is unmanaged and investments cannot be made directly in an index. |
| 5. | Barclays Capital Fixed Rate Mortgage-Backed Securities Index is composed of all securities mortgage pools by GNMA, FNMA and the FHLMC, including GNMA graduated Payment Mortgages. The index is unmanaged and investments cannot be made directly in an index. |
| 6. | Barclays Capital U.S. Credit Bond Index tracks the performance of domestic investment-grade corporate bonds and is composed of all publicly issued, fixed-rate, nonconvertible, investment-grade corporate debt. The index is unmanaged and investments cannot be made directly in an index. |
| 7. | Barclays Capital Municipal Bond Index tracks the performance of long-term, tax-exempt, investment-grade bond market. To be included in the index, bonds must have an outstanding par balance of at least $7 million and be issued as part of a transaction of at least $75 million. The index is unmanaged and investments cannot be made directly in an index. |
| 8. | The S&P 500 Index is a capitalization-weighted index of 500 stocks designed to measure performance of the broad domestic economy through changes in the aggregate market value of 500 stocks representing all major industries. The index is unmanaged and investments cannot be made directly in an index. |
| 9. | Dow Jones Industrial Average (“DJIA”) represents share prices of selected blue chip industrial corporations as well as public utility and transportation companies. The DJIA indicates daily changes in the average prices of stocks in any of its categories. It also reports total sales for each group of industries. Because it represents the top corporations of America, the DJIA’s average movements are leading economic indicators for the stock market as a whole. The average is unmanaged and investments cannot be made directly in an average. |
| 10. | NASDAQ Composite Index measures all NASDAQ domestic and non-U.S. based common stocks listed on the NASDAQ Stock Market. The index is unmanaged and investments cannot be made directly in an index. |
| 11. | Income generated by tax-free funds may be subject to the federal alternative minimum tax and state and local taxes. |
| 12. | Diversification does not assure a profit nor protect against loss. |
PRESIDENT’S MESSAGE / April 30, 2011
Table of Contents
Managed by MTB Investment Advisors, Inc.
ANNUAL REPORT: APRIL 30, 2011
MTB Group of Funds
Short Duration Government
Short-Term Corporate Bond Fund
U.S. Government Bond Fund
New York Municipal Bond Fund
Pennsylvania Municipal Bond Fund
Maryland Municipal Bond Fund
Virginia Municipal Bond Fund
Intermediate-Term Bond Fund
Income Fund | Strategic Allocation Fund
Large Cap Value Fund
Large Cap Growth Fund
Mid Cap Growth Fund
Small Cap Growth Fund
International Equity Fund | |||
Table of Contents
| 1 |
MTB SHORT DURATION GOVERNMENT BOND FUND
Management’s Discussion of Fund Performance
For the fiscal year ended April 30, 2011, MTB Short Duration Government Bond Fund (the “Fund”) returned 2.10% for Class A Shares, 1.29% for Class C Shares, and 2.35% for Institutional I Shares, based on net asset value,* versus its benchmark, the Barclays Capital 1-3 Year U.S. Government Bond Index,** which returned 1.91%.
Although economic growth continued during the past fiscal year, the pace moderated as the positive effects of prior government stimulus programs expired. Higher energy prices were also a headwind for growth as the price of a barrel of oil climbed from $75 in May of 2010 to $114 on April 30, 2011, a 52% increase! The housing market also remained anemic as the supply of homes for sale dwarfed the demand for housing. New home sales hit an all-time low in February 2011 of 270,000 sales on an annualized basis. The record high new home sales were 1,389,000 units in July of 2005. The new home sales statistic has been measured since 1963. The good news was that even with the aforementioned headwinds, economic growth as measured by gross domestic product (“GDP”), grew at a respectable pace of 2.3% for the twelve month period ended in March of 2011.
The economy finally started to create new jobs with the unemployment rate falling from 9.7% to 9.0% during the fiscal year. The private sector of the economy created 2.1 million new jobs during the past year. However the public sector and especially state and local governments continued to cut spending to balance budgets. The government sector cut over 400,000 jobs since August 2008 as part of their cost cutting. The newly employed were eager to spend and retail sales and car sales in particular improved over the past year. The consumer also benefited from the social security tax cut that was implemented for 2011.
Interest rates moved lower during the fiscal year. The 2-year treasury yield declined in yield from 0.96% to 0.60%, while the 10-year treasury yield declined by a similar amount to a yield of 3.29% as of April 30, 2011. What was noteworthy for interest rates during the fiscal year was that the 2-year and 5-year treasury notes set record low yields in anticipation of the Federal Reserve (the “Fed”) announcing a second round of quantitative easing in early November. The 2-year treasury reached a low yield of 0.33% while the 5-year treasury hit a record low yield of 1.03%. Fears of a “double dip recession” caused by weaker than expected economic growth and in particular some further job market deterioration in conjunction with renewed fears of deflation and the widely anticipated quantitative easing program were the catalysts. In particular, the consumer price index (“CPI”), excluding food and energy, set a record year over year low in October of 2010 of 0.6%, thus the Fed’s concern over deflation. In response, the Fed announced they would purchase $600 billion of treasury securities by the end of the second quarter of 2011. The record low interest rates were short lived as economic growth improved and passage of further fiscal stimulus caused interest rates to rise dramatically during November and December of 2010. The 5-year treasury yield doubled from 1% to close the year at 2%. Also weighing on interest rates were higher energy prices and the subsequent rise of inflation. At fiscal year end, inflation had increased to 1.3% for the core rate, which excludes
food and energy and 3.2 for the overall CPI for the past year. In general, broad based increases in commodity prices and oil in particular can be blamed for the higher inflation.
At fiscal year end, the Fed acknowledged “that the economic recovery is proceeding at a moderate pace and overall conditions in the labor market are improving gradually. However, investment in nonresidential structures is still weak, and the housing sector continues to be depressed.” The Fed also stated, “Inflation has picked-up in recent months, but longer-term inflation expectations have remained stable and measures of underlying inflation are still subdued.” The Fed maintained its 0 to 0.25% federal funds target throughout the fiscal year as it has since December of 2008. Furthermore, the Fed “continues to anticipate that economic conditions, including low rates of resource utilization, subdued inflation trends and stable inflation expectations, are likely to warrant exceptionally low levels for the federal funds rate for an extended period.” At fiscal year end, the federal funds futures market was not expecting a tightening of Fed policy until June of 2012.
The combination of moderate economic growth, strong earnings growth and investors’ demand for higher yielding securities resulted in outperformance for the corporate and mortgage backed sectors of the bond market. The average risk premium for investment grade corporate bonds declined by only 5 basis points during the fiscal year according to Barclays Capital. As of April 30, 2011, the average risk premium was 138 basis points. The corporate sector rebounded after risk premiums widened last spring and early summer in response to the aforementioned fears of a double dip recession and sovereign credit risks associated with Greece, Portugal and Ireland. The risk premium closed the month of June 2010 at 193 basis points, which was 50 basis points wider than the end of April 2010. These fears were somewhat allayed by the European Union’s bailout plan. The plan is designed to give these countries time to improve their fiscal position by implementing austerity programs. The mortgage backed sector was aided by the diminished supply of new mortgages as the housing market remained sluggish. Commercial banks continued to add to their mortgage holdings as loan growth remained weak.
Standard & Poor’s revised the outlook for the United States of America to negative from stable in April 2011 and affirmed the AAA sovereign credit ratings. This is the first time the United States has been placed on negative outlook by a major rating agency. Standard & Poor’s cited that it has been “More than two years after the beginning of the recent crisis, U.S. policymakers have still not agreed on how to reverse recent fiscal deterioration or address longer-term fiscal pressures.” Clearly this is a warning to the United States government that it must take steps to balance the budget and address Medicare and social security programs. This action had very little impact on the treasury market.
Looking forward, we expect economic growth to continue at a moderate pace and inflation at the core rate to move slightly higher. We are encouraged by the economy’s recent ability to create jobs which should support growth. We are concerned with the negative ramifications of higher gasoline prices but are hopeful that energy prices will moderate. We do not expect the Fed to tighten in 2011
ANNUAL REPORT / April 30, 2011
Table of Contents
| 2 |
given that the unemployment rate although declining will still be too high for the Fed to tighten and inflation will not move too high. However, we do expect longer-term interest rates to move higher as the Fed’s quantitative easing program is scheduled to expire at the end of June 2011 and then the market will have to fill the void of the Fed no longer buying $75 billion of treasury securities per month.
In the Fund, we continue to emphasize duration management and bond structure. We have reduced our average maturity in 2011 and have added some securities to hedge against a higher rate of inflation.
| * | Performance data quoted represents past performance, which is no guarantee of future results. Investment return and principal value will fluctuate so that an investor’s shares, when redeemed, may be worth more or less than their original cost. The total return for Class A Shares was 0.28%, adjusted for the Fund’s maximum |
sales charge, and the total return for Class C Shares was 0.29%, adjusted for the Fund’s contingent deferred sales charge. Mutual fund performance changes over time and current performance may be lower or higher than what is stated. For the most recent month-end performance, please visit www.mtbfunds.com or call 1-800-836-2211. |
| ** | The Barclays Capital 1-3 Year U.S. Government Bond Index is a widely recognized index of U.S. Government obligations with maturities between one and three years. The index is unmanaged and investments cannot be made directly in an index. |
| The Consumer Price Index provides a measure of inflation at the retail level. |
| Duration is a measure of a security’s price sensitivity to changes in interest rates. Securities with longer durations are more sensitive to changes in interest rates than securities of shorter durations. |
| Bond prices are sensitive to changes in interest rates and a rise in short-term interest rates could cause a decline in bond prices. |
April 30, 2011 / ANNUAL REPORT
Table of Contents
| 3 |
MTB SHORT DURATION GOVERNMENT BOND FUND –
CLASS A AND C SHARES
The graph below illustrates the hypothetical investment of $10,0001,2 in the MTB Short Duration Government Bond Fund (Class A Shares) (the “Fund”) from August 18, 2003 (start of performance) to April 30, 2011, compared to the Barclays Capital 1-3 Year U.S. Government Bond Index (“BC1-3GB”)2,3 and the Lipper Short U.S. Government Average.2,3
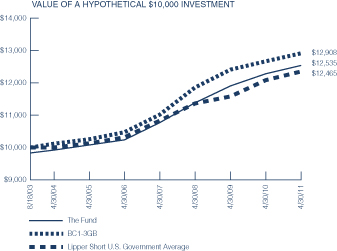
The graph below illustrates the hypothetical investment of $10,0002,4 in the MTB Short Duration Government Bond Fund (Class C Shares) (the “Fund”) from April 9, 2010 (start of performance) to April 30, 2011, compared to the Barclays Capital 1-3 Year U.S. Government Bond Index
(“BC1-3GB”)2,3 and the Lipper Short U.S. Government Average.2,3
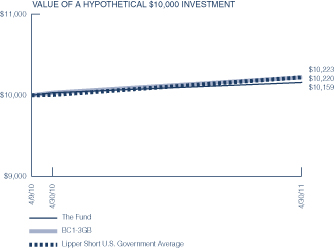
Average Annual Total Returns for the Period Ended April 30, 2011
| Class A | Class C | |||||||
| 1 Year | 0.28% | 0.29% | ||||||
| 5 Years | 3.76% | N/A | ||||||
| Start of Performance5 | 2.98% | 1.50% | ||||||
Performance data quoted represents past performance which is no guarantee of future results. Returns shown do not reflect the deduction of taxes that a shareholder would pay on Fund distributions or the redemption of Fund shares. Investment return and principal value will fluctuate so that an investor’s shares, when redeemed, may be worth more or less than their original cost. Mutual funds are not obligations of or guaranteed by any bank and are not federally insured. Mutual fund performance changes over time and current performance may be lower or higher than what is stated. For current to the most recent month end performance, visit www.mtbfunds.com or call 1-800-836-2211. Total returns shown include the maximum sales charge of 1.75% for Class A Shares and contingent deferred sales charge (“CDSC”) of up to 1.00% for Class C Shares.
Annual Operating Expense Ratio
| Class A | Class C | |||||||
| Before Waivers | 1.36% | 2.11% | ||||||
| After Waivers | 0.89% | 1.66% | ||||||
The Expense Ratio Before Waivers represents the operating costs borne by the Fund, expressed as a percentage of the Fund’s average net assets, as shown in the Fees and Expenses table in the Fund’s current prospectus (under “Total Annual Fund Operating Expenses”).
| 1 | Represents a hypothetical investment of $10,000 in Class A Shares after deducting the maximum sales charge of 1.75% ($10,000 investment minus $175 sales charge = $9,825). |
| 2 | The Fund’s performance assumes the reinvestment of all dividends and distributions. The BC1-3GB and the Lipper Short U.S. Government Average have been adjusted to reflect reinvestment of dividends on securities in the indexes. The BC1-3GB and the Lipper Short U.S. Government Average performance presented is as of the nearest month-end following inception date. |
| 3 | The BC1-3GB and the Lipper Short U.S. Government Average are not adjusted to reflect sales charges, that the Securities and Exchange Commission (“SEC”) requires to be reflected in the Fund’s performance. The index is unmanaged and, unlike the Fund, is not affected by cashflows. It is not possible to invest directly in an index or an average. |
| 4 | Represents a hypothetical investment of $10,000 in Class C Shares. The ending value of the Fund does not reflect a CDSC on any redemption over 1 year from the purchase date. |
| 5 | The start of performance for Class A Shares was August 18, 2003 and Class C Shares was April 9, 2010. |
ANNUAL REPORT / April 30, 2011
Table of Contents
| 4 |
MTB SHORT DURATION GOVERNMENT BOND FUND – INSTITUTIONAL I SHARES
The graph below illustrates the hypothetical investment of $100,0001 in the MTB Short Duration Government Bond Fund (Institutional I Shares) (the “Fund”) from April 30, 2001 to April 30, 2011, compared to the Barclays Capital 1-3 Year U.S. Government Bond Index (“BC1-3GB”)1,2 and the Lipper Short U.S. Government Average.1,2
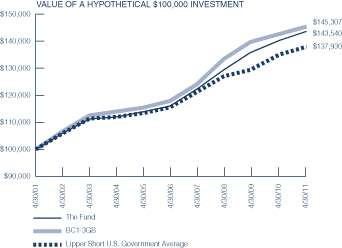
Average Annual Total Returns for the Period Ended April 30, 2011
| 1 Year | 2.35% | |||
| 5 Years | 4.36% | |||
| 10 Years | 3.68% | |||
Performance data quoted represents past performance which is no guarantee of future results. Returns shown do not reflect the deduction of taxes that a shareholder would pay on Fund distributions or the redemption of Fund shares. Investment return and principal value will fluctuate so that an investor’s shares, when redeemed, may be worth more or less than their original cost. Mutual funds are not obligations of or guaranteed by any bank and are not federally insured. Mutual fund performance changes over time and current performance may be lower or higher than what is stated. For current to the most recent month end performance, visit www.mtbfunds.com or call 1-800-836-2211.
Annual Operating Expense Ratio
| Before Waivers | 1.11% | |||
| After Waivers | 0.64% | |||
The Expense Ratio Before Waivers represents the operating costs borne by the Fund, expressed as a percentage of the Fund’s average net assets, as shown in the Fees and Expenses table in the Fund’s current prospectus (under “Total Annual Fund Operating Expenses”).
| 1 | The Fund’s performance assumes the reinvestment of all dividends and distributions. The BC1-3GB and the Lipper Short U.S. Government Average have been adjusted to reflect reinvestment of dividends on securities in the indexes. |
| 2 | The BC1-3GB and the Lipper Short U.S. Government Average are not adjusted to reflect sales charges, that the SEC requires to be reflected in the Fund’s performance. The index is unmanaged and, unlike the Fund, is not affected by cashflows. It is not possible to invest directly in an index or an average. |
April 30, 2011 / ANNUAL REPORT
Table of Contents
| 5 |
MTB SHORT-TERM CORPORATE BOND FUND
Management’s Discussion of Fund Performance
For the fiscal year ended April 30, 2011, MTB Short-Term Corporate Bond Fund (the “Fund”) returned 2.57% for Class A Shares, 1.89% for Class C Shares, and 2.83% for Institutional I Shares, based on net asset value,* versus its benchmark, the Barclays Capital 1-3 Year U.S. Government/Credit Bond Index,** which returned 2.27%.
Although economic growth continued during the past fiscal year, the pace moderated as the positive effects of prior government stimulus programs expired. Higher energy prices were also a headwind for growth as the price of a barrel of oil climbed from $75 in May of 2010 to $114 on April 30, 2011, a 52% increase! The housing market also remained anemic as the supply of homes for sale dwarfed the demand for housing. New home sales hit an all-time low in February 2011 of 270,000 sales on an annualized basis. The record high new home sales were 1,389,000 units in July of 2005. The new home sales statistic has been measured since 1963. The good news was that even with the aforementioned headwinds, economic growth as measured by gross domestic product (“GDP”), grew at a respectable pace of 2.3% for the twelve month period ended in March of 2011.
The economy finally started to create new jobs with the unemployment rate falling from 9.7% to 9.0% during the fiscal year. The private sector of the economy created 2.1 million new jobs during the past year. However the public sector and especially state and local governments continued to cut spending to balance budgets. The government sector cut over 400,000 jobs since August 2008 as part of their cost cutting. The newly employed were eager to spend and retail sales and car sales in particular improved over the past year. The consumer also benefited from the social security tax cut that was implemented for 2011.
Interest rates moved lower during the fiscal year. The 2-year treasury yield declined in yield from 0.96% to 0.60%, while the 10-year treasury yield declined by a similar amount to a yield of 3.29% as of April 30, 2011. What was noteworthy for interest rates during the fiscal year was that the 2-year and 5-year treasury notes set record low yields in anticipation of the Federal Reserve (the “Fed”) announcing a second round of quantitative easing in early November. The 2-year treasury reached a low yield of 0.33% while the 5-year treasury hit a record low yield of 1.03%. Fears of a “double dip recession” caused by weaker than expected economic growth and in particular some further job market deterioration in conjunction with renewed fears of deflation and the widely anticipated quantitative easing program were the catalysts. In particular, the consumer price index (“CPI”), excluding food and energy, set a record year over year low in October of 2010 of 0.6%, thus the Fed’s concern over deflation. In response, the Fed announced they would purchase $600 billion of treasury securities by the end of the second quarter of 2011. The record low interest rates were short lived as economic growth improved and passage of further fiscal stimulus caused interest rates to rise dramatically during November and December of 2010. The 5-year treasury yield doubled from 1% to close the year at 2%. Also weighing on interest rates were higher energy prices and the subsequent rise of inflation. At fiscal year end, inflation had increased to 1.3% for the core rate, which
excludes food and energy and 3.2 for the overall CPI for the past year. In general, broad based increases in commodity prices and oil in particular can be blamed for the higher inflation.
At fiscal year end, the Fed acknowledged “that the economic recovery is proceeding at a moderate pace and overall conditions in the labor market are improving gradually. However, investment in nonresidential structures is still weak, and the housing sector continues to be depressed.” The Fed also stated, “Inflation has picked-up in recent months, but longer-term inflation expectations have remained stable and measures of underlying inflation are still subdued.” The Fed maintained its 0 to 0.25% federal funds target throughout the fiscal year as it has since December of 2008. Furthermore, the Fed “continues to anticipate that economic conditions, including low rates of resource utilization, subdued inflation trends and stable inflation expectations, are likely to warrant exceptionally low levels for the federal funds rate for an extended period.” At fiscal year end, the federal funds futures market was not expecting a tightening of Fed policy until June of 2012.
The combination of moderate economic growth, strong earnings growth and investors’ demand for higher yielding securities resulted in outperformance for the corporate and mortgage backed sectors of the bond market. The average risk premium for investment grade corporate bonds declined by only 5 basis points during the fiscal year according to Barclays Capital. As of April 30, 2011 the average risk premium was 138 basis points. The corporate sector rebounded after risk premiums widened last spring and early summer in response to the aforementioned fears of a double dip recession and sovereign credit risks associated with Greece, Portugal and Ireland. The risk premium closed the month of June 2010 at 193 basis points, which was 50 basis points wider than the end of April 2010. These fears were somewhat allayed by the European Union’s bailout plan. The plan is designed to give these countries time to improve their fiscal position by implementing austerity programs. The mortgage backed sector was aided by the diminished supply of new mortgages as the housing market remained sluggish. Commercial banks continued to add to their mortgage holdings as loan growth remained weak.
Standard & Poor’s revised the outlook for the United States of America to negative from stable in April 2011 and affirmed the AAA sovereign credit ratings. This is the first time the United States has been placed on negative outlook by a major rating agency. Standard & Poor’s cited that it has been “ More than two years after the beginning of the recent crisis, U.S. policymakers have still not agreed on how to reverse recent fiscal deterioration or address longer-term fiscal pressures.” Clearly this is a warning to the United States government that it must take steps to balance the budget and address Medicare and social security programs. This action had very little impact on the treasury market.
Looking forward, we expect economic growth to continue at a moderate pace and inflation at the core rate to move slightly higher. We are encouraged by the economy’s recent ability to create jobs which should support growth. We are concerned with the negative ramifications of higher gasoline prices but are hopeful that energy
ANNUAL REPORT / April 30, 2011
Table of Contents
| 6 |
prices will moderate. We do not expect the Fed to tighten in 2011 given that the unemployment rate although declining will still be too high for the Fed to tighten and inflation will not move too high. However, we do expect longer-term interest rates to move higher as the Fed’s quantitative easing program is scheduled to expire at the end of June 2011 and then the market will have to fill the void of the Fed no longer buying $75 billion of treasury securities per month.
The Fund continues to be overweighted in the corporate sector, primarily in financials. In an attempt to produce the highest risk adjusted yield possible amidst a range bound interest rate environment, we have increased our allocation to high yield and BBB rated investment grade corporates. Over the course of the year, we have increased exposure to the 2 to 3-year part of the yield curve and reduced our exposure in the 1 and longer than 5-year maturity buckets. We have favored regional broker/dealers and banks as well as Real Estate Investment Trusts (“REITs”). In the REIT space, we have increased our exposure to healthcare REITs. We believe that healthcare REITs will benefit as the U.S. population ages and the healthcare sector increases as a percentage of U.S. GDP. As the economy improves further and the risk of Fed tightening increases, we expect to further increase our allocation to floating rate notes, all the while attempting to achieve an attractive risk adjusted yield for our shareholders.
| * | Performance data quoted represents past performance, which is no guarantee of future results. Investment return and principal value will fluctuate so that an investor’s shares, when redeemed, may be worth more or less than their original cost. The total return for Class A Shares was 0.79%, adjusted for the Fund’s maximum sales charge, and the total return for Class C Shares was 0.89%, adjusted for the Fund’s contingent deferred sales charge. Mutual fund performance changes over time and current performance may be lower or higher than what is stated. For the most recent month-end performance, please visit www.mtbfunds.com or call 1-800-836-2211. |
| ** | The Barclays Capital 1-3 Year U.S. Government/Credit Bond Index is an index that captures funds with exposures to both government and commercial credit. The index is unmanaged and investments cannot be made directly in an index. |
| Duration is a measure of a security’s price sensitivity to changes in interest rates. Securities with longer durations are more sensitive to changes in interest rates than securities of shorter durations. |
| Bond prices are sensitive to changes in interest rates and a rise in short-term interest rates could cause a decline in bond prices. |
April 30, 2011 / ANNUAL REPORT
Table of Contents
| 7 |
MTB SHORT-TERM CORPORATE BOND FUND – CLASS A AND C SHARES
The graph below illustrates the hypothetical investment of $10,0001,2 in the MTB Short-Term Corporate Bond Fund (Class A Shares) (the “Fund”) from August 25, 2003 (start of performance) to April 30, 2011, compared to the Barclays Capital 1-3 Year U.S. Government/Credit Bond Index (“BCGC”)2,3 and the Lipper Short Investment Grade Debt Funds Average.2,3
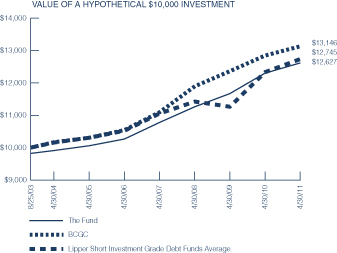
The graph below illustrates the hypothetical investment of $10,0002,4 in the MTB Short-Term Corporate Bond Fund (Class C Shares) (the “Fund”) from April 08, 2010 (start of performance) to April 30, 2011, compared to the Barclays Capital 1-3 Year U.S. Government/Credit Bond Index (“BCGC”)2,3 and the Lipper Short Investment Grade Debt Funds Average.2,3
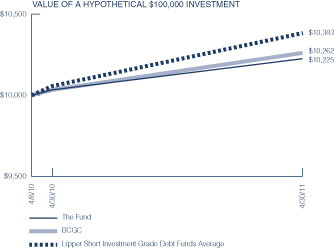
Average Annual Total Returns for the Period Ended April 30, 2011
| Class A | Class C | |||||||
| 1 Year | 0.79% | 0.89% | ||||||
| 5 Years | 3.86% | N/A | ||||||
| Start of Performance5 | 3.08% | 2.12% | ||||||
Performance data quoted represents past performance which is no guarantee of future results. Returns shown do not reflect the deduction of taxes that a shareholder would pay on Fund distributions or the redemption of Fund shares. Investment return and principal value will fluctuate so that an investor’s shares, when redeemed, may be worth more or less than their original cost. Mutual funds are not obligations of or guaranteed by any bank and are not federally insured. Mutual fund performance changes over time and current performance may be lower or higher than what is stated. For current to the most recent month end performance, visit www.mtbfunds.com or call 1-800-836-2211. Total returns shown include the maximum sales charge of 1.75% for Class A Shares and contingent deferred sales charge (“CDSC”) of up to 1.00% for Class C Shares.
Annual Operating Expense Ratio
| Class A | Class C | |||||||
| Before Waivers | 1.47% | 2.22% | ||||||
| After Waivers | 0.86% | 1.61% | ||||||
The Expense Ratio Before Waivers represents the operating costs borne by the Fund, expressed as a percentage of the Fund’s average net assets, as shown in the Fees and Expenses table in the Fund’s current prospectus (under “Total Annual Fund Operating Expenses”).
| 1 | Represents a hypothetical investment of $10,000 in Class A Shares after deducting the maximum sales charge of 1.75% ($10,000 investment minus $175 sales charge = $9,825). |
| 2 | The Fund’s performance assumes the reinvestment of all dividends and distributions. The BCGC and the Lipper Short Investment Grade Debt Funds Average have been adjusted to reflect reinvestment of dividends on securities in the indexes. The BCGC and the Lipper Short Investment Grade Debt Funds Average performance presented is as of the nearest month-end following inception date. |
| 3 | The BCGC and the Lipper Short Investment Grade Debt Funds Average are not adjusted to reflect sales charges, that the Securities and Exchange Commission (“SEC”) requires to be reflected in the Fund’s performance. The index is unmanaged and, unlike the Fund, is not affected by cashflows. It is not possible to invest directly in an index or an average. |
| 4 | Represents a hypothetical investment of $10,000 in Class C Shares. The ending value of the Fund does not reflect a CDSC on any redemption over 1 year from the purchase date. |
| 5 | The start of performance for Class A Shares was August 25, 2003 and Class C Shares was April 8, 2010. |
ANNUAL REPORT / April 30, 2011
Table of Contents
| 8 |
MTB SHORT-TERM CORPORATE BOND FUND – INSTITUTIONAL I SHARES†
The graph below illustrates the hypothetical investment of $100,0001 in the MTB Short-Term Corporate Bond Fund (Institutional I Shares) (the “Fund”) from April 30, 2001 to April 30, 2011, compared to the Barclays Capital 1-3 Year U.S. Government/Credit Bond Index (“BCGC”)1,2 and the Lipper Short Investment Grade Debt Funds Average.1,2
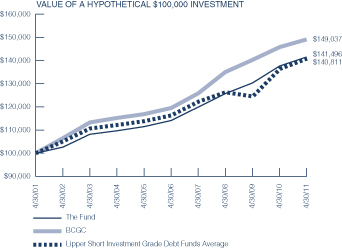
Average Annual Total Returns for the Period Ended April 30, 2011
| 1 Year | 2.83% | |||
| 5 Years | 4.40% | |||
| 10 Years | 3.53% | |||
Performance data quoted represents past performance which is no guarantee of future results. Returns shown do not reflect the deduction of taxes that a shareholder would pay on Fund distributions or the redemption of Fund shares. Investment return and principal value will fluctuate so that an investor’s shares, when redeemed, may be worth more or less than their original cost. Mutual funds are not obligations of or guaranteed by any bank and are not federally insured. Mutual fund performance changes over time and current performance may be lower or higher than what is stated. For current to the most recent month end performance, visit www.mtbfunds.com or call 1-800-836-2211.
Annual Operating Expense Ratio
| Before Waivers | 1.22% | |||
| After Waivers | 0.61% | |||
The Expense Ratio Before Waivers represents the operating costs borne by the Fund, expressed as a percentage of the Fund’s average net assets, as shown in the Fees and Expenses table in the Fund’s current prospectus (under “Total Annual Fund Operating Expenses”).
| 1 | The Fund’s performance assumes the reinvestment of all dividends and distributions. The BCGC and the Lipper Short Investment Grade Debt Funds Average have been adjusted to reflect reinvestment of dividends on securities in the indexes. |
| 2 | The BCGC and the Lipper Short Investment Grade Debt Funds Average are not adjusted to reflect sales charges, that the SEC requires to be reflected in the Fund’s performance. The index is unmanaged and, unlike the Fund, is not affected by cashflows. It is not possible to invest directly in an index or an average. |
| † | Performance presented prior to August 22, 2003 reflects the performance of the ARK Short-Term Bond Portfolio, which the MTB Short-Term Corporate Bond Fund acquired pursuant to a reorganization on that date. |
April 30, 2011 / ANNUAL REPORT
Table of Contents
| 9 |
MTB U.S. GOVERNMENT BOND FUND
Management’s Discussion of Fund Performance
For the fiscal year ended April 30, 2011, MTB U.S. Government Bond Fund (the “Fund”) returned 3.98% for Class A Shares and 4.21% for Institutional I Shares, based on net asset value,* versus its benchmark, the Barclays Capital U.S. Government Bond Index,** which returned 4.42% and its peer group, the Lipper General U.S. Government Funds Average*** which returned 4.60%.
Although economic growth continued during the past fiscal year, the pace moderated as the positive effects of prior government stimulus programs expired. Higher energy prices were also a headwind for growth as the price of a barrel of oil climbed from $75 in May of 2010 to $114 on April 30, 2011, a 52% increase! The housing market also remained anemic as the supply of homes for sale dwarfed the demand for housing. New home sales hit an all-time low in February 2011 of 270,000 sales on an annualized basis. The record high new home sales were 1,389,000 units in July of 2005. The new home sales statistic has been measured since 1963. The good news was that even with the aforementioned headwinds, economic growth as measured by gross domestic product (“GDP”), grew at a respectable pace of 2.3% for the twelve month period ended in March of 2011.
The economy finally started to create new jobs with the unemployment rate falling from 9.7% to 9.0% during the fiscal year. The private sector of the economy created 2.1 million new jobs during the past year. However the public sector and especially state and local governments continued to cut spending to balance budgets. The government sector cut over 400,000 jobs since August 2008 as part of their cost cutting. The newly employed were eager to spend and retail sales and car sales in particular improved over the past year. The consumer also benefited from the social security tax cut that was implemented for 2011.
Interest rates moved lower during the fiscal year. The 2-year treasury yield declined in yield from 0.96% to 0.60%, while the 10-year treasury yield declined by a similar amount to a yield of 3.29% as of April 30, 2011. What was noteworthy for interest rates during the fiscal year was that the 2-year and 5-year treasury notes set record low yields in anticipation of the Federal Reserve (the “Fed”) announcing a second round of quantitative easing in early November. The 2-year treasury reached a low yield of 0.33% while the 5-year treasury hit a record low yield of 1.03%. Fears of a “double dip recession” caused by weaker than expected economic growth and in particular some further job market deterioration in conjunction with renewed fears of deflation and the widely anticipated quantitative easing program were the catalysts. In particular, the consumer price index (“CPI”), excluding food and energy, set a record year over year low in October of 2010 of 0.6%, thus the Fed’s concern over deflation. In response, the Fed announced they would purchase $600 billion of treasury securities by the end of the second quarter of 2011. The record low interest rates were short lived as economic growth improved and passage of further fiscal stimulus caused interest rates to rise dramatically during November and December of 2010. The 5-year treasury yield doubled from 1% to close the year at 2%. Also weighing on interest rates were higher energy prices and the subsequent rise of inflation. At fiscal year end, inflation had increased to 1.3% for the core rate, which
excludes food and energy and 3.2 for the overall CPI for the past year. In general, broad based increases in commodity prices and oil in particular can be blamed for the higher inflation.
At fiscal year end, the Fed acknowledged “that the economic recovery is proceeding at a moderate pace and overall conditions in the labor market are improving gradually. However, investment in nonresidential structures is still weak, and the housing sector continues to be depressed.” The Fed also stated, “Inflation has picked-up in recent months, but longer-term inflation expectations have remained stable and measures of underlying inflation are still subdued.” The Fed maintained its 0 to 0.25% federal funds target throughout the fiscal year as it has since December of 2008. Furthermore, the Fed “continues to anticipate that economic conditions, including low rates of resource utilization, subdued inflation trends and stable inflation expectations, are likely to warrant exceptionally low levels for the federal funds rate for an extended period.” At fiscal year end, the federal funds futures market was not expecting a tightening of Fed policy until June of 2012.
The combination of moderate economic growth, strong earnings growth and investors’ demand for higher yielding securities resulted in outperformance for the corporate and mortgage backed sectors of the bond market. The average risk premium for investment grade corporate bonds declined by only 5 basis points during the fiscal year according to Barclays Capital. As of April 30, 2011, the average risk premium was 138 basis points. The corporate sector rebounded after risk premiums widened last spring and early summer in response to the aforementioned fears of a double dip recession and sovereign credit risks associated with Greece, Portugal and Ireland. The risk premium closed the month of June 2010 at 193 basis points, which was 50 basis points wider than the end of April 2010. These fears were somewhat allayed by the European Union’s bailout plan. The plan is designed to give these countries time to improve their fiscal position by implementing austerity programs. The mortgage backed sector was aided by the diminished supply of new mortgages as the housing market remained sluggish. Commercial banks continued to add to their mortgage holdings as loan growth remained weak.
Standard & Poor’s revised the outlook for the United States of America to negative from stable in April 2011 and affirmed the AAA sovereign credit ratings. This is the first time the United States has been placed on negative outlook by a major rating agency. Standard & Poor’s cited that it has been, “More than two years after the beginning of the recent crisis, U.S. policymakers have still not agreed on how to reverse recent fiscal deterioration or address longer-term fiscal pressures.” Clearly this is a warning to the United States government that it must take steps to balance the budget and address Medicare and social security programs. This action had very little impact on the treasury market.
Looking forward, we expect economic growth to continue at a moderate pace and inflation at the core rate to move slightly higher. We are encouraged by the economy’s recent ability to create jobs which should support growth. We are concerned with the negative ramifications of higher gasoline prices but are hopeful that energy prices will moderate. We do not expect the Fed to tighten in 2011
ANNUAL REPORT / April 30, 2011
Table of Contents
| 10 |
given that the unemployment rate although declining will still be too high for the Fed to tighten and inflation will not move too high. However, we do expect longer-term interest rates to move higher as the Fed’s quantitative easing program is scheduled to expire at the end of June 2011 and then the market will have to fill the void of the Fed no longer buying $75 billion of treasury securities per month.
The Fund benefited from our allocation to the mortgage backed securities sector as this sector provided excess return as investors sought higher yielding securities. Our duration strategy to maintain a shorter average maturity than the benchmark hurt performance as interest rates moved lower during the first half of the fiscal year. The Fund also benefited from our sector allocation to the higher yielding government agency sector versus the lower yielding U.S. Treasury sector.
| * | Performance data quoted represents past performance, which is no guarantee of future results. Investment return and principal value will fluctuate so that an investor’s shares, when redeemed, may be worth more or less than their original cost. The total return for Class A Shares was (0.73)%, adjusted for the Fund’s maximum |
sales charge, adjusted for the Fund’s contingent deferred sales charge. Mutual fund performance changes over time and current performance may be lower or higher than what is stated. For the most recent month-end performance, please visit www.mtbfunds.com or call 1-800-836-2211. |
| ** | The Barclays Capital U.S. Government Bond Index is a market value weighted index of U.S. government and agency securities (other than mortgage securities) with maturities of one year or more. The index is unmanaged and investments cannot be made directly in an index. |
| *** | Lipper General U.S. Government Funds Average represents the average of the total returns reported by all of the mutual funds designated by Lipper, Inc. as falling into the respective category indicated. These figures do not reflect sales charges. The average is unmanaged and investments cannot be made directly in an average. |
| The Consumer Price Index provides a measure of inflation at the retail level. |
| Duration is a measure of a security’s price sensitivity to changes in interest rates. Securities with longer durations are more sensitive to changes in interest rates than securities of shorter durations. |
| Bond prices are sensitive to changes in interest rates and a rise in short-term interest rates could cause a decline in bond prices. |
April 30, 2011 / ANNUAL REPORT
Table of Contents
| 11 |
MTB U.S. GOVERNMENT BOND FUND – CLASS A SHARES
The graph below illustrates the hypothetical investment of $10,0001,2 in the MTB U.S. Government Bond Fund (Class A Shares) (the “Fund”) from April 30, 2001 to April 30, 2011, compared to the Barclays Capital U.S. Government Bond Index (“BCUSGB”)2,3 and the Lipper General U.S. Government Funds Average.2,3
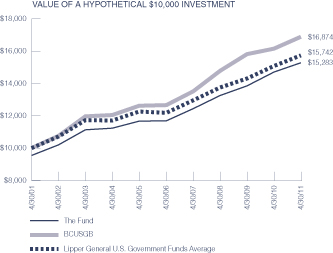
Average Annual Total Returns for the Period Ended April 30, 2011
| 1 Year | (0.73)% | |||
| 5 Years | 4.54% | |||
| 10 Years | 4.33% | |||
Performance data quoted represents past performance which is no guarantee of future results. Returns shown do not reflect the deduction of taxes that a shareholder would pay on Fund distributions or the redemption of Fund shares. Investment return and principal value will fluctuate so that an investor’s shares, when redeemed, may be worth more or less than their original cost. Mutual funds are not obligations of or guaranteed by any bank and are not federally insured. Mutual fund performance changes over time and current performance may be lower or higher than what is stated. For current to the most recent month end performance, visit www.mtbfunds.com or call 1-800-836-2211. Total returns shown include the maximum sales charge of 4.50%.
Annual Operating Expense Ratio
| Before Waivers | 1.48% | |||
| After Waivers | 1.09% | |||
The Expense Ratio Before Waivers represents the operating costs borne by the Fund, expressed as a percentage of the Fund’s average net assets, as shown in the Fees and Expenses table in the Fund’s current prospectus (under “Total Annual Fund Operating Expenses”).
| 1 | Represents a hypothetical investment of $10,000 in the Fund after deducting the maximum sales charge of 4.50% ($10,000 investment minus $450 sales charge = $9,550). |
| 2 | The Fund’s performance assumes the reinvestment of all dividends and distributions. The BCUSGB and the Lipper General U.S. Government Funds Average have been adjusted to reflect reinvestment of dividends on securities in the indexes. |
| 3 | The BCUSGB and the Lipper General U.S. Government Funds Average are not adjusted to reflect sales charges, that the Securities and Exchange Commission (“SEC”) requires to be reflected in the Fund’s performance. The index is unmanaged and, unlike the Fund, is not affected by cashflows. It is not possible to invest directly in an index or an average. |
ANNUAL REPORT / April 30, 2011
Table of Contents
| 12 |
MTB U.S. GOVERNMENT BOND FUND – INSTITUTIONAL I SHARES
The graph below illustrates the hypothetical investment of $100,0001 in the MTB U.S. Government Bond Fund (Institutional I Shares) (the “Fund”) from August 18, 2003 (start of performance) to April 30, 2011, compared to the BCUSGB1,2 and the Lipper General U.S. Government Funds Average.1,2
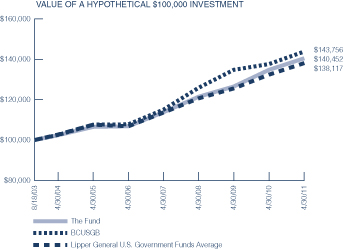
Average Annual Total Returns for the Period Ended April 30, 2011
| 1 Year | 4.21% | |||
| 5 Years | 5.62% | |||
| Start of Performance (8/18/03) | 4.51% | |||
Performance data quoted represents past performance which is no guarantee of future results. Returns shown do not reflect the deduction of taxes that a shareholder would pay on Fund distributions or the redemption of Fund shares. Investment return and principal value will fluctuate so that an investor’s shares, when redeemed, may be worth more or less than their original cost. Mutual funds are not obligations of or guaranteed by any bank and are not federally insured. Mutual fund performance changes over time and current performance may be lower or higher than what is stated. For current to the most recent month end performance, visit www.mtbfunds.com or call 1-800-836-2211.
Annual Operating Expense Ratio
| Before Waivers | 1.23% | |||
| After Waivers | 0.74% | |||
The Expense Ratio Before Waivers represents the operating costs borne by the Fund, expressed as a percentage of the Fund’s average net assets, as shown in the Fees and Expenses table in the Fund’s current prospectus (under “Total Annual Fund Operating Expenses”).
| 1 | The Fund’s performance assumes the reinvestment of all dividends and distributions. The BCUSGB and the Lipper General U.S. Government Funds Average have been adjusted to reflect reinvestment of dividends on securities in the indexes. The BCUSGB and the Lipper General U.S. Government Funds Average performance presented is as of the nearest month-end following inception date. |
| 2 | The BCUSGB and the Lipper General U.S. Government Funds Average are not adjusted to reflect sales charges, that the SEC requires to be reflected in the Fund’s performance. The index is unmanaged and, unlike the Fund, is not affected by cashflows. It is not possible to invest directly in an index or an average. |
April 30, 2011 / ANNUAL REPORT
Table of Contents
| 13 |
MTB NEW YORK MUNICIPAL BOND FUND
Management’s Discussion of Fund Performance
For the fiscal year ended April 30, 2011, MTB New York Municipal Bond Fund (the “Fund”) returned 1.83% for Class A Shares and 1.97% for Institutional I Shares, based on net asset value,* versus its benchmark, the Barclays Capital New York Tax-Exempt Index,** which returned 2.34%.
When comparing municipal yields for the fiscal year ended April 30, 2011, it appears that the municipal bond market did not move much. Short-term triple-A yields are down about 10 basis points, while long-term yields are up about 50 basis points. However, during the year, the municipal market rallied into the early part of the fall and has moved lower since.
For the first six months of the fiscal year, the municipal bond market was performing well; demand for municipal bonds was strong due to a soft economy and historically low interest rates, and the expectation for future higher income tax rates. Flows into municipal bond funds were solid. Credit spreads had recovered significantly from the wide levels they reached during the financial crisis, the popular Build America Bonds program (“BABs”) was diverting supply from the tax-exempt bond market and flows into mutual funds were strong.
The cascade of events leading to the rise in municipal interest rates began with a rise in U.S. Treasury rates. Municipal yields followed Treasury yields higher as the Federal Reserve (the “Fed”) signaled that higher inflation was essential to economic recovery and traces of economic growth were emerging. As interest rates rose, investors began selling shares of tax-exempt mutual funds and either shortening duration or moving to other more attractive asset classes. Additional selling pressures occurred in lower quality municipal bonds when S&P lowered the ratings on 16 Tobacco Settlement-Backed deals in November. This resulted in a total of 51 downgrades, prompting investor withdrawals from high yield mutual funds, forcing supply into an already weak market.
The extension of the Bush-era tax cuts further dampened investors’ need to buy additional tax-exempt bonds. With the back drop of dwindling investor demand, issuers flooded the market as the BABs program was set to expire at the end of 2010. October, November and December, typically months of reduced supply, set records as $133.8 billion of new issuance came to market. Rates continued to rise and liquidity became a challenge.
The recession’s impact on the credit quality of state and local governments came into focus. Media headlines called for probable municipal defaults, pushing yields higher as we ended the year. As we entered 2011, investors were apprehensive about the prospects for an increase in supply of tax-exempt bonds. The concern was that supply would increase in 2011 as the tax-exempt municipal bond market would again have to absorb the new supply that had previously been diverted into the taxable bond market through the BABs program.
Although mutual fund outflows continued to be strong during the first four months of 2011, unanticipated diminished supply of new issues has placed slight downward pressure in municipal yields and restored some liquidity to the market. Recent demand has been focused on the short and intermediate segments of the yield curve as well as high grade bonds. Sponsorship for longer-dated securities of lower quality still seems to be anemic as credit spreads climbed to their widest level during April 2011.
As short-term rates remain anchored by Fed policy, the yield curve continues to remain steep by historical standards, with approximately 400 basis points difference between 2-year and 30-year yields.
The Funds overall credit quality is Aa3, while the State of New York’s general obligation debt continues to be rated Aa2/AA by Moody’s and Standard & Poor’s. The Fund’s holdings in high coupon intermediate duration bonds contributed positively to the Fund’s performance over the past year, while holdings in lower coupon short duration bonds limited performance. The portfolio generally focuses on bonds in the intermediate-term maturity segment, and we remain committed to limiting the percentage allocated to bonds subject to the alternative minimum tax.
| * | Performance data quoted represents past performance, which is no guarantee of future results. Investment return and principal value will fluctuate so that an investor’s shares, when redeemed, may be worth more or less than their original cost. The total return for Class A Shares was (2.73)%, adjusted for the Fund’s maximum sales charge. Mutual fund performance changes over time and current performance may be lower or higher than what is stated. For the most recent month-end performance, please visit www.mtbfunds.com or call 1-800-836-2211. |
| ** | The Barclays Capital New York Tax-Exempt Index is a total return performance benchmark for the New York long-term investment grade tax-exempt bond market. Returns and attributes for this index are calculated semi-monthly using approximately 22,000 municipal bonds classified as general obligation bonds (state and local), revenue bonds (excluding insured revenue bonds), insured bonds (includes all bond insurers with Aaa/AAA ratings), and pre-refunded bonds. The index is unmanaged and investments cannot be made directly in an index. |
| Duration is a measure of a security’s price sensitivity to changes in interest rates. Securities with longer durations are more sensitive to changes in interest rates than securities of shorter durations. |
| High yield, lower-rated securities generally entail greater market, credit and liquidity risks than investment grade securities and may include higher volatility and higher risk of default. |
| Credit ratings pertain only to the securities in the portfolio and do not protect fund shares against market risk. Bond prices are sensitive to changes in interest rates and a rise in short-term interest rates could cause a decline in bond prices. Income may be subject to the federal alternative minimum tax. |
| New York Investment Risks. The Fund will be more susceptible to any economic, business, political or other developments which generally affect securities issued by New York issuers. The economy of New York State is large and diverse, from agriculture, manufacturing, and high technology in upstate counties to advertising, finance and banking in New York City. Any major changes to the financial conditions on New York City, however, would ultimately have an effect on the state. Bond prices are sensitive to changes in interest rates and a rise in short-term interest rates could cause a decline in bond prices. |
| Income may be subject to the federal alternative minimum tax. |
ANNUAL REPORT / April 30, 2011
Table of Contents
| 14 |
MTB NEW YORK MUNICIPAL BOND FUND – CLASS A SHARES
The graph below illustrates the hypothetical investment of $10,0001,2 in the MTB New York Municipal Bond Fund (Class A Shares) (the “Fund”) from April 30, 2001 to April 30, 2011, compared to the Barclays Capital New York Tax-Exempt Index (“BCNYTE”)2,3 and the Lipper New York Intermediate Municipal Debt Funds Average.2,3
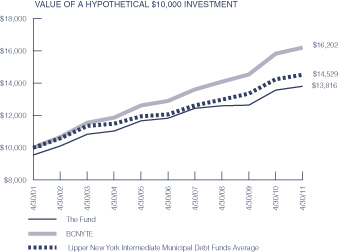
Average Annual Total Returns for the Period Ended April 30, 2011
| 1 Year | (2.73)% | |||
| 5 Years | 2.20% | |||
| 10 Years | 3.29% | |||
Performance data quoted represents past performance which is no guarantee of future results. Returns shown do not reflect the deduction of taxes that a shareholder would pay on Fund distributions or the redemption of Fund shares. Investment return and principal value will fluctuate so that an investor’s shares, when redeemed, may be worth more or less than their original cost. Mutual funds are not obligations of or guaranteed by any bank and are not federally insured. Mutual fund performance changes over time and current performance may be lower or higher than what is stated. For current to the most recent month end performance, visit www.mtbfunds.com or call 1-800-836-2211. Total returns shown include the maximum sales charge of 4.50%.
Annual Operating Expense Ratio
| Before Waivers | 1.40% | |||
| After Waivers | 0.84% | |||
The Expense Ratio Before Waivers represents the operating costs borne by the Fund, expressed as a percentage of the Fund’s average net assets, as shown in the Fees and Expenses table in the Fund’s current prospectus (under “Total Annual Fund Operating Expenses”).
| 1 | Represents a hypothetical investment of $10,000 in the Fund after deducting the maximum sales charge of 4.50% ($10,000 investment minus $450 sales charge = $9,550). |
| 2 | The Fund’s performance assumes the reinvestment of all dividends and distributions. The BCNYTE and the Lipper New York Intermediate Municipal Debt Funds Average have been adjusted to reflect reinvestment of dividends on securities in the indexes. |
| 3 | The BCNYTE and the Lipper New York Intermediate Municipal Debt Funds Average are not adjusted to reflect sales charges, that the Securities and Exchange Commission (“SEC”) requires to be reflected in the Fund’s performance. The index is unmanaged and, unlike the Fund, is not affected by cashflows. It is not possible to invest directly in an index or an average. |
April 30, 2011 / ANNUAL REPORT
Table of Contents
| 15 |
MTB NEW YORK MUNICIPAL BOND FUND – INSTITUTIONAL I SHARES
The graph below illustrates the hypothetical investment of $100,0001 in the MTB New York Municipal Bond Fund (Institutional I Shares) (the “Fund”) from August 18, 2003 (start of performance) to April 30, 2011, compared to the BCNYTE1,2 and the Lipper New York Intermediate Municipal Debt Funds Average.1,2
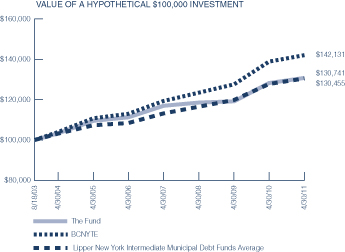
Average Annual Total Returns for the Period Ended April 30, 2011
| 1 Year | 1.97% | |||
| 5 Years | 3.29% | |||
| Start of Performance (8/18/03) | 3.54% | |||
Performance data quoted represents past performance which is no guarantee of future results. Returns shown do not reflect the deduction of taxes that a shareholder would pay on Fund distributions or the redemption of Fund shares. Investment return and principal value will fluctuate so that an investor’s shares, when redeemed, may be worth more or less than their original cost. Mutual funds are not obligations of or guaranteed by any bank and are not federally insured. Mutual fund performance changes over time and current performance may be lower or higher than what is stated. For current to the most recent month end performance, visit www.mtbfunds.com or call 1-800-836-2211.
Annual Operating Expense Ratio
| Before Waivers | 1.15% | |||
| After Waivers | 0.59% | |||
The Expense Ratio Before Waivers represents the operating costs borne by the Fund, expressed as a percentage of the Fund’s average net assets, as shown in the Fees and Expenses table in the Fund’s current prospectus (under “Total Annual Fund Operating Expenses”).
| 1 | The Fund’s performance assumes the reinvestment of all dividends and distributions. The BCNYTE and the Lipper New York Intermediate Municipal Debt Funds Average have been adjusted to reflect reinvestment of dividends on securities in the indexes. The BCNYTE and the Lipper New York Intermediate Municipal Debt Funds Lipper Average performance presented is as of the nearest month-end following inception date. |
| 2 | The BCNYTE and the Lipper New York Intermediate Municipal Debt Funds Average are not adjusted to reflect sales charges, that the SEC requires to be reflected in the Fund’s performance. The index is unmanaged and, unlike the Fund, is not affected by cashflows. It is not possible to invest directly in an index or an average. |
ANNUAL REPORT / April 30, 2011
Table of Contents
| 16 |
MTB PENNSYLVANIA MUNICIPAL BOND FUND
Management’s Discussion of Fund Performance
For the fiscal year ended April 30, 2011, MTB Pennsylvania Municipal Bond Fund (the “Fund”) returned 2.33% for Class A Shares and 2.57% for Institutional I Shares, based on net asset value,* versus its benchmarks, the Barclays Capital 7-Year Municipal Bond Index,** which returned 4.70% and 4.22% for the Barclays Capital 10-Year Municipal Bond Index.**
When comparing municipal yields for the fiscal year ended April 30, 2011, it appears that the municipal bond market did not move much. Short-term triple-A yields are down about 10 basis points, while long-term yields are up about 50 basis points. However, during the year, the municipal market rallied into the early part of the fall and has moved lower since.
For the first six months of the fiscal year, the municipal bond market was performing well; demand for municipal bonds was strong due to a soft economy and historically low interest rates, and the expectation for future higher income tax rates. Flows into municipal bond funds were solid. Credit spreads had recovered significantly from the wide levels they reached during the financial crisis, the popular Build America Bonds program (“BABs”) was diverting supply from the tax-exempt bond market and flows into mutual funds were strong.
The cascade of events leading to the rise in municipal interest rates began with a rise in U.S. Treasury rates. Municipal yields followed Treasury yields higher as the Federal Reserve (the “Fed”) signaled that higher inflation was essential to economic recovery and traces of economic growth were emerging. As interest rates rose, investors began selling shares of tax-exempt mutual funds and either shortening duration or moving to other more attractive asset classes. Additional selling pressures occurred in lower quality municipal bonds when S&P lowered the ratings on 16 Tobacco Settlement-Backed deals in November. This resulted in a total of 51 downgrades, prompting investor withdrawals from high yield mutual funds, forcing supply into an already weak market.
The extension of the Bush-era tax cuts further dampened investors’ need to buy additional tax-exempt bonds. With the back drop of dwindling investor demand, issuers flooded the market as the BABs program was set to expire at the end of 2010. October, November and December, typically months of reduced supply, set records as $133.8 billion of new issuance came to market. Rates continued to rise and liquidity became a challenge.
The recession’s impact on the credit quality of state and local governments came into focus. Media headlines called for probable municipal defaults, pushing yields higher as we ended the year. As we entered 2011, investors were apprehensive about the prospects for an increase in supply of tax-exempt bonds. The concern was that supply would increase in 2011 as the tax-exempt municipal bond market would again have to absorb the new supply that had previously been diverted into the taxable bond market through the BABs program.
Although mutual fund outflows continued to be strong during the first four months of 2011, unanticipated diminished supply of new issues has placed slight downward pressure in municipal yields and restored some liquidity to the market. Recent demand has been
focused on the short and intermediate segments of the yield curve as well as high grade bonds. Sponsorship for longer-dated securities of lower quality still seems to be anemic as credit spreads climbed to their widest level during April 2011.
As short-term rates remain anchored by Fed policy, the yield curve continues to remain steep by historical standards, with approximately 400 basis points difference between 2-year and 30-year yields.
The Fund’s overall credit quality is A1, while the Commonwealth of Pennsylvania’s general obligation debt is rated Aa1/AA by Moody’s and Standard & Poor’s. The Fund has performed in line with the Barclays Pennsylvania Bond Index (also 2.57% total return for the 12-months ended April 30, 2011), which also includes bonds with maturities across the yield curve and those only issued within the Commonwealth. This index has performed better than the Barclays Municipal Bond Index for the 12-months ended April 30, 2011 (which generated a return of 2.20%). Offsetting the negative impact of holdings in the portfolio that both carry a lower credit quality rating and longer maturity structures was the portfolio’s exposure to high-quality, pre-refunded bonds. The portfolio generally focuses on bonds in the intermediate-term maturity segment, and we remain committed to limiting the percentage allocated to bonds subject to the Alternative Minimum Tax.
| * | Performance data quoted represents past performance, which is no guarantee of future results. Investment return and principal value will fluctuate so that an investor’s shares, when redeemed, may be worth more or less than their original cost. The total return for Class A Shares was (2.30)%, adjusted for the Fund’s maximum sales charge. Mutual fund performance changes over time and current performance may be lower or higher than what is stated. For the most recent month-end performance, please visit www.mtbfunds.com or call 1-800-836-2211. |
| ** | The Barclays Capital 7-Year Municipal Bond Index is a widely recognized index of long-term investment grade tax-exempt bonds. The index includes general obligation bonds, revenue bonds, insured bonds and pre-refunded bonds with maturities between six and eight years. The Barclays Capital 10-Year Municipal Bond Index is a widely recognized index of long-term investment grade tax-exempt bonds. The index includes general obligation bonds, revenue bonds, insured bonds and pre-refunded bonds with maturities between eight and twelve years. Indexes are unmanaged and investments cannot be made directly in an index. |
| Duration is a measure of a security’s price sensitivity to changes in interest rates. Securities with longer durations are more sensitive to changes in interest rates than securities of shorter durations. |
| High yield, lower-rated securities generally entail greater market, credit and liquidity risks than investment grade securities and may include higher volatility and higher risk of default. |
| Credit ratings pertain only to the securities in the portfolio and do not protect fund shares against market risk. Bond prices are sensitive to changes in interest rates and a rise in short-term interest rates could cause a decline in bond prices. |
April 30, 2011 / ANNUAL REPORT
Table of Contents
| 17 |
| Pennsylvania Investment Risks. The Fund will be more susceptible to any economic, business, political or other developments which generally affect securities issued by Pennsylvania issuers. Pennsylvania’s economy has historically been dependent on heavy industry and agriculture but has diversified recently into medical and health services, education and financial services. Future economic difficulties in any of these industries could have an adverse impact on the finances of the state. |
| Bond prices are sensitive to changes in interest rates and a rise in short-term interest rates could cause a decline in bond prices. |
| Income may be subject to the federal alternative minimum tax. |
ANNUAL REPORT / April 30, 2011
Table of Contents
| 18 |
MTB PENNSYLVANIA MUNICIPAL BOND FUND – CLASS A AND INSTITUTIONAL I SHARES†
The graph below illustrates the hypothetical investment of $10,0001,2 in the MTB Pennsylvania Municipal Bond Fund (Class A Shares) (the “Fund”) from April 30, 2001 to April 30, 2011, compared to the Barclays Capital 10-Year Municipal Bond Index (“BC10MB”),2,3 the Barclays Capital 7-Year Municipal Bond Index (“BC7MB”)2,3 and the Lipper Other States Intermediate Municipal Debt Funds Average.2,3
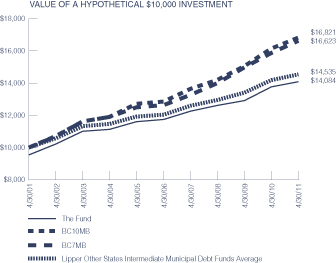
The graph below illustrates the hypothetical investment of $100,0002 in the MTB Pennsylvania Municipal Bond Fund (Institutional I Shares) (the “Fund”) from April 30, 2001 to April 30, 2011, compared to the BC10MB2,3, the BC7MB2,3 and the Lipper Other States Intermediate Municipal Debt Funds Average.2,3
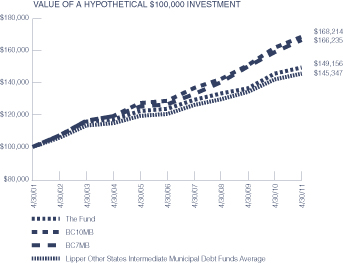
Average Annual Total Returns for the Period Ended April 30, 2011
| Class A | Institutional I | |||||||
| 1 Year | (2.30)% | 2.57% | ||||||
| 5 Years | 2.75% | 3.83% | ||||||
| 10 Years | 3.48% | 4.08% | ||||||
Performance data quoted represents past performance which is no guarantee of future results. Returns shown do not reflect the deduction of taxes that a shareholder would pay on Fund distributions or the redemption of Fund shares. Investment return and principal value will fluctuate so that an investor’s shares, when redeemed, may be worth more or less than their original cost. Mutual funds are not obligations of or guaranteed by any bank and are not federally insured. Mutual fund performance changes over time and current performance may be lower or higher than what is stated. For current to the most recent month end performance, visit www.mtbfunds.com or call 1-800-836-2211. Total returns shown include the maximum sales charge of 4.50% for Class A Shares.
Annual Operating Expense Ratio
| Class A | Institutional I | |||||||
| Before Waivers | 1.38% | 1.13% | ||||||
| After Waivers | 0.95% | 0.70% | ||||||
The Expense Ratio Before Waivers represents the operating costs borne by the Fund, expressed as a percentage of the Fund’s average net assets, as shown in the Fees and Expenses table in the Fund’s current prospectus (under “Total Annual Fund Operating Expenses”).
| 1 | Represents a hypothetical investment of $10,000 in Class A Shares after deducting the maximum sales charge of 4.50% ($10,000 investment minus $450 sales charge = $9,550). |
| 2 | The Fund’s performance assumes the reinvestment of all dividends and distributions. The BC10MB, BC7MB and the Lipper Other States Intermediate Municipal Debt Funds Average have been adjusted to reflect reinvestment of dividends on securities in the indexes. |
| 3 | The BC10MB, BC7MB and the Lipper Other States Intermediate Municipal Debt Funds Average are not adjusted to reflect sales charges, that the Securities and Exchange Commission (“SEC”) requires to be reflected in the Fund’s performance. The indexes are unmanaged and, unlike the Fund, are not affected by cashflows. It is not possible to invest directly in an index or an average. |
| † | Performance presented prior to August 15, 2003 reflects the performance of the ARK Pennsylvania Tax-Free Portfolio, which the MTB Pennsylvania Municipal Bond Fund acquired pursuant to a reorganization on that date. |
April 30, 2011 / ANNUAL REPORT
Table of Contents
| 19 |
MTB MARYLAND MUNICIPAL BOND FUND
Management’s Discussion of Fund Performance
For the fiscal year ended April 30, 2011, MTB Maryland Municipal Bond Fund (the “Fund”) returned 1.54% for Class A Shares and 1.90% for Institutional I Shares, based on net asset value,* versus its benchmarks, the Barclays Capital 7-Year Municipal Bond Index,** which returned 4.70% and 4.22% for the Barclays Capital 10-Year Municipal Bond Index.**
When comparing municipal yields for the fiscal year ended April 30, 2011, it appears that the municipal bond market did not move much. Short-term triple-A yields are down about 10 basis points, while long-term yields are up about 50 basis points. However, during the year, the municipal market rallied into the early part of the fall and has moved lower since.
For the first six months of the fiscal year, the municipal bond market was performing well; demand for municipal bonds was strong due to a soft economy and historically low interest rates, and the expectation for future higher income tax rates. Flows into municipal bond funds were solid. Credit spreads had recovered significantly from the wide levels they reached during the financial crisis, the popular Build America Bonds program (“BABs”) was diverting supply from the tax-exempt bond market and flows into mutual funds were strong.
The cascade of events leading to the rise in municipal interest rates began with a rise in U.S. Treasury rates. Municipal yields followed Treasury yields higher as the Federal Reserve (the “Fed”) signaled that higher inflation was essential to economic recovery and traces of economic growth were emerging. As interest rates rose, investors began selling shares of tax-exempt mutual funds and either shortening duration or moving to other more attractive asset classes. Additional selling pressures occurred in lower quality municipal bonds when S&P lowered the ratings on 16 Tobacco Settlement-Backed deals in November. This resulted in a total of 51 downgrades, prompting investor withdrawals from high yield mutual funds, forcing supply into an already weak market.
The extension of the Bush-era tax cuts further dampened investors’ need to buy additional tax-exempt bonds. With the back drop of dwindling investor demand, issuers flooded the market as the BABs program was set to expire at the end of 2010. October, November and December, typically months of reduced supply, set records as $133.8 billion of new issuance came to market. Rates continued to rise and liquidity became a challenge.
The recession’s impact on the credit quality of state and local governments came into focus. Media headlines called for probable municipal defaults, pushing yields higher as we ended the year. As we entered 2011, investors were apprehensive about the prospects for an increase in supply of tax-exempt bonds. The concern was that supply would increase in 2011 as the tax-exempt municipal bond market would again have to absorb the new supply that had previously been diverted into the taxable bond market through the BABs program.
Although mutual fund outflows continued to be strong during the first four months of 2011, unanticipated diminished supply of new issues has placed slight downward pressure in municipal yields and restored some liquidity to the market. Recent demand has been
focused on the short and intermediate segments of the yield curve as well as high grade bonds. Sponsorship for longer-dated securities of lower quality still seems to be anemic as credit spreads climbed to their widest level during April 2011.
As short-term rates remain anchored by Fed policy, the yield curve continues to remain steep by historical standards, with approximately 400 basis points difference between 2-year and 30-year yields.
The Fund’s overall credit quality is A1, while the State of Maryland’s general obligation debt continues to be rated in the highest category (Aaa/AAA) by Moody’s and Standard & Poor’s. As credit spreads have widened throughout the year and as long-term municipal yields rose, the Fund’s performance has been negatively impacted by positions in the Fund that both carry a lower credit rating and have longer maturity structures. Several longer-term bonds with sub-5% coupons experienced an even greater underperformance as they approached their de minimis price thresholds. With investor demand focused on high quality credits, bonds issued within the State of Maryland (as measured by the Barclays Maryland Index which generated a return of 2.85%) have performed better than the Barclays Municipal Bond Index for the 12-months ended April 30, 2011 (which generated a return of 2.20%). However, the portfolio’s exposure to several lower quality credits hindered performance. The portfolio generally focuses on bonds in the intermediate-term maturity segment, and we remain committed to limiting the percentage allocated to bonds subject to the Alternative Minimum Tax.
| * | Performance data quoted represents past performance, which is no guarantee of future results. Investment return and principal value will fluctuate so that an investor’s shares, when redeemed, may be worth more or less than their original cost. The total return for Class A Shares was (3.02)%, adjusted for the Fund’s maximum sales charge. Mutual fund performance changes over time and current performance may be lower or higher than what is stated. For the most recent month-end performance, please visit www.mtbfunds.com or call 1-800-836-2211. |
| ** | The Barclays Capital 7-Year Municipal Bond Index is a widely recognized index of long-term investment grade tax-exempt bonds. The index includes general obligation bonds, revenue bonds, insured bonds and pre-refunded bonds with maturities between six and eight years. The Barclays Capital 10-Year Municipal Bond Index is a widely recognized index of long-term investment grade tax-exempt bonds. The index includes general obligation bonds, revenue bonds, insured bonds and pre-refunded bonds with maturities between eight and twelve years. Indexes are unmanaged and investments cannot be made directly in an index. |
| Duration is a measure of a security’s price sensitivity to changes in interest rates. Securities with longer durations are more sensitive to changes in interest rates than securities of shorter durations. |
| High yield, lower-rated securities generally entail greater market, credit and liquidity risks than investment grade securities and may include higher volatility and higher risk of default. |
ANNUAL REPORT / April 30, 2011
Table of Contents
| 20 |
| Credit ratings pertain only to the securities in the portfolio and do not protect fund shares against market risk. Bond prices are sensitive to changes in interest rates and a rise in short-term interest rates could cause a decline in bond prices. |
| Maryland Investment Risks. The Fund will be more susceptible to any economic, business, political or other developments which generally affect securities issued by Maryland issuers. The economy of |
Maryland is relatively diversified across the service, trade and government sectors, but could be adversely impacted by changes to any of these sectors. |
| Bond prices are sensitive to changes in interest rates and a rise in short-term interest rates could cause a decline in bond prices. |
| Income may be subject to the federal alternative minimum tax. |
April 30, 2011 / ANNUAL REPORT
Table of Contents
| 21 |
MTB MARYLAND MUNICIPAL BOND FUND – CLASS A AND INSTITUTIONAL I SHARES†
The graph below illustrates the hypothetical investment of $10,0001,2 in the MTB Maryland Municipal Bond Fund (Class A Shares) (the “Fund”) from April 30, 2001 to April 30, 2011, compared to the Barclays Capital 10-Year Municipal Bond Index (“BC10MB”),2,3 the Barclays Capital 7-Year Municipal Bond Index (“BC7MB”)2,3 and the Lipper Other States Intermediate Municipal Debt Funds Average.2,3
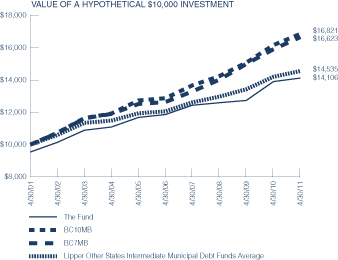
The graph below illustrates the hypothetical investment of $100,0002 in the MTB Maryland Municipal Bond Fund (Institutional I Shares) (the “Fund”) from April 30, 2001 to April 30, 2011, compared to the BC10MB,2,3 the BC7MB2,3 and the Lipper Other States Intermediate Municipal Debt Funds Average.2,3
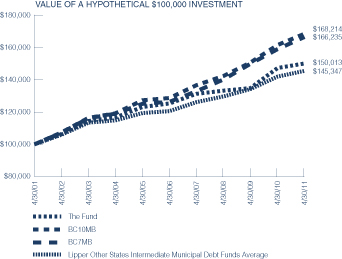
Average Annual Total Returns for the Period Ended April 30, 2011
| Class A | Institutional I | |||||||
| 1 Year | (3.02)% | 1.90% | ||||||
| 5 Years | 2.60% | 3.69% | ||||||
| 10 Years | 3.50% | 4.14% | ||||||
Performance data quoted represents past performance which is no guarantee of future results. Returns shown do not reflect the deduction of taxes that a shareholder would pay on Fund distributions or the redemption of Fund shares. Investment return and principal value will fluctuate so that an investor’s shares, when redeemed, may be worth more or less than their original cost. Mutual funds are not obligations of or guaranteed by any bank and are not federally insured. Mutual fund performance changes over time and current performance may be lower or higher than what is stated. For current to the most recent month end performance, visit www.mtbfunds.com or call 1-800-836-2211. Total returns shown include the maximum sales charge of 4.50% for Class A Shares.
Annual Operating Expense Ratio
| Class A | Institutional I | |||||||
| Before Waivers | 1.38% | 1.13% | ||||||
| After Waivers | 0.95% | 0.67% | ||||||
The Expense Ratio represents the operating costs borne by the Fund, expressed as a percentage of the Fund’s average net assets, as shown in the Fees and Expenses table in the Fund’s current prospectus (under “Total Annual Fund Operating Expenses”).
| 1 | Represents a hypothetical investment of $10,000 in Class A Shares after deducting the maximum sales charge of 4.50% ($10,000 investment minus $450 sales charge = $9,550). |
| 2 | The Fund’s performance assumes the reinvestment of all dividends and distributions. The BC10MB, BC7MB and the Lipper Other States Intermediate Municipal Debt Funds Average have been adjusted to reflect reinvestment of dividends on securities in the indexes. |
| 3 | The BC10MB, BC7MB and the Lipper Other States Intermediate Municipal Debt Funds Average are not adjusted to reflect sales charges, that the Securities and Exchange Commission (“SEC”) requires to be reflected in the Fund’s performance. The indexes are unmanaged and, unlike the Fund, are not affected by cashflows. It is not possible to invest directly in an index or an average. |
| † | The MTB Maryland Municipal Bond Fund is the successor to the ARK Maryland Tax-Free Portfolio pursuant to a reorganization which took place on August 22, 2003. The information presented above, for the period prior to August 22, 2003, is historical information for the ARK Maryland Tax-Free Portfolio. |
ANNUAL REPORT / April 30, 2011
Table of Contents
| 22 |
MTB VIRGINIA MUNICIPAL BOND FUND
Management’s Discussion of Fund Performance
For the fiscal year ended April 30, 2011, MTB Virginia Municipal Bond Fund (the “Fund”) generated a positive return of 2.48% for Class A Shares, based on net asset value,* versus its benchmarks, the Barclays Capital 7-Year Municipal Bond Index,** which returned 4.70% and 4.22% for the Barclays Capital 10-Year Municipal Bond Index.**
When comparing municipal yields for the fiscal year ended April 30, 2011, it appears that the municipal bond market did not move much. Short-term triple-A yields are down about 10 basis points, while long-term yields are up about 50 basis points. However, during the year, the municipal market rallied into the early part of the fall and has moved lower since.
For the first six months of the fiscal year, the municipal bond market was performing well; demand for municipal bonds was strong due to a soft economy and historically low interest rates, and the expectation for future higher income tax rates. Flows into municipal bond funds were solid. Credit spreads had recovered significantly from the wide levels they reached during the financial crisis, the popular Build America Bonds program (“BABs”) was diverting supply from the tax-exempt bond market and flows into mutual funds were strong.
The cascade of events leading to the rise in municipal interest rates began with a rise in U.S. Treasury rates. Municipal yields followed Treasury yields higher as the Federal Reserve (the “Fed”) signaled that higher inflation was essential to economic recovery and traces of economic growth were emerging. As interest rates rose, investors began selling shares of tax-exempt mutual funds and either shortening duration or moving to other more attractive asset classes. Additional selling pressures occurred in lower quality municipal bonds when S&P lowered the ratings on 16 Tobacco Settlement-Backed deals in November. This resulted in a total of 51 downgrades, prompting investor withdrawals from high yield mutual funds, forcing supply into an already weak market.
The extension of the Bush-era tax cuts further dampened investors’ need to buy additional tax-exempt bonds. With the back drop of dwindling investor demand, issuers flooded the market as the BABs program was set to expire at the end of 2010. October, November and December, typically months of reduced supply, set records as $133.8 billion of new issuance came to market. Rates continued to rise and liquidity became a challenge.
The recession’s impact on the credit quality of state and local governments came into focus. Media headlines called for probable municipal defaults, pushing yields higher as we ended the year. As we entered 2011, investors were apprehensive about the prospects for an increase in supply of tax-exempt bonds. The concern was that supply would increase in 2011 as the tax-exempt municipal bond market would again have to absorb the new supply that had previously been diverted into the taxable bond market through the BABs program.
Although mutual fund outflows continued to be strong during the first four months of 2011, unanticipated diminished supply of new issues has placed slight downward pressure in municipal yields and restored some liquidity to the market. Recent demand has been
focused on the short and intermediate segments of the yield curve as well as high grade bonds. Sponsorship for longer-dated securities of lower quality still seems to be anemic as credit spreads climbed to their widest level during April 2011.
As short-term rates remain anchored by Fed policy, the yield curve continues to remain steep by historical standards, with approximately 400 basis points difference between 2-year and 30-year yields.
The Fund’s overall credit quality is AA, while the Commonwealth of Virginia’s general obligation debt continues to be rated in the highest category (Aaa/AAA) by Moody’s and Standard & Poor’s. The Fund has slightly underperformed the Barclays Virginia Bond Index (2.98% total return for the 12-months ended April 30, 2011), which also includes bonds with maturities across the yield curve and those only issued within the Commonwealth and has performed better than the Barclays Municipal Bond index for the 12-months ended April 30, 2011 (which generated a return of 2.20%). The Fund’s duration posture was slightly longer than that of the Barclays Virginia Bond Index and performance was limited by several issues with lower credit quality ratings and longer maturity structures. Balancing this negative impact was the portfolio’s exposure to high-quality, pre-refunded and short- and intermediate- term bonds. The portfolio generally focuses on bonds in the intermediate-term maturity segment, and we remain committed to limiting the percentage allocated to bonds subject to the Alternative Minimum Tax.
| * | Performance data quoted represents past performance, which is no guarantee of future results. Investment return and principal value will fluctuate so that an investor’s shares, when redeemed, may be worth more or less than their original cost. The total return for Class A Shares was (2.11)%, adjusted for the Fund’s maximum sales charge. Mutual fund performance changes over time and current performance may be lower or higher than what is stated. For the most recent month-end performance, please visit www.mtbfunds.com or call 1-800-836-2211. |
| ** | The Barclays Capital 7-Year Municipal Bond Index is a widely recognized index of long-term investment grade tax-exempt bonds. The index includes general obligation bonds, revenue bonds, insured bonds and pre-refunded bonds with maturities between six and eight years. The Barclays Capital 10-Year Municipal Bond Index is a widely recognized index of long-term investment grade tax-exempt bonds. The index includes general obligation bonds, revenue bonds, insured bonds and pre-refunded bonds with maturities between eight and twelve years. Indexes are unmanaged and investments cannot be made directly in an index. |
| Duration is a measure of a security’s price sensitivity to changes in interest rates. Securities with longer durations are more sensitive to changes in interest rates than securities of shorter durations. |
| High yield, lower-rated securities generally entail greater market, credit and liquidity risks than investment grade securities and may include higher volatility and higher risk of default. |
April 30, 2011 / ANNUAL REPORT
Table of Contents
| 23 |
| Credit ratings pertain only to the securities in the portfolio and do not protect fund shares against market risk. Bond prices are sensitive to changes in interest rates and a rise in short-term interest rates could cause a decline in bond prices. |
| Virginia Investment Risks. The Fund will be more susceptible to any economic, business, political or other developments which generally affect securities issued by Virginia issuers. The economy of Virginia is |
relatively diversified across the service, trade and government sectors, but could be adversely impacted by changes to any of these sectors. Such changes could include changes in political parties in power, government spending cuts or economic downturn. |
| Bond prices are sensitive to changes in interest rates and a rise in short-term interest rates could cause a decline in bond prices. |
| Income may be subject to the federal alternative minimum tax. |
ANNUAL REPORT / April 30, 2011
Table of Contents
| 24 |
MTB VIRGINIA MUNICIPAL BOND FUND – CLASS A SHARES†
The graph below illustrates the hypothetical investment of $10,0001 in the MTB Virginia Municipal Bond Fund (Class A Shares) (the “Fund”) from April 30, 2001 to April 30, 2011, compared to the Barclays Capital 10-Year Municipal Bond Index (“BC10MB”),2 the Barclays Capital 7-Year Municipal Bond Index (“BC7MB”),2 the Lipper Virginia Municipal Debt Funds Average2 and the Lipper Other States Intermediate Municipal Debt Funds Average.2
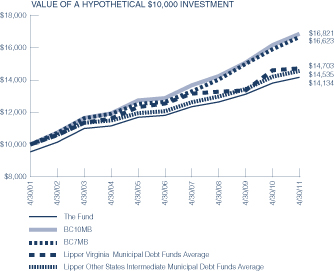
Average Annual Total Returns for the Period Ended April 30, 2011
| 1 Year | (2.11)% | |||
| 5 Years | 2.74% | |||
| 10 Years | 3.52% | |||
Performance data quoted represents past performance which is no guarantee of future results. Returns shown do not reflect the deduction of taxes that a shareholder would pay on Fund distributions or the redemption of Fund shares. Investment return and principal value will fluctuate so that an investor’s shares, when redeemed, may be worth more or less than their original cost. Mutual funds are not obligations of or guaranteed by any bank and are not federally insured. Mutual fund performance changes over time and current performance may be lower or higher than what is stated. For current to the most recent month end performance, visit www.mtbfunds.com or call 1-800-836-2211. Total returns shown include the maximum sales charge of 4.50%.
Annual Operating Expense Ratio
| Before Waivers | 1.81% | |||
| After Waivers | 0.96% | |||
The Expense Ratio represents the operating costs borne by the Fund, expressed as a percentage of the Fund’s average net assets, as shown in the Fees and Expenses table in the Fund’s current prospectus (under “Total Annual Fund Operating Expenses”).
| 1 | Represents a hypothetical investment of $10,000 in the Fund after deducting the maximum sales charge of 4.50% ($10,000 investment minus $450 sales charge = $9,550). The Fund’s performance assumes the reinvestment of all dividends and distributions. The BC10MB, BC7MB, the Lipper Virginia Municipal Debt Funds Average, and the Lipper Other States Intermediate Municipal Debt Funds Average have been adjusted to reflect reinvestment of dividends on securities in the indexes. |
| 2 | The BC10MB, BC7MB, the Lipper Virginia Municipal Debt Funds Average and the Lipper Other States Intermediate Municipal Debt Funds Average are not adjusted to reflect sales charges, that the Securities and Exchange Commission requires to be reflected in the Fund’s performance. The indexes are unmanaged and, unlike the Fund, are not affected by cashflows. It is not possible to invest directly in an index or an average. |
| † | The MTB Virginia Municipal Bond Fund is the successor to the FBR Virginia Tax-Free Portfolio pursuant to a reorganization that took place on February 24, 2006. The information presented above, for the periods prior to February 24, 2006, is historical information for the FBR Virginia Tax-Free Portfolio. |
April 30, 2011 / ANNUAL REPORT
Table of Contents
| 25 |
MTB INTERMEDIATE-TERM BOND FUND
Management’s Discussion of Fund Performance
For the fiscal year ended April 30, 2011, MTB Intermediate-Term Bond Fund (the “Fund”) returned 5.51% for Class A Shares, 4.79% for Class C Shares, and 5.96% for Institutional I Shares, based on net asset value,* versus its benchmark, the Barclays Capital Intermediate Government/Credit Bond Index,** which returned 4.91% and its peer group, the Lipper Short Intermediate Investment Grade Debt Funds Average*** which returned 4.48%.
Although economic growth continued during the past fiscal year, the pace moderated as the positive effects of prior government stimulus programs expired. Higher energy prices were also a headwind for growth as the price of a barrel of oil climbed from $75 in May of 2010 to $114 on April 30, 2011, a 52% increase! The housing market also remained anemic as the supply of homes for sale dwarfed the demand for housing. New home sales hit an all-time low in February 2011 of 270,000 sales on an annualized basis. The record high new home sales were 1,389,000 units in July of 2005. The new home sales statistic has been measured since 1963. The good news was that even with the aforementioned headwinds, economic growth as measured by gross domestic product (“GDP”), grew at a respectable pace of 2.3% for the twelve month period ended in March of 2011.
The economy finally started to create new jobs with the unemployment rate falling from 9.7% to 9.0% during the fiscal year. The private sector of the economy created 2.1 million new jobs during the past year. However the public sector and especially state and local governments continued to cut spending to balance budgets. The government sector cut over 400,000 jobs since August 2008 as part of their cost cutting. The newly employed were eager to spend and retail sales and car sales in particular improved over the past year. The consumer also benefited from the social security tax cut that was implemented for 2011.
Interest rates moved lower during the fiscal year. The 2-year treasury yield declined in yield from 0.96% to 0.60%, while the 10-year treasury yield declined by a similar amount to a yield of 3.29% as of April 30, 2011. What was noteworthy for interest rates during the fiscal year was that the 2-year and 5-year treasury notes set record low yields in anticipation of the Federal Reserve (the “Fed”) announcing a second round of quantitative easing in early November. The 2-year treasury reached a low yield of 0.33% while the 5-year treasury hit a record low yield of 1.03%. Fears of a “double dip recession” caused by weaker than expected economic growth and in particular some further job market deterioration in conjunction with renewed fears of deflation and the widely anticipated quantitative easing program were the catalysts. In particular, the consumer price index (“CPI”), excluding food and energy, set a record year over year low in October of 2010 of 0.6%, thus the Fed’s concern over deflation. In response, the Fed announced they would purchase $600 billion of treasury securities by the end of the second quarter of 2011. The record low interest rates were short lived as economic growth improved and passage of further fiscal stimulus caused interest rates to rise dramatically during November and December of 2010. The 5-year treasury yield doubled from 1% to close the year at 2%. Also weighing on interest rates were higher energy prices and the subsequent rise of inflation. At fiscal year end, inflation had increased to 1.3% for the core rate, which
excludes food and energy and 3.2 for the overall CPI for the past year. In general, broad based increases in commodity prices and oil in particular can be blamed for the higher inflation.
At fiscal year end, the Fed acknowledged “that the economic recovery is proceeding at a moderate pace and overall conditions in the labor market are improving gradually. However, investment in nonresidential structures is still weak, and the housing sector continues to be depressed.” The Fed also stated, “Inflation has picked-up in recent months, but longer-term inflation expectations have remained stable and measures of underlying inflation are still subdued.” The Fed maintained its 0 to 0.25% federal funds target throughout the fiscal year as it has since December of 2008. Furthermore, the Fed “continues to anticipate that economic conditions, including low rates of resource utilization, subdued inflation trends and stable inflation expectations, are likely to warrant exceptionally low levels for the federal funds rate for an extended period.” At fiscal year end, the federal funds futures market was not expecting a tightening of Fed policy until June of 2012.
The combination of moderate economic growth, strong earnings growth and investors’ demand for higher yielding securities resulted in outperformance for the corporate and mortgage backed sectors of the bond market. The average risk premium for investment grade corporate bonds declined by only 5 basis points during the fiscal year according to Barclays Capital. As of April 30, 2011, the average risk premium was 138 basis points. The corporate sector rebounded after risk premiums widened last spring and early summer in response to the aforementioned fears of a double dip recession and sovereign credit risks associated with Greece, Portugal and Ireland. The risk premium closed the month of June 2010 at 193 basis points, which was 50 basis points wider than the end of April 2010. These fears were somewhat allayed by the European Union’s bailout plan. The plan is designed to give these countries time to improve their fiscal position by implementing austerity programs. The mortgage backed sector was aided by the diminished supply of new mortgages as the housing market remained sluggish. Commercial banks continued to add to their mortgage holdings as loan growth remained weak.
Standard & Poor’s revised the outlook for the United States of America to negative from stable in April 2011 and affirmed the AAA sovereign credit ratings. This is the first time the United States has been placed on negative outlook by a major rating agency. Standard & Poor’s cited that it has been, “More than two years after the beginning of the recent crisis, U.S. policymakers have still not agreed on how to reverse recent fiscal deterioration or address longer-term fiscal pressures.” Clearly this is a warning to the United States government that it must take steps to balance the budget and address Medicare and social security programs. This action had very little impact on the treasury market.
Looking forward, we expect economic growth to continue at a moderate pace and inflation at the core rate to move slightly higher. We are encouraged by the economy’s recent ability to create jobs which should support growth. We are concerned with the negative ramifications of higher gasoline prices but are hopeful that energy prices will moderate. We do not expect the Fed to tighten in 2011
ANNUAL REPORT / April 30, 2011
Table of Contents
| 26 |
given that the unemployment rate although declining will still be too high for the Fed to tighten and inflation will not move too high. However, we do expect longer-term interest rates to move higher as the Fed’s quantitative easing program is scheduled to expire at the end of June 2011 and then the market will have to fill the void of the Fed no longer buying $75 billion of treasury securities per month.
The Fund continues to be overweighted in the corporate sector, primarily in financials, while being underweighted in U.S. Treasuries and U.S. Government agencies. We have increased our allocation to high yield and BBB rated investment grade corporates. Over the course of the year, we have increased exposure to the 2 to 5-year part of the yield curve and reduced our exposure maturities longer than 10 years. We have favored regional broker/dealers and banks as well as Real Estate Investment Trusts (“REITs”). In the REIT space, we have increased our exposure to healthcare REITs. We believe that healthcare REITs will benefit as the U.S. population ages and the healthcare sector increases as a percentage of U.S. GDP. As the economy improves further and the risk of Fed tightening increases, we expect to further increase our allocation to floating rate notes, all the while attempting to outperform our benchmarks on a risk adjusted basis.
| * | Performance data quoted represents past performance, which is no guarantee of future results. Investment return and principal value will fluctuate so that an investor’s shares, when redeemed, may be worth more or |
less than their original cost. The total return for Class A Shares was 0.77%, adjusted for the Fund’s maximum sales charge, and the total return for Class C Shares was 3.79%, adjusted for the Fund’s contingent deferred sales charge. Mutual fund performance changes over time and current performance may be lower or higher than what is stated. For the most recent month-end performance, please visit www.mtbfunds.com or call 1-800-836-2211. |
| ** | The Barclays Capital Intermediate Government/Credit Bond Index is a widely recognized, market value weighted index of U.S. Treasury securities, U.S. government agency obligations, corporate debt securities, Yankee bonds and non-convertible corporate debt securities issued by or guaranteed by foreign governments and agencies. The index is unmanaged and investments cannot be made directly in an index. |
| *** | Lipper Short Intermediate Investment Grade Debt Funds Average represents the average of the total returns reported by all of the mutual funds designated by Lipper, Inc. as falling into the respective category indicated. These figures do not reflect sales charges. The average is unmanaged and investments cannot be made directly in an average. |
| The Consumer Price Index provides a measure of inflation at the retail level. |
| Duration is a measure of a security’s price sensitivity to changes in interest rates. Securities with longer durations are more sensitive to changes in interest rates than securities of shorter durations. |
| Bond prices are sensitive to changes in interest rates and a rise in short-term interest rates could cause a decline in bond prices. |
April 30, 2011 / ANNUAL REPORT
Table of Contents
| 27 |
MTB INTERMEDIATE-TERM BOND FUND – CLASS A AND C SHARES
The graph below illustrates the hypothetical investment of $10,0001,2 in the MTB Intermediate-Term Bond Fund (Class A Shares) (the “Fund”) from August 18, 2003 (start of performance) to April 30, 2011, compared to the Barclays Capital Intermediate Government/Credit Bond Index (“BCIGC”)2,3 and the Lipper Short Intermediate Investment Grade Debt Funds Average.2,3
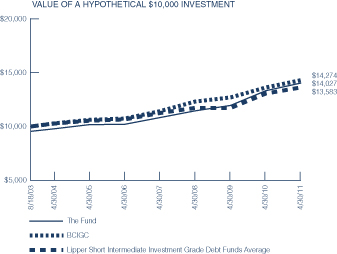
The graph below illustrates the hypothetical investment of $10,000,2,4 in the MTB Intermediate-Term Bond Fund (Class C Shares) (the “Fund”) from March 31, 2010 (start of performance) to April 30, 2011, compared to the Barclays Capital Intermediate Government/Credit Bond Index (“BCIGC”)2,3 and the Lipper Short Intermediate Investment Grade Debt Funds Average.2,3
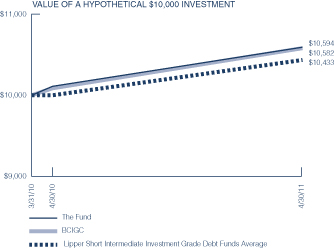
Average Annual Total Returns for the Period Ended April 30, 2011
| Class A | Class C5 | |||||||
| 1 Year | 0.77% | 3.79% | ||||||
| 5 Years | 5.64% | N/A | ||||||
| Start of Performance5 | 4.49% | 5.47% | ||||||
Performance data quoted represents past performance which is no guarantee of future results. Returns shown do not reflect the deduction of taxes that a shareholder would pay on Fund distributions or the redemption of Fund shares. Investment return and principal value will fluctuate so that an investor’s shares, when redeemed, may be worth more or less than their original cost. Mutual funds are not obligations of or guaranteed by any bank and are not federally insured. Mutual fund performance changes over time and current performance may be lower or higher than what is stated. For current to the most recent month end performance, visit www.mtbfunds.com or call 1-800-836-2211. Total returns shown include the maximum sales charge of 4.50% for Class A Shares and contingent deferred sales charge (“CDSC”) of up to 1.00% for Class C Shares.
Annual Operating Expense Ratio
| Class A | Class C | |||||||
| Before Waivers | 1.40% | 2.15% | ||||||
| After Waivers | 1.01% | 1.74% | ||||||
The Expense Ratio Before Waivers represents the operating costs borne by the Fund, expressed as a percentage of the Fund’s average net assets, as shown in the Fees and Expenses table in the Fund’s current prospectus (under “Total Annual Fund Operating Expenses”).
| 1 | Represents a hypothetical investment of $10,000 in Class A Shares after deducting the maximum sales charge of 4.50% ($10,000 investment minus $450 sales charge = $9,550). |
| 2 | The Fund’s performance assumes the reinvestment of all dividends and distributions. The BCIGC and the Lipper Short Intermediate Investment Grade Debt Funds Average have been adjusted to reflect reinvestment of dividends on securities in the indexes. The BCIGC and the Lipper Short Intermediate Investment Grade Debt Funds Average performance presented is as of the nearest month-end following inception date. |
| 3 | The BCIGC and the Lipper Short Intermediate Investment Grade Debt Funds Average are not adjusted to reflect sales charges, that the Securities and Exchange Commission (“SEC”) requires to be reflected in the Fund’s performance. The indexes are unmanaged and, unlike the Fund, are not affected by cashflows. It is not possible to invest directly in an index or an average. |
| 4 | Represents a hypothetical investment of $10,000 in Class C Shares. The ending value of the Fund does not reflect a CDSC on any redemption over 1 year from the purchase date. |
| 5 | The start of performance for Class A Shares was August 18, 2003 and Class C Shares was March 31, 2010. |
ANNUAL REPORT / April 30, 2011
Table of Contents
| 28 |
MTB INTERMEDIATE-TERM BOND FUND – INSTITUTIONAL I SHARES†
The graph below illustrates the hypothetical investment of $100,0001 in the MTB Intermediate-Term Bond Fund (Institutional I Shares) (the “Fund”) from April 30, 2001 to April 30, 2011, compared to the Barclays Capital Intermediate Government/Credit Bond Index (“BCIGC”)1,2 and the Lipper Short Intermediate Investment Grade Debt Funds Average.1,2
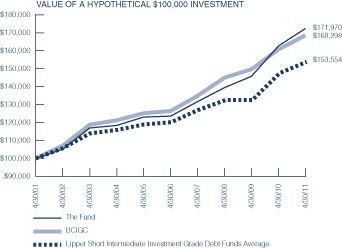
Average Annual Total Returns for the Period Ended April 30, 2011
| 1 Year | 5.96% | |||
| 5 Years | 6.84% | |||
| 10 Years | 5.57% | |||
Performance data quoted represents past performance which is no guarantee of future results. Returns shown do not reflect the deduction of taxes that a shareholder would pay on Fund distributions or the redemption of Fund shares. Investment return and principal value will fluctuate so that an investor’s shares, when redeemed, may be worth more or less than their original cost. Mutual funds are not obligations of or guaranteed by any bank and are not federally insured. Mutual fund performance changes over time and current performance may be lower or higher than what is stated. For current to the most recent month end performance, visit www.mtbfunds.com or call 1-800-836-2211.
Annual Operating Expense Ratio
| Before Waivers | 1.15% | |||
| After Waivers | 0.66% | |||
The Expense Ratio Before Waivers represents the operating costs borne by the Fund, expressed as a percentage of the Fund’s average net assets, as shown in the Fees and Expenses table in the Fund’s current prospectus (under “Total Annual Fund Operating Expenses”).
| 1 | The Fund’s performance assumes the reinvestment of all dividends and distributions. The BCIGC and the Lipper Short Investment Grade Debt Funds Average have been adjusted to reflect reinvestment of dividends on securities in the indexes. |
| 2 | The BCIGC and the Lipper Short Intermediate Investment Grade Debt Funds Average are not adjusted to reflect sales charges, that the SEC requires to be reflected in the Fund’s performance. The indexes are unmanaged and, unlike the Fund, are not affected by cashflows. It is not possible to invest directly in an index or an average. |
| † | The MTB Intermediate-Term Bond Fund is the successor to the ARK Intermediate Fixed-Income Portfolio pursuant to a reorganization that took place on August 15, 2003. The information presented above, for the periods prior to August 15, 2003, is historical information for the ARK Intermediate Fixed-Income Portfolio. |
April 30, 2011 / ANNUAL REPORT
Table of Contents
| 29 |
MTB INCOME FUND
Management’s Discussion of Fund Performance
For the fiscal year ended April 30, 2011, MTB Income Fund (the “Fund”) returned 6.50% for Class A Shares and 6.93% for Institutional I Shares, based on net asset value,* versus its benchmark, the Barclays Capital U.S. Aggregate Bond Index,** which returned 5.36%, and its peer group, the Lipper Corporate A-Rated Debt Funds Average*** which returned 6.04%.
Although economic growth continued during the past fiscal year, the pace moderated as the positive effects of prior government stimulus programs expired. Higher energy prices were also a headwind for growth as the price of a barrel of oil climbed from $75 in May of 2010 to $114 on April 30, 2011, a 52% increase! The housing market also remained anemic as the supply of homes for sale dwarfed the demand for housing. New home sales hit an all-time low in February 2011 of 270,000 sales on an annualized basis. The record high new home sales were 1,389,000 units in July of 2005. The new home sales statistic has been measured since 1963. The good news was that even with the aforementioned headwinds, economic growth as measured by gross domestic product (“GDP”), grew at a respectable pace of 2.3% for the twelve month period ended in March of 2011.
The economy finally started to create new jobs with the unemployment rate falling from 9.7% to 9.0% during the fiscal year. The private sector of the economy created 2.1 million new jobs during the past year. However the public sector and especially state and local governments continued to cut spending to balance budgets. The government sector cut over 400,000 jobs since August 2008 as part of their cost cutting. The newly employed were eager to spend and retail sales and car sales in particular improved over the past year. The consumer also benefited from the social security tax cut that was implemented for 2011.
Interest rates moved lower during the fiscal year. The 2-year treasury yield declined in yield from 0.96% to 0.60%, while the 10-year treasury yield declined by a similar amount to a yield of 3.29% as of April 30, 2011. What was noteworthy for interest rates during the fiscal year was that the 2-year and 5-year treasury notes set record low yields in anticipation of the Federal Reserve (the “Fed”) announcing a second round of quantitative easing in early November. The 2 year treasury reached a low yield of 0.33% while the 5-year treasury hit a record low yield of 1.03%. Fears of a “double dip recession” caused by weaker than expected economic growth and in particular some further job market deterioration in conjunction with renewed fears of deflation and the widely anticipated quantitative easing program were the catalysts. In particular, the consumer price index (“CPI”), excluding food and energy, set a record year over year low in October of 2010 of 0.6%, thus the Fed’s concern over deflation. In response, the Fed announced they would purchase $600 billion of treasury securities by the end of the second quarter of 2011. The record low interest rates were short lived as economic growth improved and passage of further fiscal stimulus caused interest rates to rise dramatically during November and December of 2010. The 5-year treasury yield doubled from 1% to close the year at 2%. Also weighing on interest rates were higher energy prices and the subsequent rise of inflation. At fiscal year end, inflation had increased to 1.3% for the core rate, which excludes food and energy and 3.2 for the overall CPI for the past
year. In general, broad based increases in commodity prices and oil in particular can be blamed for the higher inflation.
At fiscal year end, the Fed acknowledged “that the economic recovery is proceeding at a moderate pace and overall conditions in the labor market are improving gradually. However, investment in nonresidential structures is still weak, and the housing sector continues to be depressed.” The Fed also stated, “Inflation has picked-up in recent months, but longer-term inflation expectations have remained stable and measures of underlying inflation are still subdued.” The Fed maintained its 0 to 0.25% federal funds target throughout the fiscal year as it has since December of 2008. Furthermore, the Fed “continues to anticipate that economic conditions, including low rates of resource utilization, subdued inflation trends and stable inflation expectations, are likely to warrant exceptionally low levels for the federal funds rate for an extended period.” At fiscal year end, the federal funds futures market was not expecting a tightening of Fed policy until June of 2012.
The combination of moderate economic growth, strong earnings growth and investors’ demand for higher yielding securities resulted in outperformance for the corporate and mortgage backed sectors of the bond market. The average risk premium for investment grade corporate bonds declined by only 5 basis points during the fiscal year according to Barclays Capital. As of April 30, 2011, the average risk premium was 138 basis points. The corporate sector rebounded after risk premiums widened last spring and early summer in response to the aforementioned fears of a double dip recession and sovereign credit risks associated with Greece, Portugal and Ireland. The risk premium closed the month of June 2010 at 193 basis points, which was 50 basis points wider than the end of April 2010. These fears were somewhat allayed by the European Union’s bailout plan. The plan is designed to give these countries time to improve their fiscal position by implementing austerity programs. The mortgage backed sector was aided by the diminished supply of new mortgages as the housing market remained sluggish. Commercial banks continued to add to their mortgage holdings as loan growth remained weak.
Standard & Poor’s revised the outlook for the United States of America to negative from stable in April 2011 and affirmed the AAA sovereign credit ratings. This is the first time the United States has been placed on negative outlook by a major rating agency. Standard & Poor’s cited that it has been, “More than two years after the beginning of the recent crisis, U.S. policymakers have still not agreed on how to reverse recent fiscal deterioration or address longer-term fiscal pressures.” Clearly this is a warning to the United States government that it must take steps to balance the budget and address Medicare and social security programs. This action had very little impact on the treasury market.
Looking forward, we expect economic growth to continue at a moderate pace and inflation at the core rate to move slightly higher. We are encouraged by the economy’s recent ability to create jobs which should support growth. We are concerned with the negative ramifications of higher gasoline prices but are hopeful that energy prices will moderate. We do not expect the Fed to tighten in 2011
ANNUAL REPORT / April 30, 2011
Table of Contents
| 30 |
given that the unemployment rate although declining will still be too high for the Fed to tighten and inflation will not move too high. However, we do expect longer-term interest rates to move higher as the Fed’s quantitative easing program is scheduled to expire at the end of June 2011 and then the market will have to fill the void of the Fed no longer buying $75 billion of treasury securities per month.
The Fund’s outperformance over the past fiscal year can be attributed to our decision to overweight the higher yielding corporate sector of the bond market. The Fund provided more income than it’s benchmark, the Barclays Capital U.S. Aggregate Bond Index as a result of our sector strategy. In particular, we had an overweight in the financial sector and in particular Real Estate Investment Trusts (“REITs”). We also had an overweight in the energy sector. Our yield curve strategy to overweight the 7 to 10-year portion of the yield curve also provided positive results as this part of the yield curve outperformed the 30-year portion of the yield curve. The Fund’s performance also benefited from our decision to maintain a longer average maturity versus the benchmark during the first half of the fiscal year as interest rates moved lower.
| * | Performance data quoted represents past performance, which is no guarantee of future results. Investment return and principal value will fluctuate so that an investor’s shares, when redeemed, may be worth more or less than their original cost. The total return for Class A |
Shares was 1.74%, adjusted for the Fund’s maximum sales charge. Mutual fund performance changes over time and current performance may be lower or higher than what is stated. For the most recent month-end performance, please visit www.mtbfunds.com or call 1-800-836-2211. |
| ** | The Barclays Capital U.S. Aggregate Bond Index is an index measuring both the capital price changes and income provided by the underlying universe of securities, comprised of U.S. Treasury obligations, U.S. investment grade corporate debt and mortgage backed obligations. The index is unmanaged and investments cannot be made directly in an index. |
| *** | Lipper Corporate A-Rated Debt Fund Average represents the average of the total returns reported by all of the mutual funds designated by Lipper, Inc. as falling into the respective category indicated. These figures do not reflect sales charges. The average is unmanaged and investments cannot be made directly in an average. |
| The Consumer Price Index provides a measure of inflation at the retail level. |
| Duration is a measure of a security’s price sensitivity to changes in interest rates. Securities with longer durations are more sensitive to changes in interest rates than securities of shorter durations. |
| Bond prices are sensitive to changes in interest rates and a rise in short-term interest rates could cause a decline in bond prices. |
April 30, 2011 / ANNUAL REPORT
Table of Contents
| 31 |
MTB INCOME FUND – CLASS A AND INSTITUTIONAL I SHARES†
The graph below illustrates the hypothetical investment of $10,0001,2 in the MTB Income Fund (Class A Shares) (the “Fund”) from April 30, 2001 to April 30, 2011, compared to the Barclays Capital U.S. Aggregate Bond Index (“BCAB”)2,3 and the Lipper Corporate A-Rated Debt Funds Average.2,3
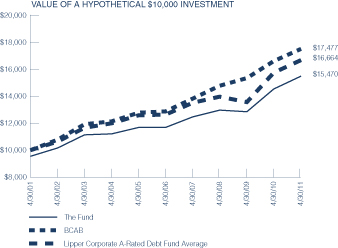
The graph below illustrates the hypothetical investment of $100,0002 in the MTB Income Fund (Institutional I Shares) (the “Fund”) from April 30, 2001 to April 30, 2011, compared to the Barclays Capital Aggregate Bond Index (BCAB)2,3 and the Lipper Corporate A-Rated Debt Funds Average.2,3
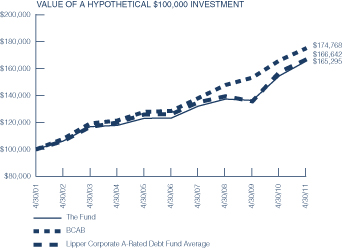
Average Annual Total Returns for the Period Ended April 30, 2011
| Class A | Institutional I | |||||||
| 1 Year | 1.74% | 6.93% | ||||||
| 5 Years | 4.81% | 6.04% | ||||||
| 10 Years | 4.46% | 5.15% | ||||||
Performance data quoted represents past performance which is no guarantee of future results. Returns shown do not reflect the deduction of taxes that a shareholder would pay on Fund distributions or the redemption of Fund shares. Investment return and principal value will fluctuate so that an investor’s shares, when redeemed, may be worth more or less than their original cost. Mutual funds are not obligations of or guaranteed by any bank and are not federally insured. Mutual fund performance changes over time and current performance may be lower or higher than what is stated. For current to the most recent month end performance, visit www.mtbfunds.com or call 1-800-836-2211. Total returns shown include the maximum sales charge of 4.50% for Class A Shares.
Annual Operating Expense Ratio
| Class A | Institutional I | |||||||
| Before Waivers | 1.26% | 1.01% | ||||||
| After Waivers | 1.01% | 0.66% | ||||||
The Expense Ratio Before Waivers represents the operating costs borne by the Fund, expressed as a percentage of the Fund’s average net assets, as shown in the Fees and Expenses table in the Fund’s current prospectus (under “Total Annual Fund Operating Expenses”).
| 1 | Represents a hypothetical investment of $10,000 in Class A Shares after deducting the maximum sales charge of 4.50% ($10,000 investment minus $450 sales charge = $9,550). |
| 2 | The Fund’s performance assumes the reinvestments of all dividends and distributions. The BCAB and the Lipper Corporate A-Rated Debt Funds Average have been adjusted to reflect reinvestment of dividends on securities in the indexes. |
| 3 | The BCAB and the Lipper Corporate A-Rated Debt Funds Average are not adjusted to reflect sales charges, that the Securities and Exchange Commission (“SEC”) requires to be reflected in the Fund’s performance. The index is unmanaged and, unlike the Fund, is not affected by cashflows. It is not possible to invest directly in an index or an average. |
| † | The MTB Income Fund is the successor to the ARK Income Portfolio pursuant to a reorganization which took place on August 22, 2003. The information presented above, for the periods prior to August 22, 2003, is historical information for the ARK Income Portfolio. |
ANNUAL REPORT / April 30, 2011
Table of Contents
| 32 |
MTB STRATEGIC ALLOCATION FUND
Management’s Discussion of Fund Performance
For the fiscal year ended April 30, 2011, MTB Strategic Allocation Fund* (the “Fund”) returned 14.54% for Class A Shares based on net asset value,** versus its benchmarks, the S&P 500 Index*** which returned 17.22%, and Barclays Capital U.S. Aggregate Bond Index,*** which returned 5.36%.
The Fund performed well over the past year, helped by the strong returns in the equity markets during this time. The equity portion of the Fund represented approximately 65% of the portfolio over the year, and within equities, our diversification into emerging markets and natural resources stocks helped the Fund’s overall performance. In addition, our bias towards growth stocks, particularly within large capitalization domestic equities, contributed to performance. Several of our underlying equity funds also performed particularly well over this time period, specifically Harbor International and MTB Large Cap Growth. We believed that coming out of the 2008 liquidity crisis large capitalization stocks would be favored due to their greater cash positions and foreign-sourced profits, allowing them to recover from the crisis better than domestic consumer-dependent small capitalization stocks, and were a bit surprised by how strongly small cap stocks performed over the past year.
Within the fixed income portion of the Fund, our overweight to bonds in the early part of the fiscal year added to the Fund’s performance as investors sought safety in U.S. Treasury bonds in April and May of 2010 during the European sovereign debt crisis. Our subsequent reduction in the bond segment of the Fund later in the year, coupled with diversification into high yield bonds (both fixed and floating rate), also contributed to the Fund’s strong performance.
We continue to look for opportunities to add value in the Fund, whether through over- or underweighting asset classes we feel are attractive or expensive, entering new asset classes such as emerging markets and natural resources that we added this past year, or through selecting underlying managers we believe have the ability to outperform. Specifically, we have begun to shift our bias from growth-oriented to dividend-oriented stocks as we believe that companies returning profits to shareholders in the form of dividends will ultimately prevail as we enter into a period of more tempered equity returns.
We thank you for your continued investment in this Fund and look forward to another good year.
| * | Performance data quoted represents past performance, which is no guarantee of future results. Investment return and principal value will fluctuate so that an investor’s shares, when redeemed, may be worth more or less than their original cost. The total return for Class A Shares was 8.26%, adjusted for the Fund’s maximum sales charge. Mutual fund performance changes over time and current performance may be lower or higher than what is stated. For the most recent month-end performance, please visit www.mtbfunds.com or call 1-800-836-2211. |
| *** | The S&P 500 Index is an unmanaged capitalization-weighted index of 500 stocks designed to measure performance of the broad domestic economy through changes in the aggregate market value of 500 leading companies in leading industries of the U.S. economy. Barclays Capital U.S. Aggregate Bond Index is an index measuring both the capital price changes and income provided by the underlying universe of securities, comprised of U.S. Treasury obligations, U.S. investment grade corporate debt and mortgage backed obligations. The indexes are unmanaged and investments cannot be made directly in an index. |
| International investing involves special risks including currency risk, political risks, increased volatility of foreign securities, and differences in auditing and other financial standards. |
| The Consumer Price Index provides a measure of inflation at the retail level. |
| Bond prices are sensitive to changes in interest rates and a rise in short-term interest rates could cause a decline in bond prices. |
| Due to its strategy of investing in other mutual funds, this Fund may incur certain additional expenses and tax results that would not be present with a direct investment in the underlying funds. |
April 30, 2011 / ANNUAL REPORT
Table of Contents
| 33 |
MTB STRATEGIC ALLOCATION FUND – CLASS A† AND INSTITUTIONAL I SHARES
The graph below illustrates the hypothetical investment of $10,0001,2 in the MTB Strategic Allocation Fund (Class A Shares) (the “Fund”) from April 30, 2001 to April 30, 2011, compared to the Standard & Poor’s 500 Index (“S&P 500”)2,3, the Barclays Capital U.S. Aggregate Bond Index (“BCAB”)2,3 and the Lipper Mixed Asset Target Allocation Growth Funds Average.2,3

The graph below illustrates the hypothetical investment of $100,0002 in the MTB Strategic Allocation Fund (Institutional I Shares) (the “Fund”) from June 11, 2010 (start of performance) to April 30, 2011, compared to the S&P 5002,3, the BCAB2,3 and the Lipper Mixed Asset Target Allocation Growth Funds Average.2,3
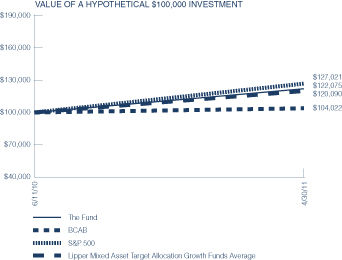
Average Annual Total Returns for the Period Ended April 30, 2011
| Class A | Institutional I | |||||||
| 1 Year | 8.26% | N/A | ||||||
| 5 Years | 2.10% | N/A | ||||||
10 Years or Start of Performance | 2.69% | 22.07% | 4 | |||||
Performance data quoted represents past performance which is no guarantee of future results. Returns shown do not reflect the deduction of taxes that a shareholder would pay on Fund distributions or the redemption of Fund shares. Investment return and principal value will fluctuate so that an investor’s shares, when redeemed, may be worth more or less than their original cost. Mutual funds are not obligations of or guaranteed by any bank and are not federally insured. Mutual fund performance changes over time and current performance may be lower or higher than what is stated. For current to the most recent month end performance, visit www.mtbfunds.com or call 1-800-836-2211. Total returns shown include the maximum sales charge of 5.50%.
Annual Operating Expense Ratio
| Class A | Institutional I | |||||||
| Before Waivers | 3.08% | 2.83% | ||||||
| After Waivers | 1.84% | 1.71% | ||||||
The Expense Ratio Before Waivers represents the operating costs borne by the Fund, expressed as a percentage of the Fund’s average net assets, as shown in the Fees and Expenses table in the Fund’s current prospectus (under “Total Annual Fund Operating Expenses”).
| 1 | Represents a hypothetical investment of $10,000 in Class A Shares after deducting the maximum sales charge of 5.50% ($10,000 investment minus $550 sales charge = $9,450). |
| 2 | The Fund’s performance assumes the reinvestment of all dividends and distributions. The S&P 500, BCAB and the Lipper Mixed Asset Target Allocation Growth Funds Average have been adjusted to reflect reinvestment of dividends on securities in the indexes. |
| 3 | S&P 500, BCAB and the Lipper Mixed Asset Target Allocation Growth Funds Average are not adjusted to reflect sales charges, that the Securities and Exchange Commission (“SEC”) requires to be reflected in the Fund’s performance. The indexes are unmanaged and, unlike the Fund, are not affected by cashflows. It is not possible to invest directly in an index or an average. |
| 4 | The total return for Institutional I Shares represents the cumulative performance for the period June 11, 2010 (commencement of operations) through April 30, 2011. |
| † | The information presented above, for the periods prior to June 11, 2010, is historical information for the MTB Managed Allocation Fund—Moderate Growth Portfolio. See Reorganization note within the notes to financial statements. |
ANNUAL REPORT / April 30, 2011
Table of Contents
| 34 |
MTB LARGE CAP VALUE FUND
Management’s Discussion of Fund Performance
For the fiscal year ended April 30, 2011, MTB Large Cap Value Fund (the “Fund”) returned 16.79% for Class A Shares and 17.08% for Institutional I Shares, based on net asset value,* versus its benchmark, the Russell 1000 Value Index,** which returned 15.24%.
Following very strong returns for the prior year, U.S. equity markets delivered a second strong year of performance for the fiscal year ended April 30, 2011. The markets continue to be driven by a gradually improving economy and strong corporate earnings growth. Corporations have demonstrated great cost control, even in an environment that is characterized by revenue growth that is difficult to come by. Overall valuations for the market, although not compelling, remain reasonable if relatively high corporate profit margins persist, and one of the several negative issues confronting the global economy doesn’t morph into a more serious problem.
Despite the market’s gains, the investment and economic environment remain uncertain. The U.S. economy has benefited from extraordinary government stimulus during the past two years. Although the economy has grown for seven consecutive quarters, it is not yet clear that the recovery is self-sustaining, and unfortunately, there continues to be a list of potential negatives that is daunting. Unemployment remains stubbornly high, the housing market is showing few signs of life, and state and local budget deficits, as well as underfunded pensions should present significant problems for the foreseeable future. As austerity programs have started to spread across the globe, the U.S. decided it would consider controlling its deficit after first extending unemployment benefits and renewing the Bush tax cuts. Perhaps we will deal with our deficit later….but eventually we will have to pay the piper. Additionally, the true economic profitability of U.S. domiciled companies with significant overseas earnings is overstated given a future tax liability involved with repatriating cash (profits) to the U.S. This liability is in addition to the repatriation issue related to current overseas cash balances. Sovereign debt risks are again making headlines, with Greek debt being priced as if a restructuring or default is inevitable. China, a critical engine of growth for the world, has continued to increase interest rates in order to control speculation and inflation. Thus far, it has been able to engineer a series of “softer landings,” but the risk of a harder downturn has increased. Lastly, the turmoil roiling the Middle East continues unabated, although the headlines recently have been more muted.
Media holdings Time Warner, Inc. and Viacom, Inc. (“Viacom”) appreciated as advertising trends have steadily recovered alongside the global economy. Viacom has tremendous business momentum. Its cable networks continue to post solid ratings, particularly at MTV. Strong revenue growth from a robust advertising environment and steadily growing affiliate fees combined with cost controls are driving margin expansion. The company also recently reactivated its share repurchase program, buying back $400 million in stock during the last quarter. General Motors Co. declined as the company reported mixed fourth quarter earnings as better-than-expected North America volume and pricing was offset by higher costs. Investors were also concerned about a potential degradation in pricing and product mix going forward given sharply rising
gasoline prices and production cutbacks due to supply shortages from Japan. The potential overhang of the U.S. government’s ownership stake also weighed on the stock. An upcoming share sale may provide an opportunity to increase our holdings. Our investment thesis for the stock remains intact as the company’s fundamentals have greatly improved since emerging from bankruptcy last year, and the issues and concerns are short-term in nature.
Political instability and rising tensions in the Middle East contributed to increased prices and volatility in the energy markets during the first quarter. Canadian Natural Resources Ltd. rose on the strength of its highly visible long-term production growth profile and leverage to rising oil prices. The company had a fire at its Horizon oil sands project in January that will reduce short-term volumes, but it should have a minimal valuation impact on the long-term value of the asset. Apache Corp. (“Apache”) appreciated despite reporting fourth quarter earnings that were below expectations. The earnings shortfall was attributable to higher costs stemming from the company’s opportunistic purchase of oil producing assets last year. First quarter earnings were pressured as poor weather conditions in Australia (Tropical Cyclones Diane and Carlos) contributed to a less favorable oil/gas production mix. It is also worth noting that nearly one-quarter of Apache’s total production (less than 15% of the company’s value) comes from the Middle East, predominately Egypt. Despite the headlines, the regime change in Egypt is not expected to result in significant changes, and the threat to the company’s assets in the region should be limited. Apache earns reasonable returns in Egypt, is a major employer in the country, sells natural gas for domestic consumption at well below market prices, and reinvests significant capital back into its operations. Occidental Petroleum Corp. (“OXY”) underperformed its peers as investors were disappointed by its production volumes in California. The company’s exploration drilling activity in California has been operating below expectations due to delays in obtaining permits. We anticipate volumes will begin to show improvements shortly as some of these operational issues are resolved. OXY sold its underperforming operations in Argentina recently, and acquired shale assets in North Dakota and south Texas which should improve earnings, return on capital employed, and free cash flow.
Citigroup, Inc. (“Citigroup”) has made significant strides in improving its capital and liquidity position; however, the stock underperformed as investors were disappointed that the company was unable to redeploy as much capital as it hoped to share repurchases and dividends given stricter regulatory requirements. Citigroup announced a 1-for-10 reverse stock-split and reinstituted a nominal dividend equal to about 1% of its earnings during the first quarter of 2011. Goldman Sachs Group, Inc. also declined as its revenue outlook from investment banking, while higher than in the fourth quarter of 2010, was below last year’s level. Uncertainty regarding the ongoing implementation of Dodd-Frank Financial Reform legislation continues to be an overhang, particularly its impact on proprietary trading. We used weakness in the stock to increase our position at attractive prices.
While the crisis in Japan has been devastating from a humanitarian standpoint, we do not expect a large financial impact on our
April 30, 2011 / ANNUAL REPORT
Table of Contents
| 35 |
insurance holdings in terms of claims, portfolio investments, revenues, or earnings. The vast majority of the losses will be covered either by Japanese insurers, the Japanese government, or its businesses/citizens. MetLife, Inc. and Hartford Financial Services Group, Inc. do have some operational/investment exposure to Japan, but we do not expect any potential financial impact to be significant. Both stocks were up modestly for the year. Our investment in insurance broker AON Corp. rose during the year as investors continue to recognize its improving fundamentals, including better margins and higher revenue growth opportunities. In addition, reinsurance pricing and demand are poised to increase following the recent global catastrophes (New Zealand earthquake, Australian floods, Japanese earthquake/tsunami).
Amgen, Inc. (“Amgen”) shares were essentially flat during the year on concerns that a draft National Coverage Determination (an evidence-based process used for Medicare coverage) might lower the hemoglobin target for dialysis patients, thus further reducing the need for the company’s Epogen/Aranesp dialysis product. While recently we had modestly reduced our exposure to the stock given our view that policy makers did indeed seek to take action that could impact Amgen, rhetoric in Washington DC ultimately softened and we were able to return to a full position in Amgen’s stock at roughly equivalent prices. Conversely, Pfizer, Inc. (“Pfizer”) outperformed as the company has been active in addressing ongoing and future challenges by shaking up its management team, acquiring King Pharmaceuticals, and articulating a willingness to potentially divest its non-pharmaceutical divisions. Pfizer’s valuation has risen off its lows in recent months, yet remains very compelling as the company has several near-term pipeline opportunities, including its oral rheumatoid arthritis drug, tofacitinib, that recently posted positive results during a second Phase 3 study.
Defense stocks Lockheed Martin Corp. (“Lockheed”) and Raytheon Co. (“Raytheon”) underperformed for most of the year as investors feared lower margins and continued to price in expectations of a tougher U.S. defense spending environment brought on, in part, by a new Defense Dept. initiative that seeks to control costs and increase efficiency. However, more recently, defense stocks rose as investors became more comfortable with the challenging budget environment, attractive valuations, and reported earnings that exceeded expectations, particularly at Lockheed given strength in its aeronautics and electronic systems divisions. The company also increased its earnings guidance for the year as a pension tailwind is expected to provide some earnings momentum. Raytheon also recently beat consensus estimates as the company was able to offset a tough sales environment with margin improvement across most of its business segments. Raytheon continues to aggressively use excess cash to repurchase outstanding shares.
Motorola, Inc. separated into two independent companies in early January, as expected. We continue to maintain investments in both companies, Motorola Mobility Holdings, Inc. and Motorola Solutions, Inc. Motorola Solutions, Inc. is a leading provider of
two-way radio and wireless network products, and is positioned to profit from the digital upgrade in public safety equipment. We believe the company will also benefit significantly if the government allocates additional frequency spectrum to public safety for wireless broadband data usage, an issue that is starting to gain momentum in Washington. The stock price has yet to discount the potential of this opportunity, which we believe could generate 25-50¢ of annualized incremental earnings per share over the next 5-7 years. We expect the company will address capital allocation (dividends and share repurchase) after completing the sale of its network business to Nokia Siemens in the second quarter of 2011. We cut our position in Motorola Mobility Holdings, Inc. (wireless devices and cable products) in mid-January given the stock’s appreciation, driven by a greater mix of its higher margin, Android-based smartphones, as well as building expectations for the growth potential of its new Xoom tablet. Subsequently, given a decline in the stock price, we increased our position in both February and March.
As discussed, we believe that there are a number of risks which could prove challenging to the global financial markets in the year ahead. For the time being, the market has continued to ‘climb a wall of worry’ viewing most negative news as a buying opportunity. While we are concerned, on the positive side we believe there are still a number of compelling investment opportunities in the market today, and we remain truly excited about the prospects for many of our investment holdings. The bottom line for us is that the financial markets seem to believe that good times are ahead and risk is low. We do not adhere to that view, and will continue to be disciplined and cautious, yet opportunistic in navigating the investment landscape. As always, we greatly appreciate your trust in allowing us to be stewards of your capital.
| * | Performance data quoted represents past performance, which is no guarantee of future results. Investment return and principal value will fluctuate so that an investor’s shares, when redeemed, may be worth more or less than their original cost. The total return for Class A Shares was 10.40%, adjusted for the Fund’s maximum sales charge. Mutual fund performance changes over time and current performance may be lower or higher than what is stated. For the most recent month-end performance, please visit www.mtbfunds.com or call 1-800-836-2211. |
| ** | The Russell 1000 Value Index measures the performance of the large-cap value segment of the U.S. equity universe. It includes those Russell 1000 companies with lower price-to-book ratios and lower expected growth values. The Russell 1000 Value Index is constructed to provide a comprehensive and unbiased barometer for the large-cap value segment. The index is completely reconstituted annually to ensure new and growing equities are included and that the represented companies continue to reflect value characteristics. The index is unmanaged and investments cannot be made directly in an index. |
ANNUAL REPORT / April 30, 2011
Table of Contents
| 36 |
MTB LARGE CAP VALUE FUND – CLASS A SHARES
The graph below illustrates the hypothetical investment of $10,0001,2 in the MTB Large Cap Value Fund (Class A Shares) (the “Fund”) from April 30, 2001 to April 30, 2011, compared to the Russell 1000 Value Index (“Russell 1000 Value”)2,3, and the Lipper Large Cap Value Funds Average.2,3
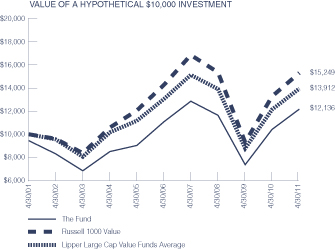
Average Annual Total Returns for the Period Ended April 30, 2011
| 1 Year | 10.40% | |||
| 5 Years | 0.74% | |||
| 10 Years | 1.95% | |||
Performance data quoted represents past performance which is no guarantee of future results. Returns shown do not reflect the deduction of taxes that a shareholder would pay on Fund distributions or the redemption of Fund shares. Investment return and principal value will fluctuate so that an investor’s shares, when redeemed, may be worth more or less than their original cost. Mutual funds are not obligations of or guaranteed by any bank and are not federally insured. Mutual fund performance changes over time and current performance may be lower or higher than what is stated. For current to the most recent month end performance, visit www.mtbfunds.com or call 1-800-836-2211. Total returns shown include the maximum sales charge of 5.50%.
Annual Operating Expense Ratio
| Before Waivers | 1.43% | |||
| After Waivers | 1.32% | |||
The Expense Ratio Before Waivers represents the operating costs borne by the Fund, expressed as a percentage of the Fund’s average net assets, as shown in the Fees and Expenses table in the Fund’s current prospectus (under “Total Annual Fund Operating Expenses”).
| 1 | Represents a hypothetical investment of $10,000 in the Fund after deducting the maximum sales charge of 5.50% ($10,000 investment minus $550 sales charge = $9,450). |
| 2 | The Fund’s performance assumes the reinvestment of all dividends and distributions. The Russell 1000 Value and the Lipper Large Cap Value Funds Average have been adjusted to reflect reinvestment of dividends on securities in the indexes. |
| 3 | The Russell 1000 Value and the Lipper Large Cap Value Funds Average are not adjusted to reflect sales charges, that the Securities and Exchange Commission (“SEC”) requires to be reflected in the Fund’s performance. The index is unmanaged and, unlike the Fund, is not affected by cashflows. It is not possible to invest directly in an index or an average. |
April 30, 2011 / ANNUAL REPORT
Table of Contents
| 37 |
MTB LARGE CAP VALUE FUND – INSTITUTIONAL I SHARES
The graph below illustrates the hypothetical investment of $100,0001 in the MTB Large Cap Value Fund (Institutional I Shares) (the “Fund”) from August 18, 2003 (start of performance) to April 30, 2011, compared to the Russell 1000 Value Index (“Russell 1000 Value”)1,2, and the Lipper Large Cap Value Funds Average.1,2
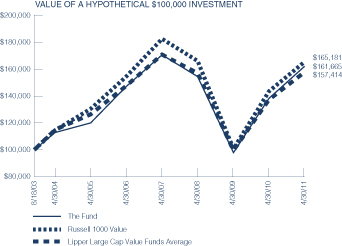
Average Annual Total Returns for the Period Ended April 30, 2011
| 1 Year | 17.08% | |||
| 5 Years | 1.94% | |||
| Start of Performance (8/18/03) | 6.43% | |||
Performance data quoted represents past performance which is no guarantee of future results. Returns shown do not reflect the deduction of taxes that a shareholder would pay on Fund distributions or the redemption of Fund shares. Investment return and principal value will fluctuate so that an investor’s shares, when redeemed, may be worth more or less than their original cost. Mutual funds are not obligations of or guaranteed by any bank and are not federally insured. Mutual fund performance changes over time and current performance may be lower or higher than what is stated. For current to the most recent month end performance, visit www.mtbfunds.com or call 1-800-836-2211.
Annual Operating Expense Ratio
| Before Waivers | 1.18% | |||
| After Waivers | 1.04% | |||
The Expense Ratio Before Waivers represents the operating costs borne by the Fund, expressed as a percentage of the Fund’s average net assets, as shown in the Fees and Expenses table in the Fund’s current prospectus (under “Total Annual Fund Operating Expenses”).
| 1 | The Fund’s performance assumes the reinvestment of all dividends and distributions. The Russell 1000 Value and the Lipper Large Cap Value Funds Average have been adjusted to reflect reinvestment of dividends on securities in the indexes. Lipper Average performance presented is as of the nearest month-end following inception date. |
| 2 | The Russell 1000 Value and the Lipper Large Cap Value Funds Average are not adjusted to reflect sales charges, that the SEC requires to be reflected in the Fund’s performance. The index is unmanaged and, unlike the Fund, is not affected by cashflows. It is not possible to invest directly in an index or an average. |
ANNUAL REPORT / April 30, 2011
Table of Contents
| 38 |
MTB LARGE CAP GROWTH FUND
Management’s Discussion of Fund Performance
For the fiscal year ended April 30, 2011, MTB Large Cap Growth Fund (“the Fund”) returned 18.00% for Class A Shares and 18.40% for Institutional I Shares, based on net asset value,* versus its benchmark, the Russell 1000 Growth Index,** which returned 20.87%.
We look at our fiscal year as a continuation of the equity recovery that began in March 2009. After experiencing the worst recession since the “Great Depression” of the 1930s, the equity markets, as you might expect, continued on their road to recovery. This fiscal year was the second year in a row of the Fund delivering a solid double-digit return, and is where you might expect it to be from a cyclical recovery standpoint given the magnitude of the correction. However, even with those two robust years, the broader equity markets remain some 12% below their prior 2007 peak, as companies’ balance sheets have improved, and they are flush with cash but the recessionary pain still lingers, and many are unwilling to commit this capital into bricks and mortar and hire additional workers. We believe that fundamental analysis will win out and take the equity markets to a new high, however near-term headwinds like civil war in the Mideast, European debt sovereignty issues, and our own internal debt problems will create roadblocks before this goal is ultimately achieved.
We believe that as the economic numbers continue to improve, equity shareholders will be rewarded. Even with a rather meaningful move off of the March 2009 bottom, investors continue with their hesitancy to recommit and add to their equity weightings. We have noticed a consistent improvement throughout our fiscal year in both the Industrial Production and Consumer Confidence data, again this positive direction should work its way into higher equity prices.
The Fund’s top performing equity positions once again came from a rather eclectic group and void of any central theme. Lululemon Athletica, Inc., a Canadian retailer that sells women’s athletic wear, appreciated over one-hundred fifty percent throughout the year. The company found an attractive niche with middle-aged working women who wanted fashion flair in their workout attire. Another winning security was our investment in Halliburton Co. This leading oil service company benefited from the move in oil prices, and their development of a new technique to extract more of the commodity from existing reservoirs. The Fund also benefited from our holding in Cummins, Inc. This industrial company which specializes in the manufacturing of diesel engines, appreciated over five-fold from our initial investment in the spring of 2009. Our confidence in a global economic recovery turned this early investment into a top performer.
The Fund was negatively impacted by our position in Auxilium Pharmaceuticals, Inc. This biotech company had completed Phase III clinical trials and won FDA approval on a drug called Xiaflex. The stock sold off as physicians were hesitant to prescribe the drug over fears of insurance reimbursement issues. Our position in Bank of America Corp. also had a negative impact on the Fund’s overall performance. We were early in our thesis that most large banks would somehow be supported and not fall into insolvency. This thesis was a primary beneficiary behind last year’s solid double digit return. However, after an initial rather large recovery move, the stock price languished as additional governmental regulatory issues weighed heavily on the over-levered companies within the banking sector. As a result our position in Bank of America Corp. fell over thirty percent in our fiscal year.
As we reflect back on fiscal year 2011, we were pleased to once again deliver solid returns in the upper teens for our shareholders. Geopolitical headwinds will continue to plague the markets, however we are convinced that the recession is behind us, and global economies remain in a recovery mode. China, Brazil, India and other emerging markets have demonstrated how vibrant growth can be, as millions of consumers matriculate to the middle class. We firmly believe that strong economic data will lead this market to new highs, and would use any market weakness as an opportunity to participate.
| * | Performance data quoted represents past performance, which is no guarantee of future results. Investment return and principal value will fluctuate so that an investor’s shares, when redeemed, may be worth more or less than their original cost. The total return for Class A Shares was 11.52%, adjusted for the Fund’s maximum sales charge. Mutual fund performance changes over time and current performance may be lower or higher than what is stated. For the most recent month-end performance, please visit www.mtbfunds.com or call 1-800-836-2211. |
| ** | The Russell 1000 Growth Index measures the performance of the large-cap growth segment of the U.S. equity universe. It includes those Russell 1000 companies with higher price-to-book ratios and higher forecasted growth values. The Russell 1000 Growth Index is constructed to provide a comprehensive and unbiased barometer for the large-cap growth segment. The index is completely reconstituted annually to ensure new and growing equities are included and that the represented companies continue to reflect growth characteristics. The index is unmanaged and investments cannot be made directly in an index. |
April 30, 2011 / ANNUAL REPORT
Table of Contents
| 39 |
MTB LARGE CAP GROWTH FUND – CLASS A SHARES
The graph below illustrates the hypothetical investment of $10,0001,2 in the MTB Large Cap Growth Fund (Class A Shares) (the “Fund”) from April 30, 2001 to April 30, 2011, compared to the Russell 1000 Growth Index (“Russell 1000 Growth”)2,3 and the Lipper Large-Cap Growth Funds Average.2,3
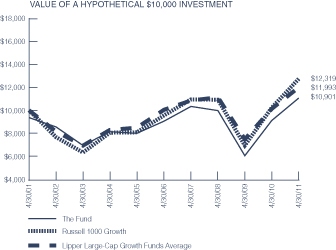
Average Annual Total Returns for the Period Ended April 30, 2011
| 1 Year | 11.52% | |||
| 5 Years | 2.32% | |||
10 Years | 0.87% | |||
Performance data quoted represents past performance which is no guarantee of future results. Returns shown do not reflect the deduction of taxes that a shareholder would pay on Fund distributions or the redemption of Fund shares. Investment return and principal value will fluctuate so that an investor’s shares, when redeemed, may be worth more or less than their original cost. Mutual funds are not obligations of or guaranteed by any bank and are not federally insured. Mutual fund performance changes over time and current performance may be lower or higher than what is stated. For current to the most recent month end performance, visit www.mtbfunds.com or call 1-800-836-2211. Total returns shown include the maximum sales charge of 5.50%.
Annual Operating Expense Ratio
| Before Waivers | 1.64% | |||
| After Waivers | 1.42% | |||
The Expense Ratio Before Waivers represents the operating costs borne by the Fund, expressed as a percentage of the Fund’s average net assets, as shown in the Fees and Expenses table in the Fund’s current prospectus (under “Total Annual Fund Operating Expenses”).
| 1 | Represents a hypothetical investment of $10,000 in the Fund after deducting the maximum sales charge of 5.50% ($10,000 investment minus $550 sales charge = $9,450). |
| 2 | The Fund’s performance assumes the reinvestment of all dividends and distributions. The Russell 1000 Growth and the Lipper Large-Cap Growth Funds Average have been adjusted to reflect reinvestment of dividends on securities in the indexes. |
| 3 | The Russell 1000 Growth Index and the Lipper Large-Cap Growth Funds Average are not adjusted to reflect sales charges, that the Securities and Exchange Commission (“SEC”) requires to be reflected in the Fund’s performance. The index is unmanaged and, unlike the Fund, is not affected by cashflows. It is not possible to invest directly in an index or an average. |
ANNUAL REPORT / April 30, 2011
Table of Contents
| 40 |
MTB LARGE CAP GROWTH FUND – INSTITUTIONAL I SHARES
The graph below illustrates the hypothetical investment of $100,0001 in the MTB Large Cap Growth Fund (Institutional I Shares) (the “Fund”) from August 18, 2003 (start of performance) to April 30, 2011, compared to the Russell 1000 Growth1,2 and the Lipper Large-Cap Growth Funds Average.1,2
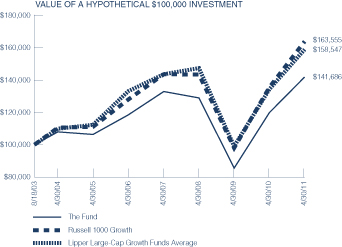
Average Annual Total Returns for the Period Ended April 30, 2011
| 1 Year | 18.40% | |||
| 5 Years | 3.66% | |||
| Start of Performance (8/18/03) | 4.63% | |||
Performance data quoted represents past performance which is no guarantee of future results. Returns shown do not reflect the deduction of taxes that a shareholder would pay on Fund distributions or the redemption of Fund shares. Investment return and principal value will fluctuate so that an investor’s shares, when redeemed, may be worth more or less than their original cost. Mutual funds are not obligations of or guaranteed by any bank and are not federally insured. Mutual fund performance changes over time and current performance may be lower or higher than what is stated. For current to the most recent month end performance, visit www.mtbfunds.com or call 1-800-836-2211.
Annual Operating Expense Ratio
| Before Waivers | 1.39% | |||
| After Waivers | 1.04% | |||
The Expense Ratio Before Waivers represents the operating costs borne by the Fund, expressed as a percentage of the Fund’s average net assets, as shown in the Fees and Expenses table in the Fund’s current prospectus (under “Total Annual Fund Operating Expenses”).
| 1 | The Fund’s performance assumes the reinvestment of all dividends and distributions. The Russell 1000 Growth and the Lipper Large-Cap Growth Funds Average have been adjusted to reflect reinvestment of dividends on securities in the indexes. Lipper Large-Cap Growth Funds Average performance presented is as of the nearest month-end following inception date. |
| 2 | The Russell 1000 Growth and the Lipper Large-Cap Growth Funds Average are not adjusted to reflect sales charges, that the SEC requires to be reflected in the Fund’s performance. The index is unmanaged and, unlike the Fund, is not affected by cashflows. It is not possible to invest directly in an index or an average. |
April 30, 2011 / ANNUAL REPORT
Table of Contents
| 41 |
MTB MID CAP GROWTH FUND
Management’s Discussion of Fund Performance
For the fiscal year ended April 30, 2011, MTB Mid Cap Growth Fund (the “Fund”) returned 32.43% for Class A Shares and 32.67% for Institutional I Shares, based on net asset value,* versus its benchmark, the Russell Mid Cap Growth Index,** which returned 27.40%.
The Fund rewarded investors with another year of solid performance, achieving top-quartile Lipper peer group ranking. The path to success was not a straight line. The year began with a significant pullback in equity markets as investors’ confidence in the sustainability of U.S. and global economic growth was shaken. Our portfolio, firmly positioned for growth, began the year on a challenging note. However, our analysis of the evidence—both macro and company-specific—led us to conclude that the dire forecasts of decelerating growth would not likely be realized. We used the pullback as an opportunity to build our holdings of competitive companies with solid fundamentals at attractive valuations. Disciplined, fact-based analysis—coupled with a longer-term investment horizon that provided some resistance to the Market’s concerns du jour—set the Fund up to benefit when investors recovered their appetite for companies with superior growth potential.
The Fund’s solid performance relative to the benchmark reflects successful stock selection in a range of sectors and industries; sector allocation had a negligible impact. Information technology, energy, materials, industrials, consumer discretionary, and consumer staples sectors each posted contributions from stock selection of greater than 100 basis points relative to the benchmark. It was particularly gratifying to see our energy and material holdings rebound after a difficult fiscal 2010. Healthcare was the only significant detractor from performance, reflecting weakness in a few holdings (Alere, Inc., MAP Pharmaceuticals, Inc., and Auxilium Pharmaceuticals, Inc.). Even with missteps, careful analysis and disciplined implementation produced a successful result for our investors.
| * | Performance data quoted represents past performance, which is no guarantee of future results. Investment return and principal value will fluctuate so that an investor’s shares, when redeemed, may be worth more or less than their original cost. The total return for Class A Shares was 25.17%, adjusted for the Fund’s maximum sales charge. Mutual fund performance changes over time and current performance may be lower or higher than what is stated. For the most recent month-end performance, please visit www.mtbfunds.com or call 1-800-836-2211. |
| ** | The Russell Mid Cap Growth Index measures the performance of the mid-cap growth segment of the U.S. equity universe. It includes those Russell Mid Cap Index companies with higher price-to-book ratios and higher forecasted growth values. The Russell Midcap Growth Index is constructed to provide a comprehensive and unbiased barometer of the mid-cap growth market. The index is completely reconstituted annually to ensure larger stocks do not distort the performance and characteristics of the true mid-cap growth market. The index is unmanaged and investments cannot be made directly in an index. |
ANNUAL REPORT / April 30, 2011
Table of Contents
| 42 |
MTB MID CAP GROWTH FUND – CLASS A SHARES†
The graph below illustrates the hypothetical investment of $10,0001,2 in the MTB Mid Cap Growth Fund (Class A Shares) (the “Fund”) from April 30, 2001 to April 30, 2011, compared to the Russell Mid Cap Growth Index (“Russell Mid Cap Growth”),2,3 and the Lipper Mid Cap Growth Funds Average.2,3
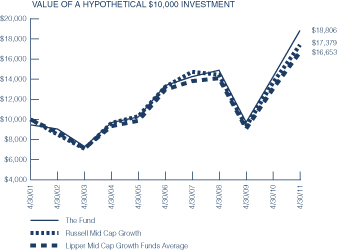
Average Annual Total Returns for the Period Ended April 30, 2011
| 1 Year | 25.17% | |||
| 5 Years | 5.88% | |||
| 10 Years | 6.52% | |||
Performance data quoted represents past performance which is no guarantee of future results. Returns shown do not reflect the deduction of taxes that a shareholder would pay on Fund distributions or the redemption of Fund shares. Investment return and principal value will fluctuate so that an investor’s shares, when redeemed, may be worth more or less than their original cost. Mutual funds are not obligations of or guaranteed by any bank and are not federally insured. Mutual fund performance changes over time and current performance may be lower or higher than what is stated. For current to the most recent month end performance, visit www.mtbfunds.com or call 1-800-836-2211. Total returns shown include the maximum sales charge of 5.50%.
Annual Operating Expense Ratio
| Before Waivers | 1.62% | |||
| After Waivers | 1.24% | |||
The Expense Ratio Before Waivers represents the operating costs borne by the Fund, expressed as a percentage of the Fund’s average net assets, as shown in the Fees and Expenses table in the Fund’s current prospectus (under “Total Annual Fund Operating Expenses”).
| 1 | Represents a hypothetical investment of $10,000 in the Fund after deducting the maximum sales charge of 5.50% ($10,000 investment minus $550 sales charge = $9,450). |
| 2 | The Fund’s performance assumes the reinvestment of all dividends and distributions. The Russell Mid Cap Growth and the Lipper Mid Cap Growth Funds Average have been adjusted to reflect reinvestment of dividends on securities in the indexes. |
| 3 | The Russell Mid Cap Growth, and the Lipper Mid Cap Growth Funds Average are not adjusted to reflect sales charges, that the Securities and Exchange Commission (“SEC”) requires to be reflected in the Fund’s performance. The index is unmanaged, and unlike the Fund, is not affected by cashflows. It is not possible to invest directly in an index or an average. |
| † | The MTB Mid Cap Growth Fund is the successor to the ARK Mid Cap Equity Portfolio pursuant to a reorganization which took place on August 22, 2003. The information presented above, for the periods prior to August 22, 2003, is historical information for the ARK Mid Cap Equity Portfolio. |
April 30, 2011 / ANNUAL REPORT
Table of Contents
| 43 |
MTB MID CAP GROWTH FUND – INSTITUTIONAL I SHARES†
The graph below illustrates the hypothetical investment of $100,0001 in the MTB Mid Cap Growth Fund (Institutional I Shares) (the “Fund”) from April 30, 2001 to April 30, 2011, compared to the Russell Mid Cap Growth Index (“Russell Mid Cap Growth”),1,2 and the Lipper Mid Cap Growth Funds Average.1,2
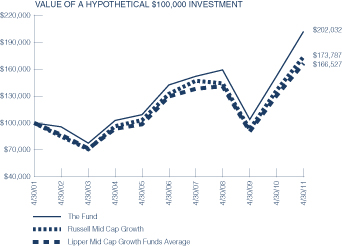
Average Annual Total Returns for the Period Ended April 30, 2011
| 1 Year | 32.67% | |||
| 5 Years | 7.26% | |||
| 10 Years | 7.29% | |||
Performance data quoted represents past performance which is no guarantee of future results. Returns shown do not reflect the deduction of taxes that a shareholder would pay on Fund distributions or the redemption of Fund shares. Investment return and principal value will fluctuate so that an investor’s shares, when redeemed, may be worth more or less than their original cost. Mutual funds are not obligations of or guaranteed by any bank and are not federally insured. Mutual fund performance changes over time and current performance may be lower or higher than what is stated. For current to the most recent month end performance, visit www.mtbfunds.com or call 1-800-836-2211.
Annual Operating Expense Ratio
| Before Waivers | 1.37% | |||
| After Waivers | 1.08% | |||
The Expense Ratio Before Waivers represents the operating costs borne by the Fund, expressed as a percentage of the Fund’s average net assets, as shown in the Fees and Expenses table in the Fund’s current prospectus (under “Total Annual Fund Operating Expenses”).
| 1 | The Fund’s performance assumes the reinvestment of all dividends and distributions. The Russell Mid Cap Growth and the Lipper Mid Cap Growth Funds Average have been adjusted to reflect reinvestment of dividends on securities in the index and average. |
| 2 | The Russell Mid Cap Growth and the Lipper Mid Cap Growth Funds Average are not adjusted to reflect sales charges, expenses, or other fees that the SEC requires to be reflected in the Fund’s performance. The index is unmanaged and, unlike the Fund, is not affected by cashflows. It is not possible to invest directly in an index or an average. |
| † | The MTB Mid Cap Growth Fund is the successor to the ARK Mid Cap Equity Portfolio pursuant to a reorganization which took place on August 22, 2003. The information presented above, for the periods prior to August 22, 2003, is historical information for the ARK Mid Cap Equity Portfolio. |
ANNUAL REPORT / April 30, 2011
Table of Contents
| 44 |
MTB SMALL CAP GROWTH FUND
Management’s Discussion of Fund Performance
For the fiscal year ended April 30, 2011, MTB Small Cap Growth Fund (the “Fund”) returned 25.69% for Class A Shares, 25.79% for Class C Shares and 25.99% for Institutional I Shares, based on net asset value,* versus its benchmark, the Russell 2000 Growth Index,** which returned 30.29%.
The Fund’s fiscal year was characterized by a continuation of the stock market rally from the lows hit in March 2009. However, the rally did not take hold until late August. At the beginning of the fiscal year, investors fretted over the possibility of a “double dip” recession as the economy transitioned from the acceleration phase of the recovery to the sustainable growth phase. During this transition period from early May to August 24, 2010, the Russell 2000 Growth Index (the “Index”) declined by (13)%. Fears of a “double dip” recession were put to rest on August 27, 2010 when Federal Reserve Chairman, Ben Bernanke, delivered a speech at the Federal Reserve Bank of Kansas City Economic Symposium in Jackson Hole, Wyoming. In his speech, Chairman Bernanke outlined the tools and strategies available for providing additional stimulus, in light of a near-zero Federal Funds rate. The market took the speech as a clear sign that the Federal Reserve was willing and prepared to do whatever it takes to ensure a smooth transition from the acceleration phase to the sustainable growth phase of the economic recovery. As a result, the Index rallied an impressive 52% between late August and the end of the Fund’s fiscal year end.
The 2011 fiscal year relative performance of the Fund got off to a slow start but finished on a positive note. We were positioned for a sustained economic recovery during the above mentioned transition period from May to August 2010, when the market declined by (13)%. During this period, the Fund underperformed the Index by (458) basis points. As you may recall, we wrote in our Second Quarter 2010 Manager Commentary “Many market participants have characterized this pause in the recovery as a prelude to a “double dip.” We believe, however, that the recovery is still intact, and that the current deceleration is a function of a normal slowdown in growth as the acceleration phase fades… Given this outlook, the Fund remains positioned for an economic recovery.” Our positioning paid off. As the market rallied 52% on the heels of Chairman Bernanke’s speech, the Fund outperformed the benchmark by 848 basis points.
Our best performing sector in the fiscal year was industrials. We were able to generate alpha through first-class stock selection. The bulk of our positions were in the machinery industry group. Historically, machinery stocks benefit when economic growth is accelerating. A few of the stand-out performers include WABCO Holdings, Inc., a manufacturer of braking and stability systems for commercial vehicles, with a 96% holding period return, and Bucyrus International, Inc., a manufacturer of mining equipment, with a 43% holding period return. Both companies substantially outperformed the rest of the sector and the overall benchmark.
For the second year in a row, our worst performing sector in the fiscal year was healthcare. Fears around the impact of healthcare reform continued to dominate investor thinking and caused increased volatility in the sector. To that end, we were underweight the sector for the fiscal year. However, our underweight was not
enough to offset poor stock selection. Many stocks in the sector became detached from their fundamental values, in our opinion, and instead traded off the rhetoric coming out of Washington DC. When we experience prolonged periods of time during which fundamental values become detached from stock prices, it becomes increasing difficult for our bottom up selection process to add value. As a result, our holdings in the Healthcare sector underperformed the Index’s holdings by 196 basis points on a relative basis.
We are pleased to have provided significant positive absolute performance. We continue to believe that the economy is entering a sustainable growth phase and have positioned the portfolio accordingly.
| * | Performance data quoted represents past performance, which is no guarantee of future results. Investment return and principal value will fluctuate so that an investor’s shares, when redeemed, may be worth more or less than their original cost. The total return for Class A Shares was 18.80%, adjusted for the Fund’s maximum sales charge, and the total return for Class C Shares was 24.79%, adjusted for the Fund’s contingent deferred sales charge. Mutual fund performance changes over time and current performance may be lower or higher than what is stated. For the most recent month-end performance, please visit www.mtbfunds.com or call 1-800-836-2211. |
| ** | The Russell 2000 Growth Index measures the performance of the small-cap growth segment of the U.S. equity universe. It includes those Russell 2000 companies with higher price-to-book ratios and higher forecasted growth values. The Russell 2000 Growth Index is constructed to provide a comprehensive and unbiased barometer for the small-cap growth segment. The Index is completely reconstituted annually to ensure larger stocks do not distort the performance and characteristics of the true small-cap opportunity set and that the represented companies continue to reflect growth characteristics. The index is unmanaged and investments cannot be made directly in an index. |
April 30, 2011 / ANNUAL REPORT
Table of Contents
| 45 |
MTB SMALL CAP GROWTH FUND – CLASS A AND C SHARES†
The graph below illustrates the hypothetical investment of $10,0001,2,3 in the MTB Small Cap Growth Fund (Class A and C Shares) (the “Fund”) from April 30, 2001 to April 30, 2011, compared to the Russell 2000 Growth Index (“Russell 2000 Growth”)3,4 and the Lipper Small Cap Growth Funds Average.3,4
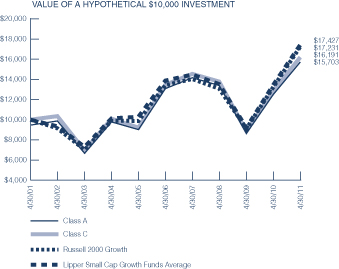
Average Annual Total Returns for the Period Ended April 30, 2011
| Class A | Class C | |||||||
| 1 Year | 18.80% | 24.79% | ||||||
| 5 Years | 2.54% | 3.79% | ||||||
| 10 Years | 4.62% | 4.94% | ||||||
Performance data quoted represents past performance which is no guarantee of future results. Returns shown do not reflect the deduction of taxes that a shareholder would pay on Fund distributions or the redemption of Fund shares. Investment return and principal value will fluctuate so that an investor’s shares, when redeemed, may be worth more or less than their original cost. Mutual funds are not obligations of or guaranteed by any bank and are not federally insured. Mutual fund performance changes over time and current performance may be lower or higher than what is stated. For current to the most recent month end performance, visit www.mtbfunds.com or call 1-800-836-2211. Total returns shown include the maximum sales charge of 5.50% for Class A Shares and contingent deferred sales charge (“CDSC”) of 1.00% as applicable for Class C Shares.
Annual Operating Expense Ratio
| Class A | Class C | |||||||
| Before Waivers | 1.70% | 2.20% | ||||||
| After Waivers | 1.47% | 1.52% | ||||||
The Expense Ratio Before Waivers represents the operating costs borne by the Fund, expressed as a percentage of the Fund’s average net assets, as shown in the Fees and Expenses table in the Fund’s current prospectus (under “Total Annual Fund Operating Expenses”).
| 1 | Represents a hypothetical investment of $10,000 in Class A Shares after deducting the maximum sales charge of 5.50% ($10,000 investment minus $550 sales charge = $9,450). |
| 2 | Represents a hypothetical investment of $10,000 in Class C Shares. The ending value of the Fund does not reflect a CDSC on any redemption over 1 year from purchase date. |
| 3 | The Fund’s performance assumes the reinvestment of all dividends and distributions. The Russell 2000 Growth and the Lipper Small Cap Growth Funds Average have been adjusted to reflect reinvestment of dividends on securities in the indexes. |
| 4 | The Russell 2000 Growth and the Lipper Small Cap Growth Funds Average are not adjusted to reflect sales charges, that the Securities and Exchange Commission (“SEC”) requires to be reflected in the Fund’s performance. The index is unmanaged and, unlike the Fund, is not affected by cashflows. It is not possible to invest directly in an index or an average. |
| † | The MTB Small Cap Growth Fund is the successor to the ARK Small Cap Equity Portfolio pursuant to a reorganization which took place on August 22, 2003. The information presented above, for the periods prior to August 23, 2003, is historical information for the ARK Small Cap Equity Portfolio. |
ANNUAL REPORT / April 30, 2011
Table of Contents
| 46 |
MTB SMALL CAP GROWTH FUND – INSTITUTIONAL I SHARES†
The graph below illustrates the hypothetical investment of $100,0001 in the MTB Small Cap Growth Fund (Institutional I Shares) (the “Fund”) from April 30, 2001 to April 30, 2011, compared to the Russell 2000 Growth1,2 and the Lipper Small Cap Growth Funds Average.1,2
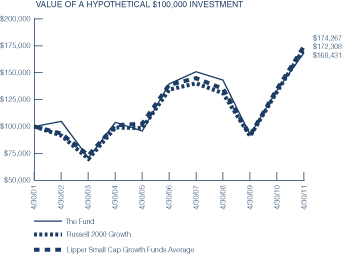
Average Annual Total Returns for the Period Ended April 30, 2011
| 1 Year | 25.99% | |||
| 5 Years | 3.85% | |||
| 10 Years | 5.35% | |||
Performance data quoted represents past performance which is no guarantee of future results. Returns shown do not reflect the deduction of taxes that a shareholder would pay on Fund distributions or the redemption of Fund shares. Investment return and principal value will fluctuate so that an investor’s shares, when redeemed, may be worth more or less than their original cost. Mutual funds are not obligations of or guaranteed by any bank and are not federally insured. Mutual fund performance changes over time and current performance may be lower or higher than what is stated. For current to the most recent month end performance, visit www.mtbfunds.com or call 1-800-836-2211.
Annual Operating Expense Ratio
| Before Waivers | 1.45% | |||
| After Waivers | 1.25% | |||
The Expense Ratio Before Waivers represents the operating costs borne by the Fund, expressed as a percentage of the Fund’s average net assets, as shown in the Fees and Expenses table in the Fund’s current prospectus (under “Total Annual Fund Operating Expenses”).
| 1 | The Fund’s performance assumes the reinvestment of all dividends and distributions. The Russell 2000 Growth and the Lipper Small Cap Growth Funds Average have been adjusted to reflect reinvestment of dividends on securities in the indexes. |
| 2 | The Russell 2000 Growth and the Lipper Small Cap Growth Funds Average are not adjusted to reflect sales charges, that the SEC requires to be reflected in the Fund’s performance. The index is unmanaged and, unlike the Fund, is not affected by cashflows. It is not possible to invest directly in an index or an average. |
| † | The MTB Small Cap Growth Fund is the successor to the ARK Small Cap Equity Portfolio pursuant to a reorganization which took place on August 22, 2003. The information presented above, for the periods prior to August 23, 2003, is historical information for the ARK Small Cap Equity Portfolio. |
April 30, 2011 / ANNUAL REPORT
Table of Contents
| 47 |
MTB INTERNATIONAL EQUITY FUND
Management’s Discussion of Fund Performance
For the fiscal year ended April 30, 2011, MTB International Equity Fund (the “Fund”) returned 20.16% for Class A Shares and 20.24% for Institutional I Shares, based on net asset value,* versus its benchmark, the Morgan Stanley Capital International—Europe, Australasia and Far East Index (“MSCI EAFE“)** which returned 19.18%.
Hansberger Global Investors (growth portion)
Hansberger Global Investors (“HGI”) serves as sub-advisor for the growth portion of the Fund. They began managing the growth portion of the Fund in October 2005. Their management discussion and analysis for the year ended April 30, 2011, follows:
HGI’s portion of the Fund assets returned 20.68% (gross of fees) for the fiscal year ended April 30, 2011. The return was more than the benchmark (HGI is benchmarked to the MSCI-ACWI ex-U.S. Index*** which gained 19.73% for the year).
All sectors were positive over the fiscal year with the portfolio delivering double digit positive absolute returns across nine of the ten sectors. For the portfolio, the energy sector was the best performing sector, returning 35.0% with UK based BG Group PLC and Canada’s Suncor Energy, Inc. benefiting from the increase in energy prices. The materials sector was the second biggest contributor to absolute return returning 28.0% in the period with Wacker Chemie AG of Germany the top performer, rising almost 71% as investors focused on the potential for increased demand for its alternative energy products. The information technology sector was the portfolio’s top relative performer, returning 27.0% compared to the 8.1% rise in the benchmark. UK chipmaker ARM Holdings PLC, whose stock price rose over 165%, was the top performer in both the sector and the portfolio for the year. Healthcare was the weakest performing sector in the portfolio, rising 7.2% in the period with Teva Pharmaceuticals Industries Ltd. of Israel, the largest detractor in the sector, registering a decline of almost 20%.
On an absolute basis, all regions were positive during the year with Europe, which returned 25.0%, and Canada and Mexico, which gained 22.7%, being the best performers. Japan was the weakest performing region, although the portfolio’s holdings still registered a gain of 8.2% despite the market registering a sharp reversal following the devastating March 11th earthquake and subsequent tsunami and nuclear crisis. On a relative basis, the portfolio added value through positive stock selection in Japan, Canada and Emerging Markets while stock selection detracted from relative performance in Europe and Pacific ex Japan.
In our opinion, economic prospects are poised to improve in the next several years, led by Emerging Markets which may potentially drive overall global economic growth. We are still favorably disposed towards international equities. Uncertainties still remain, such as sovereign debt risk, so a well-diversified approach is deemed to be prudent. There remain concerns over global growth but we are starting to see indications that conditions are improving in Northern Europe and the United States. Concerns over global growth and sovereign debt have been met with volatility and we anticipate that volatility will continue.
In this volatile environment, we will continue to seek high quality names with good secular growth potential. We believe these companies will be well positioned to provide positive returns for investors over the long-term.
LSV Asset Management (value portion)
LSV Asset Management (“LSV”) serves as sub-advisor for the value portion of the Fund. They began managing the value portion of the Fund in November 2005. Their management discussion and analysis for the year ended April 30, 2011, follows:
LSV’s portion of the Fund assets returned 21.94% (gross of fees) for the fiscal year ended April 30, 2011, outperforming LSV’s benchmark (MSCI-ACWI ex-U.S. Index) which rose 19.73%.
LSV’s value style was not favored during the past 12 months as the value portion of the benchmark (MSCI-ACWI ex-U.S. Value Index) was up just 17.92%. Fortunately, both indices had strong absolute returns for the year. The return for the LSV portion for the past two years is 30.96% on an annualized basis (71.5% cumulative return), so markets have recovered nicely since the financial crisis and LSV has exceeded the benchmark for the two year period as well.
With LSV’s ‘style’ being a detractor for this fiscal year, the excess returns were driven by stock selection. LSV does not take any significant country exposures relative to the benchmark preferring to emphasize their bottom up stock selection model and a deep value style orientation. For the year, stock selection within Japan was particularly strong in both absolute and relative terms, despite the tsunami tragedy. Japan represents the largest country exposure for the portfolio and the benchmark at around 15%. The emerging market exposure in the portfolio was also a positive contributor for the year as stock selection in Brazil and China added value as well. LSV also does not take any significant exposure in one sector of the market. The portfolio is constructed to be within a 5% band around the benchmark sector weights. Therefore, the attribution for the year ends up being driven by style (value), size (smaller) and stock selection as the primary sources of value added. This past year, both style and size were negative attributes and stock selection was quite strong enabling the portfolio return to exceed the benchmark.
Even with high absolute returns for the past two fiscal years of more than 70%, the portfolio’s characteristics remain very attractive compared to history. The price/earnings ratio on the portfolio is at around 10x and the dividend yield is 3.8%, better than what can be had on a 10-year U.S. Treasury bond! Corporate earnings and cash flows have recovered from the bottom and have kept pace with the stock price increases, meaning that valuations remain attractive and we remain optimistic that the future is bright for stock returns and the portfolio.
ANNUAL REPORT / April 30, 2011
Table of Contents
| 48 |
Baring International Investment Limited (core portion)
Baring International Investment Limited serves as sub-advisor for the core portion of the Fund. They began managing a portion of the Fund on February 13, 2009. Their management discussion and analysis for the year ended April 30, 2011, follows:
International equities performed very well over the fiscal year ended April 30, 2011. All sectors generated a positive absolute return during the year. Telecommunication services and materials were the two best sectors both rising by just under 30%. Information technology was the worst performing sector rising by only 5%. We also saw positive returns across all equity regions. Continental Europe was the best performing region rising by 27% in the year. Japan was the worst performing region rising by only 2%.
Fund performance was strong in absolute terms rising by just over 21%. This was moderately better than the benchmark. By region, our allocation detracted from performance. The biggest factor here was that we had less invested in Europe than the benchmark, and Europe was the best performing region. This was offset to some extent by our allocation to Japan. We had less invested in Japanese stocks than the benchmark, and Japan was the worst performing region.
By sector, our allocation was also negative. We had more invested in technology stocks than the benchmark, and technology was the worst performing sector. This was offset to some extent by our allocation to utilities. We had less invested in utilities than the benchmark, and utilities was a weak performing sector.
Our stock selection was strong, both by region and by sector, and more than compensated for our weak allocation. Our financials stock selection added the most value. The key factor here was that we avoided investing in the troubled European banking sector and instead focused our financial investments in insurance companies and banks with Asian or emerging market exposure. We also had strong stock selection in Pacific ex Japan and Japan. In Japan, we benefited from holding stocks that were less impacted by the earthquake than the overall market.
We think the strongly positive returns that international equities achieved in the past year was quite an achievement considering the tumultuous events of the past several months.
To recap, we saw protests that led to the fall of governments in Tunisia and Egypt, outbreak of civil war in Libya, civil unrest in Bahrain and Syria, and a nascent protest movement in Saudi Arabia; a 9.0 Richter scale earthquake in Japan (the 4th most powerful earthquake ever recorded) and its resulting tsunami, which in turn led to the ongoing, nuclear incident at Fukushima; and finally, a slow, grinding, relentless escalation of the European debt crisis.
In addition to all this, we began this calendar year with a number of ongoing risks and imbalances. Among them, the risk of China over tightening and a relapse into recession in the west. For good measure, we’ve also seen the oil price rise back above $100 per barrel. And yet, with only a few wobbles, the international equity market absorbed all of these events and moved higher over the year.
The unrest in North Africa and the Middle East has had little direct impact on the global economy because these economies remain relatively small. However, the indirect impact has been the rise in
the price of a barrel of oil as investors contemplate disrupted oil shipping lanes in the Straits of Hormuz. We continue to favor investing in the energy sector.
The compound disaster that is the Japan earthquake-tsunami-nuclear accident is having a much greater impact on the global economy. First of all it is has created tremendous human and physical loss to the world’s third largest economy which will lead to lower economic output in the short term. Second, it has led to supply chain chaos in the technology and automotive sectors as production of key components have been disrupted.
We began to look more favorably on Japan towards the end of 2010 and we had been looking to add any interesting Japanese growth stocks that our team could identify. That work was still ongoing and as a result of this the portfolio was underweight to Japan at the time of the earthquake.
This was fortunate, and now the question is whether the recent sell off in Japanese equities has created a buying opportunity. The answer is not clear cut. Some companies have seen their business models severely disrupted by the earthquake and it will be some time until normal service resumes, other companies are still finding out the extent of the disruption they will face.
However, some companies have emerged relatively unscathed with their growth plans intact. Where we can find these types of companies on attractive valuations we may make purchases for the portfolio.
The last point to note about the Japan situation is that the ongoing nuclear crisis at Fukushima has thrown a dense fog over the future growth of nuclear energy. In the past year, we had been looking for growth ideas that played into the nuclear energy theme. The one holding that we had purchased, uranium miner Paladin Energy, sold off heavily as the crisis unfolded. We are reviewing this holding but have done nothing for now.
The future growth of nuclear energy is not clear. The Europeans seem likely to react the most severely, with the exception of France, and their cancelling of new nuclear power plants would not be a surprise.
However, around half of the nuclear power plants planned globally by 2020 are for the Chinese. Though the Chinese have ordered a safety review of their planned nuclear projects, given their lack of oil resources and their over-reliance on coal it would seem that they have little alternative but to increase the share of power that they generate from nuclear. Similar arguments apply to India and to other developing markets.
Notwithstanding this, liquefied natural gas (“LNG”) is a clear beneficiary of the Japan nuclear incident and we have a strong position in the portfolio in this area.
Lost among all of the recent events was the slow and relentless escalation of the European debt crisis. How events here will unfold is unclear because the decisive factors will be as much to do with political choice as economic factors. Therefore, we are comfortable continuing to avoid owning European banks.
Also overlooked among the events of the first quarter was sufficient appreciation of the coming end to the US Federal Reserve’s second round of quantitative easing (“QE2”). The end of the first round of quantitative easing saw the U.S. economy with insufficient
April 30, 2011 / ANNUAL REPORT
Table of Contents
| 49 |
momentum to sustain growth. Barring further disasters, investors are likely to pay much more attention to this in the coming months.
We think there is a good chance that the end of QE2 could reveal the weakness of the underlying growth in the economy. It is why our focus remains to find growth stocks for our portfolios. When economic growth is scarce, growth stocks tend to perform well.
| * | Performance data quoted represents past performance, which is no guarantee of future results. Investment return and principal value will fluctuate so that an investor’s shares, when redeemed, may be worth more or less than their original cost. The total return for Class A Shares was 13.56%, adjusted for the Fund’s maximum sales charge. Mutual fund performance changes over time and current performance may be lower or higher than what is stated. For the most recent month-end performance, please visit www.mtbfunds.com or call 1-800-836-2211. |
| ** | The MSCI EAFE Index (Europe, Australasia, Far East) is a free float-adjusted market capitalization index that is designed to measure the equity market performance of developed markets, excluding the US & Canada. As of June 2007, the MSCI EAFE Index consisted of the |
following 21 developed market country indices: Australia, Austria, Belgium, Denmark, Finland, France, Germany, Greece, Hong Kong, Ireland, Italy, Japan, the Netherlands, New Zealand, Norway, Portugal, Singapore, Spain, Sweden, Switzerland, and the United Kingdom. The index is unmanaged and investments cannot be made directly in an index. |
| *** | The MSCI ACWI (All Country World Index), Ex US Index is a free float-adjusted market capitalization weighted index that is designed to measure the equity market performance of developed and emerging markets, excluding the United States. As of January 2009, the MSCI-ACWI ex-U.S. Index consisted of 46 country indices comprising 22 developed and 23 emerging market country indices. The developed market country indices included are: Australia, Austria, Belgium, Canada, Denmark, Finland, France, Germany, Greece, Hong Kong, Ireland, Italy, Japan, Netherlands, New Zealand, Norway, Portugal, Singapore, Spain, Sweden, Switzerland, and the United Kingdom. The emerging market country indices included are: Argentina, Brazil, Chile, China, Colombia, Czech Republic, Egypt, Hungary, India, Indonesia, Israel, Korea, Malaysia, Mexico, Morocco, Peru, Philippines, Poland, Russia, South Africa, Taiwan, Thailand, and Turkey. The index is unmanaged and investments cannot be made directly in an index. |
| International investing involves special risks including currency risks, increased volatility of foreign securities, political risks and differences in auditing and other financial standards. |
ANNUAL REPORT / April 30, 2011
Table of Contents
| 50 |
MTB INTERNATIONAL EQUITY FUND – CLASS A SHARES
The graph below illustrates the hypothetical investment of $10,0001,2 in the MTB International Equity Fund (Class A Shares) (the “Fund”) from April 30, 2001 to April 30, 2011, compared to the Morgan Stanley Capital International—Europe, Australasia and Far East Index (“MSCI EAFE”)2,3 and the Lipper International Multi Cap Core Funds Average.2,3
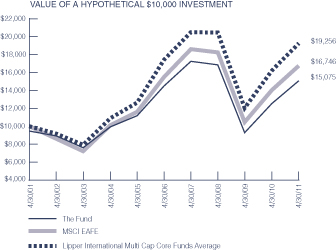
Average Annual Total Returns for the Period Ended April 30, 2011
| 1 Year | 13.56% | |||
| 5 Years | (0.37)% | |||
| 10 Years | 4.19% | |||
Performance data quoted represents past performance which is no guarantee of future results. Returns shown do not reflect the deduction of taxes that a shareholder would pay on Fund distributions or the redemption of Fund shares. Investment return and principal value will fluctuate so that an investor’s shares, when redeemed, may be worth more or less than their original cost. Mutual funds are not obligations of or guaranteed by any bank and are not federally insured. Mutual fund performance changes over time and current performance may be lower or higher than what is stated. For current to the most recent month end performance, visit www.mtbfunds.com or call 1-800-836-2211. Total returns shown include the maximum sales charge of 5.50%.
Annual Operating Expense Ratio
| Before Waivers | 1.72% | |||
| After Waivers | 1.61% | |||
The Expense Ratio Before Waivers represents the operating costs borne by the Fund, expressed as a percentage of the Fund’s average net assets, as shown in the Fees and Expenses table in the Fund’s current prospectus (under “Total Annual Fund Operating Expenses”).
| 1 | Represents a hypothetical investment of $10,000 in the Fund after deducting the maximum sales charge of 5.50% ($10,000 investment minus $550 sales charge = $9,450). |
| 2 | The Fund’s performance assumes the reinvestment of all dividends and distributions. The MSCI EAFE and the Lipper International Multi Cap Core Funds Average have been adjusted to reflect reinvestment of dividends on securities in the indexes. |
| 3 | The MSCI EAFE and the Lipper International Multi Cap Core Funds Average are not adjusted to reflect sales charges, that the Securities and Exchange Commission (“SEC”) requires to be reflected in the Fund’s performance. The index is unmanaged and, unlike the Fund, is not affected by cashflows. It is not possible to invest directly in an index or an average. |
April 30, 2011 / ANNUAL REPORT
Table of Contents
| 51 |
MTB INTERNATIONAL EQUITY FUND – INSTITUTIONAL I SHARES
The graph below illustrates the hypothetical investment of $100,0001 in the MTB International Equity Fund (Institutional I Shares) (the “Fund”) from August 18, 2003 (start of performance) to April 30, 2011, compared to the Morgan Stanley Capital International—Europe, Australasia and Far East Index (“MSCI EAFE”)1,2 and the Lipper International Multi Cap Core Funds Average.1,2
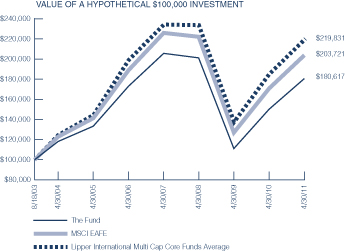
Average Annual Total Returns for the Period Ended April 30, 2011
| 1 Year | 20.24% | |||
| 5 Years | 0.86% | |||
| Start of Performance (8/18/03) | 7.98% | |||
Performance data quoted represents past performance which is no guarantee of future results. Returns shown do not reflect the deduction of taxes that a shareholder would pay on Fund distributions or the redemption of Fund shares. Investment return and principal value will fluctuate so that an investor’s shares, when redeemed, may be worth more or less than their original cost. Mutual funds are not obligations of or guaranteed by any bank and are not federally insured. Mutual fund performance changes over time and current performance may be lower or higher than what is stated. For current to the most recent month end performance, visit www.mtbfunds.com or call 1-800-836-2211.
Annual Operating Expense Ratio
| Before Waivers | 1.47% | |||
| After Waivers | 1.34% | |||
The Expense Ratio Before Waivers represents the operating costs borne by the Fund, expressed as a percentage of the Fund’s average net assets, as shown in the Fees and Expenses table in the Fund’s current prospectus (under “Total Annual Fund Operating Expenses”).
| 1 | The Fund’s performance assumes the reinvestment of all dividends and distributions. The MSCI EAFE and the Lipper International Multi Cap Core Fund Average have been adjusted to reflect reinvestment of dividends on securities in the indexes. Lipper International Multi Cap Core Funds Average performance presented is as of the nearest month-end following inception date. |
| 2 | The MSCI EAFE and the Lipper International Multi Cap Core Funds Average are not adjusted to reflect sales charges, that the SEC requires to be reflected in the Fund’s performance. The index is unmanaged and, unlike the Fund, is not affected by cashflows. It is not possible to invest directly in an index or an average. |
ANNUAL REPORT / April 30, 2011
Table of Contents
| 52 |
As a shareholder of the Fund, you incur ongoing costs, including management fees; to the extent applicable, distribution (12b-1) fees, and/or shareholder services fees; and other Fund expenses. This Example is intended to help you to understand your ongoing costs (in dollars) of investing in the Funds and to compare these costs with the ongoing costs of investing in other mutual funds. It is based on an investment of $1,000 invested at the beginning of the period and held for the entire period from November 1, 2010 to April 30, 2011.
Actual Expenses
This section of the following table provides information about actual account values and actual expenses. You may use the information in this section, together with the amount you invested, to estimate the expenses that you incurred over the period. Simply divide your account value by $1,000 (for example, an $8,600 account value divided by $1,000 = 8.6), then multiply the result by the number in the first section under the heading entitled “Expenses Paid During Period” to estimate the expenses attributable to your investment during this period.
Hypothetical Example for Comparison Purposes
This section of the following table provides information about hypothetical account values and hypothetical expenses based on the Funds’ actual expense ratios and assumed rates of return of 5% per year before expenses, which is not the Funds’ actual returns. Thus, you should not use the hypothetical account values and expenses to estimate the actual ending account balance or your expenses for the period. Rather, these figures are required to be provided to enable you to compare the ongoing costs of investing in the Funds with other funds. To do so, compare this 5% hypothetical example with the 5% hypothetical examples that appear in the shareholder reports of the other funds.
Please note that the expenses shown in the table are meant to highlight your ongoing costs only. Therefore, the Annualized Net Expense Ratio section of the table is useful in comparing ongoing costs only, and will not help you determine the relative total costs of owning different funds.
| Beginning Account Value 11/1/10 | Ending Account Value 4/30/11 | Expenses Paid During Period(1) | Annualized Net Expense Ratio(2) | |||||||||||||
| MTB SHORT DURATION GOVERNMENT BOND FUND | ||||||||||||||||
Actual | ||||||||||||||||
Class A Shares | $ | 1,000.00 | $ | 1,004.80 | $ | 4.42 | 0.89 | % | ||||||||
Class C Shares | $ | 1,000.00 | $ | 1,000.90 | $ | 8.24 | 1.66 | % | ||||||||
Institutional I Shares | $ | 1,000.00 | $ | 1,006.10 | $ | 3.18 | 0.64 | % | ||||||||
Hypothetical (assuming a 5% return before expense) | ||||||||||||||||
Class A Shares | $ | 1,000.00 | $ | 1,020.38 | $ | 4.46 | 0.89 | % | ||||||||
Class C Shares | $ | 1,000.00 | $ | 1,016.56 | $ | 8.30 | 1.66 | % | ||||||||
Institutional I Shares | $ | 1,000.00 | $ | 1,021.62 | $ | 3.21 | 0.64 | % | ||||||||
| MTB SHORT-TERM CORPORATE BOND FUND | ||||||||||||||||
Actual | ||||||||||||||||
Class A Shares | $ | 1,000.00 | $ | 1,007.00 | $ | 4.28 | 0.86 | % | ||||||||
Class C Shares | $ | 1,000.00 | $ | 1,003.20 | $ | 8.00 | 1.61 | % | ||||||||
Institutional I Shares | $ | 1,000.00 | $ | 1,008.30 | $ | 3.04 | 0.61 | % | ||||||||
Hypothetical (assuming a 5% return before expense) | ||||||||||||||||
Class A Shares | $ | 1,000.00 | $ | 1,020.53 | $ | 4.31 | 0.86 | % | ||||||||
Class C Shares | $ | 1,000.00 | $ | 1,016.81 | $ | 8.05 | 1.61 | % | ||||||||
Institutional I Shares | $ | 1,000.00 | $ | 1,021.77 | $ | 3.06 | 0.61 | % | ||||||||
| MTB U.S. GOVERNMENT BOND FUND | ||||||||||||||||
Actual | ||||||||||||||||
Class A Shares | $ | 1,000.00 | $ | 991.20 | $ | 5.38 | 1.09 | % | ||||||||
Institutional I Shares | $ | 1,000.00 | $ | 992.90 | $ | 3.66 | 0.74 | % | ||||||||
Hypothetical (assuming a 5% return before expense) | ||||||||||||||||
Class A Shares | $ | 1,000.00 | $ | 1,019.39 | $ | 5.46 | 1.09 | % | ||||||||
Institutional I Shares | $ | 1,000.00 | $ | 1,021.12 | $ | 3.71 | 0.74 | % | ||||||||
April 30, 2011 / ANNUAL REPORT
Table of Contents
| 53 |
| Beginning Account Value 11/1/10 | Ending Account Value 4/30/11 | Expenses Paid During Period(1) | Annualized Net Expense Ratio(2) | |||||||||||||
| MTB NEW YORK MUNICIPAL BOND FUND | ||||||||||||||||
Actual | ||||||||||||||||
Class A Shares | $ | 1,000.00 | $ | 987.10 | $ | 4.14 | 0.84 | % | ||||||||
Institutional I Shares | $ | 1,000.00 | $ | 988.30 | $ | 2.86 | 0.58 | % | ||||||||
Hypothetical (assuming a 5% return before expense) | ||||||||||||||||
Class A Shares | $ | 1,000.00 | $ | 1,020.63 | $ | 4.21 | 0.84 | % | ||||||||
Institutional I Shares | $ | 1,000.00 | $ | 1,021.92 | $ | 2.91 | 0.58 | % | ||||||||
| MTB PENNSYLVANIA MUNICIPAL BOND FUND | ||||||||||||||||
Actual | ||||||||||||||||
Class A Shares | $ | 1,000.00 | $ | 989.00 | $ | 4.69 | 0.95 | % | ||||||||
Institutional I Shares | $ | 1,000.00 | $ | 990.30 | $ | 3.45 | 0.70 | % | ||||||||
Hypothetical (assuming a 5% return before expense) | ||||||||||||||||
Class A Shares | $ | 1,000.00 | $ | 1,020.08 | $ | 4.76 | 0.95 | % | ||||||||
Institutional I Shares | $ | 1,000.00 | $ | 1,021.32 | $ | 3.51 | 0.70 | % | ||||||||
| MTB MARYLAND MUNICIPAL BOND FUND | ||||||||||||||||
Actual | ||||||||||||||||
Class A Shares | $ | 1,000.00 | $ | 986.50 | $ | 4.68 | 0.95 | % | ||||||||
Institutional I Shares | $ | 1,000.00 | $ | 987.90 | $ | 3.30 | 0.67 | % | ||||||||
Hypothetical (assuming a 5% return before expense) | ||||||||||||||||
Class A Shares | $ | 1,000.00 | $ | 1,020.08 | $ | 4.76 | 0.95 | % | ||||||||
Institutional I Shares | $ | 1,000.00 | $ | 1,021.47 | $ | 3.36 | 0.67 | % | ||||||||
| MTB VIRGINIA MUNICIPAL BOND FUND | ||||||||||||||||
Actual | ||||||||||||||||
Class A Shares | $ | 1,000.00 | $ | 1,032.90 | $ | 4.79 | 0.95 | % | ||||||||
Hypothetical (assuming a 5% return before expense) | ||||||||||||||||
Class A Shares | $ | 1,000.00 | $ | 1,020.08 | $ | 4.76 | 0.95 | % | ||||||||
| MTB INTERMEDIATE-TERM BOND FUND | ||||||||||||||||
Actual | ||||||||||||||||
Class A Shares | $ | 1,000.00 | $ | 1,010.70 | $ | 5.04 | 1.01 | % | ||||||||
Class C Shares | $ | 1,000.00 | $ | 1,006.90 | $ | 8.66 | 1.74 | % | ||||||||
Institutional I Shares | $ | 1,000.00 | $ | 1,012.40 | $ | 3.29 | 0.66 | % | ||||||||
Hypothetical (assuming a 5% return before expense) | ||||||||||||||||
Class A Shares | $ | 1,000.00 | $ | 1,019.79 | $ | 5.06 | 1.01 | % | ||||||||
Class C Shares | $ | 1,000.00 | $ | 1,016.17 | $ | 8.70 | 1.74 | % | ||||||||
Institutional I Shares | $ | 1,000.00 | $ | 1,021.52 | $ | 3.31 | 0.66 | % | ||||||||
| MTB INCOME FUND | ||||||||||||||||
Actual | ||||||||||||||||
Class A Shares | $ | 1,000.00 | $ | 1,008.00 | $ | 5.03 | 1.01 | % | ||||||||
Institutional I Shares | $ | 1,000.00 | $ | 1,010.80 | $ | 3.29 | 0.66 | % | ||||||||
Hypothetical (assuming a 5% return before expense) | ||||||||||||||||
Class A Shares | $ | 1,000.00 | $ | 1,019.79 | $ | 5.06 | 1.01 | % | ||||||||
Institutional I Shares | $ | 1,000.00 | $ | 1,021.52 | $ | 3.31 | 0.66 | % | ||||||||
| MTB STRATEGIC ALLOCATION FUND | ||||||||||||||||
Actual | ||||||||||||||||
Class A Shares | $ | 1,000.00 | $ | 1,106.50 | $ | 4.44 | 0.85 | % | ||||||||
Institutional I Shares | $ | 1,000.00 | $ | 1,108.50 | $ | 3.71 | 0.71 | % | ||||||||
Hypothetical (assuming a 5% return before expense) | ||||||||||||||||
Class A Shares | $ | 1,000.00 | $ | 1,020.58 | $ | 4.26 | 0.85 | % | ||||||||
Institutional I Shares | $ | 1,000.00 | $ | 1,000.00 | $ | 3.56 | 0.71 | % | ||||||||
ANNUAL REPORT / April 30, 2011
Table of Contents
| 54 |
| Beginning Account Value 11/1/10 | Ending Account Value 4/30/11 | Expenses Paid During Period(1) | Annualized Net Expense Ratio(2) | |||||||||||||
| MTB LARGE CAP VALUE FUND | ||||||||||||||||
Actual | ||||||||||||||||
Class A Shares | $ | 1,000.00 | $ | 1,172.20 | $ | 7.11 | 1.32 | % | ||||||||
Institutional I Shares | $ | 1,000.00 | $ | 1,173.60 | $ | 5.55 | 1.03 | % | ||||||||
Hypothetical (assuming a 5% return before expense) | ||||||||||||||||
Class A Shares | $ | 1,000.00 | $ | 1,018.25 | $ | 6.61 | 1.32 | % | ||||||||
Institutional I Shares | $ | 1,000.00 | $ | 1,019.69 | $ | 5.16 | 1.03 | % | ||||||||
| MTB LARGE CAP GROWTH FUND | ||||||||||||||||
Actual | ||||||||||||||||
Class A Shares | $ | 1,000.00 | $ | 1,194.80 | $ | 7.73 | 1.42 | % | ||||||||
Institutional I Shares | $ | 1,000.00 | $ | 1,195.80 | $ | 5.61 | 1.03 | % | ||||||||
Hypothetical (assuming a 5% return before expense) | ||||||||||||||||
Class A Shares | $ | 1,000.00 | $ | 1,017.75 | $ | 7.10 | 1.42 | % | ||||||||
Institutional I Shares | $ | 1,000.00 | $ | 1,019.69 | $ | 5.16 | 1.03 | % | ||||||||
| MTB MID CAP GROWTH FUND | ||||||||||||||||
Actual | ||||||||||||||||
Class A Shares | $ | 1,000.00 | $ | 1,275.40 | $ | 7.00 | 1.24 | % | ||||||||
Institutional I Shares | $ | 1,000.00 | $ | 1,276.60 | $ | 5.98 | 1.06 | % | ||||||||
Hypothetical (assuming a 5% return before expense) | ||||||||||||||||
Class A Shares | $ | 1,000.00 | $ | 1,018.65 | $ | 6.21 | 1.24 | % | ||||||||
Institutional I Shares | $ | 1,000.00 | $ | 1,019.54 | $ | 5.31 | 1.06 | % | ||||||||
| MTB SMALL CAP GROWTH FUND | ||||||||||||||||
Actual | ||||||||||||||||
Class A Shares | $ | 1,000.00 | $ | 1,313.10 | $ | 8.37 | 1.46 | % | ||||||||
Class C Shares | $ | 1,000.00 | $ | 1,313.40 | $ | 8.66 | 1.51 | % | ||||||||
Institutional I Shares | $ | 1,000.00 | $ | 1,313.60 | $ | 7.12 | 1.24 | % | ||||||||
Hypothetical (assuming a 5% return before expense) | ||||||||||||||||
Class A Shares | $ | 1,000.00 | $ | 1,017.55 | $ | 7.30 | 1.46 | % | ||||||||
Class C Shares | $ | 1,000.00 | $ | 1,017.31 | $ | 7.55 | 1.51 | % | ||||||||
Institutional I Shares | $ | 1,000.00 | $ | 1,018.65 | $ | 6.21 | 1.24 | % | ||||||||
| MTB INTERNATIONAL EQUITY FUND | ||||||||||||||||
Actual | ||||||||||||||||
Class A Shares | $ | 1,000.00 | $ | 1,119.20 | $ | 7.83 | 1.49 | % | ||||||||
Institutional I Shares | $ | 1,000.00 | $ | 1,120.60 | $ | 7.10 | 1.35 | % | ||||||||
Hypothetical (assuming a 5% return before expense) | ||||||||||||||||
Class A Shares | $ | 1,000.00 | $ | 1,017.41 | $ | 7.45 | 1.49 | % | ||||||||
Institutional I Shares | $ | 1,000.00 | $ | 1,018.10 | $ | 6.76 | 1.35 | % | ||||||||
| (1) | Expenses are equal to the Funds’ annualized net expense ratios, multiplied by the average account value over the period, multiplied by 181/365 (to reflect the most recent one-half year period). |
| (2) | Expense ratio does not reflect the indirect expenses of the underlying funds it invests in. |
April 30, 2011 / ANNUAL REPORT
Table of Contents
| 55 |
PORTFOLIO OF INVESTMENTS SUMMARY TABLE
MTB Short Duration Government Bond Fund
At April 30, 2011, the Fund’s portfolio composition was as follows: (unaudited)
| Percentage of Total Net Assets | ||||
| Collateralized Mortgage Obligations | 48.9 | % | ||
| Government Agencies | 26.6 | % | ||
| Corporate Bonds | 13.5 | % | ||
| U.S. Treasury | 10.5 | % | ||
| Mortgage-Backed Securities | 0.1 | % | ||
| Cash Equivalents1 | 0.3 | % | ||
| Other Assets and Liabilities – Net2 | 0.1 | % | ||
| TOTAL | 100.0 | % | ||
| (1) | Cash Equivalents include investments in money market mutual funds. |
| (2) | Assets, other than investments in securities, less liabilities. See Statements of Assets and Liabilities. |
| (3) | Derived from data provided by Moody’s Investors Service and Standard and Poor’s. |
| Credit Quality Diversification 3 | Percentage of Total Net Assets | |||
| AAA | 13.6 | % | ||
| Not Rated | 0.2 | % | ||
| U.S. Government Agency Securities | 75.6 | % | ||
| U.S. Treasuries | 10.5 | % | ||
| Other Assets and Liabilities – Net2 | 0.1 | % | ||
| TOTAL | 100.0 | % | ||
PORTFOLIO OF INVESTMENTS
April 30, 2011
| Description | Par Value | Value | ||||||
| COLLATERALIZED MORTGAGE OBLIGATIONS – 48.9% | ||||||||
FEDERAL HOME LOAN MORTGAGE CORPORATION (FHLMC) – 18.2% | ||||||||
Series 2003-2590, Class NU, 5.00%, 6/15/17 | $ | 339,124 | $ | 346,893 | ||||
Series 2003-2617, Class GB, 4.00%, 6/15/16 | 64,304 | 64,528 | ||||||
Series 2004-2747, Class HA, 4.00%, 10/15/13 | 341,518 | 346,994 | ||||||
Series 2004-2844, Class PV, 5.00%, 8/15/15 | 570,266 | 612,187 | ||||||
Series 2005-3062, Class LU, 5.50%, 10/15/16 | 4,738,670 | 5,150,022 | ||||||
Series 2005-3074, Class BG, 5.00%, 9/15/33 | 2,965,199 | 3,121,834 | ||||||
Series 2005-3081, Class CB, 5.00%, 5/15/21 | 2,248,176 | 2,269,322 | ||||||
Series 2006-3116, Class PB, 5.00%, 6/15/29 | 1,150,640 | 1,169,828 | ||||||
Series 2006-3196, Class PA, 5.25%, 8/15/11 | 438,296 | 439,948 | ||||||
Series 2009-3610, Class AB, 1.40%, 12/15/14 | 1,868,240 | 1,882,536 | ||||||
Series 2011-3818, Class EA, 4.50%, 11/15/13 | 2,946,962 | 3,005,042 | ||||||
TOTAL FEDERAL HOME LOAN MORTGAGE CORPORATION (FHLMC) | $ | 18,409,134 | ||||||
FEDERAL NATIONAL MORTGAGE ASSOCIATION (FNMA) – 5.1% | ||||||||
Series 2003-113, Class PD, 4.00%, 2/25/17 | 832,033 | 857,231 | ||||||
Series 2003-122, Class OK, 4.00%, 6/25/17 | 895,153 | 922,337 | ||||||
Series 2003-45, Class AB, 3.75%, 5/25/33 | 95,426 | 99,163 | ||||||
Series 2004-55, Class LA, 4.50%, 6/25/21 | 1,906,604 | 1,925,153 | ||||||
Series 2008-74, Class AD, 5.00%, 4/25/37 | 1,290,467 | 1,322,641 | ||||||
TOTAL FEDERAL NATIONAL MORTGAGE ASSOCIATION (FNMA) | $ | 5,126,525 | ||||||
| Description | Par Value | Value | ||||||
GOVERNMENT NATIONAL MORTGAGE ASSOCIATION (GNMA) – 25.6% | ||||||||
Series 2003-10, Class PV, 5.50%, 1/20/14 | $ | 3,650,738 | $ | 3,871,943 | ||||
Series 2004-65, Class PA, 4.50%, 9/20/32 | 486,165 | 490,104 | ||||||
Series 2005-20, Class VA, 5.00%, 6/16/16 | 3,660,080 | 3,781,540 | ||||||
Series 2005-44, Class PC, 5.00%, 12/20/33 | 3,326,396 | 3,569,738 | ||||||
Series 2010-17, Class K, 4.00%, 3/16/22 | 8,763,224 | 9,421,803 | ||||||
Series 2010-91, Class PA, 3.00%, 8/20/31 | 4,560,757 | 4,747,982 | ||||||
TOTAL GOVERNMENT NATIONAL MORTGAGE ASSOCIATION (GNMA) | $ | 25,883,110 | ||||||
| TOTAL COLLATERALIZED MORTGAGE OBLIGATIONS (COST $48,413,127) | $ | 49,418,769 | ||||||
| CORPORATE BONDS – 13.5% | ||||||||
BANKS – 5.1% | ||||||||
Ally Financial, Inc., FDIC Guaranteed, 2.20%, 12/19/12 | 5,000,000 | 5,136,633 | ||||||
DIVERSIFIED FINANCIAL | ||||||||
Citigroup Funding, Inc., FDIC Guaranteed, 1.88%, 10/22/12 | 5,000,000 | 5,105,896 | ||||||
2Sallie Mae, Inc., Sr. Unsecured, 4.34%, 10/03/22 | 5,595,000 | 3,467,504 | ||||||
TOTAL DIVERSIFIED FINANCIAL SERVICES | $ | 8,573,400 | ||||||
| TOTAL CORPORATE BONDS (COST $13,438,511) | $ | 13,710,033 | ||||||
(MTB Short Duration Government Bond Fund continued next page)
ANNUAL REPORT / April 30, 2011
Table of Contents
| 56 | PORTFOLIOS OF INVESTMENTS |
MTB Short Duration Government Bond Fund (concluded)
| Description | Par Value | Value | ||||||
| GOVERNMENT AGENCIES – 26.6% | ||||||||
FEDERAL FARM CREDIT BANK (FFCB) – 7.3% | ||||||||
4.50%, 10/17/12 | $ | 7,000,000 | $ | 7,419,421 | ||||
FEDERAL NATIONAL MORTGAGE ASSOCIATION (FNMA) – 19.3% | ||||||||
1.25%, 8/20/13 | 3,000,000 | 3,029,655 | ||||||
2.88%, 5/10/11 | 9,000,000 | 9,543,150 | ||||||
Sr. Subordinated, 5.25%, 8/01/12 | 6,500,000 | 6,894,009 | ||||||
TOTAL FEDERAL NATIONAL MORTGAGE ASSOCIATION (FNMA) | $ | 19,466,814 | ||||||
| TOTAL GOVERNMENT AGENCIES (COST $26,478,763) | $ | 26,886,235 | ||||||
| MORTGAGE-BACKED SECURITIES – 0.1% | ||||||||
FEDERAL NATIONAL MORTGAGE ASSOCIATION (FNMA) – 0.0%** | ||||||||
Pool 521605, 9.00%, 6/01/22 | 10,971 | 11,296 | ||||||
GOVERNMENT NATIONAL MORTGAGE ASSOCIATION (GNMA) – 0.1% | ||||||||
Pool 203632, 8.50%, 2/15/17 | 4,020 | 4,640 | ||||||
Pool 306066, 8.50%, 7/15/21 | 7,785 | 9,085 | ||||||
Pool 307983, 8.50%, 7/15/21 | 51,998 | 60,678 | ||||||
| Description | Par Value/Shares | Value | ||||||
Pool 341948, 8.50%, 1/15/23 | $ | 15,843 | $ | 18,335 | ||||
TOTAL GOVERNMENT NATIONAL MORTGAGE ASSOCIATION (GNMA) | $ | 92,738 | ||||||
| TOTAL MORTGAGE-BACKED SECURITIES (COST $96,302) | $ | 104,034 | ||||||
| U.S. TREASURY – 10.5% | ||||||||
U.S. TREASURY NOTE – 10.5% | ||||||||
0.50%, 10/15/13 | 7,000,000 | 6,951,875 | ||||||
0.75%, 3/31/13 | 3,700,000 | 3,712,430 | ||||||
TOTAL U.S. TREASURY NOTE | $ | 10,664,305 | ||||||
| TOTAL U.S. TREASURY (COST $10,671,529) | $ | 10,664,305 | ||||||
| MONEY MARKET FUND – 0.3% | ||||||||
8Dreyfus Government Cash Management Fund, Institutional Shares, 0.00% | 254,898 | 254,898 | ||||||
| TOTAL MONEY MARKET FUND (COST $254,898) | $ | 254,898 | ||||||
| TOTAL INVESTMENTS – 99.9% (COST $99,353,130) | $ | 101,038,274 | ||||||
| OTHER ASSETS LESS LIABILITIES – 0.1% | 77,256 | |||||||
| TOTAL NET ASSETS – 100.0% | $ | 101,115,530 | ||||||
Cost of investments for Federal income tax purposes is $99,353,130. The net unrealized appreciation/depreciation of investments was $1,685,144. This consists of net unrealized appreciation from investment for those securities having an excess of value over cost of $1,853,217 and net unrealized depreciation from investments for those securities having an excess of cost over value of $168,073.
Various inputs are used in determining the value of the Fund’s investments. These inputs are summarized in the three broad levels listed below.
Level 1 – quoted prices in active markets for identical securities
Level 2 – other significant observable inputs (including quoted prices for similar securities, interest rates, prepayment speeds, credit risk, etc.)
Level 3 – significant unobservable inputs (including the Fund’s own assumptions in determining the fair value of investments)
The following is a summary of the inputs used as of April 30, 2011 in valuing the Fund’s assets carried at fair value:
| Level 1 | Level 2 | Level 3 | Total | |||||||||||||
Investments in Securities | ||||||||||||||||
Collateralized Mortgage Obligations | $ | — | $ | 49,418,769 | $ | — | $ | 49,418,769 | ||||||||
Corporate Bonds | — | 13,710,033 | — | 13,710,033 | ||||||||||||
Government Agencies | — | 26,886,235 | — | 26,886,235 | ||||||||||||
Mortgage-Backed Securities | — | 104,034 | — | 104,034 | ||||||||||||
U.S. Treasury | — | 10,664,305 | — | 10,664,305 | ||||||||||||
Money Market Fund | 254,898 | — | — | 254,898 | ||||||||||||
Total | $ | 254,898 | $ | 100,783,376 | $ | — | $ | 101,038,274 | ||||||||
See Notes to Portfolios of Investments
April 30, 2011 / ANNUAL REPORT
Table of Contents
| 57 |
PORTFOLIO OF INVESTMENTS SUMMARY TABLE
MTB Short-Term Corporate Bond Fund
At April 30, 2011, the Fund’s portfolio composition was as follows: (unaudited)
| Percentage of Total Net Assets | ||||
| Corporate Bonds | 91.0 | % | ||
| Collateralized Mortgage Obligations | 3.4 | % | ||
| Asset Backed Securities | 2.5 | % | ||
| U.S. Treasury | 2.5 | % | ||
| Adjustable Rate Mortgage | 0.0 | %4 | ||
| Cash Equivalents1 | 7.3 | % | ||
| Other Assets and Liabilities – Net2 | (6.7 | )% | ||
| TOTAL | 100.0 | % | ||
| (1) | Cash Equivalents include investments in repurchase agreements. |
| (2) | Assets, other than investments in securities, less liabilities. See Statements of Assets and Liabilities. |
| (3) | Derived from data provided by Moody’s Investors Service and Standard and Poor’s. |
| (4) | Represents less than 0.05%. |
| Credit Quality Diversification3 | Percentage of Total Net Assets | |||
| AAA | 2.9 | % | ||
| AA | 13.2 | % | ||
| A | 26.5 | % | ||
| BBB | 46.4 | % | ||
| BB | 3.6 | % | ||
| B | 1.9 | % | ||
| Not Rated | 8.4 | % | ||
| U.S. Government Agency Securities | 1.3 | % | ||
| U.S. Treasuries | 2.5 | % | ||
| Other Assets and Liabilities – Net2 | (6.7 | )% | ||
| TOTAL | 100.0 | % | ||
PORTFOLIO OF INVESTMENTS
April 30, 2011
| Description | Par Value | Value | ||||||
| ADJUSTABLE RATE MORTGAGE – 0.0% | ||||||||
FEDERAL NATIONAL MORTGAGE | ||||||||
1Pool 399251, 2.44%, 8/01/11 | $ | 68 | $ | 71 | ||||
| TOTAL ADJUSTABLE RATE MORTGAGE (COST $68) | $ | 71 | ||||||
| ASSET BACKED SECURITIES – 2.5% | ||||||||
FINANCIAL SERVICES – 2.0% | ||||||||
Hyundai Auto Receivables Trust, Series 2011-A, Class A2, 0.69%, 11/15/13 | 2,000,000 | 2,001,874 | ||||||
Volkswagen Auto Loan Enhanced Trust, Series 2011-1, Class A2, 0.67%, 12/20/13 | 1,700,000 | 1,701,044 | ||||||
TOTAL FINANCIAL SERVICES | $ | 3,702,918 | ||||||
WHOLE LOAN – 0.5% | ||||||||
1,6,7Student Loan Marketing Association, Series 2011-A, Class A1, 1.21%, 6/15/11 | 1,000,000 | 1,002,028 | ||||||
| TOTAL ASSET BACKED SECURITIES (COST $4,699,849) | $ | 4,704,946 | ||||||
| COLLATERALIZED MORTGAGE OBLIGATIONS – 3.4% | ||||||||
COMMERCIAL MORTGAGE-BACKED SECURITIES (CMBS) – 2.0% | ||||||||
Merrill Lynch Mortgage Trust, Series 2006-C1, Class A2, 5.81%, 5/12/39 | 1,640,988 | 1,685,999 | ||||||
| Description | Par Value | Value | ||||||
Morgan Stanley Capital I, Series 2004-IQ7, Class A4, 5.54%, 6/15/38 | $ | 2,000,000 | $ | 2,161,266 | ||||
TOTAL COMMERCIAL MORTGAGE-BACKED SECURITIES (CMBS) | $ | 3,847,265 | ||||||
FEDERAL HOME LOAN MORTGAGE CORPORATION (FHLMC) – 1.3% | ||||||||
Series 1920, Class H, 7.00%, 1/15/12 | 13,287 | 13,503 | ||||||
Series 2003-2632, Class A, 4.00%, 1/15/18 | 754,096 | 781,475 | ||||||
Series 2003-2643, Class LB, 4.50%, 7/15/16 | 198,278 | 199,516 | ||||||
Series 2003-2643, Class DA, 4.00%, 3/15/28 | 592,558 | 595,901 | ||||||
Series 2003-2649, Class KA, 4.50%, 7/15/18 | 389,222 | 411,311 | ||||||
Series 2003-2716, Class UA, 4.50%, 7/15/20 | 145,915 | 146,708 | ||||||
Series 2004-2798, Class J, 4.50%, 4/15/17 | 132,361 | 133,300 | ||||||
Series 2005-2915, Class KP, 5.00%, 11/15/29 | 90,000 | 92,094 | ||||||
Series 2005-2938, Class DB, 5.00%, 11/15/28 | 37,798 | 38,120 | ||||||
Series 2005-3075, Class TP, 5.50%, 1/15/30 | 76,783 | 78,908 | ||||||
TOTAL FEDERAL HOME LOAN MORTGAGE CORPORATION (FHLMC) | $ | 2,490,836 | ||||||
WHOLE LOAN – 0.1% | ||||||||
GSR Mortgage Loan Trust, Series 2006-2F, Class 2A15, 5.75%, 2/25/36 | 88,092 | 87,633 | ||||||
Morgan Stanley Mortgage Loan Trust, Series 2004-1, Class 1A8, 4.75%, 11/25/18 | 57,362 | 57,611 | ||||||
TOTAL WHOLE LOAN | $ | 145,244 | ||||||
| TOTAL COLLATERALIZED MORTGAGE OBLIGATIONS (COST $6,500,425) | $ | 6,483,345 | ||||||
(MTB Short-Term Corporate Bond Fund continued next page)
ANNUAL REPORT / April 30, 2011
Table of Contents
| 58 | PORTFOLIOS OF INVESTMENTS |
MTB Short-Term Corporate Bond Fund (continued)
| Description | Par Value | Value | ||||||
CORPORATE BONDS – 91.0% | ||||||||
AUTO MANUFACTURERS – 0.1% | ||||||||
6,7Hyundai Motor Manufacturing Czech s.r.o., Company Guaranteed, 4.50%, 4/15/15 | $ | 250,000 | $ | 258,858 | ||||
AUTO PARTS & EQUIPMENT – 0.5% | ||||||||
1Johnson Controls, Inc., Sr. Unsecured, 0.72%, 5/04/11 | 1,000,000 | 1,001,623 | ||||||
BANKS – 19.7% | ||||||||
1,6,7ABN Amro Bank NV, Sr. Unsecured, 2.04%, 7/29/11 | 1,000,000 | 1,022,870 | ||||||
Ally Financial, Inc., Company Guaranteed, 4.50%, 2/11/14 | 400,000 | 404,500 | ||||||
6,7Ally Financial, Inc., Company Guaranteed, 6.25%, 12/01/17 | 1,000,000 | 1,050,000 | ||||||
American Express Bank FSB, Series 1, Sr. Unsecured, BKN1, 5.55%, 10/17/12 | 1,000,000 | 1,061,179 | ||||||
American Express Centurion Bank, Sr. Unsecured, BKNT, 5.55%, 10/17/12 | 1,000,000 | 1,061,926 | ||||||
1,12Bank of America Corp., Sr. Unsecured, MTN, 1.69%, 7/29/11 | 1,000,000 | 1,016,848 | ||||||
1Bank of Nova Scotia, Certificate of Deposit, 0.63%, 5/16/11 | 1,000,000 | 999,655 | ||||||
BB&T Corp., Sr. Unsecured | ||||||||
10.97%, 7/28/11 | 1,000,000 | 1,001,249 | ||||||
3.10%, 7/28/11 | 325,000 | 327,088 | ||||||
BB&T Corp., Subordinated, 6.50%, 8/01/11 | 1,000,000 | 1,014,415 | ||||||
BB&T Corp., Sr. Unsecured, 5.70%, 4/30/14 | 1,000,000 | 1,109,322 | ||||||
BNP Paribas, Bank Guaranteed, MTN, 3.60%, 2/23/16 | 1,000,000 | 1,017,947 | ||||||
Capital One Financial Corp., Sr. Unsecured, 4.80%, 2/21/12 | 1,250,000 | 1,290,247 | ||||||
12Capital One Financial Corp., Sr. Unsecured, 7.38%, 5/23/14 | 250,000 | 290,800 | ||||||
1Citigroup, Inc., Sr. Unsecured, 1.16%, 5/15/11 | 1,300,000 | 1,304,373 | ||||||
1Citigroup, Inc., Sr. Unsecured, 1.23%, 7/01/11 | 2,000,000 | 2,001,438 | ||||||
12Citigroup, Inc., Sr. Unsecured, 4.59%, 12/15/15 | 250,000 | 264,218 | ||||||
Credit Suisse, Sr. Unsecured, MTN, 3.45%, 7/02/12 | 3,000,000 | 3,092,220 | ||||||
Fifth Third Bancorp, Sr. Unsecured, 6.25%, 5/01/13 | 850,000 | 924,435 | ||||||
1Goldman Sachs Group, Inc., Sr. Unsecured, 1.31%, 5/07/11 | 2,000,000 | 2,008,021 | ||||||
Goldman Sachs Group, Inc., Sr. Unsecured, 5.25%, 10/15/13 | 2,000,000 | 2,160,590 | ||||||
1JPMorgan Chase & Co., Notes, MTN, 0.00%, 5/02/11 | 1,000,000 | 1,001,500 | ||||||
1JPMorgan Chase & Co., Sr. Notes, MTN, 1.07%, 7/25/11 | 1,000,000 | 1,001,799 | ||||||
1JPMorgan Chase Capital XXIII, Limited Guarantee, 1.31%, 5/16/11 | 1,000,000 | 839,346 | ||||||
12KeyCorp, Sr. Unsecured, MTN, 6.50%, 5/14/13 | 1,000,000 | 1,093,219 | ||||||
| Description | Par Value | Value | ||||||
1Morgan Stanley, Sr. Unsecured, 1.87%, 7/25/11 | $ | 1,000,000 | $ | 1,013,245 | ||||
1Morgan Stanley, Sr. Unsecured, 1.25%, 7/29/11 | 2,000,000 | 2,002,177 | ||||||
National City Bank, Subordinated, BKNT, 6.20%, 12/15/11 | 460,000 | 475,438 | ||||||
1,6,7Societe Generale, Sr. Unsecured, 1.33%, 7/11/11 | 1,000,000 | 1,002,306 | ||||||
1UBS AG, Series FRN, Sr. Unsecured, 1.27%, 7/28/11 | 2,000,000 | 2,020,644 | ||||||
12Wells Fargo & Co., Subordinated, 5.13%, 9/01/12 | 2,000,000 | 2,106,079 | ||||||
12Wells Fargo & Co., Sr. Notes, 3.63%, 4/15/15 | 250,000 | 261,478 | ||||||
TOTAL BANKS | $ | 37,240,572 | ||||||
BEVERAGES – 3.0% | ||||||||
1Anheuser-Busch InBev Worldwide, Inc., Series FRN, Company Guaranteed, 0.82%, 7/27/11 | 500,000 | 503,237 | ||||||
12Anheuser-Busch InBev Worldwide, Inc., Company Guaranteed, 2.50%, 3/26/13 | 1,000,000 | 1,026,279 | ||||||
1Coca-Cola Refreshments USA, Inc., Sr. Unsecured, 0.91%, 5/06/11 | 1,000,000 | 1,000,139 | ||||||
Diageo Capital PLC, Company Guaranteed, 5.20%, 1/30/13 | 1,000,000 | 1,072,286 | ||||||
Dr Pepper Snapple Group, Inc., Company Guaranteed, 1.70%, 12/21/11 | 1,000,000 | 1,007,410 | ||||||
Dr Pepper Snapple Group, Inc., Company Guaranteed, 2.35%, 12/21/12 | 1,000,000 | 1,021,464 | ||||||
TOTAL BEVERAGES | $ | 5,630,815 | ||||||
BUILDING MATERIALS – 0.6% | ||||||||
Masco Corp., Sr. Unsecured, 5.88%, 7/15/12 | 1,000,000 | 1,048,125 | ||||||
CHEMICALS – 2.8% | ||||||||
Dow Chemical Co., Sr. Unsecured, 4.85%, 8/15/12 | 800,000 | $ | 839,820 | |||||
Dow Chemical Co., Sr. Unsecured, 7.60%, 5/15/14 | 250,000 | 291,441 | ||||||
1Ei DU Pont de Nemours & Co., Sr. Unsecured, 0.73%, 6/25/11 | 2,000,000 | 2,008,415 | ||||||
Potash Corp. of Saskatchewan, Inc., Sr. Unsecured, 4.88%, 3/01/13 | 2,000,000 | 2,129,702 | ||||||
TOTAL CHEMICALS | $ | 5,269,378 | ||||||
COMMERCIAL SERVICES – 0.3% | ||||||||
1Western Union Co., Sr. Unsecured, 0.89%, 6/07/11 | 500,000 | 501,164 | ||||||
COMPUTERS – 1.5% | ||||||||
Hewlett-Packard Co., Sr. Unsecured, 4.25%, 2/24/12 | 1,000,000 | 1,032,968 | ||||||
International Business Machines Corp., Sr. Unsecured, 2.10%, 5/06/13 | 1,000,000 | 1,025,506 | ||||||
International Business Machines Corp., Sr. Unsecured, 1.00%, 8/05/13 | 800,000 | 800,684 | ||||||
TOTAL COMPUTERS | $ | 2,859,158 | ||||||
(MTB Short-Term Corporate Bond Fund continued next page)
April 30, 2011 / ANNUAL REPORT
Table of Contents
| PORTFOLIOS OF INVESTMENTS | 59 |
MTB Short-Term Corporate Bond Fund (continued)
| Description | Par Value | Value | ||||||
COSMETICS/PERSONAL CARE – 0.5% | ||||||||
Procter & Gamble International Funding SCA, Company Guaranteed, 1.35%, 8/26/11 | $ | 1,000,000 | $ | 1,004,991 | ||||
DIVERSIFIED FINANCIAL | ||||||||
BlackRock, Inc., Sr. Unsecured, 3.50%, 12/10/14 | 1,000,000 | 1,054,491 | ||||||
BP Capital Markets PLC, Company Guaranteed, 1.55%, 8/11/11 | 250,000 | 250,786 | ||||||
Capital One Bank USA NA, Subordinated, 6.50%, 6/13/13 | 1,000,000 | 1,098,532 | ||||||
Credit Suisse USA, Inc., Bank Guaranteed, 5.50%, 8/16/11 | 500,000 | 507,146 | ||||||
Ford Motor Credit Co. LLC, Sr. Unsecured, 7.25%, 10/25/11 | 1,000,000 | 1,027,500 | ||||||
Ford Motor Credit Co. LLC, Sr. Unsecured, 8.70%, 10/01/14 | 1,000,000 | 1,147,500 | ||||||
1General Electric Capital Corp., Sr. Unsecured, MTN, 0.92%, 7/07/11 | 1,000,000 | 1,000,701 | ||||||
12General Electric Capital Corp., Unsecured, 1.88%, 9/16/13 | 1,000,000 | 1,007,930 | ||||||
General Electric Capital Corp., Sr. Unsecured, 2.10%, 1/07/14 | 1,000,000 | 1,011,245 | ||||||
1HSBC Finance Corp., Sr. Unsecured, 0.66%, 6/15/11 | 1,000,000 | 996,539 | ||||||
12IBM International Group Capital LLC, Company Guaranteed, 5.05%, 10/22/12 | 1,000,000 | 1,063,876 | ||||||
International Lease Finance Corp., Sr. Unsecured, 5.35%, 3/01/12 | 2,000,000 | 2,047,500 | ||||||
Jefferies Group, Inc., Sr. Unsecured, | 2,000,000 | 2,027,994 | ||||||
John Deere Capital Corp., Sr. Unsecured, MTN, 4.95%, 12/17/12 | 1,000,000 | 1,067,640 | ||||||
John Deere Capital Corp., Sr. Unsecured, MTN, 4.90%, 9/09/13 | 500,000 | 544,310 | ||||||
1,6,7MassMutual Global Funding II, Notes, 0.66%, 7/14/11 | 1,000,000 | 1,000,722 | ||||||
6,7MassMutual Global Funding II, Sr. Secured, 3.63%, 7/16/12 | 500,000 | 515,759 | ||||||
Raymond James Financial, Inc., Sr. Unsecured, 4.25%, 4/15/16 | 1,500,000 | 1,537,602 | ||||||
SLM Corp., Series A, Sr. Unsecured, MTNA, 5.00%, 10/01/13 | 1,000,000 | 1,043,895 | ||||||
12SLM Corp., Sr. Notes, MTN, 6.25%, 1/25/16 | 300,000 | 318,833 | ||||||
TD Ameritrade Holding Corp., Company Guaranteed, 2.95%, 12/01/12 | 2,000,000 | 2,047,873 | ||||||
TOTAL DIVERSIFIED FINANCIAL SERVICES | $ | 22,318,374 | ||||||
ELECTRIC – 2.9% | ||||||||
Consolidated Edison Co. of New York, Inc., Series 05-C, Sr. Unsecured, 5.38%, 12/15/15 | 110,000 | 124,193 | ||||||
Dominion Resources, Inc., Sr. Unsecured, 5.70%, 9/17/12 | 2,000,000 | 2,130,811 | ||||||
Georgia Power Co., Sr. Unsecured, 1.30%, 9/15/13 | 1,000,000 | 1,001,302 | ||||||
| Description | Par Value | Value | ||||||
12Virginia Electric and Power Co., Sr. Unsecured, 5.10%, 11/30/12 | $ | 2,000,000 | $ | 2,131,835 | ||||
TOTAL ELECTRIC | $ | 5,388,141 | ||||||
ELECTRONICS – 0.6% | ||||||||
12Agilent Technologies, Inc., Sr. Unsecured, 4.45%, 9/14/12 | 1,000,000 | 1,041,212 | ||||||
FOOD – 6.4% | ||||||||
ConAgra Foods, Inc., Sr. Unsecured, 6.75%, 9/15/11 | 2,000,000 | 2,045,206 | ||||||
ConAgra Foods, Inc., Sr. Unsecured, 5.88%, 4/15/14 | 254,000 | 280,676 | ||||||
HJ Heinz Finance Co., Company Guaranteed, 6.63%, 7/15/11 | 1,250,000 | 1,265,619 | ||||||
Kellogg Co., Sr. Unsecured, 5.13%, 12/03/12 | 1,000,000 | 1,067,967 | ||||||
Kraft Foods, Inc., Sr. Unsecured, 5.63%, 11/01/11 | 52,000 | 53,372 | ||||||
12Kraft Foods, Inc., Unsecured, 5.25%, 10/01/13 | 1,000,000 | 1,090,166 | ||||||
Kraft Foods, Inc., Sr. Unsecured, 4.13%, 2/09/16 | 2,000,000 | 2,104,528 | ||||||
Kroger Co., Company Guaranteed, 5.50%, 2/01/13 | 250,000 | 267,828 | ||||||
Kroger Co., Company Guaranteed, 5.00%, 4/15/13 | 1,580,000 | 1,693,744 | ||||||
McCormick & Co., Inc., Sr. Unsecured, 5.80%, 7/15/11 | 700,000 | 707,681 | ||||||
6,7WM Wrigley Jr. Co., Sr. Secured, 3.70%, 6/30/14 | 1,500,000 | 1,546,482 | ||||||
TOTAL FOOD | $ | 12,123,269 | ||||||
GAS – 0.8% | ||||||||
1Sempra Energy, Sr. Unsecured, 1.07%, 6/15/11 | 1,500,000 | 1,507,532 | ||||||
HEALTHCARE PROVIDERS & SERVICES – 0.5% | ||||||||
1Quest Diagnostics, Inc., Company Guaranteed, 1.16%, 6/24/11 | 1,000,000 | 1,002,864 | ||||||
INSURANCE – 5.5% | ||||||||
Hartford Financial Services Group, Inc., Sr. Unsecured, 5.25%, 10/15/11 | 1,500,000 | 1,530,127 | ||||||
Lincoln National Corp., Sr. Unsecured, 5.65%, 8/27/12 | 1,246,000 | 1,317,182 | ||||||
12Lincoln National Corp., Sr. Unsecured, 4.30%, 6/15/15 | 1,000,000 | 1,055,309 | ||||||
MetLife, Inc., Sr. Unsecured, 6.13%, 12/01/11 | 500,000 | 516,488 | ||||||
MetLife, Inc., Sr. Unsecured, 2.38%, 2/06/14 | 1,750,000 | 1,775,902 | ||||||
6,7Metropolitan Life Global Funding I, Sr. Secured, 2.50%, 1/11/13 | 1,000,000 | 1,019,938 | ||||||
Principal Financial Group, Inc., Company Guaranteed, 7.88%, 5/15/14 | 1,100,000 | 1,276,743 | ||||||
Prudential Financial, Inc., Sr. Unsecured, MTN, 3.63%, 9/17/12 | 750,000 | 774,289 | ||||||
Prudential Financial, Inc., Sr. Unsecured, MTN, 2.75%, 1/14/13 | 1,000,000 | 1,021,154 | ||||||
TOTAL INSURANCE | $ | 10,287,132 | ||||||
(MTB Short-Term Corporate Bond Fund continued next page)
ANNUAL REPORT / April 30, 2011
Table of Contents
| 60 | PORTFOLIOS OF INVESTMENTS |
MTB Short-Term Corporate Bond Fund (continued)
| Description | Par Value | Value | ||||||
INTERNET – 0.5% | ||||||||
eBay, Inc., Sr. Unsecured, 0.88%, 10/15/13 | $ | 1,000,000 | $ | 997,810 | ||||
IRON/STEEL – 0.8% | ||||||||
Arcelormittal, Sr. Unsecured, 3.75%, 8/05/15 | 1,000,000 | 1,025,676 | ||||||
Arcelormittal, Sr. Unsecured, 3.75%, 3/01/16 | 500,000 | 507,486 | ||||||
TOTAL IRON/STEEL | $ | 1,533,162 | ||||||
LEISURE TIME – 0.5% | ||||||||
6,7Harley-Davidson Financial Services, Inc., Company Guaranteed, 3.88%, 3/15/16 | 1,000,000 | 1,011,251 | ||||||
MEDIA – 5.1% | ||||||||
12Comcast Cable Communications Holdings, Inc., Company Guaranteed, 8.38%, 3/15/13 | 2,000,000 | 2,251,250 | ||||||
Comcast Cable Holdings LLC, Company Guaranteed, 9.80%, 2/01/12 | 200,000 | 213,564 | ||||||
Comcast Holdings Corp., Company Guaranteed, 10.63%, 7/15/12 | 2,000,000 | 2,225,157 | ||||||
COX Communications, Inc., Unsecured, 7.13%, 10/01/12 | 1,535,000 | 1,663,084 | ||||||
12DIRECTV Holdings LLC / DIRECTV Financing Co., Inc., Company Guaranteed, 3.50%, 3/01/16 | 1,000,000 | 1,017,332 | ||||||
Time Warner Cable, Inc., Company Guaranteed, 7.50%, 4/01/14 | 1,000,000 | 1,155,325 | ||||||
Walt Disney Co., Series B, Sr. Unsecured, MTNB, 6.38%, 3/01/12 | 1,000,000 | 1,050,715 | ||||||
TOTAL MEDIA | $ | 9,576,427 | ||||||
METALS & MINING – 1.5% | ||||||||
12Vale Canada Ltd., Sr. Unsecured, 7.75%, 5/15/12 | 525,000 | 560,567 | ||||||
Xstrata Canada Corp., Company Guaranteed, 7.35%, 6/05/12 | 750,000 | 797,938 | ||||||
Xstrata Canada Corp., Company Guaranteed, 7.25%, 7/15/12 | 710,000 | 757,904 | ||||||
6,7Xstrata Finance Canada Ltd., Company Guaranteed, 5.50%, 11/16/11 | 618,000 | 633,846 | ||||||
TOTAL METALS & MINING | $ | 2,750,255 | ||||||
MISCELLANEOUS | ||||||||
General Electric Co., Sr. Unsecured, 5.00%, 2/01/13 | 1,000,000 | 1,069,013 | ||||||
ITT Corp., Sr. Unsecured, 4.90%, 5/01/14 | 500,000 | 541,325 | ||||||
TOTAL MISCELLANEOUS MANUFACTURING | $ | 1,610,338 | ||||||
OFFICE/BUSINESS EQUIPMENT – 1.7% | ||||||||
Pitney Bowes, Inc., Sr. Unsecured, 4.63%, 10/01/12 | 1,000,000 | 1,047,193 | ||||||
Xerox Corp., Sr. Unsecured, 5.50%, 5/15/12 | 2,000,000 | 2,094,829 | ||||||
TOTAL OFFICE/BUSINESS EQUIPMENT | $ | 3,142,022 | ||||||
OIL & GAS – 4.8% | ||||||||
Apache Corp., Sr. Unsecured, 6.25%, 4/15/12 | 1,000,000 | 1,053,387 | ||||||
Chesapeake Energy Corp., Company Guaranteed, 7.63%, 7/15/13 | 1,000,000 | 1,102,500 | ||||||
| Description | Par Value | Value | ||||||
ConocoPhillips, Company Guaranteed, 4.75%, 10/15/12 | $ | 1,000,000 | $ | 1,059,626 | ||||
Devon Financing Corp. ULC, Company Guaranteed, 6.88%, 9/30/11 | 1,000,000 | 1,025,749 | ||||||
Tesoro Corp., Company Guaranteed, 6.25%, 11/01/12 | 1,000,000 | 1,058,750 | ||||||
Valero Energy Corp., Company Guaranteed, 6.88%, 4/15/12 | 1,000,000 | 1,056,622 | ||||||
Valero Energy Corp., Company Guaranteed, 4.75%, 6/15/13 | 2,000,000 | 2,134,749 | ||||||
XTO Energy, Inc., Sr. Unsecured, 7.50%, 4/15/12 | 590,000 | 630,031 | ||||||
TOTAL OIL & GAS | $ | 9,121,414 | ||||||
PHARMACEUTICALS – 0.3% | ||||||||
Mead Johnson Nutrition Co., Sr. Unsecured, 3.50%, 11/01/14 | 500,000 | 522,281 | ||||||
PIPELINES – 2.8% | ||||||||
Enterprise Products Operating LLC, Company Guaranteed, 7.63%, 2/15/12 | 1,488,000 | 1,568,341 | ||||||
12Enterprise Products Operating LLC, Series G, Company Guaranteed, 5.60%, 10/15/14 | 1,000,000 | 1,111,245 | ||||||
Plains All American Pipeline LP / PAA Finance Corp., Company Guaranteed, 4.25%, 9/01/12 | 2,500,000 | 2,599,871 | ||||||
TOTAL PIPELINES | $ | 5,279,457 | ||||||
REAL ESTATE INVESTMENT TRUSTS (REIT) – 4.0% | ||||||||
AvalonBay Communities, Inc., Sr. Unsecured, MTN, 5.50%, 1/15/12 | 750,000 | 773,947 | ||||||
AvalonBay Communities, Inc., Sr. Unsecured, MTN, 6.13%, 11/01/12 | 1,000,000 | 1,074,035 | ||||||
Boston Properties LP, Sr. Unsecured, 6.25%, 1/15/13 | 500,000 | 541,121 | ||||||
CommonWealth REIT, Sr. Unsecured, 5.75%, 2/15/14 | 1,000,000 | 1,065,567 | ||||||
HCP, Inc., Sr. Unsecured, MTN, 5.95%, 9/15/11 | 1,000,000 | 1,019,328 | ||||||
HCP, Inc., Sr. Unsecured, 6.45%, 6/25/12 | 385,000 | 407,053 | ||||||
HCP, Inc., Sr. Unsecured, 2.70%, 2/01/14 | 500,000 | 506,595 | ||||||
Health Care REIT, Inc., Sr. Unsecured, 6.00%, 11/15/13 | 2,000,000 | 2,190,229 | ||||||
TOTAL REAL ESTATE INVESTMENT TRUSTS (REIT) | $ | 7,577,875 | ||||||
RETAIL – 2.6% | ||||||||
12CVS Caremark Corp., Sr. Unsecured, 4.88%, 9/15/14 | 1,600,000 | 1,755,031 | ||||||
Home Depot, Inc., Sr. Unsecured, 5.25%, 12/16/13 | 1,500,000 | 1,644,941 | ||||||
Staples, Inc., Company Guaranteed, 7.38%, 10/01/12 | 1,375,000 | 1,489,458 | ||||||
TOTAL RETAIL | $ | 4,889,430 | ||||||
SEMICONDUCTORS – 0.5% | ||||||||
6,7Broadcom Corp., Sr. Unsecured, 1.50%, 11/01/13 | 1,000,000 | 999,603 | ||||||
(MTB Short-Term Corporate Bond Fund continued next page)
April 30, 2011 / ANNUAL REPORT
Table of Contents
| PORTFOLIOS OF INVESTMENTS | 61 |
MTB Short-Term Corporate Bond Fund (continued)
| Description | Par Value | Value | ||||||
TELECOMMUNICATIONS – 3.8% | ||||||||
American Tower Corp., Sr. Unsecured, 4.63%, 4/01/15 | $ | 1,000,000 | $ | 1,050,372 | ||||
AT&T Corp., Company Guaranteed, 7.30%, 11/15/11 | 500,000 | 517,986 | ||||||
AT&T, Inc., Sr. Unsecured, 4.45%, 5/15/21 | 500,000 | 505,157 | ||||||
Cellco Partnership / Verizon Wireless Capital LLC, Sr. Unsecured, 3.75%, 5/20/11 | 1,600,000 | 1,602,793 | ||||||
Juniper Networks, Inc., Sr. Unsecured, 3.10%, 3/15/16 | 500,000 | 506,978 | ||||||
Telecom Italia Capital SA, Company Guaranteed, 6.20%, 7/18/11 | 1,000,000 | 1,011,056 | ||||||
1Verizon Communications, Inc., Series FRN, Sr. Unsecured, 0.92%, 6/28/11 | 1,000,000 | 1,010,340 | ||||||
Verizon Communications, Inc., Sr. Unsecured, 4.35%, 2/15/13 | 1,000,000 | 1,057,811 | ||||||
TOTAL TELECOMMUNICATIONS | $ | 7,262,493 | ||||||
TRANSPORTATION – 3.7% | ||||||||
Canadian National Railway Co., Sr. Unsecured, 6.38%, 10/15/11 | 1,000,000 | 1,027,243 | ||||||
Federal Express Corp., Sr. Unsecured, 9.65%, 6/15/12 | 2,600,000 | 2,844,630 | ||||||
Ryder System, Inc., Sr. Unsecured, MTN, 3.15%, 3/02/15 | 2,000,000 | 2,040,879 | ||||||
Union Pacific Corp., Sr. Unsecured, 6.13%, 1/15/12 | 416,000 | 432,518 | ||||||
12Union Pacific Corp., Sr. Unsecured, 6.50%, 4/15/12 | 536,000 | 566,459 | ||||||
TOTAL TRANSPORTATION | $ | 6,911,729 | ||||||
| TOTAL CORPORATE BONDS (COST $169,675,696) | $ | 171,668,755 | ||||||
| U.S. TREASURY – 2.5% | ||||||||
U.S. TREASURY NOTE – 2.5% | ||||||||
120.75%, 3/31/13 | 420,000 | 421,411 | ||||||
121.25%, 2/15/14 | 1,000,000 | 1,008,906 | ||||||
2.00%, 1/31/16 | 1,000,000 | 1,006,250 | ||||||
122.25%, 3/31/16 | 2,240,000 | 2,273,600 | ||||||
TOTAL U.S. TREASURY NOTE | $ | 4,710,167 | ||||||
| TOTAL U.S. TREASURY (COST $4,673,335) | $ | 4,710,167 | ||||||
| REPURCHASE AGREEMENT – 0.0% | ||||||||
Credit Suisse First Boston LLC, 0.03%, dated 04/29/11, due 05/02/11, repurchase price $72,925, collateralized by a U.S. Treasury Security 1.50%, maturing 12/31/13; total market value of $76,577. | 72,925 | 72,925 | ||||||
TOTAL REPURCHASE AGREEMENT | $ | 72,925 | ||||||
| TOTAL INVESTMENTS IN SECURITIES – 99.4% (COST $185,622,298) | $ | 187,640,209 | ||||||
| Description | Par Value | Value | ||||||
| CASH COLLATERAL INVESTED FOR SECURITIES ON LOAN – 7.3% | ||||||||
| REPURCHASE AGREEMENTS – 7.3% | ||||||||
Barclays Capital, Inc., 0.03%, dated 04/29/11, due 05/02/11, repurchase price $2,000,005, collateralized by U.S. Treasury Securities 0.00% to 0.00%, maturing 05/15/11 to 02/15/41; total market value of $2,044,410. | $ | 2,000,000 | $ | 2,000,000 | ||||
BNP Paribas Securities Corp., 0.05%, dated 04/29/11, due 05/02/11, repurchase price $3,249,679, collateralized by U.S. Government Securities 1.42% to 7.13%, maturing 09/01/13 to 09/01/49; total market value of $3,317,894. | 3,249,665 | 3,249,665 | ||||||
Credit Suisse First Boston LLC, 0.03%, dated 04/29/11, due 05/02/11, repurchase price $2,000,005, collateralized by U.S. Treasury Securities 1.88% to 7.13%, maturing 07/15/12 to 08/15/29; total market value of $2,058,121. | 2,000,000 | 2,000,000 | ||||||
JP Morgan Securities LLC, 0.05%, dated 04/29/11, due 05/02/11, repurchase price $1,500,006, collateralized by U.S. Government Securities 4.00% to 4.50%, maturing 02/01/26 to 03/01/41; total market value of $1,530,020. | 1,500,000 | 1,500,000 | ||||||
Mizuho Securities, Inc., 0.07%, dated 04/29/11, due 05/02/11, repurchase price $1,500,009, collateralized by U.S. Government Securities 0.60% to 8.50%, maturing 01/01/21 to 06/25/43; total market value of $1,530,000. | 1,500,000 | 1,500,000 | ||||||
RBC Capital Markets LLC, 0.05%, dated 04/29/11, due 05/02/11, repurchase price $1,500,006, collateralized by U.S. Government Securities 1.99% to 5.13%, maturing 02/01/17 to 04/01/41; total market value of $1,530,000. | 1,500,000 | 1,500,000 | ||||||
RBS Securities, Inc., 0.03%, dated 04/29/11, due 05/02/11, repurchase price $2,000,005, collateralized by U.S. Treasury Securities 0.75% to 6.00%, maturing 08/15/13 to 02/15/26; total market value of $2,062,697. | 2,000,000 | 2,000,000 | ||||||
| TOTAL CASH COLLATERAL INVESTED FOR SECURITIES ON LOAN (COST $13,749,665) | $ | 13,749,665 | ||||||
| TOTAL INVESTMENTS – 106.7% (COST $199,371,963) | $ | 201,389,874 | ||||||
| COLLATERAL FOR SECURITIES ON LOAN – (7.3%) | (13,749,665 | ) | ||||||
| OTHER ASSETS LESS LIABILITIES – 0.6% | 1,189,100 | |||||||
| TOTAL NET ASSETS – 100.0% | $ | 188,829,309 | ||||||
(MTB Short-Term Corporate Bond Fund continued next page)
ANNUAL REPORT / April 30, 2011
Table of Contents
| 62 | PORTFOLIOS OF INVESTMENTS |
MTB Short-Term Corporate Bond Fund (concluded)
Cost of investments for Federal income tax purposes is $199,385,926. The net unrealized appreciation/depreciation of investments was $2,003,948. This consists of net unrealized appreciation from investment for those securities having an excess of value over cost of $2,075,548 and net unrealized depreciation from investments for those securities having an excess of cost over value of $71,600.
Various inputs are used in determining the value of the Fund’s investments. These inputs are summarized in the three broad levels listed below.
Level 1 – quoted prices in active markets for identical securities
Level 2 – other significant observable inputs (including quoted prices for similar securities, interest rates, prepayment speeds, credit risk, etc.)
Level 3 – significant unobservable inputs (including the Fund’s own assumptions in determining the fair value of investments)
The following is a summary of the inputs used as of April 30, 2011 in valuing the Fund’s assets carried at fair value:
| Level 1 | Level 2 | Level 3 | Total | |||||||||||||
Investments in Securities | ||||||||||||||||
Adjustable Rate Mortgage | $ | — | $ | 71 | $ | — | $ | 71 | ||||||||
Asset Backed Securities | — | 4,704,946 | — | 4,704,946 | ||||||||||||
Collateralized Mortgage Obligations | — | 6,483,345 | — | 6,483,345 | ||||||||||||
Corporate Bonds | — | 171,668,755 | — | 171,668,755 | ||||||||||||
U.S. Treasury | — | 4,710,167 | — | 4,710,167 | ||||||||||||
Repurchase Agreements | — | 13,822,590 | — | 13,822,590 | ||||||||||||
Total | $ | — | $ | 201,389,874 | $ | — | $ | 201,389,874 | ||||||||
See Notes to Portfolios of Investments
April 30, 2011 / ANNUAL REPORT
Table of Contents
| 63 |
PORTFOLIO OF INVESTMENTS SUMMARY TABLE
MTB U.S. Government Bond Fund
At April 30, 2011, the Fund’s portfolio composition was as follows: (unaudited)
| Percentage of Total Net Assets | ||||
| Government Agencies | 36.9 | % | ||
| Mortgage-Backed Securities | 30.1 | % | ||
| U.S. Treasury | 15.9 | % | ||
| Collateralized Mortgage Obligations | 10.9 | % | ||
| Corporate Bonds | 4.6 | % | ||
| Municipal Bonds | 1.2 | % | ||
| Cash Equivalents1 | 17.5 | % | ||
| Other Assets and Liabilities – Net2 | (17.1 | )% | ||
| TOTAL | 100.0 | % | ||
| (1) | Cash Equivalents include investments in repurchase agreements. |
| (2) | Assets, other than investments in securities, less liabilities. See Statements of Assets and Liabilities. |
| (3) | Derived from data provided by Moody’s Investors Service and Standard and Poor’s. |
| Credit Quality Diversification3 | Percentage of Total Net Assets | |||
| AAA | 4.8 | % | ||
| AA | 2.0 | % | ||
| BBB | 2.9 | % | ||
| BB | 8.7 | % | ||
| Not Rated | 18.8 | % | ||
| U.S. Government Agency Securities | 64.0 | % | ||
| U.S. Treasuries | 15.9 | % | ||
| Other Assets and Liabilities – Net2 | (17.1 | )% | ||
| TOTAL | 100.0 | % | ||
PORTFOLIO OF INVESTMENTS
April 30, 2011
| Description | Par Value | Value | ||||||
| COLLATERALIZED MORTGAGE OBLIGATIONS – 10.9% | ||||||||
FEDERAL HOME LOAN MORTGAGE CORPORATION (FHLMC) – 1.0% | ||||||||
Series 1920, Class H, 7.00%, 1/15/12 | $ | 26,575 | $ | 27,005 | ||||
Series 1988-6, Class C, 9.05%, 6/15/19 | 21,729 | 24,279 | ||||||
Series 1989-112, Class I, 6.50%, 1/15/21 | 4,136 | 4,467 | ||||||
Series 1990-136, Class E, 6.00%, 4/15/21 | 11,015 | 11,817 | ||||||
Series 1990-141, Class D, 5.00%, 5/15/21 | 3,798 | 4,009 | ||||||
Series 1993-1577, Class PK, 6.50%, 9/15/23 | 232,594 | 252,418 | ||||||
Series 1993-1644, Class K, 6.75%, 12/15/23 | 176,000 | 192,999 | ||||||
Series 1994-1686, Class PJ, 5.00%, 2/15/24 | 35,900 | 37,579 | ||||||
TOTAL FEDERAL HOME LOAN MORTGAGE CORPORATION (FHLMC) | $ | 554,573 | ||||||
FEDERAL NATIONAL MORTGAGE ASSOCIATION (FNMA) – 1.1% | ||||||||
Series 1993-113, Class PK, 6.50%, 7/25/23 | 110,791 | 121,021 | ||||||
Series 1993-127, Class H, 6.50%, 7/25/23 | 107,748 | 117,807 | ||||||
Series 1993-202, Class J, 6.50%, 11/25/23 | 57,591 | 63,217 | ||||||
Series 1994-3, Class PL, 5.50%, 1/25/24 | 96,978 | 103,979 | ||||||
Series 1994-55, Class H, 7.00%, 3/25/24 | 120,604 | 133,661 | ||||||
Series 2002-52, Class QA, 6.00%, 7/18/32 | 62,429 | 66,537 | ||||||
TOTAL FEDERAL NATIONAL MORTGAGE ASSOCIATION (FNMA) | $ | 606,222 | ||||||
| Description | Par Value | Value | ||||||
WHOLE LOAN – 8.8% | ||||||||
1Banc of America Mortgage Securities, Inc., Series 2004-A, Class 2A1, 2.86%, 5/25/11 | $ | 504,533 | $ | 473,297 | ||||
1Banc of America Mortgage Securities, Inc., Series 2004-B, Class 2A1, 2.87%, 5/25/11 | 422,812 | 391,169 | ||||||
Countrywide Home Loan Mortgage Pass-Through Trust, Series 2004-8, Class 2A1, 4.50%, 6/25/19 | 1,723,347 | 1,775,017 | ||||||
1Indymac INDA Mortgage Loan Trust, Series 2005-AR1, Class 2A1, 5.06%, 5/25/11 | 2,324,272 | 2,083,701 | ||||||
TOTAL WHOLE LOAN | $ | 4,723,184 | ||||||
| TOTAL COLLATERALIZED MORTGAGE OBLIGATIONS (COST $5,887,182) | $ | 5,883,979 | ||||||
| CORPORATE BONDS – 4.6% | ||||||||
BANKS – 2.7% | ||||||||
First Tennessee Bank NA, Subordinated, BKNT, 4.63%, 5/15/13 | 1,000,000 | 1,042,510 | ||||||
U.S. Bank NA, Sr. Unsecured, MTN, 5.92%, 5/25/12 | 378,519 | 397,355 | ||||||
TOTAL BANKS | $ | 1,439,865 | ||||||
GAS UTILITIES – 0.9% | ||||||||
Bay State Gas Co., Sr. Unsecured, MTN, 9.20%, 6/06/11 | 500,000 | 502,864 | ||||||
(MTB U.S. Government Bond Fund continued next page)
ANNUAL REPORT / April 30, 2011
Table of Contents
| 64 | PORTFOLIOS OF INVESTMENTS |
MTB U.S. Government Bond Fund (continued)
| Description | Par Value | Value | ||||||
HEALTHCARE PROVIDERS & SERVICES – 1.0% | ||||||||
Howard Hughes Medical Institute, Sr. Unsecured, 3.45%, 9/01/14 | $ | 500,000 | $ | 530,885 | ||||
| TOTAL CORPORATE BONDS (COST $2,285,420) | $ | 2,473,614 | ||||||
| GOVERNMENT AGENCIES – 36.9% | ||||||||
DEVELOPMENT – 1.9% | ||||||||
Tennessee Valley Authority, Sr. Unsecured, | 1,000,000 | 1,021,406 | ||||||
FEDERAL HOME LOAN BANK (FHLB) – 4.3% | ||||||||
125.38%, 5/18/16 | 2,000,000 | 2,314,623 | ||||||
FEDERAL HOME LOAN MORTGAGE CORPORATION (FHLMC) – 20.1% | ||||||||
1.38%, 2/25/14 | 1,000,000 | 1,009,199 | ||||||
2.88%, 2/09/15 | 500,000 | 524,778 | ||||||
124.75%, 1/19/16 | 1,000,000 | 1,123,040 | ||||||
124.88%, 6/13/18 | 2,000,000 | 2,260,035 | ||||||
5.13%, 10/18/16 | 2,000,000 | 2,287,693 | ||||||
125.25%, 4/18/16 | 2,000,000 | 2,294,992 | ||||||
8.25%, 6/01/26 | 1,000,000 | 1,351,842 | ||||||
TOTAL FEDERAL HOME LOAN MORTGAGE CORPORATION (FHLMC) | $ | 10,851,579 | ||||||
FEDERAL NATIONAL MORTGAGE ASSOCIATION (FNMA) – 5.9% | ||||||||
Sr. Subordinated, 5.25%, 8/01/12 | 3,000,000 | 3,181,850 | ||||||
HOUSING – 0.1% | ||||||||
10Federal Housing Administration, Project Pass-Through Certificate, 7.43%, 4/01/22 | 38,493 | 38,108 | ||||||
U.S. Department of Housing and Urban Development, U.S. Government Guaranteed, 7.66%, 8/01/15 | 33,681 | 34,299 | ||||||
TOTAL HOUSING | $ | 72,407 | ||||||
SMALL BUSINESS ADMINISTRATION – 1.4% | ||||||||
Small Business Administration Participation Certificates, U.S. Government Guaranteed, Series 1996-C, 6.70%, 3/01/16 | 59,945 | 65,150 | ||||||
Small Business Administration Participation Certificates, U.S. Government Guaranteed, Series 1996-L, 6.70%, 12/01/16 | 178,671 | 195,051 | ||||||
Small Business Administration Participation Certificates, U.S. Government Guaranteed, Series 1996-K, 6.95%, 11/01/16 | 418,595 | 461,215 | ||||||
Small Business Administration Participation Certificates, U.S. Government Guaranteed, Series 1997-E, 7.30%, 5/01/17 | 12,456 | 13,629 | ||||||
Small Business Administration Participation Certificates, U.S. Government Guaranteed, Series 1999-I, 7.30%, 9/01/19 | 15,082 | 16,594 | ||||||
Small Business Administration Participation Certificates, U.S. Government Guaranteed, Series 1991-H, 8.85%, 8/01/11 | 89 | 90 | ||||||
TOTAL SMALL BUSINESS ADMINISTRATION | $ | 751,729 | ||||||
| Description | Par Value | Value | ||||||
TRANSPORTATION – 3.2% | ||||||||
Vessel Management Services, Inc., U.S. Government Guaranteed, 5.13%, 4/16/35 | $ | 953,000 | $ | 1,046,863 | ||||
Vessel Management Services, Inc., U.S. Government Guaranteed, 6.75%, 7/15/25 | 591,000 | 681,669 | ||||||
TOTAL TRANSPORTATION | $ | 1,728,532 | ||||||
| TOTAL GOVERNMENT AGENCIES (COST $18,074,623) | $ | 19,922,126 | ||||||
| MORTGAGE-BACKED SECURITIES – 30.1% | ||||||||
FEDERAL HOME LOAN MORTGAGE | ||||||||
Pool 287773, 7.50%, 3/01/17 | 1,210 | 1,236 | ||||||
Pool 299147, 7.50%, 8/01/17 | 84,212 | 95,591 | ||||||
Pool 538733, 9.00%, 9/01/19 | 358 | 413 | ||||||
Pool A18401, 6.00%, 2/01/34 | 1,414,757 | 1,565,782 | ||||||
Pool C78010, 5.50%, 4/01/33 | 2,379,832 | 2,580,630 | ||||||
Pool C80328, 7.50%, 7/01/25 | 73,603 | 85,090 | ||||||
Pool E00540, 6.00%, 3/01/13 | 107,846 | 113,493 | ||||||
Pool G01425, 7.50%, 5/01/32 | 161,053 | 186,490 | ||||||
Pool G01831, 6.00%, 5/01/35 | 654,450 | 724,313 | ||||||
Pool G12709, 5.00%, 7/01/22 | 702,619 | 753,295 | ||||||
TOTAL FEDERAL HOME LOAN MORTGAGE CORPORATION (FHLMC) | $ | 6,106,333 | ||||||
FEDERAL NATIONAL MORTGAGE | ||||||||
Pool 202957, 8.00%, 8/01/21 | 7,886 | 8,987 | ||||||
Pool 252439, 6.50%, 5/01/29 | 84,733 | 96,889 | ||||||
Pool 255933, 5.50%, 11/01/35 | 792,962 | 859,967 | ||||||
Pool 323419, 6.00%, 12/01/28 | 166,337 | 184,374 | ||||||
Pool 334593, 7.00%, 5/01/24 | 107,861 | 123,512 | ||||||
Pool 39862, 9.75%, 9/01/17 | 10,562 | 12,165 | ||||||
Pool 436746, 6.50%, 8/01/28 | 91,236 | 104,183 | ||||||
Pool 440401, 6.50%, 8/01/28 | 293,188 | 334,609 | ||||||
Pool 485678, 6.50%, 3/01/29 | 216,707 | 247,323 | ||||||
Pool 494375, 6.50%, 4/01/29 | 39,325 | 44,905 | ||||||
Pool 545051, 6.00%, 9/01/29 | 310,386 | 343,849 | ||||||
Pool 604867, 7.00%, 1/01/25 | 122,273 | 139,208 | ||||||
Pool 625596, 7.00%, 2/01/32 | 41,830 | 48,173 | ||||||
Pool 725418, 6.50%, 5/01/34 | 442,109 | 506,228 | ||||||
Pool 763704, 5.00%, 4/01/34 | 1,341,673 | 1,428,631 | ||||||
Pool 833143, 5.50%, 9/01/35 | 2,404,386 | 2,607,557 | ||||||
Pool 843323, 5.50%, 10/01/35 | 411,008 | 445,481 | ||||||
Pool AB1796, 3.50%, 11/01/40 | 988,393 | 944,534 | ||||||
Pool AE2520, 3.00%, 1/01/26 | 977,786 | 967,091 | ||||||
TOTAL FEDERAL NATIONAL MORTGAGE ASSOCIATION (FNMA) | $ | 9,447,666 | ||||||
(MTB U.S. Government Bond Fund continued next page)
April 30, 2011 / ANNUAL REPORT
Table of Contents
| PORTFOLIOS OF INVESTMENTS | 65 |
MTB U.S. Government Bond Fund (continued)
| Description | Par Value | Value | ||||||
GOVERNMENT NATIONAL MORTGAGE | ||||||||
Pool 1061, 9.00%, 4/20/23 | $ | 20,232 | $ | 23,759 | ||||
Pool 146927, 9.00%, 9/15/16 | 4,631 | 4,681 | ||||||
Pool 1886, 9.00%, 10/20/24 | 3,157 | 3,706 | ||||||
Pool 188603, 9.00%, 11/15/16 | 8,855 | 10,244 | ||||||
Pool 208196, 9.00%, 2/15/17 | 13,381 | 15,480 | ||||||
Pool 346572, 7.00%, 5/15/23 | 23,217 | 26,818 | ||||||
Pool 392400, 8.00%, 7/15/24 | 2,392 | 2,795 | ||||||
Pool 484269, 7.00%, 9/15/28 | 55,376 | 64,399 | ||||||
Pool 581522, 6.00%, 5/15/33 | 280,544 | 314,087 | ||||||
Pool 592505, 6.00%, 4/15/33 | 220,049 | 247,183 | ||||||
Pool 780440, 8.50%, 11/15/17 | 3,391 | 3,926 | ||||||
TOTAL GOVERNMENT NATIONAL MORTGAGE ASSOCIATION (GNMA) | $ | 717,078 | ||||||
| TOTAL MORTGAGE-BACKED SECURITIES (COST $15,344,484) | $ | 16,271,077 | ||||||
| MUNICIPAL BONDS – 1.2% | ||||||||
DEVELOPMENT – 0.3% | ||||||||
Miami FL, Rent Revenue, Series 1998 (Lease payments guaranteed by U.S. Government), 8.65%, 7/01/19 | 130,000 | 155,730 | ||||||
FACILITIES – 0.9% | ||||||||
City of Tacoma, WA, Lease Revenue Bonds, (Lease payments guaranteed by U.S. Government), 8.20%, 9/15/13 | 475,000 | 515,033 | ||||||
| TOTAL MUNICIPAL BONDS (COST $655,681) | $ | 670,763 | ||||||
| U.S. TREASURY – 15.9% | ||||||||
INFLATION INDEXED BONDS – 7.0% | ||||||||
121.13%, 1/15/21 | 1,100,000 | 1,155,460 | ||||||
2.00%, 1/15/14 | 2,000,000 | 2,635,755 | ||||||
TOTAL INFLATION INDEXED BONDS | $ | 3,791,215 | ||||||
U.S. TREASURY BONDS – 6.1% | ||||||||
4.25%, 11/15/40 | 1,000,000 | 974,375 | ||||||
4.50%, 2/15/36 | 1,286,000 | 1,320,963 | ||||||
4.50%, 8/15/39 | 1,000,000 | 1,017,812 | ||||||
TOTAL U.S. TREASURY BONDS | $ | 3,313,150 | ||||||
| U.S. TREASURY NOTES – 2.8% | ||||||||
1.25%, 10/31/15 | 625,000 | 611,426 | ||||||
3.63%, 2/15/20 | 860,000 | 894,938 | ||||||
TOTAL U.S. TREASURY NOTES | $ | 1,506,364 | ||||||
| TOTAL U.S. TREASURY (COST $8,148,982) | $ | 8,610,729 | ||||||
| Description | Par Value | Value | ||||||
| REPURCHASE AGREEMENT – 0.1% | ||||||||
Credit Suisse First Boston LLC, 0.03%, dated 04/29/11, due 05/02/11, repurchase price $62,906, collateralized by a U.S. Treasury Security 1.50%, maturing 12/31/13; total market value of $66,366. | $ | 62,906 | $ | 62,906 | ||||
| TOTAL REPURCHASE AGREEMENT (COST $62,906) | $ | 62,906 | ||||||
| TOTAL INVESTMENTS IN SECURITIES – 99.7% (COST $50,459,278) | $ | 53,895,194 | ||||||
| CASH COLLATERAL INVESTED FOR SECURITIES ON LOAN – 17.4% | ||||||||
| REPURCHASE AGREEMENT – 17.4% | ||||||||
Barclays Capital, Inc., 0.03%, dated 04/29/11, due 05/02/11, repurchase price $2,000,005, collateralized by U.S. Treasury Securities 0.00% to 0.00%, maturing 05/15/11 to 02/15/41; total market value of $2,044,410. | 2,000,000 | 2,000,000 | ||||||
BNP Paribas Securities Corp., 0.05%, dated 04/29/11, due 05/02/11, repurchase price $1,905,060, collateralized by U.S. Government Securities 1.42% to 7.13%, maturing 09/01/13 to 09/01/49; total market value of $1,945,050. | 1,905,052 | 1,905,052 | ||||||
Credit Suisse First Boston LLC, 0.03%, dated 04/29/11, due 05/02/11, repurchase price $2,000,005, collateralized by U.S. Treasury Securities 1.88% to 7.13%, maturing 07/15/12 to 08/15/29; total market value of $2,058,121. | 2,000,000 | 2,000,000 | ||||||
JP Morgan Securities LLC, 0.05%, dated 04/29/11, due 05/02/11, repurchase price $1,500,006, collateralized by U.S. Government Securities 4.00% to 4.50%, maturing 02/01/26 to 03/01/41; total market value of $1,530,020. | 1,500,000 | 1,500,000 | ||||||
RBS Securities, Inc., 0.03%, dated 04/29/11, due 05/02/11, repurchase price $2,000,005, collateralized by U.S. Treasury Securities 0.75% to 6.00%, maturing 08/15/13 to 02/15/26; total market value of $2,062,697. | 2,000,000 | 2,000,000 | ||||||
| TOTAL CASH COLLATERAL INVESTED FOR SECURITIES ON LOAN (COST $9,405,052) | $ | 9,405,052 | ||||||
| TOTAL INVESTMENTS – 117.1% (COST $59,864,330) | $ | 63,300,246 | ||||||
| COLLATERAL FOR SECURITIES ON LOAN – (17.4%) | (9,405,052 | ) | ||||||
| OTHER ASSETS LESS LIABILITIES – 0.3% | 181,310 | |||||||
| TOTAL NET ASSETS – 100.0% | $ | 54,076,504 | ||||||
(MTB U.S. Government Bond Fund continued next page)
ANNUAL REPORT / April 30, 2011
Table of Contents
| 66 | PORTFOLIOS OF INVESTMENTS |
MTB U.S. Government Bond Fund (concluded)
Cost of investments for Federal income tax purposes is $60,024,084. The net unrealized appreciation/depreciation of investments was $3,276,162. This consists of net unrealized appreciation from investment for those securities having an excess of value over cost of $3,730,733 and net unrealized depreciation from investments for those securities having an excess of cost over value of $454,571.
Various inputs are used in determining the value of the Fund’s investments. These inputs are summarized in the three broad levels listed below.
Level 1 – quoted prices in active markets for identical securities
Level 2 – other significant observable inputs (including quoted prices for similar securities, interest rates, prepayment speeds, credit risk, etc.)
Level 3 – significant unobservable inputs (including the Fund’s own assumptions in determining the fair value of investments)
The following is a summary of the inputs used as of April 30, 2011 in valuing the Fund’s assets carried at fair value:
| Level 1 | Level 2 | Level 3 | Total | |||||||||||||
Investments in Securities | ||||||||||||||||
Collateralized Mortgage Obligations | $ | — | $ | 5,883,979 | $ | — | $ | 5,883,979 | ||||||||
Corporate Bonds | — | 2,473,614 | — | 2,473,614 | ||||||||||||
Government Agencies | — | 19,884,018 | 38,108 | 19,922,126 | ||||||||||||
Mortgage-Backed Securities | — | 16,271,077 | — | 16,271,077 | ||||||||||||
Municipal Bonds | — | 670,763 | — | 670,763 | ||||||||||||
U.S. Treasury | — | 8,610,729 | — | 8,610,729 | ||||||||||||
Repurchase Agreements | — | 9,467,958 | — | 9,467,958 | ||||||||||||
Total | $ | — | $ | 63,262,138 | $ | 38,108 | $ | 63,300,246 | ||||||||
The security in Level 3 in the table above was considered a Level 3 security because it was fair valued under procedures adopted by the Board of Trustees at April 30, 2011. Such valuation is based on a review of inputs such as, but not limited to, similar securities, company specific financial information and company specific news. There were no changes in the valuation techniques used since the April 30, 2010 annual report for this security.
The following is a reconciliation of assets in which significant unobservable inputs (Level 3) were used in determining fair value:
| Investments In Securities | ||||
Balance as of April 30, 2010 | $ | 41,419 | ||
Realized gain (loss) | 729 | |||
Change in unrealized appreciation (depreciation) | (729 | ) | ||
Net purchases (sales) | (3,311 | ) | ||
Transfers in and/or out of Level 3 | — | |||
Balance as of April 30, 2011 | $ | 38,108 | ||
Net change in unrealized appreciation/(depreciation) for investments still held as of April 30, 2011 | $ | (729 | ) | |
See Notes to Portfolios of Investments
April 30, 2011 / ANNUAL REPORT
Table of Contents
| 67 |
PORTFOLIO OF INVESTMENTS SUMMARY TABLE
MTB New York Municipal Bond Fund
At April 30, 2011, the Fund’s sector classifications were as follows: (unaudited)
| Percentage of Total Net Assets | ||||
| Tobacco | 14.7 | % | ||
| General Revenue | 13.9 | % | ||
| Transportation | 11.7 | % | ||
| Higher Education | 9.9 | % | ||
| General Obligation | 8.5 | % | ||
| Medical | 8.5 | % | ||
| Water & Sewer | 7.1 | % | ||
| Power | 6.4 | % | ||
| School District | 5.7 | % | ||
| Education | 5.2 | % | ||
| Bond Bank | 3.1 | % | ||
| Multi-Family Housing | 2.0 | % | ||
| Pollution Control | 2.0 | % | ||
| Facilities | 1.0 | % | ||
| Other Assets and Liabilities – Net1 | 0.3 | % | ||
| TOTAL | 100.0 | % | ||
| (1) | Assets, other than investments in securities, less liabilities. See Statements of Assets and Liabilities. |
| (2) | Derived from data provided by Moody’s Investors Service and Standard and Poor’s. |
| Credit Quality Diversification2 | Percentage of Total Net Assets | |||
| AAA | 6.1 | % | ||
| AA | 53.4 | % | ||
| A | 21.1 | % | ||
| BBB | 7.0 | % | ||
| Not Rated | 12.1 | % | ||
| Other Assets and Liabilities – Net1 | 0.3 | % | ||
| TOTAL | 100.0 | % | ||
PORTFOLIO OF INVESTMENTS
April 30, 2011
| Description | Par Value | Value | ||||||
| MUNICIPAL BONDS – 94.1% | ||||||||
| ILLINOIS – 1.6% | ||||||||
SCHOOL DISTRICT – 1.6% | ||||||||
Chicago, IL, Board of Education, GO Unlimited, (Series A), (AMBAC), 5.25%, 12/01/15 | $ | 1,500,000 | $ | 1,648,095 | ||||
TOTAL ILLINOIS | $ | 1,648,095 | ||||||
| NEW YORK – 90.5% | ||||||||
BOND BANK – 3.1% | ||||||||
New York State Municipal Bond Bank Agency, Recovery Act, Refunding Revenue Bonds, (Subseries B1), (AGM GO of Bond Bank), 5.00%, 4/15/21 | 3,000,000 | 3,233,400 | ||||||
EDUCATION – 5.2% | ||||||||
Montgomery County, NY, IDA, Revenue Bonds, (Series A), (XLCA INS), 5.00%, 7/01/29 | 1,000,000 | 897,320 | ||||||
New York State Dormitory Authority, Refunding Revenue Bonds, Nonstate Supported Debt, School District Board Funding Program, (Series C), (State Aid Withholding)/(GO of Authority), 7.25%, 10/01/28 | 3,000,000 | 3,488,820 | ||||||
| Description | Par Value | Value | ||||||
New York State Dormitory Authority, School Districts Financing Program, (Series D), (National Reinsurance State Aid Withholding), 5.50%, 10/01/17 | $ | 895,000 | $ | 941,245 | ||||
TOTAL EDUCATION | $ | 5,327,385 | ||||||
FACILITIES – 1.0% | ||||||||
Albany, NY, Parking Authority, Unrefunded Revenue Bonds, (Series A), 5.63%, 7/15/25 | 220,000 | 221,694 | ||||||
Canton, NY, Human Services Initiatives, Inc., 5.75%, 9/01/32 | 915,000 | 822,695 | ||||||
TOTAL FACILITIES | $ | 1,044,389 | ||||||
GENERAL OBLIGATIONS – 4.2% | ||||||||
Erie County, NY, GO Unlimited Bonds, (Series D-1), (National-RE), 5.00%, 6/01/12 | 1,000,000 | 1,041,620 | ||||||
New York City, NY, GO Unlimited, (Subseries A-10), (JP Morgan Chase Bank, LOC), 0.21%, 5/02/11 | 1,660,000 | 1,660,000 | ||||||
New York City, NY, GO Unlimited, Refunding Bonds, (Series B), | 1,555,000 | 1,646,434 | ||||||
TOTAL GENERAL OBLIGATIONS | $ | 4,348,054 | ||||||
(MTB New York Municipal Bond Fund continued next page)
ANNUAL REPORT / April 30, 2011
Table of Contents
| 68 | PORTFOLIOS OF INVESTMENTS |
MTB New York Municipal Bond Fund (continued)
| Description | Par Value | Value | ||||||
GENERAL REVENUE – 13.9% | ||||||||
Grand Central, NY, District Management Association, Inc., 5.00%, 1/01/21 | $ | 1,000,000 | $ | 1,065,430 | ||||
New York City, NY, Transitional Finance Authority, Future Tax Secured, Revenue Bonds, (Subseries A-1), 5.00%, 8/01/22 | 3,200,000 | 3,510,688 | ||||||
New York State Thruway Authority, State Personal Income Tax Revenue, (Series A) 5.00%, 3/15/27 | 1,000,000 | 1,059,690 | ||||||
5.25%, 3/15/23 | 2,500,000 | 2,761,725 | ||||||
New York State Urban Development Corp., Service Contract Obligation, Refunding Revenue Bonds, (Series B), 5.25%, 1/01/23 | 5,500,000 | 5,946,050 | ||||||
TOTAL GENERAL REVENUE | $ | 14,343,583 | ||||||
HIGHER EDUCATION – 9.9% | ||||||||
Geneva, NY, Revenue Bonds, (Project A), 5.38%, 2/01/33 | 1,000,000 | 999,990 | ||||||
New York State Dormitory Authority Leas Revenue, Refunding Bonds, (Series A), (Mental Health Services Facilities), 5.00%, 8/15/24 | 2,000,000 | 2,115,000 | ||||||
New York State Dormitory Authority, Nonstate Supported Debt, Refunding Revenue Bonds, (Yeshiva university, OBG), 5.00%, 9/01/27 | 1,415,000 | 1,483,203 | ||||||
New York State Dormitory Authority, Nonstate Supported Debt, Refunding Revenue Bonds, (Yeshiva University, OBG), 5.00%, 9/01/26 | 1,000,000 | 1,056,820 | ||||||
New York State Dormitory Authority, State Supported Debt, Revenue Bonds, (AGM), 5.00%, 7/01/18 | 1,000,000 | 1,118,160 | ||||||
New York State Dormitory Authority, State University Educational Facilities, Refunding Revenue Bonds, (Series A), 7.50%, 5/15/13 | 3,000,000 | 3,376,830 | ||||||
TOTAL HIGHER EDUCATION | $ | 10,150,003 | ||||||
MEDICAL – 8.5% | ||||||||
Chemung County, NY, IDA, (Series A), 5.00%, 11/01/34 | 875,000 | 771,505 | ||||||
Chemung County, NY, IDA, (Series B), 5.00%, 11/01/34 | 1,000,000 | 881,720 | ||||||
Monroe County, NY, IDA, (Highland Hospital Rochester Project), 5.00%, 8/01/22 | 1,000,000 | 1,004,300 | ||||||
Monroe County, NY, IDA, Civic Facilities Revenue Bonds, (Highland Hospital Rochester Project), 5.00%, 8/01/25 | 995,000 | 961,260 | ||||||
New York City, NY, Health and Hospitals Corp., (Series A), 5.45%, 2/15/26 | 1,000,000 | 1,040,910 | ||||||
New York State Dormitory Authority, FHA Insured Mortgage Ellis Hospital Revenue Bonds, (FHA INS), 5.05%, 8/15/24 | 750,000 | 764,887 | ||||||
New York State Dormitory Authority, Health, Hospital, Nursing Home Improvement Revenue Bonds, (AMBAC FHA INS), 5.10%, 2/01/19 | 1,000,000 | 1,000,890 | ||||||
New York State Dormitory Authority, State Supported Debt, Mental health Services Facilities, Revenue Bonds, (Series D), (National-Reinsurance FGIC State Appropriations), 5.00%, 2/15/23 | 2,000,000 | 2,076,000 | ||||||
| Description | Par Value | Value | ||||||
Tompkins, NY, Health Care Corp., (FHA INS), 10.80%, 2/01/28 | $ | 215,000 | $ | 226,799 | ||||
TOTAL MEDICAL | $ | 8,728,271 | ||||||
MULTI-FAMILY HOUSING – 2.0% | ||||||||
East Rochester, NY, Housing Authority, Revenue Bonds, 6.13%, 4/20/43 | 1,355,000 | 1,361,843 | ||||||
5New York State HFA, Phillips Village Project, AMT, (Series A), (Phillips Village LP)/(FHA 236 SONYMA), 7.75%, 8/15/17 | 685,000 | 693,124 | ||||||
5New York State Mortgage Agency, AMT, (Series 67), 5.80%, 10/01/28 | 30,000 | 31,226 | ||||||
TOTAL MULTI-FAMILY HOUSING | $ | 2,086,193 | ||||||
POLLUTION CONTROL – 2.0% | ||||||||
5Niagara County, NY, IDA, Solid Waste Disposal, Refunding Revenue Bonds, AMT, (Series C), (Covanta ARC LLC), Mandatory Tender & Remarketing, 5.63%, 11/15/14 | 2,000,000 | 2,032,880 | ||||||
POWER – 6.4% | ||||||||
Long Island Power Authority, NY, Electric System, Refunding Revenue Bonds, (Series 2010A), 5.00%, 5/01/14 | 1,210,000 | 1,330,782 | ||||||
Long Island Power Authority, NY, Revenue Bonds, (Series E), (National Reinsurance FGIC), 5.00%, 12/01/22 | 5,000,000 | 5,290,900 | ||||||
TOTAL POWER | $ | 6,621,682 | ||||||
SCHOOL DISTRICT – 2.9% | ||||||||
Clarence Central School District, NY, GO Unlimited Bonds, (AGM State Aid Withholding), 5.00%, 5/15/16 | 1,000,000 | 1,040,890 | ||||||
Fairport Central School District, 3.00%, 6/15/16 | 900,000 | 949,401 | ||||||
Moriah, NY, Central School District, GO Unlimited Notes, RANs, 2.50%, 6/22/11 | 995,000 | 996,496 | ||||||
TOTAL SCHOOL DISTRICT | $ | 2,986,787 | ||||||
TOBACCO – 13.9% | ||||||||
New York Counties, NY, Tobacco Trust II, Refunding Revenue Bonds, 5.25%, 6/01/25 | 600,000 | 528,402 | ||||||
Tobacco Settlement Financing Corp., NY, (Series B-1C), 5.25%, 6/01/13 | 115,000 | 115,375 | ||||||
Tobacco Settlement Financing Corp., NY, (Series B-1C), Mandatory Redemption, 5.50%, 6/01/22 | 1,000,000 | 1,054,390 | ||||||
Tobacco Settlement Financing Corp., NY, Asset-Backed Series, (Series A-1) 5.50%, 6/01/18 | 3,000,000 | 3,122,520 | ||||||
5.50%, 6/01/19 | 4,575,000 | 4,879,374 | ||||||
Tobacco Settlement Financing Corp., NY, Asset-Backed Series, (Series A-1), (AMBAC State GTD), 5.25%, 6/01/22 | 3,000,000 | 3,169,410 | ||||||
Tobacco Settlement Financing Corp., NY, Asset-Backed Series, (Series A-1-Callable), 5.25%, 6/01/16 | 1,430,000 | 1,434,333 | ||||||
TOTAL TOBACCO | $ | 14,303,804 | ||||||
(MTB New York Municipal Bond Fund continued next page)
April 30, 2011 / ANNUAL REPORT
Table of Contents
| PORTFOLIOS OF INVESTMENTS | 69 |
MTB New York Municipal Bond Fund (concluded)
| Description | Par Value | Value | ||||||
TRANSPORTATION – 11.7% | ||||||||
Metropolitan Transportation Authority, NY, Revenue Bonds, (Series B), 5.00%, 11/15/22 | $ | 1,000,000 | $ | 1,046,270 | ||||
Metropolitan Transportation Authority, NY, Service Contract, Refunding Revenue Bonds, (Series A), (National Reinsurance FGIC), 5.00%, 7/01/25 | 4,500,000 | 4,516,470 | ||||||
New York State Thruway Authority, Local Highway & Bridge, Service Contract Revenue, Refunding Bonds, 5.50%, 4/01/14 | 2,000,000 | 2,082,540 | ||||||
Triborough Bridge & Tunnel Authority, NY, Refunding Revenue Bonds, ETM, (Series Y), (CAPMAC – ITC GO of Authority), 6.13%, 1/01/21 | 3,500,000 | 4,423,930 | ||||||
TOTAL TRANSPORTATION | $ | 12,069,210 | ||||||
WATER & SEWER – 5.8% | ||||||||
New York City, NY, Municipal Water Finance Authority, (Series C), 5.13%, 6/15/33 | 1,000,000 | 1,004,290 | ||||||
New York City, NY, Municipal Water Finance Authority, Water & Sewer Revenue Bonds, (Series AA), 5.00%, 6/15/21 | 3,000,000 | 3,355,620 | ||||||
New York State Environmental Facilities Corp., NY, State Clean Water & Drinking Revolving Funds, Pooled Financing Program, (Series B), 5.00%, 11/15/18 | 1,450,000 | 1,587,170 | ||||||
TOTAL WATER & SEWER | $ | 5,947,080 | ||||||
| TOTAL NEW YORK | $ | 93,222,721 | ||||||
| TEXAS – 1.2% | ||||||||
SCHOOL DISTRICT – 1.2% | ||||||||
Magnolia Independent School District, TX, GO Unlimited Bonds, (National-Reinsurance FGIC), 8.00%, 8/15/15 | 1,000,000 | 1,235,870 | ||||||
TOTAL TEXAS | $ | 1,235,870 | ||||||
| Description | Par Value | Value | ||||||
| WISCONSIN – 0.8% | ||||||||
TOBACCO – 0.8% | ||||||||
Badger, WI, Tobacco Asset Securitization Corp., Revenue Bonds, 6.13%, 6/01/27 | $ | 825,000 | $ | 856,498 | ||||
TOTAL WISCONSIN | $ | 856,498 | ||||||
| TOTAL MUNICIPAL BONDS (COST $94,973,475) | $ | 96,963,184 | ||||||
3SHORT-TERM MUNICIPAL BONDS – 5.6% |
| |||||||
| NEW YORK – 5.6% | ||||||||
GENERAL OBLIGATIONS – 4.3% | ||||||||
New York City, NY, GO Unlimited, (Subseries A-10) Daily VRDNs, (Morgan Guaranty Trust, LOC), 0.21%, 5/02/11 | 1,000,000 | 1,000,000 | ||||||
New York City, NY, GO Unlimited, (Subseries B-2) Daily VRDNs, (Morgan Guaranty Trust) | ||||||||
0.21%, 5/02/11 | 100,000 | 100,000 | ||||||
0.21%, 5/02/11 | 3,300,000 | 3,300,000 | ||||||
TOTAL GENERAL OBLIGATIONS | $ | 4,400,000 | ||||||
WATER & SEWER – 1.3% | ||||||||
New York City, NY, Municipal Water Finance Authority, Water & Sewer System, Revenue Bonds, (Series C) Daily VRDNs, (Dexia Credit Local Finance, SPA), 0.35%, 5/02/11 | 1,400,000 | 1,400,000 | ||||||
| TOTAL NEW YORK | $ | 5,800,000 | ||||||
| TOTAL SHORT-TERM MUNICIPAL BONDS (COST $5,800,000) | $ | 5,800,000 | ||||||
| TOTAL INVESTMENTS – 99.7% (COST $100,773,475) | $ | 102,763,184 | ||||||
| OTHER ASSETS LESS LIABILITIES – 0.3% | 263,205 | |||||||
| TOTAL NET ASSETS – 100.0% | $ | 103,026,389 | ||||||
Cost of investments for Federal income tax purposes is $100,711,682. The net unrealized appreciation/depreciation of investments was $2,051,502. This consists of net unrealized appreciation from investment for those securities having an excess of value over cost of $2,994,288 and net unrealized depreciation from investments for those securities having an excess of cost over value of $942,786.
Various inputs are used in determining the value of the Fund’s investments. These inputs are summarized in the three broad levels listed below.
Level 1 – quoted prices in active markets for identical securities
Level 2 – other significant observable inputs (including quoted prices for similar securities, interest rates, prepayment speeds, credit risk, etc.)
Level 3 – significant unobservable inputs (including the Fund’s own assumptions in determining the fair value of investments)
The following is a summary of the inputs used as of April 30, 2011 in valuing the Fund’s assets carried at fair value:
| Level 1 | Level 2 | Level 3 | Total | |||||||||||||
Investments in Securities | ||||||||||||||||
Municipal Bonds | $ | — | $ | 96,963,184 | $ | — | $ | 96,963,184 | ||||||||
Short-Term Municipal Bonds | — | 5,800,000 | — | 5,800,000 | ||||||||||||
Total | $ | — | $ | 102,763,184 | $ | — | $ | 102,763,184 | ||||||||
See Notes to Portfolios of Investments
ANNUAL REPORT / April 30, 2011
Table of Contents
| 70 |
PORTFOLIO OF INVESTMENTS SUMMARY TABLE
MTB Pennsylvania Municipal Bond Fund
At April 30, 2011, the Fund’s sector classifications were as follows: (unaudited)
| Percentage of Total Net Assets | ||||
| Higher Education | 21.4 | % | ||
| School District | 18.9 | % | ||
| Continuing Care | 13.2 | % | ||
| Transportation | 9.7 | % | ||
| Facilities | 7.9 | % | ||
| Education | 6.1 | % | ||
| Medical | 5.7 | % | ||
| General Obligation | 5.4 | % | ||
| Water & Sewer | 4.0 | % | ||
| Development | 2.8 | % | ||
| General Revenue | 2.8 | % | ||
| Pollution Control | 0.8 | % | ||
| Cash Equivalents1 | 0.2 | % | ||
| Other Assets and Liabilities – Net2 | 1.1 | % | ||
| TOTAL | 100.0 | % | ||
| (1) | Cash Equivalents include investments in money market mutual fund. |
| (2) | Assets, other than investments in securities, less liabilities. See Statements of Assets and Liabilities. |
| (3) | Derived from data provided by Moody’s Investors Service and Standard and Poor’s. |
| Credit Quality Diversification3 | Percentage of Total Net Assets | |||
| AAA | 5.0 | % | ||
| AA | 29.6 | % | ||
| A | 32.6 | % | ||
| BBB | 19.1 | % | ||
| Not Rated | 12.6 | % | ||
| Other Assets and Liabilities – Net2 | 1.1 | % | ||
| TOTAL | 100.0 | % | ||
PORTFOLIO OF INVESTMENTS
April 30, 2011
| Description | Par Value | Value | ||||||
| MUNICIPAL BONDS – 98.7% | ||||||||
| PENNSYLVANIA – 98.7% | ||||||||
CONTINUING CARE – 13.2% | ||||||||
Bucks County, PA, IDA, Revenue Bonds, (Series A), (Ann’s Choice, Inc.) | $ | 330,000 | $ | 324,855 | ||||
5.30%, 1/01/14 | 275,000 | 268,045 | ||||||
5.40%, 1/01/15 | 240,000 | 231,550 | ||||||
Bucks County, PA, IDA, Revenue Bonds, (Series A), (Pennswood Village)/(PRF 10/1/12 @ 101), 6.00%, 10/01/27 | 1,000,000 | 1,084,690 | ||||||
Bucks County IDA, PA, Refunding Revenue Bonds, (Series A), (Senior Lifestyles Inc., OBG), 10.00%, 5/15/19 | 4,775,000 | 7,336,167 | ||||||
Lancaster County, PA, Hospital Authority, (Masonic Homes), 5.00%, 11/01/21 | 1,160,000 | 1,188,965 | ||||||
Montgomery County, PA, IDA, (ACTS Retirement-Life Community, Inc.), 5.25%, 11/15/28 | 1,850,000 | 1,689,420 | ||||||
| Description | Par Value | Value | ||||||
Montgomery County, PA, IDA, (Whitemarsh Continuing Care Retirement Community), 6.13%, 2/01/28 | $ | 1,500,000 | $ | 1,263,345 | ||||
TOTAL CONTINUING CARE | $ | 13,387,037 | ||||||
DEVELOPMENT – 2.8% | ||||||||
Pennsylvania State IDA, Economic Development, Revenue Bonds, (AMBAC INS), 5.50%, 7/01/13 | 500,000 | 529,365 | ||||||
Philadelphia, PA, Authority for Industrial Development, Revenue Bonds, (Please Touch Museum), 5.25%, 9/01/26 | 1,000,000 | 860,520 | ||||||
Philadelphia, PA, Redevelopment Authority, (Series C), (National Reinsurance FGIC), 5.00%, 4/15/27 | 1,500,000 | 1,465,320 | ||||||
TOTAL DEVELOPMENT | $ | 2,855,205 | ||||||
EDUCATION – 6.1% | ||||||||
Berks County, PA, Vocational Technical School Authority, Refunding Revenue Bonds, (National-Reinsurance), 5.00%, 6/01/14 | 1,655,000 | 1,779,621 | ||||||
(MTB Pennsylvania Municipal Bond Fund continued next page)
April 30, 2011 / ANNUAL REPORT
Table of Contents
| PORTFOLIOS OF INVESTMENTS | 71 |
MTB Pennsylvania Municipal Bond Fund (continued)
| Description | Par Value | Value | ||||||
6,7Bucks County, PA, IDA, Revenue Bonds, (Series A), (School Lane Charter School), 4.88%, 3/15/27 | $ | 1,545,000 | $ | 1,276,464 | ||||
Charleroi, PA, Area School District, (Series C), (FGIC State Aid Withholding), 6.00%, 10/01/17 | 30,000 | 30,078 | ||||||
State Public School Building Authority, PA, College Revenue Bonds, (Northamption County Area Community College Project, OBG), 5.50%, 3/01/31 | 2,000,000 | 2,022,560 | ||||||
York County School of Technology, PA, Authority Lease Revenue, Refunding Bonds, (FGIC) (PRF 2/5/13@100), 5.50%, 2/15/21 | 1,000,000 | 1,088,070 | ||||||
TOTAL EDUCATION | $ | 6,196,793 | ||||||
FACILITIES – 7.9% | ||||||||
Delaware Valley, PA, Regional Financial Authority, Local Government Revenue Bonds, 5.75%, 7/01/32 | 2,550,000 | 2,535,873 | ||||||
Pennsylvania Convention Center Authority, Revenue Bonds, ETM, (Series A), (FGIC INS), 6.00%, 9/01/19 | 2,410,000 | 2,901,327 | ||||||
Pittsburgh, PA, Public Parking Authority, Refunding Revenue Bonds, (Series A), (National Reinsurance FGIC), 5.00%, 12/01/20 | 2,565,000 | 2,595,703 | ||||||
TOTAL FACILITIES | $ | 8,032,903 | ||||||
GENERAL OBLIGATIONS – 5.4% | ||||||||
Allegheny County, PA, GO Unlimited, (Series C-57), (National Reinsurance FGIC), 5.00%, 11/01/22 | 2,000,000 | 2,035,200 | ||||||
Butler County, PA, GO Unlimited Bonds, (National-Reinsurance FGIC), 6.00%, 7/15/11 | 1,000,000 | 1,011,620 | ||||||
Mercer County, PA, GO Unlimited, Refunding Bonds, (National-Reinsurance FGIC), 5.50%, 10/01/18 | 1,155,000 | 1,174,554 | ||||||
Mercer County, PA, GO UT, (National Reinsurance FGIC), 5.50%, 10/01/19 | 1,215,000 | 1,235,570 | ||||||
TOTAL GENERAL OBLIGATIONS | $ | 5,456,944 | ||||||
GENERAL REVENUE – 2.8% | ||||||||
Allegheny County Port Authority, PA, Special Refunding Revenue Bonds, 5.00%, 3/01/16 | 1,000,000 | 1,116,090 | ||||||
Pittsburgh & Allegheny County, PA, Sports & Exhibition Authority, Regional Asset District, Sales Tax Refunding Revenue Bonds, (AGM), 5.00%, 2/01/23 | 1,000,000 | 1,032,240 | ||||||
Southeastern Pennsylvania Transportation Authority, Refunding Revenue Bonds, 5.00%, 3/01/28 | 650,000 | 672,490 | ||||||
TOTAL GENERAL REVENUE | $ | 2,820,820 | ||||||
HIGHER EDUCATION – 21.4% | ||||||||
Allegheny County, PA, Higher Education Building Authority, University Revenue, (Carnegie Mellon University), 5.13%, 3/01/32 | 1,000,000 | 1,001,110 | ||||||
Huntingdon County, PA, General Authority Refunding Revenue Bonds, (Series A), (Juniata College), 5.00%, 5/01/27 | 1,765,000 | 1,782,279 | ||||||
| Description | Par Value | Value | ||||||
Lancaster, PA, Higher Education Authority, College Revenue, Refunding Bonds, (Franklin & Marshall College), 5.00%, 4/15/18 | $ | 2,350,000 | $ | 2,573,861 | ||||
Latrobe, PA, IDA, College Refunding Revenue Bonds, (Saint Vincent College), 5.38%, 5/01/18 | 2,000,000 | 2,001,880 | ||||||
Montgomery County, PA, Higher Education & Health Authority Hospital, (Series FF1), (Dickinson College)/(CIFG INS) | 1,420,000 | 1,506,578 | ||||||
5.00%, 5/01/20 | 1,490,000 | 1,565,528 | ||||||
Montgomery County, PA, Higher Education & Health Authority, Refunding Revenue Bonds, (Arcadia University)/(Radian), 4.50%, 4/01/30 | 1,660,000 | 1,351,306 | ||||||
Pennsylvania State Higher Education Facilities Authority, (Philadelphia College of Osteopathic Medicine), 5.00%, 12/01/13 | 1,345,000 | 1,440,549 | ||||||
Pennsylvania State Higher Education Facilities Authority, (Series EE 1), (York College of PA)/(XLCA), 5.00%, 11/01/18 | 1,020,000 | 1,084,790 | ||||||
Pennsylvania State Higher Education Facilities Authority, (St. Joseph’s University)/(Radian), 5.50%, 12/15/15 | 1,940,000 | 2,023,265 | ||||||
Pennsylvania State Higher Education Facilities Authority, (York College of Pennsylvania)/(National Reinsurance FGIC), 5.00%, 11/01/20 | �� | 550,000 | 566,500 | |||||
Pennsylvania State Higher Educational Revenue, (National Reinsurance FGIC)/(Drexel University), 5.00%, 5/01/27 | 1,250,000 | 1,257,575 | ||||||
Pennsylvania State University, Revenue Bonds, (GO of University), 5.00%, 9/01/17 | 1,335,000 | 1,490,020 | ||||||
Swarthmore Borough Authority, PA, College Revenue, Refunding Bonds, (Swarthmore College, OBG), 5.25%, 9/15/20 | 1,000,000 | 1,056,660 | ||||||
Union County, PA, Higher Educational Facilities Financing Authority, Refunding Revenue Bonds, (Series A), (Bucknell University), 5.25%, 4/01/20 | 1,000,000 | 1,070,500 | ||||||
TOTAL HIGHER EDUCATION | $ | 21,772,401 | ||||||
MEDICAL – 5.7% | ||||||||
Allegheny County, PA, HDA, Revenue Bonds, (Series A), (Jefferson Regional Medical Center, PA) 4.20%, 5/01/11 | 370,000 | 370,007 | ||||||
4.25%, 5/01/12 | 290,000 | 291,894 | ||||||
4.40%, 5/01/16 | 415,000 | 411,016 | ||||||
Lancaster County, PA, Hospital Authority, (Series B), (Lancaster General Hospital), 5.00%, 3/15/23 | 1,770,000 | 1,818,852 | ||||||
Pennsylvania State Higher Education Facilities Authority, (Series A), (University of Pennsylvania-Health System)/(AMBAC INS), 5.00%, 8/15/14 | 2,685,000 | 2,956,400 | ||||||
TOTAL MEDICAL | $ | 5,848,169 | ||||||
POLLUTION CONTROL – 0.8% | ||||||||
Bucks County, PA, IDA, Environmental Improvement Revenue Bonds, (USX Corp.)/(Mandatory Put), 5.40%, 11/01/17 | 750,000 | 772,335 | ||||||
(MTB Pennsylvania Municipal Bond Fund continued next page)
ANNUAL REPORT / April 30, 2011
Table of Contents
| 72 | PORTFOLIOS OF INVESTMENTS |
MTB Pennsylvania Municipal Bond Fund (continued)
| Description | Par Value | Value | ||||||
SCHOOL DISTRICT – 18.9% | ||||||||
Central Dauphin, PA, School District, (National State Aid Withholding)/(PRF 2/1/16 @ 100), 7.00%, 2/01/27 | $ | 2,500,000 | $ | 3,142,900 | ||||
Coatesville School District, PA, GO Unlimited Bonds, (Series A), (Assured Guaranteed State Aid Withholding), 5.00%, 8/15/27 | 1,120,000 | 1,182,541 | ||||||
Eastern York, PA, School District, GO UT, (Series A), (FSA State Aid Withholding), 5.00%, 9/01/24 | 1,200,000 | 1,260,348 | ||||||
Fleetwood Area School District, PA, GO Limited Bonds, (State Aid Withholding), 5.50%, 6/01/17 | 1,000,000 | 1,164,060 | ||||||
Haverford Township, PA, School District, GO UT, (FSA State Aid Withholding), 5.50%, 3/15/19 | 1,000,000 | 1,179,360 | ||||||
Hempfield, PA, School District, GO UT, (Series B), (National Reinsurance FGIC State Aid Withholding), 5.00%, 10/15/18 | 2,650,000 | 2,898,146 | ||||||
Jenkintown, PA, School District, GO UT, (Series A), (FGIC State Aid Withholding)/(PRF 5/15/12 @ 100), 5.00%, 5/15/28 | 1,375,000 | 1,441,756 | ||||||
Mifflin County, PA, School District, GO Unlimited, (National-IBC XLCA State Aid Withholding), 7.50%, 9/01/26 | 2,000,000 | 2,344,380 | ||||||
Philadelphia, PA, School District, GO Unlimited, (Series D), (FSA State Aid Withholding), 5.50%, 6/01/17 | 1,300,000 | 1,475,656 | ||||||
Pittsburgh School District, PA, GO Unlimited Bonds, (Series A), (AGM State Aid Withholding), 5.00%, 9/01/21 | 1,775,000 | 1,959,121 | ||||||
Tredyffrin-Easttown, PA, School District, GO UT, Refunding Bonds, (State Aid Withholding), 5.00%, 2/15/15 | 1,000,000 | 1,138,850 | ||||||
TOTAL SCHOOL DISTRICT | $ | 19,187,118 | ||||||
TRANSPORTATION – 9.7% | ||||||||
Delaware River Joint Toll Bridge Commission, PA, Refunding Revenue Bonds, 5.25%, 7/01/18 | 1,500,000 | 1,600,605 | ||||||
| Description | Par Value/Shares | Value | ||||||
Delaware River Port Authority, PA, (Series A), (FSA GO of Authority), 5.50%, 1/01/16 | $ | 3,410,000 | $ | 3,490,476 | ||||
Pennsylvania State Turnpike Commission, Oil Franchise Tax Revenue Bonds, ETM, (Series A), (AMBAC INS)/(Escrowed in State & Local Government Series COL), 5.00%, 12/01/15 | 2,090,000 | 2,097,545 | ||||||
Pennsylvania State Turnpike Commission, Refunding Revenue Bonds, (Series B), 5.00%, 12/01/21 | 2,400,000 | 2,647,392 | ||||||
TOTAL TRANSPORTATION | $ | 9,836,018 | ||||||
WATER & SEWER – 4.0% | ||||||||
Allegheny County Sanitary Authority, PA, Sewer Revenue Bonds, (Series A), (National-Reinsurance), 5.00%, 12/01/30 | 2,000,000 | 2,004,780 | ||||||
Erie Sewer Authority, PA, Revenue Bonds, 4.63%, 12/01/24 | 2,000,000 | 2,019,140 | ||||||
TOTAL WATER & SEWER | $ | 4,023,920 | ||||||
| TOTAL PENNSYLVANIA | $ | 100,189,663 | ||||||
| TOTAL MUNICIPAL BONDS (COST $97,876,823) | $ | 100,189,663 | ||||||
| MONEY MARKET FUND – 0.2% | ||||||||
8Dreyfus Tax Exempt Cash Management Fund, Institutional Shares, 0.09% | 186,908 | 186,908 | ||||||
| TOTAL MONEY MARKET FUND (COST $186,908) | $ | 186,908 | ||||||
| TOTAL INVESTMENTS – 98.9% (COST $98,063,731) | $ | 100,376,571 | ||||||
| OTHER ASSETS LESS LIABILITIES – 1.1% | 1,159,236 | |||||||
| TOTAL NET ASSETS –100.0% | $ | 101,535,807 | ||||||
Cost of investments for Federal income tax purposes is $97,906,689. The net unrealized appreciation/depreciation of investments was $2,469,882. This consists of net unrealized appreciation from investment for those securities having an excess of value over cost of $3,948,075 and net unrealized depreciation from investments for those securities having an excess of cost over value of $1,478,193.
Various inputs are used in determining the value of the Fund’s investments. These inputs are summarized in the three broad levels listed below.
Level 1 – quoted prices in active markets for identical securities
Level 2 – other significant observable inputs (including quoted prices for similar securities, interest rates, prepayment speeds, credit risk, etc.)
Level 3 – significant unobservable inputs (including the Fund’s own assumptions in determining the fair value of investments)
(MTB Pennsylvania Municipal Bond Fund continued next page)
April 30, 2011 / ANNUAL REPORT
Table of Contents
| PORTFOLIOS OF INVESTMENTS | 73 |
MTB Pennsylvania Municipal Bond Fund (concluded)
The following is a summary of the inputs used as of April 30, 2011 in valuing the Fund’s assets carried at fair value:
| Level 1 | Level 2 | Level 3 | Total | |||||||||||||
Investments in Securities | ||||||||||||||||
Municipal Bonds | $ | — | $ | 100,189,663 | $ | — | $ | 100,189,663 | ||||||||
Money Market Fund | 186,908 | — | — | 186,908 | ||||||||||||
Total | $ | 186,908 | $ | 100,189,663 | $ | — | $ | 100,376,571 | ||||||||
ANNUAL REPORT / April 30, 2011
See Notes to Portfolios of Investments
Table of Contents
| 74 |
PORTFOLIO OF INVESTMENTS SUMMARY TABLE
MTB Maryland Municipal Bond Fund
At April 30, 2011, the Fund’s sector classifications were as follows: (unaudited)
| Percentage of Total Net Assets | ||||
| Medical | 32.3 | % | ||
| General Obligation | 20.9 | % | ||
| Continuing Care | 7.8 | % | ||
| Higher Education | 6.8 | % | ||
| Development | 6.0 | % | ||
| Facilities | 5.6 | % | ||
| General Revenue | 5.3 | % | ||
| Education | 3.8 | % | ||
| Transportation | 3.3 | % | ||
| Water & Sewer | 2.9 | % | ||
| Multi-Family Housing | 1.9 | % | ||
| Special Purpose Entity | 1.9 | % | ||
| Housing | 0.0 | %4 | ||
| Cash Equivalents1 | 0.3 | % | ||
| Other Assets and Liabilities – Net2 | 1.2 | % | ||
| TOTAL | 100.0 | % | ||
| (1) | Cash Equivalents include investments in money market mutual fund. |
| (2) | Assets, other than investments in securities, less liabilities. See Statements of Assets and Liabilities. |
| (3) | Derived from data provided by Moody’s Investors Service and Standard and Poor’s. |
| (4) | Represents less than 0.05%. |
| Credit Quality Diversification3 | Percentage of Total Net Assets | |||
| AAA | 13.6 | % | ||
| AA | 35.2 | % | ||
| A | 12.5 | % | ||
| BBB | 26.0 | % | ||
| BB | 2.1 | % | ||
| B | 0.2 | % | ||
| Not Rated | 9.2 | % | ||
| Other Assets and Liabilities – Net2 | 1.2 | % | ||
| TOTAL | 100.0 | % | ||
PORTFOLIO OF INVESTMENTS
April 30, 2011
| Description | Par Value | Value | ||||||
| MUNICIPAL BONDS - 98.5% | ||||||||
| DISTRICT OF COLUMBIA – 0.9% | ||||||||
TRANSPORTATION – 0.9% | ||||||||
Washington, DC, Metro Area Transit Authority, Refunding Revenue Bonds, (National Reinsurance), 5.00%, 1/01/12 | $ | 1,000,000 | $ | 1,030,840 | ||||
TOTAL DISTRICT OF COLUMBIA | $ | 1,030,840 | ||||||
| MARYLAND – 92.2% | ||||||||
CONTINUING CARE – 7.8% | ||||||||
Baltimore County, MD, Revenue Bonds, (Series A), (Oak Crest Village, Inc.), 5.00%, 1/01/22 | 1,200,000 | 1,198,932 | ||||||
Carroll County, MD, Revenue Bonds, (Series A), (Fairhaven, Inc./Copper Ridge, Inc.)/(Radian), 5.38%, 1/01/16 | 2,000,000 | 1,922,800 | ||||||
Frederick County, MD, Revenue Bonds, (Series A),(Buckingham’s Choice, Inc.), 5.90%, 1/01/17 | 880,000 | 681,648 | ||||||
| Description | Par Value | Value | ||||||
Maryland State Health & Higher Educational Facilities Authority, (Hebrew Home of Greater Washington)/(Landow House, Inc.), 5.80%, 1/01/32 | $ | 2,135,000 | $ | 2,135,363 | ||||
Maryland State Health & Higher Educational Facilities Authority, (Series B), (Peninsula United Methodist), 5.25%, 10/01/13 | 1,000,000 | 659,520 | ||||||
Maryland State Health & Higher Educational Facilities Authority, Revenue Bonds, (Series 2007A), (King Farm Presbyterian Retirement Community) | 1,500,000 | 1,177,800 | ||||||
5.30%, 1/01/37 | 1,500,000 | 1,011,810 | ||||||
TOTAL CONTINUING CARE | $ | 8,787,873 | ||||||
DEVELOPMENT – 6.0% | ||||||||
Maryland State Community Development Administration, Revenue Bonds, (Series A), (National Reinsurance), 5.00%, 6/01/21 | 275,000 | 278,652 | ||||||
(MTB Maryland Municipal Bond Fund continued next page)
April 30, 2011 / ANNUAL REPORT
Table of Contents
| PORTFOLIOS OF INVESTMENTS | 75 |
MTB Maryland Municipal Bond Fund (continued)
| Description | Par Value | Value | ||||||
Maryland State Economic Development Corp., (Lutheran World Relief, Inc.), 5.25%, 4/01/29 | $ | 2,100,000 | $ | 1,970,010 | ||||
Maryland State Economic Development Corp., Lease Refunding Revenue Bonds, (Dept. Transaction Headquarters), 4.00%, 6/01/21 | 2,570,000 | 2,761,645 | ||||||
Maryland State Economic Development Corp., Revenue Bonds, Maryland Department of Transportation, (PRF 6/1/12 @ 100.5), 5.38%, 6/01/19 | 750,000 | 793,590 | ||||||
Maryland State IDFA, (Series B), (National Aquarium in Baltimore, Inc.), 5.10%, 11/01/22 | 1,000,000 | 1,017,600 | ||||||
TOTAL DEVELOPMENT | $ | 6,821,497 | ||||||
EDUCATION – 3.8% | ||||||||
Maryland State Health & Higher Educational Facilities Authority, (FSA INS)/(Bullis School), 5.25%, 7/01/20 | 1,585,000 | 1,602,942 | ||||||
Maryland State Health & Higher Educational Facilities Authority, (Mclean School), 6.00%, 7/01/31 | 1,500,000 | 1,421,040 | ||||||
11,13Maryland State Health & Higher Educational Facilities Authority, Revenue Bonds, (Series 2006), (Washington Christian Academy), 5.50%, 7/01/38 | 1,000,000 | 399,530 | ||||||
Maryland State IDFA, Economic Development Revenue Bonds, (Series 2005A), (Our Lady of Good Counsel High School), 6.00%, 5/01/35 | 1,000,000 | 932,760 | ||||||
TOTAL EDUCATION | $ | 4,356,272 | ||||||
FACILITIES – 5.6% | ||||||||
Baltimore County, MD, Convention Center, Refunding Revenue Bonds, (National Reinsurance), 5.38%, 9/01/11 | 2,910,000 | 2,919,719 | ||||||
Baltimore County, MD, Convention Center, Revenue Bonds, (Series A), (Baltimore Hotel Corp.)/(XLCA), 5.25%, 9/01/39 | 2,500,000 | 2,003,700 | ||||||
Montgomery County, MD, Revenue Authority Lease, Revenue Bonds, 5.00%, 4/01/13 | 1,330,000 | 1,437,531 | ||||||
TOTAL FACILITIES | $ | 6,360,950 | ||||||
GENERAL OBLIGATIONS – 20.9% | ||||||||
5Anne Arundel County, MD, GO Limited Bonds, AMT, 5.50%, 9/01/15 | 500,000 | 501,120 | ||||||
Anne Arundel County, MD, GO Limited Bonds, General Improvements, 4.50%, 3/01/25 | 2,000,000 | 2,081,420 | ||||||
Anne Arundel County, MD, GO Unlimited Bonds, 5.00%, 3/01/16 | 1,000,000 | 1,071,050 | ||||||
Baltimore County, MD, GO Unlimited, Refunding Revenue Bonds, 4.00%, 8/01/27 | 2,000,000 | 2,011,460 | ||||||
Frederick County, MD, GO Unlimited Bonds, 5.25%, 11/01/19 | 1,500,000 | 1,802,325 | ||||||
Frederick County, MD, Public Improvements, GO Unlimited Bonds, (Series A), 4.75%, 3/01/28 | 610,000 | 636,944 | ||||||
Frederick County, MD, Refunding GO Unlimited Bonds, (Series A), 5.25%, 7/01/13 | 2,080,000 | 2,175,160 | ||||||
Harford County, MD, Public Improvements, GO Unlimited Bonds, 4.00%, 7/01/20 | 2,000,000 | 2,179,500 | ||||||
| Description | Par Value | Value | ||||||
Howard County, MD, GO Unlimited, Refunding Bonds, (Series A), 5.25%, 8/15/15 | $ | 1,800,000 | $ | 1,864,728 | ||||
Maryland State, (Series A), 5.50%, 3/01/13 | 2,180,000 | 2,379,754 | ||||||
Montgomery County, MD, GO Unlimited Bonds, (Series A), (PRF 5/1/17 @ 100), 5.00%, 5/01/19 | 1,000,000 | 1,180,700 | ||||||
Queen Anne’s County, MD, (National Reinsurance), 5.00%, 11/15/16 | 1,000,000 | 1,141,370 | ||||||
St. Mary’s County, MD, GO Unlimited Bonds, (St. Mary’s Hospital), 5.00%, 10/01/21 | 1,000,000 | 1,065,190 | ||||||
St. Mary’s County, MD, Refunding GO Unlimited Bonds, 5.00%, 10/01/18 | 2,255,000 | 2,406,671 | ||||||
Washington Suburban Sanitation District, MD, GO Unlimited Bonds, 6.00%, 6/01/18 | 1,000,000 | 1,247,540 | ||||||
TOTAL GENERAL OBLIGATIONS | $ | 23,744,932 | ||||||
GENERAL REVENUE – 3.7% | ||||||||
Anne Arundel County, MD, Refunding Revenue Bonds, (National Business Park Project)/(County Guaranty), 5.13%, 7/01/28 | 2,200,000 | 2,283,292 | ||||||
Baltimore City, MD, Refunding Revenue Bonds, (Series A), (National Reinsurance FGIC), 5.25%, 7/01/17 | 1,000,000 | 1,104,340 | ||||||
Montgomery County, MD, Revenue Bonds, (Series A), (Department of Liquor Controls), 5.00%, 4/01/29 | 555,000 | 577,239 | ||||||
Montgomery County, MD, Special Obligation, Special Tax, (Series A), (Radian), 5.38%, 7/01/20 | 250,000 | 254,777 | ||||||
TOTAL GENERAL REVENUE | $ | 4,219,648 | ||||||
HIGHER EDUCATION – 6.8% | ||||||||
Maryland State Economic Development Corp., (Series A), (Collegiate Housing), 6.00%, 6/01/19 | 1,000,000 | 1,000,120 | ||||||
Maryland State Economic Development Corp., Revenue Bonds, Morgan State University Project, (Series A), 6.00%, 7/01/22 | 500,000 | 483,385 | ||||||
Maryland State Economic Development Corp., Revenue Bonds, University of Maryland/Baltimore, (Series A), 5.75%, 10/01/33 | 350,000 | 234,252 | ||||||
Maryland State Health & Higher Educational Facilities Authority, Refunding Revenue Bonds, (Maryland Institute College of Art), 5.00%, 6/01/36 | 1,900,000 | 1,646,255 | ||||||
St Mary’s College of Maryland, Academic & Auxiliary Fee, Revenue Bonds, (Subseries A), (AMBAC), 4.50%, 9/01/30 | 2,250,000 | 2,127,442 | ||||||
University System, MD, Auxiliary Facility & Tuition Revenue Bonds, (Series A), 4.00%, 4/01/16 | 2,000,000 | 2,237,880 | ||||||
TOTAL HIGHER EDUCATION | $ | 7,729,334 | ||||||
HOUSING – 0.0%** | ||||||||
5Prince Georges County, MD, Housing Authority, Single Family Mortgage, AMT, (Series A), (GNMA)/(FNMA)/(FHLMC), 5.55%, 12/01/33 | 5,000 | 5,141 | ||||||
(MTB Maryland Municipal Bond Fund continued next page)
ANNUAL REPORT / April 30, 2011
Table of Contents
| 76 | PORTFOLIOS OF INVESTMENTS |
MTB Maryland Municipal Bond Fund (continued)
| Description | Par Value | Value | ||||||
MEDICAL – 32.3% | ||||||||
Maryland State Health & Higher Educational Facilities Authority, (Carroll County, MD General Hospital), 6.00%, 7/01/37 | $ | 2,250,000 | $ | 2,256,570 | ||||
Maryland State Health & Higher Educational Facilities Authority, (Carroll Hospital Center), 5.00%, 7/01/40 | 1,000,000 | 907,520 | ||||||
Maryland State Health & Higher Educational Facilities Authority, (Frederick Memorial Hospital), 5.00%, 7/01/22 | 3,000,000 | 3,003,180 | ||||||
Maryland State Health & Higher Educational Facilities Authority, (Johns Hopkins Hospital), 5.00%, 5/15/26 | 900,000 | 900,270 | ||||||
Maryland State Health & Higher Educational Facilities Authority, (Mercy Medical Center), 5.63%, 7/01/31 | 2,000,000 | 1,846,840 | ||||||
Maryland State Health & Higher Educational Facilities Authority, (National Reinsurance)/(Howard County General Hospital, MD), 5.00%, 7/01/19 | 1,500,000 | 1,501,005 | ||||||
Maryland State Health & Higher Educational Facilities Authority, (Series A), (Catholic Health Initiatives), 6.00%, 12/01/13 | 1,370,000 | 1,375,329 | ||||||
Maryland State Health & Higher Educational Facilities Authority, (Series A), (Doctors Hospital, Inc.), 5.00%, 7/01/27 | 1,750,000 | 1,548,750 | ||||||
Maryland State Health & Higher Educational Facilities Authority, (Series A), (Medlantic/Helix Parent, Inc.)/(FSA INS), 5.25%, 8/15/12 | 1,175,000 | 1,178,408 | ||||||
Maryland State Health & Higher Educational Facilities Authority, (Series A), (Suburban Hospital), 5.50%, 7/01/16 | 600,000 | 642,972 | ||||||
Maryland State Health & Higher Educational Facilities Authority, (Series B), (University of Maryland Medical System)/(AMBAC INS), 5.00%, 7/01/15 | 1,740,000 | 1,818,944 | ||||||
Maryland State Health & Higher Educational Facilities Authority, (University of Maryland Medical System), 5.00%, 7/01/12 | 685,000 | 700,611 | ||||||
Maryland State Health & Higher Educational Facilities Authority, ETM, (AMBAC INS)/(Helix Health Systems, Inc.), 5.00%, 7/01/27 | 3,630,000 | 4,129,815 | ||||||
Maryland State Health & Higher Educational Facilities Authority, ETM, (Howard County General Hospital, MD), 5.50%, 7/01/13 | 380,000 | 392,095 | ||||||
Maryland State Health & Higher Educational Facilities Authority, Refunding Revenue Bonds, (Series C), (Upper Chesapeake Medical Center), 5.50%, 1/01/28 | 2,500,000 | 2,531,800 | ||||||
Maryland State Health & Higher Educational Facilities Authority, Refunding Revenue Bonds, ETM, (Series A), (Lifebridge Health, Inc.), 5.00%, 7/01/12 | 1,000,000 | 1,053,190 | ||||||
Maryland State Health & Higher Educational Facilities Authority, Revenue Bonds, (Johns Hopkins Hospital), 5.00%, 5/15/13 | 1,465,000 | 1,469,322 | ||||||
Maryland State Health & Higher Educational Facilities Authority, Revenue Bonds, (Kennedy Krieger Children Hospital)/ (Obligated Group), 5.50%, 7/01/33 | 500,000 | 455,840 | ||||||
| Description | Par Value | Value | ||||||
Maryland State Health & Higher Educational Facilities Authority, Revenue Bonds, (MedStar Health, Inc.), 5.25%, 5/15/46 | $ | 1,000,000 | $ | 898,610 | ||||
Maryland State Health & Higher Educational Facilities Authority, Revenue Bonds, (Peninsula Regional Medical Center) | 1,745,000 | 1,837,380 | ||||||
5.00%, 7/01/26 | 1,000,000 | 955,360 | ||||||
Maryland State Health & Higher Educational Facilities Authority, Revenue Bonds, (Series A), (Doctors Community Hospital), 5.00%, 7/01/20 | 1,000,000 | 989,430 | ||||||
Maryland State Health & Higher Educational Facilities Authority, Revenue Bonds, (Series A), (Sheppard Pratt Health System), 5.25%, 7/01/35 | 500,000 | 460,795 | ||||||
Maryland State Health & Higher Educational Facilities Authority, Revenue Bonds, (Series A), (Western Maryland Health System)/(National Reinsurance FHA 242), 4.00%, 1/01/18 | 1,935,000 | 1,990,960 | ||||||
Maryland State Health & Higher Educational Facilities Authority, Revenue Bonds, (Union Hospital of Cecil County), 5.00%, 7/01/40 | 1,000,000 | 888,010 | ||||||
Maryland State Health & Higher Educational Facilities Authority, Revenue Bonds, ETM, (Frederick Memorial Hospital)/(FGIC INS), 5.25%, 7/01/13 | 300,000 | 310,011 | ||||||
Montgomery County, MD, EDA, (Trinity Health Care Group), 5.13%, 12/01/22 | 600,000 | 602,784 | ||||||
TOTAL MEDICAL | $ | 36,645,801 | ||||||
TRANSPORTATION – 2.4% | ||||||||
Maryland State Department of Transportation, Refunding Revenue Bonds, 5.00%, 5/01/15 | 1,375,000 | 1,523,280 | ||||||
Maryland State Department of Transportation, Revenue Bonds, 5.50%, 2/01/16 | 1,000,000 | 1,180,790 | ||||||
TOTAL TRANSPORTATION | $ | 2,704,070 | ||||||
WATER & SEWER – 2.9% | ||||||||
Baltimore County, MD, Wastewater Project Revenue Bonds, (Series B), (National Reinsurance)/(PRF 7/01/15 @ 100), 5.00%, 7/01/22 | 1,290,000 | 1,481,785 | ||||||
Baltimore County, MD, Wastewater Revenue Bonds, (National Reinsurance FGIC), 6.00%, 7/01/15 | 855,000 | 924,905 | ||||||
Baltimore County, MD, Water Projects Revenue Bonds, ETM, (Series A), (FGIC INS), 5.38%, 7/01/15 | 775,000 | 866,907 | ||||||
TOTAL WATER & SEWER | $ | 3,273,597 | ||||||
| TOTAL MARYLAND | $ | 104,649,115 | ||||||
| PUERTO RICO – 3.5% | ||||||||
GENERAL REVENUE – 1.6% | ||||||||
Puerto Rico Public Finance Corp., (Series A), (AMBAC INS), 5.38%, 6/01/19 | 1,500,000 | 1,752,855 | ||||||
(MTB Maryland Municipal Bond Fund continued next page)
April 30, 2011 / ANNUAL REPORT
Table of Contents
| PORTFOLIOS OF INVESTMENTS | 77 |
MTB Maryland Municipal Bond Fund (concluded)
| Description | Par Value | Value | ||||||
MULTI-FAMILY HOUSING – 1.9% | ||||||||
Puerto Rico Housing Finance Authority, Prerefunded Revenue Bonds, Capital Guaranteed Program, (HUD LN)/(PRF 12/1/13 @ 100), 5.00%, 12/01/18 | $ | 1,400,000 | $ | 1,547,616 | ||||
Puerto Rico Housing Finance Authority, Unrefunded Revenue Bonds, Capital Funding Program, (HUD LN), 5.00%, 12/01/18 | 600,000 | 621,126 | ||||||
TOTAL MULTI-FAMILY HOUSING | $ | 2,168,742 | ||||||
| TOTAL PUERTO RICO | $ | 3,921,597 | ||||||
| WISCONSIN – 1.9% | ||||||||
SPECIAL PURPOSE ENTITY – 1.9% | ||||||||
Badger, WI, Tobacco Asset Securitization Corp., Revenue Bonds, (PRF 6/1/12 @ 100), 7.00%, 6/01/28 | 2,000,000 | 2,141,920 | ||||||
TOTAL WISCONSIN | $ | 2,141,920 | ||||||
| TOTAL MUNICIPAL BONDS (COST $111,849,173) | $ | 111,743,472 | ||||||
| Description | Shares | Value | ||||||
MONEY MARKET FUND – 0.3% | ||||||||
8Dreyfus Tax Exempt Cash Management Fund, Institutional Shares, 0.09% | 388,031 | $ | 388,031 | |||||
| TOTAL MONEY MARKET FUND (COST $388,031) | $ | 388,031 | ||||||
| TOTAL INVESTMENTS – 98.8% (COST $112,237,204) | $ | 112,131,503 | ||||||
| OTHER ASSETS LESS LIABILITIES – 1.2% | 1,330,153 | |||||||
| TOTAL NET ASSETS – 100.0% | $ | 113,461,656 | ||||||
Cost of investments for Federal income tax purposes is $112,149,425. The net unrealized appreciation/depreciation of investments was $(17,922). This consists of net unrealized appreciation from investment for those securities having an excess of value over cost of $3,892,858 and net unrealized depreciation from investments for those securities having an excess of cost over value of $3,910,780.
Various inputs are used in determining the value of the Fund’s investments. These inputs are summarized in the three broad levels listed below.
Level 1 – quoted prices in active markets for identical securities
Level 2 – other significant observable inputs (including quoted prices for similar securities, interest rates, prepayment speeds, credit risk, etc.)
Level 3 – significant unobservable inputs (including the Fund’s own assumptions in determining the fair value of investments)
The following is a summary of the inputs used as of April 30, 2011 in valuing the Fund’s assets carried at fair value:
| Level 1 | Level 2 | Level 3 | Total | |||||||||||||
Investments in Securities | ||||||||||||||||
Municipal Bonds | $ | — | $ | 111,743,472 | $ | — | $ | 111,743,472 | ||||||||
Money Market Fund | 388,031 | — | — | 388,031 | ||||||||||||
Total | $ | 388,031 | $ | 111,743,472 | $ | — | $ | 112,131,503 | ||||||||
See Notes to Portfolios of Investments
ANNUAL REPORT / April 30, 2011
Table of Contents
| 78 |
PORTFOLIO OF INVESTMENTS SUMMARY TABLE
MTB Virginia Municipal Bond Fund
At April 30, 2011, the Fund’s sector classifications were as follows: (unaudited)
| Percentage of Total Net Assets | ||||
| Medical | 16.5 | % | ||
| General Obligation | 14.3 | % | ||
| Water & Sewer | 13.8 | % | ||
| Transportation | 8.2 | % | ||
| Facilities | 6.8 | % | ||
| Education | 6.6 | % | ||
| Higher Education | 6.4 | % | ||
| General Revenue | 5.5 | % | ||
| Multi-Family Housing | 4.9 | % | ||
| Pollution Control | 3.7 | % | ||
| Development | 3.2 | % | ||
| Airport Development & Maintenance | 2.9 | % | ||
| Utilities | 2.4 | % | ||
| Tobacco Settlement | 1.9 | % | ||
| Cash Equivalents1 | 1.9 | % | ||
| Other Assets and Liabilities – Net2 | 1.0 | % | ||
| TOTAL | 100.0 | % | ||
| (1) | Cash Equivalents include investments in money market mutual fund. |
| (2) | Assets, other than investments in securities, less liabilities. See Statements of Assets and Liabilities. |
| (3) | Derived from data provided by Moody’s Investors Service and Standard and Poor’s. |
| Credit Quality Diversification3 | Percentage of Total Net Assets | |||
| AAA | 17.9 | % | ||
| AA | 51.3 | % | ||
| A | 14.9 | % | ||
| BBB | 6.3 | % | ||
| Not Rated | 8.6 | % | ||
| Other Assets and Liabilities – Net2 | 1.0 | % | ||
| TOTAL | 100.0 | % | ||
PORTFOLIO OF INVESTMENTS
April 30, 2011
| Description | Par Value | Value | ||||||
| MUNICIPAL BONDS – 97.1% | ||||||||
| DISTRICT OF COLUMBIA – 2.9% | ||||||||
AIRPORT DEVELOPMENT & MAINTENANCE – 2.9% | ||||||||
Metropolitan Washington, DC, Airports Authority Revenue Bonds, AMT, (Series D), (FSA INS) | ||||||||
55.38%, 10/01/18 | $ | 245,000 | $ | 257,985 | ||||
55.38%, 10/01/19 | 335,000 | 352,501 | ||||||
TOTAL AIRPORT DEVELOPMENT & MAINTENANCE | $ | 610,486 | ||||||
| TOTAL DISTRICT OF COLUMBIA | $ | 610,486 | ||||||
| PUERTO RICO – 5.0% | ||||||||
FACILITIES – 1.7% | ||||||||
Puerto Rico Commonwealth Infrastructure Financing Authority, Special Tax Refunding Bonds, (Series C), (FGIC INS), 5.50%, 7/01/20 | 350,000 | 366,656 | ||||||
| Description | Par Value | Value | ||||||
GENERAL OBLIGATIONS – 0.8% | ||||||||
Commonwealth of Puerto Rico, GO UT, Prerefunded, (Series A), (PRF 7/01/13 @ 100), 5.00%, 7/01/33 | $ | 150,000 | $ | 164,307 | ||||
GENERAL REVENUE – 1.2% | ||||||||
Puerto Rico Public Finance Corp., Revenue Bonds, (Series A), (U.S. Treasury and U.S. Government PRF 8/1/11 @ 100)/(National Reinsurance), 5.00%, 8/01/31 | 250,000 | 253,028 | ||||||
TRANSPORTATION – 1.3% | ||||||||
Puerto Rico Highway and Transportation Authority, (Series W), 5.50%, 7/01/13 | 250,000 | 265,185 | ||||||
| TOTAL PUERTO RICO | $ | 1,049,176 | ||||||
| VIRGINIA – 89.2% | ||||||||
DEVELOPMENT – 3.2% | ||||||||
Frederick County, VA, IDA, Revenue Bonds, (AMBAC INS), 5.00%, 12/01/14 | 455,000 | 505,309 | ||||||
(MTB Virginia Municipal Bond Fund continued next page)
April 30, 2011 / ANNUAL REPORT
Table of Contents
| PORTFOLIOS OF INVESTMENTS | 79 |
MTB Virginia Municipal Bond Fund (continued)
| Description | Par Value | Value | ||||||
Virginia Beach, Development Authority, Social Services Facility, (AMBAC INS), 5.00%, 12/01/17 | $ | 100,000 | $ | 100,288 | ||||
Virginia Beach, Development Authority, Town Center Project Phase I, (Series A), 4.25%, 8/01/13 | 50,000 | 52,119 | ||||||
TOTAL DEVELOPMENT | $ | 657,716 | ||||||
EDUCATION – 6.6% | ||||||||
Alexandria, VA, IDA, Revenue Bonds, (Episcopal High School), 5.00%, 1/01/29 | 250,000 | 252,110 | ||||||
Manassas Park Economic Development Authority, VA, Refunding Revenue Bonds, (Series A), 4.38%, 7/15/17 | 370,000 | 376,405 | ||||||
Spotsylvania County, VA, IDA, Public Facility Revenue, (Series B), (School Facilities Project)/(AMBAC), 5.00%, 8/01/28 | 325,000 | 314,749 | ||||||
Virginia State, Public School Authority, Revenue Bonds, (Series B), (School Financing-1997 Resolution)/(National-Reinsurance), 5.00%, 8/01/26 | 400,000 | 426,824 | ||||||
TOTAL EDUCATION | $ | 1,370,088 | ||||||
FACILITIES – 5.1% | ||||||||
Henrico County, VA, EDA, Refunding Revenue Bonds, (Series B), 4.50%, 8/01/21 | 325,000 | 360,604 | ||||||
Virginia State, Public Building Authority, Public Facility Revenue Bonds, (Series B) 5.00%, 8/01/16 | 135,000 | 157,718 | ||||||
5.00%, 8/01/23 | 500,000 | 539,480 | ||||||
TOTAL FACILITIES | $ | 1,057,802 | ||||||
GENERAL OBLIGATIONS – 13.5% | ||||||||
Arlington County, VA, Public Improvement, GO UT, (State Aid Withholding)/(U. S. Treasury PRF 2/1/12 @ 100), 5.25%, 2/01/15 | 350,000 | 363,114 | ||||||
Hanover County, VA, Public Improvements Refunding Bonds, GO Unlimited, 5.00%, 7/15/19 | 110,000 | 130,054 | ||||||
Loudoun County, VA, GO Unlimited Bonds, (Series A), 5.00%, 7/01/25 | 400,000 | 444,108 | ||||||
Loudoun County, VA, GO UT, (Series B), (State Aid Withholding), 5.25%, 12/01/14 | 500,000 | 574,055 | ||||||
Newport News, VA, GO Unlimited, Refunding Notes, (Series 2007A), 5.00%, 3/01/19 | 100,000 | 113,582 | ||||||
Richmond, VA, Public Improvements, GO Unlimited, Refunding Bonds, (Series B), (FSA INS), 5.00%, 7/15/16 | 500,000 | 569,325 | ||||||
5Roanoke, VA, GO UT, AMT, (Series B), (National Reinsurance FGIC), 5.00%, 10/01/11 | 165,000 | 167,680 | ||||||
Virginia Beach, Public Improvement, GO Unlimited Bonds, (Series B), 5.00%, 5/01/20 | 400,000 | 449,980 | ||||||
TOTAL GENERAL OBLIGATIONS | $ | 2,811,898 | ||||||
GENERAL REVENUE – 4.3% | ||||||||
Virginia State, Resources Authority Infrastructure, Refunding Revenue Bonds, (VA Pooled Funding Program)/(Moral Obligated), 5.00%, 11/01/30 | 500,000 | 526,075 | ||||||
| Description | Par Value | Value | ||||||
Virginia State, Resources Authority Infrastructure, Revenue Bonds, (Series A), (VA Pooled Funding Program), 4.00%, 11/01/21 | $ | 350,000 | $ | 369,030 | ||||
TOTAL GENERAL REVENUE | $ | 895,105 | ||||||
HIGHER EDUCATION – 6.4% | ||||||||
Fredericksburg, VA, IDA, Revenue Bonds, (Mary Washington College R/E)/(State and Local Government PRF 4/01/14 @ 100), 5.35%, 4/01/29 | 250,000 | 279,128 | ||||||
Virginia College Building Authority, Educational Facilities, Refunding Revenue Bonds, (Series B), (University of Richmond, OBG), 5.00%, 3/01/21 | 250,000 | 294,180 | ||||||
Virginia College Building Authority, Educational Facilities, Revenue Bonds, (Series A), (Public Higher Education Funding Program), 5.00%, 9/01/23 | 200,000 | 221,278 | ||||||
Virginia College Building Authority, Refunding Revenue Bonds, (National Reinsurance)/(Washington & Lee University), 5.25%, 1/01/31 | 500,000 | 549,200 | ||||||
TOTAL HIGHER EDUCATION | $ | 1,343,786 | ||||||
MEDICAL – 16.5% | ||||||||
Albemarle County, VA, IDA, (Martha Jefferson Hospital), 5.25%, 10/01/15 | 650,000 | 692,081 | ||||||
Albemarle County, VA, IDA, Revenue Bonds, (Westminster-Canterbury of Richmond), 4.63%, 1/01/19 | 200,000 | 190,354 | ||||||
Fairfax County, VA, IDA, Refunding Revenue Bonds, (Inova Health System), 5.25%, 8/15/19 | 500,000 | 555,460 | ||||||
Fairfax County, VA, IDA, Revenue Bonds, (Inova Health System), 5.00%, 8/15/23 | 250,000 | 266,387 | ||||||
Fredericksburg, VA, Economic Development Authority, Hospital Facilities Revenue, Refunding Bonds, (Medicorp Health System), 5.25%, 6/15/19 | 250,000 | 272,070 | ||||||
Henrico County, VA, EDA, Revenue Bonds, (Series A), (Obligated Group)/(Bon Secours Health System, Inc., St. Francis Medical)/(State and Local Government PRF 11/15/12 @ 100), 5.60%, 11/15/30 | 5,000 | 5,395 | ||||||
Henrico County, VA, EDA, Unrefunded Revenue Bonds, (Series A), (Obligated Group)/(Bon Secours Health System, Inc., St. Francis Medical), 5.60%, 11/15/30 | 495,000 | 489,194 | ||||||
Smyth County, VA, IDA, Hospital Refunding Revenue Bonds, (Mountain States Health Alliance), 5.00%, 7/01/15 | 400,000 | 422,924 | ||||||
Virginia Beach, Development Authority, (Virginia Beach, VA General Hospital)/(AMBAC INS), 5.13%, 2/15/18 | 110,000 | 120,150 | ||||||
Virginia Beach, Development Authority, Residential Care Facilities, (Westminster Canterbury), 5.38%, 11/01/32 | 500,000 | 428,120 | ||||||
TOTAL MEDICAL | $ | 3,442,135 | ||||||
MULTI-FAMILY HOUSING – 4.9% | ||||||||
5Arlington County, VA, IDA, Colonial Village Revenue Bonds, AMT, (AHC LP-2)/(FANNIE MAE), Mandatory Tender 11/1/19, 5.15%, 11/01/31 | 500,000 | 509,635 | ||||||
(MTB Virginia Municipal Bond Fund continued next page)
ANNUAL REPORT / April 30, 2011
Table of Contents
| 80 | PORTFOLIOS OF INVESTMENTS |
MTB Virginia Municipal Bond Fund (concluded)
| Description | Par Value | Value | ||||||
5Virginia State, Housing Development Authority, Rental Housing , AMT, (Series N), (GO of Authority), 5.13%, 1/01/15 | $ | 500,000 | $ | 505,170 | ||||
TOTAL MULTI-FAMILY HOUSING | $ | 1,014,805 | ||||||
POLLUTION CONTROL – 3.7% | ||||||||
Chesterfield County, VA, IDA, Pollution Control Revenue Bonds, (Virginia Electric & Power Co.), 5.88%, 6/01/17 | 200,000 | 204,456 | ||||||
Southeastern Public Service Authority, VA, Prerefunding Revenue Bonds, ETM, (AMBAC), 5.00%, 7/01/15 | 255,000 | 284,570 | ||||||
Southeastern Public Service Authority, VA, Refunding Revenue Bonds, ETM, (AMBAC), 5.00%, 7/01/15 | 245,000 | 274,169 | ||||||
TOTAL POLLUTION CONTROL | $ | 763,195 | ||||||
TOBACCO SETTLEMENT – 1.9% | ||||||||
Tobacco Settlement Financing Corp., VA, Revenue Bonds, 5.63%, 6/01/37 | 335,000 | 389,675 | ||||||
TRANSPORTATION – 6.9% | ||||||||
Richmond, VA, Metropolitan Authority, Refunding Revenue Bonds, (National Reinsurance FGIC), 5.25%, 7/15/17 | 400,000 | 443,436 | ||||||
Virginia Commonwealth Transportation Board, Federal Highway Reimbursement, Revenue Bonds, Anticipation Notes, 5.00%, 9/28/15 | 500,000 | 576,685 | ||||||
Virginia Commonwealth Transportation Board, Transportation Revenue, (National Reinsurance-IBC), 5.00%, 4/01/15 | 400,000 | 414,228 | ||||||
TOTAL TRANSPORTATION | $ | 1,434,349 | ||||||
UTILITIES – 2.4% | ||||||||
Richmond, VA, Public Utility, Revenue Bonds, 5.00%, 1/15/28 | 470,000 | 497,537 | ||||||
| Description | Par Value/Shares | Value | ||||||
WATER & SEWER – 13.8% | ||||||||
Fairfax County, VA, Water Authority Revenue Bonds, ETM, (Escrowed in U.S. Treasuries, COL), 5.80%, 1/01/16 | $ | 440,000 | $ | 486,864 | ||||
Fairfax County, VA, Water Authority Revenue, Refunding Bonds, 5.00%, 4/01/21 | 100,000 | 114,173 | ||||||
Henrico County, VA, Water & Sewer Revenue, Refunding Bonds, 5.00%, 5/01/24 | 550,000 | 611,017 | ||||||
Norfolk, VA, Water Revenue Bonds, (National Reinsurance) | 500,000 | 501,995 | ||||||
5.88%, 11/01/15 | 500,000 | 502,045 | ||||||
Upper Occoquan Sewage Authority, VA, (Series A), (National Reinsurance), 5.15%, 7/01/20 | 575,000 | 662,699 | ||||||
TOTAL WATER & SEWER | $ | 2,878,793 | ||||||
| TOTAL VIRGINIA | $ | 18,556,884 | ||||||
| TOTAL MUNICIPAL BONDS (COST $19,639,681) | $ | 20,216,546 | ||||||
| MONEY MARKET FUND – 1.9% | ||||||||
8Dreyfus Tax Exempt Cash Management Fund, Institutional Shares, 0.09% | 386,074 | 386,074 | ||||||
| TOTAL MONEY MARKET FUND (COST $386,074) | $ | 386,074 | ||||||
| TOTAL INVESTMENTS – 99.0% (COST $20,025,755) | $ | 20,602,620 | ||||||
| OTHER ASSETS LESS LIABILITIES – 1.0% | 200,616 | |||||||
| TOTAL NET ASSETS – 100.0% | $ | 20,803,236 | ||||||
Cost of investments for Federal income tax purposes is $20,004,808. The net unrealized appreciation/depreciation of investments was $597,812. This consists of net unrealized appreciation from investment for those securities having an excess of value over cost of $819,813 and net unrealized depreciation from investments for those securities having an excess of cost over value of $222,001.
Various inputs are used in determining the value of the Fund’s investments. These inputs are summarized in the three broad levels listed below.
Level 1 – quoted prices in active markets for identical securities
Level 2 – other significant observable inputs (including quoted prices for similar securities, interest rates, prepayment speeds, credit risk, etc.)
Level 3 – significant unobservable inputs (including the Fund’s own assumptions in determining the fair value of investments)
The following is a summary of the inputs used as of April 30, 2011 in valuing the Fund’s assets carried at fair value:
| Level 1 | Level 2 | Level 3 | Total | |||||||||||||
Investments in Securities | ||||||||||||||||
Municipal Bonds | $ | — | $ | 20,216,546 | $ | — | $ | 20,216,546 | ||||||||
Money Market Fund | 386,074 | — | — | 386,074 | ||||||||||||
Total | $ | 386,074 | $ | 20,216,546 | $ | — | $ | 20,602,620 | ||||||||
See Notes to Portfolios of Investments
April 30, 2011 / ANNUAL REPORT
Table of Contents
| 81 |
PORTFOLIO OF INVESTMENTS SUMMARY TABLE
MTB Intermediate-Term Bond Fund
At April 30, 2011, the Fund’s portfolio composition was as follows: (unaudited)
| Percentage of Total Net Assets | ||||
| Corporate Bonds | 54.7 | % | ||
| Mortgage-Backed Securities | 17.3 | % | ||
| U.S. Treasury | 14.4 | % | ||
| Collateralized Mortgage Obligations | 4.5 | % | ||
| Asset Backed Securities | 2.8 | % | ||
| Enhanced Equipment Trust Certificates | 1.8 | % | ||
| Government Agency | 0.9 | % | ||
| Cash Equivalents1 | 11.3 | % | ||
| Other Assets and Liabilities – Net2 | (7.7 | )% | ||
| TOTAL | 100.0 | % | ||
| (1) | Cash Equivalents include investments in repurchase agreements. |
| (2) | Assets, other than investments in securities, less liabilities. See Statements of Assets and Liabilities. |
| (3) | Derived from data provided by Moody’s Investors Service and Standard and Poor’s. |
| Credit Quality Diversification3 | Percentage of Total Net Assets | |||
| AAA | 6.7 | % | ||
| AA | 2.8 | % | ||
| A | 16.9 | % | ||
| BBB | 27.1 | % | ||
| BB | 7.2 | % | ||
| B | 2.7 | % | ||
| CCC | 0.9 | % | ||
| Not Rated | 11.2 | % | ||
| U.S. Government | 17.8 | % | ||
| U.S. Treasury | 14.4 | % | ||
| Other Assets and Liabilities – Net2 | (7.7 | )% | ||
| TOTAL | 100.0 | % | ||
PORTFOLIO OF INVESTMENTS
April 30, 2011
| Description | Par Value | Value | ||||||
| ASSET BACKED SECURITIES – 2.8% | ||||||||
FINANCIAL SERVICES – 2.2% | ||||||||
BMW Vehicle Lease Trust, Series 2009-1, Class A4, 3.66%, 8/15/13 | $ | 1,000,000 | $ | 1,007,925 | ||||
Hyundai Auto Receivables Trust, Series 2011-A, Class A2, 0.69%, 11/15/13 | 1,500,000 | 1,501,406 | ||||||
TOTAL FINANCIAL SERVICES | $ | 2,509,331 | ||||||
WHOLE LOAN – 0.6% | ||||||||
1,6,7Student Loan Marketing Association, Series 2011-A, Class A1, 1.21%, 6/15/11 | 750,000 | 751,521 | ||||||
| TOTAL ASSET BACKED SECURITIES (COST $3,249,732) | $ | 3,260,852 | ||||||
| COLLATERALIZED MORTGAGE OBLIGATIONS – 4.5% | ||||||||
COMMERCIAL MORTGAGE-BACKED SECURITIES (CMBS) – 2.9% | ||||||||
6,7American Tower Trust, Series 2007-1A, Class AFX, 5.42%, 4/15/37 | 1,000,000 | 1,085,359 | ||||||
Merrill Lynch Mortgage Trust, Series 2006-C1, Class A2, 5.81%, 5/12/39 | 1,230,741 | 1,264,500 | ||||||
Morgan Stanley Capital I, Series 2004-IQ7, Class A4, 5.54%, 6/15/38 | 1,000,000 | 1,080,633 | ||||||
TOTAL COMMERCIAL MORTGAGE-BACKED SECURITIES (CMBS) | $ | 3,430,492 | ||||||
| Description | Par Value | Value | ||||||
FEDERAL HOME LOAN MORTGAGE CORPORATION (FHLMC) – 0.5% | ||||||||
Series 1920, Class H, 7.00%, 1/15/12 | $ | 26,575 | $ | 27,005 | ||||
Series R001, Class AE, 4.38%, 4/15/15 | 505,283 | 523,998 | ||||||
TOTAL FEDERAL HOME LOAN MORTGAGE CORPORATION (FHLMC) | $ | 551,003 | ||||||
WHOLE LOAN – 1.1% | ||||||||
1Indymac INDA Mortgage Loan Trust, Series 2005-AR1, Class 2A1, 5.06%, 5/25/11 | 1,394,563 | 1,250,220 | ||||||
| TOTAL COLLATERALIZED MORTGAGE OBLIGATIONS (COST $5,259,607) | $ | 5,231,715 | ||||||
| CORPORATE BONDS – 54.7% | ||||||||
AGRICULTURE – 0.5% | ||||||||
Archer-Daniels-Midland Co., Sr. Unsecured, 4.48%, 3/01/21 | 500,000 | 516,309 | ||||||
APPAREL – 0.9% | ||||||||
Hanesbrands, Inc., Company Guaranteed, 6.38%, 12/15/20 | 1,000,000 | 1,000,000 | ||||||
AUTO MANUFACTURERS – 0.2% | ||||||||
6,7Hyundai Motor Manufacturing Czech s.r.o., Company Guaranteed, 4.50%, 4/15/15 | 250,000 | 258,858 | ||||||
AUTO PARTS & EQUIPMENT – 0.9% | ||||||||
Johnson Controls, Inc., Sr. Unsecured, 1.75%, 3/01/14 | 1,000,000 | 1,004,324 | ||||||
(MTB Intermediate-Term Bond Fund continued next page)
ANNUAL REPORT / April 30, 2011
Table of Contents
| 82 | PORTFOLIOS OF INVESTMENTS |
MTB Intermediate-Term Bond Fund (continued)
| Description | Par Value | Value | ||||||
BANKS – 12.4% | ||||||||
6,7ABN Amro Bank NV, Sr. Unsecured, 3.00%, 1/31/14 | $ | 500,000 | $ | 508,065 | ||||
Ally Financial, Inc., Company Guaranteed, 4.50%, 2/11/14 | 300,000 | 303,375 | ||||||
Ally Financial, Inc., Company Guaranteed, 8.00%, 3/15/20 | 250,000 | 281,875 | ||||||
6,7Ally Financial, Inc., Company Guaranteed, 7.50%, 9/15/20 | 500,000 | 550,000 | ||||||
1BB&T Corp., Sr. Unsecured, 0.97%, 7/28/11 | 1,000,000 | 1,001,249 | ||||||
BB&T Corp., Sr. Unsecured, MTN, 3.20%, 3/15/16 | 500,000 | 505,379 | ||||||
Citigroup, Inc., Sr. Unsecured, 5.50%, 10/15/14 | 500,000 | 544,507 | ||||||
Citigroup, Inc., Sr. Unsecured, 4.75%, 5/19/15 | 500,000 | 532,207 | ||||||
12Fifth Third Bancorp, Sr. Unsecured, 6.25%, 5/01/13 | 850,000 | 924,436 | ||||||
Goldman Sachs Group, Inc., Sr. Unsecured, 6.25%, 9/01/17 | 2,000,000 | 2,227,364 | ||||||
HSBC Holdings PLC, Sr. Unsecured, 5.10%, 4/05/21 | 500,000 | 515,621 | ||||||
1JPMorgan Chase & Co., Notes, MTN, 0.00%, 5/02/11 | 1,000,000 | 1,001,500 | ||||||
1JPMorgan Chase Capital XXIII, Limited Guarantee, 1.31%, 5/16/11 | 1,000,000 | 839,346 | ||||||
KeyCorp, Sr. Unsecured, MTN, 6.50%, 5/14/13 | 750,000 | 819,914 | ||||||
State Street Corp., Sr. Unsecured, 4.30%, 5/30/14 | 250,000 | 269,222 | ||||||
U.S. Bancorp, Jr. Subordinated, 3.44%, 2/01/16 | 1,000,000 | 1,011,458 | ||||||
U.S. Bank NA, Sr. Unsecured, MTN, 5.92%, 5/25/12 | 567,778 | 596,033 | ||||||
U.S. Bank NA, Subordinated, 6.30%, 2/04/14 | 305,000 | 340,747 | ||||||
Wells Fargo & Co., Sr. Unsecured, 3.68%, 6/15/16 | 500,000 | 513,946 | ||||||
Wells Fargo & Co., Sr. Unsecured, MTN, 4.60%, 4/01/21 | 1,000,000 | 1,015,772 | ||||||
TOTAL BANKS | $ | 14,302,016 | ||||||
BEVERAGES – 1.9% | ||||||||
Coca-Cola Refreshments USA, Inc., Sr. Unsecured, 5.00%, 8/15/13 | 2,000,000 | 2,179,194 | ||||||
BUILDING MATERIALS – 0.9% | ||||||||
Masco Corp., Sr. Unsecured, 5.88%, 7/15/12 | 1,000,000 | 1,048,125 | ||||||
CHEMICALS – 1.0% | ||||||||
Dow Chemical Co., Sr. Unsecured, 7.60%, 5/15/14 | 1,000,000 | 1,165,762 | ||||||
DIVERSIFIED FINANCIAL SERVICES – 7.9% | ||||||||
6,7Cantor Fitzgerald LP, Notes, 6.38%, 6/26/15 | 1,000,000 | 1,029,665 | ||||||
Charles Schwab Corp., Sr. Unsecured, 4.45%, 7/22/20 | 250,000 | 258,783 | ||||||
Ford Motor Credit Co. LLC, Sr. Unsecured, 8.70%, 10/01/14 | 500,000 | 573,750 | ||||||
| Description | Par Value | Value | ||||||
Ford Motor Credit Co. LLC, Sr. Unsecured, 7.00%, 4/15/15 | $ | 250,000 | $ | 275,000 | ||||
Ford Motor Credit Co. LLC, Sr. Unsecured, 6.63%, 8/15/17 | 250,000 | 275,312 | ||||||
General Electric Capital Corp., Subordinated, 5.30%, 2/11/21 | 250,000 | 259,824 | ||||||
6,7Harley-Davidson Funding Corp., Company Guaranteed, 5.75%, 12/15/14 | 500,000 | 541,828 | ||||||
International Lease Finance Corp., Sr. Unsecured, 5.35%, 3/01/12 | 1,000,000 | 1,023,750 | ||||||
Jefferies Group, Inc., Sr. Unsecured, 3.88%, 11/09/15 | 1,000,000 | 1,013,997 | ||||||
Jefferies Group, Inc., Sr. Unsecured, 5.13%, 4/13/18 | 1,000,000 | 1,005,866 | ||||||
ORIX Corp., Sr. Unsecured, 5.00%, 1/12/16 | 500,000 | 516,189 | ||||||
Raymond James Financial, Inc., Sr. Unsecured, 4.25%, 4/15/16 | 1,000,000 | 1,025,068 | ||||||
SLM Corp., Series A, Sr. Unsecured, MTNA, 5.00%, 10/01/13 | 1,000,000 | 1,043,895 | ||||||
SLM Corp., Sr. Notes, MTN, 6.25%, 1/25/16 | 300,000 | 318,833 | ||||||
TOTAL DIVERSIFIED FINANCIAL SERVICES | $ | 9,161,760 | ||||||
ELECTRIC – 1.0% | ||||||||
CenterPoint Energy, Inc., Sr. Unsecured, 6.50%, 5/01/18 | 125,000 | 141,943 | ||||||
Dominion Resources, Inc., Sr. Unsecured, 2.25%, 9/01/15 | 500,000 | 493,946 | ||||||
DTE Energy Co., Sr. Unsecured, 7.63%, 5/15/14 | 250,000 | 289,067 | ||||||
Duke Energy Corp., Sr. Unsecured, 6.30%, 2/01/14 | 250,000 | 280,213 | ||||||
TOTAL ELECTRIC | $ | 1,205,169 | ||||||
ELECTRONICS – 0.2% | ||||||||
Agilent Technologies, Inc., Sr. Unsecured, 5.00%, 7/15/20 | 250,000 | 261,819 | ||||||
ENERGY EQUIPMENT & SERVICES – 0.5% | ||||||||
National Oilwell Varco, Inc., Sr. Unsecured, 5.65%, 11/15/12 | 500,000 | 531,770 | ||||||
FOOD – 1.2% | ||||||||
Kroger Co., Company Guaranteed, 3.90%, 10/01/15 | 250,000 | 263,048 | ||||||
McCormick & Co., Inc., Sr. Unsecured, 5.75%, 12/15/17 | 500,000 | 572,319 | ||||||
6,7WM Wrigley Jr. Co., Sr. Secured, 3.70%, 6/30/14 | 500,000 | 515,494 | ||||||
TOTAL FOOD | $ | 1,350,861 | ||||||
GAS – 0.9% | ||||||||
1Sempra Energy, Sr. Unsecured, 1.07%, 6/15/11 | 1,000,000 | 1,005,022 | ||||||
HEALTHCARE PROVIDERS & SERVICES – 0.4% | ||||||||
Quest Diagnostics, Inc., Company Guaranteed, 4.70%, 4/01/21 | 500,000 | 510,247 | ||||||
(MTB Intermediate-Term Bond Fund continued next page)
April 30, 2011 / ANNUAL REPORT
Table of Contents
| PORTFOLIOS OF INVESTMENTS | 83 |
MTB Intermediate-Term Bond Fund (continued)
| Description | Par Value | Value | ||||||
HOTELS, RESTAURANTS & LEISURE – 0.5% | ||||||||
6,7Hyatt Hotels Corp., Sr. Unsecured, 6.88%, 8/15/19 | $ | 500,000 | $ | 544,386 | ||||
INSURANCE – 2.4% | ||||||||
MetLife, Inc., Sr. Unsecured, 7.72%, 2/15/19 | 1,000,000 | 1,227,220 | ||||||
Prudential Financial, Inc., Sr. Unsecured, MTN, 3.88%, 1/14/15 | 500,000 | 523,464 | ||||||
Prudential Financial, Inc., Sr. Unsecured, MTN, 4.75%, 9/17/15 | 1,000,000 | 1,079,313 | ||||||
TOTAL INSURANCE | $ | 2,829,997 | ||||||
INTERNET – 0.4% | ||||||||
eBay, Inc., Sr. Unsecured, 1.63%, 10/15/15 | 500,000 | 484,031 | ||||||
IRON/STEEL – 0.9% | ||||||||
Arcelormittal, Sr. Unsecured, 5.50%, 3/01/21 | 500,000 | 507,848 | ||||||
Cliffs Natural Resources, Inc., Sr. Unsecured, 4.88%, 4/01/21 | 500,000 | 509,182 | ||||||
TOTAL IRON/STEEL | $ | 1,017,030 | ||||||
LEISURE TIME – 0.4% | ||||||||
6,7Harley-Davidson Financial Services, Inc., Company Guaranteed, 3.88%, 3/15/16 | 500,000 | 505,626 | ||||||
MEDIA – 0.9% | ||||||||
DIRECTV Holdings LLC / DIRECTV Financing Co., Inc., Company Guaranteed, 3.50%, 3/01/16 | 500,000 | 508,666 | ||||||
DIRECTV Holdings LLC / DIRECTV Financing Co., Inc., Company Guaranteed, 5.00%, 3/01/21 | 500,000 | 514,017 | ||||||
TOTAL MEDIA | $ | 1,022,683 | ||||||
METALS & MINING – 1.9% | ||||||||
Alcoa, Inc., Sr. Unsecured, 5.40%, 4/15/21 | 500,000 | 510,021 | ||||||
Rio Tinto Finance USA Ltd., Company Guaranteed, 6.50%, 7/15/18 | 1,000,000 | 1,174,609 | ||||||
Vale Overseas Ltd., Company Guaranteed, 5.63%, 9/15/19 | 500,000 | 534,612 | ||||||
TOTAL METALS & MINING | $ | 2,219,242 | ||||||
OIL & GAS – 4.0% | ||||||||
Anadarko Petroleum Corp., Sr. Unsecured, 5.75%, 6/15/14 | 250,000 | 276,003 | ||||||
Chesapeake Energy Corp., Company Guaranteed, 6.13%, 2/15/21 | 500,000 | 518,125 | ||||||
Enterprise Products Operating LLC, Series B, Company Guaranteed, 7.03%, 1/15/68 | 1,000,000 | 1,061,883 | ||||||
Nabors Industries, Inc., Company Guaranteed, 5.00%, 9/15/20 | 250,000 | 254,883 | ||||||
Petrobras International Finance Co. – Pifco, Company Guaranteed, 5.38%, 1/27/21 | 250,000 | 254,785 | ||||||
Rowan Cos., Inc., Sr. Unsecured, 7.88%, 8/01/19 | 500,000 | 604,841 | ||||||
Sempra Energy, Sr. Unsecured, | 500,000 | 576,045 | ||||||
| Description | Par Value | Value | ||||||
Stone Energy Corp., Company Guaranteed, 8.63%, 2/01/17 | $ | 1,000,000 | $ | 1,050,000 | ||||
TOTAL OIL & GAS | $ | 4,596,565 | ||||||
PIPELINES – 1.8% | ||||||||
Plains All American Pipeline LP / PAA Finance Corp., Company Guaranteed, 5.00%, 2/01/21 | 500,000 | 512,732 | ||||||
6,7Rockies Express Pipeline LLC, Sr. Unsecured, 3.90%, 4/15/15 | 1,000,000 | 1,020,050 | ||||||
6,7Rockies Express Pipeline LLC, Sr. Unsecured, 5.63%, 4/15/20 | 500,000 | 518,833 | ||||||
TOTAL PIPELINES | $ | 2,051,615 | ||||||
REAL ESTATE INVESTMENT TRUSTS (REIT) – 5.8% | ||||||||
BioMed Realty LP, Company Guaranteed, 3.85%, 4/15/16 | 1,000,000 | 1,004,889 | ||||||
Commonwealth REIT, Sr. Unsecured, 6.65%, 1/15/18 | 500,000 | 555,966 | ||||||
Commonwealth REIT, Sr. Unsecured, 5.88%, 9/15/20 | 500,000 | 517,330 | ||||||
Digital Realty Trust LP, Company Guaranteed, 5.25%, 3/15/21 | 500,000 | 499,622 | ||||||
HCP, Inc., Sr. Unsecured, MTN, | 225,000 | 229,349 | ||||||
HCP, Inc., Sr. Unsecured, 2.70%, 2/01/14 | 1,000,000 | 1,013,191 | ||||||
HCP, Inc., Sr. Unsecured, 5.38%, 2/01/21 | 200,000 | 208,679 | ||||||
Health Care REIT, Inc., Sr. Unsecured, 6.00%, 11/15/13 | 1,000,000 | 1,095,114 | ||||||
Health Care REIT, Inc., Sr. Unsecured, 5.25%, 1/15/22 | 250,000 | 251,586 | ||||||
Mack-Cali Realty LP, Sr. Unsecured, 7.75%, 8/15/19 | 250,000 | 303,170 | ||||||
Vornado Realty LP, Sr. Unsecured, 4.25%, 4/01/15 | 1,000,000 | 1,035,238 | ||||||
TOTAL REAL ESTATE INVESTMENT TRUSTS (REIT) | $ | 6,714,134 | ||||||
RETAIL – 0.4% | ||||||||
Home Depot, Inc., Sr. Unsecured, 4.40%, 4/01/21 | 500,000 | 504,327 | ||||||
TELECOMMUNICATIONS – 3.8% | ||||||||
American Tower Corp., Sr. Unsecured, 4.63%, 4/01/15 | 250,000 | 262,593 | ||||||
6,7Crown Castle Towers LLC, Sr. Secured, 4.17%, 8/15/17 | 1,000,000 | 1,008,750 | ||||||
Qwest Communications International, Inc., Company Guaranteed, 7.13%, 4/01/18 | 1,000,000 | 1,087,188 | ||||||
6,7Telstra Corp. Ltd., Notes, 4.80%, 10/12/21 | 500,000 | 507,704 | ||||||
Verizon Communications, Inc., Sr. Unsecured, 3.00%, 4/01/16 | 1,000,000 | 1,010,893 | ||||||
Verizon Communications, Inc., Sr. Unsecured, 4.60%, 4/01/21 | 500,000 | 511,905 | ||||||
TOTAL TELECOMMUNICATIONS | $ | 4,389,033 | ||||||
(MTB Intermediate-Term Bond Fund continued next page)
ANNUAL REPORT / April 30, 2011
Table of Contents
| 84 | PORTFOLIOS OF INVESTMENTS |
MTB Intermediate-Term Bond Fund (continued)
| Description | Par Value | Value | ||||||
TRANSPORTATION – 0.7% | ||||||||
Canadian National Railway Co., Sr. Unsecured, 5.85%, 11/15/17 | $ | 500,000 | $ | 571,949 | ||||
Union Pacific Corp., Sr. Unsecured, 5.75%, 11/15/17 | 250,000 | 286,553 | ||||||
TOTAL TRANSPORTATION | $ | 858,502 | ||||||
| TOTAL CORPORATE BONDS (COST $61,058,703) | $ | 63,238,407 | ||||||
| ENHANCED EQUIPMENT TRUST CERTIFICATES – 1.8% | ||||||||
AIRLINES – 1.8% | ||||||||
American Airlines 2011-1, Class A Pass-Through Trust, Series A, Secured, 5.25%, 7/31/21 | 500,000 | 490,938 | ||||||
Continental Airlines, Inc., Series A, Pass-Thru Certificates, 7.25%, 11/10/19 | 243,094 | 264,060 | ||||||
Delta Air Lines, Inc., Series A, Pass-Thru Certificates, 7.75%, 12/17/19 | 488,103 | 536,303 | ||||||
Delta Air Lines, Inc., Series 071A, Pass-Thru Certificates, 6.82%, 8/10/22 | 784,897 | 815,803 | ||||||
TOTAL AIRLINES | $ | 2,107,104 | ||||||
| TOTAL ENHANCED EQUIPMENT TRUST CERTIFICATES (COST $2,005,498) | $ | 2,107,104 | ||||||
| GOVERNMENT AGENCY – 0.9% | ||||||||
FEDERAL NATIONAL MORTGAGE ASSOCIATION (FNMA) – 0.9% | ||||||||
2.88%, 5/10/11 | 1,000,000 | 1,060,350 | ||||||
| TOTAL GOVERNMENT AGENCY (COST $1,015,000) | $ | 1,060,350 | ||||||
| MORTGAGE-BACKED SECURITIES – 17.3% | ||||||||
FEDERAL HOME LOAN MORTGAGE CORPORATION (FHLMC) – 7.6% | ||||||||
Pool A18401, 6.00%, 2/01/34 | 171,669 | 189,995 | ||||||
Pool C90293, 7.50%, 9/01/19 | 295,983 | 342,545 | ||||||
Pool C90504, 6.50%, 12/01/21 | 114,951 | 130,351 | ||||||
Pool E76204, 5.50%, 4/01/14 | 1,287 | 1,382 | ||||||
Pool E83022, 6.00%, 4/01/16 | 65,854 | 71,645 | ||||||
Pool E92817, 5.00%, 12/01/17 | 444,257 | 478,798 | ||||||
Pool G11311, 5.00%, 10/01/17 | 294,100 | 316,047 | ||||||
Pool G12709, 5.00%, 7/01/22 | 2,996,512 | 3,212,636 | ||||||
Pool G13077, 5.50%, 4/01/23 | 3,712,729 | 4,029,239 | ||||||
TOTAL FEDERAL HOME LOAN MORTGAGE CORPORATION (FHLMC) | $ | 8,772,638 | ||||||
FEDERAL NATIONAL MORTGAGE ASSOCIATION (FNMA) – 9.0% | ||||||||
Pool 254240, 7.00%, 3/01/32 | 185,197 | 213,277 | ||||||
Pool 256674, 6.00%, 4/01/37 | 2,289,355 | 2,519,006 | ||||||
Pool 313224, 7.00%, 12/01/11 | 3,504 | 3,538 | ||||||
Pool 424286, 6.50%, 6/01/13 | 8,025 | 8,404 | ||||||
| Description | Par Value | Value | ||||||
Pool 526062, 7.50%, 12/01/29 | $ | 15,909 | $ | 18,523 | ||||
Pool 619054, 5.50%, 2/01/17 | 203,906 | 222,436 | ||||||
Pool 832365, 5.50%, 8/01/20 | 2,243,147 | 2,446,993 | ||||||
Pool 838741, 5.00%, 9/01/20 | 1,894,172 | 2,040,497 | ||||||
Pool 839291, 5.00%, 9/01/20 | 38,346 | 41,189 | ||||||
Pool AE2520, 3.00%, 1/01/26 | 2,933,357 | 2,901,274 | ||||||
TOTAL FEDERAL NATIONAL MORTGAGE ASSOCIATION (FNMA) | $ | 10,415,137 | ||||||
GOVERNMENT NATIONAL MORTGAGE ASSOCIATION | ||||||||
Pool 2616, 7.00%, 7/20/28 | 111,085 | 129,036 | ||||||
Pool 2701, 6.50%, 1/20/29 | 213,655 | 244,224 | ||||||
Pool 426727, 7.00%, 2/15/29 | 23,833 | 27,714 | ||||||
Pool 780825, 6.50%, 7/15/28 | 224,009 | 257,799 | ||||||
Pool 781231, 7.00%, 12/15/30 | 103,700 | 120,957 | ||||||
TOTAL GOVERNMENT NATIONAL MORTGAGE ASSOCIATION (GNMA) | $ | 779,730 | ||||||
| TOTAL MORTGAGE-BACKED SECURITIES (COST $18,655,043) | $ | 19,967,505 | ||||||
| U.S. TREASURY – 14.4% | ||||||||
INFLATION INDEXED BONDS – 6.6% | ||||||||
121.13%, 1/15/21 | 2,000,000 | 2,100,837 | ||||||
1.25%, 7/15/20 | 500,000 | 535,614 | ||||||
1.63%, 1/15/15 | 500,000 | 637,733 | ||||||
3.00%, 7/15/12 | 180,000 | 236,942 | ||||||
0.13%, 4/15/16 | 4,000,000 | 4,125,625 | ||||||
TOTAL INFLATION INDEXED BONDS | $ | 7,636,751 | ||||||
U.S. TREASURY NOTE – 7.8% | ||||||||
0.75%, 9/15/13 | 4,000,000 | 3,999,375 | ||||||
121.25%, 4/15/14 | 5,000,000 | 5,037,500 | ||||||
TOTAL U.S. TREASURY NOTE | $ | 9,036,875 | ||||||
| TOTAL U.S. TREASURY (COST $16,504,738) | $ | 16,673,626 | ||||||
| REPURCHASE AGREEMENT – 0.6% | ||||||||
Credit Suisse First Boston LLC, 0.03%, dated 04/29/11, due 05/02/11, repurchase price $624,795, collateralized by a U.S. Treasury Security 1.50%, maturing 12/31/13; total market value of $638,138. | 624,793 | 624,793 | ||||||
| TOTAL REPURCHASE AGREEMENT (COST $624,793) | $ | 624,793 | ||||||
| TOTAL INVESTMENTS IN SECURITIES – 97.0% (COST $108,373,114) | $ | 112,164,352 | ||||||
(MTB Intermediate-Term Bond Fund continued next page)
April 30, 2011 / ANNUAL REPORT
Table of Contents
| PORTFOLIOS OF INVESTMENTS | 85 |
MTB Intermediate-Term Bond Fund (concluded)
| Description | Par Value | Value | ||||||
| CASH COLLATERAL INVESTED FOR SECURITIES ON LOAN – 10.7% | ||||||||
REPURCHASE AGREEMENTS – 10.7% | ||||||||
Bank of America LLC, 0.05%, dated 04/29/11, due 05/02/11, repurchase price $488,550, collateralized by U.S. Government Securities 4.00% to 5.50%, maturing 01/01/26 to 04/01/41; total market value of $498,329. | $ | 488,548 | $ | 488,548 | ||||
Citigroup Global Markets, Inc., 0.06%, dated 04/29/11, due 05/02/11, repurchase price $2,000,010, collateralized by U.S. Government Securities 2.12% to 6.50%, maturing 09/01/15 to 04/01/41; total market value of $2,040,010. | 2,000,000 | 2,000,000 | ||||||
Deutsche Bank Securities, Inc., 0.05%, dated 04/29/11, due 05/02/11, repurchase price $2,935,415, collateralized by U.S. Government Securities 3.50% to 7.00%, maturing 02/01/20 to 03/01/41; total market value of $2,994,111. | 2,935,403 | 2,935,403 | ||||||
JP Morgan Securities LLC, 0.05%, dated 04/29/11, due 05/02/11, repurchase price $2,000,008, collateralized by U.S. Government Securities 4.00% to 4.50%, maturing 02/01/26 to 03/01/41; total market value of $2,040,026. | 2,000,000 | 2,000,000 | ||||||
| Description | Par Value | Value | ||||||
RBC Capital Markets LLC, 0.05%, dated 04/29/11, due 05/02/11, repurchase price $2,000,008, collateralized by U.S. Government Securities 1.99% to 5.13%, maturing 02/01/17 to 04/01/41; total market value of $2,040,000. | $ | 2,000,000 | $ | 2,000,000 | ||||
RBS Securities, Inc., 0.05%, dated 04/29/11, due 05/02/11, repurchase price $2,935,415, collateralized by U.S. Government Securities 3.50% to 6.00%, maturing 04/01/21 to 05/01/41; total market value of $2,994,165. | 2,935,403 | 2,935,403 | ||||||
| TOTAL CASH COLLATERAL INVESTED FOR SECURITIES ON LOAN (COST $12,359,354) | $ | 12,359,354 | ||||||
| TOTAL INVESTMENTS – 107.7% (COST $120,732,468) | $ | 124,523,706 | ||||||
| COLLATERAL FOR SECURITIES ON LOAN – (10.7%) | (12,359,354 | ) | ||||||
| OTHER ASSETS LESS LIABILITIES – 3.0% | 3,527,213 | |||||||
| TOTAL NET ASSETS – 100.0% | $ | 115,691,565 | ||||||
Cost of investments for Federal income tax purposes is $133,099,839. The net unrealized appreciation/depreciation of investments was $3,783,221. This consists of net unrealized appreciation from investment for those securities having an excess of value over cost of $3,999,056 and net unrealized depreciation from investments for those securities having an excess of cost over value of $215,835.
Various inputs are used in determining the value of the Fund’s investments. These inputs are summarized in the three broad levels listed below.
Level 1 – quoted prices in active markets for identical securities
Level 2 – other significant observable inputs (including quoted prices for similar securities, interest rates, prepayment speeds, credit risk, etc.)
Level 3 – significant unobservable inputs (including the Fund’s own assumptions in determining the fair value of investments)
The following is a summary of the inputs used as of April 30, 2011 in valuing the Fund’s assets carried at fair value:
| Level 1 | Level 2 | Level 3 | Total | |||||||||||||
Investments in Securities | ||||||||||||||||
Asset Backed Securities | $ | — | $ | 3,260,852 | $ | — | $ | 3,260,852 | ||||||||
Collateralized Mortgage Obligations | — | 5,231,715 | — | 5,231,715 | ||||||||||||
Corporate Bonds | — | 63,238,407 | — | 63,238,407 | ||||||||||||
Enhanced Equipment Trust Certificates | — | 2,107,104 | — | 2,107,104 | ||||||||||||
Government Agency | — | 1,060,350 | — | 1,060,350 | ||||||||||||
Mortgage-Backed Securities | — | 19,967,505 | — | 19,967,505 | ||||||||||||
U.S. Treasury | — | 16,673,626 | — | 16,673,626 | ||||||||||||
Repurchase Agreements | — | 12,984,147 | — | 12,984,147 | ||||||||||||
Total | $ | — | $ | 124,523,706 | $ | — | $ | 124,523,706 | ||||||||
See Notes to Portfolios of Investments
ANNUAL REPORT / April 30, 2011
Table of Contents
| 86 |
PORTFOLIO OF INVESTMENTS SUMMARY TABLE
MTB Income Fund
At April 30, 2011, the Fund’s portfolio composition was as follows: (unaudited)
| Percentage of Total Net Assets | ||||
| Corporate Bonds | 56.4 | % | ||
| Mortgage-Backed Securities | 17.9 | % | ||
| U.S. Treasury | 13.4 | % | ||
| Collateralized Mortgage Obligations | 5.8 | % | ||
| Asset Backed Securities | 1.7 | % | ||
| Enhanced Equipment Trust Certificates | 1.0 | % | ||
| Cash Equivalents1 | 2.5 | % | ||
| Other Assets and Liabilities – Net2 | 1.3 | % | ||
| TOTAL | 100.0 | % | ||
| (1) | Cash Equivalents include investments in repurchase agreements. |
| (2) | Assets, other than investments in securities, less liabilities. See Statements of Assets and Liabilities. |
| (3) | Derived from data provided by Moody’s Investors Service and Standard and Poor’s. |
| Credit Quality Diversification3 | Percentage of Total Net Assets | |||
| AAA | 3.9 | % | ||
| AA | 3.5 | % | ||
| A | 19.2 | % | ||
| BBB | 27.3 | % | ||
| BB | 7.1 | % | ||
| B | 2.8 | % | ||
| CCC | 1.0 | % | ||
| Not Rated | 2.5 | % | ||
| U.S. Government | 18.0 | % | ||
| U.S. Treasury | 13.4 | % | ||
| Other Assets and Liabilities – Net2 | 1.3 | % | ||
| TOTAL | 100.0 | % | ||
PORTFOLIO OF INVESTMENTS
April 30, 2011
| Description | Par Value | Value | ||||||
| ASSET BACKED SECURITIES – 1.7% | ||||||||
FINANCIAL SERVICES – 1.4% | ||||||||
Hyundai Auto Receivables Trust, Series 2011-A, Class A2, 0.69%, 11/15/13 | $ | 1,500,000 | $ | 1,501,406 | ||||
6,7LA Arena Funding LLC, Series 1999-1, Class A, 7.66%, 12/15/26 | 1,386,508 | 1,434,228 | ||||||
TOTAL FINANCIAL SERVICES | $ | 2,935,634 | ||||||
WHOLE LOAN – 0.3% | ||||||||
1,6,7Student Loan Marketing Association, Series 2011-A, Class A1, 1.21%, 6/15/11 | 750,000 | 751,521 | ||||||
| TOTAL ASSET BACKED SECURITIES (COST $3,636,409) | $ | 3,687,155 | ||||||
| COLLATERALIZED MORTGAGE OBLIGATIONS – 5.8% | ||||||||
COMMERCIAL MORTGAGE-BACKED SECURITIES (CMBS) – 2.6% | ||||||||
6,7American Tower Trust, Series 2007-1A, | 1,000,000 | 1,085,359 | ||||||
Banc of America Commercial Mortgage, Inc., Series 2007-2, Class A2, 5.63%, 4/10/49 | 1,157,694 | 1,196,450 | ||||||
Merrill Lynch Mortgage Trust, Series 2006-C1, Class A2, 5.81%, 5/12/39 | 1,230,741 | 1,264,499 | ||||||
Morgan Stanley Capital I, Series 2004-IQ7, Class A4, 5.54%, 6/15/38 | 1,000,000 | 1,080,633 | ||||||
| Description | Par Value | Value | ||||||
Morgan Stanley Capital I, Series 2005-T19, Class AAB, 4.85%, 6/12/47 | $ | 798,361 | $ | 832,229 | ||||
TOTAL COMMERCIAL MORTGAGE-BACKED SECURITIES (CMBS) | $ | 5,459,170 | ||||||
FEDERAL HOME LOAN MORTGAGE CORPORATION (FHLMC) – 0.0%** | ||||||||
Series 1920, Class H, 7.00%, 1/15/12 | 26,575 | 27,005 | ||||||
FEDERAL NATIONAL MORTGAGE ASSOCIATION (FNMA) – 0.0%** | ||||||||
Series 1988-23, Class C, 9.75%, 9/25/18 | 10,020 | 11,374 | ||||||
WHOLE LOAN – 3.2% | ||||||||
1Banc of America Mortgage Securities, Inc., Series 2004-A, Class 2A1, 2.86%, 5/25/11 | 470,672 | 441,532 | ||||||
Countrywide Home Loan Mortgage Pass-Through Trust, Series 2004-8, Class 2A1, 4.50%, 6/25/19 | 2,338,827 | 2,408,951 | ||||||
GSR Mortgage Loan Trust, Series 2006-2F, Class 2A15, 5.75%, 2/25/36 | 90,904 | 90,430 | ||||||
1Indymac INDA Mortgage Loan Trust, Series 2005-AR1, Class 2A1, 5.06%, 5/25/11 | 1,394,564 | 1,250,221 | ||||||
Morgan Stanley Mortgage Loan Trust, Series 2004-1, Class 1A8, 4.75%, 11/25/18 | 126,196 | 126,745 | ||||||
WaMu Mortgage Pass-Through Certificates, Series 2004-CB1, Class 1A, 5.25%, 6/25/19 | 2,578,919 | 2,692,450 | ||||||
TOTAL WHOLE LOAN | $ | 7,010,329 | ||||||
| TOTAL COLLATERALIZED MORTGAGE OBLIGATIONS (COST $12,172,860) | $ | 12,507,878 | ||||||
(MTB Income Fund continued next page)
April 30, 2011 / ANNUAL REPORT
Table of Contents
| PORTFOLIOS OF INVESTMENTS | 87 |
MTB Income Fund (continued)
| Description | Par Value | Value | ||||||
| CORPORATE BONDS – 56.4% | ||||||||
AEROSPACE & DEFENSE – 0.7% | ||||||||
6,7BAE Systems Holdings, Inc., Company Guaranteed, 6.38%, 6/01/19 | $ | 500,000 | $ | 556,281 | ||||
L-3 Communications Corp., Company Guaranteed, 4.75%, 7/15/20 | 500,000 | 508,986 | ||||||
Raytheon Co., Sr. Unsecured, | 500,000 | 465,930 | ||||||
TOTAL AEROSPACE & DEFENSE | $ | 1,531,197 | ||||||
AGRICULTURE – 0.2% | ||||||||
Archer-Daniels-Midland Co., Sr. Unsecured, 4.48%, 3/01/21 | 500,000 | 516,309 | ||||||
APPAREL – 0.5% | ||||||||
Hanesbrands, Inc., Company Guaranteed, 6.38%, 12/15/20 | 1,100,000 | 1,100,000 | ||||||
AUTO MANUFACTURERS – 0.2% | ||||||||
Daimler Finance North America LLC, Company Guaranteed, MTN, 5.75%, 9/08/11 | 500,000 | 509,010 | ||||||
BANKS – 12.7% | ||||||||
6,7ABN Amro Bank NV, Sr. Unsecured, 3.00%, 1/31/14 | 500,000 | 508,065 | ||||||
Ally Financial, Inc., Company Guaranteed, 4.50%, 2/11/14 | 300,000 | 303,375 | ||||||
6,7Ally Financial, Inc., Company Guaranteed, 6.25%, 12/01/17 | 1,500,000 | 1,575,000 | ||||||
Ally Financial, Inc., Company Guaranteed, 8.00%, 3/15/20 | 250,000 | 281,875 | ||||||
6,7Ally Financial, Inc., Company Guaranteed, 7.50%, 9/15/20 | 500,000 | 550,000 | ||||||
Bank of America Corp., Subordinated, 7.13%, 10/15/11 | 200,000 | 205,550 | ||||||
Bank of America Corp., Sr. Unsecured, 6.50%, 8/01/16 | 1,250,000 | 1,411,184 | ||||||
6,7Bank of New York Institutional Capital Trust A, Limited Guarantee, 7.78%, 12/01/26 | 1,500,000 | 1,554,384 | ||||||
BB&T Corp., Sr. Unsecured, MTN, 3.85%, 7/27/12 | 1,000,000 | 1,034,917 | ||||||
BB&T Corp., Subordinated, 4.75%, 10/01/12 | 500,000 | 525,546 | ||||||
BB&T Corp., Sr. Unsecured, MTN, 3.20%, 3/15/16 | 500,000 | 505,379 | ||||||
Capital One Financial Corp., Sr. Unsecured, 7.38%, 5/23/14 | 250,000 | 290,800 | ||||||
Citigroup, Inc., Sr. Unsecured, | 1,000,000 | 1,071,354 | ||||||
Citigroup, Inc., Sr. Unsecured, | 500,000 | 544,507 | ||||||
Citigroup, Inc., Sr. Unsecured, | 500,000 | 532,207 | ||||||
Citigroup, Inc., Unsecured, 8.50%, 5/22/19 | 1,000,000 | 1,250,914 | ||||||
Credit Suisse, Sr. Unsecured, 5.50%, 5/01/14 | 1,000,000 | 1,107,352 | ||||||
Credit Suisse, Sr. Unsecured, 5.30%, 8/13/19 | 250,000 | 267,692 | ||||||
Credit Suisse AG, Subordinated, | 500,000 | 516,601 | ||||||
| Description | Par Value | Value | ||||||
Discover Bank, Subordinated, 7.00%, 4/15/20 | $ | 1,000,000 | $ | 1,125,384 | ||||
12Fifth Third Bancorp, Sr. Unsecured, | 1,200,000 | 1,305,085 | ||||||
Goldman Sachs Group, Inc., Sr. Unsecured, 5.25%, 4/01/13 | 1,000,000 | 1,074,291 | ||||||
Goldman Sachs Group, Inc., Sr. Unsecured, MTN, 6.00%, 5/01/14 | 500,000 | 553,669 | ||||||
HSBC Holdings PLC, Sr. Unsecured, 5.10%, 4/05/21 | 500,000 | 515,621 | ||||||
JPMorgan Chase & Co., Sr. Unsecured, 3.40%, 6/24/15 | 500,000 | 513,526 | ||||||
JPMorgan Chase & Co., Sr. Unsecured, 2.60%, 1/15/16 | 500,000 | 489,385 | ||||||
JPMorgan Chase & Co., Sr. Unsecured, 4.40%, 7/22/20 | 500,000 | 494,839 | ||||||
JPMorgan Chase & Co., Sr. Unsecured, 4.25%, 10/15/20 | 500,000 | 489,021 | ||||||
1JPMorgan Chase Capital XXIIIi, Limited Guarantee, 1.31%, 5/16/11 | 1,000,000 | 839,346 | ||||||
KeyCorp, Sr. Unsecured, MTN, | 1,000,000 | 1,093,219 | ||||||
PNC Bank NA, Subordinated, BKNT, 6.88%, 4/01/18 | 500,000 | 581,263 | ||||||
1Societe Generale, Certificate of Deposit, 1.31%, 5/22/11 | 1,000,000 | 1,001,439 | ||||||
State Street Corp., Sr. Unsecured, 4.30%, 5/30/14 | 250,000 | 269,222 | ||||||
U.S. Bancorp, Jr. Subordinated, | 1,000,000 | 1,011,458 | ||||||
U.S. Bank NA, Sr. Unsecured, MTN, 5.92%, 5/25/12 | 378,519 | 397,355 | ||||||
Wells Fargo & Co., Sr. Unsecured, 3.68%, 6/15/16 | 500,000 | 513,946 | ||||||
Wells Fargo & Co., Sr. Unsecured, MTN, 4.60%, 4/01/21 | 1,000,000 | 1,015,772 | ||||||
TOTAL BANKS | $ | 27,320,543 | ||||||
BEVERAGES – 0.9% | ||||||||
Anheuser-Busch InBev Worldwide, Inc., Company Guaranteed, 5.38%, 1/15/20 | 1,000,000 | 1,101,832 | ||||||
Anheuser-Busch InBev Worldwide, Inc., Company Guaranteed, 4.38%, 2/15/21 | 500,000 | 511,283 | ||||||
Coca-Cola Enterprises, Inc., Sr. Unsecured, 3.50%, 9/15/20 | 500,000 | 478,419 | ||||||
TOTAL BEVERAGES | $ | 2,091,534 | ||||||
BUILDING MATERIALS – 0.8% | ||||||||
CRH America, Inc., Company Guaranteed, 5.75%, 1/15/21 | 500,000 | 524,938 | ||||||
Masco Corp., Sr. Unsecured, 5.88%, 7/15/12 | 1,000,000 | 1,048,125 | ||||||
TOTAL BUILDING MATERIALS | $ | 1,573,063 | ||||||
CAPITAL MARKETS – 1.7% | ||||||||
JPMorgan Chase Capital XVIII, Series R, Limited Guarantee, 6.95%, 8/17/36 | 1,000,000 | 1,040,493 | ||||||
Morgan Stanley, Series G, Sr. Unsecured, GMTN, 5.50%, 1/26/20 | 1,500,000 | 1,538,118 | ||||||
(MTB Income Fund continued next page)
ANNUAL REPORT / April 30, 2011
Table of Contents
| 88 | PORTFOLIOS OF INVESTMENTS |
MTB Income Fund (continued)
| Description | Par Value | Value | ||||||
Morgan Stanley, Sr. Unsecured, | $ | 1,000,000 | $ | 1,041,506 | ||||
TOTAL CAPITAL MARKETS | $ | 3,620,117 | ||||||
CHEMICALS – 0.3% | ||||||||
Potash Corp. of Saskatchewan, Inc., Sr. Unsecured, 4.88%, 3/30/20 | 500,000 | 529,338 | ||||||
COMMERCIAL SERVICES – 0.3% | ||||||||
Board of Trustees of The Leland Stanford Junior University, Bonds, 4.75%, 5/01/19 | 500,000 | 543,422 | ||||||
COMPUTERS – 0.5% | ||||||||
Dell, Inc., Sr. Unsecured, 2.30%, 9/10/15 | 275,000 | 273,801 | ||||||
Hewlett-Packard Co., Sr. Unsecured, 2.20%, 12/01/15 | 500,000 | 496,804 | ||||||
Hewlett-Packard Co., Sr. Unsecured, 3.75%, 12/01/20 | 500,000 | 488,579 | ||||||
TOTAL COMPUTERS | $ | 1,259,184 | ||||||
DIVERSIFIED FINANCIAL | ||||||||
American Express Credit Corp., Sr. Unsecured, 5.13%, 8/25/14 | 1,000,000 | 1,092,044 | ||||||
6,7ASIF Global Financing XIX, Sr. Secured, 4.90%, 1/17/13 | 1,175,000 | 1,230,078 | ||||||
6,7Cantor Fitzgerald LP, Notes, 6.38%, 6/26/15 | 1,000,000 | 1,029,665 | ||||||
Charles Schwab Corp., Sr. Unsecured, 4.45%, 7/22/20 | 250,000 | 258,783 | ||||||
6,7FMR LLC, Sr. Unsecured, 6.45%, 11/15/39 | 1,000,000 | 1,004,086 | ||||||
Ford Motor Credit Co. LLC, Sr. Unsecured, 8.70%, 10/01/14 | 500,000 | 573,750 | ||||||
Ford Motor Credit Co. LLC, Sr. Unsecured, 7.00%, 4/15/15 | 250,000 | 275,000 | ||||||
Ford Motor Credit Co. LLC, Sr. Unsecured, 6.63%, 8/15/17 | 250,000 | 275,312 | ||||||
Ford Motor Credit Co. LLC, Sr. Unsecured, 5.75%, 2/01/21 | 500,000 | 512,500 | ||||||
General Electric Capital Corp., Subordinated, 5.30%, 2/11/21 | 250,000 | 259,824 | ||||||
6,7Harley-Davidson Funding Corp., Company Guaranteed, 5.75%, 12/15/14 | 500,000 | 541,828 | ||||||
International Lease Finance Corp., Sr. Unsecured, 5.35%, 3/01/12 | 1,000,000 | 1,023,750 | ||||||
International Lease Finance Corp., Sr. Unsecured, 5.88%, 5/01/13 | 1,150,000 | 1,184,500 | ||||||
Jefferies Group, Inc., Sr. Unsecured, 5.13%, 4/13/18 | 2,000,000 | 2,011,732 | ||||||
MBNA Capital, Series A, Limited Guarantee, 8.28%, 12/01/26 | 1,000,000 | 1,030,000 | ||||||
ORIX Corp., Sr. Unsecured, 5.00%, 1/12/16 | 500,000 | 516,190 | ||||||
Raymond James Financial, Inc., Sr. Unsecured, 4.25%, 4/15/16 | 1,000,000 | 1,025,068 | ||||||
SLM Corp., Series A, Sr. Unsecured, MTNA, 5.00%, 10/01/13 | 1,000,000 | 1,043,895 | ||||||
SLM Corp., Sr. Notes, MTN, 6.25%, 1/25/16 | 400,000 | 425,111 | ||||||
| Description | Par Value | Value | ||||||
TD Ameritrade Holding Corp., Company Guaranteed, 2.95%, 12/01/12 | $ | 500,000 | $ | 511,968 | ||||
TOTAL DIVERSIFIED FINANCIAL SERVICES | $ | 15,825,084 | ||||||
ELECTRIC – 1.4% | ||||||||
CenterPoint Energy, Inc., Series B, Sr. Unsecured, 6.85%, 6/01/15 | 1,250,000 | 1,422,581 | ||||||
CenterPoint Energy, Inc., Sr. Unsecured, 6.50%, 5/01/18 | 125,000 | 141,943 | ||||||
DTE Energy Co., Sr. Unsecured, | 250,000 | 289,067 | ||||||
Duke Energy Corp., Sr. Unsecured, 6.30%, 2/01/14 | 250,000 | 280,213 | ||||||
Virginia Electric and Power Co., Sr. Unsecured, 8.88%, 11/15/38 | 500,000 | 739,760 | ||||||
TOTAL ELECTRIC | $ | 2,873,564 | ||||||
ELECTRONICS – 0.2% | ||||||||
Agilent Technologies, Inc., Sr. Unsecured, 5.00%, 7/15/20 | 250,000 | 261,819 | ||||||
Thermo Fisher Scientific, Inc., Sr. Unsecured, 4.50%, 3/01/21 | 250,000 | 258,164 | ||||||
TOTAL ELECTRONICS | $ | 519,983 | ||||||
ENERGY EQUIPMENT & | ||||||||
National Oilwell Varco, Inc., Sr. Unsecured, 5.65%, 11/15/12 | 1,500,000 | 1,595,310 | ||||||
FOOD – 1.1% | ||||||||
General Mills, Inc., Sr. Unsecured, 5.65%, 2/15/19 | 250,000 | 279,050 | ||||||
Kraft Foods, Inc., Sr. Unsecured, 5.63%, 11/01/11 | 129,000 | 132,404 | ||||||
Kroger Co., Company Guaranteed, 3.90%, 10/01/15 | 250,000 | 263,048 | ||||||
Kroger Co., Company Guaranteed, 8.00%, 9/15/29 | 500,000 | 631,869 | ||||||
McCormick & Co., Inc., Sr. Unsecured, 5.75%, 12/15/17 | 500,000 | 572,319 | ||||||
6,7WM Wrigley Jr. Co., Sr. Secured, 3.70%, 6/30/14 | 500,000 | 515,494 | ||||||
TOTAL FOOD | $ | 2,394,184 | ||||||
GAS – 0.5% | ||||||||
1Sempra Energy, Sr. Unsecured, | 1,000,000 | 1,005,022 | ||||||
HEALTHCARE PROVIDERS & SERVICES – 0.2% | ||||||||
Quest Diagnostics, Inc., Company Guaranteed, 4.70%, 4/01/21 | 500,000 | 510,247 | ||||||
HOME BUILDERS – 0.2% | ||||||||
12Ryland Group, Inc., Company Guaranteed, 6.63%, 5/01/20 | 500,000 | 491,250 | ||||||
HOTELS, RESTAURANTS & | ||||||||
6,7Hyatt Hotels Corp., Sr. Unsecured, 6.88%, 8/15/19 | 500,000 | 544,386 | ||||||
(MTB Income Fund continued next page)
April 30, 2011 / ANNUAL REPORT
Table of Contents
| PORTFOLIOS OF INVESTMENTS | 89 |
MTB Income Fund (continued)
| Description | Par Value | Value | ||||||
INSURANCE—2.0% | ||||||||
CNA Financial Corp., Sr. Unsecured, 5.75%, 8/15/21 | $ | 1,000,000 | $ | 1,050,428 | ||||
MetLife, Inc., Sr. Unsecured, 4.75%, 2/08/21 | 500,000 | 510,122 | ||||||
6,7Metropolitan Life Global Funding I, Sr. Secured, 2.50%, 1/11/13 | 500,000 | 509,969 | ||||||
Prudential Financial, Inc., Sr. Unsecured, MTN, 3.88%, 1/14/15 | 500,000 | 523,464 | ||||||
Prudential Financial, Inc., Sr. Unsecured, 6.20%, 1/15/15 | 500,000 | 556,662 | ||||||
Prudential Financial, Inc., Sr. Unsecured, MTN, 4.75%, 9/17/15 | 1,000,000 | 1,079,313 | ||||||
TOTAL INSURANCE | $ | 4,229,958 | ||||||
INTERNET – 0.4% | ||||||||
eBay, Inc., Sr. Unsecured, 1.63%, 10/15/15 | 500,000 | 484,031 | ||||||
eBay, Inc., Sr. Unsecured, 3.25%, 10/15/20 | 500,000 | 464,839 | ||||||
TOTAL INTERNET | $ | 948,870 | ||||||
IRON/STEEL – 1.4% | ||||||||
Arcelormittal, Sr. Unsecured, 5.50%, 3/01/21 | 500,000 | 507,848 | ||||||
ArcelorMittal, Sr. Unsecured, | 2,000,000 | 2,098,282 | ||||||
Cliffs Natural Resources, Inc., Sr. Unsecured, 4.88%, 4/01/21 | 500,000 | 509,182 | ||||||
TOTAL IRON/STEEL | $ | 3,115,312 | ||||||
LEISURE TIME – 0.2% | ||||||||
6,7Harley-Davidson Financial Services, Inc., Company Guaranteed, 3.88%, 3/15/16 | 500,000 | 505,626 | ||||||
MEDIA – 3.7% | ||||||||
Comcast Corp., Company Guaranteed, 5.90%, 3/15/16 | 1,000,000 | 1,128,232 | ||||||
Comcast Corp., Company Guaranteed, 5.70%, 7/01/19 | 1,500,000 | 1,649,093 | ||||||
DIRECTV Holdings LLC / DIRECTV Financing Co., Inc., Company Guaranteed, | 500,000 | 508,666 | ||||||
DIRECTV Holdings LLC / DIRECTV Financing Co., Inc., Company Guaranteed, | 1,000,000 | 1,101,530 | ||||||
DIRECTV Holdings LLC / DIRECTV Financing Co., Inc., Company Guaranteed, | 1,000,000 | 999,938 | ||||||
DIRECTV Holdings LLC / DIRECTV Financing Co., Inc., Company Guaranteed, | 500,000 | 514,017 | ||||||
DIRECTV Holdings LLC / DIRECTV Financing Co., Inc., Company Guaranteed, | 500,000 | 499,930 | ||||||
News America, Inc., Company Guaranteed, 6.90%, 8/15/39 | 500,000 | 560,632 | ||||||
Viacom, Inc., Sr. Unsecured, 5.63%, 9/15/19 | 1,000,000 | 1,107,291 | ||||||
TOTAL MEDIA | $ | 8,069,329 | ||||||
| Description | Par Value | Value | ||||||
METALS & MINING – 1.4% | ||||||||
Alcoa, Inc., Sr. Unsecured, 5.40%, 4/15/21 | $ | 500,000 | $ | 510,021 | ||||
Rio Tinto Finance USA Ltd., Company Guaranteed, 9.00%, 5/01/19 | 750,000 | 1,001,189 | ||||||
Vale Overseas Ltd., Company Guaranteed, 5.63%, 9/15/19 | 500,000 | 534,612 | ||||||
Xstrata Canada Corp., Company Guaranteed, 7.25%, 7/15/12 | 800,000 | 853,976 | ||||||
TOTAL METALS & MINING | $ | 2,899,798 | ||||||
MISCELLANEOUS MANUFACTURING – 0.8% |
| |||||||
GE Capital Trust I, Subordinated, | 1,000,000 | 1,037,500 | ||||||
Tyco Electronics Group SA, Company Guaranteed, 4.88%, 1/15/21 | 500,000 | 519,674 | ||||||
TOTAL MISCELLANEOUS MANUFACTURING | $ | 1,557,174 | ||||||
MULTI-UTILITIES – 0.3% | ||||||||
Dominion Resources, Inc., Series A, Sr. Unsecured, 5.60%, 11/15/16 | 500,000 | 561,492 | ||||||
OFFICE/BUSINESS EQUIPMENT – 1.4% | ||||||||
Steelcase, Inc., Sr. Unsecured, 6.38%, 2/15/21 | 500,000 | 519,707 | ||||||
Xerox Corp., Sr. Unsecured, 6.40%, 3/15/16 | 2,000,000 | 2,289,652 | ||||||
TOTAL OFFICE/BUSINESS EQUIPMENT | $ | 2,809,359 | ||||||
OIL & GAS – 3.1% | ||||||||
Anadarko Petroleum Corp., Sr. Unsecured, 5.75%, 6/15/14 | 250,000 | 276,003 | ||||||
Chesapeake Energy Corp., Company Guaranteed, 6.13%, 2/15/21 | 500,000 | 518,125 | ||||||
Enterprise Products Operating LLC, Series B, Company Guaranteed, 7.03%, 1/15/68 | 1,000,000 | 1,061,883 | ||||||
Nabors Industries, Inc., Company Guaranteed, 5.00%, 9/15/20 | 250,000 | 254,883 | ||||||
Petrobras International Finance Co. – Pifco, Company Guaranteed, 5.38%, 1/27/21 | 250,000 | 254,784 | ||||||
Petrobras International Finance Co. – Pifco, Company Guaranteed, 6.75%, 1/27/41 | 250,000 | 261,457 | ||||||
6,7Petroleum Co. of Trinidad & Tobago Ltd., Sr. Unsecured, 9.75%, 8/14/19 | 1,000,000 | 1,200,000 | ||||||
Rowan Cos., Inc., Sr. Unsecured, | 500,000 | 604,841 | ||||||
Sempra Energy, Sr. Unsecured, | 500,000 | 576,045 | ||||||
Stone Energy Corp., Company Guaranteed, 8.63%, 2/01/17 | 1,000,000 | 1,050,000 | ||||||
Valero Energy Corp., Company Guaranteed, 10.50%, 3/15/39 | 500,000 | 725,807 | ||||||
TOTAL OIL & GAS | $ | 6,783,828 | ||||||
OIL & GAS FIELD SERVICES – 0.6% | ||||||||
NuStar Pipeline Operating Partnership, LP, Company Guaranteed, 5.88%, 6/01/13 | 1,250,000 | 1,344,545 | ||||||
(MTB Income Fund continued next page)
ANNUAL REPORT / April 30, 2011
Table of Contents
| 90 | PORTFOLIOS OF INVESTMENTS |
MTB Income Fund (continued)
| Description | Par Value | Value | ||||||
PIPELINES – 0.9% | ||||||||
Plains All American Pipeline LP / PAA Finance Corp., Company Guaranteed, 5.00%, 2/01/21 | $ | 500,000 | $ | 512,732 | ||||
6,7Rockies Express Pipeline LLC, Sr. Unsecured, 3.90%, 4/15/15 | 1,000,000 | 1,020,050 | ||||||
6,7Rockies Express Pipeline LLC, Sr. Unsecured, 5.63%, 4/15/20 | 500,000 | 518,833 | ||||||
TOTAL PIPELINES | $ | 2,051,615 | ||||||
REAL ESTATE INVESTMENT TRUSTS (REIT) – 4.0% | ||||||||
AvalonBay Communities, Inc., Sr. Unsecured, MTN, 3.95%, 1/15/21 | 250,000 | 244,263 | ||||||
BioMed Realty LP, Company Guaranteed, 3.85%, 4/15/16 | 1,000,000 | 1,004,889 | ||||||
Boston Properties LP, Sr. Unsecured, | 650,000 | 703,788 | ||||||
Boston Properties LP, Sr. Unsecured, 5.88%, 10/15/19 | 1,000,000 | 1,103,401 | ||||||
Boston Properties LP, Sr. Unsecured, 4.13%, 5/15/21 | 250,000 | 242,686 | ||||||
Commonwealth REIT, Sr. Unsecured, 6.65%, 1/15/18 | 500,000 | 555,966 | ||||||
Commonwealth REIT, Sr. Unsecured, 5.88%, 9/15/20 | 500,000 | 517,330 | ||||||
Digital Realty Trust LP, Company Guaranteed, 5.25%, 3/15/21 | 500,000 | 499,622 | ||||||
HCP, Inc., Sr. Unsecured, MTN, | 225,000 | 229,349 | ||||||
HCP, Inc., Sr. Unsecured, 5.38%, 2/01/21 | 200,000 | 208,679 | ||||||
Health Care REIT, Inc., Sr. Unsecured, 4.95%, 1/15/21 | 1,000,000 | 987,121 | ||||||
Health Care REIT, Inc., Sr. Unsecured, | 250,000 | 251,586 | ||||||
Mack-Cali Realty LP, Sr. Unsecured, 7.75%, 8/15/19 | 250,000 | 303,170 | ||||||
Simon Property Group LP, Sr. Unsecured, 5.65%, 2/01/20 | 500,000 | 545,789 | ||||||
Vornado Realty LP, Sr. Unsecured, 4.25%, 4/01/15 | 1,000,000 | 1,035,238 | ||||||
TOTAL REAL ESTATE INVESTMENT | $ | 8,432,877 | ||||||
RETAIL – 1.5% | ||||||||
CVS Caremark Corp., Sr. Unsecured, 5.75%, 6/01/17 | 500,000 | 560,378 | ||||||
CVS Caremark Corp., Sr. Unsecured, 4.75%, 5/18/20 | 500,000 | 520,159 | ||||||
Home Depot, Inc., Sr. Unsecured, | 500,000 | 504,327 | ||||||
Home Depot, Inc., Sr. Unsecured, | 500,000 | 516,897 | ||||||
McDonald’s Corp., Sr. Unsecured, MTN, 6.30%, 3/01/38 | 500,000 | 583,398 | ||||||
| Description | Par Value | Value | ||||||
Wal-Mart Stores, Inc., Sr. Unsecured, 5.63%, 4/15/41 | $ | 500,000 | $ | 515,572 | ||||
TOTAL RETAIL | $ | 3,200,731 | ||||||
TELECOMMUNICATIONS – 3.2% | ||||||||
American Tower Corp., Sr. Unsecured, 4.63%, 4/01/15 | 250,000 | 262,593 | ||||||
AT&T, Inc., Sr. Unsecured, 6.70%, 11/15/13 | 1,000,000 | 1,128,635 | ||||||
6,7Crown Castle Towers LLC, Sr. Secured, 4.17%, 8/15/17 | 2,000,000 | 2,017,500 | ||||||
Juniper Networks, Inc., Sr. Unsecured, 4.60%, 3/15/21 | 500,000 | 509,046 | ||||||
Qwest Communications International, Inc., Company Guaranteed, 7.13%, 4/01/18 | 1,000,000 | 1,087,187 | ||||||
6,7Telstra Corp. Ltd., Notes, 4.80%, 10/12/21 | 500,000 | 507,704 | ||||||
Verizon Communications, Inc., Sr. Unsecured, 3.00%, 4/01/16 | 1,000,000 | 1,010,893 | ||||||
Verizon Communications, Inc., Sr. Unsecured, 4.60%, 4/01/21 | 500,000 | 511,905 | ||||||
TOTAL TELECOMMUNICATIONS | $ | 7,035,463 | ||||||
TRANSPORTATION – 0.8% | ||||||||
Canadian National Railway Co., Sr. Unsecured, 6.38%, 10/15/11 | 500,000 | 513,621 | ||||||
12Norfolk Southern Corp., Sr. Unsecured, 5.90%, 6/15/19 | 250,000 | 285,483 | ||||||
Union Pacific Corp., Sr. Unsecured, | 900,000 | 1,031,590 | ||||||
TOTAL TRANSPORTATION | $ | 1,830,694 | ||||||
| TOTAL CORPORATE BONDS (COST $114,945,213) | $ | 121,729,418 | ||||||
| ENHANCED EQUIPMENT TRUST CERTIFICATES – 1.0% | ||||||||
AIRLINES – 1.0% | ||||||||
American Airlines 2011-1, Class A Pass-Through Trust, Series A, Secured, | 500,000 | 490,938 | ||||||
Continental Airlines, Inc., Series A, Pass-Thru Certificates, 7.25%, 11/10/19 | 243,094 | 264,060 | ||||||
Delta Air Lines, Inc., Series A, Pass-Thru Certificates, 7.75%, 12/17/19 | 488,103 | 536,304 | ||||||
Delta Air Lines, Inc., Series 071A, Pass-Thru Certificates, 6.82%, 8/10/22 | 392,449 | 407,901 | ||||||
United Air Lines, Inc., Series 09-2, Pass-Thru Certificates, 9.75%, 1/15/17 | 461,426 | 523,718 | ||||||
TOTAL AIRLINES | $ | 2,222,921 | ||||||
| TOTAL ENHANCED EQUIPMENT TRUST CERTIFICATES (COST $2,085,071) | $ | 2,222,921 | ||||||
| MORTGAGE-BACKED SECURITIES – 17.9% | ||||||||
FEDERAL HOME LOAN MORTGAGE CORPORATION (FHLMC) – 11.1% | ||||||||
Pool A13990, 4.50%, 10/01/33 | 228,762 | 237,683 | ||||||
Pool A83578, 5.00%, 12/01/38 | 412,876 | 436,075 | ||||||
(MTB Income Fund continued next page)
April 30, 2011 / ANNUAL REPORT
Table of Contents
| PORTFOLIOS OF INVESTMENTS | 91 |
MTB Income Fund (continued)
| Description | Par Value | Value | ||||||
Pool A93505, 4.50%, 8/01/40 | $ | 9,062,771 | $ | 9,336,920 | ||||
Pool B17616, 5.50%, 1/01/20 | 320,256 | 348,859 | ||||||
Pool C00478, 8.50%, 9/01/26 | 34,882 | 40,928 | ||||||
Pool C01272, 6.00%, 12/01/31 | 160,462 | 178,494 | ||||||
Pool E00560, 6.00%, 7/01/13 | 44,186 | 46,807 | ||||||
Pool G02296, 5.00%, 6/01/36 | 1,781,050 | 1,891,142 | ||||||
Pool G02976, 5.50%, 6/01/37 | 1,293,890 | 1,396,997 | ||||||
Pool G02988, 6.00%, 5/01/37 | 1,194,322 | 1,312,112 | ||||||
Pool G03703, 5.50%, 12/01/37 | 617,411 | 666,611 | ||||||
Pool G04338, 5.50%, 5/01/38 | 6,118,783 | 6,594,901 | ||||||
Pool G04776, 5.50%, 7/01/38 | 914,252 | 985,393 | ||||||
Pool G12709, 5.00%, 7/01/22 | 460,494 | 493,707 | ||||||
TOTAL FEDERAL HOME LOAN MORTGAGE CORPORATION (FHLMC) | $ | 23,966,629 | ||||||
FEDERAL NATIONAL MORTGAGE ASSOCIATION (FNMA) – 6.5% | ||||||||
Pool 254007, 6.50%, 10/01/31 | 75,907 | 86,916 | ||||||
Pool 254759, 4.50%, 6/01/18 | 412,459 | 440,867 | ||||||
Pool 329794, 7.00%, 2/01/26 | 74,778 | 86,257 | ||||||
Pool 398162, 6.50%, 1/01/28 | 24,448 | 27,917 | ||||||
Pool 402255, 6.50%, 12/01/27 | 8,440 | 9,611 | ||||||
Pool 535939, 6.00%, 5/01/16 | 135,458 | 148,131 | ||||||
Pool 638023, 6.50%, 4/01/32 | 201,432 | 230,646 | ||||||
Pool 642345, 6.50%, 5/01/32 | 190,774 | 218,442 | ||||||
Pool 651292, 6.50%, 7/01/32 | 275,251 | 315,171 | ||||||
Pool 686398, 6.00%, 3/01/33 | 456,754 | 507,996 | ||||||
Pool 688987, 6.00%, 5/01/33 | 551,812 | 613,719 | ||||||
Pool 695818, 5.00%, 4/01/18 | 641,885 | 692,474 | ||||||
Pool 889982, 5.50%, 11/01/38 | 1,708,040 | 1,843,830 | ||||||
Pool 889995, 5.50%, 9/01/38 | 2,402,377 | 2,593,366 | ||||||
Pool 975207, 5.00%, 3/01/23 | 488,630 | 523,322 | ||||||
Pool AB1796, 3.50%, 11/01/40 | 2,965,181 | 2,833,601 | ||||||
Pool AE2520, 3.00%, 1/01/26 | 2,933,357 | 2,901,274 | ||||||
TOTAL FEDERAL NATIONAL MORTGAGE ASSOCIATION (FNMA) | $ | 14,073,540 | ||||||
GOVERNMENT NATIONAL MORTGAGE ASSOCIATION | ||||||||
Pool 2077, 7.00%, 9/20/25 | 28,092 | 32,595 | ||||||
Pool 354677, 7.50%, 10/15/23 | 72,690 | 84,298 | ||||||
Pool 354713, 7.50%, 12/15/23 | 38,286 | 44,399 | ||||||
Pool 354765, 7.00%, 2/15/24 | 83,874 | 96,883 | ||||||
Pool 354827, 7.00%, 5/15/24 | 87,727 | 101,333 | ||||||
Pool 360869, 7.50%, 5/15/24 | 33,433 | 38,892 | ||||||
Pool 361843, 7.50%, 10/15/24 | 61,858 | 71,957 | ||||||
Pool 373335, 7.50%, 5/15/22 | 26,558 | 30,692 | ||||||
Pool 385623, 7.00%, 5/15/24 | 76,562 | 88,712 | ||||||
| Description | Par Value | Value | ||||||
Pool 503405, 6.50%, 4/15/29 | $ | 115,729 | $ | 132,752 | ||||
TOTAL GOVERNMENT NATIONAL MORTGAGE ASSOCIATION (GNMA) | $ | 722,513 | ||||||
| TOTAL MORTGAGE-BACKED SECURITIES (COST $37,462,230) | $ | 38,762,682 | ||||||
| U.S. TREASURY – 13.4% | ||||||||
INFLATION INDEXED BONDS – 4.9% | ||||||||
1.13%, 1/15/21 | 10,000,000 | 10,504,185 | ||||||
2.00%, 1/15/14 | 100,000 | 131,788 | ||||||
TOTAL INFLATION INDEXED BONDS | $ | 10,635,973 | ||||||
U.S. TREASURY BOND – 0.2% | ||||||||
4.25%, 11/15/40 | 500,000 | 487,188 | ||||||
U.S. TREASURY NOTE – 8.3% | ||||||||
0.63%, 2/28/13 | 1,000,000 | 1,001,484 | ||||||
1.25%, 2/15/14 | 2,085,000 | 2,103,570 | ||||||
1.25%, 9/30/15 | 1,000,000 | 980,313 | ||||||
1.75%, 7/31/15 | 500,000 | 502,500 | ||||||
2.00%, 1/31/16 | 2,965,000 | 2,983,531 | ||||||
2.25%, 1/31/15 | 1,000,000 | 1,031,562 | ||||||
2.25%, 3/31/16 | 1,400,000 | 1,421,000 | ||||||
2.50%, 4/30/15 | 1,000,000 | 1,038,906 | ||||||
2.63%, 6/30/14 | 1,000,000 | 1,047,500 | ||||||
2.63%, 7/31/14 | 1,000,000 | 1,047,344 | ||||||
2.63%, 12/31/14 | 1,000,000 | 1,045,937 | ||||||
3.63%, 2/15/21 | 3,000,000 | 3,084,375 | ||||||
3.75%, 11/15/18 | 500,000 | 532,891 | ||||||
TOTAL U.S. TREASURY NOTE | $ | 17,820,913 | ||||||
| TOTAL U.S. TREASURY (COST $28,427,623) | $ | 28,944,074 | ||||||
| REPURCHASE AGREEMENT – 1.7% | ||||||||
Credit Suisse First Boston LLC, 0.03%, dated 04/30/11, due 05/02/11, repurchase price $3,663,975, collateralized by U.S. Treasury Securities 1.50% to 1.75%, maturing 12/31/13 to 01/31/14; total market value of $3,740,335. | 3,663,966 | 3,663,966 | ||||||
| TOTAL REPURCHASE AGREEMENT (COST $3,663,966) | $ | 3,663,966 | ||||||
| TOTAL INVESTMENTS IN SECURITIES – 97.9% (COST $202,393,372) | $ | 211,518,094 | ||||||
| CASH COLLATERAL INVESTED FOR SECURITIES ON LOAN – 0.8% | ||||||||
REPURCHASE AGREEMENTS – 0.8% | ||||||||
BNP Paribas Securities Corp., 0.05%, dated 04/29/11, due 05/02/11, repurchase price $646,951, collateralized by U.S. Government Securities 1.42% to 7.13%, maturing 09/01/13 to 09/01/49; total market value of $660,531. | 646,948 | 646,948 | ||||||
(MTB Income Fund continued next page)
ANNUAL REPORT / April 30, 2011
Table of Contents
| 92 | PORTFOLIOS OF INVESTMENTS |
MTB Income Fund (concluded)
| Description | Par Value | Value | ||||||
Mizuho Securities, Inc., 0.07%, dated 04/29/11, due 05/02/11, repurchase price $1,000,006, collateralized by U.S. Government Securities 0.60% to 8.50%, maturing 01/01/21 to 06/25/43; total market value of $1,020,000. | $ | 1,000,000 | $ | 1,000,000 | ||||
| TOTAL CASH COLLATERAL INVESTED FOR SECURITIES ON LOAN (COST $1,646,948) | $ | 1,646,948 | ||||||
| TOTAL INVESTMENTS – 98.7% (COST $204,040,320) | $ | 213,165,042 | ||||||
| COLLATERAL FOR SECURITIES ON LOAN – (0.8%) | (1,646,948 | ) | ||||||
| OTHER ASSETS LESS LIABILITIES – 2.1% | 4,469,636 | |||||||
| TOTAL NET ASSETS – 100.0% | $ | 215,987,730 | ||||||
Cost of investments for Federal income tax purposes is $205,703,681. The net unrealized appreciation/depreciation of investments was $9,108,309. This consists of net unrealized appreciation from investment for those securities having an excess of value over cost of $9,750,554 and net unrealized depreciation from investments for those securities having an excess of cost over value of $642,245.
Various inputs are used in determining the value of the Fund’s investments. These inputs are summarized in the three broad levels listed below.
Level 1 – quoted prices in active markets for identical securities
Level 2 – other significant observable inputs (including quoted prices for similar securities, interest rates, prepayment speeds, credit risk, etc.)
Level 3 – significant unobservable inputs (including the Fund’s own assumptions in determining the fair value of investments)
The following is a summary of the inputs used as of April 30, 2011 in valuing the Fund’s assets carried at fair value:
| Level 1 | Level 2 | Level 3 | Total | |||||||||||||
Investments in Securities | ||||||||||||||||
Asset Backed Securities | $ | — | $ | 3,687,155 | $ | — | $ | 3,687,155 | ||||||||
Collateralized Mortgage Obligations | — | 12,507,878 | — | 12,507,878 | ||||||||||||
Corporate Bonds | — | 121,729,418 | — | 121,729,418 | ||||||||||||
Enhanced Equipment Trust Certificates | — | 2,222,921 | — | 2,222,921 | ||||||||||||
Mortgage-Backed Securities | — | 38,762,682 | — | 38,762,682 | ||||||||||||
U.S. Treasury | — | 28,944,074 | — | 28,944,074 | ||||||||||||
Repurchase Agreements | — | 5,310,914 | — | 5,310,914 | ||||||||||||
Total | $ | — | $ | 213,165,042 | $ | — | $ | 213,165,042 | ||||||||
See Notes to Portfolios of Investments
April 30, 2011 / ANNUAL REPORT
Table of Contents
| 93 |
PORTFOLIO OF INVESTMENTS SUMMARY TABLE
MTB Strategic Allocation Fund
At April 30, 2011, the Fund’s sector classifications were as follows: (unaudited)
| Percentage of Total Net Assets | ||||
| Mutual Funds | 75.6 | % | ||
| U.S. Treasury | 7.2 | % | ||
| Corporate Bonds | 6.8 | % | ||
| Mortgage-Backed Securities | 5.3 | % | ||
| Collateralized Mortgage Obligations | 0.7 | % | ||
| Enhanced Equipment Trust Certificates | 0.2 | % | ||
| Cash Equivalents1 | 5.9 | % | ||
| Other Assets and Liabilities - Net2 | (1.7 | )% | ||
| TOTAL | 100.0 | % | ||
| (1) | Cash Equivalents include investments in money market mutual funds and repurchase agreements. |
| (2) | Assets, other than investments in securities, less liabilities. See Statements of Assets and Liabilities. |
PORTFOLIO OF INVESTMENTS
April 30, 2011
| Description | Number of Shares | Value | ||||||
| MUTUAL FUNDS – 75.6% | ||||||||
DEBT FUNDS – 9.8% | ||||||||
Artio Global High Income Fund | 74,398 | $ | 787,133 | |||||
Dreyfus International Bond Fund | 137,274 | 2,373,472 | ||||||
MFS Emerging Markets Debt Fund | 101,089 | 1,477,919 | ||||||
RidgeWorth Seix Floating Rate High Income Fund | 343,354 | 3,100,488 | ||||||
TOTAL DEBT FUNDS | $ | 7,739,012 | ||||||
EQUITY FUNDS – 65.8% | ||||||||
Alpine International Real Estate Equity Fund | 52,220 | 1,414,643 | ||||||
Guinness Atkinson Funds – China & Hong Kong Fund | 18,760 | 742,139 | ||||||
Guinness Atkinson Funds – Global Energy Fund | 45,638 | 1,592,779 | ||||||
Harbor International Fund | 23,408 | 1,578,199 | ||||||
iShares Russell 1000 Value Index Fund | 33,719 | 2,375,504 | ||||||
Lazard Emerging Markets Equity Portfolio | 105,612 | 2,367,813 | ||||||
LSV Value Equity Fund | 259,718 | 3,937,325 | ||||||
Mainstay Epoch Global Equity Yield Fund | 57,504 | 947,094 | ||||||
9MTB International Equity Fund | 1,270,152 | 12,638,017 | ||||||
9MTB Large Cap Growth Fund | 906,162 | 8,662,906 | ||||||
9MTB Large Cap Value Fund | 537,508 | 6,186,721 | ||||||
9MTB Mid Cap Growth Fund | 190,133 | 3,150,506 | ||||||
| Description | Number of Shares | Value | ||||||
9MTB Small Cap Growth Fund | 130,721 | $ | 2,452,325 | |||||
RS Global Natural Resources Fund | 37,270 | 1,569,059 | ||||||
SPDR S&P Dividend ETF | 42,624 | 2,363,501 | ||||||
TOTAL EQUITY FUNDS | $ | 51,978,531 | ||||||
| TOTAL MUTUAL FUNDS (COST $48,322,357) | $ | 59,717,543 | ||||||
| Par Value | ||||||||
| COLLATERALIZED MORTGAGE OBLIGATIONS – 0.7% | ||||||||
FEDERAL HOME LOAN MORTGAGE CORPORATION (FHLMC) – 0.1% | ||||||||
Series 2003-2686, Class GB, 5.00%, 5/15/20 | $ | 71,449 | 72,410 | |||||
FEDERAL NATIONAL MORTGAGE ASSOCIATION (FNMA) – 0.3% | ||||||||
14Series 1988-23, Class C, 9.75%, 9/25/18 | 3,340 | 3,791 | ||||||
Series 2007-35, Class DH, 5.00%, 9/25/33 | 231,034 | 243,989 | ||||||
TOTAL FEDERAL NATIONAL MORTGAGE ASSOCIATION (FNMA) | 247,780 | |||||||
WHOLE LOAN – 0.3% | ||||||||
1Banc of America Mortgage Securities, Inc., Series 2004-A, Class 2A1, 2.86%, 5/25/11 | 94,812 | 88,942 | ||||||
1Indymac INDA Mortgage Loan Trust, Series 2005-AR1, Class 2A1, 5.06%, 5/25/11 | 69,728 | 62,511 | ||||||
(MTB Strategic Allocation Fund continued next page)
ANNUAL REPORT / April 30, 2011
Table of Contents
| 94 | PORTFOLIOS OF INVESTMENTS |
MTB Strategic Allocation Fund (continued)
| Description | Par Value | Value | ||||||
Morgan Stanley Mortgage Loan Trust, Series 2004-1, Class 1A8, 4.75%, 11/25/18 | $ | 28,681 | $ | 28,805 | ||||
TOTAL WHOLE LOAN | $ | 180,258 | ||||||
| TOTAL COLLATERALIZED MORTGAGE OBLIGATIONS (COST $497,880) | $ | 500,448 | ||||||
| CORPORATE BONDS – 6.8% | ||||||||
AGRICULTURE – 0.3% | ||||||||
Archer-Daniels-Midland Co., Sr. Unsecured, | 200,000 | 217,485 | ||||||
AUTO MANUFACTURERS – 0.3% | ||||||||
14Daimler Finance North America LLC, Company Guaranteed, MTN, 5.75%, 9/08/11 | 200,000 | 203,604 | ||||||
BANKS – 1.9% | ||||||||
1BankBoston Capital Trust III, Limited Guarantee, 1.06%, 6/15/11 | 170,000 | 136,781 | ||||||
BB&T Corp., Subordinated, 4.75%, 10/01/12 | 150,000 | 157,664 | ||||||
BNP Paribas, Bank Guaranteed, MTN, 3.60%, 2/23/16 | 100,000 | 101,795 | ||||||
Capital One Financial Corp., Sr. Unsecured, | 100,000 | 116,320 | ||||||
12Fifth Third Bancorp, Sr. Unsecured, 6.25%, 5/01/13 | 100,000 | 108,757 | ||||||
Goldman Sachs Group, Inc., Sr. Unsecured, MTN, 6.00%, 5/01/14 | 70,000 | 77,514 | ||||||
5.25%, 4/01/13 | 100,000 | 107,429 | ||||||
JPMorgan Chase & Co., Sr. Unsecured, MTN, 2.05%, 1/24/14 | 100,000 | 100,661 | ||||||
3.40%, 6/24/15 | 100,000 | 102,705 | ||||||
KeyCorp, Sr. Unsecured, MTN, 6.50%, 5/14/13 | 100,000 | 109,322 | ||||||
Morgan Stanley, Sr. Unsecured, MTN, 5.63%, 9/23/19 | 80,000 | 83,258 | ||||||
PNC Funding Corp., Bank Guaranteed, 4.25%, 9/21/15 | 75,000 | 79,715 | ||||||
1SunTrust Capital III, Limited Guarantee, 0.96%, 6/15/11 | 152,000 | 116,335 | ||||||
U.S. Bank NA, Sr. Unsecured, MTN, 5.92%, 5/25/12 | 75,704 | 79,471 | ||||||
TOTAL BANKS | $ | 1,477,727 | ||||||
CHEMICALS – 0.2% | ||||||||
Dow Chemical Co., Sr. Unsecured, 7.60%, 5/15/14 | 140,000 | 163,207 | ||||||
COMPUTERS – 0.4% | ||||||||
Dell, Inc., Sr. Unsecured, 2.30%, 9/10/15 | 200,000 | 199,128 | ||||||
Hewlett-Packard Co., Sr. Unsecured, 4.75%, 6/02/14 | 80,000 | 87,739 | ||||||
TOTAL COMPUTERS | $ | 286,867 | ||||||
DIVERSIFIED FINANCIAL SERVICES – 0.7% |
| |||||||
American Express Credit Corp., Sr. Unsecured, 5.13%, 8/25/14 | 100,000 | 109,204 | ||||||
Citigroup, Inc., Sr. Unsecured, 6.00%, 8/15/17 | 200,000 | 220,908 | ||||||
| Description | Par Value | Value | ||||||
6,7FMR LLC, Sr. Unsecured, 6.45%, 11/15/39 | $ | 100,000 | $ | 100,409 | ||||
Jefferies Group, Inc., Sr. Unsecured, 5.13%, 4/13/18 | 150,000 | 150,880 | ||||||
TOTAL DIVERSIFIED FINANCIAL SERVICES | $ | 581,401 | ||||||
ELECTRIC – 0.1% | ||||||||
Virginia Electric and Power Co., Sr. Unsecured, 5.10%, 11/30/12 | 100,000 | 106,592 | ||||||
ELECTRONICS – 0.2% | ||||||||
Thermo Fisher Scientific, Inc., Sr. Unsecured, 3.25%, 11/20/14 | 150,000 | 157,831 | ||||||
FOOD – 0.6% | ||||||||
Kraft Foods, Inc., Sr. Unsecured, | 13,000 | 13,343 | ||||||
6.25%, 6/01/12 | 150,000 | 159,031 | ||||||
Kroger Co., Company Guaranteed, 3.90%, 10/01/15 | 100,000 | 105,220 | ||||||
6,7,14WM Wrigley Jr. Co., Secured, 2.45%, 6/28/12 | 200,000 | 200,965 | ||||||
TOTAL FOOD | $ | 478,559 | ||||||
INSURANCE – 0.2% | ||||||||
Hartford Financial Services Group, Inc., Sr. Unsecured, 5.25%, 10/15/11 | 150,000 | 153,013 | ||||||
METALS & MINING – 0.1% | ||||||||
Rio Tinto Finance USA Ltd., Company Guaranteed, 9.00%, 5/01/19 | 60,000 | 80,095 | ||||||
OFFICE/BUSINESS EQUIPMENT – 0.1% | ||||||||
Xerox Corp., Sr. Notes, 5.63%, 12/15/19 | 100,000 | 108,727 | ||||||
REAL ESTATE INVESTMENT TRUSTS (REIT) – 1.2% | ||||||||
AvalonBay Communities, Inc., Sr. Unsecured, MTN, 5.70%, 3/15/17 | 100,000 | 112,041 | ||||||
Boston Properties LP, Sr. Unsecured, 5.88%, 10/15/19 | 100,000 | 110,340 | ||||||
Commonwealth REIT, Sr. Unsecured, 6.65%, 1/15/18 | 100,000 | 111,193 | ||||||
Digital Realty Trust LP, Company Guaranteed, 5.88%, 2/01/20 | 100,000 | 106,235 | ||||||
HCP, Inc., Sr. Unsecured, 5.95%, 9/15/11 | 100,000 | 101,933 | ||||||
5.38%, 2/01/21 | 100,000 | 104,340 | ||||||
14Health Care REIT, Inc., Sr. Unsecured, 4.70%, 9/15/17 | 100,000 | 102,523 | ||||||
Healthcare Realty Trust, Inc., Sr. Unsecured, 6.50%, 1/17/17 | 100,000 | 112,427 | ||||||
Simon Property Group LP, Sr. Unsecured, 5.65%, 2/01/20 | 100,000 | 109,158 | ||||||
TOTAL REAL ESTATE INVESTMENT | $ | 970,190 | ||||||
RETAIL – 0.3% | ||||||||
CVS Caremark Corp., Sr. Unsecured, 5.75%, 6/01/17 | 100,000 | 112,076 | ||||||
(MTB Strategic Allocation Fund continued next page)
April 30, 2011 / ANNUAL REPORT
Table of Contents
| PORTFOLIOS OF INVESTMENTS | 95 |
MTB Strategic Allocation Fund (continued)
| Description | Par Value | Value | ||||||
Yum! Brands, Inc., Sr. Unsecured, 5.30%, 9/15/19 | $ | 100,000 | $ | 107,501 | ||||
TOTAL RETAIL | $ | 219,577 | ||||||
TELECOMMUNICATIONS – 0.2% | ||||||||
AT&T, Inc., Sr. Unsecured, 6.70%, 11/15/13 | $ | 150,000 | $ | 169,295 | ||||
| TOTAL CORPORATE BONDS (COST $5,297,743) | $ | 5,374,170 | ||||||
| ENHANCED EQUIPMENT TRUST CERTIFICATES – 0.2% | ||||||||
AIRLINES – 0.2% | ||||||||
Continental Airlines, Inc., Series A,Pass-Thru Certificates, 7.25%, 11/10/19 | 77,790 | 84,500 | ||||||
Delta Air Lines, Inc., Series 071A,Pass-Thru Certificates, 6.82%, 8/10/22 | 62,792 | 65,264 | ||||||
TOTAL AIRLINES | $ | 149,764 | ||||||
| TOTAL ENHANCED EQUIPMENT TRUST CERTIFICATES (COST $140,621) | $ | 149,764 | ||||||
| MORTGAGE-BACKED SECURITIES – 5.3% | ||||||||
FEDERAL HOME LOAN MORTGAGE CORPORATION – 2.6% | ||||||||
Pool A15865, 5.50%, 11/01/33 | 176,619 | 191,742 | ||||||
Pool A19412, 5.00%, 3/01/34 | 298,253 | 317,155 | ||||||
Pool A46082, 5.00%, 7/01/35 | 222,644 | 236,407 | ||||||
Pool A86166, 4.50%, 5/01/39 | 387,363 | 399,202 | ||||||
Pool C00478, 8.50%, 9/01/26 | 3,876 | 4,547 | ||||||
Pool G05774, 5.00%, 1/01/40 | 836,871 | 883,893 | ||||||
TOTAL FEDERAL HOME LOAN MORTGAGE CORPORATION | $ | 2,032,946 | ||||||
FEDERAL NATIONAL MORTGAGE ASSOCIATION – 2.5% | ||||||||
Pool 533246, 7.50%, 4/01/30 | 34,672 | 40,413 | ||||||
14Pool 797152, 5.00%, 11/01/19 | 212,254 | 228,651 | ||||||
Pool 868574, 5.50%, 4/01/36 | 222,831 | 241,521 | ||||||
Pool 889982, 5.50%, 11/01/38 | 944,546 | 1,019,638 | ||||||
Pool 932752, 5.00%, 4/01/40 | 146,799 | 155,258 | ||||||
Pool MA0563, 4.00%, 11/01/30 | 316,120 | 321,493 | ||||||
TOTAL FEDERAL NATIONAL MORTGAGE ASSOCIATION | $ | 2,006,974 | ||||||
GOVERNMENT NATIONAL MORTGAGE ASSOCIATION – 0.2% | ||||||||
Pool 354677, 7.50%, 10/15/23 | 45,702 | 53,000 | ||||||
Pool 354765, 7.00%, 2/15/24 | 47,864 | 55,288 | ||||||
Pool 354827, 7.00%, 5/15/24 | 52,636 | 60,800 | ||||||
TOTAL GOVERNMENT NATIONAL MORTGAGE ASSOCIATION | $ | 169,088 | ||||||
| TOTAL MORTGAGE-BACKED SECURITIES (COST $4,066,605) | $ | 4,209,008 | ||||||
| Description | Par Value/Shares | Value | ||||||
| U.S. TREASURY – 7.2% | ||||||||
U.S. TREASURY BONDS – 1.3% | ||||||||
4.75%, 2/15/37 | $ | 96,000 | $ | 102,210 | ||||
4.38%, 5/15/40 | 900,000 | 896,484 | ||||||
TOTAL U.S. TREASURY BONDS | $ | 998,694 | ||||||
U.S. TREASURY INFLATION INDEXED NOTE – 1.1% | ||||||||
1.13%, 1/15/21 | 830,000 | 871,847 | ||||||
U.S. TREASURY NOTES – 4.8% | ||||||||
4.88%, 6/30/12 | 170,000 | 179,098 | ||||||
3.13%, 4/30/13 | 200,000 | 210,125 | ||||||
4.00%, 2/15/14 | 40,000 | 43,444 | ||||||
2.13%, 5/31/15 | 1,600,000 | 1,636,750 | ||||||
4.50%, 2/15/16 | 200,000 | 224,531 | ||||||
4.50%, 5/15/17 | 200,000 | 224,312 | ||||||
1.88%, 8/31/17 | 500,000 | 482,188 | ||||||
3.50%, 5/15/20 | 800,000 | 821,750 | ||||||
TOTAL U.S. TREASURY NOTES | $ | 3,822,198 | ||||||
| TOTAL U.S. TREASURY (COST $5,603,234) | 5,692,739 | |||||||
| MONEY MARKET FUNDS – 4.3% | ||||||||
8,9MTB Money Market Fund, Series Institutional I Shares, 0.03% | 481,577 | $ | 481,577 | |||||
8,9MTB Prime Money Market Fund, Corporate Shares, 0.04% | $ | 2,905,147 | $ | 2,905,147 | ||||
| TOTAL MONEY MARKET FUNDS (COST $3,386,724) | $ | 3,386,724 | ||||||
| TOTAL INVESTMENTS IN SECURITIES – 100.1% (COST $67,315,164) | $ | 79,030,396 | ||||||
| CASH COLLATERAL INVESTED FOR SECURITIES ON LOAN – 1.6% | ||||||||
REPURCHASE AGREEMENTS – 1.6% | ||||||||
BNP Paribas Securities Corp., 0.05%, dated 04/29/11, due 05/02/11, repurchase price $1,000,004, collateralized by U.S. Government Securities 1.42% to 7.13%, maturing 09/01/13 to 09/01/49; total market value of $1,020,996. | 1,000,000 | 1,000,000 | ||||||
Deutsche Bank Securities, Inc., 0.05%, dated 04/29/11, due 05/02/11, repurchase price $274,923, collateralized by U.S. Government Securities 3.50% to 7.00%, maturing 02/01/20 to 03/01/41; total market value of $280,420. | 274,922 | 274,922 | ||||||
| TOTAL CASH COLLATERAL INVESTED FOR SECURITIES ON LOAN (COST $1,274,922) | $ | 1,274,922 | ||||||
| TOTAL INVESTMENTS – 101.7% (COST $68,590,086) | $ | 80,305,318 | ||||||
| COLLATERAL FOR SECURITIES ON LOAN – (1.6%) | (1,274,922 | ) | ||||||
| OTHER LIABILITIES LESS ASSETS – (0.1%) | (50,409 | ) | ||||||
| TOTAL NET ASSETS – 100.0% | $ | 78,979,987 | ||||||
(MTB Strategic Allocation Fund continued next page)
ANNUAL REPORT / April 30, 2011
Table of Contents
| 96 | PORTFOLIOS OF INVESTMENTS |
MTB Strategic Allocation Fund (continued)
See Notes to Portfolios of Investments
Cost of investments for Federal income tax purposes is $71,410,193. The net unrealized appreciation/depreciation of investments was $8,895,125. This consists of net unrealized appreciation from investment for those securities having an excess of value over cost of $11,145,793 and net unrealized depreciation from investments for those securities having an excess of cost over value of $2,250,668.
Various inputs are used in determining the value of the Fund’s investments. These inputs are summarized in the three broad levels listed below.
Level 1 – quoted prices in active markets for identical securities
Level 2 – other significant observable inputs (including quoted prices for similar securities, interest rates, prepayment speeds, credit risk, etc.)
Level 3 – significant unobservable inputs (including the Fund’s own assumptions in determining the fair value of investments)
The following is a summary of the inputs used as of April 30, 2011 in valuing the Fund’s assets carried at fair value:
| Level 1 | Level 2 | Level 3 | Total | |||||||||||||
Investments in Securities | ||||||||||||||||
Mutual Funds | $ | 59,717,543 | $ | — | $ | — | $ | 59,717,543 | ||||||||
Collateralized Mortgage Obligations | — | 500,448 | — | 500,448 | ||||||||||||
Corporate Bonds | — | 5,374,170 | — | 5,374,170 | ||||||||||||
Enhanced Equipment Trust Certificates | — | 149,764 | — | 149,764 | ||||||||||||
Mortgage-Backed Securities | — | 4,209,008 | — | 4,209,008 | ||||||||||||
U.S. Treasury | — | 5,692,739 | — | 5,692,739 | ||||||||||||
Money Market Funds | 3,386,724 | — | — | 3,386,724 | ||||||||||||
Repurchase Agreements | — | 1,274,922 | — | 1,274,922 | ||||||||||||
Total | $ | 63,104,267 | $ | 17,201,051 | $ | — | $ | 80,305,318 | ||||||||
April 30, 2011 / ANNUAL REPORT
Table of Contents
| 97 |
PORTFOLIO OF INVESTMENTS SUMMARY TABLE
MTB Large Cap Value Fund
At April 30, 2011, the Fund’s sector classifications were as follows: (unaudited)
| Stocks | Percentage of Total Net Assets | |||
| Insurance | 17.5 | % | ||
| Oil & Gas | 15.3 | % | ||
| Pharmaceuticals | 10.1 | % | ||
| Metals & Mining | 7.2 | % | ||
| Media | 7.1 | % | ||
| Software | 6.4 | % | ||
| Telecommunications | 5.1 | % | ||
| Banks | 5.0 | % | ||
| Biotechnology | 3.6 | % | ||
| Diversified Financial Services | 3.4 | % | ||
| Aerospace & Defense | 2.9 | % | ||
| Miscellaneous Manufacturing | 2.0 | % | ||
| Auto Manufacturers | 1.9 | % | ||
| Retail | 1.9 | % | ||
| Transportation | 1.8 | % | ||
| Office/Business Equipment | 1.5 | % | ||
| Tobacco | 1.3 | % | ||
| Electric | 1.2 | % | ||
| Oil & Gas Services | 1.1 | % | ||
| Food | 1.0 | % | ||
| Cash Equivalents1 | 2.2 | % | ||
| Other Assets and Liabilities – Net2 | 0.5 | % | ||
| TOTAL | 100.0 | % | ||
| (1) | Cash Equivalents include investments in money market mutual fund and repurchase agreements. |
| (2) | Assets, other than investments in securities, less liabilities. See Statements of Assets and Liabilities. |
PORTFOLIO OF INVESTMENTS
April 30, 2011
| Description | Number of Shares | Value | ||||||
| COMMON STOCKS – 97.3% | ||||||||
AEROSPACE & DEFENSE – 2.9% | ||||||||
Lockheed Martin Corp. | 37,005 | $ | 2,932,646 | |||||
Raytheon Co. | 48,500 | 2,354,675 | ||||||
TOTAL AEROSPACE & DEFENSE | $ | 5,287,321 | ||||||
AUTO MANUFACTURERS – 1.9% | ||||||||
*General Motors Co. | 106,700 | 3,424,003 | ||||||
BANKS – 5.0% | ||||||||
*Citigroup, Inc. | 1,109,300 | 5,091,687 | ||||||
| Description | Number of Shares | Value | ||||||
Wells Fargo & Co. | 141,600 | $ | 4,121,976 | |||||
TOTAL BANKS | $ | 9,213,663 | ||||||
BIOTECHNOLOGY – 3.6% | ||||||||
*Amgen, Inc. | 115,100 | 6,543,435 | ||||||
DIVERSIFIED FINANCIAL SERVICES – 3.4% | ||||||||
Goldman Sachs Group, Inc. | 16,800 | 2,536,968 | ||||||
JPMorgan Chase & Co. | 79,900 | 3,645,837 | ||||||
TOTAL DIVERSIFIED FINANCIAL SERVICES | $ | 6,182,805 | ||||||
(MTB Large Cap Value Fund continued next page)
ANNUAL REPORT / April 30, 2011
Table of Contents
| 98 | PORTFOLIOS OF INVESTMENTS |
MTB Large Cap Value Fund (continued)
| Description | Number of Shares | Value | ||||||
ELECTRIC – 1.2% | ||||||||
*NRG Energy, Inc. | 90,300 | $ | 2,185,260 | |||||
FOOD – 1.0% | ||||||||
Kroger Co. | 74,900 | 1,820,819 | ||||||
INSURANCE – 17.5% | ||||||||
AON Corp. | 100,000 | 5,217,000 | ||||||
*Genworth Financial, Inc. | 347,400 | 4,234,806 | ||||||
Hartford Financial Services Group, Inc. | 162,300 | 4,701,831 | ||||||
Lincoln National Corp. | 81,800 | 2,554,614 | ||||||
Loews Corp. | 103,146 | 4,565,242 | ||||||
MetLife, Inc. | 132,700 | 6,209,033 | ||||||
Unum Group | 173,800 | 4,602,224 | ||||||
TOTAL INSURANCE | $ | 32,084,750 | ||||||
MEDIA – 7.1% | ||||||||
Time Warner, Inc. | 107,600 | 4,073,736 | ||||||
Viacom, Inc. | 174,000 | 8,901,840 | ||||||
TOTAL MEDIA | $ | 12,975,576 | ||||||
METALS & MINING – 7.2% | ||||||||
AngloGold Ashanti Ltd. ADR | 155,799 | 7,942,633 | ||||||
Barrick Gold Corp. | 100,900 | 5,146,909 | ||||||
TOTAL METALS & MINING | $ | 13,089,542 | ||||||
MISCELLANEOUS | ||||||||
Ingersoll-Rand PLC | 70,850 | 3,577,925 | ||||||
OFFICE/BUSINESS EQUIPMENT – 1.5% | ||||||||
12Pitney Bowes, Inc. | 110,410 | 2,711,670 | ||||||
OIL & GAS – 15.3% | ||||||||
Apache Corp. | 64,150 | 8,555,686 | ||||||
Canadian Natural Resources Ltd. | 102,600 | 4,818,096 | ||||||
Hess Corp. | 42,800 | 3,679,088 | ||||||
Noble Energy, Inc. | 37,100 | 3,571,617 | ||||||
Occidental Petroleum Corp. | 44,600 | 5,097,334 | ||||||
Talisman Energy, Inc. | 97,100 | 2,340,110 | ||||||
TOTAL OIL & GAS | $ | 28,061,931 | ||||||
OIL & GAS SERVICES – 1.1% | ||||||||
Halliburton Co. | 40,600 | 2,049,488 | ||||||
PHARMACEUTICALS – 10.1% | ||||||||
Merck & Co., Inc. | 76,900 | 2,764,555 | ||||||
Pfizer, Inc. | 415,600 | 8,710,976 | ||||||
Sanofi-Aventis SA ADR | 175,800 | 6,947,616 | ||||||
TOTAL PHARMACEUTICALS | $ | 18,423,147 | ||||||
| Description | Number of Shares | Value | ||||||
RETAIL – 1.9% | ||||||||
CVS Caremark Corp. | 93,800 | $ | 3,399,312 | |||||
SOFTWARE – 6.4% | ||||||||
CA, Inc. | 368,000 | 9,049,120 | ||||||
Microsoft Corp. | 104,000 | 2,706,080 | ||||||
TOTAL SOFTWARE | $ | 11,755,200 | ||||||
TELECOMMUNICATIONS – 5.1% | ||||||||
*Motorola Mobility Holdings, Inc. | 164,175 | 4,278,400 | ||||||
*Motorola Solutions, Inc. | 109,285 | 5,013,996 | ||||||
TOTAL TELECOMMUNICATIONS | $ | 9,292,396 | ||||||
TOBACCO – 1.3% | ||||||||
Philip Morris International, Inc. | 34,200 | 2,374,848 | ||||||
TRANSPORTATION – 1.8% | ||||||||
Union Pacific Corp. | 32,600 | 3,373,122 | ||||||
| TOTAL COMMON STOCKS (COST $141,798,542) | $ | 177,826,213 | ||||||
| MONEY MARKET FUND – 1.4% | ||||||||
8,9MTB Prime Money Market Fund, Corporate Shares, 0.04% | 2,646,516 | $ | 2,646,516 | |||||
| TOTAL MONEY MARKET FUND (COST $2,646,516) | $ | 2,646,516 | ||||||
| TOTAL INVESTMENTS IN SECURITIES – 98.7% (COST $144,445,058) | $ | 180,472,729 | ||||||
| Par Value | ||||||||
| CASH COLLATERAL INVESTED FOR SECURITIES ON LOAN – 0.8% | ||||||||
REPURCHASE AGREEMENTS – 0.8% | ||||||||
BNP Paribas Securities Corp., 0.05%, dated 04/29/11, due 05/02/11, repurchase price $1,000,004, collateralized by U.S. Government Securities 1.42% to 7.13%, maturing 09/01/13 to 09/01/49; total market value of $1,020,996. | $ | 1,000,000 | 1,000,000 | |||||
Deutsche Bank Securities, Inc., 0.05%, dated 04/29/11, due 05/02/11, repurchase price $411,333, collateralized by U.S. Government Securities 3.50% to 7.00%, maturing 02/01/20 to 03/01/41; total market value of $419,558. | 411,331 | 411,331 | ||||||
| TOTAL CASH COLLATERAL INVESTED FOR SECURITIES ON LOAN (COST $1,411,331) | $ | 1,411,331 | ||||||
| TOTAL INVESTMENTS – 99.5% (COST $145,856,389) | $ | 181,884,060 | ||||||
| COLLATERAL FOR SECURITIES ON LOAN – (0.8%) | (1,411,331 | ) | ||||||
| OTHER ASSETS LESS LIABILITIES – 1.3% | 2,281,838 | |||||||
| TOTAL NET ASSETS – 100.0% | $ | 182,754,567 | ||||||
(MTB Large Cap Value Fund continued next page)
April 30, 2011 / ANNUAL REPORT
Table of Contents
| PORTFOLIOS OF INVESTMENTS | 99 |
MTB Large Cap Value Fund (concluded)
Cost of investments for Federal income tax purposes is $148,234,380. The net unrealized appreciation/depreciation of investments was $33,649,680. This consists of net unrealized appreciation from investment for those securities having an excess of value over cost of $44,910,005 and net unrealized depreciation from investments for those securities having an excess of cost over value of $11,260,325.
Various inputs are used in determining the value of the Fund’s investments. These inputs are summarized in the three broad levels listed below.
Level 1 – quoted prices in active markets for identical securities
Level 2 – other significant observable inputs (including quoted prices for similar securities, interest rates, prepayment speeds, credit risk, etc.)
Level 3 – significant unobservable inputs (including the Fund’s own assumptions in determining the fair value of investments)
The following is a summary of the inputs used as of April 30, 2011 in valuing the Fund’s assets carried at fair value:
| Level 1 | Level 2 | Level 3 | Total | |||||||||||||
Investments in Securities | ||||||||||||||||
Common Stocks | $ | 177,826,213 | $ | — | $ | — | $ | 177,826,213 | ||||||||
Money Market Fund | 2,646,516 | — | — | 2,646,516 | ||||||||||||
Repurchase Agreements | — | 1,411,331 | — | 1,411,331 | ||||||||||||
Total | $ | 180,472,729 | $ | 1,411,331 | $ | — | $ | 181,884,060 | ||||||||
See Notes to Portfolios of Investments
ANNUAL REPORT / April 30, 2011
Table of Contents
| 100 |
PORTFOLIO OF INVESTMENTS SUMMARY TABLE
MTB Large Cap Growth Fund
At April 30, 2011, the Fund’s sector classifications were as follows: (unaudited)
| Stocks | Percentage of Total Net Assets | |||
| Computers | 12.0 | % | ||
| Telecommunications | 6.6 | % | ||
| Machinery | 6.2 | % | ||
| Oil & Gas | 6.0 | % | ||
| Oil & Gas Services | 6.0 | % | ||
| Retail | 5.6 | % | ||
| Software | 5.1 | % | ||
| Miscellaneous Manufacturing | 4.3 | % | ||
| Internet | 4.2 | % | ||
| Semiconductors | 3.7 | % | ||
| Chemicals | 3.4 | % | ||
| Diversified Financial Services | 3.4 | % | ||
| Pharmaceuticals | 3.2 | % | ||
| Biotechnology | 3.1 | % | ||
| Aerospace & Defense | 2.3 | % | ||
| Beverages | 2.2 | % | ||
| Auto Manufacturers | 1.9 | % | ||
| Real Estate Investment Trusts (REIT) | 1.8 | % | ||
| Healthcare Providers & Services | 1.7 | % | ||
| Transportation | 1.6 | % | ||
| Commercial Services | 1.5 | % | ||
| Lodging | 1.4 | % | ||
| Media | 1.4 | % | ||
| Tobacco | 1.4 | % | ||
| Metal Fabricate/Hardware | 1.3 | % | ||
| Insurance | 1.2 | % | ||
| Auto Parts & Equipment | 1.1 | % | ||
| Hotels, Restaurants & Leisure | 1.0 | % | ||
| Home Builders | 0.9 | % | ||
| Metals & Mining | 0.9 | % | ||
| Banks | 0.8 | % | ||
| Iron/Steel | 0.7 | % | ||
| Cosmetics/Personal Care | 0.5 | % | ||
| Health Care Equipment & Supplies | 0.5 | % | ||
| Cash Equivalents1 | 5.6 | % | ||
| Other Assets and Liabilities – Net2 | (4.5 | )% | ||
| TOTAL | 100.0 | % | ||
| (1) | Cash Equivalents include investments in money market mutual funds and repurchase agreements. |
| (2) | Assets, other than investments in securities, less liabilities. See Statements of Assets and Liabilities. |
(MTB Large Cap Growth Fund continued next page)
April 30, 2011 / ANNUAL REPORT
Table of Contents
| PORTFOLIOS OF INVESTMENTS | 101 |
MTB Large Cap Growth Fund (continued)
PORTFOLIO OF INVESTMENTS
April 30, 2011
| Description | Number of Shares | Value | ||||||
| COMMON STOCKS – 98.9% | ||||||||
AEROSPACE & DEFENSE – 2.3% | ||||||||
Boeing Co. | 31,000 | $ | 2,473,180 | |||||
United Technologies Corp. | 9,000 | 806,220 | ||||||
TOTAL AEROSPACE & DEFENSE | $ | 3,279,400 | ||||||
AUTO MANUFACTURERS – 1.9% | ||||||||
*Ford Motor Co. | 180,000 | 2,784,600 | ||||||
AUTO PARTS & EQUIPMENT – 1.1% | ||||||||
Johnson Controls, Inc. | 40,000 | 1,640,000 | ||||||
BANKS – 0.8% | ||||||||
Bank of America Corp. | 98,500 | 1,209,580 | ||||||
BEVERAGES – 2.2% | ||||||||
Coca-Cola Co. | 32,000 | 2,158,720 | ||||||
PepsiCo, Inc. | 14,500 | 998,905 | ||||||
TOTAL BEVERAGES | $ | 3,157,625 | ||||||
BIOTECHNOLOGY – 3.1% | ||||||||
*Celgene Corp. | 42,500 | 2,502,400 | ||||||
*,12Human Genome Sciences, Inc. | 43,000 | 1,267,210 | ||||||
*Illumina, Inc. | 10,000 | 709,800 | ||||||
TOTAL BIOTECHNOLOGY | $ | 4,479,410 | ||||||
CHEMICALS – 3.4% | ||||||||
Air Products & Chemicals, Inc. | 19,700 | 1,881,744 | ||||||
Dow Chemical Co. | 46,700 | 1,914,233 | ||||||
Potash Corp. of Saskatchewan, Inc. | 21,000 | 1,183,980 | ||||||
TOTAL CHEMICALS | $ | 4,979,957 | ||||||
COMMERCIAL SERVICES – 1.5% | ||||||||
*,12Coinstar, Inc. | 11,500 | 620,770 | ||||||
*Hertz Global Holdings, Inc. | 50,000 | 860,500 | ||||||
Mastercard, Inc. | 2,400 | 662,136 | ||||||
TOTAL COMMERCIAL SERVICES | $ | 2,143,406 | ||||||
COMPUTERS – 12.0% | ||||||||
*Apple, Inc. | 23,000 | �� | 8,009,290 | |||||
*EMC Corp. | 93,000 | 2,635,620 | ||||||
Hewlett-Packard Co. | 27,000 | 1,089,990 | ||||||
International Business Machines Corp. | 30,500 | 5,202,690 | ||||||
*Research In Motion Ltd. | 13,000 | 632,450 | ||||||
TOTAL COMPUTERS | $ | 17,570,040 | ||||||
COSMETICS/PERSONAL CARE – 0.5% | ||||||||
Estee Lauder Cos., Inc. | 7,500 | 727,500 | ||||||
DIVERSIFIED FINANCIAL SERVICES – 3.4% |
| |||||||
Goldman Sachs Group, Inc. | 5,000 | 755,050 | ||||||
| Description | Number of Shares | Value | ||||||
Janus Capital Group, Inc. | 125,000 | $ | 1,521,250 | |||||
JPMorgan Chase & Co. | 31,000 | 1,414,530 | ||||||
T Rowe Price Group, Inc. | 20,500 | 1,317,125 | ||||||
TOTAL DIVERSIFIED FINANCIAL SERVICES | $ | 5,007,955 | ||||||
HEALTH CARE EQUIPMENT & SUPPLIES – 0.5% | ||||||||
*Varian Medical Systems, Inc. | 10,500 | 737,100 | ||||||
HEALTHCARE PROVIDERS & SERVICES – 1.7% | ||||||||
UnitedHealth Group, Inc. | 50,000 | 2,461,500 | ||||||
HOME BUILDERS – 0.9% | ||||||||
DR Horton, Inc. | 108,000 | 1,343,520 | ||||||
HOTELS, RESTAURANTS & LEISURE – 1.0% |
| |||||||
*Las Vegas Sands Corp. | 30,000 | 1,410,300 | ||||||
INSURANCE – 1.2% | ||||||||
MetLife, Inc. | 37,500 | 1,754,625 | ||||||
INTERNET – 4.2% | ||||||||
*Akamai Technologies, Inc. | 21,000 | 723,240 | ||||||
*Amazon.com, Inc. | 7,000 | 1,375,500 | ||||||
*Baidu, Inc. ADR | 6,700 | 995,084 | ||||||
*,12E-Commerce China Dangdang, Inc. ADR | 15,000 | 345,150 | ||||||
*Google, Inc. | 4,250 | 2,312,425 | ||||||
*,12Youku.Com, Inc. ADR | 7,500 | 443,400 | ||||||
TOTAL INTERNET | $ | 6,194,799 | ||||||
IRON/STEEL – 0.7% | ||||||||
Cliffs Natural Resources, Inc. | 11,000 | 1,030,920 | ||||||
LODGING – 1.4% | ||||||||
Starwood Hotels & Resorts Worldwide, Inc. | 34,000 | 2,025,380 | ||||||
MACHINERY – 6.2% | ||||||||
Caterpillar, Inc. | 27,000 | 3,116,070 | ||||||
Cummins, Inc. | 15,000 | 1,802,700 | ||||||
Deere & Co. | 21,000 | 2,047,500 | ||||||
Manitowoc Co., Inc. | 94,000 | 2,085,860 | ||||||
TOTAL MACHINERY | $ | 9,052,130 | ||||||
MEDIA – 1.4% | ||||||||
CBS Corp., Non-Voting | 81,000 | 2,042,820 | ||||||
METAL FABRICATE/HARDWARE – 1.3% | ||||||||
Precision Castparts Corp. | 12,500 | 1,931,500 | ||||||
METALS & MINING – 0.9% | ||||||||
*Stillwater Mining Co. | 60,000 | 1,368,600 | ||||||
MISCELLANEOUS MANUFACTURING – 4.3% |
| |||||||
Danaher Corp. | 44,000 | 2,430,560 | ||||||
(MTB Large Cap Growth Fund continued next page)
ANNUAL REPORT / April 30, 2011
Table of Contents
| 102 | PORTFOLIOS OF INVESTMENTS |
MTB Large Cap Growth Fund (continued)
| Description | Number of Shares | Value | ||||||
General Electric Co. | 104,500 | $ | 2,137,025 | |||||
Parker Hannifin Corp. | 18,000 | 1,697,760 | ||||||
TOTAL MISCELLANEOUS MANUFACTURING | $ | 6,265,345 | ||||||
OIL & GAS – 6.0% | ||||||||
ConocoPhillips | 10,200 | 805,086 | ||||||
Exxon Mobil Corp. | 79,500 | 6,996,000 | ||||||
*Southwestern Energy Co. | 20,000 | 877,200 | ||||||
TOTAL OIL & GAS | $ | 8,678,286 | ||||||
OIL & GAS SERVICES – 6.0% | ||||||||
Halliburton Co. | 47,000 | 2,372,560 | ||||||
National Oilwell Varco, Inc. | 17,500 | 1,342,075 | ||||||
Schlumberger Ltd. | 41,000 | 3,679,750 | ||||||
*Weatherford International Ltd. | 66,000 | 1,424,280 | ||||||
TOTAL OIL & GAS SERVICES | $ | 8,818,665 | ||||||
PHARMACEUTICALS – 3.2% | ||||||||
Abbott Laboratories | 20,000 | 1,040,800 | ||||||
*,12Auxilium Pharmaceuticals, Inc. | 19,000 | 462,840 | ||||||
*Express Scripts, Inc. | 36,500 | 2,071,010 | ||||||
*SXC Health Solutions Corp. | 21,000 | 1,158,360 | ||||||
TOTAL PHARMACEUTICALS | $ | 4,733,010 | ||||||
REAL ESTATE INVESTMENT TRUSTS (REIT) – 1.8% | ||||||||
*CB Richard Ellis Group, Inc. | 100,000 | 2,671,000 | ||||||
RETAIL – 5.6% | ||||||||
Home Depot, Inc. | 32,500 | 1,207,050 | ||||||
Ltd. Brands, Inc. | 31,000 | 1,275,960 | ||||||
*,12Lululemon Athletica, Inc. | 10,800 | 1,080,324 | ||||||
McDonald’s Corp. | 19,000 | 1,487,890 | ||||||
12Phillips-Van Heusen Corp. | 20,000 | 1,408,200 | ||||||
Target Corp. | 13,500 | 662,850 | ||||||
Wal-Mart Stores, Inc. | 20,000 | 1,099,600 | ||||||
TOTAL RETAIL | $ | 8,221,874 | ||||||
SEMICONDUCTORS – 3.7% | ||||||||
*,12Advanced Micro Devices, Inc. | 202,000 | 1,838,200 | ||||||
Applied Materials, Inc. | 55,000 | 862,950 | ||||||
Intel Corp. | 52,000 | 1,205,880 | ||||||
*Marvell Technology Group Ltd. | 46,000 | 709,780 | ||||||
*NVIDIA Corp. | 37,000 | 740,000 | ||||||
TOTAL SEMICONDUCTORS | $ | 5,356,810 | ||||||
SOFTWARE – 5.1% | ||||||||
*Citrix Systems, Inc. | 12,000 | 1,012,080 | ||||||
*Informatica Corp. | 21,000 | 1,176,210 | ||||||
Microsoft Corp. | 67,000 | 1,743,340 | ||||||
Oracle Corp. | 97,000 | 3,496,850 | ||||||
TOTAL SOFTWARE | $ | 7,428,480 | ||||||
| Description | Number of Shares | Value | ||||||
TELECOMMUNICATIONS – 6.6% | ||||||||
*Aruba Networks, Inc. | 45,000 | $ | 1,616,850 | |||||
*Ciena Corp. | 42,500 | 1,200,200 | ||||||
Cisco Systems, Inc. | 63,000 | 1,106,280 | ||||||
Corning, Inc. | 49,000 | 1,026,060 | ||||||
*,12Finisar Corp. | 46,500 | 1,306,185 | ||||||
*JDS Uniphase Corp. | 37,000 | 771,080 | ||||||
QUALCOMM, Inc. | 46,500 | 2,643,060 | ||||||
TOTAL TELECOMMUNICATIONS | $ | 9,669,715 | ||||||
TOBACCO – 1.4% | ||||||||
Philip Morris International, Inc. | 30,000 | 2,083,200 | ||||||
TRANSPORTATION – 1.6% | ||||||||
CSX Corp. | 14,000 | 1,101,660 | ||||||
Ryder System, Inc. | 21,500 | 1,150,250 | ||||||
TOTAL TRANSPORTATION | $ | 2,251,910 | ||||||
| TOTAL COMMON STOCKS (COST $101,223,440) | $ | 144,510,962 | ||||||
| MONEY MARKET FUND – 0.5% | ||||||||
8,9MTB Prime Money Market Fund, Corporate Shares, 0.04% | 697,870 | $ | 697,870 | |||||
| TOTAL MONEY MARKET FUND (COST $697,870) | $ | 697,870 | ||||||
| TOTAL INVESTMENTS IN SECURITIES – 99.4% (COST $101,921,310) | $ | 145,208,832 | ||||||
| Par Value | ||||||||
| CASH COLLATERAL INVESTED FOR SECURITIES ON LOAN – 5.1% | ||||||||
REPURCHASE AGREEMENTS – 5.1% | ||||||||
BNP Paribas Securities Corp., 0.05%, dated 04/29/11, due 05/02/11, repurchase price $1,439,974, collateralized by U.S. Government Securities 1.42% to 7.13%, maturing 09/01/13 to 09/01/49; total market value of $1,470,201. | $ | 1,439,968 | 1,439,968 | |||||
HSBC Securities, Inc., 0.05%, dated 04/29/11, due 05/02/11, repurchase price $1,500,006, collateralized by U.S. Government Securities 3.50% to 7.00%, maturing 07/01/12 to 05/01/41; total market value of $1,530,003. | 1,500,000 | 1,500,000 | ||||||
JP Morgan Securities LLC, 0.05%, dated 04/29/11, due 05/02/11, repurchase price $1,500,006, collateralized by U.S. Government Securities 4.00% to 4.50%, maturing 02/01/26 to 03/01/41; total market value of $1,530,020. | 1,500,000 | 1,500,000 | ||||||
Mizuho Securities, Inc., 0.07%, dated 04/29/11, due 05/02/11, repurchase price $1,500,009, collateralized by U.S. Government Securities 0.60% to 8.50%, maturing 01/01/21 to 06/25/43; total market value of $1,530,000. | 1,500,000 | 1,500,000 | ||||||
(MTB Large Cap Growth Fund continued next page)
April 30, 2011 / ANNUAL REPORT
Table of Contents
| PORTFOLIOS OF INVESTMENTS | 103 |
MTB Large Cap Growth Fund (concluded)
| Description | Par Value | Value | ||||||
RBC Capital Markets LLC, 0.05%, dated 04/29/11, due 05/02/11, repurchase price $1,500,006, collateralized by U.S. Government Securities 1.99% to 5.13%, maturing 02/01/17 to 04/01/41; total market value of $1,530,000. | $ | 1,500,000 | $ | 1,500,000 | ||||
| TOTAL CASH COLLATERAL INVESTED FOR SECURITIES ON LOAN (COST $7,439,968) | $ | 7,439,968 | ||||||
| TOTAL INVESTMENTS – 104.5% (COST $109,361,278) | $ | 152,648,800 | ||||||
| COLLATERAL FOR SECURITIES ON LOAN – (5.1%) | (7,439,968 | ) | ||||||
| OTHER ASSETS LESS LIABILITIES – 0.6% | 828,624 | |||||||
| TOTAL NET ASSETS – 100.0% | $ | 146,037,456 | ||||||
Cost of investments for Federal income tax purposes is $110,175,371. The net unrealized appreciation/depreciation of investments was $42,473,429. This consists of net unrealized appreciation from investment for those securities having an excess of value over cost of $44,145,661 and net unrealized depreciation from investments for those securities having an excess of cost over value of $1,672,232.
Various inputs are used in determining the value of the Fund’s investments. These inputs are summarized in the three broad levels listed below.
Level 1 – quoted prices in active markets for identical securities
Level 2 – other significant observable inputs (including quoted prices for similar securities, interest rates, prepayment speeds, credit risk, etc.)
Level 3 – significant unobservable inputs (including the Fund’s own assumptions in determining the fair value of investments)
The following is a summary of the inputs used as of April 30, 2011 in valuing the Fund’s assets carried at fair value:
| Level 1 | Level 2 | Level 3 | Total | |||||||||||||
Investments in Securities | ||||||||||||||||
Common Stocks | $ | 144,510,962 | $ | — | $ | — | $ | 144,510,962 | ||||||||
Money Market Fund | 697,870 | — | — | 697,870 | ||||||||||||
Repurchase Agreements | — | 7,439,968 | — | 7,439,968 | ||||||||||||
Total | $ | 145,208,832 | $ | 7,439,968 | $ | — | $ | 152,648,800 | ||||||||
See Notes to Portfolios of Investments
ANNUAL REPORT / April 30, 2011
Table of Contents
| 104 |
PORTFOLIO OF INVESTMENTS SUMMARY TABLE
MTB Mid Cap Growth Fund
At April 30, 2011, the Fund’s sector classifications were as follows: (unaudited)
| Stocks | Percentage of Total Net Assets | |||
| Retail | 11.8 | % | ||
| Software | 7.7 | % | ||
| Machinery | 7.1 | % | ||
| Semiconductors | 5.8 | % | ||
| Telecommunications | 5.3 | % | ||
| Pharmaceuticals | 5.1 | % | ||
| Diversified Financial Services | 4.9 | % | ||
| Commercial Services | 4.2 | % | ||
| Oil & Gas | 3.9 | % | ||
| Oil & Gas Services | 3.4 | % | ||
| Coal | 3.1 | % | ||
| Healthcare-Products | 3.0 | % | ||
| Transportation | 2.7 | % | ||
| Chemicals | 2.5 | % | ||
| Distribution/Wholesale | 2.3 | % | ||
| Internet | 2.3 | % | ||
| Media | 2.3 | % | ||
| Electronics | 2.2 | % | ||
| Apparel | 2.1 | % | ||
| Engineering & Construction | 1.9 | % | ||
| Real Estate Investment Trusts (REIT) | 1.9 | % | ||
| Metal Fabricate/Hardware | 1.7 | % | ||
| Auto Parts & Equipment | 1.6 | % | ||
| Biotechnology | 1.6 | % | ||
| Packaging & Containers | 1.5 | % | ||
| Household Products | 1.4 | % | ||
| Banks | 1.2 | % | ||
| Environmental Control | 1.1 | % | ||
| Computers | 1.0 | % | ||
| Metals & Mining | 0.9 | % | ||
| Energy-Alternate Sources | 0.7 | % | ||
| Iron/Steel | 0.7 | % | ||
| Aerospace & Defense | 0.4 | % | ||
| Cash Equivalents1 | 9.3 | % | ||
| Other Assets and Liabilities – Net2 | (8.6 | )% | ||
| TOTAL | 100.0 | % | ||
| (1) | Cash Equivalents include investments in money market mutual funds and repurchase agreements. |
| (2) | Assets, other than investments in securities, less liabilities. See Statements of Assets and Liabilities. |
(MTB Mid Cap Growth Fund continued next page)
April 30, 2011 / ANNUAL REPORT
Table of Contents
| PORTFOLIOS OF INVESTMENTS | 105 |
MTB Mid Cap Growth Fund (continued)
PORTFOLIO OF INVESTMENTS
April 30, 2011
| Description | Number of Shares | Value | ||||||
| COMMON STOCKS – 99.3% | ||||||||
AEROSPACE & DEFENSE – 0.4% | ||||||||
Goodrich Corp. | 12,800 | $ | 1,131,136 | |||||
APPAREL – 2.1% | ||||||||
Coach, Inc. | 88,900 | 5,317,109 | ||||||
AUTO PARTS & EQUIPMENT – 1.6% | ||||||||
*BorgWarner, Inc. | 51,600 | 3,985,584 | ||||||
BANKS – 1.2% | ||||||||
*Texas Capital Bancshares, Inc. | 112,300 | 2,897,340 | ||||||
BIOTECHNOLOGY – 1.6% | ||||||||
*,12Human Genome Sciences, Inc. | 53,325 | 1,571,488 | ||||||
*Life Technologies Corp. | 44,116 | 2,435,203 | ||||||
TOTAL BIOTECHNOLOGY | $ | 4,006,691 | ||||||
CHEMICALS – 2.5% | ||||||||
Mosaic Co. | 34,900 | 2,612,614 | ||||||
*Solutia, Inc. | 135,600 | 3,573,060 | ||||||
TOTAL CHEMICALS | $ | 6,185,674 | ||||||
COAL – 3.1% | ||||||||
Peabody Energy Corp. | 58,000 | 3,875,560 | ||||||
Walter Industries, Inc. | 28,400 | 3,925,448 | ||||||
TOTAL COAL | $ | 7,801,008 | ||||||
COMMERCIAL SERVICES – 4.2% | ||||||||
Global Payments, Inc. | 57,525 | 3,062,631 | ||||||
*,12Green Dot Corp. | 51,800 | 2,235,688 | ||||||
*,12ITT Educational Services, Inc. | 30,300 | 2,173,419 | ||||||
*Quanta Services, Inc. | 79,000 | 1,712,720 | ||||||
12Ritchie Bros Auctioneers, Inc. | 40,870 | 1,278,005 | ||||||
TOTAL COMMERCIAL SERVICES | $ | 10,462,463 | ||||||
COMPUTERS – 1.0% | ||||||||
*,12Stratasys, Inc. | 45,400 | 2,444,790 | ||||||
DISTRIBUTION/WHOLESALE – 2.3% | ||||||||
12Fastenal Co. | 40,200 | 2,697,018 | ||||||
*LKQ Corp. | 118,500 | 2,988,570 | ||||||
TOTAL DISTRIBUTION/WHOLESALE | $ | 5,685,588 | ||||||
DIVERSIFIED FINANCIAL | ||||||||
*IntercontinentalExchange, Inc. | 32,968 | 3,967,699 | ||||||
Raymond James Financial, Inc. | 126,800 | 4,755,000 | ||||||
T Rowe Price Group, Inc. | 54,800 | 3,520,900 | ||||||
TOTAL DIVERSIFIED FINANCIAL SERVICES | $ | 12,243,599 | ||||||
ELECTRONICS – 2.2% | ||||||||
*Dolby Laboratories, Inc. | 51,700 | 2,588,102 | ||||||
| Description | Number of Shares | Value | ||||||
FLIR Systems, Inc. | 83,100 | $ | 2,926,782 | |||||
TOTAL ELECTRONICS | $ | 5,514,884 | ||||||
ENERGY-ALTERNATE SOURCES – 0.7% | ||||||||
*,12Amyris, Inc. | 62,200 | 1,643,946 | ||||||
ENGINEERING & CONSTRUCTION – 1.9% | ||||||||
*Foster Wheeler AG | 58,125 | 2,067,506 | ||||||
*McDermott International, Inc. | 121,706 | 2,810,192 | ||||||
TOTAL ENGINEERING & CONSTRUCTION | $ | 4,877,698 | ||||||
ENVIRONMENTAL CONTROL – 1.1% | ||||||||
Waste Connections, Inc. | 93,545 | 2,878,380 | ||||||
HEALTHCARE-PRODUCTS – 3.0% | ||||||||
*Alere, Inc. | 63,050 | 2,341,677 | ||||||
*Intuitive Surgical, Inc. | 7,834 | 2,739,550 | ||||||
*,12 ResMed, Inc. | 72,600 | 2,315,214 | ||||||
TOTAL HEALTHCARE-PRODUCTS | $ | 7,396,441 | ||||||
HOUSEHOLD PRODUCTS – 1.4% | ||||||||
Church & Dwight Co., Inc. | 43,300 | 3,571,384 | ||||||
INTERNET – 2.3% | ||||||||
*F5 Networks, Inc. | 29,000 | 2,939,440 | ||||||
*Sourcefire, Inc. | 105,665 | 2,812,802 | ||||||
TOTAL INTERNET | $ | 5,752,242 | ||||||
IRON/STEEL – 0.7% | ||||||||
Cliffs Natural Resources, Inc. | 19,850 | 1,860,342 | ||||||
MACHINERY – 7.1% | ||||||||
*Babcock & Wilcox Co. | 44,153 | 1,386,846 | ||||||
Cummins, Inc. | 43,750 | 5,257,875 | ||||||
Graco, Inc. | 41,961 | 2,099,309 | ||||||
Joy Global, Inc. | 48,000 | 4,845,600 | ||||||
Rockwell Automation, Inc. | 46,850 | 4,082,040 | ||||||
TOTAL MACHINERY | $ | 17,671,670 | ||||||
MEDIA – 2.3% | ||||||||
CBS Corp., Non-Voting | 230,900 | 5,823,298 | ||||||
METAL FABRICATE/HARDWARE – 1.7% | ||||||||
Precision Castparts Corp. | 27,010 | 4,173,585 | ||||||
METALS & MINING – 0.9% | ||||||||
*Stillwater Mining Co. | 95,000 | 2,166,950 | ||||||
OIL & GAS – 3.9% | ||||||||
Cabot Oil & Gas Corp. | 71,600 | 4,029,648 | ||||||
Noble Energy, Inc. | 37,135 | 3,574,986 | ||||||
*,12Northern Oil and Gas, Inc. | 94,900 | 2,254,824 | ||||||
TOTAL OIL & GAS | $ | 9,859,458 | ||||||
(MTB Mid Cap Growth Fund continued next page)
ANNUAL REPORT / April 30, 2011
Table of Contents
| 106 | PORTFOLIOS OF INVESTMENTS |
MTB Mid Cap Growth Fund (continued)
| Description | Number of Shares | Value | ||||||
OIL & GAS SERVICES – 3.4% | ||||||||
*Cameron International Corp. | 60,900 | $ | 3,210,648 | |||||
*FMC Technologies, Inc. | 59,900 | 2,784,152 | ||||||
Lufkin Industries, Inc. | 28,200 | 2,603,706 | ||||||
TOTAL OIL & GAS SERVICES | $ | 8,598,506 | ||||||
PACKAGING & CONTAINERS – 1.5% | ||||||||
*Crown Holdings, Inc. | 99,900 | 3,736,260 | ||||||
PHARMACEUTICALS – 5.1% | ||||||||
*,12Auxilium Pharmaceuticals, Inc. | 75,175 | 1,831,263 | ||||||
*Express Scripts, Inc. | 39,352 | 2,232,833 | ||||||
Herbalife Ltd. | 42,300 | 3,797,694 | ||||||
*MAP Pharmaceuticals, Inc. | 86,500 | 1,333,830 | ||||||
Perrigo Co. | 38,624 | 3,490,065 | ||||||
TOTAL PHARMACEUTICALS | $ | 12,685,685 | ||||||
REAL ESTATE INVESTMENT TRUSTS (REIT) – 1.9% | ||||||||
*CB Richard Ellis Group, Inc. | 175,800 | 4,695,618 | ||||||
RETAIL – 11.8% | ||||||||
*DineEquity, Inc. | 67,500 | 3,372,975 | ||||||
*,12GameStop Corp. | 126,044 | 3,236,810 | ||||||
Ltd. Brands, Inc. | 52,000 | 2,140,320 | ||||||
*,12Lululemon Athletica, Inc. | 42,400 | 4,241,272 | ||||||
*Panera Bread Co. | 26,870 | 3,254,226 | ||||||
Phillips-Van Heusen Corp. | 65,200 | 4,590,732 | ||||||
Ross Stores, Inc. | 45,600 | 3,360,264 | ||||||
Tiffany & Co. | 40,500 | 2,812,320 | ||||||
TJX Cos., Inc. | 49,300 | 2,643,466 | ||||||
TOTAL RETAIL | $ | 29,652,385 | ||||||
SEMICONDUCTORS – 5.8% | ||||||||
Altera Corp. | 121,600 | 5,921,920 | ||||||
*Atmel Corp. | 155,400 | 2,377,620 | ||||||
*Broadcom Corp. | 45,100 | 1,586,618 | ||||||
*Lam Research Corp. | 60,300 | 2,913,093 | ||||||
MKS Instruments, Inc. | 64,300 | 1,824,834 | ||||||
TOTAL SEMICONDUCTORS | $ | 14,624,085 | ||||||
SOFTWARE – 7.7% | ||||||||
*Allscripts Healthcare Solutions, Inc. | 127,500 | 2,746,350 | ||||||
*ANSYS, Inc. | 85,532 | 4,729,064 | ||||||
*Autodesk, Inc. | 84,157 | 3,785,382 | ||||||
*Cerner Corp. | 19,563 | 2,351,081 | ||||||
*Citrix Systems, Inc. | 40,675 | 3,430,530 | ||||||
*Salesforce.Com, Inc. | 15,400 | 2,134,440 | ||||||
TOTAL SOFTWARE | $ | 19,176,847 | ||||||
| Description | Number of Shares | Value | ||||||
TELECOMMUNICATIONS – 5.3% | ||||||||
ADTRAN, Inc. | 77,525 | $ | 3,199,457 | |||||
*Aruba Networks, Inc. | 82,800 | 2,975,004 | ||||||
*IPG Photonics Corp. | 31,000 | 2,153,260 | ||||||
Plantronics, Inc. | 55,300 | 2,049,971 | ||||||
*RF Micro Devices, Inc. | 450,700 | 3,001,662 | ||||||
TOTAL TELECOMMUNICATIONS | $ | 13,379,354 | ||||||
TRANSPORTATION – 2.7% | ||||||||
CH Robinson Worldwide, Inc. | 43,042 | 3,451,107 | ||||||
Expeditors International of Washington, Inc. | 61,578 | 3,341,838 | ||||||
TOTAL TRANSPORTATION | $ | 6,792,945 | ||||||
| TOTAL COMMON STOCKS (COST $151,518,042) | $ | 248,692,945 | ||||||
| MONEY MARKET FUND – 1.2% | ||||||||
8,9MTB Prime Money Market Fund, | 2,937,841 | 2,937,841 | ||||||
| TOTAL MONEY MARKET FUND (COST $2,937,841) | $ | 2,937,841 | ||||||
| TOTAL INVESTMENTS IN SECURITIES – 100.5% (COST $154,455,883) | $ | 251,630,786 | ||||||
| Par Value | ||||||||
| CASH COLLATERAL INVESTED FOR SECURITIES ON LOAN – 8.1% | ||||||||
REPURCHASE AGREEMENTS – 8.1% | ||||||||
Barclays Capital, Inc., 0.03%, dated 04/29/11, due 05/02/11, repurchase price $4,500,011, collateralized by U.S. Treasury Securities 0.00% to 0.00%, maturing 05/15/11 to 02/15/41; total market value of $4,599,921. | $ | 4,500,000 | 4,500,000 | |||||
BNP Paribas Securities Corp., 0.05%, dated 04/29/11, due 05/02/11, repurchase price $156,444, collateralized by U.S. Government Securities 1.42% to 7.13%, maturing 09/01/13 to 09/01/49; total market value of $159,728. | 156,443 | 156,443 | ||||||
Credit Suisse First Boston LLC, 0.03%, dated 04/29/11, due 05/02/11, repurchase price $4,500,011, collateralized by U.S. Treasury Securities 1.88% to 7.13%, maturing 07/15/12 to 08/15/29; total market value of $4,630,773. | 4,500,000 | 4,500,000 | ||||||
JP Morgan Securities LLC, 0.05%, dated 04/29/11, due 05/02/11, repurchase price $4,000,017, collateralized by U.S. Government Securities 4.00% to 4.50%, maturing 02/01/26 to 03/01/41; total market value of $4,080,052. | 4,000,000 | 4,000,000 | ||||||
Mizuho Securities, Inc., 0.07%, dated 04/29/11, due 05/02/11, repurchase price $3,000,018, collateralized by U.S. Government Securities 0.60% to 8.50%, maturing 01/01/21 to 06/25/43; total market value of $3,060,000. | 3,000,000 | 3,000,000 | ||||||
RBC Capital Markets LLC, 0.05%, dated 04/29/11, due 05/02/11, repurchase price $4,000,017, collateralized by U.S. Government Securities 1.99% to 5.13%, maturing 02/01/17 to 04/01/41; total market value of $4,080,000. | 4,000,000 | 4,000,000 | ||||||
(MTB Mid Cap Growth Fund continued next page)
April 30, 2011 / ANNUAL REPORT
Table of Contents
| PORTFOLIOS OF INVESTMENTS | 107 |
MTB Mid Cap Growth Fund (concluded)
| Description | Value | |||||||
| TOTAL CASH COLLATERAL INVESTED FOR SECURITIES ON LOAN (COST $20,156,443) | $ | 20,156,443 | ||||||
| TOTAL INVESTMENTS – 108.6% (COST $174,612,326) | $ | 271,787,229 | ||||||
| COLLATERAL FOR SECURITIES ON LOAN – (8.1%) | (20,156,443 | ) | ||||||
| OTHER LIABILITIES LESS ASSETS – (0.5%) | (1,256,038 | ) | ||||||
| TOTAL NET ASSETS – 100.0% | $ | 250,374,748 | ||||||
Cost of investments for Federal income tax purposes is $176,689,040. The net unrealized appreciation/depreciation of investments was $95,098,189. This consists of net unrealized appreciation from investment for those securities having an excess of value over cost of $98,207,412 and net unrealized depreciation from investments for those securities having an excess of cost over value of $3,109,223.
Various inputs are used in determining the value of the Fund’s investments. These inputs are summarized in the three broad levels listed below.
Level 1 – quoted prices in active markets for identical securities
Level 2 – other significant observable inputs (including quoted prices for similar securities, interest rates, prepayment speeds, credit risk, etc.)
Level 3 – significant unobservable inputs (including the Fund’s own assumptions in determining the fair value of investments)
The following is a summary of the inputs used as of April 30, 2011 in valuing the Fund’s assets carried at fair value:
| Level 1 | Level 2 | Level 3 | Total | |||||||||||||
Investments in Securities | ||||||||||||||||
Common Stocks | $ | 248,692,945 | $ — | $ | — | $ | 248,692,945 | |||||||||
Money Market Fund | 2,937,841 | — | — | 2,937,841 | ||||||||||||
Repurchase Agreements | — | 20,156,443 | — | 20,156,443 | ||||||||||||
Total | $ | 251,630,786 | $20,156,443 | $ | — | $ | 271,787,229 | |||||||||
See Notes to Portfolios of Investments
ANNUAL REPORT / April 30, 2011
Table of Contents
| 108 |
PORTFOLIO OF INVESTMENTS SUMMARY TABLE
MTB Small Cap Growth Fund
At April 30, 2011, the Fund’s sector classifications were as follows: (unaudited)
| Stocks | Percentage of Total Net Assets | |||
| Retail | 11.3 | % | ||
| Telecommunications | 9.4 | % | ||
| Auto Parts & Equipment | 6.9 | % | ||
| Commercial Services | 5.0 | % | ||
| Semiconductors | 5.0 | % | ||
| Internet | 4.7 | % | ||
| Chemicals | 4.6 | % | ||
| Software | 4.3 | % | ||
| Healthcare-Products | 3.6 | % | ||
| Oil & Gas Services | 3.5 | % | ||
| Apparel | 3.1 | % | ||
| Engineering & Construction | 2.5 | % | ||
| Metals & Mining | 2.3 | % | ||
| Electronics | 2.1 | % | ||
| Healthcare Providers & Services | 2.0 | % | ||
| Transportation | 2.0 | % | ||
| Pharmaceuticals | 1.9 | % | ||
| Diversified Financial Services | 1.8 | % | ||
| Leisure Time | 1.8 | % | ||
| Biotechnology | 1.7 | % | ||
| Computers | 1.7 | % | ||
| Auto Manufacturers | 1.6 | % | ||
| Entertainment | 1.5 | % | ||
| Aerospace & Defense | 1.4 | % | ||
| Banks | 1.4 | % | ||
| Machinery-Diversified | 1.4 | % | ||
| Trucking and Leasing | 1.4 | % | ||
| Home Furnishings | 1.3 | % | ||
| Miscellaneous Manufacturing | 1.3 | % | ||
| Coal | 1.2 | % | ||
| Hand/Machine Tools | 1.2 | % | ||
| Metal Fabricate/Hardware | 1.1 | % | ||
| Airlines | 1.0 | % | ||
| Oil & Gas | 1.0 | % | ||
| Machinery | 0.9 | % | ||
| Agriculture | 0.7 | % | ||
| Energy-Alternate Sources | 0.5 | % | ||
| Cash Equivalents1 | 4.6 | % | ||
| Other Assets and Liabilities – Net2 | (4.7 | )% | ||
| TOTAL | 100.0 | % | ||
| (1) | Cash Equivalents include investments in money market mutual funds and repurchase agreements. |
| (2) | Assets, other than investments in securities, less liabilities. See Statements of Assets and Liabilities. |
(MTB Small Cap Growth Fund continued next page)
April 30, 2011 / ANNUAL REPORT
Table of Contents
| PORTFOLIOS OF INVESTMENTS | 109 |
MTB Small Cap Growth Fund (continued)
PORTFOLIO OF INVESTMENTS
April 30, 2011
| Description | Number of Shares | Value | ||||||
| COMMON STOCKS – 100.1% | ||||||||
AEROSPACE & DEFENSE – 1.4% | ||||||||
Triumph Group, Inc. | 32,300 | $ | 2,781,676 | |||||
AGRICULTURE – 0.7% | ||||||||
Andersons, Inc. | 30,000 | 1,489,500 | ||||||
AIRLINES – 1.0% | ||||||||
*,12US Airways Group, Inc. | 217,000 | 1,972,530 | ||||||
APPAREL – 3.1% | ||||||||
*CROCS, Inc. | 100,500 | 2,021,055 | ||||||
*Deckers Outdoor Corp. | 28,800 | 2,443,968 | ||||||
*Iconix Brand Group, Inc. | 63,000 | 1,542,870 | ||||||
TOTAL APPAREL | $ | 6,007,893 | ||||||
AUTO MANUFACTURERS – 1.6% | ||||||||
*Wabash National Corp. | 290,700 | 3,206,421 | ||||||
AUTO PARTS & EQUIPMENT – 6.9% | ||||||||
*Commercial Vehicle Group, Inc. | 126,500 | 2,183,390 | ||||||
*Dana Holding Corp. | 75,000 | 1,362,750 | ||||||
*Meritor, Inc. | 115,000 | 1,979,150 | ||||||
*Modine Manufacturing Co. | 111,500 | 1,985,815 | ||||||
*Tenneco, Inc. | 36,500 | 1,686,665 | ||||||
Titan International, Inc. | 80,000 | 2,471,200 | ||||||
*WABCO Holdings, Inc. | 25,500 | 1,883,175 | ||||||
TOTAL AUTO PARTS & EQUIPMENT | $ | 13,552,145 | ||||||
BANKS – 1.4% | ||||||||
Huntington Bancshares, Inc. | 179,600 | 1,219,484 | ||||||
*Signature Bank | 27,200 | 1,583,312 | ||||||
TOTAL BANKS | $ | 2,802,796 | ||||||
BIOTECHNOLOGY – 1.7% | ||||||||
*Dendreon Corp. | 40,000 | 1,737,200 | ||||||
*Human Genome Sciences, Inc. | 55,000 | 1,620,850 | ||||||
TOTAL BIOTECHNOLOGY | $ | 3,358,050 | ||||||
CHEMICALS – 4.6% | ||||||||
CF Industries Holdings, Inc. | 11,300 | 1,599,515 | ||||||
*Intrepid Potash, Inc. | 23,000 | 787,980 | ||||||
Kronos Worldwide, Inc. | 42,500 | 2,616,300 | ||||||
*Rockwood Holdings, Inc. | 32,000 | 1,815,680 | ||||||
*Solutia, Inc. | 86,000 | 2,266,100 | ||||||
TOTAL CHEMICALS | $ | 9,085,575 | ||||||
COAL – 1.2% | ||||||||
*,12International Coal Group, Inc. | 207,500 | 2,288,725 | ||||||
COMMERCIAL SERVICES – 5.0% | ||||||||
*Cardtronics, Inc. | 52,000 | 1,105,000 | ||||||
| Description | Number of Shares | Value | ||||||
*Hertz Global Holdings, Inc. | 94,000 | $ | 1,617,740 | |||||
*HMS Holdings Corp. | 16,000 | 1,259,360 | ||||||
*RSC Holdings, Inc. | 138,500 | 1,824,045 | ||||||
Sotheby’s | 52,500 | 2,652,300 | ||||||
*,12SuccessFactors, Inc. | 40,000 | 1,386,800 | ||||||
TOTAL COMMERCIAL SERVICES | $ | 9,845,245 | ||||||
COMPUTERS – 1.7% | ||||||||
*Fortinet, Inc. | 20,000 | 974,000 | ||||||
*NCR Corp. | 49,500 | 980,595 | ||||||
*Riverbed Technology, Inc. | 40,500 | 1,423,170 | ||||||
TOTAL COMPUTERS | $ | 3,377,765 | ||||||
DIVERSIFIED FINANCIAL SERVICES – 1.8% | ||||||||
BGC Partners, Inc. | 171,000 | 1,650,150 | ||||||
*Lpl Investment Holdings, Inc. | 50,000 | 1,834,000 | ||||||
TOTAL DIVERSIFIED FINANCIAL SERVICES | $ | 3,484,150 | ||||||
ELECTRONICS – 2.1% | ||||||||
*Coherent, Inc. | 17,500 | 1,093,925 | ||||||
*Newport Corp. | 84,000 | 1,573,320 | ||||||
Woodward, Inc. | 39,500 | 1,463,475 | ||||||
TOTAL ELECTRONICS | $ | 4,130,720 | ||||||
ENERGY-ALTERNATE SOURCES – 0.5% | ||||||||
*,12Amyris, Inc. | 35,000 | 925,050 | ||||||
ENGINEERING & | ||||||||
*Englobal Corp. | 398,700 | 1,626,696 | ||||||
KBR, Inc. | 51,500 | 1,976,055 | ||||||
*MYR Group, Inc. | 56,900 | 1,418,517 | ||||||
TOTAL ENGINEERING & CONSTRUCTION | $ | 5,021,268 | ||||||
ENTERTAINMENT – 1.5% | ||||||||
Cinemark Holdings, Inc. | 66,500 | 1,351,945 | ||||||
*Penn National Gaming, Inc. | 38,000 | 1,520,380 | ||||||
TOTAL ENTERTAINMENT | $ | 2,872,325 | ||||||
HAND/MACHINE TOOLS – 1.2% | ||||||||
Kennametal, Inc. | 55,000 | 2,322,100 | ||||||
HEALTHCARE PROVIDERS & | ||||||||
*AMERIGROUP Corp. | 29,000 | 1,980,700 | ||||||
*Healthspring, Inc. | 24,000 | 995,760 | ||||||
*Molina Healthcare, Inc. | 23,000 | 989,000 | ||||||
TOTAL HEALTHCARE PROVIDERS & SERVICES | $ | 3,965,460 | ||||||
HEALTHCARE – PRODUCTS – 3.6% | ||||||||
*Insulet Corp. | 77,000 | 1,654,730 | ||||||
(MTB Small Cap Growth Fund continued next page)
ANNUAL REPORT / April 30, 2011
Table of Contents
| 110 | PORTFOLIOS OF INVESTMENTS |
MTB Small Cap Growth Fund (continued)
| Description | Number of Shares | Value | ||||||
*Nxstage Medical, Inc. | 78,000 | $ | 1,921,920 | |||||
*,12Sirona Dental Systems, Inc. | 44,400 | 2,533,908 | ||||||
*Volcano Corp. | 37,000 | 986,420 | ||||||
TOTAL HEALTHCARE-PRODUCTS | $ | 7,096,978 | ||||||
HOME FURNISHINGS – 1.3% | ||||||||
*Select Comfort Corp. | 156,500 | 2,483,655 | ||||||
INTERNET – 4.7% | ||||||||
*Broadsoft, Inc. | 20,200 | 918,090 | ||||||
NIC, Inc. | 122,000 | 1,568,310 | ||||||
*,12OpenTable, Inc. | 5,000 | 556,450 | ||||||
*Reachlocal, Inc. | 45,000 | 1,045,800 | ||||||
*,12Sourcefire, Inc. | 50,800 | 1,352,296 | ||||||
*TIBCO Software, Inc. | 129,500 | 3,883,705 | ||||||
TOTAL INTERNET | $ | 9,324,651 | ||||||
LEISURE TIME – 1.8% | ||||||||
*Life Time Fitness, Inc. | 25,300 | 989,736 | ||||||
Polaris Industries, Inc. | 24,500 | 2,583,035 | ||||||
TOTAL LEISURE TIME | $ | 3,572,771 | ||||||
MACHINERY – 0.9% | ||||||||
*Chart Industries, Inc. | 35,000 | 1,701,350 | ||||||
MACHINERY-DIVERSIFIED – 1.4% | ||||||||
Gardner Denver, Inc. | 31,300 | 2,704,633 | ||||||
METAL FABRICATE/HARDWARE – 1.1% | ||||||||
Sun Hydraulics Corp. | 45,000 | 2,092,050 | ||||||
METALS & MINING – 2.3% | ||||||||
*Allied Nevada Gold Corp. | 24,000 | 1,033,440 | ||||||
*,12Jaguar Mining, Inc. | 182,800 | 1,021,852 | ||||||
*New Gold, Inc. | 79,500 | 890,400 | ||||||
*Quadra FNX Mining Ltd. | 58,500 | 960,212 | ||||||
*Stillwater Mining Co. | 29,000 | 661,490 | ||||||
TOTAL METALS & MINING | $ | 4,567,394 | ||||||
MISCELLANEOUS | ||||||||
*Fabrinet | 58,100 | 1,339,205 | ||||||
*Freightcar America, Inc. | 44,000 | 1,319,120 | ||||||
TOTAL MISCELLANEOUS MANUFACTURING | $ | 2,658,325 | ||||||
OIL & GAS – 1.0% | ||||||||
*Energy XXI Bermuda Ltd. | 28,500 | 1,033,125 | ||||||
*,12Northern Oil and Gas, Inc. | 39,500 | 938,520 | ||||||
TOTAL OIL & GAS | $ | 1,971,645 | ||||||
OIL & GAS SERVICES – 3.5% | ||||||||
Gulf Island Fabrication, Inc. | 48,000 | 1,696,320 | ||||||
Lufkin Industries, Inc. | 8,500 | 784,805 | ||||||
| Description | Number of Shares | Value | ||||||
*North American Energy Partners, Inc. | 159,000 | $ | 1,812,600 | |||||
*Oil States International, Inc. | 31,000 | 2,573,310 | ||||||
TOTAL OIL & GAS SERVICES | $ | 6,867,035 | ||||||
PHARMACEUTICALS – 1.9% | ||||||||
*MAP Pharmaceuticals, Inc. | 98,500 | 1,518,870 | ||||||
*SXC Health Solutions Corp. | 39,000 | 2,151,240 | ||||||
TOTAL PHARMACEUTICALS | $ | 3,670,110 | ||||||
RETAIL – 11.3% | ||||||||
*Body Central Corp. | 89,600 | 2,166,528 | ||||||
Cash America International, Inc. | 43,500 | 2,064,075 | ||||||
*DineEquity, Inc. | 30,000 | 1,499,100 | ||||||
*First Cash Financial Services, Inc. | 76,500 | 3,001,860 | ||||||
*Gordmans Stores, Inc. | 100,400 | 1,886,516 | ||||||
MSC Industrial Direct Co. | 26,500 | 1,897,135 | ||||||
*Panera Bread Co. | 16,500 | 1,998,315 | ||||||
*Ulta Salon Cosmetics & Fragrance, Inc. | 53,500 | 2,845,665 | ||||||
*,12Vera Bradley, Inc. | 63,000 | 3,064,320 | ||||||
*Zumiez, Inc. | 68,000 | 1,911,480 | ||||||
TOTAL RETAIL | $ | 22,334,994 | ||||||
SEMICONDUCTORS – 5.0% | ||||||||
*Applied Micro Circuits Corp. | 204,500 | 2,143,160 | ||||||
*Lattice Semiconductor Corp. | 157,000 | 1,066,030 | ||||||
*,12Mindspeed Technologies, Inc. | 175,000 | 1,578,500 | ||||||
*Nanometrics, Inc. | 82,000 | 1,325,940 | ||||||
*Netlogic Microsystems, Inc. | 39,000 | 1,682,070 | ||||||
*Ultratech, Inc. | 66,000 | 2,066,460 | ||||||
TOTAL SEMICONDUCTORS | $ | 9,862,160 | ||||||
SOFTWARE – 4.3% | ||||||||
*Aspen Technology, Inc. | 108,000 | 1,618,920 | ||||||
*CommVault Systems, Inc. | 23,700 | 933,543 | ||||||
Opnet Technologies, Inc. | 57,500 | 2,251,700 | ||||||
*Parametric Technology Corp. | 43,000 | 1,043,610 | ||||||
*VeriFone Systems, Inc. | 46,000 | 2,521,720 | ||||||
TOTAL SOFTWARE | $ | 8,369,493 | ||||||
TELECOMMUNICATIONS – 9.4% | ||||||||
*Acme Packet, Inc. | 15,000 | 1,239,150 | ||||||
*Allot Communications Ltd. | 122,400 | 2,001,240 | ||||||
*Aruba Networks, Inc. | 41,500 | 1,491,095 | ||||||
*,12Ciena Corp. | 142,000 | 4,010,080 | ||||||
*Finisar Corp. | 122,500 | 3,441,025 | ||||||
*IPG Photonics Corp. | 37,000 | 2,570,020 | ||||||
*RF Micro Devices, Inc. | 95,500 | 636,030 | ||||||
*SAVVIS, Inc. | 35,600 | 1,401,216 | ||||||
*SBA Communications Corp. | 43,000 | 1,661,090 | ||||||
TOTAL TELECOMMUNICATIONS | $ | 18,450,946 | ||||||
(MTB Small Cap Growth Fund continued next page)
April 30, 2011 / ANNUAL REPORT
Table of Contents
| PORTFOLIOS OF INVESTMENTS | 111 |
MTB Small Cap Growth Fund (concluded)
| Description | Number of Shares | Value | ||||||
TRANSPORTATION – 2.0% | ||||||||
Ryder System, Inc. | 37,000 | $ | 1,979,500 | |||||
Viterra, Inc. | 163,500 | 1,964,800 | ||||||
TOTAL TRANSPORTATION | $ | 3,944,300 | ||||||
TRUCKING AND LEASING – 1.4% | ||||||||
*Greenbrier Cos., Inc. | 104,000 | 2,815,280 | ||||||
| TOTAL COMMON STOCKS (COST $158,241,359) | $ | 196,977,164 | ||||||
| MONEY MARKET FUNDS – 0.4% | ||||||||
8Dreyfus Cash Management Fund, Institutional Shares, 0.00% | 3 | 3 | ||||||
8,9MTB Prime Money Market Fund, Corporate Shares, 0.04% | 851,034 | 851,034 | ||||||
| TOTAL MONEY MARKET FUNDS (COST $851,037) | $ | 851,037 | ||||||
| TOTAL INVESTMENTS IN SECURITIES – 100.5% (COST $159,092,396) | $ | 197,828,201 | ||||||
| Par Value | ||||||||
| CASH COLLATERAL INVESTED FOR SECURITIES ON LOAN – 4.2% | ||||||||
REPURCHASE AGREEMENTS – 4.2% |
| |||||||
Barclays Capital, Inc., 0.03%, dated 04/29/11, due 05/02/11, repurchase price $1,500,004, collateralized by U.S. Treasury Securities 0.00% to 0.00%, maturing 05/15/11 to 02/15/41; total market value of $1,533,307. | $ | 1,500,000 | 1,500,000 | |||||
| Description | Par Value | Value | ||||||
BNP Paribas Securities Corp., 0.05%, dated 04/29/11, due 05/02/11, repurchase price $860,471, collateralized by U.S. Government Securities 1.42% to 7.13%, maturing 09/01/13 to 09/01/49; total market value of $878,533. | $ | 860,467 | $ | 860,467 | ||||
Credit Suisse First Boston LLC, 0.03%, dated 04/29/11, due 05/02/11, repurchase price $1,500,004, collateralized by U.S. Treasury Securities 1.88% to 7.13%, maturing 07/15/12 to 08/15/29; total market value of $1,543,591. | 1,500,000 | 1,500,000 | ||||||
HSBC Securities, Inc., 0.05%, dated 04/29/11, due 05/02/11, repurchase price $1,500,006, collateralized by U.S. Government Securities 3.50% to 7.00%, maturing 07/01/12 to 05/01/41; total market value of $1,530,003. | 1,500,000 | 1,500,000 | ||||||
JP Morgan Securities LLC, 0.05%, dated 04/29/11, due 05/02/11, repurchase price $1,500,006, collateralized by U.S. Government Securities 4.00% to 4.50%, maturing 02/01/26 to 03/01/41; total market value of $1,530,020. | 1,500,000 | 1,500,000 | ||||||
RBC Capital Markets LLC, 0.05%, dated 04/29/11, due 05/02/11, repurchase price $1,500,006, collateralized by U.S. Government Securities 1.99% to 5.13%, maturing 02/01/17 to 04/01/41; total market value of $1,530,000. | 1,500,000 | 1,500,000 | ||||||
| TOTAL CASH COLLATERAL INVESTED FOR SECURITIES ON LOAN (COST $8,360,467) | $ | 8,360,467 | ||||||
| TOTAL INVESTMENTS – 104.7% (COST $167,452,863) | $ | 206,188,668 | ||||||
| COLLATERAL FOR SECURITIES ON LOAN – (4.2%) | (8,360,467 | ) | ||||||
| OTHER LIABILITIES LESS ASSETS – (0.5%) | (1,027,304 | ) | ||||||
| TOTAL NET ASSETS – 100.0% | $ | 196,800,897 | ||||||
Cost of investments for Federal income tax purposes is $169,007,865. The net unrealized appreciation/depreciation of investments was $37,180,803. This consists of net unrealized appreciation from investment for those securities having an excess of value over cost of $39,655,299 and net unrealized depreciation from investments for those securities having an excess of cost over value of $2,474,496.
Various inputs are used in determining the value of the Fund’s investments. These inputs are summarized in the three broad levels listed below.
Level 1 – quoted prices in active markets for identical securities
Level 2 – other significant observable inputs (including quoted prices for similar securities, interest rates, prepayment speeds, credit risk, etc.)
Level 3 – significant unobservable inputs (including the Fund’s own assumptions in determining the fair value of investments)
The following is a summary of the inputs used as of April 30, 2011 in valuing the Fund’s assets carried at fair value:
| Level 1 | Level 2 | Level 3 | Total | |||||||||||||
Investments in Securities | ||||||||||||||||
Common Stocks | $ | 196,977,164 | $ | — | $ | — | $ | 196,977,164 | ||||||||
Money Market Funds | 851,037 | — | — | 851,037 | ||||||||||||
Repurchase Agreements | — | 8,360,467 | — | 8,360,467 | ||||||||||||
Total | $ | 197,828,201 | $ | 8,360,467 | $ | — | $ | 206,188,668 | ||||||||
See Notes to Portfolios of Investments
ANNUAL REPORT / April 30, 2011
Table of Contents
| 112 |
PORTFOLIO OF INVESTMENTS SUMMARY TABLE
MTB International Equity Fund
At April 30, 2011, the Fund’s sector classifications were as follows: (unaudited)
| Stocks | Percentage of Total Net Assets | |||
| Oil & Gas | 10.9 | % | ||
| Banks | 9.0 | % | ||
| Metals & Mining | 7.3 | % | ||
| Insurance | 6.9 | % | ||
| Pharmaceuticals | 6.1 | % | ||
| Chemicals | 5.5 | % | ||
| Telecommunications | 5.4 | % | ||
| Diversified Financial Services | 3.6 | % | ||
| Internet | 3.1 | % | ||
| Auto Manufacturers | 2.8 | % | ||
| Food | 2.3 | % | ||
| Distribution/Wholesale | 2.1 | % | ||
| Machinery | 1.9 | % | ||
| Media | 1.8 | % | ||
| Electric | 1.6 | % | ||
| Iron/Steel | 1.6 | % | ||
| Semiconductors | 1.6 | % | ||
| Retail | 1.5 | % | ||
| Electronics | 1.4 | % | ||
| Aerospace & Defense | 1.3 | % | ||
| Real Estate Management & Development | 1.3 | % | ||
| Software | 1.3 | % | ||
| Beverages | 1.2 | % | ||
| Computers | 1.1 | % | ||
| Healthcare-Products | 1.1 | % | ||
| Holding Companies-Diversified | 1.1 | % | ||
| Engineering & Construction | 1.0 | % | ||
| Real Estate | 0.9 | % | ||
| Advertising | 0.8 | % | ||
| Apparel | 0.8 | % | ||
| Electrical Components & Equipment | 0.8 | % | ||
| Investment Companies | 0.8 | % | ||
| Water | 0.8 | % | ||
| Tobacco | 0.7 | % | ||
| Transportation | 0.7 | % | ||
| Commercial Services | 0.6 | % | ||
| Cosmetics/Personal Care | 0.6 | % | ||
| Hand/Machine Tools | 0.6 | % | ||
| Hotels, Restaurants & Leisure | 0.6 | % | ||
| Auto Parts & Equipment | 0.4 | % | ||
| Stocks | Percentage of Total Net Assets | |||
| Building Materials | 0.4 | % | ||
| Office/Business Equipment | 0.4 | % | ||
| Oil & Gas Services | 0.4 | % | ||
| Biotechnology | 0.3 | % | ||
| Energy-Alternate Sources | 0.3 | % | ||
| Miscellaneous Manufacturing | 0.3 | % | ||
| Coal | 0.2 | % | ||
| Entertainment | 0.2 | % | ||
| Equity Fund | 0.2 | % | ||
| Agriculture | 0.1 | % | ||
| Home Furnishings | 0.1 | % | ||
| Leisure Time | 0.1 | % | ||
| Shipbuilding | 0.1 | % | ||
| Household Products | 0.0 | %3 | ||
| Cash Equivalents1 | 5.7 | % | ||
| Other Assets and Liabilities – Net2 | (3.7 | )% | ||
| TOTAL | 100.0 | % | ||
| (1) | Cash Equivalents include investments in money market mutual funds and repurchase agreements. |
| (2) | Assets, other than investments in securities, less liabilities. See Statements of Assets and Liabilities. |
| (3) | Represents less than 0.05%. |
(MTB International Equity Fund continued next page)
April 30, 2011 / ANNUAL REPORT
Table of Contents
| PORTFOLIOS OF INVESTMENTS | 113 |
MTB International Equity Fund (continued)
PORTFOLIO OF INVESTMENTS
April 30, 2011
| Description | Number of Shares | Value | ||||||
| COMMON STOCKS – 96.5% | ||||||||
AUSTRALIA – 5.2% | ||||||||
BHP Billiton Ltd. | 25,427 | $ | 1,277,300 | |||||
Challenger Ltd. | 80,400 | 424,767 | ||||||
CSL Ltd. | 19,002 | 715,441 | ||||||
Downer EDI Ltd. | 63,750 | 258,541 | ||||||
Goodman Fielder Ltd. | 271,900 | 320,380 | ||||||
Macquarie Group Ltd. | 20,800 | 801,605 | ||||||
Metcash Ltd. | 75,000 | 333,761 | ||||||
Newcrest Mining Ltd. | 50,813 | 2,308,593 | ||||||
OneSteel Ltd. | 208,000 | 485,614 | ||||||
*Paladin Energy Ltd. | 381,710 | 1,380,688 | ||||||
Rio Tinto Ltd. | 21,588 | 1,945,293 | ||||||
*Sigma Pharmaceuticals Ltd. | 343,067 | 139,133 | ||||||
TABCORP Holdings Ltd. | 43,100 | 360,454 | ||||||
Woodside Petroleum, Ltd. | 14,296 | 733,345 | ||||||
WorleyParsons Ltd. | 31,692 | 1,054,281 | ||||||
TOTAL AUSTRALIA | $ | 12,539,196 | ||||||
AUSTRIA – 0.5% | ||||||||
OMV AG | 16,100 | 734,235 | ||||||
Voestalpine AG | 8,100 | 398,611 | ||||||
TOTAL AUSTRIA | $ | 1,132,846 | ||||||
BELGIUM – 0.6% | ||||||||
Anheuser-Busch InBev NV | 15,145 | 965,700 | ||||||
Delhaize Group SA | 3,400 | 294,400 | ||||||
*KBC Groep NV | 8,500 | 346,471 | ||||||
TOTAL BELGIUM | $ | 1,606,571 | ||||||
BRAZIL – 1.8% | ||||||||
Banco do Estado do Rio Grande do Sul | 58,300 | 700,400 | ||||||
Brasil Telecom SA | 3,870 | 41,499 | ||||||
Centrais Eletricas Brasileiras SA ADR | 9,400 | 139,308 | ||||||
Cia de Saneamento Basico do Estado de Sao Paulo | 3,100 | 89,796 | ||||||
Cia de Saneamento Basico do Estado de Sao Paulo ADR | 3,600 | 210,672 | ||||||
EDP – Energias do Brasil SA | 19,900 | 493,326 | ||||||
Eletropaulo Metropolitana Eletricidade de Sao Paulo SA | 23,200 | 564,811 | ||||||
Hypermarcas SA | 88,310 | 1,184,427 | ||||||
Vale SA ADR | 28,498 | 951,833 | ||||||
TOTAL BRAZIL | $ | 4,376,072 | ||||||
CANADA – 3.8% | ||||||||
Alimentation Couche Tard, Inc. | 22,200 | 583,068 | ||||||
Atco Ltd. | 4,300 | 264,731 | ||||||
| Description | Number of Shares | Value | ||||||
Bank of Nova Scotia | 14,639 | $ | 893,565 | |||||
BCE, Inc. | 12,810 | 480,096 | ||||||
Cameco Corp. | 35,910 | 1,058,627 | ||||||
Canadian Imperial Bank of Commerce | 4,700 | 406,888 | ||||||
Dorel Industries, Inc. | 8,700 | 289,280 | ||||||
Empire Co. Ltd. | 6,200 | 351,889 | ||||||
Fairfax Financial Holdings Ltd. | 1,000 | 403,847 | ||||||
Laurentian Bank of Canada | 11,300 | 600,382 | ||||||
12Manulife Financial Corp. | 49,545 | 890,324 | ||||||
Metro, Inc. | 6,900 | 337,653 | ||||||
National Bank of Canada | 11,500 | 952,185 | ||||||
*Research In Motion Ltd. | 5,100 | 248,437 | ||||||
RONA, Inc. | 23,600 | 344,964 | ||||||
Suncor Energy, Inc. | 27,578 | 1,269,691 | ||||||
TOTAL CANADA | $ | 9,375,627 | ||||||
CHILE – 0.3% | ||||||||
Sociedad Quimica y Minera de Chile SA ADR | 12,396 | 756,528 | ||||||
CHINA – 4.6% | ||||||||
12Agile Property Holdings Ltd. | 864,000 | 1,403,983 | ||||||
Bank of China Ltd. | 1,367,000 | 755,117 | ||||||
China Merchants Bank Co. Ltd. | 277,000 | 713,343 | ||||||
China Petroleum & Chemical Corp. | 674,000 | 678,665 | ||||||
China Resources Land Ltd. | 428,000 | 738,477 | ||||||
*Chongqing Iron & Steel Co. Ltd. | 910,000 | 240,206 | ||||||
Industrial & Commercial Bank of China | 906,000 | 766,447 | ||||||
*New Oriental Education & Technology Group ADR | 6,599 | 822,499 | ||||||
PetroChina Co. Ltd. | 824,000 | 1,184,077 | ||||||
12PetroChina Co. Ltd. ADR | 500 | 72,790 | ||||||
Ping An Insurance Group Co. | 72,500 | 788,363 | ||||||
Tencent Holdings Ltd. | 90,900 | 2,586,693 | ||||||
Yanzhou Coal Mining Co. Ltd. | 102,000 | 397,953 | ||||||
TOTAL CHINA | $ | 11,148,613 | ||||||
DENMARK – 0.8% | ||||||||
*Danske Bank A/S | 6,600 | 158,607 | ||||||
H Lundbeck A/S | 18,200 | 437,008 | ||||||
Novo-Nordisk A/S | 5,388 | 681,111 | ||||||
*Vestas Wind Systems A/S | 20,968 | 744,589 | ||||||
TOTAL DENMARK | $ | 2,021,315 | ||||||
FRANCE – 5.7% | ||||||||
12AXA SA | 45,861 | 1,029,096 | ||||||
BNP Paribas | 18,907 | 1,496,262 | ||||||
Casino Guichard Perrachon SA | 3,000 | 315,797 | ||||||
Credit Agricole SA | 13,000 | 216,426 | ||||||
(MTB International Equity Fund continued next page)
ANNUAL REPORT / April 30, 2011
Table of Contents
| 114 | PORTFOLIOS OF INVESTMENTS |
MTB International Equity Fund (continued)
| Description | Number of Shares | Value | ||||||
Iliad SA | 6,621 | $ | 851,124 | |||||
Publicis Groupe SA | 33,920 | 1,922,209 | ||||||
Rallye SA | 4,600 | 241,974 | ||||||
Sanofi-Aventis SA | 37,110 | 2,935,161 | ||||||
SCOR SE | 11,600 | 354,366 | ||||||
Societe Generale | 1,500 | 100,333 | ||||||
Suez Environnement Co. | 77,247 | 1,780,291 | ||||||
Total SA | 16,000 | 1,024,246 | ||||||
Total SA ADR | 11,890 | 763,695 | ||||||
12Vivendi SA | 25,200 | 790,731 | ||||||
TOTAL FRANCE | $ | 13,821,711 | ||||||
GERMANY – 7.8% | ||||||||
Adidas AG | 14,991 | 1,115,971 | ||||||
12Aixtron Se NA | 22,744 | 970,195 | ||||||
Allianz SE | 4,700 | 739,999 | ||||||
*BASF SE | 4,900 | 503,681 | ||||||
Bayer AG | 31,494 | 2,768,524 | ||||||
Bayerische Motoren Werke AG | 33,054 | 3,117,156 | ||||||
12Daimler AG | 4,800 | 371,046 | ||||||
Deutsche Bank AG | 7,400 | 483,359 | ||||||
Deutsche Boerse AG | 29,599 | 2,459,459 | ||||||
E.ON AG | 9,500 | 324,757 | ||||||
Fresenius Se & Co. KGaA | 21,660 | 2,273,314 | ||||||
12Muenchener Rueckversicherungs AG | 11,901 | 1,964,551 | ||||||
12RWE AG | 4,300 | 280,584 | ||||||
ThyssenKrupp AG | 9,200 | 423,310 | ||||||
Wacker Chemie AG | 4,516 | 1,119,050 | ||||||
TOTAL GERMANY | $ | 18,914,956 | ||||||
GREECE – 0.1% | ||||||||
Hellenic Petroleum SA | 13,900 | 148,234 | ||||||
HONG KONG – 2.4% | ||||||||
Esprit Holdings Ltd. | 157,871 | 656,589 | ||||||
Kingboard Chemical Holdings Ltd. | 121,000 | 662,939 | ||||||
Li & Fung Ltd. | 142,000 | 725,884 | ||||||
SJM Holdings Ltd. | 692,000 | 1,491,592 | ||||||
Sun Hung Kai Properties Ltd. | 101,000 | 1,577,505 | ||||||
VTech Holdings Ltd. | 56,000 | 638,146 | ||||||
TOTAL HONG KONG | $ | 5,752,655 | ||||||
HUNGARY – 0.2% | ||||||||
Egis Gyogyszergyar Nyrt | 3,600 | 394,902 | ||||||
INDIA – 1.4% | ||||||||
HDFC Bank Ltd. ADR | 4,641 | 798,716 | ||||||
Niko Resources Ltd. | 17,330 | 1,464,391 | ||||||
12Patni Computer Systems Ltd. ADR | 7,600 | 145,540 | ||||||
Tata Motors Ltd. ADR | 21,300 | 584,472 | ||||||
| Description | Number of Shares | Value | ||||||
12Tata Steel Ltd. | 31,000 | $ | 434,620 | |||||
TOTAL INDIA | $ | 3,427,739 | ||||||
IRELAND – 0.2% | ||||||||
DCC PLC | 13,500 | 449,900 | ||||||
*Irish Life & Permanent Group Holdings PLC | 38,000 | 8,443 | ||||||
TOTAL IRELAND | $ | 458,343 | ||||||
ISRAEL – 1.1% | ||||||||
Discount Investment Corp. | 10,300 | 209,032 | ||||||
Israel Chemicals Ltd. | 102,989 | 1,815,885 | ||||||
Teva Pharmaceutical Industries Ltd. ADR | 15,612 | 713,937 | ||||||
TOTAL ISRAEL | $ | 2,738,854 | ||||||
ITALY – 1.7% | ||||||||
Banco Popolare SC | 12,600 | 37,362 | ||||||
Enel SpA | 53,600 | 382,182 | ||||||
ENI SpA | 96,890 | 2,590,335 | ||||||
Finmeccanica SpA | 7,700 | 104,012 | ||||||
*Milano Assicurazioni SpA | 19,800 | 29,210 | ||||||
Saipem SpA | 18,759 | 1,064,997 | ||||||
TOTAL ITALY | $ | 4,208,098 | ||||||
JAPAN – 14.8% | ||||||||
Brother Industries Ltd. | 27,900 | 425,130 | ||||||
Canon, Inc. | 22,600 | 1,058,744 | ||||||
Chugai Pharmaceutical Co. Ltd. | 9,800 | 161,290 | ||||||
Circle K Sunkus Co. Ltd. | 11,300 | 173,021 | ||||||
Daito Trust Construction Co. Ltd. | 16,800 | 1,335,881 | ||||||
Eizo Nanao Corp. | 12,300 | 273,401 | ||||||
FANUC Corp. | 17,000 | 2,818,838 | ||||||
Geo Corp. | 300 | 346,175 | ||||||
Hitachi Capital Corp. | 10,200 | 144,735 | ||||||
Hitachi Metals Ltd. | 136,000 | 1,780,583 | ||||||
Honda Motor Co., Ltd. | 34,500 | 1,356,777 | ||||||
ITOCHU Corp. | 35,000 | 362,017 | ||||||
Itochu Techno-Solutions Corp. | 9,500 | 332,614 | ||||||
Jupiter Telecommunications Co. Ltd. | 1,200 | 1,288,541 | ||||||
JX Holdings, Inc. | 58,315 | 404,032 | ||||||
KDDI Corp. | 60 | 397,954 | ||||||
Keyence Corp. | 5,800 | 1,513,012 | ||||||
Komatsu Ltd. | 23,600 | 826,284 | ||||||
Konica Minolta Holdings, Inc. | 20,500 | 179,689 | ||||||
Kose Corp. | 3,400 | 88,694 | ||||||
Kyocera Corp. | 15,700 | 1,720,681 | ||||||
Kyowa Exeo Corp. | 26,500 | 277,692 | ||||||
Marubeni Corp. | 65,000 | 469,580 | ||||||
Ministop Co., Ltd. | 9,600 | 154,329 | ||||||
Miraca Holdings, Inc. | 10,100 | 382,260 | ||||||
(MTB International Equity Fund continued next page)
April 30, 2011 / ANNUAL REPORT
Table of Contents
| PORTFOLIOS OF INVESTMENTS | 115 |
MTB International Equity Fund (continued)
| Description | Number of Shares | Value | ||||||
Mitsubishi Corp. | 6,600 | $ | 177,296 | |||||
Mitsui & Co. Ltd. | 92,700 | 1,636,521 | ||||||
Mizuho Financial Group, Inc. | 204,000 | 321,913 | ||||||
Nidec Corp. | 16,100 | 1,397,325 | ||||||
Nihon Kohden Corp. | 17,200 | 364,505 | ||||||
Nippon Telegraph & Telephone Corp. | 10,000 | 461,690 | ||||||
NOF Corp. | 80,000 | 349,134 | ||||||
NTT DoCoMo, Inc. | 1,408 | 2,591,560 | ||||||
Rakuten, Inc. | 1,830 | 1,683,018 | ||||||
Sankyu, Inc. | 70,000 | 320,163 | ||||||
Shinmaywa Industries Ltd. | 24,000 | 102,373 | ||||||
SMC Corp. | 7,500 | 1,363,805 | ||||||
Sony Financial Holdings, Inc. | 48,800 | 901,821 | ||||||
Sumitomo Corp. | 63,400 | 865,238 | ||||||
Sumitomo Mitsui Financial Group, Inc. | 10,000 | 307,588 | ||||||
Sumitomo Mitsui Trust Holdings, Inc. | 26,820 | 91,257 | ||||||
Takeda Pharmaceutical Co. Ltd. | 13,100 | 633,077 | ||||||
Tokio Marine Holdings, Inc. | 11,500 | 318,850 | ||||||
Toyo Tire & Rubber Co. Ltd. | 147,000 | 357,012 | ||||||
Toyota Motor Corp. | 31,800 | 1,266,276 | ||||||
Unicharm Corp. | 37,700 | 1,491,919 | ||||||
Yahoo Japan Corp. | 1,460 | 532,594 | ||||||
Yokohama Rubber Co. Ltd. | 19,100 | 97,013 | ||||||
TOTAL JAPAN | $ | 35,903,902 | ||||||
LUXEMBOURG – 1.2% | ||||||||
Millicom International Cellular SA | 9,712 | 1,052,198 | ||||||
12SES SA | 67,680 | 1,777,333 | ||||||
TOTAL LUXEMBOURG | $ | 2,829,531 | ||||||
MEXICO – 0.6% | ||||||||
Alfa SAB de CV | 37,000 | 549,936 | ||||||
Telefonos de Mexico SAB de CV | 142,000 | 133,221 | ||||||
Wal-Mart de Mexico SAB de CV ADR | 26,071 | 816,283 | ||||||
TOTAL MEXICO | $ | 1,499,440 | ||||||
NETHERLANDS – 2.7% | ||||||||
*Aegon NV | 36,800 | 292,209 | ||||||
Heineken NV | 29,430 | 1,761,703 | ||||||
*ING Groep NV | 29,800 | 392,831 | ||||||
Koninklijke DSM NV | 11,800 | 813,582 | ||||||
Koninklijke Vopak NV | 29,120 | 1,395,724 | ||||||
Royal Dutch Shell PLC | 45,900 | 1,784,080 | ||||||
TOTAL NETHERLANDS | $ | 6,440,129 | ||||||
NORWAY – 1.9% | ||||||||
12Marine Harvest ASA | 1,213,010 | 1,602,211 | ||||||
Statoil ASA | 12,070 | 353,133 | ||||||
Telenor ASA | 43,737 | 755,682 | ||||||
| Description | Number of Shares | Value | ||||||
Yara International ASA | 33,659 | $ | 1,971,450 | |||||
TOTAL NORWAY | $ | 4,682,476 | ||||||
PAPUA NEW GUINEA – 0.7% | ||||||||
Oil Search Ltd. | 210,145 | 1,623,889 | ||||||
POLAND – 0.0%** | ||||||||
Telekomunikacja Polska SA | 8,200 | 54,210 | ||||||
PORTUGAL – 0.0%** | ||||||||
12Banco Espirito Santo SA | 16,030 | 67,525 | ||||||
RUSSIA – 2.0% | ||||||||
Gazprom Neft JSC | 24,100 | 609,007 | ||||||
Gazprom OAO ADR | 173,222 | 2,955,167 | ||||||
MMC Norilsk Nickel OJSC ADR | 32,100 | 885,960 | ||||||
Mobile Telesystems OJSC ADR | 25,000 | 528,750 | ||||||
TOTAL RUSSIA | $ | 4,978,884 | ||||||
SINGAPORE – 1.5% | ||||||||
DBS Group Holdings Ltd. | 147,000 | 1,798,995 | ||||||
Keppel Corp., Ltd. | 194,700 | 1,892,839 | ||||||
TOTAL SINGAPORE | $ | 3,691,834 | ||||||
SOUTH AFRICA – 0.4% | ||||||||
Astral Foods Ltd. | 16,800 | 343,421 | ||||||
Nedbank Group Ltd. | 21,637 | 481,979 | ||||||
Telkom SA Ltd. | 12,300 | 71,664 | ||||||
TOTAL SOUTH AFRICA | $ | 897,064 | ||||||
SOUTH KOREA – 2.5% | ||||||||
*BS Financial Group, Inc. | 32,200 | 468,735 | ||||||
Daegu Bank Ltd. | 24,300 | 405,888 | ||||||
*Daishin Securities Co. Ltd. | 12,200 | 164,503 | ||||||
Halla Climate Control Corp. | 22,200 | 453,674 | ||||||
Hyundai Mipo Dockyard | 1,600 | 283,675 | ||||||
Korea Exchange Bank | 49,200 | 418,245 | ||||||
KT Corp. | 3,100 | 111,370 | ||||||
*NHN Corp. | 7,940 | 1,574,441 | ||||||
Samsung Electronics Co. Ltd. | 640 | 533,308 | ||||||
*,6,7Samsung Electronics Co. Ltd. GDR | 2,876 | 1,198,277 | ||||||
Samyang Corp. | 3,100 | 240,097 | ||||||
SK Telecom Co. Ltd. | 1,400 | 212,289 | ||||||
TOTAL SOUTH KOREA | $ | 6,064,502 | ||||||
SPAIN – 1.7% | ||||||||
Banco Bilbao Vizcaya Argentaria SA | 9,348 | 119,905 | ||||||
12Banco Santander SA | 74,000 | 945,017 | ||||||
Grifols SA | 85,463 | 1,692,424 | ||||||
Repsol YPF SA | 23,700 | 846,341 | ||||||
Telefonica SA | 21,400 | 575,294 | ||||||
TOTAL SPAIN | $ | 4,178,981 | ||||||
(MTB International Equity Fund continued next page)
ANNUAL REPORT / April 30, 2011
Table of Contents
| 116 | PORTFOLIOS OF INVESTMENTS |
MTB International Equity Fund (continued)
| Description | Number of Shares | Value | ||||||
SWEDEN – 1.6% | ||||||||
Atlas Copco AB | 33,191 | $ | 974,453 | |||||
*Boliden AB | 33,900 | 764,124 | ||||||
Saab AB | 26,100 | 589,604 | ||||||
TeliaSonera AB | 196,400 | 1,603,716 | ||||||
TOTAL SWEDEN | $ | 3,931,897 | ||||||
SWITZERLAND – 6.8% | ||||||||
*ABB Ltd. | 33,700 | 930,354 | ||||||
Adecco SA | 11,548 | 824,380 | ||||||
*Baloise Holding AG | 3,500 | 387,023 | ||||||
CIE Financiere Richemont SA | 12,990 | 839,469 | ||||||
*Clariant AG | 19,000 | 394,277 | ||||||
Credit Suisse Group AG | 21,314 | 968,616 | ||||||
*Helvetia Holding AG | 800 | 375,260 | ||||||
Holcim, Ltd. | 8,417 | 732,717 | ||||||
*Julius Baer Group Ltd. | 42,929 | 2,006,000 | ||||||
Nestle SA | 12,529 | 777,812 | ||||||
Novartis AG | 9,500 | 563,960 | ||||||
Roche Holding AG | 4,514 | 732,155 | ||||||
*Swiss Reinsurance Co. Ltd. | 7,500 | 446,965 | ||||||
Syngenta AG | 6,047 | 2,139,869 | ||||||
*UBS AG | 89,530 | 1,789,565 | ||||||
*Zurich Financial Services AG | 8,979 | 2,522,424 | ||||||
TOTAL SWITZERLAND | $ | 16,430,846 | ||||||
TAIWAN – 0.5% | ||||||||
Compal Electronics, Inc. | 385,201 | 436,467 | ||||||
Gigabyte Technology Co. Ltd. | 397,000 | 412,408 | ||||||
Macronix International | 623,804 | 409,502 | ||||||
TOTAL TAIWAN | $ | 1,258,377 | ||||||
THAILAND – 0.3% | ||||||||
Krung Thai Bank PCL | 1,075,400 | 706,125 | ||||||
TURKEY – 0.2% | ||||||||
Cimsa Cimento Sanayi VE Tica | 37,700 | 254,060 | ||||||
Tupras Turkiye Petrol Rafinerileri AS | 10,800 | 350,769 | ||||||
*Turk Sise ve Cam Fabrikalari AS | 1 | 2 | ||||||
TOTAL TURKEY | $ | 604,831 | ||||||
UNITED KINGDOM – 18.9% | ||||||||
Admiral Group PLC | 52,610 | 1,486,873 | ||||||
Anglo American PLC | 19,665 | 1,024,999 | ||||||
ARM Holdings PLC | 71,794 | 744,107 | ||||||
AstraZeneca PLC | 18,700 | 933,938 | ||||||
*Autonomy Corp. PLC | 108,008 | 2,904,605 | ||||||
Aviva PLC | 45,500 | 339,570 | ||||||
BAE Systems PLC | 57,500 | 314,930 | ||||||
Barclays PLC | 74,000 | 348,938 | ||||||
| Description | Number of Shares | Value | ||||||
BG Group PLC | 109,817 | $ | 2,812,928 | |||||
BP PLC | 320,340 | 2,475,000 | ||||||
British Sky Broadcasting Group PLC | 74,625 | 1,049,547 | ||||||
BT Group PLC | 145,400 | 475,535 | ||||||
*Centamin Egypt Ltd. | 698,146 | 1,515,985 | ||||||
Computacenter PLC | 85,600 | 659,572 | ||||||
*Cookson Group PLC | 31,000 | 370,490 | ||||||
Dairy Crest Group PLC | 13,900 | 93,335 | ||||||
Drax Group PLC | 41,300 | 303,465 | ||||||
GlaxoSmithKline PLC | 20,700 | 451,391 | ||||||
Greene King PLC | 36,400 | 297,679 | ||||||
Home Retail Group PLC | 89,900 | 330,210 | ||||||
HSBC Holdings PLC ADR | 18,946 | 1,031,989 | ||||||
ICAP PLC | 165,190 | 1,430,664 | ||||||
Imperial Tobacco Group PLC | 45,780 | 1,611,186 | ||||||
Kazakhmys PLC | 8,600 | 198,093 | ||||||
Logica PLC | 249,300 | 561,329 | ||||||
Marston’s PLC | 92,160 | 166,870 | ||||||
Old Mutual PLC | 45,300 | 105,176 | ||||||
Petropavlovsk PLC | 106,986 | 1,595,819 | ||||||
*Premier Foods PLC | 67,000 | 36,002 | ||||||
Prudential PLC | 249,177 | 3,217,308 | ||||||
Resolution Ltd. | 321,487 | 1,625,478 | ||||||
Rio Tinto PLC | 24,020 | 1,749,302 | ||||||
*,10Rolls-Royce Group PLC | 22,723,392 | 37,956 | ||||||
*Rolls-Royce Group PLC | 236,702 | 2,536,319 | ||||||
Shire PLC | 68,050 | 2,102,835 | ||||||
Standard Chartered PLC | 86,149 | 2,387,272 | ||||||
Tesco PLC | 136,446 | 919,736 | ||||||
Thomas Cook Group PLC | 70,000 | 200,291 | ||||||
Tullow Oil PLC | 67,701 | 1,620,491 | ||||||
12Vedanta Resources PLC | 26,146 | 1,015,391 | ||||||
Vodafone Group PLC | 230,600 | 660,970 | ||||||
WM Morrison Supermarkets PLC | 114,300 | 562,832 | ||||||
WPP PLC | 120,261 | 1,569,853 | ||||||
TOTAL UNITED KINGDOM | $ | 45,876,259 | ||||||
| TOTAL COMMON STOCKS (COST $182,489,539) | $ | 234,542,962 | ||||||
| MUTUAL FUNDS – 0.2% | ||||||||
iShares MSCI EAFE Index Fund | 5,628 | 357,153 | ||||||
Vanguard Emerging Markets ETF | 2,122 | 107,331 | ||||||
| TOTAL MUTUAL FUNDS (COST $436,559) | $ | 464,484 | ||||||
| PREFERRED STOCKS – 1.3% | ||||||||
BRAZIL – 1.3% | ||||||||
Banco Industrial e Comercial SA | 39,700 | 284,401 | ||||||
Brasil Telecom SA | 20,466 | 189,934 | ||||||
(MTB International Equity Fund continued next page)
April 30, 2011 / ANNUAL REPORT
Table of Contents
| PORTFOLIOS OF INVESTMENTS | 117 |
MTB International Equity Fund (continued)
| Description | Number of Shares | Value | ||||||
Brasil Telecom SA ADR | 7,400 | $ | 208,680 | |||||
Centrais Eletricas Brasileiras SA, Series B | 16,900 | 307,341 | ||||||
Cia Energetica de Minas Gerais | 62,507 | 1,304,521 | ||||||
Itau Unibanco Holding SA ADR | 36,662 | 870,723 | ||||||
TOTAL BRAZIL | $ | 3,165,600 | ||||||
| TOTAL PREFERRED STOCKS (COST $2,346,301) | $ | 3,165,600 | ||||||
| MONEY MARKET FUNDS – 1.3% | ||||||||
8Dreyfus Cash Management Fund, Institutional Shares, 0.00% | 60,963 | 60,963 | ||||||
8,9MTB Prime Money Market Fund, Corporate Shares, 0.04% | 3,133,353 | 3,133,353 | ||||||
| TOTAL MONEY MARKET FUNDS (COST $3,194,316) | $ | 3,194,316 | ||||||
| TOTAL INVESTMENTS IN SECURITIES – 99.3% (COST $188,466,715) | $ | 241,367,362 | ||||||
| Par Value | ||||||||
| CASH COLLATERAL INVESTED FOR SECURITIES ON LOAN – 4.4% | ||||||||
REPURCHASE AGREEMENTS – 4.4% | ||||||||
Bank of America LLC, 0.05%, dated 04/29/11, due 05/02/11, repurchase price $2,521,317, collateralized by U.S. Government Securities 4.00% to 5.50%, maturing 01/01/26 to 04/01/41; total market value of $2,571,786. | $ | 2,521,306 | 2,521,306 | |||||
Barclays Capital, Inc., 0.03%, dated 04/29/11, due 05/02/11, repurchase price $1,400,004, collateralized by U.S. Treasury Securities 0.00% to 0.00%, maturing 05/15/11 to 02/15/41; total market value of $1,431,087. | 1,400,000 | 1,400,000 | ||||||
| Par Value | Value | |||||||
Citigroup Global Markets, Inc., 0.06%, dated 04/29/11, due 05/02/11, repurchase price $652,112, collateralized by U.S. Government Securities 2.12% to 6.50%, maturing 09/01/15 to 04/01/41; total market value of $665,154. | $ | 652,109 | $ | 652,109 | ||||
Goldman Sachs & Co., 0.05%, dated 04/29/11, due 05/02/11, repurchase price $2,521,317, collateralized by U.S. Government Securities 0.00% to 7.00%, maturing 05/02/11 to 05/01/41; total market value of $2,571,802. | 2,521,306 | 2,521,306 | ||||||
JP Morgan Securities LLC, 0.05%, dated 04/29/11, due 05/02/11, repurchase price $1,000,004, collateralized by U.S. Government Securities 4.00% to 4.50%, maturing 02/01/26 to 03/01/41; total market value of $1,020,013. | 1,000,000 | 1,000,000 | ||||||
RBS Securities, Inc., 0.05%, dated 04/29/11, due 05/02/11, repurchase price $2,521,317, collateralized by U.S. Government Securities 3.50% to 6.00%, maturing 04/01/21 to 05/01/41; total market value of $2,571,778. | 2,521,306 | 2,521,306 | ||||||
| TOTAL CASH COLLATERAL INVESTED FOR SECURITIES ON LOAN (COST $10,616,027) | $ | 10,616,027 | ||||||
| TOTAL INVESTMENTS – 103.7% (COST $199,082,742) | $ | 251,983,389 | ||||||
| COLLATERAL FOR SECURITIES ON LOAN – (4.4%) | (10,616,027 | ) | ||||||
| OTHER ASSETS LESS LIABILITIES – 0.7% | 1,523,434 | |||||||
| TOTAL NET ASSETS – 100.0% | $ | 242,890,796 | ||||||
Cost of investments for Federal income tax purposes is $202,080,258. The net unrealized appreciation/depreciation of investments was $49,903,131. This consists of net unrealized appreciation from investment for those securities having an excess of value over cost of $59,383,034 and net unrealized depreciation from investments for those securities having an excess of cost over value of $9,479,903.
Various inputs are used in determining the value of the Fund’s investments. These inputs are summarized in the three broad levels listed below.
Level 1 – quoted prices in active markets for identical securities
Level 2 – other significant observable inputs (including quoted prices for similar securities, interest rates, prepayment speeds, credit risk, etc.)
Level 3 – significant unobservable inputs (including the Fund’s own assumptions in determining the fair value of investments)
The following is a summary of the inputs used as of April 30, 2011 in valuing the Fund’s assets carried at fair value:
| Level 1 | Level 2 | Level 3(a) | Total | |||||||||||||
Investments in Securities | ||||||||||||||||
Common Stocks | $ | 234,505,006 | $ | 37,956 | $ | — | $ | 234,542,962 | ||||||||
Mutual Funds | 464,484 | — | — | 464,484 | ||||||||||||
Preferred Stocks | 3,165,600 | — | — | 3,165,600 | ||||||||||||
Money Market Funds | 3,194,316 | — | — | 3,194,316 | ||||||||||||
Repurchase Agreements | — | 10,616,027 | — | 10,616,027 | ||||||||||||
Total | $ | 241,329,406 | $ | 10,653,983 | $ | — | $ | 251,983,389 | ||||||||
| (a) | At April 30, 2010, the Fund held a security that was fair valued at $0 and classified as a Level 3 security. This security has since been sold and has therefore been removed from Level 3 securities. |
(MTB International Equity Fund continued next page)
ANNUAL REPORT / April 30, 2011
Table of Contents
| 118 | PORTFOLIOS OF INVESTMENTS |
MTB International Equity Fund (concluded)
The following is a reconciliation of assets in which significant unobservable inputs (Level 3) were used in determining fair value:
| Investments In Securities | ||||
Balance as of April 30, 2010 | $ | — | ||
Realized gain (loss) | (169,271 | ) | ||
Change in unrealized appreciation (depreciation) | 169,271 | |||
Net purchases (sales) | — | |||
Transfers in and/or out of Level 3 | — | |||
Balance as of April 30, 2011 | $ | — | ||
See Notes to Portfolios of Investments
April 30, 2011 / ANNUAL REPORT
Table of Contents
| NOTES TO PORTFOLIOS OF INVESTMENTS | 119 |
At April 30, 2011, the MTB International Equity Fund had the following outstanding foreign exchange contracts:
| Settlement Date | Contracts to Deliver/Receive | In Exchange For | Contracts at Value | Net Unrealized Appreciation (Depreciation) | ||||||||||||
CONTRACTS SOLD | ||||||||||||||||
| 5/2/2011 | 42,329 Swiss Franc | $47,938 | $48,935 | ($997) | ||||||||||||
| 5/4/2011 | 112,849 Swedish Krona | 18,721 | 18,672 | $49 | ||||||||||||
| 5/4/2011 | 9,087 Euro | 13,458 | 13,458 | $0 | ||||||||||||
| 5/4/2011 | 4,796 Pound Sterling | 7,885 | 8,011 | ($126) | ||||||||||||
| 5/4/2011 | 9,512 Euro | 14,087 | 14,087 | $0 | ||||||||||||
| NET UNREALIZED DEPRECIATION ON FOREIGN EXCHANGE CONTRACTS | ($1,074) | |||||||||||||||
| (1) | Floating rate note with current rate and next reset date shown. |
| (2) | Zero coupon security. The rate shown reflects the effective yield at purchase date. |
| (3) | Current rate and next reset date shown for Variable Rate Demand Notes. |
| (4) | Discount rate at time of purchase. |
| (5) | At April 30, 2011, the percentage of total investments at market value subject to the alternative minimum tax is as follows: |
| MTB Fund | Amount | Percentage of Total Investments | ||||||
| MTB Virginia Municipal Bond Fund | $1,792,971 | 8.7% | ||||||
| MTB New York Municipal Bond Fund | 2,757,230 | 2.7% | ||||||
| MTB Maryland Municipal Bond Fund | 506,261 | 0.5% | ||||||
| (6) | Denotes a restricted security that may be resold without restriction to “qualified institutional buyers” as defined in Rule 144A under the Securities Act of 1933 and that the Fund has determined to be liquid under criteria established by the Fund’s Board of Trustees. At April 30, 2011, these liquid restricted securities were as follows: |
| MTB Fund | Amount | Percentage of Total Net Assets | ||||||
| MTB Short-Term Corporate Bond Fund | $11,063,663 | 5.9% | ||||||
| MTB Pennsylvania Municipal Bond Fund | 1,276,464 | 1.3% | ||||||
| MTB Intermediate-Term Bond Fund | 9,346,139 | 8.1% | ||||||
| MTB Income Fund | 19,160,057 | 8.9% | ||||||
| MTB Strategic Allocation Fund | 301,374 | 0.4% | ||||||
| MTB International Equity Fund | 1,198,277 | 0.5% | ||||||
| (7) | Denotes a restricted security, or a portion thereof, that either (a) cannot be offered for public sale without first being registered, or being able to take advantage of an exemption from registration, under the Securities Act of 1933, or (b) is subject to a contractual restriction on public sales. At April 30, 2011, these restricted securities were as follows: |
| Security | Acquisition Date | Acquisition Cost | Market Value | Percentage of Total Net Assets | ||||||||||||
MTB Short-Term Corporate Bond Fund | ||||||||||||||||
| ABN Amro Bank NV | 01/27/2011 | $1,000,000 | $1,022,870 | |||||||||||||
| Ally Financial, Inc. | 11/23/2010 | 974,950 | 1,050,000 | |||||||||||||
| Broadcom Corp. | 10/27/2010 | 996,940 | 999,603 | |||||||||||||
| Harley-Davidson Financial Services, Inc. | 04/27/2011 | 503,510 | 505,626 | |||||||||||||
| Harley-Davidson Financial Services, Inc. | 03/01/2011 | 499,700 | 505,625 | |||||||||||||
| Hyundai Motor Manufacturing Czech s.r.o. | 04/15/2010 | 249,248 | 258,858 | |||||||||||||
| MassMutual Global Funding II | 04/07/2011 | 1,000,000 | 1,000,722 | |||||||||||||
| MassMutual Global Funding II | 06/25/2009 | 499,610 | 515,759 | |||||||||||||
| Metropolitan Life Global Funding I | 01/06/2010 | 997,510 | 1,019,938 | |||||||||||||
| Societe Generale | 04/11/2011 | 1,000,000 | 1,002,306 | |||||||||||||
| Student Loan Marketing Association | 04/14/2011 | 1,000,000 | 1,002,028 | |||||||||||||
| WM Wrigley Jr. Co. | 04/20/2011 | 1,553,175 | 1,546,482 | |||||||||||||
ANNUAL REPORT / April 30, 2011
Table of Contents
| 120 | NOTES TO PORTFOLIOS OF INVESTMENTS |
| Security | Acquisition Date | Acquisition Cost | Market Value | Percentage of Total Net Assets | ||||||||||||
| Xstrata Finance Canada Ltd. | 01/29/2010 | $335,570 | $326,154 | |||||||||||||
| Xstrata Finance Canada Ltd. | 07/27/2009 | 303,000 | 307,692 | |||||||||||||
| 11,063,663 | 5.9% | |||||||||||||||
MTB Pennsylvania Municipal Bond Fund | ||||||||||||||||
| Bucks County, PA, IDA, Revenue Bonds, (Series A), (School Lane Charter School) | 04/05/2007 | 1,545,000 | 1,276,464 | 1.3% | ||||||||||||
MTB Intermediate-Term Bond Fund | ||||||||||||||||
| ABN Amro Bank NV | 01/27/2011 | 499,585 | 508,065 | |||||||||||||
| Ally Financial, Inc. | 08/09/2010 | 495,580 | 550,000 | |||||||||||||
| American Tower Trust | 04/30/2007 | 1,000,000 | 1,085,359 | |||||||||||||
| Cantor Fitzgerald LP | 06/22/2010 | 996,620 | 1,029,665 | |||||||||||||
| Crown Castle Towers LLC | 08/04/2010 | 1,003,370 | 1,008,750 | |||||||||||||
| Harley-Davidson Financial Services, Inc. | 04/27/2011 | 503,510 | 505,626 | |||||||||||||
| Harley-Davidson Funding Corp. | 11/19/2009 | 499,195 | 541,828 | |||||||||||||
| Hyatt Hotels Corp. | 08/10/2009 | 499,320 | 544,386 | |||||||||||||
| Hyundai Motor Manufacturing Czech s.r.o. | 04/15/2010 | 249,248 | 258,858 | |||||||||||||
| Rockies Express Pipeline LLC | 12/15/2010 | 989,230 | 1,020,050 | |||||||||||||
| Rockies Express Pipeline LLC | 03/17/2010 | 499,555 | 518,833 | |||||||||||||
| Student Loan Marketing Association | 04/14/2011 | 750,000 | 751,521 | |||||||||||||
| Telstra Corp. Ltd. | 04/07/2011 | 496,260 | 507,704 | |||||||||||||
| WM Wrigley Jr. Co. | 06/21/2010 | 499,485 | 515,494 | |||||||||||||
| 9,346,139 | 8.1% | |||||||||||||||
MTB Income Fund | ||||||||||||||||
| ABN Amro Bank NV | 01/27/2011 | 499,585 | $508,065 | |||||||||||||
| Ally Financial, Inc. | 11/15/2010 | 1,479,030 | 1,575,000 | |||||||||||||
| Ally Financial, Inc. | 08/09/2010 | 495,580 | 550,000 | |||||||||||||
| American Tower Trust | 04/30/2007 | 1,000,000 | 1,085,359 | |||||||||||||
| ASIF Global Financing XIX | 01/08/2003 | 1,172,807 | 1,230,078 | |||||||||||||
| BAE Systems Holdings, Inc. | 06/01/2009 | 498,255 | 556,281 | |||||||||||||
| Bank of New York Institutional Capital Trust A | 11/25/1996 | 1,500,000 | 1,554,384 | |||||||||||||
| Cantor Fitzgerald LP | 06/22/2010 | 996,620 | 1,029,665 | |||||||||||||
| Crown Castle Towers LLC | 08/04/2010 | 1,003,370 | 1,008,750 | |||||||||||||
| Crown Castle Towers LLC | 07/29/2010 | 1,000,000 | 1,008,750 | |||||||||||||
| FMR LLC | 10/28/2009 | 997,720 | 1,004,086 | |||||||||||||
| Harley-Davidson Financial Services, Inc. | 04/27/2011 | 503,510 | 505,626 | |||||||||||||
| Harley-Davidson Funding Corp. | 11/19/2009 | 499,195 | 541,828 | |||||||||||||
| Hyatt Hotels Corp. | 08/10/2009 | 499,320 | 544,386 | |||||||||||||
| LA Arena Funding LLC | 04/23/1999 | 1,386,508 | 1,434,228 | |||||||||||||
| Metropolitan Life Global Funding I | 01/06/2010 | 498,755 | 509,969 | |||||||||||||
| Petroleum Co. of Trinidad & Tobago Ltd. | 08/14/2009 | 886,125 | 1,020,000 | |||||||||||||
| Petroleum Co. of Trinidad & Tobago Ltd. | 08/11/2009 | 148,826 | 180,000 | |||||||||||||
| Rockies Express Pipeline LLC | 12/15/2010 | 989,230 | 1,020,050 | |||||||||||||
| Rockies Express Pipeline LLC | 03/17/2010 | 499,555 | 518,833 | |||||||||||||
| Student Loan Marketing Association | 04/14/2011 | 750,000 | 751,521 | |||||||||||||
| Telstra Corp. Ltd. | 04/07/2011 | 496,260 | 507,704 | |||||||||||||
| WM Wrigley Jr. Co. | 06/21/2010 | 499,485 | 515,494 | |||||||||||||
| 19,160,057 | 8.9% | |||||||||||||||
April 30, 2011 / ANNUAL REPORT
Table of Contents
| NOTES TO PORTFOLIOS OF INVESTMENTS | 121 |
| Security | Acquisition Date | Acquisition Cost | Market Value | Percentage of Total Net Assets | ||||||||||||
MTB Strategic Allocation Fund | ||||||||||||||||
| FMR LLC | 06/28/2010 | $102,666 | $100,409 | |||||||||||||
| WM Wrigley Jr. Co. | 06/22/2010 | 199,934 | 200,965 | |||||||||||||
| 301,374 | 0.4% | |||||||||||||||
MTB International Equity Fund | ||||||||||||||||
| Samsung Electronics Co. Ltd. GDR | 01/19/2011 | 27,018 | 25,415 | |||||||||||||
| Samsung Electronics Co. Ltd. GDR | 11/12/2010 | 75,044 | 89,579 | |||||||||||||
| Samsung Electronics Co. Ltd. GDR | 05/20/2010 | 41,066 | 55,414 | |||||||||||||
| 170,408 | 0.1% | |||||||||||||||
| (8) | 7-Day net yield. |
| (9) | Affiliated company. See Note 4 in Notes to Financial Statements. |
| (10) | Security is fair valued in accordance with procedures adopted by the Board of Trustees. See Note 2 in Notes to Financial Statements. At April 30, 2011, the value of these securities amounted to: |
| MTB Fund | Amount | Percentage of Total Net Assets | ||||||
| MTB International Equity Fund | $37,956 | 0.0% | ||||||
| MTB U.S. Government Bond Fund | 38,108 | 0.1% | ||||||
| (11) | Security is in default. |
| (12) | Security, or a portion thereof, is on loan. See Note 2 in Notes to Financial Statements. |
| (13) | The Fund’s advisor has deemed this security to be illiquid based upon procedures approved by the Board of Trustees. |
| (14) | All or a portion of this security was segregated for extended settlement contracts. |
| * | Non-income producing security. |
| ** | Represents less than 0.05%. |
The following acronyms are used throughout this report:
ADR – American Depositary Receipt
AGM – Assured Guaranty Municipal
AMBAC – American Bond Assurance Corporation
AMT – Alternative Minimum Tax (subject to)
BKNT – Bank Note
CAPMAC – Capital Markets Assurance Corporation
CIFG – CDC (Caisse des Depots et Consignations) IXIS Financial Guarantee
COL – Collateralized
EDA – Economic Development Agency
ETF – Exchange Traded Fund
ETM – Escrowed to Maturity
FHA – Federal Housing Administration
FGIC – Financial Guarantee Insurance Company
FSA – Financial Security Assurance Inc.
GDR – Global Depositary Receipt
GO – General Obligation
GTD – Guaranteed
HDA – Housing Development Authority
HFA – Housing Finance Authority
IDA – Industrial Development Authority/Agency
IDFA – Industrial Development Finance Authority
INS – Insured
LLC – Limited Liability Corporation
LOC – Letter of Credit
LP – Limited Partnership
LT – Limited Tax
MTN – Medium Term Note
PCL – Public Company Limited
PRF – Prerefunded
SONYMA – State of New York Mortgage Agency
UT – Unlimited Tax
VRDNs – Variable Rate Demand Notes
XLCA – XL Capital Assurance Inc.
ANNUAL REPORT / April 30, 2011
Table of Contents
| 122 | STATEMENTS OF ASSETS AND LIABILITIES |
| April 30, 2011 | MTB Short Duration Government Bond Fund | MTB Short-Term Corporate Bond Fund | MTB U.S. Government Bond Fund | MTB New York Municipal Bond Fund | MTB Pennsylvania Municipal Bond Fund | |||||||||||||||
| ASSETS: | ||||||||||||||||||||
Investments, at identified cost | $ | 99,353,130 | $ | 199,371,963 | $ | 59,864,330 | $ | 100,773,475 | $ | 98,063,731 | ||||||||||
Investments in securities, at value (Including securities on loan) | $ | 101,038,274 | $ | 201,389,874 | $ | 63,300,246 | $ | 102,763,184 | $ | 100,376,571 | ||||||||||
Cash | 1,240 | — | 669 | 5,495 | 1,516 | |||||||||||||||
Income receivable | 340,740 | 1,732,364 | 443,149 | 1,510,107 | 1,554,706 | |||||||||||||||
Receivable for shares sold | 10,372 | 393,311 | 1,251 | — | 22,879 | |||||||||||||||
Receivable for investments sold | — | 3,006,392 | 520 | 2,626,175 | — | |||||||||||||||
| TOTAL ASSETS | 101,390,626 | 206,521,941 | 63,745,835 | 106,904,961 | 101,955,672 | |||||||||||||||
| LIABILITIES: | ||||||||||||||||||||
Payable to custodian | — | 2,004,980 | — | — | — | |||||||||||||||
Payable for investments purchased | — | 1,506,632 | — | 3,532,636 | — | |||||||||||||||
Collateral for securities on loan | — | 13,749,665 | 9,405,052 | — | — | |||||||||||||||
Income distribution payable | 205,780 | 252,202 | 178,810 | 283,925 | 298,191 | |||||||||||||||
Payable for shares redeemed | 21,536 | 119,710 | 28,789 | 3,149 | 65,527 | |||||||||||||||
Payable for Trustees’ fees | 367 | 703 | 596 | 387 | 363 | |||||||||||||||
Payable for distribution services fee | 4,847 | 2,940 | 1,636 | 16,294 | 1,456 | |||||||||||||||
Payable for shareholder services fee | 39 | — | 408 | 223 | 87 | |||||||||||||||
Accrued expenses | 42,527 | 55,800 | 54,040 | 41,958 | 54,241 | |||||||||||||||
| TOTAL LIABILITIES | 275,096 | 17,692,632 | 9,669,331 | 3,878,572 | 419,865 | |||||||||||||||
| NET ASSETS | $ | 101,115,530 | $ | 188,829,309 | $ | 54,076,504 | $ | 103,026,389 | $ | 101,535,807 | ||||||||||
NET ASSETS CONSIST OF: | ||||||||||||||||||||
Paid-in capital | $ | 100,273,315 | $ | 186,355,514 | $ | 53,723,042 | $ | 105,436,851 | $ | 99,718,264 | ||||||||||
Undistributed (distributions in excess of) net investment income | (1,656 | ) | 3,962 | 13,768 | (5,730 | ) | 107,695 | |||||||||||||
Accumulated net realized gain (loss) on investments | (841,273 | ) | 451,922 | (3,096,222 | ) | (4,394,441 | ) | (602,992 | ) | |||||||||||
Net unrealized appreciation (depreciation) of investments | 1,685,144 | 2,017,911 | 3,435,916 | 1,989,709 | 2,312,840 | |||||||||||||||
| TOTAL NET ASSETS | $ | 101,115,530 | $ | 188,829,309 | $ | 54,076,504 | $ | 103,026,389 | $ | 101,535,807 | ||||||||||
| COMPUTATION OF NET ASSET VALUE AND OFFERING PRICE: | ||||||||||||||||||||
Class A Shares | ||||||||||||||||||||
Net Assets | $ | 16,847,661 | $ | 11,905,318 | $ | 6,007,299 | $ | 34,106,736 | $ | 7,750,000 | ||||||||||
Shares outstanding (unlimited shares authorized) | 1,707,308 | 1,156,919 | 616,387 | 3,383,968 | 773,076 | |||||||||||||||
Net Asset Value per share | $ | 9.87 | $ | 10.29 | $ | 9.75 | $ | 10.08 | $ | 10.02 | ||||||||||
Offering price per share* | $ | 10.04 | ** | $ | 10.47 | ** | $ | 10.21 | *** | $ | 10.55 | *** | $ | 10.49 | *** | |||||
Class C Shares | ||||||||||||||||||||
Net Assets | $ | 1,231,340 | $ | 392,627 | $ | — | $ | — | $ | — | ||||||||||
Shares outstanding (unlimited shares authorized) | 124,503 | 38,126 | — | — | — | |||||||||||||||
Net Asset Value per share | $ | 9.89 | $ | 10.30 | $ | — | $ | — | $ | — | ||||||||||
Institutional I Shares | ||||||||||||||||||||
Net Assets | $ | 83,036,529 | $ | 176,531,364 | $ | 48,069,205 | $ | 68,919,653 | $ | 93,785,807 | ||||||||||
Shares outstanding (unlimited shares authorized) | 8,397,512 | 17,152,794 | 4,930,950 | 6,834,493 | 9,351,647 | |||||||||||||||
Net Asset Value per share | $ | 9.89 | $ | 10.29 | $ | 9.75 | $ | 10.08 | $ | 10.03 | ||||||||||
| * | See “How are Shares Priced?” in the Prospectus. |
| ** | Computation of offering price per share 100/98.25 of net asset value. |
| *** | Computation of offering price per share 100/95.50 of net asset value. |
See Notes which are an integral part of the Financial Statements
(Statements of Assets and Liabilities continued next page)
April 30, 2011 / ANNUAL REPORT
Table of Contents
| STATEMENTS OF ASSETS AND LIABILITIES (continued) | 123 |
| April 30, 2011 | MTB Maryland Municipal Bond Fund | MTB Virginia Municipal Bond Fund | MTB Intermediate-Term Bond Fund | MTB Income Fund | MTB Strategic Allocation Fund | |||||||||||||||
| ASSETS: | ||||||||||||||||||||
Investments, at identified cost | $ | 112,237,204 | $ | 20,025,755 | $ | 120,732,468 | $ | 204,040,320 | $ | 68,590,086 | ||||||||||
Investments in securities, at value (Including securities on loan) | $ | 112,131,503 | $ | 20,602,620 | $ | 124,523,706 | $ | 213,165,042 | $ | 80,305,318 | (a) | |||||||||
Cash | 29,065 | 102 | — | 3,032 | 170 | |||||||||||||||
Income receivable | 1,749,717 | 307,001 | 827,882 | 2,018,805 | 146,982 | |||||||||||||||
Receivable for shares sold | 819 | 161 | 15,816 | 47,733 | 675 | |||||||||||||||
Receivable for investments sold | — | — | 12,010,141 | 3,830,146 | 495,256 | |||||||||||||||
| TOTAL ASSETS | 113,911,104 | 20,909,884 | 137,377,545 | 219,064,758 | 80,948,401 | |||||||||||||||
| LIABILITIES: | ||||||||||||||||||||
Payable to custodian | — | — | 4,025,723 | — | — | |||||||||||||||
Payable for investments purchased | — | — | 4,730,100 | 506,632 | 501,848 | |||||||||||||||
Collateral for securities on loan | — | — | 12,359,354 | 1,646,948 | 1,274,922 | |||||||||||||||
Income distribution payable | 363,215 | 56,731 | 335,928 | 707,690 | — | |||||||||||||||
Payable for shares redeemed | 22,294 | — | 181,908 | 147,616 | 70,965 | |||||||||||||||
Payable for Trustees’ fees | 439 | 634 | 434 | 893 | 1,373 | |||||||||||||||
Payable for distribution services fee | 7,732 | 5,864 | 2,929 | 1,989 | 27,582 | |||||||||||||||
Payable for shareholder services fee | 845 | — | 656 | 536 | 1,190 | |||||||||||||||
Accrued expenses | 54,923 | 43,419 | 48,948 | 64,724 | 90,534 | |||||||||||||||
| TOTAL LIABILITIES | 449,448 | 106,648 | 21,685,980 | 3,077,028 | 1,968,414 | |||||||||||||||
| NET ASSETS | $ | 113,461,656 | $ | 20,803,236 | $ | 115,691,565 | $ | 215,987,730 | $ | 78,979,987 | ||||||||||
NET ASSETS CONSIST OF: | ||||||||||||||||||||
Paid-in capital | $ | 113,594,934 | $ | 20,166,915 | $ | 110,533,963 | $ | 205,288,340 | $ | 85,194,606 | ||||||||||
Undistributed (distributions in excess of) net investment income | 3,875 | 2,441 | 18,485 | 7,645 | 80,387 | |||||||||||||||
Accumulated net realized gain (loss) on investments | (31,452 | ) | 57,015 | 1,347,879 | 1,567,023 | (18,010,238 | ) | |||||||||||||
Net unrealized appreciation (depreciation) of investments | (105,701 | ) | 576,865 | 3,791,238 | 9,124,722 | 11,715,232 | ||||||||||||||
| TOTAL NET ASSETS | $ | 113,461,656 | $ | 20,803,236 | $ | 115,691,565 | $ | 215,987,730 | $ | 78,979,987 | ||||||||||
| COMPUTATION OF NET ASSET VALUE AND OFFERING PRICE: | ||||||||||||||||||||
Class A Shares | ||||||||||||||||||||
Net Assets | $ | 34,549,543 | $ | 20,803,236 | $ | 6,743,639 | $ | 6,601,515 | $ | 75,554,061 | ||||||||||
Shares outstanding (unlimited shares authorized) | 3,535,789 | 1,929,936 | 626,684 | 649,567 | 7,789,165 | |||||||||||||||
Net Asset Value per share | $ | 9.77 | $ | 10.78 | $ | 10.76 | $ | 10.16 | $ | 9.70 | ||||||||||
Offering price per share* | $ | 10.23 | ** | $ | 11.29 | ** | $ | 11.27 | ** | $ | 10.64 | ** | $ | 10.26 | *** | |||||
Class C Shares | ||||||||||||||||||||
Net Assets | $ | — | $ | — | $ | 1,323,001 | $ | — | $ | — | ||||||||||
Shares outstanding (unlimited shares authorized) | — | — | 122,742 | — | — | |||||||||||||||
Net Asset Value per share | $ | — | $ | — | $ | 10.78 | $ | — | $ | — | ||||||||||
Institutional I Shares | ||||||||||||||||||||
Net Assets | $ | 78,912,113 | $ | — | $ | 107,624,925 | $ | 209,386,215 | $ | 3,425,926 | ||||||||||
Shares outstanding (unlimited shares authorized) | 8,062,364 | — | 9,995,743 | 20,921,439 | 353,315 | |||||||||||||||
Net Asset Value per share | $ | 9.79 | $ | — | $ | 10.77 | $ | 10.01 | $ | 9.70 | ||||||||||
| (a) | Includes $36,477,199 of investments in affiliated issuers. |
| * | See “How are Shares Priced?” in the Prospectus. |
| ** | Computation of offering price per share 100/95.50 of net asset value. |
| *** | Computation of offering price per share 100/94.50 of net asset value. |
See Notes which are an integral part of the Financial Statements
(Statements of Assets and Liabilities continued next page)
ANNUAL REPORT / April 30, 2011
Table of Contents
| 124 | STATEMENTS OF ASSETS AND LIABILITIES (concluded) |
| April 30, 2011 | MTB Large Cap Value Fund | MTB Large Cap Growth Fund | MTB Mid Cap Growth Fund | MTB Small Cap Growth Fund | MTB International Equity Fund | |||||||||||||||
| ASSETS: | ||||||||||||||||||||
Investments, at identified cost | $ | 145,856,389 | $ | 109,361,278 | $ | 174,612,326 | $ | 167,452,863 | $ | 199,082,742 | ||||||||||
Investments in securities, at value (Including securities on loan)(a) | $ | 181,884,060 | $ | 152,648,800 | $ | 271,787,229 | $ | 206,188,668 | $ | 251,983,389 | ||||||||||
Cash | 3,618 | 3,106 | 5,302 | 4,716 | 6,821 | |||||||||||||||
Cash denominated in foreign currencies (642,936) | — | — | — | — | 683,751 | |||||||||||||||
Income receivable | 76,548 | 74,998 | 27,403 | 22,286 | 1,266,731 | |||||||||||||||
Receivable for shares sold | 134,766 | 113,916 | 41,779 | 24,558 | 19,565 | |||||||||||||||
Unrealized appreciation on foreign exchange contracts | — | — | — | — | 49 | |||||||||||||||
Receivable for investments sold | 2,183,679 | 1,810,419 | 766,498 | 12,219,148 | 450,726 | |||||||||||||||
| TOTAL ASSETS | 184,282,671 | 154,651,239 | 272,628,211 | 218,459,376 | 254,411,032 | |||||||||||||||
| LIABILITIES: | ||||||||||||||||||||
Payable for investments purchased | — | 1,055,447 | 665,894 | 12,670,047 | 674,827 | |||||||||||||||
Collateral for securities on loan | 1,411,331 | 7,439,968 | 20,156,443 | 8,360,467 | 10,616,027 | |||||||||||||||
Unrealized depreciation on foreign exchange contracts | — | — | — | — | 1,123 | |||||||||||||||
Payable for shares redeemed | 20,194 | 18,487 | 1,302,406 | 497,598 | 79,399 | |||||||||||||||
Payable for Trustees’ fees | 1,630 | 1,579 | 1,346 | 840 | 612 | |||||||||||||||
Payable for distribution services fee | 4,226 | 5,492 | 13,644 | 7,754 | 3,841 | |||||||||||||||
Payable for shareholder services fee | 21,547 | 13,671 | 26,520 | 20,202 | 23,511 | |||||||||||||||
Accrued expenses | 69,176 | 79,139 | 87,210 | 101,571 | 120,896 | |||||||||||||||
| TOTAL LIABILITIES | 1,528,104 | 8,613,783 | 22,253,463 | 21,658,479 | 11,520,236 | |||||||||||||||
| NET ASSETS | $ | 182,754,567 | $ | 146,037,456 | $ | 250,374,748 | $ | 196,800,897 | $ | 242,890,796 | ||||||||||
NET ASSETS CONSIST OF: | ||||||||||||||||||||
Paid-in capital | $ | 171,286,134 | $ | 126,445,287 | $ | 180,251,328 | $ | 196,980,218 | $ | 256,838,732 | ||||||||||
Undistributed (distributions in excess of) net investment income | — | — | — | — | 2,198,237 | |||||||||||||||
Accumulated net realized gain (loss) on investments | (24,559,238 | ) | (23,695,353 | ) | (27,051,483 | ) | (38,915,126 | ) | (69,124,413 | ) | ||||||||||
Net unrealized appreciation (depreciation) of investments and foreign currency translation | 36,027,671 | 43,287,522 | 97,174,903 | 38,735,805 | 52,978,240 | |||||||||||||||
| TOTAL NET ASSETS | $ | 182,754,567 | $ | 146,037,456 | $ | 250,374,748 | $ | 196,800,897 | $ | 242,890,796 | ||||||||||
| COMPUTATION OF NET ASSET VALUE AND OFFERING PRICE: | ||||||||||||||||||||
Class A Shares | ||||||||||||||||||||
Net Assets | $ | 7,314,328 | $ | 22,790,581 | $ | 63,168,323 | $ | 47,884,159 | $ | 7,964,800 | ||||||||||
Shares outstanding (unlimited shares authorized) | 637,872 | 2,389,802 | 3,896,451 | 2,630,496 | 794,223 | |||||||||||||||
Net Asset Value per share | $ | 11.47 | $ | 9.54 | $ | 16.21 | $ | 18.20 | $ | 10.03 | ||||||||||
Offering price per share* | $ | 12.14 | ** | $ | 10.10 | ** | $ | 17.15 | ** | $ | 19.26 | ** | $ | 10.61 | ** | |||||
Class C Shares | ||||||||||||||||||||
Net Assets | $ | — | $ | — | $ | — | $ | 356,638 | $ | — | ||||||||||
Shares outstanding (unlimited shares authorized) | — | — | — | 20,313 | — | |||||||||||||||
Net Asset Value per share | $ | — | $ | — | $ | — | $ | 17.56 | $ | — | ||||||||||
Institutional I Shares | ||||||||||||||||||||
Net Assets | $ | 175,440,239 | $ | 123,246,875 | $ | 187,206,425 | $ | 148,560,100 | $ | 234,925,996 | ||||||||||
Shares outstanding (unlimited shares authorized) | 15,240,302 | 12,886,542 | 11,297,175 | 7,918,900 | 23,617,618 | |||||||||||||||
Net Asset Value per share | $ | 11.51 | $ | 9.56 | $ | 16.57 | $ | 18.76 | $ | 9.95 | ||||||||||
| (a) | Includes $2,646,516, $697,869, $2,937,841, $851,034 and $3,133,353 of investments in affiliated issuers, respectively. |
| * | See “What Do Shares Cost?” in the Prospectus. |
| ** | Computation of offering price per share 100/94.50 of net asset value. |
See Notes which are an integral part of the Financial Statements
April 30, 2011 / ANNUAL REPORT
Table of Contents
| STATEMENTS OF OPERATIONS | 125 |
| Year Ended April 30, 2011 | MTB Short Duration Government Bond Fund | MTB Short-Term Corporate Bond Fund | MTB U.S. Government Bond Fund | MTB New York Municipal Bond Fund | MTB Pennsylvania Municipal Bond Fund | |||||||||||||||
| INVESTMENT INCOME: | ||||||||||||||||||||
Dividends | $ | 761 | $ | 548 | $ | 13 | $ | — | $ | 2,396 | ||||||||||
Interest | 3,352,043 | 3,414,446 | 2,808,124 | 4,605,411 | 4,446,244 | |||||||||||||||
Security lending | — | 8,499 | 1,961 | — | — | |||||||||||||||
| TOTAL INVESTMENT INCOME | 3,352,804 | 3,423,493 | 2,810,098 | 4,605,411 | 4,448,640 | |||||||||||||||
| EXPENSES: | ||||||||||||||||||||
Investment advisory fee | 618,701 | 991,916 | 440,785 | 749,533 | 734,422 | |||||||||||||||
Administrative personnel and services fee | 29,542 | 40,559 | 18,051 | 30,691 | 30,070 | |||||||||||||||
Portfolio accounting, administration and custodian fees | 52,484 | 61,831 | 46,717 | 50,200 | 52,631 | |||||||||||||||
Transfer and dividend disbursing agent fees and expenses | 36,758 | 80,826 | 36,961 | 32,565 | 20,250 | |||||||||||||||
Trustees’ fees | 19,360 | 19,734 | 19,609 | 19,331 | 18,907 | |||||||||||||||
Professional fees | 47,359 | 42,665 | 48,796 | 43,605 | 43,576 | |||||||||||||||
Distribution services fee—Class A Shares | 35,505 | 17,178 | 15,793 | 96,046 | 18,030 | |||||||||||||||
Distribution services fee—Class B Shares | 1,591 | 1,170 | 1,487 | 5,308 | 4,135 | |||||||||||||||
Distribution services fee—Class C Shares | 9,081 | 2,926 | — | — | — | |||||||||||||||
Shareholder services fee—Class A Shares | 35,505 | 17,178 | 15,793 | 96,046 | 18,030 | |||||||||||||||
Shareholder services fee—Class B Shares | 531 | 390 | 496 | 1,769 | 1,378 | |||||||||||||||
Shareholder services fee—Class C Shares | 2,270 | 732 | — | — | — | |||||||||||||||
Shareholder services fee—Institutional I Shares | 219,486 | 335,956 | 141,134 | 169,874 | 242,885 | |||||||||||||||
Share registration costs | 53,316 | 53,959 | 19,856 | 8,508 | 16,790 | |||||||||||||||
Printing and postage | 7,985 | 24,357 | 3,739 | 5,485 | 1,969 | |||||||||||||||
Miscellaneous | 20,238 | 25,306 | 15,973 | 21,120 | 21,331 | |||||||||||||||
| TOTAL EXPENSES | 1,189,712 | 1,716,683 | 825,190 | 1,330,081 | 1,224,404 | |||||||||||||||
| WAIVERS AND REIMBURSEMENTS: | ||||||||||||||||||||
Waiver/reimbursement by investment advisor | (210,872 | ) | (471,864 | ) | (169,667 | ) | (327,180 | ) | (204,775 | ) | ||||||||||
Waiver of distribution services fee—Class A Shares | (5 | ) | (6 | ) | (1 | ) | (1,193 | ) | — | |||||||||||
Waiver of distribution services fee—Class B Shares | — | — | — | — | — | |||||||||||||||
Waiver of shareholder services fee—Class A Shares | (35,505 | ) | (17,178 | ) | (9,485 | ) | (96,046 | ) | (18,030 | ) | ||||||||||
Waiver of shareholder services fee—Class B Shares | — | — | — | — | (55 | ) | ||||||||||||||
Waiver of shareholder services fee—Class C Shares | (2,089 | ) | (732 | ) | — | — | — | |||||||||||||
Waiver of shareholder services fee—Institutional I Shares | (219,486 | ) | (335,956 | ) | (141,134 | ) | (169,874 | ) | (242,885 | ) | ||||||||||
Reimbursement of transfer and dividend disbursing agent fees and expenses by Administrator | (14,924 | ) | (4,905 | ) | (14,858 | ) | (2,109 | ) | (749 | ) | ||||||||||
| TOTAL WAIVERS AND REIMBURSEMENTS | (482,881 | ) | (830,641 | ) | (335,145 | ) | (596,402 | ) | (466,494 | ) | ||||||||||
Net expenses | 706,831 | 886,042 | 490,045 | 733,679 | 757,910 | |||||||||||||||
Net investment income | 2,645,973 | 2,537,451 | 2,320,053 | 3,871,732 | 3,690,730 | |||||||||||||||
| REALIZED AND UNREALIZED GAIN (LOSS) ON INVESTMENTS: | ||||||||||||||||||||
Net realized gain (loss) on investments | (237,349 | ) | 1,293,976 | (177,256 | ) | (345,235 | ) | 335,442 | ||||||||||||
Net change in unrealized appreciation (depreciation) of investments | (194,161 | ) | 55,915 | 478,545 | (1,506,769 | ) | (1,391,118 | ) | ||||||||||||
Net realized and unrealized gain (loss) on investments | (431,510 | ) | 1,349,891 | 301,289 | (1,852,004 | ) | (1,055,676 | ) | ||||||||||||
Change in net assets resulting from operations | $ | 2,214,463 | $ | 3,887,342 | $ | 2,621,342 | $ | 2,019,728 | $ | 2,635,054 | ||||||||||
(Statements of Operations continued next page)
ANNUAL REPORT / April 30, 2011
Table of Contents
| 126 | STATEMENTS OF OPERATIONS (continued) |
| Year Ended April 30, 2011 | MTB Maryland Municipal Bond Fund | MTB Virginia Municipal Bond Fund | MTB Intermediate-Term Bond Fund | MTB Income Fund | MTB Strategic Allocation Fund(c) | |||||||||||||||
| INVESTMENT INCOME: | ||||||||||||||||||||
Dividends | $ | 2,005 | $ | 393 | $ | 420 | $ | 318 | $ | 890,482 | (a) | |||||||||
Interest | 5,598,729 | 884,540 | 5,258,289 | 9,857,895 | 479,085 | |||||||||||||||
Security lending | — | — | 4,576 | 7,075 | 2,023 | |||||||||||||||
| TOTAL INVESTMENT INCOME | 5,600,734 | 884,933 | 5,263,285 | 9,865,288 | 1,371,590 | |||||||||||||||
| EXPENSES: | ||||||||||||||||||||
Investment advisory fee | 857,991 | 149,087 | 876,731 | 1,238,549 | 437,110 | |||||||||||||||
Administrative personnel and services fee | 35,136 | 6,104 | 35,904 | 59,171 | 19,937 | |||||||||||||||
Portfolio accounting, administration and custodian fees | 60,790 | 21,167 | 70,494 | 76,238 | 38,034 | |||||||||||||||
Transfer and dividend disbursing agent fees and expenses | 22,522 | 17,312 | 22,510 | 81,818 | 158,734 | |||||||||||||||
Trustees’ fees | 19,149 | 19,411 | 19,170 | 20,026 | 22,730 | |||||||||||||||
Professional fees | 44,948 | 42,076 | 48,224 | 45,250 | 91,371 | |||||||||||||||
Distribution services fee—Class A Shares | 96,650 | 53,245 | 16,472 | 15,280 | 124,198 | |||||||||||||||
Distribution services fee—Class B Shares | 4,028 | — | 1,812 | 3,491 | 129,584 | |||||||||||||||
Distribution services fee—Class C Shares | — | — | 8,835 | — | — | |||||||||||||||
Shareholder services fee—Class A Shares | 96,650 | 53,245 | 16,472 | 15,280 | 124,198 | |||||||||||||||
Shareholder services fee—Class B Shares | 1,343 | — | 604 | 1,164 | 43,195 | |||||||||||||||
Shareholder services fee—Class C Shares | — | — | 2,209 | — | — | |||||||||||||||
Shareholder services fee—Institutional I Shares | 208,433 | — | 293,834 | 499,618 | 6,680 | |||||||||||||||
Share registration costs | 17,331 | 8,548 | 52,185 | 31,970 | 18,686 | |||||||||||||||
Printing and postage | 4,449 | 2,355 | 6,248 | 18,344 | 56,101 | |||||||||||||||
Miscellaneous | 21,698 | 9,696 | 26,645 | 36,195 | 10,858 | |||||||||||||||
| TOTAL EXPENSES | 1,491,118 | 382,246 | 1,498,349 | 2,142,394 | 1,281,416 | |||||||||||||||
| WAIVERS AND REIMBURSEMENTS: | ||||||||||||||||||||
Waiver/reimbursement by investment advisor | (261,508 | ) | (124,544 | ) | (330,599 | ) | (239,582 | ) | (400,621 | ) | ||||||||||
Waiver of distribution services fee—Class A Shares | (1,623 | ) | (3,521 | ) | (2 | ) | (403 | ) | (1,118 | ) | ||||||||||
Waiver of distribution services fee—Class B Shares | — | — | — | — | (414 | ) | ||||||||||||||
Waiver of shareholder services fee—Class A Shares | (85,709 | ) | (53,245 | ) | (9,915 | ) | (9,542 | ) | (124,198 | ) | ||||||||||
Waiver of shareholder services fee—Class B Shares | (3 | ) | — | (1 | ) | (7 | ) | (271 | ) | |||||||||||
Waiver of shareholder services fee—Class C Shares | — | — | (1,502 | ) | — | — | ||||||||||||||
Waiver of shareholder services fee—Institutional I Shares | (208,433 | ) | — | (293,834 | ) | (499,618 | ) | (3,864 | ) | |||||||||||
Reimbursement of transfer and dividend disbursing agent fees and expenses by Administrator | (1,287 | ) | (518 | ) | (879 | ) | (5,575 | ) | (37,501 | ) | ||||||||||
| TOTAL WAIVERS AND REIMBURSEMENTS | (558,563 | ) | (181,828 | ) | (636,732 | ) | (754,727 | ) | (567,987 | ) | ||||||||||
Net expenses | 932,555 | 200,418 | 861,617 | 1,387,667 | 713,429 | |||||||||||||||
Net investment income | 4,668,179 | 684,515 | 4,401,668 | 8,477,621 | 658,161 | |||||||||||||||
| REALIZED AND UNREALIZED GAIN (LOSS) ON INVESTMENTS: | ||||||||||||||||||||
Net realized gain on investments | 252,837 | 79,544 | 3,843,770 | 5,541,696 | 4,363,702 | (b) | ||||||||||||||
Realized gain distributions from other investment companies | — | — | — | — | 153,045 | |||||||||||||||
Net change in unrealized appreciation (depreciation) of investments | (2,733,910 | ) | (241,291 | ) | (999,035 | ) | 63,926 | 7,281,032 | ||||||||||||
Net realized and unrealized gain (loss) on investments | (2,481,073 | ) | (161,747 | ) | 2,844,735 | 5,605,622 | 11,797,779 | |||||||||||||
Change in net assets resulting from operations | $ | 2,187,106 | $ | 522,768 | $ | 7,246,403 | $ | 14,083,243 | $ | 12,455,940 | ||||||||||
| (a) | Including $229,540 received from affiliated issuers. |
| (b) | Including realized gain of $3,792,187 from the sales of investments in affiliated issuers. |
| (c) | Information presented for periods prior to June 14, 2010 reflects the operating results of a predecessor portfolio of the Trust. See Note 8. |
See Notes which are an integral part of the Financial Statements
(Statements of Operations continued next page)
April 30, 2011 / ANNUAL REPORT
Table of Contents
| STATEMENTS OF OPERATIONS (concluded) | 127 |
| Year Ended April 30, 2011 | MTB Large Cap Value Fund | MTB Large Cap Growth Fund | MTB Mid Cap Growth Fund | MTB Small Cap Growth Fund | MTB International Equity Fund | |||||||||||||||
| INVESTMENT INCOME: | ||||||||||||||||||||
Dividends(a)(b) | $ | 2,424,041 | $ | 1,583,327 | $ | 942,914 | $ | 622,863 | $ | 5,207,768 | ||||||||||
Security lending | 892 | 84,334 | 64,065 | 103,694 | 124,321 | |||||||||||||||
| TOTAL INVESTMENT INCOME | 2,424,933 | 1,667,661 | 1,006,979 | 726,557 | 5,332,089 | |||||||||||||||
| EXPENSES: | ||||||||||||||||||||
Investment advisory fee | 1,131,552 | 1,108,659 | 1,661,252 | 1,424,716 | 2,115,931 | |||||||||||||||
Administrative personnel and services fee | 46,302 | 37,362 | 55,963 | 48,000 | 60,608 | |||||||||||||||
Portfolio accounting, administration and custodian fees | 62,955 | 45,212 | 61,117 | 92,216 | 154,473 | |||||||||||||||
Transfer and dividend disbursing agent fees and expenses | 121,091 | 169,839 | 230,606 | 227,046 | 122,122 | |||||||||||||||
Trustees’ fees | 20,499 | 20,434 | 20,085 | 19,724 | 19,507 | |||||||||||||||
Professional fees | 41,349 | 39,574 | 56,634 | 41,972 | 43,208 | |||||||||||||||
Distribution services fee—Class A Shares | 15,573 | 49,592 | 107,871 | 99,514 | 17,570 | |||||||||||||||
Distribution services fee—Class B Shares | 4,710 | 8,543 | 11,294 | 8,875 | 2,829 | |||||||||||||||
Distribution services fee—Class C Shares | — | — | — | 2,205 | — | |||||||||||||||
Shareholder services fee—Class A Shares | 15,573 | 49,592 | 107,871 | 99,513 | 17,570 | |||||||||||||||
Shareholder services fee—Class B Shares | 1,570 | 2,848 | 3,765 | 2,958 | 943 | |||||||||||||||
Shareholder services fee—Class C Shares | — | — | — | 735 | — | |||||||||||||||
Shareholder services fee—Institutional I Shares | 386,983 | 273,637 | 376,968 | 315,828 | 510,469 | |||||||||||||||
Share registration costs | 20,973 | 32,806 | 31,299 | 36,128 | 20,631 | |||||||||||||||
Printing and postage | 28,645 | 35,746 | 44,204 | 45,806 | 30,907 | |||||||||||||||
Miscellaneous | 30,172 | 23,719 | 26,544 | 28,466 | 44,173 | |||||||||||||||
| TOTAL EXPENSES | 1,927,947 | 1,897,563 | 2,795,473 | 2,493,702 | 3,160,941 | |||||||||||||||
| WAIVERS AND REIMBURSEMENTS: | ||||||||||||||||||||
Waiver/reimbursement by investment advisor | (9,105 | ) | (156,687 | ) | (434,787 | ) | (49,958 | ) | (3,464 | ) | ||||||||||
Waiver of distribution services fee—Class A Shares | (339 | ) | (99 | ) | (91 | ) | (3,661 | ) | (843 | ) | ||||||||||
Waiver of distribution services fee—Class B Shares | (8 | ) | (20 | ) | (36 | ) | (21 | ) | (5 | ) | ||||||||||
Waiver of distribution services fee—Class C Shares | — | — | — | (1,289 | ) | — | ||||||||||||||
Waiver of shareholder services fee—Class A Shares | (6,545 | ) | (20,019 | ) | (59,603 | ) | (67,116 | ) | (17,570 | ) | ||||||||||
Waiver of shareholder services fee—Class B Shares | (22 | ) | (43 | ) | (56 | ) | (185 | ) | (11 | ) | ||||||||||
Waiver of shareholder services fee—Class C Shares | — | — | — | (621 | ) | — | ||||||||||||||
Waiver of shareholder services fee—Institutional I Shares | (227,175 | ) | (256,302 | ) | (103,377 | ) | (178,102 | ) | (300,329 | ) | ||||||||||
Reimbursement of transfer and dividend disbursing agent fees and expenses by Administrator | (10,674 | ) | (30,318 | ) | (40,363 | ) | (20,908 | ) | (9,798 | ) | ||||||||||
| TOTAL WAIVERS AND REIMBURSEMENTS | (253,868 | ) | (463,488 | ) | (638,313 | ) | (321,861 | ) | (332,020 | ) | ||||||||||
Net expenses | 1,674,079 | 1,434,075 | 2,157,160 | 2,171,841 | 2,828,921 | |||||||||||||||
Net investment income (loss) | 750,854 | 233,586 | (1,150,181 | ) | (1,445,284 | ) | 2,503,168 | |||||||||||||
| REALIZED AND UNREALIZED GAIN (LOSS) ON INVESTMENTS: | ||||||||||||||||||||
Net realized gain (loss) on investments | (59,167 | ) | 11,314,715 | 12,536,371 | 34,213,441 | 9,429,920 | ||||||||||||||
Net realized loss on foreign currencies transactions | (103 | ) | — | — | (11 | ) | (289,247 | ) | ||||||||||||
Net change in unrealized appreciation (depreciation) of investments and foreign currencies | 25,862,574 | 10,711,107 | 47,678,280 | 8,700,840 | 29,314,406 | |||||||||||||||
Net realized and unrealized gain (loss) on investments and foreign currency transactions | 25,803,304 | 22,025,822 | 60,214,651 | 42,914,270 | 38,455,079 | |||||||||||||||
Change in net assets resulting from operations | $ | 26,554,158 | $ | 22,259,408 | $ | 59,064,470 | $ | 41,468,986 | $ | 40,958,247 | ||||||||||
| (a) | Including $1,304, $521, $819, $632 and $1,153 received from affiliated issuers, respectively. |
| (b) | Net of foreign taxes withheld of $71,136, $326, $2,991, $2,662 and $455,685, respectively. |
See Notes which are an integral part of the Financial Statements
ANNUAL REPORT / April 30, 2011
Table of Contents
| 128 | STATEMENTS OF CHANGES IN NET ASSETS |
| MTB Short Duration Government Bond Fund | MTB Short-Term Corporate Bond Fund | |||||||||||||||
| Year Ended April 30, 2011 | Year Ended April 30, 2010 | Year Ended April 30, 2011 | Year Ended April 30, 2010 | |||||||||||||
| OPERATIONS: | ||||||||||||||||
Net investment income | $ | 2,645,973 | $ | 2,701,788 | $ | 2,537,451 | $ | 2,079,118 | ||||||||
Net realized gain (loss) on investments | (237,349 | ) | 52,957 | 1,293,976 | 671,265 | |||||||||||
Net change in unrealized appreciation (depreciation) of investments | (194,161 | ) | 73,808 | 55,915 | 1,802,532 | |||||||||||
Change in net assets resulting from operations | 2,214,463 | 2,828,553 | 3,887,342 | 4,552,915 | ||||||||||||
| DISTRIBUTIONS TO SHAREHOLDERS: | ||||||||||||||||
Distributions from net investment income | ||||||||||||||||
Class A Shares | (333,191 | ) | (206,283 | ) | (109,128 | ) | (60,466 | ) | ||||||||
Class B Shares | (3,499 | ) | (5,798 | ) | (1,363 | ) | (2,562 | ) | ||||||||
Class C Shares | (13,324 | ) | (146 | ) | (2,259 | ) | (71 | ) | ||||||||
Institutional I Shares | (2,299,117 | ) | (2,504,636 | ) | (2,439,743 | ) | (1,990,968 | ) | ||||||||
Distributions from net realized gain on investments | ||||||||||||||||
Class A Shares | — | — | (8,792 | ) | — | |||||||||||
Class B Shares | — | — | (237 | ) | — | |||||||||||
Class C Shares | — | — | (443 | ) | — | |||||||||||
Institutional I Shares | — | — | (214,131 | ) | — | |||||||||||
Change in net assets resulting from distributions to shareholders | (2,649,131 | ) | (2,716,863 | ) | (2,776,096 | ) | (2,054,067 | ) | ||||||||
| SHARE TRANSACTIONS: | ||||||||||||||||
Proceeds from sale of shares | ||||||||||||||||
Class A Shares | 8,674,399 | 6,048,411 | 7,946,101 | 5,470,596 | ||||||||||||
Class B Shares | 8,435 | 7,378 | 13,410 | 67,909 | ||||||||||||
Class C Shares | 1,045,861 | 210,000 | 259,710 | 130,000 | ||||||||||||
Institutional I Shares | 37,734,803 | 35,072,950 | 95,077,274 | 64,395,195 | ||||||||||||
Distributions reinvested | ||||||||||||||||
Class A Shares | 265,899 | 185,240 | 69,382 | 22,626 | ||||||||||||
Class B Shares | 3,326 | 4,599 | 1,721 | 2,693 | ||||||||||||
Class C Shares | 6,704 | — | 813 | — | ||||||||||||
Institutional I Shares | 809,777 | 807,697 | 1,422,061 | 960,203 | ||||||||||||
Cost of shares redeemed | ||||||||||||||||
Class A Shares | (2,725,621 | ) | (753,605 | ) | (1,647,678 | ) | (544,196 | ) | ||||||||
Class B Shares | (258,057 | ) | (36,053 | ) | (176,053 | ) | (66,940 | ) | ||||||||
Class C Shares | (26,104 | ) | — | (1,507 | ) | — | ||||||||||
Institutional I Shares | (32,855,236 | ) | (27,717,948 | ) | (29,642,966 | ) | (20,808,012 | ) | ||||||||
Change in net assets resulting from share transactions | 12,684,186 | 13,828,669 | 73,322,268 | 49,630,074 | ||||||||||||
Change in net assets | 12,249,518 | 13,940,359 | 74,433,514 | 52,128,922 | ||||||||||||
| NET ASSETS: | ||||||||||||||||
Beginning of year | 88,866,012 | 74,925,653 | 114,395,795 | 62,266,873 | ||||||||||||
End of year | $ | 101,115,530 | $ | 88,866,012 | $ | 188,829,309 | $ | 114,395,795 | ||||||||
Undistributed (distributions in excess of) net investment income included in net assets at end of year | $ | (1,656 | ) | $ | 1,502 | $ | 3,962 | $ | 19,004 | |||||||
| SHARES OF BENEFICIAL INTEREST: | ||||||||||||||||
Shares sold | ||||||||||||||||
Class A Shares | 877,882 | 609,999 | 775,059 | 540,736 | ||||||||||||
Class B Shares | 537 | 745 | 510 | 6,712 | ||||||||||||
Class C Shares | 105,279 | 21,193 | 25,425 | 12,769 | ||||||||||||
Institutional I Shares | 3,803,486 | 3,542,663 | 9,267,129 | 6,370,185 | ||||||||||||
Distributions reinvested | ||||||||||||||||
Class A Shares | 26,880 | 18,697 | 6,774 | 2,231 | ||||||||||||
Class B Shares | 335 | 463 | 168 | 267 | ||||||||||||
Class C Shares | 677 | — | 79 | — | ||||||||||||
Institutional I Shares | 81,679 | 81,379 | 138,880 | 94,973 | ||||||||||||
Shares redeemed | ||||||||||||||||
Class A Shares | (276,107 | ) | (76,262 | ) | (160,018 | ) | (53,631 | ) | ||||||||
Class B Shares | (26,163 | ) | (3,647 | ) | (17,138 | ) | (6,567 | ) | ||||||||
Class C Shares | (2,646 | ) | — | (147 | ) | — | ||||||||||
Institutional I Shares | (3,321,856 | ) | (2,793,368 | ) | (2,898,257 | ) | (2,052,690 | ) | ||||||||
Net change resulting from share transactions | 1,269,983 | 1,401,862 | 7,138,464 | 4,914,985 | ||||||||||||
See Notes which are an integral part of the Financial Statements
(Statements of Changes in Net Assets continued next page)
April 30, 2011 / ANNUAL REPORT
Table of Contents
| STATEMENTS OF CHANGES IN NET ASSETS (continued) | 129 |
| MTB U.S. Government Bond Fund | MTB New York Municipal Bond Fund | |||||||||||||||
Year Ended | Year Ended April 30, 2010 | Year Ended | Year Ended April 30, 2010 | |||||||||||||
| OPERATIONS: | ||||||||||||||||
Net investment income | $ | 2,320,053 | $ | 2,925,920 | $ | 3,871,732 | $ | 3,544,340 | ||||||||
Net realized gain (loss) on investments | (177,256 | ) | 422,848 | (345,235 | ) | 357,955 | ||||||||||
Net change in unrealized appreciation (depreciation) of investments | 478,545 | 1,158,641 | (1,506,769 | ) | 3,201,185 | |||||||||||
Change in net assets resulting from operations | 2,621,342 | 4,507,409 | 2,019,728 | 7,103,480 | ||||||||||||
| DISTRIBUTIONS TO SHAREHOLDERS: | ||||||||||||||||
Distributions from net investment income | ||||||||||||||||
Class A Shares | (214,807 | ) | (266,343 | ) | (1,341,392 | ) | (1,315,405 | ) | ||||||||
Class B Shares | (5,316 | ) | (7,391 | ) | (19,307 | ) | (25,187 | ) | ||||||||
Institutional I Shares | (2,104,483 | ) | (2,646,144 | ) | (2,531,467 | ) | (2,224,358 | ) | ||||||||
Change in net assets resulting from distributions to shareholders | (2,324,606 | ) | (2,919,878 | ) | (3,892,166 | ) | (3,564,950 | ) | ||||||||
| SHARE TRANSACTIONS: | ||||||||||||||||
Proceeds from sale of shares | ||||||||||||||||
Class A Shares | 380,936 | 814,384 | 2,265,693 | 7,528,247 | ||||||||||||
Class B Shares | 4,411 | 9,232 | – | — | ||||||||||||
Institutional I Shares | 6,673,438 | 8,198,902 | 16,836,677 | 19,513,135 | ||||||||||||
Distributions reinvested | ||||||||||||||||
Class A Shares | 169,782 | 227,960 | 1,054,658 | 996,575 | ||||||||||||
Class B Shares | 4,713 | 6,522 | 17,328 | 17,986 | ||||||||||||
Institutional I Shares | 1,383,518 | 1,467,155 | 998,141 | 759,742 | ||||||||||||
Cost of shares redeemed | ||||||||||||||||
Class A Shares | (1,181,684 | ) | (1,660,481 | ) | (9,155,442 | ) | (3,023,132 | ) | ||||||||
Class B Shares | (237,391 | ) | (63,758 | ) | (856,341 | ) | (369,374 | ) | ||||||||
Institutional I Shares | (20,472,804 | ) | (24,184,081 | ) | (15,032,428 | ) | (12,367,901 | ) | ||||||||
Change in net assets resulting from share transactions | (13,275,081 | ) | (15,184,165 | ) | (3,871,714 | ) | 13,055,278 | |||||||||
Change in net assets | (12,978,345 | ) | (13,596,634 | ) | (5,744,152 | ) | 16,593,808 | |||||||||
| NET ASSETS: | ||||||||||||||||
Beginning of year | 67,054,849 | 80,651,483 | 108,770,541 | 92,176,733 | ||||||||||||
End of year | $ | 54,076,504 | $ | 67,054,849 | $ | 103,026,389 | $ | 108,770,541 | ||||||||
Undistributed (distributions in excess of) net investment income included in net assets at end of year | $ | 13,768 | $ | 18,321 | $ | (5,730 | ) | $ | 10,960 | |||||||
| SHARES OF BENEFICIAL INTEREST: | ||||||||||||||||
Shares sold | ||||||||||||||||
Class A Shares | 38,936 | 84,678 | 216,375 | 745,620 | ||||||||||||
Class B Shares | 316 | 961 | – | — | ||||||||||||
Institutional I Shares | 678,594 | 850,876 | 1,657,937 | 1,924,702 | ||||||||||||
Distributions reinvested | ||||||||||||||||
Class A Shares | 17,250 | 23,691 | 103,173 | 98,660 | ||||||||||||
Class B Shares | 478 | 678 | 1,693 | 1,781 | ||||||||||||
Institutional I Shares | 140,517 | 152,439 | 97,715 | 75,142 | ||||||||||||
Shares redeemed | ||||||||||||||||
Class A Shares | (120,358 | ) | (172,939 | ) | (909,289 | ) | (298,621 | ) | ||||||||
Class B Shares | (24,481 | ) | (6,655 | ) | (77,988 | ) | (36,670 | ) | ||||||||
Institutional I Shares | (2,093,461 | ) | (2,518,133 | ) | (1,475,745 | ) | (1,224,438 | ) | ||||||||
Net change resulting from share transactions | (1,362,209 | ) | (1,584,404 | ) | (386,129 | ) | 1,286,176 | |||||||||
See Notes which are an integral part of the Financial Statements
(Statements of Changes in Net Assets continued next page)
ANNUAL REPORT / April 30, 2011
Table of Contents
| 130 | STATEMENTS OF CHANGES IN NET ASSETS (continued) |
| MTB Pennsylvania Municipal Bond Fund | MTB Maryland Municipal Bond Fund | |||||||||||||||
Year Ended | Year Ended April 30, 2010 | Year Ended | Year Ended April 30, 2010 | |||||||||||||
| OPERATIONS: | ||||||||||||||||
Net investment income | $ | 3,690,730 | $ | 4,178,579 | $ | 4,668,179 | $ | 4,908,199 | ||||||||
Net realized gain (loss) on investments | 335,442 | 836,232 | 252,837 | 135,104 | ||||||||||||
Net change in unrealized appreciation (depreciation) of investments | (1,391,118 | ) | 1,952,096 | (2,733,910 | ) | 5,950,970 | ||||||||||
Change in net assets resulting from operations | 2,635,054 | 6,966,907 | 2,187,106 | 10,994,273 | ||||||||||||
| DISTRIBUTIONS TO SHAREHOLDERS: | ||||||||||||||||
Distributions from net investment income | ||||||||||||||||
Class A Shares | (237,624 | ) | (209,657 | ) | (1,411,378 | ) | (1,567,919 | ) | ||||||||
Class B Shares | (13,838 | ) | (20,221 | ) | (15,389 | ) | (27,977 | ) | ||||||||
Institutional I Shares | (3,431,099 | ) | (3,943,809 | ) | (3,254,642 | ) | (3,307,951 | ) | ||||||||
Change in net assets resulting from distributions to shareholders | (3,682,561 | ) | (4,173,687 | ) | (4,681,409 | ) | (4,903,847 | ) | ||||||||
| SHARE TRANSACTIONS: | ||||||||||||||||
Proceeds from sale of shares | ||||||||||||||||
Class A Shares | 2,464,530 | 2,171,169 | 1,521,011 | 3,792,320 | ||||||||||||
Institutional I Shares | 11,182,194 | 12,200,394 | 9,415,881 | 14,740,146 | ||||||||||||
Distributions reinvested | ||||||||||||||||
Class A Shares | 180,604 | 156,595 | 1,040,983 | 1,162,445 | ||||||||||||
Class B Shares | 9,777 | 12,765 | 7,585 | 14,686 | ||||||||||||
Institutional I Shares | 609,900 | 549,274 | 324,919 | 241,396 | ||||||||||||
Cost of shares redeemed | ||||||||||||||||
Class A Shares | (1,548,480 | ) | (461,741 | ) | (9,493,968 | ) | (3,217,601 | ) | ||||||||
Class B Shares | (700,665 | ) | (111,482 | ) | (706,018 | ) | (542,834 | ) | ||||||||
Institutional I Shares | (15,309,800 | ) | (23,123,544 | ) | (14,166,229 | ) | (13,537,602 | ) | ||||||||
Change in net assets resulting from share transactions | (3,111,940 | ) | (8,606,570 | ) | (12,055,836 | ) | 2,652,956 | |||||||||
Change in net assets | (4,159,447 | ) | (5,813,350 | ) | (14,550,139 | ) | 8,743,382 | |||||||||
| NET ASSETS: | ||||||||||||||||
Beginning of year | 105,695,254 | 111,508,604 | 128,011,795 | 119,268,413 | ||||||||||||
End of year | $ | 101,535,807 | $ | 105,695,254 | $ | 113,461,656 | $ | 128,011,795 | ||||||||
Undistributed net investment income included in net assets at end of year | $ | 107,695 | $ | 9,316 | $ | 3,875 | $ | 15,634 | ||||||||
| SHARES OF BENEFICIAL INTEREST: | ||||||||||||||||
Shares sold | ||||||||||||||||
Class A Shares | 241,930 | 215,576 | 149,203 | 382,258 | ||||||||||||
Institutional I Shares | 1,106,663 | 1,213,701 | 948,495 | 1,502,515 | ||||||||||||
Distributions reinvested | ||||||||||||||||
Class A Shares | 17,807 | 15,601 | 104,729 | 118,373 | ||||||||||||
Class B Shares | 963 | 1,274 | 759 | 1,499 | ||||||||||||
Institutional I Shares | 60,219 | 54,738 | 32,676 | 24,529 | ||||||||||||
Shares redeemed | ||||||||||||||||
Class A Shares | (151,094 | ) | (45,947 | ) | (958,526 | ) | (326,892 | ) | ||||||||
Class B Shares | (66,995 | ) | (11,066 | ) | (67,717 | ) | (55,117 | ) | ||||||||
Institutional I Shares | (1,521,321 | ) | (2,301,884 | ) | (1,431,439 | ) | (1,374,943 | ) | ||||||||
Net change resulting from share transactions | (311,828 | ) | (858,007 | ) | (1,221,820 | ) | 272,222 | |||||||||
See Notes which are an integral part of the Financial Statements
(Statements of Changes in Net Assets continued next page)
April 30, 2011 / ANNUAL REPORT
Table of Contents
| STATEMENTS OF CHANGES IN NET ASSETS (continued) | 131 |
| MTB Virginia Municipal Bond Fund | MTB Intermediate-Term Bond Fund | |||||||||||||||
Year Ended | Year Ended April 30, 2010 | Year Ended | Year Ended April 30, 2010 | |||||||||||||
| OPERATIONS: | ||||||||||||||||
Net investment income | $ | 684,515 | $ | 693,781 | $ | 4,401,668 | $ | 5,813,673 | ||||||||
Net realized gain (loss) on investments | 79,544 | (39,832 | ) | 3,843,770 | 3,501,721 | |||||||||||
Net change in unrealized appreciation (depreciation) of investments | (241,291 | ) | 389,251 | (999,035 | ) | 4,957,848 | ||||||||||
Change in net assets resulting from operations | 522,768 | 1,043,200 | 7,246,403 | 14,273,242 | ||||||||||||
| DISTRIBUTIONS TO SHAREHOLDERS: | ||||||||||||||||
Distributions from net investment income | �� | |||||||||||||||
Class A Shares | (681,181 | ) | (690,469 | ) | (215,492 | ) | (165,290 | ) | ||||||||
Class B Shares | — | — | (6,314 | ) | (9,417 | ) | ||||||||||
Class C Shares | — | — | (21,648 | ) | (41 | ) | ||||||||||
Institutional I Shares | — | — | (4,253,857 | ) | (5,543,878 | ) | ||||||||||
Distributions from net realized gain on investments | ||||||||||||||||
Class A Shares | — | — | (69,233 | ) | — | |||||||||||
Class B Shares | — | — | (2,389 | ) | — | |||||||||||
Class C Shares | — | — | (10,680 | ) | — | |||||||||||
Institutional I Shares | — | — | (1,074,039 | ) | — | |||||||||||
Change in net assets resulting from distributions to shareholders | (681,181 | ) | (690,469 | ) | (5,653,652 | ) | (5,718,626 | ) | ||||||||
| SHARE TRANSACTIONS: | ||||||||||||||||
Proceeds from sale of shares | ||||||||||||||||
Class A Shares | 1,047,561 | 3,624,503 | 3,134,711 | 3,400,959 | ||||||||||||
Class B Shares | — | — | 27,026 | 44,949 | ||||||||||||
Class C Shares | — | — | 1,262,659 | 47,600 | ||||||||||||
Institutional I Shares | — | — | 24,929,262 | 30,942,453 | ||||||||||||
Distributions reinvested | ||||||||||||||||
Class A Shares | 373,793 | 407,733 | 216,735 | 121,868 | ||||||||||||
Class B Shares | — | — | 7,292 | 7,849 | ||||||||||||
Class C Shares | — | — | 19,469 | — | ||||||||||||
Institutional I Shares | — | — | 2,752,514 | 2,131,773 | ||||||||||||
Cost of shares redeemed | ||||||||||||||||
Class A Shares | (1,697,760 | ) | (3,231,551 | ) | (2,472,238 | ) | (596,576 | ) | ||||||||
Class B Shares | — | — | (306,283 | ) | (28,554 | ) | ||||||||||
Class C Shares | — | — | (16,372 | ) | — | |||||||||||
Institutional I Shares | — | — | (44,123,895 | ) | (45,567,993 | ) | ||||||||||
Change in net assets resulting from share transactions | (276,406 | ) | 800,685 | (14,569,120 | ) | (9,495,672 | ) | |||||||||
Change in net assets | (434,819 | ) | 1,153,416 | (12,976,369 | ) | (941,056 | ) | |||||||||
| NET ASSETS: | ||||||||||||||||
Beginning of year | 21,238,055 | 20,084,639 | 128,667,934 | 129,608,990 | ||||||||||||
End of year | $ | 20,803,236 | $ | 21,238,055 | $ | 115,691,565 | $ | 128,667,934 | ||||||||
Undistributed (distributions in excess of) net investment income included in net assets at end of year | $ | 2,441 | $ | 2,814 | $ | 18,485 | $ | 114,128 | ||||||||
| SHARES OF BENEFICIAL INTEREST: | ||||||||||||||||
Shares sold | ||||||||||||||||
Class A Shares | 96,080 | 335,369 | 293,326 | 326,066 | ||||||||||||
Class B Shares | — | — | 740 | 4,323 | ||||||||||||
Class C Shares | — | — | 117,963 | 4,501 | ||||||||||||
Institutional I Shares | — | — | 2,339,460 | 2,986,090 | ||||||||||||
Distributions reinvested | ||||||||||||||||
Class A Shares | 34,366 | 37,825 | 20,281 | 11,730 | ||||||||||||
Class B Shares | — | — | 682 | 756 | ||||||||||||
Class C Shares | — | — | 1,818 | — | ||||||||||||
Institutional I Shares | — | — | 257,459 | 205,666 | ||||||||||||
Shares redeemed | ||||||||||||||||
Class A Shares | (156,165 | ) | (299,256 | ) | (230,193 | ) | (57,448 | ) | ||||||||
Class B Shares | — | — | (28,673 | ) | (2,696 | ) | ||||||||||
Class C Shares | — | — | (1,540 | ) | — | |||||||||||
Institutional I Shares | — | — | (4,120,095 | ) | (4,398,881 | ) | ||||||||||
Net change resulting from share transactions | (25,719 | ) | 73,938 | (1,348,772 | ) | (919,893 | ) | |||||||||
See Notes which are an integral part of the Financial Statements
(Statements of Changes in Net Assets continued next page)
ANNUAL REPORT / April 30, 2011
Table of Contents
| 132 | STATEMENTS OF CHANGES IN NET ASSETS (continued) |
| MTB Income Fund | MTB Strategic Allocation Fund(a) | |||||||||||||||
Year Ended | Year Ended April 30, 2010 | Year Ended | Year Ended April 30, 2010 | |||||||||||||
| OPERATIONS: | ||||||||||||||||
Net investment income | $ | 8,477,621 | $ | 8,111,105 | $ | 658,161 | $ | 61,319 | ||||||||
Net realized gain (loss) on investments | 5,541,696 | 520,118 | 4,516,747 | (3,203,892 | ) | |||||||||||
Net change in unrealized appreciation (depreciation) of investments | 63,926 | 15,021,765 | 7,281,032 | 12,318,810 | ||||||||||||
Change in net assets resulting from operations | 14,083,243 | 23,652,988 | 12,455,940 | 9,176,237 | ||||||||||||
| DISTRIBUTIONS TO SHAREHOLDERS: | ||||||||||||||||
Distributions from net investment income | ||||||||||||||||
Class A Shares | (229,377 | ) | (236,050 | ) | (630,182 | ) | (20,575 | ) | ||||||||
Class B Shares | (14,459 | ) | (22,222 | ) | (133,160 | ) | — | |||||||||
Institutional I Shares | (8,235,941 | ) | (7,818,183 | ) | (36,841 | ) | — | |||||||||
Distributions from net realized gain on investments | ||||||||||||||||
Class A Shares | (88,622 | ) | — | (199,928 | ) | — | ||||||||||
Class B Shares | (7,145 | ) | — | (78,041 | ) | — | ||||||||||
Institutional I Shares | (2,856,073 | ) | — | (11,674 | ) | — | ||||||||||
Change in net assets resulting from distributions to shareholders | (11,431,617 | ) | (8,076,455 | ) | (1,089,826 | ) | (20,575 | ) | ||||||||
| SHARE TRANSACTIONS: | ||||||||||||||||
Proceeds from sale of shares | ||||||||||||||||
Class A Shares | 1,531,738 | 572,597 | 25,591,791 | 1,963,625 | ||||||||||||
Class B Shares | 11,396 | — | 5,712,075 | 39,395 | ||||||||||||
Institutional I Shares | 63,281,313 | 70,323,457 | 1,102,910 | — | ||||||||||||
Proceeds from shares issued in connection with the Reorganization (see Note 8) | — | — | 39,254,425 | — | ||||||||||||
Distributions reinvested | ||||||||||||||||
Class A Shares | 276,843 | 215,446 | 789,579 | 20,395 | ||||||||||||
Class B Shares | 22,645 | 21,939 | 205,155 | — | ||||||||||||
Institutional I Shares | 7,016,050 | 4,068,986 | 48,514 | — | ||||||||||||
Cost of shares redeemed | ||||||||||||||||
Class A Shares | (1,517,023 | ) | (674,170 | ) | (15,728,837 | ) | (7,917,356 | ) | ||||||||
Class B Shares | (668,876 | ) | (349,948 | ) | (24,613,701 | ) | (2,082,573 | ) | ||||||||
Institutional I Shares | (69,285,835 | ) | (42,738,218 | ) | (230,321 | ) | — | |||||||||
Change in net assets resulting from share transactions | 668,251 | 31,440,089 | 32,131,590 | (7,976,514 | ) | |||||||||||
Change in net assets | 3,319,877 | 47,016,622 | 43,497,704 | 1,179,148 | ||||||||||||
| NET ASSETS: | ||||||||||||||||
Beginning of year | 212,667,853 | 165,651,231 | 35,482,283 | 34,303,135 | ||||||||||||
End of year | $ | 215,987,730 | $ | 212,667,853 | $ | 78,979,987 | $ | 35,482,283 | ||||||||
Undistributed (distributions in excess of) net investment income included in net assets at end of year | $ | 7,645 | $ | 9,801 | $ | 80,387 | $ | 61,195 | ||||||||
| SHARES OF BENEFICIAL INTEREST: | ||||||||||||||||
Shares sold | ||||||||||||||||
Class A Shares | 146,295 | 58,548 | 2,762,858 | 242,423 | ||||||||||||
Class B Shares | 1,149 | — | 6,477 | 5,146 | ||||||||||||
Institutional I Shares | 6,335,156 | 7,316,850 | 132,039 | — | ||||||||||||
Proceeds from shares issued in connection with the Reorganization (see Note 8) | — | — | 4,895,079 | — | ||||||||||||
Distributions reinvested | ||||||||||||||||
Class A Shares | 27,285 | 22,094 | 90,048 | 2,457 | ||||||||||||
Class B Shares | 2,264 | 2,287 | 23,806 | — | ||||||||||||
Institutional I Shares | 702,473 | 422,412 | 5,488 | — | ||||||||||||
Shares redeemed | ||||||||||||||||
Class A Shares | (149,715 | ) | (69,904 | ) | (1,166,437 | ) | (969,151 | ) | ||||||||
Class B Shares | (62,370 | ) | (36,694 | ) | (2,751,953 | ) | (266,560 | ) | ||||||||
Institutional I Shares | (6,894,829 | ) | (4,439,034 | ) | (26,411 | ) | — | |||||||||
Net change resulting from share transactions | 107,708 | 3,276,559 | 3,970,994 | (985,685 | ) | |||||||||||
| (a) | Information presented for periods prior to June 14, 2010 reflects the operating results of a predecessor portfolio of the Trust. See Note 8. |
See Notes which are an integral part of the Financial Statements
(Statements of Changes in Net Assets continued next page)
April 30, 2011 / ANNUAL REPORT
Table of Contents
| STATEMENTS OF CHANGES IN NET ASSETS (continued) | 133 |
| MTB Large Cap Value Fund | MTB Large Cap Growth Fund | |||||||||||||||
Year Ended | Year Ended April 30, 2010 | Year Ended | Year Ended April 30, 2010 | |||||||||||||
| OPERATIONS: | ||||||||||||||||
Net investment income | $ | 750,854 | $ | 795,397 | $ | 233,586 | $ | 132,966 | ||||||||
Net realized gain (loss) on investments and foreign currencies transactions | (59,270 | ) | 2,094,171 | 11,314,715 | 18,456,419 | |||||||||||
Net change in unrealized appreciation (depreciation) of investments | 25,862,574 | 44,224,021 | 10,711,107 | 26,562,047 | ||||||||||||
Change in net assets resulting from operations | 26,554,158 | 47,113,589 | 22,259,408 | 45,151,432 | ||||||||||||
| DISTRIBUTIONS TO SHAREHOLDERS: | ||||||||||||||||
Distributions from net investment income | ||||||||||||||||
Class A Shares | (17,842 | ) | (36,319 | ) | (13,982 | ) | (4,990 | ) | ||||||||
Class B Shares | — | (1,135 | ) | — | — | |||||||||||
Institutional I Shares | (747,636 | ) | (1,015,193 | ) | (221,160 | ) | (216,014 | ) | ||||||||
Return of Capital | ||||||||||||||||
Class A Shares | — | (295 | ) | — | — | |||||||||||
Class B Shares | — | (9 | ) | — | — | |||||||||||
Institutional I Shares | — | (8,255 | ) | — | — | |||||||||||
Change in net assets resulting from distributions to shareholders | (765,478 | ) | (1,061,206 | ) | (235,142 | ) | (221,004 | ) | ||||||||
| SHARE TRANSACTIONS: | ||||||||||||||||
Proceeds from sale of shares | ||||||||||||||||
Class A Shares | 1,203,185 | 529,424 | 6,576,699 | 1,630,030 | ||||||||||||
Class B Shares | — | 43,435 | 500 | 20,682 | ||||||||||||
Institutional I Shares | 29,753,802 | 37,217,192 | 23,766,712 | 26,209,727 | ||||||||||||
Distributions reinvested | ||||||||||||||||
Class A Shares | 17,487 | 35,765 | 13,683 | 4,896 | ||||||||||||
Class B Shares | — | 1,122 | — | — | ||||||||||||
Institutional I Shares | 424,331 | 605,853 | 124,444 | 138,975 | ||||||||||||
Cost of shares redeemed | ||||||||||||||||
Class A Shares | (1,240,426 | ) | (939,792 | ) | (3,264,112 | ) | (2,686,345 | ) | ||||||||
Class B Shares | (1,158,768 | ) | (321,665 | ) | (6,534,972 | ) | (1,544,290 | ) | ||||||||
Institutional I Shares | (35,939,918 | ) | (42,292,335 | ) | (40,789,784 | ) | (35,463,582 | ) | ||||||||
Change in net assets resulting from share transactions | (6,940,307 | ) | (5,121,001 | ) | (20,106,830 | ) | (11,689,907 | ) | ||||||||
Change in net assets | 18,848,373 | 40,931,382 | 1,917,436 | 33,240,521 | ||||||||||||
| NET ASSETS: | ||||||||||||||||
Beginning of year | 163,906,194 | 122,974,812 | 144,120,020 | 110,879,499 | ||||||||||||
End of year | $ | 182,754,567 | $ | 163,906,194 | $ | 146,037,456 | $ | 144,120,020 | ||||||||
Undistributed (distributions in excess of) net investment income included in net assets at end of year | $ | — | $ | — | $ | — | $ | — | ||||||||
| SHARES OF BENEFICIAL INTEREST: | ||||||||||||||||
Shares sold | ||||||||||||||||
Class A Shares | 90,802 | 60,776 | 215,355 | 232,909 | ||||||||||||
Class B Shares | — | 5,187 | 75 | 3,028 | ||||||||||||
Institutional I Shares | 2,926,450 | 4,124,306 | 2,861,704 | 3,861,111 | ||||||||||||
Distributions reinvested | ||||||||||||||||
Class A Shares | 1,831 | 4,345 | 1,593 | 639 | ||||||||||||
Class B Shares | — | 155 | — | — | ||||||||||||
Institutional I Shares | 43,773 | 73,073 | 14,470 | 18,166 | ||||||||||||
Shares redeemed | ||||||||||||||||
Class A Shares | (125,283 | ) | (109,539 | ) | (397,777 | ) | (372,183 | ) | ||||||||
Class B Shares | (88,360 | ) | (37,893 | ) | (230,389 | ) | (237,330 | ) | ||||||||
Institutional I Shares | (3,559,450 | ) | (4,977,306 | ) | (5,022,075 | ) | (4,823,762 | ) | ||||||||
Net change resulting from share transactions | (710,237 | ) | (856,896 | ) | (2,557,044 | ) | (1,317,422 | ) | ||||||||
See Notes which are an integral part of the Financial Statements
(Statements of Changes in Net Assets continued next page)
ANNUAL REPORT / April 30, 2011
Table of Contents
| 134 | STATEMENTS OF CHANGES IN NET ASSETS (continued) |
| MTB Mid Cap Growth Fund | MTB Small Cap Growth Fund | |||||||||||||||
Year Ended | Year Ended April 30, 2010 | Year Ended | Year Ended April 30, 2010 | |||||||||||||
| OPERATIONS: | ||||||||||||||||
Net investment income (loss) | $ | (1,150,181 | ) | $ | (557,124 | ) | $ | (1,445,284 | ) | $ | (1,290,603 | ) | ||||
Net realized gain (loss) on investments | 12,536,371 | 6,484,335 | 34,213,430 | 44,112,354 | ||||||||||||
Net change in unrealized appreciation (depreciation) of investments | 47,678,280 | 49,397,416 | 8,700,840 | 11,355,647 | ||||||||||||
Change in net assets resulting from operations | 59,064,470 | 55,324,627 | 41,468,986 | 54,177,398 | ||||||||||||
| DISTRIBUTIONS TO SHAREHOLDERS: | ||||||||||||||||
Distributions from net investment income | ||||||||||||||||
Class A Shares | — | (11,779 | ) | — | — | |||||||||||
Institutional I Shares | — | (102,605 | ) | — | — | |||||||||||
Return of Capital | ||||||||||||||||
Class A Shares | — | (4 | ) | — | — | |||||||||||
Institutional I Shares | — | (35 | ) | — | — | |||||||||||
Change in net assets resulting from distributions to shareholders | — | (114,423 | ) | — | — | |||||||||||
| SHARE TRANSACTIONS: | ||||||||||||||||
Proceeds from sale of shares | ||||||||||||||||
Class A Shares | 21,393,078 | 1,824,567 | 3,990,977 | 2,398,244 | ||||||||||||
Class B Shares | 6,446 | 22,315 | 24,356 | 25,901 | ||||||||||||
Class C Shares | — | — | 13,000 | 36,025 | ||||||||||||
Institutional I Shares | 29,097,557 | 22,520,566 | 20,168,821 | 27,094,636 | ||||||||||||
Proceeds from shares issued in connection with the tax-free transfer of assets from Multi-Cap Growth Fund | ||||||||||||||||
Class A Shares | — | 13,033,292 | — | — | ||||||||||||
Class B Shares | — | 1,310,826 | — | — | ||||||||||||
Institutional I Shares | — | 5,885,271 | — | — | ||||||||||||
Distributions reinvested | ||||||||||||||||
Class A Shares | — | 11,594 | — | — | ||||||||||||
Institutional I Shares | — | 71,436 | — | — | ||||||||||||
Cost of shares redeemed | ||||||||||||||||
Class A Shares | (7,811,052 | ) | (4,160,318 | ) | (6,568,603 | ) | (4,170,449 | ) | ||||||||
Class B Shares | (6,225,606 | ) | (1,087,538 | ) | (2,640,289 | ) | (574,394 | ) | ||||||||
Class C Shares | — | — | (48,517 | ) | (20,374 | ) | ||||||||||
Institutional I Shares | (31,290,228 | ) | (24,908,715 | ) | (33,663,914 | ) | (29,878,753 | ) | ||||||||
Change in net assets resulting from share transactions | 5,170,195 | 14,523,296 | (18,724,169 | ) | (5,089,164 | ) | ||||||||||
Change in net assets | 64,234,665 | 69,733,500 | 22,744,817 | 49,088,234 | ||||||||||||
| NET ASSETS: | ||||||||||||||||
Beginning of year | 186,140,083 | 116,406,583 | 174,056,080 | 124,967,846 | ||||||||||||
End of year | $ | 250,374,748 | $ | 186,140,083 | $ | 196,800,897 | $ | 174,056,080 | ||||||||
Undistributed (distributions in excess of) net investment income included in net assets at end of year | $ | — | $ | — | $ | — | $ | — | ||||||||
| SHARES OF BENEFICIAL INTEREST: | ||||||||||||||||
Shares sold | ||||||||||||||||
Class A Shares | 1,166,263 | 174,629 | 217,604 | 199,125 | ||||||||||||
Class B Shares | 579 | 2,486 | 1,637 | 2,479 | ||||||||||||
Class C Shares | — | — | 767 | 3,008 | ||||||||||||
Institutional I Shares | 2,066,931 | 2,139,018 | 1,331,899 | 2,198,393 | ||||||||||||
Proceeds from shares issued in connection with the tax-free transfer of assets from Multi-Cap Growth Fund | ||||||||||||||||
Class A Shares | — | 1,162,649 | — | — | ||||||||||||
Class B Shares | — | 123,663 | — | — | ||||||||||||
Institutional I Shares | — | 514,897 | — | — | ||||||||||||
Distributions reinvested | ||||||||||||||||
Class A Shares | — | 1,050 | — | — | ||||||||||||
Institutional I Shares | — | 6,350 | — | — | ||||||||||||
Shares redeemed | ||||||||||||||||
Class A Shares | (572,968 | ) | (380,737 | ) | (438,135 | ) | (345,684 | ) | ||||||||
Class B Shares | (183,016 | ) | (109,739 | ) | (148,718 | ) | (51,242 | ) | ||||||||
Class C Shares | — | — | (3,741 | ) | (1,610 | ) | ||||||||||
Institutional I Shares | (2,270,245 | ) | (2,337,184 | ) | (2,177,036 | ) | (2,501,700 | ) | ||||||||
Net change resulting from share transactions | 207,544 | 1,297,082 | (1,215,723 | ) | (497,231 | ) | ||||||||||
See Notes which are an integral part of the Financial Statements
(Statements of Changes in Net Assets continued next page)
April 30, 2011 / ANNUAL REPORT
Table of Contents
| STATEMENTS OF CHANGES IN NET ASSETS (concluded) | 135 |
| MTB International Equity Fund | ||||||||
Year Ended | Year Ended April 30, 2010 | |||||||
| OPERATIONS: | ||||||||
Net investment income | $ | 2,503,168 | $ | 2,111,223 | ||||
Net realized gain (loss) on investments and foreign currency transaction | 9,140,673 | 6,583,321 | ||||||
Net change in unrealized appreciation (depreciation) of investments | 29,314,406 | 45,916,181 | ||||||
Change in net assets resulting from operations | 40,958,247 | 54,610,725 | ||||||
| DISTRIBUTIONS TO SHAREHOLDERS: | ||||||||
Distributions from net investment income | ||||||||
Class A Shares | (61,818 | ) | (6,817 | ) | ||||
Class B Shares | (592 | ) | — | |||||
Institutional I Shares | (2,114,620 | ) | (388,629 | ) | ||||
Change in net assets resulting from distributions to shareholders | (2,177,030 | ) | (395,446 | ) | ||||
| SHARE TRANSACTIONS: | ||||||||
Proceeds from sale of shares | ||||||||
Class A Shares | 810,200 | 344,525 | ||||||
Class B Shares | 24,656 | 20,800 | ||||||
Institutional I Shares | 35,545,768 | 29,855,800 | ||||||
Distributions reinvested | ||||||||
Class A Shares | 58,667 | 6,475 | ||||||
Class B Shares | 528 | — | ||||||
Institutional I Shares | 1,458,423 | 291,909 | ||||||
Cost of shares redeemed | ||||||||
Class A Shares | (1,071,769 | ) | (882,250 | ) | ||||
Class B Shares | (787,045 | ) | (107,143 | ) | ||||
Institutional I Shares | (36,015,695 | ) | (38,896,327 | ) | ||||
Change in net assets resulting from share transactions | 23,733 | (9,366,211 | ) | |||||
Change in net assets | 38,804,950 | 44,849,068 | ||||||
| NET ASSETS: | ||||||||
Beginning of year | 204,085,846 | 159,236,778 | ||||||
End of year | $ | 242,890,796 | $ | 204,085,846 | ||||
Undistributed net investment income included in net assets at end of year | $ | 2,198,237 | $ | 2,125,471 | ||||
| SHARES OF BENEFICIAL INTEREST: | ||||||||
Shares sold | ||||||||
Class A Shares | 63,912 | 42,509 | ||||||
Class B Shares | 2,797 | 2,625 | ||||||
Institutional I Shares | 4,088,965 | 3,711,906 | ||||||
Distributions reinvested | ||||||||
Class A Shares | 6,518 | 773 | ||||||
Class B Shares | 61 | — | ||||||
Institutional I Shares | 163,498 | 35,127 | ||||||
Shares redeemed | ||||||||
Class A Shares | (121,953 | ) | (109,302 | ) | ||||
Class B Shares | (64,897 | ) | (14,155 | ) | ||||
Institutional I Shares | (4,128,573 | ) | (4,977,380 | ) | ||||
Net change resulting from share transactions | 10,328 | (1,307,897 | ) | |||||
See Notes which are an integral part of the Financial Statements
ANNUAL REPORT / April 30, 2011
Table of Contents
| 136 | FINANCIAL HIGHLIGHTS |
For a share outstanding throughout each year ended April 30, unless otherwise noted:
| MTB SHORT DURATION GOVERNMENT BOND FUND | ||||||||||||||||||||
| CLASS A SHARES | 2011 | 2010 | 2009 | 2008 | 2007 | |||||||||||||||
| Net Asset Value, Beginning of Period | $9.90 | $ 9.90 | $ 9.78 | $ 9.61 | $ 9.48 | |||||||||||||||
| Income (Loss) From Operations: | ||||||||||||||||||||
Net Investment Income | 0.23 | (c) | 0.30 | (c) | 0.32 | (c) | 0.36 | (c) | 0.34 | |||||||||||
Net Realized and Unrealized Gain (Loss) | (0.02 | ) | 0.01 | 0.12 | 0.17 | 0.14 | ||||||||||||||
| Total Income (Loss) From Operations | 0.21 | 0.31 | 0.44 | 0.53 | 0.48 | |||||||||||||||
| Less Distributions From: | ||||||||||||||||||||
Net Investment Income | (0.24 | ) | (0.31 | ) | (0.32 | ) | (0.36 | ) | (0.35 | ) | ||||||||||
Net Realized Gains | — | — | — | — | — | |||||||||||||||
| Total Distributions | (0.24 | ) | (0.31 | ) | (0.32 | ) | (0.36 | ) | (0.35 | ) | ||||||||||
| Net Asset Value, End of Period | $9.87 | $ 9.90 | $ 9.90 | $ 9.78 | $ 9.61 | |||||||||||||||
| Total Return(a) | 2.10 | % | 3.15 | % | 4.59 | % | 5.65 | % | 5.17 | % | ||||||||||
| Net Assets, End of Period (000’s) | $16,848 | $10,680 | $5,209 | $3,005 | $3,421 | |||||||||||||||
| Ratios to Average Net Assets | ||||||||||||||||||||
Gross Expense | 1.36 | % | 1.36 | % | 1.25 | % | 1.26 | % | 1.27 | % | ||||||||||
Net Expenses(b) | 0.89 | % | 0.86 | % | 0.80 | % | 0.81 | % | 0.89 | % | ||||||||||
Net Investment Income | 2.35 | % | 3.04 | % | 3.27 | % | 3.76 | % | 3.68 | % | ||||||||||
| Portfolio Turnover Rate | 255 | % | 164 | % | 84 | % | 67 | % | 97 | % | ||||||||||
| CLASS C SHARES | 2011 | 2010(d) | ||||||||||||||||||
| Net Asset Value, Beginning of Period |
| $9.92 |
| $ 9.90 | ||||||||||||||||
| Income (Loss) From Operations: | ||||||||||||||||||||
Net Investment Income(c) | 0.15 | 0.01 | ||||||||||||||||||
Net Realized and Unrealized Gain (Loss) | (0.02 | ) | 0.02 | |||||||||||||||||
| Total Income (Loss) From Operations | 0.13 | 0.03 | ||||||||||||||||||
| Less Distributions From: | ||||||||||||||||||||
Net Investment Income |
| (0.16 | ) | (0.01 | ) | |||||||||||||||
Net Realized Gains | — | — | ||||||||||||||||||
| Total Distributions | (0.16 | ) | (0.01 | ) | ||||||||||||||||
| Net Asset Value, End of Period | $9.89 | $ 9.92 | ||||||||||||||||||
| Total Return(a) | 1.29 | % | 0.30 | % | ||||||||||||||||
| Net Assets, End of Period (000’s) |
| $1,231 |
| $210 | ||||||||||||||||
| Ratios to Average Net Assets | ||||||||||||||||||||
Gross Expense | 2.12 | % | 2.08 | %(e) | ||||||||||||||||
Net Expenses(b) | 1.66 | % | 1.72 | %(e) | ||||||||||||||||
Net Investment Income | 1.55 | % | 2.32 | %(e) | ||||||||||||||||
| Portfolio Turnover Rate | 255 | % | 164 | %(f) | ||||||||||||||||
(Financial Highlights continued next page)
April 30, 2011 / ANNUAL REPORT
Table of Contents
| FINANCIAL HIGHLIGHTS (continued) | 137 |
For a share outstanding throughout each year ended April 30, unless otherwise noted:
| MTB SHORT DURATION GOVERNMENT BOND FUND – (continued) | ||||||||||||||||||||
| INSTITUTIONAL I SHARES | 2011 | 2010 | 2009 | 2008 | 2007 | |||||||||||||||
| Net Asset Value, Beginning of Period | $9.92 | $ 9.92 | $ 9.78 | $ 9.61 | $ 9.48 | |||||||||||||||
| Income (Loss) From Operations: | ||||||||||||||||||||
Net Investment Income | 0.26 | (c) | 0.32 | (c) | 0.35 | (c) | 0.38 | (c) | 0.37 | |||||||||||
Net Realized and Unrealized Gain (Loss) | (0.03 | ) | 0.00 | 0.13 | 0.17 | 0.13 | ||||||||||||||
| Total Income (Loss) From Operations | 0.23 | 0.32 | 0.48 | 0.55 | 0.50 | |||||||||||||||
| Less Distributions From: | ||||||||||||||||||||
Net Investment Income | (0.26 | ) | (0.32 | ) | (0.34 | ) | (0.38 | ) | (0.37 | ) | ||||||||||
Net Realized Gains | — | — | — | — | — | |||||||||||||||
| Total Distributions | (0.26 | ) | (0.32 | ) | (0.34 | ) | (0.38 | ) | (0.37 | ) | ||||||||||
| Net Asset Value, End of Period | $9.89 | $ 9.92 | $ 9.92 | $ 9.78 | $ 9.61 | |||||||||||||||
| Total Return(a) | 2.35 | % | 3.32 | % | 4.96 | % | 5.81 | % | 5.40 | % | ||||||||||
| Net Assets, End of Period (000’s) | $83,037 | $77,725 | $69,442 | $164,547 | $185,478 | |||||||||||||||
| Ratios to Average Net Assets | ||||||||||||||||||||
Gross Expense | 1.11 | % | 1.11 | % | 0.99 | % | 1.01 | % | 1.02 | % | ||||||||||
Net Expenses(b) | 0.64 | % | 0.65 | % | 0.65 | % | 0.66 | % | 0.67 | % | ||||||||||
Net Investment Income | 2.61 | % | 3.25 | % | 3.45 | % | 3.91 | % | 3.92 | % | ||||||||||
| Portfolio Turnover Rate | 255 | % | 164 | % | 84 | % | 67 | % | 97 | % | ||||||||||
| (a) | Based on net asset value, which does not reflect the sales charge, redemption fee or contingent deferred sales charge, if applicable. Total returns for periods of less than one year, if any, are not annualized. |
| (b) | The investment advisor and other service providers waived or reimbursed a portion of their fees. |
| (c) | Per share numbers have been calculated using the average shares method. |
| (d) | Reflects investment operations for the period from April 12, 2010 to April 30, 2010. |
| (e) | Annualized for periods less than one year. |
| (f) | Reflects portfolio turnover for the Fund for the year ended April 30, 2010. |
See Notes which are an integral part of the Financial Statements
(Financial Highlights continued next page)
ANNUAL REPORT / April 30, 2011
Table of Contents
| 138 | FINANCIAL HIGHLIGHTS (continued) |
For a share outstanding throughout each year ended April 30, unless otherwise noted:
| MTB SHORT-TERM CORPORATE BOND FUND | ||||||||||||||||||||
| CLASS A SHARES | 2011 | 2010 | 2009 | 2008 | 2007 | |||||||||||||||
| Net Asset Value, Beginning of Period | $ 10.21 | $ 9.89 | $ 9.87 | $ 9.83 | $ 9.72 | |||||||||||||||
| Income (Loss) From Operations: | ||||||||||||||||||||
Net Investment Income | 0.16 | (c) | 0.21 | (c) | 0.27 | (c) | 0.40 | (c) | 0.37 | |||||||||||
Net Realized and Unrealized Gain (Loss) | 0.10 | 0.33 | 0.08 | 0.03 | 0.11 | |||||||||||||||
| Total Income (Loss) From Operations | 0.26 | 0.54 | 0.35 | 0.43 | 0.48 | |||||||||||||||
| Less Distributions From: | ||||||||||||||||||||
Net Investment Income | (0.17 | ) | (0.22 | ) | (0.33 | ) | (0.39 | ) | (0.37 | ) | ||||||||||
Net Realized Gains | (0.01 | ) | — | — | — | — | ||||||||||||||
| Total Distributions | (0.18 | ) | (0.22 | ) | (0.33 | ) | (0.39 | ) | (0.37 | ) | ||||||||||
| Net Asset Value, End of Period | $10.29 | $10.21 | $ 9.89 | $ 9.87 | $ 9.83 | |||||||||||||||
| Total Return(a) | 2.57 | % | 5.47 | % | 3.59 | % | 4.48 | % | 5.00 | % | ||||||||||
| Net Assets, End of Period (000’s) | $11,905 | $5,461 | $453 | $63 | $83 | |||||||||||||||
| Ratios to Average Net Assets | ||||||||||||||||||||
Gross Expense | 1.45 | % | 1.49 | % | 1.48 | % | 1.49 | % | 1.49 | % | ||||||||||
Net Expenses(b) | 0.86 | % | 0.92 | % | 0.89 | % | 0.89 | % | 0.93 | % | ||||||||||
Net Investment Income | 1.57 | % | 2.04 | % | 3.21 | % | 4.01 | % | 3.65 | % | ||||||||||
| Portfolio Turnover Rate | 142 | % | 81 | % | 94 | % | 80 | % | 64 | % | ||||||||||
| CLASS C SHARES | 2011 | 2010(d) | ||||||||||||||||||
| Net Asset Value, Beginning of Period | $10.21 | $10.18 | ||||||||||||||||||
| Income (Loss) From Operations: | ||||||||||||||||||||
Net Investment Income(c) | 0.08 | 0.01 | ||||||||||||||||||
Net Realized and Unrealized Gain (Loss) | 0.11 | 0.03 | ||||||||||||||||||
| Total Income (Loss) From Operations | 0.19 | 0.04 | ||||||||||||||||||
| Less Distributions From: | ||||||||||||||||||||
Net Investment Income | (0.09 | ) | (0.01 | ) | ||||||||||||||||
Net Realized Gains | (0.01 | ) | — | |||||||||||||||||
| Total Distributions | (0.10 | ) | (0.01 | ) | ||||||||||||||||
| Net Asset Value, End of Period | $10.30 | $10.21 | ||||||||||||||||||
| Total Return(a) | 1.89 | % | 0.35 | % | ||||||||||||||||
| Net Assets, End of Period (000’s) | $393 | $130 | ||||||||||||||||||
| Ratios to Average Net Assets | ||||||||||||||||||||
Gross Expense | 2.20 | % | 2.65 | %(e) | ||||||||||||||||
Net Expenses(b) | 1.61 | % | 1.70 | %(e) | ||||||||||||||||
Net Investment Income | 0.79 | % | 1.57 | %(e) | ||||||||||||||||
| Portfolio Turnover Rate | 142 | % | 81 | %(f) | ||||||||||||||||
(Financial Highlights continued next page)
April 30, 2011 / ANNUAL REPORT
Table of Contents
| FINANCIAL HIGHLIGHTS (continued) | 139 |
For a share outstanding throughout each year ended April 30, unless otherwise noted:
| MTB SHORT-TERM CORPORATE BOND FUND – (continued) | ||||||||||||||||||||
| INSTITUTIONAL I SHARES | 2011 | 2010 | 2009 | 2008 | 2007 | |||||||||||||||
| Net Asset Value, Beginning of Period | $ 10.21 | $ 9.89 | $ 9.88 | $ 9.83 | $ 9.72 | |||||||||||||||
| Income (Loss) From Operations: | ||||||||||||||||||||
Net Investment Income | 0.18 | (c) | 0.23 | (c) | 0.33 | (c) | 0.41 | (c) | 0.38 | |||||||||||
Net Realized and Unrealized Gain (Loss) | 0.10 | 0.32 | 0.02 | 0.05 | 0.11 | |||||||||||||||
| Total Income (Loss) From Operations | 0.28 | 0.55 | 0.35 | 0.46 | 0.49 | |||||||||||||||
| Less Distributions From: | ||||||||||||||||||||
Net Investment Income | (0.19 | ) | (0.23 | ) | (0.34 | ) | (0.41 | ) | (0.38 | ) | ||||||||||
Net Realized Gains | (0.01 | ) | — | — | — | — | ||||||||||||||
| Total Distributions | (0.20 | ) | (0.23 | ) | (0.34 | ) | (0.41 | ) | (0.38 | ) | ||||||||||
| Net Asset Value, End of Period | $10.29 | $10.21 | $ 9.89 | $ 9.88 | $ 9.83 | |||||||||||||||
| Total Return(a) | 2.83 | % | 5.66 | % | 3.64 | % | 4.74 | % | 5.18 | % | ||||||||||
| Net Assets, End of Period (000’s) | $176,531 | $108,636 | $61,655 | $54,417 | $58,771 | |||||||||||||||
| Ratios to Average Net Assets | ||||||||||||||||||||
Gross Expense | 1.20 | % | 1.22 | % | 1.23 | % | 1.24 | % | 1.24 | % | ||||||||||
Net Expenses(b) | 0.61 | % | 0.71 | % | 0.73 | % | 0.74 | % | 0.75 | % | ||||||||||
Net Investment Income | 1.81 | % | 2.32 | % | 3.42 | % | 4.17 | % | 3.93 | % | ||||||||||
| Portfolio Turnover Rate | 142 | % | 81 | % | 94 | % | 80 | % | 64 | % | ||||||||||
| (a) | Based on net asset value, which does not reflect the sales charge, redemption fee or contingent deferred sales charge, if applicable. Total returns for periods of less than one year, if any, are not annualized. |
| (b) | The investment advisor and other service providers waived or reimbursed a portion of their fees. |
| (c) | Per share numbers have been calculated using the average shares method. |
| (d) | Reflects investment operations for the period from April 9, 2010 to April 30, 2010. |
| (e) | Annualized for periods less than one year. |
| (f) | Reflects portfolio turnover for the Fund for the year ended April 30, 2010. |
See Notes which are an integral part of the Financial Statements
(Financial Highlights continued next page)
ANNUAL REPORT / April 30, 2011
Table of Contents
| 140 | FINANCIAL HIGHLIGHTS (continued) |
For a share outstanding throughout each year ended April 30, unless otherwise noted:
| MTB U.S. GOVERNMENT BOND FUND | ||||||||||||||||||||
| CLASS A SHARES | 2011 | 2010 | 2009 | 2008 | 2007 | |||||||||||||||
| Net Asset Value, Beginning of Period | $ 9.70 | $ 9.50 | $ 9.48 | $ 9.28 | $ 9.10 | |||||||||||||||
| Income (Loss) From Operations: | ||||||||||||||||||||
Net Investment Income | 0.33 | (c) | 0.37 | (c) | 0.36 | (c) | 0.39 | (c) | 0.40 | |||||||||||
Net Realized and Unrealized Gain (Loss) | 0.05 | 0.21 | 0.05 | 0.21 | 0.18 | |||||||||||||||
| Total Income (Loss) From Operations | 0.38 | 0.58 | 0.41 | 0.60 | 0.58 | |||||||||||||||
| Less Distributions From: | ||||||||||||||||||||
Net Investment Income | (0.33 | ) | (0.38 | ) | (0.39 | ) | (0.40 | ) | (0.40 | ) | ||||||||||
Net Realized Gains | — | — | — | — | — | |||||||||||||||
| Total Distributions | (0.33 | ) | (0.38 | ) | (0.39 | ) | (0.40 | ) | (0.40 | ) | ||||||||||
| Net Asset Value, End of Period | $9.75 | $ 9.70 | $ 9.50 | $ 9.48 | $ 9.28 | |||||||||||||||
| Total Return(a) | 3.98 | % | 6.17 | % | 4.42 | % | 6.58 | % | 6.46 | % | ||||||||||
| Net Assets, End of Period (000’s) | $6,007 | $6,604 | $7,078 | $37,690 | $51,955 | |||||||||||||||
| Ratios to Average Net Assets | ||||||||||||||||||||
Gross Expense | 1.53 | % | 1.48 | % | 1.38 | % | 1.33 | % | 1.27 | % | ||||||||||
Net Expenses(b) | 1.09 | % | 0.99 | % | 0.72 | % | 0.94 | % | 0.87 | % | ||||||||||
Net Investment Income | 3.38 | % | 3.88 | % | 4.30 | % | 4.22 | % | 4.29 | % | ||||||||||
| Portfolio Turnover Rate(d) | 66 | % | 50 | % | 35 | % | 52 | % | 71 | % | ||||||||||
| INSTITUTIONAL I SHARES | 2011 | 2010 | 2009 | 2008 | 2007 | |||||||||||||||
| Net Asset Value, Beginning of Period | $ 9.70 | $ 9.49 | $ 9.49 | $ 9.28 | $ 9.10 | |||||||||||||||
| Income (Loss) From Operations: | ||||||||||||||||||||
Net Investment Income | 0.37 | (c) | 0.39 | (c) | 0.39 | (c) | 0.41 | (c) | 0.40 | |||||||||||
Net Realized and Unrealized Gain (Loss) | 0.05 | 0.21 | — | 0.20 | 0.18 | |||||||||||||||
| Total Income (Loss) From Operations | 0.42 | 0.60 | 0.39 | 0.61 | 0.58 | |||||||||||||||
| Less Distributions From: | ||||||||||||||||||||
Net Investment Income | (0.37 | ) | (0.39 | ) | (0.39 | ) | (0.40 | ) | (0.40 | ) | ||||||||||
Net Realized Gains | — | — | — | — | — | |||||||||||||||
| Total Distributions | (0.37 | ) | (0.39 | ) | (0.39 | ) | (0.40 | ) | (0.40 | ) | ||||||||||
| Net Asset Value, End of Period | $9.75 | $ 9.70 | $ 9.49 | $ 9.49 | $ 9.28 | |||||||||||||||
| Total Return(a) | 4.21 | % | 6.41 | % | 4.18 | % | 6.74 | % | 6.49 | % | ||||||||||
| Net Assets, End of Period (000’s) | $48,069 | $60,221 | $73,301 | $85,617 | $119,940 | |||||||||||||||
| Ratios to Average Net Assets | ||||||||||||||||||||
Gross Expense | 1.28 | % | 1.23 | % | 1.15 | % | 1.14 | % | 1.11 | % | ||||||||||
Net Expenses(b) | 0.74 | % | 0.81 | % | 0.82 | % | 0.83 | % | 0.84 | % | ||||||||||
Net Investment Income | 3.72 | % | 4.06 | % | 4.05 | % | 4.34 | % | 4.32 | % | ||||||||||
| Portfolio Turnover Rate(d) | 66 | % | 50 | % | 35 | % | 52 | % | 71 | % | ||||||||||
| (a) | Based on net asset value, which does not reflect the sales charge, redemption fee or contingent deferred sales charge, if applicable. Total returns for periods of less than one year, if any, are not annualized. |
| (b) | The investment advisor and other service providers waived or reimbursed a portion of their fees. |
| (c) | Per share numbers have been calculated using the average shares method. |
| (d) | This calculation excludes purchases and sales from dollar roll transactions. |
See Notes which are an integral part of the Financial Statements
(Financial Highlights continued next page)
April 30, 2011 / ANNUAL REPORT
Table of Contents
| FINANCIAL HIGHLIGHTS (continued) | 141 |
For a share outstanding throughout each year ended April 30, unless otherwise noted:
| MTB NEW YORK MUNICIPAL BOND FUND | ||||||||||||||||||||
| CLASS A SHARES | 2011 | 2010 | 2009 | 2008 | 2007 | |||||||||||||||
| Net Asset Value, Beginning of Period | $ 10.25 | $ 9.89 | $10.25 | $10.51 | $10.38 | |||||||||||||||
| Income (Loss) From Operations: | ||||||||||||||||||||
Net Investment Income | 0.35 | (c) | 0.35 | (c) | 0.38 | (c) | 0.39 | (c) | 0.39 | |||||||||||
Net Realized and Unrealized Gain (Loss) | (0.16 | ) | 0.36 | (0.34 | ) | (0.27 | ) | 0.13 | ||||||||||||
| Total Income (Loss) From Operations | 0.19 | 0.71 | 0.04 | 0.12 | 0.52 | |||||||||||||||
| Less Distributions From: | ||||||||||||||||||||
Net Investment Income | (0.36 | ) | (0.35 | ) | (0.40 | ) | (0.38 | ) | (0.39 | ) | ||||||||||
Net Realized Gains | — | — | — | — | — | |||||||||||||||
| Total Distributions | (0.36 | ) | (0.35 | ) | (0.40 | ) | (0.38 | ) | (0.39 | ) | ||||||||||
| Net Asset Value, End of Period | $10.08 | $10.25 | $ 9.89 | $10.25 | $10.51 | |||||||||||||||
| Total Return(a) | 1.83 | % | 7.28 | % | 0.44 | % | 1.21 | % | 5.13 | % | ||||||||||
| Net Assets, End of Period (000’s) | $34,107 | $40,748 | $33,904 | $60,836 | $59,371 | |||||||||||||||
| Ratios to Average Net Assets | ||||||||||||||||||||
Gross Expense | 1.40 | % | 1.40 | % | 1.40 | % | 1.39 | % | 1.41 | % | ||||||||||
Net Expenses(b) | 0.84 | % | 0.80 | % | 0.75 | % | 0.79 | % | 0.80 | % | ||||||||||
Net Investment Income | 3.47 | % | 3.42 | % | 3.96 | % | 3.70 | % | 3.77 | % | ||||||||||
| Portfolio Turnover Rate | 67 | % | 64 | % | 102 | % | 119 | % | 37 | % | ||||||||||
| INSTITUTIONAL I SHARES | 2011 | 2010 | 2009 | 2008 | 2007 | |||||||||||||||
| Net Asset Value, Beginning of Period | $ 10.26 | $ 9.89 | $10.25 | $10.51 | $10.38 | |||||||||||||||
| Income (Loss) From Operations: | ||||||||||||||||||||
Net Investment Income | 0.38 | (c) | 0.36 | (c) | 0.41 | (c) | 0.40 | (c) | 0.41 | |||||||||||
Net Realized and Unrealized Gain (Loss) | (0.18 | ) | 0.37 | (0.36 | ) | (0.27 | ) | 0.13 | ||||||||||||
| Total Income (Loss) From Operations | 0.20 | 0.73 | 0.05 | 0.13 | 0.54 | |||||||||||||||
| Less Distributions From: | ||||||||||||||||||||
Net Investment Income | (0.38 | ) | (0.36 | ) | (0.41 | ) | (0.39 | ) | (0.41 | ) | ||||||||||
Net Realized Gains | — | — | — | — | — | |||||||||||||||
| Total Distributions | (0.38 | ) | (0.36 | ) | (0.41 | ) | (0.39 | ) | (0.41 | ) | ||||||||||
| Net Asset Value, End of Period | $10.08 | $10.26 | $ 9.89 | $10.25 | $10.51 | |||||||||||||||
| Total Return(a) | 1.97 | % | 7.54 | % | 0.54 | % | 1.31 | % | 5.26 | % | ||||||||||
| Net Assets, End of Period (000’s) | $68,919 | $67,239 | $57,173 | $42,737 | $44,224 | |||||||||||||||
| Ratios to Average Net Assets | ||||||||||||||||||||
Gross Expense | 1.15 | % | 1.15 | % | 1.15 | % | 1.16 | % | 1.20 | % | ||||||||||
Net Expenses(b) | 0.59 | % | 0.64 | % | 0.65 | % | 0.66 | % | 0.67 | % | ||||||||||
Net Investment Income | 3.71 | % | 3.58 | % | 4.11 | % | 3.83 | % | 3.89 | % | ||||||||||
| Portfolio Turnover Rate | 67 | % | 64 | % | 102 | % | 119 | % | 37 | % | ||||||||||
| (a) | Based on net asset value, which does not reflect the sales charge, redemption fee or contingent deferred sales charge, if applicable. Total returns for periods of less than one year, if any, are not annualized. |
| (b) | The investment advisor and other service providers waived or reimbursed a portion of their fees. |
| (c) | Per share numbers have been calculated using the average shares method. |
See Notes which are an integral part of the Financial Statements
(Financial Highlights continued next page)
ANNUAL REPORT / April 30, 2011
Table of Contents
| 142 | FINANCIAL HIGHLIGHTS (continued) |
For a share outstanding throughout each year ended April 30, unless otherwise noted:
| MTB PENNSYLVANIA MUNICIPAL BOND FUND | ||||||||||||||||||||
| CLASS A SHARES | 2011 | 2010 | 2009 | 2008 | 2007 | |||||||||||||||
| Net Asset Value, Beginning of Period | $ 10.13 | $ 9.87 | $10.02 | $10.09 | $10.01 | |||||||||||||||
| Income (Loss) From Operations: | ||||||||||||||||||||
Net Investment Income | 0.33 | (c) | 0.37 | (c) | 0.37 | (c) | 0.35 | (c) | 0.37 | |||||||||||
Net Realized and Unrealized Gain (Loss) | (0.11 | ) | 0.26 | (0.14 | ) | (0.07 | ) | 0.07 | ||||||||||||
| Total Income (Loss) From Operations | 0.22 | 0.63 | 0.23 | 0.28 | 0.44 | |||||||||||||||
| Less Distributions From: | ||||||||||||||||||||
Net Investment Income | (0.33 | ) | (0.37 | ) | (0.37 | ) | (0.35 | ) | (0.36 | ) | ||||||||||
Net Realized Gains | — | — | (0.01 | ) | — | — | ||||||||||||||
| Total Distributions | (0.33 | ) | (0.37 | ) | (0.38 | ) | (0.35 | ) | (0.36 | ) | ||||||||||
| Net Asset Value, End of Period | $10.02 | $10.13 | $ 9.87 | $10.02 | $10.09 | |||||||||||||||
| Total Return(a) | 2.33 | % | 6.51 | % | 2.39 | % | 2.87 | % | 4.49 | % | ||||||||||
| Net Assets, End of Period (000’s) | $7,750 | $6,727 | $4,731 | $5,344 | $5,407 | |||||||||||||||
| Ratios to Average Net Assets | ||||||||||||||||||||
Gross Expense | 1.40 | % | 1.38 | % | 1.37 | % | 1.38 | % | 1.40 | % | ||||||||||
Net Expenses(b) | 0.95 | % | 0.95 | % | 0.95 | % | 0.95 | % | 0.92 | % | ||||||||||
Net Investment Income | 3.30 | % | 3.69 | % | 3.77 | % | 3.54 | % | 3.63 | % | ||||||||||
| Portfolio Turnover Rate | 19 | % | 8 | % | 21 | % | 14 | % | 26 | % | ||||||||||
| INSTITUTIONAL I SHARES | 2011 | 2010 | 2009 | 2008 | 2007 | |||||||||||||||
| Net Asset Value, Beginning of Period | $ 10.13 | $ 9.87 | $10.02 | $10.09 | $10.01 | |||||||||||||||
| Income (Loss) From Operations: | ||||||||||||||||||||
Net Investment Income | 0.36 | (c) | 0.38 | (c) | 0.38 | (c) | 0.37 | (c) | 0.37 | |||||||||||
Net Realized and Unrealized Gain (Loss) | (0.10 | ) | 0.26 | (0.14 | ) | (0.08 | ) | 0.08 | ||||||||||||
| Total Income (Loss) From Operations | 0.26 | 0.64 | 0.24 | 0.29 | 0.45 | |||||||||||||||
| Less Distributions From: | ||||||||||||||||||||
Net Investment Income | (0.36 | ) | (0.38 | ) | (0.38 | ) | (0.36 | ) | (0.37 | ) | ||||||||||
Net Realized Gains | — | — | (0.01 | ) | — | — | ||||||||||||||
| Total Distributions | (0.36 | ) | (0.38 | ) | (0.39 | ) | (0.36 | ) | (0.37 | ) | ||||||||||
| Net Asset Value, End of Period | $10.03 | $10.13 | $ 9.87 | $10.02 | $10.09 | |||||||||||||||
| Total Return(a) | 2.57 | % | 6.62 | % | 2.49 | % | 2.97 | % | 4.56 | % | ||||||||||
| Net Assets, End of Period (000’s) | $93,786 | $98,299 | $106,029 | $117,723 | $133,668 | |||||||||||||||
| Ratios to Average Net Assets | ||||||||||||||||||||
Gross Expense | 1.15 | % | 1.13 | % | 1.12 | % | 1.13 | % | 1.15 | % | ||||||||||
Net Expenses(b) | 0.70 | % | 0.83 | % | 0.85 | % | 0.85 | % | 0.85 | % | ||||||||||
Net Investment Income | 3.54 | % | 3.82 | % | 3.87 | % | 3.64 | % | 3.70 | % | ||||||||||
| Portfolio Turnover Rate | 19 | % | 8 | % | 21 | % | 14 | % | 26 | % | ||||||||||
| (a) | Based on net asset value, which does not reflect the sales charge, redemption fee or contingent deferred sales charge, if applicable. Total returns for periods of less than one year, if any, are not annualized. |
| (b) | The investment advisor and other service providers waived or reimbursed a portion of their fees. |
| (c) | Per share numbers have been calculated using the average shares method. |
See Notes which are an integral part of the Financial Statements
(Financial Highlights continued next page)
April 30, 2011 / ANNUAL REPORT
Table of Contents
| FINANCIAL HIGHLIGHTS (continued) | 143 |
For a share outstanding throughout each year ended April 30, unless otherwise noted:
| MTB MARYLAND MUNICIPAL BOND FUND | ||||||||||||||||||||
| CLASS A SHARES | 2011 | 2010 | 2009 | 2008 | 2007 | |||||||||||||||
| Net Asset Value, Beginning of Period | $ 9.98 | $ 9.50 | $ 9.82 | $10.10 | $10.05 | |||||||||||||||
| Income (Loss) From Operations: | ||||||||||||||||||||
Net Investment Income | 0.36 | (c) | 0.38 | (c) | 0.40 | (c) | 0.39 | (c) | 0.39 | |||||||||||
Net Realized and Unrealized Gain (Loss) | (0.21 | ) | 0.49 | (0.30 | ) | (0.26 | ) | 0.08 | ||||||||||||
| Total Income (Loss) From Operations | 0.15 | 0.87 | 0.10 | 0.13 | 0.47 | |||||||||||||||
| Less Distributions From: | ||||||||||||||||||||
Net Investment Income | (0.36 | ) | (0.39 | ) | (0.40 | ) | (0.39 | ) | (0.39 | ) | ||||||||||
Net Realized Gains | — | — | (0.02 | ) | (0.02 | ) | (0.03 | ) | ||||||||||||
| Total Distributions | (0.36 | ) | (0.39 | ) | (0.42 | ) | (0.41 | ) | (0.42 | ) | ||||||||||
| Net Asset Value, End of Period | $9.77 | $ 9.98 | $ 9.50 | $ 9.82 | $10.10 | |||||||||||||||
| Total Return(a) | 1.54 | % | 9.24 | % | 1.10 | % | 1.30 | % | 4.74 | % | ||||||||||
| Net Assets, End of Period (000’s) | $34,550 | $42,303 | $38,627 | $41,846 | $47,611 | |||||||||||||||
| Ratios to Average Net Assets | ||||||||||||||||||||
Gross Expense | 1.38 | % | 1.38 | % | 1.38 | % | 1.39 | % | 1.38 | % | ||||||||||
Net Expenses(b) | 0.94 | % | 0.82 | % | 0.79 | % | 0.81 | % | 0.82 | % | ||||||||||
Net Investment Income | 3.62 | % | 3.90 | % | 4.21 | % | 3.95 | % | 3.89 | % | ||||||||||
| Portfolio Turnover Rate | 6 | % | 8 | % | 6 | % | 3 | % | 16 | % | ||||||||||
| INSTITUTIONAL I SHARES | 2011 | 2010 | 2009 | 2008 | 2007 | |||||||||||||||
| Net Asset Value, Beginning of Period | $ 9.99 | $ 9.51 | $ 9.83 | $10.11 | $10.06 | |||||||||||||||
| Income (Loss) From Operations: | ||||||||||||||||||||
Net Investment Income | 0.39 | (c) | 0.40 | (c) | 0.41 | (c) | 0.40 | (c) | 0.40 | |||||||||||
Net Realized and Unrealized Gain (Loss) | (0.20 | ) | 0.48 | (0.30 | ) | (0.26 | ) | 0.08 | ||||||||||||
| Total Income (Loss) From Operations | 0.19 | 0.88 | 0.11 | 0.14 | 0.48 | |||||||||||||||
| Less Distributions From: | ||||||||||||||||||||
Net Investment Income | (0.39 | ) | (0.40 | ) | (0.41 | ) | (0.40 | ) | (0.40 | ) | ||||||||||
Net Realized Gains | — | — | (0.02 | ) | (0.02 | ) | (0.03 | ) | ||||||||||||
| Total Distributions | (0.39 | ) | (0.40 | ) | (0.43 | ) | (0.42 | ) | (0.43 | ) | ||||||||||
| Net Asset Value, End of Period | $9.79 | $ 9.99 | $ 9.51 | $ 9.83 | $10.11 | |||||||||||||||
| Total Return(a) | 1.90 | % | 9.33 | % | 1.20 | % | 1.40 | % | 4.84 | % | ||||||||||
| Net Assets, End of Period (000’s) | $78,912 | $85,039 | $79,494 | $86,933 | $98,014 | |||||||||||||||
| Ratios to Average Net Assets | ||||||||||||||||||||
Gross Expense | 1.13 | % | 1.13 | % | 1.13 | % | 1.14 | % | 1.14 | % | ||||||||||
Net Expenses(b) | 0.67 | % | 0.70 | % | 0.70 | % | 0.72 | % | 0.72 | % | ||||||||||
Net Investment Income | 3.90 | % | 4.02 | % | 4.30 | % | 4.05 | % | 4.00 | % | ||||||||||
| Portfolio Turnover Rate | 6 | % | 8 | % | 6 | % | 3 | % | 16 | % | ||||||||||
| (a) | Based on net asset value, which does not reflect the sales charge, redemption fee or contingent deferred sales charge, if applicable. Total returns for periods of less than one year, if any, are not annualized. |
| (b) | The investment advisor and other service providers waived or reimbursed a portion of their fees. |
| (c) | Per share numbers have been calculated using the average shares method. |
See Notes which are an integral part of the Financial Statements
(Financial Highlights continued next page)
ANNUAL REPORT / April 30, 2011
Table of Contents
| 144 | FINANCIAL HIGHLIGHTS (continued) |
For a share outstanding throughout each year ended April 30, unless otherwise noted:
| MTB VIRGINIA MUNICIPAL BOND FUND | ||||||||||||||||||||
| CLASS A SHARES | 2011 | 2010 | 2009 | 2008 | 2007 | |||||||||||||||
| Net Asset Value, Beginning of Period | $10.86 | $10.67 | $10.67 | $10.90 | $10.93 | |||||||||||||||
| Income (Loss) From Operations: | ||||||||||||||||||||
Net Investment Income | 0.35 | (c) | 0.37 | (c) | 0.38 | (c) | 0.40 | (c) | 0.41 | |||||||||||
Net Realized and Unrealized Gain (Loss) | (0.08 | ) | 0.19 | 0.00 | (d) | (0.14 | ) | 0.08 | ||||||||||||
| Total Income (Loss) From Operations | 0.27 | 0.56 | 0.38 | 0.26 | 0.49 | |||||||||||||||
| Less Distributions From: | ||||||||||||||||||||
Net Investment Income | (0.35 | ) | (0.37 | ) | (0.38 | ) | (0.39 | ) | (0.41 | ) | ||||||||||
Net Realized Gains | — | — | (0.00 | )(d) | (0.10 | ) | (0.11 | ) | ||||||||||||
| Total Distributions | (0.35 | ) | (0.37 | ) | (0.38 | ) | (0.49 | ) | (0.52 | ) | ||||||||||
| Net Asset Value, End of Period | $10.78 | $10.86 | $10.67 | $10.67 | $10.90 | |||||||||||||||
| Total Return(a) | 2.48 | % | 5.28 | % | 3.73 | % | 2.47 | % | 4.56 | % | ||||||||||
| Net Assets, End of Period (000’s) | $20,803 | $21,238 | $20,085 | $16,570 | $18,129 | |||||||||||||||
| Ratios to Average Net Assets | ||||||||||||||||||||
Gross Expense | 1.79 | % | 1.81 | % | 1.88 | % | 1.77 | % | 1.71 | % | ||||||||||
Net Expenses(b) | 0.94 | % | 0.82 | % | 0.84 | % | 0.88 | % | 0.86 | % | ||||||||||
Net Investment Income | 3.21 | % | 3.40 | % | 3.62 | % | 3.67 | % | 3.76 | % | ||||||||||
| Portfolio Turnover Rate | 11 | % | 19 | % | 7 | % | 3 | % | 9 | % | ||||||||||
| (a) | Based on net asset value, which does not reflect the sales charge, redemption fee or contingent deferred sales charge, if applicable. Total returns for periods of less than one year, if any, are not annualized. |
| (b) | The investment advisor and other service providers waived or reimbursed a portion of their fees. |
| (c) | Per share numbers have been calculated using the average shares method. |
| (d) | Represents less than $0.01. |
See Notes which are an integral part of the Financial Statements
(Financial Highlights continued next page)
April 30, 2011 / ANNUAL REPORT
Table of Contents
| FINANCIAL HIGHLIGHTS (continued) | 145 |
For a share outstanding throughout each year ended April 30, unless otherwise noted:
| MTB INTERMEDIATE-TERM BOND FUND | ||||||||||||||||||||
| CLASS A SHARES | 2011 | 2010 | 2009 | 2008 | 2007 | |||||||||||||||
| Net Asset Value, Beginning of Period | $10.63 | $ 9.96 | $ 9.97 | $ 9.81 | $ 9.64 | |||||||||||||||
| Income (Loss) From Operations: | ||||||||||||||||||||
Net Investment Income(c) | 0.34 | 0.43 | 0.41 | 0.40 | 0.42 | |||||||||||||||
Net Realized and Unrealized Gain (Loss) | 0.24 | 0.68 | (0.00 | ) | 0.16 | 0.17 | ||||||||||||||
| Total Income (Loss) From Operations | 0.58 | 1.11 | 0.41 | 0.56 | 0.59 | |||||||||||||||
| Less Distributions From: | ||||||||||||||||||||
Net Investment Income | (0.35 | ) | (0.44 | ) | (0.42 | ) | (0.40 | ) | (0.42 | ) | ||||||||||
Net Realized Gains | (0.10 | ) | — | — | — | — | ||||||||||||||
| Total Distributions | (0.45 | ) | (0.44 | ) | (0.42 | ) | (0.40 | ) | (0.42 | ) | ||||||||||
| Net Asset Value, End of Period | $10.76 | $10.63 | $ 9.96 | $ 9.97 | $ 9.81 | |||||||||||||||
| Total Return(a) | 5.51 | % | 11.33 | % | 4.20 | % | 5.85 | % | 6.19 | % | ||||||||||
| Net Assets, End of Period (000’s) | $6,744 | $5,777 | $2,619 | $1,495 | $1,455 | |||||||||||||||
| Ratios to Average Net Assets | ||||||||||||||||||||
Gross Expense | 1.43 | % | 1.41 | % | 1.35 | % | 1.36 | % | 1.36 | % | ||||||||||
Net Expenses(b) | 1.01 | % | 0.87 | % | 0.78 | % | 0.85 | % | 0.95 | % | ||||||||||
Net Investment Income | 3.18 | % | 4.23 | % | 4.22 | % | 4.12 | % | 4.23 | % | ||||||||||
| Portfolio Turnover Rate | 485 | % | 164 | % | 191 | % | 279 | % | 189 | % | ||||||||||
| CLASS C SHARES | 2011 | 2010(d) | ||||||||||||||||||
| Net Asset Value, Beginning of Period | $10.65 | $10.55 | ||||||||||||||||||
| Income (Loss) From Operations: | ||||||||||||||||||||
Net Investment Income(c) | 0.25 | 0.02 | ||||||||||||||||||
Net Realized and Unrealized Gain (Loss) | 0.25 | 0.10 | ||||||||||||||||||
| Total Income (Loss) From Operations | 0.50 | 0.12 | ||||||||||||||||||
| Less Distributions From: | ||||||||||||||||||||
Net Investment Income | (0.27 | ) | (0.02 | ) | ||||||||||||||||
Net Realized Gains | (0.10 | ) | — | |||||||||||||||||
| Total Distributions | (0.37 | ) | (0.02 | ) | ||||||||||||||||
| Net Asset Value, End of Period | $10.78 | $10.65 | ||||||||||||||||||
| Total Return(a) | 4.79 | % | 1.10 | % | ||||||||||||||||
| Net Assets, End of Period (000’s) | $1,323 | $48 | ||||||||||||||||||
| Ratios to Average Net Assets | ||||||||||||||||||||
Gross Expense | 2.19 | % | 2.30 | %(e) | ||||||||||||||||
Net Expenses(b) | 1.74 | % | 1.81 | %(e) | ||||||||||||||||
Net Investment Income | 2.39 | % | 3.30 | %(e) | ||||||||||||||||
| Portfolio Turnover Rate | 485 | % | 164 | %(f) | ||||||||||||||||
(Financial Highlights continued next page)
ANNUAL REPORT / April 30, 2011
Table of Contents
| 146 | FINANCIAL HIGHLIGHTS (continued) |
For a share outstanding throughout each year ended April 30, unless otherwise noted:
| MTB INTERMEDIATE-TERM BOND FUND – (continued) | ||||||||||||||||||||
| INSTITUTIONAL I SHARES | 2011 | 2010 | 2009 | 2008 | 2007 | |||||||||||||||
| Net Asset Value, Beginning of Period | $10.64 | $ 9.96 | $ 9.97 | $ 9.81 | $ 9.64 | |||||||||||||||
| Income (Loss) From Operations: | ||||||||||||||||||||
Net Investment Income(c) | 0.38 | 0.47 | 0.43 | 0.42 | 0.44 | |||||||||||||||
Net Realized and Unrealized Gain (Loss) | 0.24 | 0.67 | (0.01 | ) | 0.16 | 0.17 | ||||||||||||||
| Total Income (Loss) From Operations | 0.62 | 1.14 | 0.42 | 0.58 | 0.61 | |||||||||||||||
| Less Distributions From: | ||||||||||||||||||||
Net Investment Income | (0.39 | ) | (0.46 | ) | (0.43 | ) | (0.42 | ) | (0.44 | ) | ||||||||||
Net Realized Gains | (0.10 | ) | — | — | — | — | ||||||||||||||
| Total Distributions | (0.49 | ) | (0.46 | ) | (0.43 | ) | (0.42 | ) | (0.44 | ) | ||||||||||
| Net Asset Value, End of Period | $10.77 | $10.64 | $ 9.96 | $ 9.97 | $ 9.81 | |||||||||||||||
| Total Return(a) | 5.96 | % | 11.62 | % | 4.35 | % | 6.01 | % | 6.42 | % | ||||||||||
| Net Assets, End of Period (000’s) | $107,625 | $122,553 | $126,742 | $178,343 | $195,560 | |||||||||||||||
| Ratios to Average Net Assets | ||||||||||||||||||||
Gross Expense | 1.17 | % | 1.15 | % | 1.09 | % | 1.11 | % | 1.11 | % | ||||||||||
Net Expenses(b) | 0.66 | % | 0.63 | % | 0.63 | % | 0.70 | % | 0.73 | % | ||||||||||
Net Investment Income | 3.54 | % | 4.49 | % | 4.31 | % | 4.27 | % | 4.44 | % | ||||||||||
| Portfolio Turnover Rate | 485 | % | 164 | % | 191 | % | 279 | % | 189 | % | ||||||||||
| (a) | Based on net asset value, which does not reflect the sales charge, redemption fee or contingent deferred sales charge, if applicable. Total returns for periods of less than one year, if any, are not annualized. |
| (b) | The investment advisor and other service providers waived or reimbursed a portion of their fees. |
| (c) | Per share numbers have been calculated using the average shares method. |
| (d) | Reflects investment operations for the period from April 5, 2010 to April 30, 2010. |
| (e) | Annualized for periods less than one year. |
| (f) | Reflects portfolio turnover for the Fund for the year ended April 30, 2010. |
See Notes which are an integral part of the Financial Statements
(Financial Highlights continued next page)
April 30, 2011 / ANNUAL REPORT
Table of Contents
| FINANCIAL HIGHLIGHTS (continued) | 147 |
For a share outstanding throughout each year ended April 30, unless otherwise noted:
| MTB INCOME FUND | ||||||||||||||||||||
| CLASS A SHARES | 2011 | 2010 | 2009 | 2008 | 2007 | |||||||||||||||
| Net Asset Value, Beginning of Period | $10.05 | $ 9.24 | $ 9.77 | $ 9.84 | $ 9.66 | |||||||||||||||
| Income (Loss) From Operations: | ||||||||||||||||||||
Net Investment Income | 0.38 | (c) | 0.39 | (c) | 0.45 | (c) | 0.46 | (c) | 0.44 | |||||||||||
Net Realized and Unrealized Gain (Loss) | 0.26 | 0.81 | (0.54 | ) | (0.08 | ) | 0.20 | |||||||||||||
| Total Income (Loss) From Operations | 0.64 | 1.20 | (0.09 | ) | 0.38 | 0.64 | ||||||||||||||
| Less Distributions From: | ||||||||||||||||||||
Net Investment Income | (0.38 | ) | (0.39 | ) | (0.44 | ) | (0.45 | ) | (0.45 | ) | ||||||||||
Net Realized Gains | (0.15 | ) | — | — | — | (0.01 | ) | |||||||||||||
| Total Distributions | (0.53 | ) | (0.39 | ) | (0.44 | ) | (0.45 | ) | (0.46 | ) | ||||||||||
| Net Asset Value, End of Period | $10.16 | $10.05 | $ 9.24 | $ 9.77 | $ 9.84 | |||||||||||||||
| Total Return(a) | 6.50 | % | 13.13 | % | (0.84 | )% | 3.93 | % | 6.73 | % | ||||||||||
| Net Assets, End of Period (000’s) | $6,602 | $6,289 | $5,681 | $5,572 | $6,381 | |||||||||||||||
| Ratios to Average Net Assets | ||||||||||||||||||||
Gross Expense | 1.28 | % | 1.26 | % | 1.32 | % | 1.29 | % | 1.31 | % | ||||||||||
Net Expenses(b) | 1.00 | % | 0.84 | % | 0.78 | % | 0.88 | % | 0.99 | % | ||||||||||
Net Investment Income | 3.76 | % | 4.00 | % | 4.75 | % | 4.66 | % | 4.61 | % | ||||||||||
| Portfolio Turnover Rate | 128 | % | 142 | % | 93 | % | 152 | % | 79 | % | ||||||||||
| INSTITUTIONAL I SHARES | 2011 | 2010 | 2009 | 2008 | 2007 | |||||||||||||||
| Net Asset Value, Beginning of Period | $9.90 | $ 9.10 | $ 9.63 | $ 9.71 | $ 9.53 | |||||||||||||||
| Income (Loss) From Operations: | ||||||||||||||||||||
Net Investment Income | 0.41 | (c) | 0.40 | (c) | 0.43 | (c) | 0.48 | (c) | 0.46 | |||||||||||
Net Realized and Unrealized Gain (Loss) | 0.26 | 0.80 | (0.50 | ) | (0.10 | ) | 0.19 | |||||||||||||
| Total Income (Loss) From Operations | 0.67 | 1.20 | (0.07 | ) | 0.38 | 0.65 | ||||||||||||||
| Less Distributions From: | ||||||||||||||||||||
Net Investment Income | (0.41 | ) | (0.40 | ) | (0.46 | ) | (0.46 | ) | (0.46 | ) | ||||||||||
Net Realized Gains | (0.15 | ) | — | — | — | (0.01 | ) | |||||||||||||
| Total Distributions | (0.56 | ) | (0.40 | ) | (0.46 | ) | (0.46 | ) | (0.47 | ) | ||||||||||
| Net Asset Value, End of Period | $10.01 | $ 9.90 | $ 9.10 | $ 9.63 | $ 9.71 | |||||||||||||||
| Total Return(a) | 6.93 | % | 13.39 | % | (0.71 | )% | 4.03 | % | 7.03 | % | ||||||||||
| Net Assets, End of Period (000’s) | $209,386 | $205,794 | $159,120 | $91,416 | $115,486 | |||||||||||||||
| Ratios to Average Net Assets | ||||||||||||||||||||
Gross Expense | 1.03 | % | 1.01 | % | 1.06 | % | 1.04 | % | 1.06 | % | ||||||||||
Net Expenses(b) | 0.66 | % | 0.64 | % | 0.64 | % | 0.73 | % | 0.79 | % | ||||||||||
Net Investment Income | 4.12 | % | 4.21 | % | 4.83 | % | 4.80 | % | 4.81 | % | ||||||||||
| Portfolio Turnover Rate | 128 | % | 142 | % | 93 | % | 152 | % | 79 | % | ||||||||||
| (a) | Based on net asset value, which does not reflect the sales charge, redemption fee or contingent deferred sales charge, if applicable. Total returns for periods of less than one year, if any, are not annualized. |
| (b) | The investment advisor and other service providers waived or reimbursed a portion of their fees. |
| (c) | Per share numbers have been calculated using the average shares method. |
See Notes which are an integral part of the Financial Statements
(Financial Highlights continued next page)
ANNUAL REPORT / April 30, 2011
Table of Contents
| 148 | FINANCIAL HIGHLIGHTS (continued) |
For a share outstanding throughout each year ended April 30, unless otherwise noted:
| MTB STRATEGIC ALLOCATION FUND | ||||||||||||||||||||
| CLASS A SHARES | 2011(d) | 2010(d) | 2009(d) | 2008(d) | 2007(d) | |||||||||||||||
| Net Asset Value, Beginning of Period | $ 8.62 | $ 6.72 | $10.07 | $10.67 | $10.47 | |||||||||||||||
| Income (Loss) From Operations: | ||||||||||||||||||||
Net Investment Income(c) | 0.10 | 0.04 | 0.10 | 0.10 | 0.12 | |||||||||||||||
Net Realized and Unrealized Gain (Loss) | 1.13 | 1.87 | (2.82 | ) | (0.19 | ) | 0.87 | |||||||||||||
| Total Income (Loss) From Operations | 1.23 | 1.91 | (2.72 | ) | (0.09 | ) | 0.99 | |||||||||||||
| Less Distributions From: | ||||||||||||||||||||
Net Investment Income | (0.12 | ) | (0.01 | ) | (0.10 | ) | (0.16 | ) | (0.22 | ) | ||||||||||
Net Realized Gains | (0.03 | ) | — | (0.53 | ) | (0.35 | ) | (0.57 | ) | |||||||||||
| Total Distributions | (0.15 | ) | (0.01 | ) | (0.63 | ) | (0.51 | ) | (0.79 | ) | ||||||||||
| Net Asset Value, End of Period | $ 9.70 | $ 8.62 | $ 6.72 | $10.07 | $10.67 | |||||||||||||||
| Total Return(a) | 14.54 | % | 28.39 | % | (26.61 | )% | (0.93 | )% | 9.80 | % | ||||||||||
| Net Assets, End of Period (000’s) | $75,554 | $21,822 | $21,871 | $36,868 | $41,963 | |||||||||||||||
| Ratios to Average Net Assets | ||||||||||||||||||||
Gross Expense(h) | 1.51 | % | 1.39 | % | 1.48 | % | 1.20 | % | 1.14 | % | ||||||||||
Net Expenses(b)(h) | 0.73 | % | 0.83 | % | 0.86 | % | 0.88 | % | 0.89 | % | ||||||||||
Net Investment Income | 0.97 | % | 0.46 | % | 1.31 | % | 0.98 | % | 1.20 | % | ||||||||||
| Portfolio Turnover Rate | 55 | % | 10 | % | 42 | % | 21 | % | 22 | % | ||||||||||
| INSTITUTIONAL I SHARES | 2011(g) | |||||||||||||||||||
| Net Asset Value, Beginning of Period | $ 8.08 | |||||||||||||||||||
| Income (Loss) From Operations: | ||||||||||||||||||||
Net Investment Income(c) | 0.10 | |||||||||||||||||||
Net Realized and Unrealized Gain (Loss) | 1.66 | |||||||||||||||||||
| Total Income (Loss) From Operations | 1.76 | |||||||||||||||||||
| Less Distributions From: | ||||||||||||||||||||
Net Investment Income | (0.11 | ) | ||||||||||||||||||
Net Realized Gains | (0.03 | ) | ||||||||||||||||||
| Total Distributions | (0.14 | ) | ||||||||||||||||||
| Net Asset Value, End of Period | $9.70 | |||||||||||||||||||
| Total Return(a) | 22.07 | % | ||||||||||||||||||
| Net Assets, End of Period (000’s) | $3,426 | |||||||||||||||||||
| Ratios to Average Net Assets | ||||||||||||||||||||
Gross Expense(h) | 1.44 | %(e) | ||||||||||||||||||
Net Expenses(b)(h) | 0.67 | %(e) | ||||||||||||||||||
Net Investment Income | 1.25 | %(e) | ||||||||||||||||||
| Portfolio Turnover Rate | 55 | %(f) | ||||||||||||||||||
| (a) | Based on net asset value, which does not reflect the sales charge, redemption fee or contingent deferred sales charge, if applicable. Total returns for periods of less than one year, if any, are not annualized. |
| (b) | The investment advisor and other service providers waived or reimbursed a portion of their fees. |
| (c) | Per share numbers have been calculated using the average shares method. |
| (d) | Effective June 11, 2010, shareholders of the former Managed Allocation Fund—Aggressive Growth, Managed Allocation Fund—Moderate Growth, and Managed Allocation Fund—Conservative Growth became owners of the Strategic Allocation Fund in a plan of reorganization. See Note 8. Additionally, the accounting and performance history of the Managed Allocation Fund—Moderate Growth Fund was redesignated as that of the Strategic Allocation Fund for Class A for periods prior to June 14, 2010. |
| (e) | Annualized for periods less than one year. |
| (f) | Reflects portfolio turnover for the Fund for the year ended April 30, 2011. |
| (g) | For the period from June 11, 2010 (commencement of operations) to April 30, 2011. |
| (h) | The Fund invests in other underlying funds and indirectly bears its proportionate share of fees and expenses incurred by the underlying funds in which the Fund is invested. This ratio does not include these indirect fees and expenses. |
See Notes which are an integral part of the Financial Statements
(Financial Highlights continued next page)
April 30, 2011 / ANNUAL REPORT
Table of Contents
| FINANCIAL HIGHLIGHTS (continued) | 149 |
For a share outstanding throughout each year ended April 30, unless otherwise noted:
| MTB LARGE CAP VALUE FUND | ||||||||||||||||||||
| CLASS A SHARES | 2011 | 2010 | 2009 | 2008 | 2007 | |||||||||||||||
| Net Asset Value, Beginning of Period | $9.85 | $ 7.03 | $11.32 | $13.41 | $12.44 | |||||||||||||||
| Income (Loss) From Operations: | ||||||||||||||||||||
Net Investment Income | 0.01 | (c) | 0.04 | (c) | 0.19 | (c) | 0.12 | (c) | 0.12 | |||||||||||
Net Realized and Unrealized Gain (Loss) | 1.64 | 2.83 | (4.30 | ) | (1.35 | ) | 1.80 | |||||||||||||
| Total Income (Loss) From Operations | 1.65 | 2.87 | (4.11 | ) | (1.23 | ) | 1.92 | |||||||||||||
| Less Distributions From: | ||||||||||||||||||||
Net Investment Income | (0.03 | ) | (0.05 | ) | (0.15 | ) | (0.12 | ) | (0.12 | ) | ||||||||||
Return of Capital | — | (0.00 | )(d) | — | — | — | ||||||||||||||
Net Realized Gains | — | — | (0.03 | ) | (0.74 | ) | (0.83 | ) | ||||||||||||
| Total Distributions | (0.03 | ) | (0.05 | ) | (0.18 | ) | (0.86 | ) | (0.95 | ) | ||||||||||
| Net Asset Value, End of Period | $11.47 | $ 9.85 | $ 7.03 | $11.32 | $13.41 | |||||||||||||||
| Total Return(a) | 16.79 | % | 41.02 | % | (36.53 | )% | (9.56 | )% | 16.10 | % | ||||||||||
| Net Assets, End of Period (000’s) | $7,315 | $6,606 | $5,027 | $40,021 | $39,023 | |||||||||||||||
| Ratios to Average Net Assets | ||||||||||||||||||||
Gross Expense | 1.43 | % | 1.42 | % | 1.34 | % | 1.31 | % | 1.21 | % | ||||||||||
Net Expenses(b) | 1.31 | % | 1.15 | % | 0.53 | % | 1.03 | % | 0.93 | % | ||||||||||
Net Investment Income | 0.09 | % | 0.41 | % | 2.30 | % | 0.93 | % | 0.94 | % | ||||||||||
| Portfolio Turnover Rate | 26 | % | 29 | % | 34 | % | 17 | % | 18 | % | ||||||||||
| INSTITUTIONAL I SHARES | 2011 | 2010 | 2009 | 2008 | 2007 | |||||||||||||||
| Net Asset Value, Beginning of Period | $9.88 | $ 7.05 | $11.34 | $13.41 | $12.45 | |||||||||||||||
| Income (Loss) From Operations: | ||||||||||||||||||||
Net Investment Income | 0.05 | (c) | 0.05 | (c) | 0.13 | (c) | 0.13 | (c) | 0.11 | |||||||||||
Net Realized and Unrealized Gain (Loss) | 1.63 | 2.84 | (4.26 | ) | (1.34 | ) | 1.79 | |||||||||||||
| Total Income (Loss) From Operations | 1.68 | 2.89 | (4.13 | ) | (1.21 | ) | 1.90 | |||||||||||||
| Less Distributions From: | ||||||||||||||||||||
Net Investment Income | (0.05 | ) | (0.06 | ) | (0.13 | ) | (0.12 | ) | (0.11 | ) | ||||||||||
Return of Capital | — | (0.00 | )(d) | — | — | — | ||||||||||||||
Net Realized Gains | — | — | (0.03 | ) | (0.74 | ) | (0.83 | ) | ||||||||||||
| Total Distributions | (0.05 | ) | (0.06 | ) | (0.16 | ) | (0.86 | ) | (0.94 | ) | ||||||||||
| Net Asset Value, End of Period | $11.51 | $ 9.88 | $ 7.05 | $11.34 | $13.41 | |||||||||||||||
| Total Return(a) | 17.08 | % | 41.23 | % | (36.62 | )% | (9.42 | )% | 15.92 | % | ||||||||||
| Net Assets, End of Period (000’s) | $175,440 | $156,442 | $117,108 | $121,163 | $133,496 | |||||||||||||||
| Ratios to Average Net Assets | ||||||||||||||||||||
Gross Expense | 1.18 | % | 1.17 | % | 1.13 | % | 1.13 | % | 1.14 | % | ||||||||||
Net Expenses(b) | 1.02 | % | 0.99 | % | 0.96 | % | 0.97 | % | 1.00 | % | ||||||||||
Net Investment Income | 0.48 | % | 0.57 | % | 1.55 | % | 0.99 | % | 0.88 | % | ||||||||||
| Portfolio Turnover Rate | 26 | % | 29 | % | 34 | % | 17 | % | 18 | % | ||||||||||
| (a) | Based on net asset value, which does not reflect the sales charge, redemption fee or contingent deferred sales charge, if applicable. Total returns for periods of less one year, if any, are not annualized. |
| (b) | The investment advisor and other service providers waived or reimbursed a portion of their fees. |
| (c) | Per share numbers have been calculated using the average shares method. |
| (d) | Represents less than $0.01. |
See Notes which are an integral part of the Financial Statements
(Financial Highlights continued next page)
ANNUAL REPORT / April 30, 2011
Table of Contents
| 150 | FINANCIAL HIGHLIGHTS (continued) |
For a share outstanding throughout each year ended April 30, unless otherwise noted:
| MTB LARGE CAP GROWTH FUND | ||||||||||||||||||||
| CLASS A SHARES | 2011 | 2010 | 2009 | 2008 | 2007 | |||||||||||||||
| Net Asset Value, Beginning of Period | $8.09 | $5.80 | $ 8.75 | $ 9.29 | $ 8.30 | |||||||||||||||
| Income (Loss) From Operations: | ||||||||||||||||||||
Net Investment Income (Loss)(c) | (0.05 | ) | 0.00 | (d) | (0.01 | ) | 0.00 | (d) | 0.01 | |||||||||||
Net Realized and Unrealized Gain (Loss) | 1.51 | 2.29 | (2.93 | ) | (0.27 | ) | 0.98 | |||||||||||||
| Total Income (Loss) From Operations | 1.46 | 2.29 | (2.94 | ) | (0.27 | ) | 0.99 | |||||||||||||
| Less Distributions From: | ||||||||||||||||||||
Net Investment Income | (0.01 | ) | (0.00 | )(d) | (0.01 | ) | (0.02 | ) | — | |||||||||||
Net Realized Gains | — | — | — | (0.25 | ) | — | ||||||||||||||
Return of Capital | — | — | — | (0.00 | )(d) | — | ||||||||||||||
| Total Distributions | (0.01 | ) | — | (0.01 | ) | (0.27 | ) | — | ||||||||||||
| Net Asset Value, End of Period | $9.54 | $8.09 | $ 5.80 | $ 8.75 | $ 9.29 | |||||||||||||||
| Total Return(a) | 18.00 | % | 39.52 | % | (33.56 | )% | (3.09 | )% | 11.93 | % | ||||||||||
| Net Assets, End of Period (000’s) | $22,790 | $20,790 | $15,714 | $1,858 | $1,987 | |||||||||||||||
| Ratios to Average Net Assets | ||||||||||||||||||||
Gross Expense | 1.66 | % | 1.64 | % | 1.53 | % | 1.63 | % | 1.71 | % | ||||||||||
Net Expenses(b) | 1.42 | % | 1.29 | % | 1.23 | % | 1.31 | % | 1.32 | % | ||||||||||
Net Investment Income (Loss) | (0.58 | )% | (0.06 | )% | (0.16 | )% | 0.05 | % | 0.16 | % | ||||||||||
| Portfolio Turnover Rate | 61 | % | 83 | % | 138 | % | 76 | % | 56 | % | ||||||||||
| INSTITUTIONAL I SHARES | 2011 | 2010 | 2009 | 2008 | 2007 | |||||||||||||||
| Net Asset Value, Beginning of Period | $8.09 | $ 5.80 | $ 8.75 | $ 9.28 | $ 8.30 | |||||||||||||||
| Income (Loss) From Operations: | ||||||||||||||||||||
Net Investment Income(c) | 0.02 | 0.01 | 0.02 | 0.01 | 0.03 | |||||||||||||||
Net Realized and Unrealized Gain (Loss) | 1.47 | 2.29 | (2.95 | ) | (0.27 | ) | 0.97 | |||||||||||||
| Total Income (Loss) From Operations | 1.49 | 2.30 | (2.93 | ) | (0.26 | ) | 1.00 | |||||||||||||
| Less Distributions From: | ||||||||||||||||||||
Net Investment Income | (0.02 | ) | (0.01 | ) | (0.02 | ) | (0.02 | ) | (0.02 | ) | ||||||||||
Net Realized Gains | — | — | — | (0.25 | ) | — | ||||||||||||||
Return of Capital | — | — | — | (0.00 | )(d) | — | ||||||||||||||
| Total Distributions | (0.02 | ) | (0.01 | ) | (0.02 | ) | (0.27 | ) | (0.02 | ) | ||||||||||
| Net Asset Value, End of Period | $ 9.56 | $ 8.09 | $ 5.80 | $ 8.75 | $ 9.28 | |||||||||||||||
| Total Return(a) | 18.40 | % | 39.72 | % | (33.47 | )% | (2.97 | )% | 12.09 | % | ||||||||||
| Net Assets, End of Period (000’s) | $123,247 | $121,608 | $92,658 | $69,988 | $49,283 | |||||||||||||||
| Ratios to Average Net Assets | ||||||||||||||||||||
Gross Expense | 1.41 | % | 1.39 | % | 1.36 | % | 1.38 | % | 1.46 | % | ||||||||||
Net Expenses(b) | 1.03 | % | 1.10 | % | 1.13 | % | 1.17 | % | 1.15 | % | ||||||||||
Net Investment Income | 0.25 | % | 0.14 | % | 0.30 | % | 0.16 | % | 0.30 | % | ||||||||||
| Portfolio Turnover Rate | 61 | % | 83 | % | 138 | % | 76 | % | 56 | % | ||||||||||
| (a) | Based on net asset value, which does not reflect the sales charge, redemption fee or contingent deferred sales charge, if applicable. Total returns for periods of less than one year, if any, are not annualized. |
| (b) | The investment advisor and other service providers waived or reimbursed a portion of their fees. |
| (c) | Per share numbers have been calculated using the average shares method. |
| (d) | Represents less than $0.01. |
See Notes which are an integral part of the Financial Statements
(Financial Highlights continued next page)
April 30, 2011 / ANNUAL REPORT
Table of Contents
| FINANCIAL HIGHLIGHTS (continued) | 151 |
For a share outstanding throughout each year ended April 30, unless otherwise noted:
| MTB MID CAP GROWTH FUND | ||||||||||||||||||||
| CLASS A SHARES | 2011 | 2010 | 2009 | 2008 | 2007 | |||||||||||||||
| Net Asset Value, Beginning of Period | $12.24 | $ 8.37 | $13.43 | $15.05 | $16.29 | |||||||||||||||
| Income (Loss) From Operations: | ||||||||||||||||||||
Net Investment Income (Loss)(c) | (0.11 | ) | (0.05 | ) | (0.01 | ) | (0.09 | ) | (0.07 | ) | ||||||||||
Net Realized and Unrealized Gain (Loss) | 4.08 | 3.93 | (4.74 | ) | 0.74 | 0.99 | ||||||||||||||
| Total Income (Loss) From Operations | 3.97 | 3.88 | (4.75 | ) | 0.65 | 0.92 | ||||||||||||||
| Less Distributions From: | ||||||||||||||||||||
Net Investment Income | — | (0.01 | ) | — | — | — | ||||||||||||||
Return of Capital | — | (0.00 | )(d) | — | — | — | ||||||||||||||
Net Realized Gains | — | — | (0.31 | ) | (2.27 | ) | (2.16 | ) | ||||||||||||
| Total Distributions | — | (0.01 | ) | (0.31 | ) | (2.27 | ) | (2.16 | ) | |||||||||||
| Net Asset Value, End of Period | $16.21 | $12.24 | $ 8.37 | $13.43 | $15.05 | |||||||||||||||
| Total Return(a) | 32.43 | % | 46.30 | % | (34.75 | )% | 4.48 | % | 6.64 | % | ||||||||||
| Net Assets, End of Period (000’s) | $63,168 | $40,438 | $19,638 | $6,314 | $6,930 | |||||||||||||||
| Ratios to Average Net Assets | ||||||||||||||||||||
Gross Expense | 1.62 | % | 1.62 | % | 1.59 | % | 1.66 | % | 1.64 | % | ||||||||||
Net Expenses(b) | 1.24 | % | 1.13 | % | 1.08 | % | 1.25 | % | 1.29 | % | ||||||||||
Net Investment Income (Loss) | (0.85 | )% | (0.51 | )% | (0.10 | )% | (0.60 | )% | (0.51 | )% | ||||||||||
| Portfolio Turnover Rate | 34 | % | 56 | % | 90 | % | 58 | % | 75 | % | ||||||||||
| INSTITUTIONAL I SHARES | 2011 | 2010 | 2009 | 2008 | 2007 | |||||||||||||||
| Net Asset Value, Beginning of Period | $12.49 | $ 8.54 | $13.66 | $15.25 | $16.45 | |||||||||||||||
| Income (Loss) From Operations: | ||||||||||||||||||||
Net Investment Income (Loss)(c) | (0.07 | ) | (0.04 | ) | 0.02 | (0.07 | ) | (0.05 | ) | |||||||||||
Net Realized and Unrealized Gain (Loss) | 4.15 | 4.00 | (4.83 | ) | 0.75 | 1.01 | ||||||||||||||
| Total Income (Loss) From Operations | 4.08 | 3.96 | (4.81 | ) | 0.68 | 0.96 | ||||||||||||||
| Less Distributions From: | ||||||||||||||||||||
Net Investment Income | — | (0.01 | ) | — | — | — | ||||||||||||||
Return of Capital | — | (0.00 | )(d) | — | — | — | ||||||||||||||
Net Realized Gains | — | — | (0.31 | ) | (2.27 | ) | (2.16 | ) | ||||||||||||
| Total Distributions | — | (0.01 | ) | (0.31 | ) | (2.27 | ) | (2.16 | ) | |||||||||||
| Net Asset Value, End of Period | $16.57 | $12.49 | $ 8.54 | $13.66 | $15.25 | |||||||||||||||
| Total Return(a) | 32.67 | % | 46.37 | % | (34.60 | )% | 4.63 | % | 6.83 | % | ||||||||||
| Net Assets, End of Period (000’s) | $187,207 | $143,594 | $95,447 | $68,897 | $53,180 | |||||||||||||||
| Ratios to Average Net Assets | ||||||||||||||||||||
Gross Expense | 1.37 | % | 1.36 | % | 1.39 | % | 1.41 | % | 1.39 | % | ||||||||||
Net Expenses(b) | 1.06 | % | 0.96 | % | 0.94 | % | 1.11 | % | 1.14 | % | ||||||||||
Net Investment Income (Loss) | (0.54 | )% | (0.33 | )% | 0.18 | % | (0.49 | )% | (0.35 | )% | ||||||||||
| Portfolio Turnover Rate | 34 | % | 56 | % | 90 | % | 58 | % | 75 | % | ||||||||||
| (a) | Based on net asset value, which does not reflect the sales charge, redemption fee or contingent deferred sales charge, if applicable. Total returns for periods of less than one year, if any, are not annualized. |
| (b) | The investment advisor and other service providers waived or reimbursed a portion of their fees. |
| (c) | Per share numbers have been calculated using the average shares method. |
| (d) | Represents less than $0.01. |
See Notes which are an integral part of the Financial Statements
(Financial Highlights continued next page)
ANNUAL REPORT / April 30, 2011
Table of Contents
| 152 | FINANCIAL HIGHLIGHTS (continued) |
For a share outstanding throughout each year ended April 30, unless otherwise noted:
| MTB SMALL CAP GROWTH FUND | ||||||||||||||||||||
| CLASS A SHARES | 2011 | 2010 | 2009 | 2008 | 2007 | |||||||||||||||
| Net Asset Value, Beginning of Period | $14.48 | $ 9.99 | $15.53 | $19.40 | $21.07 | |||||||||||||||
| Income (Loss) From Operations: | ||||||||||||||||||||
Net Investment Income (Loss)(c) | (0.21 | ) | (0.12 | ) | (0.06 | ) | (0.17 | ) | (0.13 | ) | ||||||||||
Net Realized and Unrealized Gain (Loss) | 3.93 | 4.61 | (5.48 | ) | (0.65 | ) | 1.59 | |||||||||||||
| Total Income (Loss) From Operations | 3.72 | 4.49 | (5.54 | ) | (0.82 | ) | 1.46 | |||||||||||||
| Less Distributions From: | ||||||||||||||||||||
Net Investment Income | — | — | — | — | — | |||||||||||||||
Net Realized Gains | — | — | — | (3.05 | ) | (3.13 | ) | |||||||||||||
| Total Distributions | — | — | — | (3.05 | ) | (3.13 | ) | |||||||||||||
| Net Asset Value, End of Period | $18.20 | $14.48 | $ 9.99 | $15.53 | $19.40 | |||||||||||||||
| Total Return(a) | 25.69 | % | 44.94 | % | (35.67 | )% | (5.26 | )% | 8.08 | % | ||||||||||
| Net Assets, End of Period (000’s) | $47,884 | $41,276 | $29,935 | $47,294 | $55,406 | |||||||||||||||
| Ratios to Average Net Assets | ||||||||||||||||||||
Gross Expense | 1.67 | % | 1.70 | % | 1.66 | % | 1.62 | % | 1.61 | % | ||||||||||
Net Expenses(b) | 1.45 | % | 1.30 | % | 1.26 | % | 1.31 | % | 1.31 | % | ||||||||||
Net Investment Income (Loss) | (1.43 | )% | (0.98 | )% | (0.49 | )% | (0.93 | )% | (0.68 | )% | ||||||||||
| Portfolio Turnover Rate | 393 | % | 635 | % | 865 | % | 600 | % | 452 | % | ||||||||||
| CLASS C SHARES | 2011 | 2010 | 2009 | 2008 | 2007 | |||||||||||||||
| Net Asset Value, Beginning of Period | $13.97 | $ 9.61 | $14.93 | $18.75 | $20.47 | |||||||||||||||
| Income (Loss) From Operations: | ||||||||||||||||||||
Net Investment Income (Loss)(c) | (0.15 | ) | (0.09 | ) | (0.05 | ) | (0.15 | ) | (0.13 | ) | ||||||||||
Net Realized and Unrealized Gain (Loss) | 3.74 | 4.45 | (5.27 | ) | (0.63 | ) | 1.54 | |||||||||||||
| Total Income (Loss) From Operations | 3.59 | 4.36 | (5.32 | ) | (0.78 | ) | 1.41 | |||||||||||||
| Less Distributions From: | ||||||||||||||||||||
Net Investment Income | — | — | — | — | — | |||||||||||||||
Net Realized Gains | — | — | — | (3.04 | ) | (3.13 | ) | |||||||||||||
| Total Distributions | — | — | — | (3.04 | ) | (3.13 | ) | |||||||||||||
| Net Asset Value, End of Period | $17.56 | $13.97 | $ 9.61 | $14.93 | $18.75 | |||||||||||||||
| Total Return(a) | 25.79 | % | 45.27 | % | (35.63 | )% | (5.23 | )% | 8.06 | % | ||||||||||
| Net Assets, End of Period (000’s) | $357 | $325 | $210 | $299 | $287 | |||||||||||||||
| Ratios to Average Net Assets | ||||||||||||||||||||
Gross Expense | 2.17 | % | 2.20 | % | 2.62 | % | 1.47 | % | 1.39 | % | ||||||||||
Net Expenses(b) | 1.48 | % | 1.09 | % | 1.22 | % | 1.28 | % | 1.31 | % | ||||||||||
Net Investment Income (Loss) | (1.05 | )% | (0.75 | )% | (0.42 | )% | (0.89 | )% | (0.68 | )% | ||||||||||
| Portfolio Turnover Rate | 393 | % | 635 | % | 865 | % | 600 | % | 452 | % | ||||||||||
(Financial Highlights continued next page)
April 30, 2011 / ANNUAL REPORT
Table of Contents
| FINANCIAL HIGHLIGHTS (continued) | 153 |
For a share outstanding throughout each year ended April 30, unless otherwise noted:
| MTB SMALL CAP GROWTH FUND – (continued) | ||||||||||||||||||||
| INSTITUTIONAL I SHARES | 2011 | 2010 | 2009 | 2008 | 2007 | |||||||||||||||
| Net Asset Value, Beginning of Period | $14.89 | $10.26 | $15.94 | $19.83 | $21.44 | |||||||||||||||
| Income (Loss) From Operations: | ||||||||||||||||||||
Net Investment Income (Loss)(c) | (0.12 | ) | (0.10 | ) | (0.05 | ) | (0.15 | ) | (0.11 | ) | ||||||||||
Net Realized and Unrealized Gain (Loss) | 3.99 | 4.73 | (5.63 | ) | (0.67 | ) | 1.63 | |||||||||||||
| Total Income (Loss) From Operations | 3.87 | 4.63 | (5.68 | ) | (0.82 | ) | 1.52 | |||||||||||||
| Less Distributions From: | ||||||||||||||||||||
Net Investment Income | — | — | — | — | — | |||||||||||||||
Net Realized Gains | — | — | — | (3.07 | ) | (3.13 | ) | |||||||||||||
| Total Distributions | — | — | — | (3.07 | ) | (3.13 | ) | |||||||||||||
| Net Asset Value, End of Period | $18.76 | $14.89 | $10.26 | $15.94 | $19.83 | |||||||||||||||
| Total Return(a) | 25.99 | % | 45.13 | % | (35.63 | )% | (5.16 | )% | 8.22 | % | ||||||||||
| Net Assets, End of Period (000’s) | $148,560 | $130,502 | $93,014 | $141,074 | $126,882 | |||||||||||||||
| Ratios to Average Net Assets | ||||||||||||||||||||
Gross Expense | 1.42 | % | 1.45 | % | 1.43 | % | 1.38 | % | 1.38 | % | ||||||||||
Net Expenses(b) | 1.24 | % | 1.17 | % | 1.18 | % | 1.19 | % | 1.18 | % | ||||||||||
Net Investment Income (Loss) | (0.81 | )% | (0.84 | )% | (0.40 | )% | (0.81 | )% | (0.56 | )% | ||||||||||
| Portfolio Turnover Rate | 393 | % | 635 | % | 865 | % | 600 | % | 452 | % | ||||||||||
| (a) | Based on net asset value, which does not reflect the sales charge, redemption fee or contingent deferred sales charge, if applicable. Total returns for periods of less than one year, if any, are not annualized. |
| (b) | The investment advisor and other service providers waived or reimbursed a portion of their fees. |
| (c) | Per share numbers have been calculated using the average shares method. |
See Notes which are an integral part of the Financial Statements
(Financial Highlights continued next page)
ANNUAL REPORT / April 30, 2011
Table of Contents
| 154 | FINANCIAL HIGHLIGHTS (concluded) |
For a share outstanding throughout each year ended April 30, unless otherwise noted:
| MTB INTERNATIONAL EQUITY FUND | ||||||||||||||||||||
| CLASS A SHARES | 2011 | 2010 | 2009 | 2008 | 2007 | |||||||||||||||
| Net Asset Value, Beginning of Period | $8.43 | $ 6.24 | $12.18 | $13.75 | $12.26 | |||||||||||||||
| Income (Loss) From Operations: | ||||||||||||||||||||
Net Investment Income(c) | 0.08 | 0.08 | 0.18 | 0.17 | 0.16 | |||||||||||||||
Net Realized and Unrealized Gain (Loss) | 1.60 | 2.12 | (5.67 | ) | (0.44 | ) | 2.08 | |||||||||||||
| Total Income (Loss) From Operations | 1.68 | 2.20 | (5.49 | ) | (0.27 | ) | 2.24 | |||||||||||||
| Less Distributions From: | ||||||||||||||||||||
Net Investment Income | (0.08 | ) | (0.01 | ) | (0.15 | ) | (0.13 | ) | (0.12 | ) | ||||||||||
Net Realized Gains | — | — | (0.30 | ) | (1.17 | ) | (0.63 | ) | ||||||||||||
| Total Distributions | (0.08 | ) | (0.01 | ) | (0.45 | ) | (1.30 | ) | (0.75 | ) | ||||||||||
| Net Asset Value, End of Period | $10.03 | $ 8.43 | $ 6.24 | $12.18 | $13.75 | |||||||||||||||
| Total Return(a) | 20.16 | % | 35.06 | % | (44.87 | )% | (2.39 | )% | 18.89 | % | ||||||||||
| Net Assets, End of Period (000’s) | $7,965 | $7,129 | $5,691 | $11,709 | $13,245 | |||||||||||||||
| Ratios to Average Net Assets | ||||||||||||||||||||
Gross Expense | 1.73 | % | 1.72 | % | 1.69 | % | 1.69 | % | 1.85 | % | ||||||||||
Net Expenses(b) | 1.47 | % | 1.43 | % | 1.37 | % | 1.43 | % | 1.54 | % | ||||||||||
Net Investment Income | 0.91 | % | 0.98 | % | 2.21 | % | 1.25 | % | 1.30 | % | ||||||||||
| Portfolio Turnover Rate | 44 | % | 52 | % | 105 | % | 58 | % | 39 | % | ||||||||||
| INSTITUTIONAL I SHARES | 2011 | 2010 | 2009 | 2008 | 2007 | |||||||||||||||
| Net Asset Value, Beginning of Period | $8.36 | $ 6.19 | $12.09 | $13.64 | $12.17 | |||||||||||||||
| Income (Loss) From Operations: | ||||||||||||||||||||
Net Investment Income(c) | 0.10 | 0.09 | 0.18 | 0.18 | 0.17 | |||||||||||||||
Net Realized and Unrealized Gain (Loss) | 1.58 | 2.10 | (5.62 | ) | (0.42 | ) | 2.06 | |||||||||||||
| Total Income (Loss) From Operations | 1.68 | 2.19 | (5.44 | ) | (0.24 | ) | 2.23 | |||||||||||||
| Less Distributions From: | ||||||||||||||||||||
Net Investment Income | (0.09 | ) | (0.02 | ) | (0.16 | ) | (0.14 | ) | (0.13 | ) | ||||||||||
Net Realized Gains | — | — | (0.30 | ) | (1.17 | ) | (0.63 | ) | ||||||||||||
| Total Distributions | (0.09 | ) | (0.02 | ) | (0.46 | ) | (1.31 | ) | (0.76 | ) | ||||||||||
| Net Asset Value, End of Period | $9.95 | $ 8.36 | $ 6.19 | $12.09 | $13.64 | |||||||||||||||
| Total Return(a) | 20.24 | % | 35.33 | % | (44.84 | )% | (2.25 | )% | 18.93 | % | ||||||||||
| Net Assets, End of Period (000’s) | $234,926 | $196,459 | $153,106 | $273,900 | $244,088 | |||||||||||||||
| Ratios to Average Net Assets | ||||||||||||||||||||
Gross Expense | 1.48 | % | 1.47 | % | 1.46 | % | 1.45 | % | 1.62 | % | ||||||||||
Net Expenses(b) | 1.33 | % | 1.32 | % | 1.30 | % | 1.31 | % | 1.46 | % | ||||||||||
Net Investment Income | 1.19 | % | 1.10 | % | 2.27 | % | 1.42 | % | 1.33 | % | ||||||||||
| Portfolio Turnover Rate | 44 | % | 52 | % | 105 | % | 58 | % | 39 | % | ||||||||||
| (a) | Based on net asset value, which does not reflect the sales charge, redemption fee or contingent deferred sales charge, if applicable. Total returns for periods of less than one year, if any, are not annualized. |
| (b) | The investment advisor and other service providers waived or reimbursed a portion of their fees. |
| (c) | Per share numbers have been calculated using the average shares method. |
See Notes which are an integral part of the Financial Statements
April 30, 2011 / ANNUAL REPORT
Table of Contents
| NOTES TO FINANCIAL STATEMENTS | 155 |
| 1. | ORGANIZATION |
MTB Group of Funds (the “Trust”) is registered under the Investment Company Act of 1940, as amended (the “Act”), as an open-end management investment company. The Trust consists of
23 portfolios, 15 of which are presented herein (individually referred to as the “Fund” or collectively as the “Funds”). The remaining 8 funds (1 of which is only made available to variable annuity contracts) are presented in separate reports.
| Fund | Investment Goal | |
| MTB Short Duration Government Bond Fund (“Short Duration Government Bond Fund”)(d) | The Fund seeks to provide current income and secondarily, preservation of capital. | |
| MTB Short-Term Corporate Bond Fund (“Short-Term Corporate Bond Fund”)(d) | The Fund seeks to provide current income. | |
| MTB U.S. Government Bond Fund (“U.S. Government Bond Fund”)(d) | The Fund seeks to provide current income and secondarily, capital appreciation. | |
| MTB New York Municipal Bond Fund (“New York Municipal Bond Fund”)(n) | The Fund seeks to provide current income that is exempt from both federal and New York personal income taxes. | |
| MTB Pennsylvania Municipal Bond Fund (“Pennsylvania Municipal Bond Fund”)(n) | The Fund seeks to provide current income that is exempt from both federal and Pennsylvania state and local income taxes. | |
| MTB Maryland Municipal Bond Fund (“Maryland Municipal Bond Fund”)(n) | The Fund seeks to provide current income that is exempt from both federal and Maryland state and local income taxes. | |
| MTB Virginia Municipal Bond Fund (“Virginia Municipal Bond Fund”)(n) | The Fund seeks to provide current income that is exempt from both federal and Virginia state and local income taxes. | |
| MTB Intermediate-Term Bond Fund (“Intermediate-Term Bond Fund”)(d) | The Fund seeks to provide current income and secondarily, capital growth. | |
| MTB Income Fund (“Income Fund”)(d) | The Fund seeks to provide current income and secondarily, capital growth. | |
| MTB Strategic Allocation Fund (“Strategic Allocation Fund”)(d),* | The Fund seeks to provide total return. | |
| MTB Large Cap Value Fund (“Large Cap Value Fund”)(d) | The Fund seeks to provide long term capital appreciation and secondarily, current income. | |
| MTB Large Cap Growth Fund (“Large Cap Growth Fund”)(d) | The Fund seeks to provide long term capital appreciation. | |
| MTB Mid Cap Growth Fund (“Mid Cap Growth Fund”)(d) | The Fund seeks to provide long term capital appreciation. | |
| MTB Small Cap Growth Fund (“Small Cap Growth Fund”)(d) | The Fund seeks to provide long term capital appreciation. | |
| MTB International Equity Fund (“International Equity Fund”)(d) | The Fund seeks to provide long term capital appreciation, primarily through a diversified portfolio of non-U.S. equity securities. | |
| (d) | Diversified |
| (n) | Non-diversified |
| * | Information presented for periods prior to June 14, 2010 reflects the operating results of a predecessor portfolio of the Trust. See Note 8. |
The Trust offers 7 classes of shares: Class A Shares, Class A2 Shares (formerly Institutional Shares), Class C Shares, Class S Shares, Corporate Shares, Institutional I Shares and Institutional II Shares. All shares of the Trust have equal rights with respect to voting, except on class-specific matters.
At a meeting of the Board of Trustees (the “Board”, or the “Trustees”) of the Trust held on March 9, 2011, the Trustees approved the conversion of the Class B Shares of each Fund, into Class A Shares of the same Fund.
On April 1, 2011, Class B Shares of the Funds were terminated after the conversion into Class A Shares of the same Fund. The conversion was tax-free for federal income tax purposes, which means that former Class B shareholders will not have a taxable gain or loss on the conversion of their Class B Shares to Class A Shares. Class B Shares of each Fund have been closed to new investors since December 31, 2008.
The assets of each portfolio are segregated and a shareholder’s interest is limited to the portfolio in which shares are held.
| 2. | SUMMARY OF SIGNIFICANT ACCOUNTING POLICIES |
The following is a summary of significant accounting policies consistently followed by the Funds in the preparation of their financial statements. These policies are in conformity with U.S. generally accepted accounting principles (“GAAP”). The preparation of financial statements in conformity with GAAP requires management to make estimates and assumptions that affect the amounts of assets, liabilities, expenses and revenues reported in the financial statements. Actual results could differ from those estimated.
Investment Valuation – Fair value of the Funds’ portfolio securities are determined as follows:
| • | for equity securities, according to the last sale price or official closing price reported in the market in which they are primarily traded (either a national securities exchange or the over-the-counter market), if available; |
(continued on next page)
ANNUAL REPORT / April 30, 2011
Table of Contents
| 156 | NOTES TO FINANCIAL STATEMENTS |
| • | in the absence of recorded sales for equity securities, according to the mean between the last closing bid and asked prices; |
| • | futures contracts and options are generally valued at market values established by the exchanges on which they are traded at the close of trading on such exchanges. Options traded in the over-the-counter market are generally valued according to the mean between the last bid and the last asked price for the option as provided by an investment dealer or other financial institution that deals in the option. The Board may determine in good faith that another method of valuing such investments is necessary to appraise their fair value; |
| • | investments in other open-end regulated investment companies are valued at net asset value (“NAV”); |
| • | for fixed income securities, according to prices as furnished by an independent pricing service, except that fixed income securities with remaining maturities of less than 60 days at the time of purchase are valued at amortized cost; and |
| • | for all other securities at fair value as determined in accordance with procedures established by and under the general supervision of the Trustees. |
Trading in foreign securities may be completed at times which vary from the closing of the New York Stock Exchange (“NYSE”). In computing its NAV, the Funds value foreign securities using the latest closing price on the primary exchange on which they are traded immediately prior to the closing of the NYSE. Certain foreign currency exchange rates are generally determined at the latest rate prior to the closing of the NYSE. Foreign securities quoted in foreign currencies are translated into U.S. dollars at current rates. Events that affect these values and exchange rates may occur between the times at which they are determined and the closing of the NYSE. If such events materially affect the value of portfolio securities, these securities may be valued at their fair value as determined in good faith by the Trustees, although the actual calculation may be done by others. An event is considered material if there is both an affirmative expectation that the security’s value will change in response to the event and a reasonable basis for quantifying the resulting change in value.
The Trust follows the authoritative guidance for fair value measurements. The guidance establishes a framework for measuring fair value and a hierarchy for inputs used in measuring fair value that maximizes the use of observable inputs and minimizes the use of unobservable inputs by requiring that the most observable inputs be used when available. The guidance establishes three tiers of inputs that may be used to measure fair value. The three tiers of inputs are summarized at the end of each Fund’s Portfolio of Investments. The inputs or methodology used for valuing securities are not necessarily an indication of the risk associated with investing in those securities.
The Funds’ policy is to disclose significant transfers between Levels based on valuations at the beginning of the reporting period. Each portfolio may hold securities which are periodically fair valued in accordance with the Funds’ fair value procedures. This may result in movements between Levels 1, 2 and 3 throughout the period. At April 30, 2011, there were no significant transfers between Levels 1, 2 and 3 assets and liabilities. This does not include
transfers between Level 1 and Level 2 investments due to the MTB International Equity Fund utilizing international fair value pricing during the year.
In May 2011, the International Accounting Standards Board and the Financial Accounting Standards Board issued new guidance to improve and align fair value measurement and disclosure requirements. The guidance was issued as International Financial Reporting Standard (“IFRS”) 13, Fair Value Measurement, and Accounting Standards Update (“ASU”) No. 2011-04, Amendments to Achieve Common Fair Value Measurement and Disclosure Requirements in U.S. GAAP and IFRSs. IFRS 13 and ASU 2011-04 include common requirements for measurement of and disclosure about fair value between U.S. GAAP and IFRS. ASU 2011-04 will require reporting entities to make disclosures about amounts and reasons for all transfers in and out of Level 1 and Level 2 fair value measurements. In addition, ASU 2011-04 will require reporting entities to disclose the following information for fair value measurements categorized within Level 3 of the fair value hierarchy: quantitative information about the unobservable inputs used in the fair value measurement, the valuation processes used by the reporting entity and a narrative description of the sensitivity of the fair value measurement to changes in unobservable inputs and the interrelationships between those unobservable inputs. The new and revised disclosures are effective for interim and annual reporting periods beginning after December 15, 2011. Management is currently evaluating the implications of ASU No. 2011-04 and its impact on the financial statements.
Repurchase Agreements – Repurchase agreements are transactions in which a Fund buys a security from a dealer or bank and agrees to sell the security back at a mutually agreed upon time and price. The repurchase price exceeds the sale price, reflecting the Fund’s return on the transaction. It is each Fund’s policy to require the counterparty to a repurchase agreement to transfer to the Funds’ custodian or sub-custodian eligible securities or cash with a market value (after transaction costs) at least equal to the repurchase price to be paid under the repurchase agreement. The eligible securities are transferred to accounts with the custodian or sub-custodian in which the Funds hold a “securities entitlement” and exercise “control” as those terms are defined in the Uniform Commercial Code. The Funds have established procedures for monitoring the market value of the transferred securities and requiring the transfer of additional eligible securities if necessary to equal at least the repurchase price. These procedures also allow the counterparty to require securities to be transferred from the account to the extent that their market value exceeds the repurchase price or in exchange for other eligible securities of equivalent market value.
The insolvency of the counterparty or other failure to repurchase the securities may delay the disposition of the underlying securities or cause the Funds to receive less than the full repurchase price.
Investment Income, Gains and Losses, Expenses and Distributions – Interest income and expenses are accrued daily. Dividend income and distributions to shareholders are recorded on the ex-dividend date. Non-cash dividends included in dividend income, if any, are recorded at fair value. Foreign dividends are recorded on the ex-dividend date or when the Funds are informed of
(continued on next page)
April 30, 2011 / ANNUAL REPORT
Table of Contents
| NOTES TO FINANCIAL STATEMENTS | 157 |
the ex-dividend date. Inflation/deflation adjustments on Treasury Inflation-Protected Securities are included in interest income. Investment transactions are accounted for on a trade date for financial reporting purposes. Realized gains and losses from investment transactions are recorded on an identified cost basis.
Expenses of the Trust, which are directly identifiable to a specific Fund, are applied to that Fund. Expenses which are not identifiable to a specific Fund are allocated in such a manner as deemed equitable, taking into consideration the nature and type of expense.
All Funds offer multiple classes of shares. Investment income, realized and unrealized gains and losses, and certain fund-level expenses are allocated to each class based on relative daily net assets, except that each class bears certain expenses unique to that class such as distribution and shareholder services fees. Distributions are declared separately for each class. No class has preferential distribution rights; differences in per share distributions rates are generally due to differences in class specific expenses. Distribution from net investment income are declared and paid as follows:
| Fund | Dividends Declared | Dividends Paid | ||
| Short Duration Government Bond Fund | Daily | Monthly | ||
| Short-Term Corporate Bond Fund | Daily | Monthly | ||
| U.S. Government Bond Fund | Daily | Monthly | ||
| New York Municipal Bond Fund | Daily | Monthly | ||
| Pennsylvania Municipal Bond Fund | Daily | Monthly | ||
| Maryland Municipal Bond Fund | Daily | Monthly | ||
| Virginia Municipal Bond Fund | Daily | Monthly | ||
| Intermediate-Term Bond Fund | Daily | Monthly | ||
| Income Fund | Daily | Monthly | ||
| Strategic Allocation Fund | Quarterly | Quarterly | ||
| Large Cap Value Fund | Quarterly | Quarterly | ||
| Large Cap Growth Fund | Annually | Annually | ||
| Mid Cap Growth Fund | Annually | Annually | ||
| Small Cap Growth Fund | Annually | Annually | ||
| International Equity Fund | Annually | Annually |
Premium and Discount Amortization/Accretion and Paydown Gains and Losses – All premiums and discounts on fixed income securities are amortized/accreted for financial statement purposes. Gains and losses realized on principal payment of mortgage-backed securities (paydown gains and losses) are classified as part of investment income.
Federal Taxes – It is the Funds’ policy to comply with the Subchapter M provision of the Internal Revenue Code of 1986, as amended (the “Code”), and to distribute to shareholders each year substantially all of their income. Accordingly, no provisions for Federal income or excise tax are necessary.
Withholding taxes and where appropriate, deferred withholding taxes, on foreign interest, dividends and capital gains have been provided for in accordance with the applicable country’s tax rules and rates.
When-Issued and Delayed Delivery Transactions – The Funds may engage in when-issued or delayed delivery transactions. The Funds record when-issued securities on the trade date and maintain security positions such that sufficient liquid assets will be available to make payment for the securities purchased. Securities purchased
on a when-issued or delayed delivery basis are marked to market daily and begin earning interest on the settlement date. Losses may occur on these transactions due to changes in market conditions or the failure of counterparties to perform under the contract.
The Funds may transact in “To Be Announced Securities” (“TBAs”). As with other delayed delivery transactions, a seller agrees to issue TBAs at a future date. However, the seller does not specify the particular securities to be delivered. Instead, the Funds agree to accept any security that meets specified criteria. For example, in a TBA mortgage transaction, the Fund and seller would agree upon the issuer, interest rate and terms of the underlying mortgages. The Funds record TBAs on the trade date utilizing information associated with the specified terms of the transaction as opposed to the specific mortgages. TBAs are marked to market daily and begin earning interest on the settlement date. Losses may occur due to the fact that the actual underlying mortgages received may be less favorable than those anticipated by the Funds.
Foreign Exchange Contracts – The International Equity Fund may enter into foreign currency commitments or foreign currency exchange transactions. The Fund may enter into foreign currency contract transactions to protect assets against adverse changes in foreign currency exchange rates or exchange control regulations. Purchased contracts are used to acquire exposure to foreign currencies; whereas, contracts to sell are used to hedge the Fund’s securities against currency fluctuations. Risks may arise upon entering into these transactions from the potential inability of counterparties to meet the terms of their commitments and from unanticipated movements in security prices or foreign exchange rates. The foreign currency transactions are adjusted by the daily exchange rate of the underlying currency and any gains or losses are recorded for financial statement purposes as unrealized until the settlement date.
Foreign Currency Translation – The accounting records of the International Equity Fund are maintained in U.S. dollars. All assets and liabilities denominated in foreign currencies (“FCs”) are translated into U.S. dollars based on the rates of exchange of such currencies against U.S. dollars on the date of valuation. Purchases and sales of securities, income and expenses are translated at the rate of exchange quoted on the respective date that such transactions are recorded. The Fund does not isolate that portion of results of operations resulting from changes in foreign exchange rates on investments from fluctuations arising from changes in market prices of securities held. Such fluctuations are included with the net realized and unrealized gain or loss from investments.
Reported net realized foreign exchange gains or losses arise from sales of portfolio securities, sales and maturities of short-term securities, sales of FCs, currency gains or losses realized between the trade and settlement dates on securities transactions, the difference between the amounts of dividends, interest, and foreign withholding taxes recorded on the Fund’s books and the U.S. dollar equivalent of the amounts actually received or paid. Net unrealized foreign exchange gains and losses arise from changes in the value of assets and liabilities other than investments in securities at period end, resulting from changes in the exchange rate.
Restricted Securities – Restricted securities are securities that either (a) cannot be offered for public sale without first being registered, or being able to take advantage of an exemption from
(continued on next page)
ANNUAL REPORT / April 30, 2011
Table of Contents
| 158 | NOTES TO FINANCIAL STATEMENTS |
registration, under the Securities Act of 1933, as amended, or (b) are subject to contractual restrictions on public sales. In some cases, when a security cannot be offered for public sale without first being registered, the issuer of the restricted security has agreed to register such securities for resale, at the issuer’s expense, either upon demand by the Fund or in connection with another registered offering of the securities. Many such restricted securities may be resold in the secondary market in transactions exempt from registration. Restricted securities may be determined to be liquid under criteria established by the Trustees. A Fund will not incur any registration costs upon such resales. The Fund’s restricted securities are valued at the price provided by dealers in the secondary market or, if no market prices are available, at the fair value as determined in accordance with procedures established by and under the general supervision of the Trustees.
Futures Contracts – The International Equity Fund may periodically purchase stock index futures contracts to manage cash flows, enhance yield and to potentially reduce transaction costs. Upon entering into a stock index futures contract with a broker, the Fund is required to deposit in a segregated account a specified amount of cash or U.S. government securities. Futures contracts are valued daily and unrealized gains or losses are recorded in a “variation margin” account. Daily, the Fund receives from or pays to the broker a specified amount of cash based upon changes in the variation margin account. When a contract is closed, the Fund recognizes a realized gain or loss. Futures contracts have market risks, including the risk that the change in the value of the contract may not correlate with the changes in the value of the underlying securities. There were no futures contracts outstanding during the year ended April 30, 2011.
Dollar Roll Transactions – The U.S. Government Bond Fund, Intermediate-Term Bond Fund and Income Fund may enter into dollar roll transactions, with respect to mortgage securities issued by GNMA, FNMA, and FHLMC, in which the Funds sell mortgage securities to financial institutions and simultaneously agree to accept substantially similar (same type, coupon, maturity) securities at a later date at an agreed upon price. Dollar roll transactions, which are treated as purchase and sales, will not exceed 12 months. There were no dollar roll transactions outstanding during the year ended April 30, 2011.
Lending of Portfolio Securities
Effective September 2009, the Trust entered into an agreement with their custodian whereby the custodian may lend securities owned by
the Funds to brokers, dealers and other financial organizations. Any increase or decrease in the fair value of securities loaned and any interest or dividends earned on those securities during the term of the loan would be for the account of the Fund. In exchange for lending securities under the terms of the agreement with their custodian, the Funds receive a lender’s fee. Fees earned by the Funds on securities lending are recorded as income. Loans of securities by the Funds are collateralized by cash, U.S. government securities or money market instruments that are maintained at all times in an amount at least equal to the current market value of the loaned securities plus a margin which varies depending on the type of securities owned. The custodian establishes and maintains the collateral in a segregated account. The Funds have the right under the lending agreement to recover the securities from the borrower on demand.
Investments purchased with cash collateral are presented on the portfolios of investments under the caption “Cash Collateral Invested for Securities on Loan.”
As of April 30, 2011, the Funds listed below had securities with the following values on loan:
| Fund | Value of | Value of | ||||||
MTB Short-Term Corporate Bond Fund | 13,445,286 | 13,749,665 | ||||||
MTB U.S. Government Bond Fund | 9,215,580 | 9,405,052 | ||||||
MTB Intermediate-Term Bond Fund | 12,115,201 | 12,359,354 | ||||||
MTB Income Fund | 1,614,000 | 1,646,948 | ||||||
MTB Strategic Allocation Fund | 1,248,491 | 1,274,922 | ||||||
MTB Large Cap Value Fund | 1,381,231 | 1,411,331 | ||||||
MTB Large Cap Growth Fund | 7,192,951 | 7,439,968 | ||||||
MTB Mid Cap Growth Fund | 19,586,779 | 20,156,443 | ||||||
| MTB Small Cap Growth Fund | 8,080,781 | 8,360,467 | ||||||
| MTB International Equity Fund | 9,472,310 | 10,616,027 | ||||||
The Funds maintain the risk of any loss on the securities on loan as well as the potential loss on investments purchased with cash collateral received from securities lending.
(continued on next page)
April 30, 2011 / ANNUAL REPORT
Table of Contents
| NOTES TO FINANCIAL STATEMENTS | 159 |
| 3. | FEDERAL TAX INFORMATION |
The timing and character of income and capital gain distributions are determined in accordance with income tax regulations, which may differ from GAAP. These differences are due in part to differing treatments for income recognition on foreign currency transactions, expiration of capital loss carryforwards, reclassification of ordinary loss to short-term gains, market discount reclass, partnership adjustments, REIT dividend reclasses, and discount accretion/premium amortization on debt securities.
As of April 30, 2011, there are no uncertain tax positions that would require financial statement recognition, de-recognition or disclosure. The Funds’ federal tax returns filed for the three-year periods ended April 30, 2010, 2009, and 2008, remain subject to examination by the Internal Revenue Service.
For the year ended April 30, 2011, permanent differences identified and reclassified among the components of net assets were as follows:
| Fund | Paid-in Capital | Increase (Decrease) in Excess of) Net | Accumulated Net Realized Gain (Loss) | |||||||||
| New York Municipal Bond Fund | $ | — | $ | 3,744 | $ | (3,744 | ) | |||||
| Pennsylvania Municipal Bond Fund | — | 90,210 | (90,210 | ) | ||||||||
| Maryland Municipal Bond Fund | — | 1,471 | (1,471 | ) | ||||||||
| Virginia Municipal Bond Fund | — | (3,707 | ) | 3,707 | ||||||||
| Strategic Allocation Fund | 10,608,806 | 161,214 | (10,770,020 | ) | ||||||||
| Large Cap Value Fund | (6,428,515 | ) | 14,624 | 6,413,891 | ||||||||
| Large Cap Growth Fund | (5,918,659 | ) | 1,556 | 5,917,103 | ||||||||
| Mid Cap Growth Fund | (6,845,120 | ) | 1,150,181 | 5,694,939 | ||||||||
| Small Cap Growth Fund | (13,144,651 | ) | 1,445,284 | 11,699,367 | ||||||||
| International Equity Fund | — | (253,372 | ) | 253,372 | ||||||||
The tax character of distributions as reported on the Statements of Changes in Net Assets for the years ended April 30, 2011 and 2010 were as follows:
| 2011 | 2010 | |||||||||||||||
| Fund | Ordinary Income* | Long-Term Capital Gains | Return of Capital | Ordinary Income* | ||||||||||||
| Short Duration Government Bond Fund | $ | 2,649,131 | $ | — | $ | — | $ | 2,716,863 | ||||||||
| Short-Term Corporate Bond Fund | 2,552,493 | 223,603 | — | 2,054,067 | ||||||||||||
| U.S. Government Bond Fund | 2,324,606 | — | — | 2,919,878 | ||||||||||||
| New York Municipal Bond Fund | 3,892,166 | ** | — | — | 3,564,950 | *** | ||||||||||
| Pennsylvania Municipal Bond Fund | 3,682,561 | ** | — | — | 4,173,687 | *** | ||||||||||
| Maryland Municipal Bond Fund | 4,681,409 | ** | — | — | 4,903,847 | *** | ||||||||||
| Virginia Municipal Bond Fund | 681,181 | ** | — | — | 690,469 | *** | ||||||||||
| Intermediate-Term Bond Fund | 5,074,368 | 579,284 | — | 5,718,626 | ||||||||||||
| Income Fund | 8,854,834 | 2,576,783 | — | 8,076,455 | ||||||||||||
| Strategic Allocation Fund | 800,183 | 289,643 | — | 20,575 | ||||||||||||
| Large Cap Value Fund | 765,478 | — | 8,559 | 1,052,647 | ||||||||||||
| Large Cap Growth Fund | 235,142 | — | — | 221,004 | ||||||||||||
| Mid Cap Growth Fund | — | — | 39 | 114,384 | ||||||||||||
| Small Cap Growth Fund | — | — | — | — | ||||||||||||
| International Equity Fund | 2,177,030 | — | — | 395,446 | ||||||||||||
| * | For tax purposes, short-term capital gain distributions are considered ordinary income distributions. |
| ** | Included in this amount is tax exempt income of $3,887,386, $3,594,614, $4,672,384 and $681,181 for New York Municipal Bond Fund, Pennsylvania Municipal Bond Fund, Maryland Municipal Bond Fund, and Virginia Municipal Bond Fund, respectively. |
| *** | Included in this amount is tax exempt income of $3,560,594, $4,173,687, $4,896,106 and $690,469 for New York Municipal Bond Fund, Pennsylvania Municipal Bond Fund, Maryland Municipal Bond Fund, and Virginia Municipal Bond Fund, respectively. |
(continued on next page)
ANNUAL REPORT / April 30, 2011
Table of Contents
| 160 | NOTES TO FINANCIAL STATEMENTS |
As of April 30, 2011, the components of distributable earnings on a tax basis were as follows:
| Fund | Undistributed/ Over Distributed Ordinary Income | Undistributed Long-Term Capital Gains | Unrealized Appreciation (Depreciation) | Capital Loss Carryforwards and Deferrals | ||||||||||||
| Short Duration Government Bond Fund | $ | (1,656 | ) | $ | — | $ | 1,685,144 | $ | (841,273 | ) | ||||||
| Short-Term Corporate Bond Fund | 230,909 | 238,938 | 2,003,948 | — | ||||||||||||
| US Government Bond Fund | 13,768 | — | 3,276,162 | (2,936,468 | ) | |||||||||||
| New York Municipal Bond Fund | (5,730 | ) | — | 2,051,502 | (4,456,234 | ) | ||||||||||
| Pennsylvania Municipal Bond Fund | 107,694 | * | — | 2,469,882 | (760,034 | ) | ||||||||||
| Maryland Municipal Bond Fund | 3,875 | * | — | (17,922 | ) | (119,233 | ) | |||||||||
| Virginia Municipal Bond Fund | 2,441 | * | 36,069 | 597,812 | — | |||||||||||
| Intermediate-Term Bond Fund | 419,703 | 954,679 | 3,783,221 | — | ||||||||||||
| Income Fund | 7,645 | 1,583,436 | 9,108,309 | — | ||||||||||||
| Strategic Allocation Fund | 80,387 | 91,452 | 8,895,125 | (15,281,583 | ) | |||||||||||
| Large Cap Value Fund | — | — | 33,649,680 | (22,181,247 | ) | |||||||||||
| Large Cap Growth Fund | — | — | 42,473,429 | (22,881,260 | ) | |||||||||||
| Mid Cap Growth Fund | — | — | 95,098,189 | (24,974,769 | ) | |||||||||||
| Small Cap Growth Fund | — | — | 37,180,803 | (37,360.124 | ) | |||||||||||
| International Equity Fund | 2,398,831 | — | 49,980,724 | (66,327,491 | ) | |||||||||||
| * | Included in this amount is tax exempt income of $107,694, $3,875 and $ 2,441 for Pennsylvania Municipal Bond Fund, Maryland Municipal Bond Fund, and Virginia Municipal Bond Fund, respectively. For tax purposes all dividends are tax-exempt in nature. Amounts shown above reflect current year timing differences including the Fund’s current dividends payable. |
At April 30, 2011, the following Funds had capital loss carryforwards which will reduce each Fund’s taxable income arising from future net realized gain on investments, if any, to the extent permitted by the Code and thus will reduce the amount of distributions to shareholders which would otherwise be necessary to relieve the Fund of any liability for federal income tax. Pursuant to the Code, such capital loss carryforwards will expire as follows:
| Fund | 2012 | 2013 | 2014 | 2015 | 2016 | 2017 | 2018 | 2019 | Total Capital Loss Carryforwards | |||||||||||||||||||||||||||
| Short Duration Government Bond Fund | $ | — | $ | — | $ | 305,277 | $ | 129,435 | $ | — | $ | — | $ | — | $ | 108,426 | $ | 543,138 | ||||||||||||||||||
| US Government Bond Fund | 72,330 | 640,541 | 385,099 | 1,129,658 | — | — | — | — | 2,227,628 | |||||||||||||||||||||||||||
| New York Municipal Bond Fund | — | — | — | 47,687 | 426,253 | 440,374 | 3,002,344 | — | 3,916,658 | |||||||||||||||||||||||||||
| Pennsylvania Municipal Bond Fund | — | — | — | — | — | 760,034 | — | — | 760,034 | |||||||||||||||||||||||||||
| Maryland Municipal Bond Fund | — | — | — | — | — | — | 98,224 | — | 98,224 | |||||||||||||||||||||||||||
| Strategic Allocation Fund | — | — | — | — | 214,149 | 13,256,414 | 1,811,021 | — | 15,281,584 | |||||||||||||||||||||||||||
| Large Cap Value Fund | — | — | — | — | 3,385,559 | 17,106,918 | 1,646,592 | — | 22,139,069 | |||||||||||||||||||||||||||
| Large Cap Growth Fund | — | — | — | — | 19,027,845 | 3,853,415 | — | — | 22,881,260 | |||||||||||||||||||||||||||
| Mid Cap Growth Fund | — | — | — | — | 5,162,793 | 18,451,046 | 1,360,930 | — | 24,974,769 | |||||||||||||||||||||||||||
| Small Cap Growth Fund | — | — | — | — | 9,116,675 | 26,969,809 | 1,273,640 | — | 37,360,124 | |||||||||||||||||||||||||||
| International Equity Fund | — | — | — | — | — | 8,395,084 | 57,932,407 | — | 66,327,491 | |||||||||||||||||||||||||||
Under the recently enacted Regulated Investment Company Modernization Act of 2010, the Funds will be permitted to carry forward capital losses incurred in taxable years beginning after December 22, 2010 for an unlimited period. However, any losses incurred during those future taxable years will be required to be utilized prior to the losses incurred in pre-enactment taxable years. As a result of this ordering rule, pre-enactment capital loss carryforwards may have an increased likelihood to expire unused. Additionally, post-enactment capital losses that are carried forward will retain their character as either short-term or long-term capital losses rather than being considered all short-term as under previous law.
As a result of the tax-free transfer of assets described in Note 8, and to the extent unrealized gains and losses that existed at the time of the reorganization are realized, the capital loss carryforwards may further be limited for up to five years from the date of the reorganization.
(continued on next page)
April 30, 2011 / ANNUAL REPORT
Table of Contents
| NOTES TO FINANCIAL STATEMENTS | 161 |
The Funds used capital loss carryforwards as follows to offset taxable capital gains realized during the year ended April 30, 2011:
| Fund | Capital Loss Carryforwards Used | |||
| Short-Term Corporate Bond Fund | $ | 595,973 | ||
| U.S. Government Bond Fund | 523,404 | |||
| New York Municipal Bond Fund | 163,992 | |||
| Pennsylvania Municipal Bond Fund | 125,175 | |||
| Maryland Municipal Bond Fund | 269,096 | |||
| Virginia Municipal Bond Fund | 41,077 | |||
| Intermediate-Term Bond Fund | 1,331,802 | |||
| Income Fund | 1,022,833 | |||
| Strategic Allocation Fund | 2,510,146 | |||
| Large Cap Value Fund | 1,223,185 | |||
| Large Cap Growth Fund | 10,853,457 | |||
| Mid Cap Growth Fund | 12,228,733 | |||
| Small Cap Growth Fund | 34,856,280 | |||
| International Equity Fund | 8,703,549 | |||
Additionally, the following capital loss carryforwards expired or were written off due to limitations during the year ended April 30, 2011:
| Fund | Capital Loss Carryforwards Expired | |||
| Strategic Allocation Fund | $ | 8,683,955 | ||
| Large Cap Value Fund | 6,413,788 | |||
| Large Cap Growth Fund | 5,917,103 | |||
| Mid Cap Growth Fund | 5,694,939 | |||
| Small Cap Growth Fund | 11,667,326 | |||
Under current tax regulations, capital losses on securities transactions realized after October 31 may be deferred and treated as occurring on the first day of the following fiscal year. Post-October losses deferred to May 1, 2011 are as follows:
| Fund | Post October Capital Losses | Post October Currency Losses | ||||||
| Short Duration Government Bond Fund | $ | 298,135 | $ | — | ||||
| U.S. Government Bond Fund | 708,840 | — | ||||||
| New York Municipal Bond Fund | 539,576 | — | ||||||
| Maryland Municipal Bond Fund | 21,009 | — | ||||||
| Large Cap Value Fund | 42,178 | — | ||||||
| International Equity Fund | — | 111,803 | ||||||
| 4. | ADVISORY FEES, SERVICING FEES, AND OTHER SERVICE PROVIDERS |
Investment Advisor – MTB Investment Advisors, Inc. (“MTBIA”, or the “Advisor”) receives for its services an annual investment advisory fee, accrued daily and paid daily, based on a percentage of each Fund’s average daily net assets (see below). The Advisor may
voluntarily choose to waive any portion of its fee and/or reimburse
certain operating expenses of the Funds. For the year ended April 30, 2011, the Advisor contractually agreed to waive, and/or reimburse operating expenses (excluding 12b-1 and shareholder services fees) of each Fund in order to limit each Fund’s average expenses for the year.
The Advisor contractually agreed to waive a portion of its investment advisory fees through August 31, 2011, exclusive of distribution (12b-1) and shareholder service fees for the following Funds:
| Fund Name | Contractual Operating Expense Limit | |||
| Short Duration Government Bond Fund | 0.64 | % | ||
| Short-Term Corporate Bond Fund | 0.61 | % | ||
| U.S. Government Bond Fund | 0.74 | % | ||
| New York Municipal Bond Fund | 0.59 | % | ||
| Pennsylvania Municipal Bond Fund | 0.70 | % | ||
| Maryland Municipal Bond Fund | 0.67 | % | ||
| Virginia Municipal Bond Fund | 0.71 | % | ||
| Intermediate-Term Bond Fund | 0.66 | % | ||
| Income Fund | 0.66 | % | ||
| Strategic Allocation Fund | 0.85 | % | ||
| Large Cap Value Fund | 0.92 | % | ||
| Large Cap Growth Fund | 1.02 | % | ||
| Mid Cap Growth Fund | 0.95 | %* | ||
| Small Cap Growth Fund | 1.13 | % | ||
| International Equity Fund | 1.36 | % | ||
| * | Effective January 17, 2011. Prior to this date the contractual operating expense limit was 0.84%. |
| Fund | Advisory Fee Annual Rate | |||
| Short Duration Government Bond Fund | 0.60 | % | ||
| Short-Term Corporate Bond Fund | 0.70 | % | ||
| U.S. Government Bond Fund | 0.70 | % | ||
| New York Municipal Bond Fund | 0.70 | % | ||
| Pennsylvania Municipal Bond Fund | 0.70 | % | ||
| Maryland Municipal Bond Fund | 0.70 | % | ||
| Virginia Municipal Bond Fund | 0.70 | % | ||
| Intermediate-Term Bond Fund | 0.70 | % | ||
| Income Fund | 0.60 | % | ||
| Strategic Allocation Fund | 0.65 | % | ||
| Large Cap Value Fund | 0.70 | % | ||
| Large Cap Growth Fund | 0.85 | % | ||
| Mid Cap Growth Fund | 0.85 | % | ||
| Small Cap Growth Fund | 0.85 | % | ||
| International Equity Fund | 1.00 | % | ||
The Advisor has entered into Sub-Advisory agreements with the following sub-advisors to manage the Funds indicated, subject to supervision by the Advisor and the Trustees, and in accordance with the investment goal and restrictions of the respective Funds. For their services, each sub-advisor receives a fee based upon the
(continued on next page)
ANNUAL REPORT / April 30, 2011
Table of Contents
| 162 | NOTES TO FINANCIAL STATEMENTS |
amount of their respective Fund’s average daily net assets that they manage for the Fund, which is paid by the Advisor and not by the Fund.
| Fund | Sub-Advisor | |
| Large Cap Value Fund | NWQ Investment Management Company LLC | |
| International Equity Fund | LSV Asset Management | |
| Baring International Investment Limited | ||
| Hansberger Global Investors, Inc. | ||
Administrative Fee – BNY Mellon provides the Trust with fund administration, accounting, and custody services. Fees for such services are based on assets and volume of transactions. For the period September 10, 2007 through September 10, 2010, BNY Mellon agreed to limit fees payable by the Trust for fund administration, accounting and custody services to $2,679,285 per year. MTBIA in its role as co-administrator, provides the Funds with certain administrative personnel and services necessary to operate the Funds. These services were provided for at an aggregate annual fee as specified below.
Administrative personnel and services fees payable to MTBIA are calculated as follows:
| Maximum Fee | Average Aggregate Daily Net Assets of the Trust | |
| 0.033% | on the first $5 billion | |
| 0.020% | on the next $2 billion | |
| 0.016% | on the next $3 billion | |
| 0.015% | on assets in excess of $10 billion | |
MTBIA may voluntarily choose to waive any portion of its fee. MTBIA can modify or terminate its voluntary waiver at any time at its sole discretion. For the year ended April 30, 2011, MTBIA did not waive any administrative personnel and services fee.
Distribution Services Fee – The Trust has adopted a Distribution Services Plan (the “Plan”) pursuant to Rule 12b-1 under the Act. The Plan allows the Funds to pay fees to financial intermediaries,
which may be paid through ALPS Distributors, Inc. (“ALPS”), the principal distributor, at an annual rate of up to 0.25% of the average daily net assets of the Funds’ Class A Shares and up to 1.00% of the average daily net assets of Class C Shares for the Short Duration Government Bond Fund, the Short-Term Corporate Bond Fund and the Intermediate-Term Bond Fund, for the sale, distribution, administration, customer servicing and recordkeeping of these Shares. The rate for Class C Shares of the Small Cap Growth Fund is 0.75% of the average daily net assets.
The Funds may reduce the maximum amount of distribution services fees it pays from time to time in its sole discretion. In addition, a financial intermediary (including ALPS, the Advisor or their affiliates), may voluntarily waive or reduce any fees to which they are entitled.
For the year ended April 30, 2011, M&T Securities, Inc. and Manufacturers and Traders Trust Company (together "M&T"), affiliates of the Advisor, received a portion of the fees paid by the Funds which are listed below:
| Fund | Distribution Fees | |||
| Short Duration Government Bond Fund | $ | 22,603 | ||
| Short-Term Corporate Bond Fund | 1,945 | |||
| U.S. Government Bond Fund | 11,278 | |||
| New York Municipal Bond Fund | 67,330 | |||
| Pennsylvania Municipal Bond Fund | 14,661 | |||
| Maryland Municipal Bond Fund | 83,753 | |||
| Virginia Municipal Bond Fund | 38,729 | |||
| Intermediate-Term Bond Fund | 6,434 | |||
| Income Fund | 6,943 | |||
| Strategic Allocation Fund | 83,367 | |||
| Large Cap Value Fund | 9,448 | |||
| Large Cap Growth Fund | 38,842 | |||
| Mid Cap Growth Fund | 72,202 | |||
| Small Cap Growth Fund | 34,185 | |||
| International Equity Fund | 6,250 | |||
(continued on next page)
April 30, 2011 / ANNUAL REPORT
Table of Contents
| NOTES TO FINANCIAL STATEMENTS | 163 |
Sales Charges – The Class A Shares of all the Funds bear front-end sales charges. Class C Shares may be subject to a contingent deferred sales charge (“CDSC”).
For year ended April 30, 2011, M&T received the amounts listed below from sales charges on the sale of Class A Shares and from the CDSC charges upon redemptions of both Class B and C Shares.
| Fund | Sales Charges from Class A Shares | CDSC Charges from Class B and Class C Shares | ||||||
| Short Duration Government Bond Fund | $ | 3,367 | $ | 5,960 | ||||
| Short-Term Corporate Bond Fund | 359 | 1,015 | ||||||
| U.S. Government Bond Fund | 329 | 144 | ||||||
| New York Municipal Bond Fund | 3,718 | 6,103 | ||||||
| Pennsylvania Municipal Bond Fund | 6,005 | 10,276 | ||||||
| Maryland Municipal Bond Fund | 830 | 9,795 | ||||||
| Virginia Municipal Bond Fund | 548 | — | ||||||
| Intermediate-Term Bond Fund | 2,761 | 400 | ||||||
| Income Fund | 1,433 | 425 | ||||||
| Strategic Allocation Fund | 17,601 | 9,692 | ||||||
| Large Cap Value Fund | 351 | 922 | ||||||
| Large Cap Growth Fund | 610 | 1,565 | ||||||
| Mid Cap Growth Fund | 1,587 | 2,293 | ||||||
| Small Cap Growth Fund | 872 | 576 | ||||||
| International Equity Fund | 432 | 883 | ||||||
Shareholder Services Fee – Pursuant to a Shareholder Services Plan adopted by the Funds and administered by ALPS, the Funds may pay up to 0.25% of the average daily net assets of each Fund’s Class A Shares, Class C Shares and Institutional I Shares to financial intermediaries (which may include ALPS, the Advisor or their affiliates) for providing shareholder services and maintaining shareholder accounts. M&T, an affiliate of the Advisor, has entered into a Shareholders Services Agreement with ALPS, under which it is entitled to receive up to 0.25% of the average daily net assets of each Fund’s Shares for whom M&T provides shareholder services. The Funds may reduce the maximum amount of shareholder service fees it pays from time to time at its sole discretion. In addition, a financial intermediary (including M&T) may waive or reduce any fees to which they are entitled. For year ended April 30, 2011, M&T received a portion of the fees paid by the following Funds which are listed below:
| Fund | Shareholder Services Fee | |||
Short Duration Government Bond Fund | $ | 455 | ||
Short-Term Corporate Bond Fund | 372 | |||
U.S. Government Bond Fund | 4,808 | |||
New York Municipal Bond Fund | 1,661 | |||
Pennsylvania Municipal Bond Fund | 837 | |||
Maryland Municipal Bond Fund | 11,204 | |||
Intermediate-Term Bond Fund | 2,916 | |||
Income Fund | 3,698 | |||
Strategic Allocation Fund | 26,591 | |||
Large Cap Value Fund | 149,704 | |||
Large Cap Growth Fund | 39,388 | |||
Mid Cap Growth Fund | 277,715 | |||
Small Cap Growth Fund | 139,014 | |||
International Equity Fund | 183,580 | |||
(continued on next page)
ANNUAL REPORT / April 30, 2011
Table of Contents
| 164 | NOTES TO FINANCIAL STATEMENTS |
Other Service Providers – Foreside Management Services, LLC (“FMS”) provides a Principal Executive Officer to the Trust. FMS has no role in determining the investment policies or which securities are to be sold or purchased by the Trust or its Funds.
ALPS Fund Services, Inc. provides transfer agency services to the Trust. For the period November 16, 2007 through November 16, 2010, BNY Mellon agreed to pay the excess amount of fees payable to ALPS Fund Services, Inc. for transfer agency services when the total expenses payable by the Trust exceed $1,047,803 per year. Effective October 1, 2010, BNY Mellon agreed to pay the excess amount of fees payable to ALPS Fund Services, Inc. when the total expenses payable by the Trust exceed $995,413 until October 1, 2011. These amounts are shown as reimbursements on the Statements of Operations.
General – Certain Officers of the Trust are also Officers or employees of the above companies that provide services to the Funds, and during their terms of office, receive no compensation from the Funds. The Trust’s Statement of Additional Information includes additional information about the Trustees.
Other Affiliated Parties and Transactions – Affiliated holdings are mutual funds which are managed by the Advisor or an affiliate of the Advisor or which are distributed by an affiliate of the Funds’ distributor. Transactions with affiliated companies during the year ended April 30, 2011 are as follows:
| Affiliated Fund Name | Balance of Shares Held 4/30/2010 | Purchases/ Additions | Sales/ Reductions | Shares Received through Reorganization | Balance of Shares Held 04/30/2011 | Value at 04/30/2011 | Dividend Income | Realized Gain/Loss | ||||||||||||||||||||||||
| Strategic Allocation Fund: | ||||||||||||||||||||||||||||||||
| Prime Money Market Fund | 1,463,533 | 17,657,317 | 17,819,671 | 1,603,968 | 2,905,147 | $ | 2,905,147 | $ | 921 | $ | — | |||||||||||||||||||||
| Money Market Fund | — | 1,479,327 | 1,122,239 | 124,489 | 481,577 | 481,577 | 107 | — | ||||||||||||||||||||||||
| Short Duration Government Bond Fund | 73,575 | 338 | 101,345 | 27,432 | — | — | 3,048 | 26,729 | ||||||||||||||||||||||||
| Short-Term Corporate Bond Fund | 250,223 | 783 | 304,618 | 53,612 | — | — | 7,519 | 99,969 | ||||||||||||||||||||||||
| U.S. Government Bond Fund | — | 32 | 16,658 | 16,626 | — | — | 76 | 9,085 | ||||||||||||||||||||||||
| Income Fund | 518,086 | 2,924 | 698,955 | 177,945 | — | — | 26,414 | 426,409 | ||||||||||||||||||||||||
| Intermediate-Term Bond Fund | 309,234 | 1,633 | 367,563 | 56,696 | — | — | 16,408 | 213,916 | ||||||||||||||||||||||||
| Large Cap Growth Fund | 1,160,361 | 21,513 | 1,275,534 | 999,822 | 906,162 | 8,662,906 | 16,847 | 2,447,315 | ||||||||||||||||||||||||
| Large Cap Value Fund | 293,647 | 141 | 40,098 | 283,818 | 537,508 | 6,186,721 | 26,472 | 15,123 | ||||||||||||||||||||||||
| Mid Cap Growth Fund | 143,578 | 7 | 37,995 | 84,543 | 190,133 | 3,150,506 | — | 269,289 | ||||||||||||||||||||||||
| Small Cap Growth Fund | 97,082 | 4,476 | 70,817 | 99,980 | 130,721 | 2,452,325 | — | 407,586 | ||||||||||||||||||||||||
| International Equity Fund | 918,800 | 20,878 | 357,294 | 687,768 | 1,270,152 | 12,638,017 | 131,728 | (123,234 | ) | |||||||||||||||||||||||
| Total | 5,228,119 | 19,189,369 | 22,212,787 | 4,216,699 | 6,421,400 | 36,477,199 | 229,540 | 3,792,187 | ||||||||||||||||||||||||
| Large Cap Value Fund: | ||||||||||||||||||||||||||||||||
| Prime Money Market Fund | 4,075,984 | 40,531,193 | 41,960,661 | — | 2,646,516 | 2,646,516 | 1,304 | — | ||||||||||||||||||||||||
| Large Cap Growth Fund: | ||||||||||||||||||||||||||||||||
| Prime Money Market Fund | — | 32,183,334 | 31,485,464 | — | 697,870 | 697,870 | 521 | — | ||||||||||||||||||||||||
| Money Market Fund | — | 1,416,244 | 1,416,244 | — | — | — | — | — | ||||||||||||||||||||||||
| Total | — | 33,599,578 | 32,901,708 | — | 697,870 | 697,870 | 521 | — | ||||||||||||||||||||||||
| Mid Cap Growth Fund: | ||||||||||||||||||||||||||||||||
| Prime Money Market Fund | 930,668 | 41,770,554 | 39,763,381 | — | 2,937,841 | 2,937,841 | 819 | — | ||||||||||||||||||||||||
| Money Market Fund | — | 6,227,612 | 6,227,612 | — | — | — | 26 | — | ||||||||||||||||||||||||
| 930,668.00 | 47,998,166 | 45,990,993 | — | 2,937,841 | 2,937,841 | 845 | — | |||||||||||||||||||||||||
| Small Cap Growth Fund: | ||||||||||||||||||||||||||||||||
| Prime Money Market Fund | — | 64,485,583 | 63,634,549 | — | 851,034 | 851,034 | 560 | — | ||||||||||||||||||||||||
| Money Market Fund | — | 6,289,111 | 6,289,111 | — | — | — | 72 | — | ||||||||||||||||||||||||
| Total | — | 70,774,694 | 69,923,660 | — | 851,034 | 851,034 | 632 | — | ||||||||||||||||||||||||
| International Equity Fund: | ||||||||||||||||||||||||||||||||
| Prime Money Market Fund | 2,771,065 | 53,491,531 | 53,129,243 | — | 3,133,353 | 3,133,353 | 1,153 | — | ||||||||||||||||||||||||
(continued on next page)
April 30, 2011 / ANNUAL REPORT
Table of Contents
| NOTES TO FINANCIAL STATEMENTS | 165 |
| 5. | INVESTMENT TRANSACTIONS |
Purchases and sales of investments, excluding short-term obligations, U.S. Government Securities and in-kind transactions, for the year ended April 30, 2011 were as follows:
| Investments | ||||||||
| Fund Name | Purchases | Sales | ||||||
| Short Duration Government Bond Fund | $ | 237,655,098 | $ | 225,205,939 | ||||
| Short-Term Corporate Bond Fund | 202,508,769 | 133,014,816 | ||||||
| U.S. Government Bond Fund | 9,779,447 | 21,592,874 | ||||||
| New York Municipal Bond Fund | 71,990,337 | 71,191,969 | ||||||
| Pennsylvania Municipal Bond Fund | 19,033,327 | 20,812,787 | ||||||
| Maryland Municipal Bond Fund | 6,613,590 | 13,358,052 | ||||||
| Virginia Municipal Bond Fund | 2,378,928 | 2,892,720 | ||||||
| Intermediate-Term Bond Fund | 202,702,748 | 225,904,485 | ||||||
| Income Fund | 199,693,845 | 201,833,102 | ||||||
| Strategic Allocation Fund | 30,248,152 | 42,583,693 | ||||||
| Large Cap Value Fund | 40,604,171 | 48,380,539 | ||||||
| Large Cap Growth Fund | 79,419,693 | 101,096,529 | ||||||
| Mid Cap Growth Fund | 68,947,362 | 66,402,098 | ||||||
| Small Cap Growth Fund | 658,990,373 | 678,634,335 | ||||||
| International Equity Fund | 92,386,893 | 92,935,434 | ||||||
Purchases and sales of investments of U.S. Government Securities for the year ended April 30, 2011 as follows:
| U.S. Government Securities | ||||||||
| Fund Name | Purchases | Sales | ||||||
| Short Duration Government Bond Fund | $ | 33,804,945 | $ | 33,488,656 | ||||
| Short-Term Corporate Bond Fund | 60,043,350 | 57,012,699 | ||||||
| U.S. Government Bond Fund | 30,631,380 | 31,076,371 | ||||||
| Intermediate-Term Bond Fund | 348,369,001 | 338,650,481 | ||||||
| Income Fund | 56,382,666 | 45,878,258 | ||||||
| Strategic Allocation Fund | 5,912,825 | 1,899,919 | ||||||
| 6. | CONCENTRATION OF RISK |
Since New York Municipal Bond Fund, Pennsylvania Municipal Bond Fund, Maryland Municipal Bond Fund and Virginia Municipal Bond Fund invest a substantial portion of their assets in issuers located in one state, they will be more susceptible to factors adversely affecting issuers of that state than would be a comparable tax-exempt mutual fund that invests nationally. In order to reduce the credit risk associated with such factors, at April 30, 2011, 38.8% for New York Municipal Bond Fund, 57.2% for Pennsylvania Municipal Bond Fund, 29.0% for Maryland Municipal Bond Fund and 43.9% for Virginia Municipal Bond Fund of the total market value of the securities in the portfolio of investments are backed by letters of credit or bond insurance of various financial institutions and financial guaranty assurance agencies. The largest percentage of the total market value of investments insured by or
supported (backed) by a letter of credit from any one institution or agency was 8.6% for New York Municipal Bond Fund, 19.1% for Pennsylvania Municipal Bond Fund, 9.2% for Maryland Municipal Bond Fund and 12.0% for Virginia Municipal Bond Fund.
International Equity Fund invests in securities of non-U.S. issuers. Although the Fund maintains a diversified investment portfolio, the political or economic developments within a particular country or region may have an adverse effect on the ability of domiciled issuers to meet their obligations. Additionally, political or economic developments may have an effect on the liquidity and volatility of portfolio securities and currency holdings.
| 7. | LINE OF CREDIT |
The Trust participated in a $10,000,000 unsecured, committed revolving line of credit (“LOC”) agreement with BNY Mellon. The LOC was made available for extraordinary or emergency purposes, primarily for financing redemption payments. Borrowings are charged interest at a rate of 1.25% per annum over the greater of the Federal Funds Rate or the overnight LIBOR Rate. The LOC included a commitment fee of 0.12% per annum on the daily unused portion. In addition, an upfront commitment fee of 0.02% was paid to BNY Mellon. The termination date of this LOC is February 8, 2012. The Funds did not utilize the LOC for the year ended April 30, 2011.
| 8. | REORGANIZATION |
On January 13, 2010, the Board approved an Agreement and Plan of Reorganization (the “Plan”) which provided the transfer of all the assets of the MTB Managed Allocation Fund—Aggressive Growth, MTB Managed Allocation Fund—Moderate Growth and MTB Managed Allocation Fund—Conservative Growth, (the “Target Funds”) for shares of the MTB Strategic Allocation Fund (“Acquiring Fund”). Shareholders approved the Plan at a meeting on May 27, 2010 and the reorganization took place on June 11, 2010. The acquisition was accomplished by a tax-free exchange of shares on June 11, 2010.
The purpose of this transaction was to combine the four Funds with the same Investment Manager and with substantially similar investment objectives, policies, and restrictions. Due to the small size of the Target Funds, and the comparatively better prospects for asset growth of the Acquiring Fund, it was believed that the shareholders best interests would be served by reorganizing the Target Funds into the Acquiring Fund.
For financial reporting purposes, the MTB Managed Allocation Fund—Moderate Growth was deemed to be the accounting survivor.
(continued on next page)
ANNUAL REPORT / April 30, 2011
Table of Contents
| 166 | NOTES TO FINANCIAL STATEMENTS |
As such, the following information is presented as if the MTB Managed Allocation—Moderate Growth Fund acquired the MTB Managed Allocation—Conservative Growth Fund, the MTB Managed Allocation—Aggressive Growth Fund, and the MTB Strategic Allocation Fund:
| Shares Prior to Reorganization | Shares Issued by Surviving Fund | Appreciation/ (Depreciation) Prior to Reorganization | Net Assets Prior to Reorganization | |||||||||||||
| MTB Managed Allocation Fund—Aggressive Growth | $ | 114,689 | $ | 15,743,533 | ||||||||||||
Class A Shares | 1,541,966 | 1,286,370 | ||||||||||||||
Class B Shares | 830,491 | 685,267 | ||||||||||||||
| MTB Managed Allocation Fund—Conservative Growth | 515,056 | 5,533,849 | ||||||||||||||
Class A Shares | 440,110 | 471,856 | ||||||||||||||
Class B Shares | 199,543 | 220,494 | ||||||||||||||
| MTB Strategic Allocation Fund | (359,578 | ) | 17,977,043 | |||||||||||||
Class A Shares | 1,113,579 | 1,813,562 | ||||||||||||||
Class B Shares | 103,099 | 175,331 | ||||||||||||||
Class I Shares | 148,233 | 242,199 | ||||||||||||||
| 4,895,079 | $ | 39,254,425 | ||||||||||||||
Prior to the acquisition the MTB Managed Allocation—Moderate Growth Fund had net assets of $31,482,373. After the acquisition, the MTB Managed Allocation—Moderate Growth Fund had net assets of $70,736,798.
Assuming the acquisition had been completed on May 1, 2010, the MTB Strategic Allocation Fund results of operations for the year ended April 30, 2011 were as follows:
Net investment income | $ | 674,489 | (a) | |
Net realized and unrealized gain on investments | 12,188,479 | (b) |
| (a) | $ | 658,161 | Statements of Operations MTB Strategic Allocation Fund Net Investment Income, pre-merger: | |||
| (17,378 | ) | MTB Managed Allocation Fund—Aggressive Growth | ||||
| 5,457 | MTB Managed Allocation Fund—Conservative Growth | |||||
| 28,249 | MTB Strategic Allocation Fund | |||||
| (b) | $ | 11,797,779 | Statements of Operations MTB Strategic Allocation Fund Realized and Unrealized Gain on Investments, pre-merger: | |||
| (115,357 | ) | MTB Managed Allocation Fund—Aggressive Growth | ||||
| 517,277 | MTB Managed Allocation Fund—Conservative Growth | |||||
| (11,220 | ) | MTB Strategic Allocation Fund |
Because the combined Funds have been managed as a single integrated fund since the acquisition was completed, it is not practicable to separate the amounts of revenues and earnings of MTB Managed Allocation Fund—Aggressive Growth, MTB Managed Allocation Fund—Conservative Growth, and MTB Managed Allocation Fund—Moderate Growth, that have been included in Strategic Allocation’s Statement of Operations.
| 9. | SUBSEQUENT EVENTS |
Management has evaluated events and transactions for potential recognition or disclosure in the financial statements through the date the financial statements were issued. Management has determined that, except as set forth below, there are no material events that would require disclosure in the Funds’ financial statements through this date.
On June 9, 2011, the Board approved the re-naming of the Institutional I and Institutional II Shares to Class I and I2 Shares, respectively. This re-naming is expected to be effective at the close of business on or about August 31, 2011.
| 10. | FEDERAL TAX INFORMATION |
| (UNAUDITED) |
Complete information regarding the tax status of distributions will be reported on Forms 1099.
Of the ordinary income (including short-term capital gain) distributions made by the Funds during the year ended April 30, 2011, the Funds designate the following percentages, or such greater percentages that constitute the maximum amount allowable pursuant to Code Sections Section 243 and 854(b)(2), as qualifying for the corporate dividends received deduction:
| Fund | ||||
| Strategic Allocation Fund | 30.13 | % | ||
| Large Cap Value Fund | 100.00 | % | ||
| Large Cap Growth Fund | 100.00 | % | ||
For the year ended April 30, 2011, the Funds designate the following percentages of the ordinary income dividends, or such greater percentages that constitute the maximum amount allowable pursuant to Code Sections 1(h)(11) and 854(b)(2), as qualified dividend income which may be subject to a maximum rate of federal income tax of 15%:
| Fund | ||||
| Strategic Allocation Fund | 55.50 | % | ||
| Large Cap Value Fund | 100.00 | % | ||
| Large Cap Growth Fund | 100.00 | % | ||
| International Equity Fund | 100.00 | % | ||
(continued on next page)
April 30, 2011 / ANNUAL REPORT
Table of Contents
| NOTES TO FINANCIAL STATEMENTS | 167 |
If the Funds meet the requirements of Section 853 of the Code, the Funds will pass through to shareholders credits of foreign taxes paid.
International Equity Fund designates foreign taxes paid of $450,417 and gross income derived from foreign sources of $5,610,959.
For the year ended April 30, 2011, the Funds designate the following percentages of the ordinary income dividends, or such greater percentages that constitute the maximum amount allowable
pursuant to Code Sections 103(a) and 852(b)(5), as exempt-interest dividends which are exempt from federal income tax other than the alternative minimum tax:
| Fund | ||||
| New York Municipal Bond Fund | 99.88 | % | ||
| Pennsylvania Municipal Bond Fund | 97.67 | % | ||
| Maryland Municipal Bond Fund | 99.81 | % | ||
| Virginia Municipal Bond Fund | 100.00 | % | ||
ANNUAL REPORT / April 30, 2011
Table of Contents
| 168 |
REPORT OF INDEPENDENT REGISTERED PUBLIC ACCOUNTING FIRM
TO THE SHAREHOLDERS AND BOARD OF TRUSTEES OF
MTB GROUP OF FUNDS
We have audited the accompanying statements of assets and liabilities, including the portfolios of investments, of MTB Short Duration Government Bond Fund, MTB Short-Term Corporate Bond Fund, MTB U.S. Government Bond Fund, MTB New York Municipal Bond Fund, MTB Pennsylvania Municipal Bond Fund, MTB Maryland Municipal Bond Fund, MTB Virginia Municipal Bond Fund, MTB Intermediate-Term Bond Fund, MTB Income Fund, MTB Strategic Allocation Fund, MTB Large Cap Value Fund, MTB Large Cap Growth Fund, MTB Mid Cap Growth Fund, MTB Small Cap Growth Fund and MTB International Equity Fund (fifteen of the Funds constituting MTB Group of Funds) (the “Funds”) as of April 30, 2011, and the related statements of operations for the year then ended, the statements of changes in net assets for each of the two years in the period then ended and the financial highlights for each of the periods indicated therein. These financial statements and financial highlights are the responsibility of the Funds’ management. Our responsibility is to express an opinion on these financial statements and financial highlights based on our audits.
We conducted our audits in accordance with standards of the Public Company Accounting Oversight Board (United States). Those standards require that we plan and perform the audit to obtain reasonable assurance about whether the financial statements and financial highlights are free of material misstatement. We were not engaged to perform an audit of the Funds’ internal control over financial reporting. Our audits included consideration of internal control over financial reporting as a basis for designing audit procedures that are appropriate in the circumstances, but not for the purpose of expressing an opinion on the effectiveness of the Funds’ internal control over financial reporting. Accordingly, we express no such opinion. An audit also includes examining, on a test basis, evidence supporting the amounts and disclosures in the financial statements and financial highlights, assessing the accounting principles used and significant estimates made by management, and evaluating the overall financial statement presentation. Our procedures included confirmation of securities owned as of April 30, 2011, by correspondence with the custodian, transfer agent of underlying funds and brokers, or by other appropriate auditing procedures where replies from the brokers were not received. We believe that our audits provide a reasonable basis for our opinion.
In our opinion, the financial statements and financial highlights referred to above present fairly, in all material respects, the financial position of the above listed Funds of the MTB Group of Funds at April 30, 2011, the results of their operations for the year then ended, the changes in their net assets for each of the two years in the period then ended, and the financial highlights for each of the periods indicated therein, in conformity with U.S. generally accepted accounting principles.

Philadelphia, Pennsylvania
June 29, 2011
April 30, 2011 / ANNUAL REPORT
Table of Contents
| 169 |
BOARD OF TRUSTEES AND TRUST OFFICERS
The following tables give information about each Trustee and the senior officers of the Trust. The tables separately list Trustee members who are “interested persons” of the Fund (i.e., “Interested” Trustees) and those who are not (i.e., “Independent” Trustees). The Trust is comprised of 23 funds. Unless otherwise noted, the business address of each Trustee and senior officer is 100 East Pratt Street, 17th floor, Baltimore, Maryland 21202. Each Trustee oversees all portfolios of the Trust and serves for an indefinite term. The Trust’s Statement of Additional Information includes additional information about the Trustees and is available, without charge and upon request, by calling 1-800-836-2211.
INTERESTED TRUSTEES BACKGROUND
Name Positions Held with Trust Date Service Began | Principal Occupation(s), Previous Positions and Other Directorships Held | |
Kenneth G. Thompson* Manufacturers and Traders Trust Company (“M&T Bank”) Birth year: 1964 TRUSTEE Began serving: December 2008 | Principal Occupation: Senior Vice President, M&T Bank.
Other Directorships Held: None | |
Jeffrey Durkee* Manufacturers and Traders Trust Company (“M&T Bank”) Birth year: 1958 TRUSTEE Began serving: December 2007 | Principal Occupation: President and Chief Executive Officer, MTB Investment Advisors, Inc. (3/07 to present).
Other Directorships Held: None
Previous Positions: Chairman and CEO Private Wealth Management, Mercantile Bankshares Corporation (4/06 to 3/07); Senior Vice-President and Director, Southern Division, Legg Mason Wood Walker (1998 to 4/06). | |
*Kenneth G. Thompson and Jeffrey Durkee are “interested” due to positions they hold with M&T Bank, the parent of the Funds’ Advisor.
INDEPENDENT TRUSTEES BACKGROUND
Name Date Service Began | Principal Occupation(s), Previous Positions and Other Directorships Held | |
Joseph J. Castiglia Birth year: 1934 CHAIRMAN AND TRUSTEE Began serving: February 1988 | Principal Occupation: Retired.
Other Directorships Held: Chairman, Community Foundation for Greater Buffalo (1/05 to 12/08); Chairman and Treasurer, Buffalo Olmstead Parks Conservancy (1/05 to 12/10); Chairman, Buffalo Philharmonic Orchestra Foundation (1/06 to 12/10); Vice Chairman, Christ the King Seminary (1/05 to 12/10); Director, Baker Victory Services (1/05 to 12/08); Director, Dunn Tire Corporation (1/05 to 12/10); Director, Read to Succeed Buffalo (1/09 to 12/10).
Previous Positions: President, Chief Executive Officer and Vice Chairman, Pratt & Lambert United, Inc., manufacturer of paints and chemical specialties (12/67 to 1/96); Chairman and Director, Catholic Health Systems of Western New York (1/97 to 5/03); Chairman Blue Cross Blue Shield of Western and Central New York (5/92 to 5/07); Director, Energy East, gas and electric utility; Chairman and Director, Federal Reserve Bank of New York, Buffalo Branch. | |
ANNUAL REPORT / April 30, 2011
Table of Contents
| 170 |
Name Date Service Began | Principal Occupation(s), Previous Positions and Other Directorships Held | |
John S. Cramer Birth year: 1942 TRUSTEE Began serving: December 2000 | Principal Occupation: Senior Consultant, Yaffe & Co., Inc., a consulting firm specializing in executive compensation and governance services (2/06 to present), Retired (2002 to 2006).
Other Directorships Held: Highmark Blue Cross Blue Shield (4/01 to present); Chek-Med Corporation (6/03 to present).
Previous Positions: President and Chief Executive Officer, PinnacleHealth Systems, a non-profit hospital and health care system in central Pennsylvania. | |
Daniel R. Gernatt, Jr. Birth year: 1940 TRUSTEE Began serving: February 1988 | Principal Occupation: CEO, Gernatt Asphalt Products, Inc. (1979 to present).
Other Directorships Held: Hilbert College (2000 to present). | |
William H. Cowie, Jr. Birth year: 1931 TRUSTEE Began serving: September 2003 | Principal Occupation: Retired.
Other Directorships Held: MedStar Health Community (1972 to present).
Previous Positions: Vice Chairman of Signet Banking Corp. | |
Richard B. Seidel Birth year: 1941 TRUSTEE Began serving: September 2003 | Principal Occupation: Founder, Chairman and Director, Girard Partners Ltd., a registered investment advisory firm and Broker/Dealer (1995 to present); Chairman and Director Girard Capital, LLC, registered investment advisors (3/09 to present).
Other Directorships Held: Tristate Capital Bank (9/07 to present); Surrey Services for Seniors (2002 to 2008). | |
Dr. Marguerite D. Hambleton Birth year: 1943 TRUSTEE Began serving: September 2005 | Principal Occupation: President, AAA New York State Association (7/09 to present).
Other Directorships Held: AAA National Foundation for Traffic Safety (12/85 to present); Catholic Health System (2004 to 2009).
Previous Positions: President, New York Federal Reserve Board, Buffalo Branch (12/05 to 4/08); President and CEO, AAA Western and Central New York (1985 to 2005). |
OFFICERS
Name Date Service Began | Principal Occupation(s) and Previous Positions | |
Timothy L. Brenner Birth year: 1956 PRESIDENT Began serving: December 2008 | Principal Occupation: Senior Vice President, M&T Bank, President of M&T Life Insurance Company. | |
Michael D. Daniels Birth year: 1967 CHIEF OPERATING OFFICER Began serving: June 2007 | Principal Occupation: Chief Operating Officer, MTB Group of Funds and MTB Investment Advisors, Inc.; Administrative Vice President, M&T Bank.
Previous Positions: Senior Vice President, MSD&T and MCA (2006 to 2007); Vice President, Calamos Asset Management (2004 to 2006); Vice President, JP Morgan Chase Bank (2002 to 2004). |
April 30, 2011 / ANNUAL REPORT
Table of Contents
| 171 |
Name Date Service Began | Principal Occupation(s) and Previous Positions | |
Jeffrey M. Seling Birth year: 1970 VICE PRESIDENT Began serving: June 2007 | Principal Occupation: Vice President, M&T Bank and MTB Investment Advisors, Inc.
Previous Positions: Vice President, MSD&T; Assistant Vice President, Wells Fargo Bank; Assistant Vice President, JP Morgan Chase Bank. | |
Bradley J. Swenson Birth year: 1972 AML COMPLIANCE OFFICER Began serving: September 2007 | Principal Occupation: Senior Vice President and Chief Compliance Officer, ALPS Distributors, Inc., ALPS Fund Services, Inc., FTAM Funds Distributor, Inc., ALPS Holdings, Inc. and ALPS Advisors, Inc.
Previous Positions: Senior Audit Manager, Janus Capital Group, Inc. | |
Gregory B. McShea Birth year: 1965 CHIEF COMPLIANCE OFFICER AND ASSISTANT SECRETARY Began serving: December 2009 | Principal Occupation: Managing Director, MTB Investment Advisors, Inc.; Chief Compliance Officer, MTB Group of Funds.
Previous Positions: General Counsel, Legg Mason Capital Management, Inc. (2007 to 2009); General Counsel, Western Asset Management Company (2003 to 2009); Associate General Counsel and Compliance Director, Legg Mason Wood Walker, Incorporated (1997 to 2003). | |
Ralph V. Partlow III 25 S. Charles St., 22nd Floor Baltimore, MD 21201 Birth year: 1957 VICE PRESIDENT Began serving: June 2010 | Principal Occupation: Administrative Vice President and Deputy General Counsel, M&T Bank (2003 to present).
Previous Positions: Vice President and Senior Counsel, Allfirst Bank (1995 to 2003). | |
Guy Nordahl 101 Barclay Street, 13E New York, NY 10286 Birth year: 1965 CHIEF FINANCIAL OFFICER AND TREASURER Began serving: September 2007 | Principal Occupation: Vice President, BNY Mellon Asset Servicing. | |
Lisa R. Grosswirth 101 Barclay Street, 13E New York, NY 10286 Birth year: 1963 SECRETARY Began serving: September 2007 | Principal Occupation: Vice President, BNY Mellon Asset Servicing (2004 to present).
Previous Positions: Supervisory Paralegal, The Dreyfus Corporation (1998 to 2004). | |
Richard J. Berthy Three Canal Plaza, Suite 100 Portland, ME 04101 Birth year: 1958 CHIEF EXECUTIVE OFFICER Began serving: September 2007 | Principal Occupation: President and Managing Partner, Foreside Financial
Previous Positions: Chief Administrative Officer, Foreside Financial Group, LLC (2005 to 2008); President and Secretary, Bainbridge Capital Management, LLC | |
Eric B. Paul Birth year: 1974 VICE PRESIDENT Began serving: June 2008 | Principal Occupation: Vice President, M&T Bank (2003 to present); Director of Proprietary Products, M&T Bank (4/08 to present). | |
ANNUAL REPORT / April 30, 2011
Table of Contents
| 172 |
SHAREHOLDER PROXY RESULTS (unaudited)
At May 27, 2010, a summary report of shares voted by proposal is as follows:
To approve plans of reorganization providing for the (I) transfer of substantially all of the assets of the Managed Allocation Fund-Conservative Growth to Strategic Allocation Fund, and (II) distribution of such shares to Class A and Class B shareholders of the Managed Allocation Fund—Conservative Growth in connection with its liquidation.
| Shares Voted | ||||
For | 485,267 | |||
Against | 27,670 | |||
Abstain | 31,287 | |||
Broker Non-Votes | 379,173 | |||
To approve plans of reorganization providing for the (I) transfer of substantially all of the assets of the Managed Allocation Fund-Moderate Growth to Strategic Allocation Fund, and (II) distribution of such shares to Class A and Class B shareholders of the Managed Allocation Fund—Moderate Growth in connection with its liquidation.
| Shares Voted | ||||
For | 2,015,821 | |||
Against | 87,984 | |||
Abstain | 139,167 | |||
Broker Non-Votes | 2,097,581 | |||
To approve plans of reorganization providing for the (I) transfer of substantially all of the assets of the Managed Allocation Fund-Aggressive Growth to Strategic Allocation Fund, and (II) distribution of such shares to Class A and Class B shareholders of the Managed Allocation Fund—Aggressive Growth in connection with its liquidation.
| Shares Voted | ||||
For | 1,127,528 | |||
Against | 118,181 | |||
Abstain | 77,065 | |||
Broker Non-Votes | 1,269,397 | |||
April 30, 2011 / ANNUAL REPORT
Table of Contents
| 173 |
Shares of the MTB Group of Funds are not FDIC insured or otherwise protected by the U.S. government, are not deposits or other obligations of, or guaranteed by, Manufacturers and Traders Trust Company, and are subject to investment risks, including possible loss of the principal amount invested.
This report is authorized for distribution to prospective investors only when preceded or accompanied by the Funds’ prospectus which contains facts concerning their objectives and policies, management fees, expenses and other information.
VOTING PROXIES ON FUND PORTFOLIO SECURITIES
A description of the policies and procedures that the Funds use to determine how to vote proxies relating to securities held in the Funds’ portfolios is available, without charge and upon request, by calling 1-800-836-2211. A report on how the Funds voted any such proxies during the most recent 12-month period ended June 30 is available through MTB Funds’ website. Go to www.mtbfunds.com; select “Proxy Voting Record” to access the link. This information is also available from the Edgar database on the SEC’s website at www.sec.gov.
QUARTERLY PORTFOLIO SCHEDULE
The Funds file with the SEC a complete schedule of their portfolio holdings, as of the close of the first and third quarters of their fiscal year, on Form N-Q. These filings are available on the SEC’s website at www.sec.gov and may be reviewed and copied at the SEC’s Public Reference Room in Washington DC. (Call 1-800-SEC-0330 for information on the operation of the Public Reference Room.)
Electronic Delivery
MTB Funds encourages you to sign up for electronic delivery of investor materials. By doing so you will receive information faster, help lower shareholder costs, and reduce the impact to the environment. To enroll in electronic delivery:
| 1.) | Go to www.mtbfunds.com and select “Individual Investors” |
| 2.) | Click on the link “Sign up for Electronic Delivery” |
| 3.) | Login to your account or create new user ID |
| 4.) | Select E-Delivery Consent from the available options, and |
| 5.) | Complete the information requested, including providing the email address where you would like to receive notification for electronic documents. |
* If you hold your account through a financial intermediary, please contact your advisor to request electronic delivery of investor materials.
Householding
In an effort to reduce volume of mail you receive, only one copy of the prospectus, annual/semi-annual report, SAI and proxy statements will be sent to shareholders who are part of the same family and share the same address.
If you would like to request additional copies of the prospectus, annual/semi-annual report or SAI, or wish to opt out of householding mailings, please contact Shareholder Services at 1-800-836-2211, or write to MTB Group of Funds, P.O. Box 44489, Denver, CO 80201.
ANNUAL REPORT / April 30, 2011
Table of Contents

Investment Advisor
MTB Investment Advisors, Inc.
100 E. Pratt Street
17th Floor
Baltimore, MD 21202
Distributor
ALPS Distributors, Inc.
1290 Broadway
Suite 1100
Denver, CO 80203
Co-Administrator
MTB Investment Advisors, Inc.
100 E. Pratt Street
17th Floor
Baltimore, MD 21202
Co-Administrator, Accountant and Custodian
The Bank of New York Mellon
101 Barclay Street
New York, NY 10286
Sub-Advisors to
MTB International Equity Fund
LSV Asset Management
1 North Wacker Drive
Suite 4000
Chicago, IL 60606
Baring International Investment Limited
155 Bishopsgate
London
EC2M 3XY
United Kingdom
Hansberger Global Investors, Inc.
401 East Las Olas Blvd.
Suite 1700
Fort Lauderdale, FL 33301
Sub-Advisor to
MTB Large Cap Value Fund
NWQ Investment Management Company LLC
2049 Century Park East
Los Angeles, CA 90067
Transfer Agent and Dividend
Disbursing Agent
ALPS Fund Services, Inc.
1290 Broadway
Suite 1100
Denver, CO 80203
Independent Registered Public
Accounting Firm
Ernst & Young LLP
Two Commerce Square
2001 Market Street
Suite 4000
Philadelphia, PA 19103
We are pleased to send you this Annual Report of MTB Group of Funds. The Annual Report contains important information about your investments in MTB Group of Funds.
Since we are required by law to send a Annual Report to each person listed as a shareholder, you (or your household) may receive more than one
Annual Report.
(6/11)
Table of Contents
MTB FUNDS
100 EAST PRATT STREET, 17th FLOOR
BALTIMORE, MD 21202
MTB-AR-011F-0611
1-800-836-2211 / mtbfunds.com


Table of Contents
| ITEM 2. | CODE OF ETHICS |
(a) As of the end of the period covered by this report, the registrant has adopted a code of ethics (the “Section 406 Standards for Investment Companies - Ethical Standards for Principal Executive and Financial Officers”) that applies to the registrant’s Principal Executive Officer and Principal Financial Officer; the registrant’s Principal Financial Officer also serves as the Principal Accounting Officer.
(b) There have been no amendments to the registrant’s code of ethics that apply to its Principal Executive Officer or Principal Financial Officer.
(c) There have been no amendments to the Funds’ code of ethics during the reporting period for this Form N-CSR.
(d) The registrant has not granted any waivers, including an implicit waiver, from any provisions of its code of ethics during the reporting period for this Form N-CSR.
(e) Not Applicable
(f)(3) The registrant hereby undertakes to provide any person, without charge, upon request, a copy of the code of ethics. To request a copy of the code of ethics, contact the registrant at 1-800-341-7400, and ask for a copy of the Section 406 Standards for Investment Companies - Ethical Standards for Principal Executive and Financial Officers.
| ITEM 3. | AUDIT COMMITTEE FINANCIAL EXPERT |
The registrant’s Board has determined that each member of the Board’s Audit Committee is an “audit committee financial expert,” and that each such member is “independent,” for purposes of this Item. The Audit Committee consists of the following Board members: Joseph J. Castiglia, William H. Cowie, Jr., John S. Cramer, and Richard B. Seidel.
| ITEM 4. | PRINCIPAL ACCOUNTANT FEES AND SERVICES |
(a) Audit Fees. The aggregate fees billed for each of the last two fiscal years for professional services rendered by the principal accountant for the audit of the Registrant’s annual financial statements or services that are normally provided by the accountant in connection with statutory and regulatory filings or engagements were as follows:
Fiscal year ended 2011 - $412,432
Fiscal year ended 2010 - $472,335
(b) Audit-Related Fees. The aggregate fees billed for each of the last two fiscal years for professional services rendered by the principal accountant for assurance and related services by the principal accountant that are reasonably related to the performance of the audit of the Registrant’s financial statements and are not reported above in Item 4(a) were as follows:
Fiscal year ended 2011 - $0
Fiscal year ended 2010 - $0
Amount requiring approval of the registrant’s audit committee pursuant to paragraph (c)(7)(ii) of Rule 2-01 of Regulation S-X, $0 and $0 respectively.
(c) Tax Fees. The aggregate fees billed for each of the last two fiscal years for professional services rendered by the principal accountant for tax compliance, tax advice and tax planning were as follows:
Fiscal year ended 2011 - $86,060
Fiscal year ended 2010 - $153,900
Table of Contents
Amount requiring approval of the registrant’s audit committee pursuant to paragraph (c)(7)(ii) of Rule 2-01 of Regulation S-X, $0 and $0 respectively.
(d) All Other Fees. The aggregate fees billed in each of the last two fiscal years for products and services provided by the principal accountant, other than the services reported in paragraphs (a) and (c) of this Item were as follows:
Fiscal year ended 2011 - $0
Fiscal year ended 2010 - $0
Amount requiring approval of the registrant’s audit committee pursuant to paragraph (c)(7)(ii) of Rule 2-01 of Regulation S-X, $0 and $0 respectively.
(e)(1) Audit Committee Policies regarding Pre-approval of Services.
The Audit Committee is required to pre-approve audit and non-audit services performed by the independent auditor in order to assure that the provision of such services do not impair the auditor’s independence. Unless a type of service to be provided by the independent auditor has received general pre-approval, it will require specific pre-approval by the Audit Committee. Any proposed services exceeding pre-approved cost levels will require specific pre- approval by the Audit Committee.
Certain services have the general pre-approval of the Audit Committee. The term of the general pre-approval is 12 months from the date of pre-approval, unless the Audit Committee specifically provides for a different period. The Audit Committee will annually review the services that may be provided by the independent auditor without obtaining specific pre-approval from the Audit Committee and may grant general pre-approval for such services. The Audit Committee will revise the list of general pre-approved services from time to time, based on subsequent determinations. The Audit Committee will not delegate its responsibilities to pre-approve services performed by the independent auditor to management.
Table of Contents
The Audit Committee has delegated pre-approval authority to its Chairman. The Chairman will report any pre-approval decisions to the Audit Committee at its next scheduled meeting. The Committee will designate another member with such pre-approval authority when the Chairman is unavailable.
AUDIT SERVICES
The annual Audit services engagement terms and fees will be subject to the specific pre-approval of the Audit Committee. The Audit Committee must approve any changes in terms, conditions and fees resulting from changes in audit scope, registered investment company (RIC) structure or other matters.
In addition to the annual Audit services engagement specifically approved by the Audit Committee, the Audit Committee may grant general pre-approval for other Audit Services, which are those services that only the independent auditor reasonably can provide. The Audit Committee has pre-approved certain Audit services, all other Audit services must be specifically pre-approved by the Audit Committee.
AUDIT-RELATED SERVICES
Audit-related services are assurance and related services that are reasonably related to the performance of the audit or review of the Company’s financial statements or that are traditionally performed by the independent auditor. The Audit Committee believes that the provision of Audit-related services does not impair the independence of the auditor, and has pre-approved certain Audit-related services, all other Audit-related services must be specifically pre-approved by the Audit Committee.
TAX SERVICES
The Audit Committee believes that the independent auditor can provide Tax services to the Company such as tax compliance, tax planning and tax advice without impairing the auditor’s independence. However, the Audit Committee will not permit the retention of the independent auditor in connection with a transaction initially recommended by the independent auditor, the purpose of which may be tax avoidance and the tax treatment of which may not be supported in the Internal Revenue Code and related regulations. The Audit Committee has pre-approved certain Tax services, all Tax services involving large and complex transactions must be specifically pre-approved by the Audit Committee.
ALL OTHER SERVICES
With respect to the provision of services other than audit, review or attest services the pre-approval requirement is waived if:
| (1) | The aggregate amount of all such services provided constitutes no more than five percent of the total amount of revenues paid by the registrant, the registrant’s adviser (not including any |
Table of Contents
sub-adviser whose role is primarily portfolio management and is subcontracted with or overseen by another investment adviser), and any entity controlling, controlled by, or under common control with the investment adviser that provides ongoing services to the registrant to its accountant during the fiscal year in which the services are provided;
| (2) | Such services were not recognized by the registrant, the registrant’s adviser (not including any sub-adviser whose role is primarily portfolio management and is subcontracted with or overseen by another investment adviser), and any entity controlling, controlled by, or under common control with the investment adviser that provides ongoing services to the registrant at the time of the engagement to be non-audit services; and |
| (3) | Such services are promptly brought to the attention of the Audit Committee of the issuer and approved prior to the completion of the audit by the Audit Committee or by one or more members of the Audit Committee who are members of the board of directors to whom authority to grant such approvals has been delegated by the Audit Committee. |
The Audit Committee may grant general pre-approval to those permissible non-audit services classified as All Other services that it believes are routine and recurring services, and would not impair the independence of the auditor.
The SEC’s rules and relevant guidance should be consulted to determine the precise definitions of prohibited non-audit services and the applicability of exceptions to certain of the prohibitions.
PRE-APPROVAL FEE LEVELS
Pre-approval fee levels for all services to be provided by the independent auditor will be established annually by the Audit Committee. Any proposed services exceeding these levels will require specific pre-approval by the Audit Committee.
PROCEDURES
Requests or applications to provide services that require specific approval by the Audit Committee will be submitted to the Audit Committee by both the independent auditor and the Principal Accounting Officer and/or Internal Auditor, and must include a joint statement as to whether, in their view, the request or application is consistent with the SEC’s rules on auditor independence.
Table of Contents
(e)(2) Percentage of services identified in items 4(b) through 4(d) that were approved by the registrants audit committee pursuant to paragraph (c)(7)(i)(C) of Rule 2-01 of Regulation S-X:
4(b)
Fiscal year ended 2011 - 0%
Fiscal year ended 2010 - 0%
Percentage of services provided to the registrants investment adviser and any entity controlling, controlled by, or under common control with the investment adviser that provides ongoing services to the registrant that were approved by the registrants audit committee pursuant to paragraph (c)(7)(i)(C) of Rule 2-01 of Regulation S-X, 0% and 0% respectively.
4(c)
Fiscal year ended 2011 - 0%
Fiscal year ended 2010 - 0%
Percentage of services provided to the registrants investment adviser and any entity controlling, controlled by, or under common control with the investment adviser that provides ongoing services to the registrant that were approved by the registrants audit committee pursuant to paragraph (c)(7)(i)(C) of Rule 2-01 of Regulation S-X, 0% and 0% respectively.
4(d)
Fiscal year ended 2011 - 0%
Fiscal year ended 2010 - 0%
Percentage of services provided to the registrants investment adviser and any entity controlling, controlled by, or under common control with the investment adviser that provides ongoing services to the registrant that were approved by the registrants audit committee pursuant to paragraph (c)(7)(i)(C) of Rule 2-01 of Regulation S-X, 0% and 0% respectively.
(f) Not Applicable
(g) Non-Audit Fees billed to the registrant, the registrant’s investment adviser, and certain entities controlling, controlled by or under common control with the investment adviser that provide ongoing services to the registrant:
Fiscal year ended 2011 - $86,060
Fiscal year ended 2010 - $153,900
Table of Contents
(h) The registrant’s Audit Committee has considered that the provision of non-audit services that were rendered to the registrant’s adviser (not including any sub-adviser whose role is primarily portfolio management and is subcontracted with or overseen by another investment adviser), and any entity controlling, controlled by, or under common control with the investment adviser that provides ongoing services to the registrant that were not pre-approved pursuant to paragraph (c)(7)(ii) of Rule 2-01 of Regulation S-X is compatible with maintaining the principal accountant’s independence.
| ITEM 5. | AUDIT COMMITTEE OF LISTED REGISTRANTS |
Not Applicable
| ITEM 6. | INVESTMENTS |
| (a) | The schedule is included as part of the report to shareholders filed under Item 1 of this Form. |
| (b) | Not Applicable |
| ITEM 7. | DISCLOSURE OF PROXY VOTING POLICIES AND PROCEDURES FOR CLOSED-END MANAGEMENT INVESTMENT COMPANIES |
Not Applicable
| ITEM 8. | PORTFOLIO MANAGERS OF CLOSED-END MANAGEMENT INVESTMENT COMPANIES |
Not Applicable
| ITEM 9. | PURCHASES OF EQUITY SECURITIES BY CLOSED-END MANAGEMENT INVESTMENT COMPANY AND AFFILIATED PURCHASERS |
Not Applicable
| ITEM 10. | SUBMISSION OF MATTERS TO A VOTE OF SECURITY HOLDERS |
No changes to report.
| ITEM 11. | CONTROLS AND PROCEDURES |
| (a) | The registrant’s principal executive officer and principal financial officer concluded that the registrant’s disclosure controls and procedures (as defined in Rule 30a-3(c) under the Investment Company Act of 1940, as amended (the “1940 Act”) (17 CFR 270.30a-3(c))), are effective as of a date within 90 days of the filing date of this report, based on the evaluation of the registrant’s disclosure controls and procedures, as required by Rule 30a-3(b) under the 1940 Act (17 CFR 270.30a-3(b)) and Rules 13a-15(b) or 15d-15(b) under the Securities Exchange Act of 1934 (the “Exchange Act”) (17 CFR 240.13a-15(b) or 240.15d-15(b)). |
| (b) | There were no changes in the registrant’s internal control over financial reporting (as defined in Rule 30a-3(d) under the 1940 Act (17 CFR 270.30a-3(d)), that occurred during the registrant’s second fiscal quarter of the period covered by this report that have materially affected, or are reasonably likely to materially affect, the registrant’s internal control over financial reporting. |
| ITEM 12. | EXHIBITS |
| (a)(1) | Not applicable. |
| (a)(2) | Certifications of the principal executive officer and principal financial officer of the Registrant as required by Rule 30a-2(a) under the 1940 Act (17 CFR 270.30a-2(a)) are filed herewith as Exhibit 99CERT. |
| (a)(3) | Not applicable. |
| (b) | Certifications pursuant to Section 906 of the Sarbanes-Oxley Act of 2002 as required by Rule 30a-2(b) under the 1940 Act (17 CFR 270.30a-2(b)), Rule 13a-14(b) or Rule 15d-14(b) under the Exchange Act (17 CFR 240.13a-14(b) or 240.15d-14(b)) and Section 1350 of Chapter 63 of Title 18 of the United States Code (18 U.S.C. 1350) are filed herewith as Exhibit 99.906CERT. |
Table of Contents
SIGNATURES
Pursuant to the requirements of the Securities Exchange Act of 1934 and the Investment Company Act of 1940, the registrant has duly caused this report to be signed on its behalf by the undersigned, thereunto duly authorized.
(Registrant) MTB Group of Funds
| By: | /s/ Richard J. Berthy | |
| Name: | Richard J. Berthy | |
| Title: | Principal Executive Officer | |
| Date: | June 30, 2011 | |
| By: | /s/ Guy Nordahl | |
| Name: | Guy Nordahl | |
| Title: | Principal Financial Officer | |
| Date: | June 30, 2011 | |
Pursuant to the requirements of the Securities Exchange Act of 1934 and the Investment Company Act of 1940, this report has been signed by the following persons on behalf of the registrant and in the capacities and on the dates indicated.
| By: | /s/ Richard J. Berthy | |
| Name: | Richard J. Berthy | |
| Title: | Principal Executive Officer | |
| Date: | June 30, 2011 | |
| By: | /s/ Guy Nordahl | |
| Name: | Guy Nordahl | |
| Title: | Principal Financial Officer | |
| Date: | June 30, 2011 | |