UNITED STATES
SECURITIES AND EXCHANGE COMMISSION
Washington, D.C. 20549
FORM N-CSR
CERTIFIED SHAREHOLDER REPORT OF REGISTERED
MANAGEMENT INVESTMENT COMPANIES
Investment Company Act file number 811-05502
Comstock Funds, Inc.
(Exact name of registrant as specified in charter)
One Corporate Center
Rye, New York 10580-1422
(Address of principal executive offices) (Zip code)
John C. Ball
Gabelli Funds, LLC
One Corporate Center
Rye, New York 10580-1422
(Name and address of agent for service)
Registrant’s telephone number, including area code: 1-800-422-3554
Date of fiscal year end: December 311
Date of reporting period: October 31, 2024 (based on prior fiscal year end)
Form N-CSR is to be used by management investment companies to file reports with the Commission not later than 10 days after the transmission to stockholders of any report that is required to be transmitted to stockholders under Rule 30e-1 under the Investment Company Act of 1940 (17 CFR 270.30e-1). The Commission may use the information provided on Form N-CSR in its regulatory, disclosure review, inspection, and policymaking roles.
A registrant is required to disclose the information specified by Form N-CSR, and the Commission will make this information public. A registrant is not required to respond to the collection of information contained in Form N-CSR unless the Form displays a currently valid Office of Management and Budget (“OMB”) control number. Please direct comments concerning the accuracy of the information collection burden estimate and any suggestions for reducing the burden to Secretary, Securities and Exchange Commission, 100 F Street, NE, Washington, DC 20549-1090. The OMB has reviewed this collection of information under the clearance requirements of 44 U.S.C. § 3507.
| 1 | Effective August 21, 2024, the Registrant changed its fiscal year end from April 30 to December 31. |
Item 1. Reports to Stockholders.
| (a) | Include a copy of the report transmitted to stockholders pursuant to Rule 30e-1 under the Act (17 CFR 270.30e-1). |
| | The Report to Shareholders is attached herewith. |
Comstock Capital Value Fund
Semi-Annual Shareholder Report - October 31, 2024

This semi-annual shareholder report contains important information about Comstock Capital Value Fund (the "Fund") for the period of May 1, 2024 to October 31, 2024. The Fund follows a value oriented strategy and seeks to achieve its investment objective by investing in equity and debt securities, money market instruments, and derivatives. The Fund may invest in, and may shift frequently among, a wide range of asset classes and market sectors. The equity securities in which the Fund invests include common and preferred stock (including convertible preferred stock), warrants, and depository receipts. There is no restriction on the market capitalization of the Fund’s equity securities. The debt securities in which the Fund may invest include: U.S. corporate debt, U.S. government and agency debt, and foreign sovereign and other debt securities (including debt securities from emerging market issuers). You can find additional information about the Fund at www.gabelli.com/funds/open_ends. You can also request this information by contacting us at 800-GABELLI (800-422-3554).
What were the Fund costs for the last six months?
(based on a hypothetical $10,000 investment)
| Class Name | Costs of a $10k Investment | Costs Paid as a % of a $10k Investment |
|---|
| Comstock Capital Value Fund - Class AAA | $0 | -% |
How did the Fund perform?
During the six months ended October 31, 2024, the Comstock Capital Value Fund underperformed its broad-based benchmark, the S&P 500 Index, as well as its comparative benchmarks, the Bloomberg US Government/Credit Bond Index and MSCI USA Value Index. Top performers during the period were focused on the Health Care, Information Technology and Communication Services sectors. Detractors from performance were primarily in the Real Estate, Energy, and Consumer Discretionary sectors. During the period, the market experienced an increase in deal volume. Private Equity deals increased substantially, and mega-deals dominated, while smaller deals declined.
How has the Fund performed over the past 10 years?
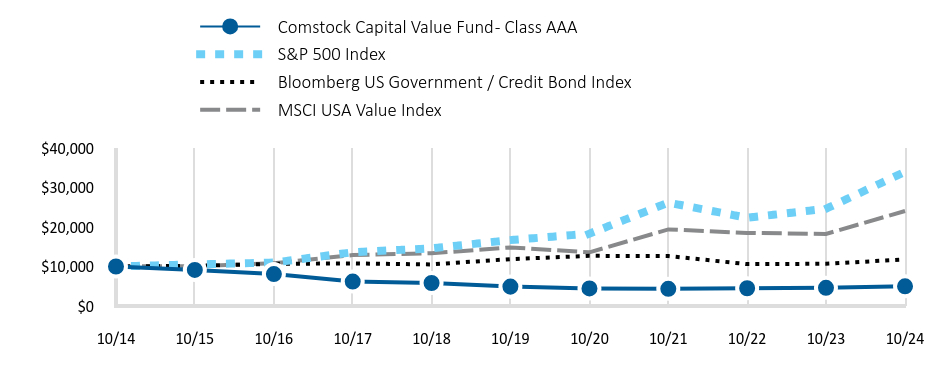
The performance chart of the fund class presented reflects a hypothetical $10,000 investment, assuming the maximum sales charge, compared to a broad-based securities market index and more narrowly based indices reflecting market sectors in which the Fund invests over a 10-year period. The chart uses total return NAV performance and assumes reinvestment of dividends and capital gains distribution. Fund expenses were deducted.
Total Return Based on a $10,000 Investment
| Comstock Capital Value Fund - Class AAA | S&P 500 Index | Bloomberg US Government / Credit Bond Index | MSCI USA Value Index |
|---|
| 10/14 | 10,000 | 10,000 | 10,000 | 10,000 |
| 10/15 | 9,131 | 10,520 | 10,172 | 10,095 |
| 10/16 | 8,072 | 10,994 | 10,664 | 10,808 |
| 10/17 | 6,179 | 13,592 | 10,776 | 12,888 |
| 10/18 | 5,822 | 14,591 | 10,527 | 13,347 |
| 10/19 | 4,905 | 16,682 | 11,855 | 14,825 |
| 10/20 | 4,453 | 18,302 | 12,694 | 13,576 |
| 10/21 | 4,334 | 26,156 | 12,633 | 19,376 |
| 10/22 | 4,488 | 22,334 | 10,607 | 18,500 |
| 10/23 | 4,607 | 24,599 | 10,685 | 18,247 |
| 10/24 | 4,976 | 33,952 | 11,778 | 24,049 |
Average Annual Total Returns
| 6 months | 1 Year | 5 Year | 10 Year |
|---|
| Comstock Capital Value Fund - Class AAA | 4.31% | 8.01% | 0.29% | (6.74)% |
| S&P 500 Index | 14.08% | 38.02% | 15.27% | 13.00% |
| Bloomberg US Government / Credit Bond Index | 5.14% | 10.23% | (0.13)% | 1.65% |
| MSCI USA Value Index | 11.55% | 31.80% | 10.16% | 9.17% |
- Total Net Assets$6,774,365
- Number of Portfolio Holdings101
- Portfolio Turnover Rate93%
- Management Fees$(83,336)
Past performance does not guarantee future results. Call 800-GABELLI (800-422-3554) or visit www.gabelli.com/funds/open_ends for current month-end performance. The table and graph presented above do not reflect the deduction of taxes a shareholder would pay on fund distributions or the redemption of fund shares.
What did the Fund invest in?
Top 10 Holdings (% of net assets)
| HashiCorp Inc. | 4.5% |
| Kellanova | 4.5% |
| Axonics Inc. | 3.6% |
| Stericycle Inc. | 3.6% |
| Amedisys Inc. | 3.3% |
| R1 RCM Inc. | 3.1% |
| Catalent Inc. | 2.8% |
| Juniper Networks Inc. | 2.7% |
| United States Steel Corp. | 2.7% |
| Endeavor Group Holdings Inc. | 2.6% |
Portfolio Weighting (% of net assets)
| Common Stocks | 91.5% |
| U.S. Government Obligations | 8.2% |
| Closed-End Funds | 0.6% |
| Rights | 0.3% |
| Other Assets and Liabilities (Net) | (0.6%) |
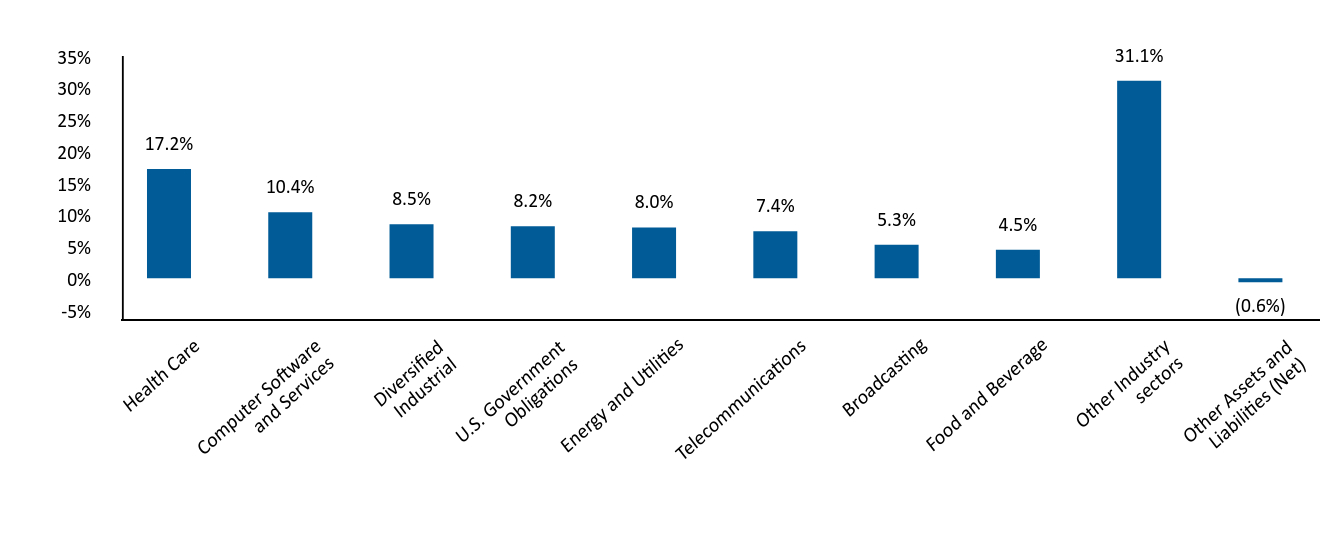
Industry Allocation (% of net assets)
| Industry Weighting | . |
|---|
| Health Care | 17.2% |
| Computer Software and Services | 10.4% |
| Diversified Industrial | 8.5% |
| U.S. Government Obligations | 8.2% |
| Energy and Utilities | 8.0% |
| Telecommunications | 7.4% |
| Broadcasting | 5.3% |
| Food and Beverage | 4.5% |
| Other Industry sectors | 31.1% |
| Other Assets and Liabilities (Net) | (0.6%) |
Comstock Capital Value Fund
Semi-Annual Shareholder Report - October 31, 2024
On August 21, 2024, the Fund’s Board of Directors approved a change in the Fund’s fiscal year end to December 31.
Where can I find additional information about the Fund?
If you wish to view additional information about the Fund; including but not limited to financial statements or holdings, please visit www.gabelli.com/funds/open_ends.
Contact Us
Phone: 800-GABELLI (800-422-3554)
Email: info@gabelli.com
If you wish to receive a copy of this document at a new address, contact 800-GABELLI (800-422-3554)
Comstock Capital Value Fund
Semi-Annual Shareholder Report - October 31, 2024
This semi-annual shareholder report contains important information about Comstock Capital Value Fund (the "Fund") for the period of May 1, 2024 to October 31, 2024. The Fund follows a value oriented strategy and seeks to achieve its investment objective by investing in equity and debt securities, money market instruments, and derivatives. The Fund may invest in, and may shift frequently among, a wide range of asset classes and market sectors. The equity securities in which the Fund invests include common and preferred stock (including convertible preferred stock), warrants, and depository receipts. There is no restriction on the market capitalization of the Fund’s equity securities. The debt securities in which the Fund may invest include: U.S. corporate debt, U.S. government and agency debt, and foreign sovereign and other debt securities (including debt securities from emerging market issuers). You can find additional information about the Fund at www.gabelli.com/funds/open_ends. You can also request this information by contacting us at 800-GABELLI (800-422-3554).
What were the Fund costs for the last six months?
(based on a hypothetical $10,000 investment)
| Class Name | Costs of a $10k Investment | Costs Paid as a % of a $10k Investment |
|---|
| Comstock Capital Value Fund - Class C | $0 | -% |
How did the Fund perform?
During the six months ended October 31, 2024, the Comstock Capital Value Fund underperformed its broad-based benchmark, the S&P 500 Index, as well as its comparative benchmarks, the Bloomberg US Government/Credit Bond Index and MSCI USA Value Index. Top performers during the period were focused on the Health Care, Information Technology and Communication Services sectors. Detractors from performance were primarily in the Real Estate, Energy, and Consumer Discretionary sectors. During the period, the market experienced an increase in deal volume. Private Equity deals increased substantially, and mega-deals dominated, while smaller deals declined.
How has the Fund performed over the past 10 years?
The performance chart of the fund class presented reflects a hypothetical $10,000 investment, assuming the maximum sales charge, compared to a broad-based securities market index and more narrowly based indices reflecting market sectors in which the Fund invests over a 10-year period. The chart uses total return NAV performance and assumes reinvestment of dividends and capital gains distribution. Fund expenses were deducted.
Total Return Based on a $10,000 Investment
| Comstock Capital Value Fund - Class C | Comstock Capital Value Fund - Class C (includes sales charge) | S&P 500 Index | Bloomberg US Government / Credit Bond Index | MSCI USA Value Index |
|---|
| 10/14 | 10,000 | 10,000 | 10,000 | 10,000 | 10,000 |
| 10/15 | 9,059 | 8,968 | 10,520 | 10,172 | 10,095 |
| 10/16 | 7,957 | 7,797 | 10,994 | 10,664 | 10,808 |
| 10/17 | 6,048 | 5,864 | 13,592 | 10,776 | 12,888 |
| 10/18 | 5,644 | 5,418 | 14,591 | 10,527 | 13,347 |
| 10/19 | 4,731 | 4,494 | 16,682 | 11,855 | 14,825 |
| 10/20 | 4,260 | 4,007 | 18,302 | 12,694 | 13,576 |
| 10/21 | 4,139 | 3,853 | 26,156 | 12,633 | 19,376 |
| 10/22 | 4,301 | 3,965 | 22,334 | 10,607 | 18,500 |
| 10/23 | 4,408 | 4,024 | 24,599 | 10,685 | 18,247 |
| 10/24 | 4,757 | 4,303 | 33,952 | 11,778 | 24,049 |
Average Annual Total Returns
| 6 months | 1 Year | 5 Year | 10 Year |
|---|
| Comstock Capital Value Fund - Class C | 4.20% | 7.92% | 0.11% | (7.16)% |
| Comstock Capital Value Fund - Class C (includes sales charge) | 3.20% | 6.92% | 0.11% | (7.16)% |
| S&P 500 Index | 14.08% | 38.02% | 15.27% | 13.00% |
| Bloomberg US Government / Credit Bond Index | 5.14% | 10.23% | (0.13)% | 1.65% |
| MSCI USA Value Index | 11.55% | 31.80% | 10.16% | 9.17% |
- Total Net Assets$6,774,365
- Number of Portfolio Holdings101
- Portfolio Turnover Rate93%
- Management Fees$(83,336)
Past performance does not guarantee future results. Call 800-GABELLI (800-422-3554) or visit www.gabelli.com/funds/open_ends for current month-end performance. The table and graph presented above do not reflect the deduction of taxes a shareholder would pay on fund distributions or the redemption of fund shares.
What did the Fund invest in?
Top 10 Holdings (% of net assets)
| HashiCorp Inc. | 4.5% |
| Kellanova | 4.5% |
| Axonics Inc. | 3.6% |
| Stericycle Inc. | 3.6% |
| Amedisys Inc. | 3.3% |
| R1 RCM Inc. | 3.1% |
| Catalent Inc. | 2.8% |
| Juniper Networks Inc. | 2.7% |
| United States Steel Corp. | 2.7% |
| Endeavor Group Holdings Inc. | 2.6% |
Portfolio Weighting (% of net assets)
| Common Stocks | 91.5% |
| U.S. Government Obligations | 8.2% |
| Closed-End Funds | 0.6% |
| Rights | 0.3% |
| Other Assets and Liabilities (Net) | (0.6%) |
Industry Allocation (% of net assets)
| Industry Weighting | . |
|---|
| Health Care | 17.2% |
| Computer Software and Services | 10.4% |
| Diversified Industrial | 8.5% |
| U.S. Government Obligations | 8.2% |
| Energy and Utilities | 8.0% |
| Telecommunications | 7.4% |
| Broadcasting | 5.3% |
| Food and Beverage | 4.5% |
| Other Industry sectors | 31.1% |
| Other Assets and Liabilities (Net) | (0.6%) |
Comstock Capital Value Fund
Semi-Annual Shareholder Report - October 31, 2024
On August 21, 2024, the Fund’s Board of Directors approved a change in the Fund’s fiscal year end to December 31.
Where can I find additional information about the Fund?
If you wish to view additional information about the Fund; including but not limited to financial statements or holdings, please visit www.gabelli.com/funds/open_ends.
Contact Us
Phone: 800-GABELLI (800-422-3554)
Email: info@gabelli.com
If you wish to receive a copy of this document at a new address, contact 800-GABELLI (800-422-3554)
Comstock Capital Value Fund
Semi-Annual Shareholder Report - October 31, 2024

This semi-annual shareholder report contains important information about Comstock Capital Value Fund (the "Fund") for the period of May 1, 2024 to October 31, 2024. The Fund follows a value oriented strategy and seeks to achieve its investment objective by investing in equity and debt securities, money market instruments, and derivatives. The Fund may invest in, and may shift frequently among, a wide range of asset classes and market sectors. The equity securities in which the Fund invests include common and preferred stock (including convertible preferred stock), warrants, and depository receipts. There is no restriction on the market capitalization of the Fund’s equity securities. The debt securities in which the Fund may invest include: U.S. corporate debt, U.S. government and agency debt, and foreign sovereign and other debt securities (including debt securities from emerging market issuers). You can find additional information about the Fund at www.gabelli.com/funds/open_ends. You can also request this information by contacting us at 800-GABELLI (800-422-3554).
What were the Fund costs for the last six months?
(based on a hypothetical $10,000 investment)
| Class Name | Costs of a $10k Investment | Costs Paid as a % of a $10k Investment |
|---|
| Comstock Capital Value Fund - Class I | $0 | -% |
How did the Fund perform?
During the six months ended October 31, 2024, the Comstock Capital Value Fund underperformed its broad-based benchmark, the S&P 500 Index, as well as its comparative benchmarks, the Bloomberg US Government/Credit Bond Index and MSCI USA Value Index. Top performers during the period were focused on the Health Care, Information Technology and Communication Services sectors. Detractors from performance were primarily in the Real Estate, Energy, and Consumer Discretionary sectors. During the period, the market experienced an increase in deal volume. Private Equity deals increased substantially, and mega-deals dominated, while smaller deals declined.
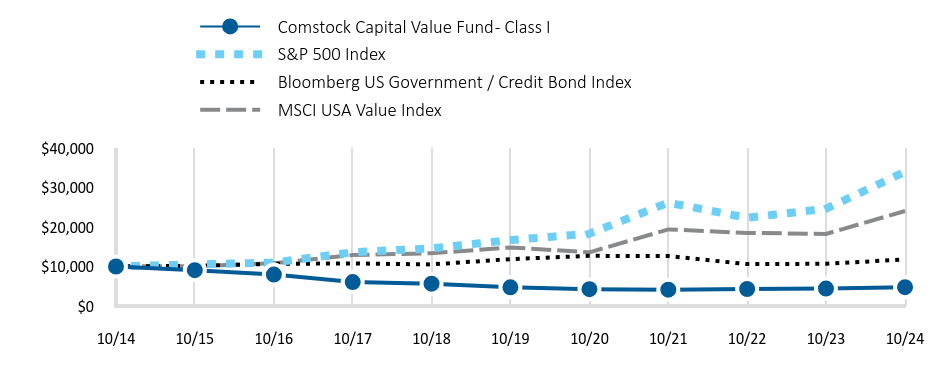
How has the Fund performed over the past 10 years?
The performance chart of the fund class presented reflects a hypothetical $10,000 investment, assuming the maximum sales charge, compared to a broad-based securities market index and more narrowly based indices reflecting market sectors in which the Fund invests over a 10-year period. The chart uses total return NAV performance and assumes reinvestment of dividends and capital gains distribution. Fund expenses were deducted.
Total Return Based on a $10,000 Investment
| Comstock Capital Value Fund - Class I | S&P 500 Index | Bloomberg US Government / Credit Bond Index | MSCI USA Value Index |
|---|
| 10/14 | 10,000 | 10,000 | 10,000 | 10,000 |
| 10/15 | 9,059 | 10,520 | 10,172 | 10,095 |
| 10/16 | 7,957 | 10,994 | 10,664 | 10,808 |
| 10/17 | 6,048 | 13,592 | 10,776 | 12,888 |
| 10/18 | 5,644 | 14,591 | 10,527 | 13,347 |
| 10/19 | 4,731 | 16,682 | 11,855 | 14,825 |
| 10/20 | 4,260 | 18,302 | 12,694 | 13,576 |
| 10/21 | 4,139 | 26,156 | 12,633 | 19,376 |
| 10/22 | 4,301 | 22,334 | 10,607 | 18,500 |
| 10/23 | 4,408 | 24,599 | 10,685 | 18,247 |
| 10/24 | 4,757 | 33,952 | 11,778 | 24,049 |
Average Annual Total Returns
| 6 months | 1 Year | 5 Year | 10 Year |
|---|
| Comstock Capital Value Fund - Class I | 4.17% | 7.73% | 0.37% | (6.56)% |
| S&P 500 Index | 14.08% | 38.02% | 15.27% | 13.00% |
| Bloomberg US Government / Credit Bond Index | 5.14% | 10.23% | (0.13)% | 1.65% |
| MSCI USA Value Index | 11.55% | 31.80% | 10.16% | 9.17% |
- Total Net Assets$6,774,365
- Number of Portfolio Holdings101
- Portfolio Turnover Rate93%
- Management Fees$(83,336)
Past performance does not guarantee future results. Call 800-GABELLI (800-422-3554) or visit www.gabelli.com/funds/open_ends for current month-end performance. The table and graph presented above do not reflect the deduction of taxes a shareholder would pay on fund distributions or the redemption of fund shares.
What did the Fund invest in?
Top 10 Holdings (% of net assets)
| HashiCorp Inc. | 4.5% |
| Kellanova | 4.5% |
| Axonics Inc. | 3.6% |
| Stericycle Inc. | 3.6% |
| Amedisys Inc. | 3.3% |
| R1 RCM Inc. | 3.1% |
| Catalent Inc. | 2.8% |
| Juniper Networks Inc. | 2.7% |
| United States Steel Corp. | 2.7% |
| Endeavor Group Holdings Inc. | 2.6% |
Portfolio Weighting (% of net assets)
| Common Stocks | 91.5% |
| U.S. Government Obligations | 8.2% |
| Closed-End Funds | 0.6% |
| Rights | 0.3% |
| Other Assets and Liabilities (Net) | (0.6%) |
Industry Allocation (% of net assets)
| Industry Weighting | . |
|---|
| Health Care | 17.2% |
| Computer Software and Services | 10.4% |
| Diversified Industrial | 8.5% |
| U.S. Government Obligations | 8.2% |
| Energy and Utilities | 8.0% |
| Telecommunications | 7.4% |
| Broadcasting | 5.3% |
| Food and Beverage | 4.5% |
| Other Industry sectors | 31.1% |
| Other Assets and Liabilities (Net) | (0.6%) |
Comstock Capital Value Fund
Semi-Annual Shareholder Report - October 31, 2024
On August 21, 2024, the Fund’s Board of Directors approved a change in the Fund’s fiscal year end to December 31.
Where can I find additional information about the Fund?
If you wish to view additional information about the Fund; including but not limited to financial statements or holdings, please visit www.gabelli.com/funds/open_ends.
Contact Us
Phone: 800-GABELLI (800-422-3554)
Email: info@gabelli.com
If you wish to receive a copy of this document at a new address, contact 800-GABELLI (800-422-3554)
Comstock Capital Value Fund
Semi-Annual Shareholder Report - October 31, 2024

This semi-annual shareholder report contains important information about Comstock Capital Value Fund (the "Fund") for the period of May 1, 2024 to October 31, 2024. The Fund follows a value oriented strategy and seeks to achieve its investment objective by investing in equity and debt securities, money market instruments, and derivatives. The Fund may invest in, and may shift frequently among, a wide range of asset classes and market sectors. The equity securities in which the Fund invests include common and preferred stock (including convertible preferred stock), warrants, and depository receipts. There is no restriction on the market capitalization of the Fund’s equity securities. The debt securities in which the Fund may invest include: U.S. corporate debt, U.S. government and agency debt, and foreign sovereign and other debt securities (including debt securities from emerging market issuers). You can find additional information about the Fund at www.gabelli.com/funds/open_ends. You can also request this information by contacting us at 800-GABELLI (800-422-3554).
What were the Fund costs for the last six months?
(based on a hypothetical $10,000 investment)
| Class Name | Costs of a $10k Investment | Costs Paid as a % of a $10k Investment |
|---|
| Comstock Capital Value Fund - Class A | $0 | -% |
How did the Fund perform?
During the six months ended October 31, 2024, the Comstock Capital Value Fund underperformed its broad-based benchmark, the S&P 500 Index, as well as its comparative benchmarks, the Bloomberg US Government/Credit Bond Index and MSCI USA Value Index. Top performers during the period were focused on the Health Care, Information Technology and Communication Services sectors. Detractors from performance were primarily in the Real Estate, Energy, and Consumer Discretionary sectors. During the period, the market experienced an increase in deal volume. Private Equity deals increased substantially, and mega-deals dominated, while smaller deals declined.
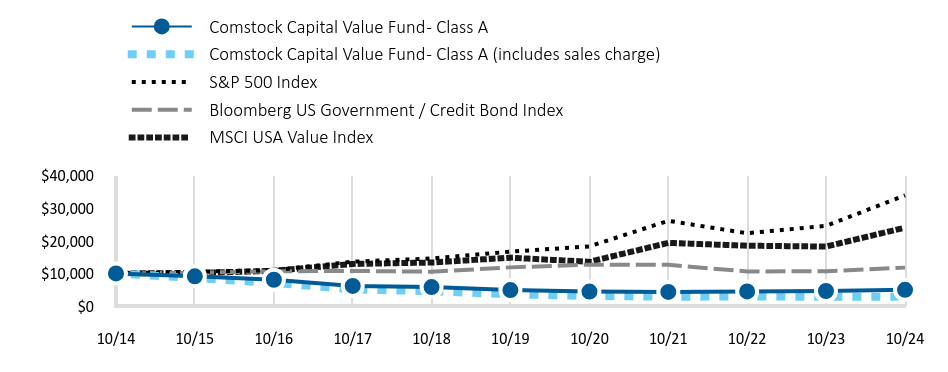
How has the Fund performed over the past 10 years?
The performance chart of the fund class presented reflects a hypothetical $10,000 investment, assuming the maximum sales charge, compared to a broad-based securities market index and more narrowly based indices reflecting market sectors in which the Fund invests over a 10-year period. The chart uses total return NAV performance and assumes reinvestment of dividends and capital gains distribution. Fund expenses were deducted.
Total Return Based on a $10,000 Investment
| Comstock Capital Value Fund - Class A | Comstock Capital Value Fund - Class A (includes sales charge) | S&P 500 Index | Bloomberg US Government / Credit Bond Index | MSCI USA Value Index |
|---|
| 10/14 | 10,000 | 10,000 | 10,000 | 10,000 | 10,000 |
| 10/15 | 9,107 | 8,583 | 10,520 | 10,172 | 10,095 |
| 10/16 | 8,060 | 7,098 | 10,994 | 10,664 | 10,808 |
| 10/17 | 6,166 | 5,118 | 13,592 | 10,776 | 12,888 |
| 10/18 | 5,798 | 4,535 | 14,591 | 10,527 | 13,347 |
| 10/19 | 4,893 | 3,608 | 16,682 | 11,855 | 14,825 |
| 10/20 | 4,440 | 3,086 | 18,302 | 12,694 | 13,576 |
| 10/21 | 4,321 | 2,830 | 26,156 | 12,633 | 19,376 |
| 10/22 | 4,476 | 2,932 | 22,334 | 10,607 | 18,500 |
| 10/23 | 4,595 | 2,837 | 24,599 | 10,685 | 18,247 |
| 10/24 | 4,952 | 2,881 | 33,952 | 11,778 | 24,049 |
Average Annual Total Returns
| 6 months | 1 Year | 5 Year | 10 Year |
|---|
| Comstock Capital Value Fund - Class A | 4.07% | 7.77% | 0.24% | (6.79)% |
| Comstock Capital Value Fund - Class A (includes sales charge) | (1.91)% | 1.57% | (0.94)% | (7.34)% |
| S&P 500 Index | 14.08% | 38.02% | 15.27% | 13.00% |
| Bloomberg US Government / Credit Bond Index | 5.14% | 10.23% | (0.13)% | 1.65% |
| MSCI USA Value Index | 11.55% | 31.80% | 10.16% | 9.17% |
- Total Net Assets$6,774,365
- Number of Portfolio Holdings101
- Portfolio Turnover Rate93%
- Management Fees$(83,336)
Past performance does not guarantee future results. Call 800-GABELLI (800-422-3554) or visit www.gabelli.com/funds/open_ends for current month-end performance. The table and graph presented above do not reflect the deduction of taxes a shareholder would pay on fund distributions or the redemption of fund shares.
What did the Fund invest in?
Top 10 Holdings (% of net assets)
| HashiCorp Inc. | 4.5% |
| Kellanova | 4.5% |
| Axonics Inc. | 3.6% |
| Stericycle Inc. | 3.6% |
| Amedisys Inc. | 3.3% |
| R1 RCM Inc. | 3.1% |
| Catalent Inc. | 2.8% |
| Juniper Networks Inc. | 2.7% |
| United States Steel Corp. | 2.7% |
| Endeavor Group Holdings Inc. | 2.6% |
Portfolio Weighting (% of net assets)
| Common Stocks | 91.5% |
| U.S. Government Obligations | 8.2% |
| Closed-End Funds | 0.6% |
| Rights | 0.3% |
| Other Assets and Liabilities (Net) | (0.6%) |
Industry Allocation (% of net assets)
| Industry Weighting | . |
|---|
| Health Care | 17.2% |
| Computer Software and Services | 10.4% |
| Diversified Industrial | 8.5% |
| U.S. Government Obligations | 8.2% |
| Energy and Utilities | 8.0% |
| Telecommunications | 7.4% |
| Broadcasting | 5.3% |
| Food and Beverage | 4.5% |
| Other Industry sectors | 31.1% |
| Other Assets and Liabilities (Net) | (0.6%) |
Comstock Capital Value Fund
Semi-Annual Shareholder Report - October 31, 2024
On August 21, 2024, the Fund’s Board of Directors approved a change in the Fund’s fiscal year end to December 31.
Where can I find additional information about the Fund?
If you wish to view additional information about the Fund; including but not limited to financial statements or holdings, please visit www.gabelli.com/funds/open_ends.
Contact Us
Phone: 800-GABELLI (800-422-3554)
Email: info@gabelli.com
If you wish to receive a copy of this document at a new address, contact 800-GABELLI (800-422-3554)
Item 2. Code of Ethics.
Not applicable.
Item 3. Audit Committee Financial Expert.
Not applicable.
Item 4. Principal Accountant Fees and Services.
Not applicable.
Item 5. Audit Committee of Listed Registrants.
Item 6. Investments.
| (a) | Schedule of Investments in securities of unaffiliated issuers as of the close of the reporting period is included as part of the report to shareholders filed under Item 1(a) of this form. |
Item 7. Financial Statements and Financial Highlights for Open-End Management Investment Companies.
| (a) | An open-end management investment company registered on Form N-1A [17 CFR 239.15A and 17 CFR 274.11A] must file its most recent annual or semi-annual financial statements required, and for the periods specified, by Regulation S-X. |
The semi-annual financial statements are attached herewith.
Comstock Capital Value Fund
Semiannual Report — October 31, 2024
To Our Shareholders,
For the six months ended October 31, 2024, the net asset value (NAV) total return per Class A Share of the Comstock Capital Value Fund was 4.07% compared with a total return of 14.08% for the Standard & Poor’s (S&P) 500 Index. Other classes of shares are available.
Enclosed are the financial statements, including the schedule of investments, as of October 31, 2024.
Summary of Portfolio Holdings (Unaudited)
The following table presents portfolio holdings as a percent of net assets as of October 31, 2024:
Comstock Capital Value Fund
| Health Care | | | 17.2 | % |
| Computer Software and Services | | | 10.4 | % |
| Diversified Industrial | | | 8.5 | % |
| U.S. Government Obligations | | | 8.2 | % |
| Energy and Utilities | | | 8.0 | % |
| Telecommunications | | | 7.4 | % |
| Broadcasting | | | 5.3 | % |
| Food and Beverage | | | 4.5 | % |
| Hotels and Gaming | | | 4.1 | % |
| Financial Services | | | 4.1 | % |
| Consumer Products | | | 3.8 | % |
| Environmental Services | | | 3.6 | % |
| Electronics | | | 3.3 | % |
| Real Estate | | | 3.1 | % |
| Retail | | | 2.6 | % |
| Specialty Chemicals | | | 2.1 | % |
| Aerospace and Defense | | | 1.3 | % |
| Business Services | | | 1.1 | % |
| Entertainment | | | 1.0 | % |
| Closed-End Funds | | | 0.6 | % |
| Automotive: Parts and Accessories | | | 0.3 | % |
| Machinery | | | 0.1 | % |
| Other Assets and Liabilities (Net) | | | (0.6 | )% |
| | | | 100.0 | % |
The Fund files a complete schedule of portfolio holdings with the Securities and Exchange Commission (the SEC) for the first and third quarters of each fiscal year on Form N-PORT. Shareholders may obtain this information at www.gabelli.com or by calling the Fund at 800-GABELLI (800-422-3554). The Fund’s Form N-PORT is available on the SEC’s website at www.sec.gov and may also be reviewed and copied at the SEC’s Public Reference Room in Washington, DC. Information on the operation of the Public Reference Room may be obtained by calling 800-SEC-0330.
Proxy Voting
The Fund files Form N-PX with its complete proxy voting record for the twelve months ended June 30, no later than August 31 of each year. A description of the Fund’s proxy voting policies, procedures, and how the Fund voted proxies relating to portfolio securities is available without charge, upon request, by (i) calling 800-GABELLI (800-422-3554); (ii) writing to The Gabelli Funds at One Corporate Center, Rye, NY 10580-1422; or (iii) visiting the SEC’s website at www.sec.gov.
Comstock Capital Value Fund
Schedule of Investments — October 31, 2024 (Unaudited)
| Shares | | | | | Cost | | | Market
Value | |
| | | | | COMMON STOCKS — 91.5% | | | | | | | | |
| | | | | Aerospace and Defense — 1.3% | | | | | | | | |
| | 2,000 | | | Spirit AeroSystems Holdings Inc., Cl. A† | | $ | 64,977 | | | $ | 64,740 | |
| | 1,500 | | | Triumph Group Inc.† | | | 22,455 | | | | 20,760 | |
| | | | | | | | 87,432 | | | | 85,500 | |
| | | | | Automotive: Parts and Accessories — 0.3% | | | | | | | | |
| | 2,500 | | | Garrett Motion Inc.† | | | 19,646 | | | | 18,575 | |
| | | | | | | | | | | | | |
| | | | | Broadcasting — 5.3% | | | | | | | | |
| | 6,000 | | | Endeavor Group Holdings Inc., Cl. A | | | 158,732 | | | | 176,940 | |
| | 4,000 | | | Paramount Global, Cl. B | | | 42,878 | | | | 43,760 | |
| | 2,093 | | | Sirius XM Holdings Inc. | | | 72,287 | | | | 55,799 | |
| | 5,000 | | | TEGNA Inc. | | | 90,024 | | | | 82,150 | |
| | | | | | | | 363,921 | | | | 358,649 | |
| | | | | Business Services — 1.1% | | | | | | | | |
| | 2,000 | | | Alight Inc., Cl. A† | | | 14,152 | | | | 13,860 | |
| | 4,500 | | | ARC Document Solutions Inc. | | | 15,238 | | | | 15,120 | |
| | 400 | | | McGrath RentCorp. | | | 43,297 | | | | 45,480 | |
| | | | | | | | 72,687 | | | | 74,460 | |
| | | | | Computer Software and Services — 10.4% | | | | | | | | |
| | 250 | | | Altair Engineering Inc., Cl. A† | | | 26,004 | | | | 25,998 | |
| | 3,000 | | | BM Technologies Inc.† | | | 14,272 | | | | 14,220 | |
| | 4,000 | | | Desktop Metal Inc., Cl. A† | | | 17,271 | | | | 19,640 | |
| | 1,250 | | | Envestnet Inc.† | | | 76,940 | | | | 78,475 | |
| | 9,000 | | | HashiCorp Inc., Cl. A† | | | 299,051 | | | | 304,740 | |
| | 1,000 | | | Instructure Holdings Inc.† | | | 23,520 | | | | 23,540 | |
| | 4,500 | | | Markforged Holding Corp.† | | | 20,903 | | | | 19,800 | |
| | 7,000 | | | Matterport Inc.† | | | 30,399 | | | | 31,920 | |
| | 2,000 | | | PropertyGuru Group Ltd.† | | | 13,103 | | | | 13,260 | |
| | 2,500 | | | Smartsheet Inc., Cl. A† | | | 138,723 | | | | 141,050 | |
| | 500 | | | Thoughtworks Holding Inc.† | | | 2,157 | | | | 2,220 | |
| | 2,000 | | | TTEC Holdings Inc. | | | 11,599 | | | | 10,400 | |
| | 2,000 | | | Zuora Inc., Cl. A† | | | 19,900 | | | | 19,800 | |
| | | | | | | | 693,842 | | | | 705,063 | |
| | | | | Consumer Products — 3.8% | | | | | | | | |
| | 2,000 | | | Capri Holdings Ltd.† | | | 101,730 | | | | 39,480 | |
| | 4,500 | | | Manitex International Inc.† | | | 25,283 | | | | 25,605 | |
| | 6,000 | | | The Duckhorn Portfolio Inc.† | | | 65,636 | | | | 65,760 | |
| | 2,800 | | | Vista Outdoor Inc.† | | | 112,443 | | | | 123,116 | |
| | | | | | | | 305,092 | | | | 253,961 | |
| | | | | Diversified Industrial — 8.5% | | | | | | | | |
| | 3,000 | | | Barnes Group Inc. | | | 134,173 | | | | 140,280 | |
| | 3,500 | | | Churchill Capital Corp. IX† | | | 35,105 | | | | 35,210 | |
| | 1,500 | | | Haynes International Inc. | | | 89,542 | | | | 90,540 | |
| | 10,500 | | | Iteris Inc.† | | | 73,736 | | | | 75,495 | |
| Shares | | | | | Cost | | | Market
Value | |
| | 1,250 | | | Stratasys Ltd.† | | $ | 16,038 | | | $ | 8,937 | |
| | 4,750 | | | United States Steel Corp. | | | 206,702 | | | | 184,538 | |
| | 1,000 | | | Universal Stainless & Alloy Products Inc.† | | | 43,687 | | | | 43,720 | |
| | | | | | | | 598,983 | | | | 578,720 | |
| | | | | Electronics — 3.3% | | | | | | | | |
| | 1,000 | | | Rogers Corp.† | | | 152,544 | | | | 100,280 | |
| | 11,000 | | | Vizio Holding Corp., Cl. A† | | | 120,262 | | | | 122,430 | |
| | | | | | | | 272,806 | | | | 222,710 | |
| | | | | Energy and Utilities — 8.0% | | | | | | | | |
| | 5,000 | | | Algonquin Power & Utilities Corp. | | | 28,449 | | | | 24,200 | |
| | 2,250 | | | ALLETE Inc. | | | 141,249 | | | | 143,797 | |
| | 2,500 | | | Atlantica Sustainable Infrastructure plc | | | 54,862 | | | | 55,150 | |
| | 2,250 | | | Avangrid Inc. | | | 80,746 | | | | 80,348 | |
| | 1,000 | | | Battalion Oil Corp.† | | | 6,618 | | | | 6,700 | |
| | 1,000 | | | Hess Corp. | | | 142,784 | | | | 134,480 | |
| | 5,000 | | | Profire Energy Inc.† | | | 12,555 | | | | 12,500 | |
| | 2,000 | | | TXNM Energy Inc. | | | 93,297 | | | | 87,080 | |
| | | | | | | | 560,560 | | | | 544,255 | |
| | | | | Entertainment — 1.0% | | | | | | | | |
| | 1,250 | | | International Game Technology plc | | | 26,890 | | | | 25,400 | |
| | 400 | | | Liberty Media Corp.-Liberty Live, Cl. C† | | | 12,877 | | | | 23,344 | |
| | 1,000 | | | Manchester United plc, Cl. A† | | | 18,768 | | | | 16,250 | |
| | 1,000 | | | WideOpenWest Inc.† | | | 4,729 | | | | 4,990 | |
| | | | | | | | 63,264 | | | | 69,984 | |
| | | | | Environmental Services — 3.6% | | | | | | | | |
| | 4,000 | | | Stericycle Inc.† | | | 239,603 | | | | 245,880 | |
| | | | | | | | | | | | | |
| | | | | Financial Services — 4.1% | | | | | | | | |
| | 250 | | | Enstar Group Ltd.† | | | 80,507 | | | | 80,625 | |
| | 1,000 | | | ICC Holdings Inc.† | | | 22,110 | | | | 23,320 | |
| | 1,500 | | | NET Lease Office Properties, REIT | | | 36,538 | | | | 45,060 | |
| | 3,750 | | | Nuvei Corp. | | | 122,828 | | | | 126,188 | |
| | | | | | | | 261,983 | | | | 275,193 | |
| | | | | Food and Beverage — 4.5% | | | | | | | | |
| | 3,750 | | | Kellanova | | | 301,526 | | | | 302,437 | |
| | | | | | | | | | | | | |
| | | | | Health Care — 16.9% | | | | | | | | |
| | 2,400 | | | Amedisys Inc.† | | | 221,379 | | | | 227,040 | |
| | 3,500 | | | Axonics Inc.† | | | 241,914 | | | | 246,050 | |
| | 3,250 | | | Catalent Inc.† | | | 186,244 | | | | 190,450 | |
| | 14,000 | | | Cyteir Therapeutics Inc., Escrow†(a) | | | 0 | | | | 0 | |
See accompanying notes to financial statements.
Comstock Capital Value Fund
Schedule of Investments (Continued) — October 31, 2024 (Unaudited)
| | | | | | | | | Market | |
| Shares | | | | | Cost | | | Value | |
| | | | | COMMON STOCKS (Continued) | | | | | | | | |
| | | | | Health Care (Continued) | | | | | | | | |
| | 2,500 | | | Longboard Pharmaceuticals Inc.† | | $ | 146,946 | | | $ | 149,300 | |
| | 14,500 | | | R1 RCM Inc.† | | | 201,192 | | | | 206,770 | |
| | 10,500 | | | Revance Therapeutics Inc.† | | | 66,885 | | | | 61,950 | |
| | 1,750 | | | SurModics Inc.† | | | 71,893 | | | | 65,660 | |
| | | | | | | | 1,136,453 | | | | 1,147,220 | |
| | | | | Hotels and Gaming — 4.1% | | | | | | | | |
| | 1,500 | | | Atlanta Braves Holdings Inc., Cl. C† | | | 47,569 | | | | 59,265 | |
| | 4,000 | | | Bally’s Corp.† | | | 68,502 | | | | 69,800 | |
| | 6,000 | | | Everi Holdings Inc.† | | | 77,253 | | | | 79,980 | |
| | 6,500 | | | GAN Ltd.† | | | 10,589 | | | | 11,635 | |
| | 5,000 | | | PlayAGS Inc.† | | | 56,914 | | | | 58,150 | |
| | | | | | | | 260,827 | | | | 278,830 | |
| | | | | Machinery — 0.1% | | | | | | | | |
| | 2,500 | | | Intevac Inc.† | | | 9,303 | | | | 8,325 | |
| | | | | | | | | | | | | |
| | | | | Real Estate — 3.1% | | | | | | | | |
| | 13,000 | | | Copper Property CTL Pass Through Trust | | | 139,960 | | | | 147,258 | |
| | 1,000 | | | Equity Commonwealth, REIT† | | | 19,779 | | | | 19,790 | |
| | 8,000 | | | Seritage Growth Properties, Cl. A† | | | 81,059 | | | | 33,520 | |
| | 750 | | | Star Holdings† | | | 12,633 | | | | 9,555 | |
| | | | | | | | 253,431 | | | | 210,123 | |
| | | | | Retail — 2.6% | | | | | | | | |
| | 8,750 | | | Albertsons Companies Inc., Cl. A | | | 178,972 | | | | 158,375 | |
| | 1,000 | | | Macy’s Inc. | | | 19,601 | | | | 15,340 | |
| | | | | | | | 198,573 | | | | 173,715 | |
| | | | | Specialty Chemicals — 2.1% | | | | | | | | |
| | 27,000 | | | Arcadium Lithium plc† | | | 149,681 | | | | 145,530 | |
| | | | | | | | | | | | | |
| | | | | Telecommunications — 7.4% | | | | | | | | |
| | 6,000 | | | Consolidated Communications Holdings Inc.† | | | 25,851 | | | | 27,810 | |
| | 2,250 | | | Frontier Communications Parent Inc.† | | | 79,599 | | | | 80,393 | |
| | 19,000 | | | Infinera Corp.† | | | 118,281 | | | | 132,166 | |
| | 4,750 | | | Juniper Networks Inc. | | | 175,577 | | | | 184,775 | |
| | 1,500 | | | Telephone and Data Systems Inc. | | | 33,070 | | | | 44,625 | |
| | 500 | | | United States Cellular Corp.† | | | 24,740 | | | | 30,850 | |
| | | | | | | | 457,118 | | | | 500,619 | |
| | | | | TOTAL COMMON STOCKS | | | 6,306,731 | | | | 6,199,749 | |
| | | | | | | | | Market | |
| Shares | | | | | Cost | | | Value | |
| | | | | CLOSED-END FUNDS — 0.6% | | | | | | | | |
| | 28,200 | | | Altaba Inc., Escrow† | | $ | 31,378 | | | $ | 40,185 | |
| | | | | | | | | | | | | |
| | | | | RIGHTS — 0.3% | | | | | | | | |
| | | | | Business Services — 0.0% | | | | | | | | |
| | 2,000 | | | Resolute Forest Products Inc., CVR† | | | 0 | | | | 4,000 | |
| | | | | | | | | | | | | |
| | | | | Financial Services — 0.0% | | | | | | | | |
| | 375 | | | Pershing Square Tontine Holdings Ltd., expire 09/29/33† | | | 0 | | | | 112 | |
| | | | | | | | | | | | | |
| | | | | Health Care — 0.3% | | | | | | | | |
| | 500 | | | ABIOMED Inc., CVR† | | | 0 | | | | 875 | |
| | 6,000 | | | Akouos Inc., CVR† | | | 0 | | | | 3,000 | |
| | 1,000 | | | Albireo Pharma Inc., CVR† | | | 0 | | | | 2,250 | |
| | 2,500 | | | Alimera Sciences Inc., CVR† | | | 0 | | | | 25 | |
| | 3,000 | | | Chinook Therapeutics Inc., CVR† | | | 0 | | | | 1,500 | |
| | 1,050 | | | CinCor Pharma Inc., CVR† | | | 0 | | | | 3,150 | |
| | 10,000 | | | Concert Pharmaceuticals Inc., CVR† | | | 0 | | | | 3,000 | |
| | 5,000 | | | Epizyme Inc., CVR† | | | 0 | | | | 100 | |
| | 2,250 | | | Fusion Pharmaceuticals Inc., CVR† | | | 0 | | | | 1,125 | |
| | 7,500 | | | Gracell Biotechnologies Inc., CVR† | | | 0 | | | | 300 | |
| | 6,500 | | | Icosavax Inc., CVR† | | | 0 | | | | 1,950 | |
| | 1,750 | | | Mirati Therapeutics Inc., CVR† | | | 0 | | | | 875 | |
| | 500 | | | Opiant Pharmaceuticals Inc., CVR† | | | 0 | | | | 250 | |
| | 6,500 | | | Paratek Pharmaceuticals Inc., CVR† | | | 0 | | | | 130 | |
| | | | | | | | 0 | | | | 18,530 | |
| | | | | TOTAL RIGHTS | | | 0 | | | | 22,642 | |
| | | | | | | | | | |
| Principal | | | | | | | | | |
| Amount | | | | | | | | | |
| | | | | U.S. GOVERNMENT OBLIGATIONS — 8.2% | | | | | | | | |
| $ | 555,000 | | | U.S. Treasury Bills, | | | | | | | | |
| | | | | 4.531% to 5.136%††, 11/14/24 to 01/23/25 | | | 551,925 | | | | 551,977 | |
| | | | | | | | | | | | | |
| | | | | TOTAL INVESTMENTS — 100.6% | | $ | 6,890,034 | | | | 6,814,553 | |
| | | | | Other Assets and Liabilities (Net) — (0.6)% | | | | | | | (40,188 | ) |
| | | | | NET ASSETS — 100.0% | | | | | | $ | 6,774,365 | |
See accompanying notes to financial statements.
Comstock Capital Value Fund
Schedule of Investments (Continued) — October 31, 2024 (Unaudited)
| (a) | Security is valued using significant unobservable inputs and is classified as Level 3 in the fair value hierarchy. |
| † | Non-income producing security. |
| †† | Represents annualized yields at dates of purchase. |
| CVR | Contingent Value Right |
| REIT | Real Estate Investment Trust |
See accompanying notes to financial statements.
Comstock Capital Value Fund
Statement of Assets and Liabilities
October 31, 2024 (Unaudited)
| Assets: | | | | |
| Investments, at value (cost $6,890,034) | | $ | 6,814,553 | |
| Cash | | | 11,187 | |
| Receivable from Adviser | | | 18,744 | |
| Dividends receivable | | | 2,453 | |
| Prepaid expenses | | | 2,710 | |
| Total Assets | | | 6,849,647 | |
| Liabilities: | | | | |
| Payable for investments purchased | | | 37,792 | |
| Payable for investment advisory fees | | | 5,758 | |
| Payable for distribution fees | | | 282 | |
| Payable for legal and audit fees | | | 20,593 | |
| Payable for shareholder communications | | | 6,357 | |
| Other accrued expenses | | | 4,500 | |
| Total Liabilities | | | 75,282 | |
| Net Assets | | | | |
| (applicable to 1,605,850 shares outstanding) | | $ | 6,774,365 | |
| Net Assets Consist of: | | | | |
| Paid-in capital | | $ | 139,840,511 | |
| Total accumulated loss | | | (133,066,146 | ) |
| Net Assets | | $ | 6,774,365 | |
| | | | | |
| Shares of Capital Stock, each at $0.001 par value: | | | | |
| Class AAA: | | | | |
| Net Asset Value, offering, and redemption price per share ($265,960 ÷ 64,777 shares outstanding; 25,000,000 shares authorized) | | $ | 4.11 | |
| Class A: | | | | |
| Net Asset Value and redemption price per share ($1,037,044 ÷ 253,274 shares outstanding; 25,000,000 shares authorized) | | $ | 4.09 | |
| Maximum offering price per share (NAV ÷ 0.9425, based on maximum sales charge of 5.75% of the offering price) | | $ | 4.34 | |
| Class C: | | | | |
| Net Asset Value and offering price per share ($3,655 ÷ 1,054 shares outstanding; 25,000,000 shares authorized) | | $ | 3.47 | (a) |
| Class I: | | | | |
| Net Asset Value, offering, and redemption price per share ($5,467,706 ÷ 1,286,745 shares outstanding; 25,000,000 shares authorized) | | $ | 4.25 | |
| (a) | Redemption price varies based on the length of time held. |
Statement of Operations
For the Six Months Ended October 31, 2024 (Unaudited)
| Investment Income: | | | | |
| Dividends (net of foreign withholding taxes of $216) | | $ | 30,130 | |
| Interest | | | 30,253 | |
| Total Investment Income | | | 60,383 | |
| Expenses: | | | | |
| Investment advisory fees | | | 33,051 | |
| Distribution fees - Class AAA | | | 329 | |
| Distribution fees - Class A | | | 1,312 | |
| Distribution fees - Class C | | | 23 | |
| Legal and audit fees | | | 26,154 | |
| Shareholder communications expenses | | | 17,210 | |
| Directors’ fees | | | 11,000 | |
| Shareholder services fees | | | 10,041 | |
| Custodian fees | | | 5,911 | |
| Registration expenses | | | 2,675 | |
| Miscellaneous expenses | | | 8,681 | |
| Total Expenses | | | 116,387 | |
| Less: | | | | |
| Expense reimbursements (See Note 3) | | | (116,387 | ) |
| Net Expenses | | | — | |
| Net Investment Income | | | 60,383 | |
| | | | | |
| Net Realized and Unrealized Gain on Investments: | | | | |
| Net realized gain on investments | | | 16,106 | |
| Net change in unrealized appreciation/depreciation: | | | | |
| on investments | | | 191,630 | |
| Net Realized and Unrealized Gain on Investments | | | 207,736 | |
| Net Increase in Net Assets Resulting from Operations | | $ | 268,119 | |
See accompanying notes to financial statements.
Comstock Capital Value Fund
Statement of Changes in Net Assets
| | | Six Months Ended
October 31,
2024
(Unaudited) | | | Year Ended
April 30,
2024 | |
| Operations: | | | | | | | | |
| Net investment income | | $ | 60,383 | | | $ | 147,339 | |
| Net realized gain on investments | | | 16,106 | | | | 267,385 | |
| Net change in unrealized appreciation/depreciation on investments | | | 191,630 | | | | (117,345 | ) |
| Net Increase in Net Assets Resulting from Operations | | | 268,119 | | | | 297,379 | |
| | | | | | | | | |
| Distributions to Shareholders: | | | | | | | | |
| Accumulated earnings | | | | | | | | |
| Class AAA | | | — | | | | (4,478 | ) |
| Class A | | | — | | | | (18,584 | ) |
| Class C | | | — | | | | (218 | ) |
| Class I | | | — | | | | (78,816 | ) |
| Total Distributions to Shareholders | | | — | | | | (102,096 | ) |
| | | | | | | | | |
| Capital Stock Transactions: | | | | | | | | |
| Proceeds from shares issued | | | | | | | | |
| Class AAA | | | 35,915 | | | | 107,161 | |
| Class A | | | 8,174 | | | | 10,777 | |
| Class I | | | 160,000 | | | | 1,278,238 | |
| Total proceeds from shares issued | | | 204,089 | | | | 1,396,176 | |
| | | | | | | | | |
| Proceeds from reinvestment of distributions | | | | | | | | |
| Class AAA | | | — | | | | 4,411 | |
| Class A | | | — | | | | 9,924 | |
| Class C | | | — | | | | 218 | |
| Class I | | | — | | | | 76,762 | |
| Total proceeds from reinvestment of distributions | | | — | | | | 91,315 | |
| | | | | | | | | |
| Cost of shares redeemed | | | | | | | | |
| Class AAA | | | (42,456 | ) | | | (113,904 | ) |
| Class A | | | (55,395 | ) | | | (177,787 | ) |
| Class C | | | (2,686 | ) | | | (4,824 | ) |
| Class I | | | (4,583 | ) | | | (145,898 | ) |
| Total cost of shares redeemed | | | (105,120 | ) | | | (442,413 | ) |
| | | | | | | | | |
| Net Increase in Net Assets from Capital Stock Transactions | | | 98,969 | | | | 1,045,078 | |
| | | | | | | | | |
| Net Increase in Net Assets | | | 367,088 | | | | 1,240,361 | |
| | | | | | | | | |
| Net Assets: | | | | | | | | |
| Beginning of year | | | 6,407,277 | | | | 5,166,916 | |
| End of period | | $ | 6,774,365 | | | $ | 6,407,277 | |
See accompanying notes to financial statements.
Comstock Capital Value Fund
Financial Highlights
Selected data for a share of capital stock outstanding throughout each period:
| | | | | | Income (Loss) from Investment Operations | | | Distributions | | | | | | | | | | | | Ratios to Average Net Assets/Supplemental Data | |
| Year Ended April 30 | | Net
Asset Value,
Beginning
of Year | | | Net
Investment
Income (Loss)(a) | | | Net
Realized
and Unrealized
Gain (Loss) on
Investments | | | Total
from
Investment
Operations | | | Net
Investment
Income | | | Total
Distributions | | | Redemption
Fees(a) | | | Net Asset
Value,
End of
Period | | | Total
Return† | | | Net
Assets,
End of
Period
(in 000’s) | | | Net
Investment
Income
(Loss) | | | Operating
Expenses
Before
Reimbursement | | | Operating
Expenses
Net of
Reimbursement | | Portfolio
Turnover
Rate | |
| Class AAA | | | | | | | | | | | | | | | | | | | | | | | | | | | | | | | | | | | | | | | | | | | | | | | | | | | | | | |
| 2025(b) | | $ | 3.94 | | | $ | 0.04 | | | $ | 0.13 | | | $ | 0.17 | | | $ | — | | | $ | — | | | $ | — | | | $ | 4.11 | | | | 4.31 | % | | $ | 266 | | | | 1.83 | %(c) | | | 3.72 | %(c) | | | 0.00 | %(c)(d)(e) | | | 93 | % |
| 2024 | | | 3.81 | | | | 0.10 | | | | 0.10 | | | | 0.20 | | | | (0.07 | ) | | | (0.07 | ) | | | — | | | | 3.94 | | | | 5.17 | | | | 262 | | | | 2.44 | | | | 3.56 | | | | 0.00 | (d)(e)(f) | | | 271 | |
| 2023 | | | 3.66 | | | | 0.07 | | | | 0.08 | | | | 0.15 | | | | — | | | | — | | | | — | | | | 3.81 | | | | 4.10 | | | | 255 | | | | 1.94 | | | | 4.05 | | | | 0.00 | (d)(e)(f) | | | 265 | |
| 2022 | | | 3.70 | | | | (0.07 | ) | | | 0.03 | | | | (0.04 | ) | | | — | | | | — | | | | — | | | | 3.66 | | | | (1.08 | ) | | | 190 | | | | (1.82 | ) | | | 4.93 | | | | 1.95 | (e)(f)(g) | | | 243 | |
| 2021 | | | 3.81 | | | | (0.11 | ) | | | (0.00 | ) | | | (0.11 | ) | | | — | | | | — | | | | 0.00 | (h) | | | 3.70 | | | | (2.89 | ) | | | 208 | | | | (3.00 | ) | | | 4.12 | | | | 3.12 | (e) | | | 0 | (i) |
| 2020 | | | 4.31 | | | | (0.15 | ) | | | (0.35 | ) | | | (0.50 | ) | | | — | | | | — | | | | 0.00 | (h) | | | 3.81 | | | | (11.60 | ) | | | 245 | | | | (3.60 | ) | | | 7.49 | | | | 5.80 | (f)(g)(j)(k) | | | 79 | |
| Class A | | | | | | | | | | | | | | | | | | | | | | | | | | | | | | | | | | | | | | | | | | | | | | | | | | | | | | |
| 2025(b) | | $ | 3.93 | | | $ | 0.04 | | | $ | 0.12 | | | $ | 0.16 | | | $ | — | | | $ | — | | | $ | — | | | $ | 4.09 | | | | 4.07 | % | | $ | 1,037 | | | | 1.83 | %(c) | | | 3.72 | %(c) | | | 0.00 | %(c)(d)(e) | | | 93 | % |
| 2024 | | | 3.80 | | | | 0.09 | | | | 0.11 | | | | 0.20 | | | | (0.07 | ) | | | (0.07 | ) | | | — | | | | 3.93 | | | | 5.19 | | | | 1,041 | | | | 2.43 | | | | 3.56 | | | | 0.00 | (d)(e)(f) | | | 271 | |
| 2023 | | | 3.65 | | | | 0.09 | | | | 0.06 | | | | 0.15 | | | | — | | | | — | | | | — | | | | 3.80 | | | | 4.11 | | | | 1,162 | | | | 2.39 | | | | 4.05 | | | | 0.00 | (d)(e)(f) | | | 265 | |
| 2022 | | | 3.69 | | | | (0.07 | ) | | | 0.03 | | | | (0.04 | ) | | | — | | | | — | | | | — | | | | 3.65 | | | | (1.08 | ) | | | 1,193 | | | | (1.95 | ) | | | 4.93 | | | | 2.07 | (e)(f)(g) | | | 243 | |
| 2021 | | | 3.80 | | | | (0.11 | ) | | | (0.00 | ) | | | (0.11 | ) | | | — | | | | — | | | | 0.00 | (h) | | | 3.69 | | | | (2.89 | ) | | | 1,554 | | | | (3.00 | ) | | | 4.12 | | | | 3.12 | (e) | | | 0 | (i) |
| 2020 | | | 4.29 | | | | (0.16 | ) | | | (0.33 | ) | | | (0.49 | ) | | | — | | | | — | | | | 0.00 | (h) | | | 3.80 | | | | (11.42 | ) | | | 1,715 | | | | (3.89 | ) | | | 7.74 | | | | 6.05 | (f)(g)(j)(k) | | | 79 | |
| Class C | | | | | | | | | | | | | | | | | | | | | | | | | | | | | | | | | | | | | | | | | | | | | | | | | | | | | | |
| 2025(b) | | $ | 3.33 | | | $ | 0.03 | | | $ | 0.11 | | | $ | 0.14 | | | $ | — | | | $ | — | | | $ | — | | | $ | 3.47 | | | | 4.20 | % | | $ | 3 | | | | 1.83 | %(c) | | | 4.48 | %(c) | | | 0.00 | %(c)(d)(e) | | | 93 | % |
| 2024 | | | 3.23 | | | | 0.08 | | | | 0.09 | | | | 0.17 | | | | (0.07 | ) | | | (0.07 | ) | | | — | | | | 3.33 | | | | 5.17 | | | | 6 | | | | 2.43 | | | | 4.31 | | | | 0.00 | (d)(e)(f) | | | 271 | |
| 2023 | | | 3.10 | | | | 0.09 | | | | 0.04 | | | | 0.13 | | | | — | | | | — | | | | — | | | | 3.23 | | | | 4.19 | | | | 10 | | | | 2.96 | | | | 4.80 | | | | 0.00 | (d)(e)(f) | | | 265 | |
| 2022 | | | 3.15 | | | | (0.07 | ) | | | 0.02 | | | | (0.05 | ) | | | — | | | | — | | | | — | | | | 3.10 | | | | (1.59 | ) | | | 35 | | | | (2.38 | ) | | | 5.68 | | | | 2.50 | (e)(f)(g) | | | 243 | |
| 2021 | | | 3.24 | | | | (0.09 | ) | | | (0.00 | ) | | | (0.09 | ) | | | — | | | | — | | | | 0.00 | (h) | | | 3.15 | | | | (2.78 | ) | | | 49 | | | | (3.73 | ) | | | 4.87 | | | | 3.87 | (e) | | | 0 | (i) |
| 2020 | | | 3.69 | | | | (0.14 | ) | | | (0.31 | ) | | | (0.45 | ) | | | — | | | | — | | | | 0.00 | (h) | | | 3.24 | | | | (12.20 | ) | | | 330 | | | | (3.90 | ) | | | 7.81 | | | | 6.12 | (f)(g)(j)(k) | | | 79 | |
| Class I | | | | | | | | | | | | | | | | | | | | | | | | | | | | | | | | | | | | | | | | | | | | | | | | | | | | | | |
| 2025(b) | | $ | 4.08 | | | $ | 0.04 | | | $ | 0.13 | | | $ | 0.17 | | | $ | — | | | $ | — | | | $ | — | | | $ | 4.25 | | | | 4.17 | % | | $ | 5,468 | | | | 1.83 | %(c) | | | 3.47 | %(c) | | | 0.00 | %(c)(d)(e) | | | 93 | % |
| 2024 | | | 3.95 | | | | 0.10 | | | | 0.10 | | | | 0.20 | | | | (0.07 | ) | | | (0.07 | ) | | | — | | | | 4.08 | | | | 4.99 | | | | 5,098 | | | | 2.44 | | | | 3.31 | | | | 0.00 | (d)(e)(f) | | | 271 | |
| 2023 | | | 3.79 | | | | 0.08 | | | | 0.08 | | | | 0.16 | | | | — | | | | — | | | | — | | | | 3.95 | | | | 4.22 | | | | 3,740 | | | | 2.10 | | | | 3.80 | | | | 0.00 | (d)(e)(f) | | | 265 | |
| 2022 | | | 3.82 | | | | (0.05 | ) | | | 0.02 | | | | (0.03 | ) | | | — | | | | — | | | | — | | | | 3.79 | | | | (0.79 | ) | | | 2,737 | | | | (1.43 | ) | | | 4.68 | | | | 1.58 | (e)(f)(g) | | | 243 | |
| 2021 | | | 3.92 | | | | (0.10 | ) | | | (0.00 | ) | | | (0.10 | ) | | | — | | | | — | | | | 0.00 | (h) | | | 3.82 | | | | (2.55 | ) | | | 1,987 | | | | (2.75 | ) | | | 3.87 | | | | 2.87 | (e) | | | 0 | (i) |
| 2020 | | | 4.42 | | | | (0.11 | ) | | | (0.39 | ) | | | (0.50 | ) | | | — | | | | — | | | | 0.00 | (h) | | | 3.92 | | | | (11.31 | ) | | | 2,263 | | | | (2.65 | ) | | | 6.51 | | | | 4.82 | (f)(g)(j)(k) | | | 79 | |
| † | Total return represents aggregate total return of a hypothetical investment at the beginning of the year and sold at the end of the period including reinvestment of distributions and does not reflect the applicable sales charges. Total return for a period of less than one year is not annualized. |
| (a) | Per share amounts have been calculated using the average shares outstanding method. |
| (b) | For the six months ended October 31, 2024, unaudited. |
| (c) | Annualized. |
| (d) | Amount represents less than 0.005%. |
| (e) | For the six months ended October 31, 2024 and the years ended April 30, 2024, 2023, 2022, and 2021, the Adviser reimbursed and/or waived expenses of $116,387, $202,406, $174,961, $114,019, and $40,792, respectively. |
| (f) | The Fund received credits from a designated broker who agreed to pay certain Fund expenses. For the years ended April 30, 2024, 2023, 2022, and 2020, if credits had not been received, the expense ratios would have been 0.02%, 0.01%, 1.96%, and 5.81% (Class AAA), 0.02%, 0.01%, 2.08%, and 6.06% (Class A), 0.02%, 0.01%, 2.51%, and 6.13% (Class C), and 0.02%, 0.01%, 1.59%, and 4.83% (Class I). For the six months ended October 31, 2024 and the year ended April 30, 2021, the Fund did not receive any credits from the designated broker. |
| (g) | The Fund incurred interest expense during the years ended April 30, 2022 and 2020. For the year ended April 30, 2022, if interest expense had not been incurred, the ratios of operating expenses to average net assets would have been 1.94% (Class AAA), 2.06% (Class A), 2.49% (Class C), and 1.57% (Class I). For the year ended April 30, 2020, the effect of interest expense was minimal. |
| (h) | Amount represents less than $0.005 per share. |
| (i) | Amount represents less than 0.5%. |
| (j) | The Fund incurred dividend expense and service fees on securities sold short. If these expenses and fees had not been incurred, the ratios of operating expenses to average net assets for the year ended April 30, 2020 would have been 5.36% (Class AAA), 5.64% (Class A), 5.68% (Class C), and 4.38% (Class I). |
| (k) | During the fiscal year ended April 30, 2020, the Adviser directly paid legal fees on behalf of the Fund. If the Fund had paid these expenses, the expense ratios for that period would have been 7.48% (Class AAA), 7.73% (Class A), 7.80% (Class C), and 6.50% (Class I). |
See accompanying notes to financial statements.
The Gabelli Comstock Capital Value Fund
Notes to Financial Statements (Unaudited)
1. Organization. Comstock Capital Value Fund (the “Fund”) is the sole series of the Comstock Funds, Inc. (the Company). The Fund is a diversified open-end management investment company registered under the Investment Company Act of 1940, as amended (the 1940 Act). The Fund seeks to maximize total return, consisting of capital appreciation and current income.
Gabelli Funds, LLC (the “Adviser”), with its principal offices located at One Corporate Center, Rye, New York 10580-1422, serves as investment adviser to the Fund. The Adviser makes investment decisions for the Fund and continuously reviews and administers the Funds’ investment program and manages the operations of each Fund under the general supervision of the Company’s Board. On August 21, 2024, the Board of Directors (the Board) approved a change of the fiscal year end of the Fund from October 31 to December 31.
2. Significant Accounting Policies. As an investment company, the Fund follows the investment company accounting and reporting guidance, which is part of U.S. generally accepted accounting principles (GAAP) that may require the use of management estimates and assumptions in the preparation of its financial statements. Actual results could differ from those estimates. The following is a summary of significant accounting policies followed by the Fund in the preparation of its financial statements.
Security Valuation. Portfolio securities listed or traded on a nationally recognized securities exchange or traded in the U.S. over-the-counter market for which market quotations are readily available are valued at the last quoted sale price or a market’s official closing price as of the close of business on the day the securities are being valued. If there were no sales that day, the security is valued at the average of the closing bid and asked prices or, if there were no asked prices quoted on that day, then the security is valued at the closing bid price on that day. If no bid or asked prices are quoted on such day, the security is valued at the most recently available price or, if the Board so determines, by such other method as the Board shall determine in good faith to reflect its fair market value. Portfolio securities traded on more than one national securities exchange or market are valued according to the broadest and most representative market, as determined by the Adviser.
Portfolio securities primarily traded on a foreign market are generally valued at the preceding closing values of such securities on the relevant market, but may be fair valued pursuant to procedures established by the Board if market conditions change significantly after the close of the foreign market, but prior to the close of business on the day the securities are being valued. Debt obligations for which market quotations are readily available are valued at the average of the latest bid and asked prices. If there were no asked prices quoted on such day, the security is valued using the closing bid price, unless the Board determines such amount does not reflect the securities’ fair value, in which case these securities will be fair valued as determined by the Board. Certain securities are valued principally using dealer quotations. Futures contracts are valued at the closing settlement price of the exchange or board of trade on which the applicable contract is traded. OTC futures and options on futures for which market quotations are readily available will be valued by quotations received from a pricing service or, if no quotations are available from a pricing service, by quotations obtained from one of more dealers in the instrument in question by the Adviser.
Securities and assets for which market quotations are not readily available are fair valued as determined by the Board. Fair valuation methodologies and procedures may include, but are not limited to: analysis and review of available financial and non-financial information about the company; comparisons with the valuation and changes in valuation of similar securities, including a comparison of foreign securities with the equivalent U.S. dollar value American Depositary Receipt securities at the close of the U.S. exchange; and evaluation of any other information that could be indicative of the value of the security.
The Gabelli Comstock Capital Value Fund
Notes to Financial Statements (Unaudited) (Continued)
The inputs and valuation techniques used to measure fair value of the Fund’s investments are summarized into three levels as described in the hierarchy below:
| ● | Level 1 — quoted prices in active markets for identical securities; |
| ● | Level 2 — other significant observable inputs (including quoted prices for similar securities, interest rates, prepayment speeds, credit risk, etc.); and |
| ● | Level 3 — significant unobservable inputs (including the Board’s determinations as to the fair value of investments). |
A financial instrument’s level within the fair value hierarchy is based on the lowest level of any input both individually and in the aggregate that is significant to the fair value measurement. The inputs or methodology used for valuing securities are not necessarily an indication of the risk associated with investing in those securities. The summary of the Fund’s investments in securities by inputs used to value the Fund’s investments as of October 31, 2024 is as follows:
| | | Valuation Inputs | | | | |
| | | Level 1
Quoted Prices | | | Level 2
Other Significant
Observable Inputs | | | Level 3
Significant
Unobservable Inputs(a) | | | Total
Market Value
at 10/31/24 | |
| INVESTMENTS IN SECURITIES: | | | | | | | | | | | | | | | | |
| ASSETS (Market Value): | | | | | | | | | | | | | | | | |
| Common Stocks: | | | | | | | | | | | | | | | | |
| Energy and Utilities | | $ | 537,555 | | | $ | 6,700 | | | | — | | | $ | 544,255 | |
| Health Care | | | 1,147,220 | | | | — | | | $ | 0 | | | | 1,147,220 | |
| Telecommunications | | | 368,453 | | | | 132,166 | | | | — | | | | 500,619 | |
| Other Industries (b) | | | 4,007,655 | | | | — | | | | — | | | | 4,007,655 | |
| Total Common Stocks | | | 6,060,883 | | | | 138,866 | | | | 0 | | | | 6,199,749 | |
| Closed-End Funds | | | — | | | | 40,185 | | | | — | | | | 40,185 | |
| Rights (b) | | | — | | | | 22,642 | | | | — | | | | 22,642 | |
| U.S. Government Obligations | | | — | | | | 551,977 | | | | — | | | | 551,977 | |
| TOTAL INVESTMENTS IN SECURITIES – ASSETS | | $ | 6,060,883 | | | $ | 753,670 | | | $ | 0 | | | $ | 6,814,553 | |
| (a) | The inputs for this security are not readily available and are derived based on the judgment of the Adviser according to procedures approved by the Board. |
| (b) | Please refer to the Schedule of Investments for the industry classifications of these portfolio holdings. |
At October 31, 2024, the total value of Level 3 investments for the Fund was less than 1% of total net assets.
Additional Information to Evaluate Qualitative Information.
General. The Fund uses recognized industry pricing services – approved by the Board and unaffiliated with the Adviser – to value most of its securities, and uses broker quotes provided by market makers of securities not valued by these and other recognized pricing sources. Several different pricing feeds are received to value domestic equity securities, international equity securities, preferred equity securities, and fixed income securities. The data within these feeds are ultimately sourced from major stock exchanges and trading systems where these securities trade. The prices supplied by external sources are checked by obtaining quotations or actual transaction prices from market participants. If a price obtained from the pricing source is deemed
The Gabelli Comstock Capital Value Fund
Notes to Financial Statements (Unaudited) (Continued)
unreliable, prices will be sought from another pricing service or from a broker/dealer that trades that security or similar securities.
Fair Valuation. Fair valued securities may be common or preferred equities, warrants, options, rights, or fixed income obligations. Where appropriate, Level 3 securities are those for which market quotations are not available, such as securities not traded for several days, or for which current bids are not available, or which are restricted as to transfer. When fair valuing a security, factors to consider include recent prices of comparable securities that are publicly traded, reliable prices of securities not publicly traded, the use of valuation models, current analyst reports, valuing the income or cash flow of the issuer, or cost if the preceding factors do not apply. A significant change in the unobservable inputs could result in a lower or higher value in Level 3 securities. The circumstances of Level 3 securities are frequently monitored to determine if fair valuation measures continue to apply.
The Adviser reports quarterly to the Board the results of the application of fair valuation policies and procedures. These may include backtesting the prices realized in subsequent trades of these fair valued securities to fair values previously recognized.
Securities Transactions and Investment Income. Securities transactions are accounted for on the trade date with realized gain/(loss) on investments determined by using the identified cost method. Interest income (including amortization of premium and accretion of discount) is recorded on an accrual basis. Premiums and discounts on debt securities are amortized using the effective yield to maturity method or amortized to earliest call date, if applicable. Dividend income is recorded on the ex-dividend date, except for certain dividends from foreign securities that are recorded as soon after the ex-dividend date as the Fund becomes aware of such dividends.
Determination of Net Asset Value and Calculation of Expenses. Certain administrative expenses are common to, and allocated among, various affiliated funds. Such allocations are made on the basis of each fund’s average net assets or other criteria directly affecting the expenses as determined by the Adviser pursuant to procedures established by the Board.
In calculating the NAV per share of each class, investment income, realized and unrealized gains and losses, redemption fees, and expenses other than class specific expenses are allocated daily to each class of shares based upon the proportion of net assets of each class at the beginning of each day. Distribution expenses are borne solely by the class incurring the expense.
Custodian Fee Credits and Interest Expense. When cash balances are maintained in the custody account, the Fund receives credits which are used to offset custodian fees. The gross expenses paid under the custody arrangement are included in custodian fees in the Statement of Operations with the corresponding expense offset, if any, shown as “Custodian fee credits.” When cash balances are overdrawn, the Fund is charged an overdraft fee of 110% of the 90 day U.S. Treasury Bill rate on outstanding balances. This amount, if any, would be included in the Statement of Operations.
Distributions to Shareholders. Distributions to shareholders are recorded on the ex-dividend date. Distributions to shareholders are based on income and capital gains as determined in accordance with federal income tax regulations, which may differ from income and capital gains as determined under GAAP. These differences are primarily due to differing treatments of income and gains on various investment securities and timing differences. These book/tax differences are either temporary or permanent in nature. To the extent these differences are
The Gabelli Comstock Capital Value Fund
Notes to Financial Statements (Unaudited) (Continued)
permanent, adjustments are made to the appropriate capital accounts in the period when the differences arise. These reclassifications have no impact on the NAV of the Fund.
The tax character of distributions paid during the fiscal year ended April 30, 2024 was as follows.
| Distributions paid from: | | | | |
| Ordinary income | | $ | 102,096 | |
| Total distributions paid | | $ | 102,096 | |
Provision for Income Taxes. The Fund intends to continue to qualify as a regulated investment company under Subchapter M of the Internal Revenue Code of 1986, as amended (the Code). It is the policy of the Fund to comply with the requirements of the Code applicable to regulated investment companies and to distribute substantially all of its net investment company taxable income and net capital gains. Therefore, no provision for federal income taxes is required.
The Fund utilized $265,351 of the capital loss carryforward for the fiscal year ended April 30, 2024.
At April 30, 2024, the Fund had net capital loss carryforwards for federal income tax purposes which are available to reduce future required distributions of net capital gains to shareholders. The Fund is permitted to carry capital losses forward for an unlimited period. Capital losses that are carried forward will retain their character as either short term or long term capital losses.
| Short term capital loss carryforward with no expiration | | $ | (74,509,465 | ) |
| Long term capital loss carryforward with no expiration | | | (58,703,548 | ) |
| Total capital loss carryforwards | | $ | (133,213,013 | ) |
The following summarizes the tax cost of investments and the related net unrealized depreciation at October 31, 2024:
| | | Cost | | | Gross
Unrealized
Appreciation | | | Gross
Unrealized
Depreciation | | |
Net Unrealized
Depreciation | |
| Investments | | $ | 6,894,077 | | | $ | 213,537 | | | $ | (293,061 | ) | | $ | (79,524 | ) |
The Fund is required to evaluate tax positions taken or expected to be taken in the course of preparing the Fund’s tax returns to determine whether the tax positions are “more-likely-than-not” of being sustained by the applicable tax authority. Income tax and related interest and penalties would be recognized by the Fund as tax expense in the Statement of Operations if the tax positions were deemed not to meet the more-likely-than-not threshold. During the six months ended October 31, 2024, the Fund did not incur any income tax, interest, or penalties. As of October 31, 2024, the Adviser has reviewed all open tax years and concluded that there was no impact to the Fund’s net assets or results of operations. The Fund’s federal and state tax returns for the prior three fiscal years remain open, subject to examination. On an ongoing basis, the Adviser will monitor the Fund’s tax positions to determine if adjustments to this conclusion are necessary.
3. Investment Advisory Agreement and Other Transactions. The Fund has entered into an investment advisory agreement (the Advisory Agreement) with the Adviser which provides that the Fund will pay the Adviser a fee, computed daily and paid monthly, at the annual rate of 1.00% of the value of its average daily net assets. In accordance with the Advisory Agreement, the Adviser provides a continuous investment program for
The Gabelli Comstock Capital Value Fund
Notes to Financial Statements (Unaudited) (Continued)
the Fund’s portfolio, oversees the administration of all aspects of the Fund’s business and affairs, and pays the compensation of all Officers and Directors of the Fund who are affiliated persons of the Adviser.
The Adviser has contractually agreed to waive its investment advisory fee and/or reimburse expenses to the extent necessary to maintain the total operating expenses (excluding brokerage costs, acquired fund fees and expenses, interest, taxes, and extraordinary expenses) until at least August 28, 2025 at no more than an annual rate of 0.00% for all classes of shares, on the first $25 million in Fund net assets. For the six months ended October 31, 2024, the Adviser reimbursed the Fund in the amount of $116,387.
4. Distribution Plan. The Fund’s Board has adopted a distribution plan (the Plan) for each class of shares, except for Class I Shares, pursuant to Rule 12b-1 under the 1940 Act. Under the Class AAA, Class A, and Class C Share Plans, payments are authorized to G.distributors, LLC (the Distributor), an affiliate of the Adviser, at annual rates of 0.25%, 0.25%, and 1.00%, respectively, of the average daily net assets of those classes, the annual limitations under each Plan. Such payments are accrued daily and paid monthly.
5. Portfolio Securities. Purchases and sales of securities during the six months ended October 31, 2024, other than short term securities and U.S. Government obligations, aggregated $6,379,463 and $5,117,731, respectively.
6. Transactions with Affiliates and Other Arrangements. During the six months ended October 31, 2024, the Fund received credits from a designated broker who agreed to pay certain Fund operating expenses.
7. Line of Credit. The Fund participates in an unsecured line of credit, which expires on June 25, 2025 and may be renewed annually, of up to $75,000,000 under which it may borrow up to 10% of its net assets from the bank for temporary borrowing purposes. Borrowings under this arrangement bear interest at a floating rate equal to the higher of the Overnight Federal Funds Rate plus 135 basis points or the Overnight Bank Funding Rate plus 135 basis points in effect on that day. This amount, if any, would be included in “Interest expense” in the Statement of Operations. During the six months ended October 31, 2024, there were no borrowings outstanding under the line of credit.
8. Capital Stock. Effective November 24, 2021, the Fund reopened its shares for sale. Class AAA and Class I Shares are offered without a sales charge. Class A Shares are subject to a maximum front-end sales charge of 5.75%. Class C Shares are subject to a 1.00% contingent deferred sales charge for one year after purchase.
The Gabelli Comstock Capital Value Fund
Notes to Financial Statements (Unaudited) (Continued)
Transactions in shares of capital stock were as follows:
| | | Six Months Ended
October 31,
2024
(Unaudited) | | | Year Ended
April 30,
2024 | |
| | | Shares | | | Shares | |
| Class AAA | | | | | | | | |
| Shares sold | | | 8,902 | | | | 27,445 | |
| Shares issued upon reinvestment of distributions | | | — | | | | 1,111 | |
| Shares redeemed | | | (10,540 | ) | | | (28,931 | ) |
| Net (decrease) | | | (1,638 | ) | | | (375 | ) |
| Class A | | | | | | | | |
| Shares sold | | | 2,075 | | | | 2,717 | |
| Shares issued upon reinvestment of distributions | | | — | | | | 2,506 | |
| Shares redeemed | | | (13,722 | ) | | | (45,903 | ) |
| Net (decrease) | | | (11,647 | ) | | | (40,680 | ) |
| Class C | | | | | | | | |
| Shares issued upon reinvestment of distributions | | | — | | | | 65 | |
| Shares redeemed | | | (799 | ) | | | (1,431 | ) |
| Net (decrease) | | | (799 | ) | | | (1,366 | ) |
| Class I | | | | | | | | |
| Shares sold | | | 37,616 | | | | 319,713 | |
| Shares issued upon reinvestment of distributions | | | — | | | | 18,677 | |
| Shares redeemed | | | (1,109 | ) | | | (36,043 | ) |
| Net increase | | | 36,507 | | | | 302,347 | |
9. Significant Shareholder. As of October 31, 2024, 65.6% of the Fund was beneficially owned by the Adviser and its affiliates, including managed accounts for which the affiliates of the Adviser have voting control but disclaim pecuniary interest.
10. Indemnifications. The Fund enters into contracts that contain a variety of indemnifications. The Fund’s maximum exposure under these arrangements is unknown. However, the Fund has not had prior claims or losses pursuant to these contracts. Management has reviewed the Fund’s existing contracts and expects the risk of loss to be remote.
11. Subsequent Events. Management has evaluated the impact on the Fund of all subsequent events occurring through the date the financial statements were issued and has determined that there were no subsequent events requiring recognition or disclosure in the financial statements.
Gabelli Funds and Your Personal Privacy
Who are we?
The Gabelli Funds are investment companies registered with the Securities and Exchange Commission under the Investment Company Act of 1940. We are managed by Gabelli Funds, LLC, which is affiliated with GAMCO Investors, Inc., a publicly held company with subsidiaries and affiliates that provide investment advisory services for a variety of clients.
What kind of non-public information do we collect about you if you become a fund shareholder?
If you apply to open an account directly with us, you will be giving us some non-public information about yourself. The non-public information we collect about you is:
| ● | Information you give us on your application form. This could include your name, address, telephone number, social security number, bank account number, and other information. |
| ● | Information about your transactions with us, any transactions with our affiliates, and transactions with the entities we hire to provide services to you. This would include information about the shares that you buy or redeem. If we hire someone else to provide services — like a transfer agent — we will also have information about the transactions that you conduct through them. |
What information do we disclose and to whom do we disclose it?
We do not disclose any non-public personal information about our customers or former customers to anyone other than our affiliates, our service providers who need to know such information, and as otherwise permitted by law. If you want to find out what the law permits, you can read the privacy rules adopted by the Securities and Exchange Commission. They are in volume 17 of the Code of Federal Regulations, Part 248. The Commission often posts information about its regulations on its website, www. sec.gov.
What do we do to protect your personal information?
We restrict access to non-public personal information about you to the people who need to know that information in order to provide services to you or the fund and to ensure that we are complying with the laws governing the securities business. We maintain physical, electronic, and procedural safeguards to keep your personal information confidential.

| (b) | An open-end management investment company registered on Form N-1A [17 CFR 239.15A and 17 CFR 274.11A] must file the information required by Item 13 of Form N-1A. |
The Financial Highlights are attached herewith.
Comstock Capital Value Fund
Financial Highlights
Selected data for a share of capital stock outstanding throughout each period:
| | | | | | Income (Loss) from Investment Operations | | | Distributions | | | | | | | | | | | | Ratios to Average Net Assets/Supplemental Data | |
| Year Ended April 30 | | Net
Asset Value,
Beginning
of Year | | | Net
Investment
Income (Loss)(a) | | | Net
Realized
and Unrealized
Gain (Loss) on
Investments | | | Total
from
Investment
Operations | | | Net
Investment
Income | | | Total
Distributions | | | Redemption
Fees(a) | | | Net Asset
Value,
End of
Period | | | Total
Return† | | | Net
Assets,
End of
Period
(in 000’s) | | | Net
Investment
Income
(Loss) | | | Operating
Expenses
Before
Reimbursement | | | Operating
Expenses
Net of
Reimbursement | | Portfolio
Turnover
Rate | |
| Class AAA | | | | | | | | | | | | | | | | | | | | | | | | | | | | | | | | | | | | | | | | | | | | | | | | | | | | | | |
| 2025(b) | | $ | 3.94 | | | $ | 0.04 | | | $ | 0.13 | | | $ | 0.17 | | | $ | — | | | $ | — | | | $ | — | | | $ | 4.11 | | | | 4.31 | % | | $ | 266 | | | | 1.83 | %(c) | | | 3.72 | %(c) | | | 0.00 | %(c)(d)(e) | | | 93 | % |
| 2024 | | | 3.81 | | | | 0.10 | | | | 0.10 | | | | 0.20 | | | | (0.07 | ) | | | (0.07 | ) | | | — | | | | 3.94 | | | | 5.17 | | | | 262 | | | | 2.44 | | | | 3.56 | | | | 0.00 | (d)(e)(f) | | | 271 | |
| 2023 | | | 3.66 | | | | 0.07 | | | | 0.08 | | | | 0.15 | | | | — | | | | — | | | | — | | | | 3.81 | | | | 4.10 | | | | 255 | | | | 1.94 | | | | 4.05 | | | | 0.00 | (d)(e)(f) | | | 265 | |
| 2022 | | | 3.70 | | | | (0.07 | ) | | | 0.03 | | | | (0.04 | ) | | | — | | | | — | | | | — | | | | 3.66 | | | | (1.08 | ) | | | 190 | | | | (1.82 | ) | | | 4.93 | | | | 1.95 | (e)(f)(g) | | | 243 | |
| 2021 | | | 3.81 | | | | (0.11 | ) | | | (0.00 | ) | | | (0.11 | ) | | | — | | | | — | | | | 0.00 | (h) | | | 3.70 | | | | (2.89 | ) | | | 208 | | | | (3.00 | ) | | | 4.12 | | | | 3.12 | (e) | | | 0 | (i) |
| 2020 | | | 4.31 | | | | (0.15 | ) | | | (0.35 | ) | | | (0.50 | ) | | | — | | | | — | | | | 0.00 | (h) | | | 3.81 | | | | (11.60 | ) | | | 245 | | | | (3.60 | ) | | | 7.49 | | | | 5.80 | (f)(g)(j)(k) | | | 79 | |
| Class A | | | | | | | | | | | | | | | | | | | | | | | | | | | | | | | | | | | | | | | | | | | | | | | | | | | | | | |
| 2025(b) | | $ | 3.93 | | | $ | 0.04 | | | $ | 0.12 | | | $ | 0.16 | | | $ | — | | | $ | — | | | $ | — | | | $ | 4.09 | | | | 4.07 | % | | $ | 1,037 | | | | 1.83 | %(c) | | | 3.72 | %(c) | | | 0.00 | %(c)(d)(e) | | | 93 | % |
| 2024 | | | 3.80 | | | | 0.09 | | | | 0.11 | | | | 0.20 | | | | (0.07 | ) | | | (0.07 | ) | | | — | | | | 3.93 | | | | 5.19 | | | | 1,041 | | | | 2.43 | | | | 3.56 | | | | 0.00 | (d)(e)(f) | | | 271 | |
| 2023 | | | 3.65 | | | | 0.09 | | | | 0.06 | | | | 0.15 | | | | — | | | | — | | | | — | | | | 3.80 | | | | 4.11 | | | | 1,162 | | | | 2.39 | | | | 4.05 | | | | 0.00 | (d)(e)(f) | | | 265 | |
| 2022 | | | 3.69 | | | | (0.07 | ) | | | 0.03 | | | | (0.04 | ) | | | — | | | | — | | | | — | | | | 3.65 | | | | (1.08 | ) | | | 1,193 | | | | (1.95 | ) | | | 4.93 | | | | 2.07 | (e)(f)(g) | | | 243 | |
| 2021 | | | 3.80 | | | | (0.11 | ) | | | (0.00 | ) | | | (0.11 | ) | | | — | | | | — | | | | 0.00 | (h) | | | 3.69 | | | | (2.89 | ) | | | 1,554 | | | | (3.00 | ) | | | 4.12 | | | | 3.12 | (e) | | | 0 | (i) |
| 2020 | | | 4.29 | | | | (0.16 | ) | | | (0.33 | ) | | | (0.49 | ) | | | — | | | | — | | | | 0.00 | (h) | | | 3.80 | | | | (11.42 | ) | | | 1,715 | | | | (3.89 | ) | | | 7.74 | | | | 6.05 | (f)(g)(j)(k) | | | 79 | |
| Class C | | | | | | | | | | | | | | | | | | | | | | | | | | | | | | | | | | | | | | | | | | | | | | | | | | | | | | |
| 2025(b) | | $ | 3.33 | | | $ | 0.03 | | | $ | 0.11 | | | $ | 0.14 | | | $ | — | | | $ | — | | | $ | — | | | $ | 3.47 | | | | 4.20 | % | | $ | 3 | | | | 1.83 | %(c) | | | 4.48 | %(c) | | | 0.00 | %(c)(d)(e) | | | 93 | % |
| 2024 | | | 3.23 | | | | 0.08 | | | | 0.09 | | | | 0.17 | | | | (0.07 | ) | | | (0.07 | ) | | | — | | | | 3.33 | | | | 5.17 | | | | 6 | | | | 2.43 | | | | 4.31 | | | | 0.00 | (d)(e)(f) | | | 271 | |
| 2023 | | | 3.10 | | | | 0.09 | | | | 0.04 | | | | 0.13 | | | | — | | | | — | | | | — | | | | 3.23 | | | | 4.19 | | | | 10 | | | | 2.96 | | | | 4.80 | | | | 0.00 | (d)(e)(f) | | | 265 | |
| 2022 | | | 3.15 | | | | (0.07 | ) | | | 0.02 | | | | (0.05 | ) | | | — | | | | — | | | | — | | | | 3.10 | | | | (1.59 | ) | | | 35 | | | | (2.38 | ) | | | 5.68 | | | | 2.50 | (e)(f)(g) | | | 243 | |
| 2021 | | | 3.24 | | | | (0.09 | ) | | | (0.00 | ) | | | (0.09 | ) | | | — | | | | — | | | | 0.00 | (h) | | | 3.15 | | | | (2.78 | ) | | | 49 | | | | (3.73 | ) | | | 4.87 | | | | 3.87 | (e) | | | 0 | (i) |
| 2020 | | | 3.69 | | | | (0.14 | ) | | | (0.31 | ) | | | (0.45 | ) | | | — | | | | — | | | | 0.00 | (h) | | | 3.24 | | | | (12.20 | ) | | | 330 | | | | (3.90 | ) | | | 7.81 | | | | 6.12 | (f)(g)(j)(k) | | | 79 | |
| Class I | | | | | | | | | | | | | | | | | | | | | | | | | | | | | | | | | | | | | | | | | | | | | | | | | | | | | | |
| 2025(b) | | $ | 4.08 | | | $ | 0.04 | | | $ | 0.13 | | | $ | 0.17 | | | $ | — | | | $ | — | | | $ | — | | | $ | 4.25 | | | | 4.17 | % | | $ | 5,468 | | | | 1.83 | %(c) | | | 3.47 | %(c) | | | 0.00 | %(c)(d)(e) | | | 93 | % |
| 2024 | | | 3.95 | | | | 0.10 | | | | 0.10 | | | | 0.20 | | | | (0.07 | ) | | | (0.07 | ) | | | — | | | | 4.08 | | | | 4.99 | | | | 5,098 | | | | 2.44 | | | | 3.31 | | | | 0.00 | (d)(e)(f) | | | 271 | |
| 2023 | | | 3.79 | | | | 0.08 | | | | 0.08 | | | | 0.16 | | | | — | | | | — | | | | — | | | | 3.95 | | | | 4.22 | | | | 3,740 | | | | 2.10 | | | | 3.80 | | | | 0.00 | (d)(e)(f) | | | 265 | |
| 2022 | | | 3.82 | | | | (0.05 | ) | | | 0.02 | | | | (0.03 | ) | | | — | | | | — | | | | — | | | | 3.79 | | | | (0.79 | ) | | | 2,737 | | | | (1.43 | ) | | | 4.68 | | | | 1.58 | (e)(f)(g) | | | 243 | |
| 2021 | | | 3.92 | | | | (0.10 | ) | | | (0.00 | ) | | | (0.10 | ) | | | — | | | | — | | | | 0.00 | (h) | | | 3.82 | | | | (2.55 | ) | | | 1,987 | | | | (2.75 | ) | | | 3.87 | | | | 2.87 | (e) | | | 0 | (i) |
| 2020 | | | 4.42 | | | | (0.11 | ) | | | (0.39 | ) | | | (0.50 | ) | | | — | | | | — | | | | 0.00 | (h) | | | 3.92 | | | | (11.31 | ) | | | 2,263 | | | | (2.65 | ) | | | 6.51 | | | | 4.82 | (f)(g)(j)(k) | | | 79 | |
| † | Total return represents aggregate total return of a hypothetical investment at the beginning of the year and sold at the end of the period including reinvestment of distributions and does not reflect the applicable sales charges. Total return for a period of less than one year is not annualized. |
| (a) | Per share amounts have been calculated using the average shares outstanding method. |
| (b) | For the six months ended October 31, 2024, unaudited. |
| (c) | Annualized. |
| (d) | Amount represents less than 0.005%. |
| (e) | For the six months ended October 31, 2024 and the years ended April 30, 2024, 2023, 2022, and 2021, the Adviser reimbursed and/or waived expenses of $116,387, $202,406, $174,961, $114,019, and $40,792, respectively. |
| (f) | The Fund received credits from a designated broker who agreed to pay certain Fund expenses. For the years ended April 30, 2024, 2023, 2022, and 2020, if credits had not been received, the expense ratios would have been 0.02%, 0.01%, 1.96%, and 5.81% (Class AAA), 0.02%, 0.01%, 2.08%, and 6.06% (Class A), 0.02%, 0.01%, 2.51%, and 6.13% (Class C), and 0.02%, 0.01%, 1.59%, and 4.83% (Class I). For the six months ended October 31, 2024 and the year ended April 30, 2021, the Fund did not receive any credits from the designated broker. |
| (g) | The Fund incurred interest expense during the years ended April 30, 2022 and 2020. For the year ended April 30, 2022, if interest expense had not been incurred, the ratios of operating expenses to average net assets would have been 1.94% (Class AAA), 2.06% (Class A), 2.49% (Class C), and 1.57% (Class I). For the year ended April 30, 2020, the effect of interest expense was minimal. |
| (h) | Amount represents less than $0.005 per share. |
| (i) | Amount represents less than 0.5%. |
| (j) | The Fund incurred dividend expense and service fees on securities sold short. If these expenses and fees had not been incurred, the ratios of operating expenses to average net assets for the year ended April 30, 2020 would have been 5.36% (Class AAA), 5.64% (Class A), 5.68% (Class C), and 4.38% (Class I). |
| (k) | During the fiscal year ended April 30, 2020, the Adviser directly paid legal fees on behalf of the Fund. If the Fund had paid these expenses, the expense ratios for that period would have been 7.48% (Class AAA), 7.73% (Class A), 7.80% (Class C), and 6.50% (Class I). |
See accompanying notes to financial statements.
Item 8. Changes in and Disagreements with Accountants for Open-End Management Investment Companies.
Not applicable.
Item 9. Proxy Disclosures for Open-End Management Investment Companies.
Not applicable.
Item 10. Remuneration Paid to Directors, Officers, and Others of Open-End Management Investment Companies.
Unless the following information is disclosed as part of the financial statements included in Item 7, an open-end management investment company registered on Form N-1A [17 CFR 239.15A and 17 CFR 274.11A] must disclose the aggregate remuneration paid by the company during the period covered by the report to:
| (1) | All directors and all members of any advisory board for regular compensation; |
| Anthony S. Colavita | $3,500 |
| Vincent D. Enright | $4,000 |
| Werner J. Roeder | $3,500 |
| (2) | Each director and each member of an advisory board for special compensation; $0 |
| (4) | Each person of whom any officer or director of the Fund is an affiliated person. $0 |
Item 11. Statement Regarding Basis for Approval of Investment Advisory Contract.
In determining whether to approve the continuance of the Investment Advisory Agreement (the Agreement), the Board, including a majority of the Trustees who have no direct or indirect interest in the Agreements and are not interested persons of the Funds, as defined in the 1940 Act (the Independent Board Members), considered the following information at a meeting on August 21, 2024:
| 1) | The nature, extent and quality of services provided by the Adviser. |
The Board reviewed in detail the nature and extent of the services provided by the Adviser under the Advisory Agreement and the quality of those services over the past year. The Board noted that these services included managing the investment program of the Fund, including the purchase and sale of portfolio securities, as well as the provision of general corporate services. The Board considered that the Adviser also provided, at its expense, office facilities for use by the Fund and supervisory personnel responsible for supervising the performance of administrative, accounting and related services for the Fund, including monitoring to assure compliance with stated investment policies and restrictions under the 1940 Act and related securities regulations. The Board noted that, in addition to managing the investment program for the Fund, the Adviser provided certain non-advisory and compliance services, including services for the Fund’s Rule 38a-1 compliance program.
The Board also considered that the Adviser paid for all compensation of officers and Board Members of the Fund who are affiliated with the Adviser, and that the Adviser further provided services to shareholders of the Fund who had invested through various programs offered by third party financial intermediaries. The Board evaluated these factors based on its direct experience with the Adviser and in consultation with Fund Counsel. The Board noted that the Adviser had engaged BNY, at its own expense, to assist it in performing certain of its administrative functions. The Board concluded that the nature and extent of the services provided was reasonable and appropriate in relation to the advisory fee, that the level of services provided by the Adviser, either directly or through BNY, had not diminished over the past year, and that the quality of services continued to be high.
The Board reviewed the personnel responsible for providing services to the Fund and concluded, based on their experience and interaction with the Adviser, that (i) the Adviser was able to retain quality personnel, (ii) the Adviser and its agents exhibited a high level of diligence and attention to detail in carrying out their advisory and administrative responsibilities under the Advisory Agreement, (iii) the Adviser was responsive to requests of the Board, (iv) the scope and depth of the Adviser’s resources was adequate, and (v) the Adviser had kept the Board apprised of developments relating to the Fund and the industry in general. The Board also focused on the Adviser’s reputation and long standing relationship with the Fund. The Board also believed that the Adviser had devoted substantial resources and made substantial commitments to address new regulatory compliance requirements applicable to the Fund.
| 2) | The performance of the Fund and the Adviser. |
The Board reviewed the investment performance of the Fund. It was noted that the Fund is a specialized investment vehicle and attracts specific types of shareholders that are attracted to the Fund’s investment strategy and portfolio. The Board considered the Fund’s one-, three-, five-, and ten-year average annual total return for the periods ended June 30, 2024, but placed greater emphasis on the Fund’s longer term performance. The peer group considered by the Board was developed by Broadridge and was comprised of comparable funds (the “Performance Peer Group”). The Board considered these comparisons helpful in its assessment as to whether the Adviser was obtaining for the Fund’s shareholders the total return performance that was available in the marketplace, given the Fund’s investment objectives, strategies, limitations and restrictions. In reviewing the performance of the Fund, the Board noted that the Fund’s performance was in the third quintile for the three-year period and in the fifth quintile for the one-, five-, and ten-year periods, and concluded that the Fund’s performance was reasonable in comparison to that of its Performance Peer Group.
In connection with its assessment of the performance of the Adviser, the Board considered the Adviser’s financial condition and whether it had the resources necessary to continue to carry out its functions under the Advisory Agreement. The Board concluded that the Adviser had the financial resources necessary to continue to perform its obligations under the Advisory Agreement and to continue to provide the high quality services that it has provided to the Fund to date.
| 3) | The cost of the advisory services and the profits to the Adviser and its affiliates from the relationship with the Fund. |
In connection with the Board’s consideration of the cost of the advisory services and the profits to the Adviser and its affiliates from the relationship with the Fund, the Board considered a number of factors. First, the Board compared the level of the advisory fee for the Fund against the comparative Broadridge expense peer group (the “Expense Peer Group”). The Board also considered comparative non-management fee expenses and comparative total fund expenses of the Fund and the Expense Peer Group. The Board considered this information as useful in assessing whether the Adviser was providing services at a cost that was competitive with other similar funds. In assessing this information, the Board considered both the comparative contract rates as well as the level of the advisory fees after waivers and/or reimbursements. In particular, the Board noted that the contractual advisory fee was above the Expense Peer Group median, the actual management fee after fee waivers and reimbursements was below the Expense Peer Group median, and that the total expense ratio was below the Expense Peer Group median.
The Board also reviewed the fees charged by the Adviser to provide similar advisory services to other regulated investment companies or accounts with similar investment objectives, noting that in some cases the fees charged by the Adviser were the same, or lower, than the fees charged to the Fund. In evaluating this information, the Board considered the difference in services provided by the Adviser to these other accounts. In particular, the Board considered the differences in risks involved in managing separate accounts and the Fund from a compliance and regulatory perspective.
The Board also considered an analysis prepared by the Adviser of the estimated profitability to the Adviser of its relationship with the Fund and reviewed with the Adviser its cost allocation methodology in connection with its profitability. In this regard, the Board reviewed pro forma income statements of the Adviser for the year ended December 31, 2023. The Board considered one analysis for the Adviser as a whole, and a second analysis for the Adviser with respect to the Fund. The Board concluded that the profitability of the Fund to the Adviser under either analysis was not excessive.
| 4) | The extent to which economies of scale will be realized as the Fund grows and whether fee levels reflect those economies of scale. |
With respect to the Board’s consideration of economies of scale, the Board discussed whether economies of scale would be realized by the Fund at higher asset levels. The Board also assessed whether certain of the Adviser’s costs would increase if asset levels rise. The Board noted the Fund’s current size and concluded that, under foreseeable conditions, they were unable to assess at this time whether economies of scale would be realized by the Fund if it were to experience significant asset growth. In the event there were to be significant asset growth in the Fund, the Board determined to reassess whether the advisory fee appropriately took into account any economies of scale that had been realized as a result of that growth.
In addition to the above factors, the Board also discussed other benefits received by the Adviser from their management of the Fund. The Board considered that the Adviser does use soft dollars in connection with its management of the Fund.
Based on a consideration of all these factors in their totality, the Board Members, including all of the Independent Board Members, determined that the Fund’s advisory fee was fair and reasonable with respect to the quality of services provided and in light of the other factors described above that the Board deemed relevant. Accordingly, the Board determined to approve the continuation of the Fund’s Advisory Agreement. The Board based its decision on evaluations of all these factors as a whole and did not consider any one factor as all-important or controlling.
Item 12. Disclosure of Proxy Voting Policies and Procedures for Closed-End Management Investment Companies.
Not applicable.
Item 13. Portfolio Managers of Closed-End Management Investment Companies.
Not applicable.
Item 14. Purchases of Equity Securities by Closed-End Management Investment Company and Affiliated Purchasers.
Not applicable.
Item 15. Submission of Matters to a Vote of Security Holders.
There have been no material changes to the procedures by which shareholders may recommend nominees to the registrant’s board of trustees, where those changes were implemented after the registrant last provided disclosure in response to the requirements of Item 407(c)(2)(iv) of Regulation S-K (17 CFR 229.407) (as required by Item 22(b)(15) of Schedule 14A (17 CFR 240.14a-101)), or this Item.
Item 16. Controls and Procedures.
| (a) | The registrant’s principal executive officer and principal financial officer have concluded, based on their evaluation of the effectiveness of the design and operation of the registrant’s disclosure controls and procedures (as defined in Rule 30a-3(c) under the Investment Company Act of 1940 (17 CFR 270.30a-3(c))) as of a date within 90 days of the filing date of this report, that the design and operation of such procedures are effective to provide reasonable assurance that information required to be disclosed by the registrant on Form N-CSR is recorded, processed, summarized and reported within the time periods specified in the Securities and Exchange Commission’s rules and forms, and that information required to be disclosed by the registrant in the reports that it files or submits on Form N-CSR is accumulated and communicated to the registrant’s management, including its principal executive and principal financial officers, as appropriate to allow timely decisions regarding required disclosure. |
| (b) | There were no changes in the registrant’s internal control over financial reporting (as defined in Rule 30a-3(d) under the 1940 Act (17 CFR 270.30a-3(d))) that occurred during the period covered by this report that have materially affected, or are reasonably likely to materially affect, the registrant’s internal control over financial reporting. |
Item 17. Disclosure of Securities Lending Activities for Closed-End Management Investment Companies.
Not applicable.
Item 18. Recovery of Erroneously Awarded Compensation.
Not Applicable.
Item 19. Exhibits.
| (a)(3)(1) | | There were no written solicitations to purchase securities under Rule 23c-1 under the Act sent or given during the period covered by the report by or on behalf of the Registrant to 10 or more persons. |
| (a)(3)(2) | | There was no change in the Registrant’s independent public accountant during the period covered by the report. |
SIGNATURES
Pursuant to the requirements of the Securities Exchange Act of 1934 and the Investment Company Act of 1940, the registrant has duly caused this report to be signed on its behalf by the undersigned, thereunto duly authorized.
| (Registrant) | Comstock Funds, Inc. | |
| | | |
| By (Signature and Title)* | /s/ John C. Ball | |
| | John C. Ball, Principal Executive Officer | |
| | | |
| Date | January 6, 2025 | |
Pursuant to the requirements of the Securities Exchange Act of 1934 and the Investment Company Act of 1940, this report has been signed below by the following persons on behalf of the registrant and in the capacities and on the dates indicated.
| By (Signature and Title)* | /s/ John C. Ball | |
| | John C. Ball, Principal Executive Officer | |
| | | |
| Date | January 6, 2025 | |
| | | |
| By (Signature and Title)* | /s/ John C. Ball | |
| | John C. Ball, Principal Financial Officer and Treasurer | |
| | | |
| Date | January 6, 2025 | |
| * | Print the name and title of each signing officer under his or her signature. |