UNITED STATES
SECURITIES AND EXCHANGE COMMISSION
Washington, D.C. 20549
FORM N-CSR
CERTIFIED SHAREHOLDER REPORT OF REGISTERED MANAGEMENT INVESTMENT COMPANIES
Investment Company Act file number 811-05502
Comstock Funds, Inc.
(Exact name of registrant as specified in charter)
One Corporate Center
Rye, New York 10580-1422
(Address of principal executive offices) (Zip code)
Bruce N. Alpert
Gabelli Funds, LLC
One Corporate Center
Rye, New York 10580-1422
(Name and address of agent for service)
Registrant’s telephone number, including area code: 1-800-422-3554
Date of fiscal year end: April 30
Date of reporting period: April 30, 2022
Form N-CSR is to be used by management investment companies to file reports with the Commission not later than 10 days after the transmission to stockholders of any report that is required to be transmitted to stockholders under Rule 30e-1 under the Investment Company Act of 1940 (17 CFR 270.30e-1). The Commission may use the information provided on Form N-CSR in its regulatory, disclosure review, inspection, and policymaking roles.
A registrant is required to disclose the information specified by Form N-CSR, and the Commission will make this information public. A registrant is not required to respond to the collection of information contained in Form N-CSR unless the Form displays a currently valid Office of Management and Budget (“OMB”) control number. Please direct comments concerning the accuracy of the information collection burden estimate and any suggestions for reducing the burden to Secretary, Securities and Exchange Commission, 450 Fifth Street, NW, Washington, DC 20549-0609. The OMB has reviewed this collection of information under the clearance requirements of 44 U.S.C. § 3507.
Item 1. Reports to Stockholders.
| (a) | The Report to Shareholders is attached herewith. |
Comstock Capital Value Fund
Annual Report — April 30, 2022
To Our Shareholders,
For the fiscal year ended April 30, 2022, the net asset value (NAV) total return per Class A Share of the Comstock Capital Value Fund was (1.1)% compared with a total return of 0.2% for the Standard & Poor’s (S&P) 500 Index. See page 3 for additional performance information for all classes of shares.
Enclosed are the financial statements, including the schedule of investments, as of April 30, 2022.
Investment Objective and Strategy (Unaudited)
The Fund seeks to maximize total return, consisting of capital appreciation and current income. The Fund follows a value oriented strategy and seeks to achieve its investment objective by investing in equity and debt securities, money market instruments, and derivatives. The Fund may invest in, and may shift frequently among, a wide range of asset classes and market sectors.
Performance Discussion (Unaudited)
Global deal merger and acquisition activity (M&A) totaled $5.9 trillion in 2021, a year over year increase of 64% and the most active year on record. The deal flow throughout the year was notably consistent, capped off with $1.5 trillion in deals in the fourth quarter. This marked the sixth consecutive quarter to pass $1 trillion. The total number of deals worldwide increased to an all time high for the year, including fifty-five deals greater than $10 billion, which is also a record. Deals with a value between $1-5 billion accounted for $1.9 trillion during the year, more than doubling year over year.
Cross border M&A activity totaled $2.1 trillion for the calendar year, an increase of 68% and an all-time high. Similarly, the value of private equity backed buyouts hit an all time high of $1.2 trillion, more than doubling year over year, accounting for nearly 20% of total M&A activity.
The resurgence of deal activity in 2021 was widespread but led by the United States based targets, which saw $2.6 trillion in deal activity, an increase of 68% year over year. European M&A tallied $1.4 trillion of transactions over the same period, an increase of 46%. The Asia Pacific and Australia each recorded all time highs, with a 48% and 300% increase, respectively.
| As permitted by regulations adopted by the Securities and Exchange Commission, paper copies of the Fund’s annual and semiannual shareholder reports will no longer be sent by mail, unless you specifically request paper copies of the reports. Instead, the reports will be made available on the Fund’s website (www.gabelli.com), and you will be notified by mail each time a report is posted and provided with a website link to access the report. If you already elected to receive sharehold-er reports electronically, you will not be affected by this change and you need not take any action. To elect to receive all future reports on paper free of charge, please contact your financial intermediary, or, if you invest directly with the Fund, you may call 800-422-3554 or send an email request to info@gabelli.com. |
Merger and acquisition activity remained robust in the first quarter of 2022, with global M&A totaling $1.0 trillion. Technology was the most active sector for dealmaking, accounting for 25% of all deal activity in the first quarter for a total of $259 billion. Technology was followed by Financials and Real Estate as the most active sectors, accounting for 13% and 12% of deal activity, respectively. Following years of record fundraising, private equity remained very active announcing $291 billion of acquisitions, an increase of 18% compared with 2021, and accounted for 29% of M&A in the first quarter.
The U.S. remained the preferred venue for dealmaking accounting for 51% of deal activity and totaling $521 billion, although that was a decline of 19% compared with 2021. Large deals were in vogue in the first quarter of 2022 as deals like Activision Blizzard’s $68.7 billion acquisition by Microsoft and Alleghany Corp.’s $11.6 billion acquisition by Berkshire Hathaway propelled deals greater than $10 billion to $254 billion, an increase of 46% compared with 2021.
Looking ahead, the drivers remain in place for another year of robust deal activity. We continue to find attractive investment opportunities in newly announced and pipeline deals. We remain focused on investing in highly strategic, well financed deals with an added focus on near term catalysts, and are upbeat about our prospect to generate absolute returns in 2022.
Notable drivers of performance include:
Arena Pharmaceuticals, Inc., a biotechnology company that develops therapeutics for autoimmune diseases, was acquired by Pfizer in March after the companies received U.S. antitrust approval. In February, Pfizer withdrew and refiled its application for antitrust approval in the hopes of avoiding a second request that would have extended the timeline for approval. Under terms of the agreement Arena shareholders received $100.00 cash per share, or about $6.7 billion. The deal closed on March 11, 2022.
Ferro Corp., a manufacturer of specialty coatings and color solutions, was acquired by Prince International after receiving antitrust approval from the U.S. Federal Trade Commission. To secure antitrust approval in the U.S. and EU, the parties agreed to divest Prince’s porcelain enamel and glass coatings business to KPS Capital, as this was the only area of business overlap. Under terms of the agreement, Ferro shareholders received $22.00 cash per share, or about $2.1 billion. The deal closed on April 21, 2022.
Nuance Communications, which provides conversational artificial intelligence software used in healthcare and enterprise applications, was acquired by Microsoft after receiving approval from the U.K. Competition and Markets Authority (CMA) on March 2, 2022. On April 12, 2021, Nuance agreed to be acquired by Microsoft for $56 cash per share, or about $19.7 billion. The companies had previously received antitrust approvals in the U.S., Australia, and EU in 2021, but the CMA launched its merger investigation in December 2021, which kicked off a three month process that resulted in clearance. Microsoft closed its acquisition of Nuance on March 3, 2022.
Veoneer, Inc., which makes automotive safety products including radar systems, driver-monitoring equipment, brakes, and advanced driver assist software, was acquired by Qualcomm after the companies received German antitrust approval on March 21, 2022. Under terms of the agreement, Veoneer shareholders received $37.00 cash per share, or about $4.5 billion. In July 2021, Veoneer agreed to be acquired by Canadian automotive supplier Magna International for $31.25 cash per share but received an unsolicited proposal to be acquired by Qualcomm in August 2021 at $37.00 cash per share, which was subsequently accepted in October 2021. The deal closed on April 1, 2022.
| The views expressed reflect the opinions of the Fund’s portfolio managers and Gabelli Funds, LLC, the Adviser, as of the date of this report and are subject to change without notice based on changes in market, economic, or other conditions. These views are not intended to be a forecast of future events and are no guarantee of future results. |
Comparative Results
Average Annual Returns through April 30, 2022 (a)(b) (Unaudited)
Total returns and average annual returns reflect changes in share price, reinvestment of distributions, and are net of expenses.
| | | | | | | | | �� | | | | | | Since | |
| | | 1 Year | | | 5 Year | | | 10 Year | | | 15 Year | | | Inception
(10/10/85) | |
| Class A (DRCVX) | | | (1.08 | )% | | | (8.17 | )% | | | (13.18 | )% | | | (10.89 | )% | | | (5.20 | )% |
| With sales charge (c) | | | (6.77 | ) | | | (9.25 | ) | | | (13.69 | ) | | | (11.24 | ) | | | (5.35 | ) |
| Class AAA (COMVX) (d) | | | (1.08 | ) | | | (8.15 | ) | | | (13.16 | ) | | | (10.87 | ) | | | (5.19 | ) |
| Class C (CPCCX) (d) | | | (1.59 | ) | | | (8.64 | ) | | | (13.68 | ) | | | (11.50 | ) | | | (5.72 | ) |
| With contingent deferred sales charge (e) | | | (2.57 | ) | | | (8.64 | ) | | | (13.68 | ) | | | (11.50 | ) | | | (5.72 | ) |
| Class I (CPCRX) (d) | | | (0.79 | ) | | | (7.90 | ) | | | (12.91 | ) | | | (10.64 | ) | | | (5.01 | ) |
| S&P 500 Index (f) | | | 0.21 | | | | 13.66 | | | | 13.67 | | | | 9.28 | | | | 11.38 | (g) |
| (a) | The Fund’s fiscal year ends on April 30. |
| (b) | Returns would have been lower had the Adviser not reimbursed certain expenses of the Fund. |
| (c) | Performance results include the effect of the maximum 5.75% sales charge at the beginning of the period. |
| (d) | The Class A Share NAVs are used to calculate performance for the periods prior to the issuance of Class AAA Shares on December 8, 2008, and Class C Shares and Class I Shares on August 22, 1995. The actual performance of the Class C Shares would have been lower and the Class AAA Shares and Class I Shares would have been higher due to the expenses associated with the Class A Shares. |
| (e) | Assuming payment of the 1% maximum contingent deferred sales charge imposed on redemptions made within one year of purchase. |
| (f) | The S&P 500 Index is a market capitalization weighted index of 500 large capitalization stocks commonly used to represent the U.S. equity market. Dividends are considered reinvested. You cannot invest directly in an index. |
| (g) | Since September 30, 1985, the date closest to the Fund’s inception date for which data is available. |
In the current prospectuses dated November 24, 2021, the gross expense ratios for Comstock Capital Value Fund Class AAA, A, C, and I Shares. are 4.12%, 4.12%, 4.87%, and 3.87%, respectively, and the net expense ratio for all share classes after contractual reimbursements by the Adviser is 0.00% through November 24, 2022. See page 11 for the expense ratios for the year ended April 30, 2022.
Returns represent past performance and do not guarantee future results. Investment returns and the principal value of an investment will fluctuate. When shares are redeemed, they may be worth more or less than their original cost. Current performance may be lower or higher than the performance data presented. Visit www.gabelli.com for performance information as of the most recent month end.
COMPARISON OF CHANGE IN VALUE OF A $10,000 INVESTMENT IN
COMSTOCK CAPITAL VALUE FUND (CLASS A SHARES) AND S&P 500 INDEX (Unaudited)
| Average Annual Total Returns* |
| | 1 Year | 5 Year | 10 Year |
| Class A | (1.08)% | (8.17)% | (13.18)% |
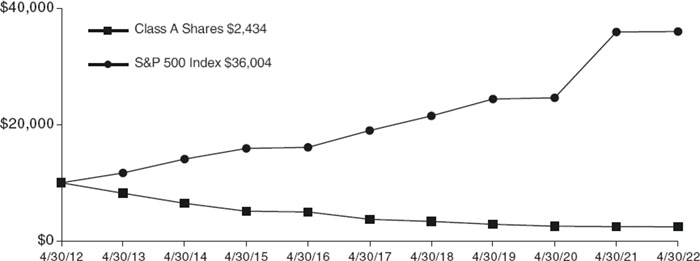
* Past performance is not predictive of future results. The performance tables and graph do not reflect the deduction of taxes that a shareholder would pay on Fund distributions or the redemption of Fund shares.
Comstock Capital Value Fund
Disclosure of Fund Expenses (Unaudited)
| For the Six Month Period from November 1, 2021 through April 30, 2022 | Expense Table |
We believe it is important for you to understand the impact of fees and expenses regarding your investment. All mutual funds have operating expenses. As a shareholder of a fund, you incur ongoing costs, which include costs for portfolio management, administrative services, and shareholder reports (like this one), among others. Operating expenses, which are deducted from a fund’s gross income, directly reduce the investment return of a fund. When a fund’s expenses are expressed as a percentage of its average net assets, this figure is known as the expense ratio. The following examples are intended to help you understand the ongoing costs (in dollars) of investing in your Fund and to compare these costs with those of other mutual funds. The examples are based on an investment of $1,000 made at the beginning of the period shown and held for the entire period.
The Expense Table below illustrates your Fund’s costs in two ways:
Actual Fund Return: This section provides information about actual account values and actual expenses. You may use this section to help you to estimate the actual expenses that you paid over the period after any fee waivers and expense reimbursements. The “Ending Account Value” shown is derived from the Fund’s actual return during the past six months, and the “Expenses Paid During Period” shows the dollar amount that would have been paid by an investor who started with $1,000 in the Fund. You may use this information, together with the amount you invested, to estimate the expenses that you paid over the period.
To do so, simply divide your account value by $1,000 (for example, an $8,600 account value divided by $1,000 = 8.6), then multiply the result by the number given for your Fund under the heading “Expenses Paid During Period” to estimate the expenses you paid during this period.
Hypothetical 5% Return: This section provides information about hypothetical account values and hypothetical expenses based on the Fund’s actual expense ratio. It assumes a hypothetical annualized return of 5% before expenses during the period shown. In this case – because the hypothetical return used is not the Fund’s actual return – the results do not apply to your investment and you cannot use the hypothetical account value and expense to estimate the actual ending account balance or expenses you
paid for the period. This example is useful in making comparisons of the ongoing costs of investing in the Fund and other funds. To do so, compare this 5% hypothetical example with the 5% hypothetical examples that appear in shareholder reports of other funds.
Please note that the expenses shown in the table are meant to highlight your ongoing costs only and do not reflect any transactional costs such as sales charges (loads), redemption fees, or exchange fees, if any, which are described in the Prospectus. If these costs were applied to your account, your costs would be higher. Therefore, the 5% hypothetical return is useful in comparing ongoing costs only, and will not help you determine the relative total costs of owning different funds. The “Annualized Expense Ratio” represents the actual expenses for the last six months and may be different from the expense ratio in the Financial Highlights which is for the fiscal year ended April 30, 2022.
| | | Beginning | | | Ending | | | Annualized | | | Expenses | |
| | | Account Value | | | Account Value | | | Expense | | | Paid During | |
| | | 11/01/21 | | | 04/30/22 | | | Ratio | | | Period * | |
| Comstock Capital Value Fund | | | | |
| Actual Fund Return | | | | | | |
| Class AAA | | | $1,000.00 | | | | $1,005.50 | | | | 0.47 | % | | | $2.34 | |
| Class A | | | $1,000.00 | | | | $1,005.50 | | | | 0.54 | % | | | $2.69 | |
| Class C | | | $1,000.00 | | | | $1,006.50 | | | | 0.59 | % | | | $2.94 | |
| Class I | | | $1,000.00 | | | | $1,008.00 | | | | 0.34 | % | | | $1.69 | |
| Hypothetical 5% Return | | | | | | | | | | | | | |
| Class AAA | | | $1,000.00 | | | | $1,022.46 | | | | 0.47 | % | | | $2.36 | |
| Class A | | | $1,000.00 | | | | $1,022.12 | | | | 0.54 | % | | | $2.71 | |
| Class C | | | $1,000.00 | | | | $1,021.87 | | | | 0.59 | % | | | $2.96 | |
| Class I | | | $1,000.00 | | | | $1,023.11 | | | | 0.34 | % | | | $1.71 | |
| * | Expenses are equal to the Fund’s annualized expense ratio for the last six months multiplied by the average account value over the period, multiplied by the number of days in the most recent fiscal half year (181 days), then divided by 365. |
Summary of Portfolio Holdings (Unaudited)
The following table presents portfolio holdings as a percent of net assets as of April 30, 2022:
Comstock Capital Value Fund
| Computer Software and Services | | | 22.6 | % |
| U.S. Government Obligations | | | 13.5 | % |
| Health Care | | | 11.0 | % |
| Financial Services | | | 10.3 | % |
| Business Services | | | 9.0 | % |
| Electronics | | | 5.6 | % |
| Real Estate | | | 4.7 | % |
| Energy and Utilities | | | 4.2 | % |
| Automotive: Parts and Accessories | | | 3.6 | % |
| Machinery | | | 3.2 | % |
| Semiconductors | | | 2.9 | % |
| Diversified Industrial | | | 2.9 | % |
| Telecommunications | | | 2.9 | % |
| Specialty Chemicals | | | 2.6 | % |
| Broadcasting | | | 2.3 | % |
| Food and Beverage | | | 2.0 | % |
| Aerospace and Defense | | | 1.9 | % |
| Building and Construction | | | 1.2 | % |
| Consumer Services | | | 0.6 | % |
| Other Assets and Liabilities (Net) | | | (7.0) | % |
| | | | 100.0 | % |
The Fund files a complete schedule of portfolio holdings with the Securities and Exchange Commission (the SEC) for the first and third quarters of each fiscal year on Form N-PORT. Shareholders may obtain this information at www.gabelli.com or by calling the Fund at 800-GABELLI (800-422-3554). The Fund’s Form N-PORT is available on the SEC’s website at www.sec.gov and may also be reviewed and copied at the SEC’s Public Reference Room in Washington, DC. Information on the operation of the Public Reference Room may be obtained by calling 800-SEC-0330.
Proxy Voting
The Fund files Form N-PX with its complete proxy voting record for the twelve months ended June 30, no later than August 31 of each year. A description of the Fund’s proxy voting policies, procedures, and how the Fund voted proxies relating to portfolio securities is available without charge, upon request, by (i) calling 800-GABELLI (800-422-3554); (ii) writing to The Gabelli Funds at One Corporate Center, Rye, NY 10580-1422; or (iii) visiting the SEC’s website at www.sec.gov.
Comstock Capital Value Fund
Schedule of Investments — April 30, 2022
| | | | | | | | | Market | |
| Shares | | | | | Cost | | | Value | |
| | | | | COMMON STOCKS — 93.5% | | | | | | | | |
| | | | | Aerospace and Defense — 1.9% | | | | | | | | |
| | 2,000 | | | Aerojet Rocketdyne Holdings Inc.† | | $ | 82,481 | | | $ | 79,960 | |
| | | | | | | | | | | | | |
| | | | | | | | | | | | | |
| | | | | Automotive: Parts and Accessories — 3.6% | |
| | 3,500 | | | Meritor Inc.† | | | 124,204 | | | | 125,685 | |
| | 1,500 | | | Tenneco Inc., Cl. A† | | | 28,018 | | | | 25,755 | |
| | | | | | | | 152,222 | | | | 151,440 | |
| | | | | Broadcasting — 2.3% | | | | | | | | |
| | 800 | | | Liberty Media Corp.- Liberty Braves, Cl. C† | | | 20,835 | | | | 20,088 | |
| | 3,500 | | | TEGNA Inc. | | | 78,262 | | | | 77,175 | |
| | | | | | | | 99,097 | | | | 97,263 | |
| | | | | Building and Construction — 1.2% | | | | | | | | |
| | 2,000 | | | Cornerstone Building Brands Inc.† | | | 48,400 | | | | 48,780 | |
| | | | | | | | | | | | | |
| | | | | Business Services — 9.0% | | | | | | | | |
| | 1,500 | | | Bottomline Technologies DE Inc.† | | | 84,642 | �� | | | 84,930 | |
| | 2,050 | | | Cerner Corp. | | | 188,381 | | | | 191,962 | |
| | 2,500 | | | Nielsen Holdings plc | | | 67,589 | | | | 67,025 | |
| | 2,500 | | | PFSweb Inc.† | | | 28,191 | | | | 28,375 | |
| | | | | | | | 368,803 | | | | 372,292 | |
| | | | | Computer Software and Services — 22.6% | | | | | | | | |
| | 1,250 | | | Activision Blizzard Inc. | | | 99,768 | | | | 94,500 | |
| | 1,500 | | | Anaplan Inc.† | | | 96,860 | | | | 97,485 | |
| | 2,000 | | | CDK Global Inc. | | | 108,952 | | | | 108,820 | |
| | 1,250 | | | Citrix Systems Inc. | | | 126,714 | | | | 125,125 | |
| | 2,000 | | | Datto Holding Corp.† | | | 69,243 | | | | 69,400 | |
| | 3,000 | | | GTY Technology Holdings Inc.† | | | 18,240 | | | | 18,270 | |
| | 5,000 | | | Mandiant Inc.† | | | 110,459 | | | | 109,900 | |
| | 2,000 | | | Mimecast Ltd.† | | | 158,727 | | | | 159,360 | |
| | 900 | | | Sailpoint Technologies Holdings Inc.† | | | 57,670 | | | | 57,447 | |
| | 1,300 | | | Twitter Inc.† | | | 64,936 | | | | 63,726 | |
| | 4,000 | | | Zynga Inc., Cl. A† | | | 34,562 | | | | 33,080 | |
| | | | | | | | 946,131 | | | | 937,113 | |
| | | | | Consumer Services — 0.6% | | | | | | | | |
| | 500 | | | Terminix Global Holdings Inc.† | | | 21,593 | | | | 22,945 | |
| | | | | | | | | | | | | |
| | | | | Diversified Industrial — 2.9% | | | | | | | | |
| | 2,500 | | | US Ecology Inc.† | | | 117,999 | | | | 119,975 | |
| | | | | | | | | | | | | |
| | | | | Electronics — 5.6% | | | | | | | | |
| | 2,500 | | | NeoPhotonics Corp.† | | | 38,058 | | | | 37,850 | |
| | 1,500 | | | Plantronics Inc.† | | | 58,778 | | | | 59,790 | |
| | | | | | | | | Market | |
| Shares | | | | | Cost | | | Value | |
| | 500 | | | Rogers Corp.† | | $ | 135,639 | | | $ | 135,360 | |
| | | | | | | | 232,475 | | | | 233,000 | |
| | | | | Energy and Utilities — 4.2% | | | | | | | | |
| | 1,750 | | | Renewable Energy Group Inc.† | | | 106,389 | | | | 106,855 | |
| | 500 | | | Shell Midstream Partners LP | | | 6,958 | | | | 7,065 | |
| | 1,500 | | | South Jersey Industries Inc. | | | 49,395 | | | | 51,285 | |
| | 500 | | | Vidler Water Resouces Inc.† | | | 7,876 | | | | 7,870 | |
| | | | | | | | 170,618 | | | | 173,075 | |
| | | | | Financial Services — 10.3% | | | | | | | | |
| | 500 | | | American National Group Inc. | | | 94,327 | | | | 94,305 | |
| | 5,000 | | | First Horizon Corp. | | | 116,578 | | | | 111,900 | |
| | 15,000 | | | Macquarie Infrastructure Holdings LLC | | | 53,869 | | | | 56,250 | |
| | 8,000 | | | MoneyGram International Inc.† | | | 83,786 | | | | 81,040 | |
| | 1,500 | | | Pershing Square Tontine Holdings Ltd., Cl. A† | | | 29,685 | | | | 29,835 | |
| | 1,000 | | | Randolph Bancorp Inc. | | | 26,370 | | | | 26,340 | |
| | 3,000 | | | Waverley Capital Acquisition Corp. 1, Cl. A† | | | 28,991 | | | | 29,130 | |
| | | | | | | | 433,606 | | | | 428,800 | |
| | | | | Food and Beverage — 2.0% | | | | | | | | |
| | 450 | | | Sanderson Farms Inc | | | 80,644 | | | | 85,217 | |
| | | | | | | | | | | | | |
| | | | | Health Care — 11.0% | | | | | | | | |
| | 5,000 | | | Antares Pharma Inc.† | | | 27,816 | | | | 27,825 | |
| | 1,800 | | | Change Healthcare Inc.† | | | 42,605 | | | | 42,408 | |
| | 2,000 | | | Intersect ENT Inc.† | | | 54,558 | | | | 54,740 | |
| | 2,500 | | | IntriCon Corp.† | | | 59,606 | | | | 60,025 | |
| | 750 | | | LHC Group Inc.† | | | 124,775 | | | | 124,387 | |
| | 500 | | | Natus Medical Inc.† | | | 16,639 | | | | 16,635 | |
| | 1,000 | | | Ortho Clinical Diagnostics Holdings plc† | | | 20,719 | | | | 17,610 | |
| | 1,500 | | | Sierra Oncology Inc.† | | | 81,730 | | | | 81,765 | |
| | 1,000 | | | Tivity Health Inc.† | | | 32,144 | | | | 32,130 | |
| | | | | | | | 460,592 | | | | 457,525 | |
| | | | | Machinery — 3.2% | | | | | | | | |
| | 5,500 | | | Intevac Inc.† | | | 29,096 | | | | 27,995 | |
| | 4,500 | | | Welbilt Inc.† | | | 106,604 | | | | 106,290 | |
| | | | | | | | 135,700 | | | | 134,285 | |
| | | | | Real Estate — 4.7% | | | | | | | | |
| | 1,000 | | | American Campus | | | | | | | | |
| | | | | Communities Inc., REIT | | | 64,719 | | | | 64,670 | |
| | 1,000 | | | Bluerock Residential Growth REIT Inc. | | | 26,323 | | | | 26,610 | |
| | 1,000 | | | Cedar Realty Trust Inc., REIT | | | 28,541 | | | | 28,380 | |
See accompanying notes to financial statements.
Comstock Capital Value Fund
Schedule of Investments (Continued) — April 30, 2022
| | | | | | | | | Market | |
| Shares | | | | | Cost | | | Value | |
| | | | | COMMON STOCKS (Continued) | | | | | | | | |
| | | | | Real Estate (Continued) | | | | | | | | |
| | 3,000 | | | Preferred Apartment Communities Inc., REIT | | $ | 74,719 | | | $ | 74,640 | |
| | | | | | | | 194,302 | | | | 194,300 | |
| | | | | | | | | | | | | |
| | | | | Semiconductors — 2.9% | | | | | | | | |
| | 2,500 | | | Tower Semiconductor Ltd.† | | | 118,538 | | | | 120,750 | |
| | | | | Specialty Chemicals — 2.6% | | | | | | | | |
| | 3,500 | | | GCP Applied Technologies Inc.† | | | 109,683 | | | | 109,795 | |
| | | | | Telecommunications — 2.9% | | | | | | | | |
| | 6,000 | | | Vonage Holdings Corp.† | | | 124,470 | | | | 119,760 | |
| | | | | TOTAL COMMON STOCKS | | | 3,897,354 | | | | 3,886,275 | |
| | | | | | | | | | | | | |
| | | | | WARRANTS — 0.0% | | | | | | | | |
| | | | | Financial Services — 0.0% | | | | | | | | |
| | 1,000 | | | Waverley Capital Acquisition Corp. 1, expire 07/15/26† | | | 499 | | | | 311 | |
| | | | | | | | | | | | | |
| Principal | | | | | | | | | | | |
| Amount | | | | | | | | | | | |
| | | | | U.S. GOVERNMENT OBLIGATIONS — 13.5% | |
| $ | 560,000 | | | U.S. Treasury Bills, 0.310% to 0.784%††, 06/02/22 to 07/28/22 | | | 559,479 | | | | 559,454 | |
| | | | | | | | | | | | | |
| | | | | TOTAL INVESTMENTS — 107.0% | | $ | 4,457,332 | | | | 4,446,040 | |
| | | | | Other Assets and Liabilities (Net) — (7.0)% | | | | | | | (290,650 | ) |
| | | | | NET ASSETS — 100.0% | | | | | | $ | 4,155,390 | |
| † | Non-income producing security. |
| †† | Represents annualized yields at dates of purchase. |
| REIT | Real Estate Investment Trust |
See accompanying notes to financial statements.
Comstock Capital Value Fund
Statement of Assets and Liabilities
April 30, 2022
| Assets: | | | |
| Investments, at value (cost $4,457,332) | | $ | 4,446,040 | |
| Receivable for investments sold | | | 12,312 | |
| Receivable from Adviser | | | 38,039 | |
| Dividends receivable | | | 470 | |
| Prepaid expenses | | | 49 | |
| Total Assets | | | 4,496,910 | |
| Liabilities: | | | | |
| Payable to bank | | | 59,322 | |
| Payable for investments purchased | | | 162,315 | |
| Payable for investment advisory fees | | | 3,437 | |
| Payable for distribution fees | | | 317 | |
| Payable for legal and audit fees | | | 93,300 | |
| Payable for shareholder communications | | | 17,829 | |
| Other accrued expenses | | | 5,000 | |
| Total Liabilities | | | 341,520 | |
| Net Assets | | | | |
| (applicable to 1,112,971 shares outstanding) | | $ | 4,155,390 | |
| Net Assets Consist of: | | | | |
| Paid-in capital | | $ | 137,863,130 | |
| Total accumulated loss | | | (133,707,740 | ) |
| Net Assets | | $ | 4,155,390 | |
| Shares of Capital Stock, each at $0.001 par value: | | | | |
| Class AAA: | | | | |
| Net Asset Value, offering, and redemption price per share ($190,053 ÷ 51,912 shares outstanding; 25,000,000 shares authorized) | | $ | 3.66 | |
| Class A: | | | | |
| Net Asset Value and redemption price per share ($1,192,805 ÷ 326,818 shares outstanding; 25,000,000 shares authorized) | | $ | 3.65 | |
| Maximum offering price per share (NAV ÷ 0.9425, based on maximum sales charge of 5.75% of the offering price) | | $ | 3.87 | |
| Class C: | | | | |
| Net Asset Value and offering price per share ($34,973 ÷ 11,270 shares outstanding; 25,000,000 shares authorized) | | $ | 3.10 | (a) |
| Class I: | | | | |
| Net Asset Value, offering, and redemption price per share ($2,737,559 ÷ 722,971 shares outstanding; 25,000,000 shares authorized) | | $ | 3.79 | |
| (a) | Redemption price varies based on the length of time held. |
Statement of Operations
For the Year Ended April 30, 2022
| Investment Income: | | | |
| Dividends | | $ | 3,797 | |
| Interest | | | 1,515 | |
| Total Investment Income | | | 5,312 | |
| Expenses: | | | | |
| Investment advisory fees. | | | 38,021 | |
| Distribution fees - Class AAA. | | | 472 | |
| Distribution fees - Class A | | | 3,394 | |
| Distribution fees - Class C | | | 392 | |
| Legal and audit fees | | | 73,640 | |
| Shareholder communications expenses | | | 25,883 | |
| Shareholder services fees | | | 22,002 | |
| Directors’ fees | | | 6,500 | |
| Custodian fees | | | 3,231 | |
| Interest expense | | | 573 | |
| Miscellaneous expenses | | | 8,063 | |
| Total Expenses | | | 182,171 | |
| Less: | | | | |
| Custodian fee credits | | | (15 | ) |
| Expense reimbursements (See Note 3) | | | (114,019 | ) |
| Expenses paid indirectly by broker (See Note 6) | | | (304 | ) |
| Total Reimbursements and Credits | | | (114,338 | ) |
| Net Expenses | | | 67,833 | |
| Net Investment Loss | | | (62,521 | ) |
| Net Realized and Unrealized Gain/(Loss) on Investments: | | | | |
| Net realized gain on investments | | | 42,735 | |
| Net change in unrealized appreciation/depreciation: | | | | |
| on investments | | | (11,527 | ) |
| Net Realized and Unrealized Gain/(Loss) on Investments | | | 31,208 | |
| Net Decrease in Net Assets Resulting from Operations | | $ | (31,313 | ) |
See accompanying notes to financial statements.
Comstock Capital Value Fund
Statement of Changes in Net Assets
| | | Year Ended
April 30, 2022 | | | Year Ended
April 30, 2021 | |
| Operations: | | | | | | |
| Net investment loss | | $ | (62,521 | ) | | $ | (118,216 | ) |
| Net realized gain on investments | | | 42,735 | | | | 7 | |
| Net change in unrealized appreciation/depreciation on investments | | | (11,527 | ) | | | (779 | ) |
| Net Decrease in Net Assets Resulting from Operations | | | (31,313 | ) | | | (118,988 | ) |
| | | | | | | | | |
| Capital Stock Transactions: | | | | | | | | |
| Proceeds from shares issued | | | | | | | | |
| Class AAA | | | 16,056 | | | | 2,812 | |
| Class A | | | 71,708 | | | | 149,013 | |
| Class C | | | — | | | | — | |
| Class I | | | 794,713 | | | | — | |
| Total proceeds from shares issued | | | 882,477 | | | | 151,825 | |
| | | | | | | | | |
| Cost of shares redeemed | | | | | | | | |
| Class AAA | | | (31,942 | ) | | | (33,454 | ) |
| Class A | | | (416,293 | ) | | | (261,342 | ) |
| Class C | | | (13,602 | ) | | | (274,033 | ) |
| Class I | | | (32,069 | ) | | | (218,877 | ) |
| Total cost of shares redeemed | | | (493,906 | ) | | | (787,706 | ) |
| Net Increase/(Decrease) in Net Assets from Capital Stock Transactions | | | 388,571 | | | | (635,881 | ) |
| | | | | | | | | |
| Net Increase/(Decrease) in Net Assets | | | 357,258 | | | | (754,869 | ) |
| | | | | | | | | |
| Net Assets: | | | | | | | | |
| Beginning of year | | | 3,798,132 | | | | 4,553,001 | |
| End of year | | $ | 4,155,390 | | | $ | 3,798,132 | |
See accompanying notes to financial statements.
Comstock Capital Value Fund
Financial Highlights
Selected data for a share of capital stock outstanding throughout each year:
| | | | | | | Income (Loss) from Investment
Operations | | | | | | | | | | | | Ratios to Average Net Assets/Supplemental Data | |
Year Ended
April 30 | | | Net Asset Value,
Beginning of Year | | | Net Investment
Loss(a) | | | Net Realized
and Unrealized
Gain (Loss) on
Investments | | | Total from Investment
Operations | | | Redemption
Fees(a) | | | Net Asset Value,
End of Year | | | Total Return† | | | Net Assets, End of
Year (in 000’s) | | | Net Investment Loss | | | Operating
Expenses Before
Reimbursement | | | Operating
Expenses Net of
Reimbursement | | Portfolio
Turnover
Rate | |
| Class AAA | | | | | | | | | | | | | | | | | | | | | | | | | | | | | | | | | | | | | | | | | | | | | | | | |
| 2022 | | | $ | 3.70 | | | $ | (0.07 | ) | | $ | 0.03 | | | $ | (0.04 | ) | | $ | — | | | $ | 3.66 | | | | (1.08 | )% | | $ | 190 | | | | (1.82 | )% | | | 4.93 | % | | | 1.95%(b)(c)(d) | | | 243 | % |
| 2021 | | | | 3.81 | | | | (0.11 | ) | | | (0.00 | )(e) | | | (0.11 | ) | | | 0.00 | (f) | | | 3.70 | | | | (2.89 | ) | | | 208 | | | | (3.00 | ) | | | 4.12 | | | | 3.12 (d) | | | 0 | (g) |
| 2020 | | | | 4.31 | | | | (0.15 | ) | | | (0.35 | ) | | | (0.50 | ) | | | 0.00 | (f) | | | 3.81 | | | | (11.60 | ) | | | 245 | | | | (3.60 | ) | | | 7.49 | | | | 5.80 (b)(c)(h)(i) | | | 79 | |
| 2019 | | | | 5.05 | | | | (0.05 | ) | | | (0.69 | ) | | | (0.74 | ) | | | 0.00 | (f) | | | 4.31 | | | | (14.65 | ) | | | 1,498 | | | | (1.02 | ) | | | 3.38 | | | | 3.38 (b)(c)(h) | | | 0 | (g) |
| 2018 | | | | 5.60 | | | | (0.09 | ) | | | (0.46 | ) | | | (0.55 | ) | | | 0.00 | (f) | | | 5.05 | | | | (9.82 | ) | | | 1,643 | | | | (1.77 | ) | | | 2.98 | | | | 2.98 (b)(c)(h) | | | 39 | |
| Class A | | | | | | | | | | | | | | | | | | | | | | | | | | | | | | | | | | | | | | | | | | | | | | | | |
| 2022 | | | $ | 3.69 | | | $ | (0.07 | ) | | $ | 0.03 | | | $ | (0.04 | ) | | $ | — | | | $ | 3.65 | | | | (1.08 | )% | | $ | 1,193 | | | | (1.95 | )% | | | 4.93 | % | | | 2.07%(b)(c)(d) | | | 243 | % |
| 2021 | | | | 3.80 | | | | (0.11 | ) | | | (0.00 | )(e) | | | (0.11 | ) | | | 0.00 | (f) | | | 3.69 | | | | (2.89 | ) | | | 1,554 | | | | (3.00 | ) | | | 4.12 | | | | 3.12 (d) | | | 0 | (g) |
| 2020 | | | | 4.29 | | | | (0.16 | ) | | | (0.33 | ) | | | (0.49 | ) | | | 0.00 | (f) | | | 3.80 | | | | (11.42 | ) | | | 1,715 | | | | (3.89 | ) | | | 7.74 | | | | 6.05 (b)(c)(h)(i) | | | 79 | |
| 2019 | | | | 5.03 | | | | (0.05 | ) | | | (0.69 | ) | | | (0.74 | ) | | | 0.00 | (f) | | | 4.29 | | | | (14.71 | ) | | | 6,006 | | | | (1.07 | ) | | | 3.38 | | | | 3.38 (b)(c)(h) | | | 0 | (g) |
| 2018 | | | | 5.59 | | | | (0.10 | ) | | | (0.46 | ) | | | (0.56 | ) | | | 0.00 | (f) | | | 5.03 | | | | (10.02 | ) | | | 8,938 | | | | (1.85 | ) | | | 2.98 | | | | 2.98 (b)(c)(h) | | | 39 | |
| Class C | | | | | | | | | | | | | | | | | | | | | | | | | | | | | | | | | | | | | | | | | | | | | | | | |
| 2022 | | | $ | 3.15 | | | $ | (0.07 | ) | | $ | 0.02 | | | $ | (0.05 | ) | | $ | — | | | $ | 3.10 | | | | (1.59 | )% | | $ | 35 | | | | (2.38 | )% | | | 5.68 | % | | | 2.50%(b)(c)(d) | | | 243 | % |
| 2021 | | | | 3.24 | | | | (0.09 | ) | | | (0.00 | )(e) | | | (0.09 | ) | | | 0.00 | (f) | | | 3.15 | | | | (2.78 | ) | | | 49 | | | | (3.73 | ) | | | 4.87 | | | | 3.87 (d) | | | 0 | (g) |
| 2020 | | | | 3.69 | | | | (0.14 | ) | | | (0.31 | ) | | | (0.45 | ) | | | 0.00 | (f) | | | 3.24 | | | | (12.20 | ) | | | 330 | | | | (3.90 | ) | | | 7.81 | | | | 6.12 (b)(c)(h)(i) | | | 79 | |
| 2019 | | | | 4.36 | | | | (0.07 | ) | | | (0.60 | ) | | | (0.67 | ) | | | 0.00 | (f) | | | 3.69 | | | | (15.37 | ) | | | 2,164 | | | | (1.81 | ) | | | 4.13 | | | | 4.13 (b)(c)(h) | | | 0 | (g) |
| 2018 | | | | 4.87 | | | | (0.12 | ) | | | (0.39 | ) | | | (0.51 | ) | | | 0.00 | (f) | | | 4.36 | | | | (10.47 | ) | | | 2,832 | | | | (2.54 | ) | | | 3.73 | | | | 3.73 (b)(c)(h) | | | 39 | |
| Class I | | | | | | | | | | | | | | | | | | | | | | | | | | | | | | | | | | | | | | | | | | | | | | | | |
| 2022 | | | $ | 3.82 | | | $ | (0.05 | ) | | $ | 0.02 | | | $ | (0.03 | ) | | $ | — | | | $ | 3.79 | | | | (0.79 | )% | | $ | 2,737 | | | | (1.43 | )% | | | 4.68 | % | | | 1.58%(b)(c)(d) | | | 243 | % |
| 2021 | | | | 3.92 | | | | (0.10 | ) | | | (0.00 | )(e) | | | (0.10 | ) | | | 0.00 | (f) | | | 3.82 | | | | (2.55 | ) | | | 1,987 | | | | (2.75 | ) | | | 3.87 | | | | 2.87 (d) | | | 0 | (g) |
| 2020 | | | | 4.42 | | | | (0.11 | ) | | | (0.39 | ) | | | (0.50 | ) | | | 0.00 | (f) | | | 3.92 | | | | (11.31 | ) | | | 2,263 | | | | (2.65 | ) | | | 6.51 | | | | 4.82 (b)(c)(h)(i) | | | 79 | |
| 2019 | | | | 5.17 | | | | (0.04 | ) | | | (0.71 | ) | | | (0.75 | ) | | | 0.00 | (f) | | | 4.42 | | | | (14.51 | ) | | | 6,316 | | | | (0.82 | ) | | | 3.13 | | | | 3.13 (b)(c)(h) | | | 0 | (g) |
| 2018 | | | | 5.72 | | | | (0.08 | ) | | | (0.47 | ) | | | (0.55 | ) | | | 0.00 | (f) | | | 5.17 | | | | (9.62 | ) | | | 6,673 | | | | (1.50 | ) | | | 2.73 | | | | 2.73 (b)(c)(h) | | | 39 | |
| † | Total return represents aggregate total return of a hypothetical investment at the beginning of the year and sold at the end of the year including reinvestment of distributions and does not reflect the applicable sales charges. |
| (a) | Per share amounts have been calculated using the average shares outstanding method. |
| (b) | The Fund received credits from a designated broker who agreed to pay certain Fund expenses. For the years ended April 30, 2022 and 2020, if credits had not been received, the expense ratios would have been 1.96% and 5.81% (Class AAA), 2.08% and 6.06% (Class A), 2.51% and 6.13% (Class C), and 1.59 and 4.83% (Class I). For the years ended April 30, 2019, and 2018, there was no impact on the expense ratios. |
| (c) | The Fund incurred interest expense during the years ended April 30, 2022, 2020, 2019, and 2018. For the years ended April 30, 2022 and 2018, if interest expense had not been incurred, the ratios of operating expenses to average net assets would have been 1.94% and 2.97% (Class AAA), 2.06% and 2.97% (Class A), 2.49% and 3.72% (Class C), and 1.57% and 2.72% (Class I). For the years ended April 30, 2020 and 2019, the effect of interest expense was minimal. |
| (d) | During the fiscal years ended April 30, 2022 and 2021. the Adviser reimbursed and/or waived expenses of $114,019 and $40,792, respectively. |
| (e) | Amount represents less than $(0.005) per share. |
| (f) | Amount represents less than $0.005 per share. |
| (g) | Amount represents less than 0.5%. |
| (h) | The Fund incurred dividend expense and service fees on securities sold short. If these expenses and fees had not been incurred, the ratios of operating expenses to average net assets for the years ended April 30, 2020, 2019, and 2018 would have been 5.36%, 2.67%, and 2.12% (Class AAA), 5.64%, 2.67%, and 2.12% (Class A), 5.68%, 3.42%, and 2.87% (Class C), and 4.38%, 2.42%, and 1.87% (Class I). |
| (i) | During the fiscal year ended April 30, 2020, the Adviser directly paid legal fees on behalf of the Fund. If the Fund had paid these expenses, the expense ratios for that period would have been 7.48% (Class AAA), 7.73% (Class A), 7.80% (Class C), and 6.50% (Class I). |
See accompanying notes to financial statements
The Gabelli Comstock Capital Value Fund
Notes to Financial Statements
1. Organization. Comstock Capital Value Fund is the sole series of the Comstock Funds, Inc. (the Company). The Fund is a diversified open-end management investment company registered under the Investment Company Act of 1940, as amended (the 1940 Act). The Fund seeks to maximize total return, consisting of capital appreciation and current income.
2. Significant Accounting Policies. As an investment company, the Fund follows the investment company accounting and reporting guidance, which is part of U.S. generally accepted accounting principles (GAAP) that may require the use of management estimates and assumptions in the preparation of its financial statements. Actual results could differ from those estimates. The following is a summary of significant accounting policies followed by the Fund in the preparation of its financial statements.
The global outbreak of the novel coronavirus disease, known as COVID-19, has caused adverse effects on many companies, sectors, nations, regions, and the markets in general, and may continue for an unpredictable duration. The effects of this pandemic may materially impact the value and performance of the Fund, its ability to buy and sell fund investments at appropriate valuations, and its ability to achieve its investment objectives.
Security Valuation. Portfolio securities listed or traded on a nationally recognized securities exchange or traded in the U.S. over-the-counter market for which market quotations are readily available are valued at the last quoted sale price or a market’s official closing price as of the close of business on the day the securities are being valued. If there were no sales that day, the security is valued at the average of the closing bid and asked prices or, if there were no asked prices quoted on that day, then the security is valued at the closing bid price on that day. If no bid or asked prices are quoted on such day, the security is valued at the most recently available price or, if the Board of Directors (the Board) so determines, by such other method as the Board shall determine in good faith to reflect its fair market value. Portfolio securities traded on more than one national securities exchange or market are valued according to the broadest and most representative market, as determined by Gabelli Funds, LLC (the Adviser).
Portfolio securities primarily traded on a foreign market are generally valued at the preceding closing values of such securities on the relevant market, but may be fair valued pursuant to procedures established by the Board if market conditions change significantly after the close of the foreign market, but prior to the close of business on the day the securities are being valued. Debt obligations for which market quotations are readily available are valued at the average of the latest bid and asked prices. If there were no asked prices quoted on such day, the security is valued using the closing bid price, unless the Board determines such amount does not reflect the securities’ fair value, in which case these securities will be fair valued as determined by the Board. Certain securities are valued principally using dealer quotations. Futures contracts are valued at the closing settlement price of the exchange or board of trade on which the applicable contract is traded. OTC futures and options on futures for which market quotations are readily available will be valued by quotations received from a pricing service or, if no quotations are available from a pricing service, by quotations obtained from one of more dealers in the instrument in question by the Adviser.
Securities and assets for which market quotations are not readily available are fair valued as determined by the Board. Fair valuation methodologies and procedures may include, but are not limited to: analysis and review of available financial and non-financial information about the company; comparisons with the valuation and changes in valuation of similar securities, including a comparison of foreign securities with the equivalent U.S. dollar value American Depositary Receipt securities at the close of the U.S. exchange; and evaluation of any other information that could be indicative of the value of the security.
The Gabelli Comstock Capital Value Fund
Notes to Financial Statements (Continued)
The inputs and valuation techniques used to measure fair value of the Fund’s investments are summarized into three levels as described in the hierarchy below:
| ● | Level 1 — quoted prices in active markets for identical securities; |
| ● | Level 2 — other significant observable inputs (including quoted prices for similar securities, interest rates, prepayment speeds, credit risk, etc.); and |
| ● | Level 3 — significant unobservable inputs (including the Board’s determinations as to the fair value of investments). |
A financial instrument’s level within the fair value hierarchy is based on the lowest level of any input both individually and in the aggregate that is significant to the fair value measurement. The inputs or methodology used for valuing securities are not necessarily an indication of the risk associated with investing in those securities. The summary of the Fund’s investments in securities by inputs used to value the Fund’s investments as of April 30, 2022 is as follows:
| | | Valuation Inputs | | | | |
| | Level 1 Quoted Prices | | | Level 2 Other
Significant Observable Inputs | | | Total Market Value at 04/30/22 | |
| INVESTMENTS IN SECURITIES: | | | | | | | | | |
| ASSETS (Market Value): | | | | | | | | | | | | |
Common Stocks (a) | | $ | 3,886,275 | | | | — | | | $ | 3,886,275 | |
| Warrants (a) | | | 311 | | | | — | | | | 311 | |
| U.S. Government Obligations | | | — | | | $ | 559,454 | | | | 559,454 | |
| TOTAL INVESTMENTS IN SECURITIES – ASSETS | | $ | 3,886,586 | | | $ | 559,454 | | | $ | 4,446,040 | |
| (a) | Please refer to the Schedule of Investments for the industry classifications of these portfolio holdings. |
The Fund held no Level 3 investments at April 30, 2022 or April 30, 2021.
Additional Information to Evaluate Qualitative Information.
General. The Fund uses recognized industry pricing services – approved by the Board and unaffiliated with the Adviser – to value most of its securities, and uses broker quotes provided by market makers of securities not valued by these and other recognized pricing sources. Several different pricing feeds are received to value domestic equity securities, international equity securities, preferred equity securities, and fixed income securities. The data within these feeds are ultimately sourced from major stock exchanges and trading systems where these securities trade. The prices supplied by external sources are checked by obtaining quotations or actual transaction prices from market participants. If a price obtained from the pricing source is deemed unreliable, prices will be sought from another pricing service or from a broker/dealer that trades that security or similar securities.
Fair Valuation. Fair valued securities may be common or preferred equities, warrants, options, rights, or fixed income obligations. Where appropriate, Level 3 securities are those for which market quotations are not available, such as securities not traded for several days, or for which current bids are not available, or which are restricted as to transfer. When fair valuing a security, factors to consider include recent prices of comparable securities that are publicly traded, reliable prices of securities not publicly traded, the use of valuation models,
The Gabelli Comstock Capital Value Fund
Notes to Financial Statements (Continued)
current analyst reports, valuing the income or cash flow of the issuer, or cost if the preceding factors do not apply. A significant change in the unobservable inputs could result in a lower or higher value in Level 3 securities. The circumstances of Level 3 securities are frequently monitored to determine if fair valuation measures continue to apply.
The Adviser reports quarterly to the Board the results of the application of fair valuation policies and procedures. These may include backtesting the prices realized in subsequent trades of these fair valued securities to fair values previously recognized.
Securities Transactions and Investment Income. Securities transactions are accounted for on the trade date with realized gain/(loss) on investments determined by using the identified cost method. Interest income (including amortization of premium and accretion of discount) is recorded on an accrual basis. Premiums and discounts on debt securities are amortized using the effective yield to maturity method or amortized to earliest call date, if applicable. Dividend income is recorded on the ex-dividend date, except for certain dividends from foreign securities that are recorded as soon after the ex-dividend date as the Fund becomes aware of such dividends.
Determination of Net Asset Value and Calculation of Expenses. Certain administrative expenses are common to, and allocated among, various affiliated funds. Such allocations are made on the basis of each fund’s average net assets or other criteria directly affecting the expenses as determined by the Adviser pursuant to procedures established by the Board.
In calculating the NAV per share of each class, investment income, realized and unrealized gains and losses, redemption fees, and expenses other than class specific expenses are allocated daily to each class of shares based upon the proportion of net assets of each class at the beginning of each day. Distribution expenses are borne solely by the class incurring the expense.
Custodian Fee Credits and Interest Expense. When cash balances are maintained in the custody account, the Fund receives credits which are used to offset custodian fees. The gross expenses paid under the custody arrangement are included in custodian fees in the Statement of Operations with the corresponding expense offset, if any, shown as “Custodian fee credits.” When cash balances are overdrawn, the Fund is charged an overdraft fee of 110% of the 90 day U.S. Treasury Bill rate on outstanding balances. This amount, if any, would be included in the Statement of Operations.
Distributions to Shareholders. Distributions to shareholders are recorded on the ex-dividend date. Distributions to shareholders are based on income and capital gains as determined in accordance with federal income tax regulations, which may differ from income and capital gains as determined under GAAP. These differences are primarily due to differing treatments income and gains on various investment securities and timing differences. These book/tax differences are either temporary or permanent in nature. To the extent these differences are permanent, adjustments are made to the appropriate capital accounts in the period when the differences arise. Permanent differences were primarily due to current year write-off of net operating loss. These reclassifications have no impact on the NAV of the Fund. For the fiscal year ended April 30, 2022, reclassifications were made to decrease paid-in capital by $84,183, with an offsetting adjustment to total distributable earnings.
No distributions were made during the fiscal years ended April 30, 2022 and 2021.
The Gabelli Comstock Capital Value Fund
Notes to Financial Statements (Continued)
Provision for Income Taxes. The Fund intends to continue to qualify as a regulated investment company under Subchapter M of the Internal Revenue Code of 1986, as amended (the Code). It is the policy of the Fund to comply with the requirements of the Code applicable to regulated investment companies and to distribute substantially all of its net investment company taxable income and net capital gains. Therefore, no provision for federal income taxes is required.
At April 30, 2022, the components of accumulated earnings/losses on a tax basis were as follows:
| Accumulated capital loss carryforwards | | $ | (133,695,696 | ) |
| Net unrealized depreciation on investments | | | (12,044 | ) |
| Total | | $ | (133,707,740 | ) |
The Fund utilized $43,349 of the capital loss carryforward for the fiscal year ended April 30, 2022.
At April 30, 2022, the Fund had net capital loss carryforwards for federal income tax purposes which are available to reduce future required distributions of net capital gains to shareholders. Capital losses that are carried forward will retain their character as either short term or long term capital losses.
| Short term capital loss carryforward with no expiration | | $ | (75,050,602 | ) |
| Long term capital loss carryforward with no expiration | | | (58,645,094 | ) |
| Total Capital Loss Carryforwards | | $ | (133,695,696 | ) |
The following summarizes the tax cost of investments and the related net unrealized depreciation at April 30, 2022:
| | | Cost | | Gross
Unrealized
Appreciation | | Gross
Unrealized
Depreciation | | Net
Unrealized
Depreciation |
| Investments | | $4,458,084 | | $24,659 | | $(36,703) | | $(12,044) |
The Fund is required to evaluate tax positions taken or expected to be taken in the course of preparing the Fund’s tax returns to determine whether the tax positions are “more-likely-than-not” of being sustained by the applicable tax authority. Income tax and related interest and penalties would be recognized by the Fund as tax expense in the Statement of Operations if the tax positions were deemed not to meet the more-likely-than-not threshold. During the fiscal year ended April 30, 2022, the Fund did not incur any income tax, interest, or penalties. As of April 30, 2022, the Adviser has reviewed all open tax years and concluded that there was no impact to the Fund’s net assets or results of operations. The Fund’s federal and state tax returns for the prior three fiscal years remain open, subject to examination. On an ongoing basis, the Adviser will monitor the Fund’s tax positions to determine if adjustments to this conclusion are necessary.
3. Investment Advisory Agreement and Other Transactions. The Fund has entered into an investment advisory agreement (the Advisory Agreement) with the Adviser which provides that the Fund will pay the Adviser a fee, computed daily and paid monthly, at the annual rate of 1.00% of the value of its average daily net assets. In accordance with the Advisory Agreement, the Adviser provides a continuous investment program for the Fund’s portfolio, oversees the administration of all aspects of the Fund’s business and affairs, and pays the compensation of all Officers and Directors of the Fund who are affiliated persons of the Adviser.
The Gabelli Comstock Capital Value Fund
Notes to Financial Statements (Continued)
Effective November 7, 2019 through November 23, 2021, the Adviser voluntarily waived its advisory fee of $40,792. Effective November 24, 2021, the Adviser agreed to waive its investment advisory fees and/or to reimburse expenses of the Fund to the extent necessary to maintain the annualized total operating expenses of the Fund (excluding brokerage costs, acquired fund fees and expenses, interest, taxes, and extraordinary expenses) at no more than an annual rate of 0.00% for all classes of shares, on the first $25 million in Fund net assets. This arrangement is in effect through November 24, 2022. For the fiscal year ended April 30, 2022, the Adviser reimbursed the Fund in the amount of $114,019.
4. Distribution Plan. The Fund’s Board has adopted a distribution plan (the Plan) for each class of shares, except for Class I Shares, pursuant to Rule 12b-1 under the 1940 Act. Under the Class AAA, Class A, and Class C Share Plans, payments are authorized to G.distributors, LLC (the Distributor), an affiliate of the Adviser, at annual rates of 0.25%, 0.25%, and 1.00%, respectively, of the average daily net assets of those classes, the annual limitations under each Plan. Such payments are accrued daily and paid monthly.
5. Portfolio Securities. Purchases and sales of securities during the fiscal year ended April 30, 2022, other than short term securities and U.S. Government obligations, aggregated $6,448,312 and $2,593,649, respectively.
6. Transactions with Affiliates and Other Arrangements. During the fiscal year ended April 30, 2022, the Fund received credits from a designated broker who agreed to pay certain Fund operating expenses. The amount of such expenses paid through this directed brokerage arrangement during this period was $304.
7. Capital Stock. Effective November 24, 2021, the Fund reopened its shares for sale. Class AAA and Class I Shares are offered without a sales charge. Class A Shares are subject to a maximum front-end sales charge of 5.75%. Class C Shares are subject to a 1.00% contingent deferred sales charge for one year after purchase.
Transactions in shares of capital stock were as follows:
| | | Year Ended
April 30, 2022 | | | Year Ended
April 30, 2021 | |
| | | Shares | | | Shares | |
| Class AAA | | | | | | | | |
| Shares sold | | | 4,402 | | | | 758 | |
| Shares redeemed | | | (8,702 | ) | | | (8,963 | ) |
| Net (decrease) | | | (4,300 | ) | | | (8,205 | ) |
| Class A | | | | | | | | |
| Shares sold | | | 19,808 | | | | 39,760 | |
| Shares redeemed | | | (114,320 | ) | | | (70,201 | ) |
| Net (decrease) | | | (94,512 | ) | | | (30,441 | ) |
| Class C | | | | | | | | |
| Shares redeemed | | | (4,370 | ) | | | (86,204 | ) |
| Net (decrease) | | | (4,370 | ) | | | (86,204 | ) |
| Class I | | | | | | | | |
| Shares sold | | | 211,248 | | | | — | |
| Shares redeemed | | | (8,517 | ) | | | (56,508 | ) |
| Net increase/(decrease) | | | 202,731 | | | | (56,508 | ) |
The Gabelli Comstock Capital Value Fund
Notes to Financial Statements (Continued)
8. Significant Shareholder. As of April 30, 2022, approximately 40.0% of the Fund was beneficially owned by the Adviser and its affiliates, including managed accounts for which the affiliates of the Adviser have voting control but disclaim pecuniary interest.
9. Indemnifications. The Fund enters into contracts that contain a variety of indemnifications. The Fund’s maximum exposure under these arrangements is unknown. However, the Fund has not had prior claims or losses pursuant to these contracts. Management has reviewed the Fund’s existing contracts and expects the risk of loss to be remote.
10. Subsequent Events. Management has evaluated the impact on the Fund of all subsequent events occurring through the date the financial statements were issued and has determined that there were no subsequent events requiring recognition or disclosure in the financial statements.
Comstock Capital Value Fund
Report of Independent Registered Public Accounting Firm
To the Shareholders of Comstock Capital Value Fund
and the Board of Directors of Comstock Funds, Inc.
Opinion on the Financial Statements
We have audited the accompanying statement of assets and liabilities of Comstock Funds, Inc. (the “Company”) (comprising Comstock Capital Value Fund (the “Fund”)), including the schedule of investments, as of April 30, 2022, and the related statement of operations for the year then ended, the statements of changes in net assets for each of the two years in the period then ended, the financial highlights for each of the five years in the period then ended and the related notes (collectively referred to as the “financial statements”). In our opinion, the financial statements present fairly, in all material respects, the financial position of the Fund comprising Comstock Funds, Inc. at April 30, 2022, the results of its operations for the year then ended, the changes in its net assets for each of the two years in the period then ended and its financial highlights for each of the five years in the period then ended, in conformity with U.S. generally accepted accounting principles.
Basis for Opinion
These financial statements are the responsibility of the Company’s management. Our responsibility is to express an opinion on the Fund’s financial statements based on our audits. We are a public accounting firm registered with the Public Company Accounting Oversight Board (United States) (“PCAOB”) and are required to be independent with respect to the Company in accordance with the U.S. federal securities laws and the applicable rules and regulations of the Securities and Exchange Commission and the PCAOB.
We conducted our audits in accordance with the standards of the PCAOB. Those standards require that we plan and perform the audit to obtain reasonable assurance about whether the financial statements are free of material misstatement, whether due to error or fraud. The Company is not required to have, nor were we engaged to perform, an audit of the Company’s internal control over financial reporting. As part of our audits, we are required to obtain an understanding of internal control over financial reporting but not for the purpose of expressing an opinion on the effectiveness of the Company’s internal control over financial reporting. Accordingly, we express no such opinion.
Our audits included performing procedures to assess the risks of material misstatement of the financial statements, whether due to error or fraud, and performing procedures that respond to those risks. Such procedures included examining, on a test basis, evidence regarding the amounts and disclosures in the financial statements. Our procedures included confirmation of securities owned as of April 30, 2022, by correspondence with the custodian and brokers or by other appropriate auditing procedures where replies from brokers were not received. Our audits also included evaluating the accounting principles used and significant estimates made by management, as well as evaluating the overall presentation of the financial statements. We believe that our audits provide a reasonable basis for our opinion.

We have served as the auditor of one or more Gabelli/GAMCO Funds investment companies since 1992.
Philadelphia, Pennsylvania
June 24, 2022
Comstock Capital Value Fund
Additional Fund Information (Unaudited)
The business and affairs of the Company are managed under the direction of the Company’s Board of Directors. Information pertaining to the Directors and Officers of the Company is set forth below. The Company’s Statement of Additional Information includes additional information about the Company’s Directors and is now available without charge, upon request, by calling 800-GABELLI (800-422-3554) or by writing to Comstock Funds, Inc. at One Corporate Center, Rye, NY 10580-1422.
Name, Position(s)
Address1
and Age | Term of Office
and
Length of
Time Served2 | Number of
Funds
in Fund
Complex
Overseen
by Director | Principal Occupation(s)
During Past Five Years | Other Directorships
Held by Director3 |
| | | | | |
| INDEPENDENT DIRECTORS4: | | | | |
| | | | | |
Anthony S. Colavita5 Director
Age: 60 | Since 2009 | 21 | Attorney, Anthony S. Colavita, P.C., Supervisor, Town of Eastchester, NY | — |
| | | | | |
Vincent D. Enright Director Age: 78 | Since 2000 | 17 | Former Senior Vice President and Chief Financial Officer of KeySpan Corp. (public utility) (1994-1998) | Director of Echo Therapeutics, Inc. (therapeutics and diagnostics) (2008-2014); Director of The LGL Group, Inc. (diversified manufacturing) (2011-2014) |
| | | | | |
Werner J. Roeder Director Age: 81 | Since 2000 | 20 | Retired physician; Former Vice President of Medical Affairs (Medical Director) of New York Presbyterian/Lawrence Hospital (1999-2014) | — |
Comstock Capital Value Fund
Additional Fund Information (Unaudited)
Name, Position(s)
Address1
and Age | Term of Office
and Length of
Time Served2 | Principal Occupation(s)
During Past Five Years |
| | | |
| OFFICERS: | | |
| | | |
Bruce N. Alpert President Age: 70 | Since 2000 | Executive Vice President and Chief Operating Officer of Gabelli Funds, LLC since 1988; Officer of registered investment companies within the Fund Complex; Senior Vice President of GAMCO Investors, Inc. since 2008; Vice President – Mutual Funds, G.research, LLC |
| | | |
John C. Ball Treasurer Age: 46 | Since 2017 | Treasurer of registered investment companies within the Fund Complex since 2017; Vice President and Assistant Treasurer of AMG Funds (2014-2017); Chief Executive Officer, G.distributors, LLC since December 2020 |
| | | |
Peter Goldstein Secretary and Vice President Age: 69 | Since 2020 | General Counsel, Gabelli Funds, LLC since July 2020; General Counsel and Chief Compliance Officer, Buckingham Capital Management, Inc. (2012-2020); Chief Legal Officer and Chief Compliance Officer, The Buckingham Research Group, Inc. (2012-2020) |
| | | |
Richard J. Walz Chief Compliance Officer Age: 63 | Since 2013 | Chief Compliance Officer of registered investment companies within the Fund Complex since 2013; Chief Compliance Officer for Gabelli Funds, LLC since 2015 |
| | | |
Daniel Plourde Vice President Age: 41 | Since 2021 | Vice President of registered investment companies within the Fund Complex since 2021; Assistant Treasurer of the North American SPDR ETFs and State Street Global Advisors Mutual Funds (2017-2021); Fund Administration at State Street Bank (2009-2017) |
| 1 | Address” One Corporate Center, Rye, NY 10580-1422, unless otherwise noted. |
| 2 | Each Director will hold office for an indefinite term until the earliest of (i) the next meeting of shareholders, if any, called for the purpose of considering the election or re-election of such Director and until the election and qualification of his or her successor, if any, elected at such meeting, or (ii) the date a Director resigns or retires, or a Director is removed by the Board of Directors or shareholders, in accordance with the Company’s By-Laws and Articles of Incorporation. For officers, includes time service in prior officer positions with the Fund. Each officer will hold office for an indefinite term until the date he or she resigns or retires or until his or her successor is elected and qualified. |
| 3 | “This column includes only directorships of companies required to report to the SEC under the Securities Exchange Act f 1934, as amended, i.e., public companies, or other investment companies registered under the 1940 Act. |
| 4 | Directors who are interested persons, as defined in the 1940 ACT, are considered “Independent” Directors. |
| 5 | Mr. Colavita’s father, Anthony J. Colavita, serves as a director of other funds in the Fund Complex. |
COMSTOCK CAPITAL VALUE FUND
One Corporate Center
Rye, NY 10580-1422
Portfolio Managers’ Biographies
Joseph Gabelli rejoined GAMCO Investors, Inc. in 2018 after serving as a data strategy consultant for Alt/S, an early stage Boston based healthcare, media, and marketing analytics firm, beginning in July 2017. From 2008 until June 2017, he served as an equity research analyst covering the global food and beverage industry for GAMCO Investors, Inc. and its affiliate, Associated Capital Group. He began his investment career at Integrity Capital Management, a Boston-based equity hedge fund, where he focused on researching small and micro-cap companies in the technology, healthcare and consumer discretionary sectors. Mr. Gabelli holds a BA from Boston College and an MBA degree from Columbia Business School, where he graduated with Dean’s Honors and Distinction.
Willis M. Brucker is a portfolio manager and global merger arbitrage analyst with experience analyzing and investing in global merger transactions and special situations. He joined GAMCO Investors, Inc. in 2004 as a research analyst after graduating from Boston College with a BS in Finance and Corporate Reporting and Analysis.
Ralph Rocco is a partner and senior portfolio manager at Gabelli and leads the merger portfolio team. Mr. Rocco has extensive merger investing experience that spans three decades and specializes in all aspects of complex global merger transactions. He holds a BA in Economics from Rutgers University.
Paolo Vicinelli is a senior portfolio manager and analyst of various portfolios managed by the Gabelli organization. Mr. Vicinelli has over 25 years of investment experience focusing on global special situations and complex merger transactions. Mr. Vicinelli is a co-author of “Deals...Deals...and More Deals,” a detailed narrative dedicated to M&A first published by Gabelli University Press in 1999. Mr. Vicinelli graduated from Colgate University in 1991 with a BA in History, and received his MBA in Finance from Columbia Business School in 1999.
Gabelli Funds and Your Personal Privacy
Who are we?
The Gabelli Funds are investment companies registered with the Securities and Exchange Commission under the Investment Company Act of 1940. We are managed by Gabelli Funds, LLC, which is affiliated with GAMCO Investors, Inc., a publicly held company with subsidiaries and affiliates that provide investment advisory services for a variety of clients.
What kind of non-public information do we collect about you if you become a fund shareholder?
If you apply to open an account directly with us, you will be giving us some non-public information about yourself. The non-public information we collect about you is:
| ● | Information you give us on your application form. This could include your name, address, telephone number, social security number, bank account number, and other information. |
| ● | Information about your transactions with us, any transactions with our affiliates, and transactions with the entities we hire to provide services to you. This would include information about the shares that you buy or redeem. If we hire someone else to provide services — like a transfer agent — we will also have information about the transactions that you conduct through them. |
What information do we disclose and to whom do we disclose it?
We do not disclose any non-public personal information about our customers or former customers to anyone other than our affiliates, our service providers who need to know such information, and as otherwise permitted by law. If you want to find out what the law permits, you can read the privacy rules adopted by the Securities and Exchange Commission. They are in volume 17 of the Code of Federal Regulations, Part 248. The Commission often posts information about its regulations on its website, www.sec.gov.
What do we do to protect your personal information?
We restrict access to non-public personal information about you to the people who need to know that information in order to provide services to you or the fund and to ensure that we are complying with the laws governing the securities business. We maintain physical, electronic, and procedural safeguards to keep your personal information confidential.
This page was intentionally left blank.

Item 2. Code of Ethics.
| (a) | The registrant, as of the end of the period covered by this report, has adopted a code of ethics that applies to the registrant’s principal executive officer, principal financial officer, principal accounting officer or controller, or persons performing similar functions, regardless of whether these individuals are employed by the registrant or a third party. |
| (c) | There have been no amendments, during the period covered by this report, to a provision of the code of ethics that applies to the registrant’s principal executive officer, principal financial officer, principal accounting officer or controller, or persons performing similar functions, regardless of whether these individuals are employed by the registrant or a third party, and that relates to any element of the code of ethics description. |
| (d) | The registrant has not granted any waivers, including an implicit waiver, from a provision of the code of ethics that applies to the registrant’s principal executive officer, principal financial officer, principal accounting officer or controller, or persons performing similar functions, regardless of whether these individuals are employed by the registrant or a third party, that relates to one or more of the items set forth in paragraph (b) of this item’s instructions. |
Item 3. Audit Committee Financial Expert.
As of the end of the period covered by the report, the registrant’s board of directors has determined that Vincent D. Enright is qualified to serve as an audit committee financial expert serving on its audit committee and that he is “independent,” as defined by Item 3 of Form N-CSR.
Item 4. Principal Accountant Fees and Services.
Audit Fees
| (a) | The aggregate fees billed for each of the last two fiscal years for professional services rendered by the principal accountant for the audit of the registrant’s annual financial statements or services that are normally provided by the accountant in connection with statutory and regulatory filings or engagements for those fiscal years are $20,000 for 2021 and $24,200 for 2022. |
Audit-Related Fees
| (b) | The aggregate fees billed in each of the last two fiscal years for assurance and related services by the principal accountant that are reasonably related to the performance of the audit of the registrant’s financial statements and are not reported under paragraph (a) of this Item are $0 for 2021 and $0 for 2022. |
Tax Fees
| (c) | The aggregate fees billed in each of the last two fiscal years for professional services rendered by the principal accountant for tax compliance, tax advice, and tax planning are $3,800 for 2021 and $3,800 for 2022. Tax fees represent tax compliance services provided in connection with the review of the Registrant’s tax returns. |
All Other Fees
| (d) | The aggregate fees billed in each of the last two fiscal years for products and services provided by the principal accountant, other than the services reported in paragraphs (a) through (c) of this Item are $0 for 2021 and $0 for 2022. |
| (e)(1) | Disclose the audit committee’s pre-approval policies and procedures described in paragraph (c)(7) of Rule 2-01 of Regulation S-X. |
Pre-Approval Policies and Procedures. The Audit Committee (“Committee”) of the registrant is responsible for pre-approving (i) all audit and permissible non-audit services to be provided by the independent registered public accounting firm to the registrant and (ii) all permissible non-audit services to be provided by the independent registered public accounting firm to the Adviser, Gabelli Funds, LLC, and any affiliate of Gabelli Funds, LLC (“Gabelli”) that provides services to the registrant (a “Covered Services Provider”) if the independent registered public accounting firm’s engagement related directly to the operations and financial reporting of the registrant. The Committee may delegate its responsibility to pre-approve any such audit and permissible non-audit services to the Chairperson of the Committee, and the Chairperson must report to the Committee, at its next regularly scheduled meeting after the Chairperson’s pre-approval of such services, his or her decision(s). The Committee may also establish detailed pre-approval policies and procedures for pre-approval of such services in accordance with applicable laws, including the delegation of some or all of the Committee’s pre-approval responsibilities to the other persons (other than Gabelli or the registrant’s officers). Pre-approval by the Committee of any permissible non-audit services is not required so long as: (i) the permissible non-audit services were not recognized by the registrant at the time of the engagement to be non-audit services; and (ii) such services are promptly brought to the attention of the Committee and approved by the Committee or Chairperson prior to the completion of the audit.
| (e)(2) | The percentage of services described in each of paragraphs (b) through (d) of this Item that were approved by the audit committee pursuant to paragraph (c)(7)(i)(C) of Rule 2-01 of Regulation S-X are as follows: |
(b) N/A
(c) 0%
(d) N/A
| (f) | The percentage of hours expended on the principal accountant’s engagement to audit the registrant’s financial statements for the most recent fiscal year that were attributed to work performed by persons other than the principal accountant’s full-time, permanent employees was less than fifty percent. |
| (g) | The aggregate non-audit fees billed by the registrant’s accountant for services rendered to the registrant, and rendered to the registrant’s investment adviser (not including any sub-adviser whose role is primarily portfolio management and is subcontracted with or overseen by another investment adviser), and any entity controlling, controlled by, or under common control with the adviser that provides ongoing services to the registrant for each of the last two fiscal years of the registrant was $44,550 for 2021 and $44,950 for 2022. |
| (h) | The registrant’s audit committee of the board of directors has considered whether the provision of non-audit services that were rendered to the registrant’s investment adviser (not including any sub-adviser whose role is primarily portfolio management and is subcontracted with or overseen by another investment adviser), and any entity controlling, controlled by, or under common control with the investment adviser that provides ongoing services to the registrant that were not pre-approved pursuant to paragraph (c)(7)(ii) of Rule 2-01 of Regulation S-X is compatible with maintaining the principal accountant’s independence. |
| (j) | The registrant is not a foreign issuer. |
Item 5. Audit Committee of Listed Registrants.
Not applicable.
Item 6. Investments.
| (a) | Schedule of Investments in securities of unaffiliated issuers as of the close of the reporting period is included as part of the report to shareholders filed under Item 1(a) of this form. |
Item 7. Disclosure of Proxy Voting Policies and Procedures for Closed-End Management Investment Companies.
Not applicable.
Item 8. Portfolio Managers of Closed-End Management Investment Companies.
Not applicable.
Item 9. Purchases of Equity Securities by Closed-End Management Investment Company and Affiliated Purchasers.
Not applicable.
Item 10. Submission of Matters to a Vote of Security Holders.
There have been no material changes to the procedures by which the shareholders may recommend nominees to the registrant’s board of directors, where those changes were implemented after the registrant last provided disclosure in response to the requirements of Item 407(c)(2)(iv) of Regulation S-K (17 CFR 229.407) (as required by Item 22(b)(15) of Schedule 14A (17 CFR 240.14a-101)), or this Item.
Item 11. Controls and Procedures.
| (a) | The registrant’s principal executive and principal financial officers, or persons performing similar functions, have concluded that the registrant’s disclosure controls and procedures (as defined in Rule 30a-3(c) under the Investment Company Act of 1940, as amended (the “1940 Act”) (17 CFR 270.30a-3(c))) are effective, as of a date within 90 days of the filing date of the report that includes the disclosure required by this paragraph, based on their evaluation of these controls and procedures required by Rule 30a-3(b) under the 1940 Act (17 CFR 270.30a-3(b)) and Rules 13a-15(b) or 15d-15(b) under the Securities Exchange Act of 1934, as amended (17 CFR 240.13a-15(b) or 240.15d-15(b)). |
| (b) | There were no changes in the registrant’s internal control over financial reporting (as defined in Rule 30a-3(d) under the 1940 Act (17 CFR 270.30a-3(d))) that occurred during the period covered by this report that has materially affected, or is reasonably likely to materially affect, the registrant’s internal control over financial reporting. |
Item 12. Disclosure of Securities Lending Activities for Closed-End Management Investment Companies.
Not applicable.
Item 13. Exhibits.
SIGNATURES
Pursuant to the requirements of the Securities Exchange Act of 1934 and the Investment Company Act of 1940, the registrant has duly caused this report to be signed on its behalf by the undersigned, thereunto duly authorized.
| (Registrant) | Comstock Funds, Inc. |
| By (Signature and Title)* | /s/ Bruce N. Alpert |
| | Bruce N. Alpert, Principal Executive Officer |
Pursuant to the requirements of the Securities Exchange Act of 1934 and the Investment Company Act of 1940, this report has been signed below by the following persons on behalf of the registrant and in the capacities and on the dates indicated.
| By (Signature and Title)* | /s/ Bruce N. Alpert |
| | Bruce N. Alpert, Principal Executive Officer |
| By (Signature and Title)* | /s/ John C. Ball |
| | John C. Ball, Principal Financial Officer and Treasurer |
* Print the name and title of each signing officer under his or her signature.