UNITED STATES
SECURITIES AND EXCHANGE COMMISSION
WASHINGTON, D.C. 20549
FORM 10-K
| x | ANNUAL REPORT PURSUANT TO SECTION 13 OR 15(d) OF THE SECURITIES EXCHANGE ACT OF 1934 |
For the fiscal year ended September 30, 2008
OR
| ¨ | TRANSITION REPORT PURSUANT TO SECTION 13 OR 15(d) OF THE SECURITIES EXCHANGE ACT OF 1934 |
For the transition period from to .
Commission file number: 000-50812
MULTI-FINELINE ELECTRONIX, INC.
(Exact name of registrant as specified in its charter)
| | |
| Delaware | | 95-3947402 |
(State or other jurisdiction of incorporation or organization) | | (I.R.S. Employer Identification No.) |
| |
| 3140 East Coronado Street Anaheim, California | | 92806 |
| (Address of principal executive offices) | | (Zip code) |
(714) 238-1488
(Registrant’s telephone number, including area code)
Securities registered pursuant to Section 12(b) of the Act:
| | |
| Title of each class | | Name of Each Exchange on Which Registered |
| |
| Common Stock, par value $0.0001 per share | | NASDAQ Global Select Market |
Securities registered pursuant to Section 12(g) of the Act: None
Indicate by check mark if the registrant is a well-known seasoned issuer, as defined in Rule 405 of the Securities Act. Yes ¨ No x
Indicate by check mark if the registrant is not required to file reports pursuant to Section 13 or Section 15(d) of the Act. Yes ¨ No x
Note – Checking the box above will not relieve any registrant required to file reports pursuant to Section 13 or Section 15(d) of the Exchange Act from their obligations under those Sections.
Indicate by check mark whether the registrant (1) has filed all reports required to be filed by Section 13 or 15(d) of the Securities Exchange Act of 1934 during the preceding 12 months (or for such shorter period that the registrant was required to file such reports), and (2) has been subject to such filing requirements for the past 90 days. Yes x No ¨
Indicate by check mark if disclosure of delinquent filers pursuant to Item 405 of Regulation S-K (§229.405 of this chapter) is not contained herein, and will not be contained, to the best of registrant’s knowledge, in definitive proxy or information statements incorporated by reference in Part III of this Form 10-K or any amendment to this Form 10-K. ¨
Indicate by check mark whether the registrant is a large accelerated filer, an accelerated filer, a non-accelerated filer or a smaller reporting company. See definition of “accelerated filer,” “large accelerated filer” and “smaller reporting company” in Rule 12b-2 of the Exchange Act.
| | |
Large accelerated filer ¨ | | Accelerated filer x |
| Non-accelerated filer ¨ (Do not check if a smaller reporting company) | | Smaller reporting company ¨ |
Indicate by check mark whether the registrant is a shell company (as defined in Rule 12b-2 of the Act). Yes ¨ No x
The aggregate market value of Common Stock held by non-affiliates of the registrant (based upon the closing sale price of the NASDAQ Global Select Market on March 31, 2008) was $98,380,308. Shares held by each executive officer, director and by each person that owns 10% or more of the outstanding Common Stock have been excluded in that such persons may be deemed to be affiliates. This determination of affiliate status is not necessarily a conclusive determination for other purposes.
The number of outstanding shares of the registrant’s Common Stock, $0.0001 par value, as of November 30, 2008 was 25,113,626.
DOCUMENTS INCORPORATED BY REFERENCE
Items 10 (as to directors and Section 16(a) Beneficial Ownership Reporting Compliance), 11, 12 (as to Beneficial Ownership), 13 and 14 of Part III incorporate by reference information from the registrant’s proxy statement to be filed with the Securities and Exchange Commission in connection with the solicitation of proxies for the registrant’s 2009 Annual Meeting of Stockholders expected to be held in March 2009.
Multi-Fineline Electronix, Inc.
Index
Part I
Overview
This Annual Report on Form 10-K (“Annual Report”), contains “forward-looking statements” that involve risks and uncertainties, as well as assumptions that, if they never materialize or prove incorrect, could cause our results to differ materially from those expressed or implied by such forward-looking statements. The forward-looking statements are contained principally in Item 1—”Business,” Item 1.A—”Risk Factors” and Item 7—”Management’s Discussion and Analysis of Financial Condition and Results of Operations.” Such forward-looking statements include any expectation of earnings, revenues or other financial items; any statements regarding the use of working capital, anticipated growth strategies and the development of and applications for new technology; factors that may affect our operating results; statements concerning new products or services; statements related to future economic conditions or performance; statements as to industry trends and other matters that do not relate strictly to historical facts or statements of assumptions underlying any of the foregoing. These statements are often identified by the use of words such as “anticipate,” “believe,” “continue,” “could,” “estimate,” “expect,” “intend,” “may,” or “will,” and similar expressions or variations. These statements are based on the beliefs and assumptions of our management based on information currently available to management. Such forward-looking statements are subject to risks, uncertainties and other factors that could cause actual results and the timing of certain events to differ materially from future results expressed or implied by such forward-looking statements. Factors that could cause or contribute to such differences include, but are not limited to, those identified below, and those discussed under Item 1.A. “Risk Factors” in this Annual Report. Furthermore, such forward-looking statements speak only as of the date of this report. We undertake no obligation to update any forward-looking statements to reflect events or circumstances after the date of such statements.
We are one of the world’s largest producers of flexible printed circuits and flexible circuit assemblies. With facilities in Anaheim, California; Suzhou, China; Pontian, Malaysia; and Singapore, we offer a global service and support base for the design and manufacture of flexible interconnect solutions.
We are a global provider of high-quality, technologically advanced flexible printed circuits and value-added component assembly solutions to the electronics industry. We believe that we are one of a limited number of manufacturers that has the ability to offer a seamless, integrated flexible printed circuit and assembly solution from design and application engineering and prototyping through high-volume fabrication, component assembly and testing. We target our solutions within the electronics market and, in particular, we focus on applications where flexible printed circuits facilitate human interaction with an electronic device and are the enabling technology in achieving a desired size, shape, weight or functionality of the device. Current applications for our products include mobile phones, smart mobile devices, consumer products, portable bar code scanners, personal digital assistants, computer/storage devices and medical devices. We provide our solutions to original equipment manufacturers (“ OEMs”) such as Motorola, Inc. and Sony Ericsson Mobile Communications and to electronic manufacturing services (“EMS”) providers such as Foxconn Electronics, Inc., Tech Full, and Flextronics International Ltd.
Our growth has been due, in part, to our early supplier involvement allowing our engineers to gain an understanding of the application and use of the customers’ circuits. This knowledge allows our engineers to utilize their expertise in flex circuit design and assist in the selection of materials and technologies to provide a high quality and cost effective product. Vertically integrated flex circuit manufacturing, assembly, and tooling operations have allowed us to offer superior lead time support to facilitate “quick turn” customer requirements.
We were incorporated as Multi-Fineline Electronix, Inc. in California in October 1984. In connection with our initial public offering, we reincorporated as Multi-Fineline Electronix, Inc. in Delaware on June 4, 2004. References in this Annual Report to “we,” “our,” “us”, the “Company” and “MFLEX” refer to Multi-Fineline Electronix, Inc. and our consolidated subsidiaries: Multi-Fineline Electronix (Suzhou) Co., Ltd., or MFC1;
1
Multi-Fineline Electronix (Suzhou No. 2) Co. Ltd., or MFC2; MFLEX Cayman Islands, Inc.; Multi-Fineline Electronix Singapore Pte. Ltd.; Multi-Fineline Electronix Malaysia Sdn. Bhd., or MFM; and Aurora Optical, Inc., except where it is made clear that the term means only the parent company.
Industry Background
We believe that the global market for flexible printed circuits will continue to grow over the coming years as consumers continue to demand smaller, more functional devices. Given inherent design and cost advantages of flexible printed circuits, they quickly are becoming a favored solution for electronics manufacturers who are striving to increase the features and functionality of electronic devices while optimizing the size, shape and weight of such devices. Asia is one of the largest and fastest growing markets for flexible printed circuits, largely because of two trends that occurred in the early 1990s—the outsourcing by OEMs of their manufacturing needs and the shifting of manufacturing facilities from the United States to Asian countries.
Historically, electronics manufacturers have relied upon rigid printed circuit boards to provide the electrical interconnections between the components in electronics devices. Rigid printed circuit boards consist of a board that contains multiple transistors, microprocessors and other components that are connected by copper wires embedded on the circuit board. Given that the rigid printed circuit boards cannot bend or twist, they inherently limit the design options available to engineers. For example, in order to design and build “flip-phone” style mobile phones, engineers had to create a method to connect the rigid printed circuit board in the base of the phone with the rigid printed circuit board in the screen. Copper wires could not be used because they are subject to failure as a result of stress from the constant bending and flexing of the wires; therefore, design engineers had to look to new materials to provide a means of electrical interconnection between the various components of the device.
To address this need, companies such as MFLEX began to design flexible printed circuits and flexible printed circuits containing components, or component assemblies, to serve as electrical interconnections. These flexible printed circuits can twist, bend and flex in a device with less risk of failure while connecting the components of the device. In addition to these functionality advantages, flexible printed circuits and component assemblies enable OEMs, EMS providers and display manufacturers to design and construct modular components that can be incorporated into the final product, which in turn reduces the complexity of the assembly of the final product, reduces the manufacturing costs and facilitates human interaction with the electronic device. As a result, manufacturers can reduce the number of assembly operations required for a product and improve the efficiency of their supply chains.
We believe that the overall market for flexible printed circuits and component assemblies is poised for substantial growth over the next several years as a result of favorable technological and market developments, including:
| | • | | Miniaturization, Portability and Complexity of Electronic Devices. As electronic devices become more powerful, complex and compact, product size becomes a principal design limitation. From an engineering standpoint, flexible printed circuits possess enhanced heat dissipation properties because they are thinner than rigid printed circuit boards and provide higher signal integrity interconnection. They also enable faster operating speeds because the components can be placed closer together and can serve as a medium for analog and digital devices. As a result, the electronics industry has relied increasingly upon flexible printed circuits and component assemblies. For example, the placement of chips and liquid crystal displays directly on the flexible printed circuit enables OEMs to increase functionality and improve packaging characteristics while managing time-to-market for their products in an overall cost-effective manner. Moreover, as electronics companies develop increased functionality for semiconductors, the traditional packaging and mounting technologies are becoming obsolete. |
2
| | • | | Outsourcing. Electronics companies increasingly are relying upon outsourcing to technically qualified, strategically located manufacturing partners that provide integrated, end-to-end flexible printed circuit and component assembly solutions comprised of design and application engineering, prototyping and competitive high-volume production services. By employing these end-to-end manufacturers, electronics companies are able to reduce time-to-market, avoid product delays, reduce manufacturing costs, minimize logistical problems and focus on their core competencies. |
| | • | | Expanding Markets and Flexible Component Demand. The global demand for wireless communication products and the complexity of wireless devices increasingly are driving the demand for more complex flexible printed circuits and component assemblies. Electronics companies have discovered that they can increase the functionality of flexible printed circuits and reduce the number of required interconnects by mounting components, such as connectors, switches, resistors, capacitors, light emitting devices, integrated circuits and optical sensors, to the flexible printed circuits. We believe that the application of flex assemblies in wireless devices is expanding rapidly, which could result in significantly more flex assemblies per device than have been used in previous-generation wireless applications. |
Competitive Strengths
We are a leading global provider of high-quality, technologically advanced flexible printed circuit and component assembly solutions to the electronics industry. We believe our competitive strengths include:
| | • | | Our Seamless and Efficient End-to-End Solution for Flexible Printed Circuit Applications. We provide a seamless, integrated end-to-end flexible printed circuit solution for our customers, ranging from design and application engineering, prototyping and high-volume manufacturing to turnkey component assembly and testing. By relying on a single provider for their flexible printed circuit requirements, our customers can benefit from opportunities for more robust product designs and process optimization during the development phase. This, in turn, frequently leads to production cost savings and quicker time-to-market. Our operations possess the expertise and capabilities to provide a seamless, integrated end-to-end solution that provides our customers with the ability to leverage any one or more of our facilities to meet their global requirements. |
| | • | | Our Design and Application Engineering Expertise Supports Our Strong Customer Relationships. Our expertise in designing and manufacturing flexible printed circuits and component assemblies has enabled us to become a partner to our customers at the earliest stages of product development. We employ our design and application engineers as part of our sales process; therefore, our customers rely on us to assist them in the early design phase of their products. Early design participation enables us to gain intricate knowledge of our customers’ products and thereby provide value-added engineering support to them. Early design participation also enables our customers to achieve lower production costs through better product design and utilization of our flexible printed circuit assembly expertise. In addition, this process fosters strong relationships with our customers, often resulting in their reliance on our products and engineering support for the life of the specific application and subsequent generations of similar applications. |
| | • | | Our Manufacturing Capabilities. We maintain manufacturing facilities in the United States, Malaysia and China. Our U.S. operations primarily provide design and application engineering and prototype manufacturing, while our Chinese operations are organized to concentrate on ramping up production of new products from prototype stage to high volume, while allowing us to consolidate the labor intensive aspects of high-volume manufacturing in a cost-efficient environment. Our Malaysian operations are still in the start-up phase and we expect to transfer some of our high-mix assembly business to this facility. We are also continuing to enhance our design and application engineering capabilities in China to best position us to provide an integrated end-to-end solution to the emerging domestic electronics markets in China and other parts of Asia. Since 2000, we have expanded our manufacturing capacity in China by acquiring additional and technologically advanced machinery, and by expanding our |
3
| | manufacturing facilities. Our ongoing attention to integrating the manufacturing processes between our facilities allows us to improve our product yields, streamline our customers’ supply chains, shorten our customers’ time to the market and lower the overall costs of our products. Furthermore, with the expansion of our manufacturing facilities and the capital equipment addition at our second manufacturing facility in China, MFC2, which became operational in October 2006, and with further expansion to satellite facilities during fiscal 2008, we increased our manufacturing capacities substantially in China, which enabled us to take on additional high-volume manufacturing programs. While we believe our Chinese manufacturing facilities benefit the company, they do subject us to additional risks inherent in international business, including those detailed under Item 7A, “Quantitative and Qualitative Disclosures About Market Risk.” |
| | • | | Our Forward Integration in the Value Chain. We have implemented a strategy of upward integration focusing on the value-added services that we provide to our customers—design and application engineering and component assembly—rather than only concentrating on acquiring the capabilities to produce the materials used to manufacture flexible printed circuits. By employing suppliers to provide us with raw materials, we have avoided unnecessary capital equipment and research and development costs and have focused more intensely on the integral steps in the manufacturing process, from design and prototyping to high-volume manufacturing and component assembly. The result of this strategy has been superior design and application engineering expertise, strong customer relationships and yearly sequential net sales growth. |
| | • | | Our Management Experience and Expertise. Many members of our management team have been with us for 12 plus years. During that time, our executive management has made a number of critical, strategic decisions that successfully managed our growth and profitability, including pursuing a strategy of deploying our design and application engineers at the early stages of a customer’s product designs; responding to the trend of OEM outsourcing; identifying China’s manufacturing capabilities; creating a seamless, integrated end-to-end solution in each of our U.S. and Chinese operations to serve the needs of multinational OEMs, EMS providers and display manufacturers; and adopting a forward integration strategy in order to focus on the engineering and assembly needs of our customers. |
Business Strategy
Our objective is to continue to expand our product offering to become a global provider of electronic products packaging technology and manufacturing by using our core technologies of high-quality, technologically advanced flexible printed circuits and assemblies as the essential ingredients. To achieve our objective, we intend to pursue the following strategies:
| | • | | Provide an Integrated Solution to Our Customers. We intend to maintain our leadership in providing a complete end-to-end solution to our customers that includes design and application engineering, prototyping, high-volume manufacturing, materials acquisition, component assembly and testing. In addition, we intend to leverage our value-added services—design and application engineering and turnkey component assembly—to help solve our customers’ product design challenges and to provide our customers with flexible printed circuit solutions designed and manufactured to maximize the reliability and functionality of their end products. By focusing on customers’ product applications and providing them with a seamless, integrated and cost-efficient flexible printed circuit and component assembly solution, we believe that we can continue to grow our market share by eliminating the need of our customers to negotiate with multiple vendors and reducing the time-to-market for their products. |
| | • | | Support the Development of Applications for Flexible Printed Circuit Technology in New Markets. We believe that flexible printed circuit technology provides a cost-effective solution to improving the functionality and packaging of electronic devices. We believe that the trend towards miniaturization will continue to drive the growth of flexible printed circuits in many industries that we currently do not serve. To address these new market opportunities, we will continue our efforts to research, develop and market new applications for flexible printed circuits and component assemblies. We believe that our |
4
| | design and application engineering and manufacturing capabilities, coupled with our flexible printed circuit assembly expertise, will enable us to effectively target additional high-volume flexible printed circuit applications in various markets of the electronics industry, including the camera cell phone and charger markets, where size, shape and weight are primary drivers of product development. |
| | • | | Expand Our Existing Expertise in the Design and Manufacture of Flexible Printed Circuit Technology. By expanding our market share in existing markets, penetrating new markets and partnering with customers in the early stage design of their products, we will continue to expand our engineering and manufacturing expertise and capabilities for applications and functionality for electronic product packaging technology and assist our customers in developing more efficient manufacturing processes for their products. We believe that we will be able to continue to capture additional market share in the sectors we serve and attract companies from other markets of the electronics industry by utilizing our expertise in design and application engineering to expand product designs and applications for flexible printed circuit solutions in conjunction with our high-volume, cost-effective manufacturing capabilities. |
| | • | | Diversify Our End Customers. We primarily serve the wireless sector. We plan to leverage our internal sales force comprised entirely of design and application engineers with our existing outside non-exclusive sales representatives to attract new customers in the wireless sector, as well as in other sectors of the electronics industry where functionality and packaging size dictate the need for flexible printed circuits and component assemblies. |
| | • | | Increase Manufacturing Capacity and Capabilities. We intend to continue to improve our manufacturing capabilities and cost reduction efforts by transitioning our Anaheim, California facility to a research and development and prototype facility. This transition will allow us to concentrate on expanding our engineering capabilities and manufacturing facilities in China, while enhancing capabilities and innovation at our Anaheim facilities. In addition, MFC2 has been specifically designed and equipped for complex programs, which are flexible printed circuits with smaller features, and a high density of components and interconnection. This capability allows us to offer our customers an efficient, technologically advanced manufacturing process for complex flexible printed circuit fabrication. In fiscal 2008, we announced our plan to begin construction on our third manufacturing facility in Suzhou, China (MFC3), which would allow us to transition the operations of our original China facility, MFC1, to a new state-of-the-art flex fabrication facility which we expected to go on line in late fiscal year 2009, or during the first half of fiscal year 2010. Given the current economic environment we have made the decision to modify our original plans for the new MFC3 manufacturing facility, and manage development of these expansion activities and requisite capital expenditures in discrete phases. |
5
Products
Our design and application engineering expertise enables us to offer flexible printed circuit and value-added component assembly solutions for a wide range of electronic applications. We offer products in a broad range of markets, including mobile phones and smart mobile devices, portable consumer products, portable bar code scanners, computer/data storage and medical devices. Representative OEM customers and their end products that incorporate our flexible printed circuit products include the following:
| | | | |
OEM Customer | | Product Category | | Representative Application |
Motorola, Inc. | | Wireless | | Flexible printed circuit component assemblies utilized in keypads, hinges and displays |
| | |
Motorola, Inc. | | Industrial | | Flexible printed circuit component assemblies for bar code scanners and terminals |
| | |
Apple Inc. | | Consumer Products | | Flexible printed circuit component assemblies for portable music storage/player devices and cellular phones/SMART phones |
| | |
International Business Machines Corporation | | Computer/data storage | | Flexible printed circuit in data storage device |
| | |
GE Healthcare | | Medical applications | | Flexible printed circuit in diagnostic equipment |
Flexible Printed Circuits. Flexible printed circuits, which consist of copper conductive patterns that have been etched or printed while affixed to flexible substrate materials such as polyimide or polyester, are used to provide connections between electronic components and as a substrate to support these electronic devices. The circuits are manufactured by subjecting the base materials to multiple processes, such as drilling, screening, photo imaging, etching, plating and finishing. We produce a wide range of flexible printed circuits, including single-sided, double-sided, multi-layer (with and without gaps between layers) and rigid-flex. Single-sided flexible printed circuits, which have an etched conductive pattern on one side of the substrate, are normally less costly and more flexible than double-sided flexible printed circuits because their construction consists of a single patterned conductor layer. Double-sided flexible printed circuits, which have conductive patterns or materials on both sides of the substrate that are interconnected by a drilled or copper-plated hole, can provide either more functionality than a single-sided flexible printed circuit by containing conductive patterns on both sides, or greater shielding of components against electromagnetic interference than a single-sided flexible printed circuit by covering one side of the circuit with a shielding material rather than a circuit pattern. Multi-layer and rigid-flex printed circuits, which consist of layers of circuitry that are stacked and then laminated, are used where the complexity of the design demands multiple layers of flexible printed circuitry. If some of the layers of circuitry are rigid printed circuit material, the product is known as a rigid-flex printed circuit. Gapped flexible printed circuits, which consist of layers of circuitry that are stacked and separated in some parts of the circuit, and laminated in other parts of the circuit, are used where the complexity of the design demands multiple layers of flexible printed circuitry but the flexibility of a single-sided flexible printed circuit in some parts of the circuit.
Flexible Printed Circuit Assemblies. Flexible printed circuits can be enhanced by attaching electronic components, such as connectors, switches, resistors, capacitors, light emitting devices, integrated circuits, cameras and optical sensors, to the circuit. The reliability of flexible printed circuit component assemblies is dependent upon proper assembly design and the use of appropriate fixtures. Connector selection is also important in determining the signal integrity of the overall assembly—a factor which is very important to devices that rely upon high system speed to function properly. We are one of the pioneers in attaching connectors and components to flexible printed circuits and have developed the expertise and technology to mount a full range of electronic devices, from ordinary passive components to advanced and sophisticated surface mount components.
6
Customers
Our customers include leading OEMs, EMS providers and display manufacturers in a variety of sectors of the electronics industry. These sectors include mobile phones and smart mobile devices, portable consumer products, portable bar code scanners, computer/data storage and medical devices. Our expertise in flexible printed circuit design and component assembly enables us to assist our customers in resolving their design challenges through our design and assembly techniques, which frequently results in the customer placing our product designs on the customers’ design specifications and can enhance the likelihood of us becoming the main provider for flexible printed circuits and component assembly included in that product. Achieving status as a main provider to an OEM for a high-volume program can enable us to build strong customer relationships with respect to existing products and any future product that requires the use of flexible printed circuits and component assemblies.
We generally work with OEMs in the design of their products, and the OEMs subsequently either purchase our products directly or instruct the EMS providers and display manufacturers to purchase our products to be incorporated into the OEM’s product. Some examples of EMS providers we sell to include Foxconn and Flextronics. Our relationships with EMS providers and display manufacturers normally are directed by the OEMs; therefore, it is typically the OEMs that negotiate product pricing and volumes directly with us, even though the purchase orders come from the EMS providers. During fiscal year 2008, Sony Ericsson Mobile Communications (USA) Inc. (“Sony Ericsson”) became our largest customer. In the fiscal years ended September 30, 2008, 2007 and 2006, we sold products to be incorporated into Sony Ericsson’s products to approximately 15, eight and six Sony Ericsson subcontractors, which aggregated to 45%, 25% and 5% of our net sales (including direct sales to Sony Ericsson amounting to 1%, 0% and 1%), respectively. In addition, Motorola and its subcontractors have historically been large customers. In the fiscal years ended September 30, 2008, 2007 and 2006, we sold products to be incorporated into Motorola’s products to approximately 49, 30 and 52 Motorola subcontractors, which aggregated to 20%, 57% and 85% of our net sales (including direct sales to Motorola amounting to 18%, 46% and 71%), respectively.
Our net sales fluctuate from quarter to quarter as a result of changes in demand for our products. Over recent years, we have experienced a strong first fiscal quarter, followed by reduced net sales in the second fiscal quarter, as a result of partial seasonality of our major customers and the markets that we serve. Our major customers provide consumer-related products that generally experience their highest sales activity during the calendar year-end holiday season; therefore, we typically experience a decline in our second fiscal quarter sales as this holiday period ends. However, this pattern may not continue. Our net sales and operating results have fluctuated significantly from period-to-period in the past and are likely to do so in the future.
Our facilities in the United States and China enable us to manufacture products for shipment anywhere in the world. For both the fiscal years ended September 30, 2008 and 2007, we derived 9% of our net sales in the United States and 91% of our net sales outside the United States. For the fiscal year ended September 30, 2006, we derived 29% of our net sales in the United States and 71% of our net sales outside the United States.
For the fiscal year ended September 30, 2008, 22% of our net sales were shipped to Hong Kong, 26% of our net sales were shipped to China, 28% of our net sales were shipped to Malaysia and 14% of our net sales were shipped to North America (including Canada and Mexico). For the fiscal year ended September 30, 2007, 25% of our net sales were shipped to Hong Kong, 36% of our net sales were shipped to China, 1% of our net sales were shipped to Japan, 13% of our net sales were shipped to Malaysia and 18% of our net sales were shipped to North America. For the fiscal year ended September 30, 2006, 10% of our net sales were shipped to Hong Kong, 51% of our net sales were shipped to China, 1% of our net sales were shipped to Japan, 2% of our net sales were shipped to Malaysia and 29% of our net sales were shipped to North America.
For the fiscal years ended September 30, 2008, 2007 and 2006, we had long-lived assets of $20.4 million, $20.4 million and $20.5 million, respectively, in the United States; $139.9 million, $113.4 million and $74.8 million, respectively, in China; and $0.1 million, $0 and $0, respectively, in Singapore.
7
Sales and Marketing
We sell our products primarily through our in-house design and application engineers, who meet regularly with our customers and potential customers to assist in the initial design of the proposed products and to provide suggestions on how our flexible printed circuit solutions can enhance product design. By utilizing market and product teams in each sector of the electronics industry that we target, we have successfully expanded our market penetration by leveraging our design and application engineers within each of these teams.
We engage the services of eight non-exclusive sales representatives to interact with customers and potential customers on our behalf. Seven of these sales representatives are located throughout the United States. We also have one sales representative in Korea. We rely on these sales representatives to initiate contact with potential customers and provide leads to our internal sales and marketing teams, as well as to create, build and maintain our customer relationships and assist in the resolution of contractual disputes.
As of September 30, 2008, our backlog, which constitutes customer orders placed with us that we believe to be firm but that have not yet shipped, was $159.5 million. We expect to ship this entire backlog during fiscal year 2009. We cannot guarantee that our customers will not cancel any or all of the orders in our backlog. Our current backlog also is not indicative of our future operating results. As of September 30, 2007 and 2006, our backlog was $164.1 million and $141.6 million, respectively.
Technology
We are a global provider of single, double-sided, multi-layer and air-gapped flexible printed circuit technology and component assemblies. Our process technology includes proprietary processes and chemical recipes, which coupled with our design expertise, unique customized fixtures and tooling and manufacturing experience, enables us to deliver high-unit volumes of complex flexible printed circuits and component assemblies at cost-effective yields.
Design Technology. The flexible printed circuits we manufacture are designed specifically for each application, frequently requiring significant joint design activities with the customer at the start of a project. We have developed design methodologies that solve difficult interconnection problems and save our customers time and money. We design and mass produce flexible printed circuits that range from single-sided circuits to more complex double-sided, multi-layer (with and without gaps between layers) and rigid-flex circuits. We continually are investing in and improving our computer-based design tools to more quickly design new flexible printed circuits, enhance cooperative design and communication with our customers and more closely integrate design and application engineering to our prototyping and manufacturing process.
Circuit Fabrication Technology. We have extensive experience producing fine-line flexible printed circuits and have developed manufacturing processes that are designed to deliver high-unit volumes at cost-effective yields. In the flexible printed circuit industry, fine-line flexible printed circuits are easier to construct as the thickness of the copper decreases; however, as the thickness of the copper decreases, the cost of fabrication increases. We have developed a manufacturing process to pattern plate in selective regions of the circuitry pattern, such as around the holes used to connect the two sides of a double-sided flexible printed circuit. In addition, the normal manufacturing technology, by itself, has been improved with new equipment which enables thicker, less expensive copper to be etched down precisely enough to form fine-line circuitry. The combination of these two processes allows us to achieve finer patterns without a substantial increase in costs and with generally acceptable yields.
In addition to fine-line techniques, we have developed a proprietary process using ultraviolet lasers to drill 0.003 inch diameter holes, known as micro-vias, for the connection of circuits on the reverse side of the substrate. The combination of the fine-lines and micro-vias are part of the new high-density interconnect technology that is one of our competitive strengths.
8
Component Assembly and Test Technology. Our component assembly and test technology involve the arrangement of the circuits on a panel to minimize material waste and facilitate requirements for component assembly, such as placing tooling holes, optical locators for vision-based machines, test points and pre-cut zones to allow part removal without compromising the integrity of the components. We assemble passive electrical and various mechanical components, including capacitors, resistors, integrated circuits, connectors, stiffeners, diodes and other devices to flexible printed circuits. We also perform advanced assembly of integrated circuit devices, as well as the functional testing of these flexible printed circuit component assemblies. Assembling these components directly onto the flexible printed circuit increases performance and reduces space, weight and cost.
Intellectual Property
Our success will depend in part on our ability to protect our intellectual property. Our intellectual property relates to proprietary processes and know-how covering methods of designing and manufacturing flexible printed circuits, attaching components, optical and photonic designs, process technology for circuit manufacturing, and embedded magnetics for chargers. We regularly require our employees to enter into confidentiality agreements and assignment of invention agreements to protect our intellectual property. In addition, we consider filing patents on our inventions that are significant to our business, although none of our existing patents or patent applications pertain to inventions that are significant to our current business. We also pursue trademarks where applicable and appropriate.
In the future, we may encounter disputes over rights and obligations concerning intellectual property. We believe that our design and manufacturing processes do not infringe the intellectual property rights of any third party; however, we cannot assure you that we will prevail in any intellectual property dispute.
Suppliers
We purchase raw circuit materials, process chemicals and various components from a limited number of outside sources, including E.I. DuPont de Nemours & Co., Mitsui Plastics, ITT, Inc and from two of our OEM customers, Sony Ericsson and Motorola. For components, we normally make short-term purchasing commitments to key suppliers for specific customer programs. These commitments are usually made for three to 12-month periods. These suppliers agree to cooperate with us in engineering activities, as required, and in some cases maintain a local inventory to provide shorter lead times and reduced inventory levels for us. In most cases, suppliers are approved and often dictated by our customers. For process chemicals, certain copper and polyimide laminate materials and certain specialty chemicals used in our manufacturing process, we rely on a limited number of key suppliers. Alternate chemical products are available from other sources, but process chemical changes often require approval by our customers and requalification of the processes, which could take weeks or months to complete. We seek to mitigate these risks by identifying stable companies with leading technology and delivery capabilities and by attempting to qualify at least two suppliers for all critical raw materials and components.
Competition
The flexible printed circuit market is competitive, with a variety of large and small companies offering design and manufacturing services. The flexible printed circuit market is differentiated by customers, applications and geography, with each niche requiring specific combinations of complex packaging and interconnection. We believe that our ability to offer an integrated, end-to-end flexible printed circuit solution has enabled us to compete favorably with respect to design capabilities; product performance, reliability and consistency; price; customer and application support; and resources, equipment and expertise in component assembly on flexible printed circuits.
We compete on a global level with a number of leading Asian providers, such as Flextronics, Young Poong Electronics (Interflex), Foxconn Electronics, Inc., Global Flex Holdings Ltd., Sumitomo Bakelite, and Fujikura Ltd., and with domestic providers. We expect others to enter the market in the Asian region because of government subsidies and lower labor rates available there.
9
We believe that our technology leadership and capabilities in designing and manufacturing flexible printed circuits and component assemblies have enabled us to build strong partnerships and customer relationships with many companies. We believe that customers typically rely upon a limited number of vendors’ designs for the life of specific applications and, to the extent possible, subsequent generations of similar applications. Accordingly, it is difficult to achieve significant sales to a particular customer for any application once a different vendor has been selected to design and manufacture a specific flexible printed circuit. This market paradigm may provide a barrier to our competitors in the markets in which we compete; however, it may also present an obstacle to our entry into other markets. Any expansion of existing products or services could expose us to new competition.
Employees
As of November 30, 2008, we employed approximately 17,400 full-time employees and 800 contract employees, including approximately 250 full-time employees in the United States, 17,000 full-time employees and 750 contract employees in China, and 100 full-time employees and 50 contract employees in other locations. However, we have experienced a decrease in our employee base in China from approximately 20,800 in September 2008, mainly as a result of attrition and our decision not to hire new employees at the same rate as we have in the recent past. In addition, we expect our employee base in China to diminish further over the next several months to approximately 14,000 to 15,000 employees. We expect this reduction in employees will come through attrition in the employee base which we normally experience, for which we do not intend to hire new employees at the same rate as we have typically hired in the recent past, coupled with a possible lay-off of employees in China. We have never had a work stoppage. We consider our employee relations to be good.
We do not have employment agreements with any of our executive officers. We have entered into employment agreements with substantially all of our employees in China. In general, these employment agreements provide for either a one or two-year term.
In addition, we believe that a small number of our employees in China have formed a trade union committee which has proposed that we enter into a collective bargaining agreement. At this time, we are not a party to, nor do we intend to enter into, a collective bargaining agreement with these or any of our other employees at any of our facilities in China. We are not aware that the committee represents any employee other than the employees who actually are members of the committee. Further, we have agreed that in the event a workers’ union capable of negotiating and entering into a collective bargaining agreement is formed at our facility in Malaysia, that we will enter into such an agreement on terms no less favorable to the employees than those they enjoyed under an agreement with their previous employer. We presently do not believe that we will experience any material harm to our business if we do or do not enter into any such collective bargaining agreements.
Environmental Controls
Flexible printed circuit manufacturing requires the use of chemicals. As a result, we are subject to a variety of environmental laws relating to the storage, discharge, handling, emission, generation, manufacture, use and disposal of chemicals, solid and hazardous waste and other toxic and hazardous materials used to manufacture our products in the United States and China. As of September 30, 2008 and 2007, we reserved $203,000 and $135,000 of restricted cash, at the direction of the County of Orange, California, to finance estimated environmental clean-up costs in the event that we vacate our Anaheim facilities; otherwise, our review of our facilities suggests that no material remediation costs will be required. However, given the uncertainties associated with environmental contamination, there can be no assurance that such costs will not harm our business, financial condition or results of operations.
We believe we have been operating our facilities in substantial compliance in all material respects with existing environmental laws and regulations. However, we cannot predict the nature, scope or effect of legislation or regulatory requirements that could be imposed or how existing or future laws or regulations will be administered or interpreted with respect to products or activities to which they have not previously been applied. For this reason, we implemented procedures designed to minimize the negative impacts and reduce potential financial risks arising from environmental issues. Compliance with more stringent laws or regulations, or more
10
vigorous enforcement policies of regulatory agencies could require substantial expenditures by us and could harm our business, results of operations and financial condition. We do not anticipate any material amount of environmental-related capital expenditures in fiscal year 2009.
Available Information
We file reports with the Securities and Exchange Commission (“SEC”). We make available on our website under “Investor Relations,” free of charge, our annual reports on Form 10-K, quarterly reports on Form 10-Q, current reports on Form 8-K and amendments to those reports as soon as reasonably practicable after we electronically file such materials with or furnish them to the SEC. Our website address is www.mflex.com. You can also read and copy any materials we file with the SEC at the SEC’s Public Reference Room at 100 F Street, NE, Washington, DC 20549. You can obtain additional information about the operation of the Public Reference Room by calling the SEC at 1-800-SEC-0330. In addition, the SEC maintains an Internet site (www.sec.gov) that contains reports, proxy and information statements, and other information regarding issuers that file electronically with the SEC, including us.
11
FACTORS THAT MAY AFFECT OUR OPERATING RESULTS
Our business, financial condition, operating results and cash flows can be impacted by a number of factors, including but not limited to those set forth below, any of which could cause our results to be adversely impacted and could result in a decline in the value or loss of your investment in our common stock. The risks and uncertainties described below are not the only ones we face. Additional risks and uncertainties not presently known to us or that we currently deem immaterial may also affect our business.
We are heavily dependent upon the wireless industry, including the handset market, and any downturn in this industry may reduce our net sales.
For the fiscal years ended September 30, 2008, 2007 and 2006, 91%, 92% and 91%, respectively, of our net sales were derived from sales to companies that provide products or services to the wireless industry. In general, the wireless industry is subject to economic cycles and periods of slowdown. Intense competition, relatively short product life cycles and significant fluctuations in product demand characterize the industry as a whole. The wireless industry is also generally subject to rapid technological change and product obsolescence. Fluctuations in demand for our products as a result of periods of slowdown in the wireless market or discontinuation of products or modifications developed in connection with next generation products could reduce our net sales.
We depend on a limited number of key customers for significant portions of our net sales and if we lose business with any of these customers, our net sales could decline substantially.
For the past several years, a substantial portion of our net sales has been derived from products that are incorporated into products manufactured by or on behalf of a limited number of key customers and their subcontractors, including Apple Inc., Motorola, Inc., Research in Motion LTD and Sony Ericsson. In the fiscal years ended September 30, 2008, 2007 and 2006 approximately 95%, 93% and 90% respectively, of our net sales were to these four customers in the aggregate. In addition, 45%, 57% and 86% of our net sales in each of the fiscal years ended September 30, 2008, 2007 and 2006, respectively, were to one customer (not the same customer in each of the three years). The loss of one of these major customers or a significant reduction in sales to any of them would seriously harm our business. For example, our net sales in fiscal year 2007 were impacted by a significant decline in net sales of 33% to Motorola compared to the prior year. Although we are continuing our efforts to reduce dependence on a limited number of customers, net sales attributable to a limited number of customers and their subcontractors are expected to continue to represent a substantial portion of our business for the foreseeable future.
We will have difficulty selling our products if customers do not design our flexible printed circuit products into their product offerings or our customers’ product offerings are not commercially successful.
We sell our flexible printed circuit products directly or indirectly to OEMs, who include our products and component assemblies in their product offerings. We must continue to design our products into our customers’ product offerings in order to remain competitive. However, our OEM customers may decide not to design our products into their product offerings in the future. If an OEM selects one of our competitors to provide a product instead of us or switches to alternative technologies developed or manufactured by one or more of our competitors, it becomes significantly more difficult for us to sell our products to that OEM because changing component providers after the initial production runs begin involves significant cost, time, effort and risk for the OEM. Even if an OEM designs one of our products into its product offering, the product may not be commercially successful, we may not receive any orders from that manufacturer, the OEM may qualify additional vendors for the product or we could be undercut by a competitor’s pricing. Additionally, if an OEM selects one or more of our competitors, they may rely upon such competitors for the life of specific offering and, to the extent possible, subsequent generations of similar offerings. Any of these events would result in fewer sales and reduced profits for us.
12
Our customers have in the past and likely will continue to cancel their orders, change production quantities, delay production or qualify additional vendors, any of which could reduce our net sales and/or increase our expenses.
Substantially all of our sales are made on a purchase order basis, and we are not always able to predict with certainty the number of orders we will receive or the timing or magnitude of the orders. Our customers may cancel, change or delay product purchase orders with little or no advance notice to us for a variety of reasons, including changes in their prospects, the success of their products in the market, reliance on a new vendor and the overall economic forecast. In general, we do not have long-term contractual relationships with our customers that require them to order minimum quantities of our products, and our customers may decide to use another manufacturer or discontinue ordering from us in their discretion. As a result of these factors, we are not always able to forecast accurately the net sales that we will make in a given period.
In addition, we are increasingly being required to purchase materials, components and equipment before a customer becomes contractually committed to an order so that we may timely deliver the expected order to the customer. We may increase our production capacity, working capital and overhead in expectation of orders that may never be placed, or, if placed, may be delayed, reduced or canceled. As a result, we may be unable to recover costs that we incur in anticipation of orders that are never placed, such as costs associated with purchased raw materials, components or equipment. Delayed, reduced or canceled orders could also result in write-offs of obsolete inventory and the underutilization of our manufacturing capacity if we decline other potential orders because we expect to use our capacity to produce orders that are later delayed, reduced or canceled.
Our industry is extremely competitive, and if we are unable to respond to competitive pressures we may lose sales and our market share could decline.
We compete primarily with large flexible printed circuit board manufacturers located throughout Asia, including Taiwan, China, Korea, Japan and Singapore. We believe that the number of companies producing flexible printed circuit boards has increased materially in recent years and may continue to increase. Certain EMS providers have developed or acquired their own flexible printed circuit manufacturing capabilities or have extensive experience in electronics assembly, and in the future may cease ordering products from us or even compete with us on OEM programs. In addition, the number of customers in the market has been decreasing through consolidation and otherwise. Furthermore, many companies in our target customer base are moving the design and manufacturing of their products to ODMs in Asia. These factors make our industry extremely competitive. We believe that one of our principal competitive advantages is our ability to interact closely with our customers throughout the design and engineering process. If we are not successful in maintaining or establishing close relationships with customers in markets in which we compete, we may not be able to grow or maintain our market share or net sales.
Our products and their terms of sale are subject to various pressures from our customers and competitors, any of which could harm our gross profits.
Our selling prices are affected by changes in overall demand for our products, changes in the specific products our customers buy, pricing of competitors’ products and our products’ life cycles. In addition, from time to time we may elect to reduce the price of certain programs we produce in order to gain additional orders on those programs. A typical life cycle for one of our products begins with higher prices when the product is introduced and decreasing prices as it matures. To offset price decreases during a product’s life cycle, we rely primarily on higher sales volume and improving our manufacturing yield and productivity to reduce a product’s cost. If we cannot reduce our manufacturing costs as prices decline during a product’s life cycle, or if we are required to pay liquidated damages to a customer due to a breach of contract or other claim, including due to quality or delivery issues, our cost of sales may increase, which would harm our profitability.
13
In addition, our key customers and their subcontractors are able to exert significant pricing pressure on us and often require us to renegotiate the terms of our arrangements with them, including liability and indemnification thresholds and payment terms, among other terms. Changes in contract terms, the extension of payment terms and regular price reductions may result in lower gross margins for us. These trends make it more difficult to compete effectively and put increased pressure on our pricing.
Significant product failures could harm our reputation and our business.
Continued improvement in manufacturing capabilities, quality control, material costs and successful product testing capabilities are critical to our growth. Our efforts to monitor, develop, modify and implement stringent testing and manufacturing processes for our products may not be sufficient. If any flaw in the design, production, assembly or testing of our products were to occur, we could experience a rate of failure in our products that would result in significant delays in product shipments, cancellation of orders, substantial penalties from our customers and their customers, substantial repair or replacement costs, an increased return rate for our products and potential damage to our reputation.
Problems with manufacturing yields could result in higher operating costs and could impair our ability to meet customer demand for our products.
We could experience low manufacturing yields due to, among other things, design errors, manufacturing failures in new or existing products, the inexperience of new employees, or the learning curve experienced during the initial and ramp up stages of new product introduction. If we cannot achieve expected yields in the manufacture of our products, we may incur higher per unit costs, reduced product availability and may be subject to substantial penalties by our customers. In addition, reduced yields can significantly harm our gross margins, resulting in lower profitability or even losses.
We must develop new technology and manufacture new products and product features in order to remain competitive, and we may not be able to do so successfully.
Our long-term strategy relies in part on supporting technological advances and developing and manufacturing new products and product features to meet our customers’ needs, including new products such as rigid flex and our charger products. However, any new technology and products developed by us may not be selected by existing or potential customers. Our customers could decide to switch to alternative technologies, adopt new or competing industry standards with which our products are incompatible or fail to adopt standards with which our products are compatible. If we choose to focus on new technology or a standard that is ultimately not accepted by the industry and/or does not become the industry standard, we may be unable to sell those products. If we are unable to obtain customer qualifications for new products or product features, cannot qualify our products for high-volume production quantities or do not execute our operational and strategic plans for new products in a timely manner, our net sales may decrease. In addition, we may incur higher manufacturing costs in connection with new technology, products or product features, as we may be required to replace, modify, design, build and install equipment, all of which would require additional capital expenditures.
If we are unable to attract or retain personnel necessary to operate our business, our ability to develop and market our products successfully could be harmed.
We believe that our success is highly dependent on our current executive officers and management team. We do not have an employment contract with Reza Meshgin, our president and chief executive officer, or any of our other key personnel, and their knowledge of our business and industry would be extremely difficult to replace. The loss of any key employee or the inability to attract or retain qualified personnel, including engineers, sales and marketing personnel, management or finance personnel could delay the development and introduction of our products, harm our reputation or otherwise damage our business.
14
Furthermore, we have experienced a significant and growing employee turnover rate in our facilities in China, due at least in part to an increase in the number of manufacturers in Suzhou, China and the surrounding areas. A large number of our employees work in our facilities in China, and our costs associated with hiring (and increasingly, with re-hiring) these employees have increased significantly over the past several years. The high turnover rate and our difficulty in retaining employees have resulted in an increase in our expenses related to recruitment and training of qualified employees. Although our current intention is to slow down hiring of new employees in these facilities until market conditions improve, a continuation of this trend if we need to hire additional employees could result in even higher costs for us. We have made plans to establish additional manufacturing facilities in Malaysia and we cannot predict whether or to what extent this trend will also be present in our Malaysia operations.
We must continue to be able to procure raw materials and components on commercially reasonable terms to manufacture our products profitably.
Generally we do not maintain a large surplus stock of raw materials or components for our products because the specific assemblies are uniquely applicable to the products we produce for our customers; therefore, we rely on short-term supply contracts with third-party suppliers to provide these raw materials and components in a timely fashion and on commercially reasonable terms. In addition, we are often required by our customers to seek components from a limited number of suppliers that have been pre-qualified by the customer. However, from time to time we have experienced shortages of the components and raw materials used in the fabrication of our products. For example, during one such shortage of flexible printed circuit materials we had to qualify an additional supplier in order to maintain the delivery of our largest production run, and during certain quarters of fiscal 2006 we experienced component shortages which resulted in delayed shipments to customers. We expect that these delays could occur in future periods. We may not be successful in managing any shortage of raw materials or components that we may experience in the future, which could adversely affect our relationships with our customers and result in a decrease in our net sales. Component shortages could also increase our cost of goods sold because we may be required to pay higher prices for components in short supply. In addition, suppliers of certain of our components may consider us too small of a customer to sell to directly, and could require us to buy through distributors, increasing the cost of such components to us.
Our manufacturing and shipping costs may also be impacted by fluctuations in the cost of oil and gas. Any fluctuations in the supply or prices of these commodities could have an adverse effect on our profit margins and financial condition.
Our global operations expose us to additional risk and uncertainties.
We have operations in a number of countries, including the United States, China, Malaysia and Singapore. Our global operations may be subject to risks that may limit our ability to operate our business. We manufacture the bulk of our products in China and Malaysia and sell our products globally, which exposes us to a number of risks that can arise from international trade transactions, local business practices and cultural considerations, including:
| | • | | political unrest, terrorism and economic instability; |
| | • | | restrictions on our ability to repatriate earnings; |
| | • | | unexpected changes in regulatory requirements and uncertainty related to developing legal and regulatory systems related to economic and business activities; |
| | • | | import-export regulations; |
| | • | | difficulties in enforcing agreements and collecting receivables; |
| | • | | limited intellectual property protection; |
15
| | • | | currency exchange fluctuations; |
| | • | | inadequate local infrastructure and disruptions of service from utilities or telecommunications providers, including electricity shortages; |
| | • | | transportation delays and difficulties of managing international distribution channels; |
| | • | | difficulties in staffing foreign subsidiaries; |
| | • | | potentially adverse tax consequences; |
| | • | | differing employment practices and labor issues; |
| | • | | the occurrence of natural disasters or other acts of force majeure; and |
| | • | | public health emergencies such as SARS and avian flu. |
We also face risks associated with currency exchange and convertibility, inflation and repatriation of earnings as a result of our foreign operations. In some countries, economic, monetary and regulatory factors could affect our ability to convert funds to U.S. dollars or move funds from accounts in these countries. We are also vulnerable to appreciation or depreciation of foreign currencies against the U.S. dollar. Although we have significant operations in Asia, a substantial portion of transactions are denominated in U.S. dollars, including approximately 97% of the total shipments made to foreign manufacturers during fiscal year 2008. The balance of our net sales is denominated in Chinese Renminbi (“RMB”). As a result, if appreciation against the U.S. dollar were to increase, it would result in an increase in the cost of our business expenses in China. Further, downward fluctuations in the value of foreign currencies relative to the U.S. dollar may make our products less price competitive than local solutions. We do not currently engage in currency hedging activities to limit the risks of currency fluctuations.
In addition, our activities in China are subject to administrative review and approval by various national and local agencies of China’s government. Given the changes occurring in China’s legal and regulatory structure, we may not be able to secure required governmental approval for our activities, which could impede our ability to operate our business.
We are in the process of restructuring our operations and increasing our manufacturing capacity, and we may have difficulty managing these changes.
We have been engaged in a number of manufacturing expansion projects, including a new MFC3 manufacturing facility, the addition of satellite facilities in Suzhou, China and the establishment of manufacturing functions in Malaysia. In addition, we have been engaged in an international restructuring effort to transition various business functions to our offices in Singapore, in order to better align these activities with our international operations. Although we have made the decision to modify our original plans for the new MFC3 manufacturing facility given the current economic environment, and manage development of these expansion activities and requisite capital expenditures in discrete phases, these efforts require significant investment by us, and have in the past and could continue to result in increased expenses and inefficiencies and reduced gross margins. For example, during fiscal 2008 we incurred a one-time tax expense of approximately $7.3 million in connection with the transition of technology, although we expect to be able to obtain favorable tax treatment in future years.
Our management team may have difficulty managing our manufacturing expansion projects or otherwise managing any growth in our business that we may experience. Risks associated with managing expansion and growth may include those related to:
| | • | | managing multiple, concurrent major manufacturing expansion projects in China and Malaysia; |
| | • | | hiring and retaining employees, particularly in China and Malaysia; |
| | • | | accurately predicting any increases or decreases in demand for our products and managing our manufacturing capacity appropriately; |
16
| | • | | managing increased employment costs and scrap rates often associated with periods of growth; |
| | • | | implementing, integrating and improving operational and financial systems, procedures and controls, including our computer systems; |
| | • | | construction delays, equipment delays or shortages, labor shortages and disputes and production start-up problems; |
| | • | | cost overruns and charges related to our expansion activities; and |
| | • | | managing expanding operations in multiple locations and multiple time zones. |
Our management team may not be effective in expanding our manufacturing facilities and operations, and our systems, procedures and controls may not be adequate to support such expansion. Any inability to manage our growth may harm our profitability and growth.
WBL Corporation Limited beneficially owns 59% of our outstanding common stock and is able to exert influence over us and our major corporate decisions.
WBL Corporation Limited, together with its affiliates and subsidiaries (“Wearnes”) beneficially owns 59% of our outstanding common stock and we expect to be a principal subsidiary of Wearnes for the foreseeable future. As a result of this ownership interest and the resulting influence over the composition of our board of directors, Wearnes has influence over our management, operations and potential significant corporate actions. For example, so long as Wearnes continues to control more than a majority of our outstanding common stock, it will have the ability to control who is elected to our board of directors each year. In addition, for so long as Wearnes effectively owns at least one-third of our voting stock, it has the ability, through a stockholders agreement with us, to approve the appointment of any new chief executive officer or the issuance of securities that would reduce Wearnes’ effective ownership of us to a level that is below a majority of our outstanding shares of common stock, as determined on a fully diluted basis. As a result, Wearnes could preclude us from engaging in an acquisition or other strategic opportunity that we may want to pursue if such acquisition or opportunity required the issuance of our common stock. This concentration of ownership may also discourage, delay or prevent a change of control of our company, which could deprive our other stockholders of an opportunity to receive a premium for their stock as part of a sale of our company, could harm the market price of our common stock and could impede the growth of our company. Wearnes could also sell a controlling interest in us to a third party, including a participant in our industry, or buy additional shares of our stock.
Wearnes and its designees on our board of directors may have interests that conflict with, or are different from, the interests of our other stockholders. These conflicts of interest could include potential competitive business activities, corporate opportunities, indemnity arrangements, registration rights, sales or distributions by Wearnes of our common stock and the exercise by Wearnes of its ability to influence our management and affairs. In general, our certificate of incorporation does not contain any provision that is designed to facilitate resolution of actual or potential conflicts of interest. If any conflict of interest is not resolved in a manner favorable to our stockholders, our stockholders’ interests may be substantially harmed.
Wearnes is currently unable to vote its shares on specified matters that require stockholder approval without obtaining its own stockholders’ and regulatory approval and it is possible that Wearnes’ stockholders or the relevant regulators may not approve the proposed corporate action.
Wearnes’ ordinary shares are listed on the Singapore Securities Exchange Trading Limited (“the Singapore Exchange”). Under the rules of the Singapore Exchange, to the extent that we constitute a principal subsidiary of Wearnes as defined by the rules of the Singapore Exchange at any time that we submit a matter for the approval of our stockholders, Wearnes may be required to obtain the approval of its own stockholders for such action before it can vote its shares with respect to our proposal or dispose of our shares of common stock. Examples of corporate actions we may seek to take that may require Wearnes to obtain its stockholders’ approval include an amendment of our certificate of incorporation, a sale of all or substantially all of our assets, a merger or reorganization transaction, and certain issuances of our capital stock.
17
To obtain stockholder approval, Wearnes must prepare a circular describing the proposal, obtain approval from the Singapore Exchange and send the circular to its stockholders, which may take several weeks or longer. In addition, Wearnes is required under its corporate rules to give its stockholders advance notice of the meeting. Consequently, if we need to obtain the approval of Wearnes at a time in which we qualify as a principal subsidiary (including this year), the process of seeking Wearnes’ stockholder approval may delay our proposed action and it is possible that Wearnes’ stockholders may not approve our proposed corporate action. It is also possible that we might not be able to establish a quorum at our stockholder meeting if Wearnes was unable to vote at the meeting as a result of the Singapore Exchange rules. The rules of the Singapore Exchange that govern Wearnes are subject to revision from time to time, and policy considerations may affect rule interpretation and application. It is possible that any change to or interpretation of existing or future rules may be more restrictive and complex than the existing rules and interpretations.
Our business requires significant investments in capital equipment, facilities and technological improvements, and we may not be able to obtain sufficient funds to make such capital expenditures.
To remain competitive we must continue to make significant investments in capital equipment, facilities and technological improvements. We expect that substantial capital will be required to expand our manufacturing capacity and fund working capital requirements for our anticipated growth. In addition, we expect that new technology requirements may increase the capital intensity of our business. We may need to raise additional funds through further debt or equity financings in order to fund our anticipated growth and capital expenditures, and we may not be able to raise additional capital on reasonable terms, or at all, particularly given the current turmoil in global credit markets. If we are unable to obtain sufficient capital in the future, we may have to curtail our capital expenditures. Any curtailment of our capital expenditures could result in a reduction in net sales, reduced quality of our products, increased manufacturing costs for our products, harm to our reputation, reduced manufacturing efficiencies or other harm to our business.
In addition, Wearnes’ approval is required for the issuance of securities that would reduce its effective ownership of us to below a majority of the outstanding shares of our common stock as determined on a fully diluted basis. If Wearnes’ approval is required for a proposed financing, it is possible that it may not approve the financing and we may not be able to complete the transaction, which could make it more difficult to obtain sufficient funds to operate and expand our business.
The global credit market crisis and economic weakness may adversely affect our earnings, liquidity and financial condition.
Global financial and credit markets recently have been, and continue to be, extremely unstable and unpredictable. Worldwide economic conditions have been weak and may be further deteriorating. The instability of the markets and weakness of the economy could affect the demand for our customers’ products, the amount, timing and stability of their orders to us, the financial strength of our customers and suppliers, their ability or willingness to do business with us, our willingness to do business with them, and/or our suppliers’ and customers’ ability to fulfill their obligations to us. These factors could adversely affect our operations, earnings and financial condition.
In addition, continued, and potentially increased, volatility, instability and weakness in the financial and credit markets could affect our ability to sell our investment securities and other financial assets, which in turn could adversely affect our liquidity and financial position. We encountered a situation in which we were unable to make such sales as described below in Item 7A,“Quantitative and Qualitative Disclosures About Market Risk.” This instability also could affect the prices at which we could make any such sales, which also could adversely affect our earnings and financial condition. These conditions could also negatively affect our ability to secure funds or raise capital, if needed.
18
We included an other-than-temporary impairment charge in our consolidated statement of income during the fiscal year ended September 30, 2008 to reduce the carrying value of certain auction rate securities we hold, and we may incur additional impairment charges with respect to auction rate securities in the future.
Our investments consist of auction rate obligation securities issued by state agencies, which are collateralized by student loans. These auction rate securities were intended to provide liquidity via an auction process that resets the applicable interest rate at predetermined calendar intervals (every twenty-eight days), allowing investors to either roll over their holdings or gain immediate liquidity by selling such interest at par. As a result of current negative conditions in the global credit markets, during the second quarter of our fiscal 2008, auctions for investment in these securities, including the auction rate securities we hold, continued to fail to settle on their respective settlement dates. Consequently, the investments are not currently liquid through the normal auction process and we determined to reclassify these investments as long-term investments instead of short-term investments during the second quarter. Our long-term investments at September 30, 2008 represented $13.3 million of auction rate securities net of the other-than-temporary impairment charge of $1.2 million which has been recorded in the September 30, 2008 consolidated statement of income.
We determined the fair value of these securities using a model that calculates the present value of the expected future cash flows from the securities and other indications of value. The valuation of our investment portfolio is subject to uncertainties that are difficult to predict. Factors that may impact its valuation include changes to credit ratings of the securities as well as to the underlying assets supporting those securities, rates of default of the underlying assets, underlying collateral value, discount rates and ongoing strength and quality of market credit and liquidity. If the current market conditions deteriorate further such that these investments remain illiquid or recovery in market values does not occur, the value of these securities may decline further such that we may be required to record additional unrealized or realized losses for impairment, with such losses reducing our income.
We cannot predict whether or if future auctions related to auction rate securities will be successful. We are currently seeking alternatives for reducing our exposure to the auction rate market, including assessing whether our auction rate securities are eligible for participation in any recently announced settlements with the various entities that marketed auction rate securities; however, there is no guarantee that we will able to achieve alternate financing or other liquidity for some or all of our auction rate securities in the near term, or at all.
We are subject to the risk of increased income tax rates and other taxes.
A number of countries in which we are located allow for tax holidays or provide other tax incentives to attract and retain business. We currently enjoy tax holidays and other tax incentives for certain of our operations in China, including two tax holidays for our second manufacturing facility in China, MFC2. However, any tax holidays we may receive may be challenged, modified or even eliminated by taxing authorities or changes in law. Our taxes could increase if tax holidays or incentives are not renewed upon expiration, or if tax rates applicable to us are otherwise increased. For example, on March 16, 2007, the Chinese government passed a new unified enterprise income tax law which became effective on January 1, 2008. Among other things, this law cancels certain income tax incentives and increases the standard withholding rate on earnings distributions. The effect of these and other changes in Chinese tax laws on our overall tax rate will be affected by, among other things, our income, the manner in which China interprets, implements and applies the new tax provisions and our ability to qualify for any exceptions or new incentives. In addition, from time to time we may be subject to various types of tax audits.
If we fail to secure or protect our intellectual property rights, competitors may be able to use our technologies, which could weaken our competitive position and harm our business.
We rely primarily on trade secrets and confidentiality procedures relating to our manufacturing processes to protect our proprietary rights. Despite our efforts, these measures can only provide limited protection. Unauthorized third parties may try to copy or reverse engineer portions of our products or otherwise obtain and
19
use our intellectual property. If we fail to protect our proprietary rights adequately, our competitors could offer similar products using processes or technologies developed by us, potentially harming our competitive position. In addition, other parties may independently develop similar or competing technologies.
We also rely on patent protection for the intellectual property that we have developed. Our patents may be expensive to obtain and there is no guarantee that either our current or future patents will provide us with any competitive advantages. A third party may challenge the validity of our patents, or circumvent our patents by developing competing products based on technology that does not infringe our patents. Further, patent protection is not available at all in certain countries and some countries that do allow registration of patents do not provide meaningful redress for patent violations. As a result, protecting intellectual property in those countries is difficult, and competitors could sell products in those countries that have functions and features that would otherwise infringe on our intellectual property. If we fail to protect our intellectual property rights adequately, our competitors may gain access to our technology and our business may be harmed.
We may be sued by third parties for alleged infringement of their proprietary rights.
From time to time, we have received, and expect to continue to receive, notices of claims of infringement, misappropriation or misuse of other parties’ proprietary rights. We could also be subject to claims arising from the allocation of intellectual property rights among us and our customers. Any claims brought against us or our customers, with or without merit, could be time-consuming and expensive to litigate or settle, and could divert management attention away from our business plan. Adverse determinations in litigation could subject us to significant liability and could result in the loss of our proprietary rights. A successful lawsuit against us could also force us to cease selling or require us to redesign any products that incorporate the infringed intellectual property. In addition, we could be required to seek a license from the holder of the intellectual property to use the infringed technology, and it is possible that we may not be able to obtain a license on reasonable terms, or at all. If we fail to develop a non-infringing technology on a timely basis or to license the infringed technology on acceptable terms, our business, financial condition and results of operations could be harmed.
Complying with environmental laws and regulations may increase our costs and reduce our profitability.
We are subject to a variety of environmental laws and regulations relating to the storage, discharge, handling, emission, generation, manufacture, use and disposal of chemicals, solid and hazardous waste and other toxic and hazardous materials used in the manufacture of flexible printed circuits and component assemblies in our operations in the United States and Asia. A significant portion of our manufacturing operations are located in China, where we are subject to constantly evolving environmental regulation. The costs of complying with any change in such regulations and the costs of remedying potential violations or resolving enforcement actions that might be initiated by governmental entities in China could be substantial.
In the event of a violation, we may be required to halt one or more segments of our operations until such violation is cured. Although we attempt to operate in compliance with all applicable environmental laws and regulations, we may not succeed in this effort at all times. The costs of remedying violations or resolving enforcement actions that might be initiated by governmental authorities could be substantial. Any remediation of environmental contamination would involve substantial expense that could harm our results of operations. In addition, we cannot predict the nature, scope or effect of future regulatory requirements to which our operations may be subject or the manner in which existing or future laws will be administered or interpreted. Future regulations may be applied to materials, products or activities that have not been subject to regulation previously. The costs of complying with new or more stringent regulations could be significant.
Potential future acquisitions could be difficult to integrate, divert the attention of key management personnel, disrupt our business, dilute stockholder value and adversely affect our financial results.
In November 2008, we entered into a Share Purchase Agreement (the “Agreement”) with Multi-Fineline Electronix Singapore Pte. Ltd., one of our wholly owned subsidiaries, to acquire all of the issued ordinary shares of Pelikon Limited (“Pelikon”), a privately held technology company focused on the development of printed
20
segmented electroluminescent displays and keypads, from the shareholders of Pelikon. The closing of such share purchase, which is expected to occur in December 2008, is subject to a number of customary closing conditions. As part of our business strategy, we intend to continue to consider acquisitions of companies; technologies and products that we feel could enhance our capabilities, complement our current products or expand the breadth of our markets or customer base. We have limited experience in acquiring other businesses and technologies. Potential and completed acquisitions and strategic investments involve numerous risks, including:
| | • | | difficulties in integrating operations, technologies, accounting and personnel; |
| | • | | problems maintaining uniform standards, procedures, controls and policies; |
| | • | | difficulties in supporting and transitioning customers of our acquired companies; |
| | • | | diversion of financial and management resources from existing operations; |
| | • | | risks associated with entering new markets in which we have no or limited prior experience; |
| | • | | potential loss of key employees; and |
| | • | | inability to generate sufficient revenues to offset acquisition or start-up costs. |
Acquisitions also frequently result in the recording of goodwill and other intangible assets which are subject to potential impairments in the future that could harm our financial results. In addition, if we finance acquisitions by issuing convertible debt or equity securities, our existing stockholders may be diluted, which could affect the market price of our stock. As a result, if we fail to properly evaluate acquisitions or investments, we may not achieve the anticipated benefits of any such acquisitions, and we may incur costs in excess of what we anticipate.
We face potential risks associated with loss, theft or damage of our property or property of our customers.
Some of our customers have entrusted us with proprietary equipment to be used in the manufacture and testing of the products we make for them. In some instances, we face potentially millions of dollars in financial exposure to those customers if such equipment is lost, damaged or stolen. Although we take precautions against such loss, theft or damage and we may insure against a portion of these risks, such insurance is expensive, may not be applicable to any loss we may experience and, even if applicable, may not be sufficient to cover any such loss. Further, deductibles for such insurance may be substantial and may adversely affect our operations if we were to experience a loss, even if insured.
The trading price of our common stock is volatile.
The trading prices of the securities of technology companies, including the trading price of our common stock, have historically been highly volatile. During the 12 months ended September 30, 2008, our common stock traded between $29.21 and $12.51 per share. Factors that could affect the trading price of our common stock include:
| | • | | fluctuations in our financial results; |
| | • | | announcements of technological innovations or events affecting other companies in our industry; |
| | • | | changes in the estimates of our financial results; |
| | • | | changes in the recommendations of any securities analysts that elect to follow our common stock; and |
| | • | | market conditions in our industry, the industries of our customers and the economy as a whole. |
In addition, although we have approximately 25 million shares of common stock outstanding, approximately 14.8 million of those shares are held by a few investors. As a result, there is a limited public float in our common stock. If any of our significant stockholders were to decide to sell a substantial portion of its shares the trading price of our common stock could decline.
21
If we fail to maintain an effective system of internal controls, we may not be able to accurately report our financial results.
Effective internal controls are necessary for us to provide reliable financial reports. If we cannot provide reliable financial reports, our operating results could be misstated, current and potential stockholders could lose confidence in our financial reporting and the trading price of our stock could be negatively affected. There can be no assurance that our internal controls over financial processes and reporting will be effective in the future.
Delaware law and our corporate charter and bylaws contain anti-takeover provisions that could delay or discourage takeover attempts that stockholders may consider favorable.
Provisions in our certificate of incorporation and bylaws may have the effect of delaying or preventing a change of control or changes in our management including, among other things, provisions providing for a classified board of directors, authorizing the board of directors to issue preferred stock and the elimination of stockholder voting by written consent. In addition, because we are incorporated in Delaware, we are governed by the provisions of Section 203 of the Delaware General Corporation Law, which may discourage, delay or prevent certain business combinations with stockholders owning 15% or more of our outstanding voting stock. These provisions in our charter, bylaws and under Delaware law could discourage delay or prevent potential takeover attempts that stockholders may consider favorable.
Because we do not intend to pay dividends, our stockholders will benefit from an investment in our common stock only if our stock price appreciates in value.
We have never declared or paid any cash dividends on our common stock. We currently intend to retain our future earnings, if any, to finance the expansion of our business and do not expect to pay any cash dividends in the foreseeable future. As a result, the success of an investment in our common stock will depend entirely upon any future appreciation in its value. There is no guarantee that our common stock will appreciate in value or even maintain the price at which it was purchased.
22
Our corporate headquarters are located in Anaheim, California. Our manufacturing facilities are located in Anaheim, California, Pontian, Malaysia and Suzhou, China, and we have an office in Singapore. We also have a facility located in Tucson, Arizona related to Aurora Optical, which we are in the process of transferring to our California facility. Following is a summary of our properties:
| | | | | | |
Function | | Location | | Square Feet | | Lease Expiration Dates |
| Executive offices, engineering and circuit fabrication and assembly | | Anaheim, California | | Owned—105,000 Leased—19,001* | | N/A April 2009 to August 2011 |
| | | |
| Aurora Optical, Inc.—Engineering, lens assembly and manufacturing | | Tucson, Arizona | | Owned—47,000 | | N/A |
| | | |
| MFC1—Engineering, circuit fabrication and assembly | | Suzhou, China | | Leased—111,038 Leased—201,470*** | | 2043** November 2008 to January 2011 |
| | | |
| MFC2—Engineering, circuit fabrication and assembly | | Suzhou, China | | Leased—485,000 Leased—193,712 | | 2052 August 2009 May 2011 |
| | | |
| Asian Regional Office | | Singapore | | Leased—3,300*** | | February 2011 |
| | | |
| MFM—Engineering and assembly | | Pontian, Malaysia | | Leased—117,842*** | | February 2011 |
| * | We have four leases relating to this space, which range in terms from seven months to three years and range in size from approximately 4,000 square feet to approximately 6,000 square feet. These leases expire in various months of each year and are typically extended on substantially the same terms. |
| ** | We have several other parcels that have long-term land leases expiring beyond 2043. Under the terms of these leases, we paid an upfront fee for use of the parcel through expiration of the lease. We have no other financial obligations on these long-term land leases other than payments of real estate taxes. However, we expect that we may move this facility to a more industrialized area in the coming years. |
| *** | Some or all of the referenced square footage is leased from a subsidiary of Wearnes. |
We believe our facilities are adequate for our current needs and that suitable additional or substitute space will be available to accommodate foreseeable expansion of our operations or to move our operations in the event one or more of our short-term leases can no longer be renewed on commercially reasonable terms at the expiration of its term.
| Item 3. | Legal Proceedings. |
From time to time, we may be party to lawsuits in the ordinary course of business. We are currently not a party to any material legal proceedings.
| Item 4. | Submission of Matters to a Vote of Security Holders. |
No matters were submitted to a vote of security holders during the fourth quarter of our fiscal year through the solicitation of proxies or otherwise.
23
Part II
| Item 5. | Market for Registrant’s Common Equity, Related Stockholder Matters and Issuer Purchases of Equity Securities. |
Market for Common Stock
Our common stock, par value $0.0001 (“Common Stock”) is traded on the NASDAQ Global Select Market (“Nasdaq”) under the symbol “MFLX.” The following table sets forth, for the periods indicated, the high and low closing prices for our Common Stock on Nasdaq, as reported in its consolidated transaction reporting system:
| | | | | | | | | | | | |
| | | Fiscal 2008 | | Fiscal 2007 |
| | | High | | Low | | High | | Low |
First Quarter | | $ | 22.46 | | $ | 13.40 | | $ | 26.06 | | $ | 19.95 |
Second Quarter | | | 23.44 | | | 12.83 | | | 20.28 | | | 15.35 |
Third Quarter | | | 28.53 | | | 17.58 | | | 17.95 | | | 14.70 |
Fourth Quarter | | | 27.78 | | | 14.40 | | | 17.51 | | | 10.28 |
Holders of Record
Stockholders of record on November 30, 2008 numbered approximately 48. Because many of the shares of our Common Stock are held by brokers and other institutions on behalf of stockholders, we are unable to estimate the total number of beneficial owners represented by these stockholders of record.
Dividends
We have never declared or paid any cash dividend on our Common Stock, nor do we currently intend to pay any cash dividend on our Common Stock in the foreseeable future. We expect to retain our earnings, if any, for the growth and development of our business. A description of the terms of our revolving credit facility can be found in this Annual Report under Item 8, Note 7.
24
Stock Performance Graph
The following graph shows the cumulative total stockholder return (change in stock price plus reinvested dividends) assuming the investment of $100 on June 25, 2004 (the day of the Company’s initial public offering) in each of our Common Stock, the NASDAQ Index and the NASDAQ Electronic Components Index. The comparisons in the table are required by the SEC and are not intended to forecast or be indicative of possible future performance of our Common Stock. This Stock Price Performance Graph is not deemed to be “soliciting material” or “filed” with the SEC under the Securities Exchange Act of 1934, and is not incorporated by reference in any past or future filing by us under the Securities Exchange Act of 1934 or the Securities Act of 1933, unless it is specifically referenced.
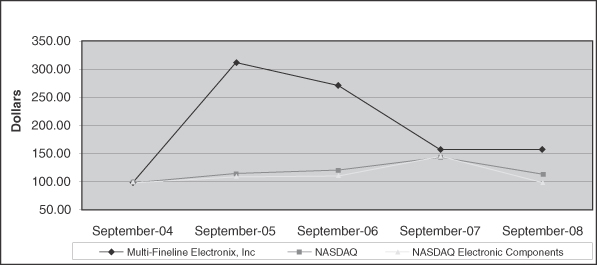
Securities Authorized for Issuance Under Equity Compensation Plans
Information regarding the securities authorized for issuance under our equity compensation plans can be found under Item 12 of this Annual Report.
25
| Item 6. | Selected Consolidated Financial Data |
The following selected consolidated financial data is qualified by reference to, and should be read in conjunction with, “Management’s Discussion and Analysis of Financial Condition and Results of Operations” included as Item 7 of this Annual Report and the Consolidated Financial Statements and related notes included in Item 8 of this Annual Report. The selected consolidated statements of income data for the years ended September 30, 2008, 2007 and 2006 and selected consolidated balance sheet data as of September 30, 2008 and 2007 are derived from audited consolidated financial statements included elsewhere in this Annual Report. The selected consolidated statements of income data for the years ended September 30, 2005 and 2004 and selected consolidated balance sheet data as of September 30, 2006, 2005 and 2004 were derived from audited consolidated financial statements not included in this Annual Report. Our historical results are not necessarily indicative of our future results.
| | | | | | | | | | | | | | | | | | | | |
| | | Year Ended September 30, | |
| | | 2008 | | | 2007 | | | 2006 | | | 2005 | | | 2004 | |
| | | (in thousands, except shares, per share data and ratios) | |
Consolidated Statement of Income Data: | | | | | | | | | | | | | | | | | | | | |
Net sales | | $ | 728,805 | | | $ | 508,147 | | | $ | 504,204 | | | $ | 357,090 | | | $ | 253,049 | |
Cost of sales | | | 611,517 | | | | 461,376 | | | | 413,156 | | | | 277,202 | | | | 197,412 | |
| | | | | | | | | | | | | | | | | | | | |
Gross profit | | | 117,288 | | | | 46,771 | | | | 91,048 | | | | 79,888 | | | | 55,637 | |
Operating expenses | | | | | | | | | | | | | | | | | | | | |
Research and development | | | 2,470 | | | | 2,499 | | | | 2,035 | | | | 883 | | | | 284 | |
Sales and marketing | | | 17,957 | | | | 12,544 | | | | 9,233 | | | | 8,783 | | | | 7,649 | |
General and administrative | | | 30,518 | | | | 24,216 | | | | 22,231 | | | | 17,587 | | | | 11,285 | |
Asset impairment and restructuring costs | | | 2,180 | | | | — | | | | — | | | | — | | | | — | |
Terminated acquisition expenses | | | — | | | | 7,821 | | | | — | | | | — | | | | — | |
| | | | | | | | | | | | | | | | | | | | |
Total operating expenses | | | 53,125 | | | | 47,080 | | | | 33,499 | | | | 27,253 | | | | 19,218 | |
| | | | | | | | | | | | | | | | | | | | |
Operating income (loss) | | | 64,163 | | | | (309 | ) | | | 57,549 | | | | 52,635 | | | | 36,419 | |
Other income (expense), net | | | | | | | | | | | | | | | | | | | | |
Interest income (expense), net | | | 1,581 | | | | 1,229 | | | | 1,257 | | | | 514 | | | | (468 | ) |
Other (expense) income, net | | | (2,742 | ) | | | 200 | | | | (229 | ) | | | 378 | | | | (100 | ) |
| | | | | | | | | | | | | | | | | | | | |
Income before (provision for) benefit from income taxes | | | 63,002 | | | | 1,120 | | | | 58,577 | | | | 53,527 | | | | 35,851 | |
(Provision for) benefit from-income taxes | | | (22,523 | ) | | | 1,918 | | | | (18,220 | ) | | | (16,361 | ) | | | (10,145 | ) |
| | | | | | | | | | | | | | | | | | | | |
Net income | | $ | 40,479 | | | $ | 3,038 | | | $ | 40,357 | | | $ | 37,166 | | | $ | 25,706 | |
| | | | | | | | | | | | | | | | | | | | |
Net income per share: | | | | | | | | | | | | | | | | | | | | |
Basic | | $ | 1.63 | | | $ | 0.12 | | | $ | 1.66 | | | $ | 1.57 | | | $ | 1.33 | |
| | | | | | | | | | | | | | | | | | | | |
Diluted | | $ | 1.59 | | | $ | 0.12 | | | $ | 1.59 | | | $ | 1.51 | | | $ | 1.27 | |
| | | | | | | | | | | | | | | | | | | | |
Shares used in calculating net income per share: | | | | | | | | | | | | | | | | | | | | |
Basic | | | 24,828,732 | | | | 24,520,040 | | | | 24,353,854 | | | | 23,603,935 | | | | 19,310,044 | |
Diluted | | | 25,433,676 | | | | 25,164,401 | | | | 25,315,548 | | | | 24,593,998 | | | | 20,306,842 | |
Consolidated Balance Sheet Data: | | | | | | | | | | | | | | | | | | | | |
Cash and cash equivalents | | $ | 62,090 | | | $ | 27,955 | | | $ | 24,460 | | | $ | 38,253 | | | $ | 16,631 | |
Working capital | | $ | 133,900 | | | $ | 107,481 | | | $ | 129,444 | | | $ | 108,126 | | | $ | 78,961 | |
Total assets | | $ | 487,610 | | | $ | 377,287 | | | $ | 327,045 | | | $ | 259,600 | | | $ | 189,998 | |
Current ratio | | | 1.8 | | | | 1.8 | | | | 2.5 | | | | 2.6 | | | | 2.7 | |
Long-term debt | | $ | — | | | $ | — | | | $ | — | | | $ | — | | | $ | — | |
Stockholders equity | | $ | 310,318 | | | $ | 250,006 | | | $ | 238,365 | | | $ | 189,041 | | | $ | 141,084 | |
26
The following table presents our unaudited quarterly consolidated income statement data for the eight quarters ended September 30, 2008. These quarterly results include all adjustments consisting of normal recurring adjustments that we consider necessary for the fair presentation for the quarters presented and are not necessarily indicative of the operating results for any future period.
| | | | | | | | | | | | | | | | | | | | | | | | | | | | | | | | |
| | | For the Quarter Ended
(Unaudited) | |
| | | September 30,
2008 | | | June 30,
2008 | | | March 31,
2008 | | | December 31,
2007 | | | September 30,
2007 | | | June 30,
2007 | | | March 31,
2007 | | | December 31,
2006 | |
| | | (in thousands, except per share data) | |
Net sales | | $ | 213,095 | | | $ | 167,623 | | | $ | 163,936 | | | $ | 184,152 | | | $ | 166,716 | | | $ | 104,138 | | | $ | 113,406 | | | $ | 123,887 | |
Cost of sales | | | 178,693 | | | | 144,450 | | | | 135,009 | | | | 153,366 | | | | 152,588 | | | | 99,355 | | | | 100,553 | | | | 108,880 | |
| | | | | | | | | | | | | | | | | | | | | | | | | | | | | | | | |
Gross profit | | | 34,402 | | | | 23,173 | | | | 28,927 | | | | 30,786 | | | | 14,128 | | | | 4,783 | | | | 12,853 | | | | 15,007 | |
Operating expenses | | | | | | | | | | | | | | | | | | | | | | | | | | | | | | | | |
Research and development | | | 752 | | | | 638 | | | | 588 | | | | 493 | | | | 701 | | | | 570 | | | | 639 | | | | 589 | |
Sales and marketing | | | 3,756 | | | | 5,056 | | | | 4,528 | | | | 4,617 | | | | 4,234 | | | | 3,263 | | | | 2,489 | | | | 2,558 | |
General and administrative | | | 8,366 | | | | 7,622 | | | | 7,753 | | | | 6,777 | | | | 6,182 | | | | 5,606 | | | | 5,462 | | | | 6,966 | |
Asset impairment and restructuring costs | | | 2,180 | | | | — | | | | — | | | | — | | | | — | | | | — | | | | — | | | | — | |
Terminated acquisition expenses | | | — | | | | — | | | | — | | | | — | | | | — | | | | 7,821 | | | | — | | | | — | |
| | | | | | | | | | | | | | | | | | | | | | | | | | | | | | | | |
Total operating expenses | | | 15,054 | | | | 13,316 | | | | 12,869 | | | | 11,887 | | | | 11,117 | | | | 17,260 | | | | 8,590 | | | | 10,113 | |
| | | | | | | | | | | | | | | | | | | | | | | | | | | | | | | | |
Operating income (loss) | | | 19,348 | | | | 9,857 | | | | 16,058 | | | | 18,899 | | | | 3,011 | | | | (12,477 | ) | | | 4,263 | | | | 4,894 | |
Interest income, net | | | 402 | | | | 404 | | | | 476 | | | | 300 | | | | 345 | | | | 414 | | | | 237 | | | | 233 | |
Other (expense) Income, net | | | (1,010 | ) | | | 48 | | | | (2,129 | ) | | | 349 | | | | (435 | ) | | | 457 | | | | 54 | | | | 124 | |
| | | | | | | | | | | | | | | | | | | | | | | | | | | | | | | | |
Income (loss) before (provision for) benefit from income taxes | | | 18,740 | | | | 10,309 | | | | 14,405 | | | | 19,548 | | | | 2,921 | | | | (11,606 | ) | | | 4,554 | | | | 5,251 | |
(Provision for) benefit from income taxes | | | (11,100 | ) | | | (1,480 | ) | | | (3,981 | ) | | | (5,962 | ) | | | 110 | | | | 4,894 | | | | (1,488 | ) | | | (1,598 | ) |
| | | | | | | | | | | | | | | | | | | | | | | | | | | | | | | | |
Net income (loss) | | $ | 7,640 | | | $ | 8,829 | | | $ | 10,424 | | | $ | 13,586 | | | $ | 3,031 | | | $ | (6,712 | ) | | $ | 3,066 | | | $ | 3,653 | |
| | | | | | | | | | | | | | | | | | | | | | | | | | | | | | | | |
Net income (loss) per share: | | | | | | | | | | | | | | | | | | | | | | | | | | | | | | | | |
Basic | | $ | 0.31 | | | $ | 0.35 | | | $ | 0.42 | | | $ | 0.55 | | | $ | 0.12 | | | $ | (0.27 | ) | | $ | 0.13 | | | $ | 0.15 | |
| | | | | | | | | | | | | | | | | | | | | | | | | | | | | | | | |
Diluted | | $ | 0.30 | | | $ | 0.34 | | | $ | 0.41 | | | $ | 0.54 | | | $ | 0.12 | | | $ | (0.27 | ) | | $ | 0.12 | | | $ | 0.14 | |
| | | | | | | | | | | | | | | | | | | | | | | | | | | | | | | | |
27
| Item 7. | Management’s Discussion and Analysis of Financial Condition and Results of Operations |
You should read this discussion together with the financial statements, related notes and other financial information included in this Annual Report. The following discussion may contain predictions, estimates and other forward-looking statements that involve a number of risks and uncertainties, including those discussed under Item 1.A-”Risk Factors” and elsewhere in this Annual Report. These risks could cause our actual results to differ materially from any future performance suggested below.
Overview
We are a global provider of high-quality, technologically advanced flexible printed circuits and value-added component assembly solutions to the electronics industry. We offer customized flexible printed circuit applications and services ranging from design and application engineering, prototyping and high-volume manufacturing to turnkey component assembly and testing. We target our solutions within the electronics market and, in particular, we focus on applications where flexible printed circuits facilitate human interaction with an electronic device and are the enabling technology in achieving a desired size, shape, weight or functionality of the device. Current applications for our products include mobile phones and smart mobile devices, portable bar code scanners, personal digital assistants, power supplies and consumable medical sensors.
From our inception in 1984 until 1989, we were engaged primarily in the manufacturing of flexible printed circuits for military and aerospace applications. In early 1990, we began to develop the concept of attaching components on flexible printed circuits for Motorola. Through these early efforts, we developed the concept of the value-added approach with respect to integrating our design engineering expertise with our component assembly capabilities. This strategy has enabled us to capitalize on two trends over the course of the 1990s, the outsourcing by OEMs of their manufacturing needs and the shift of manufacturing facilities outside of the United States. In 1994, we formed MFC1, a wholly owned Chinese subsidiary to better serve customers that have production facilities in Asia and provide a cost-effective, high-volume production platform for the manufacture of our products. MFC1 provides a complete range of capabilities and services to support our global customer base, including design engineering and high-volume production of single-sided, double-sided and multi-layer flexible printed circuits and component assemblies. In fiscal 2002, we formed MFC2, a second wholly owned subsidiary in China to further expand our flexible printed circuit manufacturing and assembly capacity. In fiscal 2008, we leased a manufacturing facility in Pontian, Malaysia for flexible printed circuit manufacturing and assembly capacity and to broaden our geographic base. In addition, in fiscal 2008, we leased office space in Singapore for our Asia Pacific regional office.
In fiscal 2005, we acquired the assets of Applied Optics, Inc., a company which designed and manufactured optical and photonic imaging solutions, and operate this business as Aurora Optical, Inc., a subsidiary of MFLEX (“Aurora Optical”). In July 2008, we began implementing a plan to close the Tucson, Arizona facility of Aurora Optical to consolidate the research and development and other design activities into our corporate headquarters in Anaheim, California, and to complete the transfer of the subsidiary’s product manufacturing activities to our China subsidiary. The closure is expected to be completed by the end of calendar year 2008. We plan to sell or dispose of certain of the related assets, which consist mainly of a company-owned building and manufacturing equipment, before the end of their expected useful life, and transfer certain pieces of manufacturing equipment, which can be modified to other uses, to our Anaheim facility at their carrying value. Based on this, we completed an impairment analysis under the guidance of Statement of Financial Accounting Standards (“SFAS”) No. 144, Accounting for the Impairment or Disposal of Long-Lived Assets(“SFAS 144”), determined that certain of the assets were impaired, and recorded a pre-tax charge of $2.0 million during the fourth quarter of 2008. Additionally, under the guidance of SFAS No.146, Accounting for Costs Associated with Exit or Disposal Activities(“SFAS 146”), a pre-tax restructuring charge composed of severance, relocation, and other costs related to the closure was estimated at $540,000, of which $180,000 was recorded in the fourth quarter of fiscal 2008, with the remainder of $360,000 expected to be recorded in the first quarter of fiscal 2009. Going forward, we believe that we can achieve approximately $2-3 million dollars per year in cost savings.
28
Net Sales
We design and manufacture our products to customer specifications. We engage the services of eight non-exclusive sales representatives to provide customer contacts and market our products directly to our global customer base. Seven of these sales representatives are located throughout the United States and we also have one sales representative in Korea. The variety of products our customers manufacture are referred to as programs. The majority of our sales are to customers outside of the United States. Sales volumes may be impacted by customer program and product mix changes and delivery schedule changes imposed on us by our customers. All sales from our Anaheim, California and Tucson, Arizona facilities are denominated in U.S. Dollars. All sales from our China facilities are denominated in U.S. Dollars for sales outside China or Chinese Renminbi for sales made in China.
During fiscal year 2008, our net sales were impacted by a shift in our customer base. Although net sales to our historically largest customer decreased from 57% of net sales in fiscal year 2007 to 20% of net sales in fiscal year 2008, our net sales to all other customers grew in total by $365 million, or nearly 67%, in fiscal year 2008 as compared to 2007. This growth was driven primarily by increases in net sales during fiscal year 2008 to our three other key customers.
Cost of Sales
Cost of sales consists of four major categories: material, overhead, labor and purchased process services. Material cost relates primarily to the purchase of copper foil, polyimide substrates and electronic components. Overhead costs include all materials and facilities associated with manufacturing support, processing supplies and expenses, support personnel costs, utilities, amortization of facilities and equipment and other related costs. Labor cost represents the cost of personnel related to the manufacture of the completed product and includes stock-based compensation expense related to such personnel. Purchased process services relate to the subcontracting of specific manufacturing processes to outside contractors. Cost of sales may be impacted by capacity utilization, manufacturing yields, product mix and production efficiencies. Also, we may be subject to increased costs as a result of changing material prices because we do not have long-term fixed supply agreements.
During fiscal year 2008, we experienced improved gross margins, primarily due to improved yields on high-volume production programs and the leveraging of fixed overhead expenses on the higher net sales.
Research and Development
Research and development costs are incurred in the development of new products and processes, including significant improvements and refinements to existing products and are expensed as incurred.
Sales and Marketing Expense
Sales and marketing expense includes commissions paid to sales representatives, personnel-related costs associated with our sales and marketing, business development and engineering support groups and expenses for overseas sales support, trade show and promotional and marketing brochures.
General and Administrative Expense
General and administrative expense primarily consists of salaries and benefits of administrative, finance, human resources, regulatory, information services and executive personnel and other expenses related to external accounting, legal and professional expenses, business insurance, management information systems, stock-based compensation, travel and entertainment and other corporate office expenses.
29
Impairment and Restructuring Expense
Asset impairment expense is the difference between the fair market value, based on the estimated future cash flows of the under-lying assets, and the carrying value, or net book value, of the assets. Impairment occurs when the carrying value exceeds the fair market value of the underlying assets. Restructuring expense represents severance, relocation, and other costs related to the closure or disposal of a business unit or location.
Interest Income
Interest income consists of interest income earned on cash, cash equivalents balances and long-term investments.
Interest Expense
Interest expense consists of interest expense incurred on our lines of credit.
Other Income (Expense), Net
Other income (expense), net, consists primarily of the loss on our auction rate securities investments and gain or loss on foreign currency exchange.
Provision for Income Taxes
We record a provision for income taxes based on the statutory rates applicable in the countries in which we do business, subject to any tax holiday periods granted by the respective governmental authorities. We account for income taxes under the provisions of SFAS No. 109,Accounting for Income Taxes (“SFAS 109”). SFAS 109 requires recognition of deferred tax assets and liabilities for the expected future tax consequences of events that have been included in the financial statements or tax returns. Under this method, deferred tax assets and liabilities are determined based on the differences between the financial reporting and tax bases of assets and liabilities using enacted tax rates in effect for the year in which the differences are expected to reverse.
Critical Accounting Policies and Estimates
This “Management’s Discussion and Analysis of Financial Condition and Results of Operations” section is based upon our consolidated financial statements, which have been prepared in accordance with accounting principles generally accepted in the United States. The preparation of consolidated financial statements requires that we make estimates and judgments that affect the reported amounts of assets, liabilities, net sales and expenses and related disclosures. On an ongoing basis, we evaluate our estimates, including those related to inventories, income taxes, accounts receivable allowances and warranty. We base our estimates on historical experience, performance metrics and on various other assumptions that we believe to be reasonable under the circumstances, the results of which form the basis for making judgments about the carrying values of assets and liabilities that are not readily apparent from other sources. Actual results will differ from these estimates under different assumptions or conditions.
We apply the following critical accounting policies in the preparation of our consolidated financial statements:
| | • | | Revenue Recognition. Revenues, which we refer to as net sales, are generated from the sale of flexible printed circuit boards, which are sold to OEMs, subcontractors and EMS providers to be included in other electronic products. An EMS provider may or may not be an OEM subcontractor. We recognize revenue when there is persuasive evidence of an arrangement with the customer that states a fixed or determinable sales price, when title and risk of loss transfers, when delivery of the product has occurred in accordance with the terms of the sale and collectability of the related account receivable is reasonably assured. Our remaining obligation to customers after delivery is limited to our warranty obligations on our product. We report revenues net of an allowance for returns, refunds and credits, which we estimate based on historical experience. |
30
| | • | | Inventories. We value our inventory at the lower of the actual cost to purchase and/or manufacture the inventory or the current estimated market value of the inventory. We regularly review our inventory and record a provision for excess or obsolete inventory based primarily on historical usage and our estimate of expected and future product demand. Our estimates of future product demand will differ from actual demand; therefore, our estimates of the provision required for excess and obsolete inventory may change, which we will record in the period such determination was made. |
| | • | | Investments. We value our investments at fair value. We regularly review our investments and record appropriate charges when the recoverable value is less than it related carrying value. The Company’s investments consist primarily of auction rate securities backed by student loans. The company utilizes a discounted cash flow method to determine the related investments fair value. Market variables utilized in developing the valuation model for these securities include relative yields on federal student loan securities, average 90 day T-Bill rates, 90 day LIBOR rates, interest rate spreads as determined by the changing credit market environment and quality of market credit and liquidity The risks and uncertainties include changes in the credit quality of the securities, changes in liquidity as a result of normal market mechanisms or issuer calls of the securities, and the effects of changes in interest rates. |
| | • | | Income Taxes. We determine if our deferred tax assets and liabilities are realizable on an ongoing basis by assessing our need for a valuation allowance and by adjusting the amount of such allowance, as necessary. In the determination of any valuation allowance, we have considered taxable income in prior carry back years, future taxable income and the feasibility of tax planning initiatives. If we determine that it is more likely than not that we will realize certain of our deferred tax assets for which we previously provided a valuation allowance, an adjustment would be required to reduce the existing valuation allowance. Conversely, if we determine that we would not be able to realize our recorded net deferred tax asset, an adjustment to increase the valuation allowance would be charged to our results of operations in the period such conclusion was reached. In addition, we operate within multiple domestic and foreign taxing jurisdictions and are subject to audit in these jurisdictions. These audits can involve complex issues, which may require an extended period of time for resolution. Although we believe that adequate consideration has been made for such issues, it is possible that the ultimate resolution of such issues could be significantly different than originally estimated. |
| | • | | Accounts Receivable Allowance. We perform ongoing credit evaluations of our customers and adjust credit limits and their credit worthiness, as determined by our review of their current credit information. We continuously monitor collections and payments from our customers and maintain an allowance for doubtful accounts based on our historical experience, our anticipation of uncollectible amounts and any specific customer collection issues that we have identified. While our credit losses historically have been within our expectations and the allowance provided, we may not continue to experience the same credit loss rates that we have in the past. The majority of our receivables are concentrated in relatively few customers; therefore, a significant change in the liquidity or financial position of any one customer could make it more difficult for us to collect our accounts receivable and require us to increase our allowance for doubtful accounts. |
| | • | | Warranty Reserves. We provide a two to thirty-six month warranty on our products. We provide a warranty reserve for the estimated cost of product warranties at the time the net sales are recognized. While we engage in quality programs and processes, up to and including the final product, our warranty obligation is affected by product failure rates, the cost of the failed product and the inbound and outbound freight costs incurred in replacing defective parts. We continuously monitor and analyze product returns for warranty and maintain a reserve for the related warranty costs based on historical experience and assumptions. If actual failure rates and the resulting cost of replacement vary from our historically based estimates, revisions to the estimated warranty reserve would be required. |
| | • | | Long-Lived Asset Impairment.We test for impairment whenever circumstances or events may affect the recoverability of long-lived assets under the guidance of SFAS 144. The evaluation is primarily dependent on the estimated future cash flows of the assets and the fair value of these items, as |
31
| | determined by management based on a number of estimates, including future cash flow projections, discount rates and terminal values. In determining these estimates, management considered information supplied by management and information obtained from discussions with market participants. The determination of fair value requires significant judgment both by management and outside experts engaged to assist in this process. |
The impairment test for long-lived assets is a two step process. The first step is to assess if events or changes in circumstances have affected the recoverability of long-lived assets. If management believes that recoverability has been affected, then step two requires management to calculate the undiscounted future cash flow related to the asset or asset group and to compare the cash flow to the carrying value of the asset or asset group. If undiscounted future cash flows exceed the carrying value, there is no impairment. On September 30, 2008, management completed impairment testing of the long-lived assets of Aurora Optical and determined that the long-lived assets were impaired.
| | • | | Restructuring Charges.We recognize restructuring charges related to plans to close or consolidate duplicate manufacturing and administrative facilities. In connection with these activities, we record restructuring charges for employee termination and relocation costs and other exit-related costs. |
The recognition of restructuring charges under the guidance of SFAS 146 requires that we make certain judgments and estimates regarding the nature, timing and amount of costs associated with the planned exit activity. To the extent that actual results differ from these estimates and assumptions, we may be required to revise the estimates of future liabilities, requiring the recognition of additional restructuring charges or the reduction of liabilities already recognized. Such changes to previously estimated amounts may be material to the consolidated financial statements. At the end of each reporting period, we evaluate the remaining accrued balances to ensure that no excess accruals are retained and the utilization of the provisions are for their intended purpose in accordance with developed exit plans.
In conjunction with the planned closure of Aurora Optical, we estimated the restructuring costs that would result from the closure. Those costs include, but are not limited to, (a) termination benefits provided to current employees that are involuntarily terminated under the terms of a benefit arrangement that, in substance, is not an ongoing benefit arrangement or an individual deferred compensation contract, (b) costs to terminate a contract that is not a capital lease, and (c) costs to consolidate facilities or relocate employees. Based on our analysis, we recorded a pre-tax restructuring charge composed of severance, relocation, and other costs related to the closure of Aurora Optical in the fourth quarter of fiscal 2008, and will recorded a similar charge in the first quarter of fiscal 2009.
| | • | | Goodwill. We evaluate the carrying value of goodwill during July of each year and between annual evaluations if events occur or circumstances change that would more likely than not reduce the fair value of the reporting unit below its carrying amount. Such circumstances could include, but are not limited to: (i) a significant adverse change in legal factors or in business climate, (ii) unanticipated competition, or (iii) an adverse action or assessment by a regulator. In performing the impairment review, we determine the carrying amount of each reporting unit by assigning assets and liabilities, including the existing goodwill, to those reporting units. A reporting unit is defined as an operating segment or one level below an operating segment (a “Component”). A Component of an operating segment is deemed a reporting unit if the Component constitutes a business for which discrete financial information is available and management regularly reviews the operating results of that Component. To evaluate whether goodwill is impaired, we compare the fair value of the reporting unit to which the goodwill is assigned to the reporting unit’s carrying amount, including goodwill. We determine the fair value of each reporting unit using the present value of expected future cash flows for that reporting unit. If the carrying amount of a reporting unit exceeds its fair value, then the amount of the impairment loss must be measured. The impairment loss would be calculated by comparing the implied fair value of reporting unit goodwill to its carrying amount. In calculating the implied fair value of reporting unit goodwill, the fair value of the reporting unit is allocated to all of the other assets and liabilities of that unit based on their fair values. The excess of the fair value of a reporting unit over the |
32
| | amount assigned to its other assets and liabilities is the implied fair value of goodwill. An impairment loss would be recognized when the carrying amount of goodwill exceeds its implied fair value. To date, we have had no impairments of goodwill. |
| | • | | Stock-Based Compensation.In first quarter of fiscal 2006, we adopted SFAS No. 123R,Share Based Payment: An Amendment of FASB Statement No.123 and 95(“SFAS 123R”). In accordance with SFAS 123R, in our first quarter of fiscal year 2006, we started to recognize compensation expense related to stock options granted to employees based on: (a) compensation cost for all share-based payments granted prior to, but not yet vested as of October 1, 2005, based on the grant date fair value estimated in accordance with SFAS No 123,Accounting for Stock-Based Compensation(“SFAS 123”), adjusted for an estimated future forfeiture rate, and (b) compensation cost for all share-based payments granted subsequent to October 1, 2005, based on the grant date fair value estimated in accordance with the provisions of SFAS 123R. |
Our assessment of the estimated fair value of the stock options granted is affected by our stock price as well as assumptions regarding a number of complex and subjective variables and the related tax impact. We utilize the Black-Scholes model to estimate the fair value of stock options granted subsequent to our initial public offering on June 25, 2004 (our “IPO”) and the minimum value method for stock options granted prior to our IPO. Generally, our calculation of the fair value for options granted under SFAS 123R is similar to the calculation of fair value under SFAS 123 with the exception of the treatment of forfeitures. Expected forfeitures of stock options are estimated based on the historical turnover of our employees. Prior to SFAS 123R, we recognized forfeitures under SFAS 123 as they occurred. The fair value of restricted stock units granted is based on the grant date price of our Common Stock.
The Black-Scholes option valuation model was developed for use in estimating the fair value of traded options that have no vesting restrictions and are fully transferable. This model also requires the input of highly subjective assumptions including:
| | (a) | the expected volatility of our common stock price, which we determine based on historical volatility of our common stock since the date of our IPO; |
| | (b) | expected dividends, which are zero, as we do not currently anticipate issuing dividends; |
| | (c) | expected life of the stock option, which is estimated based on the historical stock option exercise behavior of our employees; and |
| | (d) | risk free interest rate is based on observed interest rates (zero coupon U.S. Treasury debt securities) appropriate for the expected holding period. |
In the future, we may elect to use different assumptions under the Black-Scholes valuation model or a different valuation model, which could result in a significantly different impact on our net income or loss.
33
Results of Operations
The following table sets forth our Statement of Operations data, expressed as a percentage of net sales for the periods indicated.
| | | | | | | | | |
| | | Year Ended September 30, | |
| | | 2008 | | | 2007 | | | 2006 | |
Net sales | | 100.0 | % | | 100.0 | % | | 100.0 | % |
Cost of sales | | 83.9 | | | 90.8 | | | 81.9 | |
| | | | | | | | | |
Gross profit | | 16.1 | | | 9.2 | | | 18.1 | |
Research and development | | .3 | | | 0.5 | | | 0.4 | |
Sales and marketing expense | | 2.5 | | | 2.5 | | | 1.8 | |
General and administrative expense | | 4.2 | | | 4.8 | | | 4.5 | |
Asset impairment and restructuring costs | | .3 | | | — | | | — | |
Terminated acquisition expenses | | — | | | 1.5 | | | — | |
| | | | | | | | | |
Operating income (loss) | | 8.8 | | | (0.1 | ) | | 11.4 | |
Interest income, net | | 0.2 | | | 0.2 | | | 0.2 | |
Other (expense) income, net | | (0.4 | ) | | 0.1 | | | — | |
| | | | | | | | | |
Income before income taxes | | 8.6 | | | 0.2 | | | 11.6 | |
(Provision for) benefit from income taxes | | (3.1 | ) | | 0.4 | | | (3.6 | ) |
| | | | | | | | | |
Net income | | 5.6 | % | | 0.6 | % | | 8.0 | % |
| | | | | | | | | |
Year Ended September 30, 2008 Compared to Year Ended September 30, 2007
Net Sales. Net sales increased $220.7 million to $728.8 million in fiscal 2008 versus $508.1 million in fiscal 2007 driven primarily by increased net sales to customers within our wireless sector, which increased $191.6 million and comprised 91% of net sales in fiscal 2008 versus 92% during fiscal 2007. The increase in wireless net sales was largely due to the ramp up of new programs and unit volume shipment increases to three customers offset by declines in unit volume shipments to a fourth customer. Due to the success of our customer diversification efforts, sales to our four largest customers represented 45%, 20%, 20% and 11% of total sales for fiscal year 2008 as compared to 57% of sales to one customer in fiscal 2007. We believe that this expanded wireless customer base will provide an increased opportunity for top line revenue growth in fiscal 2009. Net sales to the consumer products sector increased 2417% or $28.7 million to $29.9 million versus $1.2 million in fiscal 2007 as a result of new program wins and unit volume increases. We believe that unit volume increases on new consumer product programs will contribute to further revenue growth in this sector in fiscal 2009. Net sales to the industrial sector, our third largest sector, decreased 23% or $5.7 million to $19.1 million for the year ended September 30, 2008 versus $24.8 million in the prior fiscal year mainly due to continued unit volume declines.
Cost of Sales and Gross Profit. Cost of sales as a percentage of net sales decreased to 84% for fiscal 2008 versus 91% for fiscal 2007. The decrease in cost of sales as a percentage of net sales was driven by several factors. The main driver was favorable customer mix changes, followed by cost leveraging from improved factory utilization and improved manufacturing yields. In the previous fiscal year, manufacturing yields were negatively impacted by the substantially larger number of new high-volume program ramp-ups that occurred during that time. This along with significant increases in overhead spending driven by the $33 million MFC2 capacity expansion that was on-going throughout the second half of fiscal 2007 resulted in increased cost of sales, due to the leveraging of fixed overhead expenses.
Gross profit increased to $117.3 million in the year ended September 30, 2008 versus $46.8 million in the prior year, an increase of 151%. As a percentage of net sales, gross profit increased to 16% for fiscal year 2008 from 9% in the prior fiscal year. The increase in gross profit is primarily due to a favorable customer mix change followed by improved plant utilization which leveraged our cost structure and improved manufacturing yields in the current fiscal year. We expect quarterly gross margins to return to the 10% to 15% range in the first half of fiscal 2009. Gross profits in the prior fiscal year were adversely impacted by the cost of sales increases stated above.
34
Research and Development. Research and development expenses remained relatively unchanged at $2.5 million for the years ended September 30, 2008 and 2007. We expect these expenses to grow as we continue to focus on additional new technologies, primarily those which will provide for additional miniaturization and cost reduction of our products, and also allow us to further differentiate ourselves from our competition.
Sales and Marketing Expense. Sales and marketing expenses increased to $18.0 million in fiscal 2008 from $12.6 million in fiscal 2007, an increase of 43%. Sales representative commissions and other sales related expense increased to $9.7 million for fiscal 2008 from $6.6 million in fiscal 2007, an increase of 47%. The increase is primarily attributable to a $2.8 million increase in commission expense related to the higher increased net sales on relatively stable average commission rates as well as a $309,000 increase in customer support expenses primarily related to our Netherlands sales office and our new Asian regional office in Singapore. Compensation and benefit expense increased to $7.3 million in fiscal 2008 from $5.9 million in fiscal 2007, an increase of 24%. As a percentage of net sales, compensation and benefit expense for fiscal 2008 decreased to 1.0% from 1.2% in fiscal 2007, primarily due to the leveraging of expense over the higher net sales volumes. We expect sales and marketing expense, as a percentage of net sales, to remain relatively flat during the upcoming fiscal year.
General and Administrative Expense. The $6.3 million increase in general and administrative expense was primarily due to a $4.5 million increase in compensation and benefits related to headcount increases in the U.S., China and Singapore, increased professional fees of $1.6 million, increased depreciation expense of $473,000 and increased information systems infrastructure costs of $432,000, offset by a decrease of $1.6 million, primarily related to a reduction in litigation expenses incurred in the prior year related to the terminated offer to acquire all of the outstanding shares of MFS Technology Ltd. (the “MFS Offer”). As a percentage of net sales, general and administrative expense decreased from 4.8% in fiscal 2007 to 4.2% in fiscal 2008 primarily due to the leveraging of expense on the higher net sales. We expect general and administrative expense, as a percentage of net sales, to remain relatively flat during the upcoming fiscal year.
Asset Impairment and Restructuring Cost.During the fiscal year ended 2008 we recorded an asset impairment and restructuring charge of $2.2 million related to the restructuring of our wholly owned subsidiary, Aurora Optical in Tucson, Arizona. No charges were recorded during the prior fiscal year. Going forward, we believe that we can achieve approximately $2 to $3 million dollars per year in cost savings.
Terminated Acquisition Costs.During the fiscal year ended September 30, 2007, we recorded a $7.8 million non-recurring charge to write-off deferred transaction costs related to the termination of the MFS Offer. No charges were recorded during the current fiscal year.
Interest Income.Interest income increased to $1.7 million for fiscal 2008 from $1.5 million for fiscal 2007, due to additional cash balances available for investment.
Interest Expense. Interest expense decreased to $106,000 in fiscal 2008 from $311,000 in fiscal 2007. The decrease is attributable to reduced borrowings on our lines of credit during fiscal 2008.
Other (Income) Expense, Net. Net other (income) expense changed to an expense of $2.7 million for the year ended September 30, 2008 from income of $200,000 for the prior year. The change is primarily due to a $1.7 million loss on foreign exchange in the current fiscal year versus a gain from foreign exchange of $178,000 during the prior year and a $1.2 million charge related to the impairment of our long term investments in auction rate securities. During the fourth fiscal quarter of 2008, due to a worsening of the economic and credit markets and significant changes in interest rates for short-term treasury bills, we determined that the impairment in value of our auction rate securities was other than temporary and therefore we recorded the charge against net income. The increase in loss on foreign exchange was due to the significant devaluation of the U.S. Dollar against the Chinese RMB, Japanese Yen, and other major foreign currencies.
35
Income Taxes.The effective tax rate for fiscal 2008 was a provision of 36%, compared to a benefit of 171% for fiscal 2007. The higher effective tax provision was primarily due to increased income generated in the U.S., a higher tax jurisdiction. The Company recorded additional tax expense of $7.3 million as a result of international reorganization efforts and the transition of technology to further strengthen the Company’s Asian operations. In addition to enhancing operational efficiencies, this action is expected to reduce the Company’s future effective tax rate.
The higher effective tax benefit in the prior fiscal year was mainly due to foreign tax credits offsetting U.S. taxes, the tax benefit of losses generated in the U.S., a higher tax jurisdiction, and income generated in China, a lower tax jurisdiction.
Year Ended September 30, 2007 Compared to Year Ended September 30, 2006
Net Sales. The essentially flat net sales of $508.1 million in fiscal 2007 versus $504.2 million in fiscal 2006 were primarily attributable to significant offsetting fluctuations in net sales to customers within our wireless sector, which comprised 92% of net sales in fiscal 2007 versus 91% during fiscal 2006. While net sales to our largest customer decreased $141.5 million, or 33% in fiscal 2007 compared to fiscal year 2006 due to price reductions and substantially reduced sales volume as a result of increased competition and softer demand from this customer, net sales to our second largest customer increased $101.8 million, or 427%, during fiscal year 2007 due to the continuation of high-volume orders on programs which were initiated at the end of fiscal 2006 as well as the ramping up of several new programs during fiscal year 2007. Sales to our largest customer, which represented 86% of our net sales in fiscal 2006, decreased to 57% of our net sales in fiscal year 2007 due to the declines mentioned above as well as the success of our customer diversification efforts, which resulted in our second largest customer increasing from a concentration of 5% of our net sales in fiscal 2006 to 25% in fiscal 2007. Net sales to the industrial sector, our second largest sector, decreased 14% or $4.1 million to $24.8 million for the year ended September 30, 2007 versus $28.9 million in fiscal year 2006 mainly due to the continued decline in demand.
Cost of Sales and Gross Profit. Cost of sales as a percentage of net sales increased to 91% for fiscal 2007 versus 82% for fiscal 2006. The increase in cost of sales as a percentage of net sales was driven by several factors. The main driver was manufacturing yield decreases, which comprised approximately 50% of the increase. Manufacturing yields were negatively impacted by the substantially larger number of new high-volume program ramp-ups that occurred during fiscal 2007 versus fiscal 2006. Yield improvements were achieved during the fourth quarter of fiscal year 2007 due to the stabilization of these new programs. Increased overhead spending driven by a 10% increase in sales volumes drove approximately 35% of the increase in cost of sales as a percentage of net sales. The increase in overhead spending was primarily driven by the $33 million MFC2 capacity expansion that was on-going throughout the second half of fiscal 2007 and resulted in some de-leveraging of fixed overhead expenses during fiscal year 2007 in anticipation of higher sales volumes in the latter portion of fiscal 2007 and throughout fiscal 2008. These sales volume increases were beginning to be realized in the fourth quarter of fiscal 2007. Approximately 15% of the increase was attributable to customer price reductions which were initiated early in fiscal 2007.
Gross profit decreased to $46.8 million in the year ended September 30, 2007 versus $91.0 million in fiscal 2006, a decrease of 49%. As a percentage of net sales, gross profit decreased to 9% for fiscal year 2007 from 18% in fiscal 2006. The decrease in gross profit is primarily due to the price reductions on our products and decreased manufacturing yields, as compared to fiscal 2006.
Research and Development. Research and development expenses increased to $2.5 million for the year ended September 30, 2007 from $2.0 million for the year ended September 30, 2006, an increase of 25%. The increase is primarily due to our increasing focus on new technologies, primarily lens applications and low profile camera modules, as well as increased research and development activities at our Anaheim location.
36
Sales and Marketing Expense. Sales representatives’ commissions and other sales related expense increased to $6.6 million for fiscal 2007 from $4.5 million in fiscal 2006, an increase of 47%. The increase is primarily attributable to a $1.7 million increase in commission expense related to the higher commission rates on new programs as well as a $400,000 increase in customer support expenses related to the expansion of our international sales offices, particularly our Netherlands sales office. Compensation and benefit expense increased to $5.9 million in fiscal 2007 from $4.7 million in fiscal 2006, an increase of 26%. As a percentage of net sales, compensation and benefit expense for fiscal 2007 increased to 1.2% from 0.9% in fiscal 2006, primarily due to the increased engineering headcount in China to support a number of new program ramp-ups during fiscal 2007.
General and Administrative Expense. As a percentage of net sales, general and administrative expense increased slightly from 4.5% in fiscal 2006 to 4.8% in fiscal 2007. The $2.0 million increase in general and administrative expense was primarily due to the $1.5 million increase in litigation expenses related to termination of the MFS Offer which were expensed as incurred during the year ended September 30, 2007. Head count increases in China related to the planned expansion of the manufacturing capacity of MFC2 in China also generated approximately $300,000 in additional administrative expense during fiscal 2007.
Terminated Acquisition Costs.During the fiscal year ended September 30, 2007, we recorded a $7.8 million non-recurring charge to write-off deferred transaction costs related to the termination of the MFS Offer. No charges were recorded during fiscal 2006.
Interest Income.Interest income remained constant at $1.5 million for fiscal 2006 and 2007.
Interest Expense. Interest expense increased slightly to $311,000 in fiscal 2007 from $203,000 in fiscal 2006. The increase is attributable to a higher average balance of $1.7 million carried on our lines of credit during the fiscal 2007 versus an average balance of $1.3 million carried during fiscal 2006.
Other (Income) Expense, Net. Net other income/expense changed to income of $200,000 for the year ended September 30, 2007 from expense of $229,000 for fiscal 2006. The change was primarily due to a $484,000 increase in gain on foreign exchange. We experienced a loss from foreign exchange of $306,000 during the year ended September 30, 2006 versus a gain of $178,000 during the year ended September 30, 2007. The increase in gain on foreign exchange is due to gains experienced on MFC2 purchases made in U.S. Dollars and recorded in RMB, MFC2’s functional currency.
Income Taxes.The effective tax rate for fiscal 2007 was a benefit of 171% compared to a provision of 31% for fiscal 2006. The higher effective tax benefit was mainly due to foreign tax credits offsetting U.S. taxes, the tax benefit of losses generated in the U.S., a higher tax jurisdiction, and income generated in China, a lower tax jurisdiction.
Liquidity and Capital Resources
Our principal sources of liquidity have been cash provided by operations, equity offerings and borrowings under our various credit facilities. Our principal uses of cash have been to finance working capital, facility expansions and other capital expenditures. We anticipate these uses will continue to be our principal uses of cash in the future. Global financial and credit markets recently have been, and continue to be, extremely unstable and unpredictable. Worldwide economic conditions have been weak and may be further deteriorating. Continued, and potentially increased, volatility, instability and weakness in the financial and credit markets could affect our ability to sell our investment securities and other financial assets, which in turn could adversely affect our liquidity and financial position. This instability also could affect the prices at which we could make any such sales, which could also adversely affect our earnings and financial condition. These conditions could also negatively affect our ability to secure funds or raise capital, if needed.
It is our policy to carefully monitor the state of our business, cash requirements and capital structure. We believe that funds generated from our operations and available from our borrowing facilities will be sufficient to fund current business operations as well as anticipated growth over at least the next twelve months. We also
37
believe we will have sufficient capital to fund our operations without the need to derive cash from the sale of our auction rate securities; however, there can be no assurance that any growth will occur and unexpected events may result in our need to raise additional capital. The valuation of the Company’s investment portfolio is subject to uncertainties that are difficult to predict. Factors that may impact its valuation include changes to credit ratings of the securities as well as to the underlying assets supporting those securities, rates of default of the underlying assets, underlying collateral value, market interest rates, discount rates and ongoing strength. Market variables utilized in developing the valuation model for these securities include relative yields on federal student loan securities, average 90 day T-Bill rates, 90 day LIBOR rates, interest rate spreads as determined by the changing credit market environment and quality of market credit and liquidity.
The following table sets forth, for the years indicated, our net cash flows provided by (used in) operating, investing and financing activities, our period-end cash and cash equivalents and certain other operating measures:
| | | | | | | | | | | | |
| | | Years Ended September 30, | |
| | | 2008 | | | 2007 | | | 2006 | |
| | | (dollars in thousands) | |
Cash flow provided by operating activities | | $ | 82,339 | | | $ | 46,690 | | | $ | 16,307 | |
Cash flow used in investing activities | | $ | (52,728 | ) | | $ | (45,083 | ) | | $ | (41,083 | ) |
Cash flow provided by (used in) financing activities | | $ | 3,805 | | | $ | (3,309 | ) | | $ | 8,918 | |
Cash and cash equivalents at year end | | $ | 62,090 | | | $ | 27,955 | | | $ | 24,460 | |
Days sales outstanding | | | 68.6 | | | | 82.8 | | | | 64.4 | |
Inventory turnover | | | 12.0 | | | | 7.7 | | | | 8.2 | |
Net cash generated from operations during fiscal 2008 was $82.3 million. During fiscal 2008, net income of $40.5 million, adjusted for depreciation and amortization, provision for doubtful accounts, deferred taxes, asset impairment and restructuring costs, impairment of long term investments, loss on equipment disposal and stock-based compensation expense generated $75.3 million of operating cash. In addition, $6.9 million in cash was generated from working capital.
Changes in the principal components of operating cash flows in our 2008 fiscal year were as follows:
| | • | | Our net accounts receivable increased to $162.4 million at September 30, 2008 from $124.3 million for the prior year, an increase of 31%. The increase in outstanding accounts receivable is attributable to the increase in sales volume in the fourth quarter of fiscal 2008 offset by a decrease in day’s sales outstanding, due to improved customer payment terms. Our net inventory balances decreased to $59.8 million at September 30, 2008 from $63.4 million for the prior year, a decrease of 6%. Inventory decreased as a result of improved shipment volumes. Our accounts payable increased to $128.6 million at September 30, 2008 from $111.9 million for the prior year, an increase of 15%, as a result of increased purchases in support of the higher business volumes. |
| | • | | Depreciation and amortization expense was $31.2 million for fiscal 2008 versus $20.4 million in the prior year due to the increased fixed asset base, mainly at MFC1 and MFC2. |
Our principal investing and financing activities in our 2008 fiscal year were as follows:
| | • | | Net cash used in investing activities was $52.7 million for fiscal 2008. Capital expenditures included $47.0 million of capital equipment and other assets, and $2.1 million in deposits for fixed asset purchases, which were related to the MFC1 and MFC2 manufacturing capacity expansion. As of September 30, 2008, we had outstanding purchase commitments totaling $9.2 million. |
| | • | | Net cash generated in financing activities was $3.8 million for fiscal 2008 and consisted of $1.6 million of tax benefit related to the exercise of stock options and $2.2 million of proceeds from the exercise of stock options. Our loans payable and borrowings outstanding against credit facilities were zero at September 30, 2008 and 2007. |
38
Net cash generated from operations during fiscal 2007 was $46.7 million. During fiscal 2007, net income of $3.0 million, adjusted for depreciation and amortization, provision for doubtful accounts, deferred taxes, loss on equipment disposal and stock-based compensation expense generated $26.4 million of operating cash. In addition, $20.3 million in cash was generated from working capital.
Changes in the principal components of operating cash flows in our 2007 fiscal year were as follows:
| | • | | Our net accounts receivable increased to $124.3 million at September 30, 2007 from $109.5 million for fiscal 2006 , an increase of 14%. The increase in outstanding accounts receivable was attributable to the increase in sales volume in the fourth quarter of fiscal 2007. Our net inventory balances increased to $63.4 million at September 30, 2007 from $56.4 million for fiscal 2006, an increase of 12%. The principal reason for the increase was the build up of inventory to support the higher sales volumes experienced in the fourth quarter as well as the expected sales increase in the first quarter of fiscal 2008. Our accounts payable increased to $111.9 million at September 30, 2007 from $70.1 million for fiscal 2006, an increase of 60%, as a result of increased purchases in support of the higher business volumes as well as the equipment expansion at MFC2. |
| | • | | Depreciation and amortization expense was $20.4 million for fiscal 2007 versus $14.5 million in fiscal 2006 due to the increased fixed asset base, mainly at MFC2. |
Our principal investing and financing activities in our 2007 fiscal year were as follows:
| | • | | Net cash used in investing activities was $45.1 million for fiscal 2007. Capital expenditures included $55.7 million of capital equipment and other assets, and $1.7 million in deposits for fixed asset purchases, which were related to the MFC2 manufacturing capacity expansion. As of September 30, 2007, we had outstanding purchase commitments related to MFC2 capital projects, which totaled $8.5 million. |
| | • | | Net cash used in financing activities was $3.3 million for fiscal 2007 and consisted of $4.0 million of repayments on our lines of credit offset by $638,000 of proceeds from the exercise of stock options. Our loans payable and borrowings outstanding against credit facilities decreased to zero at September 30, 2007 from $4.0 million at September 30, 2006. |
Net cash generated from operations during fiscal 2006 was $16.3 million. During fiscal 2006, net income of $40.4 million, adjusted for depreciation, deferred taxes, loss on equipment disposal and loss on equity investment generated $54.5 million of operating cash, offset by $38.2 million required for working capital.
Changes in the principal components of operating cash flows in our 2006 fiscal year were as follows:
| | • | | Our net accounts receivable increased to $109.5 million at September 30, 2006 from $71.5 million for fiscal 2005, an increase of 53%. The increase in outstanding accounts receivable is attributable to the extension of the payment terms for our major customer from 60 days to 90 days. Our net inventory balances increased to $56.4 million at September 30, 2006 from $45 million for fiscal 2005, an increase of 25%. The principal reason for the increase was an increase in inventory hub activity and increased raw material levels to support higher sales volumes. Our accounts payable increased to $70.1 million at September 30, 2006 from $58 million for the fiscal 2005, an increase of 21%, as a result of increased purchases in support of the higher business volumes. |
| | • | | Depreciation and amortization expense was $14.5 million for fiscal 2006 versus $11.4 million in the prior year due to the increased fixed asset base, mainly at MFC2. |
Our principal investing and financing activities in our 2006 fiscal year were as follows:
| | • | | Net cash used in investing activities was $41.1 million for fiscal 2006. Capital expenditures included $37.8 million of capital equipment and other assets, including $3.2 million in deposits for fixed asset |
39
| | purchases, which were related to the construction of the MFC2 expansion as well as improvements at the Anaheim facility. As of September 30, 2006 and 2005, we had outstanding purchase commitments related to MFC2 capital projects which totaled $8.3 million and $4.6 million, respectively. |
| | • | | Net cash provided by financing activities was $8.9 million for fiscal 2006 and consisted of $1.6 million of proceeds from the exercise of stock options and $4.0 million of net borrowings on our lines of credit. Our loans payable and borrowings outstanding against credit facilities increased to $4.0 million at September 30, 2006 from $0 at September 30, 2005. The increase in outstanding loan amounts resulted from a $4.0 million draw down on our credit facility with Norddeutsche Landesbank Girozentrale (“NLG”) to fund working capital needs. In addition, $3.4 million in cash was generated by the tax benefit related to stock options. |
Capital Commitments
As of September 30, 2008, we had no off-balance sheet arrangements as defined in Item 303(a)(4) of the Securities and Exchange Commission’s (“SEC”) Regulation S-K. The following summarizes our contractual obligations, excluding accrued taxes related to FIN 48, at September 30, 2008, and the effect those obligations are expected to have on our liquidity and cash flow in future periods (in thousands):
| | | | | | | | | | | | | | | |
| | | Payments Due by Period |
Contractual Obligations | | Total | | Less than
1 year | | 1 to 3
years | | 3 to 5
years | | More than
5 years |
Operating leases (facilities) | | $ | 2,410 | | $ | 1,281 | | $ | 1,129 | | $ | — | | $ | — |
Capital lease obligations | | | 7 | | | 7 | | | — | | | — | | | — |
Purchase obligations | | | 9,203 | | | 9,203 | | | — | | | — | | | — |
| | | | | | | | | | | | | | | |
Total contractual obligations | | $ | 11,620 | | $ | 10,491 | | $ | 1,129 | | $ | — | | $ | — |
| | | | | | | | | | | | | | | |
We have four leases or contractual arrangements relating to space at our California facilities, which range in terms from seven months to three years, and range in size from approximately 4,000 square feet to approximately 6,000 square feet. These leases expire in various months of each year and are typically extended on substantially the same terms. We have several parcels at MFC1 that have long-term land leases expiring beyond 2043. Under the terms of the leases, we paid an upfront fee for use of the parcel through expiration of the lease. We have no other financial obligations on the long-term land leases at MFC1 other than payments of real estate taxes. However, we expect that we may move this facility to a more industrialized area in the coming years.
In April 2007, our board of directors approved a $33.0 million capital expansion plan to increase our assembly capacity in the expanded MFC2 facility and in one satellite location in Suzhou. As of September 30, 2008, essentially all of the equipment related to the expansion had been installed. As of September 30, 2008, we had purchase obligations of $9.2 million which were primarily related to expansion activities at various satellite locations in Suzhou, China and for research and development equipment-related purchases at our Anaheim, California facility.
In November 2008, we entered into a Share Purchase Agreement (the “Agreement”) with Multi-Fineline Electronix Singapore Pte. Ltd. (“M-Flex Singapore”), one of our wholly owned subsidiaries and Pelikon Limited (“Pelikon”) to acquire all of the issued ordinary shares of Pelikon, a privately held technology company. Pursuant to the terms of the Agreement, in consideration for the purchase of the issued ordinary shares of Pelikon, M-Flex Singapore shall issue, at the closing, unsecured promissory notes in an aggregate principal amount equal to $10.7 million. In addition to the promissory notes, MFLEX Singapore may pay contingent consideration not to exceed $2.2 million in 2009 and $7.2 million in 2010, based on Pelikon achieving certain stipulated shipment volumes.
We adopted the provisions of FIN 48 on October 1, 2007. As of September 30, 2008, we recorded $13.8 million in long-term liabilities for accrued taxes related to uncertain tax positions under FIN 48. We are not able to reasonably estimate the timing of the long-term payments, or the amount by which our liability will increase or decrease over time; therefore, the FIN 48 liability has not been included in the contractual obligations table.
40
Recent Accounting Pronouncements
In September 2006, the Financial Accounting Standards Board (“FASB”) issued SFAS No. 157, Fair Value Measurement(“SFAS 157”). SFAS 157 defines fair value, establishes a framework for measuring fair value in generally accepted accounting principles, and expands disclosures about fair value measurements. SFAS 157 is effective for fiscal years beginning after November 15, 2007 and interim periods within those fiscal years. During 2007, the FASB became aware of numerous implementation issues as companies worked to prepare to adopt SFAS 157. Accordingly, the FASB agreed in February 2008 to a one-year deferral of the effective date for nonfinancial assets and liabilities that are recognized or disclosed at fair value on a nonrecurring basis, e.g., those measured at fair value in a business combination. SFAS 157 will be adopted by the Company beginning in the first quarter of fiscal 2009, effective October 1, 2008, and the Company does not expect that SFAS 157 will have a material impact on its consolidated financial statements.
In February 2007, the FASB issued SFAS No. 159, The Fair Value Option for Financial Assets and Financial Liabilities(“SFAS 159”). SFAS 159 permits companies to make a one-time election to carry eligible types of financial assets and liabilities at fair value, even if fair value measurement is not required under generally accepted accounting principles in the United States (“U.S. GAAP”). SFAS 159 will be adopted by the Company beginning in the first quarter of fiscal 2009, effective October 1, 2008, and the Company does not expect that SFAS 159 will have a material impact on its consolidated financial statements.
In December 2007, the FASB issued SFAS No. 141 (Revised 2007), Business Combinations (“SFAS 141R”). SFAS 141R establishes principles and requirements for how the acquiror of a business recognizes and measures in its financial statements the identifiable assets acquired, the liabilities assumed, and any non-controlling interest in the acquiree. SFAS 141R also provides guidance for recognizing and measuring the goodwill acquired in the business combination and determines what information to disclose to enable users of the financial statements to evaluate the nature and financial effects of the business combination. This statement applies prospectively to business combinations for which the acquisition date is on or after the beginning of the first annual reporting period beginning December 15, 2008, which is October 1, 2009 for the Company. The Company is currently evaluating the impact of the provisions of SFAS 141R on its consolidated financial statements.
In December 2007, the FASB issued SFAS No. 160, Non-controlling Interests in Consolidated Financial Statements—An Amendment of ARB No. 51 (“SFAS 160”). SFAS 160 establishes new accounting and reporting standards for a non-controlling interest in a subsidiary and for the deconsolidation of a subsidiary. It clarifies that a non-controlling interest in a subsidiary is an ownership interest in the consolidated entity that should be reported as equity in the consolidated financial statements. SFAS No. 160 is effective for the Company beginning October 1, 2009. The Company does not believe that SFAS 160 will have an impact on its consolidated financial statements.
In March 2008, the FASB issued SFAS No. 161, Disclosures about Derivative Instruments and Hedging Activities—an amendment of FASB Statement No. 133 (“SFAS 161”). SFAS 161 changes the disclosure requirements for derivative instruments and hedging activities. Entities are required to provide enhanced disclosures about (a) how and why an entity uses derivative instruments, (b) how derivative instruments and related hedged items are accounted for under FASB Statement 133 and its related interpretations, and (c) how derivative instruments and related hedged items affect an entity’s financial position, financial performance and cash flows. The guidance in SFAS 161 is effective for financial statements issued for fiscal years and interim periods beginning November 15, 2008 for the Company, with early application encouraged. This Statement encourages, but does not require, comparative disclosures for earlier periods at initial adoption. The Company does not believe that SFAS 161 will have an impact on its consolidated financial statements.
In May 2008, the FASB issued SFAS No. 162, The Hierarchy of Generally Accepted Accounting Principles(“SFAS 162”). SFAS 162 is intended to improve financial reporting by identifying a consistent framework, or hierarchy, for selecting accounting principles to be used in preparing financial statements that are presented in
41
conformity with U.S. GAAP for nongovernmental entities in the United States. SFAS 162 is effective 60 days following SEC approval of the Public Company Accounting Oversight Board Auditing amendments to AU Section 411, The Meaning of Present Fairly in Conformity with Generally Accepted Accounting Principles. The Company is currently evaluating the impact the provisions of SFAS 162 will have on its consolidated financial statements.
| Item 7A. | Quantitative and Qualitative Disclosures About Market Risk |
Market Risk
Market risk represents the risk of loss arising from adverse changes in market rates and foreign exchange rates. At September 30, 2008, no amounts were outstanding under our loan agreements with Shanghai Pudong Development Bank or Bank of China. The amounts outstanding under these loan agreements at any time may fluctuate and we may from time to time be subject to refinancing risk. We do not believe that a change of 100 basis points in interest would have a material effect on our results of operations or financial condition based on our current borrowing level.
Foreign Currency Risk
We derive a substantial portion of our sales outside of the United States. Approximately $643 million, or 97%, of total shipments to these foreign manufacturers for fiscal 2008 were made in U.S. Dollars. The balance of our net sales is denominated in RMB. The exchange rate for the RMB to the U.S. Dollar has been an average of 7.1 RMB per U.S. Dollar for the fiscal year ended September 30, 2008. Transactions in RMB represent approximately 3% of total net sales from foreign customers for the fiscal year ended September 30, 2008. In July 2005, the People’s Bank of China (“PBOC”) terminated the fixed exchange rate between the RMB and the U.S. Dollar, adjusted the exchange rate from 8.3 to 8.1 and established a 0.3% maximum daily appreciation against the U.S. Dollar. However, during the third quarter of fiscal 2007, the PBOC increased the rate at which the RMB/U.S. Dollar exchange can fluctuate, which resulted in a greater RMB appreciation. We anticipate the RMB appreciation against the U.S. Dollar to continue to increase in the future, which will result in an increase in the cost of our business expenses in China due to the movement of the exchange rates. We generally do not consider it necessary to hedge against currency risk, as a significant portion of our material cost of sales is denominated in U.S. Dollars, eliminating much of the need to hedge; however, we continue to be vulnerable to appreciation or depreciation of foreign currencies against the U.S. Dollar.
Liquidity Risk
As a result of the liquidity issues experienced in the global credit and capital markets, during 2008 auctions for investment in auction rate securities held by us failed. An auction fails when there is insufficient demand. However, a failed auction does not represent a default by the issuer. The auction rate securities continue to pay interest in accordance with the terms of the underlying security; however, liquidity will be limited until there is a successful auction or until such time as other markets for these investments develop. However, due to the current absence of a liquid market, we have reclassified our investments in auction rate securities from current assets to non-current assets in our consolidated condensed balance sheet. When liquidity for these types of investments returns in the market, we intend to sell these investments or reclassify them back to current assets. We do not believe that the lack of liquidity relating to auction rate securities will have an impact on our ability to fund operations.
All of our auction rate securities are rated AAA/Aaa, are collateralized by student loans substantially guaranteed by the U.S. government and continue to pay interest in accordance with their contractual terms. The valuation of our investment portfolio is subject to uncertainties that are difficult to predict. Factors that may impact the valuation include changes to credit ratings of the securities as well as to the underlying assets supporting those securities, rates of default of the underlying assets, underlying collateral value, discount rates and ongoing strength and quality of market credit and liquidity. As of September 30, 2008, the fair value of our auction rate securities of $12.1 million was determined using a model that calculates the present value of the expected future cash flows from our securities and other indications of value, and as a consequence of our belief that the impairment is of an other than temporary nature, we have recorded a charge of $1.2 million in our results of operations for the period ended September 30, 2008.
42
| Item 8. | Financial Statements and Supplementary Data |
MULTI-FINELINE ELECTRONIX, INC.
INDEX TO CONSOLIDATED FINANCIAL STATEMENTS
43
Report of Independent Registered Public Accounting Firm
To the Board of Directors and Stockholders of Multi-Fineline Electronix, Inc:
In our opinion, the consolidated financial statements listed in the accompanying index present fairly, in all material respects, the financial position of Multi-Fineline Electronix, Inc. and its subsidiaries at September 30, 2008 and 2007, and the results of their operations and their cash flows for each of the three years in the period ended September 30, 2008 in conformity with accounting principles generally accepted in the United States of America. In addition, in our opinion, the financial statement schedule listed in the accompanying index appearing under Item 8 presents fairly, in all material respects, the information set forth therein when read in conjunction with the related consolidated financial statements. Also in our opinion, the Company maintained, in all material respects, effective internal control over financial reporting as of September 30, 2008, based on criteria established inInternal Control—Integrated Framework issued by the Committee of Sponsoring Organizations of the Treadway Commission (COSO). The Company’s management is responsible for these financial statements and financial statement schedule, for maintaining effective internal control over financial reporting and for its assessment of the effectiveness of internal control over financial reporting, included in Management’s Report on Internal Control over Financial Reporting appearing under Item 9A. Our responsibility is to express opinions on these financial statements, on the financial statement schedule, and on the Company’s internal control over financial reporting based on our integrated audits. We conducted our audits in accordance with the standards of the Public Company Accounting Oversight Board (United States). Those standards require that we plan and perform the audits to obtain reasonable assurance about whether the financial statements are free of material misstatement and whether effective internal control over financial reporting was maintained in all material respects. Our audits of the financial statements included examining, on a test basis, evidence supporting the amounts and disclosures in the financial statements, assessing the accounting principles used and significant estimates made by management, and evaluating the overall financial statement presentation. Our audit of internal control over financial reporting included obtaining an understanding of internal control over financial reporting, assessing the risk that a material weakness exists, and testing and evaluating the design and operating effectiveness of internal control based on the assessed risk. Our audits also included performing such other procedures as we considered necessary in the circumstances. We believe that our audits provide a reasonable basis for our opinions.
As discussed in Note 1 to the consolidated financial statements, the Company changed the manner in which it accounts for uncertain tax positions in 2008.
A company’s internal control over financial reporting is a process designed to provide reasonable assurance regarding the reliability of financial reporting and the preparation of financial statements for external purposes in accordance with generally accepted accounting principles. A company’s internal control over financial reporting includes those policies and procedures that (i) pertain to the maintenance of records that, in reasonable detail, accurately and fairly reflect the transactions and dispositions of the assets of the company; (ii) provide reasonable assurance that transactions are recorded as necessary to permit preparation of financial statements in accordance with generally accepted accounting principles, and that receipts and expenditures of the company are being made only in accordance with authorizations of management and directors of the company; and (iii) provide reasonable assurance regarding prevention or timely detection of unauthorized acquisition, use, or disposition of the company’s assets that could have a material effect on the financial statements.
Because of its inherent limitations, internal control over financial reporting may not prevent or detect misstatements. Also, projections of any evaluation of effectiveness to future periods are subject to the risk that controls may become inadequate because of changes in conditions, or that the degree of compliance with the policies or procedures may deteriorate.
/s/ PricewaterhouseCoopers LLP
PricewaterhouseCoopers LLP
Orange County, California
December 8, 2008
44
MULTI-FINELINE ELECTRONIX, INC.
CONSOLIDATED BALANCE SHEETS
(In Thousands, Except Share Data)
| | | | | | |
| | | September 30, |
| | | 2008 | | 2007 |
| ASSETS | | | | | | |
Cash and cash equivalents | | $ | 62,090 | | $ | 27,955 |
Short term investments | | | — | | | 7,000 |
Restricted cash | | | 1 | | | 2,343 |
Accounts receivable, net of allowances of $1,520 and $1,300 at September 30, 2008 and 2007, respectively | | | 162,419 | | | 124,313 |
Inventories | | | 59,774 | | | 63,424 |
Deferred taxes | | | 6,571 | | | 4,073 |
Income taxes receivable | | | 3,445 | | | 2,701 |
Other current assets | | | 2,983 | | | 2,749 |
| | | | | | |
Total current assets | | | 297,283 | | | 234,558 |
Property, plant and equipment, net | | | 160,217 | | | 133,633 |
Long-term investments | | | 12,138 | | | — |
Restricted cash | | | 203 | | | 135 |
Deferred taxes | | | 4,964 | | | 2,185 |
Goodwill | | | 3,629 | | | 3,629 |
Other assets | | | 9,176 | | | 3,147 |
| | | | | | |
Total assets | | $ | 487,610 | | $ | 377,287 |
| | | | | | |
| LIABILITIES AND STOCKHOLDERS’ EQUITY | | | | | | |
Accounts payable | | $ | 128,642 | | $ | 111,934 |
Accrued liabilities | | | 22,938 | | | 14,994 |
Due to affiliates | | | 3,138 | | | 30 |
Income taxes payable | | | 8,658 | | | — |
Other current liabilities | | | 7 | | | 119 |
| | | | | | |
Total current liabilities | | | 163,383 | | | 127,077 |
Other liabilities | | | 13,909 | | | 204 |
| | | | | | |
Total liabilities | | | 177,292 | | | 127,281 |
| | | | | | |
Commitments and contingencies (Note 10) | | | | | | |
Stockholders’ equity | | | | | | |
Preferred stock, $0.0001 par value, 5,000,000 and 5,000,000 shares authorized at September 30, 2008 and 2007, respectively; 0 and 0 shares issued and outstanding at September 30, 2008 and 2007, respectively | | | — | | | — |
Common stock, $0.0001 par value; 100,000,000 and 100,000,000 shares authorized at September 30, 2008 and 2007, respectively; 25,011,649 and 24,598,510 shares issued and outstanding at September 30, 2008 and 2007, respectively | | | 2 | | | 2 |
Additional paid-in capital | | | 116,100 | | | 108,872 |
Retained earnings | | | 172,770 | | | 132,532 |
Accumulated other comprehensive income | | | 21,446 | | | 8,600 |
| | | | | | |
Total stockholders’ equity | | | 310,318 | | | 250,006 |
| | | | | | |
Total liabilities and stockholders’ equity | | $ | 487,610 | | $ | 377,287 |
| | | | | | |
The accompanying notes are an integral part of these consolidated financial statements.
45
MULTI-FINELINE ELECTRONIX, INC.
CONSOLIDATED STATEMENTS OF INCOME
(In Thousands, Except Per Share and Share Data)
| | | | | | | | | | | | |
| | | Years Ended September 30, | |
| | | 2008 | | | 2007 | | | 2006 | |
Net sales | | $ | 728,805 | | | $ | 508,147 | | | $ | 504,204 | |
Cost of sales | | | 611,517 | | | | 461,376 | | | | 413,156 | |
| | | | | | | | | | | | |
Gross profit | | | 117,288 | | | | 46,771 | | | | 91,048 | |
| | | | | | | | | | | | |
Operating expenses | | | | | | | | | | | | |
Research and development | | | 2,470 | | | | 2,499 | | | | 2,035 | |
Sales and marketing | | | 17,957 | | | | 12,544 | | | | 9,233 | |
General and administrative | | | 30,518 | | | | 24,216 | | | | 22,231 | |
Impairment and restructuring costs | | | 2,180 | | | | — | | | | — | |
Terminated acquisition expenses | | | — | | | | 7,821 | | | | — | |
| | | | | | | | | | | | |
Total operating expenses | | | 53,125 | | | | 47,080 | | | | 33,499 | |
| | | | | | | | | | | | |
Operating income (loss) | | | 64,163 | | | | (309 | ) | | | 57,549 | |
Other income (expense), net | | | | | | | | | | | | |
Interest expense | | | (106 | ) | | | (311 | ) | | | (203 | ) |
Interest income | | | 1,687 | | | | 1,540 | | | | 1,460 | |
Other (expense) income, net | | | (2,742 | ) | | | 200 | | | | (229 | ) |
| | | | | | | | | | | | |
Income before (provision for) benefit from income taxes | | | 63,002 | | | | 1,120 | | | | 58,577 | |
(Provision for) benefit from income taxes | | | (22,523 | ) | | | 1,918 | | | | (18,220 | ) |
| | | | | | | | | | | | |
Net income | | $ | 40,479 | | | $ | 3,038 | | | $ | 40,357 | |
| | | | | | | | | | | | |
Net income per share: | | | | | | | | | | | | |
Basic | | $ | 1.63 | | | $ | 0.12 | | | $ | 1.66 | |
Diluted | | $ | 1.59 | | | $ | 0.12 | | | $ | 1.59 | |
Shares used in computing net income per share: | | | | | | | | | | | | |
Basic | | | 24,828,732 | | | | 24,520,040 | | | | 24,353,854 | |
Diluted | | | 25,433,676 | | | | 25,164,401 | | | | 25,315,548 | |
The accompanying notes are an integral part of these consolidated financial statements.
46
MULTI-FINELINE ELECTRONIX, INC.
CONSOLIDATED STATEMENTS OF STOCKHOLDERS’ EQUITY
(In Thousands, Except Share Data)
| | | | | | | | | | | | | | | | | | | | | | |
| | | Common Stock | | Additional
Paid-in
Capital | | Retained
Earnings | | | Accumulated
Other
Comprehensive
Income | | Total
Stockholders’
Equity | | | Comprehensive
Income |
| | | Shares | | Amount | | | | | |
Balance at September 30, 2005 | | 24,179,884 | | $ | 2 | | $ | 98,564 | | $ | 89,137 | | | $ | 1,338 | | $ | 189,041 | | | $ | 38,503 |
| | | | | | | | | | | | | | | | | | | | | | |
Exercise of stock options | | 263,487 | | | — | | | 1,562 | | | — | | | | — | | | 1,562 | | | | — |
Compensation relating to the modification of stock options | | — | | | — | | | 1,984 | | | — | | | | — | | | 1,984 | | | | — |
Stock-based compensation income tax benefits | | — | | | — | | | 3,356 | | | — | | | | — | | | 3,356 | | | | — |
Net income | | — | | | — | | | — | | | 40,357 | | | | — | | | 40,357 | | | | 40,357 |
Translation adjustment | | — | | | — | | | — | | | — | | | | 2,065 | | | 2,065 | | | | 2,065 |
| | | | | | | | | | | | | | | | | | | | | | |
Balance at September 30, 2006 | | 24,443,371 | | $ | 2 | | $ | 105,466 | | $ | 129,494 | | | $ | 3,403 | | $ | 238,365 | | | $ | 42,422 |
| | | | | | | | | | | | | | | | | | | | | | |
Exercise of stock options | | 155,139 | | | — | | | 638 | | | — | | | | — | | | 638 | | | | — |
Stock-based compensation expense | | — | | | — | | | 2,715 | | | — | | | | — | | | 2,715 | | | | — |
Stock-based compensation income tax benefits | | — | | | — | | | 53 | | | — | | | | — | | | 53 | | | | — |
Net income | | — | | | — | | | — | | | 3,038 | | | | — | | | 3,038 | | | | 3,038 |
Translation adjustment | | — | | | — | | | — | | | — | | | | 5,197 | | | 5,197 | | | | 5,197 |
| | | | | | | | | | | | | | | | | | | | | | |
Balance at September 30, 2007 | | 24,598,510 | | $ | 2 | | $ | 108,872 | | $ | 132,532 | | | $ | 8,600 | | $ | 250,006 | | | $ | 8,235 |
| | | | | | | | | | | | | | | | | | | | | | |
Exercise of stock options | | 413,139 | | | — | | | 2,182 | | | — | | | | — | | | 2,182 | | | | — |
Stock-based compensation expense | | — | | | — | | | 3,423 | | | — | | | | — | | | 3,423 | | | | — |
Stock-based compensation income tax benefits | | — | | | — | | | 1,623 | | | — | | | | — | | | 1,623 | | | | — |
Net Income | | — | | | — | | | — | | | 40,479 | | | | — | | | 40,479 | | | | 40,479 |
Translation adjustment | | — | | | — | | | — | | | — | | | | 12,846 | | | 12,846 | | | | 12,846 |
Cumulative effect of adoption of FIN 48 | | — | | | — | | | — | | | (241 | ) | | | — | | | (241 | ) | | | — |
| | | | | | | | | | | | | | | | | | | | | | |
Balance at September 30, 2008 | | 25,011,649 | | $ | 2 | | $ | 116,100 | | $ | 172,770 | | | $ | 21,446 | | $ | 310,318 | | | $ | 53,325 |
| | | | | | | | | | | | | | | | | | | | | | |
The accompanying notes are an integral part of these consolidated financial statements.
47
MULTI-FINELINE ELECTRONIX, INC.
CONSOLIDATED STATEMENTS OF CASH FLOWS
(In Thousands)
| | | | | | | | | | | | |
| | | Years Ended September 30, | |
| | | 2008 | | | 2007 | | | 2006 | |
Cash flows from operating activities | | | | | | | | | | | | |
Net income | | $ | 40,479 | | | $ | 3,038 | | | $ | 40,357 | |
Adjustments to reconcile net income to net cash provided by operating activities | | | | | | | | | | | | |
Depreciation and amortization | | | 31,150 | | | | 20,447 | | | | 14,473 | |
Provision for doubtful accounts | | | 216 | | | | 696 | | | | 3 | |
Deferred income taxes | | | (4,462 | ) | | | (725 | ) | | | (2,423 | ) |
Stock-based compensation expense | | | 3,423 | | | | 2,715 | | | | 1,984 | |
Impairment of long term investments | | | 1,162 | | | | — | | | | — | |
Impairments | | | 2,450 | | | | — | | | | — | |
Loss on disposal of equipment | | | 718 | | | | 190 | | | | 107 | |
Changes in operating assets and liabilities | | | | | | | | | | | | |
Accounts receivable | | | (37,000 | ) | | | (15,492 | ) | | | (38,032 | ) |
Inventories | | | 8,360 | | | | (6,994 | ) | | | (11,455 | ) |
Due to/from affiliates, net | | | 5,592 | | | | (120 | ) | | | 237 | |
Other current assets | | | 842 | | | | (1,479 | ) | | | (345 | ) |
Other assets | | | (4,146 | ) | | | 4,127 | | | | (3,610 | ) |
Accounts payable | | | 8,137 | | | | 41,791 | | | | 12,173 | |
Accrued liabilities | | | 6,259 | | | | 1,941 | | | | 2,031 | |
Income tax payable | | | 11,327 | | | | (3,370 | ) | | | 923 | |
Other liabilities | | | 7,832 | | | | (75 | ) | | | (116 | ) |
| | | | | | | | | | | | |
Net cash provided by operating activities | | | 82,339 | | | | 46,690 | | | | 16,307 | |
| | | | | | | | | | | | |
Cash flows from investing activities | | | | | | | | | | | | |
Proceeds from sales and (purchases) of short-term investments | | | (6,300 | ) | | | 12,355 | | | | (3,265 | ) |
Cash paid for property and equipment | | | (45,949 | ) | | | (55,711 | ) | | | (34,552 | ) |
Purchases of software and capitalized internal-use software | | | (1,183 | ) | | | (195 | ) | | | (461 | ) |
Deposits on property and equipment | | | (2,086 | ) | | | (1,713 | ) | | | (3,217 | ) |
Proceeds from sale of equipment | | | 300 | | | | 369 | | | | 569 | |
Increase (decrease) in restricted cash, net | | | 2,490 | | | | (188 | ) | | | (157 | ) |
| | | | | | | | | | | | |
Net cash used in investing activities | | | (52,728 | ) | | | (45,083 | ) | | | (41,083 | ) |
| | | | | | | | | | | | |
Cash flows from financing activities | | | | | | | | | | | | |
Borrowings on line of credit | | | — | | | | — | | | | 12,000 | |
Payments on line of credit | | | — | | | | (4,000 | ) | | | (8,000 | ) |
Income tax benefit related to stock option exercise | | | 1,623 | | | | 53 | | | | 3,356 | |
Proceeds from exercise of options | | | 2,182 | | | | 638 | | | | 1,562 | |
| | | | | | | | | | | | |
Net cash provided by (used in) financing activities | | | 3,805 | | | | (3,309 | ) | | | 8,918 | |
| | | | | | | | | | | | |
Effect of exchange rate changes on cash | | | 719 | | | | 5,197 | | | | 2,065 | |
Net increase (decrease) in cash | | | 34,135 | | | | 3,495 | | | | (13,793 | ) |
Cash and cash equivalents at beginning of year | | | 27,955 | | | | 24,460 | | | | 38,253 | |
| | | | | | | | | | | | |
Cash and cash equivalents at end of year | | | 62,090 | | | $ | 27,955 | | | $ | 24,460 | |
| | | | | | | | | | | | |
Supplemental disclosure | | | | | | | | | | | | |
Interest paid | | $ | 152 | | | $ | 248 | | | $ | 68 | |
Income taxes paid | | $ | 10,839 | | | $ | 2,073 | | | $ | 17,504 | |
The accompanying notes are an integral part of these consolidated financial statements.
48
MULTI-FINELINE ELECTRONIX, INC.
NOTES TO CONSOLIDATED FINANCIAL STATEMENTS
(In Thousands, Except Per Share and Share Data)
1. Basis of Presentation and Significant Accounting Policies
Description of the Company
Multi-Fineline Electronix, Inc. (“MFLEX” or the “Company”) was incorporated in 1984 in the State of California and reincorporated in the State of Delaware in June 2004. The Company is primarily engaged in the engineering, design and manufacture of flexible printed circuit boards along with related component assemblies.
Affiliates and subsidiaries of WBL Corporation Limited (collectively “Wearnes”), a Singapore company, owned approximately 59%, 60% and 61% of the Company’s outstanding common stock as of September 30, 2008, 2007 and 2006, respectively, allowing Wearnes to exercise operating control over the Company.
Principles of Consolidation
The consolidated financial statements include the accounts of the Company and its wholly owned subsidiaries. The Company has two wholly owned subsidiaries located in China: Multi-Fineline Electronix (Suzhou) Co., Ltd. (“MFC1”), and Multi-Fineline Electronix (Suzhou No. 2) Co., Ltd. (“MFC2”); one located in the Cayman Islands: M-Flex Cayman Islands Inc.; one located in Singapore: Multi-Fineline Electronix Singapore Pte. Ltd.; one located in Malaysia: Multi-Fineline Electronix Malaysia Sdn. Bhd.; and one located in Arizona: Aurora Optical, Inc. (“Aurora Optical”). All significant intercompany transactions and balances have been eliminated in consolidation.
Use of Estimates
The preparation of financial statements in conformity with accounting principles generally accepted in the United States of America requires management to make estimates and assumptions that affect the reported amounts of assets and liabilities and the disclosure of contingent assets and liabilities at the date of the financial statements and the reported amounts of revenues and expenses during the reporting period. Estimates are used in the determination of accounts receivable allowances, valuation of inventory, warranty reserves, valuation of the Company’s common stock options and income tax contingencies. Actual results could differ from those estimates.
Cash Equivalents
The Company considers all highly liquid investments with a maturity of three months or less when purchased to be cash equivalents. Cash equivalents as of September 30, 2008 and 2007 consisted of money market funds.
Investments
The Company’s long-term investments represent auction rate securities in debt obligations, which are collateralized by student loans. These auction rate securities were intended to provide liquidity via an auction process that reset the applicable interest rate at predetermined calendar intervals (twenty eight days), allowing investors to either roll over their holdings or gain immediate liquidity by selling such interests at par. In fiscal 2008, the Company began experiencing failed auctions for the auction rate securities that have gone to auction, resulting in the Company’s inability to sell these securities. The valuation of the Company’s investment portfolio is subject to uncertainties that are difficult to predict. Factors that may impact its valuation include changes to credit ratings of the securities as well as to the underlying assets supporting those securities, rates of default of the underlying assets, underlying collateral value, market interest rates, discount rates and ongoing strength. Market variables utilized in developing the valuation model for these securities include relative yields on federal student loan securities, average 90 day T-Bill rates, 90 day LIBOR rates, interest rate spreads as determined by
49
the changing credit market environment and quality of market credit and liquidity. The Company has historically classified these securities as short-term investments. However, based on the lack of liquidity related to these investments, as described above, in the second quarter of fiscal 2008, the Company re-classified these investments as long-term assets. As of September 30, 2008, the fair value of these securities of $12,138 was determined using a model that calculates the present value of the expected future cash flows from the securities and other indications of value, using the factors previously described.
The Company reviews impairments associated with the above in accordance with Emerging Issues Task Force (“EITF”) 03-1 and FSP Statement on Financial Accounting Standard (“SFAS”) 115-1 and 124-1, The Meaning of Other-Than-Temporary-Impairment and Its Application to Certain Investments, to determine the classification of the impairment as “temporary” or “other-than-temporary.” The factors evaluated to differentiate between temporary and other-than-temporary include the projected future cash flows, credit ratings actions and the assessment of the credit quality of the underlying collateral. The Company analyzed recent changes and trends in the financial and credit markets and specific factors that impacted student loan based auction rate securities during the Company’s fiscal fourth quarter. Most notably the rates on 90 day treasuries fell sharply due to the high market interest in these securities as being a “safe” investment. The interest rate caps on many of the student loan issues are structured such that the spread of 120 basis points added to the 90 day treasury rate makes the current yield on these issues extremely low, thereby making them unattractive compared to most other alternative debt issues available in the market place. Due to these changing circumstances, the Company determined that the impairment of its investments was of an other-than-temporary nature and, accordingly, a charge of $1,200 was recorded in the September 30, 2008 consolidated statement of income.
Fair Value of Financial Instruments
The carrying amounts of the Company’s financial instruments, including cash and cash equivalents, accounts receivable, accounts payable and accrued liabilities, approximate fair value due to their short maturities. There are no borrowings outstanding as of September 30, 2008 and 2007.
Concentrations of Credit Risk
Financial instruments that potentially subject the Company to significant concentrations of credit risk consist primarily of cash, to the extent balances exceed limits that are insured by the Federal Deposit Insurance Corporation, and accounts receivable. The Company maintains its cash with major financial institutions. Credit risk exists because the Company’s flexible printed circuit boards and related component assemblies are sold to a limited number of customers (Note 9). The Company does not require collateral and maintains reserves for potential credit losses. Such losses have historically been within management’s expectations.
Accounts Receivable
The Company records revenue in accordance with the terms of the sale, which is generally at shipment. Accounts receivable are recorded at the invoiced amount, and do not bear interest. The allowance for doubtful accounts is the Company’s best estimate of the amount of probable credit losses in existing accounts receivable. The Company determines the allowance based on historical write-off experience as well as specific identification of credit issues with invoices. The Company reviews the allowance for doubtful accounts quarterly. Past due balances over 90 days and over a specified amount are reviewed individually for collectability. All other balances are reviewed on an aggregate basis. Account balances are charged off against the allowance when the Company determines it is probable the receivable will not be collected. The Company does not have any off-balance sheet credit exposure related to its customers.
Inventories
Inventories are stated at the lower of cost or market, cost being determined on a first-in, first-out basis. The Company records a provision for excess and obsolete inventory based on historical usage and expected future product demand.
50
Property, Plant and Equipment
Property, plant, and equipment are stated at cost, less accumulated depreciation. Depreciation is recorded using the straight-line method over the estimated useful lives of the assets as follows:
| | |
| Building | | 30 - 39 years |
| Machinery and equipment | | 3 - 10 years |
| Furniture and fixtures | | 5 years |
| Leasehold improvements | | Shorter of 10 years or life of lease |
Leasehold improvements are amortized over the shorter of their estimated useful lives or the term of the related lease. Maintenance, repairs and minor renewals are charged to expense as incurred. Additions, major renewals and betterments to property and equipment are capitalized. The cost of assets and related accumulated depreciation are removed from the balance sheet when such assets are disposed of, and any related gains or losses are included in operating expenses.
The Company reviews its long-lived assets for impairment whenever events or changes in circumstances indicate the carrying amount of such assets may not be recoverable. Recoverability of these assets is determined by comparing the forecasted undiscounted cash flows attributable to such assets, including any cash flows upon their eventual disposition, to their carrying value. If the carrying value of the assets exceeds the forecasted undiscounted cash flows, then the assets are written down to their fair value. As of September 30, 2008, the Company recorded a non-cash charge of $2,000 for long-lived assets impaired by the closure of the Tucson, Arizona facility of Aurora Optical (Note 13). No impairment charges were recorded in the prior year.
Capitalized Software Costs
Costs incurred to develop software for internal use are accounted for in accordance with Statement of Position (“SOP”) No. 98-1,Accounting for the Costs of Computer Software Developed or Obtained for Internal Use. In accordance with SOP No. 98-1, expenses related to preliminary project assessment, research and development, re-engineering, training and application maintenance are expensed as incurred. Costs that qualify for capitalization under SOP No. 98-1 are included in other assets and consist primarily of purchased software, payroll costs and consulting fees related to the development of the internal use software. Capitalized costs commence depreciation when they are put in service and are amortized using the straight-line method over a period of three years.
Goodwill
The Company records the assets acquired and liabilities assumed in business combinations at their respective fair values at the date of acquisition, with any excess purchase price recorded as goodwill. Valuation of intangible assets entails significant estimates and assumptions including, but not limited to, determining the timing and expected costs to complete development projects, estimating future cash flows from product sales, developing appropriate discount rates, estimating probability rates for the successful completion of development projects, continuation of customer relationships and renewal of customer contracts, and approximating the useful lives of the intangible assets acquired.
The Company reviews the recoverability of the carrying value of goodwill on an annual basis every July, or more frequently when an event occurs or circumstances change to indicate that an impairment of goodwill has possibly occurred. The determination of whether any potential impairment of goodwill exists is based upon a comparison of the fair value of the reporting unit to the accounting value of the underlying net assets of such reporting unit. If the fair value of the reporting unit is less than the accounting value of the underlying net assets, goodwill is deemed impaired and an impairment loss is recorded to the extent that the carrying value of goodwill exceeds the difference between the fair value of the reporting unit and the fair value of all its underlying identifiable assets and liabilities. The Company has determined that it has one reporting unit for evaluating its goodwill for impairment. As of September 30, 2008 and 2007, there were no such impairments of goodwill.
51
Revenue Recognition
The Company’s revenues, which the Company refers to as net sales, net of allowance for returns, refunds and credits, which are estimated based on historical experience, are generated from the sale of flexible printed circuit boards and related component assemblies, which are sold to original equipment manufacturers and electronic manufacturing services providers to be included in other electronic products. The Company recognizes revenue when there is persuasive evidence of an arrangement with the customer that states a fixed or determinable sales price, when title and risk of loss transfers, when delivery of the product has occurred in accordance with the terms of the sale and collectability of the related accounts receivable is reasonably assured. The Company does not have any post-shipment obligations (e.g., installation or training), customer acceptance or multiple-element arrangements. The Company’s remaining obligation to its customer after delivery is limited to warranty on its product.
Shipping and Handling Costs
Shipping cost related to products shipped utilizing a customer specified shipping service is paid directly by the customer. Products that are not shipped utilizing customer shipping services are charged by the Company to its customers and are included in net sales. Shipping and handling costs incurred by the Company are expensed as incurred and are recorded as a component of cost of sales.
Product Warranty Accrual
The Company warrants its products from 2 to 36 months. The standard warranty requires the Company to replace defective products returned to the Company at no cost to the customer. The Company records an estimate for warranty related costs at the time revenue is recognized based on historical amounts incurred for warranty expense and historical return rates. The warranty accrual is included in accrued liabilities in the accompanying condensed consolidated balance sheets.
Changes in the product warranty accrual for the years ended September 30, 2008, 2007 and 2006 was as follows:
| | | | | | | | | | | | | |
| | | Warranty
Accrual
Balance at
October 1 | | Warranty
Expenditures | | | Provision for
Estimated
Warranty Cost | | Warranty
Accrual
Balance at
September 30 |
2008 | | $ | 1,673 | | $ | (4,354 | ) | | $ | 5,282 | | $ | 2,601 |
2007 | | $ | 1,285 | | $ | (4,779 | ) | | $ | 5,167 | | $ | 1,673 |
2006 | | $ | 1,439 | | $ | (3,549 | ) | | $ | 3,395 | | $ | 1,285 |
Research and Development
Research and development costs are incurred in the development of new products and processes, including significant improvements and refinements to existing products and are expensed as incurred.
Income Taxes
Income taxes are computed using the asset and liability method. Under this method, deferred income taxes are recognized by applying enacted statutory tax rates applicable to future years to differences between the tax bases and financial reporting amounts of existing assets and liabilities. Valuation allowances are established when it is more likely than not that such deferred tax assets will not be realized. The Company does not file a consolidated return with its foreign wholly owned subsidiaries.
In July 2006, the Financial Accounting Standards Board (“FASB”) issued FASB Interpretation No. 48,Accounting for Uncertainty in Income Taxes, an interpretation of FASB Statement No. 109(“FIN 48”), which prescribes a recognition threshold and a measurement attribute for the financial statement recognition and
52
measurement of tax positions taken or expected to be taken in a tax return. For those benefits to be recognized, a tax position must be more likely than not to be sustained upon examination by taxing authorities, based on the technical merits of the position. The amount recognized is measured as the largest amount of benefit that has a greater than 50 percent likelihood of being realized upon ultimate settlement. As of October 1, 2007, the Company adopted FIN48 and recognizes potential accrued interest and penalties related to unrecognized tax benefit in income tax expense.
Comprehensive Income
Comprehensive income is defined as the change in equity (net assets) of a business enterprise during a period from transactions and other events and circumstances from non-owner sources. The difference between net income and comprehensive income for the years ended September 30, 2008, 2007 and 2006 was comprised entirely of the Company’s foreign currency translation adjustment.
Foreign Currency
The functional currency of the Company’s foreign subsidiaries is either the local currency or if the predominant transaction currency is “United States Dollars”, then United States Dollars will be the functional currency. Balances are translated into United States Dollars using the exchange rate at each balance sheet date for assets and liabilities and an average exchange rate for each period for statement of income amounts. Currency translation adjustments are recorded in other comprehensive income, a component of stockholders’ equity.
Foreign currency transactions occur when there is a receivable or payable denominated in other than the respective entity’s functional currency. The Company records the changes in the exchange rate for these transactions in the consolidated statements of income. For the years ended September 30, 2008, 2007 and 2006, foreign exchange transaction gains and losses were included in other expenses and were a net loss of $1,690, net gain of $178, and a net loss of $306, respectively.
Accounting for Stock-Based Compensation
The Company accounts for share-based payments under the fair value recognition provisions of SFAS No. 123R,Share Based Payment: An Amendment of FASB Statements No. 123 and 95(“SFAS 123R”), utilizing the modified-prospective-transition method, as prescribed by SFAS 123R. Under that transition method, compensation cost recognized during the year ended September 30, 2006 includes: (a) compensation cost for all share-based payments granted prior to, but not yet vested as of October 1, 2005, based on the grant date fair value estimated in accordance with SFAS 123R, adjusted for an estimated future forfeiture rate, and (b) compensation cost for all share-based payments granted subsequent to October 1, 2005, based on the grant-date fair value estimated in accordance with the provisions of SFAS 123R. Under the modified-prospective-transition method, results for the prior periods have not been restated. See Note 11 for further discussion of stock-based compensation.
Net Income Per Share—Basic and Diluted
Basic earnings per share are computed by dividing net income by the weighted average number of common shares outstanding. In computing diluted earnings per share, the weighted average number of shares outstanding is adjusted to reflect the effect of potentially dilutive securities. The impact of potentially dilutive securities is determined using the treasury stock method.
53
The following table presents a reconciliation of basic and diluted income per share:
| | | | | | |
| | | Years Ended September 30, |
| | | 2008 | | 2007 | | 2006 |
Basic weighted-average number of common shares outstanding | | 24,828,732 | | 24,520,040 | | 24,353,854 |
Dilutive effect of outstanding stock options | | 604,944 | | 644,361 | | 961,694 |
| | | | | | |
Diluted weighted-average number of common and potential common shares outstanding | | 25,433,676 | | 25,164,401 | | 25,315,548 |
| | | | | | |
Potential common shares excluded from the per share calculation because the effect of their inclusion would be anti-dilutive | | 113,025 | | 192,384 | | 58,882 |
| | | | | | |
Recent Accounting Pronouncements
In September 2006, the FASB issued SFAS No. 157, Fair Value Measurements(“SFAS 157”). SFAS 157 defines fair value, establishes a framework for measuring fair value under generally accepted accounting principles, and expands disclosures about fair value measurements. SFAS 157 is effective for fiscal years beginning after November 15, 2007 and interim periods within those fiscal years. During 2007, the FASB became aware of numerous implementation issues as companies worked to prepare to adopt SFAS 157. Accordingly, the FASB agreed in February 2008 to a one-year deferral of the effective date for nonfinancial assets and liabilities that are recognized or disclosed at fair value on a nonrecurring basis, e.g., those measured at fair value in a business combination. SFAS 157 will be adopted by the Company beginning in the first quarter of fiscal 2009, effective October 1, 2008, and the Company does not expect that SFAS 157 will have a material impact on its consolidated financial statements.
In February 2007, the FASB issued SFAS No. 159, The Fair Value Option for Financial Assets and Financial Liabilities(“SFAS 159”). SFAS 159 permits companies to make a one-time election to carry eligible types of financial assets and liabilities at fair value, even if fair value measurement is not required under generally accepted accounting principles in the United States (“U.S. GAAP”). SFAS 159 will be adopted by the Company beginning in the first quarter of fiscal 2009, effective October 1, 2008, and the Company does not expect that SFAS 159 will have a material impact on its consolidated financial statements.
In December 2007, the FASB issued SFAS No. 141 (Revised 2007), Business Combinations (“SFAS 141R”). SFAS 141R establishes principles and requirements for how the acquiror of a business recognizes and measures in its financial statements the identifiable assets acquired, the liabilities assumed, and any non-controlling interest in the acquiree. SFAS 141R also provides guidance for recognizing and measuring the goodwill acquired in the business combination and determines what information to disclose to enable users of the financial statements to evaluate the nature and financial effects of the business combination. This statement applies prospectively to business combinations for which the acquisition date is on or after the beginning of the first annual reporting period beginning December 15, 2008, which is October 1, 2009 for the Company. The Company is currently evaluating the impact of the provisions of SFAS 141R on its consolidated financial statements.
In December 2007, the FASB issued SFAS No. 160, Non-controlling Interests in Consolidated Financial Statements—An Amendment of ARB No. 51 (“SFAS 160”). SFAS 160 establishes new accounting and reporting standards for a non-controlling interest in a subsidiary and for the deconsolidation of a subsidiary. It clarifies that a non-controlling interest in a subsidiary is an ownership interest in the consolidated entity that should be reported as equity in the consolidated financial statements. SFAS No. 160 is effective for the Company beginning October 1, 2009. The Company does not believe that SFAS 160 will have an impact on its consolidated financial statements.
In March 2008, the FASB issued SFAS No. 161, Disclosures about Derivative Instruments and Hedging Activities—an amendment of FASB Statement No. 133 (“SFAS 161”). SFAS 161 changes the disclosure
54
requirements for derivative instruments and hedging activities. Entities are required to provide enhanced disclosures about (a) how and why an entity uses derivative instruments, (b) how derivative instruments and related hedged items are accounted for under FASB Statement 133 and its related interpretations, and (c) how derivative instruments and related hedged items affect an entity’s financial position, financial performance, and cash flows. The guidance in SFAS 161 is effective for financial statements issued for fiscal years and interim periods beginning November 15, 2008 for the Company, with early application encouraged. This Statement encourages, but does not require, comparative disclosures for earlier periods at initial adoption. The Company does not believe that SFAS 161 will have an impact on its consolidated financial statements.
In May 2008, the FASB issued SFAS No. 162,The Hierarchy of Generally Accepted Accounting Principles(“SFAS 162”). SFAS 162 is intended to improve financial reporting by identifying a consistent framework, or hierarchy, for selecting accounting principles to be used in preparing financial statements that are presented in conformity with U.S. GAAP for nongovernmental entities in the United States. SFAS 162 is effective 60 days following SEC approval of the Public Company Accounting Oversight Board Auditing amendments to AU Section 411, The Meaning of Present Fairly in Conformity with Generally Accepted Accounting Principles. The Company is currently evaluating the impact the provisions of SFAS 162 will have on its consolidated financial statements.
2. Restricted Cash
Restricted cash consists of funds held in short-term deposits that are legally restricted as to withdrawal. Restricted cash of $1 and $2,343 as of September 30, 2008 and 2007, respectively, was on deposit with various banks in China to secure the Company’s customs reporting activities.
The Company also had restricted cash of $203 and $135 as of September 30, 2008 and 2007, respectively, held at the direction of the County of Orange, California, to finance environmental clean-up costs, estimated by the Company and approved by the County, in the event the Company vacates its Anaheim, California manufacturing facilities. During fiscal year 2008, the Company updated its environmental clean-up cost analysis and accordingly increased its restricted cash deposit. The Company is not a party to any environmental claims. As of September 30, 2008, the Company believes the amount held as restricted cash is sufficient to pay environmental clean-up costs that may exist, if any, should the Company vacate its facilities.
3. Related Party Transactions
During the years ended September 30, 2008, 2007 and 2006, the Company has recognized revenue and recorded purchases from the following affiliated companies: (a) MFS Technology Pte. Ltd. (“MFS”); and (b) MFS Technologies (Hunan) Co. Ltd., a subsidiary of MFS. As discussed in Note 1, Wearnes owns 59% and 60% of the Company’s common stock as of September 30, 2008 and 2007, respectively. MFS is an indirect subsidiary of Wearnes.
Sales to and purchases from affiliates comprise the following:
| | | | | | | | | |
| | | Years Ended September 30, |
| | | 2008 | | 2007 | | 2006 |
Sales to affiliates: | | | | | | | | | |
MFS Technologies (Hunan) Co. Ltd. | | $ | 2,660 | | $ | — | | $ | — |
MFS | | | — | | | — | | | 25 |
| | | | | | | | | |
| | $ | 2,660 | | $ | — | | $ | 25 |
| | | | | | | | | |
Purchases from affiliates: | | | | | | | | | |
MFS | | $ | 8,982 | | $ | — | | $ | — |
| | | | | | | | | |
| | $ | 8,982 | | $ | — | | $ | — |
| | | | | | | | | |
55
Rent expense for the years ended September 30, 2008, 2007 and 2006 included related-party payments to various Wearnes subsidiaries of $257, $116 and $74, respectively. As of September 30, 2008, 2007 and 2006, the Company leased 239, 61 and 62 square feet of office and manufacturing space from Wearnes related parties.
Net amounts due from/to affiliated companies comprise the following:
| | | | | | |
| | | September 30, |
| | | 2008 | | 2007 |
Due from Affiliates | | | | | | |
MFS Technologies (Hunan) Co. Ltd. | | $ | 1,130 | | $ | — |
| | | | | | |
| | $ | 1,130 | | $ | — |
| | | | | | |
| | | | | | |
| | | September 30, |
| | | 2008 | | 2007 |
Due to affiliates | | | | | | |
Suzhou Wearnes-Xirlink Electric Co. Ltd. | | $ | — | | $ | 30 |
MFS | | | 3,138 | | | — |
| | | | | | |
| | $ | 3,138 | | $ | 30 |
| | | | | | |
4. Composition of Certain Balance Sheet Components
Inventories comprise the following:
| | | | | | |
| | | September 30, |
| | | 2008 | | 2007 |
Raw materials and supplies | | $ | 21,503 | | $ | 25,436 |
Work-in-progress | | | 24,729 | | | 26,341 |
Finished goods | | | 13,542 | | | 11,647 |
| | | | | | |
| | $ | 59,774 | | $ | 63,424 |
| | | | | | |
Property, plant, and equipment, net, comprise the following:
| | | | | | | | |
| | | September 30, | |
| | | 2008 | | | 2007 | |
Land | | $ | 4,054 | | | $ | 4,054 | |
Building | | | 37,530 | | | | 39,483 | |
Machinery and equipment | | | 192,188 | | | | 141,129 | |
Furniture and fixtures | | | 1,750 | | | | 5,131 | |
Leasehold improvements | | | 16,552 | | | | 2,703 | |
| | | | | | | | |
| | $ | 252,074 | | | $ | 192,500 | |
Accumulated depreciation and amortization | | | (91,857 | ) | | | (58,867 | ) |
| | | | | | | | |
| | $ | 160,217 | | | $ | 133,633 | |
| | | | | | | | |
Depreciation expense for the years ended September 30, 2008, 2007 and 2006, was $30,371, $19,956 and $13,821, respectively.
Included in other assets as of September 30, 2008 and 2007 is capitalized purchased software and internally developed software costs. Amortization of software costs for the years ended September 30, 2008, 2007 and 2006 was $779, $491 and $652, respectively.
56
In addition, included in other assets as of September 30, 2008 and 2007 is $2,086 and $1,713, respectively, of deposits on equipment to be purchased.
Accrued liabilities comprise the following:
| | | | | | |
| | | September 30, |
| | | 2008 | | 2007 |
Wages and compensation | | $ | 12,704 | | $ | 7,200 |
Warranty accrual | | | 2,601 | | | 1,673 |
Other taxes | | | 585 | | | 578 |
Other | | | 7,048 | | | 5,543 |
| | | | | | |
| | $ | 22,938 | | $ | 14,994 |
| | | | | | |
5. Investment—Cornerstone
In June 2004, the Company entered into a definitive agreement with Cornerstone Equipment Management, Inc. (“Cornerstone”), in which the Company agreed to invest $450 in exchange for shares equal to approximately 14% of the ownership of Cornerstone. In addition, the Company agreed to provide certain services to Cornerstone at the Company’s standard terms and conditions. The Company accounts for its investment in Cornerstone using the cost method of accounting and periodically reviews the investment for other-than-temporary declines in fair value, as defined in SFAS 115-1 and 124-1,The Meaning of Other Than-Temporary-Impairment and Its Application to Certain Investments. Fair value for this investment is evaluated based on several factors including: recent financial information, cash position, historical and forecasted financial and business information, and estimates of fair value of the Cornerstone common stock or potential new investments in Cornerstone by third parties. Based on the information acquired through these sources, the Company believes that the value of this investment experienced a decline in value during the second quarter of fiscal year 2008 that is other-than-temporary, which resulted in a recognized loss of $450 that was included in other income (expense), net for the year ended September 30, 2008.
6. Income Taxes
United States and foreign (loss) income before taxes are as follows:
| | | | | | | | | | |
| | | Years Ended September 30, |
| | | 2008 | | 2007 | | | 2006 |
United States | | $ | 42,677 | | $ | (5,261 | ) | | $ | 45,685 |
Foreign | | | 20,325 | | | 6,381 | | | | 12,892 |
| | | | | | | | | | |
| | $ | 63,002 | | $ | 1,120 | | | $ | 58,577 |
| | | | | | | | | | |
57
The (benefit from) provision for income taxes consisted of the following components:
| | | | | | | | | | | | |
| | | Years Ended September 30, | |
| | | 2008 | | | 2007 | | | 2006 | |
Current | | | | | | | | | | | | |
Federal | | $ | 19,141 | | | $ | (2,732 | ) | | $ | 16,399 | |
State | | | 2,122 | | | | (69 | ) | | | 2,317 | |
Foreign | | | 6,054 | | | | 1,608 | | | | 1,927 | |
| | | | | | | | | | | | |
| | $ | 27,317 | | | $ | (1,193 | ) | | $ | 20,643 | |
| | | | | | | | | | | | |
Deferred | | | | | | | | | | | | |
Federal | | $ | (2,179 | ) | | $ | 421 | | | $ | (1,799 | ) |
State | | | (69 | ) | | | (67 | ) | | | (89 | ) |
Foreign | | | (2,545 | ) | | | (1,079 | ) | | | (535 | ) |
| | | | | | | | | | | | |
| | | (4,793 | ) | | | (725 | ) | | | (2,423 | ) |
| | | | | | | | | | | | |
| | $ | 22,524 | | | $ | (1,918 | ) | | $ | 18,220 | |
| | | | | | | | | | | | |
Deferred tax assets and (liabilities) comprise the following:
| | | | | | | | |
| | | September 30, | |
| | | 2008 | | | 2007 | |
Deferred tax assets | | | | | | | | |
Inventory | | $ | 2,605 | | | $ | 2,432 | |
Depreciation | | | 2,716 | | | | 1,559 | |
Stock-based compensation | | | 1,494 | | | | 940 | |
Accrued expenses | | | 1,058 | | | | 472 | |
Allowance for doubtful accounts | | | 591 | | | | 506 | |
Warranty reserve | | | 1,021 | | | | 658 | |
Capital loss carryforward | | | 329 | | | | 59 | |
Net operating loss | | | 973 | | | | 299 | |
Investments | | | 633 | | | | 272 | |
Asset impairment | | | 786 | | | | — | |
State taxes | | | 697 | | | | — | |
Other | | | 68 | | | | 85 | |
| | | | | | | | |
Subtotal deferred tax assets | | | 12,971 | | | | 7,282 | |
Valuation allowance | | | (962 | ) | | | (331 | ) |
| | | | | | | | |
Total deferred tax assets | | | 12,009 | | | | 6,951 | |
| | | | | | | | |
Deferred tax liabilities | | | | | | | | |
Depreciation | | | (261 | ) | | | (419 | ) |
Amortization | | | (212 | ) | | | (108 | ) |
State taxes | | | — | | | | (166 | ) |
Other | | | (1 | ) | | | — | |
| | | | | | | | |
Total deferred tax liabilities | | | (474 | ) | | | (693 | ) |
| | | | | | | | |
Net deferred tax assets | | $ | 11,535 | | | $ | 6,258 | |
| | | | | | | | |
The Company established a valuation allowance of approximately $962 and $331 as of September 30, 2008 and 2007, respectively. The valuation allowance is comprised of capital loss carryforwards and deferred income tax benefits attributable to the Company’s investments. There is an uncertainty regarding the future realization of these deferred tax assets and management has determined that it is more likely than not that it will not receive future tax benefits.
58
As of September 30, 2008 and 2007, the Company had net operating loss carryforwards for state tax purposes of approximately $0, and $2,572, respectively. In addition, the Company had net operating loss carryforwards for foreign tax purposes of approximately $3,891 and $797, respectively. These net operating loss carryforwards will begin to expire in 2012 for foreign tax purposes.
The (benefit from) provision for income taxes differs from the amount obtained by applying the statutory tax rate as follows:
| | | | | | | | | |
| | | Years Ended September 30, | |
| | | 2008 | | | 2007 | | | 2006 | |
Provision for income taxes at statutory rate | | 35.0 | % | | 35.0 | % | | 35.0 | % |
Increase (decrease) in taxes resulting from: | | | | | | | | | |
State taxes, net of federal benefit | | 2.3 | % | | (7.9 | )% | | 2.5 | % |
Foreign tax credit | | (0.2 | )% | | (96.4 | )% | | (1.6 | )% |
Foreign rate variance | | (5.7 | )% | | (152.2 | )% | | (5.3 | )% |
Nondeductible expenses | | 0.3 | % | | 4.1 | % | | 0.1 | % |
Return to provision adjustments | | 0.0 | % | | 7.2 | % | | 0.2 | % |
IRS exam | | 0.0 | % | | 18.9 | % | | 0.0 | % |
Tax contingency reserve | | 3.2 | % | | 17.7 | % | | 0.0 | % |
Other | | 0.9 | % | | 2.4 | % | | 0.2 | % |
| | | | | | | | | |
| | 35.8 | % | | (171.2 | )% | | 31.1 | % |
| | | | | | | | | |
The Company currently enjoys tax holidays and other tax incentives for its operations in China. The tax holiday rate of 12% for the Company’s first manufacturing facility in China, MFC1, expired on December 31, 2007, and MFC1 is now subject to an income tax rate of 25%, based on current law.
The Company has obtained two tax holidays for its second manufacturing facility in China, MFC2. The first tax holiday, which commenced in 2004, allows for tax-free operation for the first two years (beginning in the first year of profitability) followed by three years of operation at a reduced rate of income tax equal to 12.5% on the profits generated from the original registered capital. The second tax holiday, which commenced in 2006, allows for tax-free operation for the first two years followed by three years of operation at a reduced rate of income tax equal to 12.5% on the profits generated from the increased capital. On February 1, 2008, MFC2 became subject to a tax holiday rate of 12.5% on both the original and increased capital. However, these tax holidays may be challenged, modified or even eliminated by taxing authorities or changes in law.
Had the Company not received the tax holiday for its operations in China, net income for the years ended September 30, 2008, 2007 and 2006 would have been decreased to the pro forma amounts below:
| | | | | | | | | | | | |
| | | Years Ended September 30, | |
| | | 2008 | | | 2007 | | | 2006 | |
Net income, as reported | | $ | 40,479 | | | $ | 3,038 | | | $ | 40,357 | |
Additional tax in China | | | (6,520 | ) | | | (1,520 | ) | | | (4,373 | ) |
Pro forma net income | | $ | 33,959 | | | $ | 1,518 | | | $ | 35,984 | |
Net income per share | | | | | | | | | | | | |
Basic, as reported | | $ | 1.63 | | | $ | 0.12 | | | $ | 1.66 | |
Basic, pro forma | | $ | 1.37 | | | $ | 0.06 | | | $ | 1.48 | |
Diluted, as reported | | $ | 1.59 | | | $ | 0.12 | | | $ | 1.59 | |
Diluted, pro forma | | $ | 1.34 | | | $ | 0.06 | | | $ | 1.42 | |
Undistributed earnings of the Company’s foreign subsidiaries amounted to approximately $73,120, $55,643 and $48,811 for the years ended September 30, 2008, 2007 and 2006, respectively. Those earnings are considered to be permanently reinvested and, accordingly, no provision for U.S. federal and state taxes has been provided
59
thereon. Upon repatriation of those earnings in the form of dividends or otherwise, the Company would be subject to both U.S. income taxes and withholding taxes payable to the foreign country. It is not practical to estimate the amount of unrecognized deferred U.S. taxes on those undistributed earnings.
As of October 1, 2007, the Company adopted FIN 48. FIN 48 prescribes a recognition threshold and a measurement attribute for the financial statement recognition and measurement of tax positions taken or expected to be taken in a tax return. For those benefits to be recognized, a tax position must be more likely than not to be sustained upon examination by taxing authorities, based on the technical merits of the position. The amount recognized is measured as the largest amount of benefit that has a greater than 50 percent likelihood of being realized upon ultimate settlement. As a result of the implementation of FIN 48, the Company recognized a $241 decrease to the October 1, 2007 balance of retained earnings related to adjustments to certain unrecognized tax benefits.
The following is a tabular reconciliation of the total amounts of unrecognized tax benefits for the year:
| | | | |
Unrecognized tax benefit at October 1, 2007 | | $ | 5,070 | |
Increases for positions taken in current period | | | 4,554 | |
Increases for positions taken in prior period | | | 3,507 | |
(Decreases) for positions taken in prior period | | | (67 | ) |
(Decreases) for settlement with taxing authorities | | | (164 | ) |
Decreases for lapse in applicable statute of limitations | | | — | |
| | | | |
Unrecognized tax benefit at September 30, 2008 | | $ | 12,900 | |
| | | | |
As of September 30, 2008, the Company had $12,900 of unrecognized tax benefits on the balance sheet, of which $6,190, if recognized, would affect the effective tax rate, and $6,710, if recognized, would reduce the Company’s deferred tax assets or other tax receivables. The Company expects a reduction of approximately $2,800 of unrecognized tax benefits within the next 12 months primarily due to expiration of statutes of limitation and audit settlement. The Company anticipates that there will be other changes to the unrecognized tax benefit associated with uncertain tax positions due to the expiration of statutes of limitation, payment of tax on amended returns, audit settlements and other changes in reserves. However, due to the uncertainty regarding the timing of these events, a current estimate of the range of other changes that may occur within the next twelve months cannot be made.
The Company recognizes potential accrued interest and penalties related to unrecognized tax benefit in income tax expense. Related to the unrecognized tax benefits noted above, the Company accrued $228 and ($23) of interest and penalties, respectively during fiscal year 2008 and in total, has recognized a liability of $881 for interest as of September 30, 2008.
The Company and its subsidiaries conduct business globally and, as a result, it or one or more of its subsidiaries file income tax returns in the U.S. federal and various state, local and foreign jurisdictions. With limited exceptions, the Company is no longer subject to U.S. federal tax examinations for years through fiscal 2004. With limited exceptions, the Company is no longer subject to state and foreign income tax examinations by taxing authorities for years through fiscal 2002. The Chinese tax authority is currently auditing MFC1’s income tax returns for tax years 2005 through 2007 and MFC2’s income tax returns for tax years 2004 through 2007.
7. Lines of Credit
In January 2008, the Company’s subsidiaries in China entered into credit line agreements with Bank of China (“BC”) providing for two lines of credit in an aggregate of 200,000 RMB ($29,333 at September 30, 2008). The lines of credit will mature in January 2009 and bear interest at LIBOR (4.052% at September 30, 2008). The credit facility contains covenants restricting the pledging of assets. As of September 30, 2008 and September 30, 2007, the Company had no borrowings outstanding under these lines of credit. In July 2008, the
60
Company’s subsidiaries in China entered into credit line agreements with Shanghai Pudong Development Bank (“SPDB”), which provide for two borrowing facilities, for 75,000 RMB each ($11,000 each at September 30, 2008). The lines of credit will mature in July 2009 and pursuant to such agreements, for so long as MFC1 or MFC2, as applicable, has at least U.S. $3,000 on deposit with SPDB, the interest rate under the applicable credit line will be LIBOR (4.052% at September 30, 2008), minus 15 basis points. Otherwise, interest shall be determined within the scope ruled by the People’s Bank of China and if there is no such rule, as determined by SPDB. The credit facility documents contain covenants restricting the pledging of assets. SPDB also has the right to adjust the MFC1 and MFC2 Credit Lines and the duration of such credit in the event of specified events. These specified events include: (i) a significant adjustment in a country’s currency policy; (ii) significant change in MFC1 or MFC2’s financial position, business environment or marketplace or that of the Company as guarantor; (iii) MFC 1 or MFC2 undergo a significant organizational change such as merger, termination, or divestiture; (iv) MFC1 or MFC2 do not use the facility according to the agreed on terms or violate the terms of the facility, there is damage or loss to pledged assets or hidden assets, withdrawn funds or MFC1 or MFC2 fail to meet its debt obligations; and (v) other occasions or situations where in the analysis of SPDB, situations would lead to the reduction of MFC1 or MFC2’s debt re-payment ability. As of September 30, 2008 and 2007, the Company had no borrowings under this line of credit.
In July 2005, the Company entered into a $15,000 credit facility with Norddeutsche Landesbank Girozentrale (“NLG”). Borrowings under this facility would bear interest at LIBOR plus 2.5% correlating with the time period of the borrowing. Each borrowing under the facility matured six months after the borrowing date with respect to such borrowing. On March 31, 2008 the Company and NLG mutually agreed to terminate this credit facility. A summary of the lines of credit follows:
| | | | | | | | | |
| | | Amounts
Available at
September 30,
2008 | | Amounts
Outstanding at
September 30, |
| | | 2008 | | 2007 |
Line of credit (BC) | | $ | 29,333 | | $ | — | | $ | — |
Line of credit (SPDB) | | | 22,000 | | | — | | | — |
| | | | | | | �� | | |
| | $ | 51,333 | | $ | — | | $ | — |
| | | | | | | | | |
8. Segment Information
Based on the evaluation of the Company’s internal financial information, management believes that the Company operates in one reportable segment which is primarily engaged in the engineering, design and manufacture of flexible circuit boards along with related component assemblies. The Company operates in three geographical areas: domestic (U.S.), China and Singapore. Net sales are presented based on the country in which the sales originate (i.e., where the legal entity is domiciled). The financial results of the Company’s geographic segments are presented on a basis consistent with the consolidated financial statements.
61
Financial information by geographic segment is as follows:
| | | | | | | | | | | | |
| | | Years Ended September 30, | |
| | | 2008 | | | 2007 | | | 2006 | |
Net sales | | | | | | | | | | | | |
United States | | $ | 709,726 | | | $ | 485,088 | | | $ | 477,002 | |
China | | | 519,062 | | | | 307,186 | | | | 251,236 | |
Singapore | | | — | | | | — | | | | — | |
Eliminations | | | (499,983 | ) | | | (284,127 | ) | | | (224,034 | ) |
| | | | | | | | | | | | |
Total | | $ | 728,805 | | | $ | 508,147 | | | $ | 504,204 | |
| | | | | | | | | | | | |
Operating (loss) income | | | | | | | | | | | | |
United States | | $ | 26,017 | | | $ | (17,884 | ) | | $ | 35,900 | |
China | | | 37,978 | | | | 17,575 | | | | 21,649 | |
Singapore | | | (238 | ) | | | — | | | | — | |
Eliminations | | | 406 | | | | — | | | | — | |
| | | | | | | | | | | | |
Total | | $ | 64,163 | | | $ | (309 | ) | | $ | 57,549 | |
| | | | | | | | | | | | |
Depreciation and amortization | | | | | | | | | | | | |
United States | | $ | 3,417 | | | $ | 3,462 | | | $ | 3,510 | |
China | | | 27,732 | | | | 16,985 | | | | 10,963 | |
Singapore | | | 1 | | | | — | | | | — | |
| | | | | | | | | | | | |
Total | | $ | 31,150 | | | $ | 20,447 | | | $ | 14,473 | |
| | | | | | | | | | | | |
| | | | | | | | |
| | | Years Ended September 30, | |
| | | 2008 | | | 2007 | |
Total assets | | | | | | | | |
United States | | $ | 382,229 | | | $ | 307,661 | |
China | | | 204,250 | | | | 236,432 | |
Singapore | | | 59,999 | | | | — | |
Eliminations | | | (158,868 | ) | | | (166,806 | ) |
| | | | | | | | |
Total | | $ | 487,610 | | | $ | 377,287 | |
| | | | | | | | |
Long-lived assets | | | | | | | | |
United States | | $ | 20,422 | | | $ | 20,421 | |
China | | | 139,913 | | | | 113,347 | |
Singapore | | | 85 | | | | — | |
| | | | | | | | |
Total | | $ | 160,420 | | | $ | 133,768 | |
| | | | | | | | |
Capital Expenditures | | | | | | | | |
United States | | $ | 3,039 | | | $ | 1,869 | |
China | | | 42,825 | | | | 55,555 | |
Singapore | | | 85 | | | | — | |
| | | | | | | | |
Total | | $ | 45,949 | | | $ | 57,424 | |
| | | | | | | | |
62
9. Significant Concentrations
Customers and Vendors
Net sales to the Company’s four largest Original Equipment Manufacturer (“OEM”) customers, inclusive of net sales made to their designated sub-contractors, are presented below.
| | | | | | | | | |
| | | Years Ended September 30, | |
| | | 2008 | | | 2007 | | | 2006 | |
Net sales | | | | | | | | | |
OEM—A | | 20 | % | | 57 | % | | 86 | % |
OEM—B | | 45 | % | | 25 | % | | 5 | % |
OEM—C | | 20 | % | | 4 | % | | — | |
OEM—D | | 11 | % | | 8 | % | | — | |
Net sales direct to the Company’s largest customers, exclusive of OEM subcontractor relationship, which account for more than 10% of the Company’s net sales, and accounts receivable from such customers are presented below. The customers consist principally of major electronic companies or electronics company sub-contractors.
| | | | | | | | | |
| | | Years Ended September 30, | |
| | | 2008 | | | 2007 | | | 2006 | |
Net sales | | | | | | | | | |
Customer—1 | | 18 | % | | 46 | % | | 71 | % |
Customer—2 | | 37 | % | | 19 | % | | 3 | % |
Customer—3 | | 15 | % | | 6 | % | | 1 | % |
Customer—4 | | 4 | % | | — | | | — | |
| |
| | | Years Ended September 30, | |
| | | 2008 | | | 2007 | | | 2006 | |
Accounts Receivable | | | | | | | | | |
Customer—1 | | 13 | % | | 39 | % | | 69 | % |
Customer—2 | | 23 | % | | 32 | % | | 3 | % |
Customer—3 | | 23 | % | | 7 | % | | — | |
Customer—4 | | 16 | % | | 1 | % | | — | |
Purchases from the Company’s vendors, which account for more than 10% of the Company’s total purchases and accounts payable, are presented below.
| | | | | | | | | |
| | | Years Ended September 30, | |
| | | 2008 | | | 2007 | | | 2006 | |
Purchases | | | | | | | | | |
Vendor—A | | 3 | % | | 8 | % | | 10 | % |
Vendor—B | | 6 | % | | 6 | % | | 19 | % |
Vendor—C | | 18 | % | | 10 | % | | — | |
Vendor—D | | 9 | % | | 22 | % | | 4 | % |
Vendor—E | | 5 | % | | 1 | % | | — | |
| |
| | | Years Ended September 30, | |
| | | 2008 | | | 2007 | | | 2006 | |
Accounts payable | | | | | | | | | |
Vendor—C | | 13 | % | | 11 | % | | — | |
Vendor—D | | 5 | % | | 7 | % | | 6 | % |
Vendor—E | | 12 | % | | 1 | % | | — | |
63
The Company’s customers require the use of materials that have been pre-qualified by them. Any interruption in pre-qualified sources of materials may result in the Company’s inability to timely deliver products to its customers.
Geographic
Information regarding net sales by geographical area based on the location of the customer is summarized below:
| | | | | | | | | |
| | | Years Ended September 30, |
| | | 2008 | | 2007 | | 2006 |
North America | | $ | 100,954 | | $ | 92,681 | | $ | 144,946 |
China | | | 192,408 | | | 185,196 | | | 259,892 |
Hong Kong | | | 158,150 | | | 126,037 | | | 50,356 |
Malaysia | | | 206,606 | | | 64,237 | | | 10,770 |
Asia-Pacific | | | 14,473 | | | 23,364 | | | 27,342 |
Europe | | | 55,870 | | | 9,094 | | | 7,341 |
Other foreign | | | 344 | | | 7,538 | | | 3,557 |
| | | | | | | | | |
| | $ | 728,805 | | $ | 508,147 | | $ | 504,204 |
| | | | | | | | | |
Sales to customers in North America include the United States, Canada, Mexico and Puerto Rico. Sales to customers in Asia-Pacific countries include Singapore, Japan, Malaysia, Thailand, Taiwan, the Philippines and Korea. Sales to customers in Europe include the Netherlands, Austria, Sweden, Hungary, Denmark, Italy, Scotland, Germany, France and the United Kingdom.
Industry
In the years ended September 30, 2008, 2007 and 2006, 91%, 92% and 91% of net sales were derived from sales to companies that provide products or services to the wireless industry. The wireless industry is subject to economic cycles and has experienced periods of slowdown in the past. It is likely that current economic conditions will impact unit volume shipments.
10. Commitments and Contingencies
Operating Leases
The Company leases its facilities and certain assets under non-cancelable operating leases which expire at various dates through 2011. Future minimum lease payments under non-cancelable operating leases at September 30, 2008 are as follows:
| | | |
Year Ending September 30, | | Operating
Leases |
2009 | | $ | 1,281 |
2010 | | | 837 |
2011 | | | 292 |
2012 | | | — |
2013 and after | | | — |
| | | |
Total | | $ | 2,410 |
| | | |
Total rent expense was $1,828, $1,301 and $1,214 for the years ended September 30, 2008, 2007 and 2006, respectively.
64
Capital Leases
During the year ended September 30, 2007 Aurora Optical extended the terms of its equipment capital lease by one year. During fiscal 2008, the capital lease obligation for Aurora Optical was paid in full. The Company is obligated to pay $7 during the year ended September 30, 2009, under the terms of a phone system lease.
Terminated MFS Offer
In March 2006, the Company announced a proposed offer (the “MFS Offer”) to acquire all of the outstanding ordinary shares of MFS, a related party publicly traded in Singapore and a subsidiary of Wearnes. Approval of the shareholders of Wearnes for the MFS Offer was a pre-condition (the “WBL Shareholder Precondition”) to the Company making the MFS Offer. On June 26, 2007, Wearnes announced that its shareholders had voted against tendering its shares of MFS for stock consideration in the MFS Offer, and against voting Wearnes’ MFLEX stock in favor of the MFS Offer. Accordingly, since one of the pre-conditions to the MFS Offer, namely the WBL Shareholder Precondition, would not be met by June 30, 2007, the Company withdrew the Company’s amended Registration Statement on Form S-4 regarding the MFS Offer on June 28, 2007. As a result, $7,821 in deferred transaction costs were expensed during the year ended September 30, 2007.
Litigation
The Company is involved in litigation from time to time in the ordinary course of business; the outcome of which the Company’s management believes will not have a material adverse affect on the Company’s financial position, results of operations or cash flows.
Other Commitments
As of September 30, 2008 and 2007, the Company had outstanding purchase commitments related to capital projects at its various facilities which totaled $9,203 and $8,457, respectively.
Pursuant to the laws applicable to the Peoples’ Republic of China’s Foreign Investment Enterprises, the Company’s two wholly owned subsidiaries in China, MFC1 and MFC2, are restricted from paying cash dividends on 10% of after-tax profit, subject to certain cumulative limits. The amount of net income restricted by the foregoing for the years ended September 30, 2008, 2007 and 2006 are $8,106, $5,362 and $4,979, respectively.
Indemnifications
In the normal course of business the Company provides indemnification and guarantees of varying scope to customers and others. These indemnities include among other things, intellectual property indemnities to customers in connection with the sale of the Company’s products, warranty guarantees to customers related to products sold and indemnities to the Company’s directors and officers to the maximum extent permitted by Delaware law. The duration of these indemnities and guarantees varies, and, in certain cases, is indeterminate. Historically, costs related to these indemnification provisions have not been significant and with the exception of the warranty accrual (Note 1) no liabilities have been recorded for these indemnification provisions.
11. Stock Option Plans
1994 Stock Plan
In December 1994, the Company adopted the 1994 Stock Plan (the “1994 Plan”), which is administered by the Company’s board of directors or a committee thereof (the “administrator”). The 1994 Plan provides for the granting of stock options and stock purchase rights to employees, officers, directors (including non-employee
65
directors) and consultants. The administrator determined the term of the options, which was prohibited from exceeding ten years from the grant date. Options granted under the 1994 Plan vest based on periods determined by the administrator, which have been one year for employees with greater than one year of service with the Company and two years for employees with less than one year of service with the Company. A total of 2,049,750 shares of common stock have been authorized for issuance and reserved under the 1994 Plan. The 1994 Plan officially terminated on December 9, 2004. Effective with the adoption of the 2004 Plan the Company ceased granting options under the 1994 Plan.
2004 Stock Incentive Plan
In June 2004, the Company adopted the 2004 Stock Incentive Plan, as amended from time to time (the “2004 Plan”), which is also administered by the administrator. The 2004 Plan provides for the granting of stock options, stock appreciation rights, restricted share awards and restricted stock units to employees, directors (including non-employee directors), advisors and consultants. Options granted under the 2004 Plan vest and expire based on periods determined by the administrator, but in no event can the expiration date be later than ten years from the date of grant (five years after the date of grant if the grant is an incentive stock option to an employee who owns more than 10% of the total combined voting power of all classes of the Company’s capital stock (a “10% owner”). Options may be either incentive stock options or nonqualified stock options. The per share exercise price on an incentive stock option shall not be less than 100% of the fair market value of the Company’s common stock on the date the option is granted (110% of the fair market value if the grant is to a 10% owner). The per share exercise price of a nonqualified stock option shall not be less than 85% of the fair market value of the Company’s common stock on the date the option is granted. A total of 2,876,400 shares of common stock have been authorized for issuance and reserved under the 2004 Plan.
The Company’s assessment of the estimated fair value of the stock options granted is affected by the Company’s stock price as well as assumptions regarding a number of complex and subjective variables and the related tax impact. The Company utilizes the Black-Scholes option valuation model to estimate the fair value of stock options granted. Expected forfeitures of stock options are estimated based on the historical turnover of the Company’s employees. Prior to SFAS 123R, the Company recognized forfeitures under SFAS 123 as they occurred. The fair value of restricted stock units granted is based on the grant date price of the Company’s common stock.
The Black-Scholes option valuation model was developed for use in estimating the fair value of traded options that have no vesting restrictions and are fully transferable. This model also requires the input of highly subjective assumptions including:
| | (a) | the expected volatility of the Company’s common stock price, which the Company determines based on historical volatility of the Company’s common stock since the date of the Company’s IPO on June 30, 2004; |
| | (b) | expected dividends, which are zero, as the Company does not currently anticipate issuing dividends; |
| | (c) | expected life of the stock option, which is estimated based on the historical stock option exercise behavior of the Company’s employees; and |
| | (d) | risk free interest rate is based on observed interest rates (zero coupon U.S. Treasury debt securities) appropriate for the expected holding period. |
The Company uses the minimum value method for each option grant prior to the Company’s IPO and the Black-Scholes option valuation model for each option grant on the date of and subsequent to the Company’s IPO. No stock options were granted during the year ended September 30, 2008.
66
Stock Options
Stock option activity for the years ended September 30, 2008, 2007 and 2006 under the 1994 and 2004 Plans is summarized as follows:
| | | | | | |
| | | Number of
Shares | | | Weighted-
Average
Exercise Price |
Options outstanding at September 30, 2005 | | 1,981,705 | | | $ | 7.65 |
Exercised | | (263,487 | ) | | | 5.94 |
Forfeited | | (12,151 | ) | | | 10.00 |
| | | | | | |
Options outstanding at September 30, 2006 | | 1,706,067 | | | $ | 7.89 |
Exercised | | (127,667 | ) | | | 5.00 |
Forfeited | | (20,860 | ) | | | 10.00 |
| | | | | | |
Options outstanding at September 30, 2007 | | 1,557,540 | | | $ | 8.10 |
Exercised | | (378,422 | ) | | | 5.76 |
Forfeited | | (23,706 | ) | | | 18.32 |
| | | | | | |
Options outstanding at September 30, 2008 | | 1,155,412 | | | $ | 8.66 |
| | | | | | |
Exercisable at September 30, 2008 | | 1,140,402 | | | $ | 8.54 |
| | | | | | |
Vested and expected to vest at September 30, 2008 | | 1,154,372 | | | $ | 8.65 |
| | | | | | |
The intrinsic value of options exercised during the year ended September 30, 2008 and 2007 was $1,251 and $1,582, respectively. During the years ended September 30, 2008 and 2007, the Company recognized compensation costs of $903 and $1,176, respectively, related to stock options. As of September 30, 2008 and 2007 there were stock options exercisable for up to 1,140,402 and 1,339,190 shares of common stock outstanding, respectively. Unearned compensation of $206 existed at September 30, 2008, related to non-vested stock options which will be recognized into expense over a weighted average period of 0.7 years.
The following table summarizes information about stock options outstanding and exercisable as of September 30, 2008:
| | | | | | | | | | | | | | | | | | | | |
Outstanding | | Exercisable |
Range of Exercise Prices | | Number of Options | | Weighted-
Average
Remaining
Contractual
Life (in
Years) | | Weighted-
Average
Exercise
Price | | Aggregate
Intrinsic
Value
(000’s) | | Number of
Options
Exercisable | | Weighted-
Average
Exercise
Price | | Aggregate
Intrinsic
Value
(000’s) | | Weighted-
Average
Remaining
Contractual
Life (in
Years) |
$2.07 | | 67,875 | | 0.3 | | $ | 2.07 | | $ | 864 | | 67,875 | | $ | 2.07 | | $ | 864 | | 0.3 |
$3.73-$4.00 | | 345,155 | | 0.9 | | | 3.99 | | | 3,726 | | 345,155 | | | 3.99 | | | 3,726 | | 0.9 |
$8.75 | | 10,000 | | 5.9 | | | 8.75 | | | 60 | | 10,000 | | | 8.75 | | | 60 | | 5.9 |
$10.00 | | 608,382 | | 5.7 | | | 10.00 | | | 2,914 | | 608,382 | | | 10.00 | | | 2,914 | | 5.7 |
$16.80-$18.08 | | 79,000 | | 6.7 | | | 17.41 | | | — | | 63,990 | | | 17.41 | | | — | | 6.7 |
$20.81 | | 45,000 | | 6.4 | | | 20.81 | | | — | | 45,000 | | | 20.81 | | | — | | 6.4 |
| | | | | | | | | | | | | | | | | | | | |
| | 1,155,412 | | | | $ | 8.66 | | $ | 7,564 | | 1,140,402 | | $ | 8.54 | | $ | 7,564 | | |
| | | | | | | | | | | | | | | | | | | | |
67
Restricted Stock Units
Restricted stock unit activity for the years ended September 30, 2008, 2007 and 2006 under the 2004 Plan is summarized as follows:
| | | | | | |
| | | Number of
Shares | | | Weighted-
Average
Grant-Date
Fair Value |
Non-vested shares outstanding at September 30, 2005 | | — | | | $ | — |
Granted | | 88,290 | | | | 42.86 |
Forfeited | | (1400 | ) | | | 53.42 |
| | | | | | |
Non-vested shares outstanding at September 30, 2006 | | 86,890 | | | | 42.69 |
| | | | | | |
Granted | | 190,200 | | | | 17.80 |
Vested | | (27,472 | ) | | | 47.61 |
| | | | | | |
Forfeited | | (2,500 | ) | | | 42.79 |
| | | | | | |
Non-vested shares outstanding at September 30, 2007 | | 247,118 | | | $ | 22.99 |
| | | | | | |
Granted | | 264,443 | | | | 19.18 |
Vested | | (34,717 | ) | | | 29.94 |
Forfeited | | (72,113 | ) | | | 17.78 |
| | | | | | |
Non-vested shares outstanding at September 30, 2008 | | 404,731 | | | $ | 20.87 |
| | | | | | |
The Company made non-performance-based and performance-based restricted stock unit (“RSU”) grants during the years ended September 30, 2008 and 2007 totaling 264,443 and 190,200, respectively, of the Company’s common stock under the 2004 Plan to certain employees, including executive officers and directors at no cost to the individuals. Each RSU represents one hypothetical share of the Company’s common stock, without voting or dividend rights. The non-performance-based RSUs granted to employees vest over a period of three years with one-third vesting on each of the anniversary dates of the grant date. The non-performance-based RSUs granted to directors vest upon the earlier to occur of (i) the Company’s next annual stockholders’ meeting or (ii) the anniversary date of the grant date; provided that one director grant made in 2008 vests over a period of three years with one-third vesting on each of the anniversary dates of the grant date. No shares are delivered until the individual satisfies the vesting schedule. Unearned compensation related to the RSUs is determined based on the fair value of the Company’s stock on the date of grant and is amortized to expense over the vesting period. In March 2006 and 2007, the Company also made restricted stock unit grants equal to 8,000 shares under the 2004 Plan to certain members of the board of directors. The RSUs granted to directors vest upon the earlier of one year after the date of grant or the next regularly scheduled annual meeting of stockholders. With respect to RSU grants equal to 155,500 of the Company’s common stock made during March 2007, one-third of the units were subject to vesting requirements based on certain financial metrics being achieved by the Company during fiscal 2007, and one-third of the units will vest on each of November 15, 2008 and 2009. The Company did not meet the vesting requirements placed on the March 2007 grant and one-third of the units associated with that grant lapsed in October 2007.
Unearned compensation related to the restricted stock units is determined based on the fair value of the Company’s stock on the date of grant and the number of units management estimates will vest if there are vesting requirements associated with the grant. The unearned compensation is amortized to expense on a straight-line basis over the vesting period.
Unearned compensation related to restricted stock units was $5,783 as of September 30, 2008, and will be recognized into expense over a weighted average vesting period of 2.1 years. During the year ended September 30, 2008 and 2007, the Company recognized compensation expense of $2,520 and $1,539 related to restricted stock units, respectively. The exercise price of all restricted stock units is zero. The Company anticipates making future grants of restricted stock units in lieu of stock options.
68
The Company realized a tax benefit of $1,071 and $732 for the years ended September 30, 2008 and 2007, respectively, related to SFAS No. 123R.
Performance-Based Restricted Stock Units
On June 11, 2008, the Company’s board of directors approved the grant of 22,000 performance-based RSUs to certain employees, including executive officers, under the 2004 Plan. These performance-based RSU’s vest and become fully exercisable subject to the achievement of defined performance objectives pertaining to each grant, with vesting to occur between the date of grant and through March 31, 2011. In accordance with SFAS No. 123R, at the end of each reporting period, the Company evaluates the probability that the performance-based RSUs granted will vest. The Company records share-based compensation cost based on the grant-date fair value and the probability that the performance metrics will be achieved. As of the year ended September 30, 2008, the Company has reviewed each of the underlying performance targets related to its outstanding performance based RSU grants and has determined that it is probable that the RSU’s will vest.
The following table summarizes information about RSUs outstanding, as of September 30, 2008:
| | | | | | | |
Range of Grant Prices | | Number
of Units | | Average
Remaining
Contractual
Life (Years) | | Weighted
Average Grant
Fair Value |
$15.27 – $19.88 | | 311,443 | | 9.0 | | $ | 18.17 |
$20.04 – $25.84 | | 59,893 | | 9.5 | | | 22.97 |
$38.65 | | 28,595 | | 7.2 | | | 38.65 |
$64.50 – $65.47 | | 4,800 | | 1.3 | | | 64.50 |
| | | | | | | |
| | 404,731 | | 9.0 | | $ | 20.87 |
| | | | | | | |
12. Employee Benefit Plan
The Company maintains a 401(k) defined contribution plan (the “Benefit Plan”). The Benefit Plan covers substantially all employees of the Company who meet minimum age and service requirements, and allows participants to defer a portion of their annual compensation on a pre-tax basis. Company contributions are determined at the discretion of the Company’s board of directors. Contributions to the Benefit Plan were $256, $151 and $145 for the years ended September 30, 2008, 2007 and 2006, respectively.
13. Restructuring Costs and Long-Lived Asset Impairment
At the end of the fourth quarter of fiscal 2008, due to the closure of the Tucson, Arizona facility of Aurora Optical, we completed our long-lived asset impairment analysis and a restructuring cost analysis in accordance with the guidance ofSFAS 144, Accounting for the Impairment or Disposal of Long-Lived Assets andSFAS 146, Accounting for Costs Associated with Exit or Disposal Activities.
Long-Lived Asset Impairment: Based on our analysis of the net book value and fair market value of the Aurora Optical assets which are planned for sale, after deducting the net book value of assets being transferred to our Anaheim facility, we determined that
the remaining assets of Aurora Optical were impaired, and we recorded a pre-tax impairment charge of $2,000. By major class of asset, the impairment charge is composed of the following:
| | | |
| | | For the Year Ended
September 30, 2008 |
Long-Lived Asset Impairment Charges: | | | |
Land & Building | | $ | 1,300 |
Manufacturing Equipment | | | 600 |
Other Assets | | | 100 |
| | | |
Total Impairment Charge | | $ | 2,000 |
| | | |
69
Restructuring Cost:Based on our analysis, a pre-tax restructuring charge composed of severance, relocation, and other costs related to the closure of Aurora Optical was estimated at $540, of which $180 was recorded in the fourth quarter of 2008, with the remainder of $360 to be recorded in the first quarter of fiscal 2009.
The $180 recorded in fiscal 2008 related to severance and outplacement charges and has been accrued as of September 30, 2008. The remaining restructuring charge to be recorded in the first quarter of fiscal 2009 is composed of $166 of severance and outplacement, $144 of relocation, and $50 of contract termination costs. There were no impairments to long-lived assets or restructuring costs for the fiscal years ended September 30, 2007 and September 30, 2006.
14. Subsequent Events
In November 2008, the Company entered into a Share Purchase Agreement (the “Agreement”) with Multi-Fineline Electronix Singapore Pte. Ltd., a wholly owned subsidiary of the Company (“MFLEX Singapore”) to acquire all of the issued ordinary shares of Pelikon Limited (“Pelikon”), a privately held technology company focused on the development of printed segmented electroluminescent displays and keypads, from the shareholders of Pelikon.
Pursuant to the terms of the Agreement, in consideration for the purchase of the issued ordinary shares of Pelikon, M-Flex Singapore shall issue, at the closing, unsecured promissory notes in an aggregate principal amount equal to $10,707, as follows: (i) up to $5,850 in unsecured promissory notes payable to all shareholders of Pelikon (the “Sellers”), on a pro rata basis (the “Sellers Promissory Notes”), and (ii) up to $4,857 in unsecured promissory notes payable to certain secured debt holders of Pelikon in settlement of debt outstanding and owed to them by Pelikon as of the closing (the “Lender Promissory Notes” and, together with the Sellers Promissory Notes, the “Initial Consideration”).
The Sellers Promissory Notes and Lender Promissory Notes accrue interest at the rate of 6% per year, and the aggregate principal amount and any accrued interest thereon is due and payable on the date that is two years following the closing, subject to certain exceptions in the case of the Sellers Promissory Notes. The aggregate principal amount of the Sellers Promissory Notes and any accrued interest thereon is subject to reduction, on a dollar for dollar basis, for, among other things, transaction costs which remain outstanding at the closing, past due real property lease obligations and certain other accounts payable and accrued expenses outstanding as of the closing in excess of agreed upon levels, and 50% of the stamp duty charge arising out of or in connection with the transactions. The Sellers Promissory Notes are subject to further reduction in the event that M-Flex Singapore or any of its affiliates is entitled to recover damages from the Sellers pursuant to the terms of the Agreement.
In addition to the Initial Consideration, the Sellers may receive contingent consideration (the “Contingent Consideration”) for each pSel Hybrid Display unit sold to a third party by M-Flex Singapore, Pelikon or any of their respective affiliates or licensees, net of applicable returns (including returns for warranty claims), during calendar years 2009 and 2010 (each calendar year, an “Earn-Out Period”), conditional upon certain sales levels being achieved in each of calendar years 2009 and 2010 (each, an “Earn-Out Target”). Any Contingent Consideration paid shall not exceed $2,190 in 2009 and $7,236 in 2010, and if one or both of the Earn-Out Targets are not achieved the Contingent Consideration will not be paid for one or both of the Earn-Out Periods, as applicable. Any Contingent Consideration payable is subject to reduction, on a dollar for dollar basis, in the event that M-Flex Singapore or any of its affiliates is entitled to recover damages from the Sellers pursuant to the terms of the Agreement and the aggregate principal amount and accrued interest under the Sellers Promissory Notes is not sufficient to cover such damages.
Completion of the transactions contemplated by the Agreement is subject to customary closing conditions, including the retention of certain key employees, receipt of required third party consents, the absence of certain claims concerning Pelikon’s intellectual property, the absence of certain liabilities, and Sellers holding at least 90% of the issued ordinary shares of Pelikon must have agreed to sell their shares to M-Flex Singapore. Until the
70
transactions are completed, Pelikon will continue to operate its business independently. Following the completion of the transactions, Pelikon will operate as a wholly owned subsidiary of M-Flex Singapore. The closing is targeted to occur on or before December 31, 2008. The Company may record a one-time charge for purchased research and development expenses related to the acquisition of Pelikon in the quarter in which the transaction closes. The amount of that charge, if any, has not yet been determined. A preliminary purchase price allocation is anticipated to be recorded by December 31, 2008.
On December 4, 2008, the Company’s board of directors authorized a share repurchase plan, pursuant to which the Company may purchase up to 2,250,000 shares in the aggregate of the Company’s common stock, to be implemented by management as appropriate. The Company expects to enter into an agreement with respect to this repurchase plan during December 2008.
71
MULTI-FINELINE ELECTRONIX, INC.
SCHEDULE II—
CONSOLIDATED VALUATION AND QUALIFYING ACCOUNTS AND RESERVES
FOR THE YEARS ENDED SEPTEMBER 30, 2008, 2007 AND 2006
(In Thousands)
| | | | | | | | | | | | | |
Allowance for Doubtful Accounts | | Balance at
Beginning of Year | | Additions Charged to
Operations | | Deductions
(Write-offs) | | | Balance at
End of Year |
2008 | | $ | 1,300 | | $ | 5,687 | | $ | (5,467 | ) | | $ | 1,520 |
2007 | | $ | 604 | | $ | 7,554 | | $ | (6,858 | ) | | $ | 1,300 |
2006 | | $ | 601 | | $ | 1,879 | | $ | (1,876 | ) | | $ | 604 |
| Item 9. | Changes in and Disagreements with Accountants on Accounting and Financial Disclosure |
There have been no changes in our independent registered public accounting firm or disagreements with such accountants on any matter of accounting principles or practices, financial statement disclosure or auditing scope of procedure.
| Item 9A. | Controls and Procedures |
Management’s Report on Internal Control Over Financial Reporting
Our management is responsible for establishing and maintaining adequate internal control over financial reporting, as such term is defined in Rules 13a-15(f) and 15d-15(f) under the Securities Exchange Act of 1934 (the “Exchange Act”). A company’s internal control over financial reporting is a process designed to provide reasonable assurance regarding the reliability of financial reporting and the preparation of financial statements for external purposes in accordance with generally accepted accounting principles. Our internal control over financial reporting includes policies and procedures that (i) pertain to the maintenance of records that, in reasonable detail, accurately and fairly reflect the transactions and dispositions of our assets; (ii) provide reasonable assurance that transactions are recorded as necessary to permit preparation of financial statements in accordance with generally accepted accounting principles, and that our receipts and expenditures are being made only in accordance with authorizations of our management and directors; and (iii) provide reasonable assurance regarding prevention or timely detection of unauthorized acquisition, use, or disposition of our assets that could have a material effect on our financial statements.
Because of its inherent limitations, internal control over financial reporting may not prevent or detect misstatements. Also, projections of any evaluation of effectiveness of controls to future periods are subject to the risk that controls may become inadequate because of changes in conditions, or that the degree of compliance with the policies or procedures may deteriorate.
Under the supervision and with the participation of management, including our Chief Executive Officer (“CEO”) and Chief Financial Officer (“CFO”), management conducted an assessment of the effectiveness of our internal control over financial reporting as of September 30, 2008. In making this assessment, management used the criteria set forth in the framework established by the Committee of Sponsoring Organizations of the Treadway Commission (COSO) entitled “Internal Control—Integrated Framework.” Based on this evaluation and on the criteria in Internal Control—Integrated Framework, management has concluded that our internal control over financial reporting was effective as of September 30, 2008.
The effectiveness of the Company’s internal control over financial reporting as of September 30, 2008 has been audited by PricewaterhouseCoopers LLP, an independent registered public accounting firm, as stated in their report which appears herein.
72
Changes in Internal Control over Financial Reporting
During the fourth fiscal quarter, there was no change in our internal control over financial reporting identified in connection with the evaluation described above that has materially affected, or is reasonably likely to materially affect, our internal control over financial reporting.
Evaluation of Disclosure Controls and Procedures
We maintain disclosure controls and procedures that are designed to ensure that information required to be disclosed in our Exchange Act reports is recorded, processed, summarized and reported within the time periods specified in the SEC’s rules and forms and that such information is accumulated and communicated to our management including our CEO and CFO, as appropriate, to allow for timely decisions regarding required disclosure. In designing and evaluating the disclosure controls and procedures, management recognizes that any controls and procedures, no matter how well designed and operated can provide only reasonable assurance of achieving the desired control objectives and management is required to apply its judgment in evaluating the cost-benefit relationship of possible controls and procedures.
Based on an evaluation carried out as of the end of the period covered by this Annual Report, under the supervision and with the participation of our management, including our CEO and CFO, our CEO and CFO have concluded that, as of the end of such period, our disclosure controls and procedures (as defined in Rule 13a-15(e) under the Exchange Act), are effective.
| Item 9B. | Other Information. |
On December 5, 2008, our board of directors approved (i) an increase in the calendar year 2009 base salaries of our 2009 named executive officers (“NEOs”) as follows: Reza Meshgin, our president and chief executive officer to $570,000; Tom Liguori, executive vice president and chief financial officer to $340,000; Thomas Lee, our executive vice president of operations to $275,000; and Christine Besnard, our vice president, general counsel and secretary to $260,000 (to be pro-rated based on a part-time schedule), (ii) an increase in the car allowance for NEOs to $12,000 per year, and (iii) a tax and financial planning allowance of $5,000 per year for NEOs.
In addition, on December 5, 2008, the special compensation committee of our board of directors, comprised solely of independent, non-employee directors, approved a fiscal year 2009 bonus plan, pursuant to which the NEOs can obtain a cash bonus (“Bonus”), at a target level equal to seventy-five percent for Mr. Meshgin, and fifty percent for Messrs. Liguori and Lee and Ms. Besnard, of such executive’s annual base salary. The bonus plan includes net revenue, net income and return on invested capital metrics which must be met in order for the NEOs to be awarded the Bonuses. In certain specified circumstances, the Bonuses may exceed these percentages.
Also on December 5, 2008, our special compensation committee approved entering into stock appreciation right agreements under our 2004 Stock Incentive Plan with certain of its employees, including the NEOs. The agreements cover grants of stock appreciation rights that will vest in one installment three years after the applicable grant date.
We recently determined to effect a layoff in our facilities in China in order to reduce our labor costs. On November 28, 2008, we posted an internal notice about potential layoffs, and subsequently we formally submitted our proposed plan of termination to the Chinese authorities. We intend to commence notifying affected employees on or about December 29, 2008.
Our plan of termination involves eliminating approximately 700 to 1,000 positions; or approximately four to five percent of our overall workforce. We expect this will result in a one-time incurrence of severance related expenses of between $1.0 to $1.5 million during the first and second quarters of fiscal 2009; however, we expect to realize cost savings in future periods as a result of increased efficiencies that we expect to realize through this reduction in labor. The expected completion date of this termination plan is on or before December 31, 2008.
73
Part III
| Item 10. | Directors, Executive Officers and Corporate Governance. |
Executive Officers of the Registrant
The following table sets forth information about our executive officers as of November 30, 2008:
| | | | |
Name | | Age | | Position(s) |
| Reza Meshgin | | 45 | | President and Chief Executive Officer |
| Thomas Liguori | | 50 | | Executive Vice President and Chief Financial Officer |
| Thomas Lee | | 49 | | Executive Vice President of Operations |
| Christine Besnard | | 38 | | Vice President, General Counsel and Secretary |
Reza Meshginjoined us in June 1989, assumed his current position as our President and Chief Executive Officer in March 2008 and was elected to the Board of Directors in April 2008. Prior to his current role, Mr. Meshgin served as our President and Chief Operating Officer from January 2003 through February 2008, was Vice President and General Manager from May 2002 through December 2003, and prior to that time was our Engineering Supervisor, Application Engineering Manager, Director of Engineering and Telecommunications Division Manager. Mr. Meshgin holds a B.S. in Electrical Engineering from Wichita State University and an M.B.A. from University of California at Irvine.
Thomas Liguorijoined us as Chief Financial Officer and Executive Vice President in February 2008. Prior to joining us, Mr. Liguori served as Chief Financial Officer at Hypercom, Inc. from November 2005 to February 2008, where he designed and built the global finance and administration functions. From February 2005 to November 2005, Mr. Liguori served as Vice President, Finance and Chief Financial Officer at Iomega Corporation, a publicly traded provider of storage and network security solutions, and from April 2000 to February 2005, as Chief Financial Officer at Channell Commercial Corporation, a publicly traded provider of designer and manufacturer of telecommunications equipment. Prior to that time, Mr. Liguori served as Chief Financial Officer of Dole Europe for Dole Food Company and was the top-ranking financial and IT executive in Dole’s operations in Europe, Africa and the Middle East, and as Vice President of Finance at Teledyne. Mr. Liguori holds a Bachelor’s in Business Administration, Summa Cum Laude, from Boston University and completed a Master’s in Business Administration in Finance, Summa Cum Laude, from Arizona State University. He is a Certified Management Accountant and a Certified Financial Manager.
Thomas Lee joined us in October 1986 as our Supervisor of Photo Department and subsequently served as our Manufacturing Manager and Director of Operations from May 1995 to May 2002. Since May 2002, Mr. Lee has served as our Executive Vice President of Operations. Prior to joining us, Mr. Lee served as a Mechanical Engineer at the Agricultural Corporation in Burma. Mr. Lee holds a B.E. in Mechanical Engineering from the Rangoon Institute of Technology in Burma.
Christine Besnard joined us as General Counsel in August 2004, assumed the role of Secretary in March 2005 and was named Vice President in March 2006. Prior to joining us, Ms. Besnard was senior corporate counsel at Sage Software, Inc., from August 2000 to July 2004, and a corporate securities associate at Pillsbury, Madison & Sutro LLP. Ms. Besnard holds a bachelor’s degree in political science from San Diego State University and a juris doctor from the University of Southern California Law Center. She was admitted to the California State Bar in 1997.
The information required by this item (with respect to our directors) will be contained in the section called “Election of Directors” in our 2009 Proxy Statement to be filed with the SEC in connection with the solicitation of proxies for our 2009 Annual Meeting of Stockholders expected to be held in March of 2009, and is incorporated herein by reference. Certain information regarding our executive officers required by this item is set forth in Part I of this Annual Report under the caption “Executive Officers of the Registrant.”
74
The information required by this item regarding compliance with Section 16(a) of the Exchange Act will be contained in, and is hereby incorporated by reference to, our 2009 Proxy Statement under the caption “Section 16(a) Beneficial Ownership Reporting Compliance.”
We have adopted a Code of Ethics for Senior Officers (“Code of Ethics”), that applies to our CEO, President, CFO and other key management employees (including other senior financial officers) who have been identified by the board of directors. We have also adopted a Code of Business Conduct that applies to all of our employees, officers and directors. The Code of Ethics is included as Exhibit 14.1 to this Annual Report. Each of the Code of Ethics and Code of Business Conduct may be found on our website at www.mflex.com. We will post (i) any waiver, if and when granted, to any provision of the Code of Ethics or Code of Business Conduct (for executive officers or directors) and (ii) any amendment to the Code of Ethics or Code of Business Conduct on our website.
We have a separately designated standing Audit Committee established in accordance with Section 3(a)(58)(A) of the Exchange Act. The members of the Audit Committee are Sanford L. Kane (Chairperson), Linda Lim, Ph.D., Donald Schwanz and Sam Yau. All of such members meet the independence standards established by Nasdaq and the requirements under Section 10A of the Exchange Act for serving on an audit committee. Further, our board of directors has determined that Mr. Kane qualifies as an “audit committee financial expert” for audit committee member purposes within the meaning of such regulations.
| Item 11. | Executive Compensation |
The information required by this item regarding executive compensation will be contained in, and is hereby incorporated by reference to, our 2009 Proxy Statement under the captions “Election of Directors—Compensation of Directors,” “Executive Compensation” and “Election of Directors—Compensation Committee Interlocks and Insider Participation.”
| Item 12. | Security Ownership of Certain Beneficial Owners and Management and Related Stockholder Matters |
The information required by this item regarding security ownership of certain beneficial owners and management will be contained in the section called “Security Ownership of Certain Beneficial Owners and Management and Related Stockholder Matters” in our 2009 Proxy Statement, and is incorporated herein by reference.
Equity Compensation Plan Information
The following summarizes our equity compensation plans at September 30, 2008:
| | | | | | | |
Plan Category | | Number of securities
to be issued upon
exercise of
outstanding options,
warrants and rights | | Weighted-average
exercise price of
outstanding options,
warrants and rights | | Number of securities
remaining available for
future issuance under
equity
compensation plans
(excluding securities
reflected in column(a)) |
| | | (a) | | (b) | | (c ) |
Equity compensation plans approved by security holders | | 1,560,143 | | $ | 6.41 | | 1,337,748 |
Equity compensation plans not approved by security holders | | — | | | — | | — |
Total | | 1,560,143 | | $ | 6.41 | | 1,337,748 |
75
| Item 13. | Certain Relationships, Related Transactions, and Director Independence |
The information required by this item regarding certain relationships and related transactions will be contained under the caption “Certain Relationships and Related Transactions” in our 2009 Proxy Statement, and is incorporated herein by reference. The information required by this item regarding director independence will be contained under the caption “Election of Directors” in our 2009 Proxy Statement, and is incorporated herein by reference.
| Item 14. | Principal Accountant Fees and Services |
The information required by this item will be contained under the captions “Ratification of Appointment of Independent Registered Public Accounting Firm—Principal Accountant Fees and Services” and “Ratification of Appointment of Independent Registered Public Accounting Firm—Pre-Approval Policies and Procedures” in our 2009 Proxy Statement and is incorporated herein by reference.
76
Part IV
| Item 15. | Exhibits, Financial Statement Schedules |
(a) Documents filed as part of this report:
(1) Financial Statements
See Index to Consolidated Financial Statements under Item 8.
(2) Financial Statement Schedule
See Index to Consolidated Financial Statements under Item 8.
(3) Exhibits
See Item 15(b) below. Each management contract or compensatory plan or arrangement required to be filed has been so identified.
(b) Exhibits:
| | |
| |
| 3.2(1) | | Restated Certificate of Incorporation of the Company |
| |
| 3.4(2) | | Amended and Restated Bylaws of the Company |
| |
| 4.1(1) | | Form of Common Stock Certificate |
| |
| 10.1(1) | | Form of Indemnification Agreement between the Company and its officers, directors and agents |
| |
| 10.2(1) | | 1994 Stock Plan of the Company, as amended |
| |
| 10.3(5) | | 2004 Stock Incentive Plan of the Company, as amended and restated |
| |
| 10.4(1) | | Corporate Services Agreement dated as of June 4, 2004 by and between the Company and Wearnes Brothers Services (Private) Limited |
| |
| 10.20(3) | | Amended and Restated Stockholders Agreement dated October 25, 2005 between Multi-Fineline Electronix, Inc., Wearnes Technology Pte. Ltd, United Wearnes Technology Pte. Ltd., and WBL Corporation Limited |
| |
| 10.21(4) | | Form of Restricted Stock Unit Agreement. |
| |
| 10.38(6) | | Master Purchase Agreement between Multi-Fineline Electronix, Inc., Multi-Fineline Electronix (Suzhou) Co., Ltd., and Multi-Fineline Electronix (Suzhou No. 2) Co., Ltd. and Sony Ericsson Mobile Communications (USA) Inc. dated April 19, 2006. |
| |
| 10.39(7) | | Line of Credit Agreement between Multi-Fineline Electronix (Suzhou) Co., Ltd. and Bank of China Co., Ltd. Suzhou Wuzhong Sub-branch dated January 24, 2008. |
| |
| 10.40(7) | | Line of Credit Agreement between Multi-Fineline Electronix (Suzhou No. 2) Co., Ltd. and Bank of China Co., Ltd. Suzhou Wuzhong Sub-branch dated January 24, 2008. |
| |
| 10.41(8) | | Comprehensive Credit Line Agreement by and between Multi-Fineline Electronix (Suzhou) Co., Ltd. and Shanghai Pudong Development Bank Suzhou Branch dated July 31, 2008. |
| |
| 10.42(8) | | Collaboration Agreement by and between by and between Multi-Fineline Electronix (Suzhou) Co., Ltd. and Shanghai Pudong Development Bank Suzhou Branch dated July 31, 2008. |
| |
| 10.43(8) | | Comprehensive Credit Line Agreement by and between Multi-Fineline Electronix (Suzhou No. 2) Co., Ltd. and Shanghai Pudong Development Bank Suzhou Branch dated July 31, 2008. |
| |
| 10.44(8) | | Collaboration Agreement by and between by and between Multi-Fineline Electronix (Suzhou No. 2) Co., Ltd. and Shanghai Pudong Development Bank Suzhou Branch dated July 31, 2008. |
77
| | |
| |
| 10.45* | | Form of Stock Appreciation Right Agreement. |
| |
| 10.46* | | Share Purchase Agreement by and among Multi-Fineline Electronix Singapore Pte. Ltd., Pelikon Limited (the “Company”), Multi-Fineline Electronix, Inc., the members of the Company set forth on the signatures pages thereto, and Michael Powell, as the Shareholders’ Representative, dated November 18, 2008. |
| |
| 10.47*(9) | | Master Development and Supply Agreement by and between Apple Computer, Inc. and Multi-Fineline Electronix, Inc. dated June 22, 2006. |
| |
| 14.1(10) | | Code of Ethics for Senior Officers |
| |
| 21.1* | | List of Subsidiaries of Registrant |
| |
| 23.1* | | Consent of PricewaterhouseCoopers LLP |
| |
| 24.1* | | Power of Attorney (see signature page of this Annual Report) |
| |
| 31.1* | | Section 302 Certification by the Company’s chief executive officer |
| |
| 31.2* | | Section 302 Certification by the Company’s principal financial officer |
| |
| 32.1* | | Section 906 Certification by the Company’s chief executive officer and principal financial officer |
(1) | Incorporated by reference to exhibits (with same exhibit numbers) to the Company’s Registration Statement on Form S-1, as amended (File No. 333-114510) declared effective by the Securities and Exchange Commission (“SEC”), on June 24, 2004. |
(2) | Incorporated by reference to an exhibit (with same exhibit number) to the Company’s Current Report on Form 8-K filed with the SEC on May 24, 2005. |
(3) | Incorporated by reference to exhibit (with same exhibit number) to the Company’s Current Report on Form 8-K filed with the SEC on October 25, 2005. |
(4) | Incorporated by reference to exhibit (with same exhibit number) to the Company’s Current Report on Form 8-K filed with the SEC on December 9, 2005. |
(5) | Incorporated by reference to exhibit (as Appendix A) to the Company’s Proxy Statement for its 2006 Annual Meeting of Stockholders on Form DEF 14A filed with the SEC on January 26, 2006. |
(6) | Incorporated by reference to exhibit (with same exhibit number) to the Company’s Current Report on Form 8-K/A filed with the SEC on July 26, 2007. Confidential treatment has been granted for certain portions of this agreement. |
(7) | Incorporated by reference to exhibits (with same exhibits numbers) to the Company’s Current Report on Form 8-K filed with the SEC on January 30, 2008. |
(8) | Incorporated by reference to exhibits (with same exhibits numbers) to the Company’s Current Report on Form 8-K filed with the SEC on August 6, 2008. |
(9) | Confidential treatment is being requested with respect to portions of this agreement. |
(10) | Incorporated by reference to exhibit (with same exhibit numbers) to the Company’s Annual Report on Form 10-K filed with the SEC for the year ended September 20, 2004. |
78
SIGNATURES
Pursuant to the requirements of Section 13 or 15(d) of the Securities Exchange Act of 1934, the registrant has duly caused this Annual Report on Form 10-K to be signed on its behalf by the undersigned, thereunto duly authorized.
| | | | | | |
| | | | Multi-Fineline Electronix, Inc. a Delaware Corporation |
| | | |
| Date: | | December 8, 2008 | | By: | | /s/ REZA MESHGIN |
| | | | | | Reza Meshgin |
| | | | | | President and Chief Executive Officer |
POWER OF ATTORNEY
KNOW ALL MEN BY THESE PRESENTS, that each person whose signature appears below constitutes and appoints Reza Meshgin and Thomas Liguori, and each of them, his true and lawful attorneys-in-fact, each with full power of substitution, for him in any and all capacities, to sign any amendments to this Annual Report on Form 10-K and to file the same, with exhibits thereto and other documents in connection therewith, with the Securities and Exchange Commission, hereby ratifying and confirming all that each of said attorneys-in-fact or their substitute or substitutes may do or cause to be done by virtue hereof.
Pursuant to the requirements of the Securities Exchange Act of 1934, this Annual Report on Form 10-K has been signed below by the following persons on behalf of the registrant and in the capacities and on the dates indicated.
| | | | |
Name | | Title | | Date |
| | |
/S/ PHILIP A. HARDING Philip A. Harding | | Chairman of the Board of Directors | | December 5, 2008 |
| | |
/S/ REZA MESHGIN Reza Meshgin | | President, Chief Executive Officer and Director (Principal Executive Officer) | | December 5, 2008 |
| | |
/S/ THOMAS LIGUORI Thomas Liguori | | Chief Financial Officer and Executive Vice President (Principal Financial and Accounting Officer) | | December 5, 2008 |
| | |
/S/ RICHARD J. DADAMO Richard J. Dadamo | | Director | | December 5, 2008 |
| | |
/S/ SANFORD L. KANE Sanford L. Kane | | Director | | December 5, 2008 |
| | |
/S/ HUAT SENG LIM, PH.D. Huat Seng Lim, Ph.D. | | Director | | December 5, 2008 |
| | |
/S/ LINDA LIM, PH.D. Linda Lim, Ph.D. | | Director | | December 5, 2008 |
79
| | | | |
Name | | Title | | Date |
| | |
/S/ DONALD SCHWANZ Donald Schwanz | | Director | | December 5, 2008 |
| | |
/S/ CHOONG SENG TAN Choon Seng Tan | | Director | | December 5, 2008 |
| | |
/S/ SAM YAU Sam Yau | | Director | | December 5, 2008 |
80
EXHIBIT INDEX
| | |
| |
| 3.2(1) | | Restated Certificate of Incorporation of the Company |
| |
| 3.4(2) | | Amended and Restated Bylaws of the Company |
| |
| 4.1(1) | | Form of Common Stock Certificate |
| |
| 10.1(1) | | Form of Indemnification Agreement between the Company and its officers, directors and agents |
| |
| 10.2(1) | | 1994 Stock Plan of the Company, as amended |
| |
| 10.3(5) | | 2004 Stock Incentive Plan of the Company, as amended and restated |
| |
| 10.4(1) | | Corporate Services Agreement dated as of June 4, 2004 by and between the Company and Wearnes Brothers Services (Private) Limited |
| |
| 10.20(3) | | Amended and Restated Stockholders Agreement dated October 25, 2005 between Multi-Fineline Electronix, Inc., Wearnes Technology Pte. Ltd, United Wearnes Technology Pte. Ltd., and WBL Corporation Limited |
| |
| 10.21(4) | | Form of Restricted Stock Unit Agreement |
| |
| 10.38(6) | | Master Purchase Agreement between Multi-Fineline Electronix, Inc., Multi-Fineline Electronix (Suzhou) Co., Ltd., and Multi-Fineline Electronix (Suzhou No. 2) Co., Ltd. and Sony Ericsson Mobile Communications (USA) Inc. dated April 19, 2006. |
| |
| 10.39(7) | | Line of Credit Agreement between Multi-Fineline Electronix (Suzhou) Co., Ltd. and Bank of China Co., Ltd. Suzhou Wuzhong Sub-branch dated January 24, 2008. |
| |
| 10.40(7) | | Line of Credit Agreement between Multi-Fineline Electronix (Suzhou No. 2) Co., Ltd. and Bank of China Co., Ltd. Suzhou Wuzhong Sub-branch dated January 24, 2008. |
| |
| 10.41(8) | | Comprehensive Credit Line Agreement by and between Multi-Fineline Electronix (Suzhou) Co., Ltd. and Shanghai Pudong Development Bank Suzhou Branch dated July 31, 2008. |
| |
| 10.42(8) | | Collaboration Agreement by and between by and between Multi-Fineline Electronix (Suzhou) Co., Ltd. and Shanghai Pudong Development Bank Suzhou Branch dated July 31, 2008. |
| |
| 10.43(8) | | Comprehensive Credit Line Agreement by and between Multi-Fineline Electronix (Suzhou No. 2) Co., Ltd. and Shanghai Pudong Development Bank Suzhou Branch dated July 31, 2008. |
| |
| 10.44(8) | | Collaboration Agreement by and between by and between Multi-Fineline Electronix (Suzhou No. 2) Co., Ltd. and Shanghai Pudong Development Bank Suzhou Branch dated July 31, 2008. |
| |
| 10.45* | | Form of Stock Appreciation Right Agreement. |
| |
| 10.46* | | Share Purchase Agreement by and among Multi-Fineline Electronix Singapore Pte. Ltd., Pelikon Limited (the “Company”), Multi-Fineline Electronix, Inc., the members of the Company set forth on the signatures pages thereto, and Michael Powell, as the Shareholders’ Representative, dated November 18, 2008. |
| |
| 10.47*(9) | | Master Development and Supply Agreement by and between Apple Computer, Inc. and Multi-Fineline Electronix, Inc. dated June 22, 2006. |
| |
| 14.1(10) | | Code of Ethics for Senior Officers |
| |
| 21.1* | | List of Subsidiaries of Registrant |
| |
| 23.1* | | Consent of PricewaterhouseCoopers LLP |
81
| | |
| |
| 24.1* | | Power of Attorney (see signature page of this Annual Report) |
| |
| 31.1* | | Section 302 Certification by the Company’s chief executive officer |
| |
| 31.2* | | Section 302 Certification by the Company’s principal financial officer |
| |
| 32.1* | | Section 906 Certification by the Company’s chief executive officer and principal financial officer |
(1) | Incorporated by reference to exhibits (with same exhibit numbers) to the Company’s Registration Statement on Form S-1, as amended (File No. 333-114510) declared effective by the Securities and Exchange Commission (“SEC”), on June 24, 2004. |
(2) | Incorporated by reference to an exhibit (with same exhibit number) to the Company’s Current Report on Form 8-K filed with the SEC on May 24, 2005. |
(3) | Incorporated by reference to exhibit (with same exhibit number) to the Company’s Current Report on Form 8-K filed with the SEC on October 25, 2005. |
(4) | Incorporated by reference to exhibit (with same exhibit number) to the Company’s Current Report on Form 8-K filed with the SEC on December 9, 2005. |
(5) | Incorporated by reference to exhibit (as Appendix A) to the Company’s Proxy Statement for its 2006 Annual Meeting of Stockholders on Form DEF 14A filed with the SEC on January 26, 2006. |
(6) | Incorporated by reference to exhibit (with same exhibit number) to the Company’s Current Report on Form 8-K/A filed with the SEC on July 26, 2007. Confidential treatment has been granted for certain portions of this agreement. |
(7) | Incorporated by reference to exhibits (with same exhibits numbers) to the Company’s Current Report on Form 8-K filed with the SEC on January 30, 2008. |
(8) | Incorporated by reference to exhibits (with same exhibits numbers) to the Company’s Current Report on Form 8-K filed with the SEC on August 6, 2008. |
(9) | Confidential treatment is being requested with respect to portions of this agreement. |
(10) | Incorporated by reference to exhibit (with same exhibit numbers) to the Company’s Annual Report on Form 10-K filed with the SEC for the year ended September 20, 2004. |
82