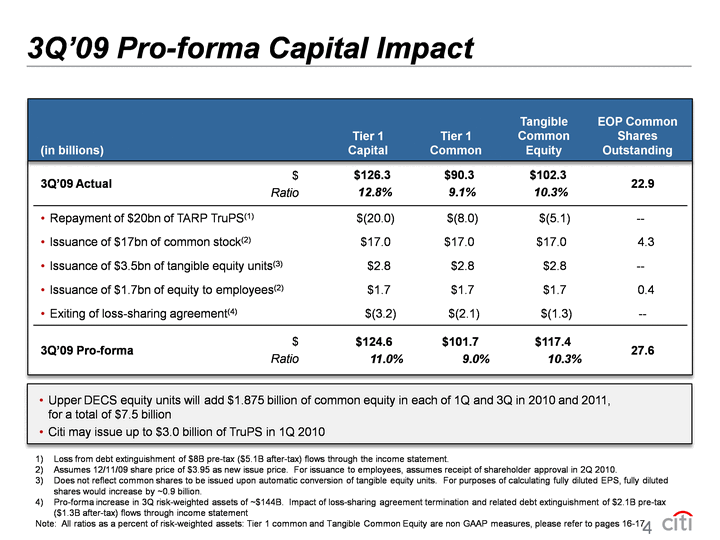
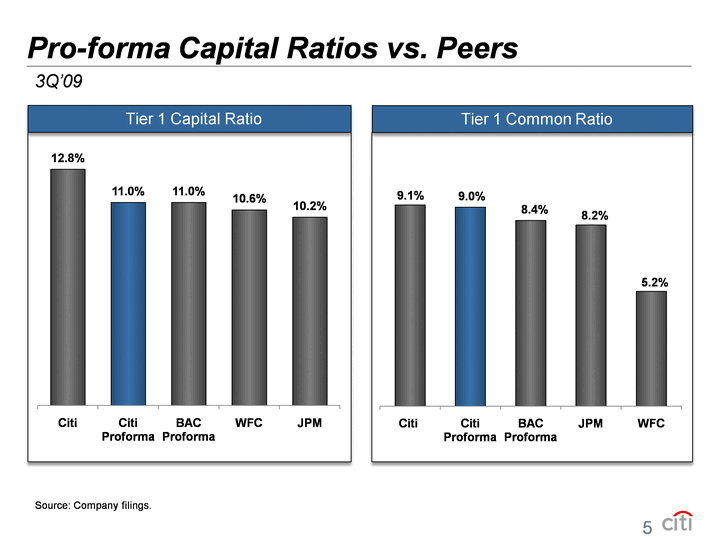
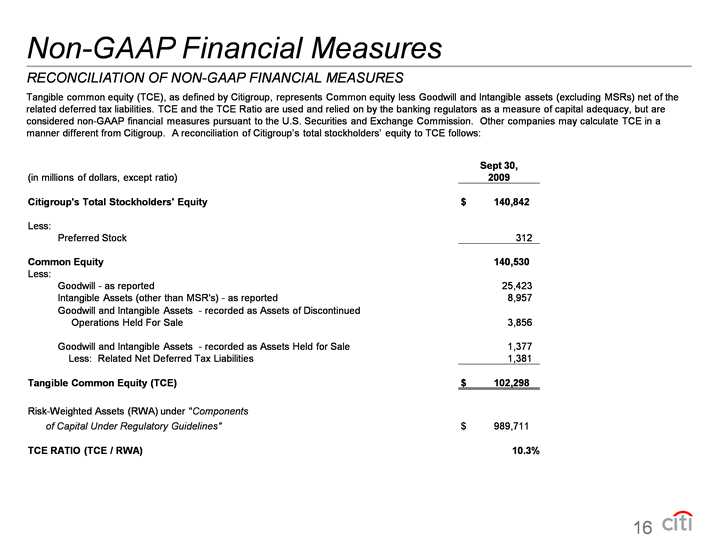
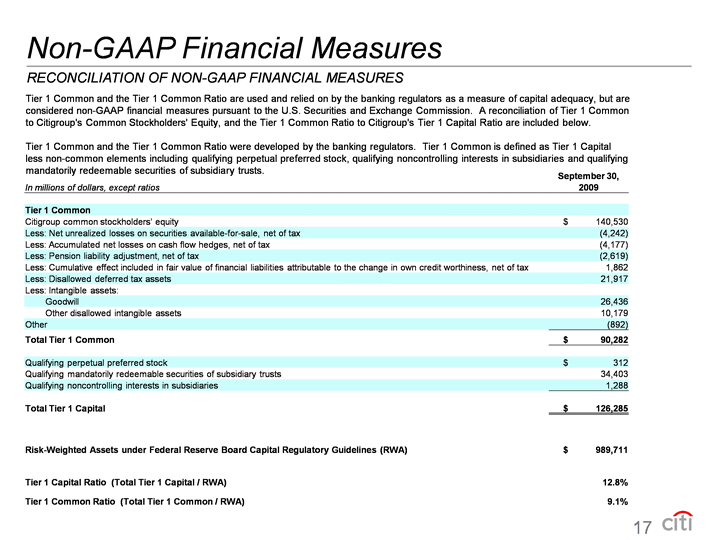
| Non-GAAP Financial Measures RECONCILIATION OF NON-GAAP FINANCIAL MEASURES Tier 1 Common and the Tier 1 Common Ratio are used and relied on by the banking regulators as a measure of capital adequacy, but are considered non-GAAP financial measures pursuant to the U.S. Securities and Exchange Commission. A reconciliation of Tier 1 Common to Citigroup's Common Stockholders' Equity, and the Tier 1 Common Ratio to Citigroup's Tier 1 Capital Ratio are included below. Tier 1 Common and the Tier 1 Common Ratio were developed by the banking regulators. Tier 1 Common is defined as Tier 1 Capital less non-common elements including qualifying perpetual preferred stock, qualifying noncontrolling interests in subsidiaries and qualifying mandatorily redeemable securities of subsidiary trusts. September 30, In millions of dollars, except ratios In millions of dollars, except ratios 2009 Tier 1 Common Tier 1 Common Citigroup common stockholders' equity Citigroup common stockholders' equity $ 140,530 Less: Net unrealized losses on securities available-for-sale, net of tax Less: Net unrealized losses on securities available-for-sale, net of tax Less: Net unrealized losses on securities available-for-sale, net of tax Less: Net unrealized losses on securities available-for-sale, net of tax (4,242) Less: Accumulated net losses on cash flow hedges, net of tax Less: Accumulated net losses on cash flow hedges, net of tax Less: Accumulated net losses on cash flow hedges, net of tax Less: Accumulated net losses on cash flow hedges, net of tax (4,177) Less: Pension liability adjustment, net of tax Less: Pension liability adjustment, net of tax Less: Pension liability adjustment, net of tax Less: Pension liability adjustment, net of tax (2,619) Less: Cumulative effect included in fair value of financial liabilities attributable to the change in own credit worthiness, net of tax Less: Cumulative effect included in fair value of financial liabilities attributable to the change in own credit worthiness, net of tax Less: Cumulative effect included in fair value of financial liabilities attributable to the change in own credit worthiness, net of tax Less: Cumulative effect included in fair value of financial liabilities attributable to the change in own credit worthiness, net of tax 1,862 Less: Disallowed deferred tax assets Less: Disallowed deferred tax assets 21,917 Less: Intangible assets: Less: Intangible assets: Goodwill 26,436 Other disallowed intangible assets 10,179 Other Other (892) Total Tier 1 Common Total Tier 1 Common $ 90,282 Qualifying perpetual preferred stock Qualifying perpetual preferred stock $ 312 Qualifying mandatorily redeemable securities of subsidiary trusts Qualifying mandatorily redeemable securities of subsidiary trusts Qualifying mandatorily redeemable securities of subsidiary trusts Qualifying mandatorily redeemable securities of subsidiary trusts 34,403 Qualifying noncontrolling interests in subsidiaries Qualifying noncontrolling interests in subsidiaries Qualifying noncontrolling interests in subsidiaries 1,288 Total Tier 1 Capital Total Tier 1 Capital Total Tier 1 Capital $ 126,285 Risk-Weighted Assets under Federal Reserve Board Capital Regulatory Guidelines (RWA) Risk-Weighted Assets under Federal Reserve Board Capital Regulatory Guidelines (RWA) Risk-Weighted Assets under Federal Reserve Board Capital Regulatory Guidelines (RWA) Risk-Weighted Assets under Federal Reserve Board Capital Regulatory Guidelines (RWA) $ 989,711 Tier 1 Capital Ratio (Total Tier 1 Capital / RWA) Tier 1 Capital Ratio (Total Tier 1 Capital / RWA) Tier 1 Capital Ratio (Total Tier 1 Capital / RWA) Tier 1 Capital Ratio (Total Tier 1 Capital / RWA) 12.8% Tier 1 Common Ratio (Total Tier 1 Common / RWA) Tier 1 Common Ratio (Total Tier 1 Common / RWA) Tier 1 Common Ratio (Total Tier 1 Common / RWA) Tier 1 Common Ratio (Total Tier 1 Common / RWA) 9.1% |
