Non-GAAP Financial Measures
The following measure is considered “non-GAAP financial measures” under SEC guidelines:
(i) Net income excluding the research settlements, litigation charges and gain on Samba.
The Company believes that these non-GAAP financial measures provide a fuller understanding of ongoing operations and enhance comparability of those results in prior periods as well as demonstrating the effects of unusual charges in the quarter. The Company believes that a meaningful analysis of its financial performance requires an understanding of the factors underlying that performance. The Company believes that investors may find it useful to see these non-GAAP financial measures to analyze financial performance without the impact of unusual items that may obscure trends in the Company’s underlying performance.
Reconciliation of the GAAP financial measures to the aforementioned non-GAAP measures follows:
| TOTAL CORPORATE & INVESTMENT BANKING | ||||||||||
| Full | Full | Full | FY04 vs. | |||||||
| (In millions) | ||||||||||
GAAP Net Income | $ | 3,172 |
| $ | 5,371 |
| $ | 2,038 |
| (62% | ) |
Excluding Charge for Regulatory Settlements | 1,323 |
| — |
| — |
|
|
| |||
Excluding Gain on Samba | — |
| — |
| (378 | ) |
|
| |||
Excluding Litigation Charges | — |
| — |
| 4,950 |
|
|
| |||
Non-GAAP Net Income as Adjusted | $ | 4,495 |
| $ | 5,371 |
| $ | 6,610 |
| 23% |
|
GAAP Revenues | $ | 19,165 |
| $ | 20,021 |
| $ | 21,774 |
| 9% |
|
Excluding Gain on Samba | — |
| — |
| (584 | ) |
|
| |||
Non-GAAP Revenues as Adjusted | $ | 19,165 |
| $ | 20,021 |
| $ | 21,190 |
| 6% |
|
GAAP Expenses | $ | 12,093 |
| $ | 11,455 |
| $ | 20,525 |
| 79% |
|
Excluding Charge for Regulatory Settlements | (1,955 | ) | — |
| — |
|
|
| |||
Excluding Litigation Charges | — |
| — |
| (7,915 | ) |
|
| |||
Non-GAAP Expenses as Adjusted | $ | 10,138 |
| $ | 11,455 |
| $ | 12,610 |
| 10% |
|
Non-GAAP Financial Measures
The following measures are considered “non-GAAP financial measures” under SEC guidelines:
(i) Income excluding the litigation charges and gain on Samba.
(ii) Diluted earnings per share excluding the litigation charges and gain on Samba.
(iii) Revenues excluding gain on the sale of Samba.
(iv) Expenses excluding litigation charges.
The Company believes that these non-GAAP financial measures provide a fuller understanding of ongoing operations and enhance comparability of those results in prior periods as well as demonstrating the effects of unusual charges in the quarter. The Company believes that a meaningful analysis of its financial performance requires an understanding of the factors underlying that performance. The Company believes that investors may find it useful to see these non-GAAP financial measures to analyze financial performance without the impact of unusual items that may obscure trends in the Company’s underlying performance.
Reconciliation of the GAAP financial measures to the aforementioned non-GAAP measures follows:
| Total Citigroup | |||||
| Full |
| Full | |||
| (in millions, except EPS) | |||||
GAAP Income | $ | 17,853 |
| $ | 17,046 |
|
Excluding Gain on Samba | — |
| (756 | ) | ||
Excluding Litigation Charges | — |
| 4,950 |
| ||
Non-GAAP Income as Adjusted | $ | 17,853 |
| $ | 21,240 |
|
GAAP Diluted Earnings Per Share | $ | 3.42 |
| $ | 3.26 |
|
Excluding Gain on Samba | — |
| (0.14 | ) | ||
Excluding Litigation Charges | — |
| 0.95 |
| ||
Non-GAAP Diluted Earnings Per Share as Adjusted | $ | 3.42 |
| $ | 4.07 |
|
GAAP Revenues | $ | 77,442 |
| $ | 86,190 |
|
Excluding Gain on Samba | — |
| (1,168 | ) | ||
Non-GAAP Revenues as Adjusted | $ | 77,442 |
| $ | 85,022 |
|
GAAP Expenses | $ | 39,168 |
| $ | 51,974 |
|
Excluding Litigation Charges | — |
| (7,915 | ) | ||
Non-GAAP Expenses as Adjusted | $ | 39,168 |
| $ | 44,059 |
|
Searchable text section of graphics shown above
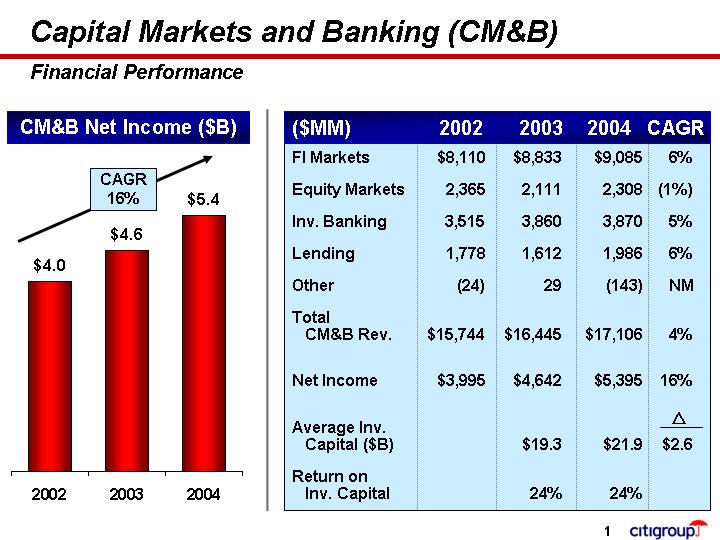
Capital Markets and Banking (CM&B)
Financial Performance
CM&B Net Income ($B)
[CHART]
($MM) |
| 2002 |
| 2003 |
| 2004 |
| CAGR |
| ||||
FI Markets |
| $ | 8,110 |
| $ | 8,833 |
| $ | 9,085 |
| 6 | % | |
Equity Markets |
| 2,365 |
| 2,111 |
| 2,308 |
| (1 | )% | ||||
Inv. Banking |
| 3,515 |
| 3,860 |
| 3,870 |
| 5 | % | ||||
Lending |
| 1,778 |
| 1,612 |
| 1,986 |
| 6 | % | ||||
Other |
| (24 | ) | 29 |
| (143 | ) | NM |
| ||||
Total CM&B Rev. |
| $ | 15,744 |
| $ | 16,445 |
| $ | 17,106 |
| 4 | % | |
Net Income |
| $ | 3,995 |
| $ | 4,642 |
| $ | 5,395 |
| 16 | % | |
Average Inv. Capital ($B) |
|
|
| $ | 19.3 |
| $ | 21.9 |
| $ | 2.6 |
| |
Return on Inv. Capital |
|
|
| 24 | % | 24 | % |
|
| ||||
[LOGO]
1
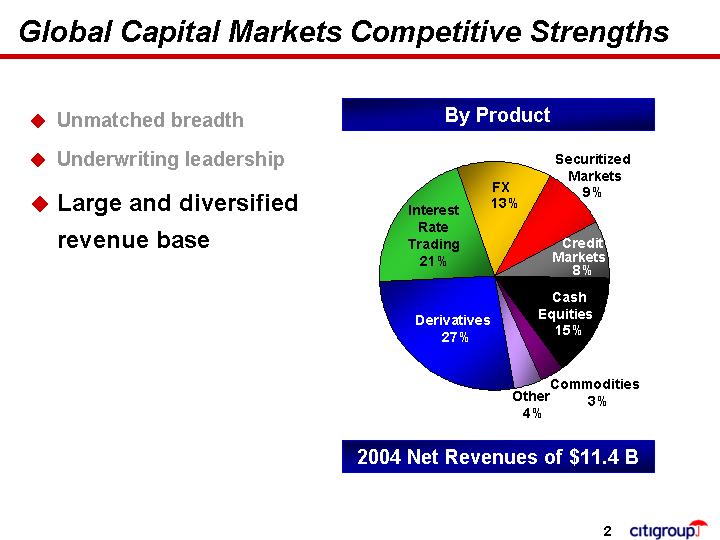
Global Capital Markets Competitive Strengths
• Unmatched breadth
• Underwriting leadership
• Large and diversified revenue base
By Product
[CHART]
2004 Net Revenues of $11.4 B
2
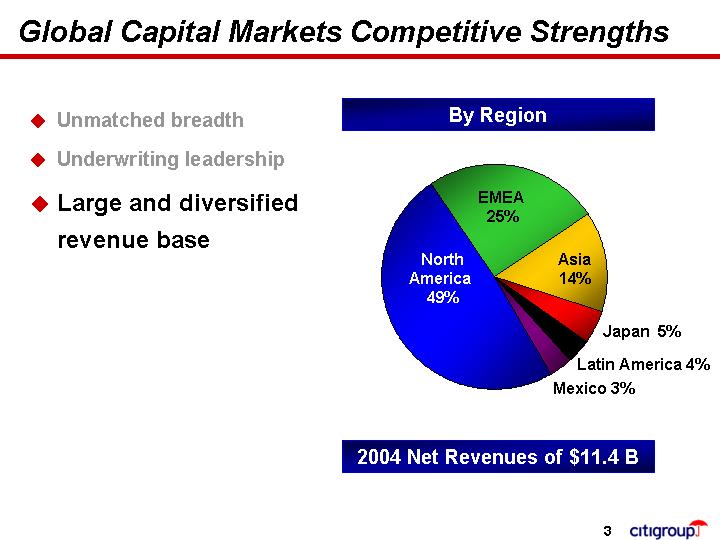
• Unmatched breadth
• Underwriting leadership
• Large and diversified revenue base
By Region
[CHART]
2004 Net Revenues of $11.4 B
3
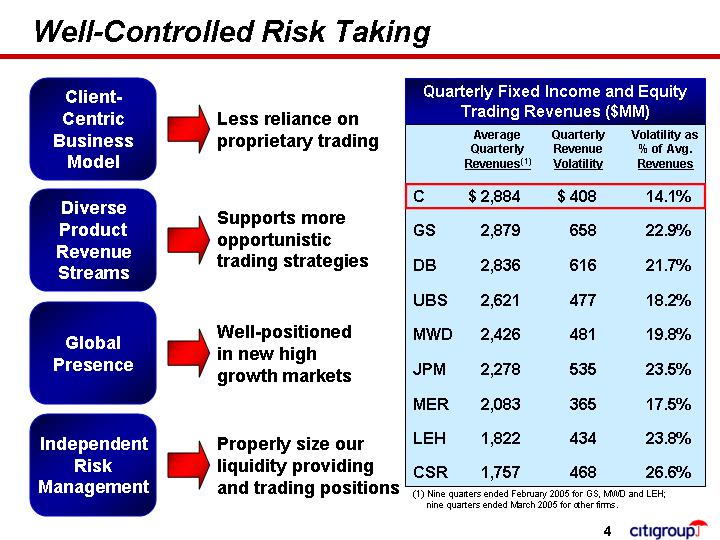
Well-Controlled Risk Taking
Client-Centric Business Model |
| Less reliance on proprietary trading |
|
|
|
Diverse Product Revenue Streams |
| Supports more opportunistic trading strategies |
|
|
|
Global Presence |
| Well-positioned in new high growth markets |
|
|
|
Independent Risk Management |
| Properly size our liquidity providing and trading positions |
Quarterly Fixed Income and Equity
Trading Revenues ($MM)
|
| Average |
| Quarterly |
| Volatility as |
| ||
|
|
|
|
|
|
|
| ||
C |
| $ | 2,884 |
| $ | 408 |
| 14.1 | % |
GS |
| 2,879 |
| 658 |
| 22.9 | % | ||
DB |
| 2,836 |
| 616 |
| 21.7 | % | ||
UBS |
| 2,621 |
| 477 |
| 18.2 | % | ||
MWD |
| 2,426 |
| 481 |
| 19.8 | % | ||
JPM |
| 2,278 |
| 535 |
| 23.5 | % | ||
MER |
| 2,083 |
| 365 |
| 17.5 | % | ||
LEH |
| 1,822 |
| 434 |
| 23.8 | % | ||
CSR |
| 1,757 |
| 468 |
| 26.6 | % | ||
(1) Nine quarters ended February 2005 for GS, MWD and LEH; nine quarters ended March 2005 for other firms.
4
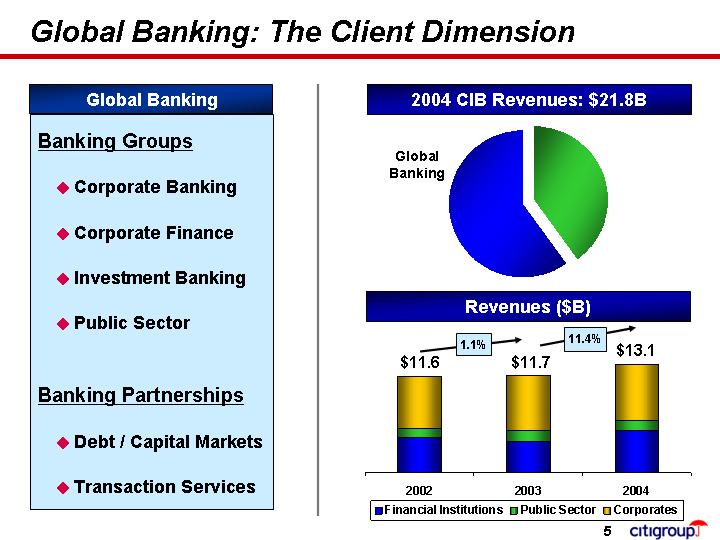
Global Banking: The Client Dimension
Global Banking
Banking Groups
• Corporate Banking
• Corporate Finance
• Investment Banking
• Public Sector
Banking Partnerships
• Debt / Capital Markets
• Transaction Services
2004 CIB Revenues: $21.8B
[CHART]
Revenues ($B)
[CHART]
5
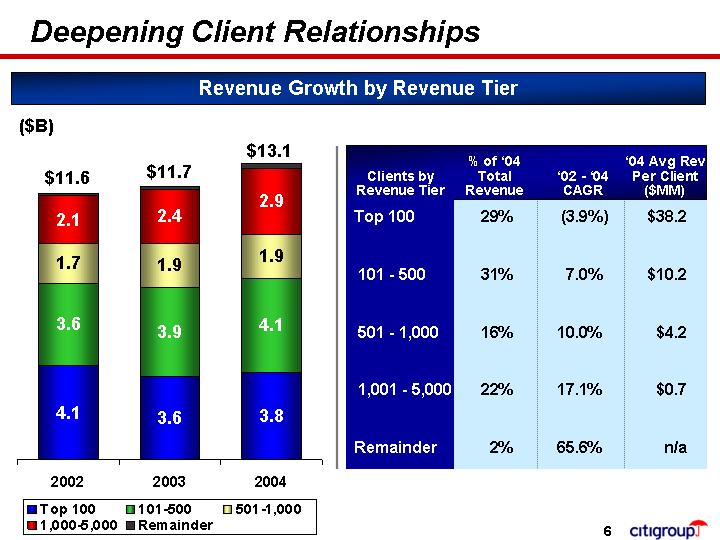
Deepening Client Relationships
Revenue Growth by Revenue Tier
($B)
[CHART]
|
| % of ‘04 |
|
|
|
|
| |
Clients by |
| Total |
| ‘02 - ‘04 |
| ‘04 Avg Rev |
| |
Revenue Tier |
| Revenue |
| CAGR |
| Per Client |
| |
|
|
|
|
|
| ($MM) |
| |
Top 100 |
| 29 | % | (3.9 | )% | $ | 38.2 |
|
|
|
|
|
|
|
|
| |
101 - 500 |
| 31 | % | 7.0 | % | $ | 10.2 |
|
|
|
|
|
|
|
|
| |
501 - 1,000 |
| 16 | % | 10.0 | % | $ | 4.2 |
|
|
|
|
|
|
|
|
| |
1,001 - 5,000 |
| 22 | % | 17.1 | % | $ | 0.7 |
|
|
|
|
|
|
|
|
| |
Remainder |
| 2 | % | 65.6 | % | n/a |
| |
6
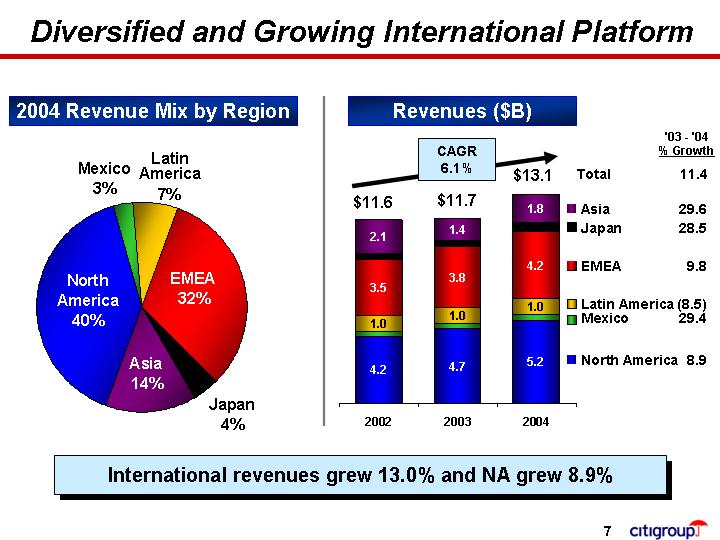
Diversified and Growing International Platform
2004 Revenue Mix by Region
[CHART]
Revenues ($B)
[CHART]
|
| ‘03 - ‘04 |
|
|
| % Growth |
|
Total |
| 11.4 |
|
|
|
|
|
Asia |
| 29.6 |
|
Japan |
| 28.5 |
|
|
|
|
|
EMEA |
| 9.8 |
|
|
|
|
|
Latin America |
| (8.5 | ) |
Mexico |
| 29.4 |
|
|
|
|
|
North America |
| 8.9 |
|
International revenues grew 13.0% and NA grew 8.9%
7
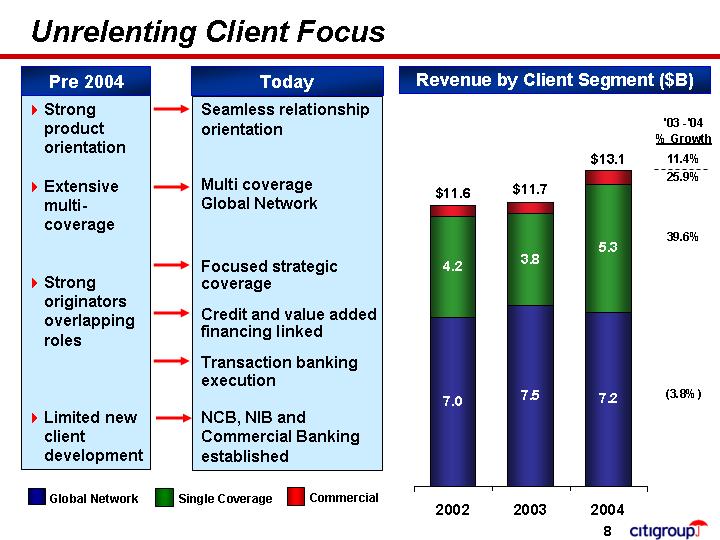
Unrelenting Client Focus
Pre 2004 |
| Today |
|
|
|
• Strong product orientation |
| Seamless relationship orientation |
|
|
|
• Extensive multi-coverage |
| Multi coverage Global Network |
|
|
|
• Strong originators overlapping roles |
| Focused strategic coverage |
|
|
|
• Limited new client development |
| NCB, NIB and Commercial Banking established |
Revenue by Client Segment ($B)
[CHART]
|
| ‘03 - ‘04 |
|
|
| % Growth |
|
Total |
| 11.4 | % |
|
|
|
|
Commercial |
| 25.9 | % |
|
|
|
|
Single Coverage |
| 39.6 | % |
|
|
|
|
Global Network |
| (3.8 | )% |
8
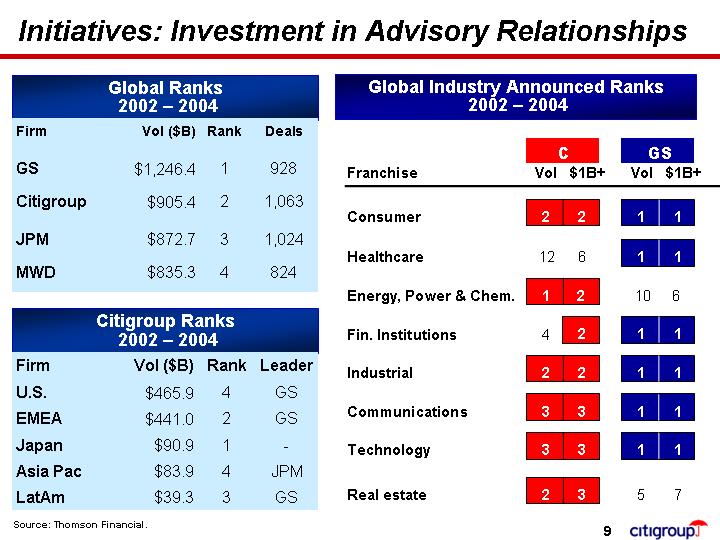
Initiatives: Investment in Advisory Relationships
Global Ranks
2002 – 2004
Firm |
| Vol ($B) |
| Rank |
| Deals |
| |
|
|
|
|
|
|
|
| |
GS |
| $ | 1,246.4 |
| 1 |
| 928 |
|
|
|
|
|
|
|
|
| |
Citigroup |
| $ | 905.4 |
| 2 |
| 1,063 |
|
|
|
|
|
|
|
|
| |
JPM |
| $ | 872.7 |
| 3 |
| 1,024 |
|
|
|
|
|
|
|
|
| |
MWD |
| $ | 835.3 |
| 4 |
| 824 |
|
Citigroup Ranks
2002 – 2004
Firm |
| Vol ($B) |
| Rank |
| Leader |
| |
|
|
|
|
|
|
|
| |
U.S. |
| $ | 465.9 |
| 4 |
| GS |
|
|
|
|
|
|
|
|
| |
EMEA |
| $ | 441.0 |
| 2 |
| GS |
|
|
|
|
|
|
|
|
| |
Japan |
| $ | 90.9 |
| 1 |
| — |
|
|
|
|
|
|
|
|
| |
Asia Pac |
| $ | 83.9 |
| 4 |
| JPM |
|
|
|
|
|
|
|
|
| |
LatAm |
| $ | 39.3 |
| 3 |
| GS |
|
Source: Thomson Financial.
Global Industry Announced Ranks
2002 – 2004
|
| C |
| GS |
| ||||
Franchise |
| Vol |
| $1B+ |
| Vol |
| $1B+ |
|
|
|
|
|
|
|
|
|
|
|
Consumer |
| 2 |
| 2 |
| 1 |
| 1 |
|
|
|
|
|
|
|
|
|
|
|
Healthcare |
| 12 |
| 6 |
| 1 |
| 1 |
|
|
|
|
|
|
|
|
|
|
|
Energy, Power & Chem. |
| 1 |
| 2 |
| 10 |
| 6 |
|
|
|
|
|
|
|
|
|
|
|
Fin. Institutions |
| 4 |
| 2 |
| 1 |
| 1 |
|
|
|
|
|
|
|
|
|
|
|
Industrial |
| 2 |
| 2 |
| 1 |
| 1 |
|
|
|
|
|
|
|
|
|
|
|
Communications |
| 3 |
| 3 |
| 1 |
| 1 |
|
|
|
|
|
|
|
|
|
|
|
Technology |
| 3 |
| 3 |
| 1 |
| 1 |
|
|
|
|
|
|
|
|
|
|
|
Real estate |
| 2 |
| 3 |
| 5 |
| 7 |
|
9
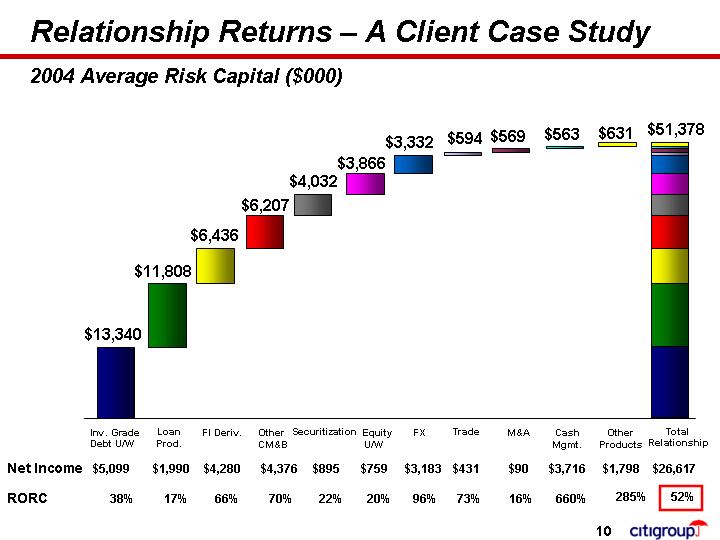
Relationship Returns – A Client Case Study
2004 Average Risk Capital ($000)
[CHART]
|
| Inv. Grade |
| Loan |
| FI Deriv. |
| Other |
| Securitization |
| Equity |
| FX |
| Trade |
| M&A |
| Cash |
| Other |
| Total |
| ||||||||||||
Net Income |
| $ | 5,099 |
| $ | 1,990 |
| $ | 4,280 |
| $ | 4,376 |
| $ | 895 |
| $ | 759 |
| $ | 3,183 |
| $ | 431 |
| $ | 90 |
| $ | 3,716 |
| $ | 1,798 |
| $ | 26,617 |
|
RORC |
| 38 | % | 17 | % | 66 | % | 70 | % | 22 | % | 20 | % | 96 | % | 73 | % | 16 | % | 660 | % | 285 | % | 52 | % | ||||||||||||
10
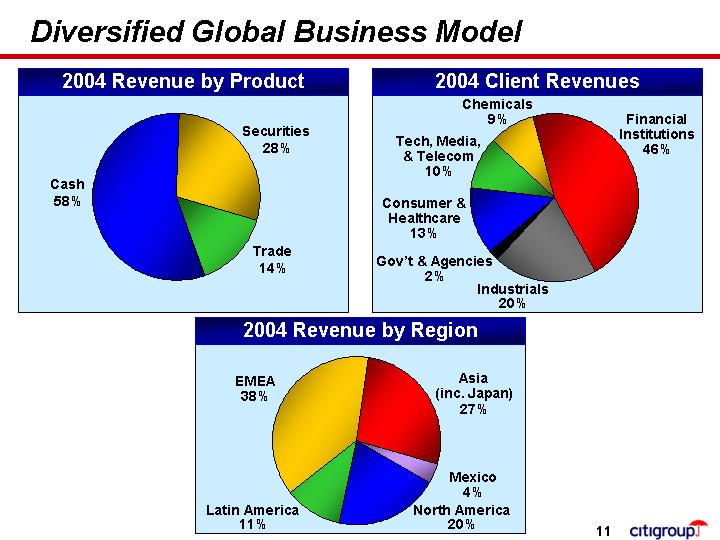
Diversified Global Business Model
2004 Revenue by Product
[CHART]
2004 Client Revenues
[CHART]
2004 Revenue by Region
[CHART]
11