Citigroup (C) 8-KRegulation FD Disclosure
Filed: 27 Oct 06, 12:00am
Exhibit 99.1
Update on Investment Initiatives October 27, 2006 |
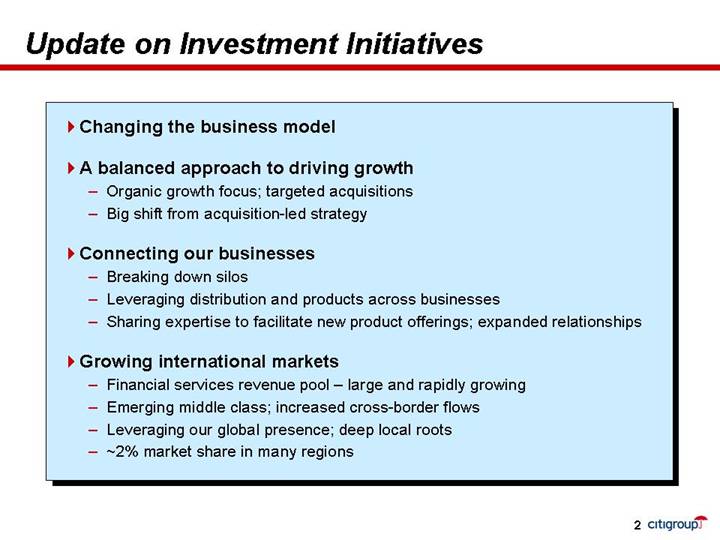
Update on Investment Initiatives Changing the business model A balanced approach to driving growth Organic growth focus; targeted acquisitions Big shift from acquisition-led strategy Connecting our businesses Breaking down silos Leveraging distribution and products across businesses Sharing expertise to facilitate new product offerings; expanded relationships Growing international markets Financial services revenue pool – large and rapidly growing Emerging middle class; increased cross-border flows Leveraging our global presence; deep local roots ~2% market share in many regions |

Investing in Organic Growth Different Investment Models Consumer Expanding distribution footprint; reaching new customers Integrating our businesses Longer payback, less volatile returns CIB Expanding product capabilities; driving increased client activity Expanding coverage of new client segments Faster payback, higher volatility Technology Facilitating growth by improved customer service; connecting businesses Strengthening platform, simplification and consolidation, expense saves |

Investment Spending International Consumer Branches/Sales Force $130 $430 Incremental Cards Acquisitions 45 75 Other 50 25 Total $225 $530 ~4 ~9 U.S. Consumer Branches $5 $100 Channel & Sales Force Expansion 0 50 Total $5 $150 ~6 ~14 Corporate & Invest. Banking $660 $360 Other (1) 110 130 Total Citigroup $1,000 $1,170 ~3 ~5 ($MM) Achieves Weighted-Average ROI in Excess of 18% by Year 3 (1) Includes Global Wealth Management on-shore expansion, Alternative Investments and Corporate Technology. Note: Break-even equals the weighted average quarter in which EBT from the investments in a particular year turns positive. Payback equals the weighted average quarter in which cumulative EBT from the investments in a particular year turns positive. ~ indicates approximately. Break-Even Payback Targeted Quarter Incremental Investments 2005 2006E |

RevenueInvestments: Contribution to GrowthIncome U.S. Cons. Int’l Cons. CIB Citigroup Other U.S. Cons. Int’l Cons. CIB Citigroup Other C ex-CIB C ex-CIB Note: Citigroup income is on a continuing operations basis. 2005 growth figures exclude the revenue impact from 2Q’04 gain on sale of Samba Financial Group of $756MM after-tax and May 2004 charges for WorldCom settlement / increased litigation reserves of $4.95B after-tax. 0.0%1.5%0.1%(1.3%)7.3%1.5%(0.5%)(0.3%)(1.7%)(1.9%)(0.8%)(2.0%)20052006 YTD0.0%0.9%0.4%3.8%1.3%0.1%2.5%0.6%0.9%4.7%2.0%0.8%20052006 YTD |
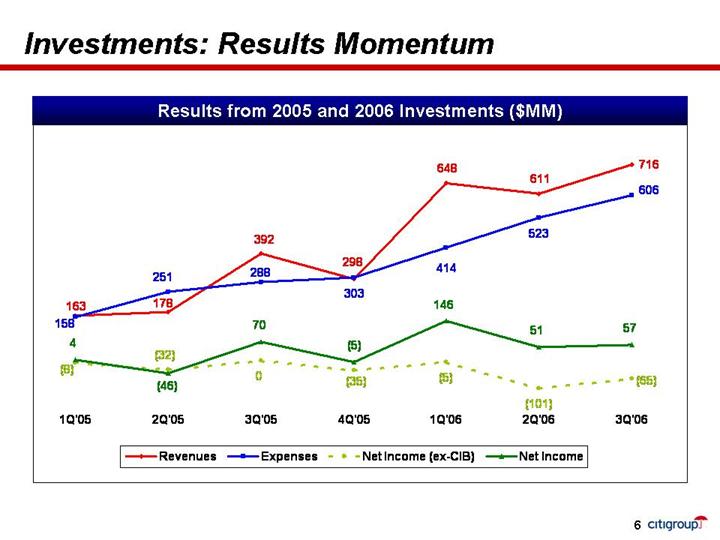
Results from 2005 and 2006 Investments ($MM)Investments: Results Momentum 7163035230(5)(101)470(5)146515761129864816339217860615828 8414251(8)(65)(32)(35)(46)1Q'052Q'053Q'054Q'051Q'062Q'063Q'06RevenuesExpensesNet Income (ex-CIB)Net Income |
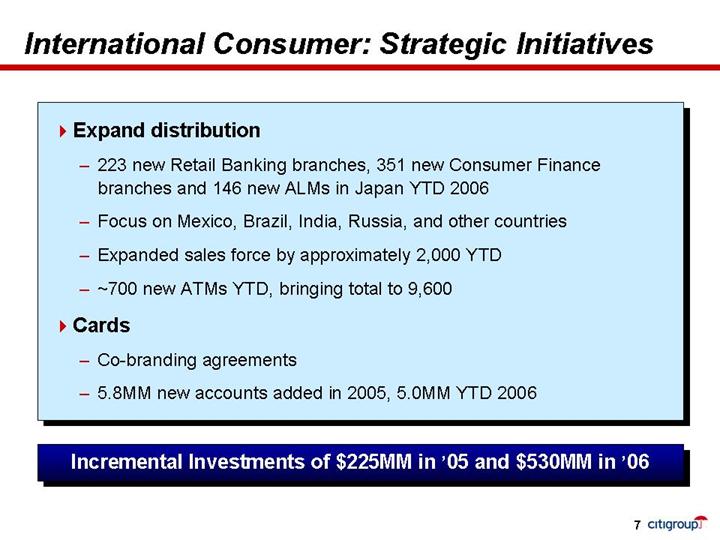
Expand distribution 223 new Retail Banking branches, 351 new Consumer Finance branches and 146 new ALMs in Japan YTD 2006 Focus on Mexico, Brazil, India, Russia, and other countries Expanded sales force by approximately 2,000 YTD ~700 new ATMs YTD, bringing total to 9,600 Cards Co-branding agreements 5.8MM new accounts added in 2005, 5.0MM YTD 2006 International Consumer: Strategic Initiatives Incremental Investments of $225MM in ’05 and $530MM in ’06 |

International Consumer Finance Investments Avg. Loans ($MM): 1179 178 345 546 799 1,106 ($MM) Incremental de novo branches: 72 68 80 97 130 111 110 132+ ~70% more branches than at EOP 2004 Quarterly EBT per Branch Quarters on Book (4) (2) Excludes Japan ALMs. (3) Data is for branches in emerging markets. (4) Quarters on book defined as number of quarters branch has been open. Results from 2Q’05 Branch/ALM Additions Cumulative De Novo Branches Since 2004 Results from ’05-’06 Investments ($MM) Average Branch Performance ($M) (2) Avg. branch at full maturity (3): Revenue $600-$800K EBT $250-$300K (1) Data is for branches in emerging markets. RevenueExpensesEBT Average branch model (1) : Break-even ~7 months Payback ~15 months Full maturity ~3 years (10)(5)0510152Q'053Q'054Q'051Q'062Q'063Q'06Total RevenueTotal ExpenseEBT72220317447140558668800+1Q'052Q'053Q'054Q'051Q'062Q'063Q'064Q'06E(30)(10)1030507090123456775573925135156534030231566(3)(6)(7)(11)(10)(5)1Q'052Q'053Q'054Q'051Q'062Q'063Q'06 |

International Cards Franchise Growth Cumulative New Accounts (M) Average Results for New Accounts Results from 2Q’05 Account Acquisitions ($MM) Mature Rev / Acct Mature Pre-Tax Income/ Acct 44% more accounts than at EOP 2004 (1.3 from incremental investments) Note: Excludes impact of attrition. $ / Acct Average Account: Break-even ~15 months Payback ~27 months Results from ’05-’06 Investments ($MM) ANR ($MM): 50128 197 271 379 528 734 RevenueExpenseEBTNote: Results based on total 2Q’05 account acquisition, not on an incremental basis.. 1,4262,8814,3525,7947,2128,88810,7831Q'052Q'053Q'054Q'051Q'062Q'063Q'06(120)(90)(60)(30)03060902Q'053Q'054Q'051Q'062Q'063Q'06RevenueExpenseEBT(150)(50)50 150250350Year 1Year 2Year 3Year 4RevenuePre-Tax Income129864203223191511118(25)(18)(12)(10)(8)(9)(8)1Q'052Q'053Q'054Q'051Q'062Q'063Q'06 |
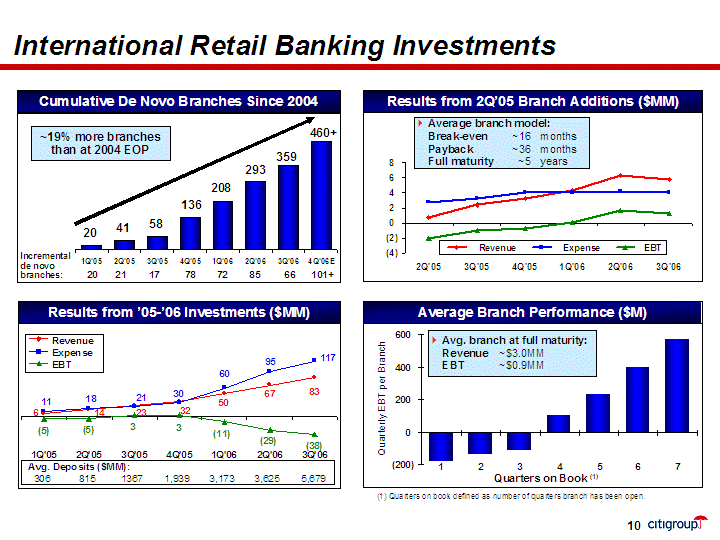
International Retail Banking Investments Average branch model: Break-even ~16 months Payback ~36 months Full maturity ~5 years Incremental de novo branches: 20 21 17 78 72 85 66 101+ ~19% more branches than at 2004 EOP Avg. Deposits ($MM): 306 815 1367 1,939 3,173 3,625 5,679Results from ’05-’06 Investments ($MM) Cumulative De Novo Branches Since 2004 Results from 2Q’05 Branch Additions ($MM) RevenueExpenseEBTAvg. branch at full maturity: Revenue ~$3.0MM EBT ~$0.9MM Quarterly EBT per Branch (1) Quarters on book defined as number of quarters branch has been open. Average Branch Performance ($M) Quarters on Book (1)2058460+ 136208412933591Q'052Q'053Q'054Q'051Q'062Q'063Q'064Q'06E8367503223146117956030211811(38)(29)(11)33(5)(5)1Q'052Q'053Q'054Q'051Q'062Q'063Q'06(200) 02004006001234567(4)(2)024682Q'053Q'054Q'051Q'062Q'063Q'06RevenueExpenseEBT |
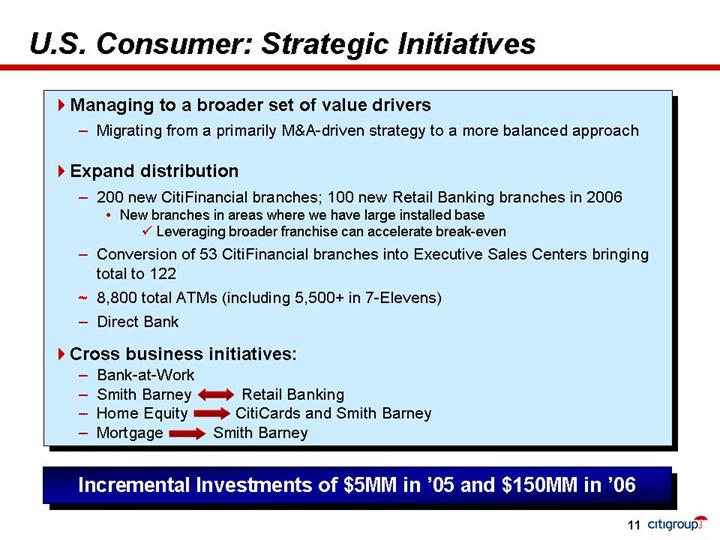
U.S. Consumer: Strategic Initiatives Incremental Investments of $5MM in ’05 and $150MM in ’06 Managing to a broader set of value drivers Migrating from a primarily M&A-driven strategy to a more balanced approach Expand distribution 200 new CitiFinancial branches; 100 new Retail Banking branches in 2006 New branches in areas where we have large installed base Leveraging broader franchise can accelerate break-even Conversion of 53 CitiFinancial branches into Executive Sales Centers bringing total to 122 ~ 8,800 total ATMs (including 5,500+ in 7-Elevens) Direct Bank Cross business initiatives: Bank-at-Work Smith Barney Retail Banking Home Equity CitiCards and Smith Barney Mortgage Smith Barney |
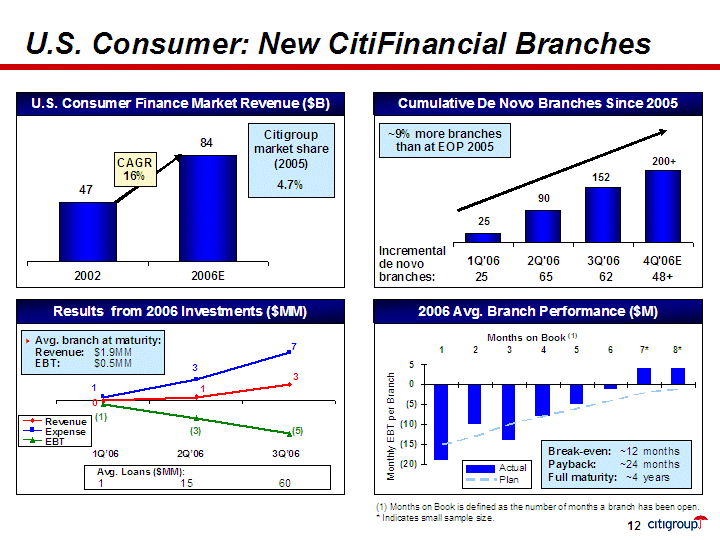
Citigroup market share (2005) 4.7% Incremental de novo branches: 25 65 62 U.S. Consumer: New CitiFinancial Branches 48+ ~9% more branches than at EOP 2005 Results from 2006 Investments ($MM) 2006 Avg. Branch Performance ($M) CAGR 16% Cumulative De Novo Branches Since 2005 U.S. Consumer Finance Market Revenue ($B) Avg. branch at maturity: Revenue: $1.9MM EBT: $0.5MM 1 15 60 1Q’06 2Q’06 3Q’06 Avg. Loans: Monthly EBT per Branch Break-even: ~12 months Payback: ~24 months Full maturity: ~4 years (1) Months on Book is defined as the number of months a branch has been open. * Indicates small sample size. Months on Book (1) RevenueExpenseEBTActual Plan (70)(50)(30)(10)101234478420022006E90200+ 251521Q'062Q'063Q'064Q'06E310731(5)(3)(1) |

U.S. Consumer: New Citibank Branches U.S. Retail Banking Market Revenue ($B) Results from ’05-’06 Investments ($MM) Citigroup market share (2005) 1.3% 3 39 127 247 418 859Cumulative De Novo Branches Since 2004 Incremental de novo branches: 2 6 3 12 11 9 39 CAGR 6% Note: Market size includes all branch distributed products. 38+ ~15% more branches than at EOP 2004 Avg. branch at maturity: Revenue: $3.3MM EBT: $1.7MM ’05-’06 Avg. Branch Performance ($M) Break-even: ~18 months Payback: ~38 months Full maturity: ~5 years Avg. Deposits: Monthly EBT per Branch Months on Book (1)(1) Months on Book is defined as the number of months a branch has been open. Actual Plan (350)(300)(250)(200)(150)(100)(50)05012345654210022147521(16)(10)(5)(4)(2)(1)2Q'053Q'054Q'051Q'062Q'063Q'06120+ 8243834232111Q'052Q'053Q'054Q'051Q'062Q'063Q'064Q'06E17222020022006E |
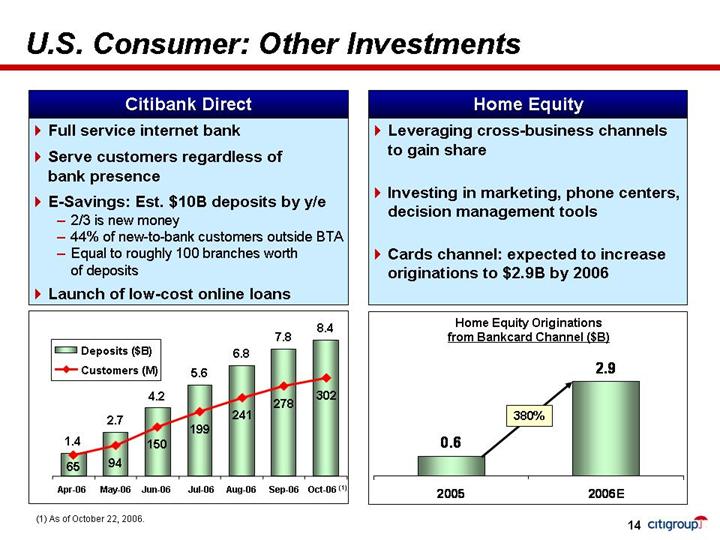
380% U.S. Consumer: Other Investments Full service internet bank Serve customers regardless of bank presence E-Savings: Est. $10B deposits by y/e 2/3 is new money 44% of new-to-bank customers outside BTA Equal to roughly 100 branches worth of deposits Launch of low-cost online loans Citibank Direct Leveraging cross-business channels to gain share Investing in marketing, phone centers, decision management tools Cards channel: expected to increase originations to $2.9B by 2006 Home Equity 2.74.25.66.87.88.41.49415019924127830265Apr-06May-06Jun-06Jul-06Aug-06Sep-06Oct-06 (1)Deposits ($B)Customers (M)Home Equity Originations from Bankcard Channel ($B) (1) As of October 22, 2006. 2.90.620052006E |

U.S. Consumer: Leveraging Across Businesses Smith Barney è Citibank Platform Quality of FA Brand and position Citibank è Smith Barney FDIC deposits of $45B+ generated by Smith Barney channel vs. $87B from Retail Bank Mortgage originations $8B annually; largest Citi channel Commercial Lending pipeline > $1B; just ramping up Next step – develop full banking relationship with Smith Barney clients Developing platform to execute integrated, quality client experience; roll out in 2007 Should accelerate break-even and provide unique model / leverage in existing and new markets |
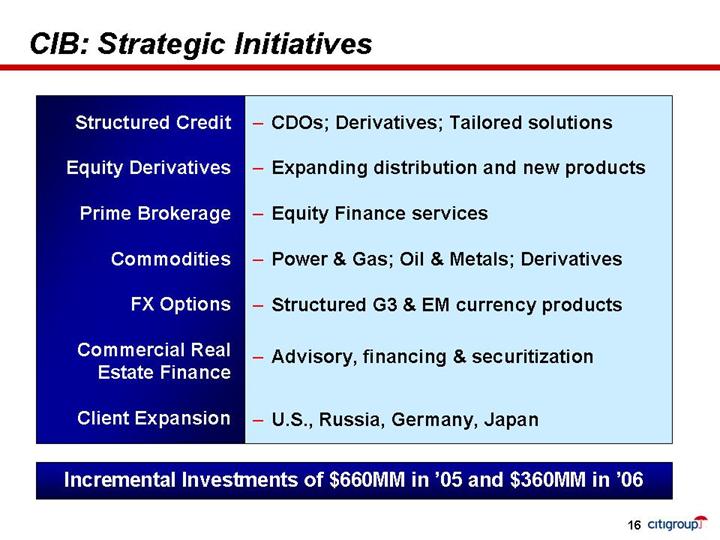
CIB: Strategic Initiatives Structured Credit Equity Derivatives Prime Brokerage Commodities FX Options Commercial Real Estate Finance Client Expansion CDOs; Derivatives; Tailored solutionsExpanding distribution and new products Equity Finance services Power & Gas; Oil & Metals; Derivatives Structured G3 & EM currency products Advisory, financing & securitization U.S., Russia, Germany, Japan Incremental Investments of $660MM in ’05 and $360MM in ’06 |
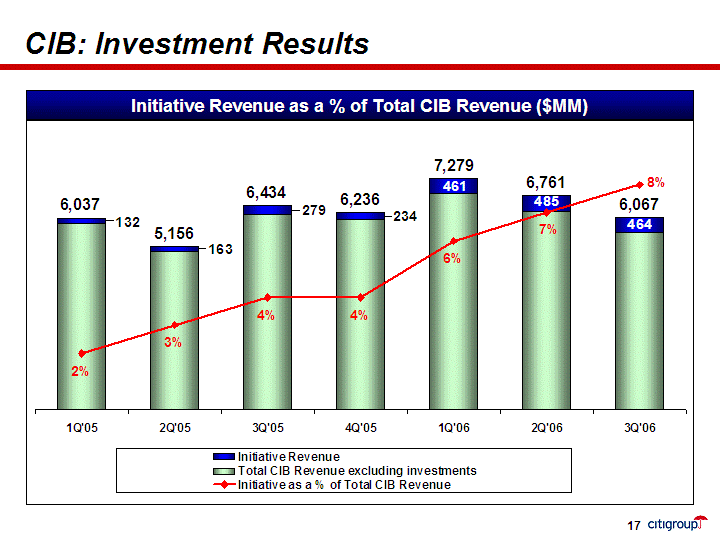
CIB: Investment Results Initiative Revenue as a % of Total CIB Revenue ($MM) 6,0375,1566,4346,2367,2796,7616,0671321632792344614854642%3%4%4%6%7%8%1Q'052Q'053Q'054Q'051Q'062Q'063Q'06Initiative RevenueTotal CIB Revenue excluding investmentsInitiative as a % of Total CIB Revenue |
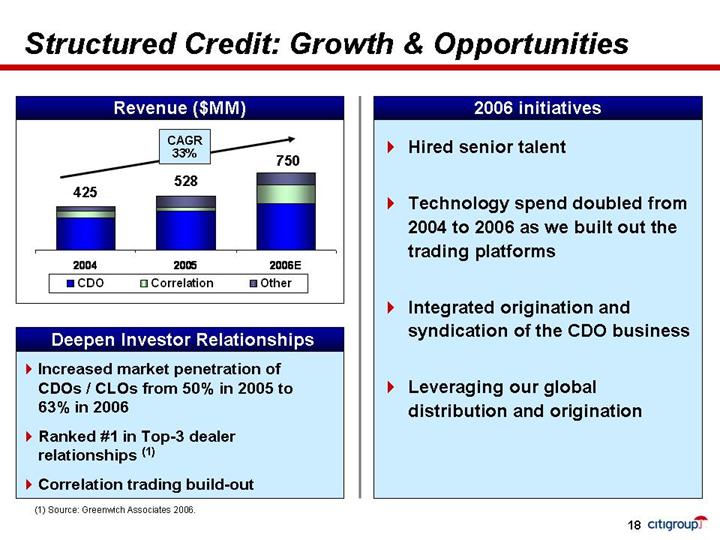
Increased market penetration of CDOs / CLOs from 50% in 2005 to 63% in 2006 Ranked #1 in Top-3 dealer relationships (1) Correlation trading build-out Deepen Investor Relationships Revenue ($MM) Hired senior talent Technology spend doubled from 2004 to 2006 as we built out the trading platforms Integrated origination and syndication of the CDO business Leveraging our global distribution and origination Structured Credit: Growth & Opportunities CAGR 33% (1) Source: Greenwich Associates 2006. 425 528 750 2006 initiatives 200420052006ECDOCorrelationOther |
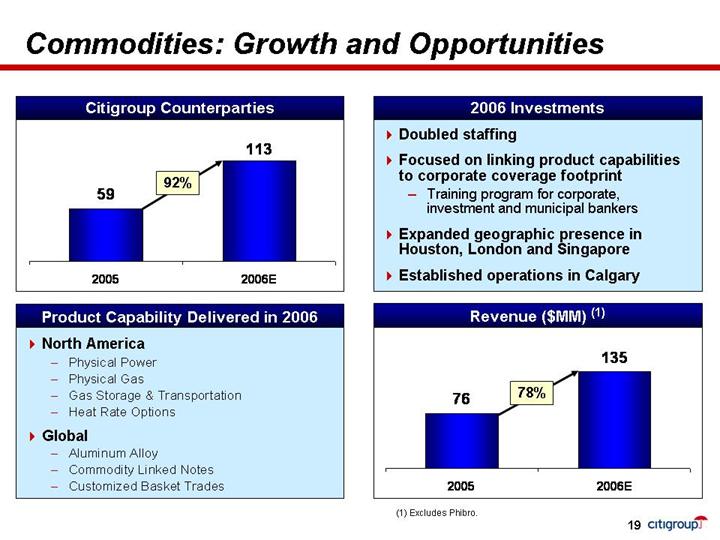
Citigroup Counterparties Product Capability Delivered in 2006 Doubled staffing Focused on linking product capabilities to corporate coverage footprint Training program for corporate, investment and municipal bankers Expanded geographic presence in Houston, London and Singapore Established operations in Calgary 2006 Investments Commodities: Growth and Opportunities North America Physical Power Physical Gas Gas Storage & Transportation Heat Rate Options Global Aluminum Alloy Commodity Linked Notes Customized Basket Trades Revenue ($MM) (1) 78% 92% (1) Excludes Phibro. 7613520052006E5911320052006E |
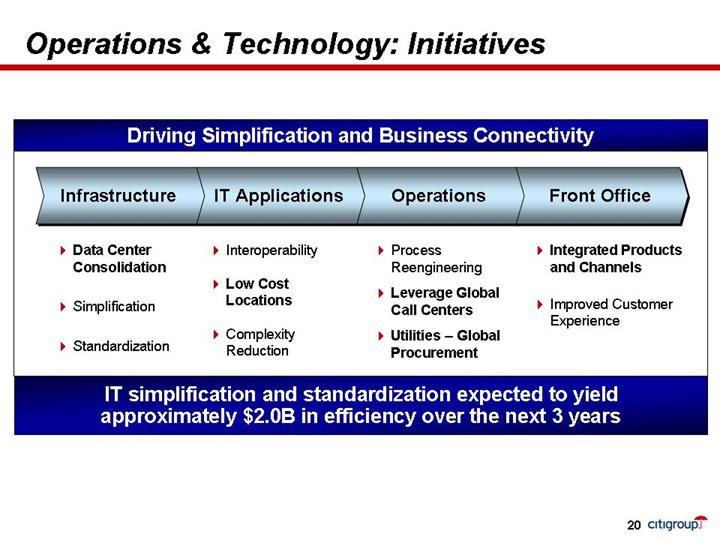
IT simplification and standardization expected to yield approximately $2.0B in efficiency over the next 3 years Data Center Consolidation Simplification Standardization Interoperability Low Cost Locations Complexity Reduction Process Reengineering Leverage Global Call Centers Utilities – Global Procurement Integrated Products and Channels Improved Customer Experience Infrastructure IT Applications Operations Front Office Driving Simplification and Business Connectivity Operations & Technology: Initiatives |
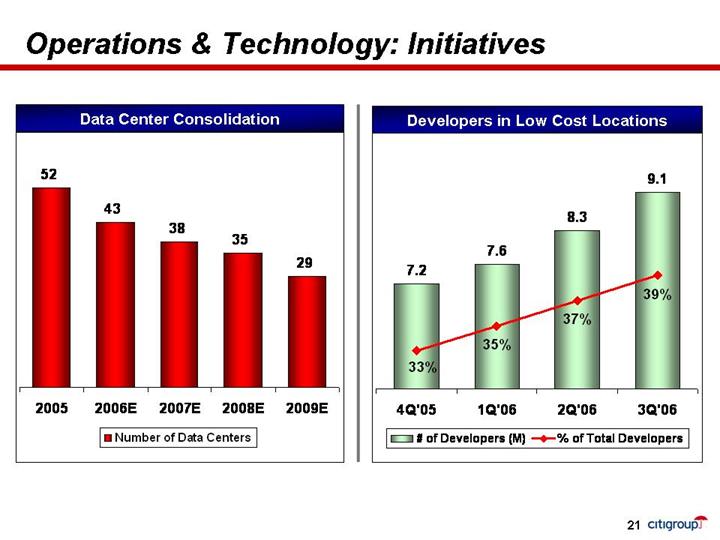
Operations & Technology: Initiatives Data Center Consolidation Developers in Low Cost Locations524338352920052006E2007E2008E2009ENumber of Data Centers7.68.39.17.235%37%39%33%4Q'051Q'062Q'063Q'06# of Developers (M)% of Total Developers |
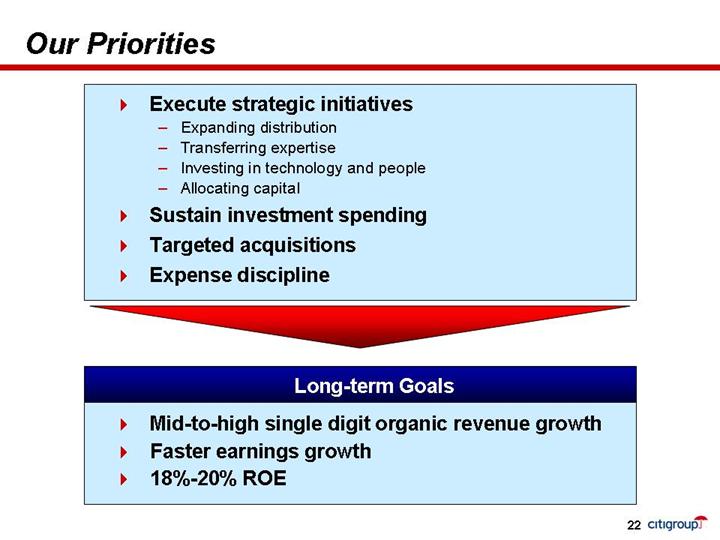
Our Priorities Execute strategic initiatives Expanding distribution Transferring expertise Investing in technology and people Allocating capital Sustain investment spending Targeted acquisitions Expense discipline Long-term Goals Mid-to-high single digit organic revenue growth Faster earnings growth 18%-20% ROE |
Certain statements in this document are “forward-looking statements” within the meaning of the Private Securities Litigation Reform Act. These statements are based on management’s current expectations and are subject to uncertainty and changes in circumstances. Actual results may differ materially from those included in these statements due to a variety of factors. More information about these factors is contained in Citigroup’s filings with the Securities and Exchange Commission.23 |