Exhibit 99.1
| Investor / Analyst Day Charles Prince Chairman and Chief Executive Officer CitigroupDecember 14, 2006 |
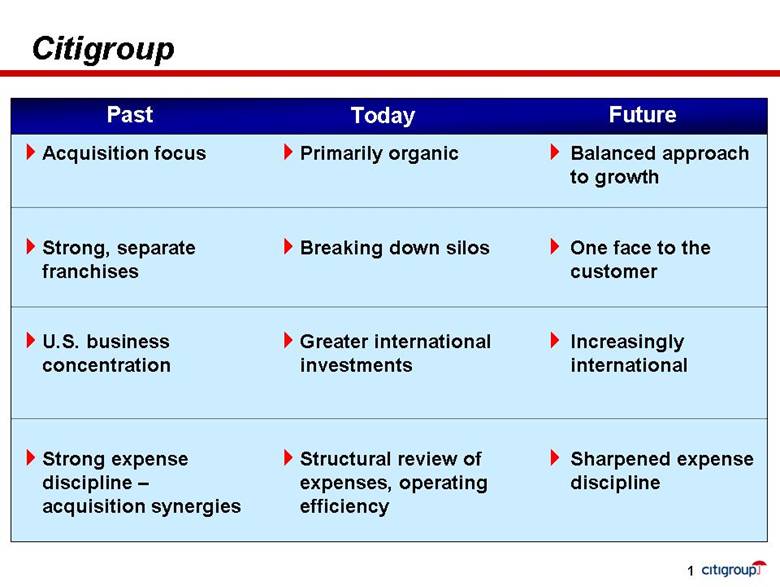
| Citigroup 1 Acquisition focus Strong, separate franchises U.S. business concentration Strong expense discipline – acquisition synergies Balanced approach to growth One face to the customer Increasingly international Sharpened expense discipline Primarily organic Breaking down silos Greater international investments Structural review of expenses, operating efficiency Past Today Future |
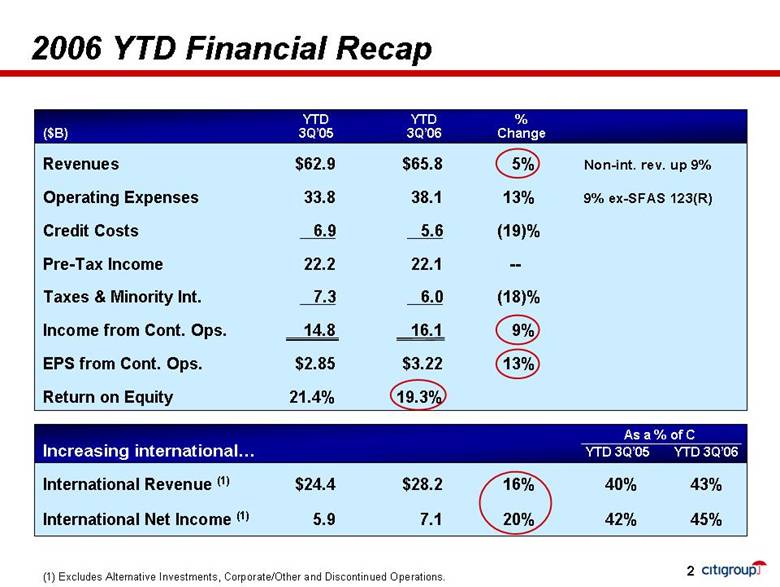
| 2006 YTD Financial Recap Revenues $62.9 $65.8 5% Non-int. rev. up 9% Operating Expenses 33.8 38.1 13% 9% ex-SFAS 123(R) Credit Costs 6.9 5.6 (19)% Pre-Tax Income 22.2 22.1 -- Taxes & Minority Int. 7.3 6.0 (18)% Income from Cont. Ops. 14.8 16.1 9% EPS from Cont. Ops. $2.85 $3.22 13% Return on Equity 21.4% 19.3% YTD YTD % ($B) 3Q’05 3Q’06 Change International Revenue (1) $24.4 $28.2 16% 40% 43% International Net Income (1) 5.9 7.1 20% 42% 45% (1) Excludes Alternative Investments, Corporate/Other and Discontinued Operations. As a % of C Increasing international YTD 3Q’05 YTD 3Q’06 2 |
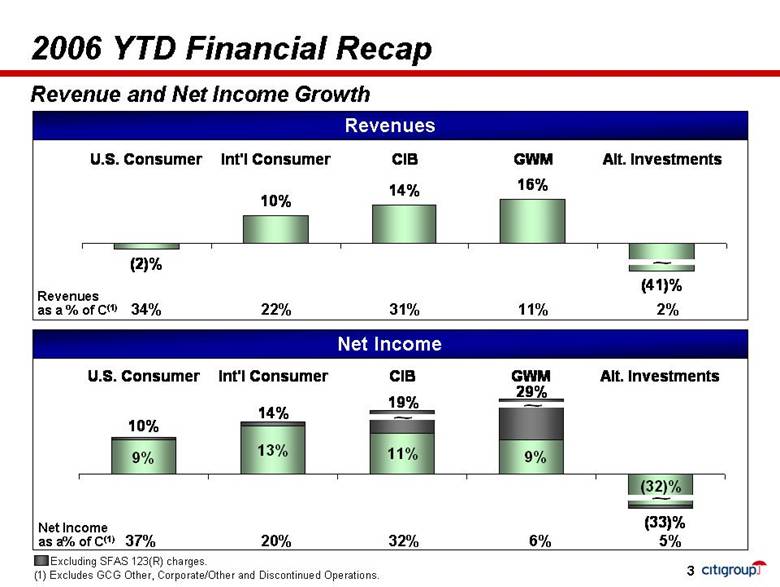
| 2006 YTD Financial Recap Revenues as a % of C(1) 34% 22% 31% 11% 2% Revenue and Net Income Growth Revenues Net Income as a% of C(1)37% 20% 32% 6% 5% Net Income (1) Excludes GCG Other, Corporate/Other and Discontinued Operations. Excluding SFAS 123(R) charges. 3 (2)%10%14%16%(41)%U.S. ConsumerInt'l ConsumerCIBGWMAlt. Investments~~9%13%(33)%9%11%(32)%29%19%14%10%U.S. ConsumerInt'l ConsumerCIBGWMAlt. Investments~ |
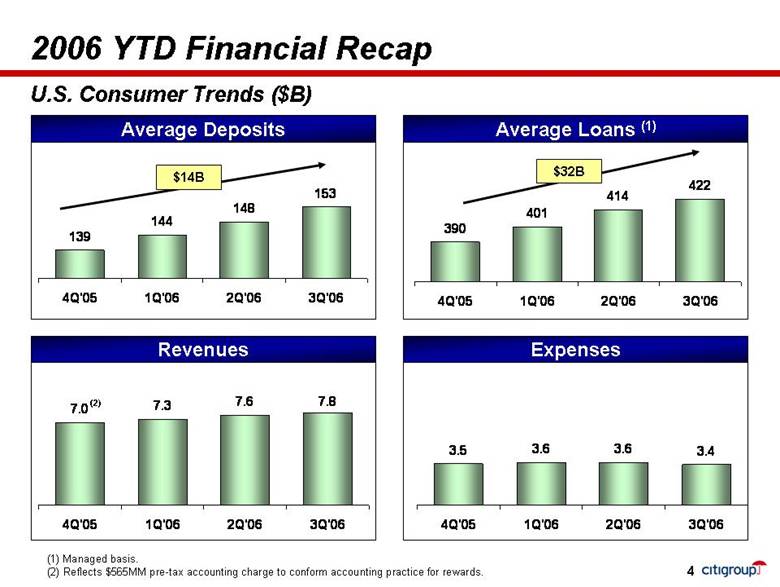
| U.S. Consumer Trends ($B) (1) Managed basis. (2) Reflects $565MM pre-tax accounting charge to conform accounting practice for rewards. 2006 YTD Financial Recap 4 Revenues Expenses $14B $32B Average Deposits Average Loans (1) (2) 3904014144224Q '051Q'062Q'063Q'067.07.37.67.84Q'051Q'062Q'063Q'063.53.63.63.44Q'051Q'062Q'063Q'061391441481534Q'051Q'062Q'063Q'06 |
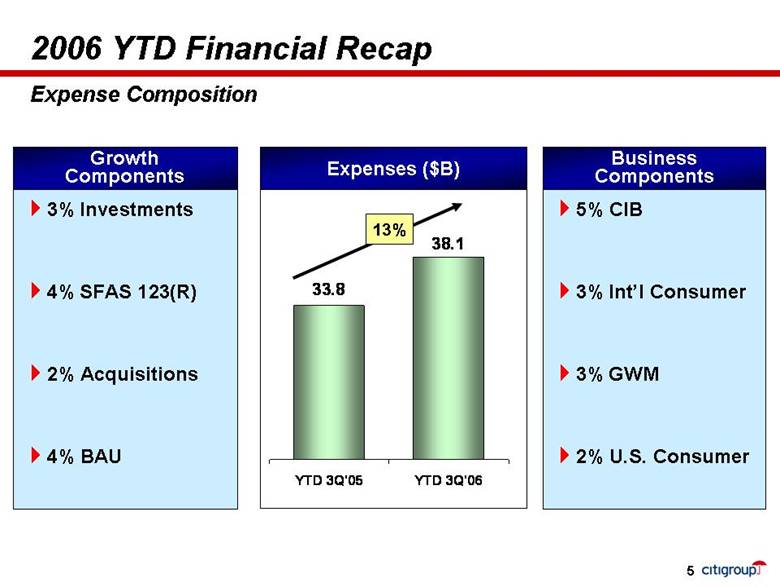
| 3% Investments4% SFAS 123(R) 2% Acquisitions 4% BAU 2006 YTD Financial Recap Expenses ($B) 13% Growth Components 5% CIB 3% Int’l Consumer3% GWM 2% U.S. Consumer Business Components Expense Composition 5 33.838.1 YTD 3Q'05YTD 3Q'06 |
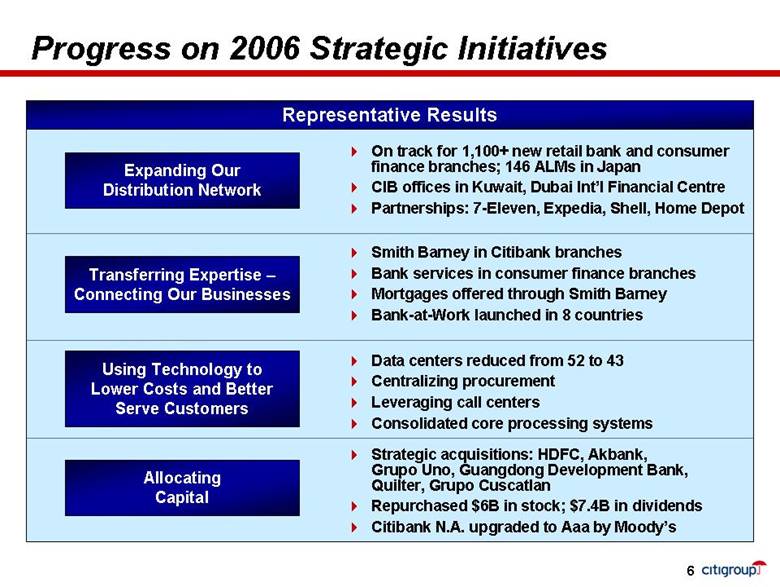
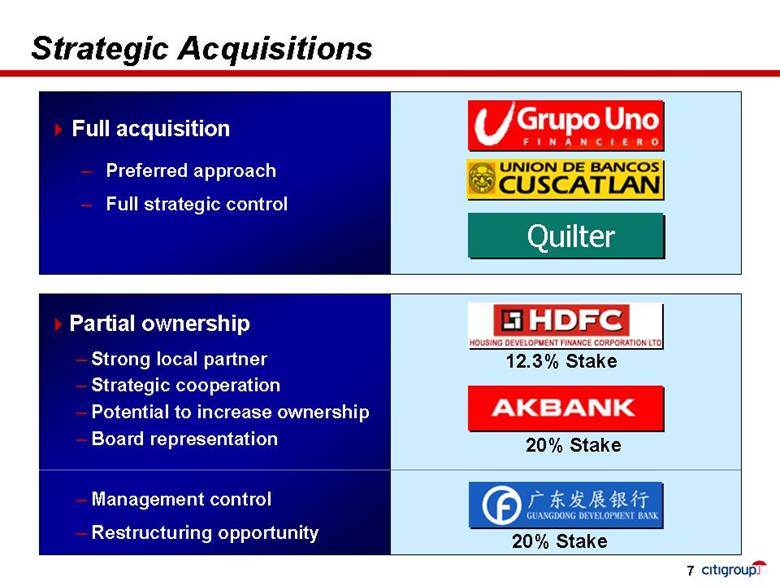
| Progress on 2006 Strategic Initiatives Expanding Our Distribution Network On track for 1,100+ new retail bank and consumer finance branches; 146 ALMs in Japan CIB offices in Kuwait, Dubai Int’l Financial Centre Partnerships: 7-Eleven, Expedia, Shell, Home Depot Transferring Expertise – Connecting Our Businesses Using Technology to Lower Costs and Better Serve Customers Allocating Capital Smith Barney in Citibank branches Bank services in consumer finance branches Mortgages offered through Smith Barney Bank-at-Work launched in 8 countries Data centers reduced from 52 to 43 Centralizing procurement Leveraging call centers Consolidated core processing systems Strategic acquisitions: HDFC, Akbank, Grupo Uno, Guangdong Development Bank, Quilter, Grupo Cuscatlan Repurchased $6B in stock; $7.4B in dividends Citibank N.A. upgraded to Aaa by Moody’s Representative Results 6 |
| Strategic Acquisitions Full acquisition Preferred approach Full strategic control Partial ownership Strong local partner Strategic cooperation Potential to increase ownership Board representation Management control Restructuring opportunity 12.3% Stake 20% Stake 20% Stake 7 Quilter |
| Generate Growth in U.S. Consumer Re-weight Towards Int’l Consumer, CIB, GWM Sharp Focus on Expense Management Credit Management Our Priorities for 2007 8 |
| Generate Growth in U.S. Consumer Broadening Core Business Activities Expanding Distribution Integrating Technology Serving Customers as One Company 9 |
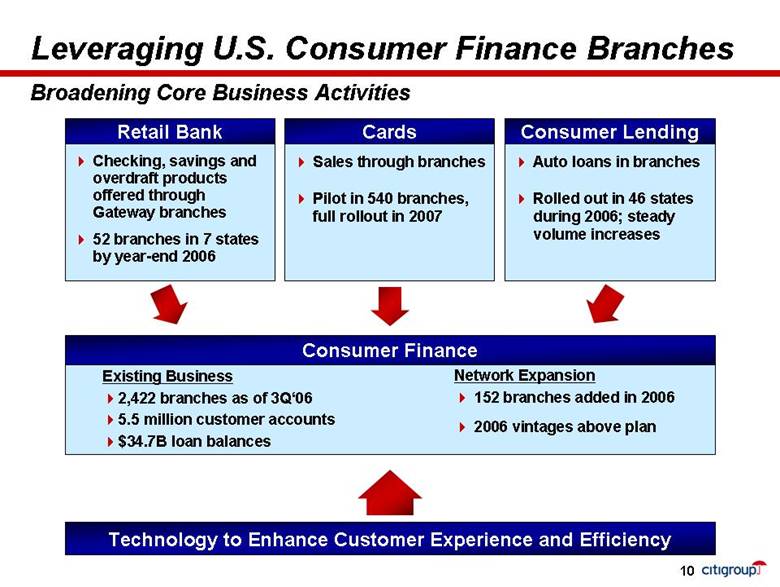
| Broadening Core Business Activities Retail Bank Cards Consumer Lending Checking, savings and overdraft products offered through Gateway branches 52 branches in 7 states by year-end 2006 Sales through branches Pilot in 540 branches, full rollout in 2007 Auto loans in branches Rolled out in 46 states during 2006; steady volume increases Existing Business 2,422 branches as of 3Q‘06 5.5 million customer accounts $34.7B loan balances Network Expansion 152 branches added in 2006 2006 vintages above plan Leveraging U.S. Consumer Finance Branches Consumer Finance Technology to Enhance Customer Experience and Efficiency 10 |
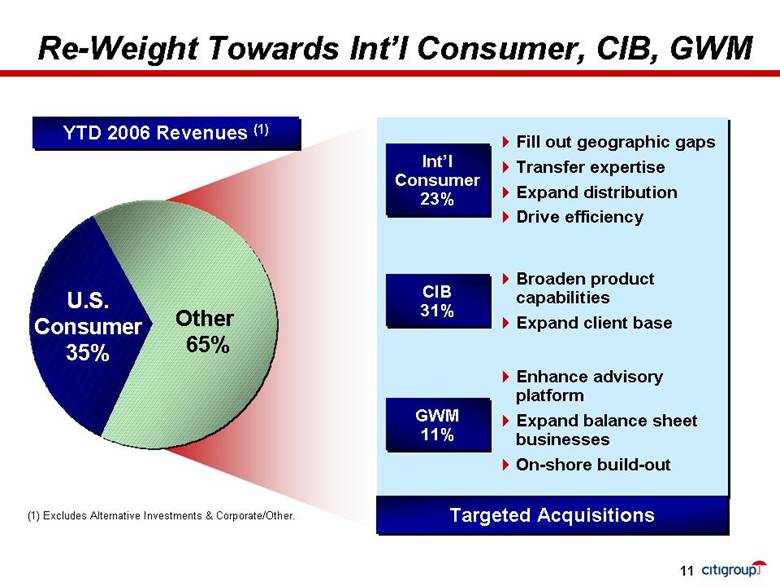
| Re-Weight Towards Int’l Consumer, CIB, GWM Fill out geographic gaps Transfer expertise Expand distribution Drive efficiency Broaden product capabilities Expand client base Enhance advisory platform Expand balance sheet businesses On-shore build-out Int’l Consumer 23% CIB 31% GWM 11% U.S. Consumer 35% YTD 2006 Revenues (1) (1) Excludes Alternative Investments & Corporate/Other. Other 65% Targeted Acquisitions 11 |
| Int’l Consumer: Expanding Distribution Benefits include: On-site convenience Payroll convenience for employer Relationship deepening with employer and employee Continue to grow strong base of 12,000 companies with ~1.5MM customers Plan to launch in 5 countries in 2007 Growing source of new accounts Over 55% in certain established countries, such as Brazil and Colombia Build on top-brand alliances Partnerships in 37 countries; 33 signed in 2006 Combination of global and local brands Global: American AAdvantage, Vodafone Local: Malev (Hungary); Shinsegae (Korea); Celcom (Malaysia); bmibaby (UK) Standardized approach to apply best practices and optimize efficiency 2007 pipeline includes 200+ prospects Citibank at Electrolux (Poland)Card Partnerships *Includes partnerships signed in 2006, but not yet launched. Note: Bankcard partnerships only. Bank-at-Work 12 26813192512331215322717AirlineOilTelecomRetailAffinityOther20052006* citibank handlowy |

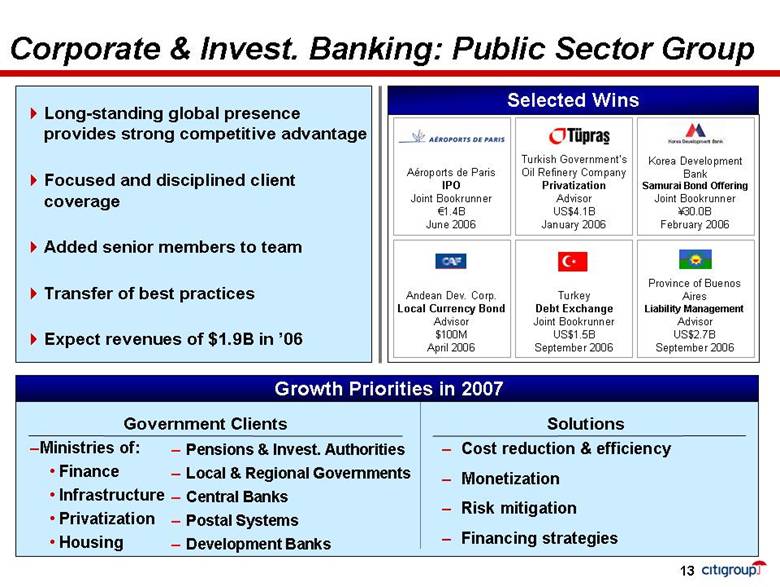
| Corporate & Invest. Banking: Public Sector Group Government Clients Ministries of: Finance Infrastructure Privatization Housing Solutions Cost reduction & efficiency Monetization Risk mitigation Financing strategies Growth Priorities in 2007 Pensions & Invest. Authorities Local & Regional Governments Central Banks Postal Systems Development Banks Long-standing global presence provides strong competitive advantage Focused and disciplined client coverage Added senior members to team Transfer of best practices Expect revenues of $1.9B in ’06 13 Korea Development Bank Samurai Bond Offering Joint Bookrunner ¥30.0B February 2006 Turkey Debt Exchange Joint Bookrunner US$1.5B September 2006 Province of Buenos Aires Liability Management Advisor US$2.7B September 2006 Turkish Government’s Oil Refinery Company Privatization Advisor US$4.1B January 2006 Andean Dev. Corp. Local Currency Bond Advisor $100M April 2006 Aéroports de Paris IPO Joint Bookrunner €1.4B June 2006 Selected Wins |
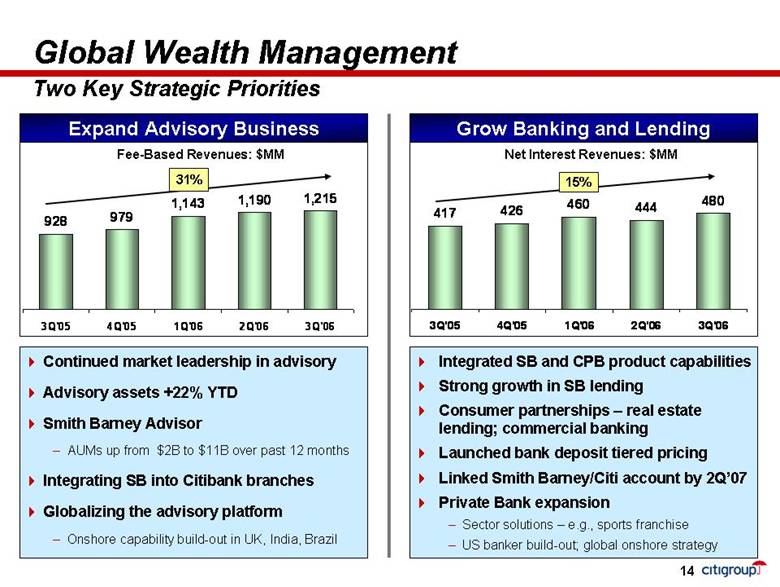
| Global Wealth Management Two Key Strategic Priorities Grow Banking and Lending Expand Advisory Business 15% Integrated SB and CPB product capabilities Strong growth in SB lending Consumer partnerships – real estate lending; commercial banking Launched bank deposit tiered pricing Linked Smith Barney/Citi account by 2Q’07 Private Bank expansion Sector solutions – e.g., sports franchise US banker build-out; global onshore strategy Continued market leadership in advisory Advisory assets +22% YTD Smith Barney Advisor AUMs up from $2B to $11B over past 12 months Integrating SB into Citibank branches Globalizing the advisory platform Onshore capability build-out in UK, India, Brazil Fee-Based Revenues: $MM Net Interest Revenues: $MM 31% 14 9289791,1431,1901,2153Q'054Q'051Q'062Q'063Q'064174264604444803Q'054Q'051Q'062Q'063Q'06 |
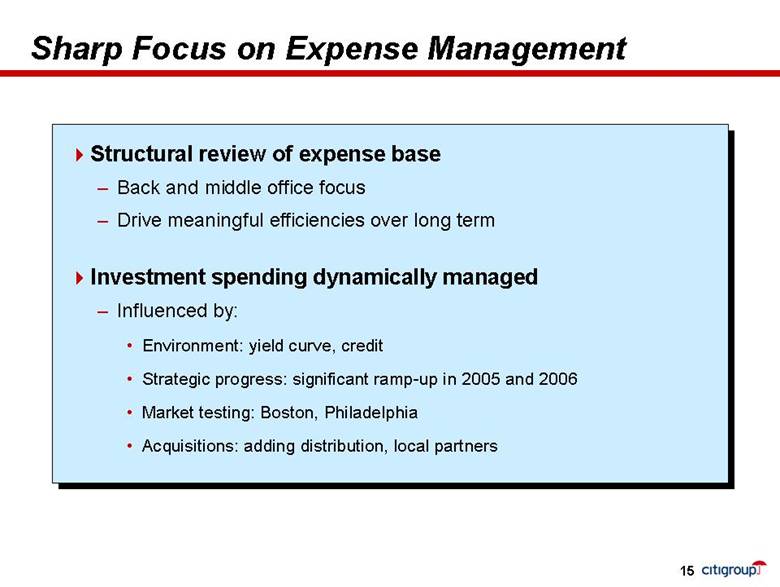
| Sharp Focus on Expense Management Structural review of expense base Back and middle office focus Drive meaningful efficiencies over long term Investment spending dynamically managed Influenced by: Environment: yield curve, credit Strategic progress: significant ramp-up in 2005 and 2006 Market testing: Boston, Philadelphia Acquisitions: adding distribution, local partners 15 |
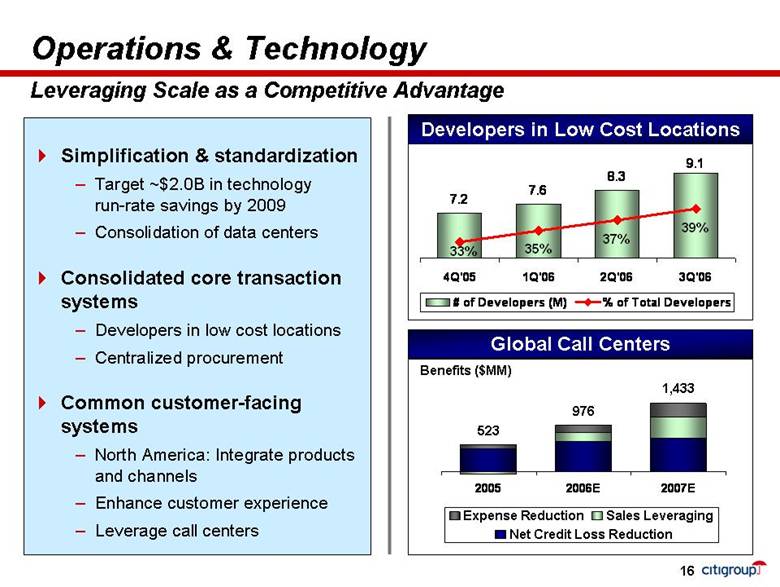
| Operations & Technology Simplification & standardization Target ~$2.0B in technology run-rate savings by 2009 Consolidation of data centers Consolidated core transaction systems Developers in low cost locations Centralized procurement Common customer-facing systems North America: Integrate products and channels Enhance customer experience Leverage call centers Leveraging Scale as a Competitive Advantage Global Call Centers Benefits ($MM) Developers in Low Cost Locations 976 1,433 523 Expense ReductionSales LeveragingNet Credit Loss Reduction16 7.68.39.17.235%37%39%33%4Q'051Q'062Q'063Q'06# of Developers (M)% of Total Developers20052006E2007E |
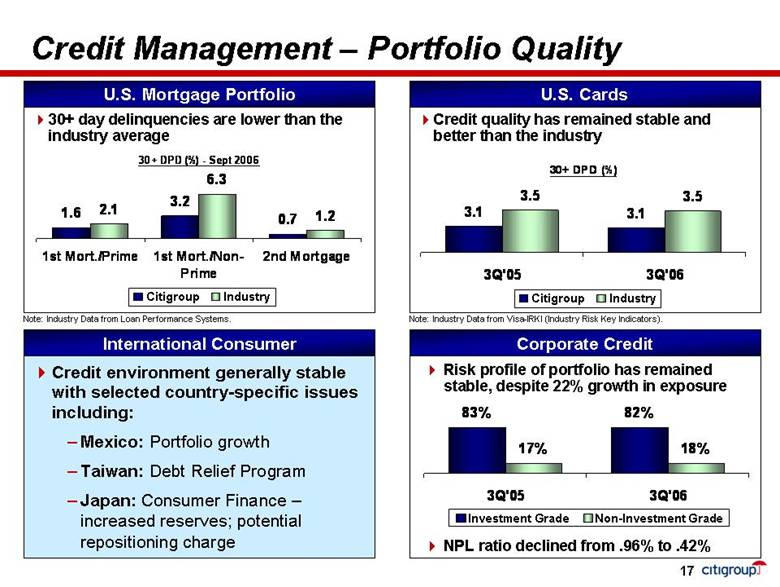
| 30+ day delinquencies are lower than the industry average Credit Management – Portfolio Quality Credit environment generally stable with selected country-specific issues including: Mexico: Portfolio growth Taiwan: Debt Relief Program Japan: Consumer Finance – increased reserves; potential repositioning charge Corporate Credit Credit quality has remained stable and better than the industry U.S. Mortgage Portfolio Risk profile of portfolio has remained stable, despite 22% growth in exposure U.S. Cards NPL ratio declined from .96% to .42% International Consumer Note: Industry Data from Loan Performance Systems. Note: Industry Data from Visa-IRKI (Industry Risk Key Indicators). CitigroupIndustryCitigroupIndustryInvestment GradeNon-Investment Grade17 30+ DPD (%) - Sept 20061.63.20.72.16.31.21st Mort./Prime1st Mort./Non-Prime2nd Mortgage30+ DPD (%)3.13.13.53.53Q'053Q'0683%82%17%18%3Q'053Q'06 |
| Selected 2007 New Deliverables 18 1. Structural expense review completed 1Q’07 2. Hardwire U.S. Consumer Connect Smith Barney and Citibank technology platforms 2Q’07 Single sales & service platform across US credit cards4Q’07 3. Assess Boston and Philadelphia test market success 2H’07 4. Additional international acquisitions 2007 Initiative Deliverable Date |

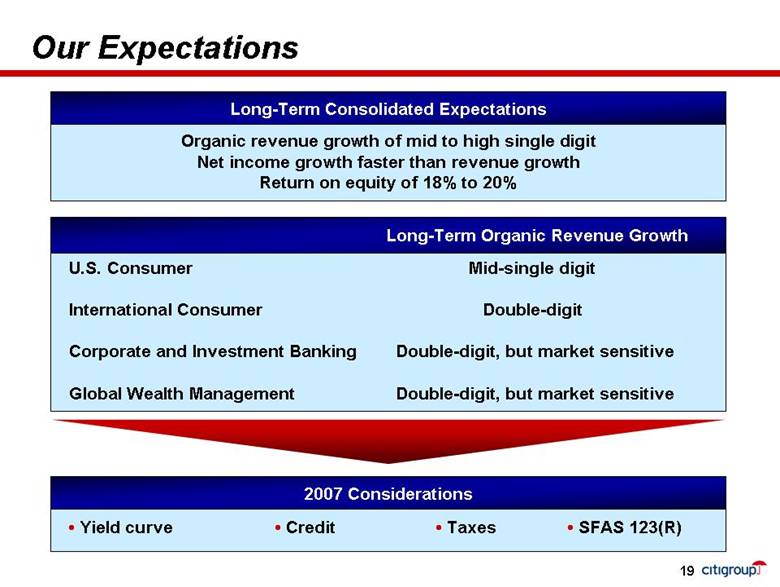
| Our Expectations Organic revenue growth of mid to high single digit Net income growth faster than revenue growth Return on equity of 18% to 20% Long-Term Consolidated Expectations • Yield curve • Credit • Taxes • SFAS 123(R) 2007 Considerations U.S. Consumer Mid-single digit International Consumer Double-digit Corporate and Investment Banking Double-digit, but market sensitive Global Wealth Management Double-digit, but market sensitive Long-Term Organic Revenue Growth 19 |
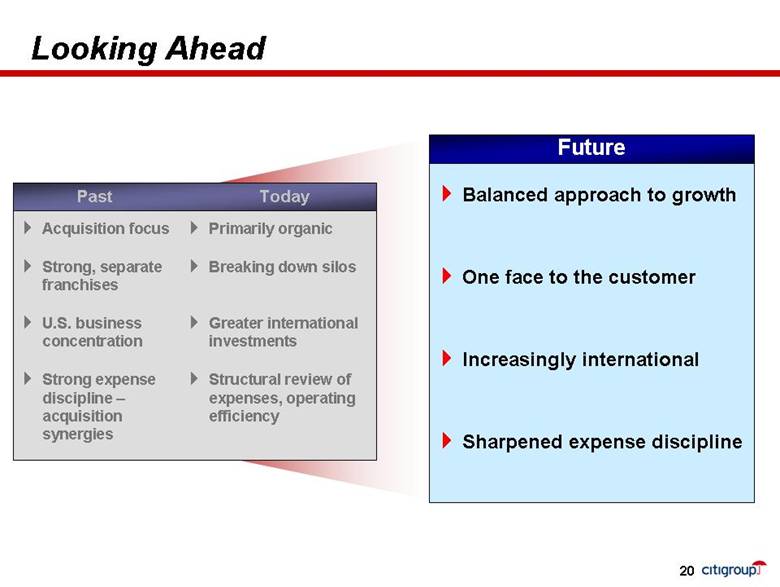
| Looking Ahead 20 Future Balanced approach to growth One face to the customer Increasingly international Sharpened expense discipline Future Acquisition focus Strong, separate franchises U.S. business concentration Strong expense discipline – acquisition synergies Primarily organic Breaking down silos Greater international investments Structural review of expenses, operating efficiency Past Today |
| Certain statements in this document are “forward-looking statements” within the meaning of the Private Securities Litigation Reform Act. These statements are based on management’s current expectations and are subject to uncertainty and changes in circumstances. Actual results may differ materially from those included in these statements due to a variety of factors. More information about these factors is contained in Citigroup’s filings with the Securities and Exchange Commission.21 |