Exhibit 99.1
| Citi Investor & Analyst Day May 9, 2008 |
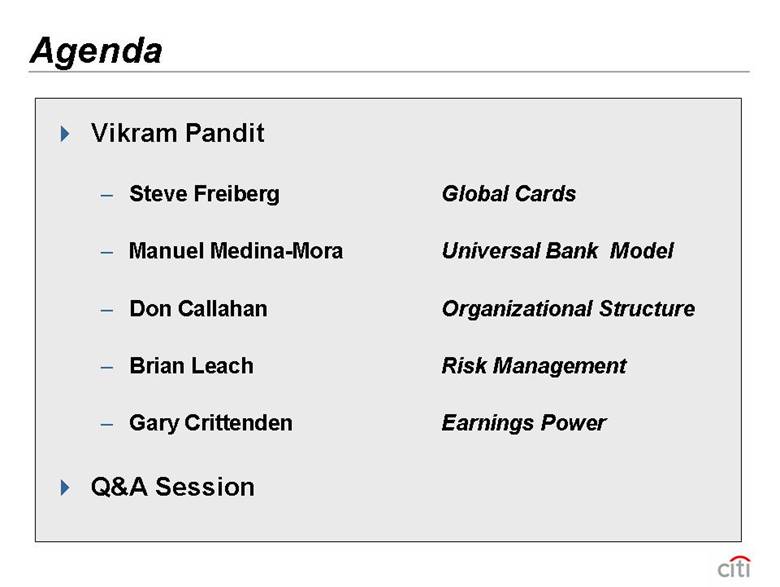
| Agenda Vikram Pandit – Steve Freiberg Global Cards – Manuel Medina-Mora Universal Bank Model – Don Callahan Organizational Structure – Brian Leach Risk Management – Gary Crittenden Earnings Power Q&A Session |
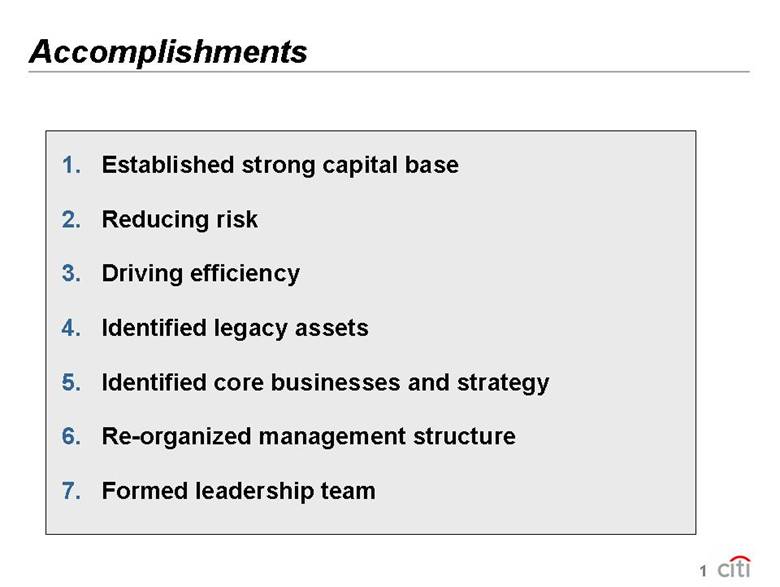
| Accomplishments 1. Established strong capital base 2. Reducing risk 3. Driving efficiency 4. Identified legacy assets 5. Identified core businesses and strategy 6. Re-organized management structure 7. Formed leadership team 1 |
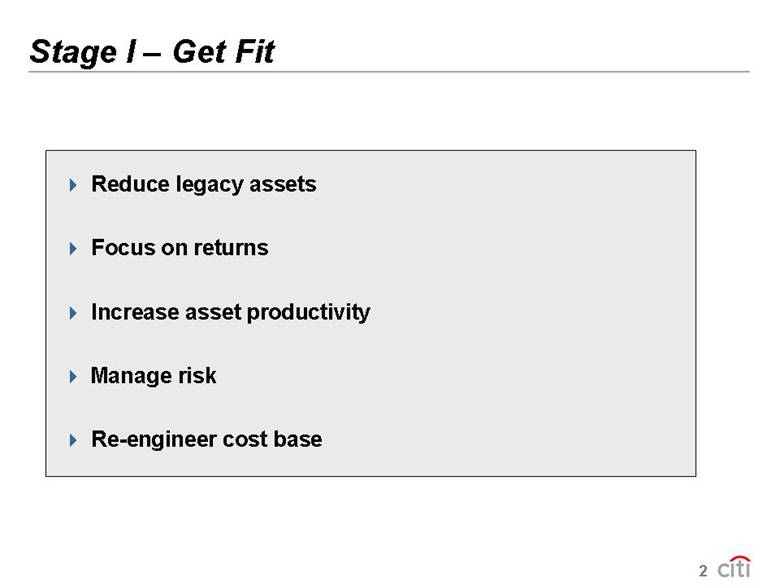
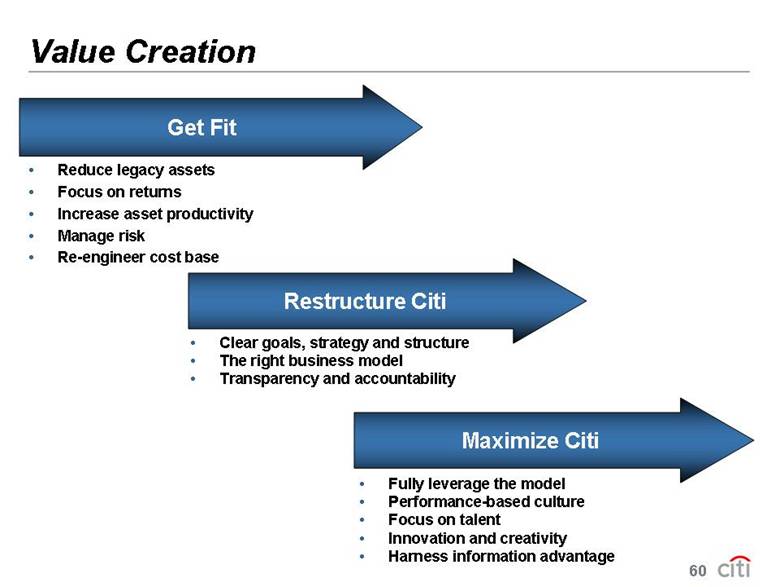
| Reduce legacy assets Focus on returns Increase asset productivity Manage risk Re-engineer cost base Stage I – Get Fit 2 |
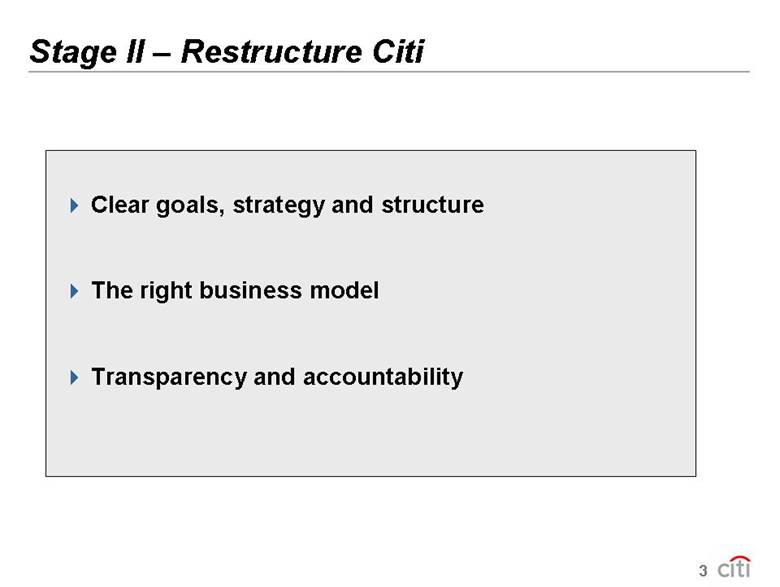
| Clear goals, strategy and structure The right business model Transparency and accountability Stage II – Restructure Citi 3 |
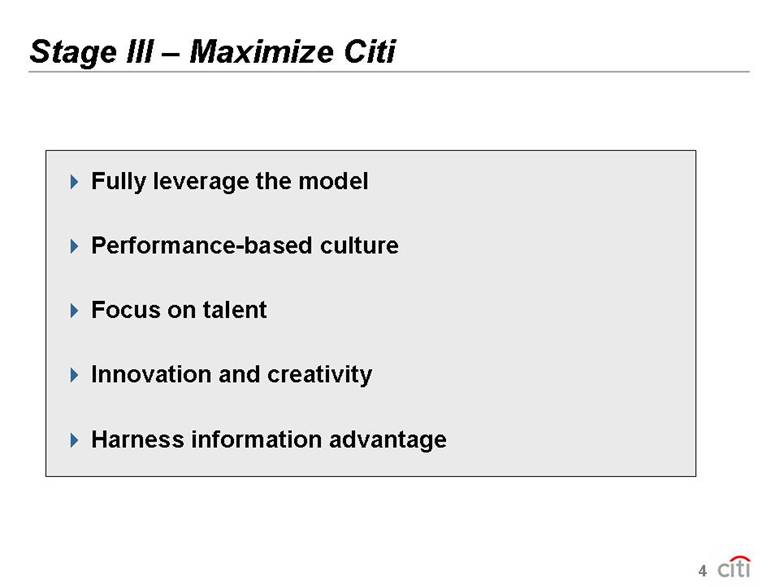
| Fully leverage the model Performance-based culture Focus on talent Innovation and creativity Harness information advantage Stage III – Maximize Citi 4 |
| Value Creation Restructure Citi Get Fit Maximize Citi • Reduce legacy assets • Focus on returns • Increase asset productivity • Manage risk • Re-engineer cost base • Clear goals, strategy and structure • The right business model • Transparency and accountability • Fully leverage the model • Performance-based culture • Focus on talent • Innovation and creativity • Harness information advantage 5 |

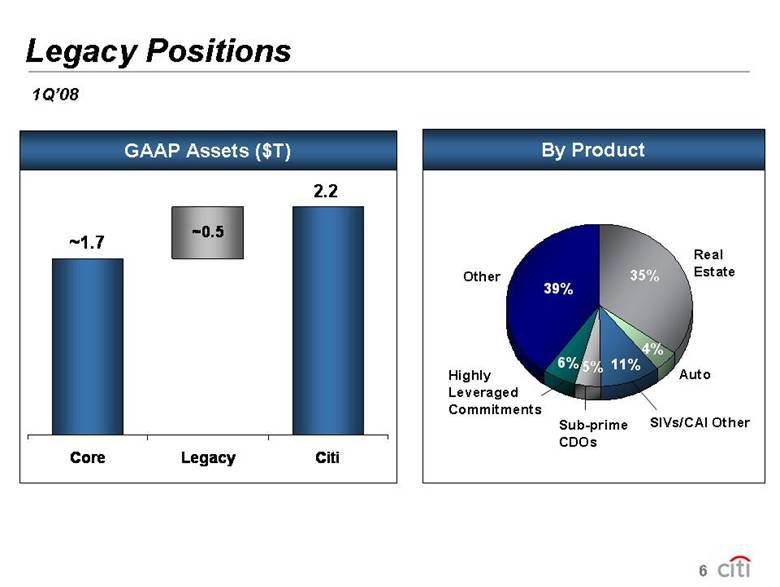
| Legacy Positions By Product 4% 11% 6% 5% 35% 39% Real Estate SIVs/CAI Other Other Highly Leveraged Commitments GAAP Assets ($T) 2.2 ~1.7 ~0.5 Core Legacy Citi Sub-prime CDOs Auto 1Q’08 6 |
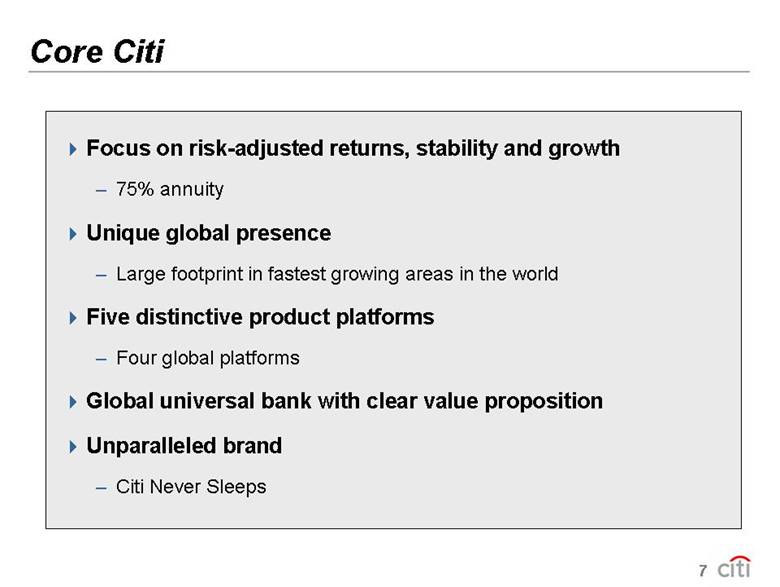
| Core Citi Focus on risk-adjusted returns, stability and growth – 75% annuity Unique global presence – Large footprint in fastest growing areas in the world Five distinctive product platforms – Four global platforms Global universal bank with clear value proposition Unparalleled brand – Citi Never Sleeps 7 |
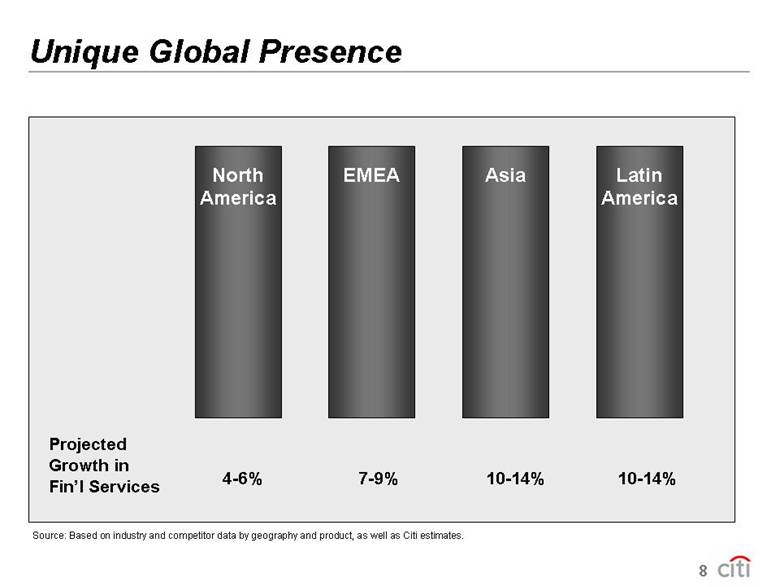
| EMEA Asia North America Latin America Unique Global Presence Projected Growth in Fin’l Services 4-6% 7-9% 10-14% 10-14% Source: Based on industry and competitor data by geography and product, as well as Citi estimates. 8 |
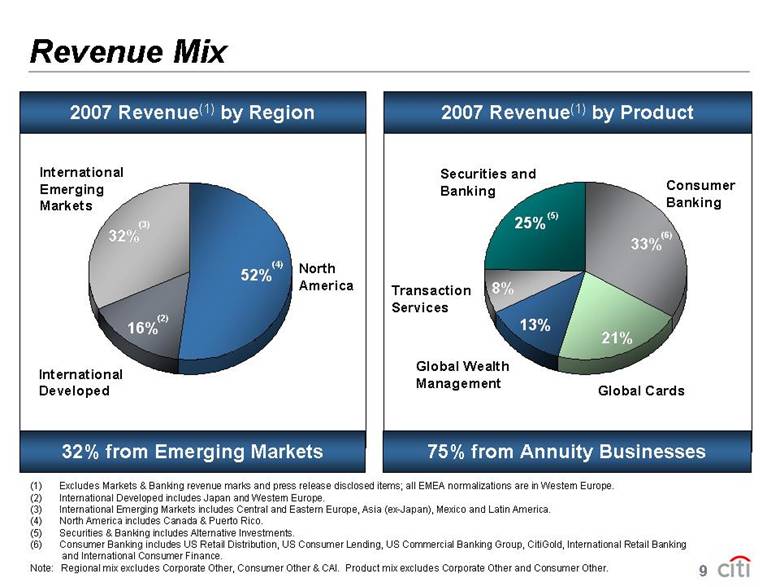
| 16% 32% 52% Revenue Mix 2007 Revenue(1) by Product 2007 Revenue(1) by Region North America International Developed International Emerging Markets 21% 13% 8% 25% 33% Consumer Banking Global Cards Global Wealth Management Transaction Services Securities and Banking (1) Excludes Markets & Banking revenue marks and press release disclosed items; all EMEA normalizations are in Western Europe. (2) International Developed includes Japan and Western Europe. (3) International Emerging Markets includes Central and Eastern Europe, Asia (ex-Japan), Mexico and Latin America. (4) North America includes Canada & Puerto Rico. (5) Securities & Banking includes Alternative Investments. (6) Consumer Banking includes US Retail Distribution, US Consumer Lending, US Commercial Banking Group, CitiGold, International Retail Banking and International Consumer Finance. Note: Regional mix excludes Corporate Other, Consumer Other & CAI. Product mix excludes Corporate Other and Consumer Other. (4) (3) (2) (5) (6) 75% from Annuity Businesses 32% from Emerging Markets 9
|
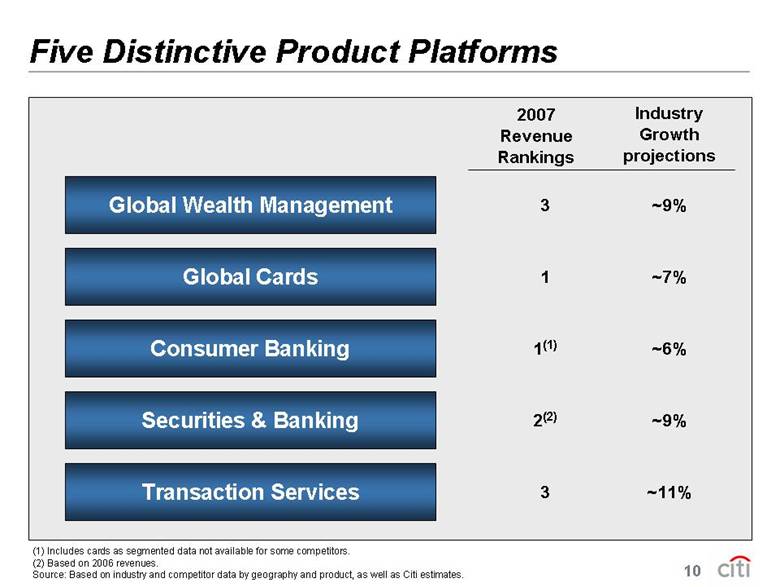
| Five Distinctive Product Platforms (1) Includes cards as segmented data not available for some competitors. (2) Based on 2006 revenues. Source: Based on industry and competitor data by geography and product, as well as Citi estimates. Global Wealth Management 3 ~9% Securities & Banking 2(2) ~9% Global Cards 1 ~7% 2007 Revenue Rankings Industry Growth projections Consumer Banking 1(1) ~6% Transaction Services 3 ~11% 10 |
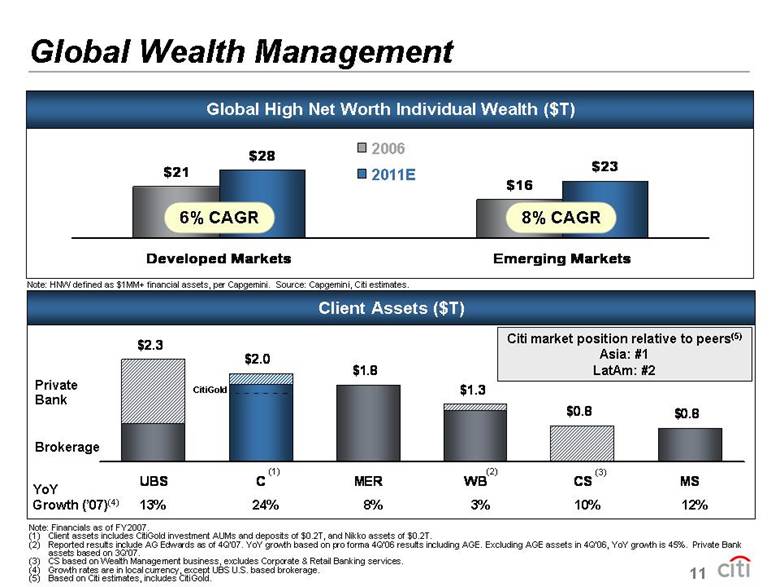
| Global Wealth Management $21 $16 $28 $23 Developed Markets Emerging Markets 6% CAGR 2006 2011E Global High Net Worth Individual Wealth ($T) 8% CAGR Note: HNW defined as $1MM+ financial assets, per Capgemini. Source: Capgemini, Citi estimates. Client Assets ($T) $2.3 $2.0 $1.8 $1.3 $0.8 $0.8 UBS C MER WB CS MS YoY Growth (’07)(4) 13% 24% 8% 3% 10% 12% Brokerage Private Bank Note: Financials as of FY2007. (1) Client assets includes CitiGold investment AUMs and deposits of $0.2T, and Nikko assets of $0.2T. (2) Reported results include AG Edwards as of 4Q’07. YoY growth based on pro forma 4Q’06 results including AGE. Excluding AGE assets in 4Q’ 06, YoY growth is 45%. Private Bank assets based on 3Q’07. (3) CS based on Wealth Management business, excludes Corporate & Retail Banking services. (4) Growth rates are in local currency, except UBS U.S. based brokerage. (5) Based on Citi estimates, includes CitiGold. (2) (1) CitiGold Citi market position relative to peers(5) Asia: #1 LatAm: #2 (3) 11 esults i nclude AG Edwards as of 4Q’07. YoY growth bas ed on pro forma 4Q’06 res ults including AGE. Excludi ng AGE assets in 4Q’ 06, YoY growth is 45%. Private Bank assets based on 3Q’07. (3) CS bas ed on Wealth Management busi ness, excludes Corporate & R etail Banki ng ser vices. (4) Growth rates are in local c urrenc y, exc ept UBS U.S. bas ed brokerage. (5) Based on Citi estimates, incl udes CitiGold. (2) (1) CitiGold Citi market position relative to peers(5) Asia: #1 LatAm: #2 (3) 11 |
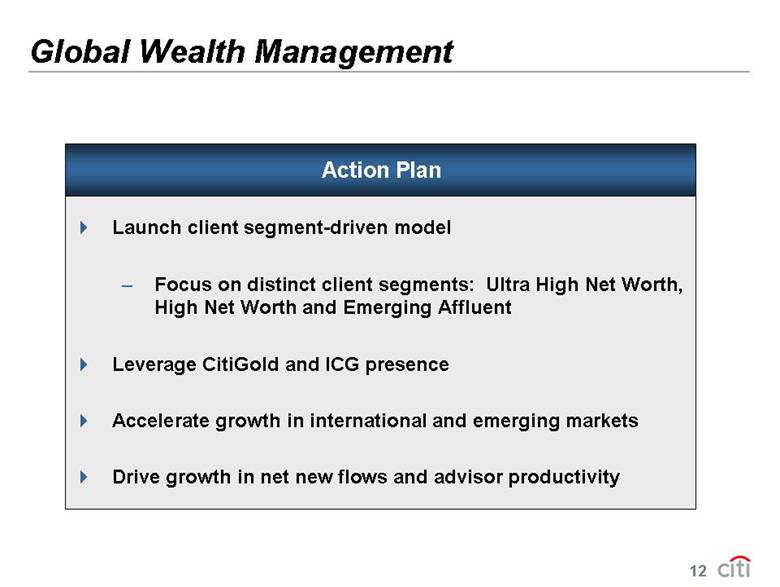
| Global Wealth Management Launch client segment-driven model – Focus on distinct client segments: Ultra High Net Worth, High Net Worth and Emerging Affluent Leverage CitiGold and ICG presence Accelerate growth in international and emerging markets Drive growth in net new flows and advisor productivity Action Plan 12 |
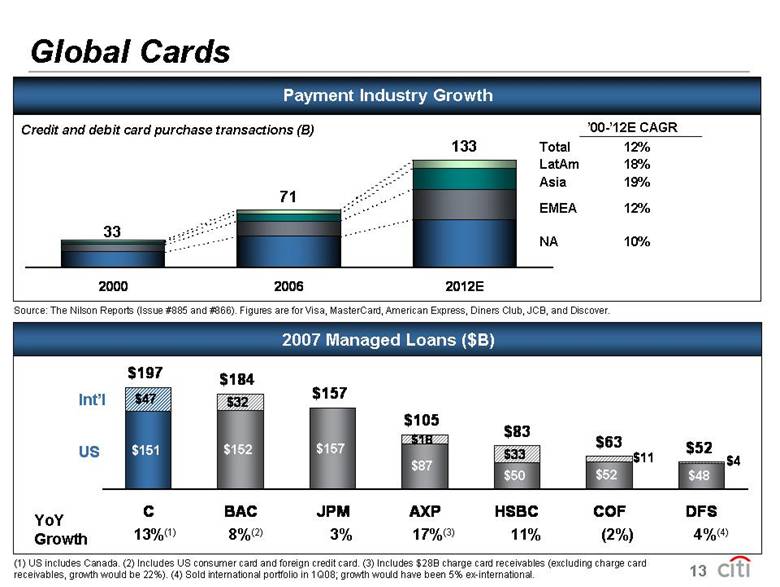
| Global Cards 2007 Managed Loans ($B) YoY Growth US Int’l $151 $152 $157 $87 $52 $48 $47 $32 $18 $33 $197 $184 $157 $105 $52 $50 $4 $11 $63 $83 C BAC JPM AXP HSBC COF DFS 13%(1) 8%(2) 3% 17%(3) 11% (2%) 4%(4) 1. Adjusted for acquisitions Payment Industry Growth 2000 2006 2012E 33 71 133 NA EMEA Asia LatAm ’00-’12E CAGR 10% 12% 19% 18% 12% Total Credit and debit card purchase transactions (B) (1) US includes Canada. (2) Includes US consumer card and foreign credit card. (3) Includes $28B charge card receivables (excluding charge card receivables, growth would be 22%). (4) Sold international portfolio in 1Q08; growth would have been 5% ex-international. Source: The Nilson Reports (Issue #885 and #866). Figures are for Visa, MasterCard, American Express, Diners Club, JCB, and Discover. 13
|
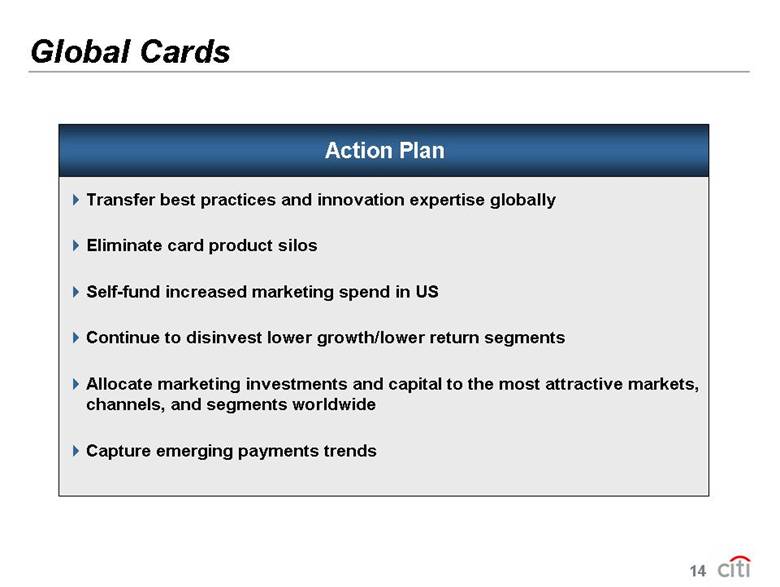
| Global Cards Action Plan Transfer best practices and innovation expertise globally Eliminate card product silos Self-fund increased marketing spend in US Continue to disinvest lower growth/lower return segments Allocate marketing investments and capital to the most attractive markets, channels, and segments worldwide Capture emerging payments trends 14 |
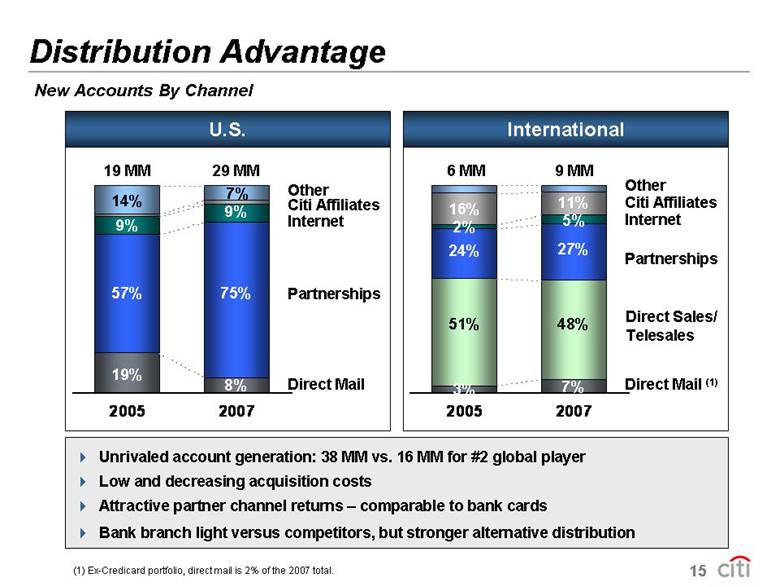
| Distribution Advantage New Accounts By Channel Unrivaled account generation: 38 MM vs. 16 MM for #2 global player Low and decreasing acquisition costs Attractive partner channel returns – comparable to bank cards Bank branch light versus competitors, but stronger alternative distribution (1) Ex-Credicard portfolio, direct mail is 2% of the 2007 total. International U.S. 2005 2007 Partnerships Direct Mail Other Internet 19% 8% 57% 75% 9% 9% Citi Affiliates 14% 7% 2005 2007 Partnerships Direct Mail (1) Other Internet 3% 7% 51% 48% 24% 27% Citi Affiliates Direct Sales/Telesales 2% 5% 16% 11% 19 MM 29 MM 6 MM 9 MM 15
|
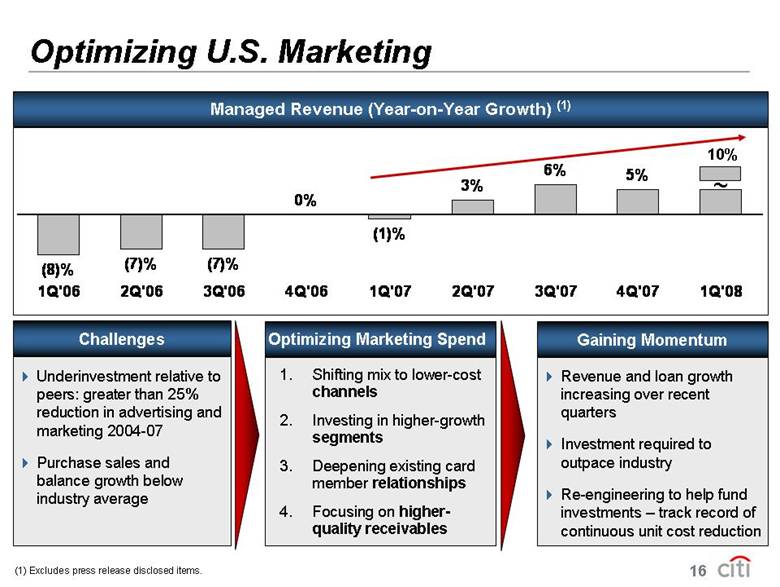
| Optimizing U.S. Marketing Underinvestment relative to peers: greater than 25% reduction in advertising and marketing 2004-07 Purchase sales and balance growth below industry average Revenue and loan growth increasing over recent quarters Investment required to outpace industry Re-engineering to help fund investments – track record of continuous unit cost reduction 1. Shifting mix to lower-cost channels 2. Investing in higher-growth segments 3. Deepening existing card member relationships 4. Focusing on higherquality receivables Challenges Gaining Momentum Optimizing Marketing Spend Managed Revenue (Year-on-Year Growth) (1) (8)% (7)% (7)% 0% (1)% 3% 6% 5% 1Q'06 2Q'06 3Q'06 4Q'06 1Q'07 2Q'07 3Q'07 4Q'07 1Q'08 ~ 10% (1) Excludes press release disclosed items. 16 |
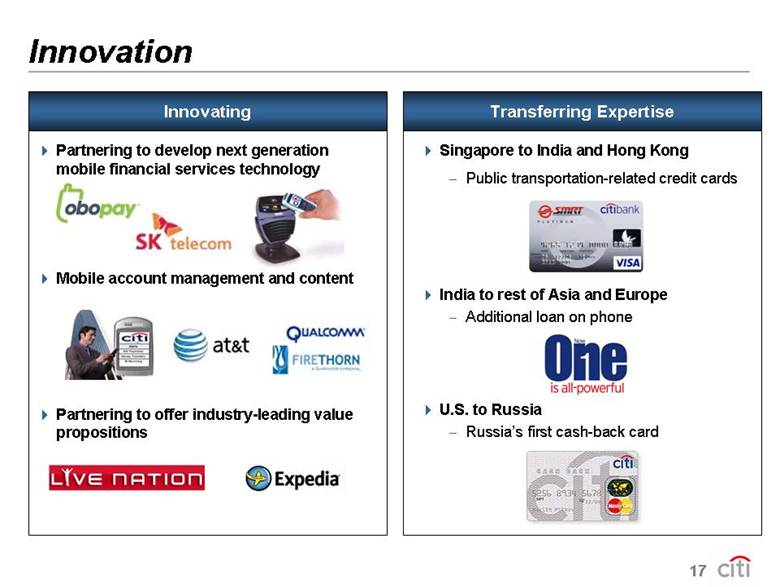
| Singapore to India and Hong Kong - Public transportation-related credit cards India to rest of Asia and Europe - Additional loan on phone U.S. to Russia - Russia’s first cash-back card Innovation Transferring Expertise Innovating Partnering to develop next generation mobile financial services technology Mobile account management and content Partnering to offer industry-leading value propositions 17 |
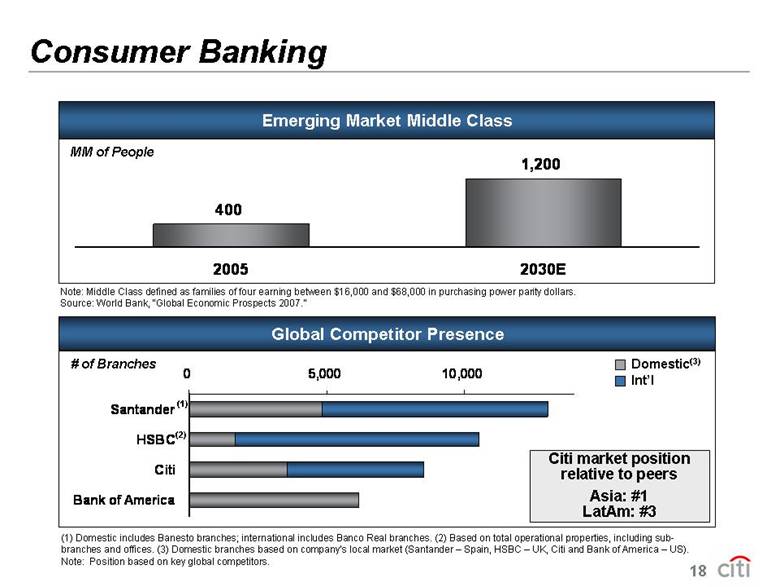
| Consumer Banking Note: Middle Class defined as families of four earning between $16,000 and $68,000 in purchasing power parity dollars. Source: World Bank, “Global Economic Prospects 2007.” Emerging Market Middle Class 400 1,200 2005 2030E MM of People Global Competitor Presence (1) Domestic includes Banesto branches; international includes Banco Real branches. (2) Based on total operational properties, including subbranches and offices. (3) Domestic branches based on company’s local market (Santander – Spain, HSBC – UK, Citi and Bank of America – US). Note: Position based on key global competitors. Domestic(3) Int’l 0 5,000 10,000 Santander HSBC Citi Bank of America (1) (2) Citi market position relative to peers Asia: #1 LatAm: #3 # of Branches 18
|
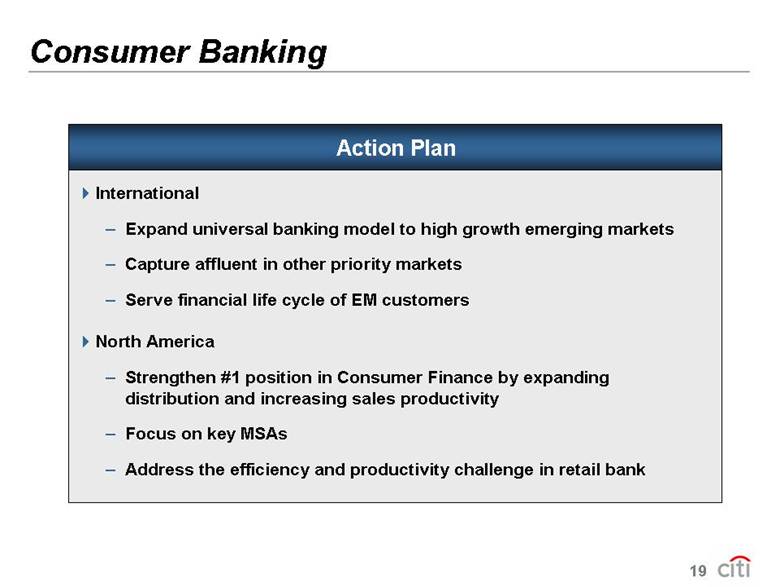
| Consumer Banking Action Plan International – Expand universal banking model to high growth emerging markets – Capture affluent in other priority markets – Serve financial life cycle of EM customers North America – Strengthen #1 position in Consumer Finance by expanding distribution and increasing sales productivity – Focus on key MSAs – Address the efficiency and productivity challenge in retail bank 19 |
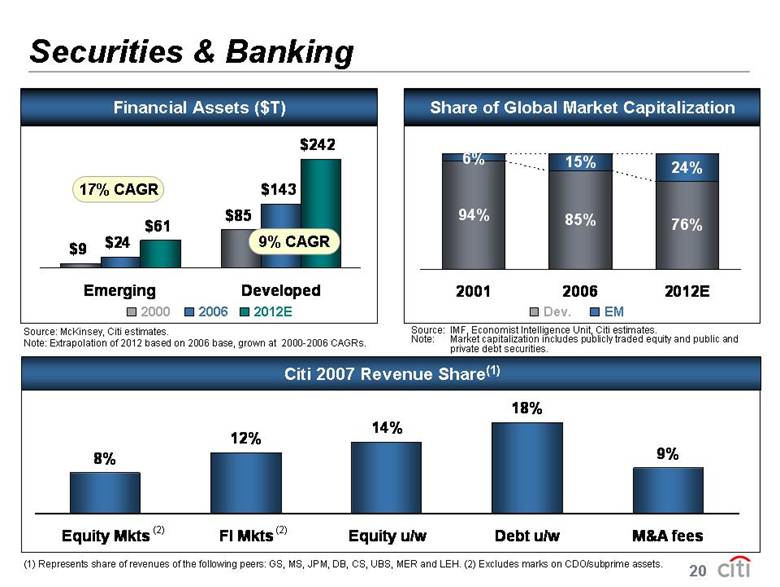
| Securities & Banking 8% 12% 14% 18% 9% Equity Mkts FI Mkts Equity u/w Debt u/w M&A fees Citi 2007 Revenue Share(1) 94% 85% 76% 6% 15% 24% 2001 2006 2012E Source: McKinsey, Citi estimates. Note: Extrapolation of 2012 based on 2006 base, grown at 2000-2006 CAGRs. Financial Assets ($T) $9 $85 $24 $143 $61 $242 Emerging Developed 17% CAGR 2006 2000 2012E Dev. EM 9% CAGR Source: IMF, Economist Intelligence Unit, Citi estimates. Note: Market capitalization includes publicly traded equity and public and private debt securities. Share of Global Market Capitalization (1) Represents share of revenues of the following peers: GS, MS, JPM, DB, CS, UBS, MER and LEH. (2) Excludes marks on CDO/subprime assets. (2) (2) 20 |
|
|
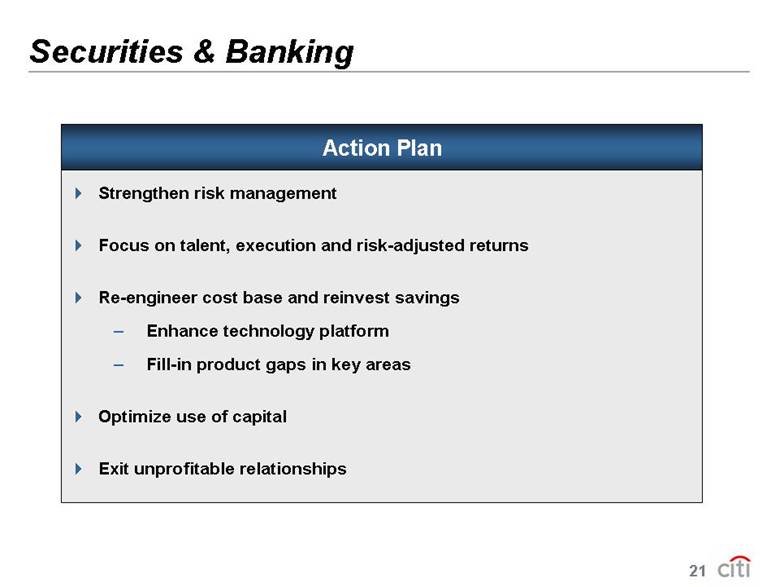
| Securities & Banking Action Plan Strengthen risk management Focus on talent, execution and risk-adjusted returns Re-engineer cost base and reinvest savings – Enhance technology platform – Fill-in product gaps in key areas Optimize use of capital Exit unprofitable relationships 21 |
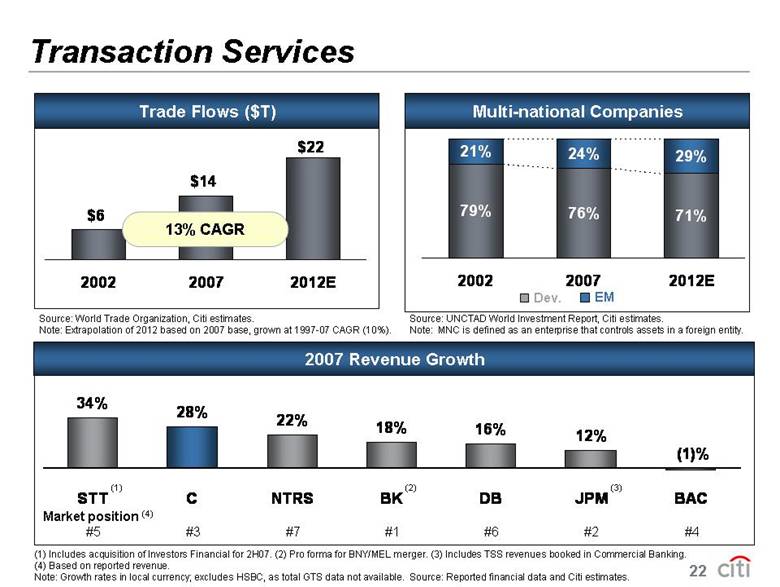
| Transaction Services 34% 28% 22% 18% 16% 12% (1)% STT C NTRS BK DB JPM BAC (1) Includes acquisition of Investors Financial for 2H07. (2) Pro forma for BNY/MEL merger. (3) Includes TSS revenues booked in Commercial Banking. (4) Based on reported rev enue. Note: Growth rates in local currency; excludes HSBC, as total GTS data not available. Source: Reported financial data and Citi estimates. (1) 2007 Revenue Growth Trade Flows ($T) $6 $14 $22 2002 2007 2012E 13% CAGR Source: World Trade Organization, Citi estimates. Note: Extrapolation of 2012 based on 2007 base, grown at 1997-07 CAGR (10%). 79% 76% 71% 21% 24% 29% 2002 2007 2012E Source: UNCTAD World Investment Report, Citi estimates. Note: MNC is defined as an enterprise that controls assets in a foreign entity. Multi-national Companies Dev. EM Market position (4) #5 #3 #7 #1 #6 #2 #4 (2) (3) 22 |
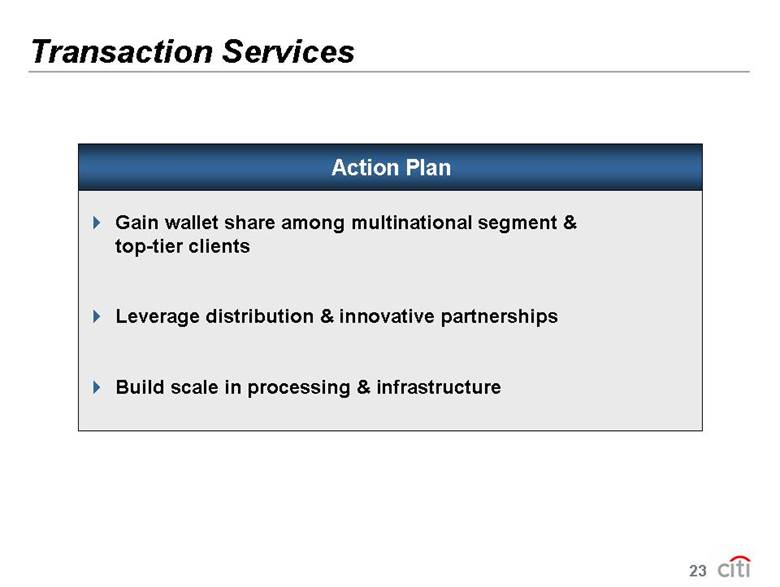
| Transaction Services Action Plan Gain wallet share among multinational segment & top-tier clients Leverage distribution & innovative partnerships Build scale in processing & infrastructure 23 |
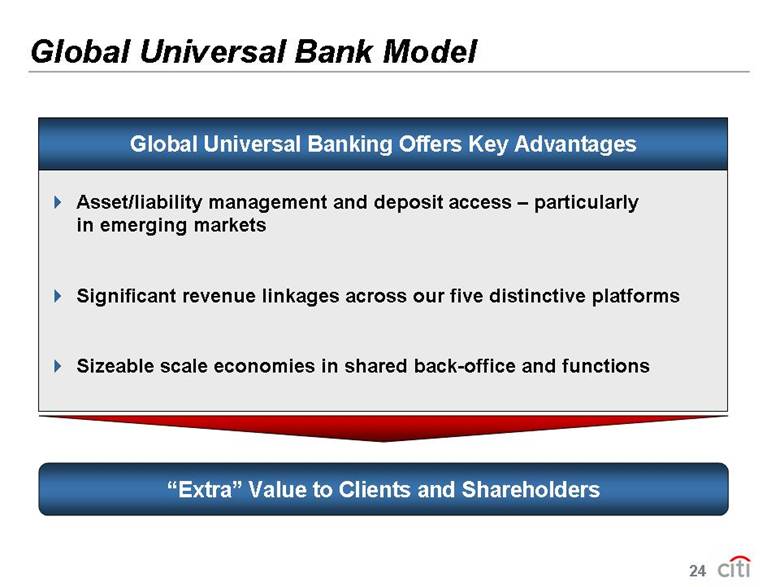
| Global Universal Bank Model Asset/liability management and deposit access – particularly in emerging markets Significant revenue linkages across our five distinctive platforms Sizeable scale economies in shared back-office and functions Global Universal Banking Offers Key Advantages “Extra” Value to Clients and Shareholders 24 |
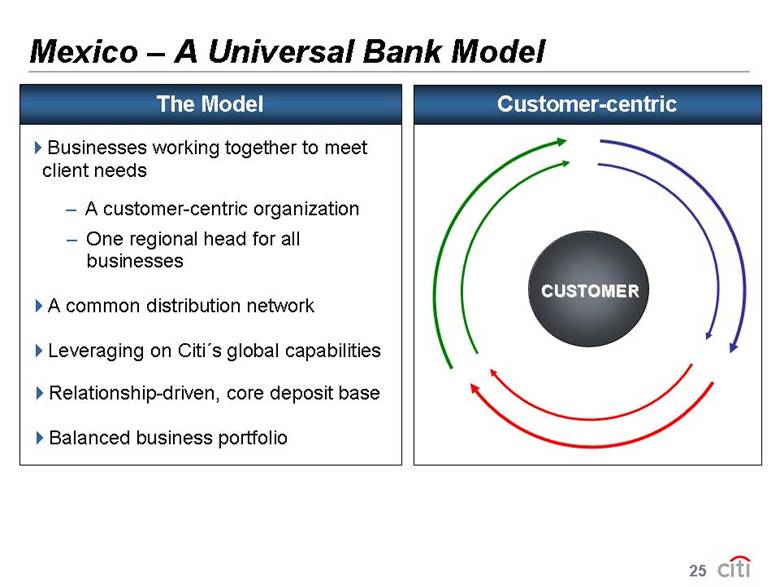
| Businesses working together to meet client needs – A customer-centric organization The Model Customer-centric CUSTOMER – One regional head for all businesses A common distribution network Leveraging on Citi´s global capabilities Relationship-driven, core deposit base Balanced business portfolio Mexico – A Universal Bank Model 25
|
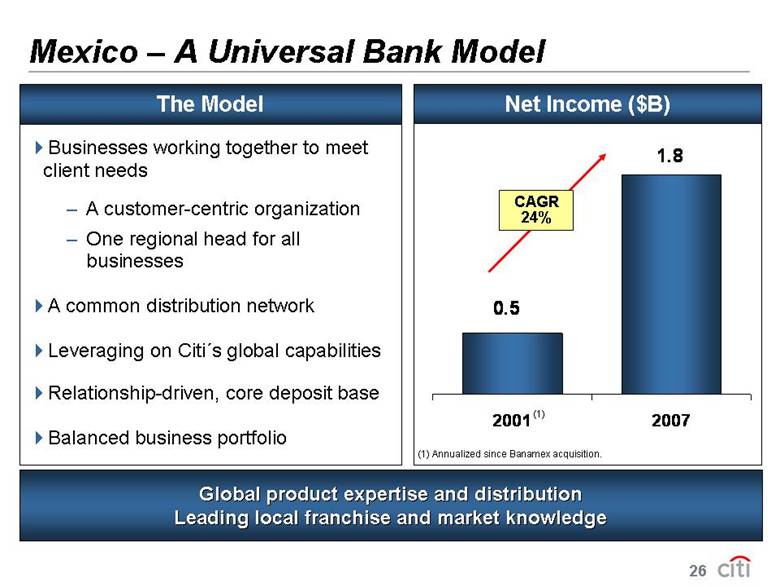
| Businesses working together to meet client needs – A customer-centric organization The Model 1.8 0.5 2001 2007 Net Income ($B) CAGR 24% (1) Annualized since Banamex acquisition. Global product expertise and distribution Leading local franchise and market knowledge – One regional head for all businesses A common distribution network Leveraging on Citi´s global capabilities Relationship-driven, core deposit base Balanced business portfolio Mexico – A Universal Bank Model (1) 26
|
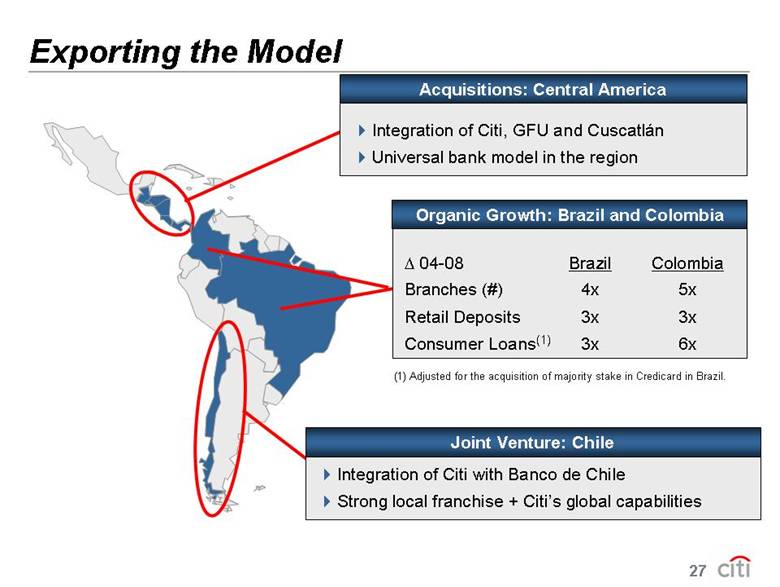
| (1) Adjusted for the acquisition of majority stake in Credicard in Brazil. . 04-08 Brazil Colombia Branches (#) 4x 5x Retail Deposits 3x 3x Consumer Loans(1) 3x 6x Organic Growth: Brazil and Colombia Integration of Citi with Banco de Chile Strong local franchise + Citi’s global capabilities Joint Venture: Chile Integration of Citi, GFU and Cuscatlán Universal bank model in the region Acquisitions: Central America Exporting the Model 27 |
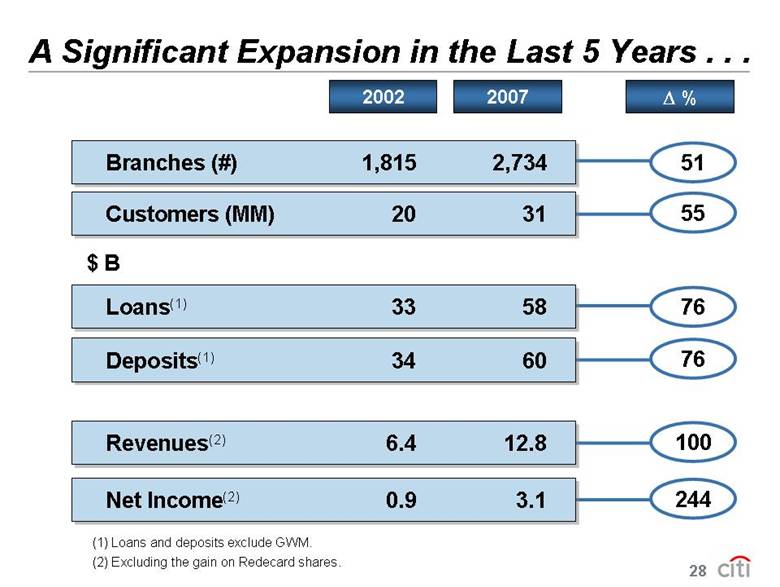
| A Significant Expansion in the Last 5 Years . . . 2002 2007 . % Branches (#) 1,815 2,734 51 55 Customers (MM) 20 31 76 Deposits(1) 34 60 100 Revenues(2) 6.4 12.8 244 Net Income(2) 0.9 3.1 76 Loans(1) 33 58 $ B (2) Excluding the gain on Redecard shares. (1) Loans and deposits exclude GWM. 28 |
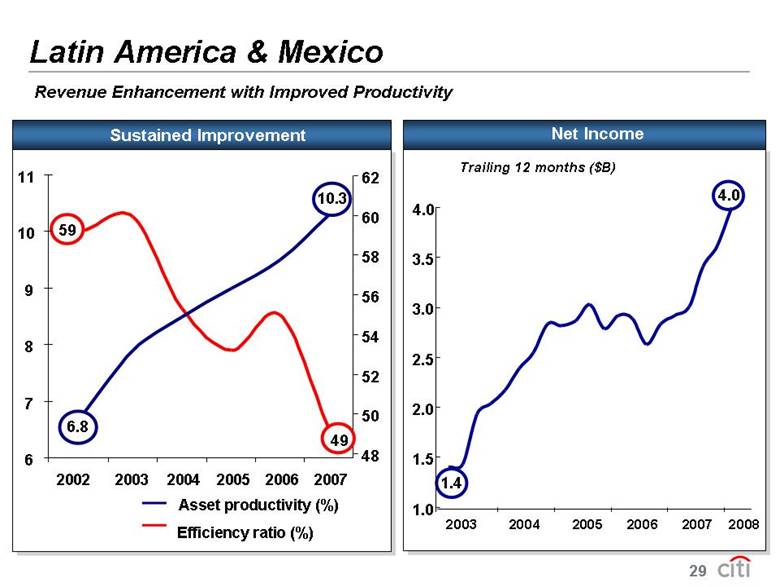
| Latin America & Mexico Sustained Improvement Revenue Enhancement with Improved Productivity Net Income Trailing 12 months ($B) 2003 2004 2005 2006 2007 2008 4.0 1.4 1.0 1.5 2.0 2.5 3.0 3.5 4.0 2002 2003 2004 2005 2006 2007 48 50 52 54 56 58 60 62 Efficiency ratio (%) 59 49 Asset productivity (%) 6.8 10.3 6 7 8 9 10 11 29 |
| [LOGO] |
| Historical View Business 5 Business 4 Business 3 Business 2 Business 1 30 |
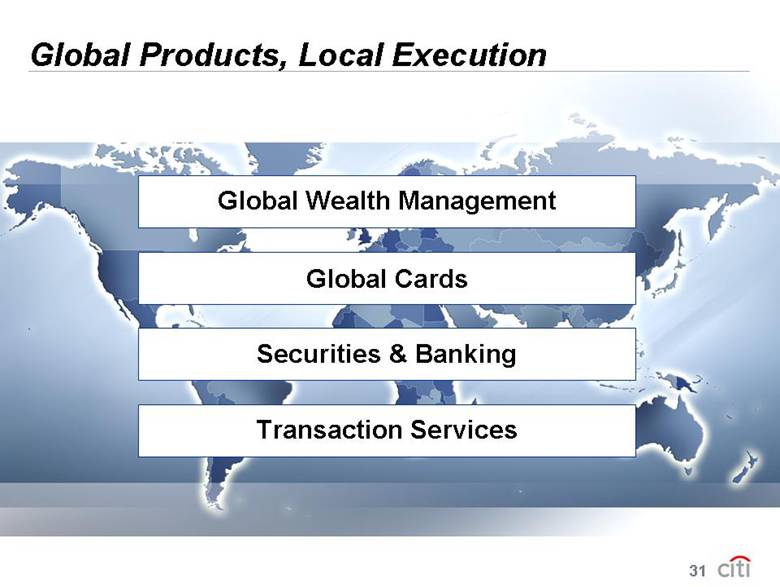
| Global Wealth Management Global Products, Local Execution Global Cards Securities & Banking Transaction Services 31 |
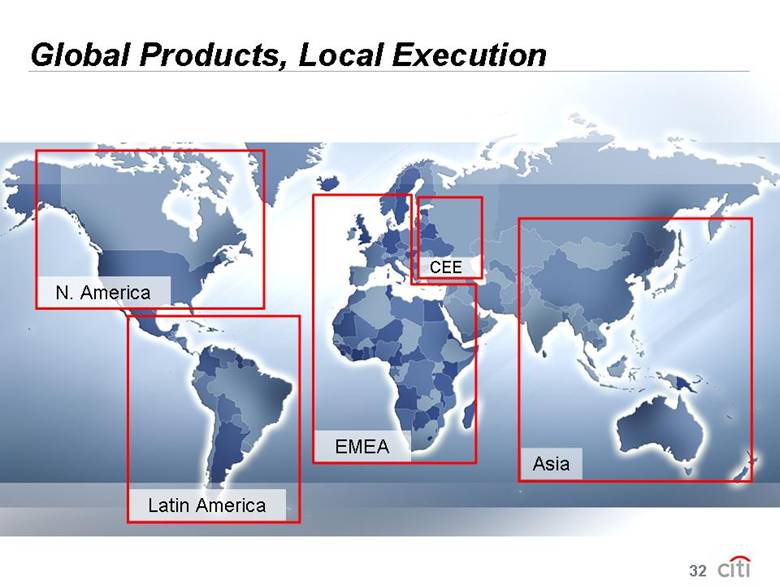
| Global Products, Local Execution EMEA Asia Latin America N. America CEE 32 |
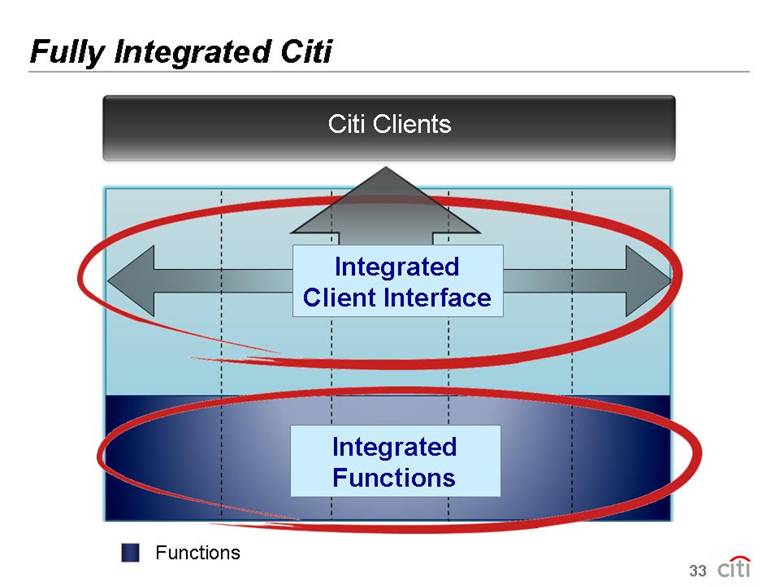
| Citi Clients Integrated Functions Integrated Client Interface Fully Integrated Citi Functions 33 |
| [LOGO] |
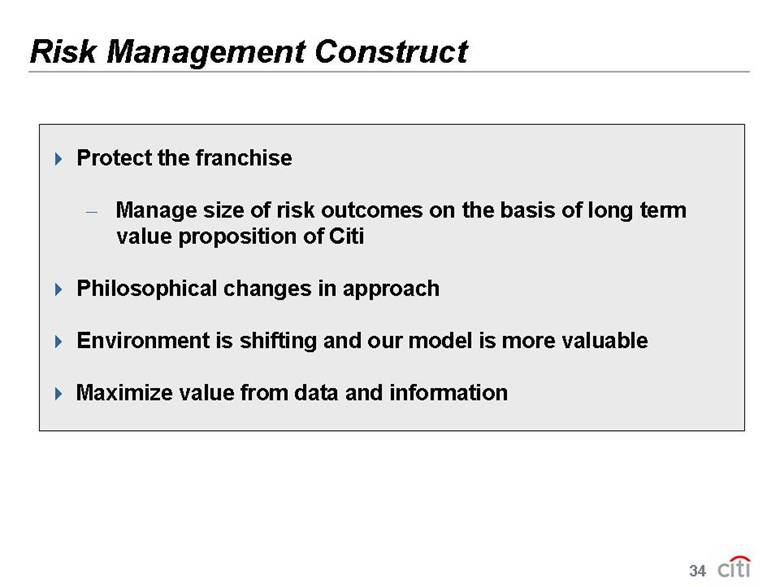
| Risk Management Construct Protect the franchise — Manage size of risk outcomes on the basis of long term value proposition of Citi Philosophical changes in approach Environment is shifting and our model is more valuable Maximize value from data and information 34 |
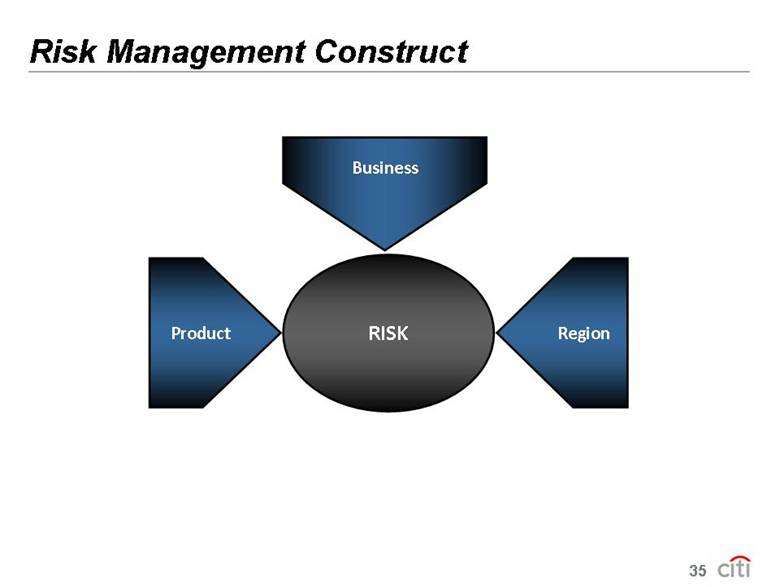
| Risk Management Construct Product Region Business RISK 35 |
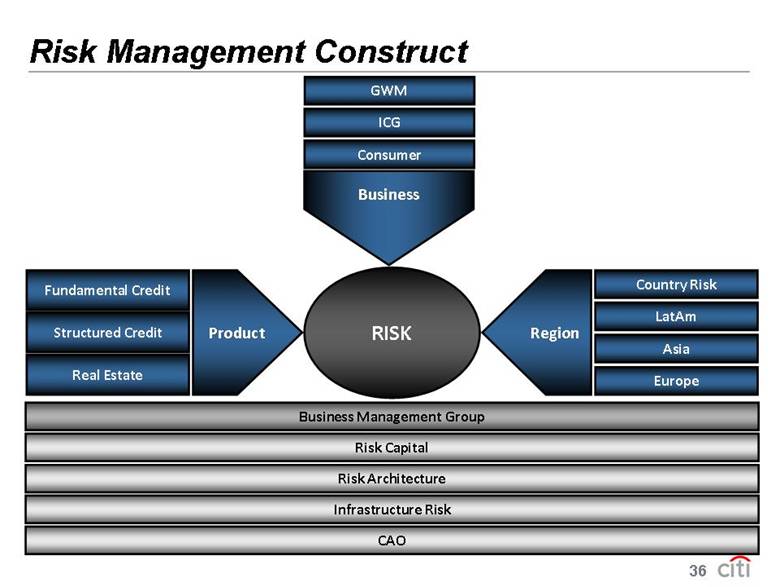
| Risk Management Construct Structured Credit Real Estate Fundamental Credit GWM Consumer ICG LatAm Europe Asia Risk Architecture Risk Capital CAO Business Management Group Country Risk Infrastructure Risk Product Region Business RISK 36 |
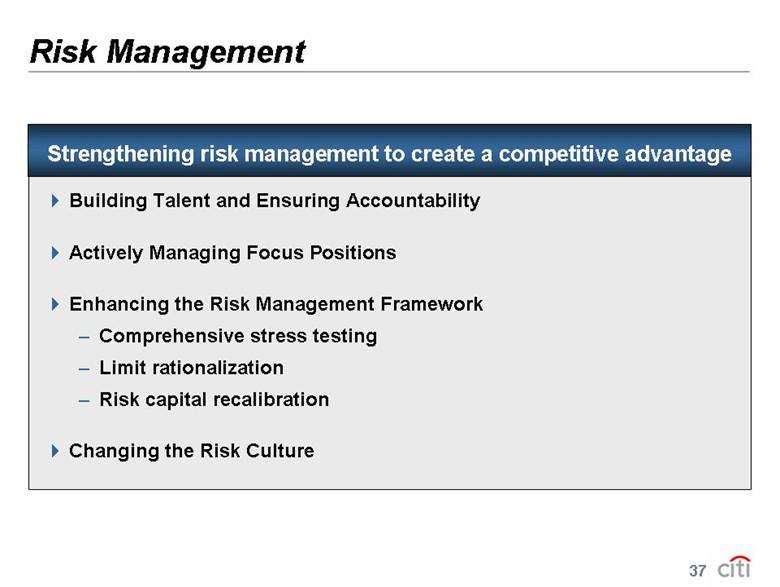
| Risk Management Building Talent and Ensuring Accountability Actively Managing Focus Positions Enhancing the Risk Management Framework – Comprehensive stress testing – Limit rationalization – Risk capital recalibration Changing the Risk Culture Strengthening risk management to create a competitive advantage 37 |
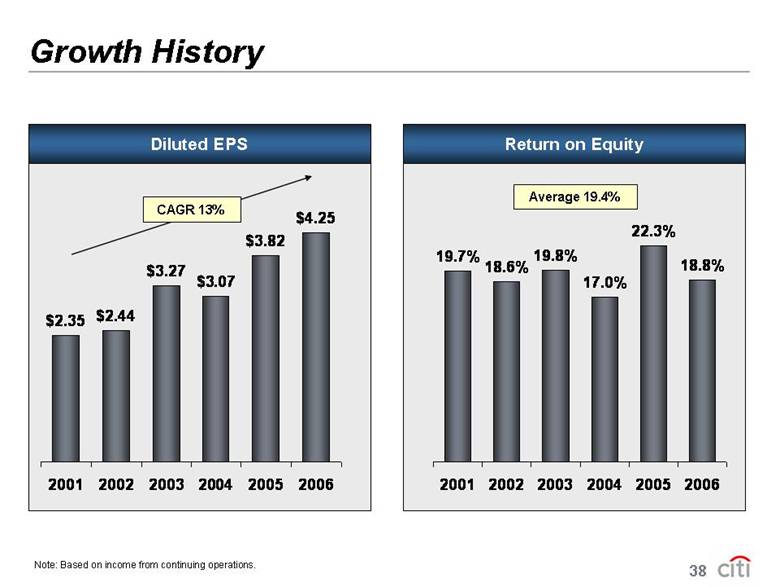
| Growth History $2.35 $2.44 $3.27 $3.07 $3.82 $4.25 2001 2002 2003 2004 2005 2006 19.7% 18.6% 19.8% 17.0% 22.3% 18.8% 2001 2002 2003 2004 2005 2006 Diluted EPS CAGR 13% Return on Equity Average 19.4% Note: Based on income from continuing operations. 38 |
| Stock Price 20 25 30 35 40 45 50 55 60 2001 2002 2003 2004 2005 2006 39 |
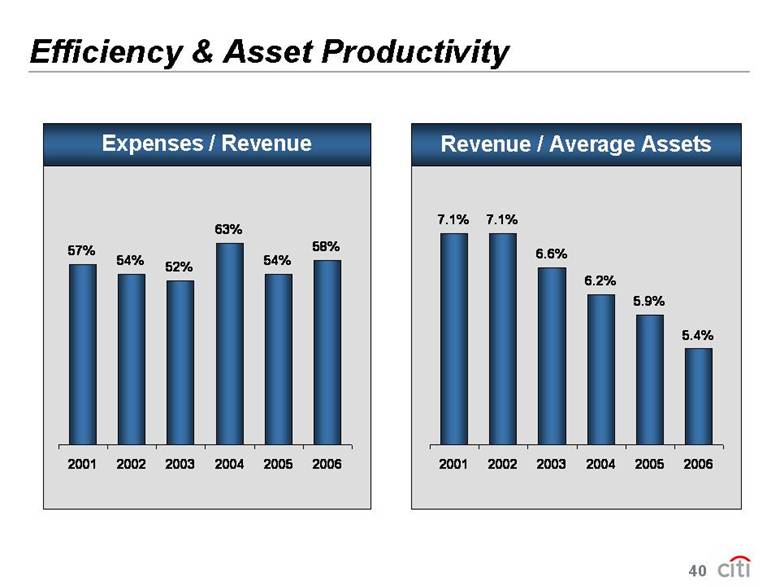
| Revenue / Average Assets Efficiency & Asset Productivity Expenses / Revenue 7.1% 7.1% 6.6% 6.2% 5.9% 5.4% 2001 2002 2003 2004 2005 2006 57% 54% 52% 63% 54% 58% 2001 2002 2003 2004 2005 2006 40 |
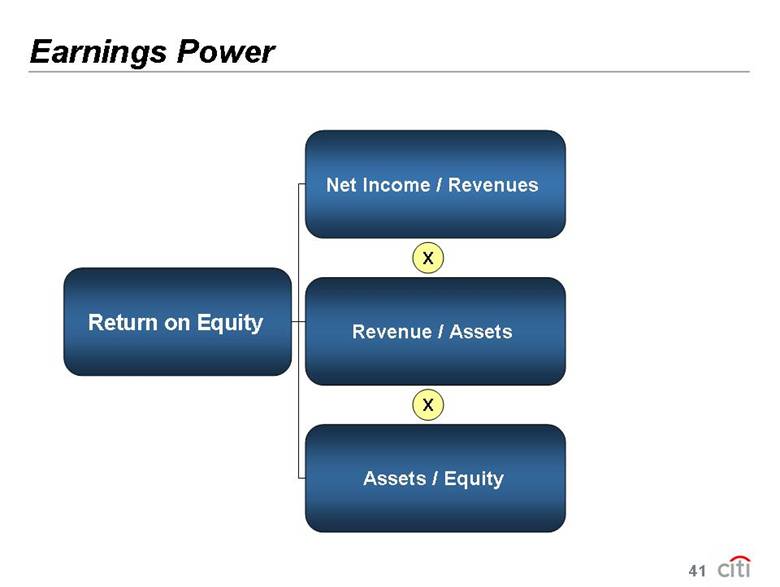
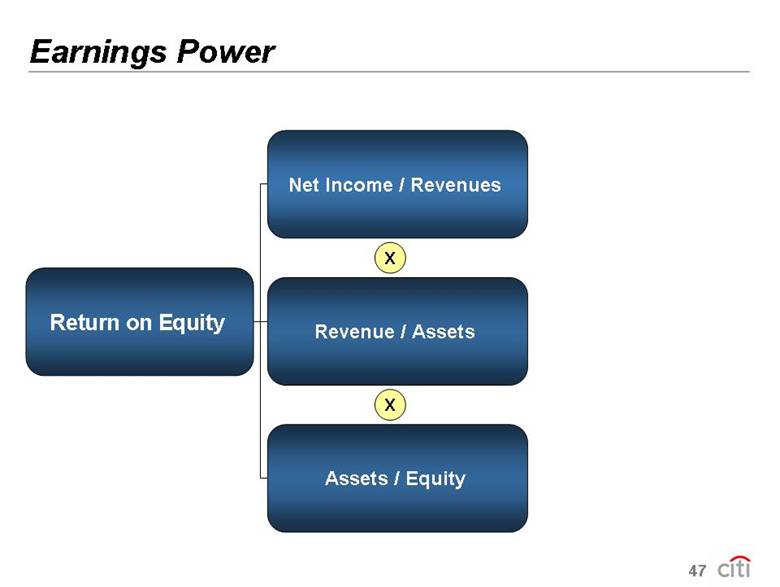
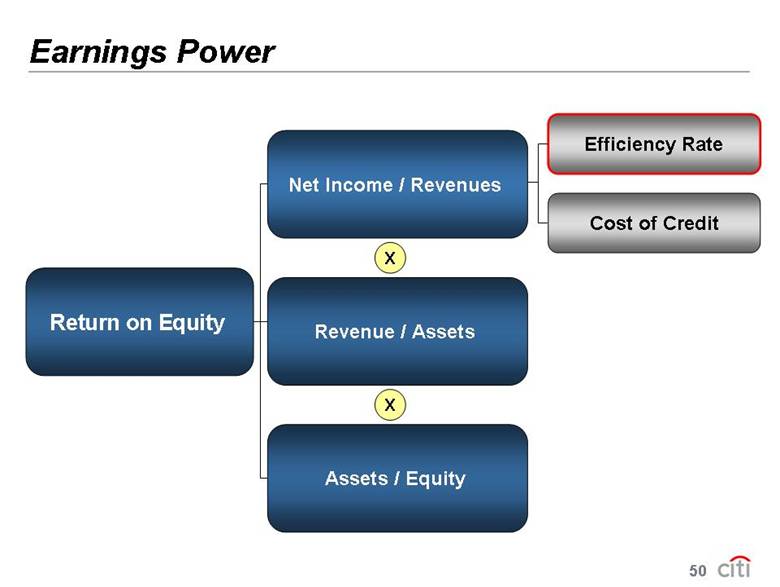
| Earnings Power Return on Equity Net Income / Revenues Assets / Equity X X Revenue / Assets 41 |
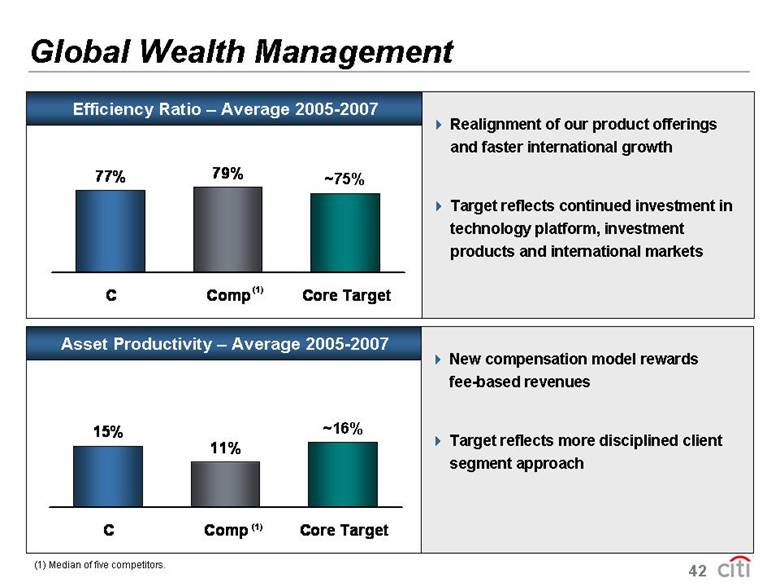
| 77% 79% C Comp Core Target 15% 11% C Comp Core Target Global Wealth Management Efficiency Ratio – Average 2005-2007 Asset Productivity – Average 2005-2007 Realignment of our product offerings and faster international growth Target reflects continued investment in technology platform, investment products and international markets New compensation model rewards fee-based revenues Target reflects more disciplined client segment approach (1) Median of five competitors. ~75% (1) (1) ~16% 42 |
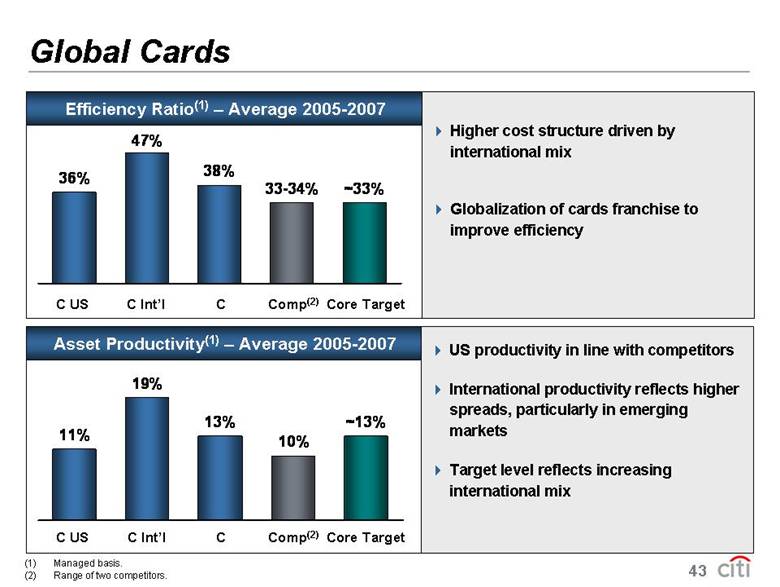
| 36% 47% 38% 33-34% ~33% Global Cards (1) Managed basis. (2) Range of two competitors. C US Comp(2) C Int’l Core Target C 11% 19% 13% 10% ~13% Efficiency Ratio(1) – Average 2005-2007 C US C Int’l Core Target C Asset Productivity(1) – Average 2005-2007 Higher cost structure driven by international mix Globalization of cards franchise to improve efficiency US productivity in line with competitors International productivity reflects higher spreads, particularly in emerging markets Target level reflects increasing international mix Comp(2) 43 |
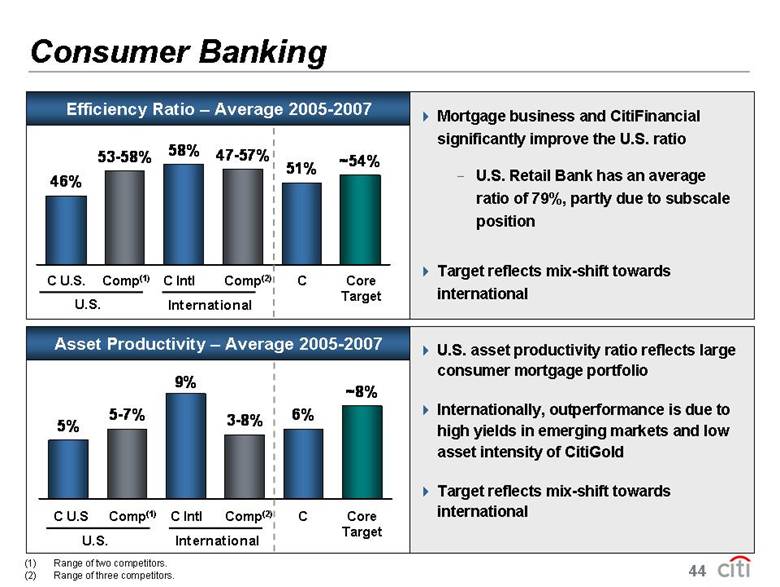
| Consumer Banking Efficiency Ratio – Average 2005-2007 Asset Productivity – Average 2005-2007 Mortgage business and CitiFinancial significantly improve the U.S. ratio - U.S. Retail Bank has an average ratio of 79%, partly due to subscale position Target reflects mix-shift towards international U.S. asset productivity ratio reflects large consumer mortgage portfolio Internationally, outperformance is due to high yields in emerging markets and low asset intensity of CitiGold Target reflects mix-shift towards international (1) Range of two competitors. (2) Range of three competitors. 46% 58% 51% ~54% 47-57% 53-58% U.S. International C U.S. Comp(1) C Intl Comp(2) C Core Target 5% 9% 6% 5-7% 3-8% ~8% U.S. International C U.S Comp(1) C Intl Comp(2) C Core Target 44 |
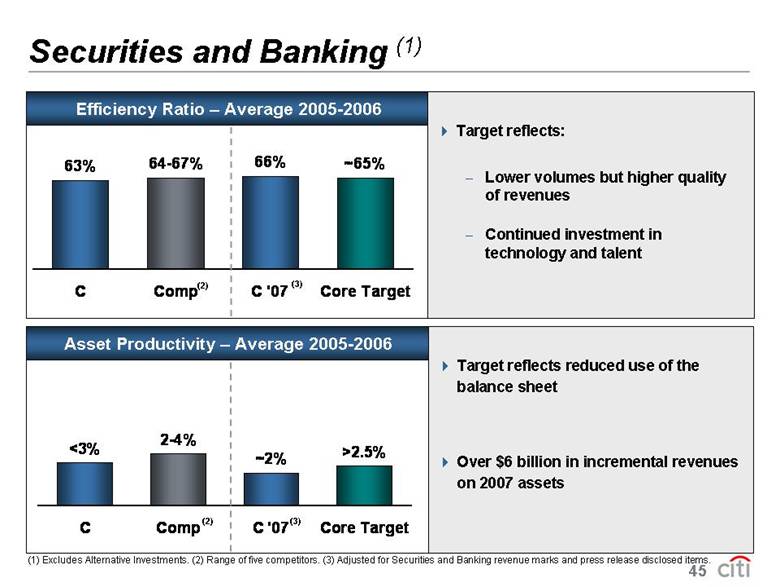
| Securities and Banking (1) (1) Excludes Alternative Investments. (2) Range of five competitors. (3) Adjusted for Securities and Banking revenue marks and press release disclosed items. ~2% 2-4% <3% >2.5% C Comp C '07 Core Target Asset Productivity – Average 2005-2006 Target reflects reduced use of the balance sheet Over $6 billion in incremental revenues on 2007 assets (2) (2) (3) 63% 66% ~65% 64-67% C Comp C '07 Core Target Efficiency Ratio – Average 2005-2006 Target reflects: - Lower volumes but higher quality of revenues - Continued investment in technology and talent (3) 45 |
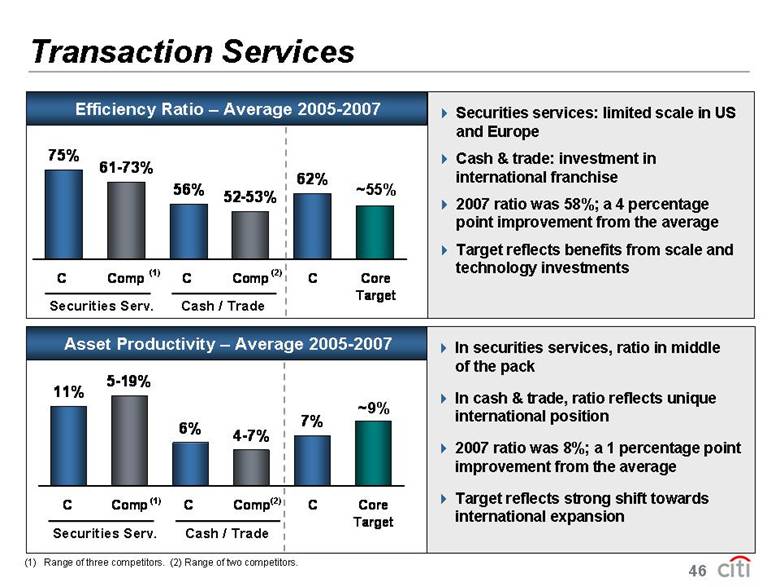
| 75% 56% 62% 52-53% 61-73% C Comp C Comp C Core Target Transaction Services Securities Serv. Cash / Trade ~55% 11% 6% 7% 5-19% 4-7% C Comp C Comp C Core Target Securities Serv. Cash / Trade ~9% Asset Productivity – Average 2005-2007 Efficiency Ratio – Average 2005-2007 Securities services: limited scale in US and Europe Cash & trade: investment in international franchise 2007 ratio was 58%; a 4 percentage point improvement from the average Target reflects benefits from scale and technology investments In securities services, ratio in middle of the pack In cash & trade, ratio reflects unique international position 2007 ratio was 8%; a 1 percentage point improvement from the average Target reflects strong shift towards international expansion (1) (2) (2) (1) (1) Range of three competitors. (2) Range of two competitors. 46 |
| Earnings Power Return on Equity Net Income / Revenues Assets / Equity X X Revenue / Assets 47 |
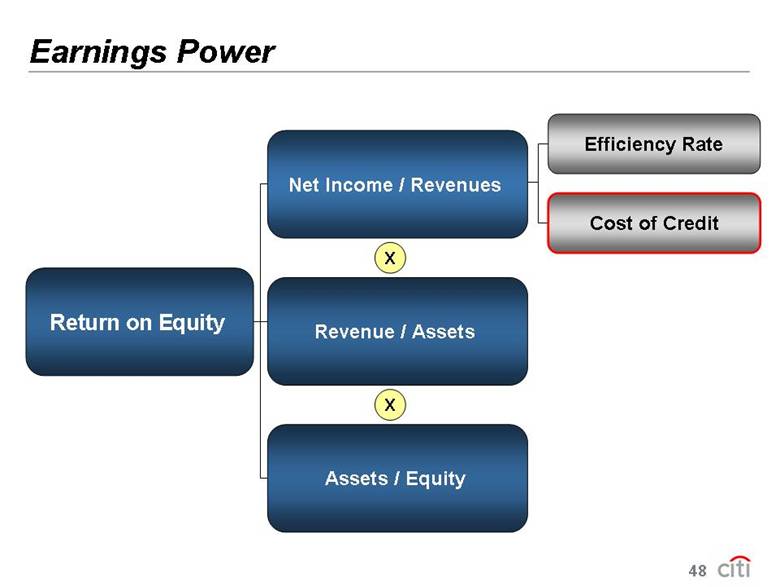
| Earnings Power Return on Equity Net Income / Revenues Assets / Equity X X Revenue / Assets Efficiency Rate Cost of Credit 48 |
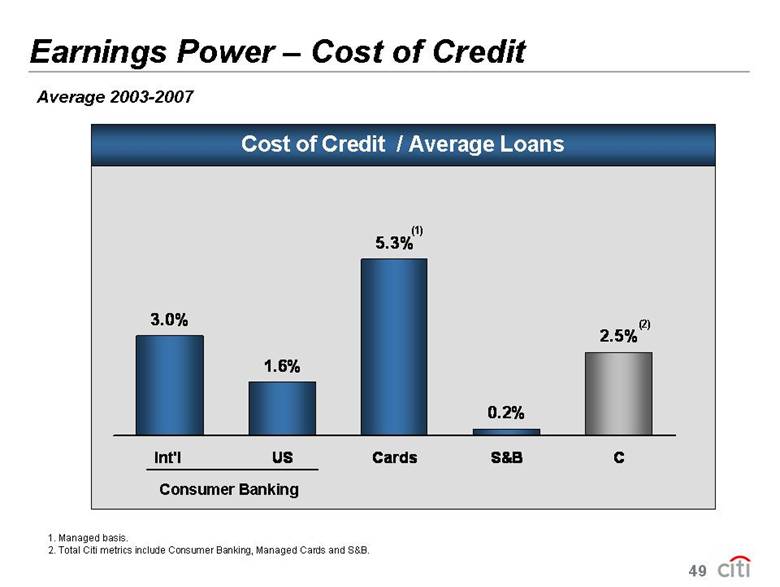
| 3.0% 1.6% 5.3% 0.2% 2.5% Int'l US Cards S&B C Cost of Credit / Average Loans Earnings Power – Cost of Credit Average 2003-2007 Consumer Banking (1) 1. Managed basis. 2. Total Citi metrics include Consumer Banking, Managed Cards and S&B. (2) 49 |
| Earnings Power Return on Equity Net Income / Revenues Assets / Equity X X Revenue / Assets Efficiency Rate Cost of Credit 50 |
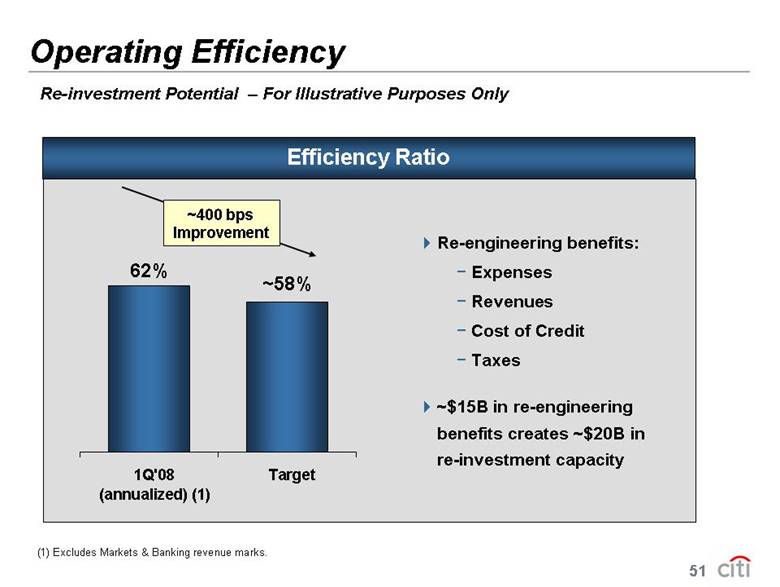
| Efficiency Ratio Operating Efficiency Re-investment Potential – For Illustrative Purposes Only 1Q'08 (annualized) Target ~58% 62% ~400 bps Improvement Re-engineering benefits: – Expenses – Revenues – Cost of Credit – Taxes ~$15B in re-engineering benefits creates ~$20B in re-investment capacity 51 (1) Excludes Markets & Banking revenue marks. |
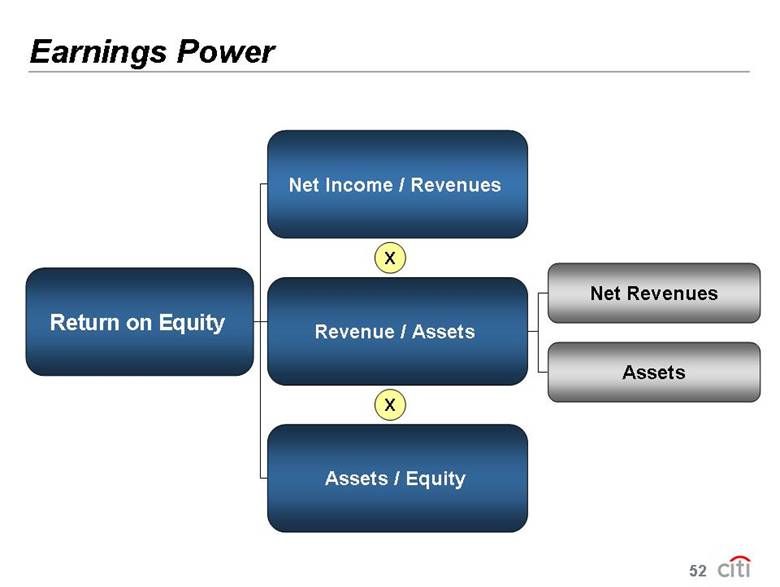
| Earnings Power Return on Equity Net Income / Revenues Assets / Equity X X Revenue / Assets Net Revenues Assets 52 |
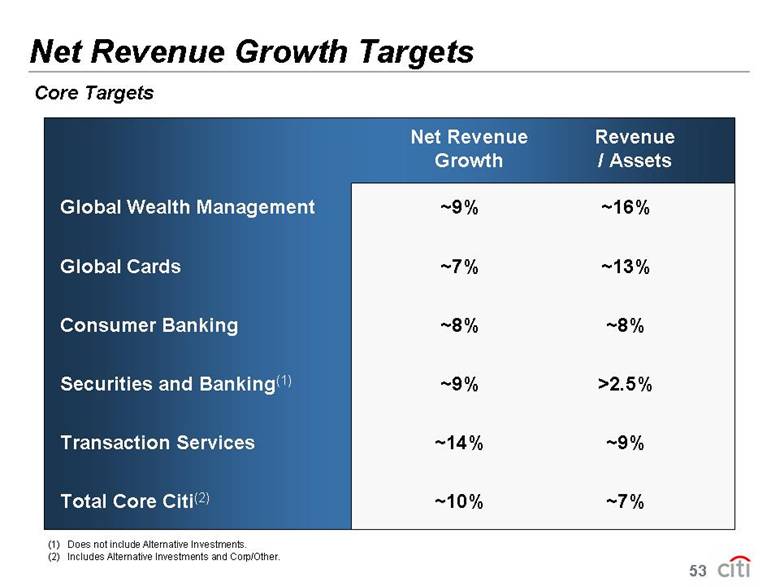
| Net Revenue Growth Targets Net Revenue Revenue Growth / Assets Global Wealth Management ~9% ~16% Global Cards ~7% ~13% Consumer Banking ~8% ~8% Securities and Banking(1) ~9% >2.5% Transaction Services ~14% ~9% Total Core Citi(2) ~10% ~7% Core Targets (1) Does not include Alternative Investments. (2) Includes Alternative Investments and Corp/Other. 53 |
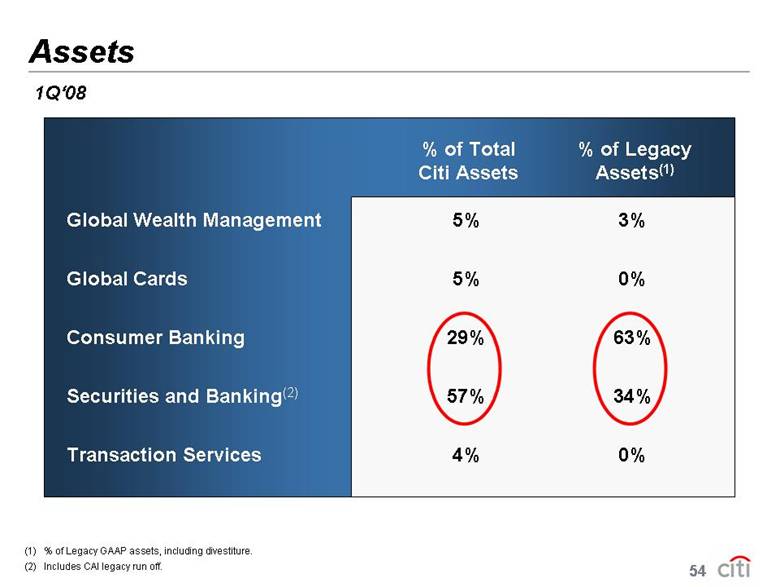
| Assets % of Total % of Legacy Citi Assets Assets(1) (1) % of Legacy GAAP assets, including divestiture. (2) Includes CAI legacy run off. Global Wealth Management 5% 3% Global Cards 5% 0% Consumer Banking 29% 63% Securities and Banking(2) 57% 34% Transaction Services 4% 0% 1Q‘08 54 |
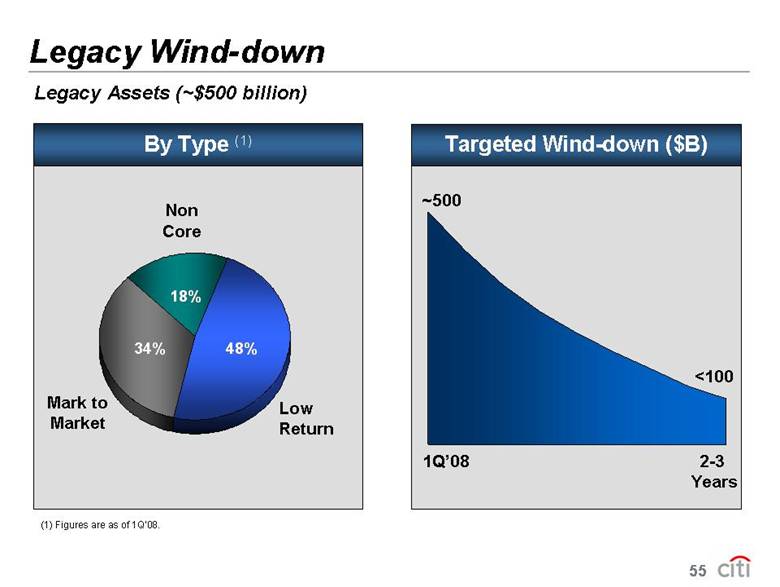
| By Type (1) Legacy Wind-down 48% 34% 18% Mark to Market Non Core Low Return Legacy Assets (~$500 billion) Targeted Wind-down ($B) (1) Figures are as of 1Q’08. 1Q’08 2-3 Years ~500 <100 55 |
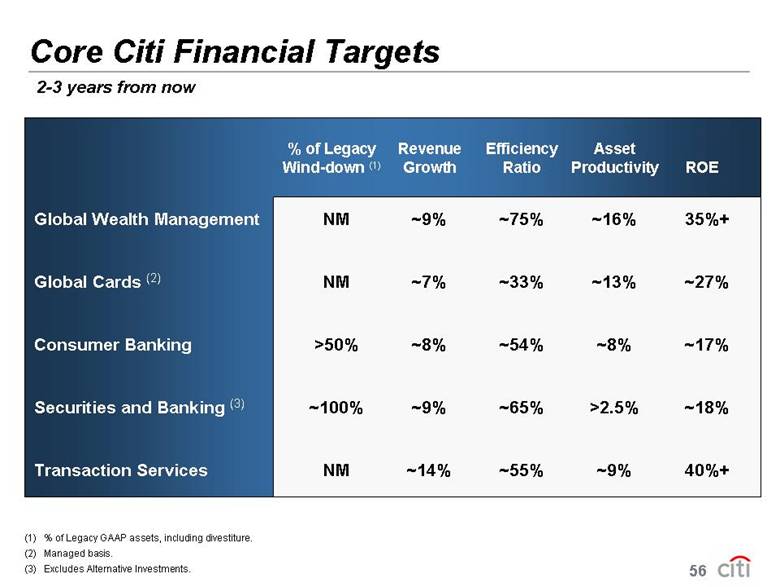
| Core Citi Financial Targets % of Legacy Revenue Efficiency Asset Wind-down (1) Growth Ratio Productivity ROE (1) % of Legacy GAAP assets, including divestiture. (2) Managed basis. (3) Excludes Alternative Investments. Global Wealth Management NM ~9% ~75% ~16% 35%+ Global Cards (2) NM ~7% ~33% ~13% ~27% Consumer Banking >50% ~8% ~54% ~8% ~17% Securities and Banking (3) ~100% ~9% ~65% >2.5% ~18% Transaction Services NM ~14% ~55% ~9% 40%+ 2-3 years from now 56
|
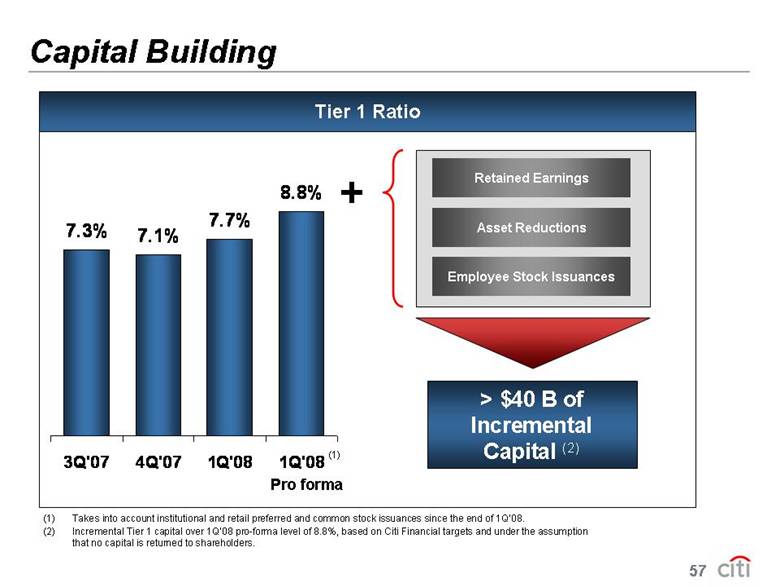
| Capital Building Tier 1 Ratio (1) Takes into account institutional and retail preferred and common stock issuances since the end of 1Q’08. (2) Incremental Tier 1 capital over 1Q’08 pro-forma level of 8.8%, based on Citi Financial targets and under the assumption that no capital is returned to shareholders. 7.3% 7.1% 7.7% 8.8% 3Q'07 4Q'07 1Q'08 1Q'08 Pro forma (1) Retained Earnings Asset Reductions Employee Stock Issuances + > $40 B of Incremental Capital (2) 57 |
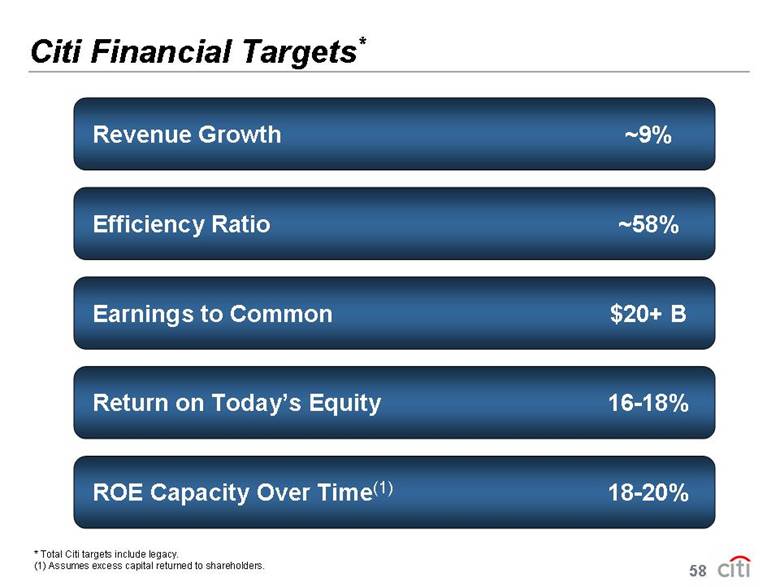
| Citi Financial Targets* Revenue Growth ~9% Efficiency Ratio ~58% Return on Today’s Equity 16-18% Earnings to Common $20+ B ROE Capacity Over Time(1) 18-20% * Total Citi targets include legacy. (1) Assumes excess capital returned to shareholders. 58 |
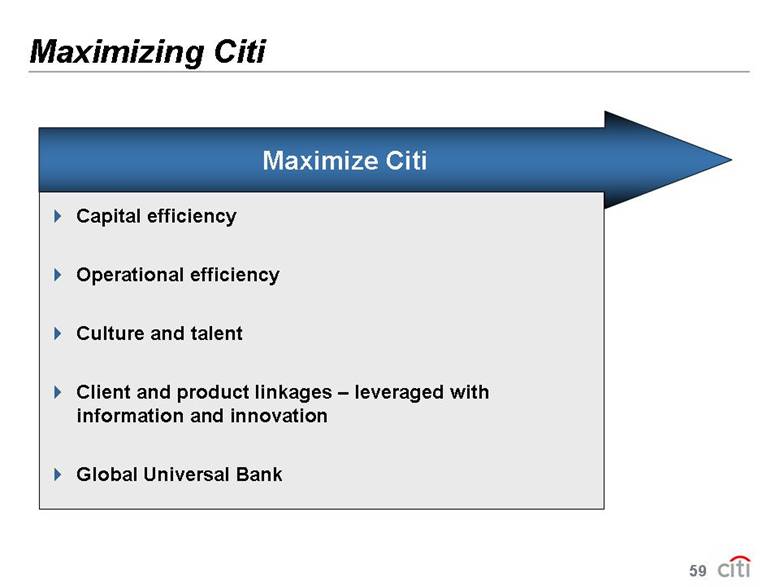
| Maximizing Citi Capital efficiency Operational efficiency Culture and talent Client and product linkages – leveraged with information and innovation Global Universal Bank Maximize Citi 59 |
| Value Creation Restructure Citi Get Fit Maximize Citi • Reduce legacy assets • Focus on returns • Increase asset productivity • Manage risk • Re-engineer cost base • Clear goals, strategy and structure • The right business model • Transparency and accountability • Fully leverage the model • Performance-based culture • Focus on talent • Innovation and creativity • Harness information advantage 60 |
| This presentation contains forward-looking statements. Citigroup’s financial results may differ materially from those statements, so please refer to Citigroup’s SEC filings for a description of the factors that could cause its actual results to differ from expectations. In particular, this presentation contains a number of financial targets for Citigroup and its various businesses. You should keep in mind that these are targets for two or three years from now, and are not estimates of future performance. They are based on a number of assumptions regarding Citigroup’s businesses and the economy. Citigroup does not plan to update these targets on any regular basis. |
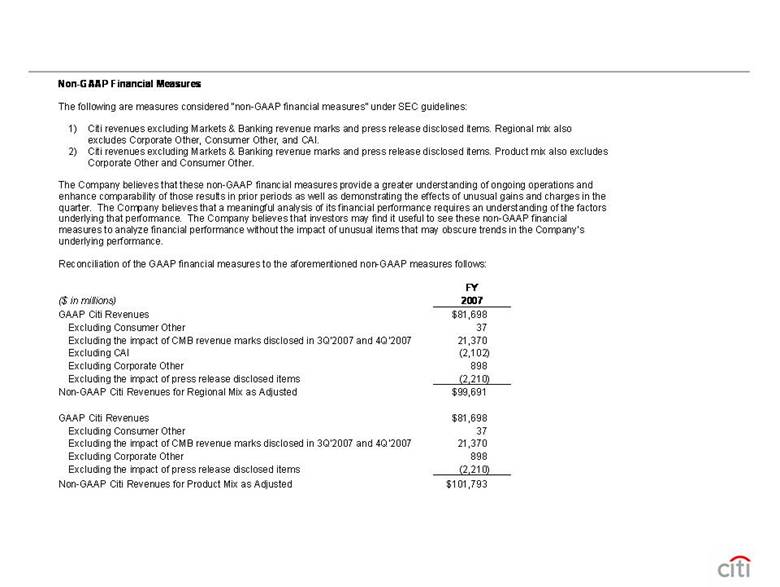
| Non-GAAP Financial Measures The following are measures considered “non-GAAP financial measures” under SEC guidelines: 1) Citi revenues excluding Markets & Banking revenue marks and press release disclosed items. Regional mix also excludes Corporate Other, Consumer Other, and CAI. 2) Citi revenues excluding Markets & Banking revenue marks and press release disclosed items. Product mix also excludes Corporate Other and Consumer Other. The Company believes that these non-GAAP financial measures provide a greater understanding of ongoing operations and enhance comparability of those results in prior periods as well as demonstrating the effects of unusual gains and charges in the quarter. The Company believes that a meaningful analysis of its financial performance requires an understanding of the factors underlying that performance. The Company believes that investors may find it useful to see these non-GAAP financial measures to analyze financial performance without the impact of unusual items that may obscure trends in the Company’s underlying performance. Reconciliation of the GAAP financial measures to the aforementioned non-GAAP measures follows: FY ($ in millions) 2007 GAAP Citi Revenues $81,698 Excluding Consumer Other 37 Excluding the impact of CMB revenue marks disclosed in 3Q’2007 and 4Q’2007 21,370 Excluding CAI (2,102) Excluding Corporate Other 898 Excluding the impact of press release disclosed items (2,210) Non-GAAP Citi Revenues for Regional Mix as Adjusted $99,691 GAAP Citi Revenues $81,698 Excluding Consumer Other 37 Excluding the impact of CMB revenue marks disclosed in 3Q’2007 and 4Q’2007 21,370 Excluding Corporate Other 898 Excluding the impact of press release disclosed items (2,210) Non-GAAP Citi Revenues for Product Mix as Adjusted $101,793 |