Exhibit 99.01
THE COMPANY
Citigroup Inc. (Citigroup and, together with its subsidiaries, the Company, Citi or Citigroup) is a global diversified financial services holding company whose businesses provide a broad range of financial services to consumer and corporate customers. Citigroup has more than 200 million customer accounts and does business in more than 100 countries. Citigroup was incorporated in 1988 under the laws of the State of Delaware.
The Company is a bank holding company within the meaning of the U.S. Bank Holding Company Act of 1956 registered with, and subject to examination by, the Board of Governors of the Federal Reserve System (FRB). Citibank, N.A. is a U.S. national bank subject to supervision and examination by the Office of the Comptroller of the Currency (OCC) and the Federal Deposit Insurance Corporation (FDIC). Some of the Company’s other subsidiaries are also subject to supervision and examination by their respective federal and state authorities.
The principal executive offices of the Company are located at 399 Park Avenue, New York, New York 10043, telephone number 212 559 1000. Additional information about Citigroup is available on the Company’s web site at www.citigroup.com. Citigroup’s recent annual reports on Form 10-K, quarterly reports on Form 10-Q, current reports on Form 8-K, as well as the Company’s other filings with the SEC, are available free of charge through the Company’s web site by clicking on the “Investors” page and selecting “All SEC Filings.” The SEC web site contains reports, proxy and information statements, and other information regarding the Company at www.sec.gov.
1
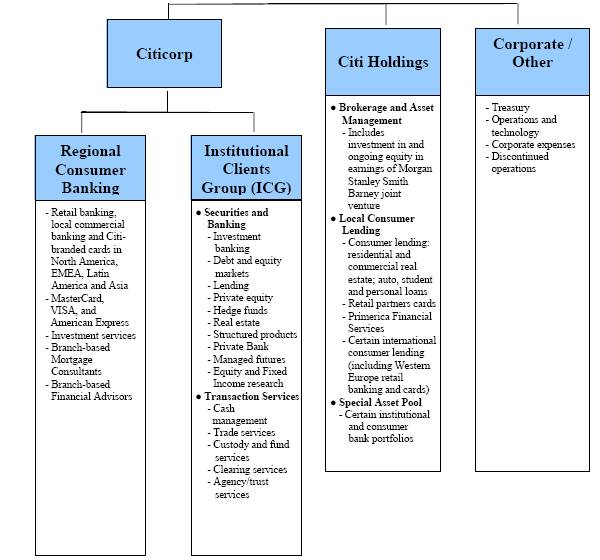
Beginning in the second quarter of 2009, Citigroup was managed along the following segment and product lines:
CITIGROUP SEGMENTS
The following are the four regions in which Citigroup operates. The regional results are fully reflected in the segment results.
CITIGROUP REGIONS(1)
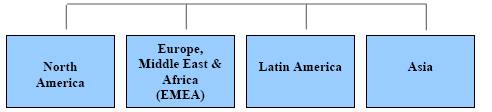
(1) Asia includes Japan, Latin America includes Mexico, and North America includes U.S., Canada and Puerto Rico.
2
FIVE-YEAR SUMMARY OF SELECTED FINANCIAL DATA |
| Citigroup Inc. and Subsidiaries |
In millions of dollars, except per share amounts and ratios |
| 2008 (1) |
| 2007 |
| 2006 |
| 2005 |
| 2004 |
| |||||
|
|
|
|
|
|
|
|
|
|
|
| |||||
Net interest revenue |
| $ | 53,749 |
| $ | 45,389 |
| $ | 37,928 |
| $ | 37,494 |
| $ | 39,564 |
|
Non-interest revenue |
| (2,150 | ) | 31,911 |
| 48,399 |
| 42,583 |
| 36,659 |
| |||||
Revenues, net of interest expense |
| $ | 51,599 |
| $ | 77,300 |
| $ | 86,327 |
| $ | 80,077 |
| $ | 76,223 |
|
Operating expenses |
| 69,240 |
| 58,737 |
| 50,301 |
| 43,549 |
| 48,149 |
| |||||
Provisions for credit losses and for benefits and claims |
| 34,714 |
| 17,917 |
| 7,537 |
| 7,971 |
| 6,658 |
| |||||
Income (Loss) from Continuing Operations before Income Taxes |
| $ | (52,355 | ) | $ | 646 |
| $ | 28,489 |
| $ | 28,557 |
| $ | 21,416 |
|
Income taxes (benefits) |
| (20,326 | ) | (2,546 | ) | 7,749 |
| 8,787 |
| 6,130 |
| |||||
Income (Loss) from Continuing Operations |
| $ | (32,029 | ) | $ | 3,192 |
| $ | 20,740 |
| $ | 19,770 |
| $ | 15,286 |
|
Income (Loss) from Discontinued Operations, net of taxes (3) |
| 4,002 |
| 708 |
| 1,087 |
| 5,417 |
| 1,978 |
| |||||
Cumulative effect of accounting change, net of taxes (3) |
| — |
| — |
| — |
| (49 | ) | — |
| |||||
Net Income (Loss) before attribution of Noncontrolling Interests |
| $ | (28,027 | ) | $ | 3,900 |
| $ | 21,827 |
| $ | 25,138 |
| $ | 17,264 |
|
Net Income (Loss) attributable to Noncontrolling Interests |
| (343 | ) | 283 |
| 289 |
| 549 |
| 218 |
| |||||
Citigroup’s Net Income (Loss) |
| $ | (27,684 | ) | $ | 3,617 |
| $ | 21,538 |
| $ | 24,589 |
| $ | 17,046 |
|
Earnings per share |
|
|
|
|
|
|
|
|
|
|
| |||||
Basic: |
|
|
|
|
|
|
|
|
|
|
| |||||
Income (loss) from continuing operations |
| $ | (6.37 | ) | $ | 0.56 |
| $ | 4.09 |
| $ | 3.69 |
| $ | 2.89 |
|
Net income |
| (5.61 | ) | 0.71 |
| 4.30 |
| 4.74 |
| 3.27 |
| |||||
Diluted: |
|
|
|
|
|
|
|
|
|
|
| |||||
Income (loss) from continuing operations |
| (6.37 | ) | 0.53 |
| 4.05 |
| 3.67 |
| 2.86 |
| |||||
Net income |
| (5.61 | ) | 0.67 |
| 4.27 |
| 4.71 |
| 3.23 |
| |||||
Dividends declared per common share |
| $ | 1.12 |
| $ | 2.16 |
| $ | 1.96 |
| $ | 1.76 |
| $ | 1.60 |
|
At December 31 |
|
|
|
|
|
|
|
|
|
|
| |||||
Total assets |
| $ | 1,938,470 |
| $ | 2,187,480 |
| $ | 1,884,167 |
| $ | 1,493,886 |
| $ | 1,483,950 |
|
Total deposits |
| 774,185 |
| 826,230 |
| 712,041 |
| 591,828 |
| 561,513 |
| |||||
Long-term debt |
| 359,593 |
| 427,112 |
| 288,494 |
| 217,499 |
| 207,910 |
| |||||
Mandatorily redeemable securities of subsidiary trusts (4) | 23,899 |
| 23,594 |
| 9,579 |
| 6,264 |
| 6,209 |
| ||||||
Common stockholders’ equity |
| 70,966 |
| 113,447 |
| 118,632 |
| 111,261 |
| 108,015 |
| |||||
Total stockholders’ equity |
| 141,630 |
| 113,447 |
| 119,632 |
| 112,386 |
| 109,140 |
| |||||
Direct staff (in thousands) |
| 323 |
| 375 |
| 327 |
| 296 |
| 283 |
| |||||
Ratios: |
|
|
|
|
|
|
|
|
|
|
| |||||
Return on common stockholders’ equity (5) |
| (28.8 | )% | 2.9 | % | 18.8 | % | 22.4 | % | 17.0 | % | |||||
Return on total stockholders’ equity (5) |
| (20.9 | ) | 3.0 |
| 18.7 |
| 22.2 |
| 16.9 |
| |||||
Tier 1 Capital |
| 11.92 | % | 7.12 | % | 8.59 | % | 8.79 | % | 8.74 | % | |||||
Total Capital |
| 15.70 |
| 10.70 |
| 11.65 |
| 12.02 |
| 11.85 |
| |||||
Leverage (6) |
| 6.08 |
| 4.03 |
| 5.16 |
| 5.35 |
| 5.20 |
| |||||
Common stockholders’ equity to assets |
| 3.66 | % | 5.19 | % | 6.30 | % | 7.45 | % | 7.28 | % | |||||
Total stockholders’ equity to assets |
| 7.31 |
| 5.19 |
| 6.35 |
| 7.52 |
| 7.35 |
| |||||
Dividend payout ratio (7) |
| NM |
| 322.4 |
| 45.9 |
| 37.4 |
| 49.5 |
| |||||
Book value per common share |
| $ | 13.02 |
| $ | 22.71 |
| $ | 24.15 |
| $ | 22.34 |
| $ | 20.79 |
|
Ratio of earnings to fixed charges and preferred stock dividends |
| NM |
| 1.01 | x | 1.50 | x | 1.79 | x | 1.99 | x | |||||
(1) | On January 1, 2009, Citigroup adopted SFAS No. 160, Noncontrolling Interests in Consolidated Financial Statements, and FSP EITF 03-6-1, Determining Whether Instruments Granted in Share-Based Payment Transactions Are Participating Securities. All periods have been restated to conform to the current period’s presentation. |
(2) | Discontinued operations for 2004 to 2008 reflect the sale of Nikko Cordial Securities to Sumitomo Mitsui Banking Corporation, the sale of Citigroup’s German Retail Banking Operations to Credit Mutuel, and the Company’s sale of CitiCapital’s equipment finance unit to General Electric. In addition, discontinued operations for 2004 to 2006 include the operations and associated gain on sale of substantially all of Citigroup’s Asset Management business, the majority of which closed on December 1, 2005. Discontinued operations from 2004 to 2006 also include the operations and associated gain on sale of Citigroup’s Travelers Life & Annuity, substantially all of Citigroup’s international insurance business and Citigroup’s Argentine pension business to MetLife Inc. The sale closed on July 1, 2005. See Note 3 to the Consolidated Financial Statements. |
(3) | Accounting change of $(49) million in 2005 represents the adoption of Financial Accounting Standards Board (FASB) Interpretation No. 47, Accounting for Conditional Asset Retirement Obligations, an interpretation of SFAS No. 143, (FIN 47). |
(4) | During 2004, the Company deconsolidated the subsidiary issuer trusts in accordance with FIN 46(R). For regulatory capital purposes, these trust securities remain a component of Tier 1 Capital. |
(5) | The return on average common stockholders’ equity is calculated using net income less preferred stock dividends divided by average common stockholders’ equity. The return on total stockholders’ equity is calculated using net income divided by average stockholders’ equity. |
(6) | Tier 1 Capital divided by each year’s fourth quarter adjusted average assets (hereinafter as adjusted average assets). |
(7) | Dividends declared per common share as a percentage of net income per diluted share. |
NM Not Meaningful
3