(c) Includes provisions for HTM debt securities and other assets.
Institutional Clients Group
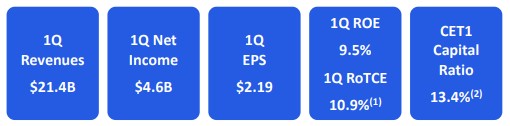
ICG revenues of $11.2 billion were up 1% (including gain/(loss) on loan hedges)(6), as strength in Treasury and Trade Solutions (TTS), Securities Services, and Fixed Income Markets was partially offset by declines in Banking and Equity Markets.
Services revenues of $4.5 billion increased 29%. TTS revenues of $3.4 billion increased 31%, driven by 41% growth in net interest income and 13% growth in non-interest revenue. Strong performance in TTS was driven by higher interest rates and business actions, which included growing deposits, managing repricing, and driving fee growth. Securities Services revenues of $1.1 billion increased 23%, as net interest income increased 94%, driven by higher interest rates across currencies, partially offset by a 6% decrease in non-interest revenue due to the impact of lower market valuations on assets under custody and administration.
Markets revenues of $5.6 billion decreased 4%, as growth in Fixed Income Markets was more than offset by a decline in Equity Markets. Fixed Income Markets revenues of $4.5 billion increased 4%, largely driven by strength in rates and currencies, partially offset by lower revenues in spread products / other fixed income. Equity Markets revenues of $1.1 billion were down 25%, primarily reflecting reduced client activity in cash and equity derivatives relative to a very strong quarter last year.
Banking revenues of $1.2 billion decreased 38%, including gain/loss on loan hedges in the current quarter and the prior-year period. Excluding gain/loss on loan hedges(6), Banking revenues of $1.4 billion decreased 21%, driven by lower revenues in Investment Banking and Corporate Lending. Investment Banking revenues of $774 million decreased 25%, as continued geopolitical uncertainty, heightened macroeconomic uncertainty and volatility continued to impact client activity. Excluding gain/loss on loan hedges(6), Corporate Lending revenues decreased 14% versus the prior-year period, driven by lower volumes and higher credit default swap premiums.
ICG operating expenses of $7.0 billion increased 4%, driven by transformation investments, other risk and control investments, and volume-related expenses, partially offset by the impacts of foreign exchange translation and productivity savings.
ICG cost of credit of $(72) million, compared to $971 million in the prior-year period, included a net ACL release for loans and unfunded commitments of $(245) million, other provisions of $151 million, and net credit losses of $22 million.
ICG net income of $3.3 billion increased 23%, largely driven by the lower cost of credit and the higher revenues, partially offset by the higher expenses.