0000831016fmr:C000121082Membercountry:CN2024-12-31
UNITED STATES
SECURITIES AND EXCHANGE COMMISSION
Washington, D.C. 20549
FORM N-CSR
CERTIFIED SHAREHOLDER REPORT OF REGISTERED
MANAGEMENT INVESTMENT COMPANIES
Investment Company Act file number 811-05511
Variable Insurance Products Fund II
(Exact name of registrant as specified in charter)
245 Summer St., Boston, Massachusetts 02210
(Address of principal executive offices) (Zip code)
Nicole Macarchuk, Secretary
245 Summer St.
Boston, Massachusetts 02210
(Name and address of agent for service)
Registrant's telephone number, including area code:
617-563-7000
| |
Date of fiscal year end: | December 31 |
|
|
Date of reporting period: | December 31, 2024 |
Item 1.
Reports to Stockholders
| |
| | ANNUAL SHAREHOLDER REPORT | AS OF DECEMBER 31, 2024 | This report describes changes to the Fund that occurred during the reporting period. |
| | VIP Extended Market Index Portfolio VIP Extended Market Index Portfolio Initial Class true |
| | | |
This annual shareholder report contains information about VIP Extended Market Index Portfolio for the period January 1, 2024 to December 31, 2024. You can find additional information about the Fund at fundresearch.fidelity.com/prospectus/sec. You can also request this information by contacting us at 1-877-208-0098 or by sending an e-mail to funddocuments@fmr.com.
What were your Fund costs for the last year?(based on hypothetical $10,000 investment)
FUND COST (PREVIOUS YEAR)
| | Costs of a $10,000 investment | Costs paid as a percentage of a $10,000 investment | |
| Initial Class | $ 13 | 0.13% | |
What affected the Fund's performance this period?
•U.S. equities gained in 2024, driven by a sturdy economy, the Federal Reserve's long-anticipated pivot to cutting interest rates and the potential for artificial intelligence to drive transformative change.
•Against this backdrop, financials gained roughly 26% and contributed most to the fund's performance for the fiscal year. Industrials, which gained approximately 14%, also helped, benefiting from the capital goods industry (+17%), as did information technology, which advanced 14%. The consumer discretionary sector rose 8%, while utilities gained 25% and health care advanced 4%. Other contributors included the real estate (+7%), consumer staples (+9%), communication services (+7%), energy (+5%) and materials (+2%) sectors.
•Turning to individual stocks, the biggest contributor was Super Micro Computer (+151%), from the technology hardware & equipment group. Carvana, within the consumer discretionary distribution & retail category, gained 284% and boosted the fund. Robinhood Markets (+192%), from the financial services industry, lifted the fund. Texas Pacific Land (+115%), from the energy sector, lifted the fund. Lastly, in capital goods, Emcor gained 111% and also helped.
•In contrast, the biggest detractor was Rivian Automotive (-43%), from the automobiles & components group. Five Below (-51%), from the consumer discretionary distribution & retail group, hurt the fund. Cleveland-Cliffs (-54%), from the materials sector, detracted. Flagstar Financial, within the banks category, returned -69% and detracted. Lastly, UiPath (-49%), a stock in the software & services group, also hurt the fund's performance
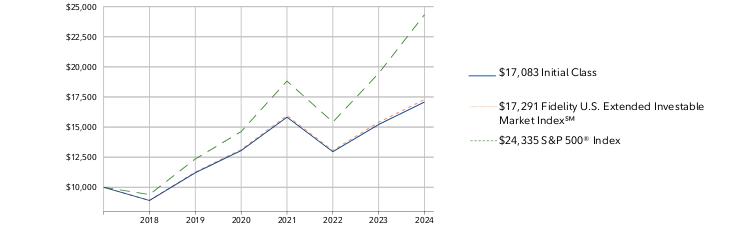
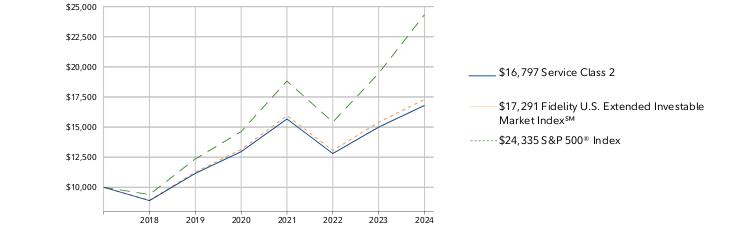
How did the Fund perform over the life of Fund?
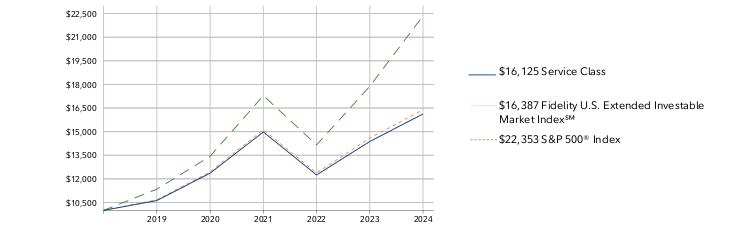
CUMULATIVE PERFORMANCE
April 17, 2018 through December 31, 2024.
Initial investment of $10,000.
Initial Class | $10,000 | $8,901 | $11,205 | $13,049 | $15,820 | $12,953 | $15,211 |
Fidelity U.S. Extended Investable Market Index℠ | $10,000 | $8,914 | $11,260 | $13,132 | $15,951 | $13,057 | $15,396 |
S&P 500® Index | $10,000 | $9,394 | $12,351 | $14,624 | $18,822 | $15,413 | $19,465 |
| | 2018 | 2019 | 2020 | 2021 | 2022 | 2023 | 2024 |
AVERAGE ANNUAL TOTAL RETURNS:| | 1 Year | 5 Year | Life of Fund A |
| Initial Class | 12.31% | 8.80% | 8.30% |
| Fidelity U.S. Extended Investable Market Index℠ | 12.31% | 8.96% | 8.50% |
| S&P 500® Index | 25.02% | 14.53% | 14.17% |
A From April 17, 2018
Visit institutional.fidelity.com for more recent performance information. |
The Fund's past performance is not a good predictor of the Fund's future performance. The graph and table do not reflect the deduction of taxes that a shareholder would pay on fund distributions or redemption of fund shares. |
Key Fund Statistics(as of December 31, 2024)
KEY FACTS | | |
| Fund Size | $285,231,260 | |
| Number of Holdings | 2,055 | |
| Total Advisory Fee | $246,777 | |
| Portfolio Turnover | 12% | |
What did the Fund invest in?
(as of December 31, 2024)
MARKET SECTORS (% of Fund's net assets) | | |
| Industrials | 19.3 | |
| Financials | 17.8 | |
| Consumer Discretionary | 12.2 | |
| Information Technology | 11.6 | |
| Health Care | 11.3 | |
| Real Estate | 6.3 | |
| Materials | 4.8 | |
| Energy | 4.6 | |
| Consumer Staples | 3.7 | |
| Communication Services | 3.2 | |
| Utilities | 2.4 | |
| |
| Common Stocks | 97.2 |
| Short-Term Investments and Net Other Assets (Liabilities) | 2.8 |
ASSET ALLOCATION (% of Fund's net assets) |
|
| | Common Stocks - 97.2 |
| | Short-Term Investments and Net Other Assets (Liabilities) - 2.8 |
| |
| United States | 98.4 |
| United Kingdom | 0.4 |
| Puerto Rico | 0.3 |
| Bermuda | 0.3 |
| Sweden | 0.1 |
| Thailand | 0.1 |
| Switzerland | 0.1 |
| Argentina | 0.1 |
| Belgium | 0.1 |
| Others | 0.1 |
GEOGRAPHIC DIVERSIFICATION (% of Fund's net assets) |
|
| | United States - 98.4 |
| | United Kingdom - 0.4 |
| | Puerto Rico - 0.3 |
| | Bermuda - 0.3 |
| | Sweden - 0.1 |
| | Thailand - 0.1 |
| | Switzerland - 0.1 |
| | Argentina - 0.1 |
| | Belgium - 0.1 |
| | Others - 0.1 |
| |
TOP HOLDINGS(% of Fund's net assets) | | |
| Eqt Corp | 0.5 | |
| Robinhood Markets Inc Class A | 0.5 | |
| Carvana Co Class A | 0.5 | |
| Smurfit WestRock PLC | 0.4 | |
| EMCOR Group Inc | 0.4 | |
| Texas Pacific Land Corp | 0.4 | |
| Expand Energy Corp | 0.4 | |
| Live Nation Entertainment Inc | 0.4 | |
| Natera Inc | 0.4 | |
| Lennox International Inc | 0.4 | |
| | 4.3 | |
How has the Fund changed?
This is a summary of certain changes to the Fund since January 1, 2024. For more complete information, you may review the Fund's next prospectus, which we expect to be available by April 30, 2025 at fundresearch.fidelity.com/prospectus/sec or upon request at 1-877-208-0098 or by sending an e-mail to funddocuments@fmr.com.
Effective June 1, 2024, the fund's management contract was amended to incorporate administrative services previously covered under separate services agreements (transfer agent and pricing & bookkeeping). The amended contract incorporates a management fee rate that may vary by class. The Adviser or an affiliate pays certain expenses of managing and operating the fund out of each class's management fee. | |
| Fidelity, the Fidelity Investments Logo and all other Fidelity trademarks or service marks used herein are trademarks or service marks of FMR LLC. Any third-party marks that are used herein are trademarks or service marks of their respective owners. © 2025 FMR LLC. All rights reserved. |
| | For additional information about the Fund; including its prospectus, financial information, holdings and proxy information, scan the QR code or visit fundresearch.fidelity.com/prospectus/sec 1.9914372.100 3072-TSRA-0325 |
| |
| | ANNUAL SHAREHOLDER REPORT | AS OF DECEMBER 31, 2024 | This report describes changes to the Fund that occurred during the reporting period. |
| | VIP Disciplined Small Cap Portfolio VIP Disciplined Small Cap Portfolio Initial Class true |
| | | |
This annual shareholder report contains information about VIP Disciplined Small Cap Portfolio for the period January 1, 2024 to December 31, 2024. You can find additional information about the Fund at fundresearch.fidelity.com/prospectus/sec. You can also request this information by contacting us at 1-877-208-0098 or by sending an e-mail to funddocuments@fmr.com.
What were your Fund costs for the last year?(based on hypothetical $10,000 investment)
FUND COST (PREVIOUS YEAR)
| | Costs of a $10,000 investment | Costs paid as a percentage of a $10,000 investment | |
| Initial Class | $ 41 | 0.38% | |
What affected the Fund's performance this period?
•U.S. equities gained in 2024, driven by a sturdy economy, the Federal Reserve's long-anticipated pivot to cutting interest rates and the potential for artificial intelligence to drive transformative change.
•Against this backdrop, security selection was the primary contributor to the fund's performance versus the Russell 2000 Index for the fiscal year, especially within financials. Stock picking in information technology, primarily within the technology hardware & equipment industry, and communication services also boosted the fund's relative performance.
•The top individual relative contributor was an overweight in Lumen Technologies (+148%). The second-largest relative contributor was an overweight in Carvana (+289%). The company was among our biggest holdings this period, though we decreased our investment in Carvana by period end. Another notable relative contributor was our stake in Super Micro Computer (+45%). The company was the fund's biggest holding this period, but the stock was not held at period end.
•In contrast, the biggest detractor from performance versus the benchmark was stock selection in utilities. An underweight in financials, primarily within the banks industry, also hampered the fund's result. Also modestly hurting our result was security selection in energy.
•The biggest individual relative detractor was our stake in Green Plains (-63%). This period we decreased our stake in Green Plains. A second notable relative detractor was an overweight in ODP (-60%). This period we decreased our stake. An underweight in Rocket Lab USA (+361%) also hurt.
•Notable changes in positioning include lower allocations to the energy and consumer discretionary sectors.
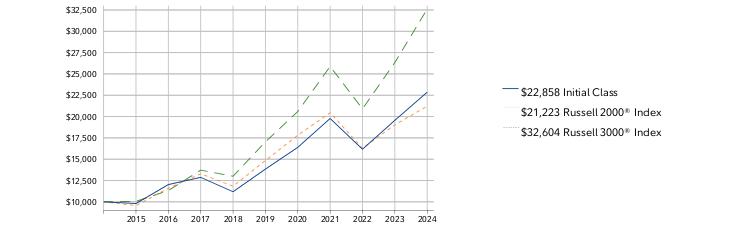
How did the Fund perform over the past 10 years?
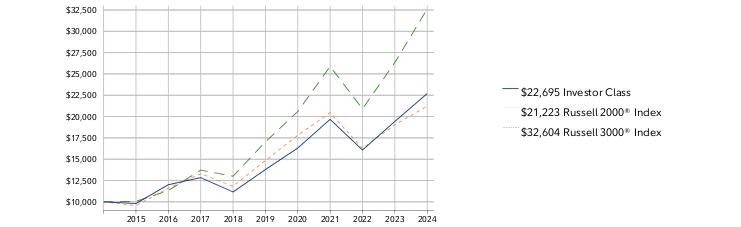
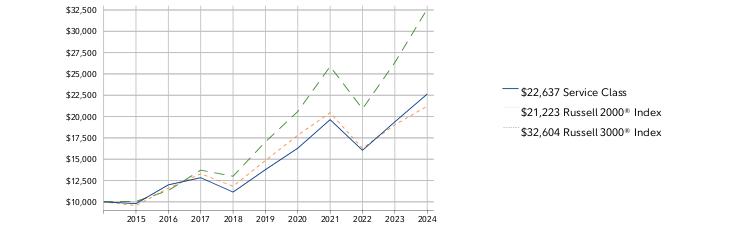
CUMULATIVE PERFORMANCE
December 31, 2014 through December 31, 2024.
Initial investment of $10,000.
Initial Class | $10,000 | $9,801 | $12,024 | $12,868 | $11,185 | $13,836 | $16,390 | $19,775 | $16,169 | $19,558 | $22,858 |
Russell 2000® Index | $10,000 | $9,559 | $11,595 | $13,294 | $11,830 | $14,849 | $17,813 | $20,453 | $16,273 | $19,028 | $21,223 |
Russell 3000® Index | $10,000 | $10,048 | $11,327 | $13,721 | $13,002 | $17,035 | $20,593 | $25,877 | $20,907 | $26,334 | $32,604 |
| | 2014 | 2015 | 2016 | 2017 | 2018 | 2019 | 2020 | 2021 | 2022 | 2023 | 2024 |
AVERAGE ANNUAL TOTAL RETURNS:| | 1 Year | 5 Year | 10 Year |
| Initial Class | 16.87% | 10.56% | 8.62% |
| Russell 2000® Index | 11.54% | 7.40% | 7.82% |
| Russell 3000® Index | 23.81% | 13.86% | 12.55% |
Visit institutional.fidelity.com for more recent performance information. |
The Fund's past performance is not a good predictor of the Fund's future performance. The graph and table do not reflect the deduction of taxes that a shareholder would pay on fund distributions or redemption of fund shares. |
Key Fund Statistics(as of December 31, 2024)
KEY FACTS | | |
| Fund Size | $472,475,702 | |
| Number of Holdings | 633 | |
| Total Advisory Fee | $1,330,379 | |
| Portfolio Turnover | 85% | |
What did the Fund invest in?
(as of December 31, 2024)
MARKET SECTORS (% of Fund's net assets) | | |
| Financials | 18.4 | |
| Industrials | 16.9 | |
| Health Care | 15.7 | |
| Information Technology | 15.3 | |
| Consumer Discretionary | 10.2 | |
| Energy | 5.1 | |
| Materials | 4.9 | |
| Real Estate | 4.3 | |
| Consumer Staples | 3.3 | |
| Communication Services | 3.1 | |
| Utilities | 0.8 | |
| |
| Common Stocks | 98.0 |
| Short-Term Investments and Net Other Assets (Liabilities) | 2.0 |
ASSET ALLOCATION (% of Fund's net assets) |
|
| | Common Stocks - 98.0 |
| | Short-Term Investments and Net Other Assets (Liabilities) - 2.0 |
| |
| United States | 98.2 |
| Thailand | 0.6 |
| Puerto Rico | 0.3 |
| Canada | 0.3 |
| Ireland | 0.2 |
| Monaco | 0.2 |
| Norway | 0.1 |
| Bermuda | 0.1 |
| Switzerland | 0.0 |
GEOGRAPHIC DIVERSIFICATION (% of Fund's net assets) |
|
| | United States - 98.2 |
| | Thailand - 0.6 |
| | Puerto Rico - 0.3 |
| | Canada - 0.3 |
| | Ireland - 0.2 |
| | Monaco - 0.2 |
| | Norway - 0.1 |
| | Bermuda - 0.1 |
| | Switzerland - 0.0 |
| |
TOP HOLDINGS(% of Fund's net assets) | | |
| Sprouts Farmers Market Inc | 0.9 | |
| Carpenter Technology Corp | 0.9 | |
| Q2 Holdings Inc | 0.9 | |
| Abercrombie & Fitch Co Class A | 0.8 | |
| Primo Brands Corp Class A | 0.8 | |
| Tenable Holdings Inc | 0.8 | |
| SkyWest Inc | 0.7 | |
| Payoneer Global Inc | 0.7 | |
| EnerSys | 0.6 | |
| Fabrinet | 0.6 | |
| | 7.7 | |
How has the Fund changed?
This is a summary of certain changes to the Fund since January 1, 2024. For more complete information, you may review the Fund's next prospectus, which we expect to be available by April 30, 2025 at fundresearch.fidelity.com/prospectus/sec or upon request at 1-877-208-0098 or by sending an e-mail to funddocuments@fmr.com.
The fees associated with this class changed during the reporting year. The variations in class fees are primarily the result of the following changes: The fund's contractual management fee was reduced during the reporting period. The fund's pricing & bookkeeping fees were changed to a fixed rate effective April 1, 2024. Effective June 1, 2024, the fund's management contract was amended to incorporate administrative services previously covered under separate services agreements (transfer agent and pricing & bookkeeping). The amended contract incorporates a management fee rate that may vary by class. The Adviser or an affiliate pays certain expenses of managing and operating the fund out of each class's management fee. | |
| Fidelity, the Fidelity Investments Logo and all other Fidelity trademarks or service marks used herein are trademarks or service marks of FMR LLC. Any third-party marks that are used herein are trademarks or service marks of their respective owners. © 2025 FMR LLC. All rights reserved. |
| | For additional information about the Fund; including its prospectus, financial information, holdings and proxy information, scan the QR code or visit fundresearch.fidelity.com/prospectus/sec 1.9914299.100 1529-TSRA-0325 |
| |
| | ANNUAL SHAREHOLDER REPORT | AS OF DECEMBER 31, 2024 | This report describes changes to the Fund that occurred during the reporting period. |
| | VIP Contrafund℠ Portfolio VIP Contrafund℠ Portfolio Service Class 2 true |
| | | |
This annual shareholder report contains information about VIP Contrafund℠ Portfolio for the period January 1, 2024 to December 31, 2024. You can find additional information about the Fund at fundresearch.fidelity.com/prospectus/sec. You can also request this information by contacting us at 1-877-208-0098 or by sending an e-mail to funddocuments@fmr.com.
What were your Fund costs for the last year?(based on hypothetical $10,000 investment)
FUND COST (PREVIOUS YEAR)
| | Costs of a $10,000 investment | Costs paid as a percentage of a $10,000 investment | |
| Service Class 2 | $ 94 | 0.81% | |
What affected the Fund's performance this period?
•U.S. equities gained in 2024, driven by a sturdy economy, the Federal Reserve's long-anticipated pivot to cutting interest rates and the potential for artificial intelligence to drive transformative change.
•Against this backdrop, security selection was the primary contributor to the fund's performance versus the S&P 500® index for the fiscal year, led by information technology, where our picks in semiconductors & semiconductor equipment helped most. Picks and an overweight in communication services, primarily within the media & entertainment industry, also boosted the fund's relative performance. Also helping our relative result was security selection in industrials, primarily within the capital goods industry.
•The top individual relative contributor was an overweight in Nvidia (+171%), the biggest holding at period end. A second notable relative contributor was an overweight in Meta Platforms (+66%). The company was the largest holding this period. An overweight in Netflix (+83%) also helped. The stock was one of the fund's biggest holdings.
•In contrast, the biggest detractor from performance versus the benchmark was an overweight in health care, primarily within the pharmaceuticals, biotechnology & life sciences industry. Also hurting our result was stock picking in energy and financials. Lastly, the fund's position in cash hurt.
•The biggest individual relative detractor was an underweight in Tesla (+63%). This period we increased our investment in Tesla. A second notable relative detractor was an overweight in Regeneron Pharmaceuticals (-19%). An overweight in UnitedHealth Group (-2%) also hurt. This period we decreased our position in UnitedHealth Group, which was one of our biggest holdings this period.
•Notable changes in positioning include higher allocations to the industrials and communication services sectors.
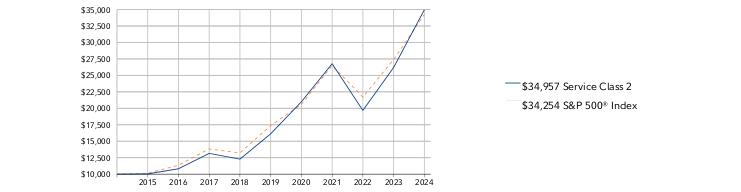
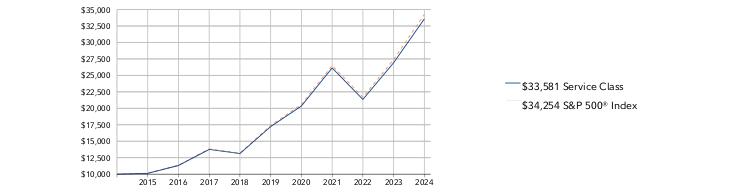
How did the Fund perform over the past 10 years?
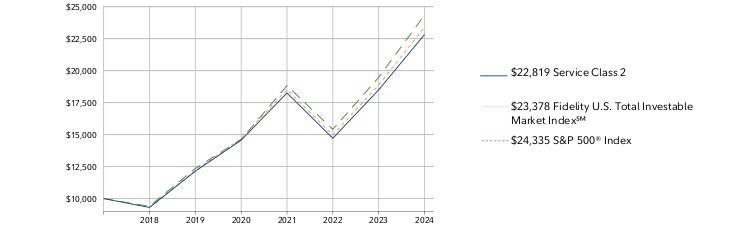
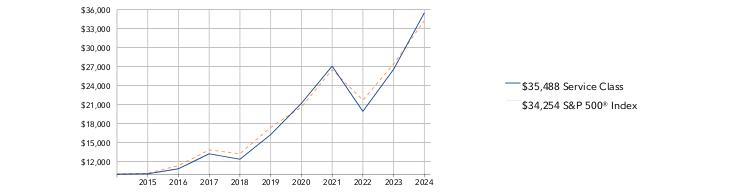
CUMULATIVE PERFORMANCE
December 31, 2014 through December 31, 2024.
Initial investment of $10,000.
Service Class 2 | $10,000 | $10,039 | $10,818 | $13,153 | $12,280 | $16,120 | $20,994 | $26,769 | $19,679 | $26,195 | $34,957 |
S&P 500® Index | $10,000 | $10,138 | $11,351 | $13,829 | $13,223 | $17,386 | $20,585 | $26,494 | $21,696 | $27,399 | $34,254 |
| | 2014 | 2015 | 2016 | 2017 | 2018 | 2019 | 2020 | 2021 | 2022 | 2023 | 2024 |
AVERAGE ANNUAL TOTAL RETURNS:| | 1 Year | 5 Year | 10 Year |
| Service Class 2 | 33.45% | 16.74% | 13.33% |
| S&P 500® Index | 25.02% | 14.53% | 13.10% |
Visit institutional.fidelity.com for more recent performance information. |
The Fund's past performance is not a good predictor of the Fund's future performance. The graph and table do not reflect the deduction of taxes that a shareholder would pay on fund distributions or redemption of fund shares. |
Key Fund Statistics(as of December 31, 2024)
KEY FACTS | | |
| Fund Size | $25,313,301,654 | |
| Number of Holdings | 404 | |
| Total Advisory Fee | $131,069,389 | |
| Portfolio Turnover | 36% | |
What did the Fund invest in?
(as of December 31, 2024)
MARKET SECTORS (% of Fund's net assets) | | |
| Information Technology | 26.6 | |
| Communication Services | 18.6 | |
| Financials | 15.5 | |
| Health Care | 11.1 | |
| Consumer Discretionary | 11.0 | |
| Industrials | 10.1 | |
| Consumer Staples | 2.1 | |
| Energy | 1.5 | |
| Materials | 0.9 | |
| Utilities | 0.8 | |
| Real Estate | 0.2 | |
| |
| Common Stocks | 97.4 |
| Preferred Stocks | 1.0 |
| Preferred Securities | 0.0 |
| Short-Term Investments and Net Other Assets (Liabilities) | 1.6 |
ASSET ALLOCATION (% of Fund's net assets) |
|
| | Common Stocks - 97.4 |
| | Preferred Stocks - 1.0 |
| | Preferred Securities - 0.0 |
| | Short-Term Investments and Net Other Assets (Liabilities) - 1.6 |
| |
| United States | 94.9 |
| Canada | 1.5 |
| Taiwan | 0.9 |
| Netherlands | 0.6 |
| China | 0.4 |
| United Kingdom | 0.3 |
| Israel | 0.2 |
| Korea (South) | 0.2 |
| Brazil | 0.2 |
| Others | 0.8 |
GEOGRAPHIC DIVERSIFICATION (% of Fund's net assets) |
|
| | United States - 94.9 |
| | Canada - 1.5 |
| | Taiwan - 0.9 |
| | Netherlands - 0.6 |
| | China - 0.4 |
| | United Kingdom - 0.3 |
| | Israel - 0.2 |
| | Korea (South) - 0.2 |
| | Brazil - 0.2 |
| | Others - 0.8 |
| |
TOP HOLDINGS(% of Fund's net assets) | | |
| NVIDIA Corp | 9.0 | |
| Meta Platforms Inc Class A | 8.6 | |
| Alphabet Inc Class C | 5.8 | |
| Microsoft Corp | 5.8 | |
| Amazon.com Inc | 5.4 | |
| Berkshire Hathaway Inc Class B | 4.3 | |
| Apple Inc | 3.7 | |
| Eli Lilly & Co | 2.7 | |
| Netflix Inc | 2.1 | |
| Costco Wholesale Corp | 1.3 | |
| | 48.7 | |
How has the Fund changed?
This is a summary of certain changes to the Fund since January 1, 2024. For more complete information, you may review the Fund's next prospectus, which we expect to be available by April 30, 2025 at fundresearch.fidelity.com/prospectus/sec or upon request at 1-877-208-0098 or by sending an e-mail to funddocuments@fmr.com.
The fund's transfer agent and pricing & bookkeeping fees were changed to a fixed rate effective December 1, 2023. Effective March 1, 2024, the fund's management contract was amended to incorporate administrative services previously covered under separate services agreements (transfer agent and pricing & bookkeeping). The amended contract incorporates a management fee rate that may vary by class. The Adviser or an affiliate pays certain expenses of managing and operating the fund out of each class's management fee. | |
| Fidelity, the Fidelity Investments Logo and all other Fidelity trademarks or service marks used herein are trademarks or service marks of FMR LLC. Any third-party marks that are used herein are trademarks or service marks of their respective owners. © 2025 FMR LLC. All rights reserved. |
| | For additional information about the Fund; including its prospectus, financial information, holdings and proxy information, scan the QR code or visit fundresearch.fidelity.com/prospectus/sec 1.9914168.100 365-TSRA-0325 |
| |
| | ANNUAL SHAREHOLDER REPORT | AS OF DECEMBER 31, 2024 | This report describes changes to the Fund that occurred during the reporting period. |
| | VIP Emerging Markets Portfolio VIP Emerging Markets Portfolio Investor Class true |
| | | |
This annual shareholder report contains information about VIP Emerging Markets Portfolio for the period January 1, 2024 to December 31, 2024. You can find additional information about the Fund at fundresearch.fidelity.com/prospectus/sec. You can also request this information by contacting us at 1-877-208-0098 or by sending an e-mail to funddocuments@fmr.com.
What were your Fund costs for the last year?(based on hypothetical $10,000 investment)
FUND COST (PREVIOUS YEAR)
| | Costs of a $10,000 investment | Costs paid as a percentage of a $10,000 investment | |
| Investor Class | $ 101 | 0.96% | |
What affected the Fund's performance this period?
•International stocks gained in 2024, as resilient global economic growth, slowing inflation and global monetary easing provided support for stocks, despite geopolitical risk. However, stocks also faced challenges, including a steep sell-off after the U.S. presidential election in November due to the potential for new tariffs and a strengthening U.S. dollar.
•Against this backdrop, emerging-markets stock picks in Asia and Europe contributed to the fund's performance versus the MSCI Emerging Markets Net MA (29-Jun-2018) Linked Index for the year.
•By sector, security selection was the primary contributor, led by communication services, where our investment choices among media & entertainment firms helped most. Security selection in materials and health care also boosted the fund's relative result.
•The top individual relative contributor was an overweight in Tencent Holdings (+44%). The company was the fund's biggest holding at period end. Outsized exposure to Meituan (+87%) helped as well. The stock was among our largest positions in 2024. An overweight in China Life Insurance (+55%) further contributed. The company was one of our more sizable holdings this period.
•In contrast, from a regional standpoint, a non-benchmark allocation to developed markets detracted from the fund's relative return. Within the benchmark, picks in South Africa and Mexico notably detracted.
•By sector, the biggest detractors from performance versus the benchmark were security selection and an underweight in information technology. Picks in consumer staples and an overweight in materials also hurt.
•The biggest individual relative detractor was an overweight in Samsung Electronics (-40%), one of our largest holdings. Outsized exposure Wal Mart de Mexico (-35%) also hurt. This period we increased our investment in the stock, making it one of the fund's largest holdings.
•Meaningful changes in positioning include increased exposure to Mexico and a lower allocation to Brazil. By sector, noteworthy shifts include decreased exposure to materials and a higher allocation to consumer staples.
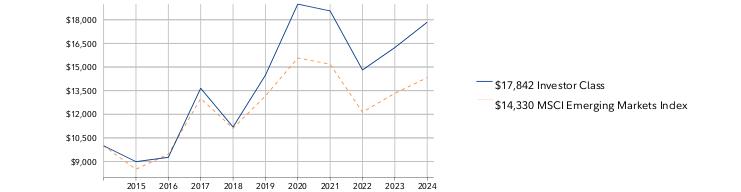
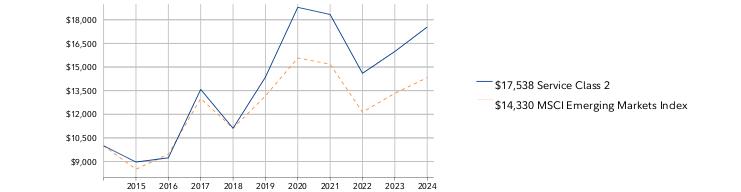
How did the Fund perform over the past 10 years?
CUMULATIVE PERFORMANCE
December 31, 2014 through December 31, 2024.
Initial investment of $10,000.
Investor Class | $10,000 | $8,992 | $9,267 | $13,653 | $11,192 | $14,481 | $18,993 | $18,561 | $14,812 | $16,235 | $17,842 |
MSCI Emerging Markets Index | $10,000 | $8,512 | $9,468 | $13,003 | $11,112 | $13,164 | $15,575 | $15,182 | $12,134 | $13,330 | $14,330 |
| | 2014 | 2015 | 2016 | 2017 | 2018 | 2019 | 2020 | 2021 | 2022 | 2023 | 2024 |
AVERAGE ANNUAL TOTAL RETURNS:| | 1 Year | 5 Year | 10 Year |
| Investor Class | 9.90% | 4.26% | 5.96% |
| MSCI Emerging Markets Index | 7.50% | 1.71% | 3.66% |
Visit institutional.fidelity.com for more recent performance information. |
The Fund's past performance is not a good predictor of the Fund's future performance. The graph and table do not reflect the deduction of taxes that a shareholder would pay on fund distributions or redemption of fund shares. |
Key Fund Statistics(as of December 31, 2024)
KEY FACTS | | |
| Fund Size | $1,093,134,890 | |
| Number of Holdings | 57 | |
| Total Advisory Fee | $9,193,754 | |
| Portfolio Turnover | 59% | |
What did the Fund invest in?
(as of December 31, 2024)
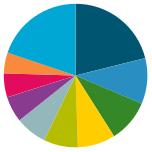
MARKET SECTORS (% of Fund's net assets) | | |
| Financials | 23.7 | |
| Information Technology | 18.5 | |
| Consumer Discretionary | 13.5 | |
| Communication Services | 11.6 | |
| Industrials | 9.8 | |
| Consumer Staples | 7.1 | |
| Materials | 6.5 | |
| Health Care | 4.7 | |
| Energy | 3.5 | |
| |
| Common Stocks | 98.9 |
| Short-Term Investments and Net Other Assets (Liabilities) | 1.1 |
ASSET ALLOCATION (% of Fund's net assets) |
|
| | Common Stocks - 98.9 |
| | Short-Term Investments and Net Other Assets (Liabilities) - 1.1 |
| |
| China | 32.7 |
| Taiwan | 13.7 |
| India | 10.1 |
| Korea (South) | 9.8 |
| Mexico | 5.7 |
| Brazil | 5.4 |
| South Africa | 4.6 |
| Greece | 3.1 |
| Hungary | 2.8 |
| Others | 12.1 |
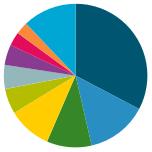
GEOGRAPHIC DIVERSIFICATION (% of Fund's net assets) |
|
| | China - 32.7 |
| | Taiwan - 13.7 |
| | India - 10.1 |
| | Korea (South) - 9.8 |
| | Mexico - 5.7 |
| | Brazil - 5.4 |
| | South Africa - 4.6 |
| | Greece - 3.1 |
| | Hungary - 2.8 |
| | Others - 12.1 |
| |
TOP HOLDINGS(% of Fund's net assets) | | |
| Tencent Holdings Ltd | 9.3 | |
| Taiwan Semiconductor Manufacturing Co Ltd | 8.6 | |
| Samsung Electronics Co Ltd | 5.2 | |
| Wal-Mart de Mexico SAB de CV Series V | 3.5 | |
| Tata Consultancy Services Ltd | 3.2 | |
| Haier Smart Home Co Ltd A Shares (China) | 3.1 | |
| Meituan B Shares | 3.1 | |
| China Life Insurance Co Ltd H Shares | 2.6 | |
| Credicorp Ltd | 2.5 | |
| Powszechna Kasa Oszczednosci Bank Polski SA | 2.5 | |
| | 43.6 | |
How has the Fund changed?
This is a summary of certain changes to the Fund since January 1, 2024. For more complete information, you may review the Fund's next prospectus, which we expect to be available by April 30, 2025 at fundresearch.fidelity.com/prospectus/sec or upon request at 1-877-208-0098 or by sending an e-mail to funddocuments@fmr.com.
The fund's transfer agent and pricing & bookkeeping fees were changed to a fixed rate effective December 1, 2023. Effective March 1, 2024, the fund's management contract was amended to incorporate administrative services previously covered under separate services agreements (transfer agent and pricing & bookkeeping). The amended contract incorporates a management fee rate that may vary by class. The Adviser or an affiliate pays certain expenses of managing and operating the fund out of each class's management fee. | The fund's sub-advisory agreement with FIL Investments (Japan) Limited was not renewed.
|
| Fidelity, the Fidelity Investments Logo and all other Fidelity trademarks or service marks used herein are trademarks or service marks of FMR LLC. Any third-party marks that are used herein are trademarks or service marks of their respective owners. © 2025 FMR LLC. All rights reserved. |
| | For additional information about the Fund; including its prospectus, financial information, holdings and proxy information, scan the QR code or visit fundresearch.fidelity.com/prospectus/sec 1.9914329.100 2024-TSRA-0325 |
| |
| | ANNUAL SHAREHOLDER REPORT | AS OF DECEMBER 31, 2024 | This report describes changes to the Fund that occurred during the reporting period. |
| | VIP International Capital Appreciation Portfolio VIP International Capital Appreciation Portfolio Service Class true |
| | | |
This annual shareholder report contains information about VIP International Capital Appreciation Portfolio for the period January 1, 2024 to December 31, 2024. You can find additional information about the Fund at fundresearch.fidelity.com/prospectus/sec. You can also request this information by contacting us at 1-877-208-0098 or by sending an e-mail to funddocuments@fmr.com.
What were your Fund costs for the last year?(based on hypothetical $10,000 investment)
FUND COST (PREVIOUS YEAR)
| | Costs of a $10,000 investment | Costs paid as a percentage of a $10,000 investment | |
| Service Class | $ 95 | 0.91% | |
What affected the Fund's performance this period?
•International stocks gained in 2024, as resilient global economic growth, slowing inflation and global monetary easing provided support for stocks, despite geopolitical risk. However, foreign stocks also faced challenges, including a steep sell-off after the U.S. presidential election in November due to the potential for new tariffs and a strengthening U.S. dollar.
•Against this backdrop, a non-benchmark allocation to the United States, along with picks in Taiwan and Europe ex U.K., primarily in Germany, contributed to the fund's performance versus the MSCI All Country World ex USA Net MA (1-Nov-2001) Linked Index for the year.
•By sector, an overweight in information technology, especially in the semiconductors & semiconductor equipment industry, helped most. Stock picks in materials also boosted relative performance.
•The top individual relative contributor was our non-benchmark stake in Nvidia (+164%). The stock was not held at period end. An out-of-index position in Broadcom gained approximately 64% and helped as well. This was an investment we established in 2024. An overweight in Taiwan Semiconductor Manufacturing (+72%) further bolstered performance and was the fund's largest holding.
•In contrast, from a regional standpoint, picks and an underweight in Japan and stock selection in Canada detracted from the fund's relative result.
•By sector, the biggest detractor from performance versus the benchmark was security selection among health care firms. Stock picks in consumer staples also hampered the fund's result.
•The biggest individual relative detractor was our stake in OBIC (-28%). The stock was not held at period end. An underweight in Shopify (+36%) also hurt. Outsized exposure to Dassault Systèmes (-25%) also weighed on performance. The stock was not held at period end.
•Notable changes in positioning include increased exposure to China and Germany. By sector, meaningful shifts include increased exposure to communication services and a lower allocation to consumer staples.
How did the Fund perform over the past 10 years?
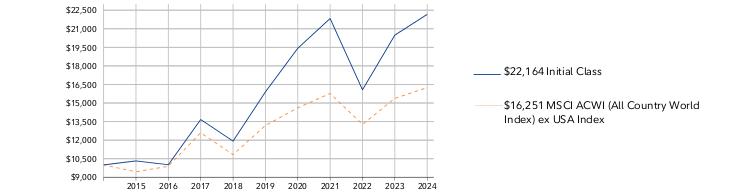
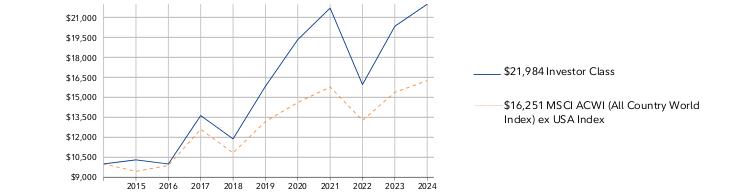
CUMULATIVE PERFORMANCE
December 31, 2014 through December 31, 2024.
Initial investment of $10,000.
Service Class | $10,000 | $10,312 | $9,992 | $13,624 | $11,874 | $15,810 | $19,306 | $21,663 | $15,926 | $20,299 | $21,930 |
MSCI ACWI (All Country World Index) ex USA Index | $10,000 | $9,446 | $9,889 | $12,599 | $10,830 | $13,184 | $14,609 | $15,776 | $13,273 | $15,372 | $16,251 |
| | 2014 | 2015 | 2016 | 2017 | 2018 | 2019 | 2020 | 2021 | 2022 | 2023 | 2024 |
AVERAGE ANNUAL TOTAL RETURNS:| | 1 Year | 5 Year | 10 Year |
| Service Class | 8.04% | 6.76% | 8.17% |
| MSCI ACWI (All Country World Index) ex USA Index | 5.72% | 4.27% | 4.98% |
Visit institutional.fidelity.com for more recent performance information. |
The Fund's past performance is not a good predictor of the Fund's future performance. The graph and table do not reflect the deduction of taxes that a shareholder would pay on fund distributions or redemption of fund shares. |
Key Fund Statistics(as of December 31, 2024)
KEY FACTS | | |
| Fund Size | $696,025,885 | |
| Number of Holdings | 63 | |
| Total Advisory Fee | $5,236,062 | |
| Portfolio Turnover | 74% | |
What did the Fund invest in?
(as of December 31, 2024)
MARKET SECTORS (% of Fund's net assets) | | |
| Industrials | 29.4 | |
| Financials | 24.8 | |
| Information Technology | 16.1 | |
| Consumer Discretionary | 13.1 | |
| Materials | 7.2 | |
| Health Care | 4.7 | |
| Communication Services | 4.2 | |
| |
| Common Stocks | 99.5 |
| Short-Term Investments and Net Other Assets (Liabilities) | 0.5 |
ASSET ALLOCATION (% of Fund's net assets) |
|
| | Common Stocks - 99.5 |
| | Short-Term Investments and Net Other Assets (Liabilities) - 0.5 |
| |
| United States | 21.1 |
| United Kingdom | 10.3 |
| France | 9.6 |
| Japan | 8.5 |
| India | 7.7 |
| China | 7.1 |
| Germany | 5.8 |
| Netherlands | 5.4 |
| Canada | 4.7 |
| Others | 19.8 |
GEOGRAPHIC DIVERSIFICATION (% of Fund's net assets) |
|
| | United States - 21.1 |
| | United Kingdom - 10.3 |
| | France - 9.6 |
| | Japan - 8.5 |
| | India - 7.7 |
| | China - 7.1 |
| | Germany - 5.8 |
| | Netherlands - 5.4 |
| | Canada - 4.7 |
| | Others - 19.8 |
| |
TOP HOLDINGS(% of Fund's net assets) | | |
| Taiwan Semiconductor Manufacturing Co Ltd | 4.6 | |
| Tencent Holdings Ltd | 2.7 | |
| SAP SE | 2.6 | |
| ASML Holding NV | 2.5 | |
| Novo Nordisk A/S Series B | 2.4 | |
| LVMH Moet Hennessy Louis Vuitton SE | 2.4 | |
| Schneider Electric SE | 2.1 | |
| Hitachi Ltd | 1.9 | |
| Hermes International SCA | 1.8 | |
| Recruit Holdings Co Ltd | 1.8 | |
| | 24.8 | |
How has the Fund changed?
This is a summary of certain changes to the Fund since January 1, 2024. For more complete information, you may review the Fund's next prospectus, which we expect to be available by April 30, 2025 at fundresearch.fidelity.com/prospectus/sec or upon request at 1-877-208-0098 or by sending an e-mail to funddocuments@fmr.com.
The fund's transfer agent and pricing & bookkeeping fees were changed to a fixed rate effective December 1, 2023. Effective March 1, 2024, the fund's management contract was amended to incorporate administrative services previously covered under separate services agreements (transfer agent and pricing & bookkeeping). The amended contract incorporates a management fee rate that may vary by class. The Adviser or an affiliate pays certain expenses of managing and operating the fund out of each class's management fee. | |
| Fidelity, the Fidelity Investments Logo and all other Fidelity trademarks or service marks used herein are trademarks or service marks of FMR LLC. Any third-party marks that are used herein are trademarks or service marks of their respective owners. © 2025 FMR LLC. All rights reserved. |
| | For additional information about the Fund; including its prospectus, financial information, holdings and proxy information, scan the QR code or visit fundresearch.fidelity.com/prospectus/sec 1.9914265.100 1391-TSRA-0325 |
| |
| | ANNUAL SHAREHOLDER REPORT | AS OF DECEMBER 31, 2024 | This report describes changes to the Fund that occurred during the reporting period. |
| | VIP Disciplined Small Cap Portfolio VIP Disciplined Small Cap Portfolio Service Class 2 true |
| | | |
This annual shareholder report contains information about VIP Disciplined Small Cap Portfolio for the period January 1, 2024 to December 31, 2024. You can find additional information about the Fund at fundresearch.fidelity.com/prospectus/sec. You can also request this information by contacting us at 1-877-208-0098 or by sending an e-mail to funddocuments@fmr.com.
What were your Fund costs for the last year?(based on hypothetical $10,000 investment)
FUND COST (PREVIOUS YEAR)
| | Costs of a $10,000 investment | Costs paid as a percentage of a $10,000 investment | |
| Service Class 2 | $ 68 | 0.63% | |
What affected the Fund's performance this period?
•U.S. equities gained in 2024, driven by a sturdy economy, the Federal Reserve's long-anticipated pivot to cutting interest rates and the potential for artificial intelligence to drive transformative change.
•Against this backdrop, security selection was the primary contributor to the fund's performance versus the Russell 2000 Index for the fiscal year, especially within financials. Stock picking in information technology, primarily within the technology hardware & equipment industry, and communication services also boosted the fund's relative performance.
•The top individual relative contributor was an overweight in Lumen Technologies (+148%). The second-largest relative contributor was an overweight in Carvana (+289%). The company was among our biggest holdings this period, though we decreased our investment in Carvana by period end. Another notable relative contributor was our stake in Super Micro Computer (+45%). The company was the fund's biggest holding this period, but the stock was not held at period end.
•In contrast, the biggest detractor from performance versus the benchmark was stock selection in utilities. An underweight in financials, primarily within the banks industry, also hampered the fund's result. Also modestly hurting our result was security selection in energy.
•The biggest individual relative detractor was our stake in Green Plains (-63%). This period we decreased our stake in Green Plains. A second notable relative detractor was an overweight in ODP (-60%). This period we decreased our stake. An underweight in Rocket Lab USA (+361%) also hurt.
•Notable changes in positioning include lower allocations to the energy and consumer discretionary sectors.
How did the Fund perform over the past 10 years?
CUMULATIVE PERFORMANCE
December 31, 2014 through December 31, 2024.
Initial investment of $10,000.
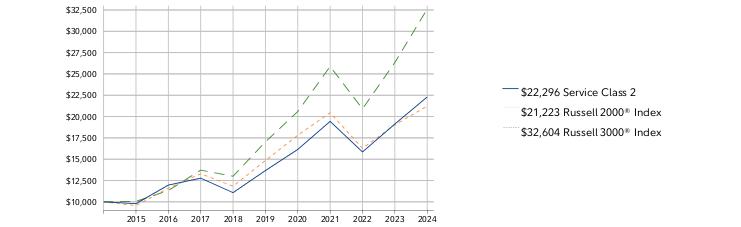
Service Class 2 | $10,000 | $9,782 | $11,964 | $12,777 | $11,078 | $13,667 | $16,144 | $19,437 | $15,850 | $19,126 | $22,296 |
Russell 2000® Index | $10,000 | $9,559 | $11,595 | $13,294 | $11,830 | $14,849 | $17,813 | $20,453 | $16,273 | $19,028 | $21,223 |
Russell 3000® Index | $10,000 | $10,048 | $11,327 | $13,721 | $13,002 | $17,035 | $20,593 | $25,877 | $20,907 | $26,334 | $32,604 |
| | 2014 | 2015 | 2016 | 2017 | 2018 | 2019 | 2020 | 2021 | 2022 | 2023 | 2024 |
AVERAGE ANNUAL TOTAL RETURNS:| | 1 Year | 5 Year | 10 Year |
| Service Class 2 | 16.57% | 10.28% | 8.35% |
| Russell 2000® Index | 11.54% | 7.40% | 7.82% |
| Russell 3000® Index | 23.81% | 13.86% | 12.55% |
Visit institutional.fidelity.com for more recent performance information. |
The Fund's past performance is not a good predictor of the Fund's future performance. The graph and table do not reflect the deduction of taxes that a shareholder would pay on fund distributions or redemption of fund shares. |
Key Fund Statistics(as of December 31, 2024)
KEY FACTS | | |
| Fund Size | $472,475,702 | |
| Number of Holdings | 633 | |
| Total Advisory Fee | $1,330,379 | |
| Portfolio Turnover | 85% | |
What did the Fund invest in?
(as of December 31, 2024)
MARKET SECTORS (% of Fund's net assets) | | |
| Financials | 18.4 | |
| Industrials | 16.9 | |
| Health Care | 15.7 | |
| Information Technology | 15.3 | |
| Consumer Discretionary | 10.2 | |
| Energy | 5.1 | |
| Materials | 4.9 | |
| Real Estate | 4.3 | |
| Consumer Staples | 3.3 | |
| Communication Services | 3.1 | |
| Utilities | 0.8 | |
| |
| Common Stocks | 98.0 |
| Short-Term Investments and Net Other Assets (Liabilities) | 2.0 |
ASSET ALLOCATION (% of Fund's net assets) |
|
| | Common Stocks - 98.0 |
| | Short-Term Investments and Net Other Assets (Liabilities) - 2.0 |
| |
| United States | 98.2 |
| Thailand | 0.6 |
| Puerto Rico | 0.3 |
| Canada | 0.3 |
| Ireland | 0.2 |
| Monaco | 0.2 |
| Norway | 0.1 |
| Bermuda | 0.1 |
| Switzerland | 0.0 |
GEOGRAPHIC DIVERSIFICATION (% of Fund's net assets) |
|
| | United States - 98.2 |
| | Thailand - 0.6 |
| | Puerto Rico - 0.3 |
| | Canada - 0.3 |
| | Ireland - 0.2 |
| | Monaco - 0.2 |
| | Norway - 0.1 |
| | Bermuda - 0.1 |
| | Switzerland - 0.0 |
| |
TOP HOLDINGS(% of Fund's net assets) | | |
| Sprouts Farmers Market Inc | 0.9 | |
| Carpenter Technology Corp | 0.9 | |
| Q2 Holdings Inc | 0.9 | |
| Abercrombie & Fitch Co Class A | 0.8 | |
| Primo Brands Corp Class A | 0.8 | |
| Tenable Holdings Inc | 0.8 | |
| SkyWest Inc | 0.7 | |
| Payoneer Global Inc | 0.7 | |
| EnerSys | 0.6 | |
| Fabrinet | 0.6 | |
| | 7.7 | |
How has the Fund changed?
This is a summary of certain changes to the Fund since January 1, 2024. For more complete information, you may review the Fund's next prospectus, which we expect to be available by April 30, 2025 at fundresearch.fidelity.com/prospectus/sec or upon request at 1-877-208-0098 or by sending an e-mail to funddocuments@fmr.com.
The fees associated with this class changed during the reporting year. The variations in class fees are primarily the result of the following changes: The fund's contractual management fee was reduced during the reporting period. The fund's pricing & bookkeeping fees were changed to a fixed rate effective April 1, 2024. Effective June 1, 2024, the fund's management contract was amended to incorporate administrative services previously covered under separate services agreements (transfer agent and pricing & bookkeeping). The amended contract incorporates a management fee rate that may vary by class. The Adviser or an affiliate pays certain expenses of managing and operating the fund out of each class's management fee. | |
| Fidelity, the Fidelity Investments Logo and all other Fidelity trademarks or service marks used herein are trademarks or service marks of FMR LLC. Any third-party marks that are used herein are trademarks or service marks of their respective owners. © 2025 FMR LLC. All rights reserved. |
| | For additional information about the Fund; including its prospectus, financial information, holdings and proxy information, scan the QR code or visit fundresearch.fidelity.com/prospectus/sec 1.9914301.100 1531-TSRA-0325 |
| |
| | ANNUAL SHAREHOLDER REPORT | AS OF DECEMBER 31, 2024 | This report describes changes to the Fund that occurred during the reporting period. |
| | VIP Emerging Markets Portfolio VIP Emerging Markets Portfolio Initial Class true |
| | | |
This annual shareholder report contains information about VIP Emerging Markets Portfolio for the period January 1, 2024 to December 31, 2024. You can find additional information about the Fund at fundresearch.fidelity.com/prospectus/sec. You can also request this information by contacting us at 1-877-208-0098 or by sending an e-mail to funddocuments@fmr.com.
What were your Fund costs for the last year?(based on hypothetical $10,000 investment)
FUND COST (PREVIOUS YEAR)
| | Costs of a $10,000 investment | Costs paid as a percentage of a $10,000 investment | |
| Initial Class | $ 92 | 0.88% | |
What affected the Fund's performance this period?
•International stocks gained in 2024, as resilient global economic growth, slowing inflation and global monetary easing provided support for stocks, despite geopolitical risk. However, stocks also faced challenges, including a steep sell-off after the U.S. presidential election in November due to the potential for new tariffs and a strengthening U.S. dollar.
•Against this backdrop, emerging-markets stock picks in Asia and Europe contributed to the fund's performance versus the MSCI Emerging Markets Net MA (29-Jun-2018) Linked Index for the year.
•By sector, security selection was the primary contributor, led by communication services, where our investment choices among media & entertainment firms helped most. Security selection in materials and health care also boosted the fund's relative result.
•The top individual relative contributor was an overweight in Tencent Holdings (+44%). The company was the fund's biggest holding at period end. Outsized exposure to Meituan (+87%) helped as well. The stock was among our largest positions in 2024. An overweight in China Life Insurance (+55%) further contributed. The company was one of our more sizable holdings this period.
•In contrast, from a regional standpoint, a non-benchmark allocation to developed markets detracted from the fund's relative return. Within the benchmark, picks in South Africa and Mexico notably detracted.
•By sector, the biggest detractors from performance versus the benchmark were security selection and an underweight in information technology. Picks in consumer staples and an overweight in materials also hurt.
•The biggest individual relative detractor was an overweight in Samsung Electronics (-40%), one of our largest holdings. Outsized exposure Wal Mart de Mexico (-35%) also hurt. This period we increased our investment in the stock, making it one of the fund's largest holdings.
•Meaningful changes in positioning include increased exposure to Mexico and a lower allocation to Brazil. By sector, noteworthy shifts include decreased exposure to materials and a higher allocation to consumer staples.
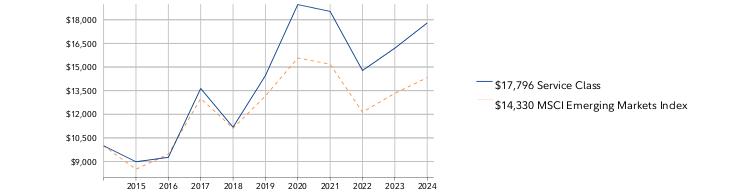
How did the Fund perform over the past 10 years?
CUMULATIVE PERFORMANCE
December 31, 2014 through December 31, 2024.
Initial investment of $10,000.
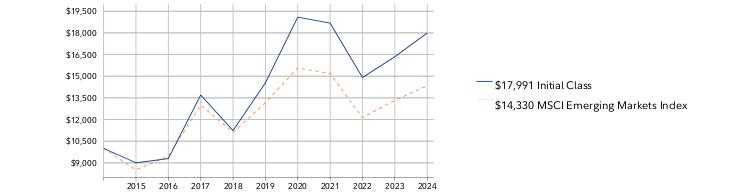
Initial Class | $10,000 | $9,003 | $9,295 | $13,700 | $11,234 | $14,544 | $19,091 | $18,677 | $14,909 | $16,350 | $17,991 |
MSCI Emerging Markets Index | $10,000 | $8,512 | $9,468 | $13,003 | $11,112 | $13,164 | $15,575 | $15,182 | $12,134 | $13,330 | $14,330 |
| | 2014 | 2015 | 2016 | 2017 | 2018 | 2019 | 2020 | 2021 | 2022 | 2023 | 2024 |
AVERAGE ANNUAL TOTAL RETURNS:| | 1 Year | 5 Year | 10 Year |
| Initial Class | 10.04% | 4.35% | 6.05% |
| MSCI Emerging Markets Index | 7.50% | 1.71% | 3.66% |
Visit institutional.fidelity.com for more recent performance information. |
The Fund's past performance is not a good predictor of the Fund's future performance. The graph and table do not reflect the deduction of taxes that a shareholder would pay on fund distributions or redemption of fund shares. |
Key Fund Statistics(as of December 31, 2024)
KEY FACTS | | |
| Fund Size | $1,093,134,890 | |
| Number of Holdings | 57 | |
| Total Advisory Fee | $9,193,754 | |
| Portfolio Turnover | 59% | |
What did the Fund invest in?
(as of December 31, 2024)
MARKET SECTORS (% of Fund's net assets) | | |
| Financials | 23.7 | |
| Information Technology | 18.5 | |
| Consumer Discretionary | 13.5 | |
| Communication Services | 11.6 | |
| Industrials | 9.8 | |
| Consumer Staples | 7.1 | |
| Materials | 6.5 | |
| Health Care | 4.7 | |
| Energy | 3.5 | |
| |
| Common Stocks | 98.9 |
| Short-Term Investments and Net Other Assets (Liabilities) | 1.1 |
ASSET ALLOCATION (% of Fund's net assets) |
|
| | Common Stocks - 98.9 |
| | Short-Term Investments and Net Other Assets (Liabilities) - 1.1 |
| |
| China | 32.7 |
| Taiwan | 13.7 |
| India | 10.1 |
| Korea (South) | 9.8 |
| Mexico | 5.7 |
| Brazil | 5.4 |
| South Africa | 4.6 |
| Greece | 3.1 |
| Hungary | 2.8 |
| Others | 12.1 |
GEOGRAPHIC DIVERSIFICATION (% of Fund's net assets) |
|
| | China - 32.7 |
| | Taiwan - 13.7 |
| | India - 10.1 |
| | Korea (South) - 9.8 |
| | Mexico - 5.7 |
| | Brazil - 5.4 |
| | South Africa - 4.6 |
| | Greece - 3.1 |
| | Hungary - 2.8 |
| | Others - 12.1 |
| |
TOP HOLDINGS(% of Fund's net assets) | | |
| Tencent Holdings Ltd | 9.3 | |
| Taiwan Semiconductor Manufacturing Co Ltd | 8.6 | |
| Samsung Electronics Co Ltd | 5.2 | |
| Wal-Mart de Mexico SAB de CV Series V | 3.5 | |
| Tata Consultancy Services Ltd | 3.2 | |
| Haier Smart Home Co Ltd A Shares (China) | 3.1 | |
| Meituan B Shares | 3.1 | |
| China Life Insurance Co Ltd H Shares | 2.6 | |
| Credicorp Ltd | 2.5 | |
| Powszechna Kasa Oszczednosci Bank Polski SA | 2.5 | |
| | 43.6 | |
How has the Fund changed?
This is a summary of certain changes to the Fund since January 1, 2024. For more complete information, you may review the Fund's next prospectus, which we expect to be available by April 30, 2025 at fundresearch.fidelity.com/prospectus/sec or upon request at 1-877-208-0098 or by sending an e-mail to funddocuments@fmr.com.
The fund's transfer agent and pricing & bookkeeping fees were changed to a fixed rate effective December 1, 2023. Effective March 1, 2024, the fund's management contract was amended to incorporate administrative services previously covered under separate services agreements (transfer agent and pricing & bookkeeping). The amended contract incorporates a management fee rate that may vary by class. The Adviser or an affiliate pays certain expenses of managing and operating the fund out of each class's management fee. | The fund's sub-advisory agreement with FIL Investments (Japan) Limited was not renewed.
|
| Fidelity, the Fidelity Investments Logo and all other Fidelity trademarks or service marks used herein are trademarks or service marks of FMR LLC. Any third-party marks that are used herein are trademarks or service marks of their respective owners. © 2025 FMR LLC. All rights reserved. |
| | For additional information about the Fund; including its prospectus, financial information, holdings and proxy information, scan the QR code or visit fundresearch.fidelity.com/prospectus/sec 1.9914326.100 2021-TSRA-0325 |
| |
| | ANNUAL SHAREHOLDER REPORT | AS OF DECEMBER 31, 2024 | This report describes changes to the Fund that occurred during the reporting period. |
| | VIP Index 500 Portfolio VIP Index 500 Portfolio Initial Class true |
| | | |
This annual shareholder report contains information about VIP Index 500 Portfolio for the period January 1, 2024 to December 31, 2024. You can find additional information about the Fund at fundresearch.fidelity.com/prospectus/sec. You can also request this information by contacting us at 1-877-208-0098 or by sending an e-mail to funddocuments@fmr.com.
What were your Fund costs for the last year?(based on hypothetical $10,000 investment)
FUND COST (PREVIOUS YEAR)
| | Costs of a $10,000 investment | Costs paid as a percentage of a $10,000 investment | |
| Initial Class | $ 11 | 0.09% | |
What affected the Fund's performance this period?
•U.S. equities gained in 2024, driven by a sturdy economy, the Federal Reserve's long-anticipated pivot to cutting interest rates and the potential for artificial intelligence to drive transformative change.
•Against this backdrop, information technology gained roughly 37% and contributed most to the fund's performance for the fiscal year. Financials, which gained about 31%, also helped, as did communication services, which advanced 40%, lifted by the media & entertainment industry (+41%). The consumer discretionary sector rose 30%, while industrials gained about 18% and consumer staples advanced 15%. Other contributors included the utilities (+23%), health care (+3%), energy (+6%), real estate (+5%) and materials (0%) sectors.
•Turning to individual stocks, the top contributor was Nvidia (+171%), from the semiconductors & semiconductor equipment industry. Within the same group, Broadcom (+111%) boosted the fund. Apple, within the technology hardware & equipment industry, gained roughly 31% and lifted the fund. Another notable contributor was Amazon.com (+44%), a stock in the consumer discretionary distribution & retail group. Lastly, in media & entertainment, Alphabet gained 36% and also contributed.
•Conversely, the biggest detractor was Intel (-60%), from the semiconductors & semiconductor equipment industry. Within the same category, Advanced Micro Devices (-18%) hurt the fund. Adobe (-25%), from the software & services group, hurt. Boeing, within the capital goods group, returned approximately -32% and hindered the fund. Lastly, in health care equipment & services, CVS Health (-41%) also hurt the fund's performance.
How did the Fund perform over the past 10 years?
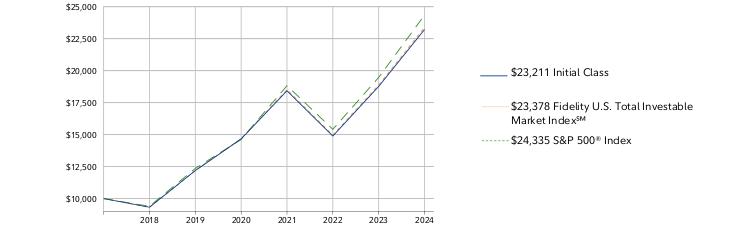
CUMULATIVE PERFORMANCE
December 31, 2014 through December 31, 2024.
Initial investment of $10,000.
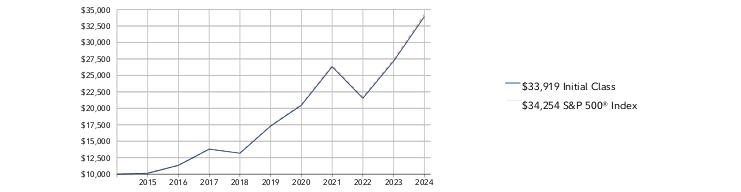
Initial Class | $10,000 | $10,133 | $11,336 | $13,796 | $13,177 | $17,308 | $20,464 | $26,312 | $21,520 | $27,157 | $33,919 |
S&P 500® Index | $10,000 | $10,138 | $11,351 | $13,829 | $13,223 | $17,386 | $20,585 | $26,494 | $21,696 | $27,399 | $34,254 |
| | 2014 | 2015 | 2016 | 2017 | 2018 | 2019 | 2020 | 2021 | 2022 | 2023 | 2024 |
AVERAGE ANNUAL TOTAL RETURNS:| | 1 Year | 5 Year | 10 Year |
| Initial Class | 24.90% | 14.40% | 12.99% |
| S&P 500® Index | 25.02% | 14.53% | 13.10% |
Visit institutional.fidelity.com for more recent performance information. |
The Fund's past performance is not a good predictor of the Fund's future performance. The graph and table do not reflect the deduction of taxes that a shareholder would pay on fund distributions or redemption of fund shares. |
Key Fund Statistics(as of December 31, 2024)
KEY FACTS | | |
| Fund Size | $16,685,418,750 | |
| Number of Holdings | 507 | |
| Total Advisory Fee | $6,932,411 | |
| Portfolio Turnover | 3% | |
What did the Fund invest in?
(as of December 31, 2024)
MARKET SECTORS (% of Fund's net assets) | | |
| Information Technology | 32.4 | |
| Financials | 13.6 | |
| Consumer Discretionary | 11.2 | |
| Health Care | 10.1 | |
| Communication Services | 9.3 | |
| Industrials | 8.1 | |
| Consumer Staples | 5.5 | |
| Energy | 3.2 | |
| Utilities | 2.3 | |
| Real Estate | 2.1 | |
| Materials | 1.9 | |
| |
| Common Stocks | 99.7 |
| Short-Term Investments and Net Other Assets (Liabilities) | 0.3 |
ASSET ALLOCATION (% of Fund's net assets) |
|
| | Common Stocks - 99.7 |
| | Short-Term Investments and Net Other Assets (Liabilities) - 0.3 |
| |
| United States | 99.4 |
| Ireland | 0.4 |
| China | 0.1 |
| Switzerland | 0.1 |
| Bailiwick Of Jersey | 0.0 |
GEOGRAPHIC DIVERSIFICATION (% of Fund's net assets) |
|
| | United States - 99.4 |
| | Ireland - 0.4 |
| | China - 0.1 |
| | Switzerland - 0.1 |
| | Bailiwick Of Jersey - 0.0 |
| |
TOP HOLDINGS(% of Fund's net assets) | | |
| Apple Inc | 7.6 | |
| NVIDIA Corp | 6.6 | |
| Microsoft Corp | 6.4 | |
| Amazon.com Inc | 4.1 | |
| Meta Platforms Inc Class A | 2.6 | |
| Tesla Inc | 2.3 | |
| Alphabet Inc Class A | 2.2 | |
| Broadcom Inc | 2.2 | |
| Alphabet Inc Class C | 1.8 | |
| Berkshire Hathaway Inc Class B | 1.7 | |
| | 37.5 | |
How has the Fund changed?
This is a summary of certain changes to the Fund since January 1, 2024. For more complete information, you may review the Fund's next prospectus, which we expect to be available by April 30, 2025 at fundresearch.fidelity.com/prospectus/sec or upon request at 1-877-208-0098 or by sending an e-mail to funddocuments@fmr.com.
The fees associated with this class changed during the reporting year. The variations in class fees are primarily the result of the following changes: Effective June 1, 2024, the fund's expense contract was amended to reduce its total expenses. | |
| Fidelity, the Fidelity Investments Logo and all other Fidelity trademarks or service marks used herein are trademarks or service marks of FMR LLC. Any third-party marks that are used herein are trademarks or service marks of their respective owners. © 2025 FMR LLC. All rights reserved. |
| | For additional information about the Fund; including its prospectus, financial information, holdings and proxy information, scan the QR code or visit fundresearch.fidelity.com/prospectus/sec 1.9914163.100 157-TSRA-0325 |
| |
| | ANNUAL SHAREHOLDER REPORT | AS OF DECEMBER 31, 2024 | This report describes changes to the Fund that occurred during the reporting period. |
| | VIP Index 500 Portfolio VIP Index 500 Portfolio Service Class 2 true |
| | | |
This annual shareholder report contains information about VIP Index 500 Portfolio for the period January 1, 2024 to December 31, 2024. You can find additional information about the Fund at fundresearch.fidelity.com/prospectus/sec. You can also request this information by contacting us at 1-877-208-0098 or by sending an e-mail to funddocuments@fmr.com.
What were your Fund costs for the last year?(based on hypothetical $10,000 investment)
FUND COST (PREVIOUS YEAR)
| | Costs of a $10,000 investment | Costs paid as a percentage of a $10,000 investment | |
| Service Class 2 | $ 39 | 0.34% | |
What affected the Fund's performance this period?
•U.S. equities gained in 2024, driven by a sturdy economy, the Federal Reserve's long-anticipated pivot to cutting interest rates and the potential for artificial intelligence to drive transformative change.
•Against this backdrop, information technology gained roughly 37% and contributed most to the fund's performance for the fiscal year. Financials, which gained about 31%, also helped, as did communication services, which advanced 40%, lifted by the media & entertainment industry (+41%). The consumer discretionary sector rose 30%, while industrials gained about 18% and consumer staples advanced 15%. Other contributors included the utilities (+23%), health care (+3%), energy (+6%), real estate (+5%) and materials (0%) sectors.
•Turning to individual stocks, the top contributor was Nvidia (+171%), from the semiconductors & semiconductor equipment industry. Within the same group, Broadcom (+111%) boosted the fund. Apple, within the technology hardware & equipment industry, gained roughly 31% and lifted the fund. Another notable contributor was Amazon.com (+44%), a stock in the consumer discretionary distribution & retail group. Lastly, in media & entertainment, Alphabet gained 36% and also contributed.
•Conversely, the biggest detractor was Intel (-60%), from the semiconductors & semiconductor equipment industry. Within the same category, Advanced Micro Devices (-18%) hurt the fund. Adobe (-25%), from the software & services group, hurt. Boeing, within the capital goods group, returned approximately -32% and hindered the fund. Lastly, in health care equipment & services, CVS Health (-41%) also hurt the fund's performance.
How did the Fund perform over the past 10 years?
CUMULATIVE PERFORMANCE
December 31, 2014 through December 31, 2024.
Initial investment of $10,000.
Service Class 2 | $10,000 | $10,108 | $11,279 | $13,693 | $13,046 | $17,092 | $20,160 | $25,856 | $21,094 | $26,553 | $33,081 |
S&P 500® Index | $10,000 | $10,138 | $11,351 | $13,829 | $13,223 | $17,386 | $20,585 | $26,494 | $21,696 | $27,399 | $34,254 |
| | 2014 | 2015 | 2016 | 2017 | 2018 | 2019 | 2020 | 2021 | 2022 | 2023 | 2024 |
AVERAGE ANNUAL TOTAL RETURNS:| | 1 Year | 5 Year | 10 Year |
| Service Class 2 | 24.59% | 14.12% | 12.71% |
| S&P 500® Index | 25.02% | 14.53% | 13.10% |
Visit institutional.fidelity.com for more recent performance information. |
The Fund's past performance is not a good predictor of the Fund's future performance. The graph and table do not reflect the deduction of taxes that a shareholder would pay on fund distributions or redemption of fund shares. |
Key Fund Statistics(as of December 31, 2024)
KEY FACTS | | |
| Fund Size | $16,685,418,750 | |
| Number of Holdings | 507 | |
| Total Advisory Fee | $6,932,411 | |
| Portfolio Turnover | 3% | |
What did the Fund invest in?
(as of December 31, 2024)
MARKET SECTORS (% of Fund's net assets) | | |
| Information Technology | 32.4 | |
| Financials | 13.6 | |
| Consumer Discretionary | 11.2 | |
| Health Care | 10.1 | |
| Communication Services | 9.3 | |
| Industrials | 8.1 | |
| Consumer Staples | 5.5 | |
| Energy | 3.2 | |
| Utilities | 2.3 | |
| Real Estate | 2.1 | |
| Materials | 1.9 | |
| |
| Common Stocks | 99.7 |
| Short-Term Investments and Net Other Assets (Liabilities) | 0.3 |
ASSET ALLOCATION (% of Fund's net assets) |
|
| | Common Stocks - 99.7 |
| | Short-Term Investments and Net Other Assets (Liabilities) - 0.3 |
| |
| United States | 99.4 |
| Ireland | 0.4 |
| China | 0.1 |
| Switzerland | 0.1 |
| Bailiwick Of Jersey | 0.0 |
GEOGRAPHIC DIVERSIFICATION (% of Fund's net assets) |
|
| | United States - 99.4 |
| | Ireland - 0.4 |
| | China - 0.1 |
| | Switzerland - 0.1 |
| | Bailiwick Of Jersey - 0.0 |
| |
TOP HOLDINGS(% of Fund's net assets) | | |
| Apple Inc | 7.6 | |
| NVIDIA Corp | 6.6 | |
| Microsoft Corp | 6.4 | |
| Amazon.com Inc | 4.1 | |
| Meta Platforms Inc Class A | 2.6 | |
| Tesla Inc | 2.3 | |
| Alphabet Inc Class A | 2.2 | |
| Broadcom Inc | 2.2 | |
| Alphabet Inc Class C | 1.8 | |
| Berkshire Hathaway Inc Class B | 1.7 | |
| | 37.5 | |
How has the Fund changed?
This is a summary of certain changes to the Fund since January 1, 2024. For more complete information, you may review the Fund's next prospectus, which we expect to be available by April 30, 2025 at fundresearch.fidelity.com/prospectus/sec or upon request at 1-877-208-0098 or by sending an e-mail to funddocuments@fmr.com.
Effective June 1, 2024, the fund's expense contract was amended to reduce its total expenses. | |
| Fidelity, the Fidelity Investments Logo and all other Fidelity trademarks or service marks used herein are trademarks or service marks of FMR LLC. Any third-party marks that are used herein are trademarks or service marks of their respective owners. © 2025 FMR LLC. All rights reserved. |
| | For additional information about the Fund; including its prospectus, financial information, holdings and proxy information, scan the QR code or visit fundresearch.fidelity.com/prospectus/sec 1.9914164.100 366-TSRA-0325 |
| |
| | ANNUAL SHAREHOLDER REPORT | AS OF DECEMBER 31, 2024 | This report describes changes to the Fund that occurred during the reporting period. |
| | VIP International Index Portfolio VIP International Index Portfolio Service Class 2 true |
| | | |
This annual shareholder report contains information about VIP International Index Portfolio for the period January 1, 2024 to December 31, 2024. You can find additional information about the Fund at fundresearch.fidelity.com/prospectus/sec. You can also request this information by contacting us at 1-877-208-0098 or by sending an e-mail to funddocuments@fmr.com.
What were your Fund costs for the last year?(based on hypothetical $10,000 investment)
FUND COST (PREVIOUS YEAR)
| | Costs of a $10,000 investment | Costs paid as a percentage of a $10,000 investment | |
| Service Class 2 | $ 42 | 0.41% | |
What affected the Fund's performance this period?
•International stocks gained in 2024, as resilient global economic growth, slowing inflation and global monetary easing provided support for stocks, despite geopolitical risk. However, stocks also faced challenges, including a steep sell-off after the U.S. presidential election in November due to the potential for new tariffs and a strengthening U.S. dollar.
•Against this backdrop, emerging markets, led by Taiwan (+30%), gained roughly 5% and contributed most to the fund's performance for the fiscal year, followed by Japan (+8%).
•By sector, financials gained 18% and contributed most. Information technology stocks also helped, gaining approximately 13%. The industrials sector rose 8%, boosted by the capital goods industry (+10%). Other contributors included the communication services (+15%) and consumer discretionary (+4%) sectors.
•Conversely, from a sector standpoint, materials returned roughly -13% and detracted most. Consumer staples (-7%), hampered by the food, beverage & tobacco industry (-10%), and energy (-5%) also hurt. Other detractors included the health care (-2%), real estate (-4%) and utilities (-2%) sectors.
•Turning to individual stocks, the biggest contributor was Taiwam Semiconductor Manufacturing (+72%), from the semiconductors & semiconductor equipment category. Tencent Holdings (+44%), from the media & entertainment category, boosted the fund. In software & services, SAP gained about 61% and boosted the fund. Hitachi, within the capital goods category, gained approximately 75% and boosted the fund. Lastly, Recruit Holdings, within the commercial & professional services group, gained 68% and also helped.
•In contrast, the biggest detractor was Samsung Electronics (-39%), from the technology hardware & equipment group. In food, beverage & tobacco, Nestle (-27%) hurt the fund's performance. Novo-Nordisk, within the pharmaceuticals, biotechnology & life sciences industry, returned about -15% and detracted. BHP, within the materials sector, returned -25% and detracted. Lastly, PDD, within the consumer discretionary distribution & retail category, returned -34% and also detracted.
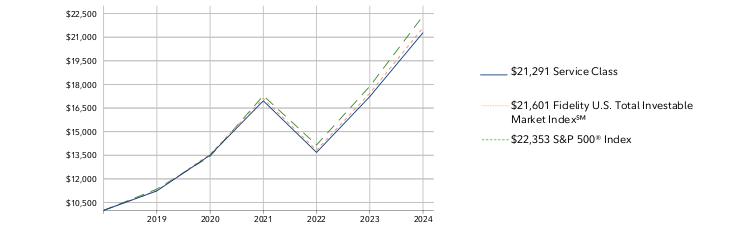
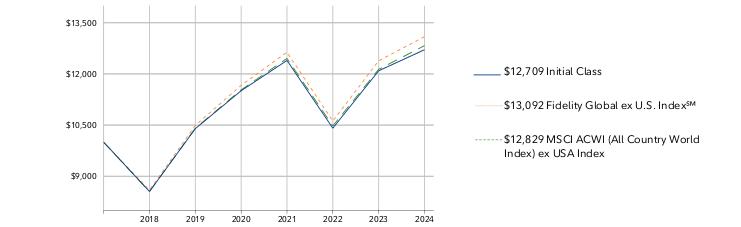
How did the Fund perform over the life of Fund?
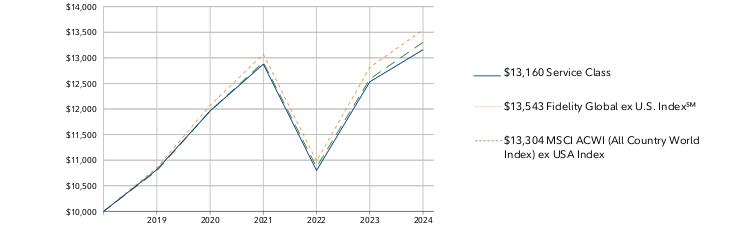
CUMULATIVE PERFORMANCE
April 17, 2018 through December 31, 2024.
Initial investment of $10,000.
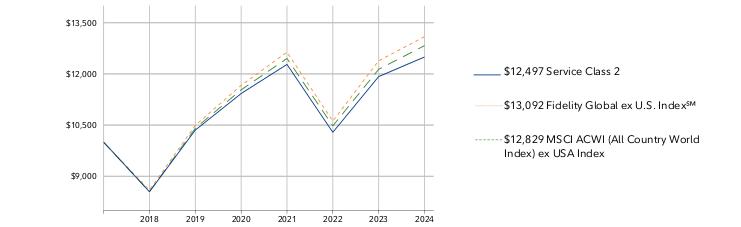
Service Class 2 | $10,000 | $8,545 | $10,354 | $11,425 | $12,279 | $10,288 | $11,922 |
Fidelity Global ex U.S. Index℠ | $10,000 | $8,593 | $10,490 | $11,666 | $12,637 | $10,616 | $12,386 |
MSCI ACWI (All Country World Index) ex USA Index | $10,000 | $8,549 | $10,407 | $11,533 | $12,454 | $10,478 | $12,135 |
| | 2018 | 2019 | 2020 | 2021 | 2022 | 2023 | 2024 |
AVERAGE ANNUAL TOTAL RETURNS:| | 1 Year | 5 Year | Life of Fund A |
| Service Class 2 | 4.82% | 3.83% | 3.38% |
| Fidelity Global ex U.S. Index℠ | 5.70% | 4.53% | 4.10% |
| MSCI ACWI (All Country World Index) ex USA Index | 5.72% | 4.27% | 3.78% |
A From April 17, 2018
Visit institutional.fidelity.com for more recent performance information. |
The Fund's past performance is not a good predictor of the Fund's future performance. The graph and table do not reflect the deduction of taxes that a shareholder would pay on fund distributions or redemption of fund shares. |
Key Fund Statistics(as of December 31, 2024)
KEY FACTS | | |
| Fund Size | $612,795,347 | |
| Number of Holdings | 2,236 | |
| Total Advisory Fee | $829,632 | |
| Portfolio Turnover | 5% | |
What did the Fund invest in?
(as of December 31, 2024)
MARKET SECTORS (% of Fund's net assets) | | |
| Financials | 24.2 | |
| Industrials | 14.2 | |
| Information Technology | 13.5 | |
| Consumer Discretionary | 10.8 | |
| Health Care | 7.8 | |
| Consumer Staples | 6.7 | |
| Materials | 5.9 | |
| Communication Services | 5.4 | |
| Energy | 4.4 | |
| Utilities | 2.8 | |
| Real Estate | 1.8 | |
| |
| Common Stocks | 97.2 |
| Preferred Stocks | 0.3 |
| Short-Term Investments and Net Other Assets (Liabilities) | 2.5 |
ASSET ALLOCATION (% of Fund's net assets) |
|
| | Common Stocks - 97.2 |
| | Preferred Stocks - 0.3 |
| | Short-Term Investments and Net Other Assets (Liabilities) - 2.5 |
| |
| Japan | 16.8 |
| United States | 8.9 |
| Canada | 7.7 |
| United Kingdom | 7.1 |
| China | 6.7 |
| Taiwan | 6.0 |
| Germany | 5.3 |
| France | 5.2 |
| Australia | 4.7 |
| Others | 31.6 |
GEOGRAPHIC DIVERSIFICATION (% of Fund's net assets) |
|
| | Japan - 16.8 |
| | United States - 8.9 |
| | Canada - 7.7 |
| | United Kingdom - 7.1 |
| | China - 6.7 |
| | Taiwan - 6.0 |
| | Germany - 5.3 |
| | France - 5.2 |
| | Australia - 4.7 |
| | Others - 31.6 |
| |
TOP HOLDINGS(% of Fund's net assets) | | |
| Taiwan Semiconductor Manufacturing Co Ltd | 3.0 | |
| Tencent Holdings Ltd | 1.2 | |
| ASML Holding NV | 1.1 | |
| Novo Nordisk A/S Series B | 1.0 | |
| Toyota Motor Corp | 1.0 | |
| SAP SE | 0.9 | |
| Nestle SA | 0.8 | |
| Roche Holding AG | 0.8 | |
| Astrazeneca PLC | 0.7 | |
| Shell PLC | 0.7 | |
| | 11.2 | |
How has the Fund changed?
This is a summary of certain changes to the Fund since January 1, 2024. For more complete information, you may review the Fund's next prospectus, which we expect to be available by April 30, 2025 at fundresearch.fidelity.com/prospectus/sec or upon request at 1-877-208-0098 or by sending an e-mail to funddocuments@fmr.com.
Effective June 1, 2024, the fund's management contract was amended to incorporate administrative services previously covered under separate services agreements (transfer agent and pricing & bookkeeping). The amended contract incorporates a management fee rate that may vary by class. The Adviser or an affiliate pays certain expenses of managing and operating the fund out of each class's management fee. | |
| Fidelity, the Fidelity Investments Logo and all other Fidelity trademarks or service marks used herein are trademarks or service marks of FMR LLC. Any third-party marks that are used herein are trademarks or service marks of their respective owners. © 2025 FMR LLC. All rights reserved. |
| | For additional information about the Fund; including its prospectus, financial information, holdings and proxy information, scan the QR code or visit fundresearch.fidelity.com/prospectus/sec 1.9914376.100 3075-TSRA-0325 |
| |
| | ANNUAL SHAREHOLDER REPORT | AS OF DECEMBER 31, 2024 | This report describes changes to the Fund that occurred during the reporting period. |
| | VIP Contrafund℠ Portfolio VIP Contrafund℠ Portfolio Investor Class true |
| | | |
This annual shareholder report contains information about VIP Contrafund℠ Portfolio for the period January 1, 2024 to December 31, 2024. You can find additional information about the Fund at fundresearch.fidelity.com/prospectus/sec. You can also request this information by contacting us at 1-877-208-0098 or by sending an e-mail to funddocuments@fmr.com.
What were your Fund costs for the last year?(based on hypothetical $10,000 investment)
FUND COST (PREVIOUS YEAR)
| | Costs of a $10,000 investment | Costs paid as a percentage of a $10,000 investment | |
| Investor Class | $ 74 | 0.63% | |
What affected the Fund's performance this period?
•U.S. equities gained in 2024, driven by a sturdy economy, the Federal Reserve's long-anticipated pivot to cutting interest rates and the potential for artificial intelligence to drive transformative change.
•Against this backdrop, security selection was the primary contributor to the fund's performance versus the S&P 500® index for the fiscal year, led by information technology, where our picks in semiconductors & semiconductor equipment helped most. Picks and an overweight in communication services, primarily within the media & entertainment industry, also boosted the fund's relative performance. Also helping our relative result was security selection in industrials, primarily within the capital goods industry.
•The top individual relative contributor was an overweight in Nvidia (+171%), the biggest holding at period end. A second notable relative contributor was an overweight in Meta Platforms (+66%). The company was the largest holding this period. An overweight in Netflix (+83%) also helped. The stock was one of the fund's biggest holdings.
•In contrast, the biggest detractor from performance versus the benchmark was an overweight in health care, primarily within the pharmaceuticals, biotechnology & life sciences industry. Also hurting our result was stock picking in energy and financials. Lastly, the fund's position in cash hurt.
•The biggest individual relative detractor was an underweight in Tesla (+63%). This period we increased our investment in Tesla. A second notable relative detractor was an overweight in Regeneron Pharmaceuticals (-19%). An overweight in UnitedHealth Group (-2%) also hurt. This period we decreased our position in UnitedHealth Group, which was one of our biggest holdings this period.
•Notable changes in positioning include higher allocations to the industrials and communication services sectors.
How did the Fund perform over the past 10 years?
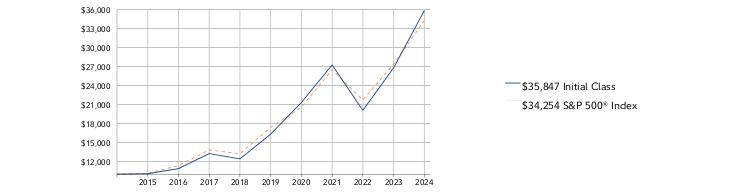
CUMULATIVE PERFORMANCE
December 31, 2014 through December 31, 2024.
Initial investment of $10,000.
Investor Class | $10,000 | $10,056 | $10,855 | $13,223 | $12,364 | $16,258 | $21,213 | $27,098 | $19,950 | $26,605 | $35,570 |
S&P 500® Index | $10,000 | $10,138 | $11,351 | $13,829 | $13,223 | $17,386 | $20,585 | $26,494 | $21,696 | $27,399 | $34,254 |
| | 2014 | 2015 | 2016 | 2017 | 2018 | 2019 | 2020 | 2021 | 2022 | 2023 | 2024 |
AVERAGE ANNUAL TOTAL RETURNS:| | 1 Year | 5 Year | 10 Year |
| Investor Class | 33.70% | 16.95% | 13.53% |
| S&P 500® Index | 25.02% | 14.53% | 13.10% |
Visit institutional.fidelity.com for more recent performance information. |
The Fund's past performance is not a good predictor of the Fund's future performance. The graph and table do not reflect the deduction of taxes that a shareholder would pay on fund distributions or redemption of fund shares. |
Key Fund Statistics(as of December 31, 2024)
KEY FACTS | | |
| Fund Size | $25,313,301,654 | |
| Number of Holdings | 404 | |
| Total Advisory Fee | $131,069,389 | |
| Portfolio Turnover | 36% | |
What did the Fund invest in?
(as of December 31, 2024)
MARKET SECTORS (% of Fund's net assets) | | |
| Information Technology | 26.6 | |
| Communication Services | 18.6 | |
| Financials | 15.5 | |
| Health Care | 11.1 | |
| Consumer Discretionary | 11.0 | |
| Industrials | 10.1 | |
| Consumer Staples | 2.1 | |
| Energy | 1.5 | |
| Materials | 0.9 | |
| Utilities | 0.8 | |
| Real Estate | 0.2 | |
| |
| Common Stocks | 97.4 |
| Preferred Stocks | 1.0 |
| Preferred Securities | 0.0 |
| Short-Term Investments and Net Other Assets (Liabilities) | 1.6 |
ASSET ALLOCATION (% of Fund's net assets) |
|
| | Common Stocks - 97.4 |
| | Preferred Stocks - 1.0 |
| | Preferred Securities - 0.0 |
| | Short-Term Investments and Net Other Assets (Liabilities) - 1.6 |
| |
| United States | 94.9 |
| Canada | 1.5 |
| Taiwan | 0.9 |
| Netherlands | 0.6 |
| China | 0.4 |
| United Kingdom | 0.3 |
| Israel | 0.2 |
| Korea (South) | 0.2 |
| Brazil | 0.2 |
| Others | 0.8 |
GEOGRAPHIC DIVERSIFICATION (% of Fund's net assets) |
|
| | United States - 94.9 |
| | Canada - 1.5 |
| | Taiwan - 0.9 |
| | Netherlands - 0.6 |
| | China - 0.4 |
| | United Kingdom - 0.3 |
| | Israel - 0.2 |
| | Korea (South) - 0.2 |
| | Brazil - 0.2 |
| | Others - 0.8 |
| |
TOP HOLDINGS(% of Fund's net assets) | | |
| NVIDIA Corp | 9.0 | |
| Meta Platforms Inc Class A | 8.6 | |
| Alphabet Inc Class C | 5.8 | |
| Microsoft Corp | 5.8 | |
| Amazon.com Inc | 5.4 | |
| Berkshire Hathaway Inc Class B | 4.3 | |
| Apple Inc | 3.7 | |
| Eli Lilly & Co | 2.7 | |
| Netflix Inc | 2.1 | |
| Costco Wholesale Corp | 1.3 | |
| | 48.7 | |
How has the Fund changed?
This is a summary of certain changes to the Fund since January 1, 2024. For more complete information, you may review the Fund's next prospectus, which we expect to be available by April 30, 2025 at fundresearch.fidelity.com/prospectus/sec or upon request at 1-877-208-0098 or by sending an e-mail to funddocuments@fmr.com.
The fees associated with this class changed during the reporting year. The variations in class fees are primarily the result of the following changes: The fund's transfer agent and pricing & bookkeeping fees were changed to a fixed rate effective December 1, 2023. Effective March 1, 2024, the fund's management contract was amended to incorporate administrative services previously covered under separate services agreements (transfer agent and pricing & bookkeeping). The amended contract incorporates a management fee rate that may vary by class. The Adviser or an affiliate pays certain expenses of managing and operating the fund out of each class's management fee. | |
| Fidelity, the Fidelity Investments Logo and all other Fidelity trademarks or service marks used herein are trademarks or service marks of FMR LLC. Any third-party marks that are used herein are trademarks or service marks of their respective owners. © 2025 FMR LLC. All rights reserved. |
| | For additional information about the Fund; including its prospectus, financial information, holdings and proxy information, scan the QR code or visit fundresearch.fidelity.com/prospectus/sec 1.9914166.100 1459-TSRA-0325 |
| |
| | ANNUAL SHAREHOLDER REPORT | AS OF DECEMBER 31, 2024 | This report describes changes to the Fund that occurred during the reporting period. |
| | VIP Extended Market Index Portfolio VIP Extended Market Index Portfolio Service Class 2 true |
| | | |
This annual shareholder report contains information about VIP Extended Market Index Portfolio for the period January 1, 2024 to December 31, 2024. You can find additional information about the Fund at fundresearch.fidelity.com/prospectus/sec. You can also request this information by contacting us at 1-877-208-0098 or by sending an e-mail to funddocuments@fmr.com.
What were your Fund costs for the last year?(based on hypothetical $10,000 investment)
FUND COST (PREVIOUS YEAR)
| | Costs of a $10,000 investment | Costs paid as a percentage of a $10,000 investment | |
| Service Class 2 | $ 39 | 0.37% | |
What affected the Fund's performance this period?
•U.S. equities gained in 2024, driven by a sturdy economy, the Federal Reserve's long-anticipated pivot to cutting interest rates and the potential for artificial intelligence to drive transformative change.
•Against this backdrop, financials gained roughly 26% and contributed most to the fund's performance for the fiscal year. Industrials, which gained approximately 14%, also helped, benefiting from the capital goods industry (+17%), as did information technology, which advanced 14%. The consumer discretionary sector rose 8%, while utilities gained 25% and health care advanced 4%. Other contributors included the real estate (+7%), consumer staples (+9%), communication services (+7%), energy (+5%) and materials (+2%) sectors.
•Turning to individual stocks, the biggest contributor was Super Micro Computer (+151%), from the technology hardware & equipment group. Carvana, within the consumer discretionary distribution & retail category, gained 284% and boosted the fund. Robinhood Markets (+192%), from the financial services industry, lifted the fund. Texas Pacific Land (+115%), from the energy sector, lifted the fund. Lastly, in capital goods, Emcor gained 111% and also helped.
•In contrast, the biggest detractor was Rivian Automotive (-43%), from the automobiles & components group. Five Below (-51%), from the consumer discretionary distribution & retail group, hurt the fund. Cleveland-Cliffs (-54%), from the materials sector, detracted. Flagstar Financial, within the banks category, returned -69% and detracted. Lastly, UiPath (-49%), a stock in the software & services group, also hurt the fund's performance
How did the Fund perform over the life of Fund?
CUMULATIVE PERFORMANCE
April 17, 2018 through December 31, 2024.
Initial investment of $10,000.
Service Class 2 | $10,000 | $8,891 | $11,153 | $12,958 | $15,671 | $12,803 | $14,994 |
Fidelity U.S. Extended Investable Market Index℠ | $10,000 | $8,914 | $11,260 | $13,132 | $15,951 | $13,057 | $15,396 |
S&P 500® Index | $10,000 | $9,394 | $12,351 | $14,624 | $18,822 | $15,413 | $19,465 |
| | 2018 | 2019 | 2020 | 2021 | 2022 | 2023 | 2024 |
AVERAGE ANNUAL TOTAL RETURNS:| | 1 Year | 5 Year | Life of Fund A |
| Service Class 2 | 12.03% | 8.53% | 8.03% |
| Fidelity U.S. Extended Investable Market Index℠ | 12.31% | 8.96% | 8.50% |
| S&P 500® Index | 25.02% | 14.53% | 14.17% |
A From April 17, 2018
Visit institutional.fidelity.com for more recent performance information. |
The Fund's past performance is not a good predictor of the Fund's future performance. The graph and table do not reflect the deduction of taxes that a shareholder would pay on fund distributions or redemption of fund shares. |
Key Fund Statistics(as of December 31, 2024)
KEY FACTS | | |
| Fund Size | $285,231,260 | |
| Number of Holdings | 2,055 | |
| Total Advisory Fee | $246,777 | |
| Portfolio Turnover | 12% | |
What did the Fund invest in?
(as of December 31, 2024)
MARKET SECTORS (% of Fund's net assets) | | |
| Industrials | 19.3 | |
| Financials | 17.8 | |
| Consumer Discretionary | 12.2 | |
| Information Technology | 11.6 | |
| Health Care | 11.3 | |
| Real Estate | 6.3 | |
| Materials | 4.8 | |
| Energy | 4.6 | |
| Consumer Staples | 3.7 | |
| Communication Services | 3.2 | |
| Utilities | 2.4 | |
| |
| Common Stocks | 97.2 |
| Short-Term Investments and Net Other Assets (Liabilities) | 2.8 |
ASSET ALLOCATION (% of Fund's net assets) |
|
| | Common Stocks - 97.2 |
| | Short-Term Investments and Net Other Assets (Liabilities) - 2.8 |
| |
| United States | 98.4 |
| United Kingdom | 0.4 |
| Puerto Rico | 0.3 |
| Bermuda | 0.3 |
| Sweden | 0.1 |
| Thailand | 0.1 |
| Switzerland | 0.1 |
| Argentina | 0.1 |
| Belgium | 0.1 |
| Others | 0.1 |
GEOGRAPHIC DIVERSIFICATION (% of Fund's net assets) |
|
| | United States - 98.4 |
| | United Kingdom - 0.4 |
| | Puerto Rico - 0.3 |
| | Bermuda - 0.3 |
| | Sweden - 0.1 |
| | Thailand - 0.1 |
| | Switzerland - 0.1 |
| | Argentina - 0.1 |
| | Belgium - 0.1 |
| | Others - 0.1 |
| |
TOP HOLDINGS(% of Fund's net assets) | | |
| Eqt Corp | 0.5 | |
| Robinhood Markets Inc Class A | 0.5 | |
| Carvana Co Class A | 0.5 | |
| Smurfit WestRock PLC | 0.4 | |
| EMCOR Group Inc | 0.4 | |
| Texas Pacific Land Corp | 0.4 | |
| Expand Energy Corp | 0.4 | |
| Live Nation Entertainment Inc | 0.4 | |
| Natera Inc | 0.4 | |
| Lennox International Inc | 0.4 | |
| | 4.3 | |
How has the Fund changed?
This is a summary of certain changes to the Fund since January 1, 2024. For more complete information, you may review the Fund's next prospectus, which we expect to be available by April 30, 2025 at fundresearch.fidelity.com/prospectus/sec or upon request at 1-877-208-0098 or by sending an e-mail to funddocuments@fmr.com.
Effective June 1, 2024, the fund's management contract was amended to incorporate administrative services previously covered under separate services agreements (transfer agent and pricing & bookkeeping). The amended contract incorporates a management fee rate that may vary by class. The Adviser or an affiliate pays certain expenses of managing and operating the fund out of each class's management fee. | |
| Fidelity, the Fidelity Investments Logo and all other Fidelity trademarks or service marks used herein are trademarks or service marks of FMR LLC. Any third-party marks that are used herein are trademarks or service marks of their respective owners. © 2025 FMR LLC. All rights reserved. |
| | For additional information about the Fund; including its prospectus, financial information, holdings and proxy information, scan the QR code or visit fundresearch.fidelity.com/prospectus/sec 1.9914373.100 3073-TSRA-0325 |
| |
| | ANNUAL SHAREHOLDER REPORT | AS OF DECEMBER 31, 2024 | This report describes changes to the Fund that occurred during the reporting period. |
| | VIP Index 500 Portfolio VIP Index 500 Portfolio Service Class true |
| | | |
This annual shareholder report contains information about VIP Index 500 Portfolio for the period January 1, 2024 to December 31, 2024. You can find additional information about the Fund at fundresearch.fidelity.com/prospectus/sec. You can also request this information by contacting us at 1-877-208-0098 or by sending an e-mail to funddocuments@fmr.com.
What were your Fund costs for the last year?(based on hypothetical $10,000 investment)
FUND COST (PREVIOUS YEAR)
| | Costs of a $10,000 investment | Costs paid as a percentage of a $10,000 investment | |
| Service Class | $ 22 | 0.19% | |
What affected the Fund's performance this period?
•U.S. equities gained in 2024, driven by a sturdy economy, the Federal Reserve's long-anticipated pivot to cutting interest rates and the potential for artificial intelligence to drive transformative change.
•Against this backdrop, information technology gained roughly 37% and contributed most to the fund's performance for the fiscal year. Financials, which gained about 31%, also helped, as did communication services, which advanced 40%, lifted by the media & entertainment industry (+41%). The consumer discretionary sector rose 30%, while industrials gained about 18% and consumer staples advanced 15%. Other contributors included the utilities (+23%), health care (+3%), energy (+6%), real estate (+5%) and materials (0%) sectors.
•Turning to individual stocks, the top contributor was Nvidia (+171%), from the semiconductors & semiconductor equipment industry. Within the same group, Broadcom (+111%) boosted the fund. Apple, within the technology hardware & equipment industry, gained roughly 31% and lifted the fund. Another notable contributor was Amazon.com (+44%), a stock in the consumer discretionary distribution & retail group. Lastly, in media & entertainment, Alphabet gained 36% and also contributed.
•Conversely, the biggest detractor was Intel (-60%), from the semiconductors & semiconductor equipment industry. Within the same category, Advanced Micro Devices (-18%) hurt the fund. Adobe (-25%), from the software & services group, hurt. Boeing, within the capital goods group, returned approximately -32% and hindered the fund. Lastly, in health care equipment & services, CVS Health (-41%) also hurt the fund's performance.
How did the Fund perform over the past 10 years?
CUMULATIVE PERFORMANCE
December 31, 2014 through December 31, 2024.
Initial investment of $10,000.
Service Class | $10,000 | $10,124 | $11,313 | $13,755 | $13,124 | $17,221 | $20,342 | $26,129 | $21,349 | $26,914 | $33,581 |
S&P 500® Index | $10,000 | $10,138 | $11,351 | $13,829 | $13,223 | $17,386 | $20,585 | $26,494 | $21,696 | $27,399 | $34,254 |
| | 2014 | 2015 | 2016 | 2017 | 2018 | 2019 | 2020 | 2021 | 2022 | 2023 | 2024 |
AVERAGE ANNUAL TOTAL RETURNS:| | 1 Year | 5 Year | 10 Year |
| Service Class | 24.77% | 14.29% | 12.88% |
| S&P 500® Index | 25.02% | 14.53% | 13.10% |
Visit institutional.fidelity.com for more recent performance information. |
The Fund's past performance is not a good predictor of the Fund's future performance. The graph and table do not reflect the deduction of taxes that a shareholder would pay on fund distributions or redemption of fund shares. |
Key Fund Statistics(as of December 31, 2024)
KEY FACTS | | |
| Fund Size | $16,685,418,750 | |
| Number of Holdings | 507 | |
| Total Advisory Fee | $6,932,411 | |
| Portfolio Turnover | 3% | |
What did the Fund invest in?
(as of December 31, 2024)
MARKET SECTORS (% of Fund's net assets) | | |
| Information Technology | 32.4 | |
| Financials | 13.6 | |
| Consumer Discretionary | 11.2 | |
| Health Care | 10.1 | |
| Communication Services | 9.3 | |
| Industrials | 8.1 | |
| Consumer Staples | 5.5 | |
| Energy | 3.2 | |
| Utilities | 2.3 | |
| Real Estate | 2.1 | |
| Materials | 1.9 | |
| |
| Common Stocks | 99.7 |
| Short-Term Investments and Net Other Assets (Liabilities) | 0.3 |
ASSET ALLOCATION (% of Fund's net assets) |
|
| | Common Stocks - 99.7 |
| | Short-Term Investments and Net Other Assets (Liabilities) - 0.3 |
| |
| United States | 99.4 |
| Ireland | 0.4 |
| China | 0.1 |
| Switzerland | 0.1 |
| Bailiwick Of Jersey | 0.0 |
GEOGRAPHIC DIVERSIFICATION (% of Fund's net assets) |
|
| | United States - 99.4 |
| | Ireland - 0.4 |
| | China - 0.1 |
| | Switzerland - 0.1 |
| | Bailiwick Of Jersey - 0.0 |
| |
TOP HOLDINGS(% of Fund's net assets) | | |
| Apple Inc | 7.6 | |
| NVIDIA Corp | 6.6 | |
| Microsoft Corp | 6.4 | |
| Amazon.com Inc | 4.1 | |
| Meta Platforms Inc Class A | 2.6 | |
| Tesla Inc | 2.3 | |
| Alphabet Inc Class A | 2.2 | |
| Broadcom Inc | 2.2 | |
| Alphabet Inc Class C | 1.8 | |
| Berkshire Hathaway Inc Class B | 1.7 | |
| | 37.5 | |
How has the Fund changed?
This is a summary of certain changes to the Fund since January 1, 2024. For more complete information, you may review the Fund's next prospectus, which we expect to be available by April 30, 2025 at fundresearch.fidelity.com/prospectus/sec or upon request at 1-877-208-0098 or by sending an e-mail to funddocuments@fmr.com.
The fees associated with this class changed during the reporting year. The variations in class fees are primarily the result of the following changes: Effective June 1, 2024, the fund's expense contract was amended to reduce its total expenses. | |
| Fidelity, the Fidelity Investments Logo and all other Fidelity trademarks or service marks used herein are trademarks or service marks of FMR LLC. Any third-party marks that are used herein are trademarks or service marks of their respective owners. © 2025 FMR LLC. All rights reserved. |
| | For additional information about the Fund; including its prospectus, financial information, holdings and proxy information, scan the QR code or visit fundresearch.fidelity.com/prospectus/sec 1.9914165.100 822-TSRA-0325 |
| |
| | ANNUAL SHAREHOLDER REPORT | AS OF DECEMBER 31, 2024 | This report describes changes to the Fund that occurred during the reporting period. |
| | VIP Total Market Index Portfolio VIP Total Market Index Portfolio Service Class true |
| | | |
This annual shareholder report contains information about VIP Total Market Index Portfolio for the period January 1, 2024 to December 31, 2024. You can find additional information about the Fund at fundresearch.fidelity.com/prospectus/sec. You can also request this information by contacting us at 1-877-208-0098 or by sending an e-mail to funddocuments@fmr.com.
What were your Fund costs for the last year?(based on hypothetical $10,000 investment)
FUND COST (PREVIOUS YEAR)
| | Costs of a $10,000 investment | Costs paid as a percentage of a $10,000 investment | |
| Service Class | $ 24 | 0.21% | |
What affected the Fund's performance this period?
•U.S. equities gained in 2024, driven by a sturdy economy, the Federal Reserve's long-anticipated pivot to cutting interest rates and the potential for artificial intelligence to drive transformative change.
•Against this backdrop, information technology gained roughly 36% and contributed most to the fund's performance for the fiscal year. Financials, which gained roughly 31%, also helped, as did communication services, which advanced 38%, lifted by the media & entertainment industry (+39%). The consumer discretionary sector rose roughly 27%, while industrials gained 17% and consumer staples advanced roughly 15%. Other contributors included the utilities (+23%), health care (+3%), energy (+6%), real estate (+5%) and materials (+0%) sectors.
•Turning to individual stocks, the top contributor was Nvidia (+171%), from the semiconductors & semiconductor equipment industry. From the same group, Broadcom (+110%) lifted the fund. Another notable contributor was Apple (+31%), a stock in the technology hardware & equipment category. In consumer discretionary distribution & retail, Amazon.com (+44%) boosted the fund. Lastly, Alphabet (+36%), a stock in the media & entertainment category, also contributed.
•Conversely, the biggest detractor was Intel (-60%), from the semiconductors & semiconductor equipment industry. From the same group, Advanced Micro Devices (-18%) detracted. In software & services, Adobe returned about -25% and hurt. Boeing (-32%), from the capital goods category, hurt the fund's performance. Lastly, CVS Health (-41%), from the health care equipment & services industry, also hurt the fund's performance.
How did the Fund perform over the life of Fund?
CUMULATIVE PERFORMANCE
April 11, 2019 through December 31, 2024.
Initial investment of $10,000.
Service Class | $10,000 | $11,236 | $13,506 | $16,957 | $13,679 | $17,228 |
Fidelity U.S. Total Investable Market Index℠ | $10,000 | $11,261 | $13,574 | $17,108 | $13,822 | $17,437 |
S&P 500® Index | $10,000 | $11,346 | $13,433 | $17,289 | $14,158 | $17,880 |
| | 2019 | 2020 | 2021 | 2022 | 2023 | 2024 |
AVERAGE ANNUAL TOTAL RETURNS:| | 1 Year | 5 Year | Life of Fund A |
| Service Class | 23.58% | 13.64% | 14.10% |
| Fidelity U.S. Total Investable Market Index℠ | 23.88% | 13.91% | 14.39% |
| S&P 500® Index | 25.02% | 14.53% | 15.07% |
A From April 11, 2019
Visit institutional.fidelity.com for more recent performance information. |
The Fund's past performance is not a good predictor of the Fund's future performance. The graph and table do not reflect the deduction of taxes that a shareholder would pay on fund distributions or redemption of fund shares. |
Key Fund Statistics(as of December 31, 2024)
KEY FACTS | | |
| Fund Size | $1,189,118,361 | |
| Number of Holdings | 2,563 | |
| Total Advisory Fee | $930,037 | |
| Portfolio Turnover | 2% | |
What did the Fund invest in?
(as of December 31, 2024)
MARKET SECTORS (% of Fund's net assets) | | |
| Information Technology | 30.2 | |
| Financials | 13.8 | |
| Consumer Discretionary | 11.0 | |
| Health Care | 10.0 | |
| Industrials | 9.1 | |
| Communication Services | 8.6 | |
| Consumer Staples | 5.1 | |
| Energy | 3.2 | |
| Real Estate | 2.4 | |
| Utilities | 2.2 | |
| Materials | 2.1 | |
| |
| Common Stocks | 97.7 |
| Short-Term Investments and Net Other Assets (Liabilities) | 2.3 |
ASSET ALLOCATION (% of Fund's net assets) |
|
| | Common Stocks - 97.7 |
| | Short-Term Investments and Net Other Assets (Liabilities) - 2.3 |
| |
| United States | 99.4 |
| Ireland | 0.4 |
| China | 0.1 |
| Switzerland | 0.1 |
| United Kingdom | 0.0 |
| Canada | 0.0 |
| Bailiwick Of Jersey | 0.0 |
| Puerto Rico | 0.0 |
| Bermuda | 0.0 |
GEOGRAPHIC DIVERSIFICATION (% of Fund's net assets) |
|
| | United States - 99.4 |
| | Ireland - 0.4 |
| | China - 0.1 |
| | Switzerland - 0.1 |
| | United Kingdom - 0.0 |
| | Canada - 0.0 |
| | Bailiwick Of Jersey - 0.0 |
| | Puerto Rico - 0.0 |
| | Bermuda - 0.0 |
| |
TOP HOLDINGS(% of Fund's net assets) | | |
| Apple Inc | 6.6 | |
| NVIDIA Corp | 5.8 | |
| Microsoft Corp | 5.5 | |
| Amazon.com Inc | 3.5 | |
| Meta Platforms Inc Class A | 2.2 | |
| Alphabet Inc Class A | 2.0 | |
| Broadcom Inc | 2.0 | |
| Tesla Inc | 1.9 | |
| Alphabet Inc Class C | 1.6 | |
| Berkshire Hathaway Inc Class B | 1.5 | |
| | 32.6 | |
How has the Fund changed?
This is a summary of certain changes to the Fund since January 1, 2024. For more complete information, you may review the Fund's next prospectus, which we expect to be available by April 30, 2025 at fundresearch.fidelity.com/prospectus/sec or upon request at 1-877-208-0098 or by sending an e-mail to funddocuments@fmr.com.
Effective June 1, 2024, the fund's management contract was amended to incorporate administrative services previously covered under separate services agreements (transfer agent and pricing & bookkeeping). The amended contract incorporates a management fee rate that may vary by class. The Adviser or an affiliate pays certain expenses of managing and operating the fund out of each class's management fee. | |
| Fidelity, the Fidelity Investments Logo and all other Fidelity trademarks or service marks used herein are trademarks or service marks of FMR LLC. Any third-party marks that are used herein are trademarks or service marks of their respective owners. © 2025 FMR LLC. All rights reserved. |
| | For additional information about the Fund; including its prospectus, financial information, holdings and proxy information, scan the QR code or visit fundresearch.fidelity.com/prospectus/sec 1.9914377.100 1018-TSRA-0325 |
| |
| | ANNUAL SHAREHOLDER REPORT | AS OF DECEMBER 31, 2024 | This report describes changes to the Fund that occurred during the reporting period. |
| | VIP Total Market Index Portfolio VIP Total Market Index Portfolio Service Class 2 true |
| | | |
This annual shareholder report contains information about VIP Total Market Index Portfolio for the period January 1, 2024 to December 31, 2024. You can find additional information about the Fund at fundresearch.fidelity.com/prospectus/sec. You can also request this information by contacting us at 1-877-208-0098 or by sending an e-mail to funddocuments@fmr.com.
What were your Fund costs for the last year?(based on hypothetical $10,000 investment)
FUND COST (PREVIOUS YEAR)
| | Costs of a $10,000 investment | Costs paid as a percentage of a $10,000 investment | |
| Service Class 2 | $ 41 | 0.36% | |
What affected the Fund's performance this period?
•U.S. equities gained in 2024, driven by a sturdy economy, the Federal Reserve's long-anticipated pivot to cutting interest rates and the potential for artificial intelligence to drive transformative change.
•Against this backdrop, information technology gained roughly 36% and contributed most to the fund's performance for the fiscal year. Financials, which gained roughly 31%, also helped, as did communication services, which advanced 38%, lifted by the media & entertainment industry (+39%). The consumer discretionary sector rose roughly 27%, while industrials gained 17% and consumer staples advanced roughly 15%. Other contributors included the utilities (+23%), health care (+3%), energy (+6%), real estate (+5%) and materials (+0%) sectors.
•Turning to individual stocks, the top contributor was Nvidia (+171%), from the semiconductors & semiconductor equipment industry. From the same group, Broadcom (+110%) lifted the fund. Another notable contributor was Apple (+31%), a stock in the technology hardware & equipment category. In consumer discretionary distribution & retail, Amazon.com (+44%) boosted the fund. Lastly, Alphabet (+36%), a stock in the media & entertainment category, also contributed.
•Conversely, the biggest detractor was Intel (-60%), from the semiconductors & semiconductor equipment industry. From the same group, Advanced Micro Devices (-18%) detracted. In software & services, Adobe returned about -25% and hurt. Boeing (-32%), from the capital goods category, hurt the fund's performance. Lastly, CVS Health (-41%), from the health care equipment & services industry, also hurt the fund's performance.
How did the Fund perform over the life of Fund?
CUMULATIVE PERFORMANCE
April 17, 2018 through December 31, 2024.
Initial investment of $10,000.
Service Class 2 | $10,000 | $9,304 | $12,136 | $14,561 | $18,256 | $14,713 | $18,494 |
Fidelity U.S. Total Investable Market Index℠ | $10,000 | $9,303 | $12,188 | $14,691 | $18,516 | $14,960 | $18,872 |
S&P 500® Index | $10,000 | $9,394 | $12,351 | $14,624 | $18,822 | $15,413 | $19,465 |
| | 2018 | 2019 | 2020 | 2021 | 2022 | 2023 | 2024 |
AVERAGE ANNUAL TOTAL RETURNS:| | 1 Year | 5 Year | Life of Fund A |
| Service Class 2 | 23.38% | 13.46% | 13.08% |
| Fidelity U.S. Total Investable Market Index℠ | 23.88% | 13.91% | 13.49% |
| S&P 500® Index | 25.02% | 14.53% | 14.17% |
A From April 17, 2018
Visit institutional.fidelity.com for more recent performance information. |
The Fund's past performance is not a good predictor of the Fund's future performance. The graph and table do not reflect the deduction of taxes that a shareholder would pay on fund distributions or redemption of fund shares. |
Key Fund Statistics(as of December 31, 2024)
KEY FACTS | | |
| Fund Size | $1,189,118,361 | |
| Number of Holdings | 2,563 | |
| Total Advisory Fee | $930,037 | |
| Portfolio Turnover | 2% | |
What did the Fund invest in?
(as of December 31, 2024)
MARKET SECTORS (% of Fund's net assets) | | |
| Information Technology | 30.2 | |
| Financials | 13.8 | |
| Consumer Discretionary | 11.0 | |
| Health Care | 10.0 | |
| Industrials | 9.1 | |
| Communication Services | 8.6 | |
| Consumer Staples | 5.1 | |
| Energy | 3.2 | |
| Real Estate | 2.4 | |
| Utilities | 2.2 | |
| Materials | 2.1 | |
| |
| Common Stocks | 97.7 |
| Short-Term Investments and Net Other Assets (Liabilities) | 2.3 |
ASSET ALLOCATION (% of Fund's net assets) |
|
| | Common Stocks - 97.7 |
| | Short-Term Investments and Net Other Assets (Liabilities) - 2.3 |
| |
| United States | 99.4 |
| Ireland | 0.4 |
| China | 0.1 |
| Switzerland | 0.1 |
| United Kingdom | 0.0 |
| Canada | 0.0 |
| Bailiwick Of Jersey | 0.0 |
| Puerto Rico | 0.0 |
| Bermuda | 0.0 |
GEOGRAPHIC DIVERSIFICATION (% of Fund's net assets) |
|
| | United States - 99.4 |
| | Ireland - 0.4 |
| | China - 0.1 |
| | Switzerland - 0.1 |
| | United Kingdom - 0.0 |
| | Canada - 0.0 |
| | Bailiwick Of Jersey - 0.0 |
| | Puerto Rico - 0.0 |
| | Bermuda - 0.0 |
| |
TOP HOLDINGS(% of Fund's net assets) | | |
| Apple Inc | 6.6 | |
| NVIDIA Corp | 5.8 | |
| Microsoft Corp | 5.5 | |
| Amazon.com Inc | 3.5 | |
| Meta Platforms Inc Class A | 2.2 | |
| Alphabet Inc Class A | 2.0 | |
| Broadcom Inc | 2.0 | |
| Tesla Inc | 1.9 | |
| Alphabet Inc Class C | 1.6 | |
| Berkshire Hathaway Inc Class B | 1.5 | |
| | 32.6 | |
How has the Fund changed?
This is a summary of certain changes to the Fund since January 1, 2024. For more complete information, you may review the Fund's next prospectus, which we expect to be available by April 30, 2025 at fundresearch.fidelity.com/prospectus/sec or upon request at 1-877-208-0098 or by sending an e-mail to funddocuments@fmr.com.
Effective June 1, 2024, the fund's management contract was amended to incorporate administrative services previously covered under separate services agreements (transfer agent and pricing & bookkeeping). The amended contract incorporates a management fee rate that may vary by class. The Adviser or an affiliate pays certain expenses of managing and operating the fund out of each class's management fee. | |
| Fidelity, the Fidelity Investments Logo and all other Fidelity trademarks or service marks used herein are trademarks or service marks of FMR LLC. Any third-party marks that are used herein are trademarks or service marks of their respective owners. © 2025 FMR LLC. All rights reserved. |
| | For additional information about the Fund; including its prospectus, financial information, holdings and proxy information, scan the QR code or visit fundresearch.fidelity.com/prospectus/sec 1.9914379.100 3077-TSRA-0325 |
| |
| | ANNUAL SHAREHOLDER REPORT | AS OF DECEMBER 31, 2024 | This report describes changes to the Fund that occurred during the reporting period. |
| | VIP Emerging Markets Portfolio VIP Emerging Markets Portfolio Service Class 2 true |
| | | |
This annual shareholder report contains information about VIP Emerging Markets Portfolio for the period January 1, 2024 to December 31, 2024. You can find additional information about the Fund at fundresearch.fidelity.com/prospectus/sec. You can also request this information by contacting us at 1-877-208-0098 or by sending an e-mail to funddocuments@fmr.com.
What were your Fund costs for the last year?(based on hypothetical $10,000 investment)
FUND COST (PREVIOUS YEAR)
| | Costs of a $10,000 investment | Costs paid as a percentage of a $10,000 investment | |
| Service Class 2 | $ 119 | 1.14% | |
What affected the Fund's performance this period?
•International stocks gained in 2024, as resilient global economic growth, slowing inflation and global monetary easing provided support for stocks, despite geopolitical risk. However, stocks also faced challenges, including a steep sell-off after the U.S. presidential election in November due to the potential for new tariffs and a strengthening U.S. dollar.
•Against this backdrop, emerging-markets stock picks in Asia and Europe contributed to the fund's performance versus the MSCI Emerging Markets Net MA (29-Jun-2018) Linked Index for the year.
•By sector, security selection was the primary contributor, led by communication services, where our investment choices among media & entertainment firms helped most. Security selection in materials and health care also boosted the fund's relative result.
•The top individual relative contributor was an overweight in Tencent Holdings (+44%). The company was the fund's biggest holding at period end. Outsized exposure to Meituan (+87%) helped as well. The stock was among our largest positions in 2024. An overweight in China Life Insurance (+55%) further contributed. The company was one of our more sizable holdings this period.
•In contrast, from a regional standpoint, a non-benchmark allocation to developed markets detracted from the fund's relative return. Within the benchmark, picks in South Africa and Mexico notably detracted.
•By sector, the biggest detractors from performance versus the benchmark were security selection and an underweight in information technology. Picks in consumer staples and an overweight in materials also hurt.
•The biggest individual relative detractor was an overweight in Samsung Electronics (-40%), one of our largest holdings. Outsized exposure Wal Mart de Mexico (-35%) also hurt. This period we increased our investment in the stock, making it one of the fund's largest holdings.
•Meaningful changes in positioning include increased exposure to Mexico and a lower allocation to Brazil. By sector, noteworthy shifts include decreased exposure to materials and a higher allocation to consumer staples.
How did the Fund perform over the past 10 years?
CUMULATIVE PERFORMANCE
December 31, 2014 through December 31, 2024.
Initial investment of $10,000.
Service Class 2 | $10,000 | $8,969 | $9,234 | $13,578 | $11,112 | $14,356 | $18,789 | $18,336 | $14,601 | $15,986 | $17,538 |
MSCI Emerging Markets Index | $10,000 | $8,512 | $9,468 | $13,003 | $11,112 | $13,164 | $15,575 | $15,182 | $12,134 | $13,330 | $14,330 |
| | 2014 | 2015 | 2016 | 2017 | 2018 | 2019 | 2020 | 2021 | 2022 | 2023 | 2024 |
AVERAGE ANNUAL TOTAL RETURNS:| | 1 Year | 5 Year | 10 Year |
| Service Class 2 | 9.71% | 4.09% | 5.78% |
| MSCI Emerging Markets Index | 7.50% | 1.71% | 3.66% |
Visit institutional.fidelity.com for more recent performance information. |
The Fund's past performance is not a good predictor of the Fund's future performance. The graph and table do not reflect the deduction of taxes that a shareholder would pay on fund distributions or redemption of fund shares. |
Key Fund Statistics(as of December 31, 2024)
KEY FACTS | | |
| Fund Size | $1,093,134,890 | |
| Number of Holdings | 57 | |
| Total Advisory Fee | $9,193,754 | |
| Portfolio Turnover | 59% | |
What did the Fund invest in?
(as of December 31, 2024)
MARKET SECTORS (% of Fund's net assets) | | |
| Financials | 23.7 | |
| Information Technology | 18.5 | |
| Consumer Discretionary | 13.5 | |
| Communication Services | 11.6 | |
| Industrials | 9.8 | |
| Consumer Staples | 7.1 | |
| Materials | 6.5 | |
| Health Care | 4.7 | |
| Energy | 3.5 | |
| |
| Common Stocks | 98.9 |
| Short-Term Investments and Net Other Assets (Liabilities) | 1.1 |
ASSET ALLOCATION (% of Fund's net assets) |
|
| | Common Stocks - 98.9 |
| | Short-Term Investments and Net Other Assets (Liabilities) - 1.1 |
| |
| China | 32.7 |
| Taiwan | 13.7 |
| India | 10.1 |
| Korea (South) | 9.8 |
| Mexico | 5.7 |
| Brazil | 5.4 |
| South Africa | 4.6 |
| Greece | 3.1 |
| Hungary | 2.8 |
| Others | 12.1 |
GEOGRAPHIC DIVERSIFICATION (% of Fund's net assets) |
|
| | China - 32.7 |
| | Taiwan - 13.7 |
| | India - 10.1 |
| | Korea (South) - 9.8 |
| | Mexico - 5.7 |
| | Brazil - 5.4 |
| | South Africa - 4.6 |
| | Greece - 3.1 |
| | Hungary - 2.8 |
| | Others - 12.1 |
| |
TOP HOLDINGS(% of Fund's net assets) | | |
| Tencent Holdings Ltd | 9.3 | |
| Taiwan Semiconductor Manufacturing Co Ltd | 8.6 | |
| Samsung Electronics Co Ltd | 5.2 | |
| Wal-Mart de Mexico SAB de CV Series V | 3.5 | |
| Tata Consultancy Services Ltd | 3.2 | |
| Haier Smart Home Co Ltd A Shares (China) | 3.1 | |
| Meituan B Shares | 3.1 | |
| China Life Insurance Co Ltd H Shares | 2.6 | |
| Credicorp Ltd | 2.5 | |
| Powszechna Kasa Oszczednosci Bank Polski SA | 2.5 | |
| | 43.6 | |
How has the Fund changed?
This is a summary of certain changes to the Fund since January 1, 2024. For more complete information, you may review the Fund's next prospectus, which we expect to be available by April 30, 2025 at fundresearch.fidelity.com/prospectus/sec or upon request at 1-877-208-0098 or by sending an e-mail to funddocuments@fmr.com.
The fund's transfer agent and pricing & bookkeeping fees were changed to a fixed rate effective December 1, 2023. Effective March 1, 2024, the fund's management contract was amended to incorporate administrative services previously covered under separate services agreements (transfer agent and pricing & bookkeeping). The amended contract incorporates a management fee rate that may vary by class. The Adviser or an affiliate pays certain expenses of managing and operating the fund out of each class's management fee. | The fund's sub-advisory agreement with FIL Investments (Japan) Limited was not renewed.
|
| Fidelity, the Fidelity Investments Logo and all other Fidelity trademarks or service marks used herein are trademarks or service marks of FMR LLC. Any third-party marks that are used herein are trademarks or service marks of their respective owners. © 2025 FMR LLC. All rights reserved. |
| | For additional information about the Fund; including its prospectus, financial information, holdings and proxy information, scan the QR code or visit fundresearch.fidelity.com/prospectus/sec 1.9914328.100 2023-TSRA-0325 |
| |
| | ANNUAL SHAREHOLDER REPORT | AS OF DECEMBER 31, 2024 | This report describes changes to the Fund that occurred during the reporting period. |
| | VIP Emerging Markets Portfolio VIP Emerging Markets Portfolio Service Class true |
| | | |
This annual shareholder report contains information about VIP Emerging Markets Portfolio for the period January 1, 2024 to December 31, 2024. You can find additional information about the Fund at fundresearch.fidelity.com/prospectus/sec. You can also request this information by contacting us at 1-877-208-0098 or by sending an e-mail to funddocuments@fmr.com.
What were your Fund costs for the last year?(based on hypothetical $10,000 investment)
FUND COST (PREVIOUS YEAR)
| | Costs of a $10,000 investment | Costs paid as a percentage of a $10,000 investment | |
| Service Class | $ 104 | 0.99% | |
What affected the Fund's performance this period?
•International stocks gained in 2024, as resilient global economic growth, slowing inflation and global monetary easing provided support for stocks, despite geopolitical risk. However, stocks also faced challenges, including a steep sell-off after the U.S. presidential election in November due to the potential for new tariffs and a strengthening U.S. dollar.
•Against this backdrop, emerging-markets stock picks in Asia and Europe contributed to the fund's performance versus the MSCI Emerging Markets Net MA (29-Jun-2018) Linked Index for the year.
•By sector, security selection was the primary contributor, led by communication services, where our investment choices among media & entertainment firms helped most. Security selection in materials and health care also boosted the fund's relative result.
•The top individual relative contributor was an overweight in Tencent Holdings (+44%). The company was the fund's biggest holding at period end. Outsized exposure to Meituan (+87%) helped as well. The stock was among our largest positions in 2024. An overweight in China Life Insurance (+55%) further contributed. The company was one of our more sizable holdings this period.
•In contrast, from a regional standpoint, a non-benchmark allocation to developed markets detracted from the fund's relative return. Within the benchmark, picks in South Africa and Mexico notably detracted.
•By sector, the biggest detractors from performance versus the benchmark were security selection and an underweight in information technology. Picks in consumer staples and an overweight in materials also hurt.
•The biggest individual relative detractor was an overweight in Samsung Electronics (-40%), one of our largest holdings. Outsized exposure Wal Mart de Mexico (-35%) also hurt. This period we increased our investment in the stock, making it one of the fund's largest holdings.
•Meaningful changes in positioning include increased exposure to Mexico and a lower allocation to Brazil. By sector, noteworthy shifts include decreased exposure to materials and a higher allocation to consumer staples.
How did the Fund perform over the past 10 years?
CUMULATIVE PERFORMANCE
December 31, 2014 through December 31, 2024.
Initial investment of $10,000.
Service Class | $10,000 | $8,985 | $9,266 | $13,639 | $11,181 | $14,458 | $18,964 | $18,531 | $14,777 | $16,197 | $17,796 |
MSCI Emerging Markets Index | $10,000 | $8,512 | $9,468 | $13,003 | $11,112 | $13,164 | $15,575 | $15,182 | $12,134 | $13,330 | $14,330 |
| | 2014 | 2015 | 2016 | 2017 | 2018 | 2019 | 2020 | 2021 | 2022 | 2023 | 2024 |
AVERAGE ANNUAL TOTAL RETURNS:| | 1 Year | 5 Year | 10 Year |
| Service Class | 9.87% | 4.24% | 5.93% |
| MSCI Emerging Markets Index | 7.50% | 1.71% | 3.66% |
Visit institutional.fidelity.com for more recent performance information. |
The Fund's past performance is not a good predictor of the Fund's future performance. The graph and table do not reflect the deduction of taxes that a shareholder would pay on fund distributions or redemption of fund shares. |
Key Fund Statistics(as of December 31, 2024)
KEY FACTS | | |
| Fund Size | $1,093,134,890 | |
| Number of Holdings | 57 | |
| Total Advisory Fee | $9,193,754 | |
| Portfolio Turnover | 59% | |
What did the Fund invest in?
(as of December 31, 2024)
MARKET SECTORS (% of Fund's net assets) | | |
| Financials | 23.7 | |
| Information Technology | 18.5 | |
| Consumer Discretionary | 13.5 | |
| Communication Services | 11.6 | |
| Industrials | 9.8 | |
| Consumer Staples | 7.1 | |
| Materials | 6.5 | |
| Health Care | 4.7 | |
| Energy | 3.5 | |
| |
| Common Stocks | 98.9 |
| Short-Term Investments and Net Other Assets (Liabilities) | 1.1 |
ASSET ALLOCATION (% of Fund's net assets) |
|
| | Common Stocks - 98.9 |
| | Short-Term Investments and Net Other Assets (Liabilities) - 1.1 |
| |
| China | 32.7 |
| Taiwan | 13.7 |
| India | 10.1 |
| Korea (South) | 9.8 |
| Mexico | 5.7 |
| Brazil | 5.4 |
| South Africa | 4.6 |
| Greece | 3.1 |
| Hungary | 2.8 |
| Others | 12.1 |
GEOGRAPHIC DIVERSIFICATION (% of Fund's net assets) |
|
| | China - 32.7 |
| | Taiwan - 13.7 |
| | India - 10.1 |
| | Korea (South) - 9.8 |
| | Mexico - 5.7 |
| | Brazil - 5.4 |
| | South Africa - 4.6 |
| | Greece - 3.1 |
| | Hungary - 2.8 |
| | Others - 12.1 |
| |
TOP HOLDINGS(% of Fund's net assets) | | |
| Tencent Holdings Ltd | 9.3 | |
| Taiwan Semiconductor Manufacturing Co Ltd | 8.6 | |
| Samsung Electronics Co Ltd | 5.2 | |
| Wal-Mart de Mexico SAB de CV Series V | 3.5 | |
| Tata Consultancy Services Ltd | 3.2 | |
| Haier Smart Home Co Ltd A Shares (China) | 3.1 | |
| Meituan B Shares | 3.1 | |
| China Life Insurance Co Ltd H Shares | 2.6 | |
| Credicorp Ltd | 2.5 | |
| Powszechna Kasa Oszczednosci Bank Polski SA | 2.5 | |
| | 43.6 | |
How has the Fund changed?
This is a summary of certain changes to the Fund since January 1, 2024. For more complete information, you may review the Fund's next prospectus, which we expect to be available by April 30, 2025 at fundresearch.fidelity.com/prospectus/sec or upon request at 1-877-208-0098 or by sending an e-mail to funddocuments@fmr.com.
The fund's transfer agent and pricing & bookkeeping fees were changed to a fixed rate effective December 1, 2023. Effective March 1, 2024, the fund's management contract was amended to incorporate administrative services previously covered under separate services agreements (transfer agent and pricing & bookkeeping). The amended contract incorporates a management fee rate that may vary by class. The Adviser or an affiliate pays certain expenses of managing and operating the fund out of each class's management fee. | The fund's sub-advisory agreement with FIL Investments (Japan) Limited was not renewed.
|
| Fidelity, the Fidelity Investments Logo and all other Fidelity trademarks or service marks used herein are trademarks or service marks of FMR LLC. Any third-party marks that are used herein are trademarks or service marks of their respective owners. © 2025 FMR LLC. All rights reserved. |
| | For additional information about the Fund; including its prospectus, financial information, holdings and proxy information, scan the QR code or visit fundresearch.fidelity.com/prospectus/sec 1.9914327.100 2022-TSRA-0325 |
| |
| | ANNUAL SHAREHOLDER REPORT | AS OF DECEMBER 31, 2024 | This report describes changes to the Fund that occurred during the reporting period. |
| | VIP International Capital Appreciation Portfolio VIP International Capital Appreciation Portfolio Initial Class true |
| | | |
This annual shareholder report contains information about VIP International Capital Appreciation Portfolio for the period January 1, 2024 to December 31, 2024. You can find additional information about the Fund at fundresearch.fidelity.com/prospectus/sec. You can also request this information by contacting us at 1-877-208-0098 or by sending an e-mail to funddocuments@fmr.com.
What were your Fund costs for the last year?(based on hypothetical $10,000 investment)
FUND COST (PREVIOUS YEAR)
| | Costs of a $10,000 investment | Costs paid as a percentage of a $10,000 investment | |
| Initial Class | $ 81 | 0.78% | |
What affected the Fund's performance this period?
•International stocks gained in 2024, as resilient global economic growth, slowing inflation and global monetary easing provided support for stocks, despite geopolitical risk. However, foreign stocks also faced challenges, including a steep sell-off after the U.S. presidential election in November due to the potential for new tariffs and a strengthening U.S. dollar.
•Against this backdrop, a non-benchmark allocation to the United States, along with picks in Taiwan and Europe ex U.K., primarily in Germany, contributed to the fund's performance versus the MSCI All Country World ex USA Net MA (1-Nov-2001) Linked Index for the year.
•By sector, an overweight in information technology, especially in the semiconductors & semiconductor equipment industry, helped most. Stock picks in materials also boosted relative performance.
•The top individual relative contributor was our non-benchmark stake in Nvidia (+164%). The stock was not held at period end. An out-of-index position in Broadcom gained approximately 64% and helped as well. This was an investment we established in 2024. An overweight in Taiwan Semiconductor Manufacturing (+72%) further bolstered performance and was the fund's largest holding.
•In contrast, from a regional standpoint, picks and an underweight in Japan and stock selection in Canada detracted from the fund's relative result.
•By sector, the biggest detractor from performance versus the benchmark was security selection among health care firms. Stock picks in consumer staples also hampered the fund's result.
•The biggest individual relative detractor was our stake in OBIC (-28%). The stock was not held at period end. An underweight in Shopify (+36%) also hurt. Outsized exposure to Dassault Systèmes (-25%) also weighed on performance. The stock was not held at period end.
•Notable changes in positioning include increased exposure to China and Germany. By sector, meaningful shifts include increased exposure to communication services and a lower allocation to consumer staples.
How did the Fund perform over the past 10 years?
CUMULATIVE PERFORMANCE
December 31, 2014 through December 31, 2024.
Initial investment of $10,000.
Initial Class | $10,000 | $10,322 | $10,014 | $13,665 | $11,923 | $15,896 | $19,423 | $21,829 | $16,067 | $20,485 | $22,164 |
MSCI ACWI (All Country World Index) ex USA Index | $10,000 | $9,446 | $9,889 | $12,599 | $10,830 | $13,184 | $14,609 | $15,776 | $13,273 | $15,372 | $16,251 |
| | 2014 | 2015 | 2016 | 2017 | 2018 | 2019 | 2020 | 2021 | 2022 | 2023 | 2024 |
AVERAGE ANNUAL TOTAL RETURNS:| | 1 Year | 5 Year | 10 Year |
| Initial Class | 8.19% | 6.87% | 8.28% |
| MSCI ACWI (All Country World Index) ex USA Index | 5.72% | 4.27% | 4.98% |
Visit institutional.fidelity.com for more recent performance information. |
The Fund's past performance is not a good predictor of the Fund's future performance. The graph and table do not reflect the deduction of taxes that a shareholder would pay on fund distributions or redemption of fund shares. |
Key Fund Statistics(as of December 31, 2024)
KEY FACTS | | |
| Fund Size | $696,025,885 | |
| Number of Holdings | 63 | |
| Total Advisory Fee | $5,236,062 | |
| Portfolio Turnover | 74% | |
What did the Fund invest in?
(as of December 31, 2024)
MARKET SECTORS (% of Fund's net assets) | | |
| Industrials | 29.4 | |
| Financials | 24.8 | |
| Information Technology | 16.1 | |
| Consumer Discretionary | 13.1 | |
| Materials | 7.2 | |
| Health Care | 4.7 | |
| Communication Services | 4.2 | |
| |
| Common Stocks | 99.5 |
| Short-Term Investments and Net Other Assets (Liabilities) | 0.5 |
ASSET ALLOCATION (% of Fund's net assets) |
|
| | Common Stocks - 99.5 |
| | Short-Term Investments and Net Other Assets (Liabilities) - 0.5 |
| |
| United States | 21.1 |
| United Kingdom | 10.3 |
| France | 9.6 |
| Japan | 8.5 |
| India | 7.7 |
| China | 7.1 |
| Germany | 5.8 |
| Netherlands | 5.4 |
| Canada | 4.7 |
| Others | 19.8 |
GEOGRAPHIC DIVERSIFICATION (% of Fund's net assets) |
|
| | United States - 21.1 |
| | United Kingdom - 10.3 |
| | France - 9.6 |
| | Japan - 8.5 |
| | India - 7.7 |
| | China - 7.1 |
| | Germany - 5.8 |
| | Netherlands - 5.4 |
| | Canada - 4.7 |
| | Others - 19.8 |
| |
TOP HOLDINGS(% of Fund's net assets) | | |
| Taiwan Semiconductor Manufacturing Co Ltd | 4.6 | |
| Tencent Holdings Ltd | 2.7 | |
| SAP SE | 2.6 | |
| ASML Holding NV | 2.5 | |
| Novo Nordisk A/S Series B | 2.4 | |
| LVMH Moet Hennessy Louis Vuitton SE | 2.4 | |
| Schneider Electric SE | 2.1 | |
| Hitachi Ltd | 1.9 | |
| Hermes International SCA | 1.8 | |
| Recruit Holdings Co Ltd | 1.8 | |
| | 24.8 | |
How has the Fund changed?
This is a summary of certain changes to the Fund since January 1, 2024. For more complete information, you may review the Fund's next prospectus, which we expect to be available by April 30, 2025 at fundresearch.fidelity.com/prospectus/sec or upon request at 1-877-208-0098 or by sending an e-mail to funddocuments@fmr.com.
The fund's transfer agent and pricing & bookkeeping fees were changed to a fixed rate effective December 1, 2023. Effective March 1, 2024, the fund's management contract was amended to incorporate administrative services previously covered under separate services agreements (transfer agent and pricing & bookkeeping). The amended contract incorporates a management fee rate that may vary by class. The Adviser or an affiliate pays certain expenses of managing and operating the fund out of each class's management fee. | |
| Fidelity, the Fidelity Investments Logo and all other Fidelity trademarks or service marks used herein are trademarks or service marks of FMR LLC. Any third-party marks that are used herein are trademarks or service marks of their respective owners. © 2025 FMR LLC. All rights reserved. |
| | For additional information about the Fund; including its prospectus, financial information, holdings and proxy information, scan the QR code or visit fundresearch.fidelity.com/prospectus/sec 1.9914264.100 1390-TSRA-0325 |
| |
| | ANNUAL SHAREHOLDER REPORT | AS OF DECEMBER 31, 2024 | This report describes changes to the Fund that occurred during the reporting period. |
| | VIP International Capital Appreciation Portfolio VIP International Capital Appreciation Portfolio Service Class 2 true |
| | | |
This annual shareholder report contains information about VIP International Capital Appreciation Portfolio for the period January 1, 2024 to December 31, 2024. You can find additional information about the Fund at fundresearch.fidelity.com/prospectus/sec. You can also request this information by contacting us at 1-877-208-0098 or by sending an e-mail to funddocuments@fmr.com.
What were your Fund costs for the last year?(based on hypothetical $10,000 investment)
FUND COST (PREVIOUS YEAR)
| | Costs of a $10,000 investment | Costs paid as a percentage of a $10,000 investment | |
| Service Class 2 | $ 108 | 1.04% | |
What affected the Fund's performance this period?
•International stocks gained in 2024, as resilient global economic growth, slowing inflation and global monetary easing provided support for stocks, despite geopolitical risk. However, foreign stocks also faced challenges, including a steep sell-off after the U.S. presidential election in November due to the potential for new tariffs and a strengthening U.S. dollar.
•Against this backdrop, a non-benchmark allocation to the United States, along with picks in Taiwan and Europe ex U.K., primarily in Germany, contributed to the fund's performance versus the MSCI All Country World ex USA Net MA (1-Nov-2001) Linked Index for the year.
•By sector, an overweight in information technology, especially in the semiconductors & semiconductor equipment industry, helped most. Stock picks in materials also boosted relative performance.
•The top individual relative contributor was our non-benchmark stake in Nvidia (+164%). The stock was not held at period end. An out-of-index position in Broadcom gained approximately 64% and helped as well. This was an investment we established in 2024. An overweight in Taiwan Semiconductor Manufacturing (+72%) further bolstered performance and was the fund's largest holding.
•In contrast, from a regional standpoint, picks and an underweight in Japan and stock selection in Canada detracted from the fund's relative result.
•By sector, the biggest detractor from performance versus the benchmark was security selection among health care firms. Stock picks in consumer staples also hampered the fund's result.
•The biggest individual relative detractor was our stake in OBIC (-28%). The stock was not held at period end. An underweight in Shopify (+36%) also hurt. Outsized exposure to Dassault Systèmes (-25%) also weighed on performance. The stock was not held at period end.
•Notable changes in positioning include increased exposure to China and Germany. By sector, meaningful shifts include increased exposure to communication services and a lower allocation to consumer staples.
How did the Fund perform over the past 10 years?
CUMULATIVE PERFORMANCE
December 31, 2014 through December 31, 2024.
Initial investment of $10,000.
Service Class 2 | $10,000 | $10,296 | $9,969 | $13,567 | $11,806 | $15,694 | $19,133 | $21,450 | $15,750 | $20,031 | $21,618 |
MSCI ACWI (All Country World Index) ex USA Index | $10,000 | $9,446 | $9,889 | $12,599 | $10,830 | $13,184 | $14,609 | $15,776 | $13,273 | $15,372 | $16,251 |
| | 2014 | 2015 | 2016 | 2017 | 2018 | 2019 | 2020 | 2021 | 2022 | 2023 | 2024 |
AVERAGE ANNUAL TOTAL RETURNS:| | 1 Year | 5 Year | 10 Year |
| Service Class 2 | 7.92% | 6.61% | 8.01% |
| MSCI ACWI (All Country World Index) ex USA Index | 5.72% | 4.27% | 4.98% |
Visit institutional.fidelity.com for more recent performance information. |
The Fund's past performance is not a good predictor of the Fund's future performance. The graph and table do not reflect the deduction of taxes that a shareholder would pay on fund distributions or redemption of fund shares. |
Key Fund Statistics(as of December 31, 2024)
KEY FACTS | | |
| Fund Size | $696,025,885 | |
| Number of Holdings | 63 | |
| Total Advisory Fee | $5,236,062 | |
| Portfolio Turnover | 74% | |
What did the Fund invest in?
(as of December 31, 2024)
MARKET SECTORS (% of Fund's net assets) | | |
| Industrials | 29.4 | |
| Financials | 24.8 | |
| Information Technology | 16.1 | |
| Consumer Discretionary | 13.1 | |
| Materials | 7.2 | |
| Health Care | 4.7 | |
| Communication Services | 4.2 | |
| |
| Common Stocks | 99.5 |
| Short-Term Investments and Net Other Assets (Liabilities) | 0.5 |
ASSET ALLOCATION (% of Fund's net assets) |
|
| | Common Stocks - 99.5 |
| | Short-Term Investments and Net Other Assets (Liabilities) - 0.5 |
| |
| United States | 21.1 |
| United Kingdom | 10.3 |
| France | 9.6 |
| Japan | 8.5 |
| India | 7.7 |
| China | 7.1 |
| Germany | 5.8 |
| Netherlands | 5.4 |
| Canada | 4.7 |
| Others | 19.8 |
GEOGRAPHIC DIVERSIFICATION (% of Fund's net assets) |
|
| | United States - 21.1 |
| | United Kingdom - 10.3 |
| | France - 9.6 |
| | Japan - 8.5 |
| | India - 7.7 |
| | China - 7.1 |
| | Germany - 5.8 |
| | Netherlands - 5.4 |
| | Canada - 4.7 |
| | Others - 19.8 |
| |
TOP HOLDINGS(% of Fund's net assets) | | |
| Taiwan Semiconductor Manufacturing Co Ltd | 4.6 | |
| Tencent Holdings Ltd | 2.7 | |
| SAP SE | 2.6 | |
| ASML Holding NV | 2.5 | |
| Novo Nordisk A/S Series B | 2.4 | |
| LVMH Moet Hennessy Louis Vuitton SE | 2.4 | |
| Schneider Electric SE | 2.1 | |
| Hitachi Ltd | 1.9 | |
| Hermes International SCA | 1.8 | |
| Recruit Holdings Co Ltd | 1.8 | |
| | 24.8 | |
How has the Fund changed?
This is a summary of certain changes to the Fund since January 1, 2024. For more complete information, you may review the Fund's next prospectus, which we expect to be available by April 30, 2025 at fundresearch.fidelity.com/prospectus/sec or upon request at 1-877-208-0098 or by sending an e-mail to funddocuments@fmr.com.
The fund's transfer agent and pricing & bookkeeping fees were changed to a fixed rate effective December 1, 2023. Effective March 1, 2024, the fund's management contract was amended to incorporate administrative services previously covered under separate services agreements (transfer agent and pricing & bookkeeping). The amended contract incorporates a management fee rate that may vary by class. The Adviser or an affiliate pays certain expenses of managing and operating the fund out of each class's management fee. | |
| Fidelity, the Fidelity Investments Logo and all other Fidelity trademarks or service marks used herein are trademarks or service marks of FMR LLC. Any third-party marks that are used herein are trademarks or service marks of their respective owners. © 2025 FMR LLC. All rights reserved. |
| | For additional information about the Fund; including its prospectus, financial information, holdings and proxy information, scan the QR code or visit fundresearch.fidelity.com/prospectus/sec 1.9914266.100 1392-TSRA-0325 |
| |
| | ANNUAL SHAREHOLDER REPORT | AS OF DECEMBER 31, 2024 | This report describes changes to the Fund that occurred during the reporting period. |
| | VIP International Index Portfolio VIP International Index Portfolio Service Class true |
| | | |
This annual shareholder report contains information about VIP International Index Portfolio for the period January 1, 2024 to December 31, 2024. You can find additional information about the Fund at fundresearch.fidelity.com/prospectus/sec. You can also request this information by contacting us at 1-877-208-0098 or by sending an e-mail to funddocuments@fmr.com.
What were your Fund costs for the last year?(based on hypothetical $10,000 investment)
FUND COST (PREVIOUS YEAR)
| | Costs of a $10,000 investment | Costs paid as a percentage of a $10,000 investment | |
| Service Class | $ 27 | 0.26% | |
What affected the Fund's performance this period?
•International stocks gained in 2024, as resilient global economic growth, slowing inflation and global monetary easing provided support for stocks, despite geopolitical risk. However, stocks also faced challenges, including a steep sell-off after the U.S. presidential election in November due to the potential for new tariffs and a strengthening U.S. dollar.
•Against this backdrop, emerging markets, led by Taiwan (+30%), gained roughly 5% and contributed most to the fund's performance for the fiscal year, followed by Japan (+8%).
•By sector, financials gained 18% and contributed most. Information technology stocks also helped, gaining approximately 13%. The industrials sector rose 8%, boosted by the capital goods industry (+10%). Other contributors included the communication services (+15%) and consumer discretionary (+4%) sectors.
•Conversely, from a sector standpoint, materials returned roughly -13% and detracted most. Consumer staples (-7%), hampered by the food, beverage & tobacco industry (-10%), and energy (-5%) also hurt. Other detractors included the health care (-2%), real estate (-4%) and utilities (-2%) sectors.
•Turning to individual stocks, the biggest contributor was Taiwam Semiconductor Manufacturing (+72%), from the semiconductors & semiconductor equipment category. Tencent Holdings (+44%), from the media & entertainment category, boosted the fund. In software & services, SAP gained about 61% and boosted the fund. Hitachi, within the capital goods category, gained approximately 75% and boosted the fund. Lastly, Recruit Holdings, within the commercial & professional services group, gained 68% and also helped.
•In contrast, the biggest detractor was Samsung Electronics (-39%), from the technology hardware & equipment group. In food, beverage & tobacco, Nestle (-27%) hurt the fund's performance. Novo-Nordisk, within the pharmaceuticals, biotechnology & life sciences industry, returned about -15% and detracted. BHP, within the materials sector, returned -25% and detracted. Lastly, PDD, within the consumer discretionary distribution & retail category, returned -34% and also detracted.
How did the Fund perform over the life of Fund?
CUMULATIVE PERFORMANCE
April 11, 2019 through December 31, 2024.
Initial investment of $10,000.
Service Class | $10,000 | $10,815 | $11,961 | $12,876 | $10,799 | $12,531 |
Fidelity Global ex U.S. Index℠ | $10,000 | $10,852 | $12,068 | $13,073 | $10,982 | $12,813 |
MSCI ACWI (All Country World Index) ex USA Index | $10,000 | $10,793 | $11,960 | $12,915 | $10,866 | $12,585 |
| | 2019 | 2020 | 2021 | 2022 | 2023 | 2024 |
AVERAGE ANNUAL TOTAL RETURNS:| | 1 Year | 5 Year | Life of Fund A |
| Service Class | 5.01% | 4.00% | 4.91% |
| Fidelity Global ex U.S. Index℠ | 5.70% | 4.53% | 5.44% |
| MSCI ACWI (All Country World Index) ex USA Index | 5.72% | 4.27% | 5.11% |
A From April 11, 2019
Visit institutional.fidelity.com for more recent performance information. |
The Fund's past performance is not a good predictor of the Fund's future performance. The graph and table do not reflect the deduction of taxes that a shareholder would pay on fund distributions or redemption of fund shares. |
Key Fund Statistics(as of December 31, 2024)
KEY FACTS | | |
| Fund Size | $612,795,347 | |
| Number of Holdings | 2,236 | |
| Total Advisory Fee | $829,632 | |
| Portfolio Turnover | 5% | |
What did the Fund invest in?
(as of December 31, 2024)
MARKET SECTORS (% of Fund's net assets) | | |
| Financials | 24.2 | |
| Industrials | 14.2 | |
| Information Technology | 13.5 | |
| Consumer Discretionary | 10.8 | |
| Health Care | 7.8 | |
| Consumer Staples | 6.7 | |
| Materials | 5.9 | |
| Communication Services | 5.4 | |
| Energy | 4.4 | |
| Utilities | 2.8 | |
| Real Estate | 1.8 | |
| |
| Common Stocks | 97.2 |
| Preferred Stocks | 0.3 |
| Short-Term Investments and Net Other Assets (Liabilities) | 2.5 |
ASSET ALLOCATION (% of Fund's net assets) |
|
| | Common Stocks - 97.2 |
| | Preferred Stocks - 0.3 |
| | Short-Term Investments and Net Other Assets (Liabilities) - 2.5 |
| |
| Japan | 16.8 |
| United States | 8.9 |
| Canada | 7.7 |
| United Kingdom | 7.1 |
| China | 6.7 |
| Taiwan | 6.0 |
| Germany | 5.3 |
| France | 5.2 |
| Australia | 4.7 |
| Others | 31.6 |
GEOGRAPHIC DIVERSIFICATION (% of Fund's net assets) |
|
| | Japan - 16.8 |
| | United States - 8.9 |
| | Canada - 7.7 |
| | United Kingdom - 7.1 |
| | China - 6.7 |
| | Taiwan - 6.0 |
| | Germany - 5.3 |
| | France - 5.2 |
| | Australia - 4.7 |
| | Others - 31.6 |
| |
TOP HOLDINGS(% of Fund's net assets) | | |
| Taiwan Semiconductor Manufacturing Co Ltd | 3.0 | |
| Tencent Holdings Ltd | 1.2 | |
| ASML Holding NV | 1.1 | |
| Novo Nordisk A/S Series B | 1.0 | |
| Toyota Motor Corp | 1.0 | |
| SAP SE | 0.9 | |
| Nestle SA | 0.8 | |
| Roche Holding AG | 0.8 | |
| Astrazeneca PLC | 0.7 | |
| Shell PLC | 0.7 | |
| | 11.2 | |
How has the Fund changed?
This is a summary of certain changes to the Fund since January 1, 2024. For more complete information, you may review the Fund's next prospectus, which we expect to be available by April 30, 2025 at fundresearch.fidelity.com/prospectus/sec or upon request at 1-877-208-0098 or by sending an e-mail to funddocuments@fmr.com.
Effective June 1, 2024, the fund's management contract was amended to incorporate administrative services previously covered under separate services agreements (transfer agent and pricing & bookkeeping). The amended contract incorporates a management fee rate that may vary by class. The Adviser or an affiliate pays certain expenses of managing and operating the fund out of each class's management fee. | |
| Fidelity, the Fidelity Investments Logo and all other Fidelity trademarks or service marks used herein are trademarks or service marks of FMR LLC. Any third-party marks that are used herein are trademarks or service marks of their respective owners. © 2025 FMR LLC. All rights reserved. |
| | For additional information about the Fund; including its prospectus, financial information, holdings and proxy information, scan the QR code or visit fundresearch.fidelity.com/prospectus/sec 1.9914374.100 1017-TSRA-0325 |
| |
| | ANNUAL SHAREHOLDER REPORT | AS OF DECEMBER 31, 2024 | This report describes changes to the Fund that occurred during the reporting period. |
| | VIP Total Market Index Portfolio VIP Total Market Index Portfolio Initial Class true |
| | | |
This annual shareholder report contains information about VIP Total Market Index Portfolio for the period January 1, 2024 to December 31, 2024. You can find additional information about the Fund at fundresearch.fidelity.com/prospectus/sec. You can also request this information by contacting us at 1-877-208-0098 or by sending an e-mail to funddocuments@fmr.com.
What were your Fund costs for the last year?(based on hypothetical $10,000 investment)
FUND COST (PREVIOUS YEAR)
| | Costs of a $10,000 investment | Costs paid as a percentage of a $10,000 investment | |
| Initial Class | $ 13 | 0.11% | |
What affected the Fund's performance this period?
•U.S. equities gained in 2024, driven by a sturdy economy, the Federal Reserve's long-anticipated pivot to cutting interest rates and the potential for artificial intelligence to drive transformative change.
•Against this backdrop, information technology gained roughly 36% and contributed most to the fund's performance for the fiscal year. Financials, which gained roughly 31%, also helped, as did communication services, which advanced 38%, lifted by the media & entertainment industry (+39%). The consumer discretionary sector rose roughly 27%, while industrials gained 17% and consumer staples advanced roughly 15%. Other contributors included the utilities (+23%), health care (+3%), energy (+6%), real estate (+5%) and materials (+0%) sectors.
•Turning to individual stocks, the top contributor was Nvidia (+171%), from the semiconductors & semiconductor equipment industry. From the same group, Broadcom (+110%) lifted the fund. Another notable contributor was Apple (+31%), a stock in the technology hardware & equipment category. In consumer discretionary distribution & retail, Amazon.com (+44%) boosted the fund. Lastly, Alphabet (+36%), a stock in the media & entertainment category, also contributed.
•Conversely, the biggest detractor was Intel (-60%), from the semiconductors & semiconductor equipment industry. From the same group, Advanced Micro Devices (-18%) detracted. In software & services, Adobe returned about -25% and hurt. Boeing (-32%), from the capital goods category, hurt the fund's performance. Lastly, CVS Health (-41%), from the health care equipment & services industry, also hurt the fund's performance.
How did the Fund perform over the life of Fund?
CUMULATIVE PERFORMANCE
April 17, 2018 through December 31, 2024.
Initial investment of $10,000.
Initial Class | $10,000 | $9,324 | $12,186 | $14,660 | $18,426 | $14,885 | $18,765 |
Fidelity U.S. Total Investable Market Index℠ | $10,000 | $9,303 | $12,188 | $14,691 | $18,516 | $14,960 | $18,872 |
S&P 500® Index | $10,000 | $9,394 | $12,351 | $14,624 | $18,822 | $15,413 | $19,465 |
| | 2018 | 2019 | 2020 | 2021 | 2022 | 2023 | 2024 |
AVERAGE ANNUAL TOTAL RETURNS:| | 1 Year | 5 Year | Life of Fund A |
| Initial Class | 23.69% | 13.75% | 13.37% |
| Fidelity U.S. Total Investable Market Index℠ | 23.88% | 13.91% | 13.49% |
| S&P 500® Index | 25.02% | 14.53% | 14.17% |
A From April 17, 2018
Visit institutional.fidelity.com for more recent performance information. |
The Fund's past performance is not a good predictor of the Fund's future performance. The graph and table do not reflect the deduction of taxes that a shareholder would pay on fund distributions or redemption of fund shares. |
Key Fund Statistics(as of December 31, 2024)
KEY FACTS | | |
| Fund Size | $1,189,118,361 | |
| Number of Holdings | 2,563 | |
| Total Advisory Fee | $930,037 | |
| Portfolio Turnover | 2% | |
What did the Fund invest in?
(as of December 31, 2024)
MARKET SECTORS (% of Fund's net assets) | | |
| Information Technology | 30.2 | |
| Financials | 13.8 | |
| Consumer Discretionary | 11.0 | |
| Health Care | 10.0 | |
| Industrials | 9.1 | |
| Communication Services | 8.6 | |
| Consumer Staples | 5.1 | |
| Energy | 3.2 | |
| Real Estate | 2.4 | |
| Utilities | 2.2 | |
| Materials | 2.1 | |
| |
| Common Stocks | 97.7 |
| Short-Term Investments and Net Other Assets (Liabilities) | 2.3 |
ASSET ALLOCATION (% of Fund's net assets) |
|
| | Common Stocks - 97.7 |
| | Short-Term Investments and Net Other Assets (Liabilities) - 2.3 |
| |
| United States | 99.4 |
| Ireland | 0.4 |
| China | 0.1 |
| Switzerland | 0.1 |
| United Kingdom | 0.0 |
| Canada | 0.0 |
| Bailiwick Of Jersey | 0.0 |
| Puerto Rico | 0.0 |
| Bermuda | 0.0 |
GEOGRAPHIC DIVERSIFICATION (% of Fund's net assets) |
|
| | United States - 99.4 |
| | Ireland - 0.4 |
| | China - 0.1 |
| | Switzerland - 0.1 |
| | United Kingdom - 0.0 |
| | Canada - 0.0 |
| | Bailiwick Of Jersey - 0.0 |
| | Puerto Rico - 0.0 |
| | Bermuda - 0.0 |
| |
TOP HOLDINGS(% of Fund's net assets) | | |
| Apple Inc | 6.6 | |
| NVIDIA Corp | 5.8 | |
| Microsoft Corp | 5.5 | |
| Amazon.com Inc | 3.5 | |
| Meta Platforms Inc Class A | 2.2 | |
| Alphabet Inc Class A | 2.0 | |
| Broadcom Inc | 2.0 | |
| Tesla Inc | 1.9 | |
| Alphabet Inc Class C | 1.6 | |
| Berkshire Hathaway Inc Class B | 1.5 | |
| | 32.6 | |
How has the Fund changed?
This is a summary of certain changes to the Fund since January 1, 2024. For more complete information, you may review the Fund's next prospectus, which we expect to be available by April 30, 2025 at fundresearch.fidelity.com/prospectus/sec or upon request at 1-877-208-0098 or by sending an e-mail to funddocuments@fmr.com.
The fees associated with this class changed during the reporting year. The variations in class fees are primarily the result of the following changes:- Management fee
- Operating expenses
Effective June 1, 2024, the fund's management contract was amended to incorporate administrative services previously covered under separate services agreements (transfer agent and pricing & bookkeeping). The amended contract incorporates a management fee rate that may vary by class. The Adviser or an affiliate pays certain expenses of managing and operating the fund out of each class's management fee. | |
| Fidelity, the Fidelity Investments Logo and all other Fidelity trademarks or service marks used herein are trademarks or service marks of FMR LLC. Any third-party marks that are used herein are trademarks or service marks of their respective owners. © 2025 FMR LLC. All rights reserved. |
| | For additional information about the Fund; including its prospectus, financial information, holdings and proxy information, scan the QR code or visit fundresearch.fidelity.com/prospectus/sec 1.9914378.100 3076-TSRA-0325 |
| |
| | ANNUAL SHAREHOLDER REPORT | AS OF DECEMBER 31, 2024 | This report describes changes to the Fund that occurred during the reporting period. |
| | VIP Contrafund℠ Portfolio VIP Contrafund℠ Portfolio Initial Class true |
| | | |
This annual shareholder report contains information about VIP Contrafund℠ Portfolio for the period January 1, 2024 to December 31, 2024. You can find additional information about the Fund at fundresearch.fidelity.com/prospectus/sec. You can also request this information by contacting us at 1-877-208-0098 or by sending an e-mail to funddocuments@fmr.com.
What were your Fund costs for the last year?(based on hypothetical $10,000 investment)
FUND COST (PREVIOUS YEAR)
| | Costs of a $10,000 investment | Costs paid as a percentage of a $10,000 investment | |
| Initial Class | $ 65 | 0.56% | |
What affected the Fund's performance this period?
•U.S. equities gained in 2024, driven by a sturdy economy, the Federal Reserve's long-anticipated pivot to cutting interest rates and the potential for artificial intelligence to drive transformative change.
•Against this backdrop, security selection was the primary contributor to the fund's performance versus the S&P 500® index for the fiscal year, led by information technology, where our picks in semiconductors & semiconductor equipment helped most. Picks and an overweight in communication services, primarily within the media & entertainment industry, also boosted the fund's relative performance. Also helping our relative result was security selection in industrials, primarily within the capital goods industry.
•The top individual relative contributor was an overweight in Nvidia (+171%), the biggest holding at period end. A second notable relative contributor was an overweight in Meta Platforms (+66%). The company was the largest holding this period. An overweight in Netflix (+83%) also helped. The stock was one of the fund's biggest holdings.
•In contrast, the biggest detractor from performance versus the benchmark was an overweight in health care, primarily within the pharmaceuticals, biotechnology & life sciences industry. Also hurting our result was stock picking in energy and financials. Lastly, the fund's position in cash hurt.
•The biggest individual relative detractor was an underweight in Tesla (+63%). This period we increased our investment in Tesla. A second notable relative detractor was an overweight in Regeneron Pharmaceuticals (-19%). An overweight in UnitedHealth Group (-2%) also hurt. This period we decreased our position in UnitedHealth Group, which was one of our biggest holdings this period.
•Notable changes in positioning include higher allocations to the industrials and communication services sectors.
How did the Fund perform over the past 10 years?
CUMULATIVE PERFORMANCE
December 31, 2014 through December 31, 2024.
Initial investment of $10,000.
Initial Class | $10,000 | $10,064 | $10,873 | $13,252 | $12,407 | $16,324 | $21,314 | $27,247 | $20,078 | $26,794 | $35,847 |
S&P 500® Index | $10,000 | $10,138 | $11,351 | $13,829 | $13,223 | $17,386 | $20,585 | $26,494 | $21,696 | $27,399 | $34,254 |
| | 2014 | 2015 | 2016 | 2017 | 2018 | 2019 | 2020 | 2021 | 2022 | 2023 | 2024 |
AVERAGE ANNUAL TOTAL RETURNS:| | 1 Year | 5 Year | 10 Year |
| Initial Class | 33.79% | 17.04% | 13.62% |
| S&P 500® Index | 25.02% | 14.53% | 13.10% |
Visit institutional.fidelity.com for more recent performance information. |
The Fund's past performance is not a good predictor of the Fund's future performance. The graph and table do not reflect the deduction of taxes that a shareholder would pay on fund distributions or redemption of fund shares. |
Key Fund Statistics(as of December 31, 2024)
KEY FACTS | | |
| Fund Size | $25,313,301,654 | |
| Number of Holdings | 404 | |
| Total Advisory Fee | $131,069,389 | |
| Portfolio Turnover | 36% | |
What did the Fund invest in?
(as of December 31, 2024)
MARKET SECTORS (% of Fund's net assets) | | |
| Information Technology | 26.6 | |
| Communication Services | 18.6 | |
| Financials | 15.5 | |
| Health Care | 11.1 | |
| Consumer Discretionary | 11.0 | |
| Industrials | 10.1 | |
| Consumer Staples | 2.1 | |
| Energy | 1.5 | |
| Materials | 0.9 | |
| Utilities | 0.8 | |
| Real Estate | 0.2 | |
| |
| Common Stocks | 97.4 |
| Preferred Stocks | 1.0 |
| Preferred Securities | 0.0 |
| Short-Term Investments and Net Other Assets (Liabilities) | 1.6 |
ASSET ALLOCATION (% of Fund's net assets) |
|
| | Common Stocks - 97.4 |
| | Preferred Stocks - 1.0 |
| | Preferred Securities - 0.0 |
| | Short-Term Investments and Net Other Assets (Liabilities) - 1.6 |
| |
| United States | 94.9 |
| Canada | 1.5 |
| Taiwan | 0.9 |
| Netherlands | 0.6 |
| China | 0.4 |
| United Kingdom | 0.3 |
| Israel | 0.2 |
| Korea (South) | 0.2 |
| Brazil | 0.2 |
| Others | 0.8 |
GEOGRAPHIC DIVERSIFICATION (% of Fund's net assets) |
|
| | United States - 94.9 |
| | Canada - 1.5 |
| | Taiwan - 0.9 |
| | Netherlands - 0.6 |
| | China - 0.4 |
| | United Kingdom - 0.3 |
| | Israel - 0.2 |
| | Korea (South) - 0.2 |
| | Brazil - 0.2 |
| | Others - 0.8 |
| |
TOP HOLDINGS(% of Fund's net assets) | | |
| NVIDIA Corp | 9.0 | |
| Meta Platforms Inc Class A | 8.6 | |
| Alphabet Inc Class C | 5.8 | |
| Microsoft Corp | 5.8 | |
| Amazon.com Inc | 5.4 | |
| Berkshire Hathaway Inc Class B | 4.3 | |
| Apple Inc | 3.7 | |
| Eli Lilly & Co | 2.7 | |
| Netflix Inc | 2.1 | |
| Costco Wholesale Corp | 1.3 | |
| | 48.7 | |
How has the Fund changed?
This is a summary of certain changes to the Fund since January 1, 2024. For more complete information, you may review the Fund's next prospectus, which we expect to be available by April 30, 2025 at fundresearch.fidelity.com/prospectus/sec or upon request at 1-877-208-0098 or by sending an e-mail to funddocuments@fmr.com.
The fees associated with this class changed during the reporting year. The variations in class fees are primarily the result of the following changes: The fund's transfer agent and pricing & bookkeeping fees were changed to a fixed rate effective December 1, 2023. Effective March 1, 2024, the fund's management contract was amended to incorporate administrative services previously covered under separate services agreements (transfer agent and pricing & bookkeeping). The amended contract incorporates a management fee rate that may vary by class. The Adviser or an affiliate pays certain expenses of managing and operating the fund out of each class's management fee. | |
| Fidelity, the Fidelity Investments Logo and all other Fidelity trademarks or service marks used herein are trademarks or service marks of FMR LLC. Any third-party marks that are used herein are trademarks or service marks of their respective owners. © 2025 FMR LLC. All rights reserved. |
| | For additional information about the Fund; including its prospectus, financial information, holdings and proxy information, scan the QR code or visit fundresearch.fidelity.com/prospectus/sec 1.9914167.100 158-TSRA-0325 |
| |
| | ANNUAL SHAREHOLDER REPORT | AS OF DECEMBER 31, 2024 | This report describes changes to the Fund that occurred during the reporting period. |
| | VIP Extended Market Index Portfolio VIP Extended Market Index Portfolio Service Class true |
| | | |
This annual shareholder report contains information about VIP Extended Market Index Portfolio for the period January 1, 2024 to December 31, 2024. You can find additional information about the Fund at fundresearch.fidelity.com/prospectus/sec. You can also request this information by contacting us at 1-877-208-0098 or by sending an e-mail to funddocuments@fmr.com.
What were your Fund costs for the last year?(based on hypothetical $10,000 investment)
FUND COST (PREVIOUS YEAR)
| | Costs of a $10,000 investment | Costs paid as a percentage of a $10,000 investment | |
| Service Class | $ 24 | 0.22% | |
What affected the Fund's performance this period?
•U.S. equities gained in 2024, driven by a sturdy economy, the Federal Reserve's long-anticipated pivot to cutting interest rates and the potential for artificial intelligence to drive transformative change.
•Against this backdrop, financials gained roughly 26% and contributed most to the fund's performance for the fiscal year. Industrials, which gained approximately 14%, also helped, benefiting from the capital goods industry (+17%), as did information technology, which advanced 14%. The consumer discretionary sector rose 8%, while utilities gained 25% and health care advanced 4%. Other contributors included the real estate (+7%), consumer staples (+9%), communication services (+7%), energy (+5%) and materials (+2%) sectors.
•Turning to individual stocks, the biggest contributor was Super Micro Computer (+151%), from the technology hardware & equipment group. Carvana, within the consumer discretionary distribution & retail category, gained 284% and boosted the fund. Robinhood Markets (+192%), from the financial services industry, lifted the fund. Texas Pacific Land (+115%), from the energy sector, lifted the fund. Lastly, in capital goods, Emcor gained 111% and also helped.
•In contrast, the biggest detractor was Rivian Automotive (-43%), from the automobiles & components group. Five Below (-51%), from the consumer discretionary distribution & retail group, hurt the fund. Cleveland-Cliffs (-54%), from the materials sector, detracted. Flagstar Financial, within the banks category, returned -69% and detracted. Lastly, UiPath (-49%), a stock in the software & services group, also hurt the fund's performance
How did the Fund perform over the life of Fund?
CUMULATIVE PERFORMANCE
April 11, 2019 through December 31, 2024.
Initial investment of $10,000.
Service Class | $10,000 | $10,624 | $12,364 | $14,980 | $12,250 | $14,374 |
Fidelity U.S. Extended Investable Market Index℠ | $10,000 | $10,672 | $12,446 | $15,118 | $12,374 | $14,591 |
S&P 500® Index | $10,000 | $11,346 | $13,433 | $17,289 | $14,158 | $17,880 |
| | 2019 | 2020 | 2021 | 2022 | 2023 | 2024 |
AVERAGE ANNUAL TOTAL RETURNS:| | 1 Year | 5 Year | Life of Fund A |
| Service Class | 12.19% | 8.70% | 8.70% |
| Fidelity U.S. Extended Investable Market Index℠ | 12.31% | 8.96% | 9.00% |
| S&P 500® Index | 25.02% | 14.53% | 15.07% |
A From April 11, 2019
Visit institutional.fidelity.com for more recent performance information. |
The Fund's past performance is not a good predictor of the Fund's future performance. The graph and table do not reflect the deduction of taxes that a shareholder would pay on fund distributions or redemption of fund shares. |
Key Fund Statistics(as of December 31, 2024)
KEY FACTS | | |
| Fund Size | $285,231,260 | |
| Number of Holdings | 2,055 | |
| Total Advisory Fee | $246,777 | |
| Portfolio Turnover | 12% | |
What did the Fund invest in?
(as of December 31, 2024)
MARKET SECTORS (% of Fund's net assets) | | |
| Industrials | 19.3 | |
| Financials | 17.8 | |
| Consumer Discretionary | 12.2 | |
| Information Technology | 11.6 | |
| Health Care | 11.3 | |
| Real Estate | 6.3 | |
| Materials | 4.8 | |
| Energy | 4.6 | |
| Consumer Staples | 3.7 | |
| Communication Services | 3.2 | |
| Utilities | 2.4 | |
| |
| Common Stocks | 97.2 |
| Short-Term Investments and Net Other Assets (Liabilities) | 2.8 |
ASSET ALLOCATION (% of Fund's net assets) |
|
| | Common Stocks - 97.2 |
| | Short-Term Investments and Net Other Assets (Liabilities) - 2.8 |
| |
| United States | 98.4 |
| United Kingdom | 0.4 |
| Puerto Rico | 0.3 |
| Bermuda | 0.3 |
| Sweden | 0.1 |
| Thailand | 0.1 |
| Switzerland | 0.1 |
| Argentina | 0.1 |
| Belgium | 0.1 |
| Others | 0.1 |
GEOGRAPHIC DIVERSIFICATION (% of Fund's net assets) |
|
| | United States - 98.4 |
| | United Kingdom - 0.4 |
| | Puerto Rico - 0.3 |
| | Bermuda - 0.3 |
| | Sweden - 0.1 |
| | Thailand - 0.1 |
| | Switzerland - 0.1 |
| | Argentina - 0.1 |
| | Belgium - 0.1 |
| | Others - 0.1 |
| |
TOP HOLDINGS(% of Fund's net assets) | | |
| Eqt Corp | 0.5 | |
| Robinhood Markets Inc Class A | 0.5 | |
| Carvana Co Class A | 0.5 | |
| Smurfit WestRock PLC | 0.4 | |
| EMCOR Group Inc | 0.4 | |
| Texas Pacific Land Corp | 0.4 | |
| Expand Energy Corp | 0.4 | |
| Live Nation Entertainment Inc | 0.4 | |
| Natera Inc | 0.4 | |
| Lennox International Inc | 0.4 | |
| | 4.3 | |
How has the Fund changed?
This is a summary of certain changes to the Fund since January 1, 2024. For more complete information, you may review the Fund's next prospectus, which we expect to be available by April 30, 2025 at fundresearch.fidelity.com/prospectus/sec or upon request at 1-877-208-0098 or by sending an e-mail to funddocuments@fmr.com.
Effective June 1, 2024, the fund's management contract was amended to incorporate administrative services previously covered under separate services agreements (transfer agent and pricing & bookkeeping). The amended contract incorporates a management fee rate that may vary by class. The Adviser or an affiliate pays certain expenses of managing and operating the fund out of each class's management fee. | |
| Fidelity, the Fidelity Investments Logo and all other Fidelity trademarks or service marks used herein are trademarks or service marks of FMR LLC. Any third-party marks that are used herein are trademarks or service marks of their respective owners. © 2025 FMR LLC. All rights reserved. |
| | For additional information about the Fund; including its prospectus, financial information, holdings and proxy information, scan the QR code or visit fundresearch.fidelity.com/prospectus/sec 1.9914371.100 1016-TSRA-0325 |
| |
| | ANNUAL SHAREHOLDER REPORT | AS OF DECEMBER 31, 2024 | This report describes changes to the Fund that occurred during the reporting period. |
| | VIP International Capital Appreciation Portfolio VIP International Capital Appreciation Portfolio Investor Class true |
| | | |
This annual shareholder report contains information about VIP International Capital Appreciation Portfolio for the period January 1, 2024 to December 31, 2024. You can find additional information about the Fund at fundresearch.fidelity.com/prospectus/sec. You can also request this information by contacting us at 1-877-208-0098 or by sending an e-mail to funddocuments@fmr.com.
What were your Fund costs for the last year?(based on hypothetical $10,000 investment)
FUND COST (PREVIOUS YEAR)
| | Costs of a $10,000 investment | Costs paid as a percentage of a $10,000 investment | |
| Investor Class | $ 89 | 0.86% | |
What affected the Fund's performance this period?
•International stocks gained in 2024, as resilient global economic growth, slowing inflation and global monetary easing provided support for stocks, despite geopolitical risk. However, foreign stocks also faced challenges, including a steep sell-off after the U.S. presidential election in November due to the potential for new tariffs and a strengthening U.S. dollar.
•Against this backdrop, a non-benchmark allocation to the United States, along with picks in Taiwan and Europe ex U.K., primarily in Germany, contributed to the fund's performance versus the MSCI All Country World ex USA Net MA (1-Nov-2001) Linked Index for the year.
•By sector, an overweight in information technology, especially in the semiconductors & semiconductor equipment industry, helped most. Stock picks in materials also boosted relative performance.
•The top individual relative contributor was our non-benchmark stake in Nvidia (+164%). The stock was not held at period end. An out-of-index position in Broadcom gained approximately 64% and helped as well. This was an investment we established in 2024. An overweight in Taiwan Semiconductor Manufacturing (+72%) further bolstered performance and was the fund's largest holding.
•In contrast, from a regional standpoint, picks and an underweight in Japan and stock selection in Canada detracted from the fund's relative result.
•By sector, the biggest detractor from performance versus the benchmark was security selection among health care firms. Stock picks in consumer staples also hampered the fund's result.
•The biggest individual relative detractor was our stake in OBIC (-28%). The stock was not held at period end. An underweight in Shopify (+36%) also hurt. Outsized exposure to Dassault Systèmes (-25%) also weighed on performance. The stock was not held at period end.
•Notable changes in positioning include increased exposure to China and Germany. By sector, meaningful shifts include increased exposure to communication services and a lower allocation to consumer staples.
How did the Fund perform over the past 10 years?
CUMULATIVE PERFORMANCE
December 31, 2014 through December 31, 2024.
Initial investment of $10,000.
Investor Class | $10,000 | $10,308 | $9,997 | $13,630 | $11,884 | $15,825 | $19,328 | $21,695 | $15,957 | $20,332 | $21,984 |
MSCI ACWI (All Country World Index) ex USA Index | $10,000 | $9,446 | $9,889 | $12,599 | $10,830 | $13,184 | $14,609 | $15,776 | $13,273 | $15,372 | $16,251 |
| | 2014 | 2015 | 2016 | 2017 | 2018 | 2019 | 2020 | 2021 | 2022 | 2023 | 2024 |
AVERAGE ANNUAL TOTAL RETURNS:| | 1 Year | 5 Year | 10 Year |
| Investor Class | 8.12% | 6.80% | 8.20% |
| MSCI ACWI (All Country World Index) ex USA Index | 5.72% | 4.27% | 4.98% |
Visit institutional.fidelity.com for more recent performance information. |
The Fund's past performance is not a good predictor of the Fund's future performance. The graph and table do not reflect the deduction of taxes that a shareholder would pay on fund distributions or redemption of fund shares. |
Key Fund Statistics(as of December 31, 2024)
KEY FACTS | | |
| Fund Size | $696,025,885 | |
| Number of Holdings | 63 | |
| Total Advisory Fee | $5,236,062 | |
| Portfolio Turnover | 74% | |
What did the Fund invest in?
(as of December 31, 2024)
MARKET SECTORS (% of Fund's net assets) | | |
| Industrials | 29.4 | |
| Financials | 24.8 | |
| Information Technology | 16.1 | |
| Consumer Discretionary | 13.1 | |
| Materials | 7.2 | |
| Health Care | 4.7 | |
| Communication Services | 4.2 | |
| |
| Common Stocks | 99.5 |
| Short-Term Investments and Net Other Assets (Liabilities) | 0.5 |
ASSET ALLOCATION (% of Fund's net assets) |
|
| | Common Stocks - 99.5 |
| | Short-Term Investments and Net Other Assets (Liabilities) - 0.5 |
| |
| United States | 21.1 |
| United Kingdom | 10.3 |
| France | 9.6 |
| Japan | 8.5 |
| India | 7.7 |
| China | 7.1 |
| Germany | 5.8 |
| Netherlands | 5.4 |
| Canada | 4.7 |
| Others | 19.8 |
GEOGRAPHIC DIVERSIFICATION (% of Fund's net assets) |
|
| | United States - 21.1 |
| | United Kingdom - 10.3 |
| | France - 9.6 |
| | Japan - 8.5 |
| | India - 7.7 |
| | China - 7.1 |
| | Germany - 5.8 |
| | Netherlands - 5.4 |
| | Canada - 4.7 |
| | Others - 19.8 |
| |
TOP HOLDINGS(% of Fund's net assets) | | |
| Taiwan Semiconductor Manufacturing Co Ltd | 4.6 | |
| Tencent Holdings Ltd | 2.7 | |
| SAP SE | 2.6 | |
| ASML Holding NV | 2.5 | |
| Novo Nordisk A/S Series B | 2.4 | |
| LVMH Moet Hennessy Louis Vuitton SE | 2.4 | |
| Schneider Electric SE | 2.1 | |
| Hitachi Ltd | 1.9 | |
| Hermes International SCA | 1.8 | |
| Recruit Holdings Co Ltd | 1.8 | |
| | 24.8 | |
How has the Fund changed?
This is a summary of certain changes to the Fund since January 1, 2024. For more complete information, you may review the Fund's next prospectus, which we expect to be available by April 30, 2025 at fundresearch.fidelity.com/prospectus/sec or upon request at 1-877-208-0098 or by sending an e-mail to funddocuments@fmr.com.
The fund's transfer agent and pricing & bookkeeping fees were changed to a fixed rate effective December 1, 2023. Effective March 1, 2024, the fund's management contract was amended to incorporate administrative services previously covered under separate services agreements (transfer agent and pricing & bookkeeping). The amended contract incorporates a management fee rate that may vary by class. The Adviser or an affiliate pays certain expenses of managing and operating the fund out of each class's management fee. | |
| Fidelity, the Fidelity Investments Logo and all other Fidelity trademarks or service marks used herein are trademarks or service marks of FMR LLC. Any third-party marks that are used herein are trademarks or service marks of their respective owners. © 2025 FMR LLC. All rights reserved. |
| | For additional information about the Fund; including its prospectus, financial information, holdings and proxy information, scan the QR code or visit fundresearch.fidelity.com/prospectus/sec 1.9914267.100 1473-TSRA-0325 |
| |
| | ANNUAL SHAREHOLDER REPORT | AS OF DECEMBER 31, 2024 | This report describes changes to the Fund that occurred during the reporting period. |
| | VIP Disciplined Small Cap Portfolio VIP Disciplined Small Cap Portfolio Investor Class true |
| | | |
This annual shareholder report contains information about VIP Disciplined Small Cap Portfolio for the period January 1, 2024 to December 31, 2024. You can find additional information about the Fund at fundresearch.fidelity.com/prospectus/sec. You can also request this information by contacting us at 1-877-208-0098 or by sending an e-mail to funddocuments@fmr.com.
What were your Fund costs for the last year?(based on hypothetical $10,000 investment)
FUND COST (PREVIOUS YEAR)
| | Costs of a $10,000 investment | Costs paid as a percentage of a $10,000 investment | |
| Investor Class | $ 44 | 0.41% | |
What affected the Fund's performance this period?
•U.S. equities gained in 2024, driven by a sturdy economy, the Federal Reserve's long-anticipated pivot to cutting interest rates and the potential for artificial intelligence to drive transformative change.
•Against this backdrop, security selection was the primary contributor to the fund's performance versus the Russell 2000 Index for the fiscal year, especially within financials. Stock picking in information technology, primarily within the technology hardware & equipment industry, and communication services also boosted the fund's relative performance.
•The top individual relative contributor was an overweight in Lumen Technologies (+148%). The second-largest relative contributor was an overweight in Carvana (+289%). The company was among our biggest holdings this period, though we decreased our investment in Carvana by period end. Another notable relative contributor was our stake in Super Micro Computer (+45%). The company was the fund's biggest holding this period, but the stock was not held at period end.
•In contrast, the biggest detractor from performance versus the benchmark was stock selection in utilities. An underweight in financials, primarily within the banks industry, also hampered the fund's result. Also modestly hurting our result was security selection in energy.
•The biggest individual relative detractor was our stake in Green Plains (-63%). This period we decreased our stake in Green Plains. A second notable relative detractor was an overweight in ODP (-60%). This period we decreased our stake. An underweight in Rocket Lab USA (+361%) also hurt.
•Notable changes in positioning include lower allocations to the energy and consumer discretionary sectors.
How did the Fund perform over the past 10 years?
CUMULATIVE PERFORMANCE
December 31, 2014 through December 31, 2024.
Initial investment of $10,000.
Investor Class | $10,000 | $9,800 | $12,009 | $12,838 | $11,157 | $13,785 | $16,311 | $19,675 | $16,077 | $19,428 | $22,695 |
Russell 2000® Index | $10,000 | $9,559 | $11,595 | $13,294 | $11,830 | $14,849 | $17,813 | $20,453 | $16,273 | $19,028 | $21,223 |
Russell 3000® Index | $10,000 | $10,048 | $11,327 | $13,721 | $13,002 | $17,035 | $20,593 | $25,877 | $20,907 | $26,334 | $32,604 |
| | 2014 | 2015 | 2016 | 2017 | 2018 | 2019 | 2020 | 2021 | 2022 | 2023 | 2024 |
AVERAGE ANNUAL TOTAL RETURNS:| | 1 Year | 5 Year | 10 Year |
| Investor Class | 16.82% | 10.49% | 8.54% |
| Russell 2000® Index | 11.54% | 7.40% | 7.82% |
| Russell 3000® Index | 23.81% | 13.86% | 12.55% |
Visit institutional.fidelity.com for more recent performance information. |
The Fund's past performance is not a good predictor of the Fund's future performance. The graph and table do not reflect the deduction of taxes that a shareholder would pay on fund distributions or redemption of fund shares. |
Key Fund Statistics(as of December 31, 2024)
KEY FACTS | | |
| Fund Size | $472,475,702 | |
| Number of Holdings | 633 | |
| Total Advisory Fee | $1,330,379 | |
| Portfolio Turnover | 85% | |
What did the Fund invest in?
(as of December 31, 2024)
MARKET SECTORS (% of Fund's net assets) | | |
| Financials | 18.4 | |
| Industrials | 16.9 | |
| Health Care | 15.7 | |
| Information Technology | 15.3 | |
| Consumer Discretionary | 10.2 | |
| Energy | 5.1 | |
| Materials | 4.9 | |
| Real Estate | 4.3 | |
| Consumer Staples | 3.3 | |
| Communication Services | 3.1 | |
| Utilities | 0.8 | |
| |
| Common Stocks | 98.0 |
| Short-Term Investments and Net Other Assets (Liabilities) | 2.0 |
ASSET ALLOCATION (% of Fund's net assets) |
|
| | Common Stocks - 98.0 |
| | Short-Term Investments and Net Other Assets (Liabilities) - 2.0 |
| |
| United States | 98.2 |
| Thailand | 0.6 |
| Puerto Rico | 0.3 |
| Canada | 0.3 |
| Ireland | 0.2 |
| Monaco | 0.2 |
| Norway | 0.1 |
| Bermuda | 0.1 |
| Switzerland | 0.0 |
GEOGRAPHIC DIVERSIFICATION (% of Fund's net assets) |
|
| | United States - 98.2 |
| | Thailand - 0.6 |
| | Puerto Rico - 0.3 |
| | Canada - 0.3 |
| | Ireland - 0.2 |
| | Monaco - 0.2 |
| | Norway - 0.1 |
| | Bermuda - 0.1 |
| | Switzerland - 0.0 |
| |
TOP HOLDINGS(% of Fund's net assets) | | |
| Sprouts Farmers Market Inc | 0.9 | |
| Carpenter Technology Corp | 0.9 | |
| Q2 Holdings Inc | 0.9 | |
| Abercrombie & Fitch Co Class A | 0.8 | |
| Primo Brands Corp Class A | 0.8 | |
| Tenable Holdings Inc | 0.8 | |
| SkyWest Inc | 0.7 | |
| Payoneer Global Inc | 0.7 | |
| EnerSys | 0.6 | |
| Fabrinet | 0.6 | |
| | 7.7 | |
How has the Fund changed?
This is a summary of certain changes to the Fund since January 1, 2024. For more complete information, you may review the Fund's next prospectus, which we expect to be available by April 30, 2025 at fundresearch.fidelity.com/prospectus/sec or upon request at 1-877-208-0098 or by sending an e-mail to funddocuments@fmr.com.
The fees associated with this class changed during the reporting year. The variations in class fees are primarily the result of the following changes: The fund's contractual management fee was reduced during the reporting period. The fund's pricing & bookkeeping fees were changed to a fixed rate effective April 1, 2024. Effective June 1, 2024, the fund's management contract was amended to incorporate administrative services previously covered under separate services agreements (transfer agent and pricing & bookkeeping). The amended contract incorporates a management fee rate that may vary by class. The Adviser or an affiliate pays certain expenses of managing and operating the fund out of each class's management fee. | |
| Fidelity, the Fidelity Investments Logo and all other Fidelity trademarks or service marks used herein are trademarks or service marks of FMR LLC. Any third-party marks that are used herein are trademarks or service marks of their respective owners. © 2025 FMR LLC. All rights reserved. |
| | For additional information about the Fund; including its prospectus, financial information, holdings and proxy information, scan the QR code or visit fundresearch.fidelity.com/prospectus/sec 1.9914302.100 1532-TSRA-0325 |
| |
| | ANNUAL SHAREHOLDER REPORT | AS OF DECEMBER 31, 2024 | This report describes changes to the Fund that occurred during the reporting period. |
| | VIP Contrafund℠ Portfolio VIP Contrafund℠ Portfolio Service Class true |
| | | |
This annual shareholder report contains information about VIP Contrafund℠ Portfolio for the period January 1, 2024 to December 31, 2024. You can find additional information about the Fund at fundresearch.fidelity.com/prospectus/sec. You can also request this information by contacting us at 1-877-208-0098 or by sending an e-mail to funddocuments@fmr.com.
What were your Fund costs for the last year?(based on hypothetical $10,000 investment)
FUND COST (PREVIOUS YEAR)
| | Costs of a $10,000 investment | Costs paid as a percentage of a $10,000 investment | |
| Service Class | $ 77 | 0.66% | |
What affected the Fund's performance this period?
•U.S. equities gained in 2024, driven by a sturdy economy, the Federal Reserve's long-anticipated pivot to cutting interest rates and the potential for artificial intelligence to drive transformative change.
•Against this backdrop, security selection was the primary contributor to the fund's performance versus the S&P 500® index for the fiscal year, led by information technology, where our picks in semiconductors & semiconductor equipment helped most. Picks and an overweight in communication services, primarily within the media & entertainment industry, also boosted the fund's relative performance. Also helping our relative result was security selection in industrials, primarily within the capital goods industry.
•The top individual relative contributor was an overweight in Nvidia (+171%), the biggest holding at period end. A second notable relative contributor was an overweight in Meta Platforms (+66%). The company was the largest holding this period. An overweight in Netflix (+83%) also helped. The stock was one of the fund's biggest holdings.
•In contrast, the biggest detractor from performance versus the benchmark was an overweight in health care, primarily within the pharmaceuticals, biotechnology & life sciences industry. Also hurting our result was stock picking in energy and financials. Lastly, the fund's position in cash hurt.
•The biggest individual relative detractor was an underweight in Tesla (+63%). This period we increased our investment in Tesla. A second notable relative detractor was an overweight in Regeneron Pharmaceuticals (-19%). An overweight in UnitedHealth Group (-2%) also hurt. This period we decreased our position in UnitedHealth Group, which was one of our biggest holdings this period.
•Notable changes in positioning include higher allocations to the industrials and communication services sectors.
How did the Fund perform over the past 10 years?
CUMULATIVE PERFORMANCE
December 31, 2014 through December 31, 2024.
Initial investment of $10,000.
Service Class | $10,000 | $10,056 | $10,851 | $13,213 | $12,356 | $16,242 | $21,184 | $27,054 | $19,916 | $26,556 | $35,488 |
S&P 500® Index | $10,000 | $10,138 | $11,351 | $13,829 | $13,223 | $17,386 | $20,585 | $26,494 | $21,696 | $27,399 | $34,254 |
| | 2014 | 2015 | 2016 | 2017 | 2018 | 2019 | 2020 | 2021 | 2022 | 2023 | 2024 |
AVERAGE ANNUAL TOTAL RETURNS:| | 1 Year | 5 Year | 10 Year |
| Service Class | 33.63% | 16.92% | 13.50% |
| S&P 500® Index | 25.02% | 14.53% | 13.10% |
Visit institutional.fidelity.com for more recent performance information. |
The Fund's past performance is not a good predictor of the Fund's future performance. The graph and table do not reflect the deduction of taxes that a shareholder would pay on fund distributions or redemption of fund shares. |
Key Fund Statistics(as of December 31, 2024)
KEY FACTS | | |
| Fund Size | $25,313,301,654 | |
| Number of Holdings | 404 | |
| Total Advisory Fee | $131,069,389 | |
| Portfolio Turnover | 36% | |
What did the Fund invest in?
(as of December 31, 2024)
MARKET SECTORS (% of Fund's net assets) | | |
| Information Technology | 26.6 | |
| Communication Services | 18.6 | |
| Financials | 15.5 | |
| Health Care | 11.1 | |
| Consumer Discretionary | 11.0 | |
| Industrials | 10.1 | |
| Consumer Staples | 2.1 | |
| Energy | 1.5 | |
| Materials | 0.9 | |
| Utilities | 0.8 | |
| Real Estate | 0.2 | |
| |
| Common Stocks | 97.4 |
| Preferred Stocks | 1.0 |
| Preferred Securities | 0.0 |
| Short-Term Investments and Net Other Assets (Liabilities) | 1.6 |
ASSET ALLOCATION (% of Fund's net assets) |
|
| | Common Stocks - 97.4 |
| | Preferred Stocks - 1.0 |
| | Preferred Securities - 0.0 |
| | Short-Term Investments and Net Other Assets (Liabilities) - 1.6 |
| |
| United States | 94.9 |
| Canada | 1.5 |
| Taiwan | 0.9 |
| Netherlands | 0.6 |
| China | 0.4 |
| United Kingdom | 0.3 |
| Israel | 0.2 |
| Korea (South) | 0.2 |
| Brazil | 0.2 |
| Others | 0.8 |
GEOGRAPHIC DIVERSIFICATION (% of Fund's net assets) |
|
| | United States - 94.9 |
| | Canada - 1.5 |
| | Taiwan - 0.9 |
| | Netherlands - 0.6 |
| | China - 0.4 |
| | United Kingdom - 0.3 |
| | Israel - 0.2 |
| | Korea (South) - 0.2 |
| | Brazil - 0.2 |
| | Others - 0.8 |
| |
TOP HOLDINGS(% of Fund's net assets) | | |
| NVIDIA Corp | 9.0 | |
| Meta Platforms Inc Class A | 8.6 | |
| Alphabet Inc Class C | 5.8 | |
| Microsoft Corp | 5.8 | |
| Amazon.com Inc | 5.4 | |
| Berkshire Hathaway Inc Class B | 4.3 | |
| Apple Inc | 3.7 | |
| Eli Lilly & Co | 2.7 | |
| Netflix Inc | 2.1 | |
| Costco Wholesale Corp | 1.3 | |
| | 48.7 | |
How has the Fund changed?
This is a summary of certain changes to the Fund since January 1, 2024. For more complete information, you may review the Fund's next prospectus, which we expect to be available by April 30, 2025 at fundresearch.fidelity.com/prospectus/sec or upon request at 1-877-208-0098 or by sending an e-mail to funddocuments@fmr.com.
The fund's transfer agent and pricing & bookkeeping fees were changed to a fixed rate effective December 1, 2023. Effective March 1, 2024, the fund's management contract was amended to incorporate administrative services previously covered under separate services agreements (transfer agent and pricing & bookkeeping). The amended contract incorporates a management fee rate that may vary by class. The Adviser or an affiliate pays certain expenses of managing and operating the fund out of each class's management fee. | |
| Fidelity, the Fidelity Investments Logo and all other Fidelity trademarks or service marks used herein are trademarks or service marks of FMR LLC. Any third-party marks that are used herein are trademarks or service marks of their respective owners. © 2025 FMR LLC. All rights reserved. |
| | For additional information about the Fund; including its prospectus, financial information, holdings and proxy information, scan the QR code or visit fundresearch.fidelity.com/prospectus/sec 1.9914169.100 470-TSRA-0325 |
| |
| | ANNUAL SHAREHOLDER REPORT | AS OF DECEMBER 31, 2024 | This report describes changes to the Fund that occurred during the reporting period. |
| | VIP Disciplined Small Cap Portfolio VIP Disciplined Small Cap Portfolio Service Class true |
| | | |
This annual shareholder report contains information about VIP Disciplined Small Cap Portfolio for the period January 1, 2024 to December 31, 2024. You can find additional information about the Fund at fundresearch.fidelity.com/prospectus/sec. You can also request this information by contacting us at 1-877-208-0098 or by sending an e-mail to funddocuments@fmr.com.
What were your Fund costs for the last year?(based on hypothetical $10,000 investment)
FUND COST (PREVIOUS YEAR)
| | Costs of a $10,000 investment | Costs paid as a percentage of a $10,000 investment | |
| Service Class | $ 49 | 0.46% | |
What affected the Fund's performance this period?
•U.S. equities gained in 2024, driven by a sturdy economy, the Federal Reserve's long-anticipated pivot to cutting interest rates and the potential for artificial intelligence to drive transformative change.
•Against this backdrop, security selection was the primary contributor to the fund's performance versus the Russell 2000 Index for the fiscal year, especially within financials. Stock picking in information technology, primarily within the technology hardware & equipment industry, and communication services also boosted the fund's relative performance.
•The top individual relative contributor was an overweight in Lumen Technologies (+148%). The second-largest relative contributor was an overweight in Carvana (+289%). The company was among our biggest holdings this period, though we decreased our investment in Carvana by period end. Another notable relative contributor was our stake in Super Micro Computer (+45%). The company was the fund's biggest holding this period, but the stock was not held at period end.
•In contrast, the biggest detractor from performance versus the benchmark was stock selection in utilities. An underweight in financials, primarily within the banks industry, also hampered the fund's result. Also modestly hurting our result was security selection in energy.
•The biggest individual relative detractor was our stake in Green Plains (-63%). This period we decreased our stake in Green Plains. A second notable relative detractor was an overweight in ODP (-60%). This period we decreased our stake. An underweight in Rocket Lab USA (+361%) also hurt.
•Notable changes in positioning include lower allocations to the energy and consumer discretionary sectors.
How did the Fund perform over the past 10 years?
CUMULATIVE PERFORMANCE
December 31, 2014 through December 31, 2024.
Initial investment of $10,000.
Service Class | $10,000 | $9,791 | $11,993 | $12,829 | $11,145 | $13,774 | $16,291 | $19,636 | $16,042 | $19,383 | $22,637 |
Russell 2000® Index | $10,000 | $9,559 | $11,595 | $13,294 | $11,830 | $14,849 | $17,813 | $20,453 | $16,273 | $19,028 | $21,223 |
Russell 3000® Index | $10,000 | $10,048 | $11,327 | $13,721 | $13,002 | $17,035 | $20,593 | $25,877 | $20,907 | $26,334 | $32,604 |
| | 2014 | 2015 | 2016 | 2017 | 2018 | 2019 | 2020 | 2021 | 2022 | 2023 | 2024 |
AVERAGE ANNUAL TOTAL RETURNS:| | 1 Year | 5 Year | 10 Year |
| Service Class | 16.79% | 10.45% | 8.51% |
| Russell 2000® Index | 11.54% | 7.40% | 7.82% |
| Russell 3000® Index | 23.81% | 13.86% | 12.55% |
Visit institutional.fidelity.com for more recent performance information. |
The Fund's past performance is not a good predictor of the Fund's future performance. The graph and table do not reflect the deduction of taxes that a shareholder would pay on fund distributions or redemption of fund shares. |
Key Fund Statistics(as of December 31, 2024)
KEY FACTS | | |
| Fund Size | $472,475,702 | |
| Number of Holdings | 633 | |
| Total Advisory Fee | $1,330,379 | |
| Portfolio Turnover | 85% | |
What did the Fund invest in?
(as of December 31, 2024)
MARKET SECTORS (% of Fund's net assets) | | |
| Financials | 18.4 | |
| Industrials | 16.9 | |
| Health Care | 15.7 | |
| Information Technology | 15.3 | |
| Consumer Discretionary | 10.2 | |
| Energy | 5.1 | |
| Materials | 4.9 | |
| Real Estate | 4.3 | |
| Consumer Staples | 3.3 | |
| Communication Services | 3.1 | |
| Utilities | 0.8 | |
| |
| Common Stocks | 98.0 |
| Short-Term Investments and Net Other Assets (Liabilities) | 2.0 |
ASSET ALLOCATION (% of Fund's net assets) |
|
| | Common Stocks - 98.0 |
| | Short-Term Investments and Net Other Assets (Liabilities) - 2.0 |
| |
| United States | 98.2 |
| Thailand | 0.6 |
| Puerto Rico | 0.3 |
| Canada | 0.3 |
| Ireland | 0.2 |
| Monaco | 0.2 |
| Norway | 0.1 |
| Bermuda | 0.1 |
| Switzerland | 0.0 |
GEOGRAPHIC DIVERSIFICATION (% of Fund's net assets) |
|
| | United States - 98.2 |
| | Thailand - 0.6 |
| | Puerto Rico - 0.3 |
| | Canada - 0.3 |
| | Ireland - 0.2 |
| | Monaco - 0.2 |
| | Norway - 0.1 |
| | Bermuda - 0.1 |
| | Switzerland - 0.0 |
| |
TOP HOLDINGS(% of Fund's net assets) | | |
| Sprouts Farmers Market Inc | 0.9 | |
| Carpenter Technology Corp | 0.9 | |
| Q2 Holdings Inc | 0.9 | |
| Abercrombie & Fitch Co Class A | 0.8 | |
| Primo Brands Corp Class A | 0.8 | |
| Tenable Holdings Inc | 0.8 | |
| SkyWest Inc | 0.7 | |
| Payoneer Global Inc | 0.7 | |
| EnerSys | 0.6 | |
| Fabrinet | 0.6 | |
| | 7.7 | |
How has the Fund changed?
This is a summary of certain changes to the Fund since January 1, 2024. For more complete information, you may review the Fund's next prospectus, which we expect to be available by April 30, 2025 at fundresearch.fidelity.com/prospectus/sec or upon request at 1-877-208-0098 or by sending an e-mail to funddocuments@fmr.com.
The fees associated with this class changed during the reporting year. The variations in class fees are primarily the result of the following changes: The fund's contractual management fee was reduced during the reporting period. The fund's pricing & bookkeeping fees were changed to a fixed rate effective April 1, 2024. Effective June 1, 2024, the fund's management contract was amended to incorporate administrative services previously covered under separate services agreements (transfer agent and pricing & bookkeeping). The amended contract incorporates a management fee rate that may vary by class. The Adviser or an affiliate pays certain expenses of managing and operating the fund out of each class's management fee. | |
| Fidelity, the Fidelity Investments Logo and all other Fidelity trademarks or service marks used herein are trademarks or service marks of FMR LLC. Any third-party marks that are used herein are trademarks or service marks of their respective owners. © 2025 FMR LLC. All rights reserved. |
| | For additional information about the Fund; including its prospectus, financial information, holdings and proxy information, scan the QR code or visit fundresearch.fidelity.com/prospectus/sec 1.9914300.100 1530-TSRA-0325 |
| |
| | ANNUAL SHAREHOLDER REPORT | AS OF DECEMBER 31, 2024 | This report describes changes to the Fund that occurred during the reporting period. |
| | VIP International Index Portfolio VIP International Index Portfolio Initial Class true |
| | | |
This annual shareholder report contains information about VIP International Index Portfolio for the period January 1, 2024 to December 31, 2024. You can find additional information about the Fund at fundresearch.fidelity.com/prospectus/sec. You can also request this information by contacting us at 1-877-208-0098 or by sending an e-mail to funddocuments@fmr.com.
What were your Fund costs for the last year?(based on hypothetical $10,000 investment)
FUND COST (PREVIOUS YEAR)
| | Costs of a $10,000 investment | Costs paid as a percentage of a $10,000 investment | |
| Initial Class | $ 17 | 0.17% | |
What affected the Fund's performance this period?
•International stocks gained in 2024, as resilient global economic growth, slowing inflation and global monetary easing provided support for stocks, despite geopolitical risk. However, stocks also faced challenges, including a steep sell-off after the U.S. presidential election in November due to the potential for new tariffs and a strengthening U.S. dollar.
•Against this backdrop, emerging markets, led by Taiwan (+30%), gained roughly 5% and contributed most to the fund's performance for the fiscal year, followed by Japan (+8%).
•By sector, financials gained 18% and contributed most. Information technology stocks also helped, gaining approximately 13%. The industrials sector rose 8%, boosted by the capital goods industry (+10%). Other contributors included the communication services (+15%) and consumer discretionary (+4%) sectors.
•Conversely, from a sector standpoint, materials returned roughly -13% and detracted most. Consumer staples (-7%), hampered by the food, beverage & tobacco industry (-10%), and energy (-5%) also hurt. Other detractors included the health care (-2%), real estate (-4%) and utilities (-2%) sectors.
•Turning to individual stocks, the biggest contributor was Taiwam Semiconductor Manufacturing (+72%), from the semiconductors & semiconductor equipment category. Tencent Holdings (+44%), from the media & entertainment category, boosted the fund. In software & services, SAP gained about 61% and boosted the fund. Hitachi, within the capital goods category, gained approximately 75% and boosted the fund. Lastly, Recruit Holdings, within the commercial & professional services group, gained 68% and also helped.
•In contrast, the biggest detractor was Samsung Electronics (-39%), from the technology hardware & equipment group. In food, beverage & tobacco, Nestle (-27%) hurt the fund's performance. Novo-Nordisk, within the pharmaceuticals, biotechnology & life sciences industry, returned about -15% and detracted. BHP, within the materials sector, returned -25% and detracted. Lastly, PDD, within the consumer discretionary distribution & retail category, returned -34% and also detracted.
How did the Fund perform over the life of Fund?
CUMULATIVE PERFORMANCE
April 17, 2018 through December 31, 2024.
Initial investment of $10,000.
Initial Class | $10,000 | $8,553 | $10,395 | $11,507 | $12,395 | $10,410 | $12,091 |
Fidelity Global ex U.S. Index℠ | $10,000 | $8,593 | $10,490 | $11,666 | $12,637 | $10,616 | $12,386 |
MSCI ACWI (All Country World Index) ex USA Index | $10,000 | $8,549 | $10,407 | $11,533 | $12,454 | $10,478 | $12,135 |
| | 2018 | 2019 | 2020 | 2021 | 2022 | 2023 | 2024 |
AVERAGE ANNUAL TOTAL RETURNS:| | 1 Year | 5 Year | Life of Fund A |
| Initial Class | 5.11% | 4.10% | 3.64% |
| Fidelity Global ex U.S. Index℠ | 5.70% | 4.53% | 4.10% |
| MSCI ACWI (All Country World Index) ex USA Index | 5.72% | 4.27% | 3.78% |
A From April 17, 2018
Visit institutional.fidelity.com for more recent performance information. |
The Fund's past performance is not a good predictor of the Fund's future performance. The graph and table do not reflect the deduction of taxes that a shareholder would pay on fund distributions or redemption of fund shares. |
Key Fund Statistics(as of December 31, 2024)
KEY FACTS | | |
| Fund Size | $612,795,347 | |
| Number of Holdings | 2,236 | |
| Total Advisory Fee | $829,632 | |
| Portfolio Turnover | 5% | |
What did the Fund invest in?
(as of December 31, 2024)
MARKET SECTORS (% of Fund's net assets) | | |
| Financials | 24.2 | |
| Industrials | 14.2 | |
| Information Technology | 13.5 | |
| Consumer Discretionary | 10.8 | |
| Health Care | 7.8 | |
| Consumer Staples | 6.7 | |
| Materials | 5.9 | |
| Communication Services | 5.4 | |
| Energy | 4.4 | |
| Utilities | 2.8 | |
| Real Estate | 1.8 | |
| |
| Common Stocks | 97.2 |
| Preferred Stocks | 0.3 |
| Short-Term Investments and Net Other Assets (Liabilities) | 2.5 |
ASSET ALLOCATION (% of Fund's net assets) |
|
| | Common Stocks - 97.2 |
| | Preferred Stocks - 0.3 |
| | Short-Term Investments and Net Other Assets (Liabilities) - 2.5 |
| |
| Japan | 16.8 |
| United States | 8.9 |
| Canada | 7.7 |
| United Kingdom | 7.1 |
| China | 6.7 |
| Taiwan | 6.0 |
| Germany | 5.3 |
| France | 5.2 |
| Australia | 4.7 |
| Others | 31.6 |
GEOGRAPHIC DIVERSIFICATION (% of Fund's net assets) |
|
| | Japan - 16.8 |
| | United States - 8.9 |
| | Canada - 7.7 |
| | United Kingdom - 7.1 |
| | China - 6.7 |
| | Taiwan - 6.0 |
| | Germany - 5.3 |
| | France - 5.2 |
| | Australia - 4.7 |
| | Others - 31.6 |
| |
TOP HOLDINGS(% of Fund's net assets) | | |
| Taiwan Semiconductor Manufacturing Co Ltd | 3.0 | |
| Tencent Holdings Ltd | 1.2 | |
| ASML Holding NV | 1.1 | |
| Novo Nordisk A/S Series B | 1.0 | |
| Toyota Motor Corp | 1.0 | |
| SAP SE | 0.9 | |
| Nestle SA | 0.8 | |
| Roche Holding AG | 0.8 | |
| Astrazeneca PLC | 0.7 | |
| Shell PLC | 0.7 | |
| | 11.2 | |
How has the Fund changed?
This is a summary of certain changes to the Fund since January 1, 2024. For more complete information, you may review the Fund's next prospectus, which we expect to be available by April 30, 2025 at fundresearch.fidelity.com/prospectus/sec or upon request at 1-877-208-0098 or by sending an e-mail to funddocuments@fmr.com.
The fees associated with this class changed during the reporting year. The variations in class fees are primarily the result of the following changes:- Management fee
- Operating expenses
Effective June 1, 2024, the fund's management contract was amended to incorporate administrative services previously covered under separate services agreements (transfer agent and pricing & bookkeeping). The amended contract incorporates a management fee rate that may vary by class. The Adviser or an affiliate pays certain expenses of managing and operating the fund out of each class's management fee. | |
| Fidelity, the Fidelity Investments Logo and all other Fidelity trademarks or service marks used herein are trademarks or service marks of FMR LLC. Any third-party marks that are used herein are trademarks or service marks of their respective owners. © 2025 FMR LLC. All rights reserved. |
| | For additional information about the Fund; including its prospectus, financial information, holdings and proxy information, scan the QR code or visit fundresearch.fidelity.com/prospectus/sec 1.9914375.100 3074-TSRA-0325 |
Item 2.
Code of Ethics
As of the end of the period, December 31, 2024, Variable Insurance Products Fund II (the trust) has adopted a code of ethics, as defined in Item 2 of Form N-CSR, that applies to its President and Treasurer and its Chief Financial Officer. A copy of the code of ethics is filed as an exhibit to this Form N-CSR.
Item 3.
Audit Committee Financial Expert
The Board of Trustees of the trust has determined that Donald F. Donahue is an audit committee financial expert, as defined in Item 3 of Form N-CSR. Mr. Donahue is independent for purposes of Item 3 of Form N-CSR.
Item 4.
Principal Accountant Fees and Services
Fees and Services
The following table presents fees billed by Deloitte & Touche LLP, the member firms of Deloitte Touche Tohmatsu, and their respective affiliates (collectively, “Deloitte Entities”) in each of the last two fiscal years for services rendered to VIP Contrafund Portfolio, VIP Disciplined Small Cap Portfolio, VIP Emerging Markets Portfolio, VIP Extended Market Index Portfolio, VIP Index 500 Portfolio, VIP International Index Portfolio and VIP Total Market Index Portfolio (the “Funds”):
Services Billed by Deloitte Entities
December 31, 2024 FeesA
| | | | |
| Audit Fees | Audit-Related Fees | Tax Fees | All Other Fees |
| | | | |
VIP Contrafund Portfolio | $50,000 | $- | $9,700 | $1,100 |
VIP Disciplined Small Cap Portfolio | $39,400 | $- | $9,700 | $900 |
VIP Emerging Markets Portfolio | $44,200 | $- | $9,700 | $1,000 |
VIP Extended Market Index Portfolio | $53,100 | $- | $10,100 | $1,200 |
VIP Index 500 Portfolio | $45,600 | $- | $10,000 | $1,000 |
VIP International Index Portfolio | $52,000 | $- | $10,400 | $1,200 |
VIP Total Market Index Portfolio | $53,100 | $- | $9,800 | $1,200 |
| | | | | |
| Audit Fees | Audit-Related Fees | Tax Fees | All Other Fees |
|
| | | | |
VIP Contrafund Portfolio | $49,800 | $- | $10,000 | $1,300 |
VIP Disciplined Small Cap Portfolio | $39,600 | $- | $9,800 | $1,100 |
VIP Emerging Markets Portfolio | $44,400 | $- | $10,000 | $1,200 |
VIP Extended Market Index Portfolio | $53,300 | $- | $10,300 | $1,400 |
VIP Index 500 Portfolio | $45,800 | $- | $10,200 | $1,200 |
VIP International Index Portfolio | $52,200 | $- | $11,100 | $1,400 |
VIP Total Market Index Portfolio | $53,300 | $- | $10,600 | $1,400 |
A Amounts may reflect rounding.
The following table presents fees billed by PricewaterhouseCoopers LLP (“PwC”) in each of the last two fiscal years for services rendered to VIP International Capital Appreciation Portfolio (the “Fund”):
Services Billed by PwC
December 31, 2024 FeesA
| | | | |
| Audit Fees | Audit-Related Fees | Tax Fees | All Other Fees |
VIP International Capital Appreciation Portfolio | $50,700 | $4,600 | $11,600 | $1,600 |
| | | | |
| Audit Fees | Audit-Related Fees | Tax Fees | All Other Fees |
VIP International Capital Appreciation Portfolio | $50,800 | $4,800 | $11,600 | $1,600 |
A Amounts may reflect rounding.
The following table(s) present(s) fees billed by Deloitte Entities and PwC that were required to be approved by the Audit Committee for services that relate directly to the operations and financial reporting of the Fund(s) and that are rendered on behalf of Fidelity Management & Research Company LLC ("FMR") and entities controlling,
controlled by, or under common control with FMR (not including any sub-adviser whose role is primarily portfolio management and is subcontracted with or overseen by another investment adviser) that provide ongoing services to the Fund(s) (“Fund Service Providers”):
Services Billed by Deloitte Entities
| | |
| December 31, 2024A | December 31, 2023A |
Audit-Related Fees | $125,000 | $75,000 |
Tax Fees | $- | $- |
All Other Fees | $2,929,500 | $- |
A Amounts may reflect rounding.
Services Billed by PwC
| | |
| December 31, 2024A | December 31, 2023A |
Audit-Related Fees | $9,701,800 | $8,881,200 |
Tax Fees | $61,000 | $1,000 |
All Other Fees | $35,000 | $- |
A Amounts may reflect rounding.
“Audit-Related Fees” represent fees billed for assurance and related services that are reasonably related to the performance of the fund audit or the review of the fund's financial statements and that are not reported under Audit Fees.
“Tax Fees” represent fees billed for tax compliance, tax advice or tax planning that relate directly to the operations and financial reporting of the fund.
“All Other Fees” represent fees billed for services provided to the fund or Fund Service Provider, a significant portion of which are assurance related, that relate directly to the operations and financial reporting of the fund, excluding those services that are reported under Audit Fees, Audit-Related Fees or Tax Fees.
Assurance services must be performed by an independent public accountant.
* * *
The aggregate non-audit fees billed by Deloitte Entities and PwC for services rendered to the Fund(s), FMR (not including any sub-adviser whose role is primarily portfolio management and is subcontracted with or overseen by another investment adviser), and any Fund Service Provider for each of the last two fiscal years of the Fund(s) are as follows:
| | |
Billed By | December 31, 2024A | December 31, 2023A |
Deloitte Entities | $3,426,000 | $5,438,100 |
PwC | $15,308,900 | $14,354,300 |
A Amounts may reflect rounding.
The trust's Audit Committee has considered non-audit services that were not pre-approved that were provided by Deloitte Entities and PwC to Fund Service Providers to be compatible with maintaining the independence of Deloitte Entities and PwC in its(their) audit of the Fund(s), taking into account representations from Deloitte Entities and PwC, in accordance with Public Company Accounting Oversight Board rules, regarding its independence from the Fund(s) and its(their) related entities and FMR’s review of the appropriateness and permissibility under applicable law of such non-audit services prior to their provision to the Fund(s) Service Providers.
Audit Committee Pre-Approval Policies and Procedures
The trust’s Audit Committee must pre-approve all audit and non-audit services provided by a fund’s independent registered public accounting firm relating to the operations or financial reporting of the fund. Prior to the commencement of any audit or non-audit services to a fund, the Audit Committee reviews the services to determine whether they are appropriate and permissible under applicable law.
The Audit Committee has adopted policies and procedures to, among other purposes, provide a framework for the Committee’s consideration of non-audit services by the audit firms that audit the Fidelity funds. The policies and procedures require that any non-audit service provided by a fund audit firm to a Fidelity fund and any non-audit service provided by a fund auditor to a Fund Service Provider that relates directly to the operations and financial reporting of a Fidelity fund (“Covered Service”) are subject to approval by the Audit Committee before such service is provided.
All Covered Services must be approved in advance of provision of the service either: (i) by formal resolution of the Audit Committee, or (ii) by oral or written approval of the service by the Chair of the Audit Committee (or if the Chair is unavailable, such other member of the Audit Committee as may be designated by the Chair to act in the Chair’s
absence). The approval contemplated by (ii) above is permitted where the Treasurer determines that action on such an engagement is necessary before the next meeting of the Audit Committee.
Non-audit services provided by a fund audit firm to a Fund Service Provider that do not relate directly to the operations and financial reporting of a Fidelity fund are reported to the Audit Committee periodically.
Non-Audit Services Approved Pursuant to Rule 2-01(c)(7)(i)(C) and (ii) of Regulation S-X (“De Minimis Exception”)
There were no non-audit services approved or required to be approved by the Audit Committee pursuant to the De Minimis Exception during the Fund’s(s’) last two fiscal years relating to services provided to (i) the Fund(s) or (ii) any Fund Service Provider that relate directly to the operations and financial reporting of the Fund(s).
The Registrant has not retained, for the preparation of the audit report on the financial statements included in the Form N-CSR, a registered public accounting firm that has a branch or office that is located in a foreign jurisdiction and that the Public Company Accounting Oversight Board (the “PCAOB”) has determined that the PCAOB is unable to inspect or investigate completely because of a position taken by an authority in the foreign jurisdiction.
The Registrant is not a “foreign issuer,” as defined in 17 CFR 240.3b-4.
Item 5.
Audit Committee of Listed Registrants
Not applicable.
Item 6.
Investments
(a)
Not applicable.
(b)
Not applicable.
Item 7.
Financial Statements and Financial Highlights for Open-End Management Investment Companies
Fidelity® Variable Insurance Products:
VIP International Capital Appreciation Portfolio
Annual Report
December 31, 2024
Contents
To view a fund's proxy voting guidelines and proxy voting record for the 12-month period ended June 30, visit http://www.fidelity.com/proxyvotingresults or visit the Securities and Exchange Commission's (SEC) web site at http://www.sec.gov.
You may also call 1-877-208-0098 to request a free copy of the proxy voting guidelines.
Fidelity® Variable Insurance Products are separate account options which are purchased through a variable insurance contract.
Standard & Poor's, S&P and S&P 500 are registered service marks of The McGraw-Hill Companies, Inc. and have been licensed for use by Fidelity Distributors Corporation.
Other third-party marks appearing herein are the property of their respective owners.
All other marks appearing herein are registered or unregistered trademarks or service marks of FMR LLC or an affiliated company. © 2025 FMR LLC. All rights reserved.
This report and the financial statements contained herein are submitted for the general information of the shareholders of the Fund. This report is not authorized for distribution to prospective investors in the Fund unless preceded or accompanied by an effective prospectus.
A fund files its complete schedule of portfolio holdings with the SEC for the first and third quarters of each fiscal year on Form N-PORT. Forms N-PORT are available on the SEC's web site at http://www.sec.gov. A fund's Forms N-PORT may be reviewed and copied at the SEC's Public Reference Room in Washington, DC. Information regarding the operation of the SEC's Public Reference Room may be obtained by calling 1-800-SEC-0330.
For a complete list of a fund's portfolio holdings, view the most recent holdings listing, semiannual report, or annual report on Fidelity's web site at http://www.fidelity.com, http://www.institutional.fidelity.com, or http://www.401k.com, as applicable.
NOT FDIC INSURED •MAY LOSE VALUE •NO BANK GUARANTEE
Neither the Fund nor Fidelity Distributors Corporation is a bank.
Item 7: Financial Statements and Financial Highlights for Open-End Management Investment Companies (Annual Report)
VIP International Capital Appreciation Portfolio
Schedule of Investments December 31, 2024
Showing Percentage of Net Assets
| Common Stocks - 99.5% |
| | | Shares | Value ($) |
| BRAZIL - 1.4% | | | |
| Consumer Discretionary - 1.4% | | | |
| Broadline Retail - 1.4% | | | |
| MercadoLibre Inc (a) | | 5,916 | 10,059,803 |
| CANADA - 4.7% | | | |
| Financials - 1.7% | | | |
| Capital Markets - 1.7% | | | |
| Brookfield Asset Management Ltd Class A (United States) | | 212,768 | 11,529,898 |
| Industrials - 1.2% | | | |
| Professional Services - 1.2% | | | |
| Thomson Reuters Corp | | 56,565 | 9,082,982 |
| Information Technology - 1.8% | | | |
| Software - 1.8% | | | |
| Constellation Software Inc/Canada | | 3,972 | 12,282,294 |
| Constellation Software Inc/Canada warrants 3/31/2040 (a)(b) | | 4,999 | 0 |
| | | | 12,282,294 |
| TOTAL CANADA | | | 32,895,174 |
| CHINA - 7.1% | | | |
| Communication Services - 2.7% | | | |
| Interactive Media & Services - 2.7% | | | |
| Tencent Holdings Ltd | | 349,265 | 18,641,260 |
| Consumer Discretionary - 4.4% | | | |
| Broadline Retail - 1.3% | | | |
| PDD Holdings Inc Class A ADR (a) | | 96,309 | 9,341,010 |
| Hotels, Restaurants & Leisure - 3.1% | | | |
| Meituan B Shares (a)(c)(d) | | 555,815 | 10,806,917 |
| Trip.com Group Ltd ADR (a) | | 153,625 | 10,547,893 |
| | | | 21,354,810 |
| TOTAL CHINA | | | 49,337,080 |
| DENMARK - 3.8% | | | |
| Health Care - 2.4% | | | |
| Pharmaceuticals - 2.4% | | | |
| Novo Nordisk A/S Series B | | 193,995 | 16,738,243 |
| Industrials - 1.4% | | | |
| Air Freight & Logistics - 1.4% | | | |
| DSV A/S | | 47,055 | 9,993,763 |
| TOTAL DENMARK | | | 26,732,006 |
| FRANCE - 9.6% | | | |
| Consumer Discretionary - 4.2% | | | |
| Textiles, Apparel & Luxury Goods - 4.2% | | | |
| Hermes International SCA | | 5,317 | 12,788,680 |
| LVMH Moet Hennessy Louis Vuitton SE | | 24,311 | 15,991,612 |
| | | | 28,780,292 |
| Health Care - 0.8% | | | |
| Health Care Equipment & Supplies - 0.8% | | | |
| EssilorLuxottica SA | | 23,505 | 5,736,307 |
| Industrials - 3.1% | | | |
| Aerospace & Defense - 1.7% | | | |
| Safran SA | | 53,112 | 11,637,244 |
| Building Products - 1.4% | | | |
| Cie de Saint-Gobain SA | | 114,697 | 10,192,170 |
TOTAL INDUSTRIALS | | | 21,829,414 |
| | | | |
| Materials - 1.5% | | | |
| Chemicals - 1.5% | | | |
| Air Liquide SA | | 64,549 | 10,493,070 |
| TOTAL FRANCE | | | 66,839,083 |
| GERMANY - 5.8% | | | |
| Financials - 1.6% | | | |
| Insurance - 1.6% | | | |
| Muenchener Rueckversicherungs-Gesellschaft AG in Muenchen | | 21,398 | 10,817,021 |
| Information Technology - 2.6% | | | |
| Software - 2.6% | | | |
| SAP SE | | 73,189 | 18,002,612 |
| Materials - 1.6% | | | |
| Construction Materials - 1.6% | | | |
| Heidelberg Materials AG | | 91,720 | 11,334,474 |
| TOTAL GERMANY | | | 40,154,107 |
| INDIA - 7.7% | | | |
| Communication Services - 1.5% | | | |
| Wireless Telecommunication Services - 1.5% | | | |
| Bharti Airtel Ltd | | 579,313 | 10,747,699 |
| Financials - 4.8% | | | |
| Banks - 4.8% | | | |
| Axis Bank Ltd | | 737,211 | 9,171,475 |
| HDFC Bank Ltd/Gandhinagar | | 586,505 | 12,133,675 |
| ICICI Bank Ltd | | 779,870 | 11,657,069 |
| | | | 32,962,219 |
| Industrials - 1.4% | | | |
| Construction & Engineering - 1.4% | | | |
| Larsen & Toubro Ltd | | 229,666 | 9,681,468 |
| TOTAL INDIA | | | 53,391,386 |
| INDONESIA - 1.4% | | | |
| Financials - 1.4% | | | |
| Banks - 1.4% | | | |
| Bank Central Asia Tbk PT | | 16,282,405 | 9,759,562 |
| IRELAND - 1.3% | | | |
| Industrials - 1.3% | | | |
| Building Products - 1.3% | | | |
| Kingspan Group PLC | | 126,374 | 9,222,222 |
| ITALY - 2.7% | | | |
| Consumer Discretionary - 1.4% | | | |
| Automobiles - 1.4% | | | |
| Ferrari NV (Italy) | | 21,962 | 9,381,827 |
| Industrials - 1.3% | | | |
| Electrical Equipment - 1.3% | | | |
| Prysmian SpA | | 143,643 | 9,174,552 |
| TOTAL ITALY | | | 18,556,379 |
| JAPAN - 8.5% | | | |
| Financials - 1.7% | | | |
| Insurance - 1.7% | | | |
| Tokio Marine Holdings Inc | | 334,355 | 11,999,375 |
| Health Care - 1.5% | | | |
| Health Care Equipment & Supplies - 1.5% | | | |
| Hoya Corp | | 84,757 | 10,518,878 |
| Industrials - 3.7% | | | |
| Industrial Conglomerates - 1.9% | | | |
| Hitachi Ltd | | 521,257 | 12,765,616 |
| Professional Services - 1.8% | | | |
| Recruit Holdings Co Ltd | | 181,955 | 12,647,313 |
TOTAL INDUSTRIALS | | | 25,412,929 |
| | | | |
| Information Technology - 1.6% | | | |
| Semiconductors & Semiconductor Equipment - 1.6% | | | |
| Disco Corp | | 41,676 | 11,055,701 |
| TOTAL JAPAN | | | 58,986,883 |
| NETHERLANDS - 5.4% | | | |
| Industrials - 1.4% | | | |
| Professional Services - 1.4% | | | |
| Wolters Kluwer NV | | 57,325 | 9,524,568 |
| Information Technology - 4.0% | | | |
| Semiconductors & Semiconductor Equipment - 4.0% | | | |
| ASM International NV | | 18,614 | 10,774,397 |
| ASML Holding NV | | 24,581 | 17,217,385 |
| | | | 27,991,782 |
| TOTAL NETHERLANDS | | | 37,516,350 |
| SWEDEN - 1.4% | | | |
| Industrials - 1.4% | | | |
| Machinery - 1.4% | | | |
| Atlas Copco AB A Shares | | 637,374 | 9,727,382 |
| SWITZERLAND - 3.2% | | | |
| Financials - 1.5% | | | |
| Insurance - 1.5% | | | |
| Zurich Insurance Group AG | | 17,577 | 10,454,195 |
| Industrials - 1.7% | | | |
| Electrical Equipment - 1.7% | | | |
| ABB Ltd | | 224,498 | 12,122,559 |
| TOTAL SWITZERLAND | | | 22,576,754 |
| TAIWAN - 4.6% | | | |
| Information Technology - 4.6% | | | |
| Semiconductors & Semiconductor Equipment - 4.6% | | | |
| Taiwan Semiconductor Manufacturing Co Ltd | | 993,912 | 32,289,881 |
| UNITED KINGDOM - 10.3% | | | |
| Consumer Discretionary - 1.7% | | | |
| Hotels, Restaurants & Leisure - 1.7% | | | |
| InterContinental Hotels Group PLC | | 95,977 | 11,941,812 |
| Financials - 3.2% | | | |
| Capital Markets - 3.2% | | | |
| 3i Group PLC | | 253,508 | 11,284,464 |
| London Stock Exchange Group PLC | | 80,144 | 11,312,724 |
| | | | 22,597,188 |
| Industrials - 5.4% | | | |
| Aerospace & Defense - 2.4% | | | |
| BAE Systems PLC | | 347,577 | 4,986,090 |
| Rolls-Royce Holdings PLC (a) | | 1,631,745 | 11,571,346 |
| | | | 16,557,436 |
| Professional Services - 1.6% | | | |
| RELX PLC | | 246,141 | 11,152,399 |
| Trading Companies & Distributors - 1.4% | | | |
| Ashtead Group PLC | | 153,958 | 9,569,542 |
TOTAL INDUSTRIALS | | | 37,279,377 |
| | | | |
| TOTAL UNITED KINGDOM | | | 71,818,377 |
| UNITED STATES - 20.6% | | | |
| Financials - 8.9% | | | |
| Capital Markets - 2.8% | | | |
| Moody's Corp | | 19,788 | 9,367,045 |
| S&P Global Inc | | 20,584 | 10,251,450 |
| | | | 19,618,495 |
| Financial Services - 3.3% | | | |
| Mastercard Inc Class A | | 20,831 | 10,968,980 |
| Visa Inc Class A | | 35,380 | 11,181,495 |
| | | | 22,150,475 |
| Insurance - 2.8% | | | |
| Arthur J Gallagher & Co | | 34,264 | 9,725,836 |
| Marsh & McLennan Cos Inc | | 46,267 | 9,827,574 |
| | | | 19,553,410 |
TOTAL FINANCIALS | | | 61,322,380 |
| | | | |
| Industrials - 6.1% | | | |
| Commercial Services & Supplies - 1.3% | | | |
| Waste Connections Inc | | 51,257 | 8,793,332 |
| Construction & Engineering - 1.4% | | | |
| Ferrovial SE | | 235,700 | 9,912,484 |
| Electrical Equipment - 2.1% | | | |
| Schneider Electric SE | | 55,006 | 13,694,078 |
| Professional Services - 1.3% | | | |
| Experian PLC | | 217,888 | 9,364,801 |
TOTAL INDUSTRIALS | | | 41,764,695 |
| | | | |
| Information Technology - 1.5% | | | |
| Semiconductors & Semiconductor Equipment - 1.5% | | | |
| Broadcom Inc | | 45,204 | 10,480,095 |
| Materials - 4.1% | | | |
| Chemicals - 1.3% | | | |
| Linde PLC | | 21,616 | 9,049,971 |
| Construction Materials - 2.8% | | | |
| CRH PLC (United Kingdom) | | 97,479 | 9,047,598 |
| Holcim AG | | 111,874 | 10,771,784 |
| | | | 19,819,382 |
TOTAL MATERIALS | | | 28,869,353 |
| | | | |
| TOTAL UNITED STATES | | | 142,436,523 |
| TOTAL COMMON STOCKS (Cost $517,307,836) | | | 692,298,952 |
| | | | |
| Money Market Funds - 0.7% |
| | | Yield (%) | Shares | Value ($) |
Fidelity Cash Central Fund (e) (Cost $4,912,417) | | 4.36 | 4,911,435 | 4,912,417 |
| | | | | |
| TOTAL INVESTMENT IN SECURITIES - 100.2% (Cost $522,220,253) | 697,211,369 |
NET OTHER ASSETS (LIABILITIES) - (0.2)% | (1,185,484) |
| NET ASSETS - 100.0% | 696,025,885 |
| | |
Legend
| (c) | Security exempt from registration under Rule 144A of the Securities Act of 1933. These securities may be resold in transactions exempt from registration, normally to qualified institutional buyers. At the end of the period, the value of these securities amounted to $10,806,917 or 1.6% of net assets. |
| (d) | Security is exempt from registration under Regulation S of the Securities Act of 1933 and may be resold to qualified foreign investors outside of the United States. At the end of the period, the value of securities amounted to $10,806,917 or 1.6% of net assets. |
| (e) | Affiliated fund that is generally available only to investment companies and other accounts managed by Fidelity Investments. The rate quoted is the annualized seven-day yield of the fund at period end. A complete unaudited listing of the fund's holdings as of its most recent quarter end is available upon request. In addition, each Fidelity Central Fund's financial statements, which are not covered by the Fund's Report of Independent Registered Public Accounting Firm, are available on the SEC's website or upon request. |
Affiliated Central Funds
Fiscal year to date information regarding the Fund's investments in Fidelity Central Funds, including the ownership percentage, is presented below.
| Affiliate | Value, beginning of period ($) | Purchases ($) | Sales Proceeds ($) | Dividend Income ($) | Realized Gain (loss) ($) | Change in Unrealized appreciation (depreciation) ($) | Value, end of period ($) | Shares, end of period | % ownership, end of period |
| Fidelity Cash Central Fund | 8,339,368 | 245,357,521 | 248,785,223 | 469,048 | 751 | - | 4,912,417 | 4,911,435 | 0.0% |
| Fidelity Securities Lending Cash Central Fund | 3,964,125 | 51,197,817 | 55,161,942 | 3,175 | - | - | - | - | 0.0% |
| Total | 12,303,493 | 296,555,338 | 303,947,165 | 472,223 | 751 | - | 4,912,417 | 4,911,435 | |
| | | | | | | | | | |
Amounts in the dividend income column in the above table include any capital gain distributions from underlying funds, which are presented in the corresponding line item in the Statement of Operations, if applicable.
Amounts in the dividend income column for Fidelity Securities Lending Cash Central Fund represents the income earned on investing cash collateral, less rebates paid to borrowers and any lending agent fees associated with the loan, plus any premium payments received for lending certain types of securities.
Amounts included in the purchases and sales proceeds columns may include in-kind transactions, if applicable.
Investment Valuation
The following is a summary of the inputs used, as of December 31, 2024, involving the Fund's assets and liabilities carried at fair value. The inputs or methodology used for valuing securities may not be an indication of the risk associated with investing in those securities. For more information on valuation inputs, and their aggregation into the levels used below, please refer to the Investment Valuation section in the accompanying Notes to Financial Statements.
| Valuation Inputs at Reporting Date: |
| Description | Total ($) | Level 1 ($) | Level 2 ($) | Level 3 ($) |
Investments in Securities: | | | | |
|
| Common Stocks | | | | |
Communication Services | 29,388,959 | 10,747,699 | 18,641,260 | - |
Consumer Discretionary | 90,859,554 | 52,119,213 | 38,740,341 | - |
Financials | 171,441,838 | 82,023,753 | 89,418,085 | - |
Health Care | 32,993,428 | 5,736,307 | 27,257,121 | - |
Industrials | 204,815,911 | 84,954,913 | 119,860,998 | - |
Information Technology | 112,102,365 | 33,536,786 | 78,565,579 | - |
Materials | 50,696,897 | 29,432,043 | 21,264,854 | - |
|
| Money Market Funds | 4,912,417 | 4,912,417 | - | - |
| Total Investments in Securities: | 697,211,369 | 303,463,131 | 393,748,238 | - |
Financial Statements
| Statement of Assets and Liabilities |
As of December 31, 2024 |
| Assets | | | | |
| Investment in securities, at value - See accompanying schedule: | | | | |
Unaffiliated issuers (cost $517,307,836) | $ | 692,298,952 | | |
Fidelity Central Funds (cost $4,912,417) | | 4,912,417 | | |
| | | | | |
| | | | | |
| Total Investment in Securities (cost $522,220,253) | | | $ | 697,211,369 |
| Foreign currency held at value (cost $121,828) | | | | 121,342 |
| Receivable for investments sold | | | | 720,070 |
| Receivable for fund shares sold | | | | 174,596 |
| Dividends receivable | | | | 195,617 |
| Reclaims receivable | | | | 1,124,677 |
| Distributions receivable from Fidelity Central Funds | | | | 22,715 |
| Prepaid expenses | | | | 618 |
| Other receivables | | | | 148,228 |
Total assets | | | | 699,719,232 |
| Liabilities | | | | |
| Payable for investments purchased | $ | 755,043 | | |
| Payable for fund shares redeemed | | 207,978 | | |
| Accrued management fee | | 466,611 | | |
| Distribution and service plan fees payable | | 29,125 | | |
| Deferred taxes | | 2,144,816 | | |
| Other payables and accrued expenses | | 89,774 | | |
| Total liabilities | | | | 3,693,347 |
| Net Assets | | | $ | 696,025,885 |
| Net Assets consist of: | | | | |
| Paid in capital | | | $ | 523,043,757 |
| Total accumulated earnings (loss) | | | | 172,982,128 |
| Net Assets | | | $ | 696,025,885 |
| | | | | |
| Net Asset Value and Maximum Offering Price | | | | |
| Initial Class : | | | | |
Net Asset Value, offering price and redemption price per share ($199,021,591 ÷ 8,741,172 shares) | | | $ | 22.77 |
| Service Class : | | | | |
Net Asset Value, offering price and redemption price per share ($10,713,998 ÷ 473,386 shares) | | | $ | 22.63 |
| Service Class 2 : | | | | |
Net Asset Value, offering price and redemption price per share ($133,452,307 ÷ 5,940,323 shares) | | | $ | 22.47 |
| Investor Class : | | | | |
Net Asset Value, offering price and redemption price per share ($352,837,989 ÷ 15,643,338 shares) | | | $ | 22.56 |
| Statement of Operations |
| Year ended December 31, 2024 |
| Investment Income | | | | |
| Dividends | | | $ | 8,993,119 |
| Interest | | | | 2,405 |
| Income from Fidelity Central Funds (including $3,175 from security lending) | | | | 472,223 |
| Income before foreign taxes withheld | | | $ | 9,467,747 |
| Less foreign taxes withheld | | | | (812,643) |
| Total income | | | | 8,655,104 |
| Expenses | | | | |
| Management fee | $ | 5,264,380 | | |
| Transfer agent fees | | 111,394 | | |
| Distribution and service plan fees | | 305,518 | | |
| Accounting fees | | 51,441 | | |
| Custodian fees and expenses | | 119,427 | | |
| Independent trustees' fees and expenses | | 2,946 | | |
| Audit fees | | 105,554 | | |
| Legal | | 2,331 | | |
| Interest | | 13,894 | | |
| Miscellaneous | | 10,499 | | |
| Total expenses before reductions | | 5,987,384 | | |
| Expense reductions | | (28,414) | | |
| Total expenses after reductions | | | | 5,958,970 |
| Net Investment income (loss) | | | | 2,696,134 |
| Realized and Unrealized Gain (Loss) | | | | |
| Net realized gain (loss) on: | | | | |
| Investment Securities: | | | | |
| Unaffiliated issuers (net of foreign taxes of $766,377) | | 60,046,646 | | |
| Fidelity Central Funds | | 751 | | |
| Foreign currency transactions | | 200,097 | | |
| Total net realized gain (loss) | | | | 60,247,494 |
| Change in net unrealized appreciation (depreciation) on: | | | | |
| Investment Securities: | | | | |
| Unaffiliated issuers (net of increase in deferred foreign taxes of $42,223) | | (12,265,527) | | |
| Assets and liabilities in foreign currencies | | (61,248) | | |
| Total change in net unrealized appreciation (depreciation) | | | | (12,326,775) |
| Net gain (loss) | | | | 47,920,719 |
| Net increase (decrease) in net assets resulting from operations | | | $ | 50,616,853 |
| Statement of Changes in Net Assets |
| |
| | Year ended December 31, 2024 | | Year ended December 31, 2023 |
| Increase (Decrease) in Net Assets | | | | |
| Operations | | | | |
| Net investment income (loss) | $ | 2,696,134 | $ | 1,788,465 |
| Net realized gain (loss) | | 60,247,494 | | 5,890,446 |
| Change in net unrealized appreciation (depreciation) | | (12,326,775) | | 127,788,158 |
| Net increase (decrease) in net assets resulting from operations | | 50,616,853 | | 135,467,069 |
| Distributions to shareholders | | (4,835,175) | | (1,768,610) |
| | | | | |
| Share transactions - net increase (decrease) | | 16,924,137 | | 6,643,708 |
| Total increase (decrease) in net assets | | 62,705,815 | | 140,342,167 |
| | | | | |
| Net Assets | | | | |
| Beginning of period | | 633,320,070 | | 492,977,903 |
| End of period | $ | 696,025,885 | $ | 633,320,070 |
| | | | | |
| | | | | |
Financial Highlights
VIP International Capital Appreciation Portfolio Initial Class |
| |
| Years ended December 31, | | 2024 | | 2023 | | 2022 | | 2021 | | 2020 |
Selected Per-Share Data | | | | | | | | | | |
| Net asset value, beginning of period | $ | 21.20 | $ | 16.69 | $ | 24.37 | $ | 23.03 | $ | 19.50 |
| Income from Investment Operations | | | | | | | | | | |
Net investment income (loss) A,B | | .11 | | .08 | | .06 | | .02 | | .08 |
| Net realized and unrealized gain (loss) | | 1.64 | | 4.51 | | (6.24) | | 2.75 | | 4.13 |
| Total from investment operations | | 1.75 | | 4.59 | | (6.18) | | 2.77 | | 4.21 |
| Distributions from net investment income | | (.18) | | (.08) | | (.05) | | - | | (.06) |
| Distributions from net realized gain | | - | | - | | (1.45) | | (1.43) | | (.61) |
| Total distributions | | (.18) | | (.08) | | (1.50) | | (1.43) | | (.68) C |
| Net asset value, end of period | $ | 22.77 | $ | 21.20 | $ | 16.69 | $ | 24.37 | $ | 23.03 |
Total Return D,E | | | | 27.50% | | (26.40)% | | 12.39% | | 22.18% |
Ratios to Average Net Assets B,F,G | | | | | | | | | | |
| Expenses before reductions | | .78% | | .83% | | .82% | | .82% | | .85% |
| Expenses net of fee waivers, if any | | | | .82% | | .82% | | .82% | | .85% |
| Expenses net of all reductions | | .78% | | .82% | | .82% | | .82% | | .80% |
| Net investment income (loss) | | .48% | | .39% | | .33% | | .08% | | .39% |
| Supplemental Data | | | | | | | | | | |
| Net assets, end of period (000 omitted) | $ | 199,022 | $ | 184,496 | $ | 144,579 | $ | 185,777 | $ | 162,289 |
Portfolio turnover rate H | | | | 72% | | 104% | | 147% | | 158% |
ACalculated based on average shares outstanding during the period.
BNet investment income (loss) is affected by the timing of the declaration of dividends by any underlying mutual funds or exchange-traded funds (ETFs). Net investment income (loss) of any mutual funds or ETFs is not included in the Fund's net investment income (loss) ratio.
CTotal distributions per share do not sum due to rounding.
DTotal returns do not reflect charges attributable to your insurance company's separate account. Inclusion of these charges would reduce the total returns shown.
ETotal returns would have been lower if certain expenses had not been reduced during the applicable periods shown.
FFees and expenses of any underlying mutual funds or exchange-traded funds (ETFs) are not included in the Fund's expense ratio. The Fund indirectly bears its proportionate share of these expenses. For additional expense information related to investments in Fidelity Central Funds, please refer to the "Investments in Fidelity Central Funds" note found in the Notes to Financial Statements section of the most recent Annual or Semi-Annual report.
GExpense ratios reflect operating expenses of the class. Expenses before reductions do not reflect amounts reimbursed, waived, or reduced through arrangements with the investment adviser, brokerage services, or other offset arrangements, if applicable, and do not represent the amount paid by the class during periods when reimbursements, waivers or reductions occur.
HAmount does not include the portfolio activity of any underlying mutual funds or exchange-traded funds (ETFs), derivatives or securities that mature within one year from acquisition.
VIP International Capital Appreciation Portfolio Service Class |
| |
| Years ended December 31, | | 2024 | | 2023 | | 2022 | | 2021 | | 2020 |
Selected Per-Share Data | | | | | | | | | | |
| Net asset value, beginning of period | $ | 21.13 | $ | 16.62 | $ | 24.28 | $ | 22.97 | $ | 19.46 |
| Income from Investment Operations | | | | | | | | | | |
Net investment income (loss) A,B | | .08 | | .06 | | .04 | | - C | | .06 |
| Net realized and unrealized gain (loss) | | 1.63 | | 4.50 | | (6.22) | | 2.73 | | 4.12 |
| Total from investment operations | | 1.71 | | 4.56 | | (6.18) | | 2.73 | | 4.18 |
| Distributions from net investment income | | (.21) | | (.05) | | (.03) | | - | | (.06) |
| Distributions from net realized gain | | - | | - | | (1.45) | | (1.42) | | (.61) |
| Total distributions | | (.21) | | (.05) | | (1.48) | | (1.42) | | (.67) |
| Net asset value, end of period | $ | 22.63 | $ | 21.13 | $ | 16.62 | $ | 24.28 | $ | 22.97 |
Total Return D,E | | | | 27.46% | | (26.49)% | | 12.21% | | 22.11% |
Ratios to Average Net Assets B,F,G | | | | | | | | | | |
| Expenses before reductions | | .92% | | .93% | | .92% | | .92% | | .94% |
| Expenses net of fee waivers, if any | | | | .92% | | .92% | | .92% | | .94% |
| Expenses net of all reductions | | .91% | | .92% | | .92% | | .92% | | .90% |
| Net investment income (loss) | | .35% | | .29% | | .23% | | (.02)% | | .30% |
| Supplemental Data | | | | | | | | | | |
| Net assets, end of period (000 omitted) | $ | 10,714 | $ | 4,053 | $ | 3,877 | $ | 5,064 | $ | 3,298 |
Portfolio turnover rate H | | | | 72% | | 104% | | 147% | | 158% |
ACalculated based on average shares outstanding during the period.
BNet investment income (loss) is affected by the timing of the declaration of dividends by any underlying mutual funds or exchange-traded funds (ETFs). Net investment income (loss) of any mutual funds or ETFs is not included in the Fund's net investment income (loss) ratio.
CAmount represents less than $.005 per share.
DTotal returns do not reflect charges attributable to your insurance company's separate account. Inclusion of these charges would reduce the total returns shown.
ETotal returns would have been lower if certain expenses had not been reduced during the applicable periods shown.
FFees and expenses of any underlying mutual funds or exchange-traded funds (ETFs) are not included in the Fund's expense ratio. The Fund indirectly bears its proportionate share of these expenses. For additional expense information related to investments in Fidelity Central Funds, please refer to the "Investments in Fidelity Central Funds" note found in the Notes to Financial Statements section of the most recent Annual or Semi-Annual report.
GExpense ratios reflect operating expenses of the class. Expenses before reductions do not reflect amounts reimbursed, waived, or reduced through arrangements with the investment adviser, brokerage services, or other offset arrangements, if applicable, and do not represent the amount paid by the class during periods when reimbursements, waivers or reductions occur.
HAmount does not include the portfolio activity of any underlying mutual funds or exchange-traded funds (ETFs), derivatives or securities that mature within one year from acquisition.
VIP International Capital Appreciation Portfolio Service Class 2 |
| |
| Years ended December 31, | | 2024 | | 2023 | | 2022 | | 2021 | | 2020 |
Selected Per-Share Data | | | | | | | | | | |
| Net asset value, beginning of period | $ | 20.94 | $ | 16.49 | $ | 24.11 | $ | 22.81 | $ | 19.33 |
| Income from Investment Operations | | | | | | | | | | |
Net investment income (loss) A,B | | .05 | | .03 | | .01 | | (.04) | | .03 |
| Net realized and unrealized gain (loss) | | 1.62 | | 4.45 | | (6.16) | | 2.73 | | 4.09 |
| Total from investment operations | | 1.67 | | 4.48 | | (6.15) | | 2.69 | | 4.12 |
| Distributions from net investment income | | (.14) | | (.03) | | (.02) | | - | | (.03) |
| Distributions from net realized gain | | - | | - | | (1.45) | | (1.39) | | (.61) |
| Total distributions | | (.14) | | (.03) | | (1.47) | | (1.39) | | (.64) |
| Net asset value, end of period | $ | 22.47 | $ | 20.94 | $ | 16.49 | $ | 24.11 | $ | 22.81 |
Total Return C,D | | | | 27.18% | | (26.57)% | | 12.11% | | 21.91% |
Ratios to Average Net Assets B,E,F | | | | | | | | | | |
| Expenses before reductions | | 1.04% | | 1.08% | | 1.07% | | 1.07% | | 1.09% |
| Expenses net of fee waivers, if any | | | | 1.07% | | 1.07% | | 1.07% | | 1.09% |
| Expenses net of all reductions | | 1.04% | | 1.07% | | 1.07% | | 1.07% | | 1.05% |
| Net investment income (loss) | | .22% | | .14% | | .08% | | (.17)% | | .15% |
| Supplemental Data | | | | | | | | | | |
| Net assets, end of period (000 omitted) | $ | 133,452 | $ | 102,350 | $ | 67,491 | $ | 68,271 | $ | 41,512 |
Portfolio turnover rate G | | | | 72% | | 104% | | 147% | | 158% |
ACalculated based on average shares outstanding during the period.
BNet investment income (loss) is affected by the timing of the declaration of dividends by any underlying mutual funds or exchange-traded funds (ETFs). Net investment income (loss) of any mutual funds or ETFs is not included in the Fund's net investment income (loss) ratio.
CTotal returns do not reflect charges attributable to your insurance company's separate account. Inclusion of these charges would reduce the total returns shown.
DTotal returns would have been lower if certain expenses had not been reduced during the applicable periods shown.
EFees and expenses of any underlying mutual funds or exchange-traded funds (ETFs) are not included in the Fund's expense ratio. The Fund indirectly bears its proportionate share of these expenses. For additional expense information related to investments in Fidelity Central Funds, please refer to the "Investments in Fidelity Central Funds" note found in the Notes to Financial Statements section of the most recent Annual or Semi-Annual report.
FExpense ratios reflect operating expenses of the class. Expenses before reductions do not reflect amounts reimbursed, waived, or reduced through arrangements with the investment adviser, brokerage services, or other offset arrangements, if applicable, and do not represent the amount paid by the class during periods when reimbursements, waivers or reductions occur.
GAmount does not include the portfolio activity of any underlying mutual funds or exchange-traded funds (ETFs), derivatives or securities that mature within one year from acquisition.
VIP International Capital Appreciation Portfolio Investor Class |
| |
| Years ended December 31, | | 2024 | | 2023 | | 2022 | | 2021 | | 2020 |
Selected Per-Share Data | | | | | | | | | | |
| Net asset value, beginning of period | $ | 21.00 | $ | 16.53 | $ | 24.15 | $ | 22.85 | $ | 19.35 |
| Income from Investment Operations | | | | | | | | | | |
Net investment income (loss) A,B | | .09 | | .06 | | .04 | | - C | | .06 |
| Net realized and unrealized gain (loss) | | 1.62 | | 4.47 | | (6.17) | | 2.72 | | 4.10 |
| Total from investment operations | | 1.71 | | 4.53 | | (6.13) | | 2.72 | | 4.16 |
| Distributions from net investment income | | (.15) | | (.06) | | (.03) | | - | | (.05) |
| Distributions from net realized gain | | - | | - | | (1.45) | | (1.42) | | (.61) |
| Total distributions | | (.15) | | (.06) | | (1.49) D | | (1.42) | | (.66) |
| Net asset value, end of period | $ | 22.56 | $ | 21.00 | $ | 16.53 | $ | 24.15 | $ | 22.85 |
Total Return E,F | | | | 27.42% | | (26.45)% | | 12.24% | | 22.14% |
Ratios to Average Net Assets B,G,H | | | | | | | | | | |
| Expenses before reductions | | .86% | | .90% | | .90% | | .90% | | .92% |
| Expenses net of fee waivers, if any | | | | .90% | | .90% | | .90% | | .92% |
| Expenses net of all reductions | | .86% | | .90% | | .90% | | .90% | | .88% |
| Net investment income (loss) | | .40% | | .32% | | .25% | | -% I | | .32% |
| Supplemental Data | | | | | | | | | | |
| Net assets, end of period (000 omitted) | $ | 352,838 | $ | 342,421 | $ | 277,031 | $ | 426,865 | $ | 378,864 |
Portfolio turnover rate J | | | | 72% | | 104% | | 147% | | 158% |
ACalculated based on average shares outstanding during the period.
BNet investment income (loss) is affected by the timing of the declaration of dividends by any underlying mutual funds or exchange-traded funds (ETFs). Net investment income (loss) of any mutual funds or ETFs is not included in the Fund's net investment income (loss) ratio.
CAmount represents less than $.005 per share.
DTotal distributions per share do not sum due to rounding.
ETotal returns do not reflect charges attributable to your insurance company's separate account. Inclusion of these charges would reduce the total returns shown.
FTotal returns would have been lower if certain expenses had not been reduced during the applicable periods shown.
GFees and expenses of any underlying mutual funds or exchange-traded funds (ETFs) are not included in the Fund's expense ratio. The Fund indirectly bears its proportionate share of these expenses. For additional expense information related to investments in Fidelity Central Funds, please refer to the "Investments in Fidelity Central Funds" note found in the Notes to Financial Statements section of the most recent Annual or Semi-Annual report.
HExpense ratios reflect operating expenses of the class. Expenses before reductions do not reflect amounts reimbursed, waived, or reduced through arrangements with the investment adviser, brokerage services, or other offset arrangements, if applicable, and do not represent the amount paid by the class during periods when reimbursements, waivers or reductions occur.
IAmount represents less than .005%.
JAmount does not include the portfolio activity of any underlying mutual funds or exchange-traded funds (ETFs), derivatives or securities that mature within one year from acquisition.
Notes to Financial Statements
For the period ended December 31, 2024
1. Organization.
VIP International Capital Appreciation Portfolio (the Fund) is a fund of Variable Insurance Products Fund II (the Trust) and is authorized to issue an unlimited number of shares. The Trust is registered under the Investment Company Act of 1940, as amended (the 1940 Act), as an open-end management investment company organized as a Massachusetts business trust. Shares of the Fund may only be purchased by insurance companies for the purpose of funding variable annuity or variable life insurance contracts. The Fund offers the following classes of shares: Initial Class shares, Service Class shares, Service Class 2 shares and Investor Class shares. All classes have equal rights and voting privileges, except for matters affecting a single class. The Fund's investments in emerging markets can be subject to social, economic, regulatory, and political uncertainties and can be extremely volatile.
2. Investments in Fidelity Central Funds.
Funds may invest in Fidelity Central Funds, which are open-end investment companies generally available only to other investment companies and accounts managed by the investment adviser and its affiliates. The Schedule of Investments lists any Fidelity Central Funds held as an investment as of period end, but does not include the underlying holdings of each Fidelity Central Fund. An investing fund indirectly bears its proportionate share of the expenses of the underlying Fidelity Central Funds.
Based on its investment objective, each Fidelity Central Fund may invest or participate in various investment vehicles or strategies that are similar to those of the investing fund. These strategies are consistent with the investment objectives of the investing fund and may involve certain economic risks which may cause a decline in value of each of the Fidelity Central Funds and thus a decline in the value of the investing fund.
| Fidelity Central Fund | Investment Manager | Investment Objective | Investment Practices | Expense RatioA |
| Fidelity Money Market Central Funds | Fidelity Management & Research Company LLC (FMR) | Each fund seeks to obtain a high level of current income consistent with the preservation of capital and liquidity. | Short-term Investments | Less than .005% |
A Expenses expressed as a percentage of average net assets and are as of each underlying Central Fund's most recent annual or semi-annual shareholder report.
A complete unaudited list of holdings for each Fidelity Central Fund is available upon request or at the Securities and Exchange Commission website at www.sec.gov. In addition, the financial statements of the Fidelity Central Funds which contain the significant accounting policies (including investment valuation policies) of those funds, and are not covered by the Report of Independent Registered Public Accounting Firm, are available on the Securities and Exchange Commission website or upon request.
3. Significant Accounting Policies.
The Fund is an investment company and applies the accounting and reporting guidance of the Financial Accounting Standards Board (FASB) Accounting Standards Codification Topic 946 Financial Services - Investment Companies. The financial statements have been prepared in conformity with accounting principles generally accepted in the United States of America (GAAP), which require management to make certain estimates and assumptions at the date of the financial statements. Actual results could differ from those estimates. The Fund operates as a single operating segment. The Fund's income, expenses, assets, and performance are regularly monitored and assessed as a whole by the investment adviser and other individuals responsible for oversight functions of the Trust, using the information presented in the financial statements and financial highlights. Subsequent events, if any, through the date that the financial statements were issued have been evaluated in the preparation of the financial statements. The Fund's Schedule of Investments lists any underlying mutual funds or exchange-traded funds (ETFs) but does not include the underlying holdings of these funds. The following summarizes the significant accounting policies of the Fund:
Investment Valuation. Investments are valued as of 4:00 p.m. Eastern time on the last calendar day of the period. The Board of Trustees (the Board) has designated the Fund's investment adviser as the valuation designee responsible for the fair valuation function and performing fair value determinations as needed. The investment adviser has established a Fair Value Committee (the Committee) to carry out the day-to-day fair valuation responsibilities and has adopted policies and procedures to govern the fair valuation process and the activities of the Committee. In accordance with these fair valuation policies and procedures, which have been approved by the Board, the Fund attempts to obtain prices from one or more third party pricing services or brokers to value its investments. When current market prices, quotations or currency exchange rates are not readily available or reliable, investments will be fair valued in good faith by the Committee, in accordance with the policies and procedures. Factors used in determining fair value vary by investment type and may include market or investment specific events, transaction data, estimated cash flows, and market observations of comparable investments. The frequency that the fair valuation procedures are used cannot be predicted and they may be utilized to a significant extent. The Committee manages the Fund's fair valuation practices and maintains the fair valuation policies and procedures. The Fund's investment adviser reports to the Board information regarding the fair valuation process and related material matters.
The Fund categorizes the inputs to valuation techniques used to value its investments into a disclosure hierarchy consisting of three levels as shown below:
Level 1 - unadjusted quoted prices in active markets for identical investments
Level 2 - other significant observable inputs (including quoted prices for similar investments, interest rates, prepayment speeds, etc.)
Level 3 - unobservable inputs (including the Fund's own assumptions based on the best information available)
Valuation techniques used to value the Fund's investments by major category are as follows:
Equity securities, including restricted securities, for which market quotations are readily available, are valued at the last reported sale price or official closing price as reported by a third party pricing service on the primary market or exchange on which they are traded and are categorized as Level 1 in the hierarchy. In the event there were no sales during the day or closing prices are not available, securities are valued at the last quoted bid price or may be valued using the last available price and are generally categorized as Level 2 in the hierarchy. For foreign equity securities, when market or security specific events arise, comparisons to the valuation of American Depositary Receipts (ADRs), futures contracts, Exchange-Traded Funds (ETFs) and certain indexes as well as quoted prices for similar securities may be used and would be categorized as Level 2 in the hierarchy. For equity securities, including restricted securities, where observable inputs are limited, assumptions about market activity and risk are used and these securities may be categorized as Level 3 in the hierarchy.
Investments in open-end mutual funds, including Fidelity Central Funds, are valued at their closing net asset value (NAV) each business day and are categorized as Level 1 in the hierarchy.
Changes in valuation techniques may result in transfers in or out of an assigned level within the disclosure hierarchy. The aggregate value of investments by input level as of December 31, 2024 is included at the end of the Fund's Schedule of Investments.
Foreign Currency. Certain Funds may use foreign currency contracts to facilitate transactions in foreign-denominated securities. Gains and losses from these transactions may arise from changes in the value of the foreign currency or if the counterparties do not perform under the contracts' terms.
Foreign-denominated assets, including investment securities, and liabilities are translated into U.S. dollars at the exchange rates at period end. Purchases and sales of investment securities, income and dividends received, and expenses denominated in foreign currencies are translated into U.S. dollars at the exchange rate in effect on the transaction date.
The effects of exchange rate fluctuations on investments are included with the net realized and unrealized gain (loss) on investment securities. Other foreign currency transactions resulting in realized and unrealized gain (loss) are disclosed separately.
Investment Transactions and Income. For financial reporting purposes, the Fund's investment holdings and NAV include trades executed through the end of the last business day of the period. The NAV per share for processing shareholder transactions is calculated as of the close of business of the New York Stock Exchange (NYSE), normally 4:00 p.m. Eastern time and includes trades executed through the end of the prior business day. Gains and losses on securities sold are determined on the basis of identified cost and include proceeds received from litigation. Commissions paid to certain brokers with whom the investment adviser, or its affiliates, places trades on behalf of a fund include an amount in addition to trade execution, which may be rebated back to a fund. Any such rebates are included in net realized gain (loss) on investments in the Statement of Operations. Dividend income is recorded on the ex-dividend date, except for certain dividends from foreign securities where the ex-dividend date may have passed, which are recorded as soon as the Fund is informed of the ex-dividend date. Non-cash dividends included in dividend income, if any, are recorded at the fair market value of the securities received. Income and capital gain distributions from Fidelity Central Funds, if any, are recorded on the ex-dividend date. Certain distributions received by the Fund represent a return of capital or capital gain. The Fund determines the components of these distributions subsequent to the ex-dividend date, based upon receipt of tax filings or other correspondence relating to the underlying investment. These distributions are recorded as a reduction of cost of investments and/or as a realized gain. Interest income is accrued as earned and includes coupon interest and amortization of premium and accretion of discount on debt securities as applicable. Investment income is recorded net of foreign taxes withheld where recovery of such taxes is uncertain. Funds may file withholding tax reclaims in certain jurisdictions to recover a portion of amounts previously withheld. Any withholding tax reclaims income is included in the Statement of Operations in foreign taxes withheld. Any receivables for withholding tax reclaims are included in the Statement of Assets and Liabilities in reclaims receivable.
Class Allocations and Expenses. Investment income, realized and unrealized capital gains and losses, common expenses of a fund, and certain fund-level expense reductions, if any, are allocated daily on a pro-rata basis to each class based on the relative net assets of each class to the total net assets of a fund. Each class differs with respect to transfer agent and distribution and service plan fees incurred, as applicable. Certain expense reductions may also differ by class, if applicable. For the reporting period, the allocated portion of income and expenses to each class as a percent of its average net assets may vary due to the timing of recording these transactions in relation to fluctuating net assets of the classes. Expenses directly attributable to a fund are charged to that fund. Expenses attributable to more than one fund are allocated among the respective funds on the basis of relative net assets or other appropriate methods. Expenses included in the accompanying financial statements reflect the expenses of that fund and do not include any expenses associated with any underlying mutual funds or exchange-traded funds (ETFs). Although not included in a fund's expenses, a fund indirectly bears its proportionate share of these expenses through the net asset value of each underlying mutual fund or exchange-traded fund (ETF). Expense estimates are accrued in the period to which they relate and adjustments are made when actual amounts are known.
Income Tax Information and Distributions to Shareholders. Each year, the Fund intends to qualify as a regulated investment company under Subchapter M of the Internal Revenue Code, including distributing substantially all of its taxable income and realized gains. As a result, no provision for U.S. Federal income taxes is required. As of December 31, 2024, the Fund did not have any unrecognized tax benefits in the financial statements; nor is the Fund aware of any tax positions for which it is reasonably possible that the total amounts of unrecognized tax benefits will significantly change in the next twelve months. The Fund files a U.S. federal tax return, in addition to state and local tax returns as required. The Fund's federal income tax returns are subject to examination by the Internal Revenue Service (IRS) for a period of three fiscal years after they are filed. State and local tax returns may be subject to examination for an additional fiscal year depending on the jurisdiction. Foreign taxes are provided for based on the Fund's understanding of the tax rules and rates that exist in the foreign markets in which it invests. The Fund is subject to a tax imposed on capital gains by certain countries in which it invests. An estimated deferred tax liability for net unrealized appreciation on the applicable securities is included in Deferred taxes on the Statement of Assets and Liabilities.
Distributions are declared and recorded on the ex-dividend date. Income and capital gain distributions are declared separately for each class. Income and capital gain distributions are determined in accordance with income tax regulations, which may differ from GAAP.
Capital accounts within the financial statements are adjusted for permanent book-tax differences. These adjustments have no impact on net assets or the results of operations. Capital accounts are not adjusted for temporary book-tax differences which will reverse in a subsequent period.
Book-tax differences are primarily due to foreign currency transactions, certain foreign taxes, passive foreign investment companies (PFIC), capital loss carryforwards and losses deferred due to wash sales and excise tax regulations.
As of period end, the cost and unrealized appreciation (depreciation) in securities, and derivatives if applicable, for federal income tax purposes were as follows:
| Gross unrealized appreciation | $181,512,645 |
| Gross unrealized depreciation | (11,029,851) |
| Net unrealized appreciation (depreciation) | $170,482,794 |
| Tax Cost | $526,728,575 |
The tax-based components of distributable earnings as of period end were as follows:
| Undistributed ordinary income | $976,263 |
| Undistributed long-term capital gain | $3,749,702 |
| Net unrealized appreciation (depreciation) on securities and other investments | $170,401,009 |
The tax character of distributions paid was as follows:
| | December 31, 2024 | December 31, 2023 |
| Ordinary Income | $4,835,175 | $ 1,768,610 |
| Total | $4,835,175 | $ 1,768,610 |
Restricted Securities (including Private Placements). Funds may invest in securities that are subject to legal or contractual restrictions on resale. These securities generally may be resold in transactions exempt from registration or to the public if the securities are registered. Disposal of these securities may involve time-consuming negotiations and expense, and prompt sale at an acceptable price may be difficult. Information regarding restricted securities held at period end is included at the end of the Schedule of Investments, if applicable.
New Accounting Pronouncement. FASB Accounting Standards Update (ASU) 2023-07 Segment Reporting (Topic 280): Improvements to Reportable Segment Disclosures became effective in this reporting period. ASU 2023-07 enhances segment information disclosure in the notes to financial statements.
4. Purchases and Sales of Investments.
Purchases and sales of securities, other than short-term securities and in-kind transactions, as applicable, are noted in the table below.
| | Purchases ($) | Sales ($) |
| VIP International Capital Appreciation Portfolio | 520,836,136 | 502,980,143 |
5. Fees and Other Transactions with Affiliates.
Management Fee. Fidelity Management & Research Company LLC (the investment adviser) and its affiliates provide the Fund with investment management related services for which the Fund pays a monthly management fee.
Effective March 1, 2024, the Fund's management contract was amended to incorporate administrative services previously covered under separate services agreements (Transfer Agent and Accounting agreements). The amended contract incorporates a management fee rate that may vary by class. The investment adviser or an affiliate pays certain expenses of managing and operating the Fund out of each class's management fee. Each class of the Fund pays a management fee to the investment adviser. The management fee is calculated and paid to the investment adviser every month. When determining a class's management fee, a mandate rate is calculated based on the monthly average net assets of a group of funds advised by FMR within a designated asset class. A discount rate is subtracted from the mandate rate once the Fund's monthly average net assets reach a certain level. The mandate rate and discount rate may vary by class. The annual management fee rate for a class of shares of the Fund is the lesser of (1) the class's mandate rate reduced by the class's discount rate (if applicable) or (2) the amount set forth in the following table.
| | Maximum Management Fee Rate % |
| Initial Class | .74 |
| Service Class | .74 |
| Service Class 2 | .74 |
| Investor Class | .82 |
One-twelfth of the management fee rate for a class is applied to the average net assets of the class for the month, giving a dollar amount which is the management fee for the class for that month. A different management fee rate may be applicable to each class of the Fund. The difference between classes is the result of separate arrangements for class-level services and/or waivers of certain expenses. It is not the result of any difference in advisory or custodial fees or other expenses related to the management of the Fund's assets, which do not vary by class. For the portion of the reporting period on or after March 1, 2024, the total annualized management fee rates were as follows:
| | Total Management Fee Rate % |
| Initial Class | .74 |
| Service Class | .74 |
| Service Class 2 | .74 |
| Investor Class | .82 |
Prior to March 1, 2024, the management fee was the sum of an individual fund fee rate that was based on an annual rate of .45% of the Fund's average net assets and an annualized group fee rate that averaged .22% during the period. The group fee rate was based upon the monthly average net assets of a group of registered investment companies with which the investment adviser has management contracts. The group fee rate decreased as assets under management increased and increased as assets under management decreased. For the portion of the reporting period prior to March 1, 2024, the total annualized management fee rate was .67%.
Effective March 1, 2024, the Fund's sub-advisory agreements with FMR Investment Management (UK) Limited, Fidelity Management & Research (Hong Kong) Limited, and Fidelity Management & Research (Japan) Limited were amended to provide that the investment adviser pays each sub-adviser monthly fees equal to 110% of the sub-adviser's costs for providing sub-advisory services.
Effective March 1, 2024, the Fund's sub-advisory agreement with FIL Investment Advisors (FIA) was amended to provide that the investment adviser pays FIA monthly fees at an annual rate of 0.44% with respect to the average daily net assets of the Fund managed by FIA. FIA in turn pays FIA(UK).
Distribution and Service Plan Fees. In accordance with Rule 12b-1 of the 1940 Act, the Fund has adopted separate 12b-1 Plans for each Service Class of shares. Each Service Class pays Fidelity Distributors Company LLC (FDC), an affiliate of the investment adviser, a service fee. For the period, the service fee is based on an annual rate of .10% of Service Class' average net assets and .25% of Service Class 2's average net assets.
For the period, total fees, all of which were re-allowed to insurance companies for the distribution of shares and providing shareholder support services, were as follows:
| Service Class | $6,719 |
| Service Class 2 | 298,799 |
| | $305,518 |
Transfer Agent Fees. Fidelity Investments Institutional Operations Company LLC (FIIOC), an affiliate of the investment adviser, is the Fund's transfer, dividend disbursing, and shareholder servicing agent. Effective March 1, 2024, the Fund's management contract was amended to incorporate transfer agent services and associated fees previously covered under a separate services agreement.
During the period January 1, 2024 through February 29, 2024, the transfer agent fees for each class were a fixed annual rate of class-level average net assets as follows:
| | Amount ($) | % of Class-Level Average Net Assets |
| Initial Class | 19,648 | .0630 |
| Service Class | 448 | .0630 |
| Service Class 2 | 10,792 | .0630 |
| Investor Class | 80,506 | .1390 |
| | 111,394 | |
Accounting Fees. Fidelity Service Company, Inc. (FSC), an affiliate of the investment adviser, maintains the Fund's accounting records. Effective March 1, 2024, the Fund's management contract was amended to incorporate accounting services and associated fees previously covered under a separate services agreement.
During the period January 1, 2024 through February 29, 2024, the accounting fees were a fixed annual rate of average net assets as follows:
| | % of Average Net Assets |
| VIP International Capital Appreciation Portfolio | .0481 |
Brokerage Commissions. A portion of portfolio transactions were placed with brokerage firms which are affiliates of the investment adviser. Brokerage commissions are included in net realized gain (loss) and change in net unrealized appreciation (depreciation) in the Statement of Operations. The commissions paid to these affiliated firms were as follows:
| | Amount ($) |
| VIP International Capital Appreciation Portfolio | 404 |
Interfund Lending Program. Pursuant to an Exemptive Order issued by the Securities and Exchange Commission (the SEC), the Fund, along with other registered investment companies having management contracts with Fidelity Management & Research Company LLC (FMR), or other affiliated entities of FMR, may participate in an interfund lending program. This program provides an alternative credit facility allowing the Fund to borrow from, or lend money to, other participating affiliated funds at rates that are beneficial to both the borrowing and lending fund. Borrowings under the program are generally for temporary or emergency purposes, including meeting fund shareholder redemptions. The interfund loan rate is determined, as specified in the Exemptive Order, by averaging, (1) the higher of the overnight time deposit rate and the current overnight repurchase agreement rate, and (2) a benchmark rate representing the lowest bank loan rate available to the funds. At period end, VIP International Capital Appreciation Portfolio had no interfund loans outstanding. Activity in this program during the period for which loans were outstanding was as follows:
| | Borrower or Lender | Average Loan Balance ($) | Weighted Average Interest Rate | Interest Expense ($) |
VIP International Capital Appreciation Portfolio | Borrower | 8,153,364 | 5.58% | 13,894 |
Interfund Trades. Funds may purchase from or sell securities to other Fidelity Funds under procedures adopted by the Board. The procedures have been designed to ensure these interfund trades are executed in accordance with Rule 17a-7 of the 1940 Act. Any interfund trades are included within the respective purchases and sales amounts shown in the Purchases and Sales of Investments note. Interfund trades during the period are noted in the table below.
| | Purchases ($) | Sales ($) | Realized Gain (Loss) ($) |
| VIP International Capital Appreciation Portfolio | 25,570,043 | 44,275,270 | 6,772,928 |
6. Committed Line of Credit.
Certain Funds participate with other funds managed by the investment adviser or an affiliate in a $4.25 billion credit facility (the "line of credit") to be utilized for temporary or emergency purposes to fund shareholder redemptions or for other short-term liquidity purposes.
Commitment fees are charged based on the unused amount of the line of credit at an annual rate of .10%, and then allocated to each participating fund based on its pro-rata portion of the line of credit. The commitment fees are reflected in Miscellaneous expenses on the Statement of Operations, and are listed below.
Interest is charged to a participating fund based on its borrowings at an annual rate of .75% plus the highest of (i) daily SOFR plus a .10% spread adjustment, (ii) Federal Funds Effective Rate, or (iii) Overnight Bank Funding Rate. During the period, there were no borrowings on this line of credit.
The line of credit agreement will expire in March 2025 unless extended or renewed.| | Amount ($) |
| VIP International Capital Appreciation Portfolio | 1,049 |
7. Security Lending.
Funds lend portfolio securities from time to time in order to earn additional income. Lending agents are used, including National Financial Services (NFS), an affiliate of the investment adviser. Pursuant to a securities lending agreement, NFS will receive a fee, which is capped at 9.9% of a fund's daily lending revenue, for its services as lending agent. A fund may lend securities to certain qualified borrowers, including NFS. On the settlement date of the loan, a fund receives collateral (in the form of U.S. Treasury obligations, letters of credit and/or cash) against the loaned securities and maintains collateral in an amount not less than 100% of the market value of the loaned securities during the period of the loan. The market value of the loaned securities is determined at the close of business of a fund and any additional required collateral is delivered to a fund on the next business day. A fund or borrower may terminate the loan at any time, and if the borrower defaults on its obligation to return the securities loaned because of insolvency or other reasons, a fund may apply collateral received from the borrower against the obligation. A fund may experience delays and costs in recovering the securities loaned. Any cash collateral received is invested in the Fidelity Securities Lending Cash Central Fund. Any loaned securities are identified as such in the Schedule of Investments, and the value of loaned securities and cash collateral at period end, as applicable, are presented in the Statement of Assets and Liabilities. Security lending income represents the income earned on investing cash collateral, less rebates paid to borrowers and any lending agent fees associated with the loan, plus any premium payments received for lending certain types of securities. Security lending income is presented in the Statement of Operations as a component of income from Fidelity Central Funds. Affiliated security lending activity, if any, was as follows:
| | Total Security Lending Fees Paid to NFS ($) | Security Lending Income From Securities Loaned to NFS ($) | Value of Securities Loaned to NFS at Period End ($) |
| VIP International Capital Appreciation Portfolio | 330 | - | - |
8. Expense Reductions.
Through arrangements with the Fund's custodian, credits realized as a result of certain uninvested cash balances were used to reduce the Fund's expenses. During the period, custodian credits reduced the Fund's expenses by $96.
In addition, during the period the investment adviser or an affiliate reimbursed and/or waived a portion of fund-level operating expenses in the amount of $28,318.
9. Distributions to Shareholders.
Distributions to shareholders of each class were as follows:
| | Year ended December 31, 2024 | Year ended December 31, 2023 |
| VIP International Capital Appreciation Portfolio | | |
| Distributions to shareholders | | |
| Initial Class | $1,533,340 | $653,377 |
| Service Class | 97,243 | 10,008 |
| Service Class 2 | 786,004 | 141,561 |
| Investor Class | 2,418,588 | 963,664 |
Total | $4,835,175 | $1,768,610 |
10. Share Transactions.
Transactions for each class of shares were as follows and may contain in-kind transactions:
| | Shares | Shares | Dollars | Dollars |
| | Year ended December 31, 2024 | Year ended December 31, 2023 | Year ended December 31, 2024 | Year ended December 31, 2023 |
| VIP International Capital Appreciation Portfolio | | | | |
| Initial Class | | | | |
| Shares sold | 436,160 | 461,433 | $10,192,579 | $8,751,478 |
| Reinvestment of distributions | 63,889 | 32,680 | 1,533,340 | 653,377 |
| Shares redeemed | (460,910) | (455,989) | (10,548,026) | (8,618,997) |
| Net increase (decrease) | 39,139 | 38,124 | $1,177,893 | $785,858 |
| Service Class | | | | |
| Shares sold | 403,551 | 19,960 | $9,334,527 | $372,424 |
| Reinvestment of distributions | 4,029 | 487 | 96,124 | 9,735 |
| Shares redeemed | (126,017) | (61,838) | (2,933,153) | (1,175,502) |
| Net increase (decrease) | 281,563 | (41,391) | $6,497,498 | $(793,343) |
| Service Class 2 | | | | |
| Shares sold | 1,862,507 | 1,541,977 | $42,363,949 | $29,210,824 |
| Reinvestment of distributions | 33,193 | 7,150 | 786,004 | 141,561 |
| Shares redeemed | (843,360) | (755,176) | (18,850,051) | (14,219,614) |
| Net increase (decrease) | 1,052,340 | 793,951 | $24,299,902 | $15,132,771 |
| Investor Class | | | | |
| Shares sold | 763,377 | 1,485,936 | $17,354,121 | $28,031,009 |
| Reinvestment of distributions | 101,750 | 48,643 | 2,418,588 | 963,664 |
| Shares redeemed | (1,526,071) | (1,989,473) | (34,823,865) | (37,476,251) |
| Net increase (decrease) | (660,944) | (454,894) | $(15,051,156) | $(8,481,578) |
11. Other.
A fund's organizational documents provide former and current trustees and officers with a limited indemnification against liabilities arising in connection with the performance of their duties to the fund. In the normal course of business, a fund may also enter into contracts that provide general indemnifications. A fund's maximum exposure under these arrangements is unknown as this would be dependent on future claims that may be made against a fund. The risk of material loss from such claims is considered remote.
At the end of the period, the investment adviser or its affiliates were owners of record of more than 10% and certain otherwise unaffiliated shareholders were owners of record of more than 10% of the outstanding shares as follows:
| Fund | Affiliated % | Number ofUnaffiliated Shareholders | Unaffiliated Shareholders % |
VIP International Capital Appreciation Portfolio | 54 | 1 | 24 |
12. Risk and Uncertainties.
Many factors affect a fund's performance. Developments that disrupt global economies and financial markets, such as pandemics, epidemics, outbreaks of infectious diseases, war, terrorism, and environmental disasters, may significantly affect a fund's investment performance. The effects of these developments to a fund will be impacted by the types of securities in which a fund invests, the financial condition, industry, economic sector, and geographic location of an issuer, and a fund's level of investment in the securities of that issuer. Significant concentrations in security types, issuers, industries, sectors, and geographic locations may magnify the factors that affect a fund's performance.
Report of Independent Registered Public Accounting Firm
To the Board of Trustees of Variable Insurance Products Fund II and Shareholders of VIP International Capital Appreciation Portfolio
Opinion on the Financial Statements
We have audited the accompanying statement of assets and liabilities, including the schedule of investments, of VIP International Capital Appreciation Portfolio (one of the funds constituting Variable Insurance Products Fund II, referred to hereafter as the "Fund") as of December 31, 2024, the related statement of operations for the year ended December 31, 2024, the statement of changes in net assets for each of the two years in the period ended December 31, 2024, including the related notes, and the financial highlights for each of the five years in the period ended December 31, 2024 (collectively referred to as the "financial statements"). In our opinion, the financial statements present fairly, in all material respects, the financial position of the Fund as of December 31, 2024, the results of its operations for the year then ended, the changes in its net assets for each of the two years in the period ended December 31, 2024 and the financial highlights for each of the five years in the period ended December 31, 2024 in conformity with accounting principles generally accepted in the United States of America.
Basis for Opinion
These financial statements are the responsibility of the Fund's management. Our responsibility is to express an opinion on the Fund's financial statements based on our audits. We are a public accounting firm registered with the Public Company Accounting Oversight Board (United States) (PCAOB) and are required to be independent with respect to the Fund in accordance with the U.S. federal securities laws and the applicable rules and regulations of the Securities and Exchange Commission and the PCAOB.
We conducted our audits of these financial statements in accordance with the standards of the PCAOB. Those standards require that we plan and perform the audit to obtain reasonable assurance about whether the financial statements are free of material misstatement, whether due to error or fraud.
Our audits included performing procedures to assess the risks of material misstatement of the financial statements, whether due to error or fraud, and performing procedures that respond to those risks. Such procedures included examining, on a test basis, evidence regarding the amounts and disclosures in the financial statements. Our audits also included evaluating the accounting principles used and significant estimates made by management, as well as evaluating the overall presentation of the financial statements. Our procedures included confirmation of securities owned as of December 31, 2024 by correspondence with the custodian and brokers; when replies were not received from brokers, we performed other auditing procedures. We believe that our audits provide a reasonable basis for our opinion.
/s/ PricewaterhouseCoopers LLP
Boston, Massachusetts
February 11, 2025
We have served as the auditor of one or more investment companies in the Fidelity group of funds since 1932.
Distributions
(Unaudited)The dividend and capital gains distributions for the fund(s) are available on Fidelity.com or Institutional.Fidelity.com.
The fund hereby designates as a capital gain dividend with respect to the taxable year ended December 31, 2024, $3,749,701, or, if subsequently determined to be different, the net capital gain of such year.
Initial Class designates 8%; Service Class designates 7%; Service Class 2 designates 9%; and Investor Class designates 9%; of the dividend distributed respectively during the fiscal year as qualifying for the dividends-received deduction for corporate shareholders.
The amounts per share which represent income derived from sources within, and taxes paid to, foreign countries or possessions of the United States are as follows:
| | Pay Date | Income | Taxes |
VIP International Capital Appreciation Portfolio | | | |
| Initial Class | 12/06/2024 | $0.2080 | $0.0511 |
| Service Class | 12/06/2024 | $0.2383 | $0.0511 |
| Service Class 2 | 12/06/2024 | $0.1714 | $0.0511 |
| Investor Class | 12/06/2024 | $0.1879 | $0.0511 |
Item 8: Changes in and Disagreements with Accountants for Open-End Management Investment Companies
(Unaudited)
Note: This is not applicable for any fund included in this document.
Item 9: Proxy Disclosures for Open-End Management Investment Companies
(Unaudited)
| A special meeting of shareholders was held on July 16, 2024. The results of votes taken among shareholders on the proposal before them are reported below. Each vote reported represents one dollar of net asset value held on the record date for the meeting. |
| Proposal 1 |
| To elect a Board of Trustees. |
| | # of Votes | % of Votes |
| Bettina Doulton |
| Affirmative | 35,115,445,138.03 | 95.41 |
| Withheld | 1,688,162,573.22 | 4.59 |
| TOTAL | 36,803,607,711.25 | 100.00 |
| Robert A. Lawrence |
| Affirmative | 35,088,609,864.54 | 95.34 |
| Withheld | 1,714,997,846.71 | 4.66 |
| TOTAL | 36,803,607,711.25 | 100.00 |
| Vijay C. Advani |
| Affirmative | 35,010,407,909.42 | 95.13 |
| Withheld | 1,793,199,801.83 | 4.87 |
| TOTAL | 36,803,607,711.25 | 100.00 |
| Thomas P. Bostick |
| Affirmative | 35,057,529,083.85 | 95.26 |
| Withheld | 1,746,078,627.39 | 4.74 |
| TOTAL | 36,803,607,711.25 | 100.00 |
| Donald F. Donahue |
| Affirmative | 35,013,585,423.05 | 95.14 |
| Withheld | 1,790,022,288.19 | 4.86 |
| TOTAL | 36,803,607,711.25 | 100.00 |
| Vicki L. Fuller |
| Affirmative | 35,122,634,645.90 | 95.43 |
| Withheld | 1,680,973,065.35 | 4.57 |
| TOTAL | 36,803,607,711.25 | 100.00 |
| Patricia L. Kampling |
| Affirmative | 35,180,534,002.80 | 95.59 |
| Withheld | 1,623,073,708.44 | 4.41 |
| TOTAL | 36,803,607,711.25 | 100.00 |
| Thomas A. Kennedy |
| Affirmative | 35,124,156,340.38 | 95.44 |
| Withheld | 1,679,451,370.87 | 4.56 |
| TOTAL | 36,803,607,711.25 | 100.00 |
| Oscar Munoz |
| Affirmative | 35,015,482,863.79 | 95.14 |
| Withheld | 1,788,124,847.45 | 4.86 |
| TOTAL | 36,803,607,711.25 | 100.00 |
| Karen B. Peetz |
| Affirmative | 35,090,964,426.07 | 95.35 |
| Withheld | 1,712,643,285.17 | 4.65 |
| TOTAL | 36,803,607,711.25 | 100.00 |
| David M. Thomas |
| Affirmative | 34,979,784,204.17 | 95.04 |
| Withheld | 1,823,823,507.08 | 4.96 |
| TOTAL | 36,803,607,711.25 | 100.00 |
| Susan Tomasky |
| Affirmative | 35,096,963,470.38 | 95.36 |
| Withheld | 1,706,644,240.86 | 4.64 |
| TOTAL | 36,803,607,711.25 | 100.00 |
| Michael E. Wiley |
| Affirmative | 34,987,599,655.10 | 95.07 |
| Withheld | 1,816,008,056.15 | 4.93 |
| TOTAL | 36,803,607,711.25 | 100.00 |
| | | |
| Proposal 1 reflects trust-wide proposal and voting results. |
Item 10: Remuneration Paid to Directors, Officers, and others of Open-End Management Investment Companies
(Unaudited)
Note: This information is disclosed as part of the financial statements for each Fund as part of Item 7: Financial Statements and Financial Highlights for Open-End Management Investment companies.
Item 11: Statement Regarding Basis for Approval of Investment Advisory Contract
(Unaudited)
Note: This is not applicable for any fund included in this document.
1.811843.120
VIPCAP-ANN-0325
Fidelity® Variable Insurance Products:
VIP Total Market Index Portfolio
VIP Extended Market Index Portfolio
VIP International Index Portfolio
Annual Report
December 31, 2024
Contents
To view a fund's proxy voting guidelines and proxy voting record for the 12-month period ended June 30, visit http://www.fidelity.com/proxyvotingresults or visit the Securities and Exchange Commission's (SEC) web site at http://www.sec.gov.
You may also call 1-877-208-0098 to request a free copy of the proxy voting guidelines.
Fidelity® Variable Insurance Products are separate account options which are purchased through a variable insurance contract.
The funds or securities referred to herein are not sponsored, endorsed, or promoted by Fidelity Product Services LLC (FPS), and FPS bears no liability with respect to any such funds or securities or any index on which such funds or securities are based. The prospectus contains a more detailed description of the relationship between FPS and any related funds.
The funds or securities referred to herein are not sponsored, endorsed, or promoted by MSCI, and MSCI bears no liability with respect to any such funds or securities or any index on which such funds or securities are based. The prospectus contains a more detailed description of the limited relationship MSCI has with Fidelity and any related funds.
Standard & Poor's®; and S&P®; are registered trademarks of Standard & Poor's Financial Services LLC ("S&P") and Dow Jones®; is a registered trademark of Dow Jones Trademark Holdings LLC ("Dow Jones"). The fund is not sponsored, endorsed, sold or promoted by SPDJI, Dow Jones, S&P, or their respective affiliates and none of such parties make any representation regarding the advisability of investing in such product(s) nor do they have any liability for any errors, omissions, or interruptions of the index or indices.
Standard & Poor's, S&P and S&P 500 are registered service marks of The McGraw-Hill Companies, Inc. and have been licensed for use by Fidelity Distributors Corporation.
Other third-party marks appearing herein are the property of their respective owners.
All other marks appearing herein are registered or unregistered trademarks or service marks of FMR LLC or an affiliated company. © 2025 FMR LLC. All rights reserved.
This report and the financial statements contained herein are submitted for the general information of the shareholders of the Funds. This report is not authorized for distribution to prospective investors in the Funds unless preceded or accompanied by an effective prospectus.
A fund files its complete schedule of portfolio holdings with the SEC for the first and third quarters of each fiscal year on Form N-PORT. Forms N-PORT are available on the SEC's web site at http://www.sec.gov. A fund's Forms N-PORT may be reviewed and copied at the SEC's Public Reference Room in Washington, DC. Information regarding the operation of the SEC's Public Reference Room may be obtained by calling 1-800-SEC-0330.
For a complete list of a fund's portfolio holdings, view the most recent holdings listing, semiannual report, or annual report on Fidelity's web site at http://www.fidelity.com, http://www.institutional.fidelity.com, or http://www.401k.com, as applicable.
NOT FDIC INSURED •MAY LOSE VALUE •NO BANK GUARANTEE
Neither the Funds nor Fidelity Distributors Corporation is a bank.
Item 7: Financial Statements and Financial Highlights for Open-End Management Investment Companies (Annual Report)
VIP Total Market Index Portfolio
Schedule of Investments December 31, 2024
Showing Percentage of Net Assets
| Common Stocks - 97.7% |
| | | Shares | Value ($) |
| ARGENTINA - 0.0% | | | |
| Materials - 0.0% | | | |
| Chemicals - 0.0% | | | |
| Arcadium Lithium PLC | | 22,185 | 113,809 |
| BAHAMAS (NASSAU) - 0.0% | | | |
| Consumer Discretionary - 0.0% | | | |
| Diversified Consumer Services - 0.0% | | | |
| OneSpaWorld Holdings Ltd | | 2,142 | 42,626 |
| BAILIWICK OF JERSEY - 0.0% | | | |
| Consumer Discretionary - 0.0% | | | |
| Automobile Components - 0.0% | | | |
| Aptiv PLC | | 5,442 | 329,132 |
| BELGIUM - 0.0% | | | |
| Communication Services - 0.0% | | | |
| Diversified Telecommunication Services - 0.0% | | | |
| Liberty Global Ltd Class A (b) | | 3,377 | 43,090 |
| Liberty Global Ltd Class C (b)(c) | | 3,325 | 43,691 |
| | | | |
| TOTAL BELGIUM | | | 86,781 |
| BERMUDA - 0.0% | | | |
| Energy - 0.0% | | | |
| Oil, Gas & Consumable Fuels - 0.0% | | | |
| Teekay Corp Ltd | | 1,242 | 8,607 |
| Financials - 0.0% | | | |
| Insurance - 0.0% | | | |
| RenaissanceRe Holdings Ltd | | 1,069 | 265,978 |
| TOTAL BERMUDA | | | 274,585 |
| CANADA - 0.0% | | | |
| Energy - 0.0% | | | |
| Oil, Gas & Consumable Fuels - 0.0% | | | |
| Teekay Tankers Ltd Class A | | 499 | 19,855 |
| Industrials - 0.0% | | | |
| Commercial Services & Supplies - 0.0% | | | |
| RB Global Inc (United States) | | 3,765 | 339,641 |
| Information Technology - 0.0% | | | |
| Software - 0.0% | | | |
| D-Wave Quantum Inc (b)(c) | | 2,898 | 24,343 |
| Materials - 0.0% | | | |
| Metals & Mining - 0.0% | | | |
| McEwen Mining Inc (b) | | 827 | 6,434 |
| TOTAL CANADA | | | 390,273 |
| CHINA - 0.1% | | | |
| Information Technology - 0.1% | | | |
| Semiconductors & Semiconductor Equipment - 0.1% | | | |
| indie Semiconductor Inc Class A (b)(c) | | 3,323 | 13,458 |
| NXP Semiconductors NV | | 5,210 | 1,082,899 |
| | | | |
| TOTAL CHINA | | | 1,096,357 |
| GERMANY - 0.0% | | | |
| Materials - 0.0% | | | |
| Chemicals - 0.0% | | | |
| Orion SA | | 1,189 | 18,774 |
| Paper & Forest Products - 0.0% | | | |
| Mercer International Inc | | 886 | 5,759 |
| TOTAL GERMANY | | | 24,533 |
| GHANA - 0.0% | | | |
| Energy - 0.0% | | | |
| Oil, Gas & Consumable Fuels - 0.0% | | | |
| Kosmos Energy Ltd (b) | | 9,535 | 32,610 |
| IRELAND - 0.4% | | | |
| Energy - 0.0% | | | |
| Oil, Gas & Consumable Fuels - 0.0% | | | |
| Ardmore Shipping Corp | | 744 | 9,040 |
| Health Care - 0.0% | | | |
| Biotechnology - 0.0% | | | |
| Prothena Corp PLC (b) | | 777 | 10,761 |
| Industrials - 0.0% | | | |
| Commercial Services & Supplies - 0.0% | | | |
| Cimpress PLC (b) | | 306 | 21,946 |
| Information Technology - 0.4% | | | |
| IT Services - 0.4% | | | |
| Accenture PLC Class A | | 12,811 | 4,506,782 |
| TOTAL IRELAND | | | 4,548,529 |
| ISRAEL - 0.0% | | | |
| Consumer Discretionary - 0.0% | | | |
| Automobile Components - 0.0% | | | |
| Mobileye Global Inc Class A (b)(c) | | 2,040 | 40,637 |
| JAPAN - 0.0% | | | |
| Information Technology - 0.0% | | | |
| Semiconductors & Semiconductor Equipment - 0.0% | | | |
| Allegro MicroSystems Inc (b) | | 3,237 | 70,761 |
| MONACO - 0.0% | | | |
| Energy - 0.0% | | | |
| Oil, Gas & Consumable Fuels - 0.0% | | | |
| Scorpio Tankers Inc | | 864 | 42,932 |
| NETHERLANDS - 0.0% | | | |
| Health Care - 0.0% | | | |
| Biotechnology - 0.0% | | | |
| uniQure NV (b) | | 880 | 15,541 |
| PHILIPPINES - 0.0% | | | |
| Industrials - 0.0% | | | |
| Professional Services - 0.0% | | | |
| TaskUS Inc Class A (b) | | 322 | 5,455 |
| PUERTO RICO - 0.0% | | | |
| Communication Services - 0.0% | | | |
| Diversified Telecommunication Services - 0.0% | | | |
| Liberty Latin America Ltd Class A (b) | | 223 | 1,418 |
| Liberty Latin America Ltd Class C (b) | | 2,940 | 18,640 |
| | | | 20,058 |
| Financials - 0.0% | | | |
| Banks - 0.0% | | | |
| First BanCorp/Puerto Rico | | 3,418 | 63,541 |
| Ofg Bancorp | | 929 | 39,315 |
| Popular Inc | | 1,494 | 140,526 |
| | | | 243,382 |
| Financial Services - 0.0% | | | |
| EVERTEC Inc | | 1,290 | 44,543 |
TOTAL FINANCIALS | | | 287,925 |
| | | | |
| TOTAL PUERTO RICO | | | 307,983 |
| SINGAPORE - 0.0% | | | |
| Health Care - 0.0% | | | |
| Pharmaceuticals - 0.0% | | | |
| Scilex Holding Co (b) | | 2,422 | 1,033 |
| Scilex Holding Co (b)(d) | | 881 | 300 |
| | | | 1,333 |
| Information Technology - 0.0% | | | |
| Semiconductors & Semiconductor Equipment - 0.0% | | | |
| Kulicke & Soffa Industries Inc | | 1,106 | 51,606 |
| TOTAL SINGAPORE | | | 52,939 |
| SWEDEN - 0.0% | | | |
| Consumer Discretionary - 0.0% | | | |
| Automobile Components - 0.0% | | | |
| Autoliv Inc | | 1,507 | 141,342 |
| Financials - 0.0% | | | |
| Insurance - 0.0% | | | |
| SiriusPoint Ltd (b) | | 1,929 | 31,616 |
| TOTAL SWEDEN | | | 172,958 |
| SWITZERLAND - 0.1% | | | |
| Communication Services - 0.0% | | | |
| Diversified Telecommunication Services - 0.0% | | | |
| Sunrise Communications AG ADR | | 1,381 | 59,493 |
| Consumer Discretionary - 0.0% | | | |
| Automobile Components - 0.0% | | | |
| Garrett Motion Inc (c) | | 2,506 | 22,629 |
| Health Care - 0.0% | | | |
| Biotechnology - 0.0% | | | |
| CRISPR Therapeutics AG (b)(c) | | 1,730 | 68,093 |
| Information Technology - 0.1% | | | |
| Electronic Equipment, Instruments & Components - 0.1% | | | |
| TE Connectivity PLC | | 6,215 | 888,559 |
| TOTAL SWITZERLAND | | | 1,038,774 |
| THAILAND - 0.0% | | | |
| Information Technology - 0.0% | | | |
| Electronic Equipment, Instruments & Components - 0.0% | | | |
| Fabrinet (b) | | 742 | 163,151 |
| UNITED KINGDOM - 0.0% | | | |
| Consumer Discretionary - 0.0% | | | |
| Hotels, Restaurants & Leisure - 0.0% | | | |
| Soho House & Co Inc Class A (b)(c) | | 664 | 4,946 |
| Energy - 0.0% | | | |
| Energy Equipment & Services - 0.0% | | | |
| TechnipFMC PLC | | 8,786 | 254,267 |
| Industrials - 0.0% | | | |
| Machinery - 0.0% | | | |
| Luxfer Holdings PLC | | 563 | 7,370 |
| Materials - 0.0% | | | |
| Metals & Mining - 0.0% | | | |
| Anglogold Ashanti Plc | | 7,060 | 162,945 |
| TOTAL UNITED KINGDOM | | | 429,528 |
| UNITED STATES - 97.1% | | | |
| Communication Services - 8.6% | | | |
| Diversified Telecommunication Services - 0.6% | | | |
| Anterix Inc (b) | | 388 | 11,900 |
| AST SpaceMobile Inc Class A (b)(c) | | 2,904 | 61,274 |
| AT&T Inc | | 146,650 | 3,339,221 |
| Atn International Inc | | 209 | 3,512 |
| Bandwidth Inc Class A (b) | | 479 | 8,153 |
| Cogent Communications Holdings Inc (c) | | 857 | 66,049 |
| Frontier Communications Parent Inc (b) | | 4,541 | 157,573 |
| Globalstar Inc (b) | | 15,443 | 31,967 |
| IDT Corp Class B | | 413 | 19,626 |
| Iridium Communications Inc | | 2,461 | 71,418 |
| Lumen Technologies Inc (b) | | 20,912 | 111,043 |
| Shenandoah Telecommunications Co | | 864 | 10,895 |
| Verizon Communications Inc | | 86,096 | 3,442,979 |
| | | | 7,335,610 |
| Entertainment - 1.4% | | | |
| AMC Entertainment Holdings Inc Class A (b)(c) | | 7,274 | 28,951 |
| Atlanta Braves Holdings Inc Class A (b)(c) | | 186 | 7,589 |
| Atlanta Braves Holdings Inc Class C (b) | | 826 | 31,603 |
| Cinemark Holdings Inc (b) | | 2,165 | 67,072 |
| Electronic Arts Inc | | 4,916 | 719,211 |
| Endeavor Group Holdings Inc Class A (c) | | 3,897 | 121,937 |
| Eventbrite Inc Class A (b) | | 1,601 | 5,378 |
| Liberty Media Corp-Liberty Formula One Class A (b) | | 558 | 46,894 |
| Liberty Media Corp-Liberty Formula One Class C (b) | | 4,453 | 412,615 |
| Liberty Media Corp-Liberty Live Class A (b) | | 517 | 34,411 |
| Liberty Media Corp-Liberty Live Class C (b) | | 842 | 57,307 |
| Lions Gate Entertainment Corp Class A (b)(c) | | 2,215 | 18,916 |
| Lions Gate Entertainment Corp Class B (b) | | 1,713 | 12,933 |
| Live Nation Entertainment Inc (b) | | 3,199 | 414,271 |
| Madison Square Garden Entertainment Corp Class A (b) | | 812 | 28,907 |
| Madison Square Garden Sports Corp Class A (b) | | 345 | 77,860 |
| Marcus Corp/The | | 533 | 11,460 |
| Netflix Inc (b) | | 8,778 | 7,824,007 |
| Playtika Holding Corp | | 1,012 | 7,022 |
| ROBLOX Corp Class A (b) | | 10,778 | 623,615 |
| Roku Inc Class A (b) | | 2,612 | 194,176 |
| Skillz Inc Class A (b)(c) | | 209 | 1,050 |
| Sphere Entertainment Co Class A (b) | | 524 | 21,128 |
| Take-Two Interactive Software Inc (b) | | 3,335 | 613,907 |
| TKO Group Holdings Inc Class A (b) | | 1,360 | 193,270 |
| Vivid Seats Inc Class A (b)(c) | | 1,854 | 8,584 |
| Walt Disney Co/The | | 37,090 | 4,129,972 |
| Warner Bros Discovery Inc (b) | | 45,675 | 482,785 |
| Warner Music Group Corp Class A | | 2,937 | 91,047 |
| | | | 16,287,878 |
| Interactive Media & Services - 5.8% | | | |
| Alphabet Inc Class A | | 119,869 | 22,691,202 |
| Alphabet Inc Class C | | 98,216 | 18,704,255 |
| Angi Inc Class A (b)(c) | | 1,275 | 2,116 |
| Bumble Inc Class A (b) | | 1,952 | 15,889 |
| Cargurus Inc Class A (b) | | 1,825 | 66,686 |
| Cars.com Inc (b) | | 1,225 | 21,229 |
| EverQuote Inc Class A (b)(c) | | 519 | 10,375 |
| fuboTV Inc (b) | | 6,199 | 7,811 |
| IAC Inc Class A (b) | | 1,428 | 61,604 |
| Match Group Inc | | 5,291 | 173,069 |
| MediaAlpha Inc Class A (b) | | 632 | 7,134 |
| Meta Platforms Inc Class A | | 44,686 | 26,164,100 |
| Nextdoor Holdings Inc Class A (b) | | 3,661 | 8,677 |
| Pinterest Inc Class A (b) | | 12,370 | 358,730 |
| QuinStreet Inc (b) | | 1,106 | 25,515 |
| Rumble Inc Class A (b)(c) | | 1,721 | 22,390 |
| Shutterstock Inc | | 470 | 14,265 |
| Snap Inc Class A (b) | | 21,589 | 232,514 |
| TripAdvisor Inc Class A (b) | | 2,160 | 31,903 |
| Vimeo Inc Class A (b) | | 3,100 | 19,840 |
| Yelp Inc Class A (b) | | 1,357 | 52,516 |
| Ziff Davis Inc (b) | | 902 | 49,015 |
| ZipRecruiter Inc Class A (b) | | 1,546 | 11,193 |
| ZoomInfo Technologies Inc (b) | | 5,843 | 61,410 |
| | | | 68,813,438 |
| Media - 0.6% | | | |
| Advantage Solutions Inc Class A (b) | | 1,085 | 3,168 |
| Altice USA Inc Class A (b)(c) | | 5,162 | 12,440 |
| AMC Networks Inc Class A (b) | | 710 | 7,029 |
| Boston Omaha Corp (b) | | 451 | 6,395 |
| Cable One Inc | | 92 | 33,315 |
| Cardlytics Inc (b)(c) | | 930 | 3,450 |
| Charter Communications Inc Class A (b) | | 1,986 | 680,741 |
| Clear Channel Outdoor Holdings Inc (b) | | 6,065 | 8,309 |
| Comcast Corp Class A | | 79,014 | 2,965,396 |
| EchoStar Corp Class A (b) | | 2,454 | 56,197 |
| Entravision Communications Corp Class A | | 1,613 | 3,791 |
| EW Scripps Co/The Class A (b) | | 1,015 | 2,243 |
| Fox Corp Class A | | 4,599 | 223,420 |
| Fox Corp Class B | | 2,679 | 122,537 |
| Gannett Co Inc (b) | | 2,354 | 11,911 |
| Gray Television Inc | | 1,714 | 5,399 |
| iHeartMedia Inc Class A (b) | | 2,343 | 4,639 |
| Integral Ad Science Holding Corp (b) | | 1,485 | 15,503 |
| Interpublic Group of Cos Inc/The | | 7,703 | 215,838 |
| John Wiley & Sons Inc Class A | | 821 | 35,886 |
| Liberty Broadband Corp Class A (b) | | 512 | 38,072 |
| Liberty Broadband Corp Class C (b) | | 2,118 | 158,342 |
| Magnite Inc (b) | | 2,527 | 40,230 |
| National CineMedia Inc (b) | | 2,004 | 13,307 |
| New York Times Co/The Class A | | 3,354 | 174,576 |
| News Corp Class A | | 7,642 | 210,461 |
| News Corp Class B | | 2,389 | 72,697 |
| Nexstar Media Group Inc | | 626 | 98,889 |
| Omnicom Group Inc | | 4,004 | 344,504 |
| Paramount Global Class A | | 480 | 10,704 |
| Paramount Global Class B (c) | | 11,510 | 120,395 |
| PubMatic Inc Class A (b) | | 793 | 11,649 |
| Scholastic Corp | | 491 | 10,473 |
| Sinclair Inc Class A | | 781 | 12,605 |
| Sirius XM Holdings Inc (c) | | 4,547 | 103,672 |
| Stagwell Inc Class A (b) | | 2,122 | 13,963 |
| TechTarget Inc/old | | 513 | 10,168 |
| TEGNA Inc | | 3,448 | 63,064 |
| Thryv Holdings Inc (b) | | 669 | 9,901 |
| Trade Desk Inc (The) Class A (b) | | 9,157 | 1,076,222 |
| WideOpenWest Inc (b) | | 805 | 3,993 |
| | | | 7,015,494 |
| Wireless Telecommunication Services - 0.2% | | | |
| Gogo Inc (b)(c) | | 1,259 | 10,185 |
| NII Holdings Inc (b)(e) | | 363 | 0 |
| Spok Holdings Inc | | 384 | 6,163 |
| T-Mobile US Inc | | 10,021 | 2,211,935 |
| Telephone and Data Systems Inc | | 2,016 | 68,766 |
| United States Cellular Corp (b) | | 298 | 18,691 |
| | | | 2,315,740 |
TOTAL COMMUNICATION SERVICES | | | 101,768,160 |
| | | | |
| Consumer Discretionary - 11.0% | | | |
| Automobile Components - 0.1% | | | |
| Adient PLC (b) | | 1,758 | 30,290 |
| American Axle & Manufacturing Holdings Inc (b) | | 2,302 | 13,421 |
| BorgWarner Inc | | 4,687 | 149,000 |
| Cooper-Standard Holdings Inc (b) | | 318 | 4,312 |
| Dana Inc | | 2,642 | 30,542 |
| Dorman Products Inc (b) | | 565 | 73,196 |
| Fox Factory Holding Corp (b) | | 821 | 24,852 |
| Gentex Corp | | 4,729 | 135,864 |
| Gentherm Inc (b) | | 618 | 24,674 |
| Goodyear Tire & Rubber Co/The (b) | | 5,792 | 52,128 |
| Holley Inc Class A (b) | | 1,357 | 4,098 |
| LCI Industries | | 534 | 55,210 |
| Lear Corp | | 1,163 | 110,136 |
| Luminar Technologies Inc Class A (b)(c) | | 521 | 2,802 |
| Modine Manufacturing Co (b) | | 1,078 | 124,973 |
| Patrick Industries Inc | | 676 | 56,162 |
| Phinia Inc | | 886 | 42,679 |
| QuantumScape Corp Class A (b)(c) | | 7,664 | 39,776 |
| Solid Power Inc (b)(c) | | 3,164 | 5,980 |
| Standard Motor Products Inc | | 409 | 12,671 |
| Stoneridge Inc (b) | | 495 | 3,103 |
| Visteon Corp (b) | | 557 | 49,417 |
| XPEL Inc (b)(f) | | 471 | 18,812 |
| | | | 1,064,098 |
| Automobiles - 2.1% | | | |
| Canoo Inc Class A (b) | | 55 | 77 |
| Ford Motor Co | | 79,892 | 790,931 |
| General Motors Co | | 22,992 | 1,224,784 |
| Harley-Davidson Inc | | 2,452 | 73,879 |
| Lucid Group Inc Class A (b)(c) | | 17,882 | 54,004 |
| Rivian Automotive Inc Class A (b)(c) | | 14,767 | 196,401 |
| Tesla Inc (b) | | 56,752 | 22,918,728 |
| Thor Industries Inc | | 1,101 | 105,377 |
| Winnebago Industries Inc | | 584 | 27,903 |
| | | | 25,392,084 |
| Broadline Retail - 3.6% | | | |
| Amazon.com Inc (b) | | 191,062 | 41,917,092 |
| ContextLogic Inc Class A (b)(c) | | 533 | 3,747 |
| Dillard's Inc Class A | | 60 | 25,904 |
| eBay Inc | | 10,004 | 619,748 |
| Etsy Inc (b) | | 2,364 | 125,032 |
| Groupon Inc (b)(c) | | 516 | 6,269 |
| Kohl's Corp (c) | | 2,245 | 31,520 |
| Macy's Inc | | 5,720 | 96,840 |
| Nordstrom Inc | | 1,970 | 47,576 |
| Ollie's Bargain Outlet Holdings Inc (b) | | 1,256 | 137,821 |
| Qurate Retail Inc Class A (b) | | 6,915 | 2,281 |
| | | | 43,013,830 |
| Distributors - 0.1% | | | |
| A-Mark Precious Metals Inc | | 349 | 9,562 |
| Genuine Parts Co | | 2,851 | 332,883 |
| LKQ Corp | | 5,385 | 197,899 |
| Pool Corp | | 783 | 266,956 |
| | | | 807,300 |
| Diversified Consumer Services - 0.1% | | | |
| ADT Inc | | 6,374 | 44,044 |
| Adtalem Global Education Inc (b) | | 781 | 70,954 |
| Bright Horizons Family Solutions Inc (b) | | 1,191 | 132,022 |
| Carriage Services Inc | | 274 | 10,919 |
| Chegg Inc (b) | | 1,911 | 3,077 |
| Coursera Inc (b) | | 2,414 | 20,519 |
| Duolingo Inc Class A (b) | | 767 | 248,684 |
| European Wax Center Inc Class A (b) | | 725 | 4,836 |
| Frontdoor Inc (b) | | 1,574 | 86,051 |
| Graham Holdings Co Class B | | 70 | 61,034 |
| Grand Canyon Education Inc (b) | | 602 | 98,608 |
| H&R Block Inc | | 2,863 | 151,281 |
| Laureate Education Inc | | 2,835 | 51,852 |
| Mister Car Wash Inc (b) | | 1,898 | 13,836 |
| Nerdy Inc Class A (b) | | 1,972 | 3,195 |
| Perdoceo Education Corp | | 1,268 | 33,564 |
| Service Corp International/US | | 2,980 | 237,864 |
| Strategic Education Inc | | 494 | 46,149 |
| Stride Inc (b) | | 874 | 90,835 |
| Udemy Inc (b) | | 1,798 | 14,798 |
| Universal Technical Institute Inc (b) | | 866 | 22,265 |
| WW International Inc (b)(c) | | 1,348 | 1,711 |
| | | | 1,448,098 |
| Hotels, Restaurants & Leisure - 2.1% | | | |
| Accel Entertainment Inc Class A (b) | | 1,178 | 12,581 |
| Airbnb Inc Class A (b) | | 9,002 | 1,182,953 |
| Aramark | | 5,401 | 201,511 |
| BJ's Restaurants Inc (b) | | 478 | 16,795 |
| Bloomin' Brands Inc | | 1,489 | 18,181 |
| Booking Holdings Inc | | 685 | 3,403,368 |
| Boyd Gaming Corp | | 1,416 | 102,717 |
| Brinker International Inc (b) | | 913 | 120,781 |
| Caesars Entertainment Inc (b) | | 4,445 | 148,552 |
| Carnival Corp (b) | | 20,672 | 515,146 |
| Cheesecake Factory Inc/The (c) | | 946 | 44,878 |
| Chipotle Mexican Grill Inc (b) | | 28,010 | 1,689,003 |
| Choice Hotels International Inc | | 457 | 64,885 |
| Churchill Downs Inc | | 1,504 | 200,844 |
| Cracker Barrel Old Country Store Inc | | 453 | 23,946 |
| Darden Restaurants Inc | | 2,424 | 452,537 |
| Dave & Buster's Entertainment Inc (b)(c) | | 616 | 17,981 |
| Denny's Corp (b)(c) | | 976 | 5,905 |
| Dine Brands Global Inc | | 288 | 8,669 |
| Domino's Pizza Inc | | 716 | 300,548 |
| DoorDash Inc Class A (b) | | 6,764 | 1,134,661 |
| DraftKings Inc Class A (b) | | 9,943 | 369,880 |
| Dutch Bros Inc Class A (b) | | 2,342 | 122,674 |
| El Pollo Loco Holdings Inc (b) | | 479 | 5,528 |
| Everi Holdings Inc (b) | | 1,732 | 23,399 |
| Expedia Group Inc Class A (b) | | 2,551 | 475,328 |
| First Watch Restaurant Group Inc (b)(c) | | 646 | 12,022 |
| Golden Entertainment Inc | | 442 | 13,967 |
| Hilton Grand Vacations Inc (b) | | 1,296 | 50,479 |
| Hilton Worldwide Holdings Inc | | 5,030 | 1,243,215 |
| Hyatt Hotels Corp Class A | | 924 | 145,050 |
| Jack in the Box Inc (c) | | 399 | 16,614 |
| Krispy Kreme Inc (c) | | 1,713 | 17,010 |
| Kura Sushi USA Inc Class A (b) | | 105 | 9,511 |
| Las Vegas Sands Corp | | 7,242 | 371,949 |
| Life Time Group Holdings Inc (b) | | 1,478 | 32,693 |
| Light & Wonder Inc Class A (b) | | 1,820 | 157,212 |
| Lindblad Expeditions Holdings Inc (b) | | 712 | 8,444 |
| Lucky Strike Entertainment Corp Class A (c) | | 539 | 5,395 |
| Marriott International Inc/MD Class A1 | | 4,776 | 1,332,217 |
| Marriott Vacations Worldwide Corp | | 673 | 60,435 |
| McDonald's Corp | | 14,669 | 4,252,396 |
| MGM Resorts International (b) | | 4,737 | 164,137 |
| Monarch Casino & Resort Inc | | 261 | 20,593 |
| Norwegian Cruise Line Holdings Ltd (b) | | 9,008 | 231,776 |
| Papa John's International Inc | | 670 | 27,517 |
| Penn Entertainment Inc (b) | | 3,007 | 59,599 |
| Planet Fitness Inc Class A (b) | | 1,733 | 171,342 |
| Playa Hotels & Resorts NV (b) | | 1,899 | 24,022 |
| PlayAGS Inc (b) | | 778 | 8,970 |
| Portillo's Inc Class A (b)(c) | | 1,112 | 10,453 |
| Potbelly Corp (b) | | 448 | 4,220 |
| Rci Hospitality Holdings Inc | | 160 | 9,195 |
| Red Robin Gourmet Burgers Inc (b) | | 296 | 1,624 |
| Red Rock Resorts Inc Class A | | 1,003 | 46,379 |
| Royal Caribbean Cruises Ltd | | 4,843 | 1,117,232 |
| Rush Street Interactive Inc Class A (b) | | 1,558 | 21,376 |
| Sabre Corp (b) | | 7,791 | 28,437 |
| Shake Shack Inc Class A (b) | | 809 | 105,008 |
| Six Flags Entertainment Corp | | 1,928 | 92,910 |
| Starbucks Corp | | 23,177 | 2,114,901 |
| Sweetgreen Inc Class A (b) | | 2,102 | 67,390 |
| Target Hospitality Corp (b) | | 680 | 6,572 |
| Texas Roadhouse Inc | | 1,365 | 246,287 |
| Travel + Leisure Co | | 1,444 | 72,850 |
| United Parks & Resorts Inc (b) | | 638 | 35,849 |
| Vail Resorts Inc | | 774 | 145,086 |
| Viking Holdings Ltd | | 1,877 | 82,701 |
| Wendy's Co/The | | 3,437 | 56,023 |
| Wingstop Inc | | 601 | 170,804 |
| Wyndham Hotels & Resorts Inc | | 1,621 | 163,381 |
| Wynn Resorts Ltd | | 1,918 | 165,255 |
| Xponential Fitness Inc Class A (b) | | 511 | 6,873 |
| Yum! Brands Inc | | 5,744 | 770,615 |
| | | | 24,641,237 |
| Household Durables - 0.5% | | | |
| Beazer Homes USA Inc (b) | | 556 | 15,268 |
| Cavco Industries Inc (b) | | 167 | 74,520 |
| Century Communities Inc | | 557 | 40,862 |
| Champion Homes Inc (b) | | 1,071 | 94,355 |
| Cricut Inc Class A | | 915 | 5,216 |
| DR Horton Inc | | 6,005 | 839,619 |
| Dream Finders Homes Inc Class A (b)(c) | | 545 | 12,682 |
| Ethan Allen Interiors Inc | | 445 | 12,509 |
| Garmin Ltd | | 3,145 | 648,688 |
| Gopro Inc Class A (b) | | 2,289 | 2,495 |
| Green Brick Partners Inc (b) | | 629 | 35,532 |
| Helen of Troy Ltd (b) | | 488 | 29,197 |
| Hovnanian Enterprises Inc Class A (b) | | 93 | 12,445 |
| Installed Building Products Inc (c) | | 480 | 84,120 |
| iRobot Corp (b) | | 668 | 5,177 |
| KB Home | | 1,494 | 98,186 |
| La-Z-Boy Inc | | 862 | 37,557 |
| Landsea Homes Corp Class A (b) | | 361 | 3,065 |
| Legacy Housing Corp (b) | | 230 | 5,676 |
| Leggett & Platt Inc | | 2,657 | 25,507 |
| Lennar Corp Class A | | 4,965 | 677,077 |
| Lennar Corp Class B | | 210 | 27,752 |
| LGI Homes Inc (b) | | 420 | 37,548 |
| Lovesac Co/The (b) | | 317 | 7,500 |
| M/I Homes Inc (b) | | 568 | 75,516 |
| Meritage Homes Corp | | 750 | 115,365 |
| Mohawk Industries Inc (b) | | 1,076 | 128,184 |
| Newell Brands Inc | | 8,569 | 85,347 |
| NVR Inc (b) | | 63 | 515,271 |
| PulteGroup Inc | | 4,250 | 462,825 |
| Purple Innovation Inc Class A (b) | | 1,233 | 962 |
| SharkNinja Inc | | 1,350 | 131,436 |
| Sonos Inc (b) | | 2,449 | 36,833 |
| Taylor Morrison Home Corp (b) | | 2,148 | 131,479 |
| Tempur Sealy International Inc | | 3,560 | 201,816 |
| Toll Brothers Inc | | 2,103 | 264,873 |
| TopBuild Corp (b) | | 616 | 191,785 |
| Tri Pointe Homes Inc (b) | | 1,952 | 70,780 |
| Whirlpool Corp | | 1,129 | 129,248 |
| Worthington Enterprises Inc | | 611 | 24,507 |
| | | | 5,398,780 |
| Leisure Products - 0.0% | | | |
| Acushnet Holdings Corp (c) | | 563 | 40,018 |
| AMMO Inc (b) | | 2,002 | 2,202 |
| Brunswick Corp/DE | | 1,380 | 89,258 |
| Clarus Corp | | 558 | 2,517 |
| Funko Inc Class A (b) | | 750 | 10,043 |
| Hasbro Inc | | 2,696 | 150,733 |
| JAKKS Pacific Inc (b) | | 199 | 5,602 |
| Johnson Outdoors Inc Class A | | 114 | 3,762 |
| Malibu Boats Inc Class A (b) | | 404 | 15,186 |
| MasterCraft Boat Holdings Inc (b) | | 301 | 5,740 |
| Mattel Inc (b) | | 6,993 | 123,986 |
| Peloton Interactive Inc Class A (b)(c) | | 7,283 | 63,362 |
| Polaris Inc (c) | | 1,095 | 63,094 |
| Revelyst Inc | | 1,171 | 22,518 |
| Smith & Wesson Brands Inc | | 884 | 8,933 |
| Sturm Ruger & Co Inc | | 326 | 11,531 |
| Topgolf Callaway Brands Corp (b) | | 2,875 | 22,598 |
| YETI Holdings Inc (b) | | 1,708 | 65,775 |
| | | | 706,858 |
| Specialty Retail - 2.0% | | | |
| 1-800-Flowers.com Inc Class A (b)(c) | | 501 | 4,093 |
| Abercrombie & Fitch Co Class A (b) | | 1,048 | 156,645 |
| Academy Sports & Outdoors Inc | | 1,496 | 86,065 |
| Advance Auto Parts Inc (c) | | 1,197 | 56,606 |
| America's Car-Mart Inc/TX (b) | | 128 | 6,560 |
| American Eagle Outfitters Inc | | 3,595 | 59,929 |
| Arhaus Inc Class A (c) | | 1,058 | 9,945 |
| Arko Corp | | 1,353 | 8,916 |
| Asbury Automotive Group Inc (b)(c) | | 413 | 100,371 |
| AutoNation Inc (b) | | 539 | 91,544 |
| AutoZone Inc (b) | | 349 | 1,117,498 |
| Bath & Body Works Inc | | 4,580 | 177,567 |
| Best Buy Co Inc | | 4,017 | 344,659 |
| Beyond Inc (b)(c) | | 861 | 4,245 |
| Boot Barn Holdings Inc (b) | | 617 | 93,673 |
| Buckle Inc/The | | 606 | 30,791 |
| Build-A-Bear Workshop Inc | | 243 | 11,188 |
| Burlington Stores Inc (b) | | 1,292 | 368,298 |
| Caleres Inc | | 708 | 16,397 |
| Camping World Holdings Inc Class A | | 915 | 19,288 |
| CarMax Inc (b) | | 3,198 | 261,468 |
| Carvana Co Class A (b) | | 2,330 | 473,829 |
| Chewy Inc Class A (b) | | 2,865 | 95,949 |
| Children's Place Inc/The (b)(c) | | 297 | 3,107 |
| Children's Place Inc/The rights (b) | | 297 | 94 |
| Citi Trends Inc (b)(c) | | 173 | 4,541 |
| Designer Brands Inc Class A (c) | | 868 | 4,635 |
| Destination XL Group Inc (b)(c) | | 893 | 2,402 |
| Dick's Sporting Goods Inc (c) | | 1,187 | 271,633 |
| EVgo Inc Class A (b)(c) | | 1,897 | 7,683 |
| Five Below Inc (b) | | 1,133 | 118,920 |
| Floor & Decor Holdings Inc Class A (b) | | 2,199 | 219,240 |
| Foot Locker Inc (b) | | 1,736 | 37,775 |
| GameStop Corp Class A (b)(c) | | 7,944 | 248,965 |
| Gap Inc/The | | 4,558 | 107,706 |
| Genesco Inc (b) | | 232 | 9,918 |
| Group 1 Automotive Inc | | 270 | 113,800 |
| GrowGeneration Corp (b) | | 943 | 1,593 |
| Guess? Inc (c) | | 597 | 8,394 |
| Haverty Furniture Cos Inc | | 283 | 6,300 |
| Home Depot Inc/The | | 20,277 | 7,887,550 |
| J Jill Inc | | 150 | 4,143 |
| Leslie's Inc (b) | | 3,885 | 8,664 |
| Lithia Motors Inc Class A | | 548 | 195,872 |
| Lowe's Cos Inc | | 11,653 | 2,875,960 |
| MarineMax Inc (b) | | 371 | 10,740 |
| Monro Inc | | 619 | 15,351 |
| Murphy USA Inc | | 381 | 191,167 |
| National Vision Holdings Inc (b) | | 1,612 | 16,797 |
| O'Reilly Automotive Inc (b) | | 1,185 | 1,405,173 |
| ODP Corp/The (b) | | 675 | 15,350 |
| OneWater Marine Inc Class A (b)(c) | | 225 | 3,911 |
| Penske Automotive Group Inc | | 378 | 57,622 |
| Petco Health & Wellness Co Inc Class A (b) | | 1,766 | 6,728 |
| PetMed Express Inc (b)(c) | | 361 | 1,739 |
| RealReal Inc/The (b)(c) | | 2,029 | 22,177 |
| Revolve Group Inc Class A (b) | | 765 | 25,620 |
| RH (b) | | 307 | 120,832 |
| Ross Stores Inc | | 6,821 | 1,031,813 |
| RumbleON Inc Class B (b) | | 349 | 1,895 |
| Sally Beauty Holdings Inc (b) | | 2,078 | 21,715 |
| Shoe Carnival Inc | | 338 | 11,181 |
| Signet Jewelers Ltd | | 906 | 73,123 |
| Sleep Number Corp (b)(c) | | 466 | 7,102 |
| Sonic Automotive Inc Class A | | 297 | 18,815 |
| Sportsman's Warehouse Holdings Inc (b) | | 582 | 1,553 |
| Stitch Fix Inc Class A (b) | | 2,174 | 9,370 |
| ThredUp Inc Class A (b) | | 1,360 | 1,890 |
| TJX Cos Inc/The | | 23,092 | 2,789,745 |
| Tractor Supply Co | | 11,033 | 585,411 |
| Ulta Beauty Inc (b) | | 977 | 424,927 |
| Upbound Group Inc | | 1,042 | 30,395 |
| Urban Outfitters Inc (b) | | 1,148 | 63,002 |
| Valvoline Inc (b) | | 2,666 | 96,456 |
| Victoria's Secret & Co (b) | | 1,580 | 65,444 |
| Warby Parker Inc Class A (b) | | 1,806 | 43,723 |
| Wayfair Inc Class A (b)(c) | | 2,026 | 89,792 |
| Williams-Sonoma Inc | | 2,632 | 487,394 |
| Winmark Corp | | 58 | 22,798 |
| Zumiez Inc (b) | | 354 | 6,786 |
| | | | 23,511,956 |
| Textiles, Apparel & Luxury Goods - 0.4% | | | |
| Capri Holdings Ltd (b) | | 2,387 | 50,270 |
| Carter's Inc (c) | | 718 | 38,908 |
| Columbia Sportswear Co | | 663 | 55,646 |
| Crocs Inc (b) | | 1,220 | 133,627 |
| Deckers Outdoor Corp (b) | | 3,120 | 633,641 |
| Figs Inc Class A (b)(c) | | 2,560 | 15,846 |
| G-III Apparel Group Ltd (b) | | 813 | 26,520 |
| Hanesbrands Inc (b) | | 7,042 | 57,322 |
| Kontoor Brands Inc (c) | | 1,034 | 88,314 |
| Levi Strauss & Co Class A | | 2,088 | 36,122 |
| Lululemon Athletica Inc (b) | | 2,353 | 899,811 |
| Movado Group Inc | | 280 | 5,509 |
| NIKE Inc Class B | | 24,577 | 1,859,742 |
| Oxford Industries Inc | | 297 | 23,398 |
| PVH Corp | | 1,156 | 122,247 |
| Ralph Lauren Corp Class A | | 821 | 189,635 |
| Skechers USA Inc Class A (b) | | 2,723 | 183,095 |
| Steven Madden Ltd | | 1,474 | 62,674 |
| Tapestry Inc | | 4,714 | 307,966 |
| Under Armour Inc Class A (b) | | 5,390 | 44,630 |
| Under Armour Inc Class C (b) | | 855 | 6,378 |
| Vera Bradley Inc (b)(c) | | 413 | 1,622 |
| VF Corp | | 6,789 | 145,692 |
| Wolverine World Wide Inc | | 1,613 | 35,809 |
| | | | 5,024,424 |
TOTAL CONSUMER DISCRETIONARY | | | 131,008,665 |
| | | | |
| Consumer Staples - 5.1% | | | |
| Beverages - 1.0% | | | |
| Boston Beer Co Inc/The Class A (b) | | 179 | 53,696 |
| Brown-Forman Corp Class B | | 3,765 | 142,995 |
| Celsius Holdings Inc (b) | | 3,214 | 84,657 |
| Coca-Cola Co/The | | 79,296 | 4,936,969 |
| Coca-Cola Consolidated Inc | | 121 | 152,459 |
| Constellation Brands Inc Class A | | 3,204 | 708,084 |
| Keurig Dr Pepper Inc | | 21,619 | 694,402 |
| MGP Ingredients Inc (c) | | 278 | 10,944 |
| Molson Coors Beverage Co Class B | | 3,594 | 206,008 |
| Monster Beverage Corp (b) | | 14,426 | 758,231 |
| National Beverage Corp | | 480 | 20,481 |
| PepsiCo Inc | | 28,081 | 4,269,997 |
| Vita Coco Co Inc/The (b) | | 772 | 28,495 |
| | | | 12,067,418 |
| Consumer Staples Distribution & Retail - 1.9% | | | |
| Albertsons Cos Inc | | 8,272 | 162,462 |
| Andersons Inc/The | | 647 | 26,216 |
| BJ's Wholesale Club Holdings Inc (b) | | 2,714 | 242,496 |
| Blue Apron Holdings Inc warrants 11/4/2028 (b)(e) | | 142 | 0 |
| Blue Apron Holdings Inc warrants 11/4/2028 (b)(e) | | 142 | 0 |
| Blue Apron Holdings Inc warrants 11/4/2028 (b)(e) | | 142 | 0 |
| Casey's General Stores Inc | | 759 | 300,739 |
| Chefs' Warehouse Inc/The (b) | | 705 | 34,771 |
| Costco Wholesale Corp | | 9,065 | 8,305,988 |
| Dollar General Corp | | 4,503 | 341,417 |
| Dollar Tree Inc (b) | | 4,139 | 310,177 |
| Grocery Outlet Holding Corp (b) | | 1,958 | 30,564 |
| Ingles Markets Inc Class A | | 300 | 19,331 |
| Kroger Co/The | | 13,577 | 830,234 |
| Performance Food Group Co (b) | | 3,185 | 269,292 |
| PriceSmart Inc | | 529 | 48,758 |
| SpartanNash Co | | 684 | 12,530 |
| Sprouts Farmers Market Inc (b) | | 2,046 | 259,985 |
| Sysco Corp | | 10,052 | 768,576 |
| Target Corp | | 9,465 | 1,279,479 |
| United Natural Foods Inc (b) | | 1,205 | 32,909 |
| US Foods Holding Corp (b) | | 4,995 | 336,963 |
| Walgreens Boots Alliance Inc | | 14,715 | 137,291 |
| Walmart Inc | | 88,817 | 8,024,616 |
| Weis Markets Inc | | 333 | 22,551 |
| | | | 21,797,345 |
| Food Products - 0.6% | | | |
| Archer-Daniels-Midland Co | | 9,790 | 494,591 |
| B&G Foods Inc (c) | | 1,564 | 10,776 |
| Beyond Meat Inc (b)(c) | | 1,187 | 4,463 |
| BRC Inc Class A (b) | | 874 | 2,770 |
| Bunge Global SA | | 2,902 | 225,660 |
| Cal-Maine Foods Inc | | 837 | 86,144 |
| Calavo Growers Inc | | 333 | 8,492 |
| Conagra Brands Inc | | 9,808 | 272,172 |
| Darling Ingredients Inc (b) | | 3,280 | 110,503 |
| Flowers Foods Inc | | 3,968 | 81,979 |
| Fresh Del Monte Produce Inc | | 687 | 22,815 |
| Freshpet Inc (b) | | 994 | 147,221 |
| General Mills Inc | | 11,376 | 725,448 |
| Hain Celestial Group Inc (b) | | 1,854 | 11,402 |
| Hershey Co/The | | 3,022 | 511,776 |
| Hormel Foods Corp | | 5,948 | 186,589 |
| Ingredion Inc | | 1,331 | 183,092 |
| J & J Snack Foods Corp | | 315 | 48,866 |
| JM Smucker Co | | 2,181 | 240,172 |
| John B Sanfilippo & Son Inc | | 178 | 15,506 |
| Kellanova | | 5,472 | 443,068 |
| Kraft Heinz Co/The | | 18,049 | 554,285 |
| Lamb Weston Holdings Inc | | 2,942 | 196,614 |
| Lancaster Colony Corp | | 401 | 69,429 |
| McCormick & Co Inc/MD | | 5,153 | 392,865 |
| Mission Produce Inc (b) | | 930 | 13,364 |
| Mondelez International Inc | | 27,312 | 1,631,346 |
| Pilgrim's Pride Corp (b)(c) | | 807 | 36,630 |
| Post Holdings Inc (b) | | 977 | 111,827 |
| Seaboard Corp | | 5 | 12,148 |
| Seneca Foods Corp Class A (b) | | 90 | 7,133 |
| Simply Good Foods Co/The (b) | | 1,841 | 71,762 |
| The Campbell's Company | | 4,033 | 168,902 |
| Tootsie Roll Industries Inc Class A | | 351 | 11,348 |
| TreeHouse Foods Inc (b) | | 957 | 33,619 |
| Tyson Foods Inc Class A | | 5,843 | 335,622 |
| Utz Brands Inc Class A (c) | | 1,414 | 22,143 |
| Vital Farms Inc (b) | | 603 | 22,727 |
| Westrock Coffee Co (b) | | 658 | 4,224 |
| WK Kellogg Co (c) | | 1,343 | 24,161 |
| | | | 7,553,654 |
| Household Products - 1.0% | | | |
| Central Garden & Pet Co (b) | | 93 | 3,608 |
| Central Garden & Pet Co Class A | | 1,169 | 38,635 |
| Church & Dwight Co Inc | | 5,008 | 524,388 |
| Clorox Co/The | | 2,533 | 411,385 |
| Colgate-Palmolive Co | | 16,710 | 1,519,106 |
| Energizer Holdings Inc | | 1,311 | 45,741 |
| Kimberly-Clark Corp | | 6,883 | 901,948 |
| Procter & Gamble Co/The | | 48,130 | 8,068,995 |
| Reynolds Consumer Products Inc | | 1,117 | 30,147 |
| Spectrum Brands Holdings Inc | | 567 | 47,906 |
| WD-40 Co | | 275 | 66,737 |
| | | | 11,658,596 |
| Personal Care Products - 0.1% | | | |
| Beauty Health Co/The Class A (b) | | 1,724 | 2,741 |
| BellRing Brands Inc (b) | | 2,649 | 199,576 |
| Coty Inc Class A (b) | | 7,328 | 51,003 |
| Edgewell Personal Care Co | | 987 | 33,163 |
| elf Beauty Inc (b)(c) | | 1,157 | 145,261 |
| Estee Lauder Cos Inc/The Class A | | 4,775 | 358,030 |
| Herbalife Ltd (b) | | 2,105 | 14,082 |
| Honest Co Inc/The (b) | | 1,422 | 9,854 |
| Interparfums Inc | | 360 | 47,344 |
| Kenvue Inc | | 39,185 | 836,600 |
| Medifast Inc (b) | | 198 | 3,489 |
| Nu Skin Enterprises Inc Class A | | 927 | 6,387 |
| Olaplex Holdings Inc (b)(c) | | 2,144 | 3,709 |
| USANA Health Sciences Inc (b) | | 224 | 8,039 |
| | | | 1,719,278 |
| Tobacco - 0.5% | | | |
| Altria Group Inc | | 34,873 | 1,823,509 |
| Philip Morris International Inc | | 31,800 | 3,827,131 |
| Turning Point Brands Inc | | 364 | 21,876 |
| Universal Corp/VA | | 500 | 27,420 |
| | | | 5,699,936 |
TOTAL CONSUMER STAPLES | | | 60,496,227 |
| | | | |
| Energy - 3.2% | | | |
| Energy Equipment & Services - 0.3% | | | |
| Archrock Inc | | 3,488 | 86,816 |
| Atlas Energy Solutions Inc (c) | | 1,192 | 26,439 |
| Baker Hughes Co Class A | | 20,313 | 833,239 |
| Bristow Group Inc (b) | | 504 | 17,287 |
| Cactus Inc Class A | | 1,377 | 80,362 |
| ChampionX Corp | | 3,973 | 108,026 |
| Core Laboratories Inc (c) | | 983 | 17,016 |
| DMC Global Inc (b) | | 373 | 2,741 |
| Expro Group Holdings NV (b) | | 2,143 | 26,723 |
| Halliburton Co | | 18,092 | 491,921 |
| Helix Energy Solutions Group Inc (b) | | 2,965 | 27,634 |
| Helmerich & Payne Inc | | 2,060 | 65,961 |
| Innovex International Inc (b) | | 728 | 10,170 |
| KLX Energy Services Holdings Inc (b) | | 265 | 1,319 |
| Kodiak Gas Services Inc | | 525 | 21,436 |
| Liberty Energy Inc Class A | | 3,334 | 66,313 |
| Nabors Industries Ltd (b) | | 192 | 10,977 |
| Noble Corp PLC | | 2,847 | 89,396 |
| NOV Inc | | 8,156 | 119,078 |
| NPK International Inc (b) | | 1,725 | 13,231 |
| Oceaneering International Inc (b) | | 2,043 | 53,281 |
| Oil States International Inc (b) | | 1,346 | 6,811 |
| Patterson-UTI Energy Inc | | 7,208 | 59,538 |
| ProPetro Holding Corp (b) | | 1,644 | 15,339 |
| Ranger Energy Services Inc Class A | | 362 | 5,604 |
| RPC Inc (c) | | 1,585 | 9,415 |
| Schlumberger NV | | 29,071 | 1,114,582 |
| SEACOR Marine Holdings Inc (b) | | 458 | 3,004 |
| Select Water Solutions Inc Class A | | 1,856 | 24,573 |
| Solaris Energy Infrastructure Inc Class A | | 553 | 15,915 |
| TETRA Technologies Inc (b) | | 2,539 | 9,090 |
| Tidewater Inc (b) | | 967 | 52,905 |
| Transocean Ltd (b)(c) | | 15,625 | 58,594 |
| Valaris Ltd (b) | | 1,341 | 59,326 |
| Weatherford International PLC | | 1,513 | 108,376 |
| | | | 3,712,438 |
| Oil, Gas & Consumable Fuels - 2.9% | | | |
| Aemetis Inc (b)(c) | | 1,020 | 2,744 |
| Amplify Energy Corp (b)(c) | | 709 | 4,254 |
| Antero Midstream Corp | | 6,826 | 103,004 |
| Antero Resources Corp (b) | | 5,998 | 210,230 |
| APA Corp | | 7,602 | 175,530 |
| Berry Corp | | 1,655 | 6,835 |
| California Resources Corp | | 1,454 | 75,448 |
| Centrus Energy Corp Class A (b)(c) | | 284 | 18,917 |
| Cheniere Energy Inc | | 4,629 | 994,633 |
| Chevron Corp | | 34,782 | 5,037,825 |
| Chord Energy Corp | | 1,281 | 149,775 |
| Civitas Resources Inc | | 1,883 | 86,373 |
| Clean Energy Fuels Corp (b) | | 3,574 | 8,971 |
| CNX Resources Corp (b) | | 3,125 | 114,594 |
| Comstock Resources Inc (c) | | 1,782 | 32,468 |
| ConocoPhillips | | 23,754 | 2,355,684 |
| CONSOL Energy Inc | | 558 | 59,527 |
| Coterra Energy Inc | | 15,169 | 387,416 |
| Crescent Energy Co Class A (c) | | 3,119 | 45,569 |
| CVR CHC LP | | 678 | 12,706 |
| Delek US Holdings Inc | | 1,299 | 24,032 |
| Devon Energy Corp | | 12,836 | 420,122 |
| Diamondback Energy Inc | | 3,838 | 628,780 |
| Dorian LPG Ltd | | 716 | 17,449 |
| DT Midstream Inc | | 1,991 | 197,965 |
| EOG Resources Inc | | 11,632 | 1,425,851 |
| Eqt Corp | | 12,163 | 560,836 |
| Evolution Petroleum Corp (c) | | 736 | 3,849 |
| Excelerate Energy Inc Class A | | 370 | 11,193 |
| Expand Energy Corp | | 4,227 | 420,798 |
| Exxon Mobil Corp | | 90,857 | 9,773,487 |
| FutureFuel Corp | | 509 | 2,693 |
| Gevo Inc (b)(c) | | 4,584 | 9,581 |
| Granite Ridge Resources Inc | | 1,111 | 7,177 |
| Green Plains Inc (b) | | 1,280 | 12,134 |
| Gulfport Energy Corp (b) | | 258 | 47,524 |
| Hallador Energy Co (b) | | 692 | 7,923 |
| Hess Corp | | 5,654 | 752,039 |
| HF Sinclair Corp | | 3,353 | 117,523 |
| International Seaways Inc | | 846 | 30,405 |
| Kinder Morgan Inc | | 39,489 | 1,081,999 |
| Kinetik Holdings Inc Class A | | 772 | 43,780 |
| Magnolia Oil & Gas Corp Class A (c) | | 3,930 | 91,883 |
| Marathon Petroleum Corp | | 6,851 | 955,715 |
| Matador Resources Co | | 2,403 | 135,193 |
| Murphy Oil Corp | | 2,972 | 89,933 |
| New Fortress Energy Inc Class A (c) | | 1,377 | 20,820 |
| NextDecade Corp (b)(c) | | 2,705 | 20,856 |
| Northern Oil & Gas Inc | | 2,068 | 76,847 |
| Occidental Petroleum Corp | | 13,789 | 681,314 |
| ONEOK Inc | | 11,948 | 1,199,579 |
| Ovintiv Inc | | 5,422 | 219,591 |
| Par Pacific Holdings Inc (b) | | 1,145 | 18,767 |
| PBF Energy Inc Class A | | 2,004 | 53,206 |
| Peabody Energy Corp | | 2,533 | 53,041 |
| Permian Resources Corp Class A | | 13,093 | 188,277 |
| Phillips 66 | | 8,567 | 976,038 |
| Range Resources Corp | | 4,980 | 179,180 |
| REX American Resources Corp (b) | | 334 | 13,924 |
| Riley Exploration Permian Inc | | 188 | 6,001 |
| Ring Energy Inc (b) | | 2,319 | 3,154 |
| SandRidge Energy Inc | | 695 | 8,138 |
| Sitio Royalties Corp Class A | | 1,617 | 31,014 |
| SM Energy Co | | 2,373 | 91,977 |
| Talos Energy Inc (b) | | 2,449 | 23,780 |
| Targa Resources Corp | | 4,480 | 799,680 |
| Texas Pacific Land Corp (c) | | 386 | 426,901 |
| Uranium Energy Corp (b)(c) | | 8,255 | 55,226 |
| VAALCO Energy Inc | | 2,189 | 9,566 |
| Valero Energy Corp | | 6,558 | 803,945 |
| Vital Energy Inc (b)(c) | | 563 | 17,408 |
| Vitesse Energy Inc (c) | | 514 | 12,850 |
| W&T Offshore Inc | | 1,749 | 2,903 |
| Williams Cos Inc/The | | 24,927 | 1,349,049 |
| World Kinect Corp | | 1,170 | 32,187 |
| | | | 34,127,586 |
TOTAL ENERGY | | | 37,840,024 |
| | | | |
| Financials - 13.8% | | | |
| Banks - 3.6% | | | |
| 1st Source Corp | | 348 | 20,316 |
| Amalgamated Financial Corp | | 419 | 14,024 |
| Amerant Bancorp Inc Class A | | 695 | 15,575 |
| Ameris Bancorp | | 1,348 | 84,344 |
| Arrow Financial Corp | | 265 | 7,608 |
| Associated Banc-Corp | | 3,084 | 73,708 |
| Atlantic Union Bankshares Corp | | 1,873 | 70,949 |
| Axos Financial Inc (b) | | 1,116 | 77,953 |
| Banc of California Inc | | 2,769 | 42,809 |
| BancFirst Corp | | 404 | 47,341 |
| Bancorp Inc/The (b) | | 990 | 52,104 |
| Bank First Corp | | 186 | 18,431 |
| Bank of America Corp | | 138,045 | 6,067,079 |
| Bank of Hawaii Corp | | 803 | 57,206 |
| Bank OZK | | 2,202 | 98,055 |
| BankUnited Inc | | 1,565 | 59,736 |
| Banner Corp | | 693 | 46,272 |
| Berkshire Hills Bancorp Inc | | 855 | 24,308 |
| BOK Financial Corp | | 478 | 50,883 |
| Brookline Bancorp Inc | | 1,778 | 20,980 |
| Byline Bancorp Inc | | 505 | 14,645 |
| Cadence Bank | | 3,765 | 129,704 |
| Camden National Corp | | 305 | 13,036 |
| Capitol Federal Financial Inc | | 2,366 | 13,983 |
| Cathay General Bancorp | | 1,459 | 69,463 |
| Central Pacific Financial Corp | | 550 | 15,978 |
| Citigroup Inc | | 39,021 | 2,746,688 |
| Citizens Financial Group Inc | | 9,180 | 401,717 |
| City Holding Co | | 299 | 35,426 |
| Coastal Financial Corp/WA Class A (b) | | 230 | 19,529 |
| Columbia Banking System Inc | | 4,319 | 116,656 |
| Columbia Financial Inc (b) | | 524 | 8,284 |
| Comerica Inc | | 2,725 | 168,541 |
| Commerce Bancshares Inc/MO | | 2,537 | 158,080 |
| Community Financial System Inc | | 1,103 | 68,033 |
| Community Trust Bancorp Inc | | 299 | 15,856 |
| Connectone Bancorp Inc | | 741 | 16,976 |
| CrossFirst Bankshares Inc (b) | | 895 | 13,559 |
| Cullen/Frost Bankers Inc | | 1,319 | 177,076 |
| Customers Bancorp Inc (b) | | 590 | 28,721 |
| CVB Financial Corp | | 2,646 | 56,651 |
| Dime Community Bancshares Inc | | 769 | 23,635 |
| Eagle Bancorp Inc | | 596 | 15,514 |
| East West Bancorp Inc | | 2,845 | 272,437 |
| Eastern Bankshares Inc | | 3,877 | 66,878 |
| Enterprise Financial Services Corp | | 756 | 42,638 |
| Equity Bancshares Inc Class A | | 276 | 11,708 |
| Esquire Financial Holdings Inc | | 137 | 10,892 |
| FB Financial Corp | | 699 | 36,005 |
| Fifth Third Bancorp | | 13,844 | 585,324 |
| First Bancorp/Southern Pines NC | | 875 | 38,474 |
| First Bancshares Inc/The | | 557 | 19,495 |
| First Busey Corp | | 1,093 | 25,762 |
| First Citizens BancShares Inc/NC Class A | | 245 | 517,690 |
| First Commonwealth Financial Corp | | 2,074 | 35,092 |
| First Financial Bancorp | | 1,924 | 51,717 |
| First Financial Bankshares Inc | | 2,663 | 96,001 |
| First Financial Corp/IN | | 216 | 9,977 |
| First Foundation Inc | | 1,246 | 7,738 |
| First Hawaiian Inc | | 2,577 | 66,873 |
| First Horizon Corp | | 10,996 | 221,459 |
| First Interstate BancSystem Inc Class A | | 1,739 | 56,465 |
| First Merchants Corp | | 1,234 | 49,224 |
| First Mid Bancshares Inc | | 408 | 15,023 |
| First of Long Island Corp/The | | 379 | 4,427 |
| Flagstar Financial Inc (c) | | 6,250 | 58,313 |
| Flushing Financial Corp | | 550 | 7,854 |
| FNB Corp/PA | | 7,444 | 110,022 |
| Fulton Financial Corp | | 3,787 | 73,013 |
| German American Bancorp Inc | | 609 | 24,494 |
| Glacier Bancorp Inc | | 2,343 | 117,665 |
| Great Southern Bancorp Inc | | 173 | 10,328 |
| Hancock Whitney Corp | | 1,791 | 98,004 |
| Hanmi Financial Corp | | 601 | 14,196 |
| Harborone Northeast Bancorp Inc | | 823 | 9,736 |
| Heartland Financial USA Inc | | 867 | 53,151 |
| Heritage Commerce Corp | | 1,220 | 11,444 |
| Heritage Financial Corp Wash | | 692 | 16,954 |
| Hilltop Holdings Inc | | 954 | 27,313 |
| Hingham Institution For Savings The | | 39 | 9,911 |
| Home BancShares Inc/AR | | 3,853 | 109,040 |
| HomeStreet Inc (b) | | 395 | 4,511 |
| Hope Bancorp Inc | | 2,448 | 30,086 |
| Horizon Bancorp Inc/IN | | 876 | 14,112 |
| Huntington Bancshares Inc/OH | | 29,716 | 483,479 |
| Independent Bank Corp | | 891 | 57,193 |
| Independent Bank Corp/MI | | 414 | 14,420 |
| Independent Bank Group Inc | | 728 | 44,168 |
| International Bancshares Corp | | 1,120 | 70,739 |
| JPMorgan Chase & Co | | 58,188 | 13,948,246 |
| Kearny Financial Corp/MD | | 1,217 | 8,616 |
| KeyCorp | | 19,005 | 325,746 |
| Lakeland Financial Corp | | 507 | 34,861 |
| Live Oak Bancshares Inc | | 669 | 26,459 |
| M&T Bank Corp | | 3,417 | 642,430 |
| Mercantile Bank Corp | | 326 | 14,504 |
| Metropolitan Bank Holding Corp (b) | | 194 | 11,330 |
| Midland States Bancorp Inc | | 435 | 10,614 |
| National Bank Holdings Corp Class A | | 764 | 32,898 |
| Nbt Bancorp Inc | | 959 | 45,802 |
| Nicolet Bankshares Inc | | 262 | 27,486 |
| Northfield Bancorp Inc | | 769 | 8,936 |
| Northwest Bancshares Inc | | 2,526 | 33,318 |
| OceanFirst Financial Corp | | 1,211 | 21,919 |
| Old National Bancorp/IN | | 6,563 | 142,450 |
| Old Second Bancorp Inc | | 906 | 16,109 |
| Origin Bancorp Inc | | 607 | 20,207 |
| Pacific Premier Bancorp Inc | | 1,941 | 48,370 |
| Park National Corp | | 296 | 50,743 |
| Pathward Financial Inc | | 503 | 37,011 |
| Peapack-Gladstone Financial Corp | | 334 | 10,705 |
| Peoples Bancorp Inc/OH | | 697 | 22,088 |
| Pinnacle Financial Partners Inc | | 1,575 | 180,164 |
| PNC Financial Services Group Inc/The | | 8,127 | 1,567,292 |
| Preferred Bank/Los Angeles CA | | 257 | 22,200 |
| Premier Financial Corp | | 699 | 17,873 |
| Prosperity Bancshares Inc | | 1,968 | 148,289 |
| Provident Financial Services Inc | | 2,647 | 49,949 |
| QCR Holdings Inc | | 341 | 27,498 |
| Regions Financial Corp | | 18,720 | 440,294 |
| Renasant Corp | | 1,294 | 46,261 |
| S&T Bancorp Inc | | 781 | 29,850 |
| Sandy Spring Bancorp Inc | | 914 | 30,811 |
| Seacoast Banking Corp of Florida | | 1,712 | 47,131 |
| ServisFirst Bancshares Inc | | 1,017 | 86,181 |
| Simmons First National Corp Class A | | 2,551 | 56,581 |
| Southside Bancshares Inc | | 558 | 17,722 |
| SouthState Corp | | 1,571 | 156,283 |
| Stellar Bancorp Inc | | 975 | 27,641 |
| Stock Yards Bancorp Inc (c) | | 541 | 38,741 |
| Synovus Financial Corp | | 2,964 | 151,846 |
| Texas Capital Bancshares Inc (b) | | 961 | 75,150 |
| TFS Financial Corp | | 1,072 | 13,464 |
| Tompkins Financial Corp | | 247 | 16,754 |
| Towne Bank/Portsmouth VA | | 1,403 | 47,786 |
| TriCo Bancshares | | 672 | 29,366 |
| Triumph Financial Inc (b) | | 447 | 40,623 |
| Truist Financial Corp | | 27,399 | 1,188,569 |
| TrustCo Bank Corp NY | | 397 | 13,224 |
| Trustmark Corp | | 1,223 | 43,258 |
| UMB Financial Corp | | 898 | 101,348 |
| United Bankshares Inc/WV | | 2,812 | 105,591 |
| United Community Banks Inc/GA | | 2,497 | 80,678 |
| Univest Financial Corp | | 594 | 17,529 |
| US Bancorp | | 31,931 | 1,527,260 |
| Valley National Bancorp | | 8,669 | 78,541 |
| Veritex Holdings Inc | | 1,109 | 30,120 |
| WaFd Inc | | 1,642 | 52,938 |
| Washington Trust Bancorp Inc | | 359 | 11,255 |
| Webster Financial Corp | | 3,520 | 194,374 |
| Wells Fargo & Co | | 69,618 | 4,889,968 |
| WesBanco Inc | | 1,189 | 38,690 |
| Westamerica BanCorp | | 546 | 28,643 |
| Western Alliance Bancorp | | 2,240 | 187,130 |
| Wintrust Financial Corp | | 1,369 | 170,728 |
| WSFS Financial Corp | | 1,196 | 63,543 |
| Zions Bancorp NA | | 3,038 | 164,812 |
| | | | 42,883,674 |
| Capital Markets - 3.3% | | | |
| Affiliated Managers Group Inc | | 614 | 113,541 |
| Ameriprise Financial Inc | | 2,007 | 1,068,587 |
| Ares Management Corp Class A | | 3,774 | 668,111 |
| Artisan Partners Asset Management Inc Class A | | 1,419 | 61,088 |
| B Riley Financial Inc (c) | | 321 | 1,473 |
| Bank of New York Mellon Corp/The | | 15,075 | 1,158,212 |
| BGC Group Inc Class A | | 7,872 | 71,320 |
| Blackrock Inc | | 2,846 | 2,917,464 |
| Blackstone Inc | | 14,729 | 2,539,575 |
| Blue Owl Capital Inc Class A | | 10,573 | 245,928 |
| Bridge Investment Group Holdings Inc Class A | | 790 | 6,636 |
| Brightsphere Investment Group Inc | | 548 | 14,434 |
| Carlyle Group Inc/The | | 4,314 | 217,814 |
| Cboe Global Markets Inc | | 2,141 | 418,351 |
| Charles Schwab Corp/The | | 30,555 | 2,261,376 |
| CME Group Inc Class A | | 7,363 | 1,709,909 |
| Cohen & Steers Inc (c) | | 563 | 51,987 |
| Coinbase Global Inc Class A (b) | | 4,152 | 1,030,942 |
| Diamond Hill Investment Group Inc | | 55 | 8,531 |
| DigitalBridge Group Inc Class A | | 3,156 | 35,600 |
| Donnelley Financial Solutions Inc (b) | | 569 | 35,693 |
| Ellington Credit Co (c) | | 545 | 3,608 |
| Evercore Inc Class A | | 731 | 202,626 |
| FactSet Research Systems Inc | | 778 | 373,658 |
| Federated Hermes Inc Class B | | 1,584 | 65,118 |
| Forge Global Holdings Inc Class A (b) | | 2,107 | 1,961 |
| Franklin Resources Inc | | 6,370 | 129,247 |
| GCM Grosvenor Inc Class A (c) | | 820 | 10,061 |
| Goldman Sachs Group Inc/The | | 6,458 | 3,697,981 |
| Hamilton Lane Inc Class A | | 837 | 123,918 |
| Houlihan Lokey Inc Class A | | 1,090 | 189,289 |
| Interactive Brokers Group Inc Class A | | 2,223 | 392,737 |
| Intercontinental Exchange Inc | | 11,737 | 1,748,930 |
| Invesco Ltd | | 9,304 | 162,634 |
| Janus Henderson Group PLC | | 2,630 | 111,854 |
| Jefferies Financial Group Inc | | 3,320 | 260,288 |
| KKR & Co Inc Class A | | 13,793 | 2,040,123 |
| Lazard Inc Class A | | 2,321 | 119,485 |
| LPL Financial Holdings Inc | | 1,529 | 499,234 |
| MarketAxess Holdings Inc | | 774 | 174,955 |
| Moelis & Co Class A | | 1,456 | 107,569 |
| Moody's Corp | | 3,202 | 1,515,731 |
| Morgan Stanley | | 25,477 | 3,202,969 |
| Morningstar Inc | | 553 | 186,228 |
| MSCI Inc | | 1,609 | 965,416 |
| Nasdaq Inc | | 8,451 | 653,347 |
| Northern Trust Corp | | 4,126 | 422,915 |
| Open Lending Corp (b) | | 2,086 | 12,453 |
| Oppenheimer Holdings Inc Class A | | 113 | 7,242 |
| P10 Inc Class A | | 928 | 11,702 |
| Perella Weinberg Partners Class A | | 1,083 | 25,819 |
| Piper Sandler Cos | | 321 | 96,284 |
| PJT Partners Inc Class A (c) | | 493 | 77,800 |
| Raymond James Financial Inc | | 3,793 | 589,167 |
| Robinhood Markets Inc Class A (b) | | 14,519 | 540,978 |
| S&P Global Inc | | 6,546 | 3,260,105 |
| SEI Investments Co | | 2,026 | 167,104 |
| State Street Corp | | 6,106 | 599,304 |
| StepStone Group Inc Class A | | 1,298 | 75,128 |
| Stifel Financial Corp | | 2,100 | 222,768 |
| StoneX Group Inc (b) | | 592 | 57,998 |
| T Rowe Price Group Inc | | 4,559 | 515,577 |
| TPG Inc Class A | | 1,803 | 113,301 |
| Tradeweb Markets Inc Class A | | 2,379 | 311,459 |
| Victory Capital Holdings Inc Class A | | 918 | 60,092 |
| Virtu Financial Inc Class A | | 1,649 | 58,836 |
| Virtus Invt Partners Inc | | 135 | 29,778 |
| WisdomTree Inc | | 2,392 | 25,116 |
| | | | 38,856,465 |
| Consumer Finance - 0.6% | | | |
| Ally Financial Inc | | 5,621 | 202,412 |
| American Express Co | | 11,482 | 3,407,743 |
| Bread Financial Holdings Inc | | 1,033 | 63,075 |
| Capital One Financial Corp | | 7,812 | 1,393,036 |
| Credit Acceptance Corp (b)(c) | | 127 | 59,621 |
| Discover Financial Services | | 5,137 | 889,883 |
| Encore Capital Group Inc (b)(c) | | 471 | 22,500 |
| Enova International Inc (b) | | 534 | 51,200 |
| EZCORP Inc Class A (b) | | 1,109 | 13,552 |
| FirstCash Holdings Inc | | 807 | 83,605 |
| Green Dot Corp Class A (b) | | 1,064 | 11,321 |
| LendingClub Corp (b) | | 2,262 | 36,622 |
| Lendingtree Inc (b) | | 211 | 8,176 |
| Moneylion Inc Class A (b) | | 130 | 11,181 |
| Navient Corp | | 1,612 | 21,423 |
| Nelnet Inc Class A | | 356 | 38,024 |
| NerdWallet Inc Class A (b) | | 826 | 10,986 |
| OneMain Holdings Inc | | 2,480 | 129,282 |
| PRA Group Inc (b) | | 776 | 16,211 |
| PROG Holdings Inc | | 846 | 35,752 |
| SLM Corp | | 4,477 | 123,476 |
| SoFi Technologies Inc Class A (b)(c) | | 21,815 | 335,951 |
| Synchrony Financial | | 8,086 | 525,590 |
| Upstart Holdings Inc (b) | | 1,608 | 99,005 |
| World Acceptance Corp (b) | | 65 | 7,308 |
| | | | 7,596,935 |
| Financial Services - 4.1% | | | |
| Affirm Holdings Inc Class A (b) | | 4,917 | 299,445 |
| Apollo Global Management Inc | | 9,202 | 1,519,802 |
| AvidXchange Holdings Inc (b) | | 3,853 | 39,840 |
| Berkshire Hathaway Inc Class B (b) | | 37,458 | 16,978,963 |
| Block Inc Class A (b) | | 11,363 | 965,741 |
| Cannae Holdings Inc | | 1,127 | 22,382 |
| Cantaloupe Inc (b) | | 1,094 | 10,404 |
| Cass Information Systems Inc | | 262 | 10,718 |
| Corebridge Financial Inc | | 4,989 | 149,321 |
| Corpay Inc (b) | | 1,421 | 480,895 |
| Enact Holdings Inc | | 607 | 19,655 |
| Equitable Holdings Inc | | 6,552 | 309,058 |
| Essent Group Ltd | | 2,195 | 119,496 |
| Euronet Worldwide Inc (b) | | 878 | 90,294 |
| Federal Agricultural Mortgage Corp Class C | | 187 | 36,830 |
| Fidelity National Information Services Inc | | 11,156 | 901,070 |
| Fiserv Inc (b) | | 11,770 | 2,417,793 |
| Flywire Corp (b) | | 2,258 | 46,560 |
| Global Payments Inc | | 5,210 | 583,833 |
| HA Sustainable Infrastructure Capital Inc | | 2,353 | 63,131 |
| I3 Verticals Inc Class A (b) | | 430 | 9,907 |
| International Money Express Inc (b) | | 635 | 13,227 |
| Jack Henry & Associates Inc | | 1,491 | 261,372 |
| Jackson Financial Inc | | 1,544 | 134,452 |
| Marqeta Inc Class A (b) | | 8,834 | 33,481 |
| Mastercard Inc Class A | | 16,869 | 8,882,709 |
| Merchants Bancorp/IN | | 565 | 20,606 |
| MGIC Investment Corp | | 5,361 | 127,109 |
| Mr Cooper Group Inc (b) | | 1,329 | 127,597 |
| NCR Atleos Corp (b) | | 1,470 | 49,862 |
| NewtekOne Inc | | 535 | 6,832 |
| NMI Holdings Inc (b) | | 1,613 | 59,294 |
| Paymentus Holdings Inc Class A (b) | | 357 | 11,663 |
| Payoneer Global Inc (b) | | 5,155 | 51,756 |
| PayPal Holdings Inc (b) | | 20,913 | 1,784,925 |
| PennyMac Financial Services Inc | | 641 | 65,472 |
| Radian Group Inc | | 3,125 | 99,125 |
| Remitly Global Inc (b) | | 2,977 | 67,191 |
| Repay Holdings Corp Class A (b) | | 1,464 | 11,170 |
| Rocket Cos Inc Class A (b) | | 2,598 | 29,253 |
| Sezzle Inc (b) | | 50 | 12,790 |
| Shift4 Payments Inc Class A (b)(c) | | 1,338 | 138,858 |
| Toast Inc Class A (b) | | 8,303 | 302,644 |
| UWM Holdings Corp Class A | | 1,909 | 11,206 |
| Visa Inc Class A | | 34,162 | 10,796,559 |
| Voya Financial Inc | | 2,023 | 139,243 |
| Walker & Dunlop Inc | | 651 | 63,284 |
| Western Union Co/The | | 6,842 | 72,525 |
| WEX Inc (b) | | 845 | 148,145 |
| | | | 48,597,488 |
| Insurance - 2.1% | | | |
| AFLAC Inc | | 10,301 | 1,065,535 |
| Allstate Corp/The | | 5,400 | 1,041,066 |
| Ambac Financial Group Inc/Old (b) | | 1,000 | 12,650 |
| American Coastal Insurance Corp | | 510 | 6,865 |
| American Financial Group Inc/OH | | 1,481 | 202,793 |
| American International Group Inc | | 13,168 | 958,630 |
| Amerisafe Inc | | 396 | 20,410 |
| Aon PLC | | 4,439 | 1,594,311 |
| Arch Capital Group Ltd | | 7,662 | 707,586 |
| Arthur J Gallagher & Co | | 4,477 | 1,270,796 |
| Assurant Inc | | 1,059 | 225,800 |
| Assured Guaranty Ltd | | 1,027 | 92,440 |
| Axis Capital Holdings Ltd | | 1,575 | 139,577 |
| Baldwin Insurance Group Inc/The Class A (b) | | 1,340 | 51,938 |
| Brighthouse Financial Inc (b) | | 1,228 | 58,993 |
| Brown & Brown Inc | | 4,832 | 492,961 |
| Chubb Ltd | | 7,678 | 2,121,431 |
| Cincinnati Financial Corp | | 3,196 | 459,265 |
| CNO Financial Group Inc | | 2,182 | 81,192 |
| eHealth Inc (b) | | 713 | 6,702 |
| Employers Holdings Inc | | 504 | 25,820 |
| Enstar Group Ltd (b) | | 258 | 83,089 |
| Erie Indemnity Co Class A | | 511 | 210,650 |
| Everest Group Ltd | | 886 | 321,140 |
| Fidelity National Financial Inc/US | | 5,323 | 298,833 |
| First American Financial Corp | | 2,122 | 132,498 |
| Genworth Financial Inc Class A (b) | | 8,732 | 61,037 |
| Globe Life Inc | | 1,837 | 204,862 |
| Goosehead Insurance Inc Class A (b) | | 489 | 52,431 |
| Hanover Insurance Group Inc/The | | 742 | 114,758 |
| Hartford Financial Services Group Inc/The | | 5,989 | 655,197 |
| HCI Group Inc | | 166 | 19,344 |
| Hippo Holdings Inc (b)(c) | | 397 | 10,628 |
| Horace Mann Educators Corp | | 831 | 32,600 |
| James River Group Holdings Ltd | | 664 | 3,234 |
| Kemper Corp | | 1,260 | 83,714 |
| Kinsale Capital Group Inc | | 453 | 210,704 |
| Lemonade Inc (b)(c) | | 1,111 | 40,751 |
| Lincoln National Corp | | 3,509 | 111,270 |
| Loews Corp | | 3,718 | 314,877 |
| Markel Group Inc (b) | | 264 | 455,725 |
| Marsh & McLennan Cos Inc | | 10,043 | 2,133,234 |
| MBIA Inc (c) | | 942 | 6,085 |
| Mercury General Corp | | 561 | 37,295 |
| MetLife Inc | | 12,030 | 985,016 |
| Old Republic International Corp | | 4,875 | 176,426 |
| Oscar Health Inc Class A (b) | | 3,898 | 52,389 |
| Palomar Hldgs Inc (b) | | 530 | 55,963 |
| Primerica Inc | | 691 | 187,551 |
| Principal Financial Group Inc | | 4,363 | 337,740 |
| ProAssurance Corp (b) | | 1,019 | 16,212 |
| Progressive Corp/The | | 11,974 | 2,869,090 |
| Prudential Financial Inc | | 7,301 | 865,388 |
| Reinsurance Group of America Inc | | 1,347 | 287,760 |
| RLI Corp | | 854 | 140,765 |
| Root Inc/OH Class A (b)(c) | | 147 | 10,671 |
| Ryan Specialty Holdings Inc Class A | | 2,108 | 135,249 |
| Safety Insurance Group Inc | | 306 | 25,214 |
| Selective Insurance Group Inc | | 1,253 | 117,181 |
| Skyward Specialty Insurance Group Inc (b) | | 698 | 35,277 |
| Stewart Information Services Corp | | 589 | 39,752 |
| The Travelers Companies, Inc. | | 4,662 | 1,123,029 |
| Tiptree Inc Class A | | 396 | 8,261 |
| Trupanion Inc (b)(c) | | 682 | 32,872 |
| United Fire Group Inc | | 414 | 11,778 |
| Universal Insurance Holdings Inc | | 495 | 10,425 |
| Unum Group | | 3,490 | 254,875 |
| W R Berkley Corp | | 6,149 | 359,839 |
| White Mountains Insurance Group Ltd | | 52 | 101,143 |
| Willis Towers Watson PLC | | 2,075 | 649,973 |
| | | | 25,120,556 |
| Mortgage Real Estate Investment Trusts (REITs) - 0.1% | | | |
| AGNC Investment Corp | | 16,069 | 147,996 |
| Annaly Capital Management Inc | | 10,264 | 187,832 |
| Apollo Commercial Real Estate Finance Inc | | 2,655 | 22,992 |
| Arbor Realty Trust Inc (c) | | 3,963 | 54,888 |
| Ares Commercial Real Estate Corp (c) | | 1,061 | 6,249 |
| ARMOUR Residential REIT Inc (c) | | 955 | 18,011 |
| Blackstone Mortgage Trust Inc Class A (c) | | 3,630 | 63,198 |
| Brightspire Capital Inc Class A | | 2,749 | 15,504 |
| Chimera Investment Corp | | 1,648 | 23,072 |
| Claros Mortgage Trust Inc (c) | | 2,333 | 10,545 |
| Dynex Capital Inc | | 1,477 | 18,684 |
| Ellington Financial Inc (c) | | 1,765 | 21,392 |
| Franklin BSP Realty Trust Inc | | 1,713 | 21,481 |
| Granite Point Mortgage Trust Inc | | 859 | 2,397 |
| Invesco Mortgage Capital Inc | | 1,055 | 8,493 |
| Kkr Real Estate Finance Trust Inc | | 1,212 | 12,241 |
| Ladder Capital Corp Class A | | 2,244 | 25,110 |
| MFA Financial Inc | | 2,022 | 20,604 |
| New York Mortgage Trust Inc | | 1,814 | 10,993 |
| Orchid Island Capital Inc (c) | | 1,397 | 10,869 |
| Pennymac Mortgage Investment Trust | | 1,795 | 22,599 |
| Ready Capital Corp (c) | | 3,359 | 22,908 |
| Redwood Trust Inc | | 2,694 | 17,592 |
| Rithm Capital Corp | | 10,763 | 116,563 |
| Starwood Property Trust Inc | | 6,559 | 124,293 |
| TPG RE Finance Trust Inc | | 1,280 | 10,880 |
| Two Harbors Investment Corp | | 2,150 | 25,435 |
| | | | 1,042,821 |
TOTAL FINANCIALS | | | 164,097,939 |
| | | | |
| Health Care - 10.0% | | | |
| Biotechnology - 2.0% | | | |
| 2seventy bio Inc (b)(c) | | 884 | 2,599 |
| 4D Molecular Therapeutics Inc (b) | | 767 | 4,272 |
| 89bio Inc (b) | | 1,798 | 14,060 |
| AbbVie Inc | | 36,132 | 6,420,657 |
| Absci Corp (b)(c) | | 1,604 | 4,202 |
| ACADIA Pharmaceuticals Inc (b) | | 2,458 | 45,104 |
| ACELYRIN Inc (b) | | 1,403 | 4,405 |
| Actinium Pharmaceuticals Inc (b) | | 607 | 765 |
| Acumen Pharmaceuticals Inc (b) | | 497 | 855 |
| Adicet Bio Inc (b) | | 1,160 | 1,116 |
| ADMA Biologics Inc (b) | | 4,730 | 81,120 |
| Adverum Biotechnologies Inc (b) | | 334 | 1,560 |
| Agenus Inc (b) | | 349 | 956 |
| Agios Pharmaceuticals Inc (b) | | 1,199 | 39,399 |
| Akebia Therapeutics Inc (b) | | 4,200 | 7,980 |
| Akero Therapeutics Inc (b) | | 1,294 | 35,999 |
| Aldeyra Therapeutics Inc (b) | | 773 | 3,857 |
| Alector Inc (b) | | 1,727 | 3,264 |
| Alkermes PLC (b) | | 3,410 | 98,072 |
| Allogene Therapeutics Inc (b) | | 2,955 | 6,294 |
| Alnylam Pharmaceuticals Inc (b) | | 2,629 | 618,630 |
| Altimmune Inc (b)(c) | | 1,353 | 9,755 |
| ALX Oncology Holdings Inc (b) | | 481 | 803 |
| Amgen Inc | | 10,995 | 2,865,737 |
| Amicus Therapeutics Inc (b) | | 5,381 | 50,689 |
| AnaptysBio Inc (b) | | 381 | 5,044 |
| Anavex Life Sciences Corp (b)(c) | | 1,787 | 19,192 |
| Anika Therapeutics Inc (b) | | 292 | 4,806 |
| Annexon Inc (b) | | 1,703 | 8,736 |
| Apellis Pharmaceuticals Inc (b) | | 2,119 | 67,617 |
| Apogee Therapeutics Inc (b) | | 689 | 31,212 |
| Arbutus Biopharma Corp (b) | | 2,917 | 9,539 |
| Arcellx Inc (b) | | 777 | 59,588 |
| Arcturus Therapeutics Holdings Inc (b) | | 522 | 8,858 |
| Arcus Biosciences Inc (b) | | 1,129 | 16,811 |
| Arcutis Biotherapeutics Inc (b)(c) | | 2,141 | 29,824 |
| Ardelyx Inc (b) | | 4,747 | 24,067 |
| Arrowhead Pharmaceuticals Inc (b) | | 2,600 | 48,880 |
| ARS Pharmaceuticals Inc (b)(c) | | 1,049 | 11,067 |
| Astria Therapeutics Inc (b) | | 775 | 6,929 |
| Aura Biosciences Inc (b) | | 817 | 6,716 |
| Avid Bioservices Inc (b)(c) | | 1,294 | 15,981 |
| Avidity Biosciences Inc (b) | | 2,414 | 70,199 |
| Avita Medical Inc (b) | | 476 | 6,093 |
| Beam Therapeutics Inc (b)(c) | | 1,501 | 37,225 |
| BioCryst Pharmaceuticals Inc (b) | | 4,156 | 31,253 |
| Biogen Inc (b) | | 2,992 | 457,537 |
| Biohaven Ltd (b) | | 1,730 | 64,616 |
| BioMarin Pharmaceutical Inc (b) | | 3,912 | 257,136 |
| Biomea Fusion Inc (b)(c) | | 542 | 2,103 |
| Bluebird Bio Inc (b)(c) | | 179 | 1,493 |
| Blueprint Medicines Corp (b) | | 1,312 | 114,433 |
| Bridgebio Pharma Inc (b) | | 3,036 | 83,308 |
| C4 Therapeutics Inc (b) | | 1,011 | 3,640 |
| Cabaletta Bio Inc (b) | | 894 | 2,029 |
| CareDx Inc (b) | | 1,035 | 22,159 |
| Cargo Therapeutics Inc (b) | | 713 | 10,281 |
| Caribou Biosciences Inc (b) | | 1,579 | 2,511 |
| Carisma Therapeutics Inc rights (b)(e) | | 1,904 | 0 |
| Cartesian Therapeutics Inc rights (b)(e) | | 1,985 | 854 |
| Catalyst Pharmaceuticals Inc (b) | | 2,238 | 46,707 |
| Celcuity Inc (b) | | 536 | 7,016 |
| Celldex Therapeutics Inc (b) | | 1,358 | 34,317 |
| Cogent Biosciences Inc (b) | | 2,024 | 15,787 |
| Coherus Biosciences Inc (b)(c) | | 2,789 | 3,849 |
| Crinetics Pharmaceuticals Inc (b) | | 1,663 | 85,029 |
| Cullinan Therapeutics Inc (b) | | 1,026 | 12,497 |
| Cytokinetics Inc (b)(c) | | 2,449 | 115,201 |
| Day One Biopharmaceuticals Inc (b) | | 1,314 | 16,648 |
| Denali Therapeutics Inc (b) | | 2,483 | 50,604 |
| Disc Medicine Inc (b) | | 390 | 24,726 |
| Dynavax Technologies Corp (b) | | 2,598 | 33,176 |
| Dyne Therapeutics Inc (b) | | 1,596 | 37,602 |
| Editas Medicine Inc (b)(c) | | 1,669 | 2,120 |
| Emergent BioSolutions Inc (b) | | 1,012 | 9,675 |
| Enanta Pharmaceuticals Inc (b) | | 414 | 2,381 |
| Erasca Inc (b)(c) | | 4,223 | 10,600 |
| Exact Sciences Corp (b) | | 3,787 | 212,792 |
| Exelixis Inc (b) | | 5,855 | 194,972 |
| Fate Therapeutics Inc (b) | | 1,898 | 3,132 |
| Geron Corp (b) | | 10,612 | 37,566 |
| Gilead Sciences Inc | | 25,478 | 2,353,403 |
| Gossamer Bio Inc (b) | | 3,718 | 3,363 |
| GRAIL Inc (c) | | 502 | 8,961 |
| Halozyme Therapeutics Inc (b) | | 2,607 | 124,641 |
| Heron Therapeutics Inc (b)(c) | | 2,984 | 4,566 |
| Humacyte Inc Class A (b)(c) | | 1,755 | 8,863 |
| Ideaya Biosciences Inc (b) | | 1,720 | 44,204 |
| IGM Biosciences Inc (b)(c) | | 353 | 2,157 |
| ImmunityBio Inc (b)(c) | | 3,234 | 8,279 |
| Immunovant Inc (b) | | 1,351 | 33,464 |
| Incyte Corp (b) | | 3,286 | 226,964 |
| Inhibrx Biosciences Inc | | 147 | 2,264 |
| Inovio Pharmaceuticals Inc (b)(c) | | 476 | 871 |
| Inozyme Pharma Inc (b) | | 862 | 2,388 |
| Insmed Inc (b) | | 3,533 | 243,918 |
| Intellia Therapeutics Inc (b) | | 1,996 | 23,273 |
| Ionis Pharmaceuticals Inc (b) | | 3,274 | 114,459 |
| Iovance Biotherapeutics Inc (b)(c) | | 4,603 | 34,062 |
| Ironwood Pharmaceuticals Inc Class A (b) | | 2,716 | 12,032 |
| iTeos Therapeutics Inc (b) | | 534 | 4,101 |
| Janux Therapeutics Inc (b) | | 558 | 29,875 |
| KalVista Pharmaceuticals Inc (b)(c) | | 623 | 5,277 |
| Karyopharm Therapeutics Inc (b)(c) | | 3,171 | 2,145 |
| Keros Therapeutics Inc (b) | | 634 | 10,036 |
| Kiniksa Pharmaceuticals International Plc Class A (b) | | 756 | 14,954 |
| Kodiak Sciences Inc (b) | | 567 | 5,642 |
| Krystal Biotech Inc (b) | | 527 | 82,560 |
| Kura Oncology Inc (b) | | 1,509 | 13,143 |
| Kymera Therapeutics Inc (b) | | 940 | 37,816 |
| Larimar Therapeutics Inc (b) | | 631 | 2,442 |
| Lexeo Therapeutics Inc (b) | | 483 | 3,178 |
| Lexicon Pharmaceuticals Inc (b) | | 3,462 | 2,557 |
| Lyell Immunopharma Inc (b) | | 3,060 | 1,958 |
| MacroGenics Inc (b)(c) | | 1,207 | 3,923 |
| Madrigal Pharmaceuticals Inc (b) | | 343 | 105,840 |
| MannKind Corp (b)(c) | | 5,456 | 35,082 |
| Mersana Therapeutics Inc (b) | | 1,724 | 2,465 |
| MiMedx Group Inc (b) | | 2,421 | 23,290 |
| Mineralys Therapeutics Inc (b) | | 435 | 5,355 |
| Mirum Pharmaceuticals Inc (b)(c) | | 798 | 32,997 |
| Moderna Inc (b) | | 6,935 | 288,357 |
| Myriad Genetics Inc (b) | | 1,813 | 24,856 |
| Natera Inc (b) | | 2,533 | 400,974 |
| Neurocrine Biosciences Inc (b) | | 2,073 | 282,965 |
| Novavax Inc (b)(c) | | 3,143 | 25,270 |
| Nurix Therapeutics Inc (b)(c) | | 1,178 | 22,194 |
| Nuvalent Inc Class A (b) | | 779 | 60,980 |
| Ocugen Inc (b)(c) | | 5,208 | 4,192 |
| Olema Pharmaceuticals Inc (b)(c) | | 743 | 4,332 |
| OmniAb Operations Inc (b)(e) | | 93 | 200 |
| OmniAb Operations Inc (b)(e) | | 93 | 178 |
| Organogenesis Holdings Inc Class A (b) | | 1,355 | 4,336 |
| ORIC Pharmaceuticals Inc (b) | | 935 | 7,545 |
| PDL BioPharma Inc (b)(e) | | 644 | 0 |
| PDS Biotechnology Corp (b) | | 610 | 994 |
| Poseida Therapeutics Inc (b) | | 1,479 | 14,198 |
| Praxis Precision Medicines Inc (b) | | 326 | 25,089 |
| Precigen Inc (b) | | 2,875 | 3,220 |
| Prime Medicine Inc (b)(c) | | 1,158 | 3,381 |
| Protagonist Therapeutics Inc (b) | | 1,234 | 47,632 |
| PTC Therapeutics Inc (b) | | 1,548 | 69,877 |
| Puma Biotechnology Inc (b) | | 695 | 2,120 |
| RAPT Therapeutics Inc (b) | | 527 | 833 |
| Recursion Pharmaceuticals Inc Class A (b)(c) | | 4,865 | 32,887 |
| Regeneron Pharmaceuticals Inc (b) | | 2,173 | 1,547,893 |
| REGENXBIO Inc (b) | | 865 | 6,686 |
| Relay Therapeutics Inc (b) | | 2,493 | 10,271 |
| Replimune Group Inc (b) | | 1,230 | 14,895 |
| REVOLUTION Medicines Inc (b)(c) | | 3,230 | 141,280 |
| Rhythm Pharmaceuticals Inc (b) | | 1,054 | 59,003 |
| Rigel Pharmaceuticals Inc (b) | | 346 | 5,820 |
| Rocket Pharmaceuticals Inc (b) | | 1,413 | 17,761 |
| Roivant Sciences Ltd (b) | | 9,058 | 107,156 |
| Sage Therapeutics Inc (b) | | 1,150 | 6,245 |
| Sana Biotechnology Inc (b)(c) | | 2,543 | 4,145 |
| Sangamo Therapeutics Inc (b)(c) | | 4,205 | 4,289 |
| Sarepta Therapeutics Inc (b) | | 1,959 | 238,195 |
| Savara Inc (b)(c) | | 2,113 | 6,487 |
| Scholar Rock Holding Corp (b) | | 1,230 | 53,161 |
| SpringWorks Therapeutics Inc (b) | | 1,500 | 54,195 |
| Stoke Therapeutics Inc (b) | | 781 | 8,614 |
| Summit Therapeutics Inc (b) | | 2,779 | 49,591 |
| Sutro Biopharma Inc (b) | | 1,528 | 2,812 |
| Syndax Pharmaceuticals Inc (b) | | 1,706 | 22,553 |
| Tango Therapeutics Inc (b) | | 1,297 | 4,008 |
| Tenaya Therapeutics Inc (b)(c) | | 898 | 1,284 |
| TG Therapeutics Inc (b) | | 2,745 | 82,625 |
| Travere Therapeutics Inc (b) | | 1,336 | 23,273 |
| Twist Bioscience Corp (b) | | 1,177 | 54,695 |
| Tyra Biosciences Inc (b) | | 387 | 5,379 |
| Ultragenyx Pharmaceutical Inc (b) | | 1,919 | 80,732 |
| United Therapeutics Corp (b) | | 913 | 322,143 |
| Vanda Pharmaceuticals Inc (b) | | 1,340 | 6,419 |
| Vaxcyte Inc (b) | | 2,305 | 188,687 |
| Vera Therapeutics Inc Class A (b) | | 981 | 41,486 |
| Veracyte Inc (b) | | 1,550 | 61,380 |
| Vericel Corp (b) | | 995 | 54,635 |
| Vertex Pharmaceuticals Inc (b) | | 5,282 | 2,127,061 |
| Verve Therapeutics Inc (b)(c) | | 1,359 | 7,665 |
| Viking Therapeutics Inc (b)(c) | | 2,291 | 92,190 |
| Vir Biotechnology Inc (b) | | 1,934 | 14,196 |
| Viridian Therapeutics Inc (b) | | 1,244 | 23,847 |
| Voyager Therapeutics Inc (b) | | 903 | 5,120 |
| X4 Pharmaceuticals Inc (b)(c) | | 2,954 | 2,167 |
| Xencor Inc (b) | | 1,244 | 28,587 |
| Y-mAbs Therapeutics Inc (b) | | 664 | 5,199 |
| Zentalis Pharmaceuticals Inc (b) | | 1,048 | 3,175 |
| | | | 23,420,667 |
| Health Care Equipment & Supplies - 2.1% | | | |
| Abbott Laboratories | | 35,581 | 4,024,567 |
| Align Technology Inc (b) | | 1,440 | 300,254 |
| Alphatec Holdings Inc (b)(c) | | 1,970 | 18,085 |
| AngioDynamics Inc (b) | | 772 | 7,072 |
| Artivion Inc (b) | | 742 | 21,214 |
| AtriCure Inc (b) | | 981 | 29,979 |
| Avanos Medical Inc (b) | | 955 | 15,204 |
| Axogen Inc (b) | | 891 | 14,684 |
| Baxter International Inc | | 10,474 | 305,422 |
| Becton Dickinson & Co | | 5,911 | 1,341,029 |
| Boston Scientific Corp (b) | | 30,094 | 2,687,996 |
| Butterfly Network Inc Class A (b)(c) | | 3,406 | 10,627 |
| Cerus Corp (b) | | 3,738 | 5,757 |
| CONMED Corp (c) | | 618 | 42,296 |
| Cooper Cos Inc/The (b) | | 4,078 | 374,891 |
| CVRx Inc (b) | | 222 | 2,812 |
| DENTSPLY SIRONA Inc | | 4,196 | 79,640 |
| Dexcom Inc (b) | | 8,202 | 637,870 |
| Edwards Lifesciences Corp (b) | | 12,325 | 912,420 |
| Embecta Corp | | 1,128 | 23,293 |
| Enovis Corp (b) | | 1,130 | 49,584 |
| Envista Holdings Corp (b)(c) | | 3,574 | 68,942 |
| GE HealthCare Technologies Inc | | 9,349 | 730,905 |
| Glaukos Corp (b) | | 1,131 | 169,582 |
| Globus Medical Inc Class A (b) | | 2,315 | 191,474 |
| Haemonetics Corp (b) | | 1,036 | 80,891 |
| Hologic Inc (b) | | 4,761 | 343,220 |
| ICU Medical Inc (b) | | 504 | 78,206 |
| IDEXX Laboratories Inc (b) | | 1,686 | 697,060 |
| Inari Medical Inc (b) | | 1,011 | 51,612 |
| Inogen Inc (b) | | 498 | 4,566 |
| Inspire Medical Systems Inc (b) | | 616 | 114,194 |
| Insulet Corp (b) | | 1,434 | 374,374 |
| Integer Holdings Corp (b) | | 678 | 89,849 |
| Integra LifeSciences Holdings Corp (b) | | 1,352 | 30,663 |
| Intuitive Surgical Inc (b) | | 7,254 | 3,786,298 |
| iRadimed Corp | | 169 | 9,295 |
| iRhythm Technologies Inc (b) | | 632 | 56,987 |
| Lantheus Holdings Inc (b) | | 1,425 | 127,481 |
| LeMaitre Vascular Inc | | 414 | 38,146 |
| LivaNova PLC (b) | | 1,102 | 51,034 |
| Masimo Corp (b)(c) | | 905 | 149,597 |
| Medtronic PLC | | 26,227 | 2,095,013 |
| Merit Medical Systems Inc (b) | | 1,197 | 115,774 |
| Neogen Corp (b)(c) | | 4,155 | 50,442 |
| Nevro Corp (b) | | 770 | 2,863 |
| Novocure Ltd (b) | | 1,982 | 59,064 |
| Omnicell Inc (b) | | 941 | 41,893 |
| OraSure Technologies Inc (b) | | 1,377 | 4,970 |
| Orthofix Medical Inc (b) | | 796 | 13,898 |
| OrthoPediatrics Corp (b) | | 338 | 7,835 |
| Outset Medical Inc (b)(c) | | 1,132 | 1,256 |
| Paragon 28 Inc (b)(c) | | 808 | 8,347 |
| Penumbra Inc (b) | | 797 | 189,272 |
| PROCEPT BioRobotics Corp (b) | | 1,043 | 83,982 |
| Pulmonx Corp (b) | | 833 | 5,656 |
| QuidelOrtho Corp (b) | | 1,172 | 52,213 |
| ResMed Inc | | 3,007 | 687,671 |
| RxSight Inc (b) | | 671 | 23,069 |
| Semler Scientific Inc (b)(c) | | 105 | 5,670 |
| Senseonics Holdings Inc (b) | | 10,758 | 5,631 |
| SI-BONE Inc (b) | | 700 | 9,814 |
| Sight Sciences Inc (b) | | 534 | 1,943 |
| Solventum Corp | | 2,838 | 187,478 |
| STAAR Surgical Co (b)(c) | | 1,019 | 24,752 |
| STERIS PLC | | 2,021 | 415,437 |
| Stryker Corp | | 7,011 | 2,524,311 |
| Surmodics Inc (b) | | 281 | 11,128 |
| Tactile Systems Technology Inc (b) | | 466 | 7,983 |
| Tandem Diabetes Care Inc (b) | | 1,318 | 47,474 |
| Teleflex Inc | | 969 | 172,463 |
| TransMedics Group Inc (b)(c) | | 680 | 42,398 |
| Treace Medical Concepts Inc (b) | | 927 | 6,897 |
| UFP Technologies Inc (b) | | 146 | 35,698 |
| Utah Medical Products Inc | | 67 | 4,117 |
| Varex Imaging Corp (b) | | 856 | 12,489 |
| Zimmer Biomet Holdings Inc | | 4,173 | 440,794 |
| Zimvie Inc (b) | | 515 | 7,184 |
| Zynex Inc (b)(c) | | 331 | 2,650 |
| | | | 25,558,601 |
| Health Care Providers & Services - 1.9% | | | |
| 23andMe Holding Co Class A (b) | | 251 | 815 |
| Acadia Healthcare Co Inc (b)(c) | | 1,881 | 74,582 |
| Accolade Inc (b) | | 1,281 | 4,380 |
| AdaptHealth Corp (b) | | 2,080 | 19,802 |
| Addus HomeCare Corp (b) | | 362 | 45,377 |
| agilon health Inc (b) | | 5,898 | 11,206 |
| Alignment Healthcare Inc (b) | | 2,047 | 23,029 |
| Amedisys Inc (b) | | 664 | 60,285 |
| AMN Healthcare Services Inc (b) | | 741 | 17,725 |
| Astrana Health Inc (b) | | 834 | 26,296 |
| Brookdale Senior Living Inc (b) | | 3,822 | 19,225 |
| Cardinal Health Inc | | 4,988 | 589,931 |
| Castle Biosciences Inc (b) | | 569 | 15,164 |
| Cencora Inc | | 3,564 | 800,760 |
| Centene Corp (b) | | 10,770 | 652,447 |
| Chemed Corp | | 309 | 163,708 |
| Cigna Group/The | | 5,720 | 1,579,521 |
| Clover Health Investments Corp Class A (b) | | 8,010 | 25,232 |
| Community Health Systems Inc (b) | | 2,288 | 6,840 |
| Concentra Group Holdings Parent Inc | | 1,670 | 33,033 |
| CorVel Corp (b) | | 567 | 63,084 |
| Cross Country Healthcare Inc (b)(c) | | 605 | 10,987 |
| CVS Health Corp | | 25,749 | 1,155,873 |
| DaVita Inc (b) | | 947 | 141,624 |
| DocGo Inc Class A (b) | | 1,936 | 8,209 |
| Elevance Health Inc | | 4,745 | 1,750,431 |
| Encompass Health Corp | | 2,060 | 190,241 |
| Enhabit Inc (b) | | 1,033 | 8,068 |
| Ensign Group Inc/The | | 1,163 | 154,516 |
| Fulgent Genetics Inc (b) | | 397 | 7,333 |
| Guardant Health Inc (b) | | 2,490 | 76,070 |
| HCA Healthcare Inc | | 3,801 | 1,140,870 |
| HealthEquity Inc (b) | | 1,784 | 171,175 |
| Henry Schein Inc (b) | | 2,601 | 179,989 |
| Hims & Hers Health Inc Class A (b)(c) | | 3,924 | 94,882 |
| Humana Inc | | 2,465 | 625,395 |
| Labcorp Holdings Inc | | 1,719 | 394,201 |
| LifeStance Health Group Inc (b) | | 2,575 | 18,978 |
| McKesson Corp | | 2,652 | 1,511,401 |
| Modivcare Inc (b)(c) | | 237 | 2,805 |
| Molina Healthcare Inc (b) | | 1,201 | 349,551 |
| National HealthCare Corp | | 244 | 26,245 |
| National Research Corp Class A | | 270 | 4,762 |
| NeoGenomics Inc (b) | | 2,585 | 42,601 |
| OPKO Health Inc (b)(c) | | 6,879 | 10,112 |
| Option Care Health Inc (b) | | 3,535 | 82,012 |
| Owens & Minor Inc (b) | | 1,520 | 19,866 |
| Patterson Cos Inc | | 1,598 | 49,314 |
| Pediatrix Medical Group Inc (b) | | 1,683 | 22,081 |
| Pennant Group Inc/The (b) | | 594 | 15,753 |
| Premier Inc Class A | | 2,135 | 45,262 |
| Privia Health Group Inc (b) | | 2,171 | 42,443 |
| Progyny Inc (b) | | 1,622 | 27,980 |
| Quest Diagnostics Inc | | 2,278 | 343,659 |
| RadNet Inc (b) | | 1,316 | 91,909 |
| Select Medical Holdings Corp | | 2,147 | 40,471 |
| Surgery Partners Inc (b) | | 1,530 | 32,390 |
| Talkspace Inc Class A (b) | | 2,987 | 9,230 |
| Tenet Healthcare Corp (b) | | 1,963 | 247,789 |
| UnitedHealth Group Inc | | 18,888 | 9,554,684 |
| Universal Health Services Inc Class B | | 1,219 | 218,713 |
| US Physical Therapy Inc | | 309 | 27,411 |
| | | | 23,179,728 |
| Health Care Technology - 0.1% | | | |
| American Well Corp (b) | | 209 | 1,514 |
| Certara Inc (b) | | 2,261 | 24,080 |
| Definitive Healthcare Corp Class A (b) | | 1,083 | 4,451 |
| Doximity Inc Class A (b) | | 2,571 | 137,266 |
| Evolent Health Inc Class A (b) | | 2,100 | 23,625 |
| GoodRx Holdings Inc Class A (b) | | 1,558 | 7,245 |
| Health Catalyst Inc (b) | | 1,186 | 8,385 |
| HealthStream Inc | | 481 | 15,296 |
| Multiplan Corp Class A (b)(c) | | 116 | 1,713 |
| OptimizeRx Corp (b) | | 382 | 1,857 |
| Phreesia Inc (b) | | 1,103 | 27,751 |
| Schrodinger Inc/United States (b)(c) | | 1,079 | 20,814 |
| Simulations Plus Inc | | 347 | 9,678 |
| Teladoc Health Inc (b) | | 3,408 | 30,979 |
| TruBridge Inc (b) | | 263 | 5,186 |
| Veeva Systems Inc Class A (b) | | 3,050 | 641,263 |
| | | | 961,103 |
| Life Sciences Tools & Services - 1.0% | | | |
| 10X Genomics Inc Class A (b) | | 2,153 | 30,917 |
| Adaptive Biotechnologies Corp (b) | | 2,271 | 13,615 |
| Agilent Technologies Inc | | 5,970 | 802,010 |
| Avantor Inc (b) | | 13,919 | 293,273 |
| Azenta Inc (b) | | 995 | 49,750 |
| Bio-Rad Laboratories Inc Class A (b) | | 395 | 129,761 |
| Bio-Techne Corp | | 3,239 | 233,305 |
| BioLife Solutions Inc (b)(c) | | 742 | 19,262 |
| Bruker Corp | | 2,282 | 133,771 |
| Charles River Laboratories International Inc (b) | | 1,059 | 195,491 |
| Codexis Inc (b) | | 1,465 | 6,988 |
| CryoPort Inc (b) | | 974 | 7,578 |
| Cytek Biosciences Inc (b) | | 2,223 | 14,427 |
| Danaher Corp | | 13,143 | 3,016,977 |
| Fortrea Holdings Inc (b) | | 1,799 | 33,551 |
| Illumina Inc (b) | | 3,264 | 436,168 |
| IQVIA Holdings Inc (b) | | 3,545 | 696,628 |
| Lifecore Biomedical Inc (b) | | 679 | 5,045 |
| Maravai LifeSciences Holdings Inc Class A (b) | | 2,341 | 12,758 |
| MaxCyte Inc (United States) (b) | | 2,235 | 9,298 |
| Medpace Holdings Inc (b) | | 521 | 173,092 |
| Mesa Laboratories Inc (c) | | 105 | 13,846 |
| Mettler-Toledo International Inc (b) | | 434 | 531,077 |
| OmniAb Inc (b)(c) | | 1,941 | 6,871 |
| Pacific Biosciences of California Inc (b)(c) | | 5,169 | 9,459 |
| Quanterix Corp (b)(c) | | 767 | 8,153 |
| Repligen Corp (b) | | 1,070 | 154,016 |
| Revvity Inc | | 2,529 | 282,262 |
| Sotera Health Co (b) | | 3,122 | 42,709 |
| Standard BioTools Inc (b) | | 6,291 | 11,009 |
| Thermo Fisher Scientific Inc | | 7,810 | 4,062,997 |
| Waters Corp (b) | | 1,215 | 450,741 |
| West Pharmaceutical Services Inc | | 1,485 | 486,427 |
| | | | 12,373,232 |
| Pharmaceuticals - 2.9% | | | |
| Amneal Intermediate Inc Class A (b) | | 2,916 | 23,095 |
| Amphastar Pharmaceuticals Inc (b) | | 759 | 28,182 |
| Amylyx Pharmaceuticals Inc (b) | | 1,144 | 4,324 |
| ANI Pharmaceuticals Inc (b) | | 327 | 18,077 |
| Arvinas Inc (b) | | 1,256 | 24,078 |
| Assertio Holdings Inc (b) | | 1,677 | 1,460 |
| Atea Pharmaceuticals Inc (b) | | 1,669 | 5,591 |
| Axsome Therapeutics Inc (b) | | 835 | 70,649 |
| Bristol-Myers Squibb Co | | 41,473 | 2,345,713 |
| Cassava Sciences Inc (b)(c) | | 875 | 2,065 |
| Collegium Pharmaceutical Inc (b) | | 624 | 17,878 |
| Corcept Therapeutics Inc (b) | | 1,914 | 96,446 |
| CorMedix Inc (b)(c) | | 1,152 | 9,331 |
| Edgewise Therapeutics Inc (b) | | 1,195 | 31,907 |
| Elanco Animal Health Inc (b) | | 10,176 | 123,231 |
| Eli Lilly & Co | | 16,135 | 12,456,220 |
| Enliven Therapeutics Inc (b)(c) | | 576 | 12,960 |
| Esperion Therapeutics Inc New (b) | | 3,439 | 7,566 |
| Evolus Inc (b) | | 958 | 10,576 |
| EyePoint Pharmaceuticals Inc (b) | | 1,054 | 7,852 |
| Fulcrum Therapeutics Inc (b) | | 990 | 4,653 |
| Harmony Biosciences Holdings Inc (b) | | 590 | 20,302 |
| Harrow Inc (b) | | 599 | 20,096 |
| Innoviva Inc (b) | | 1,117 | 19,380 |
| Intra-Cellular Therapies Inc (b) | | 2,019 | 168,627 |
| Jazz Pharmaceuticals PLC (b) | | 1,270 | 156,401 |
| Johnson & Johnson | | 49,228 | 7,119,353 |
| Ligand Pharmaceuticals Inc (b) | | 372 | 39,860 |
| Liquidia Corp (b) | | 824 | 9,690 |
| Merck & Co Inc | | 51,849 | 5,157,939 |
| Mind Medicine MindMed Inc (b)(c) | | 1,477 | 10,280 |
| Nuvation Bio Inc Class A (b) | | 3,444 | 9,161 |
| Ocular Therapeutix Inc (b) | | 2,482 | 21,196 |
| Omeros Corp (b) | | 1,200 | 11,856 |
| Organon & Co | | 5,214 | 77,793 |
| Pacira BioSciences Inc (b) | | 934 | 17,597 |
| Perrigo Co PLC | | 2,770 | 71,217 |
| Pfizer Inc | | 115,931 | 3,075,649 |
| Phathom Pharmaceuticals Inc (b) | | 705 | 5,725 |
| Phibro Animal Health Corp Class A | | 438 | 9,198 |
| Pliant Therapeutics Inc (b) | | 1,095 | 14,421 |
| Prestige Consumer Healthcare Inc (b) | | 1,000 | 78,090 |
| Revance Therapeutics Inc (b) | | 1,726 | 5,247 |
| Royalty Pharma PLC Class A | | 7,967 | 203,238 |
| scPharmaceuticals Inc (b) | | 429 | 1,519 |
| SIGA Technologies Inc (c) | | 752 | 4,520 |
| Supernus Pharmaceuticals Inc (b) | | 1,126 | 40,716 |
| Tarsus Pharmaceuticals Inc (b) | | 710 | 39,313 |
| Terns Pharmaceuticals Inc (b) | | 859 | 4,759 |
| Theravance Biopharma Inc (b) | | 767 | 7,217 |
| Ventyx Biosciences Inc (b) | | 1,314 | 2,878 |
| Verrica Pharmaceuticals Inc (b)(c) | | 370 | 258 |
| Viatris Inc | | 24,468 | 304,627 |
| WaVe Life Sciences Ltd (b) | | 2,422 | 29,960 |
| Xeris Biopharma Holdings Inc (b) | | 2,776 | 9,411 |
| Xeris Biopharma Holdings Inc rights (b)(e) | | 400 | 0 |
| Zevra Therapeutics Inc (b)(c) | | 954 | 7,956 |
| Zoetis Inc Class A | | 9,269 | 1,510,198 |
| | | | 33,587,502 |
TOTAL HEALTH CARE | | | 119,080,833 |
| | | | |
| Industrials - 9.1% | | | |
| Aerospace & Defense - 1.7% | | | |
| AAR Corp (b) | | 716 | 43,876 |
| AeroVironment Inc (b) | | 576 | 88,641 |
| AerSale Corp (b) | | 732 | 4,612 |
| Archer Aviation Inc Class A (b)(c) | | 4,444 | 43,329 |
| Astronics Corp (b)(c) | | 612 | 9,768 |
| Axon Enterprise Inc (b) | | 1,468 | 872,462 |
| Boeing Co (b) | | 11,975 | 2,119,575 |
| BWX Technologies Inc | | 1,874 | 208,745 |
| Cadre Holdings Inc | | 513 | 16,570 |
| Curtiss-Wright Corp | | 785 | 278,573 |
| Ducommun Inc (b) | | 261 | 16,615 |
| GE Aerospace | | 22,176 | 3,698,735 |
| General Dynamics Corp | | 5,272 | 1,389,119 |
| HEICO Corp | | 815 | 193,758 |
| HEICO Corp Class A | | 1,527 | 284,144 |
| Hexcel Corp | | 1,697 | 106,402 |
| Howmet Aerospace Inc | | 8,347 | 912,911 |
| Huntington Ingalls Industries Inc | | 806 | 152,310 |
| Kratos Defense & Security Solutions Inc (b) | | 3,123 | 82,385 |
| L3Harris Technologies Inc | | 3,881 | 816,097 |
| Leonardo DRS Inc (b) | | 1,479 | 47,786 |
| Lockheed Martin Corp | | 4,338 | 2,108,008 |
| Mercury Systems Inc (b) | | 1,017 | 42,714 |
| Moog Inc Class A | | 593 | 116,726 |
| National Presto Industries Inc | | 103 | 10,137 |
| Northrop Grumman Corp | | 2,811 | 1,319,174 |
| Rocket Lab USA Inc Class A (b)(c) | | 7,119 | 181,321 |
| RTX Corp | | 27,198 | 3,147,353 |
| Spirit AeroSystems Holdings Inc Class A (b) | | 2,408 | 82,065 |
| Textron Inc | | 3,845 | 294,104 |
| TransDigm Group Inc | | 1,148 | 1,454,837 |
| Triumph Group Inc (b) | | 1,583 | 29,539 |
| V2X Inc (b) | | 243 | 11,623 |
| Virgin Galactic Holdings Inc Class A (b)(c) | | 530 | 3,116 |
| Woodward Inc | | 1,222 | 203,365 |
| | | | 20,390,495 |
| Air Freight & Logistics - 0.3% | | | |
| Air Transport Services Group Inc (b) | | 1,020 | 22,420 |
| CH Robinson Worldwide Inc | | 2,400 | 247,968 |
| Expeditors International of Washington Inc | | 2,884 | 319,461 |
| FedEx Corp | | 4,608 | 1,296,369 |
| Forward Air Corp Class A (c) | | 375 | 12,093 |
| GXO Logistics Inc (b) | | 2,420 | 105,270 |
| Hub Group Inc Class A | | 1,282 | 57,126 |
| United Parcel Service Inc Class B | | 14,983 | 1,889,356 |
| | | | 3,950,063 |
| Building Products - 0.7% | | | |
| A O Smith Corp | | 2,460 | 167,797 |
| AAON Inc | | 1,378 | 162,163 |
| Advanced Drainage Systems Inc | | 1,447 | 167,273 |
| Allegion plc | | 1,777 | 232,218 |
| American Woodmark Corp (b) | | 311 | 24,734 |
| Apogee Enterprises Inc | | 445 | 31,777 |
| Armstrong World Industries Inc | | 895 | 126,490 |
| AZEK Co Inc/The Class A (b) | | 2,974 | 141,176 |
| AZZ Inc | | 601 | 49,234 |
| Builders FirstSource Inc (b) | | 2,386 | 341,031 |
| Carlisle Cos Inc | | 945 | 348,554 |
| Carrier Global Corp | | 17,175 | 1,172,366 |
| CSW Industrials Inc | | 342 | 120,658 |
| Fortune Brands Innovations Inc | | 2,552 | 174,378 |
| Gibraltar Industries Inc (b) | | 623 | 36,695 |
| Griffon Corp | | 821 | 58,513 |
| Hayward Holdings Inc (b) | | 2,884 | 44,096 |
| Insteel Industries Inc | | 398 | 10,749 |
| Janus International Group Inc (b) | | 2,860 | 21,021 |
| JELD-WEN Holding Inc (b) | | 1,686 | 13,808 |
| Johnson Controls International plc | | 13,656 | 1,077,868 |
| Lennox International Inc | | 656 | 399,701 |
| Masco Corp | | 4,466 | 324,098 |
| Masterbrand Inc (b) | | 2,593 | 37,884 |
| Owens Corning | | 1,782 | 303,510 |
| Quanex Building Products Corp | | 931 | 22,567 |
| Resideo Technologies Inc (b) | | 3,036 | 69,980 |
| Simpson Manufacturing Co Inc | | 871 | 144,438 |
| Tecnoglass Inc | | 452 | 35,853 |
| Trane Technologies PLC | | 4,612 | 1,703,442 |
| Trex Co Inc (b) | | 2,230 | 153,937 |
| UFP Industries Inc | | 1,255 | 141,376 |
| Zurn Elkay Water Solutions Corp (c) | | 2,951 | 110,072 |
| | | | 7,969,457 |
| Commercial Services & Supplies - 0.6% | | | |
| ABM Industries Inc | | 1,303 | 66,688 |
| ACCO Brands Corp | | 2,005 | 10,526 |
| ACV Auctions Inc Class A (b) | | 3,170 | 68,472 |
| Aris Water Solutions Inc Class A (c) | | 553 | 13,244 |
| Brady Corp Class A | | 884 | 65,283 |
| BrightView Holdings Inc (b) | | 1,173 | 18,756 |
| Brink's Co/The | | 914 | 84,792 |
| Casella Waste Systems Inc Class A (b) | | 1,268 | 134,167 |
| CECO Environmental Corp (b) | | 589 | 17,805 |
| Cintas Corp | | 7,006 | 1,279,997 |
| Clean Harbors Inc (b) | | 1,040 | 239,346 |
| Copart Inc (b) | | 17,912 | 1,027,970 |
| CoreCivic Inc (b) | | 2,214 | 48,132 |
| Deluxe Corp | | 861 | 19,450 |
| Driven Brands Holdings Inc (b) | | 1,202 | 19,400 |
| Ennis Inc | | 527 | 11,114 |
| Enviri Corp (b) | | 1,627 | 12,528 |
| GEO Group Inc/The (b) | | 2,800 | 78,344 |
| Healthcare Services Group Inc (b) | | 1,522 | 17,678 |
| HNI Corp | | 947 | 47,700 |
| Interface Inc | | 1,151 | 28,027 |
| Liquidity Services Inc (b) | | 476 | 15,370 |
| Matthews International Corp Class A | | 594 | 16,442 |
| MillerKnoll Inc | | 1,411 | 31,874 |
| Montrose Environmental Group Inc (b) | | 655 | 12,150 |
| MSA Safety Inc | | 812 | 134,605 |
| OPENLANE Inc (b) | | 2,194 | 43,529 |
| Pitney Bowes Inc | | 3,217 | 23,291 |
| Republic Services Inc | | 4,163 | 837,512 |
| Rollins Inc | | 5,747 | 266,373 |
| Steelcase Inc Class A | | 1,841 | 21,761 |
| Tetra Tech Inc | | 5,477 | 218,204 |
| UniFirst Corp/MA | | 318 | 54,407 |
| Veralto Corp | | 5,049 | 514,241 |
| Vestis Corp | | 2,337 | 35,616 |
| Viad Corp (b) | | 436 | 18,534 |
| VSE Corp | | 341 | 32,429 |
| Waste Management Inc | | 7,464 | 1,506,162 |
| | | | 7,091,919 |
| Construction & Engineering - 0.3% | | | |
| AECOM | | 2,739 | 292,580 |
| Ameresco Inc Class A (b)(c) | | 633 | 14,863 |
| API Group Corp (b) | | 4,960 | 178,411 |
| Arcosa Inc | | 1,008 | 97,514 |
| Argan Inc | | 255 | 34,945 |
| Bowman Consulting Group Ltd (b) | | 320 | 7,984 |
| Comfort Systems USA Inc | | 727 | 308,292 |
| Construction Partners Inc Class A (b) | | 886 | 78,376 |
| Dycom Industries Inc (b) | | 597 | 103,914 |
| EMCOR Group Inc | | 953 | 432,567 |
| Everus Construction Group Inc | | 1,057 | 69,498 |
| Fluor Corp (b) | | 3,511 | 173,163 |
| Granite Construction Inc | | 884 | 77,536 |
| Great Lakes Dredge & Dock Corp (b) | | 1,319 | 14,892 |
| IES Holdings Inc (b) | | 169 | 33,962 |
| Limbach Holdings Inc (b) | | 205 | 17,536 |
| MasTec Inc (b) | | 1,260 | 171,536 |
| Matrix Service Co (b) | | 440 | 5,266 |
| MYR Group Inc (b) | | 333 | 49,540 |
| Primoris Services Corp | | 1,103 | 84,269 |
| Quanta Services Inc | | 3,012 | 951,943 |
| Sterling Infrastructure Inc (b) | | 633 | 106,629 |
| Tutor Perini Corp (b) | | 887 | 21,465 |
| Valmont Industries Inc | | 414 | 126,961 |
| WillScot Holdings Corp (b) | | 3,874 | 129,585 |
| | | | 3,583,227 |
| Electrical Equipment - 0.9% | | | |
| Acuity Brands Inc | | 631 | 184,334 |
| Allient Inc | | 304 | 7,381 |
| American Superconductor Corp (b)(c) | | 799 | 19,679 |
| AMETEK Inc | | 4,735 | 853,531 |
| Array Technologies Inc (b)(c) | | 2,935 | 17,727 |
| Atkore Inc | | 720 | 60,084 |
| Blink Charging Co (b) | | 1,737 | 2,414 |
| Bloom Energy Corp Class A (b)(c) | | 4,006 | 88,973 |
| ChargePoint Holdings Inc Class A (b)(c) | | 7,717 | 8,257 |
| Eaton Corp PLC | | 8,141 | 2,701,754 |
| Emerson Electric Co | | 11,714 | 1,451,716 |
| Energy Vault Holdings Inc Class A (b)(c) | | 1,669 | 3,805 |
| EnerSys | | 812 | 75,053 |
| Enovix Corp Class B (b)(c) | | 2,946 | 32,023 |
| Eos Energy Enterprises Inc (b)(c) | | 4,258 | 20,694 |
| Fluence Energy Inc Class A (b)(c) | | 1,218 | 19,342 |
| FuelCell Energy Inc (b)(c) | | 276 | 2,495 |
| GE Vernova Inc | | 5,621 | 1,848,916 |
| Generac Holdings Inc (b) | | 1,235 | 191,487 |
| GrafTech International Ltd (b) | | 4,181 | 7,233 |
| Hubbell Inc | | 1,099 | 460,360 |
| LSI Industries Inc | | 543 | 10,545 |
| Net Power Inc Class A (b) | | 724 | 7,667 |
| NEXTracker Inc Class A (b) | | 2,967 | 108,385 |
| NuScale Power Corp Class A (b)(c) | | 1,745 | 31,288 |
| nVent Electric PLC | | 3,410 | 232,426 |
| Plug Power Inc (b)(c) | | 16,689 | 35,548 |
| Powell Industries Inc | | 190 | 42,114 |
| Preformed Line Products Co | | 54 | 6,901 |
| Regal Rexnord Corp | | 1,368 | 212,218 |
| Rockwell Automation Inc | | 2,323 | 663,890 |
| Sensata Technologies Holding PLC | | 3,138 | 85,981 |
| Shoals Technologies Group Inc (b) | | 3,294 | 18,216 |
| Stem Inc Class A (b)(c) | | 2,751 | 1,659 |
| Sunrun Inc (b)(c) | | 4,513 | 41,745 |
| Thermon Group Holdings Inc (b) | | 690 | 19,851 |
| TPI Composites Inc (b)(c) | | 746 | 1,410 |
| Vertiv Holdings Co Class A | | 7,674 | 871,843 |
| Vicor Corp (b) | | 457 | 22,082 |
| | | | 10,471,027 |
| Ground Transportation - 0.9% | | | |
| ArcBest Corp | | 497 | 46,380 |
| Avis Budget Group Inc | | 346 | 27,891 |
| Covenant Logistics Group Inc Class A | | 156 | 8,504 |
| CSX Corp | | 39,642 | 1,279,247 |
| Ftai Infrastructure Inc | | 2,075 | 15,065 |
| Heartland Express Inc | | 908 | 10,188 |
| Hertz Global Holdings Inc (b)(c) | | 2,538 | 9,289 |
| JB Hunt Transport Services Inc | | 1,650 | 281,589 |
| Knight-Swift Transportation Holdings Inc | | 3,324 | 176,305 |
| Landstar System Inc | | 731 | 125,630 |
| Lyft Inc Class A (b) | | 7,420 | 95,718 |
| Marten Transport Ltd | | 1,127 | 17,592 |
| Norfolk Southern Corp | | 4,624 | 1,085,253 |
| Old Dominion Freight Line Inc | | 3,859 | 680,728 |
| Proficient Auto Logistics Inc | | 310 | 2,501 |
| RXO Inc (b)(c) | | 2,844 | 67,801 |
| Ryder System Inc | | 887 | 139,135 |
| Saia Inc (b)(c) | | 544 | 247,917 |
| Schneider National Inc Class B | | 1,012 | 29,631 |
| U-Haul Holding Co (b)(c) | | 250 | 17,273 |
| U-Haul Holding Co Class N | | 2,003 | 128,292 |
| Uber Technologies Inc (b) | | 42,973 | 2,592,131 |
| Union Pacific Corp | | 12,453 | 2,839,782 |
| Werner Enterprises Inc (c) | | 1,251 | 44,936 |
| XPO Inc (b) | | 2,382 | 312,399 |
| | | | 10,281,177 |
| Industrial Conglomerates - 0.4% | | | |
| 3M Co | | 11,237 | 1,450,584 |
| Honeywell International Inc | | 13,318 | 3,008,403 |
| | | | 4,458,987 |
| Machinery - 1.8% | | | |
| 3D Systems Corp (b)(c) | | 2,837 | 9,305 |
| AGCO Corp | | 1,275 | 119,187 |
| Alamo Group Inc | | 208 | 38,669 |
| Albany International Corp Class A | | 631 | 50,461 |
| Allison Transmission Holdings Inc | | 1,780 | 192,347 |
| Astec Industries Inc | | 470 | 15,792 |
| Atmus Filtration Technologies Inc | | 1,734 | 67,938 |
| Barnes Group Inc | | 928 | 43,857 |
| Blue Bird Corp (b) | | 636 | 24,569 |
| Caterpillar Inc | | 9,916 | 3,597,128 |
| Chart Industries Inc (b) | | 862 | 164,504 |
| CNH Industrial NV Class A | | 17,951 | 203,385 |
| Columbus McKinnon Corp/NY | | 596 | 22,195 |
| Crane Co | | 999 | 151,598 |
| Cummins Inc | | 2,801 | 976,429 |
| Deere & Co | | 5,242 | 2,221,035 |
| Desktop Metal Inc (b)(c) | | 547 | 1,279 |
| Donaldson Co Inc | | 2,463 | 165,883 |
| Douglas Dynamics Inc | | 461 | 10,893 |
| Dover Corp | | 2,805 | 526,218 |
| Energy Recovery Inc (b) | | 1,119 | 16,449 |
| Enerpac Tool Group Corp Class A | | 1,136 | 46,678 |
| Enpro Inc | | 436 | 75,188 |
| Esab Corp | | 1,167 | 139,970 |
| ESCO Technologies Inc | | 523 | 69,669 |
| Federal Signal Corp | | 1,259 | 116,319 |
| Flowserve Corp | | 2,696 | 155,074 |
| Fortive Corp | | 7,157 | 536,775 |
| Franklin Electric Co Inc | | 814 | 79,324 |
| Gates Industrial Corp PLC (b) | | 4,638 | 95,404 |
| Gorman-Rupp Co/The | | 411 | 15,585 |
| Graco Inc | | 3,455 | 291,222 |
| Graham Corp (b) | | 218 | 9,694 |
| Greenbrier Cos Inc/The (c) | | 628 | 38,302 |
| Helios Technologies Inc | | 667 | 29,775 |
| Hillenbrand Inc | | 1,427 | 43,923 |
| Hillman Solutions Corp Class A (b) | | 4,004 | 38,999 |
| Hyliion Holdings Corp Class A (b)(c) | | 2,513 | 6,559 |
| Hyster-Yale Inc Class A | | 215 | 10,950 |
| IDEX Corp | | 1,550 | 324,400 |
| Illinois Tool Works Inc | | 5,512 | 1,397,623 |
| Ingersoll Rand Inc | | 8,248 | 746,114 |
| ITT Inc | | 1,674 | 239,181 |
| John Bean Technologies Corp (c) | | 658 | 83,632 |
| Kadant Inc | | 238 | 82,108 |
| Kennametal Inc | | 1,639 | 39,369 |
| Lincoln Electric Holdings Inc | | 1,166 | 218,590 |
| Lindsay Corp | | 215 | 25,437 |
| Manitowoc Co Inc/The (b) | | 699 | 6,382 |
| Middleby Corp/The (b) | | 1,105 | 149,672 |
| Miller Industries Inc/TN | | 233 | 15,229 |
| Mueller Industries Inc | | 2,319 | 184,036 |
| Mueller Water Products Inc Class A1 | | 3,233 | 72,743 |
| Nikola Corp (b)(c) | | 808 | 961 |
| Nordson Corp | | 1,115 | 233,303 |
| Oshkosh Corp | | 1,341 | 127,489 |
| Otis Worldwide Corp | | 8,187 | 758,198 |
| PACCAR Inc | | 10,724 | 1,115,510 |
| Parker-Hannifin Corp | | 2,627 | 1,670,851 |
| Pentair PLC | | 3,374 | 339,559 |
| Proto Labs Inc (b) | | 520 | 20,327 |
| RBC Bearings Inc (b) | | 595 | 177,988 |
| REV Group Inc | | 1,064 | 33,910 |
| Shyft Group Inc/The | | 663 | 7,784 |
| Snap-on Inc | | 1,076 | 365,280 |
| SPX Technologies Inc (b) | | 949 | 138,098 |
| Standex International Corp | | 237 | 44,317 |
| Stanley Black & Decker Inc | | 3,155 | 253,315 |
| Symbotic Inc Class A (b)(c) | | 755 | 17,901 |
| Tennant CO | | 378 | 30,818 |
| Terex Corp | | 1,396 | 64,523 |
| Timken Co/The | | 1,319 | 94,137 |
| Titan International Inc (b) | | 1,001 | 6,797 |
| Toro Co/The | | 2,135 | 171,014 |
| Trinity Industries Inc | | 1,676 | 58,828 |
| Wabash National Corp | | 905 | 15,503 |
| Watts Water Technologies Inc Class A | | 565 | 114,865 |
| Westinghouse Air Brake Technologies Corp | | 3,569 | 676,647 |
| Xylem Inc/NY | | 4,967 | 576,271 |
| | | | 21,117,241 |
| Marine Transportation - 0.0% | | | |
| Genco Shipping & Trading Ltd | | 896 | 12,490 |
| Kirby Corp (b) | | 1,188 | 125,690 |
| Matson Inc | | 679 | 91,556 |
| Pangaea Logistics Solutions Ltd | | 641 | 3,436 |
| | | | 233,172 |
| Passenger Airlines - 0.1% | | | |
| Alaska Air Group Inc (b) | | 2,584 | 167,314 |
| Allegiant Travel Co | | 284 | 26,730 |
| American Airlines Group Inc (b)(c) | | 13,457 | 234,556 |
| Blade Air Mobility Inc (b) | | 1,385 | 5,886 |
| Delta Air Lines Inc | | 13,120 | 793,760 |
| Frontier Group Holdings Inc (b)(c) | | 1,593 | 11,326 |
| JetBlue Airways Corp (b) | | 6,069 | 47,702 |
| Joby Aviation Inc Class A (b)(c) | | 9,084 | 73,853 |
| SkyWest Inc (b) | | 826 | 82,707 |
| Southwest Airlines Co | | 12,266 | 412,383 |
| Sun Country Airlines Holdings Inc (b) | | 814 | 11,868 |
| United Airlines Holdings Inc (b) | | 6,726 | 653,095 |
| | | | 2,521,180 |
| Professional Services - 0.9% | | | |
| Alight Inc Class A | | 9,471 | 65,539 |
| Amentum Holdings Inc | | 2,537 | 53,353 |
| Asure Software Inc (b)(c) | | 438 | 4,122 |
| Automatic Data Processing Inc | | 8,325 | 2,436,977 |
| Barrett Business Services Inc | | 532 | 23,110 |
| Booz Allen Hamilton Holding Corp Class A | | 2,645 | 340,412 |
| Broadridge Financial Solutions Inc | | 2,384 | 538,999 |
| CACI International Inc (b) | | 458 | 185,059 |
| Cbiz Inc (b) | | 1,029 | 84,203 |
| Clarivate PLC (b)(c) | | 9,251 | 46,995 |
| Concentrix Corp | | 991 | 42,881 |
| Conduent Inc (b) | | 2,910 | 11,756 |
| CRA International Inc | | 133 | 24,898 |
| CSG Systems International Inc | | 566 | 28,928 |
| Dayforce Inc (b)(c) | | 3,240 | 235,354 |
| Dun & Bradstreet Holdings Inc | | 6,392 | 79,644 |
| Equifax Inc | | 2,534 | 645,790 |
| ExlService Holdings Inc (b) | | 3,313 | 147,031 |
| Exponent Inc | | 1,026 | 91,417 |
| First Advantage Corp (b) | | 991 | 18,561 |
| FiscalNote Holdings Inc Class A (b)(c) | | 1,132 | 1,211 |
| Forrester Research Inc (b) | | 206 | 3,228 |
| Franklin Covey Co (b) | | 234 | 8,794 |
| FTI Consulting Inc (b) | | 725 | 138,569 |
| Genpact Ltd | | 3,358 | 144,226 |
| Heidrick & Struggles International Inc | | 399 | 17,680 |
| Huron Consulting Group Inc (b) | | 333 | 41,379 |
| ICF International Inc (c) | | 379 | 45,181 |
| Innodata Inc (b)(c) | | 533 | 21,064 |
| Insperity Inc | | 720 | 55,807 |
| Jacobs Solutions Inc | | 2,565 | 342,735 |
| KBR Inc | | 2,734 | 158,381 |
| Kelly Services Inc Class A | | 665 | 9,270 |
| Kforce Inc | | 352 | 19,958 |
| Korn Ferry | | 1,093 | 73,723 |
| Legalzoom.com Inc (b) | | 2,232 | 16,762 |
| Leidos Holdings Inc | | 2,757 | 397,173 |
| ManpowerGroup Inc | | 960 | 55,411 |
| Maximus Inc | | 1,220 | 91,073 |
| NV5 Global Inc (b) | | 1,075 | 20,253 |
| Parsons Corp (b) | | 946 | 87,269 |
| Paychex Inc | | 6,548 | 918,161 |
| Paycom Software Inc | | 997 | 204,355 |
| Paycor HCM Inc (b) | | 1,707 | 31,699 |
| Paylocity Holding Corp (b) | | 890 | 177,528 |
| Planet Labs PBC Class A (b)(c) | | 4,078 | 16,475 |
| Rcm Technologies Inc (b) | | 122 | 2,704 |
| Resources Connection Inc (c) | | 678 | 5,783 |
| Robert Half Inc | | 2,105 | 148,318 |
| Science Applications International Corp | | 1,053 | 117,704 |
| Spire Global Inc Class A (b)(c) | | 488 | 6,866 |
| SS&C Technologies Holdings Inc | | 4,367 | 330,931 |
| TransUnion | | 3,983 | 369,264 |
| TriNet Group Inc | | 627 | 56,913 |
| TrueBlue Inc (b) | | 552 | 4,637 |
| TTEC Holdings Inc (c) | | 318 | 1,587 |
| Upwork Inc (b) | | 2,479 | 40,532 |
| Verisk Analytics Inc | | 2,911 | 801,777 |
| Verra Mobility Corp Class A (b) | | 3,406 | 82,357 |
| | | | 10,171,767 |
| Trading Companies & Distributors - 0.5% | | | |
| Air Lease Corp Class A | | 2,138 | 103,073 |
| Alta Equipment Group Inc Class A (c) | | 399 | 2,608 |
| Applied Industrial Technologies Inc | | 785 | 187,984 |
| Beacon Roofing Supply Inc (b) | | 1,272 | 129,210 |
| BlueLinx Holdings Inc (b) | | 173 | 17,674 |
| Boise Cascade Co | | 806 | 95,801 |
| Core & Main Inc Class A (b) | | 3,952 | 201,196 |
| Custom Truck One Source Inc Class A (b) | | 1,033 | 4,969 |
| Distribution Solutions Group Inc (b) | | 199 | 6,846 |
| DNOW Inc (b) | | 2,134 | 27,763 |
| DXP Enterprises Inc/TX (b) | | 248 | 20,490 |
| Fastenal Co | | 11,704 | 841,635 |
| Ferguson Enterprises Inc | | 4,119 | 714,935 |
| FTAI Aviation Ltd | | 2,092 | 301,332 |
| GATX Corp | | 733 | 113,586 |
| Global Industrial Co | | 263 | 6,520 |
| GMS Inc (b) | | 823 | 69,815 |
| H&E Equipment Services Inc | | 670 | 32,803 |
| Herc Holdings Inc | | 582 | 110,190 |
| Hudson Technologies Inc (b) | | 705 | 3,934 |
| Karat Packaging Inc | | 157 | 4,751 |
| McGrath RentCorp | | 500 | 55,910 |
| Mrc Global Inc (b) | | 1,706 | 21,803 |
| MSC Industrial Direct Co Inc Class A | | 903 | 67,445 |
| Rush Enterprises Inc Class A | | 1,251 | 68,542 |
| SiteOne Landscape Supply Inc (b) | | 936 | 123,337 |
| Titan Machinery Inc (b)(c) | | 451 | 6,373 |
| Transcat Inc (b) | | 184 | 19,456 |
| United Rentals Inc | | 1,362 | 959,447 |
| Watsco Inc | | 713 | 337,884 |
| Wesco International Inc | | 918 | 166,121 |
| WW Grainger Inc | | 908 | 957,077 |
| Xometry Inc Class A (b) | | 891 | 38,010 |
| | | | 5,818,520 |
TOTAL INDUSTRIALS | | | 108,058,232 |
| | | | |
| Information Technology - 29.6% | | | |
| Communications Equipment - 0.8% | | | |
| ADTRAN Holdings Inc (b) | | 1,517 | 12,637 |
| Applied Optoelectronics Inc (b)(c) | | 809 | 29,820 |
| Arista Networks Inc | | 21,079 | 2,329,862 |
| Aviat Networks Inc (b) | | 252 | 4,564 |
| Calix Inc (b) | | 1,237 | 43,134 |
| Ciena Corp (b) | | 2,945 | 249,765 |
| Cisco Systems Inc | | 82,365 | 4,876,008 |
| Clearfield Inc (b)(c) | | 257 | 7,967 |
| CommScope Holding Co Inc (b) | | 4,303 | 22,419 |
| Comtech Telecommunications Corp (b) | | 444 | 1,780 |
| Digi International Inc (b) | | 719 | 21,735 |
| Extreme Networks Inc (b) | | 2,628 | 43,993 |
| F5 Inc (b) | | 1,193 | 300,004 |
| Harmonic Inc (b) | | 2,384 | 31,540 |
| Infinera Corp (b)(c) | | 4,176 | 27,436 |
| Juniper Networks Inc | | 6,716 | 251,514 |
| Lumentum Holdings Inc (b) | | 1,395 | 117,110 |
| Motorola Solutions Inc | | 3,410 | 1,576,204 |
| Netgear Inc (b) | | 554 | 15,440 |
| NetScout Systems Inc (b) | | 1,456 | 31,537 |
| Viasat Inc (b)(c) | | 1,656 | 14,093 |
| Viavi Solutions Inc (b) | | 4,479 | 45,238 |
| | | | 10,053,800 |
| Electronic Equipment, Instruments & Components - 0.6% | | | |
| Advanced Energy Industries Inc | | 783 | 90,538 |
| Amphenol Corp Class A | | 24,629 | 1,710,485 |
| Arlo Technologies Inc (b) | | 1,991 | 22,279 |
| Arrow Electronics Inc (b) | | 1,090 | 123,301 |
| Avnet Inc (c) | | 1,820 | 95,222 |
| Badger Meter Inc | | 606 | 128,545 |
| Bel Fuse Inc Class B | | 206 | 16,989 |
| Belden Inc | | 840 | 94,592 |
| Benchmark Electronics Inc | | 741 | 33,641 |
| CDW Corp/DE | | 2,735 | 475,999 |
| Cognex Corp | | 3,529 | 126,550 |
| Coherent Corp (b) | | 3,139 | 297,357 |
| Corning Inc | | 15,752 | 748,535 |
| Crane NXT Co | | 991 | 57,696 |
| CTS Corp | | 616 | 32,482 |
| Daktronics Inc (b) | | 750 | 12,645 |
| ePlus Inc (b) | | 534 | 39,452 |
| Evolv Technologies Holdings Inc Class A (b)(c) | | 2,149 | 8,489 |
| FARO Technologies Inc (b) | | 416 | 10,550 |
| Insight Enterprises Inc (b) | | 567 | 86,241 |
| IPG Photonics Corp (b) | | 556 | 40,432 |
| Itron Inc (b) | | 910 | 98,808 |
| Jabil Inc | | 2,321 | 333,992 |
| Keysight Technologies Inc (b) | | 3,573 | 573,931 |
| Kimball Electronics Inc (b) | | 533 | 9,983 |
| Knowles Corp (b)(c) | | 1,799 | 35,854 |
| Lightwave Logic Inc (b)(c) | | 2,331 | 4,895 |
| Littelfuse Inc | | 516 | 121,595 |
| Luna Innovations Inc (b) | | 515 | 1,112 |
| Methode Electronics Inc | | 650 | 7,664 |
| MicroVision Inc (b)(c) | | 4,036 | 5,287 |
| Mirion Technologies Inc Class A (b) | | 3,768 | 65,752 |
| Napco Security Technologies Inc | | 726 | 25,817 |
| nLight Inc (b) | | 1,017 | 10,668 |
| Novanta Inc (b) | | 741 | 113,203 |
| OSI Systems Inc (b) | | 319 | 53,410 |
| Ouster Inc Class A (b) | | 901 | 11,010 |
| PAR Technology Corp (b)(c) | | 732 | 53,194 |
| PC Connection Inc | | 245 | 16,971 |
| Plexus Corp (b) | | 551 | 86,220 |
| Richardson Electronics Ltd/United States | | 287 | 4,027 |
| Rogers Corp (b) | | 343 | 34,852 |
| Sanmina Corp (b) | | 1,108 | 83,842 |
| ScanSource Inc (b) | | 450 | 21,353 |
| SmartRent Inc Class A (b) | | 3,689 | 6,456 |
| TD SYNNEX Corp | | 1,567 | 183,778 |
| Teledyne Technologies Inc (b) | | 957 | 444,172 |
| Trimble Inc (b) | | 4,998 | 353,159 |
| TTM Technologies Inc (b) | | 2,075 | 51,356 |
| Vishay Intertechnology Inc | | 2,387 | 40,436 |
| Vishay Precision Group Inc (b) | | 248 | 5,821 |
| Vontier Corp | | 3,166 | 115,464 |
| Zebra Technologies Corp Class A (b) | | 1,055 | 407,462 |
| | | | 7,633,564 |
| IT Services - 0.9% | | | |
| Akamai Technologies Inc (b) | | 3,104 | 296,898 |
| Amdocs Ltd | | 2,375 | 202,208 |
| Applied Digital Corp (b)(c) | | 2,044 | 15,616 |
| ASGN Inc (b) | | 929 | 77,423 |
| BigCommerce Holdings Inc (b) | | 1,373 | 8,402 |
| Cloudflare Inc Class A (b) | | 6,217 | 669,447 |
| Cognizant Technology Solutions Corp Class A | | 10,142 | 779,920 |
| Couchbase Inc (b) | | 792 | 12,347 |
| DigitalOcean Holdings Inc (b) | | 1,281 | 43,644 |
| DXC Technology Co (b) | | 3,748 | 74,885 |
| EPAM Systems Inc (b) | | 1,166 | 272,634 |
| Fastly Inc Class A (b) | | 2,608 | 24,620 |
| Gartner Inc (b) | | 1,574 | 762,556 |
| GoDaddy Inc Class A (b) | | 2,881 | 568,623 |
| Grid Dynamics Holdings Inc (b) | | 1,156 | 25,709 |
| Hackett Group Inc/The | | 525 | 16,128 |
| IBM Corporation | | 18,839 | 4,141,377 |
| Kyndryl Holdings Inc (b) | | 4,742 | 164,073 |
| MongoDB Inc Class A (b) | | 1,502 | 349,681 |
| Okta Inc Class A (b) | | 3,298 | 259,882 |
| Rackspace Technology Inc (b) | | 1,635 | 3,612 |
| Snowflake Inc Class A (b) | | 6,850 | 1,057,709 |
| Twilio Inc Class A (b) | | 3,287 | 355,259 |
| Unisys Corp (b) | | 1,472 | 9,318 |
| VeriSign Inc (b) | | 1,720 | 355,971 |
| | | | 10,547,942 |
| Semiconductors & Semiconductor Equipment - 10.2% | | | |
| ACM Research Inc Class A (b)(c) | | 1,012 | 15,281 |
| Advanced Micro Devices Inc (b) | | 33,104 | 3,998,632 |
| Aehr Test Systems (b)(c) | | 527 | 8,764 |
| Alpha & Omega Semiconductor Ltd (b) | | 489 | 18,108 |
| Ambarella Inc (b) | | 770 | 56,010 |
| Amkor Technology Inc | | 2,284 | 58,676 |
| Analog Devices Inc | | 10,145 | 2,155,407 |
| Applied Materials Inc | | 16,935 | 2,754,139 |
| Atomera Inc (b)(c) | | 477 | 5,533 |
| Axcelis Technologies Inc (b)(c) | | 653 | 45,625 |
| AXT Inc (b) | | 738 | 1,601 |
| Broadcom Inc | | 95,211 | 22,073,719 |
| CEVA Inc (b) | | 473 | 14,923 |
| Cirrus Logic Inc (b) | | 1,101 | 109,638 |
| Cohu Inc (b) | | 1,015 | 27,101 |
| Credo Technology Group Holding Ltd (b) | | 2,909 | 195,514 |
| Diodes Inc (b) | | 969 | 59,758 |
| Enphase Energy Inc (b) | | 2,774 | 190,518 |
| Entegris Inc | | 3,094 | 306,492 |
| First Solar Inc (b) | | 2,191 | 386,142 |
| FormFactor Inc (b) | | 1,604 | 70,576 |
| Ichor Holdings Ltd (b) | | 690 | 22,232 |
| Impinj Inc (b) | | 472 | 68,563 |
| Intel Corp | | 87,288 | 1,750,124 |
| inTEST Corp (b) | | 209 | 1,795 |
| KLA Corp | | 2,749 | 1,732,200 |
| Kopin Corp (b) | | 1,913 | 2,602 |
| Lam Research Corp | | 26,673 | 1,926,591 |
| Lattice Semiconductor Corp (b) | | 2,825 | 160,036 |
| MACOM Technology Solutions Holdings Inc (b) | | 1,184 | 153,813 |
| Marvell Technology Inc | | 17,706 | 1,955,628 |
| MaxLinear Inc Class A (b) | | 1,547 | 30,600 |
| Microchip Technology Inc | | 10,979 | 629,646 |
| Micron Technology Inc | | 22,683 | 1,909,001 |
| MKS Instruments Inc | | 1,383 | 144,371 |
| Monolithic Power Systems Inc | | 998 | 590,517 |
| Navitas Semiconductor Corp Class A (b)(c) | | 2,751 | 9,821 |
| NVE Corp | | 88 | 7,166 |
| NVIDIA Corp | | 503,165 | 67,570,029 |
| ON Semiconductor Corp (b) | | 8,765 | 552,633 |
| Onto Innovation Inc (b) | | 1,012 | 168,670 |
| PDF Solutions Inc (b) | | 645 | 17,467 |
| Penguin Solutions Inc (b) | | 1,071 | 20,552 |
| Photronics Inc (b) | | 1,280 | 30,157 |
| Power Integrations Inc | | 1,149 | 70,893 |
| Qorvo Inc (b) | | 1,945 | 136,014 |
| QUALCOMM Inc | | 22,784 | 3,500,078 |
| Rambus Inc (b) | | 2,218 | 117,243 |
| Rigetti Computing Inc Class A (b)(c) | | 3,593 | 54,829 |
| Semtech Corp (b) | | 1,539 | 95,187 |
| Silicon Laboratories Inc (b) | | 667 | 82,855 |
| SiTime Corp (b) | | 387 | 83,023 |
| SkyWater Technology Inc (b) | | 374 | 5,161 |
| Skyworks Solutions Inc | | 3,267 | 289,718 |
| SolarEdge Technologies Inc (b)(c) | | 1,137 | 15,463 |
| Synaptics Inc (b) | | 792 | 60,445 |
| Teradyne Inc | | 3,340 | 420,573 |
| Texas Instruments Inc | | 18,671 | 3,500,999 |
| Ultra Clean Holdings Inc (b) | | 896 | 32,211 |
| Universal Display Corp | | 907 | 132,603 |
| Veeco Instruments Inc (b) | | 1,148 | 30,766 |
| Wolfspeed Inc (b)(c) | | 2,481 | 16,523 |
| | | | 120,650,955 |
| Software - 10.2% | | | |
| 8x8 Inc (b) | | 2,299 | 6,138 |
| A10 Networks Inc | | 1,454 | 26,754 |
| ACI Worldwide Inc (b) | | 2,158 | 112,022 |
| Adeia Inc | | 2,221 | 31,050 |
| Adobe Inc (b) | | 9,070 | 4,033,248 |
| Agilysys Inc (b) | | 449 | 59,138 |
| Alarm.com Holdings Inc (b) | | 1,000 | 60,800 |
| Alkami Technology Inc (b) | | 1,164 | 42,696 |
| Altair Engineering Inc Class A (b)(c) | | 1,219 | 133,005 |
| Amplitude Inc Class A (b) | | 1,649 | 17,397 |
| ANSYS Inc (b) | | 1,790 | 603,821 |
| Appfolio Inc Class A (b) | | 474 | 116,945 |
| Appian Corp Class A (b) | | 817 | 26,945 |
| AppLovin Corp Class A (b) | | 4,375 | 1,416,756 |
| Asana Inc Class A (b) | | 1,682 | 34,094 |
| Aspen Technology Inc (b) | | 545 | 136,048 |
| Atlassian Corp Class A (b) | | 3,260 | 793,419 |
| Aurora Innovation Inc Class A (b)(c) | | 20,260 | 127,638 |
| Autodesk Inc (b) | | 4,406 | 1,302,281 |
| AvePoint Inc Class A (b) | | 2,166 | 35,761 |
| Bentley Systems Inc Class B | | 3,170 | 148,039 |
| BILL Holdings Inc (b) | | 2,000 | 169,420 |
| Blackbaud Inc (b) | | 835 | 61,723 |
| BlackLine Inc (b) | | 1,046 | 63,555 |
| Blend Labs Inc Class A (b) | | 3,778 | 15,905 |
| Box Inc Class A (b) | | 3,000 | 94,800 |
| Braze Inc Class A (b) | | 1,222 | 51,177 |
| C3.ai Inc Class A (b)(c) | | 2,275 | 78,328 |
| Cadence Design Systems Inc (b) | | 5,602 | 1,683,177 |
| Ccc Intelligent Solutions Holdings Inc Class A (b) | | 8,460 | 99,236 |
| Cerence Inc (b) | | 757 | 5,942 |
| Cipher Mining Inc (b) | | 4,135 | 19,186 |
| Cleanspark Inc (b)(c) | | 4,970 | 45,774 |
| Clear Secure Inc Class A | | 1,865 | 49,684 |
| Clearwater Analytics Holdings Inc Class A (b) | | 3,248 | 89,385 |
| Commvault Systems Inc (b) | | 896 | 135,215 |
| Confluent Inc Class A (b) | | 5,132 | 143,491 |
| Consensus Cloud Solutions Inc (b) | | 378 | 9,019 |
| Crowdstrike Holdings Inc Class A (b) | | 4,723 | 1,616,022 |
| CS Disco Inc (b) | | 470 | 2,344 |
| Daily Journal Corp (b) | | 18 | 10,224 |
| Datadog Inc Class A (b) | | 6,366 | 909,638 |
| Digimarc Corp (b)(c) | | 286 | 10,711 |
| Digital Turbine Inc (b) | | 1,716 | 2,899 |
| DocuSign Inc (b) | | 4,190 | 376,849 |
| Dolby Laboratories Inc Class A | | 1,226 | 95,751 |
| Domo Inc Class B (b) | | 725 | 5,133 |
| DoubleVerify Holdings Inc (b) | | 2,870 | 55,133 |
| Dropbox Inc Class A (b) | | 4,884 | 146,715 |
| Dynatrace Inc (b) | | 6,098 | 331,426 |
| E2open Parent Holdings Inc Class A (b) | | 4,121 | 10,962 |
| Elastic NV (b) | | 1,751 | 173,489 |
| Enfusion Inc Class A (b) | | 926 | 9,538 |
| Fair Isaac Corp (b) | | 501 | 997,456 |
| Five9 Inc (b) | | 1,548 | 62,911 |
| Fortinet Inc (b) | | 12,986 | 1,226,917 |
| Freshworks Inc Class A (b) | | 3,764 | 60,864 |
| Gen Digital Inc | | 11,086 | 303,535 |
| Gitlab Inc Class A (b) | | 2,368 | 133,437 |
| Guidewire Software Inc (b) | | 1,690 | 284,900 |
| HashiCorp Inc Class A (b) | | 3,140 | 107,419 |
| HubSpot Inc (b) | | 1,051 | 732,305 |
| Informatica Inc Class A (b) | | 1,375 | 35,654 |
| Intapp Inc (b) | | 991 | 63,513 |
| InterDigital Inc (c) | | 511 | 98,991 |
| Intuit Inc | | 5,718 | 3,593,763 |
| Jamf Holding Corp (b) | | 1,232 | 17,310 |
| Klaviyo Inc Class A (b) | | 1,465 | 60,417 |
| LiveRamp Holdings Inc (b) | | 1,349 | 40,969 |
| Logility Supply Chain Solutions Inc Class A | | 612 | 6,781 |
| Manhattan Associates Inc (b) | | 1,254 | 338,881 |
| MARA Holdings Inc (b)(c) | | 6,061 | 101,643 |
| Matterport Inc Class A (b) | | 6,108 | 28,952 |
| Meridianlink Inc (b) | | 520 | 10,738 |
| Microsoft Corp | | 152,030 | 64,080,645 |
| MicroStrategy Inc Class A (b)(c) | | 3,573 | 1,034,812 |
| Mitek Systems Inc (b) | | 955 | 10,629 |
| N-able Inc/US (b) | | 1,451 | 13,552 |
| nCino Inc (b) | | 1,914 | 64,272 |
| NCR Voyix Corp (b) | | 2,953 | 40,870 |
| NextNav Inc Class A (b)(c) | | 1,273 | 19,808 |
| Nutanix Inc Class A (b) | | 5,016 | 306,879 |
| Olo Inc Class A (b) | | 2,248 | 17,265 |
| ON24 Inc (b) | | 728 | 4,702 |
| OneSpan Inc | | 701 | 12,997 |
| Oracle Corp | | 32,690 | 5,447,462 |
| PagerDuty Inc (b)(c) | | 1,906 | 34,804 |
| Palantir Technologies Inc Class A (b) | | 41,191 | 3,115,275 |
| Palo Alto Networks Inc (b) | | 13,244 | 2,409,878 |
| Pegasystems Inc | | 915 | 85,278 |
| Porch Group Inc (b) | | 1,959 | 9,638 |
| Procore Technologies Inc (b) | | 2,181 | 163,422 |
| Progress Software Corp | | 895 | 58,309 |
| PROS Holdings Inc (b) | | 845 | 18,556 |
| PTC Inc (b) | | 2,458 | 451,952 |
| Q2 Holdings Inc (b) | | 1,240 | 124,806 |
| Qualys Inc (b) | | 760 | 106,567 |
| Rapid7 Inc (b) | | 1,311 | 52,742 |
| Rekor Systems Inc (b)(c) | | 1,418 | 2,211 |
| RingCentral Inc Class A (b) | | 1,654 | 57,907 |
| Riot Platforms Inc (b)(c) | | 5,523 | 56,390 |
| Roper Technologies Inc | | 2,191 | 1,138,991 |
| Salesforce Inc | | 19,820 | 6,626,421 |
| Samsara Inc Class A (b) | | 4,195 | 183,280 |
| SEMrush Holdings Inc Class A (b) | | 685 | 8,138 |
| SentinelOne Inc Class A (b) | | 5,894 | 130,847 |
| Servicenow Inc (b) | | 4,213 | 4,466,286 |
| Smartsheet Inc Class A (b) | | 2,844 | 159,349 |
| SolarWinds Corp | | 1,130 | 16,103 |
| SoundHound AI Inc Class A (b)(c) | | 6,678 | 132,492 |
| Sprinklr Inc Class A (b) | | 2,349 | 19,849 |
| Sprout Social Inc Class A (b) | | 1,070 | 32,860 |
| SPS Commerce Inc (b) | | 764 | 140,568 |
| Synopsys Inc (b) | | 3,135 | 1,521,604 |
| Telos Corp (b) | | 854 | 2,920 |
| Tenable Holdings Inc (b) | | 2,466 | 97,111 |
| Teradata Corp (b) | | 1,948 | 60,680 |
| Terawulf Inc (b)(c) | | 6,221 | 35,211 |
| Tyler Technologies Inc (b) | | 873 | 503,407 |
| UiPath Inc Class A (b) | | 9,234 | 117,364 |
| Unity Software Inc (b) | | 5,953 | 133,764 |
| Varonis Systems Inc (b) | | 2,304 | 102,367 |
| Verint Systems Inc (b) | | 1,229 | 33,736 |
| Veritone Inc (b)(c) | | 797 | 2,613 |
| Vertex Inc Class A (b) | | 1,040 | 55,484 |
| Weave Communications Inc (b) | | 776 | 12,354 |
| Workday Inc Class A (b) | | 4,345 | 1,121,140 |
| Workiva Inc Class A (b) | | 1,060 | 116,070 |
| Xperi Inc (b) | | 925 | 9,500 |
| Yext Inc (b) | | 2,187 | 13,909 |
| Zeta Global Holdings Corp Class A (b) | | 4,074 | 73,291 |
| Zoom Communications Inc Class A (b) | | 5,396 | 440,368 |
| Zscaler Inc (b) | | 1,920 | 346,387 |
| Zuora Inc Class A (b) | | 2,743 | 27,211 |
| | | | 119,826,505 |
| Technology Hardware, Storage & Peripherals - 6.9% | | | |
| Apple Inc | | 310,978 | 77,875,111 |
| Corsair Gaming Inc (b) | | 810 | 5,354 |
| Dell Technologies Inc Class C | | 5,886 | 678,303 |
| Diebold Nixdorf Inc (b) | | 760 | 32,710 |
| Eastman Kodak Co (b) | | 1,568 | 10,302 |
| Hewlett Packard Enterprise Co | | 26,601 | 567,931 |
| HP Inc | | 20,030 | 653,579 |
| Immersion Corp (c) | | 547 | 4,775 |
| IonQ Inc (b)(c) | | 3,989 | 166,621 |
| NetApp Inc | | 4,208 | 488,465 |
| Pure Storage Inc Class A (b) | | 6,326 | 388,606 |
| Seagate Technology Holdings PLC | | 4,298 | 370,960 |
| Super Micro Computer Inc (b) | | 10,308 | 314,188 |
| Turtle Beach Corp (b) | | 352 | 6,093 |
| Western Digital Corp (b) | | 6,687 | 398,746 |
| Xerox Holdings Corp (c) | | 2,321 | 19,566 |
| | | | 81,981,310 |
TOTAL INFORMATION TECHNOLOGY | | | 350,694,076 |
| | | | |
| Materials - 2.1% | | | |
| Chemicals - 1.3% | | | |
| AdvanSix Inc | | 559 | 15,926 |
| Air Products and Chemicals Inc | | 4,546 | 1,318,522 |
| Albemarle Corp (c) | | 2,410 | 207,453 |
| Alto Ingredients Inc (b) | | 1,041 | 1,623 |
| American Vanguard Corp | | 468 | 2,167 |
| Ashland Inc | | 1,016 | 72,603 |
| Aspen Aerogels Inc (b) | | 1,241 | 14,743 |
| Avient Corp | | 1,894 | 77,389 |
| Axalta Coating Systems Ltd (b) | | 4,508 | 154,264 |
| Balchem Corp | | 671 | 109,370 |
| Cabot Corp | | 1,132 | 103,363 |
| Celanese Corp | | 2,245 | 155,376 |
| CF Industries Holdings Inc | | 3,694 | 315,172 |
| Chemours Co/The | | 3,032 | 51,241 |
| Core Molding Technologies Inc (b) | | 142 | 2,349 |
| Corteva Inc | | 14,165 | 806,838 |
| Danimer Scientific Inc warrants 7/15/2025 (b) | | 461 | 16 |
| Dow Inc | | 14,351 | 575,906 |
| DuPont de Nemours Inc | | 8,541 | 651,251 |
| Eastman Chemical Co | | 2,396 | 218,803 |
| Ecolab Inc | | 5,176 | 1,212,840 |
| Ecovyst Inc (b) | | 2,138 | 16,334 |
| Element Solutions Inc | | 4,588 | 116,673 |
| FMC Corp | | 2,575 | 125,171 |
| Ginkgo Bioworks Holdings Inc Class A (b)(c) | | 745 | 7,316 |
| Hawkins Inc | | 398 | 48,823 |
| HB Fuller Co | | 1,140 | 76,927 |
| Huntsman Corp | | 3,285 | 59,229 |
| Ingevity Corp (b) | | 715 | 29,136 |
| Innospec Inc | | 505 | 55,580 |
| International Flavors & Fragrances Inc | | 5,232 | 442,366 |
| Intrepid Potash Inc (b) | | 187 | 4,099 |
| Koppers Holdings Inc | | 410 | 13,284 |
| Kronos Worldwide Inc | | 459 | 4,475 |
| Linde PLC | | 9,828 | 4,114,689 |
| LSB Industries Inc (b) | | 1,103 | 8,372 |
| LyondellBasell Industries NV Class A1 | | 5,321 | 395,191 |
| Mativ Holdings Inc | | 1,070 | 11,663 |
| Minerals Technologies Inc | | 673 | 51,289 |
| Mosaic Co/The | | 6,557 | 161,171 |
| NewMarket Corp | | 159 | 84,008 |
| Olin Corp | | 2,434 | 82,269 |
| Origin Materials Inc Class A (b)(c) | | 2,094 | 2,680 |
| Perimeter Solutions Inc | | 2,739 | 35,004 |
| PPG Industries Inc | | 4,770 | 569,777 |
| PureCycle Technologies Inc (b)(c) | | 2,706 | 27,737 |
| Quaker Chemical Corp (c) | | 282 | 39,694 |
| Rayonier Advanced Materials Inc (b) | | 1,340 | 11,055 |
| RPM International Inc | | 2,634 | 324,140 |
| Scotts Miracle-Gro Co/The | | 863 | 57,251 |
| Sensient Technologies Corp | | 854 | 60,856 |
| Sherwin-Williams Co/The | | 4,745 | 1,612,968 |
| Stepan Co | | 424 | 27,433 |
| Trinseo PLC | | 793 | 4,044 |
| Tronox Holdings PLC | | 2,340 | 23,564 |
| Westlake Corp | | 692 | 79,338 |
| | | | 14,850,821 |
| Construction Materials - 0.1% | | | |
| Eagle Materials Inc | | 688 | 169,771 |
| Knife River Corp (b) | | 1,165 | 118,411 |
| Martin Marietta Materials Inc | | 1,250 | 645,625 |
| Summit Materials Inc Class A (b) | | 2,450 | 123,970 |
| United States Lime & Minerals Inc | | 214 | 28,406 |
| Vulcan Materials Co | | 2,701 | 694,778 |
| | | | 1,780,961 |
| Containers & Packaging - 0.3% | | | |
| Amcor PLC | | 29,566 | 278,216 |
| AptarGroup Inc | | 1,355 | 212,871 |
| Ardagh Metal Packaging SA | | 3,041 | 9,153 |
| Avery Dennison Corp | | 1,648 | 308,390 |
| Ball Corp | | 6,220 | 342,909 |
| Berry Global Group Inc | | 2,346 | 151,716 |
| Crown Holdings Inc | | 2,440 | 201,764 |
| Graphic Packaging Holding CO | | 6,159 | 167,278 |
| Greif Inc Class A | | 509 | 31,110 |
| International Paper Co | | 7,107 | 382,499 |
| Myers Industries Inc | | 721 | 7,960 |
| O-I Glass Inc (b) | | 3,108 | 33,691 |
| Packaging Corp of America | | 1,814 | 408,386 |
| Pactiv Evergreen Inc | | 815 | 14,238 |
| Ranpak Holdings Corp Class A (b) | | 939 | 6,460 |
| Sealed Air Corp | | 3,015 | 101,997 |
| Silgan Holdings Inc | | 1,682 | 87,548 |
| Smurfit WestRock PLC | | 10,090 | 543,447 |
| Sonoco Products Co | | 2,029 | 99,117 |
| TriMas Corp | | 742 | 18,246 |
| | | | 3,406,996 |
| Metals & Mining - 0.4% | | | |
| Alcoa Corp | | 5,300 | 200,234 |
| Alpha Metallurgical Resources Inc | | 222 | 44,427 |
| Arch Resources Inc Class A | | 364 | 51,404 |
| ATI Inc (b) | | 2,563 | 141,068 |
| Carpenter Technology Corp | | 1,023 | 173,613 |
| Century Aluminum Co (b) | | 1,052 | 19,167 |
| Cleveland-Cliffs Inc (b) | | 9,452 | 88,849 |
| Coeur Mining Inc (b) | | 8,107 | 46,372 |
| Commercial Metals Co | | 2,374 | 117,750 |
| Compass Minerals International Inc | | 634 | 7,133 |
| Freeport-McMoRan Inc | | 29,415 | 1,120,123 |
| Gatos Silver Inc (b) | | 922 | 12,890 |
| Hecla Mining Co | | 12,467 | 61,213 |
| Kaiser Aluminum Corp | | 313 | 21,995 |
| Materion Corp | | 421 | 41,628 |
| Metallus Inc (b) | | 737 | 10,414 |
| MP Materials Corp (b)(c) | | 2,481 | 38,704 |
| Newmont Corp | | 23,488 | 874,223 |
| Nucor Corp | | 4,861 | 567,327 |
| Olympic Steel Inc | | 180 | 5,906 |
| Piedmont Lithium Inc (b)(c) | | 326 | 2,848 |
| Radius Recycling Inc Class A | | 538 | 8,188 |
| Ramaco Resources Inc Class A | | 522 | 5,356 |
| Ramaco Resources Inc Class B | | 7 | 68 |
| Reliance Inc | | 1,130 | 304,264 |
| Royal Gold Inc | | 1,356 | 178,789 |
| Ryerson Holding Corp (c) | | 543 | 10,051 |
| Steel Dynamics Inc | | 2,942 | 335,594 |
| SunCoke Energy Inc | | 1,673 | 17,901 |
| United States Steel Corp (c) | | 4,596 | 156,218 |
| Universal Stainless & Alloy Products Inc (b) | | 186 | 8,190 |
| Warrior Met Coal Inc | | 1,087 | 58,959 |
| Worthington Steel Inc | | 686 | 21,829 |
| | | | 4,752,695 |
| Paper & Forest Products - 0.0% | | | |
| Clearwater Paper Corp (b) | | 326 | 9,705 |
| Louisiana-Pacific Corp | | 1,285 | 133,062 |
| Sylvamo Corp | | 720 | 56,894 |
| | | | 199,661 |
TOTAL MATERIALS | | | 24,991,134 |
| | | | |
| Real Estate - 2.4% | | | |
| Diversified REITs - 0.0% | | | |
| Alexander & Baldwin Inc | | 1,487 | 26,379 |
| American Assets Trust Inc | | 949 | 24,921 |
| Armada Hoffler Properties Inc Class A | | 1,388 | 14,199 |
| Broadstone Net Lease Inc Class A | | 3,870 | 61,378 |
| CTO Realty Growth Inc | | 436 | 8,593 |
| Empire State Realty Trust Inc Class A | | 2,688 | 27,740 |
| Essential Properties Realty Trust Inc | | 3,632 | 113,609 |
| Gladstone Commercial Corp | | 890 | 14,454 |
| Global Net Lease Inc | | 3,998 | 29,185 |
| One Liberty Properties Inc | | 348 | 9,480 |
| WP Carey Inc | | 4,497 | 244,997 |
| | | | 574,935 |
| Health Care REITs - 0.3% | | | |
| Alexandria Real Estate Equities Inc | | 3,198 | 311,965 |
| CareTrust REIT Inc | | 3,180 | 86,019 |
| Community Healthcare Trust Inc | | 544 | 10,450 |
| Diversified Healthcare Trust | | 4,369 | 10,049 |
| Global Medical REIT Inc | | 1,263 | 9,750 |
| Healthcare Realty Trust Inc | | 7,521 | 127,481 |
| Healthpeak Properties Inc | | 14,465 | 293,206 |
| LTC Properties Inc | | 935 | 32,304 |
| Medical Properties Trust Inc (c) | | 12,012 | 47,447 |
| National Health Investors Inc | | 912 | 63,202 |
| Omega Healthcare Investors Inc | | 5,277 | 199,734 |
| Sabra Health Care REIT Inc | | 4,869 | 84,331 |
| Universal Health Realty Income Trust | | 274 | 10,196 |
| Ventas Inc | | 8,454 | 497,856 |
| Welltower Inc | | 11,832 | 1,491,187 |
| | | | 3,275,177 |
| Hotel & Resort REITs - 0.0% | | | |
| Apple Hospitality REIT Inc | | 4,549 | 69,827 |
| Chatham Lodging Trust | | 1,072 | 9,594 |
| DiamondRock Hospitality Co | | 4,254 | 38,414 |
| Host Hotels & Resorts Inc | | 14,393 | 252,166 |
| Park Hotels & Resorts Inc | | 4,229 | 59,502 |
| Pebblebrook Hotel Trust | | 2,403 | 32,561 |
| RLJ Lodging Trust | | 3,116 | 31,814 |
| Ryman Hospitality Properties Inc | | 1,233 | 128,651 |
| Service Properties Trust | | 3,197 | 8,120 |
| Summit Hotel Properties Inc | | 2,253 | 15,433 |
| Sunstone Hotel Investors Inc | | 4,094 | 48,473 |
| Xenia Hotels & Resorts Inc | | 2,085 | 30,983 |
| | | | 725,538 |
| Industrial REITs - 0.3% | | | |
| Americold Realty Trust Inc | | 5,406 | 115,688 |
| EastGroup Properties Inc | | 1,007 | 161,613 |
| First Industrial Realty Trust Inc | | 2,731 | 136,905 |
| Industrial Logistics Properties Trust | | 1,284 | 4,687 |
| Lineage Inc (c) | | 1,239 | 72,568 |
| LXP Industrial Trust | | 6,010 | 48,801 |
| Plymouth Industrial REIT Inc | | 816 | 14,525 |
| Prologis Inc | | 18,947 | 2,002,699 |
| Rexford Industrial Realty Inc | | 4,523 | 174,859 |
| STAG Industrial Inc Class A | | 3,797 | 128,415 |
| Terreno Realty Corp | | 1,996 | 118,043 |
| | | | 2,978,803 |
| Office REITs - 0.1% | | | |
| Brandywine Realty Trust | | 3,510 | 19,656 |
| BXP Inc | | 2,984 | 221,890 |
| City Office Reit Inc | | 901 | 4,974 |
| COPT Defense Properties | | 2,340 | 72,423 |
| Cousins Properties Inc | | 3,091 | 94,708 |
| Douglas Emmett Inc (c) | | 3,508 | 65,108 |
| Easterly Government Properties Inc | | 1,952 | 22,175 |
| Equity Commonwealth | | 2,196 | 3,887 |
| Highwoods Properties Inc | | 2,210 | 67,582 |
| Hudson Pacific Properties Inc | | 2,798 | 8,478 |
| JBG SMITH Properties | | 1,870 | 28,742 |
| Kilroy Realty Corp | | 2,197 | 88,869 |
| NET Lease Office Properties | | 306 | 9,550 |
| Office Properties Income Trust | | 771 | 771 |
| Orion Office REIT Inc | | 1,152 | 4,274 |
| Paramount Group Inc | | 3,679 | 18,174 |
| Peakstone Realty Trust | | 796 | 8,812 |
| Piedmont Office Realty Trust Inc Class A1 | | 2,493 | 22,811 |
| Postal Realty Trust Inc Class A | | 523 | 6,825 |
| SL Green Realty Corp | | 1,345 | 91,352 |
| Vornado Realty Trust | | 3,409 | 143,314 |
| | | | 1,004,375 |
| Real Estate Management & Development - 0.2% | | | |
| Anywhere Real Estate Inc (b) | | 1,864 | 6,151 |
| CBRE Group Inc Class A (b) | | 6,165 | 809,403 |
| Compass Inc Class A (b) | | 8,362 | 48,918 |
| CoStar Group Inc (b) | | 8,405 | 601,714 |
| Cushman & Wakefield PLC (b) | | 4,627 | 60,521 |
| Douglas Elliman Inc (b) | | 1,663 | 2,777 |
| eXp World Holdings Inc (c) | | 1,669 | 19,210 |
| Forestar Group Inc (b) | | 383 | 9,927 |
| Howard Hughes Holdings Inc (b) | | 615 | 47,306 |
| Jones Lang LaSalle Inc (b) | | 975 | 246,812 |
| Kennedy-Wilson Holdings Inc | | 2,411 | 24,086 |
| Marcus & Millichap Inc | | 500 | 19,130 |
| Newmark Group Inc Class A | | 2,831 | 36,265 |
| Opendoor Technologies Inc Class A (b) | | 12,757 | 20,411 |
| RE/MAX Holdings Inc Class A (b) | | 418 | 4,460 |
| Redfin Corp (b)(c) | | 2,423 | 19,069 |
| RMR Group Inc/The Class A | | 329 | 6,791 |
| Seaport Entertainment Group Inc | | 86 | 2,404 |
| Seritage Growth Properties Class A (b) | | 736 | 3,032 |
| St Joe Co/The | | 817 | 36,708 |
| Zillow Group Inc Class A (b) | | 1,381 | 97,844 |
| Zillow Group Inc Class C (b) | | 2,825 | 209,191 |
| | | | 2,332,130 |
| Residential REITs - 0.3% | | | |
| American Homes 4 Rent Class A | | 6,442 | 241,060 |
| Apartment Investment and Management Co Class A | | 2,655 | 24,134 |
| AvalonBay Communities Inc | | 2,906 | 639,233 |
| Camden Property Trust | | 2,186 | 253,663 |
| Centerspace | | 305 | 20,176 |
| Elme Communities | | 1,762 | 26,906 |
| Equity LifeStyle Properties Inc | | 3,825 | 254,745 |
| Equity Residential | | 6,988 | 501,459 |
| Essex Property Trust Inc | | 1,316 | 375,639 |
| Independence Realty Trust Inc | | 4,685 | 92,950 |
| Invitation Homes Inc | | 11,666 | 372,962 |
| Mid-America Apartment Communities Inc | | 2,391 | 369,577 |
| NexPoint Residential Trust Inc | | 456 | 19,037 |
| Sun Communities Inc | | 2,404 | 295,620 |
| UDR Inc | | 6,158 | 267,319 |
| UMH Properties Inc | | 1,362 | 25,715 |
| Veris Residential Inc | | 1,642 | 27,306 |
| | | | 3,807,501 |
| Retail REITs - 0.3% | | | |
| Acadia Realty Trust | | 2,123 | 51,292 |
| Agree Realty Corp | | 2,065 | 145,479 |
| Alexander's Inc | | 42 | 8,403 |
| Brixmor Property Group Inc | | 6,180 | 172,051 |
| CBL & Associates Properties Inc | | 298 | 8,764 |
| Curbline Properties Corp | | 1,994 | 46,301 |
| Federal Realty Investment Trust | | 1,545 | 172,963 |
| Getty Realty Corp | | 1,024 | 30,853 |
| InvenTrust Properties Corp | | 1,555 | 46,852 |
| Kimco Realty Corp | | 13,808 | 323,521 |
| Kite Realty Group Trust | | 4,578 | 115,549 |
| Macerich Co/The | | 4,380 | 87,250 |
| NETSTREIT Corp (c) | | 1,606 | 22,725 |
| NNN REIT Inc | | 3,777 | 154,290 |
| Phillips Edison & Co Inc | | 2,500 | 93,650 |
| Realty Income Corp | | 17,807 | 951,072 |
| Regency Centers Corp | | 3,337 | 246,704 |
| Retail Opportunity Investments Corp | | 2,576 | 44,719 |
| Saul Centers Inc | | 269 | 10,437 |
| Simon Property Group Inc | | 6,266 | 1,079,068 |
| SITE Centers Corp | | 909 | 13,899 |
| Tanger Inc | | 2,275 | 77,646 |
| Urban Edge Properties | | 2,464 | 52,976 |
| Whitestone REIT | | 873 | 12,370 |
| | | | 3,968,834 |
| Specialized REITs - 0.9% | | | |
| American Tower Corp | | 9,556 | 1,752,667 |
| Crown Castle Inc | | 8,894 | 807,219 |
| CubeSmart | | 4,647 | 199,124 |
| Digital Realty Trust Inc | | 6,295 | 1,116,292 |
| EPR Properties | | 1,544 | 68,368 |
| Equinix Inc | | 1,941 | 1,830,150 |
| Extra Space Storage Inc | | 4,343 | 649,713 |
| Farmland Partners Inc | | 919 | 10,807 |
| Four Corners Property Trust Inc | | 1,905 | 51,702 |
| Gaming and Leisure Properties Inc | | 5,614 | 270,370 |
| Gladstone Land Corp | | 749 | 8,127 |
| Iron Mountain Inc | | 6,003 | 630,975 |
| Lamar Advertising Co Class A | | 1,796 | 218,645 |
| National Storage Affiliates Trust | | 1,435 | 54,401 |
| Outfront Media Inc | | 2,791 | 49,512 |
| PotlatchDeltic Corp | | 1,462 | 57,384 |
| Public Storage Operating Co | | 3,225 | 965,694 |
| Rayonier Inc | | 2,806 | 73,237 |
| Safehold Inc | | 932 | 17,223 |
| SBA Communications Corp Class A | | 2,202 | 448,768 |
| Uniti Group Inc | | 4,810 | 26,455 |
| VICI Properties Inc | | 21,389 | 624,773 |
| Weyerhaeuser Co | | 14,936 | 420,448 |
| | | | 10,352,054 |
TOTAL REAL ESTATE | | | 29,019,347 |
| | | | |
| Utilities - 2.2% | | | |
| Electric Utilities - 1.3% | | | |
| ALLETE Inc | | 1,176 | 76,205 |
| Alliant Energy Corp | | 5,256 | 310,840 |
| American Electric Power Co Inc | | 10,883 | 1,003,739 |
| Constellation Energy Corp | | 6,396 | 1,430,849 |
| Duke Energy Corp | | 15,787 | 1,700,891 |
| Edison International | | 7,901 | 630,816 |
| Entergy Corp | | 8,747 | 663,198 |
| Evergy Inc | | 4,679 | 287,992 |
| Eversource Energy | | 7,328 | 420,847 |
| Exelon Corp | | 20,449 | 769,700 |
| FirstEnergy Corp | | 10,467 | 416,377 |
| Genie Energy Ltd Class B | | 402 | 6,267 |
| Hawaiian Electric Industries Inc (b) | | 3,374 | 32,829 |
| IDACORP Inc | | 1,096 | 119,771 |
| MGE Energy Inc | | 751 | 70,564 |
| NextEra Energy Inc | | 42,023 | 3,012,630 |
| NRG Energy Inc | | 4,226 | 381,270 |
| OGE Energy Corp | | 4,122 | 170,033 |
| Otter Tail Corp (c) | | 872 | 64,388 |
| PG&E Corp | | 43,680 | 881,462 |
| Pinnacle West Capital Corp | | 2,327 | 197,260 |
| Portland General Electric Co | | 2,138 | 93,260 |
| PPL Corp | | 15,103 | 490,243 |
| Southern Co/The | | 22,354 | 1,840,181 |
| TXNM Energy Inc | | 1,828 | 89,883 |
| Xcel Energy Inc | | 11,399 | 769,660 |
| | | | 15,931,155 |
| Gas Utilities - 0.1% | | | |
| Atmos Energy Corp | | 3,163 | 440,512 |
| Chesapeake Utilities Corp | | 455 | 55,214 |
| MDU Resources Group Inc | | 4,212 | 75,900 |
| National Fuel Gas Co | | 1,883 | 114,260 |
| New Jersey Resources Corp | | 2,055 | 95,866 |
| Northwest Natural Holding Co | | 849 | 33,586 |
| ONE Gas Inc | | 1,149 | 79,568 |
| Southwest Gas Holdings Inc | | 1,222 | 86,408 |
| Spire Inc | | 1,166 | 79,090 |
| UGI Corp | | 4,421 | 124,805 |
| | | | 1,185,209 |
| Independent Power and Renewable Electricity Producers - 0.1% | | | |
| AES Corp/The | | 14,607 | 187,992 |
| Altus Power Inc Class A (b)(c) | | 1,046 | 4,257 |
| Clearway Energy Inc Class A | | 756 | 18,484 |
| Clearway Energy Inc Class C | | 1,576 | 40,976 |
| Montauk Renewables Inc (b) | | 1,158 | 4,609 |
| Ormat Technologies Inc (c) | | 1,125 | 76,185 |
| Sunnova Energy International Inc (b)(c) | | 2,137 | 7,330 |
| Vistra Corp | | 7,029 | 969,088 |
| | | | 1,308,921 |
| Multi-Utilities - 0.6% | | | |
| Ameren Corp | | 5,457 | 486,437 |
| Avista Corp | | 1,590 | 58,242 |
| Black Hills Corp | | 1,408 | 82,396 |
| CenterPoint Energy Inc | | 13,342 | 423,342 |
| CMS Energy Corp | | 6,103 | 406,765 |
| Consolidated Edison Inc | | 7,076 | 631,391 |
| Dominion Energy Inc | | 17,172 | 924,884 |
| DTE Energy Co | | 4,234 | 511,256 |
| NiSource Inc | | 9,150 | 336,354 |
| NorthWestern Corp | | 1,244 | 66,504 |
| Public Service Enterprise Group Inc | | 10,193 | 861,207 |
| Sempra | | 12,950 | 1,135,974 |
| Unitil Corp | | 312 | 16,907 |
| WEC Energy Group Inc | | 6,459 | 607,404 |
| | | | 6,549,063 |
| Water Utilities - 0.1% | | | |
| American States Water Co | | 756 | 58,756 |
| American Water Works Co Inc | | 3,988 | 496,466 |
| Artesian Resources Corp Class A | | 197 | 6,229 |
| California Water Service Group | | 1,187 | 53,807 |
| Consolidated Water Co Ltd | | 320 | 8,285 |
| Essential Utilities Inc | | 5,165 | 187,593 |
| Middlesex Water Co | | 371 | 19,526 |
| SJW Group | | 610 | 30,024 |
| York Water Co/The | | 281 | 9,194 |
| | | | 869,880 |
TOTAL UTILITIES | | | 25,844,228 |
| | | | |
| TOTAL UNITED STATES | | | 1,152,898,865 |
| TOTAL COMMON STOCKS (Cost $782,811,567) | | | 1,162,178,759 |
| | | | |
| U.S. Treasury Obligations - 0.1% |
| | | Yield (%) (g) | Principal Amount (a) | Value ($) |
US Treasury Bills 0% 2/20/2025 (h) (Cost $944,175) | | 4.46 | 950,000 | 944,599 |
| | | | | |
| Money Market Funds - 2.9% |
| | | Yield (%) | Shares | Value ($) |
| Fidelity Cash Central Fund (i) | | 4.36 | 23,792,502 | 23,797,261 |
| Fidelity Securities Lending Cash Central Fund (i)(j) | | 4.35 | 10,315,263 | 10,316,295 |
| TOTAL MONEY MARKET FUNDS (Cost $34,113,556) | | | | 34,113,556 |
| | | | | |
| TOTAL INVESTMENT IN SECURITIES - 100.7% (Cost $817,869,298) | 1,197,236,914 |
NET OTHER ASSETS (LIABILITIES) - (0.7)% | (8,118,553) |
| NET ASSETS - 100.0% | 1,189,118,361 |
| | |
| Futures Contracts |
| | Number of contracts | Expiration Date | Notional Amount ($) | Value ($) | Unrealized Appreciation/ (Depreciation) ($) |
| Purchased | | | | | |
| | | | | | |
| Equity Contracts | | | | | |
| CME E-mini Russell 2000 Index Contracts (United States) | 23 | Mar 2025 | 2,587,270 | (15,020) | (15,020) |
| CME E-mini S&P 500 Index Contracts (United States) | 75 | Mar 2025 | 22,259,063 | (258,265) | (258,265) |
| CME E-mini S&P MidCap 400 Index Contracts (United States) | 3 | Mar 2025 | 944,010 | (2,526) | (2,526) |
| | | | | | |
| TOTAL FUTURES CONTRACTS | | | | | (275,811) |
| The notional amount of futures purchased as a percentage of Net Assets is 2.1% |
Legend
| (a) | Amount is stated in United States dollars unless otherwise noted. |
| (c) | Security or a portion of the security is on loan at period end. |
| (d) | Equity security is subject to lock-up or market standoff agreement and valued at a discount to the market price of the equivalent equity security. As of period end, the total fair value of equity securities discounted due to contractual sale restrictions is $300 and all restrictions are set to expire on or before January 31, 2025. Under normal market conditions, there are no circumstances that could cause the restrictions to lapse. |
| (f) | Security is exempt from registration under Regulation S of the Securities Act of 1933 and may be resold to qualified foreign investors outside of the United States. At the end of the period, the value of securities amounted to $18,812 or 0.0% of net assets. |
| (g) | Yield represents either the annualized yield at the date of purchase, or the stated coupon rate, or, for floating and adjustable rate securities, the rate at period end. |
| (h) | Security or a portion of the security was pledged to cover margin requirements for futures contracts. At period end, the value of securities pledged amounted to $944,599. |
| (i) | Affiliated fund that is generally available only to investment companies and other accounts managed by Fidelity Investments. The rate quoted is the annualized seven-day yield of the fund at period end. A complete unaudited listing of the fund's holdings as of its most recent quarter end is available upon request. In addition, each Fidelity Central Fund's financial statements, which are not covered by the Fund's Report of Independent Registered Public Accounting Firm, are available on the SEC's website or upon request. |
| (j) | Investment made with cash collateral received from securities on loan. |
Affiliated Central Funds
Fiscal year to date information regarding the Fund's investments in Fidelity Central Funds, including the ownership percentage, is presented below.
| Affiliate | Value, beginning of period ($) | Purchases ($) | Sales Proceeds ($) | Dividend Income ($) | Realized Gain (loss) ($) | Change in Unrealized appreciation (depreciation) ($) | Value, end of period ($) | Shares, end of period | % ownership, end of period |
| Fidelity Cash Central Fund | 24,575,444 | 194,439,061 | 195,217,246 | 1,163,657 | 2 | - | 23,797,261 | 23,792,502 | 0.0% |
| Fidelity Securities Lending Cash Central Fund | 10,430,214 | 37,330,435 | 37,444,354 | 88,445 | - | - | 10,316,295 | 10,315,263 | 0.0% |
| Total | 35,005,658 | 231,769,496 | 232,661,600 | 1,252,102 | 2 | - | 34,113,556 | 34,107,765 | |
| | | | | | | | | | |
Amounts in the dividend income column in the above table include any capital gain distributions from underlying funds, which are presented in the corresponding line item in the Statement of Operations, if applicable.
Amounts in the dividend income column for Fidelity Securities Lending Cash Central Fund represents the income earned on investing cash collateral, less rebates paid to borrowers and any lending agent fees associated with the loan, plus any premium payments received for lending certain types of securities.
Amounts included in the purchases and sales proceeds columns may include in-kind transactions, if applicable.
Investment Valuation
The following is a summary of the inputs used, as of December 31, 2024, involving the Fund's assets and liabilities carried at fair value. The inputs or methodology used for valuing securities may not be an indication of the risk associated with investing in those securities. For more information on valuation inputs, and their aggregation into the levels used below, please refer to the Investment Valuation section in the accompanying Notes to Financial Statements.
| Valuation Inputs at Reporting Date: |
| Description | Total ($) | Level 1 ($) | Level 2 ($) | Level 3 ($) |
Investments in Securities: | | | | |
|
| Common Stocks | | | | |
Communication Services | 101,934,492 | 101,934,492 | - | - |
Consumer Discretionary | 131,589,977 | 131,589,883 | 94 | - |
Consumer Staples | 60,496,227 | 60,496,227 | - | - |
Energy | 38,207,335 | 38,207,335 | - | - |
Financials | 164,683,458 | 164,683,458 | - | - |
Health Care | 119,176,561 | 119,175,029 | 300 | 1,232 |
Industrials | 108,432,644 | 108,432,644 | - | - |
Information Technology | 357,495,635 | 357,495,635 | - | - |
Materials | 25,298,855 | 25,298,855 | - | - |
Real Estate | 29,019,347 | 29,019,347 | - | - |
Utilities | 25,844,228 | 25,844,228 | - | - |
|
| U.S. Treasury Obligations | 944,599 | - | 944,599 | - |
|
| Money Market Funds | 34,113,556 | 34,113,556 | - | - |
| Total Investments in Securities: | 1,197,236,914 | 1,196,290,689 | 944,993 | 1,232 |
Derivative Instruments: Liabilities | | | | |
Futures Contracts | (275,811) | (275,811) | - | - |
| Total Liabilities | (275,811) | (275,811) | - | - |
| Total Derivative Instruments: | (275,811) | (275,811) | - | - |
Value of Derivative Instruments
The following table is a summary of the Fund's value of derivative instruments by primary risk exposure as of December 31, 2024. For additional information on derivative instruments, please refer to the Derivative Instruments section in the accompanying Notes to Financial Statements.
Primary Risk Exposure / Derivative Type | Value |
| Asset ($) | Liability ($) |
| Equity Risk | | |
Futures Contracts (a) | 0 | (275,811) |
| Total Equity Risk | 0 | (275,811) |
| Total Value of Derivatives | 0 | (275,811) |
(a)Reflects gross cumulative appreciation (depreciation) on futures contracts as presented in the Schedule of Investments. In the Statement of Assets and Liabilities, the period end daily variation margin is included in receivable or payable for daily variation margin on futures contracts, and the net cumulative appreciation (depreciation) is included in Total accumulated earnings (loss).
VIP Total Market Index Portfolio
Financial Statements
| Statement of Assets and Liabilities |
As of December 31, 2024 |
| Assets | | | | |
| Investment in securities, at value (including securities loaned of $9,913,467) - See accompanying schedule: | | | | |
Unaffiliated issuers (cost $783,755,742) | $ | 1,163,123,358 | | |
Fidelity Central Funds (cost $34,113,556) | | 34,113,556 | | |
| | | | | |
| | | | | |
| Total Investment in Securities (cost $817,869,298) | | | $ | 1,197,236,914 |
| Segregated cash with brokers for derivative instruments | | | | 433,784 |
| Cash | | | | 1,030 |
| Foreign currency held at value (cost $97) | | | | 97 |
| Receivable for fund shares sold | | | | 1,823,493 |
| Dividends receivable | | | | 740,585 |
| Distributions receivable from Fidelity Central Funds | | | | 103,683 |
| Other receivables | | | | 1,941 |
Total assets | | | | 1,200,341,527 |
| Liabilities | | | | |
| Payable for fund shares redeemed | $ | 695,164 | | |
| Accrued management fee | | 109,814 | | |
| Distribution and service plan fees payable | | 20,681 | | |
| Payable for daily variation margin on futures contracts | | 81,193 | | |
| Collateral on securities loaned | | 10,316,314 | | |
| Total liabilities | | | | 11,223,166 |
| Net Assets | | | $ | 1,189,118,361 |
| Net Assets consist of: | | | | |
| Paid in capital | | | $ | 819,855,871 |
| Total accumulated earnings (loss) | | | | 369,262,490 |
| Net Assets | | | $ | 1,189,118,361 |
| | | | | |
| Net Asset Value and Maximum Offering Price | | | | |
| Initial Class : | | | | |
Net Asset Value, offering price and redemption price per share ($1,087,743,955 ÷ 51,606,002 shares) | | | $ | 21.08 |
| Service Class : | | | | |
Net Asset Value, offering price and redemption price per share ($5,360,164 ÷ 254,738 shares) | | | $ | 21.04 |
| Service Class 2 : | | | | |
Net Asset Value, offering price and redemption price per share ($96,014,242 ÷ 4,575,653 shares) | | | $ | 20.98 |
| Statement of Operations |
| Year ended December 31, 2024 |
| Investment Income | | | | |
| Dividends | | | $ | 13,305,813 |
| Interest | | | | 63,079 |
| Income from Fidelity Central Funds (including $88,445 from security lending) | | | | 1,252,102 |
| Total income | | | | 14,620,994 |
| Expenses | | | | |
| Management fee | $ | 930,037 | | |
| Transfer agent fees | | 229,073 | | |
| Distribution and service plan fees | | 197,864 | | |
| Independent trustees' fees and expenses | | 4,239 | | |
| Miscellaneous | | 2,624 | | |
| Total expenses before reductions | | 1,363,837 | | |
| Expense reductions | | (1,627) | | |
| Total expenses after reductions | | | | 1,362,210 |
| Net Investment income (loss) | | | | 13,258,784 |
| Realized and Unrealized Gain (Loss) | | | | |
| Net realized gain (loss) on: | | | | |
| Investment Securities: | | | | |
| Unaffiliated issuers | | (1,462,599) | | |
| Fidelity Central Funds | | 2 | | |
| Foreign currency transactions | | 945 | | |
| Futures contracts | | 3,816,125 | | |
| Total net realized gain (loss) | | | | 2,354,473 |
| Change in net unrealized appreciation (depreciation) on: | | | | |
| Investment Securities: | | | | |
| Unaffiliated issuers | | 196,296,518 | | |
| Assets and liabilities in foreign currencies | | (1,638) | | |
| Futures contracts | | (968,560) | | |
| Total change in net unrealized appreciation (depreciation) | | | | 195,326,320 |
| Net gain (loss) | | | | 197,680,793 |
| Net increase (decrease) in net assets resulting from operations | | | $ | 210,939,577 |
| Statement of Changes in Net Assets |
| |
| | Year ended December 31, 2024 | | Year ended December 31, 2023 |
| Increase (Decrease) in Net Assets | | | | |
| Operations | | | | |
| Net investment income (loss) | $ | 13,258,784 | $ | 10,842,847 |
| Net realized gain (loss) | | 2,354,473 | | (233,648) |
| Change in net unrealized appreciation (depreciation) | | 195,326,320 | | 151,439,889 |
| Net increase (decrease) in net assets resulting from operations | | 210,939,577 | | 162,049,088 |
| Distributions to shareholders | | (13,954,136) | | (7,738,444) |
| | | | | |
| Share transactions - net increase (decrease) | | 155,393,473 | | 102,198,089 |
| Total increase (decrease) in net assets | | 352,378,914 | | 256,508,733 |
| | | | | |
| Net Assets | | | | |
| Beginning of period | | 836,739,447 | | 580,230,714 |
| End of period | $ | 1,189,118,361 | $ | 836,739,447 |
| | | | | |
| | | | | |
Financial Highlights
VIP Total Market Index Portfolio Initial Class |
| |
| Years ended December 31, | | 2024 | | 2023 | | 2022 | | 2021 | | 2020 |
Selected Per-Share Data | | | | | | | | | | |
| Net asset value, beginning of period | $ | 17.26 | $ | 13.83 | $ | 17.40 | $ | 14.07 | $ | 11.86 |
| Income from Investment Operations | | | | | | | | | | |
Net investment income (loss) A,B | | .26 | | .24 | | .22 | | .19 | | .19 |
| Net realized and unrealized gain (loss) | | 3.83 | | 3.36 | | (3.56) | | 3.41 | | 2.21 |
| Total from investment operations | | 4.09 | | 3.60 | | (3.34) | | 3.60 | | 2.40 |
| Distributions from net investment income | | (.27) | | (.17) | | (.20) | | (.17) | | (.18) |
| Distributions from net realized gain | | - | | - | | (.03) | | (.11) | | (.02) |
| Total distributions | | (.27) | | (.17) | | (.23) | | (.27) C | | (.19) C |
| Net asset value, end of period | $ | 21.08 | $ | 17.26 | $ | 13.83 | $ | 17.40 | $ | 14.07 |
Total Return D,E | | | | 26.07% | | (19.22)% | | 25.69% | | 20.30% |
Ratios to Average Net Assets B,F,G | | | | | | | | | | |
| Expenses before reductions | | .11% | | .12% | | .12% | | .12% | | .12% |
| Expenses net of fee waivers, if any | | | | .12% | | .12% | | .12% | | .12% |
| Expenses net of all reductions | | .11% | | .12% | | .12% | | .12% | | .12% |
| Net investment income (loss) | | 1.32% | | 1.58% | | 1.45% | | 1.18% | | 1.57% |
| Supplemental Data | | | | | | | | | | |
| Net assets, end of period (000 omitted) | $ | 1,087,744 | $ | 778,339 | $ | 548,368 | $ | 569,470 | $ | 259,544 |
Portfolio turnover rate H | | | | 2% | | 6% | | 3% | | 9% |
ACalculated based on average shares outstanding during the period.
BNet investment income (loss) is affected by the timing of the declaration of dividends by any underlying mutual funds or exchange-traded funds (ETFs). Net investment income (loss) of any mutual funds or ETFs is not included in the Fund's net investment income (loss) ratio.
CTotal distributions per share do not sum due to rounding.
DTotal returns do not reflect charges attributable to your insurance company's separate account. Inclusion of these charges would reduce the total returns shown.
ETotal returns would have been lower if certain expenses had not been reduced during the applicable periods shown.
FFees and expenses of any underlying mutual funds or exchange-traded funds (ETFs) are not included in the Fund's expense ratio. The Fund indirectly bears its proportionate share of these expenses. For additional expense information related to investments in Fidelity Central Funds, please refer to the "Investments in Fidelity Central Funds" note found in the Notes to Financial Statements section of the most recent Annual or Semi-Annual report.
GExpense ratios reflect operating expenses of the class. Expenses before reductions do not reflect amounts reimbursed, waived, or reduced through arrangements with the investment adviser, brokerage services, or other offset arrangements, if applicable, and do not represent the amount paid by the class during periods when reimbursements, waivers or reductions occur.
HAmount does not include the portfolio activity of any underlying mutual funds or exchange-traded funds (ETFs), derivatives or securities that mature within one year from acquisition.
VIP Total Market Index Portfolio Service Class |
| |
| Years ended December 31, | | 2024 | | 2023 | | 2022 | | 2021 | | 2020 |
Selected Per-Share Data | | | | | | | | | | |
| Net asset value, beginning of period | $ | 17.23 | $ | 13.82 | $ | 17.40 | $ | 14.07 | $ | 11.86 |
| Income from Investment Operations | | | | | | | | | | |
Net investment income (loss) A,B | | .24 | | .23 | | .20 | | .17 | | .17 |
| Net realized and unrealized gain (loss) | | 3.82 | | 3.35 | | (3.56) | | 3.41 | | 2.22 |
| Total from investment operations | | 4.06 | | 3.58 | | (3.36) | | 3.58 | | 2.39 |
| Distributions from net investment income | | (.25) | | (.17) | | (.19) | | (.15) | | (.17) |
| Distributions from net realized gain | | - | | - | | (.03) | | (.11) | | (.02) |
| Total distributions | | (.25) | | (.17) | | (.22) | | (.25) C | | (.18) C |
| Net asset value, end of period | $ | 21.04 | $ | 17.23 | $ | 13.82 | $ | 17.40 | $ | 14.07 |
Total Return D,E | | | | 25.94% | | (19.33)% | | 25.55% | | 20.20% |
Ratios to Average Net Assets B,F,G | | | | | | | | | | |
| Expenses before reductions | | .21% | | .22% | | .22% | | .22% | | .22% |
| Expenses net of fee waivers, if any | | | | .22% | | .22% | | .22% | | .22% |
| Expenses net of all reductions | | .21% | | .22% | | .22% | | .22% | | .22% |
| Net investment income (loss) | | 1.22% | | 1.48% | | 1.35% | | 1.08% | | 1.47% |
| Supplemental Data | | | | | | | | | | |
| Net assets, end of period (000 omitted) | $ | 5,360 | $ | 3,865 | $ | 493 | $ | 414 | $ | 347 |
Portfolio turnover rate H | | | | 2% | | 6% | | 3% | | 9% |
ACalculated based on average shares outstanding during the period.
BNet investment income (loss) is affected by the timing of the declaration of dividends by any underlying mutual funds or exchange-traded funds (ETFs). Net investment income (loss) of any mutual funds or ETFs is not included in the Fund's net investment income (loss) ratio.
CTotal distributions per share do not sum due to rounding.
DTotal returns do not reflect charges attributable to your insurance company's separate account. Inclusion of these charges would reduce the total returns shown.
ETotal returns would have been lower if certain expenses had not been reduced during the applicable periods shown.
FFees and expenses of any underlying mutual funds or exchange-traded funds (ETFs) are not included in the Fund's expense ratio. The Fund indirectly bears its proportionate share of these expenses. For additional expense information related to investments in Fidelity Central Funds, please refer to the "Investments in Fidelity Central Funds" note found in the Notes to Financial Statements section of the most recent Annual or Semi-Annual report.
GExpense ratios reflect operating expenses of the class. Expenses before reductions do not reflect amounts reimbursed, waived, or reduced through arrangements with the investment adviser, brokerage services, or other offset arrangements, if applicable, and do not represent the amount paid by the class during periods when reimbursements, waivers or reductions occur.
HAmount does not include the portfolio activity of any underlying mutual funds or exchange-traded funds (ETFs), derivatives or securities that mature within one year from acquisition.
VIP Total Market Index Portfolio Service Class 2 |
| |
| Years ended December 31, | | 2024 | | 2023 | | 2022 | | 2021 | | 2020 |
Selected Per-Share Data | | | | | | | | | | |
| Net asset value, beginning of period | $ | 17.19 | $ | 13.79 | $ | 17.36 | $ | 14.05 | $ | 11.86 |
| Income from Investment Operations | | | | | | | | | | |
Net investment income (loss) A,B | | .21 | | .21 | | .17 | | .15 | | .16 |
| Net realized and unrealized gain (loss) | | 3.81 | | 3.33 | | (3.54) | | 3.41 | | 2.21 |
| Total from investment operations | | 4.02 | | 3.54 | | (3.37) | | 3.56 | | 2.37 |
| Distributions from net investment income | | (.23) | | (.14) | | (.18) | | (.14) | | (.16) |
| Distributions from net realized gain | | - | | - | | (.03) | | (.11) | | (.02) |
| Total distributions | | (.23) | | (.14) | | (.20) C | | (.25) | | (.18) |
| Net asset value, end of period | $ | 20.98 | $ | 17.19 | $ | 13.79 | $ | 17.36 | $ | 14.05 |
Total Return D,E | | | | 25.71% | | (19.41)% | | 25.38% | | 19.98% |
Ratios to Average Net Assets B,F,G | | | | | | | | | | |
| Expenses before reductions | | .36% | | .37% | | .37% | | .37% | | .37% |
| Expenses net of fee waivers, if any | | | | .37% | | .37% | | .37% | | .37% |
| Expenses net of all reductions | | .36% | | .37% | | .37% | | .37% | | .37% |
| Net investment income (loss) | | 1.07% | | 1.33% | | 1.20% | | .93% | | 1.32% |
| Supplemental Data | | | | | | | | | | |
| Net assets, end of period (000 omitted) | $ | 96,014 | $ | 54,535 | $ | 31,370 | $ | 13,135 | $ | 4,116 |
Portfolio turnover rate H | | | | 2% | | 6% | | 3% | | 9% |
ACalculated based on average shares outstanding during the period.
BNet investment income (loss) is affected by the timing of the declaration of dividends by any underlying mutual funds or exchange-traded funds (ETFs). Net investment income (loss) of any mutual funds or ETFs is not included in the Fund's net investment income (loss) ratio.
CTotal distributions per share do not sum due to rounding.
DTotal returns do not reflect charges attributable to your insurance company's separate account. Inclusion of these charges would reduce the total returns shown.
ETotal returns would have been lower if certain expenses had not been reduced during the applicable periods shown.
FFees and expenses of any underlying mutual funds or exchange-traded funds (ETFs) are not included in the Fund's expense ratio. The Fund indirectly bears its proportionate share of these expenses. For additional expense information related to investments in Fidelity Central Funds, please refer to the "Investments in Fidelity Central Funds" note found in the Notes to Financial Statements section of the most recent Annual or Semi-Annual report.
GExpense ratios reflect operating expenses of the class. Expenses before reductions do not reflect amounts reimbursed, waived, or reduced through arrangements with the investment adviser, brokerage services, or other offset arrangements, if applicable, and do not represent the amount paid by the class during periods when reimbursements, waivers or reductions occur.
HAmount does not include the portfolio activity of any underlying mutual funds or exchange-traded funds (ETFs), derivatives or securities that mature within one year from acquisition.
VIP Extended Market Index Portfolio
Schedule of Investments December 31, 2024
Showing Percentage of Net Assets
| Common Stocks - 97.2% |
| | | Shares | Value ($) |
| ARGENTINA - 0.1% | | | |
| Materials - 0.1% | | | |
| Chemicals - 0.1% | | | |
| Arcadium Lithium PLC | | 48,413 | 248,359 |
| BAHAMAS (NASSAU) - 0.0% | | | |
| Consumer Discretionary - 0.0% | | | |
| Diversified Consumer Services - 0.0% | | | |
| OneSpaWorld Holdings Ltd | | 4,730 | 94,127 |
| BELGIUM - 0.1% | | | |
| Communication Services - 0.1% | | | |
| Diversified Telecommunication Services - 0.1% | | | |
| Liberty Global Ltd Class A (b) | | 7,378 | 94,143 |
| Liberty Global Ltd Class C (b)(c) | | 7,541 | 99,089 |
| | | | |
| TOTAL BELGIUM | | | 193,232 |
| BERMUDA - 0.3% | | | |
| Energy - 0.0% | | | |
| Oil, Gas & Consumable Fuels - 0.0% | | | |
| Teekay Corp Ltd | | 2,551 | 17,678 |
| Financials - 0.3% | | | |
| Insurance - 0.3% | | | |
| RenaissanceRe Holdings Ltd | | 2,347 | 583,958 |
| TOTAL BERMUDA | | | 601,636 |
| CANADA - 0.0% | | | |
| Energy - 0.0% | | | |
| Oil, Gas & Consumable Fuels - 0.0% | | | |
| Teekay Tankers Ltd Class A | | 1,155 | 45,957 |
| Information Technology - 0.0% | | | |
| Software - 0.0% | | | |
| D-Wave Quantum Inc (b)(c) | | 6,776 | 56,919 |
| Materials - 0.0% | | | |
| Metals & Mining - 0.0% | | | |
| McEwen Mining Inc (b) | | 1,953 | 15,194 |
| TOTAL CANADA | | | 118,070 |
| CHINA - 0.0% | | | |
| Information Technology - 0.0% | | | |
| Semiconductors & Semiconductor Equipment - 0.0% | | | |
| indie Semiconductor Inc Class A (b)(c) | | 7,375 | 29,868 |
| GERMANY - 0.0% | | | |
| Materials - 0.0% | | | |
| Chemicals - 0.0% | | | |
| Orion SA | | 2,623 | 41,417 |
| Paper & Forest Products - 0.0% | | | |
| Mercer International Inc | | 2,139 | 13,904 |
| TOTAL GERMANY | | | 55,321 |
| GHANA - 0.0% | | | |
| Energy - 0.0% | | | |
| Oil, Gas & Consumable Fuels - 0.0% | | | |
| Kosmos Energy Ltd (b) | | 21,437 | 73,315 |
| IRELAND - 0.0% | | | |
| Energy - 0.0% | | | |
| Oil, Gas & Consumable Fuels - 0.0% | | | |
| Ardmore Shipping Corp | | 1,850 | 22,478 |
| Health Care - 0.0% | | | |
| Biotechnology - 0.0% | | | |
| Prothena Corp PLC (b) | | 1,651 | 22,866 |
| Industrials - 0.0% | | | |
| Commercial Services & Supplies - 0.0% | | | |
| Cimpress PLC (b) | | 690 | 49,487 |
| TOTAL IRELAND | | | 94,831 |
| ISRAEL - 0.0% | | | |
| Consumer Discretionary - 0.0% | | | |
| Automobile Components - 0.0% | | | |
| Mobileye Global Inc Class A (b)(c) | | 4,515 | 89,939 |
| JAPAN - 0.1% | | | |
| Information Technology - 0.1% | | | |
| Semiconductors & Semiconductor Equipment - 0.1% | | | |
| Allegro MicroSystems Inc (b) | | 7,045 | 154,004 |
| MONACO - 0.0% | | | |
| Energy - 0.0% | | | |
| Oil, Gas & Consumable Fuels - 0.0% | | | |
| Scorpio Tankers Inc | | 1,907 | 94,759 |
| NETHERLANDS - 0.0% | | | |
| Health Care - 0.0% | | | |
| Biotechnology - 0.0% | | | |
| uniQure NV (b) | | 2,065 | 36,468 |
| PHILIPPINES - 0.0% | | | |
| Industrials - 0.0% | | | |
| Professional Services - 0.0% | | | |
| TaskUS Inc Class A (b) | | 727 | 12,314 |
| PUERTO RICO - 0.3% | | | |
| Communication Services - 0.0% | | | |
| Diversified Telecommunication Services - 0.0% | | | |
| Liberty Latin America Ltd Class A (b) | | 3,261 | 20,739 |
| Liberty Latin America Ltd Class C (b) | | 3,937 | 24,961 |
| | | | 45,700 |
| Financials - 0.3% | | | |
| Banks - 0.3% | | | |
| First BanCorp/Puerto Rico | | 7,259 | 134,945 |
| Ofg Bancorp | | 2,082 | 88,110 |
| Popular Inc | | 3,257 | 306,354 |
| | | | 529,409 |
| Financial Services - 0.0% | | | |
| EVERTEC Inc | | 2,912 | 100,551 |
TOTAL FINANCIALS | | | 629,960 |
| | | | |
| TOTAL PUERTO RICO | | | 675,660 |
| SINGAPORE - 0.0% | | | |
| Health Care - 0.0% | | | |
| Pharmaceuticals - 0.0% | | | |
| Scilex Holding Co (b) | | 4,477 | 1,909 |
| Scilex Holding Co (b)(d) | | 1,785 | 608 |
| | | | 2,517 |
| Information Technology - 0.0% | | | |
| Semiconductors & Semiconductor Equipment - 0.0% | | | |
| Kulicke & Soffa Industries Inc | | 2,475 | 115,484 |
| TOTAL SINGAPORE | | | 118,001 |
| SWEDEN - 0.1% | | | |
| Consumer Discretionary - 0.1% | | | |
| Automobile Components - 0.1% | | | |
| Autoliv Inc | | 3,297 | 309,226 |
| Financials - 0.0% | | | |
| Insurance - 0.0% | | | |
| SiriusPoint Ltd (b) | | 4,387 | 71,903 |
| TOTAL SWEDEN | | | 381,129 |
| SWITZERLAND - 0.1% | | | |
| Communication Services - 0.0% | | | |
| Diversified Telecommunication Services - 0.0% | | | |
| Sunrise Communications AG ADR | | 2,958 | 127,431 |
| Consumer Discretionary - 0.0% | | | |
| Automobile Components - 0.0% | | | |
| Garrett Motion Inc (c) | | 5,563 | 50,233 |
| Health Care - 0.1% | | | |
| Biotechnology - 0.1% | | | |
| CRISPR Therapeutics AG (b)(c) | | 3,844 | 151,300 |
| TOTAL SWITZERLAND | | | 328,964 |
| THAILAND - 0.1% | | | |
| Information Technology - 0.1% | | | |
| Electronic Equipment, Instruments & Components - 0.1% | | | |
| Fabrinet (b) | | 1,628 | 357,965 |
| UNITED KINGDOM - 0.4% | | | |
| Consumer Discretionary - 0.0% | | | |
| Hotels, Restaurants & Leisure - 0.0% | | | |
| Soho House & Co Inc Class A (b)(c) | | 1,492 | 11,115 |
| Energy - 0.3% | | | |
| Energy Equipment & Services - 0.3% | | | |
| TechnipFMC PLC | | 19,273 | 557,761 |
| Industrials - 0.0% | | | |
| Machinery - 0.0% | | | |
| Luxfer Holdings PLC | | 1,294 | 16,938 |
| Materials - 0.1% | | | |
| Metals & Mining - 0.1% | | | |
| Anglogold Ashanti Plc | | 15,457 | 356,748 |
| TOTAL UNITED KINGDOM | | | 942,562 |
| UNITED STATES - 95.6% | | | |
| Communication Services - 3.1% | | | |
| Diversified Telecommunication Services - 0.4% | | | |
| Anterix Inc (b) | | 840 | 25,763 |
| AST SpaceMobile Inc Class A (b)(c) | | 6,316 | 133,268 |
| Atn International Inc | | 414 | 6,959 |
| Bandwidth Inc Class A (b) | | 1,206 | 20,526 |
| Cogent Communications Holdings Inc | | 1,914 | 147,512 |
| Frontier Communications Parent Inc (b) | | 9,950 | 345,265 |
| Globalstar Inc (b) | | 34,855 | 72,150 |
| IDT Corp Class B | | 948 | 45,049 |
| Iridium Communications Inc | | 5,360 | 155,547 |
| Lumen Technologies Inc (b) | | 45,768 | 243,028 |
| Shenandoah Telecommunications Co | | 2,142 | 27,011 |
| | | | 1,222,078 |
| Entertainment - 1.0% | | | |
| AMC Entertainment Holdings Inc Class A (b)(c) | | 16,466 | 65,535 |
| Atlanta Braves Holdings Inc Class A (b)(c) | | 581 | 23,704 |
| Atlanta Braves Holdings Inc Class C (b) | | 1,587 | 60,719 |
| Cinemark Holdings Inc (b) | | 4,836 | 149,819 |
| Endeavor Group Holdings Inc Class A (c) | | 8,542 | 267,279 |
| Eventbrite Inc Class A (b) | | 3,155 | 10,600 |
| Lions Gate Entertainment Corp Class A (b)(c) | | 2,979 | 25,441 |
| Lions Gate Entertainment Corp Class B (b) | | 4,989 | 37,667 |
| Live Nation Entertainment Inc (b) | | 7,044 | 912,198 |
| Madison Square Garden Entertainment Corp Class A (b) | | 1,818 | 64,721 |
| Madison Square Garden Sports Corp Class A (b) | | 754 | 170,163 |
| Marcus Corp/The | | 1,174 | 25,241 |
| Playtika Holding Corp | | 2,157 | 14,970 |
| Roku Inc Class A (b) | | 5,735 | 426,340 |
| Skillz Inc Class A (b) | | 429 | 2,157 |
| Sphere Entertainment Co Class A (b) | | 1,205 | 48,586 |
| TKO Group Holdings Inc Class A (b) | | 2,989 | 424,767 |
| Vivid Seats Inc Class A (b)(c) | | 3,946 | 18,270 |
| Warner Music Group Corp Class A | | 6,386 | 197,966 |
| | | | 2,946,143 |
| Interactive Media & Services - 0.5% | | | |
| Angi Inc Class A (b)(c) | | 2,941 | 4,882 |
| Bumble Inc Class A (b) | | 4,238 | 34,497 |
| Cargurus Inc Class A (b) | | 3,910 | 142,871 |
| Cars.com Inc (b) | | 2,700 | 46,791 |
| EverQuote Inc Class A (b)(c) | | 1,272 | 25,427 |
| fuboTV Inc (b) | | 15,647 | 19,715 |
| IAC Inc Class A (b) | | 3,212 | 138,566 |
| Match Group Inc | | 11,605 | 379,600 |
| MediaAlpha Inc Class A (b) | | 1,353 | 15,275 |
| Nextdoor Holdings Inc Class A (b) | | 7,431 | 17,611 |
| QuinStreet Inc (b) | | 2,472 | 57,029 |
| Rumble Inc Class A (b)(c) | | 3,577 | 46,537 |
| Shutterstock Inc | | 1,084 | 32,899 |
| TripAdvisor Inc Class A (b) | | 4,923 | 72,713 |
| Vimeo Inc Class A (b) | | 6,972 | 44,621 |
| Yelp Inc Class A (b) | | 2,995 | 115,907 |
| Ziff Davis Inc (b) | | 2,033 | 110,473 |
| ZipRecruiter Inc Class A (b) | | 3,625 | 26,245 |
| ZoomInfo Technologies Inc (b) | | 13,107 | 137,755 |
| | | | 1,469,414 |
| Media - 1.1% | | | |
| Advantage Solutions Inc Class A (b)(c) | | 2,334 | 6,815 |
| Altice USA Inc Class A (b)(c) | | 11,492 | 27,696 |
| AMC Networks Inc Class A (b) | | 1,575 | 15,593 |
| Boston Omaha Corp (b) | | 1,104 | 15,655 |
| Cable One Inc (c) | | 209 | 75,683 |
| Cardlytics Inc (b)(c) | | 1,919 | 7,119 |
| Clear Channel Outdoor Holdings Inc (b) | | 13,897 | 19,039 |
| EchoStar Corp Class A (b) | | 5,438 | 124,530 |
| Entravision Communications Corp Class A | | 2,436 | 5,725 |
| EW Scripps Co/The Class A (b) | | 2,218 | 4,902 |
| Gannett Co Inc (b) | | 5,572 | 28,194 |
| Gray Television Inc | | 3,869 | 12,187 |
| iHeartMedia Inc Class A (b) | | 4,792 | 9,488 |
| Integral Ad Science Holding Corp (b) | | 3,413 | 35,632 |
| John Wiley & Sons Inc Class A | | 1,838 | 80,339 |
| Liberty Broadband Corp Class A (b) | | 884 | 65,734 |
| Liberty Broadband Corp Class C (b) | | 4,891 | 365,651 |
| Magnite Inc (b) | | 5,605 | 89,232 |
| National CineMedia Inc (b) | | 4,401 | 29,223 |
| New York Times Co/The Class A | | 7,363 | 383,244 |
| News Corp Class A | | 16,892 | 465,206 |
| News Corp Class B | | 5,164 | 157,140 |
| Nexstar Media Group Inc | | 1,367 | 215,945 |
| Paramount Global Class A | | 1,055 | 23,527 |
| Paramount Global Class B (c) | | 25,274 | 264,366 |
| PubMatic Inc Class A (b) | | 1,887 | 27,720 |
| Scholastic Corp | | 1,082 | 23,079 |
| Sinclair Inc Class A | | 1,769 | 28,552 |
| Sirius XM Holdings Inc (c) | | 9,924 | 226,267 |
| Stagwell Inc Class A (b) | | 4,602 | 30,281 |
| TechTarget Inc/old | | 1,103 | 21,861 |
| TEGNA Inc | | 7,495 | 137,084 |
| Thryv Holdings Inc (b) | | 1,461 | 21,623 |
| WideOpenWest Inc (b) | | 1,849 | 9,171 |
| | | | 3,053,503 |
| Wireless Telecommunication Services - 0.1% | | | |
| Gogo Inc (b)(c) | | 2,510 | 20,306 |
| NII Holdings Inc (b)(e) | | 1,280 | 0 |
| Spok Holdings Inc | | 996 | 15,985 |
| Telephone and Data Systems Inc | | 4,391 | 149,777 |
| United States Cellular Corp (b) | | 644 | 40,392 |
| | | | 226,460 |
TOTAL COMMUNICATION SERVICES | | | 8,917,598 |
| | | | |
| Consumer Discretionary - 12.1% | | | |
| Automobile Components - 0.8% | | | |
| Adient PLC (b) | | 3,909 | 67,352 |
| American Axle & Manufacturing Holdings Inc (b) | | 5,377 | 31,348 |
| BorgWarner Inc | | 10,267 | 326,389 |
| Cooper-Standard Holdings Inc (b) | | 690 | 9,356 |
| Dana Inc | | 5,753 | 66,505 |
| Dorman Products Inc (b) | | 1,228 | 159,087 |
| Fox Factory Holding Corp (b) | | 1,892 | 57,271 |
| Gentex Corp | | 10,376 | 298,102 |
| Gentherm Inc (b) | | 1,384 | 55,256 |
| Goodyear Tire & Rubber Co/The (b) | | 12,912 | 116,208 |
| Holley Inc Class A (b) | | 2,049 | 6,188 |
| LCI Industries | | 1,150 | 118,899 |
| Lear Corp | | 2,536 | 240,159 |
| Luminar Technologies Inc Class A (b)(c) | | 1,098 | 5,907 |
| Modine Manufacturing Co (b) | | 2,359 | 273,479 |
| Patrick Industries Inc | | 1,506 | 125,118 |
| Phinia Inc | | 1,941 | 93,498 |
| QuantumScape Corp Class A (b)(c) | | 16,744 | 86,901 |
| Solid Power Inc (b)(c) | | 6,195 | 11,709 |
| Standard Motor Products Inc | | 951 | 29,462 |
| Stoneridge Inc (b) | | 1,115 | 6,991 |
| Visteon Corp (b) | | 1,231 | 109,214 |
| XPEL Inc (b)(f) | | 1,019 | 40,699 |
| | | | 2,335,098 |
| Automobiles - 0.4% | | | |
| Canoo Inc Class A (b)(c) | | 123 | 173 |
| Harley-Davidson Inc | | 5,341 | 160,924 |
| Lucid Group Inc Class A (b)(c) | | 39,318 | 118,740 |
| Rivian Automotive Inc Class A (b)(c) | | 32,428 | 431,293 |
| Thor Industries Inc | | 2,401 | 229,800 |
| Winnebago Industries Inc | | 1,313 | 62,735 |
| | | | 1,003,665 |
| Broadline Retail - 0.4% | | | |
| ContextLogic Inc Class A (b)(c) | | 939 | 6,601 |
| Dillard's Inc Class A (c) | | 137 | 59,148 |
| Etsy Inc (b) | | 5,169 | 273,389 |
| Groupon Inc (b)(c) | | 1,020 | 12,393 |
| Kohl's Corp (c) | | 5,056 | 70,986 |
| Macy's Inc | | 12,452 | 210,812 |
| Nordstrom Inc | | 4,298 | 103,797 |
| Ollie's Bargain Outlet Holdings Inc (b) | | 2,755 | 302,307 |
| Qurate Retail Inc Class A (b) | | 14,204 | 4,687 |
| | | | 1,044,120 |
| Distributors - 0.0% | | | |
| A-Mark Precious Metals Inc | | 835 | 22,879 |
| Diversified Consumer Services - 1.1% | | | |
| ADT Inc | | 13,932 | 96,270 |
| Adtalem Global Education Inc (b) | | 1,683 | 152,901 |
| Bright Horizons Family Solutions Inc (b) | | 2,614 | 289,762 |
| Carriage Services Inc | | 556 | 22,157 |
| Chegg Inc (b) | | 4,144 | 6,671 |
| Coursera Inc (b) | | 5,501 | 46,759 |
| Duolingo Inc Class A (b) | | 1,685 | 546,328 |
| European Wax Center Inc Class A (b) | | 1,555 | 10,372 |
| Frontdoor Inc (b) | | 3,446 | 188,393 |
| Graham Holdings Co Class B | | 155 | 135,148 |
| Grand Canyon Education Inc (b) | | 1,309 | 214,414 |
| H&R Block Inc | | 6,284 | 332,047 |
| Laureate Education Inc | | 6,169 | 112,831 |
| Mister Car Wash Inc (b) | | 4,153 | 30,275 |
| Nerdy Inc Class A (b) | | 4,497 | 7,284 |
| Perdoceo Education Corp | | 2,825 | 74,778 |
| Service Corp International/US | | 6,551 | 522,901 |
| Strategic Education Inc | | 1,112 | 103,883 |
| Stride Inc (b) | | 1,916 | 199,130 |
| Udemy Inc (b) | | 4,055 | 33,373 |
| Universal Technical Institute Inc (b) | | 1,935 | 49,749 |
| WW International Inc (b)(c) | | 3,327 | 4,224 |
| | | | 3,179,650 |
| Hotels, Restaurants & Leisure - 2.9% | | | |
| Accel Entertainment Inc Class A (b) | | 2,554 | 27,277 |
| Aramark | | 11,848 | 442,049 |
| BJ's Restaurants Inc (b) | | 1,066 | 37,454 |
| Bloomin' Brands Inc | | 3,394 | 41,441 |
| Boyd Gaming Corp | | 3,093 | 224,366 |
| Brinker International Inc (b) | | 1,998 | 264,315 |
| Caesars Entertainment Inc (b) | | 9,741 | 325,544 |
| Cheesecake Factory Inc/The (c) | | 2,076 | 98,485 |
| Choice Hotels International Inc | | 1,029 | 146,097 |
| Churchill Downs Inc | | 3,300 | 440,682 |
| Cracker Barrel Old Country Store Inc | | 993 | 52,490 |
| Dave & Buster's Entertainment Inc (b)(c) | | 1,385 | 40,428 |
| Denny's Corp (b)(c) | | 2,073 | 12,542 |
| Dine Brands Global Inc | | 700 | 21,070 |
| Dutch Bros Inc Class A (b) | | 5,122 | 268,290 |
| El Pollo Loco Holdings Inc (b) | | 1,028 | 11,863 |
| Everi Holdings Inc (b) | | 3,858 | 52,122 |
| First Watch Restaurant Group Inc (b) | | 1,519 | 28,269 |
| Golden Entertainment Inc | | 916 | 28,946 |
| Hilton Grand Vacations Inc (b) | | 2,903 | 113,072 |
| Hyatt Hotels Corp Class A | | 2,023 | 317,571 |
| Jack in the Box Inc (c) | | 862 | 35,894 |
| Krispy Kreme Inc | | 3,813 | 37,863 |
| Kura Sushi USA Inc Class A (b) | | 257 | 23,279 |
| Life Time Group Holdings Inc (b) | | 3,234 | 71,536 |
| Light & Wonder Inc Class A (b) | | 3,993 | 344,915 |
| Lindblad Expeditions Holdings Inc (b) | | 1,745 | 20,696 |
| Lucky Strike Entertainment Corp Class A (c) | | 1,140 | 11,411 |
| Marriott Vacations Worldwide Corp | | 1,458 | 130,928 |
| Monarch Casino & Resort Inc | | 577 | 45,525 |
| Norwegian Cruise Line Holdings Ltd (b) | | 19,782 | 508,991 |
| Papa John's International Inc | | 1,484 | 60,948 |
| Penn Entertainment Inc (b) | | 6,660 | 132,001 |
| Planet Fitness Inc Class A (b) | | 3,804 | 376,101 |
| Playa Hotels & Resorts NV (b) | | 4,417 | 55,875 |
| PlayAGS Inc (b) | | 1,872 | 21,584 |
| Portillo's Inc Class A (b) | | 2,593 | 24,374 |
| Potbelly Corp (b) | | 1,267 | 11,935 |
| Rci Hospitality Holdings Inc | | 353 | 20,287 |
| Red Robin Gourmet Burgers Inc (b) | | 539 | 2,959 |
| Red Rock Resorts Inc Class A | | 2,237 | 103,439 |
| Rush Street Interactive Inc Class A (b) | | 3,511 | 48,171 |
| Sabre Corp (b) | | 17,487 | 63,828 |
| Shake Shack Inc Class A (b) | | 1,798 | 233,380 |
| Six Flags Entertainment Corp | | 4,189 | 201,868 |
| Sweetgreen Inc Class A (b) | | 4,589 | 147,123 |
| Target Hospitality Corp (b) | | 1,526 | 14,749 |
| Texas Roadhouse Inc | | 2,999 | 541,110 |
| Travel + Leisure Co | | 3,143 | 158,564 |
| United Parks & Resorts Inc (b) | | 1,366 | 76,756 |
| Vail Resorts Inc | | 1,693 | 317,353 |
| Viking Holdings Ltd | | 4,088 | 180,117 |
| Wendy's Co/The | | 7,599 | 123,864 |
| Wingstop Inc | | 1,318 | 374,576 |
| Wyndham Hotels & Resorts Inc | | 3,551 | 357,905 |
| Wynn Resorts Ltd | | 4,207 | 362,475 |
| Xponential Fitness Inc Class A (b) | | 1,151 | 15,481 |
| | | | 8,252,234 |
| Household Durables - 1.7% | | | |
| Beazer Homes USA Inc (b) | | 1,269 | 34,847 |
| Cavco Industries Inc (b) | | 372 | 165,998 |
| Century Communities Inc | | 1,231 | 90,306 |
| Champion Homes Inc (b) | | 2,383 | 209,942 |
| Cricut Inc Class A | | 2,444 | 13,931 |
| Dream Finders Homes Inc Class A (b)(c) | | 1,249 | 29,064 |
| Ethan Allen Interiors Inc | | 1,070 | 30,078 |
| Gopro Inc Class A (b) | | 4,716 | 5,139 |
| Green Brick Partners Inc (b) | | 1,375 | 77,674 |
| Helen of Troy Ltd (b) | | 1,043 | 62,403 |
| Hovnanian Enterprises Inc Class A (b) | | 217 | 29,039 |
| Installed Building Products Inc | | 1,050 | 184,013 |
| iRobot Corp (b) | | 1,548 | 11,997 |
| KB Home | | 3,252 | 213,721 |
| La-Z-Boy Inc | | 1,889 | 82,304 |
| Landsea Homes Corp Class A (b) | | 766 | 6,502 |
| Legacy Housing Corp (b) | | 491 | 12,118 |
| Leggett & Platt Inc | | 6,033 | 57,917 |
| LGI Homes Inc (b) | | 936 | 83,678 |
| Lovesac Co/The (b) | | 683 | 16,160 |
| M/I Homes Inc (b) | | 1,238 | 164,592 |
| Meritage Homes Corp | | 1,639 | 252,111 |
| Mohawk Industries Inc (b) | | 2,358 | 280,909 |
| Newell Brands Inc | | 18,728 | 186,531 |
| Purple Innovation Inc Class A (b) | | 1,868 | 1,456 |
| SharkNinja Inc | | 2,960 | 288,186 |
| Sonos Inc (b) | | 5,491 | 82,585 |
| Taylor Morrison Home Corp (b) | | 4,699 | 287,626 |
| Tempur Sealy International Inc | | 7,811 | 442,806 |
| Toll Brothers Inc | | 4,621 | 582,015 |
| TopBuild Corp (b) | | 1,350 | 420,309 |
| Tri Pointe Homes Inc (b) | | 4,235 | 153,561 |
| Whirlpool Corp | | 2,471 | 282,880 |
| Worthington Enterprises Inc | | 1,423 | 57,077 |
| | | | 4,899,475 |
| Leisure Products - 0.5% | | | |
| Acushnet Holdings Corp | | 1,256 | 89,276 |
| AMMO Inc (b) | | 3,887 | 4,275 |
| Brunswick Corp/DE | | 2,994 | 193,652 |
| Clarus Corp | | 1,050 | 4,735 |
| Funko Inc Class A (b) | | 1,519 | 20,339 |
| Hasbro Inc | | 5,894 | 329,534 |
| JAKKS Pacific Inc (b) | | 385 | 10,838 |
| Johnson Outdoors Inc Class A | | 237 | 7,821 |
| Malibu Boats Inc Class A (b) | | 933 | 35,071 |
| MasterCraft Boat Holdings Inc (b) | | 580 | 11,061 |
| Mattel Inc (b) | | 15,315 | 271,535 |
| Peloton Interactive Inc Class A (b) | | 15,927 | 138,565 |
| Polaris Inc (c) | | 2,377 | 136,963 |
| Revelyst Inc | | 2,574 | 49,498 |
| Smith & Wesson Brands Inc | | 1,962 | 19,826 |
| Sturm Ruger & Co Inc | | 802 | 28,367 |
| Topgolf Callaway Brands Corp (b) | | 6,337 | 49,809 |
| YETI Holdings Inc (b) | | 3,831 | 147,532 |
| | | | 1,548,697 |
| Specialty Retail - 3.0% | | | |
| 1-800-Flowers.com Inc Class A (b)(c) | | 1,111 | 9,077 |
| Abercrombie & Fitch Co Class A (b) | | 2,302 | 344,080 |
| Academy Sports & Outdoors Inc | | 3,271 | 188,181 |
| Advance Auto Parts Inc (c) | | 2,690 | 127,210 |
| America's Car-Mart Inc/TX (b) | | 270 | 13,838 |
| American Eagle Outfitters Inc | | 7,972 | 132,893 |
| Arhaus Inc Class A (c) | | 2,504 | 23,538 |
| Arko Corp | | 3,303 | 21,767 |
| Asbury Automotive Group Inc (b)(c) | | 901 | 218,970 |
| AutoNation Inc (b) | | 1,180 | 200,411 |
| Bath & Body Works Inc | | 10,049 | 389,600 |
| Beyond Inc (b)(c) | | 1,689 | 8,327 |
| Boot Barn Holdings Inc (b) | | 1,376 | 208,904 |
| Buckle Inc/The | | 1,360 | 69,102 |
| Build-A-Bear Workshop Inc | | 580 | 26,703 |
| Caleres Inc | | 1,567 | 36,292 |
| Camping World Holdings Inc Class A | | 2,019 | 42,561 |
| Carvana Co Class A (b) | | 5,126 | 1,042,423 |
| Chewy Inc Class A (b) | | 6,368 | 213,264 |
| Children's Place Inc/The (b)(c) | | 485 | 5,073 |
| Children's Place Inc/The rights (b) | | 485 | 154 |
| Citi Trends Inc (b)(c) | | 333 | 8,741 |
| Designer Brands Inc Class A (c) | | 1,830 | 9,772 |
| Destination XL Group Inc (b)(c) | | 1,940 | 5,219 |
| Dick's Sporting Goods Inc (c) | | 2,607 | 596,586 |
| EVgo Inc Class A (b)(c) | | 4,318 | 17,488 |
| Five Below Inc (b) | | 2,480 | 260,301 |
| Floor & Decor Holdings Inc Class A (b) | | 4,826 | 481,152 |
| Foot Locker Inc (b) | | 3,731 | 81,187 |
| GameStop Corp Class A (b)(c) | | 17,461 | 547,228 |
| Gap Inc/The | | 9,960 | 235,355 |
| Genesco Inc (b) | | 514 | 21,974 |
| Group 1 Automotive Inc | | 589 | 248,252 |
| GrowGeneration Corp (b)(c) | | 2,649 | 4,476 |
| Guess? Inc (c) | | 1,202 | 16,900 |
| Haverty Furniture Cos Inc | | 585 | 13,022 |
| J Jill Inc | | 305 | 8,424 |
| Leslie's Inc (b) | | 7,965 | 17,762 |
| Lithia Motors Inc Class A | | 1,204 | 430,346 |
| MarineMax Inc (b) | | 901 | 26,084 |
| Monro Inc | | 1,364 | 33,827 |
| Murphy USA Inc | | 839 | 420,968 |
| National Vision Holdings Inc (b) | | 3,525 | 36,731 |
| ODP Corp/The (b) | | 1,523 | 34,633 |
| OneWater Marine Inc Class A (b)(c) | | 640 | 11,123 |
| Penske Automotive Group Inc | | 843 | 128,507 |
| Petco Health & Wellness Co Inc Class A (b) | | 3,779 | 14,398 |
| PetMed Express Inc (b)(c) | | 1,197 | 5,770 |
| RealReal Inc/The (b)(c) | | 4,385 | 47,928 |
| Revolve Group Inc Class A (b)(c) | | 1,709 | 57,234 |
| RH (b) | | 673 | 264,886 |
| RumbleON Inc Class B (b) | | 1,138 | 6,179 |
| Sally Beauty Holdings Inc (b) | | 4,543 | 47,474 |
| Shoe Carnival Inc | | 760 | 25,141 |
| Signet Jewelers Ltd | | 2,014 | 162,550 |
| Sleep Number Corp (b)(c) | | 969 | 14,768 |
| Sonic Automotive Inc Class A | | 645 | 40,861 |
| Sportsman's Warehouse Holdings Inc (b) | | 1,270 | 3,390 |
| Stitch Fix Inc Class A (b) | | 4,393 | 18,934 |
| ThredUp Inc Class A (b) | | 3,515 | 4,885 |
| Upbound Group Inc | | 2,211 | 64,495 |
| Urban Outfitters Inc (b) | | 2,537 | 139,231 |
| Valvoline Inc (b) | | 5,807 | 210,097 |
| Victoria's Secret & Co (b) | | 3,532 | 146,295 |
| Warby Parker Inc Class A (b) | | 3,993 | 96,671 |
| Wayfair Inc Class A (b)(c) | | 4,403 | 195,141 |
| Winmark Corp | | 130 | 51,099 |
| Zumiez Inc (b) | | 683 | 13,093 |
| | | | 8,648,946 |
| Textiles, Apparel & Luxury Goods - 1.3% | | | |
| Capri Holdings Ltd (b) | | 5,313 | 111,892 |
| Carter's Inc (c) | | 1,609 | 87,192 |
| Columbia Sportswear Co | | 1,479 | 124,132 |
| Crocs Inc (b) | | 2,673 | 292,774 |
| Figs Inc Class A (b)(c) | | 5,990 | 37,078 |
| G-III Apparel Group Ltd (b) | | 1,776 | 57,933 |
| Hanesbrands Inc (b) | | 15,927 | 129,646 |
| Kontoor Brands Inc (c) | | 2,256 | 192,685 |
| Levi Strauss & Co Class A | | 4,489 | 77,660 |
| Movado Group Inc | | 654 | 12,871 |
| Oxford Industries Inc | | 675 | 53,177 |
| PVH Corp | | 2,516 | 266,067 |
| Ralph Lauren Corp Class A | | 1,802 | 416,226 |
| Skechers USA Inc Class A (b) | | 5,968 | 401,288 |
| Steven Madden Ltd | | 3,258 | 138,530 |
| Tapestry Inc | | 10,358 | 676,688 |
| Under Armour Inc Class A (b) | | 7,844 | 64,949 |
| Under Armour Inc Class C (b) | | 6,705 | 50,019 |
| Vera Bradley Inc (b)(c) | | 904 | 3,552 |
| VF Corp | | 14,892 | 319,582 |
| Wolverine World Wide Inc | | 3,545 | 78,699 |
| | | | 3,592,640 |
TOTAL CONSUMER DISCRETIONARY | | | 34,527,404 |
| | | | |
| Consumer Staples - 3.7% | | | |
| Beverages - 0.5% | | | |
| Boston Beer Co Inc/The Class A (b) | | 400 | 119,992 |
| Brown-Forman Corp Class B | | 8,250 | 313,335 |
| Celsius Holdings Inc (b) | | 7,037 | 185,355 |
| Coca-Cola Consolidated Inc | | 265 | 333,897 |
| MGP Ingredients Inc (c) | | 653 | 25,708 |
| Molson Coors Beverage Co Class B | | 7,897 | 452,656 |
| National Beverage Corp | | 1,043 | 44,505 |
| Vita Coco Co Inc/The (b) | | 1,733 | 63,965 |
| | | | 1,539,413 |
| Consumer Staples Distribution & Retail - 1.4% | | | |
| Albertsons Cos Inc | | 18,154 | 356,545 |
| Andersons Inc/The | | 1,450 | 58,754 |
| BJ's Wholesale Club Holdings Inc (b) | | 5,968 | 533,241 |
| Blue Apron Holdings Inc warrants 11/4/2028 (b)(e) | | 341 | 0 |
| Blue Apron Holdings Inc warrants 11/4/2028 (b)(e) | | 341 | 0 |
| Blue Apron Holdings Inc warrants 11/4/2028 (b)(e) | | 341 | 0 |
| Casey's General Stores Inc | | 1,669 | 661,308 |
| Chefs' Warehouse Inc/The (b) | | 1,534 | 75,657 |
| Grocery Outlet Holding Corp (b) | | 4,399 | 68,668 |
| Ingles Markets Inc Class A | | 656 | 42,273 |
| Performance Food Group Co (b) | | 7,009 | 592,611 |
| PriceSmart Inc | | 1,122 | 103,415 |
| SpartanNash Co | | 1,543 | 28,267 |
| Sprouts Farmers Market Inc (b) | | 4,502 | 572,069 |
| United Natural Foods Inc (b) | | 2,648 | 72,317 |
| US Foods Holding Corp (b) | | 10,997 | 741,858 |
| Weis Markets Inc | | 724 | 49,029 |
| | | | 3,956,012 |
| Food Products - 1.2% | | | |
| B&G Foods Inc (c) | | 3,759 | 25,900 |
| Beyond Meat Inc (b)(c) | | 3,143 | 11,818 |
| BRC Inc Class A (b) | | 1,995 | 6,324 |
| Cal-Maine Foods Inc | | 1,834 | 188,755 |
| Calavo Growers Inc | | 810 | 20,655 |
| Darling Ingredients Inc (b) | | 7,164 | 241,355 |
| Flowers Foods Inc | | 8,810 | 182,015 |
| Fresh Del Monte Produce Inc | | 1,503 | 49,915 |
| Freshpet Inc (b) | | 2,182 | 323,176 |
| Hain Celestial Group Inc (b) | | 4,191 | 25,775 |
| Hormel Foods Corp | | 13,066 | 409,880 |
| Ingredion Inc | | 2,928 | 402,776 |
| J & J Snack Foods Corp | | 702 | 108,901 |
| John B Sanfilippo & Son Inc | | 400 | 34,844 |
| Lancaster Colony Corp | | 870 | 150,632 |
| Mission Produce Inc (b) | | 2,058 | 29,573 |
| Pilgrim's Pride Corp (b)(c) | | 1,790 | 81,248 |
| Post Holdings Inc (b) | | 2,121 | 242,770 |
| Seaboard Corp | | 11 | 26,726 |
| Seneca Foods Corp Class A (b) | | 186 | 14,742 |
| Simply Good Foods Co/The (b) | | 4,133 | 161,104 |
| The Campbell's Company | | 8,863 | 371,182 |
| Tootsie Roll Industries Inc Class A | | 790 | 25,541 |
| TreeHouse Foods Inc (b) | | 2,142 | 75,248 |
| Utz Brands Inc Class A | | 3,313 | 51,882 |
| Vital Farms Inc (b) | | 1,377 | 51,899 |
| Westrock Coffee Co (b) | | 1,414 | 9,078 |
| WK Kellogg Co (c) | | 2,945 | 52,981 |
| | | | 3,376,695 |
| Household Products - 0.2% | | | |
| Central Garden & Pet Co (b)(c) | | 808 | 31,350 |
| Central Garden & Pet Co Class A | | 1,917 | 63,357 |
| Energizer Holdings Inc | | 2,969 | 103,588 |
| Reynolds Consumer Products Inc | | 2,449 | 66,099 |
| Spectrum Brands Holdings Inc | | 1,275 | 107,725 |
| WD-40 Co | | 610 | 148,035 |
| | | | 520,154 |
| Personal Care Products - 0.4% | | | |
| Beauty Health Co/The Class A (b) | | 2,822 | 4,487 |
| BellRing Brands Inc (b) | | 5,806 | 437,424 |
| Coty Inc Class A (b) | | 16,439 | 114,415 |
| Edgewell Personal Care Co | | 2,231 | 74,962 |
| elf Beauty Inc (b)(c) | | 2,539 | 318,771 |
| Herbalife Ltd (b) | | 4,583 | 30,660 |
| Honest Co Inc/The (b) | | 3,128 | 21,677 |
| Interparfums Inc | | 817 | 107,444 |
| Medifast Inc (b) | | 432 | 7,612 |
| Nu Skin Enterprises Inc Class A | | 2,159 | 14,876 |
| Olaplex Holdings Inc (b) | | 5,414 | 9,366 |
| USANA Health Sciences Inc (b) | | 527 | 18,914 |
| | | | 1,160,608 |
| Tobacco - 0.0% | | | |
| Turning Point Brands Inc | | 806 | 48,440 |
| Universal Corp/VA | | 1,094 | 59,995 |
| | | | 108,435 |
TOTAL CONSUMER STAPLES | | | 10,661,317 |
| | | | |
| Energy - 4.3% | | | |
| Energy Equipment & Services - 1.0% | | | |
| Archrock Inc | | 7,589 | 188,890 |
| Atlas Energy Solutions Inc (c) | | 2,685 | 59,553 |
| Bristow Group Inc (b) | | 1,108 | 38,004 |
| Cactus Inc Class A | | 3,001 | 175,138 |
| ChampionX Corp | | 8,611 | 234,133 |
| Core Laboratories Inc (c) | | 2,093 | 36,230 |
| DMC Global Inc (b) | | 701 | 5,152 |
| Expro Group Holdings NV (b) | | 4,806 | 59,931 |
| Helix Energy Solutions Group Inc (b) | | 6,486 | 60,450 |
| Helmerich & Payne Inc | | 4,487 | 143,674 |
| Innovex International Inc (b) | | 1,585 | 22,142 |
| KLX Energy Services Holdings Inc (b) | | 575 | 2,864 |
| Kodiak Gas Services Inc | | 1,203 | 49,118 |
| Liberty Energy Inc Class A | | 7,460 | 148,379 |
| Nabors Industries Ltd (b) | | 403 | 23,040 |
| Noble Corp PLC | | 6,175 | 193,895 |
| NOV Inc | | 17,768 | 259,414 |
| NPK International Inc (b) | | 4,026 | 30,879 |
| Oceaneering International Inc (b) | | 4,615 | 120,359 |
| Oil States International Inc (b) | | 2,944 | 14,897 |
| Patterson-UTI Energy Inc | | 15,959 | 131,821 |
| ProPetro Holding Corp (b) | | 3,754 | 35,025 |
| Ranger Energy Services Inc Class A | | 750 | 11,610 |
| RPC Inc (c) | | 3,621 | 21,509 |
| SEACOR Marine Holdings Inc (b) | | 1,004 | 6,586 |
| Select Water Solutions Inc Class A | | 4,214 | 55,793 |
| Solaris Energy Infrastructure Inc Class A | | 1,277 | 36,752 |
| TETRA Technologies Inc (b) | | 5,496 | 19,676 |
| Tidewater Inc (b) | | 2,184 | 119,487 |
| Transocean Ltd (b)(c) | | 35,295 | 132,356 |
| Valaris Ltd (b) | | 2,977 | 131,702 |
| Weatherford International PLC | | 3,297 | 236,165 |
| | | | 2,804,624 |
| Oil, Gas & Consumable Fuels - 3.3% | | | |
| Aemetis Inc (b)(c) | | 2,139 | 5,754 |
| Amplify Energy Corp (b) | | 1,531 | 9,186 |
| Antero Midstream Corp | | 15,225 | 229,745 |
| Antero Resources Corp (b) | | 13,168 | 461,538 |
| APA Corp | | 16,670 | 384,910 |
| Berry Corp | | 3,622 | 14,959 |
| California Resources Corp | | 3,151 | 163,505 |
| Centrus Energy Corp Class A (b)(c) | | 652 | 43,430 |
| Chord Energy Corp | | 2,804 | 327,844 |
| Civitas Resources Inc | | 4,101 | 188,113 |
| Clean Energy Fuels Corp (b) | | 8,257 | 20,725 |
| CNX Resources Corp (b) | | 6,822 | 250,163 |
| Comstock Resources Inc (c) | | 4,044 | 73,682 |
| CONSOL Energy Inc | | 1,214 | 129,510 |
| Crescent Energy Co Class A (c) | | 6,864 | 100,283 |
| CVR CHC LP | | 1,603 | 30,040 |
| Delek US Holdings Inc | | 2,885 | 53,373 |
| Dorian LPG Ltd | | 1,588 | 38,700 |
| DT Midstream Inc | | 4,375 | 435,006 |
| Eqt Corp | | 26,745 | 1,233,212 |
| Evolution Petroleum Corp (c) | | 1,332 | 6,966 |
| Excelerate Energy Inc Class A | | 805 | 24,351 |
| Expand Energy Corp | | 9,299 | 925,715 |
| FutureFuel Corp | | 1,165 | 6,163 |
| Gevo Inc (b)(c) | | 9,709 | 20,292 |
| Granite Ridge Resources Inc | | 2,440 | 15,762 |
| Green Plains Inc (b) | | 2,995 | 28,393 |
| Gulfport Energy Corp (b) | | 572 | 105,362 |
| Hallador Energy Co (b) | | 1,381 | 15,812 |
| HF Sinclair Corp | | 7,326 | 256,776 |
| International Seaways Inc | | 1,882 | 67,639 |
| Kinetik Holdings Inc Class A | | 1,688 | 95,726 |
| Magnolia Oil & Gas Corp Class A (c) | | 8,545 | 199,782 |
| Matador Resources Co | | 5,244 | 295,027 |
| Murphy Oil Corp | | 6,445 | 195,026 |
| New Fortress Energy Inc Class A (c) | | 2,999 | 45,345 |
| NextDecade Corp (b)(c) | | 6,179 | 47,640 |
| Northern Oil & Gas Inc | | 4,506 | 167,443 |
| Par Pacific Holdings Inc (b) | | 2,548 | 41,762 |
| PBF Energy Inc Class A | | 4,461 | 118,440 |
| Peabody Energy Corp | | 5,626 | 117,808 |
| Permian Resources Corp Class A | | 28,651 | 412,001 |
| Range Resources Corp | | 10,915 | 392,722 |
| REX American Resources Corp (b) | | 729 | 30,392 |
| Riley Exploration Permian Inc | | 411 | 13,119 |
| Ring Energy Inc (b) | | 4,891 | 6,652 |
| SandRidge Energy Inc | | 1,648 | 19,298 |
| Sitio Royalties Corp Class A | | 3,700 | 70,966 |
| SM Energy Co | | 5,167 | 200,273 |
| Talos Energy Inc (b) | | 5,493 | 53,337 |
| Texas Pacific Land Corp (c) | | 848 | 937,854 |
| Uranium Energy Corp (b)(c) | | 18,575 | 124,267 |
| VAALCO Energy Inc | | 4,903 | 21,426 |
| Vital Energy Inc (b)(c) | | 1,231 | 38,063 |
| Vitesse Energy Inc (c) | | 1,215 | 30,375 |
| W&T Offshore Inc (c) | | 3,820 | 6,341 |
| World Kinect Corp | | 2,705 | 74,415 |
| | | | 9,422,409 |
TOTAL ENERGY | | | 12,227,033 |
| | | | |
| Financials - 17.2% | | | |
| Banks - 5.9% | | | |
| 1st Source Corp | | 747 | 43,610 |
| Amalgamated Financial Corp | | 970 | 32,466 |
| Amerant Bancorp Inc Class A | | 1,587 | 35,565 |
| Ameris Bancorp | | 2,915 | 182,392 |
| Arrow Financial Corp | | 623 | 17,886 |
| Associated Banc-Corp | | 6,695 | 160,011 |
| Atlantic Union Bankshares Corp | | 4,050 | 153,414 |
| Axos Financial Inc (b) | | 2,437 | 170,224 |
| Banc of California Inc | | 6,113 | 94,507 |
| BancFirst Corp | | 902 | 105,696 |
| Bancorp Inc/The (b) | | 2,208 | 116,207 |
| Bank First Corp | | 411 | 40,726 |
| Bank of Hawaii Corp | | 1,777 | 126,593 |
| Bank OZK | | 4,758 | 211,874 |
| BankUnited Inc | | 3,337 | 127,373 |
| Banner Corp | | 1,567 | 104,629 |
| Berkshire Hills Bancorp Inc | | 1,876 | 53,335 |
| BOK Financial Corp | | 1,019 | 108,473 |
| Brookline Bancorp Inc | | 3,964 | 46,775 |
| Byline Bancorp Inc | | 1,152 | 33,408 |
| Cadence Bank | | 8,208 | 282,766 |
| Camden National Corp | | 672 | 28,721 |
| Capitol Federal Financial Inc | | 5,640 | 33,332 |
| Cathay General Bancorp | | 3,256 | 155,018 |
| Central Pacific Financial Corp | | 1,230 | 35,732 |
| City Holding Co | | 670 | 79,382 |
| Coastal Financial Corp/WA Class A (b) | | 480 | 40,757 |
| Columbia Banking System Inc | | 9,432 | 254,758 |
| Columbia Financial Inc (b) | | 1,277 | 20,189 |
| Comerica Inc | | 5,973 | 369,430 |
| Commerce Bancshares Inc/MO | | 5,532 | 344,699 |
| Community Financial System Inc | | 2,380 | 146,798 |
| Community Trust Bancorp Inc | | 701 | 37,174 |
| Connectone Bancorp Inc | | 1,567 | 35,900 |
| CrossFirst Bankshares Inc (b) | | 1,869 | 28,315 |
| Cullen/Frost Bankers Inc | | 2,879 | 386,506 |
| Customers Bancorp Inc (b) | | 1,331 | 64,793 |
| CVB Financial Corp | | 5,932 | 127,004 |
| Dime Community Bancshares Inc | | 1,574 | 48,377 |
| Eagle Bancorp Inc | | 1,396 | 36,338 |
| East West Bancorp Inc | | 6,234 | 596,968 |
| Eastern Bankshares Inc | | 8,699 | 150,058 |
| Enterprise Financial Services Corp | | 1,664 | 93,850 |
| Equity Bancshares Inc Class A | | 578 | 24,519 |
| Esquire Financial Holdings Inc | | 308 | 24,486 |
| FB Financial Corp | | 1,583 | 81,540 |
| First Bancorp/Southern Pines NC | | 1,847 | 81,213 |
| First Bancshares Inc/The | | 1,262 | 44,170 |
| First Busey Corp | | 2,368 | 55,814 |
| First Commonwealth Financial Corp | | 4,572 | 77,358 |
| First Financial Bancorp | | 4,335 | 116,525 |
| First Financial Bankshares Inc | | 5,786 | 208,585 |
| First Financial Corp/IN | | 498 | 23,003 |
| First Foundation Inc | | 3,027 | 18,798 |
| First Hawaiian Inc | | 5,776 | 149,887 |
| First Horizon Corp | | 24,099 | 485,354 |
| First Interstate BancSystem Inc Class A | | 3,863 | 125,432 |
| First Merchants Corp | | 2,662 | 106,187 |
| First Mid Bancshares Inc | | 937 | 34,500 |
| First of Long Island Corp/The | | 892 | 10,418 |
| Flagstar Financial Inc (c) | | 13,483 | 125,796 |
| Flushing Financial Corp | | 1,345 | 19,207 |
| FNB Corp/PA | | 16,170 | 238,993 |
| Fulton Financial Corp | | 8,194 | 157,980 |
| German American Bancorp Inc | | 1,328 | 53,412 |
| Glacier Bancorp Inc | | 5,105 | 256,373 |
| Great Southern Bancorp Inc | | 398 | 23,761 |
| Hancock Whitney Corp | | 3,887 | 212,697 |
| Hanmi Financial Corp | | 1,399 | 33,044 |
| Harborone Northeast Bancorp Inc | | 1,780 | 21,057 |
| Heartland Financial USA Inc | | 1,943 | 119,116 |
| Heritage Commerce Corp | | 2,821 | 26,461 |
| Heritage Financial Corp Wash | | 1,592 | 39,004 |
| Hilltop Holdings Inc | | 2,039 | 58,377 |
| Hingham Institution For Savings The | | 85 | 21,602 |
| Home BancShares Inc/AR | | 8,346 | 236,192 |
| HomeStreet Inc (b) | | 698 | 7,970 |
| Hope Bancorp Inc | | 5,517 | 67,804 |
| Horizon Bancorp Inc/IN | | 2,009 | 32,365 |
| Independent Bank Corp | | 1,901 | 122,025 |
| Independent Bank Corp/MI | | 967 | 33,681 |
| Independent Bank Group Inc | | 1,627 | 98,710 |
| International Bancshares Corp | | 2,423 | 153,037 |
| Kearny Financial Corp/MD | | 2,364 | 16,736 |
| Lakeland Financial Corp | | 1,158 | 79,624 |
| Live Oak Bancshares Inc | | 1,502 | 59,404 |
| Mercantile Bank Corp | | 743 | 33,056 |
| Metropolitan Bank Holding Corp (b) | | 457 | 26,689 |
| Midland States Bancorp Inc | | 983 | 23,985 |
| National Bank Holdings Corp Class A | | 1,712 | 73,719 |
| Nbt Bancorp Inc | | 2,096 | 100,105 |
| Nicolet Bankshares Inc | | 603 | 63,261 |
| Northfield Bancorp Inc | | 1,746 | 20,289 |
| Northwest Bancshares Inc | | 5,790 | 76,370 |
| OceanFirst Financial Corp | | 2,633 | 47,657 |
| Old National Bancorp/IN | | 14,344 | 311,337 |
| Old Second Bancorp Inc | | 2,045 | 36,360 |
| Origin Bancorp Inc | | 1,319 | 43,910 |
| Pacific Premier Bancorp Inc | | 4,386 | 109,299 |
| Park National Corp | | 649 | 111,258 |
| Pathward Financial Inc | | 1,120 | 82,410 |
| Peapack-Gladstone Financial Corp | | 723 | 23,172 |
| Peoples Bancorp Inc/OH | | 1,552 | 49,183 |
| Pinnacle Financial Partners Inc | | 3,444 | 393,959 |
| Preferred Bank/Los Angeles CA | | 564 | 48,718 |
| Premier Financial Corp | | 1,613 | 41,244 |
| Prosperity Bancshares Inc | | 4,284 | 322,799 |
| Provident Financial Services Inc | | 5,932 | 111,937 |
| QCR Holdings Inc | | 774 | 62,415 |
| Renasant Corp | | 2,827 | 101,065 |
| S&T Bancorp Inc | | 1,699 | 64,936 |
| Sandy Spring Bancorp Inc | | 2,031 | 68,465 |
| Seacoast Banking Corp of Florida | | 3,827 | 105,357 |
| ServisFirst Bancshares Inc | | 2,261 | 191,597 |
| Simmons First National Corp Class A | | 5,629 | 124,851 |
| Southside Bancshares Inc | | 1,293 | 41,066 |
| SouthState Corp | | 3,430 | 341,216 |
| Stellar Bancorp Inc | | 2,193 | 62,172 |
| Stock Yards Bancorp Inc (c) | | 1,214 | 86,935 |
| Synovus Financial Corp | | 6,476 | 331,765 |
| Texas Capital Bancshares Inc (b) | | 2,081 | 162,734 |
| TFS Financial Corp | | 2,384 | 29,943 |
| Tompkins Financial Corp | | 571 | 38,731 |
| Towne Bank/Portsmouth VA | | 3,120 | 106,267 |
| TriCo Bancshares | | 1,500 | 65,550 |
| Triumph Financial Inc (b) | | 976 | 88,699 |
| TrustCo Bank Corp NY | | 869 | 28,946 |
| Trustmark Corp | | 2,749 | 97,232 |
| UMB Financial Corp | | 1,995 | 225,156 |
| United Bankshares Inc/WV | | 6,077 | 228,191 |
| United Community Banks Inc/GA | | 5,391 | 174,183 |
| Univest Financial Corp | | 1,352 | 39,898 |
| Valley National Bancorp | | 19,284 | 174,713 |
| Veritex Holdings Inc | | 2,492 | 67,683 |
| WaFd Inc | | 3,637 | 117,257 |
| Washington Trust Bancorp Inc | | 746 | 23,387 |
| Webster Financial Corp | | 7,714 | 425,967 |
| WesBanco Inc | | 2,662 | 86,621 |
| Westamerica BanCorp | | 1,180 | 61,903 |
| Western Alliance Bancorp | | 4,909 | 410,098 |
| Wintrust Financial Corp | | 2,990 | 372,883 |
| WSFS Financial Corp | | 2,646 | 140,582 |
| Zions Bancorp NA | | 6,644 | 360,437 |
| | | | 16,603,864 |
| Capital Markets - 3.8% | | | |
| Affiliated Managers Group Inc | | 1,342 | 248,163 |
| Artisan Partners Asset Management Inc Class A | | 3,156 | 135,866 |
| B Riley Financial Inc (c) | | 735 | 3,373 |
| BGC Group Inc Class A | | 17,127 | 155,171 |
| Blue Owl Capital Inc Class A | | 23,223 | 540,167 |
| Bridge Investment Group Holdings Inc Class A | | 1,712 | 14,380 |
| Brightsphere Investment Group Inc | | 1,264 | 33,294 |
| Carlyle Group Inc/The | | 9,456 | 477,433 |
| Cohen & Steers Inc (c) | | 1,197 | 110,531 |
| Diamond Hill Investment Group Inc | | 134 | 20,783 |
| DigitalBridge Group Inc Class A | | 6,927 | 78,137 |
| Donnelley Financial Solutions Inc (b) | | 1,223 | 76,719 |
| Ellington Credit Co | | 1,029 | 6,811 |
| Evercore Inc Class A | | 1,604 | 444,613 |
| Federated Hermes Inc Class B | | 3,574 | 146,927 |
| Forge Global Holdings Inc Class A (b) | | 4,573 | 4,256 |
| Franklin Resources Inc | | 13,885 | 281,727 |
| GCM Grosvenor Inc Class A | | 2,037 | 24,994 |
| Hamilton Lane Inc Class A | | 1,823 | 269,895 |
| Houlihan Lokey Inc Class A | | 2,388 | 414,700 |
| Interactive Brokers Group Inc Class A | | 4,891 | 864,093 |
| Invesco Ltd | | 20,239 | 353,778 |
| Janus Henderson Group PLC | | 5,711 | 242,889 |
| Jefferies Financial Group Inc | | 7,285 | 571,144 |
| Lazard Inc Class A | | 5,073 | 261,158 |
| MarketAxess Holdings Inc | | 1,701 | 384,494 |
| Moelis & Co Class A | | 3,167 | 233,978 |
| Morningstar Inc | | 1,213 | 408,490 |
| Open Lending Corp (b) | | 4,802 | 28,668 |
| Oppenheimer Holdings Inc Class A | | 289 | 18,522 |
| P10 Inc Class A | | 2,001 | 25,233 |
| Perella Weinberg Partners Class A | | 2,351 | 56,048 |
| Piper Sandler Cos | | 712 | 213,564 |
| PJT Partners Inc Class A | | 1,073 | 169,330 |
| Robinhood Markets Inc Class A (b) | | 31,926 | 1,189,563 |
| SEI Investments Co | | 4,436 | 365,881 |
| StepStone Group Inc Class A | | 2,833 | 163,974 |
| Stifel Financial Corp | | 4,608 | 488,817 |
| StoneX Group Inc (b) | | 1,281 | 125,500 |
| TPG Inc Class A | | 3,938 | 247,464 |
| Tradeweb Markets Inc Class A | | 5,231 | 684,843 |
| Victory Capital Holdings Inc Class A | | 2,058 | 134,717 |
| Virtu Financial Inc Class A | | 3,684 | 131,445 |
| Virtus Invt Partners Inc | | 304 | 67,056 |
| WisdomTree Inc | | 5,296 | 55,608 |
| | | | 10,974,197 |
| Consumer Finance - 1.1% | | | |
| Ally Financial Inc | | 12,346 | 444,579 |
| Bread Financial Holdings Inc | | 2,227 | 135,981 |
| Credit Acceptance Corp (b)(c) | | 282 | 132,388 |
| Encore Capital Group Inc (b) | | 1,049 | 50,111 |
| Enova International Inc (b) | | 1,195 | 114,577 |
| EZCORP Inc Class A (b) | | 2,346 | 28,668 |
| FirstCash Holdings Inc | | 1,756 | 181,922 |
| Green Dot Corp Class A (b) | | 2,533 | 26,951 |
| LendingClub Corp (b) | | 4,970 | 80,464 |
| Lendingtree Inc (b) | | 506 | 19,607 |
| Moneylion Inc Class A (b) | | 277 | 23,825 |
| Navient Corp | | 3,477 | 46,209 |
| Nelnet Inc Class A | | 789 | 84,273 |
| NerdWallet Inc Class A (b) | | 1,857 | 24,698 |
| OneMain Holdings Inc | | 5,420 | 282,545 |
| PRA Group Inc (b) | | 1,766 | 36,892 |
| PROG Holdings Inc | | 1,899 | 80,252 |
| SLM Corp | | 9,785 | 269,870 |
| SoFi Technologies Inc Class A (b) | | 47,944 | 738,338 |
| Upstart Holdings Inc (b) | | 3,507 | 215,926 |
| World Acceptance Corp (b) | | 158 | 17,765 |
| | | | 3,035,841 |
| Financial Services - 2.3% | | | |
| Affirm Holdings Inc Class A (b) | | 10,806 | 658,085 |
| AvidXchange Holdings Inc (b) | | 8,468 | 87,559 |
| Cannae Holdings Inc | | 2,487 | 49,392 |
| Cantaloupe Inc (b) | | 2,551 | 24,260 |
| Cass Information Systems Inc | | 565 | 23,114 |
| Corebridge Financial Inc | | 10,911 | 326,566 |
| Enact Holdings Inc | | 1,363 | 44,134 |
| Equitable Holdings Inc | | 14,378 | 678,210 |
| Essent Group Ltd | | 4,787 | 260,604 |
| Euronet Worldwide Inc (b) | | 1,903 | 195,705 |
| Federal Agricultural Mortgage Corp Class C | | 418 | 82,325 |
| Flywire Corp (b) | | 5,068 | 104,502 |
| HA Sustainable Infrastructure Capital Inc (c) | | 5,273 | 141,475 |
| I3 Verticals Inc Class A (b) | | 980 | 22,579 |
| International Money Express Inc (b) | | 1,421 | 29,599 |
| Jackson Financial Inc | | 3,385 | 294,766 |
| Marqeta Inc Class A (b) | | 18,660 | 70,721 |
| Merchants Bancorp/IN | | 1,224 | 44,639 |
| MGIC Investment Corp | | 11,668 | 276,648 |
| Mr Cooper Group Inc (b) | | 2,903 | 278,717 |
| NCR Atleos Corp (b) | | 3,218 | 109,155 |
| NewtekOne Inc | | 1,087 | 13,881 |
| NMI Holdings Inc (b) | | 3,572 | 131,307 |
| Paymentus Holdings Inc Class A (b) | | 872 | 28,488 |
| Payoneer Global Inc (b) | | 11,493 | 115,390 |
| PennyMac Financial Services Inc | | 1,440 | 147,082 |
| Radian Group Inc | | 6,773 | 214,840 |
| Remitly Global Inc (b) | | 6,610 | 149,188 |
| Repay Holdings Corp Class A (b) | | 3,361 | 25,644 |
| Rocket Cos Inc Class A (b) | | 5,856 | 65,939 |
| Sezzle Inc (b) | | 112 | 28,650 |
| Shift4 Payments Inc Class A (b)(c) | | 2,935 | 304,594 |
| Toast Inc Class A (b) | | 18,255 | 665,395 |
| UWM Holdings Corp Class A | | 4,430 | 26,004 |
| Voya Financial Inc | | 4,427 | 304,710 |
| Walker & Dunlop Inc | | 1,455 | 141,441 |
| Western Union Co/The | | 15,269 | 161,851 |
| WEX Inc (b) | | 1,849 | 324,167 |
| | | | 6,651,326 |
| Insurance - 3.3% | | | |
| Ambac Financial Group Inc/Old (b) | | 2,208 | 27,931 |
| American Coastal Insurance Corp | | 1,164 | 15,667 |
| American Financial Group Inc/OH | | 3,245 | 444,338 |
| Amerisafe Inc | | 854 | 44,015 |
| Assurant Inc | | 2,327 | 496,163 |
| Assured Guaranty Ltd | | 2,225 | 200,272 |
| Axis Capital Holdings Ltd | | 3,438 | 304,676 |
| Baldwin Insurance Group Inc/The Class A (b) | | 2,977 | 115,389 |
| Brighthouse Financial Inc (b) | | 2,697 | 129,564 |
| CNO Financial Group Inc | | 4,755 | 176,934 |
| eHealth Inc (b) | | 1,143 | 10,744 |
| Employers Holdings Inc | | 1,109 | 56,814 |
| Enstar Group Ltd (b) | | 562 | 180,992 |
| Erie Indemnity Co Class A | | 1,123 | 462,934 |
| First American Financial Corp | | 4,637 | 289,534 |
| Genworth Financial Inc Class A (b) | | 19,403 | 135,627 |
| Globe Life Inc | | 4,037 | 450,206 |
| Goosehead Insurance Inc Class A (b) | | 1,098 | 117,728 |
| Hanover Insurance Group Inc/The | | 1,620 | 250,549 |
| HCI Group Inc | | 380 | 44,281 |
| Hippo Holdings Inc (b) | | 868 | 23,236 |
| Horace Mann Educators Corp | | 1,856 | 72,811 |
| James River Group Holdings Ltd | | 1,559 | 7,592 |
| Kemper Corp | | 2,723 | 180,916 |
| Kinsale Capital Group Inc | | 995 | 462,804 |
| Lemonade Inc (b)(c) | | 2,445 | 89,683 |
| Lincoln National Corp | | 7,656 | 242,772 |
| Loews Corp | | 8,170 | 691,918 |
| MBIA Inc (c) | | 1,722 | 11,124 |
| Mercury General Corp | | 1,191 | 79,178 |
| Old Republic International Corp | | 10,664 | 385,930 |
| Oscar Health Inc Class A (b) | | 8,692 | 116,820 |
| Palomar Hldgs Inc (b) | | 1,187 | 125,335 |
| Primerica Inc | | 1,519 | 412,287 |
| ProAssurance Corp (b) | | 2,298 | 36,561 |
| Reinsurance Group of America Inc | | 2,959 | 632,131 |
| RLI Corp | | 1,870 | 308,232 |
| Root Inc/OH Class A (b)(c) | | 340 | 24,681 |
| Ryan Specialty Holdings Inc Class A | | 4,604 | 295,393 |
| Safety Insurance Group Inc | | 662 | 54,549 |
| Selective Insurance Group Inc | | 2,741 | 256,338 |
| Skyward Specialty Insurance Group Inc (b) | | 1,502 | 75,911 |
| Stewart Information Services Corp | | 1,256 | 84,767 |
| Tiptree Inc Class A | | 989 | 20,631 |
| Trupanion Inc (b)(c) | | 1,501 | 72,348 |
| United Fire Group Inc | | 928 | 26,402 |
| Universal Insurance Holdings Inc | | 1,126 | 23,714 |
| Unum Group | | 7,677 | 560,651 |
| White Mountains Insurance Group Ltd | | 114 | 221,737 |
| | | | 9,550,810 |
| Mortgage Real Estate Investment Trusts (REITs) - 0.8% | | | |
| AGNC Investment Corp | | 35,287 | 324,993 |
| Annaly Capital Management Inc | | 22,590 | 413,398 |
| Apollo Commercial Real Estate Finance Inc | | 5,937 | 51,414 |
| Arbor Realty Trust Inc (c) | | 8,487 | 117,545 |
| Ares Commercial Real Estate Corp | | 2,444 | 14,395 |
| ARMOUR Residential REIT Inc (c) | | 2,209 | 41,662 |
| Blackstone Mortgage Trust Inc Class A (c) | | 7,777 | 135,398 |
| Brightspire Capital Inc Class A | | 5,945 | 33,530 |
| Chimera Investment Corp | | 3,571 | 49,994 |
| Claros Mortgage Trust Inc (c) | | 5,162 | 23,332 |
| Dynex Capital Inc | | 3,487 | 44,111 |
| Ellington Financial Inc (c) | | 4,059 | 49,195 |
| Franklin BSP Realty Trust Inc | | 3,776 | 47,351 |
| Granite Point Mortgage Trust Inc | | 2,217 | 6,185 |
| Invesco Mortgage Capital Inc | | 2,645 | 21,292 |
| Kkr Real Estate Finance Trust Inc | | 2,606 | 26,321 |
| Ladder Capital Corp Class A | | 5,098 | 57,047 |
| MFA Financial Inc | | 4,617 | 47,047 |
| New York Mortgage Trust Inc | | 3,974 | 24,082 |
| Orchid Island Capital Inc (c) | | 3,022 | 23,511 |
| Pennymac Mortgage Investment Trust | | 3,949 | 49,718 |
| Ready Capital Corp (c) | | 7,543 | 51,443 |
| Redwood Trust Inc | | 6,227 | 40,662 |
| Rithm Capital Corp | | 23,515 | 254,667 |
| Starwood Property Trust Inc | | 14,400 | 272,880 |
| TPG RE Finance Trust Inc | | 2,901 | 24,659 |
| Two Harbors Investment Corp | | 4,818 | 56,997 |
| | | | 2,302,829 |
TOTAL FINANCIALS | | | 49,118,867 |
| | | | |
| Health Care - 11.2% | | | |
| Biotechnology - 4.8% | | | |
| 2seventy bio Inc (b)(c) | | 2,070 | 6,086 |
| 4D Molecular Therapeutics Inc (b) | | 1,874 | 10,438 |
| 89bio Inc (b) | | 4,152 | 32,469 |
| Absci Corp (b)(c) | | 4,116 | 10,784 |
| ACADIA Pharmaceuticals Inc (b) | | 5,473 | 100,430 |
| ACELYRIN Inc (b) | | 2,991 | 9,392 |
| Actinium Pharmaceuticals Inc (b) | | 1,185 | 1,492 |
| Acumen Pharmaceuticals Inc (b) | | 1,078 | 1,853 |
| Adicet Bio Inc (b) | | 2,272 | 2,186 |
| ADMA Biologics Inc (b) | | 10,497 | 180,024 |
| Adverum Biotechnologies Inc (b) | | 724 | 3,381 |
| Agenus Inc (b) | | 733 | 2,008 |
| Agios Pharmaceuticals Inc (b) | | 2,539 | 83,432 |
| Akebia Therapeutics Inc (b) | | 9,382 | 17,826 |
| Akero Therapeutics Inc (b) | | 2,868 | 79,788 |
| Aldeyra Therapeutics Inc (b) | | 1,740 | 8,683 |
| Alector Inc (b) | | 3,857 | 7,290 |
| Alkermes PLC (b) | | 7,432 | 213,744 |
| Allogene Therapeutics Inc (b) | | 6,295 | 13,408 |
| Altimmune Inc (b)(c) | | 3,183 | 22,949 |
| ALX Oncology Holdings Inc (b) | | 1,084 | 1,809 |
| Amicus Therapeutics Inc (b) | | 12,068 | 113,681 |
| AnaptysBio Inc (b) | | 824 | 10,910 |
| Anavex Life Sciences Corp (b)(c) | | 3,995 | 42,906 |
| Anika Therapeutics Inc (b) | | 611 | 10,057 |
| Annexon Inc (b) | | 3,638 | 18,663 |
| Apellis Pharmaceuticals Inc (b) | | 4,675 | 149,179 |
| Apogee Therapeutics Inc (b) | | 1,472 | 66,682 |
| Arbutus Biopharma Corp (b) | | 7,068 | 23,112 |
| Arcellx Inc (b) | | 1,752 | 134,361 |
| Arcturus Therapeutics Holdings Inc (b) | | 1,069 | 18,141 |
| Arcus Biosciences Inc (b) | | 2,475 | 36,853 |
| Arcutis Biotherapeutics Inc (b)(c) | | 4,704 | 65,527 |
| Ardelyx Inc (b) | | 10,808 | 54,797 |
| Arrowhead Pharmaceuticals Inc (b) | | 5,537 | 104,096 |
| ARS Pharmaceuticals Inc (b)(c) | | 2,362 | 24,919 |
| Astria Therapeutics Inc (b) | | 1,514 | 13,535 |
| Aura Biosciences Inc (b) | | 1,657 | 13,621 |
| Avid Bioservices Inc (b)(c) | | 2,949 | 36,420 |
| Avidity Biosciences Inc (b) | | 5,280 | 153,542 |
| Avita Medical Inc (b) | | 1,251 | 16,013 |
| Beam Therapeutics Inc (b) | | 3,323 | 82,410 |
| BioCryst Pharmaceuticals Inc (b) | | 9,291 | 69,868 |
| Biohaven Ltd (b) | | 3,751 | 140,100 |
| Biomea Fusion Inc (b)(c) | | 1,082 | 4,198 |
| Bluebird Bio Inc (b)(c) | | 387 | 3,228 |
| Blueprint Medicines Corp (b) | | 2,858 | 249,275 |
| Bridgebio Pharma Inc (b) | | 6,609 | 181,351 |
| C4 Therapeutics Inc (b) | | 2,390 | 8,604 |
| Cabaletta Bio Inc (b) | | 2,140 | 4,858 |
| CareDx Inc (b) | | 2,416 | 51,727 |
| Cargo Therapeutics Inc (b) | | 1,699 | 24,500 |
| Caribou Biosciences Inc (b) | | 4,403 | 7,001 |
| Carisma Therapeutics Inc rights (b)(e) | | 6,389 | 0 |
| Cartesian Therapeutics Inc rights (b)(e) | | 3,666 | 1,575 |
| Catalyst Pharmaceuticals Inc (b) | | 4,991 | 104,162 |
| Celcuity Inc (b) | | 1,141 | 14,936 |
| Celldex Therapeutics Inc (b) | | 2,973 | 75,128 |
| Cogent Biosciences Inc (b) | | 4,609 | 35,950 |
| Coherus Biosciences Inc (b)(c) | | 6,130 | 8,459 |
| Crinetics Pharmaceuticals Inc (b) | | 3,612 | 184,682 |
| Cullinan Therapeutics Inc (b) | | 2,378 | 28,964 |
| Cytokinetics Inc (b) | | 5,307 | 249,641 |
| Day One Biopharmaceuticals Inc (b) | | 2,995 | 37,947 |
| Denali Therapeutics Inc (b) | | 5,491 | 111,907 |
| Disc Medicine Inc (b) | | 881 | 55,855 |
| Dynavax Technologies Corp (b) | | 5,564 | 71,052 |
| Dyne Therapeutics Inc (b) | | 3,483 | 82,059 |
| Editas Medicine Inc (b)(c) | | 3,244 | 4,120 |
| Emergent BioSolutions Inc (b) | | 2,281 | 21,806 |
| Enanta Pharmaceuticals Inc (b) | | 788 | 4,531 |
| Erasca Inc (b)(c) | | 10,041 | 25,203 |
| Exelixis Inc (b) | | 12,846 | 427,772 |
| Fate Therapeutics Inc (b) | | 3,853 | 6,357 |
| Geron Corp (b) | | 23,323 | 82,563 |
| Gossamer Bio Inc (b) | | 8,119 | 7,344 |
| Halozyme Therapeutics Inc (b) | | 5,708 | 272,899 |
| Heron Therapeutics Inc (b)(c) | | 5,564 | 8,513 |
| Humacyte Inc Class A (b)(c) | | 3,749 | 18,932 |
| Ideaya Biosciences Inc (b) | | 3,776 | 97,043 |
| IGM Biosciences Inc (b)(c) | | 815 | 4,980 |
| ImmunityBio Inc (b)(c) | | 7,353 | 18,824 |
| Immunovant Inc (b) | | 2,955 | 73,195 |
| Incyte Corp (b) | | 7,203 | 497,511 |
| Inhibrx Biosciences Inc | | 413 | 6,360 |
| Inovio Pharmaceuticals Inc (b)(c) | | 1,082 | 1,980 |
| Inozyme Pharma Inc (b) | | 2,191 | 6,069 |
| Insmed Inc (b) | | 7,738 | 534,232 |
| Intellia Therapeutics Inc (b) | | 4,580 | 53,403 |
| Ionis Pharmaceuticals Inc (b) | | 7,109 | 248,531 |
| Iovance Biotherapeutics Inc (b)(c) | | 9,997 | 73,978 |
| Ironwood Pharmaceuticals Inc Class A (b) | | 6,309 | 27,949 |
| iTeos Therapeutics Inc (b) | | 1,176 | 9,032 |
| Janux Therapeutics Inc (b) | | 1,243 | 66,550 |
| KalVista Pharmaceuticals Inc (b)(c) | | 1,565 | 13,256 |
| Karyopharm Therapeutics Inc (b)(c) | | 5,473 | 3,701 |
| Keros Therapeutics Inc (b) | | 1,449 | 22,938 |
| Kiniksa Pharmaceuticals International Plc Class A (b) | | 1,645 | 32,538 |
| Kodiak Sciences Inc (b) | | 1,800 | 17,910 |
| Krystal Biotech Inc (b) | | 1,143 | 179,062 |
| Kura Oncology Inc (b) | | 3,354 | 29,213 |
| Kymera Therapeutics Inc (b) | | 2,012 | 80,943 |
| Larimar Therapeutics Inc (b) | | 1,349 | 5,221 |
| Lexeo Therapeutics Inc (b) | | 1,027 | 6,758 |
| Lexicon Pharmaceuticals Inc (b) | | 8,155 | 6,022 |
| Lyell Immunopharma Inc (b) | | 6,293 | 4,028 |
| MacroGenics Inc (b) | | 3,288 | 10,686 |
| Madrigal Pharmaceuticals Inc (b) | | 763 | 235,439 |
| MannKind Corp (b)(c) | | 12,253 | 78,787 |
| Mersana Therapeutics Inc (b) | | 4,062 | 5,809 |
| MiMedx Group Inc (b) | | 5,302 | 51,005 |
| Mineralys Therapeutics Inc (b) | | 1,030 | 12,679 |
| Mirum Pharmaceuticals Inc (b)(c) | | 1,819 | 75,216 |
| Myriad Genetics Inc (b) | | 4,102 | 56,238 |
| Natera Inc (b) | | 5,567 | 881,256 |
| Neurocrine Biosciences Inc (b) | | 4,549 | 620,939 |
| Novavax Inc (b)(c) | | 7,068 | 56,827 |
| Nurix Therapeutics Inc (b) | | 2,630 | 49,549 |
| Nuvalent Inc Class A (b) | | 1,690 | 132,293 |
| Ocugen Inc (b)(c) | | 12,814 | 10,315 |
| Olema Pharmaceuticals Inc (b)(c) | | 1,585 | 9,241 |
| OmniAb Operations Inc (b)(e) | | 200 | 430 |
| OmniAb Operations Inc (b)(e) | | 200 | 381 |
| Organogenesis Holdings Inc Class A (b) | | 3,166 | 10,131 |
| ORIC Pharmaceuticals Inc (b)(c) | | 1,930 | 15,575 |
| PDL BioPharma Inc (b)(e) | | 2,200 | 0 |
| PDS Biotechnology Corp (b)(c) | | 1,390 | 2,266 |
| Poseida Therapeutics Inc (b) | | 3,198 | 30,701 |
| Praxis Precision Medicines Inc (b) | | 761 | 58,567 |
| Precigen Inc (b) | | 5,360 | 6,003 |
| Prime Medicine Inc (b)(c) | | 2,374 | 6,932 |
| Protagonist Therapeutics Inc (b) | | 2,671 | 103,101 |
| PTC Therapeutics Inc (b) | | 3,477 | 156,952 |
| Puma Biotechnology Inc (b) | | 1,775 | 5,414 |
| RAPT Therapeutics Inc (b) | | 1,175 | 1,857 |
| Recursion Pharmaceuticals Inc Class A (b)(c) | | 10,701 | 72,339 |
| REGENXBIO Inc (b) | | 1,956 | 15,120 |
| Relay Therapeutics Inc (b) | | 5,817 | 23,966 |
| Replimune Group Inc (b) | | 2,729 | 33,048 |
| REVOLUTION Medicines Inc (b)(c) | | 7,075 | 309,461 |
| Rhythm Pharmaceuticals Inc (b) | | 2,355 | 131,833 |
| Rigel Pharmaceuticals Inc (b) | | 758 | 12,750 |
| Rocket Pharmaceuticals Inc (b) | | 3,217 | 40,438 |
| Roivant Sciences Ltd (b) | | 19,713 | 233,205 |
| Sage Therapeutics Inc (b) | | 2,350 | 12,761 |
| Sana Biotechnology Inc (b)(c) | | 5,415 | 8,826 |
| Sangamo Therapeutics Inc (b)(c) | | 8,554 | 8,725 |
| Sarepta Therapeutics Inc (b) | | 4,294 | 522,107 |
| Savara Inc (b)(c) | | 4,933 | 15,144 |
| Scholar Rock Holding Corp (b) | | 2,718 | 117,472 |
| SpringWorks Therapeutics Inc (b) | | 3,361 | 121,433 |
| Stoke Therapeutics Inc (b) | | 1,685 | 18,586 |
| Summit Therapeutics Inc (b) | | 6,199 | 110,621 |
| Sutro Biopharma Inc (b) | | 3,405 | 6,265 |
| Syndax Pharmaceuticals Inc (b) | | 3,784 | 50,024 |
| Tango Therapeutics Inc (b) | | 2,743 | 8,476 |
| Tenaya Therapeutics Inc (b)(c) | | 2,930 | 4,190 |
| TG Therapeutics Inc (b) | | 6,010 | 180,901 |
| Travere Therapeutics Inc (b) | | 3,016 | 52,539 |
| Twist Bioscience Corp (b) | | 2,615 | 121,519 |
| Tyra Biosciences Inc (b) | | 870 | 12,093 |
| Ultragenyx Pharmaceutical Inc (b) | | 4,164 | 175,179 |
| United Therapeutics Corp (b) | | 2,004 | 707,091 |
| Vanda Pharmaceuticals Inc (b) | | 2,644 | 12,665 |
| Vaxcyte Inc (b) | | 5,049 | 413,311 |
| Vera Therapeutics Inc Class A (b) | | 2,096 | 88,640 |
| Veracyte Inc (b) | | 3,436 | 136,066 |
| Vericel Corp (b) | | 2,223 | 122,065 |
| Verve Therapeutics Inc (b) | | 3,277 | 18,482 |
| Viking Therapeutics Inc (b)(c) | | 4,992 | 200,878 |
| Vir Biotechnology Inc (b) | | 4,137 | 30,366 |
| Viridian Therapeutics Inc (b) | | 2,820 | 54,059 |
| Voyager Therapeutics Inc (b) | | 1,960 | 11,113 |
| X4 Pharmaceuticals Inc (b)(c) | | 6,250 | 4,585 |
| Xencor Inc (b) | | 2,734 | 62,827 |
| Y-mAbs Therapeutics Inc (b) | | 1,442 | 11,291 |
| Zentalis Pharmaceuticals Inc (b) | | 2,268 | 6,872 |
| | | | 13,791,112 |
| Health Care Equipment & Supplies - 2.2% | | | |
| Alphatec Holdings Inc (b) | | 4,556 | 41,824 |
| AngioDynamics Inc (b) | | 1,907 | 17,468 |
| Artivion Inc (b) | | 1,701 | 48,632 |
| AtriCure Inc (b) | | 2,211 | 67,568 |
| Avanos Medical Inc (b) | | 2,098 | 33,400 |
| Axogen Inc (b) | | 2,036 | 33,553 |
| Butterfly Network Inc Class A (b)(c) | | 7,402 | 23,094 |
| Cerus Corp (b) | | 9,066 | 13,962 |
| CONMED Corp (c) | | 1,401 | 95,884 |
| CVRx Inc (b) | | 625 | 7,919 |
| DENTSPLY SIRONA Inc | | 9,147 | 173,610 |
| Embecta Corp | | 2,521 | 52,059 |
| Enovis Corp (b) | | 2,532 | 111,104 |
| Envista Holdings Corp (b)(c) | | 7,783 | 150,134 |
| Glaukos Corp (b) | | 2,471 | 370,502 |
| Globus Medical Inc Class A (b) | | 5,076 | 419,837 |
| Haemonetics Corp (b) | | 2,306 | 180,052 |
| ICU Medical Inc (b) | | 1,101 | 170,842 |
| Inari Medical Inc (b) | | 2,272 | 115,986 |
| Inogen Inc (b) | | 1,097 | 10,059 |
| Inspire Medical Systems Inc (b) | | 1,343 | 248,965 |
| Integer Holdings Corp (b) | | 1,507 | 199,708 |
| Integra LifeSciences Holdings Corp (b) | | 3,040 | 68,947 |
| iRadimed Corp | | 353 | 19,415 |
| iRhythm Technologies Inc (b) | | 1,418 | 127,861 |
| Lantheus Holdings Inc (b) | | 3,126 | 279,652 |
| LeMaitre Vascular Inc | | 930 | 85,690 |
| LivaNova PLC (b) | | 2,440 | 112,996 |
| Masimo Corp (b) | | 1,986 | 328,286 |
| Merit Medical Systems Inc (b) | | 2,613 | 252,729 |
| Neogen Corp (b) | | 8,922 | 108,313 |
| Nevro Corp (b) | | 1,436 | 5,342 |
| Novocure Ltd (b) | | 4,431 | 132,044 |
| Omnicell Inc (b) | | 2,042 | 90,910 |
| OraSure Technologies Inc (b) | | 2,984 | 10,772 |
| Orthofix Medical Inc (b) | | 1,655 | 28,896 |
| OrthoPediatrics Corp (b) | | 779 | 18,057 |
| Outset Medical Inc (b)(c) | | 1,928 | 2,140 |
| Paragon 28 Inc (b)(c) | | 1,685 | 17,406 |
| Penumbra Inc (b) | | 1,749 | 415,354 |
| PROCEPT BioRobotics Corp (b) | | 2,316 | 186,484 |
| Pulmonx Corp (b) | | 1,628 | 11,054 |
| QuidelOrtho Corp (b) | | 2,566 | 114,315 |
| RxSight Inc (b) | | 1,503 | 51,673 |
| Semler Scientific Inc (b)(c) | | 262 | 14,148 |
| Senseonics Holdings Inc (b) | | 19,924 | 10,428 |
| SI-BONE Inc (b) | | 1,642 | 23,021 |
| Sight Sciences Inc (b) | | 1,223 | 4,452 |
| Solventum Corp | | 6,220 | 410,893 |
| STAAR Surgical Co (b)(c) | | 2,223 | 53,997 |
| Surmodics Inc (b) | | 615 | 24,354 |
| Tactile Systems Technology Inc (b) | | 1,109 | 18,997 |
| Tandem Diabetes Care Inc (b) | | 2,911 | 104,854 |
| Teleflex Inc | | 2,122 | 377,674 |
| TransMedics Group Inc (b)(c) | | 1,495 | 93,213 |
| Treace Medical Concepts Inc (b) | | 2,086 | 15,520 |
| UFP Technologies Inc (b) | | 327 | 79,955 |
| Utah Medical Products Inc | | 139 | 8,544 |
| Varex Imaging Corp (b) | | 1,781 | 25,985 |
| Zimvie Inc (b) | | 1,321 | 18,428 |
| Zynex Inc (b)(c) | | 701 | 5,615 |
| | | | 6,344,576 |
| Health Care Providers & Services - 2.1% | | | |
| 23andMe Holding Co Class A (b) | | 634 | 2,060 |
| Acadia Healthcare Co Inc (b) | | 4,189 | 166,094 |
| Accolade Inc (b) | | 3,583 | 12,253 |
| AdaptHealth Corp (b) | | 4,714 | 44,877 |
| Addus HomeCare Corp (b) | | 811 | 101,659 |
| agilon health Inc (b) | | 14,059 | 26,712 |
| Alignment Healthcare Inc (b) | | 4,512 | 50,760 |
| Amedisys Inc (b) | | 1,469 | 133,371 |
| AMN Healthcare Services Inc (b) | | 1,706 | 40,808 |
| Astrana Health Inc (b) | | 1,860 | 58,646 |
| Brookdale Senior Living Inc (b) | | 8,802 | 44,274 |
| Castle Biosciences Inc (b) | | 1,267 | 33,766 |
| Chemed Corp | | 678 | 359,204 |
| Clover Health Investments Corp Class A (b) | | 18,037 | 56,817 |
| Community Health Systems Inc (b) | | 5,243 | 15,677 |
| Concentra Group Holdings Parent Inc | | 3,700 | 73,186 |
| CorVel Corp (b) | | 1,227 | 136,516 |
| Cross Country Healthcare Inc (b)(c) | | 1,474 | 26,768 |
| DaVita Inc (b) | | 2,075 | 310,316 |
| DocGo Inc Class A (b) | | 3,963 | 16,803 |
| Encompass Health Corp | | 4,525 | 417,884 |
| Enhabit Inc (b) | | 2,142 | 16,729 |
| Ensign Group Inc/The | | 2,552 | 339,059 |
| Fulgent Genetics Inc (b) | | 835 | 15,422 |
| Guardant Health Inc (b) | | 5,545 | 169,400 |
| HealthEquity Inc (b) | | 3,913 | 375,452 |
| Henry Schein Inc (b) | | 5,703 | 394,648 |
| Hims & Hers Health Inc Class A (b)(c) | | 8,538 | 206,449 |
| LifeStance Health Group Inc (b) | | 5,919 | 43,623 |
| Modivcare Inc (b)(c) | | 502 | 5,943 |
| National HealthCare Corp | | 545 | 58,620 |
| National Research Corp Class A | | 714 | 12,595 |
| NeoGenomics Inc (b) | | 5,781 | 95,271 |
| OPKO Health Inc (b)(c) | | 14,858 | 21,841 |
| Option Care Health Inc (b) | | 7,703 | 178,710 |
| Owens & Minor Inc (b) | | 3,255 | 42,543 |
| Patterson Cos Inc | | 3,535 | 109,090 |
| Pediatrix Medical Group Inc (b) | | 3,727 | 48,898 |
| Pennant Group Inc/The (b) | | 1,358 | 36,014 |
| Premier Inc Class A | | 4,741 | 100,509 |
| Privia Health Group Inc (b) | | 4,650 | 90,908 |
| Progyny Inc (b) | | 3,469 | 59,840 |
| RadNet Inc (b) | | 2,927 | 204,422 |
| Select Medical Holdings Corp | | 4,735 | 89,255 |
| Surgery Partners Inc (b) | | 3,316 | 70,200 |
| Talkspace Inc Class A (b) | | 6,130 | 18,942 |
| Tenet Healthcare Corp (b) | | 4,313 | 544,430 |
| Universal Health Services Inc Class B | | 2,677 | 480,307 |
| US Physical Therapy Inc | | 664 | 58,903 |
| | | | 6,016,474 |
| Health Care Technology - 0.3% | | | |
| American Well Corp (b) | | 510 | 3,698 |
| Certara Inc (b) | | 5,037 | 53,644 |
| Definitive Healthcare Corp Class A (b) | | 2,346 | 9,642 |
| Doximity Inc Class A (b) | | 5,636 | 300,907 |
| Evolent Health Inc Class A (b) | | 4,841 | 54,461 |
| GoodRx Holdings Inc Class A (b) | | 3,528 | 16,405 |
| Health Catalyst Inc (b) | | 2,802 | 19,810 |
| HealthStream Inc | | 1,123 | 35,711 |
| Multiplan Corp Class A (b) | | 262 | 3,872 |
| OptimizeRx Corp (b) | | 714 | 3,470 |
| Phreesia Inc (b) | | 2,506 | 63,051 |
| Schrodinger Inc/United States (b) | | 2,465 | 47,550 |
| Simulations Plus Inc | | 706 | 19,690 |
| Teladoc Health Inc (b) | | 7,624 | 69,303 |
| TruBridge Inc (b) | | 620 | 12,226 |
| | | | 713,440 |
| Life Sciences Tools & Services - 0.7% | | | |
| 10X Genomics Inc Class A (b) | | 4,774 | 68,555 |
| Adaptive Biotechnologies Corp (b) | | 5,069 | 30,389 |
| Azenta Inc (b) | | 2,207 | 110,350 |
| Bio-Rad Laboratories Inc Class A (b) | | 862 | 283,176 |
| BioLife Solutions Inc (b)(c) | | 1,596 | 41,432 |
| Bruker Corp | | 4,978 | 291,810 |
| Codexis Inc (b) | | 2,953 | 14,086 |
| CryoPort Inc (b) | | 2,316 | 18,018 |
| Cytek Biosciences Inc (b) | | 4,966 | 32,229 |
| Fortrea Holdings Inc (b) | | 4,075 | 75,999 |
| Lifecore Biomedical Inc (b) | | 1,378 | 10,238 |
| Maravai LifeSciences Holdings Inc Class A (b) | | 5,502 | 29,986 |
| MaxCyte Inc (United States) (b) | | 4,915 | 20,446 |
| Medpace Holdings Inc (b) | | 1,144 | 380,071 |
| Mesa Laboratories Inc (c) | | 241 | 31,781 |
| OmniAb Inc (b)(c) | | 4,545 | 16,089 |
| Pacific Biosciences of California Inc (b)(c) | | 11,537 | 21,113 |
| Quanterix Corp (b)(c) | | 1,578 | 16,774 |
| Repligen Corp (b) | | 2,345 | 337,539 |
| Sotera Health Co (b) | | 6,841 | 93,585 |
| Standard BioTools Inc (b) | | 14,210 | 24,868 |
| | | | 1,948,534 |
| Pharmaceuticals - 1.1% | | | |
| Amneal Intermediate Inc Class A (b) | | 6,558 | 51,939 |
| Amphastar Pharmaceuticals Inc (b) | | 1,702 | 63,195 |
| Amylyx Pharmaceuticals Inc (b) | | 2,189 | 8,274 |
| ANI Pharmaceuticals Inc (b) | | 746 | 41,239 |
| Arvinas Inc (b) | | 2,926 | 56,091 |
| Assertio Holdings Inc (b) | | 4,049 | 3,527 |
| Atea Pharmaceuticals Inc (b) | | 2,986 | 10,003 |
| Axsome Therapeutics Inc (b) | | 1,819 | 153,906 |
| Cassava Sciences Inc (b)(c) | | 2,006 | 4,734 |
| Collegium Pharmaceutical Inc (b) | | 1,403 | 40,196 |
| Corcept Therapeutics Inc (b) | | 4,189 | 211,084 |
| CorMedix Inc (b)(c) | | 2,620 | 21,222 |
| Edgewise Therapeutics Inc (b) | | 2,605 | 69,554 |
| Elanco Animal Health Inc (b) | | 22,272 | 269,714 |
| Enliven Therapeutics Inc (b)(c) | | 1,349 | 30,353 |
| Esperion Therapeutics Inc New (b) | | 7,735 | 17,017 |
| Evolus Inc (b) | | 2,323 | 25,646 |
| EyePoint Pharmaceuticals Inc (b) | | 2,564 | 19,102 |
| Fulcrum Therapeutics Inc (b) | | 1,986 | 9,334 |
| Harmony Biosciences Holdings Inc (b) | | 1,358 | 46,729 |
| Harrow Inc (b) | | 1,341 | 44,991 |
| Innoviva Inc (b) | | 2,490 | 43,202 |
| Intra-Cellular Therapies Inc (b) | | 4,430 | 369,994 |
| Jazz Pharmaceuticals PLC (b) | | 2,782 | 342,603 |
| Ligand Pharmaceuticals Inc (b) | | 817 | 87,542 |
| Liquidia Corp (b) | | 1,815 | 21,344 |
| Mind Medicine MindMed Inc (b)(c) | | 3,171 | 22,070 |
| Nuvation Bio Inc Class A (b) | | 7,355 | 19,564 |
| Ocular Therapeutix Inc (b) | | 5,594 | 47,773 |
| Omeros Corp (b) | | 2,931 | 28,958 |
| Organon & Co | | 11,609 | 173,206 |
| Pacira BioSciences Inc (b) | | 2,114 | 39,828 |
| Perrigo Co PLC | | 6,152 | 158,168 |
| Phathom Pharmaceuticals Inc (b) | | 1,531 | 12,432 |
| Phibro Animal Health Corp Class A | | 966 | 20,286 |
| Pliant Therapeutics Inc (b) | | 2,443 | 32,174 |
| Prestige Consumer Healthcare Inc (b) | | 2,235 | 174,531 |
| Revance Therapeutics Inc (b) | | 3,754 | 11,412 |
| scPharmaceuticals Inc (b)(c) | | 1,507 | 5,335 |
| SIGA Technologies Inc (c) | | 2,025 | 12,170 |
| Supernus Pharmaceuticals Inc (b) | | 2,450 | 88,592 |
| Tarsus Pharmaceuticals Inc (b) | | 1,574 | 87,152 |
| Terns Pharmaceuticals Inc (b) | | 1,940 | 10,748 |
| Theravance Biopharma Inc (b) | | 1,573 | 14,802 |
| Ventyx Biosciences Inc (b) | | 3,330 | 7,293 |
| Verrica Pharmaceuticals Inc (b)(c) | | 803 | 561 |
| WaVe Life Sciences Ltd (b) | | 5,148 | 63,681 |
| Xeris Biopharma Holdings Inc (b) | | 6,942 | 23,533 |
| Xeris Biopharma Holdings Inc rights (b)(e) | | 1,262 | 0 |
| Zevra Therapeutics Inc (b) | | 2,036 | 16,980 |
| | | | 3,133,784 |
TOTAL HEALTH CARE | | | 31,947,920 |
| | | | |
| Industrials - 19.3% | | | |
| Aerospace & Defense - 1.4% | | | |
| AAR Corp (b) | | 1,560 | 95,597 |
| AeroVironment Inc (b) | | 1,264 | 194,517 |
| AerSale Corp (b) | | 1,553 | 9,784 |
| Archer Aviation Inc Class A (b)(c) | | 9,764 | 95,199 |
| Astronics Corp (b) | | 1,271 | 20,285 |
| BWX Technologies Inc | | 4,114 | 458,258 |
| Cadre Holdings Inc | | 1,184 | 38,243 |
| Curtiss-Wright Corp | | 1,723 | 611,441 |
| Ducommun Inc (b) | | 610 | 38,833 |
| Hexcel Corp | | 3,689 | 231,300 |
| Huntington Ingalls Industries Inc | | 1,767 | 333,910 |
| Kratos Defense & Security Solutions Inc (b) | | 6,805 | 179,516 |
| Leonardo DRS Inc (b) | | 3,292 | 106,365 |
| Mercury Systems Inc (b) | | 2,265 | 95,130 |
| Moog Inc Class A | | 1,295 | 254,908 |
| National Presto Industries Inc | | 239 | 23,522 |
| Rocket Lab USA Inc Class A (b)(c) | | 15,646 | 398,504 |
| Spirit AeroSystems Holdings Inc Class A (b) | | 5,259 | 179,227 |
| Triumph Group Inc (b) | | 3,410 | 63,631 |
| V2X Inc (b) | | 520 | 24,872 |
| Virgin Galactic Holdings Inc Class A (b)(c) | | 1,122 | 6,596 |
| Woodward Inc | | 2,686 | 447,004 |
| | | | 3,906,642 |
| Air Freight & Logistics - 0.3% | | | |
| Air Transport Services Group Inc (b) | | 2,226 | 48,927 |
| CH Robinson Worldwide Inc | | 5,276 | 545,116 |
| Forward Air Corp Class A (c) | | 883 | 28,477 |
| GXO Logistics Inc (b) | | 5,381 | 234,074 |
| Hub Group Inc Class A | | 2,781 | 123,921 |
| | | | 980,515 |
| Building Products - 2.3% | | | |
| A O Smith Corp | | 5,406 | 368,743 |
| AAON Inc | | 3,026 | 356,100 |
| Advanced Drainage Systems Inc | | 3,177 | 367,261 |
| Allegion plc | | 3,916 | 511,743 |
| American Woodmark Corp (b) | | 718 | 57,103 |
| Apogee Enterprises Inc | | 993 | 70,910 |
| Armstrong World Industries Inc | | 1,959 | 276,865 |
| AZEK Co Inc/The Class A (b) | | 6,515 | 309,267 |
| AZZ Inc | | 1,352 | 110,756 |
| CSW Industrials Inc | | 748 | 263,894 |
| Fortune Brands Innovations Inc | | 5,588 | 381,828 |
| Gibraltar Industries Inc (b) | | 1,360 | 80,104 |
| Griffon Corp | | 1,846 | 131,564 |
| Hayward Holdings Inc (b) | | 6,304 | 96,388 |
| Insteel Industries Inc | | 841 | 22,715 |
| Janus International Group Inc (b) | | 6,498 | 47,760 |
| JELD-WEN Holding Inc (b) | | 3,816 | 31,253 |
| Lennox International Inc | | 1,442 | 878,612 |
| Masterbrand Inc (b) | | 5,677 | 82,941 |
| Owens Corning | | 3,913 | 666,462 |
| Quanex Building Products Corp | | 2,082 | 50,468 |
| Resideo Technologies Inc (b) | | 6,592 | 151,946 |
| Simpson Manufacturing Co Inc | | 1,902 | 315,409 |
| Tecnoglass Inc | | 1,004 | 79,637 |
| Trex Co Inc (b) | | 4,895 | 337,902 |
| UFP Industries Inc | | 2,744 | 309,112 |
| Zurn Elkay Water Solutions Corp (c) | | 6,450 | 240,585 |
| | | | 6,597,328 |
| Commercial Services & Supplies - 1.5% | | | |
| ABM Industries Inc | | 2,840 | 145,351 |
| ACCO Brands Corp | | 4,349 | 22,832 |
| ACV Auctions Inc Class A (b) | | 6,784 | 146,534 |
| Aris Water Solutions Inc Class A | | 1,237 | 29,626 |
| Brady Corp Class A | | 1,999 | 147,626 |
| BrightView Holdings Inc (b) | | 2,559 | 40,918 |
| Brink's Co/The | | 1,993 | 184,891 |
| Casella Waste Systems Inc Class A (b) | | 2,772 | 293,305 |
| CECO Environmental Corp (b) | | 1,290 | 38,997 |
| Clean Harbors Inc (b) | | 2,282 | 525,180 |
| CoreCivic Inc (b) | | 4,919 | 106,939 |
| Deluxe Corp | | 1,986 | 44,864 |
| Driven Brands Holdings Inc (b) | | 2,617 | 42,238 |
| Ennis Inc | | 1,145 | 24,148 |
| Enviri Corp (b) | | 3,758 | 28,937 |
| GEO Group Inc/The (b) | | 6,130 | 171,517 |
| Healthcare Services Group Inc (b) | | 3,377 | 39,224 |
| HNI Corp | | 2,142 | 107,893 |
| Interface Inc | | 2,582 | 62,872 |
| Liquidity Services Inc (b) | | 997 | 32,193 |
| Matthews International Corp Class A | | 1,382 | 38,254 |
| MillerKnoll Inc | | 3,171 | 71,633 |
| Montrose Environmental Group Inc (b) | | 1,404 | 26,044 |
| MSA Safety Inc | | 1,769 | 293,247 |
| OPENLANE Inc (b) | | 4,899 | 97,196 |
| Pitney Bowes Inc | | 6,987 | 50,586 |
| Rollins Inc | | 12,634 | 585,587 |
| Steelcase Inc Class A | | 4,173 | 49,325 |
| Tetra Tech Inc | | 12,041 | 479,713 |
| UniFirst Corp/MA | | 678 | 115,999 |
| Vestis Corp | | 5,183 | 78,989 |
| Viad Corp (b) | | 947 | 40,257 |
| VSE Corp | | 724 | 68,852 |
| | | | 4,231,767 |
| Construction & Engineering - 2.0% | | | |
| AECOM | | 6,027 | 643,804 |
| Ameresco Inc Class A (b)(c) | | 1,470 | 34,516 |
| API Group Corp (b) | | 10,878 | 391,282 |
| Arcosa Inc | | 2,195 | 212,344 |
| Argan Inc | | 571 | 78,250 |
| Bowman Consulting Group Ltd (b) | | 622 | 15,518 |
| Comfort Systems USA Inc | | 1,600 | 678,496 |
| Construction Partners Inc Class A (b) | | 1,969 | 174,178 |
| Dycom Industries Inc (b) | | 1,310 | 228,019 |
| EMCOR Group Inc | | 2,099 | 952,736 |
| Everus Construction Group Inc | | 2,306 | 151,620 |
| Fluor Corp (b) | | 7,710 | 380,257 |
| Granite Construction Inc | | 1,962 | 172,087 |
| Great Lakes Dredge & Dock Corp (b) | | 3,021 | 34,106 |
| IES Holdings Inc (b) | | 383 | 76,968 |
| Limbach Holdings Inc (b) | | 465 | 39,776 |
| MasTec Inc (b) | | 2,768 | 376,836 |
| Matrix Service Co (b) | | 1,187 | 14,207 |
| MYR Group Inc (b) | | 750 | 111,578 |
| Primoris Services Corp | | 2,414 | 184,430 |
| Sterling Infrastructure Inc (b) | | 1,383 | 232,966 |
| Tutor Perini Corp (b) | | 1,979 | 47,892 |
| Valmont Industries Inc | | 907 | 278,150 |
| WillScot Holdings Corp (b) | | 8,488 | 283,924 |
| | | | 5,793,940 |
| Electrical Equipment - 1.3% | | | |
| Acuity Brands Inc | | 1,384 | 404,308 |
| Allient Inc | | 700 | 16,996 |
| American Superconductor Corp (b)(c) | | 1,767 | 43,521 |
| Array Technologies Inc (b)(c) | | 6,370 | 38,475 |
| Atkore Inc | | 1,629 | 135,940 |
| Blink Charging Co (b)(c) | | 4,524 | 6,288 |
| Bloom Energy Corp Class A (b)(c) | | 8,916 | 198,024 |
| ChargePoint Holdings Inc Class A (b)(c) | | 16,832 | 18,010 |
| Energy Vault Holdings Inc Class A (b) | | 4,289 | 9,779 |
| EnerSys | | 1,795 | 165,912 |
| Enovix Corp Class B (b)(c) | | 6,655 | 72,340 |
| Eos Energy Enterprises Inc (b)(c) | | 10,128 | 49,222 |
| Fluence Energy Inc Class A (b)(c) | | 2,746 | 43,606 |
| FuelCell Energy Inc (b)(c) | | 765 | 6,916 |
| Generac Holdings Inc (b) | | 2,710 | 420,186 |
| GrafTech International Ltd (b) | | 8,343 | 14,433 |
| LSI Industries Inc | | 1,152 | 22,372 |
| Net Power Inc Class A (b) | | 1,517 | 16,065 |
| NEXTracker Inc Class A (b) | | 6,466 | 236,203 |
| NuScale Power Corp Class A (b)(c) | | 3,809 | 68,295 |
| nVent Electric PLC | | 7,481 | 509,906 |
| Plug Power Inc (b)(c) | | 36,814 | 78,414 |
| Powell Industries Inc | | 419 | 92,871 |
| Preformed Line Products Co | | 142 | 18,146 |
| Regal Rexnord Corp | | 2,995 | 464,615 |
| Sensata Technologies Holding PLC | | 6,812 | 186,649 |
| Shoals Technologies Group Inc (b) | | 7,629 | 42,188 |
| Stem Inc Class A (b)(c) | | 6,093 | 3,674 |
| Sunrun Inc (b)(c) | | 10,141 | 93,804 |
| Thermon Group Holdings Inc (b) | | 1,527 | 43,932 |
| TPI Composites Inc (b)(c) | | 1,434 | 2,710 |
| Vicor Corp (b) | | 1,060 | 51,219 |
| | | | 3,575,019 |
| Ground Transportation - 1.2% | | | |
| ArcBest Corp | | 1,056 | 98,546 |
| Avis Budget Group Inc | | 775 | 62,473 |
| Covenant Logistics Group Inc Class A | | 372 | 20,278 |
| Ftai Infrastructure Inc | | 4,774 | 34,659 |
| Heartland Express Inc | | 1,848 | 20,735 |
| Hertz Global Holdings Inc (b)(c) | | 5,792 | 21,199 |
| Knight-Swift Transportation Holdings Inc | | 7,286 | 386,449 |
| Landstar System Inc | | 1,599 | 274,804 |
| Lyft Inc Class A (b) | | 16,282 | 210,038 |
| Marten Transport Ltd | | 2,602 | 40,617 |
| Proficient Auto Logistics Inc | | 661 | 5,333 |
| RXO Inc (b)(c) | | 6,194 | 147,665 |
| Ryder System Inc | | 1,944 | 304,936 |
| Saia Inc (b)(c) | | 1,197 | 545,509 |
| Schneider National Inc Class B | | 2,164 | 63,362 |
| U-Haul Holding Co (b)(c) | | 462 | 31,919 |
| U-Haul Holding Co Class N | | 4,495 | 287,905 |
| Werner Enterprises Inc (c) | | 2,762 | 99,211 |
| XPO Inc (b) | | 5,237 | 686,833 |
| | | | 3,342,471 |
| Machinery - 4.5% | | | |
| 3D Systems Corp (b) | | 6,178 | 20,264 |
| AGCO Corp | | 2,791 | 260,903 |
| Alamo Group Inc | | 463 | 86,076 |
| Albany International Corp Class A | | 1,417 | 113,317 |
| Allison Transmission Holdings Inc | | 3,914 | 422,947 |
| Astec Industries Inc | | 1,047 | 35,179 |
| Atmus Filtration Technologies Inc | | 3,769 | 147,669 |
| Barnes Group Inc | | 2,033 | 96,080 |
| Blue Bird Corp (b) | | 1,432 | 55,318 |
| Chart Industries Inc (b) | | 1,892 | 361,069 |
| CNH Industrial NV Class A | | 39,425 | 446,685 |
| Columbus McKinnon Corp/NY | | 1,276 | 47,518 |
| Crane Co | | 2,189 | 332,181 |
| Desktop Metal Inc (b)(c) | | 1,079 | 2,524 |
| Donaldson Co Inc | | 5,419 | 364,970 |
| Douglas Dynamics Inc | | 989 | 23,370 |
| Energy Recovery Inc (b) | | 2,663 | 39,146 |
| Enerpac Tool Group Corp Class A | | 2,415 | 99,232 |
| Enpro Inc | | 944 | 162,793 |
| Esab Corp | | 2,557 | 306,687 |
| ESCO Technologies Inc | | 1,163 | 154,923 |
| Federal Signal Corp | | 2,751 | 254,165 |
| Flowserve Corp | | 5,907 | 339,771 |
| Franklin Electric Co Inc | | 1,773 | 172,779 |
| Gates Industrial Corp PLC (b) | | 10,162 | 209,032 |
| Gorman-Rupp Co/The | | 948 | 35,948 |
| Graco Inc | | 7,599 | 640,520 |
| Graham Corp (b) | | 466 | 20,723 |
| Greenbrier Cos Inc/The (c) | | 1,395 | 85,081 |
| Helios Technologies Inc | | 1,507 | 67,272 |
| Hillenbrand Inc | | 3,111 | 95,757 |
| Hillman Solutions Corp Class A (b) | | 8,725 | 84,982 |
| Hyliion Holdings Corp Class A (b)(c) | | 5,156 | 13,457 |
| Hyster-Yale Inc Class A | | 508 | 25,872 |
| ITT Inc | | 3,674 | 524,941 |
| John Bean Technologies Corp (c) | | 1,437 | 182,643 |
| Kadant Inc | | 530 | 182,845 |
| Kennametal Inc | | 3,477 | 83,518 |
| Lincoln Electric Holdings Inc | | 2,552 | 478,423 |
| Lindsay Corp | | 487 | 57,617 |
| Manitowoc Co Inc/The (b) | | 1,677 | 15,311 |
| Middleby Corp/The (b) | | 2,421 | 327,924 |
| Miller Industries Inc/TN | | 513 | 33,530 |
| Mueller Industries Inc | | 5,100 | 404,736 |
| Mueller Water Products Inc Class A1 | | 7,011 | 157,748 |
| Nikola Corp (b)(c) | | 2,097 | 2,494 |
| Nordson Corp | | 2,447 | 512,010 |
| Oshkosh Corp | | 2,932 | 278,745 |
| Pentair PLC | | 7,439 | 748,661 |
| Proto Labs Inc (b) | | 1,152 | 45,032 |
| RBC Bearings Inc (b) | | 1,306 | 390,677 |
| REV Group Inc | | 2,366 | 75,404 |
| Shyft Group Inc/The | | 1,355 | 15,908 |
| Snap-on Inc | | 2,369 | 804,228 |
| SPX Technologies Inc (b) | | 2,082 | 302,973 |
| Standex International Corp | | 539 | 100,788 |
| Symbotic Inc Class A (b)(c) | | 1,697 | 40,236 |
| Tennant CO | | 837 | 68,241 |
| Terex Corp | | 3,031 | 140,093 |
| Timken Co/The | | 2,880 | 205,546 |
| Titan International Inc (b) | | 2,016 | 13,689 |
| Toro Co/The | | 4,678 | 374,708 |
| Trinity Industries Inc | | 3,736 | 131,134 |
| Wabash National Corp | | 1,985 | 34,003 |
| Watts Water Technologies Inc Class A | | 1,233 | 250,669 |
| | | | 12,608,685 |
| Marine Transportation - 0.2% | | | |
| Genco Shipping & Trading Ltd | | 2,005 | 27,950 |
| Kirby Corp (b) | | 2,602 | 275,292 |
| Matson Inc | | 1,512 | 203,878 |
| Pangaea Logistics Solutions Ltd | | 1,410 | 7,557 |
| | | | 514,677 |
| Passenger Airlines - 0.5% | | | |
| Alaska Air Group Inc (b) | | 5,677 | 367,586 |
| Allegiant Travel Co | | 646 | 60,802 |
| American Airlines Group Inc (b)(c) | | 29,549 | 515,039 |
| Blade Air Mobility Inc (b) | | 3,052 | 12,971 |
| Frontier Group Holdings Inc (b)(c) | | 3,804 | 27,046 |
| JetBlue Airways Corp (b) | | 13,333 | 104,797 |
| Joby Aviation Inc Class A (b)(c) | | 19,531 | 158,787 |
| SkyWest Inc (b) | | 1,804 | 180,635 |
| Sun Country Airlines Holdings Inc (b) | | 1,699 | 24,771 |
| | | | 1,452,434 |
| Professional Services - 2.3% | | | |
| Alight Inc Class A | | 20,550 | 142,206 |
| Asure Software Inc (b)(c) | | 1,160 | 10,916 |
| Barrett Business Services Inc | | 1,173 | 50,955 |
| CACI International Inc (b) | | 1,004 | 405,676 |
| Cbiz Inc (b) | | 2,248 | 183,954 |
| Clarivate PLC (b)(c) | | 20,706 | 105,186 |
| Concentrix Corp | | 2,092 | 90,521 |
| Conduent Inc (b) | | 6,962 | 28,126 |
| CRA International Inc | | 301 | 56,347 |
| CSG Systems International Inc | | 1,250 | 63,888 |
| Dayforce Inc (b)(c) | | 7,117 | 516,979 |
| Dun & Bradstreet Holdings Inc | | 13,932 | 173,593 |
| ExlService Holdings Inc (b) | | 7,263 | 322,332 |
| Exponent Inc | | 2,289 | 203,950 |
| First Advantage Corp (b)(c) | | 2,280 | 42,704 |
| FiscalNote Holdings Inc Class A (b)(c) | | 3,113 | 3,330 |
| Forrester Research Inc (b) | | 446 | 6,989 |
| Franklin Covey Co (b) | | 501 | 18,828 |
| FTI Consulting Inc (b) | | 1,589 | 303,706 |
| Genpact Ltd | | 7,374 | 316,713 |
| Heidrick & Struggles International Inc | | 927 | 41,075 |
| Huron Consulting Group Inc (b) | | 739 | 91,828 |
| ICF International Inc (c) | | 841 | 100,256 |
| Innodata Inc (b)(c) | | 1,116 | 44,104 |
| Insperity Inc | | 1,609 | 124,714 |
| KBR Inc | | 5,989 | 346,943 |
| Kelly Services Inc Class A | | 1,363 | 19,000 |
| Kforce Inc | | 804 | 45,587 |
| Korn Ferry | | 2,380 | 160,531 |
| Legalzoom.com Inc (b) | | 4,952 | 37,190 |
| ManpowerGroup Inc | | 2,119 | 122,309 |
| Maximus Inc | | 2,716 | 202,749 |
| NV5 Global Inc (b) | | 2,303 | 43,389 |
| Parsons Corp (b) | | 2,105 | 194,186 |
| Paycom Software Inc | | 2,190 | 448,884 |
| Paycor HCM Inc (b) | | 3,680 | 68,338 |
| Paylocity Holding Corp (b) | | 1,951 | 389,166 |
| Planet Labs PBC Class A (b)(c) | | 9,655 | 39,006 |
| Rcm Technologies Inc (b) | | 194 | 4,299 |
| Resources Connection Inc (c) | | 1,326 | 11,311 |
| Robert Half Inc | | 4,607 | 324,609 |
| Science Applications International Corp | | 2,308 | 257,988 |
| Spire Global Inc Class A (b)(c) | | 1,036 | 14,577 |
| TriNet Group Inc | | 1,387 | 125,898 |
| TrueBlue Inc (b) | | 1,490 | 12,516 |
| TTEC Holdings Inc (c) | | 708 | 3,532 |
| Upwork Inc (b) | | 5,536 | 90,514 |
| Verra Mobility Corp Class A (b) | | 7,445 | 180,020 |
| | | | 6,591,418 |
| Trading Companies & Distributors - 1.8% | | | |
| Air Lease Corp Class A | | 4,658 | 224,562 |
| Alta Equipment Group Inc Class A (c) | | 908 | 5,937 |
| Applied Industrial Technologies Inc | | 1,725 | 413,086 |
| Beacon Roofing Supply Inc (b) | | 2,785 | 282,900 |
| BlueLinx Holdings Inc (b) | | 376 | 38,412 |
| Boise Cascade Co | | 1,758 | 208,956 |
| Core & Main Inc Class A (b) | | 8,683 | 442,052 |
| Custom Truck One Source Inc Class A (b) | | 2,322 | 11,169 |
| Distribution Solutions Group Inc (b) | | 458 | 15,755 |
| DNOW Inc (b) | | 4,878 | 63,463 |
| DXP Enterprises Inc/TX (b) | | 582 | 48,085 |
| FTAI Aviation Ltd | | 4,598 | 662,296 |
| GATX Corp | | 1,601 | 248,091 |
| Global Industrial Co | | 585 | 14,502 |
| GMS Inc (b) | | 1,791 | 151,931 |
| H&E Equipment Services Inc | | 1,417 | 69,376 |
| Herc Holdings Inc | | 1,278 | 241,964 |
| Hudson Technologies Inc (b) | | 1,602 | 8,939 |
| Karat Packaging Inc | | 302 | 9,139 |
| McGrath RentCorp | | 1,101 | 123,114 |
| Mrc Global Inc (b) | | 3,799 | 48,551 |
| MSC Industrial Direct Co Inc Class A | | 2,035 | 151,994 |
| Rush Enterprises Inc Class A | | 2,792 | 152,974 |
| SiteOne Landscape Supply Inc (b) | | 2,039 | 268,679 |
| Titan Machinery Inc (b) | | 815 | 11,516 |
| Transcat Inc (b) | | 413 | 43,671 |
| Watsco Inc | | 1,567 | 742,586 |
| Wesco International Inc | | 2,014 | 364,453 |
| Xometry Inc Class A (b) | | 1,976 | 84,296 |
| | | | 5,152,449 |
TOTAL INDUSTRIALS | | | 54,747,345 |
| | | | |
| Information Technology - 11.4% | | | |
| Communications Equipment - 0.8% | | | |
| ADTRAN Holdings Inc (b) | | 3,268 | 27,222 |
| Applied Optoelectronics Inc (b)(c) | | 1,801 | 66,385 |
| Aviat Networks Inc (b) | | 507 | 9,182 |
| Calix Inc (b) | | 2,656 | 92,615 |
| Ciena Corp (b) | | 6,466 | 548,381 |
| Clearfield Inc (b) | | 498 | 15,438 |
| CommScope Holding Co Inc (b) | | 9,679 | 50,428 |
| Comtech Telecommunications Corp (b) | | 1,058 | 4,242 |
| Digi International Inc (b) | | 1,642 | 49,638 |
| Extreme Networks Inc (b) | | 5,784 | 96,824 |
| Harmonic Inc (b) | | 5,131 | 67,883 |
| Infinera Corp (b)(c) | | 9,451 | 62,093 |
| Juniper Networks Inc | | 14,798 | 554,185 |
| Lumentum Holdings Inc (b) | | 3,056 | 256,551 |
| Netgear Inc (b) | | 1,302 | 36,287 |
| NetScout Systems Inc (b) | | 3,257 | 70,547 |
| Viasat Inc (b)(c) | | 3,830 | 32,593 |
| Viavi Solutions Inc (b) | | 9,856 | 99,546 |
| | | | 2,140,040 |
| Electronic Equipment, Instruments & Components - 2.0% | | | |
| Advanced Energy Industries Inc | | 1,698 | 196,340 |
| Arlo Technologies Inc (b) | | 4,502 | 50,377 |
| Arrow Electronics Inc (b) | | 2,384 | 269,678 |
| Avnet Inc (c) | | 3,973 | 207,867 |
| Badger Meter Inc | | 1,324 | 280,847 |
| Bel Fuse Inc Class B | | 466 | 38,431 |
| Belden Inc | | 1,836 | 206,752 |
| Benchmark Electronics Inc | | 1,632 | 74,093 |
| Cognex Corp | | 7,730 | 277,198 |
| Coherent Corp (b) | | 6,899 | 653,543 |
| Crane NXT Co | | 2,223 | 129,423 |
| CTS Corp | | 1,390 | 73,295 |
| Daktronics Inc (b) | | 1,820 | 30,685 |
| ePlus Inc (b) | | 1,212 | 89,543 |
| Evolv Technologies Holdings Inc Class A (b)(c) | | 4,573 | 18,063 |
| FARO Technologies Inc (b) | | 868 | 22,012 |
| Insight Enterprises Inc (b) | | 1,266 | 192,559 |
| IPG Photonics Corp (b) | | 1,223 | 88,937 |
| Itron Inc (b) | | 2,025 | 219,875 |
| Kimball Electronics Inc (b) | | 1,153 | 21,596 |
| Knowles Corp (b)(c) | | 3,890 | 77,528 |
| Lightwave Logic Inc (b)(c) | | 4,948 | 10,391 |
| Littelfuse Inc | | 1,119 | 263,692 |
| Luna Innovations Inc (b) | | 1,363 | 2,944 |
| Methode Electronics Inc | | 1,649 | 19,442 |
| MicroVision Inc (b)(c) | | 8,250 | 10,808 |
| Mirion Technologies Inc Class A (b) | | 8,374 | 146,126 |
| Napco Security Technologies Inc | | 1,632 | 58,034 |
| nLight Inc (b) | | 2,113 | 22,165 |
| Novanta Inc (b) | | 1,617 | 247,029 |
| OSI Systems Inc (b) | | 719 | 120,382 |
| Ouster Inc Class A (b) | | 1,770 | 21,629 |
| PAR Technology Corp (b)(c) | | 1,641 | 119,251 |
| PC Connection Inc | | 564 | 39,068 |
| Plexus Corp (b) | | 1,226 | 191,844 |
| Richardson Electronics Ltd/United States | | 500 | 7,015 |
| Rogers Corp (b) | | 772 | 78,443 |
| Sanmina Corp (b) | | 2,460 | 186,148 |
| ScanSource Inc (b) | | 1,019 | 48,352 |
| SmartRent Inc Class A (b) | | 7,295 | 12,766 |
| TD SYNNEX Corp | | 3,423 | 401,449 |
| TTM Technologies Inc (b) | | 4,629 | 114,568 |
| Vishay Intertechnology Inc | | 5,079 | 86,038 |
| Vishay Precision Group Inc (b) | | 503 | 11,805 |
| Vontier Corp | | 6,915 | 252,190 |
| | | | 5,690,221 |
| IT Services - 0.5% | | | |
| Amdocs Ltd | | 5,221 | 444,516 |
| Applied Digital Corp (b)(c) | | 4,637 | 35,427 |
| ASGN Inc (b) | | 2,025 | 168,764 |
| BigCommerce Holdings Inc (b) | | 2,751 | 16,836 |
| Couchbase Inc (b) | | 1,834 | 28,592 |
| DigitalOcean Holdings Inc (b) | | 2,811 | 95,771 |
| DXC Technology Co (b) | | 8,160 | 163,037 |
| Fastly Inc Class A (b) | | 5,874 | 55,451 |
| Grid Dynamics Holdings Inc (b) | | 2,538 | 56,445 |
| Hackett Group Inc/The | | 1,155 | 35,482 |
| Kyndryl Holdings Inc (b) | | 10,407 | 360,082 |
| Rackspace Technology Inc (b) | | 3,906 | 8,631 |
| Unisys Corp (b) | | 3,318 | 21,003 |
| | | | 1,490,037 |
| Semiconductors & Semiconductor Equipment - 1.8% | | | |
| ACM Research Inc Class A (b)(c) | | 2,199 | 33,205 |
| Aehr Test Systems (b)(c) | | 1,220 | 20,289 |
| Alpha & Omega Semiconductor Ltd (b) | | 1,047 | 38,770 |
| Ambarella Inc (b) | | 1,747 | 127,077 |
| Amkor Technology Inc | | 5,062 | 130,043 |
| Atomera Inc (b)(c) | | 1,428 | 16,565 |
| Axcelis Technologies Inc (b)(c) | | 1,472 | 102,849 |
| AXT Inc (b) | | 1,600 | 3,471 |
| CEVA Inc (b) | | 1,072 | 33,822 |
| Cirrus Logic Inc (b) | | 2,401 | 239,092 |
| Cohu Inc (b) | | 2,166 | 57,832 |
| Credo Technology Group Holding Ltd (b) | | 6,393 | 429,674 |
| Diodes Inc (b) | | 2,102 | 129,630 |
| FormFactor Inc (b) | | 3,514 | 154,616 |
| Ichor Holdings Ltd (b) | | 1,485 | 47,847 |
| Impinj Inc (b) | | 1,028 | 149,327 |
| inTEST Corp (b) | | 451 | 3,873 |
| Kopin Corp (b) | | 4,118 | 5,599 |
| Lattice Semiconductor Corp (b) | | 6,200 | 351,230 |
| MACOM Technology Solutions Holdings Inc (b) | | 2,598 | 337,506 |
| MaxLinear Inc Class A (b) | | 3,414 | 67,529 |
| MKS Instruments Inc | | 3,027 | 315,989 |
| Navitas Semiconductor Corp Class A (b)(c) | | 6,024 | 21,506 |
| NVE Corp | | 214 | 17,426 |
| Onto Innovation Inc (b) | | 2,223 | 370,507 |
| PDF Solutions Inc (b) | | 1,411 | 38,210 |
| Penguin Solutions Inc (b) | | 2,371 | 45,499 |
| Photronics Inc (b) | | 2,820 | 66,439 |
| Power Integrations Inc | | 2,565 | 158,261 |
| Rambus Inc (b) | | 4,846 | 256,160 |
| Rigetti Computing Inc Class A (b)(c) | | 7,147 | 109,063 |
| Semtech Corp (b) | | 3,374 | 208,682 |
| Silicon Laboratories Inc (b) | | 1,457 | 180,989 |
| SiTime Corp (b) | | 843 | 180,849 |
| SkyWater Technology Inc (b) | | 945 | 13,041 |
| SolarEdge Technologies Inc (b)(c) | | 2,612 | 35,523 |
| Synaptics Inc (b) | | 1,761 | 134,400 |
| Ultra Clean Holdings Inc (b) | | 2,048 | 73,626 |
| Universal Display Corp | | 1,985 | 290,207 |
| Veeco Instruments Inc (b) | | 2,519 | 67,509 |
| Wolfspeed Inc (b)(c) | | 5,740 | 38,228 |
| | | | 5,101,960 |
| Software - 5.8% | | | |
| 8x8 Inc (b) | | 5,996 | 16,009 |
| A10 Networks Inc | | 3,306 | 60,830 |
| ACI Worldwide Inc (b) | | 4,708 | 244,392 |
| Adeia Inc | | 4,802 | 67,132 |
| Agilysys Inc (b) | | 1,010 | 133,027 |
| Alarm.com Holdings Inc (b) | | 2,222 | 135,098 |
| Alkami Technology Inc (b) | | 2,552 | 93,607 |
| Altair Engineering Inc Class A (b) | | 2,673 | 291,651 |
| Amplitude Inc Class A (b) | | 3,596 | 37,938 |
| Appfolio Inc Class A (b) | | 1,036 | 255,602 |
| Appian Corp Class A (b) | | 1,874 | 61,805 |
| Asana Inc Class A (b) | | 3,776 | 76,540 |
| Aspen Technology Inc (b) | | 1,195 | 298,308 |
| Aurora Innovation Inc Class A (b)(c) | | 44,513 | 280,432 |
| AvePoint Inc Class A (b) | | 4,544 | 75,021 |
| Bentley Systems Inc Class B | | 6,939 | 324,051 |
| BILL Holdings Inc (b) | | 4,395 | 372,300 |
| Blackbaud Inc (b) | | 1,812 | 133,943 |
| BlackLine Inc (b) | | 2,305 | 140,052 |
| Blend Labs Inc Class A (b) | | 8,624 | 36,307 |
| Box Inc Class A (b) | | 6,544 | 206,790 |
| Braze Inc Class A (b) | | 2,691 | 112,699 |
| C3.ai Inc Class A (b)(c) | | 4,993 | 171,909 |
| Ccc Intelligent Solutions Holdings Inc Class A (b) | | 18,766 | 220,125 |
| Cerence Inc (b) | | 2,043 | 16,038 |
| Cipher Mining Inc (b) | | 9,690 | 44,962 |
| Cleanspark Inc (b)(c) | | 11,233 | 103,456 |
| Clear Secure Inc Class A | | 4,158 | 110,769 |
| Clearwater Analytics Holdings Inc Class A (b) | | 7,225 | 198,832 |
| Commvault Systems Inc (b) | | 1,967 | 296,840 |
| Confluent Inc Class A (b) | | 11,256 | 314,718 |
| Consensus Cloud Solutions Inc (b) | | 819 | 19,541 |
| CS Disco Inc (b) | | 1,053 | 5,254 |
| Daily Journal Corp (b) | | 39 | 22,152 |
| Digimarc Corp (b)(c) | | 684 | 25,616 |
| Digital Turbine Inc (b) | | 3,751 | 6,339 |
| Dolby Laboratories Inc Class A | | 2,686 | 209,777 |
| Domo Inc Class B (b) | | 1,375 | 9,735 |
| DoubleVerify Holdings Inc (b) | | 6,413 | 123,194 |
| Dropbox Inc Class A (b) | | 10,662 | 320,286 |
| Dynatrace Inc (b) | | 13,405 | 728,562 |
| E2open Parent Holdings Inc Class A (b) | | 9,730 | 25,882 |
| Elastic NV (b) | | 3,844 | 380,864 |
| Enfusion Inc Class A (b) | | 1,828 | 18,828 |
| Five9 Inc (b) | | 3,382 | 137,444 |
| Freshworks Inc Class A (b) | | 8,157 | 131,899 |
| Gitlab Inc Class A (b) | | 5,198 | 292,907 |
| Guidewire Software Inc (b) | | 3,719 | 626,949 |
| HashiCorp Inc Class A (b) | | 6,836 | 233,860 |
| Informatica Inc Class A (b) | | 3,056 | 79,242 |
| Intapp Inc (b) | | 2,222 | 142,408 |
| InterDigital Inc (c) | | 1,135 | 219,872 |
| Jamf Holding Corp (b) | | 2,825 | 39,691 |
| Klaviyo Inc Class A (b) | | 3,269 | 134,814 |
| LiveRamp Holdings Inc (b) | | 3,017 | 91,626 |
| Logility Supply Chain Solutions Inc Class A | | 1,511 | 16,742 |
| Manhattan Associates Inc (b) | | 2,756 | 744,781 |
| MARA Holdings Inc (b)(c) | | 13,256 | 222,303 |
| Matterport Inc Class A (b) | | 12,549 | 59,482 |
| Meridianlink Inc (b) | | 1,240 | 25,606 |
| Mitek Systems Inc (b) | | 2,036 | 22,661 |
| N-able Inc/US (b) | | 3,286 | 30,691 |
| nCino Inc (b) | | 4,164 | 139,827 |
| NCR Voyix Corp (b) | | 6,482 | 89,711 |
| NextNav Inc Class A (b)(c) | | 2,902 | 45,155 |
| Nutanix Inc Class A (b) | | 11,026 | 674,571 |
| Olo Inc Class A (b) | | 4,993 | 38,346 |
| ON24 Inc (b) | | 1,613 | 10,420 |
| OneSpan Inc | | 1,664 | 30,851 |
| PagerDuty Inc (b)(c) | | 4,271 | 77,988 |
| Pegasystems Inc | | 2,003 | 186,680 |
| Porch Group Inc (b) | | 4,340 | 21,353 |
| Procore Technologies Inc (b) | | 4,785 | 358,540 |
| Progress Software Corp | | 1,918 | 124,958 |
| PROS Holdings Inc (b) | | 1,959 | 43,020 |
| Q2 Holdings Inc (b) | | 2,711 | 272,862 |
| Qualys Inc (b) | | 1,658 | 232,485 |
| Rapid7 Inc (b) | | 2,796 | 112,483 |
| Rekor Systems Inc (b)(c) | | 3,073 | 4,794 |
| RingCentral Inc Class A (b) | | 3,688 | 129,117 |
| Riot Platforms Inc (b)(c) | | 11,896 | 121,458 |
| Samsara Inc Class A (b) | | 9,216 | 402,647 |
| SEMrush Holdings Inc Class A (b) | | 1,415 | 16,810 |
| SentinelOne Inc Class A (b) | | 12,917 | 286,757 |
| Smartsheet Inc Class A (b) | | 6,220 | 348,507 |
| SolarWinds Corp | | 2,442 | 34,799 |
| SoundHound AI Inc Class A (b)(c) | | 14,730 | 292,243 |
| Sprinklr Inc Class A (b) | | 5,368 | 45,360 |
| Sprout Social Inc Class A (b) | | 2,270 | 69,712 |
| SPS Commerce Inc (b) | | 1,671 | 307,447 |
| Telos Corp (b) | | 2,219 | 7,589 |
| Tenable Holdings Inc (b) | | 5,362 | 211,156 |
| Teradata Corp (b) | | 4,307 | 134,163 |
| Terawulf Inc (b)(c) | | 13,658 | 77,304 |
| UiPath Inc Class A (b) | | 20,116 | 255,674 |
| Unity Software Inc (b) | | 13,043 | 293,076 |
| Varonis Systems Inc (b) | | 5,051 | 224,416 |
| Verint Systems Inc (b) | | 2,784 | 76,421 |
| Veritone Inc (b)(c) | | 1,314 | 4,309 |
| Vertex Inc Class A (b) | | 2,337 | 124,679 |
| Weave Communications Inc (b) | | 1,855 | 29,532 |
| Workiva Inc Class A (b) | | 2,313 | 253,274 |
| Xperi Inc (b) | | 2,143 | 22,009 |
| Yext Inc (b) | | 4,886 | 31,075 |
| Zeta Global Holdings Corp Class A (b) | | 9,072 | 163,205 |
| Zuora Inc Class A (b) | | 6,145 | 60,958 |
| | | | 16,567,932 |
| Technology Hardware, Storage & Peripherals - 0.5% | | | |
| Corsair Gaming Inc (b) | | 2,168 | 14,330 |
| Diebold Nixdorf Inc (b) | | 1,698 | 73,082 |
| Eastman Kodak Co (b) | | 3,176 | 20,866 |
| Immersion Corp | | 1,200 | 10,476 |
| IonQ Inc (b)(c) | | 8,770 | 366,323 |
| Pure Storage Inc Class A (b) | | 13,906 | 854,246 |
| Turtle Beach Corp (b) | | 726 | 12,567 |
| Xerox Holdings Corp (c) | | 5,039 | 42,479 |
| | | | 1,394,369 |
TOTAL INFORMATION TECHNOLOGY | | | 32,384,559 |
| | | | |
| Materials - 4.6% | | | |
| Chemicals - 1.6% | | | |
| AdvanSix Inc | | 1,180 | 33,618 |
| Alto Ingredients Inc (b) | | 3,901 | 6,086 |
| American Vanguard Corp | | 1,057 | 4,894 |
| Ashland Inc | | 2,180 | 155,783 |
| Aspen Aerogels Inc (b) | | 2,842 | 33,763 |
| Avient Corp | | 4,113 | 168,057 |
| Axalta Coating Systems Ltd (b) | | 9,865 | 337,581 |
| Balchem Corp | | 1,458 | 237,647 |
| Cabot Corp | | 2,467 | 225,262 |
| Chemours Co/The | | 6,731 | 113,754 |
| Core Molding Technologies Inc (b) | | 315 | 5,210 |
| Danimer Scientific Inc warrants 7/15/2025 (b) | | 1,003 | 36 |
| Ecovyst Inc (b) | | 4,652 | 35,541 |
| Element Solutions Inc | | 10,021 | 254,834 |
| FMC Corp | | 5,623 | 273,334 |
| Ginkgo Bioworks Holdings Inc Class A (b)(c) | | 1,673 | 16,429 |
| Hawkins Inc | | 860 | 105,496 |
| HB Fuller Co | | 2,465 | 166,338 |
| Huntsman Corp | | 7,277 | 131,204 |
| Ingevity Corp (b) | | 1,650 | 67,238 |
| Innospec Inc | | 1,135 | 124,918 |
| Intrepid Potash Inc (b) | | 492 | 10,785 |
| Koppers Holdings Inc | | 946 | 30,650 |
| Kronos Worldwide Inc | | 863 | 8,414 |
| LSB Industries Inc (b) | | 2,256 | 17,123 |
| Mativ Holdings Inc | | 2,556 | 27,860 |
| Minerals Technologies Inc | | 1,429 | 108,904 |
| NewMarket Corp | | 347 | 183,337 |
| Olin Corp | | 5,301 | 179,174 |
| Origin Materials Inc Class A (b)(c) | | 5,811 | 7,438 |
| Perimeter Solutions Inc | | 6,222 | 79,517 |
| PureCycle Technologies Inc (b)(c) | | 6,239 | 63,950 |
| Quaker Chemical Corp (c) | | 615 | 86,567 |
| Rayonier Advanced Materials Inc (b) | | 2,881 | 23,768 |
| RPM International Inc | | 5,790 | 712,518 |
| Scotts Miracle-Gro Co/The | | 1,933 | 128,235 |
| Sensient Technologies Corp | | 1,896 | 135,109 |
| Stepan Co | | 966 | 62,500 |
| Trinseo PLC | | 1,427 | 7,278 |
| Tronox Holdings PLC | | 5,166 | 52,022 |
| Westlake Corp | | 1,511 | 173,236 |
| | | | 4,595,408 |
| Construction Materials - 0.3% | | | |
| Eagle Materials Inc | | 1,513 | 373,349 |
| Knife River Corp (b) | | 2,547 | 258,877 |
| Summit Materials Inc Class A (b) | | 5,369 | 271,671 |
| United States Lime & Minerals Inc | | 468 | 62,122 |
| | | | 966,019 |
| Containers & Packaging - 1.3% | | | |
| AptarGroup Inc | | 2,984 | 468,786 |
| Ardagh Metal Packaging SA | | 6,625 | 19,941 |
| Berry Global Group Inc | | 5,149 | 332,986 |
| Crown Holdings Inc | | 5,365 | 443,632 |
| Graphic Packaging Holding CO | | 13,504 | 366,769 |
| Greif Inc Class A | | 1,170 | 71,510 |
| Myers Industries Inc | | 1,620 | 17,885 |
| O-I Glass Inc (b) | | 6,928 | 75,100 |
| Pactiv Evergreen Inc | | 1,827 | 31,918 |
| Ranpak Holdings Corp Class A (b) | | 1,777 | 12,225 |
| Sealed Air Corp | | 6,560 | 221,925 |
| Silgan Holdings Inc | | 3,651 | 190,035 |
| Smurfit WestRock PLC | | 22,198 | 1,195,584 |
| Sonoco Products Co | | 4,426 | 216,210 |
| TriMas Corp | | 1,698 | 41,754 |
| | | | 3,706,260 |
| Metals & Mining - 1.2% | | | |
| Alcoa Corp | | 11,629 | 439,344 |
| Alpha Metallurgical Resources Inc | | 498 | 99,660 |
| Arch Resources Inc Class A | | 820 | 115,800 |
| ATI Inc (b) | | 5,597 | 308,059 |
| Carpenter Technology Corp | | 2,246 | 381,169 |
| Century Aluminum Co (b) | | 2,298 | 41,870 |
| Cleveland-Cliffs Inc (b) | | 21,073 | 198,086 |
| Coeur Mining Inc (b) | | 17,981 | 102,851 |
| Commercial Metals Co | | 5,170 | 256,432 |
| Compass Minerals International Inc | | 1,625 | 18,281 |
| Gatos Silver Inc (b) | | 2,158 | 30,169 |
| Hecla Mining Co | | 28,129 | 138,113 |
| Kaiser Aluminum Corp | | 705 | 49,540 |
| Materion Corp | | 921 | 91,068 |
| Metallus Inc (b) | | 1,788 | 25,264 |
| MP Materials Corp (b)(c) | | 5,581 | 87,064 |
| Olympic Steel Inc | | 462 | 15,158 |
| Piedmont Lithium Inc (b)(c) | | 892 | 7,796 |
| Radius Recycling Inc Class A | | 1,222 | 18,599 |
| Ramaco Resources Inc Class A | | 1,116 | 11,450 |
| Ramaco Resources Inc Class B | | 15 | 148 |
| Royal Gold Inc | | 2,956 | 389,749 |
| Ryerson Holding Corp (c) | | 1,278 | 23,656 |
| SunCoke Energy Inc | | 3,840 | 41,088 |
| United States Steel Corp (c) | | 10,070 | 342,279 |
| Universal Stainless & Alloy Products Inc (b) | | 384 | 16,908 |
| Warrior Met Coal Inc | | 2,373 | 128,712 |
| Worthington Steel Inc | | 1,533 | 48,780 |
| | | | 3,427,093 |
| Paper & Forest Products - 0.2% | | | |
| Clearwater Paper Corp (b) | | 712 | 21,195 |
| Louisiana-Pacific Corp | | 2,816 | 291,597 |
| Sylvamo Corp | | 1,540 | 121,691 |
| | | | 434,483 |
TOTAL MATERIALS | | | 13,129,263 |
| | | | |
| Real Estate - 6.3% | | | |
| Diversified REITs - 0.3% | | | |
| Alexander & Baldwin Inc | | 3,353 | 59,482 |
| American Assets Trust Inc | | 2,229 | 58,534 |
| Armada Hoffler Properties Inc Class A | | 3,239 | 33,135 |
| Broadstone Net Lease Inc Class A | | 8,592 | 136,269 |
| CTO Realty Growth Inc | | 913 | 17,995 |
| Empire State Realty Trust Inc Class A | | 6,074 | 62,684 |
| Essential Properties Realty Trust Inc | | 7,953 | 248,770 |
| Gladstone Commercial Corp | | 2,029 | 32,951 |
| Global Net Lease Inc | | 8,911 | 65,050 |
| One Liberty Properties Inc | | 727 | 19,803 |
| | | | 734,673 |
| Health Care REITs - 0.5% | | | |
| CareTrust REIT Inc | | 6,990 | 189,080 |
| Community Healthcare Trust Inc | | 1,183 | 22,725 |
| Diversified Healthcare Trust | | 9,323 | 21,443 |
| Global Medical REIT Inc | | 2,888 | 22,295 |
| Healthcare Realty Trust Inc | | 16,432 | 278,522 |
| LTC Properties Inc | | 1,967 | 67,960 |
| Medical Properties Trust Inc (c) | | 27,115 | 107,104 |
| National Health Investors Inc | | 1,949 | 135,066 |
| Omega Healthcare Investors Inc | | 11,643 | 440,688 |
| Sabra Health Care REIT Inc | | 10,636 | 184,216 |
| Universal Health Realty Income Trust | | 561 | 20,874 |
| | | | 1,489,973 |
| Hotel & Resort REITs - 0.4% | | | |
| Apple Hospitality REIT Inc | | 10,170 | 156,110 |
| Chatham Lodging Trust | | 2,117 | 18,947 |
| DiamondRock Hospitality Co | | 9,450 | 85,334 |
| Park Hotels & Resorts Inc | | 9,484 | 133,440 |
| Pebblebrook Hotel Trust | | 5,514 | 74,715 |
| RLJ Lodging Trust | | 7,034 | 71,817 |
| Ryman Hospitality Properties Inc | | 2,702 | 281,927 |
| Service Properties Trust | | 7,006 | 17,794 |
| Summit Hotel Properties Inc | | 5,017 | 34,366 |
| Sunstone Hotel Investors Inc | | 9,197 | 108,892 |
| Xenia Hotels & Resorts Inc | | 4,538 | 67,435 |
| | | | 1,050,777 |
| Industrial REITs - 0.7% | | | |
| Americold Realty Trust Inc | | 11,807 | 252,670 |
| EastGroup Properties Inc | | 2,207 | 354,201 |
| First Industrial Realty Trust Inc | | 5,997 | 300,630 |
| Industrial Logistics Properties Trust | | 2,344 | 8,555 |
| Lineage Inc (c) | | 2,701 | 158,198 |
| LXP Industrial Trust | | 13,289 | 107,907 |
| Plymouth Industrial REIT Inc | | 1,864 | 33,178 |
| Rexford Industrial Realty Inc | | 9,911 | 383,159 |
| STAG Industrial Inc Class A | | 8,280 | 280,030 |
| Terreno Realty Corp | | 4,390 | 259,625 |
| | | | 2,138,153 |
| Office REITs - 0.8% | | | |
| Brandywine Realty Trust | | 7,790 | 43,624 |
| BXP Inc | | 6,550 | 487,058 |
| City Office Reit Inc | | 1,636 | 9,031 |
| COPT Defense Properties | | 5,046 | 156,174 |
| Cousins Properties Inc | | 6,908 | 211,661 |
| Douglas Emmett Inc (c) | | 7,618 | 141,390 |
| Easterly Government Properties Inc | | 4,544 | 51,620 |
| Equity Commonwealth | | 4,883 | 8,643 |
| Highwoods Properties Inc | | 4,783 | 146,264 |
| Hudson Pacific Properties Inc | | 6,856 | 20,774 |
| JBG SMITH Properties | | 3,993 | 61,372 |
| Kilroy Realty Corp | | 4,782 | 193,432 |
| NET Lease Office Properties | | 692 | 21,597 |
| Office Properties Income Trust | | 1,890 | 1,889 |
| Orion Office REIT Inc | | 2,270 | 8,422 |
| Paramount Group Inc | | 8,499 | 41,985 |
| Peakstone Realty Trust | | 1,714 | 18,974 |
| Piedmont Office Realty Trust Inc Class A1 | | 5,618 | 51,405 |
| Postal Realty Trust Inc Class A | | 1,459 | 19,040 |
| SL Green Realty Corp | | 2,925 | 198,666 |
| Vornado Realty Trust | | 7,469 | 313,997 |
| | | | 2,207,018 |
| Real Estate Management & Development - 0.7% | | | |
| Anywhere Real Estate Inc (b) | | 4,111 | 13,566 |
| Compass Inc Class A (b) | | 18,774 | 109,828 |
| Cushman & Wakefield PLC (b) | | 10,417 | 136,254 |
| Douglas Elliman Inc (b) | | 3,464 | 5,785 |
| eXp World Holdings Inc (c) | | 3,761 | 43,289 |
| Forestar Group Inc (b) | | 805 | 20,866 |
| Howard Hughes Holdings Inc (b) | | 1,381 | 106,227 |
| Jones Lang LaSalle Inc (b) | | 2,138 | 541,213 |
| Kennedy-Wilson Holdings Inc | | 5,393 | 53,876 |
| Marcus & Millichap Inc | | 1,084 | 41,474 |
| Newmark Group Inc Class A | | 6,202 | 79,448 |
| Opendoor Technologies Inc Class A (b) | | 27,973 | 44,757 |
| RE/MAX Holdings Inc Class A (b) | | 754 | 8,045 |
| Redfin Corp (b)(c) | | 5,396 | 42,467 |
| RMR Group Inc/The Class A | | 685 | 14,138 |
| Seaport Entertainment Group Inc | | 181 | 5,059 |
| Seritage Growth Properties Class A (b) | | 1,420 | 5,850 |
| St Joe Co/The | | 1,711 | 76,875 |
| Zillow Group Inc Class A (b) | | 2,489 | 176,346 |
| Zillow Group Inc Class C (b) | | 6,728 | 498,208 |
| | | | 2,023,571 |
| Residential REITs - 0.8% | | | |
| American Homes 4 Rent Class A | | 14,183 | 530,728 |
| Apartment Investment and Management Co Class A | | 5,964 | 54,213 |
| Camden Property Trust | | 4,813 | 558,501 |
| Centerspace | | 710 | 46,967 |
| Elme Communities | | 4,079 | 62,286 |
| Equity LifeStyle Properties Inc | | 8,417 | 560,572 |
| Independence Realty Trust Inc | | 10,189 | 202,150 |
| NexPoint Residential Trust Inc | | 1,006 | 42,000 |
| UMH Properties Inc | | 3,082 | 58,188 |
| Veris Residential Inc | | 3,608 | 60,001 |
| | | | 2,175,606 |
| Retail REITs - 1.5% | | | |
| Acadia Realty Trust | | 4,760 | 115,002 |
| Agree Realty Corp | | 4,545 | 320,195 |
| Alexander's Inc | | 96 | 19,206 |
| Brixmor Property Group Inc | | 13,603 | 378,708 |
| CBL & Associates Properties Inc | | 663 | 19,499 |
| Curbline Properties Corp | | 4,255 | 98,801 |
| Federal Realty Investment Trust | | 3,412 | 381,973 |
| Getty Realty Corp | | 2,308 | 69,540 |
| InvenTrust Properties Corp | | 3,442 | 103,707 |
| Kimco Realty Corp | | 30,425 | 712,858 |
| Kite Realty Group Trust | | 9,993 | 252,223 |
| Macerich Co/The | | 9,755 | 194,320 |
| NETSTREIT Corp (c) | | 3,633 | 51,407 |
| NNN REIT Inc | | 8,305 | 339,259 |
| Phillips Edison & Co Inc | | 5,573 | 208,765 |
| Regency Centers Corp | | 7,377 | 545,382 |
| Retail Opportunity Investments Corp | | 5,835 | 101,296 |
| Saul Centers Inc | | 553 | 21,456 |
| SITE Centers Corp | | 2,146 | 32,812 |
| Tanger Inc | | 4,957 | 169,182 |
| Urban Edge Properties | | 5,609 | 120,594 |
| Whitestone REIT | | 1,945 | 27,561 |
| | | | 4,283,746 |
| Specialized REITs - 0.6% | | | |
| CubeSmart | | 10,199 | 437,027 |
| EPR Properties | | 3,449 | 152,722 |
| Farmland Partners Inc | | 2,080 | 24,461 |
| Four Corners Property Trust Inc | | 4,314 | 117,082 |
| Gladstone Land Corp | | 1,470 | 15,949 |
| Lamar Advertising Co Class A | | 3,961 | 482,212 |
| National Storage Affiliates Trust | | 3,206 | 121,539 |
| Outfront Media Inc | | 6,127 | 108,693 |
| PotlatchDeltic Corp | | 3,274 | 128,505 |
| Rayonier Inc | | 6,113 | 159,549 |
| Safehold Inc | | 2,040 | 37,699 |
| Uniti Group Inc | | 10,823 | 59,527 |
| | | | 1,844,965 |
TOTAL REAL ESTATE | | | 17,948,482 |
| | | | |
| Utilities - 2.4% | | | |
| Electric Utilities - 1.0% | | | |
| ALLETE Inc | | 2,606 | 168,869 |
| Genie Energy Ltd Class B | | 1,070 | 16,681 |
| Hawaiian Electric Industries Inc (b) | | 7,470 | 72,683 |
| IDACORP Inc | | 2,397 | 261,944 |
| MGE Energy Inc | | 1,633 | 153,437 |
| NRG Energy Inc | | 9,288 | 837,964 |
| OGE Energy Corp | | 9,034 | 372,653 |
| Otter Tail Corp | | 1,869 | 138,007 |
| Pinnacle West Capital Corp | | 5,100 | 432,327 |
| Portland General Electric Co | | 4,607 | 200,957 |
| TXNM Energy Inc | | 4,061 | 199,679 |
| | | | 2,855,201 |
| Gas Utilities - 0.6% | | | |
| Chesapeake Utilities Corp | | 1,019 | 123,656 |
| MDU Resources Group Inc | | 9,180 | 165,424 |
| National Fuel Gas Co | | 4,109 | 249,334 |
| New Jersey Resources Corp | | 4,462 | 208,152 |
| Northwest Natural Holding Co | | 1,774 | 70,178 |
| ONE Gas Inc | | 2,554 | 176,865 |
| Southwest Gas Holdings Inc | | 2,715 | 191,978 |
| Spire Inc | | 2,600 | 176,358 |
| UGI Corp | | 9,657 | 272,617 |
| | | | 1,634,562 |
| Independent Power and Renewable Electricity Producers - 0.1% | | | |
| Altus Power Inc Class A (b) | | 2,448 | 9,963 |
| Clearway Energy Inc Class A | | 1,851 | 45,257 |
| Clearway Energy Inc Class C | | 3,470 | 90,220 |
| Montauk Renewables Inc (b) | | 2,612 | 10,396 |
| Ormat Technologies Inc | | 2,431 | 164,627 |
| Sunnova Energy International Inc (b)(c) | | 5,142 | 17,637 |
| | | | 338,100 |
| Multi-Utilities - 0.4% | | | |
| Avista Corp | | 3,561 | 130,439 |
| Black Hills Corp | | 3,141 | 183,811 |
| NiSource Inc | | 20,119 | 739,575 |
| NorthWestern Corp | | 2,780 | 148,619 |
| Unitil Corp | | 728 | 39,450 |
| | | | 1,241,894 |
| Water Utilities - 0.3% | | | |
| American States Water Co | | 1,682 | 130,725 |
| Artesian Resources Corp Class A | | 394 | 12,458 |
| California Water Service Group | | 2,684 | 121,666 |
| Consolidated Water Co Ltd | | 727 | 18,822 |
| Essential Utilities Inc | | 11,347 | 412,124 |
| Middlesex Water Co | | 792 | 41,683 |
| SJW Group | | 1,320 | 64,970 |
| York Water Co/The | | 639 | 20,908 |
| | | | 823,356 |
TOTAL UTILITIES | | | 6,893,113 |
| | | | |
| TOTAL UNITED STATES | | | 272,502,901 |
| TOTAL COMMON STOCKS (Cost $209,129,665) | | | 277,203,425 |
| | | | |
| U.S. Treasury Obligations - 0.1% |
| | | Yield (%) (g) | Principal Amount (a) | Value ($) |
US Treasury Bills 0% 2/20/2025 (h) (Cost $331,952) | | 4.46 | 334,000 | 332,101 |
| | | | | |
| Money Market Funds - 8.8% |
| | | Yield (%) | Shares | Value ($) |
| Fidelity Cash Central Fund (i) | | 4.36 | 7,869,376 | 7,870,950 |
| Fidelity Securities Lending Cash Central Fund (i)(j) | | 4.35 | 17,099,707 | 17,101,417 |
| TOTAL MONEY MARKET FUNDS (Cost $24,972,367) | | | | 24,972,367 |
| | | | | |
| TOTAL INVESTMENT IN SECURITIES - 106.1% (Cost $234,433,984) | 302,507,893 |
NET OTHER ASSETS (LIABILITIES) - (6.1)% | (17,276,633) |
| NET ASSETS - 100.0% | 285,231,260 |
| | |
| Futures Contracts |
| | Number of contracts | Expiration Date | Notional Amount ($) | Value ($) | Unrealized Appreciation/ (Depreciation) ($) |
| Purchased | | | | | |
| | | | | | |
| Equity Contracts | | | | | |
| CME E-mini Russell 2000 Index Contracts (United States) | 39 | Mar 2025 | 4,387,110 | (153,251) | (153,251) |
| CME E-mini S&P MidCap 400 Index Contracts (United States) | 14 | Mar 2025 | 4,405,380 | (188,716) | (188,716) |
| | | | | | |
| TOTAL FUTURES CONTRACTS | | | | | (341,967) |
| The notional amount of futures purchased as a percentage of Net Assets is 3.0% |
Legend
| (a) | Amount is stated in United States dollars unless otherwise noted. |
| (c) | Security or a portion of the security is on loan at period end. |
| (d) | Equity security is subject to lock-up or market standoff agreement and valued at a discount to the market price of the equivalent equity security. As of period end, the total fair value of equity securities discounted due to contractual sale restrictions is $608 and all restrictions are set to expire on or before January 31, 2025. Under normal market conditions, there are no circumstances that could cause the restrictions to lapse. |
| (f) | Security is exempt from registration under Regulation S of the Securities Act of 1933 and may be resold to qualified foreign investors outside of the United States. At the end of the period, the value of securities amounted to $40,699 or 0.0% of net assets. |
| (g) | Yield represents either the annualized yield at the date of purchase, or the stated coupon rate, or, for floating and adjustable rate securities, the rate at period end. |
| (h) | Security or a portion of the security was pledged to cover margin requirements for futures contracts. At period end, the value of securities pledged amounted to $332,101. |
| (i) | Affiliated fund that is generally available only to investment companies and other accounts managed by Fidelity Investments. The rate quoted is the annualized seven-day yield of the fund at period end. A complete unaudited listing of the fund's holdings as of its most recent quarter end is available upon request. In addition, each Fidelity Central Fund's financial statements, which are not covered by the Fund's Report of Independent Registered Public Accounting Firm, are available on the SEC's website or upon request. |
| (j) | Investment made with cash collateral received from securities on loan. |
Affiliated Central Funds
Fiscal year to date information regarding the Fund's investments in Fidelity Central Funds, including the ownership percentage, is presented below.
| Affiliate | Value, beginning of period ($) | Purchases ($) | Sales Proceeds ($) | Dividend Income ($) | Realized Gain (loss) ($) | Change in Unrealized appreciation (depreciation) ($) | Value, end of period ($) | Shares, end of period | % ownership, end of period |
| Fidelity Cash Central Fund | 5,254,308 | 87,529,212 | 84,912,493 | 270,721 | (77) | - | 7,870,950 | 7,869,376 | 0.0% |
| Fidelity Securities Lending Cash Central Fund | 17,231,416 | 58,402,746 | 58,532,745 | 183,203 | - | - | 17,101,417 | 17,099,707 | 0.1% |
| Total | 22,485,724 | 145,931,958 | 143,445,238 | 453,924 | (77) | - | 24,972,367 | 24,969,083 | |
| | | | | | | | | | |
Amounts in the dividend income column in the above table include any capital gain distributions from underlying funds, which are presented in the corresponding line item in the Statement of Operations, if applicable.
Amounts in the dividend income column for Fidelity Securities Lending Cash Central Fund represents the income earned on investing cash collateral, less rebates paid to borrowers and any lending agent fees associated with the loan, plus any premium payments received for lending certain types of securities.
Amounts included in the purchases and sales proceeds columns may include in-kind transactions, if applicable.
Investment Valuation
The following is a summary of the inputs used, as of December 31, 2024, involving the Fund's assets and liabilities carried at fair value. The inputs or methodology used for valuing securities may not be an indication of the risk associated with investing in those securities. For more information on valuation inputs, and their aggregation into the levels used below, please refer to the Investment Valuation section in the accompanying Notes to Financial Statements.
| Valuation Inputs at Reporting Date: |
| Description | Total ($) | Level 1 ($) | Level 2 ($) | Level 3 ($) |
Investments in Securities: | | | | |
|
| Common Stocks | | | | |
Communication Services | 9,283,961 | 9,283,961 | - | - |
Consumer Discretionary | 35,082,044 | 35,081,890 | 154 | - |
Consumer Staples | 10,661,317 | 10,661,317 | - | - |
Energy | 13,038,981 | 13,038,981 | - | - |
Financials | 50,404,688 | 50,404,688 | - | - |
Health Care | 32,161,071 | 32,158,077 | 608 | 2,386 |
Industrials | 54,826,084 | 54,826,084 | - | - |
Information Technology | 33,098,799 | 33,098,799 | - | - |
Materials | 13,804,885 | 13,804,885 | - | - |
Real Estate | 17,948,482 | 17,948,482 | - | - |
Utilities | 6,893,113 | 6,893,113 | - | - |
|
| U.S. Treasury Obligations | 332,101 | - | 332,101 | - |
|
| Money Market Funds | 24,972,367 | 24,972,367 | - | - |
| Total Investments in Securities: | 302,507,893 | 302,172,644 | 332,863 | 2,386 |
Derivative Instruments: Liabilities | | | | |
Futures Contracts | (341,967) | (341,967) | - | - |
| Total Liabilities | (341,967) | (341,967) | - | - |
| Total Derivative Instruments: | (341,967) | (341,967) | - | - |
Value of Derivative Instruments
The following table is a summary of the Fund's value of derivative instruments by primary risk exposure as of December 31, 2024. For additional information on derivative instruments, please refer to the Derivative Instruments section in the accompanying Notes to Financial Statements.
Primary Risk Exposure / Derivative Type | Value |
| Asset ($) | Liability ($) |
| Equity Risk | | |
Futures Contracts (a) | 0 | (341,967) |
| Total Equity Risk | 0 | (341,967) |
| Total Value of Derivatives | 0 | (341,967) |
(a)Reflects gross cumulative appreciation (depreciation) on futures contracts as presented in the Schedule of Investments. In the Statement of Assets and Liabilities, the period end daily variation margin is included in receivable or payable for daily variation margin on futures contracts, and the net cumulative appreciation (depreciation) is included in Total accumulated earnings (loss).
VIP Extended Market Index Portfolio
Financial Statements
| Statement of Assets and Liabilities |
As of December 31, 2024 |
| Assets | | | | |
| Investment in securities, at value (including securities loaned of $16,437,511) - See accompanying schedule: | | | | |
Unaffiliated issuers (cost $209,461,617) | $ | 277,535,526 | | |
Fidelity Central Funds (cost $24,972,367) | | 24,972,367 | | |
| | | | | |
| | | | | |
| Total Investment in Securities (cost $234,433,984) | | | $ | 302,507,893 |
| Segregated cash with brokers for derivative instruments | | | | 211,485 |
| Cash | | | | 2,258 |
| Foreign currency held at value (cost $12,965) | | | | 12,399 |
| Receivable for fund shares sold | | | | 24,037 |
| Dividends receivable | | | | 286,861 |
| Distributions receivable from Fidelity Central Funds | | | | 37,777 |
| Receivable for daily variation margin on futures contracts | | | | 11,810 |
| Other receivables | | | | 4,332 |
Total assets | | | | 303,098,852 |
| Liabilities | | | | |
| Payable for fund shares redeemed | $ | 726,975 | | |
| Accrued management fee | | 29,529 | | |
| Distribution and service plan fees payable | | 9,647 | | |
| Collateral on securities loaned | | 17,101,441 | | |
| Total liabilities | | | | 17,867,592 |
| Net Assets | | | $ | 285,231,260 |
| Net Assets consist of: | | | | |
| Paid in capital | | | $ | 246,065,041 |
| Total accumulated earnings (loss) | | | | 39,166,219 |
| Net Assets | | | $ | 285,231,260 |
| | | | | |
| Net Asset Value and Maximum Offering Price | | | | |
| Initial Class : | | | | |
Net Asset Value, offering price and redemption price per share ($194,742,356 ÷ 13,571,705 shares) | | | $ | 14.35 |
| Service Class : | | | | |
Net Asset Value, offering price and redemption price per share ($73,200,776 ÷ 5,115,886 shares) | | | $ | 14.31 |
| Service Class 2 : | | | | |
Net Asset Value, offering price and redemption price per share ($17,288,128 ÷ 1,209,733 shares) | | | $ | 14.29 |
| Statement of Operations |
| Year ended December 31, 2024 |
| Investment Income | | | | |
| Dividends | | | $ | 3,334,997 |
| Interest | | | | 22,124 |
| Income from Fidelity Central Funds (including $183,203 from security lending) | | | | 453,924 |
| Total income | | | | 3,811,045 |
| Expenses | | | | |
| Management fee | $ | 246,777 | | |
| Transfer agent fees | | 56,293 | | |
| Distribution and service plan fees | | 84,174 | | |
| Independent trustees' fees and expenses | | 1,015 | | |
| Miscellaneous | | 1,592 | | |
| Total expenses before reductions | | 389,851 | | |
| Expense reductions | | (7,936) | | |
| Total expenses after reductions | | | | 381,915 |
| Net Investment income (loss) | | | | 3,429,130 |
| Realized and Unrealized Gain (Loss) | | | | |
| Net realized gain (loss) on: | | | | |
| Investment Securities: | | | | |
| Unaffiliated issuers | | 10,284,884 | | |
| Fidelity Central Funds | | (77) | | |
| Foreign currency transactions | | 3,203 | | |
| Futures contracts | | 968,682 | | |
| Total net realized gain (loss) | | | | 11,256,692 |
| Change in net unrealized appreciation (depreciation) on: | | | | |
| Investment Securities: | | | | |
| Unaffiliated issuers | | 13,718,398 | | |
| Assets and liabilities in foreign currencies | | (7,557) | | |
| Futures contracts | | (605,042) | | |
| Total change in net unrealized appreciation (depreciation) | | | | 13,105,799 |
| Net gain (loss) | | | | 24,362,491 |
| Net increase (decrease) in net assets resulting from operations | | | $ | 27,791,621 |
| Statement of Changes in Net Assets |
| |
| | Year ended December 31, 2024 | | Year ended December 31, 2023 |
| Increase (Decrease) in Net Assets | | | | |
| Operations | | | | |
| Net investment income (loss) | $ | 3,429,130 | $ | 3,993,457 |
| Net realized gain (loss) | | 11,256,692 | | (38,314,424) |
| Change in net unrealized appreciation (depreciation) | | 13,105,799 | | 60,990,283 |
| Net increase (decrease) in net assets resulting from operations | | 27,791,621 | | 26,669,316 |
| Distributions to shareholders | | (3,555,697) | | (3,304,163) |
| | | | | |
| Share transactions - net increase (decrease) | | 47,236,187 | | 16,845,034 |
| Total increase (decrease) in net assets | | 71,472,111 | | 40,210,187 |
| | | | | |
| Net Assets | | | | |
| Beginning of period | | 213,759,149 | | 173,548,962 |
| End of period | $ | 285,231,260 | $ | 213,759,149 |
| | | | | |
| | | | | |
Financial Highlights
VIP Extended Market Index Portfolio Initial Class |
| |
| Years ended December 31, | | 2024 | | 2023 | | 2022 | | 2021 | | 2020 |
Selected Per-Share Data | | | | | | | | | | |
| Net asset value, beginning of period | $ | 12.94 | $ | 11.22 | $ | 14.19 | $ | 12.52 | $ | 10.87 |
| Income from Investment Operations | | | | | | | | | | |
Net investment income (loss) A,B | | .20 | | .20 | | .18 | | .18 | | .13 |
| Net realized and unrealized gain (loss) | | 1.40 | | 1.73 | | (2.75) | | 2.44 | | 1.66 |
| Total from investment operations | | 1.60 | | 1.93 | | (2.57) | | 2.62 | | 1.79 |
| Distributions from net investment income | | (.19) | | (.21) | | (.17) | | (.18) | | (.14) |
| Distributions from net realized gain | | - | | - | | (.24) | | (.77) | | - |
| Total distributions | | (.19) | | (.21) | | (.40) C | | (.95) | | (.14) |
| Net asset value, end of period | $ | 14.35 | $ | 12.94 | $ | 11.22 | $ | 14.19 | $ | 12.52 |
Total Return D,E | | | | 17.44% | | (18.13)% | | 21.24% | | 16.46% |
Ratios to Average Net Assets B,F,G | | | | | | | | | | |
| Expenses before reductions | | .13% | | .13% | | .13% | | .13% | | .13% |
| Expenses net of fee waivers, if any | | | | .13% | | .13% | | .13% | | .13% |
| Expenses net of all reductions | | .12% | | .12% | | .13% | | .13% | | .13% |
| Net investment income (loss) | | 1.43% | | 1.66% | | 1.51% | | 1.20% | | 1.34% |
| Supplemental Data | | | | | | | | | | |
| Net assets, end of period (000 omitted) | $ | 194,742 | $ | 165,753 | $ | 140,653 | $ | 160,811 | $ | 95,143 |
Portfolio turnover rate H | | | | 80% | | 18% | | 27% | | 46% |
ACalculated based on average shares outstanding during the period.
BNet investment income (loss) is affected by the timing of the declaration of dividends by any underlying mutual funds or exchange-traded funds (ETFs). Net investment income (loss) of any mutual funds or ETFs is not included in the Fund's net investment income (loss) ratio.
CTotal distributions per share do not sum due to rounding.
DTotal returns do not reflect charges attributable to your insurance company's separate account. Inclusion of these charges would reduce the total returns shown.
ETotal returns would have been lower if certain expenses had not been reduced during the applicable periods shown.
FFees and expenses of any underlying mutual funds or exchange-traded funds (ETFs) are not included in the Fund's expense ratio. The Fund indirectly bears its proportionate share of these expenses. For additional expense information related to investments in Fidelity Central Funds, please refer to the "Investments in Fidelity Central Funds" note found in the Notes to Financial Statements section of the most recent Annual or Semi-Annual report.
GExpense ratios reflect operating expenses of the class. Expenses before reductions do not reflect amounts reimbursed, waived, or reduced through arrangements with the investment adviser, brokerage services, or other offset arrangements, if applicable, and do not represent the amount paid by the class during periods when reimbursements, waivers or reductions occur.
HAmount does not include the portfolio activity of any underlying mutual funds or exchange-traded funds (ETFs), derivatives or securities that mature within one year from acquisition.
VIP Extended Market Index Portfolio Service Class |
| |
| Years ended December 31, | | 2024 | | 2023 | | 2022 | | 2021 | | 2020 |
Selected Per-Share Data | | | | | | | | | | |
| Net asset value, beginning of period | $ | 12.91 | $ | 11.20 | $ | 14.17 | $ | 12.50 | $ | 10.86 |
| Income from Investment Operations | | | | | | | | | | |
Net investment income (loss) A,B | | .18 | | .18 | | .17 | | .16 | | .13 |
| Net realized and unrealized gain (loss) | | 1.40 | | 1.74 | | (2.75) | | 2.45 | | 1.65 |
| Total from investment operations | | 1.58 | | 1.92 | | (2.58) | | 2.61 | | 1.78 |
| Distributions from net investment income | | (.18) | | (.21) | | (.16) | | (.17) | | (.14) |
| Distributions from net realized gain | | - | | - | | (.24) | | (.77) | | - |
| Total distributions | | (.18) | | (.21) | | (.39) C | | (.94) | | (.14) |
| Net asset value, end of period | $ | 14.31 | $ | 12.91 | $ | 11.20 | $ | 14.17 | $ | 12.50 |
Total Return D,E | | | | 17.34% | | (18.22)% | | 21.16% | | 16.37% |
Ratios to Average Net Assets B,F,G | | | | | | | | | | |
| Expenses before reductions | | .22% | | .23% | | .23% | | .23% | | .23% |
| Expenses net of fee waivers, if any | | | | .23% | | .23% | | .23% | | .23% |
| Expenses net of all reductions | | .22% | | .22% | | .23% | | .23% | | .23% |
| Net investment income (loss) | | 1.34% | | 1.56% | | 1.41% | | 1.10% | | 1.24% |
| Supplemental Data | | | | | | | | | | |
| Net assets, end of period (000 omitted) | $ | 73,201 | $ | 40,805 | $ | 26,672 | $ | 23,331 | $ | 18,141 |
Portfolio turnover rate H | | | | 80% | | 18% | | 27% | | 46% |
ACalculated based on average shares outstanding during the period.
BNet investment income (loss) is affected by the timing of the declaration of dividends by any underlying mutual funds or exchange-traded funds (ETFs). Net investment income (loss) of any mutual funds or ETFs is not included in the Fund's net investment income (loss) ratio.
CTotal distributions per share do not sum due to rounding.
DTotal returns do not reflect charges attributable to your insurance company's separate account. Inclusion of these charges would reduce the total returns shown.
ETotal returns would have been lower if certain expenses had not been reduced during the applicable periods shown.
FFees and expenses of any underlying mutual funds or exchange-traded funds (ETFs) are not included in the Fund's expense ratio. The Fund indirectly bears its proportionate share of these expenses. For additional expense information related to investments in Fidelity Central Funds, please refer to the "Investments in Fidelity Central Funds" note found in the Notes to Financial Statements section of the most recent Annual or Semi-Annual report.
GExpense ratios reflect operating expenses of the class. Expenses before reductions do not reflect amounts reimbursed, waived, or reduced through arrangements with the investment adviser, brokerage services, or other offset arrangements, if applicable, and do not represent the amount paid by the class during periods when reimbursements, waivers or reductions occur.
HAmount does not include the portfolio activity of any underlying mutual funds or exchange-traded funds (ETFs), derivatives or securities that mature within one year from acquisition.
VIP Extended Market Index Portfolio Service Class 2 |
| |
| Years ended December 31, | | 2024 | | 2023 | | 2022 | | 2021 | | 2020 |
Selected Per-Share Data | | | | | | | | | | |
| Net asset value, beginning of period | $ | 12.90 | $ | 11.20 | $ | 14.16 | $ | 12.50 | $ | 10.87 |
| Income from Investment Operations | | | | | | | | | | |
Net investment income (loss) A,B | | .16 | | .17 | | .15 | | .14 | | .11 |
| Net realized and unrealized gain (loss) | | 1.40 | | 1.72 | | (2.73) | | 2.44 | | 1.65 |
| Total from investment operations | | 1.56 | | 1.89 | | (2.58) | | 2.58 | | 1.76 |
| Distributions from net investment income | | (.17) | | (.19) | | (.14) | | (.15) | | (.13) |
| Distributions from net realized gain | | - | | - | | (.24) | | (.77) | | - |
| Total distributions | | (.17) | | (.19) | | (.38) | | (.92) | | (.13) |
| Net asset value, end of period | $ | 14.29 | $ | 12.90 | $ | 11.20 | $ | 14.16 | $ | 12.50 |
Total Return C,D | | | | 17.11% | | (18.30)% | | 20.93% | | 16.19% |
Ratios to Average Net Assets B,E,F | | | | | | | | | | |
| Expenses before reductions | | .37% | | .38% | | .38% | | .38% | | .38% |
| Expenses net of fee waivers, if any | | | | .38% | | .38% | | .38% | | .38% |
| Expenses net of all reductions | | .37% | | .37% | | .38% | | .38% | | .38% |
| Net investment income (loss) | | 1.19% | | 1.41% | | 1.26% | | .95% | | 1.09% |
| Supplemental Data | | | | | | | | | | |
| Net assets, end of period (000 omitted) | $ | 17,288 | $ | 7,201 | $ | 6,224 | $ | 7,228 | $ | 4,824 |
Portfolio turnover rate G | | | | 80% | | 18% | | 27% | | 46% |
ACalculated based on average shares outstanding during the period.
BNet investment income (loss) is affected by the timing of the declaration of dividends by any underlying mutual funds or exchange-traded funds (ETFs). Net investment income (loss) of any mutual funds or ETFs is not included in the Fund's net investment income (loss) ratio.
CTotal returns do not reflect charges attributable to your insurance company's separate account. Inclusion of these charges would reduce the total returns shown.
DTotal returns would have been lower if certain expenses had not been reduced during the applicable periods shown.
EFees and expenses of any underlying mutual funds or exchange-traded funds (ETFs) are not included in the Fund's expense ratio. The Fund indirectly bears its proportionate share of these expenses. For additional expense information related to investments in Fidelity Central Funds, please refer to the "Investments in Fidelity Central Funds" note found in the Notes to Financial Statements section of the most recent Annual or Semi-Annual report.
FExpense ratios reflect operating expenses of the class. Expenses before reductions do not reflect amounts reimbursed, waived, or reduced through arrangements with the investment adviser, brokerage services, or other offset arrangements, if applicable, and do not represent the amount paid by the class during periods when reimbursements, waivers or reductions occur.
GAmount does not include the portfolio activity of any underlying mutual funds or exchange-traded funds (ETFs), derivatives or securities that mature within one year from acquisition.
VIP International Index Portfolio
Schedule of Investments December 31, 2024
Showing Percentage of Net Assets
| Common Stocks - 97.2% |
| | | Shares | Value ($) |
| ARGENTINA - 0.0% | | | |
| Energy - 0.0% | | | |
| Oil, Gas & Consumable Fuels - 0.0% | | | |
| Vista Energy SAB de CV ADR (b) | | 1,735 | 93,881 |
| AUSTRALIA - 4.7% | | | |
| Communication Services - 0.1% | | | |
| Diversified Telecommunication Services - 0.0% | | | |
| Telstra Group Ltd | | 90,328 | 224,193 |
| Interactive Media & Services - 0.1% | | | |
| CAR Group Ltd | | 8,400 | 187,327 |
| REA Group Ltd | | 1,148 | 165,779 |
| SEEK Ltd | | 7,945 | 110,989 |
| | | | 464,095 |
TOTAL COMMUNICATION SERVICES | | | 688,288 |
| | | | |
| Consumer Discretionary - 0.3% | | | |
| Broadline Retail - 0.2% | | | |
| Wesfarmers Ltd | | 25,296 | 1,119,943 |
| Diversified Consumer Services - 0.0% | | | |
| IDP Education Ltd | | 6,141 | 48,006 |
| Hotels, Restaurants & Leisure - 0.1% | | | |
| Aristocrat Leisure Ltd | | 14,055 | 594,687 |
| Lottery Corp/The | | 49,752 | 152,122 |
| | | | 746,809 |
| Specialty Retail - 0.0% | | | |
| JB Hi-Fi Ltd | | 2,430 | 139,395 |
TOTAL CONSUMER DISCRETIONARY | | | 2,054,153 |
| | | | |
| Consumer Staples - 0.2% | | | |
| Beverages - 0.0% | | | |
| Treasury Wine Estates Ltd | | 17,995 | 126,193 |
| Consumer Staples Distribution & Retail - 0.2% | | | |
| Coles Group Ltd | | 29,861 | 349,134 |
| Endeavour Group Ltd/Australia | | 33,633 | 87,432 |
| Metcash Ltd | | 24,271 | 46,570 |
| Woolworths Group Ltd | | 27,234 | 513,954 |
| | | | 997,090 |
TOTAL CONSUMER STAPLES | | | 1,123,283 |
| | | | |
| Energy - 0.2% | | | |
| Oil, Gas & Consumable Fuels - 0.2% | | | |
| Ampol Ltd | | 5,325 | 92,912 |
| Santos Ltd | | 72,456 | 299,576 |
| Whitehaven Coal Ltd | | 18,335 | 70,360 |
| Woodside Energy Group Ltd | | 42,327 | 655,431 |
| | | | 1,118,279 |
| Financials - 1.8% | | | |
| Banks - 1.4% | | | |
| ANZ Group Holdings Ltd | | 66,915 | 1,182,042 |
| Bank of Queensland Ltd | | 14,747 | 61,155 |
| Bendigo & Adelaide Bank Ltd | | 12,666 | 102,699 |
| Commonwealth Bank of Australia | | 37,305 | 3,538,533 |
| National Australia Bank Ltd | | 68,775 | 1,579,284 |
| Westpac Banking Corp | | 77,126 | 1,542,864 |
| | | | 8,006,577 |
| Capital Markets - 0.2% | | | |
| ASX Ltd | | 4,320 | 174,015 |
| Macquarie Group Ltd | | 7,915 | 1,085,862 |
| Magellan Financial Group Ltd warrants 4/16/2027 (b) | | 252 | 16 |
| | | | 1,259,893 |
| Financial Services - 0.0% | | | |
| AMP Ltd | | 59,085 | 57,965 |
| Challenger Ltd | | 11,484 | 42,718 |
| Washington H Soul Pattinson & Co Ltd | | 5,495 | 116,387 |
| | | | 217,070 |
| Insurance - 0.2% | | | |
| Insurance Australia Group Ltd | | 52,833 | 276,650 |
| Medibank Pvt Ltd | | 61,355 | 143,928 |
| QBE Insurance Group Ltd | | 33,488 | 397,966 |
| Steadfast Group Ltd | | 24,663 | 88,538 |
| Suncorp Group Ltd | | 28,377 | 333,891 |
| | | | 1,240,973 |
TOTAL FINANCIALS | | | 10,724,513 |
| | | | |
| Health Care - 0.1% | | | |
| Health Care Equipment & Supplies - 0.0% | | | |
| Ansell Ltd | | 3,250 | 68,032 |
| Cochlear Ltd | | 1,458 | 261,596 |
| | | | 329,628 |
| Health Care Providers & Services - 0.1% | | | |
| EBOS Group Ltd | | 3,547 | 73,527 |
| Ramsay Health Care Ltd | | 4,198 | 89,747 |
| Sonic Healthcare Ltd | | 10,732 | 179,416 |
| | | | 342,690 |
| Health Care Technology - 0.0% | | | |
| Pro Medicus Ltd | | 1,207 | 186,858 |
TOTAL HEALTH CARE | | | 859,176 |
| | | | |
| Industrials - 0.3% | | | |
| Commercial Services & Supplies - 0.1% | | | |
| Brambles Ltd | | 31,043 | 369,679 |
| Cleanaway Waste Management Ltd | | 50,041 | 82,078 |
| | | | 451,757 |
| Construction & Engineering - 0.0% | | | |
| Worley Ltd | | 10,828 | 91,817 |
| Ground Transportation - 0.0% | | | |
| Aurizon Holdings Ltd | | 41,364 | 83,207 |
| Passenger Airlines - 0.0% | | | |
| Qantas Airways Ltd (b) | | 17,539 | 97,376 |
| Professional Services - 0.1% | | | |
| ALS Ltd | | 10,782 | 100,636 |
| Computershare Ltd | | 12,472 | 262,079 |
| | | | 362,715 |
| Trading Companies & Distributors - 0.0% | | | |
| Reece Ltd | | 5,285 | 73,208 |
| SGH Ltd | | 4,488 | 128,087 |
| | | | 201,295 |
| Transportation Infrastructure - 0.1% | | | |
| Atlas Arteria Ltd unit | | 23,388 | 68,761 |
| Qube Holdings Ltd | | 39,453 | 96,945 |
| Transurban Group unit | | 69,184 | 573,380 |
| | | | 739,086 |
TOTAL INDUSTRIALS | | | 2,027,253 |
| | | | |
| Information Technology - 0.1% | | | |
| IT Services - 0.0% | | | |
| NEXTDC Ltd (b) | | 14,210 | 132,545 |
| Software - 0.1% | | | |
| Technology One Ltd | | 6,651 | 128,892 |
| WiseTech Global Ltd | | 4,173 | 312,683 |
| | | | 441,575 |
TOTAL INFORMATION TECHNOLOGY | | | 574,120 |
| | | | |
| Materials - 1.2% | | | |
| Chemicals - 0.0% | | | |
| Incitec Pivot Ltd | | 39,046 | 70,810 |
| Orica Ltd | | 10,811 | 110,945 |
| | | | 181,755 |
| Containers & Packaging - 0.0% | | | |
| Orora Ltd | | 30,385 | 46,265 |
| Metals & Mining - 1.2% | | | |
| BHP Group Ltd | | 113,059 | 2,758,048 |
| BlueScope Steel Ltd | | 9,810 | 113,484 |
| Evolution Mining Ltd | | 44,470 | 132,394 |
| Fortescue Ltd | | 37,754 | 425,131 |
| Glencore PLC | | 220,308 | 970,276 |
| IGO Ltd | | 14,740 | 43,518 |
| Iluka Resources Ltd | | 9,601 | 30,009 |
| Lynas Rare Earths Ltd (b) | | 19,098 | 76,007 |
| Mineral Resources Ltd | | 3,841 | 81,426 |
| Northern Star Resources Ltd | | 25,601 | 244,658 |
| Pilbara Minerals Ltd (b) | | 62,998 | 85,394 |
| Rio Tinto Ltd | | 8,284 | 602,262 |
| Rio Tinto PLC | | 23,739 | 1,401,315 |
| South32 Ltd | | 100,948 | 211,747 |
| | | | 7,175,669 |
TOTAL MATERIALS | | | 7,403,689 |
| | | | |
| Real Estate - 0.3% | | | |
| Diversified REITs - 0.1% | | | |
| Charter Hall Group unit | | 10,629 | 94,406 |
| GPT Group/The unit | | 42,594 | 115,209 |
| Mirvac Group unit | | 87,722 | 101,804 |
| Stockland unit | | 53,530 | 159,035 |
| | | | 470,454 |
| Industrial REITs - 0.1% | | | |
| Goodman Group unit | | 38,927 | 858,706 |
| Office REITs - 0.0% | | | |
| Dexus unit | | 24,016 | 98,999 |
| Real Estate Management & Development - 0.0% | | | |
| Lendlease Group unit | | 14,600 | 56,298 |
| Retail REITs - 0.1% | | | |
| Scentre Group unit | | 115,504 | 245,215 |
| Vicinity Ltd unit | | 86,060 | 111,860 |
| | | | 357,075 |
TOTAL REAL ESTATE | | | 1,841,532 |
| | | | |
| Utilities - 0.1% | | | |
| Electric Utilities - 0.1% | | | |
| Origin Energy Ltd | | 38,394 | 259,027 |
| Gas Utilities - 0.0% | | | |
| Apa Group unit | | 28,320 | 122,175 |
| Multi-Utilities - 0.0% | | | |
| AGL Energy Ltd | | 13,520 | 94,477 |
TOTAL UTILITIES | | | 475,679 |
| | | | |
| TOTAL AUSTRALIA | | | 28,889,965 |
| AUSTRIA - 0.2% | | | |
| Energy - 0.0% | | | |
| Oil, Gas & Consumable Fuels - 0.0% | | | |
| OMV AG | | 3,152 | 121,915 |
| Financials - 0.2% | | | |
| Banks - 0.2% | | | |
| BAWAG Group AG (c)(d) | | 1,739 | 146,179 |
| Erste Group Bank AG | | 7,405 | 457,621 |
| Raiffeisen Bank International AG | | 2,861 | 58,530 |
| | | | 662,330 |
| Insurance - 0.0% | | | |
| UNIQA Insurance Group AG | | 2,703 | 21,923 |
TOTAL FINANCIALS | | | 684,253 |
| | | | |
| Industrials - 0.0% | | | |
| Commercial Services & Supplies - 0.0% | | | |
| DO & Co AG (b) | | 173 | 32,256 |
| Machinery - 0.0% | | | |
| ANDRITZ AG | | 1,615 | 81,939 |
TOTAL INDUSTRIALS | | | 114,195 |
| | | | |
| Information Technology - 0.0% | | | |
| Semiconductors & Semiconductor Equipment - 0.0% | | | |
| ams-OSRAM AG (b) | | 2,117 | 13,846 |
| Materials - 0.0% | | | |
| Construction Materials - 0.0% | | | |
| Wienerberger AG | | 2,470 | 68,518 |
| Metals & Mining - 0.0% | | | |
| voestalpine AG | | 2,357 | 44,753 |
| Paper & Forest Products - 0.0% | | | |
| Mondi PLC | | 9,836 | 146,779 |
TOTAL MATERIALS | | | 260,050 |
| | | | |
| Real Estate - 0.0% | | | |
| Real Estate Management & Development - 0.0% | | | |
| CA Immobilien Anlagen AG (e) | | 939 | 22,683 |
| IMMOFINANZ AG (b)(f) | | 1,102 | 0 |
| | | | 22,683 |
| Utilities - 0.0% | | | |
| Electric Utilities - 0.0% | | | |
| Verbund AG Class A | | 1,857 | 134,650 |
| TOTAL AUSTRIA | | | 1,351,592 |
| BELGIUM - 0.5% | | | |
| Consumer Discretionary - 0.0% | | | |
| Distributors - 0.0% | | | |
| D'ieteren Group | | 479 | 79,735 |
| Consumer Staples - 0.3% | | | |
| Beverages - 0.3% | | | |
| Anheuser-Busch InBev SA/NV | | 20,035 | 1,003,032 |
| Food Products - 0.0% | | | |
| Lotus Bakeries NV | | 9 | 100,498 |
TOTAL CONSUMER STAPLES | | | 1,103,530 |
| | | | |
| Financials - 0.1% | | | |
| Banks - 0.1% | | | |
| KBC Group NV | | 5,859 | 452,387 |
| Financial Services - 0.0% | | | |
| Groupe Bruxelles Lambert NV | | 1,866 | 127,668 |
| Sofina SA | | 344 | 77,823 |
| | | | 205,491 |
| Insurance - 0.0% | | | |
| Ageas SA/NV | | 3,815 | 185,337 |
TOTAL FINANCIALS | | | 843,215 |
| | | | |
| Health Care - 0.1% | | | |
| Pharmaceuticals - 0.1% | | | |
| UCB SA | | 2,686 | 534,757 |
| Industrials - 0.0% | | | |
| Construction & Engineering - 0.0% | | | |
| Ackermans & van Haaren NV | | 494 | 97,481 |
| Materials - 0.0% | | | |
| Chemicals - 0.0% | | | |
| Solvay SA Class A | | 1,580 | 50,998 |
| Syensqo SA | | 1,633 | 119,355 |
| Umicore SA | | 4,311 | 44,498 |
| | | | 214,851 |
| Real Estate - 0.0% | | | |
| Health Care REITs - 0.0% | | | |
| Aedifica SA | | 1,071 | 62,348 |
| Cofinimmo SA | | 846 | 48,724 |
| | | | 111,072 |
| Industrial REITs - 0.0% | | | |
| Warehouses De Pauw CVA | | 3,894 | 76,638 |
TOTAL REAL ESTATE | | | 187,710 |
| | | | |
| Utilities - 0.0% | | | |
| Electric Utilities - 0.0% | | | |
| Elia Group SA/NV | | 761 | 58,648 |
| TOTAL BELGIUM | | | 3,119,927 |
| BRAZIL - 1.3% | | | |
| Communication Services - 0.0% | | | |
| Diversified Telecommunication Services - 0.0% | | | |
| Telefonica Brasil SA | | 8,800 | 66,621 |
| Wireless Telecommunication Services - 0.0% | | | |
| TIM SA/Brazil | | 18,100 | 42,424 |
TOTAL COMMUNICATION SERVICES | | | 109,045 |
| | | | |
| Consumer Discretionary - 0.0% | | | |
| Broadline Retail - 0.0% | | | |
| Magazine Luiza SA (b) | | 7,181 | 7,555 |
| Specialty Retail - 0.0% | | | |
| Lojas Renner SA | | 23,426 | 45,958 |
| Vibra Energia SA | | 23,400 | 67,574 |
| | | | 113,532 |
TOTAL CONSUMER DISCRETIONARY | | | 121,087 |
| | | | |
| Consumer Staples - 0.1% | | | |
| Beverages - 0.1% | | | |
| Ambev SA | | 98,600 | 187,373 |
| Consumer Staples Distribution & Retail - 0.0% | | | |
| Atacadao SA | | 10,700 | 9,405 |
| Raia Drogasil SA | | 24,716 | 88,017 |
| Sendas Distribuidora S/A | | 31,400 | 28,615 |
| | | | 126,037 |
| Food Products - 0.0% | | | |
| BRF SA | | 11,500 | 47,207 |
| Personal Care Products - 0.0% | | | |
| Natura & Co Holding SA | | 19,293 | 39,849 |
TOTAL CONSUMER STAPLES | | | 400,466 |
| | | | |
| Energy - 0.2% | | | |
| Oil, Gas & Consumable Fuels - 0.2% | | | |
| Brava Energia | | 8,884 | 33,823 |
| Cosan SA | | 25,300 | 33,417 |
| Petroleo Brasileiro SA | | 100,800 | 590,489 |
| Petroleo Brasileiro SA | | 81,000 | 516,719 |
| PRIO SA/Brazil | | 18,500 | 120,232 |
| Ultrapar Participacoes SA | | 16,600 | 42,670 |
| | | | 1,337,350 |
| Financials - 0.5% | | | |
| Banks - 0.4% | | | |
| Banco Bradesco SA | | 32,694 | 56,308 |
| Banco Bradesco SA | | 119,041 | 222,750 |
| Banco do Brasil SA | | 64,300 | 251,565 |
| Itau Unibanco Holding SA | | 108,200 | 538,211 |
| Itausa SA | | 129,034 | 184,428 |
| NU Holdings Ltd/Cayman Islands Class A (b) | | 71,391 | 739,611 |
| | | | 1,992,873 |
| Capital Markets - 0.1% | | | |
| B3 SA - Brasil Bolsa Balcao | | 123,400 | 206,138 |
| Banco BTG Pactual SA unit | | 22,400 | 98,623 |
| XP Inc depository receipt | | 8,344 | 99,015 |
| | | | 403,776 |
| Financial Services - 0.0% | | | |
| Pagseguro Digital Ltd Class A (b) | | 4,194 | 26,254 |
| StoneCo Ltd Class A (b) | | 6,387 | 50,904 |
| | | | 77,158 |
| Insurance - 0.0% | | | |
| BB Seguridade Participacoes SA | | 14,800 | 86,675 |
| Caixa Seguridade Participacoes S/A | | 11,300 | 26,065 |
| | | | 112,740 |
TOTAL FINANCIALS | | | 2,586,547 |
| | | | |
| Health Care - 0.0% | | | |
| Health Care Providers & Services - 0.0% | | | |
| Hapvida Participacoes e Investimentos S/A (b)(c)(d) | | 103,000 | 37,179 |
| Rede D'Or Sao Luiz SA (c)(d) | | 24,199 | 99,572 |
| | | | 136,751 |
| Pharmaceuticals - 0.0% | | | |
| Hypera SA | | 8,800 | 25,768 |
TOTAL HEALTH CARE | | | 162,519 |
| | | | |
| Industrials - 0.1% | | | |
| Aerospace & Defense - 0.0% | | | |
| Embraer SA (b) | | 15,500 | 140,979 |
| Electrical Equipment - 0.1% | | | |
| WEG SA | | 32,700 | 279,317 |
| Ground Transportation - 0.0% | | | |
| Localiza Rent a Car SA | | 19,552 | 101,909 |
| Rumo SA | | 27,200 | 78,546 |
| | | | 180,455 |
| Transportation Infrastructure - 0.0% | | | |
| CCR SA | | 22,300 | 36,710 |
| Santos Brasil Participacoes SA | | 9,700 | 20,616 |
| | | | 57,326 |
TOTAL INDUSTRIALS | | | 658,077 |
| | | | |
| Information Technology - 0.0% | | | |
| Software - 0.0% | | | |
| TOTVS SA | | 11,400 | 49,362 |
| Materials - 0.3% | | | |
| Chemicals - 0.0% | | | |
| Yara International ASA | | 3,567 | 94,256 |
| Containers & Packaging - 0.0% | | | |
| Klabin SA unit | | 21,580 | 81,040 |
| Metals & Mining - 0.3% | | | |
| Bradespar SA | | 5,214 | 13,993 |
| Cia Siderurgica Nacional SA | | 13,400 | 19,218 |
| Gerdau SA | | 31,070 | 91,231 |
| Metalurgica Gerdau SA | | 15,100 | 25,053 |
| Vale SA | | 79,901 | 705,520 |
| Wheaton Precious Metals Corp | | 10,108 | 568,951 |
| | | | 1,423,966 |
| Paper & Forest Products - 0.0% | | | |
| Suzano SA | | 15,479 | 154,794 |
TOTAL MATERIALS | | | 1,754,056 |
| | | | |
| Real Estate - 0.0% | | | |
| Real Estate Management & Development - 0.0% | | | |
| Allos SA | | 8,400 | 24,624 |
| Multiplan Empreendimentos Imobiliarios SA | | 7,000 | 23,885 |
| | | | 48,509 |
| Utilities - 0.1% | | | |
| Electric Utilities - 0.1% | | | |
| Centrais Eletricas Brasileiras SA | | 20,486 | 113,177 |
| Centrais Eletricas Brasileiras SA Series B | | 4,466 | 27,355 |
| Cia Energetica de Minas Gerais | | 42,323 | 76,112 |
| Cia Paranaense de Energia - Copel | | 11,100 | 14,805 |
| Cia Paranaense de Energia - Copel Series B | | 29,200 | 43,248 |
| Energisa S/A unit | | 6,300 | 37,201 |
| Equatorial Energia SA | | 22,911 | 101,615 |
| Transmissora Alianca de Energia Eletrica S/A unit | | 4,800 | 25,531 |
| | | | 439,044 |
| Independent Power and Renewable Electricity Producers - 0.0% | | | |
| Eneva SA (b) | | 27,600 | 47,044 |
| Engie Brasil Energia SA | | 5,550 | 31,891 |
| | | | 78,935 |
| Water Utilities - 0.0% | | | |
| Cia de Saneamento Basico do Estado de Sao Paulo SABESP | | 10,200 | 146,119 |
| Cia De Sanena Do Parana unit | | 5,400 | 24,291 |
| | | | 170,410 |
TOTAL UTILITIES | | | 688,389 |
| | | | |
| TOTAL BRAZIL | | | 7,915,407 |
| CAMEROON - 0.0% | | | |
| Energy - 0.0% | | | |
| Oil, Gas & Consumable Fuels - 0.0% | | | |
| Golar LNG Ltd | | 2,289 | 96,870 |
| CANADA - 7.7% | | | |
| Communication Services - 0.1% | | | |
| Diversified Telecommunication Services - 0.1% | | | |
| BCE Inc (e) | | 6,715 | 155,653 |
| Quebecor Inc Class B | | 3,504 | 76,786 |
| TELUS Corp | | 10,992 | 149,038 |
| | | | 381,477 |
| Wireless Telecommunication Services - 0.0% | | | |
| Rogers Communications Inc Class B | | 8,453 | 259,861 |
TOTAL COMMUNICATION SERVICES | | | 641,338 |
| | | | |
| Consumer Discretionary - 0.3% | | | |
| Automobile Components - 0.0% | | | |
| Magna International Inc | | 6,015 | 251,404 |
| Broadline Retail - 0.2% | | | |
| Canadian Tire Corp Ltd Class A | | 1,169 | 122,979 |
| Dollarama Inc | | 6,293 | 614,131 |
| | | | 737,110 |
| Hotels, Restaurants & Leisure - 0.1% | | | |
| Restaurant Brands International Inc | | 7,062 | 460,286 |
| Textiles, Apparel & Luxury Goods - 0.0% | | | |
| Gildan Activewear Inc | | 3,374 | 158,789 |
TOTAL CONSUMER DISCRETIONARY | | | 1,607,589 |
| | | | |
| Consumer Staples - 0.3% | | | |
| Consumer Staples Distribution & Retail - 0.3% | | | |
| Alimentation Couche-Tard Inc | | 17,489 | 969,928 |
| Empire Co Ltd Class A | | 3,177 | 97,004 |
| George Weston Ltd | | 1,209 | 188,013 |
| Loblaw Cos Ltd | | 3,207 | 422,045 |
| Metro Inc/CN | | 4,526 | 283,849 |
| | | | 1,960,839 |
| Food Products - 0.0% | | | |
| Saputo Inc | | 5,442 | 94,609 |
TOTAL CONSUMER STAPLES | | | 2,055,448 |
| | | | |
| Energy - 1.4% | | | |
| Oil, Gas & Consumable Fuels - 1.4% | | | |
| ARC Resources Ltd | | 13,316 | 241,503 |
| Cameco Corp | | 9,696 | 498,544 |
| Canadian Natural Resources Ltd | | 47,424 | 1,464,174 |
| Cenovus Energy Inc | | 28,970 | 439,150 |
| Enbridge Inc | | 48,532 | 2,059,854 |
| Gibson Energy Inc | | 3,537 | 60,236 |
| Imperial Oil Ltd | | 3,687 | 227,230 |
| Keyera Corp | | 5,092 | 155,723 |
| MEG Energy Corp | | 5,942 | 97,556 |
| Parkland Corp | | 3,058 | 69,161 |
| Pembina Pipeline Corp | | 12,934 | 477,877 |
| South Bow Corp | | 4,666 | 110,105 |
| Suncor Energy Inc | | 28,305 | 1,010,351 |
| TC Energy Corp (e) | | 23,125 | 1,077,703 |
| Tourmaline Oil Corp | | 7,377 | 341,381 |
| Veren Inc | | 13,647 | 70,160 |
| Whitecap Resources Inc (e) | | 13,403 | 95,106 |
| | | | 8,495,814 |
| Financials - 3.0% | | | |
| Banks - 1.9% | | | |
| Bank of Montreal | | 16,260 | 1,578,547 |
| Bank of Nova Scotia/The | | 27,422 | 1,472,541 |
| Canadian Imperial Bank of Commerce | | 21,028 | 1,330,186 |
| National Bank of Canada | | 7,591 | 692,006 |
| Royal Bank of Canada | | 31,555 | 3,804,733 |
| Toronto Dominion Bank | | 38,938 | 2,073,065 |
| | | | 10,951,078 |
| Capital Markets - 0.4% | | | |
| Brookfield Asset Management Ltd Class A | | 8,309 | 450,638 |
| Brookfield Corp Class A | | 32,096 | 1,844,775 |
| Onex Corp Subordinate Voting Shares | | 1,402 | 109,510 |
| TMX Group Ltd | | 6,198 | 190,927 |
| | | | 2,595,850 |
| Insurance - 0.7% | | | |
| Fairfax Financial Holdings Ltd Subordinate Voting Shares | | 478 | 665,067 |
| Great-West Lifeco Inc | | 6,068 | 201,232 |
| iA Financial Corp Inc | | 2,096 | 194,399 |
| Intact Financial Corp | | 3,980 | 724,676 |
| Manulife Financial Corp | | 39,648 | 1,218,029 |
| Power Corp of Canada Subordinate Voting Shares | | 12,182 | 380,007 |
| Sun Life Financial Inc | | 12,885 | 765,059 |
| | | | 4,148,469 |
TOTAL FINANCIALS | | | 17,695,397 |
| | | | |
| Industrials - 0.9% | | | |
| Aerospace & Defense - 0.1% | | | |
| Bombardier Inc Class B (b) | | 1,926 | 130,973 |
| CAE Inc (b) | | 7,102 | 180,335 |
| | | | 311,308 |
| Commercial Services & Supplies - 0.0% | | | |
| Element Fleet Management Corp | | 9,008 | 182,109 |
| Construction & Engineering - 0.1% | | | |
| AtkinsRealis Group Inc | | 3,903 | 207,063 |
| Stantec Inc | | 2,542 | 199,441 |
| WSP Global Inc | | 2,779 | 489,044 |
| | | | 895,548 |
| Ground Transportation - 0.6% | | | |
| Canadian National Railway Co | | 12,353 | 1,254,421 |
| Canadian Pacific Kansas City Ltd | | 20,799 | 1,505,972 |
| TFI International Inc | | 1,772 | 239,447 |
| | | | 2,999,840 |
| Passenger Airlines - 0.0% | | | |
| Air Canada (b) | | 7,409 | 114,734 |
| Professional Services - 0.1% | | | |
| Thomson Reuters Corp | | 3,013 | 483,816 |
| Trading Companies & Distributors - 0.0% | | | |
| Finning International Inc | | 3,149 | 83,443 |
| Toromont Industries Ltd | | 1,820 | 143,883 |
| | | | 227,326 |
TOTAL INDUSTRIALS | | | 5,214,681 |
| | | | |
| Information Technology - 0.9% | | | |
| Electronic Equipment, Instruments & Components - 0.0% | | | |
| Celestica Inc Subordinate Voting Shares (b) | | 2,634 | 243,087 |
| IT Services - 0.6% | | | |
| CGI Inc Class A | | 4,547 | 497,514 |
| Shopify Inc Class A (b) | | 26,979 | 2,871,417 |
| | | | 3,368,931 |
| Software - 0.3% | | | |
| Constellation Software Inc/Canada | | 439 | 1,357,484 |
| Constellation Software Inc/Canada warrants 3/31/2040 (b)(f) | | 363 | 0 |
| Descartes Systems Group Inc/The (b) | | 1,897 | 215,639 |
| Open Text Corp | | 5,975 | 169,093 |
| | | | 1,742,216 |
TOTAL INFORMATION TECHNOLOGY | | | 5,354,234 |
| | | | |
| Materials - 0.6% | | | |
| Chemicals - 0.1% | | | |
| Methanex Corp | | 1,504 | 75,155 |
| Nutrien Ltd (e) | | 11,021 | 493,145 |
| | | | 568,300 |
| Containers & Packaging - 0.0% | | | |
| CCL Industries Inc Class B | | 3,317 | 170,644 |
| Metals & Mining - 0.5% | | | |
| Agnico Eagle Mines Ltd/CA | | 11,160 | 873,111 |
| Alamos Gold Inc Class A | | 9,341 | 172,335 |
| B2Gold Corp | | 28,821 | 70,576 |
| Barrick Gold Corp | | 39,031 | 605,239 |
| Franco-Nevada Corp | | 4,288 | 503,899 |
| Kinross Gold Corp | | 27,343 | 253,942 |
| Pan American Silver Corp | | 8,076 | 163,380 |
| Teck Resources Ltd Class B | | 10,264 | 416,144 |
| | | | 3,058,626 |
| Paper & Forest Products - 0.0% | | | |
| West Fraser Timber Co Ltd | | 1,296 | 112,294 |
TOTAL MATERIALS | | | 3,909,864 |
| | | | |
| Real Estate - 0.0% | | | |
| Real Estate Management & Development - 0.0% | | | |
| Colliers International Group Inc Subordinate Voting Shares | | 928 | 126,199 |
| FirstService Corp Subordinate Voting Shares | | 927 | 167,924 |
| | | | 294,123 |
| Utilities - 0.2% | | | |
| Electric Utilities - 0.2% | | | |
| Emera Inc | | 6,425 | 240,158 |
| Fortis Inc/Canada | | 11,056 | 459,408 |
| Hydro One Ltd (c)(d) | | 7,113 | 219,063 |
| | | | 918,629 |
| Gas Utilities - 0.0% | | | |
| AltaGas Ltd | | 6,635 | 154,538 |
| Brookfield Infrastructure Corp | | 2,615 | 104,931 |
| | | | 259,469 |
| Independent Power and Renewable Electricity Producers - 0.0% | | | |
| Brookfield Renewable Corp | | 2,997 | 82,939 |
| Northland Power Inc (e) | | 5,615 | 69,921 |
| | | | 152,860 |
| Multi-Utilities - 0.0% | | | |
| Algonquin Power & Utilities Corp (e) | | 16,837 | 74,730 |
| Canadian Utilities Ltd Class A | | 2,874 | 69,677 |
| | | | 144,407 |
TOTAL UTILITIES | | | 1,475,365 |
| | | | |
| TOTAL CANADA | | | 46,743,853 |
| CHILE - 0.2% | | | |
| Consumer Discretionary - 0.0% | | | |
| Broadline Retail - 0.0% | | | |
| Falabella SA | | 16,918 | 59,794 |
| Specialty Retail - 0.0% | | | |
| Empresas Copec SA | | 7,960 | 48,655 |
TOTAL CONSUMER DISCRETIONARY | | | 108,449 |
| | | | |
| Consumer Staples - 0.0% | | | |
| Beverages - 0.0% | | | |
| Embotelladora Andina SA Class B | | 8,701 | 26,465 |
| Consumer Staples Distribution & Retail - 0.0% | | | |
| Cencosud SA | | 27,870 | 61,652 |
TOTAL CONSUMER STAPLES | | | 88,117 |
| | | | |
| Financials - 0.0% | | | |
| Banks - 0.0% | | | |
| Banco de Chile | | 1,001,278 | 113,818 |
| Banco de Credito e Inversiones SA | | 1,787 | 49,593 |
| Banco Santander Chile | | 1,405,506 | 66,846 |
| | | | 230,257 |
| Industrials - 0.0% | | | |
| Marine Transportation - 0.0% | | | |
| Cia Sud Americana DE Vapores SA | | 306,044 | 16,525 |
| Passenger Airlines - 0.0% | | | |
| Latam Airlines Group SA | | 4,101,215 | 56,620 |
TOTAL INDUSTRIALS | | | 73,145 |
| | | | |
| Materials - 0.2% | | | |
| Chemicals - 0.1% | | | |
| Sociedad Quimica y Minera de Chile SA Class B | | 3,149 | 115,888 |
| Metals & Mining - 0.1% | | | |
| Antofagasta PLC | | 7,689 | 153,051 |
| Lundin Mining Corp | | 14,425 | 124,135 |
| | | | 277,186 |
| Paper & Forest Products - 0.0% | | | |
| Empresas Cmpc SA | | 24,290 | 38,123 |
TOTAL MATERIALS | | | 431,197 |
| | | | |
| Utilities - 0.0% | | | |
| Electric Utilities - 0.0% | | | |
| Enel Americas SA | | 420,190 | 36,863 |
| Enel Chile SA | | 550,737 | 31,842 |
| | | | 68,705 |
| TOTAL CHILE | | | 999,870 |
| CHINA - 6.7% | | | |
| Communication Services - 1.6% | | | |
| Diversified Telecommunication Services - 0.0% | | | |
| China Tower Corp Ltd H Shares (c)(d) | | 1,042,000 | 150,263 |
| Entertainment - 0.2% | | | |
| iQIYI Inc Class A ADR (b) | | 10,536 | 21,177 |
| Kingsoft Corp Ltd | | 20,800 | 90,119 |
| Netease Inc | | 38,805 | 690,723 |
| Tencent Music Entertainment Group Class A ADR | | 14,764 | 167,571 |
| | | | 969,590 |
| Interactive Media & Services - 1.4% | | | |
| Autohome Inc Class A ADR | | 1,503 | 39,003 |
| Baidu Inc A Shares (b) | | 50,840 | 536,190 |
| Bilibili Inc Z Shares (b) | | 6,202 | 112,246 |
| Kanzhun Ltd ADR | | 7,390 | 101,982 |
| Kuaishou Technology B Shares (b)(c)(d) | | 62,500 | 332,753 |
| Tencent Holdings Ltd | | 139,500 | 7,445,509 |
| | | | 8,567,683 |
TOTAL COMMUNICATION SERVICES | | | 9,687,536 |
| | | | |
| Consumer Discretionary - 2.3% | | | |
| Automobile Components - 0.0% | | | |
| Fuyao Glass Industry Group Co Ltd H Shares (c)(d) | | 13,600 | 97,973 |
| Automobiles - 0.3% | | | |
| Brilliance China Automotive Holdings Ltd | | 60,000 | 29,510 |
| BYD Co Ltd H Shares | | 22,293 | 758,255 |
| Geely Automobile Holdings Ltd | | 112,000 | 213,714 |
| Great Wall Motor Co Ltd H Shares (e) | | 51,500 | 90,578 |
| Li Auto Inc A Shares (b) | | 28,360 | 338,749 |
| XPeng Inc A Shares (b) | | 29,194 | 171,836 |
| Yadea Group Holdings Ltd (c)(d) | | 25,130 | 41,869 |
| | | | 1,644,511 |
| Broadline Retail - 1.3% | | | |
| Alibaba Group Holding Ltd | | 362,156 | 3,832,827 |
| JD.com Inc A Shares | | 63,754 | 1,106,974 |
| PDD Holdings Inc Class A ADR (b) | | 16,096 | 1,561,151 |
| Prosus NV Class N | | 31,045 | 1,233,258 |
| Vipshop Holdings Ltd Class A ADR | | 8,218 | 110,696 |
| | | | 7,844,906 |
| Diversified Consumer Services - 0.0% | | | |
| New Oriental Education & Technology Group Inc | | 28,410 | 181,200 |
| TAL Education Group Class A ADR (b) | | 10,023 | 100,430 |
| | | | 281,630 |
| Hotels, Restaurants & Leisure - 0.6% | | | |
| H World Group Ltd | | 37,700 | 124,690 |
| Haidilao International Holding Ltd (c)(d) | | 33,000 | 67,558 |
| Meituan B Shares (b)(c)(d) | | 122,830 | 2,388,230 |
| Tongcheng Travel Holdings Ltd (c) | | 26,000 | 60,927 |
| Trip.com Group Ltd (b) | | 12,310 | 847,178 |
| | | | 3,488,583 |
| Household Durables - 0.0% | | | |
| Haier Smart Home Co Ltd H Shares | | 51,600 | 180,299 |
| Specialty Retail - 0.0% | | | |
| Chow Tai Fook Jewellery Group Ltd | | 49,800 | 43,153 |
| Pop Mart International Group Ltd (c)(d) | | 13,800 | 159,293 |
| Topsports International Holdings Ltd (c)(d) | | 62,000 | 23,788 |
| | | | 226,234 |
| Textiles, Apparel & Luxury Goods - 0.1% | | | |
| ANTA Sports Products Ltd | | 26,600 | 266,628 |
| Li Ning Co Ltd | | 51,500 | 109,145 |
| Shenzhou International Group Holdings Ltd | | 17,800 | 142,095 |
| | | | 517,868 |
TOTAL CONSUMER DISCRETIONARY | | | 14,282,004 |
| | | | |
| Consumer Staples - 0.2% | | | |
| Beverages - 0.1% | | | |
| China Resources Beer Holdings Co Ltd | | 34,500 | 112,304 |
| Nongfu Spring Co Ltd H Shares (c)(d)(e) | | 40,200 | 175,725 |
| Tsingtao Brewery Co Ltd H Shares | | 14,000 | 102,386 |
| | | | 390,415 |
| Consumer Staples Distribution & Retail - 0.0% | | | |
| Alibaba Health Information Technology Ltd (b)(e) | | 130,000 | 55,571 |
| JD Health International Inc (b)(c)(d) | | 23,450 | 84,843 |
| | | | 140,414 |
| Food Products - 0.1% | | | |
| China Feihe Ltd (c)(d) | | 86,000 | 60,348 |
| China Mengniu Dairy Co Ltd | | 67,000 | 151,484 |
| Tingyi Cayman Islands Holding Corp | | 42,000 | 54,726 |
| Want Want China Holdings Ltd | | 93,000 | 54,603 |
| Wilmar International Ltd | | 58,800 | 133,475 |
| | | | 454,636 |
| Personal Care Products - 0.0% | | | |
| Giant Biogene Holding Co ltd (c)(d) | | 10,000 | 64,249 |
| Hengan International Group Co Ltd | | 14,500 | 41,913 |
| | | | 106,162 |
| Tobacco - 0.0% | | | |
| Smoore International Holdings Ltd (c)(d) | | 41,000 | 70,210 |
TOTAL CONSUMER STAPLES | | | 1,161,837 |
| | | | |
| Energy - 0.2% | | | |
| Energy Equipment & Services - 0.0% | | | |
| China Oilfield Services Ltd H Shares | | 40,000 | 36,257 |
| Oil, Gas & Consumable Fuels - 0.2% | | | |
| China Coal Energy Co Ltd H Shares | | 47,000 | 56,218 |
| China Petroleum & Chemical Corp H Shares | | 542,000 | 310,546 |
| China Shenhua Energy Co Ltd H Shares | | 75,500 | 326,627 |
| PetroChina Co Ltd H Shares | | 470,000 | 369,748 |
| Yankuang Energy Group Co Ltd H Shares | | 71,800 | 82,740 |
| | | | 1,145,879 |
TOTAL ENERGY | | | 1,182,136 |
| | | | |
| Financials - 1.3% | | | |
| Banks - 1.0% | | | |
| Agricultural Bank of China Ltd H Shares | | 686,000 | 391,286 |
| Bank of China Ltd H Shares | | 1,865,000 | 953,313 |
| Bank of Communications Co Ltd H Shares | | 476,000 | 391,628 |
| BOC Hong Kong Holdings Ltd | | 80,000 | 256,996 |
| China CITIC Bank Corp Ltd H Shares | | 203,000 | 140,358 |
| China Construction Bank Corp H Shares | | 2,198,000 | 1,820,989 |
| China Merchants Bank Co Ltd H Shares | | 74,000 | 381,117 |
| China Minsheng Banking Corp Ltd H Shares | | 145,300 | 64,356 |
| Industrial & Commercial Bank of China Ltd H Shares | | 1,645,000 | 1,103,494 |
| Postal Savings Bank of China Co Ltd H Shares (c)(d) | | 173,000 | 102,018 |
| | | | 5,605,555 |
| Capital Markets - 0.0% | | | |
| China Galaxy Securities Co Ltd H Shares | | 77,000 | 70,292 |
| China International Capital Corp Ltd H Shares (c)(d) | | 33,200 | 54,801 |
| CITIC Securities Co Ltd H Shares | | 31,175 | 85,698 |
| Huatai Securities Co Ltd H Shares (c)(d) | | 35,400 | 59,800 |
| | | | 270,591 |
| Consumer Finance - 0.0% | | | |
| Qifu Technology Inc Class A ADR | | 2,561 | 98,291 |
| Financial Services - 0.0% | | | |
| Far East Horizon Ltd | | 35,000 | 25,552 |
| Insurance - 0.3% | | | |
| China Life Insurance Co Ltd H Shares | | 166,000 | 313,762 |
| China Pacific Insurance Group Co Ltd H Shares | | 57,800 | 187,540 |
| New China Life Insurance Co Ltd H Shares | | 19,300 | 58,646 |
| People's Insurance Co Group of China Ltd/The H Shares | | 194,000 | 96,667 |
| PICC Property & Casualty Co Ltd H Shares | | 154,000 | 243,096 |
| Ping An Insurance Group Co of China Ltd H Shares | | 141,000 | 827,579 |
| | | | 1,727,290 |
TOTAL FINANCIALS | | | 7,727,279 |
| | | | |
| Health Care - 0.2% | | | |
| Biotechnology - 0.2% | | | |
| Akeso Inc (b)(c)(d) | | 14,000 | 109,417 |
| Beigene Ltd H Shares (b) | | 17,954 | 255,985 |
| Innovent Biologics Inc (b)(c)(d) | | 30,000 | 141,374 |
| | | | 506,776 |
| Health Care Equipment & Supplies - 0.0% | | | |
| Shandong Weigao Group Medical Polymer Co Ltd H Shares | | 56,000 | 33,167 |
| Health Care Providers & Services - 0.0% | | | |
| Hygeia Healthcare Holdings Co Ltd (b)(c)(d) | | 7,200 | 13,219 |
| Sinopharm Group Co Ltd H Shares | | 29,600 | 81,178 |
| | | | 94,397 |
| Life Sciences Tools & Services - 0.0% | | | |
| Genscript Biotech Corp (b) | | 24,000 | 30,407 |
| Wuxi Apptec Co Ltd H Shares (c)(d) | | 8,052 | 58,576 |
| Wuxi Biologics Cayman Inc (b)(c)(d) | | 79,500 | 179,745 |
| | | | 268,728 |
| Pharmaceuticals - 0.0% | | | |
| CSPC Pharmaceutical Group Ltd | | 184,400 | 113,489 |
| Hansoh Pharmaceutical Group Co Ltd (c)(d) | | 24,000 | 53,398 |
| | | | 166,887 |
TOTAL HEALTH CARE | | | 1,069,955 |
| | | | |
| Industrials - 0.2% | | | |
| Air Freight & Logistics - 0.0% | | | |
| JD Logistics Inc (b)(c)(d) | | 42,100 | 69,384 |
| Building Products - 0.0% | | | |
| Xinyi Glass Holdings Ltd | | 51,325 | 52,140 |
| Commercial Services & Supplies - 0.0% | | | |
| China Everbright Environment Group Ltd | | 80,000 | 39,863 |
| Construction & Engineering - 0.0% | | | |
| China Railway Group Ltd H Shares | | 92,000 | 46,908 |
| China State Construction International Holdings Ltd | | 40,000 | 63,142 |
| | | | 110,050 |
| Ground Transportation - 0.0% | | | |
| Full Truck Alliance Co Ltd ADR | | 16,516 | 178,703 |
| Industrial Conglomerates - 0.0% | | | |
| CITIC Ltd | | 176,000 | 208,708 |
| Machinery - 0.2% | | | |
| Airtac International Group | | 3,092 | 79,391 |
| CRRC Corp Ltd H Shares | | 98,000 | 63,216 |
| Weichai Power Co Ltd H Shares | | 43,000 | 65,774 |
| Yangzijiang Shipbuildling (Holdings) Ltd | | 59,900 | 131,147 |
| Zhuzhou CRRC Times Electric Co Ltd H Shares | | 10,500 | 44,343 |
| | | | 383,871 |
| Marine Transportation - 0.0% | | | |
| COSCO SHIPPING Holdings Co Ltd H Shares | | 72,000 | 118,661 |
| SITC International Holdings Co Ltd | | 28,000 | 74,627 |
| | | | 193,288 |
| Transportation Infrastructure - 0.0% | | | |
| China Merchants Port Holdings Co Ltd | | 26,353 | 46,960 |
TOTAL INDUSTRIALS | | | 1,282,967 |
| | | | |
| Information Technology - 0.4% | | | |
| Communications Equipment - 0.0% | | | |
| BYD Electronic International Co Ltd | | 16,500 | 89,334 |
| ZTE Corp H Shares | | 16,600 | 52,044 |
| | | | 141,378 |
| Electronic Equipment, Instruments & Components - 0.0% | | | |
| Aac Technologies Holdings Inc | | 15,500 | 74,839 |
| Kingboard Holdings Ltd | | 13,500 | 32,470 |
| Sunny Optical Technology Group Co Ltd | | 15,800 | 140,064 |
| | | | 247,373 |
| IT Services - 0.0% | | | |
| Chinasoft International Ltd | | 54,000 | 36,085 |
| Semiconductors & Semiconductor Equipment - 0.0% | | | |
| Daqo New Energy Corp ADR (b)(e) | | 1,002 | 19,479 |
| GCL Technology Holdings Ltd (b) | | 452,000 | 62,853 |
| Silergy Corp | | 8,000 | 98,159 |
| Xinyi Solar Holdings Ltd | | 101,236 | 40,929 |
| | | | 221,420 |
| Software - 0.0% | | | |
| Kingdee International Software Group Co Ltd (b) | | 65,000 | 71,389 |
| Technology Hardware, Storage & Peripherals - 0.4% | | | |
| Lenovo Group Ltd | | 148,000 | 192,083 |
| Xiaomi Corp B Shares (b)(c)(d) | | 318,200 | 1,395,566 |
| | | | 1,587,649 |
TOTAL INFORMATION TECHNOLOGY | | | 2,305,294 |
| | | | |
| Materials - 0.1% | | | |
| Chemicals - 0.0% | | | |
| Ganfeng Lithium Group Co Ltd H Shares (c)(d) | | 9,080 | 23,499 |
| Construction Materials - 0.0% | | | |
| Anhui Conch Cement Co Ltd H Shares | | 26,000 | 66,551 |
| China National Building Material Co Ltd H Shares | | 104,000 | 47,403 |
| | | | 113,954 |
| Metals & Mining - 0.1% | | | |
| Aluminum Corp of China Ltd H Shares | | 88,000 | 50,874 |
| China Hongqiao Group Ltd | | 51,000 | 77,222 |
| CMOC Group Ltd H Shares | | 81,000 | 54,753 |
| Zhaojin Mining Industry Co Ltd H Shares | | 33,000 | 46,568 |
| Zijin Mining Group Co Ltd H Shares | | 134,000 | 243,962 |
| | | | 473,379 |
TOTAL MATERIALS | | | 610,832 |
| | | | |
| Real Estate - 0.1% | | | |
| Real Estate Management & Development - 0.1% | | | |
| China Overseas Land & Investment Ltd | | 83,000 | 132,515 |
| China Resources Land Ltd | | 63,500 | 184,368 |
| China Resources Mixc Lifestyle Services Ltd (c)(d) | | 13,245 | 49,285 |
| Country Garden Services Holdings Co Ltd | | 48,000 | 34,115 |
| ESR Group Ltd (c)(d) | | 48,600 | 74,715 |
| KE Holdings Inc ADR | | 15,949 | 293,781 |
| Longfor Group Holdings Ltd (c)(d) | | 42,386 | 54,574 |
| Wharf Holdings Ltd/The | | 21,000 | 59,080 |
| | | | 882,433 |
| Utilities - 0.1% | | | |
| Gas Utilities - 0.0% | | | |
| China Gas Holdings Ltd | | 58,400 | 50,905 |
| China Resources Gas Group Ltd | | 20,100 | 79,581 |
| ENN Energy Holdings Ltd | | 16,600 | 117,956 |
| Kunlun Energy Co Ltd | | 80,000 | 86,524 |
| | | | 334,966 |
| Independent Power and Renewable Electricity Producers - 0.1% | | | |
| CGN Power Co Ltd H Shares (c)(d) | | 245,000 | 89,904 |
| China Longyuan Power Group Corp Ltd H Shares | | 74,000 | 61,360 |
| China Power International Development Ltd | | 101,000 | 41,223 |
| China Resources Power Holdings Co Ltd | | 40,000 | 97,236 |
| Huaneng Power International Inc H Shares | | 90,000 | 49,597 |
| | | | 339,320 |
TOTAL UTILITIES | | | 674,286 |
| | | | |
| TOTAL CHINA | | | 40,866,559 |
| COLOMBIA - 0.0% | | | |
| Financials - 0.0% | | | |
| Banks - 0.0% | | | |
| Bancolombia SA | | 6,012 | 51,311 |
| Utilities - 0.0% | | | |
| Electric Utilities - 0.0% | | | |
| Interconexion Electrica SA ESP | | 10,197 | 38,653 |
| TOTAL COLOMBIA | | | 89,964 |
| CONGO DEMOCRATIC REPUBLIC OF - 0.0% | | | |
| Materials - 0.0% | | | |
| Metals & Mining - 0.0% | | | |
| Ivanhoe Mine Ltd Class A (b) | | 15,935 | 189,120 |
| CZECH REPUBLIC - 0.0% | | | |
| Financials - 0.0% | | | |
| Banks - 0.0% | | | |
| Komercni Banka AS | | 1,676 | 58,455 |
| Moneta Money Bank AS (c)(d) | | 5,645 | 28,726 |
| | | | 87,181 |
| Utilities - 0.0% | | | |
| Electric Utilities - 0.0% | | | |
| CEZ AS | | 3,613 | 142,127 |
| TOTAL CZECH REPUBLIC | | | 229,308 |
| DENMARK - 1.6% | | | |
| Consumer Discretionary - 0.1% | | | |
| Textiles, Apparel & Luxury Goods - 0.1% | | | |
| Pandora A/S | | 1,843 | 337,153 |
| Consumer Staples - 0.0% | | | |
| Beverages - 0.0% | | | |
| Carlsberg AS Series B | | 2,083 | 200,057 |
| Financials - 0.1% | | | |
| Banks - 0.1% | | | |
| Danske Bank A/S | | 15,193 | 429,883 |
| Insurance - 0.0% | | | |
| Tryg A/S | | 7,572 | 159,345 |
TOTAL FINANCIALS | | | 589,228 |
| | | | |
| Health Care - 1.1% | | | |
| Biotechnology - 0.1% | | | |
| Ascendis Pharma A/S ADR (b) | | 1,062 | 146,206 |
| Genmab A/S (b) | | 1,473 | 307,625 |
| | | | 453,831 |
| Health Care Equipment & Supplies - 0.0% | | | |
| Coloplast AS Series B | | 2,762 | 302,611 |
| Demant A/S (b) | | 2,081 | 76,369 |
| | | | 378,980 |
| Pharmaceuticals - 1.0% | | | |
| Novo Nordisk A/S Series B | | 70,272 | 6,063,197 |
TOTAL HEALTH CARE | | | 6,896,008 |
| | | | |
| Industrials - 0.2% | | | |
| Air Freight & Logistics - 0.1% | | | |
| DSV A/S | | 3,819 | 811,097 |
| Electrical Equipment - 0.1% | | | |
| Vestas Wind Systems A/S (b) | | 22,494 | 308,548 |
| Marine Transportation - 0.0% | | | |
| AP Moller - Maersk A/S Series B | | 98 | 163,048 |
| Transportation Infrastructure - 0.0% | | | |
| Svitzer Group A/S | | 320 | 9,966 |
TOTAL INDUSTRIALS | | | 1,292,659 |
| | | | |
| Materials - 0.1% | | | |
| Chemicals - 0.1% | | | |
| Novonesis (Novozymes) B Series B | | 7,842 | 444,103 |
| Utilities - 0.0% | | | |
| Independent Power and Renewable Electricity Producers - 0.0% | | | |
| Orsted AS (b)(c)(d) | | 4,226 | 190,308 |
| TOTAL DENMARK | | | 9,949,516 |
| EGYPT - 0.0% | | | |
| Consumer Staples - 0.0% | | | |
| Tobacco - 0.0% | | | |
| Eastern Co SAE | | 31,244 | 18,129 |
| Financials - 0.0% | | | |
| Banks - 0.0% | | | |
| Commercial International Bank - Egypt (CIB) | | 55,890 | 86,298 |
| Capital Markets - 0.0% | | | |
| EFG Holding S.A.E. (b) | | 29,412 | 11,975 |
TOTAL FINANCIALS | | | 98,273 |
| | | | |
| Materials - 0.0% | | | |
| Chemicals - 0.0% | | | |
| Abou Kir Fertilizers & Chemical Industries | | 6,862 | 6,602 |
| Misr Fertilizers Production Co SAE | | 7,090 | 5,187 |
| | | | 11,789 |
| Real Estate - 0.0% | | | |
| Real Estate Management & Development - 0.0% | | | |
| Talaat Moustafa Group | | 22,424 | 24,700 |
| TOTAL EGYPT | | | 152,891 |
| FINLAND - 0.6% | | | |
| Communication Services - 0.0% | | | |
| Diversified Telecommunication Services - 0.0% | | | |
| Elisa Oyj A Shares | | 3,388 | 146,695 |
| Consumer Staples - 0.0% | | | |
| Consumer Staples Distribution & Retail - 0.0% | | | |
| Kesko Oyj B Shares | | 6,094 | 114,761 |
| Energy - 0.0% | | | |
| Oil, Gas & Consumable Fuels - 0.0% | | | |
| Neste Oyj | | 9,576 | 121,186 |
| Financials - 0.3% | | | |
| Banks - 0.2% | | | |
| Nordea Bank Abp (Sweden) | | 78,184 | 850,115 |
| Insurance - 0.1% | | | |
| Sampo Oyj A Shares | | 11,602 | 473,266 |
TOTAL FINANCIALS | | | 1,323,381 |
| | | | |
| Health Care - 0.0% | | | |
| Pharmaceuticals - 0.0% | | | |
| Orion Oyj B Shares | | 2,388 | 105,821 |
| Industrials - 0.1% | | | |
| Machinery - 0.1% | | | |
| Kone Oyj B Shares | | 8,891 | 432,859 |
| Metso Oyj | | 15,700 | 146,040 |
| Valmet Oyj (e) | | 3,205 | 77,453 |
| Wartsila OYJ Abp | | 10,809 | 191,572 |
| | | | 847,924 |
| Information Technology - 0.1% | | | |
| Communications Equipment - 0.1% | | | |
| Nokia Oyj | | 118,269 | 523,153 |
| Materials - 0.1% | | | |
| Containers & Packaging - 0.0% | | | |
| Huhtamaki Oyj | | 2,163 | 76,582 |
| Paper & Forest Products - 0.1% | | | |
| Stora Enso Oyj R Shares | | 13,660 | 137,474 |
| UPM-Kymmene Oyj | | 11,885 | 326,833 |
| | | | 464,307 |
TOTAL MATERIALS | | | 540,889 |
| | | | |
| Utilities - 0.0% | | | |
| Electric Utilities - 0.0% | | | |
| Fortum Oyj | | 9,809 | 137,321 |
| TOTAL FINLAND | | | 3,861,131 |
| FRANCE - 5.2% | | | |
| Communication Services - 0.2% | | | |
| Diversified Telecommunication Services - 0.1% | | | |
| Orange SA | | 40,915 | 408,243 |
| Entertainment - 0.0% | | | |
| Vivendi SE | | 13,752 | 36,652 |
| Media - 0.1% | | | |
| Canal+ SADIR | | 13,752 | 34,949 |
| Louis Hachette Group | | 13,752 | 21,510 |
| Publicis Groupe SA | | 5,190 | 553,734 |
| | | | 610,193 |
TOTAL COMMUNICATION SERVICES | | | 1,055,088 |
| | | | |
| Consumer Discretionary - 1.1% | | | |
| Automobile Components - 0.1% | | | |
| Cie Generale des Etablissements Michelin SCA Series B | | 15,927 | 524,085 |
| Automobiles - 0.0% | | | |
| Renault SA | | 4,177 | 203,573 |
| Hotels, Restaurants & Leisure - 0.0% | | | |
| Accor SA | | 4,062 | 197,566 |
| Sodexo SA | | 1,810 | 149,147 |
| | | | 346,713 |
| Textiles, Apparel & Luxury Goods - 1.0% | | | |
| Hermes International SCA | | 753 | 1,811,149 |
| Kering SA | | 1,568 | 387,289 |
| LVMH Moet Hennessy Louis Vuitton SE | | 5,686 | 3,740,213 |
| | | | 5,938,651 |
TOTAL CONSUMER DISCRETIONARY | | | 7,013,022 |
| | | | |
| Consumer Staples - 0.6% | | | |
| Beverages - 0.1% | | | |
| Pernod Ricard SA | | 4,387 | 495,326 |
| Consumer Staples Distribution & Retail - 0.0% | | | |
| Carrefour SA | | 11,030 | 156,988 |
| Food Products - 0.2% | | | |
| Danone SA | | 14,094 | 952,469 |
| Personal Care Products - 0.3% | | | |
| L'Oreal SA | | 5,124 | 1,813,912 |
TOTAL CONSUMER STAPLES | | | 3,418,695 |
| | | | |
| Energy - 0.4% | | | |
| Oil, Gas & Consumable Fuels - 0.4% | | | |
| TotalEnergies SE | | 49,707 | 2,747,968 |
| Financials - 0.6% | | | |
| Banks - 0.4% | | | |
| BNP Paribas SA | | 22,436 | 1,377,500 |
| Credit Agricole SA | | 22,285 | 306,631 |
| Societe Generale SA Series A | | 16,110 | 452,135 |
| | | | 2,136,266 |
| Financial Services - 0.0% | | | |
| Edenred SE | | 5,565 | 183,023 |
| Insurance - 0.2% | | | |
| AXA SA | | 38,269 | 1,361,980 |
TOTAL FINANCIALS | | | 3,681,269 |
| | | | |
| Health Care - 0.3% | | | |
| Health Care Equipment & Supplies - 0.3% | | | |
| EssilorLuxottica SA | | 6,421 | 1,567,021 |
| Life Sciences Tools & Services - 0.0% | | | |
| Sartorius Stedim Biotech | | 607 | 118,647 |
TOTAL HEALTH CARE | | | 1,685,668 |
| | | | |
| Industrials - 1.2% | | | |
| Aerospace & Defense - 0.7% | | | |
| Airbus SE | | 13,773 | 2,205,485 |
| Safran SA | | 7,522 | 1,648,128 |
| Thales SA | | 2,014 | 289,252 |
| | | | 4,142,865 |
| Building Products - 0.2% | | | |
| Cie de Saint-Gobain SA | | 11,227 | 997,650 |
| Construction & Engineering - 0.2% | | | |
| Bouygues SA | | 4,138 | 122,529 |
| Eiffage SA | | 1,597 | 140,148 |
| Vinci SA | | 11,412 | 1,174,941 |
| | | | 1,437,618 |
| Electrical Equipment - 0.1% | | | |
| Legrand SA | | 5,829 | 566,995 |
| Professional Services - 0.0% | | | |
| Bureau Veritas SA | | 6,480 | 196,939 |
| Teleperformance SE | | 1,274 | 109,691 |
| | | | 306,630 |
| Transportation Infrastructure - 0.0% | | | |
| Getlink SE Series A | | 6,995 | 111,621 |
TOTAL INDUSTRIALS | | | 7,563,379 |
| | | | |
| Information Technology - 0.2% | | | |
| IT Services - 0.1% | | | |
| Capgemini SE | | 3,462 | 565,441 |
| Software - 0.1% | | | |
| Dassault Systemes SE | | 14,615 | 505,736 |
TOTAL INFORMATION TECHNOLOGY | | | 1,071,177 |
| | | | |
| Materials - 0.4% | | | |
| Chemicals - 0.4% | | | |
| Air Liquide SA | | 12,879 | 2,093,607 |
| Arkema SA | | 1,394 | 106,204 |
| | | | 2,199,811 |
| Real Estate - 0.0% | | | |
| Retail REITs - 0.0% | | | |
| Unibail-Rodamco-Westfield unit | | 2,232 | 168,130 |
| Utilities - 0.2% | | | |
| Multi-Utilities - 0.2% | | | |
| Engie SA | | 39,114 | 620,325 |
| Veolia Environnement SA | | 13,926 | 390,729 |
| | | | 1,011,054 |
| TOTAL FRANCE | | | 31,615,261 |
| GERMANY - 5.1% | | | |
| Communication Services - 0.4% | | | |
| Diversified Telecommunication Services - 0.4% | | | |
| Deutsche Telekom AG | | 77,765 | 2,330,080 |
| Interactive Media & Services - 0.0% | | | |
| Scout24 SE (c)(d) | | 1,671 | 147,300 |
TOTAL COMMUNICATION SERVICES | | | 2,477,380 |
| | | | |
| Consumer Discretionary - 0.5% | | | |
| Automobile Components - 0.0% | | | |
| Continental AG | | 2,406 | 162,125 |
| Automobiles - 0.3% | | | |
| Bayerische Motoren Werke AG | | 6,199 | 507,149 |
| Mercedes-Benz Group AG | | 17,160 | 956,701 |
| | | | 1,463,850 |
| Specialty Retail - 0.0% | | | |
| Zalando SE (b)(c)(d) | | 4,868 | 163,327 |
| Textiles, Apparel & Luxury Goods - 0.2% | | | |
| adidas AG | | 3,689 | 904,872 |
| Puma SE | | 2,349 | 108,009 |
| | | | 1,012,881 |
TOTAL CONSUMER DISCRETIONARY | | | 2,802,183 |
| | | | |
| Consumer Staples - 0.0% | | | |
| Household Products - 0.0% | | | |
| Henkel AG & Co KGaA | | 2,266 | 174,634 |
| Personal Care Products - 0.0% | | | |
| Beiersdorf AG | | 2,156 | 276,928 |
TOTAL CONSUMER STAPLES | | | 451,562 |
| | | | |
| Financials - 1.1% | | | |
| Banks - 0.1% | | | |
| Commerzbank AG | | 22,168 | 361,088 |
| Capital Markets - 0.3% | | | |
| Deutsche Bank AG | | 44,438 | 765,958 |
| Deutsche Boerse AG | | 4,197 | 966,805 |
| | | | 1,732,763 |
| Insurance - 0.7% | | | |
| Allianz SE | | 8,728 | 2,682,666 |
| Hannover Rueck SE | | 1,342 | 335,573 |
| Muenchener Rueckversicherungs-Gesellschaft AG in Muenchen | | 2,980 | 1,506,436 |
| | | | 4,524,675 |
TOTAL FINANCIALS | | | 6,618,526 |
| | | | |
| Health Care - 0.3% | | | |
| Biotechnology - 0.0% | | | |
| BioNTech SE ADR (b) | | 1,959 | 223,228 |
| Health Care Equipment & Supplies - 0.1% | | | |
| Carl Zeiss Meditec Ag | | 794 | 37,438 |
| Siemens Healthineers AG (c)(d) | | 6,264 | 332,215 |
| | | | 369,653 |
| Health Care Providers & Services - 0.1% | | | |
| Fresenius Medical Care AG | | 4,443 | 202,293 |
| Fresenius SE & Co KGaA (b) | | 9,285 | 322,584 |
| | | | 524,877 |
| Pharmaceuticals - 0.1% | | | |
| Bayer AG | | 21,893 | 437,312 |
| Merck KGaA | | 2,879 | 418,960 |
| | | | 856,272 |
TOTAL HEALTH CARE | | | 1,974,030 |
| | | | |
| Industrials - 1.1% | | | |
| Aerospace & Defense - 0.2% | | | |
| MTU Aero Engines AG | | 1,197 | 399,252 |
| Rheinmetall AG | | 970 | 617,534 |
| | | | 1,016,786 |
| Air Freight & Logistics - 0.1% | | | |
| Deutsche Post AG | | 20,576 | 726,382 |
| Electrical Equipment - 0.1% | | | |
| Siemens Energy AG (b) | | 12,637 | 670,666 |
| Industrial Conglomerates - 0.6% | | | |
| Siemens AG | | 16,758 | 3,267,723 |
| Machinery - 0.1% | | | |
| Daimler Truck Holding AG | | 11,549 | 440,838 |
| Gea Group Ag | | 3,458 | 171,290 |
| Knorr-Bremse AG | | 1,465 | 106,757 |
| | | | 718,885 |
| Passenger Airlines - 0.0% | | | |
| Deutsche Lufthansa AG | | 13,033 | 83,377 |
| Trading Companies & Distributors - 0.0% | | | |
| Brenntag SE | | 2,862 | 172,117 |
TOTAL INDUSTRIALS | | | 6,655,936 |
| | | | |
| Information Technology - 1.1% | | | |
| Semiconductors & Semiconductor Equipment - 0.2% | | | |
| Infineon Technologies AG | | 29,011 | 946,970 |
| Software - 0.9% | | | |
| Nemetschek SE | | 1,247 | 120,904 |
| SAP SE | | 22,735 | 5,592,225 |
| | | | 5,713,129 |
TOTAL INFORMATION TECHNOLOGY | | | 6,660,099 |
| | | | |
| Materials - 0.3% | | | |
| Chemicals - 0.2% | | | |
| BASF SE | | 19,868 | 871,234 |
| Covestro AG | | 5,037 | 302,619 |
| Symrise AG | | 2,942 | 312,823 |
| | | | 1,486,676 |
| Construction Materials - 0.1% | | | |
| Heidelberg Materials AG | | 2,998 | 370,484 |
TOTAL MATERIALS | | | 1,857,160 |
| | | | |
| Real Estate - 0.1% | | | |
| Real Estate Management & Development - 0.1% | | | |
| LEG Immobilien SE | | 1,668 | 141,334 |
| Vonovia SE | | 18,320 | 556,399 |
| | | | 697,733 |
| Utilities - 0.2% | | | |
| Independent Power and Renewable Electricity Producers - 0.1% | | | |
| RWE AG | | 15,056 | 450,373 |
| Multi-Utilities - 0.1% | | | |
| E.ON SE | | 49,994 | 582,333 |
TOTAL UTILITIES | | | 1,032,706 |
| | | | |
| TOTAL GERMANY | | | 31,227,315 |
| GREECE - 0.1% | | | |
| Communication Services - 0.0% | | | |
| Diversified Telecommunication Services - 0.0% | | | |
| Hellenic Telecommunications Organization SA | | 4,043 | 62,317 |
| Consumer Discretionary - 0.0% | | | |
| Hotels, Restaurants & Leisure - 0.0% | | | |
| OPAP SA | | 4,077 | 66,304 |
| Specialty Retail - 0.0% | | | |
| JUMBO SA | | 2,536 | 67,144 |
TOTAL CONSUMER DISCRETIONARY | | | 133,448 |
| | | | |
| Energy - 0.0% | | | |
| Oil, Gas & Consumable Fuels - 0.0% | | | |
| Motor Oil Hellas Corinth Refineries SA | | 1,425 | 30,466 |
| Financials - 0.1% | | | |
| Banks - 0.1% | | | |
| Alpha Services and Holdings SA | | 47,556 | 79,655 |
| Eurobank Ergasias Services and Holdings SA | | 54,610 | 125,864 |
| National Bank of Greece SA | | 16,790 | 133,223 |
| Piraeus Financial Holdings SA | | 22,477 | 89,466 |
| | | | 428,208 |
| Industrials - 0.0% | | | |
| Construction & Engineering - 0.0% | | | |
| GEK TERNA SA | | 1,547 | 29,613 |
| Industrial Conglomerates - 0.0% | | | |
| Metlen Energy & Metals SA | | 2,474 | 85,901 |
| Marine Transportation - 0.0% | | | |
| Star Bulk Carriers Corp | | 2,609 | 39,005 |
TOTAL INDUSTRIALS | | | 154,519 |
| | | | |
| Utilities - 0.0% | | | |
| Electric Utilities - 0.0% | | | |
| Public Power Corp SA | | 4,195 | 53,622 |
| Independent Power and Renewable Electricity Producers - 0.0% | | | |
| Terna Energy SA | | 1,214 | 25,075 |
TOTAL UTILITIES | | | 78,697 |
| | | | |
| TOTAL GREECE | | | 887,655 |
| GUATEMALA - 0.0% | | | |
| Communication Services - 0.0% | | | |
| Wireless Telecommunication Services - 0.0% | | | |
| Millicom International Cellular SA depository receipt | | 2,052 | 50,299 |
| HONG KONG - 1.1% | | | |
| Communication Services - 0.0% | | | |
| Diversified Telecommunication Services - 0.0% | | | |
| HKT Trust & HKT Ltd unit | | 80,000 | 98,884 |
| Consumer Staples - 0.0% | | | |
| Food Products - 0.0% | | | |
| WH Group Ltd (c)(d) | | 174,500 | 135,032 |
| Financials - 0.7% | | | |
| Banks - 0.0% | | | |
| Hang Seng Bank Ltd | | 15,900 | 195,611 |
| Capital Markets - 0.2% | | | |
| Futu Holdings Ltd Class A ADR | | 1,289 | 103,107 |
| Hong Kong Exchanges & Clearing Ltd | | 26,543 | 993,471 |
| | | | 1,096,578 |
| Insurance - 0.5% | | | |
| AIA Group Ltd | | 246,400 | 1,769,858 |
| Prudential PLC | | 60,806 | 482,558 |
| | | | 2,252,416 |
TOTAL FINANCIALS | | | 3,544,605 |
| | | | |
| Health Care - 0.0% | | | |
| Pharmaceuticals - 0.0% | | | |
| Sino Biopharmaceutical Ltd | | 218,250 | 89,923 |
| Industrials - 0.1% | | | |
| Ground Transportation - 0.0% | | | |
| MTR Corp Ltd | | 34,471 | 120,279 |
| Industrial Conglomerates - 0.0% | | | |
| Jardine Matheson Holdings Ltd (Singapore) | | 4,603 | 188,585 |
| Swire Pacific Ltd A Shares | | 9,000 | 81,637 |
| | | | 270,222 |
| Machinery - 0.1% | | | |
| Techtronic Industries Co Ltd | | 29,000 | 382,727 |
| Marine Transportation - 0.0% | | | |
| Orient Overseas International Ltd | | 3,000 | 44,459 |
TOTAL INDUSTRIALS | | | 817,687 |
| | | | |
| Information Technology - 0.0% | | | |
| Semiconductors & Semiconductor Equipment - 0.0% | | | |
| ASMPT Ltd | | 6,800 | 65,578 |
| Real Estate - 0.2% | | | |
| Real Estate Management & Development - 0.2% | | | |
| CK Asset Holdings Ltd | | 40,634 | 166,896 |
| Hang Lung Properties Ltd | | 39,848 | 31,964 |
| Henderson Land Development Co Ltd | | 29,610 | 89,974 |
| Hongkong Land Holdings Ltd (Singapore) | | 23,115 | 102,862 |
| New World Development Co Ltd | | 31,250 | 20,762 |
| Sino Land Co Ltd | | 82,174 | 83,056 |
| Sun Hung Kai Properties Ltd | | 33,500 | 318,764 |
| Swire Properties Ltd | | 23,000 | 46,849 |
| Wharf Real Estate Investment Co Ltd | | 34,000 | 86,941 |
| | | | 948,068 |
| Retail REITs - 0.0% | | | |
| Link REIT | | 59,604 | 252,102 |
TOTAL REAL ESTATE | | | 1,200,170 |
| | | | |
| Utilities - 0.1% | | | |
| Electric Utilities - 0.1% | | | |
| CK Infrastructure Holdings Ltd | | 13,500 | 100,381 |
| CLP Holdings Ltd | | 37,000 | 310,330 |
| Power Assets Holdings Ltd | | 30,500 | 212,846 |
| | | | 623,557 |
| Gas Utilities - 0.0% | | | |
| Hong Kong & China Gas Co Ltd | | 241,403 | 193,019 |
TOTAL UTILITIES | | | 816,576 |
| | | | |
| TOTAL HONG KONG | | | 6,768,455 |
| HUNGARY - 0.1% | | | |
| Energy - 0.0% | | | |
| Oil, Gas & Consumable Fuels - 0.0% | | | |
| MOL Hungarian Oil & Gas PLC Class A | | 10,419 | 71,613 |
| Financials - 0.1% | | | |
| Banks - 0.1% | | | |
| OTP Bank Nyrt | | 5,361 | 292,760 |
| Health Care - 0.0% | | | |
| Pharmaceuticals - 0.0% | | | |
| Richter Gedeon Nyrt | | 3,072 | 80,438 |
| TOTAL HUNGARY | | | 444,811 |
| INDIA - 4.0% | | | |
| Communication Services - 0.2% | | | |
| Wireless Telecommunication Services - 0.2% | | | |
| Bharti Airtel Ltd | | 59,609 | 1,105,895 |
| Consumer Discretionary - 0.4% | | | |
| Automobiles - 0.3% | | | |
| Bajaj Auto Ltd | | 1,492 | 153,392 |
| Mahindra & Mahindra Ltd | | 19,945 | 700,813 |
| Maruti Suzuki India Ltd | | 2,942 | 373,275 |
| Tata Motors Ltd | | 40,001 | 345,948 |
| | | | 1,573,428 |
| Hotels, Restaurants & Leisure - 0.1% | | | |
| Zomato Ltd (b) | | 149,493 | 485,695 |
| Specialty Retail - 0.0% | | | |
| Trent Ltd | | 4,038 | 336,102 |
| Textiles, Apparel & Luxury Goods - 0.0% | | | |
| Titan Co Ltd | | 9,305 | 353,704 |
TOTAL CONSUMER DISCRETIONARY | | | 2,748,929 |
| | | | |
| Consumer Staples - 0.2% | | | |
| Beverages - 0.0% | | | |
| Varun Beverages Ltd | | 26,780 | 199,798 |
| Personal Care Products - 0.1% | | | |
| Hindustan Unilever Ltd | | 19,903 | 541,137 |
| Tobacco - 0.1% | | | |
| ITC Ltd | | 66,945 | 378,329 |
TOTAL CONSUMER STAPLES | | | 1,119,264 |
| | | | |
| Energy - 0.5% | | | |
| Oil, Gas & Consumable Fuels - 0.5% | | | |
| Bharat Petroleum Corp Ltd | | 43,507 | 148,673 |
| Coal India Ltd | | 50,836 | 228,188 |
| Indian Oil Corp Ltd | | 85,055 | 135,570 |
| Oil & Natural Gas Corp Ltd | | 86,963 | 243,112 |
| Reliance Industries Ltd | | 153,829 | 2,184,718 |
| | | | 2,940,261 |
| Financials - 1.3% | | | |
| Banks - 1.1% | | | |
| Axis Bank Ltd | | 50,998 | 634,455 |
| HDFC Bank Ltd/Gandhinagar | | 125,644 | 2,599,336 |
| ICICI Bank Ltd | | 116,149 | 1,736,132 |
| IndusInd Bank Ltd/Gift City | | 12,842 | 144,076 |
| Kotak Mahindra Bank Ltd | | 24,385 | 508,905 |
| State Bank of India | | 39,809 | 369,778 |
| Yes Bank Ltd (b) | | 418,832 | 95,872 |
| | | | 6,088,554 |
| Consumer Finance - 0.1% | | | |
| Bajaj Finance Ltd | | 6,213 | 495,333 |
| Shriram Finance Ltd | | 6,284 | 212,141 |
| | | | 707,474 |
| Financial Services - 0.1% | | | |
| Jio Financial Services Ltd (b) | | 73,601 | 256,886 |
| Power Finance Corp Ltd | | 32,346 | 169,513 |
| REC Ltd | | 27,373 | 160,147 |
| | | | 586,546 |
TOTAL FINANCIALS | | | 7,382,574 |
| | | | |
| Health Care - 0.1% | | | |
| Pharmaceuticals - 0.1% | | | |
| Sun Pharmaceutical Industries Ltd | | 23,540 | 518,858 |
| Industrials - 0.3% | | | |
| Aerospace & Defense - 0.1% | | | |
| Bharat Electronics Ltd | | 79,725 | 273,090 |
| Hindustan Aeronautics Ltd (c) | | 4,169 | 203,543 |
| | | | 476,633 |
| Construction & Engineering - 0.2% | | | |
| Larsen & Toubro Ltd | | 15,017 | 633,035 |
| Electrical Equipment - 0.0% | | | |
| Suzlon Energy Ltd (b) | | 239,516 | 174,134 |
| Passenger Airlines - 0.0% | | | |
| InterGlobe Aviation Ltd (b)(c)(d) | | 4,207 | 223,877 |
| Trading Companies & Distributors - 0.0% | | | |
| Adani Enterprises Ltd | | 6,349 | 187,592 |
| Transportation Infrastructure - 0.0% | | | |
| Adani Ports & Special Economic Zone Ltd | | 16,352 | 235,225 |
TOTAL INDUSTRIALS | | | 1,930,496 |
| | | | |
| Information Technology - 0.6% | | | |
| IT Services - 0.6% | | | |
| HCL Technologies Ltd | | 23,599 | 528,721 |
| Infosys Ltd | | 80,519 | 1,764,477 |
| LTIMindtree Ltd (c)(d) | | 2,058 | 134,325 |
| Tata Consultancy Services Ltd | | 22,586 | 1,080,668 |
| Wipro Ltd | | 62,972 | 222,105 |
| | | | 3,730,296 |
| Materials - 0.2% | | | |
| Chemicals - 0.0% | | | |
| Asian Paints Ltd | | 10,039 | 267,610 |
| Construction Materials - 0.1% | | | |
| UltraTech Cement Ltd | | 2,575 | 343,799 |
| Metals & Mining - 0.1% | | | |
| Hindalco Industries Ltd | | 32,559 | 229,199 |
| Tata Steel Ltd | | 161,373 | 260,308 |
| Vedanta Ltd | | 37,444 | 194,458 |
| | | | 683,965 |
TOTAL MATERIALS | | | 1,295,374 |
| | | | |
| Real Estate - 0.0% | | | |
| Real Estate Management & Development - 0.0% | | | |
| DLF Ltd | | 14,371 | 138,519 |
| Utilities - 0.2% | | | |
| Electric Utilities - 0.1% | | | |
| Power Grid Corp of India Ltd | | 101,581 | 366,412 |
| Tata Power Co Ltd/The | | 37,708 | 172,895 |
| | | | 539,307 |
| Gas Utilities - 0.0% | | | |
| GAIL India Ltd | | 59,566 | 132,924 |
| Independent Power and Renewable Electricity Producers - 0.1% | | | |
| Adani Green Energy Ltd (b) | | 8,172 | 99,374 |
| Adani Power Ltd (b) | | 19,864 | 122,889 |
| NTPC Ltd | | 105,786 | 412,049 |
| | | | 634,312 |
TOTAL UTILITIES | | | 1,306,543 |
| | | | |
| TOTAL INDIA | | | 24,217,009 |
| INDONESIA - 0.4% | | | |
| Communication Services - 0.0% | | | |
| Diversified Telecommunication Services - 0.0% | | | |
| Sarana Menara Nusantara Tbk PT | | 469,100 | 19,077 |
| Telkom Indonesia Persero Tbk PT | | 1,059,100 | 177,279 |
| | | | 196,356 |
| Wireless Telecommunication Services - 0.0% | | | |
| Indosat Tbk PT | | 183,600 | 28,221 |
TOTAL COMMUNICATION SERVICES | | | 224,577 |
| | | | |
| Consumer Discretionary - 0.0% | | | |
| Broadline Retail - 0.0% | | | |
| GoTo Gojek Tokopedia Tbk PT Class A (b) | | 22,955,800 | 99,089 |
| Mitra Adiperkasa Tbk PT | | 190,600 | 16,635 |
| | | | 115,724 |
| Consumer Staples - 0.0% | | | |
| Consumer Staples Distribution & Retail - 0.0% | | | |
| Sumber Alfaria Trijaya Tbk PT | | 366,900 | 64,708 |
| Food Products - 0.0% | | | |
| Charoen Pokphand Indonesia Tbk PT | | 162,100 | 47,749 |
| Indofood CBP Sukses Makmur Tbk PT | | 49,500 | 34,844 |
| Indofood Sukses Makmur Tbk PT | | 99,500 | 47,585 |
| | | | 130,178 |
TOTAL CONSUMER STAPLES | | | 194,886 |
| | | | |
| Energy - 0.0% | | | |
| Oil, Gas & Consumable Fuels - 0.0% | | | |
| Alamtri Resources Indonesia Tbk PT | | 311,600 | 46,923 |
| Bumi Resources Tbk PT (b) | | 3,705,700 | 27,105 |
| United Tractors Tbk PT | | 33,400 | 55,516 |
| | | | 129,544 |
| Financials - 0.4% | | | |
| Banks - 0.4% | | | |
| Bank Central Asia Tbk PT | | 1,153,600 | 691,460 |
| Bank Mandiri Persero Tbk PT | | 998,100 | 351,335 |
| Bank Negara Indonesia Persero Tbk PT | | 332,100 | 89,377 |
| Bank Rakyat Indonesia Persero Tbk PT | | 1,587,251 | 400,699 |
| | | | 1,532,871 |
| Health Care - 0.0% | | | |
| Health Care Providers & Services - 0.0% | | | |
| Mitra Keluarga Karyasehat Tbk PT (c) | | 119,100 | 18,748 |
| Pharmaceuticals - 0.0% | | | |
| Kalbe Farma Tbk PT | | 426,300 | 35,878 |
TOTAL HEALTH CARE | | | 54,626 |
| | | | |
| Industrials - 0.0% | | | |
| Industrial Conglomerates - 0.0% | | | |
| Astra International Tbk PT | | 454,400 | 138,131 |
| Materials - 0.0% | | | |
| Chemicals - 0.0% | | | |
| Barito Pacific Tbk PT | | 584,388 | 33,232 |
| Construction Materials - 0.0% | | | |
| Semen Indonesia Persero Tbk PT | | 75,491 | 15,408 |
| Metals & Mining - 0.0% | | | |
| Aneka Tambang Tbk | | 179,700 | 16,978 |
| Bumi Resources Minerals Tbk PT (b) | | 1,802,100 | 38,725 |
| Merdeka Copper Gold Tbk PT (b) | | 296,888 | 29,738 |
| | | | 85,441 |
| Paper & Forest Products - 0.0% | | | |
| Indah Kiat Pulp & Paper Tbk PT | | 54,800 | 23,093 |
TOTAL MATERIALS | | | 157,174 |
| | | | |
| Utilities - 0.0% | | | |
| Gas Utilities - 0.0% | | | |
| Perusahaan Gas Negara Tbk PT Class B | | 223,300 | 22,016 |
| TOTAL INDONESIA | | | 2,569,549 |
| IRELAND - 0.2% | | | |
| Consumer Staples - 0.0% | | | |
| Food Products - 0.0% | | | |
| Kerry Group PLC Class A | | 3,370 | 325,518 |
| Financials - 0.1% | | | |
| Banks - 0.1% | | | |
| AIB Group PLC | | 36,718 | 202,723 |
| Bank of Ireland Group PLC | | 22,502 | 205,256 |
| | | | 407,979 |
| Industrials - 0.1% | | | |
| Building Products - 0.0% | | | |
| Kingspan Group PLC | | 3,414 | 249,139 |
| Trading Companies & Distributors - 0.1% | | | |
| AerCap Holdings NV | | 4,238 | 405,577 |
TOTAL INDUSTRIALS | | | 654,716 |
| | | | |
| TOTAL IRELAND | | | 1,388,213 |
| ISRAEL - 0.7% | | | |
| Communication Services - 0.0% | | | |
| Diversified Telecommunication Services - 0.0% | | | |
| Bezeq The Israeli Telecommunication Corp Ltd | | 44,909 | 64,112 |
| Media - 0.0% | | | |
| Perion Network Ltd (b) | | 949 | 8,038 |
TOTAL COMMUNICATION SERVICES | | | 72,150 |
| | | | |
| Consumer Discretionary - 0.0% | | | |
| Broadline Retail - 0.0% | | | |
| Global-e Online Ltd (b) | | 2,231 | 121,656 |
| Consumer Staples - 0.0% | | | |
| Consumer Staples Distribution & Retail - 0.0% | | | |
| Shufersal Ltd | | 4,516 | 47,142 |
| Food Products - 0.0% | | | |
| Strauss Group Ltd | | 1,226 | 23,255 |
TOTAL CONSUMER STAPLES | | | 70,397 |
| | | | |
| Energy - 0.0% | | | |
| Oil, Gas & Consumable Fuels - 0.0% | | | |
| Delek Group Ltd | | 213 | 27,829 |
| Financials - 0.3% | | | |
| Banks - 0.3% | | | |
| Bank Hapoalim BM | | 29,751 | 360,236 |
| Bank Leumi Le-Israel BM | | 33,798 | 403,010 |
| First International Bank of Israel Ltd | | 1,151 | 56,798 |
| Israel Discount Bank Ltd Class A | | 27,613 | 189,277 |
| Mizrahi Tefahot Bank Ltd | | 3,428 | 148,605 |
| | | | 1,157,926 |
| Capital Markets - 0.0% | | | |
| Plus500 Ltd | | 1,588 | 53,836 |
| Consumer Finance - 0.0% | | | |
| Isracard Ltd | | 4,566 | 20,333 |
| Insurance - 0.0% | | | |
| Clal Insurance Enterprises Holdings Ltd | | 1,414 | 33,332 |
| Harel Insurance Investments & Financial Services Ltd | | 2,393 | 33,168 |
| Phoenix Financial Ltd | | 3,876 | 56,699 |
| | | | 123,199 |
TOTAL FINANCIALS | | | 1,355,294 |
| | | | |
| Health Care - 0.1% | | | |
| Pharmaceuticals - 0.1% | | | |
| Teva Pharmaceutical Industries Ltd ADR (b) | | 25,253 | 556,576 |
| Industrials - 0.0% | | | |
| Aerospace & Defense - 0.0% | | | |
| Elbit Systems Ltd | | 555 | 145,487 |
| Construction & Engineering - 0.0% | | | |
| Electra Ltd/Israel | | 46 | 25,946 |
| Machinery - 0.0% | | | |
| Kornit Digital Ltd (b)(e) | | 1,037 | 32,095 |
| Marine Transportation - 0.0% | | | |
| ZIM Integrated Shipping Services Ltd | | 2,068 | 44,400 |
TOTAL INDUSTRIALS | | | 247,928 |
| | | | |
| Information Technology - 0.2% | | | |
| IT Services - 0.0% | | | |
| Wix.com Ltd (b) | | 1,239 | 265,827 |
| Semiconductors & Semiconductor Equipment - 0.0% | | | |
| Camtek Ltd/Israel (Israel) | | 594 | 48,689 |
| Nova Ltd (Israel) (b) | | 648 | 128,174 |
| Tower Semiconductor Ltd (b) | | 2,451 | 127,354 |
| | | | 304,217 |
| Software - 0.2% | | | |
| Check Point Software Technologies Ltd (b)(e) | | 1,962 | 366,306 |
| JFrog Ltd (b) | | 2,042 | 60,055 |
| Nice Ltd (b) | | 1,400 | 239,219 |
| Sapiens International Corp NV (Israel) | | 685 | 18,588 |
| | | | 684,168 |
TOTAL INFORMATION TECHNOLOGY | | | 1,254,212 |
| | | | |
| Materials - 0.0% | | | |
| Chemicals - 0.0% | | | |
| ICL Group Ltd | | 15,975 | 79,095 |
| Israel Corp Ltd Class A1 | | 101 | 26,529 |
| | | | 105,624 |
| Real Estate - 0.1% | | | |
| Diversified REITs - 0.0% | | | |
| Reit 1 Ltd | | 4,219 | 22,270 |
| Real Estate Management & Development - 0.1% | | | |
| Airport City Ltd (b) | | 1,368 | 22,031 |
| Alony Hetz Properties & Investments Ltd | | 3,775 | 31,567 |
| Amot Investments Ltd | | 5,038 | 28,602 |
| Azrieli Group Ltd | | 811 | 67,124 |
| Big Shopping Centers Ltd (b) | | 365 | 54,246 |
| Melisron Ltd | | 568 | 50,621 |
| Mivne Real Estate Kd Ltd | | 12,782 | 38,288 |
| | | | 292,479 |
TOTAL REAL ESTATE | | | 314,749 |
| | | | |
| Utilities - 0.0% | | | |
| Independent Power and Renewable Electricity Producers - 0.0% | | | |
| Enlight Renewable Energy Ltd (b) | | 2,644 | 45,855 |
| TOTAL ISRAEL | | | 4,172,270 |
| ITALY - 1.7% | | | |
| Communication Services - 0.0% | | | |
| Diversified Telecommunication Services - 0.0% | | | |
| Infrastrutture Wireless Italiane SpA (c)(d) | | 8,055 | 81,895 |
| Telecom Italia SpA/Milano (b) | | 204,631 | 52,271 |
| Telecom Italia SpA/Milano (b) | | 17,775 | 5,330 |
| | | | 139,496 |
| Consumer Discretionary - 0.2% | | | |
| Automobiles - 0.2% | | | |
| Ferrari NV (Italy) | | 2,463 | 1,052,156 |
| Textiles, Apparel & Luxury Goods - 0.0% | | | |
| Brunello Cucinelli SpA | | 758 | 82,757 |
| Moncler SpA | | 5,080 | 268,263 |
| Prada Spa | | 11,400 | 88,289 |
| | | | 439,309 |
TOTAL CONSUMER DISCRETIONARY | | | 1,491,465 |
| | | | |
| Consumer Staples - 0.0% | | | |
| Beverages - 0.0% | | | |
| Davide Campari-Milano NV | | 12,713 | 79,563 |
| Energy - 0.1% | | | |
| Oil, Gas & Consumable Fuels - 0.1% | | | |
| Eni SpA | | 48,321 | 660,951 |
| Financials - 0.9% | | | |
| Banks - 0.7% | | | |
| Banca Popolare di Sondrio SPA | | 10,074 | 84,942 |
| Banco BPM SpA | | 33,661 | 272,387 |
| BPER Banca SPA | | 23,652 | 150,283 |
| FinecoBank Banca Fineco SpA | | 13,577 | 236,130 |
| Intesa Sanpaolo SpA | | 358,587 | 1,438,227 |
| Mediobanca Banca di Credito Finanziario SpA | | 13,168 | 191,984 |
| UniCredit SpA | | 36,482 | 1,461,045 |
| | | | 3,834,998 |
| Capital Markets - 0.0% | | | |
| Azimut Holding SpA | | 2,330 | 57,901 |
| Financial Services - 0.0% | | | |
| Nexi SpA (b)(c)(d) | | 18,350 | 101,882 |
| Insurance - 0.2% | | | |
| Generali | | 24,136 | 681,785 |
| Poste Italiane Spa (c)(d) | | 10,238 | 144,441 |
| Unipol Gruppo SpA | | 10,124 | 126,157 |
| | | | 952,383 |
TOTAL FINANCIALS | | | 4,947,164 |
| | | | |
| Health Care - 0.0% | | | |
| Health Care Providers & Services - 0.0% | | | |
| Amplifon SpA | | 2,056 | 52,923 |
| Pharmaceuticals - 0.0% | | | |
| Recordati Industria Chimica e Farmaceutica SpA | | 2,248 | 117,827 |
TOTAL HEALTH CARE | | | 170,750 |
| | | | |
| Industrials - 0.2% | | | |
| Aerospace & Defense - 0.0% | | | |
| Leonardo SpA | | 9,036 | 242,703 |
| Electrical Equipment - 0.2% | | | |
| Prysmian SpA | | 6,571 | 419,693 |
| Machinery - 0.0% | | | |
| Interpump Group SpA | | 1,853 | 81,883 |
| Passenger Airlines - 0.0% | | | |
| Ryanair Holdings PLC ADR (e) | | 6,071 | 264,635 |
TOTAL INDUSTRIALS | | | 1,008,914 |
| | | | |
| Information Technology - 0.0% | | | |
| IT Services - 0.0% | | | |
| Reply SpA | | 501 | 79,609 |
| Materials - 0.0% | | | |
| Construction Materials - 0.0% | | | |
| Buzzi SpA | | 1,901 | 70,062 |
| Utilities - 0.3% | | | |
| Electric Utilities - 0.3% | | | |
| Enel SpA | | 172,245 | 1,229,171 |
| Terna - Rete Elettrica Nazionale | | 31,374 | 247,641 |
| | | | 1,476,812 |
| Gas Utilities - 0.0% | | | |
| Italgas SpA | | 10,901 | 61,089 |
| Snam SpA | | 45,698 | 202,568 |
| | | | 263,657 |
| Multi-Utilities - 0.0% | | | |
| A2A SpA | | 35,367 | 78,582 |
| Hera SpA | | 17,505 | 62,230 |
| | | | 140,812 |
TOTAL UTILITIES | | | 1,881,281 |
| | | | |
| TOTAL ITALY | | | 10,529,255 |
| JAPAN - 16.8% | | | |
| Communication Services - 1.1% | | | |
| Diversified Telecommunication Services - 0.1% | | | |
| Internet Initiative Japan Inc | | 3,000 | 56,923 |
| Nippon Telegraph & Telephone Corp | | 666,900 | 666,142 |
| | | | 723,065 |
| Entertainment - 0.4% | | | |
| Capcom Co Ltd | | 7,500 | 165,592 |
| Konami Group Corp | | 2,300 | 215,212 |
| Nexon Co Ltd | | 9,200 | 136,853 |
| Nintendo Co Ltd | | 26,100 | 1,520,111 |
| Square Enix Holdings Co Ltd | | 2,000 | 78,134 |
| Toho Co Ltd/Tokyo | | 2,800 | 109,422 |
| | | | 2,225,324 |
| Interactive Media & Services - 0.0% | | | |
| Kakaku.com Inc | | 2,800 | 43,064 |
| LY Corp | | 59,800 | 158,117 |
| | | | 201,181 |
| Media - 0.0% | | | |
| CyberAgent Inc | | 9,100 | 62,622 |
| Dentsu Group Inc | | 4,900 | 117,750 |
| Hakuhodo DY Holdings Inc | | 6,500 | 49,510 |
| Kadokawa Corp | | 2,900 | 57,947 |
| | | | 287,829 |
| Wireless Telecommunication Services - 0.6% | | | |
| KDDI Corp | | 31,800 | 1,012,849 |
| SoftBank Corp | | 626,100 | 790,350 |
| SoftBank Group Corp | | 23,300 | 1,331,497 |
| | | | 3,134,696 |
TOTAL COMMUNICATION SERVICES | | | 6,572,095 |
| | | | |
| Consumer Discretionary - 3.2% | | | |
| Automobile Components - 0.3% | | | |
| Aisin Corp | | 14,200 | 160,415 |
| Bridgestone Corp | | 13,100 | 440,332 |
| Denso Corp | | 47,100 | 649,369 |
| JTEKT Corp | | 5,900 | 43,708 |
| Koito Manufacturing Co Ltd | | 5,400 | 68,914 |
| NHK Spring Co Ltd | | 4,600 | 58,470 |
| Nifco Inc/Japan | | 2,000 | 48,670 |
| Niterra Co Ltd | | 3,700 | 119,457 |
| Stanley Electric Co Ltd | | 3,200 | 52,959 |
| Sumitomo Electric Industries Ltd | | 17,700 | 316,431 |
| Sumitomo Rubber Industries Ltd | | 4,100 | 46,473 |
| Toyo Tire Corp | | 2,700 | 41,964 |
| Yokohama Rubber Co Ltd/The | | 3,100 | 66,336 |
| | | | 2,113,498 |
| Automobiles - 1.3% | | | |
| Honda Motor Co Ltd (e) | | 108,300 | 1,031,104 |
| Isuzu Motors Ltd | | 13,200 | 179,565 |
| Mazda Motor Corp | | 13,400 | 91,369 |
| Mitsubishi Motors Corp | | 15,700 | 52,465 |
| Nissan Motor Co Ltd | | 50,600 | 153,462 |
| Subaru Corp | | 13,400 | 238,095 |
| Suzuki Motor Corp | | 43,800 | 490,750 |
| Toyota Motor Corp | | 274,600 | 5,361,632 |
| Yamaha Motor Co Ltd | | 23,400 | 206,170 |
| | | | 7,804,612 |
| Broadline Retail - 0.2% | | | |
| Isetan Mitsukoshi Holdings Ltd | | 8,300 | 142,508 |
| J Front Retailing Co Ltd | | 6,000 | 79,928 |
| Pan Pacific International Holdings Corp | | 11,900 | 326,419 |
| Rakuten Group Inc (b) | | 33,000 | 177,787 |
| Ryohin Keikaku Co Ltd | | 6,200 | 141,161 |
| Takashimaya Co Ltd | | 7,400 | 58,845 |
| | | | 926,648 |
| Hotels, Restaurants & Leisure - 0.1% | | | |
| Food & Life Cos Ltd | | 2,600 | 55,256 |
| McDonald's Holdings Co Japan Ltd (e) | | 1,900 | 74,747 |
| Oriental Land Co Ltd/Japan | | 27,200 | 586,328 |
| Skylark Holdings Co Ltd | | 5,100 | 79,411 |
| Zensho Holdings Co Ltd | | 2,000 | 113,941 |
| | | | 909,683 |
| Household Durables - 0.7% | | | |
| Casio Computer Co Ltd | | 4,800 | 39,874 |
| Haseko Corp | | 4,700 | 60,408 |
| Iida Group Holdings Co Ltd | | 3,900 | 59,004 |
| Nikon Corp | | 7,400 | 76,235 |
| Open House Group Co Ltd | | 1,500 | 50,802 |
| Panasonic Holdings Corp | | 51,400 | 525,340 |
| Rinnai Corp | | 2,600 | 53,852 |
| Sekisui House Ltd | | 14,800 | 352,893 |
| Sharp Corp/Japan (b) | | 6,100 | 37,807 |
| Sony Group Corp | | 139,200 | 2,933,718 |
| Sumitomo Forestry Co Ltd | | 4,600 | 154,771 |
| | | | 4,344,704 |
| Leisure Products - 0.1% | | | |
| Bandai Namco Holdings Inc | | 14,700 | 350,525 |
| Sega Sammy Holdings Inc | | 3,400 | 66,468 |
| Shimano Inc | | 1,800 | 242,132 |
| Yamaha Corp | | 11,100 | 78,955 |
| | | | 738,080 |
| Specialty Retail - 0.4% | | | |
| Fast Retailing Co Ltd | | 4,600 | 1,551,772 |
| Nitori Holdings Co Ltd | | 1,900 | 225,136 |
| Sanrio Co Ltd | | 4,600 | 161,963 |
| Shimamura Co Ltd | | 1,100 | 61,619 |
| USS Co Ltd | | 9,700 | 84,889 |
| Yamada Holdings Co Ltd | | 13,100 | 37,723 |
| ZOZO Inc | | 3,000 | 92,394 |
| | | | 2,215,496 |
| Textiles, Apparel & Luxury Goods - 0.1% | | | |
| Asics Corp (e) | | 16,900 | 334,036 |
| Goldwin Inc | | 900 | 50,592 |
| | | | 384,628 |
TOTAL CONSUMER DISCRETIONARY | | | 19,437,349 |
| | | | |
| Consumer Staples - 1.0% | | | |
| Beverages - 0.1% | | | |
| Asahi Group Holdings Ltd | | 33,900 | 355,634 |
| Coca-Cola Bottlers Japan Holdings Inc | | 3,400 | 53,957 |
| Ito En Ltd | | 1,400 | 31,489 |
| Kirin Holdings Co Ltd (e) | | 18,200 | 236,311 |
| Sapporo Holdings Ltd | | 1,800 | 94,837 |
| Suntory Beverage & Food Ltd | | 2,800 | 89,208 |
| | | | 861,436 |
| Consumer Staples Distribution & Retail - 0.3% | | | |
| Aeon Co Ltd | | 19,400 | 454,026 |
| Cosmos Pharmaceutical Corp | | 1,100 | 46,819 |
| Kobe Bussan Co Ltd | | 3,300 | 72,147 |
| MatsukiyoCocokara & Co | | 8,800 | 128,914 |
| Seven & i Holdings Co Ltd | | 53,400 | 837,186 |
| Sugi Holdings Co Ltd | | 2,600 | 40,773 |
| Sundrug Co Ltd | | 1,500 | 38,362 |
| Tsuruha Holdings Inc | | 800 | 44,361 |
| Welcia Holdings Co Ltd | | 2,300 | 30,017 |
| | | | 1,692,605 |
| Food Products - 0.3% | | | |
| Ajinomoto Co Inc | | 10,700 | 435,607 |
| Calbee Inc | | 2,300 | 46,045 |
| Ezaki Glico Co Ltd | | 1,300 | 38,782 |
| House Foods Group Inc | | 1,700 | 31,289 |
| Kagome Co Ltd | | 1,800 | 34,022 |
| Kewpie Corp | | 2,600 | 55,422 |
| Kikkoman Corp | | 21,600 | 239,850 |
| MEIJI Holdings Co Ltd | | 6,000 | 121,453 |
| NH Foods Ltd | | 2,290 | 74,110 |
| Nichirei Corp | | 3,000 | 79,551 |
| Nisshin Seifun Group Inc | | 5,900 | 68,764 |
| Nissin Foods Holdings Co Ltd | | 5,400 | 131,203 |
| Toyo Suisan Kaisha Ltd | | 2,300 | 157,285 |
| Yakult Honsha Co Ltd | | 6,800 | 129,090 |
| Yamazaki Baking Co Ltd | | 3,600 | 67,346 |
| | | | 1,709,819 |
| Household Products - 0.1% | | | |
| Lion Corp (e) | | 6,300 | 70,569 |
| Unicharm Corp | | 28,800 | 238,406 |
| | | | 308,975 |
| Personal Care Products - 0.1% | | | |
| Kao Corp | | 10,400 | 420,801 |
| Kobayashi Pharmaceutical Co Ltd (e) | | 1,200 | 47,513 |
| Kose Corp | | 800 | 36,501 |
| Rohto Pharmaceutical Co Ltd | | 4,900 | 89,610 |
| Shiseido Co Ltd | | 8,900 | 157,380 |
| | | | 751,805 |
| Tobacco - 0.1% | | | |
| Japan Tobacco Inc (e) | | 24,500 | 628,495 |
TOTAL CONSUMER STAPLES | | | 5,953,135 |
| | | | |
| Energy - 0.1% | | | |
| Oil, Gas & Consumable Fuels - 0.1% | | | |
| Cosmo Energy Holdings Co Ltd | | 1,600 | 70,459 |
| ENEOS Holdings Inc | | 67,600 | 354,640 |
| Idemitsu Kosan Co Ltd | | 22,035 | 145,145 |
| Inpex Corp | | 21,600 | 271,760 |
| Iwatani Corp | | 4,800 | 54,881 |
| | | | 896,885 |
| Financials - 2.4% | | | |
| Banks - 1.4% | | | |
| Aozora Bank Ltd | | 2,900 | 45,648 |
| Chiba Bank Ltd/The | | 16,000 | 123,325 |
| Concordia Financial Group Ltd | | 26,000 | 142,987 |
| Fukuoka Financial Group Inc | | 4,300 | 107,049 |
| Hachijuni Bank Ltd/The | | 10,800 | 69,497 |
| Japan Post Bank Co Ltd | | 30,700 | 291,596 |
| Kyoto Financial Group Inc | | 6,800 | 100,264 |
| Kyushu Financial Group Inc | | 9,500 | 43,882 |
| Mebuki Financial Group Inc | | 22,800 | 93,072 |
| Mitsubishi UFJ Financial Group Inc | | 275,000 | 3,210,544 |
| Mizuho Financial Group Inc | | 56,630 | 1,382,482 |
| Resona Holdings Inc | | 51,800 | 373,415 |
| Shizuoka Financial Group Inc | | 11,100 | 90,022 |
| Sumitomo Mitsui Financial Group Inc | | 88,100 | 2,114,422 |
| Sumitomo Mitsui Trust Group Inc | | 16,100 | 376,088 |
| Yamaguchi Financial Group Inc | | 4,700 | 49,003 |
| | | | 8,613,296 |
| Capital Markets - 0.2% | | | |
| Daiwa Securities Group Inc | | 30,800 | 203,241 |
| Japan Exchange Group Inc | | 23,300 | 258,523 |
| Nihon M&A Center Holdings Inc | | 6,300 | 26,474 |
| Nomura Holdings Inc | | 65,600 | 380,601 |
| SBI Holdings Inc | | 6,000 | 151,845 |
| | | | 1,020,684 |
| Consumer Finance - 0.0% | | | |
| Credit Saison Co Ltd | | 3,600 | 83,831 |
| Marui Group Co Ltd | | 4,099 | 65,386 |
| | | | 149,217 |
| Financial Services - 0.1% | | | |
| GMO Payment Gateway Inc | | 1,000 | 50,659 |
| Mitsubishi HC Capital Inc | | 21,700 | 143,706 |
| ORIX Corp | | 25,700 | 552,136 |
| Tokyo Century Corp | | 4,100 | 41,770 |
| Zenkoku Hosho Co Ltd | | 1,200 | 42,282 |
| | | | 830,553 |
| Insurance - 0.7% | | | |
| Dai-ichi Life Holdings Inc | | 21,200 | 564,903 |
| Japan Post Holdings Co Ltd | | 42,900 | 404,021 |
| Japan Post Insurance Co Ltd | | 4,200 | 77,596 |
| Ms&Ad Insurance Group Holdings Inc | | 29,400 | 634,967 |
| Sompo Holdings Inc | | 22,100 | 572,617 |
| T&D Holdings Inc | | 12,100 | 221,475 |
| Tokio Marine Holdings Inc | | 44,100 | 1,582,667 |
| | | | 4,058,246 |
TOTAL FINANCIALS | | | 14,671,996 |
| | | | |
| Health Care - 1.2% | | | |
| Health Care Equipment & Supplies - 0.4% | | | |
| Asahi Intecc Co Ltd | | 5,300 | 86,770 |
| Hoya Corp | | 7,800 | 968,029 |
| Nihon Kohden Corp | | 3,800 | 52,068 |
| Olympus Corp | | 26,200 | 391,173 |
| Sysmex Corp | | 10,700 | 196,181 |
| Terumo Corp | | 33,240 | 641,723 |
| | | | 2,335,944 |
| Health Care Providers & Services - 0.0% | | | |
| Alfresa Holdings Corp | | 4,200 | 57,764 |
| Medipal Holdings Corp | | 4,600 | 69,594 |
| Suzuken Co Ltd/Aichi Japan | | 1,500 | 45,158 |
| | | | 172,516 |
| Health Care Technology - 0.0% | | | |
| M3 Inc | | 9,400 | 81,450 |
| Pharmaceuticals - 0.8% | | | |
| Astellas Pharma Inc | | 40,400 | 392,313 |
| Chugai Pharmaceutical Co Ltd | | 14,200 | 625,952 |
| Daiichi Sankyo Co Ltd | | 43,400 | 1,187,565 |
| Eisai Co Ltd | | 6,600 | 179,715 |
| Hisamitsu Pharmaceutical Co Inc | | 1,600 | 41,539 |
| Kyowa Kirin Co Ltd | | 5,600 | 84,213 |
| Nippon Shinyaku Co Ltd | | 1,400 | 35,493 |
| Ono Pharmaceutical Co Ltd | | 10,500 | 109,321 |
| Otsuka Holdings Co Ltd | | 11,800 | 641,919 |
| Santen Pharmaceutical Co Ltd | | 8,000 | 82,291 |
| Shionogi & Co Ltd | | 18,100 | 253,856 |
| Takeda Pharmaceutical Co Ltd | | 35,538 | 940,773 |
| Tsumura & CO | | 1,500 | 44,882 |
| | | | 4,619,832 |
TOTAL HEALTH CARE | | | 7,209,742 |
| | | | |
| Industrials - 4.1% | | | |
| Air Freight & Logistics - 0.0% | | | |
| NIPPON EXPRESS HOLDINGS INC | | 5,400 | 81,875 |
| Sankyu Inc | | 1,200 | 41,733 |
| SG Holdings Co Ltd | | 10,500 | 100,499 |
| Yamato Holdings Co Ltd | | 7,100 | 79,815 |
| | | | 303,922 |
| Building Products - 0.2% | | | |
| Agc Inc | | 4,900 | 143,134 |
| Daikin Industries Ltd | | 6,500 | 758,426 |
| Lixil Corp | | 6,300 | 69,088 |
| Sanwa Holdings Corp | | 5,100 | 142,681 |
| TOTO Ltd | | 3,500 | 83,847 |
| | | | 1,197,176 |
| Commercial Services & Supplies - 0.1% | | | |
| Dai Nippon Printing Co Ltd | | 10,200 | 142,735 |
| Kokuyo Co Ltd | | 2,200 | 39,108 |
| Park24 Co Ltd | | 2,900 | 40,797 |
| Secom Co Ltd | | 9,400 | 319,223 |
| Sohgo Security Services Co Ltd | | 8,400 | 57,737 |
| TOPPAN Holdings Inc | | 7,100 | 188,350 |
| | | | 787,950 |
| Construction & Engineering - 0.1% | | | |
| COMSYS Holdings Corp | | 2,600 | 53,350 |
| EXEO Group Inc | | 4,400 | 48,434 |
| JGC Holdings Corp | | 5,400 | 44,923 |
| Kajima Corp | | 10,000 | 181,149 |
| Kinden Corp | | 2,600 | 50,167 |
| Obayashi Corp | | 16,100 | 211,993 |
| Shimizu Corp | | 12,700 | 100,300 |
| SHO-BOND Holdings Co Ltd | | 1,100 | 36,500 |
| Taisei Corp | | 4,100 | 171,785 |
| | | | 898,601 |
| Electrical Equipment - 0.3% | | | |
| Fuji Electric Co Ltd | | 3,300 | 176,424 |
| Fujikura Ltd | | 6,100 | 249,037 |
| Mabuchi Motor Co Ltd | | 2,500 | 35,693 |
| Mitsubishi Electric Corp | | 47,100 | 795,319 |
| NIDEC CORP | | 23,400 | 420,303 |
| | | | 1,676,776 |
| Ground Transportation - 0.4% | | | |
| Central Japan Railway Co | | 23,000 | 431,608 |
| East Japan Railway Co | | 25,300 | 448,086 |
| Hankyu Hanshin Holdings Inc | | 5,700 | 149,143 |
| Keikyu Corp | | 6,300 | 52,211 |
| Keio Corp | | 2,900 | 70,584 |
| Keisei Electric Railway Co Ltd | | 11,400 | 102,364 |
| Kintetsu Group Holdings Co Ltd | | 4,200 | 88,354 |
| Kyushu Railway Co | | 3,500 | 85,195 |
| Nagoya Railroad Co Ltd | | 4,400 | 49,007 |
| Nankai Electric Railway Co Ltd | | 2,500 | 39,444 |
| Odakyu Electric Railway Co Ltd | | 8,100 | 74,580 |
| Seibu Holdings Inc | | 5,500 | 112,136 |
| Seino Holdings Co Ltd | | 3,200 | 48,271 |
| Sotetsu Holdings Inc | | 2,200 | 34,878 |
| Tobu Railway Co Ltd | | 4,700 | 76,329 |
| Tokyu Corp | | 13,900 | 148,130 |
| West Japan Railway Co | | 10,900 | 193,059 |
| | | | 2,203,379 |
| Industrial Conglomerates - 0.5% | | | |
| Hikari Tsushin Inc | | 500 | 109,568 |
| Hitachi Ltd | | 103,300 | 2,529,823 |
| Keihan Holdings Co Ltd | | 2,400 | 50,488 |
| Sekisui Chemical Co Ltd | | 9,100 | 157,021 |
| | | | 2,846,900 |
| Machinery - 0.9% | | | |
| Amada Co Ltd | | 7,600 | 73,891 |
| Daifuku Co Ltd | | 8,500 | 178,271 |
| DMG Mori Co Ltd | | 3,000 | 48,486 |
| Ebara Corp | | 9,200 | 141,152 |
| FANUC Corp | | 20,900 | 545,970 |
| Harmonic Drive Systems Inc | | 1,300 | 27,637 |
| Hitachi Construction Machinery Co Ltd | | 2,300 | 50,975 |
| Hoshizaki Corp | | 2,500 | 99,527 |
| IHI Corp | | 3,500 | 204,613 |
| Japan Steel Works Ltd/The | | 1,700 | 61,636 |
| Kawasaki Heavy Industries Ltd | | 3,800 | 173,105 |
| Komatsu Ltd | | 21,700 | 591,159 |
| Kubota Corp (e) | | 23,600 | 273,400 |
| Kurita Water Industries Ltd | | 2,400 | 84,563 |
| Makita Corp | | 6,200 | 190,833 |
| MINEBEA MITSUMI Inc | | 9,100 | 145,765 |
| MISUMI Group Inc | | 6,400 | 99,857 |
| Mitsubishi Heavy Industries Ltd | | 75,200 | 1,048,585 |
| Miura Co Ltd | | 2,400 | 60,707 |
| Nabtesco Corp | | 2,700 | 48,185 |
| NGK Insulators Ltd | | 5,700 | 71,970 |
| NSK Ltd | | 10,300 | 44,588 |
| SMC Corp | | 1,380 | 535,884 |
| Sumitomo Heavy Industries Ltd | | 2,700 | 55,113 |
| THK Co Ltd | | 2,700 | 63,148 |
| Toyota Industries Corp | | 4,200 | 343,405 |
| Yaskawa Electric Corp | | 5,900 | 150,569 |
| | | | 5,412,994 |
| Marine Transportation - 0.1% | | | |
| Kawasaki Kisen Kaisha Ltd | | 15,100 | 214,824 |
| Mitsui OSK Lines Ltd | | 8,100 | 281,867 |
| Nippon Yusen KK | | 10,300 | 342,820 |
| | | | 839,511 |
| Passenger Airlines - 0.0% | | | |
| ANA Holdings Inc | | 3,500 | 63,524 |
| Japan Airlines Co Ltd | | 3,200 | 50,446 |
| | | | 113,970 |
| Professional Services - 0.5% | | | |
| BayCurrent Inc | | 3,000 | 101,433 |
| Persol Holdings Co Ltd | | 41,400 | 62,227 |
| Recruit Holdings Co Ltd | | 36,800 | 2,557,891 |
| TechnoPro Holdings Inc | | 2,300 | 43,312 |
| | | | 2,764,863 |
| Trading Companies & Distributors - 1.0% | | | |
| ITOCHU Corp | | 32,200 | 1,583,415 |
| Marubeni Corp | | 37,400 | 561,321 |
| Mitsubishi Corp | | 93,200 | 1,524,913 |
| Mitsui & Co Ltd | | 67,500 | 1,399,891 |
| MonotaRO Co Ltd | | 5,500 | 93,400 |
| Nagase & Co Ltd | | 2,600 | 53,290 |
| Sojitz Corp | | 5,080 | 103,530 |
| Sumitomo Corp | | 27,300 | 590,804 |
| Toyota Tsusho Corp | | 15,900 | 281,184 |
| | | | 6,191,748 |
| Transportation Infrastructure - 0.0% | | | |
| Japan Airport Terminal Co Ltd | | 2,100 | 66,733 |
| Kamigumi Co Ltd | | 2,200 | 47,874 |
| Mitsubishi Logistics Corp | | 8,000 | 58,509 |
| | | | 173,116 |
TOTAL INDUSTRIALS | | | 25,410,906 |
| | | | |
| Information Technology - 2.1% | | | |
| Electronic Equipment, Instruments & Components - 0.7% | | | |
| Alps Alpine Co Ltd | | 4,000 | 40,458 |
| Azbil Corp | | 10,800 | 84,254 |
| Dexerials Corp | | 3,900 | 61,259 |
| Hamamatsu Photonics KK | | 6,400 | 71,812 |
| Hirose Electric Co Ltd | | 700 | 83,371 |
| Horiba Ltd | | 900 | 52,349 |
| Ibiden Co Ltd | | 3,100 | 94,077 |
| Jeol Ltd | | 1,100 | 39,401 |
| Keyence Corp | | 4,400 | 1,788,475 |
| Kyocera Corp | | 31,300 | 310,237 |
| Murata Manufacturing Co Ltd | | 41,200 | 653,631 |
| Omron Corp | | 4,300 | 144,785 |
| Shimadzu Corp | | 6,100 | 172,945 |
| Taiyo Yuden Co Ltd | | 3,000 | 42,190 |
| TDK Corp | | 43,320 | 557,901 |
| Yokogawa Electric Corp | | 5,100 | 108,474 |
| | | | 4,305,619 |
| IT Services - 0.4% | | | |
| BIPROGY Inc | | 1,800 | 54,511 |
| Fujitsu Ltd | | 38,300 | 672,800 |
| NEC Corp | | 6,100 | 522,020 |
| Nomura Research Institute Ltd | | 9,900 | 290,680 |
| NTT Data Group Corp | | 12,800 | 243,390 |
| Obic Co Ltd | | 7,300 | 217,731 |
| Otsuka Corp | | 5,000 | 114,684 |
| SCSK Corp | | 3,300 | 69,861 |
| SHIFT Inc (b) | | 300 | 34,729 |
| TIS Inc | | 4,500 | 106,877 |
| | | | 2,327,283 |
| Semiconductors & Semiconductor Equipment - 0.7% | | | |
| Advantest Corp | | 17,100 | 972,286 |
| Disco Corp | | 2,143 | 568,489 |
| Lasertec Corp | | 1,800 | 168,741 |
| Renesas Electronics Corp | | 36,200 | 458,112 |
| Rohm Co Ltd | | 7,700 | 72,696 |
| SCREEN Holdings Co Ltd | | 2,200 | 129,882 |
| Shinko Electric Industries Co Ltd (b) | | 1,500 | 54,387 |
| Socionext Inc | | 4,000 | 62,489 |
| SUMCO Corp (e) | | 7,500 | 55,234 |
| Tokyo Electron Ltd | | 10,500 | 1,578,354 |
| Tokyo Seimitsu Co Ltd | | 900 | 42,081 |
| Ulvac Inc | | 1,000 | 39,188 |
| | | | 4,201,939 |
| Software - 0.0% | | | |
| Oracle Corp Japan | | 700 | 67,422 |
| Trend Micro Inc/Japan | | 2,800 | 150,957 |
| | | | 218,379 |
| Technology Hardware, Storage & Peripherals - 0.3% | | | |
| Brother Industries Ltd | | 5,700 | 97,720 |
| Canon Inc | | 21,400 | 695,108 |
| FUJIFILM Holdings Corp | | 27,700 | 573,102 |
| Konica Minolta Inc | | 11,100 | 46,093 |
| Ricoh Co Ltd | | 13,500 | 153,315 |
| Seiko Epson Corp | | 7,100 | 128,105 |
| | | | 1,693,443 |
TOTAL INFORMATION TECHNOLOGY | | | 12,746,663 |
| | | | |
| Materials - 0.8% | | | |
| Chemicals - 0.6% | | | |
| ADEKA Corp | | 2,200 | 39,604 |
| Aica Kogyo Co Ltd | | 1,400 | 29,380 |
| Air Water Inc (Osaka) | | 5,100 | 62,119 |
| Asahi Kasei Corp | | 31,100 | 214,286 |
| Daicel Corp | | 5,700 | 50,952 |
| DIC Corp | | 1,800 | 38,712 |
| Kaneka Corp | | 1,400 | 33,402 |
| Kansai Paint Co Ltd | | 4,000 | 57,530 |
| Kuraray Co Ltd | | 7,300 | 104,563 |
| Mitsubishi Chemical Group Corp | | 31,900 | 161,115 |
| Mitsubishi Gas Chemical Co Inc | | 4,400 | 79,124 |
| Mitsui Chemicals Inc | | 4,200 | 91,684 |
| Nippon Paint Holdings Co Ltd | | 23,800 | 154,815 |
| Nippon Sanso Holdings Corp | | 4,700 | 132,148 |
| Nissan Chemical Corp | | 3,100 | 96,616 |
| Nitto Denko Corp | | 15,700 | 262,486 |
| NOF Corp | | 5,300 | 74,307 |
| Resonac Holdings Corp | | 4,100 | 102,103 |
| Shin-Etsu Chemical Co Ltd | | 44,600 | 1,468,997 |
| Sumitomo Chemical Co Ltd | | 36,700 | 80,990 |
| Teijin Ltd | | 4,300 | 36,434 |
| Tokyo Ohka Kogyo Co Ltd | | 2,700 | 60,625 |
| Toray Industries Inc | | 36,300 | 229,846 |
| Tosoh Corp | | 7,200 | 96,235 |
| UBE Corp | | 2,100 | 31,949 |
| Zeon Corp | | 4,700 | 44,776 |
| | | | 3,834,798 |
| Construction Materials - 0.0% | | | |
| Taiheiyo Cement Corp | | 2,700 | 60,877 |
| Containers & Packaging - 0.0% | | | |
| Rengo Co Ltd | | 5,500 | 30,620 |
| Toyo Seikan Group Holdings Ltd | | 3,300 | 50,472 |
| | | | 81,092 |
| Metals & Mining - 0.2% | | | |
| Dowa Holdings Co Ltd | | 1,300 | 36,476 |
| JFE Holdings Inc | | 14,300 | 161,019 |
| Kobe Steel Ltd | | 8,900 | 88,964 |
| Maruichi Steel Tube Ltd | | 1,700 | 37,783 |
| Mitsubishi Materials Corp | | 3,000 | 45,351 |
| Nippon Steel Corp | | 21,800 | 438,085 |
| Sumitomo Metal Mining Co Ltd | | 6,100 | 139,074 |
| Yamato Kogyo Co Ltd | | 1,100 | 51,901 |
| | | | 998,653 |
| Paper & Forest Products - 0.0% | | | |
| Oji Holdings Corp | | 21,500 | 82,171 |
TOTAL MATERIALS | | | 5,057,591 |
| | | | |
| Real Estate - 0.6% | | | |
| Diversified REITs - 0.1% | | | |
| Activia Properties Inc | | 16 | 33,404 |
| Daiwa House REIT Investment Corp | | 52 | 76,606 |
| KDX Realty Investment Corp | | 93 | 88,364 |
| Nomura Real Estate Master Fund Inc | | 99 | 86,640 |
| Sekisui House Reit Inc | | 98 | 48,145 |
| United Urban Investment Corp | | 71 | 63,534 |
| | | | 396,693 |
| Hotel & Resort REITs - 0.0% | | | |
| Invincible Investment Corp | | 173 | 72,787 |
| Japan Hotel REIT Investment Corp | | 112 | 50,253 |
| | | | 123,040 |
| Industrial REITs - 0.0% | | | |
| GLP J-REIT | | 111 | 87,053 |
| Industrial & Infrastructure Fund Investment Corp | | 58 | 42,354 |
| Japan Logistics Fund Inc | | 21 | 35,128 |
| LaSalle Logiport REIT | | 41 | 37,028 |
| Mitsui Fudosan Logistics Park Inc | | 56 | 36,124 |
| | | | 237,687 |
| Office REITs - 0.1% | | | |
| Japan Prime Realty Investment Corp | | 22 | 44,112 |
| Japan Real Estate Investment Corp | | 160 | 109,721 |
| Nippon Building Fund Inc | | 189 | 147,025 |
| Orix JREIT Inc | | 61 | 63,619 |
| | | | 364,477 |
| Real Estate Management & Development - 0.4% | | | |
| Daito Trust Construction Co Ltd | | 1,400 | 156,376 |
| Daiwa House Industry Co Ltd | | 14,000 | 429,816 |
| Hulic Co Ltd (e) | | 13,300 | 115,803 |
| Mitsubishi Estate Co Ltd | | 28,300 | 392,853 |
| Mitsui Fudosan Co Ltd | | 62,700 | 501,434 |
| Nomura Real Estate Holdings Inc | | 2,400 | 59,563 |
| Sumitomo Realty & Development Co Ltd | | 10,600 | 329,647 |
| Tokyo Tatemono Co Ltd | | 4,700 | 77,569 |
| Tokyu Fudosan Holdings Corp | | 13,200 | 80,565 |
| | | | 2,143,626 |
| Residential REITs - 0.0% | | | |
| Advance Residence Investment Corp | | 32 | 59,467 |
| Nippon Accommodations Fund Inc | | 11 | 41,037 |
| | | | 100,504 |
| Retail REITs - 0.0% | | | |
| Frontier Real Estate Investment Corp | | 60 | 29,629 |
| Japan Metropolitan Fund Invest | | 158 | 90,576 |
| | | | 120,205 |
TOTAL REAL ESTATE | | | 3,486,232 |
| | | | |
| Utilities - 0.2% | | | |
| Electric Utilities - 0.1% | | | |
| Chubu Electric Power Co Inc | | 17,000 | 178,348 |
| Chugoku Electric Power Co Inc/The | | 7,100 | 41,148 |
| Kansai Electric Power Co Inc/The | | 18,000 | 199,510 |
| Kyushu Electric Power Co Inc | | 10,600 | 95,191 |
| Tohoku Electric Power Co Inc | | 11,230 | 84,647 |
| Tokyo Electric Power Co Holdings Inc (b) | | 17,200 | 51,413 |
| | | | 650,257 |
| Gas Utilities - 0.1% | | | |
| Osaka Gas Co Ltd | | 9,100 | 199,032 |
| Toho Gas Co Ltd | | 2,100 | 56,735 |
| Tokyo Gas Co Ltd | | 7,900 | 218,883 |
| | | | 474,650 |
| Independent Power and Renewable Electricity Producers - 0.0% | | | |
| Electric Power Development Co Ltd | | 3,796 | 62,050 |
TOTAL UTILITIES | | | 1,186,957 |
| | | | |
| TOTAL JAPAN | | | 102,629,551 |
| JORDAN - 0.0% | | | |
| Health Care - 0.0% | | | |
| Pharmaceuticals - 0.0% | | | |
| Hikma Pharmaceuticals PLC | | 3,417 | 85,255 |
| KOREA (SOUTH) - 2.8% | | | |
| Communication Services - 0.2% | | | |
| Diversified Telecommunication Services - 0.0% | | | |
| LG Uplus Corp | | 4,714 | 32,825 |
| Entertainment - 0.1% | | | |
| CJ ENM Co Ltd (b) | | 268 | 9,666 |
| HYBE Co Ltd | | 466 | 60,557 |
| JYP Entertainment Corp | | 619 | 28,988 |
| Kakao Games Corp (b) | | 853 | 9,374 |
| Krafton Inc (b) | | 673 | 141,233 |
| NCSoft Corp | | 359 | 44,148 |
| Netmarble Corp (b)(c)(d) | | 457 | 15,824 |
| Pearl Abyss Corp (b) | | 740 | 13,720 |
| SM Entertainment Co Ltd | | 271 | 13,747 |
| Wemade Co Ltd (b) | | 471 | 11,035 |
| | | | 348,292 |
| Interactive Media & Services - 0.1% | | | |
| Kakao Corp | | 6,778 | 172,979 |
| NAVER Corp | | 3,363 | 446,874 |
| SOOP Co Ltd | | 169 | 10,316 |
| | | | 630,169 |
| Media - 0.0% | | | |
| Cheil Worldwide Inc | | 1,520 | 17,357 |
TOTAL COMMUNICATION SERVICES | | | 1,028,643 |
| | | | |
| Consumer Discretionary - 0.4% | | | |
| Automobile Components - 0.0% | | | |
| Hankook Tire & Technology Co Ltd | | 1,578 | 40,576 |
| Hanon Systems | | 5,227 | 14,030 |
| HL Mando Co Ltd | | 679 | 18,435 |
| Hyundai Mobis Co Ltd | | 1,374 | 217,615 |
| Hyundai Wia Corp | | 378 | 9,580 |
| | | | 300,236 |
| Automobiles - 0.2% | | | |
| Hyundai Motor Co | | 3,051 | 431,366 |
| Kia Corp | | 5,610 | 378,060 |
| | | | 809,426 |
| Broadline Retail - 0.2% | | | |
| Coupang Inc Class A (b) | | 28,857 | 634,277 |
| Lotte Shopping Co Ltd | | 282 | 10,225 |
| Shinsegae Inc | | 149 | 13,310 |
| | | | 657,812 |
| Hotels, Restaurants & Leisure - 0.0% | | | |
| Delivery Hero SE (b)(c)(d) | | 4,563 | 128,185 |
| GS P&L Co Ltd | | 163 | 2,431 |
| Hanjin Kal Corp | | 613 | 30,979 |
| Kangwon Land Inc | | 2,877 | 30,934 |
| | | | 192,529 |
| Household Durables - 0.0% | | | |
| Coway Co Ltd | | 1,215 | 54,594 |
| LG Electronics Inc | | 2,405 | 134,565 |
| | | | 189,159 |
| Specialty Retail - 0.0% | | | |
| Hotel Shilla Co Ltd | | 722 | 17,846 |
| Textiles, Apparel & Luxury Goods - 0.0% | | | |
| F&F Co Ltd | | 281 | 10,227 |
| Fila Holdings Corp | | 831 | 22,462 |
| Youngone Corp | | 485 | 13,817 |
| | | | 46,506 |
TOTAL CONSUMER DISCRETIONARY | | | 2,213,514 |
| | | | |
| Consumer Staples - 0.1% | | | |
| Consumer Staples Distribution & Retail - 0.0% | | | |
| BGF retail Co Ltd | | 189 | 13,016 |
| E-MART Inc | | 395 | 16,778 |
| GS Retail Co Ltd | | 691 | 7,669 |
| | | | 37,463 |
| Food Products - 0.0% | | | |
| CJ CheilJedang Corp | | 178 | 30,531 |
| NongShim Co Ltd | | 85 | 21,393 |
| Orion Corp/Republic of Korea | | 475 | 32,676 |
| | | | 84,600 |
| Personal Care Products - 0.0% | | | |
| Amorepacific Corp | | 661 | 46,584 |
| AMOREPACIFIC Group | | 698 | 9,757 |
| Cosmax Inc | | 183 | 18,324 |
| LG H&H Co Ltd | | 213 | 43,631 |
| | | | 118,296 |
| Tobacco - 0.1% | | | |
| KT&G Corp | | 2,292 | 165,161 |
TOTAL CONSUMER STAPLES | | | 405,520 |
| | | | |
| Energy - 0.0% | | | |
| Oil, Gas & Consumable Fuels - 0.0% | | | |
| HD Hyundai Co Ltd | | 1,033 | 55,161 |
| S-Oil Corp | | 953 | 35,439 |
| SK Innovation Co Ltd (b) | | 1,236 | 93,052 |
| | | | 183,652 |
| Financials - 0.4% | | | |
| Banks - 0.3% | | | |
| BNK Financial Group Inc | | 6,647 | 46,242 |
| DGB Financial Group Inc | | 3,576 | 19,674 |
| Hana Financial Group Inc | | 6,512 | 248,143 |
| Industrial Bank of Korea | | 5,904 | 56,999 |
| JB Financial Group Co Ltd | | 2,288 | 25,053 |
| KakaoBank Corp | | 7,746 | 108,993 |
| KB Financial Group Inc | | 8,451 | 473,921 |
| Shinhan Financial Group Co Ltd | | 11,351 | 366,559 |
| Woori Financial Group Inc | | 14,675 | 152,272 |
| | | | 1,497,856 |
| Capital Markets - 0.0% | | | |
| KIWOOM Securities Co Ltd | | 288 | 22,394 |
| Korea Investment Holdings Co Ltd | | 896 | 42,788 |
| Mirae Asset Securities Co Ltd | | 5,830 | 31,296 |
| NH Investment & Securities Co Ltd | | 3,161 | 29,633 |
| Samsung Securities Co Ltd | | 1,463 | 42,600 |
| | | | 168,711 |
| Consumer Finance - 0.0% | | | |
| Samsung Card Co Ltd | | 522 | 13,875 |
| Financial Services - 0.0% | | | |
| Kakao Pay Corp (b) | | 584 | 10,236 |
| Meritz Financial Group Inc | | 1,791 | 125,310 |
| | | | 135,546 |
| Insurance - 0.1% | | | |
| DB Insurance Co Ltd | | 962 | 66,564 |
| Hanwha Life Insurance Co Ltd | | 5,993 | 9,899 |
| Hyundai Marine & Fire Insurance Co Ltd | | 1,318 | 21,943 |
| Korean Reinsurance Co | | 2,791 | 14,985 |
| Samsung Fire & Marine Insurance Co Ltd | | 732 | 176,483 |
| Samsung Life Insurance Co Ltd | | 2,361 | 150,460 |
| | | | 440,334 |
TOTAL FINANCIALS | | | 2,256,322 |
| | | | |
| Health Care - 0.2% | | | |
| Biotechnology - 0.2% | | | |
| Alteogen Inc (b) | | 934 | 193,228 |
| Celltrion Inc | | 3,348 | 420,173 |
| Hugel Inc (b) | | 115 | 21,622 |
| SK Bioscience Co Ltd (b) | | 540 | 18,310 |
| | | | 653,333 |
| Health Care Equipment & Supplies - 0.0% | | | |
| HLB Inc (b) | | 2,718 | 132,889 |
| Health Care Providers & Services - 0.0% | | | |
| Hanmi Science Co ltd | | 786 | 15,468 |
| Life Sciences Tools & Services - 0.0% | | | |
| LigaChem Biosciences Inc (b) | | 567 | 41,290 |
| Samsung Biologics Co Ltd (b)(c)(d) | | 412 | 262,907 |
| | | | 304,197 |
| Pharmaceuticals - 0.0% | | | |
| Celltrion Pharm Inc | | 438 | 16,616 |
| Hanall Biopharma Co Ltd (b) | | 814 | 21,024 |
| Hanmi Pharm Co Ltd | | 140 | 26,366 |
| Sam Chun Dang Pharm Co Ltd (b) | | 293 | 29,080 |
| SK Biopharmaceuticals Co Ltd (b) | | 611 | 45,439 |
| ST Pharm Co Ltd | | 266 | 15,844 |
| Yuhan Corp | | 1,370 | 109,925 |
| | | | 264,294 |
TOTAL HEALTH CARE | | | 1,370,181 |
| | | | |
| Industrials - 0.4% | | | |
| Aerospace & Defense - 0.0% | | | |
| Hanwha Aerospace Co Ltd | | 672 | 147,556 |
| Hanwha Systems Co Ltd | | 1,723 | 26,231 |
| Korea Aerospace Industries Ltd | | 1,598 | 59,140 |
| LIG Nex1 Co Ltd | | 244 | 36,334 |
| | | | 269,261 |
| Air Freight & Logistics - 0.0% | | | |
| Cj Logistics Corp | | 224 | 12,689 |
| Hyundai Glovis Co Ltd | | 984 | 78,171 |
| | | | 90,860 |
| Commercial Services & Supplies - 0.0% | | | |
| S-1 Corp | | 399 | 15,874 |
| Construction & Engineering - 0.0% | | | |
| DL E&C Co Ltd | | 693 | 14,973 |
| GS Engineering & Construction Corp (b) | | 1,442 | 16,844 |
| Hyundai Engineering & Construction Co Ltd | | 1,631 | 27,835 |
| KEPCO Engineering & Construction Co Inc | | 401 | 14,195 |
| Samsung E&A Co Ltd (b) | | 3,399 | 37,732 |
| | | | 111,579 |
| Electrical Equipment - 0.2% | | | |
| CS Wind Corp | | 571 | 15,957 |
| Doosan Enerbility Co Ltd (b) | | 9,943 | 116,417 |
| Doosan Fuel Cell Co Ltd (b) | | 962 | 10,259 |
| Ecopro BM Co Ltd (b) | | 1,187 | 86,554 |
| Ecopro Co Ltd (b) | | 2,330 | 88,967 |
| Hanwha Industrial Solutions Co Ltd/ New | | 700 | 14,603 |
| HD Hyundai Electric Co Ltd | | 505 | 129,303 |
| L&F Co Ltd (b) | | 618 | 33,271 |
| LG Energy Solution Ltd (b) | | 938 | 218,153 |
| LS Corp | | 393 | 24,705 |
| LS Electric Co Ltd | | 331 | 35,678 |
| POSCO Future M Co Ltd | | 696 | 65,485 |
| Shinsung Delta Tech Co Ltd | | 351 | 27,189 |
| SK IE Technology Co Ltd (b)(c)(d) | | 551 | 8,278 |
| Taihan Electric Wire Co Ltd (b) | | 2,403 | 18,014 |
| | | | 892,833 |
| Industrial Conglomerates - 0.1% | | | |
| CJ Corp | | 287 | 19,057 |
| Doosan Co Ltd | | 163 | 27,605 |
| GS Holdings Corp | | 1,000 | 26,416 |
| Hanwha Corp | | 839 | 15,166 |
| LG Corp | | 2,081 | 100,415 |
| Lotte Corp | | 550 | 8,040 |
| Samsung C&T Corp | | 1,666 | 128,200 |
| SK Inc | | 793 | 70,101 |
| SK Square Co Ltd (b) | | 1,996 | 104,392 |
| | | | 499,392 |
| Machinery - 0.1% | | | |
| Doosan Bobcat Inc | | 1,164 | 32,515 |
| Hanwha Ocean Co Ltd (b) | | 2,422 | 60,576 |
| HD Hyundai Heavy Industries Co Ltd (b) | | 487 | 93,926 |
| HD Hyundai Infracore Co Ltd | | 3,096 | 14,306 |
| HD HYUNDAI MIPO (b) | | 513 | 46,344 |
| HD Korea Shipbuilding & Offshore Engineering Co Ltd (b) | | 1,021 | 156,372 |
| Hyundai Elevator Co Ltd | | 488 | 17,181 |
| Hyundai Rotem Co Ltd | | 1,627 | 54,354 |
| Rainbow Robotics (b) | | 161 | 17,542 |
| Samsung Heavy Industries Co Ltd (b) | | 15,920 | 120,962 |
| | | | 614,078 |
| Marine Transportation - 0.0% | | | |
| HMM Co Ltd | | 6,596 | 78,467 |
| Pan Ocean Co Ltd | | 5,296 | 11,774 |
| | | | 90,241 |
| Passenger Airlines - 0.0% | | | |
| Korean Air Lines Co Ltd | | 4,057 | 61,474 |
| Trading Companies & Distributors - 0.0% | | | |
| Posco International Corp | | 1,047 | 27,698 |
TOTAL INDUSTRIALS | | | 2,673,290 |
| | | | |
| Information Technology - 1.0% | | | |
| Electronic Equipment, Instruments & Components - 0.1% | | | |
| Daeduck Electronics Co Ltd / New | | 777 | 8,040 |
| Daejoo Electronic Materials Co Ltd (b) | | 252 | 12,541 |
| IsuPetasys Co Ltd | | 1,096 | 19,766 |
| LG Display Co Ltd (b) | | 8,014 | 48,706 |
| LG Innotek Co Ltd | | 303 | 32,661 |
| Lotte Energy Materials Corp | | 474 | 7,396 |
| Samsung Electro-Mechanics Co Ltd | | 1,214 | 100,277 |
| Samsung SDI Co Ltd | | 1,151 | 189,462 |
| SOLUM Co Ltd (b) | | 852 | 11,002 |
| | | | 429,851 |
| IT Services - 0.0% | | | |
| Posco DX Co Ltd | | 1,143 | 14,491 |
| Samsung SDS Co Ltd | | 846 | 72,498 |
| | | | 86,989 |
| Semiconductors & Semiconductor Equipment - 0.2% | | | |
| DB HiTek Co Ltd | | 752 | 16,614 |
| Eo Technics Co Ltd | | 191 | 17,582 |
| Hanmi Semiconductor Co Ltd | | 939 | 51,262 |
| HPSP Co Ltd | | 992 | 17,125 |
| Koh Young Technology Inc | | 997 | 5,413 |
| LEENO Industrial Inc | | 204 | 25,947 |
| LX Semicon Co Ltd | | 246 | 9,368 |
| SK Hynix Inc | | 11,994 | 1,368,725 |
| WONIK IPS Co Ltd (b) | | 632 | 9,415 |
| | | | 1,521,451 |
| Software - 0.0% | | | |
| Douzone Bizon Co Ltd | | 400 | 16,985 |
| Technology Hardware, Storage & Peripherals - 0.7% | | | |
| CosmoAM&T Co Ltd (b) | | 503 | 17,276 |
| Samsung Electronics Co Ltd | | 107,415 | 3,817,481 |
| | | | 3,834,757 |
TOTAL INFORMATION TECHNOLOGY | | | 5,890,033 |
| | | | |
| Materials - 0.1% | | | |
| Chemicals - 0.0% | | | |
| Advanced Nano Products Co Ltd | | 205 | 7,993 |
| Cosmochemical Co Ltd (b) | | 580 | 5,928 |
| Dongjin Semichem Co Ltd | | 643 | 8,900 |
| Enchem Co Ltd (b) | | 351 | 31,227 |
| Hansol Chemical Co Ltd | | 189 | 12,225 |
| Hanwha Solutions Corp | | 2,385 | 25,588 |
| HS Hyosung Advanced Materials Corp | | 57 | 6,657 |
| Hyosung TNC Corp | | 49 | 7,862 |
| KCC Corp | | 99 | 15,660 |
| Kum Yang Co Ltd (b) | | 850 | 12,011 |
| Kumho Petrochemical Co Ltd | | 357 | 21,772 |
| LG Chem Ltd | | 1,058 | 176,518 |
| Lotte Chemical Corp | | 442 | 17,783 |
| OCI Holdings Co Ltd | | 281 | 11,045 |
| SKC Co Ltd (b) | | 426 | 29,860 |
| Soulbrain Co Ltd | | 87 | 9,573 |
| | | | 400,602 |
| Metals & Mining - 0.1% | | | |
| Hyundai Steel Co | | 1,899 | 26,804 |
| Korea Zinc Co Ltd | | 240 | 161,889 |
| POSCO Holdings Inc | | 1,696 | 288,116 |
| | | | 476,809 |
TOTAL MATERIALS | | | 877,411 |
| | | | |
| Utilities - 0.0% | | | |
| Electric Utilities - 0.0% | | | |
| Korea Electric Power Corp (b) | | 5,810 | 78,381 |
| TOTAL KOREA (SOUTH) | | | 16,976,947 |
| KUWAIT - 0.2% | | | |
| Communication Services - 0.0% | | | |
| Wireless Telecommunication Services - 0.0% | | | |
| Mobile Telecommunications Co KSCP | | 55,500 | 84,429 |
| Financials - 0.2% | | | |
| Banks - 0.2% | | | |
| Boubyan Bank KSCP | | 30,392 | 55,303 |
| Gulf Bank KSCP | | 51,907 | 54,887 |
| Kuwait Finance House KSCP | | 251,997 | 609,762 |
| National Bank of Kuwait SAKP | | 185,772 | 539,902 |
| | | | 1,259,854 |
| Industrials - 0.0% | | | |
| Air Freight & Logistics - 0.0% | | | |
| Agility Global PLC | | 94,276 | 33,624 |
| Agility Public Warehousing Co KSC | | 33,831 | 27,104 |
| | | | 60,728 |
| Industrial Conglomerates - 0.0% | | | |
| National Industries Group Holding SAK | | 48,942 | 39,370 |
TOTAL INDUSTRIALS | | | 100,098 |
| | | | |
| Real Estate - 0.0% | | | |
| Real Estate Management & Development - 0.0% | | | |
| Mabanee Co KPSC | | 14,547 | 35,955 |
| TOTAL KUWAIT | | | 1,480,336 |
| LUXEMBOURG - 0.1% | | | |
| Communication Services - 0.0% | | | |
| Media - 0.0% | | | |
| SES SA Series A depository receipt | | 7,897 | 25,015 |
| Health Care - 0.0% | | | |
| Life Sciences Tools & Services - 0.0% | | | |
| Eurofins Scientific SE | | 2,894 | 147,819 |
| Materials - 0.1% | | | |
| Metals & Mining - 0.1% | | | |
| APERAM SA | | 916 | 23,930 |
| ArcelorMittal SA | | 10,077 | 234,130 |
| | | | 258,060 |
| TOTAL LUXEMBOURG | | | 430,894 |
| MACAU - 0.1% | | | |
| Consumer Discretionary - 0.1% | | | |
| Hotels, Restaurants & Leisure - 0.1% | | | |
| Galaxy Entertainment Group Ltd | | 46,000 | 193,643 |
| Sands China Ltd (b) | | 52,400 | 141,008 |
| | | | |
| TOTAL MACAU | | | 334,651 |
| MALAYSIA - 0.5% | | | |
| Communication Services - 0.0% | | | |
| Diversified Telecommunication Services - 0.0% | | | |
| Telekom Malaysia Berhad | | 46,439 | 69,064 |
| Wireless Telecommunication Services - 0.0% | | | |
| Axiata Group Berhad | | 68,599 | 38,200 |
| CELCOMDIGI BHD | | 74,500 | 60,313 |
| Maxis Bhd | | 54,000 | 44,079 |
| | | | 142,592 |
| Consumer Discretionary - 0.0% | | | |
| Hotels, Restaurants & Leisure - 0.0% | | | |
| Genting Bhd | | 48,600 | 41,954 |
| Genting Malaysia Bhd | | 67,100 | 33,914 |
| | | | 75,868 |
| Specialty Retail - 0.0% | | | |
| MR DIY Group M Bhd (c)(d) | | 99,200 | 41,042 |
TOTAL CONSUMER DISCRETIONARY | | | 116,910 |
| | | | |
| Consumer Staples - 0.1% | | | |
| Food Products - 0.1% | | | |
| IOI Corp Bhd | | 70,600 | 61,261 |
| Kuala Lumpur Kepong Bhd | | 12,571 | 61,288 |
| Nestle Malaysia Bhd | | 1,400 | 31,302 |
| PPB Group Bhd | | 15,900 | 44,093 |
| QL Resources Bhd | | 39,450 | 41,995 |
| SD Guthrie Bhd | | 82,176 | 90,970 |
| | | | 330,909 |
| Energy - 0.0% | | | |
| Energy Equipment & Services - 0.0% | | | |
| Dialog Group Bhd | | 93,200 | 38,560 |
| Oil, Gas & Consumable Fuels - 0.0% | | | |
| Petronas Dagangan Bhd | | 8,000 | 34,565 |
TOTAL ENERGY | | | 73,125 |
| | | | |
| Financials - 0.2% | | | |
| Banks - 0.2% | | | |
| AMMB Holdings Bhd | | 47,800 | 58,581 |
| CIMB Group Holdings Bhd | | 169,571 | 310,965 |
| Hong Leong Bank Bhd | | 17,500 | 80,465 |
| Malayan Banking Bhd | | 169,858 | 388,986 |
| Public Bank Bhd | | 337,800 | 344,486 |
| RHB Bank Bhd | | 42,939 | 62,226 |
| | | | 1,245,709 |
| Health Care - 0.0% | | | |
| Health Care Providers & Services - 0.0% | | | |
| IHH Healthcare Bhd | | 68,600 | 111,994 |
| Industrials - 0.1% | | | |
| Construction & Engineering - 0.1% | | | |
| Gamuda Bhd | | 122,944 | 130,326 |
| IJM Corp Bhd | | 59,300 | 40,316 |
| | | | 170,642 |
| Industrial Conglomerates - 0.0% | | | |
| Sime Darby Bhd | | 70,200 | 37,051 |
| Sunway Bhd | | 48,000 | 51,419 |
| | | | 88,470 |
| Marine Transportation - 0.0% | | | |
| MISC Bhd | | 30,000 | 50,990 |
| Transportation Infrastructure - 0.0% | | | |
| Malaysia Airports Holdings Bhd | | 25,005 | 59,164 |
TOTAL INDUSTRIALS | | | 369,266 |
| | | | |
| Information Technology - 0.0% | | | |
| Semiconductors & Semiconductor Equipment - 0.0% | | | |
| Inari Amertron Bhd | | 63,900 | 43,729 |
| Materials - 0.0% | | | |
| Chemicals - 0.0% | | | |
| Petronas Chemicals Group Bhd | | 63,700 | 73,650 |
| Metals & Mining - 0.0% | | | |
| Press Metal Aluminium Holdings Bhd | | 88,800 | 97,310 |
TOTAL MATERIALS | | | 170,960 |
| | | | |
| Utilities - 0.1% | | | |
| Electric Utilities - 0.1% | | | |
| Tenaga Nasional Bhd | | 63,600 | 212,498 |
| Gas Utilities - 0.0% | | | |
| Petronas Gas Bhd | | 21,800 | 86,195 |
| Multi-Utilities - 0.0% | | | |
| YTL Corp Bhd | | 111,900 | 66,817 |
| YTL Power International Bhd | | 57,500 | 56,838 |
| | | | 123,655 |
TOTAL UTILITIES | | | 422,348 |
| | | | |
| TOTAL MALAYSIA | | | 3,096,606 |
| MEXICO - 0.5% | | | |
| Communication Services - 0.0% | | | |
| Wireless Telecommunication Services - 0.0% | | | |
| America Movil SAB de CV Series B | | 425,300 | 304,937 |
| Consumer Staples - 0.2% | | | |
| Beverages - 0.2% | | | |
| Arca Continental SAB de CV | | 11,000 | 91,129 |
| Coca-Cola Femsa SAB de CV unit | | 11,800 | 91,673 |
| Fomento Economico Mexicano SAB de CV unit | | 39,400 | 335,783 |
| | | | 518,585 |
| Consumer Staples Distribution & Retail - 0.0% | | | |
| Wal-Mart de Mexico SAB de CV Series V | | 109,000 | 286,941 |
| Food Products - 0.0% | | | |
| Gruma SAB de CV Series B | | 3,890 | 60,800 |
| Grupo Bimbo SAB de CV | | 32,100 | 85,042 |
| | | | 145,842 |
| Household Products - 0.0% | | | |
| Kimberly Clark DE Mexico Sab D Series A | | 31,500 | 44,415 |
TOTAL CONSUMER STAPLES | | | 995,783 |
| | | | |
| Financials - 0.1% | | | |
| Banks - 0.1% | | | |
| Banco del Bajio SA (c)(d) | | 18,000 | 36,041 |
| Grupo Financiero Banorte SAB de CV | | 55,300 | 355,310 |
| Grupo Financiero Inbursa SAB de CV Series O (b) | | 39,000 | 81,157 |
| | | | 472,508 |
| Insurance - 0.0% | | | |
| Qualitas Controladora SAB de CV | | 4,400 | 37,015 |
TOTAL FINANCIALS | | | 509,523 |
| | | | |
| Industrials - 0.1% | | | |
| Industrial Conglomerates - 0.0% | | | |
| Alfa SAB de CV Series A | | 71,999 | 52,106 |
| Grupo Carso SAB de CV Series A1 | | 12,000 | 66,345 |
| | | | 118,451 |
| Transportation Infrastructure - 0.1% | | | |
| Grupo Aeroportuario del Centro Norte SAB de CV Series B | | 6,200 | 53,362 |
| Grupo Aeroportuario del Pacifico SAB de CV Series B | | 9,090 | 159,793 |
| Grupo Aeroportuario del Sureste SAB de CV Series B | | 3,840 | 98,469 |
| Promotora y Operadora de Infraestructura SAB de CV | | 4,295 | 36,383 |
| | | | 348,007 |
TOTAL INDUSTRIALS | | | 466,458 |
| | | | |
| Materials - 0.1% | | | |
| Chemicals - 0.0% | | | |
| Orbia Advance Corp SAB de CV (e) | | 21,500 | 15,446 |
| Construction Materials - 0.0% | | | |
| Cemex SAB de CV unit | | 337,400 | 189,000 |
| Metals & Mining - 0.1% | | | |
| Grupo Mexico SAB de CV Series B | | 69,500 | 329,751 |
| Industrias Penoles SAB de CV (b) | | 4,195 | 53,557 |
| Ternium SA ADR | | 957 | 27,829 |
| | | | 411,137 |
TOTAL MATERIALS | | | 615,583 |
| | | | |
| Real Estate - 0.0% | | | |
| Diversified REITs - 0.0% | | | |
| Fibra Uno Administracion SA de CV | | 62,200 | 61,809 |
| Industrial REITs - 0.0% | | | |
| Prologis Property Mexico SA de CV | | 20,700 | 57,491 |
| Real Estate Management & Development - 0.0% | | | |
| Corp Inmobiliaria Vesta SAB de CV | | 19,100 | 48,741 |
TOTAL REAL ESTATE | | | 168,041 |
| | | | |
| TOTAL MEXICO | | | 3,060,325 |
| NETHERLANDS - 2.4% | | | |
| Communication Services - 0.1% | | | |
| Diversified Telecommunication Services - 0.0% | | | |
| Koninklijke KPN NV | | 74,793 | 272,728 |
| Entertainment - 0.1% | | | |
| Universal Music Group NV | | 17,051 | 436,150 |
| Media - 0.0% | | | |
| Havas NV | | 13,752 | 23,111 |
TOTAL COMMUNICATION SERVICES | | | 731,989 |
| | | | |
| Consumer Staples - 0.2% | | | |
| Beverages - 0.1% | | | |
| Heineken Holding NV Class A | | 2,516 | 150,769 |
| Heineken NV | | 6,168 | 439,588 |
| | | | 590,357 |
| Consumer Staples Distribution & Retail - 0.1% | | | |
| Koninklijke Ahold Delhaize NV | | 20,882 | 681,148 |
TOTAL CONSUMER STAPLES | | | 1,271,505 |
| | | | |
| Financials - 0.5% | | | |
| Banks - 0.2% | | | |
| ING Groep NV | | 73,645 | 1,154,134 |
| Capital Markets - 0.0% | | | |
| Euronext NV (c)(d) | | 2,134 | 239,397 |
| Financial Services - 0.3% | | | |
| Adyen NV (b)(c)(d) | | 692 | 1,028,367 |
| EXOR NV | | 1,992 | 182,715 |
| | | | 1,211,082 |
| Insurance - 0.0% | | | |
| NN Group NV | | 6,362 | 277,245 |
TOTAL FINANCIALS | | | 2,881,858 |
| | | | |
| Health Care - 0.2% | | | |
| Biotechnology - 0.1% | | | |
| Argenx SE (b) | | 1,332 | 822,792 |
| Health Care Equipment & Supplies - 0.1% | | | |
| Koninklijke Philips NV | | 17,804 | 450,998 |
TOTAL HEALTH CARE | | | 1,273,790 |
| | | | |
| Industrials - 0.2% | | | |
| Professional Services - 0.2% | | | |
| Wolters Kluwer NV | | 5,549 | 921,969 |
| Trading Companies & Distributors - 0.0% | | | |
| IMCD NV | | 1,270 | 188,778 |
TOTAL INDUSTRIALS | | | 1,110,747 |
| | | | |
| Information Technology - 1.2% | | | |
| Semiconductors & Semiconductor Equipment - 1.2% | | | |
| ASM International NV | | 1,031 | 596,777 |
| ASML Holding NV | | 8,904 | 6,236,671 |
| BE Semiconductor Industries NV | | 1,714 | 234,892 |
| | | | 7,068,340 |
| Materials - 0.0% | | | |
| Chemicals - 0.0% | | | |
| Akzo Nobel NV | | 3,796 | 227,847 |
| TOTAL NETHERLANDS | | | 14,566,076 |
| NEW ZEALAND - 0.2% | | | |
| Communication Services - 0.0% | | | |
| Diversified Telecommunication Services - 0.0% | | | |
| Spark New Zealand Ltd | | 40,903 | 67,497 |
| Consumer Staples - 0.0% | | | |
| Food Products - 0.0% | | | |
| a2 Milk Co Ltd/The (b)(e) | | 16,054 | 56,587 |
| Financials - 0.0% | | | |
| Financial Services - 0.0% | | | |
| Infratil Ltd | | 21,501 | 151,576 |
| Health Care - 0.0% | | | |
| Health Care Equipment & Supplies - 0.0% | | | |
| Fisher & Paykel Healthcare Corp Ltd | | 13,034 | 280,033 |
| Industrials - 0.0% | | | |
| Building Products - 0.0% | | | |
| Fletcher Building Ltd (b) | | 23,411 | 37,331 |
| Transportation Infrastructure - 0.0% | | | |
| Auckland International Airport Ltd | | 32,995 | 160,608 |
TOTAL INDUSTRIALS | | | 197,939 |
| | | | |
| Information Technology - 0.2% | | | |
| Software - 0.2% | | | |
| Xero Ltd (b) | | 3,194 | 333,231 |
| Utilities - 0.0% | | | |
| Electric Utilities - 0.0% | | | |
| Contact Energy Ltd | | 17,746 | 94,325 |
| Mercury NZ Ltd | | 15,144 | 49,567 |
| | | | 143,892 |
| Independent Power and Renewable Electricity Producers - 0.0% | | | |
| Meridian Energy Ltd | | 28,476 | 94,160 |
TOTAL UTILITIES | | | 238,052 |
| | | | |
| TOTAL NEW ZEALAND | | | 1,324,915 |
| NORWAY - 0.4% | | | |
| Communication Services - 0.0% | | | |
| Diversified Telecommunication Services - 0.0% | | | |
| Telenor ASA | | 14,057 | 156,705 |
| Media - 0.0% | | | |
| Schibsted ASA A Shares | | 1,537 | 47,527 |
| Schibsted ASA B Shares | | 2,146 | 63,004 |
| | | | 110,531 |
TOTAL COMMUNICATION SERVICES | | | 267,236 |
| | | | |
| Consumer Discretionary - 0.0% | | | |
| Broadline Retail - 0.0% | | | |
| Europris ASA (c)(d) | | 3,803 | 24,288 |
| Consumer Staples - 0.1% | | | |
| Food Products - 0.1% | | | |
| Leroy Seafood Group ASA | | 6,313 | 27,263 |
| Mowi ASA | | 9,970 | 170,570 |
| Orkla ASA | | 16,608 | 143,489 |
| Salmar ASA | | 1,616 | 76,730 |
| | | | 418,052 |
| Energy - 0.1% | | | |
| Energy Equipment & Services - 0.0% | | | |
| Seadrill Ltd (b) | | 1,533 | 59,680 |
| TGS ASA | | 4,292 | 42,756 |
| | | | 102,436 |
| Oil, Gas & Consumable Fuels - 0.1% | | | |
| Aker BP ASA | | 6,848 | 133,370 |
| Equinor ASA | | 17,437 | 413,589 |
| Frontline PLC (Norway) | | 3,188 | 43,843 |
| SFL Corp Ltd | | 2,403 | 24,558 |
| Var Energi ASA | | 20,591 | 63,835 |
| | | | 679,195 |
TOTAL ENERGY | | | 781,631 |
| | | | |
| Financials - 0.1% | | | |
| Banks - 0.1% | | | |
| DNB Bank ASA | | 19,343 | 385,555 |
| SpareBank 1 SMN | | 2,845 | 42,817 |
| SpareBank 1 Sor-Norge ASA | | 4,206 | 54,167 |
| | | | 482,539 |
| Insurance - 0.0% | | | |
| Gjensidige Forsikring ASA | | 4,287 | 75,697 |
| Protector Forsikring ASA | | 1,323 | 33,122 |
| Storebrand ASA A Shares | | 10,060 | 107,110 |
| | | | 215,929 |
TOTAL FINANCIALS | | | 698,468 |
| | | | |
| Industrials - 0.1% | | | |
| Aerospace & Defense - 0.1% | | | |
| Kongsberg Gruppen ASA | | 1,958 | 220,167 |
| Industrial Conglomerates - 0.0% | | | |
| Aker ASA A Shares | | 512 | 24,693 |
| Machinery - 0.0% | | | |
| AutoStore Holdings Ltd (b)(c)(d) | | 25,513 | 24,900 |
| TOMRA Systems ASA | | 5,157 | 66,414 |
| | | | 91,314 |
| Marine Transportation - 0.0% | | | |
| Golden Ocean Group Ltd (Norway) | | 2,659 | 23,260 |
TOTAL INDUSTRIALS | | | 359,434 |
| | | | |
| Information Technology - 0.0% | | | |
| Semiconductors & Semiconductor Equipment - 0.0% | | | |
| Nordic Semiconductor ASA (b) | | 3,677 | 32,447 |
| Materials - 0.0% | | | |
| Metals & Mining - 0.0% | | | |
| Norsk Hydro ASA | | 29,558 | 162,589 |
| TOTAL NORWAY | | | 2,744,145 |
| PERU - 0.1% | | | |
| Financials - 0.1% | | | |
| Banks - 0.1% | | | |
| Credicorp Ltd | | 1,514 | 277,547 |
| Materials - 0.0% | | | |
| Metals & Mining - 0.0% | | | |
| Cia de Minas Buenaventura SAA ADR | | 5,264 | 60,641 |
| TOTAL PERU | | | 338,188 |
| PHILIPPINES - 0.2% | | | |
| Communication Services - 0.0% | | | |
| Wireless Telecommunication Services - 0.0% | | | |
| PLDT Inc | | 1,935 | 43,075 |
| Consumer Discretionary - 0.0% | | | |
| Hotels, Restaurants & Leisure - 0.0% | | | |
| Jollibee Foods Corp | | 9,600 | 44,335 |
| Financials - 0.0% | | | |
| Banks - 0.0% | | | |
| Bank of the Philippine Islands | | 47,239 | 99,060 |
| BDO Unibank Inc | | 46,648 | 114,918 |
| Metropolitan Bank & Trust Co | | 40,576 | 50,038 |
| | | | 264,016 |
| Industrials - 0.2% | | | |
| Industrial Conglomerates - 0.1% | | | |
| Ayala Corp | | 5,580 | 57,253 |
| SM Investments Corp | | 10,880 | 167,351 |
| | | | 224,604 |
| Transportation Infrastructure - 0.1% | | | |
| International Container Terminal Services Inc | | 18,010 | 119,383 |
TOTAL INDUSTRIALS | | | 343,987 |
| | | | |
| Real Estate - 0.0% | | | |
| Real Estate Management & Development - 0.0% | | | |
| Ayala Land Inc | | 132,800 | 59,525 |
| SM Prime Holdings Inc | | 257,200 | 110,620 |
| | | | 170,145 |
| Utilities - 0.0% | | | |
| Electric Utilities - 0.0% | | | |
| Manila Electric Co | | 6,510 | 54,585 |
| TOTAL PHILIPPINES | | | 920,143 |
| POLAND - 0.3% | | | |
| Communication Services - 0.0% | | | |
| Entertainment - 0.0% | | | |
| CD Projekt SA | | 1,535 | 71,153 |
| Consumer Discretionary - 0.1% | | | |
| Broadline Retail - 0.0% | | | |
| Allegro.eu SA (b)(c)(d) | | 14,017 | 91,903 |
| Textiles, Apparel & Luxury Goods - 0.1% | | | |
| LPP SA | | 29 | 109,184 |
TOTAL CONSUMER DISCRETIONARY | | | 201,087 |
| | | | |
| Consumer Staples - 0.0% | | | |
| Consumer Staples Distribution & Retail - 0.0% | | | |
| Dino Polska SA (b)(c)(d) | | 1,073 | 101,268 |
| Energy - 0.0% | | | |
| Oil, Gas & Consumable Fuels - 0.0% | | | |
| ORLEN SA | | 12,968 | 148,199 |
| Financials - 0.2% | | | |
| Banks - 0.2% | | | |
| Alior Bank SA | | 2,010 | 41,843 |
| Bank Polska Kasa Opieki SA | | 3,919 | 130,848 |
| mBank SA (b) | | 298 | 39,481 |
| Powszechna Kasa Oszczednosci Bank Polski SA | | 19,193 | 277,705 |
| Santander Bank Polska SA | | 861 | 95,393 |
| | | | 585,270 |
| Consumer Finance - 0.0% | | | |
| KRUK SA | | 396 | 39,866 |
| Insurance - 0.0% | | | |
| Powszechny Zaklad Ubezpieczen SA | | 12,686 | 140,799 |
TOTAL FINANCIALS | | | 765,935 |
| | | | |
| Industrials - 0.0% | | | |
| Air Freight & Logistics - 0.0% | | | |
| InPost SA (b) | | 4,909 | 83,953 |
| Construction & Engineering - 0.0% | | | |
| Budimex SA | | 293 | 33,101 |
TOTAL INDUSTRIALS | | | 117,054 |
| | | | |
| Materials - 0.0% | | | |
| Metals & Mining - 0.0% | | | |
| Grupa Kety SA | | 214 | 35,362 |
| KGHM Polska Miedz SA | | 3,060 | 85,202 |
| | | | 120,564 |
| Utilities - 0.0% | | | |
| Electric Utilities - 0.0% | | | |
| PGE Polska Grupa Energetyczna SA (b) | | 18,851 | 27,705 |
| TOTAL POLAND | | | 1,552,965 |
| PORTUGAL - 0.1% | | | |
| Consumer Staples - 0.0% | | | |
| Consumer Staples Distribution & Retail - 0.0% | | | |
| Jeronimo Martins SGPS SA | | 6,196 | 118,414 |
| Energy - 0.0% | | | |
| Oil, Gas & Consumable Fuels - 0.0% | | | |
| Galp Energia SGPS SA | | 9,718 | 161,073 |
| Financials - 0.0% | | | |
| Banks - 0.0% | | | |
| Banco Comercial Portugues SA | | 199,016 | 95,798 |
| Utilities - 0.1% | | | |
| Electric Utilities - 0.1% | | | |
| EDP SA | | 67,097 | 214,832 |
| TOTAL PORTUGAL | | | 590,117 |
| QATAR - 0.2% | | | |
| Communication Services - 0.0% | | | |
| Diversified Telecommunication Services - 0.0% | | | |
| Ooredoo QPSC | | 17,225 | 54,641 |
| Energy - 0.0% | | | |
| Oil, Gas & Consumable Fuels - 0.0% | | | |
| Qatar Fuel QSC | | 12,961 | 53,396 |
| Qatar Gas Transport Co Ltd | | 61,615 | 70,212 |
| | | | 123,608 |
| Financials - 0.2% | | | |
| Banks - 0.2% | | | |
| Commercial Bank of Qatar | | 72,269 | 86,342 |
| Masraf Al Rayan QSC | | 136,564 | 92,380 |
| Qatar International Islamic Bank QSC | | 24,302 | 72,752 |
| Qatar Islamic Bank QPSC | | 37,429 | 219,578 |
| Qatar National Bank QPSC | | 98,736 | 468,868 |
| | | | 939,920 |
| Industrials - 0.0% | | | |
| Industrial Conglomerates - 0.0% | | | |
| Industries Qatar QSC | | 35,371 | 128,913 |
| Marine Transportation - 0.0% | | | |
| Qatar Navigation QSC | | 21,454 | 64,757 |
TOTAL INDUSTRIALS | | | 193,670 |
| | | | |
| Materials - 0.0% | | | |
| Chemicals - 0.0% | | | |
| Mesaieed Petrochemical Holding Co | | 114,692 | 47,093 |
| Real Estate - 0.0% | | | |
| Real Estate Management & Development - 0.0% | | | |
| Barwa Real Estate Co | | 47,408 | 36,848 |
| Utilities - 0.0% | | | |
| Multi-Utilities - 0.0% | | | |
| Qatar Electricity & Water Co QSC | | 10,875 | 46,893 |
| TOTAL QATAR | | | 1,442,673 |
| ROMANIA - 0.0% | | | |
| Real Estate - 0.0% | | | |
| Real Estate Management & Development - 0.0% | | | |
| NEPI Rockcastle NV | | 12,615 | 92,219 |
| RUSSIA - 0.0% | | | |
| Communication Services - 0.0% | | | |
| Interactive Media & Services - 0.0% | | | |
| VK IPJSC GDR (b)(c)(f) | | 1,767 | 0 |
| Consumer Staples - 0.0% | | | |
| Consumer Staples Distribution & Retail - 0.0% | | | |
| Magnit PJSC (b)(f) | | 1,150 | 0 |
| Energy - 0.0% | | | |
| Oil, Gas & Consumable Fuels - 0.0% | | | |
| Gazprom PJSC (b)(f) | | 183,050 | 0 |
| LUKOIL PJSC (b)(f) | | 5,452 | 0 |
| Novatek PJSC (b)(f) | | 14,792 | 0 |
| Surgutneftegaz Pjsc (b)(f) | | 146,500 | 0 |
| Tatneft PJSC (b)(f) | | 23,930 | 0 |
| | | | 0 |
| Financials - 0.0% | | | |
| Banks - 0.0% | | | |
| Sberbank of Russia PJSC (b)(f) | | 163,450 | 0 |
| Materials - 0.0% | | | |
| Metals & Mining - 0.0% | | | |
| Alrosa PJSC (b)(f) | | 37,350 | 0 |
| GMK Norilskiy Nickel PAO (b)(f) | | 91,700 | 0 |
| Polyus PJSC (b)(f) | | 494 | 0 |
| Severstal PAO (b)(f) | | 2,873 | 0 |
| | | | 0 |
| TOTAL RUSSIA | | | 0 |
| SAUDI ARABIA - 1.0% | | | |
| Communication Services - 0.1% | | | |
| Diversified Telecommunication Services - 0.1% | | | |
| Saudi Telecom Co | | 40,133 | 427,242 |
| Media - 0.0% | | | |
| Saudi Research & Media Group (b) | | 877 | 64,187 |
| Wireless Telecommunication Services - 0.0% | | | |
| Etihad Etisalat Co | | 8,426 | 119,750 |
| Mobile Telecommunications Co Saudi Arabia | | 10,161 | 27,746 |
| | | | 147,496 |
TOTAL COMMUNICATION SERVICES | | | 638,925 |
| | | | |
| Consumer Discretionary - 0.0% | | | |
| Hotels, Restaurants & Leisure - 0.0% | | | |
| Leejam Sports Co JSC | | 547 | 26,990 |
| Specialty Retail - 0.0% | | | |
| Aldrees Petroleum and Transport Services Co | | 1,068 | 34,166 |
| Jarir Marketing Co | | 13,241 | 44,614 |
| | | | 78,780 |
TOTAL CONSUMER DISCRETIONARY | | | 105,770 |
| | | | |
| Consumer Staples - 0.0% | | | |
| Consumer Staples Distribution & Retail - 0.0% | | | |
| Abdullah Al Othaim Markets Co | | 9,949 | 27,802 |
| Nahdi Medical Co | | 1,165 | 36,463 |
| | | | 64,265 |
| Food Products - 0.0% | | | |
| Almarai Co JSC | | 9,130 | 138,989 |
| Saudia Dairy & Foodstuff Co | | 330 | 29,668 |
| Savola Group/The (b) | | 3,275 | 31,988 |
| | | | 200,645 |
TOTAL CONSUMER STAPLES | | | 264,910 |
| | | | |
| Energy - 0.0% | | | |
| Energy Equipment & Services - 0.0% | | | |
| Ades Holding Co | | 7,751 | 35,810 |
| Financials - 0.5% | | | |
| Banks - 0.5% | | | |
| Al Rajhi Bank | | 43,687 | 1,099,907 |
| Alinma Bank | | 27,306 | 210,387 |
| Bank Al-Jazira | | 11,275 | 56,114 |
| Bank AlBilad | | 13,541 | 140,729 |
| Banque Saudi Fransi | | 27,491 | 115,893 |
| Riyad Bank | | 32,803 | 249,685 |
| Saudi Awwal Bank | | 8,198 | 73,419 |
| Saudi Investment Bank/The | | 13,550 | 52,290 |
| Saudi National Bank/The | | 65,566 | 582,824 |
| | | | 2,581,248 |
| Capital Markets - 0.0% | | | |
| Saudi Tadawul Group Holding Co | | 1,048 | 60,469 |
| Insurance - 0.0% | | | |
| Bupa Arabia for Cooperative Insurance Co | | 556 | 30,631 |
| Co for Cooperative Insurance/The | | 1,667 | 65,484 |
| | | | 96,115 |
TOTAL FINANCIALS | | | 2,737,832 |
| | | | |
| Health Care - 0.0% | | | |
| Health Care Providers & Services - 0.0% | | | |
| Al Hammadi Holding | | 1,800 | 18,396 |
| Dallah Healthcare Co | | 682 | 27,226 |
| Dr Sulaiman Al Habib Medical Services Group Co | | 2,270 | 169,401 |
| Mouwasat Medical Services Co | | 2,127 | 48,174 |
| | | | 263,197 |
| Industrials - 0.0% | | | |
| Air Freight & Logistics - 0.0% | | | |
| SAL Saudi Logistics Services | | 546 | 36,706 |
| Commercial Services & Supplies - 0.0% | | | |
| Catrion Catering Holding Co | | 893 | 28,995 |
| Industrial Conglomerates - 0.0% | | | |
| Astra Industrial Group Co | | 819 | 39,235 |
TOTAL INDUSTRIALS | | | 104,936 |
| | | | |
| Information Technology - 0.0% | | | |
| IT Services - 0.0% | | | |
| Arabian Internet & Communications Services Co | | 526 | 37,797 |
| Elm Co | | 588 | 174,488 |
| | | | 212,285 |
| Materials - 0.3% | | | |
| Chemicals - 0.2% | | | |
| Advanced Petrochemical Co (b) | | 2,733 | 23,348 |
| National Industrialization Co (b) | | 7,514 | 20,317 |
| SABIC Agri-Nutrients Co | | 5,144 | 151,963 |
| Sahara International Petrochemical Co | | 7,963 | 52,728 |
| Saudi Aramco Base Oil Co | | 1,091 | 32,462 |
| Saudi Basic Industries Corp | | 20,040 | 357,343 |
| Saudi Industrial Investment Group | | 8,426 | 37,450 |
| Saudi Kayan Petrochemical Co (b) | | 15,981 | 29,858 |
| Yanbu National Petrochemical Co | | 6,127 | 61,639 |
| | | | 767,108 |
| Construction Materials - 0.0% | | | |
| Saudi Cement Co | | 1,770 | 20,091 |
| Metals & Mining - 0.1% | | | |
| Saudi Arabian Mining Co (b) | | 27,151 | 363,468 |
TOTAL MATERIALS | | | 1,150,667 |
| | | | |
| Real Estate - 0.0% | | | |
| Real Estate Management & Development - 0.0% | | | |
| Dar Al Arkan Real Estate Development Co (b) | | 11,868 | 47,694 |
| Emaar Economic City (b) | | 12,311 | 28,669 |
| | | | 76,363 |
| Utilities - 0.1% | | | |
| Electric Utilities - 0.0% | | | |
| Saudi Electricity Co | | 17,802 | 80,070 |
| Independent Power and Renewable Electricity Producers - 0.1% | | | |
| ACWA Power Co | | 4,732 | 505,516 |
| Multi-Utilities - 0.0% | | | |
| Power & Water Utility Co for Jubail & Yanbu | | 1,667 | 24,312 |
TOTAL UTILITIES | | | 609,898 |
| | | | |
| TOTAL SAUDI ARABIA | | | 6,200,593 |
| SINGAPORE - 1.2% | | | |
| Communication Services - 0.2% | | | |
| Diversified Telecommunication Services - 0.1% | | | |
| NETLINK NBN TRUST (c) | | 65,700 | 41,854 |
| Singapore Telecommunications Ltd | | 165,600 | 373,484 |
| | | | 415,338 |
| Entertainment - 0.1% | | | |
| Sea Ltd Class A ADR (b) | | 7,775 | 824,928 |
TOTAL COMMUNICATION SERVICES | | | 1,240,266 |
| | | | |
| Consumer Discretionary - 0.0% | | | |
| Hotels, Restaurants & Leisure - 0.0% | | | |
| Genting Singapore Ltd | | 124,700 | 69,854 |
| Energy - 0.0% | | | |
| Oil, Gas & Consumable Fuels - 0.0% | | | |
| Hafnia Ltd | | 6,520 | 34,795 |
| Financials - 0.7% | | | |
| Banks - 0.7% | | | |
| DBS Group Holdings Ltd | | 45,002 | 1,440,697 |
| Oversea-Chinese Banking Corp Ltd | | 85,585 | 1,045,959 |
| United Overseas Bank Ltd | | 34,200 | 909,813 |
| | | | 3,396,469 |
| Capital Markets - 0.0% | | | |
| Singapore Exchange Ltd | | 18,100 | 168,853 |
TOTAL FINANCIALS | | | 3,565,322 |
| | | | |
| Industrials - 0.1% | | | |
| Aerospace & Defense - 0.0% | | | |
| ST Engineering Financial I Ltd | | 33,400 | 113,971 |
| Ground Transportation - 0.1% | | | |
| ComfortDelGro Corp Ltd | | 47,700 | 51,694 |
| Grab Holdings Ltd Class A (b) | | 53,886 | 254,342 |
| | | | 306,036 |
| Industrial Conglomerates - 0.0% | | | |
| Keppel Ltd | | 31,300 | 156,769 |
| Machinery - 0.0% | | | |
| Seatrium Ltd (b) | | 47,984 | 72,732 |
| Passenger Airlines - 0.0% | | | |
| Singapore Airlines Ltd | | 30,350 | 143,122 |
| Transportation Infrastructure - 0.0% | | | |
| SATS Ltd | | 19,523 | 52,036 |
TOTAL INDUSTRIALS | | | 844,666 |
| | | | |
| Information Technology - 0.1% | | | |
| Electronic Equipment, Instruments & Components - 0.0% | | | |
| Venture Corp Ltd | | 5,900 | 56,812 |
| Semiconductors & Semiconductor Equipment - 0.1% | | | |
| STMicroelectronics NV (Italy) | | 14,536 | 361,521 |
TOTAL INFORMATION TECHNOLOGY | | | 418,333 |
| | | | |
| Real Estate - 0.1% | | | |
| Diversified REITs - 0.0% | | | |
| Suntec Real Estate Investment Trust | | 50,300 | 43,094 |
| Hotel & Resort REITs - 0.0% | | | |
| CapitaLand Ascott Trust unit | | 58,347 | 37,171 |
| Industrial REITs - 0.1% | | | |
| CapitaLand Ascendas REIT | | 78,606 | 147,928 |
| Frasers Logistics & Commercial Trust (c) | | 64,600 | 41,627 |
| Mapletree Industrial Trust | | 46,570 | 75,363 |
| Mapletree Logistics Trust | | 75,655 | 70,356 |
| | | | 335,274 |
| Real Estate Management & Development - 0.0% | | | |
| CapitaLand Investment Ltd/Singapore | | 50,820 | 97,498 |
| City Developments Ltd | | 10,800 | 40,412 |
| UOL Group Ltd | | 10,400 | 39,295 |
| | | | 177,205 |
| Retail REITs - 0.0% | | | |
| CapitaLand Integrated Commercial Trust | | 120,099 | 169,729 |
| Mapletree Pan Asia Commercial Trust | | 50,846 | 45,051 |
| | | | 214,780 |
TOTAL REAL ESTATE | | | 807,524 |
| | | | |
| Utilities - 0.0% | | | |
| Multi-Utilities - 0.0% | | | |
| Sembcorp Industries Ltd | | 19,900 | 80,436 |
| TOTAL SINGAPORE | | | 7,061,196 |
| SOUTH AFRICA - 0.9% | | | |
| Communication Services - 0.0% | | | |
| Media - 0.0% | | | |
| MultiChoice Group (b) | | 5,946 | 34,070 |
| Wireless Telecommunication Services - 0.0% | | | |
| MTN Group Ltd | | 41,979 | 204,028 |
| Vodacom Group Ltd | | 13,312 | 71,490 |
| | | | 275,518 |
TOTAL COMMUNICATION SERVICES | | | 309,588 |
| | | | |
| Consumer Discretionary - 0.2% | | | |
| Broadline Retail - 0.2% | | | |
| Naspers Ltd Class N | | 3,973 | 879,851 |
| Woolworths Holdings Ltd/South Africa | | 20,090 | 66,247 |
| | | | 946,098 |
| Specialty Retail - 0.0% | | | |
| Foschini Group Ltd | | 7,371 | 66,079 |
| Mr Price Group Ltd | | 5,688 | 88,651 |
| | | | 154,730 |
TOTAL CONSUMER DISCRETIONARY | | | 1,100,828 |
| | | | |
| Consumer Staples - 0.1% | | | |
| Consumer Staples Distribution & Retail - 0.1% | | | |
| Bid Corp Ltd | | 7,475 | 170,297 |
| Clicks Group Ltd | | 5,308 | 105,678 |
| Shoprite Holdings Ltd | | 10,678 | 166,064 |
| | | | 442,039 |
| Food Products - 0.0% | | | |
| Tiger Brands Ltd | | 3,533 | 54,331 |
TOTAL CONSUMER STAPLES | | | 496,370 |
| | | | |
| Energy - 0.0% | | | |
| Oil, Gas & Consumable Fuels - 0.0% | | | |
| Exxaro Resources Ltd | | 5,409 | 45,066 |
| Financials - 0.3% | | | |
| Banks - 0.2% | | | |
| Absa Group Ltd | | 18,537 | 185,799 |
| Capitec Bank Holdings Ltd | | 2,010 | 333,912 |
| Nedbank Group Ltd | | 10,131 | 151,559 |
| Standard Bank Group Ltd | | 29,858 | 350,648 |
| | | | 1,021,918 |
| Financial Services - 0.1% | | | |
| FirstRand Ltd | | 112,550 | 451,460 |
| Remgro Ltd | | 11,132 | 91,270 |
| | | | 542,730 |
| Insurance - 0.0% | | | |
| Discovery Ltd | | 13,043 | 135,559 |
| Old Mutual Ltd | | 105,973 | 70,470 |
| OUTsurance Group Ltd | | 18,661 | 65,534 |
| Sanlam Ltd | | 37,381 | 172,215 |
| | | | 443,778 |
TOTAL FINANCIALS | | | 2,008,426 |
| | | | |
| Health Care - 0.0% | | | |
| Pharmaceuticals - 0.0% | | | |
| Aspen Pharmacare Holdings Ltd | | 8,612 | 75,046 |
| Industrials - 0.0% | | | |
| Industrial Conglomerates - 0.0% | | | |
| Bidvest Group Ltd | | 7,581 | 105,815 |
| Materials - 0.3% | | | |
| Chemicals - 0.0% | | | |
| Sasol Ltd | | 12,973 | 57,130 |
| Metals & Mining - 0.3% | | | |
| Anglo American Platinum Ltd | | 1,255 | 37,856 |
| Anglo American PLC | | 29,807 | 881,308 |
| Gold Fields Ltd | | 19,913 | 260,530 |
| Harmony Gold Mining Co Ltd | | 12,291 | 98,524 |
| Impala Platinum Holdings Ltd (b) | | 20,302 | 94,921 |
| Northam Platinum Holdings Ltd | | 7,907 | 41,100 |
| Sibanye Stillwater Ltd (b) | | 62,987 | 50,277 |
| | | | 1,464,516 |
| Paper & Forest Products - 0.0% | | | |
| Sappi Ltd | | 13,269 | 34,459 |
TOTAL MATERIALS | | | 1,556,105 |
| | | | |
| Real Estate - 0.0% | | | |
| Diversified REITs - 0.0% | | | |
| Growthpoint Properties Ltd | | 77,810 | 52,284 |
| TOTAL SOUTH AFRICA | | | 5,749,528 |
| SPAIN - 1.6% | | | |
| Communication Services - 0.1% | | | |
| Diversified Telecommunication Services - 0.1% | | | |
| Cellnex Telecom SA (c)(d) | | 13,063 | 412,615 |
| Telefonica SA (e) | | 107,270 | 437,756 |
| | | | 850,371 |
| Consumer Discretionary - 0.3% | | | |
| Hotels, Restaurants & Leisure - 0.1% | | | |
| Amadeus IT Group SA Class A | | 10,026 | 708,286 |
| Specialty Retail - 0.2% | | | |
| Industria de Diseno Textil SA | | 24,994 | 1,280,292 |
TOTAL CONSUMER DISCRETIONARY | | | 1,988,578 |
| | | | |
| Energy - 0.1% | | | |
| Oil, Gas & Consumable Fuels - 0.1% | | | |
| Repsol SA | | 27,114 | 329,922 |
| Financials - 0.6% | | | |
| Banks - 0.6% | | | |
| Banco Bilbao Vizcaya Argentaria SA | | 128,444 | 1,256,752 |
| Banco de Sabadell SA | | 121,380 | 235,998 |
| Banco Santander SA | | 345,340 | 1,597,631 |
| Bankinter SA | | 14,263 | 112,876 |
| CaixaBank SA | | 87,431 | 474,678 |
| | | | 3,677,935 |
| Industrials - 0.1% | | | |
| Construction & Engineering - 0.0% | | | |
| ACS Actividades de Construccion y Servicios SA (b) | | 4,161 | 208,784 |
| Transportation Infrastructure - 0.1% | | | |
| Abertis Infraestructuras SA (f) | | 363 | 0 |
| Aena SME SA (c)(d) | | 1,635 | 334,320 |
| | | | 334,320 |
TOTAL INDUSTRIALS | | | 543,104 |
| | | | |
| Real Estate - 0.0% | | | |
| Diversified REITs - 0.0% | | | |
| Merlin Properties Socimi SA | | 8,872 | 93,371 |
| Utilities - 0.4% | | | |
| Electric Utilities - 0.4% | | | |
| Acciona SA | | 556 | 62,604 |
| Endesa SA | | 7,047 | 151,613 |
| Iberdrola SA | | 129,046 | 1,778,284 |
| Redeia Corp SA | | 9,023 | 154,217 |
| | | | 2,146,718 |
| Gas Utilities - 0.0% | | | |
| Enagas SA | | 5,300 | 64,672 |
| Naturgy Energy Group SA | | 3,405 | 82,463 |
| | | | 147,135 |
| Independent Power and Renewable Electricity Producers - 0.0% | | | |
| EDP Renovaveis SA (b) | | 6,769 | 70,397 |
TOTAL UTILITIES | | | 2,364,250 |
| | | | |
| TOTAL SPAIN | | | 9,847,531 |
| SWEDEN - 2.1% | | | |
| Communication Services - 0.1% | | | |
| Diversified Telecommunication Services - 0.1% | | | |
| Telia Co AB | | 51,936 | 143,971 |
| Entertainment - 0.0% | | | |
| Embracer Group AB B Shares (b) | | 19,909 | 54,272 |
| Interactive Media & Services - 0.0% | | | |
| Hemnet Group AB | | 1,778 | 53,996 |
| Wireless Telecommunication Services - 0.0% | | | |
| Tele2 AB B Shares | | 12,275 | 121,210 |
TOTAL COMMUNICATION SERVICES | | | 373,449 |
| | | | |
| Consumer Discretionary - 0.1% | | | |
| Automobile Components - 0.0% | | | |
| Dometic Group AB (d) | | 6,967 | 32,745 |
| Automobiles - 0.0% | | | |
| Volvo Car AB (b) | | 14,594 | 31,631 |
| Hotels, Restaurants & Leisure - 0.1% | | | |
| Evolution AB (c)(d) | | 4,223 | 325,508 |
| Household Durables - 0.0% | | | |
| Electrolux AB B Shares (b) | | 5,094 | 42,312 |
| Leisure Products - 0.0% | | | |
| Thule Group AB (c)(d) | | 2,328 | 71,878 |
| Specialty Retail - 0.0% | | | |
| H & M Hennes & Mauritz AB B Shares (e) | | 12,623 | 170,112 |
TOTAL CONSUMER DISCRETIONARY | | | 674,186 |
| | | | |
| Consumer Staples - 0.1% | | | |
| Consumer Staples Distribution & Retail - 0.0% | | | |
| Axfood AB B Shares | | 2,469 | 52,219 |
| Food Products - 0.0% | | | |
| AAK AB | | 4,048 | 115,471 |
| Household Products - 0.1% | | | |
| Essity AB B Shares | | 13,492 | 360,596 |
TOTAL CONSUMER STAPLES | | | 528,286 |
| | | | |
| Financials - 0.5% | | | |
| Banks - 0.2% | | | |
| Skandinaviska Enskilda Banken AB A Shares | | 36,819 | 504,005 |
| Svenska Handelsbanken AB A Shares | | 34,711 | 358,393 |
| Swedbank AB A1 Shares | | 20,460 | 403,695 |
| | | | 1,266,093 |
| Capital Markets - 0.1% | | | |
| Avanza Bank Holding AB | | 2,628 | 64,822 |
| EQT AB | | 8,026 | 222,053 |
| Nordnet AB | | 3,466 | 73,556 |
| | | | 360,431 |
| Financial Services - 0.2% | | | |
| Industrivarden AB A Shares | | 3,351 | 105,826 |
| Industrivarden AB C Shares | | 3,334 | 105,198 |
| Investor AB B Shares | | 40,662 | 1,075,735 |
| Kinnevik AB B Shares (b) | | 5,322 | 35,471 |
| L E Lundbergforetagen AB B Shares | | 1,622 | 73,448 |
| | | | 1,395,678 |
TOTAL FINANCIALS | | | 3,022,202 |
| | | | |
| Health Care - 0.0% | | | |
| Biotechnology - 0.0% | | | |
| Swedish Orphan Biovitrum AB B Shares (b) | | 5,127 | 147,084 |
| Health Care Equipment & Supplies - 0.0% | | | |
| Elekta AB B Shares | | 7,786 | 43,033 |
| Getinge AB B Shares | | 4,805 | 78,847 |
| | | | 121,880 |
| Health Care Technology - 0.0% | | | |
| Sectra AB B Shares (b) | | 2,942 | 73,564 |
TOTAL HEALTH CARE | | | 342,528 |
| | | | |
| Industrials - 0.9% | | | |
| Aerospace & Defense - 0.0% | | | |
| Saab AB B Shares | | 7,301 | 154,218 |
| Building Products - 0.2% | | | |
| Assa Abloy AB B Shares | | 22,106 | 652,930 |
| Nibe Industrier AB B Shares | | 33,955 | 132,703 |
| | | | 785,633 |
| Commercial Services & Supplies - 0.0% | | | |
| Bravida Holding AB (c)(d) | | 4,479 | 32,427 |
| Loomis AB | | 1,565 | 47,584 |
| Securitas AB B Shares | | 11,194 | 138,511 |
| | | | 218,522 |
| Construction & Engineering - 0.0% | | | |
| Skanska AB B Shares | | 7,927 | 166,725 |
| Sweco AB B Shares | | 4,537 | 67,539 |
| | | | 234,264 |
| Industrial Conglomerates - 0.0% | | | |
| Investment AB Latour B Shares | | 3,092 | 77,105 |
| Lifco AB B Shares | | 4,729 | 137,034 |
| | | | 214,139 |
| Machinery - 0.7% | | | |
| Alfa Laval AB | | 6,450 | 269,686 |
| Atlas Copco AB A Shares | | 57,341 | 875,119 |
| Atlas Copco AB B Shares | | 34,300 | 463,322 |
| Epiroc AB A Shares | | 13,779 | 240,135 |
| Epiroc AB B Shares | | 8,908 | 138,807 |
| Husqvarna AB B Shares | | 7,997 | 41,735 |
| Indutrade AB | | 5,932 | 148,516 |
| Sandvik AB | | 24,065 | 431,519 |
| SKF AB B Shares | | 8,326 | 156,228 |
| Trelleborg AB B Shares | | 4,207 | 143,962 |
| Volvo AB A Shares | | 4,478 | 109,361 |
| Volvo AB B Shares | | 35,207 | 855,607 |
| | | | 3,873,997 |
| Trading Companies & Distributors - 0.0% | | | |
| AddTech AB B Shares | | 5,788 | 157,571 |
| Beijer Ref AB B Shares | | 8,618 | 127,044 |
| | | | 284,615 |
TOTAL INDUSTRIALS | | | 5,765,388 |
| | | | |
| Information Technology - 0.2% | | | |
| Communications Equipment - 0.1% | | | |
| Telefonaktiebolaget LM Ericsson B Shares | | 68,749 | 556,761 |
| Electronic Equipment, Instruments & Components - 0.1% | | | |
| Hexagon AB B Shares | | 45,627 | 435,621 |
| Lagercrantz Group AB B Shares | | 4,395 | 82,467 |
| | | | 518,088 |
| Software - 0.0% | | | |
| Fortnox AB | | 10,762 | 70,133 |
TOTAL INFORMATION TECHNOLOGY | | | 1,144,982 |
| | | | |
| Materials - 0.1% | | | |
| Chemicals - 0.0% | | | |
| Hexpol AB B Shares | | 5,847 | 54,328 |
| Containers & Packaging - 0.0% | | | |
| Billerud Aktiebolag | | 4,901 | 44,917 |
| Metals & Mining - 0.0% | | | |
| Boliden AB | | 6,059 | 170,042 |
| SSAB AB B Shares | | 13,621 | 54,059 |
| | | | 224,101 |
| Paper & Forest Products - 0.1% | | | |
| Holmen AB B Shares | | 2,055 | 75,447 |
| Svenska Cellulosa AB SCA B Shares | | 13,313 | 169,002 |
| | | | 244,449 |
TOTAL MATERIALS | | | 567,795 |
| | | | |
| Real Estate - 0.1% | | | |
| Real Estate Management & Development - 0.1% | | | |
| Castellum AB (b) | | 9,379 | 102,192 |
| Fabege AB | | 5,489 | 41,079 |
| Fastighets AB Balder B Shares (b) | | 15,809 | 109,739 |
| Sagax AB B Shares | | 4,928 | 100,753 |
| Wallenstam AB B Shares | | 9,748 | 42,115 |
| Wihlborgs Fastigheter AB | | 6,048 | 57,288 |
| | | | 453,166 |
| TOTAL SWEDEN | | | 12,871,982 |
| SWITZERLAND - 2.7% | | | |
| Communication Services - 0.1% | | | |
| Diversified Telecommunication Services - 0.1% | | | |
| Swisscom AG | | 566 | 314,635 |
| Consumer Discretionary - 0.3% | | | |
| Textiles, Apparel & Luxury Goods - 0.3% | | | |
| Cie Financiere Richemont SA Series A | | 11,982 | 1,812,568 |
| Swatch Group AG/The | | 644 | 117,054 |
| | | | 1,929,622 |
| Consumer Staples - 0.1% | | | |
| Food Products - 0.1% | | | |
| Chocoladefabriken Lindt & Spruengli AG | | 22 | 244,108 |
| Chocoladefabriken Lindt & Spruengli AG | | 2 | 220,373 |
| | | | 464,481 |
| Financials - 1.0% | | | |
| Capital Markets - 0.6% | | | |
| Julius Baer Group Ltd | | 4,587 | 297,565 |
| Partners Group Holding AG | | 488 | 661,385 |
| UBS Group AG | | 71,779 | 2,193,193 |
| | | | 3,152,143 |
| Insurance - 0.4% | | | |
| Baloise Holding AG | | 1,021 | 184,613 |
| Swiss Life Holding AG | | 640 | 493,355 |
| Zurich Insurance Group AG | | 3,263 | 1,940,720 |
| | | | 2,618,688 |
TOTAL FINANCIALS | | | 5,770,831 |
| | | | |
| Health Care - 0.3% | | | |
| Health Care Equipment & Supplies - 0.1% | | | |
| Sonova Holding AG | | 1,102 | 359,785 |
| Straumann Holding AG | | 2,628 | 331,027 |
| | | | 690,812 |
| Life Sciences Tools & Services - 0.2% | | | |
| Lonza Group AG | | 1,610 | 950,513 |
| Pharmaceuticals - 0.0% | | | |
| Sandoz Group AG | | 9,604 | 393,345 |
TOTAL HEALTH CARE | | | 2,034,670 |
| | | | |
| Industrials - 0.6% | | | |
| Building Products - 0.1% | | | |
| Geberit AG | | 744 | 421,864 |
| Electrical Equipment - 0.3% | | | |
| ABB Ltd | | 35,627 | 1,923,805 |
| Machinery - 0.1% | | | |
| Schindler Holding AG | | 907 | 250,248 |
| VAT Group AG (c)(d) | | 601 | 227,010 |
| | | | 477,258 |
| Marine Transportation - 0.0% | | | |
| Kuehne + Nagel International AG | | 1,189 | 272,243 |
| Professional Services - 0.1% | | | |
| Adecco Group AG | | 3,704 | 91,498 |
| SGS SA | | 3,387 | 339,167 |
| | | | 430,665 |
TOTAL INDUSTRIALS | | | 3,525,835 |
| | | | |
| Information Technology - 0.0% | | | |
| Technology Hardware, Storage & Peripherals - 0.0% | | | |
| Logitech International SA | | 3,525 | 291,462 |
| Materials - 0.3% | | | |
| Chemicals - 0.3% | | | |
| DSM-Firmenich AG | | 4,615 | 466,503 |
| Givaudan SA | | 177 | 773,491 |
| Sika AG | | 3,573 | 852,543 |
| | | | 2,092,537 |
| TOTAL SWITZERLAND | | | 16,424,073 |
| TAIWAN - 6.0% | | | |
| Communication Services - 0.1% | | | |
| Diversified Telecommunication Services - 0.1% | | | |
| Chunghwa Telecom Co Ltd | | 84,000 | 316,092 |
| Entertainment - 0.0% | | | |
| International Games System Co Ltd | | 6,000 | 178,088 |
| Wireless Telecommunication Services - 0.0% | | | |
| Far EasTone Telecommunications Co Ltd | | 39,000 | 106,219 |
| Taiwan Mobile Co Ltd | | 40,000 | 138,353 |
| | | | 244,572 |
TOTAL COMMUNICATION SERVICES | | | 738,752 |
| | | | |
| Consumer Discretionary - 0.1% | | | |
| Automobile Components - 0.0% | | | |
| Cheng Shin Rubber Industry Co Ltd | | 44,000 | 65,691 |
| Tong Yang Industry Co Ltd | | 10,000 | 34,074 |
| | | | 99,765 |
| Automobiles - 0.0% | | | |
| Yulon Motor Co Ltd | | 13,560 | 20,941 |
| Broadline Retail - 0.0% | | | |
| momo.com Inc | | 1,801 | 18,293 |
| Poya International Co Ltd | | 1,060 | 16,049 |
| | | | 34,342 |
| Household Durables - 0.0% | | | |
| Nien Made Enterprise Co Ltd | | 4,000 | 44,636 |
| Leisure Products - 0.0% | | | |
| Giant Manufacturing Co Ltd | | 7,181 | 30,932 |
| Merida Industry Co Ltd | | 5,000 | 22,977 |
| | | | 53,909 |
| Specialty Retail - 0.0% | | | |
| Hotai Motor Co Ltd | | 8,120 | 153,089 |
| Textiles, Apparel & Luxury Goods - 0.1% | | | |
| Eclat Textile Co Ltd | | 4,000 | 61,956 |
| Feng TAY Enterprise Co Ltd | | 13,020 | 52,696 |
| Makalot Industrial Co Ltd | | 5,287 | 51,667 |
| Pou Chen Corp | | 54,000 | 60,655 |
| Ruentex Industries Ltd | | 19,561 | 43,123 |
| | | | 270,097 |
TOTAL CONSUMER DISCRETIONARY | | | 676,779 |
| | | | |
| Consumer Staples - 0.1% | | | |
| Consumer Staples Distribution & Retail - 0.0% | | | |
| President Chain Store Corp | | 13,000 | 104,196 |
| Food Products - 0.1% | | | |
| Great Wall Enterprise Co Ltd | | 15,945 | 25,025 |
| Lien Hwa Industrial Holdings Corp | | 24,887 | 38,447 |
| Uni-President Enterprises Corp | | 106,000 | 261,233 |
| | | | 324,705 |
TOTAL CONSUMER STAPLES | | | 428,901 |
| | | | |
| Energy - 0.0% | | | |
| Oil, Gas & Consumable Fuels - 0.0% | | | |
| Formosa Petrochemical Corp | | 39,000 | 41,118 |
| Financials - 0.7% | | | |
| Banks - 0.4% | | | |
| Chang Hwa Commercial Bank Ltd | | 168,328 | 91,530 |
| CTBC Financial Holding Co Ltd | | 435,000 | 517,644 |
| E.Sun Financial Holding Co Ltd | | 354,492 | 290,906 |
| Far Eastern International Bank | | 82,821 | 33,295 |
| First Financial Holding Co Ltd | | 251,077 | 207,244 |
| Hua Nan Financial Holdings Co Ltd | | 229,193 | 182,481 |
| King's Town Bank Co Ltd | | 20,000 | 30,873 |
| Mega Financial Holding Co Ltd | | 259,524 | 305,843 |
| Shanghai Commercial & Savings Bank Ltd/The | | 108,131 | 130,434 |
| SinoPac Financial Holdings Co Ltd | | 280,649 | 195,590 |
| Taichung Commercial Bank Co Ltd | | 81,994 | 46,840 |
| Taishin Financial Holding Co Ltd | | 285,623 | 151,370 |
| Taiwan Business Bank | | 146,305 | 66,171 |
| Taiwan Cooperative Financial Holding Co Ltd | | 242,547 | 179,536 |
| | | | 2,429,757 |
| Capital Markets - 0.0% | | | |
| IBF Financial Holdings Co Ltd | | 62,538 | 28,475 |
| Consumer Finance - 0.0% | | | |
| Yulon Finance Corp | | 7,233 | 22,905 |
| Financial Services - 0.1% | | | |
| Chailease Holding Co Ltd | | 37,073 | 127,517 |
| Yuanta Financial Holding Co Ltd | | 286,207 | 296,125 |
| | | | 423,642 |
| Insurance - 0.2% | | | |
| Cathay Financial Holding Co Ltd | | 214,897 | 446,788 |
| Fubon Financial Holding Co Ltd | | 197,186 | 542,057 |
| KGI Financial Holding Co Ltd | | 373,000 | 195,330 |
| Shin Kong Financial Holding Co Ltd (b) | | 383,453 | 137,795 |
| | | | 1,321,970 |
TOTAL FINANCIALS | | | 4,226,749 |
| | | | |
| Health Care - 0.0% | | | |
| Biotechnology - 0.0% | | | |
| PharmaEssentia Corp (b) | | 7,000 | 131,091 |
| Pharmaceuticals - 0.0% | | | |
| Oneness Biotech Co Ltd | | 6,878 | 18,296 |
TOTAL HEALTH CARE | | | 149,387 |
| | | | |
| Industrials - 0.2% | | | |
| Construction & Engineering - 0.0% | | | |
| United Integrated Services Co Ltd | | 4,000 | 58,665 |
| Electrical Equipment - 0.1% | | | |
| Bizlink Holding Inc | | 3,070 | 57,098 |
| Chung-Hsin Electric & Machinery Manufacturing Corp | | 9,000 | 42,144 |
| Fortune Electric Co Ltd | | 4,400 | 75,301 |
| Shihlin Electric & Engineering Corp | | 7,000 | 40,866 |
| Tatung Co Ltd (b) | | 40,000 | 58,320 |
| Teco Electric and Machinery Co Ltd | | 28,000 | 44,502 |
| Voltronic Power Technology Corp | | 2,000 | 113,167 |
| Walsin Lihwa Corp | | 69,308 | 50,022 |
| | | | 481,420 |
| Industrial Conglomerates - 0.0% | | | |
| Far Eastern New Century Corp | | 83,000 | 79,897 |
| Machinery - 0.0% | | | |
| Hiwin Technologies Corp | | 6,479 | 64,839 |
| Marine Transportation - 0.1% | | | |
| Evergreen Marine Corp Taiwan Ltd | | 22,670 | 155,450 |
| Wan Hai Lines Ltd | | 31,000 | 76,578 |
| Wisdom Marine Lines Co Ltd | | 9,000 | 18,504 |
| Yang Ming Marine Transport Corp | | 38,000 | 87,651 |
| | | | 338,183 |
| Passenger Airlines - 0.0% | | | |
| China Airlines Ltd | | 61,000 | 47,640 |
| Eva Airways Corp | | 58,562 | 79,105 |
| | | | 126,745 |
| Transportation Infrastructure - 0.0% | | | |
| Taiwan High Speed Rail Corp | | 48,000 | 40,667 |
TOTAL INDUSTRIALS | | | 1,190,416 |
| | | | |
| Information Technology - 4.7% | | | |
| Communications Equipment - 0.0% | | | |
| Accton Technology Corp | | 11,000 | 258,443 |
| Wistron NeWeb Corp | | 8,000 | 33,465 |
| | | | 291,908 |
| Electronic Equipment, Instruments & Components - 0.7% | | | |
| AUO Corp | | 161,600 | 72,072 |
| Chroma ATE Inc | | 9,000 | 111,938 |
| Compeq Manufacturing Co Ltd | | 25,000 | 53,299 |
| Delta Electronics Inc | | 43,000 | 562,624 |
| E Ink Holdings Inc | | 20,000 | 166,472 |
| Elite Material Co Ltd | | 7,000 | 131,421 |
| FLEXium Interconnect Inc | | 6,000 | 11,748 |
| Foxconn Technology Co Ltd | | 23,000 | 52,032 |
| Genius Electronic Optical Co Ltd | | 2,000 | 30,845 |
| Gold Circuit Electronics Ltd | | 7,000 | 51,360 |
| Hon Hai Precision Industry Co Ltd | | 268,600 | 1,501,077 |
| Innolux Corp | | 175,291 | 76,564 |
| Largan Precision Co Ltd | | 2,000 | 162,755 |
| Lotes Co Ltd | | 2,045 | 121,464 |
| Nan Ya Printed Circuit Board Corp | | 5,000 | 19,825 |
| Primax Electronics Ltd | | 11,000 | 25,453 |
| Simplo Technology Co Ltd | | 4,000 | 48,405 |
| Sinbon Electronics Co Ltd | | 5,000 | 39,861 |
| Synnex Technology International Corp | | 29,000 | 62,543 |
| Taiwan Union Technology Corp | | 6,000 | 31,060 |
| Tong Hsing Electronic Industries Ltd | | 3,640 | 15,389 |
| Tripod Technology Corp | | 10,000 | 60,060 |
| Unimicron Technology Corp | | 29,000 | 124,217 |
| Walsin Technology Corp | | 7,000 | 19,691 |
| Wpg Holding Co Ltd | | 36,920 | 76,849 |
| WT Microelectronics Co Ltd | | 14,000 | 46,851 |
| Yageo Corp | | 10,851 | 178,485 |
| Zhen Ding Technology Holding Ltd | | 14,000 | 51,111 |
| | | | 3,905,471 |
| Semiconductors & Semiconductor Equipment - 3.6% | | | |
| Alchip Technologies Ltd | | 2,000 | 199,187 |
| AP Memory Technology Corp | | 3,000 | 28,866 |
| ASE Technology Holding Co Ltd | | 76,000 | 373,051 |
| ASMedia Technology Inc | | 1,000 | 60,267 |
| ASPEED Technology Inc | | 1,000 | 101,170 |
| Chipbond Technology Corp | | 13,000 | 25,505 |
| Elan Microelectronics Corp | | 6,000 | 27,584 |
| eMemory Technology Inc | | 1,000 | 102,128 |
| Faraday Technology Corp | | 5,154 | 37,719 |
| Global Unichip Corp | | 2,000 | 82,545 |
| Globalwafers Co Ltd | | 6,000 | 69,701 |
| Jentech Precision Industrial Co Ltd | | 2,000 | 92,696 |
| King Yuan Electronics Co Ltd | | 24,000 | 81,233 |
| Kinsus Interconnect Technology Corp | | 6,000 | 18,431 |
| Macronix International Co Ltd | | 38,060 | 22,934 |
| MediaTek Inc | | 36,000 | 1,547,041 |
| Nanya Technology Corp (b) | | 25,000 | 22,238 |
| Novatek Microelectronics Corp | | 13,000 | 198,517 |
| Parade Technologies Ltd | | 2,000 | 46,687 |
| Phison Electronics Corp | | 4,000 | 65,031 |
| Powerchip Semiconductor Manufacturing Corp (b) | | 73,999 | 35,793 |
| Powertech Technology Inc | | 16,000 | 59,379 |
| Radiant Opto-Electronics Corp | | 10,000 | 59,812 |
| Realtek Semiconductor Corp | | 11,000 | 190,034 |
| Silicon Motion Technology Corp ADR | | 718 | 38,808 |
| Sino-American Silicon Products Inc | | 12,000 | 49,156 |
| Taiwan Semiconductor Manufacturing Co Ltd | | 538,000 | 17,478,364 |
| United Microelectronics Corp | | 256,000 | 333,338 |
| Vanguard International Semiconductor Corp | | 22,921 | 69,791 |
| Win Semiconductors Corp (b) | | 9,000 | 30,699 |
| Winbond Electronics Corp (b) | | 69,708 | 31,398 |
| | | | 21,579,103 |
| Technology Hardware, Storage & Peripherals - 0.4% | | | |
| Acer Inc | | 67,000 | 81,128 |
| Advantech Co Ltd | | 11,028 | 116,260 |
| Asia Vital Components Co Ltd | | 7,000 | 132,003 |
| Asustek Computer Inc | | 15,000 | 281,053 |
| AURAS Technology Co Ltd | | 2,000 | 40,756 |
| Catcher Technology Co Ltd | | 15,000 | 88,573 |
| Chicony Electronics Co Ltd | | 15,010 | 69,461 |
| Compal Electronics Inc | | 89,000 | 101,858 |
| Getac Holdings Corp | | 9,000 | 29,025 |
| Gigabyte Technology Co Ltd | | 12,000 | 99,249 |
| HTC Corp (b) | | 15,000 | 22,456 |
| Inventec Corp | | 69,000 | 105,105 |
| King Slide Works Co Ltd | | 2,000 | 94,124 |
| Lite-On Technology Corp | | 49,000 | 148,294 |
| Micro-Star International Co Ltd | | 16,000 | 89,328 |
| Pegatron Corp | | 45,000 | 125,787 |
| Qisda Corp | | 39,000 | 39,898 |
| Quanta Computer Inc | | 62,000 | 539,408 |
| Wistron Corp | | 64,058 | 202,299 |
| Wiwynn Corp | | 3,000 | 238,071 |
| | | | 2,644,136 |
TOTAL INFORMATION TECHNOLOGY | | | 28,420,618 |
| | | | |
| Materials - 0.1% | | | |
| Chemicals - 0.1% | | | |
| China Petrochemical Development Corp (b) | | 73,479 | 16,452 |
| Formosa Chemicals & Fibre Corp | | 90,000 | 74,837 |
| Formosa Plastics Corp | | 105,000 | 113,554 |
| Nan Ya Plastics Corp | | 124,000 | 112,900 |
| Taiwan Fertilizer Co Ltd | | 16,000 | 24,912 |
| | | | 342,655 |
| Construction Materials - 0.0% | | | |
| Asia Cement Corp | | 55,000 | 67,713 |
| TCC Group Holdings Co Ltd | | 152,162 | 146,946 |
| | | | 214,659 |
| Metals & Mining - 0.0% | | | |
| China Steel Corp | | 280,000 | 167,625 |
| TA Chen Stainless Pipe | | 42,315 | 39,007 |
| Tung Ho Steel Enterprise Corp | | 10,370 | 21,468 |
| | | | 228,100 |
| Paper & Forest Products - 0.0% | | | |
| YFY Inc | | 29,000 | 26,254 |
TOTAL MATERIALS | | | 811,668 |
| | | | |
| Real Estate - 0.0% | | | |
| Real Estate Management & Development - 0.0% | | | |
| Highwealth Construction Corp | | 39,296 | 51,970 |
| Ruentex Development Co Ltd | | 39,371 | 51,427 |
| | | | 103,397 |
| TOTAL TAIWAN | | | 36,787,785 |
| THAILAND - 0.5% | | | |
| Communication Services - 0.1% | | | |
| Diversified Telecommunication Services - 0.0% | | | |
| True Corp PCL (b) | | 57,977 | 18,183 |
| True Corp PCL depository receipt (b) | | 317,103 | 102,216 |
| | | | 120,399 |
| Media - 0.0% | | | |
| VGI PCL warrants (b) | | 9,600 | 28 |
| VGI PCL warrants 5/23/2027 (b) | | 9,690 | 28 |
| | | | 56 |
| Wireless Telecommunication Services - 0.1% | | | |
| Advanced Info Service PCL | | 3,200 | 26,661 |
| Advanced Info Service PCL depository receipt | | 20,700 | 172,466 |
| Intouch Holdings PCL depository receipt | | 20,100 | 56,632 |
| | | | 255,759 |
TOTAL COMMUNICATION SERVICES | | | 376,214 |
| | | | |
| Consumer Discretionary - 0.0% | | | |
| Automobile Components - 0.0% | | | |
| Sri Trang Agro-Industry PCL depository receipt | | 17,200 | 9,019 |
| Broadline Retail - 0.0% | | | |
| Central Retail Corp Pcl | | 6,541 | 6,431 |
| Central Retail Corp Pcl depository receipt | | 57,300 | 56,344 |
| | | | 62,775 |
| Hotels, Restaurants & Leisure - 0.0% | | | |
| Asset World Corp PCL depository receipt | | 199,200 | 20,348 |
| Central Plaza Hotel PCL depository receipt | | 13,300 | 13,328 |
| Minor International PCL | | 4,710 | 3,551 |
| Minor International PCL depository receipt | | 57,438 | 43,307 |
| | | | 80,534 |
| Specialty Retail - 0.0% | | | |
| Home Product Center PCL | | 9,000 | 2,448 |
| Home Product Center PCL depository receipt | | 77,100 | 20,973 |
| PTT Oil & Retail Business PCL depository receipt | | 67,500 | 26,091 |
| Siam Global House PCL depository receipt | | 51,677 | 20,784 |
| | | | 70,296 |
TOTAL CONSUMER DISCRETIONARY | | | 222,624 |
| | | | |
| Consumer Staples - 0.1% | | | |
| Beverages - 0.0% | | | |
| Carabao Group PCL | | 1,900 | 4,332 |
| Carabao Group PCL depository receipt | | 9,300 | 21,205 |
| Osotspa PCL depository receipt | | 32,100 | 19,391 |
| Thai Beverage PCL | | 191,900 | 76,583 |
| | | | 121,511 |
| Consumer Staples Distribution & Retail - 0.1% | | | |
| Berli Jucker PCL depository receipt | | 20,400 | 13,773 |
| CP ALL PCL | | 10,000 | 16,188 |
| CP ALL PCL depository receipt | | 87,500 | 141,650 |
| | | | 171,611 |
| Food Products - 0.0% | | | |
| Charoen Pokphand Foods PCL depository receipt | | 76,400 | 50,662 |
| Thai Union Group PCL depository receipt | | 44,800 | 16,920 |
| | | | 67,582 |
TOTAL CONSUMER STAPLES | | | 360,704 |
| | | | |
| Energy - 0.1% | | | |
| Oil, Gas & Consumable Fuels - 0.1% | | | |
| Banpu PCL depository receipt | | 97,200 | 16,893 |
| IRPC PCL depository receipt | | 210,800 | 7,544 |
| PTT Exploration & Production PCL | | 9,700 | 33,857 |
| PTT Exploration & Production PCL depository receipt | | 22,000 | 76,789 |
| PTT PCL | | 22,700 | 21,016 |
| PTT PCL depository receipt | | 168,100 | 155,631 |
| Thai Oil PCL | | 3,254 | 2,690 |
| Thai Oil PCL depository receipt | | 16,422 | 13,577 |
| | | | 327,997 |
| Financials - 0.1% | | | |
| Banks - 0.1% | | | |
| Bangkok Bank PCL depository receipt | | 12,900 | 56,611 |
| Kasikornbank PCL depository receipt | | 25,900 | 117,063 |
| Kiatnakin Phatra Bank PCL | | 1,900 | 2,902 |
| Kiatnakin Phatra Bank PCL depository receipt | | 5,600 | 8,555 |
| Kiatnakin Phatra Bank PCL warrants 3/17/2026 (b) | | 158 | 5 |
| Kiatnakin Phatra Bank PCL warrants 3/17/2026 (b) | | 342 | 13 |
| Krung Thai Bank PCL | | 9,800 | 5,987 |
| Krung Thai Bank PCL depository receipt | | 66,800 | 40,813 |
| SCB X PCL | | 6,050 | 20,682 |
| SCB X PCL depository receipt | | 13,000 | 44,442 |
| Thanachart Capital PCL depository receipt | | 10,800 | 15,885 |
| Tisco Financial Group PCL | | 2,000 | 5,734 |
| Tisco Financial Group PCL depository receipt | | 7,000 | 20,068 |
| TMBThanachart Bank PCL | | 220,872 | 11,953 |
| TMBThanachart Bank PCL depository receipt | | 856,456 | 46,347 |
| | | | 397,060 |
| Consumer Finance - 0.0% | | | |
| Bangkok Commercial Asset Management PCL depository receipt | | 29,600 | 5,241 |
| Krungthai Card PCL depository receipt | | 23,600 | 34,288 |
| Muangthai Capital PCL depository receipt | | 15,000 | 20,883 |
| Ngern Tid Lor PCL depository receipt | | 36,375 | 17,951 |
| Srisawad Corp PCL depository receipt | | 15,840 | 19,168 |
| | | | 97,531 |
| Insurance - 0.0% | | | |
| Thai Life Insurance PCL | | 42,000 | 13,663 |
| Thai Life Insurance PCL depository receipt | | 24,100 | 7,840 |
| | | | 21,503 |
TOTAL FINANCIALS | | | 516,094 |
| | | | |
| Health Care - 0.0% | | | |
| Health Care Providers & Services - 0.0% | | | |
| Bangkok Chain Hospital PCL depository receipt | | 24,400 | 10,829 |
| Bangkok Dusit Medical Services PCL depository receipt | | 106,300 | 75,766 |
| Bumrungrad Hospital Pcl depository receipt | | 8,500 | 49,277 |
| Chularat Hospital PCL depository receipt | | 114,000 | 8,088 |
| | | | 143,960 |
| Industrials - 0.0% | | | |
| Ground Transportation - 0.0% | | | |
| BTS Group Holdings PCL depository receipt (b) | | 155,344 | 27,508 |
| Transportation Infrastructure - 0.0% | | | |
| Airports of Thailand PCL | | 14,300 | 24,704 |
| Airports of Thailand PCL depository receipt | | 80,600 | 139,238 |
| Bangkok Expressway & Metro PCL | | 53,200 | 10,975 |
| Bangkok Expressway & Metro PCL depository receipt | | 129,900 | 26,797 |
| | | | 201,714 |
TOTAL INDUSTRIALS | | | 229,222 |
| | | | |
| Information Technology - 0.1% | | | |
| Electronic Equipment, Instruments & Components - 0.1% | | | |
| Delta Electronics Thailand PCL depository receipt | | 102,800 | 452,399 |
| Hana Microelectronics PCL depository receipt | | 17,300 | 12,364 |
| KCE Electronics PCL depository receipt | | 11,100 | 7,850 |
| | | | 472,613 |
| Materials - 0.0% | | | |
| Chemicals - 0.0% | | | |
| Indorama Ventures PCL depository receipt | | 44,500 | 32,058 |
| PTT Global Chemical PCL depository receipt | | 36,500 | 25,828 |
| | | | 57,886 |
| Construction Materials - 0.0% | | | |
| Siam Cement PCL/The | | 500 | 2,439 |
| Siam Cement PCL/The depository receipt | | 6,100 | 29,755 |
| | | | 32,194 |
| Containers & Packaging - 0.0% | | | |
| SCG Packaging PCL depository receipt | | 27,200 | 15,445 |
TOTAL MATERIALS | | | 105,525 |
| | | | |
| Real Estate - 0.0% | | | |
| Real Estate Management & Development - 0.0% | | | |
| Central Pattana PCL depository receipt | | 30,000 | 49,708 |
| Land & Houses PCL depository receipt | | 83,200 | 12,222 |
| WHA Corp PCL depository receipt | | 167,700 | 26,835 |
| | | | 88,765 |
| Utilities - 0.0% | | | |
| Independent Power and Renewable Electricity Producers - 0.0% | | | |
| B Grimm Power PCL | | 2,800 | 1,581 |
| B Grimm Power PCL depository receipt | | 25,400 | 14,339 |
| Electricity Generating PCL depository receipt | | 4,900 | 16,663 |
| Energy Absolute PCL | | 1,100 | 126 |
| Energy Absolute PCL depository receipt | | 45,200 | 5,166 |
| Energy Absolute PCL rights 1/23/2025 (b) | | 45,200 | 3,046 |
| Energy Absolute PCL rights 1/23/2025 (b) | | 1,100 | 74 |
| Global Power Synergy PCL | | 1,646 | 1,822 |
| Global Power Synergy PCL depository receipt | | 14,400 | 15,938 |
| Gulf Energy Development PCL | | 20,100 | 34,696 |
| Gulf Energy Development PCL depository receipt | | 108,800 | 187,807 |
| Ratch Group PCL depository receipt | | 11,200 | 9,766 |
| | | | 291,024 |
| TOTAL THAILAND | | | 3,134,742 |
| TURKEY - 0.3% | | | |
| Communication Services - 0.0% | | | |
| Wireless Telecommunication Services - 0.0% | | | |
| Turkcell Iletisim Hizmetleri AS | | 26,459 | 69,417 |
| Consumer Discretionary - 0.0% | | | |
| Automobile Components - 0.0% | | | |
| EGE Endustri VE Ticaret AS | | 23 | 6,376 |
| Automobiles - 0.0% | | | |
| Ford Otomotiv Sanayi AS | | 1,560 | 41,325 |
| Tofas Turk Otomobil Fabrikasi AS | | 2,646 | 15,343 |
| | | | 56,668 |
| Household Durables - 0.0% | | | |
| Arcelik AS (b) | | 4,591 | 18,431 |
| Specialty Retail - 0.0% | | | |
| Dogan Sirketler Grubu Holding AS | | 22,565 | 9,244 |
| Textiles, Apparel & Luxury Goods - 0.0% | | | |
| Aksa (Akrilik Kimya Sanayi) | | 34,284 | 12,542 |
| Mavi Giyim Sanayi Ve Ticaret AS Class B (c)(d) | | 6,447 | 15,894 |
| | | | 28,436 |
TOTAL CONSUMER DISCRETIONARY | | | 119,155 |
| | | | |
| Consumer Staples - 0.0% | | | |
| Beverages - 0.0% | | | |
| Anadolu Efes Biracilik Ve Malt Sanayii AS | | 4,253 | 23,038 |
| Coca-Cola Icecek AS | | 18,722 | 31,731 |
| | | | 54,769 |
| Consumer Staples Distribution & Retail - 0.0% | | | |
| BIM Birlesik Magazalar AS | | 9,883 | 147,666 |
| Migros Ticaret AS | | 1,953 | 30,202 |
| Sok Marketler Ticaret AS | | 6,783 | 7,901 |
| | | | 185,769 |
| Food Products - 0.0% | | | |
| Kayseri Seker Fabrikasi AS (b) | | 5,492 | 3,073 |
| Ulker Biskuvi Sanayi AS (b) | | 4,184 | 13,922 |
| | | | 16,995 |
TOTAL CONSUMER STAPLES | | | 257,533 |
| | | | |
| Energy - 0.0% | | | |
| Oil, Gas & Consumable Fuels - 0.0% | | | |
| Turkiye Petrol Rafinerileri AS | | 20,256 | 81,261 |
| Financials - 0.1% | | | |
| Banks - 0.1% | | | |
| Akbank TAS | | 68,314 | 125,248 |
| Haci Omer Sabanci Holding AS | | 30,067 | 81,603 |
| Turkiye Is Bankasi AS Class C | | 193,575 | 74,099 |
| Yapi ve Kredi Bankasi AS | | 72,893 | 63,101 |
| | | | 344,051 |
| Capital Markets - 0.0% | | | |
| Is Yatirim Menkul Degerler AS | | 12,166 | 16,853 |
| Financial Services - 0.0% | | | |
| Borusan Yatirim ve Pazarlama AS | | 169 | 9,742 |
| Turkiye Sinai Kalkinma Bankasi AS (b) | | 24,772 | 8,558 |
| | | | 18,300 |
| Insurance - 0.0% | | | |
| Anadolu Anonim Turk Sigorta Sirketi (b) | | 3,624 | 10,656 |
| Turkiye Sigorta AS | | 19,211 | 9,955 |
| | | | 20,611 |
TOTAL FINANCIALS | | | 399,815 |
| | | | |
| Health Care - 0.0% | | | |
| Health Care Providers & Services - 0.0% | | | |
| MLP Saglik Hizmetleri AS (b)(c)(d) | | 1,373 | 14,828 |
| Industrials - 0.2% | | | |
| Aerospace & Defense - 0.0% | | | |
| Aselsan Elektronik Sanayi Ve Ticaret AS | | 26,488 | 54,292 |
| Building Products - 0.0% | | | |
| Kaleseramik Canakkale Kalebodur Seramik Sanayi AS | | 4,205 | 4,199 |
| Construction & Engineering - 0.0% | | | |
| Enka Insaat ve Sanayi AS | | 40,281 | 55,346 |
| Kontrolmatik Enerji Ve Muhendislik AS | | 7,031 | 7,668 |
| Tekfen Holding AS (b) | | 4,598 | 9,366 |
| | | | 72,380 |
| Electrical Equipment - 0.0% | | | |
| Astor Transformator Enerji Turizm Insaat Ve Petrol Sanayi Ticaret AS | | 5,210 | 16,777 |
| Europower Enerji VE Otomasyon Teknolojileri Sanayi Ticaret AS | | 5,028 | 4,716 |
| Sarkuysan Elektrolitik Bakir Sanayi ve Ticaret AS | | 10,746 | 5,739 |
| | | | 27,232 |
| Industrial Conglomerates - 0.1% | | | |
| AG Anadolu Grubu Holding AS Class A | | 2,676 | 23,680 |
| Alarko Holding AS | | 3,964 | 10,310 |
| Bera Holding AS (b) | | 14,379 | 6,069 |
| KOC Holding AS | | 28,103 | 141,900 |
| Turkiye Sise ve Cam Fabrikalari AS | | 29,468 | 34,590 |
| | | | 216,549 |
| Machinery - 0.0% | | | |
| Otokar Otomotiv Ve Savunma Sanayi A.S. | | 775 | 10,616 |
| Turk Traktor ve Ziraat Makineleri AS | | 577 | 12,234 |
| | | | 22,850 |
| Passenger Airlines - 0.1% | | | |
| Pegasus Hava Tasimaciligi AS | | 4,618 | 27,809 |
| Turk Hava Yollari AO (b) | | 15,672 | 124,502 |
| | | | 152,311 |
| Transportation Infrastructure - 0.0% | | | |
| TAV Havalimanlari Holding AS (b) | | 4,578 | 35,463 |
TOTAL INDUSTRIALS | | | 585,276 |
| | | | |
| Information Technology - 0.0% | | | |
| Software - 0.0% | | | |
| MIA Teknoloji AS (b) | | 6,142 | 7,317 |
| Technology Hardware, Storage & Peripherals - 0.0% | | | |
| Reeder Teknoloji Sanayi VE Ticaret AS | | 4,993 | 2,026 |
TOTAL INFORMATION TECHNOLOGY | | | 9,343 |
| | | | |
| Materials - 0.0% | | | |
| Chemicals - 0.0% | | | |
| Hektas Ticaret TAS (b) | | 75,506 | 8,261 |
| Petkim Petrokimya Holding AS (b) | | 24,767 | 12,674 |
| Politeknik Metal Sanayi ve Ticaret AS (b) | | 15 | 2,970 |
| Sasa Polyester Sanayi AS | | 236,320 | 27,192 |
| | | | 51,097 |
| Construction Materials - 0.0% | | | |
| Nuh Cimento Sanayi AS | | 1,475 | 12,510 |
| Oyak Cimento Fabrikalari AS | | 28,333 | 19,224 |
| | | | 31,734 |
| Metals & Mining - 0.0% | | | |
| Borusan Birlesik Boru Fabrikalari Sanayi ve Ticaret AS (b) | | 995 | 12,124 |
| Eregli Demir ve Celik Fabrikalari TAS | | 78,138 | 53,902 |
| Kardemir Karabuk Demir Celik Sanayi ve Ticaret AS Class D | | 14,750 | 11,301 |
| Koza Altin Isletmeleri AS (b) | | 21,586 | 13,780 |
| Koza Anadolu Metal Madencilik Isletmeleri AS (b) | | 4,018 | 8,434 |
| | | | 99,541 |
TOTAL MATERIALS | | | 182,372 |
| | | | |
| Real Estate - 0.0% | | | |
| Residential REITs - 0.0% | | | |
| Emlak Konut Gayrimenkul Yatirim Ortakligi AS (b) | | 38,961 | 15,002 |
| Utilities - 0.0% | | | |
| Electric Utilities - 0.0% | | | |
| Enerjisa Enerji AS (c)(d) | | 5,058 | 8,422 |
| Independent Power and Renewable Electricity Producers - 0.0% | | | |
| Aksa Enerji Uretim AS | | 6,380 | 7,071 |
TOTAL UTILITIES | | | 15,493 |
| | | | |
| TOTAL TURKEY | | | 1,749,495 |
| UNITED ARAB EMIRATES - 0.4% | | | |
| Communication Services - 0.1% | | | |
| Diversified Telecommunication Services - 0.1% | | | |
| Emirates Telecommunications Group Co PJSC | | 77,541 | 344,528 |
| Consumer Discretionary - 0.0% | | | |
| Hotels, Restaurants & Leisure - 0.0% | | | |
| Americana Restaurants International PLC - Foreign Co | | 64,067 | 38,547 |
| Specialty Retail - 0.0% | | | |
| Abu Dhabi National Oil Co for Distribution PJSC | | 63,690 | 61,036 |
TOTAL CONSUMER DISCRETIONARY | | | 99,583 |
| | | | |
| Financials - 0.2% | | | |
| Banks - 0.2% | | | |
| Abu Dhabi Commercial Bank PJSC | | 65,230 | 185,050 |
| Abu Dhabi Islamic Bank PJSC | | 32,481 | 122,211 |
| Dubai Islamic Bank PJSC | | 64,397 | 124,304 |
| Emirates NBD Bank PJSC | | 54,929 | 320,776 |
| First Abu Dhabi Bank PJSC | | 98,532 | 368,585 |
| | | | 1,120,926 |
| Industrials - 0.0% | | | |
| Industrial Conglomerates - 0.0% | | | |
| Modon Holding PSC (b) | | 73,138 | 66,507 |
| Multiply Group PJSC (b) | | 73,653 | 41,508 |
| | | | 108,015 |
| Passenger Airlines - 0.0% | | | |
| Air Arabia PJSC | | 50,683 | 42,500 |
| Transportation Infrastructure - 0.0% | | | |
| Salik Co PJSC | | 42,475 | 62,445 |
TOTAL INDUSTRIALS | | | 212,960 |
| | | | |
| Real Estate - 0.1% | | | |
| Real Estate Management & Development - 0.1% | | | |
| Aldar Properties PJSC | | 83,762 | 175,138 |
| Emaar Development PJSC | | 18,119 | 67,582 |
| Emaar Properties PJSC | | 137,713 | 481,783 |
| | | | 724,503 |
| Utilities - 0.0% | | | |
| Multi-Utilities - 0.0% | | | |
| Dubai Electricity & Water Authority PJSC | | 201,036 | 155,441 |
| TOTAL UNITED ARAB EMIRATES | | | 2,657,941 |
| UNITED KINGDOM - 7.1% | | | |
| Communication Services - 0.3% | | | |
| Diversified Telecommunication Services - 0.0% | | | |
| BT Group PLC | | 126,401 | 227,947 |
| Interactive Media & Services - 0.1% | | | |
| Auto Trader Group PLC (c)(d) | | 19,911 | 197,017 |
| Rightmove PLC | | 17,594 | 141,362 |
| | | | 338,379 |
| Media - 0.1% | | | |
| Informa PLC | | 29,618 | 296,037 |
| ITV PLC | | 79,566 | 73,311 |
| WPP PLC | | 24,053 | 247,935 |
| | | | 617,283 |
| Wireless Telecommunication Services - 0.1% | | | |
| Vodafone Group PLC | | 500,770 | 427,197 |
TOTAL COMMUNICATION SERVICES | | | 1,610,806 |
| | | | |
| Consumer Discretionary - 0.6% | | | |
| Broadline Retail - 0.1% | | | |
| B&M European Value Retail SA | | 21,194 | 97,375 |
| Next PLC | | 2,609 | 310,225 |
| | | | 407,600 |
| Distributors - 0.0% | | | |
| Inchcape PLC | | 9,260 | 89,205 |
| Diversified Consumer Services - 0.0% | | | |
| Pearson PLC | | 14,792 | 237,196 |
| Hotels, Restaurants & Leisure - 0.4% | | | |
| Compass Group PLC | | 37,871 | 1,260,099 |
| Entain PLC | | 14,251 | 122,602 |
| InterContinental Hotels Group PLC | | 3,560 | 442,948 |
| Whitbread PLC | | 3,988 | 147,081 |
| | | | 1,972,730 |
| Household Durables - 0.1% | | | |
| Barratt Redrow PLC | | 30,690 | 169,090 |
| Bellway PLC | | 2,671 | 83,328 |
| Berkeley Group Holdings PLC | | 2,282 | 111,057 |
| Persimmon PLC | | 7,146 | 107,174 |
| Taylor Wimpey PLC | | 78,887 | 120,066 |
| | | | 590,715 |
| Leisure Products - 0.0% | | | |
| Games Workshop Group PLC | | 740 | 123,305 |
| Specialty Retail - 0.0% | | | |
| JD Sports Fashion PLC | | 54,994 | 66,024 |
| Kingfisher PLC | | 40,715 | 126,557 |
| | | | 192,581 |
| Textiles, Apparel & Luxury Goods - 0.0% | | | |
| Burberry Group PLC | | 8,015 | 98,016 |
TOTAL CONSUMER DISCRETIONARY | | | 3,711,348 |
| | | | |
| Consumer Staples - 1.6% | | | |
| Beverages - 0.3% | | | |
| Coca-Cola Europacific Partners PLC | | 4,615 | 354,478 |
| Diageo PLC | | 49,561 | 1,574,941 |
| | | | 1,929,419 |
| Consumer Staples Distribution & Retail - 0.2% | | | |
| J Sainsbury PLC | | 37,556 | 128,637 |
| Marks & Spencer Group PLC | | 45,566 | 213,395 |
| Ocado Group PLC (b) | | 13,693 | 51,820 |
| Tesco PLC | | 152,796 | 702,763 |
| | | | 1,096,615 |
| Food Products - 0.0% | | | |
| Associated British Foods PLC | | 7,146 | 182,768 |
| Tate & Lyle PLC | | 8,671 | 70,505 |
| | | | 253,273 |
| Household Products - 0.2% | | | |
| Reckitt Benckiser Group PLC | | 15,534 | 940,285 |
| Personal Care Products - 0.5% | | | |
| Unilever PLC | | 55,567 | 3,157,352 |
| Tobacco - 0.4% | | | |
| British American Tobacco PLC | | 44,470 | 1,604,688 |
| Imperial Brands PLC | | 17,646 | 564,299 |
| | | | 2,168,987 |
TOTAL CONSUMER STAPLES | | | 9,545,931 |
| | | | |
| Energy - 0.0% | | | |
| Energy Equipment & Services - 0.0% | | | |
| Subsea 7 SA | | 5,066 | 80,151 |
| Financials - 2.0% | | | |
| Banks - 1.2% | | | |
| Barclays PLC | | 327,381 | 1,095,154 |
| HSBC Holdings PLC | | 411,452 | 4,041,735 |
| Lloyds Banking Group PLC | | 1,380,404 | 942,718 |
| NatWest Group PLC | | 149,890 | 751,137 |
| Standard Chartered PLC | | 46,336 | 570,452 |
| | | | 7,401,196 |
| Capital Markets - 0.5% | | | |
| 3i Group PLC | | 21,693 | 965,626 |
| abrdn plc | | 41,570 | 73,457 |
| Hargreaves Lansdown PLC | | 7,786 | 107,025 |
| IG Group Holdings PLC | | 8,210 | 101,805 |
| Intermediate Capital Group PLC | | 6,495 | 167,988 |
| London Stock Exchange Group PLC | | 10,302 | 1,454,178 |
| Man Group Plc/Jersey | | 26,533 | 71,216 |
| Schroders PLC | | 20,708 | 83,891 |
| St James's Place PLC | | 12,256 | 133,180 |
| | | | 3,158,366 |
| Financial Services - 0.1% | | | |
| M&G PLC | | 48,713 | 120,656 |
| Wise PLC Class A (b) | | 14,851 | 198,191 |
| | | | 318,847 |
| Insurance - 0.2% | | | |
| Admiral Group PLC | | 6,017 | 199,164 |
| Aviva PLC | | 59,685 | 350,286 |
| Beazley PLC | | 14,439 | 147,592 |
| Hiscox Ltd | | 7,574 | 102,688 |
| Legal & General Group PLC | | 132,344 | 380,736 |
| Phoenix Group Holdings PLC | | 17,959 | 114,663 |
| | | | 1,295,129 |
TOTAL FINANCIALS | | | 12,173,538 |
| | | | |
| Health Care - 0.8% | | | |
| Health Care Equipment & Supplies - 0.1% | | | |
| ConvaTec Group PLC (c)(d) | | 36,030 | 99,774 |
| Smith & Nephew PLC | | 19,472 | 241,305 |
| | | | 341,079 |
| Pharmaceuticals - 0.7% | | | |
| Astrazeneca PLC | | 34,554 | 4,505,140 |
TOTAL HEALTH CARE | | | 4,846,219 |
| | | | |
| Industrials - 1.2% | | | |
| Aerospace & Defense - 0.5% | | | |
| BAE Systems PLC | | 67,499 | 968,292 |
| Melrose Industries PLC | | 27,493 | 190,610 |
| Rolls-Royce Holdings PLC (b) | | 189,511 | 1,343,898 |
| | | | 2,502,800 |
| Commercial Services & Supplies - 0.0% | | | |
| Rentokil Initial PLC | | 56,262 | 280,830 |
| Industrial Conglomerates - 0.1% | | | |
| CK Hutchison Holdings Ltd | | 60,000 | 318,987 |
| DCC PLC | | 2,188 | 140,793 |
| Smiths Group PLC | | 7,675 | 165,167 |
| | | | 624,947 |
| Machinery - 0.1% | | | |
| IMI PLC | | 5,801 | 132,246 |
| Spirax Group PLC | | 1,638 | 140,569 |
| Weir Group PLC/The | | 5,733 | 156,749 |
| | | | 429,564 |
| Passenger Airlines - 0.0% | | | |
| International Consolidated Airlines Group SA | | 54,322 | 204,641 |
| Professional Services - 0.3% | | | |
| Intertek Group PLC | | 3,593 | 212,669 |
| RELX PLC | | 41,598 | 1,884,763 |
| | | | 2,097,432 |
| Trading Companies & Distributors - 0.2% | | | |
| Ashtead Group PLC | | 9,748 | 605,905 |
| Bunzl PLC | | 7,541 | 311,161 |
| Diploma PLC | | 2,985 | 158,819 |
| Howden Joinery Group PLC | | 12,239 | 121,580 |
| RS GROUP PLC | | 10,673 | 91,059 |
| | | | 1,288,524 |
TOTAL INDUSTRIALS | | | 7,428,738 |
| | | | |
| Information Technology - 0.1% | | | |
| Electronic Equipment, Instruments & Components - 0.0% | | | |
| Halma PLC | | 8,415 | 283,279 |
| Spectris PLC | | 2,223 | 69,797 |
| | | | 353,076 |
| Software - 0.1% | | | |
| Sage Group PLC/The | | 22,346 | 356,121 |
TOTAL INFORMATION TECHNOLOGY | | | 709,197 |
| | | | |
| Materials - 0.0% | | | |
| Chemicals - 0.0% | | | |
| Croda International PLC | | 3,074 | 130,022 |
| Johnson Matthey PLC | | 4,027 | 67,555 |
| | | | 197,577 |
| Containers & Packaging - 0.0% | | | |
| DS Smith PLC | | 30,752 | 208,661 |
TOTAL MATERIALS | | | 406,238 |
| | | | |
| Real Estate - 0.1% | | | |
| Diversified REITs - 0.0% | | | |
| British Land Co PLC/The | | 20,381 | 91,956 |
| Land Securities Group PLC | | 16,616 | 121,481 |
| | | | 213,437 |
| Industrial REITs - 0.1% | | | |
| Segro PLC | | 30,161 | 264,763 |
| Tritax Big Box REIT PLC | | 54,624 | 90,745 |
| | | | 355,508 |
| Office REITs - 0.0% | | | |
| Derwent London PLC | | 2,548 | 62,489 |
| Residential REITs - 0.0% | | | |
| UNITE Group PLC/The | | 9,171 | 92,596 |
TOTAL REAL ESTATE | | | 724,030 |
| | | | |
| Utilities - 0.4% | | | |
| Electric Utilities - 0.1% | | | |
| SSE PLC | | 24,376 | 488,605 |
| Multi-Utilities - 0.2% | | | |
| Centrica PLC | | 116,445 | 194,759 |
| National Grid PLC | | 108,965 | 1,294,532 |
| | | | 1,489,291 |
| Water Utilities - 0.1% | | | |
| Severn Trent PLC | | 5,901 | 185,277 |
| United Utilities Group PLC | | 15,238 | 200,452 |
| | | | 385,729 |
TOTAL UTILITIES | | | 2,363,625 |
| | | | |
| TOTAL UNITED KINGDOM | | | 43,599,821 |
| UNITED STATES - 6.4% | | | |
| Communication Services - 0.2% | | | |
| Entertainment - 0.2% | | | |
| Spotify Technology SA (b) | | 3,270 | 1,462,933 |
| Consumer Discretionary - 0.1% | | | |
| Automobiles - 0.1% | | | |
| Stellantis NV (Italy) | | 49,185 | 641,439 |
| Consumer Staples - 0.9% | | | |
| Food Products - 0.8% | | | |
| JBS S/A | | 15,500 | 91,075 |
| Nestle SA | | 58,410 | 4,792,144 |
| | | | 4,883,219 |
| Personal Care Products - 0.1% | | | |
| Haleon PLC | | 156,647 | 738,615 |
TOTAL CONSUMER STAPLES | | | 5,621,834 |
| | | | |
| Energy - 1.0% | | | |
| Energy Equipment & Services - 0.0% | | | |
| Tenaris SA | | 9,866 | 186,255 |
| Oil, Gas & Consumable Fuels - 1.0% | | | |
| BP PLC | | 366,312 | 1,810,669 |
| DHT Holdings Inc | | 3,168 | 29,430 |
| Shell PLC | | 140,260 | 4,372,045 |
| | | | 6,212,144 |
TOTAL ENERGY | | | 6,398,399 |
| | | | |
| Financials - 0.2% | | | |
| Insurance - 0.2% | | | |
| Swiss Re AG | | 6,510 | 941,118 |
| Health Care - 2.8% | | | |
| Biotechnology - 0.3% | | | |
| CSL Ltd | | 10,771 | 1,877,212 |
| Legend Biotech Corp ADR (b) | | 1,761 | 57,303 |
| | | | 1,934,515 |
| Health Care Equipment & Supplies - 0.2% | | | |
| Alcon AG | | 11,133 | 943,340 |
| Inmode Ltd (b) | | 1,703 | 28,440 |
| | | | 971,780 |
| Life Sciences Tools & Services - 0.1% | | | |
| ICON PLC (b) | | 1,845 | 386,915 |
| QIAGEN NV | | 4,977 | 221,915 |
| | | | 608,830 |
| Pharmaceuticals - 2.2% | | | |
| Bausch Health Cos Inc (b) | | 6,633 | 53,461 |
| GSK PLC | | 92,399 | 1,558,520 |
| Novartis AG | | 43,938 | 4,277,685 |
| Roche Holding AG | | 15,633 | 4,371,092 |
| Roche Holding AG | | 669 | 199,473 |
| Sanofi SA | | 24,562 | 2,387,692 |
| | | | 12,847,923 |
TOTAL HEALTH CARE | | | 16,363,048 |
| | | | |
| Industrials - 0.9% | | | |
| Building Products - 0.0% | | | |
| Reliance Worldwide Corp Ltd | | 17,746 | 55,139 |
| Commercial Services & Supplies - 0.2% | | | |
| GFL Environmental Inc Subordinate Voting Shares | | 5,122 | 228,333 |
| Waste Connections Inc | | 5,754 | 987,121 |
| | | | 1,215,454 |
| Construction & Engineering - 0.1% | | | |
| Ferrovial SE | | 11,133 | 468,204 |
| Electrical Equipment - 0.5% | | | |
| Schneider Electric SE | | 11,992 | 2,985,481 |
| Professional Services - 0.1% | | | |
| Experian PLC | | 20,493 | 880,787 |
TOTAL INDUSTRIALS | | | 5,605,065 |
| | | | |
| Information Technology - 0.1% | | | |
| Software - 0.1% | | | |
| CyberArk Software Ltd (b) | | 959 | 319,491 |
| Monday.com Ltd (b) | | 844 | 198,711 |
| Sinch AB (b)(c)(d) | | 15,066 | 28,229 |
| | | | 546,431 |
| Materials - 0.2% | | | |
| Construction Materials - 0.2% | | | |
| Holcim AG | | 11,746 | 1,130,963 |
| James Hardie Industries PLC depository receipt (b) | | 9,613 | 296,280 |
| | | | 1,427,243 |
| TOTAL UNITED STATES | | | 39,007,510 |
| ZAMBIA - 0.0% | | | |
| Materials - 0.0% | | | |
| Metals & Mining - 0.0% | | | |
| First Quantum Minerals Ltd (b) | | 15,056 | 194,085 |
| TOTAL COMMON STOCKS (Cost $531,761,538) | | | 595,372,234 |
| | | | |
| Non-Convertible Preferred Stocks - 0.3% |
| | | Shares | Value ($) |
| COLOMBIA - 0.0% | | | |
| Financials - 0.0% | | | |
| Banks - 0.0% | | | |
| Bancolombia SA | | 10,206 | 81,499 |
| GERMANY - 0.2% | | | |
| Consumer Discretionary - 0.1% | | | |
| Automobiles - 0.1% | | | |
| Dr Ing hc F Porsche AG (c)(d) | | 2,025 | 122,713 |
| Porsche Automobil Holding SE | | 3,359 | 126,569 |
| Volkswagen AG | | 4,086 | 376,996 |
| | | | 626,278 |
| Consumer Staples - 0.1% | | | |
| Household Products - 0.1% | | | |
| Henkel AG & Co KGaA | | 3,548 | 311,289 |
| Health Care - 0.0% | | | |
| Life Sciences Tools & Services - 0.0% | | | |
| Sartorius AG | | 562 | 125,278 |
| TOTAL GERMANY | | | 1,062,845 |
| KOREA (SOUTH) - 0.1% | | | |
| Consumer Discretionary - 0.0% | | | |
| Automobiles - 0.0% | | | |
| Hyundai Motor Co | | 495 | 50,594 |
| Hyundai Motor Co Series 2 | | 813 | 84,962 |
| | | | 135,556 |
| Information Technology - 0.1% | | | |
| Technology Hardware, Storage & Peripherals - 0.1% | | | |
| Samsung Electronics Co Ltd | | 18,719 | 553,697 |
| Materials - 0.0% | | | |
| Chemicals - 0.0% | | | |
| LG Chem Ltd | | 162 | 17,249 |
| TOTAL KOREA (SOUTH) | | | 706,502 |
| RUSSIA - 0.0% | | | |
| Energy - 0.0% | | | |
| Oil, Gas & Consumable Fuels - 0.0% | | | |
| Surgutneftegaz Pjsc (b)(f) | | 105,000 | 0 |
| Transneft PJSC (b)(f) | | 2,400 | 0 |
| | | | 0 |
| Financials - 0.0% | | | |
| Banks - 0.0% | | | |
| Sberbank of Russia PJSC (b)(f) | | 15,430 | 0 |
| TOTAL RUSSIA | | | 0 |
| TOTAL NON-CONVERTIBLE PREFERRED STOCKS (Cost $2,780,087) | | | 1,850,846 |
| | | | |
| U.S. Treasury Obligations - 0.0% |
| | | Yield (%) (g) | Principal Amount (a) | Value ($) |
US Treasury Bills 0% 2/20/2025 (h) (Cost $313,068) | | 4.46 | 315,000 | 313,209 |
| | | | | |
| Money Market Funds - 3.2% |
| | | Yield (%) | Shares | Value ($) |
| Fidelity Cash Central Fund (i) | | 4.36 | 13,766,076 | 13,768,830 |
| Fidelity Securities Lending Cash Central Fund (i)(j) | | 4.35 | 5,554,400 | 5,554,955 |
| TOTAL MONEY MARKET FUNDS (Cost $19,323,785) | | | | 19,323,785 |
| | | | | |
| TOTAL INVESTMENT IN SECURITIES - 100.7% (Cost $554,178,478) | 616,860,074 |
NET OTHER ASSETS (LIABILITIES) - (0.7)% | (4,064,727) |
| NET ASSETS - 100.0% | 612,795,347 |
| | |
| Futures Contracts |
| | Number of contracts | Expiration Date | Notional Amount ($) | Value ($) | Unrealized Appreciation/ (Depreciation) ($) |
| Purchased | | | | | |
| | | | | | |
| Equity Contracts | | | | | |
| ICE MSCI EAFE Index Contracts (United States) | 85 | Mar 2025 | 9,636,875 | (240,112) | (240,112) |
| ICE MSCI Emerging Markets Index Contracts (United States) | 86 | Mar 2025 | 4,617,340 | (138,653) | (138,653) |
| TME S&P/TSX 60 Index Contracts (Canada) | 6 | Mar 2025 | 1,239,779 | (27,910) | (27,910) |
| | | | | | |
| TOTAL FUTURES CONTRACTS | | | | | (406,675) |
| The notional amount of futures purchased as a percentage of Net Assets is 2.6% |
Legend
| (a) | Amount is stated in United States dollars unless otherwise noted. |
| (c) | Security is exempt from registration under Regulation S of the Securities Act of 1933 and may be resold to qualified foreign investors outside of the United States. At the end of the period, the value of securities amounted to $12,691,432 or 2.1% of net assets. |
| (d) | Security exempt from registration under Rule 144A of the Securities Act of 1933. These securities may be resold in transactions exempt from registration, normally to qualified institutional buyers. At the end of the period, the value of these securities amounted to $12,357,478 or 2.0% of net assets. |
| (e) | Security or a portion of the security is on loan at period end. |
| (g) | Yield represents either the annualized yield at the date of purchase, or the stated coupon rate, or, for floating and adjustable rate securities, the rate at period end. |
| (h) | Security or a portion of the security was pledged to cover margin requirements for futures contracts. At period end, the value of securities pledged amounted to $313,209. |
| (i) | Affiliated fund that is generally available only to investment companies and other accounts managed by Fidelity Investments. The rate quoted is the annualized seven-day yield of the fund at period end. A complete unaudited listing of the fund's holdings as of its most recent quarter end is available upon request. In addition, each Fidelity Central Fund's financial statements, which are not covered by the Fund's Report of Independent Registered Public Accounting Firm, are available on the SEC's website or upon request. |
| (j) | Investment made with cash collateral received from securities on loan. |
Affiliated Central Funds
Fiscal year to date information regarding the Fund's investments in Fidelity Central Funds, including the ownership percentage, is presented below.
| Affiliate | Value, beginning of period ($) | Purchases ($) | Sales Proceeds ($) | Dividend Income ($) | Realized Gain (loss) ($) | Change in Unrealized appreciation (depreciation) ($) | Value, end of period ($) | Shares, end of period | % ownership, end of period |
| Fidelity Cash Central Fund | 18,828,567 | 100,486,127 | 105,545,492 | 748,711 | (372) | - | 13,768,830 | 13,766,076 | 0.0% |
| Fidelity Securities Lending Cash Central Fund | 3,602,272 | 58,970,292 | 57,017,609 | 46,583 | - | - | 5,554,955 | 5,554,400 | 0.0% |
| Total | 22,430,839 | 159,456,419 | 162,563,101 | 795,294 | (372) | - | 19,323,785 | 19,320,476 | |
| | | | | | | | | | |
Amounts in the dividend income column in the above table include any capital gain distributions from underlying funds, which are presented in the corresponding line item in the Statement of Operations, if applicable.
Amounts in the dividend income column for Fidelity Securities Lending Cash Central Fund represents the income earned on investing cash collateral, less rebates paid to borrowers and any lending agent fees associated with the loan, plus any premium payments received for lending certain types of securities.
Amounts included in the purchases and sales proceeds columns may include in-kind transactions, if applicable.
Investment Valuation
The following is a summary of the inputs used, as of December 31, 2024, involving the Fund's assets and liabilities carried at fair value. The inputs or methodology used for valuing securities may not be an indication of the risk associated with investing in those securities. For more information on valuation inputs, and their aggregation into the levels used below, please refer to the Investment Valuation section in the accompanying Notes to Financial Statements.
| Valuation Inputs at Reporting Date: |
| Description | Total ($) | Level 1 ($) | Level 2 ($) | Level 3 ($) |
Investments in Securities: | | | | |
|
| Common Stocks | | | | |
Communication Services | 34,351,238 | 11,487,578 | 22,863,660 | - |
Consumer Discretionary | 66,728,497 | 24,236,899 | 42,491,598 | - |
Consumer Staples | 39,680,668 | 14,620,470 | 25,060,198 | - |
Energy | 28,918,755 | 18,708,712 | 10,210,043 | - |
Financials | 139,011,395 | 74,788,649 | 64,222,746 | - |
Health Care | 49,470,802 | 14,049,185 | 35,421,617 | - |
Industrials | 88,264,358 | 35,481,737 | 52,782,621 | - |
Information Technology | 80,020,687 | 15,540,143 | 64,480,544 | - |
Materials | 37,548,219 | 17,504,105 | 20,044,114 | - |
Real Estate | 12,948,836 | 10,311,378 | 2,637,458 | - |
Utilities | 18,428,779 | 9,469,929 | 8,958,850 | - |
|
| Non-Convertible Preferred Stocks | | | | |
Consumer Discretionary | 761,834 | - | 761,834 | - |
Consumer Staples | 311,289 | 311,289 | - | - |
Energy | - | - | - | - |
Financials | 81,499 | 81,499 | - | - |
Health Care | 125,278 | 125,278 | - | - |
Information Technology | 553,697 | - | 553,697 | - |
Materials | 17,249 | - | 17,249 | - |
|
| U.S. Treasury Obligations | 313,209 | - | 313,209 | - |
|
| Money Market Funds | 19,323,785 | 19,323,785 | - | - |
| Total Investments in Securities: | 616,860,074 | 266,040,636 | 350,819,438 | - |
Derivative Instruments: Liabilities | | | | |
Futures Contracts | (406,675) | (406,675) | - | - |
| Total Liabilities | (406,675) | (406,675) | - | - |
| Total Derivative Instruments: | (406,675) | (406,675) | - | - |
Value of Derivative Instruments
The following table is a summary of the Fund's value of derivative instruments by primary risk exposure as of December 31, 2024. For additional information on derivative instruments, please refer to the Derivative Instruments section in the accompanying Notes to Financial Statements.
Primary Risk Exposure / Derivative Type | Value |
| Asset ($) | Liability ($) |
| Equity Risk | | |
Futures Contracts (a) | 0 | (406,675) |
| Total Equity Risk | 0 | (406,675) |
| Total Value of Derivatives | 0 | (406,675) |
(a)Reflects gross cumulative appreciation (depreciation) on futures contracts as presented in the Schedule of Investments. In the Statement of Assets and Liabilities, the period end daily variation margin is included in receivable or payable for daily variation margin on futures contracts, and the net cumulative appreciation (depreciation) is included in Total accumulated earnings (loss).
VIP International Index Portfolio
Financial Statements
| Statement of Assets and Liabilities |
As of December 31, 2024 |
| Assets | | | | |
| Investment in securities, at value (including securities loaned of $5,273,193) - See accompanying schedule: | | | | |
Unaffiliated issuers (cost $534,854,693) | $ | 597,536,289 | | |
Fidelity Central Funds (cost $19,323,785) | | 19,323,785 | | |
| | | | | |
| | | | | |
| Total Investment in Securities (cost $554,178,478) | | | $ | 616,860,074 |
| Segregated cash with brokers for derivative instruments | | | | 183,397 |
| Foreign currency held at value (cost $475,641) | | | | 470,711 |
| Receivable for fund shares sold | | | | 436,319 |
| Dividends receivable | | | | 620,013 |
| Reclaims receivable | | | | 1,097,631 |
| Distributions receivable from Fidelity Central Funds | | | | 58,067 |
| Other receivables | | | | 16 |
Total assets | | | | 619,726,228 |
| Liabilities | | | | |
| Payable for fund shares redeemed | $ | 330,381 | | |
| Accrued management fee | | 82,869 | | |
| Distribution and service plan fees payable | | 26,015 | | |
| Payable for daily variation margin on futures contracts | | 18,022 | | |
| Deferred taxes | | 918,525 | | |
| Other payables and accrued expenses | | 83 | | |
| Collateral on securities loaned | | 5,554,986 | | |
| Total liabilities | | | | 6,930,881 |
| Net Assets | | | $ | 612,795,347 |
| Net Assets consist of: | | | | |
| Paid in capital | | | $ | 584,633,070 |
| Total accumulated earnings (loss) | | | | 28,162,277 |
| Net Assets | | | $ | 612,795,347 |
| | | | | |
| Net Asset Value and Maximum Offering Price | | | | |
| Initial Class : | | | | |
Net Asset Value, offering price and redemption price per share ($481,217,548 ÷ 44,436,439 shares) | | | $ | 10.83 |
| Service Class : | | | | |
Net Asset Value, offering price and redemption price per share ($12,380,466 ÷ 1,143,035 shares) | | | $ | 10.83 |
| Service Class 2 : | | | | |
Net Asset Value, offering price and redemption price per share ($119,197,333 ÷ 11,068,371 shares) | | | $ | 10.77 |
| Statement of Operations |
| Year ended December 31, 2024 |
| Investment Income | | | | |
| Dividends | | | $ | 17,758,435 |
| Interest | | | | 37,926 |
| Income from Fidelity Central Funds (including $46,583 from security lending) | | | | 795,294 |
| Income before foreign taxes withheld | | | $ | 18,591,655 |
| Less foreign taxes withheld | | | | (1,647,950) |
| Total income | | | | 16,943,705 |
| Expenses | | | | |
| Management fee | $ | 829,632 | | |
| Transfer agent fees | | 138,438 | | |
| Distribution and service plan fees | | 275,482 | | |
| Independent trustees' fees and expenses | | 2,513 | | |
| Miscellaneous | | 4,215 | | |
| Total expenses before reductions | | 1,250,280 | | |
| Expense reductions | | (17,781) | | |
| Total expenses after reductions | | | | 1,232,499 |
| Net Investment income (loss) | | | | 15,711,206 |
| Realized and Unrealized Gain (Loss) | | | | |
| Net realized gain (loss) on: | | | | |
| Investment Securities: | | | | |
| Unaffiliated issuers (net of foreign taxes of $42,399) | | (5,877,358) | | |
| Fidelity Central Funds | | (372) | | |
| Foreign currency transactions | | (126,417) | | |
| Futures contracts | | 1,960,531 | | |
| Total net realized gain (loss) | | | | (4,043,616) |
| Change in net unrealized appreciation (depreciation) on: | | | | |
| Investment Securities: | | | | |
| Unaffiliated issuers (net of increase in deferred foreign taxes of $428,194) | | 16,828,026 | | |
| Assets and liabilities in foreign currencies | | (98,736) | | |
| Futures contracts | | (1,203,066) | | |
| Total change in net unrealized appreciation (depreciation) | | | | 15,526,224 |
| Net gain (loss) | | | | 11,482,608 |
| Net increase (decrease) in net assets resulting from operations | | | $ | 27,193,814 |
| Statement of Changes in Net Assets |
| |
| | Year ended December 31, 2024 | | Year ended December 31, 2023 |
| Increase (Decrease) in Net Assets | | | | |
| Operations | | | | |
| Net investment income (loss) | $ | 15,711,206 | $ | 12,605,760 |
| Net realized gain (loss) | | (4,043,616) | | (6,009,232) |
| Change in net unrealized appreciation (depreciation) | | 15,526,224 | | 59,534,615 |
| Net increase (decrease) in net assets resulting from operations | | 27,193,814 | | 66,131,143 |
| Distributions to shareholders | | (17,618,671) | | (13,591,191) |
| | | | | |
| Share transactions - net increase (decrease) | | 73,883,025 | | 105,237,570 |
| Total increase (decrease) in net assets | | 83,458,168 | | 157,777,522 |
| | | | | |
| Net Assets | | | | |
| Beginning of period | | 529,337,179 | | 371,559,657 |
| End of period | $ | 612,795,347 | $ | 529,337,179 |
| | | | | |
| | | | | |
Financial Highlights
VIP International Index Portfolio Initial Class |
| |
| Years ended December 31, | | 2024 | | 2023 | | 2022 | | 2021 | | 2020 |
Selected Per-Share Data | | | | | | | | | | |
| Net asset value, beginning of period | $ | 10.61 | $ | 9.40 | $ | 11.45 | $ | 10.95 | $ | 10.03 |
| Income from Investment Operations | | | | | | | | | | |
Net investment income (loss) A,B | | .30 | | .29 | | .29 | | .28 | | .20 |
| Net realized and unrealized gain (loss) | | .25 | | 1.21 | | (2.12) | | .56 | | .87 |
| Total from investment operations | | .55 | | 1.50 | | (1.83) | | .84 | | 1.07 |
| Distributions from net investment income | | (.33) | | (.29) | | (.22) | | (.30) | | (.15) |
| Distributions from net realized gain | | - | | - | | - | | (.04) | | - C |
| Total distributions | | (.33) | | (.29) | | (.22) | | (.34) | | (.15) |
| Net asset value, end of period | $ | 10.83 | $ | 10.61 | $ | 9.40 | $ | 11.45 | $ | 10.95 |
Total Return D,E | | | | 16.16% | | (16.02)% | | 7.72% | | 10.69% |
Ratios to Average Net Assets B,F,G | | | | | | | | | | |
| Expenses before reductions | | .17% | | .17% | | .17% | | .17% | | .17% |
| Expenses net of fee waivers, if any | | | | .17% | | .17% | | .17% | | .17% |
| Expenses net of all reductions | | .16% | | .17% | | .17% | | .17% | | .17% |
| Net investment income (loss) | | 2.70% | | 2.85% | | 2.96% | | 2.38% | | 2.08% |
| Supplemental Data | | | | | | | | | | |
| Net assets, end of period (000 omitted) | $ | 481,218 | $ | 432,410 | $ | 313,947 | $ | 346,107 | $ | 213,113 |
Portfolio turnover rate H | | | | 6% | | 20% | | 18% | | 10% |
ACalculated based on average shares outstanding during the period.
BNet investment income (loss) is affected by the timing of the declaration of dividends by any underlying mutual funds or exchange-traded funds (ETFs). Net investment income (loss) of any mutual funds or ETFs is not included in the Fund's net investment income (loss) ratio.
CAmount represents less than $.005 per share.
DTotal returns do not reflect charges attributable to your insurance company's separate account. Inclusion of these charges would reduce the total returns shown.
ETotal returns would have been lower if certain expenses had not been reduced during the applicable periods shown.
FFees and expenses of any underlying mutual funds or exchange-traded funds (ETFs) are not included in the Fund's expense ratio. The Fund indirectly bears its proportionate share of these expenses. For additional expense information related to investments in Fidelity Central Funds, please refer to the "Investments in Fidelity Central Funds" note found in the Notes to Financial Statements section of the most recent Annual or Semi-Annual report.
GExpense ratios reflect operating expenses of the class. Expenses before reductions do not reflect amounts reimbursed, waived, or reduced through arrangements with the investment adviser, brokerage services, or other offset arrangements, if applicable, and do not represent the amount paid by the class during periods when reimbursements, waivers or reductions occur.
HAmount does not include the portfolio activity of any underlying mutual funds or exchange-traded funds (ETFs), derivatives or securities that mature within one year from acquisition.
VIP International Index Portfolio Service Class |
| |
| Years ended December 31, | | 2024 | | 2023 | | 2022 | | 2021 | | 2020 |
Selected Per-Share Data | | | | | | | | | | |
| Net asset value, beginning of period | $ | 10.61 | $ | 9.40 | $ | 11.44 | $ | 10.94 | $ | 10.02 |
| Income from Investment Operations | | | | | | | | | | |
Net investment income (loss) A,B | | .29 | | .28 | | .30 | | .27 | | .18 |
| Net realized and unrealized gain (loss) | | .25 | | 1.21 | | (2.14) | | .56 | | .88 |
| Total from investment operations | | .54 | | 1.49 | | (1.84) | | .83 | | 1.06 |
| Distributions from net investment income | | (.32) | | (.28) | | (.20) | | (.29) | | (.14) |
| Distributions from net realized gain | | - | | - | | - | | (.04) | | - C |
| Total distributions | | (.32) | | (.28) | | (.20) | | (.33) | | (.14) |
| Net asset value, end of period | $ | 10.83 | $ | 10.61 | $ | 9.40 | $ | 11.44 | $ | 10.94 |
Total Return D,E | | | | 16.04% | | (16.13)% | | 7.65% | | 10.60% |
Ratios to Average Net Assets B,F,G | | | | | | | | | | |
| Expenses before reductions | | .26% | | .27% | | .27% | | .27% | | .27% |
| Expenses net of fee waivers, if any | | | | .27% | | .27% | | .27% | | .27% |
| Expenses net of all reductions | | .26% | | .27% | | .27% | | .27% | | .27% |
| Net investment income (loss) | | 2.61% | | 2.75% | | 2.86% | | 2.28% | | 1.98% |
| Supplemental Data | | | | | | | | | | |
| Net assets, end of period (000 omitted) | $ | 12,380 | $ | 11,438 | $ | 8,884 | $ | 54,755 | $ | 5,832 |
Portfolio turnover rate H | | | | 6% | | 20% | | 18% | | 10% |
ACalculated based on average shares outstanding during the period.
BNet investment income (loss) is affected by the timing of the declaration of dividends by any underlying mutual funds or exchange-traded funds (ETFs). Net investment income (loss) of any mutual funds or ETFs is not included in the Fund's net investment income (loss) ratio.
CAmount represents less than $.005 per share.
DTotal returns do not reflect charges attributable to your insurance company's separate account. Inclusion of these charges would reduce the total returns shown.
ETotal returns would have been lower if certain expenses had not been reduced during the applicable periods shown.
FFees and expenses of any underlying mutual funds or exchange-traded funds (ETFs) are not included in the Fund's expense ratio. The Fund indirectly bears its proportionate share of these expenses. For additional expense information related to investments in Fidelity Central Funds, please refer to the "Investments in Fidelity Central Funds" note found in the Notes to Financial Statements section of the most recent Annual or Semi-Annual report.
GExpense ratios reflect operating expenses of the class. Expenses before reductions do not reflect amounts reimbursed, waived, or reduced through arrangements with the investment adviser, brokerage services, or other offset arrangements, if applicable, and do not represent the amount paid by the class during periods when reimbursements, waivers or reductions occur.
HAmount does not include the portfolio activity of any underlying mutual funds or exchange-traded funds (ETFs), derivatives or securities that mature within one year from acquisition.
VIP International Index Portfolio Service Class 2 |
| |
| Years ended December 31, | | 2024 | | 2023 | | 2022 | | 2021 | | 2020 |
Selected Per-Share Data | | | | | | | | | | |
| Net asset value, beginning of period | $ | 10.56 | $ | 9.36 | $ | 11.41 | $ | 10.92 | $ | 10.02 |
| Income from Investment Operations | | | | | | | | | | |
Net investment income (loss) A,B | | .27 | | .26 | | .26 | | .25 | | .17 |
| Net realized and unrealized gain (loss) | | .25 | | 1.21 | | (2.10) | | .56 | | .87 |
| Total from investment operations | | .52 | | 1.47 | | (1.84) | | .81 | | 1.04 |
| Distributions from net investment income | | (.31) | | (.27) | | (.21) | | (.28) | | (.13) |
| Distributions from net realized gain | | - | | - | | - | | (.04) | | - C |
| Total distributions | | (.31) | | (.27) | | (.21) | | (.32) | | (.14) D |
| Net asset value, end of period | $ | 10.77 | $ | 10.56 | $ | 9.36 | $ | 11.41 | $ | 10.92 |
Total Return E,F | | | | 15.88% | | (16.21)% | | 7.48% | | 10.34% |
Ratios to Average Net Assets B,G,H | | | | | | | | | | |
| Expenses before reductions | | .41% | | .42% | | .42% | | .42% | | .42% |
| Expenses net of fee waivers, if any | | | | .42% | | .42% | | .42% | | .42% |
| Expenses net of all reductions | | .41% | | .42% | | .42% | | .42% | | .42% |
| Net investment income (loss) | | 2.46% | | 2.61% | | 2.71% | | 2.13% | | 1.83% |
| Supplemental Data | | | | | | | | | | |
| Net assets, end of period (000 omitted) | $ | 119,197 | $ | 85,489 | $ | 48,729 | $ | 39,406 | $ | 15,151 |
Portfolio turnover rate I | | | | 6% | | 20% | | 18% | | 10% |
ACalculated based on average shares outstanding during the period.
BNet investment income (loss) is affected by the timing of the declaration of dividends by any underlying mutual funds or exchange-traded funds (ETFs). Net investment income (loss) of any mutual funds or ETFs is not included in the Fund's net investment income (loss) ratio.
CAmount represents less than $.005 per share.
DTotal distributions per share do not sum due to rounding.
ETotal returns do not reflect charges attributable to your insurance company's separate account. Inclusion of these charges would reduce the total returns shown.
FTotal returns would have been lower if certain expenses had not been reduced during the applicable periods shown.
GFees and expenses of any underlying mutual funds or exchange-traded funds (ETFs) are not included in the Fund's expense ratio. The Fund indirectly bears its proportionate share of these expenses. For additional expense information related to investments in Fidelity Central Funds, please refer to the "Investments in Fidelity Central Funds" note found in the Notes to Financial Statements section of the most recent Annual or Semi-Annual report.
HExpense ratios reflect operating expenses of the class. Expenses before reductions do not reflect amounts reimbursed, waived, or reduced through arrangements with the investment adviser, brokerage services, or other offset arrangements, if applicable, and do not represent the amount paid by the class during periods when reimbursements, waivers or reductions occur.
IAmount does not include the portfolio activity of any underlying mutual funds or exchange-traded funds (ETFs), derivatives or securities that mature within one year from acquisition.
Notes to Financial Statements
For the period ended December 31, 2024
1. Organization.
VIP Total Market Index Portfolio, VIP Extended Market Index Portfolio and VIP International Index Portfolio (the Funds) are funds of Variable Insurance Products Fund II (the Trust). Each Fund is authorized to issue an unlimited number of shares. The Trust is registered under the Investment Company Act of 1940, as amended (the 1940 Act), as an open-end management investment company organized as a Massachusetts business trust. Investments in emerging markets, if applicable, can be subject to social, economic, regulatory, and political uncertainties and can be extremely volatile. Shares of each Fund may only be purchased by insurance companies for the purpose of funding variable annuity or variable life insurance contracts. Each Fund offers the following classes of shares: Initial Class, Service Class and Service Class 2 shares. All classes have equal rights and voting privileges, except for matters affecting a single class.
2. Investments in Fidelity Central Funds.
Funds may invest in Fidelity Central Funds, which are open-end investment companies generally available only to other investment companies and accounts managed by the investment adviser and its affiliates. The Schedule of Investments lists any Fidelity Central Funds held as an investment as of period end, but does not include the underlying holdings of each Fidelity Central Fund. An investing fund indirectly bears its proportionate share of the expenses of the underlying Fidelity Central Funds.
Based on its investment objective, each Fidelity Central Fund may invest or participate in various investment vehicles or strategies that are similar to those of the investing fund. These strategies are consistent with the investment objectives of the investing fund and may involve certain economic risks which may cause a decline in value of each of the Fidelity Central Funds and thus a decline in the value of the investing fund.
| Fidelity Central Fund | Investment Manager | Investment Objective | Investment Practices | Expense RatioA |
| Fidelity Money Market Central Funds | Fidelity Management & Research Company LLC (FMR) | Each fund seeks to obtain a high level of current income consistent with the preservation of capital and liquidity. | Short-term Investments | Less than .005% |
A Expenses expressed as a percentage of average net assets and are as of each underlying Central Fund's most recent annual or semi-annual shareholder report.
A complete unaudited list of holdings for each Fidelity Central Fund is available upon request or at the Securities and Exchange Commission website at www.sec.gov. In addition, the financial statements of the Fidelity Central Funds which contain the significant accounting policies (including investment valuation policies) of those funds, and are not covered by the Report of Independent Registered Public Accounting Firm, are available on the Securities and Exchange Commission website or upon request.
3. Significant Accounting Policies.
Each Fund is an investment company and applies the accounting and reporting guidance of the Financial Accounting Standards Board (FASB) Accounting Standards Codification Topic 946 Financial Services - Investment Companies. The financial statements have been prepared in conformity with accounting principles generally accepted in the United States of America (GAAP), which require management to make certain estimates and assumptions at the date of the financial statements. Actual results could differ from those estimates. Each Fund operates as a single operating segment. Each Fund's income, expenses, assets, and performance are regularly monitored and assessed as a whole by the investment adviser and other individuals responsible for oversight functions of the Trust, using the information presented in the financial statements and financial highlights. Subsequent events, if any, through the date that the financial statements were issued have been evaluated in the preparation of the financial statements. Each Fund's Schedule of Investments lists any underlying mutual funds or exchange-traded funds (ETFs) but does not include the underlying holdings of these funds. The following summarizes the significant accounting policies of each Fund:
Investment Valuation. Investments are valued as of 4:00 p.m. Eastern time on the last calendar day of the period. The Board of Trustees (the Board) has designated each Fund's investment adviser as the valuation designee responsible for the fair valuation function and performing fair value determinations as needed. The investment adviser has established a Fair Value Committee (the Committee) to carry out the day-to-day fair valuation responsibilities and has adopted policies and procedures to govern the fair valuation process and the activities of the Committee. In accordance with these fair valuation policies and procedures, which have been approved by the Board, each Fund attempts to obtain prices from one or more third party pricing services or brokers to value its investments. When current market prices, quotations or currency exchange rates are not readily available or reliable, investments will be fair valued in good faith by the Committee, in accordance with the policies and procedures. Factors used in determining fair value vary by investment type and may include market or investment specific events, transaction data, estimated cash flows, and market observations of comparable investments. The frequency that the fair valuation procedures are used cannot be predicted and they may be utilized to a significant extent. The Committee manages each Fund's fair valuation practices and maintains the fair valuation policies and procedures. Each Fund's investment adviser reports to the Board information regarding the fair valuation process and related material matters.
Each Fund categorizes the inputs to valuation techniques used to value its investments into a disclosure hierarchy consisting of three levels as shown below:
Level 1 - unadjusted quoted prices in active markets for identical investments
Level 2 - other significant observable inputs (including quoted prices for similar investments, interest rates, prepayment speeds, etc.)
Level 3 - unobservable inputs (including the Fund's own assumptions based on the best information available)
Valuation techniques used to value each Fund's investments by major category are as follows:
Equity securities, including restricted securities, for which market quotations are readily available, are valued at the last reported sale price or official closing price as reported by a third party pricing service on the primary market or exchange on which they are traded and are categorized as Level 1 in the hierarchy. In the event there were no sales during the day or closing prices are not available, securities are valued at the last quoted bid price or may be valued using the last available price and are generally categorized as Level 2 in the hierarchy. For foreign equity securities, when market or security specific events arise, comparisons to the valuation of American Depositary Receipts (ADRs), futures contracts, Exchange-Traded Funds (ETFs) and certain indexes as well as quoted prices for similar securities may be used and would be categorized as Level 2 in the hierarchy. For equity securities, including restricted securities, where observable inputs are limited, assumptions about market activity and risk are used and these securities may be categorized as Level 3 in the hierarchy.
Debt securities, including restricted securities, are valued based on evaluated prices received from third party pricing services or from brokers who make markets in such securities. U.S. government and government agency obligations are valued by pricing services who utilize matrix pricing which considers yield or price of bonds of comparable quality, coupon, maturity and type or by broker-supplied prices. When independent prices are unavailable or unreliable, debt securities may be valued utilizing pricing methodologies which consider similar factors that would be used by third party pricing services. Debt securities are generally categorized as Level 2 in the hierarchy but may be Level 3 depending on the circumstances.
Futures contracts are valued at the settlement price established each day by the board of trade or exchange on which they are traded and are categorized as Level 1 in the hierarchy. Investments in open-end mutual funds, including the Fidelity Central Funds, are valued at their closing net asset value (NAV) each business day and are categorized as Level 1 in the hierarchy.
Changes in valuation techniques may result in transfers in or out of an assigned level within the disclosure hierarchy. The aggregate value of investments by input level as of December 31, 2024 is included at the end of each Fund's Schedule of Investments.
Foreign Currency. Certain Funds may use foreign currency contracts to facilitate transactions in foreign-denominated securities. Gains and losses from these transactions may arise from changes in the value of the foreign currency or if the counterparties do not perform under the contracts' terms.
Foreign-denominated assets, including investment securities, and liabilities are translated into U.S. dollars at the exchange rates at period end. Purchases and sales of investment securities, income and dividends received, and expenses denominated in foreign currencies are translated into U.S. dollars at the exchange rate in effect on the transaction date.
The effects of exchange rate fluctuations on investments are included with the net realized and unrealized gain (loss) on investment securities. Other foreign currency transactions resulting in realized and unrealized gain (loss) are disclosed separately.
Investment Transactions and Income. For financial reporting purposes, the Funds' investment holdings and NAV include trades executed through the end of the last business day of the period. The NAV per share for processing shareholder transactions is calculated as of the close of business of the New York Stock Exchange (NYSE), normally 4:00 p.m. Eastern time and includes trades executed through the end of the prior business day. Gains and losses on securities sold are determined on the basis of identified cost and for certain Funds include proceeds received from litigation. Commissions paid to certain brokers with whom the investment adviser, or its affiliates, places trades on behalf of a fund include an amount in addition to trade execution, which may be rebated back to a fund. Any such rebates are included in net realized gain (loss) on investments in the Statement of Operations. Dividend income is recorded on the ex-dividend date, except for certain dividends from foreign securities where the ex-dividend date may have passed, which are recorded as soon as the Funds are informed of the ex-dividend date. Non-cash dividends included in dividend income, if any, are recorded at the fair market value of the securities received. Income and capital gain distributions from Fidelity Central Funds, if any, are recorded on the ex-dividend date. Certain distributions received by the Funds represent a return of capital or capital gain. The Funds determine the components of these distributions subsequent to the ex-dividend date, based upon receipt of tax filings or other correspondence relating to the underlying investment. These distributions are recorded as a reduction of cost of investments and/or as a realized gain. Interest income is accrued as earned and includes coupon interest and amortization of premium and accretion of discount on debt securities as applicable. Investment income is recorded net of foreign taxes withheld where recovery of such taxes is uncertain. Funds may file withholding tax reclaims in certain jurisdictions to recover a portion of amounts previously withheld. Any withholding tax reclaims income is included in the Statement of Operations in dividends or foreign taxes withheld, as applicable. Any receivables for withholding tax reclaims are included in the Statement of Assets and Liabilities in dividends receivable or reclaims receivable, as applicable.
Class Allocations and Expenses. Investment income, realized and unrealized capital gains and losses, common expenses of a fund, and certain fund-level expense reductions, if any, are allocated daily on a pro-rata basis to each class based on the relative net assets of each class to the total net assets of a fund. Each class differs with respect to transfer agent and distribution and service plan fees incurred, as applicable. Certain expense reductions may also differ by class, if applicable. For the reporting period, the allocated portion of income and expenses to each class as a percent of its average net assets may vary due to the timing of recording these transactions in relation to fluctuating net assets of the classes. Expenses directly attributable to a fund are charged to that fund. Expenses attributable to more than one fund are allocated among the respective funds on the basis of relative net assets or other appropriate methods. Expenses included in the accompanying financial statements reflect the expenses of that fund and do not include any expenses associated with any underlying mutual funds or exchange-traded funds (ETFs). Although not included in a fund's expenses, a fund indirectly bears its proportionate share of these expenses through the net asset value of each underlying mutual fund or exchange-traded fund (ETF). Expense estimates are accrued in the period to which they relate and adjustments are made when actual amounts are known.
Income Tax Information and Distributions to Shareholders. Each year, each Fund intends to qualify as a regulated investment company under Subchapter M of the Internal Revenue Code, including distributing substantially all of its taxable income and realized gains. As a result, no provision for U.S. Federal income taxes is required. As of December 31, 2024, each Fund did not have any unrecognized tax benefits in the financial statements; nor is each Fund aware of any tax positions for which it is reasonably possible that the total amounts of unrecognized tax benefits will significantly change in the next twelve months. Each Fund files a U.S. federal tax return, in addition to state and local tax returns as required. Each Fund's federal income tax returns are subject to examination by the Internal Revenue Service (IRS) for a period of three fiscal years after they are filed. State and local tax returns may be subject to examination for an additional fiscal year depending on the jurisdiction. Foreign taxes are provided for based on each Fund's understanding of the tax rules and rates that exist in the foreign markets in which it invests. VIP International Index Portfolio is subject to a tax imposed on capital gains by certain countries in which it invests. An estimated deferred tax liability for net unrealized appreciation on the applicable securities is included in Deferred taxes on the Statement of Assets and Liabilities.
Distributions are declared and recorded on the ex-dividend date. Income and capital gain distributions are declared separately for each class. Income and capital gain distributions are determined in accordance with income tax regulations, which may differ from GAAP.
Capital accounts within the financial statements are adjusted for permanent book-tax differences. These adjustments have no impact on net assets or the results of operations. Capital accounts are not adjusted for temporary book-tax differences which will reverse in a subsequent period.
Book-tax differences are primarily due to futures contracts, foreign currency transactions, passive foreign investment companies (PFIC), partnerships, capital loss carryforwards, certain foreign taxes and losses deferred due to wash sales.
As of period end, the cost and unrealized appreciation (depreciation) in securities, and derivatives if applicable, for federal income tax purposes were as follows for each Fund:
| | Tax cost ($) | Gross unrealized appreciation ($) | Gross unrealized depreciation ($) | Net unrealized appreciation (depreciation)($) |
| VIP Total Market Index Portfolio | 827,938,172 | 426,618,069 | (57,319,328) | 369,298,741 |
| VIP Extended Market Index Portfolio | 243,540,562 | 81,789,988 | (22,822,657) | 58,967,331 |
| VIP International Index Portfolio | 564,192,261 | 124,500,051 | (71,860,147) | 52,639,904 |
The tax-based components of distributable earnings as of period end were as follows for each Fund:
| | Undistributed ordinary income ($) | Capital loss carryforward ($) | Net unrealized appreciation (depreciation) on securities and other investments ($) |
| VIP Total Market Index Portfolio | 2,667,599 | (2,703,851) | 369,298,741 |
| VIP Extended Market Index Portfolio | 678,735 | (20,479,281) | 58,966,765 |
| VIP International Index Portfolio | 1,496,548 | (25,014,327) | 52,598,582 |
Capital loss carryforwards are only available to offset future capital gains of the Funds to the extent provided by regulations and may be limited. The capital loss carryforward information presented below, including any applicable limitation, is estimated as of fiscal period end and is subject to adjustment.
| | Short-term ($) | Long-term ($) | Total capital loss carryforward ($) |
| VIP Total Market Index Portfolio | - | (2,703,851) | (2,703,851) |
| VIP Extended Market Index Portfolio | (1,511,601) | (18,967,680) | (20,479,281) |
| VIP International Index Portfolio | (7,641,043) | (17,373,284) | (25,014,327) |
The tax character of distributions paid was as follows:
| December 31, 2024 | | |
| | Ordinary Income ($) | Total ($) |
| VIP Total Market Index Portfolio | 13,954,136 | 13,954,136 |
| VIP Extended Market Index Portfolio | 3,555,697 | 3,555,697 |
| VIP International Index Portfolio | 17,618,671 | 17,618,671 |
| December 31, 2023 | | |
| | Ordinary Income ($) | Total ($) |
| VIP Total Market Index Portfolio | 7,738,444 | 7,738,444 |
| VIP Extended Market Index Portfolio | 3,304,163 | 3,304,163 |
| VIP International Index Portfolio | 13,591,191 | 13,591,191 |
Restricted Securities (including Private Placements). Funds may invest in securities that are subject to legal or contractual restrictions on resale. These securities generally may be resold in transactions exempt from registration or to the public if the securities are registered. Disposal of these securities may involve time-consuming negotiations and expense, and prompt sale at an acceptable price may be difficult. Information regarding restricted securities held at period end is included at the end of the Schedule of Investments, if applicable.
New Accounting Pronouncement. FASB Accounting Standards Update (ASU) 2023-07 Segment Reporting (Topic 280): Improvements to Reportable Segment Disclosures became effective in this reporting period. ASU 2023-07 enhances segment information disclosure in the notes to financial statements.
4. Derivative Instruments.
Risk Exposures and the Use of Derivative Instruments. Each Fund's investment objectives allow for various types of derivative instruments, including futures contracts. Derivatives are investments whose value is primarily derived from underlying assets, indices or reference rates and may be transacted on an exchange or over-the-counter (OTC). Derivatives may involve a future commitment to buy or sell a specified asset based on specified terms, to exchange future cash flows at periodic intervals based on a notional principal amount, or for one party to make one or more payments upon the occurrence of specified events in exchange for periodic payments from the other party.
Derivatives were used to increase returns and to manage exposure to certain risks as defined below. The success of any strategy involving derivatives depends on analysis of numerous economic factors, and if the strategies for investment do not work as intended, the objectives may not be achieved.
Derivatives were used to increase or decrease exposure to the following risk(s):
| Equity Risk | Equity risk relates to the fluctuations in the value of financial instruments as a result of changes in market prices (other than those arising from interest rate risk or foreign exchange risk), whether caused by factors specific to an individual investment, its issuer, or all factors affecting all instruments traded in a market or market segment. |
Funds are also exposed to additional risks from investing in derivatives, such as liquidity risk and counterparty credit risk. Liquidity risk is the risk that a fund will be unable to close out the derivative in the open market in a timely manner. Counterparty credit risk is the risk that the counterparty will not be able to fulfill its obligation to a fund. Counterparty credit risk related to exchange-traded contracts may be mitigated by the protection provided by the exchange on which they trade.
Investing in derivatives may involve greater risks than investing in the underlying assets directly and, to varying degrees, may involve risk of loss in excess of any initial investment and collateral received and amounts recognized in the Statement of Assets and Liabilities. In addition, there may be the risk that the change in value of the derivative contract does not correspond to the change in value of the underlying instrument.
Futures Contracts. A futures contract is an agreement between two parties to buy or sell a specified underlying instrument for a fixed price at a specified future date. Futures contracts were used to manage exposure to the stock market.
Upon entering into a futures contract, a fund is required to deposit either cash or securities (initial margin) with a clearing broker in an amount equal to a certain percentage of the face value of the contract. Futures contracts are marked-to-market daily and subsequent daily payments are made or received by a fund depending on the daily fluctuations in the value of the futures contracts and are recorded as unrealized appreciation or (depreciation). This receivable and/or payable, if any, is included in daily variation margin on futures contracts in the Statement of Assets and Liabilities. Realized gain or (loss) is recorded upon the expiration or closing of a futures contract. The net realized gain (loss) and change in net unrealized appreciation (depreciation) on futures contracts during the period is presented in the Statement of Operations.
Any open futures contracts at period end are presented in the Schedule of Investments under the caption "Futures Contracts". The notional amount at value reflects each contract's exposure to the underlying instrument or index at period end, and is representative of volume of activity during the period, unless an average notional amount is presented in the table below.
| | Average Notional Amount ($) |
| VIP International Index Portfolio | 18,131,730 |
Any securities deposited to meet initial margin requirements are identified in the Schedule of Investments. Any cash deposited to meet initial margin requirements is presented as segregated cash with brokers for derivative instruments in the Statement of Assets and Liabilities.
5. Purchases and Sales of Investments.
Purchases and sales of securities, other than short-term securities, U.S. government securities and in-kind transactions, as applicable, are noted in the table below.
| | Purchases ($) | Sales ($) |
| VIP Total Market Index Portfolio | 186,126,836 | 23,872,052 |
| VIP Extended Market Index Portfolio | 81,862,511 | 29,681,408 |
| VIP International Index Portfolio | 106,259,164 | 27,549,203 |
6. Fees and Other Transactions with Affiliates.
Management Fee and Expense Contract. Fidelity Management & Research Company LLC (the investment adviser) and its affiliates provide the Funds with investment management related services for which the Funds pay a monthly management fee.
Effective June 1, 2024, each Fund's management contract was amended to incorporate administrative services previously covered under separate services agreements (Transfer Agent agreements). The amended contract incorporates a management fee rate that may vary by class. The investment adviser or an affiliate pays certain expenses of managing and operating each Fund out of each class's management fee.
Each class of each Fund pays a management fee to the investment adviser. The management fee is calculated and paid to the investment adviser every month based on an annual rate expressed as a percentage of each class's average net assets as noted in the following table:
| | Initial Class | Service Class | Service Class 2 |
| VIP Total Market Index Portfolio | .11% | .11% | .11% |
| VIP Extended Market Index Portfolio | .12% | .12% | .12% |
| VIP International Index Portfolio | .16% | .16% | .16% |
A different management fee rate may be applicable to each class of each Fund. The difference between classes is the result of separate arrangements for class-level services and/or waivers of certain expenses. It is not the result of any difference in advisory or custodial fees or other expenses related to the management of each Fund's assets, which do not vary by class.
Prior to June 1, 2024, the management fee was based on an annual rate of .06%, .07% and .11% of VIP Total Market Index Portfolio's, VIP Extended Market Index Portfolio's and VIP International Index Portfolio's average net assets, respectively. Under the management contract, the investment adviser paid all other fund-level expenses, except the compensation of the independent Trustees and certain miscellaneous expenses such as proxy and shareholder meeting expenses.
In addition, under the expense contract, the investment adviser paid class-level expenses as necessary so that the total expenses did not exceed certain amounts of each class' average net assets on an annual basis with certain exceptions, as noted in the following table. The expense contract was discontinued effective May 31, 2024.
| | Initial Class | Service Class | Service Class 2 |
| VIP Total Market Index Portfolio | .12% | .22% | .37% |
| VIP Extended Market Index Portfolio | .13% | .23% | .38% |
| VIP International Index Portfolio | .17% | .27% | .42% |
Sub-Adviser. Geode Capital Management, LLC (Geode), serves as sub-adviser for the Fund. Geode provides discretionary investment advisory services to the Fund and is paid by the investment adviser for providing these services.
Distribution and Service Plan Fees. In accordance with Rule 12b-1 of the 1940 Act, the Funds have adopted separate 12b-1 Plans for each Service Class of shares. Each Service Class pays Fidelity Distributors Company LLC (FDC), an affiliate of the investment adviser, a service fee. For the period, the service fee is based on an annual rate of .10% of Service Class' average net assets and .25% of Service Class 2's average net assets.
For the period, total fees, all of which were reallowed to insurance companies for the distribution of shares and providing shareholder support services were as follows:
| | Service Class ($) | Service Class 2 ($) | Total ($) |
VIP Total Market Index Portfolio | 4,427 | 193,437 | 197,864 |
VIP Extended Market Index Portfolio | 56,186 | 27,988 | 84,174 |
VIP International Index Portfolio | 12,869 | 262,613 | 275,482 |
Transfer Agent Fees. Fidelity Investments Institutional Operations Company LLC (FIIOC), an affiliate of the investment adviser, is the transfer, dividend disbursing and shareholder servicing agent for each class of the Funds.
Effective June 1, 2024, the Fund's management contract was amended to incorporate transfer agent services and associated fees previously covered under a separate services agreement.
Prior to June 1, 2024, for each Fund, FIIOC received asset-based fees based on each class's average net assets for transfer agent services, typesetting, and printing and mailing of shareholder reports, excluding mailing of proxy statements, equal to an annual rate of .06% of average net assets. Under the expense contract, each class of each Fund paid a portion of the transfer agent fees equal to an annual rate of .06% of class-level average net assets. For the portion of the reporting period prior to June 1, 2024, the total transfer agent fees paid by each applicable class were as follows:
| | Amount ($) |
| VIP Total Market Index Portfolio | |
| Initial Class | 211,789 |
| Service Class | 954 |
| Service Class 2 | 16,330 |
| | 229,073 |
| VIP Extended Market Index Portfolio | |
| Initial Class | 41,832 |
| Service Class | 12,390 |
| Service Class 2 | 2,071 |
| | 56,293 |
| VIP International Index Portfolio | |
| Initial Class | 112,125 |
| Service Class | 2,978 |
| Service Class 2 | 23,335 |
| | 138,438 |
Interfund Trades. Funds may purchase from or sell securities to other Fidelity Funds under procedures adopted by the Board. The procedures have been designed to ensure these interfund trades are executed in accordance with Rule 17a-7 of the 1940 Act. Any interfund trades are included within the respective purchases and sales amounts shown in the Purchases and Sales of Investments note. During the period, there were no interfund trades.
7. Committed Line of Credit.
Certain Funds participate with other funds managed by the investment adviser or an affiliate in a $4.25 billion credit facility (the "line of credit") to be utilized for temporary or emergency purposes to fund shareholder redemptions or for other short-term liquidity purposes.
Commitment fees are charged based on the unused amount of the line of credit at an annual rate of .10%, and then allocated to each participating fund based on its pro-rata portion of the line of credit. The commitment fees are borne by the investment adviser.
Interest is charged to a participating fund based on its borrowings at an annual rate of .75% plus the highest of (i) daily SOFR plus a .10% spread adjustment, (ii) Federal Funds Effective Rate, or (iii) Overnight Bank Funding Rate. During the period, there were no borrowings on this line of credit.
The line of credit agreement will expire in March 2025 unless extended or renewed.
8. Security Lending.
Funds lend portfolio securities from time to time in order to earn additional income. Lending agents are used, including National Financial Services (NFS), an affiliate of the investment adviser. Pursuant to a securities lending agreement, NFS will receive a fee, which is capped at 9.9% of a fund's daily lending revenue, for its services as lending agent. A fund may lend securities to certain qualified borrowers, including NFS. On the settlement date of the loan, a fund receives collateral (in the form of U.S. Treasury obligations, letters of credit and/or cash) against the loaned securities and maintains collateral in an amount not less than 100% of the market value of the loaned securities during the period of the loan. The market value of the loaned securities is determined at the close of business of a fund and any additional required collateral is delivered to a fund on the next business day. A fund or borrower may terminate the loan at any time, and if the borrower defaults on its obligation to return the securities loaned because of insolvency or other reasons, a fund may apply collateral received from the borrower against the obligation. A fund may experience delays and costs in recovering the securities loaned. Any cash collateral received is invested in the Fidelity Securities Lending Cash Central Fund. Any loaned securities are identified as such in the Schedule of Investments, and the value of loaned securities and cash collateral at period end, as applicable, are presented in the Statement of Assets and Liabilities. Security lending income represents the income earned on investing cash collateral, less rebates paid to borrowers and any lending agent fees associated with the loan, plus any premium payments received for lending certain types of securities. Security lending income is presented in the Statement of Operations as a component of income from Fidelity Central Funds. Affiliated security lending activity, if any, was as follows:
| | Total Security Lending Fees Paid to NFS ($) | Security Lending Income From Securities Loaned to NFS ($) | Value of Securities Loaned to NFS at Period End ($) |
| VIP Total Market Index Portfolio | 8,527 | 614 | 16,397 |
| VIP Extended Market Index Portfolio | 18,381 | 1,473 | 14,640 |
| VIP International Index Portfolio | 4,871 | 4 | - |
9. Expense Reductions.
Through arrangements with each applicable Fund's custodian, credits realized as a result of certain uninvested cash balances were used to reduce each applicable Fund's or class' expenses. All of the applicable expense reductions are noted in the table below.
| | Custodian credits ($) |
| VIP Total Market Index Portfolio | 1,627 |
| VIP Extended Market Index Portfolio | 7,936 |
| VIP International Index Portfolio | 17,781 |
10. Distributions to Shareholders.
Distributions to shareholders of each class were as follows:
| | Year ended December 31, 2024 | Year ended December 31, 2023 |
| VIP Total Market Index Portfolio | | |
| Distributions to shareholders | | |
| Initial Class | $12,954,202 | $7,277,989 |
| Service Class | 59,847 | 40,809 |
| Service Class 2 | 940,087 | 419,646 |
Total | $13,954,136 | $7,738,444 |
| VIP Extended Market Index Portfolio | | |
| Distributions to shareholders | | |
| Initial Class | $2,552,856 | $2,555,843 |
| Service Class | 830,166 | 643,814 |
| Service Class 2 | 172,675 | 104,506 |
Total | $3,555,697 | $3,304,163 |
| VIP International Index Portfolio | | |
| Distributions to shareholders | | |
| Initial Class | $14,110,542 | $ 11,292,801 |
| Service Class | 356,984 | 288,828 |
| Service Class 2 | 3,151,145 | 2,009,562 |
Total | $17,618,671 | $13,591,191 |
11. Share Transactions.
Transactions for each class of shares were as follows and may contain in-kind transactions:
| | Shares | Shares | Dollars | Dollars |
| | Year ended December 31, 2024 | Year ended December 31, 2023 | Year ended December 31, 2024 | Year ended December 31, 2023 |
| VIP Total Market Index Portfolio | | | | |
| Initial Class | | | | |
| Shares sold | 9,787,880 | 9,219,753 | $191,245,836 | $144,247,291 |
| Reinvestment of distributions | 621,187 | 445,955 | 12,954,202 | 7,277,989 |
| Shares redeemed | (3,903,819) | (4,215,357) | (76,353,562) | (65,841,556) |
| Net increase (decrease) | 6,505,248 | 5,450,351 | $127,846,476 | $85,683,724 |
| Service Class | | | | |
| Shares sold | 129,349 | 264,228 | $2,542,768 | $4,305,263 |
| Reinvestment of distributions | 2,768 | 2,421 | 57,821 | 39,458 |
| Shares redeemed | (101,680) | (77,976) | (1,998,060) | (1,293,441) |
| Net increase (decrease) | 30,437 | 188,673 | $602,529 | $3,051,280 |
| Service Class 2 | | | | |
| Shares sold | 1,903,302 | 1,344,060 | $36,606,402 | $20,399,590 |
| Reinvestment of distributions | 45,113 | 25,808 | 940,087 | 419,646 |
| Shares redeemed | (544,845) | (472,917) | (10,602,021) | (7,356,151) |
| Net increase (decrease) | 1,403,570 | 896,951 | $26,944,468 | $13,463,085 |
| VIP Extended Market Index Portfolio | | | | |
| Initial Class | | | | |
| Shares sold | 3,180,242 | 15,958,059 | $44,304,131 | $181,843,758 |
| Reinvestment of distributions | 171,238 | 220,141 | 2,552,856 | 2,555,843 |
| Shares redeemed | (2,591,549) | (15,905,507) | (35,254,596) | (177,049,776) |
| Net increase (decrease) | 759,931 | 272,693 | $11,602,391 | $7,349,825 |
| Service Class | | | | |
| Shares sold | 3,142,903 | 1,587,422 | $42,655,451 | $18,985,279 |
| Reinvestment of distributions | 55,659 | 55,377 | 828,451 | 641,821 |
| Shares redeemed | (1,244,424) | (862,835) | (16,964,170) | (10,262,803) |
| Net increase (decrease) | 1,954,138 | 779,964 | $26,519,732 | $9,364,297 |
| Service Class 2 | | | | |
| Shares sold | 902,129 | 393,756 | $12,617,486 | $4,658,754 |
| Reinvestment of distributions | 11,493 | 9,025 | 172,675 | 104,506 |
| Shares redeemed | (262,126) | (400,385) | (3,676,097) | (4,632,348) |
| Net increase (decrease) | 651,496 | 2,396 | $9,114,064 | $130,912 |
| VIP International Index Portfolio | | | | |
| Initial Class | | | | |
| Shares sold | 7,021,927 | 9,207,032 | $78,007,909 | $93,616,574 |
| Reinvestment of distributions | 1,264,490 | 1,121,155 | 14,110,542 | 11,292,801 |
| Shares redeemed | (4,612,110) | (2,970,025) | (51,710,576) | (30,072,430) |
| Net increase (decrease) | 3,674,307 | 7,358,162 | $40,407,875 | $74,836,945 |
| Service Class | | | | |
| Shares sold | 860,996 | 512,259 | $9,648,701 | $5,154,366 |
| Reinvestment of distributions | 31,696 | 28,356 | 353,608 | 285,854 |
| Shares redeemed | (827,567) | (407,592) | (9,365,201) | (4,073,452) |
| Net increase (decrease) | 65,125 | 133,023 | $637,108 | $1,366,768 |
| Service Class 2 | | | | |
| Shares sold | 4,200,170 | 3,911,974 | $46,464,863 | $39,271,954 |
| Reinvestment of distributions | 283,491 | 200,301 | 3,151,145 | 2,009,562 |
| Shares redeemed | (1,514,094) | (1,220,718) | (16,777,966) | (12,247,659) |
| Net increase (decrease) | 2,969,567 | 2,891,557 | $32,838,042 | $29,033,857 |
12. Other.
A fund's organizational documents provide former and current trustees and officers with a limited indemnification against liabilities arising in connection with the performance of their duties to the fund. In the normal course of business, a fund may also enter into contracts that provide general indemnifications. A fund's maximum exposure under these arrangements is unknown as this would be dependent on future claims that may be made against a fund. The risk of material loss from such claims is considered remote.
At the end of the period, the investment adviser or its affiliates were owners of record of more than 10% and certain otherwise unaffiliated shareholders each were owners of record of more than 10% of the outstanding shares as follows:
| Fund | Affiliated % | Number ofUnaffiliated Shareholders | Unaffiliated Shareholders % |
| VIP Extended Market Index Portfolio | 54% | 2 | 31% |
| VIP International Index Portfolio | 54% | 1 | 29% |
| VIP Total Market Index Portfolio | 77% | 1 | 12% |
13. Risk and Uncertainties.
Many factors affect a fund's performance. Developments that disrupt global economies and financial markets, such as pandemics, epidemics, outbreaks of infectious diseases, war, terrorism, and environmental disasters, may significantly affect a fund's investment performance. The effects of these developments to a fund will be impacted by the types of securities in which a fund invests, the financial condition, industry, economic sector, and geographic location of an issuer, and a fund's level of investment in the securities of that issuer. Significant concentrations in security types, issuers, industries, sectors, and geographic locations may magnify the factors that affect a fund's performance.
Report of Independent Registered Public Accounting Firm
To the Board of Trustees of Variable Insurance Products Fund II and the Shareholders of VIP Total Market Index Portfolio, VIP Extended Market Index Portfolio, and VIP International Index Portfolio:
Opinion on the Financial Statements and Financial Highlights
We have audited the accompanying statements of assets and liabilities of VIP Total Market Index Portfolio, VIP Extended Market Index Portfolio, and VIP International Index Portfolio (the "Funds"), each a fund of Variable Insurance Products Fund II, including the schedules of investments, as of December 31, 2024, the related statements of operations for the year then ended, the statements of changes in net assets for each of the two years in the period then ended, the financial highlights for each of the five years in the period then ended, and the related notes. In our opinion, the financial statements and financial highlights present fairly, in all material respects, the financial position of each of the Funds as of December 31, 2024, and the results of their operations for the year then ended, the changes in their net assets for each of the two years in the period then ended, and the financial highlights for each of the five years in the period then ended in conformity with accounting principles generally accepted in the United States of America.
Basis for Opinion
These financial statements and financial highlights are the responsibility of the Funds' management. Our responsibility is to express an opinion on the Funds' financial statements and financial highlights based on our audits. We are a public accounting firm registered with the Public Company Accounting Oversight Board (United States) (PCAOB) and are required to be independent with respect to the Funds in accordance with the U.S. federal securities laws and the applicable rules and regulations of the Securities and Exchange Commission and the PCAOB.
We conducted our audits in accordance with the standards of the PCAOB. Those standards require that we plan and perform the audit to obtain reasonable assurance about whether the financial statements and financial highlights are free of material misstatement, whether due to error or fraud. The Funds are not required to have, nor were we engaged to perform, an audit of their internal control over financial reporting. As part of our audits, we are required to obtain an understanding of internal control over financial reporting but not for the purpose of expressing an opinion on the effectiveness of the Funds' internal control over financial reporting. Accordingly, we express no such opinion.
Our audits included performing procedures to assess the risks of material misstatement of the financial statements and financial highlights, whether due to error or fraud, and performing procedures that respond to those risks. Such procedures included examining, on a test basis, evidence regarding the amounts and disclosures in the financial statements and financial highlights. Our audits also included evaluating the accounting principles used and significant estimates made by management, as well as evaluating the overall presentation of the financial statements and financial highlights. Our procedures included confirmation of securities owned as of December 31, 2024, by correspondence with the custodian and brokers; when replies were not received from brokers, we performed other auditing procedures. We believe that our audits provide a reasonable basis for our opinion.
/s/ Deloitte & Touche LLP
Boston, Massachusetts
February 14, 2025
We have served as the auditor of one or more of the Fidelity investment companies since 1999.
Distributions
(Unaudited)The dividend and capital gains distributions for the fund(s) are available on Fidelity.com or Institutional.Fidelity.com.
The funds hereby designate the amounts noted below as distributions paid during the fiscal year ended 2024 as qualifying to be taxed as section 163(j) interest dividends:
| VIP Total Market Index Portfolio | $1,096,369 |
| VIP Extended Market Index Portfolio | $259,489 |
| VIP International Index Portfolio | $719,001 |
A percentage of the dividends distributed during the fiscal year for the following funds qualify for the dividends-received deduction for corporate shareholders:
| | Initial Class | Service Class | Service Class 2 | | |
| VIP Total Market Index Portfolio | | | | | |
| February, 2024 | 52% | 55% | 58% | | |
| December, 2024 | 100% | 100% | 100% | | |
| VIP Extended Market Index Portfolio | | | | | |
| February, 2024 | 4% | 4% | 4% | | |
| December, 2024 | 70% | 74% | 79% | | |
| VIP International Index Portfolio | | | | | |
| February, 2024 | 0% | 0% | 0% | | |
| December, 2024 | 0% | 0% | 0% | | |
The amounts per share which represent income derived from sources within, and taxes paid to, foreign countries or possessions of the United States are as follows:
| | Pay Date | Income | Taxes |
| VIP International Index Portfolio | | | |
| Initial Class | 12/06/24 | $0.2918 | $0.0288 |
| Service Class | 12/06/24 | $0.2832 | $0.0288 |
| Service Class 2 | 12/06/24 | $0.2736 | $0.0288 |
Item 8: Changes in and Disagreements with Accountants for Open-End Management Investment Companies
(Unaudited)
Note: This is not applicable for any fund included in this document.
Item 9: Proxy Disclosures for Open-End Management Investment Companies
(Unaudited)
| A special meeting of shareholders was held on July 16, 2024. The results of votes taken among shareholders on the proposal before them are reported below. Each vote reported represents one dollar of net asset value held on the record date for the meeting. |
| Proposal 1 |
| To elect a Board of Trustees. |
| | # of Votes | % of Votes |
| Bettina Doulton |
| Affirmative | 35,115,445,138.03 | 95.41 |
| Withheld | 1,688,162,573.22 | 4.59 |
| TOTAL | 36,803,607,711.25 | 100.00 |
| Robert A. Lawrence |
| Affirmative | 35,088,609,864.54 | 95.34 |
| Withheld | 1,714,997,846.71 | 4.66 |
| TOTAL | 36,803,607,711.25 | 100.00 |
| Vijay C. Advani |
| Affirmative | 35,010,407,909.42 | 95.13 |
| Withheld | 1,793,199,801.83 | 4.87 |
| TOTAL | 36,803,607,711.25 | 100.00 |
| Thomas P. Bostick |
| Affirmative | 35,057,529,083.85 | 95.26 |
| Withheld | 1,746,078,627.39 | 4.74 |
| TOTAL | 36,803,607,711.25 | 100.00 |
| Donald F. Donahue |
| Affirmative | 35,013,585,423.05 | 95.14 |
| Withheld | 1,790,022,288.19 | 4.86 |
| TOTAL | 36,803,607,711.25 | 100.00 |
| Vicki L. Fuller |
| Affirmative | 35,122,634,645.90 | 95.43 |
| Withheld | 1,680,973,065.35 | 4.57 |
| TOTAL | 36,803,607,711.25 | 100.00 |
| Patricia L. Kampling |
| Affirmative | 35,180,534,002.80 | 95.59 |
| Withheld | 1,623,073,708.44 | 4.41 |
| TOTAL | 36,803,607,711.25 | 100.00 |
| Thomas A. Kennedy |
| Affirmative | 35,124,156,340.38 | 95.44 |
| Withheld | 1,679,451,370.87 | 4.56 |
| TOTAL | 36,803,607,711.25 | 100.00 |
| Oscar Munoz |
| Affirmative | 35,015,482,863.79 | 95.14 |
| Withheld | 1,788,124,847.45 | 4.86 |
| TOTAL | 36,803,607,711.25 | 100.00 |
| Karen B. Peetz |
| Affirmative | 35,090,964,426.07 | 95.35 |
| Withheld | 1,712,643,285.17 | 4.65 |
| TOTAL | 36,803,607,711.25 | 100.00 |
| David M. Thomas |
| Affirmative | 34,979,784,204.17 | 95.04 |
| Withheld | 1,823,823,507.08 | 4.96 |
| TOTAL | 36,803,607,711.25 | 100.00 |
| Susan Tomasky |
| Affirmative | 35,096,963,470.38 | 95.36 |
| Withheld | 1,706,644,240.86 | 4.64 |
| TOTAL | 36,803,607,711.25 | 100.00 |
| Michael E. Wiley |
| Affirmative | 34,987,599,655.10 | 95.07 |
| Withheld | 1,816,008,056.15 | 4.93 |
| TOTAL | 36,803,607,711.25 | 100.00 |
| | | |
| Proposal 1 reflects trust-wide proposal and voting results. |
Item 10: Remuneration Paid to Directors, Officers, and others of Open-End Management Investment Companies
(Unaudited)
Note: This information is disclosed as part of the financial statements for each Fund as part of Item 7: Financial Statements and Financial Highlights for Open-End Management Investment companies.
Item 11: Statement Regarding Basis for Approval of Investment Advisory Contract
(Unaudited)
Note: This is not applicable for any fund included in this document.
1.9891400.106
VIPSAI-ANN-0325
Fidelity® Variable Insurance Products:
VIP Disciplined Small Cap Portfolio
Annual Report
December 31, 2024
Contents
To view a fund's proxy voting guidelines and proxy voting record for the 12-month period ended June 30, visit http://www.fidelity.com/proxyvotingresults or visit the Securities and Exchange Commission's (SEC) web site at http://www.sec.gov.
You may also call 1-877-208-0098 to request a free copy of the proxy voting guidelines.
Fidelity® Variable Insurance Products are separate account options which are purchased through a variable insurance contract.
Standard & Poor's, S&P and S&P 500 are registered service marks of The McGraw-Hill Companies, Inc. and have been licensed for use by Fidelity Distributors Corporation.
Other third-party marks appearing herein are the property of their respective owners.
All other marks appearing herein are registered or unregistered trademarks or service marks of FMR LLC or an affiliated company. © 2025 FMR LLC. All rights reserved.
This report and the financial statements contained herein are submitted for the general information of the shareholders of the Fund. This report is not authorized for distribution to prospective investors in the Fund unless preceded or accompanied by an effective prospectus.
A fund files its complete schedule of portfolio holdings with the SEC for the first and third quarters of each fiscal year on Form N-PORT. Forms N-PORT are available on the SEC's web site at http://www.sec.gov. A fund's Forms N-PORT may be reviewed and copied at the SEC's Public Reference Room in Washington, DC. Information regarding the operation of the SEC's Public Reference Room may be obtained by calling 1-800-SEC-0330.
For a complete list of a fund's portfolio holdings, view the most recent holdings listing, semiannual report, or annual report on Fidelity's web site at http://www.fidelity.com, http://www.institutional.fidelity.com, or http://www.401k.com, as applicable.
NOT FDIC INSURED •MAY LOSE VALUE •NO BANK GUARANTEE
Neither the Fund nor Fidelity Distributors Corporation is a bank.
Item 7: Financial Statements and Financial Highlights for Open-End Management Investment Companies (Annual Report)
VIP Disciplined Small Cap Portfolio
Schedule of Investments December 31, 2024
Showing Percentage of Net Assets
| Common Stocks - 98.0% |
| | | Shares | Value ($) |
| BERMUDA - 0.1% | | | |
| Energy - 0.1% | | | |
| Oil, Gas & Consumable Fuels - 0.1% | | | |
| Teekay Corp Ltd | | 72,557 | 502,820 |
| CANADA - 0.3% | | | |
| Energy - 0.2% | | | |
| Oil, Gas & Consumable Fuels - 0.2% | | | |
| Teekay Tankers Ltd Class A | | 22,583 | 898,578 |
| Health Care - 0.1% | | | |
| Biotechnology - 0.1% | | | |
| Aurinia Pharmaceuticals Inc (a) | | 43,917 | 394,374 |
| TOTAL CANADA | | | 1,292,952 |
| GERMANY - 0.0% | | | |
| Health Care - 0.0% | | | |
| Biotechnology - 0.0% | | | |
| Affimed NV (a)(b) | | 4,468 | 5,317 |
| IRELAND - 0.2% | | | |
| Energy - 0.0% | | | |
| Oil, Gas & Consumable Fuels - 0.0% | | | |
| Ardmore Shipping Corp | | 12,286 | 149,275 |
| Industrials - 0.2% | | | |
| Commercial Services & Supplies - 0.2% | | | |
| Cimpress PLC (a) | | 12,995 | 932,001 |
| TOTAL IRELAND | | | 1,081,276 |
| MONACO - 0.2% | | | |
| Energy - 0.2% | | | |
| Oil, Gas & Consumable Fuels - 0.2% | | | |
| Scorpio Tankers Inc | | 15,509 | 770,642 |
| Industrials - 0.0% | | | |
| Marine Transportation - 0.0% | | | |
| Costamare Inc | | 9,281 | 119,261 |
| TOTAL MONACO | | | 889,903 |
| NORWAY - 0.1% | | | |
| Energy - 0.1% | | | |
| Oil, Gas & Consumable Fuels - 0.1% | | | |
| SFL Corp Ltd (b) | | 62,452 | 638,259 |
| PUERTO RICO - 0.3% | | | |
| Financials - 0.3% | | | |
| Banks - 0.3% | | | |
| First BanCorp/Puerto Rico | | 87,143 | 1,619,988 |
| SWITZERLAND - 0.0% | | | |
| Health Care - 0.0% | | | |
| Biotechnology - 0.0% | | | |
| ADC Therapeutics SA (a)(b) | | 40,126 | 79,851 |
| THAILAND - 0.6% | | | |
| Information Technology - 0.6% | | | |
| Electronic Equipment, Instruments & Components - 0.6% | | | |
| Fabrinet (a) | | 13,640 | 2,999,163 |
| UNITED STATES - 96.2% | | | |
| Communication Services - 3.1% | | | |
| Diversified Telecommunication Services - 1.0% | | | |
| AST SpaceMobile Inc Class A (a)(b) | | 7,527 | 158,820 |
| Atn International Inc | | 23,406 | 393,455 |
| Bandwidth Inc Class A (a) | | 94,440 | 1,607,369 |
| IDT Corp Class B | | 3,926 | 186,564 |
| Lumen Technologies Inc (a) | | 385,873 | 2,048,986 |
| Shenandoah Telecommunications Co | | 11,148 | 140,575 |
| | | | 4,535,769 |
| Entertainment - 0.6% | | | |
| AMC Entertainment Holdings Inc Class A (a)(b) | | 21,619 | 86,044 |
| Cinemark Holdings Inc (a) | | 22,450 | 695,501 |
| Eventbrite Inc Class A (a) | | 122,062 | 410,128 |
| Lions Gate Entertainment Corp Class A (a)(b) | | 7,991 | 68,243 |
| Lions Gate Entertainment Corp Class B (a) | | 22,161 | 167,316 |
| Madison Square Garden Entertainment Corp Class A (a) | | 38,500 | 1,370,600 |
| Marcus Corp/The | | 12,034 | 258,731 |
| | | | 3,056,563 |
| Interactive Media & Services - 1.2% | | | |
| TrueCar Inc (a) | | 134,139 | 500,338 |
| Vimeo Inc Class A (a) | | 327,718 | 2,097,395 |
| Yelp Inc Class A (a) | | 76,710 | 2,968,678 |
| Zedge Inc Class B (a) | | 11,195 | 30,115 |
| ZipRecruiter Inc Class A (a) | | 23,168 | 167,736 |
| | | | 5,764,262 |
| Media - 0.1% | | | |
| Gannett Co Inc (a) | | 55,132 | 278,968 |
| Stagwell Inc Class A (a) | | 14,512 | 95,488 |
| | | | 374,456 |
| Wireless Telecommunication Services - 0.2% | | | |
| Telephone and Data Systems Inc | | 33,316 | 1,136,409 |
TOTAL COMMUNICATION SERVICES | | | 14,867,459 |
| | | | |
| Consumer Discretionary - 10.2% | | | |
| Automobile Components - 0.7% | | | |
| American Axle & Manufacturing Holdings Inc (a) | | 116,244 | 677,703 |
| Cooper-Standard Holdings Inc (a)(b) | | 50,392 | 683,316 |
| Goodyear Tire & Rubber Co/The (a) | | 203,684 | 1,833,156 |
| Luminar Technologies Inc Class A (a)(b) | | 38,580 | 207,560 |
| Stoneridge Inc (a) | | 9,150 | 57,370 |
| | | | 3,459,105 |
| Automobiles - 0.5% | | | |
| Winnebago Industries Inc | | 45,185 | 2,158,939 |
| Diversified Consumer Services - 0.2% | | | |
| Chegg Inc (a) | | 205,378 | 330,658 |
| Graham Holdings Co Class B | | 856 | 746,364 |
| | | | 1,077,022 |
| Hotels, Restaurants & Leisure - 2.1% | | | |
| Brinker International Inc (a) | | 9,349 | 1,236,779 |
| Dine Brands Global Inc | | 2,223 | 66,912 |
| International Game Technology PLC | | 59,845 | 1,056,863 |
| Life Time Group Holdings Inc (a) | | 47,747 | 1,056,164 |
| Light & Wonder Inc Class A (a) | | 8,579 | 741,054 |
| Monarch Casino & Resort Inc | | 1,335 | 105,332 |
| PlayAGS Inc (a) | | 83,294 | 960,380 |
| Red Rock Resorts Inc Class A | | 30,043 | 1,389,188 |
| Shake Shack Inc Class A (a) | | 15,668 | 2,033,706 |
| Texas Roadhouse Inc | | 2,468 | 445,301 |
| United Parks & Resorts Inc (a) | | 11,545 | 648,714 |
| | | | 9,740,393 |
| Household Durables - 2.6% | | | |
| Ethan Allen Interiors Inc | | 27,215 | 765,014 |
| Flexsteel Industries Inc | | 11,896 | 646,428 |
| Installed Building Products Inc (b) | | 13,316 | 2,333,629 |
| KB Home | | 15,152 | 995,789 |
| M/I Homes Inc (a) | | 18,380 | 2,443,621 |
| Meritage Homes Corp | | 8,952 | 1,376,997 |
| Taylor Morrison Home Corp (a) | | 37,484 | 2,294,396 |
| Tri Pointe Homes Inc (a) | | 36,677 | 1,329,908 |
| | | | 12,185,782 |
| Leisure Products - 0.2% | | | |
| Peloton Interactive Inc Class A (a)(b) | | 86,611 | 753,516 |
| Revelyst Inc | | 8,453 | 162,551 |
| Sturm Ruger & Co Inc | | 4,800 | 169,776 |
| | | | 1,085,843 |
| Specialty Retail - 3.6% | | | |
| Abercrombie & Fitch Co Class A (a) | | 25,309 | 3,782,937 |
| American Eagle Outfitters Inc | | 173,009 | 2,884,060 |
| Carparts Com Inc (a) | | 134,272 | 145,014 |
| Carvana Co Class A (a) | | 11,162 | 2,269,904 |
| EVgo Inc Class A (a)(b) | | 26,462 | 107,171 |
| ODP Corp/The (a) | | 15,877 | 361,043 |
| Petco Health & Wellness Co Inc Class A (a) | | 317,615 | 1,210,113 |
| Sally Beauty Holdings Inc (a) | | 163,466 | 1,708,220 |
| Sleep Number Corp (a)(b) | | 25,576 | 389,778 |
| Sonic Automotive Inc Class A (b) | | 9,239 | 585,291 |
| Upbound Group Inc | | 77,713 | 2,266,888 |
| Urban Outfitters Inc (a) | | 15,227 | 835,658 |
| Victoria's Secret & Co (a) | | 16,386 | 678,708 |
| | | | 17,224,785 |
| Textiles, Apparel & Luxury Goods - 0.3% | | | |
| G-III Apparel Group Ltd (a) | | 3,369 | 109,897 |
| Hanesbrands Inc (a) | | 48,745 | 396,784 |
| Kontoor Brands Inc | | 9,443 | 806,527 |
| Rocky Brands Inc | | 4,032 | 91,929 |
| | | | 1,405,137 |
TOTAL CONSUMER DISCRETIONARY | | | 48,337,006 |
| | | | |
| Consumer Staples - 3.3% | | | |
| Beverages - 1.1% | | | |
| Coca-Cola Consolidated Inc | | 1,210 | 1,524,588 |
| National Beverage Corp | | 4,195 | 179,001 |
| Primo Brands Corp Class A | | 111,235 | 3,422,701 |
| | | | 5,126,290 |
| Consumer Staples Distribution & Retail - 1.1% | | | |
| Natural Grocers by Vitamin Cottage Inc | | 14,527 | 577,012 |
| PriceSmart Inc | | 1,211 | 111,618 |
| Sprouts Farmers Market Inc (a) | | 31,439 | 3,994,954 |
| United Natural Foods Inc (a) | | 20,550 | 561,221 |
| Weis Markets Inc | | 2,331 | 157,855 |
| | | | 5,402,660 |
| Food Products - 0.9% | | | |
| Cal-Maine Foods Inc | | 9,104 | 936,984 |
| Fresh Del Monte Produce Inc | | 13,507 | 448,566 |
| Lancaster Colony Corp | | 13,825 | 2,393,661 |
| WK Kellogg Co (b) | | 26,146 | 470,367 |
| | | | 4,249,578 |
| Household Products - 0.1% | | | |
| Energizer Holdings Inc | | 12,507 | 436,369 |
| Personal Care Products - 0.1% | | | |
| Honest Co Inc/The (a) | | 37,471 | 259,674 |
| Medifast Inc (a)(b) | | 9,413 | 165,857 |
| | | | 425,531 |
TOTAL CONSUMER STAPLES | | | 15,640,428 |
| | | | |
| Energy - 4.5% | | | |
| Energy Equipment & Services - 1.8% | | | |
| Archrock Inc | | 92,814 | 2,310,141 |
| Bristow Group Inc (a) | | 16,075 | 551,373 |
| ChampionX Corp | | 19,186 | 521,667 |
| Expro Group Holdings NV (a) | | 13,000 | 162,110 |
| Helix Energy Solutions Group Inc (a) | | 87,292 | 813,561 |
| Helmerich & Payne Inc (b) | | 47,007 | 1,505,165 |
| Nabors Industries Ltd (a)(b) | | 16,916 | 967,088 |
| Nabors Industries Ltd warrants 6/11/2026 (a) | | 5,910 | 21,571 |
| Oil States International Inc (a) | | 48,119 | 243,482 |
| Tidewater Inc (a) | | 14,437 | 789,848 |
| Transocean Ltd (a)(b) | | 76,465 | 286,744 |
| Weatherford International PLC | | 7,380 | 528,629 |
| | | | 8,701,379 |
| Oil, Gas & Consumable Fuels - 2.7% | | | |
| Berry Corp | | 41,392 | 170,949 |
| California Resources Corp | | 18,459 | 957,838 |
| CNX Resources Corp (a) | | 42,917 | 1,573,766 |
| CONSOL Energy Inc | | 9,206 | 982,096 |
| Crescent Energy Co Class A (b) | | 192,789 | 2,816,647 |
| Delek US Holdings Inc | | 25,455 | 470,918 |
| Dorian LPG Ltd | | 9,205 | 224,326 |
| Excelerate Energy Inc Class A | | 3,791 | 114,678 |
| Green Plains Inc (a) | | 10,693 | 101,369 |
| International Seaways Inc | | 12,153 | 436,779 |
| Matador Resources Co | | 27,966 | 1,573,367 |
| Murphy Oil Corp | | 28,331 | 857,296 |
| Riley Exploration Permian Inc | | 13,236 | 422,493 |
| Sitio Royalties Corp Class A | | 13,488 | 258,700 |
| Uranium Energy Corp (a)(b) | | 31,885 | 213,311 |
| World Kinect Corp (b) | | 48,981 | 1,347,467 |
| | | | 12,522,000 |
TOTAL ENERGY | | | 21,223,379 |
| | | | |
| Financials - 18.1% | | | |
| Banks - 8.2% | | | |
| 1st Source Corp | | 5,872 | 342,807 |
| Amalgamated Financial Corp | | 21,032 | 703,941 |
| Ameris Bancorp | | 27,036 | 1,691,643 |
| Associated Banc-Corp | | 24,355 | 582,085 |
| Atlantic Union Bankshares Corp (b) | | 5,895 | 223,303 |
| Axos Financial Inc (a) | | 16,781 | 1,172,153 |
| BancFirst Corp | | 11,760 | 1,378,037 |
| Bank of Hawaii Corp (b) | | 8,933 | 636,387 |
| Berkshire Hills Bancorp Inc | | 5,899 | 167,709 |
| Byline Bancorp Inc | | 9,672 | 280,488 |
| Cadence Bank | | 28,773 | 991,230 |
| Capital City Bank Group Inc | | 1,334 | 48,890 |
| Cathay General Bancorp | | 7,971 | 379,499 |
| Central Pacific Financial Corp | | 41,820 | 1,214,871 |
| City Holding Co | | 1,096 | 129,854 |
| Coastal Financial Corp/WA Class A (a) | | 2,204 | 187,142 |
| Community Financial System Inc (b) | | 23,948 | 1,477,113 |
| Community Trust Bancorp Inc | | 5,717 | 303,173 |
| CVB Financial Corp | | 35,604 | 762,282 |
| Esquire Financial Holdings Inc | | 1,646 | 130,857 |
| FB Financial Corp | | 26,954 | 1,388,401 |
| Financial Institutions Inc | | 7,687 | 209,778 |
| First Busey Corp | | 55,755 | 1,314,145 |
| First Financial Bancorp | | 21,578 | 580,017 |
| First Financial Bankshares Inc | | 36,607 | 1,319,682 |
| First Merchants Corp | | 27,873 | 1,111,854 |
| Fulton Financial Corp | | 56,903 | 1,097,090 |
| Great Southern Bancorp Inc (b) | | 16,726 | 998,542 |
| Hancock Whitney Corp | | 1,577 | 86,292 |
| Independent Bank Corp/MI | | 2,985 | 103,967 |
| Lakeland Financial Corp (b) | | 35,247 | 2,423,584 |
| Mercantile Bank Corp | | 1,897 | 84,397 |
| Midland States Bancorp Inc | | 3,753 | 91,572 |
| NB Bancorp Inc | | 93,150 | 1,682,289 |
| Nbt Bancorp Inc | | 4,672 | 223,135 |
| Northfield Bancorp Inc | | 77,975 | 906,070 |
| Northwest Bancshares Inc | | 191,504 | 2,525,938 |
| OceanFirst Financial Corp | | 27,069 | 489,949 |
| Old National Bancorp/IN | | 9,199 | 199,664 |
| Park National Corp (b) | | 4,740 | 812,578 |
| Peapack-Gladstone Financial Corp | | 8,641 | 276,944 |
| Provident Financial Services Inc (b) | | 47,700 | 900,099 |
| Renasant Corp (b) | | 32,518 | 1,162,519 |
| S&T Bancorp Inc | | 4,458 | 170,385 |
| ServisFirst Bancshares Inc | | 7,084 | 600,298 |
| Sierra Bancorp | | 11,332 | 327,721 |
| Stock Yards Bancorp Inc (b) | | 1,802 | 129,040 |
| TriCo Bancshares | | 3,047 | 133,154 |
| UMB Financial Corp | | 2,813 | 317,475 |
| United Bankshares Inc/WV | | 14,370 | 539,594 |
| Veritex Holdings Inc | | 20,992 | 570,143 |
| WaFd Inc | | 9,698 | 312,664 |
| WesBanco Inc | | 59,605 | 1,939,547 |
| Westamerica BanCorp | | 14,658 | 768,959 |
| | | | 38,600,950 |
| Capital Markets - 3.3% | | | |
| Artisan Partners Asset Management Inc Class A | | 3,349 | 144,173 |
| BGC Group Inc Class A | | 282,269 | 2,557,357 |
| Brightsphere Investment Group Inc | | 23,607 | 621,808 |
| DigitalBridge Group Inc Class A | | 69,056 | 778,952 |
| Federated Hermes Inc Class B | | 62,371 | 2,564,072 |
| Oppenheimer Holdings Inc Class A | | 3,734 | 239,312 |
| PJT Partners Inc Class A (b) | | 7,653 | 1,207,720 |
| StepStone Group Inc Class A | | 14,828 | 858,245 |
| Stifel Financial Corp | | 17,212 | 1,825,849 |
| StoneX Group Inc (a) | | 10,088 | 988,321 |
| Victory Capital Holdings Inc Class A | | 18,684 | 1,223,055 |
| Virtus Invt Partners Inc | | 703 | 155,068 |
| WisdomTree Inc (b) | | 240,949 | 2,529,965 |
| | | | 15,693,897 |
| Consumer Finance - 1.7% | | | |
| Bread Financial Holdings Inc | | 3,577 | 218,412 |
| Dave Inc Class A (a) | | 16,317 | 1,418,274 |
| EZCORP Inc Class A (a) | | 108,569 | 1,326,713 |
| FirstCash Holdings Inc | | 12,163 | 1,260,087 |
| Green Dot Corp Class A (a) | | 8,544 | 90,907 |
| Lendingtree Inc (a) | | 14,599 | 565,711 |
| NerdWallet Inc Class A (a) | | 16,805 | 223,507 |
| PROG Holdings Inc | | 56,956 | 2,406,961 |
| Regional Management Corp | | 9,008 | 306,092 |
| | | | 7,816,664 |
| Financial Services - 2.5% | | | |
| AvidXchange Holdings Inc (a) | | 279,902 | 2,894,187 |
| Compass Diversified Holdings | | 118,079 | 2,725,263 |
| Flywire Corp (a) | | 31,144 | 642,189 |
| NMI Holdings Inc (a) | | 58,731 | 2,158,952 |
| Payoneer Global Inc (a) | | 305,648 | 3,068,706 |
| Waterstone Financial Inc | | 16,975 | 228,144 |
| | | | 11,717,441 |
| Insurance - 2.1% | | | |
| American Coastal Insurance Corp | | 7,670 | 103,237 |
| Amerisafe Inc | | 3,512 | 181,008 |
| CNO Financial Group Inc | | 35,633 | 1,325,904 |
| Genworth Financial Inc Class A (a) | | 181,049 | 1,265,533 |
| HCI Group Inc (b) | | 5,096 | 593,837 |
| Heritage Insurance Holdings Inc (a) | | 29,375 | 355,438 |
| Lemonade Inc (a)(b) | | 28,670 | 1,051,616 |
| Oscar Health Inc Class A (a) | | 53,881 | 724,161 |
| Root Inc/OH Class A (a)(b) | | 8,261 | 599,666 |
| Selective Insurance Group Inc | | 25,283 | 2,364,466 |
| Trupanion Inc (a) | | 10,926 | 526,633 |
| Universal Insurance Holdings Inc | | 28,967 | 610,045 |
| | | | 9,701,544 |
| Mortgage Real Estate Investment Trusts (REITs) - 0.3% | | | |
| Kkr Real Estate Finance Trust Inc | | 52,211 | 527,331 |
| Ladder Capital Corp Class A | | 25,919 | 290,034 |
| TPG RE Finance Trust Inc | | 112,334 | 954,839 |
| | | | 1,772,204 |
TOTAL FINANCIALS | | | 85,302,700 |
| | | | |
| Health Care - 15.6% | | | |
| Biotechnology - 7.6% | | | |
| 2seventy bio Inc (a)(b) | | 47,019 | 138,236 |
| 89bio Inc (a)(b) | | 18,670 | 145,999 |
| Absci Corp (a)(b) | | 45,121 | 118,217 |
| ACADIA Pharmaceuticals Inc (a) | | 36,486 | 669,518 |
| ACELYRIN Inc (a)(b) | | 23,721 | 74,484 |
| Adicet Bio Inc (a) | | 45,925 | 44,180 |
| ADMA Biologics Inc (a) | | 29,721 | 509,715 |
| Adverum Biotechnologies Inc (a)(b) | | 11,364 | 53,070 |
| Agenus Inc (a)(b) | | 31,216 | 85,532 |
| Agios Pharmaceuticals Inc (a) | | 5,602 | 184,082 |
| Akebia Therapeutics Inc (a) | | 241,442 | 458,740 |
| Akero Therapeutics Inc (a) | | 8,797 | 244,733 |
| Alector Inc (a) | | 46,279 | 87,467 |
| Alkermes PLC (a) | | 34,115 | 981,147 |
| Allakos Inc (a) | | 159,089 | 192,498 |
| Allovir Inc (a)(b) | | 179,553 | 75,412 |
| Altimmune Inc (a)(b) | | 11,600 | 83,636 |
| Amicus Therapeutics Inc (a) | | 64,994 | 612,243 |
| Anika Therapeutics Inc (a) | | 7,615 | 125,343 |
| Annexon Inc (a) | | 40,152 | 205,980 |
| Apogee Therapeutics Inc (a) | | 1,300 | 58,890 |
| Arcellx Inc (a) | | 4,782 | 366,732 |
| Arcturus Therapeutics Holdings Inc (a) | | 12,935 | 219,507 |
| Arcutis Biotherapeutics Inc (a)(b) | | 47,263 | 658,374 |
| ArriVent Biopharma Inc | | 4,089 | 108,931 |
| Arrowhead Pharmaceuticals Inc (a) | | 12,010 | 225,788 |
| Assembly Biosciences Inc (a) | | 4,013 | 63,325 |
| Atara Biotherapeutics Inc (a)(b) | | 9,631 | 128,189 |
| Atreca Inc Class A rights (a)(c) | | 11,775 | 0 |
| Avid Bioservices Inc (a)(b) | | 29,963 | 370,043 |
| Avidity Biosciences Inc (a) | | 21,282 | 618,881 |
| Beam Therapeutics Inc (a) | | 5,788 | 143,542 |
| Bioatla Inc (a) | | 47,735 | 28,221 |
| BioCryst Pharmaceuticals Inc (a) | | 53,643 | 403,395 |
| Biohaven Ltd (a) | | 21,450 | 801,158 |
| Black Diamond Therapeutics Inc (a)(b) | | 58,658 | 125,528 |
| Bluebird Bio Inc (a)(b) | | 13,516 | 112,723 |
| Blueprint Medicines Corp (a) | | 8,062 | 703,168 |
| Bolt Biotherapeutics Inc (a) | | 27,696 | 14,820 |
| Bridgebio Pharma Inc (a) | | 14,395 | 394,999 |
| C4 Therapeutics Inc (a)(b) | | 50,447 | 181,609 |
| CareDx Inc (a) | | 22,947 | 491,295 |
| Carisma Therapeutics Inc rights (a)(c) | | 165,842 | 2 |
| Cartesian Therapeutics Inc rights (a)(c) | | 46,724 | 20,091 |
| Catalyst Pharmaceuticals Inc (a) | | 29,052 | 606,315 |
| Celldex Therapeutics Inc (a) | | 9,263 | 234,076 |
| Cogent Biosciences Inc (a) | | 40,394 | 315,073 |
| Crinetics Pharmaceuticals Inc (a) | | 10,725 | 548,369 |
| Cullinan Therapeutics Inc (a)(b) | | 17,190 | 209,374 |
| Cytokinetics Inc (a) | | 13,901 | 653,903 |
| CytomX Therapeutics Inc (a) | | 108,311 | 111,560 |
| Denali Therapeutics Inc (a) | | 11,123 | 226,687 |
| Design Therapeutics Inc (a)(b) | | 25,200 | 155,484 |
| Dynavax Technologies Corp (a) | | 4,990 | 63,722 |
| Dyne Therapeutics Inc (a) | | 5,572 | 131,276 |
| Eagle Pharmaceuticals Inc/DE (a) | | 6,814 | 3,407 |
| Editas Medicine Inc (a)(b) | | 78,242 | 99,367 |
| Emergent BioSolutions Inc (a) | | 35,532 | 339,686 |
| Enanta Pharmaceuticals Inc (a) | | 18,509 | 106,427 |
| Erasca Inc (a)(b) | | 96,321 | 241,766 |
| Fate Therapeutics Inc (a) | | 65,499 | 108,073 |
| FibroGen Inc (a) | | 99,250 | 52,553 |
| Fortress Biotech Inc (a)(b) | | 20,629 | 41,774 |
| Geron Corp (a) | | 47,052 | 166,564 |
| Halozyme Therapeutics Inc (a) | | 17,105 | 817,790 |
| Heron Therapeutics Inc (a)(b) | | 25,098 | 38,400 |
| Ideaya Biosciences Inc (a) | | 7,730 | 198,661 |
| Immunovant Inc (a) | | 1,807 | 44,759 |
| Inhibrx Biosciences Inc | | 11,876 | 182,890 |
| Insmed Inc (a) | | 29,052 | 2,005,751 |
| Intellia Therapeutics Inc (a) | | 2,264 | 26,398 |
| Iovance Biotherapeutics Inc (a)(b) | | 20,681 | 153,039 |
| Ironwood Pharmaceuticals Inc Class A (a)(b) | | 77,722 | 344,308 |
| Jasper Therapeutics Inc Class A (a) | | 11,899 | 254,401 |
| Jounce Therapeutics Inc rights (a)(c) | | 67,389 | 1 |
| KalVista Pharmaceuticals Inc (a)(b) | | 20,394 | 172,737 |
| Karyopharm Therapeutics Inc (a)(b) | | 94,334 | 63,798 |
| Kodiak Sciences Inc (a) | | 60,080 | 597,796 |
| Krystal Biotech Inc (a) | | 2,920 | 457,447 |
| Kura Oncology Inc (a) | | 36,158 | 314,936 |
| Kymera Therapeutics Inc (a) | | 2,361 | 94,983 |
| MacroGenics Inc (a)(b) | | 39,900 | 129,675 |
| Madrigal Pharmaceuticals Inc (a) | | 2,381 | 734,705 |
| Mural Oncology PLC (a) | | 3,019 | 9,721 |
| Myriad Genetics Inc (a) | | 32,765 | 449,208 |
| Neurogene Inc (a) | | 3,698 | 84,536 |
| Nkarta Inc (a) | | 42,606 | 106,089 |
| Novavax Inc (a)(b) | | 46,348 | 372,638 |
| Nurix Therapeutics Inc (a)(b) | | 16,965 | 319,621 |
| Nuvalent Inc Class A (a) | | 2,834 | 221,846 |
| Oncternal Therapeutics Inc rights (a)(c) | | 466 | 0 |
| Organogenesis Holdings Inc Class A (a) | | 30,019 | 96,061 |
| ORIC Pharmaceuticals Inc (a)(b) | | 31,769 | 256,376 |
| Passage Bio Inc (a) | | 21,054 | 11,940 |
| Precigen Inc (a)(b) | | 111,048 | 124,374 |
| Protagonist Therapeutics Inc (a) | | 4,371 | 168,721 |
| PTC Therapeutics Inc (a) | | 18,804 | 848,813 |
| Puma Biotechnology Inc (a) | | 38,077 | 116,135 |
| Q32 Bio Inc (a)(b) | | 24,341 | 83,733 |
| Q32 Bio Inc rights (a)(c) | | 22,439 | 0 |
| RAPT Therapeutics Inc (a) | | 4,926 | 7,783 |
| Recursion Pharmaceuticals Inc Class A (a)(b) | | 71,255 | 481,684 |
| Relay Therapeutics Inc (a) | | 31,946 | 131,618 |
| Replimune Group Inc (a) | | 29,747 | 360,236 |
| REVOLUTION Medicines Inc (a) | | 23,904 | 1,045,561 |
| Rhythm Pharmaceuticals Inc (a) | | 13,601 | 761,384 |
| Rocket Pharmaceuticals Inc (a) | | 5,923 | 74,452 |
| Sage Therapeutics Inc (a)(b) | | 40,203 | 218,302 |
| Sana Biotechnology Inc (a) | | 45,946 | 74,892 |
| Sangamo Therapeutics Inc (a)(b) | | 220,038 | 224,439 |
| Scholar Rock Holding Corp (a) | | 23,011 | 994,535 |
| SpringWorks Therapeutics Inc (a) | | 5,492 | 198,426 |
| Summit Therapeutics Inc (a) | | 3,028 | 54,035 |
| Surface Oncology Inc rights (a)(c) | | 32,938 | 0 |
| Sutro Biopharma Inc (a)(b) | | 54,469 | 100,223 |
| Syndax Pharmaceuticals Inc (a) | | 8,970 | 118,583 |
| Tenaya Therapeutics Inc (a)(b) | | 32,623 | 46,651 |
| TG Therapeutics Inc (a) | | 16,571 | 498,787 |
| Tourmaline Bio Inc (a)(b) | | 7,060 | 143,177 |
| Travere Therapeutics Inc (a) | | 37,710 | 656,908 |
| Twist Bioscience Corp (a) | | 15,500 | 720,285 |
| Vanda Pharmaceuticals Inc (a)(b) | | 49,378 | 236,521 |
| Vaxcyte Inc (a) | | 18,151 | 1,485,842 |
| Vera Therapeutics Inc Class A (a) | | 1,049 | 44,362 |
| Veracyte Inc (a) | | 19,562 | 774,655 |
| Vericel Corp (a) | | 3,319 | 182,246 |
| Voyager Therapeutics Inc (a)(b) | | 28,887 | 163,789 |
| XBiotech Inc (a)(b) | | 7,080 | 27,966 |
| Y-mAbs Therapeutics Inc (a) | | 12,500 | 97,875 |
| Zentalis Pharmaceuticals Inc (a) | | 42,799 | 129,681 |
| | | | 35,702,084 |
| Health Care Equipment & Supplies - 2.8% | | | |
| Accuray Inc Del (a) | | 178,351 | 353,135 |
| AtriCure Inc (a) | | 18,767 | 573,520 |
| Avanos Medical Inc (a) | | 36,647 | 583,420 |
| Axogen Inc (a) | | 77,588 | 1,278,650 |
| Bioventus Inc (a) | | 83,501 | 876,761 |
| Cerus Corp (a)(b) | | 183,372 | 282,393 |
| CONMED Corp (b) | | 6,576 | 450,061 |
| Glaukos Corp (a) | | 7,727 | 1,158,586 |
| Haemonetics Corp (a) | | 10,458 | 816,561 |
| Inari Medical Inc (a) | | 7,569 | 386,397 |
| iRhythm Technologies Inc (a) | | 21,038 | 1,896,996 |
| Lantheus Holdings Inc (a) | | 5,308 | 474,854 |
| LeMaitre Vascular Inc | | 1,871 | 172,394 |
| Merit Medical Systems Inc (a) | | 20,700 | 2,002,104 |
| Novocure Ltd (a) | | 16 | 477 |
| RxSight Inc (a) | | 7,982 | 274,421 |
| Tactile Systems Technology Inc (a)(b) | | 13,549 | 232,094 |
| Tandem Diabetes Care Inc (a) | | 20,789 | 748,820 |
| Varex Imaging Corp (a)(b) | | 56,462 | 823,781 |
| | | | 13,385,425 |
| Health Care Providers & Services - 2.1% | | | |
| 23andMe Holding Co Class A (a)(b) | | 15,114 | 49,121 |
| Addus HomeCare Corp (a) | | 1,691 | 211,967 |
| Alignment Healthcare Inc (a) | | 29,716 | 334,305 |
| BrightSpring Health Services Inc (a) | | 71,176 | 1,212,127 |
| Brookdale Senior Living Inc (a) | | 55,510 | 279,215 |
| Concentra Group Holdings Parent Inc | | 13,246 | 262,006 |
| CorVel Corp (a) | | 4,113 | 457,612 |
| Ensign Group Inc/The | | 1,776 | 235,959 |
| Guardant Health Inc (a) | | 55,984 | 1,710,311 |
| HealthEquity Inc (a) | | 19,479 | 1,869,010 |
| Hims & Hers Health Inc Class A (a) | | 13,009 | 314,558 |
| Option Care Health Inc (a) | | 59,010 | 1,369,032 |
| Owens & Minor Inc (a) | | 7,530 | 98,417 |
| PACS Group Inc | | 15,700 | 205,827 |
| Patterson Cos Inc | | 30,421 | 938,792 |
| Progyny Inc (a) | | 28,607 | 493,471 |
| | | | 10,041,730 |
| Health Care Technology - 0.9% | | | |
| Health Catalyst Inc (a) | | 69,776 | 493,316 |
| HealthStream Inc | | 59,132 | 1,880,398 |
| Phreesia Inc (a) | | 64,982 | 1,634,947 |
| Teladoc Health Inc (a) | | 39,804 | 361,818 |
| | | | 4,370,479 |
| Life Sciences Tools & Services - 0.4% | | | |
| Adaptive Biotechnologies Corp (a) | | 70,758 | 424,195 |
| Codexis Inc (a) | | 53,949 | 257,337 |
| Cytek Biosciences Inc (a)(b) | | 48,828 | 316,894 |
| Medpace Holdings Inc (a) | | 965 | 320,602 |
| Mesa Laboratories Inc (b) | | 968 | 127,650 |
| NanoString Technologies Inc (a)(c) | | 42,707 | 3,066 |
| OmniAb Inc (a)(b) | | 22,019 | 77,947 |
| Quanterix Corp (a)(b) | | 24,178 | 257,012 |
| | | | 1,784,703 |
| Pharmaceuticals - 1.8% | | | |
| Amneal Intermediate Inc Class A (a) | | 62,803 | 497,400 |
| Amphastar Pharmaceuticals Inc (a) | | 1,679 | 62,341 |
| Amylyx Pharmaceuticals Inc (a) | | 4,947 | 18,700 |
| ANI Pharmaceuticals Inc (a) | | 2,255 | 124,656 |
| Atea Pharmaceuticals Inc (a) | | 21,416 | 71,744 |
| Avadel Pharmaceuticals PLC Class A (a) | | 33,401 | 351,045 |
| Axsome Therapeutics Inc (a) | | 3,870 | 327,441 |
| Cara Therapeutics Inc (a) | | 4,549 | 27,840 |
| Collegium Pharmaceutical Inc (a)(b) | | 11,440 | 327,756 |
| Corcept Therapeutics Inc (a) | | 18,730 | 943,805 |
| Edgewise Therapeutics Inc (a) | | 17,810 | 475,527 |
| Evolus Inc (a) | | 25,191 | 278,109 |
| Harrow Inc (a) | | 1,975 | 66,261 |
| Ligand Pharmaceuticals Inc (a)(b) | | 4,875 | 522,356 |
| Nektar Therapeutics (a) | | 151,524 | 140,917 |
| Nuvation Bio Inc Class A (a) | | 96,447 | 256,549 |
| Pacira BioSciences Inc (a) | | 17,766 | 334,711 |
| Phibro Animal Health Corp Class A | | 15,580 | 327,180 |
| Pliant Therapeutics Inc (a) | | 13,296 | 175,108 |
| Prestige Consumer Healthcare Inc (a) | | 12,047 | 940,750 |
| Relmada Therapeutics Inc (a) | | 29,525 | 15,352 |
| Revance Therapeutics Inc (a) | | 68,166 | 207,225 |
| Septerna Inc | | 5,742 | 131,492 |
| Supernus Pharmaceuticals Inc (a) | | 14,793 | 534,915 |
| Tarsus Pharmaceuticals Inc (a) | | 8,198 | 453,923 |
| Terns Pharmaceuticals Inc (a) | | 29,021 | 160,776 |
| Ventyx Biosciences Inc (a) | | 31,125 | 68,164 |
| WaVe Life Sciences Ltd (a) | | 35,183 | 435,214 |
| | | | 8,277,257 |
TOTAL HEALTH CARE | | | 73,561,678 |
| | | | |
| Industrials - 16.7% | | | |
| Aerospace & Defense - 1.9% | | | |
| AAR Corp (a) | | 40,529 | 2,483,617 |
| Archer Aviation Inc Class A (a) | | 11,801 | 115,060 |
| Ducommun Inc (a) | | 25,640 | 1,632,242 |
| Intuitive Machines Inc Class A (a) | | 25,106 | 455,925 |
| Kratos Defense & Security Solutions Inc (a) | | 53,219 | 1,403,917 |
| Moog Inc Class A | | 6,165 | 1,213,519 |
| Park Aerospace Corp | | 6,097 | 89,321 |
| Rocket Lab USA Inc Class A (a) | | 61,237 | 1,559,706 |
| Virgin Galactic Holdings Inc Class A (a)(b) | | 1,186 | 6,974 |
| | | | 8,960,281 |
| Building Products - 1.3% | | | |
| Apogee Enterprises Inc | | 21,487 | 1,534,387 |
| CSW Industrials Inc | | 2,177 | 768,046 |
| Gibraltar Industries Inc (a) | | 16,819 | 990,639 |
| Griffon Corp | | 24,070 | 1,715,469 |
| Resideo Technologies Inc (a) | | 41,121 | 947,839 |
| UFP Industries Inc | | 1,072 | 120,760 |
| | | | 6,077,140 |
| Commercial Services & Supplies - 1.5% | | | |
| ABM Industries Inc | | 28,161 | 1,441,280 |
| Brink's Co/The | | 11,200 | 1,039,024 |
| CECO Environmental Corp (a)(b) | | 50,795 | 1,535,533 |
| GEO Group Inc/The (a) | | 12,094 | 338,390 |
| HNI Corp | | 3,677 | 185,210 |
| Interface Inc | | 39,179 | 954,009 |
| OPENLANE Inc (a) | | 42,994 | 853,001 |
| Pitney Bowes Inc (b) | | 70,323 | 509,139 |
| Steelcase Inc Class A | | 16,916 | 199,947 |
| | | | 7,055,533 |
| Construction & Engineering - 2.2% | | | |
| Arcosa Inc | | 21,945 | 2,122,959 |
| Comfort Systems USA Inc | | 5,510 | 2,336,571 |
| Dycom Industries Inc (a) | | 3,626 | 631,142 |
| EMCOR Group Inc | | 5,417 | 2,458,776 |
| Fluor Corp (a) | | 33,924 | 1,673,132 |
| Limbach Holdings Inc (a) | | 1,624 | 138,916 |
| Sterling Infrastructure Inc (a) | | 5,493 | 925,296 |
| | | | 10,286,792 |
| Electrical Equipment - 1.5% | | | |
| Allient Inc | | 13,767 | 334,263 |
| Array Technologies Inc (a) | | 34,204 | 206,592 |
| EnerSys | | 33,052 | 3,054,997 |
| Fluence Energy Inc Class A (a)(b) | | 47,146 | 748,678 |
| LSI Industries Inc | | 25,978 | 504,493 |
| NuScale Power Corp Class A (a)(b) | | 4,251 | 76,220 |
| Powell Industries Inc | | 279 | 61,840 |
| Preformed Line Products Co | | 7,159 | 914,849 |
| Vicor Corp (a)(b) | | 24,952 | 1,205,681 |
| | | | 7,107,613 |
| Ground Transportation - 0.4% | | | |
| Covenant Logistics Group Inc Class A | | 1,805 | 98,391 |
| Marten Transport Ltd | | 113,268 | 1,768,113 |
| RXO Inc (a)(b) | | 6,529 | 155,651 |
| | | | 2,022,155 |
| Machinery - 2.8% | | | |
| Albany International Corp Class A | | 12,469 | 997,146 |
| Atmus Filtration Technologies Inc | | 54,781 | 2,146,320 |
| Blue Bird Corp (a) | | 4,300 | 166,109 |
| Enerpac Tool Group Corp Class A | | 11,081 | 455,318 |
| Federal Signal Corp | | 5,366 | 495,765 |
| Gorman-Rupp Co/The | | 10,321 | 391,372 |
| Hillman Solutions Corp Class A (a) | | 69,085 | 672,888 |
| Hurco Cos Inc | | 5,989 | 115,528 |
| Hyster-Yale Inc Class A (b) | | 14,164 | 721,373 |
| L B Foster Co Class A (a) | | 3,644 | 98,023 |
| Mueller Water Products Inc Class A1 | | 110,109 | 2,477,453 |
| Proto Labs Inc (a) | | 9,065 | 354,351 |
| Tennant CO | | 5,444 | 443,849 |
| Terex Corp | | 26,860 | 1,241,469 |
| Trinity Industries Inc | | 37,412 | 1,313,161 |
| Watts Water Technologies Inc Class A | | 6,665 | 1,354,995 |
| | | | 13,445,120 |
| Marine Transportation - 0.3% | | | |
| Matson Inc | | 9,955 | 1,342,332 |
| Passenger Airlines - 0.8% | | | |
| JetBlue Airways Corp (a) | | 49,041 | 385,463 |
| Joby Aviation Inc Class A (a) | | 11,973 | 97,340 |
| SkyWest Inc (a) | | 30,996 | 3,103,630 |
| Sun Country Airlines Holdings Inc (a) | | 14,680 | 214,034 |
| | | | 3,800,467 |
| Professional Services - 2.1% | | | |
| Barrett Business Services Inc | | 17,773 | 772,059 |
| CRA International Inc | | 6,022 | 1,127,318 |
| CSG Systems International Inc | | 50,925 | 2,602,777 |
| ExlService Holdings Inc (a) | | 42,516 | 1,886,860 |
| Huron Consulting Group Inc (a) | | 3,506 | 435,656 |
| ICF International Inc (b) | | 1,803 | 214,936 |
| Insperity Inc | | 10,842 | 840,363 |
| Maximus Inc | | 1,400 | 104,509 |
| Parsons Corp (a) | | 11,716 | 1,080,801 |
| Planet Labs PBC Class A (a)(b) | | 71,399 | 288,452 |
| TriNet Group Inc | | 3,687 | 334,669 |
| Willdan Group Inc (a) | | 3,039 | 115,756 |
| | | | 9,804,156 |
| Trading Companies & Distributors - 1.9% | | | |
| Applied Industrial Technologies Inc | | 10,925 | 2,616,210 |
| Beacon Roofing Supply Inc (a) | | 2,229 | 226,422 |
| Boise Cascade Co | | 6,676 | 793,509 |
| DXP Enterprises Inc/TX (a) | | 17,659 | 1,458,987 |
| FTAI Aviation Ltd | | 17,954 | 2,586,094 |
| Mrc Global Inc (a) | | 34,585 | 441,996 |
| Rush Enterprises Inc Class A | | 15,285 | 837,465 |
| | | | 8,960,683 |
TOTAL INDUSTRIALS | | | 78,862,272 |
| | | | |
| Information Technology - 14.7% | | | |
| Communications Equipment - 0.7% | | | |
| CommScope Holding Co Inc (a) | | 215,064 | 1,120,484 |
| Extreme Networks Inc (a) | | 29,706 | 497,278 |
| Harmonic Inc (a) | | 56,839 | 751,980 |
| NetScout Systems Inc (a) | | 35,687 | 772,980 |
| | | | 3,142,722 |
| Electronic Equipment, Instruments & Components - 3.0% | | | |
| Arlo Technologies Inc (a)(b) | | 63,768 | 713,564 |
| Badger Meter Inc | | 8,709 | 1,847,353 |
| Belden Inc | | 12,066 | 1,358,752 |
| Benchmark Electronics Inc | | 33,154 | 1,505,192 |
| Daktronics Inc (a) | | 7,041 | 118,711 |
| Insight Enterprises Inc (a) | | 5,829 | 886,591 |
| Itron Inc (a) | | 20,912 | 2,270,625 |
| Mirion Technologies Inc Class A (a) | | 61,825 | 1,078,846 |
| PC Connection Inc | | 11,739 | 813,161 |
| Plexus Corp (a) | | 9,253 | 1,447,909 |
| Sanmina Corp (a) | | 25,336 | 1,917,175 |
| | | | 13,957,879 |
| IT Services - 0.1% | | | |
| Core Scientific Inc (b) | | 78,441 | 1,102,096 |
| Semiconductors & Semiconductor Equipment - 3.1% | | | |
| ACM Research Inc Class A (a)(b) | | 12,589 | 190,094 |
| Alpha & Omega Semiconductor Ltd (a) | | 6,467 | 239,473 |
| Ambarella Inc (a) | | 21,391 | 1,555,981 |
| Credo Technology Group Holding Ltd (a) | | 33,771 | 2,269,749 |
| Diodes Inc (a) | | 10,801 | 666,098 |
| Lattice Semiconductor Corp (a) | | 9,579 | 542,650 |
| MaxLinear Inc Class A (a) | | 97,981 | 1,938,064 |
| Onto Innovation Inc (a) | | 2,753 | 458,843 |
| PDF Solutions Inc (a)(b) | | 20,679 | 559,987 |
| Photronics Inc (a) | | 40,425 | 952,413 |
| Rambus Inc (a) | | 17,479 | 923,940 |
| Rigetti Computing Inc Class A (a) | | 13,733 | 209,566 |
| Semtech Corp (a) | | 18,531 | 1,146,142 |
| Ultra Clean Holdings Inc (a) | | 78,282 | 2,814,238 |
| | | | 14,467,238 |
| Software - 7.2% | | | |
| 8x8 Inc (a)(b) | | 549,554 | 1,467,309 |
| Alarm.com Holdings Inc (a) | | 15,736 | 956,749 |
| Altair Engineering Inc Class A (a) | | 5,019 | 547,623 |
| Appian Corp Class A (a) | | 6,878 | 226,836 |
| Aurora Innovation Inc Class A (a)(b) | | 86,881 | 547,350 |
| AvePoint Inc Class A (a) | | 10,689 | 176,475 |
| Blackbaud Inc (a) | | 4,200 | 310,464 |
| BlackLine Inc (a) | | 12,887 | 783,014 |
| Cerence Inc (a)(b) | | 42,343 | 332,393 |
| Clear Secure Inc Class A | | 58,887 | 1,568,750 |
| Clearwater Analytics Holdings Inc Class A (a) | | 12,665 | 348,541 |
| Commvault Systems Inc (a) | | 17,160 | 2,589,616 |
| Domo Inc Class B (a)(b) | | 68,289 | 483,486 |
| Intapp Inc (a) | | 15,724 | 1,007,751 |
| Jamf Holding Corp (a) | | 20,722 | 291,144 |
| LivePerson Inc (a)(b) | | 116,442 | 176,992 |
| LiveRamp Holdings Inc (a) | | 13,963 | 424,056 |
| Logility Supply Chain Solutions Inc Class A | | 17,083 | 189,280 |
| Meridianlink Inc (a) | | 2,836 | 58,562 |
| PagerDuty Inc (a) | | 61,262 | 1,118,644 |
| Progress Software Corp | | 17,015 | 1,108,527 |
| PROS Holdings Inc (a)(b) | | 51,141 | 1,123,056 |
| Q2 Holdings Inc (a) | | 36,350 | 3,658,628 |
| Qualys Inc (a) | | 17,328 | 2,429,732 |
| SoundHound AI Inc Class A (a)(b) | | 33,146 | 657,617 |
| Sprout Social Inc Class A (a)(b) | | 13,005 | 399,384 |
| SPS Commerce Inc (a) | | 12,843 | 2,362,984 |
| Tenable Holdings Inc (a) | | 80,400 | 3,166,152 |
| Upland Software Inc (a) | | 19,729 | 85,624 |
| Weave Communications Inc (a) | | 48,086 | 765,529 |
| Workiva Inc Class A (a) | | 14,675 | 1,606,913 |
| Xperi Inc (a) | | 148,878 | 1,528,977 |
| Yext Inc (a)(b) | | 108,533 | 690,270 |
| Zuora Inc Class A (a) | | 70,893 | 703,259 |
| | | | 33,891,687 |
| Technology Hardware, Storage & Peripherals - 0.6% | | | |
| Diebold Nixdorf Inc (a) | | 19,311 | 831,145 |
| IonQ Inc (a)(b) | | 24,472 | 1,022,196 |
| Xerox Holdings Corp (b) | | 100,763 | 849,432 |
| | | | 2,702,773 |
TOTAL INFORMATION TECHNOLOGY | | | 69,264,395 |
| | | | |
| Materials - 4.9% | | | |
| Chemicals - 2.0% | | | |
| American Vanguard Corp | | 47,145 | 218,281 |
| Balchem Corp | | 3,019 | 492,082 |
| Hawkins Inc | | 13,257 | 1,626,236 |
| HB Fuller Co | | 33,459 | 2,257,814 |
| Minerals Technologies Inc | | 32,407 | 2,469,738 |
| Sensient Technologies Corp | | 30,101 | 2,144,997 |
| Trinseo PLC | | 42,860 | 218,586 |
| | | | 9,427,734 |
| Construction Materials - 0.6% | | | |
| Knife River Corp (a) | | 20,197 | 2,052,823 |
| United States Lime & Minerals Inc | | 5,946 | 789,272 |
| | | | 2,842,095 |
| Containers & Packaging - 0.2% | | | |
| Ardagh Metal Packaging SA | | 33,342 | 100,359 |
| Myers Industries Inc | | 2,639 | 29,134 |
| O-I Glass Inc (a) | | 76,284 | 826,919 |
| | | | 956,412 |
| Metals & Mining - 2.1% | | | |
| ATI Inc (a) | | 17,878 | 984,005 |
| Carpenter Technology Corp | | 22,756 | 3,861,921 |
| Coeur Mining Inc (a) | | 86,371 | 494,042 |
| Commercial Metals Co | | 13,205 | 654,968 |
| Hecla Mining Co | | 338,447 | 1,661,775 |
| Materion Corp | | 2,018 | 199,540 |
| Olympic Steel Inc | | 24,026 | 788,293 |
| SunCoke Energy Inc | | 93,568 | 1,001,178 |
| Worthington Steel Inc | | 2,791 | 88,809 |
| | | | 9,734,531 |
TOTAL MATERIALS | | | 22,960,772 |
| | | | |
| Real Estate - 4.3% | | | |
| Diversified REITs - 0.6% | | | |
| American Assets Trust Inc | | 59,584 | 1,564,676 |
| Empire State Realty Trust Inc Class A | | 124,659 | 1,286,481 |
| | | | 2,851,157 |
| Health Care REITs - 0.7% | | | |
| American Healthcare REIT Inc | | 33,385 | 948,802 |
| CareTrust REIT Inc | | 54,955 | 1,486,533 |
| Community Healthcare Trust Inc | | 12,644 | 242,891 |
| Diversified Healthcare Trust | | 42,135 | 96,910 |
| Global Medical REIT Inc | | 43,569 | 336,353 |
| Healthpeak Properties Inc | | 14,532 | 294,564 |
| | | | 3,406,053 |
| Hotel & Resort REITs - 0.0% | | | |
| Ashford Hospitality Trust Inc (a) | | 5,478 | 39,387 |
| Industrial REITs - 0.1% | | | |
| Terreno Realty Corp | | 4,996 | 295,463 |
| Office REITs - 0.3% | | | |
| COPT Defense Properties | | 33,506 | 1,037,011 |
| SL Green Realty Corp | | 8,768 | 595,522 |
| | | | 1,632,533 |
| Real Estate Management & Development - 1.0% | | | |
| Anywhere Real Estate Inc (a) | | 149,303 | 492,700 |
| Compass Inc Class A (a) | | 434,483 | 2,541,726 |
| eXp World Holdings Inc (b) | | 58,690 | 675,522 |
| Opendoor Technologies Inc Class A (a) | | 198,777 | 318,043 |
| RE/MAX Holdings Inc Class A (a) | | 10,579 | 112,878 |
| Redfin Corp (a)(b) | | 60,034 | 472,468 |
| RMR Group Inc/The Class A | | 3,589 | 74,076 |
| | | | 4,687,413 |
| Residential REITs - 0.0% | | | |
| Veris Residential Inc | | 11,891 | 197,747 |
| Retail REITs - 0.9% | | | |
| Alexander's Inc | | 1,250 | 250,075 |
| Macerich Co/The | | 76,284 | 1,519,577 |
| Phillips Edison & Co Inc | | 40,549 | 1,518,966 |
| Tanger Inc | | 13,291 | 453,622 |
| Whitestone REIT | | 36,323 | 514,697 |
| | | | 4,256,937 |
| Specialized REITs - 0.7% | | | |
| Outfront Media Inc | | 145,907 | 2,588,390 |
| Safehold Inc | | 11,964 | 221,095 |
| Uniti Group Inc | | 61,484 | 338,162 |
| | | | 3,147,647 |
TOTAL REAL ESTATE | | | 20,514,337 |
| | | | |
| Utilities - 0.8% | | | |
| Gas Utilities - 0.6% | | | |
| New Jersey Resources Corp | | 25,806 | 1,203,850 |
| Southwest Gas Holdings Inc | | 22,679 | 1,603,632 |
| | | | 2,807,482 |
| Independent Power and Renewable Electricity Producers - 0.0% | | | |
| Sunnova Energy International Inc (a) | | 20,303 | 69,639 |
| Multi-Utilities - 0.1% | | | |
| Avista Corp | | 7,053 | 258,351 |
| Water Utilities - 0.1% | | | |
| Consolidated Water Co Ltd | | 5,119 | 132,531 |
| SJW Group | | 6,237 | 306,985 |
| | | | 439,516 |
TOTAL UTILITIES | | | 3,574,988 |
| | | | |
| TOTAL UNITED STATES | | | 454,109,414 |
| TOTAL COMMON STOCKS (Cost $402,258,381) | | | 463,218,943 |
| | | | |
| Money Market Funds - 7.3% |
| | | Yield (%) | Shares | Value ($) |
| Fidelity Cash Central Fund (d) | | 4.36 | 6,205,308 | 6,206,549 |
| Fidelity Securities Lending Cash Central Fund (d)(e) | | 4.35 | 28,205,054 | 28,207,874 |
| TOTAL MONEY MARKET FUNDS (Cost $34,414,423) | | | | 34,414,423 |
| | | | | |
| TOTAL INVESTMENT IN SECURITIES - 105.3% (Cost $436,672,804) | 497,633,366 |
NET OTHER ASSETS (LIABILITIES) - (5.3)% | (25,157,664) |
| NET ASSETS - 100.0% | 472,475,702 |
| | |
| Futures Contracts |
| | Number of contracts | Expiration Date | Notional Amount ($) | Value ($) | Unrealized Appreciation/ (Depreciation) ($) |
| Purchased | | | | | |
| | | | | | |
| Equity Contracts | | | | | |
| CME E-mini Russell 2000 Index Contracts (United States) | 57 | Mar 2025 | 6,411,930 | (175,441) | (175,441) |
| | | | | | |
| The notional amount of futures purchased as a percentage of Net Assets is 1.4% |
Legend
| (b) | Security or a portion of the security is on loan at period end. |
| (d) | Affiliated fund that is generally available only to investment companies and other accounts managed by Fidelity Investments. The rate quoted is the annualized seven-day yield of the fund at period end. A complete unaudited listing of the fund's holdings as of its most recent quarter end is available upon request. In addition, each Fidelity Central Fund's financial statements, which are not covered by the Fund's Report of Independent Registered Public Accounting Firm, are available on the SEC's website or upon request. |
| (e) | Investment made with cash collateral received from securities on loan. |
Affiliated Central Funds
Fiscal year to date information regarding the Fund's investments in Fidelity Central Funds, including the ownership percentage, is presented below.
| Affiliate | Value, beginning of period ($) | Purchases ($) | Sales Proceeds ($) | Dividend Income ($) | Realized Gain (loss) ($) | Change in Unrealized appreciation (depreciation) ($) | Value, end of period ($) | Shares, end of period | % ownership, end of period |
| Fidelity Cash Central Fund | 9,388,082 | 106,999,871 | 110,181,435 | 388,432 | 31 | - | 6,206,549 | 6,205,308 | 0.0% |
| Fidelity Securities Lending Cash Central Fund | 18,624,405 | 150,806,324 | 141,222,855 | 60,800 | - | - | 28,207,874 | 28,205,054 | 0.1% |
| Total | 28,012,487 | 257,806,195 | 251,404,290 | 449,232 | 31 | - | 34,414,423 | 34,410,362 | |
| | | | | | | | | | |
Amounts in the dividend income column in the above table include any capital gain distributions from underlying funds, which are presented in the corresponding line item in the Statement of Operations, if applicable.
Amounts in the dividend income column for Fidelity Securities Lending Cash Central Fund represents the income earned on investing cash collateral, less rebates paid to borrowers and any lending agent fees associated with the loan, plus any premium payments received for lending certain types of securities.
Amounts included in the purchases and sales proceeds columns may include in-kind transactions, if applicable.
Investment Valuation
The following is a summary of the inputs used, as of December 31, 2024, involving the Fund's assets and liabilities carried at fair value. The inputs or methodology used for valuing securities may not be an indication of the risk associated with investing in those securities. For more information on valuation inputs, and their aggregation into the levels used below, please refer to the Investment Valuation section in the accompanying Notes to Financial Statements.
| Valuation Inputs at Reporting Date: |
| Description | Total ($) | Level 1 ($) | Level 2 ($) | Level 3 ($) |
Investments in Securities: | | | | |
|
| Common Stocks | | | | |
Communication Services | 14,867,459 | 14,867,459 | - | - |
Consumer Discretionary | 48,337,006 | 48,337,006 | - | - |
Consumer Staples | 15,640,428 | 15,640,428 | - | - |
Energy | 24,182,953 | 24,182,953 | - | - |
Financials | 86,922,688 | 86,922,688 | - | - |
Health Care | 74,041,220 | 74,018,060 | - | 23,160 |
Industrials | 79,913,534 | 79,913,534 | - | - |
Information Technology | 72,263,558 | 72,263,558 | - | - |
Materials | 22,960,772 | 22,960,772 | - | - |
Real Estate | 20,514,337 | 20,514,337 | - | - |
Utilities | 3,574,988 | 3,574,988 | - | - |
|
| Money Market Funds | 34,414,423 | 34,414,423 | - | - |
| Total Investments in Securities: | 497,633,366 | 497,610,206 | - | 23,160 |
Derivative Instruments: Liabilities | | | | |
Futures Contracts | (175,441) | (175,441) | - | - |
| Total Liabilities | (175,441) | (175,441) | - | - |
| Total Derivative Instruments: | (175,441) | (175,441) | - | - |
Value of Derivative Instruments
The following table is a summary of the Fund's value of derivative instruments by primary risk exposure as of December 31, 2024. For additional information on derivative instruments, please refer to the Derivative Instruments section in the accompanying Notes to Financial Statements.
Primary Risk Exposure / Derivative Type | Value |
| Asset ($) | Liability ($) |
| Equity Risk | | |
Futures Contracts (a) | 0 | (175,441) |
| Total Equity Risk | 0 | (175,441) |
| Total Value of Derivatives | 0 | (175,441) |
(a)Reflects gross cumulative appreciation (depreciation) on futures contracts as presented in the Schedule of Investments. In the Statement of Assets and Liabilities, the period end daily variation margin is included in receivable or payable for daily variation margin on futures contracts, and the net cumulative appreciation (depreciation) is included in Total accumulated earnings (loss).
Financial Statements
| Statement of Assets and Liabilities |
As of December 31, 2024 |
| Assets | | | | |
| Investment in securities, at value (including securities loaned of $26,769,171) - See accompanying schedule: | | | | |
Unaffiliated issuers (cost $402,258,381) | $ | 463,218,943 | | |
Fidelity Central Funds (cost $34,414,423) | | 34,414,423 | | |
| | | | | |
| | | | | |
| Total Investment in Securities (cost $436,672,804) | | | $ | 497,633,366 |
| Segregated cash with brokers for derivative instruments | | | | 502,311 |
| Cash | | | | 55,469 |
| Receivable for investments sold | | | | 7,562,716 |
| Receivable for fund shares sold | | | | 272,480 |
| Dividends receivable | | | | 394,893 |
| Distributions receivable from Fidelity Central Funds | | | | 38,566 |
| Receivable for daily variation margin on futures contracts | | | | 6,351 |
| Prepaid expenses | | | | 355 |
Total assets | | | | 506,466,507 |
| Liabilities | | | | |
| Payable for investments purchased | $ | 5,461,006 | | |
| Payable for fund shares redeemed | | 112,686 | | |
| Accrued management fee | | 150,667 | | |
| Distribution and service plan fees payable | | 10,228 | | |
| Other payables and accrued expenses | | 51,505 | | |
| Collateral on securities loaned | | 28,204,713 | | |
| Total liabilities | | | | 33,990,805 |
| Net Assets | | | $ | 472,475,702 |
| Net Assets consist of: | | | | |
| Paid in capital | | | $ | 377,967,598 |
| Total accumulated earnings (loss) | | | | 94,508,104 |
| Net Assets | | | $ | 472,475,702 |
| | | | | |
| Net Asset Value and Maximum Offering Price | | | | |
| Initial Class : | | | | |
Net Asset Value, offering price and redemption price per share ($36,379,027 ÷ 1,938,020 shares) | | | $ | 18.77 |
| Service Class : | | | | |
Net Asset Value, offering price and redemption price per share ($5,797,374 ÷ 307,768 shares) | | | $ | 18.84 |
| Service Class 2 : | | | | |
Net Asset Value, offering price and redemption price per share ($44,833,061 ÷ 2,385,564 shares) | | | $ | 18.79 |
| Investor Class : | | | | |
Net Asset Value, offering price and redemption price per share ($385,466,240 ÷ 20,672,480 shares) | | | $ | 18.65 |
| Statement of Operations |
| Year ended December 31, 2024 |
| Investment Income | | | | |
| Dividends | | | $ | 4,874,174 |
| Interest | | | | 24,423 |
| Income from Fidelity Central Funds (including $60,800 from security lending) | | | | 449,232 |
| Total income | | | | 5,347,829 |
| Expenses | | | | |
| Management fee | $ | 1,330,379 | | |
| Transfer agent fees | | 198,486 | | |
| Distribution and service plan fees | | 90,394 | | |
| Accounting fees | | 56,642 | | |
| Custodian fees and expenses | | 10,585 | | |
| Independent trustees' fees and expenses | | 1,745 | | |
| Audit fees | | 53,848 | | |
| Legal | | 12,723 | | |
| Miscellaneous | | 10,650 | | |
| Total expenses before reductions | | 1,765,452 | | |
| Expense reductions | | (2,888) | | |
| Total expenses after reductions | | | | 1,762,564 |
| Net Investment income (loss) | | | | 3,585,265 |
| Realized and Unrealized Gain (Loss) | | | | |
| Net realized gain (loss) on: | | | | |
| Investment Securities: | | | | |
| Unaffiliated issuers | | 49,984,933 | | |
| Fidelity Central Funds | | 31 | | |
| Futures contracts | | (426,457) | | |
| Total net realized gain (loss) | | | | 49,558,507 |
| Change in net unrealized appreciation (depreciation) on: | | | | |
| Investment Securities: | | | | |
| Unaffiliated issuers | | 8,547,489 | | |
| Futures contracts | | (465,814) | | |
| Total change in net unrealized appreciation (depreciation) | | | | 8,081,675 |
| Net gain (loss) | | | | 57,640,182 |
| Net increase (decrease) in net assets resulting from operations | | | $ | 61,225,447 |
| Statement of Changes in Net Assets |
| |
| | Year ended December 31, 2024 | | Year ended December 31, 2023 |
| Increase (Decrease) in Net Assets | | | | |
| Operations | | | | |
| Net investment income (loss) | $ | 3,585,265 | $ | 3,035,791 |
| Net realized gain (loss) | | 49,558,507 | | 8,907,977 |
| Change in net unrealized appreciation (depreciation) | | 8,081,675 | | 50,232,166 |
| Net increase (decrease) in net assets resulting from operations | | 61,225,447 | | 62,175,934 |
| Distributions to shareholders | | (7,157,877) | | (3,253,587) |
| | | | | |
| Share transactions - net increase (decrease) | | 43,051,671 | | 6,641,370 |
| Total increase (decrease) in net assets | | 97,119,241 | | 65,563,717 |
| | | | | |
| Net Assets | | | | |
| Beginning of period | | 375,356,461 | | 309,792,744 |
| End of period | $ | 472,475,702 | $ | 375,356,461 |
| | | | | |
| | | | | |
Financial Highlights
VIP Disciplined Small Cap Portfolio Initial Class |
| |
| Years ended December 31, | | 2024 | | 2023 | | 2022 | | 2021 | | 2020 |
Selected Per-Share Data | | | | | | | | | | |
| Net asset value, beginning of period | $ | 16.30 | $ | 13.62 | $ | 20.38 | $ | 17.27 | $ | 14.68 |
| Income from Investment Operations | | | | | | | | | | |
Net investment income (loss) A,B | | .16 | | .15 | | .14 | | .10 | | .10 |
| Net realized and unrealized gain (loss) | | 2.61 | | 2.69 | | (3.56) | | 3.44 | | 2.60 |
| Total from investment operations | | 2.77 | | 2.84 | | (3.42) | | 3.54 | | 2.70 |
| Distributions from net investment income | | (.19) | | (.16) | | (.13) | | (.08) | | (.11) |
| Distributions from net realized gain | | (.11) | | - | | (3.21) | | (.35) | | - |
| Total distributions | | (.30) | | (.16) | | (3.34) | | (.43) | | (.11) |
| Net asset value, end of period | $ | 18.77 | $ | 16.30 | $ | 13.62 | $ | 20.38 | $ | 17.27 |
Total Return C,D | | | | 20.96% | | (18.23)% | | 20.66% | | 18.45% |
Ratios to Average Net Assets B,E,F | | | | | | | | | | |
| Expenses before reductions | | .38% | | .46% | | .49% | | .57% | | .60% |
| Expenses net of fee waivers, if any | | | | .46% | | .49% | | .57% | | .60% |
| Expenses net of all reductions | | .38% | | .46% | | .49% | | .57% | | .60% |
| Net investment income (loss) | | .90% | | 1.00% | | .96% | | .48% | | .77% |
| Supplemental Data | | | | | | | | | | |
| Net assets, end of period (000 omitted) | $ | 36,379 | $ | 29,418 | $ | 25,329 | $ | 30,964 | $ | 23,919 |
Portfolio turnover rate G | | | | 100% | | 102% | | 92% | | 57% |
ACalculated based on average shares outstanding during the period.
BNet investment income (loss) is affected by the timing of the declaration of dividends by any underlying mutual funds or exchange-traded funds (ETFs). Net investment income (loss) of any mutual funds or ETFs is not included in the Fund's net investment income (loss) ratio.
CTotal returns do not reflect charges attributable to your insurance company's separate account. Inclusion of these charges would reduce the total returns shown.
DTotal returns would have been lower if certain expenses had not been reduced during the applicable periods shown.
EFees and expenses of any underlying mutual funds or exchange-traded funds (ETFs) are not included in the Fund's expense ratio. The Fund indirectly bears its proportionate share of these expenses. For additional expense information related to investments in Fidelity Central Funds, please refer to the "Investments in Fidelity Central Funds" note found in the Notes to Financial Statements section of the most recent Annual or Semi-Annual report.
FExpense ratios reflect operating expenses of the class. Expenses before reductions do not reflect amounts reimbursed, waived, or reduced through arrangements with the investment adviser, brokerage services, or other offset arrangements, if applicable, and do not represent the amount paid by the class during periods when reimbursements, waivers or reductions occur.
GAmount does not include the portfolio activity of any underlying mutual funds or exchange-traded funds (ETFs), derivatives or securities that mature within one year from acquisition.
VIP Disciplined Small Cap Portfolio Service Class |
| |
| Years ended December 31, | | 2024 | | 2023 | | 2022 | | 2021 | | 2020 |
Selected Per-Share Data | | | | | | | | | | |
| Net asset value, beginning of period | $ | 16.37 | $ | 13.68 | $ | 20.45 | $ | 17.33 | $ | 14.74 |
| Income from Investment Operations | | | | | | | | | | |
Net investment income (loss) A,B | | .16 | | .13 | | .13 | | .08 | | .09 |
| Net realized and unrealized gain (loss) | | 2.61 | | 2.70 | | (3.58) | | 3.46 | | 2.59 |
| Total from investment operations | | 2.77 | | 2.83 | | (3.45) | | 3.54 | | 2.68 |
| Distributions from net investment income | | (.19) | | (.14) | | (.11) | | (.06) | | (.09) |
| Distributions from net realized gain | | (.11) | | - | | (3.21) | | (.35) | | - |
| Total distributions | | (.30) | | (.14) | | (3.32) | | (.42) C | | (.09) |
| Net asset value, end of period | $ | 18.84 | $ | 16.37 | $ | 13.68 | $ | 20.45 | $ | 17.33 |
Total Return D,E | | | | 20.83% | | (18.30)% | | 20.53% | | 18.28% |
Ratios to Average Net Assets B,F,G | | | | | | | | | | |
| Expenses before reductions | | .46% | | .56% | | .59% | | .67% | | .70% |
| Expenses net of fee waivers, if any | | | | .56% | | .59% | | .67% | | .70% |
| Expenses net of all reductions | | .46% | | .56% | | .59% | | .67% | | .70% |
| Net investment income (loss) | | .82% | | .90% | | .86% | | .38% | | .67% |
| Supplemental Data | | | | | | | | | | |
| Net assets, end of period (000 omitted) | $ | 5,797 | $ | 241 | $ | 201 | $ | 301 | $ | 255 |
Portfolio turnover rate H | | | | 100% | | 102% | | 92% | | 57% |
ACalculated based on average shares outstanding during the period.
BNet investment income (loss) is affected by the timing of the declaration of dividends by any underlying mutual funds or exchange-traded funds (ETFs). Net investment income (loss) of any mutual funds or ETFs is not included in the Fund's net investment income (loss) ratio.
CTotal distributions per share do not sum due to rounding.
DTotal returns do not reflect charges attributable to your insurance company's separate account. Inclusion of these charges would reduce the total returns shown.
ETotal returns would have been lower if certain expenses had not been reduced during the applicable periods shown.
FFees and expenses of any underlying mutual funds or exchange-traded funds (ETFs) are not included in the Fund's expense ratio. The Fund indirectly bears its proportionate share of these expenses. For additional expense information related to investments in Fidelity Central Funds, please refer to the "Investments in Fidelity Central Funds" note found in the Notes to Financial Statements section of the most recent Annual or Semi-Annual report.
GExpense ratios reflect operating expenses of the class. Expenses before reductions do not reflect amounts reimbursed, waived, or reduced through arrangements with the investment adviser, brokerage services, or other offset arrangements, if applicable, and do not represent the amount paid by the class during periods when reimbursements, waivers or reductions occur.
HAmount does not include the portfolio activity of any underlying mutual funds or exchange-traded funds (ETFs), derivatives or securities that mature within one year from acquisition.
VIP Disciplined Small Cap Portfolio Service Class 2 |
| |
| Years ended December 31, | | 2024 | | 2023 | | 2022 | | 2021 | | 2020 |
Selected Per-Share Data | | | | | | | | | | |
| Net asset value, beginning of period | $ | 16.33 | $ | 13.65 | $ | 20.42 | $ | 17.30 | $ | 14.72 |
| Income from Investment Operations | | | | | | | | | | |
Net investment income (loss) A,B | | .12 | | .11 | | .10 | | .05 | | .07 |
| Net realized and unrealized gain (loss) | | 2.60 | | 2.70 | | (3.57) | | 3.46 | | 2.59 |
| Total from investment operations | | 2.72 | | 2.81 | | (3.47) | | 3.51 | | 2.66 |
| Distributions from net investment income | | (.16) | | (.13) | | (.09) | | (.03) | | (.08) |
| Distributions from net realized gain | | (.11) | | - | | (3.21) | | (.35) | | - |
| Total distributions | | (.26) C | | (.13) | | (3.30) | | (.39) C | | (.08) |
| Net asset value, end of period | $ | 18.79 | $ | 16.33 | $ | 13.65 | $ | 20.42 | $ | 17.30 |
Total Return D,E | | | | 20.67% | | (18.45)% | | 20.39% | | 18.12% |
Ratios to Average Net Assets B,F,G | | | | | | | | | | |
| Expenses before reductions | | .63% | | .71% | | .74% | | .82% | | .85% |
| Expenses net of fee waivers, if any | | | | .71% | | .74% | | .82% | | .85% |
| Expenses net of all reductions | | .62% | | .71% | | .74% | | .82% | | .85% |
| Net investment income (loss) | | .65% | | .75% | | .71% | | .23% | | .52% |
| Supplemental Data | | | | | | | | | | |
| Net assets, end of period (000 omitted) | $ | 44,833 | $ | 28,724 | $ | 18,360 | $ | 20,389 | $ | 13,720 |
Portfolio turnover rate H | | | | 100% | | 102% | | 92% | | 57% |
ACalculated based on average shares outstanding during the period.
BNet investment income (loss) is affected by the timing of the declaration of dividends by any underlying mutual funds or exchange-traded funds (ETFs). Net investment income (loss) of any mutual funds or ETFs is not included in the Fund's net investment income (loss) ratio.
CTotal distributions per share do not sum due to rounding.
DTotal returns do not reflect charges attributable to your insurance company's separate account. Inclusion of these charges would reduce the total returns shown.
ETotal returns would have been lower if certain expenses had not been reduced during the applicable periods shown.
FFees and expenses of any underlying mutual funds or exchange-traded funds (ETFs) are not included in the Fund's expense ratio. The Fund indirectly bears its proportionate share of these expenses. For additional expense information related to investments in Fidelity Central Funds, please refer to the "Investments in Fidelity Central Funds" note found in the Notes to Financial Statements section of the most recent Annual or Semi-Annual report.
GExpense ratios reflect operating expenses of the class. Expenses before reductions do not reflect amounts reimbursed, waived, or reduced through arrangements with the investment adviser, brokerage services, or other offset arrangements, if applicable, and do not represent the amount paid by the class during periods when reimbursements, waivers or reductions occur.
HAmount does not include the portfolio activity of any underlying mutual funds or exchange-traded funds (ETFs), derivatives or securities that mature within one year from acquisition.
VIP Disciplined Small Cap Portfolio Investor Class |
| |
| Years ended December 31, | | 2024 | | 2023 | | 2022 | | 2021 | | 2020 |
Selected Per-Share Data | | | | | | | | | | |
| Net asset value, beginning of period | $ | 16.20 | $ | 13.54 | $ | 20.28 | $ | 17.18 | $ | 14.61 |
| Income from Investment Operations | | | | | | | | | | |
Net investment income (loss) A,B | | .15 | | .13 | | .13 | | .08 | | .09 |
| Net realized and unrealized gain (loss) | | 2.59 | | 2.68 | | (3.54) | | 3.44 | | 2.58 |
| Total from investment operations | | 2.74 | | 2.81 | | (3.41) | | 3.52 | | 2.67 |
| Distributions from net investment income | | (.18) | | (.15) | | (.12) | | (.07) | | (.10) |
| Distributions from net realized gain | | (.11) | | - | | (3.21) | | (.35) | | - |
| Total distributions | | (.29) | | (.15) | | (3.33) | | (.42) | | (.10) |
| Net asset value, end of period | $ | 18.65 | $ | 16.20 | $ | 13.54 | $ | 20.28 | $ | 17.18 |
Total Return C,D | | | | 20.85% | | (18.29)% | | 20.62% | | 18.33% |
Ratios to Average Net Assets B,E,F | | | | | | | | | | |
| Expenses before reductions | | .41% | | .54% | | .57% | | .65% | | .67% |
| Expenses net of fee waivers, if any | | | | .54% | | .57% | | .65% | | .67% |
| Expenses net of all reductions | | .40% | | .54% | | .57% | | .65% | | .67% |
| Net investment income (loss) | | .87% | | .92% | | .88% | | .41% | | .70% |
| Supplemental Data | | | | | | | | | | |
| Net assets, end of period (000 omitted) | $ | 385,466 | $ | 316,973 | $ | 265,902 | $ | 355,854 | $ | 256,709 |
Portfolio turnover rate G | | | | 100% | | 102% | | 92% | | 57% |
ACalculated based on average shares outstanding during the period.
BNet investment income (loss) is affected by the timing of the declaration of dividends by any underlying mutual funds or exchange-traded funds (ETFs). Net investment income (loss) of any mutual funds or ETFs is not included in the Fund's net investment income (loss) ratio.
CTotal returns do not reflect charges attributable to your insurance company's separate account. Inclusion of these charges would reduce the total returns shown.
DTotal returns would have been lower if certain expenses had not been reduced during the applicable periods shown.
EFees and expenses of any underlying mutual funds or exchange-traded funds (ETFs) are not included in the Fund's expense ratio. The Fund indirectly bears its proportionate share of these expenses. For additional expense information related to investments in Fidelity Central Funds, please refer to the "Investments in Fidelity Central Funds" note found in the Notes to Financial Statements section of the most recent Annual or Semi-Annual report.
FExpense ratios reflect operating expenses of the class. Expenses before reductions do not reflect amounts reimbursed, waived, or reduced through arrangements with the investment adviser, brokerage services, or other offset arrangements, if applicable, and do not represent the amount paid by the class during periods when reimbursements, waivers or reductions occur.
GAmount does not include the portfolio activity of any underlying mutual funds or exchange-traded funds (ETFs), derivatives or securities that mature within one year from acquisition.
Notes to Financial Statements
For the period ended December 31, 2024
1. Organization.
VIP Disciplined Small Cap Portfolio (the Fund) is a fund of Variable Insurance Products Fund II (the Trust) and is authorized to issue an unlimited number of shares. The Trust is registered under the Investment Company Act of 1940, as amended (the 1940 Act), as an open-end management investment company organized as a Massachusetts business trust. Shares of the Fund may only be purchased by insurance companies for the purpose of funding variable annuity or variable life insurance contracts. The Fund offers the following classes of shares: Initial Class shares, Service Class shares, Service Class 2 shares and Investor Class shares. All classes have equal rights and voting privileges, except for matters affecting a single class.
2. Investments in Fidelity Central Funds.
Funds may invest in Fidelity Central Funds, which are open-end investment companies generally available only to other investment companies and accounts managed by the investment adviser and its affiliates. The Schedule of Investments lists any Fidelity Central Funds held as an investment as of period end, but does not include the underlying holdings of each Fidelity Central Fund. An investing fund indirectly bears its proportionate share of the expenses of the underlying Fidelity Central Funds.
Based on its investment objective, each Fidelity Central Fund may invest or participate in various investment vehicles or strategies that are similar to those of the investing fund. These strategies are consistent with the investment objectives of the investing fund and may involve certain economic risks which may cause a decline in value of each of the Fidelity Central Funds and thus a decline in the value of the investing fund.
| Fidelity Central Fund | Investment Manager | Investment Objective | Investment Practices | Expense RatioA |
| Fidelity Money Market Central Funds | Fidelity Management & Research Company LLC (FMR) | Each fund seeks to obtain a high level of current income consistent with the preservation of capital and liquidity. | Short-term Investments | Less than .005% |
A Expenses expressed as a percentage of average net assets and are as of each underlying Central Fund's most recent annual or semi-annual shareholder report.
A complete unaudited list of holdings for each Fidelity Central Fund is available upon request or at the Securities and Exchange Commission website at www.sec.gov. In addition, the financial statements of the Fidelity Central Funds which contain the significant accounting policies (including investment valuation policies) of those funds, and are not covered by the Report of Independent Registered Public Accounting Firm, are available on the Securities and Exchange Commission website or upon request.
3. Significant Accounting Policies.
The Fund is an investment company and applies the accounting and reporting guidance of the Financial Accounting Standards Board (FASB) Accounting Standards Codification Topic 946 Financial Services - Investment Companies. The financial statements have been prepared in conformity with accounting principles generally accepted in the United States of America (GAAP), which require management to make certain estimates and assumptions at the date of the financial statements. Actual results could differ from those estimates. The Fund operates as a single operating segment. The Fund's income, expenses, assets, and performance are regularly monitored and assessed as a whole by the investment adviser and other individuals responsible for oversight functions of the Trust, using the information presented in the financial statements and financial highlights. Subsequent events, if any, through the date that the financial statements were issued have been evaluated in the preparation of the financial statements. The Fund's Schedule of Investments lists any underlying mutual funds or exchange-traded funds (ETFs) but does not include the underlying holdings of these funds. The following summarizes the significant accounting policies of the Fund:
Investment Valuation. Investments are valued as of 4:00 p.m. Eastern time on the last calendar day of the period. The Board of Trustees (the Board) has designated the Fund's investment adviser as the valuation designee responsible for the fair valuation function and performing fair value determinations as needed. The investment adviser has established a Fair Value Committee (the Committee) to carry out the day-to-day fair valuation responsibilities and has adopted policies and procedures to govern the fair valuation process and the activities of the Committee. In accordance with these fair valuation policies and procedures, which have been approved by the Board, the Fund attempts to obtain prices from one or more third party pricing services or brokers to value its investments. When current market prices, quotations or currency exchange rates are not readily available or reliable, investments will be fair valued in good faith by the Committee, in accordance with the policies and procedures. Factors used in determining fair value vary by investment type and may include market or investment specific events, transaction data, estimated cash flows, and market observations of comparable investments. The frequency that the fair valuation procedures are used cannot be predicted and they may be utilized to a significant extent. The Committee manages the Fund's fair valuation practices and maintains the fair valuation policies and procedures. The Fund's investment adviser reports to the Board information regarding the fair valuation process and related material matters.
The Fund categorizes the inputs to valuation techniques used to value its investments into a disclosure hierarchy consisting of three levels as shown below:
Level 1 - unadjusted quoted prices in active markets for identical investments
Level 2 - other significant observable inputs (including quoted prices for similar investments, interest rates, prepayment speeds, etc.)
Level 3 - unobservable inputs (including the Fund's own assumptions based on the best information available)
Valuation techniques used to value the Fund's investments by major category are as follows:
Equity securities, including restricted securities, for which market quotations are readily available, are valued at the last reported sale price or official closing price as reported by a third party pricing service on the primary market or exchange on which they are traded and are categorized as Level 1 in the hierarchy. In the event there were no sales during the day or closing prices are not available, securities are valued at the last quoted bid price or may be valued using the last available price and are generally categorized as Level 2 in the hierarchy. For foreign equity securities, when market or security specific events arise, comparisons to the valuation of American Depositary Receipts (ADRs), futures contracts, Exchange-Traded Funds (ETFs) and certain indexes as well as quoted prices for similar securities may be used and would be categorized as Level 2 in the hierarchy. For equity securities, including restricted securities, where observable inputs are limited, assumptions about market activity and risk are used and these securities may be categorized as Level 3 in the hierarchy.
Futures contracts are valued at the settlement price established each day by the board of trade or exchange on which they are traded and are categorized as Level 1 in the hierarchy.
Investments in open-end mutual funds, including the Fidelity Central Funds, are valued at their closing net asset value (NAV) each business day and are categorized as Level 1 in the hierarchy.
Changes in valuation techniques may result in transfers in or out of an assigned level within the disclosure hierarchy. The aggregate value of investments by input level as of December 31, 2024 is included at the end of the Fund's Schedule of Investments.
Investment Transactions and Income. For financial reporting purposes, the Fund's investment holdings and NAV include trades executed through the end of the last business day of the period. The NAV per share for processing shareholder transactions is calculated as of the close of business of the New York Stock Exchange (NYSE), normally 4:00 p.m. Eastern time and includes trades executed through the end of the prior business day. Gains and losses on securities sold are determined on the basis of identified cost and include proceeds received from litigation. Commissions paid to certain brokers with whom the investment adviser, or its affiliates, places trades on behalf of a fund include an amount in addition to trade execution, which may be rebated back to a fund. Any such rebates are included in net realized gain (loss) on investments in the Statement of Operations. Dividend income is recorded on the ex-dividend date, except for certain dividends from foreign securities where the ex-dividend date may have passed, which are recorded as soon as the Fund is informed of the ex-dividend date. Non-cash dividends included in dividend income, if any, are recorded at the fair market value of the securities received. Income and capital gain distributions from Fidelity Central Funds, if any, are recorded on the ex-dividend date. Certain distributions received by the Fund represent a return of capital or capital gain. The Fund determines the components of these distributions subsequent to the ex-dividend date, based upon receipt of tax filings or other correspondence relating to the underlying investment. These distributions are recorded as a reduction of cost of investments and/or as a realized gain.
Class Allocations and Expenses. Investment income, realized and unrealized capital gains and losses, common expenses of a fund, and certain fund-level expense reductions, if any, are allocated daily on a pro-rata basis to each class based on the relative net assets of each class to the total net assets of a fund. Each class differs with respect to transfer agent and distribution and service plan fees incurred, as applicable. Certain expense reductions may also differ by class, if applicable. For the reporting period, the allocated portion of income and expenses to each class as a percent of its average net assets may vary due to the timing of recording these transactions in relation to fluctuating net assets of the classes. Expenses directly attributable to a fund are charged to that fund. Expenses attributable to more than one fund are allocated among the respective funds on the basis of relative net assets or other appropriate methods. Expenses included in the accompanying financial statements reflect the expenses of that fund and do not include any expenses associated with any underlying mutual funds or exchange-traded funds (ETFs). Although not included in a fund's expenses, a fund indirectly bears its proportionate share of these expenses through the net asset value of each underlying mutual fund or exchange-traded fund (ETF). Expense estimates are accrued in the period to which they relate and adjustments are made when actual amounts are known.
Income Tax Information and Distributions to Shareholders. Each year, the Fund intends to qualify as a regulated investment company under Subchapter M of the Internal Revenue Code, including distributing substantially all of its taxable income and realized gains. As a result, no provision for U.S. Federal income taxes is required. As of December 31, 2024, the Fund did not have any unrecognized tax benefits in the financial statements; nor is the Fund aware of any tax positions for which it is reasonably possible that the total amounts of unrecognized tax benefits will significantly change in the next twelve months. The Fund files a U.S. federal tax return, in addition to state and local tax returns as required. The Fund's federal income tax returns are subject to examination by the Internal Revenue Service (IRS) for a period of three fiscal years after they are filed. State and local tax returns may be subject to examination for an additional fiscal year depending on the jurisdiction.
Distributions are declared and recorded on the ex-dividend date. Income and capital gain distributions are declared separately for each class. Income and capital gain distributions are determined in accordance with income tax regulations, which may differ from GAAP.
Capital accounts within the financial statements are adjusted for permanent book-tax differences. These adjustments have no impact on net assets or the results of operations. Capital accounts are not adjusted for temporary book-tax differences which will reverse in a subsequent period.
Book-tax differences are primarily due to futures contracts, passive foreign investment companies (PFIC), capital loss carryforwards and losses deferred due to wash sales.
As of period end, the cost and unrealized appreciation (depreciation) in securities, and derivatives if applicable, for federal income tax purposes were as follows:
| Gross unrealized appreciation | $96,654,187 |
| Gross unrealized depreciation | (38,397,565) |
| Net unrealized appreciation (depreciation) | $58,256,622 |
| Tax Cost | $439,376,744 |
The tax-based components of distributable earnings as of period end were as follows:
| Undistributed ordinary income | $6,057,807 |
| Undistributed long-term capital gain | $30,193,673 |
| Net unrealized appreciation (depreciation) on securities and other investments | $58,256,622 |
The tax character of distributions paid was as follows:
| | December 31, 2024 | December 31, 2023 |
| Ordinary Income | $7,157,877 | $3,253,587 |
New Accounting Pronouncement. FASB Accounting Standards Update (ASU) 2023-07 Segment Reporting (Topic 280): Improvements to Reportable Segment Disclosures became effective in this reporting period. ASU 2023-07 enhances segment information disclosure in the notes to financial statements.
4. Derivative Instruments.
Risk Exposures and the Use of Derivative Instruments. The Fund's investment objectives allow for various types of derivative instruments, including futures contracts. Derivatives are investments whose value is primarily derived from underlying assets, indices or reference rates and may be transacted on an exchange or over-the-counter (OTC). Derivatives may involve a future commitment to buy or sell a specified asset based on specified terms, to exchange future cash flows at periodic intervals based on a notional principal amount, or for one party to make one or more payments upon the occurrence of specified events in exchange for periodic payments from the other party.
Derivatives were used to increase returns and to manage exposure to certain risks as defined below. The success of any strategy involving derivatives depends on analysis of numerous economic factors, and if the strategies for investment do not work as intended, the objectives may not be achieved.
Derivatives were used to increase or decrease exposure to the following risk(s):
| | |
| Equity Risk | Equity risk relates to the fluctuations in the value of financial instruments as a result of changes in market prices (other than those arising from interest rate risk or foreign exchange risk), whether caused by factors specific to an individual investment, its issuer, or all factors affecting all instruments traded in a market or market segment. |
Funds are also exposed to additional risks from investing in derivatives, such as liquidity risk and counterparty credit risk. Liquidity risk is the risk that a fund will be unable to close out the derivative in the open market in a timely manner. Counterparty credit risk is the risk that the counterparty will not be able to fulfill its obligation to a fund. Counterparty credit risk related to exchange-traded contracts may be mitigated by the protection provided by the exchange on which they trade.
Investing in derivatives may involve greater risks than investing in the underlying assets directly and, to varying degrees, may involve risk of loss in excess of any initial investment and collateral received and amounts recognized in the Statement of Assets and Liabilities. In addition, there may be the risk that the change in value of the derivative contract does not correspond to the change in value of the underlying instrument.
Futures Contracts. A futures contract is an agreement between two parties to buy or sell a specified underlying instrument for a fixed price at a specified future date. Futures contracts were used to manage exposure to the stock market.
Upon entering into a futures contract, a fund is required to deposit either cash or securities (initial margin) with a clearing broker in an amount equal to a certain percentage of the face value of the contract. Futures contracts are marked-to-market daily and subsequent daily payments are made or received by a fund depending on the daily fluctuations in the value of the futures contracts and are recorded as unrealized appreciation or (depreciation). This receivable and/or payable, if any, is included in daily variation margin on futures contracts in the Statement of Assets and Liabilities. Realized gain or (loss) is recorded upon the expiration or closing of a futures contract. The net realized gain (loss) and change in net unrealized appreciation (depreciation) on futures contracts during the period is presented in the Statement of Operations.
Any open futures contracts at period end are presented in the Schedule of Investments under the caption "Futures Contracts". The notional amount at value reflects each contract's exposure to the underlying instrument or index at period end, and is representative of volume of activity during the period.
Any securities deposited to meet initial margin requirements are identified in the Schedule of Investments. Any cash deposited to meet initial margin requirements is presented as segregated cash with brokers for derivative instruments in the Statement of Assets and Liabilities.
5. Purchases and Sales of Investments.
Purchases and sales of securities, other than short-term securities and in-kind transactions, as applicable, are noted in the table below.
| | Purchases ($) | Sales ($) |
| VIP Disciplined Small Cap Portfolio | 395,423,461 | 350,158,879 |
6. Fees and Other Transactions with Affiliates.
Management Fee. Fidelity Management & Research Company LLC (the investment adviser) and its affiliates provide the Fund with investment management related services for which the Fund pays a monthly management fee.
Effective June 1, 2024, the Fund's management contract was amended to incorporate administrative services previously covered under separate services agreements (Transfer Agent and Accounting agreements). The amended contract incorporates a management fee rate that may vary by class. The investment adviser or an affiliate pays certain expenses of managing and operating the Fund out of each class's management fee.
Each class of the Fund pays a management fee to the investment adviser. The management fee is calculated and paid to the investment adviser every month based on an annual rate expressed as a percentage of each class's average net assets as noted in the following table:
| | Management Fee Rate |
Initial Class | .30% |
Service Class | .30% |
Service Class 2 | .30% |
Investor Class | .38% |
A different management fee rate may be applicable to each class of the Fund. The difference between classes is the result of separate arrangements for class-level services and/or waivers of certain expenses. It is not the result of any difference in advisory or custodial fees or other expenses related to the management of the Fund's assets, which do not vary by class.
Prior to June 1, 2024, the management fee was based on an annual rate of .24% of the Fund's average net assets.
Distribution and Service Plan Fees. In accordance with Rule 12b-1 of the 1940 Act, the Fund has adopted separate 12b-1 Plans for each Service Class of shares. Each Service Class pays Fidelity Distributors Company LLC (FDC), an affiliate of the investment adviser, a service fee. For the period, the service fee is based on an annual rate of .10% of Service Class' average net assets and .25% of Service Class 2's average net assets.
For the period, total fees, all of which were re-allowed to insurance companies for the distribution of shares and providing shareholder support services, were as follows:
| Service Class | $2,187 |
| Service Class 2 | 88,207 |
| | $90,394 |
Transfer Agent Fees. Fidelity Investments Institutional Operations Company LLC (FIIOC), an affiliate of the investment adviser, is the Fund's transfer, dividend disbursing, and shareholder servicing agent.
Effective June 1, 2024, the Fund's management contract was amended to incorporate transfer agent services and associated fees previously covered under a separate services agreement.
Prior to June 1, 2024, FIIOC received an asset-based fee with respect to each class. Each class paid a fee for transfer agent services, typesetting and printing and mailing of shareholder reports, excluding mailing of proxy statements. For the portion of the reporting period prior to June 1, 2024, the fees were equivalent to the following annualized rates:
| | Amount ($) | % of Class-Level Average Net Assets |
| Initial Class | 7,664 | .06 |
| Service Class | 63 | . 06 |
| Service Class 2 | 7,854 | . 06 |
| Investor Class | 182,905 | .14 |
| | 198,486 | |
Accounting Fees. Fidelity Service Company, Inc. (FSC), an affiliate of the investment adviser, maintains the Fund's accounting records.
Effective June 1, 2024, the Fund's management contract was amended to incorporate accounting services and associated fees previously covered under a separate services agreement.
Prior to June 1, 2024, the accounting fee was based on the level of average net assets for each month. For the portion of the reporting period prior to June 1, 2024, the fees were equivalent to the following annualized rates:
| | % of Average Net Assets |
| VIP Disciplined Small Cap Portfolio | .04 |
Brokerage Commissions. A portion of portfolio transactions were placed with brokerage firms which are affiliates of the investment adviser. Brokerage commissions are included in net realized gain (loss) and change in net unrealized appreciation (depreciation) in the Statement of Operations. The commissions paid to these affiliated firms were as follows:
| | Amount ($) |
| VIP Disciplined Small Cap Portfolio | 7,673 |
Interfund Trades. Funds may purchase from or sell securities to other Fidelity Funds under procedures adopted by the Board. The procedures have been designed to ensure these interfund trades are executed in accordance with Rule 17a-7 of the 1940 Act. Any interfund trades are included within the respective purchases and sales amounts shown in the Purchases and Sales of Investments note. Interfund trades during the period are noted in the table below.
| | Purchases ($) | Sales ($) | Realized Gain (Loss) ($) |
| VIP Disciplined Small Cap Portfolio | 15,955,254 | 16,529,494 | 2,496,269 |
7. Committed Line of Credit.
Certain Funds participate with other funds managed by the investment adviser or an affiliate in a $4.25 billion credit facility (the "line of credit") to be utilized for temporary or emergency purposes to fund shareholder redemptions or for other short-term liquidity purposes.
Commitment fees are charged based on the unused amount of the line of credit at an annual rate of .10%, and then allocated to each participating fund based on its pro-rata portion of the line of credit. The commitment fees are reflected in Miscellaneous expenses on the Statement of Operations, and are listed below.
Interest is charged to a participating fund based on its borrowings at an annual rate of .75% plus the highest of (i) daily SOFR plus a .10% spread adjustment, (ii) Federal Funds Effective Rate, or (iii) Overnight Bank Funding Rate. During the period, there were no borrowings on this line of credit.
The line of credit agreement will expire in March 2025 unless extended or renewed.
| | Amount ($) |
| VIP Disciplined Small Cap Portfolio | 610 |
8. Security Lending.
Funds lend portfolio securities from time to time in order to earn additional income. Lending agents are used, including National Financial Services (NFS), an affiliate of the investment adviser. Pursuant to a securities lending agreement, NFS will receive a fee, which is capped at 9.9% of a fund's daily lending revenue, for its services as lending agent. A fund may lend securities to certain qualified borrowers, including NFS. On the settlement date of the loan, a fund receives collateral (in the form of U.S. Treasury obligations, letters of credit and/or cash) against the loaned securities and maintains collateral in an amount not less than 100% of the market value of the loaned securities during the period of the loan. The market value of the loaned securities is determined at the close of business of a fund and any additional required collateral is delivered to a fund on the next business day. A fund or borrower may terminate the loan at any time, and if the borrower defaults on its obligation to return the securities loaned because of insolvency or other reasons, a fund may apply collateral received from the borrower against the obligation. A fund may experience delays and costs in recovering the securities loaned. Any cash collateral received is invested in the Fidelity Securities Lending Cash Central Fund. Any loaned securities are identified as such in the Schedule of Investments, and the value of loaned securities and cash collateral at period end, as applicable, are presented in the Statement of Assets and Liabilities. Security lending income represents the income earned on investing cash collateral, less rebates paid to borrowers and any lending agent fees associated with the loan, plus any premium payments received for lending certain types of securities. Security lending income is presented in the Statement of Operations as a component of income from Fidelity Central Funds. Affiliated security lending activity, if any, was as follows:
| | Total Security Lending Fees Paid to NFS ($) | Security Lending Income From Securities Loaned to NFS ($) | Value of Securities Loaned to NFS at Period End ($) |
| VIP Disciplined Small Cap Portfolio | 6,298 | 531 | 8,690 |
9. Expense Reductions.
Through arrangements with the Fund's custodian, credits realized as a result of certain uninvested cash balances were used to reduce the Fund's expenses. During the period, custodian credits reduced the Fund's expenses by $2,888.
10. Distributions to Shareholders.
Distributions to shareholders of each class were as follows:
| | Year ended December 31, 2024 | Year ended December 31, 2023 |
| VIP Disciplined Small Cap Portfolio | | |
| Distributions to shareholders | | |
| Initial Class | $554,379 | $277,541 |
| Service Class | 81,788 | 2,091 |
| Service Class 2 | 598,603 | 202,940 |
| Investor Class | 5,923,107 | 2,771,015 |
Total | $7,157,877 | $3,253,587 |
11. Share Transactions.
Transactions for each class of shares were as follows and may contain in-kind transactions:
| | Shares | Shares | Dollars | Dollars |
| | Year ended December 31, 2024 | Year ended December 31, 2023 | Year ended December 31, 2024 | Year ended December 31, 2023 |
| VIP Disciplined Small Cap Portfolio | | | | |
| Initial Class | | | | |
| Shares sold | 601,655 | 380,048 | $11,132,241 | $5,678,117 |
| Reinvestment of distributions | 27,805 | 19,035 | 554,378 | 277,541 |
| Shares redeemed | (496,552) | (453,667) | (8,720,929) | (6,562,061) |
| Net increase (decrease) | 132,908 | (54,584) | $2,965,690 | $(606,403) |
| Service Class | | | | |
| Shares sold | 314,295 | - | $5,669,875 | - |
| Reinvestment of distributions | 3,789 | - | 77,444 | - |
| Shares redeemed | (25,045) | - | (504,535) | - |
| Net increase (decrease) | 293,039 | - | $5,242,784 | - |
| Service Class 2 | | | | |
| Shares sold | 1,034,036 | 704,050 | $19,036,140 | $10,213,550 |
| Reinvestment of distributions | 29,813 | 13,893 | 598,603 | 202,940 |
| Shares redeemed | (437,488) | (303,646) | (7,698,562) | (4,480,203) |
| Net increase (decrease) | 626,361 | 414,297 | $11,936,181 | $5,936,287 |
| Investor Class | | | | |
| Shares sold | 3,778,284 | 2,671,006 | $68,741,857 | $40,584,220 |
| Reinvestment of distributions | 298,765 | 191,197 | 5,923,107 | 2,771,015 |
| Shares redeemed | (2,973,727) | (2,934,436) | (51,757,948) | (42,043,749) |
| Net increase (decrease) | 1,103,322 | (72,233) | $22,907,016 | $1,311,486 |
12. Other.
A fund's organizational documents provide former and current trustees and officers with a limited indemnification against liabilities arising in connection with the performance of their duties to the fund. In the normal course of business, a fund may also enter into contracts that provide general indemnifications. A fund's maximum exposure under these arrangements is unknown as this would be dependent on future claims that may be made against a fund. The risk of material loss from such claims is considered remote.
At the end of the period, the investment adviser or its affiliates were owners of record of more than 10% of the outstanding shares as follows:
| Fund | Affiliated % |
| VIP Disciplined Small Cap Portfolio | 88% |
13. Risk and Uncertainties.
Many factors affect a fund's performance. Developments that disrupt global economies and financial markets, such as pandemics, epidemics, outbreaks of infectious diseases, war, terrorism, and environmental disasters, may significantly affect a fund's investment performance. The effects of these developments to a fund will be impacted by the types of securities in which a fund invests, the financial condition, industry, economic sector, and geographic location of an issuer, and a fund's level of investment in the securities of that issuer. Significant concentrations in security types, issuers, industries, sectors, and geographic locations may magnify the factors that affect a fund's performance.
Report of Independent Registered Public Accounting Firm
To the Board of Trustees of Variable Insurance Products Fund II and the Shareholders of VIP Disciplined Small Cap Portfolio:
Opinion on the Financial Statements and Financial Highlights
We have audited the accompanying statement of assets and liabilities of VIP Disciplined Small Cap Portfolio (the "Fund"), a fund of Variable Insurance Products Fund II, including the schedule of investments, as of December 31, 2024, the related statement of operations for the year then ended, the statement of changes in net assets for each of the two years in the period then ended, the financial highlights for each of the five years in the period then ended, and the related notes. In our opinion, the financial statements and financial highlights present fairly, in all material respects, the financial position of the Fund as of December 31, 2024, and the results of its operations for the year then ended, the changes in its net assets for each of the two years in the period then ended, and the financial highlights for each of the five years in the period then ended in conformity with accounting principles generally accepted in the United States of America.
Basis for Opinion
These financial statements and financial highlights are the responsibility of the Fund's management. Our responsibility is to express an opinion on the Fund's financial statements and financial highlights based on our audits. We are a public accounting firm registered with the Public Company Accounting Oversight Board (United States) (PCAOB) and are required to be independent with respect to the Fund in accordance with the U.S. federal securities laws and the applicable rules and regulations of the Securities and Exchange Commission and the PCAOB.
We conducted our audits in accordance with the standards of the PCAOB. Those standards require that we plan and perform the audit to obtain reasonable assurance about whether the financial statements and financial highlights are free of material misstatement, whether due to error or fraud. The Fund is not required to have, nor were we engaged to perform, an audit of its internal control over financial reporting. As part of our audits, we are required to obtain an understanding of internal control over financial reporting but not for the purpose of expressing an opinion on the effectiveness of the Fund's internal control over financial reporting. Accordingly, we express no such opinion.
Our audits included performing procedures to assess the risks of material misstatement of the financial statements and financial highlights, whether due to error or fraud, and performing procedures that respond to those risks. Such procedures included examining, on a test basis, evidence regarding the amounts and disclosures in the financial statements and financial highlights. Our audits also included evaluating the accounting principles used and significant estimates made by management, as well as evaluating the overall presentation of the financial statements and financial highlights. Our procedures included confirmation of securities owned as of December 31, 2024, by correspondence with the custodian and brokers; when replies were not received from brokers, we performed other auditing procedures. We believe that our audits provide a reasonable basis for our opinion.
/s/ Deloitte & Touche LLP
Boston, Massachusetts
February 13, 2025
We have served as the auditor of one or more of the Fidelity investment companies since 1999.
Distributions
(Unaudited)The dividend and capital gains distributions for the fund(s) are available on Fidelity.com or Institutional.Fidelity.com.
The fund hereby designates as a capital gain dividend with respect to the taxable year ended December 31, 2024, $30,193,673, or, if subsequently determined to be different, the net capital gain of such year.
The fund designates $329,384 of distributions paid during the fiscal year ended 2024 as qualifying to be taxed as section 163(j) interest dividends.
Initial Class designates 72% and 45%; Service Class designates 77% and 45%; Service Class 2 designates 89% and 50%; Investor Class designates 77% and 45%; of the dividends distributed in February and December, respectively during the fiscal year as qualifying for the dividends-received deduction for corporate shareholders.
Item 8: Changes in and Disagreements with Accountants for Open-End Management Investment Companies
(Unaudited)
Note: This is not applicable for any fund included in this document.
Item 9: Proxy Disclosures for Open-End Management Investment Companies
(Unaudited)
| A special meeting of shareholders was held on July 16, 2024. The results of votes taken among shareholders on the proposal before them are reported below. Each vote reported represents one dollar of net asset value held on the record date for the meeting. |
| Proposal 1 |
| To elect a Board of Trustees. |
| | # of Votes | % of Votes |
| Bettina Doulton |
| Affirmative | 35,115,445,138.03 | 95.41 |
| Withheld | 1,688,162,573.22 | 4.59 |
| TOTAL | 36,803,607,711.25 | 100.00 |
| Robert A. Lawrence |
| Affirmative | 35,088,609,864.54 | 95.34 |
| Withheld | 1,714,997,846.71 | 4.66 |
| TOTAL | 36,803,607,711.25 | 100.00 |
| Vijay C. Advani |
| Affirmative | 35,010,407,909.42 | 95.13 |
| Withheld | 1,793,199,801.83 | 4.87 |
| TOTAL | 36,803,607,711.25 | 100.00 |
| Thomas P. Bostick |
| Affirmative | 35,057,529,083.85 | 95.26 |
| Withheld | 1,746,078,627.39 | 4.74 |
| TOTAL | 36,803,607,711.25 | 100.00 |
| Donald F. Donahue |
| Affirmative | 35,013,585,423.05 | 95.14 |
| Withheld | 1,790,022,288.19 | 4.86 |
| TOTAL | 36,803,607,711.25 | 100.00 |
| Vicki L. Fuller |
| Affirmative | 35,122,634,645.90 | 95.43 |
| Withheld | 1,680,973,065.35 | 4.57 |
| TOTAL | 36,803,607,711.25 | 100.00 |
| Patricia L. Kampling |
| Affirmative | 35,180,534,002.80 | 95.59 |
| Withheld | 1,623,073,708.44 | 4.41 |
| TOTAL | 36,803,607,711.25 | 100.00 |
| Thomas A. Kennedy |
| Affirmative | 35,124,156,340.38 | 95.44 |
| Withheld | 1,679,451,370.87 | 4.56 |
| TOTAL | 36,803,607,711.25 | 100.00 |
| Oscar Munoz |
| Affirmative | 35,015,482,863.79 | 95.14 |
| Withheld | 1,788,124,847.45 | 4.86 |
| TOTAL | 36,803,607,711.25 | 100.00 |
| Karen B. Peetz |
| Affirmative | 35,090,964,426.07 | 95.35 |
| Withheld | 1,712,643,285.17 | 4.65 |
| TOTAL | 36,803,607,711.25 | 100.00 |
| David M. Thomas |
| Affirmative | 34,979,784,204.17 | 95.04 |
| Withheld | 1,823,823,507.08 | 4.96 |
| TOTAL | 36,803,607,711.25 | 100.00 |
| Susan Tomasky |
| Affirmative | 35,096,963,470.38 | 95.36 |
| Withheld | 1,706,644,240.86 | 4.64 |
| TOTAL | 36,803,607,711.25 | 100.00 |
| Michael E. Wiley |
| Affirmative | 34,987,599,655.10 | 95.07 |
| Withheld | 1,816,008,056.15 | 4.93 |
| TOTAL | 36,803,607,711.25 | 100.00 |
| | | |
| Proposal 1 reflects trust-wide proposal and voting results. |
Item 10: Remuneration Paid to Directors, Officers, and others of Open-End Management Investment Companies
(Unaudited)
Note: This information is disclosed as part of the financial statements for each Fund as part of Item 7: Financial Statements and Financial Highlights for Open-End Management Investment companies.
Item 11: Statement Regarding Basis for Approval of Investment Advisory Contract
(Unaudited)
Note: This is not applicable for any fund included in this document.
1.820582.119
VDSC-ANN-0325
Fidelity® Variable Insurance Products:
VIP Emerging Markets Portfolio
Annual Report
December 31, 2024
Contents
To view a fund's proxy voting guidelines and proxy voting record for the 12-month period ended June 30, visit http://www.fidelity.com/proxyvotingresults or visit the Securities and Exchange Commission's (SEC) web site at http://www.sec.gov.
You may also call 1-877-208-0098 to request a free copy of the proxy voting guidelines.
Fidelity® Variable Insurance Products are separate account options which are purchased through a variable insurance contract.
Standard & Poor's, S&P and S&P 500 are registered service marks of The McGraw-Hill Companies, Inc. and have been licensed for use by Fidelity Distributors Corporation.
Other third-party marks appearing herein are the property of their respective owners.
All other marks appearing herein are registered or unregistered trademarks or service marks of FMR LLC or an affiliated company. © 2025 FMR LLC. All rights reserved.
This report and the financial statements contained herein are submitted for the general information of the shareholders of the Fund. This report is not authorized for distribution to prospective investors in the Fund unless preceded or accompanied by an effective prospectus.
A fund files its complete schedule of portfolio holdings with the SEC for the first and third quarters of each fiscal year on Form N-PORT. Forms N-PORT are available on the SEC's web site at http://www.sec.gov. A fund's Forms N-PORT may be reviewed and copied at the SEC's Public Reference Room in Washington, DC. Information regarding the operation of the SEC's Public Reference Room may be obtained by calling 1-800-SEC-0330.
For a complete list of a fund's portfolio holdings, view the most recent holdings listing, semiannual report, or annual report on Fidelity's web site at http://www.fidelity.com, http://www.institutional.fidelity.com, or http://www.401k.com, as applicable.
NOT FDIC INSURED •MAY LOSE VALUE •NO BANK GUARANTEE
Neither the Fund nor Fidelity Distributors Corporation is a bank.
Item 7: Financial Statements and Financial Highlights for Open-End Management Investment Companies (Annual Report)
VIP Emerging Markets Portfolio
Schedule of Investments December 31, 2024
Showing Percentage of Net Assets
| Common Stocks - 98.9% |
| | | Shares | Value ($) |
| AUSTRALIA - 0.6% | | | |
| Energy - 0.6% | | | |
| Oil, Gas & Consumable Fuels - 0.6% | | | |
| Paladin Energy Ltd (a) | | 1,545,216 | 7,230,471 |
| BRAZIL - 5.4% | | | |
| Energy - 1.4% | | | |
| Oil, Gas & Consumable Fuels - 1.4% | | | |
| Petroleo Brasileiro SA ADR (b) | | 1,207,347 | 15,526,482 |
| Financials - 2.1% | | | |
| Banks - 2.1% | | | |
| Itau Unibanco Holding SA | | 4,453,850 | 22,154,441 |
| Industrials - 0.5% | | | |
| Ground Transportation - 0.5% | | | |
| Localiza Rent a Car SA | | 1,018,400 | 5,308,073 |
| Materials - 1.4% | | | |
| Metals & Mining - 1.4% | | | |
| Gerdau SA ADR | | 5,411,460 | 15,585,005 |
| TOTAL BRAZIL | | | 58,574,001 |
| CHILE - 1.3% | | | |
| Materials - 1.3% | | | |
| Metals & Mining - 1.3% | | | |
| Antofagasta PLC | | 696,300 | 13,859,998 |
| CHINA - 32.7% | | | |
| Communication Services - 9.3% | | | |
| Interactive Media & Services - 9.3% | | | |
| Tencent Holdings Ltd | | 1,914,305 | 102,171,869 |
| Consumer Discretionary - 10.2% | | | |
| Broadline Retail - 2.0% | | | |
| PDD Holdings Inc Class A ADR (a) | | 230,600 | 22,365,894 |
| Diversified Consumer Services - 1.1% | | | |
| New Oriental Education & Technology Group Inc | | 1,955,600 | 12,472,842 |
| Hotels, Restaurants & Leisure - 4.0% | | | |
| Meituan B Shares (a)(c)(d) | | 1,707,960 | 33,208,501 |
| Shangri-La Asia Ltd | | 14,114,597 | 9,631,870 |
| | | | 42,840,371 |
| Household Durables - 3.1% | | | |
| Haier Smart Home Co Ltd A Shares (China) | | 8,784,697 | 34,263,369 |
TOTAL CONSUMER DISCRETIONARY | | | 111,942,476 |
| | | | |
| Consumer Staples - 2.1% | | | |
| Beverages - 2.1% | | | |
| Kweichow Moutai Co Ltd A Shares (China) | | 56,000 | 11,692,000 |
| Tsingtao Brewery Co Ltd H Shares | | 1,578,900 | 11,547,002 |
| | | | 23,239,002 |
| Financials - 5.2% | | | |
| Banks - 1.5% | | | |
| China Construction Bank Corp H Shares | | 20,137,000 | 16,683,002 |
| Insurance - 3.7% | | | |
| China Life Insurance Co Ltd H Shares | | 14,498,863 | 27,404,777 |
| PICC Property & Casualty Co Ltd H Shares | | 7,788,000 | 12,293,702 |
| | | | 39,698,479 |
TOTAL FINANCIALS | | | 56,381,481 |
| | | | |
| Health Care - 3.1% | | | |
| Life Sciences Tools & Services - 1.7% | | | |
| Wuxi Apptec Co Ltd H Shares (b)(c)(d) | | 2,541,500 | 18,488,634 |
| Pharmaceuticals - 1.4% | | | |
| Hansoh Pharmaceutical Group Co Ltd (c)(d) | | 6,864,000 | 15,271,696 |
TOTAL HEALTH CARE | | | 33,760,330 |
| | | | |
| Industrials - 2.4% | | | |
| Machinery - 2.4% | | | |
| Shenzhen Inovance Technology Co Ltd A Shares (China) | | 3,221,733 | 25,855,606 |
| Materials - 0.4% | | | |
| Chemicals - 0.4% | | | |
| Shandong Sinocera Functional Material Co Ltd A Shares (China) | | 1,765,089 | 4,120,520 |
| TOTAL CHINA | | | 357,471,284 |
| GREECE - 3.1% | | | |
| Financials - 3.1% | | | |
| Banks - 3.1% | | | |
| Eurobank Ergasias Services and Holdings SA | | 4,568,722 | 10,529,935 |
| National Bank of Greece SA | | 2,895,500 | 22,974,666 |
| | | | |
| TOTAL GREECE | | | 33,504,601 |
| HONG KONG - 0.6% | | | |
| Industrials - 0.6% | | | |
| Marine Transportation - 0.6% | | | |
| Pacific Basin Shipping Ltd | | 34,027,600 | 7,185,243 |
| HUNGARY - 2.8% | | | |
| Financials - 1.2% | | | |
| Banks - 1.2% | | | |
| OTP Bank Nyrt | | 244,300 | 13,341,023 |
| Health Care - 1.6% | | | |
| Pharmaceuticals - 1.6% | | | |
| Richter Gedeon Nyrt | | 642,841 | 16,832,283 |
| TOTAL HUNGARY | | | 30,173,306 |
| INDIA - 10.1% | | | |
| Financials - 3.7% | | | |
| Banks - 3.7% | | | |
| HDFC Bank Ltd/Gandhinagar | | 1,147,015 | 23,729,562 |
| ICICI Bank Ltd | | 1,080,200 | 16,146,238 |
| | | | 39,875,800 |
| Industrials - 1.4% | | | |
| Construction & Engineering - 1.4% | | | |
| Larsen & Toubro Ltd | | 370,908 | 15,635,461 |
| Information Technology - 3.2% | | | |
| IT Services - 3.2% | | | |
| Tata Consultancy Services Ltd | | 742,000 | 35,502,318 |
| Materials - 1.8% | | | |
| Chemicals - 0.7% | | | |
| Solar Industries India Ltd | | 69,587 | 7,954,879 |
| Construction Materials - 1.1% | | | |
| JK Cement Ltd | | 216,900 | 11,646,703 |
| TOTAL INDIA | | | 110,615,161 |
| KOREA (SOUTH) - 9.8% | | | |
| Consumer Discretionary - 1.8% | | | |
| Automobile Components - 1.1% | | | |
| Hyundai Mobis Co Ltd | | 75,920 | 12,024,243 |
| Automobiles - 0.7% | | | |
| Hyundai Motor Co | | 55,890 | 7,902,004 |
TOTAL CONSUMER DISCRETIONARY | | | 19,926,247 |
| | | | |
| Industrials - 2.8% | | | |
| Aerospace & Defense - 1.8% | | | |
| Korea Aerospace Industries Ltd | | 535,795 | 19,828,954 |
| Machinery - 1.0% | | | |
| HD HYUNDAI MIPO (a) | | 119,105 | 10,759,938 |
TOTAL INDUSTRIALS | | | 30,588,892 |
| | | | |
| Information Technology - 5.2% | | | |
| Technology Hardware, Storage & Peripherals - 5.2% | | | |
| Samsung Electronics Co Ltd | | 1,581,640 | 56,210,775 |
| TOTAL KOREA (SOUTH) | | | 106,725,914 |
| MALAYSIA - 1.1% | | | |
| Financials - 1.1% | | | |
| Banks - 1.1% | | | |
| CIMB Group Holdings Bhd | | 6,381,200 | 11,702,078 |
| MEXICO - 5.7% | | | |
| Consumer Staples - 5.0% | | | |
| Beverages - 1.5% | | | |
| Fomento Economico Mexicano SAB de CV ADR | | 187,200 | 16,003,728 |
| Consumer Staples Distribution & Retail - 3.5% | | | |
| Wal-Mart de Mexico SAB de CV Series V | | 14,702,900 | 38,705,203 |
TOTAL CONSUMER STAPLES | | | 54,708,931 |
| | | | |
| Financials - 0.7% | | | |
| Banks - 0.7% | | | |
| Grupo Financiero Banorte SAB de CV | | 1,207,068 | 7,755,546 |
| TOTAL MEXICO | | | 62,464,477 |
| NETHERLANDS - 0.9% | | | |
| Communication Services - 0.9% | | | |
| Interactive Media & Services - 0.9% | | | |
| Nebius Group NV Class A (a) | | 341,000 | 9,445,700 |
| PERU - 2.5% | | | |
| Financials - 2.5% | | | |
| Banks - 2.5% | | | |
| Credicorp Ltd | | 149,900 | 27,479,668 |
| POLAND - 2.5% | | | |
| Financials - 2.5% | | | |
| Banks - 2.5% | | | |
| Powszechna Kasa Oszczednosci Bank Polski SA | | 1,881,800 | 27,227,826 |
| RUSSIA - 0.0% | | | |
| Energy - 0.0% | | | |
| Oil, Gas & Consumable Fuels - 0.0% | | | |
| LUKOIL PJSC ADR (a)(e) | | 437,463 | 4 |
| Financials - 0.0% | | | |
| Banks - 0.0% | | | |
| Sberbank of Russia PJSC ADR (a)(e) | | 1,813,510 | 18 |
| TOTAL RUSSIA | | | 22 |
| SOUTH AFRICA - 4.6% | | | |
| Communication Services - 1.4% | | | |
| Wireless Telecommunication Services - 1.4% | | | |
| MTN Group Ltd | | 3,228,219 | 15,689,845 |
| Financials - 1.6% | | | |
| Financial Services - 1.6% | | | |
| FirstRand Ltd | | 4,300,700 | 17,250,952 |
| Materials - 1.6% | | | |
| Metals & Mining - 1.6% | | | |
| Impala Platinum Holdings Ltd (a) | | 3,687,516 | 17,240,777 |
| TOTAL SOUTH AFRICA | | | 50,181,574 |
| TAIWAN - 13.7% | | | |
| Consumer Discretionary - 1.5% | | | |
| Textiles, Apparel & Luxury Goods - 1.5% | | | |
| Eclat Textile Co Ltd | | 1,087,000 | 16,836,388 |
| Industrials - 2.1% | | | |
| Machinery - 2.1% | | | |
| Hiwin Technologies Corp | | 2,243,967 | 22,456,519 |
| Information Technology - 10.1% | | | |
| Electronic Equipment, Instruments & Components - 1.5% | | | |
| Yageo Corp | | 1,009,051 | 16,597,598 |
| Semiconductors & Semiconductor Equipment - 8.6% | | | |
| Taiwan Semiconductor Manufacturing Co Ltd | | 2,896,175 | 94,089,965 |
TOTAL INFORMATION TECHNOLOGY | | | 110,687,563 |
| | | | |
| TOTAL TAIWAN | | | 149,980,470 |
| TURKEY - 0.0% | | | |
| Industrials - 0.0% | | | |
| Electrical Equipment - 0.0% | | | |
| Astor Transformator Enerji Turizm Insaat Ve Petrol Sanayi Ticaret AS | | 319,751 | 1,029,632 |
| UNITED ARAB EMIRATES - 1.5% | | | |
| Energy - 1.5% | | | |
| Oil, Gas & Consumable Fuels - 1.5% | | | |
| Adnoc Gas PLC | | 17,395,500 | 16,623,298 |
| TOTAL COMMON STOCKS (Cost $964,912,263) | | | 1,081,474,724 |
| | | | |
| Money Market Funds - 1.2% |
| | | Yield (%) | Shares | Value ($) |
| Fidelity Cash Central Fund (f) | | 4.36 | 6,944,122 | 6,945,511 |
| Fidelity Securities Lending Cash Central Fund (f)(g) | | 4.35 | 5,793,471 | 5,794,050 |
| TOTAL MONEY MARKET FUNDS (Cost $12,739,561) | | | | 12,739,561 |
| | | | | |
| TOTAL INVESTMENT IN SECURITIES - 100.1% (Cost $977,651,824) | 1,094,214,285 |
NET OTHER ASSETS (LIABILITIES) - (0.1)% | (1,079,395) |
| NET ASSETS - 100.0% | 1,093,134,890 |
| | |
Legend
| (b) | Security or a portion of the security is on loan at period end. |
| (c) | Security exempt from registration under Rule 144A of the Securities Act of 1933. These securities may be resold in transactions exempt from registration, normally to qualified institutional buyers. At the end of the period, the value of these securities amounted to $66,968,831 or 6.1% of net assets. |
| (d) | Security is exempt from registration under Regulation S of the Securities Act of 1933 and may be resold to qualified foreign investors outside of the United States. At the end of the period, the value of securities amounted to $66,968,831 or 6.1% of net assets. |
| (f) | Affiliated fund that is generally available only to investment companies and other accounts managed by Fidelity Investments. The rate quoted is the annualized seven-day yield of the fund at period end. A complete unaudited listing of the fund's holdings as of its most recent quarter end is available upon request. In addition, each Fidelity Central Fund's financial statements, which are not covered by the Fund's Report of Independent Registered Public Accounting Firm, are available on the SEC's website or upon request. |
| (g) | Investment made with cash collateral received from securities on loan. |
Affiliated Central Funds
Fiscal year to date information regarding the Fund's investments in Fidelity Central Funds, including the ownership percentage, is presented below.
| Affiliate | Value, beginning of period ($) | Purchases ($) | Sales Proceeds ($) | Dividend Income ($) | Realized Gain (loss) ($) | Change in Unrealized appreciation (depreciation) ($) | Value, end of period ($) | Shares, end of period | % ownership, end of period |
| Fidelity Cash Central Fund | 2,235,287 | 454,930,309 | 450,220,220 | 1,023,710 | 135 | - | 6,945,511 | 6,944,122 | 0.0% |
| Fidelity Securities Lending Cash Central Fund | - | 72,631,331 | 66,837,281 | 61,428 | - | - | 5,794,050 | 5,793,471 | 0.0% |
| Total | 2,235,287 | 527,561,640 | 517,057,501 | 1,085,138 | 135 | - | 12,739,561 | 12,737,593 | |
| | | | | | | | | | |
Amounts in the dividend income column in the above table include any capital gain distributions from underlying funds, which are presented in the corresponding line item in the Statement of Operations, if applicable.
Amounts in the dividend income column for Fidelity Securities Lending Cash Central Fund represents the income earned on investing cash collateral, less rebates paid to borrowers and any lending agent fees associated with the loan, plus any premium payments received for lending certain types of securities.
Amounts included in the purchases and sales proceeds columns may include in-kind transactions, if applicable.
Investment Valuation
The following is a summary of the inputs used, as of December 31, 2024, involving the Fund's assets and liabilities carried at fair value. The inputs or methodology used for valuing securities may not be an indication of the risk associated with investing in those securities. For more information on valuation inputs, and their aggregation into the levels used below, please refer to the Investment Valuation section in the accompanying Notes to Financial Statements.
| Valuation Inputs at Reporting Date: |
| Description | Total ($) | Level 1 ($) | Level 2 ($) | Level 3 ($) |
Investments in Securities: | | | | |
|
| Common Stocks | | | | |
Communication Services | 127,307,414 | 9,445,700 | 117,861,714 | - |
Consumer Discretionary | 148,705,111 | 66,261,133 | 82,443,978 | - |
Consumer Staples | 77,947,933 | 77,947,933 | - | - |
Energy | 39,380,255 | 39,380,251 | - | 4 |
Financials | 256,673,434 | 172,333,727 | 84,339,689 | 18 |
Health Care | 50,592,613 | 50,592,613 | - | - |
Industrials | 108,059,426 | 55,014,015 | 53,045,411 | - |
Information Technology | 202,400,656 | 35,502,318 | 166,898,338 | - |
Materials | 70,407,882 | 53,167,105 | 17,240,777 | - |
|
| Money Market Funds | 12,739,561 | 12,739,561 | - | - |
| Total Investments in Securities: | 1,094,214,285 | 572,384,356 | 521,829,907 | 22 |
Financial Statements
| Statement of Assets and Liabilities |
As of December 31, 2024 |
| Assets | | | | |
| Investment in securities, at value (including securities loaned of $5,568,378) - See accompanying schedule: | | | | |
Unaffiliated issuers (cost $964,912,263) | $ | 1,081,474,724 | | |
Fidelity Central Funds (cost $12,739,561) | | 12,739,561 | | |
| | | | | |
| | | | | |
| Total Investment in Securities (cost $977,651,824) | | | $ | 1,094,214,285 |
| Foreign currency held at value (cost $401,798) | | | | 401,047 |
| Receivable for investments sold | | | | 8,059,480 |
| Receivable for fund shares sold | | | | 395,063 |
| Dividends receivable | | | | 1,893,508 |
| Distributions receivable from Fidelity Central Funds | | | | 25,144 |
| Prepaid expenses | | | | 978 |
| Other receivables | | | | 95,839 |
Total assets | | | | 1,105,085,344 |
| Liabilities | | | | |
| Payable for investments purchased | $ | 1,112,752 | | |
| Payable for fund shares redeemed | | 1,736,809 | | |
| Accrued management fee | | 798,140 | | |
| Distribution and service plan fees payable | | 54,593 | | |
| Deferred taxes | | 2,309,401 | | |
| Audit fee payable | | 48,950 | | |
| Custody fee payable | | 78,934 | | |
| Other payables and accrued expenses | | 16,825 | | |
| Collateral on securities loaned | | 5,794,050 | | |
| Total liabilities | | | | 11,950,454 |
| Net Assets | | | $ | 1,093,134,890 |
| Net Assets consist of: | | | | |
| Paid in capital | | | $ | 1,047,433,875 |
| Total accumulated earnings (loss) | | | | 45,701,015 |
| Net Assets | | | $ | 1,093,134,890 |
| | | | | |
| Net Asset Value and Maximum Offering Price | | | | |
| Initial Class : | | | | |
Net Asset Value, offering price and redemption price per share ($502,778,106 ÷ 43,805,153 shares) | | | $ | 11.48 |
| Service Class : | | | | |
Net Asset Value, offering price and redemption price per share ($192,922,161 ÷ 16,764,146 shares) | | | $ | 11.51 |
| Service Class 2 : | | | | |
Net Asset Value, offering price and redemption price per share ($180,147,273 ÷ 15,712,659 shares) | | | $ | 11.47 |
| Investor Class : | | | | |
Net Asset Value, offering price and redemption price per share ($217,287,350 ÷ 19,033,768 shares) | | | $ | 11.42 |
| Statement of Operations |
| Year ended December 31, 2024 |
| Investment Income | | | | |
| Dividends | | | $ | 29,669,645 |
| Income from Fidelity Central Funds (including $61,428 from security lending) | | | | 1,085,138 |
| Income before foreign taxes withheld | | | $ | 30,754,783 |
| Less foreign taxes withheld | | | | (3,067,113) |
| Total income | | | | 27,687,670 |
| Expenses | | | | |
| Management fee | $ | 9,238,849 | | |
| Transfer agent fees | | 131,169 | | |
| Distribution and service plan fees | | 630,521 | | |
| Accounting fees | | 74,294 | | |
| Custodian fees and expenses | | 253,372 | | |
| Independent trustees' fees and expenses | | 4,702 | | |
| Audit fees | | 119,957 | | |
| Legal | | 2,615 | | |
| Interest | | 25,698 | | |
| Miscellaneous | | 20,974 | | |
| Total expenses before reductions | | 10,502,151 | | |
| Expense reductions | | (45,095) | | |
| Total expenses after reductions | | | | 10,457,056 |
| Net Investment income (loss) | | | | 17,230,614 |
| Realized and Unrealized Gain (Loss) | | | | |
| Net realized gain (loss) on: | | | | |
| Investment Securities: | | | | |
| Unaffiliated issuers (net of foreign taxes of $6,359,994) | | 51,537,749 | | |
| Fidelity Central Funds | | 135 | | |
| Foreign currency transactions | | (766,294) | | |
| Total net realized gain (loss) | | | | 50,771,590 |
| Change in net unrealized appreciation (depreciation) on: | | | | |
| Investment Securities: | | | | |
| Unaffiliated issuers (net of decrease in deferred foreign taxes of $3,488,017) | | 35,598,950 | | |
| Assets and liabilities in foreign currencies | | (43,001) | | |
| Total change in net unrealized appreciation (depreciation) | | | | 35,555,949 |
| Net gain (loss) | | | | 86,327,539 |
| Net increase (decrease) in net assets resulting from operations | | | $ | 103,558,153 |
| Statement of Changes in Net Assets |
| |
| | Year ended December 31, 2024 | | Year ended December 31, 2023 |
| Increase (Decrease) in Net Assets | | | | |
| Operations | | | | |
| Net investment income (loss) | $ | 17,230,614 | $ | 19,613,969 |
| Net realized gain (loss) | | 50,771,590 | | (25,974,767) |
| Change in net unrealized appreciation (depreciation) | | 35,555,949 | | 99,689,528 |
| Net increase (decrease) in net assets resulting from operations | | 103,558,153 | | 93,328,730 |
| Distributions to shareholders | | (13,550,279) | | (21,738,144) |
| Distributions to shareholders from tax return of capital | | (1,405,712) | | - |
| | | | | |
| Total Distributions | | (14,955,991) | | (21,738,144) |
| Share transactions - net increase (decrease) | | (29,240,317) | | (7,562,062) |
| Total increase (decrease) in net assets | | 59,361,845 | | 64,028,524 |
| | | | | |
| Net Assets | | | | |
| Beginning of period | | 1,033,773,045 | | 969,744,521 |
| End of period | $ | 1,093,134,890 | $ | 1,033,773,045 |
| | | | | |
| | | | | |
Financial Highlights
VIP Emerging Markets Portfolio Initial Class |
| |
| Years ended December 31, | | 2024 | | 2023 | | 2022 | | 2021 | | 2020 |
Selected Per-Share Data | | | | | | | | | | |
| Net asset value, beginning of period | $ | 10.58 | $ | 9.87 | $ | 12.59 | $ | 14.75 | $ | 12.68 |
| Income from Investment Operations | | | | | | | | | | |
Net investment income (loss) A,B | | .19 | | .21 C | | .24 | | .21 | | .11 |
| Net realized and unrealized gain (loss) | | .88 | | .74 | | (2.78) | | (.47) | | 3.46 |
| Total from investment operations | | 1.07 | | .95 | | (2.54) | | (.26) | | 3.57 |
| Distributions from net investment income | | (.15) | | (.24) | | (.18) | | (.31) | | (.10) |
| Distributions from net realized gain | | - | | - | | - | | (1.59) | | (1.39) |
| Distributions from tax return of capital | | (.02) | | - | | - | | - | | - |
| Total distributions | | (.17) | | (.24) | | (.18) | | (1.90) | | (1.50) D |
| Net asset value, end of period | $ | 11.48 | $ | 10.58 | $ | 9.87 | $ | 12.59 | $ | 14.75 |
Total Return E,F | | | | 9.66% | | (20.17)% | | (2.17)% | | 31.27% |
Ratios to Average Net Assets B,G,H | | | | | | | | | | |
| Expenses before reductions | | .88% | | .92% | | .92% | | .91% | | .92% |
| Expenses net of fee waivers, if any | | | | .91% | | .91% | | .91% | | .92% |
| Expenses net of all reductions | | .88% | | .91% | | .91% | | .91% | | .90% |
| Net investment income (loss) | | 1.65% | | 2.04% C | | 2.29% | | 1.47% | | .97% |
| Supplemental Data | | | | | | | | | | |
| Net assets, end of period (000 omitted) | $ | 502,778 | $ | 487,596 | $ | 413,887 | $ | 484,510 | $ | 399,283 |
Portfolio turnover rate I | | | | 39% | | 62% | | 46% | | 80% |
ACalculated based on average shares outstanding during the period.
BNet investment income (loss) is affected by the timing of the declaration of dividends by any underlying mutual funds or exchange-traded funds (ETFs). Net investment income (loss) of any mutual funds or ETFs is not included in the Fund's net investment income (loss) ratio.
CNet investment income per share reflects one or more large, non-recurring dividend(s) which amounted to $.05 per share. Excluding such non-recurring dividend(s), the ratio of net investment income (loss) to average net assets would have been 1.57%.
DTotal distributions per share do not sum due to rounding.
ETotal returns do not reflect charges attributable to your insurance company's separate account. Inclusion of these charges would reduce the total returns shown.
FTotal returns would have been lower if certain expenses had not been reduced during the applicable periods shown.
GFees and expenses of any underlying mutual funds or exchange-traded funds (ETFs) are not included in the Fund's expense ratio. The Fund indirectly bears its proportionate share of these expenses. For additional expense information related to investments in Fidelity Central Funds, please refer to the "Investments in Fidelity Central Funds" note found in the Notes to Financial Statements section of the most recent Annual or Semi-Annual report.
HExpense ratios reflect operating expenses of the class. Expenses before reductions do not reflect amounts reimbursed, waived, or reduced through arrangements with the investment adviser, brokerage services, or other offset arrangements, if applicable, and do not represent the amount paid by the class during periods when reimbursements, waivers or reductions occur.
IAmount does not include the portfolio activity of any underlying mutual funds or exchange-traded funds (ETFs), derivatives or securities that mature within one year from acquisition.
VIP Emerging Markets Portfolio Service Class |
| |
| Years ended December 31, | | 2024 | | 2023 | | 2022 | | 2021 | | 2020 |
Selected Per-Share Data | | | | | | | | | | |
| Net asset value, beginning of period | $ | 10.61 | $ | 9.89 | $ | 12.61 | $ | 14.77 | $ | 12.70 |
| Income from Investment Operations | | | | | | | | | | |
Net investment income (loss) A,B | | .18 | | .20 C | | .23 | | .20 | | .11 |
| Net realized and unrealized gain (loss) | | .87 | | .74 | | (2.78) | | (.47) | | 3.45 |
| Total from investment operations | | 1.05 | | .94 | | (2.55) | | (.27) | | 3.56 |
| Distributions from net investment income | | (.14) | | (.22) | | (.17) | | (.29) | | (.10) |
| Distributions from net realized gain | | - | | - | | - | | (1.59) | | (1.39) |
| Distributions from tax return of capital | | (.01) | | - | | - | | - | | - |
| Total distributions | | (.15) | | (.22) | | (.17) | | (1.89) D | | (1.49) |
| Net asset value, end of period | $ | 11.51 | $ | 10.61 | $ | 9.89 | $ | 12.61 | $ | 14.77 |
Total Return E,F | | | | 9.61% | | (20.26)% | | (2.28)% | | 31.17% |
Ratios to Average Net Assets B,G,H | | | | | | | | | | |
| Expenses before reductions | | .99% | | 1.02% | | 1.02% | | 1.01% | | 1.02% |
| Expenses net of fee waivers, if any | | | | 1.01% | | 1.01% | | 1.01% | | 1.02% |
| Expenses net of all reductions | | .99% | | 1.01% | | 1.01% | | 1.01% | | 1.00% |
| Net investment income (loss) | | 1.54% | | 1.94% C | | 2.19% | | 1.37% | | .87% |
| Supplemental Data | | | | | | | | | | |
| Net assets, end of period (000 omitted) | $ | 192,922 | $ | 177,698 | $ | 197,602 | $ | 319,731 | $ | 316,596 |
Portfolio turnover rate I | | | | 39% | | 62% | | 46% | | 80% |
ACalculated based on average shares outstanding during the period.
BNet investment income (loss) is affected by the timing of the declaration of dividends by any underlying mutual funds or exchange-traded funds (ETFs). Net investment income (loss) of any mutual funds or ETFs is not included in the Fund's net investment income (loss) ratio.
CNet investment income per share reflects one or more large, non-recurring dividend(s) which amounted to $.05 per share. Excluding such non-recurring dividend(s), the ratio of net investment income (loss) to average net assets would have been 1.47%.
DTotal distributions per share do not sum due to rounding.
ETotal returns do not reflect charges attributable to your insurance company's separate account. Inclusion of these charges would reduce the total returns shown.
FTotal returns would have been lower if certain expenses had not been reduced during the applicable periods shown.
GFees and expenses of any underlying mutual funds or exchange-traded funds (ETFs) are not included in the Fund's expense ratio. The Fund indirectly bears its proportionate share of these expenses. For additional expense information related to investments in Fidelity Central Funds, please refer to the "Investments in Fidelity Central Funds" note found in the Notes to Financial Statements section of the most recent Annual or Semi-Annual report.
HExpense ratios reflect operating expenses of the class. Expenses before reductions do not reflect amounts reimbursed, waived, or reduced through arrangements with the investment adviser, brokerage services, or other offset arrangements, if applicable, and do not represent the amount paid by the class during periods when reimbursements, waivers or reductions occur.
IAmount does not include the portfolio activity of any underlying mutual funds or exchange-traded funds (ETFs), derivatives or securities that mature within one year from acquisition.
VIP Emerging Markets Portfolio Service Class 2 |
| |
| Years ended December 31, | | 2024 | | 2023 | | 2022 | | 2021 | | 2020 |
Selected Per-Share Data | | | | | | | | | | |
| Net asset value, beginning of period | $ | 10.58 | $ | 9.86 | $ | 12.58 | $ | 14.74 | $ | 12.69 |
| Income from Investment Operations | | | | | | | | | | |
Net investment income (loss) A,B | | .16 | | .18 C | | .21 | | .18 | | .09 |
| Net realized and unrealized gain (loss) | | .87 | | .75 | | (2.77) | | (.47) | | 3.44 |
| Total from investment operations | | 1.03 | | .93 | | (2.56) | | (.29) | | 3.53 |
| Distributions from net investment income | | (.13) | | (.21) | | (.16) | | (.28) | | (.08) |
| Distributions from net realized gain | | - | | - | | - | | (1.59) | | (1.39) |
| Distributions from tax return of capital | | (.01) | | - | | - | | - | | - |
| Total distributions | | (.14) | | (.21) | | (.16) | | (1.87) | | (1.48) D |
| Net asset value, end of period | $ | 11.47 | $ | 10.58 | $ | 9.86 | $ | 12.58 | $ | 14.74 |
Total Return E,F | | | | 9.49% | | (20.37)% | | (2.41)% | | 30.88% |
Ratios to Average Net Assets B,G,H | | | | | | | | | | |
| Expenses before reductions | | 1.14% | | 1.17% | | 1.17% | | 1.16% | | 1.17% |
| Expenses net of fee waivers, if any | | | | 1.16% | | 1.17% | | 1.16% | | 1.17% |
| Expenses net of all reductions | | 1.14% | | 1.16% | | 1.17% | | 1.16% | | 1.15% |
| Net investment income (loss) | | 1.40% | | 1.79% C | | 2.04% | | 1.22% | | .72% |
| Supplemental Data | | | | | | | | | | |
| Net assets, end of period (000 omitted) | $ | 180,147 | $ | 157,772 | $ | 137,866 | $ | 145,374 | $ | 91,103 |
Portfolio turnover rate I | | | | 39% | | 62% | | 46% | | 80% |
ACalculated based on average shares outstanding during the period.
BNet investment income (loss) is affected by the timing of the declaration of dividends by any underlying mutual funds or exchange-traded funds (ETFs). Net investment income (loss) of any mutual funds or ETFs is not included in the Fund's net investment income (loss) ratio.
CNet investment income per share reflects one or more large, non-recurring dividend(s) which amounted to $.05 per share. Excluding such non-recurring dividend(s), the ratio of net investment income (loss) to average net assets would have been 1.32%.
DTotal distributions per share do not sum due to rounding.
ETotal returns do not reflect charges attributable to your insurance company's separate account. Inclusion of these charges would reduce the total returns shown.
FTotal returns would have been lower if certain expenses had not been reduced during the applicable periods shown.
GFees and expenses of any underlying mutual funds or exchange-traded funds (ETFs) are not included in the Fund's expense ratio. The Fund indirectly bears its proportionate share of these expenses. For additional expense information related to investments in Fidelity Central Funds, please refer to the "Investments in Fidelity Central Funds" note found in the Notes to Financial Statements section of the most recent Annual or Semi-Annual report.
HExpense ratios reflect operating expenses of the class. Expenses before reductions do not reflect amounts reimbursed, waived, or reduced through arrangements with the investment adviser, brokerage services, or other offset arrangements, if applicable, and do not represent the amount paid by the class during periods when reimbursements, waivers or reductions occur.
IAmount does not include the portfolio activity of any underlying mutual funds or exchange-traded funds (ETFs), derivatives or securities that mature within one year from acquisition.
VIP Emerging Markets Portfolio Investor Class |
| |
| Years ended December 31, | | 2024 | | 2023 | | 2022 | | 2021 | | 2020 |
Selected Per-Share Data | | | | | | | | | | |
| Net asset value, beginning of period | $ | 10.53 | $ | 9.82 | $ | 12.52 | $ | 14.68 | $ | 12.63 |
| Income from Investment Operations | | | | | | | | | | |
Net investment income (loss) A,B | | .18 | | .20 C | | .23 | | .20 | | .10 |
| Net realized and unrealized gain (loss) | | .87 | | .74 | | (2.76) | | (.47) | | 3.44 |
| Total from investment operations | | 1.05 | | .94 | | (2.53) | | (.27) | | 3.54 |
| Distributions from net investment income | | (.15) | | (.23) | | (.17) | | (.30) | | (.10) |
| Distributions from net realized gain | | - | | - | | - | | (1.59) | | (1.39) |
| Distributions from tax return of capital | | (.01) | | - | | - | | - | | - |
| Total distributions | | (.16) | | (.23) | | (.17) | | (1.89) | | (1.49) |
| Net asset value, end of period | $ | 11.42 | $ | 10.53 | $ | 9.82 | $ | 12.52 | $ | 14.68 |
Total Return D,E | | | | 9.61% | | (20.20)% | | (2.28)% | | 31.16% |
Ratios to Average Net Assets B,F,G | | | | | | | | | | |
| Expenses before reductions | | .97% | | .99% | | .99% | | .99% | | 1.00% |
| Expenses net of fee waivers, if any | | | | .99% | | .99% | | .99% | | 1.00% |
| Expenses net of all reductions | | .96% | | .99% | | .99% | | .99% | | .98% |
| Net investment income (loss) | | 1.57% | | 1.96% C | | 2.22% | | 1.39% | | .89% |
| Supplemental Data | | | | | | | | | | |
| Net assets, end of period (000 omitted) | $ | 217,287 | $ | 210,708 | $ | 220,389 | $ | 303,059 | $ | 293,751 |
Portfolio turnover rate H | | | | 39% | | 62% | | 46% | | 80% |
ACalculated based on average shares outstanding during the period.
BNet investment income (loss) is affected by the timing of the declaration of dividends by any underlying mutual funds or exchange-traded funds (ETFs). Net investment income (loss) of any mutual funds or ETFs is not included in the Fund's net investment income (loss) ratio.
CNet investment income per share reflects one or more large, non-recurring dividend(s) which amounted to $.05 per share. Excluding such non-recurring dividend(s), the ratio of net investment income (loss) to average net assets would have been 1.49%.
DTotal returns do not reflect charges attributable to your insurance company's separate account. Inclusion of these charges would reduce the total returns shown.
ETotal returns would have been lower if certain expenses had not been reduced during the applicable periods shown.
FFees and expenses of any underlying mutual funds or exchange-traded funds (ETFs) are not included in the Fund's expense ratio. The Fund indirectly bears its proportionate share of these expenses. For additional expense information related to investments in Fidelity Central Funds, please refer to the "Investments in Fidelity Central Funds" note found in the Notes to Financial Statements section of the most recent Annual or Semi-Annual report.
GExpense ratios reflect operating expenses of the class. Expenses before reductions do not reflect amounts reimbursed, waived, or reduced through arrangements with the investment adviser, brokerage services, or other offset arrangements, if applicable, and do not represent the amount paid by the class during periods when reimbursements, waivers or reductions occur.
HAmount does not include the portfolio activity of any underlying mutual funds or exchange-traded funds (ETFs), derivatives or securities that mature within one year from acquisition.
Notes to Financial Statements
For the period ended December 31, 2024
1. Organization.
VIP Emerging Markets Portfolio (the Fund) is a fund of Variable Insurance Products Fund II (the Trust) and is authorized to issue an unlimited number of shares. The Trust is registered under the Investment Company Act of 1940, as amended (the 1940 Act), as an open-end management investment company organized as a Massachusetts business trust. Shares of the Fund may only be purchased by insurance companies for the purpose of funding variable annuity or variable life insurance contracts. The Fund offers the following classes of shares: Initial Class shares, Service Class shares, Service Class 2 shares and Investor Class shares. All classes have equal rights and voting privileges, except for matters affecting a single class. The Fund's investments in emerging markets can be subject to social, economic, regulatory, and political uncertainties and can be extremely volatile.
2. Investments in Fidelity Central Funds.
Funds may invest in Fidelity Central Funds, which are open-end investment companies generally available only to other investment companies and accounts managed by the investment adviser and its affiliates. The Schedule of Investments lists any Fidelity Central Funds held as an investment as of period end, but does not include the underlying holdings of each Fidelity Central Fund. An investing fund indirectly bears its proportionate share of the expenses of the underlying Fidelity Central Funds.
Based on its investment objective, each Fidelity Central Fund may invest or participate in various investment vehicles or strategies that are similar to those of the investing fund. These strategies are consistent with the investment objectives of the investing fund and may involve certain economic risks which may cause a decline in value of each of the Fidelity Central Funds and thus a decline in the value of the investing fund.
| Fidelity Central Fund | Investment Manager | Investment Objective | Investment Practices | Expense RatioA |
| Fidelity Money Market Central Funds | Fidelity Management & Research Company LLC (FMR) | Each fund seeks to obtain a high level of current income consistent with the preservation of capital and liquidity. | Short-term Investments | Less than .005% |
A Expenses expressed as a percentage of average net assets and are as of each underlying Central Fund's most recent annual or semi-annual shareholder report.
A complete unaudited list of holdings for each Fidelity Central Fund is available upon request or at the Securities and Exchange Commission website at www.sec.gov. In addition, the financial statements of the Fidelity Central Funds which contain the significant accounting policies (including investment valuation policies) of those funds, and are not covered by the Report of Independent Registered Public Accounting Firm, are available on the Securities and Exchange Commission website or upon request.
3. Significant Accounting Policies.
The Fund is an investment company and applies the accounting and reporting guidance of the Financial Accounting Standards Board (FASB) Accounting Standards Codification Topic 946 Financial Services - Investment Companies. The financial statements have been prepared in conformity with accounting principles generally accepted in the United States of America (GAAP), which require management to make certain estimates and assumptions at the date of the financial statements. Actual results could differ from those estimates. The Fund operates as a single operating segment. The Fund's income, expenses, assets, and performance are regularly monitored and assessed as a whole by the investment adviser and other individuals responsible for oversight functions of the Trust, using the information presented in the financial statements and financial highlights. Subsequent events, if any, through the date that the financial statements were issued have been evaluated in the preparation of the financial statements. The Fund's Schedule of Investments lists any underlying mutual funds or exchange-traded funds (ETFs) but does not include the underlying holdings of these funds. The following summarizes the significant accounting policies of the Fund:
Investment Valuation. Investments are valued as of 4:00 p.m. Eastern time on the last calendar day of the period. The Board of Trustees (the Board) has designated the Fund's investment adviser as the valuation designee responsible for the fair valuation function and performing fair value determinations as needed. The investment adviser has established a Fair Value Committee (the Committee) to carry out the day-to-day fair valuation responsibilities and has adopted policies and procedures to govern the fair valuation process and the activities of the Committee. In accordance with these fair valuation policies and procedures, which have been approved by the Board, the Fund attempts to obtain prices from one or more third party pricing services or brokers to value its investments. When current market prices, quotations or currency exchange rates are not readily available or reliable, investments will be fair valued in good faith by the Committee, in accordance with the policies and procedures. Factors used in determining fair value vary by investment type and may include market or investment specific events, transaction data, estimated cash flows, and market observations of comparable investments. The frequency that the fair valuation procedures are used cannot be predicted and they may be utilized to a significant extent. The Committee manages the Fund's fair valuation practices and maintains the fair valuation policies and procedures. The Fund's investment adviser reports to the Board information regarding the fair valuation process and related material matters.
The Fund categorizes the inputs to valuation techniques used to value its investments into a disclosure hierarchy consisting of three levels as shown below:
Level 1 - unadjusted quoted prices in active markets for identical investments
Level 2 - other significant observable inputs (including quoted prices for similar investments, interest rates, prepayment speeds, etc.)
Level 3 - unobservable inputs (including the Fund's own assumptions based on the best information available)
Valuation techniques used to value the Fund's investments by major category are as follows:
Equity securities, including restricted securities, for which market quotations are readily available, are valued at the last reported sale price or official closing price as reported by a third party pricing service on the primary market or exchange on which they are traded and are categorized as Level 1 in the hierarchy. In the event there were no sales during the day or closing prices are not available, securities are valued at the last quoted bid price or may be valued using the last available price and are generally categorized as Level 2 in the hierarchy. For foreign equity securities, when market or security specific events arise, comparisons to the valuation of American Depositary Receipts (ADRs), futures contracts, Exchange-Traded Funds (ETFs) and certain indexes as well as quoted prices for similar securities may be used and would be categorized as Level 2 in the hierarchy. For equity securities, including restricted securities, where observable inputs are limited, assumptions about market activity and risk are used and these securities may be categorized as Level 3 in the hierarchy.
Investments in open-end mutual funds, including the Fidelity Central Funds, are valued at their closing net asset value (NAV) each business day and are categorized as Level 1 in the hierarchy.
Changes in valuation techniques may result in transfers in or out of an assigned level within the disclosure hierarchy. The aggregate value of investments by input level as of December 31, 2024 is included at the end of the Fund's Schedule of Investments.
Foreign Currency. Certain Funds may use foreign currency contracts to facilitate transactions in foreign-denominated securities. Gains and losses from these transactions may arise from changes in the value of the foreign currency or if the counterparties do not perform under the contracts' terms.
Foreign-denominated assets, including investment securities, and liabilities are translated into U.S. dollars at the exchange rates at period end. Purchases and sales of investment securities, income and dividends received, and expenses denominated in foreign currencies are translated into U.S. dollars at the exchange rate in effect on the transaction date.
The effects of exchange rate fluctuations on investments are included with the net realized and unrealized gain (loss) on investment securities. Other foreign currency transactions resulting in realized and unrealized gain (loss) are disclosed separately.
Investment Transactions and Income. For financial reporting purposes, the Fund's investment holdings and NAV include trades executed through the end of the last business day of the period. The NAV per share for processing shareholder transactions is calculated as of the close of business of the New York Stock Exchange (NYSE), normally 4:00 p.m. Eastern time and includes trades executed through the end of the prior business day. Gains and losses on securities sold are determined on the basis of identified cost and include proceeds received from litigation. Commissions paid to certain brokers with whom the investment adviser, or its affiliates, places trades on behalf of a fund include an amount in addition to trade execution, which may be rebated back to a fund. Any such rebates are included in net realized gain (loss) on investments in the Statement of Operations. Dividend income is recorded on the ex-dividend date, except for certain dividends from foreign securities where the ex-dividend date may have passed, which are recorded as soon as the Fund is informed of the ex-dividend date. Non-cash dividends included in dividend income, if any, are recorded at the fair market value of the securities received. Income and capital gain distributions from Fidelity Central Funds, if any, are recorded on the ex-dividend date. Investment income is recorded net of foreign taxes withheld where recovery of such taxes is uncertain. Funds may file withholding tax reclaims in certain jurisdictions to recover a portion of amounts previously withheld. Any withholding tax reclaims income is included in the Statement of Operations in foreign taxes withheld. Any receivables for withholding tax reclaims are included in the Statement of Assets and Liabilities in dividends receivable.
Class Allocations and Expenses. Investment income, realized and unrealized capital gains and losses, common expenses of a fund, and certain fund-level expense reductions, if any, are allocated daily on a pro-rata basis to each class based on the relative net assets of each class to the total net assets of a fund. Each class differs with respect to transfer agent and distribution and service plan fees incurred, as applicable. Certain expense reductions may also differ by class, if applicable. For the reporting period, the allocated portion of income and expenses to each class as a percent of its average net assets may vary due to the timing of recording these transactions in relation to fluctuating net assets of the classes. Expenses directly attributable to a fund are charged to that fund. Expenses attributable to more than one fund are allocated among the respective funds on the basis of relative net assets or other appropriate methods. Expenses included in the accompanying financial statements reflect the expenses of that fund and do not include any expenses associated with any underlying mutual funds or exchange-traded funds (ETFs). Although not included in a fund's expenses, a fund indirectly bears its proportionate share of these expenses through the net asset value of each underlying mutual fund or exchange-traded fund (ETF). Expense estimates are accrued in the period to which they relate and adjustments are made when actual amounts are known.
Income Tax Information and Distributions to Shareholders. Each year, the Fund intends to qualify as a regulated investment company under Subchapter M of the Internal Revenue Code, including distributing substantially all of its taxable income and realized gains. As a result, no provision for U.S. Federal income taxes is required. As of December 31, 2024, the Fund did not have any unrecognized tax benefits in the financial statements; nor is the Fund aware of any tax positions for which it is reasonably possible that the total amounts of unrecognized tax benefits will significantly change in the next twelve months. The Fund files a U.S. federal tax return, in addition to state and local tax returns as required. The Fund's federal income tax returns are subject to examination by the Internal Revenue Service (IRS) for a period of three fiscal years after they are filed. State and local tax returns may be subject to examination for an additional fiscal year depending on the jurisdiction. Foreign taxes are provided for based on the Fund's understanding of the tax rules and rates that exist in the foreign markets in which it invests. The Fund is subject to a tax imposed on capital gains by certain countries in which it invests. An estimated deferred tax liability for net unrealized appreciation on the applicable securities is included in Deferred taxes on the Statement of Assets and Liabilities.
Distributions are declared and recorded on the ex-dividend date. Income and capital gain distributions are declared separately for each class. Income and capital gain distributions are determined in accordance with income tax regulations, which may differ from GAAP.
Capital accounts within the financial statements are adjusted for permanent book-tax differences. These adjustments have no impact on net assets or the results of operations. Capital accounts are not adjusted for temporary book-tax differences which will reverse in a subsequent period.
Book-tax differences are primarily due to foreign currency transactions, certain foreign taxes, passive foreign investment companies (PFIC), capital loss carryforwards and losses deferred due to wash sales and excise tax regulations.
As of period end, the cost and unrealized appreciation (depreciation) in securities, and derivatives if applicable, for federal income tax purposes were as follows:
| Gross unrealized appreciation | $234,848,481 |
| Gross unrealized depreciation | (134,254,503) |
| Net unrealized appreciation (depreciation) | $100,593,978 |
| Tax Cost | $993,620,307 |
The Fund intends to elect to defer to the next fiscal year ordinary losses in the amount of $2,578,331 recognized during the period November 1, 2024 to December 31, 2024.
For the applicable period ended December 31, 2024, the Fund's distributions exceeded the aggregate amount of taxable income and net realized gains resulting in a return of capital for tax purposes. This was due to reductions in taxable income available for distribution after certain distributions had been made.
The tax-based components of distributable earnings as of period end were as follows:
| Capital loss carryforward | $(49,965,290) |
| Net unrealized appreciation (depreciation) on securities and other investments | $100,554,037 |
Capital loss carryforwards are only available to offset future capital gains of the Fund to the extent provided by regulations and may be limited. The capital loss carryforward information presented below, including any applicable limitation, is estimated as of fiscal period end and is subject to adjustment.
Short-term | $(46,698,292) |
Long-term | (3,266,998) |
| Total capital loss carryforward | $(49,965,290) |
The tax character of distributions paid was as follows:
| | December 31, 2024 | December 31, 2023 |
| Ordinary Income | $13,550,279 | $21,738,144 |
| Tax Return of Capital | 1,405,712 | - |
| Total | $14,955,991 | $21,738,144 |
Restricted Securities (including Private Placements). Funds may invest in securities that are subject to legal or contractual restrictions on resale. These securities generally may be resold in transactions exempt from registration or to the public if the securities are registered. Disposal of these securities may involve time-consuming negotiations and expense, and prompt sale at an acceptable price may be difficult. Information regarding restricted securities held at period end is included at the end of the Schedule of Investments, if applicable.
New Accounting Pronouncement. FASB Accounting Standards Update (ASU) 2023-07 Segment Reporting (Topic 280): Improvements to Reportable Segment Disclosures became effective in this reporting period. ASU 2023-07 enhances segment information disclosure in the notes to financial statements.
4. Purchases and Sales of Investments.
Purchases and sales of securities, other than short-term securities and in-kind transactions, as applicable, are noted in the table below.
| | Purchases ($) | Sales ($) |
| VIP Emerging Markets Portfolio | 632,510,840 | 675,901,205 |
5. Fees and Other Transactions with Affiliates.
Management Fee. Fidelity Management & Research Company LLC (the investment adviser) and its affiliates provide the Fund with investment management related services for which the Fund pays a monthly management fee.
Effective March 1, 2024, the Fund's management contract was amended to incorporate administrative services previously covered under separate services agreements (Transfer Agent and Accounting agreements). The amended contract incorporates a management fee rate that may vary by class. The investment adviser or an affiliate pays certain expenses of managing and operating the Fund out of each class's management fee. Each class of the Fund pays a management fee to the investment adviser. The management fee is calculated and paid to the investment adviser every month. When determining a class's management fee, a mandate rate is calculated based on the monthly average net assets of a group of funds advised by FMR within a designated asset class. A discount rate is subtracted from the mandate rate once the Fund's monthly average net assets reach a certain level. The mandate rate and discount rate may vary by class. The annual management fee rate for a class of shares of the Fund is the lesser of (1) the class's mandate rate reduced by the class's discount rate (if applicable) or (2) the amount set forth in the following table.
| | Maximum Management Fee Rate % |
| Initial Class | .85 |
| Service Class | .85 |
| Service Class 2 | .85 |
| Investor Class | .93 |
One-twelfth of the management fee rate for a class is applied to the average net assets of the class for the month, giving a dollar amount which is the management fee for the class for that month. A different management fee rate may be applicable to each class of the Fund. The difference between classes is the result of separate arrangements for class-level services and/or waivers of certain expenses. It is not the result of any difference in advisory or custodial fees or other expenses related to the management of the Fund's assets, which do not vary by class. For the portion of the reporting period on or after March 1, 2024, the total annualized management fee rates were as follows:
| | Total Management Fee Rate % |
| Initial Class | .84 |
| Service Class | .84 |
| Service Class 2 | .84 |
| Investor Class | .92 |
Prior to March 1, 2024, the management fee was the sum of an individual fund fee rate that was based on an annual rate of .55% of the Fund's average net assets and an annualized group fee rate that averaged .22% during the period. The group fee rate was based upon the monthly average net assets of a group of registered investment companies with which the investment adviser has management contracts. The group fee rate decreased as assets under management increased and increased as assets under management decreased. For the portion of the reporting period prior to March 1, 2024, the total annualized management fee rate was .77%.
Effective March 1, 2024, the Fund's sub-advisory agreements with FMR Investment Management (UK) Limited, Fidelity Management & Research (Hong Kong) Limited, and Fidelity Management & Research (Japan) Limited were amended to provide that the investment adviser pays each sub-adviser monthly fees equal to 110% of the sub-adviser's costs for providing sub-advisory services.
Effective March 1, 2024, the Fund's sub-advisory agreement with FIL Investment Advisors (FIA) was amended to provide that the investment adviser pays FIA monthly fees at an annual rate of 0.50% with respect to the average daily net assets of the Fund managed by FIA. FIA in turn pays FIA(UK).
Distribution and Service Plan Fees. In accordance with Rule 12b-1 of the 1940 Act, the Fund has adopted separate 12b-1 Plans for each Service Class of shares. Each Service Class pays Fidelity Distributors Company LLC (FDC), an affiliate of the investment adviser, a service fee. For the period, the service fee is based on an annual rate of .10% of Service Class' average net assets and .25% of Service Class 2's average net assets.
For the period, total fees, all of which were re-allowed to insurance companies for the distribution of shares and providing shareholder support services, were as follows:
| Service Class | $198,656 |
| Service Class 2 | 431,865 |
| | $630,521 |
Transfer Agent Fees. Fidelity Investments Institutional Operations Company LLC (FIIOC), an affiliate of the investment adviser, is the Fund's transfer, dividend disbursing, and shareholder servicing agent. Effective March 1, 2024, the Fund's management contract was amended to incorporate transfer agent services and associated fees previously covered under a separate services agreement.
During the period January 1, 2024 through February 29, 2024, the transfer agent fees for each class were a fixed annual rate of class-level average net assets as follows:
| | Amount ($) | % of Class-Level Average Net Assets |
| Initial Class | 49,686 | .0630 |
| Service Class | 18,309 | .0630 |
| Service Class 2 | 16,076 | .0630 |
| Investor Class | 47,098 | .1390 |
| | 131,169 | |
Accounting Fees. Fidelity Service Company, Inc. (FSC), an affiliate of the investment adviser, maintains the Fund's accounting records. Effective March 1, 2024, the Fund's management contract was amended to incorporate accounting services and associated fees previously covered under a separate services agreement.
During the period January 1, 2024 through February 29, 2024, the accounting fees were a fixed annual rate of average net assets as follows:
| | % of Average Net Assets |
| VIP Emerging Markets Portfolio | .0444 |
Brokerage Commissions. A portion of portfolio transactions were placed with brokerage firms which are affiliates of the investment adviser. Brokerage commissions are included in net realized gain (loss) and change in net unrealized appreciation (depreciation) in the Statement of Operations. The commissions paid to these affiliated firms were as follows:
| | Amount ($) |
| VIP Emerging Markets Portfolio | 2,391 |
Interfund Lending Program. Pursuant to an Exemptive Order issued by the Securities and Exchange Commission (the SEC), the Fund, along with other registered investment companies having management contracts with Fidelity Management & Research Company LLC (FMR), or other affiliated entities of FMR, may participate in an interfund lending program. This program provides an alternative credit facility allowing the Fund to borrow from, or lend money to, other participating affiliated funds at rates that are beneficial to both the borrowing and lending fund. Borrowings under the program are generally for temporary or emergency purposes, including meeting fund shareholder redemptions. The interfund loan rate is determined, as specified in the Exemptive Order, by averaging, (1) the higher of the overnight time deposit rate and the current overnight repurchase agreement rate, and (2) a benchmark rate representing the lowest bank loan rate available to the funds. At period end, there were no interfund loans outstanding. Activity in this program during the period for which loans were outstanding was as follows:
| | Borrower or Lender | Average Loan Balance ($) | Weighted Average Interest Rate | Interest Expense ($) |
| VIP Emerging Markets Portfolio | Borrower | 8,055,286 | 5.47% | 25,698 |
Interfund Trades. Funds may purchase from or sell securities to other Fidelity Funds under procedures adopted by the Board. The procedures have been designed to ensure these interfund trades are executed in accordance with Rule 17a-7 of the 1940 Act. Any interfund trades are included within the respective purchases and sales amounts shown in the Purchases and Sales of Investments note. Interfund trades during the period are noted in the table below.
| | Purchases ($) | Sales ($) | Realized Gain (Loss) ($) |
| VIP Emerging Markets Portfolio | 7,870,590 | 21,651,910 | (2,128,387) |
6. Committed Line of Credit.
Certain Funds participate with other funds managed by the investment adviser or an affiliate in a $4.25 billion credit facility (the "line of credit") to be utilized for temporary or emergency purposes to fund shareholder redemptions or for other short-term liquidity purposes.
Commitment fees are charged based on the unused amount of the line of credit at an annual rate of .10%, and then allocated to each participating fund based on its pro-rata portion of the line of credit. The commitment fees are reflected in Miscellaneous expenses on the Statement of Operations, and are listed below.
Interest is charged to a participating fund based on its borrowings at an annual rate of .75% plus the highest of (i) daily SOFR plus a .10% spread adjustment, (ii) Federal Funds Effective Rate, or (iii) Overnight Bank Funding Rate. During the period, there were no borrowings on this line of credit.
The line of credit agreement will expire in March 2025 unless extended or renewed.
| | Amount ($) |
| VIP Emerging Markets Portfolio | 1,685 |
7. Security Lending.
Funds lend portfolio securities from time to time in order to earn additional income. Lending agents are used, including National Financial Services (NFS), an affiliate of the investment adviser. Pursuant to a securities lending agreement, NFS will receive a fee, which is capped at 9.9% of a fund's daily lending revenue, for its services as lending agent. A fund may lend securities to certain qualified borrowers, including NFS. On the settlement date of the loan, a fund receives collateral (in the form of U.S. Treasury obligations, letters of credit and/or cash) against the loaned securities and maintains collateral in an amount not less than 100% of the market value of the loaned securities during the period of the loan. The market value of the loaned securities is determined at the close of business of a fund and any additional required collateral is delivered to a fund on the next business day. A fund or borrower may terminate the loan at any time, and if the borrower defaults on its obligation to return the securities loaned because of insolvency or other reasons, a fund may apply collateral received from the borrower against the obligation. A fund may experience delays and costs in recovering the securities loaned. Any cash collateral received is invested in the Fidelity Securities Lending Cash Central Fund. Any loaned securities are identified as such in the Schedule of Investments, and the value of loaned securities and cash collateral at period end, as applicable, are presented in the Statement of Assets and Liabilities. Security lending income represents the income earned on investing cash collateral, less rebates paid to borrowers and any lending agent fees associated with the loan, plus any premium payments received for lending certain types of securities. Security lending income is presented in the Statement of Operations as a component of income from Fidelity Central Funds. Affiliated security lending activity, if any, was as follows:
| | Total Security Lending Fees Paid to NFS ($) | Security Lending Income From Securities Loaned to NFS ($) | Value of Securities Loaned to NFS at Period End ($) |
| VIP Emerging Markets Portfolio | 6,670 | - | - |
8. Expense Reductions.
During the period the investment adviser or an affiliate reimbursed and/or waived a portion of fund-level operating expenses in the amount of $45,095.
9. Distributions to Shareholders.
Distributions to shareholders of each class were as follows:
| | Year ended December 31, 2024 | Year ended December 31, 2023 |
| VIP Emerging Markets Portfolio | | |
| Distributions to shareholders | | |
| Initial Class | $6,587,374 | $10,432,932 |
| Service Class | 2,253,424 | 3,752,146 |
| Service Class 2 | 1,931,349 | 3,063,350 |
| Investor Class | 2,778,132 | 4,489,716 |
Total | $13,550,279 | $21,738,144 |
| Tax Return of Capital | | |
| Initial Class | $685,021 | $- |
| Service Class | 279,738 | - |
| Service Class 2 | 237,818 | - |
| Investor Class | 203,135 | - |
Total | $1,405,712 | $- |
10. Share Transactions.
Transactions for each class of shares were as follows and may contain in-kind transactions:
| | Shares | Shares | Dollars | Dollars |
| | Year ended December 31, 2024 | Year ended December 31, 2023 | Year ended December 31, 2024 | Year ended December 31, 2023 |
| VIP Emerging Markets Portfolio | | | | |
| Initial Class | | | | |
| Shares sold | 14,364,200 | 17,232,219 | $165,607,016 | $175,824,961 |
| Reinvestment of distributions | 614,004 | 1,021,229 | 7,272,395 | 10,432,932 |
| Shares redeemed | (17,242,432) | (14,111,973) | (198,562,615) | (146,554,091) |
| Net increase (decrease) | (2,264,228) | 4,141,475 | $(25,683,204) | $39,703,802 |
| Service Class | | | | |
| Shares sold | 6,140,549 | 1,890,368 | $68,289,613 | $19,536,650 |
| Reinvestment of distributions | 213,451 | 366,165 | 2,533,162 | 3,752,146 |
| Shares redeemed | (6,338,882) | (5,483,043) | (73,170,254) | (56,029,027) |
| Net increase (decrease) | 15,118 | (3,226,510) | $(2,347,479) | $(32,740,231) |
| Service Class 2 | | | | |
| Shares sold | 3,501,387 | 3,649,996 | $40,277,123 | $37,985,313 |
| Reinvestment of distributions | 183,454 | 300,044 | 2,169,167 | 3,063,350 |
| Shares redeemed | (2,889,926) | (3,010,040) | (33,225,651) | (30,778,926) |
| Net increase (decrease) | 794,915 | 940,000 | $9,220,639 | $10,269,737 |
| Investor Class | | | | |
| Shares sold | 3,818,109 | 4,029,370 | $45,356,414 | $41,660,066 |
| Reinvestment of distributions | 253,135 | 441,711 | 2,981,267 | 4,489,716 |
| Shares redeemed | (5,052,854) | (6,903,875) | (58,767,954) | (70,945,152) |
| Net increase (decrease) | (981,610) | (2,432,794) | $(10,430,273) | $(24,795,370) |
11. Other.
A fund's organizational documents provide former and current trustees and officers with a limited indemnification against liabilities arising in connection with the performance of their duties to the fund. In the normal course of business, a fund may also enter into contracts that provide general indemnifications. A fund's maximum exposure under these arrangements is unknown as this would be dependent on future claims that may be made against a fund. The risk of material loss from such claims is considered remote.
At the end of the period, the investment adviser or its affiliates were owners of record of more than 10% and certain otherwise unaffiliated shareholders each were owners of record of more than 10% of the outstanding shares as follows:
| Fund | Affiliated % | Number ofUnaffiliated Shareholders | Unaffiliated Shareholders % |
| VIP Emerging Markets Portfolio | 12% | 1 | 16% |
Mutual funds managed by the investment adviser or its affiliates, in aggregate, were the owners of record of more than 20% of the total outstanding shares.
| Fund | % of shares held |
| VIP Emerging Markets Portfolio | 38% |
12. Risk and Uncertainties.
Many factors affect a fund's performance. Developments that disrupt global economies and financial markets, such as pandemics, epidemics, outbreaks of infectious diseases, war, terrorism, and environmental disasters, may significantly affect a fund's investment performance. The effects of these developments to a fund will be impacted by the types of securities in which a fund invests, the financial condition, industry, economic sector, and geographic location of an issuer, and a fund's level of investment in the securities of that issuer. Significant concentrations in security types, issuers, industries, sectors, and geographic locations may magnify the factors that affect a fund's performance.
Report of Independent Registered Public Accounting Firm
To the Board of Trustees of Variable Insurance Products Fund II and the Shareholders of VIP Emerging Markets Portfolio:
Opinion on the Financial Statements and Financial Highlights
We have audited the accompanying statement of assets and liabilities of VIP Emerging Markets Portfolio (the "Fund"), a fund of Variable Insurance Products Fund II, including the schedule of investments, as of December 31, 2024, the related statement of operations for the year then ended, the statement of changes in net assets for each of the two years in the period then ended, the financial highlights for each of the five years in the period then ended, and the related notes. In our opinion, the financial statements and financial highlights present fairly, in all material respects, the financial position of the Fund as of December 31, 2024, and the results of its operations for the year then ended, the changes in its net assets for each of the two years in the period then ended, and the financial highlights for each of the five years in the period then ended in conformity with accounting principles generally accepted in the United States of America.
Basis for Opinion
These financial statements and financial highlights are the responsibility of the Fund's management. Our responsibility is to express an opinion on the Fund's financial statements and financial highlights based on our audits. We are a public accounting firm registered with the Public Company Accounting Oversight Board (United States) (PCAOB) and are required to be independent with respect to the Fund in accordance with the U.S. federal securities laws and the applicable rules and regulations of the Securities and Exchange Commission and the PCAOB.
We conducted our audits in accordance with the standards of the PCAOB. Those standards require that we plan and perform the audit to obtain reasonable assurance about whether the financial statements and financial highlights are free of material misstatement, whether due to error or fraud. The Fund is not required to have, nor were we engaged to perform, an audit of its internal control over financial reporting. As part of our audits, we are required to obtain an understanding of internal control over financial reporting but not for the purpose of expressing an opinion on the effectiveness of the Fund's internal control over financial reporting. Accordingly, we express no such opinion.
Our audits included performing procedures to assess the risks of material misstatement of the financial statements and financial highlights, whether due to error or fraud, and performing procedures that respond to those risks. Such procedures included examining, on a test basis, evidence regarding the amounts and disclosures in the financial statements and financial highlights. Our audits also included evaluating the accounting principles used and significant estimates made by management, as well as evaluating the overall presentation of the financial statements and financial highlights. Our procedures included confirmation of securities owned as of December 31,2024, by correspondence with the custodian and brokers; when replies were not received from brokers, we performed other auditing procedures. We believe that our audits provide a reasonable basis for our opinion.
/s/ Deloitte & Touche LLP
Boston, Massachusetts
February 13, 2025
We have served as the auditor of one or more of the Fidelity investment companies since 1999.
Distributions
(Unaudited)The dividend and capital gains distributions for the fund(s) are available on Fidelity.com or Institutional.Fidelity.com.
The fund designates $184,004 of distributions paid during the fiscal year ended 2024 as qualifying to be taxed as section 163(j) interest dividends.
The amounts per share which represent income derived from sources within, and taxes paid to, foreign countries or possessions of the United States are as follows:
| | Pay Date | Income | Taxes |
| Insert Fund Name | | | |
| Initial Class | 12/11/2024 | $0.2479 | $0.0985 |
| Service Class | 12/11/2024 | $0.2334 | $0.0985 |
| Service Class 2 | 12/11/2024 | $0.2227 | $0.0985 |
| Investor Class | 12/11/2024 | $0.2382 | $0.0985 |
Item 8: Changes in and Disagreements with Accountants for Open-End Management Investment Companies
(Unaudited)
Note: This is not applicable for any fund included in this document.
Item 9: Proxy Disclosures for Open-End Management Investment Companies
(Unaudited)
| A special meeting of shareholders was held on July 16, 2024. The results of votes taken among shareholders on the proposal before them are reported below. Each vote reported represents one dollar of net asset value held on the record date for the meeting. |
| Proposal 1 |
| To elect a Board of Trustees. |
| | # of Votes | % of Votes |
| Bettina Doulton |
| Affirmative | 35,115,445,138.03 | 95.41 |
| Withheld | 1,688,162,573.22 | 4.59 |
| TOTAL | 36,803,607,711.25 | 100.00 |
| Robert A. Lawrence |
| Affirmative | 35,088,609,864.54 | 95.34 |
| Withheld | 1,714,997,846.71 | 4.66 |
| TOTAL | 36,803,607,711.25 | 100.00 |
| Vijay C. Advani |
| Affirmative | 35,010,407,909.42 | 95.13 |
| Withheld | 1,793,199,801.83 | 4.87 |
| TOTAL | 36,803,607,711.25 | 100.00 |
| Thomas P. Bostick |
| Affirmative | 35,057,529,083.85 | 95.26 |
| Withheld | 1,746,078,627.39 | 4.74 |
| TOTAL | 36,803,607,711.25 | 100.00 |
| Donald F. Donahue |
| Affirmative | 35,013,585,423.05 | 95.14 |
| Withheld | 1,790,022,288.19 | 4.86 |
| TOTAL | 36,803,607,711.25 | 100.00 |
| Vicki L. Fuller |
| Affirmative | 35,122,634,645.90 | 95.43 |
| Withheld | 1,680,973,065.35 | 4.57 |
| TOTAL | 36,803,607,711.25 | 100.00 |
| Patricia L. Kampling |
| Affirmative | 35,180,534,002.80 | 95.59 |
| Withheld | 1,623,073,708.44 | 4.41 |
| TOTAL | 36,803,607,711.25 | 100.00 |
| Thomas A. Kennedy |
| Affirmative | 35,124,156,340.38 | 95.44 |
| Withheld | 1,679,451,370.87 | 4.56 |
| TOTAL | 36,803,607,711.25 | 100.00 |
| Oscar Munoz |
| Affirmative | 35,015,482,863.79 | 95.14 |
| Withheld | 1,788,124,847.45 | 4.86 |
| TOTAL | 36,803,607,711.25 | 100.00 |
| Karen B. Peetz |
| Affirmative | 35,090,964,426.07 | 95.35 |
| Withheld | 1,712,643,285.17 | 4.65 |
| TOTAL | 36,803,607,711.25 | 100.00 |
| David M. Thomas |
| Affirmative | 34,979,784,204.17 | 95.04 |
| Withheld | 1,823,823,507.08 | 4.96 |
| TOTAL | 36,803,607,711.25 | 100.00 |
| Susan Tomasky |
| Affirmative | 35,096,963,470.38 | 95.36 |
| Withheld | 1,706,644,240.86 | 4.64 |
| TOTAL | 36,803,607,711.25 | 100.00 |
| Michael E. Wiley |
| Affirmative | 34,987,599,655.10 | 95.07 |
| Withheld | 1,816,008,056.15 | 4.93 |
| TOTAL | 36,803,607,711.25 | 100.00 |
| | | |
| Proposal 1 reflects trust-wide proposal and voting results. |
Item 10: Remuneration Paid to Directors, Officers, and others of Open-End Management Investment Companies
(Unaudited)
Note: This information is disclosed as part of the financial statements for each Fund as part of Item 7: Financial Statements and Financial Highlights for Open-End Management Investment companies.
Item 11: Statement Regarding Basis for Approval of Investment Advisory Contract
(Unaudited)
Note: This is not applicable for any fund included in this document.
1.858135.116
VIPEM-ANN-0325
Fidelity® Variable Insurance Products:
VIP Contrafund℠ Portfolio
Annual Report
December 31, 2024
Contents
To view a fund's proxy voting guidelines and proxy voting record for the 12-month period ended June 30, visit http://www.fidelity.com/proxyvotingresults or visit the Securities and Exchange Commission's (SEC) web site at http://www.sec.gov.
You may also call 1-877-208-0098 to request a free copy of the proxy voting guidelines.
Fidelity® Variable Insurance Products are separate account options which are purchased through a variable insurance contract.
Standard & Poor's, S&P and S&P 500 are registered service marks of The McGraw-Hill Companies, Inc. and have been licensed for use by Fidelity Distributors Corporation.
Other third-party marks appearing herein are the property of their respective owners.
All other marks appearing herein are registered or unregistered trademarks or service marks of FMR LLC or an affiliated company. © 2025 FMR LLC. All rights reserved.
This report and the financial statements contained herein are submitted for the general information of the shareholders of the Fund. This report is not authorized for distribution to prospective investors in the Fund unless preceded or accompanied by an effective prospectus.
A fund files its complete schedule of portfolio holdings with the SEC for the first and third quarters of each fiscal year on Form N-PORT. Forms N-PORT are available on the SEC's web site at http://www.sec.gov. A fund's Forms N-PORT may be reviewed and copied at the SEC's Public Reference Room in Washington, DC. Information regarding the operation of the SEC's Public Reference Room may be obtained by calling 1-800-SEC-0330.
For a complete list of a fund's portfolio holdings, view the most recent holdings listing, semiannual report, or annual report on Fidelity's web site at http://www.fidelity.com, http://www.institutional.fidelity.com, or http://www.401k.com, as applicable.
NOT FDIC INSURED •MAY LOSE VALUE •NO BANK GUARANTEE
Neither the Fund nor Fidelity Distributors Corporation is a bank.
Item 7: Consolidated Financial Statements and Consolidated Financial Highlights for Open-End Management Investment Companies (Annual Report)
VIP Contrafund℠ Portfolio
Consolidated Schedule of Investments December 31, 2024
Showing Percentage of Net Assets
| Common Stocks - 97.4% |
| | | Shares | Value ($) |
| AUSTRALIA - 0.0% | | | |
| Industrials - 0.0% | | | |
| Commercial Services & Supplies - 0.0% | | | |
| Clean TeQ Water Ltd (b) | | 3,117 | 627 |
| Information Technology - 0.0% | | | |
| Software - 0.0% | | | |
| Canva Inc Class A (c)(d) | | 9,774 | 12,511,600 |
| TOTAL AUSTRALIA | | | 12,512,227 |
| BELGIUM - 0.0% | | | |
| Health Care - 0.0% | | | |
| Pharmaceuticals - 0.0% | | | |
| UCB SA | | 70,600 | 14,055,780 |
| BRAZIL - 0.2% | | | |
| Consumer Discretionary - 0.1% | | | |
| Broadline Retail - 0.1% | | | |
| MercadoLibre Inc (b) | | 13,800 | 23,466,072 |
| Financials - 0.1% | | | |
| Banks - 0.1% | | | |
| NU Holdings Ltd/Cayman Islands Class A (b) | | 1,934,200 | 20,038,312 |
| Materials - 0.0% | | | |
| Metals & Mining - 0.0% | | | |
| Wheaton Precious Metals Corp | | 73,800 | 4,153,994 |
| TOTAL BRAZIL | | | 47,658,378 |
| CANADA - 1.5% | | | |
| Communication Services - 0.0% | | | |
| Entertainment - 0.0% | | | |
| Lionsgate Studios Corp | | 216,181 | 1,642,976 |
| Consumer Discretionary - 0.0% | | | |
| Broadline Retail - 0.0% | | | |
| Dollarama Inc | | 67,300 | 6,567,772 |
| Consumer Staples - 0.0% | | | |
| Consumer Staples Distribution & Retail - 0.0% | | | |
| Alimentation Couche-Tard Inc | | 84,700 | 4,697,404 |
| Energy - 0.5% | | | |
| Oil, Gas & Consumable Fuels - 0.5% | | | |
| ARC Resources Ltd | | 74,200 | 1,345,712 |
| Cameco Corp (United States) | | 141,700 | 7,281,963 |
| Canadian Natural Resources Ltd | | 785,000 | 24,236,182 |
| Canadian Natural Resources Ltd (United States) | | 2,627,200 | 81,101,664 |
| PrairieSky Royalty Ltd | | 43,700 | 852,142 |
| Suncor Energy Inc | | 35,000 | 1,249,330 |
| | | | 116,066,993 |
| Financials - 0.5% | | | |
| Banks - 0.1% | | | |
| Royal Bank of Canada | | 311,594 | 37,570,331 |
| Capital Markets - 0.1% | | | |
| Brookfield Asset Management Ltd Class A | | 6,417 | 348,026 |
| Brookfield Asset Management Ltd Class A (United States) | | 323,400 | 17,525,046 |
| Brookfield Corp Class A | | 41,900 | 2,408,277 |
| | | | 20,281,349 |
| Insurance - 0.3% | | | |
| Fairfax Financial Holdings Ltd Subordinate Voting Shares | | 17,600 | 24,487,808 |
| Intact Financial Corp | | 222,900 | 40,585,494 |
| | | | 65,073,302 |
TOTAL FINANCIALS | | | 122,924,982 |
| | | | |
| Industrials - 0.1% | | | |
| Commercial Services & Supplies - 0.0% | | | |
| RB Global Inc (United States) | | 54,600 | 4,925,466 |
| Ground Transportation - 0.1% | | | |
| Canadian Pacific Kansas City Ltd | | 206,000 | 14,915,635 |
| Professional Services - 0.0% | | | |
| Thomson Reuters Corp | | 70,765 | 11,363,162 |
TOTAL INDUSTRIALS | | | 31,204,263 |
| | | | |
| Information Technology - 0.2% | | | |
| Electronic Equipment, Instruments & Components - 0.0% | | | |
| Celestica Inc Subordinate Voting Shares (b) | | 81,300 | 7,503,049 |
| IT Services - 0.2% | | | |
| Shopify Inc Class A (b) | | 409,400 | 43,573,068 |
| Software - 0.0% | | | |
| Constellation Software Inc/Canada | | 500 | 1,546,109 |
TOTAL INFORMATION TECHNOLOGY | | | 52,622,226 |
| | | | |
| Materials - 0.2% | | | |
| Metals & Mining - 0.2% | | | |
| Agnico Eagle Mines Ltd/CA | | 59,400 | 4,647,204 |
| Alamos Gold Inc Class A | | 78,400 | 1,446,428 |
| Franco-Nevada Corp | | 120,555 | 14,166,859 |
| Lundin Gold Inc | | 351,900 | 7,505,829 |
| Novagold Resources Inc (b) | | 136,016 | 455,137 |
| Orla Mining Ltd (b) | | 2,379,600 | 13,177,235 |
| | | | 41,398,692 |
| TOTAL CANADA | | | 377,125,308 |
| CHINA - 0.3% | | | |
| Consumer Discretionary - 0.3% | | | |
| Automobiles - 0.0% | | | |
| BYD Co Ltd H Shares | | 255,500 | 8,690,355 |
| Broadline Retail - 0.3% | | | |
| PDD Holdings Inc Class A ADR (b) | | 605,700 | 58,746,843 |
| Hotels, Restaurants & Leisure - 0.0% | | | |
| Meituan B Shares (b)(e)(f) | | 108,400 | 2,107,661 |
TOTAL CONSUMER DISCRETIONARY | | | 69,544,859 |
| | | | |
| Health Care - 0.0% | | | |
| Biotechnology - 0.0% | | | |
| Zai Lab Ltd ADR (b) | | 61,300 | 1,605,447 |
| Information Technology - 0.0% | | | |
| Semiconductors & Semiconductor Equipment - 0.0% | | | |
| NXP Semiconductors NV | | 31,800 | 6,609,630 |
| TOTAL CHINA | | | 77,759,936 |
| CONGO DEMOCRATIC REPUBLIC OF - 0.2% | | | |
| Materials - 0.2% | | | |
| Metals & Mining - 0.2% | | | |
| Ivanhoe Mine Ltd Class A (b) | | 3,824,119 | 45,385,558 |
| FINLAND - 0.0% | | | |
| Consumer Discretionary - 0.0% | | | |
| Textiles, Apparel & Luxury Goods - 0.0% | | | |
| Amer Sports Inc | | 430,900 | 12,047,964 |
| FRANCE - 0.1% | | | |
| Health Care - 0.1% | | | |
| Health Care Equipment & Supplies - 0.1% | | | |
| EssilorLuxottica SA | | 58,174 | 14,197,147 |
| GERMANY - 0.1% | | | |
| Consumer Discretionary - 0.1% | | | |
| Textiles, Apparel & Luxury Goods - 0.1% | | | |
| adidas AG | | 51,500 | 12,632,398 |
| Birkenstock Holding Plc (b) | | 28,400 | 1,609,144 |
| | | | |
| TOTAL GERMANY | | | 14,241,542 |
| IRELAND - 0.1% | | | |
| Financials - 0.1% | | | |
| Banks - 0.1% | | | |
| AIB Group PLC | | 846,100 | 4,671,386 |
| Bank of Ireland Group PLC | | 361,500 | 3,297,493 |
| | | | 7,968,879 |
| Financial Services - 0.0% | | | |
| Circle Internet Financial LLC (c) | | 103,462 | 3,133,864 |
| Circle Internet Financial LLC (c) | | 65,587 | 1,986,630 |
| | | | 5,120,494 |
| Information Technology - 0.0% | | | |
| IT Services - 0.0% | | | |
| Accenture PLC Class A | | 4,400 | 1,547,876 |
| TOTAL IRELAND | | | 14,637,249 |
| ISRAEL - 0.2% | | | |
| Health Care - 0.2% | | | |
| Pharmaceuticals - 0.2% | | | |
| Teva Pharmaceutical Industries Ltd ADR (b) | | 1,966,688 | 43,345,804 |
| Information Technology - 0.0% | | | |
| IT Services - 0.0% | | | |
| Wix.com Ltd (b) | | 14,819 | 3,179,416 |
| Software - 0.0% | | | |
| Cellebrite DI Ltd (b) | | 49,451 | 1,089,405 |
| Check Point Software Technologies Ltd (b) | | 54,984 | 10,265,513 |
| | | | 11,354,918 |
TOTAL INFORMATION TECHNOLOGY | | | 14,534,334 |
| | | | |
| TOTAL ISRAEL | | | 57,880,138 |
| ITALY - 0.0% | | | |
| Industrials - 0.0% | | | |
| Passenger Airlines - 0.0% | | | |
| Ryanair Holdings PLC ADR | | 7,410 | 323,002 |
| JAPAN - 0.1% | | | |
| Consumer Discretionary - 0.0% | | | |
| Broadline Retail - 0.0% | | | |
| Pan Pacific International Holdings Corp | | 58,800 | 1,612,894 |
| Specialty Retail - 0.0% | | | |
| Fast Retailing Co Ltd | | 28,700 | 9,681,708 |
| Textiles, Apparel & Luxury Goods - 0.0% | | | |
| Asics Corp | | 124,000 | 2,450,920 |
TOTAL CONSUMER DISCRETIONARY | | | 13,745,522 |
| | | | |
| Industrials - 0.1% | | | |
| Industrial Conglomerates - 0.0% | | | |
| Hitachi Ltd | | 57,000 | 1,395,933 |
| Machinery - 0.1% | | | |
| Mitsubishi Heavy Industries Ltd | | 515,200 | 7,183,924 |
| Trading Companies & Distributors - 0.0% | | | |
| ITOCHU Corp | | 93,300 | 4,587,970 |
| Mitsui & Co Ltd | | 119,800 | 2,484,547 |
| | | | 7,072,517 |
TOTAL INDUSTRIALS | | | 15,652,374 |
| | | | |
| Information Technology - 0.0% | | | |
| Semiconductors & Semiconductor Equipment - 0.0% | | | |
| Advantest Corp | | 95,600 | 5,435,706 |
| TOTAL JAPAN | | | 34,833,602 |
| KOREA (SOUTH) - 0.2% | | | |
| Consumer Discretionary - 0.2% | | | |
| Automobiles - 0.1% | | | |
| Hyundai Motor Co | | 131,400 | 18,577,980 |
| Broadline Retail - 0.1% | | | |
| Coupang Inc Class A (b) | | 1,338,995 | 29,431,110 |
| TOTAL KOREA (SOUTH) | | | 48,009,090 |
| NETHERLANDS - 0.6% | | | |
| Communication Services - 0.1% | | | |
| Entertainment - 0.1% | | | |
| Universal Music Group NV | | 711,012 | 18,187,065 |
| Financials - 0.0% | | | |
| Financial Services - 0.0% | | | |
| Adyen NV (b)(e)(f) | | 1,000 | 1,486,079 |
| Health Care - 0.3% | | | |
| Biotechnology - 0.3% | | | |
| Argenx SE ADR (b) | | 126,900 | 78,043,500 |
| Information Technology - 0.2% | | | |
| Semiconductors & Semiconductor Equipment - 0.2% | | | |
| ASML Holding NV depository receipt | | 63,600 | 44,079,888 |
| TOTAL NETHERLANDS | | | 141,796,532 |
| SPAIN - 0.0% | | | |
| Financials - 0.0% | | | |
| Banks - 0.0% | | | |
| Banco Santander SA | | 1,399,600 | 6,474,903 |
| SWEDEN - 0.0% | | | |
| Industrials - 0.0% | | | |
| Machinery - 0.0% | | | |
| Indutrade AB | | 46,600 | 1,166,701 |
| SWITZERLAND - 0.2% | | | |
| Consumer Discretionary - 0.1% | | | |
| Textiles, Apparel & Luxury Goods - 0.1% | | | |
| On Holding AG Class A (b) | | 521,935 | 28,586,380 |
| Financials - 0.1% | | | |
| Capital Markets - 0.1% | | | |
| UBS Group AG | | 458,320 | 14,003,871 |
| TOTAL SWITZERLAND | | | 42,590,251 |
| TAIWAN - 0.9% | | | |
| Information Technology - 0.9% | | | |
| Semiconductors & Semiconductor Equipment - 0.9% | | | |
| Taiwan Semiconductor Manufacturing Co Ltd ADR | | 1,115,200 | 220,240,848 |
| THAILAND - 0.0% | | | |
| Information Technology - 0.0% | | | |
| Electronic Equipment, Instruments & Components - 0.0% | | | |
| Fabrinet (b) | | 27,200 | 5,980,736 |
| UNITED KINGDOM - 0.3% | | | |
| Consumer Discretionary - 0.1% | | | |
| Hotels, Restaurants & Leisure - 0.1% | | | |
| Deliveroo PLC Class A (b)(e)(f) | | 164,300 | 291,870 |
| Flutter Entertainment PLC (b) | | 93,600 | 24,190,920 |
| Flutter Entertainment PLC (United Kingdom) (b) | | 26,100 | 6,770,175 |
| | | | 31,252,965 |
| Financials - 0.1% | | | |
| Banks - 0.0% | | | |
| Starling Bank Ltd Class D (b)(c)(d) | | 2,643,467 | 8,372,671 |
| Capital Markets - 0.1% | | | |
| London Stock Exchange Group PLC | | 92,300 | 13,028,604 |
TOTAL FINANCIALS | | | 21,401,275 |
| | | | |
| Industrials - 0.1% | | | |
| Aerospace & Defense - 0.1% | | | |
| Rolls-Royce Holdings PLC (b) | | 2,484,572 | 17,619,077 |
| Professional Services - 0.0% | | | |
| RELX PLC | | 320,800 | 14,535,123 |
TOTAL INDUSTRIALS | | | 32,154,200 |
| | | | |
| TOTAL UNITED KINGDOM | | | 84,808,440 |
| UNITED STATES - 92.4% | | | |
| Communication Services - 18.4% | | | |
| Entertainment - 2.9% | | | |
| Electronic Arts Inc | | 29,700 | 4,345,110 |
| Liberty Media Corp-Liberty Formula One Class C (b) | | 445,827 | 41,310,330 |
| Liberty Media Corp-Liberty Live Class C (b) | | 17,283 | 1,176,281 |
| Live Nation Entertainment Inc (b) | | 39,500 | 5,115,250 |
| Netflix Inc (b) | | 593,299 | 528,819,265 |
| ROBLOX Corp Class A (b) | | 117,000 | 6,769,620 |
| Roku Inc Class A (b) | | 624,250 | 46,406,745 |
| Spotify Technology SA (b) | | 40,100 | 17,939,938 |
| Walt Disney Co/The | | 711,258 | 79,198,578 |
| | | | 731,081,117 |
| Interactive Media & Services - 14.9% | | | |
| Alphabet Inc Class C | | 7,746,940 | 1,475,327,254 |
| Epic Games Inc (b)(c)(d) | | 18,849 | 12,789,235 |
| Meta Platforms Inc Class A | | 3,738,622 | 2,189,000,567 |
| Pinterest Inc Class A (b) | | 1,632,800 | 47,351,200 |
| Reddit Inc Class A | | 290,336 | 47,452,516 |
| Reddit Inc Class B (b) | | 62,205 | 10,166,785 |
| | | | 3,782,087,557 |
| Media - 0.6% | | | |
| Charter Communications Inc Class A (b) | | 172,100 | 58,990,717 |
| EchoStar Corp (d) | | 3,554,022 | 81,387,104 |
| Omnicom Group Inc | | 30,000 | 2,581,200 |
| Trade Desk Inc (The) Class A (b) | | 24,900 | 2,926,497 |
| | | | 145,885,518 |
| Wireless Telecommunication Services - 0.0% | | | |
| T-Mobile US Inc | | 15,300 | 3,377,168 |
TOTAL COMMUNICATION SERVICES | | | 4,662,431,360 |
| | | | |
| Consumer Discretionary - 10.1% | | | |
| Automobiles - 0.8% | | | |
| General Motors Co | | 154,900 | 8,251,523 |
| Rad Power Bikes Inc (b)(c)(d) | | 401,674 | 84,352 |
| Rad Power Bikes Inc warrants 10/6/2033 (b)(c)(d) | | 384,164 | 199,765 |
| Tesla Inc (b) | | 463,600 | 187,220,224 |
| | | | 195,755,864 |
| Broadline Retail - 5.4% | | | |
| Amazon.com Inc (b) | | 6,281,140 | 1,378,019,305 |
| Diversified Consumer Services - 0.1% | | | |
| Duolingo Inc Class A (b) | | 90,961 | 29,492,284 |
| Hotels, Restaurants & Leisure - 1.5% | | | |
| Airbnb Inc Class A (b) | | 375,512 | 49,346,032 |
| Booking Holdings Inc | | 5,700 | 28,319,994 |
| Carnival Corp (b) | | 211,000 | 5,258,120 |
| Cava Group Inc (b) | | 116,500 | 13,141,200 |
| Chipotle Mexican Grill Inc (b) | | 1,633,300 | 98,487,990 |
| Churchill Downs Inc | | 22,000 | 2,937,880 |
| DoorDash Inc Class A (b) | | 170,000 | 28,517,500 |
| DraftKings Inc Class A (b) | | 39,100 | 1,454,520 |
| Dutch Bros Inc Class A (b) | | 45,100 | 2,362,338 |
| Hilton Worldwide Holdings Inc | | 457,700 | 113,125,132 |
| Royal Caribbean Cruises Ltd | | 15,600 | 3,598,764 |
| Starbucks Corp | | 108,000 | 9,855,000 |
| Texas Roadhouse Inc | | 10,900 | 1,966,687 |
| Viking Holdings Ltd | | 222,800 | 9,816,568 |
| | | | 368,187,725 |
| Household Durables - 0.7% | | | |
| DR Horton Inc | | 18,400 | 2,572,688 |
| Garmin Ltd | | 48,245 | 9,951,014 |
| Lennar Corp Class A | | 223,198 | 30,437,511 |
| NVR Inc (b) | | 6,300 | 51,527,070 |
| PulteGroup Inc | | 703,408 | 76,601,131 |
| | | | 171,089,414 |
| Specialty Retail - 1.3% | | | |
| Abercrombie & Fitch Co Class A (b) | | 33,700 | 5,037,139 |
| Chewy Inc Class A (b) | | 48,700 | 1,630,963 |
| Dick's Sporting Goods Inc | | 55,429 | 12,684,372 |
| Fanatics Inc Class A (b)(c)(d) | | 232,280 | 13,936,800 |
| Gap Inc/The | | 304,724 | 7,200,628 |
| Group 1 Automotive Inc | | 1,200 | 505,776 |
| Home Depot Inc/The | | 128,600 | 50,024,114 |
| Lowe's Cos Inc | | 294,275 | 72,627,071 |
| Murphy USA Inc | | 113,480 | 56,938,590 |
| O'Reilly Automotive Inc (b) | | 26,800 | 31,779,440 |
| TJX Cos Inc/The | | 509,154 | 61,510,895 |
| Williams-Sonoma Inc | | 67,308 | 12,464,095 |
| | | | 326,339,883 |
| Textiles, Apparel & Luxury Goods - 0.3% | | | |
| Crocs Inc (b) | | 416,300 | 45,597,339 |
| Deckers Outdoor Corp (b) | | 81,154 | 16,481,566 |
| Ralph Lauren Corp Class A | | 49,200 | 11,364,216 |
| VF Corp (g) | | 222,000 | 4,764,120 |
| | | | 78,207,241 |
TOTAL CONSUMER DISCRETIONARY | | | 2,547,091,716 |
| | | | |
| Consumer Staples - 2.1% | | | |
| Beverages - 0.4% | | | |
| Coca-Cola Co/The | | 528,800 | 32,923,088 |
| Keurig Dr Pepper Inc | | 2,000,100 | 64,243,212 |
| | | | 97,166,300 |
| Consumer Staples Distribution & Retail - 1.5% | | | |
| Casey's General Stores Inc | | 45,300 | 17,949,219 |
| Costco Wholesale Corp | | 371,501 | 340,395,222 |
| Walmart Inc | | 204,100 | 18,440,435 |
| | | | 376,784,876 |
| Food Products - 0.1% | | | |
| Bowery Farming Inc (b)(c) | | 34,182 | 0 |
| Bowery Farming Inc warrants (b)(c)(d) | | 12,010 | 0 |
| Freshpet Inc (b) | | 158,000 | 23,401,380 |
| | | | 23,401,380 |
| Household Products - 0.0% | | | |
| Procter & Gamble Co/The | | 16,400 | 2,749,460 |
| Personal Care Products - 0.1% | | | |
| BellRing Brands Inc (b) | | 7,100 | 534,914 |
| elf Beauty Inc (b)(g) | | 193,000 | 24,231,150 |
| | | | 24,766,064 |
TOTAL CONSUMER STAPLES | | | 524,868,080 |
| | | | |
| Energy - 1.0% | | | |
| Energy Equipment & Services - 0.0% | | | |
| Baker Hughes Co Class A | | 67,400 | 2,764,748 |
| Oil, Gas & Consumable Fuels - 1.0% | | | |
| Cheniere Energy Inc | | 7,200 | 1,547,064 |
| CONSOL Energy Inc | | 553,800 | 59,079,384 |
| Exxon Mobil Corp | | 1,283,200 | 138,033,824 |
| Marathon Petroleum Corp | | 10,100 | 1,408,950 |
| Sable Offshore Corp (d) | | 519,473 | 11,895,932 |
| Shell PLC ADR | | 782,600 | 49,029,890 |
| | | | 260,995,044 |
TOTAL ENERGY | | | 263,759,792 |
| | | | |
| Financials - 14.6% | | | |
| Banks - 2.8% | | | |
| Bank of America Corp | | 1,341,647 | 58,965,386 |
| Citigroup Inc | | 482,300 | 33,949,097 |
| East West Bancorp Inc | | 63,900 | 6,119,063 |
| First Citizens BancShares Inc/NC Class A | | 9,300 | 19,651,086 |
| JPMorgan Chase & Co | | 1,392,939 | 333,901,408 |
| Wells Fargo & Co | | 3,578,500 | 251,353,840 |
| | | | 703,939,880 |
| Capital Markets - 1.7% | | | |
| Ameriprise Financial Inc | | 151,400 | 80,609,902 |
| Bank of New York Mellon Corp/The | | 1,104,824 | 84,883,628 |
| Blackstone Inc | | 58,811 | 10,140,193 |
| Charles Schwab Corp/The | | 19,800 | 1,465,398 |
| Goldman Sachs Group Inc/The | | 53,600 | 30,692,432 |
| Interactive Brokers Group Inc Class A | | 32,900 | 5,812,443 |
| KKR & Co Inc Class A | | 83,600 | 12,365,276 |
| MarketAxess Holdings Inc | | 224,400 | 50,723,376 |
| Moody's Corp | | 151,483 | 71,707,508 |
| Morgan Stanley | | 577,500 | 72,603,300 |
| MSCI Inc | | 11,828 | 7,096,918 |
| Raymond James Financial Inc | | 20,600 | 3,199,798 |
| S&P Global Inc | | 3,000 | 1,494,090 |
| | | | 432,794,262 |
| Consumer Finance - 0.9% | | | |
| American Express Co | | 360,400 | 106,963,116 |
| Capital One Financial Corp | | 144,300 | 25,731,576 |
| Discover Financial Services | | 518,200 | 89,767,786 |
| | | | 222,462,478 |
| Financial Services - 7.6% | | | |
| Apollo Global Management Inc | | 554,100 | 91,515,156 |
| Berkshire Hathaway Inc Class B (b) | | 2,380,188 | 1,078,891,617 |
| Block Inc Class A (b) | | 16,400 | 1,393,836 |
| Fiserv Inc (b) | | 319,200 | 65,570,064 |
| Mastercard Inc Class A | | 490,600 | 258,335,242 |
| Paymentus Holdings Inc Class A (b) | | 27,700 | 904,958 |
| PayPal Holdings Inc (b) | | 268,200 | 22,890,870 |
| Shift4 Payments Inc Class A (b) | | 77,200 | 8,011,816 |
| Toast Inc Class A (b) | | 1,671,300 | 60,918,885 |
| Visa Inc Class A | | 1,023,117 | 323,345,897 |
| | | | 1,911,778,341 |
| Insurance - 1.6% | | | |
| American International Group Inc | | 341,711 | 24,876,561 |
| Aon PLC | | 8,300 | 2,981,028 |
| Arthur J Gallagher & Co | | 423,900 | 120,324,015 |
| Chubb Ltd | | 235,100 | 64,958,130 |
| Marsh & McLennan Cos Inc | | 390,867 | 83,024,059 |
| Progressive Corp/The | | 335,600 | 80,413,116 |
| The Travelers Companies, Inc. | | 142,400 | 34,302,736 |
| Willis Towers Watson PLC | | 4,800 | 1,503,552 |
| | | | 412,383,197 |
TOTAL FINANCIALS | | | 3,683,358,158 |
| | | | |
| Health Care - 10.5% | | | |
| Biotechnology - 2.0% | | | |
| Alnylam Pharmaceuticals Inc (b) | | 290,786 | 68,424,854 |
| Apogee Therapeutics Inc (b) | | 44,600 | 2,020,380 |
| Arcellx Inc (b) | | 35,700 | 2,737,833 |
| Avidity Biosciences Inc (b) | | 89,700 | 2,608,476 |
| Crinetics Pharmaceuticals Inc (b) | | 26,400 | 1,349,832 |
| Denali Therapeutics Inc (b) | | 131,298 | 2,675,853 |
| Exelixis Inc (b) | | 44,400 | 1,478,520 |
| Gilead Sciences Inc | | 51,100 | 4,720,107 |
| Insmed Inc (b) | | 35,445 | 2,447,123 |
| Janux Therapeutics Inc (b) | | 78,300 | 4,192,182 |
| Legend Biotech Corp ADR (b) | | 387,900 | 12,622,266 |
| Moderna Inc (b) | | 43,200 | 1,796,256 |
| Natera Inc (b) | | 10,300 | 1,630,490 |
| Recursion Pharmaceuticals Inc Class A (b)(g) | | 138,227 | 934,414 |
| Regeneron Pharmaceuticals Inc (b) | | 301,734 | 214,934,180 |
| United Therapeutics Corp (b) | | 108,047 | 38,123,303 |
| Vertex Pharmaceuticals Inc (b) | | 336,115 | 135,353,511 |
| Viking Therapeutics Inc (b) | | 29,100 | 1,170,984 |
| | | | 499,220,564 |
| Health Care Equipment & Supplies - 2.3% | | | |
| Alcon AG (United States) | | 138,500 | 11,757,265 |
| Boston Scientific Corp (b) | | 2,904,100 | 259,394,212 |
| Cooper Cos Inc/The (b) | | 28,557 | 2,625,245 |
| Glaukos Corp (b) | | 11,200 | 1,679,328 |
| Globus Medical Inc Class A (b) | | 19,600 | 1,621,116 |
| Insulet Corp (b) | | 269,500 | 70,358,365 |
| Intuitive Surgical Inc (b) | | 344,318 | 179,720,223 |
| PROCEPT BioRobotics Corp (b) | | 21,600 | 1,739,232 |
| Stryker Corp | | 124,000 | 44,646,200 |
| TransMedics Group Inc (b) | | 324,500 | 20,232,575 |
| | | | 593,773,761 |
| Health Care Providers & Services - 1.5% | | | |
| BrightSpring Health Services Inc (b) | | 85,183 | 1,450,666 |
| HCA Healthcare Inc | | 40,950 | 12,291,143 |
| McKesson Corp | | 80,900 | 46,105,719 |
| Tenet Healthcare Corp (b) | | 192,506 | 24,300,032 |
| UnitedHealth Group Inc | | 597,040 | 302,018,655 |
| | | | 386,166,215 |
| Health Care Technology - 0.3% | | | |
| Doximity Inc Class A (b) | | 1,514,900 | 80,880,511 |
| Veeva Systems Inc Class A (b) | | 9,200 | 1,934,300 |
| | | | 82,814,811 |
| Life Sciences Tools & Services - 1.0% | | | |
| Danaher Corp | | 520,800 | 119,549,640 |
| Thermo Fisher Scientific Inc | | 235,900 | 122,722,257 |
| Veterinary Emergency Group (b)(c)(d)(h) | | 155,147 | 9,856,489 |
| | | | 252,128,386 |
| Pharmaceuticals - 3.4% | | | |
| Eli Lilly & Co | | 895,953 | 691,675,716 |
| Intra-Cellular Therapies Inc (b) | | 169,530 | 14,159,146 |
| Merck & Co Inc | | 1,475,600 | 146,792,688 |
| | | | 852,627,550 |
TOTAL HEALTH CARE | | | 2,666,731,287 |
| | | | |
| Industrials - 9.0% | | | |
| Aerospace & Defense - 2.5% | | | |
| Axon Enterprise Inc (b) | | 53,280 | 31,665,370 |
| Boeing Co (b) | | 676,670 | 119,770,590 |
| GE Aerospace | | 1,298,277 | 216,539,622 |
| HEICO Corp | | 4,260 | 1,012,772 |
| Howmet Aerospace Inc | | 914,300 | 99,996,991 |
| Leonardo DRS Inc (b) | | 100,400 | 3,243,924 |
| Loar Holdings Inc (g) | | 22,811 | 1,685,961 |
| Relativity Space Inc warrants (b)(c)(d) | | 10,617 | 2,760 |
| Rocket Lab USA Inc Class A (b) | | 500 | 12,735 |
| Space Exploration Technologies Corp (b)(c)(d) | | 178,012 | 32,932,220 |
| Space Exploration Technologies Corp Class C (b)(c)(d) | | 16,934 | 3,132,790 |
| TransDigm Group Inc | | 76,300 | 96,693,464 |
| | | | 606,689,199 |
| Air Freight & Logistics - 0.0% | | | |
| Zipline International Inc (b)(c)(d) | | 50,479 | 2,117,594 |
| Building Products - 1.2% | | | |
| AZEK Co Inc/The Class A (b) | | 888,600 | 42,181,842 |
| Builders FirstSource Inc (b) | | 370,800 | 52,998,444 |
| Carrier Global Corp | | 174,000 | 11,877,240 |
| Tecnoglass Inc | | 426,800 | 33,853,776 |
| Trane Technologies PLC | | 420,720 | 155,392,932 |
| | | | 296,304,234 |
| Commercial Services & Supplies - 0.6% | | | |
| Cintas Corp | | 129,300 | 23,623,110 |
| Clean Harbors Inc (b) | | 80,244 | 18,467,354 |
| Copart Inc (b) | | 697,700 | 40,041,003 |
| GFL Environmental Inc Subordinate Voting Shares | | 558,000 | 24,875,050 |
| GFL Environmental Inc Subordinate Voting Shares (United States) (g) | | 734,700 | 32,723,538 |
| Republic Services Inc | | 52,100 | 10,481,478 |
| Veralto Corp | | 86,454 | 8,805,340 |
| | | | 159,016,873 |
| Construction & Engineering - 0.6% | | | |
| Comfort Systems USA Inc | | 6,700 | 2,841,202 |
| EMCOR Group Inc | | 200,350 | 90,938,865 |
| Quanta Services Inc | | 195,879 | 61,907,558 |
| | | | 155,687,625 |
| Electrical Equipment - 1.0% | | | |
| Eaton Corp PLC | | 246,376 | 81,764,803 |
| GE Vernova Inc | | 400,219 | 131,644,036 |
| Generac Holdings Inc (b) | | 39,309 | 6,094,860 |
| Hubbell Inc | | 85,935 | 35,997,312 |
| Vertiv Holdings Co Class A | | 78,900 | 8,963,829 |
| | | | 264,464,840 |
| Ground Transportation - 0.2% | | | |
| Uber Technologies Inc (b) | | 845,500 | 51,000,560 |
| XPO Inc (b) | | 11,700 | 1,534,455 |
| | | | 52,535,015 |
| Industrial Conglomerates - 0.1% | | | |
| 3M Co | | 253,400 | 32,711,406 |
| Machinery - 1.8% | | | |
| Allison Transmission Holdings Inc | | 490,000 | 52,949,400 |
| Caterpillar Inc | | 92,800 | 33,664,128 |
| Deere & Co | | 249,800 | 105,840,260 |
| Ingersoll Rand Inc | | 35,700 | 3,229,422 |
| PACCAR Inc | | 693,595 | 72,147,752 |
| Parker-Hannifin Corp | | 217,800 | 138,527,334 |
| Westinghouse Air Brake Technologies Corp | | 301,200 | 57,104,508 |
| | | | 463,462,804 |
| Passenger Airlines - 0.0% | | | |
| Alaska Air Group Inc (b) | | 48,200 | 3,120,950 |
| Professional Services - 0.6% | | | |
| Dayforce Inc (b) | | 101,500 | 7,372,960 |
| Equifax Inc | | 271,400 | 69,166,290 |
| Leidos Holdings Inc | | 7,800 | 1,123,668 |
| Paycom Software Inc | | 271,654 | 55,680,920 |
| UL Solutions Inc Class A | | 67,300 | 3,356,924 |
| Verisk Analytics Inc | | 84,000 | 23,136,120 |
| | | | 159,836,882 |
| Trading Companies & Distributors - 0.4% | | | |
| FTAI Aviation Ltd | | 55,600 | 8,008,624 |
| United Rentals Inc | | 26,400 | 18,597,216 |
| WW Grainger Inc | | 62,800 | 66,194,340 |
| | | | 92,800,180 |
TOTAL INDUSTRIALS | | | 2,288,747,602 |
| | | | |
| Information Technology - 25.2% | | | |
| Communications Equipment - 1.1% | | | |
| Arista Networks Inc | | 2,035,296 | 224,961,267 |
| Motorola Solutions Inc | | 89,100 | 41,184,693 |
| | | | 266,145,960 |
| Electronic Equipment, Instruments & Components - 1.3% | | | |
| Amphenol Corp Class A | | 4,817,970 | 334,608,017 |
| Coherent Corp (b) | | 25,100 | 2,377,723 |
| Sanmina Corp (b) | | 7,900 | 597,793 |
| Zebra Technologies Corp Class A (b) | | 4,000 | 1,544,880 |
| | | | 339,128,413 |
| IT Services - 0.2% | | | |
| Cloudflare Inc Class A (b) | | 101,800 | 10,961,824 |
| Gartner Inc (b) | | 17,591 | 8,522,312 |
| GoDaddy Inc Class A (b) | | 169,756 | 33,504,742 |
| Kyndryl Holdings Inc (b) | | 130,500 | 4,515,300 |
| Twilio Inc Class A (b) | | 36,000 | 3,890,880 |
| X Holdings Corp Class A (b)(c)(d) | | 55,300 | 1,688,308 |
| | | | 63,083,366 |
| Semiconductors & Semiconductor Equipment - 11.1% | | | |
| Advanced Micro Devices Inc (b) | | 113,973 | 13,766,799 |
| Analog Devices Inc | | 50,105 | 10,645,308 |
| Applied Materials Inc | | 46,400 | 7,546,032 |
| ARM Holdings PLC ADR (b) | | 71,200 | 8,783,232 |
| Astera Labs Inc (b) | | 99,200 | 13,139,040 |
| Broadcom Inc | | 1,278,000 | 296,291,520 |
| Lam Research Corp | | 836,400 | 60,413,172 |
| Marvell Technology Inc | | 400,700 | 44,257,315 |
| Micron Technology Inc | | 473,100 | 39,816,096 |
| Monolithic Power Systems Inc | | 47,950 | 28,372,015 |
| NVIDIA Corp | | 16,987,200 | 2,281,211,089 |
| | | | 2,804,241,618 |
| Software - 7.8% | | | |
| Adobe Inc (b) | | 60,300 | 26,814,204 |
| Alkami Technology Inc (b) | | 9,300 | 341,123 |
| Appfolio Inc Class A (b) | | 40,383 | 9,963,294 |
| Applied Intuition Inc Class A (c)(d) | | 14,726 | 913,012 |
| AppLovin Corp Class A (b) | | 113,900 | 36,884,237 |
| Atlassian Corp Class A (b) | | 7,147 | 1,739,437 |
| Cadence Design Systems Inc (b) | | 351,621 | 105,648,046 |
| Clear Secure Inc Class A | | 209,247 | 5,574,340 |
| Coreweave Inc Class A (c)(d) | | 11,787 | 11,078,012 |
| CyberArk Software Ltd (b) | | 55,757 | 18,575,445 |
| Datadog Inc Class A (b) | | 65,456 | 9,353,008 |
| DocuSign Inc (b) | | 129,800 | 11,674,212 |
| Dynatrace Inc (b) | | 26,100 | 1,418,535 |
| Fair Isaac Corp (b) | | 300 | 597,279 |
| Figma Inc Class A (c)(d) | | 166,194 | 4,658,418 |
| Fortinet Inc (b) | | 263,600 | 24,904,928 |
| HubSpot Inc (b) | | 2,100 | 1,463,217 |
| Klaviyo Inc Class A (b) | | 77,081 | 3,178,820 |
| Microsoft Corp | | 3,412,300 | 1,438,284,450 |
| Monday.com Ltd (b) | | 231,300 | 54,457,272 |
| Onestream Inc Class A | | 74,000 | 2,110,480 |
| OpenAI Global LLC rights (b)(c)(d) | | 12,537,443 | 12,537,443 |
| Oracle Corp | | 7,200 | 1,199,808 |
| Palo Alto Networks Inc (b) | | 27,400 | 4,985,704 |
| Rubrik Inc Class A (b) | | 70,487 | 4,607,030 |
| Salesforce Inc | | 98,938 | 33,077,942 |
| Samsara Inc Class A (b) | | 360,168 | 15,735,740 |
| Servicenow Inc (b) | | 82,702 | 87,674,044 |
| ServiceTitan Inc Class A (b)(g) | | 10,500 | 1,080,135 |
| Stripe Inc Class B (b)(c)(d) | | 74,500 | 2,049,495 |
| Synopsys Inc (b) | | 64,000 | 31,063,040 |
| Tanium Inc Class B (b)(c)(d) | | 350,002 | 3,216,518 |
| Zoom Communications Inc Class A (b) | | 124,000 | 10,119,640 |
| | | | 1,976,978,308 |
| Technology Hardware, Storage & Peripherals - 3.7% | | | |
| Apple Inc | | 3,675,700 | 920,468,794 |
| Dell Technologies Inc Class C | | 41,427 | 4,774,047 |
| | | | 925,242,841 |
TOTAL INFORMATION TECHNOLOGY | | | 6,374,820,506 |
| | | | |
| Materials - 0.5% | | | |
| Chemicals - 0.2% | | | |
| Air Products and Chemicals Inc | | 123,700 | 35,877,948 |
| Sherwin-Williams Co/The | | 41,335 | 14,051,007 |
| | | | 49,928,955 |
| Construction Materials - 0.2% | | | |
| CRH PLC | | 110,600 | 10,232,712 |
| Eagle Materials Inc | | 135,800 | 33,510,008 |
| | | | 43,742,720 |
| Containers & Packaging - 0.0% | | | |
| International Paper Co | | 187,100 | 10,069,722 |
| Silgan Holdings Inc | | 14,651 | 762,584 |
| | | | 10,832,306 |
| Metals & Mining - 0.1% | | | |
| ATI Inc (b) | | 40,300 | 2,218,112 |
| Freeport-McMoRan Inc | | 419,172 | 15,962,070 |
| Ivanhoe Electric Inc / US (b) | | 324,078 | 2,446,789 |
| Steel Dynamics Inc | | 42,506 | 4,848,659 |
| | | | 25,475,630 |
TOTAL MATERIALS | | | 129,979,611 |
| | | | |
| Real Estate - 0.2% | | | |
| Health Care REITs - 0.2% | | | |
| Welltower Inc | | 305,800 | 38,539,974 |
| Real Estate Management & Development - 0.0% | | | |
| CBRE Group Inc Class A (b) | | 34,600 | 4,542,634 |
TOTAL REAL ESTATE | | | 43,082,608 |
| | | | |
| Utilities - 0.8% | | | |
| Electric Utilities - 0.4% | | | |
| American Electric Power Co Inc | | 14,900 | 1,374,227 |
| Constellation Energy Corp | | 327,055 | 73,165,474 |
| NRG Energy Inc | | 108,600 | 9,797,892 |
| PG&E Corp | | 263,500 | 5,317,430 |
| Southern Co/The | | 25,800 | 2,123,856 |
| | | | 91,778,879 |
| Independent Power and Renewable Electricity Producers - 0.4% | | | |
| Vistra Corp | | 745,667 | 102,805,109 |
TOTAL UTILITIES | | | 194,583,988 |
| | | | |
| TOTAL UNITED STATES | | | 23,379,454,708 |
| TOTAL COMMON STOCKS (Cost $10,776,856,679) | | | 24,653,180,040 |
| | | | |
| Convertible Preferred Stocks - 1.0% |
| | | Shares | Value ($) |
| CHINA - 0.1% | | | |
| Communication Services - 0.1% | | | |
| Interactive Media & Services - 0.1% | | | |
| ByteDance Ltd Series E1 (b)(c)(d) | | 60,761 | 15,048,069 |
| UNITED STATES - 0.9% | | | |
| Consumer Discretionary - 0.0% | | | |
| Automobiles - 0.0% | | | |
| Rad Power Bikes Inc Series A (b)(c)(d) | | 52,367 | 10,996 |
| Rad Power Bikes Inc Series C (b)(c)(d) | | 206,059 | 117,454 |
| Rad Power Bikes Inc Series D (b)(c)(d) | | 277,030 | 263,179 |
| Waymo LLC (c)(d) | | 115,088 | 8,934,282 |
| | | | 9,325,911 |
| Hotels, Restaurants & Leisure - 0.0% | | | |
| Discord Inc Series I (b)(c)(d) | | 2,500 | 617,550 |
TOTAL CONSUMER DISCRETIONARY | | | 9,943,461 |
| | | | |
| Consumer Staples - 0.0% | | | |
| Consumer Staples Distribution & Retail - 0.0% | | | |
| GoBrands Inc Series G (b)(c)(d) | | 5,376 | 181,010 |
| GoBrands Inc Series H (b)(c)(d) | | 6,820 | 294,351 |
| | | | 475,361 |
| Financials - 0.0% | | | |
| Financial Services - 0.0% | | | |
| Tenstorrent Holdings Inc Series C1 (b)(c)(d) | | 62,943 | 4,669,112 |
| Health Care - 0.0% | | | |
| Biotechnology - 0.0% | | | |
| ElevateBio LLC Series C (b)(c)(d) | | 515,200 | 1,494,080 |
| Health Care Providers & Services - 0.0% | | | |
| Lyra Health Inc Series E (b)(c)(d) | | 229,170 | 2,271,075 |
| Lyra Health Inc Series F (b)(c)(d) | | 6,800 | 67,388 |
| Somatus Inc Series E (b)(c)(d) | | 1,539 | 1,702,549 |
| | | | 4,041,012 |
TOTAL HEALTH CARE | | | 5,535,092 |
| | | | |
| Industrials - 0.8% | | | |
| Aerospace & Defense - 0.7% | | | |
| Relativity Space Inc Series E (b)(c)(d) | | 208,655 | 196,136 |
| Relativity Space Inc Series F (b)(c)(d) | | 106,172 | 99,801 |
| Space Exploration Technologies Corp Series G (b)(c)(d) | | 7,336 | 13,571,600 |
| Space Exploration Technologies Corp Series J (b)(c)(d) | | 49,518 | 91,608,301 |
| Space Exploration Technologies Corp Series N (b)(c)(d) | | 39,568 | 73,200,800 |
| | | | 178,676,638 |
| Air Freight & Logistics - 0.1% | | | |
| Zipline International Inc Series E (b)(c)(d) | | 132,331 | 5,551,285 |
| Zipline International Inc Series F (b)(c)(d) | | 90,550 | 3,798,573 |
| Zipline International Inc Series G (c)(d) | | 80,131 | 3,361,495 |
| | | | 12,711,353 |
| Construction & Engineering - 0.0% | | | |
| Beta Technologies Inc Series B, 6% (b)(c)(d) | | 26,772 | 3,602,440 |
| Beta Technologies Inc Series C, 6% (c)(d) | | 27,089 | 3,130,947 |
| | | | 6,733,387 |
TOTAL INDUSTRIALS | | | 198,121,378 |
| | | | |
| Information Technology - 0.1% | | | |
| Software - 0.1% | | | |
| Applied Intuition Inc Series A2 (c)(d) | | 19,169 | 1,188,478 |
| Applied Intuition Inc Series B2 (c)(d) | | 9,243 | 573,066 |
| MOLOCO Inc Series A (b)(c)(d) | | 44,901 | 2,932,035 |
| Nuro Inc/CA Series C (b)(c)(d) | | 305,791 | 1,002,995 |
| Nuro Inc/CA Series D (b)(c)(d) | | 63,961 | 265,438 |
| Stripe Inc Series H (b)(c)(d) | | 30,400 | 836,304 |
| Stripe Inc Series I (b)(c)(d) | | 203,647 | 5,602,329 |
| xAI Corp Series C (c)(d) | | 354,485 | 7,674,600 |
| | | | 20,075,245 |
| TOTAL UNITED STATES | | | 238,819,649 |
| TOTAL CONVERTIBLE PREFERRED STOCKS (Cost $138,178,035) | | | 253,867,718 |
| | | | |
| Preferred Securities - 0.0% |
| | | Principal Amount (a) | Value ($) |
| UNITED STATES - 0.0% | | | |
| Consumer Discretionary - 0.0% | | | |
| Automobiles - 0.0% | | | |
Rad Power Bikes Inc 8% 12/31/2025 (c)(d) (Cost $384,164) | | 384,164 | 501,296 |
| | | | |
| Money Market Funds - 1.8% |
| | | Yield (%) | Shares | Value ($) |
| Fidelity Cash Central Fund (i) | | 4.36 | 424,885,718 | 424,970,696 |
| Fidelity Securities Lending Cash Central Fund (i)(j) | | 4.35 | 20,297,871 | 20,299,900 |
| TOTAL MONEY MARKET FUNDS (Cost $445,265,688) | | | | 445,270,596 |
| | | | | |
| TOTAL INVESTMENT IN SECURITIES - 100.2% (Cost $11,360,684,566) | 25,352,819,650 |
NET OTHER ASSETS (LIABILITIES) - (0.2)% | (39,517,996) |
| NET ASSETS - 100.0% | 25,313,301,654 |
| | |
Legend
| (a) | Amount is stated in United States dollars unless otherwise noted. |
| (d) | Restricted securities (including private placements) - Investment in securities not registered under the Securities Act of 1933 (excluding 144A issues). At the end of the period, the value of restricted securities (excluding 144A issues) amounted to $479,729,532 or 1.9% of net assets. |
| (e) | Security exempt from registration under Rule 144A of the Securities Act of 1933. These securities may be resold in transactions exempt from registration, normally to qualified institutional buyers. At the end of the period, the value of these securities amounted to $3,885,610 or 0.0% of net assets. |
| (f) | Security is exempt from registration under Regulation S of the Securities Act of 1933 and may be resold to qualified foreign investors outside of the United States. At the end of the period, the value of securities amounted to $3,885,610 or 0.0% of net assets. |
| (g) | Security or a portion of the security is on loan at period end. |
| (h) | Investment is owned by a wholly-owned subsidiary (Subsidiary) that is treated as a corporation for U.S. tax purposes. |
| (i) | Affiliated fund that is generally available only to investment companies and other accounts managed by Fidelity Investments. The rate quoted is the annualized seven-day yield of the fund at period end. A complete unaudited listing of the fund's holdings as of its most recent quarter end is available upon request. In addition, each Fidelity Central Fund's financial statements, which are not covered by the Fund's Report of Independent Registered Public Accounting Firm, are available on the SEC's website or upon request. |
| (j) | Investment made with cash collateral received from securities on loan. |
| Additional information on each restricted holding is as follows: |
| Security | Acquisition Date | Acquisition Cost ($) |
| Applied Intuition Inc Class A | 7/02/24 | 879,067 |
| | | |
| Applied Intuition Inc Series A2 | 7/02/24 | 1,144,292 |
| | | |
| Applied Intuition Inc Series B2 | 7/02/24 | 551,760 |
| | | |
| Beta Technologies Inc Series B, 6% | 4/04/22 | 2,762,067 |
| | | |
| Beta Technologies Inc Series C, 6% | 10/24/24 | 3,100,878 |
| | | |
| Bowery Farming Inc warrants | 10/25/23 | 0 |
| | | |
| ByteDance Ltd Series E1 | 11/18/20 | 6,657,837 |
| | | |
| Canva Inc Class A | 3/18/24 | 10,425,546 |
| | | |
| Coreweave Inc Class A | 11/29/23 - 10/03/24 | 4,648,339 |
| | | |
| Discord Inc Series I | 9/15/21 | 1,376,561 |
| | | |
| EchoStar Corp | 9/30/24 | 99,654,777 |
| | | |
| ElevateBio LLC Series C | 3/09/21 | 2,161,264 |
| | | |
| Epic Games Inc | 7/13/20 - 7/30/20 | 10,838,175 |
| | | |
| Fanatics Inc Class A | 8/13/20 - 12/15/21 | 7,999,411 |
| | | |
| Figma Inc Class A | 5/15/24 | 3,854,537 |
| | | |
| GoBrands Inc Series G | 3/02/21 | 1,342,480 |
| | | |
| GoBrands Inc Series H | 7/22/21 | 2,649,506 |
| | | |
| Lyra Health Inc Series E | 1/14/21 | 2,098,418 |
| | | |
| Lyra Health Inc Series F | 6/04/21 | 106,790 |
| | | |
| MOLOCO Inc Series A | 6/26/23 | 2,694,060 |
| | | |
| Nuro Inc/CA Series C | 10/30/20 | 3,991,979 |
| | | |
| Nuro Inc/CA Series D | 10/29/21 | 1,333,313 |
| | | |
| OpenAI Global LLC rights | 9/30/24 | 12,537,443 |
| | | |
| Rad Power Bikes Inc | 1/21/21 | 1,937,611 |
| | | |
| Rad Power Bikes Inc 8% 12/31/2025 | 10/06/23 | 384,164 |
| | | |
| Rad Power Bikes Inc Series A | 1/21/21 | 252,610 |
| | | |
| Rad Power Bikes Inc Series C | 1/21/21 | 993,996 |
| | | |
| Rad Power Bikes Inc Series D | 9/17/21 | 2,655,000 |
| | | |
| Rad Power Bikes Inc warrants 10/6/2033 | 10/06/23 | 0 |
| | | |
| Relativity Space Inc Series E | 5/27/21 | 4,764,658 |
| | | |
| Relativity Space Inc Series F | 11/14/23 | 2,406,601 |
| | | |
| Relativity Space Inc warrants | 11/14/23 | 0 |
| | | |
| Sable Offshore Corp | 1/16/24 | 5,194,730 |
| | | |
| Somatus Inc Series E | 1/31/22 | 1,342,985 |
| | | |
| Space Exploration Technologies Corp | 2/16/21 - 7/01/24 | 10,252,748 |
| | | |
| Space Exploration Technologies Corp Class C | 7/01/24 | 1,896,608 |
| | | |
| Space Exploration Technologies Corp Series G | 9/07/23 | 5,942,160 |
| | | |
| Space Exploration Technologies Corp Series J | 9/07/23 | 40,109,580 |
| | | |
| Space Exploration Technologies Corp Series N | 8/04/20 | 10,683,360 |
| | | |
| Starling Bank Ltd Class D | 6/18/21 - 4/05/22 | 5,186,912 |
| | | |
| Stripe Inc Class B | 5/18/21 | 2,989,564 |
| | | |
| Stripe Inc Series H | 3/15/21 | 1,219,800 |
| | | |
| Stripe Inc Series I | 3/20/23 - 5/12/23 | 4,100,257 |
| | | |
| Tanium Inc Class B | 9/18/20 | 3,988,343 |
| | | |
| Tenstorrent Holdings Inc Series C1 | 4/23/21 | 3,742,265 |
| | | |
| Veterinary Emergency Group | 9/16/21 - 11/13/23 | 5,851,651 |
| | | |
| Waymo LLC | 10/18/24 | 9,000,031 |
| | | |
| X Holdings Corp Class A | 10/25/22 | 5,530,000 |
| | | |
| xAI Corp Series C | 11/22/24 | 7,674,600 |
| | | |
| Zipline International Inc | 10/12/21 | 1,817,244 |
| | | |
| Zipline International Inc Series E | 12/21/20 | 4,317,881 |
| | | |
| Zipline International Inc Series F | 4/11/23 | 3,639,847 |
| | | |
| Zipline International Inc Series G | 6/07/24 | 3,361,199 |
| | | |
Affiliated Central Funds
Fiscal year to date information regarding the Fund's investments in Fidelity Central Funds, including the ownership percentage, is presented below.
| Affiliate | Value, beginning of period ($) | Purchases ($) | Sales Proceeds ($) | Dividend Income ($) | Realized Gain (loss) ($) | Change in Unrealized appreciation (depreciation) ($) | Value, end of period ($) | Shares, end of period | % ownership, end of period |
| Fidelity Cash Central Fund | 395,872,372 | 5,151,832,164 | 5,122,739,149 | 18,048,098 | 5,309 | - | 424,970,696 | 424,885,718 | 0.8% |
| Fidelity Securities Lending Cash Central Fund | 16,332,762 | 376,458,707 | 372,491,569 | 69,766 | - | - | 20,299,900 | 20,297,871 | 0.1% |
| Total | 412,205,134 | 5,528,290,871 | 5,495,230,718 | 18,117,864 | 5,309 | - | 445,270,596 | 445,183,589 | |
| | | | | | | | | | |
Amounts in the dividend income column in the above table include any capital gain distributions from underlying funds, which are presented in the corresponding line item in the Consolidated Statement of Operations, if applicable.
Amounts in the dividend income column for Fidelity Securities Lending Cash Central Fund represents the income earned on investing cash collateral, less rebates paid to borrowers and any lending agent fees associated with the loan, plus any premium payments received for lending certain types of securities.
Amounts included in the purchases and sales proceeds columns may include in-kind transactions, if applicable.
Investment Valuation
The following is a summary of the inputs used, as of December 31, 2024, involving the Fund's assets and liabilities carried at fair value. The inputs or methodology used for valuing securities may not be an indication of the risk associated with investing in those securities. For more information on valuation inputs, and their aggregation into the levels used below, please refer to the Investment Valuation section in the accompanying Notes to Consolidated Financial Statements.
| Valuation Inputs at Reporting Date: |
| Description | Total ($) | Level 1 ($) | Level 2 ($) | Level 3 ($) |
Investments in Securities: | | | | |
|
| Common Stocks | | | | |
Communication Services | 4,682,261,401 | 4,651,285,101 | 18,187,065 | 12,789,235 |
Consumer Discretionary | 2,794,553,882 | 2,741,275,261 | 39,057,704 | 14,220,917 |
Consumer Staples | 529,565,484 | 529,565,484 | - | - |
Energy | 379,826,785 | 379,826,785 | - | - |
Financials | 3,882,776,953 | 3,848,294,202 | 20,989,586 | 13,493,165 |
Health Care | 2,817,978,965 | 2,808,122,476 | - | 9,856,489 |
Industrials | 2,369,248,769 | 2,283,256,831 | 47,806,574 | 38,185,364 |
Information Technology | 6,738,383,350 | 6,684,294,838 | 5,435,706 | 48,652,806 |
Materials | 220,917,855 | 220,917,855 | - | - |
Real Estate | 43,082,608 | 43,082,608 | - | - |
Utilities | 194,583,988 | 194,583,988 | - | - |
|
| Convertible Preferred Stocks | | | | |
Communication Services | 15,048,069 | - | - | 15,048,069 |
Consumer Discretionary | 9,943,461 | - | - | 9,943,461 |
Consumer Staples | 475,361 | - | - | 475,361 |
Financials | 4,669,112 | - | - | 4,669,112 |
Health Care | 5,535,092 | - | - | 5,535,092 |
Industrials | 198,121,378 | - | - | 198,121,378 |
Information Technology | 20,075,245 | - | - | 20,075,245 |
|
| Preferred Securities | | | | |
Consumer Discretionary | 501,296 | - | - | 501,296 |
|
| Money Market Funds | 445,270,596 | 445,270,596 | - | - |
| Total Investments in Securities: | 25,352,819,650 | 24,829,776,025 | 131,476,635 | 391,566,990 |
The following is a reconciliation of consolidated Investments in Securities for which Level 3 inputs were used in determining value. Beginning balances have been updated to conform to current period presentation, as applicable.
| |
| Investments in Securities: | |
| Beginning Balance | $ | 236,373,012 | |
| Net Realized Gain (Loss) on Investment Securities | | - | |
| Net Unrealized Gain (Loss) on Investment Securities | | 102,774,850 | |
| Cost of Purchases | | 56,170,912 | |
| Proceeds of Sales | | - | |
| Amortization/Accretion | | - | |
| Transfers into Level 3 | | - | |
| Transfers out of Level 3 | | (3,751,784) | |
| Ending Balance | $ | 391,566,990 | |
| The change in unrealized gain (loss) for the period attributable to Level 3 securities held at December 31, 2024 | $ | 102,774,850 | |
| The information used in the above reconciliation represents fiscal year to date activity for any Investments in Securities identified as using Level 3 inputs at either the beginning or the end of the current fiscal period. Cost of purchases and proceeds of sales may include securities received and/or delivered through in-kind transactions, corporate actions or exchanges. Transfers into Level 3 were attributable to a lack of observable market data resulting from decreases in market activity, decreases in liquidity, security restructurings or corporate actions. Transfers out of Level 3 were attributable to observable market data becoming available for those securities. Transfers in or out of Level 3 represent the beginning value of any Security or Instrument where a change in the pricing level occurred from the beginning to the end of the period. Realized and unrealized gains (losses) disclosed in the reconciliation are included in Net Gain (Loss) on the Fund's consolidated Statement of Operations. | |
Consolidated Financial Statements
| Consolidated Statement of Assets and Liabilities |
As of December 31, 2024 |
| Assets | | | | |
| Investment in securities, at value (including securities loaned of $19,829,282) - See accompanying schedule: | | | | |
Unaffiliated issuers (cost $10,915,418,878) | $ | 24,907,549,054 | | |
Fidelity Central Funds (cost $445,265,688) | | 445,270,596 | | |
| | | | | |
| | | | | |
| Total Investment in Securities (cost $11,360,684,566) | | | $ | 25,352,819,650 |
| Foreign currency held at value (cost $164,429) | | | | 164,429 |
| Receivable for investments sold | | | | 1,909,747 |
| Receivable for fund shares sold | | | | 3,422,316 |
| Dividends receivable | | | | 9,157,531 |
| Distributions receivable from Fidelity Central Funds | | | | 1,680,295 |
| Prepaid expenses | | | | 21,792 |
| Other receivables | | | | 982,686 |
Total assets | | | | 25,370,158,446 |
| Liabilities | | | | |
| Payable for investments purchased | $ | 1,367,253 | | |
| Payable for fund shares redeemed | | 19,302,846 | | |
| Accrued management fee | | 11,947,634 | | |
| Distribution and service plan fees payable | | 2,244,612 | | |
| Other payables and accrued expenses | | 1,698,471 | | |
| Collateral on securities loaned | | 20,295,976 | | |
| Total liabilities | | | | 56,856,792 |
| Commitments and contingent liabilities (see Significant Accounting Policies note) | | | | |
| Net Assets | | | $ | 25,313,301,654 |
| Net Assets consist of: | | | | |
| Paid in capital | | | $ | 10,546,864,044 |
| Total accumulated earnings (loss) | | | | 14,766,437,610 |
| Net Assets | | | $ | 25,313,301,654 |
| | | | | |
| Net Asset Value and Maximum Offering Price | | | | |
| Initial Class : | | | | |
Net Asset Value, offering price and redemption price per share ($10,464,444,006 ÷ 180,616,302 shares) | | | $ | 57.94 |
| Service Class : | | | | |
Net Asset Value, offering price and redemption price per share ($1,943,438,627 ÷ 33,809,345 shares) | | | $ | 57.48 |
| Service Class 2 : | | | | |
Net Asset Value, offering price and redemption price per share ($9,737,590,022 ÷ 175,448,891 shares) | | | $ | 55.50 |
| Investor Class : | | | | |
Net Asset Value, offering price and redemption price per share ($3,167,828,999 ÷ 55,241,041 shares) | | | $ | 57.35 |
| Consolidated Statement of Operations |
| Year ended December 31, 2024 |
| Investment Income | | | | |
| Dividends | | | $ | 156,142,859 |
| Income from Fidelity Central Funds (including $69,766 from security lending) | | | | 18,117,864 |
| Total income | | | | 174,260,723 |
| Expenses | | | | |
| Management fee | $ | 132,018,075 | | |
| Transfer agent fees | | 2,597,830 | | |
| Distribution and service plan fees | | 24,821,561 | | |
| Accounting fees | | 286,408 | | |
| Custodian fees and expenses | | 221,847 | | |
| Independent trustees' fees and expenses | | 101,401 | | |
| Audit fees | | 83,764 | | |
| Legal | | 33,352 | | |
| Miscellaneous | | 1,045,140 | | |
| Total expenses before reductions | | 161,209,378 | | |
| Expense reductions | | (948,686) | | |
| Total expenses after reductions | | | | 160,260,692 |
| Net Investment income (loss) | | | | 14,000,031 |
| Realized and Unrealized Gain (Loss) | | | | |
| Net realized gain (loss) on: | | | | |
| Investment Securities: | | | | |
| Unaffiliated issuers (net of foreign taxes of $380,089) | | 3,625,429,350 | | |
| Fidelity Central Funds | | 5,309 | | |
| Foreign currency transactions | | (183,385) | | |
| Total net realized gain (loss) | | | | 3,625,251,274 |
| Change in net unrealized appreciation (depreciation) on: | | | | |
| Investment Securities: | | | | |
| Unaffiliated issuers (net of decrease in deferred foreign taxes of $269,473) | | 3,060,210,431 | | |
| Unfunded commitments | | 134,032 | | |
| Assets and liabilities in foreign currencies | | (48,605) | | |
| Total change in net unrealized appreciation (depreciation) | | | | 3,060,295,858 |
| Net gain (loss) | | | | 6,685,547,132 |
| Net increase (decrease) in net assets resulting from operations | | | $ | 6,699,547,163 |
| Consolidated Statement of Changes in Net Assets |
| |
| | Year ended December 31, 2024 | | Year ended December 31, 2023 |
| Increase (Decrease) in Net Assets | | | | |
| Operations | | | | |
| Net investment income (loss) | $ | 14,000,031 | $ | 82,903,790 |
| Net realized gain (loss) | | 3,625,251,274 | | 596,291,261 |
| Change in net unrealized appreciation (depreciation) | | 3,060,295,858 | | 4,695,038,802 |
| Net increase (decrease) in net assets resulting from operations | | 6,699,547,163 | | 5,374,233,853 |
| Distributions to shareholders | | (2,923,314,742) | | (748,784,809) |
| | | | | |
| Share transactions - net increase (decrease) | | 961,960,504 | | (920,961,947) |
| Total increase (decrease) in net assets | | 4,738,192,925 | | 3,704,487,097 |
| | | | | |
| Net Assets | | | | |
| Beginning of period | | 20,575,108,729 | | 16,870,621,632 |
| End of period | $ | 25,313,301,654 | $ | 20,575,108,729 |
| | | | | |
| | | | | |
Consolidated Financial Highlights
VIP Contrafund℠ Portfolio Initial Class |
| |
| Years ended December 31, | | 2024 | | 2023 | | 2022 | | 2021 | | 2020 |
Selected Per-Share Data | | | | | | | | | | |
| Net asset value, beginning of period | $ | 48.63 | $ | 37.88 | $ | 54.35 | $ | 48.17 | $ | 37.17 |
| Income from Investment Operations | | | | | | | | | | |
Net investment income (loss) A,B | | .10 | | .24 | | .22 | | .04 | | .07 |
| Net realized and unrealized gain (loss) | | 16.57 | | 12.32 | | (14.37) | | 12.88 | | 11.24 |
| Total from investment operations | | 16.67 | | 12.56 | | (14.15) | | 12.92 | | 11.31 |
| Distributions from net investment income | | (.10) C | | (.22) | | (.22) | | (.02) C | | (.10) |
| Distributions from net realized gain | | (7.26) C | | (1.59) | | (2.09) | | (6.72) C | | (.21) |
| Total distributions | | (7.36) | | (1.81) | | (2.32) D | | (6.74) | | (.31) |
| Net asset value, end of period | $ | 57.94 | $ | 48.63 | $ | 37.88 | $ | 54.35 | $ | 48.17 |
Total Return E,F | | | | 33.45% | | (26.31)% | | 27.83% | | 30.57% |
Ratios to Average Net Assets B,G,H | | | | | | | | | | |
| Expenses before reductions | | .56% | | .60% | | .60% | | .60% | | .61% |
| Expenses net of fee waivers, if any | | | | .59% | | .60% | | .60% | | .61% |
| Expenses net of all reductions | | .56% | | .59% | | .60% | | .60% | | .61% |
| Net investment income (loss) | | .17% | | .55% | | .50% | | .08% | | .17% |
| Supplemental Data | | | | | | | | | | |
| Net assets, end of period (000 omitted) | $ | 10,464,444 | $ | 8,698,765 | $ | 7,255,740 | $ | 10,409,645 | $ | 8,916,447 |
Portfolio turnover rate I | | | | 30% | | 38% | | 34% | | 39% |
ACalculated based on average shares outstanding during the period.
BNet investment income (loss) is affected by the timing of the declaration of dividends by any underlying mutual funds or exchange-traded funds (ETFs). Net investment income (loss) of any mutual funds or ETFs is not included in the Fund's net investment income (loss) ratio.
CThe amount shown reflects reclassifications related to book to tax differences that were made in the year shown.
DTotal distributions per share do not sum due to rounding.
ETotal returns do not reflect charges attributable to your insurance company's separate account. Inclusion of these charges would reduce the total returns shown.
FTotal returns would have been lower if certain expenses had not been reduced during the applicable periods shown.
GFees and expenses of any underlying mutual funds or exchange-traded funds (ETFs) are not included in the Fund's expense ratio. The Fund indirectly bears its proportionate share of these expenses. For additional expense information related to investments in Fidelity Central Funds, please refer to the "Investments in Fidelity Central Funds" note found in the Notes to Consolidated Financial Statements section of the most recent Annual or Semi-Annual report.
HExpense ratios reflect operating expenses of the class. Expenses before reductions do not reflect amounts reimbursed, waived, or reduced through arrangements with the investment adviser, brokerage services, or other offset arrangements, if applicable, and do not represent the amount paid by the class during periods when reimbursements, waivers or reductions occur.
IAmount does not include the portfolio activity of any underlying mutual funds or exchange-traded funds (ETFs), derivatives or securities that mature within one year from acquisition.
VIP Contrafund℠ Portfolio Service Class |
| |
| Years ended December 31, | | 2024 | | 2023 | | 2022 | | 2021 | | 2020 |
Selected Per-Share Data | | | | | | | | | | |
| Net asset value, beginning of period | $ | 48.30 | $ | 37.63 | $ | 54.00 | $ | 47.89 | $ | 36.96 |
| Income from Investment Operations | | | | | | | | | | |
Net investment income (loss) A,B | | .04 | | .20 | | .17 | | (.01) | | .03 |
| Net realized and unrealized gain (loss) | | 16.44 | | 12.23 | | (14.27) | | 12.80 | | 11.17 |
| Total from investment operations | | 16.48 | | 12.43 | | (14.10) | | 12.79 | | 11.20 |
| Distributions from net investment income | | (.04) C | | (.18) | | (.18) | | (.01) C | | (.06) |
| Distributions from net realized gain | | (7.26) C | | (1.59) | | (2.09) | | (6.67) C | | (.21) |
| Total distributions | | (7.30) | | (1.76) D | | (2.27) | | (6.68) | | (.27) |
| Net asset value, end of period | $ | 57.48 | $ | 48.30 | $ | 37.63 | $ | 54.00 | $ | 47.89 |
Total Return E,F | | | | 33.34% | | (26.38)% | | 27.71% | | 30.43% |
Ratios to Average Net Assets B,G,H | | | | | | | | | | |
| Expenses before reductions | | .66% | | .70% | | .70% | | .70% | | .71% |
| Expenses net of fee waivers, if any | | | | .69% | | .70% | | .70% | | .71% |
| Expenses net of all reductions | | .66% | | .69% | | .70% | | .70% | | .71% |
| Net investment income (loss) | | .07% | | .45% | | .40% | | (.02)% | | .07% |
| Supplemental Data | | | | | | | | | | |
| Net assets, end of period (000 omitted) | $ | 1,943,439 | $ | 1,616,699 | $ | 1,326,910 | $ | 2,001,479 | $ | 1,734,783 |
Portfolio turnover rate I | | | | 30% | | 38% | | 34% | | 39% |
ACalculated based on average shares outstanding during the period.
BNet investment income (loss) is affected by the timing of the declaration of dividends by any underlying mutual funds or exchange-traded funds (ETFs). Net investment income (loss) of any mutual funds or ETFs is not included in the Fund's net investment income (loss) ratio.
CThe amount shown reflects reclassifications related to book to tax differences that were made in the year shown.
DTotal distributions per share do not sum due to rounding.
ETotal returns do not reflect charges attributable to your insurance company's separate account. Inclusion of these charges would reduce the total returns shown.
FTotal returns would have been lower if certain expenses had not been reduced during the applicable periods shown.
GFees and expenses of any underlying mutual funds or exchange-traded funds (ETFs) are not included in the Fund's expense ratio. The Fund indirectly bears its proportionate share of these expenses. For additional expense information related to investments in Fidelity Central Funds, please refer to the "Investments in Fidelity Central Funds" note found in the Notes to Consolidated Financial Statements section of the most recent Annual or Semi-Annual report.
HExpense ratios reflect operating expenses of the class. Expenses before reductions do not reflect amounts reimbursed, waived, or reduced through arrangements with the investment adviser, brokerage services, or other offset arrangements, if applicable, and do not represent the amount paid by the class during periods when reimbursements, waivers or reductions occur.
IAmount does not include the portfolio activity of any underlying mutual funds or exchange-traded funds (ETFs), derivatives or securities that mature within one year from acquisition.
VIP Contrafund℠ Portfolio Service Class 2 |
| |
| Years ended December 31, | | 2024 | | 2023 | | 2022 | | 2021 | | 2020 |
Selected Per-Share Data | | | | | | | | | | |
| Net asset value, beginning of period | $ | 46.83 | $ | 36.54 | $ | 52.51 | $ | 46.73 | $ | 36.10 |
| Income from Investment Operations | | | | | | | | | | |
Net investment income (loss) A,B | | (.04) | | .13 | | .11 | | (.08) | | (.03) |
| Net realized and unrealized gain (loss) | | 15.94 | | 11.86 | | (13.87) | | 12.46 | | 10.90 |
| Total from investment operations | | 15.90 | | 11.99 | | (13.76) | | 12.38 | | 10.87 |
| Distributions from net investment income | | (.01) C | | (.11) | | (.11) | | - C,D | | (.03) |
| Distributions from net realized gain | | (7.22) C | | (1.59) | | (2.09) | | (6.60) C | | (.21) |
| Total distributions | | (7.23) | | (1.70) | | (2.21) E | | (6.60) | | (.24) |
| Net asset value, end of period | $ | 55.50 | $ | 46.83 | $ | 36.54 | $ | 52.51 | $ | 46.73 |
Total Return F,G | | | | 33.12% | | (26.49)% | | 27.51% | | 30.23% |
Ratios to Average Net Assets B,H,I | | | | | | | | | | |
| Expenses before reductions | | .81% | | .85% | | .85% | | .85% | | .86% |
| Expenses net of fee waivers, if any | | | | .84% | | .85% | | .85% | | .86% |
| Expenses net of all reductions | | .81% | | .84% | | .85% | | .85% | | .86% |
| Net investment income (loss) | | (.08)% | | .30% | | .25% | | (.17)% | | (.08)% |
| Supplemental Data | | | | | | | | | | |
| Net assets, end of period (000 omitted) | $ | 9,737,590 | $ | 7,940,382 | $ | 6,472,771 | $ | 9,861,435 | $ | 8,379,335 |
Portfolio turnover rate J | | | | 30% | | 38% | | 34% | | 39% |
ACalculated based on average shares outstanding during the period.
BNet investment income (loss) is affected by the timing of the declaration of dividends by any underlying mutual funds or exchange-traded funds (ETFs). Net investment income (loss) of any mutual funds or ETFs is not included in the Fund's net investment income (loss) ratio.
CThe amount shown reflects reclassifications related to book to tax differences that were made in the year shown.
DAmount represents less than $.005 per share.
ETotal distributions per share do not sum due to rounding.
FTotal returns do not reflect charges attributable to your insurance company's separate account. Inclusion of these charges would reduce the total returns shown.
GTotal returns would have been lower if certain expenses had not been reduced during the applicable periods shown.
HFees and expenses of any underlying mutual funds or exchange-traded funds (ETFs) are not included in the Fund's expense ratio. The Fund indirectly bears its proportionate share of these expenses. For additional expense information related to investments in Fidelity Central Funds, please refer to the "Investments in Fidelity Central Funds" note found in the Notes to Consolidated Financial Statements section of the most recent Annual or Semi-Annual report.
IExpense ratios reflect operating expenses of the class. Expenses before reductions do not reflect amounts reimbursed, waived, or reduced through arrangements with the investment adviser, brokerage services, or other offset arrangements, if applicable, and do not represent the amount paid by the class during periods when reimbursements, waivers or reductions occur.
JAmount does not include the portfolio activity of any underlying mutual funds or exchange-traded funds (ETFs), derivatives or securities that mature within one year from acquisition.
VIP Contrafund℠ Portfolio Investor Class |
| |
| Years ended December 31, | | 2024 | | 2023 | | 2022 | | 2021 | | 2020 |
Selected Per-Share Data | | | | | | | | | | |
| Net asset value, beginning of period | $ | 48.20 | $ | 37.56 | $ | 53.92 | $ | 47.83 | $ | 36.91 |
| Income from Investment Operations | | | | | | | | | | |
Net investment income (loss) A,B | | .05 | | .21 | | .18 | | - C | | .04 |
| Net realized and unrealized gain (loss) | | 16.43 | | 12.21 | | (14.26) | | 12.78 | | 11.16 |
| Total from investment operations | | 16.48 | | 12.42 | | (14.08) | | 12.78 | | 11.20 |
| Distributions from net investment income | | (.07) D | | (.19) | | (.19) | | (.01) D | | (.07) |
| Distributions from net realized gain | | (7.26) D | | (1.59) | | (2.09) | | (6.68) D | | (.21) |
| Total distributions | | (7.33) | | (1.78) | | (2.28) | | (6.69) | | (.28) |
| Net asset value, end of period | $ | 57.35 | $ | 48.20 | $ | 37.56 | $ | 53.92 | $ | 47.83 |
Total Return E,F | | | | 33.36% | | (26.38)% | | 27.74% | | 30.48% |
Ratios to Average Net Assets B,G,H | | | | | | | | | | |
| Expenses before reductions | | .64% | | .67% | | .68% | | .67% | | .69% |
| Expenses net of fee waivers, if any | | | | .67% | | .67% | | .67% | | .69% |
| Expenses net of all reductions | | .63% | | .67% | | .67% | | .67% | | .68% |
| Net investment income (loss) | | .09% | | .48% | | .43% | | .01% | | .09% |
| Supplemental Data | | | | | | | | | | |
| Net assets, end of period (000 omitted) | $ | 3,167,829 | $ | 2,319,263 | $ | 1,815,201 | $ | 2,622,106 | $ | 2,101,100 |
Portfolio turnover rate I | | | | 30% | | 38% | | 34% | | 39% |
ACalculated based on average shares outstanding during the period.
BNet investment income (loss) is affected by the timing of the declaration of dividends by any underlying mutual funds or exchange-traded funds (ETFs). Net investment income (loss) of any mutual funds or ETFs is not included in the Fund's net investment income (loss) ratio.
CAmount represents less than $.005 per share.
DThe amount shown reflects reclassifications related to book to tax differences that were made in the year shown.
ETotal returns do not reflect charges attributable to your insurance company's separate account. Inclusion of these charges would reduce the total returns shown.
FTotal returns would have been lower if certain expenses had not been reduced during the applicable periods shown.
GFees and expenses of any underlying mutual funds or exchange-traded funds (ETFs) are not included in the Fund's expense ratio. The Fund indirectly bears its proportionate share of these expenses. For additional expense information related to investments in Fidelity Central Funds, please refer to the "Investments in Fidelity Central Funds" note found in the Notes to Consolidated Financial Statements section of the most recent Annual or Semi-Annual report.
HExpense ratios reflect operating expenses of the class. Expenses before reductions do not reflect amounts reimbursed, waived, or reduced through arrangements with the investment adviser, brokerage services, or other offset arrangements, if applicable, and do not represent the amount paid by the class during periods when reimbursements, waivers or reductions occur.
IAmount does not include the portfolio activity of any underlying mutual funds or exchange-traded funds (ETFs), derivatives or securities that mature within one year from acquisition.
Notes to Consolidated Financial Statements
For the period ended December 31, 2024
1. Organization.
VIP Contrafund Portfolio (the Fund) is a fund of Variable Insurance Products Fund II (the Trust) and is authorized to issue an unlimited number of shares. The Trust is registered under the Investment Company Act of 1940, as amended (the 1940 Act), as an open-end management investment company organized as a Massachusetts business trust. Shares of the Fund may only be purchased by insurance companies for the purpose of funding variable annuity or variable life insurance contracts. The Fund offers the following classes of shares: Initial Class shares, Service Class shares, Service Class 2 shares and Investor Class shares. All classes have equal rights and voting privileges, except for matters affecting a single class.
2. Investments in Fidelity Central Funds.
Funds may invest in Fidelity Central Funds, which are open-end investment companies generally available only to other investment companies and accounts managed by the investment adviser and its affiliates. The Consolidated Schedule of Investments lists any Fidelity Central Funds held as an investment as of period end, but does not include the underlying holdings of each Fidelity Central Fund. An investing fund indirectly bears its proportionate share of the expenses of the underlying Fidelity Central Funds.
Based on its investment objective, each Fidelity Central Fund may invest or participate in various investment vehicles or strategies that are similar to those of the investing fund. These strategies are consistent with the investment objectives of the investing fund and may involve certain economic risks which may cause a decline in value of each of the Fidelity Central Funds and thus a decline in the value of the investing fund.
| Fidelity Central Fund | Investment Manager | Investment Objective | Investment Practices | Expense RatioA |
| Fidelity Money Market Central Funds | Fidelity Management & Research Company LLC (FMR) | Each fund seeks to obtain a high level of current income consistent with the preservation of capital and liquidity. | Short-term Investments | Less than .005% |
A Expenses expressed as a percentage of average net assets and are as of each underlying Central Fund's most recent annual or semi-annual shareholder report.
A complete unaudited list of holdings for each Fidelity Central Fund is available upon request or at the Securities and Exchange Commission website at www.sec.gov. In addition, the financial statements of the Fidelity Central Funds which contain the significant accounting policies (including investment valuation policies) of those funds, and are not covered by the Report of Independent Registered Public Accounting Firm, are available on the Securities and Exchange Commission website or upon request.
3. Significant Accounting Policies.
The Fund is an investment company and applies the accounting and reporting guidance of the Financial Accounting Standards Board (FASB) Accounting Standards Codification Topic 946 Financial Services - Investment Companies. The consolidated financial statements have been prepared in conformity with accounting principles generally accepted in the United States of America (GAAP), which require management to make certain estimates and assumptions at the date of the consolidated financial statements. Actual results could differ from those estimates. The Fund operates as a single operating segment. The Fund's income, expenses, assets, and performance are regularly monitored and assessed as a whole by the investment adviser and other individuals responsible for oversight functions of the Trust, using the information presented in the financial statements and financial highlights. Subsequent events, if any, through the date that the consolidated financial statements were issued have been evaluated in the preparation of the consolidated financial statements. The Fund's Consolidated Schedule of Investments lists any underlying mutual funds or exchange-traded funds (ETFs) but does not include the underlying holdings of these funds. The following summarizes the significant accounting policies of the Fund:
Investment Valuation. Investments are valued as of 4:00 p.m. Eastern time on the last calendar day of the period. The Board of Trustees (the Board) has designated the Fund's investment adviser as the valuation designee responsible for the fair valuation function and performing fair value determinations as needed. The investment adviser has established a Fair Value Committee (the Committee) to carry out the day-to-day fair valuation responsibilities and has adopted policies and procedures to govern the fair valuation process and the activities of the Committee. In accordance with these fair valuation policies and procedures, which have been approved by the Board, the Fund attempts to obtain prices from one or more third party pricing services or brokers to value its investments. When current market prices, quotations or currency exchange rates are not readily available or reliable, investments will be fair valued in good faith by the Committee, in accordance with the policies and procedures. Factors used in determining fair value vary by investment type and may include market or investment specific events, transaction data, estimated cash flows, and market observations of comparable investments. The frequency that the fair valuation procedures are used cannot be predicted and they may be utilized to a significant extent. The Committee manages the Fund's fair valuation practices and maintains the fair valuation policies and procedures. The Fund's investment adviser reports to the Board information regarding the fair valuation process and related material matters.
The Fund categorizes the inputs to valuation techniques used to value its investments into a disclosure hierarchy consisting of three levels as shown below:
Level 1 - unadjusted quoted prices in active markets for identical investments
Level 2 - other significant observable inputs (including quoted prices for similar investments, interest rates, prepayment speeds, etc.)
Level 3 - unobservable inputs (including the Fund's own assumptions based on the best information available)
Valuation techniques used to value the Fund's investments by major category are as follows:
Equity securities, including restricted securities, for which market quotations are readily available, are valued at the last reported sale price or official closing price as reported by a third party pricing service on the primary market or exchange on which they are traded and are categorized as Level 1 in the hierarchy. In the event there were no sales during the day or closing prices are not available, securities are valued at the last quoted bid price or may be valued using the last available price and are generally categorized as Level 2 in the hierarchy. For foreign equity securities, when market or security specific events arise, comparisons to the valuation of American Depositary Receipts (ADRs), futures contracts, Exchange-Traded Funds (ETFs) and certain indexes as well as quoted prices for similar securities may be used and would be categorized as Level 2 in the hierarchy. For equity securities, including restricted securities, where observable inputs are limited, assumptions about market activity and risk are used and these securities may be categorized as Level 3 in the hierarchy. Securities, including private placements or other restricted securities, for which observable inputs are not available are valued using alternate valuation approaches, including the market approach, the income approach and cost approach, and are categorized as Level 3 in the hierarchy. The market approach considers factors including the price of recent investments in the same or a similar security or financial metrics of comparable securities. The income approach considers factors including expected future cash flows, security specific risks and corresponding discount rates. The cost approach considers factors including the value of the security's underlying assets and liabilities.
Debt securities, including restricted securities, are valued based on evaluated prices received from third party pricing services or from brokers who make markets in such securities. Preferred securities are valued by pricing services who utilize matrix pricing which considers yield or price of bonds of comparable quality, coupon, maturity and type or by broker-supplied prices. When independent prices are unavailable or unreliable, debt securities may be valued utilizing pricing methodologies which consider similar factors that would be used by third party pricing services. Debt securities are generally categorized as Level 2 in the hierarchy but may be Level 3 depending on the circumstances.
Investments in open-end mutual funds, including the Fidelity Central Funds, are valued at their closing net asset value (NAV) each business day and are categorized as Level 1 in the hierarchy.
The following provides information on Level 3 securities held by the Fund that were valued at period end based on unobservable inputs. These amounts exclude valuations provided by a broker.
| Asset Type | Fair Value | Valuation Technique(s) | Unobservable Input | Amount or Range/Weighted Average | Impact to Valuation from an Increase in InputA |
| Common Stocks | $137,197,976 | Market comparable | Enterprise value/Revenue multiple (EV/R) | 1.5 - 61.8 / 11.6 | Increase |
| | | | Enterprise value/EBITDA multiple (EV/EBITDA) | 21.5 - 33.4 / 31.9 | Increase |
| | | | Enterprise value/Net income multiple (EV/NI) | 14.0 | Increase |
| | | Recovery value | Recovery value | $0.00 | Increase |
| | | Black scholes | Discount rate | 4.3% - 4.4% / 4.4% | Increase |
| | | | Term | 1.0 - 5.0 / 2.2 | Increase |
| | | | Volatility | 60.0% - 100.0% / 60.2% | Increase |
| Convertible Preferred Stocks | $253,867,718 | Market comparable | Enterprise value/Revenue multiple (EV/R) | 0.9 - 61.8 / 22.3 | Increase |
| | | | Enterprise value/EBITDA multiple (EV/EBITDA) | 33.4 | Increase |
| | | Market approach | Transaction price | $20.85 - $78.20 / $71.07 | Increase |
| | | | Discount rate | 85.0% | Decrease |
| | | Recovery value | Recovery value | $0.00 | Increase |
| | | Black scholes | Discount rate | 4.3% - 4.4% / 4.4% | Increase |
| | | | Term | 2.0 - 5.0 / 3.3 | Increase |
| | | | Volatility | 60.0% - 80.0% / 76.1% | Increase |
| Preferred Securities | $501,296 | Market comparable | Enterprise value/Revenue multiple (EV/R) | 1.5 | Increase |
| | | Recovery value | Recovery value | $0.00 | Increase |
| | | Black scholes | Discount rate | 4.4% | Increase |
| | | | Term | 2.1 | Increase |
| | | | Volatility | 60.0% | Increase |
A Represents the directional change in the fair value of the Level 3 investments that could have resulted from an increase in the corresponding input as of period end. A decrease to the unobservable input would have had the opposite effect. Significant changes in these inputs may have resulted in a significantly higher or lower fair value measurement at period end.
Changes in valuation techniques may result in transfers in or out of an assigned level within the disclosure hierarchy. The aggregate value of investments by input level as of December 31, 2024, as well as a roll forward of Level 3 investments, is included at the end of the Fund's Consolidated Schedule of Investments.
Foreign Currency. Certain Funds may use foreign currency contracts to facilitate transactions in foreign-denominated securities. Gains and losses from these transactions may arise from changes in the value of the foreign currency or if the counterparties do not perform under the contracts' terms.
Foreign-denominated assets, including investment securities, and liabilities are translated into U.S. dollars at the exchange rates at period end. Purchases and sales of investment securities, income and dividends received, and expenses denominated in foreign currencies are translated into U.S. dollars at the exchange rate in effect on the transaction date.
The effects of exchange rate fluctuations on investments are included with the net realized and unrealized gain (loss) on investment securities. Other foreign currency transactions resulting in realized and unrealized gain (loss) are disclosed separately.
Investment Transactions and Income. For financial reporting purposes, the Fund's investment holdings and NAV include trades executed through the end of the last business day of the period. The NAV per share for processing shareholder transactions is calculated as of the close of business of the New York Stock Exchange (NYSE), normally 4:00 p.m. Eastern time and includes trades executed through the end of the prior business day. Gains and losses on securities sold are determined on the basis of identified cost and include proceeds received from litigation. Commissions paid to certain brokers with whom the investment adviser, or its affiliates, places trades on behalf of a fund include an amount in addition to trade execution, which may be rebated back to a fund. Any such rebates are included in net realized gain (loss) on investments in the Consolidated Statement of Operations. Dividend income is recorded on the ex-dividend date, except for certain dividends from foreign securities where the ex-dividend date may have passed, which are recorded as soon as the Fund is informed of the ex-dividend date. Non-cash dividends included in dividend income, if any, are recorded at the fair market value of the securities received. Income and capital gain distributions from Fidelity Central Funds, if any, are recorded on the ex-dividend date. Certain distributions received by the Fund represent a return of capital or capital gain. The Fund determines the components of these distributions subsequent to the ex-dividend date, based upon receipt of tax filings or other correspondence relating to the underlying investment. These distributions are recorded as a reduction of cost of investments and/or as a realized gain. Investment income is recorded net of foreign taxes withheld where recovery of such taxes is uncertain. Funds may file withholding tax reclaims in certain jurisdictions to recover a portion of amounts previously withheld. Any withholding tax reclaims income is included in the Consolidated Statement of Operations in dividends. Any receivables for withholding tax reclaims are included in the Consolidated Statement of Assets and Liabilities in dividends receivable.
Class Allocations and Expenses. Investment income, realized and unrealized capital gains and losses, common expenses of a fund, and certain fund-level expense reductions, if any, are allocated daily on a pro-rata basis to each class based on the relative net assets of each class to the total net assets of a fund. Each class differs with respect to transfer agent and distribution and service plan fees incurred, as applicable. Certain expense reductions may also differ by class, if applicable. For the reporting period, the allocated portion of income and expenses to each class as a percent of its average net assets may vary due to the timing of recording these transactions in relation to fluctuating net assets of the classes. Expenses directly attributable to a fund are charged to that fund. Expenses attributable to more than one fund are allocated among the respective funds on the basis of relative net assets or other appropriate methods. Expenses included in the accompanying consolidated financial statements reflect the expenses of that fund and do not include any expenses associated with any underlying mutual funds or exchange-traded funds (ETFs). Although not included in a fund's expenses, a fund indirectly bears its proportionate share of these expenses through the net asset value of each underlying mutual fund or exchange-traded fund (ETF). Expense estimates are accrued in the period to which they relate and adjustments are made when actual amounts are known.
Deferred Trustee Compensation. Under a Deferred Compensation Plan (the Plan) for certain Funds, certain independent Trustees have elected to defer receipt of a portion of their annual compensation. Deferred amounts are invested in affiliated mutual funds, are marked-to-market and remain in a fund until distributed in accordance with the Plan. The investment of deferred amounts and the offsetting payable to the Trustees presented below are included in the accompanying Consolidated Statement of Assets and Liabilities in other receivables and other payables and accrued expenses, as applicable.
| VIP Contrafund Portfolio | $954,137 |
Income Tax Information and Distributions to Shareholders. Each year, the Fund intends to qualify as a regulated investment company under Subchapter M of the Internal Revenue Code, including distributing substantially all of its taxable income and realized gains. As a result, no provision for U.S. Federal income taxes is required. As of December 31, 2024, the Fund did not have any unrecognized tax benefits in the consolidated financial statements; nor is the Fund aware of any tax positions for which it is reasonably possible that the total amounts of unrecognized tax benefits will significantly change in the next twelve months. The Fund files a U.S. federal tax return, in addition to state and local tax returns as required. The Fund's federal income tax returns are subject to examination by the Internal Revenue Service (IRS) for a period of three fiscal years after they are filed. State and local tax returns may be subject to examination for an additional fiscal year depending on the jurisdiction. Foreign taxes are provided for based on the Fund's understanding of the tax rules and rates that exist in the foreign markets in which it invests. The Fund is subject to a tax imposed on capital gains by certain countries in which it invests.
Distributions are declared and recorded on the ex-dividend date. Income and capital gain distributions are declared separately for each class. Income and capital gain distributions are determined in accordance with income tax regulations, which may differ from GAAP. These differences resulted in distribution reclassifications.
Capital accounts within the consolidated financial statements are adjusted for permanent book-tax differences. These adjustments have no impact on net assets or the results of operations. Capital accounts are not adjusted for temporary book-tax differences which will reverse in a subsequent period.
Book-tax differences are primarily due to foreign currency transactions, certain foreign taxes, passive foreign investment companies (PFIC), partnerships, deferred Trustee compensation and losses deferred due to wash sales.
As of period end, the cost and unrealized appreciation (depreciation) in securities, and derivatives if applicable, for federal income tax purposes were as follows:
| Gross unrealized appreciation | $14,270,291,620 |
| Gross unrealized depreciation | (306,481,379) |
| Net unrealized appreciation (depreciation) | $13,963,810,241 |
| Tax Cost | $11,389,009,409 |
The tax-based components of distributable earnings as of period end were as follows:
| Undistributed ordinary income | $51,618,904 |
| Undistributed long-term capital gain | $751,621,754 |
| Net unrealized appreciation (depreciation) on securities and other investments | $13,963,741,516 |
The tax character of distributions paid was as follows:
| | December 31, 2024 | December 31, 2023 |
| Ordinary Income | $44,737,768 | $ 72,299,398 |
| Long-term Capital Gains | 2,878,576,974 | 676,485,411 |
| Total | $2,923,314,742 | $ 748,784,809 |
Restricted Securities (including Private Placements). Funds may invest in securities that are subject to legal or contractual restrictions on resale. These securities generally may be resold in transactions exempt from registration or to the public if the securities are registered. Disposal of these securities may involve time-consuming negotiations and expense, and prompt sale at an acceptable price may be difficult. Information regarding restricted securities held at period end is included at the end of the Consolidated Schedule of Investments, if applicable.
Commitments. A commitment is an agreement to acquire an investment at a future date (subject to conditions) in connection with a potential public or non-public offering. Commitments outstanding at period end are presented in the table below. Unrealized appreciation (depreciation) on any commitments outstanding at period end is separately presented in the Consolidated Statement of Assets and Liabilities as Unrealized appreciation (depreciation) on unfunded commitments, and any change in unrealized appreciation (depreciation) on unfunded commitments during the period is separately presented in the Consolidated Statement of Operations, as applicable based on contractual conditions of each commitment.
| | Investment to be Acquired | Commitment Amount ($) | Unrealized Appreciation (Depreciation)($) |
| VIP Contrafund Portfolio | Revolute Group Holdings, Ltd. | 5,000,397 | - |
Special Purpose Acquisition Companies. Funds may invest in stock, warrants, and other securities of special purpose acquisition companies (SPACs) or similar special purpose entities. A SPAC is a publicly traded company that raises investment capital via an initial public offering (IPO) for the purpose of acquiring the equity securities of one or more existing companies via reorganization, business combination, acquisition or other similar transactions within a designated time frame.
Private Investment in Public Equity. Funds may acquire equity securities of an issuer through a private investment in a public equity (PIPE) transaction, including through commitments to purchase securities on a when-issued basis. A PIPE typically involves the purchase of securities directly from a publicly traded company in a private placement transaction. Securities purchased through PIPE transactions will be restricted from trading and considered illiquid until a resale registration statement for the shares is filed and declared effective.
At the current and/or prior period end, the Fund had commitments to purchase when-issued securities through PIPE transactions with SPACs. The commitments are contingent upon the SPACs acquiring the securities of target companies. Unrealized appreciation (depreciation) on any commitments outstanding at period end is separately presented in the Consolidated Statement of Assets and Liabilities as Unrealized appreciation (depreciation) on unfunded commitments, and any change in unrealized appreciation (depreciation) on unfunded commitments during the period is separately presented in the Consolidated Statement of Operations, as applicable.
Consolidated Subsidiary. The Funds included in the table below hold certain investments through a wholly-owned subsidiary ("Subsidiary"), which may be subject to federal and state taxes upon disposition.
As of period end, investments in Subsidiaries were as follows:
| | Amount ($) | % of Net Assets |
| VIP Contrafund Portfolio | 9,856,489 | .04 |
The financial statements have been consolidated to include the Subsidiary accounts where applicable. Accordingly, all inter-company transactions and balances have been eliminated.
At period end, any estimated tax liability for these investments is presented as "Deferred taxes" in the Consolidated Statement of Assets and Liabilities and included in "Change in net unrealized appreciation (depreciation) on investment securities" in the Consolidated Statement of Operations. The tax liability incurred may differ materially depending on conditions when these investments are disposed. Any cash held by a Subsidiary is restricted as to its use and is presented as "Restricted cash" in the Consolidated Statement of Assets and Liabilities, if applicable.
New Accounting Pronouncement. FASB Accounting Standards Update (ASU) 2023-07 Segment Reporting (Topic 280): Improvements to Reportable Segment Disclosures became effective in this reporting period. ASU 2023-07 enhances segment information disclosure in the notes to financial statements.
4. Purchases and Sales of Investments.
Purchases and sales of securities, other than short-term securities and in-kind transactions, as applicable, are noted in the table below.
| | Purchases ($) | Sales ($) |
| VIP Contrafund Portfolio | 8,334,835,278 | 10,296,776,761 |
5. Fees and Other Transactions with Affiliates.
Management Fee. Fidelity Management & Research Company LLC (the investment adviser) and its affiliates provide the Fund with investment management related services for which the Fund pays a monthly management fee.
Effective March 1, 2024, the Fund's management contract was amended to incorporate administrative services previously covered under separate services agreements (Transfer Agent and Accounting agreements). The amended contract incorporates a management fee rate that may vary by class. The investment adviser or an affiliate pays certain expenses of managing and operating the Fund out of each class's management fee. Each class of the Fund pays a management fee to the investment adviser. The management fee is calculated and paid to the investment adviser every month. When determining a class's management fee, a mandate rate is calculated based on the monthly average net assets of a group of funds advised by FMR within a designated asset class. A discount rate is subtracted from the mandate rate once the Fund's monthly average net assets reach a certain level. The mandate rate and discount rate may vary by class. The annual management fee rate for a class of shares of the Fund is the lesser of (1) the class's mandate rate reduced by the class's discount rate (if applicable) or (2) the amount set forth in the following table.
| | Maximum Management Fee Rate % |
| Initial Class | .56 |
| Service Class | .56 |
| Service Class 2 | .56 |
| Investor Class | .64 |
One-twelfth of the management fee rate for a class is applied to the average net assets of the class for the month, giving a dollar amount which is the management fee for the class for that month. A different management fee rate may be applicable to each class of the Fund. The difference between classes is the result of separate arrangements for class-level services and/or waivers of certain expenses. It is not the result of any difference in advisory or custodial fees or other expenses related to the management of the Fund's assets, which do not vary by class. For the portion of the reporting period on or after March 1, 2024, the total annualized management fee rates were as follows:
| | Total Management Fee Rate % |
| Initial Class | .55 |
| Service Class | .55 |
| Service Class 2 | .55 |
| Investor Class | .62 |
Prior to March 1, 2024, the management fee was the sum of an individual fund fee rate that was based on an annual rate of .30% of the Fund's average net assets and an annualized group fee rate that averaged .22% during the period. The group fee rate was based upon the monthly average net assets of a group of registered investment companies with which the investment adviser has management contracts. The group fee rate decreased as assets under management increased and increased as assets under management decreased. For the portion of the reporting period prior to March 1, 2024, the total annualized management fee rate was .52%.
Effective March 1, 2024, the Fund's sub-advisory agreements with FMR Investment Management (UK) Limited, Fidelity Management & Research (Hong Kong) Limited, and Fidelity Management & Research (Japan) Limited were amended to provide that the investment adviser pays each sub-adviser monthly fees equal to 110% of the sub-adviser's costs for providing sub-advisory services.
Distribution and Service Plan Fees. In accordance with Rule 12b-1 of the 1940 Act, the Fund has adopted separate 12b-1 Plans for each Service Class of shares. Each Service Class pays Fidelity Distributors Company LLC (FDC), an affiliate of the investment adviser, a service fee. For the period, the service fee is based on an annual rate of .10% of Service Class' average net assets and .25% of Service Class 2's average net assets.
For the period, total fees, all of which were re-allowed to insurance companies for the distribution of shares and providing shareholder support services, were as follows:
| Service Class | $1,859,256 |
| Service Class 2 | 22,962,305 |
| | $24,821,561 |
Transfer Agent Fees. Fidelity Investments Institutional Operations Company LLC (FIIOC), an affiliate of the investment adviser, is the Fund's transfer, dividend disbursing, and shareholder servicing agent. Effective March 1, 2024, the Fund's management contract was amended to incorporate transfer agent services and associated fees previously covered under a separate services agreement.
During the period January 1, 2024 through February 29, 2024, the transfer agent fees for each class were a fixed annual rate of class-level average net assets as follows:
| | Amount ($) | % of Class-Level Average Net Assets |
| Initial Class | 964,029 | .0630 |
| Service Class | 179,323 | .0630 |
| Service Class 2 | 880,530 | .0630 |
| Investor Class | 573,948 | .1390 |
| | 2,597,830 | |
Accounting Fees. Fidelity Service Company, Inc. (FSC), an affiliate of the investment adviser, maintains the Fund's accounting records. Effective March 1, 2024, the Fund's management contract was amended to incorporate accounting services and associated fees previously covered under a separate services agreement.
During the period January 1, 2024 through February 29, 2024, the accounting fees were a fixed annual rate of average net assets as follows:
| | % of Average Net Assets |
| VIP Contrafund Portfolio | .0079 |
Brokerage Commissions. A portion of portfolio transactions were placed with brokerage firms which are affiliates of the investment adviser. Brokerage commissions are included in net realized gain (loss) and change in net unrealized appreciation (depreciation) in the Consolidated Statement of Operations. The commissions paid to these affiliated firms were as follows:
| | Amount ($) |
| VIP Contrafund Portfolio | 82,116 |
Interfund Trades. Funds may purchase from or sell securities to other Fidelity Funds under procedures adopted by the Board. The procedures have been designed to ensure these interfund trades are executed in accordance with Rule 17a-7 of the 1940 Act. Any interfund trades are included within the respective purchases and sales amounts shown in the Purchases and Sales of Investments note. Interfund trades during the period are noted in the table below.
| | Purchases ($) | Sales ($) | Realized Gain (Loss) ($) |
| VIP Contrafund Portfolio | 391,434,157 | 574,906,458 | 211,445,869 |
Other. During the period, the investment adviser reimbursed the Fund for certain losses as follows:
| | Amount ($) |
| VIP Contrafund Portfolio | 1,660 |
6. Committed Line of Credit.
Certain Funds participate with other funds managed by the investment adviser or an affiliate in a $4.25 billion credit facility (the "line of credit") to be utilized for temporary or emergency purposes to fund shareholder redemptions or for other short-term liquidity purposes.
Commitment fees are charged based on the unused amount of the line of credit at an annual rate of .10%, and then allocated to each participating fund based on its pro-rata portion of the line of credit. The commitment fees are reflected in Miscellaneous expenses on the Consolidated Statement of Operations, and are listed below.
Interest is charged to a participating fund based on its borrowings at an annual rate of .75% plus the highest of (i) daily SOFR plus a .10% spread adjustment, (ii) Federal Funds Effective Rate, or (iii) Overnight Bank Funding Rate. During the period, there were no borrowings on this line of credit.
The line of credit agreement will expire in March 2025 unless extended or renewed.
| | Amount ($) |
| VIP Contrafund Portfolio | 35,795 |
7. Security Lending.
Funds lend portfolio securities from time to time in order to earn additional income. Lending agents are used, including National Financial Services (NFS), an affiliate of the investment adviser. Pursuant to a securities lending agreement, NFS will receive a fee, which is capped at 9.9% of a fund's daily lending revenue, for its services as lending agent. A fund may lend securities to certain qualified borrowers, including NFS. On the settlement date of the loan, a fund receives collateral (in the form of U.S. Treasury obligations, letters of credit and/or cash) against the loaned securities and maintains collateral in an amount not less than 100% of the market value of the loaned securities during the period of the loan. The market value of the loaned securities is determined at the close of business of a fund and any additional required collateral is delivered to a fund on the next business day. A fund or borrower may terminate the loan at any time, and if the borrower defaults on its obligation to return the securities loaned because of insolvency or other reasons, a fund may apply collateral received from the borrower against the obligation. A fund may experience delays and costs in recovering the securities loaned. Any cash collateral received is invested in the Fidelity Securities Lending Cash Central Fund. Any loaned securities are identified as such in the Consolidated Schedule of Investments, and the value of loaned securities and cash collateral at period end, as applicable, are presented in the Consolidated Statement of Assets and Liabilities. Security lending income represents the income earned on investing cash collateral, less rebates paid to borrowers and any lending agent fees associated with the loan, plus any premium payments received for lending certain types of securities. Security lending income is presented in the Consolidated Statement of Operations as a component of income from Fidelity Central Funds. Affiliated security lending activity, if any, was as follows:
| | Total Security Lending Fees Paid to NFS ($) | Security Lending Income From Securities Loaned to NFS ($) | Value of Securities Loaned to NFS at Period End ($) |
| VIP Contrafund Portfolio | 7,375 | 671 | - |
8. Expense Reductions.
During the period the investment adviser or an affiliate reimbursed and/or waived a portion of fund-level operating expenses in the amount of $948,686.
9. Distributions to Shareholders.
Distributions to shareholders of each class were as follows:
| | Year ended December 31, 2024 | Year ended December 31, 2023 |
| VIP Contrafund Portfolio | | |
| Distributions to shareholders | | |
| Initial Class | $1,198,216,939 | $320,984,692 |
| Service Class | 222,798,961 | 58,518,242 |
| Service Class 2 | 1,139,536,535 | 285,886,635 |
| Investor Class | 362,762,307 | 83,395,240 |
Total | $2,923,314,742 | $748,784,809 |
10. Share Transactions.
Transactions for each class of shares were as follows and may contain in-kind transactions:
| | Shares | Shares | Dollars | Dollars |
| | Year ended December 31, 2024 | Year ended December 31, 2023 | Year ended December 31, 2024 | Year ended December 31, 2023 |
| VIP Contrafund Portfolio | | | | |
| Initial Class | | | | |
| Shares sold | 4,492,507 | 4,110,919 | $265,168,218 | $180,496,540 |
| Reinvestment of distributions | 19,936,503 | 6,982,855 | 1,198,216,939 | 320,984,692 |
| Shares redeemed | (22,682,186) | (23,784,190) | (1,320,390,644) | (1,033,654,034) |
| Net increase (decrease) | 1,746,824 | (12,690,416) | $142,994,513 | $(532,172,802) |
| Service Class | | | | |
| Shares sold | 1,533,314 | 1,285,445 | $89,531,876 | $55,626,808 |
| Reinvestment of distributions | 3,736,171 | 1,282,658 | 222,798,961 | 58,518,242 |
| Shares redeemed | (4,934,126) | (4,356,727) | (286,753,769) | (190,607,593) |
| Net increase (decrease) | 335,359 | (1,788,624) | $25,577,068 | $(76,462,543) |
| Service Class 2 | | | | |
| Shares sold | 12,539,962 | 14,097,176 | $713,738,120 | $586,643,496 |
| Reinvestment of distributions | 19,787,071 | 6,468,560 | 1,139,536,535 | 285,886,634 |
| Shares redeemed | (26,429,239) | (28,172,816) | (1,479,990,334) | (1,185,207,168) |
| Net increase (decrease) | 5,897,794 | (7,607,080) | $373,284,321 | $(312,677,038) |
| Investor Class | | | | |
| Shares sold | 3,303,371 | 1,597,440 | $189,471,634 | $71,639,465 |
| Reinvestment of distributions | 6,095,213 | 1,827,014 | 362,762,307 | 83,395,240 |
| Shares redeemed | (2,271,940) | (3,637,392) | (132,129,339) | (154,684,269) |
| Net increase (decrease) | 7,126,644 | (212,938) | $420,104,602 | $350,436 |
11. Other.
A fund's organizational documents provide former and current trustees and officers with a limited indemnification against liabilities arising in connection with the performance of their duties to the fund. In the normal course of business, a fund may also enter into contracts that provide general indemnifications. A fund's maximum exposure under these arrangements is unknown as this would be dependent on future claims that may be made against a fund. The risk of material loss from such claims is considered remote.
At the end of the period, the investment adviser or its affiliates were owners of record of more than 10% and certain otherwise unaffiliated shareholders were owners of record of more than 10% of the outstanding shares as follows:
| Fund | Affiliated % | Number of Unaffiliated Shareholders | Unaffiliated Shareholders % |
VIP Contrafund Portfolio | 18% | 1 | 12% |
12. Risk and Uncertainties.
Many factors affect a fund's performance. Developments that disrupt global economies and financial markets, such as pandemics, epidemics, outbreaks of infectious diseases, war, terrorism, and environmental disasters, may significantly affect a fund's investment performance. The effects of these developments to a fund will be impacted by the types of securities in which a fund invests, the financial condition, industry, economic sector, and geographic location of an issuer, and a fund's level of investment in the securities of that issuer. Significant concentrations in security types, issuers, industries, sectors, and geographic locations may magnify the factors that affect a fund's performance.
Report of Independent Registered Public Accounting Firm
To the Board of Trustees of Variable Insurance Products Fund II and the Shareholders of VIP Contrafund Portfolio:
Opinion on the Financial Statements and Financial Highlights
We have audited the accompanying consolidated statement of assets and liabilities of VIP Contrafund Portfolio (the "Fund"), a fund of Variable Insurance Products Fund II, including the consolidated schedule of investments, as of December 31, 2024, the related consolidated statement of operations for the year then ended, the consolidated statement of changes in net assets for each of the two years in the period then ended, the consolidated financial highlights for each of the five years in the period then ended, and the related notes (collectively referred to as the "financial statements"). In our opinion, the financial statements and financial highlights present fairly, in all material respects, the financial position of the Fund as of December 31, 2024, and the results of its operations for the year then ended, the changes in its net assets for each of the two years in the period then ended, and the financial highlights for each of the five years in the period then ended in conformity with accounting principles generally accepted in the United States of America.
Basis for Opinion
These financial statements and financial highlights are the responsibility of the Fund's management. Our responsibility is to express an opinion on the Fund's financial statements and financial highlights based on our audits. We are a public accounting firm registered with the Public Company Accounting Oversight Board (United States) (PCAOB) and are required to be independent with respect to the Fund in accordance with the U.S. federal securities laws and the applicable rules and regulations of the Securities and Exchange Commission and the PCAOB.
We conducted our audits in accordance with the standards of the PCAOB. Those standards require that we plan and perform the audit to obtain reasonable assurance about whether the financial statements and financial highlights are free of material misstatement, whether due to error or fraud. The Fund is not required to have, nor were we engaged to perform, an audit of its internal control over financial reporting. As part of our audits, we are required to obtain an understanding of internal control over financial reporting but not for the purpose of expressing an opinion on the effectiveness of the Fund's internal control over financial reporting. Accordingly, we express no such opinion.
Our audits included performing procedures to assess the risks of material misstatement of the financial statements and financial highlights, whether due to error or fraud, and performing procedures that respond to those risks. Such procedures included examining, on a test basis, evidence regarding the amounts and disclosures in the financial statements and financial highlights. Our audits also included evaluating the accounting principles used and significant estimates made by management, as well as evaluating the overall presentation of the financial statements and financial highlights. Our procedures included confirmation of securities owned as of December 31, 2024, by correspondence with the custodian and brokers; when replies were not received from brokers, we performed other auditing procedures. We believe that our audits provide a reasonable basis for our opinion.
/s/ Deloitte & Touche LLP
Boston, Massachusetts
February 11, 2025
We have served as the auditor of one or more of the Fidelity investment companies since 1999.
Distributions
(Unaudited)The dividend and capital gains distributions for the fund(s) are available on Fidelity.com or Institutional.Fidelity.com.
The fund hereby designates as a capital gain dividend with respect to the taxable year ended December 31, 2024, $3,554,058,452, or, if subsequently determined to be different, the net capital gain of such year.
Initial Class, Service Class, Service Class 2, and Investor Class designate 100% of the dividends distributed during the fiscal year as qualifying for the dividends-received deduction for corporate shareholders.
Item 8: Changes in and Disagreements with Accountants for Open-End Management Investment Companies
(Unaudited)
Note: This is not applicable for any fund included in this document.
Item 9: Proxy Disclosures for Open-End Management Investment Companies
(Unaudited)
| A special meeting of shareholders was held on July 16, 2024. The results of votes taken among shareholders on the proposal before them are reported below. Each vote reported represents one dollar of net asset value held on the record date for the meeting. |
| Proposal 1 |
| To elect a Board of Trustees. |
| | # of Votes | % of Votes |
| Bettina Doulton |
| Affirmative | 35,115,445,138.03 | 95.41 |
| Withheld | 1,688,162,573.22 | 4.59 |
| TOTAL | 36,803,607,711.25 | 100.00 |
| Robert A. Lawrence |
| Affirmative | 35,088,609,864.54 | 95.34 |
| Withheld | 1,714,997,846.71 | 4.66 |
| TOTAL | 36,803,607,711.25 | 100.00 |
| Vijay C. Advani |
| Affirmative | 35,010,407,909.42 | 95.13 |
| Withheld | 1,793,199,801.83 | 4.87 |
| TOTAL | 36,803,607,711.25 | 100.00 |
| Thomas P. Bostick |
| Affirmative | 35,057,529,083.85 | 95.26 |
| Withheld | 1,746,078,627.39 | 4.74 |
| TOTAL | 36,803,607,711.25 | 100.00 |
| Donald F. Donahue |
| Affirmative | 35,013,585,423.05 | 95.14 |
| Withheld | 1,790,022,288.19 | 4.86 |
| TOTAL | 36,803,607,711.25 | 100.00 |
| Vicki L. Fuller |
| Affirmative | 35,122,634,645.90 | 95.43 |
| Withheld | 1,680,973,065.35 | 4.57 |
| TOTAL | 36,803,607,711.25 | 100.00 |
| Patricia L. Kampling |
| Affirmative | 35,180,534,002.80 | 95.59 |
| Withheld | 1,623,073,708.44 | 4.41 |
| TOTAL | 36,803,607,711.25 | 100.00 |
| Thomas A. Kennedy |
| Affirmative | 35,124,156,340.38 | 95.44 |
| Withheld | 1,679,451,370.87 | 4.56 |
| TOTAL | 36,803,607,711.25 | 100.00 |
| Oscar Munoz |
| Affirmative | 35,015,482,863.79 | 95.14 |
| Withheld | 1,788,124,847.45 | 4.86 |
| TOTAL | 36,803,607,711.25 | 100.00 |
| Karen B. Peetz |
| Affirmative | 35,090,964,426.07 | 95.35 |
| Withheld | 1,712,643,285.17 | 4.65 |
| TOTAL | 36,803,607,711.25 | 100.00 |
| David M. Thomas |
| Affirmative | 34,979,784,204.17 | 95.04 |
| Withheld | 1,823,823,507.08 | 4.96 |
| TOTAL | 36,803,607,711.25 | 100.00 |
| Susan Tomasky |
| Affirmative | 35,096,963,470.38 | 95.36 |
| Withheld | 1,706,644,240.86 | 4.64 |
| TOTAL | 36,803,607,711.25 | 100.00 |
| Michael E. Wiley |
| Affirmative | 34,987,599,655.10 | 95.07 |
| Withheld | 1,816,008,056.15 | 4.93 |
| TOTAL | 36,803,607,711.25 | 100.00 |
| | | |
| Proposal 1 reflects trust-wide proposal and voting results. |
Item 10: Remuneration Paid to Directors, Officers, and others of Open-End Management Investment Companies
(Unaudited)
Note: This information is disclosed as part of the consolidated financial statements for each Fund as part of Item 7: Consolidated Financial Statements and Consolidated Financial Highlights for Open-End Management Investment companies.
Item 11: Statement Regarding Basis for Approval of Investment Advisory Contract
(Unaudited)
Note: This is not applicable for any fund included in this document.
1.540131.127
VIPCON-ANN-0325
Fidelity® Variable Insurance Products:
VIP Index 500 Portfolio
Annual Report
December 31, 2024
Contents
To view a fund's proxy voting guidelines and proxy voting record for the 12-month period ended June 30, visit http://www.fidelity.com/proxyvotingresults or visit the Securities and Exchange Commission's (SEC) web site at http://www.sec.gov.
You may also call 1-877-208-0098 to request a free copy of the proxy voting guidelines.
Fidelity® Variable Insurance Products are separate account options which are purchased through a variable insurance contract.
Standard & Poor's®; and S&P®; are registered trademarks of Standard & Poor's Financial Services LLC ("S&P") and Dow Jones®; is a registered trademark of Dow Jones Trademark Holdings LLC ("Dow Jones"). The fund is not sponsored, endorsed, sold or promoted by SPDJI, Dow Jones, S&P, or their respective affiliates and none of such parties make any representation regarding the advisability of investing in such product(s) nor do they have any liability for any errors, omissions, or interruptions of the index or indices.
Standard & Poor's, S&P and S&P 500 are registered service marks of The McGraw-Hill Companies, Inc. and have been licensed for use by Fidelity Distributors Corporation.
Other third-party marks appearing herein are the property of their respective owners.
All other marks appearing herein are registered or unregistered trademarks or service marks of FMR LLC or an affiliated company. © 2025 FMR LLC. All rights reserved.
This report and the financial statements contained herein are submitted for the general information of the shareholders of the Fund. This report is not authorized for distribution to prospective investors in the Fund unless preceded or accompanied by an effective prospectus.
A fund files its complete schedule of portfolio holdings with the SEC for the first and third quarters of each fiscal year on Form N-PORT. Forms N-PORT are available on the SEC's web site at http://www.sec.gov. A fund's Forms N-PORT may be reviewed and copied at the SEC's Public Reference Room in Washington, DC. Information regarding the operation of the SEC's Public Reference Room may be obtained by calling 1-800-SEC-0330.
For a complete list of a fund's portfolio holdings, view the most recent holdings listing, semiannual report, or annual report on Fidelity's web site at http://www.fidelity.com, http://www.institutional.fidelity.com, or http://www.401k.com, as applicable.
NOT FDIC INSURED •MAY LOSE VALUE •NO BANK GUARANTEE
Neither the Fund nor Fidelity Distributors Corporation is a bank.
Item 7: Financial Statements and Financial Highlights for Open-End Management Investment Companies (Annual Report)
Schedule of Investments December 31, 2024
Showing Percentage of Net Assets
| Common Stocks - 99.7% |
| | | Shares | Value ($) |
| BAILIWICK OF JERSEY - 0.0% | | | |
| Consumer Discretionary - 0.0% | | | |
| Automobile Components - 0.0% | | | |
| Aptiv PLC | | 78,440 | 4,744,051 |
| CHINA - 0.1% | | | |
| Information Technology - 0.1% | | | |
| Semiconductors & Semiconductor Equipment - 0.1% | | | |
| NXP Semiconductors NV | | 84,825 | 17,630,876 |
| IRELAND - 0.4% | | | |
| Information Technology - 0.4% | | | |
| IT Services - 0.4% | | | |
| Accenture PLC Class A | | 208,533 | 73,359,825 |
| SWITZERLAND - 0.1% | | | |
| Information Technology - 0.1% | | | |
| Electronic Equipment, Instruments & Components - 0.1% | | | |
| TE Connectivity PLC | | 99,853 | 14,275,983 |
| UNITED STATES - 99.1% | | | |
| Communication Services - 9.3% | | | |
| Diversified Telecommunication Services - 0.7% | | | |
| AT&T Inc | | 2,394,605 | 54,525,156 |
| Verizon Communications Inc | | 1,404,865 | 56,180,551 |
| | | | 110,705,707 |
| Entertainment - 1.4% | | | |
| Electronic Arts Inc | | 79,651 | 11,652,941 |
| Live Nation Entertainment Inc (b) | | 52,325 | 6,776,088 |
| Netflix Inc (b) | | 142,656 | 127,152,146 |
| Take-Two Interactive Software Inc (b) | | 54,516 | 10,035,305 |
| Walt Disney Co/The | | 604,365 | 67,296,043 |
| Warner Bros Discovery Inc (b) | | 745,434 | 7,879,237 |
| | | | 230,791,760 |
| Interactive Media & Services - 6.6% | | | |
| Alphabet Inc Class A | | 1,949,983 | 369,131,782 |
| Alphabet Inc Class C | | 1,588,297 | 302,475,281 |
| Match Group Inc (c) | | 83,794 | 2,740,901 |
| Meta Platforms Inc Class A | | 727,531 | 425,976,676 |
| | | | 1,100,324,640 |
| Media - 0.5% | | | |
| Charter Communications Inc Class A (b) | | 32,270 | 11,061,188 |
| Comcast Corp Class A | | 1,273,889 | 47,809,055 |
| Fox Corp Class A | | 77,865 | 3,782,682 |
| Fox Corp Class B | | 39,714 | 1,816,518 |
| Interpublic Group of Cos Inc/The | | 124,327 | 3,483,643 |
| News Corp Class A | | 126,286 | 3,477,916 |
| News Corp Class B | | 37,278 | 1,134,370 |
| Omnicom Group Inc (c) | | 65,111 | 5,602,150 |
| Paramount Global Class B (c) | | 198,688 | 2,078,276 |
| | | | 80,245,798 |
| Wireless Telecommunication Services - 0.1% | | | |
| T-Mobile US Inc | | 162,661 | 35,904,163 |
| Consumer Discretionary - 11.2% | | | |
| Automobile Components - 0.0% | | | |
| BorgWarner Inc (c) | | 72,991 | 2,320,384 |
| Automobiles - 2.5% | | | |
| Ford Motor Co | | 1,302,743 | 12,897,156 |
| General Motors Co | | 366,973 | 19,548,652 |
| Tesla Inc (b) | | 932,024 | 376,388,572 |
| | | | 408,834,380 |
| Broadline Retail - 4.2% | | | |
| Amazon.com Inc (b) | | 3,123,159 | 685,189,853 |
| eBay Inc | | 159,855 | 9,903,017 |
| | | | 695,092,870 |
| Distributors - 0.1% | | | |
| Genuine Parts Co | | 46,400 | 5,417,664 |
| LKQ Corp | | 86,755 | 3,188,246 |
| Pool Corp | | 12,700 | 4,329,938 |
| | | | 12,935,848 |
| Hotels, Restaurants & Leisure - 1.9% | | | |
| Airbnb Inc Class A (b) | | 144,464 | 18,984,014 |
| Booking Holdings Inc | | 11,045 | 54,876,199 |
| Caesars Entertainment Inc (b) | | 70,909 | 2,369,778 |
| Carnival Corp (b) | | 346,660 | 8,638,767 |
| Chipotle Mexican Grill Inc (b) | | 454,737 | 27,420,641 |
| Darden Restaurants Inc (c) | | 39,212 | 7,320,488 |
| Domino's Pizza Inc | | 11,524 | 4,837,314 |
| Expedia Group Inc Class A (b) | | 40,990 | 7,637,667 |
| Hilton Worldwide Holdings Inc | | 81,354 | 20,107,455 |
| Las Vegas Sands Corp | | 116,144 | 5,965,156 |
| Marriott International Inc/MD Class A1 | | 76,974 | 21,471,128 |
| McDonald's Corp | | 239,156 | 69,328,933 |
| MGM Resorts International (b) | | 75,512 | 2,616,491 |
| Norwegian Cruise Line Holdings Ltd (b) | | 146,896 | 3,779,634 |
| Royal Caribbean Cruises Ltd | | 82,553 | 19,044,152 |
| Starbucks Corp | | 378,281 | 34,518,141 |
| Wynn Resorts Ltd | | 30,873 | 2,660,018 |
| Yum! Brands Inc | | 93,132 | 12,494,589 |
| | | | 324,070,565 |
| Household Durables - 0.3% | | | |
| DR Horton Inc | | 97,321 | 13,607,422 |
| Garmin Ltd (c) | | 51,267 | 10,574,331 |
| Lennar Corp Class A | | 79,694 | 10,867,871 |
| Mohawk Industries Inc (b) | | 17,502 | 2,085,013 |
| NVR Inc (b) | | 1,022 | 8,358,836 |
| PulteGroup Inc | | 68,440 | 7,453,116 |
| | | | 52,946,589 |
| Leisure Products - 0.0% | | | |
| Hasbro Inc | | 43,780 | 2,447,740 |
| Specialty Retail - 1.8% | | | |
| AutoZone Inc (b) | | 5,641 | 18,062,482 |
| Best Buy Co Inc | | 65,212 | 5,595,190 |
| CarMax Inc (b) | | 51,700 | 4,226,991 |
| Home Depot Inc/The | | 331,491 | 128,946,684 |
| Lowe's Cos Inc | | 189,322 | 46,724,670 |
| O'Reilly Automotive Inc (b) | | 19,266 | 22,845,623 |
| Ross Stores Inc | | 110,719 | 16,748,463 |
| TJX Cos Inc/The | | 376,404 | 45,473,367 |
| Tractor Supply Co | | 178,277 | 9,459,378 |
| Ulta Beauty Inc (b) | | 15,724 | 6,838,839 |
| | | | 304,921,687 |
| Textiles, Apparel & Luxury Goods - 0.4% | | | |
| Deckers Outdoor Corp (b) | | 50,701 | 10,296,866 |
| Lululemon Athletica Inc (b) | | 37,696 | 14,415,327 |
| NIKE Inc Class B | | 397,337 | 30,066,492 |
| Ralph Lauren Corp Class A | | 13,428 | 3,101,599 |
| Tapestry Inc | | 77,770 | 5,080,714 |
| | | | 62,960,998 |
TOTAL CONSUMER DISCRETIONARY | | | 1,866,531,061 |
| | | | |
| Consumer Staples - 5.5% | | | |
| Beverages - 1.1% | | | |
| Brown-Forman Corp Class B (c) | | 60,780 | 2,308,424 |
| Coca-Cola Co/The | | 1,293,878 | 80,556,844 |
| Constellation Brands Inc Class A | | 52,103 | 11,514,763 |
| Keurig Dr Pepper Inc | | 375,738 | 12,068,705 |
| Molson Coors Beverage Co Class B | | 58,295 | 3,341,469 |
| Monster Beverage Corp (b) | | 233,685 | 12,282,484 |
| PepsiCo Inc | | 457,875 | 69,624,473 |
| | | | 191,697,162 |
| Consumer Staples Distribution & Retail - 2.0% | | | |
| Costco Wholesale Corp | | 147,867 | 135,486,096 |
| Dollar General Corp | | 73,333 | 5,560,108 |
| Dollar Tree Inc (b) | | 67,502 | 5,058,600 |
| Kroger Co/The | | 222,137 | 13,583,678 |
| Sysco Corp | | 163,941 | 12,534,929 |
| Target Corp | | 153,743 | 20,782,979 |
| Walgreens Boots Alliance Inc | | 239,380 | 2,233,415 |
| Walmart Inc | | 1,448,607 | 130,881,642 |
| | | | 326,121,447 |
| Food Products - 0.6% | | | |
| Archer-Daniels-Midland Co | | 159,541 | 8,060,011 |
| Bunge Global SA | | 46,602 | 3,623,772 |
| Conagra Brands Inc | | 159,309 | 4,420,825 |
| General Mills Inc | | 185,298 | 11,816,453 |
| Hershey Co/The | | 49,278 | 8,345,229 |
| Hormel Foods Corp | | 97,087 | 3,045,619 |
| JM Smucker Co | | 35,467 | 3,905,626 |
| Kellanova | | 89,753 | 7,267,300 |
| Kraft Heinz Co/The | | 294,546 | 9,045,508 |
| Lamb Weston Holdings Inc | | 47,591 | 3,180,507 |
| McCormick & Co Inc/MD | | 84,196 | 6,419,103 |
| Mondelez International Inc | | 446,276 | 26,656,066 |
| The Campbell's Company (c) | | 65,565 | 2,745,862 |
| Tyson Foods Inc Class A | | 95,320 | 5,475,181 |
| | | | 104,007,062 |
| Household Products - 1.1% | | | |
| Church & Dwight Co Inc | | 81,790 | 8,564,231 |
| Clorox Co/The | | 41,310 | 6,709,157 |
| Colgate-Palmolive Co | | 272,664 | 24,787,884 |
| Kimberly-Clark Corp | | 111,299 | 14,584,621 |
| Procter & Gamble Co/The | | 785,945 | 131,763,679 |
| | | | 186,409,572 |
| Personal Care Products - 0.1% | | | |
| Estee Lauder Cos Inc/The Class A | | 77,850 | 5,837,192 |
| Kenvue Inc | | 639,837 | 13,660,520 |
| | | | 19,497,712 |
| Tobacco - 0.6% | | | |
| Altria Group Inc | | 565,624 | 29,576,479 |
| Philip Morris International Inc | | 518,893 | 62,448,773 |
| | | | 92,025,252 |
TOTAL CONSUMER STAPLES | | | 919,758,207 |
| | | | |
| Energy - 3.2% | | | |
| Energy Equipment & Services - 0.2% | | | |
| Baker Hughes Co Class A | | 330,230 | 13,546,035 |
| Halliburton Co | | 293,173 | 7,971,374 |
| Schlumberger NV | | 471,269 | 18,068,453 |
| | | | 39,585,862 |
| Oil, Gas & Consumable Fuels - 3.0% | | | |
| APA Corp (c) | | 123,581 | 2,853,484 |
| Chevron Corp | | 557,759 | 80,785,814 |
| ConocoPhillips | | 431,695 | 42,811,193 |
| Coterra Energy Inc | | 245,817 | 6,278,166 |
| Devon Energy Corp | | 219,234 | 7,175,529 |
| Diamondback Energy Inc | | 62,365 | 10,217,258 |
| EOG Resources Inc | | 187,706 | 23,009,001 |
| Eqt Corp | | 199,129 | 9,181,838 |
| Exxon Mobil Corp | | 1,466,769 | 157,780,341 |
| Hess Corp | | 92,236 | 12,268,310 |
| Kinder Morgan Inc | | 645,104 | 17,675,850 |
| Marathon Petroleum Corp | | 107,257 | 14,962,352 |
| Occidental Petroleum Corp (c) | | 225,463 | 11,140,127 |
| ONEOK Inc | | 194,957 | 19,573,683 |
| Phillips 66 | | 137,826 | 15,702,516 |
| Targa Resources Corp | | 72,773 | 12,989,981 |
| Texas Pacific Land Corp | | 6,286 | 6,952,065 |
| Valero Energy Corp | | 105,654 | 12,952,124 |
| Williams Cos Inc/The | | 406,815 | 22,016,828 |
| | | | 486,326,460 |
TOTAL ENERGY | | | 525,912,322 |
| | | | |
| Financials - 13.6% | | | |
| Banks - 3.4% | | | |
| Bank of America Corp | | 2,227,783 | 97,911,063 |
| Citigroup Inc | | 631,172 | 44,428,197 |
| Citizens Financial Group Inc | | 147,085 | 6,436,440 |
| Fifth Third Bancorp | | 223,800 | 9,462,264 |
| Huntington Bancshares Inc/OH | | 484,613 | 7,884,654 |
| JPMorgan Chase & Co | | 939,562 | 225,222,407 |
| KeyCorp | | 330,821 | 5,670,271 |
| M&T Bank Corp | | 55,376 | 10,411,242 |
| PNC Financial Services Group Inc/The | | 132,421 | 25,537,390 |
| Regions Financial Corp | | 303,359 | 7,135,004 |
| Truist Financial Corp | | 443,041 | 19,219,119 |
| US Bancorp | | 520,639 | 24,902,163 |
| Wells Fargo & Co | | 1,111,152 | 78,047,316 |
| | | | 562,267,530 |
| Capital Markets - 3.1% | | | |
| Ameriprise Financial Inc | | 32,377 | 17,238,486 |
| Bank of New York Mellon Corp/The | | 242,651 | 18,642,876 |
| Blackrock Inc | | 48,586 | 49,805,994 |
| Blackstone Inc | | 240,954 | 41,545,289 |
| Cboe Global Markets Inc | | 34,957 | 6,830,598 |
| Charles Schwab Corp/The | | 498,897 | 36,923,367 |
| CME Group Inc Class A | | 120,261 | 27,928,212 |
| FactSet Research Systems Inc (c) | | 12,678 | 6,088,990 |
| Franklin Resources Inc | | 103,089 | 2,091,676 |
| Goldman Sachs Group Inc/The | | 104,761 | 59,988,244 |
| Intercontinental Exchange Inc | | 191,619 | 28,553,147 |
| Invesco Ltd | | 149,747 | 2,617,578 |
| KKR & Co Inc Class A | | 225,318 | 33,326,785 |
| MarketAxess Holdings Inc | | 12,570 | 2,841,323 |
| Moody's Corp | | 52,006 | 24,618,080 |
| Morgan Stanley | | 413,989 | 52,046,697 |
| MSCI Inc | | 26,155 | 15,693,262 |
| Nasdaq Inc | | 138,104 | 10,676,820 |
| Northern Trust Corp | | 66,152 | 6,780,580 |
| Raymond James Financial Inc | | 61,062 | 9,484,760 |
| S&P Global Inc | | 105,959 | 52,770,761 |
| State Street Corp | | 97,837 | 9,602,702 |
| T Rowe Price Group Inc | | 74,145 | 8,385,058 |
| | | | 524,481,285 |
| Consumer Finance - 0.6% | | | |
| American Express Co | | 185,724 | 55,121,026 |
| Capital One Financial Corp | | 127,318 | 22,703,346 |
| Discover Financial Services | | 83,791 | 14,515,115 |
| Synchrony Financial | | 129,939 | 8,446,034 |
| | | | 100,785,521 |
| Financial Services - 4.4% | | | |
| Apollo Global Management Inc | | 149,176 | 24,637,908 |
| Berkshire Hathaway Inc Class B (b) | | 611,709 | 277,275,456 |
| Corpay Inc (b) | | 23,265 | 7,873,341 |
| Fidelity National Information Services Inc | | 179,664 | 14,511,461 |
| Fiserv Inc (b) | | 189,864 | 39,001,863 |
| Global Payments Inc | | 84,915 | 9,515,575 |
| Jack Henry & Associates Inc | | 24,355 | 4,269,432 |
| Mastercard Inc Class A | | 273,556 | 144,046,383 |
| PayPal Holdings Inc (b) | | 334,578 | 28,556,232 |
| Visa Inc Class A | | 576,719 | 182,266,273 |
| | | | 731,953,924 |
| Insurance - 2.1% | | | |
| AFLAC Inc | | 166,851 | 17,259,067 |
| Allstate Corp/The | | 88,371 | 17,037,045 |
| American International Group Inc | | 208,166 | 15,154,485 |
| Aon PLC | | 72,173 | 25,921,655 |
| Arch Capital Group Ltd | | 125,015 | 11,545,135 |
| Arthur J Gallagher & Co | | 83,366 | 23,663,439 |
| Assurant Inc | | 17,114 | 3,649,047 |
| Brown & Brown Inc | | 79,204 | 8,080,392 |
| Chubb Ltd | | 125,107 | 34,567,064 |
| Cincinnati Financial Corp | | 52,198 | 7,500,853 |
| Erie Indemnity Co Class A | | 8,333 | 3,435,113 |
| Everest Group Ltd | | 14,343 | 5,198,764 |
| Globe Life Inc | | 28,014 | 3,124,121 |
| Hartford Financial Services Group Inc/The | | 96,743 | 10,583,684 |
| Loews Corp | | 60,305 | 5,107,230 |
| Marsh & McLennan Cos Inc | | 163,897 | 34,813,362 |
| MetLife Inc | | 194,109 | 15,893,645 |
| Principal Financial Group Inc | | 70,218 | 5,435,575 |
| Progressive Corp/The | | 195,502 | 46,844,235 |
| Prudential Financial Inc | | 118,812 | 14,082,786 |
| The Travelers Companies, Inc. | | 75,762 | 18,250,308 |
| W R Berkley Corp | | 100,439 | 5,877,690 |
| Willis Towers Watson PLC | | 33,613 | 10,528,936 |
| | | | 343,553,631 |
TOTAL FINANCIALS | | | 2,263,041,891 |
| | | | |
| Health Care - 10.1% | | | |
| Biotechnology - 1.6% | | | |
| AbbVie Inc | | 589,740 | 104,796,799 |
| Amgen Inc | | 179,386 | 46,755,167 |
| Biogen Inc (b) | | 48,664 | 7,441,699 |
| Gilead Sciences Inc | | 415,938 | 38,420,193 |
| Incyte Corp (b) | | 53,406 | 3,688,752 |
| Moderna Inc (b) | | 113,012 | 4,699,039 |
| Regeneron Pharmaceuticals Inc (b) | | 35,131 | 25,024,865 |
| Vertex Pharmaceuticals Inc (b) | | 85,942 | 34,608,843 |
| | | | 265,435,357 |
| Health Care Equipment & Supplies - 2.2% | | | |
| Abbott Laboratories | | 578,838 | 65,472,366 |
| Align Technology Inc (b) | | 23,411 | 4,881,428 |
| Baxter International Inc | | 170,445 | 4,970,176 |
| Becton Dickinson & Co | | 96,462 | 21,884,334 |
| Boston Scientific Corp (b) | | 491,859 | 43,932,846 |
| Cooper Cos Inc/The (b) | | 66,416 | 6,105,623 |
| Dexcom Inc (b) | | 130,353 | 10,137,553 |
| Edwards Lifesciences Corp (b) | | 196,835 | 14,571,695 |
| GE HealthCare Technologies Inc | | 152,473 | 11,920,339 |
| Hologic Inc (b) | | 77,460 | 5,584,091 |
| IDEXX Laboratories Inc (b) | | 27,328 | 11,298,488 |
| Insulet Corp (b) | | 23,425 | 6,115,565 |
| Intuitive Surgical Inc (b) | | 118,868 | 62,044,341 |
| Medtronic PLC | | 427,999 | 34,188,560 |
| ResMed Inc | | 48,991 | 11,203,752 |
| Solventum Corp | | 46,161 | 3,049,396 |
| STERIS PLC | | 32,947 | 6,772,585 |
| Stryker Corp | | 114,500 | 41,225,725 |
| Teleflex Inc | | 15,499 | 2,758,512 |
| Zimmer Biomet Holdings Inc | | 66,438 | 7,017,846 |
| | | | 375,135,221 |
| Health Care Providers & Services - 2.0% | | | |
| Cardinal Health Inc | | 80,769 | 9,552,550 |
| Cencora Inc | | 58,527 | 13,149,846 |
| Centene Corp (b) | | 168,488 | 10,207,003 |
| Cigna Group/The | | 92,828 | 25,633,524 |
| CVS Health Corp | | 419,968 | 18,852,364 |
| DaVita Inc (b) | | 15,050 | 2,250,728 |
| Elevance Health Inc | | 77,399 | 28,552,491 |
| HCA Healthcare Inc | | 60,863 | 18,268,029 |
| Henry Schein Inc (b) | | 41,608 | 2,879,274 |
| Humana Inc | | 40,183 | 10,194,829 |
| Labcorp Holdings Inc | | 27,911 | 6,400,551 |
| McKesson Corp | | 42,364 | 24,143,667 |
| Molina Healthcare Inc (b) | | 19,089 | 5,555,853 |
| Quest Diagnostics Inc | | 37,256 | 5,620,440 |
| UnitedHealth Group Inc | | 307,126 | 155,362,758 |
| Universal Health Services Inc Class B (c) | | 19,594 | 3,515,555 |
| | | | 340,139,462 |
| Life Sciences Tools & Services - 1.1% | | | |
| Agilent Technologies Inc | | 95,894 | 12,882,400 |
| Bio-Techne Corp | | 53,029 | 3,819,679 |
| Charles River Laboratories International Inc (b) | | 17,067 | 3,150,568 |
| Danaher Corp | | 214,531 | 49,245,591 |
| IQVIA Holdings Inc (b) | | 57,545 | 11,308,168 |
| Mettler-Toledo International Inc (b) | | 7,043 | 8,618,378 |
| Revvity Inc | | 40,617 | 4,533,263 |
| Thermo Fisher Scientific Inc | | 127,653 | 66,408,921 |
| Waters Corp (b) | | 19,804 | 7,346,888 |
| West Pharmaceutical Services Inc | | 24,170 | 7,917,125 |
| | | | 175,230,981 |
| Pharmaceuticals - 3.2% | | | |
| Bristol-Myers Squibb Co | | 676,852 | 38,282,749 |
| Eli Lilly & Co | | 262,956 | 203,002,033 |
| Johnson & Johnson | | 803,484 | 116,199,856 |
| Merck & Co Inc | | 844,206 | 83,981,613 |
| Pfizer Inc | | 1,891,212 | 50,173,854 |
| Viatris Inc | | 398,743 | 4,964,350 |
| Zoetis Inc Class A | | 150,563 | 24,531,230 |
| | | | 521,135,685 |
TOTAL HEALTH CARE | | | 1,677,076,706 |
| | | | |
| Industrials - 8.1% | | | |
| Aerospace & Defense - 1.8% | | | |
| Axon Enterprise Inc (b) | | 24,176 | 14,368,280 |
| Boeing Co (b) | | 249,488 | 44,159,376 |
| GE Aerospace | | 361,195 | 60,243,714 |
| General Dynamics Corp (c) | | 86,116 | 22,690,705 |
| Howmet Aerospace Inc | | 135,585 | 14,828,931 |
| Huntington Ingalls Industries Inc | | 13,050 | 2,466,059 |
| L3Harris Technologies Inc | | 63,299 | 13,310,514 |
| Lockheed Martin Corp | | 70,405 | 34,212,606 |
| Northrop Grumman Corp | | 45,706 | 21,449,369 |
| RTX Corp | | 444,203 | 51,403,171 |
| Textron Inc | | 61,913 | 4,735,725 |
| TransDigm Group Inc | | 18,766 | 23,781,776 |
| | | | 307,650,226 |
| Air Freight & Logistics - 0.4% | | | |
| CH Robinson Worldwide Inc | | 39,450 | 4,075,974 |
| Expeditors International of Washington Inc (c) | | 46,716 | 5,174,731 |
| FedEx Corp | | 75,016 | 21,104,251 |
| United Parcel Service Inc Class B | | 244,083 | 30,778,867 |
| | | | 61,133,823 |
| Building Products - 0.5% | | | |
| A O Smith Corp | | 39,751 | 2,711,416 |
| Allegion plc | | 29,009 | 3,790,896 |
| Builders FirstSource Inc (b) | | 38,408 | 5,489,655 |
| Carrier Global Corp | | 278,469 | 19,008,294 |
| Johnson Controls International plc | | 222,936 | 17,596,338 |
| Lennox International Inc | | 10,700 | 6,519,510 |
| Masco Corp | | 72,000 | 5,225,040 |
| Trane Technologies PLC | | 75,097 | 27,737,078 |
| | | | 88,078,227 |
| Commercial Services & Supplies - 0.5% | | | |
| Cintas Corp | | 114,403 | 20,901,428 |
| Copart Inc (b) | | 292,559 | 16,789,961 |
| Republic Services Inc | | 67,925 | 13,665,152 |
| Rollins Inc | | 93,846 | 4,349,762 |
| Veralto Corp | | 82,556 | 8,408,329 |
| Waste Management Inc | | 121,889 | 24,595,981 |
| | | | 88,710,613 |
| Construction & Engineering - 0.1% | | | |
| Quanta Services Inc (c) | | 49,262 | 15,569,255 |
| Electrical Equipment - 0.8% | | | |
| AMETEK Inc | | 77,193 | 13,914,810 |
| Eaton Corp PLC | | 131,889 | 43,770,002 |
| Emerson Electric Co | | 190,291 | 23,582,764 |
| GE Vernova Inc | | 91,994 | 30,259,586 |
| Generac Holdings Inc (b) | | 19,855 | 3,078,518 |
| Hubbell Inc | | 17,910 | 7,502,320 |
| Rockwell Automation Inc | | 37,677 | 10,767,710 |
| | | | 132,875,710 |
| Ground Transportation - 0.9% | | | |
| CSX Corp | | 643,581 | 20,768,359 |
| JB Hunt Transport Services Inc | | 26,585 | 4,536,996 |
| Norfolk Southern Corp | | 75,494 | 17,718,442 |
| Old Dominion Freight Line Inc | | 62,702 | 11,060,633 |
| Uber Technologies Inc (b) | | 702,739 | 42,389,216 |
| Union Pacific Corp | | 202,327 | 46,138,649 |
| | | | 142,612,295 |
| Industrial Conglomerates - 0.4% | | | |
| 3M Co | | 181,737 | 23,460,429 |
| Honeywell International Inc | | 217,007 | 49,019,712 |
| | | | 72,480,141 |
| Machinery - 1.6% | | | |
| Caterpillar Inc | | 161,125 | 58,449,706 |
| Cummins Inc | | 45,786 | 15,961,000 |
| Deere & Co | | 84,916 | 35,978,909 |
| Dover Corp | | 45,785 | 8,589,266 |
| Fortive Corp | | 115,787 | 8,684,025 |
| IDEX Corp | | 25,292 | 5,293,363 |
| Illinois Tool Works Inc | | 89,681 | 22,739,514 |
| Ingersoll Rand Inc | | 134,496 | 12,166,508 |
| Nordson Corp | | 18,127 | 3,792,893 |
| Otis Worldwide Corp | | 133,311 | 12,345,932 |
| PACCAR Inc | | 174,976 | 18,201,004 |
| Parker-Hannifin Corp | | 42,960 | 27,323,849 |
| Pentair PLC | | 55,141 | 5,549,390 |
| Snap-on Inc (c) | | 17,523 | 5,948,708 |
| Stanley Black & Decker Inc | | 51,436 | 4,129,796 |
| Westinghouse Air Brake Technologies Corp | | 57,365 | 10,875,830 |
| Xylem Inc/NY | | 81,062 | 9,404,813 |
| | | | 265,434,506 |
| Passenger Airlines - 0.2% | | | |
| Delta Air Lines Inc | | 213,953 | 12,944,157 |
| Southwest Airlines Co (c) | | 200,172 | 6,729,782 |
| United Airlines Holdings Inc (b) | | 109,751 | 10,656,822 |
| | | | 30,330,761 |
| Professional Services - 0.6% | | | |
| Automatic Data Processing Inc | | 135,982 | 39,806,011 |
| Broadridge Financial Solutions Inc | | 38,991 | 8,815,475 |
| Dayforce Inc (b)(c) | | 52,629 | 3,822,971 |
| Equifax Inc | | 41,378 | 10,545,183 |
| Jacobs Solutions Inc | | 41,466 | 5,540,687 |
| Leidos Holdings Inc | | 44,533 | 6,415,424 |
| Paychex Inc | | 106,901 | 14,989,658 |
| Paycom Software Inc | | 16,210 | 3,322,563 |
| Verisk Analytics Inc | | 47,127 | 12,980,190 |
| | | | 106,238,162 |
| Trading Companies & Distributors - 0.3% | | | |
| Fastenal Co | | 191,181 | 13,747,825 |
| United Rentals Inc | | 21,900 | 15,427,236 |
| WW Grainger Inc | | 14,790 | 15,589,400 |
| | | | 44,764,461 |
TOTAL INDUSTRIALS | | | 1,355,878,180 |
| | | | |
| Information Technology - 31.8% | | | |
| Communications Equipment - 0.9% | | | |
| Arista Networks Inc | | 344,746 | 38,104,775 |
| Cisco Systems Inc | | 1,330,261 | 78,751,451 |
| F5 Inc (b) | | 19,389 | 4,875,752 |
| Juniper Networks Inc | | 110,500 | 4,138,225 |
| Motorola Solutions Inc | | 55,774 | 25,780,416 |
| | | | 151,650,619 |
| Electronic Equipment, Instruments & Components - 0.5% | | | |
| Amphenol Corp Class A | | 402,340 | 27,942,514 |
| CDW Corp/DE | | 44,480 | 7,741,299 |
| Corning Inc | | 257,077 | 12,216,299 |
| Jabil Inc | | 37,663 | 5,419,706 |
| Keysight Technologies Inc (b) | | 57,923 | 9,304,171 |
| Teledyne Technologies Inc (b) | | 15,555 | 7,219,542 |
| Trimble Inc (b) | | 81,446 | 5,754,974 |
| Zebra Technologies Corp Class A (b) | | 17,206 | 6,645,301 |
| | | | 82,243,806 |
| IT Services - 0.7% | | | |
| Akamai Technologies Inc (b) | | 50,134 | 4,795,317 |
| Cognizant Technology Solutions Corp Class A | | 165,466 | 12,724,335 |
| EPAM Systems Inc (b) | | 18,929 | 4,425,979 |
| Gartner Inc (b) | | 25,745 | 12,472,680 |
| GoDaddy Inc Class A (b) | | 46,853 | 9,247,377 |
| IBM Corporation | | 308,582 | 67,835,581 |
| VeriSign Inc (b) | | 27,581 | 5,708,164 |
| | | | 117,209,433 |
| Semiconductors & Semiconductor Equipment - 11.4% | | | |
| Advanced Micro Devices Inc (b) | | 541,582 | 65,417,691 |
| Analog Devices Inc | | 165,701 | 35,204,834 |
| Applied Materials Inc | | 275,135 | 44,745,205 |
| Broadcom Inc | | 1,558,710 | 361,371,327 |
| Enphase Energy Inc (b) | | 45,091 | 3,096,850 |
| First Solar Inc (b) | | 35,709 | 6,293,354 |
| Intel Corp | | 1,439,387 | 28,859,709 |
| KLA Corp | | 44,642 | 28,129,817 |
| Lam Research Corp | | 429,419 | 31,016,934 |
| Microchip Technology Inc | | 179,241 | 10,279,471 |
| Micron Technology Inc | | 370,024 | 31,141,220 |
| Monolithic Power Systems Inc | | 16,271 | 9,627,551 |
| NVIDIA Corp | | 8,186,389 | 1,099,350,180 |
| ON Semiconductor Corp (b) | | 142,110 | 8,960,036 |
| QUALCOMM Inc | | 370,781 | 56,959,377 |
| Skyworks Solutions Inc (c) | | 53,246 | 4,721,855 |
| Teradyne Inc | | 54,359 | 6,844,885 |
| Texas Instruments Inc | | 304,440 | 57,085,544 |
| | | | 1,889,105,840 |
| Software - 10.4% | | | |
| Adobe Inc (b) | | 146,908 | 65,327,049 |
| ANSYS Inc (b) | | 29,195 | 9,848,349 |
| Autodesk Inc (b) | | 71,752 | 21,207,739 |
| Cadence Design Systems Inc (b) | | 91,530 | 27,501,104 |
| Crowdstrike Holdings Inc Class A (b) | | 77,665 | 26,573,856 |
| Fair Isaac Corp (b) | | 8,126 | 16,178,297 |
| Fortinet Inc (b) | | 212,305 | 20,058,576 |
| Gen Digital Inc | | 180,964 | 4,954,794 |
| Intuit Inc | | 93,542 | 58,791,147 |
| Microsoft Corp | | 2,481,239 | 1,045,842,239 |
| Oracle Corp | | 536,375 | 89,381,530 |
| Palantir Technologies Inc Class A (b) | | 684,085 | 51,737,349 |
| Palo Alto Networks Inc (b) | | 218,427 | 39,744,977 |
| PTC Inc (b) | | 40,083 | 7,370,061 |
| Roper Technologies Inc | | 35,785 | 18,602,832 |
| Salesforce Inc | | 319,045 | 106,666,315 |
| Servicenow Inc (b) | | 68,748 | 72,881,130 |
| Synopsys Inc (b) | | 51,266 | 24,882,466 |
| Tyler Technologies Inc (b) | | 14,283 | 8,236,149 |
| Workday Inc Class A (b) | | 71,084 | 18,341,805 |
| | | | 1,734,127,764 |
| Technology Hardware, Storage & Peripherals - 7.9% | | | |
| Apple Inc | | 5,044,598 | 1,263,268,231 |
| Dell Technologies Inc Class C | | 102,512 | 11,813,483 |
| Hewlett Packard Enterprise Co | | 433,422 | 9,253,560 |
| HP Inc | | 321,642 | 10,495,178 |
| NetApp Inc (c) | | 68,349 | 7,933,952 |
| Seagate Technology Holdings PLC | | 70,599 | 6,093,400 |
| Super Micro Computer Inc (b) | | 167,934 | 5,118,628 |
| Western Digital Corp (b) | | 115,379 | 6,880,050 |
| | | | 1,320,856,482 |
TOTAL INFORMATION TECHNOLOGY | | | 5,295,193,944 |
| | | | |
| Materials - 1.9% | | | |
| Chemicals - 1.3% | | | |
| Air Products and Chemicals Inc | | 74,193 | 21,518,938 |
| Albemarle Corp (c) | | 39,266 | 3,380,017 |
| Celanese Corp | | 36,504 | 2,526,442 |
| CF Industries Holdings Inc | | 58,075 | 4,954,959 |
| Corteva Inc | | 229,368 | 13,064,801 |
| Dow Inc | | 233,649 | 9,376,334 |
| DuPont de Nemours Inc | | 139,481 | 10,635,426 |
| Eastman Chemical Co (c) | | 38,683 | 3,532,532 |
| Ecolab Inc | | 84,103 | 19,707,015 |
| FMC Corp (c) | | 41,702 | 2,027,134 |
| International Flavors & Fragrances Inc | | 85,296 | 7,211,777 |
| Linde PLC | | 158,907 | 66,529,595 |
| LyondellBasell Industries NV Class A1 | | 86,711 | 6,440,026 |
| Mosaic Co/The | | 106,006 | 2,605,627 |
| PPG Industries Inc | | 77,425 | 9,248,416 |
| Sherwin-Williams Co/The | | 77,327 | 26,285,767 |
| | | | 209,044,806 |
| Construction Materials - 0.1% | | | |
| Martin Marietta Materials Inc | | 20,397 | 10,535,050 |
| Vulcan Materials Co | | 44,073 | 11,336,898 |
| | | | 21,871,948 |
| Containers & Packaging - 0.2% | | | |
| Amcor PLC | | 482,874 | 4,543,844 |
| Avery Dennison Corp | | 26,819 | 5,018,639 |
| Ball Corp | | 99,603 | 5,491,113 |
| International Paper Co | | 115,867 | 6,235,962 |
| Packaging Corp of America | | 29,745 | 6,696,492 |
| Smurfit WestRock PLC | | 164,836 | 8,878,068 |
| | | | 36,864,118 |
| Metals & Mining - 0.3% | | | |
| Freeport-McMoRan Inc | | 479,547 | 18,261,150 |
| Newmont Corp | | 379,934 | 14,141,143 |
| Nucor Corp | | 78,365 | 9,145,979 |
| Steel Dynamics Inc | | 47,253 | 5,390,150 |
| | | | 46,938,422 |
TOTAL MATERIALS | | | 314,719,294 |
| | | | |
| Real Estate - 2.1% | | | |
| Health Care REITs - 0.3% | | | |
| Alexandria Real Estate Equities Inc | | 51,909 | 5,063,723 |
| Healthpeak Properties Inc | | 233,434 | 4,731,706 |
| Ventas Inc | | 140,004 | 8,244,836 |
| Welltower Inc | | 197,422 | 24,881,095 |
| | | | 42,921,360 |
| Hotel & Resort REITs - 0.0% | | | |
| Host Hotels & Resorts Inc | | 233,300 | 4,087,416 |
| Industrial REITs - 0.2% | | | |
| Prologis Inc | | 309,094 | 32,671,236 |
| Office REITs - 0.0% | | | |
| BXP Inc | | 48,543 | 3,609,657 |
| Real Estate Management & Development - 0.1% | | | |
| CBRE Group Inc Class A (b) | | 100,392 | 13,180,466 |
| CoStar Group Inc (b) | | 136,774 | 9,791,650 |
| | | | 22,972,116 |
| Residential REITs - 0.3% | | | |
| AvalonBay Communities Inc | | 47,404 | 10,427,459 |
| Camden Property Trust | | 35,626 | 4,134,041 |
| Equity Residential | | 113,984 | 8,179,492 |
| Essex Property Trust Inc | | 21,452 | 6,123,259 |
| Invitation Homes Inc | | 190,019 | 6,074,907 |
| Mid-America Apartment Communities Inc | | 38,981 | 6,025,293 |
| UDR Inc | | 100,274 | 4,352,894 |
| | | | 45,317,345 |
| Retail REITs - 0.3% | | | |
| Federal Realty Investment Trust | | 25,520 | 2,856,963 |
| Kimco Realty Corp | | 224,785 | 5,266,713 |
| Realty Income Corp | | 292,095 | 15,600,794 |
| Regency Centers Corp | | 54,573 | 4,034,582 |
| Simon Property Group Inc | | 102,331 | 17,622,422 |
| | | | 45,381,474 |
| Specialized REITs - 0.9% | | | |
| American Tower Corp | | 155,948 | 28,602,423 |
| Crown Castle Inc | | 145,042 | 13,164,012 |
| Digital Realty Trust Inc | | 104,061 | 18,453,137 |
| Equinix Inc | | 32,201 | 30,362,001 |
| Extra Space Storage Inc | | 70,735 | 10,581,956 |
| Iron Mountain Inc | | 97,903 | 10,290,584 |
| Public Storage Operating Co | | 52,591 | 15,747,849 |
| SBA Communications Corp Class A | | 35,905 | 7,317,439 |
| VICI Properties Inc (c) | | 351,837 | 10,277,159 |
| Weyerhaeuser Co | | 242,490 | 6,826,094 |
| | | | 151,622,654 |
TOTAL REAL ESTATE | | | 348,583,258 |
| | | | |
| Utilities - 2.3% | | | |
| Electric Utilities - 1.6% | | | |
| Alliant Energy Corp | | 85,694 | 5,067,943 |
| American Electric Power Co Inc | | 177,776 | 16,396,280 |
| Constellation Energy Corp | | 104,380 | 23,350,850 |
| Duke Energy Corp | | 257,799 | 27,775,264 |
| Edison International | | 129,204 | 10,315,647 |
| Entergy Corp | | 143,112 | 10,850,752 |
| Evergy Inc | | 76,827 | 4,728,702 |
| Eversource Energy | | 122,279 | 7,022,483 |
| Exelon Corp | | 335,348 | 12,622,499 |
| FirstEnergy Corp | | 171,244 | 6,812,086 |
| NextEra Energy Inc | | 686,255 | 49,197,622 |
| NRG Energy Inc | | 67,602 | 6,099,052 |
| PG&E Corp | | 729,592 | 14,723,167 |
| Pinnacle West Capital Corp | | 37,939 | 3,216,089 |
| PPL Corp | | 246,155 | 7,990,191 |
| Southern Co/The | | 365,658 | 30,100,968 |
| Xcel Energy Inc | | 191,641 | 12,939,600 |
| | | | 249,209,195 |
| Gas Utilities - 0.0% | | | |
| Atmos Energy Corp | | 51,789 | 7,212,654 |
| Independent Power and Renewable Electricity Producers - 0.1% | | | |
| AES Corp/The | | 237,511 | 3,056,766 |
| Vistra Corp | | 113,541 | 15,653,898 |
| | | | 18,710,664 |
| Multi-Utilities - 0.6% | | | |
| Ameren Corp | | 89,026 | 7,935,778 |
| CenterPoint Energy Inc | | 217,415 | 6,898,578 |
| CMS Energy Corp | | 99,650 | 6,641,672 |
| Consolidated Edison Inc | | 115,653 | 10,319,717 |
| Dominion Energy Inc | | 280,280 | 15,095,881 |
| DTE Energy Co | | 69,078 | 8,341,169 |
| NiSource Inc | | 155,843 | 5,728,788 |
| Public Service Enterprise Group Inc | | 166,288 | 14,049,673 |
| Sempra | | 211,407 | 18,544,622 |
| WEC Energy Group Inc | | 105,599 | 9,930,530 |
| | | | 103,486,408 |
| Water Utilities - 0.0% | | | |
| American Water Works Co Inc | | 65,021 | 8,094,464 |
TOTAL UTILITIES | | | 386,713,385 |
| | | | |
| TOTAL UNITED STATES | | | 16,511,380,316 |
| TOTAL COMMON STOCKS (Cost $4,353,397,520) | | | 16,621,391,051 |
| | | | |
| U.S. Treasury Obligations - 0.0% |
| | | Yield (%) (d) | Principal Amount (a) | Value ($) |
US Treasury Bills 0% 2/20/2025 (e) (Cost $3,092,920) | | 4.46 | 3,112,000 | 3,094,309 |
| | | | | |
| Money Market Funds - 0.5% |
| | | Yield (%) | Shares | Value ($) |
| Fidelity Cash Central Fund (f) | | 4.36 | 49,148,944 | 49,158,774 |
| Fidelity Securities Lending Cash Central Fund (f)(g) | | 4.35 | 41,675,234 | 41,679,401 |
| TOTAL MONEY MARKET FUNDS (Cost $90,835,858) | | | | 90,838,175 |
| | | | | |
| TOTAL INVESTMENT IN SECURITIES - 100.2% (Cost $4,447,326,298) | 16,715,323,535 |
NET OTHER ASSETS (LIABILITIES) - (0.2)% | (29,904,785) |
| NET ASSETS - 100.0% | 16,685,418,750 |
| | |
| Futures Contracts |
| | Number of contracts | Expiration Date | Notional Amount ($) | Value ($) | Unrealized Appreciation/ (Depreciation) ($) |
| Purchased | | | | | |
| | | | | | |
| Equity Contracts | | | | | |
| CME E-mini S&P 500 Index Contracts (United States) | 205 | Mar 2025 | 60,841,438 | (1,299,019) | (1,299,019) |
| | | | | | |
| The notional amount of futures purchased as a percentage of Net Assets is 0.4% |
Legend
| (a) | Amount is stated in United States dollars unless otherwise noted. |
| (c) | Security or a portion of the security is on loan at period end. |
| (d) | Yield represents either the annualized yield at the date of purchase, or the stated coupon rate, or, for floating and adjustable rate securities, the rate at period end. |
| (e) | Security or a portion of the security was pledged to cover margin requirements for futures contracts. At period end, the value of securities pledged amounted to $3,055,530. |
| (f) | Affiliated fund that is generally available only to investment companies and other accounts managed by Fidelity Investments. The rate quoted is the annualized seven-day yield of the fund at period end. A complete unaudited listing of the fund's holdings as of its most recent quarter end is available upon request. In addition, each Fidelity Central Fund's financial statements, which are not covered by the Fund's Report of Independent Registered Public Accounting Firm, are available on the SEC's website or upon request. |
| (g) | Investment made with cash collateral received from securities on loan. |
Affiliated Central Funds
Fiscal year to date information regarding the Fund's investments in Fidelity Central Funds, including the ownership percentage, is presented below.
| Affiliate | Value, beginning of period ($) | Purchases ($) | Sales Proceeds ($) | Dividend Income ($) | Realized Gain (loss) ($) | Change in Unrealized appreciation (depreciation) ($) | Value, end of period ($) | Shares, end of period | % ownership, end of period |
| Fidelity Cash Central Fund | 117,664,213 | 686,612,030 | 755,116,690 | 4,029,765 | (779) | - | 49,158,774 | 49,148,944 | 0.1% |
| Fidelity Securities Lending Cash Central Fund | 37,723,681 | 1,435,565,113 | 1,431,609,393 | 91,085 | - | - | 41,679,401 | 41,675,234 | 0.2% |
| Total | 155,387,894 | 2,122,177,143 | 2,186,726,083 | 4,120,850 | (779) | - | 90,838,175 | 90,824,178 | |
| | | | | | | | | | |
Amounts in the dividend income column in the above table include any capital gain distributions from underlying funds, which are presented in the corresponding line item in the Statement of Operations, if applicable.
Amounts in the dividend income column for Fidelity Securities Lending Cash Central Fund represents the income earned on investing cash collateral, less rebates paid to borrowers and any lending agent fees associated with the loan, plus any premium payments received for lending certain types of securities.
Amounts included in the purchases and sales proceeds columns may include in-kind transactions, if applicable.
Investment Valuation
The following is a summary of the inputs used, as of December 31, 2024, involving the Fund's assets and liabilities carried at fair value. The inputs or methodology used for valuing securities may not be an indication of the risk associated with investing in those securities. For more information on valuation inputs, and their aggregation into the levels used below, please refer to the Investment Valuation section in the accompanying Notes to Financial Statements.
| Valuation Inputs at Reporting Date: |
| Description | Total ($) | Level 1 ($) | Level 2 ($) | Level 3 ($) |
Investments in Securities: | | | | |
|
| Common Stocks | | | | |
Communication Services | 1,557,972,068 | 1,557,972,068 | - | - |
Consumer Discretionary | 1,871,275,112 | 1,871,275,112 | - | - |
Consumer Staples | 919,758,207 | 919,758,207 | - | - |
Energy | 525,912,322 | 525,912,322 | - | - |
Financials | 2,263,041,891 | 2,263,041,891 | - | - |
Health Care | 1,677,076,706 | 1,677,076,706 | - | - |
Industrials | 1,355,878,180 | 1,355,878,180 | - | - |
Information Technology | 5,400,460,628 | 5,400,460,628 | - | - |
Materials | 314,719,294 | 314,719,294 | - | - |
Real Estate | 348,583,258 | 348,583,258 | - | - |
Utilities | 386,713,385 | 386,713,385 | - | - |
|
| U.S. Treasury Obligations | 3,094,309 | - | 3,094,309 | - |
|
| Money Market Funds | 90,838,175 | 90,838,175 | - | - |
| Total Investments in Securities: | 16,715,323,535 | 16,712,229,226 | 3,094,309 | - |
Derivative Instruments: Liabilities | | | | |
Futures Contracts | (1,299,019) | (1,299,019) | - | - |
| Total Liabilities | (1,299,019) | (1,299,019) | - | - |
| Total Derivative Instruments: | (1,299,019) | (1,299,019) | - | - |
Value of Derivative Instruments
The following table is a summary of the Fund's value of derivative instruments by primary risk exposure as of December 31, 2024. For additional information on derivative instruments, please refer to the Derivative Instruments section in the accompanying Notes to Financial Statements.
Primary Risk Exposure / Derivative Type | Value |
| Asset ($) | Liability ($) |
| Equity Risk | | |
Futures Contracts (a) | 0 | (1,299,019) |
| Total Equity Risk | 0 | (1,299,019) |
| Total Value of Derivatives | 0 | (1,299,019) |
(a)Reflects gross cumulative appreciation (depreciation) on futures contracts as presented in the Schedule of Investments. In the Statement of Assets and Liabilities, the period end daily variation margin is included in receivable or payable for daily variation margin on futures contracts, and the net cumulative appreciation (depreciation) is included in Total accumulated earnings (loss).
Financial Statements
| Statement of Assets and Liabilities |
As of December 31, 2024 |
| Assets | | | | |
| Investment in securities, at value (including securities loaned of $40,823,855) - See accompanying schedule: | | | | |
Unaffiliated issuers (cost $4,356,490,440) | $ | 16,624,485,360 | | |
Fidelity Central Funds (cost $90,835,858) | | 90,838,175 | | |
| | | | | |
| | | | | |
| Total Investment in Securities (cost $4,447,326,298) | | | $ | 16,715,323,535 |
| Cash | | | | 890 |
| Receivable for fund shares sold | | | | 16,608,653 |
| Dividends receivable | | | | 10,201,434 |
| Distributions receivable from Fidelity Central Funds | | | | 192,618 |
| Other receivables | | | | 70,141 |
Total assets | | | | 16,742,397,271 |
| Liabilities | | | | |
| Payable for fund shares redeemed | $ | 13,185,310 | | |
| Accrued management fee | | 639,846 | | |
| Distribution and service plan fees payable | | 614,235 | | |
| Payable for daily variation margin on futures contracts | | 229,551 | | |
| Other affiliated payables | | 639,846 | | |
| Other payables and accrued expenses | | 11,273 | | |
| Collateral on securities loaned | | 41,658,460 | | |
| Total liabilities | | | | 56,978,521 |
| Net Assets | | | $ | 16,685,418,750 |
| Net Assets consist of: | | | | |
| Paid in capital | | | $ | 4,336,947,951 |
| Total accumulated earnings (loss) | | | | 12,348,470,799 |
| Net Assets | | | $ | 16,685,418,750 |
| | | | | |
| Net Asset Value and Maximum Offering Price | | | | |
| Initial Class : | | | | |
Net Asset Value, offering price and redemption price per share ($13,674,620,543 ÷ 24,010,672 shares) | | | $ | 569.52 |
| Service Class : | | | | |
Net Asset Value, offering price and redemption price per share ($218,707,465 ÷ 385,781 shares) | | | $ | 566.92 |
| Service Class 2 : | | | | |
Net Asset Value, offering price and redemption price per share ($2,792,090,742 ÷ 4,974,957 shares) | | | $ | 561.23 |
| Statement of Operations |
| Year ended December 31, 2024 |
| Investment Income | | | | |
| Dividends | | | $ | 208,058,583 |
| Interest | | | | 275,096 |
| Income from Fidelity Central Funds (including $91,085 from security lending) | | | | 4,120,850 |
| Total income | | | | 212,454,529 |
| Expenses | | | | |
| Management fee | $ | 6,932,411 | | |
| Transfer agent fees | | 7,530,722 | | |
| Distribution and service plan fees | | 6,717,863 | | |
| Independent trustees' fees and expenses | | 65,181 | | |
| Total expenses before reductions | | 21,246,177 | | |
| Expense reductions | | (11,902) | | |
| Total expenses after reductions | | | | 21,234,275 |
| Net Investment income (loss) | | | | 191,220,254 |
| Realized and Unrealized Gain (Loss) | | | | |
| Net realized gain (loss) on: | | | | |
| Investment Securities: | | | | |
| Unaffiliated issuers | | 72,027,745 | | |
| Fidelity Central Funds | | (779) | | |
| Futures contracts | | 18,577,789 | | |
| Total net realized gain (loss) | | | | 90,604,755 |
| Change in net unrealized appreciation (depreciation) on: | | | | |
| Investment Securities: | | | | |
| Unaffiliated issuers | | 3,068,738,225 | | |
| Futures contracts | | (5,479,800) | | |
| Total change in net unrealized appreciation (depreciation) | | | | 3,063,258,425 |
| Net gain (loss) | | | | 3,153,863,180 |
| Net increase (decrease) in net assets resulting from operations | | | $ | 3,345,083,434 |
| Statement of Changes in Net Assets |
| |
| | Year ended December 31, 2024 | | Year ended December 31, 2023 |
| Increase (Decrease) in Net Assets | | | | |
| Operations | | | | |
| Net investment income (loss) | $ | 191,220,254 | $ | 183,549,520 |
| Net realized gain (loss) | | 90,604,755 | | (13,390,061) |
| Change in net unrealized appreciation (depreciation) | | 3,063,258,425 | | 2,612,835,198 |
| Net increase (decrease) in net assets resulting from operations | | 3,345,083,434 | | 2,782,994,657 |
| Distributions to shareholders | | (203,127,941) | | (282,961,836) |
| | | | | |
| Share transactions - net increase (decrease) | | 15,181,113 | | 806,514,394 |
| Total increase (decrease) in net assets | | 3,157,136,606 | | 3,306,547,215 |
| | | | | |
| Net Assets | | | | |
| Beginning of period | | 13,528,282,144 | | 10,221,734,929 |
| End of period | $ | 16,685,418,750 | $ | 13,528,282,144 |
| | | | | |
| | | | | |
Financial Highlights
VIP Index 500 Portfolio Initial Class |
| |
| Years ended December 31, | | 2024 | | 2023 | | 2022 | | 2021 | | 2020 |
Selected Per-Share Data | | | | | | | | | | |
| Net asset value, beginning of period | $ | 461.79 | $ | 374.78 | $ | 468.27 | $ | 371.59 | $ | 320.35 |
| Income from Investment Operations | | | | | | | | | | |
Net investment income (loss) A,B | | 6.78 | | 6.54 | | 6.03 | | 5.42 | | 5.43 |
| Net realized and unrealized gain (loss) | | 108.14 | | 90.48 | | (90.47) | | 99.69 | | 52.57 |
| Total from investment operations | | 114.92 | | 97.02 | | (84.44) | | 105.11 | | 58.00 |
| Distributions from net investment income | | (6.86) | | (6.24) | | (5.95) | | (5.38) | | (5.72) |
| Distributions from net realized gain | | (.33) | | (3.77) | | (3.09) | | (3.04) | | (1.04) |
| Total distributions | | (7.19) | | (10.01) | | (9.05) C | | (8.43) C | | (6.76) |
| Net asset value, end of period | $ | 569.52 | $ | 461.79 | $ | 374.78 | $ | 468.27 | $ | 371.59 |
Total Return D,E | | | | 26.19% | | (18.21)% | | 28.58% | | 18.24% |
Ratios to Average Net Assets B,F,G | | | | | | | | | | |
| Expenses before reductions | | .09% | | .10% | | .10% | | .10% | | .10% |
| Expenses net of fee waivers, if any | | | | .10% | | .10% | | .10% | | .10% |
| Expenses net of all reductions | | .09% | | .10% | | .10% | | .10% | | .10% |
| Net investment income (loss) | | 1.28% | | 1.57% | | 1.50% | | 1.28% | | 1.70% |
| Supplemental Data | | | | | | | | | | |
| Net assets, end of period (000 omitted) | $ | 13,674,621 | $ | 11,016,176 | $ | 8,488,600 | $ | 10,323,307 | $ | 7,930,738 |
Portfolio turnover rate H | | | | 4% | | 7% | | 2% | | 8% |
ACalculated based on average shares outstanding during the period.
BNet investment income (loss) is affected by the timing of the declaration of dividends by any underlying mutual funds or exchange-traded funds (ETFs). Net investment income (loss) of any mutual funds or ETFs is not included in the Fund's net investment income (loss) ratio.
CTotal distributions per share do not sum due to rounding.
DTotal returns do not reflect charges attributable to your insurance company's separate account. Inclusion of these charges would reduce the total returns shown.
ETotal returns would have been lower if certain expenses had not been reduced during the applicable periods shown.
FFees and expenses of any underlying mutual funds or exchange-traded funds (ETFs) are not included in the Fund's expense ratio. The Fund indirectly bears its proportionate share of these expenses. For additional expense information related to investments in Fidelity Central Funds, please refer to the "Investments in Fidelity Central Funds" note found in the Notes to Financial Statements section of the most recent Annual or Semi-Annual report.
GExpense ratios reflect operating expenses of the class. Expenses before reductions do not reflect amounts reimbursed, waived, or reduced through arrangements with the investment adviser, brokerage services, or other offset arrangements, if applicable, and do not represent the amount paid by the class during periods when reimbursements, waivers or reductions occur.
HAmount does not include the portfolio activity of any underlying mutual funds or exchange-traded funds (ETFs), derivatives or securities that mature within one year from acquisition.
VIP Index 500 Portfolio Service Class |
| |
| Years ended December 31, | | 2024 | | 2023 | | 2022 | | 2021 | | 2020 |
Selected Per-Share Data | | | | | | | | | | |
| Net asset value, beginning of period | $ | 459.76 | $ | 373.19 | $ | 466.34 | $ | 370.12 | $ | 319.14 |
| Income from Investment Operations | | | | | | | | | | |
Net investment income (loss) A,B | | 6.21 | | 6.10 | | 5.60 | | 4.97 | | 5.09 |
| Net realized and unrealized gain (loss) | | 107.63 | | 90.08 | | (90.11) | | 99.27 | | 52.34 |
| Total from investment operations | | 113.84 | | 96.18 | | (84.51) | | 104.24 | | 57.43 |
| Distributions from net investment income | | (6.34) | | (5.84) | | (5.55) | | (4.98) | | (5.41) |
| Distributions from net realized gain | | (.33) | | (3.77) | | (3.09) | | (3.04) | | (1.04) |
| Total distributions | | (6.68) C | | (9.61) | | (8.64) | | (8.02) | | (6.45) |
| Net asset value, end of period | $ | 566.92 | $ | 459.76 | $ | 373.19 | $ | 466.34 | $ | 370.12 |
Total Return D,E | | | | 26.07% | | (18.30)% | | 28.45% | | 18.13% |
Ratios to Average Net Assets B,F,G | | | | | | | | | | |
| Expenses before reductions | | .19% | | .20% | | .20% | | .20% | | .20% |
| Expenses net of fee waivers, if any | | | | .20% | | .20% | | .20% | | .20% |
| Expenses net of all reductions | | .19% | | .20% | | .20% | | .20% | | .20% |
| Net investment income (loss) | | 1.18% | | 1.47% | | 1.40% | | 1.18% | | 1.60% |
| Supplemental Data | | | | | | | | | | |
| Net assets, end of period (000 omitted) | $ | 218,707 | $ | 183,012 | $ | 145,264 | $ | 175,058 | $ | 138,695 |
Portfolio turnover rate H | | | | 4% | | 7% | | 2% | | 8% |
ACalculated based on average shares outstanding during the period.
BNet investment income (loss) is affected by the timing of the declaration of dividends by any underlying mutual funds or exchange-traded funds (ETFs). Net investment income (loss) of any mutual funds or ETFs is not included in the Fund's net investment income (loss) ratio.
CTotal distributions per share do not sum due to rounding.
DTotal returns do not reflect charges attributable to your insurance company's separate account. Inclusion of these charges would reduce the total returns shown.
ETotal returns would have been lower if certain expenses had not been reduced during the applicable periods shown.
FFees and expenses of any underlying mutual funds or exchange-traded funds (ETFs) are not included in the Fund's expense ratio. The Fund indirectly bears its proportionate share of these expenses. For additional expense information related to investments in Fidelity Central Funds, please refer to the "Investments in Fidelity Central Funds" note found in the Notes to Financial Statements section of the most recent Annual or Semi-Annual report.
GExpense ratios reflect operating expenses of the class. Expenses before reductions do not reflect amounts reimbursed, waived, or reduced through arrangements with the investment adviser, brokerage services, or other offset arrangements, if applicable, and do not represent the amount paid by the class during periods when reimbursements, waivers or reductions occur.
HAmount does not include the portfolio activity of any underlying mutual funds or exchange-traded funds (ETFs), derivatives or securities that mature within one year from acquisition.
VIP Index 500 Portfolio Service Class 2 |
| |
| Years ended December 31, | | 2024 | | 2023 | | 2022 | | 2021 | | 2020 |
Selected Per-Share Data | | | | | | | | | | |
| Net asset value, beginning of period | $ | 455.28 | $ | 369.70 | $ | 461.95 | $ | 366.73 | $ | 316.37 |
| Income from Investment Operations | | | | | | | | | | |
Net investment income (loss) A,B | | 5.37 | | 5.43 | | 4.98 | | 4.30 | | 4.61 |
| Net realized and unrealized gain (loss) | | 106.51 | | 89.18 | | (89.29) | | 98.34 | | 51.78 |
| Total from investment operations | | 111.88 | | 94.61 | | (84.31) | | 102.64 | | 56.39 |
| Distributions from net investment income | | (5.60) | | (5.26) | | (4.84) | | (4.38) | | (4.99) |
| Distributions from net realized gain | | (.33) | | (3.77) | | (3.09) | | (3.04) | | (1.04) |
| Total distributions | | (5.93) | | (9.03) | | (7.94) C | | (7.42) | | (6.03) |
| Net asset value, end of period | $ | 561.23 | $ | 455.28 | $ | 369.70 | $ | 461.95 | $ | 366.73 |
Total Return D,E | | | | 25.88% | | (18.42)% | | 28.26% | | 17.95% |
Ratios to Average Net Assets B,F,G | | | | | | | | | | |
| Expenses before reductions | | .34% | | .35% | | .35% | | .35% | | .35% |
| Expenses net of fee waivers, if any | | | | .35% | | .35% | | .35% | | .35% |
| Expenses net of all reductions | | .34% | | .35% | | .35% | | .35% | | .35% |
| Net investment income (loss) | | 1.03% | | 1.32% | | 1.25% | | 1.03% | | 1.45% |
| Supplemental Data | | | | | | | | | | |
| Net assets, end of period (000 omitted) | $ | 2,792,091 | $ | 2,329,094 | $ | 1,587,871 | $ | 2,535,922 | $ | 2,016,568 |
Portfolio turnover rate H | | | | 4% | | 7% | | 2% | | 8% |
ACalculated based on average shares outstanding during the period.
BNet investment income (loss) is affected by the timing of the declaration of dividends by any underlying mutual funds or exchange-traded funds (ETFs). Net investment income (loss) of any mutual funds or ETFs is not included in the Fund's net investment income (loss) ratio.
CTotal distributions per share do not sum due to rounding.
DTotal returns do not reflect charges attributable to your insurance company's separate account. Inclusion of these charges would reduce the total returns shown.
ETotal returns would have been lower if certain expenses had not been reduced during the applicable periods shown.
FFees and expenses of any underlying mutual funds or exchange-traded funds (ETFs) are not included in the Fund's expense ratio. The Fund indirectly bears its proportionate share of these expenses. For additional expense information related to investments in Fidelity Central Funds, please refer to the "Investments in Fidelity Central Funds" note found in the Notes to Financial Statements section of the most recent Annual or Semi-Annual report.
GExpense ratios reflect operating expenses of the class. Expenses before reductions do not reflect amounts reimbursed, waived, or reduced through arrangements with the investment adviser, brokerage services, or other offset arrangements, if applicable, and do not represent the amount paid by the class during periods when reimbursements, waivers or reductions occur.
HAmount does not include the portfolio activity of any underlying mutual funds or exchange-traded funds (ETFs), derivatives or securities that mature within one year from acquisition.
Notes to Financial Statements
For the period ended December 31, 2024
1. Organization.
VIP Index 500 Portfolio (the Fund) is a fund of Variable Insurance Products Fund II (the Trust) and is authorized to issue an unlimited number of shares. The Trust is registered under the Investment Company Act of 1940, as amended (the 1940 Act), as an open-end management investment company organized as a Massachusetts business trust. Shares of the Fund may only be purchased by insurance companies for the purpose of funding variable annuity or variable life insurance contracts. The Fund offers the following classes of shares: Initial Class shares, Service Class shares and Service Class 2 shares. All classes have equal rights and voting privileges, except for matters affecting a single class.
2. Investments in Fidelity Central Funds.
Funds may invest in Fidelity Central Funds, which are open-end investment companies generally available only to other investment companies and accounts managed by the investment adviser and its affiliates. The Schedule of Investments lists any Fidelity Central Funds held as an investment as of period end, but does not include the underlying holdings of each Fidelity Central Fund. An investing fund indirectly bears its proportionate share of the expenses of the underlying Fidelity Central Funds.
Based on its investment objective, each Fidelity Central Fund may invest or participate in various investment vehicles or strategies that are similar to those of the investing fund. These strategies are consistent with the investment objectives of the investing fund and may involve certain economic risks which may cause a decline in value of each of the Fidelity Central Funds and thus a decline in the value of the investing fund.
| Fidelity Central Fund | Investment Manager | Investment Objective | Investment Practices | Expense RatioA |
| Fidelity Money Market Central Funds | Fidelity Management & Research Company LLC (FMR) | Each fund seeks to obtain a high level of current income consistent with the preservation of capital and liquidity. | Short-term Investments | Less than .005% |
A Expenses expressed as a percentage of average net assets and are as of each underlying Central Fund's most recent annual or semi-annual shareholder report.
A complete unaudited list of holdings for each Fidelity Central Fund is available upon request or at the Securities and Exchange Commission website at www.sec.gov. In addition, the financial statements of the Fidelity Central Funds which contain the significant accounting policies (including investment valuation policies) of those funds, and are not covered by the Report of Independent Registered Public Accounting Firm, are available on the Securities and Exchange Commission website or upon request.
3. Significant Accounting Policies.
The Fund is an investment company and applies the accounting and reporting guidance of the Financial Accounting Standards Board (FASB) Accounting Standards Codification Topic 946 Financial Services - Investment Companies. The financial statements have been prepared in conformity with accounting principles generally accepted in the United States of America (GAAP), which require management to make certain estimates and assumptions at the date of the financial statements. Actual results could differ from those estimates. The Fund operates as a single operating segment. The Fund's income, expenses, assets, and performance are regularly monitored and assessed as a whole by the investment adviser and other individuals responsible for oversight functions of the Trust, using the information presented in the financial statements and financial highlights. Subsequent events, if any, through the date that the financial statements were issued have been evaluated in the preparation of the financial statements. The Fund's Schedule of Investments lists any underlying mutual funds or exchange-traded funds (ETFs) but does not include the underlying holdings of these funds. The following summarizes the significant accounting policies of the Fund:
Investment Valuation. Investments are valued as of 4:00 p.m. Eastern time on the last calendar day of the period. The Board of Trustees (the Board) has designated the Fund's investment adviser as the valuation designee responsible for the fair valuation function and performing fair value determinations as needed. The investment adviser has established a Fair Value Committee (the Committee) to carry out the day-to-day fair valuation responsibilities and has adopted policies and procedures to govern the fair valuation process and the activities of the Committee. In accordance with these fair valuation policies and procedures, which have been approved by the Board, the Fund attempts to obtain prices from one or more third party pricing services or brokers to value its investments. When current market prices, quotations or currency exchange rates are not readily available or reliable, investments will be fair valued in good faith by the Committee, in accordance with the policies and procedures. Factors used in determining fair value vary by investment type and may include market or investment specific events, transaction data, estimated cash flows, and market observations of comparable investments. The frequency that the fair valuation procedures are used cannot be predicted and they may be utilized to a significant extent. The Committee manages the Fund's fair valuation practices and maintains the fair valuation policies and procedures. The Fund's investment adviser reports to the Board information regarding the fair valuation process and related material matters.
The Fund categorizes the inputs to valuation techniques used to value its investments into a disclosure hierarchy consisting of three levels as shown below:
Level 1 - unadjusted quoted prices in active markets for identical investments
Level 2 - other significant observable inputs (including quoted prices for similar investments, interest rates, prepayment speeds, etc.)
Level 3 - unobservable inputs (including the Fund's own assumptions based on the best information available)
Valuation techniques used to value the Fund's investments by major category are as follows:
Equity securities, including restricted securities, for which market quotations are readily available, are valued at the last reported sale price or official closing price as reported by a third party pricing service on the primary market or exchange on which they are traded and are categorized as Level 1 in the hierarchy. In the event there were no sales during the day or closing prices are not available, securities are valued at the last quoted bid price or may be valued using the last available price and are generally categorized as Level 2 in the hierarchy. For foreign equity securities, when market or security specific events arise, comparisons to the valuation of American Depositary Receipts (ADRs), futures contracts, Exchange-Traded Funds (ETFs) and certain indexes as well as quoted prices for similar securities may be used and would be categorized as Level 2 in the hierarchy. For equity securities, including restricted securities, where observable inputs are limited, assumptions about market activity and risk are used and these securities may be categorized as Level 3 in the hierarchy.
Debt securities, including restricted securities, are valued based on evaluated prices received from third party pricing services or from brokers who make markets in such securities. U.S. government and government agency obligations are valued by pricing services who utilize matrix pricing which considers yield or price of bonds of comparable quality, coupon, maturity and type or by broker-supplied prices. When independent prices are unavailable or unreliable, debt securities may be valued utilizing pricing methodologies which consider similar factors that would be used by third party pricing services. Debt securities are generally categorized as Level 2 in the hierarchy but may be Level 3 depending on the circumstances.
Futures contracts are valued at the settlement price established each day by the board of trade or exchange on which they are traded and are categorized as Level 1 in the hierarchy. Investments in open-end mutual funds, including the Fidelity Central Funds, are valued at their closing net asset value (NAV) each business day and are categorized as Level 1 in the hierarchy.
Changes in valuation techniques may result in transfers in or out of an assigned level within the disclosure hierarchy. The aggregate value of investments by input level as of December 31, 2024 is included at the end of the Fund's Schedule of Investments.
Investment Transactions and Income. For financial reporting purposes, the Fund's investment holdings and NAV include trades executed through the end of the last business day of the period. The NAV per share for processing shareholder transactions is calculated as of the close of business of the New York Stock Exchange (NYSE), normally 4:00 p.m. Eastern time and includes trades executed through the end of the prior business day. Gains and losses on securities sold are determined on the basis of identified cost and include proceeds received from litigation. Commissions paid to certain brokers with whom the investment adviser, or its affiliates, places trades on behalf of a fund include an amount in addition to trade execution, which may be rebated back to a fund. Any such rebates are included in net realized gain (loss) on investments in the Statement of Operations. Dividend income is recorded on the ex-dividend date, except for certain dividends from foreign securities where the ex-dividend date may have passed, which are recorded as soon as the Fund is informed of the ex-dividend date. Non-cash dividends included in dividend income, if any, are recorded at the fair market value of the securities received. Income and capital gain distributions from Fidelity Central Funds, if any, are recorded on the ex-dividend date. Certain distributions received by the Fund represent a return of capital or capital gain. The Fund determines the components of these distributions subsequent to the ex-dividend date, based upon receipt of tax filings or other correspondence relating to the underlying investment. These distributions are recorded as a reduction of cost of investments and/or as a realized gain. Interest income is accrued as earned and includes coupon interest and amortization of premium and accretion of discount on debt securities as applicable. Funds may file withholding tax reclaims in certain jurisdictions to recover a portion of amounts previously withheld. Any withholding tax reclaims income is included in the Statement of Operations in dividends. Any receivables for withholding tax reclaims are included in the Statement of Assets and Liabilities in dividends receivable.
Class Allocations and Expenses. Investment income, realized and unrealized capital gains and losses, common expenses of a fund, and certain fund-level expense reductions, if any, are allocated daily on a pro-rata basis to each class based on the relative net assets of each class to the total net assets of a fund. Each class differs with respect to transfer agent and distribution and service plan fees incurred, as applicable. Certain expense reductions may also differ by class, if applicable. For the reporting period, the allocated portion of income and expenses to each class as a percent of its average net assets may vary due to the timing of recording these transactions in relation to fluctuating net assets of the classes. Expenses directly attributable to a fund are charged to that fund. Expenses attributable to more than one fund are allocated among the respective funds on the basis of relative net assets or other appropriate methods. Expenses included in the accompanying financial statements reflect the expenses of that fund and do not include any expenses associated with any underlying mutual funds or exchange-traded funds (ETFs). Although not included in a fund's expenses, a fund indirectly bears its proportionate share of these expenses through the net asset value of each underlying mutual fund or exchange-traded fund (ETF). Expense estimates are accrued in the period to which they relate and adjustments are made when actual amounts are known.
Deferred Trustee Compensation. Under a Deferred Compensation Plan (the Plan) for certain Funds, certain independent Trustees have elected to defer receipt of a portion of their annual compensation. Deferred amounts are invested in affiliated mutual funds, are marked-to-market and remain in a fund until distributed in accordance with the Plan. The investment of deferred amounts and the offsetting payable to the Trustees presented below are included in the accompanying Statement of Assets and Liabilities in other receivables and other payables and accrued expenses, as applicable.
| VIP Index 500 Portfolio | $10,324 |
Income Tax Information and Distributions to Shareholders. Each year, the Fund intends to qualify as a regulated investment company under Subchapter M of the Internal Revenue Code, including distributing substantially all of its taxable income and realized gains. As a result, no provision for U.S. Federal income taxes is required. As of December 31, 2024, the Fund did not have any unrecognized tax benefits in the financial statements; nor is the Fund aware of any tax positions for which it is reasonably possible that the total amounts of unrecognized tax benefits will significantly change in the next twelve months. The Fund files a U.S. federal tax return, in addition to state and local tax returns as required. The Fund's federal income tax returns are subject to examination by the Internal Revenue Service (IRS) for a period of three fiscal years after they are filed. State and local tax returns may be subject to examination for an additional fiscal year depending on the jurisdiction.
Distributions are declared and recorded on the ex-dividend date. Income and capital gain distributions are declared separately for each class. Income and capital gain distributions are determined in accordance with income tax regulations, which may differ from GAAP.
Capital accounts within the financial statements are adjusted for permanent book-tax differences. These adjustments have no impact on net assets or the results of operations. Capital accounts are not adjusted for temporary book-tax differences which will reverse in a subsequent period.
Book-tax differences are primarily due to the short-term gain distributions from the underlying funds, futures contracts, capital loss carryforwards and losses deferred due to wash sales.
As of period end, the cost and unrealized appreciation (depreciation) in securities, and derivatives if applicable, for federal income tax purposes were as follows:
| Gross unrealized appreciation | $12,458,494,943 |
| Gross unrealized depreciation | (212,073,702) |
| Net unrealized appreciation (depreciation) | $12,246,421,241 |
| Tax Cost | $4,468,902,294 |
The tax-based components of distributable earnings as of period end were as follows:
| Undistributed ordinary income | $37,575,806 |
| Undistributed long-term capital gain | $64,473,756 |
| Net unrealized appreciation (depreciation) on securities and other investments | $12,246,421,241 |
The tax character of distributions paid was as follows:
| | December 31, 2024 | December 31, 2023 |
| Ordinary Income | $203,127,941 | $ 175,379,919 |
| Long-term Capital Gains | - | 107,581,917 |
| Total | $203,127,941 | $ 282,961,836 |
New Accounting Pronouncement. FASB Accounting Standards Update (ASU) 2023-07 Segment Reporting (Topic 280): Improvements to Reportable Segment Disclosures became effective in this reporting period. ASU 2023-07 enhances segment information disclosure in the notes to financial statements.
4. Derivative Instruments.
Risk Exposures and the Use of Derivative Instruments. The Fund's investment objectives allow for various types of derivative instruments, including futures contracts. Derivatives are investments whose value is primarily derived from underlying assets, indices or reference rates and may be transacted on an exchange or over-the-counter (OTC). Derivatives may involve a future commitment to buy or sell a specified asset based on specified terms, to exchange future cash flows at periodic intervals based on a notional principal amount, or for one party to make one or more payments upon the occurrence of specified events in exchange for periodic payments from the other party.
Derivatives were used to increase returns and to manage exposure to certain risks as defined below. The success of any strategy involving derivatives depends on analysis of numerous economic factors, and if the strategies for investment do not work as intended, the objectives may not be achieved.
Derivatives were used to increase or decrease exposure to the following risk(s):
| | |
| Equity Risk | Equity risk relates to the fluctuations in the value of financial instruments as a result of changes in market prices (other than those arising from interest rate risk or foreign exchange risk), whether caused by factors specific to an individual investment, its issuer, or all factors affecting all instruments traded in a market or market segment. |
Funds are also exposed to additional risks from investing in derivatives, such as liquidity risk and counterparty credit risk. Liquidity risk is the risk that a fund will be unable to close out the derivative in the open market in a timely manner. Counterparty credit risk is the risk that the counterparty will not be able to fulfill its obligation to a fund. Counterparty credit risk related to exchange-traded contracts may be mitigated by the protection provided by the exchange on which they trade.
Investing in derivatives may involve greater risks than investing in the underlying assets directly and, to varying degrees, may involve risk of loss in excess of any initial investment and collateral received and amounts recognized in the Statement of Assets and Liabilities. In addition, there may be the risk that the change in value of the derivative contract does not correspond to the change in value of the underlying instrument.
Futures Contracts. A futures contract is an agreement between two parties to buy or sell a specified underlying instrument for a fixed price at a specified future date. Futures contracts were used to manage exposure to the stock market.
Upon entering into a futures contract, a fund is required to deposit either cash or securities (initial margin) with a clearing broker in an amount equal to a certain percentage of the face value of the contract. Futures contracts are marked-to-market daily and subsequent daily payments are made or received by a fund depending on the daily fluctuations in the value of the futures contracts and are recorded as unrealized appreciation or (depreciation). This receivable and/or payable, if any, is included in daily variation margin on futures contracts in the Statement of Assets and Liabilities. Realized gain or (loss) is recorded upon the expiration or closing of a futures contract. The net realized gain (loss) and change in net unrealized appreciation (depreciation) on futures contracts during the period is presented in the Statement of Operations.
Any open futures contracts at period end are presented in the Schedule of Investments under the caption "Futures Contracts". The notional amount at value reflects each contract's exposure to the underlying instrument or index at period end, and is representative of volume of activity during the period.
Any securities deposited to meet initial margin requirements are identified in the Schedule of Investments. Any cash deposited to meet initial margin requirements is presented as segregated cash with brokers for derivative instruments in the Statement of Assets and Liabilities.
5. Purchases and Sales of Investments.
Purchases and sales of securities, other than short-term securities and in-kind transactions, as applicable, are noted in the table below.
| | Purchases ($) | Sales ($) |
| VIP Index 500 Portfolio | 514,688,900 | 429,171,897 |
6. Fees and Other Transactions with Affiliates.
Management Fee and Expense Contract. Fidelity Management & Research Company LLC (the investment adviser) and its affiliates provide the Fund with investment management related services for which the Fund pays a monthly management fee. The management fee is based on an annual rate of .045% of the Fund's average net assets. Under the management contract, the investment adviser pays all other fund-level expenses, except the compensation of the independent Trustees and certain other expenses such as interest expense. In addition, under an expense contract, the investment adviser pays class-level expenses as necessary so that total expenses do not exceed an annual rate of .09% of each class' average net assets (.10% prior to June 1, 2024), excluding the distribution and service fee for each applicable class, with certain exceptions.
Sub-Adviser. Geode Capital Management, LLC (Geode), serves as sub-adviser for the Fund. Geode provides discretionary investment advisory services to the Fund and is paid by the investment adviser for providing these services.
Distribution and Service Plan Fees. In accordance with Rule 12b-1 of the 1940 Act, the Fund has adopted separate 12b-1 Plans for each Service Class of shares. Each Service Class pays Fidelity Distributors Company LLC (FDC), an affiliate of the investment adviser, a service fee. For the period, the service fee is based on an annual rate of .10% of Service Class' average net assets and .25% of Service Class 2's average net assets.
For the period, total fees, all of which were re-allowed to insurance companies for the distribution of shares and providing shareholder support services, were as follows:
| Service Class | $204,644 |
| Service Class 2 | 6,513,219 |
| | $6,717,863 |
Transfer Agent Fees. Fidelity Investments Institutional Operations Company LLC (FIIOC), an affiliate of the investment adviser, is the transfer, dividend disbursing, and shareholder servicing agent for each class. FIIOC receives asset-based fees based on each class's average net assets for transfer agent services, typesetting, and printing and mailing of shareholder reports, excluding mailing of proxy statements, equal to an annual rate of .06% of average net assets. Under the expense contract, each class pays a portion of the transfer agent fees equal to an annual rate of .045% of class-level average net assets (.055% prior to June 1, 2024). For the period, transfer agent fees for each class were as follows:
| Initial Class | $ 6,155,969 |
| Service Class | 100,156 |
| Service Class 2 | 1,274,597 |
| | $ 7,530,722 |
Interfund Trades. Funds may purchase from or sell securities to other Fidelity Funds under procedures adopted by the Board. The procedures have been designed to ensure these interfund trades are executed in accordance with Rule 17a-7 of the 1940 Act. Any interfund trades are included within the respective purchases and sales amounts shown in the Purchases and Sales of Investments note. During the period, there were no interfund trades.
7. Committed Line of Credit.
Certain Funds participate with other funds managed by the investment adviser or an affiliate in a $4.25 billion credit facility (the "line of credit") to be utilized for temporary or emergency purposes to fund shareholder redemptions or for other short-term liquidity purposes.
Commitment fees are charged based on the unused amount of the line of credit at an annual rate of .10%, and then allocated to each participating fund based on its pro-rata portion of the line of credit. The commitment fees are borne by the investment adviser.
Interest is charged to a participating fund based on its borrowings at an annual rate of .75% plus the highest of (i) daily SOFR plus a .10% spread adjustment, (ii) Federal Funds Effective Rate, or (iii) Overnight Bank Funding Rate. During the period, there were no borrowings on this line of credit.
The line of credit agreement will expire in March 2025 unless extended or renewed.
8. Security Lending.
Funds lend portfolio securities from time to time in order to earn additional income. Lending agents are used, including National Financial Services (NFS), an affiliate of the investment adviser. Pursuant to a securities lending agreement, NFS will receive a fee, which is capped at 9.9% of a fund's daily lending revenue, for its services as lending agent. A fund may lend securities to certain qualified borrowers, including NFS. On the settlement date of the loan, a fund receives collateral (in the form of U.S. Treasury obligations, letters of credit and/or cash) against the loaned securities and maintains collateral in an amount not less than 100% of the market value of the loaned securities during the period of the loan. The market value of the loaned securities is determined at the close of business of a fund and any additional required collateral is delivered to a fund on the next business day. A fund or borrower may terminate the loan at any time, and if the borrower defaults on its obligation to return the securities loaned because of insolvency or other reasons, a fund may apply collateral received from the borrower against the obligation. A fund may experience delays and costs in recovering the securities loaned. Any cash collateral received is invested in the Fidelity Securities Lending Cash Central Fund. Any loaned securities are identified as such in the Schedule of Investments, and the value of loaned securities and cash collateral at period end, as applicable, are presented in the Statement of Assets and Liabilities. Security lending income represents the income earned on investing cash collateral, less rebates paid to borrowers and any lending agent fees associated with the loan, plus any premium payments received for lending certain types of securities. Security lending income is presented in the Statement of Operations as a component of income from Fidelity Central Funds. Affiliated security lending activity, if any, was as follows:
| | Total Security Lending Fees Paid to NFS ($) | Security Lending Income From Securities Loaned to NFS ($) | Value of Securities Loaned to NFS at Period End ($) |
| VIP Index 500 Portfolio | 9,809 | 3 | - |
9. Expense Reductions.
Through arrangements with the Fund's custodian, credits realized as a result of certain uninvested cash balances were used to reduce the Fund's expenses. During the period, custodian credits reduced the Fund's expenses by $11,902.
10. Distributions to Shareholders.
Distributions to shareholders of each class were as follows:
| | Year ended December 31, 2024 | Year ended December 31, 2023 |
| VIP Index 500 Portfolio | | |
| Distributions to shareholders | | |
| Initial Class | $171,053,450 | $235,364,725 |
| Service Class | 2,581,669 | 3,801,611 |
| Service Class 2 | 29,492,822 | 43,795,500 |
Total | $203,127,941 | $282,961,836 |
11. Share Transactions.
Transactions for each class of shares were as follows and may contain in-kind transactions:
| | Shares | Shares | Dollars | Dollars |
| | Year ended December 31, 2024 | Year ended December 31, 2023 | Year ended December 31, 2024 | Year ended December 31, 2023 |
| VIP Index 500 Portfolio | | | | |
| Initial Class | | | | |
| Shares sold | 2,223,261 | 3,180,206 | $1,163,288,871 | $1,282,707,479 |
| Reinvestment of distributions | 302,153 | 564,464 | 171,053,450 | 235,364,724 |
| Shares redeemed | (2,369,981) | (2,539,189) | (1,243,534,937) | (1,046,695,109) |
| Net increase (decrease) | 155,433 | 1,205,481 | $90,807,384 | $471,377,094 |
| Service Class | | | | |
| Shares sold | 34,661 | 51,357 | $17,719,074 | $21,547,420 |
| Reinvestment of distributions | 4,590 | 9,169 | 2,581,669 | 3,801,612 |
| Shares redeemed | (51,530) | (51,713) | (26,523,564) | (21,681,481) |
| Net increase (decrease) | (12,279) | 8,813 | $(6,222,821) | $3,667,551 |
| Service Class 2 | | | | |
| Shares sold | 368,930 | 1,864,869 | $192,833,063 | $741,143,215 |
| Reinvestment of distributions | 53,013 | 106,746 | 29,492,822 | 43,795,500 |
| Shares redeemed | (562,715) | (1,150,933) | (291,729,335) | (453,468,966) |
| Net increase (decrease) | (140,772) | 820,682 | $(69,403,450) | $331,469,749 |
12. Other.
A fund's organizational documents provide former and current trustees and officers with a limited indemnification against liabilities arising in connection with the performance of their duties to the fund. In the normal course of business, a fund may also enter into contracts that provide general indemnifications. A fund's maximum exposure under these arrangements is unknown as this would be dependent on future claims that may be made against a fund. The risk of material loss from such claims is considered remote.
At the end of the period, the investment adviser or its affiliates were owners of record of more than 10% of the outstanding shares as follows:
| Fund | Affiliated % |
VIP Index 500 Portfolio | 42% |
13. Risk and Uncertainties.
Many factors affect a fund's performance. Developments that disrupt global economies and financial markets, such as pandemics, epidemics, outbreaks of infectious diseases, war, terrorism, and environmental disasters, may significantly affect a fund's investment performance. The effects of these developments to a fund will be impacted by the types of securities in which a fund invests, the financial condition, industry, economic sector, and geographic location of an issuer, and a fund's level of investment in the securities of that issuer. Significant concentrations in security types, issuers, industries, sectors, and geographic locations may magnify the factors that affect a fund's performance.
Report of Independent Registered Public Accounting Firm
To the Board of Trustees of Variable Insurance Products Fund II and the Shareholders of VIP Index 500 Portfolio:
Opinion on the Financial Statements and Financial Highlights
We have audited the accompanying statement of assets and liabilities of VIP Index 500 Portfolio (the "Fund"), a fund of Variable Insurance Products Fund II, including the schedule of investments, as of December 31, 2024, the related statement of operations for the year then ended, the statement of changes in net assets for each of the two years in the period then ended, the financial highlights for each of the five years in the period then ended, and the related notes. In our opinion, the financial statements and financial highlights present fairly, in all material respects, the financial position of the Fund as of December 31, 2024, and the results of its operations for the year then ended, the changes in its net assets for each of the two years in the period then ended, and the financial highlights for each of the five years in the period then ended in conformity with accounting principles generally accepted in the United States of America.
Basis for Opinion
These financial statements and financial highlights are the responsibility of the Fund's management. Our responsibility is to express an opinion on the Fund's financial statements and financial highlights based on our audits. We are a public accounting firm registered with the Public Company Accounting Oversight Board (United States) (PCAOB) and are required to be independent with respect to the Fund in accordance with the U.S. federal securities laws and the applicable rules and regulations of the Securities and Exchange Commission and the PCAOB.
We conducted our audits in accordance with the standards of the PCAOB. Those standards require that we plan and perform the audit to obtain reasonable assurance about whether the financial statements and financial highlights are free of material misstatement, whether due to error or fraud. The Fund is not required to have, nor were we engaged to perform, an audit of its internal control over financial reporting. As part of our audits, we are required to obtain an understanding of internal control over financial reporting but not for the purpose of expressing an opinion on the effectiveness of the Fund's internal control over financial reporting. Accordingly, we express no such opinion.
Our audits included performing procedures to assess the risks of material misstatement of the financial statements and financial highlights, whether due to error or fraud, and performing procedures that respond to those risks. Such procedures included examining, on a test basis, evidence regarding the amounts and disclosures in the financial statements and financial highlights. Our audits also included evaluating the accounting principles used and significant estimates made by management, as well as evaluating the overall presentation of the financial statements and financial highlights. Our procedures included confirmation of securities owned as of December 31, 2024, by correspondence with the custodian and brokers; when replies were not received from brokers, we performed other auditing procedures. We believe that our audits provide a reasonable basis for our opinion.
/s/ Deloitte & Touche LLP
Boston, Massachusetts
February 13, 2025
We have served as the auditor of one or more of the Fidelity investment companies since 1999.
Distributions
(Unaudited)The dividend and capital gains distributions for the fund(s) are available on Fidelity.com or Institutional.Fidelity.com.
The fund hereby designates as a capital gain dividend with respect to the taxable year ended December 31, 2024, $64,473,755, or, if subsequently determined to be different, the net capital gain of such year.
The fund designates $3,855,900 of distributions paid during the fiscal year ended 2024 as qualifying to be taxed as section 163(j) interest dividends.
Initial Class designates 58% and 100%, Service Class designates 61% and 100%, and Service Class 2 designates 67% and 100% of the dividends distributed in February and December, respectively, during the fiscal year as qualifying for the dividends-received deduction for corporate shareholders.
Item 8: Changes in and Disagreements with Accountants for Open-End Management Investment Companies
(Unaudited)
Note: This is not applicable for any fund included in this document.
Item 9: Proxy Disclosures for Open-End Management Investment Companies
(Unaudited)
| A special meeting of shareholders was held on July 16, 2024. The results of votes taken among shareholders on the proposal before them are reported below. Each vote reported represents one dollar of net asset value held on the record date for the meeting. |
| Proposal 1 |
| To elect a Board of Trustees. |
| | # of Votes | % of Votes |
| Bettina Doulton |
| Affirmative | 35,115,445,138.03 | 95.41 |
| Withheld | 1,688,162,573.22 | 4.59 |
| TOTAL | 36,803,607,711.25 | 100.00 |
| Robert A. Lawrence |
| Affirmative | 35,088,609,864.54 | 95.34 |
| Withheld | 1,714,997,846.71 | 4.66 |
| TOTAL | 36,803,607,711.25 | 100.00 |
| Vijay C. Advani |
| Affirmative | 35,010,407,909.42 | 95.13 |
| Withheld | 1,793,199,801.83 | 4.87 |
| TOTAL | 36,803,607,711.25 | 100.00 |
| Thomas P. Bostick |
| Affirmative | 35,057,529,083.85 | 95.26 |
| Withheld | 1,746,078,627.39 | 4.74 |
| TOTAL | 36,803,607,711.25 | 100.00 |
| Donald F. Donahue |
| Affirmative | 35,013,585,423.05 | 95.14 |
| Withheld | 1,790,022,288.19 | 4.86 |
| TOTAL | 36,803,607,711.25 | 100.00 |
| Vicki L. Fuller |
| Affirmative | 35,122,634,645.90 | 95.43 |
| Withheld | 1,680,973,065.35 | 4.57 |
| TOTAL | 36,803,607,711.25 | 100.00 |
| Patricia L. Kampling |
| Affirmative | 35,180,534,002.80 | 95.59 |
| Withheld | 1,623,073,708.44 | 4.41 |
| TOTAL | 36,803,607,711.25 | 100.00 |
| Thomas A. Kennedy |
| Affirmative | 35,124,156,340.38 | 95.44 |
| Withheld | 1,679,451,370.87 | 4.56 |
| TOTAL | 36,803,607,711.25 | 100.00 |
| Oscar Munoz |
| Affirmative | 35,015,482,863.79 | 95.14 |
| Withheld | 1,788,124,847.45 | 4.86 |
| TOTAL | 36,803,607,711.25 | 100.00 |
| Karen B. Peetz |
| Affirmative | 35,090,964,426.07 | 95.35 |
| Withheld | 1,712,643,285.17 | 4.65 |
| TOTAL | 36,803,607,711.25 | 100.00 |
| David M. Thomas |
| Affirmative | 34,979,784,204.17 | 95.04 |
| Withheld | 1,823,823,507.08 | 4.96 |
| TOTAL | 36,803,607,711.25 | 100.00 |
| Susan Tomasky |
| Affirmative | 35,096,963,470.38 | 95.36 |
| Withheld | 1,706,644,240.86 | 4.64 |
| TOTAL | 36,803,607,711.25 | 100.00 |
| Michael E. Wiley |
| Affirmative | 34,987,599,655.10 | 95.07 |
| Withheld | 1,816,008,056.15 | 4.93 |
| TOTAL | 36,803,607,711.25 | 100.00 |
| | | |
| Proposal 1 reflects trust-wide proposal and voting results. |
Item 10: Remuneration Paid to Directors, Officers, and others of Open-End Management Investment Companies
(Unaudited)
Note: This information is disclosed as part of the financial statements for each Fund as part of Item 7: Financial Statements and Financial Highlights for Open-End Management Investment companies.
Item 11: Statement Regarding Basis for Approval of Investment Advisory Contract
(Unaudited)
Note: This is not applicable for any fund included in this document.
1.540028.127
VIPIDX-ANN-0325
Item 8.
Changes in and Disagreements with Accountants for Open-End Management Investment Companies
See Item 7.
Item 9.
Proxy Disclosures for Open-End Management Investment Companies
See Item 7.
Item 10.
Remuneration Paid to Directors, Officers, and Others of Open-End Management Investment Companies
See Item 7.
Item 11.
Statement Regarding Basis for Approval of Investment Advisory Contract
See Item 7.
Item 12.
Disclosure of Proxy Voting Policies and Procedures for Closed-End Management Investment Companies
Not applicable.
Item 13.
Portfolio Managers of Closed-End Management Investment Companies
Not applicable.
Item 14.
Purchase of Equity Securities by Closed-End Management Investment Company and Affiliated Purchasers
Not applicable.
Item 15.
Submission of Matters to a Vote of Security Holders
There were no material changes to the procedures by which shareholders may recommend nominees to the trust’s Board of Trustees.
Item 16.
Controls and Procedures
(a)(i) The President and Treasurer and the Chief Financial Officer have concluded that the trust’s disclosure controls and procedures (as defined in Rule 30a-3(c) under the Investment Company Act) provide reasonable assurances that material information relating to the trust is made known to them by the appropriate persons, based on their evaluation of these controls and procedures as of a date within 90 days of the filing date of this report.
(a)(ii) There was no change in the trust’s internal control over financial reporting (as defined in Rule 30a-3(d) under the Investment Company Act) that occurred during the period covered by this report that has materially affected, or is reasonably likely to materially affect, the trust’s internal control over financial reporting.
Item 17.
Disclosure of Securities Lending Activities for Closed-End Management Investment Companies
Not applicable.
Item 18.
Recovery of Erroneously Awarded Compensation
(a)
Not applicable.
(b)
Not applicable.
Item 19.
Exhibits
SIGNATURES
Pursuant to the requirements of the Securities Exchange Act of 1934 and the Investment Company Act of 1940, the registrant has duly caused this report to be signed on its behalf by the undersigned, thereunto duly authorized.
Variable Insurance Products Fund II
|
By: | /s/Stacie M. Smith |
| Stacie M. Smith |
| President and Treasurer (Principal Executive Officer) |
|
|
Date: | February 21, 2025 |
Pursuant to the requirements of the Securities Exchange Act of 1934 and the Investment Company Act of 1940, this report has been signed below by the following persons on behalf of the registrant and in the capacities and on the dates indicated.
|
By: | /s/Stacie M. Smith |
| Stacie M. Smith |
| President and Treasurer (Principal Executive Officer) |
|
|
Date: | February 21, 2025 |
|
By: | /s/Stephanie Caron |
| Stephanie Caron |
| Chief Financial Officer (Principal Financial Officer) |
|
|
Date: | February 21, 2025 |