UNITED STATES
SECURITIES AND EXCHANGE COMMISSION
Washington, D.C. 20549
FORM N-CSR
CERTIFIED SHAREHOLDER REPORT OF REGISTERED
MANAGEMENT INVESTMENT COMPANIES
Investment Company Act file number 811-5511
Variable Insurance Products Fund II
(Exact name of registrant as specified in charter)
82 Devonshire St., Boston, Massachusetts 02109
(Address of principal executive offices) (Zip code)
Eric D. Roiter, Secretary
82 Devonshire St.
Boston, Massachusetts 02109
(Name and address of agent for service)
Registrant's telephone number, including area code: 617-563-7000
Date of fiscal year end: | December 31 |
| |
Date of reporting period: | June 30, 2006 |
Item 1. Reports to Stockholders
New Investment Structure of VIP Portfolios
Fidelity has recently changed the way VIP Investment Grade Bond Portfolio invests in investment-grade debt securities and certain other types of investments. Rather than investing directly in investment-grade debt securities, VIP Investment Grade Bond Portfolio will now gain exposure to the investment-grade sector through its investment in a central fund.
A central fund is a mutual fund used by this fund and other Fidelity funds as an investment vehicle to gain exposure to a particular market sector - - in this case, investment-grade debt. Instead of multiple funds each investing in investment-grade debt securities individually, they can now take advantage of consolidating investments in a single, larger pool of investment-grade debt securities by investing directly in a central fund.
Shares of the central funds are offered only to other Fidelity mutual funds and accounts; investors cannot directly invest in them. It is important to note that this new investment structure does not change the investment strategy of any of the VIP Portfolios.
If you have any questions, please call Fidelity or the insurance company that issued your policy.
VIPIGB-BUCK-0806 439707.1.0 June 30, 2006
1.834097.100
Fidelity® Variable Insurance Products:
Investment Grade Bond Portfolio
Semiannual Report
June 30, 2006
(2_fidelity_logos) (Registered_Trademark)
Contents
Note to Shareholders | <Click Here> | An explanation of the changes to the fund. |
Shareholder Expense Example | <Click Here> | An example of shareholder expenses. |
Investment Changes | <Click Here> | A summary of major shifts in the fund's investments over the past six months. |
Investments | <Click Here> | A complete list of the fund's investments with their
market values. |
Financial Statements | <Click Here> | Statements of assets and liabilities, operations, and
changes in net assets, as well as financial highlights. |
Notes | <Click Here> | Notes to the financial statements. |
Board Approval of Investment Advisory Contracts and Management Fees | <Click Here> | |
Fidelity VIP Investment Grade Central Investment Portfolio Financial Statements | <Click Here> | Complete list of investments and financial statements for
Fidelity VIP Investment Grade Central Investment Portfolio. |
| | |
To view a fund's proxy voting guidelines and proxy voting record for the 12-month period ended June 30, visit www.fidelity.com/proxyvotingresults or visit the Securities and Exchange Commission's (SEC) web site at www.sec.gov. You may also call 1-877-208-0098 to request a free copy of the proxy voting guidelines.
Fidelity Variable Insurance Products are separate account options which are purchased through a variable insurance contract.
Standard & Poor's, S&P and S&P 500 are registered service marks of The McGraw-Hill Companies, Inc. and have been licensed for use by Fidelity Distributors Corporation.
Other third party marks appearing herein are the property of their respective owners.
All marks appearing herein are registered or unregistered trademarks or service marks of FMR Corp. or an affiliated company.
This report and the financial statements contained herein are submitted for the general information of the shareholders of the fund. This report is not authorized for distribution to prospective investors in the fund unless preceded or accompanied by an effective prospectus.
A fund files its complete schedule of portfolio holdings with the SEC for the first and third quarters of each fiscal year on Form N-Q. Forms N-Q are available on the SEC's web site at http://www.sec.gov. A fund's Forms N-Q may be reviewed and copied at the SEC's Public Reference Room in Washington, DC. Information regarding the operation of the SEC's Public Reference Room may be obtained by calling 1-800-SEC-0330. For a complete list of a fund's portfolio holdings, view the most recent quarterly holdings report, semiannual report, or annual report on Fidelity's web site at http://www.advisor.fidelity.com.
NOT FDIC INSURED · MAY LOSE VALUE · NO BANK GUARANTEE
Neither the fund nor Fidelity Distributors Corporation is a bank.
Semiannual Report
Note to Shareholders:
On June 23, 2006, shortly before the end of the Fund's June 30 semiannual period, Fidelity changed its investment approach for managing VIP Investment Grade Bond Portfolio. The change does not impact the Fund's investment objective or risk profile but only the mechanics of how we manage the Fund's investment portfolio. Rather than invest directly in investment-grade debt securities, the Fund will gain exposure to the investment-grade market sector by investing in Central Funds that are available only to other Fidelity mutual funds and accounts. Central Funds allow us to manage investments in the same or similar securities by multiple Fidelity funds in a single pooled vehicle.
In converting to a Central Fund structure on June 23, the Fund transferred nearly all - about 98% - of its assets into Fidelity VIP Investment Grade Central Investment Portfolio, which like your Fund is managed by Ford O'Neil. The remaining assets continue to be invested in Fidelity® Specialized High Income Central Investment Portfolio and short-term repurchase agreements.
The new approach changes the way this semiannual report presents the Fund's holdings and financial information. The highlights are as follows:
* The Investment Changes page should continue to look the same as in previous reports because we are doing a complete "look-through," which means the securities held directly by the Fund as well as the securities and other investments held indirectly through investment in the underlying Fidelity Central Funds (Fidelity VIP Investment Grade Central Investment Portfolio and Fidelity Specialized High Income Central Investment Portfolio) are reflected in the information provided.
* The Investments section will continue to reflect direct investments of the Fund but these will now include only the two Central Funds and repurchase agreements. The individual securities and other investments, such as swap agreements, previously held by the Fund, were transferred to the Fidelity VIP Investment Grade Central Investment Portfolio, so they are no longer directly held. However, we are attaching the financial statements of the largest Central Fund holding - that of the Fidelity VIP Investment Grade Central Investment Portfolio - to this semiannual report so that shareholders can see the individual holdings and related financial information. For similar details on the Fund's small stake in Fidelity Specialized High Income Central Investment Portfolio, information on underlying holdings will continue to be available upon request or at advisor.fidelity.com.
* The Statement of Operations, within the Financial Statements, will continue to show the income, expenses, realized and unrealized gains and/or losses of VIP Investment Grade Bond Portfolio. The Financial Highlights, within the Financial Statements, and the Shareholder Expense Example also will continue to provide information for VIP Investment Grade Bond Portfolio as well as include information regarding expenses for the underlying Central Funds. VIP Investment Grade Bond Portfolio, as an investing fund in the Central Funds, indirectly bears a share of the Central Fund expenses, and this information is being provided in the expense example and Financial Highlights in a footnote reference to illustrate these impacts.
Semiannual Report
VIP Investment Grade Bond Portfolio
Shareholder Expense Example
The Fund invests in Fidelity Central Funds, which are open-end investment companies with similar investment objectives to those of the Fund, available only to other mutual funds and accounts managed by Fidelity Management & Research Company, (FMR) and its affiliates. In addition to the direct expenses incurred by the Fund presented in the table, as a shareholder of the underlying Fidelity Central Funds, the Fund also indirectly bears its proportionate share of the expenses of the underlying Fidelity Central Funds. These expenses are not included in the Fund's annualized expense ratio used to calculate either the actual or hypothetical expense estimates presented in the table but are provided in a footnote to the table.
As a shareholder of the Fund, you incur two types of costs: (1) transaction costs, and (2) ongoing costs, including management fees, distribution and/or service (12b-1) fees and other Fund expenses. This Example is intended to help you understand your ongoing costs (in dollars) of investing in the Fund and to compare these costs with the ongoing costs of investing in other mutual funds.
The Example is based on an investment of $1,000 invested at the beginning of the period and held for the entire period (January 1, 2006 to June 30, 2006).
Actual Expenses
The first line of the accompanying table for each class of the Fund provides information about actual account values and actual expenses. You may use the information in this line, together with the amount you invested, to estimate the expenses that you paid over the period. Simply divide your account value by $1,000.00 (for example, an $8,600 account value divided by $1,000.00 = 8.6), then multiply the result by the number in the first line for a class of the Fund under the heading entitled "Expenses Paid During Period" to estimate the expenses you paid on your account during this period. The estimate of expenses does not include any fees or other expenses of any variable annuity or variable life insurance product. If they were, the estimate of expenses you paid during the period would be higher, and your ending account value would be lower.
Hypothetical Example for Comparison Purposes
The second line of the accompanying table for each class of the Fund provides information about hypothetical account values and hypothetical expenses based on a Class' actual expense ratio and an assumed rate of return of 5% per year before expenses, which is not the Class' actual return. The hypothetical account values and expenses may not be used to estimate the actual ending account balance or expenses you paid for the period. You may use this information to compare the ongoing costs of investing in the Fund and other funds. To do so, compare this 5% hypothetical example with the 5% hypothetical examples that appear in the shareholder reports of the other funds. The estimate of expenses does not include any fees or other expenses of any variable annuity or variable life insurance product. If they were, the estimate of expenses you paid during the period would be higher, and your ending account value would be lower.
Please note that the expenses shown in the table are meant to highlight your ongoing costs only and do not reflect any transaction costs. Therefore, the second line of the table is useful in comparing ongoing costs only, and will not help you determine the relative total costs of owning different funds.
| Beginning
Account Value
January 1, 2006 | Ending
Account Value
June 30, 2006 | Expenses Paid
During Period*
January 1, 2006
to June 30, 2006 |
Initial Class | | | |
Actual | $ 1,000.00 | $ 993.60 | $ 2.17 |
Hypothetical A | $ 1,000.00 | $ 1,022.61 | $ 2.21 |
Service Class | | | |
Actual | $ 1,000.00 | $ 993.60 | $ 2.67 |
Hypothetical A | $ 1,000.00 | $ 1,022.12 | $ 2.71 |
Service Class 2 | | | |
Actual | $ 1,000.00 | $ 993.30 | $ 3.46 |
Hypothetical A | $ 1,000.00 | $ 1,021.32 | $ 3.51 |
Investor Class | | | |
Actual | $ 1,000.00 | $ 993.40 | $ 2.37 |
Hypothetical A | $ 1,000.00 | $ 1,022.41 | $ 2.41 |
A 5% return per year before expenses
* Expenses are equal to each Class' annualized expense ratio (shown in the table below); multiplied by the average account value over the period, multiplied by 181/365 (to reflect the one-half year period).
| Annualized
Expense Ratio |
Initial Class | .44% |
Service Class | .54% |
Service Class 2 | .70% |
Investor Class | .48% |
In addition to the expenses noted above, the Fund also indirectly bears its proportionate share of the expenses of the underlying Fidelity Central Funds. Annualized expenses of the underlying Fidelity Central Funds as of their most recent fiscal half-year ranged from .0012% for Fidelity VIP Investment Grade Central Investment Portfolio to .0403% for Fidelity Specialized High Income Central Investment Portfolio.
Semiannual Report
VIP Investment Grade Bond Portfolio
Investment Changes
The information in the following tables is based on the combined investments of the Fund and its pro-rata share of the investments of Fidelity VIP Investment Grade Central Investment Portfolio and the other Fidelity Central Fund.
Quality Diversification (% of fund's net assets) |
As of June 30, 2006 | As of December 31, 2005 |
 | U.S. Government and
U.S. Government Agency
Obligations 58.9% | | | U.S. Government and
U.S. Government Agency
Obligations 60.0% | |
 | AAA 8.2% | | | AAA 9.9% | |
 | AA 4.0% | | | AA 3.7% | |
 | A 6.0% | | | A 7.7% | |
 | BBB 14.2% | | | BBB 13.5% | |
 | BB and Below 3.0% | | | BB and Below 2.7% | |
 | Not Rated 0.7% | | | Not Rated 0.1% | |
 | Short-Term Investments and
Net Other Assets 5.0% | | | Short-Term Investments and
Net Other Assets 2.4% | |
We have used ratings from Moody's® Investors Services, Inc. Where Moody's ratings are not available, we have used S&P® ratings. |
Average Years to Maturity as of June 30, 2006 |
| | 6 months ago |
Years | 6.5 | 6.2 |
Average years to maturity is based on the average time remaining until principal payments are expected from each of the fund's bonds, weighted by dollar amount. |
Duration as of June 30, 2006 |
| | 6 months ago |
Years | 4.5 | 4.3 |
Duration shows how much a bond fund's price fluctuates with changes in comparable interest rates. If rates rise 1%, for example, a fund with a five-year duration is likely to lose about 5% of its value. Other factors also can influence a bond fund's performance and share price. Accordingly, a bond fund's actual performance may differ from this example. |
Asset Allocation (% of fund's net assets) |
As of June 30, 2006* | As of December 31, 2005** |
| Corporate Bonds 20.4% | | | Corporate Bonds 19.5% | |
| U.S. Government and
U.S. Government Agency
Obligations 58.9% | | | U.S. Government and
U.S. Government Agency
Obligations 60.0% | |
| Asset-Backed Securities 6.3% | | | Asset-Backed Securities 7.3% | |
| CMOs and Other
Mortgage Related Securities 8.5% | | | CMOs and Other
Mortgage Related Securities 9.7% | |
| Other Investments 0.9% | | | Other Investments 1.1% | |
| Short-Term Investments and
Net Other Assets 5.0% | | | Short-Term Investments and
Net Other Assets 2.4% | |
* Foreign investments | 6.2% | | ** Foreign investments | 5.1% | |
* Futures and Swaps | 17.4% | | ** Futures and Swaps | 16.7% | |
Fidelity VIP Investment Grade Central Investment Portfolio's holdings and financial statements are included at the end of this report. |
For an unaudited list of holdings of the other Fidelity Central Fund, visit advisor.fidelity.com. |
Semiannual Report
VIP Investment Grade Bond Portfolio
Investments June 30, 2006 (Unaudited)
Showing Percentage of Net Assets
Fixed-Income Central Funds - 98.8% |
| Shares | | Value (Note 1) |
INVESTMENT GRADE FIXED-INCOME FUNDS - 97.7% |
Fidelity VIP Investment Grade Central Investment Portfolio (a) | 17,086,362 | | $ 1,718,546,312 |
HIGH YIELD FIXED-INCOME FUNDS - 1.1% |
Fidelity Specialized High Income Central Investment Portfolio (b) | 200,090 | | 19,380,717 |
TOTAL FIXED-INCOME FUNDS (Cost $1,790,830,456) | 1,737,927,029 |
Cash Equivalents - 1.1% |
| Maturity
Amount | | |
Investments in repurchase agreements (Collateralized by U.S. Government Obligations) in a joint trading account at 5.3%, dated 6/30/06 due 7/3/06
(Cost $18,621,000) | $ 18,629,223 | | 18,621,000 |
TOTAL INVESTMENT PORTFOLIO - 99.9% (Cost $1,809,451,456) | 1,756,548,029 |
NET OTHER ASSETS - 0.1% | | 1,552,933 |
NET ASSETS - 100% | $ 1,758,100,962 |
Legend |
(a) Affiliated fund that is available only to investment companies and other accounts managed by Fidelity Investments. Fidelity VIP Investment Grade Central Investment Portfolio's investments and financial statements are included at the end of this report as an attachment. |
(b) Affiliated fund that is available only to investment companies and other accounts managed by Fidelity Investments. A complete unaudited list of holdings for Fidelity Specialized High Income Central Investment Portfolio, as of the Investing Fund's report date, is available upon request or at advisor.fidelity.com. The reports are located just after the Investing Fund's financial statements and quarterly reports but are not part of the financial statements or quarterly reports. In addition, the Fidelity Specialized High Income Central Investment Portfolio's financial statements are available on the EDGAR Database on the SEC's web site, www.sec.gov, or upon request. |
Affiliated Central Funds |
Information regarding fiscal year to date income earned by the Fund from investments in Fidelity Central Funds is as follows: |
Fund | Income earned |
Fidelity Specialized High Income Central Investment Portfolio | $ 657,557 |
Fidelity Ultra-Short Central Fund | 5,622,690 |
Fidelity VIP Investment Grade Central Investment Portfolio | 1,641,937 |
Total | $ 7,922,184 |
|
Additional information regarding the Fund's fiscal year to date purchases and sales, including the ownership percentage, of the Fidelity Central Funds is as follows: |
Fund | Value,
beginning of period | Purchases | Sales
Proceeds | Value,
end of period | % ownership, end of period |
Fidelity Specialized High Income Central Investment Portfolio | $ 19,830,920 | $ - | $ - | $ 19,380,717 | 9.5% |
Fidelity Ultra-Short Central Fund | 239,885,774 | - | 239,875,236 | - | 0.0% |
Fidelity VIP Investment Grade Central Investment Portfolio | - | 1,708,732,662* | - | 1,718,546,312 | 64.9% |
Total | $ 259,716,694 | $ 1,708,732,662 | $ 239,875,236 | $ 1,737,927,029 | |
* $1,586,248,322 represents the value of shares received through in-kind contributions. |
See accompanying notes which are an integral part of the financial statements.
VIP Investment Grade Bond Portfolio
VIP Investment Grade Bond Portfolio
Financial Statements
Statement of Assets and Liabilities
| June 30, 2006 (Unaudited) |
| | |
Assets | | |
Investment in securities, at value (including repurchase agreements of $18,621,000) -
See accompanying schedule: Unaffiliated issuers
(cost $18,621,000) | $ 18,621,000 | |
Fidelity Central Funds
(cost $1,790,830,456) | 1,737,927,029 | |
Total Investments
(cost $1,809,451,456) | | $ 1,756,548,029 |
Cash | | 853 |
Receivable for investments sold | | 289,324 |
Receivable for fund shares sold | | 1,161,711 |
Interest receivable | | 2,472,178 |
Prepaid expenses | | 3,271 |
Total assets | | 1,760,475,366 |
| | |
Liabilities | | |
Payable for fund shares redeemed | $ 1,571,664 | |
Distributions payable | 7,225 | |
Accrued management fee | 466,690 | |
Distribution fees payable | 82,942 | |
Other affiliated payables | 150,944 | |
Other payables and accrued expenses | 94,939 | |
Total liabilities | | 2,374,404 |
| | |
Net Assets | | $ 1,758,100,962 |
Net Assets consist of: | | |
Paid in capital | | $ 1,781,175,382 |
Undistributed net investment income | | 40,136,470 |
Accumulated undistributed net realized gain (loss) on investments | | (10,307,463) |
Net unrealized appreciation (depreciation) on investments | | (52,903,427) |
Net Assets | | $ 1,758,100,962 |
Statement of Assets and Liabilities - continued
| June 30, 2006 (Unaudited) |
| | |
Initial Class:
Net Asset Value, offering price and redemption price per share ($1,174,633,498 ÷ 96,644,342 shares) | | $ 12.15 |
| | |
Service Class:
Net Asset Value, offering price and redemption price per share ($101,576,020 ÷ 8,407,356 shares) | | $ 12.08 |
| | |
Service Class 2:
Net Asset Value, offering price and redemption price per share ($368,192,106 ÷ 30,739,751 shares) | | $ 11.98 |
| | |
Investor Class:
Net Asset Value, offering price and redemption price per share ($113,699,338 ÷ 9,370,945 shares) | | $ 12.13 |
See accompanying notes which are an integral part of the financial statements.
Semiannual Report
VIP Investment Grade Bond Portfolio
Financial Statements - continued
Statement of Operations
| Six months ended June 30, 2006 (Unaudited) |
| | |
Investment Income | | |
Interest | | $ 36,019,159 |
Income from Fidelity Central Funds | | 7,922,184 |
Total income | | 43,941,343 |
| | |
Expenses | | |
Management fee | $ 2,743,848 | |
Transfer agent fees | 602,935 | |
Distribution fees | 445,304 | |
Accounting and security lending fees | 304,041 | |
Independent trustees' compensation | 3,254 | |
Custodian fees and expenses | 50,122 | |
Registration fees | 2,635 | |
Audit | 28,107 | |
Legal | 835 | |
Miscellaneous | 58,803 | |
Total expenses before reductions | 4,239,884 | |
Expense reductions | (4,595) | 4,235,289 |
Net investment income | | 39,706,054 |
Realized and Unrealized Gain (Loss) Net realized gain (loss) on: | | |
Investment securities: | | |
Unaffiliated issuers | (4,471,306) | |
Fidelity Central Funds | 122,728 | |
Swap agreements | (1,679,225) | |
Total net realized gain (loss) | | (6,027,803) |
Change in net unrealized appreciation (depreciation) on: Investment securities: | | |
Unaffiliated issuers | (54,001,118) | |
Fidelity Central Funds | 9,230,181 | |
Swap agreements | 160,399 | |
Delayed delivery commitments | 166,349 | |
Total change in net unrealized appreciation (depreciation) | | (44,444,189) |
Net gain (loss) | | (50,471,992) |
Net increase (decrease) in net assets resulting from operations | | $ (10,765,938) |
Statement of Changes in Net Assets
| Six months ended June 30, 2006
(Unaudited) | Year ended
December 31, 2005 |
Increase (Decrease) in Net Assets | | |
Operations | | |
Net investment income | $ 39,706,054 | $ 67,231,687 |
Net realized gain (loss) | (6,027,803) | 1,396,471 |
Change in net unrealized appreciation (depreciation) | (44,444,189) | (34,203,111) |
Net increase (decrease) in net assets resulting from operations | (10,765,938) | 34,425,047 |
Distributions to shareholders from net investment income | (66,380,131) | (58,445,252) |
Distributions to shareholders from net realized gain | (4,008,469) | (35,504,454) |
Total distributions | (70,388,600) | (93,949,706) |
Share transactions - net increase (decrease) | 146,978,639 | 140,385,374 |
Total increase (decrease) in net assets | 65,824,101 | 80,860,715 |
| | |
Net Assets | | |
Beginning of period | 1,692,276,861 | 1,611,416,146 |
End of period (including undistributed net investment income of $40,136,470 and undistributed net investment income of $67,307,813, respectively) | $ 1,758,100,962 | $ 1,692,276,861 |
See accompanying notes which are an integral part of the financial statements.
VIP Investment Grade Bond Portfolio
Financial Highlights - Initial Class
| Six months ended June 30, 2006 | Years ended December 31, |
| (Unaudited) | 2005 | 2004 | 2003 | 2002 | 2001 |
Selected Per-Share Data | | | | | | |
Net asset value, beginning of period | $ 12.76 | $ 13.25 | $ 13.65 | $ 13.70 | $ 12.92 | $ 12.59 |
Income from Investment Operations | | | | | | |
Net investment income C | .288 | .523 | .476 | .467 | .610 | .685 |
Net realized and unrealized gain (loss) | (.367) | (.243) | .104 | .213 | .680 | .335 |
Total from investment operations | (.079) | .280 | .580 | .680 | 1.290 | 1.020 |
Distributions from net investment income | (.501) | (.480) | (.570) | (.540) | (.510) | (.690) |
Distributions from net realized gain | (.030) | (.290) | (.410) | (.190) | - | - |
Total distributions | (.531) | (.770) | (.980) | (.730) | (.510) | (.690) |
Net asset value, end of period | $ 12.15 | $ 12.76 | $ 13.25 | $ 13.65 | $ 13.70 | $ 12.92 |
Total Return B | (.64)% | 2.19% | 4.46% | 5.20% | 10.34% | 8.46% |
Ratios to Average Net Assets E | | | | | | |
Expenses before reductions | .44% A | .49% | .56% | .54% | .54% | .54% |
Expenses net of fee waivers, if any | .44% A | .49% | .56% | .54% | .54% | .54% |
Expenses net of all reductions | .44% A | .49% | .56% | .54% | .53% | .54% |
Net investment income | 4.72% A | 4.12% | 3.65% | 3.48% | 4.71% | 5.47% |
Supplemental Data | | | | | | |
Net assets, end of period (000 omitted) | $ 1,174,633 | $ 1,284,600 | $ 1,374,972 | $ 1,528,417 | $ 1,965,036 | $ 1,445,925 |
Portfolio turnover rate D | 71% A | 157% | 170% | 218% | 192% | 278% |
A Annualized
B Total returns for periods of less than one year are not annualized, would have been lower had certain expenses not been reduced during the periods shown, and do not reflect charges attributable to your insurance company's separate account. Inclusion of these charges would reduce the total returns shown.
C Calculated based on average shares outstanding during the period.
D Amounts do not include the portfolio activity of the Fidelity Central Funds.
E Expense ratios reflect operating expenses of the class. Expenses before reductions do not reflect amounts reimbursed by the investment adviser or expense offset arrangements and do not represent the amount paid by the class during periods when reimbursements or reductions occur. Expenses net of fee waivers reflect expenses after reimbursement by the investment adviser but prior to reductions from expense offset arrangements. Expenses net of all reductions represent the net expenses paid by the class. Fees and expenses of the Fidelity Central Funds are not included in the Fund's annualized ratios. The Fund indirectly bears its proportionate share of the expenses of the Fidelity Central Funds. Based on their most recent shareholder report date, the expenses were .00003% (unannualized) and .0417% (annualized) for Fidelity VIP Investment Grade Central Investment Portfolio and Fidelity Specialized High Income Central Investment Portfolio, respectively.
Financial Highlights - Service Class
| Six months ended June 30, 2006 | Years ended December 31, |
| (Unaudited) | 2005 | 2004 | 2003 | 2002 | 2001 |
Selected Per-Share Data | | | | | | |
Net asset value, beginning of period | $ 12.68 | $ 13.18 | $ 13.61 | $ 13.66 | $ 12.89 | $ 12.58 |
Income from Investment Operations | | | | | | |
Net investment income C | .279 | .511 | .456 | .448 | .591 | .674 |
Net realized and unrealized gain (loss) | (.357) | (.246) | .104 | .212 | .679 | .326 |
Total from investment operations | (.078) | .265 | .560 | .660 | 1.270 | 1.000 |
Distributions from net investment income | (.492) | (.475) | (.580) | (.520) | (.500) | (.690) |
Distributions from net realized gain | (.030) | (.290) | (.410) | (.190) | - | - |
Total distributions | (.522) | (.765) | (.990) | (.710) | (.500) | (.690) |
Net asset value, end of period | $ 12.08 | $ 12.68 | $ 13.18 | $ 13.61 | $ 13.66 | $ 12.89 |
Total Return B | (.64)% | 2.08% | 4.32% | 5.06% | 10.20% | 8.30% |
Ratios to Average Net Assets E | | | | | | |
Expenses before reductions | .54% A | .58% | .66% | .64% | .64% | .64% |
Expenses net of fee waivers, if any | .54% A | .58% | .66% | .64% | .64% | .64% |
Expenses net of all reductions | .54% A | .58% | .66% | .64% | .64% | .64% |
Net investment income | 4.62% A | 4.06% | 3.54% | 3.38% | 4.60% | 5.37% |
Supplemental Data | | | | | | |
Net assets, end of period (000 omitted) | $ 101,576 | $ 79,205 | $ 50,143 | $ 18,305 | $ 975 | $ 115 |
Portfolio turnover rate D | 71% A | 157% | 170% | 218% | 192% | 278% |
A Annualized
B Total returns for periods of less than one year are not annualized, would have been lower had certain expenses not been reduced during the periods shown, and do not reflect charges attributable to your insurance company's separate account. Inclusion of these charges would reduce the total returns shown.
C Calculated based on average shares outstanding during the period.
D Amounts do not include the portfolio activity of the Fidelity Central Funds.
E Expense ratios reflect operating expenses of the class. Expenses before reductions do not reflect amounts reimbursed by the investment adviser or expense offset arrangements and do not represent the amount paid by the class during periods when reimbursements or reductions occur. Expenses net of fee waivers reflect expenses after reimbursement by the investment adviser but prior to reductions from expense offset arrangements. Expenses net of all reductions represent the net expenses paid by the class. Fees and expenses of the Fidelity Central Funds are not included in the Fund's annualized ratios. The Fund indirectly bears its proportionate share of the expenses of the Fidelity Central Funds. Based on their most recent shareholder report date, the expenses were .00003% (unannualized) and .0417% (annualized) for Fidelity VIP Investment Grade Central Investment Portfolio and Fidelity Specialized High Income Central Investment Portfolio, respectively.
See accompanying notes which are an integral part of the financial statements.
Semiannual Report
Financial Highlights - Service Class 2
| Six months ended June 30, 2006 | Years ended December 31, |
| (Unaudited) | 2005 | 2004 | 2003 | 2002 | 2001 |
Selected Per-Share Data | | | | | | |
Net asset value, beginning of period | $ 12.57 | $ 13.08 | $ 13.50 | $ 13.57 | $ 12.82 | $ 12.54 |
Income from Investment Operations | | | | | | |
Net investment income C | .268 | .488 | .435 | .427 | .571 | .643 |
Net realized and unrealized gain (loss) | (.350) | (.248) | .105 | .213 | .679 | .327 |
Total from investment operations | (.082) | .240 | .540 | .640 | 1.250 | .970 |
Distributions from net investment income | (.478) | (.460) | (.550) | (.520) | (.500) | (.690) |
Distributions from net realized gain | (.030) | (.290) | (.410) | (.190) | - | - |
Total distributions | (.508) | (.750) | (.960) | (.710) | (.500) | (.690) |
Net asset value, end of period | $ 11.98 | $ 12.57 | $ 13.08 | $ 13.50 | $ 13.57 | $ 12.82 |
Total Return B | (.67)% | 1.89% | 4.19% | 4.94% | 10.09% | 8.08% |
Ratios to Average Net Assets E | | | | | | |
Expenses before reductions | .70% A | .73% | .81% | .79% | .79% | .82% |
Expenses net of fee waivers, if any | .70% A | .73% | .81% | .79% | .79% | .82% |
Expenses net of all reductions | .70% A | .73% | .81% | .79% | .79% | .82% |
Net investment income | 4.47% A | 3.90% | 3.39% | 3.23% | 4.45% | 5.19% |
Supplemental Data | | | | | | |
Net assets, end of period (000 omitted) | $ 368,192 | $ 285,528 | $ 186,302 | $ 115,411 | $ 71,631 | $ 18,225 |
Portfolio turnover rate D | 71% A | 157% | 170% | 218% | 192% | 278% |
A Annualized
B Total returns for periods of less than one year are not annualized, would have been lower had certain expenses not been reduced during the periods shown, and do not reflect charges attributable to your insurance company's separate account. Inclusion of these charges would reduce the total returns shown.
C Calculated based on average shares outstanding during the period.
D Amounts do not include the portfolio activity of the Fidelity Central Funds.
E Expense ratios reflect operating expenses of the class. Expenses before reductions do not reflect amounts reimbursed by the investment adviser or expense offset arrangements and do not represent the amount paid by the class during periods when reimbursements or reductions occur. Expenses net of fee waivers reflect expenses after reimbursement by the investment adviser but prior to reductions from expense offset arrangements. Expenses net of all reductions represent the net expenses paid by the class. Fees and expenses of the Fidelity Central Funds are not included in the Fund's annualized ratios. The Fund indirectly bears its proportionate share of the expenses of the Fidelity Central Funds. Based on their most recent shareholder report date, the expenses were .00003% (unannualized) and .0417% (annualized) for Fidelity VIP Investment Grade Central Investment Portfolio and Fidelity Specialized High Income Central Investment Portfolio, respectively.
Financial Highlights - Investor Class
| Six months ended June 30, 2006 | Year ended
December 31, |
| (Unaudited) | 2005 F |
Selected Per-Share Data | | |
Net asset value, beginning of period | $ 12.75 | $ 12.65 |
Income from Investment Operations | | |
Net investment income C | .282 | .242 |
Net realized and unrealized gain (loss) | (.364) | (.142) |
Total from investment operations | (.082) | .100 |
Distributions from net investment income | (.508) | - |
Distributions from net realized gain | (.030) | - |
Total distributions | (.538) | - |
Net asset value, end of period | $ 12.13 | $ 12.75 |
Total Return B | (.66)% | .79% |
Ratios to Average Net AssetsE | | |
Expenses before reductions | .48% A | .49% A |
Expenses net of fee waivers, if any | .48% A | .49% A |
Expenses net of all reductions | .48% A | .49% A |
Net investment income | 4.68% A | 4.40% A |
Supplemental Data | | |
Net assets, end of period (000 omitted) | $ 113,699 | $ 42,944 |
Portfolio turnover rate D | 71% A | 157% |
A Annualized
B Total returns for periods of less than one year are not annualized, would have been lower had certain expenses not been reduced during the periods shown, and do not reflect charges attributable to your insurance company's separate account. Inclusion of these charges would reduce the total returns shown.
C Calculated based on average shares outstanding during the period.
D Amounts do not include the portfolio activity of the Fidelity Central Funds.
E Expense ratios reflect operating expenses of the class. Expenses before reductions do not reflect amounts reimbursed by the investment adviser or expense offset arrangements and do not represent the amount paid by the class during periods when reimbursements or reductions occur. Expense ratios before reductions for start-up periods may not be representative of longer-term operating periods. Expenses net of fee waivers reflect expenses after reimbursement by the investment adviser but prior to reductions from expense offset arrangements. Expenses net of all reductions represent the net expenses paid by the class. Fees and expenses of the Fidelity Central Funds are not included in the Fund's annualized ratios. The Fund indirectly bears its proportionate share of the expenses of the Fidelity Central Funds. Based on their most recent shareholder report date, the expenses were .00003% (unannualized) and .0417% (annualized) for Fidelity VIP Investment Grade Central Investment Portfolio and Fidelity Specialized High Income Central Investment Portfolio, respectively.
F For the period July 21, 2005 (commencement of sale of shares) to December 31, 2005.
See accompanying notes which are an integral part of the financial statements.
VIP Investment Grade Bond Portfolio
Notes to Financial Statements
For the period ended June 30, 2006 (Unaudited)
1. Organization.
VIP Investment Grade Bond Portfolio (the Fund) is a fund of Variable Insurance Products Fund II (the trust) (referred to in this report as VIP Investment Grade Bond Portfolio) and is authorized to issue an unlimited number of shares. The trust is registered under the Investment Company Act of 1940, as amended (the 1940 Act), as an open-end management investment company organized as a Massachusetts business trust. Shares of the Fund may only be purchased by insurance companies for the purpose of funding variable annuity or variable life insurance contracts. The Fund offers the following classes of shares: Initial Class shares, Service Class shares, Service Class 2 shares, and Investor Class shares. All classes have equal rights and voting privileges, except for matters affecting a single class. Investment income, realized and unrealized capital gains and losses, the common expenses of the Fund, and certain fund-level expense reductions, if any, are allocated on a pro rata basis to each class based on the relative net assets of each class to the total net assets of the Fund. Each class differs with respect to transfer agent and distribution and service plan fees incurred. The financial statements have been prepared in conformity with accounting principles generally accepted in the United States of America, which require management to make certain estimates and assumptions at the date of the financial statements.
2. Investment in Fidelity Central Funds.
The Fund may invest in Fidelity Central Funds which are open-end investment companies available only to other investment companies and accounts managed by Fidelity Management & Research Company (FMR) and its affiliates. The Fund's Schedule of Investments lists each of the Fidelity Central Funds as an investment of the Fund but does not include the underlying holdings of each Fidelity Central Fund. As an Investing Fund, the Fund indirectly bears its proportionate share of the expenses of the Fidelity Central Funds.
On June 23, 2006, the Fund completed a non-taxable exchange of securities with a value, including accrued interest, of $1,586,248,322 (which included $62,111,318 of unrealized depreciation) for 15,862,483 shares (each then valued at $100.00 per share) of Fidelity VIP Investment Grade Central Investment Portfolio (VIP Investment Grade CIP), an affiliated investment company with the same investment objective as the Fund. Effective with this exchange, the Fund invests substantially all of its assets in VIP Investment Grade CIP which is managed by Fidelity Investments Money Management, Inc. (FIMM), an affiliate of FMR and seeks a high level of income by normally investing in investment-grade debt securities. VIP Investment Grade CIP's operating and accounting policies are outlined in its financial statements, included at the end of this report as an attachment.
In addition to VIP Investment Grade CIP, the Fund may also invest in other Fidelity Central Funds including the Fidelity Specialized High Income Central Investment Portfolio (Specialized High Income CIP). A complete unaudited list of holdings for the Specialized High Income CIP, as of the Fund's report date, is available upon request or at advisor.fidelity.com. The reports are located just after the Fund's financial statements and quarterly reports but are not part of the financial statements or quarterly reports. In addition, the financial statements of Specialized High Income CIP are available on the EDGAR Database on the SEC's web site, www.sec.gov, or upon request.
Based on their investment objectives, each Fidelity Central Fund may invest or participate in various investment vehicles or strategies that are similar to those of the Fund. These strategies are consistent with the investment objectives of the Fund and may involve certain economic risks which may cause a decline in the value of each of the Fidelity Central Funds and thus a decline in the value of the Fund. The following table summarizes the Fund's investment in Fidelity Central Funds:
Central Fund | Investment Manager | Investment Objective | Investment Practices |
VIP Investment Grade CIP | FIMM | Seeks a high level of current income by normally investing in investment-grade debt securities and repurchase agreements | Repurchase Agreements Delayed Delivery & When Issued Securities Restricted Securities Swap Agreements Mortgage Dollar Rolls |
Specialized High Income CIP | Fidelity Management & Research Company, Inc. (FMRC) | Seeks a high level of current income by normally investing in income-producing debt securities, with an emphasis on lower-quality debt securities. | Repurchase Agreements Delayed Delivery & When Issued Securities Restricted Securities |
3. Significant Accounting Policies.
The following summarizes the significant accounting policies of the Fund:
Security Valuation. Net asset value per share is calculated as of the close of business of the New York Stock Exchange, normally 4:00 p.m. Eastern time. Investments in open end mutual funds, including the Fidelity Central Funds, are valued at their closing net asset value each business day. Short-term securities with remaining maturities of sixty days or less for which quotations are not readily available are valued on the basis of amortized cost.
Semiannual Report
Notes to Financial Statements (Unaudited) - continued
3. Significant Accounting Policies - continued
Investment Transactions and Income. Security transactions, including shares of the Fidelity Central Funds, are accounted for as of trade date. Gains and losses on securities sold are determined on the basis of identified cost. Income and capital gain distributions from the Fidelity Central Funds, if any, are recorded on the ex-dividend date, with any income distributions receivable as of period end included in Interest Receivable on the Statement of Assets and Liabilities. Interest income is accrued as earned. Interest income includes coupon interest and amortization of premium and accretion of discount on debt securities.
Expenses. Most expenses of the trust can be directly attributed to a fund. Expenses which cannot be directly attributed are apportioned among each fund in the trust. Expenses included in the accompanying financial statements reflect the expenses of the Fund and do not include any expenses of the Fidelity Central Funds. Although not included in the Fund's expenses, the Fund indirectly bears its proportionate share of the Fidelity Central Funds' expenses through the impact of these expenses on each Fidelity Central Fund's net asset value. Based on their most recent shareholder report date, the expenses were .00003% (unannualized) and .0417% (annualized) for VIP Investment Grade CIP and Specialized High Income CIP, respectively.
Income Tax Information and Distributions to Shareholders. Each year, the Fund intends to qualify as a regulated investment company by distributing all of its taxable income and realized gains under Subchapter M of the Internal Revenue Code. As a result, no provision for income taxes is required in the accompanying financial statements.
Distributions are recorded on the ex-dividend date. Income dividends and capital gain distributions are declared separately for each class. Income and capital gain distributions are determined in accordance with income tax regulations, which may differ from generally accepted accounting principles. Capital accounts within the financial statements are adjusted for permanent book-tax differences. These adjustments have no impact on net assets or the results of operations. Temporary book-tax differences will reverse in a subsequent period.
Book-tax differences are primarily due to swap agreements, market discount, partnerships, deferred trustees compensation, financing transactions and losses deferred due to wash sales and excise tax regulations.
The federal tax cost of investments and unrealized appreciation (depreciation) as of period end were as follows:
Unrealized appreciation | $ 6,894,881 | |
Unrealized depreciation | (608,202) | |
Net unrealized appreciation (depreciation) | $ 6,286,679 | |
Cost for federal income tax purposes | $ 1,750,261,350 | |
New Accounting Pronouncement. In July 2006, Financial Accounting Standards Board Interpretation No. 48, Accounting for Uncertainty in Income Taxes - an interpretation of FASB Statement 109 (FIN 48) was issued and is effective for fiscal years beginning after December 15, 2006. FIN 48 sets forth a threshold for financial statement recognition, measurement and disclosure of a tax position taken or expected to be taken on a tax return. Management is currently evaluating the impact, if any, the adoption of FIN 48 will have on the Fund's net assets and results of operations.
4. Operating Policies.
The following represents the Operating Policies of the Fund for the period ended June 30, 2006. Prior to the exchange of securities with VIP Investment Grade CIP, the Fund invested directly in repurchase agreements, swap agreements, mortgage dollar rolls and participated in the securities lending program. After the exchange, the Fund invested primarily in Fidelity Central Funds and repurchase agreements.
Repurchase Agreements. FMR has received an Exemptive Order from the Securities and Exchange Commission (the SEC) which permits the Fund and other affiliated entities of FMR to transfer uninvested cash balances into joint trading accounts which are then invested in repurchase agreements. The Fund may also invest directly with institutions in repurchase agreements. Repurchase agreements are collateralized by government or non-government securities. Upon settlement date, collateral is held in segregated accounts with custodian banks and may be obtained in the event of a default of the counterparty. The Fund monitors, on a daily basis, the value of the collateral to ensure it is at least equal to the principal amount of the repurchase agreement (including accrued interest). In the event of a default by the counterparty, realization of the collateral proceeds could be delayed, during which time the value of the collateral may decline.
Swap Agreements. The Fund invested in swaps for the purpose of managing its exposure to interest rate, credit or market risk.
Interest rate swaps are agreements to exchange cash flows periodically based on a notional principal amount, for example, the exchange of fixed rate interest payments for floating rate interest payments. Periodic payments received or made by the Fund are recorded in the accompanying Statement of Operations as realized gains or losses, respectively. The primary risk associated with interest rate swaps is that unfavorable changes in the fluctuation of interest rates could adversely impact a fund.
VIP Investment Grade Bond Portfolio
4. Operating Policies - continued
Swap Agreements - continued
Total return swaps are agreements to exchange the return generated by one instrument or index for the return generated by another instrument, for example, the agreement to pay interest in exchange for a market-linked return based on a notional amount. To the extent the total return of the index exceeds the offsetting interest obligation, a fund will receive a payment from the counterparty. To the extent it is less, a fund will make a payment to the counterparty. Periodic payments received or made by the Fund are recorded in the accompanying Statement of Operations as realized gains or losses, respectively.
Credit default swaps involve the exchange of a fixed rate premium for protection against the loss in value of an underlying debt instrument in the event of a defined credit event (such as payment default or bankruptcy). Under the terms of the swap, one party acts as a "guarantor" receiving a periodic payment that is a fixed percentage applied to a notional principal amount. In return the party agrees to purchase the notional amount of the underlying instrument, at par, if a credit event occurs during the term of the swap. The fund may enter into credit default swaps in which either it or its counterparty act as guarantors. By acting as the guarantor of a swap, a fund assumes the market and credit risk of the underlying instrument including liquidity and loss of value. Periodic payments and premiums received or made by the Fund are recorded in the accompanying Statement of Operations as realized gains or losses, respectively.
Swaps are marked-to-market daily based on dealer-supplied valuations and changes in value are recorded as unrealized appreciation (depreciation). Gains or losses are realized upon early termination of the swap agreement. Collateral, in the form of cash or securities, may be required to be held in segregated accounts with a fund's custodian in compliance with swap contracts. At the end of the period, there were no open swap contracts directly held by the Fund.
Mortgage Dollar Rolls. To earn additional income, the Fund employed trading strategies which involved the sale and simultaneous agreement to repurchase similar securities ("mortgage dollar rolls") or the purchase and simultaneous agreement to sell similar securities ("reverse mortgage dollar rolls"). The securities traded are mortgage securities and bear the same interest rate but may be collateralized by different pools of mortgages. During the period between the sale and repurchase in a mortgage dollar roll transaction, a fund will not be entitled to receive interest and principal payments on the securities sold but will invest the proceeds of the sale in other securities which may enhance the yield and total return. In addition, the difference between the sale price and the future purchase price is recorded as an adjustment to investment income. During the period between the purchase and subsequent sale in a reverse mortgage dollar roll transaction a fund is entitled to interest and principal payments on the securities purchased. The price differential between the purchase and sale is recorded as an adjustment to investment income. Losses may arise due to changes in the value of the securities or if the counterparty does not perform under the terms of the agreement. If the counterparty files for bankruptcy or becomes insolvent, a fund's right to repurchase or sell securities may be limited. At the end of the period, there were no open mortgage dollar roll transactions.
5. Purchases and Sales of Investments.
Purchases and sales of securities, including the Fidelity Central Funds, other than short-term securities, U.S. government securities, and in-kind transactions aggregated $302,709,343 and $329,533,908, respectively.
6. Fees and Other Transactions with Affiliates.
Management Fee. FMR and its affiliates provide the Fund with investment management related services for which the Fund pays a monthly management fee. The management fee is the sum of an individual fund fee rate that is based on an annual rate of .20% of the Fund's average net assets and a group fee rate that averaged .12% during the period. The group fee rate is based upon the average net assets of all the mutual funds advised by FMR. The group fee rate decreases as assets under management increase and increases as assets under management decrease. For the period, the total annualized management fee rate was .32% of the Fund's average net assets.
FMR pays a portion of the management fees received from the Fund to the Fidelity Central Funds' investment advisers, who are also affiliates, for managing the assets of the Fidelity Central Funds.
Distribution and Service Plan. In accordance with Rule 12b-1 of the 1940 Act, the Fund has adopted separate 12b-1 Plans for each Service Class of shares. Each Service Class pays Fidelity Distributors Corporation (FDC), an affiliate of FMR, a service fee. For the period, the service fee is based on an annual rate of .10% of Service Class' average net assets and .25% of Service Class 2's average net assets.
For the period, each class paid FDC the following amounts, all of which were re-allowed to insurance companies for the distribution of shares and providing shareholder support services:
Service Class | $ 42,534 | |
Service Class 2 | 402,770 | |
| $ 445,304 | |
Semiannual Report
Notes to Financial Statements (Unaudited) - continued
6. Fees and Other Transactions with Affiliates - continued
Transfer Agent Fees. Fidelity Investments Institutional Operations Company, Inc. (FIIOC), an affiliate of FMR, is the Fund's transfer, dividend disbursing, and shareholder servicing agent. FIIOC receives an asset-based fee with respect to each class. FIIOC pays a portion of the expenses related to the typesetting, printing and mailing of shareholder reports, except proxy statements. Each class with the exception of Investor Class pays a transfer agent fee, excluding out of pocket expenses, equal to an annual rate of .07% of their month end net assets. Investor Class pays an asset-based transfer agent fee of .10% of its month end net assets. The total transfer agent fees paid by each class to FIIOC, including out of pocket expenses, were as follows:
Initial Class | $ 418,633 | |
Service Class | 29,071 | |
Service Class 2 | 112,167 | |
Investor Class | 43,064 | |
| $ 602,935 | |
Accounting and Security Lending Fees. FSC maintains the Fund's accounting records. The accounting fee is based on the level of average net assets for the month. Under a separate contract, FSC administers the security lending program. The security lending fee was based on the number and duration of lending transactions.
7. Committed Line of Credit.
The Fund participates with other funds managed by FMR in a $4.2 billion credit facility (the "line of credit") to be utilized for temporary or emergency purposes to fund shareholder redemptions or for other short-term liquidity purposes. The Fund has agreed to pay commitment fees on its pro rata portion of the line of credit, which amounts to $1,647 and is reflected in Miscellaneous Expense on the Statement of Operations. During the period, there were no borrowings on this line of credit.
8. Security Lending.
The Fund lent portfolio securities from time to time in order to earn additional income. On the settlement date of the loan, the Fund received collateral (in the form of U.S. Treasury obligations, letters of credit and/or cash) against the loaned securities and maintained collateral in an amount not less than 100% of the market value of the loaned securities during the period of the loan. The market value of the loaned securities was determined at the close of business of the Fund and any additional required collateral was delivered to the Fund on the next business day. If the borrower defaulted on its obligation to return the securities loaned because of insolvency or other reasons, the Fund could experience delays and costs in recovering the securities loaned or in gaining access to the collateral. Any cash collateral received was invested in cash equivalents. At period end, there were no security loans outstanding. Security lending income represents the income earned on investing cash collateral, less fees and expenses associated with the loan, plus any premium payments that may be received on the loan of certain types of securities. Net income from lending portfolio securities during the period amounted to $14,122.
9. Expense Reductions.
Through arrangements with the Fund's custodian and each class' transfer agent, credits realized as a result of uninvested cash balances were used to reduce the Fund's expenses. During the period, these credits reduced the Fund's custody expenses by $4,595.
10. Other.
The Fund's organizational documents provide former and current trustees and officers with a limited indemnification against liabilities arising in connection with the performance of their duties to the Fund. In the normal course of business, the Fund may also enter into contracts that provide general indemnifications. The Fund's maximum exposure under these arrangements is unknown as this would be dependent on future claims that may be made against the Fund. The risk of material loss from such claims is considered remote.
At the end of the period, FMR or its affiliates were the owners of record of 42% of the total outstanding shares of the Fund and one otherwise unaffiliated shareholder was the owner of record of 18% of the total outstanding shares of the Fund.
VIP Investment Grade Bond Portfolio
11. Distributions to Shareholders.
Distributions to shareholders of each class were as follows:
| Six months ended
June 30,
2006 | Year ended
December 31,
2005A |
From net investment income | | |
Initial Class | $ 49,399,358 | $ 49,548,838 |
Service Class | 3,145,302 | 2,004,690 |
Service Class 2 | 11,428,030 | 6,891,724 |
Investor Class | 2,407,441 | - |
Total | $ 66,380,131 | $ 58,445,252 |
From net realized gain | | |
Initial Class | $ 2,957,677 | $ 29,935,756 |
Service Class | 191,787 | 1,223,916 |
Service Class 2 | 717,240 | 4,344,782 |
Investor Class | 141,765 | - |
Total | $ 4,008,469 | $ 35,504,454 |
A Distributions for Investor Class are for the period July 21, 2005 (commencement of sale of shares) to December 31, 2005.
12. Share Transactions.
Transactions for each class of shares were as follows:
| Shares | Dollars |
| Six months ended
June 30,
2006 | Year ended
December 31,
2005 A | Six months ended
June 30,
2006 | Year ended
December 31,
2005 A |
Initial Class | | | | |
Shares sold | 5,054,751 | 9,751,566 | $ 62,070,593 | $ 123,954,380 |
Reinvestment of distributions | 4,287,542 | 6,313,312 | 52,350,889 | 79,484,594 |
Shares redeemed | (13,379,201) | (19,145,427) | (164,682,403) | (242,534,635) |
Net increase (decrease) | (4,036,908) | (3,080,549) | $ (50,260,921) | $ (39,095,661) |
Service Class | | | | |
Shares sold | 2,481,583 | 3,811,638 | $ 30,244,252 | $ 48,166,490 |
Reinvestment of distributions | 274,884 | 257,670 | 3,337,089 | 3,228,606 |
Shares redeemed | (593,729) | (1,627,866) | (7,277,229) | (20,466,743) |
Net increase (decrease) | 2,162,738 | 2,441,442 | $ 26,304,112 | $ 30,928,353 |
Service Class 2 | | | | |
Shares sold | 9,019,310 | 10,206,644 | $ 109,218,911 | $ 127,817,135 |
Reinvestment of distributions | 1,008,743 | 903,256 | 12,145,271 | 11,236,506 |
Shares redeemed | (1,995,957) | (2,644,156) | (24,243,785) | (33,109,195) |
Net increase (decrease) | 8,032,096 | 8,465,744 | $ 97,120,397 | $ 105,944,446 |
Investor Class | | | | |
Shares sold | 6,144,914 | 3,400,484 | $ 75,585,959 | $ 43,007,802 |
Reinvestment of distributions | 208,558 | - | 2,542,317 | - |
Shares redeemed | (351,337) | (31,674) | (4,313,225) | (399,566) |
Net increase (decrease) | 6,002,135 | 3,368,810 | $ 73,815,051 | $ 42,608,236 |
A Share transactions for Investor Class are for the period July 21, 2005 (commencement of sale of shares) to December 31, 2005.
Semiannual Report
Board Approval of Investment Advisory Contracts and Management Fees
VIP Investment Grade Bond Portfolio
On January 19, 2006, the Board of Trustees, including the Independent Trustees (together, the Board), voted to approve a general research services agreement (the Agreement) between FMR, FMR Co., Inc. (FMRC), Fidelity Investments Money Management, Inc. (FIMM), and Fidelity Research & Analysis Company (FRAC) (together, the Investment Advisers) for the fund, effective January 20, 2006, pursuant to which FRAC may provide general research and investment advisory support services to FMRC and FIMM. The Board considered that it has approved previously various sub-advisory agreements for the fund with affiliates of FMR that allow FMR to obtain research, non-discretionary advice, or discretionary portfolio management at no additional expense to the fund. The Board, assisted by the advice of fund counsel and independent Trustees' counsel, considered a broad range of information and determined that it would be beneficial for the fund to access the research and investment advisory support services supplied by FRAC at no additional expense to the fund.
The Board reached this determination in part because the new arrangement will involve no changes in (i) the contractual terms of and fees payable under the fund's management contract or sub-advisory agreements; (ii) the investment process or strategies employed in the management of the fund's assets; (iii) the nature or level of services provided under the fund's management contract or sub-advisory agreements; (iv) the day-to-day management of the fund or the persons primarily responsible for such management; or (v) the ultimate control or beneficial ownership of FMR, FMRC, or FIMM. The Board also considered that the establishment of the Agreement would not necessitate prior shareholder approval of the Agreement or result in an assignment and termination of the fund's management contract or sub-advisory agreements under the Investment Company Act of 1940.
Because the Board was approving an arrangement with FRAC under which the fund will not bear any additional management fees or expenses and under which the fund's portfolio manager would not change, it did not consider the fund's investment performance, competitiveness of management fee and total expenses, costs of services and profitability, or economies of scale to be significant factors in its decision.
In connection with its future renewal of the fund's management contract and sub-advisory agreements, the Board will consider: (i) the nature, extent, and quality of services provided to the fund, including shareholder and administrative services and investment performance; (ii) the competitiveness of the fund's management fee and total expenses; (iii) the costs of the services and profitability, including the revenues earned and the expenses incurred by Fidelity in conducting the business of developing, marketing, distributing, managing, administering, and servicing the fund and its shareholders; and (iv) whether there have been economies of scale in respect of the management of the Fidelity funds, whether the Fidelity funds (including the fund) have appropriately benefited from any such economies of scale, and whether there is potential for realization of any further economies.
Based on its evaluation of all of the conclusions noted above, and after considering all material factors, the Board ultimately concluded that the fund's Agreement is fair and reasonable, and that the fund's Agreement should be approved.
Each year, typically in June, the Board of Trustees, including the Independent Trustees (together, the Board), votes on the renewal of the management contract and sub-advisory agreements (together, the Advisory Contracts) for the fund. The Board, assisted by the advice of fund counsel and Independent Trustees' counsel, requests and considers a broad range of information throughout the year.
The Board meets regularly each month except August and takes into account throughout the year matters bearing on Advisory Contracts. The Board, acting directly and through its separate committees, considers at each of its meetings factors that are relevant to the annual renewal of the fund's Advisory Contracts, including the services and support provided to the fund and its shareholders. At the time of the renewal, the Board had 12 standing committees, each composed of Independent Trustees with varying backgrounds, to which the Board has assigned specific subject matter responsibilities in order to enhance effective decision-making by the Board. Each committee has adopted a written charter outlining the structure and purposes of the committee. One such committee, the Fixed-Income Contract Committee, meets periodically as needed throughout the year to consider matters specifically related to the annual renewal of Advisory Contracts. The committee requests and receives information on, and makes recommendations to the Independent Trustees concerning, the approval and annual review of the Advisory Contracts.
At its June 2006 meeting, the Board of Trustees, including the Independent Trustees, unanimously determined to renew the Advisory Contracts for the fund. In reaching its determination, the Board considered all factors it believed relevant, including (i) the nature, extent, and quality of the services to be provided to the fund and its shareholders (including the investment performance of the fund); (ii) the competitiveness of the management fee and total expenses of the fund; (iii) the total costs of the services to be provided by and the profits to be realized by the investment adviser and its affiliates from the relationship with the fund; (iv) the extent to which economies of scale would be realized as the fund grows; and (v) whether fee levels reflect these economies of scale, if any, for the benefit of fund shareholders.
In determining whether to renew the Advisory Contracts for the fund, the Board ultimately reached a determination, with the assistance of fund counsel and Independent Trustees' counsel, that the renewal of the Advisory Contracts and the compensation to be received by Fidelity under the management contract is consistent with Fidelity's fiduciary duty under applicable law. In addition to evaluating the specific factors noted above, the Board, in reaching its determination, is aware that shareholders in the fund have a broad range of investment choices available to them, including a
Semiannual Report
Board Approval of Investment Advisory Contracts and Management Fees - continued
wide choice among mutual funds offered by competitors to Fidelity, and that the fund's shareholders, with the opportunity to review and weigh the disclosure provided by the fund in its prospectus and other public disclosures, have chosen to invest in this fund, managed by Fidelity.
Nature, Extent, and Quality of Services Provided. The Board considered staffing within the investment adviser, FMR, and the sub-advisers (together, the Investment Advisers), including the background of the fund's portfolio managers and the fund's investment objective and discipline. The Independent Trustees also had discussions with senior management of Fidelity's investment operations and investment groups. The Board considered the structure of the portfolio manager compensation program and whether this structure provides appropriate incentives.
Resources Dedicated to Investment Management and Support Services. The Board reviewed the size, education, and experience of the Investment Advisers' investment staff, their use of technology, and the Investment Advisers' approach to recruiting, training, and retaining portfolio managers and other research, advisory, and management personnel. The Board considered Fidelity's extensive global research capabilities that enable the Investment Advisers to aggregate data from various sources in an effort to produce positive investment results. The Board noted that Fidelity's analysts have access to a variety of technological tools that enable them to perform both fundamental and quantitative analysis and to specialize in various disciplines. The Board also considered that Fidelity's portfolio managers and analysts have access to daily portfolio attribution that allows for monitoring of a fund's portfolio, as well as an electronic communication system that provides immediate real-time access to research concerning issuers and credit enhancers. In addition, the Board considered the trading resources that are an integrated part of the fixed-income portfolio management investment process.
Shareholder and Administrative Services. The Board considered (i) the nature, extent, quality, and cost of administrative, distribution, and shareholder services performed by the Investment Advisers and their affiliates under the Advisory Contracts and under separate agreements covering transfer agency, pricing and bookkeeping, and securities lending services for the fund; (ii) the nature and extent of the Investment Advisers' supervision of third party service providers, principally custodians and subcustodians; and (iii) the resources devoted to, and the record of compliance with, the fund's compliance policies and procedures.
The Board noted that the growth of fund assets across the complex allows Fidelity to reinvest in the development of services designed to enhance the value or convenience of the Fidelity funds as investment vehicles. These services include 24-hour access to account information and market information through phone representatives and over the Internet, and investor education materials and asset allocation tools.
Investment in a Large Fund Family. The Board considered the benefits to shareholders of investing in a Fidelity fund, including the benefits of investing in a fund that is part of a large family of funds offering a variety of investment disciplines and providing for a large variety of mutual fund investor services. The Board noted that, since the last Advisory Contract renewals in June 2005, Fidelity has taken a number of actions that benefited particular funds, including (i) dedicating additional resources to investment research and to restructure the investment research teams; (ii) voluntarily entering into contractual arrangements with certain brokers pursuant to which Fidelity pays for research products and services separately out of its own resources, rather than bundling with fund commissions; (iii) launching the Fidelity Advantage Class of its five Spartan stock index funds and three Spartan bond index funds, which is a lower-fee class available to shareholders with higher account balances; (iv) contractually agreeing to impose expense limitations on Fidelity U.S. Bond Index Fund and reducing the fund's initial investment minimum; and (v) offering shareholders of each of the Fidelity Institutional Money Market Funds the privilege of exchanging shares of the fund for shares of other Fidelity funds.
Investment Performance. The Board considered whether the fund has operated within its investment objective, as well as its record of compliance with its investment restrictions. It also reviewed the fund's absolute investment performance for each class (except Investor Class), as well as the fund's relative investment performance for each class (except Investor Class) measured against (i) a broad-based securities market index, and (ii) a peer group of mutual funds deemed appropriate by the Board over multiple periods. The following charts considered by the Board show, over the one-, three-, and five-year periods ended December 31, 2005, the cumulative total returns of Service Class 2 and Initial Class of the fund, the cumulative total returns of a broad-based securities market index ("benchmark"), and a range of cumulative total returns of a peer group of mutual funds identified by Lipper Inc. as having an investment objective similar to that of the fund. The returns of Service Class 2 and Initial Class represent the performance of classes with the highest and lowest 12b-1 fees, respectively (not necessarily with the highest and lowest total expenses). (Investor Class of the fund, which has no 12b-1 fee, had less than one year of performance as of December 31, 2005.) The box within each chart shows the 25th percentile return (bottom of box) and the 75th percentile return (top of box) of the Lipper peer group. Returns shown above the box are in the first quartile and returns shown below the box are in the fourth quartile. The percentage beaten numbers noted below each chart correspond to the percentile box and represent the percentage of funds in the Lipper peer group whose performance was equal to or lower than that of the class indicated.
VIP Investment Grade Bond Portfolio
VIP Investment Grade Bond Portfolio
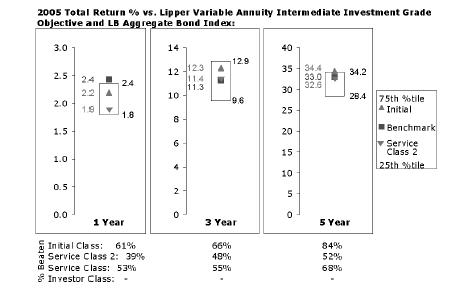
The Board reviewed the fund's relative investment performance against its Lipper peer group and stated that the performance of Initial Class of the fund was in the second quartile for the one- and three-year periods and the first quartile for the five-year period. The Board also stated that the relative investment performance of Initial Class of the fund compared favorably to its benchmark for the three- and five-year periods, although the fund's one-year cumulative total return was lower than its benchmark. The Board considered that the variations in performance among the fund's classes reflect the variations in class expenses, which result in lower performance for higher expense classes.
Based on its review, and giving particular weight to the nature and quality of the resources dedicated by the Investment Advisers to maintain and improve relative performance, the Board concluded that the nature, extent, and quality of the services provided to the fund will benefit the fund's shareholders, particularly in light of the Board's view that the fund's shareholders benefit from investing in a fund that is part of a large family of funds offering a variety of investment disciplines and services.
Competitiveness of Management Fee and Total Fund Expenses. The Board considered the fund's management fee and total expenses compared to "mapped groups" of competitive funds and classes. Fidelity creates "mapped groups" by combining similar Lipper investment objective categories that have comparable management fee characteristics. Combining Lipper investment objective categories aids the Board's management fee and total expense comparisons by broadening the competitive group used for comparison and by reducing the number of universes to which various Fidelity funds are compared.
The Board considered two proprietary management fee comparisons for the 12-month periods shown in the chart below. The group of Lipper funds used by the Board for management fee comparisons is referred to below as the "Total Mapped Group" and, for the reasons explained above, is broader than the Lipper peer group used by the Board for performance comparisons. The Total Mapped Group comparison focuses on a fund's standing relative to the total universe of comparable funds available to investors, in terms of gross management fees before expense reimbursements or caps. "TMG %" represents the percentage of funds in the Total Mapped Group that had management fees that were lower than the fund's. For example, a TMG % of 4% means that 96% of the funds in the Total Mapped Group had higher management fees than the fund. The "Asset-Size Peer Group" (ASPG) comparison focuses on a fund's standing relative to non-Fidelity funds similar in size to the fund within the Total Mapped Group. The ASPG represents at least 15% of the funds in the Total Mapped Group with comparable asset size and management fee characteristics, subject to a minimum of 50 funds (or all funds in the Total Mapped Group if fewer than 50). Additional information, such as the ASPG quartile in which the fund's management fee ranked, is also included in the chart and considered by the Board.
Semiannual Report
Board Approval of Investment Advisory Contracts and Management Fees - continued
VIP Investment Grade Bond Portfolio

The Board noted that the fund's management fee ranked below the median of its Total Mapped Group and below the median of its ASPG for 2005.
Furthermore, the Board considered that it had approved an amendment (effective June 1, 2005) to the fund's management contract that lowered the fund's individual fund fee rate from 30 basis points to 20 basis points. The Board considered that the chart reflects the fund's lower management fee for 2005, as if the lower rate were in effect for the entire year.
Based on its review, the Board concluded that the fund's management fee was fair and reasonable in light of the services that the fund receives and the other factors considered.
In its review of each class's total expenses, the Board considered the fund's management fee as well as other fund or class expenses, as applicable, such as transfer agent fees, pricing and bookkeeping fees, fund-paid 12b-1 fees, and custodial, legal, and audit fees. The Board also noted the effects of any waivers and reimbursements on fees and expenses. As part of its review, the Board also considered current and historical total expenses of each class of the fund compared to competitive fund median expenses. Each class of the fund is compared to those funds and classes in the Total Mapped Group (used by the Board for management fee comparisons) that have a similar sales load structure.
The Board noted that the total expenses of each class ranked below its competitive median for 2005. The Board considered that each class's total expenses reflect the fund's lower management fee for 2005, as if the lower rate were in effect for the entire year.
In its review of total expenses, the Board also considered Fidelity fee structures and other information on clients that FMR and its affiliates service in other competitive markets, such as other mutual funds advised or subadvised by FMR or its affiliates, pension plan clients, and other institutional clients.
Based on its review, the Board concluded that the total expenses of each class of the fund were reasonable in light of the services that the fund and its shareholders receive and the other factors considered.
Costs of the Services and Profitability. The Board considered the revenues earned and the expenses incurred by Fidelity in conducting the business of developing, marketing, distributing, managing, administering and servicing the fund and its shareholders. The Board also considered the level of Fidelity's profits in respect of all the Fidelity funds.
On an annual basis, FMR presents to the Board Fidelity's profitability for the fund. Fidelity calculates the profitability for each fund, as well as aggregate profitability for groups of Fidelity funds and all Fidelity funds, using a series of detailed revenue and cost allocation methodologies which originate with the audited books and records of Fidelity. The Audit Committee of the Board reviews any significant changes from the prior year's methodologies.
PricewaterhouseCoopers LLP (PwC), independent registered accounting firm and auditor to Fidelity and certain Fidelity funds, has been engaged annually by the Board as part of the Board's assessment of the results of Fidelity's profitability analysis. PwC's engagement includes the review and assessment of Fidelity's methodologies used in determining the revenues and expenses attributable to Fidelity's mutual fund business, and completion of agreed-upon procedures surrounding the mathematical accuracy of fund profitability and its conformity to allocation methodologies. After considering PwC's reports issued under the engagement and information provided by Fidelity, the Board believes that while other allocation methods may also be reasonable, Fidelity's profitability methodologies are reasonable in all material respects.
VIP Investment Grade Bond Portfolio
The Board has also reviewed Fidelity's non-fund businesses and any fall-out benefits related to the mutual fund business as well as cases where Fidelity's affiliates may benefit from or be related to the fund's business.
The Board considered the costs of the services provided by and the profits realized by Fidelity in connection with the operation of the fund and determined that the amount of profit is a fair entrepreneurial profit for the management of the fund.
Economies of Scale. The Board considered whether there have been economies of scale in respect of the management of the Fidelity funds, whether the Fidelity funds (including the fund) have appropriately benefited from any such economies of scale, and whether there is potential for realization of any further economies of scale. The Board considered the extent to which the fund will benefit from economies of scale through increased services to the fund, through waivers or reimbursements, or through fee or expense reductions. The Board also noted that the reduction in the fund's individual fund fee rate by 10 basis points delivers significant economies to fund shareholders.
The Board recognized that the fund's management contract incorporates a "group fee" structure, which provides for lower fee rates as total fund assets under FMR's management increase, and for higher fee rates as total fund assets under FMR's management decrease. The Board considered that the group fee is designed to deliver the benefits of economies of scale to fund shareholders when total fund assets increase, even if assets of any particular fund are unchanged or have declined, because some portion of Fidelity's costs are attributable to services provided to all Fidelity funds, and all funds benefit if those costs can be allocated among more assets. The Board concluded that, given the group fee structure, fund shareholders will achieve a certain level of economies of scale as assets under FMR's management increase at the fund complex level, regardless of whether Fidelity achieves any such economies of scale.
The Board further concluded that any potential economies of scale are being shared between fund shareholders and Fidelity in an appropriate manner.
Additional Information Requested by the Board. In order to develop fully the factual basis for consideration of the Advisory Contracts, the Board requested additional information on several topics, including (i) Fidelity's fund profitability methodology and profitability trends within certain funds; (ii) funds and accounts managed by Fidelity other than the Fidelity funds, including fee arrangements; (iii) the total expenses of certain funds and classes relative to competitors; (iv) fund performance trends; and (v) Fidelity's fee structures.
Based on its evaluation of all of the conclusions noted above, and after considering all material factors, the Board ultimately concluded that the advisory fee structures are fair and reasonable, and that the fund's Advisory Contracts should be renewed.
Semiannual Report
The following are the financial statements for the Fidelity VIP Investment Grade Central Investment
Portfolio as of June 30, 2006 which is a direct investment of VIP Investment Grade Bond Portfolio.
Not Part of Financial Report
Shareholder Expense Example
As a shareholder of the Fund, you incur two types of costs: (1) transaction costs, and (2) ongoing costs. This Example is intended to help you understand your ongoing costs (in dollars) of investing in the Fund and to compare these costs with the ongoing costs of investing in other mutual funds.
The actual expense Example is based on an investment of $1,000 invested at the beginning of the period and held for the entire period (June 23, 2006 to June 30, 2006). The hypothetical expense Example is based on an investment of $1,000 invested for the one-half year period (January 1, 2006 to June 30, 2006).
Actual Expenses
The first line of the accompanying table provides information about actual account values and actual expenses. You may use the information in this line, together with the amount you invested, to estimate the expenses that you paid over the period. Simply divide your account value by $1,000.00 (for example, an $8,600 account value divided by $1,000.00 = 8.6), then multiply the result by the number in the first line under the heading entitled "Expenses Paid During Period" to estimate the expenses you paid on your account during this period. In addition, the Fund, as a shareholder in the underlying Fidelity Central Fund, will indirectly bear its pro rata share of the fees and expenses incurred by the underlying Fidelity Central Fund. These fees and expenses are not included in the Fund's annualized expense ratio used to calculate the expense estimate in the table below.
Hypothetical Example for Comparison Purposes
The second line of the accompanying table provides information about hypothetical account values and hypothetical expenses based on the Fund's actual expense ratio and an assumed rate of return of 5% per year before expenses, which is not the Fund's actual return. The hypothetical account values and expenses may not be used to estimate the actual ending account balance or expenses you paid for the period. You may use this information to compare the ongoing costs of investing in the Fund and other funds. To do so, compare this 5% hypothetical example with the 5% hypothetical examples that appear in the shareholder reports of the other funds. In addition, the Fund, as a shareholder in the underlying Fidelity Central Fund, will indirectly bear its pro rata share of the fees and expenses incurred by the underlying Fidelity Central Fund. These fees and expenses are not included in the Fund's annualized expense ratio used to calculate the expense estimate in the table below.
Please note that the expenses shown in the table are meant to highlight your ongoing costs only and do not reflect any transaction costs. Therefore, the second line of the table is useful in comparing ongoing costs only, and will not help you determine the relative total costs of owning different funds.
| Beginning
Account Value | Ending
Account Value
June 30, 2006 | Expenses Paid
During Period |
Actual | $ 1,000.00 | $ 1,006.80 | $ - A, C |
Hypothetical (5% return per year before expenses) | $ 1,000.00 | $ 1,024.79 | $ .01 B |
A Actual expenses are equal to the Fund's annualized expense ratio of .0012%; multiplied by the average account value over the period, multiplied by 8/365 (to reflect the period June 23, 2006 to June 30, 2006).
B Hypothetical expenses are equal to the Fund's annualized expense ratio of .0012%; multiplied by the average account value over the period, multiplied by 181/365 (to reflect the one-half year period).
C Amount represents less than $.01.
The fees and expenses of the underlying Fidelity Central Fund in which the Fund invests are not included in the Fund's annualized expense ratio.
Not Part of Financial Report
Investment Summary
The information in the following tables is based on the combined investments of the Fund and its pro-rata share of the investments of Fidelity's Central Fund.
Quality Diversification (% of fund's net assets) |
As of June 30, 2006 |
 | U.S. Government and U.S. Government Agency Obligations 60.3% | |
 | AAA 8.3% | |
| AA 4.2% | |
 | A 6.2% | |
| BBB 14.5% | |
| BB and Below 2.0% | |
| Not Rated 0.8% | |
| Short-Term Investments and Net Other Assets 3.7% | |
We have used ratings from Moody's® Investors Services, Inc. Where Moody's ratings are not available, we have used S&P® ratings. |
Average Years to Maturity as of June 30, 2006 |
| |
Years | 6.6 |
Average years to maturity is based on the average time remaining until principal payments are expected from each of the fund's bonds, weighted by dollar amount. |
Duration as of June 30, 2006 |
| |
Years | 4.7 |
Duration shows how much a bond fund's price fluctuates with changes in comparable interest rates. If rates rise 1%, for example, a fund with a five-year duration is likely to lose about 5% of its value. Other factors also can influence a bond fund's performance and share price. Accordingly, a bond fund's actual performance may differ from this example. |
Asset Allocation (% of fund's net assets) |
As of June 30, 2006 * |
| Corporate Bonds 19.9% | |
| U.S. Government and U.S. Government Agency Obligations 60.3% | |
| Asset-Backed Securities 6.5% | |
| CMOs and Other Mortgage Related Securities 8.6% | |
 | Other Investments 1.0% | |
| Short-Term Investments and Net Other Assets 3.7% | |
* Foreign investments | 6.2% | |
* Futures and Swaps | 17.8% | |
For an unaudited list of holdings for each Fidelity Central Fund, visit advisor.fidelity.com.
Not Part of Financial Report
Investments June 30, 2006 (Unaudited)
Showing Percentage of Net Assets
Nonconvertible Bonds - 19.3% |
| Principal Amount | | Value (Note 1) |
CONSUMER DISCRETIONARY - 2.2% |
Automobiles - 0.2% |
Ford Motor Co.: | | | |
6.625% 10/1/28 | $ 7,200,000 | | $ 4,968,000 |
7.45% 7/16/31 | 2,220,000 | | 1,603,950 |
| | 6,571,950 |
Household Durables - 0.1% |
Fortune Brands, Inc. 5.125% 1/15/11 | 4,010,000 | | 3,840,553 |
Media - 1.7% |
AOL Time Warner, Inc.: | | | |
6.75% 4/15/11 | 100,000 | | 102,521 |
6.875% 5/1/12 | 290,000 | | 299,707 |
7.625% 4/15/31 | 1,625,000 | | 1,749,678 |
Comcast Corp.: | | | |
4.95% 6/15/16 | 2,975,000 | | 2,651,290 |
5.5% 3/15/11 | 2,675,000 | | 2,627,160 |
6.45% 3/15/37 | 3,775,000 | | 3,545,801 |
Cox Communications, Inc.: | | | |
4.625% 1/15/10 | 3,350,000 | | 3,195,414 |
4.625% 6/1/13 | 3,475,000 | | 3,119,056 |
Liberty Media Corp.: | | | |
5.7% 5/15/13 | 1,845,000 | | 1,676,644 |
8.25% 2/1/30 | 4,050,000 | | 3,876,409 |
News America Holdings, Inc. 7.75% 12/1/45 | 1,905,000 | | 2,002,942 |
News America, Inc. 6.2% 12/15/34 | 3,695,000 | | 3,353,179 |
Time Warner Entertainment Co. LP 8.375% 7/15/33 | 6,300,000 | | 7,127,329 |
Time Warner, Inc.: | | | |
6.625% 5/15/29 | 3,350,000 | | 3,218,801 |
9.125% 1/15/13 | 402,000 | | 459,700 |
Viacom, Inc. 5.75% 4/30/11 (a) | 5,695,000 | | 5,598,185 |
| | 44,603,816 |
Multiline Retail - 0.2% |
The May Department Stores Co. 6.7% 7/15/34 | 4,045,000 | | 3,950,056 |
TOTAL CONSUMER DISCRETIONARY | | 58,966,375 |
CONSUMER STAPLES - 0.4% |
Beverages - 0.1% |
FBG Finance Ltd. 5.125% 6/15/15 (a) | 2,805,000 | | 2,569,767 |
Food Products - 0.1% |
H.J. Heinz Co. 6.428% 12/1/08 (a)(e) | 2,935,000 | | 2,981,931 |
Personal Products - 0.1% |
Avon Products, Inc. 5.125% 1/15/11 | 740,000 | | 718,925 |
|
| Principal Amount | | Value (Note 1) |
Tobacco - 0.1% |
Altria Group, Inc. 7% 11/4/13 | $ 505,000 | | $ 532,775 |
Philip Morris Companies, Inc. 7.65% 7/1/08 | 2,500,000 | | 2,585,543 |
| | 3,118,318 |
TOTAL CONSUMER STAPLES | | 9,388,941 |
ENERGY - 2.0% |
Energy Equipment & Services - 0.2% |
Petronas Capital Ltd. 7% 5/22/12 (a) | 6,135,000 | | 6,431,462 |
Oil, Gas & Consumable Fuels - 1.8% |
Amerada Hess Corp. 6.65% 8/15/11 | 1,045,000 | | 1,074,018 |
Duke Capital LLC: | | | |
4.37% 3/1/09 | 3,575,000 | | 3,456,053 |
6.25% 2/15/13 | 855,000 | | 863,235 |
6.75% 2/15/32 | 4,975,000 | | 5,037,615 |
Empresa Nacional de Petroleo 6.75% 11/15/12 (a) | 6,135,000 | | 6,332,191 |
EnCana Holdings Finance Corp. 5.8% 5/1/14 | 640,000 | | 625,845 |
Kerr-McGee Corp. 6.95% 7/1/24 | 1,000,000 | | 1,000,000 |
Kinder Morgan Energy Partners LP: | | | |
5.125% 11/15/14 | 1,045,000 | | 953,998 |
5.8% 3/15/35 | 2,220,000 | | 1,894,437 |
National Gas Co. of Trinidad & Tobago Ltd. 6.05% 1/15/36 (a) | 925,000 | | 851,498 |
Nexen, Inc. 5.875% 3/10/35 | 4,105,000 | | 3,623,988 |
Pemex Project Funding Master Trust: | | | |
5.75% 12/15/15 (a) | 650,000 | | 598,650 |
5.75% 12/15/15 | 200,000 | | 184,200 |
6.125% 8/15/08 | 6,850,000 | | 6,836,300 |
6.625% 6/15/35 (a) | 5,950,000 | | 5,384,750 |
7.375% 12/15/14 | 1,350,000 | | 1,393,200 |
7.875% 2/1/09 (e) | 4,480,000 | | 4,648,000 |
Talisman Energy, Inc. 5.85% 2/1/37 | 2,045,000 | | 1,803,522 |
Transcontinental Gas Pipe Line Corp. 6.4% 4/15/16 (a) | 1,380,000 | | 1,321,350 |
| | 47,882,850 |
TOTAL ENERGY | | 54,314,312 |
FINANCIALS - 7.6% |
Capital Markets - 1.3% |
Goldman Sachs Group, Inc.: | | | |
5.25% 10/15/13 | 3,770,000 | | 3,612,342 |
5.7% 9/1/12 | 2,935,000 | | 2,906,501 |
6.45% 5/1/36 | 3,000,000 | | 2,874,060 |
6.6% 1/15/12 | 4,610,000 | | 4,757,792 |
Lazard Group LLC 7.125% 5/15/15 | 4,210,000 | | 4,254,841 |
Nonconvertible Bonds - continued |
| Principal Amount | | Value (Note 1) |
FINANCIALS - continued |
Capital Markets - continued |
Merrill Lynch & Co., Inc. 4.25% 2/8/10 | $ 7,275,000 | | $ 6,914,509 |
Morgan Stanley 6.6% 4/1/12 | 7,695,000 | | 7,987,879 |
| | 33,307,924 |
Commercial Banks - 0.6% |
Corporacion Andina de Fomento 5.2% 5/21/13 | 1,560,000 | | 1,479,565 |
Korea Development Bank 3.875% 3/2/09 | 5,775,000 | | 5,498,799 |
SouthTrust Corp. 5.8% 6/15/14 | 1,440,000 | | 1,416,377 |
Wachovia Bank NA 4.875% 2/1/15 | 4,405,000 | | 4,076,532 |
Wachovia Corp. 4.875% 2/15/14 | 785,000 | | 734,587 |
Woori Bank 6.125% 5/3/16 (a)(e) | 2,335,000 | | 2,301,796 |
| | 15,507,656 |
Consumer Finance - 0.6% |
Capital One Bank 6.5% 6/13/13 | 275,000 | | 281,210 |
Capital One Financial Corp. 4.8% 2/21/12 | 1,100,000 | | 1,037,658 |
Ford Motor Credit Co. 7.875% 6/15/10 | 200,000 | | 184,498 |
Household Finance Corp. 4.125% 11/16/09 | 2,880,000 | | 2,741,086 |
Household International, Inc. 5.836% 2/15/08 | 5,225,000 | | 5,238,110 |
HSBC Finance Corp. 5% 6/30/15 | 3,525,000 | | 3,252,948 |
MBNA America Bank NA 7.125% 11/15/12 | 1,075,000 | | 1,147,529 |
MBNA Corp. 7.5% 3/15/12 | 1,860,000 | | 2,011,982 |
| | 15,895,021 |
Diversified Financial Services - 1.4% |
Alliance Capital Management LP 5.625% 8/15/06 | 2,625,000 | | 2,625,139 |
Bank of America Corp. 7.4% 1/15/11 | 8,125,000 | | 8,645,138 |
Citigroup, Inc. 5% 9/15/14 | 2,325,000 | | 2,176,123 |
JPMorgan Chase & Co.: | | | |
4.891% 9/1/15 (e) | 20,000 | | 19,258 |
5.6% 6/1/11 | 127,000 | | 126,185 |
5.75% 1/2/13 | 3,500,000 | | 3,464,549 |
JPMorgan Chase Capital XVII 5.85% 8/1/35 | 12,475,000 | | 11,025,168 |
Prime Property Funding, Inc. 5.125% 6/1/15 (a) | 3,375,000 | | 3,094,747 |
Teva Pharmaceutical Finance LLC 5.55% 2/1/16 | 2,940,000 | | 2,757,261 |
ZFS Finance USA Trust II 6.45% 12/15/65 (a)(e) | 3,400,000 | | 3,110,691 |
| | 37,044,259 |
|
| Principal Amount | | Value (Note 1) |
Insurance - 0.8% |
Axis Capital Holdings Ltd. 5.75% 12/1/14 | $ 2,670,000 | | $ 2,518,801 |
Lincoln National Corp. 7% 5/17/66 (e) | 5,510,000 | | 5,467,264 |
Marsh & McLennan Companies, Inc.: | | | |
5.75% 9/15/15 | 790,000 | | 745,742 |
7.125% 6/15/09 | 4,259,000 | | 4,382,592 |
Principal Life Global Funding I 6.25% 2/15/12 (a) | 2,310,000 | | 2,356,778 |
Symetra Financial Corp. 6.125% 4/1/16 (a) | 2,320,000 | | 2,246,312 |
The St. Paul Travelers Companies, Inc. 5.5% 12/1/15 | 4,060,000 | | 3,834,796 |
| | 21,552,285 |
Real Estate Investment Trusts - 1.8% |
Archstone-Smith Operating Trust 5.25% 5/1/15 | 4,875,000 | | 4,582,875 |
Arden Realty LP: | | | |
5.25% 3/1/15 | 625,000 | | 597,995 |
7% 11/15/07 | 5,000,000 | | 5,091,600 |
AvalonBay Communities, Inc. 5% 8/1/07 | 2,315,000 | | 2,281,632 |
Brandywine Operating Partnership LP 5.75% 4/1/12 | 1,770,000 | | 1,732,464 |
BRE Properties, Inc. 5.95% 3/15/07 | 250,000 | | 250,296 |
CarrAmerica Realty Corp.: | | | |
5.125% 9/1/11 | 10,465,000 | | 10,496,280 |
5.5% 12/15/10 | 3,335,000 | | 3,359,082 |
Colonial Properties Trust: | | | |
4.75% 2/1/10 | 615,000 | | 588,789 |
5.5% 10/1/15 | 5,650,000 | | 5,280,982 |
Developers Diversified Realty Corp.: | | | |
4.625% 8/1/10 | 225,000 | | 214,259 |
5% 5/3/10 | 2,435,000 | | 2,359,483 |
5.25% 4/15/11 | 1,395,000 | | 1,350,813 |
5.375% 10/15/12 | 1,240,000 | | 1,191,635 |
HRPT Properties Trust 5.75% 11/1/15 | 670,000 | | 638,336 |
Mack-Cali Realty LP 5.05% 4/15/10 | 305,000 | | 293,977 |
Simon Property Group LP: | | | |
5.1% 6/15/15 | 3,210,000 | | 2,966,721 |
5.625% 8/15/14 | 4,550,000 | | 4,410,543 |
United Dominion Realty Trust 5.25% 1/15/15 | 445,000 | | 414,483 |
Washington (REIT) 5.95% 6/15/11 | 1,100,000 | | 1,094,982 |
| | 49,197,227 |
Real Estate Management & Development - 0.6% |
EOP Operating LP: | | | |
4.65% 10/1/10 | 10,395,000 | | 9,856,144 |
6.8% 1/15/09 | 150,000 | | 153,173 |
Nonconvertible Bonds - continued |
| Principal Amount | | Value (Note 1) |
FINANCIALS - continued |
Real Estate Management & Development - continued |
EOP Operating LP: - continued | | | |
7% 7/15/11 | $ 1,925,000 | | $ 1,999,813 |
Post Apartment Homes LP 6.3% 6/1/13 | 2,655,000 | | 2,638,167 |
Regency Centers LP 6.75% 1/15/12 | 2,035,000 | | 2,106,911 |
| | 16,754,208 |
Thrifts & Mortgage Finance - 0.5% |
Independence Community Bank Corp. 3.75% 4/1/14 (e) | 3,820,000 | | 3,612,230 |
Residential Capital Corp. 6.875% 6/30/15 | 3,875,000 | | 3,871,082 |
Washington Mutual, Inc. 4.625% 4/1/14 | 5,300,000 | | 4,788,105 |
| | 12,271,417 |
TOTAL FINANCIALS | | 201,529,997 |
HEALTH CARE - 0.1% |
Health Care Equipment & Supplies - 0.1% |
Boston Scientific Corp. 6.4% 6/15/16 | 2,975,000 | | 2,898,123 |
INDUSTRIALS - 1.3% |
Aerospace & Defense - 0.3% |
BAE Systems Holdings, Inc. 4.75% 8/15/10 (a) | 3,465,000 | | 3,320,066 |
Bombardier, Inc.: | | | |
6.3% 5/1/14 (a) | 4,515,000 | | 3,928,050 |
7.45% 5/1/34 (a) | 420,000 | | 350,700 |
| | 7,598,816 |
Airlines - 0.8% |
American Airlines, Inc. pass thru trust certificates: | | | |
6.855% 10/15/10 | 313,445 | | 316,641 |
6.978% 10/1/12 | 839,816 | | 855,743 |
7.024% 4/15/11 | 2,180,000 | | 2,239,950 |
7.858% 4/1/13 | 3,480,000 | | 3,688,800 |
Continental Airlines, Inc. pass thru trust certificates: | | | |
6.648% 3/15/19 | 2,326,553 | | 2,313,411 |
6.795% 2/2/20 | 4,151,572 | | 3,943,993 |
Delta Air Lines, Inc. pass thru trust certificates: | | | |
7.111% 3/18/13 | 1,290,000 | | 1,288,388 |
7.57% 11/18/10 | 2,285,000 | | 2,293,569 |
U.S. Airways pass thru trust certificates 6.85% 7/30/19 | 1,671,576 | | 1,692,470 |
United Airlines pass thru Certificates: | | | |
6.071% 9/1/14 | 1,213,640 | | 1,210,606 |
|
| Principal Amount | | Value (Note 1) |
6.201% 3/1/10 | $ 514,677 | | $ 514,677 |
6.602% 9/1/13 | 1,544,695 | | 1,550,194 |
| | 21,908,442 |
Industrial Conglomerates - 0.2% |
Hutchison Whampoa International 03/13 Ltd. 6.5% 2/13/13 (a) | 3,860,000 | | 3,907,293 |
TOTAL INDUSTRIALS | | 33,414,551 |
INFORMATION TECHNOLOGY - 0.2% |
Semiconductors & Semiconductor Equipment - 0.2% |
Chartered Semiconductor Manufacturing Ltd.: | | | |
5.75% 8/3/10 | 195,000 | | 189,690 |
6.375% 8/3/15 | 4,830,000 | | 4,611,013 |
| | 4,800,703 |
MATERIALS - 0.2% |
Metals & Mining - 0.1% |
Newmont Mining Corp. 5.875% 4/1/35 | 2,985,000 | | 2,671,503 |
Paper & Forest Products - 0.1% |
International Paper Co. 4.25% 1/15/09 | 1,900,000 | | 1,825,976 |
TOTAL MATERIALS | | 4,497,479 |
TELECOMMUNICATION SERVICES - 2.8% |
Diversified Telecommunication Services - 2.4% |
AT&T Broadband Corp. 8.375% 3/15/13 | 2,150,000 | | 2,387,876 |
AT&T, Inc. 6.8% 5/15/36 | 11,550,000 | | 11,448,083 |
British Telecommunications PLC 8.875% 12/15/30 | 4,750,000 | | 5,837,779 |
Deutsche Telekom International Finance BV 5.25% 7/22/13 | 2,500,000 | | 2,348,493 |
Embarq Corp.: | | | |
7.082% 6/1/16 | 2,610,000 | | 2,595,663 |
7.995% 6/1/36 | 4,122,000 | | 4,143,035 |
SBC Communications, Inc.: | | | |
6.15% 9/15/34 | 1,180,000 | | 1,082,946 |
6.45% 6/15/34 | 3,620,000 | | 3,441,034 |
Sprint Capital Corp.: | | | |
6.875% 11/15/28 | 4,455,000 | | 4,487,998 |
8.375% 3/15/12 | 2,635,000 | | 2,911,406 |
Telecom Italia Capital SA: | | | |
4.95% 9/30/14 | 2,000,000 | | 1,790,514 |
6.375% 11/15/33 | 6,500,000 | | 5,877,008 |
Telefonica Emisiones SAU 7.045% 6/20/36 | 9,110,000 | | 9,116,377 |
Nonconvertible Bonds - continued |
| Principal Amount | | Value (Note 1) |
TELECOMMUNICATION SERVICES - continued |
Diversified Telecommunication Services - continued |
Verizon Global Funding Corp. 7.75% 12/1/30 | $ 5,043,000 | | $ 5,439,118 |
Verizon New York, Inc. 6.875% 4/1/12 | 1,095,000 | | 1,109,556 |
| | 64,016,886 |
Wireless Telecommunication Services - 0.4% |
America Movil SA de CV: | | | |
4.125% 3/1/09 | 1,755,000 | | 1,664,468 |
6.375% 3/1/35 | 5,155,000 | | 4,480,829 |
AT&T Wireless Services, Inc. 7.875% 3/1/11 | 1,530,000 | | 1,647,997 |
Nextel Communications, Inc. 5.95% 3/15/14 | 1,555,000 | | 1,516,125 |
Vodafone Group PLC 5% 12/16/13 | 1,890,000 | | 1,746,859 |
| | 11,056,278 |
TOTAL TELECOMMUNICATION SERVICES | | 75,073,164 |
UTILITIES - 2.5% |
Electric Utilities - 1.5% |
Cleveland Electric Illuminating Co. 5.65% 12/15/13 | 4,640,000 | | 4,497,807 |
Exelon Corp.: | | | |
4.9% 6/15/15 | 5,075,000 | | 4,633,962 |
6.75% 5/1/11 | 2,230,000 | | 2,304,493 |
FirstEnergy Corp. 6.45% 11/15/11 | 2,980,000 | | 3,032,216 |
Monongahela Power Co. 5% 10/1/06 | 2,260,000 | | 2,254,678 |
Nevada Power Co. 6.5% 5/15/18 (a) | 2,130,000 | | 2,078,880 |
Niagara Mohawk Power Corp. 8.875% 5/15/07 | 75,000 | | 76,882 |
PPL Energy Supply LLC: | | | |
5.7% 10/15/35 | 3,030,000 | | 2,873,076 |
6.2% 5/15/16 | 2,715,000 | | 2,691,295 |
Progress Energy, Inc.: | | | |
5.625% 1/15/16 | 2,000,000 | | 1,911,384 |
7.1% 3/1/11 | 6,980,000 | | 7,281,208 |
TXU Energy Co. LLC 7% 3/15/13 | 7,275,000 | | 7,425,869 |
| | 41,061,750 |
Gas Utilities - 0.0% |
Texas Eastern Transmission Corp. 7.3% 12/1/10 | 185,000 | | 194,461 |
Independent Power Producers & Energy Traders - 0.3% |
Constellation Energy Group, Inc. 7% 4/1/12 | 5,525,000 | | 5,759,227 |
TXU Corp. 5.55% 11/15/14 | 980,000 | | 888,272 |
| | 6,647,499 |
|
| Principal Amount | | Value (Note 1) |
Multi-Utilities - 0.7% |
Dominion Resources, Inc.: | | | |
4.75% 12/15/10 | $ 3,540,000 | | $ 3,378,838 |
5.95% 6/15/35 | 5,065,000 | | 4,541,163 |
6.25% 6/30/12 | 3,230,000 | | 3,252,494 |
MidAmerican Energy Holdings, Inc.: | | | |
5.875% 10/1/12 | 2,880,000 | | 2,856,914 |
6.125% 4/1/36 (a) | 3,860,000 | | 3,608,251 |
TECO Energy, Inc. 7% 5/1/12 | 1,740,000 | | 1,731,300 |
| | 19,368,960 |
TOTAL UTILITIES | | 67,272,670 |
TOTAL NONCONVERTIBLE BONDS (Cost $529,532,335) | 512,156,315 |
U.S. Government and Government Agency Obligations - 26.2% |
|
U.S. Government Agency Obligations - 4.5% |
Fannie Mae: | | | |
3.25% 1/15/08 | 11,565,000 | | 11,189,242 |
3.25% 8/15/08 | 1,090,000 | | 1,042,311 |
3.25% 2/15/09 | 3,286,000 | | 3,111,773 |
3.375% 12/15/08 | 374,000 | | 356,404 |
4.625% 5/1/13 | 20,450,000 | | 19,188,133 |
4.75% 12/15/10 | 9,565,000 | | 9,292,570 |
5.25% 8/1/12 | 10,000,000 | | 9,770,630 |
5.5% 3/15/11 | 9,615,000 | | 9,620,394 |
6.25% 2/1/11 | 3,890,000 | | 3,984,064 |
Freddie Mac: | | | |
4% 6/12/13 | 17,620,000 | | 16,045,688 |
4.25% 7/15/09 | 7,900,000 | | 7,641,820 |
5.75% 1/15/12 | 6,410,000 | | 6,485,407 |
5.875% 3/21/11 | 13,965,000 | | 14,076,483 |
6.625% 9/15/09 | 3,475,000 | | 3,593,810 |
Tennessee Valley Authority 5.375% 4/1/56 | 2,375,000 | | 2,244,280 |
U.S. Department of Housing and Urban Development Government guaranteed participation certificates Series 1996-A, 7.63% 8/1/14 | 2,530,000 | | 2,513,945 |
TOTAL U.S. GOVERNMENT AGENCY OBLIGATIONS | | 120,156,954 |
U.S. Treasury Inflation Protected Obligations - 5.3% |
U.S. Treasury Inflation-Indexed Notes: | | | |
0.875% 4/15/10 | 23,605,926 | | 22,268,820 |
U.S. Government and Government Agency Obligations - continued |
| Principal Amount | | Value (Note 1) |
U.S. Treasury Inflation Protected Obligations - continued |
U.S. Treasury Inflation-Indexed Notes: - continued | | | |
2% 1/15/14 (c) | $ 109,127,841 | | $ 105,325,118 |
2.375% 4/15/11 | 13,707,239 | | 13,652,540 |
TOTAL U.S. TREASURY INFLATION PROTECTED OBLIGATIONS | | 141,246,478 |
U.S. Treasury Obligations - 16.4% |
U.S. Treasury Bonds 6.25% 5/15/30 | 11,684,000 | | 13,233,953 |
U.S. Treasury Notes: | | | |
3.375% 12/15/08 | 145,000,000 | | 139,154,760 |
3.375% 10/15/09 | 20,000,000 | | 18,959,380 |
4.25% 8/15/13 | 99,342,000 | | 94,250,723 |
4.375% 12/15/10 | 59,935,000 | | 58,216,544 |
4.75% 5/15/14 | 102,120,000 | | 99,618,877 |
6.5% 2/15/10 | 9,820,000 | | 10,259,985 |
TOTAL U.S. TREASURY OBLIGATIONS | | 433,694,222 |
TOTAL U.S. GOVERNMENT AND GOVERNMENT AGENCY OBLIGATIONS (Cost $716,313,197) | 695,097,654 |
U.S. Government Agency - Mortgage Securities - 30.8% |
|
Fannie Mae - 29.0% |
3.732% 1/1/35 (e) | 521,229 | | 510,940 |
3.748% 12/1/34 (e) | 363,462 | | 354,666 |
3.757% 10/1/33 (e) | 332,882 | | 323,521 |
3.769% 12/1/34 (e) | 66,024 | | 64,843 |
3.791% 6/1/34 (e) | 1,535,353 | | 1,479,481 |
3.817% 6/1/33 (e) | 270,164 | | 264,034 |
3.833% 1/1/35 (e) | 322,262 | | 316,400 |
3.844% 1/1/35 (e) | 933,288 | | 915,546 |
3.852% 10/1/33 (e) | 8,365,552 | | 8,158,170 |
3.867% 1/1/35 (e) | 548,250 | | 538,474 |
3.898% 10/1/34 (e) | 381,439 | | 376,644 |
3.919% 12/1/34 (e) | 331,811 | | 325,922 |
3.95% 1/1/35 (e) | 415,270 | | 408,422 |
3.958% 12/1/34 (e) | 2,097,729 | | 2,061,501 |
3.96% 12/1/34 (e) | 313,020 | | 307,996 |
3.963% 5/1/33 (e) | 102,198 | | 100,055 |
3.979% 12/1/34 (e) | 386,262 | | 380,121 |
3.981% 5/1/34 (e) | 112,079 | | 111,663 |
3.997% 12/1/34 (e) | 202,485 | | 198,942 |
3.997% 1/1/35 (e) | 269,797 | | 265,365 |
|
| Principal Amount | | Value (Note 1) |
4% 8/1/18 to 6/1/19 | $ 4,094,835 | | $ 3,791,228 |
4.009% 2/1/35 (e) | 292,736 | | 287,546 |
4.034% 10/1/18 (e) | 298,038 | | 291,291 |
4.034% 2/1/35 (e) | 284,878 | | 279,992 |
4.035% 12/1/34 (e) | 554,830 | | 546,231 |
4.046% 1/1/35 (e) | 256,615 | | 252,494 |
4.049% 1/1/35 (e) | 169,624 | | 166,706 |
4.065% 4/1/33 (e) | 112,150 | | 110,359 |
4.068% 1/1/35 (e) | 557,205 | | 548,228 |
4.079% 2/1/35 (e) | 514,224 | | 505,811 |
4.089% 2/1/35 (e) | 215,038 | | 211,623 |
4.09% 2/1/35 (e) | 235,102 | | 231,101 |
4.106% 1/1/35 (e) | 585,106 | | 575,539 |
4.109% 11/1/34 (e) | 443,873 | | 436,665 |
4.112% 2/1/35 (e) | 1,001,378 | | 986,037 |
4.115% 1/1/35 (e) | 608,574 | | 599,001 |
4.115% 2/1/35 (e) | 703,418 | | 691,846 |
4.129% 1/1/35 (e) | 1,035,803 | | 1,019,313 |
4.144% 1/1/35 (e) | 872,556 | | 863,263 |
4.148% 2/1/35 (e) | 510,076 | | 502,114 |
4.16% 1/1/35 (e) | 1,034,922 | | 1,020,692 |
4.172% 1/1/35 (e) | 703,497 | | 679,789 |
4.178% 10/1/34 (e) | 853,360 | | 843,537 |
4.178% 1/1/35 (e) | 508,756 | | 501,150 |
4.181% 11/1/34 (e) | 145,351 | | 144,066 |
4.199% 11/1/34 (e) | 31,239 | | 30,866 |
4.205% 1/1/35 (e) | 316,859 | | 312,356 |
4.216% 10/1/34 (e) | 63,357 | | 62,486 |
4.245% 10/1/34 (e) | 55,377 | | 54,717 |
4.25% 2/1/35 (e) | 342,115 | | 331,889 |
4.25% 2/1/35 (e) | 189,893 | | 187,394 |
4.274% 8/1/33 (e) | 656,858 | | 646,308 |
4.275% 3/1/35 (e) | 332,700 | | 327,331 |
4.287% 12/1/34 (e) | 204,182 | | 201,113 |
4.289% 7/1/34 (e) | 244,749 | | 243,077 |
4.294% 3/1/33 (e) | 388,420 | | 382,873 |
4.305% 5/1/35 (e) | 437,602 | | 431,086 |
4.306% 10/1/33 (e) | 146,192 | | 143,267 |
4.317% 3/1/33 (e) | 185,931 | | 179,911 |
4.33% 6/1/33 (e) | 178,783 | | 176,024 |
4.355% 4/1/35 (e) | 199,999 | | 196,905 |
4.356% 1/1/35 (e) | 349,711 | | 339,087 |
4.362% 2/1/34 (e) | 752,612 | | 737,033 |
4.395% 2/1/35 (e) | 501,220 | | 486,665 |
4.398% 5/1/35 (e) | 961,030 | | 946,663 |
4.416% 1/1/35 (e) | 432,984 | | 427,043 |
4.429% 10/1/34 (e) | 1,588,124 | | 1,580,295 |
4.439% 3/1/35 (e) | 450,150 | | 436,789 |
4.461% 8/1/34 (e) | 1,014,950 | | 993,656 |
4.469% 5/1/35 (e) | 300,978 | | 296,569 |
4.487% 1/1/35 (e) | 472,096 | | 467,059 |
4.493% 3/1/35 (e) | 1,092,932 | | 1,062,472 |
4.498% 8/1/34 (e) | 2,015,707 | | 2,010,768 |
U.S. Government Agency - Mortgage Securities - continued |
| Principal Amount | | Value (Note 1) |
Fannie Mae - continued |
4.5% 4/1/18 to 3/1/35 | $ 111,008,019 | | $ 103,801,939 |
4.5% 7/13/36 (b) | 15,000,000 | | 13,587,450 |
4.513% 10/1/35 (e) | 91,086 | | 89,532 |
4.517% 3/1/35 (e) | 1,049,223 | | 1,020,484 |
4.525% 2/1/35 (e) | 5,256,885 | | 5,160,263 |
4.538% 2/1/35 (e) | 2,117,850 | | 2,093,918 |
4.538% 2/1/35 (e) | 316,301 | | 312,553 |
4.544% 7/1/35 (e) | 1,201,691 | | 1,184,507 |
4.547% 2/1/35 (e) | 214,944 | | 212,629 |
4.553% 9/1/34 (e) | 1,199,721 | | 1,196,446 |
4.556% 1/1/35 (e) | 670,622 | | 663,541 |
4.576% 7/1/35 (e) | 1,246,036 | | 1,228,280 |
4.581% 2/1/35 (e) | 965,274 | | 942,281 |
4.586% 8/1/34 (e) | 414,261 | | 411,668 |
4.587% 2/1/35 (e) | 3,282,661 | | 3,198,166 |
4.616% 11/1/34 (e) | 1,036,228 | | 1,013,390 |
4.633% 3/1/35 (e) | 153,479 | | 151,890 |
4.644% 1/1/33 (e) | 217,624 | | 215,544 |
4.667% 11/1/34 (e) | 1,182,456 | | 1,156,431 |
4.675% 3/1/35 (e) | 2,602,844 | | 2,576,555 |
4.684% 9/1/34 (e) | 109,944 | | 109,457 |
4.698% 10/1/32 (e) | 67,932 | | 67,616 |
4.7% 3/1/35 (e) | 580,962 | | 567,210 |
4.726% 7/1/34 (e) | 965,910 | | 947,780 |
4.73% 2/1/33 (e) | 65,894 | | 65,344 |
4.731% 10/1/34 (e) | 1,247,695 | | 1,223,065 |
4.732% 10/1/32 (e) | 88,000 | | 88,718 |
4.746% 1/1/35 (e) | 53,295 | | 52,852 |
4.778% 12/1/34 (e) | 866,689 | | 849,936 |
4.792% 12/1/32 (e) | 463,244 | | 461,095 |
4.798% 12/1/34 (e) | 342,169 | | 335,592 |
4.811% 6/1/35 (e) | 1,568,684 | | 1,551,460 |
4.813% 8/1/34 (e) | 343,500 | | 341,405 |
4.815% 5/1/33 (e) | 31,708 | | 31,470 |
4.825% 11/1/34 (e) | 957,797 | | 940,470 |
4.873% 10/1/34 (e) | 3,780,274 | | 3,713,931 |
4.988% 11/1/32 (e) | 244,185 | | 243,943 |
4.988% 12/1/32 (e) | 33,723 | | 33,535 |
4.998% 2/1/35 (e) | 135,431 | | 134,568 |
5% 10/1/17 to 7/1/36 | 203,200,867 | | 192,449,831 |
5% 7/13/36 (b) | 25,000,000 | | 23,364,750 |
5.044% 7/1/34 (e) | 180,290 | | 178,139 |
5.064% 11/1/34 (e) | 80,642 | | 80,207 |
5.078% 9/1/34 (e) | 3,095,582 | | 3,057,878 |
5.097% 5/1/35 (e) | 2,167,349 | | 2,154,908 |
5.176% 5/1/35 (e) | 3,261,252 | | 3,220,160 |
5.182% 8/1/33 (e) | 468,742 | | 465,071 |
5.183% 5/1/35 (e) | 1,226,565 | | 1,211,270 |
|
| Principal Amount | | Value (Note 1) |
5.197% 6/1/35 (e) | $ 1,499,971 | | $ 1,493,296 |
5.213% 5/1/35 (e) | 3,599,108 | | 3,555,775 |
5.303% 7/1/35 (e) | 189,979 | | 189,215 |
5.5% 6/1/09 to 7/1/36 | 206,048,680 | | 198,891,619 |
5.505% 2/1/36 (e) | 6,164,250 | | 6,112,101 |
5.636% 1/1/36 (e) | 1,725,340 | | 1,717,024 |
5.916% 1/1/36 (e) | 1,233,274 | | 1,229,599 |
6% 2/1/13 to 6/1/36 | 41,044,615 | | 40,850,897 |
6% 7/13/36 (b) | 25,000,000 | | 24,597,500 |
6.5% 6/1/11 to 7/1/34 | 55,900,398 | | 56,537,197 |
7% 3/1/15 to 8/1/32 | 4,775,107 | | 4,909,200 |
7.5% 8/1/08 to 11/1/31 | 3,717,430 | | 3,863,768 |
8% 1/1/30 to 6/1/30 | 132,426 | | 140,676 |
8.5% 3/1/25 to 6/1/25 | 1,446 | | 1,535 |
TOTAL FANNIE MAE | | 769,488,560 |
Freddie Mac - 1.0% |
4% 2/1/20 | 4,262,447 | | 3,933,514 |
4.048% 12/1/34 (e) | 356,760 | | 349,611 |
4.103% 12/1/34 (e) | 520,683 | | 510,472 |
4.139% 1/1/35 (e) | 1,535,148 | | 1,505,197 |
4.268% 3/1/35 (e) | 436,727 | | 428,626 |
4.285% 5/1/35 (e) | 821,715 | | 807,393 |
4.3% 12/1/34 (e) | 512,193 | | 494,783 |
4.344% 2/1/35 (e) | 930,825 | | 914,936 |
4.358% 3/1/35 (e) | 773,782 | | 747,907 |
4.381% 2/1/35 (e) | 959,913 | | 927,746 |
4.439% 2/1/34 (e) | 466,022 | | 454,982 |
4.443% 3/1/35 (e) | 515,052 | | 498,308 |
4.459% 6/1/35 (e) | 637,064 | | 625,380 |
4.465% 3/1/35 (e) | 511,345 | | 495,135 |
4.5% 5/1/19 | 46,519 | | 43,991 |
4.548% 2/1/35 (e) | 787,826 | | 763,743 |
4.783% 10/1/32 (e) | 61,381 | | 60,737 |
4.86% 3/1/33 (e) | 177,146 | | 175,495 |
5.005% 4/1/35 (e) | 2,462,949 | | 2,438,517 |
5.14% 4/1/35 (e) | 2,119,640 | | 2,083,797 |
5.332% 6/1/35 (e) | 1,504,999 | | 1,488,023 |
5.43% 8/1/33 (e) | 217,407 | | 217,653 |
5.549% 4/1/32 (e) | 84,269 | | 84,854 |
5.567% 1/1/36 (e) | 3,027,708 | | 2,997,492 |
6% 5/1/33 | 4,355,718 | | 4,308,415 |
7.5% 5/1/17 to 11/1/31 | 447,787 | | 465,432 |
8% 7/1/17 to 5/1/27 | 51,296 | | 53,889 |
8.5% 3/1/20 to 1/1/28 | 294,235 | | 312,753 |
TOTAL FREDDIE MAC | | 28,188,781 |
Government National Mortgage Association - 0.8% |
4.25% 7/20/34 (e) | 707,298 | | 695,720 |
6% 8/15/08 to 8/15/29 | 3,549,191 | | 3,543,084 |
U.S. Government Agency - Mortgage Securities - continued |
| Principal Amount | | Value (Note 1) |
Government National Mortgage Association - continued |
6.5% 6/15/08 to 9/15/32 | $ 4,889,023 | | $ 4,973,267 |
7% 1/15/28 to 11/15/32 | 8,464,624 | | 8,755,034 |
7.5% 12/15/06 to 10/15/28 | 1,839,621 | | 1,922,192 |
8% 2/15/17 to 1/15/31 | 252,680 | | 268,269 |
8.5% 12/15/16 to 11/15/30 | 102,406 | | 108,441 |
TOTAL GOVERNMENT NATIONAL MORTGAGE ASSOCIATION | | 20,266,007 |
TOTAL U.S. GOVERNMENT AGENCY - MORTGAGE SECURITIES (Cost $840,414,162) | 817,943,348 |
Asset-Backed Securities - 3.6% |
|
ACE Securities Corp.: | | | |
Series 2004-HE1: | | | |
Class M1, 5.8225% 2/25/34 (e) | 950,000 | | 952,388 |
Class M2, 6.4225% 2/25/34 (e) | 1,075,000 | | 1,083,897 |
Series 2005-SD1 Class A1, 5.7225% 11/25/50 (e) | 573,605 | | 574,421 |
Aesop Funding II LLC Series 2005-1A Class A1, 3.95% 4/20/08 (a) | 1,200,000 | | 1,166,493 |
Aircraft Lease Securitization Ltd. Series 2005-1 Class C1, 8.88% 9/9/30 (a)(e) | 451,970 | | 458,749 |
AmeriCredit Automobile Receivables Trust: | | | |
Series 2003-BX Class A4B, 5.6075% 1/6/10 (e) | 1,000,863 | | 1,002,346 |
Series 2006-1: | | | |
Class A3, 5.11% 10/6/10 | 97,000 | | 96,089 |
Class B1, 5.2% 3/6/11 | 305,000 | | 300,948 |
Class C1, 5.28% 11/6/11 | 1,850,000 | | 1,822,830 |
Class E1, 6.62% 5/6/13 (a) | 1,540,000 | | 1,537,213 |
Ameriquest Mortgage Securities, Inc. Series 2004-R2: | | | |
Class M1, 5.7525% 4/25/34 (e) | 535,000 | | 534,988 |
Class M2, 5.8025% 4/25/34 (e) | 425,000 | | 424,990 |
Amortizing Residential Collateral Trust Series 2002-BC1 Class M2, 6.4225% 1/25/32 (e) | 223,880 | | 225,561 |
ARG Funding Corp. Series 2005-1A Class A1, 4.02% 4/20/09 (a) | 1,300,000 | | 1,266,609 |
Argent Securities, Inc.: | | | |
Series 2004-W5 Class M1, 5.9225% 4/25/34 (e) | 1,730,000 | | 1,731,986 |
Series 2006-W1 Class M10, 7.8225% 3/25/36 (e) | 1,860,000 | | 1,711,345 |
|
| Principal Amount | | Value (Note 1) |
Asset Backed Securities Corp. Home Equity Loan Trust: | | | |
Series 2004-HE2 Class M1, 5.8725% 4/25/34 (e) | $ 1,660,000 | | $ 1,674,449 |
Series 2004-HE3: | | | |
Class M1, 5.8625% 6/25/34 (e) | 175,000 | | 176,432 |
Class M2, 6.4425% 6/25/34 (e) | 400,000 | | 404,767 |
Capital Auto Receivables Asset Trust Series 2006-1: | | | |
Class A3, 5.03% 10/15/09 | 995,000 | | 985,778 |
Class B, 5.26% 10/15/10 | 945,000 | | 931,049 |
Class C, 5.55% 1/18/11 | 5,965,000 | | 5,867,813 |
Class D, 7.16% 1/15/13 (a) | 645,000 | | 638,348 |
Capital One Multi-Asset Execution Trust Series 2004-6 Class B, 4.15% 7/16/12 | 4,465,000 | | 4,267,779 |
CDC Mortgage Capital Trust Series 2004-HE2 Class M2, 6.5225% 7/26/34 (e) | 275,000 | | 276,943 |
Cendant Timeshare Receivables Funding LLC Series 2005-1A Class A1, 4.67% 5/20/17 (a) | 1,368,510 | | 1,335,778 |
CIT Equipment Collateral Trust Series 2006-VT1 Class A3, 5.13% 12/21/08 | 3,380,000 | | 3,356,361 |
Citibank Credit Card Issuance Trust: | | | |
Series 2005-B1 Class B1, 4.4% 9/15/10 | 5,120,000 | | 4,980,323 |
Series 2006-B2 Class B2, 5.15% 3/7/11 | 2,270,000 | | 2,237,693 |
CNH Equipment Trust Series 2006-A Class A3, 5.2% 8/16/10 | 2,415,000 | | 2,399,266 |
Countrywide Home Loans, Inc.: | | | |
Series 2004-2 Class M1, 5.8225% 5/25/34 (e) | 3,145,000 | | 3,157,700 |
Series 2004-3 Class M1, 5.8225% 6/25/34 (e) | 625,000 | | 628,194 |
Series 2004-4: | | | |
Class A, 5.6925% 8/25/34 (e) | 135,071 | | 135,228 |
Class M1, 5.8025% 7/25/34 (e) | 550,000 | | 553,371 |
Class M2, 5.8525% 6/25/34 (e) | 620,000 | | 623,335 |
Series 2005-1: | | | |
Class MV1, 5.7225% 7/25/35 (e) | 1,275,000 | | 1,279,331 |
Class MV2, 5.7625% 7/25/35 (e) | 1,520,000 | | 1,525,992 |
Crown Castle Towers LLC/Crown Atlantic Holdings Sub LLC/Crown Communication, Inc. Series 2005-1A: | | | |
Class B, 4.878% 6/15/35 (a) | 2,052,000 | | 1,972,818 |
Class C, 5.074% 6/15/35 (a) | 1,862,000 | | 1,790,484 |
Asset-Backed Securities - continued |
| Principal Amount | | Value (Note 1) |
DB Master Finance LLC Series 2006-1 Class M1, 8.285% 6/20/31 (a) | $ 840,000 | | $ 843,237 |
First Franklin Mortgage Loan Trust Series 2004-FF2: | | | |
Class M3, 5.8725% 3/25/34 (e) | 175,000 | | 175,472 |
Class M4, 6.2225% 3/25/34 (e) | 125,000 | | 125,762 |
Ford Credit Auto Owner Trust Series 2006-A Class A3, 5.05% 11/15/09 | 2,335,000 | | 2,314,833 |
Fremont Home Loan Trust: | | | |
Series 2004-A: | | | |
Class M1, 5.8725% 1/25/34 (e) | 2,000,000 | | 2,009,401 |
Class M2, 6.4725% 1/25/34 (e) | 2,300,000 | | 2,315,138 |
Series 2005-A: | | | |
Class M1, 5.7525% 1/25/35 (e) | 250,000 | | 251,689 |
Class M2, 5.7825% 1/25/35 (e) | 350,000 | | 351,859 |
Class M3, 5.8125% 1/25/35 (e) | 200,000 | | 201,389 |
Class M4, 6.0025% 1/25/35 (e) | 150,000 | | 151,575 |
GSAMP Trust Series 2004-FM2: | | | |
Class M1, 5.8225% 1/25/34 (e) | 1,498,100 | | 1,498,069 |
Class M2, 6.4225% 1/25/34 (e) | 600,000 | | 599,987 |
Class M3, 6.6225% 1/25/34 (e) | 600,000 | | 599,988 |
HSBC Home Equity Loan Trust Series 2005-2: | | | |
Class M1, 5.7269% 1/20/35 (e) | 761,950 | | 763,638 |
Class M2, 5.7569% 1/20/35 (e) | 573,011 | | 575,037 |
Hyundai Auto Receivables Trust: | | | |
Series 2004-1 Class A4, 5.26% 11/15/12 | 2,010,000 | | 1,988,251 |
Series 2006-1: | | | |
Class A3, 5.13% 6/15/10 | 745,000 | | 739,866 |
Class B, 5.29% 11/15/12 | 315,000 | | 312,110 |
Class C, 5.34% 11/15/12 | 405,000 | | 401,477 |
Lancer Funding Ltd. Series 2006-1A Class A3, 6.6367% 4/6/46 (a)(e) | 1,695,000 | | 1,695,000 |
Long Beach Mortgage Loan Trust Series 2004-2: | | | |
Class M1, 5.8525% 6/25/34 (e) | 525,000 | | 525,991 |
Class M2, 6.4025% 6/25/34 (e) | 160,000 | | 161,379 |
Meritage Mortgage Loan Trust Series 2004-1: | | | |
Class M1, 5.8225% 7/25/34 (e) | 925,000 | | 927,038 |
Class M2, 5.8725% 7/25/34 (e) | 150,000 | | 150,371 |
Class M3, 6.2725% 7/25/34 (e) | 350,000 | | 352,222 |
Class M4, 6.4225% 7/25/34 (e) | 225,000 | | 226,559 |
Morgan Stanley ABS Capital I, Inc. Series 2004-NC2 Class M1, 5.8725% 12/25/33 (e) | 985,000 | | 991,322 |
|
| Principal Amount | | Value (Note 1) |
Morgan Stanley Dean Witter Capital I Trust Series 2003-NC1 Class M1, 6.3725% 11/25/32 (e) | $ 1,038,917 | | $ 1,043,371 |
National Collegiate Student Loan Trust Series 2005-GT1 Class AIO, 6.75% 12/25/09 (g) | 1,750,000 | | 371,350 |
Onyx Acceptance Owner Trust Series 2005-A Class A3, 3.69% 5/15/09 | 450,000 | | 444,915 |
Park Place Securities, Inc. Series 2005-WCH1: | | | |
Class M2, 5.8425% 1/25/35 (e) | 1,700,000 | | 1,709,510 |
Class M4, 6.1525% 1/25/35 (e) | 3,650,000 | | 3,679,821 |
Providian Master Note Trust Series 2006-B1A Class B1, 5.35% 3/15/13 (a) | 4,570,000 | | 4,521,444 |
Saxon Asset Securities Trust Series 2004-1 Class M1, 5.8525% 3/25/35 (e) | 1,675,000 | | 1,678,087 |
Specialty Underwriting & Residential Finance Series 2003-BC4 Class M1, 5.9225% 11/25/34 (e) | 685,000 | | 688,948 |
Structured Asset Securities Corp. Series 2004-GEL1 Class A, 5.6825% 2/25/34 (e) | 239,140 | | 239,135 |
Volkswagen Auto Lease Trust Series 2005-A Class A4, 3.94% 10/20/10 | 2,195,000 | | 2,153,353 |
World Omni Auto Receivables Trust Series 2006-A Class A3, 5.01% 10/15/10 | 2,230,000 | | 2,210,457 |
TOTAL ASSET-BACKED SECURITIES (Cost $96,816,080) | 96,079,136 |
Collateralized Mortgage Obligations - 4.8% |
|
Private Sponsor - 2.4% |
Adjustable Rate Mortgage Trust floater: | | | |
Series 2005-1 Class 5A2, 5.6525% 5/25/35 (e) | 1,327,665 | | 1,323,789 |
Series 2005-2 Class 6A2, 5.6025% 6/25/35 (e) | 557,376 | | 558,126 |
Series 2005-3 Class 8A2, 5.5625% 7/25/35 (e) | 1,135,319 | | 1,137,417 |
Bank of America Mortgage Securities, Inc. Series 2005-E Class 2A7, 4.6126% 6/25/35 (e) | 2,680,000 | | 2,562,436 |
Bear Stearns Alt-A Trust floater Series 2005-1 Class A1, 5.6025% 1/25/35 (e) | 2,511,071 | | 2,515,526 |
CS First Boston Mortgage Securities Corp. floater: | | | |
Series 2004-AR3 Class 6A2, 5.6925% 4/25/34 (e) | 365,284 | | 365,588 |
Collateralized Mortgage Obligations - continued |
| Principal Amount | | Value (Note 1) |
Private Sponsor - continued |
CS First Boston Mortgage Securities Corp. floater: - continued | | | |
Series 2004-AR5 Class 11A2, 5.6925% 6/25/34 (e) | $ 163,541 | | $ 163,689 |
Granite Master Issuer PLC floater Series 2006-1A Class C2, 5.7894% 12/20/54 (a)(e) | 2,200,000 | | 2,199,054 |
Impac CMB Trust floater: | | | |
Series 2005-1: | | | |
Class M1, 5.7825% 4/25/35 (e) | 897,878 | | 899,822 |
Class M2, 5.8225% 4/25/35 (e) | 1,550,336 | | 1,553,257 |
Series 2005-2 Class 1A2, 5.6325% 4/25/35 (e) | 816,047 | | 818,087 |
JPMorgan Mortgage Trust Series 2005-A8 Class 2A3, 4.9605% 11/25/35 (e) | 760,000 | | 737,266 |
Lehman Structured Securities Corp. floater Series 2005-1 Class A2, 5.4713% 9/26/45 (a)(e) | 2,961,470 | | 2,964,709 |
Master Alternative Loan Trust Series 2004-3 Class 3A1, 6% 4/25/34 | 506,296 | | 493,164 |
Merrill Lynch Mortgage Investors, Inc. floater: | | | |
Series 2005-A Class A2, 5.2138% 2/25/30 (e) | 2,188,697 | | 2,188,133 |
Series 2005-B Class A2, 5.5475% 7/25/30 (e) | 2,246,429 | | 2,244,968 |
Opteum Mortgage Acceptance Corp. floater Series 2005-3 Class APT, 5.6125% 7/25/35 (e) | 1,908,173 | | 1,910,260 |
Residential Asset Mortgage Products, Inc. sequential pay Series 2004-SL2 Class A1, 6.5% 10/25/16 | 393,646 | | 395,991 |
Residential Finance LP/Residential Finance Development Corp. floater Series 2003-CB1: | | | |
Class B3, 6.62% 6/10/35 (a)(e) | 1,168,870 | | 1,190,370 |
Class B4, 6.82% 6/10/35 (a)(e) | 1,045,831 | | 1,066,702 |
Class B5, 7.42% 6/10/35 (a)(e) | 714,572 | | 731,521 |
Class B6, 7.92% 6/10/35 (a)(e) | 421,172 | | 427,849 |
Sequoia Mortgage Trust floater: | | | |
Series 2005-1 Class A2, 4.97% 2/20/35 (e) | 1,655,708 | | 1,654,750 |
Series 2005-2 Class A2, 5.19% 3/20/35 (e) | 1,989,147 | | 1,985,911 |
Structured Adjustable Rate Mortgage Loan Trust floater Series 2001-14 Class A1, 5.6325% 7/25/35 (e) | 3,676,679 | | 3,692,516 |
Thornburg Mortgage Securities Trust floater Series 2005-3 Class A4, 5.5925% 10/25/35 (e) | 3,832,906 | | 3,823,643 |
|
| Principal Amount | | Value (Note 1) |
Wachovia Mortgage Loan Trust LLC Series 2005-B Class 2A4, 5.1895% 10/20/35 (e) | $ 605,000 | | $ 590,043 |
WaMu Mortgage pass thru certificates floater Series 2005-AR13 Class A1C1, 5.5125% 10/25/45 (e) | 2,013,586 | | 2,013,371 |
Wells Fargo Mortgage Backed Securities Trust: | | | |
Series 2005-AR10 Class 2A2, 4.1096% 6/25/35 (e) | 4,837,903 | | 4,709,435 |
Series 2005-AR12 Class 2A6, 4.3196% 7/25/35 (e) | 5,154,889 | | 4,996,770 |
Series 2005-AR4 Class 2A2, 4.5305% 4/25/35 (e) | 4,137,931 | | 4,009,220 |
Series 2005-AR9 Class 2A1, 4.3623% 5/25/35 (e) | 2,129,879 | | 2,091,116 |
Series 2006-AR8 Class 2A6, 5.24% 4/25/36 (e) | 6,240,000 | | 6,130,769 |
TOTAL PRIVATE SPONSOR | | 64,145,268 |
U.S. Government Agency - 2.4% |
Fannie Mae planned amortization class: | | | |
Series 1999-54 Class PH, 6.5% 11/18/29 | 3,400,000 | | 3,441,451 |
Series 1999-57 Class PH, 6.5% 12/25/29 | 2,700,000 | | 2,718,763 |
Fannie Mae Grantor Trust floater Series 2005-90 Class FG, 5.5725% 10/25/35 (e) | 3,035,817 | | 3,022,256 |
Fannie Mae guaranteed REMIC pass thru certificates: | | | |
planned amortization class Series 2004-81: | | | |
Class KC, 4.5% 4/25/17 | 11,215,000 | | 10,750,302 |
Class KD, 4.5% 7/25/18 | 2,625,000 | | 2,457,971 |
sequential pay: | | | |
Series 2004-3 Class BA, 4% 7/25/17 | 272,409 | | 259,263 |
Series 2004-86 Class KC, 4.5% 5/25/19 | 1,225,527 | | 1,171,045 |
Series 2004-91 Class AH, 4.5% 5/25/29 | 2,545,536 | | 2,452,412 |
Freddie Mac planned amortization class Series 3033 Class UD, 5.5% 10/15/30 | 1,910,000 | | 1,883,252 |
Freddie Mac Multi-class participation certificates guaranteed: | | | |
planned amortization class: | | | |
Series 2500 Class TE, 5.5% 9/15/17 | 10,275,186 | | 10,166,177 |
Series 2677 Class LD, 4.5% 3/15/17 | 8,800,218 | | 8,347,281 |
Series 2702 Class WB, 5% 4/15/17 | 2,947,632 | | 2,886,826 |
Collateralized Mortgage Obligations - continued |
| Principal Amount | | Value (Note 1) |
U.S. Government Agency - continued |
Freddie Mac Multi-class participation certificates guaranteed: - continued | | | |
planned amortization class: | | | |
Series 2885 Class PC, 4.5% 3/15/18 | $ 2,560,000 | | $ 2,450,708 |
Series 3018 Class UD, 5.5% 9/15/30 | 2,825,000 | | 2,785,701 |
Series 3049 Class DB, 5.5% 6/15/31 | 4,440,000 | | 4,377,103 |
Series 3102 Class OH, 1/15/36 (h) | 1,940,000 | | 1,389,525 |
sequential pay Series 2750 Class ZT, 5% 2/15/34 | 2,179,537 | | 1,814,801 |
TOTAL U.S. GOVERNMENT AGENCY | | 62,374,837 |
TOTAL COLLATERALIZED MORTGAGE OBLIGATIONS (Cost $128,293,866) | 126,520,105 |
Commercial Mortgage Securities - 4.7% |
|
Asset Securitization Corp.: | | | |
sequential pay Series 1995-MD4 Class A1, 7.1% 8/13/29 | 4,550 | | 4,586 |
Series 1997-D5: | | | |
Class A2, 6.8207% 2/14/43 (e) | 1,435,000 | | 1,505,504 |
Class A3, 6.8707% 2/14/43 (e) | 1,545,000 | | 1,577,107 |
Banc of America Large Loan, Inc.: | | | |
floater: | | | |
Series 2005-ESHA: | | | |
Class E, 5.7638% 7/14/20 (a)(e) | 835,000 | | 838,523 |
Class F, 5.9338% 7/14/20 (a)(e) | 505,000 | | 507,225 |
Class G, 6.0638% 7/14/20 (a)(e) | 250,000 | | 251,100 |
Class H, 6.2838% 7/14/20 (a)(e) | 335,000 | | 336,340 |
Series 2005-MIB1: | | | |
Class C, 5.5088% 3/15/22 (a)(e) | 390,000 | | 391,134 |
Class D, 5.5588% 3/15/22 (a)(e) | 395,000 | | 396,175 |
Class F, 5.6688% 3/15/22 (a)(e) | 385,000 | | 385,561 |
Class G, 5.7288% 3/15/22 (a)(e) | 250,000 | | 249,952 |
Series 2006-ESH: | | | |
Class A, 6.0588% 7/14/11 (a)(e) | 1,277,778 | | 1,273,112 |
Class B, 6.1588% 7/14/11 (a)(e) | 587,321 | | 585,178 |
|
| Principal Amount | | Value (Note 1) |
Class C, 6.3088% 7/14/11 (a)(e) | $ 1,276,209 | | $ 1,271,560 |
Class D, 6.9388% 7/14/11 (a)(e) | 783,603 | | 781,233 |
Bayview Commercial Asset Trust floater: | | | |
Series 2004-1: | | | |
Class A, 5.6825% 4/25/34 (a)(e) | 663,613 | | 664,442 |
Class B, 7.2225% 4/25/34 (a)(e) | 66,361 | | 66,983 |
Class M1, 5.8825% 4/25/34 (a)(e) | 66,361 | | 66,610 |
Class M2, 6.5225% 4/25/34 (a)(e) | 66,361 | | 67,025 |
Series 2004-3: | | | |
Class A1, 5.6925% 1/25/35 (a)(e) | 2,487,091 | | 2,493,309 |
Class A2, 5.7425% 1/25/35 (a)(e) | 331,612 | | 332,234 |
Class M1, 5.8225% 1/25/35 (a)(e) | 414,515 | | 416,588 |
Class M2, 6.3225% 1/25/35 (a)(e) | 248,709 | | 251,585 |
Chase Commercial Mortgage Securities Corp. Series 2001-245 Class A2, 6.275% 2/12/16 (a)(e) | 1,345,000 | | 1,378,606 |
Chase Manhattan Bank-First Union National Bank Commercial Mortgage Trust sequential pay Series 1999-1 Class A2, 7.439% 8/15/31 | 5,000,000 | | 5,223,677 |
COMM: | | | |
floater Series 2002-FL7 Class D, 5.7688% 11/15/14 (a)(e) | 248,000 | | 248,222 |
Series 2004-LBN2 Class X2, 1.0021% 3/10/39 (a)(e)(g) | 6,781,658 | | 204,702 |
Commercial Mortgage pass thru certificates floater Series 2005-FL11: | | | |
Class B, 5.4488% 11/15/17 (a)(e) | 830,280 | | 830,279 |
Class E, 5.5888% 11/15/17 (a)(e) | 376,068 | | 376,112 |
Class F, 5.6488% 11/15/17 (a)(e) | 341,880 | | 341,920 |
CS First Boston Mortgage Securities Corp.: | | | |
sequential pay: | | | |
Series 1997-C2 Class A3, 6.55% 1/17/35 | 2,004,109 | | 2,021,547 |
Series 1999-C1 Class A2, 7.29% 9/15/41 | 5,237,833 | | 5,423,284 |
Series 2000-C1 Class A2, 7.545% 4/15/62 | 1,600,000 | | 1,687,032 |
Series 2004-C1: | | | |
Class A3, 4.321% 1/15/37 | 2,235,000 | | 2,103,919 |
Commercial Mortgage Securities - continued |
| Principal Amount | | Value (Note 1) |
CS First Boston Mortgage Securities Corp.: - continued | | | |
sequential pay: | | | |
Series 2004-C1: | | | |
Class A4, 4.75% 1/15/37 | $ 3,035,000 | | $ 2,822,104 |
Series 1997-C2 Class D, 7.27% 1/17/35 | 1,900,000 | | 1,954,991 |
Series 1998-C1: | | | |
Class C, 6.78% 5/17/40 | 5,000,000 | | 5,124,080 |
Class D, 7.17% 5/17/40 | 595,000 | | 625,225 |
Series 2001-CKN5 Class AX, 0.8981% 9/15/34 (a)(e)(g) | 28,641,933 | | 1,610,679 |
Series 2002-CP3 Class G, 6.639% 7/15/35 (a) | 250,000 | | 257,747 |
Series 2004-C1 Class ASP, 0.8788% 1/15/37 (a)(e)(g) | 32,628,363 | | 973,738 |
Deutsche Mortgage & Asset Receiving Corp. sequential pay Series 1998-C1 Class D, 7.231% 6/15/31 | 4,940,000 | | 5,077,887 |
DLJ Commercial Mortgage Corp. sequential pay Series 2000-CF1 Class A1B, 7.62% 6/10/33 | 3,500,000 | | 3,714,569 |
GGP Mall Properties Trust sequential pay Series 2001-C1A Class A2, 5.007% 11/15/11 (a) | 3,339,115 | | 3,332,246 |
Ginnie Mae guaranteed REMIC pass thru securities sequential pay Series 2003-22 Class B, 3.963% 5/16/32 | 3,295,000 | | 3,102,367 |
Greenwich Capital Commercial Funding Corp. Series 2006-GG7 Class A3, 6.1101% 7/10/38 (b) | 3,460,000 | | 3,482,170 |
GS Mortgage Securities Corp. II: | | | |
sequential pay Series 2003-C1 Class A2A, 3.59% 1/10/40 | 3,345,000 | | 3,249,420 |
Series 1998-GLII Class E, 6.9706% 4/13/31 (e) | 1,615,000 | | 1,647,783 |
Series 2006-GG6 Class A2, 5.506% 4/10/38 (e) | 2,990,000 | | 2,960,183 |
J.P. Morgan Commercial Mortgage Finance Corp. sequential pay Series 2000-C9 Class A2, 7.77% 10/15/32 | 3,970,000 | | 4,177,494 |
JP Morgan Chase Commercial Mortgage Securities Corp. sequential pay Series 2006-CB15 Class A3, 5.819% 6/12/43 (e) | 5,840,000 | | 5,809,457 |
LB-UBS Commercial Mortgage Trust: | | | |
sequential pay: | | | |
Series 2000-C3 Class A2, 7.95% 1/15/10 | 2,180,000 | | 2,328,816 |
Series 2001-C3 Class A1, 6.058% 6/15/20 | 2,475,208 | | 2,494,420 |
Series 2001-C3 Class B, 6.512% 6/15/36 | 1,810,000 | | 1,868,866 |
Leafs CMBS I Ltd./Leafs CMBS I Corp. Series 2002-1A: | | | |
Class B, 4.13% 11/20/37 (a) | 3,860,000 | | 3,464,238 |
|
| Principal Amount | | Value (Note 1) |
Class C, 4.13% 11/20/37 (a) | $ 3,760,000 | | $ 3,269,038 |
Merrill Lynch Mortgage Trust sequential pay Series 2004-KEY2 Class A2, 4.166% 8/12/39 | 215,000 | | 203,944 |
Morgan Stanley Capital I, Inc.: | | | |
sequential pay Series 2004-HQ3 Class A2, 4.05% 1/13/41 | 2,235,000 | | 2,118,374 |
Series 2005-IQ9 Class X2, 1.0693% 7/15/56 (a)(e)(g) | 27,769,981 | | 1,169,633 |
Providence Place Group Ltd. Partnership Series 2000-C1 Class A2, 7.75% 7/20/28 (a) | 2,130,000 | | 2,576,427 |
Thirteen Affiliates of General Growth Properties, Inc.: | | | |
sequential pay Series 1 Class A2, 6.602% 11/15/07 (a) | 7,200,000 | | 7,280,430 |
Series 1: | | | |
Class D2, 6.992% 11/15/07 (a) | 4,260,000 | | 4,316,245 |
Class E2, 7.224% 11/15/07 (a) | 2,550,000 | | 2,589,342 |
Trizechahn Office Properties Trust Series 2001-TZHA Class E3, 7.253% 3/15/13 (a) | 752,838 | | 766,945 |
Wachovia Bank Commercial Mortgage Trust sequential pay: | | | |
Series 2003-C6 Class A2, 4.498% 8/15/35 | 3,595,000 | | 3,475,925 |
Series 2003-C7 Class A1, 4.241% 10/15/35 (a) | 1,346,172 | | 1,287,098 |
TOTAL COMMERCIAL MORTGAGE SECURITIES (Cost $125,821,746) | 123,684,247 |
Foreign Government and Government Agency Obligations - 0.8% |
|
Israeli State 4.625% 6/15/13 | 985,000 | | 908,037 |
United Mexican States: | | | |
5.875% 1/15/14 | 3,850,000 | | 3,734,500 |
6.75% 9/27/34 | 3,535,000 | | 3,411,275 |
7.5% 4/8/33 | 11,212,000 | | 11,912,750 |
TOTAL FOREIGN GOVERNMENT AND GOVERNMENT AGENCY OBLIGATIONS (Cost $19,357,264) | 19,966,562 |
Supranational Obligations - 0.1% |
|
Corporacion Andina de Fomento 6.875% 3/15/12
(Cost $1,706,548) | | 1,725,000 | | 1,804,353 |
Fixed-Income Central Funds - 7.8% |
| Shares | | |
Fidelity Ultra-Short Central Fund (f)
(Cost $208,122,749) | 2,092,948 | | 208,164,608 |
Preferred Securities - 0.1% |
| Principal Amount | | Value (Note 1) |
FINANCIALS - 0.1% |
Diversified Financial Services - 0.1% |
MUFG Capital Finance 1 Ltd. 6.346% (e)
(Cost $3,520,000) | $ 3,520,000 | | $ 3,459,507 |
Cash Equivalents - 3.9% |
| Maturity Amount | | |
Investments in repurchase agreements (Collateralized by U.S. Government Obligations) in a joint trading account at 5.3%, dated 6/30/06 due 7/3/06
(Cost $103,213,000) | $ 103,258,576 | | 103,213,000 |
TOTAL INVESTMENT PORTFOLIO - 102.1% (Cost $2,773,110,947) | 2,708,088,835 |
NET OTHER ASSETS - (2.1)% | (54,481,197) |
NET ASSETS - 100% | $ 2,653,607,638 |
Swap Agreements |
| Expiration Date | | Notional Amount | | Value |
Credit Default Swaps |
Receive monthly notional amount multiplied by 2.5% and pay Credit Suisse First Boston upon default event of Ameriquest Mortgage Securities, Inc., par value of the notional amount of Ameriquest Mortgage Securities, Inc. Series 2004-R11 Class M9, 8.03% 11/25/34 | Dec. 2034 | | $ 1,075,000 | | $ 5,551 |
Receive monthly notional amount multiplied by 3.3% and pay to Morgan Stanley, Inc. upon default event of Ameriquest Mortgage Securities, Inc., par value of the notional amount of Ameriquest Mortgage Securities, Inc. Series 2004-R11 Class M9, 7.6913% 11/25/34 | Dec. 2034 | | 775,000 | | 15,103 |
|
| Expiration Date | | Notional Amount | | Value |
Receive monthly notional amount multiplied by 3.35% and pay Morgan Stanley, Inc. upon default event of Morgan Stanley ABS Capital I, Inc., par value of the notional amount of Morgan Stanley ABS Capital I, Inc. Series 2004-HE7 Class B3, 7.6913% 8/25/34 | Sept. 2034 | | $ 465,000 | | $ 10,576 |
Receive monthly notional amount multiplied by 3.35% and pay Morgan Stanley, Inc. upon default event of Morgan Stanley ABS Capital I, Inc., par value of the notional amount of Morgan Stanley ABS Capital I, Inc. Series 2004-NC7 Class B3, 7.6913% 7/25/34 | August 2034 | | 465,000 | | 9,962 |
Receive monthly notional amount multiplied by 3.35% and pay Morgan Stanley, Inc. upon default event of Morgan Stanley ABS Capital I, Inc., par value of the notional amount of Morgan Stanley ABS Capital I, Inc. Series 2004-HE8 Class B3, 7.3913% 9/25/34 | Oct. 2034 | | 465,000 | | 11,190 |
Receive monthly notional amount multiplied by .82% and pay UBS upon default event of Morgan Stanley ABS Capital I, Inc., par value of the notional amount of Morgan Stanley ABS Capital I, Inc. Series 2004-NC6 Class M3, 5.6413% 7/25/34 | August 2034 | | 465,000 | | 2,581 |
Swap Agreements - continued |
| Expiration Date | | Notional Amount | | Value |
Credit Default Swaps - continued |
Receive monthly notional amount multiplied by .85% and pay UBS upon default event of Ameriquest Mortgage Securities, Inc., par value of the notional amount of Ameriquest Mortgage Securities, Inc. Series 2004-R9 Class M5, 5.5913% 10/25/34 | Nov. 2034 | | $ 465,000 | | $ 2,420 |
Receive monthly notional amount multiplied by .85% and pay UBS upon default event of Morgan Stanley ABS Capital I, Inc., par value of the notional amount of Morgan Stanley ABS Capital I, Inc. Series 2004-NC8 Class M6, 5.4413% 9/25/34 | Oct. 2034 | | 465,000 | | 2,907 |
Receive monthly notional amount multiplied by 1.6% and pay Morgan Stanley, Inc. upon default event of Park Place Securities, Inc., par value of the notional amount of Park Place Securities, Inc. Series 2005-WHQ2 Class M7, 5.4413% 5/25/35 | June 2035 | | 640,000 | | 5,382 |
|
| Expiration Date | | Notional Amount | | Value |
Receive monthly notional amount multiplied by 1.66% and pay Morgan Stanley, Inc. upon default event of Park Place Securities, Inc., par value of the notional amount of Park Place Securities, Inc. Series 2005-WHQ2 Class M7, 5.4413% 5/25/35 | June 2035 | | $ 465,000 | | $ 4,655 |
Receive monthly notional amount multiplied by 2.39% and pay UBS upon default event of Fremont Home Loan Trust, par value of the notional amount of Fremont Home Loan Trust Series 2004-1 Class M9, 7.73% 2/25/34 | March 2034 | | 2,966,000 | | 8,003 |
Receive monthly notional amount multiplied by 2.4% and pay Deutsche Bank upon default event of Fremont Home Loan Trust, par value of the notional amount of Fremont Home Loan Trust Series 2004-A Class B3, 7.2288% 1/25/34 | Feb. 2034 | | 923,143 | | 1,531 |
Receive monthly notional amount multiplied by 2.54% and pay Merrill Lynch upon default event of Countrywide Home Loans, Inc., par value of the notional amount of Countrywide Home Loans, Inc. Series 2003-BC1 Class B1, 7.6913% 3/25/32 | April 2032 | | 64,775 | | 311 |
Swap Agreements - continued |
| Expiration Date | | Notional Amount | | Value |
Credit Default Swaps - continued |
Receive monthly notional amount multiplied by 2.7% and pay Morgan Stanley, Inc. upon default event of Park Place Securities, Inc., par value of the notional amount of Park Place Securities, Inc. Series 2005-WHQ2 Class M9, 6.41% 5/25/35 | June 2035 | | $ 770,000 | | $ 3,477 |
Receive monthly notional amount multiplied by 2.79% and pay Merrill Lynch, Inc. upon default event of New Century Home Equity Loan Trust, par value of the notional amount of New Century Home Equity Loan Trust Series 2004-4 Class M9, 7.0788% 2/25/35 | March 2035 | | 1,715,000 | | 16,101 |
Receive monthly notional amount multiplied by 5% and pay Deutsche Bank upon default event of MASTR Asset Backed Securities Trust, par value of the notional amount of MASTR Asset Backed Securities Trust Series 2003-NC1 Class M6, 8.1913% 4/25/33 | May 2033 | | 465,000 | | 5,879 |
Receive quarterly notional amount multiplied by .30% and pay Goldman Sachs upon default event of Entergy Corp., par value of the notional amount of Entergy Corp. 7.75% 12/15/09 | March 2008 | | 2,830,000 | | 3,339 |
|
| Expiration Date | | Notional Amount | | Value |
Receive quarterly notional amount multiplied by .35% and pay Goldman Sachs upon default event of Southern California Edison Co., par value of the notional amount of Southern California Edison Co. 7.625% 1/15/10 | Sept. 2010 | | $ 1,900,000 | | $ 5,928 |
Receive quarterly notional amount multiplied by .37% and pay Goldman Sachs upon default event of Pacific Gas & Electric Co., par value of the notional amount of Pacific Gas & Electric Co. 4.8% 3/1/14 | March 2011 | | 2,420,000 | | 11,035 |
Receive quarterly notional amount multiplied by .37% and pay Morgan Stanley, Inc. upon default event of Pacific Gas & Electric Co. par value of the notional amount of Pacific Gas & Electric Co. 4.8% 3/1/14 | March 2011 | | 3,675,000 | | 16,758 |
Receive quarterly notional amount multiplied by .40% and pay Goldman Sachs, upon each default even of one of the issues of Dow Jones CDX N.A Investment Grade 6 Index, par value of the proportional notional amount (d) | June 2011 | | 1,000,000 | | (210) |
Swap Agreements - continued |
| Expiration Date | | Notional Amount | | Value |
Credit Default Swaps - continued |
Receive quarterly notional amount multiplied by .40% and pay Lehman Brothers, Inc., upon default event of one of the issues of Dow Jones CDX N.A. Investment Grade 6 Index, par value of the proportional notional amount (d) | June 2011 | | $ 1,000,000 | | $ 1,960 |
Receive quarterly notional amount multiplied by .41% and pay Merrill Lynch, Inc. upon default event of Talisman Energy, Inc., par value of the notional amount of Talisman Energy, Inc. 7.25% 10/15/27 | March 2009 | | 1,400,000 | | 7,588 |
Receive semi-annually notional amount multiplied by .5% and pay Credit Suisse First Boston upon default event of Russian Federation, par value of the notional amount of Russian Federation 5% 3/31/30 | June 2008 | | 1,885,000 | | 377 |
Receive semi-annually notional amount multiplied by .5% and pay Deutsche Bank upon default event of Russian Federation, par value of Russian Federation 5% 3/31/30 | June 2008 | | 3,395,000 | | 340 |
|
| Expiration Date | | Notional Amount | | Value |
Receive semi-annually notional amount multiplied by .61% and pay JPMorgan Chase, Inc. upon default event of United Mexican States, par value of the notional amount of United Mexican States 7.5% 4/8/33 | May 2011 | | $ 4,290,000 | | $ (30,416) |
Receive semi-annually notional amount multiplied by .625% and pay Deutsche Bank upon default event of United Mexican States, par value of the notional amount of United Mexican States 7.5% 4/8/33 | May 2011 | | 2,260,000 | | (14,577) |
TOTAL CREDIT DEFAULT SWAPS | | 38,703,918 | | 107,751 |
Interest Rate Swaps |
Receive quarterly a fixed rate equal to 4% and pay quarterly a floating rate based on 3-month LIBOR with JPMorgan Chase, Inc. | July 2009 | | 42,000,000 | | (1,932,840) |
Receive quarterly a fixed rate equal to 4.3875% and pay quarterly a floating rate based on 3-month LIBOR with Credit Suisse First Boston | March 2010 | | 11,825,000 | | (471,226) |
Receive quarterly a fixed rate equal to 4.774% and pay quarterly a floating rate based on 3-month LIBOR with Credit Suisse First Boston | March 2015 | | 11,825,000 | | (725,582) |
Receive semi-annually a fixed rate equal to 4.378% and pay quarterly a floating rate based on 3-month LIBOR with Lehman Brothers, Inc. | Sept. 2008 | | 25,400,000 | | (384,556) |
Swap Agreements - continued |
| Expiration Date | | Notional Amount | | Value |
Interest Rate Swaps - continued |
Receive semi-annually a fixed rate equal to 4.492% and pay quarterly a floating rate based on 3-month LIBOR with Lehman Brothers, Inc. | Sept. 2010 | | $ 1,500,000 | | $ (47,340) |
Receive semi-annually a fixed rate equal to 4.7515% and pay quarterly a floating rate based on 3-month LIBOR with UBS | Jan. 2009 | | 50,000,000 | | (459,500) |
Receive semi-annually a fixed rate equal to 4.8575% and pay quarterly a floating rate based on 3-month LIBOR with Lehman Brothers, Inc. | Dec. 2008 | | 32,000,000 | | (551,360) |
Receive semi-annually a fixed rate equal to 4.921% and pay quarterly a floating rate based on 3-month LIBOR with Lehman Brothers, Inc. | Dec. 2008 | | 250,000 | | (3,928) |
Receive semi-annually a fixed rate equal to 4.93% and pay quarterly a floating rate based on 3-month LIBOR with Lehman Brothers, Inc. | Nov. 2010 | | 1,000,000 | | (27,400) |
Receive semi-annually a fixed rate equal to 5.276% and pay quarterly a floating rate based on 3-month LIBOR with Deutsche Bank | April 2011 | | 52,500,000 | | (781,725) |
Receive semi-annually a fixed rate equal to 5.3315% and pay quarterly a floating rate based on 3-month LIBOR with JPMorgan Chase, Inc. | April 2011 | | 15,000,000 | | (187,800) |
|
| Expiration Date | | Notional Amount | | Value |
Receive semi-annually a fixed rate equal to 5.354% and pay quarterly a floating rate based on 3-month LIBOR with Deutsche Bank | April 2011 | | $ 32,000,000 | | $ (378,560) |
Receive semi-annually a fixed rate of 5.312% and pay quarterly a floating rate based on the 3-month LIBOR with Lehman Brothers, Inc. | April 2011 | | 105,000,000 | | (1,357,650) |
TOTAL INTEREST RATE SWAPS | | 380,300,000 | | (7,309,467) |
Total Return Swaps |
Receive monthly a return equal to Banc of America Securities LLC AAA 10 Yr Commercial Mortgage Backed Securities Daily Index and pay monthly a floating rate based on 1-month LIBOR minus 20 basis points with Bank of America | July 2006 | | 12,500,000 | | (27,670) |
Receive monthly a return equal to Lehman Brothers CMBS AAA 8.5+ Index and pay monthly a floating rate based on 1-month LIBOR with Citibank | Sept. 2006 | | 15,000,000 | | (16,561) |
Receive quarterly a return equal to Banc of America Securities LLC AAA 10 Yr Mortgage Backed Securities Daily Index and pay quarterly a floating rate based on 3-month LIBOR minus 15 basis points with Bank of America | August 2006 | | 23,200,000 | | (182,977) |
TOTAL TOTAL RETURN SWAPS | | 50,700,000 | | (227,208) |
| | $ 469,703,918 | | $ (7,428,924) |
Legend |
(a) Security exempt from registration under Rule 144A of the Securities Act of 1933. These securities may be resold in transactions exempt from registration, normally to qualified institutional buyers. At the period end, the value of these securities amounted to $136,079,242 or 5.1% of net assets. |
(b) Security or a portion of the security purchased on a delayed delivery or when-issued basis. |
(c) Security or a portion of the security has been segregated as collateral for open swap agreements. At the period end, the value of securities pledged amounted to $2,998,827. |
(d) Dow Jones CDX N.A. Investment Grade 6 is a tradable index of credit default swaps on investment grade debt of U.S. companies. |
(e) The coupon rate shown on floating or adjustable rate securities represents the rate at period end. |
(f) Affiliated Fund that is available only to investment companies and other accounts managed by Fidelity Investments. A complete unaudited list of holdings for each Fidelity Central Fund, as of the Investing Fund's report date, is available upon request or at advisor.fidelity.com. The reports are located just after the Fund's financial statements and quarterly reports but are not part of the financial statements or quarterly reports. In addition, the Fidelity Central Fund's financial statements are available on the EDGAR Database on the SEC's web site, www.sec.gov, or upon request. |
(g) Security represents right to receive monthly interest payments on an underlying pool of mortgages. Principal shown is the par amount of the mortgage pool. |
(h) Principal Only Strips represent the right to receive the monthly principal payments on an underlying pool of mortgage loans. |
Affiliated Central Funds |
Information regarding fiscal year to date income earned by the Fund from the investments in Fidelity Central Funds is as follows: |
Fund | Income earned |
Fidelity Ultra-Short Central Fund | $ 96,726 |
|
Additional information regarding the Fund's fiscal year to date purchases and sales, including the ownership percentage, of the Fidelity Central Funds is as follows: |
Fund | Value, beginning
of period | Purchases | Sales
Proceeds | Value, end
of period | % ownership,
end of period |
Fidelity Ultra-Short Central Fund | $ - | $ 208,122,749 | $ - | $ 208,164,608 | 2.9% |
See accompanying notes which are an integral part of the financial statements.
Not Part of Financial Report
Financial Statements
Statement of Assets and Liabilities
| June 30, 2006 (Unaudited) |
| | |
Assets | | |
Investment in securities, at value (including repurchase agreements of $103,213,000) - See accompanying schedule: Unaffiliated issuers (cost $2,564,988,198) | $ 2,499,924,227 | |
Fidelity Central Funds (cost $208,122,749) | 208,164,608 | |
Total Investments (cost $2,773,110,947) | | $ 2,708,088,835 |
Cash | | 91,152 |
Receivable for investments sold | | 2,964,534 |
Receivable for swap agreements | | 28,200 |
Interest receivable | | 18,573,756 |
Total assets | | 2,729,746,477 |
| | |
Liabilities | | |
Payable for investments purchased
Regular delivery | $ 1,416,433 | |
Delayed delivery | 64,804,191 | |
Distributions payable | 2,488,624 | |
Swap agreements, at value | 7,428,924 | |
Other payables and accrued
expenses | 667 | |
Total liabilities | | 76,138,839 |
| | |
Net Assets | | $ 2,653,607,638 |
Net Assets consist of: | | |
Paid in capital | | $ 2,725,815,402 |
Undistributed net investment income | | 247,342 |
Accumulated undistributed net realized gain (loss) on investments | | (3,425) |
Net unrealized appreciation (depreciation) on investments | | (72,451,681) |
Net Assets, for 26,382,098 shares outstanding | | $ 2,653,607,638 |
Net Asset Value, offering price and redemption price per share ($2,653,607,638 ÷ 26,382,098 shares) | | $ 100.58 |
Statement of Operations
| For the period June 23, 2006 (commencement of operations) to June 30, 2006 (Unaudited) |
| | |
Investment Income | | |
Interest | | $ 2,639,905 |
Income from Fidelity Central Funds | | 96,726 |
Total income | | 2,736,631 |
| | |
Expenses | | |
Custodian fees and expenses | | 667 |
Net investment income | | 2,735,964 |
Realized and Unrealized Gain (Loss) Net realized gain (loss) on: | | |
Investment securities: | | |
Unaffiliated issuers | $ (31,622) | |
Swap agreements | 28,197 | |
Total net realized gain (loss) | | (3,425) |
Change in net unrealized appreciation (depreciation) on: Investment securities | 13,247,680 | |
Swap agreements | 1,698,645 | |
Total change in net unrealized appreciation (depreciation) | | 14,946,325 |
Net gain (loss) | | 14,942,900 |
Net increase (decrease) in net assets resulting from operations | | $ 17,678,864 |
See accompanying notes which are an integral part of the financial statements.
Not Part of Financial Report
Financial Statements - continued
Statement of Changes in Net Assets
| For the period June 23, 2006 (commencement of operations) to June 30, 2006 (Unaudited) |
Increase (Decrease) in Net Assets | |
Operations | |
Net investment income | $ 2,735,964 |
Net realized gain (loss) | (3,425) |
Change in net unrealized appreciation (depreciation) | 14,946,325 |
Net increase (decrease) in net assets resulting from operations | 17,678,864 |
Distributions to shareholders from net investment income | (2,488,622) |
Affiliated share transactions
Proceeds from sales of shares | 270,789,917 |
Contributions in kind | 2,367,627,479 |
Net increase (decrease) in net assets resulting from share transactions | 2,638,417,396 |
Total increase (decrease) in net assets | 2,653,607,638 |
| |
Net Assets | |
Beginning of period | - |
End of period (including undistributed net investment income of $247,342) | $ 2,653,607,638 |
Other Information Shares | |
Sold | 2,705,823 |
Issued for in-kind contributions | 23,676,275 |
Net increase (decrease) | 26,382,098 |
Financial Highlights
| Period ended
June 30, 2006
(Unaudited) E |
| |
Selected Per-Share Data | |
Net asset value, beginning of period | $ 100.00 |
Income from Investment Operations | |
Net investment income B | .106 |
Net realized and unrealized gain (loss) | .574 |
Total from investment operations | .680 |
Distributions from net investment income | (.100) |
Net asset value, end of period | $ 100.58 |
Total Return A | .68% |
Ratios to Average Net Assets C, F | |
Expenses before reductions | .00003% |
Expenses net of fee waivers, if any | .00003% |
Expenses net of all reductions | .00003% |
Net investment income | .11% |
Supplemental Data | |
Net assets, end of period (000 omitted) | $ 2,653,608 |
Portfolio turnover rate D | 0% |
A Total returns for periods of less than one year are not annualized.
B Calculated based on average shares outstanding during the period.
C Fees and expenses of the Fidelity Central Fund are not included in the Fund's annualized expense ratios. The Fund indirectly bears its proportionate share of the expenses of the Fidelity Central Fund. Expenses of the Fidelity Central Fund as of its most recent fiscal year end were approximately .0044%.
D Amount does not include the portfolio activity of the Fidelity Central Fund.
E For the period June 23, 2006 (commencement of operations) to June 30, 2006.
F Expense ratios reflect operating expenses of the Fund. Expenses before reductions do not reflect amounts reimbursed by the investment adviser or expense offset arrangements and do not represent the amount paid by the Fund during periods when reimbursements or reductions occur. Expense ratios before reductions for start-up periods may not be representative of longer term operating periods. Expenses net of fee waivers reflect expenses after reimbursement by the investment adviser but prior to reductions from expense offset arrangements. Expenses net of all reductions represent the net expenses paid by the Fund.
See accompanying notes which are an integral part of the financial statements.
Not Part of Financial Report
Notes to Financial Statements
For the period ended June 30, 2006 (Unaudited)
1. Significant Accounting Policies.
Fidelity VIP Investment Grade Central Investment Portfolio (the Fund) is a fund of Fidelity Garrison Street Trust (the trust) and is authorized to issue an unlimited number of shares. The trust is registered under the Investment Company Act of 1940, as amended (the 1940 Act), as an open-end management investment company organized as a Massachusetts business trust. Shares of the Fund are only offered to other investment companies and accounts managed by Fidelity Management & Research Company (FMR), or its affiliates (the Investing Funds). The Fund is referred to as a Fidelity Central Fund and it may also invest in other Fidelity Central Funds available only to investment companies and other accounts managed by FMR and its affiliates. The financial statements have been prepared in conformity with accounting principles generally accepted in the United States of America, which require management to make certain estimates and assumptions at the date of the financial statements. The following summarizes the significant accounting policies of the Fund:
Security Valuation. Investments are valued and net asset value per share is calculated (NAV calculation) as of the close of business of the New York Stock Exchange, normally 4:00 p.m. Eastern time. Wherever possible, the Fund uses independent pricing services approved by the Board of Trustees to value its investments. Debt securities, including restricted securities, for which quotations are readily available, are valued by independent pricing services or by dealers who make markets in such securities. Pricing services consider yield or price of bonds of comparable quality, coupon, maturity and type as well as dealer supplied prices. When current market prices or quotations are not readily available or do not accurately reflect fair value, valuations may be determined in accordance with procedures adopted by the Board of Trustees. The frequency of when fair value pricing is used is unpredictable. The value of securities used for NAV calculation under fair value pricing may differ from published prices for the same securities. Investments in open-end mutual funds, including Fidelity Central Funds, are valued at their closing net asset value each business day. Short-term securities with remaining maturities of sixty days or less for which quotations are not readily available are valued at amortized cost, which approximates value.
Investment Transactions and Income. Security transactions, including the Fund's investment activity in other Fidelity Central Funds, are accounted for as of trade date. Gains and losses on securities sold are determined on the basis of identified cost. Interest income and income distributions from Fidelity Central Funds are accrued as earned, with any income distributions receivable as of period end included in Interest Receivable on the Statement of Assets & Liabilities. Interest income includes coupon interest and amortization of premium and accretion of discount on debt securities. Inflation-indexed bonds are fixed-income securities whose principal value is periodically adjusted according to the rate of inflation. Interest is accrued based on the principal value, which is adjusted for inflation. Any increase in the principal amount of an inflation-indexed bond is recorded as interest income, even though the principal is not received until maturity.
Expenses. Most expenses of the trust can be directly attributed to a fund. Expenses which cannot be directly attributed are apportioned among each Fund in the trust.
Income Tax Information and Distributions to Shareholders. Each year, the Fund intends to qualify as a regulated investment company by distributing all of its taxable income and realized gains under Subchapter M of the Internal Revenue Code. As a result, no provision for income taxes is required in the accompanying financial statements.
Dividends are declared daily and paid monthly from net investment income. Distributions from realized gains, if any, are recorded on the ex-dividend date. Income and capital gain distributions are determined in accordance with income tax regulations, which may differ from generally accepted accounting principles. Capital accounts within the financial statements are adjusted for permanent book-tax differences. These adjustments have no impact on net assets or the results of operations. Temporary book-tax differences will reverse in a subsequent period.
The federal tax cost of investments and unrealized appreciation (depreciation) as of period end were as follows:
Unrealized appreciation | $ 8,572,714 | |
Unrealized depreciation | (71,292,885) | |
Net unrealized appreciation (depreciation) | $ (62,720,171) | |
Cost for federal income tax purposes | $ 2,770,809,006 | |
New Accounting Pronouncement. In July 2006, Financial Accounting Standards Board Interpretation No. 48, Accounting for Uncertainty in Income Taxes - an interpretation of FASB Statement 109 (FIN 48) was issued and is effective for fiscal years beginning after December 15, 2006. FIN 48 sets forth a threshold for financial statement recognition, measurement and disclosure of a tax position taken or expected to be taken on a tax return. Management is currently evaluating the impact, if any, the adoption of FIN 48 will have on the Fund's net assets and results of operations.
2. Operating Policies.
Repurchase Agreements. FMR has received an Exemptive Order from the Securities and Exchange Commission (the SEC) which permits the Fund and other affiliated entities of FMR to transfer uninvested cash balances into joint trading accounts which are then invested in repurchase agreements. The Fund may also invest directly with institutions in repurchase agreements. Repurchase agreements are collateralized by government or non-government securities. Upon settlement date, collateral is held in segregated accounts with custodian banks and may be obtained in the event of a default of the counterparty. The Fund monitors, on a daily basis, the value of the collateral to ensure it is at least equal to the principal amount of the repurchase agreement (including accrued interest). In the event of a default by the counterparty, realization of the collateral proceeds could be delayed, during which time the value of the collateral may decline.
Not Part of Financial Report
Notes to Financial Statements (Unaudited) - continued
2. Operating Policies - continued
Delayed Delivery Transactions and When-Issued Securities. The Fund may purchase or sell securities on a delayed delivery or when-issued basis. Payment and delivery may take place after the customary settlement period for that security. The price of the underlying securities and the date when the securities will be delivered and paid for are fixed at the time the transaction is negotiated. During the time a delayed delivery sell is outstanding, the contract is marked-to-market daily and equivalent deliverable securities are held for the transaction. The value of the securities purchased on a delayed delivery or when-issued basis are identified as such in the Fund's Schedule of Investments. The Fund may receive compensation for interest forgone in the purchase of a delayed delivery or when-issued security. With respect to purchase commitments, the Fund identifies securities as segregated in its records with a value at least equal to the amount of the commitment. Losses may arise due to changes in the value of the underlying securities or if the counterparty does not perform under the contract's terms, or if the issuer does not issue the securities due to political, economic, or other factors.
Restricted Securities. The Fund may invest in securities that are subject to legal or contractual restrictions on resale. These securities generally may be resold in transactions exempt from registration or to the public if the securities are registered. Disposal of these securities may involve time-consuming negotiations and expense, and prompt sale at an acceptable price may be difficult. Information regarding restricted securities is included at the end of the Fund's Schedule of Investments.
Swap Agreements. The Fund may invest in swaps for the purpose of managing its exposure to interest rate, credit or market risk.
Interest rate swaps are agreements to exchange cash flows periodically based on a notional principal amount, for example, the exchange of fixed rate interest payments for floating rate interest payments. Periodic payments received or made by the Fund are recorded in the accompanying Statement of Operations as realized gains or losses, respectively. The primary risk associated with interest rate swaps is that unfavorable changes in the fluctuation of interest rates could adversely impact a fund.
Total return swaps are agreements to exchange the return generated by one instrument or index for the return generated by another instrument, for example, the agreement to pay interest in exchange for a market-linked return based on a notional amount. To the extent the total return of the index exceeds the offsetting interest obligation, a fund will receive a payment from the counterparty. To the extent it is less, a fund will make a payment to the counterparty. Periodic payments received or made by the Fund are recorded in the accompanying Statement of Operations as realized gains or losses, respectively.
Credit default swaps involve the exchange of a fixed rate premium for protection against the loss in value of an underlying debt instrument in the event of a defined credit event (such as payment default or bankruptcy). Under the terms of the swap, one party acts as a "guarantor" receiving a periodic payment that is a fixed percentage applied to a notional principal amount. In return the party agrees to purchase the notional amount of the underlying instrument, at par, if a credit event occurs during the term of the swap. The Fund may enter into credit default swaps in which either it or its counterparty act as guarantors. By acting as the guarantor of a swap, a fund assumes the market and credit risk of the underlying instrument including liquidity and loss of value. Periodic payments and premiums received or made by the Fund are recorded in the accompanying Statement of Operations as realized gains or losses, respectively.
Swaps are marked-to-market daily based on dealer-supplied valuations and changes in value are recorded as unrealized appreciation (depreciation). Gains or losses are realized upon early termination of the swap agreement. Collateral, in the form of cash or securities, may be required to be held in segregated accounts with a fund's custodian in compliance with swap contracts. Risks may exceed amounts recognized on the Statement of Assets and Liabilities. These risks include changes in the returns of the underlying instruments, failure of the counterparties to perform under the contracts' terms and the possible lack of liquidity with respect to the swap agreements. Details of swap agreements open at period end are included in the Fund's Schedule of Investments under the caption "Swap Agreements."
Mortgage Dollar Rolls. To earn additional income, the Fund may employ trading strategies which involve the sale and simultaneous agreement to repurchase similar securities ("mortgage dollar rolls") or the purchase and simultaneous agreement to sell similar securities ("reverse mortgage dollar rolls"). The securities traded are mortgage securities and bear the same interest rate but may be collateralized by different pools of mortgages. During the period between the sale and repurchase in a mortgage dollar roll transaction, a fund will not be entitled to receive interest and principal payments on the securities sold but will invest the proceeds of the sale in other securities which may enhance the yield and total return. In addition, the difference between the sale price and the future purchase price is recorded as an adjustment to investment income. During the period between the purchase and subsequent sale in a reverse mortgage dollar roll transaction a fund is entitled to interest and principal payments on the securities purchased. The price differential between the purchase and sale is recorded as an adjustment to investment income. Losses may arise due to changes in the value of the securities or if the counterparty does not perform under the terms of the agreement. If the counterparty files for bankruptcy or becomes insolvent, a fund's right to repurchase or sell securities may be limited.
Not Part of Financial Report
3. Purchases and Sales of Investments.
Purchases and sales of securities, other than short-term securities, U.S. government securities, and in-kind transactions, aggregated $212,658,889 and $2,348,720, respectively.
4. Fees and Other Transactions with Affiliates.
Management Fee and Expense Contract. Fidelity Investments Money Management, Inc. (FIMM) an affiliate of FMR, provides the Fund with investment management services. The Fund does not pay any fees for these services. Pursuant to the Fund's management contract with FIMM, FMR pays FIMM a portion of the management fees it receives from the Investing Funds. In addition, under an expense contract FMR pays all other expenses of the Fund, excluding custody fees, the compensation of the independent Trustees, and certain exceptions such as interest expense.
Investments in Fidelity Central Funds. The Fund may invest in other Fidelity Central Funds managed by FIMM, including the Fidelity Ultra-Short Central Fund (Ultra-Short Central Fund), which seeks to obtain a high level of current income consistent with preservation of capital by investing in U.S. dollar denominated money market and investment-grade debt securities.
A complete unaudited list of holdings for the Ultra-Short Central Fund, as of the Fund's report date, is available upon request or at advisor.fidelity.com. The reports are located just after the Fund's financial statements and quarterly reports but are not part of the financial statements or quarterly reports. In addition, the Ultra-Short Central Fund's financial statements are available on the EDGAR Database on the SEC's web site, www.sec.gov, or upon request.
Share Transactions. On June 23, 2006, the Investing Funds completed a non-taxable exchange with the Fund. The Investing Funds delivered securities with a value, including accrued interest, of $2,367,627,479 (which included $87,398,006 of unrealized depreciation) in exchange for 23,676,275 shares (each then valued at $100.00 per share) of the Fund, as presented in the accompanying Statement of Changes in Net Assets. This is considered a non-taxable exchange for federal income tax purposes, with no gain or loss recognized by the Fund or its shareholders.
5. Other.
The Fund's organizational documents provide former and current trustees and officers with a limited indemnification against liabilities arising in connection with the performance of their duties to the Fund. In the normal course of business, the Fund may also enter into contracts that provide general indemnifications. The Fund's maximum exposure under these arrangements is unknown as this would be dependent on future claims that may be made against the Fund. The risk of material loss from such claims is considered remote.
At the end of the period, mutual funds managed by FMR or an FMR affiliate were the owners of record of all of the outstanding shares of the Fund according to the following schedule:
Fund | Ownership % |
VIP Asset Manager Portfolio | 29.5% |
VIP Asset Manager: Growth Portfolio | 1.6% |
VIP Balanced Portfolio | 4.0% |
VIP Investment Grade Bond Portfolio | 64.9% |
Not Part of Financial Report
Not Part of Financial Report
Not Part of Financial Report
Not Part of Financial Report
Investment Adviser
Fidelity Management & Research Company
Boston, MA
Investment Sub-Adviser
Fidelity Investments Money Management, Inc.
Fidelity Research & Analysis Company
(formerly Fidelity Management & Research (Far East) Inc.)
Fidelity International Investment Advisors
Fidelity International Investment Advisors (U.K.) Limited
General Distributor
Fidelity Distributors Corporation
Boston, MA
Transfer and Service Agents
Fidelity Investments Institutional Operations Co., Inc.
Boston, MA
Fidelity Service Company, Inc.
Boston, MA
Custodian
The Bank of New York
New York, NY
VIPIGB-SANN-0806
1.705629.108
Item 2. Code of Ethics
Not applicable.
Item 3. Audit Committee Financial Expert
Not applicable.
Item 4. Principal Accountant Fees and Services
Not applicable.
Item 5. Audit Committee of Listed Registrants
Not applicable.
Item 6. Schedule of Investments
Not applicable.
Item 7. Disclosure of Proxy Voting Policies and Procedures for Closed-End Management Investment Companies
Not applicable.
Item 8. Portfolio Managers of Closed-End Management Investment Companies
Not applicable.
Item 9. Purchase of Equity Securities by Closed-End Management Investment Company and Affiliated Purchasers
Not applicable.
Item 10. Submission of Matters to a Vote of Security Holders
There were no material changes to the procedures by which shareholders may recommend nominees to the Variable Insurance Products Fund II: Investment Grade Bond Portfolio's Board of Trustees.
Item 11. Controls and Procedures
(a)(i) The President and Treasurer and the Chief Financial Officer have concluded that the Variable Insurance Products Fund II: Investment Grade Bond Portfolio's (the "Fund") disclosure controls and procedures (as defined in Rule 30a-3(c) under the Investment Company Act) provide reasonable assurances that material information relating to the Fund is made known to them by the appropriate persons, based on their evaluation of these controls and procedures as of a date within 90 days of the filing date of this report.
(a)(ii) There was no change in the Fund's internal control over financial reporting (as defined in Rule 30a-3(d) under the Investment Company Act) that occurred during the second fiscal quarter of the period covered by this report that has materially affected, or is reasonably likely to materially affect, the Fund's internal control over financial reporting.
Item 12. Exhibits
(a) | (1) | Not applicable. |
(a) | (2) | Certification pursuant to Rule 30a-2(a) under the Investment Company Act of 1940 (17 CFR 270.30a-2(a)) is filed and attached hereto as Exhibit 99.CERT. |
(a) | (3) | Not applicable. |
(b) | | Certification pursuant to Rule 30a-2(b) under the Investment Company Act of 1940 (17 CFR 270.30a-2(b)) is furnished and attached hereto as Exhibit 99.906CERT. |
SIGNATURES
Pursuant to the requirements of the Securities Exchange Act of 1934 and the Investment Company Act of 1940, the registrant has duly caused this report to be signed on its behalf by the undersigned, thereunto duly authorized.
Variable Insurance Products Fund II
By: | /s/Christine Reynolds |
| Christine Reynolds |
| President and Treasurer |
| |
Date: | August 22, 2006 |
Pursuant to the requirements of the Securities Exchange Act of 1934 and the Investment Company Act of 1940, this report has been signed below by the following persons on behalf of the registrant and in the capacities and on the dates indicated.
By: | /s/Christine Reynolds |
| Christine Reynolds |
| President and Treasurer |
| |
Date: | August 22, 2006 |
By: | /s/Joseph B. Hollis |
| Joseph B. Hollis |
| Chief Financial Officer |
| |
Date: | August 22, 2006 |