As filed with the Securities and Exchange Commission on 11/12/2024
UNITED STATES
SECURITIES AND EXCHANGE COMMISSION
Washington, D.C. 20549
FORM N-CSR
CERTIFIED SHAREHOLDER REPORT OF REGISTERED
MANAGEMENT INVESTMENT COMPANIES
811-05518
Investment Company Act file number
The RBB FUND, INC.
(Exact name of registrant as specified in charter)
615 East Michigan Street
Milwaukee, WI 53202
(Address of principal executive offices) (Zip code)
Steven Plump, President
c/o U.S. Bank Global Fund Services
615 East Michigan Street
Milwaukee, WI 53202
(Name and address of agent for service)
(609) 731-6256
Registrant's telephone number, including area code
Date of fiscal year end: August 31
Date of reporting period: August 31, 2024
Item 1. Reports to Stockholders.
0000831114 rbb:SP500TotalReturnIndex26Member 2023-09-01 2024-08-31 0000831114 rbb:Russell3000ValueTotalReturnIndex10Member 2020-08-31
| | |
| Abbey Capital Futures Strategy Fund | |
Class I | ABYIX |
Annual Shareholder Report | August 31, 2024 |
This annual shareholder report contains important information about the Abbey Capital Futures Strategy Fund (the “Fund”) for the period of September 1, 2023, to August 31, 2024. You can find additional information about the Fund at https://www.abbeycapital.com/abbey-capital-futures-strategy-fund/. You can also request this information by contacting us at 1-844-261-6484.
This report describes changes to the Fund that occurred during the reporting period.
WHAT WERE THE FUND COSTS FOR THE PAST YEAR? (based on a hypothetical $10,000 investment)
| | |
Class Name | Costs of a $10,000 investment | Costs paid as a percentage of a $10,000 investment |
| Class I | $178 | 1.79% |
HOW DID THE FUND PERFORM LAST YEAR AND WHAT AFFECTED ITS PERFORMANCE?
The Fund saw negative performance for the one-year period ended August 31, 2024. The Fund’s Diversified Trendfollowing trading advisers were the primary source of negative performance at the trading style level.
At the market sector level, the Fund saw losses in fixed income and major currencies. Uncertainty about the timing of potential interest rate cuts by central banks was a key factor influencing these markets. This uncertainty contributed to a lack of clear price trends and several price reversals that proved challenging for some of the Fund’s underlying trading advisers. Performance across energy and metals markets was also negative.
The Fund did capture gains in agricultural commodities and equities. Strong price uptrends in cocoa were the primary source of gains within agricultural commodities. Meanwhile, long positions across equity indices also resulted in gains as global stocks reached new record highs during the period.
| |
Top Contributors |
| ↑ | Agricultural Commodities |
| ↑ | Equity indices |
| |
Top Detractors |
| ↓ | Currencies |
| ↓ | Fixed Income |
| ↓ | Energy |
| ↓ | Metals |
HOW DID THE FUND PERFORM OVER THE PAST 10 YEARS?*
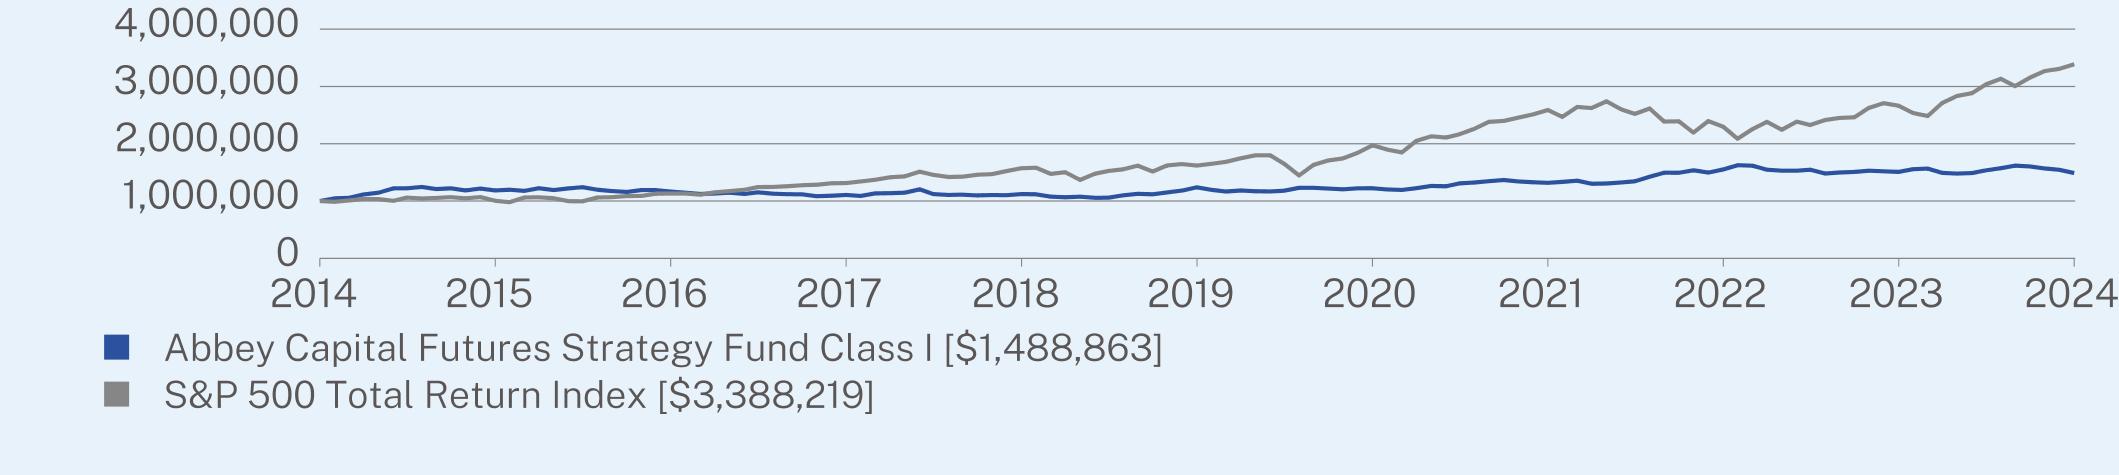
The $1,000,000 chart reflects a hypothetical $1,000,000 investment in the class of shares noted. The chart uses total return NAV performance and assumes reinvestment of dividends and capital gains. Fund expenses, including management fees and other expenses, were deducted.
| Abbey Capital Futures Strategy Fund | PAGE 1 | TSR-AR-74925K367 |
CUMULATIVE PERFORMANCE (Initial Investment of $1,000,000)
| | 08/31/2014 | 09/30/2014 | 10/31/2014 | 11/30/2014 | 12/31/2014 | 01/31/2015 | 02/28/2015 | 03/31/2015 | 04/30/2015 | 05/31/2015 | 06/30/2015 | 07/31/2015 | 08/31/2015 | 09/30/2015 | 10/31/2015 | 11/30/2015 | 12/31/2015 | 01/31/2016 | 02/29/2016 | 03/31/2016 | 04/30/2016 | 05/31/2016 | 06/30/2016 | 07/31/2016 | 08/31/2016 | 09/30/2016 | 10/31/2016 | 11/30/2016 | 12/31/2016 | 01/31/2017 | 02/28/2017 | 03/31/2017 | 04/30/2017 | 05/31/2017 | 06/30/2017 | 07/31/2017 | 08/31/2017 | 09/30/2017 | 10/31/2017 | 11/30/2017 | 12/31/2017 | 01/31/2018 | 02/28/2018 | 03/31/2018 | 04/30/2018 | 05/31/2018 | 06/30/2018 | 07/31/2018 | 08/31/2018 | 09/30/2018 | 10/31/2018 | 11/30/2018 | 12/31/2018 | 01/31/2019 | 02/28/2019 | 03/31/2019 | 04/30/2019 | 05/31/2019 | 06/30/2019 | 07/31/2019 | 08/31/2019 | 09/30/2019 | 10/31/2019 | 11/30/2019 | 12/31/2019 | 01/31/2020 | 02/29/2020 | 03/31/2020 | 04/30/2020 | 05/31/2020 | 06/30/2020 | 07/31/2020 | 08/31/2020 | 09/30/2020 | 10/31/2020 | 11/30/2020 | 12/31/2020 | 01/31/2021 | 02/28/2021 | 03/31/2021 | 04/30/2021 | 05/31/2021 | 06/30/2021 | 07/31/2021 | 08/31/2021 | 09/30/2021 | 10/31/2021 | 11/30/2021 | 12/31/2021 | 01/31/2022 | 02/28/2022 | 03/31/2022 | 04/30/2022 | 05/31/2022 | 06/30/2022 | 07/31/2022 | 08/31/2022 | 09/30/2022 | 10/31/2022 | 11/30/2022 | 12/31/2022 | 01/31/2023 | 02/28/2023 | 03/31/2023 | 04/30/2023 | 05/31/2023 | 06/30/2023 | 07/31/2023 | 08/31/2023 | 09/30/2023 | 10/31/2023 | 11/30/2023 | 12/31/2023 | 01/31/2024 | 02/29/2024 | 03/31/2024 | 04/30/2024 | 05/31/2024 | 06/30/2024 | 07/31/2024 | 08/31/2024 |
| Abbey Capital Futures Strategy Fund Class I | 10,00,000 | 10,46,332 | 10,55,985 | 11,15,830 | 11,45,165 | 12,21,969 | 12,21,969 | 12,46,586 | 12,09,168 | 12,21,969 | 11,85,536 | 12,18,030 | 11,84,552 | 11,97,352 | 11,77,659 | 12,23,938 | 11,92,330 | 12,20,954 | 12,42,668 | 11,97,265 | 11,73,576 | 11,58,771 | 11,91,343 | 11,90,356 | 11,64,693 | 11,45,940 | 11,23,238 | 11,31,134 | 11,46,927 | 11,24,225 | 11,51,862 | 11,29,160 | 11,19,290 | 11,17,316 | 10,84,744 | 10,92,640 | 11,06,459 | 10,89,679 | 11,34,095 | 11,37,056 | 11,45,940 | 12,05,161 | 11,22,251 | 11,06,459 | 11,11,394 | 10,98,562 | 11,04,484 | 11,02,510 | 11,21,264 | 11,18,303 | 10,76,848 | 10,65,990 | 10,75,426 | 10,56,645 | 10,58,622 | 11,01,125 | 11,26,825 | 11,17,929 | 11,50,547 | 11,82,177 | 12,40,495 | 11,96,016 | 11,66,362 | 11,84,154 | 11,70,632 | 11,67,407 | 11,80,307 | 12,30,830 | 12,30,830 | 12,17,930 | 12,05,031 | 12,22,230 | 12,23,305 | 12,01,806 | 11,94,281 | 12,23,305 | 12,63,395 | 12,57,936 | 13,08,166 | 13,23,453 | 13,46,384 | 13,67,131 | 13,42,016 | 13,27,821 | 13,17,993 | 13,34,373 | 13,55,120 | 13,01,614 | 13,05,970 | 13,24,077 | 13,44,447 | 14,24,797 | 14,94,962 | 14,93,830 | 15,36,834 | 14,96,094 | 15,51,546 | 16,25,106 | 16,17,184 | 15,47,020 | 15,29,643 | 15,29,643 | 15,47,900 | 14,80,090 | 14,98,346 | 15,07,474 | 15,29,643 | 15,19,211 | 15,08,779 | 15,55,724 | 15,66,156 | 14,91,826 | 14,79,549 | 14,88,863 | 15,35,431 | 15,74,017 | 16,17,924 | 16,03,288 | 15,70,025 | 15,44,745 | 14,88,863 |
| S&P 500 Total Return Index | 10,00,000 | 9,85,976 | 10,10,059 | 10,37,224 | 10,34,611 | 10,03,553 | 10,61,229 | 10,44,446 | 10,54,466 | 10,68,025 | 10,47,350 | 10,69,294 | 10,04,779 | 9,79,917 | 10,62,577 | 10,65,737 | 10,48,929 | 9,96,876 | 9,95,531 | 10,63,066 | 10,67,188 | 10,86,352 | 10,89,167 | 11,29,323 | 11,30,909 | 11,31,123 | 11,10,490 | 11,51,617 | 11,74,380 | 11,96,654 | 12,44,168 | 12,45,619 | 12,58,411 | 12,76,121 | 12,84,086 | 13,10,490 | 13,14,502 | 13,41,617 | 13,72,925 | 14,15,032 | 14,30,765 | 15,12,682 | 14,56,929 | 14,19,904 | 14,25,352 | 14,59,677 | 14,68,661 | 15,23,316 | 15,72,953 | 15,81,907 | 14,73,783 | 15,03,816 | 13,68,035 | 14,77,664 | 15,25,109 | 15,54,745 | 16,17,696 | 15,14,894 | 16,21,658 | 16,44,965 | 16,18,908 | 16,49,199 | 16,84,920 | 17,46,081 | 17,98,781 | 17,98,076 | 16,50,059 | 14,46,256 | 16,31,657 | 17,09,370 | 17,43,364 | 18,41,664 | 19,74,044 | 18,99,037 | 18,48,534 | 20,50,882 | 21,29,735 | 21,08,233 | 21,66,368 | 22,61,245 | 23,81,925 | 23,98,561 | 24,54,555 | 25,12,863 | 25,89,268 | 24,68,842 | 26,41,813 | 26,23,508 | 27,41,084 | 25,99,241 | 25,21,416 | 26,15,035 | 23,86,999 | 23,91,378 | 21,93,985 | 23,96,280 | 22,98,555 | 20,86,861 | 22,55,816 | 23,81,881 | 22,44,650 | 23,85,690 | 23,27,482 | 24,12,933 | 24,50,595 | 24,61,247 | 26,23,875 | 27,08,167 | 26,65,049 | 25,37,985 | 24,84,620 | 27,11,528 | 28,34,715 | 28,82,350 | 30,36,255 | 31,33,945 | 30,05,941 | 31,54,989 | 32,68,197 | 33,07,979 | 33,88,219 |
ANNUAL AVERAGE TOTAL RETURN (%)
| | | |
| | 1 Year | 5 Years | 10 Years |
Class I | -1.32 | 3.72 | 4.06 |
S&P 500 Total Return Index | 27.14 | 15.92 | 12.98 |
Visit https://www.abbeycapital.com/abbey-capital-futures-strategy-fund/ for more recent performance information.
| * | The Fund’s past performance is not a good predictor of how the Fund will perform in the future. The graph and table do not reflect the deduction of taxes that a shareholder would pay on Fund distributions or redemption of Fund shares. |
KEY FUND STATISTICS (as of August 31, 2024)
| |
Net Assets | $2,713,572,669 |
Number of Holdings | 1,015 |
Net Advisory Fee | $46,899,087 |
Portfolio Turnover | 0% |
Visit https://www.abbeycapital.com/abbey-capital-futures-strategy-fund/ for more recent performance information.
WHAT DID THE FUND INVEST IN? (as of August 31, 2024)
| |
Market Group | Risk Allocation (% of overall Value at Risk) |
Agricultural Products | 7.5% |
Currency | 19.1% |
Energy | 12.8% |
Equity | 27.8% |
Fixed Income | 21.9% |
Metals | 10.8% |
The data shown relates to the positions held by the Fund and its wholly owned and controlled subsidiaries and does not take into account any other assets held by the Fund (primarily cash and cash-equivalents). The Fund is actively managed and percentages may vary over time.
Value at Risk Definition: Value-at-Risk (VaR) expresses market risk as a percentage of a portfolio’s value. The VaR figures quoted are as of August 31, 2024, based on a historic VaR calculation with a 5-year lookback period (1300 days), calculated at the 95th percentile. The historical approach to evaluating a portfolio’s VaR involves applying the current positions to the historical portfolio prices of the corresponding instruments, and then calculating how the current positioning would have performed historically. For any chosen threshold value, the hypothetical returns then provide an estimate of the current VaR figure.
MATERIAL FUND CHANGES:
This is a summary of certain changes to the Fund since September 1, 2023. For more complete information, you may review the Fund’s next prospectus, which we expect to be available by December 31, 2024 at https://www.abbeycapital.com/abbey-capital-futures-strategy-fund/ or upon request at 1-844-261-6482.
On April 29, 2024, QMS Capital Management LP began serving as a trading adviser to the Fund.
| Abbey Capital Futures Strategy Fund | PAGE 2 | TSR-AR-74925K367 |
For additional information about the Fund; including its prospectus, financial information, holdings and proxy information, scan the QR code or visit https://www.abbeycapital.com/abbey-capital-futures-strategy-fund/
HOUSEHOLDING
To reduce Fund expenses, only one copy of most shareholder documents may be mailed to shareholders with multiple accounts at the same address (Householding). If you would prefer that your Fund documents not be householded, please contact the Fund at 1-844-261-6484, or contact your financial intermediary. Your instructions will typically be effective within 30 days of receipt by the Fund or your financial intermediary.
| Abbey Capital Futures Strategy Fund | PAGE 3 | TSR-AR-74925K367 |
1000000118455211646931106459112126412404951223305131799315515461508779148886310000001004779113090913145021572953161890819740442589268229855526650493388219
| | |
| Abbey Capital Futures Strategy Fund | |
Class A | ABYAX |
Annual Shareholder Report | August 31, 2024 |
This annual shareholder report contains important information about the Abbey Capital Futures Strategy Fund (the “Fund”) for the period of September 1, 2023, to August 31, 2024. You can find additional information about the Fund at https://www.abbeycapital.com/abbey-capital-futures-strategy-fund/. You can also request this information by contacting us at 1-844-261-6484.
This report describes changes to the Fund that occurred during the reporting period.
WHAT WERE THE FUND COSTS FOR THE PAST YEAR? (based on a hypothetical $10,000 investment)
| | |
Class Name | Costs of a $10,000 investment | Costs paid as a percentage of a $10,000 investment |
| Class A | $202 | 2.04% |
HOW DID THE FUND PERFORM LAST YEAR AND WHAT AFFECTED ITS PERFORMANCE?
The Fund saw negative performance for the one-year period ended August 31, 2024. The Fund’s Diversified Trendfollowing trading advisers were the primary source of negative performance at the trading style level.
At the market sector level, the Fund saw losses in fixed income and major currencies. Uncertainty about the timing of potential interest rate cuts by central banks was a key factor influencing these markets. This uncertainty contributed to a lack of clear price trends and several price reversals that proved challenging for some of the Fund’s underlying trading advisers. Performance across energy and metals markets was also negative.
The Fund did capture gains in agricultural commodities and equities. Strong price uptrends in cocoa were the primary source of gains within agricultural commodities. Meanwhile, long positions across equity indices also resulted in gains as global stocks reached new record highs during the period.
| |
Top Contributors |
| ↑ | Agricultural Commodities |
| ↑ | Equity indices |
| |
Top Detractors |
| ↓ | Currencies |
| ↓ | Fixed Income |
| ↓ | Energy |
| ↓ | Metals |
HOW DID THE FUND PERFORM OVER THE PAST 10 YEARS?*
The $10,000 chart reflects a hypothetical $10,000 investment in the class of shares noted and assumes the maximum sales charge. The chart uses total return NAV performance and assumes reinvestment of dividends and capital gains. Fund expenses, including 12b-1 fees, management fees and other expenses, were deducted.
| Abbey Capital Futures Strategy Fund | PAGE 1 | TSR-AR-74925K375 |
CUMULATIVE PERFORMANCE (Initial Investment of $10,000)
| | 08/31/2014 | 09/30/2014 | 10/31/2014 | 11/30/2014 | 12/31/2014 | 01/31/2015 | 02/28/2015 | 03/31/2015 | 04/30/2015 | 05/31/2015 | 06/30/2015 | 07/31/2015 | 08/31/2015 | 09/30/2015 | 10/31/2015 | 11/30/2015 | 12/31/2015 | 01/31/2016 | 02/29/2016 | 03/31/2016 | 04/30/2016 | 05/31/2016 | 06/30/2016 | 07/31/2016 | 08/31/2016 | 09/30/2016 | 10/31/2016 | 11/30/2016 | 12/31/2016 | 01/31/2017 | 02/28/2017 | 03/31/2017 | 04/30/2017 | 05/31/2017 | 06/30/2017 | 07/31/2017 | 08/31/2017 | 09/30/2017 | 10/31/2017 | 11/30/2017 | 12/31/2017 | 01/31/2018 | 02/28/2018 | 03/31/2018 | 04/30/2018 | 05/31/2018 | 06/30/2018 | 07/31/2018 | 08/31/2018 | 09/30/2018 | 10/31/2018 | 11/30/2018 | 12/31/2018 | 01/31/2019 | 02/28/2019 | 03/31/2019 | 04/30/2019 | 05/31/2019 | 06/30/2019 | 07/31/2019 | 08/31/2019 | 09/30/2019 | 10/31/2019 | 11/30/2019 | 12/31/2019 | 01/31/2020 | 02/29/2020 | 03/31/2020 | 04/30/2020 | 05/31/2020 | 06/30/2020 | 07/31/2020 | 08/31/2020 | 09/30/2020 | 10/31/2020 | 11/30/2020 | 12/31/2020 | 01/31/2021 | 02/28/2021 | 03/31/2021 | 04/30/2021 | 05/31/2021 | 06/30/2021 | 07/31/2021 | 08/31/2021 | 09/30/2021 | 10/31/2021 | 11/30/2021 | 12/31/2021 | 01/31/2022 | 02/28/2022 | 03/31/2022 | 04/30/2022 | 05/31/2022 | 06/30/2022 | 07/31/2022 | 08/31/2022 | 09/30/2022 | 10/31/2022 | 11/30/2022 | 12/31/2022 | 01/31/2023 | 02/28/2023 | 03/31/2023 | 04/30/2023 | 05/31/2023 | 06/30/2023 | 07/31/2023 | 08/31/2023 | 09/30/2023 | 10/31/2023 | 11/30/2023 | 12/31/2023 | 01/31/2024 | 02/29/2024 | 03/31/2024 | 04/30/2024 | 05/31/2024 | 06/30/2024 | 07/31/2024 | 08/31/2024 |
| Abbey Capital Futures Strategy Fund Class A | 9,427 | 9,864 | 9,945 | 10,519 | 10,787 | 11,511 | 11,501 | 11,733 | 11,381 | 11,492 | 11,149 | 11,455 | 11,140 | 11,260 | 11,065 | 11,501 | 11,202 | 11,462 | 11,675 | 11,248 | 11,016 | 10,877 | 11,183 | 11,165 | 10,924 | 10,747 | 10,524 | 10,608 | 10,747 | 10,534 | 10,794 | 10,571 | 10,478 | 10,459 | 10,153 | 10,218 | 10,357 | 10,200 | 10,608 | 10,636 | 10,719 | 11,267 | 10,487 | 10,330 | 10,385 | 10,265 | 10,311 | 10,292 | 10,469 | 10,441 | 10,051 | 9,940 | 10,023 | 9,847 | 9,865 | 10,255 | 10,497 | 10,413 | 10,710 | 11,007 | 11,555 | 11,128 | 10,849 | 11,016 | 10,891 | 10,861 | 10,972 | 11,435 | 11,435 | 11,314 | 11,193 | 11,344 | 11,365 | 11,163 | 11,083 | 11,355 | 11,717 | 11,666 | 12,126 | 12,269 | 12,484 | 12,678 | 12,432 | 12,300 | 12,208 | 12,351 | 12,545 | 12,054 | 12,089 | 12,248 | 12,428 | 13,179 | 13,824 | 13,803 | 14,205 | 13,824 | 14,331 | 15,008 | 14,934 | 14,289 | 14,124 | 14,112 | 14,283 | 13,661 | 13,819 | 13,904 | 14,100 | 14,002 | 13,904 | 14,331 | 14,417 | 13,734 | 13,623 | 13,697 | 14,116 | 14,473 | 14,880 | 14,744 | 14,424 | 14,202 | 13,673 |
| S&P 500 Total Return Index | 10,000 | 9,860 | 10,101 | 10,372 | 10,346 | 10,036 | 10,612 | 10,444 | 10,545 | 10,680 | 10,474 | 10,693 | 10,048 | 9,799 | 10,626 | 10,657 | 10,489 | 9,969 | 9,955 | 10,631 | 10,672 | 10,864 | 10,892 | 11,293 | 11,309 | 11,311 | 11,105 | 11,516 | 11,744 | 11,967 | 12,442 | 12,456 | 12,584 | 12,761 | 12,841 | 13,105 | 13,145 | 13,416 | 13,729 | 14,150 | 14,308 | 15,127 | 14,569 | 14,199 | 14,254 | 14,597 | 14,687 | 15,233 | 15,730 | 15,819 | 14,738 | 15,038 | 13,680 | 14,777 | 15,251 | 15,547 | 16,177 | 15,149 | 16,217 | 16,450 | 16,189 | 16,492 | 16,849 | 17,461 | 17,988 | 17,981 | 16,501 | 14,463 | 16,317 | 17,094 | 17,434 | 18,417 | 19,740 | 18,990 | 18,485 | 20,509 | 21,297 | 21,082 | 21,664 | 22,612 | 23,819 | 23,986 | 24,546 | 25,129 | 25,893 | 24,688 | 26,418 | 26,235 | 27,411 | 25,992 | 25,214 | 26,150 | 23,870 | 23,914 | 21,940 | 23,963 | 22,986 | 20,869 | 22,558 | 23,819 | 22,446 | 23,857 | 23,275 | 24,129 | 24,506 | 24,612 | 26,239 | 27,082 | 26,650 | 25,380 | 24,846 | 27,115 | 28,347 | 28,824 | 30,363 | 31,339 | 30,059 | 31,550 | 32,682 | 33,080 | 33,882 |
ANNUAL AVERAGE TOTAL RETURN (%)
| | | |
| | 1 Year | 5 Years | 10 Years |
Class A (without sales charge) | -1.67 | 3.42 | 3.79 |
Class A (with sales charge) | -7.36 | 2.21 | 3.18 |
S&P 500 Total Returns Index | 27.14 | 15.92 | 12.98 |
Visit https://www.abbeycapital.com/abbey-capital-futures-strategy-fund/ for more recent performance information.
| * | The Fund’s past performance is not a good predictor of how the Fund will perform in the future. The graph and table do not reflect the deduction of taxes that a shareholder would pay on Fund distributions or redemption of Fund shares. |
KEY FUND STATISTICS (as of August 31, 2024)
| |
Net Assets | $2,713,572,669 |
Number of Holdings | 1,015 |
Net Advisory Fee | $46,899,087 |
Portfolio Turnover | 0% |
Visit https://www.abbeycapital.com/abbey-capital-futures-strategy-fund/ for more recent performance information.
WHAT DID THE FUND INVEST IN? (as of August 31, 2024)
| |
Market Group | Risk Allocation (% of overall Value at Risk) |
Agricultural Products | 7.5% |
Currency | 19.1% |
Energy | 12.8% |
Equity | 27.8% |
Fixed Income | 21.9% |
Metals | 10.8% |
The data shown relates to the positions held by the Fund and its wholly owned and controlled subsidiaries and does not take into account any other assets held by the Fund (primarily cash and cash-equivalents). The Fund is actively managed and percentages may vary over time.
Value at Risk Definition: Value-at-Risk (VaR) expresses market risk as a percentage of a portfolio’s value. The VaR figures quoted are as of August 31, 2024, based on a historic VaR calculation with a 5-year lookback period (1300 days), calculated at the 95th percentile. The historical approach to evaluating a portfolio’s VaR involves applying the current positions to the historical portfolio prices of the corresponding instruments, and then calculating how the current positioning would have performed historically. For any chosen threshold value, the hypothetical returns then provide an estimate of the current VaR figure.
MATERIAL FUND CHANGES:
This is a summary of certain changes to the Fund since September 1, 2023. For more complete information, you may review the Fund’s next prospectus, which we expect to be available by December 31, 2024 at https://www.abbeycapital.com/abbey-capital-futures-strategy-fund/ or upon request at 1-844-261-6482.
| Abbey Capital Futures Strategy Fund | PAGE 2 | TSR-AR-74925K375 |
On April 29, 2024, QMS Capital Management LP began serving as a trading adviser to the Fund.
For additional information about the Fund; including its prospectus, financial information, holdings and proxy information, scan the QR code or visit https://www.abbeycapital.com/abbey-capital-futures-strategy-fund/
HOUSEHOLDING
To reduce Fund expenses, only one copy of most shareholder documents may be mailed to shareholders with multiple accounts at the same address (Householding). If you would prefer that your Fund documents not be householded, please contact the Fund at 1-844-261-6484, or contact your financial intermediary. Your instructions will typically be effective within 30 days of receipt by the Fund or your financial intermediary.
| Abbey Capital Futures Strategy Fund | PAGE 3 | TSR-AR-74925K375 |
9427111401092410357104691155511365122081433113904136731000010048113091314515730161891974025893229862665033882
| | |
| Abbey Capital Futures Strategy Fund | |
Class C | ABYCX |
Annual Shareholder Report | August 31, 2024 |
This annual shareholder report contains important information about the Abbey Capital Futures Strategy Fund (the “Fund”) for the period of September 1, 2023, to August 31, 2024. You can find additional information about the Fund at https://www.abbeycapital.com/abbey-capital-futures-strategy-fund/. You can also request this information by contacting us at 1-844-261-6484.
This report describes changes to the Fund that occurred during the reporting period.
WHAT WERE THE FUND COSTS FOR THE PAST YEAR? (based on a hypothetical $10,000 investment)
| | |
Class Name | Costs of a $10,000 investment | Costs paid as a percentage of a $10,000 investment |
| Class C | $276 | 2.79% |
HOW DID THE FUND PERFORM LAST YEAR AND WHAT AFFECTED ITS PERFORMANCE?
The Fund saw negative performance for the one-year period ended August 31, 2024. The Fund’s Diversified Trendfollowing trading advisers were the primary source of negative performance at the trading style level.
At the market sector level, the Fund saw losses in fixed income and major currencies. Uncertainty about the timing of potential interest rate cuts by central banks was a key factor influencing these markets. This uncertainty contributed to a lack of clear price trends and several price reversals that proved challenging for some of the Fund’s underlying trading advisers. Performance across energy and metals markets was also negative.
The Fund did capture gains in agricultural commodities and equities. Strong price uptrends in cocoa were the primary source of gains within agricultural commodities. Meanwhile, long positions across equity indices also resulted in gains as global stocks reached new record highs during the period.
| |
Top Contributors |
| ↑ | Agricultural Commodities |
| ↑ | Equity indices |
| |
Top Detractors |
| ↓ | Currencies |
| ↓ | Fixed Income |
| ↓ | Energy |
| ↓ | Metals |
HOW DID THE FUND PERFORM OVER THE PAST TEN YEARS?*
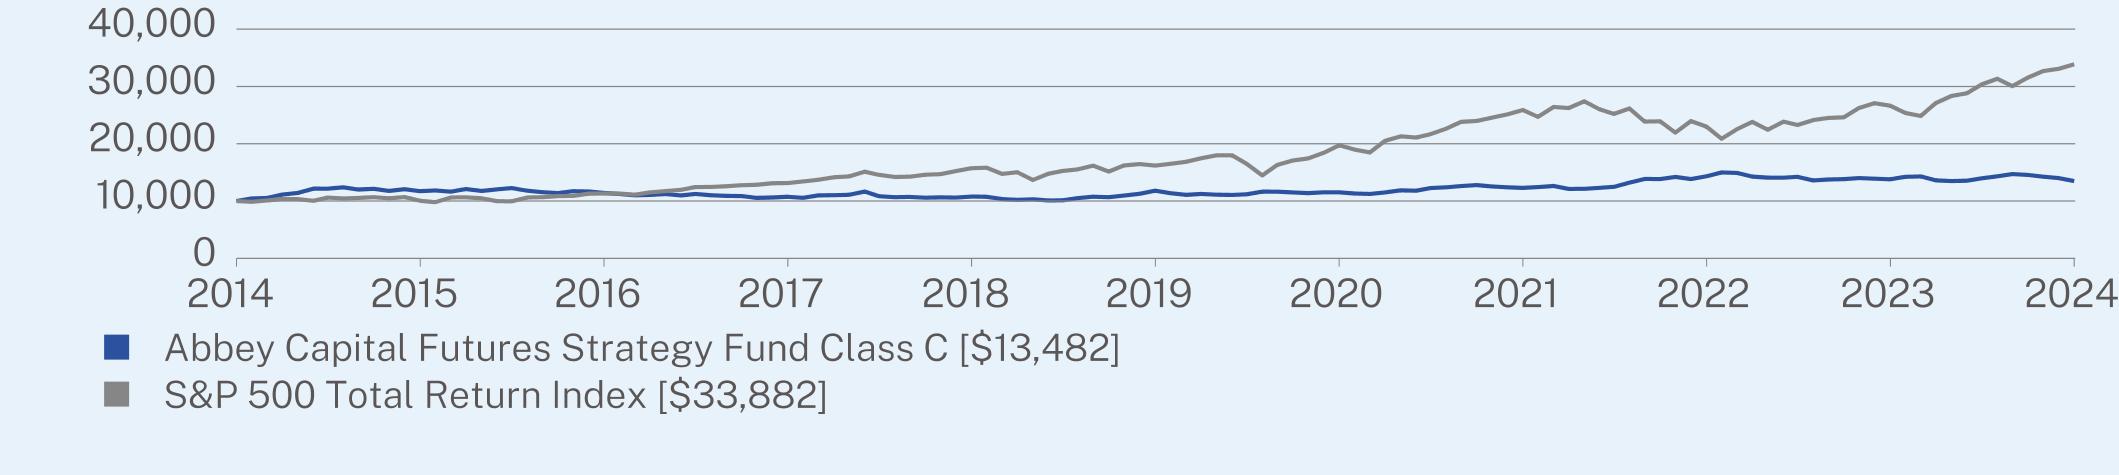
The $10,000 chart reflects a hypothetical $10,000 investment in the class of shares noted and assumes the maximum sales charge. The chart uses total return NAV performance and assumes reinvestment of dividends and capital gains. Fund expenses, including 12b-1 fees, management fees and other expenses, were deducted.
| Abbey Capital Futures Strategy Fund | PAGE 1 | TSR-AR-74925K359 |
CUMULATIVE PERFORMANCE (Initial Investment of $10,000)
| | 08/31/2014 | 09/30/2014 | 10/31/2014 | 11/30/2014 | 12/31/2014 | 01/31/2015 | 02/28/2015 | 03/31/2015 | 04/30/2015 | 05/31/2015 | 06/30/2015 | 07/31/2015 | 08/31/2015 | 09/30/2015 | 10/31/2015 | 11/30/2015 | 12/31/2015 | 01/31/2016 | 02/29/2016 | 03/31/2016 | 04/30/2016 | 05/31/2016 | 06/30/2016 | 07/31/2016 | 08/31/2016 | 09/30/2016 | 10/31/2016 | 11/30/2016 | 12/31/2016 | 01/31/2017 | 02/28/2017 | 03/31/2017 | 04/30/2017 | 05/31/2017 | 06/30/2017 | 07/31/2017 | 08/31/2017 | 09/30/2017 | 10/31/2017 | 11/30/2017 | 12/31/2017 | 01/31/2018 | 02/28/2018 | 03/31/2018 | 04/30/2018 | 05/31/2018 | 06/30/2018 | 07/31/2018 | 08/31/2018 | 09/30/2018 | 10/31/2018 | 11/30/2018 | 12/31/2018 | 01/31/2019 | 02/28/2019 | 03/31/2019 | 04/30/2019 | 05/31/2019 | 06/30/2019 | 07/31/2019 | 08/31/2019 | 09/30/2019 | 10/31/2019 | 11/30/2019 | 12/31/2019 | 01/31/2020 | 02/29/2020 | 03/31/2020 | 04/30/2020 | 05/31/2020 | 06/30/2020 | 07/31/2020 | 08/31/2020 | 09/30/2020 | 10/31/2020 | 11/30/2020 | 12/31/2020 | 01/31/2021 | 02/28/2021 | 03/31/2021 | 04/30/2021 | 05/31/2021 | 06/30/2021 | 07/31/2021 | 08/31/2021 | 09/30/2021 | 10/31/2021 | 11/30/2021 | 12/31/2021 | 01/31/2022 | 02/28/2022 | 03/31/2022 | 04/30/2022 | 05/31/2022 | 06/30/2022 | 07/31/2022 | 08/31/2022 | 09/30/2022 | 10/31/2022 | 11/30/2022 | 12/31/2022 | 01/31/2023 | 02/28/2023 | 03/31/2023 | 04/30/2023 | 05/31/2023 | 06/30/2023 | 07/31/2023 | 08/31/2023 | 09/30/2023 | 10/31/2023 | 11/30/2023 | 12/31/2023 | 01/31/2024 | 02/29/2024 | 03/31/2024 | 04/30/2024 | 05/31/2024 | 06/30/2024 | 07/31/2024 | 08/31/2024 |
| Abbey Capital Futures Strategy Fund Class C | 10,000 | 10,455 | 10,542 | 11,131 | 11,414 | 12,170 | 12,161 | 12,395 | 12,013 | 12,130 | 11,758 | 12,070 | 11,728 | 11,846 | 11,639 | 12,097 | 11,770 | 12,043 | 12,258 | 11,799 | 11,546 | 11,390 | 11,711 | 11,682 | 11,419 | 11,234 | 11,000 | 11,068 | 11,214 | 10,980 | 11,243 | 11,009 | 10,902 | 10,873 | 10,551 | 10,619 | 10,746 | 10,571 | 10,990 | 11,019 | 11,097 | 11,653 | 10,844 | 10,678 | 10,717 | 10,590 | 10,639 | 10,610 | 10,785 | 10,746 | 10,337 | 10,220 | 10,307 | 10,112 | 10,122 | 10,522 | 10,766 | 10,668 | 10,961 | 11,263 | 11,809 | 11,370 | 11,078 | 11,243 | 11,106 | 11,064 | 11,180 | 11,641 | 11,631 | 11,505 | 11,379 | 11,526 | 11,526 | 11,316 | 11,243 | 11,505 | 11,865 | 11,802 | 12,268 | 12,396 | 12,608 | 12,788 | 12,544 | 12,396 | 12,300 | 12,438 | 12,629 | 12,120 | 12,141 | 12,305 | 12,480 | 13,212 | 13,857 | 13,835 | 14,218 | 13,835 | 14,327 | 14,993 | 14,906 | 14,261 | 14,087 | 14,075 | 14,226 | 13,596 | 13,759 | 13,822 | 14,012 | 13,898 | 13,797 | 14,226 | 14,301 | 13,608 | 13,494 | 13,558 | 13,965 | 14,308 | 14,703 | 14,563 | 14,245 | 14,003 | 13,482 |
| S&P 500 Total Return Index | 10,000 | 9,860 | 10,101 | 10,372 | 10,346 | 10,036 | 10,612 | 10,444 | 10,545 | 10,680 | 10,474 | 10,693 | 10,048 | 9,799 | 10,626 | 10,657 | 10,489 | 9,969 | 9,955 | 10,631 | 10,672 | 10,864 | 10,892 | 11,293 | 11,309 | 11,311 | 11,105 | 11,516 | 11,744 | 11,967 | 12,442 | 12,456 | 12,584 | 12,761 | 12,841 | 13,105 | 13,145 | 13,416 | 13,729 | 14,150 | 14,308 | 15,127 | 14,569 | 14,199 | 14,254 | 14,597 | 14,687 | 15,233 | 15,730 | 15,819 | 14,738 | 15,038 | 13,680 | 14,777 | 15,251 | 15,547 | 16,177 | 15,149 | 16,217 | 16,450 | 16,189 | 16,492 | 16,849 | 17,461 | 17,988 | 17,981 | 16,501 | 14,463 | 16,317 | 17,094 | 17,434 | 18,417 | 19,740 | 18,990 | 18,485 | 20,509 | 21,297 | 21,082 | 21,664 | 22,612 | 23,819 | 23,986 | 24,546 | 25,129 | 25,893 | 24,688 | 26,418 | 26,235 | 27,411 | 25,992 | 25,214 | 26,150 | 23,870 | 23,914 | 21,940 | 23,963 | 22,986 | 20,869 | 22,558 | 23,819 | 22,446 | 23,857 | 23,275 | 24,129 | 24,506 | 24,612 | 26,239 | 27,082 | 26,650 | 25,380 | 24,846 | 27,115 | 28,347 | 28,824 | 30,363 | 31,339 | 30,059 | 31,550 | 32,682 | 33,080 | 33,882 |
ANNUAL AVERAGE TOTAL RETURN (%)
| | | |
| | 1 Year | 5 Years | 10 Years |
Class C (without contingent deferred sales charge)1 | -2.29 | 2.68 | 3.03 |
Class C (with contingent deferred sales charge)1 | -3.26 | 2.68 | 3.03 |
S&P 500 Total Return Index | 27.14 | 15.92 | 12.98 |
Visit https://www.abbeycapital.com/abbey-capital-futures-strategy-fund/ for more recent performance information.
| * | The Fund’s past performance is not a good predictor of how the Fund will perform in the future. The graph and table do not reflect the deduction of taxes that a shareholder would pay on Fund distributions or redemption of Fund shares. |
| 1 | The inception date of Class C Shares of the Fund was October 6, 2015 and the inception date of the Fund was July 1, 2014. Class C Shares performance prior to its inception on October 6, 2015 is the performance of Class I Shares, adjusted for the Class C Shares expense ratio. |
KEY FUND STATISTICS (as of August 31, 2024)
| |
Net Assets | $2,713,572,669 |
Number of Holdings | 1,015 |
Net Advisory Fee | $46,899,087 |
Portfolio Turnover | 0% |
Visit https://www.abbeycapital.com/abbey-capital-futures-strategy-fund/ for more recent performance information.
WHAT DID THE FUND INVEST IN? (as of August 31, 2024)
| |
Market Group | Risk Allocation (% of overall Value at Risk) |
Agricultural Products | 7.5% |
Currency | 19.1% |
Energy | 12.8% |
Equity | 27.8% |
Fixed Income | 21.9% |
Metals | 10.8% |
The data shown relates to the positions held by the Fund and its wholly owned and controlled subsidiaries and does not take into account any other assets held by the Fund (primarily cash and cash-equivalents). The Fund is actively managed and percentages may vary over time.
Value at Risk Definition: Value-at-Risk (VaR) expresses market risk as a percentage of a portfolio’s value. The VaR figures quoted are as of August 31, 2024, based on a historic VaR calculation with a 5-year lookback period (1300 days), calculated at the 95th percentile. The historical approach to evaluating a portfolio’s VaR involves applying the current positions to the historical portfolio prices of the corresponding instruments, and then calculating how the current positioning would have performed historically. For any chosen threshold value, the hypothetical returns then provide an estimate of the current VaR figure.
| Abbey Capital Futures Strategy Fund | PAGE 2 | TSR-AR-74925K359 |
MATERIAL FUND CHANGES:
This is a summary of certain changes to the Fund since September 1, 2023. For more complete information, you may review the Fund’s next prospectus, which we expect to be available by December 31, 2024 at https://www.abbeycapital.com/abbey-capital-futures-strategy-fund/ or upon request at 1-844-261-6482.
On April 29, 2024, QMS Capital Management LP began serving as a trading adviser to the Fund.
For additional information about the Fund; including its prospectus, financial information, holdings and proxy information, scan the QR code or visit https://www.abbeycapital.com/abbey-capital-futures-strategy-fund/
HOUSEHOLDING
To reduce Fund expenses, only one copy of most shareholder documents may be mailed to shareholders with multiple accounts at the same address (Householding). If you would prefer that your Fund documents not be householded, please contact the Fund at 1-844-261-6484, or contact your financial intermediary. Your instructions will typically be effective within 30 days of receipt by the Fund or your financial intermediary.
| Abbey Capital Futures Strategy Fund | PAGE 3 | TSR-AR-74925K359 |
10000117281141910746107851180911526123001432713797134821000010048113091314515730161891974025893229862665033882
| | |
| Abbey Capital Multi Asset Fund | |
Class I | MAFIX |
Annual Shareholder Report | August 31, 2024 |
This annual shareholder report contains important information about the Abbey Capital Multi Asset Fund (the “Fund”) for the period of September 1, 2023, to August 31, 2024. You can find additional information about the Fund at https://www.abbeycapital.com/products/mutual-funds/multi-asset-fund/. You can also request this information by contacting us at 1-844-261-6484.
This report describes changes to the Fund that occurred during the reporting period.
WHAT WERE THE FUND COSTS FOR THE PAST YEAR? (based on a hypothetical $10,000 investment)
| | |
Class Name | Costs of a $10,000 investment | Costs paid as a percentage of a $10,000 investment |
| Class I | $185 | 1.79% |
HOW DID THE FUND PERFORM LAST YEAR AND WHAT AFFECTED ITS PERFORMANCE?
The Fund saw positive performance for the one-year period ended August 31, 2024. The Fund’s Long US Equity strategy was the driver of positive performance, with partially offsetting losses recorded by the Fund’s Managed Futures strategy.
The Fund’s Long US Equity strategy saw positive returns from its allocation to S&P 500 futures. US stocks rallied strongly over the period, outperforming many other global markets. US stocks were supported by strong momentum in technology and artificial intelligence-related stocks as well as solid corporate earnings data. The prospect of a dovish shift in US monetary policy was another tailwind for stocks at times.
For the Fund’s Managed futures strategy, losses occurred in fixed income and major currencies. Uncertainty about the timing of potential interest rate cuts by central banks was a key factor influencing these markets, contributing to a lack of clear price trends and several price reversals that proved challenging. Performance in energy markets was also negative for the Managed Futures strategy, with partially offsetting gains recorded in equities, agricultural commodities and metals.
| |
Top Contributors |
| ↑ | Equity indices |
| ↑ | Agricultural Commodities |
| ↑ | Metals |
| |
Top Detractors |
| ↓ | Currencies |
| ↓ | Fixed Income |
| ↓ | Energy |
HOW DID THE FUND PERFORM SINCE INCEPTION?*
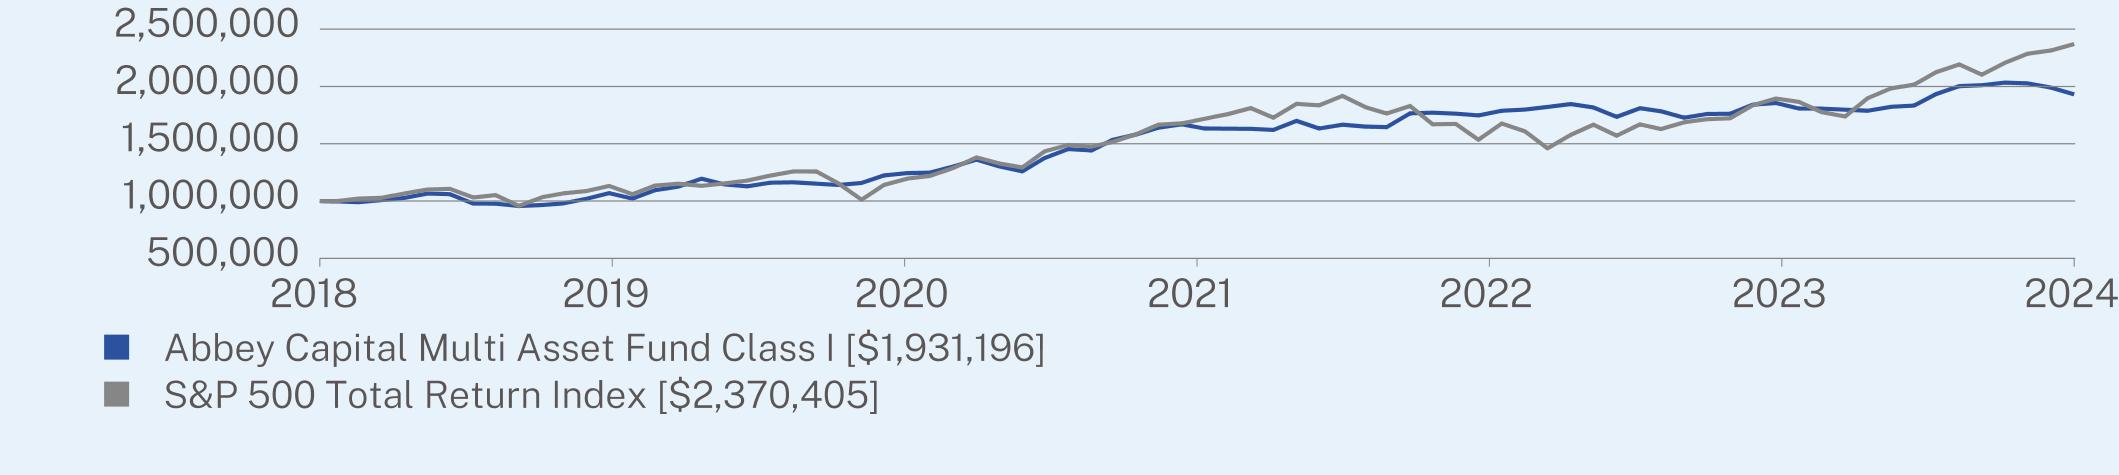
The $1,000,000 chart reflects a hypothetical $1,000,000 investment in the class of shares noted. The chart uses total return NAV performance and assumes reinvestment of dividends and capital gains. Fund expenses, including management fees and other expenses, were deducted.
| Abbey Capital Multi Asset Fund | PAGE 1 | TSR-AR-74933W882 |
CUMULATIVE PERFORMANCE (Initial Investment of $1,000,000)
| | 04-10-2018 | 04/30/2018 | 05/31/2018 | 06/30/2018 | 07/31/2018 | 08/31/2018 | 09/30/2018 | 10/31/2018 | 11/30/2018 | 12/31/2018 | 01/31/2019 | 02/28/2019 | 03/31/2019 | 04/30/2019 | 05/31/2019 | 06/30/2019 | 07/31/2019 | 08/31/2019 | 09/30/2019 | 10/31/2019 | 11/30/2019 | 12/31/2019 | 01/31/2020 | 02/29/2020 | 03/31/2020 | 04/30/2020 | 05/31/2020 | 06/30/2020 | 07/31/2020 | 08/31/2020 | 09/30/2020 | 10/31/2020 | 11/30/2020 | 12/31/2020 | 01/31/2021 | 02/28/2021 | 03/31/2021 | 04/30/2021 | 05/31/2021 | 06/30/2021 | 07/31/2021 | 08/31/2021 | 09/30/2021 | 10/31/2021 | 11/30/2021 | 12/31/2021 | 01/31/2022 | 02/28/2022 | 03/31/2022 | 04/30/2022 | 05/31/2022 | 06/30/2022 | 07/31/2022 | 08/31/2022 | 09/30/2022 | 10/31/2022 | 11/30/2022 | 12/31/2022 | 01/31/2023 | 02/28/2023 | 03/31/2023 | 04/30/2023 | 05/31/2023 | 06/30/2023 | 07/31/2023 | 08/31/2023 | 09/30/2023 | 10/31/2023 | 11/30/2023 | 12/31/2023 | 01/31/2024 | 02/29/2024 | 03/31/2024 | 04/30/2024 | 05/31/2024 | 06/30/2024 | 07/31/2024 | 08/31/2024 |
| Abbey Capital Multi Asset Fund Class I | 10,00,000 | 9,98,000 | 9,90,000 | 10,08,000 | 10,27,000 | 10,65,000 | 10,60,000 | 9,78,000 | 9,77,000 | 9,56,781 | 9,65,519 | 9,79,717 | 10,20,129 | 10,69,279 | 10,21,222 | 10,94,400 | 11,26,074 | 11,94,884 | 11,45,734 | 11,28,259 | 11,59,933 | 11,63,798 | 11,51,496 | 11,40,424 | 11,57,647 | 12,24,079 | 12,43,763 | 12,47,454 | 13,01,584 | 13,61,865 | 13,02,814 | 12,59,756 | 13,76,628 | 14,53,482 | 14,41,233 | 15,33,777 | 15,80,049 | 16,39,930 | 16,69,871 | 16,33,125 | 16,31,764 | 16,30,403 | 16,20,877 | 16,99,811 | 16,33,125 | 16,66,056 | 16,49,501 | 16,44,986 | 17,65,387 | 17,71,407 | 17,62,377 | 17,47,327 | 17,87,963 | 17,98,498 | 18,21,073 | 18,46,658 | 18,16,558 | 17,34,826 | 18,09,981 | 17,83,364 | 17,26,998 | 17,59,878 | 17,61,444 | 18,41,296 | 18,55,388 | 18,06,850 | 18,06,850 | 17,97,456 | 17,88,061 | 18,22,190 | 18,33,578 | 19,32,823 | 20,02,782 | 20,10,917 | 20,33,585 | 20,26,887 | 19,90,043 | 19,31,196 |
| S&P 500 Total Return Index | 10,00,000 | 9,97,179 | 10,21,193 | 10,27,479 | 10,65,715 | 11,00,442 | 11,06,705 | 10,31,062 | 10,52,073 | 9,57,081 | 10,33,777 | 10,66,970 | 10,87,703 | 11,31,743 | 10,59,823 | 11,34,516 | 11,50,821 | 11,32,592 | 11,53,783 | 11,78,774 | 12,21,562 | 12,58,431 | 12,57,938 | 11,54,385 | 10,11,804 | 11,41,511 | 11,95,879 | 12,19,661 | 12,88,432 | 13,81,045 | 13,28,570 | 12,93,238 | 14,34,801 | 14,89,967 | 14,74,924 | 15,15,595 | 15,81,972 | 16,66,400 | 16,78,039 | 17,17,212 | 17,58,004 | 18,11,457 | 17,27,207 | 18,48,218 | 18,35,412 | 19,17,668 | 18,18,434 | 17,63,988 | 18,29,484 | 16,69,950 | 16,73,013 | 15,34,916 | 16,76,443 | 16,08,074 | 14,59,973 | 15,78,174 | 16,66,369 | 15,70,362 | 16,69,034 | 16,28,311 | 16,88,093 | 17,14,442 | 17,21,894 | 18,35,668 | 18,94,639 | 18,64,474 | 17,75,579 | 17,38,245 | 18,96,991 | 19,83,173 | 20,16,498 | 21,24,171 | 21,92,515 | 21,02,963 | 22,07,237 | 22,86,438 | 23,14,269 | 23,70,405 |
ANNUAL AVERAGE TOTAL RETURN (%)
| | | |
| | 1 Year | 5 Years | Since Inception of Class I Shares
(04/11/2018) |
Class I | 6.88 | 10.08 | 10.85 |
S&P 500 Total Return Index | 27.14 | 15.92 | 14.46 |
Visit https://www.abbeycapital.com/products/mutual-funds/multi-asset-fund/ for more recent performance information.
| * | The Fund’s past performance is not a good predictor of how the Fund will perform in the future. The graph and table do not reflect the deduction of taxes that a shareholder would pay on Fund distributions or redemption of Fund shares. |
KEY FUND STATISTICS (as of August 31, 2024)
| |
Net Assets | $1,021,674,121 |
Number of Holdings | 557 |
Net Advisory Fee | $12,621,844 |
Portfolio Turnover | 0% |
Visit https://www.abbeycapital.com/products/mutual-funds/multi-asset-fund/ for more recent performance information.
WHAT DID THE FUND INVEST IN? (as of August 31, 2024)
| |
Market Group | Risk Allocation (% of overall Value at Risk) |
Agricultural Products | 4.5% |
Currency | 16.6% |
Energy | 7.3% |
Equity | 50.8% |
Fixed Income | 13.4% |
Metals | 7.4% |
The data shown relates to the positions held by the Fund and its wholly owned and controlled subsidiaries and does not take into account any other assets held by the Fund (primarily cash and cash-equivalents). The Fund is actively managed and percentages may vary over time.
Value at Risk Definition: Value-at-Risk (VaR) expresses market risk as a percentage of a portfolio’s value. The VaR figures quoted are as of August 31, 2024, based on a historic VaR calculation with a 5-year lookback period (1300 days), calculated at the 95th percentile. The historical approach to evaluating a portfolio’s VaR involves applying the current positions to the historical portfolio prices of the corresponding instruments, and then calculating how the current positioning would have performed historically. For any chosen threshold value, the hypothetical returns then provide an estimate of the current VaR figure.
MATERIAL FUND CHANGES:
This is a summary of certain changes to the Fund since September 1, 2023. For more complete information, you may review the Fund’s next prospectus, which we expect to be available by December 31, 2024 at https://www.abbeycapital.com/products/mutual-funds/multi-asset-fund/ or upon request at 1-844-261-6484.
| Abbey Capital Multi Asset Fund | PAGE 2 | TSR-AR-74933W882 |
Graham Capital Management L.P. began serving as a trading adviser to the Fund on April 4, 2024 and Winton Capital Management Limited began serving as a trading adviser to the Fund on June 13, 2024. In addition, Systematica Investments Limited (acting as the general partner of Systematica Investments LP) began serving as a trading adviser to the Fund on October 22, 2024 (subsequent to the end of the reporting period).
For additional information about the Fund; including its prospectus, financial information, holdings and proxy information, scan the QR code or visit https://www.abbeycapital.com/products/mutual-funds/multi-asset-fund/
HOUSEHOLDING
To reduce Fund expenses, only one copy of most shareholder documents may be mailed to shareholders with multiple accounts at the same address (Householding). If you would prefer that your Fund documents not be householded, please contact the Fund at 1-844-261-6484, or contact your financial intermediary. Your instructions will typically be effective within 30 days of receipt by the Fund or your financial intermediary.
| Abbey Capital Multi Asset Fund | PAGE 3 | TSR-AR-74933W882 |
10650001194884136186516304031798498180685019311961100442113259213810451811457160807418644742370405
| | |
| Abbey Capital Multi Asset Fund | |
Class A | MAFAX |
Annual Shareholder Report | August 31, 2024 |
This annual shareholder report contains important information about the Abbey Capital Multi Asset Fund (the “Fund”) for the period of September 1, 2023, to August 31, 2024. You can find additional information about the Fund at https://www.abbeycapital.com/products/mutual-funds/multi-asset-fund/. You can also request this information by contacting us at 1-844-261-6484.
This report describes changes to the Fund that occurred during the reporting period.
WHAT WERE THE FUND COSTS FOR THE PAST YEAR? (based on a hypothetical $10,000 investment)
| | |
Class Name | Costs of a $10,000 investment | Costs paid as a percentage of a $10,000 investment |
| Class A | $211 | 2.04% |
HOW DID THE FUND PERFORM LAST YEAR AND WHAT AFFECTED ITS PERFORMANCE?
The Fund saw positive performance for the one-year period ended August 31, 2024. The Fund’s Long US Equity strategy was the driver of positive performance, with partially offsetting losses recorded by the Fund’s Managed Futures strategy.
The Fund’s Long US Equity strategy saw positive returns from its allocation to S&P 500 futures. US stocks rallied strongly over the period, outperforming many other global markets. US stocks were supported by strong momentum in technology and artificial intelligence-related stocks as well as solid corporate earnings data. The prospect of a dovish shift in US monetary policy was another tailwind for stocks at times.
For the Fund’s Managed futures strategy, losses occurred in fixed income and major currencies. Uncertainty about the timing of potential interest rate cuts by central banks was a key factor influencing these markets, contributing to a lack of clear price trends and several price reversals that proved challenging. Performance in energy markets was also negative for the Managed Futures strategy, with partially offsetting gains recorded in equities, agricultural commodities and metals.
| |
Top Contributors |
| ↑ | Equity indices |
| ↑ | Agricultural Commodities |
| ↑ | Metals |
| |
Top Detractors |
| ↓ | Currencies |
| ↓ | Fixed Income |
| ↓ | Energy |
HOW DID THE FUND PERFORM SINCE INCEPTION?*
The $10,000 chart reflects a hypothetical $10,000 investment in the class of shares noted and assumes the maximum sales charge. The chart uses total return NAV performance and assumes reinvestment of dividends and capital gains. Fund expenses, including 12b-1 fees, management fees and other expenses, were deducted.
| Abbey Capital Multi Asset Fund | PAGE 1 | TSR-AR-74933W700 |
CUMULATIVE PERFORMANCE (Initial Investment of $10,000)
| | 04-10-2018 | 04/30/2018 | 05/31/2018 | 06/30/2018 | 07/31/2018 | 08/31/2018 | 09/30/2018 | 10/31/2018 | 11/30/2018 | 12/31/2018 | 01/31/2019 | 02/28/2019 | 03/31/2019 | 04/30/2019 | 05/31/2019 | 06/30/2019 | 07/31/2019 | 08/31/2019 | 09/30/2019 | 10/31/2019 | 11/30/2019 | 12/31/2019 | 01/31/2020 | 02/29/2020 | 03/31/2020 | 04/30/2020 | 05/31/2020 | 06/30/2020 | 07/31/2020 | 08/31/2020 | 09/30/2020 | 10/31/2020 | 11/30/2020 | 12/31/2020 | 01/31/2021 | 02/28/2021 | 03/31/2021 | 04/30/2021 | 05/31/2021 | 06/30/2021 | 07/31/2021 | 08/31/2021 | 09/30/2021 | 10/31/2021 | 11/30/2021 | 12/31/2021 | 01/31/2022 | 02/28/2022 | 03/31/2022 | 04/30/2022 | 05/31/2022 | 06/30/2022 | 07/31/2022 | 08/31/2022 | 09/30/2022 | 10/31/2022 | 11/30/2022 | 12/31/2022 | 01/31/2023 | 02/28/2023 | 03/31/2023 | 04/30/2023 | 05/31/2023 | 06/30/2023 | 07/31/2023 | 08/31/2023 | 09/30/2023 | 10/31/2023 | 11/30/2023 | 12/31/2023 | 01/31/2024 | 02/29/2024 | 03/31/2024 | 04/30/2024 | 05/31/2024 | 06/30/2024 | 07/31/2024 | 08/31/2024 |
| Abbey Capital Multi Asset Fund Class A | 9,425 | 9,405 | 9,327 | 9,495 | 9,672 | 10,028 | 9,979 | 9,205 | 9,193 | 9,001 | 9,081 | 9,213 | 9,591 | 10,051 | 9,598 | 10,283 | 10,579 | 11,223 | 10,759 | 10,593 | 10,888 | 10,922 | 10,804 | 10,698 | 10,857 | 11,478 | 11,660 | 11,692 | 12,197 | 12,759 | 12,204 | 11,798 | 12,890 | 13,606 | 13,489 | 14,352 | 14,782 | 15,339 | 15,616 | 15,269 | 15,253 | 15,237 | 15,145 | 15,879 | 15,253 | 15,557 | 15,399 | 15,342 | 16,465 | 16,521 | 16,423 | 16,282 | 16,661 | 16,760 | 16,970 | 17,195 | 16,914 | 16,143 | 16,844 | 16,595 | 16,055 | 16,362 | 16,376 | 17,121 | 17,252 | 16,800 | 16,785 | 16,698 | 16,610 | 16,910 | 17,032 | 17,941 | 18,577 | 18,653 | 18,865 | 18,804 | 18,456 | 17,910 |
| S&P 500 Total Return Index | 10,000 | 9,972 | 10,212 | 10,275 | 10,657 | 11,004 | 11,067 | 10,311 | 10,521 | 9,571 | 10,338 | 10,670 | 10,877 | 11,317 | 10,598 | 11,345 | 11,508 | 11,326 | 11,538 | 11,788 | 12,216 | 12,584 | 12,579 | 11,544 | 10,118 | 11,415 | 11,959 | 12,197 | 12,884 | 13,810 | 13,286 | 12,932 | 14,348 | 14,900 | 14,749 | 15,156 | 15,820 | 16,664 | 16,780 | 17,172 | 17,580 | 18,115 | 17,272 | 18,482 | 18,354 | 19,177 | 18,184 | 17,640 | 18,295 | 16,699 | 16,730 | 15,349 | 16,764 | 16,081 | 14,600 | 15,782 | 16,664 | 15,704 | 16,690 | 16,283 | 16,881 | 17,144 | 17,219 | 18,357 | 18,946 | 18,645 | 17,756 | 17,382 | 18,970 | 19,832 | 20,165 | 21,242 | 21,925 | 21,030 | 22,072 | 22,864 | 23,143 | 23,704 |
ANNUAL AVERAGE TOTAL RETURN (%)
| | | |
| | 1 Year | 5 Years | Since Inception of the Fund
(04/11/2018) |
Class A (without sales charge)1 | 6.61 | 9.80 | 10.57 |
Class A (with sales charge)1 | 0.50 | 8.51 | 9.55 |
S&P 500 Total Return Index | 27.14 | 15.92 | 14.46 |
Visit https://www.abbeycapital.com/products/mutual-funds/multi-asset-fund/ for more recent performance information.
| * | The Fund’s past performance is not a good predictor of how the Fund will perform in the future. The graph and table do not reflect the deduction of taxes that a shareholder would pay on Fund distributions or redemption of Fund shares. |
| 1 | The inception date of Class A Shares of the Fund was February 16, 2022 and the inception date of the Fund was April 11, 2018. Class A Shares performance prior to its inception on February 16, 2022 is the performance of Class I Shares, adjusted for the Class A Shares expense ratio. |
KEY FUND STATISTICS (as of August 31, 2024)
| |
Net Assets | $1,021,674,121 |
Number of Holdings | 557 |
Net Advisory Fee | $12,621,844 |
Portfolio Turnover | 0% |
Visit https://www.abbeycapital.com/products/mutual-funds/multi-asset-fund/ for more recent performance information.
WHAT DID THE FUND INVEST IN? (as of August 31, 2024)
| |
Market Group | Risk Allocation (% of overall Value at Risk) |
Agricultural Products | 4.5% |
Currency | 16.6% |
Energy | 7.3% |
Equity | 50.8% |
Fixed Income | 13.4% |
Metals | 7.4% |
The data shown relates to the positions held by the Fund and its wholly owned and controlled subsidiaries and does not take into account any other assets held by the Fund (primarily cash and cash-equivalents). The Fund is actively managed and percentages may vary over time.
Value at Risk Definition: Value-at-Risk (VaR) expresses market risk as a percentage of a portfolio’s value. The VaR figures quoted are as of August 31, 2024, based on a historic VaR calculation with a 5-year lookback period (1300 days), calculated at the 95th percentile. The historical approach to evaluating a portfolio’s VaR involves applying the current positions to the historical portfolio prices of the corresponding instruments, and then calculating how the current positioning would have performed historically. For any chosen threshold value, the hypothetical returns then provide an estimate of the current VaR figure.
| Abbey Capital Multi Asset Fund | PAGE 2 | TSR-AR-74933W700 |
MATERIAL FUND CHANGES:
This is a summary of certain changes to the Fund since September 1, 2023. For more complete information, you may review the Fund’s next prospectus, which we expect to be available by December 31, 2024 at https://www.abbeycapital.com/products/mutual-funds/multi-asset-fund/ or upon request at 1-844-261-6484.
Graham Capital Management L.P. began serving as a trading adviser to the Fund on April 4, 2024 and Winton Capital Management Limited began serving as a trading adviser to the Fund on June 13, 2024. In addition, Systematica Investments Limited (acting as the general partner of Systematica Investments LP) began serving as a trading adviser to the Fund on October 22, 2024 (subsequent to the end of the reporting period).
For additional information about the Fund; including its prospectus, financial information, holdings and proxy information, scan the QR code or visit https://www.abbeycapital.com/products/mutual-funds/multi-asset-fund/
HOUSEHOLDING
To reduce Fund expenses, only one copy of most shareholder documents may be mailed to shareholders with multiple accounts at the same address (Householding). If you would prefer that your Fund documents not be householded, please contact the Fund at 1-844-261-6484, or contact your financial intermediary. Your instructions will typically be effective within 30 days of receipt by the Fund or your financial intermediary.
| Abbey Capital Multi Asset Fund | PAGE 3 | TSR-AR-74933W700 |
1002811223127591523716760168001791011004113261381018115160811864523704
| | |
| Abbey Capital Multi Asset Fund | |
Class C | MAFCX |
Annual Shareholder Report | August 31, 2024 |
This annual shareholder report contains important information about the Abbey Capital Multi Asset Fund (the “Fund”) for the period of September 1, 2023, to August 31, 2024. You can find additional information about the Fund at https://www.abbeycapital.com/products/mutual-funds/multi-asset-fund/. You can also request this information by contacting us at 1-844-261-6484.
This report describes changes to the Fund that occurred during the reporting period.
WHAT WERE THE FUND COSTS FOR THE PAST YEAR? (based on a hypothetical $10,000 investment)
| | |
Class Name | Costs of a $10,000 investment | Costs paid as a percentage of a $10,000 investment |
| Class C | $287 | 2.79% |
HOW DID THE FUND PERFORM LAST YEAR AND WHAT AFFECTED ITS PERFORMANCE?
The Fund saw positive performance for the one-year period ended August 31, 2024. The Fund’s Long US Equity strategy was the driver of positive performance, with partially offsetting losses recorded by the Fund’s Managed Futures strategy.
The Fund’s Long US Equity strategy saw positive returns from its allocation to S&P 500 futures. US stocks rallied strongly over the period, outperforming many other global markets. US stocks were supported by strong momentum in technology and artificial intelligence-related stocks as well as solid corporate earnings data. The prospect of a dovish shift in US monetary policy was another tailwind for stocks at times.
For the Fund’s Managed futures strategy, losses occurred in fixed income and major currencies. Uncertainty about the timing of potential interest rate cuts by central banks was a key factor influencing these markets, contributing to a lack of clear price trends and several price reversals that proved challenging. Performance in energy markets was also negative for the Managed Futures strategy, with partially offsetting gains recorded in equities, agricultural commodities and metals.
| |
Top Contributors |
| ↑ | Equity indices |
| ↑ | Agricultural Commodities |
| ↑ | Metals |
| |
Top Detractors |
| ↓ | Currencies |
| ↓ | Fixed Income |
| ↓ | Energy |
HOW DID THE FUND PERFORM SINCE INCEPTION?*
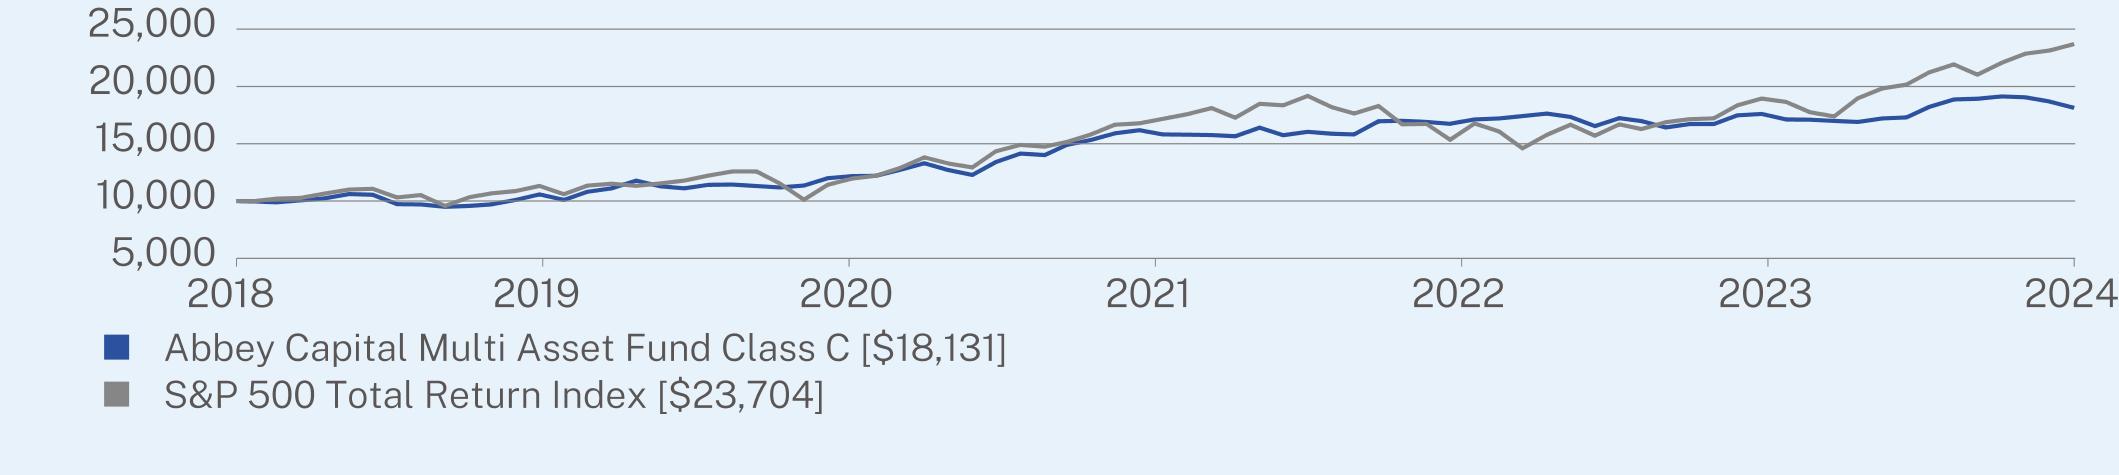
The $10,000 chart reflects a hypothetical $10,000 investment in the class of shares noted and assumes the maximum sales charge. The chart uses total return NAV performance and assumes reinvestment of dividends and capital gains. Fund expenses, including 12b-1 fees, management fees and other expenses, were deducted.
| Abbey Capital Multi Asset Fund | PAGE 1 | TSR-AR-74933W809 |
CUMULATIVE PERFORMANCE (Initial Investment of $10,000)
| | 04-10-2018 | 04/30/2018 | 05/31/2018 | 06/30/2018 | 07/31/2018 | 08/31/2018 | 09/30/2018 | 10/31/2018 | 11/30/2018 | 12/31/2018 | 01/31/2019 | 02/28/2019 | 03/31/2019 | 04/30/2019 | 05/31/2019 | 06/30/2019 | 07/31/2019 | 08/31/2019 | 09/30/2019 | 10/31/2019 | 11/30/2019 | 12/31/2019 | 01/31/2020 | 02/29/2020 | 03/31/2020 | 04/30/2020 | 05/31/2020 | 06/30/2020 | 07/31/2020 | 08/31/2020 | 09/30/2020 | 10/31/2020 | 11/30/2020 | 12/31/2020 | 01/31/2021 | 02/28/2021 | 03/31/2021 | 04/30/2021 | 05/31/2021 | 06/30/2021 | 07/31/2021 | 08/31/2021 | 09/30/2021 | 10/31/2021 | 11/30/2021 | 12/31/2021 | 01/31/2022 | 02/28/2022 | 03/31/2022 | 04/30/2022 | 05/31/2022 | 06/30/2022 | 07/31/2022 | 08/31/2022 | 09/30/2022 | 10/31/2022 | 11/30/2022 | 12/31/2022 | 01/31/2023 | 02/28/2023 | 03/31/2023 | 04/30/2023 | 05/31/2023 | 06/30/2023 | 07/31/2023 | 08/31/2023 | 09/30/2023 | 10/31/2023 | 11/30/2023 | 12/31/2023 | 01/31/2024 | 02/29/2024 | 03/31/2024 | 04/30/2024 | 05/31/2024 | 06/30/2024 | 07/31/2024 | 08/31/2024 |
| Abbey Capital Multi Asset Fund Class C | 10,000 | 9,974 | 9,886 | 10,057 | 10,238 | 10,608 | 10,549 | 9,725 | 9,707 | 9,498 | 9,577 | 9,710 | 10,102 | 10,581 | 10,096 | 10,811 | 11,115 | 11,784 | 11,290 | 11,108 | 11,411 | 11,439 | 11,309 | 11,191 | 11,350 | 11,992 | 12,175 | 12,201 | 12,720 | 13,298 | 12,711 | 12,280 | 13,408 | 14,145 | 14,014 | 14,902 | 15,339 | 15,907 | 16,184 | 15,815 | 15,788 | 15,761 | 15,656 | 16,405 | 15,745 | 16,046 | 15,872 | 15,814 | 16,962 | 17,005 | 16,904 | 16,744 | 17,122 | 17,209 | 17,412 | 17,630 | 17,340 | 16,541 | 17,236 | 16,979 | 16,420 | 16,722 | 16,722 | 17,478 | 17,599 | 17,115 | 17,100 | 16,994 | 16,904 | 17,208 | 17,301 | 18,224 | 18,866 | 18,928 | 19,132 | 19,054 | 18,678 | 18,131 |
| S&P 500 Total Return Index | 10,000 | 9,972 | 10,212 | 10,275 | 10,657 | 11,004 | 11,067 | 10,311 | 10,521 | 9,571 | 10,338 | 10,670 | 10,877 | 11,317 | 10,598 | 11,345 | 11,508 | 11,326 | 11,538 | 11,788 | 12,216 | 12,584 | 12,579 | 11,544 | 10,118 | 11,415 | 11,959 | 12,197 | 12,884 | 13,810 | 13,286 | 12,932 | 14,348 | 14,900 | 14,749 | 15,156 | 15,820 | 16,664 | 16,780 | 17,172 | 17,580 | 18,115 | 17,272 | 18,482 | 18,354 | 19,177 | 18,184 | 17,640 | 18,295 | 16,699 | 16,730 | 15,349 | 16,764 | 16,081 | 14,600 | 15,782 | 16,664 | 15,704 | 16,690 | 16,283 | 16,881 | 17,144 | 17,219 | 18,357 | 18,946 | 18,645 | 17,756 | 17,382 | 18,970 | 19,832 | 20,165 | 21,242 | 21,925 | 21,030 | 22,072 | 22,864 | 23,143 | 23,704 |
ANNUAL AVERAGE TOTAL RETURN (%)
| | | |
| | 1 Year | 5 Years | Since Inception of the Fund
(04/11/2018) |
Class C (without contingent deferred sales charge)1 | 5.93 | 9.00 | 9.76 |
Class C (with contingent deferred sales charge)1 | 4.93 | 9.00 | 9.76 |
S&P 500 Total Return Index | 27.14 | 15.92 | 14.46 |
Visit https://www.abbeycapital.com/products/mutual-funds/multi-asset-fund/ for more recent performance information.
| * | The Fund’s past performance is not a good predictor of how the Fund will perform in the future. The graph and table do not reflect the deduction of taxes that a shareholder would pay on Fund distributions or redemption of Fund shares. |
| 1 | The inception date of Class C Shares of the Fund was November 8, 2021 and the inception date of the Fund was April 11, 2018. Class C Shares performance prior to its inception on November 8, 2021 is the performance of Class I Shares, adjusted for the Class C Shares expense ratio. |
KEY FUND STATISTICS (as of August 31, 2024)
| |
Net Assets | $1,021,674,121 |
Number of Holdings | 557 |
Net Advisory Fee | $12,621,844 |
Portfolio Turnover | 0% |
Visit https://www.abbeycapital.com/products/mutual-funds/multi-asset-fund/ for more recent performance information.
WHAT DID THE FUND INVEST IN? (as of August 31, 2024)
| |
Market Group | Risk Allocation (% of overall Value at Risk) |
Agricultural Products | 4.5% |
Currency | 16.6% |
Energy | 7.3% |
Equity | 50.8% |
Fixed Income | 13.4% |
Metals | 7.4% |
The data shown relates to the positions held by the Fund and its wholly owned and controlled subsidiaries and does not take into account any other assets held by the Fund (primarily cash and cash-equivalents). The Fund is actively managed and percentages may vary over time.
Value at Risk Definition: Value-at-Risk (VaR) expresses market risk as a percentage of a portfolio’s value. The VaR figures quoted are as of August 31, 2024, based on a historic VaR calculation with a 5-year lookback period (1300 days), calculated at the 95th percentile. The historical approach to evaluating a portfolio’s VaR involves applying the current positions to the historical portfolio prices of the corresponding instruments, and then calculating how the current positioning would have performed historically. For any chosen threshold value, the hypothetical returns then provide an estimate of the current VaR figure.
| Abbey Capital Multi Asset Fund | PAGE 2 | TSR-AR-74933W809 |
MATERIAL FUND CHANGES:
This is a summary of certain changes to the Fund since September 1, 2023. For more complete information, you may review the Fund’s next prospectus, which we expect to be available by December 31, 2024 at https://www.abbeycapital.com/products/mutual-funds/multi-asset-fund/ or upon request at 1-844-261-6484.
Graham Capital Management L.P. began serving as a trading adviser to the Fund on April 4, 2024 and Winton Capital Management Limited began serving as a trading adviser to the Fund on June 13, 2024. In addition, Systematica Investments Limited (acting as the general partner of Systematica Investments LP) began serving as a trading adviser to the Fund on October 22, 2024 (subsequent to the end of the reporting period).
For additional information about the Fund; including its prospectus, financial information, holdings and proxy information, scan the QR code or visit https://www.abbeycapital.com/products/mutual-funds/multi-asset-fund/
HOUSEHOLDING
To reduce Fund expenses, only one copy of most shareholder documents may be mailed to shareholders with multiple accounts at the same address (Householding). If you would prefer that your Fund documents not be householded, please contact the Fund at 1-844-261-6484, or contact your financial intermediary. Your instructions will typically be effective within 30 days of receipt by the Fund or your financial intermediary.
| Abbey Capital Multi Asset Fund | PAGE 3 | TSR-AR-74933W809 |
1060811784132981576117209171151813111004113261381018115160811864523704
| | |
| Adara Smaller Companies Fundtrue | |
Annual Shareholder Report | August 31, 2024 |
This annual shareholder report contains important information about the Adara Smaller Companies Fund (the “Fund”) for the period of September 1, 2023, to August 31, 2024. You can find additional information about the Fund at https://rbbfund.com/additional-fund-information/. You can also request this information by contacting us at 1-844-261-6482.
This report describes changes to the Fund that occurred during the reporting period.
WHAT WERE THE FUND COSTS FOR THE PAST YEAR? (based on a hypothetical $10,000 investment)
| | |
Fund Name | Costs of a $10,000 investment | Costs paid as a percentage of a $10,000 investment |
| Adara Smaller Companies Fund | $87 | 0.80% |
HOW DID THE FUND PERFORM LAST YEAR AND WHAT AFFECTED ITS PERFORMANCE?
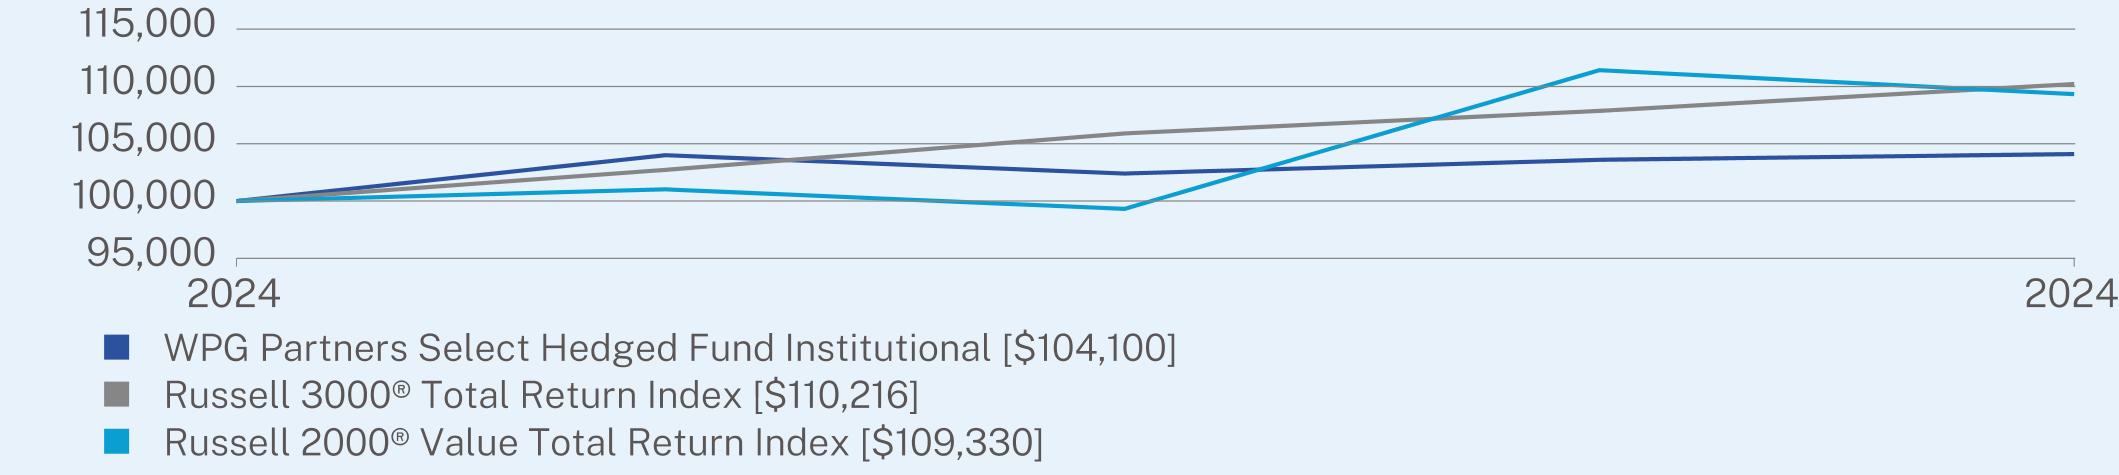
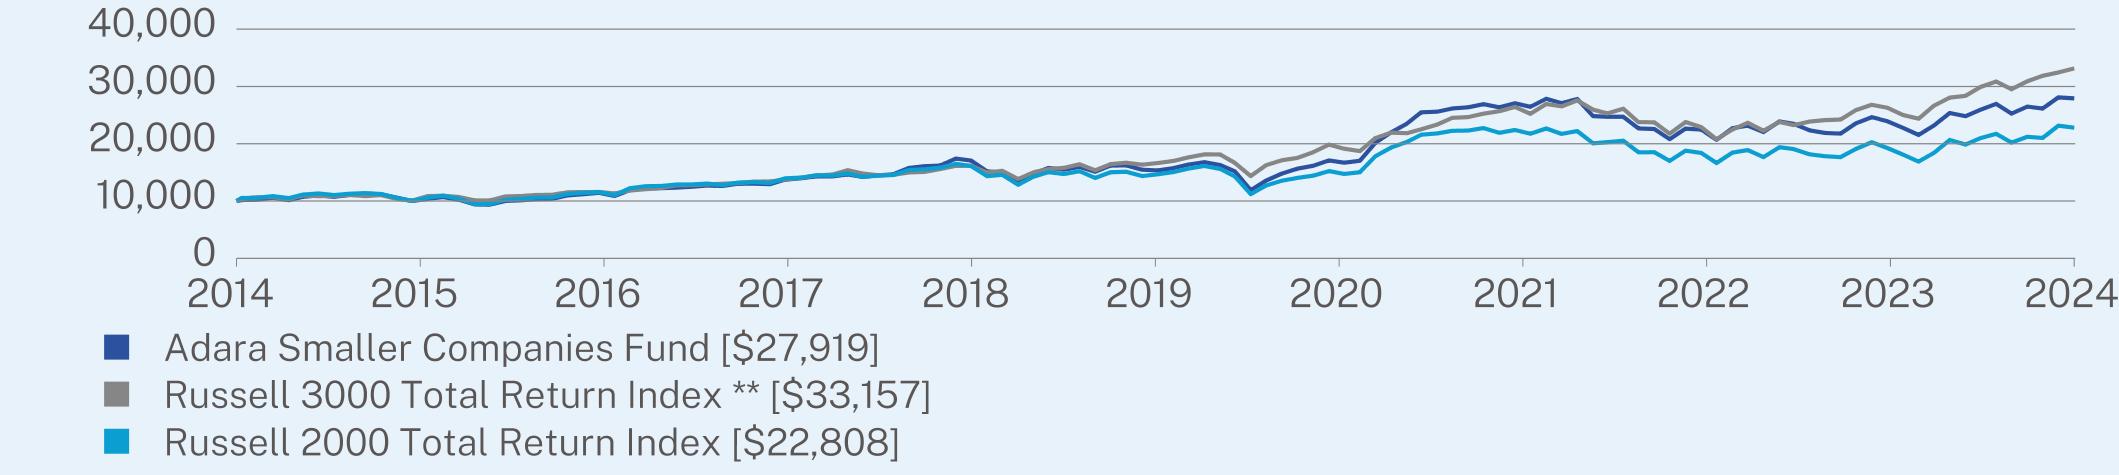
The Fund generated a return of 16.72% for the fiscal year ended August 31, 2024, underperforming the benchmark Russell 2000 Total Return Index, which returned 18.47% over the same period. The Fund’s 1.75% underperformance of the benchmark was due in large part to the Fund’s higher quality bias, which caused the Fund to trail the benchmark during the strong market rally.
U.S. equity markets generated strong gains in the fiscal year as markets reacted positively to lower yields, inflation continued trending lower and the Federal Reserve pivoted away from raising interest rates and toward cutting rates in 2024. A recession did not materialize, and markets benefited from excitement around artificial intelligence.
The Fund’s assets were allocated to five underlying sub-advisers during the fiscal year: microcap managers Driehaus Capital Management LLC (“Driehaus”) and Pacific Ridge Capital Partners LLC (“Pacific Ridge”); small-cap managers Pier Capital LLC (“Pier”) and River Road Asset Management LLC (“River Road”); and tax-loss harvesting manager Aperio Group LLC (“Aperio”). Performance of the Fund’s sub-advisers for the fiscal year was led by Driehaus, with a return of +22.00%, followed in order by Aperio at +20.34%, Pacific Ridge at +17.05%, Pier at +15.42% and River Road at +12.99%. As of August 31, 2024, the Fund’s assets were allocated 25% to Driehaus, 23% to Pacific Ridge, 19% to Aperio, 17% to River Road, 14% to Pier and the remaining 2% in a cash sleeve.
| |
Top Contributors |
| ↑ | Crinetics Pharmaceuticals Inc |
| ↑ | Heritage Insurance Holdings Inc |
| ↑ | FTAI Aviation Ltd. |
| |
Top Detractors |
| ↓ | Red Robin Gourmet Burgers Inc |
| ↓ | Aehr Test Systems |
| ↓ | Kimball Electronics Inc |
HOW DID THE FUND PERFORM SINCE INCEPTION?*
The $10,000 chart reflects a hypothetical $10,000 investment in the Fund. The chart uses total return NAV performance and assumes reinvestment of dividends and capital gains. Fund expenses, including management fees and other expenses, were deducted.
| Adara Smaller Companies Fund | PAGE 1 | TSR-AR-74925K342 |
CUMULATIVE PERFORMANCE (Initial Investment of $10,000)
| | 10/21/2014 | 10/31/2014 | 11/30/2014 | 12/31/2014 | 01/31/2015 | 02/28/2015 | 03/31/2015 | 04/30/2015 | 05/31/2015 | 06/30/2015 | 07/31/2015 | 08/31/2015 | 09/30/2015 | 10/31/2015 | 11/30/2015 | 12/31/2015 | 01/31/2016 | 02/29/2016 | 03/31/2016 | 04/30/2016 | 05/31/2016 | 06/30/2016 | 07/31/2016 | 08/31/2016 | 09/30/2016 | 10/31/2016 | 11/30/2016 | 12/31/2016 | 01/31/2017 | 02/28/2017 | 03/31/2017 | 04/30/2017 | 05/31/2017 | 06/30/2017 | 07/31/2017 | 08/31/2017 | 09/30/2017 | 10/31/2017 | 11/30/2017 | 12/31/2017 | 01/31/2018 | 02/28/2018 | 03/31/2018 | 04/30/2018 | 05/31/2018 | 06/30/2018 | 07/31/2018 | 08/31/2018 | 09/30/2018 | 10/31/2018 | 11/30/2018 | 12/31/2018 | 01/31/2019 | 02/28/2019 | 03/31/2019 | 04/30/2019 | 05/31/2019 | 06/30/2019 | 07/31/2019 | 08/31/2019 | 09/30/2019 | 10/31/2019 | 11/30/2019 | 12/31/2019 | 01/31/2020 | 02/29/2020 | 03/31/2020 | 04/30/2020 | 05/31/2020 | 06/30/2020 | 07/31/2020 | 08/31/2020 | 09/30/2020 | 10/31/2020 | 11/30/2020 | 12/31/2020 | 01/31/2021 | 02/28/2021 | 03/31/2021 | 04/30/2021 | 05/31/2021 | 06/30/2021 | 07/31/2021 | 08/31/2021 | 09/30/2021 | 10/31/2021 | 11/30/2021 | 12/31/2021 | 01/31/2022 | 02/28/2022 | 03/31/2022 | 04/30/2022 | 05/31/2022 | 06/30/2022 | 07/31/2022 | 08/31/2022 | 09/30/2022 | 10/31/2022 | 11/30/2022 | 12/31/2022 | 01/31/2023 | 02/28/2023 | 03/31/2023 | 04/30/2023 | 05/31/2023 | 06/30/2023 | 07/31/2023 | 08/31/2023 | 09/30/2023 | 10/31/2023 | 11/30/2023 | 12/31/2023 | 01/31/2024 | 02/29/2024 | 03/31/2024 | 04/30/2024 | 05/31/2024 | 06/30/2024 | 07/31/2024 | 08/31/2024 |
| Adara Smaller Companies Fund | 10000 | 10170 | 10230 | 10560 | 10150 | 10750 | 10970 | 10740 | 11060 | 11310 | 11180 | 10590 | 10020 | 10380 | 10690 | 10220 | 9420 | 9370 | 10020 | 10130 | 10320 | 10380 | 10990 | 11200 | 11440 | 10890 | 11920 | 12210 | 12240 | 12330 | 12490 | 12710 | 12640 | 13020 | 13040 | 12940 | 13730 | 13960 | 14300 | 14304 | 14646 | 14220 | 14470 | 14667 | 15779 | 16090 | 16194 | 17409 | 17056 | 15186 | 14968 | 13414 | 14806 | 15766 | 15466 | 15970 | 15106 | 16198 | 16222 | 15466 | 15346 | 15742 | 16366 | 16786 | 16288 | 15168 | 11896 | 13576 | 14795 | 15641 | 16151 | 17085 | 16699 | 17035 | 20146 | 21984 | 23509 | 25488 | 25589 | 26156 | 26358 | 26912 | 26358 | 27063 | 26446 | 27845 | 27089 | 27809 | 24825 | 24715 | 24715 | 22669 | 22575 | 20794 | 22638 | 22481 | 20685 | 22716 | 23153 | 22039 | 23889 | 23481 | 22353 | 21883 | 21773 | 23560 | 24641 | 23920 | 22792 | 21538 | 23184 | 25364 | 24812 | 25932 | 26957 | 25253 | 26484 | 26137 | 28093 | 27919 |
| Russell 3000 Total Return Index ** | 10000 | 10401 | 10654 | 10653 | 10357 | 10957 | 10845 | 10894 | 11045 | 10860 | 11042 | 10375 | 10073 | 10868 | 10929 | 10704 | 10100 | 10097 | 10808 | 10875 | 11070 | 11092 | 11533 | 11562 | 11580 | 11330 | 11837 | 12068 | 12295 | 12752 | 12761 | 12896 | 13028 | 13145 | 13393 | 13419 | 13746 | 14046 | 14473 | 14618 | 15388 | 14821 | 14523 | 14579 | 14990 | 15088 | 15589 | 16136 | 16163 | 14973 | 15273 | 13851 | 15040 | 15569 | 15797 | 16427 | 15364 | 16443 | 16688 | 16348 | 16635 | 16993 | 17639 | 18148 | 18128 | 16644 | 14355 | 16256 | 17126 | 17517 | 18512 | 19853 | 19130 | 18717 | 20994 | 21939 | 21841 | 22524 | 23331 | 24534 | 24646 | 25253 | 25680 | 26413 | 25228 | 26934 | 26524 | 27568 | 25946 | 25293 | 26113 | 23770 | 23738 | 21752 | 23793 | 22905 | 20781 | 22485 | 23659 | 22273 | 23807 | 23251 | 23873 | 24127 | 24221 | 25875 | 26802 | 26285 | 25033 | 24369 | 26642 | 28055 | 28366 | 29901 | 30866 | 29507 | 30902 | 31858 | 32450 | 33157 |
| Russell 2000 Total Return Index | 10000 | 10548 | 10557 | 10858 | 10509 | 11133 | 11327 | 11038 | 11290 | 11374 | 11242 | 10536 | 10019 | 10583 | 10927 | 10379 | 9466 | 9466 | 10221 | 10382 | 10615 | 10609 | 11242 | 11441 | 11568 | 11018 | 12247 | 12590 | 12640 | 12884 | 12901 | 13042 | 12777 | 13218 | 13317 | 13147 | 13968 | 14087 | 14493 | 14434 | 14812 | 14238 | 14422 | 14547 | 15430 | 15540 | 15811 | 16493 | 16096 | 14348 | 14576 | 12845 | 14290 | 15032 | 14718 | 15218 | 14034 | 15026 | 15113 | 14366 | 14665 | 15052 | 15671 | 16123 | 15606 | 14292 | 11187 | 12724 | 13552 | 14031 | 14419 | 15231 | 14723 | 15031 | 17802 | 19341 | 20315 | 21581 | 21798 | 22255 | 22301 | 22733 | 21912 | 22403 | 21742 | 22667 | 21722 | 22208 | 20070 | 20284 | 20536 | 18501 | 18529 | 17005 | 18780 | 18396 | 16633 | 18464 | 18896 | 17669 | 19391 | 19064 | 18153 | 17827 | 17662 | 19098 | 20266 | 19252 | 18118 | 16883 | 18411 | 20660 | 19857 | 20980 | 21731 | 20201 | 21215 | 21018 | 23154 | 22808 |
ANNUAL AVERAGE TOTAL RETURN (%)
| | | |
| | 1 Year | 5 Years | Since Inception
(10/21/2014) |
Adara Smaller Companies | 16.72 | 12.54 | 10.97 |
Russell 3000 Total Return Index** | 26.14 | 15.19 | 12.93 |
Russell 2000 Total Return Index | 18.47 | 9.68 | 8.72 |
Visit https://rbbfund.com/additional-fund-information/ for more recent performance information.
| * | The Fund’s past performance is not a good predictor of how the Fund will perform in the future. The graph and table do not reflect the deduction of taxes that a shareholder would pay on Fund distributions or redemption of Fund shares. |
| ** | Effective with this report, and pursuant to new regulatory requirements, the Russell 3000 Total Return Index replaced the Russell 2000 Total Return Index as the Fund’s primary benchmark to represent a broad-based securities market index. The Fund continues to use the Russell 2000 Total Return Index as an additional benchmark. |
KEY FUND STATISTICS (as of August 31, 2024)
| |
Net Assets | $603,895,805 |
Number of Holdings | 665 |
Net Advisory Fee | $3,658,869 |
Portfolio Turnover | 58% |
Visit https://rbbfund.com/additional-fund-information/ for more recent performance information.
WHAT DID THE FUND INVEST IN? (as of August 31, 2024)
| |
Top 10 Holdings | (% of Net Assets) |
First American Treasury Obligations Fund | 6.8% |
Crinetics Pharmaceuticals, Inc. | 0.9% |
TransMedics Group, Inc. | 0.8% |
Build-A-Bear Workshop, Inc. | 0.7% |
Northwest Pipe Co. | 0.7% |
Talen Energy Corp. | 0.7% |
White Mountains Insurance Group Ltd. | 0.6% |
Barrett Business Services, Inc. | 0.6% |
Hamilton Beach Brands Holding Co. | 0.6% |
Northeast Bank | 0.6% |
| |
Top Sectors | (% of Net Assets) |
Consumer, Non-cyclical | 23.3% |
Financial | 20.6% |
Industrial | 16.6% |
Consumer, Cyclical | 14.1% |
Technology | 8.8% |
Energy | 3.9% |
Communications | 3.0% |
Utilities | 1.8% |
Basic Materials | 1.1% |
Cash & Other | 6.8% |
Material Fund Changes:
This is a summary of certain changes to the Fund since September 1, 2023. For more complete information, you may review the Fund’s next prospectus, which we expect to be available by December 31, 2024 at https://rbbfund.com/additional-fund-information/ or upon request at 1-844-261-6482.
| Adara Smaller Companies Fund | PAGE 2 | TSR-AR-74925K342 |
During the fiscal year, certain changes occured with respect to personnel of the Fund’s sub-advisers who serve as portfolio managers of the Fund (each, a “PM”). At Aperio, Robert Tymoczko retired from the firm and was removed as a PM. Michael Branch at Aperio was added as a PM. At Pacific Ridge, Mark Cooper transitioned his portfolio management responsibilities and was removed as a PM. At River Road, R. James Shircliff retired from the firm and was removed as a PM.
For additional information about the Fund; including its prospectus, financial information, holdings and proxy information, scan the QR code or visit https://rbbfund.com/additional-fund-information/
HOUSEHOLDING
To reduce Fund expenses, only one copy of most shareholder documents may be mailed to shareholders with multiple accounts at the same address (Householding). If you would prefer that your Fund documents not be householded, please contact the Fund at 1-844-261-6482, or contact your financial intermediary. Your instructions will typically be effective within 30 days of receipt by the Fund or your financial intermediary.
| Adara Smaller Companies Fund | PAGE 3 | TSR-AR-74925K342 |
105901120012940174091546617085270632248123920279191037511562134191613616348198532641322905262853315710536114411314716493143661523122403183961925222808
| | |
| Aquarius International Fundtrue | |
Annual Shareholder Report | August 31, 2024 |
This annual shareholder report contains important information about the Aquarius International Fund (the “Fund”) for the period of September 1, 2023, to August 31, 2024. You can find additional information about the Fund at https://rbbfund.com/additional-fund-information/. You can also request this information by contacting us at 1-844-261-6482.
This report describes changes to the Fund that occurred during the reporting period.
WHAT WERE THE FUND COSTS FOR THE PAST YEAR? (based on a hypothetical $10,000 investment)
| | |
Fund Name | Costs of a $10,000 investment | Costs paid as a percentage of a $10,000 investment |
| Aquarius International Fund | $76 | 0.69% |
HOW DID THE FUND PERFORM LAST YEAR AND WHAT AFFECTED ITS PERFORMANCE?
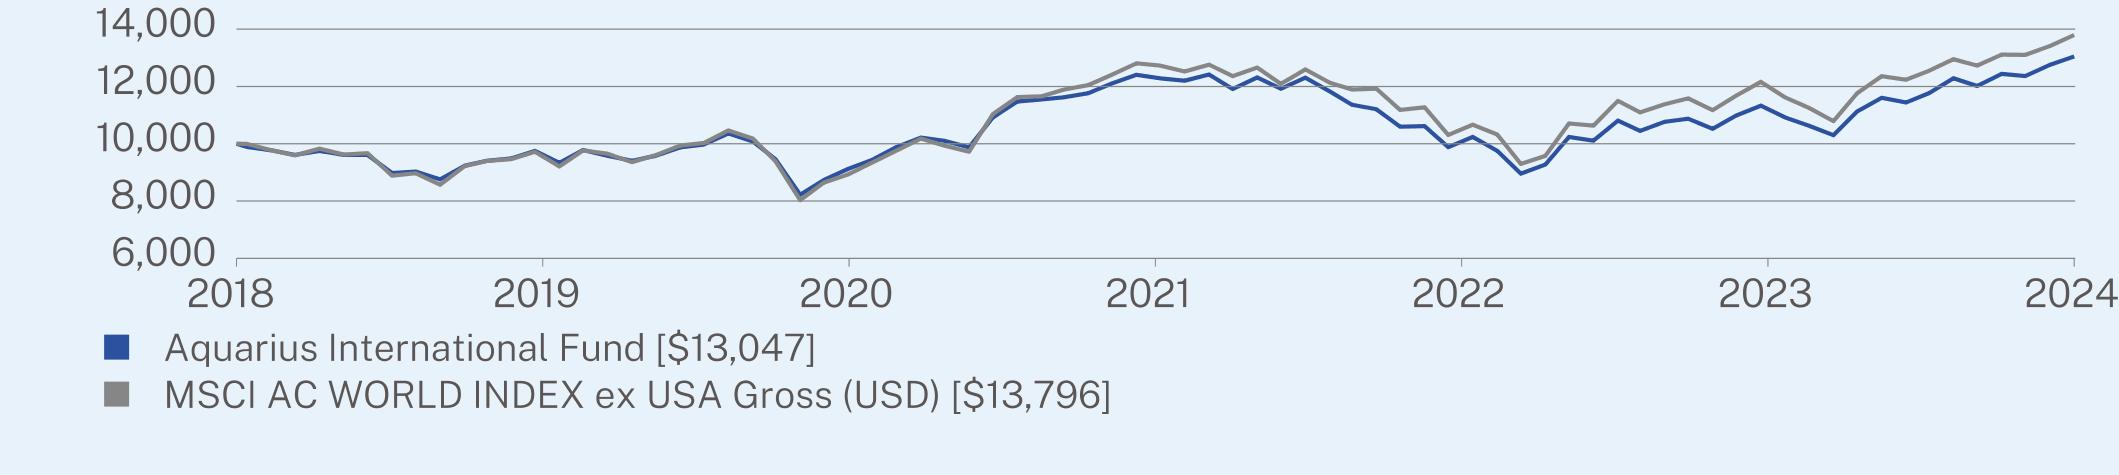
The Fund generated a return of 19.53% for the fiscal year ended August 31, 2024, slightly outperforming the 18.79% return of the Fund’s benchmark, the MSCI AC World Index ex USA Gross Index, over the same period.
Developed international equities, as measured by the MSCI EAFE Index, led performance and were up 19.99% for the period. Emerging markets, as measured by the MSCI Emerging Markets Index, were up 15.52% for the period, trailing developed markets. A decline of 1.85% in the U.S. Dollar Index during the period marginally contributed to returns.
The Fund ended the fiscal year with four underlying sub-advisers: international developed markets managers Mawer Investment Management Ltd. (“Mawer”) and Boston Partners Global Investors Inc. (“Boston Partners”); emerging markets manager Driehaus Capital Management LLC (“Driehaus”); and tax-loss harvesting manager Aperio Group, LLC (“Aperio”). Mawer had the strongest performance of the underlying sub-advisers in the 2024 fiscal year with a +22.17% return, followed by Aperio at +20.34%, Boston Partners at +19.11% and Driehaus at +17.82%. The Fund allocated 34% of its assets to each of Mawer and Boston Partners as of the end of the fiscal year, followed by 16% to Driehaus and 13% to Aperio, with the remaining 3% in a cash sleeve.
| |
Top Contributors |
| ↑ | Taiwan Semiconductor Manufacturing Co |
| ↑ | Rheinmetall |
| ↑ | Wolters Kluwer |
| |
Top Detractors |
| ↓ | PANASONIC HOLDINGS CORP |
| ↓ | EDENRED MALAKOFF |
| ↓ | RECKITT BENCKISER GROUP PLC |
HOW DID THE FUND PERFORM SINCE INCEPTION?*
The $10,000 chart reflects a hypothetical $10,000 investment in the Fund. The chart uses total return NAV performance and assumes reinvestment of dividends and capital gains. Fund expenses, including management fees and other expenses, were deducted.
| Aquarius International Fund | PAGE 1 | TSR-AR-74933W502 |
CUMULATIVE PERFORMANCE (Initial Investment of $10,000)
| | 04/17/2018 | 04/30/2018 | 05/31/2018 | 06/30/2018 | 07/31/2018 | 08/31/2018 | 09/30/2018 | 10/31/2018 | 11/30/2018 | 12/31/2018 | 01/31/2019 | 02/28/2019 | 03/31/2019 | 04/30/2019 | 05/31/2019 | 06/30/2019 | 07/31/2019 | 08/31/2019 | 09/30/2019 | 10/31/2019 | 11/30/2019 | 12/31/2019 | 01/31/2020 | 02/29/2020 | 03/31/2020 | 04/30/2020 | 05/31/2020 | 06/30/2020 | 07/31/2020 | 08/31/2020 | 09/30/2020 | 10/31/2020 | 11/30/2020 | 12/31/2020 | 01/31/2021 | 02/28/2021 | 03/31/2021 | 04/30/2021 | 05/31/2021 | 06/30/2021 | 07/31/2021 | 08/31/2021 | 09/30/2021 | 10/31/2021 | 11/30/2021 | 12/31/2021 | 01/31/2022 | 02/28/2022 | 03/31/2022 | 04/30/2022 | 05/31/2022 | 06/30/2022 | 07/31/2022 | 08/31/2022 | 09/30/2022 | 10/31/2022 | 11/30/2022 | 12/31/2022 | 01/31/2023 | 02/28/2023 | 03/31/2023 | 04/30/2023 | 05/31/2023 | 06/30/2023 | 07/31/2023 | 08/31/2023 | 09/30/2023 | 10/31/2023 | 11/30/2023 | 12/31/2023 | 01/31/2024 | 02/29/2024 | 03/31/2024 | 04/30/2024 | 05/31/2024 | 06/30/2024 | 07/31/2024 | 08/31/2024 |
| Aquarius International Fund | 10000 | 9890 | 9770 | 9610 | 9750 | 9610 | 9610 | 8980 | 9030 | 8757 | 9234 | 9406 | 9487 | 9751 | 9335 | 9782 | 9579 | 9406 | 9579 | 9873 | 9974 | 10360 | 10082 | 9454 | 8220 | 8734 | 9125 | 9434 | 9886 | 10216 | 10102 | 9876 | 10915 | 11475 | 11547 | 11620 | 11765 | 12107 | 12408 | 12283 | 12201 | 12418 | 11910 | 12315 | 11921 | 12307 | 11824 | 11362 | 11204 | 10595 | 10616 | 9881 | 10238 | 9755 | 8957 | 9272 | 10238 | 10108 | 10809 | 10448 | 10766 | 10873 | 10522 | 10989 | 11329 | 10915 | 10628 | 10299 | 11127 | 11603 | 11440 | 11766 | 12287 | 12016 | 12439 | 12363 | 12754 | 13047 |
| MSCI AC WORLD INDEX ex USA Gross (USD) | 10000 | 9995 | 9775 | 9595 | 9828 | 9624 | 9672 | 8886 | 8972 | 8569 | 9218 | 9399 | 9463 | 9720 | 9209 | 9768 | 9653 | 9357 | 9602 | 9938 | 10027 | 10465 | 10185 | 9381 | 8030 | 8644 | 8931 | 9339 | 9760 | 10179 | 9933 | 9721 | 11030 | 11629 | 11657 | 11889 | 12048 | 12410 | 12807 | 12728 | 12522 | 12762 | 12361 | 12659 | 12091 | 12594 | 12131 | 11893 | 11922 | 11181 | 11273 | 10308 | 10665 | 10324 | 9297 | 9577 | 10709 | 10633 | 11498 | 11095 | 11378 | 11584 | 11174 | 11682 | 12160 | 11614 | 11252 | 10789 | 11763 | 12357 | 12236 | 12548 | 12952 | 12729 | 13111 | 13103 | 13411 | 13796 |
ANNUAL AVERAGE TOTAL RETURN (%)
| | | |
| | 1 Year | 5 Years | Since Inception
(04/17/2018) |
Aquarius International Fund | 19.53 | 6.76 | 4.26 |
MSCI AC WORLD INDEX ex USA Gross (USD) | 18.79 | 8.08 | 5.18 |
Visit https://rbbfund.com/additional-fund-information/ for more recent performance information.
| * | The Fund’s past performance is not a good predictor of how the Fund will perform in the future. The graph and table do not reflect the deduction of taxes that a shareholder would pay on Fund distributions or redemption of Fund shares. |
KEY FUND STATISTICS (as of August 31, 2024)
| |
Net Assets | $581,434,302 |
Number of Holdings | 749 |
Net Advisory Fee | $2,590,499 |
Portfolio Turnover | 59% |
Visit https://rbbfund.com/additional-fund-information/ for more recent performance information.
WHAT DID THE FUND INVEST IN? (as of August 31, 2024)
| |
Top 10 Holdings | (% of Net Assets) |
First American Treasury Obligations Fund | 6.0% |
Taiwan Semiconductor Manufacturing Co. Ltd. | 3.3% |
Samsung Electronics Co. Ltd. | 2.6% |
BAE Systems PLC | 1.8% |
AstraZeneca PLC | 1.8% |
Shell PLC | 1.7% |
Aon PLC | 1.4% |
Novartis AG | 1.4% |
Tencent Holdings Ltd. | 1.2% |
Wolters Kluwer | 1.2% |
| |
Top Sectors | (% of Net Assets) |
Financial | 20.6% |
Consumer, Non-cyclical | 19.0% |
Industrial | 14.3% |
Technology | 11.1% |
Consumer, Cyclical | 10.1% |
Communications | 5.2% |
Basic Materials | 5.1% |
Energy | 5.0% |
Utilities | 2.7% |
Cash & Other | 6.9% |
Material Fund Changes:
This is a summary of certain changes to the Fund since September 1, 2023. For more complete information, you may review the Fund’s next prospectus, which we expect to be available by December 31, 2024 at https://rbbfund.com/additional-fund-information/ or upon request at 1-844-261-6482.
| Aquarius International Fund | PAGE 2 | TSR-AR-74933W502 |
During fiscal year, certain changes occured with repect to personnel of one of the Fund’s sub-advisers who serve as portfolio managers of the Fund (each, a “PM”). At Aperio, Robert Tymoczko retired from the firm and was removed as a PM. Michael Branch was added as a PM.
For additional information about the Fund; including its prospectus, financial information, holdings and proxy information, scan the QR code or visit https://rbbfund.com/additional-fund-information/
HOUSEHOLDING
To reduce Fund expenses, only one copy of most shareholder documents may be mailed to shareholders with multiple accounts at the same address (Householding). If you would prefer that your Fund documents not be householded, please contact the Fund at 1-844-261-6482, or contact your financial intermediary. Your instructions will typically be effective within 30 days of receipt by the Fund or your financial intermediary.
| Aquarius International Fund | PAGE 3 | TSR-AR-74933W502 |
96109406102161241897551091513047962493571017912762103241161413796
| | |
| Boston Partners All-Cap Value Fund | |
Institutional Class | BPAIX |
Annual Shareholder Report | August 31, 2024 |
This annual shareholder report contains important information about the Boston Partners All-Cap Value Fund (the “Fund”) for the period of September 1, 2023, to August 31, 2024. You can find additional information about the Fund at https://www.bostonpartners.com/fund/bp-all-cap-value-fund-inst/. You can also request this information by contacting us at 1-888-261-4073.
WHAT WERE THE FUND COSTS FOR THE PAST YEAR? (based on a hypothetical $10,000 investment)
| | |
Class Name | Costs of a $10,000 investment | Costs paid as a percentage of a $10,000 investment |
| Institutional Class | $88 | 0.80% |
HOW DID THE FUND PERFORM LAST YEAR AND WHAT AFFECTED ITS PERFORMANCE?
For the 12 months ended August 31, 2024, the Fund posted a sizable gain, although it did trail the returns of the Russell 3000® Value Index, and the Fund’s broad-based securities market index, the Russell 3000® Index, for the same period.
What factors influenced performance?
The U.S. stock market was propelled higher during the past 12 months by a combination of solid economic growth, rapidly declining inflation, and the likelihood of Federal Reserve interest rate cuts. Although stocks experienced periodic bouts of volatility, the overall direction of the U.S. stock market was positive.
What were the top contributors and detractors?
Relative to the Russell 3000® Value Index, the biggest contribution to the Fund’s performance came from its holdings in the Materials sector, even though the Fund’s weight in the sector was less than that of the Russell 3000® Value Index. Stock selection in the Consumer Staples and Information Technology sectors also helped. The biggest detractors from relative performance were the Fund’s overweight position in the Health Care sector and disappointing stock selection within the Communication Services sector.
How is the Fund currently positioned?
The Fund’s largest sector overweights at the end of the period were in Information Technology, Health Care, and Financials. The Fund held meaningful underweights in the Real Estate, Utilities, and Consumer Staples sectors at the end of the reporting period.
| |
Top Contributors |
| ↑ | JPMorgan Chase & Co. |
| ↑ | CRH Public Limited Company |
| ↑ | Advanced Micro Devices, Inc. |
| ↑ | Howmet Aerospace, Inc. |
| ↑ | Check Point Software Technology |
| |
Top Detractors |
| ↓ | Advanced Micro Devices, Inc. |
| ↓ | Bristol-Myers Squibb Company |
| ↓ | Pfizer, Inc. |
| ↓ | Globe Life, Inc. |
| ↓ | SLB |
| Boston Partners All-Cap Value Fund | PAGE 1 | TSR-AR-749255139 |
HOW DID THE FUND PERFORM OVER THE PAST 10 YEARS?*
The $100,000 chart reflects a hypothetical $100,000 investment in the class of shares noted. The chart uses total return NAV performance and assumes reinvestment of dividends and capital gains. Fund expenses, including management fees and other expenses, were deducted.
CUMULATIVE PERFORMANCE (Initial Investment of $100,000)
| | 08/31/2014 | 09/30/2014 | 10/31/2014 | 11/30/2014 | 12/31/2014 | 01/31/2015 | 02/28/2015 | 03/31/2015 | 04/30/2015 | 05/31/2015 | 06/30/2015 | 07/31/2015 | 08/31/2015 | 09/30/2015 | 10/31/2015 | 11/30/2015 | 12/31/2015 | 01/31/2016 | 02/29/2016 | 03/31/2016 | 04/30/2016 | 05/31/2016 | 06/30/2016 | 07/31/2016 | 08/31/2016 | 09/30/2016 | 10/31/2016 | 11/30/2016 | 12/31/2016 | 01/31/2017 | 02/28/2017 | 03/31/2017 | 04/30/2017 | 05/31/2017 | 06/30/2017 | 07/31/2017 | 08/31/2017 | 09/30/2017 | 10/31/2017 | 11/30/2017 | 12/31/2017 | 01/31/2018 | 02/28/2018 | 03/31/2018 | 04/30/2018 | 05/31/2018 | 06/30/2018 | 07/31/2018 | 08/31/2018 | 09/30/2018 | 10/31/2018 | 11/30/2018 | 12/31/2018 | 01/31/2019 | 02/28/2019 | 03/31/2019 | 04/30/2019 | 05/31/2019 | 06/30/2019 | 07/31/2019 | 08/31/2019 | 09/30/2019 | 10/31/2019 | 11/30/2019 | 12/31/2019 | 01/31/2020 | 02/29/2020 | 03/31/2020 | 04/30/2020 | 05/31/2020 | 06/30/2020 | 07/31/2020 | 08/31/2020 | 09/30/2020 | 10/31/2020 | 11/30/2020 | 12/31/2020 | 01/31/2021 | 02/28/2021 | 03/31/2021 | 04/30/2021 | 05/31/2021 | 06/30/2021 | 07/31/2021 | 08/31/2021 | 09/30/2021 | 10/31/2021 | 11/30/2021 | 12/31/2021 | 01/31/2022 | 02/28/2022 | 03/31/2022 | 04/30/2022 | 05/31/2022 | 06/30/2022 | 07/31/2022 | 08/31/2022 | 09/30/2022 | 10/31/2022 | 11/30/2022 | 12/31/2022 | 01/31/2023 | 02/28/2023 | 03/31/2023 | 04/30/2023 | 05/31/2023 | 06/30/2023 | 07/31/2023 | 08/31/2023 | 09/30/2023 | 10/31/2023 | 11/30/2023 | 12/31/2023 | 01/31/2024 | 02/29/2024 | 03/31/2024 | 04/30/2024 | 05/31/2024 | 06/30/2024 | 07/31/2024 | 08/31/2024 |
| Boston Partners All-Cap Value Fund Institutional Class | 100000 | 97870 | 99696 | 102087 | 102524 | 98595 | 105631 | 104717 | 105814 | 107458 | 105631 | 106819 | 100879 | 97224 | 105037 | 106134 | 103500 | 96142 | 95704 | 102185 | 104183 | 107058 | 105644 | 110274 | 112661 | 112710 | 109884 | 117729 | 118843 | 120716 | 124816 | 124816 | 124866 | 126334 | 128207 | 130333 | 129422 | 133572 | 135293 | 138431 | 140075 | 147681 | 142769 | 139442 | 140075 | 140498 | 139442 | 145199 | 147153 | 147417 | 135110 | 138015 | 123448 | 134911 | 138563 | 137777 | 144182 | 134911 | 144857 | 146711 | 140305 | 144519 | 147048 | 153229 | 157861 | 151517 | 137040 | 112758 | 125966 | 131445 | 130580 | 136117 | 141481 | 137040 | 135829 | 156362 | 164359 | 163069 | 173327 | 183761 | 191791 | 198356 | 195425 | 194429 | 197946 | 191674 | 201052 | 193843 | 206417 | 204374 | 203941 | 206788 | 195647 | 202641 | 185063 | 196081 | 190510 | 176460 | 199485 | 209945 | 201413 | 211221 | 206116 | 200338 | 201816 | 195904 | 209273 | 216865 | 213371 | 208131 | 200674 | 213976 | 226415 | 228808 | 235762 | 246380 | 232622 | 239650 | 237482 | 248922 | 254007 |
| Russell 3000® Total Return Index** | 100000 | 97916 | 100610 | 103048 | 103047 | 100179 | 105979 | 104902 | 105376 | 106834 | 105046 | 106803 | 100356 | 97431 | 105127 | 105710 | 103540 | 97698 | 97666 | 104542 | 105190 | 107072 | 107292 | 111550 | 111835 | 112011 | 109587 | 114492 | 116726 | 118923 | 123346 | 123430 | 124738 | 126015 | 127152 | 129549 | 129799 | 132964 | 135866 | 139991 | 141391 | 148843 | 143357 | 140479 | 141013 | 144994 | 145942 | 150786 | 156081 | 156339 | 144828 | 147728 | 133979 | 145479 | 150596 | 152795 | 158896 | 148613 | 159052 | 161416 | 158125 | 160901 | 164364 | 170612 | 175538 | 175347 | 160990 | 138851 | 157241 | 165650 | 169437 | 179058 | 192030 | 185038 | 181044 | 203069 | 212204 | 211260 | 217864 | 225673 | 237306 | 238389 | 244268 | 248398 | 255482 | 244019 | 260521 | 256556 | 266658 | 250969 | 244647 | 252583 | 229916 | 229607 | 210399 | 230138 | 221549 | 201005 | 217489 | 228841 | 215441 | 230280 | 224897 | 230911 | 233371 | 234279 | 250277 | 259248 | 254244 | 242133 | 235715 | 257695 | 271363 | 274371 | 289223 | 298552 | 285415 | 298900 | 308153 | 313882 | 320715 |
| Russell 3000® Value Total Return Index | 100000 | 97572 | 100111 | 101963 | 102754 | 98633 | 103391 | 102228 | 102933 | 104140 | 102231 | 102409 | 96395 | 93451 | 100356 | 100935 | 98510 | 93301 | 93328 | 100129 | 102234 | 103844 | 104702 | 107933 | 108903 | 108758 | 106930 | 113646 | 116636 | 117331 | 121344 | 120125 | 119954 | 119550 | 121672 | 123226 | 121673 | 125645 | 126500 | 130357 | 132023 | 136870 | 130312 | 128301 | 128858 | 130132 | 130495 | 135441 | 137534 | 137529 | 130023 | 133778 | 120700 | 130356 | 134585 | 135105 | 139919 | 130756 | 140071 | 141168 | 136768 | 141788 | 143865 | 148241 | 152392 | 148786 | 134374 | 110757 | 123280 | 127464 | 126875 | 131754 | 137295 | 133749 | 132359 | 150619 | 156773 | 155960 | 165740 | 175412 | 182183 | 186534 | 184472 | 185398 | 189158 | 182760 | 191885 | 185137 | 196545 | 191520 | 189636 | 194884 | 183627 | 187194 | 170707 | 182338 | 176885 | 161221 | 177977 | 188753 | 180861 | 190689 | 184105 | 182513 | 184852 | 177910 | 189859 | 196977 | 191411 | 183873 | 177128 | 190638 | 201941 | 201587 | 208975 | 219350 | 209719 | 216542 | 214415 | 226123 | 231651 |
ANNUAL AVERAGE TOTAL RETURN (%)
| | | |
| | 1 Year | 5 Year | 10 Year |
Institutional Class | 19.04 | 12.60 | 9.77 |
Russell 3000® Total Return Index** | 26.14 | 15.19 | 12.36 |
Russell 3000® Value Total Return Index | 21.02 | 11.11 | 8.76 |
Visit https://www.bostonpartners.com/fund/bp-all-cap-value-fund-inst/ for more recent performance information.
| * | The Fund’s past performance is not a good predictor of how the Fund will perform in the future. The graph and table do not reflect the deduction of taxes that a shareholder would pay on Fund distributions or redemption of Fund shares. |
| ** | Effective with this report, and pursuant to new regulatory requirements, the Russell 3000 Total Return Index replaced the Russell 3000 Value Total Return Index as the Fund’s primary benchmark to represent a broad-based securities market index. The Fund continues to use the Russell 3000 Value Total Return Index as an additional benchmark. |
KEY FUND STATISTICS (as of August 31, 2024)
| |
Net Assets | $1,492,964,230 |
Number of Holdings | 113 |
Net Advisory Fee | $9,219,182 |
Portfolio Turnover | 24% |
Visit https://www.bostonpartners.com/fund/bp-all-cap-value-fund-inst/ for more recent performance information.
WHAT DID THE FUND INVEST IN? (as of August 31, 2024)
| |
Top 10 Holdings | (% of net assets) |
Alphabet, Inc. | 2.4% |
JPMorgan Chase & Co. | 2.2% |
Johnson & Johnson | 2.1% |
AbbVie, Inc. | 2.0% |
Corpay, Inc. | 2.0% |
Oracle Corp. | 2.0% |
Check Point Software Technologies Ltd. | 2.0% |
CRH PLC | 1.9% |
NVR, Inc. | 1.9% |
Booking Holdings, Inc. | 1.8% |
| |
Top Sectors† | (% of net assets) |
Financials | 25.4% |
Health Care | 20.0% |
Information Technology | 16.5% |
Industrials | 14.2% |
Consumer Discretionary | 7.2% |
Communication Services | 4.9% |
Energy | 4.3% |
Consumer Staples | 3.4% |
Materials | 2.9% |
Cash & Other | 1.2% |
| † | The Global Industry Classification Standard (“GICS®”) was developed by and/or is the exclusive property of MSCI, Inc. (“MSCI”) and Standard & Poor’s Financial Services LLC (“S&P”). GICS® is a service mark of MSCI and S&P and has been licensed for use by U.S. Bank Global Fund Services. |
| Boston Partners All-Cap Value Fund | PAGE 2 | TSR-AR-749255139 |
For additional information about the Fund; including its prospectus, financial information, holdings and proxy information, scan the QR code or visit https://www.bostonpartners.com/fund/bp-all-cap-value-fund-inst/.
HOUSEHOLDING
To reduce Fund expenses, only one copy of most shareholder documents may be mailed to shareholders with multiple accounts at the same address (Householding). If you would prefer that your Fund documents not be householded, please contact the Fund at 1-888-261-4073, or contact your financial intermediary. Your instructions will typically be effective within 30 days of receipt by the Fund or your financial intermediary.
| Boston Partners All-Cap Value Fund | PAGE 3 | TSR-AR-749255139 |
10000010087911266112942214715314030514148119794619051021337125400710000010035611183512979915608115812519203025548222154925424432071510000096395108903121673137534136768137295189158176885191411231651
| | |
| Boston Partners All-Cap Value Fund | |
Investor Class | BPAVX |
Annual Shareholder Report | August 31, 2024 |
This annual shareholder report contains important information about the Boston Partners All-Cap Value Fund (the “Fund”) for the period of September 1, 2023, to August 31, 2024. You can find additional information about the Fund at https://www.bostonpartners.com/fund/bp-all-cap-value-fund/. You can also request this information by contacting us at 1-888-261-4073.
WHAT WERE THE FUND COSTS FOR THE PAST YEAR? (based on a hypothetical $10,000 investment)
| | |
Class Name | Costs of a $10,000 investment | Costs paid as a percentage of a $10,000 investment |
| Investor Class | $115 | 1.05% |
HOW DID THE FUND PERFORM LAST YEAR AND WHAT AFFECTED ITS PERFORMANCE?
For the 12 months ended August 31, 2024, the Fund posted a sizable gain, although it did trail the returns of the Russell 3000® Value Index, and the Fund’s broad-based securities market index, the Russell 3000® Index, for the same period.
What factors influenced performance?
The U.S. stock market was propelled higher during the past 12 months by a combination of solid economic growth, rapidly declining inflation, and the likelihood of Federal Reserve interest rate cuts. Although stocks experienced periodic bouts of volatility, the overall direction of the U.S. stock market was positive.
What were the top contributors and detractors?
Relative to the Russell 3000® Value Index, the biggest contribution to the Fund’s performance came from its holdings in the Materials sector, even though the Fund’s weight in the sector was less than that of the Russell 3000® Value Index. Stock selection in the Consumer Staples and Information Technology sectors also helped. The biggest detractors from relative performance were the Fund’s overweight position in the Health Care sector and disappointing stock selection within the Communication Services sector.
How is the Fund currently positioned?
The Fund’s largest sector overweights at the end of the period were in Information Technology, Health Care, and Financials. The Fund held meaningful underweights in the Real Estate, Utilities, and Consumer Staples sectors at the end of the reporting period.
| |
Top Contributors |
| ↑ | JPMorgan Chase & Co. |
| ↑ | CRH Public Limited Company |
| ↑ | Advanced Micro Devices, Inc. |
| ↑ | Howmet Aerospace, Inc. |
| ↑ | Check Point Software Technology |
| |
Top Detractors |
| ↓ | Advanced Micro Devices, Inc. |
| ↓ | Bristol-Myers Squibb Company |
| ↓ | Pfizer, Inc. |
| ↓ | Globe Life, Inc. |
| ↓ | SLB |
| Boston Partners All-Cap Value Fund | PAGE 1 | TSR-AR-749255121 |
HOW DID THE FUND PERFORM OVER THE PAST 10 YEARS?*
The $10,000 chart reflects a hypothetical $10,000 investment in the class of shares noted. The chart uses total return NAV performance and assumes reinvestment of dividends and capital gains. Fund expenses, including 12b-1 fees, management fees and other expenses, were deducted.
CUMULATIVE PERFORMANCE (Initial Investment of $10,000)
| | 08/31/2014 | 09/30/2014 | 10/31/2014 | 11/30/2014 | 12/31/2014 | 01/31/2015 | 02/28/2015 | 03/31/2015 | 04/30/2015 | 05/31/2015 | 06/30/2015 | 07/31/2015 | 08/31/2015 | 09/30/2015 | 10/31/2015 | 11/30/2015 | 12/31/2015 | 01/31/2016 | 02/29/2016 | 03/31/2016 | 04/30/2016 | 05/31/2016 | 06/30/2016 | 07/31/2016 | 08/31/2016 | 09/30/2016 | 10/31/2016 | 11/30/2016 | 12/31/2016 | 01/31/2017 | 02/28/2017 | 03/31/2017 | 04/30/2017 | 05/31/2017 | 06/30/2017 | 07/31/2017 | 08/31/2017 | 09/30/2017 | 10/31/2017 | 11/30/2017 | 12/31/2017 | 01/31/2018 | 02/28/2018 | 03/31/2018 | 04/30/2018 | 05/31/2018 | 06/30/2018 | 07/31/2018 | 08/31/2018 | 09/30/2018 | 10/31/2018 | 11/30/2018 | 12/31/2018 | 01/31/2019 | 02/28/2019 | 03/31/2019 | 04/30/2019 | 05/31/2019 | 06/30/2019 | 07/31/2019 | 08/31/2019 | 09/30/2019 | 10/31/2019 | 11/30/2019 | 12/31/2019 | 01/31/2020 | 02/29/2020 | 03/31/2020 | 04/30/2020 | 05/31/2020 | 06/30/2020 | 07/31/2020 | 08/31/2020 | 09/30/2020 | 10/31/2020 | 11/30/2020 | 12/31/2020 | 01/31/2021 | 02/28/2021 | 03/31/2021 | 04/30/2021 | 05/31/2021 | 06/30/2021 | 07/31/2021 | 08/31/2021 | 09/30/2021 | 10/31/2021 | 11/30/2021 | 12/31/2021 | 01/31/2022 | 02/28/2022 | 03/31/2022 | 04/30/2022 | 05/31/2022 | 06/30/2022 | 07/31/2022 | 08/31/2022 | 09/30/2022 | 10/31/2022 | 11/30/2022 | 12/31/2022 | 01/31/2023 | 02/28/2023 | 03/31/2023 | 04/30/2023 | 05/31/2023 | 06/30/2023 | 07/31/2023 | 08/31/2023 | 09/30/2023 | 10/31/2023 | 11/30/2023 | 12/31/2023 | 01/31/2024 | 02/29/2024 | 03/31/2024 | 04/30/2024 | 05/31/2024 | 06/30/2024 | 07/31/2024 | 08/31/2024 |
| Boston Partners All-Cap Value Fund Investor Class | 10000 | 9786 | 9965 | 10201 | 10244 | 9850 | 10546 | 10455 | 10565 | 10730 | 10542 | 10656 | 10066 | 9699 | 10473 | 10578 | 10315 | 9579 | 9535 | 10178 | 10373 | 10656 | 10515 | 10978 | 11212 | 11212 | 10929 | 11709 | 11813 | 11995 | 12409 | 12399 | 12404 | 12546 | 12733 | 12940 | 12844 | 13253 | 13420 | 13733 | 13891 | 14644 | 14154 | 13818 | 13881 | 13918 | 13812 | 14381 | 14570 | 14591 | 13370 | 13655 | 12215 | 13343 | 13700 | 13622 | 14253 | 13332 | 14309 | 14493 | 13856 | 14269 | 14515 | 15124 | 15579 | 14945 | 13516 | 11121 | 12424 | 12961 | 12870 | 13413 | 13939 | 13499 | 13379 | 15390 | 16179 | 16052 | 17055 | 18081 | 18863 | 19507 | 19211 | 19113 | 19455 | 18829 | 19750 | 19037 | 20264 | 20063 | 20020 | 20289 | 19195 | 19879 | 18151 | 19226 | 18676 | 17296 | 19550 | 20563 | 19726 | 20685 | 20182 | 19607 | 19753 | 19164 | 20474 | 21214 | 20857 | 20348 | 19614 | 20910 | 22120 | 22348 | 23024 | 24053 | 22708 | 23391 | 23171 | 24288 | 24773 |
| Russell 3000® Total Return Index** | 10000 | 9792 | 10061 | 10305 | 10305 | 10018 | 10598 | 10490 | 10538 | 10683 | 10505 | 10680 | 10036 | 9743 | 10513 | 10571 | 10354 | 9770 | 9767 | 10454 | 10519 | 10707 | 10729 | 11155 | 11184 | 11201 | 10959 | 11449 | 11673 | 11892 | 12335 | 12343 | 12474 | 12601 | 12715 | 12955 | 12980 | 13296 | 13587 | 13999 | 14139 | 14884 | 14336 | 14048 | 14101 | 14499 | 14594 | 15079 | 15608 | 15634 | 14483 | 14773 | 13398 | 14548 | 15060 | 15279 | 15890 | 14861 | 15905 | 16142 | 15813 | 16090 | 16436 | 17061 | 17554 | 17535 | 16099 | 13885 | 15724 | 16565 | 16944 | 17906 | 19203 | 18504 | 18104 | 20307 | 21220 | 21126 | 21786 | 22567 | 23731 | 23839 | 24427 | 24840 | 25548 | 24402 | 26052 | 25656 | 26666 | 25097 | 24465 | 25258 | 22992 | 22961 | 21040 | 23014 | 22155 | 20101 | 21749 | 22884 | 21544 | 23028 | 22490 | 23091 | 23337 | 2328 | 25028 | 25925 | 25424 | 24213 | 23571 | 25769 | 27136 | 27437 | 28922 | 29855 | 28542 | 29890 | 30815 | 31388 | 32071 |
| Russell 3000® Value Total Return Index | 10000 | 9757 | 10011 | 10196 | 10275 | 9863 | 10339 | 10223 | 10293 | 10414 | 10223 | 10241 | 9640 | 9345 | 10036 | 10093 | 9851 | 9330 | 9333 | 10013 | 10223 | 10384 | 10470 | 10793 | 10890 | 10876 | 10693 | 11365 | 11664 | 11733 | 12134 | 12012 | 11995 | 11955 | 12167 | 12323 | 12167 | 12564 | 12650 | 13036 | 13202 | 13687 | 13031 | 12830 | 12886 | 13013 | 13049 | 13544 | 13753 | 13753 | 13002 | 13378 | 12070 | 13036 | 13458 | 13510 | 13992 | 13076 | 14007 | 14117 | 13677 | 14179 | 14387 | 14824 | 15239 | 14879 | 13437 | 11076 | 12328 | 12746 | 12688 | 13175 | 13729 | 13375 | 13236 | 15062 | 15677 | 15596 | 16574 | 17541 | 18218 | 18653 | 18447 | 18540 | 18916 | 18276 | 19188 | 18514 | 19654 | 19152 | 18964 | 19488 | 18363 | 18719 | 17071 | 18234 | 17688 | 16122 | 17798 | 18875 | 18086 | 19069 | 18411 | 18251 | 18485 | 17791 | 18986 | 19698 | 19141 | 18387 | 17713 | 19064 | 20194 | 20159 | 20897 | 21935 | 20972 | 21654 | 21441 | 22612 | 23165 |
ANNUAL AVERAGE TOTAL RETURN (%)
| | | |
| | 1 Year | 5 Year | 10 Year |
Investor Class | 18.77 | 12.32 | 9.50 |
Russell 3000® Total Return Index** | 26.14 | 15.19 | 12.36 |
Russell 3000® Value Total Return Index | 21.02 | 11.11 | 8.76 |
Visit https://www.bostonpartners.com/fund/bp-all-cap-value-fund/ for more recent performance information.
| * | The Fund’s past performance is not a good predictor of how the Fund will perform in the future. The graph and table do not reflect the deduction of taxes that a shareholder would pay on Fund distributions or redemption of Fund shares. |
| ** | Effective with this report, and pursuant to new regulatory requirements, the Russell 3000 Total Return Index replaced the Russell 3000 Value Total Return Index as the Fund’s primary benchmark to represent a broad-based securities market index. The Fund continues to use the Russell 3000 Value Total Return Index as an additional benchmark. |
KEY FUND STATISTICS (as of August 31, 2024)
| |
Net Assets | $1,492,964,230 |
Number of Holdings | 113 |
Net Advisory Fee | $9,219,182 |
Portfolio Turnover | 24% |
Visit https://www.bostonpartners.com/fund/bp-all-cap-value-fund/ for more recent performance information.
WHAT DID THE FUND INVEST IN? (as of August 31, 2024)
| |
Top 10 Holdings | (% of net assets) |
Alphabet, Inc. | 2.4% |
JPMorgan Chase & Co. | 2.2% |
Johnson & Johnson | 2.1% |
AbbVie, Inc. | 2.0% |
Corpay, Inc. | 2.0% |
Oracle Corp. | 2.0% |
Check Point Software Technologies Ltd. | 2.0% |
CRH PLC | 1.9% |
NVR, Inc. | 1.9% |
Booking Holdings, Inc. | 1.8% |
| |
Top Sectors† | (% of net assets) |
Financials | 25.4% |
Health Care | 20.0% |
Information Technology | 16.5% |
Industrials | 14.2% |
Consumer Discretionary | 7.2% |
Communication Services | 4.9% |
Energy | 4.3% |
Consumer Staples | 3.4% |
Materials | 2.9% |
Cash & Other | 1.2% |
| † | The Global Industry Classification Standard (“GICS®”) was developed by and/or is the exclusive property of MSCI, Inc. (“MSCI”) and Standard & Poor’s Financial Services LLC (“S&P”). GICS® is a service mark of MSCI and S&P and has been licensed for use by U.S. Bank Global Fund Services. |
| Boston Partners All-Cap Value Fund | PAGE 2 | TSR-AR-749255121 |
For additional information about the Fund; including its prospectus, financial information, holdings and proxy information, scan the QR code or visit https://www.bostonpartners.com/fund/bp-all-cap-value-fund/.
HOUSEHOLDING
To reduce Fund expenses, only one copy of most shareholder documents may be mailed to shareholders with multiple accounts at the same address (Householding). If you would prefer that your Fund documents not be householded, please contact the Fund at 1-888-261-4073, or contact your financial intermediary. Your instructions will typically be effective within 30 days of receipt by the Fund or your financial intermediary.
| Boston Partners All-Cap Value Fund | PAGE 3 | TSR-AR-749255121 |
10000100661121212844145701385613939194551867620857247731000010036111841298015608158131920325548221552542432071100009640108901216713753136771372918916176881914123165
| | |
| Boston Partners Small Cap Value Fund II | |
Institutional Class | BPSIX |
Annual Shareholder Report | August 31, 2024 |
This annual shareholder report contains important information about the Boston Partners Small Cap Value Fund II (the “Fund”) for the period of September 1, 2023, to August 31, 2024. You can find additional information about the Fund at https://www.bostonpartners.com/fund/bp-small-cap-value-fund-ii-inst/. You can also request this information by contacting us at 1-888-261-4073.
WHAT WERE THE FUND COSTS FOR THE PAST YEAR? (based on a hypothetical $10,000 investment)
| | |
Class Name | Costs of a $10,000 investment | Costs paid as a percentage of a $10,000 investment |
| Institutional Class | $108 | 0.99% |
HOW DID THE FUND PERFORM LAST YEAR AND WHAT AFFECTED ITS PERFORMANCE?
For the 12 months ended August 31, 2024, the Fund posted a sizable gain, although it did trail the returns of the broad equity market, as measured by the Russell 3000® Index, and the returns of the Russell 2000® Value Index (the “Index”) for the same period.
What factors influenced performance?
The U.S. stock market was propelled higher during the past 12 months by a combination of solid economic growth, rapidly declining inflation, and the likelihood of Federal Reserve interest rate cuts. Although stocks experienced periodic bouts of volatility, the overall direction of the U.S. stock market was positive.
What were the top contributors and detractors?
Relative to the Index, the biggest contribution to the Fund’s performance came from its holdings in the Industrials sector, where the Fund held a meaningful overweight. Stock selection in the Information Technology and Financials sectors also helped. The biggest detractors from relative performance were the Fund’s holdings in the Communication Services and Materials sectors.
How is the Fund currently positioned?
The Fund’s largest sectors overweight at the end of the period were in Industrials, Information Technology, and Consumer Discretionary. The Fund’s largest underweights at the end of the period were in Real Estate and Utilities.
| |
Top Contributors |
| ↑ | SLM Corp |
| ↑ | Evercore, Inc. Class A |
| ↑ | Viper Energy, Inc. |
| ↑ | BGC Group, Inc. Class A |
| ↑ | Brink’s Company |
| |
Top Detractors |
| ↓ | Extreme Networks |
| ↓ | Piedmont Lithium |
| ↓ | Belden, Inc. |
| ↓ | Solo Brands, Inc. Class A |
| ↓ | Atkore, Inc. |
| Boston Partners Small Cap Value Fund II | PAGE 1 | TSR-AR-749255345 |
HOW DID THE FUND PERFORM OVER THE PAST 10 YEARS?*
The $100,000 chart reflects a hypothetical $100,000 investment in the class of shares noted. The chart uses total return NAV performance and assumes reinvestment of dividends and capital gains. Fund expenses, including management fees and other expenses, were deducted.
CUMULATIVE PERFORMANCE (Initial Investment of $100,000)
| | 08/31/2014 | 09/30/2014 | 10/31/2014 | 11/30/2014 | 12/31/2014 | 01/31/2015 | 02/28/2015 | 03/31/2015 | 04/30/2015 | 05/31/2015 | 06/30/2015 | 07/31/2015 | 08/31/2015 | 09/30/2015 | 10/31/2015 | 11/30/2015 | 12/31/2015 | 01/31/2016 | 02/29/2016 | 03/31/2016 | 04/30/2016 | 05/31/2016 | 06/30/2016 | 07/31/2016 | 08/31/2016 | 09/30/2016 | 10/31/2016 | 11/30/2016 | 12/31/2016 | 01/31/2017 | 02/28/2017 | 03/31/2017 | 04/30/2017 | 05/31/2017 | 06/30/2017 | 07/31/2017 | 08/31/2017 | 09/30/2017 | 10/31/2017 | 11/30/2017 | 12/31/2017 | 01/31/2018 | 02/28/2018 | 03/31/2018 | 04/30/2018 | 05/31/2018 | 06/30/2018 | 07/31/2018 | 08/31/2018 | 09/30/2018 | 10/31/2018 | 11/30/2018 | 12/31/2018 | 01/31/2019 | 02/28/2019 | 03/31/2019 | 04/30/2019 | 05/31/2019 | 06/30/2019 | 07/31/2019 | 08/31/2019 | 09/30/2019 | 10/31/2019 | 11/30/2019 | 12/31/2019 | 01/31/2020 | 02/29/2020 | 03/31/2020 | 04/30/2020 | 05/31/2020 | 06/30/2020 | 07/31/2020 | 08/31/2020 | 09/30/2020 | 10/31/2020 | 11/30/2020 | 12/31/2020 | 01/31/2021 | 02/28/2021 | 03/31/2021 | 04/30/2021 | 05/31/2021 | 06/30/2021 | 07/31/2021 | 08/31/2021 | 09/30/2021 | 10/31/2021 | 11/30/2021 | 12/31/2021 | 01/31/2022 | 02/28/2022 | 03/31/2022 | 04/30/2022 | 05/31/2022 | 06/30/2022 | 07/31/2022 | 08/31/2022 | 09/30/2022 | 10/31/2022 | 11/30/2022 | 12/31/2022 | 01/31/2023 | 02/28/2023 | 03/31/2023 | 04/30/2023 | 05/31/2023 | 06/30/2023 | 07/31/2023 | 08/31/2023 | 09/30/2023 | 10/31/2023 | 11/30/2023 | 12/31/2023 | 01/31/2024 | 02/29/2024 | 03/31/2024 | 04/30/2024 | 05/31/2024 | 06/30/2024 | 07/31/2024 | 08/31/2024 |
| Boston Partners Small Cap Value II Fund Institutional Class | 100000 | 94437 | 99029 | 99029 | 100625 | 97158 | 102426 | 103956 | 103371 | 104226 | 104722 | 103371 | 98554 | 94232 | 99094 | 101255 | 96265 | 89721 | 90338 | 98020 | 99632 | 100628 | 100106 | 106319 | 109069 | 109022 | 105323 | 117605 | 121266 | 121654 | 122720 | 121411 | 122090 | 119327 | 123689 | 124513 | 120975 | 129069 | 130523 | 132947 | 133128 | 135207 | 128870 | 130796 | 130137 | 136423 | 136119 | 138806 | 140631 | 137235 | 125321 | 125169 | 111370 | 124298 | 129436 | 124460 | 131384 | 120728 | 129544 | 132411 | 126678 | 131979 | 133926 | 139010 | 142572 | 137086 | 122403 | 86995 | 98188 | 102233 | 105724 | 110046 | 116695 | 111487 | 113758 | 134593 | 144856 | 146917 | 159954 | 171153 | 178563 | 183187 | 180346 | 177337 | 180179 | 175944 | 182463 | 173939 | 182205 | 176714 | 179758 | 178087 | 166628 | 172119 | 156482 | 169970 | 164181 | 147650 | 165136 | 170627 | 161270 | 177179 | 175768 | 164991 | 160885 | 154663 | 169417 | 179745 | 175960 | 169353 | 161527 | 170828 | 188164 | 181278 | 188309 | 198167 | 187947 | 196934 | 193818 | 211576 | 209546 |
| Russell 3000® Total Return Index** | 100000 | 97916 | 100610 | 103048 | 103047 | 100179 | 105979 | 104902 | 105376 | 106834 | 105046 | 106803 | 100356 | 97431 | 105127 | 105710 | 103540 | 97698 | 97666 | 104542 | 105190 | 107072 | 107292 | 111550 | 111835 | 112011 | 109587 | 114492 | 116726 | 118923 | 123346 | 123430 | 124738 | 126015 | 127152 | 129549 | 129799 | 132964 | 135866 | 139991 | 141391 | 148843 | 143357 | 140479 | 141013 | 144994 | 145942 | 150786 | 156081 | 156339 | 144828 | 147728 | 133979 | 145479 | 150596 | 152795 | 158896 | 148613 | 159052 | 161416 | 158125 | 160901 | 164364 | 170612 | 175538 | 175347 | 160990 | 138851 | 157241 | 165650 | 169437 | 179058 | 192030 | 185038 | 181044 | 203069 | 212204 | 211260 | 217864 | 225673 | 237306 | 238389 | 244268 | 248398 | 255482 | 244019 | 260521 | 256556 | 266658 | 250969 | 244647 | 252583 | 229916 | 229607 | 210399 | 230138 | 221549 | 201005 | 217489 | 228841 | 215441 | 230280 | 224897 | 230911 | 233371 | 234279 | 250277 | 259248 | 254244 | 242133 | 235715 | 257695 | 271363 | 274371 | 289223 | 298552 | 285415 | 298900 | 308153 | 313882 | 320715 |
| Russell 2000® Value Total Return Index | 100000 | 93254 | 99768 | 99304 | 102018 | 97772 | 102312 | 104038 | 101816 | 102660 | 102794 | 99959 | 95050 | 91759 | 96897 | 99652 | 94398 | 88057 | 88657 | 96006 | 98039 | 99837 | 100140 | 105543 | 108166 | 109019 | 105435 | 119430 | 124361 | 123474 | 125260 | 124200 | 124689 | 120806 | 125032 | 125823 | 122731 | 131420 | 131593 | 135401 | 134109 | 135761 | 128973 | 130568 | 132832 | 140559 | 141410 | 143907 | 147335 | 143679 | 130815 | 132924 | 116857 | 129639 | 134677 | 130794 | 135740 | 124653 | 132593 | 132806 | 125394 | 131833 | 135026 | 138188 | 143026 | 135311 | 122163 | 92022 | 103374 | 106341 | 109419 | 111676 | 117693 | 112216 | 116230 | 138669 | 149654 | 157528 | 172327 | 181333 | 185001 | 190757 | 189602 | 182815 | 187710 | 183949 | 190963 | 184440 | 191962 | 180770 | 183761 | 187357 | 172817 | 176133 | 158734 | 174102 | 168596 | 151416 | 170478 | 175686 | 164159 | 179825 | 175679 | 163081 | 159014 | 155886 | 168270 | 180968 | 172262 | 163290 | 153550 | 167372 | 188203 | 179654 | 185531 | 193662 | 181323 | 189803 | 186604 | 209346 | 205416 |
ANNUAL AVERAGE TOTAL RETURN (%)
| | | |
| | 1 Year | 5 Year | 10 Year |
Institutional Class | 19.09 | 10.59 | 7.68 |
Russell 3000® Total Return Index** | 26.14 | 15.19 | 12.36 |
Russell 2000® Value Total Return Index | 19.25 | 10.38 | 7.46 |
Visit https://www.bostonpartners.com/fund/bp-small-cap-value-fund-ii-inst/ for more recent performance information.
| * | The Fund’s past performance is not a good predictor of how the Fund will perform in the future. The graph and table do not reflect the deduction of taxes that a shareholder would pay on Fund distributions or redemption of Fund shares. |
| ** | Effective with this report, and pursuant to new regulatory requirements, the Russell 3000 Total Return Index replaced the Russell 2000 Value Total Return Index as the Fund’s primary benchmark to represent a broad-based securities market index. The Fund continues to use the Russell 2000 Value Total Return Index as an additional benchmark. |
KEY FUND STATISTICS (as of August 31, 2024)
| |
Net Assets | $600,174,202 |
Number of Holdings | 175 |
Net Advisory Fee | $4,608,246 |
Portfolio Turnover | 55% |
Visit https://www.bostonpartners.com/fund/bp-small-cap-value-fund-ii-inst/ for more recent performance information.
WHAT DID THE FUND INVEST IN? (as of August 31, 2024)
| |
Top 10 Holdings | (% of net assets) |
Federal Agricultural Mortgage Corp. | 1.8% |
Brink’s Co. | 1.8% |
SLM Corp. | 1.7% |
Viper Energy, Inc. | 1.3% |
InterDigital, Inc. | 1.3% |
Western Alliance Bancorp | 1.2% |
FirstCash Holdings, Inc. | 1.2% |
Preferred Bank | 1.2% |
Wintrust Financial Corp. | 1.1% |
Beacon Roofing Supply, Inc. | 1.1% |
| |
Top Sectors* | (% of net assets) |
Financials | 30.2% |
Industrials | 22.2% |
Consumer Discretionary | 12.6% |
Information Technology | 8.8% |
Energy | 6.8% |
Health Care | 5.5% |
Communication Services | 3.8% |
Materials | 2.9% |
Consumer Staples | 2.3% |
Cash & Other | 4.9% |
| * | The Global Industry Classification Standard (“GICS®”) was developed by and/or is the exclusive property of MSCI, Inc. (“MSCI”) and Standard & Poor’s Financial Services LLC (“S&P”). GICS® is a service mark of MSCI and S&P and has been licensed for use by U.S. Bank Global Fund Services. |
| Boston Partners Small Cap Value Fund II | PAGE 2 | TSR-AR-749255345 |
For additional information about the Fund; including its prospectus, financial information, holdings and proxy information, scan the QR code or visit https://www.bostonpartners.com/fund/bp-small-cap-value-fund-ii-inst/.
HOUSEHOLDING
To reduce Fund expenses, only one copy of most shareholder documents may be mailed to shareholders with multiple accounts at the same address (Householding). If you would prefer that your Fund documents not be householded, please contact the Fund at 1-888-261-4073, or contact your financial intermediary. Your instructions will typically be effective within 30 days of receipt by the Fund or your financial intermediary.
| Boston Partners Small Cap Value Fund II | PAGE 3 | TSR-AR-749255345 |
1000009855410906912097514063112667811669518017916418117596020954610000010035611183512979915608115812519203025548222154925424432071510000095050108166122731147335125394117693187710168596172262205416
| | |
| Boston Partners Small Cap Value Fund II | |
Investor Class | BPSCX |
Annual Shareholder Report | August 31, 2024 |
This annual shareholder report contains important information about the Boston Partners Small Cap Value Fund II (the “Fund”) for the period of September 1, 2023, to August 31, 2024. You can find additional information about the Fund at https://www.bostonpartners.com/fund/bp-small-cap-value-fund-ii/. You can also request this information by contacting us at 1-888-261-4073.
WHAT WERE THE FUND COSTS FOR THE PAST YEAR? (based on a hypothetical $10,000 investment)
| | |
Class Name | Costs of a $10,000 investment | Costs paid as a percentage of a $10,000 investment |
| Investor Class | $136 | 1.24% |
HOW DID THE FUND PERFORM LAST YEAR AND WHAT AFFECTED ITS PERFORMANCE?
For the 12 months ended August 31, 2024, the Fund posted a sizable gain, although it did trail the returns of the broad equity market, as measured by the Russell 3000® Index, and the returns of the Russell 2000® Value Index (the “Index”) for the same period.
What factors influenced performance?
The U.S. stock market was propelled higher during the past 12 months by a combination of solid economic growth, rapidly declining inflation, and the likelihood of Federal Reserve interest rate cuts. Although stocks experienced periodic bouts of volatility, the overall direction of the U.S. stock market was positive.
What were the top contributors and detractors?
Relative to the Index, the biggest contribution to the Fund’s performance came from its holdings in the Industrials sector, where the Fund held a meaningful overweight. Stock selection in the Information Technology and Financials sectors also helped. The biggest detractors from relative performance were the Fund’s holdings in the Communication Services and Materials sectors.
How is the Fund currently positioned?
The Fund’s largest sectors overweight at the end of the period were in Industrials, Information Technology, and Consumer Discretionary. The Fund’s largest underweights at the end of the period were in Real Estate and Utilities.
| |
Top Contributors |
| ↑ | SLM Corp |
| ↑ | Evercore, Inc. Class A |
| ↑ | Viper Energy, Inc. |
| ↑ | BGC Group, Inc. Class A |
| ↑ | Brink’s Company |
| |
Top Detractors |
| ↓ | Extreme Networks |
| ↓ | Piedmont Lithium |
| ↓ | Belden, Inc. |
| ↓ | Solo Brands, Inc. Class A |
| ↓ | Atkore, Inc. |
| Boston Partners Small Cap Value Fund II | PAGE 1 | TSR-AR-749255337 |
HOW DID THE FUND PERFORM OVER THE PAST 10 YEARS?*
The $10,000 chart reflects a hypothetical $10,000 investment in the class of shares noted. The chart uses total return NAV performance and assumes reinvestment of dividends and capital gains. Fund expenses, including 12b-1 fees, management fees and other expenses, were deducted.
CUMULATIVE PERFORMANCE (Initial Investment of $10,000)
| | 08/31/2014 | 09/30/2014 | 10/31/2014 | 11/30/2014 | 12/31/2014 | 01/31/2015 | 02/28/2015 | 03/31/2015 | 04/30/2015 | 05/31/2015 | 06/30/2015 | 07/31/2015 | 08/31/2015 | 09/30/2015 | 10/31/2015 | 11/30/2015 | 12/31/2015 | 01/31/2016 | 02/29/2016 | 03/31/2016 | 04/30/2016 | 05/31/2016 | 06/30/2016 | 07/31/2016 | 08/31/2016 | 09/30/2016 | 10/31/2016 | 11/30/2016 | 12/31/2016 | 01/31/2017 | 02/28/2017 | 03/31/2017 | 04/30/2017 | 05/31/2017 | 06/30/2017 | 07/31/2017 | 08/31/2017 | 09/30/2017 | 10/31/2017 | 11/30/2017 | 12/31/2017 | 01/31/2018 | 02/28/2018 | 03/31/2018 | 04/30/2018 | 05/31/2018 | 06/30/2018 | 07/31/2018 | 08/31/2018 | 09/30/2018 | 10/31/2018 | 11/30/2018 | 12/31/2018 | 01/31/2019 | 02/28/2019 | 03/31/2019 | 04/30/2019 | 05/31/2019 | 06/30/2019 | 07/31/2019 | 08/31/2019 | 09/30/2019 | 10/31/2019 | 11/30/2019 | 12/31/2019 | 01/31/2020 | 02/29/2020 | 03/31/2020 | 04/30/2020 | 05/31/2020 | 06/30/2020 | 07/31/2020 | 08/31/2020 | 09/30/2020 | 10/31/2020 | 11/30/2020 | 12/31/2020 | 01/31/2021 | 02/28/2021 | 03/31/2021 | 04/30/2021 | 05/31/2021 | 06/30/2021 | 07/31/2021 | 08/31/2021 | 09/30/2021 | 10/31/2021 | 11/30/2021 | 12/31/2021 | 01/31/2022 | 02/28/2022 | 03/31/2022 | 04/30/2022 | 05/31/2022 | 06/30/2022 | 07/31/2022 | 08/31/2022 | 09/30/2022 | 10/31/2022 | 11/30/2022 | 12/31/2022 | 01/31/2023 | 02/28/2023 | 03/31/2023 | 04/30/2023 | 05/31/2023 | 06/30/2023 | 07/31/2023 | 08/31/2023 | 09/30/2023 | 10/31/2023 | 11/30/2023 | 12/31/2023 | 01/31/2024 | 02/29/2024 | 03/31/2024 | 04/30/2024 | 05/31/2024 | 06/30/2024 | 07/31/2024 | 08/31/2024 |
| Boston Partners Small Cap Value II Fund Investor Class | 10000 | 9440 | 9899 | 9899 | 10052 | 9706 | 10229 | 10384 | 10318 | 10402 | 10449 | 10313 | 9832 | 9398 | 9884 | 10094 | 9593 | 8939 | 9003 | 9760 | 9923 | 10016 | 9967 | 10582 | 10852 | 10847 | 10474 | 11698 | 12057 | 12092 | 12197 | 12067 | 12127 | 11851 | 12282 | 12363 | 12011 | 12810 | 12950 | 13186 | 13202 | 13407 | 12772 | 12966 | 12898 | 13517 | 13480 | 13748 | 13926 | 13585 | 12404 | 12383 | 11016 | 12293 | 12797 | 12305 | 12988 | 11929 | 12803 | 13077 | 12506 | 13027 | 13217 | 13722 | 14069 | 13525 | 12070 | 8581 | 9681 | 10076 | 10420 | 10844 | 11497 | 10981 | 11199 | 13250 | 14252 | 14459 | 15735 | 16838 | 17557 | 18011 | 17729 | 17430 | 17706 | 17287 | 17919 | 17080 | 17891 | 17349 | 17639 | 17479 | 16345 | 16881 | 15341 | 16659 | 16092 | 14466 | 16179 | 16715 | 15798 | 17349 | 17203 | 16143 | 15745 | 15128 | 16567 | 17575 | 17203 | 16554 | 15785 | 16693 | 18383 | 17706 | 18390 | 19346 | 18345 | 19218 | 18910 | 20640 | 20437 |
| Russell 3000® Total Return Index** | 10000 | 9792 | 10061 | 10305 | 10305 | 10018 | 10598 | 10490 | 10538 | 10683 | 10505 | 10680 | 10036 | 9743 | 10513 | 10571 | 10354 | 9770 | 9767 | 10454 | 10519 | 10707 | 10729 | 11155 | 11184 | 11201 | 10959 | 11449 | 11673 | 11892 | 12335 | 12343 | 12474 | 12601 | 12715 | 12955 | 12980 | 13296 | 13587 | 13999 | 14139 | 14884 | 14336 | 14048 | 14101 | 14499 | 14594 | 15079 | 15608 | 15634 | 14483 | 14773 | 13398 | 14548 | 15060 | 15279 | 15890 | 14861 | 15905 | 16142 | 15813 | 16090 | 16436 | 17061 | 17554 | 17535 | 16099 | 13885 | 15724 | 16565 | 16944 | 17906 | 19203 | 18504 | 18104 | 20307 | 21220 | 21126 | 21786 | 22567 | 23731 | 23839 | 24427 | 24840 | 25548 | 24402 | 26052 | 25656 | 26666 | 25097 | 24465 | 25258 | 22992 | 22961 | 21040 | 23014 | 22155 | 20101 | 21749 | 22884 | 21544 | 23028 | 22490 | 23091 | 23337 | 23428 | 25028 | 25925 | 25424 | 24213 | 23571 | 25769 | 27136 | 27437 | 28922 | 29855 | 28542 | 29890 | 30815 | 31388 | 32071 |
| Russell 2000® Value Total Return Index | 10000 | 9325 | 9977 | 9930 | 10202 | 9777 | 10231 | 10404 | 10182 | 10266 | 10279 | 9996 | 9505 | 9176 | 9690 | 9965 | 9440 | 8806 | 8866 | 9601 | 9804 | 9984 | 10014 | 10554 | 10817 | 10902 | 10544 | 11943 | 12436 | 12347 | 12526 | 12420 | 12469 | 12081 | 12503 | 12582 | 12273 | 13142 | 13159 | 13540 | 13411 | 13576 | 12897 | 13057 | 13283 | 14056 | 14141 | 14391 | 14733 | 14368 | 13081 | 13292 | 11686 | 12964 | 13468 | 13079 | 13574 | 12465 | 13259 | 13281 | 12539 | 13183 | 13503 | 13819 | 14303 | 13531 | 12216 | 9202 | 10337 | 10634 | 10942 | 11168 | 11769 | 11222 | 11623 | 13867 | 14965 | 15753 | 17233 | 18133 | 18500 | 19076 | 18960 | 18281 | 18771 | 18395 | 19096 | 18444 | 19196 | 18077 | 18376 | 18736 | 17282 | 17613 | 15873 | 17410 | 16860 | 15142 | 17048 | 17569 | 16416 | 17982 | 17568 | 16308 | 15901 | 15589 | 16827 | 18097 | 17226 | 16329 | 15355 | 16737 | 18820 | 17965 | 18553 | 19366 | 18132 | 18980 | 18660 | 20935 | 20542 |
ANNUAL AVERAGE TOTAL RETURN (%)
| | | |
| | 1 Year | 5 Year | 10 Year |
Investor Class | 18.80 | 10.32 | 7.41 |
Russell 3000® Total Return Index** | 26.14 | 15.19 | 12.36 |
Russell 2000® Value Total Return Index | 19.25 | 10.38 | 7.46 |
Visit https://www.bostonpartners.com/fund/bp-small-cap-value-fund-ii/ for more recent performance information.
| * | The Fund’s past performance is not a good predictor of how the Fund will perform in the future. The graph and table do not reflect the deduction of taxes that a shareholder would pay on Fund distributions or redemption of Fund shares. |
| ** | Effective with this report, and pursuant to new regulatory requirements, the Russell 3000 Total Return Index replaced the Russell 2000 Value Total Return Index as the Fund’s primary benchmark to represent a broad-based securities market index. The Fund continues to use the Russell 2000 Value Total Return Index as an additional benchmark. |
KEY FUND STATISTICS (as of August 31, 2024)
| |
Net Assets | $600,174,202 |
Number of Holdings | 175 |
Net Advisory Fee | $4,608,246 |
Portfolio Turnover | 55% |
Visit https://www.bostonpartners.com/fund/bp-small-cap-value-fund-ii/ for more recent performance information.
WHAT DID THE FUND INVEST IN? (as of August 31, 2024)
| |
Top 10 Holdings | (% of net assets) |
Federal Agricultural Mortgage Corp. | 1.8% |
Brink’s Co. | 1.8% |
SLM Corp. | 1.7% |
Viper Energy, Inc. | 1.3% |
InterDigital, Inc. | 1.3% |
Western Alliance Bancorp | 1.2% |
FirstCash Holdings, Inc. | 1.2% |
Preferred Bank | 1.2% |
Wintrust Financial Corp. | 1.1% |
Beacon Roofing Supply, Inc. | 1.1% |
| |
Top Sectors* | (% of net assets) |
Financials | 30.2% |
Industrials | 22.2% |
Consumer Discretionary | 12.6% |
Information Technology | 8.8% |
Energy | 6.8% |
Health Care | 5.5% |
Communication Services | 3.8% |
Materials | 2.9% |
Consumer Staples | 2.3% |
Cash & Other | 4.9% |
| * | The Global Industry Classification Standard (“GICS®”) was developed by and/or is the exclusive property of MSCI, Inc. (“MSCI”) and Standard & Poor’s Financial Services LLC (“S&P”). GICS® is a service mark of MSCI and S&P and has been licensed for use by U.S. Bank Global Fund Services. |
| Boston Partners Small Cap Value Fund II | PAGE 2 | TSR-AR-749255337 |
For additional information about the Fund; including its prospectus, financial information, holdings and proxy information, scan the QR code or visit https://www.bostonpartners.com/fund/bp-small-cap-value-fund-ii/.
HOUSEHOLDING
To reduce Fund expenses, only one copy of most shareholder documents may be mailed to shareholders with multiple accounts at the same address (Householding). If you would prefer that your Fund documents not be householded, please contact the Fund at 1-888-261-4073, or contact your financial intermediary. Your instructions will typically be effective within 30 days of receipt by the Fund or your financial intermediary.
| Boston Partners Small Cap Value Fund II | PAGE 3 | TSR-AR-749255337 |
1000098321085212011139261250611497177061609217203204371000010036111841298015608158131920325548221552542432071100009505108171227314733125391176918771168601722620542
| | |
| WPG Partners Select Small Cap Value Fund | |
Institutional | WPGSX |
Annual Shareholder Report | August 31, 2024 |
This annual shareholder report contains important information about the WPG Partners Select Small Cap Value Fund (the “Fund”) for the period of September 1, 2023, to August 31, 2024. You can find additional information about the Fund at https://www.bostonpartners.com/affiliates/wpg-select-small-cap-value-fund/. You can also request this information by contacting us at 1-888-261-4073.
WHAT WERE THE FUND COSTS FOR THE PAST YEAR? (based on a hypothetical $10,000 investment)
| | |
Class Name | Costs of a $10,000 investment | Costs paid as a percentage of a $10,000 investment |
| Institutional | $120 | 1.10% |
HOW DID THE FUND PERFORM LAST YEAR AND WHAT AFFECTED ITS PERFORMANCE?
For the 12 months ended August 31, 2024, the Fund posted a sizable gain, although it did trail the return of the Russell 2000® Value Index (the “Index”), as well as the Funds broad-based securities market index, the Russell 3000® Index, for the same period.
What factors influenced performance?
The U.S. economy generally continued to expand during the past 12 months, as inflation rates dropped significantly, which offered some relief to consumers. While there remained some concern about the timing and pace of Federal Reserve’s pivot to an easing policy, the backdrop for equities was constructive during the period.
What were the top contributors and detractors?
Compared to the Index, stock selection within the Materials, Financials, and Health Care sectors were the top contributors to performance. Stock-picking within the Information Technology and Consumer Staples sectors represented the most significant drag on results.
How is the Fund currently positioned?
As of the end of the report period, the Fund held large overweight positions in the Information Technology, Materials, and Health Care sectors, and similarly sized underweights in the Real Estate, Utilities, and Energy sectors.
| |
Top Contributors |
| ↑ | Tenet Healthcare Corporation |
| ↑ | Rayonier Advanced Materials, Inc. |
| ↑ | BGC Group, Inc. Class A |
| ↑ | Gildan Activewear Inc. |
| ↑↑ | Kemper Corp |
| |
Top Detractors |
| ↓ | Treehouse Foods, Inc. |
| ↓ | Kosmos Energy Ltd. |
| ↓ | Sight Sciences, Inc. |
| ↓ | 8X8, Inc. |
| ↓ | Enovis Corporation |
| WPG Partners Select Small Cap Value Fund | PAGE 1 | TSR-AR-74933W676 |
HOW DID THE FUND PERFORM SINCE INCEPTION?*
The $100,000 chart reflects a hypothetical $100,000 investment in the class of shares noted. The chart uses total return NAV performance and assumes reinvestment of dividends and capital gains. Fund expenses, including management fees and other expenses, were deducted.
CUMULATIVE PERFORMANCE (Initial Investment of $100,000)
| | 12/29/2021 | 12/31/2021 | 01/31/2022 | 02/28/2022 | 03/31/2022 | 04/30/2022 | 05/31/2022 | 06/30/2022 | 07/31/2022 | 08/31/2022 | 09/30/2022 | 10/31/2022 | 11/30/2022 | 12/31/2022 | 01/31/2023 | 02/28/2023 | 03/31/2023 | 04/30/2023 | 05/31/2023 | 06/30/2023 | 07/31/2023 | 08/31/2023 | 09/30/2023 | 10/31/2023 | 11/30/2023 | 12/31/2023 | 01/31/2024 | 02/29/2024 | 03/31/2024 | 04/30/2024 | 05/31/2024 | 06/30/2024 | 07/31/2024 | 08/31/2024 |
| WPG Partners Select Small Cap Value Fund Institutional | 100000 | 99900 | 98200 | 105200 | 107700 | 101000 | 102300 | 90300 | 96300 | 94000 | 87400 | 99700 | 103600 | 103357 | 110968 | 109666 | 108865 | 112270 | 109265 | 118279 | 122586 | 118379 | 112070 | 105660 | 112771 | 123749 | 123865 | 125600 | 133811 | 126062 | 134274 | 130920 | 140981 | 139825 |
| Russell 3000® Total Return Index** | 100000 | 99528 | 93672 | 91312 | 94274 | 85814 | 85699 | 78529 | 85897 | 82691 | 75023 | 81176 | 85413 | 80411 | 85950 | 83941 | 86185 | 87103 | 87442 | 93413 | 96762 | 94894 | 90374 | 87978 | 96182 | 101284 | 102406 | 107949 | 111432 | 106528 | 111562 | 115015 | 117153 | 119704 |
| Russell 2000® Value Total Return Index | 100000 | 99881 | 94057 | 95614 | 97485 | 89919 | 91645 | 82592 | 90588 | 87723 | 78784 | 88702 | 91412 | 85415 | 93566 | 91408 | 84854 | 82738 | 81110 | 87553 | 94160 | 89631 | 84963 | 79894 | 87086 | 97925 | 93477 | 96535 | 100766 | 94345 | 98757 | 97093 | 108926 | 106881 |
ANNUAL AVERAGE TOTAL RETURN (%)
| | |
| | 1 Year | Since Inception
(12/29/2021) |
Institutional Class | 18.12 | 13.37 |
Russell 3000® Total Return Index** | 26.14 | 6.96 |
Russell 2000® Value Total Return Index | 19.25 | 2.52 |
Visit https://www.bostonpartners.com/affiliates/wpg-select-small-cap-value-fund/ for more recent performance information.
| * | The Fund’s past performance is not a good predictor of how the Fund will perform in the future. The graph and table do not reflect the deduction of taxes that a shareholder would pay on Fund distributions or redemption of Fund shares. |
| ** | Effective with this report, and pursuant to new regulatory requirements, the Russell 3000 Total Return Index replaced the Russell 2000 Value Total Return Index as the Fund’s primary benchmark to represent a broad-based securities market index. The Fund continues to use the Russell 2000 Value Total Return Index as an additional benchmark. |
KEY FUND STATISTICS (as of August 31, 2024)
| |
Net Assets | $123,629,636 |
Number of Holdings | 42 |
Net Advisory Fee | $877,619 |
Portfolio Turnover | 160% |
Visit https://www.bostonpartners.com/affiliates/wpg-select-small-cap-value-fund/ for more recent performance information.
| WPG Partners Select Small Cap Value Fund | PAGE 2 | TSR-AR-74933W676 |
WHAT DID THE FUND INVEST IN? (as of August 31, 2024)
| |
Top 10 Holdings | (% of net assets) |
Kemper Corp. | 4.7% |
BGC Group, Inc. | 4.7% |
Arcosa, Inc. | 4.7% |
Enovis Corp. | 4.6% |
Clarivate PLC | 4.3% |
Nomad Foods Ltd. | 3.7% |
Gildan Activewear, Inc. | 3.6% |
Air Lease Corp. | 3.5% |
Rayonier Advanced Materials, Inc. | 3.3% |
Tower Semiconductor Ltd. | 3.3% |
| |
Top Sectors† | (% of net assets) |
Financials | 26.3% |
Industrials | 13.4% |
Information Technology | 12.6% |
Health Care | 12.4% |
Materials | 8.7% |
Consumer Discretionary | 7.0% |
Real Estate | 6.4% |
Consumer Staples | 4.9% |
Energy | 3.0% |
Cash & Other | 5.3% |
| † | The Global Industry Classification Standard (“GICS®”) was developed by and/or is the exclusive property of MSCI, Inc. (“MSCI”) and Standard & Poor’s Financial Services LLC (“S&P”). GICS® is a service mark of MSCI and S&P and has been licensed for use by U.S. Bank Global Fund Services. |
For additional information about the Fund; including its prospectus, financial information, holdings and proxy information, scan the QR code or visit https://www.bostonpartners.com/affiliates/wpg-select-small-cap-value-fund/.
HOUSEHOLDING
To reduce Fund expenses, only one copy of most shareholder documents may be mailed to shareholders with multiple accounts at the same address (Householding). If you would prefer that your Fund documents not be householded, please contact the Fund at 1-888-261-4073, or contact your financial intermediary. Your instructions will typically be effective within 30 days of receipt by the Fund or your financial intermediary.
| WPG Partners Select Small Cap Value Fund | PAGE 3 | TSR-AR-74933W676 |
9400011837913982582691948941197048772389631106881
| | |
| WPG Partners Small Cap Value Diversified Fund | |
Institutional | WPGTX |
Annual Shareholder Report | August 31, 2024 |
This annual shareholder report contains important information about the WPG Partners Small Cap Value Diversified Fund (the “Fund”) for the period of September 1, 2023, to August 31, 2024. You can find additional information about the Fund at https://www.bostonpartners.com/affiliates/wpg-small-cap-value-diversified-fund/. You can also request this information by contacting us at 1-888-261-4073.
WHAT WERE THE FUND COSTS FOR THE PAST YEAR? (based on a hypothetical $10,000 investment)
| | |
Class Name | Costs of a $10,000 investment | Costs paid as a percentage of a $10,000 investment |
| Institutional | $122 | 1.10% |
HOW DID THE FUND PERFORM LAST YEAR AND WHAT AFFECTED ITS PERFORMANCE?
For the 12 months ended August 31, 2024, the Fund posted a sizable gain, outperforming the return of the Russell 2000®Value Index (the “Index”). However, the Fund’s returns for the period did trail the broad stock market, as represented by the Russell 3000® Index.
What factors influenced performance?
The U.S. economy generally continued to expand during the past 12 months, as inflation rates dropped significantly, which offered some relief to consumers. While there remained some concern about the timing and pace of Federal Reserve’s pivot to an easing policy, the backdrop for equities was constructive during the period.
What were the top contributors and detractors?
Compared to the Index, stock selection within the Energy, Industrials, and Health Care sectors were the top contributors to Fund performance. Stock-picking within the Consumer Staples sector was the most significant drag on results.
How is the Fund currently positioned?
As of the end of the reporting period, the Fund held large overweight positions in the Industrials and Materials sectors, and similarly sized underweights in the Financials and Real Estate sectors.
| |
Top Contributors |
| ↑ | Tenet Healthcare Corporation |
| ↑ | Kodiak Gas Services, Inc. |
| ↑ | Gildan Activewear Inc. |
| ↑ | Stelco Holdings, Inc. |
| ↑ | Scorpio Tankers Inc. |
| |
Top Detractors |
| ↓ | Piedmont Lithium, Inc. |
| ↓ | Kosmos Energy Ltd. |
| ↓ | Treehouse Foods, Inc. |
| ↓ | Pacira Biosciences, Inc. |
| ↓ | Savers Value Village, Inc. |
| WPG Partners Small Cap Value Diversified Fund | PAGE 1 | TSR-AR-74925K706 |
HOW DID THE FUND PERFORM OVER THE PAST 10 YEARS?*
The $100,000 chart reflects a hypothetical $100,000 investment in the class of shares noted. The chart uses total return NAV performance and assumes reinvestment of dividends and capital gains. Fund expenses, including management fees and other expenses, were deducted.
CUMULATIVE PERFORMANCE (Initial Investment of $100,000)
| | 08/31/2014 | 09/30/2014 | 10/31/2014 | 11/30/2014 | 12/31/2014 | 01/31/2015 | 02/28/2015 | 03/31/2015 | 04/30/2015 | 05/31/2015 | 06/30/2015 | 07/31/2015 | 08/31/2015 | 09/30/2015 | 10/31/2015 | 11/30/2015 | 12/31/2015 | 01/31/2016 | 02/29/2016 | 03/31/2016 | 04/30/2016 | 05/31/2016 | 06/30/2016 | 07/31/2016 | 08/31/2016 | 09/30/2016 | 10/31/2016 | 11/30/2016 | 12/31/2016 | 01/31/2017 | 02/28/2017 | 03/31/2017 | 04/30/2017 | 05/31/2017 | 06/30/2017 | 07/31/2017 | 08/31/2017 | 09/30/2017 | 10/31/2017 | 11/30/2017 | 12/31/2017 | 01/31/2018 | 02/28/2018 | 03/31/2018 | 04/30/2018 | 05/31/2018 | 06/30/2018 | 07/31/2018 | 08/31/2018 | 09/30/2018 | 10/31/2018 | 11/30/2018 | 12/31/2018 | 01/31/2019 | 02/28/2019 | 03/31/2019 | 04/30/2019 | 05/31/2019 | 06/30/2019 | 07/31/2019 | 08/31/2019 | 09/30/2019 | 10/31/2019 | 11/30/2019 | 12/31/2019 | 01/31/2020 | 02/29/2020 | 03/31/2020 | 04/30/2020 | 05/31/2020 | 06/30/2020 | 07/31/2020 | 08/31/2020 | 09/30/2020 | 10/31/2020 | 11/30/2020 | 12/31/2020 | 01/31/2021 | 02/28/2021 | 03/31/2021 | 04/30/2021 | 05/31/2021 | 06/30/2021 | 07/31/2021 | 08/31/2021 | 09/30/2021 | 10/31/2021 | 11/30/2021 | 12/31/2021 | 01/31/2022 | 02/28/2022 | 03/31/2022 | 04/30/2022 | 05/31/2022 | 06/30/2022 | 07/31/2022 | 08/31/2022 | 09/30/2022 | 10/31/2022 | 11/30/2022 | 12/31/2022 | 01/31/2023 | 02/28/2023 | 03/31/2023 | 04/30/2023 | 05/31/2023 | 06/30/2023 | 07/31/2023 | 08/31/2023 | 09/30/2023 | 10/31/2023 | 11/30/2023 | 12/31/2023 | 01/31/2024 | 02/29/2024 | 03/31/2024 | 04/30/2024 | 05/31/2024 | 06/30/2024 | 07/31/2024 | 08/31/2024 |
| WPG Partners Small Cap Value Diversified Fund Institutional | 100000 | 92850 | 93242 | 92409 | 94871 | 89175 | 94926 | 96602 | 95373 | 93419 | 92972 | 89175 | 85992 | 80632 | 84596 | 86216 | 81838 | 75162 | 74126 | 82759 | 84370 | 86327 | 85579 | 89262 | 89204 | 89780 | 85406 | 94902 | 97899 | 98188 | 98303 | 96512 | 95240 | 92524 | 95934 | 94894 | 93218 | 99517 | 100557 | 103331 | 103464 | 102845 | 97036 | 95058 | 98025 | 104082 | 103711 | 106368 | 108284 | 105256 | 94440 | 94687 | 80943 | 91869 | 96799 | 92868 | 97132 | 88471 | 93268 | 93334 | 87872 | 92269 | 93201 | 95999 | 99840 | 93081 | 83646 | 63972 | 72538 | 74345 | 75683 | 76218 | 80032 | 75148 | 77690 | 91475 | 98530 | 103379 | 116782 | 124661 | 129712 | 134157 | 130857 | 126412 | 130184 | 131329 | 136649 | 130723 | 138004 | 134791 | 144019 | 148598 | 140191 | 145591 | 129254 | 139644 | 136158 | 123034 | 139917 | 145659 | 140820 | 152340 | 151373 | 145653 | 145412 | 140095 | 151695 | 157898 | 151534 | 144687 | 138081 | 148715 | 160953 | 159565 | 164684 | 176311 | 167287 | 175096 | 171712 | 183426 | 183339 |
| Russell 3000® Total Return Index** | 100000 | 97916 | 100610 | 103048 | 103047 | 100179 | 105979 | 104902 | 105376 | 106834 | 105046 | 106803 | 100356 | 97431 | 105127 | 105710 | 103540 | 97698 | 97666 | 104542 | 105190 | 107072 | 107292 | 111550 | 111835 | 112011 | 109587 | 114492 | 116726 | 118923 | 123346 | 123430 | 124738 | 126015 | 127152 | 129549 | 129799 | 132964 | 135866 | 139991 | 141391 | 148843 | 143357 | 140479 | 141013 | 144994 | 145942 | 150786 | 156081 | 156339 | 144828 | 147728 | 133979 | 145479 | 150596 | 152795 | 158896 | 148613 | 159052 | 161416 | 158125 | 160901 | 164364 | 170612 | 175538 | 175347 | 160990 | 138851 | 157241 | 165650 | 169437 | 179058 | 192030 | 185038 | 181044 | 203069 | 212204 | 211260 | 217864 | 225673 | 237306 | 238389 | 244268 | 248398 | 255482 | 244019 | 260521 | 256556 | 266658 | 250969 | 244647 | 252583 | 229916 | 229607 | 210399 | 230138 | 221549 | 201005 | 217489 | 228841 | 215441 | 230280 | 224897 | 230911 | 233371 | 234279 | 250277 | 259248 | 254244 | 242133 | 235715 | 257695 | 271363 | 274371 | 289223 | 298552 | 285415 | 298900 | 308153 | 313882 | 320715 |
| Russell 2000® Value Total Return Index | 100000 | 93254 | 99768 | 99304 | 102018 | 97772 | 102312 | 104038 | 101816 | 102660 | 102794 | 99959 | 95050 | 91759 | 96897 | 99652 | 94398 | 88057 | 88657 | 96006 | 98039 | 99837 | 100140 | 105543 | 108166 | 109019 | 105435 | 119430 | 124361 | 123474 | 125260 | 124200 | 124689 | 120806 | 125032 | 125823 | 122731 | 131420 | 131593 | 135401 | 134109 | 135761 | 128973 | 130568 | 132832 | 140559 | 141410 | 143907 | 147335 | 143679 | 130815 | 132924 | 116857 | 129639 | 134677 | 130794 | 135740 | 124653 | 132593 | 132806 | 125394 | 131833 | 135026 | 138188 | 143026 | 135311 | 122163 | 92022 | 103374 | 106341 | 109419 | 111676 | 117693 | 112216 | 116230 | 138669 | 149654 | 157528 | 172327 | 181333 | 185001 | 190757 | 189602 | 182815 | 187710 | 183949 | 190963 | 184440 | 191962 | 180770 | 183761 | 187357 | 172817 | 176133 | 158734 | 174102 | 168596 | 151416 | 170478 | 175686 | 164159 | 179825 | 175679 | 163081 | 159014 | 155886 | 168270 | 180968 | 172262 | 163290 | 153550 | 167372 | 188203 | 179654 | 185531 | 193662 | 181323 | 189803 | 186604 | 209346 | 205416 |
ANNUAL AVERAGE TOTAL RETURN (%)
| | | |
| | 1 Year | 5 Year | 10 Year |
Institutional Class | 20.99 | 15.85 | 6.25 |
Russell 3000® Total Return Index** | 26.14 | 15.19 | 12.36 |
Russell 2000® Value Total Return Index | 19.25 | 10.38 | 7.46 |
Visit https://www.bostonpartners.com/affiliates/wpg-small-cap-value-diversified-fund/ for more recent performance information.
| * | The Fund’s past performance is not a good predictor of how the Fund will perform in the future. The graph and table do not reflect the deduction of taxes that a shareholder would pay on Fund distributions or redemption of Fund shares. |
| ** | Effective with this report, and pursuant to new regulatory requirements, the Russell 3000 Total Return Index replaced the Russell 2000 Value Total Return Index as the Fund’s primary benchmark to represent a broad-based securities market index. The Fund continues to use the Russell 2000 Value Total Return Index as an additional benchmark. |
KEY FUND STATISTICS (as of August 31, 2024)
| |
Net Assets | $33,078,153 |
Number of Holdings | 96 |
Net Advisory Fee | $189,474 |
Portfolio Turnover | 74% |
Visit https://www.bostonpartners.com/affiliates/wpg-small-cap-value-diversified-fund/ for more recent performance information.
| WPG Partners Small Cap Value Diversified Fund | PAGE 2 | TSR-AR-74925K706 |
WHAT DID THE FUND INVEST IN? (as of August 31, 2024)
| |
Top 10 Holdings | (% of net assets) |
Tenet Healthcare Corp. | 2.9% |
Gildan Activewear, Inc. | 2.5% |
Kemper Corp. | 2.3% |
Brixmor Property Group, Inc. | 2.3% |
Arcosa, Inc. | 2.2% |
Clarivate PLC | 2.1% |
Enovis Corp. | 2.0% |
Nomad Foods Ltd. | 1.9% |
Stelco Holdings, Inc. | 1.9% |
BGC Group, Inc. | 1.9% |
| |
Top Sectors† | (% of net assets) |
Industrials | 20.6% |
Financials | 19.1% |
Materials | 10.3% |
Energy | 8.4% |
Consumer Discretionary | 8.4% |
Health Care | 8.1% |
Information Technology | 7.7% |
Real Estate | 5.9% |
Utilities | 4.0% |
Cash & Other | 7.5% |
| † | The Global Industry Classification Standard (“GICS®”) was developed by and/or is the exclusive property of MSCI, Inc. (“MSCI”) and Standard & Poor’s Financial Services LLC (“S&P”). GICS® is a service mark of MSCI and S&P and has been licensed for use by U.S. Bank Global Fund Services. |
For additional information about the Fund; including its prospectus, financial information, holdings and proxy information, scan the QR code or visit https://www.bostonpartners.com/affiliates/wpg-small-cap-value-diversified-fund/.
HOUSEHOLDING
To reduce Fund expenses, only one copy of most shareholder documents may be mailed to shareholders with multiple accounts at the same address (Householding). If you would prefer that your Fund documents not be householded, please contact the Fund at 1-888-261-4073, or contact your financial intermediary. Your instructions will typically be effective within 30 days of receipt by the Fund or your financial intermediary.
| WPG Partners Small Cap Value Diversified Fund | PAGE 3 | TSR-AR-74925K706 |
100000859928920493218108284878728003213018413615815153418333910000010035611183512979915608115812519203025548222154925424432071510000095050108166122731147335125394117693187710168596172262205416
| | |
| Boston Partners Global Sustainability Fund | |
Institutional Class | BPGSX |
Annual Shareholder Report | August 31, 2024 |
This annual shareholder report contains important information about the Boston Partners Global Sustainability Fund (the “Fund”) for the period of September 1, 2023, to August 31, 2024. You can find additional information about the Fund at https://www.bostonpartners.com/fund/global-sus-fund/. You can also request this information by contacting us at 1-888-261-4073.
WHAT WERE THE FUND COSTS FOR THE PAST YEAR? (based on a hypothetical $10,000 investment)
| | |
Class Name | Costs of a $10,000 investment | Costs paid as a percentage of a $10,000 investment |
| Institutional Class | $100 | 0.90% |
HOW DID THE FUND PERFORM LAST YEAR AND WHAT AFFECTED ITS PERFORMANCE?
For the 12 months ended August 31, 2024, the Fund posted a sizable gain, although it did trail the returns of the MSCI World Index - Net Return (the “Index”) for the same period.
What factors influenced performance?
Global economies generally continued to expand during the past 12 months, as inflation rates dropped significantly, which offered some relief to consumers. While there remained some concern about the timing and pace of central banks’ pivot to easing policies, the backdrop for equities was constructive during the period.
What were the top contributors and detractors?
Relative to the Index, the biggest contribution to Fund performance came from its holdings in the Financial sector, where the Fund also held a meaningful overweight. Stock selection in Industrials also helped. The biggest detractors from relative performance were the Fund’s stock selection and large underweight in the Information Technology sector. Stock selection in the Energy and Communication Services sectors also detracted from performance versus the Index.
How is the Fund currently positioned?
The Fund’s largest sector overweights at the end of the period were in the Industrials, Consumer Staples, and Financials sectors. The Fund’s largest underweights were in the Real Estate and Utilities sectors.
| |
Top Contributors |
| ↑ | Dell Technologies, Inc. Class C |
| ↑ | Rheinmetall AG |
| ↑ | Mitsubishi Heavy Industries Ltd. |
| ↑ | JPMorgan Chase & Co. |
| ↑ | Hitachi Ltd. |
| |
Top Detractors |
| ↓ | SLB |
| ↓ | Panasonic Holdings Corporation |
| ↓ | Halliburton Company |
| ↓ | WH Smith PLC |
| ↓ | Koninklijke Ahold Delhaize N.V |
HOW DID THE FUND PERFORM SINCE INCEPTION?*
The $100,000 chart reflects a hypothetical $100,000 investment in the class of shares noted. The chart uses total return NAV performance and assumes reinvestment of dividends and capital gains. Fund expenses, including management fees and other expenses, were deducted.
| Boston Partners Global Sustainability Fund | PAGE 1 | TSR-AR-74933W684 |
CUMULATIVE PERFORMANCE (Initial Investment of $100,000)
| | 12/29/2021 | 12/31/2021 | 01/31/2022 | 02/28/2022 | 03/31/2022 | 04/30/2022 | 05/31/2022 | 06/30/2022 | 07/31/2022 | 08/31/2022 | 09/30/2022 | 10/31/2022 | 11/30/2022 | 12/31/2022 | 01/31/2023 | 02/28/2023 | 03/31/2023 | 04/30/2023 | 05/31/2023 | 06/30/2023 | 07/31/2023 | 08/31/2023 | 09/30/2023 | 10/31/2023 | 11/30/2023 | 12/31/2023 | 01/31/2024 | 02/29/2024 | 03/31/2024 | 04/30/2024 | 05/31/2024 | 06/30/2024 | 07/31/2024 | 08/31/2024 |
| Boston Partners Global Sustainability Fund Institutional Class | 100000 | 99600 | 99100 | 97200 | 96800 | 92100 | 94800 | 86000 | 90100 | 86200 | 79600 | 88400 | 95800 | 93453 | 99237 | 98324 | 97613 | 97918 | 95280 | 101063 | 104716 | 101469 | 98831 | 94366 | 103296 | 108801 | 108595 | 111583 | 118280 | 114158 | 120649 | 117043 | 121680 | 123122 |
| MSCI World Index - Gross Return (USD)** | 100000 | 99641 | 94389 | 92032 | 94615 | 86793 | 86926 | 79427 | 85756 | 82204 | 74596 | 79974 | 85574 | 81972 | 87794 | 85718 | 88429 | 90024 | 89194 | 94622 | 97825 | 95528 | 91441 | 88809 | 97181 | 101986 | 103233 | 107650 | 111170 | 107091 | 111945 | 114260 | 116299 | 119413 |
| MSCI World Index - Net Return (USD) | 100000 | 99636 | 94364 | 91978 | 94502 | 86651 | 86717 | 79205 | 85494 | 81920 | 74304 | 79640 | 85178 | 81561 | 87331 | 85232 | 87866 | 89406 | 88513 | 93867 | 97020 | 94702 | 90617 | 87988 | 96237 | 100961 | 102173 | 106505 | 109927 | 105844 | 110570 | 112820 | 114808 | 117843 |
ANNUAL AVERAGE TOTAL RETURN (%)
| | |
| | 1 Year | Since Inception
(12/29/2021) |
Institutional Class | 21.34 | 8.10 |
MSCI World Index - Gross Return (USD)** | 25.00 | 6.87 |
MSCI World Index - Net Return (USD) | 24.43 | 6.34 |
Visit https://www.bostonpartners.com/fund/global-sus-fund/ for more recent performance information.
| * | The Fund’s past performance is not a good predictor of how the Fund will perform in the future. The graph and table do not reflect the deduction of taxes that a shareholder would pay on Fund distributions or redemption of Fund shares. |
| ** | Effective with this report, and pursuant to new regulatory requirements, the MSCI World Index - Gross Return replaced the MSCI World Index - Net Return as the Fund’s primary benchmark to represent a broad-based securities market index. The Fund continues to use the MSCI World Index - Net Return as an additional benchmark. |
KEY FUND STATISTICS (as of August 31, 2024)
| |
Net Assets | $11,397,468 |
Number of Holdings | 85 |
Net Advisory Fee | $26,963 |
Portfolio Turnover | 73% |
Visit https://www.bostonpartners.com/fund/global-sus-fund/ for more recent performance information.
WHAT DID THE FUND INVEST IN? (as of August 31, 2024)
| |
Top 10 Holdings | (% of net assets) |
SPIE SA | 2.4% |
JPMorgan Chase & Co. | 2.3% |
Deutsche Telekom AG | 2.2% |
Sumitomo Mitsui Financial Group, Inc. | 2.0% |
Tesco PLC | 2.0% |
Rheinmetall AG | 2.0% |
Alphabet, Inc. | 1.9% |
Cie de Saint-Gobain SA | 1.9% |
Kansai Paint Co., Ltd. | 1.9% |
Informa PLC | 1.9% |
| |
Top Sectors† | (% of net assets) |
Financials | 22.5% |
Industrials | 20.5% |
Health Care | 16.0% |
Consumer Staples | 11.6% |
Communication Services | 8.8% |
Information Technology | 6.8% |
Consumer Discretionary | 5.3% |
Energy | 3.8% |
Materials | 2.9% |
Cash & Other | 1.8% |
| † | The Global Industry Classification Standard (“GICS®”) was developed by and/or is the exclusive property of MSCI, Inc. (“MSCI”) and Standard & Poor’s Financial Services LLC (“S&P”). GICS® is a service mark of MSCI and S&P and has been licensed for use by U.S. Bank Global Fund Services. |
For additional information about the Fund; including its prospectus, financial information, holdings and proxy information, scan the QR code or visit https://www.bostonpartners.com/fund/global-sus-fund/.
| Boston Partners Global Sustainability Fund | PAGE 2 | TSR-AR-74933W684 |
HOUSEHOLDING
To reduce Fund expenses, only one copy of most shareholder documents may be mailed to shareholders with multiple accounts at the same address (Householding). If you would prefer that your Fund documents not be householded, please contact the Fund at 1-888-261-4073, or contact your financial intermediary. Your instructions will typically be effective within 30 days of receipt by the Fund or your financial intermediary.
| Boston Partners Global Sustainability Fund | PAGE 3 | TSR-AR-74933W684 |
8620010146912312282204955281194138192094702117843
| | |
| Boston Partners Global Equity Fund | |
Institutional Class | BPGIX |
Annual Shareholder Report | August 31, 2024 |
This annual shareholder report contains important information about the Boston Partners Global Equity Fund (the “Fund”) for the period of September 1, 2023, to August 31, 2024. You can find additional information about the Fund at https://www.bostonpartners.com/fund/bp-global-equity-fund/. You can also request this information by contacting us at 1-888-261-4073.
WHAT WERE THE FUND COSTS FOR THE PAST YEAR? (based on a hypothetical $10,000 investment)
| | |
Class Name | Costs of a $10,000 investment | Costs paid as a percentage of a $10,000 investment |
| Institutional Class | $106 | 0.95% |
HOW DID THE FUND PERFORM LAST YEAR AND WHAT AFFECTED ITS PERFORMANCE?
For the 12 months ended August 31, 2024, the Fund posted a sizable gain, although it did trail the returns of the MSCI World Index - Net Return (the “Index”) for the same period.
What factors influenced performance?
Global economies generally continued to expand during the past 12 months, as inflation rates dropped significantly, which offered some relief to consumers. While there remained some concern about the timing and pace of central banks’ pivot to easing policies, the backdrop for equities was constructive during the period.
What were the top contributors and detractors?
Compared with the Index, the biggest detractor from relative performance was the Fund’s significant underweight position in the Information Technology sector; disappointing stock selection within the Energy sector also weighed on returns. The biggest contribution to performance was strong stock picking in the Financial sector, where the Fund held an overweight position. Stock selection in the Consumer Staples and Materials sectors also contributed to Fund performance for the period.
How is the Fund currently positioned?
As of the end of the reporting period, the Fund held significant overweight positions in the Financials and Industrials sectors, and meaningful underweights in the Information Technology and Communication Services sectors.
| |
Top Contributors |
| ↑ | Rheinmetall AG |
| ↑ | CRH Public Limited Company |
| ↑ | JPMorgan Chase & Co. |
| ↑ | Mitsubishi Heavy Industries Ltd. |
| ↑ | US Foods Holding Corp. |
| |
Top Detractors |
| ↓ | Reckitt Benckiser Group PLC |
| ↓ | SLB |
| ↓ | STMicroelectronics NV |
| ↓ | Cisco Systems, Inc. |
| ↓ | Kering SA |
| Boston Partners Global Equity Fund | PAGE 1 | TSR-AR-74925K557 |
HOW DID THE FUND PERFORM OVER THE PAST 10 YEARS?*
The $100,000 chart reflects a hypothetical $100,000 investment in the class of shares noted. The chart uses total return NAV performance and assumes reinvestment of dividends and capital gains. Fund expenses, including management fees and other expenses, were deducted.
CUMULATIVE PERFORMANCE (Initial Investment of $100,000)
| | 08/31/2014 | 09/30/2014 | 10/31/2014 | 11/30/2014 | 12/31/2014 | 01/31/2015 | 02/28/2015 | 03/31/2015 | 04/30/2015 | 05/31/2015 | 06/30/2015 | 07/31/2015 | 08/31/2015 | 09/30/2015 | 10/31/2015 | 11/30/2015 | 12/31/2015 | 01/31/2016 | 02/29/2016 | 03/31/2016 | 04/30/2016 | 05/31/2016 | 06/30/2016 | 07/31/2016 | 08/31/2016 | 09/30/2016 | 10/31/2016 | 11/30/2016 | 12/31/2016 | 01/31/2017 | 02/28/2017 | 03/31/2017 | 04/30/2017 | 05/31/2017 | 06/30/2017 | 07/31/2017 | 08/31/2017 | 09/30/2017 | 10/31/2017 | 11/30/2017 | 12/31/2017 | 01/31/2018 | 02/28/2018 | 03/31/2018 | 04/30/2018 | 05/31/2018 | 06/30/2018 | 07/31/2018 | 08/31/2018 | 09/30/2018 | 10/31/2018 | 11/30/2018 | 12/31/2018 | 01/31/2019 | 02/28/2019 | 03/31/2019 | 04/30/2019 | 05/31/2019 | 06/30/2019 | 07/31/2019 | 08/31/2019 | 09/30/2019 | 10/31/2019 | 11/30/2019 | 12/31/2019 | 01/31/2020 | 02/29/2020 | 03/31/2020 | 04/30/2020 | 05/31/2020 | 06/30/2020 | 07/31/2020 | 08/31/2020 | 09/30/2020 | 10/31/2020 | 11/30/2020 | 12/31/2020 | 01/31/2021 | 02/28/2021 | 03/31/2021 | 04/30/2021 | 05/31/2021 | 06/30/2021 | 07/31/2021 | 08/31/2021 | 09/30/2021 | 10/31/2021 | 11/30/2021 | 12/31/2021 | 01/31/2022 | 02/28/2022 | 03/31/2022 | 04/30/2022 | 05/31/2022 | 06/30/2022 | 07/31/2022 | 08/31/2022 | 09/30/2022 | 10/31/2022 | 11/30/2022 | 12/31/2022 | 01/31/2023 | 02/28/2023 | 03/31/2023 | 04/30/2023 | 05/31/2023 | 06/30/2023 | 07/31/2023 | 08/31/2023 | 09/30/2023 | 10/31/2023 | 11/30/2023 | 12/31/2023 | 01/31/2024 | 02/29/2024 | 03/31/2024 | 04/30/2024 | 05/31/2024 | 06/30/2024 | 07/31/2024 | 08/31/2024 |
| Boston Partners Global Equity Fund Institutional Class | 100000 | 96087 | 97370 | 99230 | 97911 | 96571 | 102938 | 101463 | 104814 | 106087 | 103943 | 104345 | 98246 | 94359 | 100056 | 100994 | 98694 | 92500 | 91356 | 98626 | 99569 | 100983 | 99098 | 103272 | 105022 | 105695 | 102868 | 105291 | 107080 | 109618 | 112362 | 113185 | 114831 | 117301 | 117575 | 119633 | 119290 | 121828 | 124366 | 127384 | 128895 | 135336 | 130085 | 127424 | 127424 | 126654 | 126024 | 130155 | 131135 | 131485 | 121683 | 121963 | 111951 | 119845 | 122122 | 121742 | 125917 | 116960 | 124019 | 123108 | 120755 | 124171 | 127055 | 128952 | 132968 | 128349 | 116030 | 93701 | 102402 | 107175 | 108869 | 112257 | 116646 | 112719 | 110178 | 129966 | 137304 | 137854 | 145866 | 154742 | 159063 | 165582 | 161969 | 160712 | 162911 | 159220 | 163933 | 156863 | 167185 | 167265 | 166545 | 164786 | 157350 | 164706 | 147916 | 155272 | 149435 | 136562 | 153753 | 166385 | 162050 | 172193 | 170002 | 167811 | 169272 | 162131 | 171869 | 177874 | 172274 | 168947 | 162456 | 176251 | 184910 | 183503 | 188881 | 199554 | 193597 | 202780 | 195748 | 205511 | 210475 |
| MSCI World Index - Gross Return (USD)** | 100000 | 97327 | 97980 | 99990 | 98419 | 96659 | 102370 | 100834 | 103250 | 103694 | 101325 | 103177 | 96392 | 92880 | 100267 | 99817 | 98103 | 92259 | 91629 | 97914 | 99525 | 100175 | 99101 | 103314 | 103453 | 104049 | 102062 | 103585 | 106101 | 108687 | 111756 | 113026 | 114756 | 117294 | 117790 | 120646 | 120876 | 123637 | 126005 | 128799 | 130582 | 137506 | 131867 | 129078 | 130641 | 131584 | 131569 | 135711 | 137454 | 138277 | 128156 | 129679 | 119868 | 129235 | 133186 | 135026 | 139891 | 131945 | 140695 | 141432 | 138606 | 141622 | 145265 | 149380 | 153913 | 153019 | 140151 | 121695 | 135056 | 141670 | 145477 | 152485 | 162734 | 157183 | 152402 | 171952 | 179302 | 177563 | 182173 | 188339 | 197190 | 200146 | 203194 | 206884 | 212097 | 203384 | 214959 | 210320 | 219372 | 207809 | 202620 | 208307 | 191086 | 191377 | 174869 | 188802 | 180983 | 164233 | 176072 | 188401 | 180471 | 193290 | 188718 | 194687 | 198199 | 196372 | 208323 | 215373 | 210317 | 201318 | 195525 | 213956 | 224534 | 227280 | 237005 | 244755 | 235774 | 246461 | 251557 | 256047 | 262903 |
| MSCI World Index - Net Return (USD) | 100000 | 97286 | 97915 | 99878 | 98267 | 96486 | 102139 | 100541 | 102899 | 103253 | 100852 | 102662 | 95869 | 92333 | 99650 | 99154 | 97411 | 91583 | 90902 | 97070 | 98606 | 99160 | 98049 | 102191 | 102276 | 102820 | 100830 | 102280 | 104727 | 107255 | 110230 | 111404 | 113054 | 115445 | 115890 | 118663 | 118830 | 121497 | 123793 | 126476 | 128186 | 134954 | 129364 | 126544 | 127998 | 128800 | 128739 | 132760 | 134402 | 135151 | 125227 | 126649 | 117019 | 126124 | 129916 | 131623 | 136290 | 128426 | 136889 | 137567 | 134753 | 137621 | 141123 | 145053 | 149398 | 148489 | 135938 | 117948 | 130833 | 137153 | 140781 | 147516 | 157372 | 151943 | 147282 | 166114 | 173157 | 171436 | 175829 | 181679 | 190134 | 192873 | 195748 | 199254 | 204213 | 195734 | 206821 | 202289 | 210934 | 199774 | 194721 | 200065 | 183445 | 183584 | 167681 | 180995 | 173428 | 157306 | 168603 | 180326 | 172668 | 184885 | 180441 | 186016 | 189277 | 187387 | 198720 | 205396 | 200490 | 191841 | 186274 | 203738 | 213740 | 216305 | 225476 | 232722 | 224077 | 234083 | 238846 | 243055 | 249479 |
ANNUAL AVERAGE TOTAL RETURN (%)
| | | |
| | 1 Year | 5 Year | 10 Year |
Institutional Class | 22.17 | 11.75 | 7.73 |
MSCI World Index - Gross Return (USD)** | 25.00 | 13.66 | 10.15 |
MSCI World - Net Return (USD) | 24.43 | 13.11 | 9.57 |
Visit https://www.bostonpartners.com/fund/bp-global-equity-fund/ for more recent performance information.
| * | The Fund’s past performance is not a good predictor of how the Fund will perform in the future. The graph and table do not reflect the deduction of taxes that a shareholder would pay on Fund distributions or redemption of Fund shares. |
| ** | Effective with this report, and pursuant to new regulatory requirements, the MSCI World Index - Gross Return replaced the MSCI World Index - Net Return as the Fund’s primary benchmark to represent a broad-based securities market index. The Fund continues to use the MSCI World Index - Net Return as an additional benchmark. |
KEY FUND STATISTICS (as of August 31, 2024)
| |
Net Assets | $244,647,495 |
Number of Holdings | 106 |
Net Advisory Fee | $1,627,577 |
Portfolio Turnover | 48% |
Visit https://www.bostonpartners.com/fund/bp-global-equity-fund/ for more recent performance information.
WHAT DID THE FUND INVEST IN? (as of August 31, 2024)
| |
Top 10 Holdings | (% of net assets) |
CRH PLC | 2.4% |
JPMorgan Chase & Co. | 1.9% |
Tesco PLC | 1.9% |
Siemens AG | 1.8% |
Samsung Electronics Co., Ltd. | 1.7% |
ING Groep NV | 1.6% |
Sony Group Corp. | 1.5% |
US Foods Holding Corp. | 1.5% |
Shell PLC | 1.5% |
Fidelity National Information Services, Inc. | 1.5% |
| |
Top Sectors† | (% of net assets) |
Financials | 24.5% |
Industrials | 17.6% |
Health Care | 10.7% |
Consumer Staples | 10.5% |
Information Technology | 6.8% |
Energy | 6.6% |
Consumer Discretionary | 6.4% |
Materials | 5.5% |
Utilities | 3.6% |
Cash & Other | 7.8% |
| † | The Global Industry Classification Standard (“GICS®”) was developed by and/or is the exclusive property of MSCI, Inc. (“MSCI”) and Standard & Poor’s Financial Services LLC (“S&P”). GICS® is a service mark of MSCI and S&P and has been licensed for use by U.S. Bank Global Fund Services. |
| Boston Partners Global Equity Fund | PAGE 2 | TSR-AR-74925K557 |
For additional information about the Fund; including its prospectus, financial information, holdings and proxy information, scan the QR code or visit https://www.bostonpartners.com/fund/bp-global-equity-fund/.
HOUSEHOLDING
To reduce Fund expenses, only one copy of most shareholder documents may be mailed to shareholders with multiple accounts at the same address (Householding). If you would prefer that your Fund documents not be householded, please contact the Fund at 1-888-261-4073, or contact your financial intermediary. Your instructions will typically be effective within 30 days of receipt by the Fund or your financial intermediary.
| Boston Partners Global Equity Fund | PAGE 3 | TSR-AR-74925K557 |
100000982461050221192901311351207551166461629111494351722742104751000009639210345312087613745413860616273421209718098321031726290310000095869102276118830134402134753157372204213173428200490249479
| | |
| Boston Partners Long/Short Equity Fund | |
Institutional Class | BPLSX |
Annual Shareholder Report | August 31, 2024 |
This annual shareholder report contains important information about the Boston Partners Long/Short Equity Fund (the “Fund”) for the period of September 1, 2023, to August 31, 2024. You can find additional information about the Fund at https://www.bostonpartners.com/fund/bp-long-short-equity-fund-inst/. You can also request this information by contacting us at 1-888-261-4073.
WHAT WERE THE FUND COSTS FOR THE PAST YEAR? (based on a hypothetical $10,000 investment)
| | |
Class Name | Costs of a $10,000 investment | Costs paid as a percentage of a $10,000 investment |
| Institutional Class | $228 | 2.04% |
HOW DID THE FUND PERFORM LAST YEAR AND WHAT AFFECTED ITS PERFORMANCE?
For the 12 months ended August 31, 2024, the Fund posted a sizable gain, although it did trail the return of its benchmark, the S&P 500 Index for the same period.
What factors influenced performance?
The U.S. economy generally continued to expand during the past 12 months, as inflation rates dropped significantly, which offered some relief to consumers. While there remained some concern about the timing and pace of Federal Reserve’s pivot to an easing policy, the backdrop for equities was constructive during the period.
What were the top contributors and detractors?
Overall, the Fund’s short positions generally contributed to its returns relative to the benchmark, the S&P 500 Index, while the Funds long positions generally detracted. Regarding specific sectors, security selection within the long portfolio’s Information Technology and Communication Services sector allocations weighed on returns. Within the short portfolio, Consumer Discretionary, Information Technology, and Industrials sector positions all boosted relative results.
How is the Fund currently positioned?
As of the end of reporting period the Funds, largest relative overweight long positions were in the Financials and Health Care sectors, and it had no long exposure to Utilities. The Fund’s largest short positions were in the Consumer Discretionary and Information Technology sectors.
HOW DID THE FUND PERFORM OVER THE PAST 10 YEARS?*
The $100,000 chart reflects a hypothetical $100,000 investment in the class of shares noted. The chart uses total return NAV performance and assumes reinvestment of dividends and capital gains. Fund expenses, including management fees and other expenses, were deducted.
CUMULATIVE PERFORMANCE (Initial Investment of $100,000)
| | 08/31/2014 | 09/30/2014 | 10/31/2014 | 11/30/2014 | 12/31/2014 | 01/31/2015 | 02/28/2015 | 03/31/2015 | 04/30/2015 | 05/31/2015 | 06/30/2015 | 07/31/2015 | 08/31/2015 | 09/30/2015 | 10/31/2015 | 11/30/2015 | 12/31/2015 | 01/31/2016 | 02/29/2016 | 03/31/2016 | 04/30/2016 | 05/31/2016 | 06/30/2016 | 07/31/2016 | 08/31/2016 | 09/30/2016 | 10/31/2016 | 11/30/2016 | 12/31/2016 | 01/31/2017 | 02/28/2017 | 03/31/2017 | 04/30/2017 | 05/31/2017 | 06/30/2017 | 07/31/2017 | 08/31/2017 | 09/30/2017 | 10/31/2017 | 11/30/2017 | 12/31/2017 | 01/31/2018 | 02/28/2018 | 03/31/2018 | 04/30/2018 | 05/31/2018 | 06/30/2018 | 07/31/2018 | 08/31/2018 | 09/30/2018 | 10/31/2018 | 11/30/2018 | 12/31/2018 | 01/31/2019 | 02/28/2019 | 03/31/2019 | 04/30/2019 | 05/31/2019 | 06/30/2019 | 07/31/2019 | 08/31/2019 | 09/30/2019 | 10/31/2019 | 11/30/2019 | 12/31/2019 | 01/31/2020 | 02/29/2020 | 03/31/2020 | 04/30/2020 | 05/31/2020 | 06/30/2020 | 07/31/2020 | 08/31/2020 | 09/30/2020 | 10/31/2020 | 11/30/2020 | 12/31/2020 | 01/31/2021 | 02/28/2021 | 03/31/2021 | 04/30/2021 | 05/31/2021 | 06/30/2021 | 07/31/2021 | 08/31/2021 | 09/30/2021 | 10/31/2021 | 11/30/2021 | 12/31/2021 | 01/31/2022 | 02/28/2022 | 03/31/2022 | 04/30/2022 | 05/31/2022 | 06/30/2022 | 07/31/2022 | 08/31/2022 | 09/30/2022 | 10/31/2022 | 11/30/2022 | 12/31/2022 | 01/31/2023 | 02/28/2023 | 03/31/2023 | 04/30/2023 | 05/31/2023 | 06/30/2023 | 07/31/2023 | 08/31/2023 | 09/30/2023 | 10/31/2023 | 11/30/2023 | 12/31/2023 | 01/31/2024 | 02/29/2024 | 03/31/2024 | 04/30/2024 | 05/31/2024 | 06/30/2024 | 07/31/2024 | 08/31/2024 |
| Boston Partners Long/Short Equity Fund Institutional Class | 100000 | 96380 | 95364 | 94481 | 94874 | 91215 | 91071 | 90975 | 94344 | 93333 | 92082 | 89146 | 91600 | 92611 | 97521 | 95788 | 93837 | 96204 | 96730 | 101621 | 104357 | 104620 | 102410 | 104357 | 105672 | 105409 | 104883 | 113035 | 114929 | 115771 | 116717 | 114456 | 111457 | 107513 | 110300 | 112562 | 110248 | 114929 | 113772 | 114876 | 118108 | 120811 | 114185 | 112012 | 114185 | 113549 | 111004 | 112913 | 108725 | 108831 | 105597 | 105862 | 99839 | 104791 | 103927 | 103754 | 105539 | 99551 | 103985 | 104561 | 102142 | 104791 | 105770 | 106173 | 108940 | 103668 | 98015 | 87724 | 95220 | 95410 | 94712 | 95537 | 96236 | 92679 | 93568 | 100795 | 102018 | 94413 | 105078 | 115568 | 120202 | 126059 | 118715 | 121425 | 124223 | 123873 | 125185 | 123086 | 134691 | 140082 | 139808 | 139625 | 138346 | 143463 | 134508 | 138894 | 134600 | 126924 | 137341 | 145474 | 144386 | 152213 | 149741 | 147475 | 147990 | 141914 | 149638 | 153963 | 154375 | 152624 | 151801 | 160039 | 166335 | 168364 | 171026 | 175590 | 169758 | 175717 | 173815 | 183451 | 190677 |
| S&P 500 Total Return Index | 100000 | 98598 | 101006 | 103722 | 103461 | 100355 | 106123 | 104445 | 105447 | 106803 | 104735 | 106929 | 100478 | 97992 | 106258 | 106574 | 104893 | 99688 | 99553 | 106307 | 106719 | 108635 | 108917 | 112932 | 113091 | 113112 | 111049 | 115162 | 117438 | 119665 | 124417 | 124562 | 125841 | 127612 | 128409 | 131049 | 131450 | 134162 | 137292 | 141503 | 143077 | 151268 | 145693 | 141990 | 142535 | 145968 | 146866 | 152332 | 157295 | 158191 | 147378 | 150382 | 136804 | 147766 | 152511 | 155474 | 161770 | 151489 | 162166 | 164496 | 161891 | 164920 | 168492 | 174608 | 179878 | 179808 | 165006 | 144626 | 163166 | 170937 | 174336 | 184166 | 197404 | 189904 | 184853 | 205088 | 212973 | 210823 | 216637 | 226125 | 238192 | 239856 | 245456 | 251286 | 258927 | 246884 | 264181 | 262351 | 274108 | 259924 | 252142 | 261503 | 238700 | 239138 | 219398 | 239628 | 229856 | 208686 | 225582 | 238188 | 224465 | 238569 | 232748 | 241293 | 245060 | 246125 | 262387 | 270817 | 266505 | 253798 | 248462 | 271153 | 283471 | 288235 | 303626 | 313395 | 300594 | 315499 | 326820 | 330798 | 338822 |
| Boston Partners Long/Short Equity Fund | PAGE 1 | TSR-AR-749255261 |
ANNUAL AVERAGE TOTAL RETURN (%)
| | | |
| | 1 Year | 5 Year | 10 Year |
Institutional Class | 23.51 | 13.30 | 6.67 |
S&P 500 Total Return Index | 27.14 | 15.92 | 12.98 |
Visit https://www.bostonpartners.com/fund/bp-long-short-equity-fund-inst/ for more recent performance information.
| * | The Fund’s past performance is not a good predictor of how the Fund will perform in the future. The graph and table do not reflect the deduction of taxes that a shareholder would pay on Fund distributions or redemption of Fund shares. |
KEY FUND STATISTICS (as of August 31, 2024)
| |
Net Assets | $62,893,716 |
Number of Holdings | 193 |
Net Advisory Fee | $965,071 |
Portfolio Turnover | 35% |
Visit https://www.bostonpartners.com/fund/bp-long-short-equity-fund-inst/ for more recent performance information.
WHAT DID THE FUND INVEST IN? (as of August 31, 2024)
| |
Top 10 Holdings | (% of net assets) |
BGC Group, Inc. | 3.2% |
Fairfax Financial Holdings Ltd. | 2.9% |
Canadian Natural Resources Ltd. | 2.7% |
Check Point Software Technologies Ltd. | 2.1% |
Alphabet, Inc. | 2.0% |
Newmark Group, Inc. | 2.0% |
Catalyst Pharmaceuticals, Inc. | 1.8% |
Sterling Infrastructure, Inc. | 1.7% |
PetIQ, Inc. | 1.6% |
Lantheus Holdings, Inc. | 1.6% |
| |
Top Sectors† | (% of net assets) |
Financials | 18.8% |
Health Care | 14.5% |
Information Technology | 11.4% |
Industrials | 9.7% |
Energy | 5.2% |
Consumer Discretionary | 5.0% |
Consumer Staples | 4.8% |
Real Estate | 2.9% |
Communication Services | 2.8% |
Materials | 2.6% |
| † | The Global Industry Classification Standard (“GICS®”) was developed by and/or is the exclusive property of MSCI, Inc. (“MSCI”) and Standard & Poor’s Financial Services LLC (“S&P”). GICS® is a service mark of MSCI and S&P and has been licensed for use by U.S. Bank Global Fund Services. |
For additional information about the Fund; including its prospectus, financial information, holdings and proxy information, scan the QR code or visit https://www.bostonpartners.com/fund/bp-long-short-equity-fund-inst/.
HOUSEHOLDING
To reduce Fund expenses, only one copy of most shareholder documents may be mailed to shareholders with multiple accounts at the same address (Householding). If you would prefer that your Fund documents not be householded, please contact the Fund at 1-888-261-4073, or contact your financial intermediary. Your instructions will typically be effective within 30 days of receipt by the Fund or your financial intermediary.
| Boston Partners Long/Short Equity Fund | PAGE 2 | TSR-AR-749255261 |
1000009160010567211024810872510214296236124223134600154375190677100000100478113091131450157295161891197404258927229856266505338822
| | |
| Boston Partners Long/Short Equity Fund | |
Investor Class | BPLEX |
Annual Shareholder Report | August 31, 2024 |
This annual shareholder report contains important information about the Boston Partners Long/Short Equity Fund (the “Fund”) for the period of September 1, 2023, to August 31, 2024. You can find additional information about the Fund at https://www.bostonpartners.com/fund/bp-long-short-equity-fund/. You can also request this information by contacting us at 1-888-261-4073.
WHAT WERE THE FUND COSTS FOR THE PAST YEAR? (based on a hypothetical $10,000 investment)
| | |
Class Name | Costs of a $10,000 investment | Costs paid as a percentage of a $10,000 investment |
| Investor Class | $256 | 2.29% |
HOW DID THE FUND PERFORM LAST YEAR AND WHAT AFFECTED ITS PERFORMANCE?
For the 12 months ended August 31, 2024, the Fund posted a sizable gain, although it did trail the return of its benchmark, the S&P 500 Index for the same period.
What factors influenced performance?
The U.S. economy generally continued to expand during the past 12 months, as inflation rates dropped significantly, which offered some relief to consumers. While there remained some concern about the timing and pace of Federal Reserve’s pivot to an easing policy, the backdrop for equities was constructive during the period.
What were the top contributors and detractors?
Overall, the Fund’s short positions generally contributed to its returns relative to the benchmark, the S&P 500 Index, while the Funds long positions generally detracted. Regarding specific sectors, security selection within the long portfolio’s Information Technology and Communication Services sector allocations weighed on returns. Within the short portfolio, Consumer Discretionary, Information Technology, and Industrials sector positions all boosted relative results.
How is the Fund currently positioned?
As of the end of reporting period the Funds, largest relative overweight long positions were in the Financials and Health Care sectors, and it had no long exposure to Utilities. The Fund’s largest short positions were in the Consumer Discretionary and Information Technology sectors.
HOW DID THE FUND PERFORM OVER THE PAST 10 YEARS?*
The $10,000 chart reflects a hypothetical $10,000 investment in the class of shares noted. The chart uses total return NAV performance and assumes reinvestment of dividends and capital gains. Fund expenses, including 12b-1 fees, management fees and other expenses, were deducted.
CUMULATIVE PERFORMANCE (Initial Investment of $10,000)
| | 08/31/2014 | 09/30/2014 | 10/31/2014 | 11/30/2014 | 12/31/2014 | 01/31/2015 | 02/28/2015 | 03/31/2015 | 04/30/2015 | 05/31/2015 | 06/30/2015 | 07/31/2015 | 08/31/2015 | 09/30/2015 | 10/31/2015 | 11/30/2015 | 12/31/2015 | 01/31/2016 | 02/29/2016 | 03/31/2016 | 04/30/2016 | 05/31/2016 | 06/30/2016 | 07/31/2016 | 08/31/2016 | 09/30/2016 | 10/31/2016 | 11/30/2016 | 12/31/2016 | 01/31/2017 | 02/28/2017 | 03/31/2017 | 04/30/2017 | 05/31/2017 | 06/30/2017 | 07/31/2017 | 08/31/2017 | 09/30/2017 | 10/31/2017 | 11/30/2017 | 12/31/2017 | 01/31/2018 | 02/28/2018 | 03/31/2018 | 04/30/2018 | 05/31/2018 | 06/30/2018 | 07/31/2018 | 08/31/2018 | 09/30/2018 | 10/31/2018 | 11/30/2018 | 12/31/2018 | 01/31/2019 | 02/28/2019 | 03/31/2019 | 04/30/2019 | 05/31/2019 | 06/30/2019 | 07/31/2019 | 08/31/2019 | 09/30/2019 | 10/31/2019 | 11/30/2019 | 12/31/2019 | 01/31/2020 | 02/29/2020 | 03/31/2020 | 04/30/2020 | 05/31/2020 | 06/30/2020 | 07/31/2020 | 08/31/2020 | 09/30/2020 | 10/31/2020 | 11/30/2020 | 12/31/2020 | 01/31/2021 | 02/28/2021 | 03/31/2021 | 04/30/2021 | 05/31/2021 | 06/30/2021 | 07/31/2021 | 08/31/2021 | 09/30/2021 | 10/31/2021 | 11/30/2021 | 12/31/2021 | 01/31/2022 | 02/28/2022 | 03/31/2022 | 04/30/2022 | 05/31/2022 | 06/30/2022 | 07/31/2022 | 08/31/2022 | 09/30/2022 | 10/31/2022 | 11/30/2022 | 12/31/2022 | 01/31/2023 | 02/28/2023 | 03/31/2023 | 04/30/2023 | 05/31/2023 | 06/30/2023 | 07/31/2023 | 08/31/2023 | 09/30/2023 | 10/31/2023 | 11/30/2023 | 12/31/2023 | 01/31/2024 | 02/29/2024 | 03/31/2024 | 04/30/2024 | 05/31/2024 | 06/30/2024 | 07/31/2024 | 08/31/2024 |
| Boston Partners Long/Short Equity Fund Investor Class | 10000 | 9634 | 9531 | 9438 | 9479 | 9110 | 9094 | 9079 | 9418 | 9315 | 9187 | 8894 | 9135 | 9238 | 9721 | 9546 | 9348 | 9585 | 9636 | 10117 | 10388 | 10416 | 10190 | 10382 | 10512 | 10484 | 10427 | 11236 | 11422 | 11507 | 11597 | 11371 | 11072 | 10676 | 10953 | 11173 | 10942 | 11405 | 11286 | 11394 | 11713 | 11975 | 11319 | 11097 | 11308 | 11245 | 10989 | 11177 | 10761 | 10772 | 10453 | 10476 | 9874 | 10360 | 10273 | 10254 | 10429 | 9836 | 10273 | 10323 | 10086 | 10348 | 10441 | 10479 | 10747 | 10226 | 9670 | 8648 | 9385 | 9406 | 9329 | 9406 | 9482 | 9128 | 9211 | 9918 | 10038 | 9289 | 10337 | 11366 | 11815 | 12395 | 11666 | 11935 | 12205 | 12165 | 12295 | 12085 | 13221 | 13747 | 13716 | 13695 | 13568 | 14073 | 13190 | 13621 | 13190 | 12443 | 13453 | 14252 | 14136 | 14900 | 14658 | 14427 | 14476 | 13882 | 14633 | 15058 | 15094 | 14924 | 14839 | 15627 | 16244 | 16447 | 16698 | 17151 | 16573 | 17151 | 16963 | 17901 | 18605 |
| S&P 500 Total Return Index | 10000 | 9860 | 10101 | 10372 | 10346 | 10036 | 10612 | 10444 | 10545 | 10680 | 10474 | 10693 | 10048 | 9799 | 10626 | 10657 | 10489 | 9969 | 9955 | 10631 | 10672 | 10864 | 10892 | 11293 | 11309 | 11311 | 11105 | 11516 | 11744 | 11967 | 12442 | 12456 | 12584 | 12761 | 12841 | 13105 | 13145 | 13416 | 13729 | 14150 | 14308 | 15127 | 14569 | 14199 | 14254 | 14597 | 14687 | 15233 | 15730 | 15819 | 14738 | 15038 | 13680 | 14777 | 15251 | 15547 | 16177 | 15149 | 16217 | 16450 | 16189 | 16492 | 16849 | 17461 | 17988 | 17981 | 16501 | 14463 | 16317 | 17094 | 17434 | 18417 | 19740 | 18990 | 18485 | 20509 | 21297 | 21082 | 21664 | 22612 | 23819 | 23986 | 24546 | 25129 | 25893 | 24688 | 26418 | 26235 | 27411 | 25992 | 25214 | 26150 | 23870 | 23914 | 21940 | 23963 | 22986 | 20869 | 22558 | 23819 | 22446 | 23857 | 23275 | 24129 | 24506 | 24612 | 26239 | 27082 | 26650 | 25380 | 24846 | 27115 | 28347 | 28824 | 30363 | 31339 | 30059 | 31550 | 32682 | 33080 | 33882 |
| Boston Partners Long/Short Equity Fund | PAGE 1 | TSR-AR-749255253 |
ANNUAL AVERAGE TOTAL RETURN (%)
| | | |
| | 1 Year | 5 Year | 10 Year |
Investor Class | 23.26 | 13.01 | 6.40 |
S&P 500 Total Return Index | 27.14 | 15.92 | 12.98 |
Visit https://www.bostonpartners.com/fund/bp-long-short-equity-fund/ for more recent performance information.
| * | The Fund’s past performance is not a good predictor of how the Fund will perform in the future. The graph and table do not reflect the deduction of taxes that a shareholder would pay on Fund distributions or redemption of Fund shares. |
KEY FUND STATISTICS (as of August 31, 2024)
| |
Net Assets | $62,893,716 |
Number of Holdings | 193 |
Net Advisory Fee | $965,071 |
Portfolio Turnover | 35% |
Visit https://www.bostonpartners.com/fund/bp-long-short-equity-fund/ for more recent performance information.
WHAT DID THE FUND INVEST IN? (as of August 31, 2024)
| |
Top 10 Holdings | (% of net assets) |
BGC Group, Inc. | 3.2% |
Fairfax Financial Holdings Ltd. | 2.9% |
Canadian Natural Resources Ltd. | 2.7% |
Check Point Software Technologies Ltd. | 2.1% |
Alphabet, Inc. | 2.0% |
Newmark Group, Inc. | 2.0% |
Catalyst Pharmaceuticals, Inc. | 1.8% |
Sterling Infrastructure, Inc. | 1.7% |
PetIQ, Inc. | 1.6% |
Lantheus Holdings, Inc. | 1.6% |
| |
Top Sectors† | (% of net assets) |
Financials | 18.8% |
Health Care | 14.5% |
Information Technology | 11.4% |
Industrials | 9.7% |
Energy | 5.2% |
Consumer Discretionary | 5.0% |
Consumer Staples | 4.8% |
Real Estate | 2.9% |
Communication Services | 2.8% |
Materials | 2.6% |
| † | The Global Industry Classification Standard (“GICS®”) was developed by and/or is the exclusive property of MSCI, Inc. (“MSCI”) and Standard & Poor’s Financial Services LLC (“S&P”). GICS® is a service mark of MSCI and S&P and has been licensed for use by U.S. Bank Global Fund Services. |
For additional information about the Fund; including its prospectus, financial information, holdings and proxy information, scan the QR code or visit https://www.bostonpartners.com/fund/bp-long-short-equity-fund/.
HOUSEHOLDING
To reduce Fund expenses, only one copy of most shareholder documents may be mailed to shareholders with multiple accounts at the same address (Householding). If you would prefer that your Fund documents not be householded, please contact the Fund at 1-888-261-4073, or contact your financial intermediary. Your instructions will typically be effective within 30 days of receipt by the Fund or your financial intermediary.
| Boston Partners Long/Short Equity Fund | PAGE 2 | TSR-AR-749255253 |
100009135105121094210761100869482122051319015094186051000010048113091314515730161891974025893229862665033882
| | |
| Boston Partners Long/Short Research Fund | |
Institutional Class | BPIRX |
Annual Shareholder Report | August 31, 2024 |
This annual shareholder report contains important information about the Boston Partners Long/Short Research Fund (the “Fund”) for the period of September 1, 2023, to August 31, 2024. You can find additional information about the Fund at https://www.bostonpartners.com/fund/bp-ls-research-fund-inst/. You can also request this information by contacting us at 1-888-261-4073.
WHAT WERE THE FUND COSTS FOR THE PAST YEAR? (based on a hypothetical $10,000 investment)
| | |
Class Name | Costs of a $10,000 investment | Costs paid as a percentage of a $10,000 investment |
| Institutional Class | $208 | 1.90% |
HOW DID THE FUND PERFORM LAST YEAR AND WHAT AFFECTED ITS PERFORMANCE?
For the 12 months ended August 31, 2024, the Fund posted a sizable gain, although it did trail the return of its benchmark, the S&P 500 Index for the same time period.
What factors influenced performance?
The U.S. stock market was propelled higher during the past 12 months by a combination of solid economic growth, rapidly declining inflation, and the likelihood of Federal Reserve interest rate cuts. Although stocks experienced periodic bouts of volatility, the overall direction of the U.S. stock market was positive.
What were the top contributors and detractors?
Relative to the Fund’s benchmark, the Fund’s short positions across several sectors made a positive contribution to performance on balance. The Fund’s underweight long positions in certain sectors and stock selection in others contributed to its relative underperformance.
How is the Fund currently positioned?
The Fund’s largest short positions by sector at the end of the period were in Financials, Industrials, and Consumer Discretionary. The Fund’s largest long positions by sector at the end of the period were in Financials, Industrials, and Information Technology.
HOW DID THE FUND PERFORM OVER THE PAST 10 YEARS?*
The $100,000 chart reflects a hypothetical $100,000 investment in the class of shares noted. The chart uses total return NAV performance and assumes reinvestment of dividends and capital gains. Fund expenses, including management fees and other expenses, were deducted.
CUMULATIVE PERFORMANCE (Initial Investment of $100,000)
| | 08/31/2014 | 09/30/2014 | 10/31/2014 | 11/30/2014 | 12/31/2014 | 01/31/2015 | 02/28/2015 | 03/31/2015 | 04/30/2015 | 05/31/2015 | 06/30/2015 | 07/31/2015 | 08/31/2015 | 09/30/2015 | 10/31/2015 | 11/30/2015 | 12/31/2015 | 01/31/2016 | 02/29/2016 | 03/31/2016 | 04/30/2016 | 05/31/2016 | 06/30/2016 | 07/31/2016 | 08/31/2016 | 09/30/2016 | 10/31/2016 | 11/30/2016 | 12/31/2016 | 01/31/2017 | 02/28/2017 | 03/31/2017 | 04/30/2017 | 05/31/2017 | 06/30/2017 | 07/31/2017 | 08/31/2017 | 09/30/2017 | 10/31/2017 | 11/30/2017 | 12/31/2017 | 01/31/2018 | 02/28/2018 | 03/31/2018 | 04/30/2018 | 05/31/2018 | 06/30/2018 | 07/31/2018 | 08/31/2018 | 09/30/2018 | 10/31/2018 | 11/30/2018 | 12/31/2018 | 01/31/2019 | 02/28/2019 | 03/31/2019 | 04/30/2019 | 05/31/2019 | 06/30/2019 | 07/31/2019 | 08/31/2019 | 09/30/2019 | 10/31/2019 | 11/30/2019 | 12/31/2019 | 01/31/2020 | 02/29/2020 | 03/31/2020 | 04/30/2020 | 05/31/2020 | 06/30/2020 | 07/31/2020 | 08/31/2020 | 09/30/2020 | 10/31/2020 | 11/30/2020 | 12/31/2020 | 01/31/2021 | 02/28/2021 | 03/31/2021 | 04/30/2021 | 05/31/2021 | 06/30/2021 | 07/31/2021 | 08/31/2021 | 09/30/2021 | 10/31/2021 | 11/30/2021 | 12/31/2021 | 01/31/2022 | 02/28/2022 | 03/31/2022 | 04/30/2022 | 05/31/2022 | 06/30/2022 | 07/31/2022 | 08/31/2022 | 09/30/2022 | 10/31/2022 | 11/30/2022 | 12/31/2022 | 01/31/2023 | 02/28/2023 | 03/31/2023 | 04/30/2023 | 05/31/2023 | 06/30/2023 | 07/31/2023 | 08/31/2023 | 09/30/2023 | 10/31/2023 | 11/30/2023 | 12/31/2023 | 01/31/2024 | 02/29/2024 | 03/31/2024 | 04/30/2024 | 05/31/2024 | 06/30/2024 | 07/31/2024 | 08/31/2024 |
| Boston Partners Long/Short Research Fund Institutional Class | 100000 | 98877 | 99736 | 101255 | 102128 | 99518 | 103534 | 102864 | 103266 | 105474 | 103801 | 104136 | 101727 | 100054 | 104604 | 104471 | 103677 | 99505 | 98879 | 103121 | 103051 | 104511 | 102495 | 104581 | 105902 | 105137 | 104581 | 107154 | 107432 | 108962 | 110769 | 110283 | 109935 | 110769 | 111395 | 113273 | 113134 | 113968 | 114594 | 116680 | 118279 | 122730 | 119740 | 117375 | 116471 | 115706 | 114177 | 116680 | 115706 | 116819 | 111534 | 111813 | 105750 | 110586 | 110660 | 109853 | 112125 | 107728 | 111979 | 113225 | 111026 | 113738 | 114617 | 116742 | 119049 | 115525 | 108928 | 97008 | 99107 | 98283 | 97233 | 98133 | 99782 | 97533 | 97158 | 105855 | 109228 | 105180 | 111102 | 116725 | 121223 | 125046 | 124597 | 123922 | 126096 | 126321 | 130594 | 128795 | 135221 | 138350 | 139364 | 139534 | 137419 | 142240 | 134544 | 136827 | 135136 | 130316 | 139534 | 144607 | 143987 | 144805 | 141735 | 140712 | 140610 | 136925 | 142145 | 143270 | 144805 | 143884 | 142759 | 147773 | 150818 | 154694 | 157658 | 164041 | 159824 | 164953 | 164611 | 169057 | 172021 |
| S&P 500 Total Return Index | 100000 | 98598 | 101006 | 103722 | 103461 | 100355 | 106123 | 104445 | 105447 | 106803 | 104735 | 106929 | 100478 | 97992 | 106258 | 106574 | 104893 | 99688 | 99553 | 106307 | 106719 | 108635 | 108917 | 112932 | 113091 | 113112 | 111049 | 115162 | 117438 | 119665 | 124417 | 124562 | 125841 | 127612 | 128409 | 131049 | 131450 | 134162 | 137292 | 141503 | 143077 | 151268 | 145693 | 141990 | 142535 | 145968 | 146866 | 152332 | 157295 | 158191 | 147378 | 150382 | 136804 | 147766 | 152511 | 155474 | 161770 | 151489 | 162166 | 164496 | 161891 | 164920 | 168492 | 174608 | 179878 | 179808 | 165006 | 144626 | 163166 | 170937 | 174336 | 184166 | 197404 | 189904 | 184853 | 205088 | 212973 | 210823 | 216637 | 226125 | 238192 | 239856 | 245456 | 251286 | 258927 | 246884 | 264181 | 262351 | 274108 | 259924 | 252142 | 261503 | 238700 | 239138 | 219398 | 239628 | 229856 | 208686 | 225582 | 238188 | 224465 | 238569 | 232748 | 241293 | 245060 | 246125 | 262387 | 270817 | 266505 | 253798 | 248462 | 271153 | 283471 | 288235 | 303626 | 313395 | 300594 | 315499 | 326820 | 330798 | 338822 |
| Boston Partners Long/Short Research Fund | PAGE 1 | TSR-AR-74925K581 |
ANNUAL AVERAGE TOTAL RETURN (%)
| | | |
| | 1 Year | 5 Year | 10 Year |
Institutional Class | 18.79 | 9.14 | 5.57 |
S&P 500 Total Return Index | 27.14 | 15.92 | 12.98 |
Visit https://www.bostonpartners.com/fund/bp-ls-research-fund-inst/ for more recent performance information.
| * | The Fund’s past performance is not a good predictor of how the Fund will perform in the future. The graph and table do not reflect the deduction of taxes that a shareholder would pay on Fund distributions or redemption of Fund shares. |
KEY FUND STATISTICS (as of August 31, 2024)
| |
Net Assets | $591,951,816 |
Number of Holdings | 407 |
Net Advisory Fee | $7,466,784 |
Portfolio Turnover | 53% |
Visit https://www.bostonpartners.com/fund/bp-ls-research-fund-inst/ for more recent performance information.
WHAT DID THE FUND INVEST IN? (as of August 31, 2024)
| |
Top 10 Holdings | (% of net assets) |
JPMorgan Chase & Co. | 1.8% |
AbbVie, Inc. | 1.5% |
UnitedHealth Group, Inc. | 1.5% |
Wells Fargo & Co. | 1.4% |
Alphabet, Inc. | 1.3% |
Booking Holdings, Inc. | 1.2% |
Frontdoor, Inc. | 1.1% |
Amgen, Inc. | 1.1% |
Bank of America Corp. | 1.0% |
Kinross Gold Corp. | 0.9% |
| |
Top Sectors† | (% of net assets) |
Financials | 15.6% |
Industrials | 14.5% |
Health Care | 11.2% |
Information Technology | 10.7% |
Energy | 4.8% |
Communication Services | 3.7% |
Utilities | 3.7% |
Consumer Discretionary | 3.7% |
Consumer Staples | 3.1% |
Materials | 2.2% |
| † | The Global Industry Classification Standard (“GICS®”) was developed by and/or is the exclusive property of MSCI, Inc. (“MSCI”) and Standard & Poor’s Financial Services LLC (“S&P”). GICS® is a service mark of MSCI and S&P and has been licensed for use by U.S. Bank Global Fund Services. |
For additional information about the Fund; including its prospectus, financial information, holdings and proxy information, scan the QR code or visit https://www.bostonpartners.com/fund/bp-ls-research-fund-inst/.
HOUSEHOLDING
To reduce Fund expenses, only one copy of most shareholder documents may be mailed to shareholders with multiple accounts at the same address (Householding). If you would prefer that your Fund documents not be householded, please contact the Fund at 1-888-261-4073, or contact your financial intermediary. Your instructions will typically be effective within 30 days of receipt by the Fund or your financial intermediary.
| Boston Partners Long/Short Research Fund | PAGE 2 | TSR-AR-74925K581 |
10000010172710590211313411570611102699782126096135136144805172021100000100478113091131450157295161891197404258927229856266505338822
| | |
| Boston Partners Long/Short Research Fund | |
Investor Class | BPRRX |
Annual Shareholder Report | August 31, 2024 |
This annual shareholder report contains important information about the Boston Partners Long/Short Research Fund (the “Fund”) for the period of September 1, 2023, to August 31, 2024. You can find additional information about the Fund at https://www.bostonpartners.com/fund/bp-ls-research-fund/. You can also request this information by contacting us at 1-888-261-4073.
WHAT WERE THE FUND COSTS FOR THE PAST YEAR? (based on a hypothetical $10,000 investment)
| | |
Class Name | Costs of a $10,000 investment | Costs paid as a percentage of a $10,000 investment |
| Investor Class | $235 | 2.15% |
HOW DID THE FUND PERFORM LAST YEAR AND WHAT AFFECTED ITS PERFORMANCE?
For the 12 months ended August 31, 2024, the Fund posted a sizable gain, although it did trail the return of its benchmark, the S&P 500 Index for the same time period.
What factors influenced performance?
The U.S. stock market was propelled higher during the past 12 months by a combination of solid economic growth, rapidly declining inflation, and the likelihood of Federal Reserve interest rate cuts. Although stocks experienced periodic bouts of volatility, the overall direction of the U.S. stock market was positive.
What were the top contributors and detractors?
Relative to the Fund’s benchmark, the Fund’s short positions across several sectors made a positive contribution to performance on balance. The Fund’s underweight long positions in certain sectors and stock selection in others contributed to its relative underperformance.
How is the Fund currently positioned?
The Fund’s largest short positions by sector at the end of the period were in Financials, Industrials, and Consumer Discretionary. The Fund’s largest long positions by sector at the end of the period were in Financials, Industrials, and Information Technology.
| |
Top Contributors |
| ↑ | Andrada Mining Ltd. |
| ↑ | JP Morgan Chase & Co. |
| ↑ | Dell Technologies Inc. |
| ↑ | Broadcom, Inc. |
| ↑ | Wells Fargo & Company |
| |
Top Detractors |
| ↓ | Palantir Technologies, Inc. |
| ↓ | Glacier Bancorp, Inc. |
| ↓ | Commonwealth Bank of Australia |
| ↓ | Freshpet, Inc. |
| ↓ | KB Home |
| Boston Partners Long/Short Research Fund | PAGE 1 | TSR-AR-74925K573 |
HOW DID THE FUND PERFORM OVER THE PAST 10 YEARS?*
The $10,000 chart reflects a hypothetical $10,000 investment in the class of shares noted. The chart uses total return NAV performance and assumes reinvestment of dividends and capital gains. Fund expenses, including 12b-1 fees, management fees and other expenses, were deducted.
CUMULATIVE PERFORMANCE (Initial Investment of $10,000)
| | 08/31/2014 | 09/30/2014 | 10/31/2014 | 11/30/2014 | 12/31/2014 | 01/31/2015 | 02/28/2015 | 03/31/2015 | 04/30/2015 | 05/31/2015 | 06/30/2015 | 07/31/2015 | 08/31/2015 | 09/30/2015 | 10/31/2015 | 11/30/2015 | 12/31/2015 | 01/31/2016 | 02/29/2016 | 03/31/2016 | 04/30/2016 | 05/31/2016 | 06/30/2016 | 07/31/2016 | 08/31/2016 | 09/30/2016 | 10/31/2016 | 11/30/2016 | 12/31/2016 | 01/31/2017 | 02/28/2017 | 03/31/2017 | 04/30/2017 | 05/31/2017 | 06/30/2017 | 07/31/2017 | 08/31/2017 | 09/30/2017 | 10/31/2017 | 11/30/2017 | 12/31/2017 | 01/31/2018 | 02/28/2018 | 03/31/2018 | 04/30/2018 | 05/31/2018 | 06/30/2018 | 07/31/2018 | 08/31/2018 | 09/30/2018 | 10/31/2018 | 11/30/2018 | 12/31/2018 | 01/31/2019 | 02/28/2019 | 03/31/2019 | 04/30/2019 | 05/31/2019 | 06/30/2019 | 07/31/2019 | 08/31/2019 | 09/30/2019 | 10/31/2019 | 11/30/2019 | 12/31/2019 | 01/31/2020 | 02/29/2020 | 03/31/2020 | 04/30/2020 | 05/31/2020 | 06/30/2020 | 07/31/2020 | 08/31/2020 | 09/30/2020 | 10/31/2020 | 11/30/2020 | 12/31/2020 | 01/31/2021 | 02/28/2021 | 03/31/2021 | 04/30/2021 | 05/31/2021 | 06/30/2021 | 07/31/2021 | 08/31/2021 | 09/30/2021 | 10/31/2021 | 11/30/2021 | 12/31/2021 | 01/31/2022 | 02/28/2022 | 03/31/2022 | 04/30/2022 | 05/31/2022 | 06/30/2022 | 07/31/2022 | 08/31/2022 | 09/30/2022 | 10/31/2022 | 11/30/2022 | 12/31/2022 | 01/31/2023 | 02/28/2023 | 03/31/2023 | 04/30/2023 | 05/31/2023 | 06/30/2023 | 07/31/2023 | 08/31/2023 | 09/30/2023 | 10/31/2023 | 11/30/2023 | 12/31/2023 | 01/31/2024 | 02/29/2024 | 03/31/2024 | 04/30/2024 | 05/31/2024 | 06/30/2024 | 07/31/2024 | 08/31/2024 |
| Boston Partners Long/Short Research Fund Investor Class | 10000 | 9880 | 9967 | 10120 | 10201 | 9945 | 10343 | 10269 | 10310 | 10526 | 10357 | 10384 | 10141 | 9972 | 10431 | 10411 | 10331 | 9916 | 9853 | 10267 | 10267 | 10408 | 10197 | 10408 | 10534 | 10457 | 10401 | 10654 | 10682 | 10829 | 11005 | 10956 | 10913 | 11005 | 11061 | 11244 | 11229 | 11307 | 11370 | 11574 | 11728 | 12164 | 11869 | 11630 | 11538 | 11461 | 11307 | 11553 | 11454 | 11560 | 11033 | 11061 | 10461 | 10935 | 10942 | 10861 | 11076 | 10646 | 11068 | 11187 | 10965 | 11224 | 11313 | 11520 | 11746 | 11398 | 10740 | 9569 | 9773 | 9690 | 9576 | 9667 | 9833 | 9607 | 9569 | 10415 | 10748 | 10347 | 10929 | 11481 | 11919 | 12290 | 12244 | 12176 | 12396 | 12403 | 12826 | 12645 | 13269 | 13586 | 13671 | 13689 | 13475 | 13954 | 13192 | 13406 | 13244 | 12773 | 13663 | 14168 | 14097 | 14170 | 13879 | 13775 | 13754 | 13401 | 13900 | 14014 | 14160 | 14056 | 13941 | 14440 | 14727 | 15110 | 15400 | 16015 | 15597 | 16096 | 16050 | 16491 | 16769 |
| S&P 500 Total Return Index | 10000 | 9860 | 10101 | 10372 | 10346 | 10036 | 10612 | 10444 | 10545 | 10680 | 10474 | 10693 | 10048 | 9799 | 10626 | 10657 | 10489 | 9969 | 9955 | 10631 | 10672 | 10864 | 10892 | 11293 | 11309 | 11311 | 11105 | 11516 | 11744 | 11967 | 12442 | 12456 | 12584 | 12761 | 12841 | 13105 | 13145 | 13416 | 13729 | 14150 | 14308 | 15127 | 14569 | 14199 | 14254 | 14597 | 14687 | 15233 | 15730 | 15819 | 14738 | 15038 | 13680 | 14777 | 15251 | 15547 | 16177 | 15149 | 16217 | 16450 | 16189 | 16492 | 16849 | 17461 | 17988 | 17981 | 16501 | 14463 | 16317 | 17094 | 17434 | 18417 | 19740 | 18990 | 18485 | 20509 | 21297 | 21082 | 21664 | 22612 | 23819 | 23986 | 24546 | 25129 | 25893 | 24688 | 26418 | 26235 | 27411 | 25992 | 25214 | 26150 | 23870 | 23914 | 21940 | 23963 | 22986 | 20869 | 22558 | 23819 | 22446 | 23857 | 23275 | 24129 | 24506 | 24612 | 26239 | 27082 | 26650 | 25380 | 24846 | 27115 | 28347 | 28824 | 30363 | 31339 | 30059 | 31550 | 32682 | 33080 | 33882 |
ANNUAL AVERAGE TOTAL RETURN (%)
| | | |
| | 1 Year | 5 Year | 10 Year |
Investor Class | 18.43 | 8.87 | 5.31 |
S&P 500 Total Return Index | 27.14 | 15.92 | 12.98 |
Visit https://www.bostonpartners.com/fund/bp-ls-research-fund/ for more recent performance information.
| * | The Fund’s past performance is not a good predictor of how the Fund will perform in the future. The graph and table do not reflect the deduction of taxes that a shareholder would pay on Fund distributions or redemption of Fund shares. |
KEY FUND STATISTICS (as of August 31, 2024)
| |
Net Assets | $591,951,816 |
Number of Holdings | 407 |
Net Advisory Fee | $7,466,784 |
Portfolio Turnover | 53% |
Visit https://www.bostonpartners.com/fund/bp-ls-research-fund/ for more recent performance information.
WHAT DID THE FUND INVEST IN? (as of August 31, 2024)
| |
Top 10 Holdings | (% of net assets) |
JPMorgan Chase & Co. | 1.8% |
AbbVie, Inc. | 1.5% |
UnitedHealth Group, Inc. | 1.5% |
Wells Fargo & Co. | 1.4% |
Alphabet, Inc. | 1.3% |
Booking Holdings, Inc. | 1.2% |
Frontdoor, Inc. | 1.1% |
Amgen, Inc. | 1.1% |
Bank of America Corp. | 1.0% |
Kinross Gold Corp. | 0.9% |
| |
Top Sectors† | (% of net assets) |
Financials | 15.6% |
Industrials | 14.5% |
Health Care | 11.2% |
Information Technology | 10.7% |
Energy | 4.8% |
Communication Services | 3.7% |
Utilities | 3.7% |
Consumer Discretionary | 3.7% |
Consumer Staples | 3.1% |
Materials | 2.2% |
| † | The Global Industry Classification Standard (“GICS®”) was developed by and/or is the exclusive property of MSCI, Inc. (“MSCI”) and Standard & Poor’s Financial Services LLC (“S&P”). GICS® is a service mark of MSCI and S&P and has been licensed for use by U.S. Bank Global Fund Services. |
For additional information about the Fund; including its prospectus, financial information, holdings and proxy information, scan the QR code or visit https://www.bostonpartners.com/fund/bp-ls-research-fund/.
| Boston Partners Long/Short Research Fund | PAGE 2 | TSR-AR-74925K573 |
HOUSEHOLDING
To reduce Fund expenses, only one copy of most shareholder documents may be mailed to shareholders with multiple accounts at the same address (Householding). If you would prefer that your Fund documents not be householded, please contact the Fund at 1-888-261-4073, or contact your financial intermediary. Your instructions will typically be effective within 30 days of receipt by the Fund or your financial intermediary.
| Boston Partners Long/Short Research Fund | PAGE 3 | TSR-AR-74925K573 |
1000010141105341122911454109659833123961324414160167691000010048113091314515730161891974025893229862665033882
| | |
| Boston Partners Global Long/Short Fund | |
Institutional Class | BGLSX |
Annual Shareholder Report | August 31, 2024 |
This annual shareholder report contains important information about the Boston Partners Global Long/Short Fund (the “Fund”) for the period of September 1, 2023, to August 31, 2024. You can find additional information about the Fund at https://www.bostonpartners.com/fund/bp-global-ls-fund-inst/. You can also request this information by contacting us at 1-888-261-4073.
This report describes changes to the Fund that occurred during the reporting period.
WHAT WERE THE FUND COSTS FOR THE PAST YEAR? (based on a hypothetical $10,000 investment)
| | |
Class Name | Costs of a $10,000 investment | Costs paid as a percentage of a $10,000 investment |
| Institutional Class | $193 | 1.78% |
HOW DID THE FUND PERFORM LAST YEAR AND WHAT AFFECTED ITS PERFORMANCE?
For the 12 months ended August 31, 2024, the Fund posted a sizable gain, although it did trail the returns of the MSCI World Index - Net Return (the “Index”) for the same period.
What factors influenced performance?
Global economies generally continued to expand during the past 12 months, as inflation rates dropped significantly, which offered some relief to consumers. While there remained some concern about the timing and pace of central banks’ pivot to easing policies, the backdrop for equities was constructive during the period.
What were the top contributors and detractors?
Overall, the Fund’s short positions generally contributed to returns relative to the Index, while its long positions generally detracted. Regarding specific sectors, security selection within the long portfolio’s Information Technology, Communication Services, and Health Care sector allocations weighed on returns. Within the short portfolio, Consumer Discretionary, Materials, and Consumer Staples sector positions all boosted relative results.
How is the Fund currently positioned?
As of the end of the reporting period, the Fund held relative overweight long positions in the Energy and Materials sectors, and had no long exposure to Real Estate. The Fund’s largest short positions at the end of the reporting period were in the Financials, Information Technology, and Consumer Discretionary sectors.
HOW DID THE FUND PERFORM OVER THE PAST 10 YEARS?*
The $100,000 chart reflects a hypothetical $100,000 investment in the class of shares noted. The chart uses total return NAV performance and assumes reinvestment of dividends and capital gains. Fund expenses, including management fees and other expenses, were deducted.
CUMULATIVE PERFORMANCE (Initial Investment of $100,000)
| | 31-08-2014 | 30-09-2014 | 31-10-2014 | 30-11-2014 | 31-12-2014 | 31-01-2015 | 28-02-2015 | 31-03-2015 | 30-04-2015 | 31-05-2015 | 30-06-2015 | 31-07-2015 | 31-08-2015 | 30-09-2015 | 31-10-2015 | 30-11-2015 | 31-12-2015 | 31-01-2016 | 29-02-2016 | 31-03-2016 | 30-04-2016 | 31-05-2016 | 30-06-2016 | 31-07-2016 | 31-08-2016 | 30-09-2016 | 31-10-2016 | 30-11-2016 | 31-12-2016 | 31-01-2017 | 28-02-2017 | 31-03-2017 | 30-04-2017 | 31-05-2017 | 30-06-2017 | 31-07-2017 | 31-08-2017 | 30-09-2017 | 31-10-2017 | 30-11-2017 | 31-12-2017 | 31-01-2018 | 28-02-2018 | 31-03-2018 | 30-04-2018 | 31-05-2018 | 30-06-2018 | 31-07-2018 | 31-08-2018 | 30-09-2018 | 31-10-2018 | 30-11-2018 | 31-12-2018 | 31-01-2019 | 28-02-2019 | 31-03-2019 | 30-04-2019 | 31-05-2019 | 30-06-2019 | 31-07-2019 | 31-08-2019 | 30-09-2019 | 31-10-2019 | 30-11-2019 | 31-12-2019 | 31-01-2020 | 29-02-2020 | 31-03-2020 | 30-04-2020 | 31-05-2020 | 30-06-2020 | 31-07-2020 | 31-08-2020 | 30-09-2020 | 31-10-2020 | 30-11-2020 | 31-12-2020 | 31-01-2021 | 28-02-2021 | 31-03-2021 | 30-04-2021 | 31-05-2021 | 30-06-2021 | 31-07-2021 | 31-08-2021 | 30-09-2021 | 31-10-2021 | 30-11-2021 | 31-12-2021 | 31-01-2022 | 28-02-2022 | 31-03-2022 | 30-04-2022 | 31-05-2022 | 30-06-2022 | 31-07-2022 | 31-08-2022 | 30-09-2022 | 31-10-2022 | 30-11-2022 | 31-12-2022 | 31-01-2023 | 28-02-2023 | 31-03-2023 | 30-04-2023 | 31-05-2023 | 30-06-2023 | 31-07-2023 | 31-08-2023 | 30-09-2023 | 31-10-2023 | 30-11-2023 | 31-12-2023 | 31-01-2024 | 29-02-2024 | 31-03-2024 | 30-04-2024 | 31-05-2024 | 30-06-2024 | 31-07-2024 | 31-08-2024 |
| Boston Partners Global Long/Short Fund Institutional Class | 1,00,000 | 98,737 | 98,639 | 99,417 | 98,542 | 97,959 | 1,01,166 | 99,514 | 1,02,818 | 1,04,665 | 1,03,596 | 1,04,665 | 1,02,527 | 1,01,458 | 1,04,568 | 1,04,956 | 1,04,999 | 1,03,145 | 1,00,803 | 1,03,633 | 1,03,828 | 1,05,584 | 1,04,901 | 1,05,682 | 1,06,365 | 1,06,560 | 1,05,877 | 1,06,170 | 1,07,472 | 1,07,961 | 1,09,624 | 1,09,526 | 1,09,526 | 1,10,504 | 1,09,917 | 1,10,895 | 1,10,895 | 1,11,873 | 1,13,340 | 1,15,002 | 1,15,589 | 1,17,936 | 1,15,491 | 1,13,144 | 1,12,949 | 1,11,384 | 1,10,504 | 1,12,851 | 1,12,655 | 1,13,633 | 1,10,504 | 1,09,233 | 1,04,932 | 1,08,320 | 1,07,523 | 1,06,925 | 1,07,722 | 1,05,131 | 1,07,523 | 1,07,523 | 1,07,024 | 1,08,718 | 1,08,818 | 1,08,121 | 1,09,753 | 1,05,916 | 1,00,262 | 90,468 | 96,122 | 96,930 | 97,738 | 99,454 | 98,141 | 96,122 | 94,708 | 1,04,200 | 1,09,219 | 1,07,199 | 1,13,261 | 1,20,333 | 1,22,152 | 1,26,597 | 1,22,960 | 1,23,162 | 1,23,061 | 1,23,162 | 1,24,375 | 1,21,849 | 1,28,517 | 1,35,893 | 1,37,610 | 1,36,297 | 1,38,217 | 1,44,279 | 1,39,631 | 1,38,924 | 1,37,913 | 1,35,792 | 1,46,198 | 1,48,825 | 1,49,230 | 1,49,953 | 1,47,577 | 1,48,817 | 1,48,094 | 1,48,713 | 1,53,671 | 1,53,877 | 1,52,225 | 1,55,013 | 1,53,257 | 1,59,041 | 1,61,698 | 1,62,746 | 1,63,689 | 1,71,758 | 1,70,710 | 1,75,531 | 1,74,378 | 1,76,474 | 1,78,674 |
| MSCI World Index - Gross Return (USD)** | 1,00,000 | 97,327 | 97,980 | 99,990 | 98,419 | 96,659 | 1,02,370 | 1,00,834 | 1,03,250 | 1,03,694 | 1,01,325 | 1,03,177 | 96,392 | 92,880 | 1,00,267 | 99,817 | 98,103 | 92,259 | 91,629 | 97,914 | 99,525 | 1,00,175 | 99,101 | 1,03,314 | 1,03,453 | 1,04,049 | 1,02,062 | 1,03,585 | 1,06,101 | 1,08,687 | 1,11,756 | 1,13,026 | 1,14,756 | 1,17,294 | 1,17,790 | 1,20,646 | 1,20,876 | 1,23,637 | 1,26,005 | 1,28,799 | 1,30,582 | 1,37,506 | 1,31,867 | 1,29,078 | 1,30,641 | 1,31,584 | 1,31,569 | 1,35,711 | 1,37,454 | 1,38,277 | 1,28,156 | 1,29,679 | 1,19,868 | 1,29,235 | 1,33,186 | 1,35,026 | 1,39,891 | 1,31,945 | 1,40,695 | 1,41,432 | 1,38,606 | 1,41,622 | 1,45,265 | 1,49,380 | 1,53,913 | 1,53,019 | 1,40,151 | 1,21,695 | 1,35,056 | 1,41,670 | 1,45,477 | 1,52,485 | 1,62,734 | 1,57,183 | 1,52,402 | 1,71,952 | 1,79,302 | 1,77,563 | 1,82,173 | 1,88,339 | 1,97,190 | 2,00,146 | 2,03,194 | 2,06,884 | 2,12,097 | 2,03,384 | 2,14,959 | 2,10,320 | 2,19,372 | 2,07,809 | 2,02,620 | 2,08,307 | 1,91,086 | 1,91,377 | 1,74,869 | 1,88,802 | 1,80,983 | 1,64,233 | 1,76,072 | 1,88,401 | 1,80,471 | 1,93,290 | 1,88,718 | 1,94,687 | 1,98,199 | 1,96,372 | 2,08,323 | 2,15,373 | 2,10,317 | 2,01,318 | 1,95,525 | 2,13,956 | 2,24,534 | 2,27,280 | 2,37,005 | 2,44,755 | 2,35,774 | 2,46,461 | 2,51,557 | 2,56,047 | 2,62,903 |
| MSCI World - Net Return (USD) | 1,00,000 | 97,286 | 97,915 | 99,878 | 98,267 | 96,486 | 1,02,139 | 1,00,541 | 1,02,899 | 1,03,253 | 1,00,852 | 1,02,662 | 95,869 | 92,333 | 99,650 | 99,154 | 97,411 | 91,583 | 90,902 | 97,070 | 98,606 | 99,160 | 98,049 | 1,02,191 | 1,02,276 | 1,02,820 | 1,00,830 | 1,02,280 | 1,04,727 | 1,07,255 | 1,10,230 | 1,11,404 | 1,13,054 | 1,15,445 | 1,15,890 | 1,18,663 | 1,18,830 | 1,21,497 | 1,23,793 | 1,26,476 | 1,28,186 | 1,34,954 | 1,29,364 | 1,26,544 | 1,27,998 | 1,28,800 | 1,28,739 | 1,32,760 | 1,34,402 | 1,35,151 | 1,25,227 | 1,26,649 | 1,17,019 | 1,26,124 | 1,29,916 | 1,31,623 | 1,36,290 | 1,28,426 | 1,36,889 | 1,37,567 | 1,34,753 | 1,37,621 | 1,41,123 | 1,45,053 | 1,49,398 | 1,48,489 | 1,35,938 | 1,17,948 | 1,30,833 | 1,37,153 | 1,40,781 | 1,47,516 | 1,57,372 | 1,51,943 | 1,47,282 | 1,66,114 | 1,73,157 | 1,71,436 | 1,75,829 | 1,81,679 | 1,90,134 | 1,92,873 | 1,95,748 | 1,99,254 | 2,04,213 | 1,95,734 | 2,06,821 | 2,02,289 | 2,10,934 | 1,99,774 | 1,94,721 | 2,00,065 | 1,83,445 | 1,83,584 | 1,67,681 | 1,80,995 | 1,73,428 | 1,57,306 | 1,68,603 | 1,80,326 | 1,72,668 | 1,84,885 | 1,80,441 | 1,86,016 | 1,89,277 | 1,87,387 | 1,98,720 | 2,05,396 | 2,00,490 | 1,91,841 | 1,86,274 | 2,03,738 | 2,13,740 | 2,16,305 | 2,25,476 | 2,32,722 | 2,24,077 | 2,34,083 | 2,38,846 | 2,43,055 | 2,49,479 |
| Boston Partners Global Long/Short Fund | PAGE 1 | TSR-AR-74925K466 |
ANNUAL AVERAGE TOTAL RETURN (%)
| | | |
| | 1 Year | 5 Year | 10 Year |
Institutional Class | 17.38 | 10.79 | 5.98 |
MSCI World Index - Gross Return (USD)** | 25.00 | 13.66 | 10.15 |
MSCI World Index - Net Return (USD) | 24.43 | 13.11 | 9.57 |
Visit https://www.bostonpartners.com/fund/bp-global-ls-fund-inst/ for more recent performance information.
| * | The Fund’s past performance is not a good predictor of how the Fund will perform in the future. The graph and table do not reflect the deduction of taxes that a shareholder would pay on Fund distributions or redemption of Fund shares. |
| ** | Effective with this report, and pursuant to new regulatory requirements, the MSCI World Index - Gross Return replaced the MSCI World Index - Net Return as the Fund’s primary benchmark to represent a broad-based securities market index. The Fund continues to use the MSCI World Index - Net Return as an additional benchmark. |
KEY FUND STATISTICS (as of August 31, 2024)
| |
Net Assets | $178,648,373 |
Number of Holdings | 162 |
Net Advisory Fee | $2,462,427 |
Portfolio Turnover | 198% |
Visit https://www.bostonpartners.com/fund/bp-global-ls-fund-inst/ for more recent performance information.
WHAT DID THE FUND INVEST IN? (as of August 31, 2024)
| |
Top 10 Holdings | (% of net assets) |
iShares 1-3 Year Treasury Bond ETF | 4.5% |
Oracle Corp. | 3.4% |
Cenovus Energy, Inc. | 2.8% |
Samsung Electronics Co., Ltd. | 2.8% |
Everest Group Ltd. | 2.5% |
Sandoz Group AG | 2.3% |
Beazley PLC | 2.3% |
Kinross Gold Corp. | 2.0% |
Teck Resources Ltd. | 1.9% |
Enel SpA | 1.7% |
| |
Top Sectors† | (% of net assets) |
Financials | 12.5% |
Information Technology | 12.3% |
Health Care | 9.9% |
Materials | 8.7% |
Industrials | 6.4% |
Consumer Discretionary | 5.4% |
Energy | 5.4% |
Utilities | 3.2% |
Consumer Staples | 2.6% |
Communication Services | 2.2% |
| † | The Global Industry Classification Standard (“GICS®”) was developed by and/or is the exclusive property of MSCI, Inc. (“MSCI”) and Standard & Poor’s Financial Services LLC (“S&P”). GICS® is a service mark of MSCI and S&P and has been licensed for use by U.S. Bank Global Fund Services. |
Material Fund Changes:
This is a summary of certain changes to the Fund since September 1, 2023.
At a meeting of the Board of Directors of The RBB Fund, Inc. (the “Board”) held on May 15-16, 2024, the Board unanimously voted to approve, subject to shareholder approval, an Agreement and Plan of Reorganization (the “Plan of Reorganization”) whereby the Fund would be reorganized into the John Hancock Disciplined Value Global Long/Short Fund (the “Successor Fund”), a newly-organized series of John Hancock Investment Trust. At a special meeting of shareholders of the Fund held on September 17, 2024, the Plan of Reorganization was approved by the Fund’s shareholders. The reorganization contemplated by the Plan of Reorganization (the “Reorganization”) occurred as of 4:00 p.m. Eastern time on October 18, 2024, at which time the following actions, among others, occurred:
| | • The Fund transferred all of its assets to the Successor Fund and the Successor Fund assumed all of the Fund’s known liabilities.
• The Successor Fund issued Class I shares to the Fund in an amount equal to the value of the Fund’s net assets attributable to its Institutional Class shares. These shares were distributed to the Fund’s Institutional Class shareholders in proportion to their holdings on the Reorganization date.
• Shareholders of the Fund became shareholders of the Successor Fund. |
| Boston Partners Global Long/Short Fund | PAGE 2 | TSR-AR-74925K466 |
Following the Reorganization:
| | • John Hancock Investment Management LLC serves as the investment adviser of the Successor Fund and Boston Partners Global Investors, Inc. (“Boston Partners”), which served as the investment adviser of the Fund, serves as the Successor Fund’s sub-adviser.
• The Successor Fund is managed by the same portfolio managers from Boston Partners (Christopher K. Hart, CFA and Joshua M. Jones, CFA), plus one additional portfolio manager from Boston Partners (Soyoun Song), as the Fund, using substantially similar investment strategies and portfolio management techniques.
• The total annual operating expenses of Class I shares of the Successor Fund are lower than the total annual operating expenses of the Institutional Class shares of the Fund. |
For more complete information, please review the prospectus of the Successor Fund at https://www.jhinvestments.com/resources/all-resources/fund-documents/prospectus/john-hancock-disciplined-value-global-long-short-fund-prospectus/ or upon request at (800) 225-5291.
For additional information about the Fund; including its prospectus, financial information, holdings and proxy information, scan the QR code or visit https://www.bostonpartners.com/fund/bp-global-ls-fund-inst/.
HOUSEHOLDING
To reduce Fund expenses, only one copy of most shareholder documents may be mailed to shareholders with multiple accounts at the same address (Householding). If you would prefer that your Fund documents not be householded, please contact the Fund at 1-888-261-4073, or contact your financial intermediary. Your instructions will typically be effective within 30 days of receipt by the Fund or your financial intermediary.
| Boston Partners Global Long/Short Fund | PAGE 3 | TSR-AR-74925K466 |
100000102527106365110895112655107024981411230611379131522251786741000009639210345312087613745413860616273421209718098321031726290310000095869102276118830134402134753157372204213173428200490249479
| | |
| Boston Partners Global Long/Short Fund | |
Investor Class | BGRSX |
Annual Shareholder Report | August 31, 2024 |
This annual shareholder report contains important information about the Boston Partners Global Long/Short Fund (the “Fund”) for the period of September 1, 2023, to August 31, 2024. You can find additional information about the Fund at https://www.bostonpartners.com/fund/bp-global-ls-fund/. You can also request this information by contacting us at 1-888-261-4073.
This report describes changes to the Fund that occurred during the reporting period.
WHAT WERE THE FUND COSTS FOR THE PAST YEAR? (based on a hypothetical $10,000 investment)
| | |
Class Name | Costs of a $10,000 investment | Costs paid as a percentage of a $10,000 investment |
| Investor Class | $220 | 2.03% |
HOW DID THE FUND PERFORM LAST YEAR AND WHAT AFFECTED ITS PERFORMANCE?
For the 12 months ended August 31, 2024, the Fund posted a sizable gain, although it did trail the returns of the MSCI World Index - Net Return (the “Index”) for the same period.
What factors influenced performance?
Global economies generally continued to expand during the past 12 months, as inflation rates dropped significantly, which offered some relief to consumers. While there remained some concern about the timing and pace of central banks’ pivot to easing policies, the backdrop for equities was constructive during the period.
What were the top contributors and detractors?
Overall, the Fund’s short positions generally contributed to returns relative to the Index, while its long positions generally detracted. Regarding specific sectors, security selection within the long portfolio’s Information Technology, Communication Services, and Health Care sector allocations weighed on returns. Within the short portfolio, Consumer Discretionary, Materials, and Consumer Staples sector positions all boosted relative results.
How is the Fund currently positioned?
As of the end of the reporting period, the Fund held relative overweight long positions in the Energy and Materials sectors, and had no long exposure to Real Estate. The Fund’s largest short positions at the end of the reporting period were in the Financials, Information Technology, and Consumer Discretionary sectors.
HOW DID THE FUND PERFORM OVER THE PAST 10 YEARS?*
The $10,000 chart reflects a hypothetical $10,000 investment in the class of shares noted. The chart uses total return NAV performance and assumes reinvestment of dividends and capital gains. Fund expenses, including 12b-1 fees, management fees and other expenses, were deducted.
CUMULATIVE PERFORMANCE (Initial Investment of $10,000)
| | 31-08-2014 | 30-09-2014 | 31-10-2014 | 30-11-2014 | 31-12-2014 | 31-01-2015 | 28-02-2015 | 31-03-2015 | 30-04-2015 | 31-05-2015 | 30-06-2015 | 31-07-2015 | 31-08-2015 | 30-09-2015 | 31-10-2015 | 30-11-2015 | 31-12-2015 | 31-01-2016 | 29-02-2016 | 31-03-2016 | 30-04-2016 | 31-05-2016 | 30-06-2016 | 31-07-2016 | 31-08-2016 | 30-09-2016 | 31-10-2016 | 30-11-2016 | 31-12-2016 | 31-01-2017 | 28-02-2017 | 31-03-2017 | 30-04-2017 | 31-05-2017 | 30-06-2017 | 31-07-2017 | 31-08-2017 | 30-09-2017 | 31-10-2017 | 30-11-2017 | 31-12-2017 | 31-01-2018 | 28-02-2018 | 31-03-2018 | 30-04-2018 | 31-05-2018 | 30-06-2018 | 31-07-2018 | 31-08-2018 | 30-09-2018 | 31-10-2018 | 30-11-2018 | 31-12-2018 | 31-01-2019 | 28-02-2019 | 31-03-2019 | 30-04-2019 | 31-05-2019 | 30-06-2019 | 31-07-2019 | 31-08-2019 | 30-09-2019 | 31-10-2019 | 30-11-2019 | 31-12-2019 | 31-01-2020 | 29-02-2020 | 31-03-2020 | 30-04-2020 | 31-05-2020 | 30-06-2020 | 31-07-2020 | 31-08-2020 | 30-09-2020 | 31-10-2020 | 30-11-2020 | 31-12-2020 | 31-01-2021 | 28-02-2021 | 31-03-2021 | 30-04-2021 | 31-05-2021 | 30-06-2021 | 31-07-2021 | 31-08-2021 | 30-09-2021 | 31-10-2021 | 30-11-2021 | 31-12-2021 | 31-01-2022 | 28-02-2022 | 31-03-2022 | 30-04-2022 | 31-05-2022 | 30-06-2022 | 31-07-2022 | 31-08-2022 | 30-09-2022 | 31-10-2022 | 30-11-2022 | 31-12-2022 | 31-01-2023 | 28-02-2023 | 31-03-2023 | 30-04-2023 | 31-05-2023 | 30-06-2023 | 31-07-2023 | 31-08-2023 | 30-09-2023 | 31-10-2023 | 30-11-2023 | 31-12-2023 | 31-01-2024 | 29-02-2024 | 31-03-2024 | 30-04-2024 | 31-05-2024 | 30-06-2024 | 31-07-2024 | 31-08-2024 |
| Boston Partners Global Long/Short Fund Investor Class | 10,000 | 9,864 | 9,854 | 9,932 | 9,845 | 9,786 | 10,097 | 9,942 | 10,262 | 10,447 | 10,340 | 10,437 | 10,214 | 10,107 | 10,418 | 10,457 | 10,461 | 10,266 | 10,041 | 10,324 | 10,334 | 10,500 | 10,432 | 10,510 | 10,578 | 10,588 | 10,529 | 10,549 | 10,680 | 10,719 | 10,885 | 10,875 | 10,875 | 10,963 | 10,905 | 11,002 | 10,993 | 11,100 | 11,247 | 11,403 | 11,452 | 11,686 | 11,442 | 11,208 | 11,188 | 11,032 | 10,944 | 11,169 | 11,139 | 11,237 | 10,934 | 10,797 | 10,377 | 10,706 | 10,626 | 10,567 | 10,646 | 10,387 | 10,626 | 10,616 | 10,567 | 10,726 | 10,736 | 10,666 | 10,820 | 10,448 | 9,885 | 8,910 | 9,463 | 9,553 | 9,624 | 9,794 | 9,664 | 9,463 | 9,322 | 10,247 | 10,740 | 10,539 | 11,132 | 11,826 | 11,997 | 12,439 | 12,077 | 12,097 | 12,077 | 12,087 | 12,198 | 11,957 | 12,610 | 13,334 | 13,495 | 13,364 | 13,545 | 14,139 | 13,686 | 13,606 | 13,505 | 13,304 | 14,310 | 14,571 | 14,599 | 14,661 | 14,435 | 14,548 | 14,476 | 14,538 | 15,020 | 15,041 | 14,877 | 15,144 | 14,969 | 15,524 | 15,784 | 15,877 | 15,971 | 16,762 | 16,658 | 17,116 | 17,002 | 17,200 | 17,408 |
| MSCI World Index - Gross Return (USD)** | 10,000 | 9,733 | 9,798 | 9,999 | 9,842 | 9,666 | 10,237 | 10,083 | 10,325 | 10,369 | 10,132 | 10,318 | 9,639 | 9,288 | 10,027 | 9,982 | 9,810 | 9,226 | 9,163 | 9,791 | 9,953 | 10,018 | 9,910 | 10,331 | 10,345 | 10,405 | 10,206 | 10,359 | 10,610 | 10,869 | 11,176 | 11,303 | 11,476 | 11,729 | 11,779 | 12,065 | 12,088 | 12,364 | 12,600 | 12,880 | 13,058 | 13,751 | 13,187 | 12,908 | 13,064 | 13,158 | 13,157 | 13,571 | 13,745 | 13,828 | 12,816 | 12,968 | 11,987 | 12,923 | 13,319 | 13,503 | 13,989 | 13,195 | 14,070 | 14,143 | 13,861 | 14,162 | 14,527 | 14,938 | 15,391 | 15,302 | 14,015 | 12,170 | 13,506 | 14,167 | 14,548 | 15,249 | 16,273 | 15,718 | 15,240 | 17,195 | 17,930 | 17,756 | 18,217 | 18,834 | 19,719 | 20,015 | 20,319 | 20,688 | 21,210 | 20,338 | 21,496 | 21,032 | 21,937 | 20,781 | 20,262 | 20,831 | 19,109 | 19,138 | 17,487 | 18,880 | 18,098 | 16,423 | 17,607 | 18,840 | 18,047 | 19,329 | 18,872 | 19,469 | 19,820 | 19,637 | 20,832 | 21,537 | 21,032 | 20,132 | 19,552 | 21,396 | 22,453 | 22,728 | 23,700 | 24,476 | 23,577 | 24,646 | 25,156 | 25,605 | 26,290 |
| MSCI World Index - Net Return (USD) | 10,000 | 9,729 | 9,792 | 9,988 | 9,827 | 9,649 | 10,214 | 10,054 | 10,290 | 10,325 | 10,085 | 10,266 | 9,587 | 9,233 | 9,965 | 9,915 | 9,741 | 9,158 | 9,090 | 9,707 | 9,861 | 9,916 | 9,805 | 10,219 | 10,228 | 10,282 | 10,083 | 10,228 | 10,473 | 10,725 | 11,023 | 11,140 | 11,305 | 11,545 | 11,589 | 11,866 | 11,883 | 12,150 | 12,379 | 12,648 | 12,819 | 13,495 | 12,936 | 12,654 | 12,800 | 12,880 | 12,874 | 13,276 | 13,440 | 13,515 | 12,523 | 12,665 | 11,702 | 12,612 | 12,992 | 13,162 | 13,629 | 12,843 | 13,689 | 13,757 | 13,475 | 13,762 | 14,112 | 14,505 | 14,940 | 14,849 | 13,594 | 11,795 | 13,083 | 13,715 | 14,078 | 14,752 | 15,737 | 15,194 | 14,728 | 16,611 | 17,316 | 17,144 | 17,583 | 18,168 | 19,013 | 19,287 | 19,575 | 19,925 | 20,421 | 19,573 | 20,682 | 20,229 | 21,093 | 19,977 | 19,472 | 20,007 | 18,344 | 18,358 | 16,768 | 18,099 | 17,343 | 15,731 | 16,860 | 18,033 | 17,267 | 18,488 | 18,044 | 18,602 | 18,928 | 18,739 | 19,872 | 20,540 | 20,049 | 19,184 | 18,627 | 20,374 | 21,374 | 21,631 | 22,548 | 23,272 | 22,408 | 23,408 | 23,885 | 24,306 | 24,948 |
| Boston Partners Global Long/Short Fund | PAGE 1 | TSR-AR-74925K458 |
ANNUAL AVERAGE TOTAL RETURN (%)
| | | |
| | 1 Year | 5 Year | 10 Year |
Investor Class | 17.02 | 10.50 | 5.70 |
MSCI World Index - Gross Return (USD)** | 25.00 | 13.66 | 10.15 |
MSCI World - Net Return (USD) | 24.43 | 13.11 | 9.57 |
Visit https://www.bostonpartners.com/fund/bp-global-ls-fund/ for more recent performance information.
| * | The Fund’s past performance is not a good predictor of how the Fund will perform in the future. The graph and table do not reflect the deduction of taxes that a shareholder would pay on Fund distributions or redemption of Fund shares. |
| ** | Effective with this report, and pursuant to new regulatory requirements, the MSCI World Index - Gross Return replaced the MSCI World Index - Net Return as the Fund’s primary benchmark to represent a broad-based securities market index. The Fund continues to use the MSCI World Index - Net Return as an additional benchmark. |
KEY FUND STATISTICS (as of August 31, 2024)
| |
Net Assets | $178,648,373 |
Number of Holdings | 162 |
Net Advisory Fee | $2,462,427 |
Portfolio Turnover | 198% |
Visit https://www.bostonpartners.com/fund/bp-global-ls-fund/ for more recent performance information.
WHAT DID THE FUND INVEST IN? (as of August 31, 2024)
| |
Top 10 Holdings | (% of net assets) |
iShares 1-3 Year Treasury Bond ETF | 4.5% |
Oracle Corp. | 3.4% |
Cenovus Energy, Inc. | 2.8% |
Samsung Electronics Co., Ltd. | 2.8% |
Everest Group Ltd. | 2.5% |
Sandoz Group AG | 2.3% |
Beazley PLC | 2.3% |
Kinross Gold Corp. | 2.0% |
Teck Resources Ltd. | 1.9% |
Enel SpA | 1.7% |
| |
Top Sectors† | (% of net assets) |
Financials | 12.5% |
Information Technology | 12.3% |
Health Care | 9.9% |
Materials | 8.7% |
Industrials | 6.4% |
Consumer Discretionary | 5.4% |
Energy | 5.4% |
Utilities | 3.2% |
Consumer Staples | 2.6% |
Communication Services | 2.2% |
| † | The Global Industry Classification Standard (“GICS®”) was developed by and/or is the exclusive property of MSCI, Inc. (“MSCI”) and Standard & Poor’s Financial Services LLC (“S&P”). GICS® is a service mark of MSCI and S&P and has been licensed for use by U.S. Bank Global Fund Services. |
Material Fund Changes:
This is a summary of certain changes to the Fund since September 1, 2023.
At a meeting of the Board of Directors of The RBB Fund, Inc. (the “Board”) held on May 15-16, 2024, the Board unanimously voted to approve, subject to shareholder approval, an Agreement and Plan of Reorganization (the “Plan of Reorganization”) whereby the Fund would be reorganized into the John Hancock Disciplined Value Global Long/Short Fund (the “Successor Fund”), a newly-organized series of John Hancock Investment Trust. At a special meeting of shareholders of the Fund held on September 17, 2024, the Plan of Reorganization was approved by the Fund’s shareholders. The reorganization contemplated by the Plan of Reorganization (the “Reorganization”) occurred as of 4:00 p.m. Eastern time on October 18, 2024, at which time the following actions, among others, occurred:
| | • The Fund transferred all of its assets to the Successor Fund and the Successor Fund assumed all of the Fund’s known liabilities.
• The Successor Fund issued Class A shares to the Fund in an amount equal to the value of the Fund’s net assets attributable to its Investor Class shares. These shares were distributed to the Fund’s Investor Class shareholders in proportion to their holdings on the Reorganization date.
• Shareholders of the Fund became shareholders of the Successor Fund. |
| Boston Partners Global Long/Short Fund | PAGE 2 | TSR-AR-74925K458 |
Following the Reorganization:
| | • John Hancock Investment Management LLC serves as the investment adviser of the Successor Fund and Boston Partners Global Investors, Inc. (“Boston Partners”), which served as the investment adviser of the Fund, serves as the Successor Fund’s sub-adviser.
• The Successor Fund is managed by the same portfolio managers from Boston Partners (Christopher K. Hart, CFA and Joshua M. Jones, CFA), plus one additional portfolio manager from Boston Partners (Soyoun Song), as the Fund, using substantially similar investment strategies and portfolio management techniques.
• The total annual operating expenses of Class A shares of the Successor Fund are lower than the total annual operating expenses of the Investor Class shares of the Fund. |
For more complete information, please review the prospectus of the Successor Fund at https://www.jhinvestments.com/resources/all-resources/fund-documents/prospectus/john-hancock-disciplined-value-global-long-short-fund-prospectus/ or upon request at (800) 225-5291.
For additional information about the Fund; including its prospectus, financial information, holdings and proxy information, scan the QR code or visit https://www.bostonpartners.com/fund/bp-global-ls-fund/.
HOUSEHOLDING
To reduce Fund expenses, only one copy of most shareholder documents may be mailed to shareholders with multiple accounts at the same address (Householding). If you would prefer that your Fund documents not be householded, please contact the Fund at 1-888-261-4073, or contact your financial intermediary. Your instructions will typically be effective within 30 days of receipt by the Fund or your financial intermediary.
| Boston Partners Global Long/Short Fund | PAGE 3 | TSR-AR-74925K458 |
100001021410578109931113910567966412077135051487717408100009639103451208813745138611627321210180982103226290100009587102281188313440134751573720421173432004924948
| | |
| Boston Partners Emerging Markets Dynamic Equity Fund | |
Institutional Class | BELSX |
Annual Shareholder Report | August 31, 2024 |
This annual shareholder report contains important information about the Boston Partners Emerging Markets Dynamic Equity Fund (the “Fund”) for the period of September 1, 2023, to August 31, 2024. You can find additional information about the Fund at https://www.bostonpartners.com/fund/bp-emerging-markets-de-fund/. You can also request this information by contacting us at 1-888-261-4073.
WHAT WERE THE FUND COSTS FOR THE PAST YEAR? (based on a hypothetical $10,000 investment)
| | |
Class Name | Costs of a $10,000 investment | Costs paid as a percentage of a $10,000 investment |
| Institutional Class | $146 | 1.45% |
HOW DID THE FUND PERFORM LAST YEAR AND WHAT AFFECTED ITS PERFORMANCE?
For the 12 months ended August 31, 2024, the Fund underperformed the MSCI Emerging Market Index - Net Return (the “Index”).
What factors influenced performance?
Global economies generally continued to expand during the past 12 months, as inflation rates dropped significantly, which offered some relief to consumers. While there remained some concern about the timing and pace of central banks’ pivot to easing policies, the backdrop for equities was constructive during the period. The Fund’s allocation to certain sectors and stock selection within sectors both negatively impacted performance.
What were the top contributors and detractors?
Relative to the Index, the Fund’s overweight in the Materials sector and stock selection within that sector were among the biggest detractors during the year. Conversely, the Fund’s short positions within the Materials sector represented one of the strongest positive contributors to performance relative to the Index.
How is the Fund currently positioned?
The Fund’s largest short positions by sector at the end of the period were in Information Technology, Industrials, and Consumer Discretionary. The Fund’s largest long positions by sector at the end of the reporting period were in Information Technology, Consumer Discretionary, and Consumer Services.
HOW DID THE FUND PERFORM SINCE INCEPTION?*
The $100,000 chart reflects a hypothetical $100,000 investment in the class of shares noted. The chart uses total return NAV performance and assumes reinvestment of dividends and capital gains. Fund expenses, including management fees and other expenses, were deducted.
CUMULATIVE PERFORMANCE (Initial Investment of $100,000)
| | 01/03/2015 | 03/31/2015 | 04/30/2015 | 05/31/2015 | 06/30/2015 | 07/31/2015 | 08/31/2015 | 09/30/2015 | 10/31/2015 | 11/30/2015 | 12/31/2015 | 01/31/2016 | 02/29/2016 | 03/31/2016 | 04/30/2016 | 05/31/2016 | 06/30/2016 | 07/31/2016 | 08/31/2016 | 09/30/2016 | 10/31/2016 | 11/30/2016 | 12/31/2016 | 01/31/2017 | 02/28/2017 | 03/31/2017 | 04/30/2017 | 05/31/2017 | 06/30/2017 | 07/31/2017 | 08/31/2017 | 09/30/2017 | 10/31/2017 | 11/30/2017 | 12/31/2017 | 01/31/2018 | 02/28/2018 | 03/31/2018 | 04/30/2018 | 05/31/2018 | 06/30/2018 | 07/31/2018 | 08/31/2018 | 09/30/2018 | 10/31/2018 | 11/30/2018 | 12/31/2018 | 01/31/2019 | 02/28/2019 | 03/31/2019 | 04/30/2019 | 05/31/2019 | 06/30/2019 | 07/31/2019 | 08/31/2019 | 09/30/2019 | 10/31/2019 | 11/30/2019 | 12/31/2019 | 01/31/2020 | 02/29/2020 | 03/31/2020 | 04/30/2020 | 05/31/2020 | 06/30/2020 | 07/31/2020 | 08/31/2020 | 09/30/2020 | 10/31/2020 | 11/30/2020 | 12/31/2020 | 01/31/2021 | 02/28/2021 | 03/31/2021 | 04/30/2021 | 05/31/2021 | 06/30/2021 | 07/31/2021 | 08/31/2021 | 09/30/2021 | 10/31/2021 | 11/30/2021 | 12/31/2021 | 01/31/2022 | 02/28/2022 | 03/31/2022 | 04/30/2022 | 05/31/2022 | 06/30/2022 | 07/31/2022 | 08/31/2022 | 09/30/2022 | 10/31/2022 | 11/30/2022 | 12/31/2022 | 01/31/2023 | 02/28/2023 | 03/31/2023 | 04/30/2023 | 05/31/2023 | 06/30/2023 | 07/31/2023 | 08/31/2023 | 09/30/2023 | 10/31/2023 | 11/30/2023 | 12/31/2023 | 01/31/2024 | 02/29/2024 | 03/31/2024 | 04/30/2024 | 05/31/2024 | 06/30/2024 | 07/31/2024 | 08/31/2024 |
| Boston Partners Emerging Markets Dynamic Equity Fund Institutional Class | 100000 | 99250 | 104030 | 102624 | 100469 | 100281 | 98407 | 94189 | 95595 | 94096 | 94658 | 94189 | 93346 | 97001 | 97563 | 98126 | 99531 | 103280 | 104217 | 104499 | 105436 | 100375 | 102148 | 105219 | 107573 | 111770 | 113919 | 116580 | 117194 | 121698 | 124052 | 123950 | 124154 | 124666 | 127463 | 133765 | 128658 | 127245 | 124529 | 121812 | 118552 | 118661 | 113988 | 114206 | 105295 | 107143 | 104136 | 111785 | 111238 | 113752 | 117139 | 109818 | 115500 | 116483 | 114189 | 113752 | 116483 | 117576 | 122315 | 119413 | 116288 | 108253 | 114614 | 115395 | 119971 | 125105 | 125328 | 123989 | 125774 | 131689 | 136766 | 136161 | 142086 | 139910 | 140514 | 140151 | 140031 | 139547 | 138338 | 134952 | 133017 | 129026 | 128987 | 132980 | 131649 | 127777 | 125357 | 123542 | 117855 | 121243 | 123784 | 126688 | 125962 | 124268 | 123164 | 121958 | 121505 | 122862 | 127234 | 125877 | 128892 | 132510 | 129948 | 127988 | 126028 | 131606 | 131455 | 130249 | 134470 | 138842 | 143063 | 143364 | 140199 | 135375 | 131304 |
| MSCI Emerging Market - Gross Return (USD) | 100000 | 98598 | 106206 | 101974 | 99403 | 92574 | 84233 | 81729 | 87565 | 84155 | 82326 | 76990 | 76873 | 87064 | 87555 | 84306 | 87758 | 92225 | 94548 | 95792 | 96029 | 91614 | 91880 | 96912 | 99886 | 102433 | 104697 | 107814 | 108972 | 115556 | 118176 | 117733 | 121868 | 122119 | 126566 | 137125 | 130820 | 128421 | 127877 | 123376 | 118332 | 121036 | 117799 | 117213 | 107015 | 111433 | 108548 | 118061 | 118337 | 119353 | 121889 | 113083 | 120232 | 118861 | 113100 | 115296 | 120170 | 120013 | 129046 | 123035 | 116554 | 98632 | 107683 | 108533 | 116567 | 127088 | 129929 | 127875 | 130529 | 142609 | 153161 | 157896 | 159113 | 156749 | 160673 | 164436 | 164775 | 153782 | 157856 | 151638 | 153156 | 146927 | 149755 | 146932 | 142558 | 139387 | 131655 | 132267 | 123587 | 123387 | 123948 | 109479 | 106095 | 121847 | 120200 | 129703 | 121302 | 125028 | 123635 | 121594 | 126326 | 134277 | 126044 | 122798 | 118041 | 127507 | 132539 | 126397 | 132432 | 135771 | 136407 | 137218 | 142717 | 143241 | 145602 |
| MSCI Emerging Market - Net Return (USD) | 100000 | 98578 | 106160 | 101909 | 99262 | 92381 | 84026 | 81498 | 87311 | 83906 | 82035 | 76713 | 76588 | 86722 | 87194 | 83941 | 87296 | 91689 | 93968 | 95176 | 95403 | 91011 | 91212 | 96204 | 99149 | 101652 | 103877 | 106948 | 108025 | 114464 | 117017 | 116552 | 120638 | 120880 | 125219 | 135656 | 129399 | 126993 | 126431 | 121952 | 116885 | 119452 | 116222 | 115606 | 105538 | 109888 | 106977 | 116343 | 116605 | 117583 | 120059 | 111347 | 118296 | 116850 | 111153 | 113275 | 118051 | 117889 | 126684 | 120778 | 114409 | 96788 | 105651 | 106462 | 114288 | 124501 | 127253 | 125212 | 127792 | 139611 | 149875 | 154469 | 155651 | 153300 | 157117 | 160761 | 161038 | 150200 | 154132 | 148006 | 149466 | 143375 | 146065 | 143300 | 139017 | 135877 | 128319 | 128884 | 120319 | 120024 | 120525 | 106395 | 103092 | 118382 | 116719 | 125935 | 117769 | 121336 | 119961 | 117946 | 122424 | 130045 | 122034 | 118843 | 114226 | 123367 | 128190 | 122238 | 128053 | 131226 | 131813 | 132557 | 137786 | 138196 | 140427 |
| Boston Partners Emerging Markets Dynamic Equity Fund | PAGE 1 | TSR-AR-74925K326 |
ANNUAL AVERAGE TOTAL RETURN (%)
| | | |
| | 1 Year | 5 Year | Since Inception
(03/01/2015)2 |
Institutional Class | 1.04 | 2.83 | 2.91 |
MSCI Emerging Market - Gross Return (USD)1 | 15.52 | 5.18 | 4.03 |
MSCI Emerging Market - Net Return (USD) | 15.07 | 4.79 | 3.64 |
Visit https://www.bostonpartners.com/fund/bp-emerging-markets-de-fund/ for more recent performance information.
| * | The Fund’s past performance is not a good predictor of how the Fund will perform in the future. The graph and table do not reflect the deduction of taxes that a shareholder would pay on Fund distributions or redemption of Fund shares. |
| 1 | Effective with this report, and pursuant to new regulatory requirements, the MSCI Emerging Markets Index - Gross Return replaced the MSCI Emerging Markets Index - Net Return as the Fund’s primary benchmark to represent a broad-based securities market index. The Fund continues to use the MSCI Emerging Markets Index - Net Return as an additional benchmark. |
| 2 | The inception date of the Fund was March 1, 2015. The Fund commenced operations as a series of The RBB Fund, Inc. on December 15, 2015, when substantially all of the assets of Boston Partners Emerging Market Long/Short Equity (the “Prior Account”) transferred to the Fund. The Fund is managed in all material respects in a manner equivalent to the management of the Prior Account. Accordingly, the performance information shown above for periods prior to December 15, 2015 is that of the Prior Account. |
KEY FUND STATISTICS (as of August 31, 2024)
| |
Net Assets | $59,967,605 |
Number of Holdings | 354 |
Net Advisory Fee | $662,894 |
Portfolio Turnover | 202% |
Visit https://www.bostonpartners.com/fund/bp-emerging-markets-de-fund/ for more recent performance information.
WHAT DID THE FUND INVEST IN? (as of August 31, 2024)
| |
Top 10 Holdings | (% of net assets) |
BlackRock Liquidity Funds Treasury Trust Fund Portfolio | 4.4% |
Federated Hermes U.S. Treasury Cash Reserves | 4.4% |
Goldman Sachs Financial Square Funds - Treasury Instruments Fund | 4.4% |
Fidelity Treasury Portfolio | 4.4% |
America Movil SAB de CV | 2.5% |
JD.com, Inc. | 2.4% |
Wuxi NCE Power Co. Ltd. | 2.1% |
Taiwan Semiconductor Manufacturing Co. Ltd. | 2.0% |
Kumho Petrochemical Co. Ltd. | 1.9% |
COSCO SHIPPING Holdings Co. Ltd. | 1.6% |
| |
Top Sectors† | (% of net assets) |
Materials | 9.7% |
Information Technology | 9.7% |
Industrials | 9.1% |
Consumer Staples | 7.5% |
Consumer Discretionary | 7.0% |
Communication Services | 6.4% |
Financials | 5.0% |
Health Care | 3.2% |
Real Estate | 2.2% |
Energy | 0.3% |
| † | The Global Industry Classification Standard (“GICS®”) was developed by and/or is the exclusive property of MSCI, Inc. (“MSCI”) and Standard & Poor’s Financial Services LLC (“S&P”). GICS® is a service mark of MSCI and S&P and has been licensed for use by U.S. Bank Global Fund Services. |
For additional information about the Fund; including its prospectus, financial information, holdings and proxy information, scan the QR code or visit https://www.bostonpartners.com/fund/bp-emerging-markets-de-fund/.
| Boston Partners Emerging Markets Dynamic Equity Fund | PAGE 2 | TSR-AR-74925K326 |
HOUSEHOLDING
To reduce Fund expenses, only one copy of most shareholder documents may be mailed to shareholders with multiple accounts at the same address (Householding). If you would prefer that your Fund documents not be householded, please contact the Fund at 1-888-261-4073, or contact your financial intermediary. Your instructions will typically be effective within 30 days of receipt by the Fund or your financial intermediary.
| Boston Partners Emerging Markets Dynamic Equity Fund | PAGE 3 | TSR-AR-74925K326 |
9840710421712405211398811418912532813833812378412994813130484233945481181761177991131001299291578561239481260441456028402693968117017116222111153127253154132120525122034140427
| | |
| WPG Partners Select Hedged Fund | |
Institutional | WPGHX |
Annual Shareholder Report | August 31, 2024 |
This annual shareholder report contains important information about the WPG Partners Select Hedged Fund (the “Fund”) for the period of May 3, 2024, to August 31, 2024 (the “period”). You can find additional information about the Fund at https://www.bostonpartners.com/affiliates/wpg-select-hedged-fund/. You can also request this information by contacting us at 1-888-261-4073.
WHAT WERE THE FUND COSTS FOR THE PERIOD? (based on a hypothetical $10,000 investment)
| | |
Class Name | Costs of a $10,000 investment | Costs paid as a percentage of a $10,000 investment |
| Institutional | $86a | 2.54% |
| a | Amount shown reflects the expenses of the Fund from inception date through August 31, 2024. Expenses would be higher if the Fund had been in operations for the full year. |
HOW DID THE FUND PERFORM LAST YEAR AND WHAT AFFECTED ITS PERFORMANCE?
For the period ended August 31, 2024, the Fund posted a modest gain, although it trailed the returns of the Russell 2000 Value Index the (“Index”), as well as the Fund’s broad-based securities market index, the Russell 3000 Index, for the same period.
What factors influenced performance?
The U.S. economy generally continued to expand during the period, as inflation rates dropped significantly, which offered some relief to consumers. While there remained some concern about the timing and pace of Federal Reserve’s pivot to an easing policy, the backdrop for equities was constructive during the period.
What were the top contributors and detractors?
Overall, the Fund’s short positions generally contributed to returns relative to the Index, while its long positions generally detracted. Regarding specific sectors, security selection within the long portfolio’s Information Technology and Financials sector allocations weighed on returns. Within the short portfolio, Industrials, Materials, and Consumer Staples sector positions all boosted relative results.
How is the Fund currently positioned?
As of the end of the reporting period, the Fund’s largest relative overweight long positions were in Information Technology and Materials, and it has no long exposure to Utilities. The Fund’s largest short positions were in the Industrials, Consumer Discretionary, and Financials sectors.
HOW DID THE FUND PERFORM SINCE INCEPTION?*
The $100,000 chart reflects a hypothetical $100,000 investment in the class of shares noted. The chart uses total return NAV performance and assumes reinvestment of dividends and capital gains. Fund expenses, including management fees and other expenses, were deducted.
| WPG Partners Select Hedged Fund | PAGE 1 | TSR-AR-74933W247 |
CUMULATIVE PERFORMANCE (Initial Investment of $100,000)
| | 03/05/2024 | 05/31/2024 | 06/30/2024 | 07/31/2024 | 08/31/2024 |
| WPG Partners Select Hedged Fund Institutional | 100000 | 104000 | 102400 | 103600 | 104100 |
| Russell 3000® Total Return Index | 100000 | 102720 | 105900 | 107868 | 110216 |
| Russell 2000® Value Total Return Index | 100000 | 101020 | 99318 | 111422 | 109330 |
ANNUAL AVERAGE TOTAL RETURN (%)
| |
| | Since Inception
(05/03/2024) |
Institutional Class | 4.10 |
Russell 3000® Total Return Index | 10.22 |
Russell 2000® Value Total Return Index | 9.33 |
Visit https://www.bostonpartners.com/affiliates/wpg-select-hedged-fund/ for more recent performance information.
| * | The Fund’s past performance is not a good predictor of how the Fund will perform in the future. The graph and table do not reflect the deduction of taxes that a shareholder would pay on Fund distributions or redemption of Fund shares. |
KEY FUND STATISTICS (as of August 31, 2024)
| |
Net Assets | $53,925,425 |
Number of Holdings | 109 |
Net Advisory Fee | $155,515 |
Portfolio Turnover | 36% |
Visit https://www.bostonpartners.com/affiliates/wpg-select-hedged-fund/ for more recent performance information.
WHAT DID THE FUND INVEST IN? (as of August 31, 2024)
| |
Top 10 Holdings | (% of net assets) |
Kemper Corp. | 4.7% |
BGC Group, Inc. | 4.7% |
Arcosa, Inc. | 4.7% |
Enovis Corp. | 4.6% |
Clarivate PLC | 4.3% |
Nomad Foods Ltd. | 3.8% |
Gildan Activewear, Inc. | 3.6% |
Air Lease Corp. | 3.5% |
Rayonier Advanced Materials, Inc. | 3.4% |
Tower Semiconductor Ltd. | 3.4% |
| |
Top Sectors† | (% of net assets) |
Financials | 17.9% |
Health Care | 8.1% |
Materials | 7.0% |
Real Estate | 5.2% |
Information Technology | 3.7% |
Energy | 3.0% |
Communication Services | 2.1% |
Consumer Staples | -1.2% |
Consumer Discretionary | -5.3% |
Industrials | -9.1% |
| † | The Global Industry Classification Standard (“GICS®”) was developed by and/or is the exclusive property of MSCI, Inc. (“MSCI”) and Standard & Poor’s Financial Services LLC (“S&P”). GICS® is a service mark of MSCI and S&P and has been licensed for use by U.S. Bank Global Fund Services. |
For additional information about the Fund; including its prospectus, financial information, holdings and proxy information, scan the QR code or visit https://www.bostonpartners.com/affiliates/wpg-select-hedged-fund/.
| WPG Partners Select Hedged Fund | PAGE 2 | TSR-AR-74933W247 |
HOUSEHOLDING
To reduce Fund expenses, only one copy of most shareholder documents may be mailed to shareholders with multiple accounts at the same address (Householding). If you would prefer that your Fund documents not be householded, please contact the Fund at 1-888-261-4073, or contact your financial intermediary. Your instructions will typically be effective within 30 days of receipt by the Fund or your financial intermediary.
| WPG Partners Select Hedged Fund | PAGE 3 | TSR-AR-74933W247 |
104100110216109330
| | |
| Campbell Systematic Macro Fund | |
Class A | EBSAX |
Annual Shareholder Report | August 31, 2024 |
This annual shareholder report contains important information about the Campbell Systematic Macro Fund (the “Fund”) for the period of September 1, 2023 to August 31, 2024. You can find additional information about the Fund at https://www.campbell.com/systematicmacro. You can also request this information by contacting us at 1-844-261-6488.
This report describes changes to the Fund that occurred during the reporting period.
WHAT WERE THE FUND COSTS FOR THE PAST YEAR? (based on a hypothetical $10,000 investment)
| | |
Class Name | Costs of a $10,000 investment | Costs paid as a percentage of a $10,000 investment |
| Class A | $203 | 2.00% |
HOW DID THE FUND PERFORM LAST YEAR AND WHAT AFFECTED ITS PERFORMANCE?
The Fund produced net gains during the 12-month period ended August 31, 2024, outperforming the SG CTA Index, which returned -0.65% over the same period.
The exposures affecting performance included gains in equity index derivatives and losses in commodity futures, fixed income futures, and foreign exchange forwards. For the majority of the reporting period, the Fund maintained a net long position in equity index derivatives, a net short position in fixed income futures, and varied positioning in commodity futures and foreign exchange forwards.
WHAT FACTORS INFLUENCED PERFORMANCE?
From a strategy perspective, the Fund trades a variety of systematic models which are grouped into momentum, quant macro, and short-term strategies. Momentum strategies were the most profitable strategies during the period, primarily gaining in equity indices and commodities and experiencing losses in fixed income and foreign exchange. Short-term strategies were also profitable, gaining in equity indices and fixed income markets and experiencing losses in foreign exchange and commodities. Finally, the quant macro strategies were unprofitable during the period, with losses in commodities, equity indices and fixed income more than offsetting gains in foreign exchange.
| |
Top Contributors |
| ↑ | S&P 500 Index Futures +1.6% |
| ↑ | Nikkei Index Futures +1.4% |
| ↑ | Corn Futures +1.4% |
| ↑ | Silver Futures +1.3% |
| ↑ | New Zealand Dollar Forwards +1.2% |
| |
Top Detractors |
| ↓ | Long Gilt Futures -1.2% |
| ↓ | Australian 10 Year 6% Bond Futures -1.3% |
| ↓ | Gold Futures -1.5% |
| ↓ | Euro Forwards -1.8% |
| ↓ | Canadian Dollar Forwards -2.1% |
| Campbell Systematic Macro Fund | PAGE 1 | TSR-AR-74933W841 |
HOW DID THE FUND PERFORM OVER THE PAST 10 YEARS?*
The $10,000 chart reflects a hypothetical $10,000 investment in the class of shares noted and assumes the maximum sales charge. The chart uses total return NAV performance and assumes reinvestment of dividends and capital gains. Fund expenses, including 12b-1 fees, management fees and other expenses, were deducted.
CUMULATIVE PERFORMANCE (Initial Investment of $10,000)
| | 08/31/2014 | 09/30/2014 | 10/31/2014 | 11/30/2014 | 12/31/2014 | 01/31/2015 | 02/28/2015 | 03/31/2015 | 04/30/2015 | 05/31/2015 | 06/30/2015 | 07/31/2015 | 08/31/2015 | 09/30/2015 | 10/31/2015 | 11/30/2015 | 12/31/2015 | 01/31/2016 | 02/29/2016 | 03/31/2016 | 04/30/2016 | 05/31/2016 | 06/30/2016 | 07/31/2016 | 08/31/2016 | 09/30/2016 | 10/31/2016 | 11/30/2016 | 12/31/2016 | 01/31/2017 | 02/28/2017 | 03/31/2017 | 04/30/2017 | 05/31/2017 | 06/30/2017 | 07/31/2017 | 08/31/2017 | 09/30/2017 | 10/31/2017 | 11/30/2017 | 12/31/2017 | 01/31/2018 | 02/28/2018 | 03/31/2018 | 04/30/2018 | 05/31/2018 | 06/30/2018 | 07/31/2018 | 08/31/2018 | 09/30/2018 | 10/31/2018 | 11/30/2018 | 12/31/2018 | 01/31/2019 | 02/28/2019 | 03/31/2019 | 04/30/2019 | 05/31/2019 | 06/30/2019 | 07/31/2019 | 08/31/2019 | 09/30/2019 | 10/31/2019 | 11/30/2019 | 12/31/2019 | 01/31/2020 | 02/29/2020 | 03/31/2020 | 04/30/2020 | 05/31/2020 | 06/30/2020 | 07/31/2020 | 08/31/2020 | 09/30/2020 | 10/31/2020 | 11/30/2020 | 12/31/2020 | 01/31/2021 | 02/28/2021 | 03/31/2021 | 04/30/2021 | 05/31/2021 | 06/30/2021 | 07/31/2021 | 08/31/2021 | 09/30/2021 | 10/31/2021 | 11/30/2021 | 12/31/2021 | 01/31/2022 | 02/28/2022 | 03/31/2022 | 04/30/2022 | 05/31/2022 | 06/30/2022 | 07/31/2022 | 08/31/2022 | 09/30/2022 | 10/31/2022 | 11/30/2022 | 12/31/2022 | 01/31/2023 | 02/28/2023 | 03/31/2023 | 04/30/2023 | 05/31/2023 | 06/30/2023 | 07/31/2023 | 08/31/2023 | 09/30/2023 | 10/31/2023 | 11/30/2023 | 12/31/2023 | 01/31/2024 | 02/29/2024 | 03/31/2024 | 04/30/2024 | 05/31/2024 | 06/30/2024 | 07/31/2024 | 08/31/2024 |
| Campbell Systematic Macro Fund Class A | 9647 | 10223 | 10409 | 10984 | 11410 | 12060 | 12010 | 12266 | 11814 | 11696 | 10712 | 10879 | 10958 | 10987 | 10830 | 11351 | 10974 | 11244 | 11335 | 10944 | 10292 | 10162 | 10533 | 10944 | 10473 | 10152 | 9841 | 9661 | 9701 | 9420 | 9811 | 9691 | 9811 | 9711 | 9340 | 9380 | 9471 | 9380 | 9962 | 10022 | 10072 | 10703 | 9571 | 9701 | 9681 | 9270 | 9551 | 9280 | 9541 | 9511 | 9060 | 9030 | 9348 | 9222 | 9337 | 9770 | 10056 | 9873 | 10432 | 10992 | 11494 | 11197 | 10706 | 10683 | 10421 | 10962 | 11124 | 11070 | 11002 | 10827 | 10597 | 10556 | 10219 | 10151 | 10205 | 10381 | 10746 | 10543 | 10813 | 11327 | 11624 | 11962 | 11895 | 11989 | 11854 | 11773 | 11935 | 11597 | 11701 | 12366 | 12395 | 13509 | 14478 | 14276 | 14999 | 14782 | 15404 | 15982 | 16112 | 15597 | 15282 | 15415 | 16128 | 15846 | 15846 | 16045 | 15830 | 15448 | 15547 | 16112 | 15813 | 15362 | 14959 | 14942 | 15497 | 15749 | 15867 | 15615 | 15884 | 16271 | 16035 |
| S&P 500 Total Return Index | 10000 | 9860 | 10101 | 10372 | 10346 | 10036 | 10612 | 10444 | 10545 | 10680 | 10474 | 10693 | 10048 | 9799 | 10626 | 10657 | 10489 | 9969 | 9955 | 10631 | 10672 | 10864 | 10892 | 11293 | 11309 | 11311 | 11105 | 11516 | 11744 | 11967 | 12442 | 12456 | 12584 | 12761 | 12841 | 13105 | 13145 | 13416 | 13729 | 14150 | 14308 | 15127 | 14569 | 14199 | 14254 | 14597 | 14687 | 15233 | 15730 | 15819 | 14738 | 15038 | 13680 | 14777 | 15251 | 15547 | 16177 | 15149 | 16217 | 16450 | 16189 | 16492 | 16849 | 17461 | 17988 | 17981 | 16501 | 14463 | 16317 | 17094 | 17434 | 18417 | 19740 | 18990 | 18485 | 20509 | 21297 | 21082 | 21664 | 22612 | 23819 | 23986 | 24546 | 25129 | 25893 | 24688 | 26418 | 26235 | 27411 | 25992 | 25214 | 26150 | 23870 | 23914 | 21940 | 23963 | 22986 | 20869 | 22558 | 23819 | 22446 | 23857 | 23275 | 24129 | 24506 | 24612 | 26239 | 27082 | 26650 | 25380 | 24846 | 27115 | 28347 | 28824 | 30363 | 31339 | 30059 | 31550 | 32682 | 33080 | 33882 |
| BarclayHedge BTOP50 Index | 10000 | 10188 | 10338 | 10879 | 11004 | 11424 | 11332 | 11502 | 11160 | 11077 | 10593 | 10861 | 10681 | 10851 | 10714 | 11022 | 10848 | 11177 | 11459 | 11104 | 10862 | 10684 | 10898 | 11054 | 10814 | 10627 | 10412 | 10338 | 10331 | 10182 | 10238 | 10144 | 10086 | 10095 | 9835 | 9894 | 10077 | 9876 | 10176 | 10148 | 10236 | 10556 | 9967 | 9992 | 10025 | 9823 | 9878 | 9828 | 9987 | 9989 | 9753 | 9738 | 9808 | 9639 | 9680 | 9972 | 10290 | 10131 | 10326 | 10644 | 11042 | 10701 | 10429 | 10501 | 10470 | 10476 | 10319 | 10199 | 10229 | 10192 | 10145 | 10459 | 10457 | 10306 | 10258 | 10527 | 10979 | 10856 | 11183 | 11278 | 11578 | 11830 | 11702 | 11826 | 11852 | 11956 | 12323 | 12010 | 12091 | 12304 | 12474 | 13254 | 13948 | 14008 | 14185 | 13737 | 13966 | 14533 | 14670 | 13923 | 13964 | 13979 | 14171 | 13468 | 13662 | 13741 | 13931 | 13972 | 13885 | 14310 | 14211 | 13824 | 13686 | 13848 | 14481 | 14962 | 15225 | 14894 | 14640 | 14418 | 14063 |
| SG CTA Index | 10000 | 10193 | 10360 | 10942 | 11113 | 11593 | 11558 | 11755 | 11382 | 11336 | 10857 | 11192 | 10981 | 11109 | 10976 | 11268 | 11116 | 11580 | 11924 | 11566 | 11309 | 11077 | 11578 | 11723 | 11357 | 11224 | 10931 | 10733 | 10797 | 10676 | 10914 | 10804 | 10790 | 10795 | 10424 | 10503 | 10723 | 10499 | 10955 | 10988 | 11065 | 11498 | 10769 | 10755 | 10763 | 10491 | 10548 | 10474 | 10750 | 10682 | 10384 | 10272 | 10420 | 10224 | 10267 | 10621 | 10912 | 10657 | 10919 | 11307 | 11689 | 11315 | 11046 | 11142 | 11072 | 11164 | 10997 | 11012 | 11037 | 10931 | 10775 | 11051 | 10910 | 10699 | 10685 | 10818 | 11422 | 11285 | 11609 | 11712 | 12064 | 12296 | 12166 | 12201 | 12166 | 12237 | 12550 | 12083 | 12127 | 12386 | 12698 | 13680 | 14478 | 14461 | 14690 | 14241 | 14706 | 15293 | 15365 | 14583 | 14570 | 14453 | 14761 | 13815 | 14097 | 14383 | 14572 | 14417 | 14342 | 14832 | 14681 | 14177 | 14061 | 14204 | 14899 | 15420 | 15731 | 15399 | 15081 | 14741 | 14249 |
ANNUAL AVERAGE TOTAL RETURN (%)
| | | |
| | 1 Year | 5 Year | 10 Year |
Class A (without sales charge)3 | 3.15 | 6.89 | 5.21 |
Class A (with sales charge)3 | -0.47 | 6.12 | 4.84 |
S&P 500 Total Return Index1 | 27.14 | 15.92 | 12.98 |
BarclayHedge BTOP50 Index | 1.28 | 4.96 | 3.47 |
SG CTA Index2 | -0.65 | 4.04 | 3.60 |
Visit https://www.campbell.com/systematicmacro for more recent performance information.
| * | The Fund’s past performance is not a good predictor of how the Fund will perform in the future. The graph and table do not reflect the deduction of taxes that a shareholder would pay on Fund distributions or redemption of Fund shares. |
| 1 | Effective with this report, and pursuant to new regulatory requirements, the S&P 500 Total Return Index is included as a broad-based securities market index that represents the overall applicable domestic equity markets. |
| 2 | The SG CTA Index replaced the BarclayHedge BTOP 50 Index as a more narrowly based index that reflects the market sectors in which the Fund invests. |
| 3 | The Fund commenced operations on March 8, 2013 as a separate portfolio (the “Predecessor Fund”) of Equinox Funds Trust. Effective May 29, 2020, the Predecessor Fund was reorganized as a new series of The RBB Fund, Inc. The performance shown for periods prior to May 29, 2020 represents the performance of the Predecessor Fund. |
KEY FUND STATISTICS (as of August 31, 2024)
| |
Net Assets | $1,244,878,883 |
Number of Holdings | 149 |
Net Advisory Fee | $15,974,611 |
Portfolio Turnover (excludes derivatives) | 0% |
Visit https://www.campbell.com/systematicmacro for more recent performance information.
| Campbell Systematic Macro Fund | PAGE 2 | TSR-AR-74933W841 |
WHAT DID THE FUND INVEST IN? (as of August 31, 2024)
| |
Top 10 Holdings† | (% of net assets) |
United States Treasury Bill | 73.1% |
NZD/USD FWD 20240918 | 0.6% |
IDR/USD FWD 20240918 | 0.5% |
AUD/USD FWD 20240918 | 0.4% |
NOK/USD FWD 20240918 | 0.4% |
GBP/USD FWD 20240918 | 0.3% |
London Metals - Copper | 0.3% |
US Cocoa | 0.2% |
Natural Gas | 0.2% |
USD/ZAR FWD 20240918 | 0.1% |
| † | AUD Australian Dollar
GBP British Pound
IDR Indonesian Rupiah
NOK Norwegian Krone
NZD New Zealand Dollar
USD United States Dollar
ZAR South African Rand |
| |
Top Sectors | (% of net assets) |
U.S. Treasury Bills | 73.1% |
Cash & Other | 26.6% |
Futures Contracts | 0.2% |
Forwards | 0.1% |
Material Fund Changes:
This is a summary of certain planned changes to the Fund since September 1, 2023. For more complete information, you may review the Fund’s next prospectus, which we expect to be available by December 31, 2024 at https://www.campbell.com/systematicmacro or upon request at 1-844-261-6488. The Board of Directors (the “Board”) of The RBB Fund, Inc. (the “Company”) solicited approval from shareholders of the Fund, a series of the Company, for a proposed new investment advisory agreements between Campbell & Company Investment Adviser, LLC (the “Adviser”), the investment adviser of the Fund, and each of the Company, on behalf of the Fund, and the Fund’s subsidiary, Campbell Systematic Macro Offshore Limited (the “Subsidiary”) (collectively, the “New Investment Advisory Agreements”). The New Investment Advisory Agreements are required as a result of the long-planned transition of majority ownership (the “Transition”) of the Adviser’s parent company, Campbell & Company, LP (“Campbell & Company”). The Transition is the result of long-term business continuity and succession planning by Campbell & Company, pursuant to which senior executives and employees will increase their ownership to 80%, by redeeming a portion of the interests held by founder D. Keith Campbell, his family and his related entities, who will continue to own 20% of Campbell & Company. The redemption proceeds will be paid to the Campbell family over a ten-year period based on a percentage of revenues in excess of a threshold designed to protect working capital and reserves, which threshold will be adjusted each year for inflation. As a result, the Transition is expected to further align the interests of Campbell & Company, its executives and employees, and its founder, as they continue to participate in the success of the firm. The new Investment Advisory Agreements are substantially similar to the Adviser’s current agreements on behalf of the Fund and the Subsidiary. There will be no increase in advisory fees. The Adviser’s current portfolio managers will continue to manage the Fund and the Subsidiary according to their current investment objectives and investment strategies. The Adviser does not expect the Transition to have any material impact on the quality of investment advisory services provided to the Fund and the Subsidiary. The Board has unanimously voted to approve the New Investment Advisory Agreements and shareholders of the Fund approved the New Investment Advisory Agreement at a shareholder meeting held on October 25, 2024.
For additional information about the Fund; including its prospectus, financial information, holdings and proxy information, scan the QR code or visit https://www.campbell.com/systematicmacro
HOUSEHOLDING
To reduce Fund expenses, only one copy of most shareholder documents may be mailed to shareholders with multiple accounts at the same address (Householding). If you would prefer that your Fund documents not be householded, please contact the Fund at 1-844-261-6488, or contact your financial intermediary. Your instructions will typically be effective within 30 days of receipt by the Fund or your financial intermediary.
| Campbell Systematic Macro Fund | PAGE 3 | TSR-AR-74933W841 |
964710958104739471954111494102191185415404155471603510000100481130913145157301618919740258932298626650338821000010681108141007799871104210457118521396613885140631000010981113571072310750116891091012166147061434214249
| | |
| Campbell Systematic Macro Fund | |
Class C | EBSCX |
Annual Shareholder Report | August 31, 2024 |
This annual shareholder report contains important information about the Campbell Systematic Macro Fund (the “Fund”) for the period of September 1, 2023 to August 31, 2024. You can find additional information about the Fund at https://www.campbell.com/systematicmacro. You can also request this information by contacting us at 1-844-261-6488.
This report describes changes to the Fund that occurred during the reporting period.
WHAT WERE THE FUND COSTS FOR THE PAST YEAR? (based on a hypothetical $10,000 investment)
| | |
Class Name | Costs of a $10,000 investment | Costs paid as a percentage of a $10,000 investment |
| Class C | $278 | 2.75% |
HOW DID THE FUND PERFORM LAST YEAR AND WHAT AFFECTED ITS PERFORMANCE?
The Fund produced net gains during the 12-month period ended August 31, 2024, outperforming the SG CTA Index, which returned -0.65% over the same period.
The exposures affecting performance included gains in equity index derivatives and losses in commodity futures, fixed income futures, and foreign exchange forwards. For the majority of the reporting period, the Fund maintained a net long position in equity index derivatives, a net short position in fixed income futures, and varied positioning in commodity futures and foreign exchange forwards.
WHAT FACTORS INFLUENCED PERFORMANCE?
From a strategy perspective, the Fund trades a variety of systematic models which are grouped into momentum, quant macro, and short-term strategies. Momentum strategies were the most profitable strategies during the period, primarily gaining in equity indices and commodities and experiencing losses in fixed income and foreign exchange. Short-term strategies were also profitable, gaining in equity indices and fixed income markets and experiencing losses in foreign exchange and commodities. Finally, the quant macro strategies were unprofitable during the period, with losses in commodities, equity indices and fixed income more than offsetting gains in foreign exchange.
| |
Top Contributors |
| ↑ | S&P 500 Index Futures +1.6% |
| ↑ | Nikkei Index Futures +1.4% |
| ↑ | Corn Futures +1.4% |
| ↑ | Silver Futures +1.3% |
| ↑ | New Zealand Dollar Forwards +1.2% |
| |
Top Detractors |
| ↓ | Long Gilt Futures -1.2% |
| ↓ | Australian 10 Year 6% Bond Futures -1.3% |
| ↓ | Gold Futures -1.5% |
| ↓ | Euro Forwards -1.8% |
| ↓ | Canadian Dollar Forwards -2.1% |
| Campbell Systematic Macro Fund | PAGE 1 | TSR-AR-74933W817 |
HOW DID THE FUND PERFORM OVER THE PAST 10 YEARS?*
The $10,000 chart reflects a hypothetical $10,000 investment in the class of shares noted and assumes the maximum sales charge. The chart uses total return NAV performance and assumes reinvestment of dividends and capital gains. Fund expenses, including 12b-1 fees, management fees and other expenses, were deducted.
CUMULATIVE PERFORMANCE (Initial Investment of $10,000)
| | 08/31/2014 | 09/30/2014 | 10/31/2014 | 11/30/2014 | 12/31/2014 | 01/31/2015 | 02/28/2015 | 03/31/2015 | 04/30/2015 | 05/31/2015 | 06/30/2015 | 07/31/2015 | 08/31/2015 | 09/30/2015 | 10/31/2015 | 11/30/2015 | 12/31/2015 | 01/31/2016 | 02/29/2016 | 03/31/2016 | 04/30/2016 | 05/31/2016 | 06/30/2016 | 07/31/2016 | 08/31/2016 | 09/30/2016 | 10/31/2016 | 11/30/2016 | 12/31/2016 | 01/31/2017 | 02/28/2017 | 03/31/2017 | 04/30/2017 | 05/31/2017 | 06/30/2017 | 07/31/2017 | 08/31/2017 | 09/30/2017 | 10/31/2017 | 11/30/2017 | 12/31/2017 | 01/31/2018 | 02/28/2018 | 03/31/2018 | 04/30/2018 | 05/31/2018 | 06/30/2018 | 07/31/2018 | 08/31/2018 | 09/30/2018 | 10/31/2018 | 11/30/2018 | 12/31/2018 | 01/31/2019 | 02/28/2019 | 03/31/2019 | 04/30/2019 | 05/31/2019 | 06/30/2019 | 07/31/2019 | 08/31/2019 | 09/30/2019 | 10/31/2019 | 11/30/2019 | 12/31/2019 | 01/31/2020 | 02/29/2020 | 03/31/2020 | 04/30/2020 | 05/31/2020 | 06/30/2020 | 07/31/2020 | 08/31/2020 | 09/30/2020 | 10/31/2020 | 11/30/2020 | 12/31/2020 | 01/31/2021 | 02/28/2021 | 03/31/2021 | 04/30/2021 | 05/31/2021 | 06/30/2021 | 07/31/2021 | 08/31/2021 | 09/30/2021 | 10/31/2021 | 11/30/2021 | 12/31/2021 | 01/31/2022 | 02/28/2022 | 03/31/2022 | 04/30/2022 | 05/31/2022 | 06/30/2022 | 07/31/2022 | 08/31/2022 | 09/30/2022 | 10/31/2022 | 11/30/2022 | 12/31/2022 | 01/31/2023 | 02/28/2023 | 03/31/2023 | 04/30/2023 | 05/31/2023 | 06/30/2023 | 07/31/2023 | 08/31/2023 | 09/30/2023 | 10/31/2023 | 11/30/2023 | 12/31/2023 | 01/31/2024 | 02/29/2024 | 03/31/2024 | 04/30/2024 | 05/31/2024 | 06/30/2024 | 07/31/2024 | 08/31/2024 |
| Campbell Systematic Macro Fund Class C | 10,000 | 10,579 | 10,763 | 11,361 | 11,792 | 12,457 | 12,396 | 12,652 | 12,181 | 12,048 | 11,035 | 11,188 | 11,270 | 11,290 | 11,127 | 11,649 | 11,263 | 11,533 | 11,626 | 11,211 | 10,535 | 10,400 | 10,774 | 11,179 | 10,691 | 10,369 | 10,037 | 9,850 | 9,881 | 9,590 | 9,985 | 9,860 | 9,964 | 9,870 | 9,486 | 9,517 | 9,600 | 9,507 | 10,078 | 10,140 | 10,182 | 10,816 | 9,663 | 9,798 | 9,766 | 9,351 | 9,621 | 9,351 | 9,600 | 9,559 | 9,101 | 9,060 | 9,386 | 9,245 | 9,363 | 9,786 | 10,068 | 9,868 | 10,432 | 10,972 | 11,466 | 11,172 | 10,667 | 10,655 | 10,376 | 10,918 | 11,056 | 11,001 | 10,918 | 10,751 | 10,515 | 10,459 | 10,112 | 10,029 | 10,070 | 10,237 | 10,584 | 10,390 | 10,654 | 11,154 | 11,445 | 11,779 | 11,709 | 11,793 | 11,668 | 11,570 | 11,723 | 11,390 | 11,475 | 12,120 | 12,150 | 13,230 | 14,175 | 13,965 | 14,671 | 14,431 | 15,046 | 15,601 | 15,706 | 15,202 | 14,873 | 14,994 | 15,685 | 15,409 | 15,392 | 15,582 | 15,357 | 14,977 | 15,063 | 15,599 | 15,305 | 14,849 | 14,450 | 14,432 | 14,953 | 15,197 | 15,283 | 15,040 | 15,301 | 15,648 | 15,422 |
| S&P 500 Total Return Index | 10,000 | 9,860 | 10,101 | 10,372 | 10,346 | 10,036 | 10,612 | 10,444 | 10,545 | 10,680 | 10,474 | 10,693 | 10,048 | 9,799 | 10,626 | 10,657 | 10,489 | 9,969 | 9,955 | 10,631 | 10,672 | 10,864 | 10,892 | 11,293 | 11,309 | 11,311 | 11,105 | 11,516 | 11,744 | 11,967 | 12,442 | 12,456 | 12,584 | 12,761 | 12,841 | 13,105 | 13,145 | 13,416 | 13,729 | 14,150 | 14,308 | 15,127 | 14,569 | 14,199 | 14,254 | 14,597 | 14,687 | 15,233 | 15,730 | 15,819 | 14,738 | 15,038 | 13,680 | 14,777 | 15,251 | 15,547 | 16,177 | 15,149 | 16,217 | 16,450 | 16,189 | 16,492 | 16,849 | 17,461 | 17,988 | 17,981 | 16,501 | 14,463 | 16,317 | 17,094 | 17,434 | 18,417 | 19,740 | 18,990 | 18,485 | 20,509 | 21,297 | 21,082 | 21,664 | 22,612 | 23,819 | 23,986 | 24,546 | 25,129 | 25,893 | 24,688 | 26,418 | 26,235 | 27,411 | 25,992 | 25,214 | 26,150 | 23,870 | 23,914 | 21,940 | 23,963 | 22,986 | 20,869 | 22,558 | 23,819 | 22,446 | 23,857 | 23,275 | 24,129 | 24,506 | 24,612 | 26,239 | 27,082 | 26,650 | 25,380 | 24,846 | 27,115 | 28,347 | 28,824 | 30,363 | 31,339 | 30,059 | 31,550 | 32,682 | 33,080 | 33,882 |
| BarclayHedge BTOP50 Index | 10,000 | 10,188 | 10,338 | 10,879 | 11,004 | 11,424 | 11,332 | 11,502 | 11,160 | 11,077 | 10,593 | 10,861 | 10,681 | 10,851 | 10,714 | 11,022 | 10,848 | 11,177 | 11,459 | 11,104 | 10,862 | 10,684 | 10,898 | 11,054 | 10,814 | 10,627 | 10,412 | 10,338 | 10,331 | 10,182 | 10,238 | 10,144 | 10,086 | 10,095 | 9,835 | 9,894 | 10,077 | 9,876 | 10,176 | 10,148 | 10,236 | 10,556 | 9,967 | 9,992 | 10,025 | 9,823 | 9,878 | 9,828 | 9,987 | 9,989 | 9,753 | 9,738 | 9,808 | 9,639 | 9,680 | 9,972 | 10,290 | 10,131 | 10,326 | 10,644 | 11,042 | 10,701 | 10,429 | 10,501 | 10,470 | 10,476 | 10,319 | 10,199 | 10,229 | 10,192 | 10,145 | 10,459 | 10,457 | 10,306 | 10,258 | 10,527 | 10,979 | 10,856 | 11,183 | 11,278 | 11,578 | 11,830 | 11,702 | 11,826 | 11,852 | 11,956 | 12,323 | 12,010 | 12,091 | 12,304 | 12,474 | 13,254 | 13,948 | 14,008 | 14,185 | 13,737 | 13,966 | 14,533 | 14,670 | 13,923 | 13,964 | 13,979 | 14,171 | 13,468 | 13,662 | 13,741 | 13,931 | 13,972 | 13,885 | 14,310 | 14,211 | 13,824 | 13,686 | 13,848 | 14,481 | 14,962 | 15,225 | 14,894 | 14,640 | 14,418 | 14,063 |
| SG CTA Index | 10,000 | 10,193 | 10,360 | 10,942 | 11,113 | 11,593 | 11,558 | 11,755 | 11,382 | 11,336 | 10,857 | 11,192 | 10,981 | 11,109 | 10,976 | 11,268 | 11,116 | 11,580 | 11,924 | 11,566 | 11,309 | 11,077 | 11,578 | 11,723 | 11,357 | 11,224 | 10,931 | 10,733 | 10,797 | 10,676 | 10,914 | 10,804 | 10,790 | 10,795 | 10,424 | 10,503 | 10,723 | 10,499 | 10,955 | 10,988 | 11,065 | 11,498 | 10,769 | 10,755 | 10,763 | 10,491 | 10,548 | 10,474 | 10,750 | 10,682 | 10,384 | 10,272 | 10,420 | 10,224 | 10,267 | 10,621 | 10,912 | 10,657 | 10,919 | 11,307 | 11,689 | 11,315 | 11,046 | 11,142 | 11,072 | 11,164 | 10,997 | 11,012 | 11,037 | 10,931 | 10,775 | 11,051 | 10,910 | 10,699 | 10,685 | 10,818 | 11,422 | 11,285 | 11,609 | 11,712 | 12,064 | 12,296 | 12,166 | 12,201 | 12,166 | 12,237 | 12,550 | 12,083 | 12,127 | 12,386 | 12,698 | 13,680 | 14,478 | 14,461 | 14,690 | 14,241 | 14,706 | 15,293 | 15,365 | 14,583 | 14,570 | 14,453 | 14,761 | 13,815 | 14,097 | 14,383 | 14,572 | 14,417 | 14,342 | 14,832 | 14,681 | 14,177 | 14,061 | 14,204 | 14,899 | 15,420 | 15,731 | 15,399 | 15,081 | 14,741 | 14,249 |
ANNUAL AVERAGE TOTAL RETURN (%)
| | | |
| | 1 Year | 5 Year | 10 Year |
Class C (without sales charge)3 | 2.38 | 6.11 | 4.43 |
Class C (with sales charge)3 | 1.38 | 6.11 | 4.43 |
S&P 500 Total Return Index1 | 27.14 | 15.92 | 12.98 |
BarclayHedge BTOP50 Index | 1.28 | 4.96 | 3.47 |
SG CTA Index2 | -0.65 | 4.04 | 3.60 |
Visit https://www.campbell.com/systematicmacro for more recent performance information.
| * | The Fund’s past performance is not a good predictor of how the Fund will perform in the future. The graph and table do not reflect the deduction of taxes that a shareholder would pay on Fund distributions or redemption of Fund shares. |
| 1 | Effective with this report, and pursuant to new regulatory requirements, the S&P 500 Total Return Index is included as a broad-based securities market index that represents the overall applicable domestic equity markets. |
| 2 | The SG CTA Index replaced the BarclayHedge BTOP 50 Index as a more narrowly based index that reflects the market sectors in which the Fund invests. |
| 3 | The Fund commenced operations on March 8, 2013 as a separate portfolio (the “Predecessor Fund”) of Equinox Funds Trust. Effective May 29, 2020, the Predecessor Fund was reorganized as a new series of The RBB Fund, Inc. The performance shown for periods prior to May 29, 2020 represents the performance of the Predecessor Fund. |
KEY FUND STATISTICS (as of August 31, 2024)
| |
Net Assets | $1,244,878,883 |
Number of Holdings | 149 |
Net Advisory Fee | $15,974,611 |
Portfolio Turnover (excludes derivatives) | 0% |
Visit https://www.campbell.com/systematicmacro for more recent performance information.
| Campbell Systematic Macro Fund | PAGE 2 | TSR-AR-74933W817 |
WHAT DID THE FUND INVEST IN? (as of August 31, 2024)
| |
Top 10 Holdings† | (% of net assets) |
United States Treasury Bill | 73.1% |
NZD/USD FWD 20240918 | 0.6% |
IDR/USD FWD 20240918 | 0.5% |
AUD/USD FWD 20240918 | 0.4% |
NOK/USD FWD 20240918 | 0.4% |
GBP/USD FWD 20240918 | 0.3% |
London Metals - Copper | 0.3% |
US Cocoa | 0.2% |
Natural Gas | 0.2% |
USD/ZAR FWD 20240918 | 0.1% |
| † | AUD Australian Dollar
GBP British Pound
IDR Indonesian Rupiah
NOK Norwegian Krone
NZD New Zealand Dollar
USD United States Dollar
ZAR South African Rand |
| |
Top Sectors | (% of net assets) |
U.S. Treasury Bills | 73.1% |
Cash & Other | 26.6% |
Futures Contracts | 0.2% |
Forwards | 0.1% |
Material Fund Changes:
This is a summary of certain planned changes to the Fund since September 1, 2023. For more complete information, you may review the Fund’s next prospectus, which we expect to be available by December 31, 2024 at https://www.campbell.com/systematicmacro or upon request at 1-844-261-6488. The Board of Directors (the “Board”) of The RBB Fund, Inc. (the “Company”) solicited approval from shareholders of the Fund, a series of the Company, for a proposed new investment advisory agreements between Campbell & Company Investment Adviser, LLC (the “Adviser”), the investment adviser of the Fund, and each of the Company, on behalf of the Fund, and the Fund’s subsidiary, Campbell Systematic Macro Offshore Limited (the “Subsidiary”) (collectively, the “New Investment Advisory Agreements”). The New Investment Advisory Agreements are required as a result of the long-planned transition of majority ownership (the “Transition”) of the Adviser’s parent company, Campbell & Company, LP (“Campbell & Company”). The Transition is the result of long-term business continuity and succession planning by Campbell & Company, pursuant to which senior executives and employees will increase their ownership to 80%, by redeeming a portion of the interests held by founder D. Keith Campbell, his family and his related entities, who will continue to own 20% of Campbell & Company. The redemption proceeds will be paid to the Campbell family over a ten-year period based on a percentage of revenues in excess of a threshold designed to protect working capital and reserves, which threshold will be adjusted each year for inflation. As a result, the Transition is expected to further align the interests of Campbell & Company, its executives and employees, and its founder, as they continue to participate in the success of the firm. The new Investment Advisory Agreements are substantially similar to the Adviser’s current agreements on behalf of the Fund and the Subsidiary. There will be no increase in advisory fees. The Adviser’s current portfolio managers will continue to manage the Fund and the Subsidiary according to their current investment objectives and investment strategies. The Adviser does not expect the Transition to have any material impact on the quality of investment advisory services provided to the Fund and the Subsidiary. The Board has unanimously voted to approve the New Investment Advisory Agreements and shareholders of the Fund approved the New Investment Advisory Agreement at a shareholder meeting held on October 25, 2024.
For additional information about the Fund; including its prospectus, financial information, holdings and proxy information, scan the QR code or visit https://www.campbell.com/systematicmacro
HOUSEHOLDING
To reduce Fund expenses, only one copy of most shareholder documents may be mailed to shareholders with multiple accounts at the same address (Householding). If you would prefer that your Fund documents not be householded, please contact the Fund at 1-844-261-6488, or contact your financial intermediary. Your instructions will typically be effective within 30 days of receipt by the Fund or your financial intermediary.
| Campbell Systematic Macro Fund | PAGE 3 | TSR-AR-74933W817 |
1000011270106919600960011466101121166815046150631542210000100481130913145157301618919740258932298626650338821000010681108141007799871104210457118521396613885140631000010981113571072310750116891091012166147061434214249
| | |
| Campbell Systematic Macro Fund | |
Class I | EBSIX |
Annual Shareholder Report | August 31, 2024 |
This annual shareholder report contains important information about the Campbell Systematic Macro Fund (the “Fund”) for the period of September 1, 2023 to August 31, 2024. You can find additional information about the Fund at https://www.campbell.com/systematicmacro. You can also request this information by contacting us at 1-844-261-6488.
This report describes changes to the Fund that occurred during the reporting period.
WHAT WERE THE FUND COSTS FOR THE PAST YEAR? (based on a hypothetical $10,000 investment)
| | |
Class Name | Costs of a $10,000 investment | Costs paid as a percentage of a $10,000 investment |
| Class I | $178 | 1.75% |
HOW DID THE FUND PERFORM LAST YEAR AND WHAT AFFECTED ITS PERFORMANCE?
The Fund produced net gains during the 12-month period ended August 31, 2024, outperforming the SG CTA Index, which returned -0.65% over the same period.
The exposures affecting performance included gains in equity index derivatives and losses in commodity futures, fixed income futures, and foreign exchange forwards. For the majority of the reporting period, the Fund maintained a net long position in equity index derivatives, a net short position in fixed income futures, and varied positioning in commodity futures and foreign exchange forwards.
WHAT FACTORS INFLUENCED PERFORMANCE?
From a strategy perspective, the Fund trades a variety of systematic models which are grouped into momentum, quant macro, and short-term strategies. Momentum strategies were the most profitable strategies during the period, primarily gaining in equity indices and commodities and experiencing losses in fixed income and foreign exchange. Short-term strategies were also profitable, gaining in equity indices and fixed income markets and experiencing losses in foreign exchange and commodities. Finally, the quant macro strategies were unprofitable during the period, with losses in commodities, equity indices and fixed income more than offsetting gains in foreign exchange.
| |
Top Contributors |
| ↑ | S&P 500 Index Futures +1.6% |
| ↑ | Nikkei Index Futures +1.4% |
| ↑ | Corn Futures +1.4% |
| ↑ | Silver Futures +1.3% |
| ↑ | New Zealand Dollar Forwards +1.2% |
| |
Top Detractors |
| ↓ | Long Gilt Futures -1.2% |
| ↓ | Australian 10 Year 6% Bond Futures -1.3% |
| ↓ | Gold Futures -1.5% |
| ↓ | Euro Forwards -1.8% |
| ↓ | Canadian Dollar Forwards -2.1% |
| Campbell Systematic Macro Fund | PAGE 1 | TSR-AR-74933W833 |
HOW DID THE FUND PERFORM OVER THE PAST 10 YEARS?*
The $10,000 chart reflects a hypothetical $10,000 investment in the class of shares noted. The chart uses total return NAV performance and assumes reinvestment of dividends and capital gains. Fund expenses, including management fees and other expenses, were deducted.
CUMULATIVE PERFORMANCE (Initial Investment of $10,000)
| | 08/31/2014 | 09/30/2014 | 10/31/2014 | 11/30/2014 | 12/31/2014 | 01/31/2015 | 02/28/2015 | 03/31/2015 | 04/30/2015 | 05/31/2015 | 06/30/2015 | 07/31/2015 | 08/31/2015 | 09/30/2015 | 10/31/2015 | 11/30/2015 | 12/31/2015 | 01/31/2016 | 02/29/2016 | 03/31/2016 | 04/30/2016 | 05/31/2016 | 06/30/2016 | 07/31/2016 | 08/31/2016 | 09/30/2016 | 10/31/2016 | 11/30/2016 | 12/31/2016 | 01/31/2017 | 02/28/2017 | 03/31/2017 | 04/30/2017 | 05/31/2017 | 06/30/2017 | 07/31/2017 | 08/31/2017 | 09/30/2017 | 10/31/2017 | 11/30/2017 | 12/31/2017 | 01/31/2018 | 02/28/2018 | 03/31/2018 | 04/30/2018 | 05/31/2018 | 06/30/2018 | 07/31/2018 | 08/31/2018 | 09/30/2018 | 10/31/2018 | 11/30/2018 | 12/31/2018 | 01/31/2019 | 02/28/2019 | 03/31/2019 | 04/30/2019 | 05/31/2019 | 06/30/2019 | 07/31/2019 | 08/31/2019 | 09/30/2019 | 10/31/2019 | 11/30/2019 | 12/31/2019 | 01/31/2020 | 02/29/2020 | 03/31/2020 | 04/30/2020 | 05/31/2020 | 06/30/2020 | 07/31/2020 | 08/31/2020 | 09/30/2020 | 10/31/2020 | 11/30/2020 | 12/31/2020 | 01/31/2021 | 02/28/2021 | 03/31/2021 | 04/30/2021 | 05/31/2021 | 06/30/2021 | 07/31/2021 | 08/31/2021 | 09/30/2021 | 10/31/2021 | 11/30/2021 | 12/31/2021 | 01/31/2022 | 02/28/2022 | 03/31/2022 | 04/30/2022 | 05/31/2022 | 06/30/2022 | 07/31/2022 | 08/31/2022 | 09/30/2022 | 10/31/2022 | 11/30/2022 | 12/31/2022 | 01/31/2023 | 02/28/2023 | 03/31/2023 | 04/30/2023 | 05/31/2023 | 06/30/2023 | 07/31/2023 | 08/31/2023 | 09/30/2023 | 10/31/2023 | 11/30/2023 | 12/31/2023 | 01/31/2024 | 02/29/2024 | 03/31/2024 | 04/30/2024 | 05/31/2024 | 06/30/2024 | 07/31/2024 | 08/31/2024 |
| Campbell Systematic Macro Fund Class I | 10,000 | 10,594 | 10,786 | 11,390 | 11,839 | 12,521 | 12,460 | 12,734 | 12,266 | 12,144 | 11,127 | 11,300 | 11,392 | 11,412 | 11,259 | 11,799 | 11,421 | 11,701 | 11,805 | 11,400 | 10,715 | 10,580 | 10,974 | 11,400 | 10,912 | 10,590 | 10,258 | 10,082 | 10,123 | 9,832 | 10,237 | 10,113 | 10,237 | 10,144 | 9,760 | 9,801 | 9,895 | 9,801 | 10,403 | 10,476 | 10,538 | 11,193 | 10,009 | 10,154 | 10,123 | 9,708 | 9,999 | 9,718 | 9,988 | 9,957 | 9,490 | 9,459 | 9,799 | 9,669 | 9,799 | 10,250 | 10,558 | 10,356 | 10,949 | 11,529 | 12,063 | 11,755 | 11,245 | 11,233 | 10,947 | 11,523 | 11,691 | 11,635 | 11,565 | 11,382 | 11,158 | 11,116 | 10,765 | 10,709 | 10,765 | 10,947 | 11,326 | 11,116 | 11,396 | 11,944 | 12,253 | 12,603 | 12,547 | 12,646 | 12,519 | 12,435 | 12,603 | 12,253 | 12,351 | 13,062 | 13,092 | 14,286 | 15,299 | 15,103 | 15,874 | 15,632 | 16,297 | 16,917 | 17,053 | 16,503 | 16,173 | 16,312 | 17,075 | 16,797 | 16,797 | 17,005 | 16,780 | 16,381 | 16,485 | 17,092 | 16,780 | 16,300 | 15,877 | 15,859 | 16,459 | 16,723 | 16,847 | 16,600 | 16,882 | 17,288 | 17,041 |
| S&P 500 Total Return Index | 10,000 | 9,860 | 10,101 | 10,372 | 10,346 | 10,036 | 10,612 | 10,444 | 10,545 | 10,680 | 10,474 | 10,693 | 10,048 | 9,799 | 10,626 | 10,657 | 10,489 | 9,969 | 9,955 | 10,631 | 10,672 | 10,864 | 10,892 | 11,293 | 11,309 | 11,311 | 11,105 | 11,516 | 11,744 | 11,967 | 12,442 | 12,456 | 12,584 | 12,761 | 12,841 | 13,105 | 13,145 | 13,416 | 13,729 | 14,150 | 14,308 | 15,127 | 14,569 | 14,199 | 14,254 | 14,597 | 14,687 | 15,233 | 15,730 | 15,819 | 14,738 | 15,038 | 13,680 | 14,777 | 15,251 | 15,547 | 16,177 | 15,149 | 16,217 | 16,450 | 16,189 | 16,492 | 16,849 | 17,461 | 17,988 | 17,981 | 16,501 | 14,463 | 16,317 | 17,094 | 17,434 | 18,417 | 19,740 | 18,990 | 18,485 | 20,509 | 21,297 | 21,082 | 21,664 | 22,612 | 23,819 | 23,986 | 24,546 | 25,129 | 25,893 | 24,688 | 26,418 | 26,235 | 27,411 | 25,992 | 25,214 | 26,150 | 23,870 | 23,914 | 21,940 | 23,963 | 22,986 | 20,869 | 22,558 | 23,819 | 22,446 | 23,857 | 23,275 | 24,129 | 24,506 | 24,612 | 26,239 | 27,082 | 26,650 | 25,380 | 24,846 | 27,115 | 28,347 | 28,824 | 30,363 | 31,339 | 30,059 | 31,550 | 32,682 | 33,080 | 33,882 |
| BarclayHedge BTOP50 Index | 10,000 | 10,188 | 10,338 | 10,879 | 11,004 | 11,424 | 11,332 | 11,502 | 11,160 | 11,077 | 10,593 | 10,861 | 10,681 | 10,851 | 10,714 | 11,022 | 10,848 | 11,177 | 11,459 | 11,104 | 10,862 | 10,684 | 10,898 | 11,054 | 10,814 | 10,627 | 10,412 | 10,338 | 10,331 | 10,182 | 10,238 | 10,144 | 10,086 | 10,095 | 9,835 | 9,894 | 10,077 | 9,876 | 10,176 | 10,148 | 10,236 | 10,556 | 9,967 | 9,992 | 10,025 | 9,823 | 9,878 | 9,828 | 9,987 | 9,989 | 9,753 | 9,738 | 9,808 | 9,639 | 9,680 | 9,972 | 10,290 | 10,131 | 10,326 | 10,644 | 11,042 | 10,701 | 10,429 | 10,501 | 10,470 | 10,476 | 10,319 | 10,199 | 10,229 | 10,192 | 10,145 | 10,459 | 10,457 | 10,306 | 10,258 | 10,527 | 10,979 | 10,856 | 11,183 | 11,278 | 11,578 | 11,830 | 11,702 | 11,826 | 11,852 | 11,956 | 12,323 | 12,010 | 12,091 | 12,304 | 12,474 | 13,254 | 13,948 | 14,008 | 14,185 | 13,737 | 13,966 | 14,533 | 14,670 | 13,923 | 13,964 | 13,979 | 14,171 | 13,468 | 13,662 | 13,741 | 13,931 | 13,972 | 13,885 | 14,310 | 14,211 | 13,824 | 13,686 | 13,848 | 14,481 | 14,962 | 15,225 | 14,894 | 14,640 | 14,418 | 14,063 |
| SG CTA Index | 10,000 | 10,193 | 10,360 | 10,942 | 11,113 | 11,593 | 11,558 | 11,755 | 11,382 | 11,336 | 10,857 | 11,192 | 10,981 | 11,109 | 10,976 | 11,268 | 11,116 | 11,580 | 11,924 | 11,566 | 11,309 | 11,077 | 11,578 | 11,723 | 11,357 | 11,224 | 10,931 | 10,733 | 10,797 | 10,676 | 10,914 | 10,804 | 10,790 | 10,795 | 10,424 | 10,503 | 10,723 | 10,499 | 10,955 | 10,988 | 11,065 | 11,498 | 10,769 | 10,755 | 10,763 | 10,491 | 10,548 | 10,474 | 10,750 | 10,682 | 10,384 | 10,272 | 10,420 | 10,224 | 10,267 | 10,621 | 10,912 | 10,657 | 10,919 | 11,307 | 11,689 | 11,315 | 11,046 | 11,142 | 11,072 | 11,164 | 10,997 | 11,012 | 11,037 | 10,931 | 10,775 | 11,051 | 10,910 | 10,699 | 10,685 | 10,818 | 11,422 | 11,285 | 11,609 | 11,712 | 12,064 | 12,296 | 12,166 | 12,201 | 12,166 | 12,237 | 12,550 | 12,083 | 12,127 | 12,386 | 12,698 | 13,680 | 14,478 | 14,461 | 14,690 | 14,241 | 14,706 | 15,293 | 15,365 | 14,583 | 14,570 | 14,453 | 14,761 | 13,815 | 14,097 | 14,383 | 14,572 | 14,417 | 14,342 | 14,832 | 14,681 | 14,177 | 14,061 | 14,204 | 14,899 | 15,420 | 15,731 | 15,399 | 15,081 | 14,741 | 14,249 |
ANNUAL AVERAGE TOTAL RETURN (%)
| | | |
| | 1 Year | 5 Year | 10 Year |
Class I3 | 3.42 | 7.15 | 5.47 |
S&P 500 Total Return Index1 | 27.14 | 15.92 | 12.98 |
BarclayHedge BTOP50 Index | 1.28 | 4.96 | 3.47 |
SG CTA Index2 | -0.65 | 4.04 | 3.60 |
Visit https://www.campbell.com/systematicmacro for more recent performance information.
| * | The Fund’s past performance is not a good predictor of how the Fund will perform in the future. The graph and table do not reflect the deduction of taxes that a shareholder would pay on Fund distributions or redemption of Fund shares. |
| 1 | Effective with this report, and pursuant to new regulatory requirements, the S&P 500 Total Return Index is included as a broad-based securities market index that represents the overall applicable domestic equity markets. |
| 2 | The SG CTA Index replaced the BarclayHedge BTOP 50 Index as a more narrowly based index that reflects the market sectors in which the Fund invests. |
| 3 | The Fund commenced operations on March 8, 2013 as a separate portfolio (the “Predecessor Fund”) of Equinox Funds Trust. Effective May 29, 2020, the Predecessor Fund was reorganized as a new series of The RBB Fund, Inc. The performance shown for periods prior to May 29, 2020 represents the performance of the Predecessor Fund. |
KEY FUND STATISTICS (as of August 31, 2024)
| |
Net Assets | $1,244,878,883 |
Number of Holdings | 149 |
Net Advisory Fee | $15,974,611 |
Portfolio Turnover (excludes derivatives) | 0% |
Visit https://www.campbell.com/systematicmacro for more recent performance information.
| Campbell Systematic Macro Fund | PAGE 2 | TSR-AR-74933W833 |
WHAT DID THE FUND INVEST IN? (as of August 31, 2024)
| |
Top 10 Holdings† | (% of net assets) |
United States Treasury Bill | 73.1% |
NZD/USD FWD 20240918 | 0.6% |
IDR/USD FWD 20240918 | 0.5% |
AUD/USD FWD 20240918 | 0.4% |
NOK/USD FWD 20240918 | 0.4% |
GBP/USD FWD 20240918 | 0.3% |
London Metals - Copper | 0.3% |
US Cocoa | 0.2% |
Natural Gas | 0.2% |
USD/ZAR FWD 20240918 | 0.1% |
| † | AUD Australian Dollar
GBP British Pound
IDR Indonesian Rupiah
NOK Norwegian Krone
NZD New Zealand Dollar
USD United States Dollar
ZAR South African Rand |
| |
Top Sectors | (% of net assets) |
U.S. Treasury Bills | 73.1% |
Cash & Other | 26.6% |
Futures Contracts | 0.2% |
Forwards | 0.1% |
Material Fund Changes:
This is a summary of certain planned changes to the Fund since September 1, 2023. For more complete information, you may review the Fund’s next prospectus, which we expect to be available by December 31, 2024 at https://www.campbell.com/systematicmacro or upon request at 1-844-261-6488. The Board of Directors (the “Board”) of The RBB Fund, Inc. (the “Company”) solicited approval from shareholders of the Fund, a series of the Company, for a proposed new investment advisory agreements between Campbell & Company Investment Adviser, LLC (the “Adviser”), the investment adviser of the Fund, and each of the Company, on behalf of the Fund, and the Fund’s subsidiary, Campbell Systematic Macro Offshore Limited (the “Subsidiary”) (collectively, the “New Investment Advisory Agreements”). The New Investment Advisory Agreements are required as a result of the long-planned transition of majority ownership (the “Transition”) of the Adviser’s parent company, Campbell & Company, LP (“Campbell & Company”). The Transition is the result of long-term business continuity and succession planning by Campbell & Company, pursuant to which senior executives and employees will increase their ownership to 80%, by redeeming a portion of the interests held by founder D. Keith Campbell, his family and his related entities, who will continue to own 20% of Campbell & Company. The redemption proceeds will be paid to the Campbell family over a ten-year period based on a percentage of revenues in excess of a threshold designed to protect working capital and reserves, which threshold will be adjusted each year for inflation. As a result, the Transition is expected to further align the interests of Campbell & Company, its executives and employees, and its founder, as they continue to participate in the success of the firm. The new Investment Advisory Agreements are substantially similar to the Adviser’s current agreements on behalf of the Fund and the Subsidiary. There will be no increase in advisory fees. The Adviser’s current portfolio managers will continue to manage the Fund and the Subsidiary according to their current investment objectives and investment strategies. The Adviser does not expect the Transition to have any material impact on the quality of investment advisory services provided to the Fund and the Subsidiary. The Board has unanimously voted to approve the New Investment Advisory Agreements and shareholders of the Fund approved the New Investment Advisory Agreement at a shareholder meeting held on October 25, 2024.
For additional information about the Fund; including its prospectus, financial information, holdings and proxy information, scan the QR code or visit https://www.campbell.com/systematicmacro
HOUSEHOLDING
To reduce Fund expenses, only one copy of most shareholder documents may be mailed to shareholders with multiple accounts at the same address (Householding). If you would prefer that your Fund documents not be householded, please contact the Fund at 1-844-261-6488, or contact your financial intermediary. Your instructions will typically be effective within 30 days of receipt by the Fund or your financial intermediary.
| Campbell Systematic Macro Fund | PAGE 3 | TSR-AR-74933W833 |
1000011392109129895998812063107651251916297164851704110000100481130913145157301618919740258932298626650338821000010681108141007799871104210457118521396613885140631000010981113571072310750116891091012166147061434214249
| | |
| Free Market U.S. Equity Fund | |
Class L | FMUEX |
Annual Shareholder Report | August 31, 2024 |
This annual shareholder report contains important information about the Free Market U.S. Equity Fund (the “Fund”) for the period of September 1, 2023, to August 31, 2024. You can find additional information about the Fund at http://funddocs.filepoint.com/matsonmoney/. You can also request this information by contacting us at 1-866-780-0357 Ext. 3863.
WHAT WERE THE FUND COSTS FOR THE PAST YEAR? (based on a hypothetical $10,000 investment)
| | |
Class Name | Costs of a $10,000 investment | Costs paid as a percentage of a $10,000 investment |
| Class L | $59 | 0.54% |
HOW DID THE FUND PERFORM LAST YEAR AND WHAT AFFECTED ITS PERFORMANCE?
For the twelve months ended August 31, 2024 (the “period”) the Fund provided a total return of 20.30% at net asset value. This compares with a return of 26.14% over the same period for the Fund’s benchmark, the Russell 3000® Index.
As a result of the Fund’s diversified investment approach, performance principally was determined by broad structural trends in equity markets rather than the behavior of a limited number of stocks. Among the most important factors explaining differences in the performance of diversified equity funds, like the Fund, are the size and value/growth characteristics of the underlying fund holdings. Size is measured by market capitalization and “value” classification is a function of stock price relative to one or more fundamental characteristics.
U.S. large cap stocks performed better than U.S. small cap stocks during the period. The S&P 500® Index returned 27.14%, the Russell 2500® Index returned 17.37%, and the Russell 2000® Index returned 18.47%. Furthermore, for the same time period, the Russell 1000® Value Index returned 21.15% while the Russell 2000® Value returned 19.25% for the twelve months ended August 31, 2024.
HOW DID THE FUND PERFORM OVER THE PAST 10 YEARS?*
The $10,000 chart reflects a hypothetical $10,000 investment in the class of shares noted. The chart uses total return NAV performance and assumes reinvestment of dividends and capital gains. Fund expenses, including management fees and other expenses, were deducted.
CUMULATIVE PERFORMANCE (Initial Investment of $10,000)
| | 08/31/2014 | 09/30/2014 | 10/31/2014 | 11/30/2014 | 12/31/2014 | 01/31/2015 | 02/28/2015 | 03/31/2015 | 04/30/2015 | 05/31/2015 | 06/30/2015 | 07/31/2015 | 08/31/2015 | 09/30/2015 | 10/31/2015 | 11/30/2015 | 12/31/2015 | 01/31/2016 | 02/29/2016 | 03/31/2016 | 04/30/2016 | 05/31/2016 | 06/30/2016 | 07/31/2016 | 08/31/2016 | 09/30/2016 | 10/31/2016 | 11/30/2016 | 12/31/2016 | 01/31/2017 | 02/28/2017 | 03/31/2017 | 04/30/2017 | 05/31/2017 | 06/30/2017 | 07/31/2017 | 08/31/2017 | 09/30/2017 | 10/31/2017 | 11/30/2017 | 12/31/2017 | 01/31/2018 | 02/28/2018 | 03/31/2018 | 04/30/2018 | 05/31/2018 | 06/30/2018 | 07/31/2018 | 08/31/2018 | 09/30/2018 | 10/31/2018 | 11/30/2018 | 12/31/2018 | 01/31/2019 | 02/28/2019 | 03/31/2019 | 04/30/2019 | 05/31/2019 | 06/30/2019 | 07/31/2019 | 08/31/2019 | 09/30/2019 | 10/31/2019 | 11/30/2019 | 12/31/2019 | 01/31/2020 | 02/29/2020 | 03/31/2020 | 04/30/2020 | 05/31/2020 | 06/30/2020 | 07/31/2020 | 08/31/2020 | 09/30/2020 | 10/31/2020 | 11/30/2020 | 12/31/2020 | 01/31/2021 | 02/28/2021 | 03/31/2021 | 04/30/2021 | 05/31/2021 | 06/30/2021 | 07/31/2021 | 08/31/2021 | 09/30/2021 | 10/31/2021 | 11/30/2021 | 12/31/2021 | 01/31/2022 | 02/28/2022 | 03/31/2022 | 04/30/2022 | 05/31/2022 | 06/30/2022 | 07/31/2022 | 08/31/2022 | 09/30/2022 | 10/31/2022 | 11/30/2022 | 12/31/2022 | 01/31/2023 | 02/28/2023 | 03/31/2023 | 04/30/2023 | 05/31/2023 | 06/30/2023 | 07/31/2023 | 08/31/2023 | 09/30/2023 | 10/31/2023 | 11/30/2023 | 12/31/2023 | 01/31/2024 | 02/29/2024 | 03/31/2024 | 04/30/2024 | 05/31/2024 | 06/30/2024 | 07/31/2024 | 08/31/2024 |
| Free Market U.S. Equity Fund Class L | 10,000 | 9,562 | 9,896 | 9,954 | 10,089 | 9,621 | 10,233 | 10,251 | 10,221 | 10,353 | 10,311 | 10,173 | 9,645 | 9,286 | 9,915 | 10,083 | 9,658 | 9,021 | 9,073 | 9,756 | 9,912 | 10,023 | 9,977 | 10,400 | 10,524 | 10,589 | 10,302 | 11,376 | 11,708 | 11,742 | 11,960 | 11,885 | 11,980 | 11,796 | 12,048 | 12,185 | 11,994 | 12,675 | 12,839 | 13,207 | 13,281 | 13,727 | 13,097 | 13,034 | 13,119 | 13,621 | 13,649 | 14,024 | 14,406 | 14,194 | 13,013 | 13,197 | 11,705 | 12,859 | 13,301 | 13,062 | 13,549 | 12,342 | 13,279 | 13,384 | 12,664 | 13,174 | 13,436 | 13,893 | 14,335 | 13,702 | 12,310 | 9,683 | 11,052 | 11,503 | 11,669 | 12,096 | 12,705 | 12,207 | 12,349 | 14,272 | 15,148 | 15,566 | 16,901 | 17,857 | 18,388 | 18,927 | 18,726 | 18,565 | 18,967 | 18,493 | 19,313 | 18,927 | 19,958 | 19,135 | 19,169 | 19,404 | 18,086 | 18,581 | 16,794 | 18,237 | 17,683 | 16,047 | 18,036 | 18,934 | 17,892 | 19,248 | 18,884 | 18,283 | 18,129 | 17,637 | 19,084 | 20,039 | 19,439 | 18,620 | 17,810 | 19,275 | 20,952 | 20,649 | 21,406 | 22,419 | 21,208 | 22,154 | 21,956 | 23,489 | 23,385 |
| Russell 3000 Total Return1 | 10,000 | 9,792 | 10,061 | 10,305 | 10,305 | 10,018 | 10,598 | 10,490 | 10,538 | 10,683 | 10,505 | 10,680 | 10,036 | 9,743 | 10,513 | 10,571 | 10,354 | 9,770 | 9,767 | 10,454 | 10,519 | 10,707 | 10,729 | 11,155 | 11,184 | 11,201 | 10,959 | 11,449 | 11,673 | 11,892 | 12,335 | 12,343 | 12,474 | 12,601 | 12,715 | 12,955 | 12,980 | 13,296 | 13,587 | 13,999 | 14,139 | 14,884 | 14,336 | 14,048 | 14,101 | 14,499 | 14,594 | 15,079 | 15,608 | 15,634 | 14,483 | 14,773 | 13,398 | 14,548 | 15,060 | 15,279 | 15,890 | 14,861 | 15,905 | 16,142 | 15,813 | 16,090 | 16,436 | 17,061 | 17,554 | 17,535 | 16,099 | 13,885 | 15,724 | 16,565 | 16,944 | 17,906 | 19,203 | 18,504 | 18,104 | 20,307 | 21,220 | 21,126 | 21,786 | 22,567 | 23,731 | 23,839 | 24,427 | 24,840 | 25,548 | 24,402 | 26,052 | 25,656 | 26,666 | 25,097 | 24,465 | 25,258 | 22,992 | 22,961 | 21,040 | 23,014 | 22,155 | 20,101 | 21,749 | 22,884 | 21,544 | 23,028 | 22,490 | 23,091 | 23,337 | 23,428 | 25,028 | 25,925 | 25,424 | 24,213 | 23,571 | 25,769 | 27,136 | 27,437 | 28,922 | 29,855 | 28,542 | 29,890 | 30,815 | 31,388 | 32,071 |
| Russell 2500 Total Return | 10,000 | 9,486 | 9,906 | 9,992 | 10,128 | 9,921 | 10,512 | 10,652 | 10,465 | 10,690 | 10,615 | 10,596 | 9,968 | 9,522 | 10,055 | 10,252 | 9,835 | 9,050 | 9,114 | 9,873 | 10,019 | 10,230 | 10,226 | 10,759 | 10,845 | 10,897 | 10,455 | 11,344 | 11,564 | 11,725 | 12,007 | 11,999 | 12,091 | 11,956 | 12,255 | 12,382 | 12,279 | 12,836 | 13,035 | 13,463 | 13,508 | 13,920 | 13,348 | 13,476 | 13,508 | 14,143 | 14,245 | 14,521 | 15,144 | 14,914 | 13,400 | 13,653 | 12,157 | 13,557 | 14,197 | 14,080 | 14,574 | 13,537 | 14,497 | 14,648 | 14,062 | 14,311 | 14,585 | 15,211 | 15,533 | 15,217 | 13,941 | 10,916 | 12,505 | 13,428 | 13,816 | 14,367 | 15,017 | 14,629 | 14,894 | 17,320 | 18,638 | 19,095 | 20,341 | 20,675 | 21,501 | 21,546 | 21,801 | 21,419 | 21,905 | 21,216 | 22,256 | 21,328 | 22,027 | 20,194 | 20,421 | 20,746 | 18,978 | 19,042 | 17,223 | 19,005 | 18,500 | 16,738 | 18,344 | 19,118 | 17,981 | 19,779 | 19,315 | 18,591 | 18,348 | 18,026 | 19,562 | 20,535 | 19,728 | 18,626 | 17,495 | 19,070 | 21,114 | 20,562 | 21,680 | 22,575 | 21,063 | 21,939 | 21,610 | 23,215 | 23,156 |
| Composite Index2 | 10,000 | 9,593 | 10,032 | 10,141 | 10,292 | 9,922 | 10,447 | 10,459 | 10,386 | 10,532 | 10,451 | 10,415 | 9,812 | 9,472 | 10,116 | 10,287 | 9,927 | 9,290 | 9,302 | 10,006 | 10,161 | 10,349 | 10,385 | 10,851 | 10,991 | 11,038 | 10,723 | 11,630 | 11,962 | 12,030 | 12,360 | 12,310 | 12,381 | 12,262 | 12,545 | 12,694 | 12,549 | 13,124 | 13,257 | 13,651 | 13,693 | 14,153 | 13,539 | 13,479 | 13,591 | 14,097 | 14,174 | 14,570 | 14,987 | 14,832 | 13,652 | 13,933 | 12,449 | 13,631 | 14,159 | 14,074 | 14,594 | 13,546 | 14,483 | 14,592 | 14,043 | 14,487 | 14,799 | 15,287 | 15,751 | 15,326 | 13,945 | 11,301 | 12,717 | 13,276 | 13,533 | 14,021 | 14,805 | 14,277 | 14,338 | 16,565 | 17,569 | 17,937 | 19,032 | 19,817 | 20,484 | 20,809 | 20,940 | 20,730 | 21,245 | 20,550 | 21,585 | 20,949 | 21,844 | 20,590 | 20,517 | 21,016 | 19,333 | 19,536 | 17,822 | 19,425 | 18,829 | 17,052 | 18,840 | 19,652 | 18,529 | 19,954 | 19,457 | 19,032 | 18,974 | 18,674 | 20,043 | 21,065 | 20,322 | 19,320 | 18,431 | 20,031 | 21,771 | 21,409 | 22,370 | 23,275 | 22,009 | 22,989 | 22,991 | 24,640 | 24,747 |
| Free Market U.S. Equity Fund | PAGE 1 | TSR-AR-74925K839 |
ANNUAL AVERAGE TOTAL RETURN (%)
| | | |
| | 1 Year | 5 Year | 10 Year |
Free Market U.S. Equity Fund | 20.30 | 13.05 | 8.87 |
Russell 3000 Total Return1 | 26.14 | 15.19 | 12.36 |
Russell 2500 Total Return | 17.37 | 10.49 | 8.76 |
Composite Index2 | 21.77 | 12.00 | 9.48 |
| 1 | Effective with this report, and pursuant to new regulatory requirements, the Russell 3000 Total Return Index replaced the Russell 2500 Total Return Index as the Fund’s primary benchmark to represent a broad-based securities market index. |
| 2 | The Composite Index is comprised of the S&P 500® Index, Russell 1000® Value Index, Russell 2000® Index and Russell 2000® Value Index, each weighted 25%, respectively. |
Visit http://funddocs.filepoint.com/matsonmoney/ for more recent performance information.
| * | The Fund’s past performance is not a good predictor of how the Fund will perform in the future. The graph and table do not reflect the deduction of taxes that a shareholder would pay on Fund distributions or redemption of Fund shares. |
KEY FUND STATISTICS (as of August 31, 2024)
| |
Net Assets | $4,301,185,599 |
Number of Holdings | 9 |
Net Advisory Fee | $19,003,981 |
Portfolio Turnover | 4% |
WHAT DID THE FUND INVEST IN? (as of August 31, 2024)
| |
Top 10 Holdings | (% of Net Assets) |
U.S. Small Cap Value Portfolio | 25.1% |
U.S. Micro Cap Portfolio | 15.1% |
U.S. Small Cap Portfolio | 15.1% |
U.S. Large Cap Value Portfolio III | 15.0% |
iShares MSCI USA Value Factor ETF | 9.3% |
iShares Core S&P 500 ETF | 8.2% |
U.S. Large Company Portfolio | 6.7% |
U.S. Large Cap Value Series | 5.6% |
Invesco Government & Agency Portfolio | 0.1% |
| |
Top Sectors | (% of Net Assets) |
Finance and Insurance | 94.4% |
Cash & Other | 5.6% |
For additional information about the Fund; including its prospectus, financial information, holdings and proxy information, scan the QR code or visit http://funddocs.filepoint.com/matsonmoney/
HOUSEHOLDING
To reduce Fund expenses, only one copy of most shareholder documents may be mailed to shareholders with multiple accounts at the same address (Householding). If you would prefer that your Fund documents not be householded, please contact the Fund at 1-866-780-0357 Ext. 3863, or contact your financial intermediary. Your instructions will typically be effective within 30 days of receipt by the Fund or your financial intermediary.
| Free Market U.S. Equity Fund | PAGE 2 | TSR-AR-74925K839 |
1000096451052411994144061266412705189671768319439233851000010036111841298015608158131920325548221552542432071100009968108451227915144140621501721905185001972823156100009812109911254914987140431480521245188292032224747
| | |
| Free Market International Equity Fund | |
Class L | FMNEX |
Annual Shareholder Report | August 31, 2024 |
This annual shareholder report contains important information about the Free Market International Equity Fund (the “Fund”) for the period of September 1, 2023, to August 31, 2024. You can find additional information about the Fund at http://funddocs.filepoint.com/matsonmoney/. You can also request this information by contacting us at 1-866-780-0357 Ext. 3863.
WHAT WERE THE FUND COSTS FOR THE PAST YEAR? (based on a hypothetical $10,000 investment)
| | |
Class Name | Costs of a $10,000 investment | Costs paid as a percentage of a $10,000 investment |
| Class L | $60 | 0.55% |
HOW DID THE FUND PERFORM LAST YEAR AND WHAT AFFECTED ITS PERFORMANCE?
For the twelve months ended August 31, 2024 (the “period”) the Fund provided a total return of 17.86% at net asset value. This compares with a return of 19.45% over the same period for the Fund’s benchmark, the MSCI World (ex USA) Index (Net Dividends), which captures large and mid-cap representation across 22 of 23 Developed Markets (DM) countries excluding the U.S.
As a result of the Fund’s diversified investment approach, performance principally was determined by broad structural trends in global equity markets rather than the behavior of a limited number of stocks. Among the most important factors explaining differences in the behavior of diversified international equity funds, like the Fund, are company size and company value/growth characteristics of the underlying fund holdings and broad exposure to emerging market equities.
International value stocks fared better than international growth stocks during the fiscal year. The MSCI EAFE Value Index increased by 20.38%, while the MSCI EAFE Small Cap Value Index returned 16.86% and the MSCI Emerging Markets Index returned 15.07%. Furthermore, the MSCI EAFE Small Cap Index returned 15.08% for the twelve months ended August 31, 2024, while the MSCI EAFE Index returned 19.40% for the same period.
HOW DID THE FUND PERFORM OVER THE PAST 10 YEARS?*
The $10,000 chart reflects a hypothetical $10,000 investment in the class of shares noted. The chart uses total return NAV performance and assumes reinvestment of dividends and capital gains. Fund expenses, including management fees and other expenses, were deducted.
CUMULATIVE PERFORMANCE (Initial Investment of $10,000)
| | 08/31/2014 | 09/30/2014 | 10/31/2014 | 11/30/2014 | 12/31/2014 | 01/31/2015 | 02/28/2015 | 03/31/2015 | 04/30/2015 | 05/31/2015 | 06/30/2015 | 07/31/2015 | 08/31/2015 | 09/30/2015 | 10/31/2015 | 11/30/2015 | 12/31/2015 | 01/31/2016 | 02/29/2016 | 03/31/2016 | 04/30/2016 | 05/31/2016 | 06/30/2016 | 07/31/2016 | 08/31/2016 | 09/30/2016 | 10/31/2016 | 11/30/2016 | 12/31/2016 | 01/31/2017 | 02/28/2017 | 03/31/2017 | 04/30/2017 | 05/31/2017 | 06/30/2017 | 07/31/2017 | 08/31/2017 | 09/30/2017 | 10/31/2017 | 11/30/2017 | 12/31/2017 | 01/31/2018 | 02/28/2018 | 03/31/2018 | 04/30/2018 | 05/31/2018 | 06/30/2018 | 07/31/2018 | 08/31/2018 | 09/30/2018 | 10/31/2018 | 11/30/2018 | 12/31/2018 | 01/31/2019 | 02/28/2019 | 03/31/2019 | 04/30/2019 | 05/31/2019 | 06/30/2019 | 07/31/2019 | 08/31/2019 | 09/30/2019 | 10/31/2019 | 11/30/2019 | 12/31/2019 | 01/31/2020 | 02/29/2020 | 03/31/2020 | 04/30/2020 | 05/31/2020 | 06/30/2020 | 07/31/2020 | 08/31/2020 | 09/30/2020 | 10/31/2020 | 11/30/2020 | 12/31/2020 | 01/31/2021 | 02/28/2021 | 03/31/2021 | 04/30/2021 | 05/31/2021 | 06/30/2021 | 07/31/2021 | 08/31/2021 | 09/30/2021 | 10/31/2021 | 11/30/2021 | 12/31/2021 | 01/31/2022 | 02/28/2022 | 03/31/2022 | 04/30/2022 | 05/31/2022 | 06/30/2022 | 07/31/2022 | 08/31/2022 | 09/30/2022 | 10/31/2022 | 11/30/2022 | 12/31/2022 | 01/31/2023 | 02/28/2023 | 03/31/2023 | 04/30/2023 | 05/31/2023 | 06/30/2023 | 07/31/2023 | 08/31/2023 | 09/30/2023 | 10/31/2023 | 11/30/2023 | 12/31/2023 | 01/31/2024 | 02/29/2024 | 03/31/2024 | 04/30/2024 | 05/31/2024 | 06/30/2024 | 07/31/2024 | 08/31/2024 |
| Free Market International Equity Fund Class L | 10,000 | 9,441 | 9,286 | 9,231 | 8,990 | 8,942 | 9,516 | 9,324 | 9,850 | 9,860 | 9,640 | 9,458 | 8,875 | 8,464 | 8,980 | 8,865 | 8,727 | 8,113 | 7,984 | 8,677 | 8,984 | 8,826 | 8,559 | 9,054 | 9,153 | 9,331 | 9,301 | 9,192 | 9,434 | 9,853 | 9,965 | 10,190 | 10,394 | 10,589 | 10,721 | 11,161 | 11,212 | 11,498 | 11,662 | 11,723 | 12,050 | 12,684 | 12,040 | 11,892 | 12,093 | 11,734 | 11,406 | 11,660 | 11,322 | 11,374 | 10,329 | 10,276 | 9,682 | 10,419 | 10,606 | 10,507 | 10,815 | 10,045 | 10,595 | 10,342 | 10,001 | 10,375 | 10,771 | 10,881 | 11,397 | 10,787 | 9,885 | 7,797 | 8,553 | 8,948 | 9,253 | 9,478 | 10,031 | 9,772 | 9,501 | 10,991 | 11,707 | 11,614 | 12,265 | 12,695 | 13,055 | 13,578 | 13,299 | 13,276 | 13,485 | 13,183 | 13,520 | 12,741 | 13,404 | 13,345 | 13,145 | 13,121 | 12,403 | 12,697 | 11,413 | 11,826 | 11,378 | 10,236 | 10,754 | 12,073 | 11,995 | 12,983 | 12,666 | 12,702 | 13,007 | 12,385 | 12,983 | 13,629 | 13,178 | 12,873 | 12,373 | 13,251 | 13,932 | 13,669 | 13,969 | 14,606 | 14,419 | 15,144 | 14,719 | 15,306 | 15,531 |
| MSCI WORLD ex USA Index (Net Dividends) | 10,000 | 9,590 | 9,437 | 9,553 | 9,235 | 9,203 | 9,753 | 9,590 | 10,005 | 9,918 | 9,636 | 9,789 | 9,076 | 8,618 | 9,266 | 9,118 | 8,955 | 8,338 | 8,222 | 8,780 | 9,063 | 8,960 | 8,688 | 9,115 | 9,124 | 9,235 | 9,055 | 8,910 | 9,201 | 9,475 | 9,584 | 9,827 | 10,036 | 10,371 | 10,381 | 10,690 | 10,687 | 10,964 | 11,114 | 11,227 | 11,428 | 11,961 | 11,393 | 11,195 | 11,452 | 11,235 | 11,112 | 11,385 | 11,170 | 11,257 | 10,363 | 10,353 | 9,818 | 10,519 | 10,789 | 10,844 | 11,151 | 10,624 | 11,255 | 11,119 | 10,846 | 11,150 | 11,511 | 11,655 | 12,026 | 11,793 | 10,747 | 9,229 | 9,872 | 10,292 | 10,645 | 10,928 | 11,492 | 11,168 | 10,729 | 12,376 | 12,939 | 12,801 | 13,127 | 13,462 | 13,885 | 14,368 | 14,222 | 14,316 | 14,546 | 14,128 | 14,548 | 13,868 | 14,572 | 13,929 | 13,712 | 13,871 | 12,960 | 13,068 | 11,838 | 12,427 | 11,846 | 10,750 | 11,342 | 12,550 | 12,490 | 13,513 | 13,198 | 13,491 | 13,874 | 13,269 | 13,900 | 14,350 | 13,795 | 13,329 | 12,767 | 13,967 | 14,730 | 14,794 | 15,046 | 15,554 | 15,142 | 15,721 | 15,460 | 15,945 | 16,477 |
| Composite Index1 | 10,000 | 9,480 | 9,378 | 9,405 | 9,121 | 9,144 | 9,642 | 9,499 | 9,993 | 9,882 | 9,640 | 9,586 | 8,907 | 8,513 | 9,115 | 8,935 | 8,829 | 8,173 | 8,090 | 8,785 | 8,997 | 8,869 | 8,656 | 9,121 | 9,203 | 9,351 | 9,248 | 9,016 | 9,266 | 9,599 | 9,777 | 10,023 | 10,302 | 10,627 | 10,657 | 11,078 | 11,144 | 11,368 | 11,581 | 11,689 | 11,963 | 12,677 | 12,125 | 11,906 | 12,093 | 11,758 | 11,506 | 11,741 | 11,475 | 11,523 | 10,574 | 10,646 | 10,145 | 10,908 | 11,090 | 11,121 | 11,406 | 10,747 | 11,331 | 11,176 | 10,784 | 11,119 | 11,562 | 11,666 | 12,212 | 11,808 | 10,816 | 9,093 | 9,807 | 10,182 | 10,581 | 10,973 | 11,540 | 11,265 | 10,999 | 12,578 | 13,309 | 13,338 | 13,685 | 13,902 | 14,299 | 14,694 | 14,513 | 14,349 | 14,651 | 14,201 | 14,435 | 13,701 | 14,295 | 13,830 | 13,575 | 13,541 | 12,730 | 12,823 | 11,642 | 12,033 | 11,667 | 10,456 | 10,794 | 12,063 | 12,093 | 13,036 | 12,640 | 12,799 | 13,021 | 12,517 | 13,045 | 13,646 | 13,091 | 12,721 | 12,142 | 13,212 | 13,919 | 13,717 | 13,963 | 14,446 | 14,226 | 14,678 | 14,549 | 15,045 | 15,398 |
| Free Market International Equity Fund | PAGE 1 | TSR-AR-74925K821 |
ANNUAL AVERAGE TOTAL RETURN (%)
| | | |
| | 1 Year | 5 Year | 10 Year |
Free Market International Equity Fund | 17.86 | 9.20 | 4.50 |
MSCI WORLD ex USA Index (Net Dividends) | 19.45 | 8.72 | 5.12 |
Composite Index1 | 17.63 | 7.38 | 4.41 |
| 1 | The Composite Index is comprised comprised of the MSCI EAFE Index, MSCI EAFE Value Index, MSCI EAFE Small Company Index and MSCI Emerging Markets Free Index, each weighted 25%, respectively. |
Visit http://funddocs.filepoint.com/matsonmoney/ for more recent performance information.
| * | The Fund’s past performance is not a good predictor of how the Fund will perform in the future. The graph and table do not reflect the deduction of taxes that a shareholder would pay on Fund distributions or redemption of Fund shares. |
KEY FUND STATISTICS (as of August 31, 2024)
| |
Net Assets | $3,283,448,219 |
Number of Holdings | 11 |
Net Advisory Fee | $14,615,451 |
Portfolio Turnover | 13% |
WHAT DID THE FUND INVEST IN? (as of August 31, 2024)
| |
Top 10 Holdings | (% of Net Assets) |
DFA International Small Cap Value Portfolio | 40.2% |
DFA International Value Portfolio III | 15.2% |
DFA International Value Series | 14.9% |
Dimensional International Small Cap ETF | 8.6% |
iShares Core MSCI Emerging Markets ETF | 5.1% |
iShares Core MSCI EAFE ETF | 5.0% |
Emerging Markets Small Cap Portfolio | 4.8% |
Emerging Markets Value Portfolio | 4.8% |
Canadian Small Company Series | 1.3% |
Invesco Government & Agency Portfolio | 0.1% |
| |
Top Sectors | (% of Net Assets) |
Finance and Insurance | 83.8% |
Cash & Other | 16.2% |
For additional information about the Fund; including its prospectus, financial information, holdings and proxy information, scan the QR code or visit http://funddocs.filepoint.com/matsonmoney/
HOUSEHOLDING
To reduce Fund expenses, only one copy of most shareholder documents may be mailed to shareholders with multiple accounts at the same address (Householding). If you would prefer that your Fund documents not be householded, please contact the Fund at 1-866-780-0357 Ext. 3863, or contact your financial intermediary. Your instructions will typically be effective within 30 days of receipt by the Fund or your financial intermediary.
| Free Market International Equity Fund | PAGE 2 | TSR-AR-74925K821 |
100008875915311212113221000110031134851137813178155311000090769124106871117010846114921454611846137951647710000890792031114411475107841154014651116671309115398
| | |
| Free Market Fixed Income Fund | |
Class L | FMFIX |
Annual Shareholder Report | August 31, 2024 |
This annual shareholder report contains important information about the Free Market Fixed Income Fund (the “Fund”) for the period of September 1, 2023, to August 31, 2024. You can find additional information about the Fund at http://funddocs.filepoint.com/matsonmoney/. You can also request this information by contacting us at 1-866-780-0357 Ext. 3863.
WHAT WERE THE FUND COSTS FOR THE PAST YEAR? (based on a hypothetical $10,000 investment)
| | |
Class Name | Costs of a $10,000 investment | Costs paid as a percentage of a $10,000 investment |
| Class L | $57 | 0.55% |
HOW DID THE FUND PERFORM LAST YEAR AND WHAT AFFECTED ITS PERFORMANCE?
For the twelve months ended August 31, 2024 (the “period”) the Fund returned 6.30%. This compares with a return of 7.30% over the same period for the Fund’s benchmark, the Bloomberg U.S. Aggregate Bond Index.
The Fund focuses on assets that invest in high quality and shorter-term government and corporate fixed income assets, both in the U.S. as well as international.
HOW DID THE FUND PERFORM OVER THE PAST 10 YEARS?*
The $10,000 chart reflects a hypothetical $10,000 investment in the class of shares noted. The chart uses total return NAV performance and assumes reinvestment of dividends and capital gains. Fund expenses, including management fees and other expenses, were deducted.
CUMULATIVE PERFORMANCE (Initial Investment of $10,000)
| | 08/31/2014 | 09/30/2014 | 10/31/2014 | 11/30/2014 | 12/31/2014 | 01/31/2015 | 02/28/2015 | 03/31/2015 | 04/30/2015 | 05/31/2015 | 06/30/2015 | 07/31/2015 | 08/31/2015 | 09/30/2015 | 10/31/2015 | 11/30/2015 | 12/31/2015 | 01/31/2016 | 02/29/2016 | 03/31/2016 | 04/30/2016 | 05/31/2016 | 06/30/2016 | 07/31/2016 | 08/31/2016 | 09/30/2016 | 10/31/2016 | 11/30/2016 | 12/31/2016 | 01/31/2017 | 02/28/2017 | 03/31/2017 | 04/30/2017 | 05/31/2017 | 06/30/2017 | 07/31/2017 | 08/31/2017 | 09/30/2017 | 10/31/2017 | 11/30/2017 | 12/31/2017 | 01/31/2018 | 02/28/2018 | 03/31/2018 | 04/30/2018 | 05/31/2018 | 06/30/2018 | 07/31/2018 | 08/31/2018 | 09/30/2018 | 10/31/2018 | 11/30/2018 | 12/31/2018 | 01/31/2019 | 02/28/2019 | 03/31/2019 | 04/30/2019 | 05/31/2019 | 06/30/2019 | 07/31/2019 | 08/31/2019 | 09/30/2019 | 10/31/2019 | 11/30/2019 | 12/31/2019 | 01/31/2020 | 02/29/2020 | 03/31/2020 | 04/30/2020 | 05/31/2020 | 06/30/2020 | 07/31/2020 | 08/31/2020 | 09/30/2020 | 10/31/2020 | 11/30/2020 | 12/31/2020 | 01/31/2021 | 02/28/2021 | 03/31/2021 | 04/30/2021 | 05/31/2021 | 06/30/2021 | 07/31/2021 | 08/31/2021 | 09/30/2021 | 10/31/2021 | 11/30/2021 | 12/31/2021 | 01/31/2022 | 02/28/2022 | 03/31/2022 | 04/30/2022 | 05/31/2022 | 06/30/2022 | 07/31/2022 | 08/31/2022 | 09/30/2022 | 10/31/2022 | 11/30/2022 | 12/31/2022 | 01/31/2023 | 02/28/2023 | 03/31/2023 | 04/30/2023 | 05/31/2023 | 06/30/2023 | 07/31/2023 | 08/31/2023 | 09/30/2023 | 10/31/2023 | 11/30/2023 | 12/31/2023 | 01/31/2024 | 02/29/2024 | 03/31/2024 | 04/30/2024 | 05/31/2024 | 06/30/2024 | 07/31/2024 | 08/31/2024 |
| Free Market Fixed Income Fund Class L | 10,000 | 9,968 | 9,998 | 10,036 | 9,998 | 10,106 | 10,057 | 10,076 | 10,076 | 10,066 | 10,037 | 10,057 | 10,037 | 10,086 | 10,066 | 10,047 | 10,017 | 10,106 | 10,135 | 10,185 | 10,194 | 10,185 | 10,273 | 10,293 | 10,263 | 10,267 | 10,247 | 10,139 | 10,147 | 10,167 | 10,187 | 10,197 | 10,227 | 10,256 | 10,233 | 10,273 | 10,303 | 10,275 | 10,275 | 10,255 | 10,254 | 10,194 | 10,174 | 10,194 | 10,184 | 10,214 | 10,216 | 10,226 | 10,266 | 10,242 | 10,232 | 10,252 | 10,321 | 10,403 | 10,424 | 10,527 | 10,547 | 10,619 | 10,688 | 10,709 | 10,792 | 10,779 | 10,800 | 10,800 | 10,815 | 10,909 | 10,971 | 10,800 | 10,957 | 11,020 | 11,061 | 11,124 | 11,114 | 11,108 | 11,108 | 11,150 | 11,169 | 11,148 | 11,085 | 11,053 | 11,074 | 11,095 | 11,106 | 11,159 | 11,148 | 11,090 | 11,058 | 11,069 | 11,051 | 10,935 | 10,871 | 10,680 | 10,532 | 10,564 | 10,443 | 10,592 | 10,422 | 10,209 | 10,219 | 10,368 | 10,331 | 10,470 | 10,373 | 10,524 | 10,567 | 10,545 | 10,536 | 10,569 | 10,590 | 10,535 | 10,525 | 10,719 | 10,892 | 10,914 | 10,892 | 10,954 | 10,899 | 10,976 | 11,036 | 11,169 | 11,258 |
| Bloomberg U.S. Aggregate Bond Index1 | 10,000 | 9,932 | 10,030 | 10,101 | 10,110 | 10,322 | 10,225 | 10,273 | 10,236 | 10,211 | 10,100 | 10,170 | 10,156 | 10,224 | 10,226 | 10,199 | 10,166 | 10,306 | 10,379 | 10,474 | 10,514 | 10,517 | 10,706 | 10,774 | 10,761 | 10,755 | 10,673 | 10,420 | 10,435 | 10,456 | 10,526 | 10,520 | 10,601 | 10,683 | 10,672 | 10,718 | 10,814 | 10,763 | 10,769 | 10,755 | 10,805 | 10,680 | 10,579 | 10,647 | 10,568 | 10,643 | 10,630 | 10,633 | 10,701 | 10,632 | 10,548 | 10,611 | 10,806 | 10,921 | 10,914 | 11,124 | 11,127 | 11,324 | 11,466 | 11,492 | 11,789 | 11,727 | 11,762 | 11,756 | 11,748 | 11,974 | 12,189 | 12,118 | 12,333 | 12,391 | 12,469 | 12,655 | 12,553 | 12,546 | 12,490 | 12,612 | 12,630 | 12,539 | 12,358 | 12,204 | 12,300 | 12,340 | 12,427 | 12,566 | 12,542 | 12,433 | 12,430 | 12,467 | 12,435 | 12,167 | 12,031 | 11,697 | 11,253 | 11,326 | 11,148 | 11,420 | 11,098 | 10,618 | 10,481 | 10,866 | 10,817 | 11,150 | 10,862 | 11,138 | 11,205 | 11,083 | 11,044 | 11,036 | 10,965 | 10,687 | 10,518 | 10,994 | 11,415 | 11,384 | 11,223 | 11,327 | 11,041 | 11,228 | 11,334 | 11,599 | 11,765 |
| FTSE World Government Bond Index 1-5 Yr Currency-Hedged USD | 10,000 | 9,998 | 10,022 | 10,047 | 10,045 | 10,101 | 10,086 | 10,107 | 10,106 | 10,112 | 10,096 | 10,123 | 10,121 | 10,155 | 10,157 | 10,154 | 10,146 | 10,222 | 10,251 | 10,262 | 10,262 | 10,267 | 10,335 | 10,338 | 10,327 | 10,346 | 10,326 | 10,276 | 10,297 | 10,300 | 10,325 | 10,327 | 10,357 | 10,379 | 10,364 | 10,390 | 10,425 | 10,408 | 10,421 | 10,415 | 10,414 | 10,383 | 10,392 | 10,430 | 10,423 | 10,432 | 10,457 | 10,457 | 10,477 | 10,474 | 10,496 | 10,544 | 10,635 | 10,674 | 10,683 | 10,758 | 10,777 | 10,853 | 10,921 | 10,937 | 11,035 | 11,026 | 11,041 | 11,033 | 11,045 | 11,124 | 11,207 | 11,294 | 11,320 | 11,335 | 11,354 | 11,374 | 11,367 | 11,381 | 11,385 | 11,390 | 11,400 | 11,397 | 11,356 | 11,358 | 11,365 | 11,378 | 11,366 | 11,404 | 11,396 | 11,368 | 11,311 | 11,339 | 11,308 | 11,237 | 11,195 | 11,040 | 10,956 | 10,986 | 10,935 | 11,032 | 10,884 | 10,739 | 10,746 | 10,834 | 10,800 | 10,912 | 10,816 | 10,995 | 11,037 | 11,025 | 10,965 | 11,013 | 11,055 | 11,027 | 11,064 | 11,204 | 11,368 | 11,400 | 11,343 | 11,394 | 11,345 | 11,419 | 11,497 | 11,644 | 11,739 |
| Composite Index2 | 10,000 | 9,973 | 10,021 | 10,056 | 10,045 | 10,150 | 10,101 | 10,132 | 10,122 | 10,120 | 10,082 | 10,111 | 10,107 | 10,151 | 10,142 | 10,122 | 10,107 | 10,195 | 10,229 | 10,267 | 10,281 | 10,276 | 10,375 | 10,394 | 10,377 | 10,384 | 10,351 | 10,236 | 10,242 | 10,258 | 10,288 | 10,289 | 10,329 | 10,364 | 10,356 | 10,385 | 10,431 | 10,403 | 10,403 | 10,389 | 10,405 | 10,347 | 10,315 | 10,353 | 10,320 | 10,368 | 10,369 | 10,371 | 10,416 | 10,389 | 10,377 | 10,423 | 10,534 | 10,589 | 10,595 | 10,701 | 10,714 | 10,825 | 10,903 | 10,908 | 11,055 | 11,031 | 11,063 | 11,058 | 11,066 | 11,177 | 11,300 | 11,356 | 11,433 | 11,461 | 11,489 | 11,547 | 11,520 | 11,521 | 11,499 | 11,534 | 11,542 | 11,515 | 11,449 | 11,394 | 11,430 | 11,451 | 11,465 | 11,524 | 11,514 | 11,470 | 11,444 | 11,459 | 11,438 | 11,321 | 11,263 | 11,075 | 10,911 | 10,964 | 10,884 | 11,000 | 10,853 | 10,644 | 10,599 | 10,771 | 10,769 | 10,924 | 10,796 | 10,980 | 11,030 | 10,982 | 10,949 | 10,973 | 10,980 | 10,896 | 10,865 | 11,091 | 11,300 | 11,323 | 11,255 | 11,318 | 11,213 | 11,325 | 11,403 | 11,568 | 11,682 |
ANNUAL AVERAGE TOTAL RETURN (%)
| | | |
| | 1 Year | 5 Year | 10 Year |
Free Market Fixed Income Fund | 6.30 | 0.85 | 1.19 |
Bloomberg U.S. Aggregate Bond Index1 | 7.30 | -0.04 | 1.64 |
FTSE World Government Bond Index 1-5 Yr Currency-Hedged USD | 6.19 | 1.25 | 1.62 |
Composite Index2 | 6.39 | 1.11 | 1.57 |
| 1 | Effective with this report, and pursuant to new regulatory requirements, the Bloomberg U.S. Aggregate Bond Index replaced the FTSE World Government Bond Index 1-5 Years as the Fund’s primary benchmark to represent a broad-based securities market index. |
| 2 | The Composite Index is comprised of the Three-Month Treasury Bill Index, Bloomberg Barclays Intermediate Government/Credit Bond Index, ICE BofA Merrill Lynch 1-3 Year US Government/Corporate Index and Bloomberg Barclays U.S. Capital Aggregate Bond Index, each weighted 25%, respectively. |
| Free Market Fixed Income Fund | PAGE 1 | TSR-AR-74925K813 |
Visit http://funddocs.filepoint.com/matsonmoney/ for more recent performance information.
| * | The Fund’s past performance is not a good predictor of how the Fund will perform in the future. The graph and table do not reflect the deduction of taxes that a shareholder would pay on Fund distributions or redemption of Fund shares. |
KEY FUND STATISTICS (as of August 31, 2024)
| |
Net Assets | $2,890,938,074 |
Number of Holdings | 10 |
Net Advisory Fee | $13,737,559 |
Portfolio Turnover | 8% |
WHAT DID THE FUND INVEST IN? (as of August 31, 2024)
| |
Top 10 Holdings | (% of Net Assets) |
DFA Two-Year Global Fixed Income Portfolio | 25.0% |
iShares 1-5 Year Investment Grade Corporate Bond ETF | 24.0% |
iShares Core International Aggregate Bond ETF | 15.1% |
DFA One-Year Fixed Income Portfolio | 14.4% |
iShares 5-10 Year Investment Grade Corporate Bond ETF | 6.1% |
iShares 3-7 Year Treasury Bond ETF | 6.0% |
Dimensional Inflation-Protected Securities ETF | 5.0% |
iShares 1-3 Year Treasury Bond ETF | 4.0% |
Invesco Government & Agency Portfolio | 0.5% |
| |
Top Sectors | (% of Net Assets) |
Finance and Insurance | 99.5% |
Cash & Other | 0.5% |
For additional information about the Fund; including its prospectus, financial information, holdings and proxy information, scan the QR code or visit http://funddocs.filepoint.com/matsonmoney/
HOUSEHOLDING
To reduce Fund expenses, only one copy of most shareholder documents may be mailed to shareholders with multiple accounts at the same address (Householding). If you would prefer that your Fund documents not be householded, please contact the Fund at 1-866-780-0357 Ext. 3863, or contact your financial intermediary. Your instructions will typically be effective within 30 days of receipt by the Fund or your financial intermediary.
| Free Market Fixed Income Fund | PAGE 2 | TSR-AR-74925K813 |
1000010037102631030310266107921111411148104221059011258100001015610761108141070111789125531254211098109651176510000101211032710425104771103511367113961088411055117391000010107103771043110416110551152011514108531098011682
| | |
| Matson Money U.S. Equity VI Portfolio | |
Class L | FMVUX |
Annual Shareholder Report | August 31, 2024 |
This annual shareholder report contains important information about the Matson Money U.S. Equity VI Portfolio (the “Fund”) for the period of September 1, 2023, to August 31, 2024. You can find additional information about the Fund at http://funddocs.filepoint.com/matsonmoney/. You can also request this information by contacting us at 1-866-780-0357 Ext. 3863.
WHAT WERE THE FUND COSTS FOR THE PAST YEAR? (based on a hypothetical $10,000 investment)
| | |
Class Name | Costs of a $10,000 investment | Costs paid as a percentage of a $10,000 investment |
| Class L | $84 | 0.76% |
HOW DID THE FUND PERFORM LAST YEAR AND WHAT AFFECTED ITS PERFORMANCE?
For the twelve months ended August 31, 2024 (the “period”) the Fund provided a total return of 19.90% at net asset value. This compares with a return of 26.14% over the same period for the Fund’s benchmark, the Russell 3000® Index.
As a result of the Funds’s diversified investment approach, performance principally was determined by broad structural trends in equity markets rather than the behavior of a limited number of stocks. Among the most important factors explaining differences in the performance of diversified equity funds, like the Fund, are the size and value/growth characteristics of the underlying fund holdings. Size is measured by market capitalization and “value” classification is a function of stock price relative to one or more fundamental characteristics.
U.S. large cap stocks performed better than U.S. small cap stocks during the period. The S&P 500® Index returned 27.14%, the Russell 2500® Index returned 17.37%, and the Russell 2000® Index returned 18.47%. Furthermore, for the same time period, the Russell 1000® Value Index returned 21.15% while the Russell 2000® Value returned 19.25% for the twelve months ended August 31, 2024.
HOW DID THE FUND PERFORM OVER THE PAST 10 YEARS?*
The $10,000 chart reflects a hypothetical $10,000 investment in the class of shares noted. The chart uses total return NAV performance and assumes reinvestment of dividends and capital gains. Fund expenses, including management fees and other expenses, were deducted.
CUMULATIVE PERFORMANCE (Initial Investment of $10,000)
| | 08/31/2014 | 09/30/2014 | 10/31/2014 | 11/30/2014 | 12/31/2014 | 01/31/2015 | 02/28/2015 | 03/31/2015 | 04/30/2015 | 05/31/2015 | 06/30/2015 | 07/31/2015 | 08/31/2015 | 09/30/2015 | 10/31/2015 | 11/30/2015 | 12/31/2015 | 01/31/2016 | 02/29/2016 | 03/31/2016 | 04/30/2016 | 05/31/2016 | 06/30/2016 | 07/31/2016 | 08/31/2016 | 09/30/2016 | 10/31/2016 | 11/30/2016 | 12/31/2016 | 01/31/2017 | 02/28/2017 | 03/31/2017 | 04/30/2017 | 05/31/2017 | 06/30/2017 | 07/31/2017 | 08/31/2017 | 09/30/2017 | 10/31/2017 | 11/30/2017 | 12/31/2017 | 01/31/2018 | 02/28/2018 | 03/31/2018 | 04/30/2018 | 05/31/2018 | 06/30/2018 | 07/31/2018 | 08/31/2018 | 09/30/2018 | 10/31/2018 | 11/30/2018 | 12/31/2018 | 01/31/2019 | 02/28/2019 | 03/31/2019 | 04/30/2019 | 05/31/2019 | 06/30/2019 | 07/31/2019 | 08/31/2019 | 09/30/2019 | 10/31/2019 | 11/30/2019 | 12/31/2019 | 01/31/2020 | 02/29/2020 | 03/31/2020 | 04/30/2020 | 05/31/2020 | 06/30/2020 | 07/31/2020 | 08/31/2020 | 09/30/2020 | 10/31/2020 | 11/30/2020 | 12/31/2020 | 01/31/2021 | 02/28/2021 | 03/31/2021 | 04/30/2021 | 05/31/2021 | 06/30/2021 | 07/31/2021 | 08/31/2021 | 09/30/2021 | 10/31/2021 | 11/30/2021 | 12/31/2021 | 01/31/2022 | 02/28/2022 | 03/31/2022 | 04/30/2022 | 05/31/2022 | 06/30/2022 | 07/31/2022 | 08/31/2022 | 09/30/2022 | 10/31/2022 | 11/30/2022 | 12/31/2022 | 01/31/2023 | 02/28/2023 | 03/31/2023 | 04/30/2023 | 05/31/2023 | 06/30/2023 | 07/31/2023 | 08/31/2023 | 09/30/2023 | 10/31/2023 | 11/30/2023 | 12/31/2023 | 01/31/2024 | 02/29/2024 | 03/31/2024 | 04/30/2024 | 05/31/2024 | 06/30/2024 | 07/31/2024 | 08/31/2024 |
| Matson Money U.S. Equity VI Portfolio Class L | 10,000 | 9,567 | 9,866 | 9,910 | 10,028 | 9,578 | 10,189 | 10,204 | 10,178 | 10,298 | 10,249 | 10,125 | 9,608 | 9,241 | 9,867 | 10,024 | 9,597 | 8,966 | 9,024 | 9,687 | 9,839 | 9,936 | 9,889 | 10,314 | 10,443 | 10,497 | 10,221 | 11,257 | 11,572 | 11,617 | 11,828 | 11,755 | 11,828 | 11,642 | 11,902 | 12,040 | 11,845 | 12,515 | 12,657 | 13,035 | 13,114 | 13,551 | 12,935 | 12,866 | 12,939 | 13,397 | 13,422 | 13,799 | 14,162 | 13,961 | 12,785 | 12,969 | 11,501 | 12,630 | 13,077 | 12,842 | 13,331 | 12,160 | 13,073 | 13,179 | 12,478 | 12,985 | 13,238 | 13,681 | 14,111 | 13,493 | 12,120 | 9,524 | 10,858 | 11,302 | 11,472 | 11,876 | 12,475 | 12,003 | 12,149 | 14,048 | 14,901 | 15,267 | 16,581 | 17,495 | 18,048 | 18,571 | 18,373 | 18,215 | 18,626 | 18,160 | 18,987 | 18,586 | 19,560 | 18,764 | 18,835 | 19,080 | 17,793 | 18,273 | 16,523 | 17,935 | 17,390 | 15,820 | 17,739 | 18,622 | 17,649 | 18,989 | 18,620 | 18,013 | 17,874 | 17,376 | 18,795 | 19,748 | 19,153 | 18,341 | 17,516 | 18,923 | 20,544 | 20,256 | 21,022 | 22,010 | 20,858 | 21,768 | 21,519 | 23,031 | 22,965 |
| Russell 3000 Total Return1 | 10,000 | 9,792 | 10,061 | 10,305 | 10,305 | 10,018 | 10,598 | 10,490 | 10,538 | 10,683 | 10,505 | 10,680 | 10,036 | 9,743 | 10,513 | 10,571 | 10,354 | 9,770 | 9,767 | 10,454 | 10,519 | 10,707 | 10,729 | 11,155 | 11,184 | 11,201 | 10,959 | 11,449 | 11,673 | 11,892 | 12,335 | 12,343 | 12,474 | 12,601 | 12,715 | 12,955 | 12,980 | 13,296 | 13,587 | 13,999 | 14,139 | 14,884 | 14,336 | 14,048 | 14,101 | 14,499 | 14,594 | 15,079 | 15,608 | 15,634 | 14,483 | 14,773 | 13,398 | 14,548 | 15,060 | 15,279 | 15,890 | 14,861 | 15,905 | 16,142 | 15,813 | 16,090 | 16,436 | 17,061 | 17,554 | 17,535 | 16,099 | 13,885 | 15,724 | 16,565 | 16,944 | 17,906 | 19,203 | 18,504 | 18,104 | 20,307 | 21,220 | 21,126 | 21,786 | 22,567 | 23,731 | 23,839 | 24,427 | 24,840 | 25,548 | 24,402 | 26,052 | 25,656 | 26,666 | 25,097 | 24,465 | 25,258 | 22,992 | 22,961 | 21,040 | 23,014 | 22,155 | 20,101 | 21,749 | 22,884 | 21,544 | 23,028 | 22,490 | 23,091 | 23,337 | 23,428 | 25,028 | 25,925 | 25,424 | 24,213 | 23,571 | 25,769 | 27,136 | 27,437 | 28,922 | 29,855 | 28,542 | 29,890 | 30,815 | 31,388 | 32,071 |
| Russell 2500 Total Return | 10,000 | 9,486 | 9,906 | 9,992 | 10,128 | 9,921 | 10,512 | 10,652 | 10,465 | 10,690 | 10,615 | 10,596 | 9,968 | 9,522 | 10,055 | 10,252 | 9,835 | 9,050 | 9,114 | 9,873 | 10,019 | 10,230 | 10,226 | 10,759 | 10,845 | 10,897 | 10,455 | 11,344 | 11,564 | 11,725 | 12,007 | 11,999 | 12,091 | 11,956 | 12,255 | 12,382 | 12,279 | 12,836 | 13,035 | 13,463 | 13,508 | 13,920 | 13,348 | 13,476 | 13,508 | 14,143 | 14,245 | 14,521 | 15,144 | 14,914 | 13,400 | 13,653 | 12,157 | 13,557 | 14,197 | 14,080 | 14,574 | 13,537 | 14,497 | 14,648 | 14,062 | 14,311 | 14,585 | 15,211 | 15,533 | 15,217 | 13,941 | 10,916 | 12,505 | 13,428 | 13,816 | 14,367 | 15,017 | 14,629 | 14,894 | 17,320 | 18,638 | 19,095 | 20,341 | 20,675 | 21,501 | 21,546 | 21,801 | 21,419 | 21,905 | 21,216 | 22,256 | 21,328 | 22,027 | 20,194 | 20,421 | 20,746 | 18,978 | 19,042 | 17,223 | 19,005 | 18,500 | 16,738 | 18,344 | 19,118 | 17,981 | 19,779 | 19,315 | 18,591 | 18,348 | 18,026 | 19,562 | 20,535 | 19,728 | 18,626 | 17,495 | 19,070 | 21,114 | 20,562 | 21,680 | 22,575 | 21,063 | 21,939 | 21,610 | 23,215 | 23,156 |
| Composite Index2 | 10,000 | 9,593 | 10,032 | 10,141 | 10,292 | 9,922 | 10,447 | 10,459 | 10,386 | 10,532 | 10,451 | 10,415 | 9,812 | 9,472 | 10,116 | 10,287 | 9,927 | 9,290 | 9,302 | 10,006 | 10,161 | 10,349 | 10,385 | 10,851 | 10,991 | 11,038 | 10,723 | 11,630 | 11,962 | 12,030 | 12,360 | 12,310 | 12,381 | 12,262 | 12,545 | 12,694 | 12,549 | 13,124 | 13,257 | 13,651 | 13,693 | 14,153 | 13,539 | 13,479 | 13,591 | 14,097 | 14,174 | 14,570 | 14,987 | 14,832 | 13,652 | 13,933 | 12,449 | 13,631 | 14,159 | 14,074 | 14,594 | 13,546 | 14,483 | 14,592 | 14,043 | 14,487 | 14,799 | 15,287 | 15,751 | 15,326 | 13,945 | 11,301 | 12,717 | 13,276 | 13,533 | 14,021 | 14,805 | 14,277 | 14,338 | 16,565 | 17,569 | 17,937 | 19,032 | 19,817 | 20,484 | 20,809 | 20,940 | 20,730 | 21,245 | 20,550 | 21,585 | 20,949 | 21,844 | 20,590 | 20,517 | 21,016 | 19,333 | 19,536 | 17,822 | 19,425 | 18,829 | 17,052 | 18,840 | 19,652 | 18,529 | 19,954 | 19,457 | 19,032 | 18,974 | 18,674 | 20,043 | 21,065 | 20,322 | 19,320 | 18,431 | 20,031 | 21,771 | 21,409 | 22,370 | 23,275 | 22,009 | 22,989 | 22,991 | 24,640 | 24,747 |
| Matson Money U.S. Equity VI Portfolio | PAGE 1 | TSR-AR-74925K441 |
ANNUAL AVERAGE TOTAL RETURN (%)
| | | |
| | 1 Year | 5 Year | 10 Year |
Matson Money U.S. Equity VI Portfolio | 19.90 | 12.98 | 8.67 |
Russell 3000 Total Return1 | 26.14 | 15.19 | 12.36 |
Russell 2500 Total Return | 17.37 | 10.49 | 8.76 |
Composite Index2 | 21.77 | 12.00 | 9.48 |
| 1 | Effective with this report, and pursuant to new regulatory requirements, the Russell 3000 Total Return Index replaced the Russell 2500 Total Return Index as the Fund’s primary benchmark to represent a broad-based securities market index. |
| 2 | The Composite Index is comprised of the S&P 500® Index, Russell 1000® Value Index, Russell 2000® Index and Russell 2000® Value Index, each weighted 25%, respectively. |
Visit http://funddocs.filepoint.com/matsonmoney/ for more recent performance information.
| * | The Fund’s past performance is not a good predictor of how the Fund will perform in the future. The graph and table do not reflect the deduction of taxes that a shareholder would pay on Fund distributions or redemption of Fund shares. |
KEY FUND STATISTICS (as of August 31, 2024)
| |
Net Assets | $28,304,674 |
Number of Holdings | 8 |
Net Advisory Fee | $138,890 |
Portfolio Turnover | 8% |
WHAT DID THE FUND INVEST IN? (as of August 31, 2024)
| |
Top 10 Holdings | (% of Net Assets) |
U.S. Large Cap Value Portfolio III | 26.1% |
U.S. Small Cap Portfolio | 15.1% |
U.S. Micro Cap Portfolio | 15.1% |
VA U.S. Targeted Value Portfolio | 15.1% |
U.S. Large Company Portfolio | 13.7% |
U.S. Small Cap Value Portfolio | 10.1% |
VA U.S. Large Value Portfolio | 4.0% |
STIT-Government & Agency Portfolio | 0.9% |
| |
Top Sectors | (% of Net Assets) |
Finance and Insurance | 99.2% |
Cash & Other | 0.8% |
For additional information about the Fund; including its prospectus, financial information, holdings and proxy information, scan the QR code or visit http://funddocs.filepoint.com/matsonmoney/
HOUSEHOLDING
To reduce Fund expenses, only one copy of most shareholder documents may be mailed to shareholders with multiple accounts at the same address (Householding). If you would prefer that your Fund documents not be householded, please contact the Fund at 1-866-780-0357 Ext. 3863, or contact your financial intermediary. Your instructions will typically be effective within 30 days of receipt by the Fund or your financial intermediary.
| Matson Money U.S. Equity VI Portfolio | PAGE 2 | TSR-AR-74925K441 |
1000096081044311845141621247812475186261739019153229651000010036111841298015608158131920325548221552542432071100009968108451227915144140621501721905185001972823156100009812109911254914987140431480521245188292032224747
| | |
| Matson Money International Equity VI Portfolio | |
Class L | FMVIX |
Annual Shareholder Report | August 31, 2024 |
This annual shareholder report contains important information about the Matson Money International Equity VI Portfolio (the “Fund”) for the period of September 1, 2023, to August 31, 2024. You can find additional information about the Fund at http://funddocs.filepoint.com/matsonmoney/. You can also request this information by contacting us at 1-866-780-0357 Ext. 3863.
WHAT WERE THE FUND COSTS FOR THE PAST YEAR? (based on a hypothetical $10,000 investment)
| | |
Class Name | Costs of a $10,000 investment | Costs paid as a percentage of a $10,000 investment |
| Class L | $90 | 0.83% |
HOW DID THE FUND PERFORM LAST YEAR AND WHAT AFFECTED ITS PERFORMANCE?
For the twelve months ended August 31, 2024 (the “period”) the Fund provided a total return of 17.23% at net asset value. This compares with a return of 19.45% over the same period for the Fund’s benchmark, the MSCI World (ex USA) Index, which captures large and mid-cap representation across 22 of 23 Developed Markets (DM) countries excluding the U.S.
As a result of the Fund’s diversified investment approach, performance principally was determined by broad structural trends in global equity markets rather than the behavior of a limited number of stocks. Among the most important factors explaining differences in the behavior of diversified international equity funds, like the Fund, are company size and company value/growth characteristics of the underlying fund holdings and broad exposure to emerging market equities.
International value stocks fared better than international growth stocks during the fiscal year. The MSCI EAFE Value Index increased by 20.38%, while the MSCI EAFE Small Cap Value Index returned 16.86% and the MSCI Emerging Markets Index returned 15.07%. Furthermore, the MSCI EAFE Small Cap Index returned 15.08% for the twelve months ended August 31, 2024, while the MSCI EAFE Index returned 19.40% for the same period.
HOW DID THE FUND PERFORM OVER THE PAST 10 YEARS?*
The $10,000 chart reflects a hypothetical $10,000 investment in the class of shares noted. The chart uses total return NAV performance and assumes reinvestment of dividends and capital gains. Fund expenses, including management fees and other expenses, were deducted.
CUMULATIVE PERFORMANCE (Initial Investment of $10,000)
| | 08/31/2014 | 09/30/2014 | 10/31/2014 | 11/30/2014 | 12/31/2014 | 01/31/2015 | 02/28/2015 | 03/31/2015 | 04/30/2015 | 05/31/2015 | 06/30/2015 | 07/31/2015 | 08/31/2015 | 09/30/2015 | 10/31/2015 | 11/30/2015 | 12/31/2015 | 01/31/2016 | 02/29/2016 | 03/31/2016 | 04/30/2016 | 05/31/2016 | 06/30/2016 | 07/31/2016 | 08/31/2016 | 09/30/2016 | 10/31/2016 | 11/30/2016 | 12/31/2016 | 01/31/2017 | 02/28/2017 | 03/31/2017 | 04/30/2017 | 05/31/2017 | 06/30/2017 | 07/31/2017 | 08/31/2017 | 09/30/2017 | 10/31/2017 | 11/30/2017 | 12/31/2017 | 01/31/2018 | 02/28/2018 | 03/31/2018 | 04/30/2018 | 05/31/2018 | 06/30/2018 | 07/31/2018 | 08/31/2018 | 09/30/2018 | 10/31/2018 | 11/30/2018 | 12/31/2018 | 01/31/2019 | 02/28/2019 | 03/31/2019 | 04/30/2019 | 05/31/2019 | 06/30/2019 | 07/31/2019 | 08/31/2019 | 09/30/2019 | 10/31/2019 | 11/30/2019 | 12/31/2019 | 01/31/2020 | 02/29/2020 | 03/31/2020 | 04/30/2020 | 05/31/2020 | 06/30/2020 | 07/31/2020 | 08/31/2020 | 09/30/2020 | 10/31/2020 | 11/30/2020 | 12/31/2020 | 01/31/2021 | 02/28/2021 | 03/31/2021 | 04/30/2021 | 05/31/2021 | 06/30/2021 | 07/31/2021 | 08/31/2021 | 09/30/2021 | 10/31/2021 | 11/30/2021 | 12/31/2021 | 01/31/2022 | 02/28/2022 | 03/31/2022 | 04/30/2022 | 05/31/2022 | 06/30/2022 | 07/31/2022 | 08/31/2022 | 09/30/2022 | 10/31/2022 | 11/30/2022 | 12/31/2022 | 01/31/2023 | 02/28/2023 | 03/31/2023 | 04/30/2023 | 05/31/2023 | 06/30/2023 | 07/31/2023 | 08/31/2023 | 09/30/2023 | 10/31/2023 | 11/30/2023 | 12/31/2023 | 01/31/2024 | 02/29/2024 | 03/31/2024 | 04/30/2024 | 05/31/2024 | 06/30/2024 | 07/31/2024 | 08/31/2024 |
| Matson Money International Equity VI Portfolio Class L | 10,000 | 9,450 | 9,292 | 9,233 | 8,977 | 8,930 | 9,491 | 9,302 | 9,816 | 9,820 | 9,593 | 9,412 | 8,820 | 8,404 | 8,910 | 8,796 | 8,641 | 8,035 | 7,895 | 8,565 | 8,857 | 8,709 | 8,452 | 8,929 | 9,038 | 9,206 | 9,178 | 9,070 | 9,306 | 9,712 | 9,803 | 10,023 | 10,226 | 10,420 | 10,536 | 10,967 | 11,017 | 11,290 | 11,460 | 11,526 | 11,836 | 12,471 | 11,836 | 11,695 | 11,874 | 11,534 | 11,214 | 11,465 | 11,142 | 11,189 | 10,175 | 10,137 | 9,550 | 10,271 | 10,443 | 10,351 | 10,651 | 9,913 | 10,452 | 10,191 | 9,847 | 10,209 | 10,594 | 10,722 | 11,208 | 10,626 | 9,739 | 7,706 | 8,422 | 8,810 | 9,106 | 9,309 | 9,864 | 9,600 | 9,337 | 10,806 | 11,496 | 11,406 | 12,034 | 12,458 | 12,798 | 13,308 | 13,058 | 13,015 | 13,213 | 12,930 | 13,256 | 12,496 | 13,140 | 13,085 | 12,880 | 12,834 | 12,137 | 12,423 | 11,184 | 11,581 | 11,144 | 10,031 | 10,532 | 11,816 | 11,736 | 12,699 | 12,383 | 12,420 | 12,710 | 12,109 | 12,689 | 13,305 | 12,860 | 12,554 | 12,052 | 12,917 | 13,575 | 13,318 | 13,612 | 14,221 | 14,029 | 14,717 | 14,301 | 14,856 | 15,075 |
| MSCI WORLD ex USA Index (Net Dividends) | 10,000 | 9,590 | 9,437 | 9,553 | 9,235 | 9,203 | 9,753 | 9,590 | 10,005 | 9,918 | 9,636 | 9,789 | 9,076 | 8,618 | 9,266 | 9,118 | 8,955 | 8,338 | 8,222 | 8,780 | 9,063 | 8,960 | 8,688 | 9,115 | 9,124 | 9,235 | 9,055 | 8,910 | 9,201 | 9,475 | 9,584 | 9,827 | 10,036 | 10,371 | 10,381 | 10,690 | 10,687 | 10,964 | 11,114 | 11,227 | 11,428 | 11,961 | 11,393 | 11,195 | 11,452 | 11,235 | 11,112 | 11,385 | 11,170 | 11,257 | 10,363 | 10,353 | 9,818 | 10,519 | 10,789 | 10,844 | 11,151 | 10,624 | 11,255 | 11,119 | 10,846 | 11,150 | 11,511 | 11,655 | 12,026 | 11,793 | 10,747 | 9,229 | 9,872 | 10,292 | 10,645 | 10,928 | 11,492 | 11,168 | 10,729 | 12,376 | 12,939 | 12,801 | 13,127 | 13,462 | 13,885 | 14,368 | 14,222 | 14,316 | 14,546 | 14,128 | 14,548 | 13,868 | 14,572 | 13,929 | 13,712 | 13,871 | 12,960 | 13,068 | 11,838 | 12,427 | 11,846 | 10,750 | 11,342 | 12,550 | 12,490 | 13,513 | 13,198 | 13,491 | 13,874 | 13,269 | 13,900 | 14,350 | 13,795 | 13,329 | 12,767 | 13,967 | 14,730 | 14,794 | 15,046 | 15,554 | 15,142 | 15,721 | 15,460 | 15,945 | 16,477 |
| Composite Index1 | 10,000 | 9,480 | 9,378 | 9,405 | 9,121 | 9,144 | 9,642 | 9,499 | 9,993 | 9,882 | 9,640 | 9,586 | 8,907 | 8,513 | 9,115 | 8,935 | 8,829 | 8,173 | 8,090 | 8,785 | 8,997 | 8,869 | 8,656 | 9,121 | 9,203 | 9,351 | 9,248 | 9,016 | 9,266 | 9,599 | 9,777 | 10,023 | 10,302 | 10,627 | 10,657 | 11,078 | 11,144 | 11,368 | 11,581 | 11,689 | 11,963 | 12,677 | 12,125 | 11,906 | 12,093 | 11,758 | 11,506 | 11,741 | 11,475 | 11,523 | 10,574 | 10,646 | 10,145 | 10,908 | 11,090 | 11,121 | 11,406 | 10,747 | 11,331 | 11,176 | 10,784 | 11,119 | 11,562 | 11,666 | 12,212 | 11,808 | 10,816 | 9,093 | 9,807 | 10,182 | 10,581 | 10,973 | 11,540 | 11,265 | 10,999 | 12,578 | 13,309 | 13,338 | 13,685 | 13,902 | 14,299 | 14,694 | 14,513 | 14,349 | 14,651 | 14,201 | 14,435 | 13,701 | 14,295 | 13,830 | 13,575 | 13,541 | 12,730 | 12,823 | 11,642 | 12,033 | 11,667 | 10,456 | 10,794 | 12,063 | 12,093 | 13,036 | 12,640 | 12,799 | 13,021 | 12,517 | 13,045 | 13,646 | 13,091 | 12,721 | 12,142 | 13,212 | 13,919 | 13,717 | 13,963 | 14,446 | 14,226 | 14,678 | 14,549 | 15,045 | 15,398 |
| Matson Money International Equity VI Portfolio | PAGE 1 | TSR-AR-74925K433 |
ANNUAL AVERAGE TOTAL RETURN (%)
| | | |
| | 1 Year | 5 Year | 10 Year |
Matson Money International Equity VI Portfolio | 17.23 | 8.89 | 4.19 |
MSCI WORLD ex USA Index (Net Dividends) | 19.45 | 8.72 | 5.12 |
Composite Index1 | 17.63 | 7.38 | 4.41 |
| 1 | Composite Index is comprised of the MSCI EAFE Index, MSCI EAFE Value Index, MSCI EAFE Small Company Index and MSCI Emerging Markets Free Index, each weighted 25%, respectively. |
Visit http://funddocs.filepoint.com/matsonmoney/ for more recent performance information.
| * | The Fund’s past performance is not a good predictor of how the Fund will perform in the future. The graph and table do not reflect the deduction of taxes that a shareholder would pay on Fund distributions or redemption of Fund shares. |
KEY FUND STATISTICS (as of August 31, 2024)
| |
Net Assets | $20,957,033 |
Number of Holdings | 10 |
Net Advisory Fee | $103,360 |
Portfolio Turnover | 6% |
WHAT DID THE FUND INVEST IN? (as of August 31, 2024)
| |
Top 10 Holdings | (% of Net Assets) |
DFA International Value Portfolio III | 30.2% |
DFA International Small Cap Value Portfolio | 28.1% |
VA International Small Portfolio | 17.1% |
iShares Core MSCI Emerging Markets ETF | 5.2% |
VA International Value Portfolio | 5.0% |
Emerging Markets Value Portfolio | 4.8% |
Emerging Markets Small Cap Portfolio | 4.8% |
iShares Core MSCI EAFE ETF | 4.0% |
STIT-Government & Agency Portfolio | 0.9% |
| |
Top Sectors | (% of Net Assets) |
Finance and Insurance | 99.4% |
Cash & Other | 0.6% |
For additional information about the Fund; including its prospectus, financial information, holdings and proxy information, scan the QR code or visit http://funddocs.filepoint.com/matsonmoney/
HOUSEHOLDING
To reduce Fund expenses, only one copy of most shareholder documents may be mailed to shareholders with multiple accounts at the same address (Householding). If you would prefer that your Fund documents not be householded, please contact the Fund at 1-866-780-0357 Ext. 3863, or contact your financial intermediary. Your instructions will typically be effective within 30 days of receipt by the Fund or your financial intermediary.
| Matson Money International Equity VI Portfolio | PAGE 2 | TSR-AR-74925K433 |
1000088209038110171114298479864132131114412860150751000090769124106871117010846114921454611846137951647710000890792031114411475107841154014651116671309115398
| | |
| Matson Money Fixed Income VI Portfolio | |
Class L | FMVFX |
Annual Shareholder Report | August 31, 2024 |
This annual shareholder report contains important information about the Matson Money Fixed Income VI Portfolio (the “Fund”) for the period of September 1, 2023, to August 31, 2024. You can find additional information about the Fund at http://funddocs.filepoint.com/matsonmoney/. You can also request this information by contacting us at 1-866-780-0357 Ext. 3863.
WHAT WERE THE FUND COSTS FOR THE PAST YEAR? (based on a hypothetical $10,000 investment)
| | |
Class Name | Costs of a $10,000 investment | Costs paid as a percentage of a $10,000 investment |
| Class L | $78 | 0.76% |
HOW DID THE FUND PERFORM LAST YEAR AND WHAT AFFECTED ITS PERFORMANCE?
For the twelve months ended August 31, 2024 (the “period”) the Fund returned 6.12%. This compares with a return of 7.30% over the same period for the Fund’s benchmark, the Bloomberg U.S. Aggregate Bond Index.
The Fund focuses on assets that invest in high quality and shorter-term government and corporate fixed income assets, both in the U.S. as well as international.
HOW DID THE FUND PERFORM OVER THE PAST 10 YEARS?*
The $10,000 chart reflects a hypothetical $10,000 investment in the class of shares noted. The chart uses total return NAV performance and assumes reinvestment of dividends and capital gains. Fund expenses, including management fees and other expenses, were deducted.
CUMULATIVE PERFORMANCE (Initial Investment of $10,000)
| | 08/31/2014 | 09/30/2014 | 10/31/2014 | 11/30/2014 | 12/31/2014 | 01/31/2015 | 02/28/2015 | 03/31/2015 | 04/30/2015 | 05/31/2015 | 06/30/2015 | 07/31/2015 | 08/31/2015 | 09/30/2015 | 10/31/2015 | 11/30/2015 | 12/31/2015 | 01/31/2016 | 02/29/2016 | 03/31/2016 | 04/30/2016 | 05/31/2016 | 06/30/2016 | 07/31/2016 | 08/31/2016 | 09/30/2016 | 10/31/2016 | 11/30/2016 | 12/31/2016 | 01/31/2017 | 02/28/2017 | 03/31/2017 | 04/30/2017 | 05/31/2017 | 06/30/2017 | 07/31/2017 | 08/31/2017 | 09/30/2017 | 10/31/2017 | 11/30/2017 | 12/31/2017 | 01/31/2018 | 02/28/2018 | 03/31/2018 | 04/30/2018 | 05/31/2018 | 06/30/2018 | 07/31/2018 | 08/31/2018 | 09/30/2018 | 10/31/2018 | 11/30/2018 | 12/31/2018 | 01/31/2019 | 02/28/2019 | 03/31/2019 | 04/30/2019 | 05/31/2019 | 06/30/2019 | 07/31/2019 | 08/31/2019 | 09/30/2019 | 10/31/2019 | 11/30/2019 | 12/31/2019 | 01/31/2020 | 02/29/2020 | 03/31/2020 | 04/30/2020 | 05/31/2020 | 06/30/2020 | 07/31/2020 | 08/31/2020 | 09/30/2020 | 10/31/2020 | 11/30/2020 | 12/31/2020 | 01/31/2021 | 02/28/2021 | 03/31/2021 | 04/30/2021 | 05/31/2021 | 06/30/2021 | 07/31/2021 | 08/31/2021 | 09/30/2021 | 10/31/2021 | 11/30/2021 | 12/31/2021 | 01/31/2022 | 02/28/2022 | 03/31/2022 | 04/30/2022 | 05/31/2022 | 06/30/2022 | 07/31/2022 | 08/31/2022 | 09/30/2022 | 10/31/2022 | 11/30/2022 | 12/31/2022 | 01/31/2023 | 02/28/2023 | 03/31/2023 | 04/30/2023 | 05/31/2023 | 06/30/2023 | 07/31/2023 | 08/31/2023 | 09/30/2023 | 10/31/2023 | 11/30/2023 | 12/31/2023 | 01/31/2024 | 02/29/2024 | 03/31/2024 | 04/30/2024 | 05/31/2024 | 06/30/2024 | 07/31/2024 | 08/31/2024 |
| Matson Money Fixed Income VI Portfolio Class L | 10,000 | 9,964 | 9,996 | 10,028 | 9,986 | 10,091 | 10,031 | 10,047 | 10,043 | 10,035 | 9,999 | 10,015 | 9,995 | 10,035 | 10,019 | 9,991 | 9,960 | 10,044 | 10,064 | 10,100 | 10,100 | 10,080 | 10,168 | 10,184 | 10,160 | 10,168 | 10,140 | 10,032 | 10,033 | 10,054 | 10,078 | 10,082 | 10,115 | 10,135 | 10,119 | 10,147 | 10,179 | 10,147 | 10,147 | 10,123 | 10,120 | 10,067 | 10,038 | 10,059 | 10,042 | 10,079 | 10,083 | 10,087 | 10,128 | 10,100 | 10,087 | 10,112 | 10,180 | 10,260 | 10,277 | 10,373 | 10,390 | 10,457 | 10,524 | 10,540 | 10,633 | 10,612 | 10,628 | 10,628 | 10,641 | 10,730 | 10,790 | 10,611 | 10,773 | 10,837 | 10,884 | 10,939 | 10,930 | 10,926 | 10,926 | 10,960 | 10,984 | 10,963 | 10,894 | 10,864 | 10,886 | 10,898 | 10,911 | 10,971 | 10,954 | 10,894 | 10,847 | 10,860 | 10,837 | 10,712 | 10,644 | 10,446 | 10,291 | 10,325 | 10,196 | 10,351 | 10,179 | 9,964 | 9,973 | 10,123 | 10,074 | 10,213 | 10,113 | 10,265 | 10,300 | 10,274 | 10,274 | 10,304 | 10,318 | 10,261 | 10,252 | 10,439 | 10,605 | 10,627 | 10,600 | 10,658 | 10,605 | 10,681 | 10,734 | 10,873 | 10,949 |
| Bloomberg U.S. Aggregate Bond Index1 | 10,000 | 9,932 | 10,030 | 10,101 | 10,110 | 10,322 | 10,225 | 10,273 | 10,236 | 10,211 | 10,100 | 10,170 | 10,156 | 10,224 | 10,226 | 10,199 | 10,166 | 10,306 | 10,379 | 10,474 | 10,514 | 10,517 | 10,706 | 10,774 | 10,761 | 10,755 | 10,673 | 10,420 | 10,435 | 10,456 | 10,526 | 10,520 | 10,601 | 10,683 | 10,672 | 10,718 | 10,814 | 10,763 | 10,769 | 10,755 | 10,805 | 10,680 | 10,579 | 10,647 | 10,568 | 10,643 | 10,630 | 10,633 | 10,701 | 10,632 | 10,548 | 10,611 | 10,806 | 10,921 | 10,914 | 11,124 | 11,127 | 11,324 | 11,466 | 11,492 | 11,789 | 11,727 | 11,762 | 11,756 | 11,748 | 11,974 | 12,189 | 12,118 | 12,333 | 12,391 | 12,469 | 12,655 | 12,553 | 12,546 | 12,490 | 12,612 | 12,630 | 12,539 | 12,358 | 12,204 | 12,300 | 12,340 | 12,427 | 12,566 | 12,542 | 12,433 | 12,430 | 12,467 | 12,435 | 12,167 | 12,031 | 11,697 | 11,253 | 11,326 | 11,148 | 11,420 | 11,098 | 10,618 | 10,481 | 10,866 | 10,817 | 11,150 | 10,862 | 11,138 | 11,205 | 11,083 | 11,044 | 11,036 | 10,965 | 10,687 | 10,518 | 10,994 | 11,415 | 11,384 | 11,223 | 11,327 | 11,041 | 11,228 | 11,334 | 11,599 | 11,765 |
| FTSE World Government Bond Index 1-5 Yr Currency-Hedged USD | 10,000 | 9,998 | 10,022 | 10,047 | 10,045 | 10,101 | 10,086 | 10,107 | 10,106 | 10,112 | 10,096 | 10,123 | 10,121 | 10,155 | 10,157 | 10,154 | 10,146 | 10,222 | 10,251 | 10,262 | 10,262 | 10,267 | 10,335 | 10,338 | 10,327 | 10,346 | 10,326 | 10,276 | 10,297 | 10,300 | 10,325 | 10,327 | 10,357 | 10,379 | 10,364 | 10,390 | 10,425 | 10,408 | 10,421 | 10,415 | 10,414 | 10,383 | 10,392 | 10,430 | 10,423 | 10,432 | 10,457 | 10,457 | 10,477 | 10,474 | 10,496 | 10,544 | 10,635 | 10,674 | 10,683 | 10,758 | 10,777 | 10,853 | 10,921 | 10,937 | 11,035 | 11,026 | 11,041 | 11,033 | 11,045 | 11,124 | 11,207 | 11,294 | 11,320 | 11,335 | 11,354 | 11,374 | 11,367 | 11,381 | 11,385 | 11,390 | 11,400 | 11,397 | 11,356 | 11,358 | 11,365 | 11,378 | 11,366 | 11,404 | 11,396 | 11,368 | 11,311 | 11,339 | 11,308 | 11,237 | 11,195 | 11,040 | 10,956 | 10,986 | 10,935 | 11,032 | 10,884 | 10,739 | 10,746 | 10,834 | 10,800 | 10,912 | 10,816 | 10,995 | 11,037 | 11,025 | 10,965 | 11,013 | 11,055 | 11,027 | 11,064 | 11,204 | 11,368 | 11,400 | 11,343 | 11,394 | 11,345 | 11,419 | 11,497 | 11,644 | 11,739 |
| Composite Index2 | 10,000 | 9,973 | 10,021 | 10,056 | 10,045 | 10,150 | 10,101 | 10,132 | 10,122 | 10,120 | 10,082 | 10,111 | 10,107 | 10,151 | 10,142 | 10,122 | 10,107 | 10,195 | 10,229 | 10,267 | 10,281 | 10,276 | 10,375 | 10,394 | 10,377 | 10,384 | 10,351 | 10,236 | 10,242 | 10,258 | 10,288 | 10,289 | 10,329 | 10,364 | 10,356 | 10,385 | 10,431 | 10,403 | 10,403 | 10,389 | 10,405 | 10,347 | 10,315 | 10,353 | 10,320 | 10,368 | 10,369 | 10,371 | 10,416 | 10,389 | 10,377 | 10,423 | 10,534 | 10,589 | 10,595 | 10,701 | 10,714 | 10,825 | 10,903 | 10,908 | 11,055 | 11,031 | 11,063 | 11,058 | 11,066 | 11,177 | 11,300 | 11,356 | 11,433 | 11,461 | 11,489 | 11,547 | 11,520 | 11,521 | 11,499 | 11,534 | 11,542 | 11,515 | 11,449 | 11,394 | 11,430 | 11,451 | 11,465 | 11,524 | 11,514 | 11,470 | 11,444 | 11,459 | 11,438 | 11,321 | 11,263 | 11,075 | 10,911 | 10,964 | 10,884 | 11,000 | 10,853 | 10,644 | 10,599 | 10,771 | 10,769 | 10,924 | 10,796 | 10,980 | 11,030 | 10,982 | 10,949 | 10,973 | 10,980 | 10,896 | 10,865 | 11,091 | 11,300 | 11,323 | 11,255 | 11,318 | 11,213 | 11,325 | 11,403 | 11,568 | 11,682 |
ANNUAL AVERAGE TOTAL RETURN (%)
| | | |
| | 1 Year | 5 Year | 10 Year |
Matson Money Fixed Income VI Portfolio | 6.12 | 0.59 | 0.91 |
Bloomberg U.S. Aggregate Bond Index1 | 7.30 | -0.04 | 1.64 |
FTSE World Government Bond Index 1-5 Yr Currency-Hedged USD | 6.19 | 1.25 | 1.62 |
Composite Index2 | 6.39 | 1.11 | 1.57 |
| 1 | Effective with this report, and pursuant to new regulatory requirements, the Bloomberg U.S. Aggregate Bond Index replaced the FTSE World Government Bond Index 1-5 Years as the Fund’s primary benchmark to represent a broad-based securities market index. |
| 2 | The Composite Index is comprised of the Three-Month Treasury Bill Index, Bloomberg Barclays Intermediate Government/Credit Bond Index, ICE BofA Merrill Lynch 1-3 Year US Government/Corporate Index and Bloomberg Barclays U.S. Capital Aggregate Bond Index, each weighted 25%, respectively. |
| Matson Money Fixed Income VI Portfolio | PAGE 1 | TSR-AR-74925K425 |
Visit http://funddocs.filepoint.com/matsonmoney/ for more recent performance information.
| * | The Fund’s past performance is not a good predictor of how the Fund will perform in the future. The graph and table do not reflect the deduction of taxes that a shareholder would pay on Fund distributions or redemption of Fund shares. |
KEY FUND STATISTICS (as of August 31, 2024)
| |
Net Assets | $25,753,004 |
Number of Holdings | 11 |
Net Advisory Fee | $134,682 |
Portfolio Turnover | 15% |
WHAT DID THE FUND INVEST IN? (as of August 31, 2024)
| |
Top 10 Holdings | (% of Net Assets) |
iShares 1-5 Year Investment Grade Corporate Bond ETF | 24.1% |
DFA Two-Year Global Fixed Income Portfolio | 15.0% |
iShares Core International Aggregate Bond ETF | 15.0% |
DFA One-Year Fixed Income Portfolio | 11.5% |
VA Global Bond Portfolio | 10.0% |
iShares 3-7 Year Treasury Bond ETF | 6.0% |
iShares 5-10 Year Investment Grade Corporate Bond ETF | 6.0% |
Dimensional Inflation-Protected Securities ETF | 5.0% |
iShares 1-3 Year Treasury Bond ETF | 4.0% |
VA Short-Term Fixed Income Portfolio | 2.0% |
| |
Top Sectors | (% of Net Assets) |
Finance and Insurance | 98.7% |
Cash & Other | 1.3% |
For additional information about the Fund; including its prospectus, financial information, holdings and proxy information, scan the QR code or visit http://funddocs.filepoint.com/matsonmoney/
HOUSEHOLDING
To reduce Fund expenses, only one copy of most shareholder documents may be mailed to shareholders with multiple accounts at the same address (Householding). If you would prefer that your Fund documents not be householded, please contact the Fund at 1-866-780-0357 Ext. 3863, or contact your financial intermediary. Your instructions will typically be effective within 30 days of receipt by the Fund or your financial intermediary.
| Matson Money Fixed Income VI Portfolio | PAGE 2 | TSR-AR-74925K425 |
100009995101601017910128106331093010954101791031810949100001015610761108141070111789125531254211098109651176510000101211032710425104771103511367113961088411055117391000010107103771043110416110551152011514108531098011682
| | |
| Motley Fool Global Opportunities ETF | |
TMFG (Principal U.S. Listing Exchange: CBOE) |
Annual Shareholder Report | August 31, 2024 |
This annual shareholder report contains important information about the Motley Fool Global Opportunities ETF (the “Fund”) for the period of September 1, 2023, to August 31, 2024. You can find additional information about the Fund at https://fooletfs.com/our-funds. You can also request this information by contacting us at 1-703-302-1100.
WHAT WERE THE FUND COSTS FOR THE PAST YEAR? (based on a hypothetical $10,000 investment)
| | |
Fund Name | Costs of a $10,000 investment | Costs paid as a percentage of a $10,000 investment |
| Motley Fool Global Opportunities ETF | $94 | 0.85% |
HOW DID THE FUND PERFORM LAST YEAR AND WHAT AFFECTED ITS PERFORMANCE?
For the 12-month period ended August 31, 2024, the Fund underperformed its benchmark, the FTSE Global All Cap Net Tax Index. Nevertheless, to us it was a strong year towards the Fund’s investment objective of capital appreciation.
WHAT FACTORS INFLUENCED PERFORMANCE?
The Fund enjoys a global investing universe to pursue ownership of high quality businesses. But during the period, what seemed to us to matter most was geographic exposure. US stocks performed remarkably well and far outpaced non-US stocks, even though both developed international and emerging market stocks turned in healthy positive returns.
The Fund’s relative positioning worked against it, as our portfolio had a lower US weighting and higher international weighting than the benchmark. With fewer than 40 holdings, the Fund’s sector and security exposures were significantly different than the benchmark index. Notably, the lower exposure to the Information Technology sector, stock selection in the Health Care sector contributed negatively to Fund performance, while stock selection in the Consumer Staples sector positively contributed to performance.
A FUN FACT ABOUT THE PORTFOLIO!
As of August 31, 2024, the Fund’s top five holdings (Axon Enterprise, Inc., Amazon.com, Inc., Waste Connections, Inc., ICON PLC, and Watsco, Inc.) have been held in the portfolio an average of more than six years (we think demonstrating our long-term orientation, but you can decide!).
| |
Top Contributors |
| ↑ | Axon Enterprise, Inc. (NasdaqGS:AXON) |
| ↑ | International Container Terminal Services, Inc. (PSE:ICT) |
| ↑ | Taiwan Semiconductor Manufacturing Company Ltd. (NYSE:TSM) |
| |
Top Detractors |
| ↓ | Yum China Holdings, Inc. (NYSE:YUMC) |
| ↓ | Paycom Software, Inc. (NYSE:PAYC) |
| ↓ | Atlassian Corp. (NasdaqGS:TEAM) |
HOW DID THE FUND PERFORM OVER THE PAST 10 YEARS?*
The $10,000 chart reflects a hypothetical $10,000 investment in the class of shares noted. The chart uses total return NAV performance and assumes reinvestment of dividends and capital gains. Fund expenses, including management fees and other expenses were deducted.
| Motley Fool Global Opportunities ETF | PAGE 1 | TSR-AR-74933W635 |
CUMULATIVE PERFORMANCE (Initial Investment of $10,000)
| | 06/17/2014 | 06/30/2014 | 07/31/2014 | 08/31/2014 | 09/30/2014 | 10/31/2014 | 11/30/2014 | 12/31/2014 | 01/31/2015 | 02/28/2015 | 03/31/2015 | 04/30/2015 | 05/31/2015 | 06/30/2015 | 07/31/2015 | 08/31/2015 | 09/30/2015 | 10/31/2015 | 11/30/2015 | 12/31/2015 | 01/31/2016 | 02/29/2016 | 03/31/2016 | 04/30/2016 | 05/31/2016 | 06/30/2016 | 07/31/2016 | 08/31/2016 | 09/30/2016 | 10/31/2016 | 11/30/2016 | 12/31/2016 | 01/31/2017 | 02/28/2017 | 03/31/2017 | 04/30/2017 | 05/31/2017 | 06/30/2017 | 07/31/2017 | 08/31/2017 | 09/30/2017 | 10/31/2017 | 11/30/2017 | 12/31/2017 | 01/31/2018 | 02/28/2018 | 03/31/2018 | 04/30/2018 | 05/31/2018 | 06/30/2018 | 07/31/2018 | 08/31/2018 | 09/30/2018 | 10/31/2018 | 11/30/2018 | 12/31/2018 | 01/31/2019 | 02/28/2019 | 03/31/2019 | 04/30/2019 | 05/31/2019 | 06/30/2019 | 07/31/2019 | 08/31/2019 | 09/30/2019 | 10/31/2019 | 11/30/2019 | 12/31/2019 | 01/31/2020 | 02/29/2020 | 03/31/2020 | 04/30/2020 | 05/31/2020 | 06/30/2020 | 07/31/2020 | 08/31/2020 | 09/30/2020 | 10/31/2020 | 11/30/2020 | 12/31/2020 | 01/31/2021 | 02/28/2021 | 03/31/2021 | 04/30/2021 | 05/31/2021 | 06/30/2021 | 07/31/2021 | 08/31/2021 | 09/30/2021 | 10/31/2021 | 11/30/2021 | 12/31/2021 | 01/31/2022 | 02/28/2022 | 03/31/2022 | 04/30/2022 | 05/31/2022 | 06/30/2022 | 07/31/2022 | 08/31/2022 | 09/30/2022 | 10/31/2022 | 11/30/2022 | 12/31/2022 | 01/31/2023 | 02/28/2023 | 03/31/2023 | 04/30/2023 | 05/31/2023 | 06/30/2023 | 07/31/2023 | 08/31/2023 | 09/30/2023 | 10/31/2023 | 11/30/2023 | 12/31/2023 | 01/31/2024 | 02/29/2024 | 03/31/2024 | 04/30/2024 | 05/31/2024 | 06/30/2024 | 07/31/2024 | 08/31/2024 |
| Motley Fool Global Opportunities ETF ** (at Net Asset Value) | 10,000 | 10,117 | 10,081 | 10,406 | 10,050 | 10,317 | 10,400 | 10,145 | 10,147 | 10,570 | 10,378 | 10,583 | 10,614 | 10,649 | 10,807 | 9,999 | 9,651 | 10,219 | 10,246 | 10,004 | 9,292 | 9,227 | 9,940 | 9,940 | 9,907 | 9,974 | 10,284 | 10,456 | 10,533 | 10,267 | 10,213 | 10,293 | 10,705 | 10,881 | 11,156 | 11,695 | 12,209 | 12,192 | 12,477 | 12,524 | 12,579 | 13,100 | 13,517 | 13,442 | 14,829 | 14,581 | 14,434 | 14,109 | 14,298 | 14,286 | 14,516 | 15,337 | 15,231 | 13,459 | 13,879 | 12,926 | 13,965 | 14,735 | 15,216 | 16,133 | 15,434 | 16,281 | 16,512 | 16,095 | 15,767 | 15,902 | 16,730 | 16,984 | 17,185 | 16,307 | 14,068 | 15,871 | 17,359 | 18,110 | 19,377 | 20,221 | 19,544 | 19,759 | 22,199 | 23,103 | 22,981 | 23,739 | 23,002 | 24,403 | 23,917 | 24,810 | 25,461 | 26,461 | 25,482 | 26,240 | 24,453 | 24,979 | 22,862 | 21,831 | 22,554 | 20,060 | 19,348 | 17,867 | 19,628 | 19,155 | 17,266 | 17,790 | 19,106 | 17,885 | 20,023 | 19,291 | 20,001 | 20,075 | 19,784 | 20,835 | 21,466 | 21,307 | 20,411 | 19,697 | 21,549 | 22,907 | 22,865 | 24,227 | 24,951 | 23,661 | 24,098 | 24,251 | 24,873 | 25,782 |
| Motley Fool Global Opportunities ETF (at Market Price) | 10,000 | 10,117 | 10,081 | 10,406 | 10,050 | 10,317 | 10,400 | 10,145 | 10,147 | 10,570 | 10,378 | 10,583 | 10,614 | 10,649 | 10,807 | 9,999 | 9,651 | 10,219 | 10,246 | 10,004 | 9,292 | 9,227 | 9,940 | 9,940 | 9,907 | 9,974 | 10,284 | 10,456 | 10,533 | 10,267 | 10,213 | 10,293 | 10,705 | 10,881 | 11,156 | 11,695 | 12,209 | 12,192 | 12,477 | 12,524 | 12,579 | 13,100 | 13,517 | 13,442 | 14,829 | 14,581 | 14,434 | 14,109 | 14,298 | 14,286 | 14,516 | 15,337 | 15,231 | 13,459 | 13,879 | 12,926 | 13,965 | 14,735 | 15,216 | 16,133 | 15,434 | 16,281 | 16,512 | 16,095 | 15,767 | 15,902 | 16,730 | 16,984 | 17,185 | 16,307 | 14,068 | 15,871 | 17,359 | 18,110 | 19,377 | 20,221 | 19,544 | 19,759 | 22,199 | 23,103 | 22,981 | 23,739 | 23,002 | 24,403 | 23,917 | 24,810 | 25,461 | 26,461 | 25,482 | 26,240 | 24,453 | 24,824 | 22,835 | 21,512 | 22,550 | 19,941 | 19,307 | 17,829 | 19,539 | 19,145 | 17,217 | 17,744 | 19,015 | 17,835 | 19,968 | 19,269 | 19,977 | 20,062 | 19,752 | 20,812 | 21,458 | 21,287 | 20,383 | 19,658 | 21,521 | 22,870 | 22,845 | 24,201 | 24,917 | 23,659 | 24,077 | 24,185 | 24,810 | 25,726 |
| FTSE Global All Cap (Fair Value 16.00) Net Tax (US RIC) Index | 10,000 | 10,096 | 9,922 | 10,180 | 9,821 | 9,925 | 10,044 | 9,863 | 9,732 | 10,282 | 10,148 | 10,427 | 10,455 | 10,222 | 10,267 | 9,594 | 9,264 | 9,927 | 9,890 | 9,690 | 9,146 | 9,049 | 9,737 | 9,872 | 9,919 | 9,890 | 10,300 | 10,347 | 10,428 | 10,220 | 10,345 | 10,547 | 10,854 | 11,145 | 11,297 | 11,478 | 11,706 | 11,778 | 12,099 | 12,152 | 12,404 | 12,663 | 12,911 | 13,122 | 13,826 | 13,221 | 13,042 | 13,115 | 13,181 | 13,098 | 13,486 | 13,595 | 13,625 | 12,566 | 12,776 | 11,849 | 12,815 | 13,160 | 13,314 | 13,773 | 12,944 | 13,782 | 13,777 | 13,485 | 13,775 | 14,154 | 14,513 | 15,027 | 14,801 | 13,686 | 11,672 | 12,952 | 13,619 | 14,045 | 14,753 | 15,634 | 15,173 | 14,839 | 16,693 | 17,538 | 17,468 | 17,949 | 18,434 | 19,217 | 19,522 | 19,759 | 19,869 | 20,344 | 19,509 | 20,503 | 19,955 | 20,737 | 19,782 | 19,261 | 19,597 | 18,045 | 18,127 | 16,611 | 17,785 | 17,094 | 15,455 | 16,425 | 17,803 | 17,031 | 18,307 | 17,744 | 18,233 | 18,480 | 18,272 | 19,335 | 20,048 | 19,479 | 18,668 | 18,110 | 19,748 | 20,770 | 20,774 | 21,715 | 22,396 | 21,611 | 22,565 | 22,942 | 23,429 | 23,984 |
ANNUAL AVERAGE TOTAL RETURN (%)
| | | |
| | 1 Year | 5 Years | 10 Years |
Motley Fool Global Opportunities ETF (at Net Asset Value)** | 21.00 | 9.88 | 9.50 |
Motley Fool Global Opportunities ETF (at Market Price) | 20.86 | 9.83 | 9.47 |
FTSE Global All Cap (Fair Value 16.00) Net Tax (US RIC) Index | 23.13 | 12.21 | 8.95 |
Visit https://fooletfs.com/our-funds for more recent performance information.
| * | The Fund’s past performance is not a good predictor of how the Fund will perform in the future. The graph and table do not reflect the deduction of taxes that a shareholder would pay on Fund distributions or redemption of Fund shares. |
| ** | The Fund operated as a series of The Motley Fool Funds Trust (the “Predecessor Fund”) prior to December 21, 2016 at which time the Predecessor Fund was reorganized into the Fund. The performance shown for periods prior to December 21, 2016 represents the performance of the Predecessor Fund. These returns reflect expense waivers by the Fund’s investment adviser. Without these waivers, returns would have been lower. |
KEY FUND STATISTICS (as of August 31, 2024)
| |
Net Assets | $440,462,472 |
Number of Holdings | 40 |
Net Advisory Fee | $3,631,316 |
Portfolio Turnover | 38% |
30-Day SEC Yield | 0.61% |
30-Day SEC Yield Unsubsidized | 0.61% |
WHAT DID THE FUND INVEST IN? (as of August 31, 2024)
| |
Top 10 Holdings | (% of Net Assets) |
Axon Enterprise, Inc. | 5.5% |
Amazon.com, Inc. | 4.6% |
Waste Connections, Inc. | 4.3% |
ICON PLC | 3.9% |
Watsco, Inc. | 3.7% |
Alphabet, Inc. | 3.5% |
Mastercard, Inc. | 3.5% |
Nintendo Co. Ltd. | 3.4% |
Costco Wholesale Corp. | 3.3% |
Rentokil Initial PLC | 3.3% |
| |
Top Sectors | (% of Net Assets) |
Industrials | 24.5% |
Communication Services | 18.0% |
Consumer Discretionary | 12.7% |
Financials | 10.9% |
Health Care | 10.2% |
Real Estate | 7.2% |
Information Technology | 5.7% |
Consumer Staples | 5.4% |
Materials | 2.2% |
Cash & Other | 3.2% |
For additional information about the Fund; including its prospectus, financial information, holdings and proxy information, scan the QR code or visit https://fooletfs.com/our-funds
| Motley Fool Global Opportunities ETF | PAGE 2 | TSR-AR-74933W635 |
HOUSEHOLDING
To reduce Fund expenses, only one copy of most shareholder documents may be mailed to shareholders with multiple accounts at the same address (Householding). If you would prefer that your Fund documents not be householded, please contact the Fund at 1-703-302-1100, or contact your financial intermediary. Your instructions will typically be effective within 30 days of receipt by the Fund or your financial intermediary.
| Motley Fool Global Opportunities ETF | PAGE 3 | TSR-AR-74933W635 |
104069999104561252415337160952022126461191552130725782104069999104561252415337160952022126461191452128725726101809594103471215213595134851563420344170941947923984
| | |
| Motley Fool Mid-Cap Growth ETF | |
TMFM (Principal U.S. Listing Exchange: CBOE) |
Annual Shareholder Report | August 31, 2024 |
This annual shareholder report contains important information about the Motley Fool Mid-Cap Growth ETF (the “Fund”) for the period of September 1, 2023, to August 31, 2024. You can find additional information about the Fund at https://fooletfs.com/our-funds. You can also request this information by contacting us at 1-703-302-1100.
WHAT WERE THE FUND COSTS FOR THE PAST YEAR? (based on a hypothetical $10,000 investment)
| | |
Fund Name | Costs of a $10,000 investment | Costs paid as a percentage of a $10,000 investment |
| Motley Fool Mid-Cap Growth ETF | $93 | 0.85% |
HOW DID THE FUND PERFORM LAST YEAR AND WHAT AFFECTED ITS PERFORMANCE?
For the 12-month period ended August 31, 2024 (the “period”), the Fund outperformed its benchmark, the Russell Midcap Growth Total Return Index. Importantly, it was a strong year towards the Fund’s investment objective of capital appreciation.
WHAT FACTORS INFLUENCED PERFORMANCE?
A primary driver of US stock returns for the period was size: generally speaking, the bigger the company, the better the returns. In absolute, the return of middle-sized stocks (mid-caps) was strong. Although mid-caps did not keep pace with large- or mega-cap stocks, they outpaced small-caps.
On balance, both sector weightings and stock selection contributed to the Fund’s outperformance. The most notable drivers of portfolio returns came from the Health Care and Real Estate sectors. While the Fund was marginally underweight its benchmark in Health Care, our average returns within the sector were nearly triple that of the benchmarks. The opposite played out in Real Estate, where the Fund is considerably overweight relative to the benchmark and our holdings performed dramatically worse than the benchmarks. With only 30 holdings, these types of deviations don’t surprise us.
A FUN FACT ABOUT THE PORTFOLIO!
At August 31, 2024, the Fund held the stock of 30 companies. 27 of 30 generated positive operating profits over their most recently reported twelve months and 29 of 30 generated positive operating cash flows.
| |
Top Contributors |
| ↑ | Axon Enterprise, Inc. (NasdaqGS:AXON) |
| ↑ | Brown & Brown, Inc. (NYSE:BRO) |
| ↑ | Tyler Technologies, Inc. (NYSE:TYL) |
| |
Top Detractors |
| ↓ | Paycom Software, Inc. (NYSE:PAYC) |
| ↓ | Jones Lang LaSalle Inc. (NYSE:JLL) |
| ↓ | Payloity Holding Corp. (NasdaqGS:PCTY) |
HOW DID THE FUND PERFORM OVER THE PAST 10 YEARS?*
The $10,000 chart reflects a hypothetical $10,000 investment in the class of shares noted. The chart uses total return NAV performance and assumes reinvestment of dividends and capital gains. Fund expenses, including management fees and other expenses were deducted.
| Motley Fool Mid-Cap Growth ETF | PAGE 1 | TSR-AR-74933W627 |
CUMULATIVE PERFORMANCE (Initial Investment of $10,000)
| | 06/17/2014 | 06/30/2014 | 07/31/2014 | 08/31/2014 | 09/30/2014 | 10/31/2014 | 11/30/2014 | 12/31/2014 | 01/31/2015 | 02/28/2015 | 03/31/2015 | 04/30/2015 | 05/31/2015 | 06/30/2015 | 07/31/2015 | 08/31/2015 | 09/30/2015 | 10/31/2015 | 11/30/2015 | 12/31/2015 | 01/31/2016 | 02/29/2016 | 03/31/2016 | 04/30/2016 | 05/31/2016 | 06/30/2016 | 07/31/2016 | 08/31/2016 | 09/30/2016 | 10/31/2016 | 11/30/2016 | 12/31/2016 | 01/31/2017 | 02/28/2017 | 03/31/2017 | 04/30/2017 | 05/31/2017 | 06/30/2017 | 07/31/2017 | 08/31/2017 | 09/30/2017 | 10/31/2017 | 11/30/2017 | 12/31/2017 | 01/31/2018 | 02/28/2018 | 03/31/2018 | 04/30/2018 | 05/31/2018 | 06/30/2018 | 07/31/2018 | 08/31/2018 | 09/30/2018 | 10/31/2018 | 11/30/2018 | 12/31/2018 | 01/31/2019 | 02/28/2019 | 03/31/2019 | 04/30/2019 | 05/31/2019 | 06/30/2019 | 07/31/2019 | 08/31/2019 | 09/30/2019 | 10/31/2019 | 11/30/2019 | 12/31/2019 | 01/31/2020 | 02/29/2020 | 03/31/2020 | 04/30/2020 | 05/31/2020 | 06/30/2020 | 07/31/2020 | 08/31/2020 | 09/30/2020 | 10/31/2020 | 11/30/2020 | 12/31/2020 | 01/31/2021 | 02/28/2021 | 03/31/2021 | 04/30/2021 | 05/31/2021 | 06/30/2021 | 07/31/2021 | 08/31/2021 | 09/30/2021 | 10/31/2021 | 11/30/2021 | 12/31/2021 | 01/31/2022 | 02/28/2022 | 03/31/2022 | 04/30/2022 | 05/31/2022 | 06/30/2022 | 07/31/2022 | 08/31/2022 | 09/30/2022 | 10/31/2022 | 11/30/2022 | 12/31/2022 | 01/31/2023 | 02/28/2023 | 03/31/2023 | 04/30/2023 | 05/31/2023 | 06/30/2023 | 07/31/2023 | 08/31/2023 | 09/30/2023 | 10/31/2023 | 11/30/2023 | 12/31/2023 | 01/31/2024 | 02/29/2024 | 03/31/2024 | 04/30/2024 | 05/31/2024 | 06/30/2024 | 07/31/2024 | 08/31/2024 |
| Motley Fool Mid-Cap Growth ETF (at Net Asset Value) † | 10,000 | 10,116 | 9,932 | 10,267 | 9,905 | 10,371 | 10,628 | 10,697 | 10,509 | 11,153 | 11,215 | 10,968 | 11,058 | 11,054 | 11,154 | 10,494 | 9,969 | 10,483 | 10,684 | 10,407 | 9,569 | 9,672 | 10,381 | 10,230 | 10,325 | 10,251 | 10,743 | 10,763 | 10,663 | 10,286 | 11,202 | 11,196 | 11,268 | 11,599 | 11,481 | 11,751 | 11,738 | 12,276 | 12,303 | 12,412 | 12,962 | 13,620 | 14,441 | 14,488 | 15,287 | 15,009 | 15,003 | 14,707 | 15,080 | 15,038 | 15,257 | 16,275 | 16,080 | 13,890 | 14,311 | 12,865 | 14,128 | 14,703 | 14,810 | 15,591 | 14,691 | 15,591 | 15,879 | 15,304 | 15,153 | 15,404 | 16,591 | 16,776 | 17,530 | 16,544 | 14,136 | 15,790 | 17,688 | 18,436 | 19,600 | 19,706 | 19,044 | 19,203 | 21,307 | 22,258 | 22,265 | 22,479 | 21,793 | 23,033 | 22,265 | 23,136 | 23,838 | 24,510 | 23,653 | 25,122 | 23,122 | 23,403 | 20,944 | 20,460 | 21,104 | 18,657 | 17,972 | 16,852 | 18,496 | 17,975 | 16,612 | 17,201 | 17,844 | 16,915 | 18,523 | 17,970 | 17,841 | 18,060 | 17,524 | 18,915 | 19,686 | 19,516 | 18,824 | 18,042 | 19,131 | 20,598 | 20,190 | 21,395 | 22,037 | 20,774 | 21,324 | 21,395 | 23,015 | 23,213 |
| Motley Fool Mid-Cap Growth ETF (at Market Price) † | 10,000 | 10,116 | 9,932 | 10,267 | 9,905 | 10,371 | 10,628 | 10,697 | 10,509 | 11,153 | 11,215 | 10,968 | 11,058 | 11,054 | 11,154 | 10,494 | 9,969 | 10,483 | 10,684 | 10,407 | 9,569 | 9,672 | 10,381 | 10,230 | 10,325 | 10,251 | 10,743 | 10,763 | 10,663 | 10,286 | 11,202 | 11,196 | 11,268 | 11,599 | 11,481 | 11,751 | 11,738 | 12,276 | 12,303 | 12,412 | 12,962 | 13,620 | 14,441 | 14,488 | 15,287 | 15,009 | 15,003 | 14,707 | 15,080 | 15,038 | 15,257 | 16,275 | 16,080 | 13,890 | 14,311 | 12,865 | 14,128 | 14,703 | 14,810 | 15,591 | 14,691 | 15,591 | 15,879 | 15,304 | 15,153 | 15,404 | 16,591 | 16,776 | 17,530 | 16,544 | 14,136 | 15,790 | 17,688 | 18,436 | 19,600 | 19,706 | 19,044 | 19,203 | 21,307 | 22,258 | 22,265 | 22,479 | 21,793 | 23,033 | 22,265 | 23,136 | 23,838 | 24,510 | 23,653 | 25,122 | 23,122 | 23,277 | 20,916 | 20,434 | 21,024 | 18,744 | 17,959 | 16,786 | 18,419 | 17,930 | 16,578 | 17,179 | 17,714 | 16,909 | 18,459 | 17,951 | 17,832 | 18,055 | 17,518 | 18,932 | 19,671 | 19,481 | 18,818 | 18,030 | 19,132 | 20,582 | 20,149 | 21,406 | 22,038 | 20,771 | 21,278 | 21,361 | 23,005 | 23,194 |
| Russell 3000 Total Return Index ** | 10,000 | 10,110 | 9,911 | 10,327 | 10,111 | 10,389 | 10,641 | 10,641 | 10,345 | 10,944 | 10,833 | 10,882 | 11,032 | 10,848 | 11,029 | 10,363 | 10,061 | 10,856 | 10,916 | 10,692 | 10,089 | 10,086 | 10,796 | 10,862 | 11,057 | 11,080 | 11,519 | 11,549 | 11,567 | 11,317 | 11,823 | 12,054 | 12,281 | 12,737 | 12,746 | 12,881 | 13,013 | 13,130 | 13,378 | 13,404 | 13,731 | 14,030 | 14,456 | 14,601 | 15,370 | 14,804 | 14,507 | 14,562 | 14,973 | 15,071 | 15,571 | 16,118 | 16,144 | 14,956 | 15,255 | 13,835 | 15,023 | 15,551 | 15,778 | 16,408 | 15,347 | 16,424 | 16,669 | 16,329 | 16,615 | 16,973 | 17,618 | 18,127 | 18,107 | 16,625 | 14,338 | 16,237 | 17,106 | 17,497 | 18,490 | 19,830 | 19,108 | 18,696 | 20,970 | 21,913 | 21,816 | 22,498 | 23,304 | 24,505 | 24,617 | 25,224 | 25,651 | 26,382 | 25,199 | 26,903 | 26,493 | 27,537 | 25,916 | 25,264 | 26,083 | 23,742 | 23,710 | 21,727 | 23,765 | 22,878 | 20,757 | 22,459 | 23,631 | 22,248 | 23,780 | 23,224 | 23,845 | 24,099 | 24,193 | 25,845 | 26,771 | 26,255 | 25,004 | 24,341 | 26,611 | 28,022 | 28,333 | 29,867 | 30,830 | 29,473 | 30,866 | 31,822 | 32,413 | 33,119 |
| Russell Midcap Growth Total Return Index | 10,000 | 10,131 | 9,829 | 10,358 | 10,058 | 10,335 | 10,675 | 10,645 | 10,465 | 11,186 | 11,217 | 11,138 | 11,271 | 11,089 | 11,269 | 10,613 | 10,203 | 10,845 | 10,869 | 10,623 | 9,819 | 9,973 | 10,685 | 10,678 | 10,854 | 10,852 | 11,389 | 11,356 | 11,350 | 10,889 | 11,362 | 11,402 | 11,782 | 12,121 | 12,188 | 12,369 | 12,664 | 12,702 | 12,914 | 13,005 | 13,373 | 13,747 | 14,206 | 14,283 | 15,091 | 14,617 | 14,594 | 14,456 | 14,996 | 15,054 | 15,378 | 16,264 | 16,195 | 14,591 | 14,962 | 13,604 | 15,168 | 16,057 | 16,274 | 17,006 | 16,027 | 17,153 | 17,553 | 17,234 | 17,037 | 17,353 | 18,217 | 18,430 | 18,602 | 17,320 | 14,737 | 17,044 | 18,756 | 19,196 | 20,730 | 21,294 | 20,995 | 21,021 | 23,845 | 24,988 | 24,905 | 25,330 | 24,847 | 26,243 | 25,842 | 27,598 | 27,883 | 28,783 | 27,389 | 29,309 | 28,071 | 28,169 | 24,534 | 24,236 | 24,625 | 21,853 | 21,007 | 19,436 | 21,815 | 21,100 | 19,309 | 20,827 | 21,960 | 20,642 | 22,443 | 22,222 | 22,528 | 22,202 | 22,215 | 23,932 | 24,656 | 23,844 | 22,682 | 21,525 | 24,151 | 25,981 | 25,842 | 27,784 | 28,449 | 26,797 | 27,082 | 27,535 | 27,702 | 28,390 |
ANNUAL AVERAGE TOTAL RETURN (%)
| | | |
| | 1 Year | 5 Years | 10 Years |
Motley Fool Mid Cap Growth ETF (at Net Asset Value)† | 18.95 | 8.69 | 8.50 |
Motley Fool Mid Cap Growth ETF (at Market Price)† | 19.06 | 8.67 | 8.49 |
Russell 3000 Total Return Index** | 26.14 | 15.19 | 12.36 |
Russell Midcap Growth Total Return Index | 19.07 | 10.50 | 10.61 |
Visit https://fooletfs.com/our-funds for more recent performance information.
| * | The Fund’s past performance is not a good predictor of how the Fund will perform in the future. The graph and table do not reflect the deduction of taxes that a shareholder would pay on Fund distributions or redemption of Fund shares. |
| ** | Effective with this report, and pursuant to new regulatory requirements, the Russell 3000 Index replaced the Russell Midcap Growth Total Return Index as the Fund’s primary benchmark to represent a broad-based securities market index. |
| † | The Fund operated as a series of The Motley Fool Funds Trust (the “Predecessor Fund”) prior to December 21, 2016 at which time the Predecessor Fund was reorganized into the Fund. The performance shown for periods prior to December 21, 2016 represents the performance of the Predecessor Fund. These returns reflect expense waivers by the Fund’s investment adviser. Without these waivers, returns would have been lower. |
KEY FUND STATISTICS (as of August 31, 2024)
| |
Net Assets | $203,138,972 |
Number of Holdings | 31 |
Net Advisory Fee | $1,633,412 |
Portfolio Turnover | 31% |
30-Day SEC Yield | -0.01% |
30-Day SEC Yield Unsubsidized | -0.01% |
WHAT DID THE FUND INVEST IN? (as of August 31, 2024)
| |
Top 10 Holdings | (% of Net Assets) |
Brown & Brown, Inc. | 6.3% |
Axon Enterprise, Inc. | 6.0% |
Tyler Technologies, Inc. | 5.9% |
Broadridge Financial Solutions, Inc. | 4.8% |
Goosehead Insurance, Inc. | 4.5% |
StoneX Group, Inc. | 3.8% |
Globus Medical, Inc. | 3.7% |
Cooper Cos., Inc. | 3.7% |
RXO, Inc. | 3.7% |
SBA Communications Corp. | 3.6% |
| |
Top Sectors | (% of Net Assets) |
Industrials | 30.3% |
Health Care | 21.4% |
Financials | 20.3% |
Information Technology | 11.1% |
Real Estate | 7.7% |
Consumer Discretionary | 5.1% |
Materials | 2.5% |
Cash & Other | 1.6% |
| Motley Fool Mid-Cap Growth ETF | PAGE 2 | TSR-AR-74933W627 |
For additional information about the Fund; including its prospectus, financial information, holdings and proxy information, scan the QR code or visit https://fooletfs.com/our-funds
HOUSEHOLDING
To reduce Fund expenses, only one copy of most shareholder documents may be mailed to shareholders with multiple accounts at the same address (Householding). If you would prefer that your Fund documents not be householded, please contact the Fund at 1-703-302-1100, or contact your financial intermediary. Your instructions will typically be effective within 30 days of receipt by the Fund or your financial intermediary.
| Motley Fool Mid-Cap Growth ETF | PAGE 3 | TSR-AR-74933W627 |
1026710494107631241216275153041970624510179751951623213102671049410763124121627515304197062451017930194812319410327103631154913404161181632919830263822287826255331191035810613113561300516264172342129428783211002384428390
| | |
| Motley Fool 100 Index ETF | |
TMFC (Principal U.S. Listing Exchange: CBOE) |
Annual Shareholder Report | August 31, 2024 |
This annual shareholder report contains important information about the Motley Fool 100 Index ETF (the “Fund”) for the period of September 1, 2023, to August 31, 2024. You can find additional information about the Fund at https://fooletfs.com/our-funds. You can also request this information by contacting us at 1-703-302-1100.
This report describes changes to the Fund that occurred during the reporting period.
WHAT WERE THE FUND COSTS FOR THE PAST YEAR? (based on a hypothetical $10,000 investment)
| | |
Fund Name | Costs of a $10,000 investment | Costs paid as a percentage of a $10,000 investment |
| Motley Fool 100 Index ETF | $58 | 0.50% |
HOW DID THE FUND PERFORM LAST YEAR AND WHAT AFFECTED ITS PERFORMANCE?
For the 12-month period ended August 31, 2024, the Fund outperformed its benchmark, the S&P 500 Total Return Index (the “S&P 500”), and closely tracked its underlying index, the Motley Fool 100 Index.
WHAT FACTORS INFLUENCED PERFORMANCE?
The Fund invests in US stocks, which had a very strong twelve months. Looking more closely at US stocks, performance of the largest companies -- often referred to as “mega caps” -- was even better. The Fund follows the Motley Fool 100 Index that is market cap weighted, which resulted in a high exposure to mega caps which helped returns. It was a good year for mega caps and the Fund was largely invested in mega caps.
Another factor that contributed to performance was the Fund’s sector exposures. The Fund had, on average, more than 40% of assets invested in the Information Technology sector, compared to roughly 30% for the S&P 500. This hefty weighting helped returns, as did the sector’s strong performance in general. Tech was the strongest performing sector in the S&P 500. The worst performing sector in the S&P 500 was Energy, and the Fund had, on average, less than a 1% weighting during the year in the energy sector.
A FUN FACT ABOUT THE PORTFOLIO!
Six of the top ten holdings, as of August 31, 2024, were top ten holdings when the Fund’s inception more than six years ago, in January 2018 (Apple, Microsoft, Alphabet, Amazon, Meta Platforms, and Berkshire Hathaway).
| |
Top Contributors |
| ↑ | NVDIA Corp. (NasdaqGS:NVDA) |
| ↑ | Microsoft Corp. (NasdaqGS:MSFT) |
| ↑ | Meta Platforms, Inc. (NasdaqGS:META) |
| |
Top Detractors |
| ↓ | Tesla, Inc. (NasdaqGS:TSLA) |
| ↓ | Oracle Corp. (NYSE:ORCL) |
| ↓ | Johnson & Johnson (NYSE:JNJ) |
HOW DID THE FUND PERFORM SINCE INCEPTION?*
The $10,000 chart reflects a hypothetical $10,000 investment in the class of shares noted. The chart uses total return NAV performance and assumes reinvestment of dividends and capital gains. Fund expenses, including management fees and other expenses were deducted.
| Motley Fool 100 Index ETF | PAGE 1 | TSR-AR-74933W601 |
CUMULATIVE PERFORMANCE (Initial Investment of $10,000)
| | 01/29/2018 | 01/31/2018 | 02/28/2018 | 03/31/2018 | 04/30/2018 | 05/31/2018 | 06/30/2018 | 07/31/2018 | 08/31/2018 | 09/30/2018 | 10/31/2018 | 11/30/2018 | 12/31/2018 | 01/31/2019 | 02/28/2019 | 03/31/2019 | 04/30/2019 | 05/31/2019 | 06/30/2019 | 07/31/2019 | 08/31/2019 | 09/30/2019 | 10/31/2019 | 11/30/2019 | 12/31/2019 | 01/31/2020 | 02/29/2020 | 03/31/2020 | 04/30/2020 | 05/31/2020 | 06/30/2020 | 07/31/2020 | 08/31/2020 | 09/30/2020 | 10/31/2020 | 11/30/2020 | 12/31/2020 | 01/31/2021 | 02/28/2021 | 03/31/2021 | 04/30/2021 | 05/31/2021 | 06/30/2021 | 07/31/2021 | 08/31/2021 | 09/30/2021 | 10/31/2021 | 11/30/2021 | 12/31/2021 | 01/31/2022 | 02/28/2022 | 03/31/2022 | 04/30/2022 | 05/31/2022 | 06/30/2022 | 07/31/2022 | 08/31/2022 | 09/30/2022 | 10/31/2022 | 11/30/2022 | 12/31/2022 | 01/31/2023 | 02/28/2023 | 03/31/2023 | 04/30/2023 | 05/31/2023 | 06/30/2023 | 07/31/2023 | 08/31/2023 | 09/30/2023 | 10/31/2023 | 11/30/2023 | 12/31/2023 | 01/31/2024 | 02/29/2024 | 03/31/2024 | 04/30/2024 | 05/31/2024 | 06/30/2024 | 07/31/2024 | 08/31/2024 |
| Motley Fool 100 Index ETF (at Net Asset Value) | 10,000 | 9,942 | 9,745 | 9,393 | 9,539 | 9,940 | 10,056 | 10,420 | 11,049 | 11,077 | 10,211 | 10,310 | 9,405 | 10,196 | 10,444 | 10,733 | 11,291 | 10,517 | 11,225 | 11,472 | 11,300 | 11,301 | 11,712 | 12,251 | 12,624 | 13,030 | 12,197 | 11,165 | 12,781 | 13,556 | 14,161 | 15,225 | 17,026 | 16,110 | 15,505 | 17,095 | 17,878 | 17,787 | 17,808 | 18,077 | 19,276 | 19,025 | 20,075 | 20,661 | 21,409 | 20,209 | 21,904 | 21,985 | 22,399 | 20,723 | 19,787 | 20,757 | 18,143 | 17,694 | 16,248 | 18,222 | 17,303 | 15,616 | 16,283 | 16,977 | 15,577 | 17,005 | 16,801 | 18,068 | 18,414 | 19,473 | 20,784 | 21,528 | 21,233 | 20,098 | 19,869 | 22,019 | 22,855 | 23,429 | 24,940 | 25,372 | 24,320 | 25,849 | 27,518 | 27,400 | 28,158 |
| Motley Fool 100 Index ETF (at Market Price) | 10,000 | 9,960 | 9,770 | 9,410 | 9,560 | 9,950 | 10,070 | 10,425 | 11,065 | 11,070 | 10,230 | 10,280 | 9,377 | 10,197 | 10,438 | 10,710 | 11,319 | 10,509 | 11,188 | 11,475 | 11,279 | 11,299 | 11,716 | 12,265 | 12,630 | 13,019 | 12,180 | 11,133 | 12,777 | 13,520 | 14,157 | 15,178 | 17,019 | 16,123 | 15,552 | 17,130 | 17,934 | 17,792 | 17,868 | 18,076 | 19,275 | 19,077 | 20,097 | 20,696 | 21,428 | 20,244 | 21,930 | 21,991 | 22,471 | 20,703 | 19,799 | 20,804 | 18,175 | 17,656 | 16,216 | 18,215 | 17,305 | 15,633 | 16,297 | 16,908 | 15,540 | 16,999 | 16,785 | 18,081 | 18,372 | 19,495 | 20,791 | 21,521 | 21,222 | 20,082 | 19,863 | 22,024 | 22,848 | 23,415 | 24,960 | 25,385 | 24,346 | 25,871 | 27,539 | 27,411 | 28,128 |
| S&P 500 Total Return Index | 10,000 | 9,897 | 9,532 | 9,290 | 9,325 | 9,550 | 9,609 | 9,966 | 10,291 | 10,350 | 9,642 | 9,839 | 8,950 | 9,668 | 9,978 | 10,172 | 10,584 | 9,911 | 10,610 | 10,762 | 10,592 | 10,790 | 11,024 | 11,424 | 11,769 | 11,764 | 10,796 | 9,462 | 10,675 | 11,184 | 11,406 | 12,049 | 12,915 | 12,425 | 12,094 | 13,418 | 13,934 | 13,793 | 14,174 | 14,794 | 15,584 | 15,693 | 16,059 | 16,441 | 16,940 | 16,153 | 17,284 | 17,164 | 17,934 | 17,006 | 16,497 | 17,109 | 15,617 | 15,646 | 14,354 | 15,678 | 15,038 | 13,653 | 14,759 | 15,584 | 14,686 | 15,609 | 15,228 | 15,787 | 16,033 | 16,103 | 17,167 | 17,718 | 17,436 | 16,605 | 16,256 | 17,740 | 18,546 | 18,858 | 19,865 | 20,504 | 19,667 | 20,642 | 21,382 | 21,643 | 22,168 |
| Motley Fool 100 Index | 10,000 | 9,941 | 9,738 | 9,391 | 9,541 | 9,948 | 10,067 | 10,436 | 11,072 | 11,104 | 10,242 | 10,346 | 9,441 | 10,243 | 10,495 | 10,791 | 11,357 | 10,582 | 11,300 | 11,555 | 11,386 | 11,391 | 11,812 | 12,362 | 12,743 | 13,160 | 12,321 | 11,278 | 12,917 | 13,707 | 14,325 | 15,411 | 17,241 | 16,319 | 15,714 | 17,335 | 18,138 | 18,053 | 18,083 | 18,363 | 19,591 | 19,344 | 20,421 | 21,028 | 21,798 | 20,584 | 22,321 | 22,411 | 22,848 | 21,148 | 20,199 | 21,198 | 18,532 | 18,084 | 16,609 | 18,636 | 17,703 | 15,981 | 16,672 | 17,394 | 15,968 | 17,440 | 17,237 | 18,545 | 18,908 | 20,004 | 21,360 | 22,135 | 21,841 | 20,680 | 20,447 | 22,650 | 23,523 | 24,124 | 25,692 | 26,151 | 25,076 | 26,664 | 28,400 | 28,277 | 29,102 |
ANNUAL AVERAGE TOTAL RETURN (%)
| | | |
| | 1 Year | 5 Years | Since Inception
(01/29/2018) |
Motley Fool 100 Index ETF (at Net Asset Value) | 32.61 | 20.03 | 17.02 |
Motley Fool 100 Index ETF (at Market Price) | 32.54 | 20.05 | 17.00 |
S&P 500 Total Return Index | 27.14 | 15.92 | 12.85 |
Motley Fool 100 Index | 33.25 | 20.64 | 17.61 |
Visit https://fooletfs.com/our-funds for more recent performance information.
| * | The Fund’s past performance is not a good predictor of how the Fund will perform in the future. The graph and table do not reflect the deduction of taxes that a shareholder would pay on Fund distributions or redemption of Fund shares. |
KEY FUND STATISTICS (as of August 31, 2024)
| |
Net Assets | $969,884,838 |
Number of Holdings | 102 |
Net Advisory Fee | $3,573,161 |
Portfolio Turnover | 24% |
30-Day SEC Yield | 0.22% |
30-Day SEC Yield Unsubsidized | 0.22% |
WHAT DID THE FUND INVEST IN? (as of August 31, 2024)
| |
Top 10 Holdings | (% of Net Assets) |
Apple, Inc. | 9.7% |
Microsoft Corp. | 8.5% |
NVIDIA Corp. | 7.9% |
Alphabet, Inc. | 5.6% |
Amazon.com, Inc. | 5.1% |
Meta Platforms, Inc. | 4.7% |
Berkshire Hathaway, Inc. | 4.7% |
Eli Lilly & Co. | 3.5% |
Broadcom, Inc. | 3.1% |
Tesla, Inc. | 2.9% |
| |
Top Sectors | (% of Net Assets) |
Information Technology | 38.3% |
Financials | 15.0% |
Communication Services | 13.9% |
Consumer Discretionary | 12.7% |
Health Care | 11.8% |
Industrials | 3.7% |
Consumer Staples | 1.9% |
Real Estate | 1.4% |
Materials | 0.8% |
Cash & Other | 0.5% |
Material Fund Changes
This is a summary of certain changes to the Fund since February 29, 2024. For more complete information, you may review the Fund’s next prospectus, which we expect to be available by December 31, 2024 at https://fooletfs.com/our-funds or upon request at 1-703-302-1100.
| Motley Fool 100 Index ETF | PAGE 2 | TSR-AR-74933W601 |
The Fund seeks investment results that correspond (before fees and expenses) generally to the total return performance of the Motley Fool 100 Index (“Index”). The Motley Fool, LLC, the sponsor of the Index, has announced an index methodology revision for the Index to address certain diversification requirements under Section 851 of the Internal Revenue Code of 1986, as amended. The revised index methodology was implemented with respect to the Index effective June 1, 2024. For more information, please see the Fund’s Prospectus and Summary Prospectus.
For additional information about the Fund; including its prospectus, financial information, holdings and proxy information, scan the QR code or visit https://fooletfs.com/our-funds
HOUSEHOLDING
To reduce Fund expenses, only one copy of most shareholder documents may be mailed to shareholders with multiple accounts at the same address (Householding). If you would prefer that your Fund documents not be householded, please contact the Fund at 1-703-302-1100, or contact your financial intermediary. Your instructions will typically be effective within 30 days of receipt by the Fund or your financial intermediary.
| Motley Fool 100 Index ETF | PAGE 3 | TSR-AR-74933W601 |
11049113001702621409173032123328158110651127917019214281730521222281281029110592129151694015038174362216811072113861724121798177032184129102
| | |
| Motley Fool Small-Cap Growth ETF | |
TMFS (Principal U.S. Listing Exchange: CBOE) |
Annual Shareholder Report | August 31, 2024 |
This annual shareholder report contains important information about the Motley Fool Small-Cap Growth ETF (the “Fund”) for the period of September 1, 2023, to August 31, 2024. You can find additional information about the Fund at https://fooletfs.com/our-funds. You can also request this information by contacting us at 1-703-302-1100.
WHAT WERE THE FUND COSTS FOR THE PAST YEAR? (based on a hypothetical $10,000 investment)
| | |
Fund Name | Costs of a $10,000 investment | Costs paid as a percentage of a $10,000 investment |
| Motley Fool Small-Cap Growth ETF | $90 | 0.85% |
HOW DID THE FUND PERFORM LAST YEAR AND WHAT AFFECTED ITS PERFORMANCE?
For the 12-month period ended August 31, 2024 (the “period”), the Fund underperformed its benchmark, the Russell 2000 Growth Total Return Index. Importantly, the Fund made proress towards its investment objective of capital appreciation.
WHAT FACTORS INFLUENCED PERFORMANCE?
While small cap stocks failed to keep up with the blistering performance of their larger brethren, and while there were three 10% peak-to-trough declines in the Russell 2000 Growth Total Return Index, it was still a healthy 12-month showing for smaller companies. Nine of 11 sectors increased in value (Utilities and Energy were the laggards) with six up more than 15%.
The Fund benefitted from this rising tide. The Fund’s performance was acutely impacted by the poor performance of a few individual holdings, notably in the Consumer Discretionary and Information Technology sectors. In a portfolio of only 35 or so holdings, a few negative performers can have a big impact. While concentration works both ways, it was a detractor during this period, and the Fund’s stronger performance in the Financials and Industrials sectors were not enough to overcome it.
A FUN FACT ABOUT THE PORTFOLIO!
Of the 34 stocks that the Fund holds at period end, insiders at the company own an average of 4.7% of the outstanding shares. Over 70% of the Fund’s holdings have insider ownership greater than 1%.
| |
Top Contributors |
| ↑ | Q2 Holdings, Inc. (NYSE:QTWO) |
| ↑ | Axon Enterprise, Inc. (NasdaqGS:AXON) |
| ↑ | Leonardo DRS, Inc. (NasdaqGS:DRS) |
| |
Top Detractors |
| ↓ | Fox Factory Holding Corp. (NasdaqGS:FOXF) |
| ↓ | Inari Medical (NasdaqGS:NARI) |
| ↓ | Wolfspeed, Inc. (NYSE:WOLF) |
HOW DID THE FUND PERFORM SINCE INCEPTION?*
The $10,000 chart reflects a hypothetical $10,000 investment in the class of shares noted. The chart uses total return NAV performance and assumes reinvestment of dividends and capital gains. Fund expenses, including management fees and other expenses were deducted.
| Motley Fool Small-Cap Growth ETF | PAGE 1 | TSR-AR-74933W874 |
CUMULATIVE PERFORMANCE (Initial Investment of $10,000)
| | 10/29/2018 | 10/31/2018 | 11/30/2018 | 12/31/2018 | 01/31/2019 | 02/28/2019 | 03/31/2019 | 04/30/2019 | 05/31/2019 | 06/30/2019 | 07/31/2019 | 08/31/2019 | 09/30/2019 | 10/31/2019 | 11/30/2019 | 12/31/2019 | 01/31/2020 | 02/29/2020 | 03/31/2020 | 04/30/2020 | 05/31/2020 | 06/30/2020 | 07/31/2020 | 08/31/2020 | 09/30/2020 | 10/31/2020 | 11/30/2020 | 12/31/2020 | 01/31/2021 | 02/28/2021 | 03/31/2021 | 04/30/2021 | 05/31/2021 | 06/30/2021 | 07/31/2021 | 08/31/2021 | 09/30/2021 | 10/31/2021 | 11/30/2021 | 12/31/2021 | 01/31/2022 | 02/28/2022 | 03/31/2022 | 04/30/2022 | 05/31/2022 | 06/30/2022 | 07/31/2022 | 08/31/2022 | 09/30/2022 | 10/31/2022 | 11/30/2022 | 12/31/2022 | 01/31/2023 | 02/28/2023 | 03/31/2023 | 04/30/2023 | 05/31/2023 | 06/30/2023 | 07/31/2023 | 08/31/2023 | 09/30/2023 | 10/31/2023 | 11/30/2023 | 12/31/2023 | 01/31/2024 | 02/29/2024 | 03/31/2024 | 04/30/2024 | 05/31/2024 | 06/30/2024 | 07/31/2024 | 08/31/2024 |
| Motley Fool Small-Cap Growth ETF (at Net Asset Value) | 10,000 | 10,371 | 10,496 | 9,413 | 10,628 | 11,834 | 11,600 | 11,916 | 11,116 | 12,034 | 12,288 | 11,665 | 11,239 | 11,560 | 12,996 | 13,021 | 13,510 | 12,990 | 10,718 | 12,457 | 14,047 | 14,577 | 15,284 | 16,515 | 15,553 | 16,323 | 18,924 | 20,560 | 21,103 | 21,953 | 20,086 | 20,987 | 20,045 | 21,362 | 21,200 | 21,799 | 20,937 | 21,309 | 19,514 | 20,090 | 17,473 | 16,991 | 17,040 | 15,228 | 14,084 | 12,880 | 13,724 | 13,808 | 12,747 | 13,305 | 13,751 | 13,463 | 14,997 | 14,602 | 14,737 | 14,996 | 14,697 | 15,802 | 16,601 | 16,036 | 15,340 | 14,273 | 15,059 | 16,847 | 16,100 | 16,966 | 17,530 | 16,190 | 17,035 | 17,127 | 18,565 | 17,940 |
| Motley Fool Small-Cap Growth ETF (at Market Price) | 10,000 | 10,395 | 10,525 | 9,405 | 10,625 | 11,860 | 11,585 | 11,917 | 11,135 | 12,050 | 12,290 | 11,669 | 11,250 | 11,540 | 13,012 | 13,006 | 13,515 | 12,996 | 10,559 | 12,433 | 13,986 | 14,500 | 15,232 | 16,556 | 15,562 | 16,309 | 19,045 | 20,598 | 21,122 | 21,982 | 20,047 | 20,983 | 20,058 | 21,378 | 21,223 | 21,777 | 20,916 | 21,341 | 19,484 | 20,104 | 17,433 | 16,956 | 17,073 | 15,205 | 14,076 | 12,772 | 13,698 | 13,799 | 12,742 | 13,301 | 13,651 | 13,442 | 14,952 | 14,585 | 14,674 | 14,951 | 14,684 | 15,796 | 16,575 | 16,037 | 15,324 | 14,259 | 15,043 | 16,856 | 16,114 | 16,969 | 17,524 | 16,183 | 17,012 | 17,104 | 18,549 | 17,925 |
| Russell 3000 Total Return Index ** | 10,000 | 10,271 | 10,477 | 9,502 | 10,318 | 10,681 | 10,836 | 11,269 | 10,540 | 11,280 | 11,448 | 11,215 | 11,411 | 11,657 | 12,100 | 12,450 | 12,436 | 11,418 | 9,848 | 11,152 | 11,748 | 12,017 | 12,699 | 13,619 | 13,123 | 12,840 | 14,402 | 15,050 | 14,983 | 15,451 | 16,005 | 16,830 | 16,907 | 17,324 | 17,617 | 18,119 | 17,306 | 18,477 | 18,195 | 18,912 | 17,799 | 17,351 | 17,914 | 16,306 | 16,284 | 14,922 | 16,322 | 15,713 | 14,256 | 15,425 | 16,230 | 15,280 | 16,332 | 15,950 | 16,377 | 16,551 | 16,616 | 17,750 | 18,386 | 18,031 | 17,173 | 16,717 | 18,276 | 19,246 | 19,459 | 20,512 | 21,174 | 20,242 | 21,199 | 21,855 | 22,261 | 22,746 |
| Russell 2000 Growth Total Return Index | 10,000 | 10,313 | 10,474 | 9,250 | 10,318 | 10,985 | 10,836 | 11,166 | 10,338 | 11,134 | 11,243 | 10,758 | 10,669 | 10,973 | 11,619 | 11,885 | 11,754 | 10,905 | 8,823 | 10,137 | 11,095 | 11,521 | 11,917 | 12,616 | 12,346 | 12,440 | 14,633 | 16,001 | 16,772 | 17,326 | 16,781 | 17,147 | 16,657 | 17,438 | 16,803 | 17,109 | 16,453 | 17,223 | 16,382 | 16,455 | 14,249 | 14,311 | 14,377 | 12,613 | 12,375 | 11,609 | 12,908 | 12,787 | 11,637 | 12,741 | 12,949 | 12,118 | 13,323 | 13,179 | 12,853 | 12,704 | 12,706 | 13,760 | 14,403 | 13,653 | 12,753 | 11,769 | 12,841 | 14,378 | 13,917 | 15,048 | 15,469 | 14,278 | 15,042 | 15,017 | 16,246 | 16,066 |
ANNUAL AVERAGE TOTAL RETURN (%)
| | | |
| | 1 Year | 5 Years | Since Inception
(10/29/2018) |
Motley Fool Small-Cap Growth ETF (at Net Asset Value) | 11.87 | 8.99 | 10.53 |
Motley Fool Small-Cap Growth ETF (at Market Price) | 11.77 | 8.96 | 10.51 |
Russell 3000 Total Return Index** | 26.14 | 15.19 | 15.11 |
Russell 2000 Growth Total Return Index | 17.67 | 8.35 | 8.46 |
Visit https://fooletfs.com/our-funds for more recent performance information.
| * | The Fund’s past performance is not a good predictor of how the Fund will perform in the future. The graph and table do not reflect the deduction of taxes that a shareholder would pay on Fund distributions or redemption of Fund shares. |
| ** | Effective with this report and pursuant to new regulatory requirements, the Russell 3000 Index replaced the Russell 2000 Growth Total Return Index as the Fund’s primary benchmark to represent a broad-based securities market index. |
KEY FUND STATISTICS (as of August 31, 2024)
| |
Net Assets | $78,248,680 |
Number of Holdings | 35 |
Net Advisory Fee | $665,835 |
Portfolio Turnover | 30% |
30-Day SEC Yield | -0.32% |
30-Day SEC Yield Unsubsidized | -0.32% |
WHAT DID THE FUND INVEST IN? (as of August 31, 2024)
| |
Top 10 Holdings | (% of Net Assets) |
Globus Medical, Inc. | 4.8% |
Axon Enterprise, Inc. | 4.4% |
Leonardo DRS, Inc. | 4.3% |
Alarm.com Holdings, Inc. | 4.3% |
Goosehead Insurance, Inc. | 4.2% |
RXO, Inc. | 4.2% |
Ultragenyx Pharmaceutical, Inc. | 3.8% |
Smartsheet, Inc. | 3.7% |
Watsco, Inc. | 3.6% |
GXO Logistics, Inc. | 3.6% |
| |
Top Sectors | (% of Net Assets) |
Industrials | 26.8% |
Health Care | 22.1% |
Information Technology | 21.0% |
Financials | 14.2% |
Consumer Discretionary | 7.3% |
Energy | 3.3% |
Real Estate | 2.6% |
Consumer Staples | 2.1% |
Cash & Other | 0.6% |
| Motley Fool Small-Cap Growth ETF | PAGE 2 | TSR-AR-74933W874 |
For additional information about the Fund; including its prospectus, financial information, holdings and proxy information, scan the QR code or visit https://fooletfs.com/our-funds
HOUSEHOLDING
To reduce Fund expenses, only one copy of most shareholder documents may be mailed to shareholders with multiple accounts at the same address (Householding). If you would prefer that your Fund documents not be householded, please contact the Fund at 1-703-302-1100, or contact your financial intermediary. Your instructions will typically be effective within 30 days of receipt by the Fund or your financial intermediary.
| Motley Fool Small-Cap Growth ETF | PAGE 3 | TSR-AR-74933W874 |
116651651521799138081603617940116691655621777137991603717925112151361918119157131803122746107581261617109127871365316066
| | |
| Motley Fool Capital Efficiency 100 Index ETF | |
TMFE (Principal U.S. Listing Exchange: NYSE) |
Annual Shareholder Report | August 31, 2024 |
This annual shareholder report contains important information about the Motley Fool Capital Efficiency 100 Index ETF (the “Fund”) for the period of September 1, 2023, to August 31, 2024. You can find additional information about the Fund at https://fooletfs.com/our-funds. You can also request this information by contacting us at 1-703-302-1100.
This report describes changes to the Fund that occurred during the reporting period.
WHAT WERE THE FUND COSTS FOR THE PAST YEAR? (based on a hypothetical $10,000 investment)
| | |
Fund Name | Costs of a $10,000 investment | Costs paid as a percentage of a $10,000 investment |
| Motley Fool Capital Efficiency 100 Index ETF | $59 | 0.50% |
HOW DID THE FUND PERFORM LAST YEAR AND WHAT AFFECTED ITS PERFORMANCE?
For the 12-month period ended August 31, 2024, the Fund outperformed its benchmark, the S&P 500 Total Return Index (the “S&P 500”), and closely tracked its underlying index, The Motley Fool Capital Efficiency 100 Index.
WHAT FACTORS INFLUENCED PERFORMANCE?
The Fund invests in US stocks, which had a very strong twelve months. Looking more closely at US stocks, performance of the largest companies -- often referred to as “mega caps” -- was even better. As it was, the Fund benefitted from considerable exposure to mega caps, as more than 75% of assets were invested in stocks with a market cap greater than $100 billion.
Both sector exposures and individual position weightings contributed positively to performance. This means that, in aggregate, the sector over- and underweights, and position over- and underweights boosted returns. More specifically, investments in the Information Technology and Communication Services sectors provided the strongest tailwinds, while investments in the Financials and Health Care sectors created headwinds, at least when compared to the S&P 500.
A FUN FACT ABOUT THE PORTFOLIO!
The Fund aims to track the Motley Fool Capital Efficiency Index that borrows from the academic research on the gross profitability premium published by Robert Novy-Marx at the University of Rochester.
| |
Top Contributors |
| ↑ | NVIDIA Corp. (NasdaqGS:NVDA) |
| ↑ | Meta Platforms, Inc. (NasdaqGS:META) |
| ↑ | Broadcom Inc. (NasdaqGS:AVGO) |
| |
Top Detractors |
| ↓ | Oracle Corp. NYSE:ORCL) |
| ↓ | Johnson & Johnson (NYSE:JNJ) |
| ↓ | VMware LLC (NYSE:VMW) |
HOW DID THE FUND PERFORM SINCE INCEPTION?*
The $10,000 chart reflects a hypothetical $10,000 investment in the class of shares noted. The chart uses total return NAV performance and assumes reinvestment of dividends and capital gains. Fund expenses, including management fees and other expenses were deducted.
| Motley Fool Capital Efficiency 100 Index ETF | PAGE 1 | TSR-AR-74933W643 |
CUMULATIVE PERFORMANCE (Initial Investment of $10,000)
| | 12/30/2021 | 12/31/2021 | 01/31/2022 | 02/28/2022 | 03/31/2022 | 04/30/2022 | 05/31/2022 | 06/30/2022 | 07/31/2022 | 08/31/2022 | 09/30/2022 | 10/31/2022 | 11/30/2022 | 12/31/2022 | 01/31/2023 | 02/28/2023 | 03/31/2023 | 04/30/2023 | 05/31/2023 | 06/30/2023 | 07/31/2023 | 08/31/2023 | 09/30/2023 | 10/31/2023 | 11/30/2023 | 12/31/2023 | 01/31/2024 | 02/29/2024 | 03/31/2024 | 04/30/2024 | 05/31/2024 | 06/30/2024 | 07/31/2024 | 08/31/2024 |
| Motley Fool Capital Efficiency 100 Index ETF (at Net Asset Value) | 10,000 | 9,947 | 9,183 | 8,739 | 9,007 | 8,039 | 7,970 | 7,335 | 8,144 | 7,687 | 6,926 | 7,307 | 7,817 | 7,396 | 7,954 | 7,723 | 8,266 | 8,470 | 8,772 | 9,367 | 9,674 | 9,594 | 9,128 | 9,094 | 10,000 | 10,434 | 10,845 | 11,532 | 11,708 | 11,132 | 11,719 | 12,431 | 12,434 | 12,898 |
| Motley Fool Capital Efficiency 100 Index ETF (at Market Price) | 10,000 | 9,964 | 9,207 | 8,748 | 9,190 | 8,049 | 8,050 | 7,296 | 8,114 | 7,691 | 6,944 | 7,303 | 7,750 | 7,390 | 7,931 | 7,720 | 8,265 | 8,465 | 8,772 | 9,380 | 9,664 | 9,613 | 9,126 | 9,096 | 10,001 | 10,428 | 10,867 | 11,578 | 11,764 | 11,145 | 11,706 | 12,435 | 12,516 | 12,914 |
| S&P 500 Total Return Index | 10,000 | 9,974 | 9,458 | 9,175 | 9,516 | 8,686 | 8,702 | 7,983 | 8,720 | 8,364 | 7,594 | 8,208 | 8,667 | 8,168 | 8,681 | 8,469 | 8,780 | 8,917 | 8,956 | 9,548 | 9,854 | 9,698 | 9,235 | 9,041 | 9,867 | 10,315 | 10,488 | 11,048 | 11,404 | 10,938 | 11,480 | 11,892 | 12,037 | 12,329 |
| Motley Fool Capital Efficiency 100 - Total Return Index | 10,000 | 9,949 | 9,184 | 8,738 | 9,011 | 8,039 | 7,979 | 7,334 | 8,148 | 7,693 | 6,933 | 7,319 | 7,835 | 7,416 | 7,980 | 7,751 | 8,300 | 8,508 | 8,816 | 9,419 | 9,732 | 9,656 | 9,188 | 9,152 | 10,049 | 10,494 | 10,914 | 11,615 | 11,798 | 11,220 | 11,818 | 12,541 | 12,550 | 13,025 |
ANNUAL AVERAGE TOTAL RETURN (%)
| | |
| | 1 Year | Since Inception
(12/30/2021) |
Motley Fool Capital Efficiency 100 Index ETF (at Net Asset Value) | 34.44 | 10.01 |
Motley Fool Capital Efficiency 100 Index ETF (at Market Price) | 34.34 | 10.06 |
S&P 500 Total Return Index | 27.14 | 8.16 |
Motley Fool Capital Efficiency 100 - Total Return Index | 34.89 | 10.41 |
Visit https://fooletfs.com/our-funds for more recent performance information.
| * | The Fund’s past performance is not a good predictor of how the Fund will perform in the future. The graph and table do not reflect the deduction of taxes that a shareholder would pay on Fund distributions or redemption of Fund shares. |
KEY FUND STATISTICS (as of August 31, 2024)
| |
Net Assets | $47,326,338 |
Number of Holdings | 100 |
Net Advisory Fee | $170,046 |
Portfolio Turnover | 35% |
30-Day SEC Yield | 0.24% |
30-Day SEC Yield Unsubsidized | 0.24% |
WHAT DID THE FUND INVEST IN? (as of August 31, 2024)
| |
Top 10 Holdings | (% of Net Assets) |
UnitedHealth Group, Inc. | 5.6% |
Eli Lilly & Co. | 5.0% |
Mastercard, Inc. | 5.0% |
Apple, Inc. | 4.9% |
Meta Platforms, Inc. | 4.8% |
Costco Wholesale Corp. | 4.8% |
Visa, Inc. | 4.7% |
Home Depot, Inc. | 4.7% |
Amazon.com, Inc. | 4.5% |
Microsoft Corp. | 4.3% |
| |
Top Sectors | (% of Net Assets) |
Information Technology | 32.7% |
Health Care | 19.3% |
Communication Services | 13.4% |
Consumer Discretionary | 11.6% |
Financials | 10.5% |
Consumer Staples | 5.6% |
Industrials | 4.5% |
Materials | 2.2% |
Cash & Other | 0.2% |
Material Fund Changes
This is a summary of certain changes to the Fund since February 29, 2024. For more complete information, you may review the Fund’s next prospectus, which we expect to be available by December 31, 2024 at https://fooletfs.com/our-funds or upon request at 1-703-302-1100.
| Motley Fool Capital Efficiency 100 Index ETF | PAGE 2 | TSR-AR-74933W643 |
The Fund seeks investment results that correspond (before fees and expenses) generally to the total return performance of the Motley Fool Capital Efficiency 100 Index (“Index”). The Motley Fool, LLC, the sponsor of the Index, has announced an index methodology revision for the Index to address certain diversification requirements under Section 851 of the Internal Revenue Code of 1986, as amended. The revised index methodology was implemented with respect to the Index effective June 1, 2024. For more information, please see the Fund’s Prospectus and Summary Prospectus.
For additional information about the Fund; including its prospectus, financial information, holdings and proxy information, scan the QR code or visit https://fooletfs.com/our-funds
HOUSEHOLDING
To reduce Fund expenses, only one copy of most shareholder documents may be mailed to shareholders with multiple accounts at the same address (Householding). If you would prefer that your Fund documents not be householded, please contact the Fund at 1-703-302-1100, or contact your financial intermediary. Your instructions will typically be effective within 30 days of receipt by the Fund or your financial intermediary.
| Motley Fool Capital Efficiency 100 Index ETF | PAGE 3 | TSR-AR-74933W643 |
7687959412898769196131291483649698123297693965613025
| | |
| Motley Fool Next Index ETF | |
TMFX (Principal U.S. Listing Exchange: NYSE) |
Annual Shareholder Report | August 31, 2024 |
This annual shareholder report contains important information about the Motley Fool Next Index ETF (the “Fund”) for the period of September 1, 2023, to August 31, 2024. You can find additional information about the Fund at https://fooletfs.com/our-funds. You can also request this information by contacting us at 1-703-302-1100.
WHAT WERE THE FUND COSTS FOR THE PAST YEAR? (based on a hypothetical $10,000 investment)
| | |
Fund Name | Costs of a $10,000 investment | Costs paid as a percentage of a $10,000 investment |
| Motley Fool Next Index ETF | $54 | 0.50% |
HOW DID THE FUND PERFORM LAST YEAR AND WHAT AFFECTED ITS PERFORMANCE?
For the 12-month period ended August 31, 2024 (the “period”), the Fund underperformed its benchmark, the Russell Midcap Growth Total Return Index, and closely tracked its underlying index, the Motley Fool Next Index (the “Index”).
WHAT FACTORS INFLUENCED PERFORMANCE?
A primary driver of US stock returns for the period was size: generally speaking, the bigger the company, the better the returns. In absolute, the return of middle sized stocks (mid-caps) was strong. Although mid-caps did not keep pace with large- or mega-cap stocks, they outpaced small-caps. The Fund’s holdings, as measured by median market cap, are about half as large as the Russell Midcap Growth Index, which turned out to hurt the relative comparison for the year.
The index that underlies the Fund, the Motley Fool Next Index, consists of stocks that are actively recommended or are high conviction picks from the research team at The Motley Fool, LLC, the sponsor of the Index. Therefore, security selection will often be an important explanatory factor in performance, and it was so this period. On average, the securities selected underperformed the index constituents, most notably in the Communication Services sector. Security selection in the Health Care sector did positively contribute to relative returns, but not enough to overcome shortcomings in other sectors.
A FUN FACT ABOUT THE PORTFOLIO!
At August 31, 2024, the Fund held the stock of 197 companies headquartered across 35 US states and Washington, DC. It probably isn’t surprising that the highest concentration resides in California (51 companies), but it might be surprising that Massachusetts is next in line (18 companies).
| |
Top Contributors |
| ↑ | Fair Isaac Corp. (NYSE:FICO) |
| ↑ | GoDaddy Inc. (NYSE:GDDY) |
| ↑ | Axon Enterprise, Inc. (NasdaqGS:AXON) |
| |
Top Detractors |
| ↓ | Paycom Software, Inc. (NYSE:PAYC) |
| ↓ | Unity Software Inc. (NYSE:U) |
| ↓ | Celsius Holdings, Inc. (NasdaqGS:CELH) |
HOW DID THE FUND PERFORM SINCE INCEPTION?*
The $10,000 chart reflects a hypothetical $10,000 investment in the class of shares noted. The chart uses total return NAV performance and assumes reinvestment of dividends and capital gains. Fund expenses, including management fees and other expenses were deducted.
| Motley Fool Next Index ETF | PAGE 1 | TSR-AR-74933W650 |
CUMULATIVE PERFORMANCE (Initial Investment of $10,000)
| | 12/30/2021 | 12/31/2021 | 01/31/2022 | 02/28/2022 | 03/31/2022 | 04/30/2022 | 05/31/2022 | 06/30/2022 | 07/31/2022 | 08/31/2022 | 09/30/2022 | 10/31/2022 | 11/30/2022 | 12/31/2022 | 01/31/2023 | 02/28/2023 | 03/31/2023 | 04/30/2023 | 05/31/2023 | 06/30/2023 | 07/31/2023 | 08/31/2023 | 09/30/2023 | 10/31/2023 | 11/30/2023 | 12/31/2023 | 01/31/2024 | 02/29/2024 | 03/31/2024 | 04/30/2024 | 05/31/2024 | 06/30/2024 | 07/31/2024 | 08/31/2024 |
| Motley Fool Next Index ETF (at Net Asset Value) | 10,000 | 9,947 | 8,838 | 8,756 | 8,720 | 7,683 | 7,412 | 6,869 | 7,619 | 7,512 | 6,795 | 7,308 | 7,611 | 7,173 | 7,916 | 7,643 | 7,637 | 7,437 | 7,433 | 8,025 | 8,295 | 7,904 | 7,401 | 6,867 | 7,659 | 8,459 | 8,204 | 8,644 | 8,813 | 8,299 | 8,577 | 8,684 | 8,933 | 9,114 |
| Motley Fool Next Index ETF (at Market Price) | 10,000 | 9,975 | 8,860 | 8,766 | 8,735 | 7,675 | 7,420 | 6,855 | 7,615 | 7,503 | 6,760 | 7,307 | 7,591 | 7,166 | 7,897 | 7,641 | 7,617 | 7,433 | 7,431 | 8,030 | 8,287 | 7,907 | 7,401 | 6,870 | 7,662 | 8,452 | 8,191 | 8,633 | 8,814 | 8,303 | 8,563 | 8,628 | 8,931 | 9,107 |
| Russell 3000 Total Return Index ** | 10,000 | 9,973 | 9,386 | 9,149 | 9,446 | 8,599 | 8,587 | 7,869 | 8,607 | 8,286 | 7,517 | 8,134 | 8,558 | 8,057 | 8,612 | 8,411 | 8,636 | 8,728 | 8,762 | 9,360 | 9,696 | 9,508 | 9,055 | 8,815 | 9,637 | 10,149 | 10,261 | 10,817 | 11,165 | 10,674 | 11,178 | 11,525 | 11,739 | 11,994 |
| Russell Midcap Growth Total Return Index | 10,000 | 9,957 | 8,672 | 8,567 | 8,704 | 7,724 | 7,425 | 6,870 | 7,711 | 7,458 | 6,825 | 7,362 | 7,762 | 7,296 | 7,933 | 7,855 | 7,963 | 7,848 | 7,853 | 8,460 | 8,716 | 8,428 | 8,018 | 7,608 | 8,537 | 9,184 | 9,134 | 9,821 | 10,056 | 9,472 | 9,573 | 9,733 | 9,792 | 10,035 |
| Motley Fool Next - Total Return Index | 10,000 | 9,957 | 8,834 | 8,755 | 8,723 | 7,685 | 7,417 | 6,871 | 7,632 | 7,528 | 6,811 | 7,330 | 7,638 | 7,195 | 7,947 | 7,675 | 7,672 | 7,476 | 7,477 | 8,075 | 8,351 | 7,961 | 7,458 | 6,923 | 7,727 | 8,540 | 8,285 | 8,735 | 8,913 | 8,396 | 8,682 | 8,795 | 9,053 | 9,240 |
ANNUAL AVERAGE TOTAL RETURN (%)
| | |
| | 1 Year | Since Inception
(12/30/2021) |
Motley Fool Next Index ETF (at Net Asset Value) | 15.31 | -3.42 |
Motley Fool Next Index ETF (at Market Price) | 15.18 | -3.44 |
Russell 3000 Total Return Index** | 26.14 | 7.05 |
Russell Midcap Growth Total Return Index | 19.07 | 0.13 |
Motley Fool Next - Total Return Index | 16.06 | -2.92 |
Visit https://fooletfs.com/our-funds for more recent performance information.
| * | The Fund’s past performance is not a good predictor of how the Fund will perform in the future. The graph and table do not reflect the deduction of taxes that a shareholder would pay on Fund distributions or redemption of Fund shares. |
| ** | Effective with this report, and pursuant to new regulatory requirements, the Russell 3000 Index replaced the Russell MidCap Growth Total Return Index as the Fund’s primary benchmark to represent a broad-based securities market index. |
KEY FUND STATISTICS (as of August 31, 2024)
| |
Net Assets | $24,514,571 |
Number of Holdings | 197 |
Net Advisory Fee | $129,230 |
Portfolio Turnover | 18% |
30-Day SEC Yield | 0.07% |
30-Day SEC Yield Unsubsidized | 0.07% |
WHAT DID THE FUND INVEST IN? (as of August 31, 2024)
| |
Top 10 Holdings | (% of Net Assets) |
Alnylam Pharmaceuticals, Inc. | 1.9% |
HEICO Corp. | 1.8% |
Westinghouse Air Brake Technologies Corp. | 1.7% |
NVR, Inc. | 1.7% |
Tractor Supply Co. | 1.7% |
Take-Two Interactive Software, Inc. | 1.6% |
Cloudflare, Inc. | 1.6% |
Axon Enterprise, Inc. | 1.6% |
HubSpot, Inc. | 1.5% |
Broadridge Financial Solutions, Inc. | 1.5% |
| |
Top Sectors | (% of Net Assets) |
Information Technology | 26.2% |
Industrials | 18.9% |
Consumer Discretionary | 17.6% |
Health Care | 12.4% |
Financials | 10.8% |
Communication Services | 6.0% |
Consumer Staples | 4.2% |
Real Estate | 1.3% |
Materials | 1.2% |
Cash & Other | 1.4% |
| Motley Fool Next Index ETF | PAGE 2 | TSR-AR-74933W650 |
For additional information about the Fund; including its prospectus, financial information, holdings and proxy information, scan the QR code or visit https://fooletfs.com/our-funds
HOUSEHOLDING
To reduce Fund expenses, only one copy of most shareholder documents may be mailed to shareholders with multiple accounts at the same address (Householding). If you would prefer that your Fund documents not be householded, please contact the Fund at 1-703-302-1100, or contact your financial intermediary. Your instructions will typically be effective within 30 days of receipt by the Fund or your financial intermediary.
| Motley Fool Next Index ETF | PAGE 3 | TSR-AR-74933W650 |
75127904911475037907910782869508119947458842810035752879619240
| | |
| Optima Strategic Credit Fund | |
Founders Class Shares | OPTCX |
Annual Shareholder Report | August 31, 2024 |
This annual shareholder report contains important information about the Optima Strategic Credit Fund (the “Fund”) for the period of September 1, 2023, to August 31, 2024. You can find additional information about the Fund at https://rbbfund.com/additional-fund-information/. You can also request this information by contacting us at 1-866-239-2026.
WHAT WERE THE FUND COSTS FOR THE PAST YEAR? (based on a hypothetical $10,000 investment)
| | |
Class Name | Costs of a $10,000 investment | Costs paid as a percentage of a $10,000 investment |
| Founders Class Shares | $212 | 2.06% |
HOW DID THE FUND PERFORM LAST YEAR AND WHAT AFFECTED ITS PERFORMANCE?
Throughout the latter half of 2023 the Fund was mostly positioned in a “risk-off” posture due to, what we believed to be, unfavorable trends in credit markets by allocating to short-duration U.S. treasury bills. The environment dramatically changed towards the end of 2023. The Fund’s systematic model favored a “risk-on” environment throughout 1Q 2024 and much of 2Q 2024 and tactically allocated to higher-yielding credit instruments. At 8/31/2024, the Fund continues to be invested in higher-yielding credit as the Fund’s systematic model continues to favor “risk-on”.
HOW DID THE FUND PERFORM SINCE INCEPTION?*
The $10,000 chart reflects a hypothetical $10,000 investment in the class of shares noted. The chart uses total return NAV performance and assumes reinvestment of dividends and capital gains. Fund expenses, including management fees and other expenses were deducted.
CUMULATIVE PERFORMANCE (Initial Investment of $10,000)
| | 12/29/2021 | 12/31/2021 | 01/31/2022 | 02/28/2022 | 03/31/2022 | 04/30/2022 | 05/31/2022 | 06/30/2022 | 07/31/2022 | 08/31/2022 | 09/30/2022 | 10/31/2022 | 11/30/2022 | 12/31/2022 | 01/31/2023 | 02/28/2023 | 03/31/2023 | 04/30/2023 | 05/31/2023 | 06/30/2023 | 07/31/2023 | 08/31/2023 | 09/30/2023 | 10/31/2023 | 11/30/2023 | 12/31/2023 | 01/31/2024 | 02/29/2024 | 03/31/2024 | 04/30/2024 | 05/31/2024 | 06/30/2024 | 07/31/2024 | 08/31/2024 |
| Optima Strategic Credit Fund Founders Class Shares | 10000 | 10000 | 9990 | 9990 | 9970 | 9950 | 9950 | 9910 | 9900 | 9890 | 9882 | 9882 | 9922 | 9906 | 9936 | 9886 | 9826 | 9816 | 9846 | 9872 | 9912 | 9902 | 9937 | 9970 | 10001 | 10089 | 10134 | 10252 | 10412 | 10362 | 10468 | 10491 | 10480 | 10491 |
| Bloomberg U.S. Universal Total Return Index | 10000 | 10032 | 9813 | 9679 | 9419 | 9068 | 9118 | 8935 | 9160 | 8922 | 8538 | 8444 | 8759 | 8729 | 9000 | 8779 | 8985 | 9039 | 8946 | 8932 | 8941 | 8887 | 8675 | 8545 | 8929 | 9268 | 9246 | 9135 | 9225 | 9009 | 9158 | 9242 | 9452 | 9591 |
| Markit CDX.NA.HY 5Y Long Total Return Index | 10000 | 10002 | 9816 | 9728 | 9802 | 9474 | 9520 | 9107 | 9536 | 9370 | 9290 | 9675 | 10004 | 9947 | 10246 | 10180 | 10196 | 10261 | 10314 | 10582 | 10757 | 10773 | 10689 | 10632 | 11106 | 11412 | 11481 | 11663 | 11840 | 11783 | 11995 | 12028 | 12202 | 12345 |
ANNUAL AVERAGE TOTAL RETURN (%)
| | |
| | 1 Year | Since Inception
(12/29/2021) |
Founders Class Shares | 5.95 | 1.81 |
Bloomberg U.S. Universal Total Return Index | 7.92 | -1.55 |
Markit CDX.NA.HY 5Y Long Total Return Index | 14.59 | 8.21 |
Visit https://rbbfund.com/additional-fund-information/ for more recent performance information.
| * | The Fund’s past performance is not a good predictor of how the Fund will perform in the future. The graph and table do not reflect the deduction of taxes that a shareholder would pay on Fund distributions or redemption of Fund shares. |
| Optima Strategic Credit Fund | PAGE 1 | TSR-AR-74933W718 |
KEY FUND STATISTICS (as of August 31, 2024)
| |
Net Assets | $21,385,816 |
Number of Holdings | 2 |
Net Advisory Fee | $96,075 |
Portfolio Turnover | 0% |
WHAT DID THE FUND INVEST IN? (as of August 31, 2024)
| |
Top 10 Holdings | (% of Net Assets) |
First American Treasury Obligations Fund | 76.9% |
CDX North American High Yield Index Series 42 | 6.9% |
| |
Top Sectors | (% of Net Assets) |
Cash & Other | 100.0% |
This annual shareholder report contains important information about the Optima Strategic Credit Fund (the “Fund”) for the period of September 1, 2023, to August 31, 2024. You can find additional information about the Fund at https://rbbfund.com/additional-fund-information/. You can also request this information by contacting us at 1-866-239-2026.
HOUSEHOLDING
To reduce Fund expenses, only one copy of most shareholder documents may be mailed to shareholders with multiple accounts at the same address (Householding). If you would prefer that your Optima Asset Management LLC documents not be householded, please contact Optima Asset Management LLC at 1-866-239-2026, or contact your financial intermediary. Your instructions will typically be effective within 30 days of receipt by Optima Asset Management LLC or your financial intermediary.
| Optima Strategic Credit Fund | PAGE 2 | TSR-AR-74933W718 |
989099021049189228887959193701077312345
| | |
| SGI US Large Cap Core ETF | |
SGLC (Principal U.S. Listing Exchange: NYSE) |
Annual Shareholder Report | August 31, 2024 |
This annual shareholder report contains important information about the SGI US Large Cap Core ETF (the “Fund”) for the period of September 1, 2023 to August 31, 2024. You can find additional information about the Fund at https://sgiam.com/literature/. You can also request this information by contacting us at 1-855-744-8500.
WHAT WERE THE FUND COSTS FOR THE PAST YEAR? (based on a hypothetical $10,000 investment)
| | |
Fund Name | Costs of a $10,000 investment | Costs paid as a percentage of a $10,000 investment |
| SGI US Large Cap Core ETF | $97 | 0.85% |
HOW DID THE FUND PERFORM LAST YEAR AND WHAT AFFECTED ITS PERFORMANCE?
For the fiscal year ending August 31, 2024, net of fees, the Fund returned 27.67% outperforming its benchmark, the S&P 500 TR Index, which returned 27.14%. The Fund also outperformed its secondary benchmark, the Russell 1000 Total Return Index, which returned 26.60%. Active management meaningfully contributed to outperformance with strong stock selection as the primary reason, but allocation decisions partially offset these gains.
WHAT FACTORS INFLUENCED PERFORMANCE?
To crush skyrocketing inflation, the Federal Reserve raised the fed funds rate a significant 5.25% during a 16-month period from March 2022 through July 2023. This approach was effective and all key U.S. inflation indicators fell during the fiscal year. As a result, the Federal Reserve signaled no further rate increases and the possibility of upcoming rate cuts. This sparked a strong rally in equities and risk assets in general. Growth stocks, particularly semiconductor and AI related stocks, had tremendous performance. Broad market indices of international stocks also performed well, however, U.S market indices performed even better with many reaching all-time highs.
WHAT WERE THE TOP CONTRIBUTORS AND DETRACTORS?
The most contributing sectors to performance were Information Technology and Financials. Strong stock selection in the Consumer Discretionary sector also benefited relative performance. The most detracting sector was Industrials, which was hurt by both an average underweight allocation and underperforming stock selection. The second worst contributing sector was Energy, but stock selection helped cushion the impact of underperformance from underweight allocation.
| |
Top Contributors |
| ↑ | Meta Platforms Inc. |
| ↑ | Applied Materials Inc. |
| ↑ | United Therapeutics Corp. |
| ↑ | American International Group |
| ↑ | Qualcomm Inc. |
| |
Top Detractors |
| ↓ | Broadcom Inc. |
| ↓ | Apple Inc. |
| ↓ | Micron Technology Inc. |
| ↓ | Nvidia Corp. |
| ↓ | Eli Lilly & Co. |
| SGI US Large Cap Core ETF | PAGE 1 | TSR-AR-74933W593 |
HOW DID THE FUND PERFORM SINCE INCEPTION?*
The $10,000 chart reflects a hypothetical $10,000 investment in the class of shares noted. The chart uses total return NAV performance and assumes reinvestment of dividends and capital gains. Fund expenses, including management fees and other expenses, were deducted.
CUMULATIVE PERFORMANCE (Initial Investment of $10,000)
| | 03/30/2023 | 03/31/2023 | 04/30/2023 | 05/31/2023 | 06/30/2023 | 07/31/2023 | 08/31/2023 | 09/30/2023 | 10/31/2023 | 11/30/2023 | 12/31/2023 | 01/31/2024 | 02/29/2024 | 03/31/2024 | 04/30/2024 | 05/31/2024 | 06/30/2024 | 07/31/2024 | 08/31/2024 |
| SGI US Large Cap Core ETF NAV | 10,000 | 10,131 | 10,332 | 10,333 | 10,933 | 11,452 | 11,203 | 10,795 | 10,557 | 11,515 | 12,049 | 12,380 | 13,046 | 13,563 | 12,955 | 13,730 | 14,149 | 13,989 | 14,302 |
| SGI US Large Cap Core ETF Market | 10,000 | 10,127 | 10,364 | 10,336 | 10,947 | 11,450 | 11,200 | 10,812 | 10,564 | 11,512 | 12,041 | 12,362 | 13,054 | 13,515 | 12,963 | 13,759 | 14,169 | 14,068 | 14,305 |
| S&P 500 Total Return Index | 10,000 | 10,145 | 10,303 | 10,348 | 11,032 | 11,386 | 11,205 | 10,671 | 10,446 | 11,400 | 11,918 | 12,118 | 12,765 | 13,176 | 12,638 | 13,265 | 13,741 | 13,908 | 14,245 |
| Russell 1000 Total Return Index | 10,000 | 10,151 | 10,277 | 10,325 | 11,022 | 11,401 | 11,202 | 10,676 | 10,417 | 11,390 | 11,953 | 12,119 | 12,774 | 13,183 | 12,622 | 13,217 | 13,654 | 13,853 | 14,181 |
ANNUAL AVERAGE TOTAL RETURN (%)
| | |
| | 1 Year | Since Inception
(03/30/2023) |
SGI US Large Cap Core ETF NAV | 27.67 | 28.61 |
SGI US Large Cap Core ETF Market | 27.72 | 28.63 |
S&P 500 Total Return Index | 27.14 | 28.25 |
Russell 1000 Total Return Index | 26.60 | 27.85 |
Visit https://sgiam.com/literature/ for more recent performance information.
| * | The Fund’s past performance is not a good predictor of how the Fund will perform in the future. The graph and table do not reflect the deduction of taxes that a shareholder would pay on Fund distributions or redemption of Fund shares. |
KEY FUND STATISTICS (as of August 31, 2024)
| |
Net Assets | $92,291,570 |
Number of Holdings | 117 |
Net Advisory Fee | $795,489 |
Portfolio Turnover | 225% |
WHAT DID THE FUND INVEST IN? (as of August 31, 2024)
| |
Top 10 Holdings | (% of net assets) |
Microsoft Corp. | 6.2% |
NVIDIA Corp. | 5.5% |
Amazon.com, Inc. | 4.7% |
Alphabet, Inc. | 4.7% |
Apple, Inc. | 4.2% |
Meta Platforms, Inc. | 4.1% |
Mastercard, Inc. | 3.5% |
Allstate Corp., (The) | 3.4% |
QUALCOMM, Inc. | 3.3% |
Veeva Systems, Inc. | 2.9% |
| |
Top Sectors | (% of net assets) |
Technology | 30.1% |
Financial | 18.4% |
Consumer, Non-cyclical | 18.5% |
Communications | 15.6% |
Consumer, Cyclical | 7.3% |
Industrial | 4.4% |
Energy | 1.2% |
Utilities | 1.1% |
Basic Materials | 0.9% |
Cash & Other | 2.5% |
For additional information about the Fund; including its prospectus, financial information, holdings and proxy information, scan the QR code or visit https://sgiam.com/literature/
| SGI US Large Cap Core ETF | PAGE 2 | TSR-AR-74933W593 |
HOUSEHOLDING
To reduce Fund expenses, only one copy of most shareholder documents may be mailed to shareholders with multiple accounts at the same address (Householding). If you would prefer that your Fund documents not be householded, please contact the Fund at 1-855-744-8500, or contact your financial intermediary. Your instructions will typically be effective within 30 days of receipt by the Fund or your financial intermediary.
| SGI US Large Cap Core ETF | PAGE 3 | TSR-AR-74933W593 |
1120314302112001430511205142451120214181
| | |
| SGI Dynamic Tactical ETF | |
DYTA (Principal U.S. Listing Exchange: NASDAQ) |
Annual Shareholder Report | August 31, 2024 |
This annual shareholder report contains important information about the SGI Dynamic Tactical ETF (the “Fund”) for the period of September 1, 2023 to August 31, 2024. You can find additional information about the Fund at https://sgiam.com/literature/. You can also request this information by contacting us at 1-855-744-8500.
WHAT WERE THE FUND COSTS FOR THE PAST YEAR? (based on a hypothetical $10,000 investment)
| | |
Fund Name | Costs of a $10,000 investment | Costs paid as a percentage of a $10,000 investment |
| SGI Dynamic Tactical ETF | $104 | 0.95% |
HOW DID THE FUND PERFORM LAST YEAR AND WHAT AFFECTED ITS PERFORMANCE?
For the fiscal year ending August 31, 2024, the Fund delivered a net return of 18.75%, underperforming its benchmark, the S&P 500 Total Return index, which returned 27.14%. On an absolute basis, strategic allocations to the US Large Cap Core, Invesco QQQ Trust, MSCI US Minimum Volatility, and Schwab Dividend Equity Funds contributed 17.67% to the Fund’s performance. Our timing in US Small Cap was mixed—negative in the early part of the year but positive later, resulting in a net contribution of 0.43%. The remaining gains were achieved by effectively managing fixed income duration risk, capitalizing on the reversal in interest rates over the year.
WHAT FACTORS INFLUENCED PERFORMANCE?
To crush skyrocketing inflation, the Federal Reserve raised the fed funds rate a significant 5.25% during a 16-month period from March 2022 through July 2023. This approach was effective and all key U.S. inflation indicators fell during the fiscal year. As a result, the Federal Reserve signaled no further rate increases and the possibility of upcoming rate cuts. This sparked a strong rally in equities and risk assets in general. Growth stocks, particularly semiconductor and AI related stocks, had tremendous performance. Broad market indices of international stocks also performed well, however, U.S market indices performed even better with many reaching all-time highs. The fixed income market saw significant volatility, with the benchmark US 10-Year Treasury rate reaching a peak of 5% before settling below 4%.
The broad-based index may not necessarily reflect an accurate description of the underlying holdings found in the Fund.
| |
Top Contributors |
| ↑ | SGI US Large Cap Core |
| ↑ | Invesco QQQ Trust |
| ↑ | iShares MSCI US Min Vol |
| ↑ | Vanguard US Small Cap |
| ↑ | Schwab Dividend Equity |
| |
Top Detractors |
| ↓ | iShares Core S&P Small Cap |
| ↓ | SPDR S&P 500 ETF |
| ↓ | iShares MSCI US Small Cap |
| ↓ | Invesco Opt Yield Divers |
| ↓ | SPDR Long Term Treasury |
HOW DID THE FUND PERFORM SINCE INCEPTION?*
The $10,000 chart reflects a hypothetical $10,000 investment in the class of shares noted. The chart uses total return NAV performance and assumes reinvestment of dividends and capital gains. Fund expenses, including management fees and other expenses, were deducted.
| SGI Dynamic Tactical ETF | PAGE 1 | TSR-AR-74933W577 |
CUMULATIVE PERFORMANCE (Initial Investment of $10,000)
| | 03/29/2023 | 03/31/2023 | 04/30/2023 | 05/31/2023 | 06/30/2023 | 07/31/2023 | 08/31/2023 | 09/30/2023 | 10/31/2023 | 11/30/2023 | 12/31/2023 | 01/31/2024 | 02/29/2024 | 03/31/2024 | 04/30/2024 | 05/31/2024 | 06/30/2024 | 07/31/2024 | 08/31/2024 |
| SGI Dynamic Tactical ETF NAV | 10,000 | 10,138 | 10,154 | 10,069 | 10,379 | 10,621 | 10,390 | 9,972 | 9,777 | 10,380 | 10,920 | 11,003 | 11,444 | 11,756 | 11,270 | 11,813 | 12,137 | 12,249 | 12,338 |
| SGI Dynamic Tactical ETF Market | 10,000 | 10,141 | 10,176 | 10,074 | 10,390 | 10,652 | 10,420 | 9,956 | 9,782 | 10,376 | 10,914 | 10,990 | 11,422 | 11,753 | 11,249 | 11,801 | 12,120 | 12,262 | 12,322 |
| S&P 500 Total Return Index** | 10,000 | 10,204 | 10,363 | 10,408 | 11,096 | 11,453 | 11,270 | 10,733 | 10,507 | 11,467 | 11,988 | 12,189 | 12,840 | 13,253 | 12,712 | 13,342 | 13,821 | 13,989 | 14,329 |
| Composite Index | 10,000 | 10,169 | 10,304 | 10,309 | 10,811 | 11,070 | 10,920 | 10,460 | 10,254 | 11,072 | 11,555 | 11,693 | 12,120 | 12,441 | 11,981 | 12,477 | 12,843 | 13,035 | 13,319 |
ANNUAL AVERAGE TOTAL RETURN (%)
| | |
| | 1 Year | Since Inception
(03/29/2023) |
SGI Dynamic Tactical ETF NAV | 18.75 | 15.89 |
SGI Dynamic Tactical ETF Market | 18.25 | 15.79 |
S&P 500 Total Return Index** | 27.14 | 28.72 |
Composite Index | 21.97 | 22.28 |
Visit https://sgiam.com/literature/ for more recent performance information.
| * | The Fund’s past performance is not a good predictor of how the Fund will perform in the future. The graph and table do not reflect the deduction of taxes that a shareholder would pay on Fund distributions or redemption of Fund shares. |
| ** | Effective with this report, and pursuant to new regulatory requirements, the S&P 500 Total Return Index replaced the Composite Index as the Fund’s primary benchmark to represent a broad-based securities market index. |
KEY FUND STATISTICS (as of August 31, 2024)
| |
Net Assets | $59,608,737 |
Number of Holdings | 8 |
Net Advisory Fee | $797,772 |
Portfolio Turnover | 167% |
WHAT DID THE FUND INVEST IN? (as of August 31, 2024)
| |
Top 10 Holdings | (% of net assets) |
SGI U.S. Large Cap Core ETF | 35.4% |
iShares Core U.S. Aggregate Bond ETF | 20.3% |
iShares MSCI USA Min Vol Factor ETF | 10.1% |
SGI Enhanced Nasdaq-100 ETF | 8.8% |
Schwab US Dividend Equity ETF | 8.1% |
Vanguard Small-Cap ETF | 7.1% |
iShares Core MSCI EAFE ETF | 5.1% |
PGIM Ultra Short Bond ETF | 4.8% |
| |
Top Sectors | (% of net assets) |
Cash & Other | 100.0% |
For additional information about the Fund; including its prospectus, financial information, holdings and proxy information, scan the QR code or visit https://sgiam.com/literature/
| SGI Dynamic Tactical ETF | PAGE 2 | TSR-AR-74933W577 |
HOUSEHOLDING
To reduce Fund expenses, only one copy of most shareholder documents may be mailed to shareholders with multiple accounts at the same address (Householding). If you would prefer that your Fund documents not be householded, please contact the Fund at 1-855-744-8500, or contact your financial intermediary. Your instructions will typically be effective within 30 days of receipt by the Fund or your financial intermediary.
| SGI Dynamic Tactical ETF | PAGE 3 | TSR-AR-74933W577 |
1039012338104201232211270143291092013319
| | |
| SGI U.S. Large Cap Equity Fund | |
Class I | SILVX |
Annual Shareholder Report | August 31, 2024 |
This annual shareholder report contains important information about the SGI U.S. Large Cap Equity Fund (the “Fund”) for the period of September 1, 2023 to August 31, 2024. You can find additional information about the Fund at https://sgiam.com/literature/. You can also request this information by contacting us at 1-855-744-8500.
WHAT WERE THE FUND COSTS FOR THE PAST YEAR? (based on a hypothetical $10,000 investment)
| | |
Class Name | Costs of a $10,000 investment | Costs paid as a percentage of a $10,000 investment |
| Class I | $111 | 0.98% |
HOW DID THE FUND PERFORM LAST YEAR AND WHAT AFFECTED ITS PERFORMANCE?
For the fiscal year ending August 31, 2024, net of fees, the Fund returned 26.51% underperforming its benchmark, the S&P 500 Total Return Index, which returned 27.14%. The Fund significantly outperformed its secondary benchmark, the S&P 500 Low Volatility Index, which returned 19.14%.
WHAT FACTORS INFLUENCED PERFORMANCE?
To crush skyrocketing inflation, the Federal Reserve raised the fed funds rate a significant 5.25% during a 16-month period from March 2022 through July 2023. This approach was effective and all key U.S. inflation indicators fell during the fiscal year. As a result, the Federal Reserve signaled no further rate increases and the possibility of upcoming rate cuts. This sparked a strong rally in equities and risk assets in general. Growth stocks, particularly semiconductor and AI related stocks, had tremendous performance. Broad market indices of international stocks also performed well, however, U.S market indices performed even better with many reaching all-time highs.
WHAT WERE THE TOP CONTRIBUTORS AND DETRACTORS?
Active management meaningfully contributed to outperformance with strong stock selection as the primary reason. The most contributing sectors to performance were Health Care and Information Technology. Strong stock selection in the Financials and Consumer Discretionary sectors also benefited relative performance. The most detracting sector was Industrials, which was hurt by both an average underweight allocation and underperforming stock selection. The second worst contributing sector was Energy, which was hurt by both an average overweight allocation and underperforming stock selection.
| |
Top Contributors |
| ↑ | United Therapeutics Corp. |
| ↑ | Progressive Corp. |
| ↑ | DR Horton Inc. |
| ↑ | GoDaddy Inc. - Class A |
| ↑ | Regeneron Pharmaceuticals |
| |
Top Detractors |
| ↓ | Republic Services Inc. |
| ↓ | United Airlines Holdings Inc. |
| ↓ | Kellanova |
| ↓ | Waste Management Inc. |
| ↓ | Berkshire Hathaway Inc. |
| SGI U.S. Large Cap Equity Fund | PAGE 1 | TSR-AR-74925K524 |
HOW DID THE FUND PERFORM OVER THE PAST 10 YEARS?*
The $1,000,000 chart reflects a hypothetical $1,000,000 investment in the class of shares noted. The chart uses total return NAV performance and assumes reinvestment of dividends and capital gains. Fund expenses, including management fees and other expenses, were deducted.
CUMULATIVE PERFORMANCE (Initial Investment of $1,000,000)
| | 08/31/2014 | 09/30/2014 | 10/31/2014 | 11/30/2014 | 12/31/2014 | 01/31/2015 | 02/28/2015 | 03/31/2015 | 04/30/2015 | 05/31/2015 | 06/30/2015 | 07/31/2015 | 08/31/2015 | 09/30/2015 | 10/31/2015 | 11/30/2015 | 12/31/2015 | 01/31/2016 | 02/29/2016 | 03/31/2016 | 04/30/2016 | 05/31/2016 | 06/30/2016 | 07/31/2016 | 08/31/2016 | 09/30/2016 | 10/31/2016 | 11/30/2016 | 12/31/2016 | 01/31/2017 | 02/28/2017 | 03/31/2017 | 04/30/2017 | 05/31/2017 | 06/30/2017 | 07/31/2017 | 08/31/2017 | 09/30/2017 | 10/31/2017 | 11/30/2017 | 12/31/2017 | 01/31/2018 | 02/28/2018 | 03/31/2018 | 04/30/2018 | 05/31/2018 | 06/30/2018 | 07/31/2018 | 08/31/2018 | 09/30/2018 | 10/31/2018 | 11/30/2018 | 12/31/2018 | 01/31/2019 | 02/28/2019 | 03/31/2019 | 04/30/2019 | 05/31/2019 | 06/30/2019 | 07/31/2019 | 08/31/2019 | 09/30/2019 | 10/31/2019 | 11/30/2019 | 12/31/2019 | 01/31/2020 | 02/29/2020 | 03/31/2020 | 04/30/2020 | 05/31/2020 | 06/30/2020 | 07/31/2020 | 08/31/2020 | 09/30/2020 | 10/31/2020 | 11/30/2020 | 12/31/2020 | 01/31/2021 | 02/28/2021 | 03/31/2021 | 04/30/2021 | 05/31/2021 | 06/30/2021 | 07/31/2021 | 08/31/2021 | 09/30/2021 | 10/31/2021 | 11/30/2021 | 12/31/2021 | 01/31/2022 | 02/28/2022 | 03/31/2022 | 04/30/2022 | 05/31/2022 | 06/30/2022 | 07/31/2022 | 08/31/2022 | 09/30/2022 | 10/31/2022 | 11/30/2022 | 12/31/2022 | 01/31/2023 | 02/28/2023 | 03/31/2023 | 04/30/2023 | 05/31/2023 | 06/30/2023 | 07/31/2023 | 08/31/2023 | 09/30/2023 | 10/31/2023 | 11/30/2023 | 12/31/2023 | 01/31/2024 | 02/29/2024 | 03/31/2024 | 04/30/2024 | 05/31/2024 | 06/30/2024 | 07/31/2024 | 08/31/2024 |
| SGI U.S. Large Cap Equity Fund Class I | 1,000,000 | 991,254 | 1,023,324 | 1,065,598 | 1,065,636 | 1,052,705 | 1,083,891 | 1,077,045 | 1,061,832 | 1,072,481 | 1,051,944 | 1,100,624 | 1,048,141 | 1,051,944 | 1,112,794 | 1,106,709 | 1,103,647 | 1,075,995 | 1,097,141 | 1,163,018 | 1,146,752 | 1,168,711 | 1,199,617 | 1,216,696 | 1,194,737 | 1,178,471 | 1,151,632 | 1,184,164 | 1,201,185 | 1,202,853 | 1,248,732 | 1,242,892 | 1,251,234 | 1,267,917 | 1,268,751 | 1,287,103 | 1,287,103 | 1,303,786 | 1,312,962 | 1,378,026 | 1,398,270 | 1,466,304 | 1,422,440 | 1,409,907 | 1,428,706 | 1,460,932 | 1,488,683 | 1,542,394 | 1,608,637 | 1,612,218 | 1,493,159 | 1,516,434 | 1,400,933 | 1,500,800 | 1,565,200 | 1,589,466 | 1,645,466 | 1,564,266 | 1,653,866 | 1,688,400 | 1,702,400 | 1,718,266 | 1,711,733 | 1,745,333 | 1,779,370 | 1,809,090 | 1,670,076 | 1,467,788 | 1,591,462 | 1,679,663 | 1,688,292 | 1,791,833 | 1,874,282 | 1,823,470 | 1,786,081 | 1,911,672 | 1,983,457 | 1,921,715 | 1,924,609 | 1,969,951 | 2,063,528 | 2,064,493 | 2,131,058 | 2,190,871 | 2,239,107 | 2,106,940 | 2,279,625 | 2,240,071 | 2,329,668 | 2,162,783 | 2,072,061 | 2,172,864 | 2,093,341 | 2,103,422 | 1,963,418 | 2,051,900 | 1,999,259 | 1,843,574 | 2,036,220 | 2,135,903 | 2,050,067 | 2,106,588 | 2,046,535 | 2,070,085 | 2,092,458 | 2,032,405 | 2,132,494 | 2,166,642 | 2,119,541 | 2,068,908 | 2,046,535 | 2,187,838 | 2,264,513 | 2,322,483 | 2,376,752 | 2,455,689 | 2,354,551 | 2,439,655 | 2,486,524 | 2,554,361 | 2,681,401 |
| S&P 500 Total Return Index** | 1,000,000 | 985,976 | 1,010,059 | 1,037,224 | 1,034,611 | 1,003,553 | 1,061,229 | 1,044,446 | 1,054,466 | 1,068,025 | 1,047,350 | 1,069,294 | 1,004,779 | 979,917 | 1,062,577 | 1,065,737 | 1,048,929 | 996,876 | 995,531 | 1,063,066 | 1,067,188 | 1,086,352 | 1,089,167 | 1,129,323 | 1,130,909 | 1,131,123 | 1,110,490 | 1,151,617 | 1,174,380 | 1,196,654 | 1,244,168 | 1,245,619 | 1,258,411 | 1,276,121 | 1,284,086 | 1,310,490 | 1,314,502 | 1,341,617 | 1,372,925 | 1,415,032 | 1,430,765 | 1,512,682 | 1,456,929 | 1,419,904 | 1,425,352 | 1,459,677 | 1,468,661 | 1,523,316 | 1,572,953 | 1,581,907 | 1,473,783 | 1,503,816 | 1,368,035 | 1,477,664 | 1,525,109 | 1,554,745 | 1,617,696 | 1,514,894 | 1,621,658 | 1,644,965 | 1,618,908 | 1,649,199 | 1,684,920 | 1,746,081 | 1,798,781 | 1,798,076 | 1,650,059 | 1,446,256 | 1,631,657 | 1,709,370 | 1,743,364 | 1,841,664 | 1,974,044 | 1,899,037 | 1,848,534 | 2,050,882 | 2,129,735 | 2,108,233 | 2,166,368 | 2,261,245 | 2,381,925 | 2,398,561 | 2,454,555 | 2,512,863 | 2,589,268 | 2,468,842 | 2,641,813 | 2,623,508 | 2,741,084 | 2,599,241 | 2,521,416 | 2,615,035 | 2,386,999 | 2,391,378 | 2,193,985 | 2,396,280 | 2,298,555 | 2,086,861 | 2,255,816 | 2,381,881 | 2,244,650 | 2,385,690 | 2,327,482 | 2,412,933 | 2,450,595 | 2,461,247 | 2,623,875 | 2,708,167 | 2,665,049 | 2,537,985 | 2,484,620 | 2,711,528 | 2,834,715 | 2,882,350 | 3,036,255 | 3,133,945 | 3,005,941 | 3,154,989 | 3,268,197 | 3,307,979 | 3,388,219 |
| S&P 500 Low Volatility Index | 1,000,000 | 991,397 | 1,040,380 | 1,070,079 | 1,083,051 | 1,078,254 | 1,094,659 | 1,090,844 | 1,069,261 | 1,079,318 | 1,060,181 | 1,106,174 | 1,051,916 | 1,047,644 | 1,119,004 | 1,131,241 | 1,130,030 | 1,110,574 | 1,122,024 | 1,188,960 | 1,180,595 | 1,200,247 | 1,269,203 | 1,273,452 | 1,249,476 | 1,237,319 | 1,209,527 | 1,216,002 | 1,247,239 | 1,256,467 | 1,312,945 | 1,312,277 | 1,326,546 | 1,362,311 | 1,357,916 | 1,376,638 | 1,388,362 | 1,399,302 | 1,425,951 | 1,480,948 | 1,464,365 | 1,503,190 | 1,439,459 | 1,451,709 | 1,443,480 | 1,453,988 | 1,474,827 | 1,526,828 | 1,554,643 | 1,549,131 | 1,504,627 | 1,577,594 | 1,468,319 | 1,565,773 | 1,630,290 | 1,668,244 | 1,707,442 | 1,691,509 | 1,755,056 | 1,773,624 | 1,816,808 | 1,856,857 | 1,849,835 | 1,850,676 | 1,883,247 | 1,941,062 | 1,756,108 | 1,525,980 | 1,628,250 | 1,634,632 | 1,628,354 | 1,749,505 | 1,799,906 | 1,768,490 | 1,717,668 | 1,823,550 | 1,862,334 | 1,829,191 | 1,809,020 | 1,932,203 | 2,013,153 | 2,036,480 | 2,037,062 | 2,112,782 | 2,149,644 | 2,044,808 | 2,141,372 | 2,112,743 | 2,317,096 | 2,211,927 | 2,160,948 | 2,277,263 | 2,224,800 | 2,212,703 | 2,118,179 | 2,207,823 | 2,167,774 | 1,986,964 | 2,125,724 | 2,249,620 | 2,210,854 | 2,211,622 | 2,138,997 | 2,172,346 | 2,230,105 | 2,113,268 | 2,200,807 | 2,221,707 | 2,155,465 | 2,073,906 | 2,065,369 | 2,175,605 | 2,226,676 | 2,248,769 | 2,286,023 | 2,356,690 | 2,284,952 | 2,341,572 | 2,337,778 | 2,440,690 | 2,567,914 |
ANNUAL AVERAGE TOTAL RETURN (%)
| | | |
| | 1 Year | 5 Year | 10 Year |
Class I | 26.51 | 9.51 | 10.37 |
S&P 500 Total Return Index** | 27.14 | 15.92 | 12.98 |
S&P 500 Low Volatility Index | 19.14 | 7.17 | 9.89 |
Visit https://sgiam.com/literature/ for more recent performance information.
| * | The Fund’s past performance is not a good predictor of how the Fund will perform in the future. The graph and table do not reflect the deduction of taxes that a shareholder would pay on Fund distributions or redemption of Fund shares. |
| ** | Effective with this report, and pursuant to new regulatory requirements, the S&P 500 Total Return Index replaced the S&P 500 Low Volatility Index as the Fund’s primary benchmark to represent a broad-based securities market index. |
KEY FUND STATISTICS (as of August 31, 2024)
| |
Net Assets | $232,958,382 |
Number of Holdings | 93 |
Net Advisory Fee | $1,852,151 |
Portfolio Turnover | 194% |
WHAT DID THE FUND INVEST IN? (as of August 31, 2024)
| |
Top 10 Holdings | (% of net assets) |
United Therapeutics Corp. | 3.9% |
Progressive Corp. | 3.9% |
Everest Group Ltd. | 3.6% |
Automatic Data Processing, Inc. | 3.3% |
Colgate-Palmolive Co. | 3.3% |
Owens Corning | 3.2% |
Elevance Health, Inc. | 3.1% |
Regeneron Pharmaceuticals, Inc. | 3.1% |
Alphabet, Inc. | 3.1% |
Cardinal Health, Inc. | 2.7% |
| |
Top Sectors | (% of net assets) |
Consumer, Non-cyclical | 33.4% |
Financial | 17.4% |
Industrial | 11.6% |
Communications | 11.5% |
Consumer, Cyclical | 8.1% |
Technology | 7.7% |
Utilities | 3.9% |
Energy | 3.0% |
Basic Materials | 1.6% |
Cash & Other | 1.8% |
For additional information about the Fund; including its prospectus, financial information, holdings and proxy information, scan the QR code or visit https://sgiam.com/literature/
| SGI U.S. Large Cap Equity Fund | PAGE 2 | TSR-AR-74925K524 |
HOUSEHOLDING
To reduce Fund expenses, only one copy of most shareholder documents may be mailed to shareholders with multiple accounts at the same address (Householding). If you would prefer that your Fund documents not be householded, please contact the Fund at 1-855-744-8500, or contact your financial intermediary. Your instructions will typically be effective within 30 days of receipt by the Fund or your financial intermediary.
| SGI U.S. Large Cap Equity Fund | PAGE 3 | TSR-AR-74925K524 |
100000010481411194737128710316086371702400187428222391071999259211954126814011000000100477911309091314502157295316189081974044258926822985552665049338821910000001051916124947613883621554643181680817999062149644216777421554652567914
| | |
| SGI U.S. Large Cap Equity Fund | |
Class A | LVOLX |
Annual Shareholder Report | August 31, 2024 |
This annual shareholder report contains important information about the SGI U.S. Large Cap Equity Fund (the “Fund”) for the period of September 1, 2023 to August 31, 2024. You can find additional information about the Fund at https://sgiam.com/literature/. You can also request this information by contacting us at 1-855-744-8500.
WHAT WERE THE FUND COSTS FOR THE PAST YEAR? (based on a hypothetical $10,000 investment)
| | |
Class Name | Costs of a $10,000 investment | Costs paid as a percentage of a $10,000 investment |
| Class A | $138 | 1.22% |
HOW DID THE FUND PERFORM LAST YEAR AND WHAT AFFECTED ITS PERFORMANCE?
For the fiscal year ended August 31, 2024, net of fees, the Fund returned 26.19% underperforming its benchmark, the S&P 500 Total Return Index, which returned 27.14%. The Fund significantly outperformed its secondary benchmark, the S&P 500 Low Volatility Index, which returned 19.14%.
WHAT FACTORS INFLUENCED PERFORMANCE?
To crush skyrocketing inflation, the Federal Reserve raised the fed funds rate a significant 5.25% during a 16-month period from March 2022 through July 2023. This approach was effective and all key U.S. inflation indicators fell during the fiscal year. As a result, the Federal Reserve signaled no further rate increases and the possibility of upcoming rate cuts. This sparked a strong rally in equities and risk assets in general. Growth stocks, particularly semiconductor and AI related stocks, had tremendous performance. Broad market indices of international stocks also performed well, however, U.S market indices performed even better with many reaching all-time highs.
WHAT WERE THE TOP CONTRIBUTORS AND DETRACTORS?
Active management meaningfully contributed to outperformance with strong stock selection as the primary reason. The most contributing sectors to performance were Health Care and Information Technology. Strong stock selection in the Financials and Consumer Discretionary sectors also benefited relative performance. The most detracting sector was Industrials, which was hurt by both an average underweight allocation and underperforming stock selection. The second worst contributing sector was Energy, which was hurt by both an average overweight allocation and underperforming stock selection.
| |
Top Contributors |
| ↑ | United Therapeutics Corp. |
| ↑ | Progressive Corp. |
| ↑ | DR Horton Inc. |
| ↑ | GoDaddy Inc. - Class A |
| ↑ | Regeneron Pharmaceuticals |
| |
Top Detractors |
| ↓ | Republic Services Inc. |
| ↓ | United Airlines Holdings Inc. |
| ↓ | Kellanova |
| ↓ | Waste Management Inc. |
| ↓ | Berkshire Hathaway Inc. |
| SGI U.S. Large Cap Equity Fund | PAGE 1 | TSR-AR-74925K516 |
HOW DID THE FUND PERFORM SINCE INCEPTION?*
The $10,000 chart reflects a hypothetical $10,000 investment in the class of shares noted and assumes the maximum sales charge. The chart uses total return NAV performance and assumes reinvestment of dividends and capital gains. Fund expenses, including 12b-1 fees, management fees and other expenses, were deducted.
CUMULATIVE PERFORMANCE (Initial Investment of $10,000)
| | 10/29/2015 | 10/31/2015 | 11/30/2015 | 12/31/2015 | 01/31/2016 | 02/29/2016 | 03/31/2016 | 04/30/2016 | 05/31/2016 | 06/30/2016 | 07/31/2016 | 08/31/2016 | 09/30/2016 | 10/31/2016 | 11/30/2016 | 12/31/2016 | 01/31/2017 | 02/28/2017 | 03/31/2017 | 04/30/2017 | 05/31/2017 | 06/30/2017 | 07/31/2017 | 08/31/2017 | 09/30/2017 | 10/31/2017 | 11/30/2017 | 12/31/2017 | 01/31/2018 | 02/28/2018 | 03/31/2018 | 04/30/2018 | 05/31/2018 | 06/30/2018 | 07/31/2018 | 08/31/2018 | 09/30/2018 | 10/31/2018 | 11/30/2018 | 12/31/2018 | 01/31/2019 | 02/28/2019 | 03/31/2019 | 04/30/2019 | 05/31/2019 | 06/30/2019 | 07/31/2019 | 08/31/2019 | 09/30/2019 | 10/31/2019 | 11/30/2019 | 12/31/2019 | 01/31/2020 | 02/29/2020 | 03/31/2020 | 04/30/2020 | 05/31/2020 | 06/30/2020 | 07/31/2020 | 08/31/2020 | 09/30/2020 | 10/31/2020 | 11/30/2020 | 12/31/2020 | 01/31/2021 | 02/28/2021 | 03/31/2021 | 04/30/2021 | 05/31/2021 | 06/30/2021 | 07/31/2021 | 08/31/2021 | 09/30/2021 | 10/31/2021 | 11/30/2021 | 12/31/2021 | 01/31/2022 | 02/28/2022 | 03/31/2022 | 04/30/2022 | 05/31/2022 | 06/30/2022 | 07/31/2022 | 08/31/2022 | 09/30/2022 | 10/31/2022 | 11/30/2022 | 12/31/2022 | 01/31/2023 | 02/28/2023 | 03/31/2023 | 04/30/2023 | 05/31/2023 | 06/30/2023 | 07/31/2023 | 08/31/2023 | 09/30/2023 | 10/31/2023 | 11/30/2023 | 12/31/2023 | 01/31/2024 | 02/29/2024 | 03/31/2024 | 04/30/2024 | 05/31/2024 | 06/30/2024 | 07/31/2024 | 08/31/2024 |
| SGI U.S. Large Cap Equity Fund Class A | 9477 | 9439 | 9387 | 9365 | 9123 | 9303 | 9861 | 9716 | 9903 | 10165 | 10309 | 10116 | 9978 | 9744 | 10020 | 10167 | 10174 | 10562 | 10506 | 10576 | 10711 | 10718 | 10873 | 10873 | 11014 | 11085 | 11636 | 11801 | 12373 | 12004 | 11891 | 12049 | 12320 | 12554 | 13006 | 13556 | 13579 | 12577 | 12773 | 11796 | 12633 | 13181 | 13377 | 13839 | 13158 | 13909 | 14199 | 14316 | 14441 | 14387 | 14661 | 14947 | 15195 | 14024 | 12323 | 13366 | 14096 | 14160 | 15035 | 15717 | 15292 | 14971 | 16030 | 16623 | 16099 | 16123 | 16494 | 17276 | 17284 | 17840 | 18339 | 18734 | 17630 | 19064 | 18734 | 19475 | 18075 | 17309 | 18159 | 17487 | 17571 | 16394 | 17123 | 16693 | 15377 | 16983 | 17814 | 17095 | 17565 | 17056 | 17252 | 17428 | 16939 | 17761 | 18045 | 17644 | 17223 | 17027 | 18202 | 18839 | 19309 | 19770 | 20424 | 19575 | 20281 | 20670 | 21212 | 22265 |
| S&P 500 Total Return Index** | 10000 | 9952 | 9982 | 9824 | 9337 | 9324 | 9956 | 9995 | 10175 | 10201 | 10577 | 10592 | 10594 | 10401 | 10786 | 10999 | 11208 | 11653 | 11666 | 11786 | 11952 | 12027 | 12274 | 12311 | 12565 | 12859 | 13253 | 13400 | 14168 | 13645 | 13299 | 13350 | 13671 | 13755 | 14267 | 14732 | 14816 | 13803 | 14084 | 12813 | 13840 | 14284 | 14561 | 15151 | 14188 | 15188 | 15406 | 15162 | 15446 | 15781 | 16353 | 16847 | 16840 | 15454 | 13545 | 15282 | 16010 | 16328 | 17249 | 18489 | 17786 | 17313 | 19208 | 19947 | 19745 | 20290 | 21178 | 22309 | 22464 | 22989 | 23535 | 24251 | 23123 | 24743 | 24571 | 25673 | 24344 | 23615 | 24492 | 22356 | 22397 | 20548 | 22443 | 21528 | 19545 | 21128 | 22308 | 21023 | 22344 | 21799 | 22599 | 22952 | 23052 | 24575 | 25364 | 24960 | 23770 | 23271 | 25396 | 26549 | 26996 | 28437 | 29352 | 28153 | 29549 | 30609 | 30982 | 31733 |
| S&P 500 Low Volatility Index | 10000 | 9929 | 10037 | 10027 | 9854 | 9956 | 10549 | 10475 | 10650 | 11261 | 11299 | 11086 | 10979 | 10732 | 10789 | 11067 | 11148 | 11650 | 11644 | 11770 | 12088 | 12049 | 12215 | 12319 | 12416 | 12652 | 13140 | 12993 | 13338 | 12772 | 12881 | 12808 | 12901 | 13086 | 13547 | 13794 | 13745 | 13350 | 13998 | 13028 | 13893 | 14465 | 14802 | 15150 | 15009 | 15572 | 15737 | 16120 | 16476 | 16413 | 16421 | 16710 | 17223 | 15582 | 13540 | 14447 | 14504 | 14448 | 15523 | 15970 | 15692 | 15241 | 16180 | 16524 | 16230 | 16051 | 17144 | 17862 | 18069 | 18075 | 18746 | 19073 | 18143 | 19000 | 18746 | 20559 | 19626 | 19174 | 20206 | 19740 | 19633 | 18794 | 19590 | 19234 | 17630 | 18861 | 19961 | 19617 | 19623 | 18979 | 19275 | 19787 | 18751 | 19527 | 19713 | 19125 | 18401 | 18326 | 19304 | 19757 | 19953 | 20284 | 20911 | 20274 | 20776 | 20743 | 21656 | 22785 |
ANNUAL AVERAGE TOTAL RETURN (%)
| | | |
| | 1 Year | 5 Year | Since Inception
(10/29/2015) |
Class A (without sales charge) | 26.19 | 9.23 | 10.14 |
Class A (with sales charge) | 19.56 | 8.07 | 9.48 |
S&P 500 Total Return Index** | 27.14 | 15.92 | 13.95 |
S&P 500 Low Volatility Index | 19.14 | 7.17 | 9.76 |
Visit https://sgiam.com/literature/ for more recent performance information.
| * | The Fund’s past performance is not a good predictor of how the Fund will perform in the future. The graph and table do not reflect the deduction of taxes that a shareholder would pay on Fund distributions or redemption of Fund shares. |
| ** | Effective with this report, and pursuant to new regulatory requirements, the S&P 500 Total Return Index replaced the S&P 500 Low Volatility Index as the Fund’s primary benchmark to represent a broad-based securities market index. |
KEY FUND STATISTICS (as of August 31, 2024)
| |
Net Assets | $232,958,382 |
Number of Holdings | 93 |
Net Advisory Fee | $1,852,151 |
Portfolio Turnover | 194% |
WHAT DID THE FUND INVEST IN? (as of August 31, 2024)
| |
Top 10 Holdings | (% of net assets) |
United Therapeutics Corp. | 3.9% |
Progressive Corp. | 3.9% |
Everest Group Ltd. | 3.6% |
Automatic Data Processing, Inc. | 3.3% |
Colgate-Palmolive Co. | 3.3% |
Owens Corning | 3.2% |
Elevance Health, Inc. | 3.1% |
Regeneron Pharmaceuticals, Inc. | 3.1% |
Alphabet, Inc. | 3.1% |
Cardinal Health, Inc. | 2.7% |
| |
Top Sectors | (% of net assets) |
Consumer, Non-cyclical | 33.4% |
Financial | 17.4% |
Industrial | 11.6% |
Communications | 11.5% |
Consumer, Cyclical | 8.1% |
Technology | 7.7% |
Utilities | 3.9% |
Energy | 3.0% |
Basic Materials | 1.6% |
Cash & Other | 1.8% |
| SGI U.S. Large Cap Equity Fund | PAGE 2 | TSR-AR-74925K516 |
For additional information about the Fund; including its prospectus, financial information, holdings and proxy information, scan the QR code or visit https://sgiam.com/literature/
HOUSEHOLDING
To reduce Fund expenses, only one copy of most shareholder documents may be mailed to shareholders with multiple accounts at the same address (Householding). If you would prefer that your Fund documents not be householded, please contact the Fund at 1-855-744-8500, or contact your financial intermediary. Your instructions will typically be effective within 30 days of receipt by the Fund or your financial intermediary.
| SGI U.S. Large Cap Equity Fund | PAGE 3 | TSR-AR-74925K516 |
101161087313556143161571718734166931764422265105921231114732151621848924251215282496031733110861231913794161201597019073192341912522785
| | |
| SGI U.S. Large Cap Equity Fund | |
Class C | SGICX |
Annual Shareholder Report | August 31, 2024 |
This annual shareholder report contains important information about the SGI U.S. Large Cap Equity Fund (the “Fund”) for the period of September 1, 2023 to August 31, 2024. You can find additional information about the Fund at https://sgiam.com/literature/. You can also request this information by contacting us at 1-855-744-8500.
WHAT WERE THE FUND COSTS FOR THE PAST YEAR? (based on a hypothetical $10,000 investment)
| | |
Class Name | Costs of a $10,000 investment | Costs paid as a percentage of a $10,000 investment |
| Class C | $222 | 1.97% |
HOW DID THE FUND PERFORM LAST YEAR AND WHAT AFFECTED ITS PERFORMANCE?
For the fiscal year ended August 31, 2024, net of fees, the Fund returned 25.23% underperforming its benchmark, the S&P 500 Total Return Index, which returned 27.14%. The Fund significantly outperformed its secondary benchmark, the S&P 500 Low Volatility Index, which returned 19.14%.
WHAT FACTORS INFLUENCED PERFORMANCE?
To crush skyrocketing inflation, the Federal Reserve raised the fed funds rate a significant 5.25% during a 16-month period from March 2022 through July 2023. This approach was effective and all key U.S. inflation indicators fell during the fiscal year. As a result, the Federal Reserve signaled no further rate increases and the possibility of upcoming rate cuts. This sparked a strong rally in equities and risk assets in general. Growth stocks, particularly semiconductor and AI related stocks, had tremendous performance. Broad market indices of international stocks also performed well, however, U.S market indices performed even better with many reaching all-time highs.
WHAT WERE THE TOP CONTRIBUTORS AND DETRACTORS?
Active management meaningfully contributed to outperformance with strong stock selection as the primary reason. The most contributing sectors to performance were Health Care and Information Technology. Strong stock selection in the Financials and Consumer Discretionary sectors also benefited relative performance. The most detracting sector was Industrials, which was hurt by both an average underweight allocation and underperforming stock selection. The second worst contributing sector was Energy, which was hurt by both an average overweight allocation and underperforming stock selection.
| |
Top Contributors |
| ↑ | United Therapeutics Corp. |
| ↑ | Progressive Corp. |
| ↑ | DR Horton Inc. |
| ↑ | GoDaddy Inc. - Class A |
| ↑ | Regeneron Pharmaceuticals |
| |
Top Detractors |
| ↓ | Republic Services Inc. |
| ↓ | United Airlines Holdings Inc. |
| ↓ | Kellanova |
| ↓ | Waste Management Inc. |
| ↓ | Berkshire Hathaway Inc. |
| SGI U.S. Large Cap Equity Fund | PAGE 1 | TSR-AR-74925K284 |
HOW DID THE FUND PERFORM SINCE INCEPTION?*
The $10,000 chart reflects a hypothetical $10,000 investment in the class of shares noted. The chart uses total return NAV performance and assumes reinvestment of dividends and capital gains. Fund expenses, including 12b-1 fees, management fees and other expenses, were deducted.
CUMULATIVE PERFORMANCE (Initial Investment of $10,000)
| | 12/31/2015 | 01/31/2016 | 02/29/2016 | 03/31/2016 | 04/30/2016 | 05/31/2016 | 06/30/2016 | 07/31/2016 | 08/31/2016 | 09/30/2016 | 10/31/2016 | 11/30/2016 | 12/31/2016 | 01/31/2017 | 02/28/2017 | 03/31/2017 | 04/30/2017 | 05/31/2017 | 06/30/2017 | 07/31/2017 | 08/31/2017 | 09/30/2017 | 10/31/2017 | 11/30/2017 | 12/31/2017 | 01/31/2018 | 02/28/2018 | 03/31/2018 | 04/30/2018 | 05/31/2018 | 06/30/2018 | 07/31/2018 | 08/31/2018 | 09/30/2018 | 10/31/2018 | 11/30/2018 | 12/31/2018 | 01/31/2019 | 02/28/2019 | 03/31/2019 | 04/30/2019 | 05/31/2019 | 06/30/2019 | 07/31/2019 | 08/31/2019 | 09/30/2019 | 10/31/2019 | 11/30/2019 | 12/31/2019 | 01/31/2020 | 02/29/2020 | 03/31/2020 | 04/30/2020 | 05/31/2020 | 06/30/2020 | 07/31/2020 | 08/31/2020 | 09/30/2020 | 10/31/2020 | 11/30/2020 | 12/31/2020 | 01/31/2021 | 02/28/2021 | 03/31/2021 | 04/30/2021 | 05/31/2021 | 06/30/2021 | 07/31/2021 | 08/31/2021 | 09/30/2021 | 10/31/2021 | 11/30/2021 | 12/31/2021 | 01/31/2022 | 02/28/2022 | 03/31/2022 | 04/30/2022 | 05/31/2022 | 06/30/2022 | 07/31/2022 | 08/31/2022 | 09/30/2022 | 10/31/2022 | 11/30/2022 | 12/31/2022 | 01/31/2023 | 02/28/2023 | 03/31/2023 | 04/30/2023 | 05/31/2023 | 06/30/2023 | 07/31/2023 | 08/31/2023 | 09/30/2023 | 10/31/2023 | 11/30/2023 | 12/31/2023 | 01/31/2024 | 02/29/2024 | 03/31/2024 | 04/30/2024 | 05/31/2024 | 06/30/2024 | 07/31/2024 | 08/31/2024 |
| SGI U.S. Large Cap Equity Fund Class C | 10,000 | 9,742 | 9,919 | 10,457 | 10,295 | 10,486 | 10,752 | 10,899 | 10,693 | 10,538 | 10,287 | 10,567 | 10,713 | 10,720 | 11,119 | 11,059 | 11,127 | 11,270 | 11,270 | 11,421 | 11,413 | 11,556 | 11,624 | 12,197 | 12,363 | 12,949 | 12,555 | 12,427 | 12,588 | 12,869 | 13,094 | 13,560 | 14,130 | 14,146 | 13,086 | 13,286 | 12,267 | 13,125 | 13,682 | 13,882 | 14,356 | 13,641 | 14,406 | 14,698 | 14,806 | 14,931 | 14,864 | 15,139 | 15,420 | 15,666 | 14,453 | 12,748 | 13,808 | 14,555 | 14,622 | 15,513 | 16,208 | 15,759 | 15,420 | 16,488 | 17,100 | 16,547 | 16,564 | 16,938 | 17,721 | 17,721 | 18,273 | 18,775 | 19,166 | 18,027 | 19,481 | 19,132 | 19,876 | 18,440 | 17,648 | 18,500 | 17,806 | 17,876 | 16,677 | 17,410 | 16,955 | 15,618 | 17,232 | 18,054 | 17,316 | 17,781 | 17,264 | 17,450 | 17,615 | 17,109 | 17,925 | 18,204 | 17,791 | 17,347 | 17,150 | 18,308 | 18,949 | 19,411 | 19,851 | 20,496 | 19,637 | 20,335 | 20,700 | 21,237 | 22,279 |
| S&P 500 Total Return Index** | 10,000 | 9,504 | 9,491 | 10,135 | 10,174 | 10,357 | 10,384 | 10,766 | 10,782 | 10,784 | 10,587 | 10,979 | 11,196 | 11,408 | 11,861 | 11,875 | 11,997 | 12,166 | 12,242 | 12,494 | 12,532 | 12,790 | 13,089 | 13,490 | 13,640 | 14,421 | 13,890 | 13,537 | 13,589 | 13,916 | 14,002 | 14,523 | 14,996 | 15,081 | 14,050 | 14,337 | 13,042 | 14,087 | 14,540 | 14,822 | 15,422 | 14,442 | 15,460 | 15,682 | 15,434 | 15,723 | 16,063 | 16,646 | 17,149 | 17,142 | 15,731 | 13,788 | 15,555 | 16,296 | 16,620 | 17,558 | 18,820 | 18,105 | 17,623 | 19,552 | 20,304 | 20,099 | 20,653 | 21,558 | 22,708 | 22,867 | 23,401 | 23,956 | 24,685 | 23,537 | 25,186 | 25,011 | 26,132 | 24,780 | 24,038 | 24,931 | 22,757 | 22,798 | 20,916 | 22,845 | 21,913 | 19,895 | 21,506 | 22,708 | 21,399 | 22,744 | 22,189 | 23,004 | 23,363 | 23,464 | 25,015 | 25,818 | 25,407 | 24,196 | 23,687 | 25,850 | 27,025 | 27,479 | 28,946 | 29,878 | 28,657 | 30,078 | 31,157 | 31,537 | 32,302 |
| S&P 500 Low Volatility Index | 10,000 | 9,828 | 9,929 | 10,521 | 10,447 | 10,621 | 11,232 | 11,269 | 11,057 | 10,949 | 10,703 | 10,761 | 11,037 | 11,119 | 11,619 | 11,613 | 11,739 | 12,056 | 12,017 | 12,182 | 12,286 | 12,383 | 12,619 | 13,105 | 12,959 | 13,302 | 12,738 | 12,847 | 12,774 | 12,867 | 13,051 | 13,511 | 13,758 | 13,709 | 13,315 | 13,961 | 12,994 | 13,856 | 14,427 | 14,763 | 15,110 | 14,969 | 15,531 | 15,695 | 16,078 | 16,432 | 16,370 | 16,377 | 16,665 | 17,177 | 15,540 | 13,504 | 14,409 | 14,465 | 14,410 | 15,482 | 15,928 | 15,650 | 15,200 | 16,137 | 16,480 | 16,187 | 16,009 | 17,099 | 17,815 | 18,021 | 18,027 | 18,697 | 19,023 | 18,095 | 18,950 | 18,696 | 20,505 | 19,574 | 19,123 | 20,152 | 19,688 | 19,581 | 18,744 | 19,538 | 19,183 | 17,583 | 18,811 | 19,908 | 19,565 | 19,571 | 18,929 | 19,224 | 19,735 | 18,701 | 19,476 | 19,661 | 19,074 | 18,353 | 18,277 | 19,253 | 19,705 | 19,900 | 20,230 | 20,855 | 20,220 | 20,721 | 20,688 | 21,598 | 22,724 |
ANNUAL AVERAGE TOTAL RETURN (%)
| | | |
| | 1 Year | 5 Year | Since Inception
(12/31/2015) |
Class C (without sales charge) | 25.23 | 8.52 | 9.68 |
S&P 500 Total Return Index** | 27.14 | 15.92 | 14.48 |
S&P 500 Low Volatility Index | 19.14 | 7.17 | 9.93 |
Visit https://sgiam.com/literature/ for more recent performance information.
| * | The Fund’s past performance is not a good predictor of how the Fund will perform in the future. The graph and table do not reflect the deduction of taxes that a shareholder would pay on Fund distributions or redemption of Fund shares. |
| ** | Effective with this report, and pursuant to new regulatory requirements, the S&P 500 Total Return Index replaced the S&P 500 Low Volatility Index as the Fund’s primary benchmark to represent a broad-based securities market index. |
KEY FUND STATISTICS (as of August 31, 2024)
| |
Net Assets | $232,958,382 |
Number of Holdings | 93 |
Net Advisory Fee | $1,852,151 |
Portfolio Turnover | 194% |
WHAT DID THE FUND INVEST IN? (as of August 31, 2024)
| |
Top 10 Holdings | (% of net assets) |
United Therapeutics Corp. | 3.9% |
Progressive Corp. | 3.9% |
Everest Group Ltd. | 3.6% |
Automatic Data Processing, Inc. | 3.3% |
Colgate-Palmolive Co. | 3.3% |
Owens Corning | 3.2% |
Elevance Health, Inc. | 3.1% |
Regeneron Pharmaceuticals, Inc. | 3.1% |
Alphabet, Inc. | 3.1% |
Cardinal Health, Inc. | 2.7% |
| |
Top Sectors | (% of net assets) |
Consumer, Non-cyclical | 33.4% |
Financial | 17.4% |
Industrial | 11.6% |
Communications | 11.5% |
Consumer, Cyclical | 8.1% |
Technology | 7.7% |
Utilities | 3.9% |
Energy | 3.0% |
Basic Materials | 1.6% |
Cash & Other | 1.8% |
For additional information about the Fund; including its prospectus, financial information, holdings and proxy information, scan the QR code or visit https://sgiam.com/literature/
| SGI U.S. Large Cap Equity Fund | PAGE 2 | TSR-AR-74925K284 |
HOUSEHOLDING
To reduce Fund expenses, only one copy of most shareholder documents may be mailed to shareholders with multiple accounts at the same address (Householding). If you would prefer that your Fund documents not be householded, please contact the Fund at 1-855-744-8500, or contact your financial intermediary. Your instructions will typically be effective within 30 days of receipt by the Fund or your financial intermediary.
| SGI U.S. Large Cap Equity Fund | PAGE 3 | TSR-AR-74925K284 |
106931141314130148061620819166169551779122279107821253214996154341882024685219132540732302110571228613758160781592819023191831907422724
| | |
| SGI Global Equity Fund | |
Class I | SGLIX |
Annual Shareholder Report | August 31, 2024 |
This annual shareholder report contains important information about the SGI Global Equity Fund (the “Fund”) for the period of September 1, 2023 to August 31, 2024. You can find additional information about the Fund at https://sgiam.com/literature/. You can also request this information by contacting us at 1-855-744-8500.
WHAT WERE THE FUND COSTS FOR THE PAST YEAR? (based on a hypothetical $10,000 investment)
| | |
Class Name | Costs of a $10,000 investment | Costs paid as a percentage of a $10,000 investment |
| Class I | $92 | 0.84% |
HOW DID THE FUND PERFORM LAST YEAR AND WHAT AFFECTED ITS PERFORMANCE?
For the fiscal year ending August 31, 2024, net of fees, the Fund returned 19.84% underperforming its benchmark, the S&P 500 Broad Market Index, which returned 22.97%.
WHAT FACTORS INFLUENCED PERFORMANCE?
To crush skyrocketing inflation, the Federal Reserve raised the fed funds rate a significant 5.25% during a 16-month period from March 2022 through July 2023. This approach was effective and all key U.S. inflation indicators fell during the fiscal year. As a result, the Federal Reserve signaled no further rate increases and the possibility of upcoming rate cuts. This sparked a strong rally in equities and risk assets in general. Growth stocks, particularly semiconductor and AI related stocks, had tremendous performance. Broad market indices of international stocks also performed well, however, U.S market indices performed even better with many reaching all-time highs.
WHAT WERE THE TOP CONTRIBUTORS AND DETRACTORS?
Active management meaningfully contributed to performance with strong stock selection as the primary reason. The most contributing sectors to performance were Consumer Staples and Financials. Strong stock selection in the Health Care and Industrials sectors also benefited relative performance. The most detracting sector was Consumer Discretionary, which was hurt by both an average overweight allocation and underperforming stock selection. The second worst contributing sector was Energy, which was hurt by both an average underweight allocation and underperforming stock selection.
| |
Top Contributors |
| ↑ | Commvault Systems Inc. |
| ↑ | Enova International Inc. |
| ↑ | M/I Homes Inc. |
| ↑ | Eagle Materials Inc. |
| ↑ | Matson Inc. |
| |
Top Detractors |
| ↓ | Incyte Corp. |
| ↓ | Waste Management Inc. |
| ↓ | Motorola Solutions Inc. |
| ↓ | Republic Services Inc. |
| ↓ | Eli Lilly & Co. |
HOW DID THE FUND PERFORM OVER THE PAST 10 YEARS?*
The $1,000,000 chart reflects a hypothetical $1,000,000 investment in the class of shares noted. The chart uses total return NAV performance and assumes reinvestment of dividends and capital gains. Fund expenses, including management fees and other expenses, were deducted.
| SGI Global Equity Fund | PAGE 1 | TSR-AR-74925K417 |
CUMULATIVE PERFORMANCE (Initial Investment of $1,000,000)
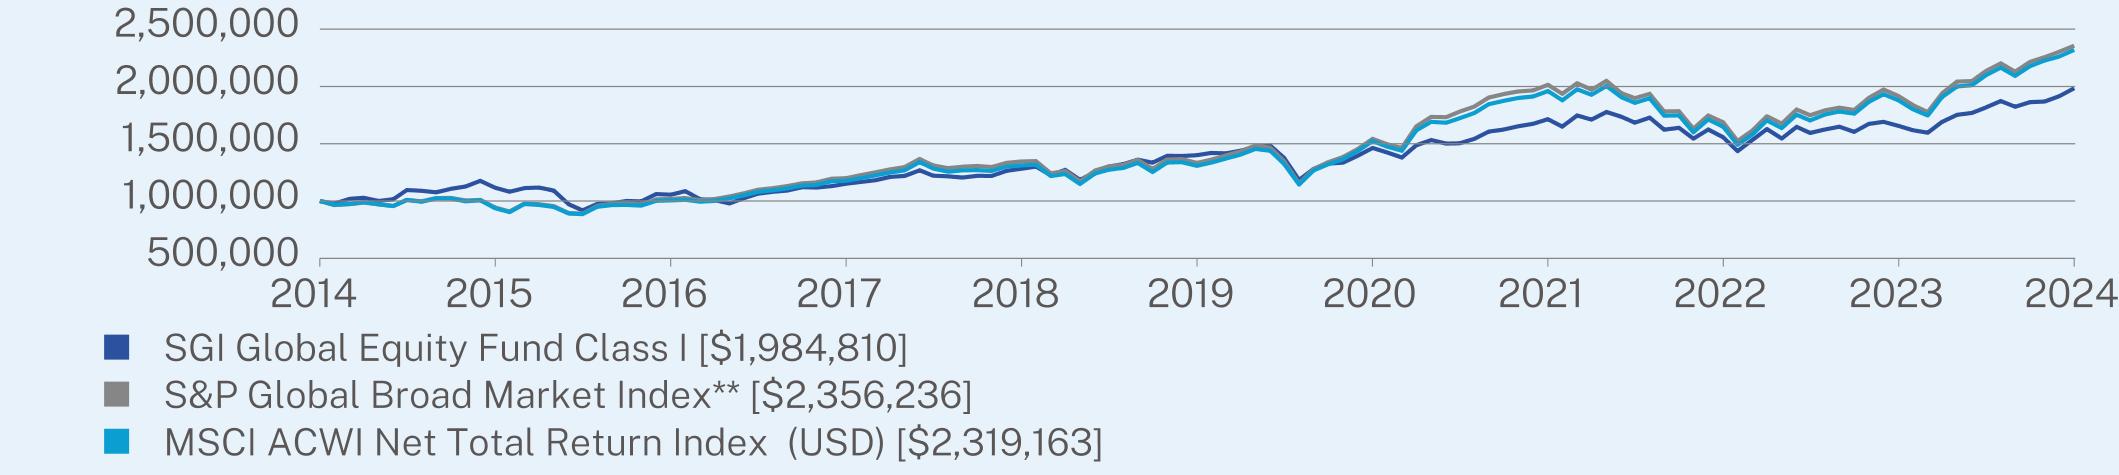
| | 08/31/2014 | 09/30/2014 | 10/31/2014 | 11/30/2014 | 12/31/2014 | 01/31/2015 | 02/28/2015 | 03/31/2015 | 04/30/2015 | 05/31/2015 | 06/30/2015 | 07/31/2015 | 08/31/2015 | 09/30/2015 | 10/31/2015 | 11/30/2015 | 12/31/2015 | 01/31/2016 | 02/29/2016 | 03/31/2016 | 04/30/2016 | 05/31/2016 | 06/30/2016 | 07/31/2016 | 08/31/2016 | 09/30/2016 | 10/31/2016 | 11/30/2016 | 12/31/2016 | 01/31/2017 | 02/28/2017 | 03/31/2017 | 04/30/2017 | 05/31/2017 | 06/30/2017 | 07/31/2017 | 08/31/2017 | 09/30/2017 | 10/31/2017 | 11/30/2017 | 12/31/2017 | 01/31/2018 | 02/28/2018 | 03/31/2018 | 04/30/2018 | 05/31/2018 | 06/30/2018 | 07/31/2018 | 08/31/2018 | 09/30/2018 | 10/31/2018 | 11/30/2018 | 12/31/2018 | 01/31/2019 | 02/28/2019 | 03/31/2019 | 04/30/2019 | 05/31/2019 | 06/30/2019 | 07/31/2019 | 08/31/2019 | 09/30/2019 | 10/31/2019 | 11/30/2019 | 12/31/2019 | 01/31/2020 | 02/29/2020 | 03/31/2020 | 04/30/2020 | 05/31/2020 | 06/30/2020 | 07/31/2020 | 08/31/2020 | 09/30/2020 | 10/31/2020 | 11/30/2020 | 12/31/2020 | 01/31/2021 | 02/28/2021 | 03/31/2021 | 04/30/2021 | 05/31/2021 | 06/30/2021 | 07/31/2021 | 08/31/2021 | 09/30/2021 | 10/31/2021 | 11/30/2021 | 12/31/2021 | 01/31/2022 | 02/28/2022 | 03/31/2022 | 04/30/2022 | 05/31/2022 | 06/30/2022 | 07/31/2022 | 08/31/2022 | 09/30/2022 | 10/31/2022 | 11/30/2022 | 12/31/2022 | 01/31/2023 | 02/28/2023 | 03/31/2023 | 04/30/2023 | 05/31/2023 | 06/30/2023 | 07/31/2023 | 08/31/2023 | 09/30/2023 | 10/31/2023 | 11/30/2023 | 12/31/2023 | 01/31/2024 | 02/29/2024 | 03/31/2024 | 04/30/2024 | 05/31/2024 | 06/30/2024 | 07/31/2024 | 08/31/2024 |
| SGI Global Equity Fund Class I | 1,000,000 | 977,190 | 1,018,465 | 1,028,602 | 1,000,594 | 1,016,370 | 1,096,039 | 1,089,335 | 1,076,319 | 1,106,688 | 1,126,803 | 1,176,103 | 1,115,759 | 1,081,052 | 1,112,999 | 1,117,731 | 1,091,484 | 972,136 | 917,964 | 976,368 | 980,177 | 1,000,491 | 997,529 | 1,060,589 | 1,055,087 | 1,086,405 | 1,015,304 | 1,008,109 | 978,907 | 1,026,731 | 1,064,398 | 1,080,480 | 1,091,060 | 1,121,109 | 1,117,723 | 1,129,997 | 1,151,581 | 1,166,393 | 1,182,053 | 1,210,408 | 1,219,719 | 1,268,389 | 1,220,989 | 1,215,910 | 1,204,906 | 1,220,142 | 1,219,296 | 1,263,734 | 1,282,356 | 1,300,554 | 1,225,644 | 1,272,622 | 1,185,073 | 1,250,744 | 1,299,675 | 1,322,423 | 1,360,624 | 1,334,871 | 1,394,103 | 1,393,244 | 1,400,112 | 1,419,427 | 1,416,422 | 1,439,171 | 1,469,755 | 1,483,977 | 1,375,979 | 1,184,426 | 1,279,980 | 1,327,091 | 1,334,646 | 1,394,645 | 1,463,533 | 1,424,867 | 1,379,979 | 1,487,088 | 1,532,458 | 1,501,594 | 1,503,831 | 1,542,746 | 1,606,263 | 1,624,155 | 1,651,888 | 1,673,806 | 1,714,510 | 1,649,651 | 1,746,716 | 1,710,932 | 1,777,456 | 1,735,672 | 1,684,029 | 1,727,691 | 1,622,996 | 1,638,959 | 1,544,593 | 1,624,405 | 1,556,800 | 1,435,204 | 1,533,325 | 1,628,161 | 1,545,501 | 1,647,466 | 1,594,541 | 1,624,645 | 1,648,923 | 1,603,767 | 1,673,200 | 1,691,166 | 1,656,206 | 1,617,848 | 1,596,484 | 1,691,166 | 1,752,692 | 1,768,920 | 1,816,623 | 1,872,685 | 1,823,016 | 1,863,341 | 1,868,259 | 1,914,978 | 1,984,810 |
| S&P Global Broad Market Index** | 1,000,000 | 964,882 | 972,501 | 987,149 | 971,020 | 956,937 | 1,009,476 | 997,687 | 1,026,007 | 1,027,395 | 1,005,362 | 1,010,387 | 943,219 | 909,124 | 978,433 | 973,005 | 955,688 | 895,136 | 890,970 | 958,936 | 975,097 | 977,365 | 970,762 | 1,014,468 | 1,018,542 | 1,026,486 | 1,007,085 | 1,017,885 | 1,040,153 | 1,068,707 | 1,098,571 | 1,112,395 | 1,130,786 | 1,154,794 | 1,162,353 | 1,194,485 | 1,199,320 | 1,225,356 | 1,250,607 | 1,275,688 | 1,296,982 | 1,367,011 | 1,310,806 | 1,287,375 | 1,299,685 | 1,305,695 | 1,297,517 | 1,333,334 | 1,345,664 | 1,348,535 | 1,242,496 | 1,262,204 | 1,171,527 | 1,266,149 | 1,301,387 | 1,315,475 | 1,359,172 | 1,280,003 | 1,362,254 | 1,365,794 | 1,332,420 | 1,360,676 | 1,398,909 | 1,433,727 | 1,484,981 | 1,465,231 | 1,346,115 | 1,153,346 | 1,279,844 | 1,340,145 | 1,383,481 | 1,453,886 | 1,542,929 | 1,495,819 | 1,464,263 | 1,651,479 | 1,734,088 | 1,731,668 | 1,779,573 | 1,824,696 | 1,903,590 | 1,933,370 | 1,956,450 | 1,965,117 | 2,014,541 | 1,936,247 | 2,027,979 | 1,971,707 | 2,049,269 | 1,941,630 | 1,897,948 | 1,935,594 | 1,782,007 | 1,784,102 | 1,631,709 | 1,746,828 | 1,686,981 | 1,524,363 | 1,616,149 | 1,740,260 | 1,675,584 | 1,798,617 | 1,749,041 | 1,791,856 | 1,815,115 | 1,794,457 | 1,899,510 | 1,972,918 | 1,916,158 | 1,837,515 | 1,775,801 | 1,940,142 | 2,042,953 | 2,047,131 | 2,134,391 | 2,202,094 | 2,128,991 | 2,215,178 | 2,255,024 | 2,303,024 | 2,356,236 |
| MSCI ACWI Net Total Return Index (USD) | 1,000,000 | 967,572 | 974,384 | 990,682 | 971,565 | 956,375 | 1,009,618 | 993,974 | 1,022,814 | 1,021,479 | 997,432 | 1,006,093 | 937,125 | 903,173 | 974,059 | 966,016 | 948,594 | 891,384 | 885,252 | 950,856 | 964,892 | 966,108 | 960,260 | 1,001,641 | 1,005,011 | 1,011,169 | 994,005 | 1,001,559 | 1,023,195 | 1,051,174 | 1,080,663 | 1,093,880 | 1,110,930 | 1,135,462 | 1,140,625 | 1,172,499 | 1,176,992 | 1,199,731 | 1,224,645 | 1,248,352 | 1,268,478 | 1,340,039 | 1,283,761 | 1,256,282 | 1,268,278 | 1,269,859 | 1,262,986 | 1,301,074 | 1,311,292 | 1,317,001 | 1,218,307 | 1,236,125 | 1,149,049 | 1,239,788 | 1,272,951 | 1,288,955 | 1,332,480 | 1,253,438 | 1,335,515 | 1,339,426 | 1,307,654 | 1,335,165 | 1,371,707 | 1,405,195 | 1,454,676 | 1,438,610 | 1,322,412 | 1,143,881 | 1,266,423 | 1,321,500 | 1,363,726 | 1,435,848 | 1,523,732 | 1,474,601 | 1,438,754 | 1,616,099 | 1,691,133 | 1,683,445 | 1,722,435 | 1,768,444 | 1,845,765 | 1,874,486 | 1,899,189 | 1,912,276 | 1,960,139 | 1,879,165 | 1,975,087 | 1,927,524 | 2,004,628 | 1,906,175 | 1,856,941 | 1,897,163 | 1,745,308 | 1,747,354 | 1,600,059 | 1,711,795 | 1,648,773 | 1,490,935 | 1,580,912 | 1,703,530 | 1,636,499 | 1,753,795 | 1,703,530 | 1,756,057 | 1,781,295 | 1,762,214 | 1,864,531 | 1,932,789 | 1,878,778 | 1,801,091 | 1,746,936 | 1,908,174 | 1,999,830 | 2,011,553 | 2,097,876 | 2,163,743 | 2,092,352 | 2,177,330 | 2,225,827 | 2,261,721 | 2,319,163 |
ANNUAL AVERAGE TOTAL RETURN (%)
| | | |
| | 1 Year | 5 Year | 10 Year |
Class I | 19.84 | 7.23 | 7.10 |
S&P Global Broad Market Index** | 22.97 | 12.08 | 8.95 |
MSCI ACWI Net Total Return Index (USD) | 23.44 | 12.14 | 8.78 |
Visit https://sgiam.com/literature/ for more recent performance information.
| * | The Fund’s past performance is not a good predictor of how the Fund will perform in the future. The graph and table do not reflect the deduction of taxes that a shareholder would pay on Fund distributions or redemption of Fund shares. |
| ** | Effective with this report, and pursuant to new regulatory requirements, the S&P Global Broad Market Index replaced the MSCI ACWI Index as the Fund’s primary benchmark to represent a broad-based securities market index. |
KEY FUND STATISTICS (as of August 31, 2024)
| |
Net Assets | $108,187,210 |
Number of Holdings | 94 |
Net Advisory Fee | $646,296 |
Portfolio Turnover | 102% |
30-Day SEC Yield | 1.23% |
30-Day SEC Yield Unsubsidized | 0.90% |
WHAT DID THE FUND INVEST IN? (as of August 31, 2024)
| |
Top 10 Holdings | (% of net assets) |
Progressive Corp. | 3.9% |
Colgate-Palmolive Co. | 3.7% |
Takeda Pharmaceutical Co. Ltd. | 3.3% |
Rio Tinto PLC | 2.8% |
Coca-Cola Co. | 2.7% |
United Therapeutics Corp. | 2.7% |
Microsoft Corp. | 2.6% |
Kroger Co., (The) | 2.6% |
Lockheed Martin Corp. | 2.3% |
McKesson Corp. | 2.2% |
| |
Top Sectors | (% of net assets) |
Consumer, Non-cyclical | 36.4% |
Financial | 19.3% |
Communications | 9.7% |
Industrial | 9.2% |
Technology | 7.7% |
Consumer, Cyclical | 7.2% |
Basic Materials | 3.2% |
Utilities | 2.5% |
Energy | 1.8% |
Cash & Other | 3.0% |
For additional information about the Fund; including its prospectus, financial information, holdings and proxy information, scan the QR code or visit https://sgiam.com/literature/
| SGI Global Equity Fund | PAGE 2 | TSR-AR-74925K417 |
HOUSEHOLDING
To reduce Fund expenses, only one copy of most shareholder documents may be mailed to shareholders with multiple accounts at the same address (Householding). If you would prefer that your Fund documents not be householded, please contact the Fund at 1-855-744-8500, or contact your financial intermediary. Your instructions will typically be effective within 30 days of receipt by the Fund or your financial intermediary.
| SGI Global Equity Fund | PAGE 3 | TSR-AR-74925K417 |
1000000111575910550871151581128235614001121463533171451015568001656206198481010000009432191018542119932013456641332420154292920145411686981191615823562361000000937125100501111769921311292130765415237321960139164877318787782319163
| | |
| | |
Class I | BOGIX |
Annual Shareholder Report | August 31, 2024 |
This annual shareholder report contains important information about the SGI Small Cap Core Fund (the “Fund”) for the period of September 1, 2023 to August 31, 2024. You can find additional information about the Fund at https://sgiam.com/literature/. You can also request this information by contacting us at 1-855-744-8500.
WHAT WERE THE FUND COSTS FOR THE PAST YEAR? (based on a hypothetical $10,000 investment)
| | |
Class Name | Costs of a $10,000 investment | Costs paid as a percentage of a $10,000 investment |
| Class I | $134 | 1.23% |
HOW DID THE FUND PERFORM LAST YEAR AND WHAT AFFECTED ITS PERFORMANCE?
For the fiscal year ending August 31, 2024, net of fees, the Fund returned 17.38% underperforming its benchmark, Russell 3000 Index, which returned 26.14%. The Fund also slightly underperformed its secondary benchmark, Russell 2000 Index, which returned 18.47%.
WHAT FACTORS INFLUENCED PERFORMANCE?
To crush skyrocketing inflation, the Federal Reserve raised the fed funds rate a significant 5.25% during a 16-month period from March 2022 through July 2023. This approach was effective and all key U.S. inflation indicators fell during the fiscal year. As a result, the Federal Reserve signaled no further rate increases and the possibility of upcoming rate cuts. This sparked a strong rally in equities and risk assets in general. Growth stocks, particularly semiconductor and AI related stocks, had tremendous performance. Broad market indices of international stocks also performed well, however, U.S market indices performed even better with many reaching all-time highs.
WHAT WERE THE TOP CONTRIBUTORS AND DETRACTORS?
The sector contributing the most to performance was Consumer Discretionary sector, with strong stock selection benefiting relative performance. However, the biggest detractor was the Information Technology sector, where both an average underweight allocation and underperforming stock selection negatively impacted performance. The second largest detractor was the Materials sector, which also suffered from an average overweight allocation and underperforming stock selection.
The broad-based index may not necessarily reflect an accurate description of the underlying holdings found in the Fund.
| |
Top Contributors |
| ↑ | Commvault Systems Inc. |
| ↑ | Enova International Inc. |
| ↑ | M/I Homes Inc. |
| ↑ | Eagle Materials Inc. |
| ↑ | Matson Inc. |
| |
Top Detractors |
| ↓ | Super Micro Computer Inc. |
| ↓ | Par Pacific Holdings Inc. |
| ↓ | Omnicell Inc. |
| ↓ | Titan Machinery Inc. |
| ↓ | Allegiant Travel Co. |
| SGI Small Cap Core Fund | PAGE 1 | TSR-AR-749255188 |
HOW DID THE FUND PERFORM OVER THE PAST 10 YEARS?*
The $1,000,000 chart reflects a hypothetical $1,000,000 investment in the class of shares noted. The chart uses total return NAV performance and assumes reinvestment of dividends and capital gains. Fund expenses, including management fees and other expenses, were deducted.
CUMULATIVE PERFORMANCE (Initial Investment of $1,000,000)

| | 08/31/2014 | 09/30/2014 | 10/31/2014 | 11/30/2014 | 12/31/2014 | 01/31/2015 | 02/28/2015 | 03/31/2015 | 04/30/2015 | 05/31/2015 | 06/30/2015 | 07/31/2015 | 08/31/2015 | 09/30/2015 | 10/31/2015 | 11/30/2015 | 12/31/2015 | 01/31/2016 | 02/29/2016 | 03/31/2016 | 04/30/2016 | 05/31/2016 | 06/30/2016 | 07/31/2016 | 08/31/2016 | 09/30/2016 | 10/31/2016 | 11/30/2016 | 12/31/2016 | 01/31/2017 | 02/28/2017 | 03/31/2017 | 04/30/2017 | 05/31/2017 | 06/30/2017 | 07/31/2017 | 08/31/2017 | 09/30/2017 | 10/31/2017 | 11/30/2017 | 12/31/2017 | 01/31/2018 | 02/28/2018 | 03/31/2018 | 04/30/2018 | 05/31/2018 | 06/30/2018 | 07/31/2018 | 08/31/2018 | 09/30/2018 | 10/31/2018 | 11/30/2018 | 12/31/2018 | 01/31/2019 | 02/28/2019 | 03/31/2019 | 04/30/2019 | 05/31/2019 | 06/30/2019 | 07/31/2019 | 08/31/2019 | 09/30/2019 | 10/31/2019 | 11/30/2019 | 12/31/2019 | 01/31/2020 | 02/29/2020 | 03/31/2020 | 04/30/2020 | 05/31/2020 | 06/30/2020 | 07/31/2020 | 08/31/2020 | 09/30/2020 | 10/31/2020 | 11/30/2020 | 12/31/2020 | 01/31/2021 | 02/28/2021 | 03/31/2021 | 04/30/2021 | 05/31/2021 | 06/30/2021 | 07/31/2021 | 08/31/2021 | 09/30/2021 | 10/31/2021 | 11/30/2021 | 12/31/2021 | 01/31/2022 | 02/28/2022 | 03/31/2022 | 04/30/2022 | 05/31/2022 | 06/30/2022 | 07/31/2022 | 08/31/2022 | 09/30/2022 | 10/31/2022 | 11/30/2022 | 12/31/2022 | 01/31/2023 | 02/28/2023 | 03/31/2023 | 04/30/2023 | 05/31/2023 | 06/30/2023 | 07/31/2023 | 08/31/2023 | 09/30/2023 | 10/31/2023 | 11/30/2023 | 12/31/2023 | 01/31/2024 | 02/29/2024 | 03/31/2024 | 04/30/2024 | 05/31/2024 | 06/30/2024 | 07/31/2024 | 08/31/2024 |
| SGI Small Cap Core Fund Class I | 1,000,000 | 939,585 | 945,626 | 943,525 | 942,569 | 922,243 | 988,075 | 1,001,423 | 992,322 | 996,266 | 978,063 | 963,805 | 910,109 | 827,895 | 892,817 | 918,603 | 870,052 | 780,338 | 799,336 | 878,496 | 902,419 | 906,993 | 885,884 | 949,563 | 949,915 | 985,801 | 929,510 | 1,031,889 | 1,042,092 | 1,064,960 | 1,078,330 | 1,069,534 | 1,084,662 | 1,041,388 | 1,071,645 | 1,124,770 | 1,127,233 | 1,176,487 | 1,209,910 | 1,196,893 | 1,219,930 | 1,261,337 | 1,215,242 | 1,189,461 | 1,196,102 | 1,288,680 | 1,281,649 | 1,287,118 | 1,372,665 | 1,362,900 | 1,205,086 | 1,170,711 | 1,024,743 | 1,154,519 | 1,202,119 | 1,179,217 | 1,212,897 | 1,110,512 | 1,194,036 | 1,219,183 | 1,152,723 | 1,160,357 | 1,194,485 | 1,253,312 | 1,271,179 | 1,218,926 | 1,140,097 | 880,185 | 1,006,312 | 1,086,042 | 1,138,745 | 1,227,935 | 1,268,476 | 1,232,890 | 1,255,863 | 1,440,999 | 1,545,245 | 1,650,160 | 1,748,904 | 1,786,407 | 1,830,083 | 1,858,092 | 1,878,030 | 1,841,001 | 1,834,355 | 1,785,933 | 1,840,052 | 1,758,873 | 1,849,628 | 1,719,546 | 1,733,136 | 1,734,431 | 1,626,352 | 1,674,243 | 1,533,159 | 1,697,542 | 1,652,239 | 1,496,270 | 1,660,653 | 1,711,780 | 1,604,977 | 1,750,174 | 1,771,661 | 1,684,412 | 1,657,717 | 1,619,302 | 1,795,101 | 1,874,535 | 1,790,543 | 1,701,341 | 1,593,909 | 1,729,339 | 1,944,204 | 1,912,951 | 1,971,550 | 2,051,636 | 1,908,393 | 1,999,548 | 1,950,064 | 2,142,140 | 2,101,772 |
| Russell 3000 Index** | 1,000,000 | 979,155 | 1,006,095 | 1,030,477 | 1,030,465 | 1,001,786 | 1,059,790 | 1,049,016 | 1,053,761 | 1,068,336 | 1,050,462 | 1,068,032 | 1,003,555 | 974,312 | 1,051,268 | 1,057,096 | 1,035,398 | 976,976 | 976,661 | 1,045,424 | 1,051,903 | 1,070,722 | 1,072,924 | 1,115,505 | 1,118,350 | 1,120,108 | 1,095,874 | 1,144,917 | 1,167,258 | 1,189,228 | 1,233,457 | 1,234,296 | 1,247,379 | 1,260,145 | 1,271,517 | 1,295,492 | 1,297,988 | 1,329,643 | 1,358,658 | 1,399,914 | 1,413,906 | 1,488,434 | 1,433,571 | 1,404,793 | 1,410,133 | 1,449,941 | 1,459,423 | 1,507,856 | 1,560,808 | 1,563,392 | 1,448,275 | 1,477,282 | 1,339,792 | 1,454,792 | 1,505,956 | 1,527,945 | 1,588,959 | 1,486,135 | 1,590,516 | 1,614,159 | 1,581,254 | 1,609,006 | 1,643,643 | 1,706,121 | 1,755,383 | 1,753,466 | 1,609,904 | 1,388,513 | 1,572,408 | 1,656,498 | 1,694,369 | 1,790,581 | 1,920,298 | 1,850,378 | 1,810,441 | 2,030,687 | 2,122,044 | 2,112,605 | 2,178,639 | 2,256,728 | 2,373,060 | 2,383,893 | 2,442,678 | 2,483,985 | 2,554,823 | 2,440,193 | 2,605,210 | 2,565,555 | 2,666,583 | 2,509,692 | 2,446,475 | 2,525,829 | 2,299,155 | 2,296,073 | 2,103,986 | 2,301,378 | 2,215,492 | 2,010,052 | 2,174,888 | 2,288,409 | 2,154,415 | 2,302,795 | 2,248,972 | 2,309,108 | 2,333,710 | 2,342,790 | 2,502,768 | 2,592,485 | 2,542,440 | 2,421,333 | 2,357,146 | 2,576,946 | 2,713,632 | 2,743,707 | 2,892,225 | 2,985,521 | 2,854,153 | 2,989,003 | 3,081,535 | 3,138,817 | 3,207,145 |
| Russell 2000 Index | 1,000,000 | 939,506 | 1,001,437 | 1,002,335 | 1,030,901 | 997,741 | 1,056,973 | 1,075,387 | 1,047,962 | 1,071,887 | 1,079,914 | 1,067,363 | 1,000,289 | 951,212 | 1,004,803 | 1,037,488 | 985,396 | 898,746 | 898,706 | 970,433 | 985,664 | 1,007,865 | 1,007,230 | 1,067,368 | 1,086,244 | 1,098,343 | 1,046,128 | 1,162,784 | 1,195,364 | 1,200,079 | 1,223,239 | 1,224,840 | 1,238,272 | 1,213,081 | 1,255,015 | 1,264,339 | 1,248,254 | 1,326,157 | 1,337,461 | 1,376,006 | 1,370,452 | 1,406,268 | 1,351,815 | 1,369,299 | 1,381,137 | 1,464,973 | 1,475,470 | 1,501,186 | 1,565,902 | 1,528,238 | 1,362,246 | 1,383,899 | 1,219,511 | 1,356,704 | 1,427,237 | 1,397,365 | 1,444,835 | 1,332,466 | 1,426,641 | 1,434,855 | 1,364,010 | 1,392,390 | 1,429,061 | 1,487,888 | 1,530,790 | 1,481,696 | 1,356,963 | 1,062,143 | 1,208,033 | 1,286,645 | 1,332,125 | 1,368,996 | 1,446,130 | 1,397,824 | 1,427,100 | 1,690,150 | 1,836,349 | 1,928,758 | 2,048,968 | 2,069,547 | 2,113,005 | 2,117,362 | 2,158,385 | 2,080,448 | 2,126,984 | 2,064,270 | 2,152,083 | 2,062,406 | 2,108,477 | 1,905,486 | 1,925,827 | 1,949,796 | 1,756,553 | 1,759,208 | 1,614,525 | 1,783,086 | 1,746,599 | 1,579,213 | 1,753,067 | 1,794,015 | 1,677,579 | 1,841,086 | 1,809,988 | 1,723,508 | 1,692,522 | 1,676,887 | 1,813,221 | 1,924,106 | 1,827,846 | 1,720,237 | 1,602,919 | 1,747,998 | 1,961,575 | 1,885,282 | 1,991,879 | 2,063,187 | 1,917,974 | 2,014,194 | 1,995,562 | 2,198,309 | 2,165,471 |
ANNUAL AVERAGE TOTAL RETURN (%)
| | | |
| | 1 Year | 5 Year | 10 Year |
Class I | 17.38 | 12.76 | 7.71 |
Russell 3000 Index** | 26.14 | 15.19 | 12.36 |
Russell 2000 Index | 18.47 | 9.68 | 8.03 |
Visit https://sgiam.com/literature/ for more recent performance information.
| * | The Fund’s past performance is not a good predictor of how the Fund will perform in the future. The graph and table do not reflect the deduction of taxes that a shareholder would pay on Fund distributions or redemption of Fund shares. |
| ** | Effective with this report, and pursuant to new regulatory requirements, the Russell 3000 Index replaced the Russell 2000 Index as the Fund’s primary benchmark to represent a broad-based securities market index. |
KEY FUND STATISTICS (as of August 31, 2024)
| |
Net Assets | $124,720,143 |
Number of Holdings | 190 |
Net Advisory Fee | $1,092,436 |
Portfolio Turnover | 211% |
WHAT DID THE FUND INVEST IN? (as of August 31, 2024)
| |
Top 10 Holdings | (% of net assets) |
OFG Bancorp | 1.2% |
Catalyst Pharmaceuticals Partners, Inc. | 1.2% |
Sylvamo Corp. | 1.2% |
NMI Holdings, Inc. | 1.2% |
Hancock Whitney Corp. | 1.2% |
Pilgrim’s Pride Corp. | 1.2% |
Mueller Water Products, Inc. | 1.2% |
Korn/Ferry International | 1.2% |
Taylor Morrison Home Corp. | 1.2% |
Essent Group Ltd. | 1.2% |
| |
Top Sectors | (% of net assets) |
Financial | 21.9% |
Industrial | 21.5% |
Consumer, Non-cyclical | 20.3% |
Consumer, Cyclical | 18.1% |
Technology | 7.3% |
Energy | 2.7% |
Utilities | 2.7% |
Basic Materials | 2.2% |
Communications | 1.1% |
Cash & Other | 2.2% |
For additional information about the Fund; including its prospectus, financial information, holdings and proxy information, scan the QR code or visit https://sgiam.com/literature/
| SGI Small Cap Core Fund | PAGE 2 | TSR-AR-749255188 |
HOUSEHOLDING
To reduce Fund expenses, only one copy of most shareholder documents may be mailed to shareholders with multiple accounts at the same address (Householding). If you would prefer that your Fund documents not be householded, please contact the Fund at 1-855-744-8500, or contact your financial intermediary. Your instructions will typically be effective within 30 days of receipt by the Fund or your financial intermediary.
| SGI Small Cap Core Fund | PAGE 3 | TSR-AR-749255188 |
1000000910109949915112723313726651152723126847618343551652239179054321017721000000100355511183501297988156080815812541920298255482322154922542440320714510000001000289108624412482541565902136401014461302126984174659918278462165471
| | |
| | |
Class I | SGPKX |
Annual Shareholder Report | August 31, 2024 |
This annual shareholder report contains important information about the SGI Peak Growth Fund (the “Fund”) for the period of September 1, 2023 to August 31, 2024. You can find additional information about the Fund at https://sgiam.com/literature/. You can also request this information by contacting us at 1-855-744-8500.
WHAT WERE THE FUND COSTS FOR THE PAST YEAR? (based on a hypothetical $10,000 investment)
| | |
Class Name | Costs of a $10,000 investment | Costs paid as a percentage of a $10,000 investment |
| Class I | $143 | 1.30% |
HOW DID THE FUND PERFORM LAST YEAR AND WHAT AFFECTED ITS PERFORMANCE?
For the fiscal year ending August 31, 2024, net of fees, the Fund returned 19.25% underperforming its benchmark, the S&P 500 Total Return Index, which returned 27.14%. On an absolute basis, strategic allocations to SGI US Large Cap Equity Fund, SGI Global Equity Fund, SGI Small Cap Core Fund, and SGI US Large Cap Core ETF contributed 17.19% to the Fund’s performance.
WHAT FACTORS INFLUENCED PERFORMANCE?
To crush skyrocketing inflation, the Federal Reserve raised the fed funds rate a significant 5.25% during a 16-month period from March 2022 through July 2023. This approach was effective and all key U.S. inflation indicators fell during the fiscal year. As a result, the Federal Reserve signaled no further rate increases and the possibility of upcoming rate cuts. This sparked a strong rally in equities and risk assets in general. Growth stocks, particularly semiconductor and AI related stocks, had tremendous performance. Broad market indices of international stocks also performed well, however, U.S market indices performed even better with many reaching all-time highs.
WHAT WERE THE TOP CONTRIBUTORS AND DETRACTORS?
Overweight exposure to equities and underweight exposure to fixed income benefited performance the most. Factors that contributed least to relative performance were exposure to non-US, emerging markets, and small cap stocks.
| |
Top Contributors |
| ↑ | SGI US Large Cap Equity |
| ↑ | SGI Global Equity Fund |
| ↑ | SGI Small Cap Core Fund |
| ↑ | SGI US Large Cap Core ETF |
| ↑ | SGI Dynamic Tactical ETF |
| |
Top Detractors |
| ↓ | US Dollar Cash Holdings |
| ↓ | SGI Enhanced Core ETF |
| ↓ | iShares Core MSCI Emerging |
| ↓ | iShares Core MSCI EAFE ETF |
| ↓ | SGI Small Cap Equity Fund |
HOW DID THE FUND PERFORM SINCE INCEPTION?*
The $10,000 chart reflects a hypothetical $10,000 investment in the class of shares noted. The chart uses total return NAV performance and assumes reinvestment of dividends and capital gains. Fund expenses, including management fees and other expenses, were deducted.
| SGI Peak Growth Fund | PAGE 1 | TSR-AR-74933W783 |
CUMULATIVE PERFORMANCE (Initial Investment of $10,000)
| | 8/6/2020 | 06/30/2020 | 07/31/2020 | 08/31/2020 | 09/30/2020 | 10/31/2020 | 11/30/2020 | 12/31/2020 | 01/31/2021 | 02/28/2021 | 03/31/2021 | 04/30/2021 | 05/31/2021 | 06/30/2021 | 07/31/2021 | 08/31/2021 | 09/30/2021 | 10/31/2021 | 11/30/2021 | 12/31/2021 | 01/31/2022 | 02/28/2022 | 03/31/2022 | 04/30/2022 | 05/31/2022 | 06/30/2022 | 07/31/2022 | 08/31/2022 | 09/30/2022 | 10/31/2022 | 11/30/2022 | 12/31/2022 | 01/31/2023 | 02/28/2023 | 03/31/2023 | 04/30/2023 | 05/31/2023 | 06/30/2023 | 07/31/2023 | 08/31/2023 | 09/30/2023 | 10/31/2023 | 11/30/2023 | 12/31/2023 | 01/31/2024 | 02/29/2024 | 03/31/2024 | 04/30/2024 | 05/31/2024 | 06/30/2024 | 07/31/2024 | 08/31/2024 |
| SGI Peak Growth Fund Class I | 10,000 | 10,120 | 10,600 | 10,940 | 10,630 | 10,470 | 11,170 | 11,610 | 11,490 | 11,520 | 11,750 | 12,130 | 12,200 | 12,400 | 12,440 | 12,630 | 12,130 | 12,760 | 12,420 | 12,903 | 12,210 | 11,964 | 12,165 | 11,506 | 11,685 | 10,937 | 11,562 | 11,160 | 10,266 | 11,082 | 11,629 | 11,060 | 11,708 | 11,463 | 11,474 | 11,530 | 11,250 | 11,898 | 12,200 | 11,854 | 11,451 | 11,150 | 11,909 | 12,619 | 12,664 | 13,035 | 13,428 | 12,844 | 13,349 | 13,450 | 13,866 | 14,136 |
| S&P 500 Total Return Index | 10,000 | 9,601 | 10,143 | 10,872 | 10,459 | 10,181 | 11,295 | 11,729 | 11,611 | 11,931 | 12,453 | 13,118 | 13,210 | 13,518 | 13,839 | 14,260 | 13,597 | 14,549 | 14,449 | 15,096 | 14,315 | 13,886 | 14,402 | 13,146 | 13,170 | 12,083 | 13,197 | 12,659 | 11,493 | 12,424 | 13,118 | 12,362 | 13,139 | 12,818 | 13,289 | 13,496 | 13,555 | 14,451 | 14,915 | 14,677 | 13,978 | 13,684 | 14,933 | 15,612 | 15,874 | 16,722 | 17,260 | 16,555 | 17,376 | 17,999 | 18,218 | 18,660 |
ANNUAL AVERAGE TOTAL RETURN (%)
| | |
| | 1 Year | Since Inception
(06/08/2020) |
Class I (without sales charge) | 19.25 | 8.53 |
S&P 500 Total Return Index | 27.14 | 15.89 |
Visit https://sgiam.com/literature/ for more recent performance information.
| * | The Fund’s past performance is not a good predictor of how the Fund will perform in the future. The graph and table do not reflect the deduction of taxes that a shareholder would pay on Fund distributions or redemption of Fund shares. |
KEY FUND STATISTICS (as of August 31, 2024)
| |
Net Assets | $28,007,183 |
Number of Holdings | 7 |
Net Advisory Fee | $175,697 |
Portfolio Turnover | 44% |
WHAT DID THE FUND INVEST IN? (as of August 31, 2024)
| |
Top 10 Holdings | (% of net assets) |
SGI U.S. Large Cap Equity Fund | 29.5% |
SGI Small Cap Core Fund | 17.3% |
SGI Enhanced Global Income ETF | 14.8% |
SGI Global Equity Fund | 14.1% |
SGI U.S. Large Cap Core ETF | 12.9% |
SGI Dynamic Tactical ETF | 9.7% |
SGI Enhanced Core ETF | 1.0% |
| |
Top Sectors | (% of net assets) |
Cash & Other | 100.0% |
For additional information about the Fund; including its prospectus, financial information, holdings and proxy information, scan the QR code or visit https://sgiam.com/literature/
HOUSEHOLDING
To reduce Fund expenses, only one copy of most shareholder documents may be mailed to shareholders with multiple accounts at the same address (Householding). If you would prefer that your Fund documents not be householded, please contact the Fund at 1-855-744-8500, or contact your financial intermediary. Your instructions will typically be effective within 30 days of receipt by the Fund or your financial intermediary.
| SGI Peak Growth Fund | PAGE 2 | TSR-AR-74933W783 |
10940126301116011854141361087214260126591467718660
| | |
| SGI Prudent Growth Fund | |
Class I | SGPGX |
Annual Shareholder Report | August 31, 2024 |
This annual shareholder report contains important information about the SGI Prudent Growth Fund (the “Fund”) for the period of September 1, 2023 to August 31, 2024. You can find additional information about the Fund at https://sgiam.com/literature/. You can also request this information by contacting us at 1-855-744-8500.
WHAT WERE THE FUND COSTS FOR THE PAST YEAR? (based on a hypothetical $10,000 investment)
| | |
Class Name | Costs of a $10,000 investment | Costs paid as a percentage of a $10,000 investment |
| Class I | $142 | 1.31% |
HOW DID THE FUND PERFORM LAST YEAR AND WHAT AFFECTED ITS PERFORMANCE?
For the fiscal year ending August 31, 2024, net of fees, the Fund returned 16.62% underperforming its benchmark, the S&P 500 Total Return Index, which returned 27.14%. On an absolute basis, strategic allocations to SGI US Large Cap Equity Fund, SGI Global Equity Fund, SGI Large Cap Core ETF, and SGI Dynamic Tactical ETF contributed 13.47% to the fund’s performance.
WHAT FACTORS INFLUENCED PERFORMANCE?
To crush skyrocketing inflation, the Federal Reserve raised the fed funds rate a significant 5.25% during a 16-month period from March 2022 through July 2023. This approach was effective and all key U.S. inflation indicators fell during the fiscal year. As a result, the Federal Reserve signaled no further rate increases and the possibility of upcoming rate cuts. This sparked a strong rally in equities and risk assets in general. Growth stocks, particularly semiconductor and AI related stocks, had tremendous performance. Broad market indices of international stocks also performed well, however, U.S market indices performed even better with many reaching all-time highs.
WHAT WERE THE TOP CONTRIBUTORS AND DETRACTORS?
Overweight exposure to equities and underweight exposure to fixed income benefited performance the most. Factors that contributed least to relative performance were exposure to bond funds, and small cap stocks.
The broad-based index may not necessarily reflect an accurate description of the underlying holdings found in the Fund.
| |
Top Contributors |
| ↑ | SGI US Large Cap Equity Fund |
| ↑ | SGI Global Equity Fund |
| ↑ | SGI US Large Cap Core ETF |
| ↑ | SGI Dynamic Tactical ETF |
| ↑ | SGI Small Cap Core Fund |
| |
Top Detractors |
| ↓ | US Dollar Cash Holdings |
| ↓ | PGIM Ultra Short Bond ETF |
| ↓ | iShares IBOXX High Yield ETF |
| ↓ | iShares 20+ Year Treasury |
| ↓ | SGI US Small Cap Equity Fund |
HOW DID THE FUND PERFORM SINCE INCEPTION?*
The $10,000 chart reflects a hypothetical $10,000 investment in the class of shares noted. The chart uses total return NAV performance and assumes reinvestment of dividends and capital gains. Fund expenses, including management fees and other expenses, were deducted.
| SGI Prudent Growth Fund | PAGE 1 | TSR-AR-74933W775 |
CUMULATIVE PERFORMANCE (Initial Investment of $10,000)
| | 8/6/2020 | 06/30/2020 | 07/31/2020 | 08/31/2020 | 09/30/2020 | 10/31/2020 | 11/30/2020 | 12/31/2020 | 01/31/2021 | 02/28/2021 | 03/31/2021 | 04/30/2021 | 05/31/2021 | 06/30/2021 | 07/31/2021 | 08/31/2021 | 09/30/2021 | 10/31/2021 | 11/30/2021 | 12/31/2021 | 01/31/2022 | 02/28/2022 | 03/31/2022 | 04/30/2022 | 05/31/2022 | 06/30/2022 | 07/31/2022 | 08/31/2022 | 09/30/2022 | 10/31/2022 | 11/30/2022 | 12/31/2022 | 01/31/2023 | 02/28/2023 | 03/31/2023 | 04/30/2023 | 05/31/2023 | 06/30/2023 | 07/31/2023 | 08/31/2023 | 09/30/2023 | 10/31/2023 | 11/30/2023 | 12/31/2023 | 01/31/2024 | 02/29/2024 | 03/31/2024 | 04/30/2024 | 05/31/2024 | 06/30/2024 | 07/31/2024 | 08/31/2024 |
| SGI Prudent Growth Fund Class I | 10,000 | 10,050 | 10,390 | 10,600 | 10,400 | 10,250 | 10,750 | 11,016 | 10,886 | 10,816 | 10,966 | 11,266 | 11,306 | 11,476 | 11,556 | 11,697 | 11,326 | 11,757 | 11,556 | 11,841 | 11,343 | 11,142 | 11,195 | 10,676 | 10,803 | 10,273 | 10,697 | 10,379 | 9,744 | 10,273 | 10,697 | 10,319 | 10,775 | 10,531 | 10,659 | 10,712 | 10,521 | 10,924 | 11,125 | 10,903 | 10,563 | 10,362 | 10,977 | 11,488 | 11,563 | 11,819 | 12,085 | 11,638 | 12,000 | 12,128 | 12,426 | 12,714 |
| S&P 500 Total Return Index | 10,000 | 9,601 | 10,143 | 10,872 | 10,459 | 10,181 | 11,295 | 11,729 | 11,611 | 11,931 | 12,453 | 13,118 | 13,210 | 13,518 | 13,839 | 14,260 | 13,597 | 14,549 | 14,449 | 15,096 | 14,315 | 13,886 | 14,402 | 13,146 | 13,170 | 12,083 | 13,197 | 12,659 | 11,493 | 12,424 | 13,118 | 12,362 | 13,139 | 12,818 | 13,289 | 13,496 | 13,555 | 14,451 | 14,915 | 14,677 | 13,978 | 13,684 | 14,933 | 15,612 | 15,874 | 16,722 | 17,260 | 16,555 | 17,376 | 17,999 | 18,218 | 18,660 |
ANNUAL AVERAGE TOTAL RETURN (%)
| | |
| | 1 Year | Since Inception
(06/08/2020) |
Class I (without sales charge) | 16.62 | 5.84 |
S&P 500 Total Return Index | 27.14 | 15.89 |
Visit https://sgiam.com/literature/ for more recent performance information.
| * | The Fund’s past performance is not a good predictor of how the Fund will perform in the future. The graph and table do not reflect the deduction of taxes that a shareholder would pay on Fund distributions or redemption of Fund shares. |
KEY FUND STATISTICS (as of August 31, 2024)
| |
Net Assets | $26,929,138 |
Number of Holdings | 10 |
Net Advisory Fee | $179,498 |
Portfolio Turnover | 61% |
30-Day SEC Yield | 0.48% |
WHAT DID THE FUND INVEST IN? (as of August 31, 2024)
| |
Top 10 Holdings | (% of net assets) |
SGI U.S. Large Cap Equity Fund | 30.3% |
iShares Core U.S. Aggregate Bond ETF | 9.4% |
SGI Enhanced Global Income ETF | 9.0% |
SGI Global Equity Fund | 8.9% |
SGI U.S. Large Cap Core ETF | 8.9% |
SGI Enhanced Core ETF | 8.5% |
SGI Small Cap Core Fund | 8.0% |
SGI Dynamic Tactical ETF | 4.9% |
iShares iBoxx $ High Yield Corporate Bond ETF | 4.8% |
iShares 20+ Year Treasury Bond ETF | 4.7% |
| |
Top Sectors | (% of net assets) |
Cash & Other | 100.0% |
For additional information about the Fund; including its prospectus, financial information, holdings and proxy information, scan the QR code or visit https://sgiam.com/literature/
| SGI Prudent Growth Fund | PAGE 2 | TSR-AR-74933W775 |
HOUSEHOLDING
To reduce Fund expenses, only one copy of most shareholder documents may be mailed to shareholders with multiple accounts at the same address (Householding). If you would prefer that your Fund documents not be householded, please contact the Fund at 1-855-744-8500, or contact your financial intermediary. Your instructions will typically be effective within 30 days of receipt by the Fund or your financial intermediary.
| SGI Prudent Growth Fund | PAGE 3 | TSR-AR-74933W775 |
10600116971037910903127141087214260126591467718660
| | |
| SGI Enhanced Core ETF | |
USDX (Principal U.S. Listing Exchange: NASDAQ) |
Annual Shareholder Report | August 31, 2024 |
This annual shareholder report contains important information about the SGI Enhanced Core ETF (the “Fund”) for the period of February 28, 2024 to August 31, 2024. You can find additional information about the Fund at https://sgiam.com/literature/. You can also request this information by contacting us at 1-855-744-8500.
WHAT WERE THE FUND COSTS FOR THE PAST YEAR? (based on a hypothetical $10,000 investment)
| | |
Fund Name | Costs of a $10,000 investment | Costs paid as a percentage of a $10,000 investment |
| SGI Enhanced Core ETF | $51* | 0.99% |
| * | Amount shown reflects the expense of the Fund from inception date through August 31, 2024. Expenses would be higher if the fund had been in operations for the entire period of this report. |
HOW DID THE FUND PERFORM LAST YEAR AND WHAT AFFECTED ITS PERFORMANCE?
From inception, February 28, 2024, to the end of the fiscal year, August 31, 2024, net of fees, the Fund returned 4.10% slightly underperforming its benchmark, the S&P U.S. Aggregate Bond Index, which returned 4.84%. The Fund’s total gross return was 4.59%, which is composed of money market yield and options return. Of the 4.59% gross return, 2.03% can be attributed to the options yield, and the remaining 2.56% can be attributed to the money market yield.
WHAT FACTORS INFLUENCED PERFORMANCE?
To crush skyrocketing inflation, the Federal Reserve raised the fed funds rate a significant 5.25% during a 16-month period from March 2022 through July 2023. This approach was effective and all key U.S. inflation indicators fell during the fiscal year. As a result, the Federal Reserve signaled no further rate increases and the possibility of upcoming rate cuts. This sparked a strong rally in equities and risk assets in general. Growth stocks, particularly semiconductor and AI related stocks, had tremendous performance. Broad market indices of international stocks also performed well, however, U.S market indices performed even better with many reaching all-time highs.
The broad-based index may not necessarily reflect an accurate description of the underlying holdings found in the Fund.
| |
Top Contributors |
| ↑ | Money Market Yield |
| ↑ | Options Yield |
HOW DID THE FUND PERFORM SINCE INCEPTION?*
The $10,000 chart reflects a hypothetical $10,000 investment in the class of shares noted. The chart uses total return NAV performance and assumes reinvestment of dividends and capital gains. Fund expenses, including management fees and other expenses, were deducted.
CUMULATIVE PERFORMANCE (Initial Investment of $10,000)
| | 02/28/2024 | 02/29/2024 | 03/31/2024 | 04/30/2024 | 05/31/2024 | 06/30/2024 | 07/31/2024 | 08/31/2024 |
| SGI Enhanced Core ETF NAV | 10,000 | 10,000 | 10,040 | 10,095 | 10,174 | 10,241 | 10,327 | 10,411 |
| SGI Enhanced Core ETF Market | 10,000 | 10,012 | 10,044 | 10,104 | 10,178 | 10,236 | 10,329 | 10,411 |
| S&P U.S. Aggregate Bond Index** | 10,000 | 10,013 | 10,095 | 9,881 | 10,032 | 10,129 | 10,337 | 10,484 |
| S&P 500 Total Return Index | 10,000 | 10,054 | 10,378 | 9,954 | 10,448 | 10,823 | 10,954 | 11,220 |
| SGI Enhanced Core ETF | PAGE 1 | TSR-AR-74933W254 |
ANNUAL AVERAGE TOTAL RETURN (%)
| |
| | Since Inception
(02/28/2024) |
SGI Enhanced Core ETF NAV | 4.10 |
SGI Enhanced Core ETF Market | 4.11 |
S&P U.S. Aggregate Bond Index** | 4.84 |
S&P 500 Total Return Index | 12.20 |
Visit https://sgiam.com/literature/ for more recent performance information.
| * | The Fund’s past performance is not a good predictor of how the Fund will perform in the future. The graph and table do not reflect the deduction of taxes that a shareholder would pay on Fund distributions or redemption of Fund shares. |
| ** | Effective with this report, and pursuant to new regulatory requirements, the S&P U.S. Aggregate Bond Index replaced the S&P 500 Total Return Index as the Fund’s primary benchmark to represent a broad-based securities market index. |
KEY FUND STATISTICS (as of August 31, 2024)
| |
Net Assets | $129,257,035 |
Number of Holdings | 14 |
Net Advisory Fee | $405,684 |
Portfolio Turnover | 0% |
WHAT DID THE FUND INVEST IN? (as of August 31, 2024)
| |
Top 10 Holdings | (% of net assets) |
Vanguard Treasury Money Market Fund | 18.9% |
Vanguard Federal Money Market Fund | 18.9% |
PIMCO Government Money Market Fund | 16.6% |
Fidelity Government Cash Reserves | 16.6% |
First American Government Obligations Fund | 2.0% |
T Rowe Price US Treasury Money Fund, Inc. | 0.0% |
JPMorgan Liquid Assets Money Market Fund | 0.0% |
S&P 500 Index | 0.0% |
| |
Top Sectors | (% of net assets) |
Cash & Other | 100.0% |
For additional information about the Fund; including its prospectus, financial information, holdings and proxy information, scan the QR code or visit https://sgiam.com/literature/
HOUSEHOLDING
To reduce Fund expenses, only one copy of most shareholder documents may be mailed to shareholders with multiple accounts at the same address (Householding). If you would prefer that your Fund documents not be householded, please contact the Fund at 1-855-744-8500, or contact your financial intermediary. Your instructions will typically be effective within 30 days of receipt by the Fund or your financial intermediary.
| SGI Enhanced Core ETF | PAGE 2 | TSR-AR-74933W254 |
10411104111048411220
| | |
| SGI Enhanced Global Income ETF | |
GINX (Principal U.S. Listing Exchange: NASDAQ) |
Annual Shareholder Report | August 31, 2024 |
This annual shareholder report contains important information about the SGI Enhanced Global Income ETF (the “Fund”) for the period of February 28, 2024 to August 31, 2024. You can find additional information about the Fund at https://sgiam.com/literature/. You can also request this information by contacting us at 1-855-744-8500.
WHAT WERE THE FUND COSTS FOR THE PAST YEAR? (based on a hypothetical $10,000 investment)
| | |
Fund Name | Costs of a $10,000 investment | Costs paid as a percentage of a $10,000 investment |
| SGI Enhanced Global Income ETF | $601 | 1.14% |
| 1 | Amount shown reflects the expense of the Fund from inception date through August 31, 2024. Expenses would be higher if the fund had been in operations for the entire period of this report. |
HOW DID THE FUND PERFORM LAST YEAR AND WHAT AFFECTED ITS PERFORMANCE?
From inception, February 28, 2024, to the end of the fiscal year, August 31, 2024, net of fees, the Fund returned 8.01% underperforming its benchmark, the S&P Global Broad Market Index, which returned 10.89%. The Fund’s total gross return was 8.32%, which is composed of equities return and options return. Of the 8.32% gross return, 1.11% can be attributed to the options yield, and the remaining 7.21% can be attributed to the equities return.
WHAT FACTORS INFLUENCED PERFORMANCE?
To crush skyrocketing inflation, the Federal Reserve raised the fed funds rate a significant 5.25% during a 16-month period from March 2022 through July 2023. This approach was effective and all key U.S. inflation indicators fell during the fiscal year. As a result, the Federal Reserve signaled no further rate increases and the possibility of upcoming rate cuts. This sparked a strong rally in equities and risk assets in general. Growth stocks, particularly semiconductor and AI related stocks, had tremendous performance. Broad market indices of international stocks also performed well, however, U.S market indices performed even better with many reaching all-time highs.
WHAT WERE THE TOP CONTRIBUTORS AND DETRACTORS?
Stock selection and sector allocations both detracted from relative performance during the period. Strong stock selection in the Consumer Discretionary and Financials sectors contributed the most to relative returns. Communication Services was the largest detracting sector affected by weak stock selection. A significant underweight exposure to the Information Technology sector further impacted performance negatively. A significant overweight exposure to the Energy sector also hurt relative performance.
| |
Top Contributors |
| ↑ | Shinhan Financial Group - ADR |
| ↑ | Unitedhealth Group Inc. |
| ↑ | Infosys Ltd-SP ADR |
| ↑ | Novo-Nordisk A/S-Spons ADR |
| ↑ | TJX Companies Inc. |
| |
Top Detractors |
| ↓ | Nvidia Corp. |
| ↓ | Telkom Indonesia Persero - ADR |
| ↓ | TIM SA-ADR |
| ↓ | Coca-Cola Femsa SAB-SP ADR |
| ↓ | Micron Technology Inc. |
| SGI Enhanced Global Income ETF | PAGE 1 | TSR-AR-74933W262 |
HOW DID THE FUND PERFORM SINCE INCEPTION?*
The $10,000 chart reflects a hypothetical $10,000 investment in the class of shares noted. The chart uses total return NAV performance and assumes reinvestment of dividends and capital gains. Fund expenses, including management fees and other expenses, were deducted.
CUMULATIVE PERFORMANCE (Initial Investment of $10,000)
| | 02/28/2024 | 02/29/2024 | 03/31/2024 | 04/30/2024 | 05/31/2024 | 06/30/2024 | 07/31/2024 | 08/31/2024 |
| SGI Enhanced Global Income ETF NAV | 10,000 | 10,016 | 10,349 | 10,000 | 10,358 | 10,428 | 10,614 | 10,803 |
| SGI Enhanced Global Income ETF Market | 10,000 | 10,039 | 10,365 | 10,007 | 10,366 | 10,430 | 10,636 | 10,769 |
| S&P Global Broad Market Index** | 10,000 | 10,045 | 10,364 | 10,020 | 10,425 | 10,613 | 10,839 | 11,089 |
| S&P 500 Total Return Index | 10,000 | 10,054 | 10,378 | 9,954 | 10,448 | 10,823 | 10,954 | 11,220 |
ANNUAL AVERAGE TOTAL RETURN (%)
| |
| | Since Inception
(02/28/2024) |
SGI Enhanced Global Income ETF NAV | 8.01 |
SGI Enhanced Global Income ETF Market | 7.69 |
S&P Global Broad Market Index** | 10.89 |
S&P 500 Total Return Index | 12.20 |
Visit https://sgiam.com/literature/ for more recent performance information.
| * | The Fund’s past performance is not a good predictor of how the Fund will perform in the future. The graph and table do not reflect the deduction of taxes that a shareholder would pay on Fund distributions or redemption of Fund shares. |
| ** | Effective with this report, and pursuant to new regulatory requirements, the S&P Global Broad Market Index replaced the S&P 500 Total Return Index as the Fund’s primary benchmark to represent a broad-based securities market index. |
KEY FUND STATISTICS (as of August 31, 2024)
| |
Net Assets | $68,238,628 |
Number of Holdings | 85 |
Net Advisory Fee | $261,368 |
Portfolio Turnover | 158% |
WHAT DID THE FUND INVEST IN? (as of August 31, 2024)
| |
Top 10 Holdings | (% of net assets) |
Eli Lilly & Co. | 3.9% |
Meta Platforms, Inc. | 3.9% |
Apple, Inc. | 3.7% |
Rio Tinto PLC | 3.3% |
Novo Nordisk AS | 3.2% |
Alphabet, Inc. | 3.1% |
Equinor ASA | 2.9% |
Microsoft Corp. | 2.8% |
Bancolombia SA | 2.6% |
Shinhan Financial Group Co. Ltd. | 2.4% |
| |
Top Sectors | (% of net assets) |
Financial | 19.7% |
Technology | 19.0% |
Consumer, Non-cyclical | 15.8% |
Communications | 15.0% |
Industrial | 9.2% |
Energy | 7.8% |
Consumer, Cyclical | 4.8% |
Utilities | 3.4% |
Basic Materials | 3.3% |
Cash & Other | 2.0% |
| SGI Enhanced Global Income ETF | PAGE 2 | TSR-AR-74933W262 |
For additional information about the Fund; including its prospectus, financial information, holdings and proxy information, scan the QR code or visit https://sgiam.com/literature/
HOUSEHOLDING
To reduce Fund expenses, only one copy of most shareholder documents may be mailed to shareholders with multiple accounts at the same address (Householding). If you would prefer that your Fund documents not be householded, please contact the Fund at 1-855-744-8500, or contact your financial intermediary. Your instructions will typically be effective within 30 days of receipt by the Fund or your financial intermediary.
| SGI Enhanced Global Income ETF | PAGE 3 | TSR-AR-74933W262 |
10803107691108911220
| | |
| SGI Enhanced Nasdaq-100 ETF | |
QXQ (Principal U.S. Listing Exchange: NASDAQ) |
Annual Shareholder Report | August 31, 2024 |
This annual shareholder report contains important information about the SGI Enhanced Nasdaq-100 ETF (the “Fund”) for the period of June 13, 2024 to August 31, 2024. You can find additional information about the Fund at https://sgiam.com/literature/. You can also request this information by contacting us at 1-855-744-8500.
WHAT WERE THE FUND COSTS FOR THE PAST YEAR? (based on a hypothetical $10,000 investment)
| | |
Fund Name | Costs of a $10,000 investment | Costs paid as a percentage of a $10,000 investment |
| SGI Enhanced Nasdaq-100 ETF | $26* | 1.18% |
| * | Amount shown reflects the expense of the Fund from inception date through August 31, 2024. Expenses would be higher if the fund had been in operations for the entire period of this report. |
HOW DID THE FUND PERFORM LAST YEAR AND WHAT AFFECTED ITS PERFORMANCE?
From inception, June 13, 2024, to the end of the fiscal year, August 31, 2024, net of fees, the Fund returned 1.70% underperforming its benchmark, the S&P 500 Total Return Index. The Fund outperformed its secondary benchmark, the Nasdaq-100 Index, which returned 0.15%. The Fund’s total gross return was 1.88%, which is composed of futures return and options return. Of the 1.88% gross return, 0.81% can be attributed to the options yield, and the remaining 1.07% can be attributed to the futures return.
WHAT FACTORS INFLUENCED PERFORMANCE?
To crush skyrocketing inflation, the Federal Reserve raised the fed funds rate a significant 5.25% during a 16-month period from March 2022 through July 2023. This approach was effective and all key U.S. inflation indicators fell during the fiscal year. As a result, the Federal Reserve signaled no further rate increases and the possibility of upcoming rate cuts. This sparked a strong rally in equities and risk assets in general. Growth stocks, particularly semiconductor and AI related stocks, had tremendous performance. Broad market indices of international stocks also performed well, however, U.S market indices performed even better with many reaching all-time highs.
The broad-based index may not necessarily reflect an accurate description of the underlying holdings found in the Fund.
| |
Top Contributors |
| ↑ | Futures Returns |
| ↑ | Options Yield |
HOW DID THE FUND PERFORM SINCE INCEPTION?*
The $10,000 chart reflects a hypothetical $10,000 investment in the class of shares noted. The chart uses total return NAV performance and assumes reinvestment of dividends and capital gains. Fund expenses, including management fees and other expenses, were deducted.
| SGI Enhanced Nasdaq-100 ETF | PAGE 1 | TSR-AR-74933W239 |
CUMULATIVE PERFORMANCE (Initial Investment of $10,000)
| | 06/13/2024 | 06/30/2024 | 07/31/2024 | 08/31/2024 |
| SGI Enhanced Nasdaq-100 ETF NAV | 10,000 | 10,073 | 10,111 | 10,172 |
| SGI Enhanced Nasdaq-100 ETF Market | 10,000 | 10,117 | 10,121 | 10,176 |
| S&P 500 Total Return Index | 10,000 | 10,056 | 10,178 | 10,425 |
| NASDAQ 100 Index | 10,000 | 10,058 | 9,898 | 10,015 |
ANNUAL AVERAGE TOTAL RETURN (%)
| |
| | Since Inception
(06/13/2024) |
SGI Enhanced Nasdaq-100 ETF NAV | 1.70 |
SGI Enhanced Nasdaq-100 ETF Market | 1.76 |
S&P 500 Total Return Index | 4.25 |
NASDAQ 100 Index | 0.15 |
Visit https://sgiam.com/literature/ for more recent performance information.
| * | The Fund’s past performance is not a good predictor of how the Fund will perform in the future. The graph and table do not reflect the deduction of taxes that a shareholder would pay on Fund distributions or redemption of Fund shares. |
KEY FUND STATISTICS (as of August 31, 2024)
| |
Net Assets | $10,553,512 |
Number of Holdings | 5 |
Net Advisory Fee | $15,052 |
Portfolio Turnover | 0% |
WHAT DID THE FUND INVEST IN? (as of August 31, 2024)
| |
Top 10 Holdings | (% of net assets) |
First American Government Obligations Fund | 4.7% |
S&P 500 Index | 0.0% |
Micro E-Mini Nasdaq 100 Future Sept 2024 | 0.0% |
Nasdaq 100 Index | -0.9% |
| |
Top Sectors | (% of net assets) |
Cash & Other | 100.0% |
For additional information about the Fund; including its prospectus, financial information, holdings and proxy information, scan the QR code or visit https://sgiam.com/literature/
HOUSEHOLDING
To reduce Fund expenses, only one copy of most shareholder documents may be mailed to shareholders with multiple accounts at the same address (Householding). If you would prefer that your Fund documents not be householded, please contact the Fund at 1-855-744-8500, or contact your financial intermediary. Your instructions will typically be effective within 30 days of receipt by the Fund or your financial intermediary.
| SGI Enhanced Nasdaq-100 ETF | PAGE 2 | TSR-AR-74933W239 |
10172101761042510015
| | |
| US Treasury 3 Month Bill ETF | |
TBIL (Principal U.S. Listing Exchange: NASDAQ) |
Annual Shareholder Report | August 31, 2024 |
This annual shareholder report contains important information about the US Treasury 3 Month Bill ETF (the “Fund”) for the period from September 1, 2023, to August 31, 2024. You can find additional information about the Fund at https://www.ustreasuryetf.com/etf/tbil/. You can also request this information by contacting us at 1-800-617-0004.
WHAT WERE THE FUND COSTS FOR THE PAST YEAR? (based on a hypothetical $10,000 investment)
| | |
Fund Name | Costs of a $10,000 investment | Costs paid as a percentage of a $10,000 investment |
| US Treasury 3 Month Bill ETF | $15 | 0.15% |
HOW DID THE FUND PERFORM LAST YEAR AND WHAT AFFECTED ITS PERFORMANCE?
The investment objective of the Fund is to seek investment results that correspond (before fees and expenses) generally to the price and yield performance of the ICE BofA US 3-Month Treasury Bill Index (the “Index”). The Fund delivered competitive returns for the year, with 5.37% compared to the Index’s 5.51%. Dividends represented the majority of the returns, with the price only improving by 0.28% for the year.
HOW DID THE FUND PERFORM SINCE INCEPTION?*
The $10,000 chart reflects a hypothetical $10,000 investment in the class of shares noted. The chart uses total return NAV performance and assumes reinvestment of dividends and capital gains. Fund expenses, including management fees and other expenses, were deducted.
CUMULATIVE PERFORMANCE (Initial Investment of $10,000)
| | 44781 | 08/31/2022 | 09/30/2022 | 10/31/2022 | 11/30/2022 | 12/31/2022 | 01/31/2023 | 02/28/2023 | 03/31/2023 | 04/30/2023 | 05/31/2023 | 06/30/2023 | 07/31/2023 | 08/31/2023 | 09/30/2023 | 10/31/2023 | 11/30/2023 | 12/31/2023 | 01/31/2024 | 02/29/2024 | 03/31/2024 | 04/30/2024 | 05/31/2024 | 06/30/2024 | 07/31/2024 | 08/31/2024 |
| US Treasury 3 Month Bill ETF NAV | 10000 | 10010 | 10042 | 10059 | 10094 | 10130 | 10164 | 10200 | 10250 | 10284 | 10326 | 10373 | 10414 | 10460 | 10508 | 10554 | 10600 | 10648 | 10693 | 10736 | 10783 | 10828 | 10879 | 10923 | 10971 | 11022 |
| US Treasury 3 Month Bill ETF Market | 10000 | 10012 | 10044 | 10061 | 10099 | 10133 | 10166 | 10204 | 10253 | 10288 | 10331 | 10379 | 10415 | 10469 | 10509 | 10557 | 10602 | 10651 | 10692 | 10739 | 10782 | 10827 | 10881 | 10922 | 10970 | 11020 |
| ICE US Treasury Core Bond Index | 10000 | 9813 | 9459 | 9325 | 9575 | 9528 | 9764 | 9536 | 9812 | 9865 | 9749 | 9676 | 9643 | 9593 | 9381 | 9267 | 9587 | 9897 | 9884 | 9754 | 9809 | 9589 | 9728 | 9826 | 10041 | 10170 |
| ICE BofA 3 Month Treasury Bill | 10000 | 10012 | 10037 | 10053 | 10086 | 10122 | 10154 | 10188 | 10232 | 10264 | 10305 | 10352 | 10394 | 10441 | 10489 | 10536 | 10583 | 10633 | 10679 | 10723 | 10771 | 10818 | 10870 | 10914 | 10964 | 11016 |
ANNUAL AVERAGE TOTAL RETURN (%)
| | |
| | 1 Year | Since Inception
(08/08/2022) |
US Treasury 3 Month Bill ETF NAV | 5.37 | 4.83 |
US Treasury 3 Month Bill ETF Market | 5.27 | 4.82 |
ICE US Treasury Core Bond Index | 6.01 | 0.82 |
ICE BofA 3 Month Treasury Bill | 5.51 | 4.80 |
Visit https://www.ustreasuryetf.com/etf/tbil/ for more recent performance information.
| * | The Fund’s past performance is not a good predictor of how the Fund will perform in the future. The graph and table do not reflect the deduction of taxes that a shareholder would pay on Fund distributions or redemption of Fund shares. |
| US Treasury 3 Month Bill ETF | PAGE 1 | TSR-AR-74933W452 |
KEY FUND STATISTICS (as of August 31, 2024)
| |
Net Assets | $4,104,507,086 |
Number of Holdings | 2 |
Net Advisory Fee | $4,625,006 |
Portfolio Turnover | 0% |
30-Day SEC Yield | 4.77% |
30-Day SEC Yield Unsubsidized | 4.77% |
Visit https://www.ustreasuryetf.com/etf/tbil/ for more recent performance information.
WHAT DID THE FUND INVEST IN? (as of August 31, 2024)
| |
Top 10 Holdings | (% of Net Assets) |
United States Treasury Bill | 100.0% |
| |
Top Sectors | (% of Net Assets) |
Cash & Other | 100.0% |
For additional information about the Fund; including its prospectus, financial information, holdings and proxy information, scan the QR code or visit https://www.ustreasuryetf.com/etf/tbil/
HOUSEHOLDING
To reduce Fund expenses, only one copy of most shareholder documents may be mailed to shareholders with multiple accounts at the same address (Householding). If you would prefer that your Fund documents not be householded, please contact the Fund at 1-800-617-0004, or contact your financial intermediary. Your instructions will typically be effective within 30 days of receipt by F/m Investments or your financial intermediary.
| US Treasury 3 Month Bill ETF | PAGE 2 | TSR-AR-74933W452 |
1001010460110221001210469110209813959310170100121044111016
| | |
| US Treasury 6 Month Bill ETF | |
XBIL (Principal U.S. Listing Exchange: NASDAQ) |
Annual Shareholder Report | August 31, 2024 |
This annual shareholder report contains important information about the US Treasury 6 Month Bill ETF (the “Fund”) for the period from September 1, 2023, to August 31, 2024. You can find additional information about the Fund at https://www.ustreasuryetf.com/etf/xbil/. You can also request this information by contacting us at 1-800-617-0004.
WHAT WERE THE FUND COSTS FOR THE PAST YEAR? (based on a hypothetical $10,000 investment)
| | |
Fund Name | Costs of a $10,000 investment | Costs paid as a percentage of a $10,000 investment |
| US Treasury 6 Month Bill ETF | $15 | 0.15% |
HOW DID THE FUND PERFORM LAST YEAR AND WHAT AFFECTED ITS PERFORMANCE?
The investment objective of the Fund is to seek investment results that correspond (before fees and expenses) generally to the price and yield performance of the ICE BofA US 6-Month Treasury Bill Index (the “Index”). The Fund delivered competitive returns for the year, with 5.48% compared to the Index’s 5.66%. Dividends represented the majority of the return, with the price only improving by 0.44% for the year.
HOW DID THE FUND PERFORM SINCE INCEPTION?*
The $10,000 chart reflects a hypothetical $10,000 investment in the class of shares noted. The chart uses total return NAV performance and assumes reinvestment of dividends and capital gains. Fund expenses, including management fees and other expenses, were deducted.
CUMULATIVE PERFORMANCE (Initial Investment of $10,000)
| | 45080 | 03/31/2023 | 04/30/2023 | 05/31/2023 | 06/30/2023 | 07/31/2023 | 08/31/2023 | 09/30/2023 | 10/31/2023 | 11/30/2023 | 12/31/2023 | 01/31/2024 | 02/29/2024 | 03/31/2024 | 04/30/2024 | 05/31/2024 | 06/30/2024 | 07/31/2024 | 08/31/2024 |
| US Treasury 6 Month Bill ETF NAV | 10000 | 10046 | 10076 | 10099 | 10147 | 10189 | 10235 | 10282 | 10324 | 10377 | 10429 | 10470 | 10505 | 10550 | 10591 | 10640 | 10685 | 10740 | 10795 |
| US Treasury 6 Month Bill ETF Market | 10000 | 10052 | 10080 | 10104 | 10153 | 10191 | 10242 | 10284 | 10330 | 10382 | 10432 | 10470 | 10508 | 10551 | 10592 | 10640 | 10682 | 10738 | 10796 |
| ICE US Treasury Core Bond Index | 10000 | 10323 | 10378 | 10256 | 10179 | 10144 | 10093 | 9869 | 9749 | 10086 | 10412 | 10399 | 10261 | 10320 | 10088 | 10234 | 10337 | 10563 | 10700 |
| ICE BofA 6-Month US Treasury Bill Total Return Index | 10000 | 10048 | 10082 | 10107 | 10155 | 10198 | 10243 | 10290 | 10335 | 10389 | 10443 | 10488 | 10525 | 10572 | 10615 | 10665 | 10710 | 10767 | 10823 |
ANNUAL AVERAGE TOTAL RETURN (%)
| | |
| | 1 Year | Since Inception
(03/07/2023) |
US Treasury 6 Month Bill ETF NAV | 5.48 | 5.28 |
US Treasury 6 Month Bill ETF Market | 5.41 | 5.28 |
ICE US Treasury Core Bond Index | 6.01 | 4.65 |
ICE BofA 6-Month US Treasury Bill Total Return Index | 5.66 | 5.46 |
Visit https://www.ustreasuryetf.com/etf/xbil/ for more recent performance information.
| * | The Fund’s past performance is not a good predictor of how the Fund will perform in the future. The graph and table do not reflect the deduction of taxes that a shareholder would pay on Fund distributions or redemption of Fund shares. |
| US Treasury 6 Month Bill ETF | PAGE 1 | TSR-AR-74933W460 |
KEY FUND STATISTICS (as of August 31, 2024)
| |
Net Assets | $598,493,825 |
Number of Holdings | 2 |
Net Advisory Fee | $800,012 |
Portfolio Turnover | 0% |
30-Day SEC Yield | 4.54% |
30-Day SEC Yield Unsubsidized | 4.54% |
Visit https://www.ustreasuryetf.com/etf/xbil/ for more recent performance information.
WHAT DID THE FUND INVEST IN? (as of August 31, 2024)
| |
Top 10 Holdings | (% of Net Assets) |
United States Treasury Bill | 100.0% |
| |
Top Sectors | (% of Net Assets) |
Cash & Other | 100.0% |
For additional information about the Fund; including its prospectus, financial information, holdings and proxy information, scan the QR code or visit https://www.ustreasuryetf.com/etf/xbil/
HOUSEHOLDING
To reduce Fund expenses, only one copy of most shareholder documents may be mailed to shareholders with multiple accounts at the same address (Householding). If you would prefer that your Fund documents not be householded, please contact the Fund at 1-800-617-0004, or contact your financial intermediary. Your instructions will typically be effective within 30 days of receipt by F/m Investments or your financial intermediary.
| US Treasury 6 Month Bill ETF | PAGE 2 | TSR-AR-74933W460 |
1023510795102421079610093107001024310823
| | |
| US Treasury 12 Month Bill ETF | |
OBIL (Principal U.S. Listing Exchange: NASDAQ) |
Annual Shareholder Report | August 31, 2024 |
This annual shareholder report contains important information about the US Treasury 12 Month Bill ETF (the “Fund”) for the period from September 1, 2023, to August 31, 2024. You can find additional information about the Fund at https://www.ustreasuryetf.com/etf/obil/. You can also request this information by contacting us at 1-800-617-0004.
WHAT WERE THE FUND COSTS FOR THE PAST YEAR? (based on a hypothetical $10,000 investment)
| | |
Fund Name | Costs of a $10,000 investment | Costs paid as a percentage of a $10,000 investment |
| US Treasury 12 Month Bill ETF | $15 | 0.15% |
HOW DID THE FUND PERFORM LAST YEAR AND WHAT AFFECTED ITS PERFORMANCE?
The investment objective of the Fund is to seek investment results that correspond (before fees and expenses) generally to the price and yield performance of the ICE BofA US 1-Year Treasury Bill Index (the “Index”). The Fund delivered competitive returns for the year, with 5.58% compared to the Index’s 5.61%. Dividends represented the majority of the returns, with the price only improving by 0.79% for the year.
HOW DID THE FUND PERFORM SINCE INCEPTION?*
The $10,000 chart reflects a hypothetical $10,000 investment in the class of shares noted. The chart uses total return NAV performance and assumes reinvestment of dividends and capital gains. Fund expenses, including management fees and other expenses, were deducted.
CUMULATIVE PERFORMANCE (Initial Investment of $10,000)
| | 11/14/2022 | 11/30/2022 | 12/31/2022 | 01/31/2023 | 02/28/2023 | 03/31/2023 | 04/30/2023 | 05/31/2023 | 06/30/2023 | 07/31/2023 | 08/31/2023 | 09/30/2023 | 10/31/2023 | 11/30/2023 | 12/31/2023 | 01/31/2024 | 02/29/2024 | 03/31/2024 | 04/30/2024 | 05/31/2024 | 06/30/2024 | 07/31/2024 | 08/31/2024 |
| US Treasury 12 Month Bill ETF NAV | 10000 | 10012 | 10055 | 10094 | 10101 | 10178 | 10193 | 10191 | 10214 | 10256 | 10301 | 10338 | 10380 | 10449 | 10528 | 10568 | 10580 | 10618 | 10638 | 10687 | 10731 | 10806 | 10876 |
| US Treasury 12 Month Bill ETF Market | 10000 | 10011 | 10059 | 10096 | 10106 | 10180 | 10197 | 10196 | 10218 | 10261 | 10308 | 10343 | 10384 | 10457 | 10530 | 10570 | 10586 | 10619 | 10638 | 10688 | 10730 | 10804 | 10878 |
| ICE US Treasury Core Bond Index | 10000 | 10154 | 10104 | 10354 | 10112 | 10405 | 10462 | 10338 | 10261 | 10226 | 10173 | 9948 | 9827 | 10166 | 10496 | 10482 | 10343 | 10402 | 10168 | 10316 | 10420 | 10648 | 10785 |
| ICE BofA US 1-Year Treasury Bill Total Return Index | 10000 | 10010 | 10051 | 10093 | 10105 | 10182 | 10196 | 10200 | 10224 | 10270 | 10315 | 10353 | 10399 | 10474 | 10545 | 10584 | 10594 | 10634 | 10654 | 10705 | 10750 | 10822 | 10894 |
ANNUAL AVERAGE TOTAL RETURN (%)
| | |
| | 1 Year | Since Inception
(11/15/2022) |
US Treasury 12 Month Bill ETF NAV | 5.58 | 4.79 |
US Treasury 12 Month Bill ETF Market | 5.54 | 4.80 |
ICE US Treasury Core Bond Index | 6.01 | 4.30 |
ICE BofA US 1-Year Treasury Bill Total Return Index | 5.61 | 4.89 |
Visit https://www.ustreasuryetf.com/etf/obil/ for more recent performance information.
| * | The Fund’s past performance is not a good predictor of how the Fund will perform in the future. The graph and table do not reflect the deduction of taxes that a shareholder would pay on Fund distributions or redemption of Fund shares. |
| US Treasury 12 Month Bill ETF | PAGE 1 | TSR-AR-74933W478 |
KEY FUND STATISTICS (as of August 31, 2024)
| |
Net Assets | $237,097,582 |
Number of Holdings | 2 |
Net Advisory Fee | $310,472 |
Portfolio Turnover | 0% |
30-Day SEC Yield | 4.29% |
30-Day SEC Yield Unsubsidized | 4.29% |
Visit https://www.ustreasuryetf.com/etf/obil/ for more recent performance information.
WHAT DID THE FUND INVEST IN? (as of August 31, 2024)
| |
Top 10 Holdings | (% of Net Assets) |
United States Treasury Bill | 100.0% |
| |
Top Sectors | (% of Net Assets) |
Cash & Other | 100.0% |
For additional information about the Fund; including its prospectus, financial information, holdings and proxy information, scan the QR code or visit https://www.ustreasuryetf.com/etf/obil/
HOUSEHOLDING
To reduce Fund expenses, only one copy of most shareholder documents may be mailed to shareholders with multiple accounts at the same address (Householding). If you would prefer that your Fund documents not be householded, please contact the Fund at 1-800-617-0004, or contact your financial intermediary. Your instructions will typically be effective within 30 days of receipt by F/m Investments or your financial intermediary.
| US Treasury 12 Month Bill ETF | PAGE 2 | TSR-AR-74933W478 |
1030110876103081087810173107851031510894
| | |
| US Treasury 2 Year Note ETF | |
UTWO (Principal U.S. Listing Exchange: NASDAQ) |
Annual Shareholder Report | August 31, 2024 |
This annual shareholder report contains important information about the US Treasury 2 Year Note ETF (the “Fund”) for the period from September 1, 2023, to August 31, 2024. You can find additional information about the Fund at https://www.ustreasuryetf.com/etf/utwo/. You can also request this information by contacting us at 1-800-617-0004.
WHAT WERE THE FUND COSTS FOR THE PAST YEAR? (based on a hypothetical $10,000 investment)
| | |
Fund Name | Costs of a $10,000 investment | Costs paid as a percentage of a $10,000 investment |
| US Treasury 2 Year Note ETF | $15 | 0.15% |
HOW DID THE FUND PERFORM LAST YEAR AND WHAT AFFECTED ITS PERFORMANCE?
The investment objective of the Fund is to seek investment results that correspond (before fees and expenses) generally to the price and yield performance of the ICE BofA Current 2-Year US Treasury Index (the “Index”). The Fund delivered competitive returns for the year, with 5.54% compared to the Index’s 5.56%. Dividends represented the majority of the return, with the price only improving by 1.20% for the year.
HOW DID THE FUND PERFORM SINCE INCEPTION?*
The $10,000 chart reflects a hypothetical $10,000 investment in the class of shares noted. The chart uses total return NAV performance and assumes reinvestment of dividends and capital gains. Fund expenses, including management fees and other expenses, were deducted.
CUMULATIVE PERFORMANCE (Initial Investment of $10,000)
| | 44781 | 08/31/2022 | 09/30/2022 | 10/31/2022 | 11/30/2022 | 12/31/2022 | 01/31/2023 | 02/28/2023 | 03/31/2023 | 04/30/2023 | 05/31/2023 | 06/30/2023 | 07/31/2023 | 08/31/2023 | 09/30/2023 | 10/31/2023 | 11/30/2023 | 12/31/2023 | 01/31/2024 | 02/29/2024 | 03/31/2024 | 04/30/2024 | 05/31/2024 | 06/30/2024 | 07/31/2024 | 08/31/2024 |
| US Treasury 2 Year Note ETF NAV | 10000 | 9980 | 9868 | 9845 | 9899 | 9907 | 9975 | 9883 | 10048 | 10068 | 10020 | 9955 | 9983 | 10018 | 10009 | 10041 | 10137 | 10251 | 10289 | 10243 | 10274 | 10233 | 10301 | 10360 | 10480 | 10573 |
| US Treasury 2 Year Note ETF Market | 10000 | 9980 | 9876 | 9853 | 9899 | 9916 | 9974 | 9888 | 10051 | 10072 | 10020 | 9962 | 9982 | 10024 | 10012 | 10043 | 10141 | 10257 | 10295 | 10247 | 10275 | 10233 | 10306 | 10361 | 10479 | 10576 |
| ICE US Treasury Core Bond Index | 10000 | 9813 | 9459 | 9325 | 9575 | 9528 | 9764 | 9536 | 9812 | 9865 | 9749 | 9676 | 9643 | 9593 | 9381 | 9267 | 9587 | 9897 | 9884 | 9754 | 9809 | 9589 | 9728 | 9826 | 10041 | 10170 |
| ICE BofA U.S. Treasury Current 2 Yr TR | 10000 | 9977 | 9860 | 9839 | 9892 | 9904 | 9968 | 9880 | 10046 | 10066 | 10017 | 9953 | 9981 | 10015 | 10007 | 10040 | 10138 | 10251 | 10289 | 10241 | 10273 | 10232 | 10300 | 10360 | 10479 | 10573 |
ANNUAL AVERAGE TOTAL RETURN (%)
| | |
| | 1 Year | Since Inception
(08/09/2022) |
US Treasury 2 Year Note ETF NAV | 5.54 | 2.74 |
US Treasury 2 Year Note ETF Market | 5.51 | 2.75 |
ICE US Treasury Core Bond Index | 6.01 | 0.82 |
ICE BofA U.S. Treasury Current 2 Yr TR | 5.56 | 2.74 |
Visit https://www.ustreasuryetf.com/etf/utwo/ for more recent performance information.
| * | The Fund’s past performance is not a good predictor of how the Fund will perform in the future. The graph and table do not reflect the deduction of taxes that a shareholder would pay on Fund distributions or redemption of Fund shares. |
| US Treasury 2 Year Note ETF | PAGE 1 | TSR-AR-74933W486 |
KEY FUND STATISTICS (as of August 31, 2024)
| |
Net Assets | $452,474,166 |
Number of Holdings | 1 |
Net Advisory Fee | $545,743 |
Portfolio Turnover | 1091% |
30-Day SEC Yield | 3.86% |
30-Day SEC Yield Unsubsidized | 3.86% |
Visit https://www.ustreasuryetf.com/etf/utwo/ for more recent performance information.
WHAT DID THE FUND INVEST IN? (as of August 31, 2024)
| |
Top 10 Holdings | (% of Net Assets) |
United States Treasury Note/Bond | 99.6% |
| |
Top Sectors | (% of Net Assets) |
Government | 99.6% |
Cash & Other | 0.4% |
For additional information about the Fund; including its prospectus, financial information, holdings and proxy information, scan the QR code or visit https://www.ustreasuryetf.com/etf/utwo/
HOUSEHOLDING
To reduce Fund expenses, only one copy of most shareholder documents may be mailed to shareholders with multiple accounts at the same address (Householding). If you would prefer that your Fund documents not be householded, please contact the Fund at 1-800-617-0004, or contact your financial intermediary. Your instructions will typically be effective within 30 days of receipt by F/m Investments or your financial intermediary.
| US Treasury 2 Year Note ETF | PAGE 2 | TSR-AR-74933W486 |
9980100181057399801002410576981395931017099771001510573
| | |
| US Treasury 3 Year Note ETF | |
UTRE (Principal U.S. Listing Exchange: NASDAQ) |
Annual Shareholder Report | August 31, 2024 |
This annual shareholder report contains important information about the US Treasury 3 Year Note ETF (the “Fund”) for the period from September 1, 2023, to August 31, 2024. You can find additional information about the Fund at https://www.ustreasuryetf.com/etf/utre/. You can also request this information by contacting us at 1-800-617-0004.
WHAT WERE THE FUND COSTS FOR THE PAST YEAR? (based on a hypothetical $10,000 investment)
| | |
Fund Name | Costs of a $10,000 investment | Costs paid as a percentage of a $10,000 investment |
| US Treasury 3 Year Note ETF | $15 | 0.15% |
HOW DID THE FUND PERFORM LAST YEAR AND WHAT AFFECTED ITS PERFORMANCE?
The investment objective of the Fund is to seek investment results that correspond (before fees and expenses) generally to the price and yield performance of the ICE BofA Current 3-Year US Treasury Index (the “Index”). The Fund delivered competitive returns for the year, with 5.82% compared to the Index’s 5.93%. Dividends represented the majority of the return, with the price only improving by 1.81% for the year.
HOW DID THE FUND PERFORM SINCE INCEPTION?*
The $10,000 chart reflects a hypothetical $10,000 investment in the class of shares noted. The chart uses total return NAV performance and assumes reinvestment of dividends and capital gains. Fund expenses, including management fees and other expenses, were deducted.
CUMULATIVE PERFORMANCE (Initial Investment of $10,000)
| | 03/27/2023 | 03/31/2023 | 04/30/2023 | 05/31/2023 | 06/30/2023 | 07/31/2023 | 08/31/2023 | 09/30/2023 | 10/31/2023 | 11/30/2023 | 12/31/2023 | 01/31/2024 | 02/29/2024 | 03/31/2024 | 04/30/2024 | 05/31/2024 | 06/30/2024 | 07/31/2024 | 08/31/2024 |
| US Treasury 3 Year Note ETF NAV | 10000 | 10003 | 10048 | 9983 | 9882 | 9911 | 9934 | 9888 | 9899 | 10047 | 10196 | 10228 | 10143 | 10175 | 10084 | 10176 | 10245 | 10406 | 10513 |
| US Treasury 3 Year Note ETF Market | 10000 | 10005 | 10049 | 9989 | 9885 | 9909 | 9938 | 9891 | 9902 | 10052 | 10203 | 10227 | 10146 | 10177 | 10083 | 10177 | 10245 | 10403 | 10512 |
| ICE US Treasury Core Bond Index | 10000 | 10039 | 10094 | 9975 | 9900 | 9866 | 9816 | 9598 | 9482 | 9809 | 10127 | 10113 | 9980 | 10036 | 9811 | 9953 | 10054 | 10274 | 10406 |
| ICE BofA Current 3-Year US Treasury Total Return Index | 10000 | 10001 | 10047 | 9987 | 9886 | 9913 | 9935 | 9891 | 9904 | 10052 | 10204 | 10236 | 10150 | 10182 | 10091 | 10182 | 10253 | 10416 | 10524 |
ANNUAL AVERAGE TOTAL RETURN (%)
| | |
| | 1 Year | Since Inception
(03/28/2023) |
US Treasury 3 Year Note ETF NAV | 5.82 | 3.56 |
US Treasury 3 Year Note ETF Market | 5.78 | 3.56 |
ICE US Treasury Core Bond Index | 6.01 | 2.82 |
ICE BofA Current 3-Year US Treasury Total Return Index | 5.93 | 3.64 |
Visit https://www.ustreasuryetf.com/etf/utre/ for more recent performance information.
| * | The Fund’s past performance is not a good predictor of how the Fund will perform in the future. The graph and table do not reflect the deduction of taxes that a shareholder would pay on Fund distributions or redemption of Fund shares. |
| US Treasury 3 Year Note ETF | PAGE 1 | TSR-AR-74933W494 |
KEY FUND STATISTICS (as of August 31, 2024)
| |
Net Assets | $7,454,545 |
Number of Holdings | 1 |
Net Advisory Fee | $8,651 |
Portfolio Turnover | 905% |
30-Day SEC Yield | 3.55% |
30-Day SEC Yield Unsubsidized | 3.55% |
Visit https://www.ustreasuryetf.com/etf/utre/ for more recent performance information.
WHAT DID THE FUND INVEST IN? (as of August 31, 2024)
| |
Top 10 Holdings | (% of Net Assets) |
United States Treasury Note/Bond | 99.8% |
| |
Top Sectors | (% of Net Assets) |
Government | 99.8% |
Cash & Other | 0.2% |
For additional information about the Fund; including its prospectus, financial information, holdings and proxy information, scan the QR code or visit https://www.ustreasuryetf.com/etf/utre/
HOUSEHOLDING
To reduce Fund expenses, only one copy of most shareholder documents may be mailed to shareholders with multiple accounts at the same address (Householding). If you would prefer that your Fund documents not be householded, please contact the Fund at 1-800-617-0004, or contact your financial intermediary. Your instructions will typically be effective within 30 days of receipt by F/m Investments or your financial intermediary.
| US Treasury 3 Year Note ETF | PAGE 2 | TSR-AR-74933W494 |
993410513993810512981610406993510524
| | |
| US Treasury 5 Year Note ETF | |
UFIV (Principal U.S. Listing Exchange: NASDAQ) |
Annual Shareholder Report | August 31, 2024 |
This annual shareholder report contains important information about the US Treasury 5 Year Note ETF (the “Fund”) for the period from September 1, 2023, to August 31, 2024. You can find additional information about the Fund at https://www.ustreasuryetf.com/etf/ufiv/. You can also request this information by contacting us at 1-800-617-0004.
WHAT WERE THE FUND COSTS FOR THE PAST YEAR? (based on a hypothetical $10,000 investment)
| | |
Fund Name | Costs of a $10,000 investment | Costs paid as a percentage of a $10,000 investment |
| US Treasury 5 Year Note ETF | $15 | 0.15% |
HOW DID THE FUND PERFORM LAST YEAR AND WHAT AFFECTED ITS PERFORMANCE?
The investment objective of the Fund is to seek investment results that correspond (before fees and expenses) generally to the price and yield performance of the ICE BofA Current 5-Year US Treasury Index (the “Index”). The Fund delivered competitive returns for the year, with 6.06% compared to the Index’s 6.20%. Dividends represented the majority of the return, with the price only improving by 2.21% for the year.
HOW DID THE FUND PERFORM SINCE INCEPTION?*
The $10,000 chart reflects a hypothetical $10,000 investment in the class of shares noted. The chart uses total return NAV performance and assumes reinvestment of dividends and capital gains. Fund expenses, including management fees and other expenses, were deducted.
CUMULATIVE PERFORMANCE (Initial Investment of $10,000)
| | 03/27/2023 | 03/31/2023 | 04/30/2023 | 05/31/2023 | 06/30/2023 | 07/31/2023 | 08/31/2023 | 09/30/2023 | 10/31/2023 | 11/30/2023 | 12/31/2023 | 01/31/2024 | 02/29/2024 | 03/31/2024 | 04/30/2024 | 05/31/2024 | 06/30/2024 | 07/31/2024 | 08/31/2024 |
| US Treasury 5 Year Note ETF NAV | 10000 | 10008 | 10073 | 9965 | 9832 | 9838 | 9831 | 9708 | 9649 | 9902 | 10130 | 10150 | 10007 | 10053 | 9866 | 9989 | 10091 | 10310 | 10427 |
| US Treasury 5 Year Note ETF Market | 10000 | 10008 | 10072 | 9980 | 9839 | 9845 | 9838 | 9713 | 9654 | 9907 | 10139 | 10147 | 10011 | 10058 | 9864 | 9991 | 10093 | 10306 | 10425 |
| ICE US Treasury Core Bond Index | 10000 | 10039 | 10094 | 9975 | 9900 | 9866 | 9816 | 9598 | 9482 | 9809 | 10127 | 10113 | 9980 | 10036 | 9811 | 9953 | 10054 | 10274 | 10406 |
| ICE BofA Current 5-Year US Treasury Total Return Index | 10000 | 10004 | 10070 | 9970 | 9836 | 9843 | 9835 | 9712 | 9659 | 9913 | 10141 | 10164 | 10017 | 10064 | 9881 | 10004 | 10106 | 10325 | 10445 |
ANNUAL AVERAGE TOTAL RETURN (%)
| | |
| | 1 Year | Since Inception
(03/28/2023) |
US Treasury 5 Year Note ETF NAV | 6.06 | 2.97 |
US Treasury 5 Year Note ETF Market | 5.97 | 2.95 |
ICE US Treasury Core Bond Index | 6.01 | 2.82 |
ICE BofA Current 5-Year US Treasury Total Return Index | 6.20 | 3.09 |
Visit https://www.ustreasuryetf.com/etf/ufiv/ for more recent performance information.
| * | The Fund’s past performance is not a good predictor of how the Fund will perform in the future. The graph and table do not reflect the deduction of taxes that a shareholder would pay on Fund distributions or redemption of Fund shares. |
| US Treasury 5 Year Note ETF | PAGE 1 | TSR-AR-74933W510 |
KEY FUND STATISTICS (as of August 31, 2024)
| |
Net Assets | $24,208,442 |
Number of Holdings | 1 |
Net Advisory Fee | $21,494 |
Portfolio Turnover | 1036% |
30-Day SEC Yield | 3.35% |
30-Day SEC Yield Unsubsidized | 3.35% |
Visit https://www.ustreasuryetf.com/etf/ufiv/ for more recent performance information.
WHAT DID THE FUND INVEST IN? (as of August 31, 2024)
| |
Top 10 Holdings | (% of Net Assets) |
United States Treasury Note/Bond | 99.6% |
| |
Top Sectors | (% of Net Assets) |
Government | 99.6% |
Cash & Other | 0.4% |
For additional information about the Fund; including its prospectus, financial information, holdings and proxy information, scan the QR code or visit https://www.ustreasuryetf.com/etf/ufiv/
HOUSEHOLDING
To reduce Fund expenses, only one copy of most shareholder documents may be mailed to shareholders with multiple accounts at the same address (Householding). If you would prefer that your Fund documents not be householded, please contact the Fund at 1-800-617-0004, or contact your financial intermediary. Your instructions will typically be effective within 30 days of receipt by F/m Investments or your financial intermediary.
| US Treasury 5 Year Note ETF | PAGE 2 | TSR-AR-74933W510 |
983110427983810425981610406983510445
| | |
| US Treasury 7 Year Note ETF | |
USVN (Principal U.S. Listing Exchange: NASDAQ) |
Annual Shareholder Report | August 31, 2024 |
This annual shareholder report contains important information about the US Treasury 7 Year Note ETF (the “Fund”) for the period from September 1, 2023, to August 31, 2024. You can find additional information about the Fund at https://www.ustreasuryetf.com/etf/usvn/. You can also request this information by contacting us at 1-800-617-0004.
WHAT WERE THE FUND COSTS FOR THE PAST YEAR? (based on a hypothetical $10,000 investment)
| | |
Fund Name | Costs of a $10,000 investment | Costs paid as a percentage of a $10,000 investment |
| US Treasury 7 Year Note ETF | $15 | 0.15% |
HOW DID THE FUND PERFORM LAST YEAR AND WHAT AFFECTED ITS PERFORMANCE?
The investment objective of the Fund is to seek investment results that correspond (before fees and expenses) generally to the price and yield performance of the ICE BofA Current 7-Year US Treasury Index (the “Index”). The Fund performed well for the year, returning 6.15% versus the Index at 6.06%. Dividends represented the majority of the returns, with the price only improving by 2.52% for the year.
HOW DID THE FUND PERFORM SINCE INCEPTION?*
The $10,000 chart reflects a hypothetical $10,000 investment in the class of shares noted. The chart uses total return NAV performance and assumes reinvestment of dividends and capital gains. Fund expenses, including management fees and other expenses, were deducted.
CUMULATIVE PERFORMANCE (Initial Investment of $10,000)
| | 03/27/2023 | 03/31/2023 | 04/30/2023 | 05/31/2023 | 06/30/2023 | 07/31/2023 | 08/31/2023 | 09/30/2023 | 10/31/2023 | 11/30/2023 | 12/31/2023 | 01/31/2024 | 02/29/2024 | 03/31/2024 | 04/30/2024 | 05/31/2024 | 06/30/2024 | 07/31/2024 | 08/31/2024 |
| US Treasury 7 Year Note ETF NAV | 10000 | 10011 | 10085 | 9964 | 9821 | 9789 | 9742 | 9528 | 9401 | 9740 | 10044 | 10054 | 9870 | 9933 | 9680 | 9835 | 9954 | 10218 | 10341 |
| US Treasury 7 Year Note ETF Market | 10000 | 10015 | 10087 | 9974 | 9823 | 9789 | 9745 | 9530 | 9406 | 9741 | 10052 | 10048 | 9877 | 9938 | 9679 | 9836 | 9957 | 10216 | 10341 |
| ICE US Treasury Core Bond Index | 10000 | 10039 | 10094 | 9975 | 9900 | 9866 | 9816 | 9598 | 9482 | 9809 | 10127 | 10113 | 9980 | 10036 | 9811 | 9953 | 10054 | 10274 | 10406 |
| ICE BofA Current 7-Year US Treasury Total Return Index | 10000 | 10010 | 10085 | 9969 | 9827 | 9798 | 9753 | 9538 | 9406 | 9742 | 10042 | 10057 | 9871 | 9937 | 9688 | 9842 | 9964 | 10220 | 10344 |
ANNUAL AVERAGE TOTAL RETURN (%)
| | |
| | 1 Year | Since Inception
(03/28/2023) |
US Treasury 7 Year Note ETF NAV | 6.15 | 2.37 |
US Treasury 7 Year Note ETF Market | 6.11 | 2.37 |
ICE US Treasury Core Bond Index | 6.01 | 2.82 |
ICE BofA Current 7-Year US Treasury Total Return Index | 6.06 | 2.39 |
Visit https://www.ustreasuryetf.com/etf/usvn/ for more recent performance information.
| * | The Fund’s past performance is not a good predictor of how the Fund will perform in the future. The graph and table do not reflect the deduction of taxes that a shareholder would pay on Fund distributions or redemption of Fund shares. |
| US Treasury 7 Year Note ETF | PAGE 1 | TSR-AR-74933W528 |
KEY FUND STATISTICS (as of August 31, 2024)
| |
Net Assets | $5,391,694 |
Number of Holdings | 1 |
Net Advisory Fee | $6,540 |
Portfolio Turnover | 1064% |
30-Day SEC Yield | 3.42% |
30-Day SEC Yield Unsubsidized | 3.42% |
Visit https://www.ustreasuryetf.com/etf/usvn/ for more recent performance information.
WHAT DID THE FUND INVEST IN? (as of August 31, 2024)
| |
Top 10 Holdings | (% of Net Assets) |
United States Treasury Note/Bond | 99.5% |
| |
Top Sectors | (% of Net Assets) |
Government | 99.5% |
Cash & Other | 0.5% |
For additional information about the Fund; including its prospectus, financial information, holdings and proxy information, scan the QR code or visit https://www.ustreasuryetf.com/etf/usvn/
HOUSEHOLDING
To reduce Fund expenses, only one copy of most shareholder documents may be mailed to shareholders with multiple accounts at the same address (Householding). If you would prefer that your Fund documents not be householded, please contact the Fund at 1-800-617-0004, or contact your financial intermediary. Your instructions will typically be effective within 30 days of receipt by F/m Investments or your financial intermediary.
| US Treasury 7 Year Note ETF | PAGE 2 | TSR-AR-74933W528 |
974210341974510341981610406975310344
| | |
| US Treasury 10 Year Note ETF | |
UTEN (Principal U.S. Listing Exchange: NASDAQ) |
Annual Shareholder Report | August 31, 2024 |
This annual shareholder report contains important information about the US Treasury 10 Year Note ETF (the “Fund”) for the period from September 1, 2023, to August 31, 2024. You can find additional information about the Fund at https://www.ustreasuryetf.com/etf/uten/. You can also request this information by contacting us at 1-800-617-0004.
WHAT WERE THE FUND COSTS FOR THE PAST YEAR? (based on a hypothetical $10,000 investment)
| | |
Fund Name | Costs of a $10,000 investment | Costs paid as a percentage of a $10,000 investment |
| US Treasury 10 Year Note ETF | $15 | 0.15% |
HOW DID THE FUND PERFORM LAST YEAR AND WHAT AFFECTED ITS PERFORMANCE?
The investment objective of the Fund is to seek investment results that correspond (before fees and expenses) generally to the price and yield performance of the ICE BofA Current 10-Year US Treasury Index (the “Index”). The Fund delivered competitive returns for the year, with 5.15% compared to the Index’s 5.26%. Dividends represented the majority of the return, with the price only improving by 2.02% for the year.
HOW DID THE FUND PERFORM SINCE INCEPTION?*
The $10,000 chart reflects a hypothetical $10,000 investment in the class of shares noted. The chart uses total return NAV performance and assumes reinvestment of dividends and capital gains. Fund expenses, including management fees and other expenses, were deducted.
CUMULATIVE PERFORMANCE (Initial Investment of $10,000)
| | 44781 | 08/31/2022 | 09/30/2022 | 10/31/2022 | 11/30/2022 | 12/31/2022 | 01/31/2023 | 02/28/2023 | 03/31/2023 | 04/30/2023 | 05/31/2023 | 06/30/2023 | 07/31/2023 | 08/31/2023 | 09/30/2023 | 10/31/2023 | 11/30/2023 | 12/31/2023 | 01/31/2024 | 02/29/2024 | 03/31/2024 | 04/30/2024 | 05/31/2024 | 06/30/2024 | 07/31/2024 | 08/31/2024 |
| US Treasury 10 Year Note ETF NAV | 10000 | 9700 | 9185 | 9017 | 9342 | 9206 | 9519 | 9218 | 9574 | 9642 | 9500 | 9388 | 9313 | 9228 | 8907 | 8708 | 9122 | 9492 | 9475 | 9281 | 9340 | 9024 | 9191 | 9308 | 9575 | 9704 |
| US Treasury 10 Year Note ETF Market | 10000 | 9669 | 9189 | 9025 | 9333 | 9203 | 9519 | 9222 | 9580 | 9645 | 9503 | 9385 | 9308 | 9235 | 8913 | 8716 | 9137 | 9496 | 9479 | 9288 | 9345 | 9027 | 9198 | 9308 | 9582 | 9708 |
| ICE US Treasury Core Bond Index | 10000 | 9813 | 9459 | 9325 | 9575 | 9528 | 9764 | 9536 | 9812 | 9865 | 9749 | 9676 | 9643 | 9593 | 9381 | 9267 | 9587 | 9897 | 9884 | 9754 | 9809 | 9589 | 9728 | 9826 | 10041 | 10170 |
| ICE BofA Current 10-Year US Treasury Total Return Index | 10000 | 9701 | 9188 | 9016 | 9353 | 9248 | 9530 | 9234 | 9591 | 9660 | 9519 | 9406 | 9332 | 9244 | 8922 | 8723 | 9140 | 9510 | 9494 | 9298 | 9357 | 9042 | 9212 | 9329 | 9598 | 9731 |
ANNUAL AVERAGE TOTAL RETURN (%)
| | |
| | 1 Year | Since Inception
(08/09/2022) |
US Treasury 10 Year Note ETF NAV | 5.15 | -1.45 |
US Treasury 10 Year Note ETF Market | 5.12 | -1.43 |
ICE US Treasury Core Bond Index | 6.01 | 0.82 |
ICE BofA Current 10-Year US Treasury Total Return Index | 5.26 | -1.31 |
Visit https://www.ustreasuryetf.com/etf/uten/ for more recent performance information.
| * | The Fund’s past performance is not a good predictor of how the Fund will perform in the future. The graph and table do not reflect the deduction of taxes that a shareholder would pay on Fund distributions or redemption of Fund shares. |
| US Treasury 10 Year Note ETF | PAGE 1 | TSR-AR-74933W536 |
KEY FUND STATISTICS (as of August 31, 2024)
| |
Net Assets | $156,974,726 |
Number of Holdings | 1 |
Net Advisory Fee | $168,751 |
Portfolio Turnover | 317% |
30-Day SEC Yield | 3.64% |
30-Day SEC Yield Unsubsidized | 3.64% |
Visit https://www.ustreasuryetf.com/etf/uten/ for more recent performance information.
WHAT DID THE FUND INVEST IN? (as of August 31, 2024)
| |
Top 10 Holdings | (% of Net Assets) |
United States Treasury Note/Bond | 99.8% |
| |
Top Sectors | (% of Net Assets) |
Government | 99.8% |
Cash & Other | 0.2% |
For additional information about the Fund; including its prospectus, financial information, holdings and proxy information, scan the QR code or visit https://www.ustreasuryetf.com/etf/uten/
HOUSEHOLDING
To reduce Fund expenses, only one copy of most shareholder documents may be mailed to shareholders with multiple accounts at the same address (Householding). If you would prefer that your Fund documents not be householded, please contact the Fund at 1-800-617-0004, or contact your financial intermediary. Your instructions will typically be effective within 30 days of receipt by F/m Investments or your financial intermediary.
| US Treasury 10 Year Note ETF | PAGE 2 | TSR-AR-74933W536 |
9700922897049669923597089813959310170970192449731
| | |
| US Treasury 20 Year Bond ETF | |
UTWY (Principal U.S. Listing Exchange: NASDAQ) |
Annual Shareholder Report | August 31, 2024 |
This annual shareholder report contains important information about the US Treasury 20 Year Bond ETF (the “Fund”) for the period from September 1, 2023, to August 31, 2024. You can find additional information about the Fund at https://www.ustreasuryetf.com/etf/utwy/. You can also request this information by contacting us at 1-800-617-0004.
WHAT WERE THE FUND COSTS FOR THE PAST YEAR? (based on a hypothetical $10,000 investment)
| | |
Fund Name | Costs of a $10,000 investment | Costs paid as a percentage of a $10,000 investment |
| US Treasury 20 Year Bond ETF | $15 | 0.15% |
HOW DID THE FUND PERFORM LAST YEAR AND WHAT AFFECTED ITS PERFORMANCE?
The investment objective of the Fund is to seek investment results that correspond (before fees and expenses) generally to the price and yield performance of the ICE BofA Current 20-Year US Treasury Index (the “Index”). The Fund delivered competitive returns for the year, with 4.47% compared to the Index’s 4.53%. Dividends represented the majority of the return, with the price only improving by 1.38% for the year.
HOW DID THE FUND PERFORM SINCE INCEPTION?*
The $10,000 chart reflects a hypothetical $10,000 investment in the class of shares noted. The chart uses total return NAV performance and assumes reinvestment of dividends and capital gains. Fund expenses, including management fees and other expenses, were deducted.
CUMULATIVE PERFORMANCE (Initial Investment of $10,000)
| | 03/27/2023 | 03/31/2023 | 04/30/2023 | 05/31/2023 | 06/30/2023 | 07/31/2023 | 08/31/2023 | 09/30/2023 | 10/31/2023 | 11/30/2023 | 12/31/2023 | 01/31/2024 | 02/29/2024 | 03/31/2024 | 04/30/2024 | 05/31/2024 | 06/30/2024 | 07/31/2024 | 08/31/2024 |
| US Treasury 20 Year Bond ETF NAV | 10000 | 10127 | 10175 | 9919 | 9888 | 9720 | 9490 | 8912 | 8556 | 9193 | 9822 | 9730 | 9494 | 9584 | 9086 | 9322 | 9442 | 9750 | 9914 |
| US Treasury 20 Year Bond ETF Market | 10000 | 10146 | 10191 | 9925 | 9880 | 9716 | 9496 | 8921 | 8562 | 9205 | 9828 | 9748 | 9497 | 9595 | 9097 | 9323 | 9453 | 9755 | 9913 |
| ICE US Treasury Core Bond Index | 10000 | 10039 | 10094 | 9975 | 9900 | 9866 | 9816 | 9598 | 9482 | 9809 | 10127 | 10113 | 9980 | 10036 | 9811 | 9953 | 10054 | 10274 | 10406 |
| ICE BofA Current 20-Year US Treasury Total Return Index | 10000 | 10128 | 10177 | 9920 | 9885 | 9718 | 9491 | 8911 | 8556 | 9196 | 9822 | 9731 | 9497 | 9584 | 9087 | 9323 | 9441 | 9749 | 9921 |
ANNUAL AVERAGE TOTAL RETURN (%)
| | |
| | 1 Year | Since Inception
(03/28/2023) |
US Treasury 20 Year Bond ETF NAV | 4.47 | -0.60 |
US Treasury 20 Year Bond ETF Market | 4.39 | -0.61 |
ICE US Treasury Core Bond Index | 6.01 | 2.82 |
ICE BofA Current 20-Year US Treasury Total Return Index | 4.53 | -0.55 |
Visit https://www.ustreasuryetf.com/etf/utwy/ for more recent performance information.
| * | The Fund’s past performance is not a good predictor of how the Fund will perform in the future. The graph and table do not reflect the deduction of taxes that a shareholder would pay on Fund distributions or redemption of Fund shares. |
| US Treasury 20 Year Bond ETF | PAGE 1 | TSR-AR-74933W544 |
KEY FUND STATISTICS (as of August 31, 2024)
| |
Net Assets | $26,249,570 |
Number of Holdings | 2 |
Net Advisory Fee | $20,746 |
Portfolio Turnover | 344% |
30-Day SEC Yield | 3.88% |
30-Day SEC Yield Unsubsidized | 3.88% |
Visit https://www.ustreasuryetf.com/etf/utwy/ for more recent performance information.
WHAT DID THE FUND INVEST IN? (as of August 31, 2024)
| |
Top 10 Holdings | (% of Net Assets) |
United States Treasury Note/Bond | 99.7% |
United States Treasury Bill | 0.3% |
| |
Top Sectors | (% of Net Assets) |
Government | 99.7% |
Cash & Other | 0.3% |
For additional information about the Fund; including its prospectus, financial information, holdings and proxy information, scan the QR code or visit https://www.ustreasuryetf.com/etf/utwy/
HOUSEHOLDING
To reduce Fund expenses, only one copy of most shareholder documents may be mailed to shareholders with multiple accounts at the same address (Householding). If you would prefer that your Fund documents not be householded, please contact the Fund at 1-800-617-0004, or contact your financial intermediary. Your instructions will typically be effective within 30 days of receipt by F/m Investments or your financial intermediary.
| US Treasury 20 Year Bond ETF | PAGE 2 | TSR-AR-74933W544 |
949099149496991398161040694919921
| | |
| US Treasury 30 Year Bond ETF | |
UTHY (Principal U.S. Listing Exchange: NASDAQ) |
Annual Shareholder Report | August 31, 2024 |
This annual shareholder report contains important information about the US Treasury 30 Year Bond ETF (the “Fund”) for the period from September 1, 2023, to August 31, 2024. You can find additional information about the Fund at https://www.ustreasuryetf.com/etf/uthy/. You can also request this information by contacting us at 1-800-617-0004.
WHAT WERE THE FUND COSTS FOR THE PAST YEAR? (based on a hypothetical $10,000 investment)
| | |
Fund Name | Costs of a $10,000 investment | Costs paid as a percentage of a $10,000 investment |
| US Treasury 30 Year Bond ETF | $15 | 0.15% |
HOW DID THE FUND PERFORM LAST YEAR AND WHAT AFFECTED ITS PERFORMANCE?
The investment objective of the Fund is to seek investment results that correspond (before fees and expenses) generally to the price and yield performance of the ICE BofA Current 30-Year US Treasury Index (the “Index”). The Fund performed well for the year, returning 3.59% versus the Index at 3.53%. Dividends represented the majority of the return, with the price only improving by 1.18% for the year.
HOW DID THE FUND PERFORM SINCE INCEPTION?*
The $10,000 chart reflects a hypothetical $10,000 investment in the class of shares noted. The chart uses total return NAV performance and assumes reinvestment of dividends and capital gains. Fund expenses, including management fees and other expenses, were deducted.
CUMULATIVE PERFORMANCE (Initial Investment of $10,000)
| | 03/27/2023 | 03/31/2023 | 04/30/2023 | 05/31/2023 | 06/30/2023 | 07/31/2023 | 08/31/2023 | 09/30/2023 | 10/31/2023 | 11/30/2023 | 12/31/2023 | 01/31/2024 | 02/29/2024 | 03/31/2024 | 04/30/2024 | 05/31/2024 | 06/30/2024 | 07/31/2024 | 08/31/2024 |
| US Treasury 30 Year Bond ETF NAV | 10000 | 10187 | 10204 | 9925 | 9942 | 9696 | 9383 | 8667 | 8202 | 8991 | 9731 | 9509 | 9310 | 9363 | 8752 | 8994 | 9163 | 9496 | 9720 |
| US Treasury 30 Year Bond ETF Market | 10000 | 10200 | 10228 | 9920 | 9939 | 9691 | 9388 | 8668 | 8204 | 8973 | 9746 | 9484 | 9315 | 9365 | 8755 | 8994 | 9163 | 9504 | 9727 |
| ICE US Treasury Core Bond Index | 10000 | 10039 | 10094 | 9975 | 9900 | 9866 | 9816 | 9598 | 9482 | 9809 | 10127 | 10113 | 9980 | 10036 | 9811 | 9953 | 10054 | 10274 | 10406 |
| ICE BofA Current 30-Year US Treasury Total Return Index | 10000 | 10188 | 10206 | 9920 | 9934 | 9689 | 9388 | 8667 | 8203 | 8992 | 9731 | 9511 | 9302 | 9353 | 8743 | 8990 | 9157 | 9491 | 9720 |
ANNUAL AVERAGE TOTAL RETURN (%)
| | |
| | 1 Year | Since Inception
(03/28/2023) |
US Treasury 30 Year Bond ETF NAV | 3.59 | -1.97 |
US Treasury 30 Year Bond ETF Market | 3.61 | -1.92 |
ICE US Treasury Core Bond Index | 6.01 | 2.82 |
ICE BofA Current 30-Year US Treasury Total Return Index | 3.53 | -1.97 |
Visit https://www.ustreasuryetf.com/etf/uthy/ for more recent performance information.
| * | The Fund’s past performance is not a good predictor of how the Fund will perform in the future. The graph and table do not reflect the deduction of taxes that a shareholder would pay on Fund distributions or redemption of Fund shares. |
| US Treasury 30 Year Bond ETF | PAGE 1 | TSR-AR-74933W551 |
KEY FUND STATISTICS (as of August 31, 2024)
| |
Net Assets | $17,954,668 |
Number of Holdings | 2 |
Net Advisory Fee | $20,561 |
Portfolio Turnover | 286% |
30-Day SEC Yield | 3.95% |
30-Day SEC Yield Unsubsidized | 3.95% |
Visit https://www.ustreasuryetf.com/etf/uthy/ for more recent performance information.
WHAT DID THE FUND INVEST IN? (as of August 31, 2024)
| |
Top 10 Holdings | (% of Net Assets) |
United States Treasury Note/Bond | 99.4% |
United States Treasury Bill | 0.4% |
| |
Top Sectors | (% of Net Assets) |
Government | 99.4% |
Cash & Other | 0.6% |
For additional information about the Fund; including its prospectus, financial information, holdings and proxy information, scan the QR code or visit https://www.ustreasuryetf.com/etf/uthy/
HOUSEHOLDING
To reduce Fund expenses, only one copy of most shareholder documents may be mailed to shareholders with multiple accounts at the same address (Householding). If you would prefer that your Fund documents not be householded, please contact the Fund at 1-800-617-0004, or contact your financial intermediary. Your instructions will typically be effective within 30 days of receipt by F/m Investments or your financial intermediary.
| US Treasury 30 Year Bond ETF | PAGE 2 | TSR-AR-74933W551 |
938397209388972798161040693889720
| | |
|
| |
ZTWO (Principal U.S. Listing Exchange: NYSE) |
Annual Shareholder Report | August 31, 2024 |
This annual shareholder report contains important information about the F/m 2-Year Investment Grade Corporate Bond ETF (the “Fund”) for the period from January 10, 2024, to August 31, 2024. You can find additional information about the Fund at https://www.fminvest.com/etfs/us-credit-series/ztwo/. You can also request this information by contacting us at 1-800-617-0004.
WHAT WERE THE FUND COSTS FOR THE PAST PERIOD? (based on a hypothetical $10,000 investment)
| | |
Fund Name | Costs of a $10,000 investment | Costs paid as a percentage of a $10,000 investment |
| F/m 2-Year Investment Grade Corporate Bond ETF | $10* | 0.15% |
| * Amount shown reflects the expenses of the Fund from inception date through 8/31/24. Expenses would be higher if the Fund had been in operations for the full year. | | |
HOW DID THE FUND PERFORM LAST YEAR AND WHAT AFFECTED ITS PERFORMANCE?
From the Fund inception date (January 10, 2024) to August 31, 2024, returns for the Fund closely tracked its expense-free target index.
The Fund seeks to track the investments of an index composed of U.S. dollar denominated, investment-grade corporate bonds, as represented by the ICE 2-Year US Target Maturity Corporate Index (the “2-Year Corporate Index”). The Fund invests in a representative sampling of securities included in the 2-Year Corporate Index that collectively has an investment profile similar to that of the 2-Year Corporate Index. Due to the use of representative sampling, the Fund may or may not hold all of the securities that are included in the 2-Year Corporate Index.
HOW DID THE FUND PERFORM SINCE INCEPTION?*
The $10,000 chart reflects a hypothetical $10,000 investment in the class of shares noted. The chart uses total return NAV performance and assumes reinvestment of dividends and capital gains. Fund expenses, including management fees and other expenses, were deducted.
CUMULATIVE PERFORMANCE (Initial Investment of $10,000)
| | 10/01/2024 | 01/31/2024 | 02/29/2024 | 03/31/2024 | 04/30/2024 | 05/31/2024 | 06/30/2024 | 07/31/2024 | 08/31/2024 |
| F/m 2-Year Investment Grade Corporate Bond ETF NAV | 10,000 | 10,045 | 10,016 | 10,067 | 10,047 | 10,122 | 10,174 | 10,303 | 10,396 |
| F/m 2-Year Investment Grade Corporate Bond ETF Market | 10,000 | 10,048 | 10,024 | 10,083 | 10,055 | 10,133 | 10,178 | 10,308 | 10,409 |
| ICE BofA US Corporate Index | 10,000 | 10,090 | 9,949 | 10,067 | 9,833 | 10,015 | 10,079 | 10,317 | 10,476 |
| ICE 2-Year US Target Maturity Corporate Index | 10,000 | 10,056 | 10,031 | 10,084 | 10,066 | 10,142 | 10,196 | 10,326 | 10,422 |
| F/m 2-Year Investment Grade Corporate Bond ETF | PAGE 1 | TSR-AR-74933W429 |
ANNUAL AVERAGE TOTAL RETURN (%)
| |
| | Since Inception
(01/10/2024) |
F/m 2-Year Investment Grade Corporate Bond ETF NAV | 3.96 |
F/m 2-Year Investment Grade Corporate Bond ETF Market | 4.09 |
ICE BofA US Corporate Index | 4.76 |
ICE 2-Year US Target Maturity Corporate Index | 4.22 |
Visit https://www.fminvest.com/etfs/us-credit-series/ztwo/ for more recent performance information.
| * | The Fund’s past performance is not a good predictor of how the Fund will perform in the future. The graph and table do not reflect the deduction of taxes that a shareholder would pay on Fund distributions or redemption of Fund shares. |
KEY FUND STATISTICS (as of August 31, 2024)
| |
Net Assets | $10,125,460 |
Number of Holdings | 395 |
Net Advisory Fee | $9,200 |
Portfolio Turnover | 110% |
30-Day SEC Yield | 4.67% |
30-Day SEC Yield Unsubsidized | 4.67% |
Visit https://www.fminvest.com/etfs/us-credit-series/ztwo/ for more recent performance information.
WHAT DID THE FUND INVEST IN? (as of August 31, 2024)
| |
Top 10 Holdings | (% of Net Assets) |
Howmet Aerospace, Inc. | 0.3% |
Cisco Systems, Inc. | 0.3% |
BHP Billiton Finance USA Ltd. | 0.3% |
National Rural Utilities Cooperative Finance Corp. | 0.3% |
Texas Instruments, Inc. | 0.3% |
Vistra Operations Co. LLC | 0.3% |
Crown Castle, Inc. | 0.3% |
Starbucks Corp. | 0.3% |
Philip Morris International, Inc. | 0.3% |
John Deere Capital Corp. | 0.3% |
| |
Top Sectors | (% of Net Assets) |
Financials | 32.1% |
Industrials | 9.5% |
Technology | 8.8% |
Utilities | 8.5% |
Consumer Discretionary | 7.9% |
Consumer Staples | 7.3% |
Energy | 7.2% |
Health Care | 6.7% |
Materials | 6.5% |
Cash & Other | 5.5% |
For additional information about the Fund; including its prospectus, financial information, holdings and proxy information, scan the QR code or visit https://www.fminvest.com/etfs/us-credit-series/ztwo/
HOUSEHOLDING
To reduce Fund expenses, only one copy of most shareholder documents may be mailed to shareholders with multiple accounts at the same address (Householding). If you would prefer that your Fund documents not be householded, please contact the Fund at 1-800-617-0004, or contact your financial intermediary. Your instructions will typically be effective within 30 days of receipt by F/m Investments or your financial intermediary.
| F/m 2-Year Investment Grade Corporate Bond ETF | PAGE 2 | TSR-AR-74933W429 |
10396104091047610422
| | |
| F/m 3-Year Investment Grade Corporate Bond ETF | |
ZTRE (Principal U.S. Listing Exchange: NYSE) |
Annual Shareholder Report | August 31, 2024 |
This annual shareholder report contains important information about the F/m 3-Year Investment Grade Corporate Bond ETF (the “Fund”) for the period from January 10, 2024, to August 31, 2024. You can find additional information about the Fund at https://www.fminvest.com/etfs/us-credit-series/ztre/. You can also request this information by contacting us at 1-800-617-0004.
WHAT WERE THE FUND COSTS FOR THE PAST PERIOD? (based on a hypothetical $10,000 investment)
| | |
Fund Name | Costs of a $10,000 investment | Costs paid as a percentage of a $10,000 investment |
| F/m 3-Year Investment Grade Corporate Bond ETF | $10* | 0.15% |
| * Amount shown reflects the expenses of the Fund from inception date through 8/31/24. Expenses would be higher if the Fund had been in operations for the full year. | | |
HOW DID THE FUND PERFORM LAST YEAR AND WHAT AFFECTED ITS PERFORMANCE?
From the Fund inception date (January 10, 2024) to August 31, 2024, returns for the Fund closely tracked its expense-free target index.
The Fund seeks to track the investments of an index composed of U.S. dollar denominated, investment-grade corporate bonds, as represented by the ICE 3-Year US Target Maturity Corporate Index (the “3-Year Corporate Index”). The Fund invests in a representative sampling of securities included in the 3-Year Corporate Index that collectively has an investment profile similar to that of the 3-Year Corporate Index. Due to the use of representative sampling, the Fund may or may not hold all of the securities that are included in the 3-Year Corporate Index.
HOW DID THE FUND PERFORM SINCE INCEPTION?*
The $10,000 chart reflects a hypothetical $10,000 investment in the class of shares noted. The chart uses total return NAV performance and assumes reinvestment of dividends and capital gains. Fund expenses, including management fees and other expenses, were deducted.
CUMULATIVE PERFORMANCE (Initial Investment of $10,000)
| | 10/01/2024 | 01/31/2024 | 02/29/2024 | 03/31/2024 | 04/30/2024 | 05/31/2024 | 06/30/2024 | 07/31/2024 | 08/31/2024 |
| F/m 3-Year Investment Grade Corporate Bond ETF NAV | 10,000 | 10,060 | 10,000 | 10,065 | 10,001 | 10,108 | 10,165 | 10,326 | 10,441 |
| F/m 3-Year Investment Grade Corporate Bond ETF Market | 10,000 | 10,064 | 10,005 | 10,079 | 10,008 | 10,116 | 10,167 | 10,320 | 10,455 |
| ICE BofA US Corporate Index | 10,000 | 10,090 | 9,949 | 10,067 | 9,833 | 10,015 | 10,079 | 10,317 | 10,476 |
| ICE 3-Year US Target Maturity Corporate Index | 10,000 | 10,068 | 10,014 | 10,078 | 10,015 | 10,122 | 10,181 | 10,340 | 10,458 |
| F/m 3-Year Investment Grade Corporate Bond ETF | PAGE 1 | TSR-AR-74933W395 |
ANNUAL AVERAGE TOTAL RETURN (%)
| |
| | Since Inception
(01/10/2024) |
F/m 3-Year Investment Grade Corporate Bond ETF NAV | 4.41 |
F/m 3-Year Investment Grade Corporate Bond ETF Market | 4.55 |
ICE BofA US Corporate Index | 4.76 |
ICE 3-Year US Target Maturity Corporate Index | 4.58 |
Visit https://www.fminvest.com/etfs/us-credit-series/ztre/ for more recent performance information.
| * | The Fund’s past performance is not a good predictor of how the Fund will perform in the future. The graph and table do not reflect the deduction of taxes that a shareholder would pay on Fund distributions or redemption of Fund shares. |
KEY FUND STATISTICS (as of August 31, 2024)
| |
Net Assets | $22,377,312 |
Number of Holdings | 401 |
Net Advisory Fee | $16,566 |
Portfolio Turnover | 86% |
30-Day SEC Yield | 4.50% |
30-Day SEC Yield Unsubsidized | 4.50% |
Visit https://www.fminvest.com/etfs/us-credit-series/ztre/ for more recent performance information.
WHAT DID THE FUND INVEST IN? (as of August 31, 2024)
| |
Top 10 Holdings | (% of Net Assets) |
Mount Vernon Liquid Assets Portfolio, LLC | 0.4% |
APA Infrastructure Ltd. | 0.3% |
Goldman Sachs BDC, Inc. | 0.3% |
Tapestry, Inc. | 0.3% |
Jefferies Financial Group, Inc. | 0.3% |
JPMorgan Chase & Co. | 0.3% |
Jabil, Inc. | 0.3% |
Nokia Oyj | 0.3% |
Santander Holdings USA, Inc. | 0.3% |
ONEOK, Inc. | 0.3% |
| |
Top Sectors | (% of Net Assets) |
Financials | 28.9% |
Industrials | 9.7% |
Energy | 9.4% |
Consumer Discretionary | 8.8% |
Utilities | 8.5% |
Health Care | 8.4% |
Consumer Staples | 8.0% |
Technology | |
Materials | 6.7% |
Cash & Other | 4.2% |
For additional information about the Fund; including its prospectus, financial information, holdings and proxy information, scan the QR code or visit https://www.fminvest.com/etfs/us-credit-series/ztre/
HOUSEHOLDING
To reduce Fund expenses, only one copy of most shareholder documents may be mailed to shareholders with multiple accounts at the same address (Householding). If you would prefer that your Fund documents not be householded, please contact the Fund at 1-800-617-0004, or contact your financial intermediary. Your instructions will typically be effective within 30 days of receipt by F/m Investments or your financial intermediary.
| F/m 3-Year Investment Grade Corporate Bond ETF | PAGE 2 | TSR-AR-74933W395 |
10441104551047610458
| | |
| F/m 10-Year Investment Grade Corporate Bond ETF | |
ZTEN (Principal U.S. Listing Exchange: NYSE) |
Annual Shareholder Report | August 31, 2024 |
This annual shareholder report contains important information about the F/m 10-Year Investment Grade Corporate Bond ETF (the “Fund”) for the period from January 10, 2024, to August 31, 2024. You can find additional information about the Fund at https://www.fminvest.com/etfs/us-credit-series/zten/. You can also request this information by contacting us at 1-800-617-0004.
WHAT WERE THE FUND COSTS FOR THE PAST PERIOD? (based on a hypothetical $10,000 investment)
| | |
Fund Name | Costs of a $10,000 investment | Costs paid as a percentage of a $10,000 investment |
| F/m 10-Year Investment Grade Corporate Bond ETF | $10* | 0.15% |
| * Amount shown reflects the expenses of the Fund from inception date through 8/31/24. Expenses would be higher if the Fund had been in operations for the full year. | | |
HOW DID THE FUND PERFORM LAST YEAR AND WHAT AFFECTED ITS PERFORMANCE?
From the Fund inception date (January 10, 2024) to August 31, 2024, returns for the Fund closely tracked its expense-free target index.
The Fund seeks to track the investments of an index composed of U.S. dollar denominated, investment-grade corporate bonds, as represented by the ICE 10-Year US Target Maturity Corporate Index (the “10-Year Corporate Index”). The Fund invests in a representative sampling of securities included in the 10-Year Corporate Index that collectively has an investment profile similar to that of the 10-Year Corporate Index. Due to the use of representative sampling, the Fund may or may not hold all of the securities that are included in the 10-Year Corporate Index.
HOW DID THE FUND PERFORM SINCE INCEPTION?*
The $10,000 chart reflects a hypothetical $10,000 investment in the class of shares noted. The chart uses total return NAV performance and assumes reinvestment of dividends and capital gains. Fund expenses, including management fees and other expenses, were deducted.
CUMULATIVE PERFORMANCE (Initial Investment of $10,000)
| | 01-10-2024 | 01/31/2024 | 02/29/2024 | 03/31/2024 | 04/30/2024 | 05/31/2024 | 06/30/2024 | 07/31/2024 | 08/31/2024 |
| F/m 10-Year Investment Grade Corporate Bond ETF NAV | 10,000 | 10,104 | 9,919 | 10,071 | 9,787 | 10,000 | 10,085 | 10,371 | 10,532 |
| F/m 10-Year Investment Grade Corporate Bond ETF Market | 10,000 | 10,087 | 9,938 | 10,076 | 9,793 | 10,017 | 10,093 | 10,370 | 10,568 |
| ICE BofA US Corporate Index | 10,000 | 10,090 | 9,949 | 10,067 | 9,833 | 10,015 | 10,079 | 10,317 | 10,476 |
| ICE 10-Year US Target Maturity Corporate Index | 10,000 | 10,104 | 9,936 | 10,087 | 9,808 | 10,024 | 10,103 | 10,388 | 10,553 |
| F/m 10-Year Investment Grade Corporate Bond ETF | PAGE 1 | TSR-AR-74933W411 |
ANNUAL AVERAGE TOTAL RETURN (%)
| |
| | Since Inception
(01/10/2024) |
F/m 10-Year Investment Grade Corporate Bond ETF NAV | 5.32 |
F/m 10-Year Investment Grade Corporate Bond ETF Market | 5.68 |
ICE BofA US Corporate Index | 4.76 |
ICE 10-Year US Target Maturity Corporate Index | 5.53 |
Visit https://www.fminvest.com/etfs/us-credit-series/zten/ for more recent performance information.
| * | The Fund’s past performance is not a good predictor of how the Fund will perform in the future. The graph and table do not reflect the deduction of taxes that a shareholder would pay on Fund distributions or redemption of Fund shares. |
KEY FUND STATISTICS (as of August 31, 2024)
| |
Net Assets | $16,395,014 |
Number of Holdings | 242 |
Net Advisory Fee | $13,424 |
Portfolio Turnover | 131% |
30-Day SEC Yield | 5.12% |
30-Day SEC Yield Unsubsidized | 5.12% |
Visit https://www.fminvest.com/etfs/us-credit-series/zten/ for more recent performance information.
WHAT DID THE FUND INVEST IN? (as of August 31, 2024)
| |
Top 10 Holdings | (% of Net Assets) |
Mount Vernon Liquid Assets Portfolio, LLC | 2.4% |
Bank of New York Mellon Corp. | 0.4% |
Procter & Gamble Co. | 0.4% |
Brookfield Finance, Inc. | 0.4% |
UnitedHealth Group, Inc. | 0.4% |
Capital One Financial Corp. | 0.4% |
AutoZone, Inc. | 0.4% |
PNC Financial Services Group, Inc. | 0.4% |
Choice Hotels International, Inc. | 0.4% |
American Express Co. | 0.4% |
| |
Top Sectors | (% of Net Assets) |
Financials | 28.4% |
Utilities | 12.6% |
Health Care | 10.2% |
Energy | 10.2% |
Industrials | 9.4% |
Consumer Discretionary | 6.6% |
Technology | 6.5% |
Consumer Staples | 5.7% |
Materials | 5.3% |
Cash & Other | 5.1% |
For additional information about the Fund; including its prospectus, financial information, holdings and proxy information, scan the QR code or visit https://www.fminvest.com/etfs/us-credit-series/zten/
HOUSEHOLDING
To reduce Fund expenses, only one copy of most shareholder documents may be mailed to shareholders with multiple accounts at the same address (Householding). If you would prefer that your Fund documents not be householded, please contact the Fund at 1-800-617-0004, or contact your financial intermediary. Your instructions will typically be effective within 30 days of receipt by F/m Investments or your financial intermediary.
| F/m 10-Year Investment Grade Corporate Bond ETF | PAGE 2 | TSR-AR-74933W411 |
10532105681047610553
| | |
| Oakhurst Fixed Income Fund | |
Institutional Class | OHFIX |
Annual Shareholder Report | August 31, 2024 |
This annual shareholder report contains important information about the Oakhurst Fixed Income Fund (the “Fund”) for the period from September 1, 2023, to August 31, 2024. You can find additional information about the Fund at https://www.fminvest.com/mutual-funds/ohfix. You can also request this information by contacting us at 1-800-292-6775.
WHAT WERE THE FUND COSTS FOR THE PAST YEAR? (based on a hypothetical $10,000 investment)
| | |
Class Name | Costs of a $10,000 investment | Costs paid as a percentage of a $10,000 investment |
| Institutional Class | $60 | 0.58% |
HOW DID THE FUND PERFORM LAST YEAR AND WHAT AFFECTED ITS PERFORMANCE?
The Fund comfortably outperformed its index during the past fiscal year as duration and sector strategies both proved beneficial. Expecting benchmark yields to rise, Fund duration had started the year well below that of the index in an effort to minimize the impact of higher rates. As inflation fell and valuations improved, the duration of the Fund was extended closer to improve performance during a declining rate environment. Overweight allocations to mortgage-backed securities and corporate bonds also aided relative Fund performance due to the additional income and strong performance from these sectors. With elevated recession risk, a reduction in corporate bonds and an increased focus on higher quality securities was warranted.
| |
Top Contributors |
| | United States Treasury Note/Bond 4.13%, 11/15/2032 |
| | United States Treasury Note/Bond 3.88%, 08/15/2033 |
| | United States Treasury Note/Bond 3.50%, 02/15/2033 |
| | United States Treasury Note/Bond 3.00%, 02/15/2042 |
| |
Top Detractors |
| ↓ | New York Community Bancorp, Inc., 8.27% (3 mo. Term SOFR + 3.04%), 11/06/2028 |
| | United States Treasury Note/Bond 4.88%, 05/31/2026 |
| | 91282CDY4 United States Treasury Note/Bond 1.88%, 02/15/2032 |
| | 31620RAJ4 Fidelity National Financial Inc 3.40% 06/15/2032 |
HOW DID THE FUND PERFORM OVER THE PAST 10 YEARS?*
The $10,000 chart reflects a hypothetical $10,000 investment in the class of shares noted. The chart uses total return NAV performance and assumes reinvestment of dividends and capital gains. Fund expenses, including management fees and other expenses, were deducted.
CUMULATIVE PERFORMANCE (Initial Investment of $10,000)
| | 08/31/2014 | 09/30/2014 | 10/32/014 | 11/30/2014 | 12./31/2014 | 01/31/2015 | 02/28/2.015 | 03/31/2015 | 04/30/2015 | 05/31/2015 | 06/30/2015 | 07/31/2015 | 08/31/2015 | 09/30/2015 | 10/31/2015 | 11/30/2015 | 12./31/2015 | 01/31/2016 | 02/29/2016 | 03/31/2016 | 04/30/2016 | 05/31/2016 | 06/30/2016 | 07/31/2016 | 08/31/2016 | 09/30/2016 | 10/31/2016 | 11/30/2016 | 12/3122016 | 01/31/2017 | 02/28/2017 | 03/31/2017 | 04/3.022017 | 05/31/2017 | 06/30/2017 | 07/31/2017 | 08/31/2017 | 09/30/2017 | 10/31/2017 | 11/30/2017 | 12/31/2017 | 01/31/2018 | 02/28/2018 | 03/31/2018 | 04/30/2018 | 05/31/2018 | 06/30/2018 | 07/31/2018 | 08/31/2018 | 09/30/2018 | 10/31/2018 | 11/30/2018 | 12/31/2018 | 01/31/2019 | 02 / 28 / 2019 | 03 / 31 2019 | 04/ 30 / 2019 | 05 / 31 2019 | 06 / 30 / 2019 | 07 / 31 2019 | 08 31 2019 | 09 / 30 2019 | 10 / 31 / 2019 | 11 30 / 2019 | 12 / 31 2019 | 10/31/2020 | 02/29/2020 | 03/31/2020 | 04/30/2020 | 05/31/2020 | 06/30/2020 | 07/31/2020 | 08/31/2020 | 09/30/2020 | 10/31/2020 | 11/30/2020 | 12/31/2020 | 01/31/2021 | 02/28/2021 | 03/31/2021 | 04/30/2021 | 05/31/2021 | 06/30/2021 | 07/31/2021 | 08/31/2021 | 09/30/2021 | 10/31/2021 | 11/30/2021 | 12/31/2021 | 01/31/2022 | 02/28/2022 | 03/31/2022 | 04/30/2022 | 05/31/0222 | 06/30/2022 | 07/31/2022 | 08/31/2022 | 09/30/2022 | 10/21/2022 | 11/30/2022 | 12/31/2022 | 01/31/2023 | 02/28/2023 | 03/31/2023 | 04/30/2023 | 05/31/2023 | 06/30/2023 | 07/31/2023 | 08/31/2023 | 09/30/2023 | 10/31/2023 | 11/30/2023 | 12/31/2023 | 01/31/2024 | 02/29/2024 | 03/31/2024 | 04/30/2024 | 05/31/2024 | 06/30/2024 | 07/31/2024 | 08/31/2024 |
| Oakhurst Fixed Income Fund Institutional Class | 10,000 | 9,953 | 10,005 | 10,059 | 10,046 | 10,181 | 10,152 | 10,196 | 10,197 | 10,200 | 10,129 | 10,172 | 10,174 | 10,227 | 10,250 | 10,241 | 10,226 | 10,313 | 10,326 | 10,415 | 10,461 | 10,486 | 1 0,620 | 10,687 | 10,708 | 10,724 | 10,697 | 10,527 | 10,547 | 10,604 | 10,669 | 10,673 | 10,742 | 10,834 | 10,825 | 10,894 | 10,977 | 1 0,948 | 10,975 | 10,955 | 10,982 | 10,910 | 10,858 | 10,883 | 10,830 | 10,895 | 10,898 | 10,905 | 10,978 | 10,948 | 10,911 | 10,951 | 11,064 | 11,161 | 1 1 , 187 | 1 1 , 354 | 11 ,396 | 11 , 564 | 1 1 , 673 | 1 1 ,689 | 11,903 | 1 1 , 866 | 1 1 , 908 | 11 , 884 | 11 ,877 | 12067 | 12246 | 11961 | 12188 | 12257 | 13422 | 12579 | 12552 | 12564 | 12525 | 12632 | 12674 | 12654 | 12538 | 12438 | 12520 | 12577 | 12625 | 12744 | 12730 | 12652 | 12597 | 12610 | 12597 | 12390 | 12249 | 11906 | 11583 | 11569 | 11406 | 11621 | 11382 | 10947 | 10807 | 11090 | 11051 | 11351 | 11160 | 11383 | 11454 | 11356 | 11309 | 11340 | 11311 | 11095 | 10965 | 11373 | 11790 | 11791 | 11651 | 11767 | 11496 | 11671 | 11815 | 12049 | 12240 |
| Bloomberg U.S. Aggregate Bond Index | 10,000 | 9,932 | 10,030 | 10,101 | 10,110 | 10,322 | 10,225 | 10,273 | 10,236 | 10,211 | 10,100 | 10,170 | 10,156 | 10,224 | 10,226 | 10,199 | 10,166 | 10,306 | 10,379 | 10,474 | 10,514 | 10,517 | 10,706 | 10,774 | 10,761 | 10,755 | 10,673 | 10,420 | 10,435 | 10,456 | 10,526 | 10,520 | 1 0,601 | 10,683 | 10,672 | 10,718 | 10,814 | 10,763 | 10,769 | 10,755 | 10,805 | 10,680 | 10,579 | 10,647 | 10,568 | 10,643 | 10,630 | 10,633 | 10,701 | 10,632 | 10,548 | 10,611 | 10806 | 10921 | 10 , 914 | 11 , 124 | 11 , 127 | 1 1 , 324 | 11 ,466 | 11 , 492 | 11,789 | 1 1 ,727 | 11762 | 11 ,755 | 11 ,748 | 11974 | 12189 | 12118 | 12333 | 12391 | 12469 | 12655 | 12553 | 12546 | 12490 | 12612 | 12630 | 12539 | 12358 | 12204 | 12300 | 12340 | 12427 | 12566 | 12542 | 12433 | 12430 | 12467 | 12435 | 12167 | 12031 | 11697 | 11253 | 11326 | 11148 | 11420 | 11098 | 10618 | 10481 | 10866 | 10817 | 11150 | 10862 | 11138 | 11205 | 11083 | 11044 | 11036 | 10965 | 10687 | 10518 | 10994 | 11415 | 11384 | 11223 | 11327 | 11041 | 11228 | 11334 | 11599 | 11765 |
| Oakhurst Fixed Income Fund | PAGE 1 | TSR-AR-74933W320 |
ANNUAL AVERAGE TOTAL RETURN (%)
| | | |
| | 1 Year | 5 Year | 10 Year |
Institutional Class | 8.21 | 0.56 | 2.04 |
Bloomberg U.S. Aggregate Bond Index | 7.30 | -0.04 | 1.64 |
Visit https://www.fminvest.com/mutual-funds/ohfix for more recent performance information.
| * | The Fund’s past performance is not a good predictor of how the Fund will perform in the future. The graph and table do not reflect the deduction of taxes that a shareholder would pay on Fund distributions or redemption of Fund shares. |
KEY FUND STATISTICS (as of August 31, 2024)
| |
Net Assets | $124,797,712 |
Number of Holdings | 180 |
Net Advisory Fee | $345,974 |
Portfolio Turnover | 41% |
Visit https://www.fminvest.com/mutual-funds/ohfix for more recent performance information.
WHAT DID THE FUND INVEST IN? (as of August 31, 2024)
| |
Top 10 Holdings | (%) of net assets |
United States Treasury Note/Bond | 30.2% |
Federal Home Loan Mortgage Corp. | 8.5% |
Federal National Mortgage Association | 8.4% |
Government National Mortgage Association | 5.6% |
United States of America | 2.9% |
Sequoia Mortgage Trust | 2.0% |
Invesco Treasury Portfolio | 1.5% |
Alaska Airlines, Inc. | 1.0% |
WaMu Mortgage Pass Through Certificates | 0.9% |
RCKT Mortgage Trust | 0.9% |
| |
Top Sectors | (%) of net assets |
Government | 33.0% |
Mortgage Securities | 31.6% |
Financials | 11.4% |
Asset Backed Securities | 4.7% |
Consumer Discretionary | 3.9% |
Technology | 3.1% |
Energy | 2.8% |
Health Care | 2.8% |
Utilities | 2.5% |
Cash & Other | 4.2% |
For additional information about the Fund; including its prospectus, financial information, holdings and proxy information, scan the QR code or visit https://www.fminvest.com/mutual-funds/ohfix
HOUSEHOLDING
To reduce Fund expenses, only one copy of most shareholder documents may be mailed to shareholders with multiple accounts at the same address (Householding). If you would prefer that your Fund documents not be householded, please contact the Fund at 1-800-292-6775, or contact your financial intermediary. Your instructions will typically be effective within 30 days of receipt by F/m Investments or your financial intermediary.
| Oakhurst Fixed Income Fund | PAGE 2 | TSR-AR-74933W320 |
10000101741070810977109781190312552127301138211311122401000010156107611081410701117891255312542110981096511765
| | |
| Oakhurst Short Duration Bond Fund | |
Institutional Class | OHSDX |
Annual Shareholder Report | August 31, 2024 |
This annual shareholder report contains important information about the Oakhurst Short Duration Bond Fund (the “Fund”) for the period from September 1, 2023, to August 31, 2024. You can find additional information about the Fund at https://www.fminvest.com/mutual-funds/ohsdx. You can also request this information by contacting us at 1-800-292-6775.
WHAT WERE THE FUND COSTS FOR THE PAST YEAR? (based on a hypothetical $10,000 investment)
| | |
Class Name | Costs of a $10,000 investment | Costs paid as a percentage of a $10,000 investment |
| Institutional Class | $62 | 0.60% |
HOW DID THE FUND PERFORM LAST YEAR AND WHAT AFFECTED ITS PERFORMANCE?
The Fund performance easily outdistanced that of the ICE BofA 1-3 Year US Corporate & Government Total Return Index (the “Index”) during the fiscal year. Meaningful overweight allocations to both corporate bonds, mortgage-backed securities, and asset-backed securities generated substantial income advantages and turned in strong performance. Fund duration began the year slightly longer than that of the Index and was extended further as expectations for Federal Reserve interest rate cuts grew closer. The longer maturities and higher interest rate sensitivity (duration) was timely as shorter maturity Treasury yields fell considerably during the year. With an increased concern over future economic conditions, Fund duration has been lengthened further and the quality improved.
| |
Top Contributors |
| ↑ | Federal Home Loan Mortgage Corp. Series 4938, Class BL, 2.25%, 07/25/2049 |
| | Federal National Mortgage Association Series 2018-45, Class AB, 3.00%, 06/25/2048 |
| | Elwood Energy LLC, 8.16%, 07/05/2026 |
| | Mastr Adjustable Rate Mortgages Trust Series 2004-2, Class M1, 6.22% (1 mo. Term SOFR + 0.94%), 12/25/2034 |
| |
Top Detractors |
| ↓ | Countrywide Asset-Backed Certificates, Series 2004-6, Class 2A3, 6.59% (1 mo. Term SOFR + 1.31%), 11/25/2034 |
| | Mastr Adjustable Rate Mortgages Trust Series 2004-5, Class 4A1, 4.04%, 04/25/2035 |
| | Series 2004-4, Class 2A, 6.02% (1 mo. Term SOFR + 0.67%), 06/19/2034 |
| | Series 2003-13, Class 1A1, 6.30%, 10/25/2033 |
HOW DID THE FUND PERFORM OVER THE PAST 10 YEARS?*
The $10,000 chart reflects a hypothetical $10,000 investment in the class of shares noted. The chart uses total return NAV performance and assumes reinvestment of dividends and capital gains. Fund expenses, including management fees and other expenses, were deducted.
CUMULATIVE PERFORMANCE (Initial Investment of $10,000)
| | 08/31/2014 | 09/30/2014 | 10/31/2014 | 11/30/2014 | 12/31/2014 | 01/31/2015 | 02/28/2015 | 03/31/2015 | 04/30/2015 | 05/31/2015 | 06/30/2015 | 07/31/2015 | 08/31/2015 | 09/30/2015 | 10/31/2015 | 11/30/2015 | 12/31/2015 | 01/31/2016 | 02/29/2016 | 03/31/2016 | 04/30/2016 | 05/31/2016 | 06/30/2016 | 07/31/2016 | 08/31/2016 | 09/30/2016 | 10/31/2016 | 11/30/2016 | 12/31/2016 | 01/31/2017 | 02/28/2017 | 03/31/2017 | 04/30/2017 | 05/31/2017 | 06/30/2017 | 07/31/2017 | 08/31/2017 | 09/30/2017 | 10/31/2017 | 11/30/2017 | 12/31/2017 | 01/31/2018 | 02/28/2018 | 03/31/2018 | 04/30/2018 | 05/31/2018 | 06/30/2018 | 07/31/2018 | 08/31/2018 | 09/30/2018 | 10/31/2018 | 11/30/2018 | 12/31/2018 | 01/31/2019 | 02/28/2019 | 03/31/2019 | 04/30/2019 | 05/31/2019 | 06/30/2019 | 07/31/2019 | 08/31/2019 | 09/30/2019 | 10/31/2019 | 11/30/2019 | 12/31/2019 | 01/31/2020 | 02/29/2020 | 03/31/2020 | 04/30/2020 | 05/31/2020 | 06/30/2020 | 07/31/2020 | 08/31/2020 | 09/30/2020 | 10/31/2020 | 11/30/2020 | 12/31/2020 | 01/31/2021 | 02/28/2021 | 03/31/2021 | 04/30/2021 | 05/31/2021 | 06/30/2021 | 07/31/2021 | 08/31/2021 | 09/30/2021 | 10/31/2021 | 11/30/2021 | 12/31/2021 | 01/31/2022 | 02/28/2022 | 03/31/2022 | 04/30/2022 | 05/31/2022 | 06/30/2022 | 07/31/2022 | 08/31/2022 | 09/30/2022 | 10/31/2022 | 11/30/2022 | 12/31/2022 | 01/31/2023 | 02/28/2023 | 03/31/2023 | 04/30/2023 | 05/31/2023 | 06/30/2023 | 07/31/2023 | 08/31/2023 | 09/30/2023 | 10/31/2023 | 11/30/2023 | 12/31/2023 | 01/31/2024 | 02/29/2024 | 03/31/2024 | 04/30/2024 | 05/31/2024 | 06/30/2024 | 07/31/2024 | 08/31/2024 |
| Oakhurst Short Duration Bond Fund Institutional Class | 10000 | 9977 | 10006 | 10023 | 10004 | 10052 | 10059 | 10087 | 10106 | 10124 | 10112 | 10130 | 10139 | 10157 | 10165 | 10163 | 10153 | 10180 | 10177 | 10239 | 10278 | 10288 | 10349 | 10379 | 10377 | 10397 | 10406 | 10365 | 10386 | 10427 | 10455 | 10466 | 10498 | 10539 | 10537 | 10567 | 10600 | 10598 | 10609 | 10586 | 10595 | 10586 | 10575 | 10584 | 10584 | 10619 | 10629 | 10642 | 10676 | 10676 | 10680 | 10702 | 10763 | 10807 | 10832 | 10911 | 10946 | 11016 | 11065 | 11077 | 11136 | 11148 | 11190 | 11180 | 11187 | 11245 | 11313 | 11064 | 11200 | 11276 | 11364 | 11434 | 11465 | 11476 | 11489 | 11545 | 11580 | 11633 | 11652 | 11646 | 11667 | 11697 | 11695 | 11716 | 11724 | 11721 | 11693 | 11669 | 11654 | 11606 | 11547 | 11364 | 11287 | 11294 | 11176 | 11272 | 11179 | 11002 | 10934 | 11027 | 11048 | 11237 | 11170 | 11250 | 11324 | 11301 | 11311 | 11400 | 11429 | 11419 | 11417 | 11568 | 11750 | 11814 | 11786 | 11861 | 11826 | 11915 | 12015 | 12165 | 12306 |
| Bloomberg U.S. Aggregate Bond Index | 10000 | 9932 | 10030 | 10101 | 10110 | 10322 | 10225 | 10273 | 10236 | 10211 | 10100 | 10170 | 10156 | 10224 | 10226 | 10199 | 10166 | 10306 | 10379 | 10474 | 10514 | 10517 | 10706 | 10774 | 10761 | 10755 | 10673 | 10420 | 10435 | 10456 | 10526 | 10520 | 10601 | 10683 | 10672 | 10718 | 10814 | 10763 | 10769 | 10755 | 10805 | 10680 | 10579 | 10647 | 10568 | 10643 | 10630 | 10633 | 10701 | 10632 | 10548 | 10611 | 10806 | 10921 | 10914 | 11124 | 11127 | 11324 | 11466 | 11492 | 11789 | 11727 | 11762 | 11756 | 11748 | 11974 | 12189 | 12118 | 12333 | 12391 | 12469 | 12655 | 12553 | 12546 | 12490 | 12612 | 12630 | 12539 | 12358 | 12204 | 12300 | 12340 | 12427 | 12566 | 12542 | 12433 | 12430 | 12467 | 12435 | 12167 | 12031 | 11697 | 11253 | 11326 | 11148 | 11420 | 11098 | 10618 | 10481 | 10866 | 10817 | 11150 | 10862 | 11138 | 11205 | 11083 | 11044 | 11036 | 10965 | 10687 | 10518 | 10994 | 11415 | 11384 | 11223 | 11327 | 11041 | 11228 | 11334 | 11599 | 11765 |
| ICE BofA 1-3 Year US Corporate & Government Total Retun Index | 10000 | 9993 | 10019 | 10035 | 10007 | 10057 | 10044 | 10066 | 10074 | 10082 | 10081 | 10087 | 10080 | 10109 | 10107 | 10087 | 10074 | 10127 | 10137 | 10173 | 10186 | 10180 | 10240 | 10242 | 10231 | 10243 | 10239 | 10197 | 10203 | 10221 | 10238 | 10243 | 10261 | 10278 | 10274 | 10301 | 10321 | 10309 | 10308 | 10287 | 10291 | 10265 | 10256 | 10272 | 10262 | 10300 | 10302 | 10309 | 10344 | 10338 | 10350 | 10379 | 10459 | 10499 | 10517 | 10586 | 10611 | 10683 | 10743 | 10739 | 10824 | 10819 | 10857 | 10857 | 10884 | 10944 | 11030 | 11058 | 11128 | 11166 | 11192 | 11215 | 11220 | 11223 | 11224 | 11238 | 11248 | 11251 | 11245 | 11245 | 11255 | 11267 | 11252 | 11271 | 11272 | 11262 | 11227 | 11225 | 11202 | 11126 | 11071 | 10913 | 10854 | 10914 | 10845 | 10892 | 10816 | 10682 | 10668 | 10753 | 10778 | 10861 | 10785 | 10938 | 10976 | 10943 | 10901 | 10948 | 10989 | 10986 | 11020 | 11145 | 11276 | 11324 | 11285 | 11328 | 11295 | 11376 | 11440 | 11574 | 11679 |
| Oakhurst Short Duration Bond Fund | PAGE 1 | TSR-AR-74933W312 |
ANNUAL AVERAGE TOTAL RETURN (%)
| | | |
| | 1 Year | 5 Year | 10 Year |
Institutional Class | 7.68 | 2.00 | 2.09 |
Bloomberg U.S. Aggregate Bond Index** | 7.30 | -0.04 | 1.64 |
ICE BofA 1-3 Year US Corporate & Government Total Retun Index | 6.28 | 1.53 | 1.56 |
Visit https://www.fminvest.com/mutual-funds/ohsdx for more recent performance information.
| * | The Fund’s past performance is not a good predictor of how the Fund will perform in the future. The graph and table do not reflect the deduction of taxes that a shareholder would pay on Fund distributions or redemption of Fund shares. |
| ** | Effective with this report, and pursuant to new regulatory requirements, the Bloomberg U.S. Aggregate Bond Index replaced the ICE BofA 1-3 Year US Corporate & Government Total Return Index as the Fund’s primary benchmark to represent a broad-based securities market index. The Fund continues to use the ICE BofA 1-3 Year US Corporate & Government Total Return Index as an additional benchmark. |
KEY FUND STATISTICS (as of August 31, 2024)
| |
Net Assets | $15,456,246 |
Number of Holdings | 96 |
Net Advisory Fee | $(68,380) |
Portfolio Turnover | 48% |
Visit https://www.fminvest.com/mutual-funds/ohsdx for more recent performance information.
WHAT DID THE FUND INVEST IN? (as of August 31, 2024)
| |
Top 10 Holdings | (%) of net assets |
Federal National Mortgage Association | 9.7% |
United States Treasury Note/Bond | 9.2% |
Federal Home Loan Mortgage Corp. | 6.8% |
MortgageIT Trust | 4.1% |
Government National Mortgage Association | 3.6% |
Carvana Auto Receivables Trust | 2.9% |
Mastr Seasoned Securities Trust | 1.9% |
Leidos, Inc. | 1.9% |
Phillips 66 Partners LP | 1.9% |
Goldman Sachs BDC, Inc. | 1.9% |
| |
Top Sectors | (%) of net assets |
Mortgage Securities | 38.3% |
Financials | 13.4% |
Asset Backed Securities | 11.7% |
Government | 9.2% |
Consumer Discretionary | 5.1% |
Energy | 4.8% |
Communications | 4.0% |
Technology | 3.0% |
Utilities | 3.0% |
Cash & Other | 7.5% |
For additional information about the Fund; including its prospectus, financial information, holdings and proxy information, scan the QR code or visit https://www.fminvest.com/mutual-funds/ohsdx
HOUSEHOLDING
To reduce Fund expenses, only one copy of most shareholder documents may be mailed to shareholders with multiple accounts at the same address (Householding). If you would prefer that your Fund documents not be householded, please contact the Fund at 1-800-292-6775, or contact your financial intermediary. Your instructions will typically be effective within 30 days of receipt by F/m Investments or your financial intermediary.
| Oakhurst Short Duration Bond Fund | PAGE 2 | TSR-AR-74933W312 |
100001013910377106001067611136114651172411179114291230610000101561076110814107011178912553125421109810965117651000010080102311032110344108241122011272108161098911679
| | |
| Oakhurst Short Duration High Yield Credit Fund | |
Institutional Class | OHSHX |
Annual Shareholder Report | August 31, 2024 |
This annual shareholder report contains important information about the Oakhurst Short Duration High Yield Credit Fund (the “Fund”) for the period from September 1, 2023, to August 31, 2024. You can find additional information about the Fund at https://www.fminvest.com/mutual-funds/ohshx. You can also request this information by contacting us at 1-800-292-6775.
WHAT WERE THE FUND COSTS FOR THE PAST YEAR? (based on a hypothetical $10,000 investment)
| | |
Class Name | Costs of a $10,000 investment | Costs paid as a percentage of a $10,000 investment |
| Institutional Class | $100 | 0.95% |
HOW DID THE FUND PERFORM LAST YEAR AND WHAT AFFECTED ITS PERFORMANCE?
For the 12-month period ended August 31, 2024, the Fund underperformed its benchmark, the ICE BofA 1-5 Year US Cash Pay High Yield Constrained Index, primarily due to security selection. The Fund’s overweight allocation to BB-rated credits while reducing CCCs and lower-rated single-Bs was a detractor from relative performance, as CCCs as a group meaningfully outperformed higher rating categories in the recent credit rally. Among the primary contributors to relative performance was the Fund’s underweight positions in several higher beta issuers that underperformed, primarily within the Media and Telecom sector, which continued to struggle managing highly levered capital structures in a higher rate environment.
We believe a quality-tilted investment style adds value by avoiding losers, and as such, we remain vigilant on changes in market conditions and focus on prudent credit selection, with emphasis on downside protection.
HOW DID THE FUND PERFORM SINCE INCEPTION?*
The $10,000 chart reflects a hypothetical $10,000 investment in the class of shares noted. The chart uses total return NAV performance and assumes reinvestment of dividends and capital gains. Fund expenses, including management fees and other expenses, were deducted.
CUMULATIVE PERFORMANCE (Initial Investment of $10,000)
| | 42014 | 10/31/2015 | 11/30/2015 | 12/31/2015 | 01/31/2016 | 02/29/2016 | 03/31/2016 | 04/30/2016 | 05/31/2016 | 06/30/2016 | 07/31/2016 | 08/31/2016 | 09/30/2016 | 10/31/2016 | 11/30/2016 | 12/31/2016 | 01/31/2017 | 02/28/2017 | 03/31/2017 | 04/30/2017 | 05/31/2017 | 06/30/2017 | 07/31/2017 | 08/31/2017 | 09/30/2017 | 10/31/2017 | 11/30/2017 | 12/31/2017 | 01/31/2018 | 02/28/2018 | 03/31/2018 | 04/30/2018 | 05/31/2018 | 06/30/2018 | 07/31/2018 | 08/31/2018 | 09/30/2018 | 10/31/2018 | 11/30/2018 | 12/31/2018 | 01/31/2019 | 02/28/2019 | 03/31/2019 | 04/30/2019 | 05/31/2019 | 06/30/2019 | 07/31/2019 | 08/31/2019 | 09/30/2019 | 10/31/2019 | 11/30/2019 | 12/31/2019 | 01/31/2020 | 02/29/2020 | 03/31/2020 | 04/30/2020 | 05/31/2020 | 06/30/2020 | 07/31/2020 | 08/31/2020 | 09/30/2020 | 10/31/2020 | 11/30/2020 | 12/31/2020 | 01/31/2021 | 02/28/2021 | 03/31/2021 | 04/30/2021 | 05/31/2021 | 06/30/2021 | 07/31/2021 | 08/31/2021 | 09/30/2021 | 10/31/2021 | 11/30/2021 | 12/31/2021 | 01/31/2022 | 02/28/2022 | 03/31/2022 | 04/30/2022 | 05/31/2022 | 06/30/2022 | 07/31/2022 | 08/31/2022 | 09/30/2022 | 10/31/2022 | 11/30/2022 | 12/31/2022 | 01/31/2023 | 02/28/2023 | 03/31/2023 | 04/30/2023 | 05/31/2023 | 06/30/2023 | 07/31/2023 | 08/31/2023 | 09/30/2023 | 10/31/2023 | 11/30/2023 | 12/31/2023 | 01/31/2024 | 02/29/2024 | 03/31/2024 | 04/30/2024 | 05/31/2024 | 06/30/2024 | 07/31/2024 | 08/31/2024 |
| Oakhurst Short Duration High Yield Credit Fund Institutional Class | 10000 | 10082 | 9939 | 9743 | 9537 | 9505 | 9774 | 9973 | 10024 | 10122 | 10352 | 10540 | 10628 | 10705 | 10684 | 10867 | 11028 | 11131 | 11133 | 11271 | 11358 | 11371 | 11463 | 11450 | 11510 | 11582 | 11539 | 11609 | 11722 | 11632 | 11597 | 11624 | 11642 | 11653 | 11729 | 11803 | 11860 | 11724 | 11673 | 11469 | 11865 | 12021 | 12117 | 12248 | 12118 | 12320 | 12394 | 12378 | 12460 | 12449 | 12447 | 12608 | 12619 | 12426 | 11068 | 11546 | 11973 | 12104 | 12443 | 12659 | 12696 | 12748 | 13118 | 13300 | 13390 | 13465 | 13551 | 13639 | 13680 | 13784 | 13804 | 13855 | 13893 | 13862 | 13793 | 13960 | 13766 | 13676 | 13619 | 13337 | 13098 | 12395 | 12782 | 12731 | 12428 | 12616 | 12638 | 12559 | 12930 | 12784 | 12804 | 12891 | 12813 | 12999 | 13158 | 13248 | 13193 | 13174 | 13541 | 13901 | 13970 | 13992 | 14143 | 14063 | 14224 | 14344 | 14496 | 14659 |
| Bloomberg U.S. Aggregate Bond Index | 10000 | 9995 | 9969 | 9937 | 10073 | 10145 | 10238 | 10277 | 10280 | 10465 | 10531 | 10519 | 10513 | 10432 | 10185 | 10200 | 10220 | 10288 | 10283 | 10362 | 10442 | 10432 | 10477 | 10570 | 10520 | 10526 | 10513 | 10561 | 10439 | 10340 | 10407 | 10329 | 10403 | 10390 | 10393 | 10460 | 10392 | 10310 | 10372 | 10562 | 10674 | 10668 | 10873 | 10876 | 11069 | 11208 | 11232 | 11524 | 11462 | 11497 | 11491 | 11483 | 11704 | 11914 | 11844 | 12055 | 12111 | 12187 | 12369 | 12270 | 12263 | 12208 | 12328 | 12345 | 12256 | 12079 | 11928 | 12023 | 12062 | 12147 | 12283 | 12259 | 12153 | 12150 | 12186 | 12154 | 11893 | 11760 | 11433 | 10999 | 11070 | 10897 | 11163 | 10847 | 10379 | 10244 | 10621 | 10573 | 10898 | 10617 | 10886 | 10952 | 10833 | 10794 | 10787 | 10718 | 10446 | 10281 | 10746 | 11158 | 11127 | 10970 | 11071 | 10792 | 10974 | 11078 | 11337 | 11500 |
| ICE BofA 1-5 Year US Cash Pay High Yield Constrained Index | 10000 | 10204 | 9998 | 9759 | 9573 | 9578 | 9968 | 10342 | 10465 | 10585 | 10802 | 11015 | 11117 | 11180 | 11189 | 11399 | 11531 | 11694 | 11688 | 11796 | 11894 | 11910 | 12013 | 12016 | 12109 | 12147 | 12106 | 12144 | 12254 | 12209 | 12186 | 12275 | 12319 | 12367 | 12492 | 12566 | 12646 | 12489 | 12401 | 12141 | 12596 | 12772 | 12850 | 12970 | 12841 | 13048 | 13086 | 13089 | 13118 | 13120 | 13112 | 13358 | 13362 | 13171 | 11572 | 11910 | 12374 | 12540 | 12978 | 13146 | 13076 | 13127 | 13602 | 13854 | 13951 | 14065 | 14166 | 14297 | 14358 | 14497 | 14497 | 14567 | 14606 | 14619 | 14495 | 14695 | 14491 | 14438 | 14371 | 14084 | 14069 | 13330 | 13942 | 13755 | 13389 | 13726 | 13936 | 13860 | 14292 | 14208 | 14291 | 14413 | 14322 | 14534 | 14719 | 14799 | 14718 | 14564 | 15076 | 15532 | 15541 | 15627 | 15770 | 15664 | 15812 | 15952 | 16232 | 16464 |
ANNUAL AVERAGE TOTAL RETURN (%)
| | | |
| | 1 Year | 5 Year | Since Inception
(10/01/2015) |
Institutional Class | 10.66 | 3.44 | 4.38 |
Bloomberg U.S. Aggregate Bond Index** | 7.30 | -0.04 | 1.58 |
ICE BofA 1-5 Year US Cash Pay High Yield Constrained Index | 11.25 | 4.70 | 5.75 |
Visit https://www.fminvest.com/mutual-funds/ohshx for more recent performance information.
| Oakhurst Short Duration High Yield Credit Fund | PAGE 1 | TSR-AR-74933W296 |
| * | The Fund’s past performance is not a good predictor of how the Fund will perform in the future. The graph and table do not reflect the deduction of taxes that a shareholder would pay on Fund distributions or redemption of Fund shares. |
| ** | Effective with this report, and pursuant to new regulatory requirements, the Bloomberg U.S. Aggregate Bond Index replaced the ICE BofA 1-5 Year US Cash Pay High Yield Constrained Index as the Fund’s primary benchmark to represent a broad-based securities market index. The Fund continues to use the ICE BofA 1-5 Year US Cash Pay High Yield Constrained Index as an additional benchmark. |
KEY FUND STATISTICS (as of August 31, 2024)
| |
Net Assets | $36,451,432 |
Number of Holdings | 86 |
Net Advisory Fee | $162,025 |
Portfolio Turnover | 49% |
Visit https://www.fminvest.com/mutual-funds/ohshx for more recent performance information.
WHAT DID THE FUND INVEST IN? (as of August 31, 2024)
| |
Top 10 Holdings | (%) of net assets |
Fly Leasing Ltd. | 3.7% |
Invesco Treasury Portfolio | 3.5% |
PennyMac Corp. | 2.3% |
White Cap Parent LLC | 2.1% |
Burford Capital Global Finance LLC | 2.0% |
Brundage-Bone Concrete Pumping Holdings, Inc. | 2.0% |
Midcap Financial Issuer Trust | 2.0% |
Sabre GLBL, Inc. | 2.0% |
Energizer Holdings, Inc. | 2.0% |
HUB International Ltd. | 2.0% |
| |
Top Sectors | (%) of net assets |
Financials | 26.2% |
Consumer Discretionary | 24.3% |
Technology | 8.8% |
Energy | 8.7% |
Materials | 6.1% |
Consumer Staples | 6.0% |
Communications | 5.8% |
Industrials | 4.4% |
Utilities | 3.0% |
Cash & Other | 6.7% |
For additional information about the Fund; including its prospectus, financial information, holdings and proxy information, scan the QR code or visit https://www.fminvest.com/mutual-funds/ohshx
HOUSEHOLDING
To reduce Fund expenses, only one copy of most shareholder documents may be mailed to shareholders with multiple accounts at the same address (Householding). If you would prefer that your Fund documents not be householded, please contact the Fund at 1-800-292-6775, or contact your financial intermediary. Your instructions will typically be effective within 30 days of receipt by F/m Investments or your financial intermediary.
| Oakhurst Short Duration High Yield Credit Fund | PAGE 2 | TSR-AR-74933W296 |
105401145011803123781265913855127311324814659105191057010460115241227012259108471071811500110151201612566130891314614567137551479916464
| | |
| F/m Opportunistic Income ETF | |
XFIX (Principal U.S. Listing Exchange: NASDAQ) |
Annual Shareholder Report | August 31, 2024 |
This annual shareholder report contains important information about the F/m Opportunistic Income ETF (the “Fund”) for the period from September 5, 2023, to August 31, 2024. You can find additional information about the Fund at https://www.fminvest.com/etfs/xfix. You can also request this information by contacting us at 1-800-617-0004.
WHAT WERE THE FUND COSTS FOR THE PAST YEAR? (based on a hypothetical $10,000 investment)
| | |
Fund Name | Costs of a $10,000 investment | Costs paid as a percentage of a $10,000 investment |
| F/m Opportunistic Income ETF | $41 | 0.39% |
HOW DID THE FUND PERFORM LAST YEAR AND WHAT AFFECTED ITS PERFORMANCE?
The F/m Opportunistic Income Fund (XFIX) performed well for the fiscal period, returning 10.93% versus the U.S. Aggregate Bond Index’s return of 8.37%. For most of the period, the Fund’s duration was shorter than the duration of the index, mitigating the negative effect of higher interest rates. Also, the Fund concentrated on the BBB Corporate bond category and higher yielding, but improving credits that were rated BBB. The Fund’s investments in Energy, Technology and Consumer Discretionary led the way for the period. As the Fund closed out the period and the risk of recession rose, investments were added to increase liquidity and safety (the US Treasury 10 Year Note ETF) and diversification (the F/m 3-Year Investment Grade Corporate Bond ETF).
HOW DID THE FUND PERFORM SINCE INCEPTION?*
The $10,000 chart reflects a hypothetical $10,000 investment in the class of shares noted. The chart uses total return NAV performance and assumes reinvestment of dividends and capital gains. Fund expenses, including management fees and other expenses, were deducted.
CUMULATIVE PERFORMANCE (Initial Investment of $10,000)
| | 09-05-2023 | 09/30/2023 | 10/31/2023 | 11/30/2023 | 12/31/2023 | 01/31/2024 | 02/29/2024 | 03/31/2024 | 04/30/2024 | 05/31/2024 | 06/30/2024 | 07/31/2024 | 08/31/2024 |
| F/m Opportunistic Income ETF NAV | 10,000 | 9,870 | 9,682 | 10,130 | 10,547 | 10,585 | 10,440 | 10,616 | 10,414 | 10,630 | 10,703 | 10,911 | 11,093 |
| F/m Opportunistic Income ETF Market | 10,000 | 9,886 | 9,709 | 10,156 | 10,599 | 10,587 | 10,490 | 10,658 | 10,435 | 10,663 | 10,715 | 10,944 | 11,115 |
| Bloomberg U.S. Aggregate Bond Index | 10,000 | 9,843 | 9,688 | 10,126 | 10,514 | 10,485 | 10,337 | 10,432 | 10,169 | 10,341 | 10,439 | 10,683 | 10,837 |
ANNUAL AVERAGE TOTAL RETURN (%)
| |
| | Since Inception
(09/05/2023) |
F/m Opportunistic Income ETF NAV | 10.93 |
F/m Opportunistic Income ETF Market | 11.15 |
Bloomberg U.S. Aggregate Bond Index | 8.37 |
Visit https://www.fminvest.com/etfs/xfix for more recent performance information.
| * | The Fund’s past performance is not a good predictor of how the Fund will perform in the future. The graph and table do not reflect the deduction of taxes that a shareholder would pay on Fund distributions or redemption of Fund shares. |
| F/m Opportunistic Income ETF | PAGE 1 | TSR-AR-74933W445 |
KEY FUND STATISTICS (as of August 31, 2024)
| |
Net Assets | $35,343,097 |
Number of Holdings | 28 |
Net Advisory Fee | $108,078 |
Portfolio Turnover | 92% |
30-Day SEC Yield | 5.16% |
30-Day SEC Yield Unsubsidized | 5.16% |
Visit https://www.fminvest.com/etfs/xfix for more recent performance information.
WHAT DID THE FUND INVEST IN? (as of August 31, 2024)
| |
Top 10 Holdings | (%) of net assets |
US Treasury 10 Year Note ETF | 8.2% |
Mount Vernon Liquid Assets Portfolio, LLC | 8.1% |
F/m 3-Year Investment Grade Corporate Bond ETF | 5.9% |
Viatris, Inc. | 4.8% |
Kyndryl Holdings, Inc. | 4.8% |
Kinder Morgan, Inc. | 4.7% |
Concentrix Corp. | 4.7% |
JPMorgan Chase & Co. | 4.6% |
Celanese US Holdings LLC | 4.6% |
VF Corp. | 4.6% |
| |
Top Sectors | (%) of net assets |
Financials | 13.7% |
Energy | 11.7% |
Technology | 11.5% |
Information Technology | 10.9% |
Consumer Discretionary | 9.0% |
Materials | 8.6% |
Health Care | 4.8% |
Industrials | 4.7% |
Utilities | 4.5% |
Cash & Other | 20.6% |
For additional information about the Fund; including its prospectus, financial information, holdings and proxy information, scan the QR code or visit https://www.fminvest.com/etfs/xfix
HOUSEHOLDING
To reduce Fund expenses, only one copy of most shareholder documents may be mailed to shareholders with multiple accounts at the same address (Householding). If you would prefer that your Fund documents not be householded, please contact the Fund at 1-800-617-0004, or contact your financial intermediary. Your instructions will typically be effective within 30 days of receipt by F/m Investments or your financial intermediary.
| F/m Opportunistic Income ETF | PAGE 2 | TSR-AR-74933W445 |
110931111510837
| | |
| F/m Investments Large Cap Focused Fund | |
Institutional Class | IAFLX |
Annual Shareholder Report | August 31, 2024 |
This annual shareholder report contains important information about the F/m Investments Large Cap Focused Fund (the “Fund”) for the period from July 1, 2024, to August 31, 2024. You can find additional information about the Fund at https://www.fminvest.com/mutual-funds/iafmx-iaflx. You can also request this information by contacting us at 1-800-292-6775.
WHAT WERE THE FUND COSTS FOR THE PERIOD? (based on a hypothetical $10,000 investment)
| | |
Class Name | Costs of a $10,000 investment | Costs paid as a percentage of a $10,000 investment |
| Institutional Class | $15* | 0.90% |
| | |
| * Expenses paid in the above example are for the Fund’s current fiscal period from July 1, 2024 through August 31, 2024. | | |
HOW DID THE FUND PERFORM LAST YEAR AND WHAT AFFECTED ITS PERFORMANCE?
Over the last 12-months ended 08/31/2024, the Fund underperformed its benchmark. This short-term relative underperformance was driven by our quantActive investment process which has long-term capital appreciation as a goal. We expect that some short-term periods will reflect on this long-term objective. In terms of the drivers for the relative underperformance, we would like to state that our investment process led us to be overexposed to information technology stocks that were not the best performers over the forestated period. These information technology stocks corrected over the Spring of 2024. Furthermore, we were underexposed to investments in utilities, financials and healthcare sectors. These are traditionally more defensive sectors and we did not have overexposures to those sectors.
HOW DID THE FUND PERFORM SINCE INCEPTION? *
The $100,000 chart reflects a hypothetical $100,000 investment in the class of shares noted. The chart uses total return NAV performance and assumes reinvestment of dividends and capital gains. Fund expenses, including management fees and other expenses, were deducted.
CUMULATIVE PERFORMANCE (Initial Investment of $100,000)
| | 10/30/2016 | 10/31/2016 | 11/30/2016 | 12/31/2016 | 01/31/2017 | 02/28/2017 | 03/31/2017 | 04/30/2017 | 05/31/2017 | 06/30/2017 | 07/31/2017 | 08/31/2017 | 09/30/2017 | 10/31/2017 | 11/30/2017 | 12/31/2017 | 01/31/2018 | 02/28/2018 | 03/31/2018 | 04/30/2018 | 05/31/2018 | 06/30/2018 | 07/31/2018 | 08/31/2018 | 09/30/2018 | 10/31/2018 | 11/30/2018 | 12/31/2018 | 01/31/2019 | 02/28/2019 | 03/31/2019 | 04/30/2019 | 05/31/2019 | 06/30/2019 | 07/31/2019 | 08/31/2019 | 09/30/2019 | 10/31/2019 | 11/30/2019 | 12/31/2019 | 01/31/2020 | 02/29/2020 | 03/31/2020 | 04/30/2020 | 05/31/2020 | 06/30/2020 | 07/31/2020 | 08/31/2020 | 09/30/2020 | 10/31/2020 | 11/30/2020 | 12/31/2020 | 01/31/2021 | 02/28/2021 | 03/31/2021 | 04/30/2021 | 05/31/2021 | 06/30/2021 | 07/31/2021 | 08/31/2021 | 09/30/2021 | 10/31/2021 | 11/30/2021 | 12/31/2021 | 01/31/2022 | 02/28/2022 | 03/31/2022 | 04/30/2022 | 05/31/2022 | 06/30/2022 | 07/31/2022 | 08/31/2022 | 09/30/2022 | 10/31/2022 | 11/30/2022 | 12/31/2022 | 01/31/2023 | 02/28/2023 | 03/31/2023 | 04/30/2023 | 05/31/2023 | 06/30/2023 | 07/31/2023 | 08/31/2023 | 09/30/2023 | 10/31/2023 | 11/30/2023 | 12/31/2023 | 01/31/2024 | 02/29/2024 | 03/31/2024 | 04/30/2024 | 05/31/2024 | 06/30/2024 | 07/31/2024 | 08/31/2024 |
| F/m Investments Large Cap Focused Fund Institutional Class | 100000 | 97300 | 101700 | 102030 | 105034 | 108138 | 109639 | 111041 | 114746 | 112143 | 114646 | 115747 | 117750 | 124659 | 128063 | 128366 | 137434 | 135577 | 133392 | 134921 | 142350 | 142241 | 143006 | 154477 | 156771 | 143880 | 143443 | 130247 | 142404 | 148771 | 150855 | 157107 | 146688 | 155950 | 160117 | 155950 | 153287 | 156181 | 165327 | 169533 | 173042 | 164330 | 148236 | 169654 | 181513 | 193130 | 212249 | 232821 | 223503 | 216243 | 236451 | 241825 | 248008 | 251306 | 247321 | 261611 | 260786 | 276175 | 281671 | 286068 | 271641 | 291701 | 302419 | 305381 | 279177 | 277635 | 282945 | 248005 | 243038 | 217860 | 245093 | 232076 | 201076 | 213407 | 227452 | 209384 | 227217 | 227016 | 246252 | 241042 | 262281 | 281717 | 286926 | 278110 | 257673 | 255669 | 287327 | 295342 | 309368 | 328803 | 328202 | 311772 | 330206 | 350643 | 343831 | 350844 |
| S&P 500 Total Return Index | 100000 | 98485 | 102132 | 104151 | 106126 | 110340 | 110469 | 111603 | 113174 | 113880 | 116222 | 116578 | 118983 | 121759 | 125494 | 126889 | 134154 | 129209 | 125926 | 126409 | 129453 | 130250 | 135097 | 139499 | 140293 | 130704 | 133367 | 121326 | 131048 | 135256 | 137884 | 143467 | 134350 | 143818 | 145885 | 143574 | 146261 | 149429 | 154853 | 159527 | 159464 | 146337 | 128263 | 144705 | 151597 | 154612 | 163330 | 175070 | 168418 | 163939 | 181885 | 188878 | 186971 | 192126 | 200541 | 211243 | 212719 | 217685 | 222856 | 229632 | 218952 | 234292 | 232668 | 243096 | 230516 | 223614 | 231917 | 211693 | 212082 | 194576 | 212516 | 203850 | 185075 | 200059 | 211239 | 199069 | 211577 | 206415 | 213993 | 217334 | 218278 | 232701 | 240176 | 236353 | 225084 | 220351 | 240475 | 251400 | 255624 | 269273 | 277937 | 266585 | 279803 | 289843 | 293371 | 300488 |
| Russell 1000 Growth Total Return Index | 100000 | 97902 | 100032 | 101270 | 104683 | 109031 | 110292 | 112814 | 115748 | 115443 | 118511 | 120684 | 122253 | 126990 | 130848 | 131866 | 141206 | 137503 | 133733 | 134200 | 140082 | 141431 | 145583 | 153542 | 154401 | 140593 | 142086 | 129870 | 141544 | 146608 | 150781 | 157593 | 147638 | 157777 | 161340 | 160104 | 160124 | 164638 | 171942 | 177129 | 181089 | 168757 | 152155 | 174670 | 186396 | 194513 | 209478 | 231095 | 220222 | 212743 | 234526 | 245312 | 243497 | 243440 | 247623 | 264471 | 260813 | 277176 | 286310 | 297015 | 280381 | 304666 | 306529 | 313009 | 286145 | 273992 | 284710 | 250328 | 244508 | 225140 | 252162 | 240415 | 217043 | 229729 | 240197 | 221808 | 240295 | 237442 | 253672 | 256175 | 267851 | 286168 | 295809 | 293153 | 277210 | 273263 | 303052 | 316472 | 324365 | 346496 | 352595 | 337640 | 357853 | 381983 | 375486 | 383306 |
| F/m Investments Large Cap Focused Fund | PAGE 1 | TSR_AR_74933W288 |
ANNUAL AVERAGE TOTAL RETURN (%)
| | | |
| | 1 Year | 5 Years | Since Inception
(10/03/2016) |
Institutional Class** | 26.15 | 17.61 | 17.20 |
S&P 500 Total Return Index | 27.14 | 15.92 | 14.92 |
Russell 1000 Growth Total Return Index | 30.75 | 19.08 | 18.52 |
Visit https://www.fminvest.com/mutual-funds/iafmx-iaflx for more recent performance information.
| * | The Fund’s past performance is not a good predictor of how the Fund will perform in the future. The graph and table do not reflect the deduction of taxes that a shareholder would pay on Fund distributions or redemption of Fund shares. |
| ** | The Fund commenced operations on October 3, 2016 as a separate series (the “Predecessor Fund”) of F/m Funds Trust. Effective as of the close of business on October 27, 2023, the Predecessor Fund was reorganized as a new series of The RBB Fund, Inc. The performance shown for periods prior to October 30, 2023 represents the performance of the Predecessor Fund. |
KEY FUND STATISTICS (as of August 31, 2024)
| |
Net Assets | $65,543,939 |
Number of Holdings | 24 |
Net Advisory Fee | $66,788 |
Portfolio Turnover | 19% |
WHAT DID THE FUND INVEST IN? (as of August 31, 2024)*
| |
Top 10 Holdings | (%) of net assets |
Apple, Inc. | 11.0% |
NVIDIA Corp. | 10.0% |
First American Treasury Obligations Fund | 8.0% |
Microsoft Corp. | 7.3% |
Amazon.com, Inc. | 6.8% |
Meta Platforms, Inc. | 6.5% |
Netflix, Inc. | 5.3% |
Alphabet, Inc. | 4.5% |
Advanced Micro Devices, Inc. | 4.3% |
Adobe, Inc. | 3.2% |
| |
Top Sectors | (%) of net assets |
Information Technology | 54.6% |
Communication Services | 16.3% |
Consumer Discretionary | 12.0% |
Industrials | 4.4% |
Health Care | 2.4% |
Consumer Staples | 2.4% |
Cash & Other | 7.9% |
| * | The Global Industry Classification Standard (“GICS®”) was developed by and/or is the exclusive property of MSCI, Inc. (“MSCI”) and Standard & Poor’s Financial Services LLC (“S&P”). GICS® is a service mark of MSCI and S&P and has been licensed for use by U.S. Bank Global Fund Services. |
For additional information about the Fund; including its prospectus, financial information, holdings and proxy information, scan the QR code or visit https://www.fminvest.com/mutual-funds/iafmx-iaflx
HOUSEHOLDING
To reduce Fund expenses, only one copy of most shareholder documents may be mailed to shareholders with multiple accounts at the same address (Householding). If you would prefer that your Fund documents not be householded, please contact the Fund, LLC at 1-800-292-6775 or contact your financial intermediary. Your instructions will typically be effective within 30 days of receipt by F/m Investments, LLC or your financial intermediary.
| F/m Investments Large Cap Focused Fund | PAGE 2 | TSR_AR_74933W288 |
| | |
| F/m Investments Large Cap Focused Fund | |
Investor Class | IAFMX |
Annual Shareholder Report | August 31, 2024 |
This annual shareholder report contains important information about the F/m Investments Large Cap Focused Fund (the “Fund”) for the period from July 1, 2024, to August 31, 2024. You can find additional information about the Fund at https://www.fminvest.com/mutual-funds/iafmx-iaflx. You can also request this information by contacting us at 1-800-292-6775.
WHAT WERE THE FUND COSTS FOR THE PERIOD? (based on a hypothetical $10,000 investment)
| | |
Class Name | Costs of a $10,000 investment | Costs paid as a percentage of a $10,000 investment |
| Investor Class | $19* | 1.15% |
| | |
| * Expenses paid in the above example are for the Fund’s fiscal period from July 1, 2024 through August 31, 2024. | | |
HOW DID THE FUND PERFORM LAST YEAR AND WHAT AFFECTED ITS PERFORMANCE?
Over the last 12-months ended 08/31/2024, the Fund underperformed its benchmark. This short-term relative underperformance was driven by our quantActive investment process which has long-term capital appreciation as a goal. We expect that some short-term periods will reflect on this long-term objective. In terms of the drivers for the relative underperformance, we would like to state that our investment process led us to be overexposed to information technology stocks that were not the best performers over the forestated period. These information technology stocks corrected over the Spring of 2024. Furthermore, we were underexposed to investments in utilities, financials and healthcare sectors. These are traditionally more defensive sectors and we did not have overexposures to those sectors.
HOW DID THE FUND PERFORM SINCE INCEPTION? *
The $10,000 chart reflects a hypothetical $10,000 investment in the class of shares noted. The chart uses total return NAV performance and assumes reinvestment of dividends and capital gains. Fund expenses, including 12b-1 fees, management fees and other expenses, were deducted.
CUMULATIVE PERFORMANCE (Initial Investment of $10,000)
| | 3/10/2016 | 10/31/2016 | 11/30/2016 | 12/31/2016 | 01/31/2017 | 02/28/2017 | 03/31/2017 | 04/30/2017 | 05/31/2017 | 06/30/2017 | 07/31/2017 | 08/31/2017 | 09/30/2017 | 10/31/2017 | 11/30/2017 | 12/31/2017 | 01/31/2018 | 02/28/2018 | 03/31/2018 | 04/30/2018 | 05/31/2018 | 06/30/2018 | 07/31/2018 | 08/31/2018 | 09/30/2018 | 10/31/2018 | 11/30/2018 | 12/31/2018 | 01/31/2019 | 02/28/2019 | 03/31/2019 | 04/30/2019 | 05/31/2019 | 06/30/2019 | 07/31/2019 | 08/31/2019 | 09/30/2019 | 10/31/2019 | 11/30/2019 | 12/31/2019 | 01/31/2020 | 02/29/2020 | 03/31/2020 | 04/30/2020 | 05/31/2020 | 06/30/2020 | 07/31/2020 | 08/31/2020 | 09/30/2020 | 10/31/2020 | 11/30/2020 | 12/31/2020 | 01/31/2021 | 02/28/2021 | 03/31/2021 | 04/30/2021 | 05/31/2021 | 06/30/2021 | 07/31/2021 | 08/31/2021 | 09/30/2021 | 10/31/2021 | 11/30/2021 | 12/31/2021 | 01/31/2022 | 02/28/2022 | 03/31/2022 | 04/30/2022 | 05/31/2022 | 06/30/2022 | 07/31/2022 | 08/31/2022 | 09/30/2022 | 10/31/2022 | 11/30/2022 | 12/31/2022 | 01/31/2023 | 02/28/2023 | 03/31/2023 | 04/30/2023 | 05/31/2023 | 06/30/2023 | 07/31/2023 | 08/31/2023 | 09/30/2023 | 10/31/2023 | 11/30/2023 | 12/31/2023 | 01/31/2024 | 02/29/2024 | 03/31/2024 | 04/30/2024 | 05/31/2024 | 06/30/2024 | 07/31/2024 | 08/31/2024 |
| F/m Investments Large Cap Focused Fund Investor Class | 10000 | 9730 | 10170 | 10197 | 10497 | 10808 | 10948 | 11098 | 11468 | 11198 | 11448 | 11548 | 11748 | 12439 | 12779 | 12801 | 13707 | 13511 | 13292 | 13434 | 14176 | 14165 | 14242 | 15377 | 15606 | 14318 | 14264 | 12958 | 14171 | 14795 | 15003 | 15626 | 14575 | 15499 | 15904 | 15499 | 15222 | 15511 | 16412 | 16838 | 17175 | 16296 | 14706 | 16826 | 17994 | 19151 | 21041 | 23077 | 22150 | 21415 | 23414 | 23949 | 24551 | 24880 | 24483 | 25879 | 25796 | 27315 | 27849 | 28273 | 26836 | 28821 | 29875 | 30155 | 27574 | 27420 | 27933 | 24479 | 23967 | 21488 | 24172 | 22890 | 19813 | 21026 | 22411 | 20625 | 22389 | 22349 | 24233 | 23732 | 25816 | 27700 | 28221 | 27359 | 25335 | 25135 | 28241 | 29023 | 30386 | 32290 | 32230 | 30607 | 32410 | 34415 | 33733 | 34415 |
| S&P 500 Total Return Index | 10000 | 9848 | 10213 | 10415 | 10613 | 11034 | 11047 | 11160 | 11317 | 11388 | 11622 | 11658 | 11898 | 12176 | 12549 | 12689 | 13415 | 12921 | 12593 | 12641 | 12945 | 13025 | 13510 | 13950 | 14029 | 13070 | 13337 | 12133 | 13105 | 13526 | 13788 | 14347 | 13435 | 14382 | 14589 | 14357 | 14626 | 14943 | 15485 | 15953 | 15946 | 14634 | 12826 | 14471 | 15160 | 15461 | 16333 | 17507 | 16842 | 16394 | 18188 | 18888 | 18697 | 19213 | 20054 | 21124 | 21272 | 21768 | 22286 | 22963 | 21895 | 23429 | 23267 | 24310 | 23052 | 22361 | 23192 | 21169 | 21208 | 19458 | 21252 | 20385 | 18508 | 20006 | 21124 | 19907 | 21158 | 20642 | 21399 | 21733 | 21828 | 23270 | 24018 | 23635 | 22508 | 22035 | 24047 | 25140 | 25562 | 26927 | 27794 | 26658 | 27980 | 28984 | 29337 | 30049 |
| Russell 1000 Growth Total Return Index | 10000 | 9790 | 10003 | 10127 | 10468 | 10903 | 11029 | 11281 | 11575 | 11544 | 11851 | 12068 | 12225 | 12699 | 13085 | 13187 | 14121 | 13750 | 13373 | 13420 | 14008 | 14143 | 14558 | 15354 | 15440 | 14059 | 14209 | 12987 | 14154 | 14661 | 15078 | 15759 | 14764 | 15778 | 16134 | 16010 | 16012 | 16464 | 17194 | 17713 | 18109 | 16876 | 15216 | 17467 | 18640 | 19451 | 20948 | 23109 | 22022 | 21274 | 23453 | 24531 | 24350 | 24344 | 24762 | 26447 | 26081 | 27718 | 28631 | 29702 | 28038 | 30467 | 30653 | 31301 | 28615 | 27399 | 28471 | 25033 | 24451 | 22514 | 25216 | 24042 | 21704 | 22973 | 24020 | 22181 | 24030 | 23744 | 25367 | 25617 | 26785 | 28617 | 29581 | 29315 | 27721 | 27326 | 30305 | 31647 | 32437 | 34650 | 35260 | 33764 | 35785 | 38198 | 37549 | 38331 |
| F/m Investments Large Cap Focused Fund | PAGE 1 | TSR_AR_74933W270 |
ANNUAL AVERAGE TOTAL RETURN (%)
| | | |
| | 1 Year | 5 Years | Since Inception
(10/03/2016) |
Investor Class** | 25.79 | 17.30 | 16.91 |
S&P 500 Total Return Index | 27.14 | 15.92 | 14.92 |
Russell 1000 Growth Total Return Index | 30.75 | 19.08 | 18.52 |
Visit https://www.fminvest.com/mutual-funds/iafmx-iaflx for more recent performance information.
| * | The Fund’s past performance is not a good predictor of how the Fund will perform in the future. The graph and table do not reflect the deduction of taxes that a shareholder would pay on Fund distributions or redemption of Fund shares. |
| ** | The Fund commenced operations on October 3, 2016 as a separate series (the “Predecessor Fund”) of F/m Funds Trust. Effective as of the close of business on October 27, 2023, the Predecessor Fund was reorganized as a new series of The RBB Fund, Inc. The performance shown for periods prior to October 30, 2023 represents the performance of the Predecessor Fund. |
KEY FUND STATISTICS (as of August 31, 2024)
| |
Net Assets | $65,543,939 |
Number of Holdings | 24 |
Net Advisory Fee | $66,788 |
Portfolio Turnover | 19% |
WHAT DID THE FUND INVEST IN? (as of August 31, 2024)*
| |
Top 10 Holdings | (%) of net assets |
Apple, Inc. | 11.0% |
NVIDIA Corp. | 10.0% |
First American Treasury Obligations Fund | 8.0% |
Microsoft Corp. | 7.3% |
Amazon.com, Inc. | 6.8% |
Meta Platforms, Inc. | 6.5% |
Netflix, Inc. | 5.3% |
Alphabet, Inc. | 4.5% |
Advanced Micro Devices, Inc. | 4.3% |
Adobe, Inc. | 3.2% |
| |
Top Sectors | (%) of net assets |
Information Technology | 54.6% |
Communication Services | 16.3% |
Consumer Discretionary | 12.0% |
Industrials | 4.4% |
Health Care | 2.4% |
Consumer Staples | 2.4% |
Cash & Other | 7.9% |
| * | The Global Industry Classification Standard (“GICS®”) was developed by and/or is the exclusive property of MSCI, Inc. (“MSCI”) and Standard & Poor’s Financial Services LLC (“S&P”). GICS® is a service mark of MSCI and S&P and has been licensed for use by U.S. Bank Global Fund Services. |
For additional information about the Fund; including its prospectus, financial information, holdings and proxy information, scan the QR code or visit https://www.fminvest.com/mutual-funds/iafmx-iaflx
HOUSEHOLDING
To reduce Fund expenses, only one copy of most shareholder documents may be mailed to shareholders with multiple accounts at the same address (Householding). If you would prefer that your Fund documents not be householded, please contact the Fund at 1-800-292-6775, or contact your financial intermediary. Your instructions will typically be effective within 30 days of receipt by F/m Investments or your financial intermediary.
| F/m Investments Large Cap Focused Fund | PAGE 2 | TSR_AR_74933W270 |
Item 2. Code of Ethics.
The registrant has adopted a code of ethics that applies to the registrant’s Principal Executive Officer and Principal Financial Officer. The registrant has not made any substantive amendments to its code of ethics during the period covered by this report. The registrant has not granted any waivers from any provisions of the code of ethics during the period covered by this report. A copy of the registrant’s Code of Ethics is filed herewith.
Item 3. Audit Committee Financial Expert.
The registrant’s board of directors has determined that the registrant has at least one audit committee financial expert serving on its audit committee. Gregory P. Chandler, Nicholas A. Giordano and Martha A. Tirinnanzi are the registrant’s audit committee financial experts and each of them is “independent” as defined in Item 3 of Form N-CSR.
Item 4. Principal Accountant Fees and Services.
Audit Fees
| (a) | The aggregate fees billed for each of the last two fiscal years for professional services rendered by the principal accountant for the audit of the registrant's annual financial statements or services that are normally provided by the accountant in connection with statutory and regulatory filings or engagements for those fiscal years were: |
| | | Fiscal Year 2024 | | | Fiscal Year 2023 | |
| Ernst & Young LLP | | $ | 789,050 | | | $ | 727,675 | |
| PricewaterhouseCoopers LLP | | $ | 240,805 | | | $ | 233,791 | |
| Tait, Weller & Baker | | $ | 104,000 | | | $ | 101,500 | |
| Cohen & Co | | $ | 228,750 | | | $ | 116,000 | |
Audit-Related Fees
| (b) | The aggregate fees billed in each of the last two fiscal years for assurance and related services by the principal accountant that are reasonably related to the performance of the audit of the registrant's financial statements and are not reported under paragraph (a) of this Item were related to review of the semi-annual reports and N-1A filings for Ernst & Young LLP and review of semi-annual reports for Tait, Weller & Baker and Cohen & Co. and PricewaterhouseCoopers LLP, were as follows: |
| | | Fiscal Year 2024 | | | Fiscal Year 2023 | |
| Ernst & Young LLP | | $ | 24,700 | | | $ | 11,500 | |
| PricewaterhouseCoopers LLP | | $ | 0 | | | $ | 0 | |
| Tait, Weller & Baker | | $ | 3,000 | | | $ | 2,800 | |
| Cohen & Co | | $ | 5,700 | | | $ | 1,500 | |
Tax Fees
| (c) | The aggregate fees billed in each of the last two fiscal years for professional services rendered by the principal accountant for tax compliance, tax advice, and tax planning were related to federal and state tax return review and excise distribution review and were as follows: |
| | | Fiscal Year 2024 | | | Fiscal Year 2023 | |
| Ernst & Young LLP | | $ | 218,480 | | | $ | 201,550 | |
| PricewaterhouseCoopers LLP | | $ | 43,072 | | | $ | 41,817 | |
| Tait, Weller & Baker | | $ | 21,400 | | | $ | 20,900 | |
| Cohen & Co | | $ | 66,500 | | | $ | 38,500 | |
All Other Fees
| (d) | The aggregate fees billed in each of the last two fiscal years for products and services provided by the principal accountant, other than the services reported in paragraphs (a) through (c) of this Item were: |
| | | Fiscal Year 2024 | | | Fiscal Year 2023 | |
| Ernst & Young LLP | | $ | 0 | | | $ | 0 | |
| PricewaterhouseCoopers LLP | | $ | 0 | | | $ | 0 | |
| Tait, Weller & Baker | | $ | 0 | | | $ | 0 | |
| Cohen & Co | | $ | 0 | | | $ | 0 | |
(e)(1) Pre-Approval of Audit and Permitted Non-Audit Services
| 1. | Pre-Approval Requirements of the Company. The Committee shall pre-approve all auditing services and permissible non-audit services (e.g., tax services) to be provided to the Company by the Auditor, including the fees associated with those services. |
| 2. | Pre-Approval Requirements of Affiliates. Additionally, the Committee shall pre-approve any engagement of the Auditor to provide non-audit services to an investment adviser of a Portfolio or to any affiliate of such investment adviser that provides ongoing services to the Company, if the engagement relates directly to the operations and financial reporting of the Company. |
| 3. | Delegation. The Committee may delegate to the Chairman of the Committee, or if the Chairman is not available, one or more of its members, the authority to grant pre-approvals. The decisions of any member to whom authority is delegated shall be presented to the full Committee at its next scheduled meeting. |
| 4. | Prohibited Services. The Committee shall confirm with the Auditor that the Auditor is not performing contemporaneously with the Company’s audit any prohibited non-audit services for the Company, any investment adviser of a Portfolio, or any affiliates of the Company or such investment advisers. The Auditor is responsible for informing the Committee of whether it believes that a particular service is permissible or prohibited pursuant to applicable regulations and standards. |
| (e)(2) | The percentage of services described in each of paragraphs (b) through (d) of this Item that were approved by the audit committee pursuant to paragraph (c)(7)(i)(C) of Rule 2-01 of Regulation S-X are as follows: |
(b) Not applicable.
(c) Not applicable.
(d) Not applicable.
| (f) | The percentage of hours expended on the principal accountant’s engagement to audit the registrant’s financial statements for the most recent fiscal year that were attributed to work performed by persons other than the principal accountant’s full-time, permanent employees was less than 50%. |
| (g) | The aggregate non-audit fees billed by the registrant’s accountant for services rendered to the registrant, and rendered to the registrant’s investment adviser (not including any sub-adviser whose role is primarily portfolio management and is subcontracted with or overseen by another investment adviser), and any entity controlling, controlled by, or under common control with the adviser that provides ongoing services to the registrant for each of the last two fiscal years of the registrant were: |
| | | Fiscal Year 2024 | | | Fiscal Year 2023 | |
| Ernst & Young LLP | | $ | 243,180 | | | $ | 213,050 | |
| PricewaterhouseCoopers LLP | | $ | 43,072 | | | $ | 41,817 | |
| Tait, Weller & Baker | | $ | 24,400 | | | $ | 23,700 | |
| Cohen & Co | | $ | 72,200 | | | $ | 40,000 | |
Item 5. Audit Committee of Listed Registrants.
Not applicable.
Item 6. Investments.
| (a) | The registrant’s Schedule of Investments is included as part of the report to shareholders filed under Item 7 of this Form. |
Item 7. Financial Statements and Financial Highlights for Open-End Management Investment Companies.

Abbey Capital Futures Strategy Fund
of
THE RBB FUND, INC.
Financial Statements
August 31, 2024
Abbey Capital Futures Strategy Fund
Consolidated Portfolio of Investments
August 31, 2024
| | | Par | | | Value | |
SHORT-TERM INVESTMENTS — 78.5% | | | | | | | | |
U.S. Treasury Bills — 78.5% | | | | | | | | |
5.21%, 09/05/2024(a) | | $ | 8,659,000 | | | $ | 8,656,491 | |
5.25%, 09/12/2024(a) | | | 56,778,000 | | | | 56,704,028 | |
5.21%, 09/19/2024(a) | | | 105,249,000 | | | | 105,004,589 | |
5.22%, 09/26/2024(a) | | | 100,462,000 | | | | 100,128,885 | |
5.21%, 10/03/2024(a) | | | 95,348,000 | | | | 94,939,593 | |
5.26%, 10/10/2024(a) | | | 159,182,000 | | | | 158,342,304 | |
5.26%, 10/17/2024(a) | | | 244,195,000 | | | | 242,673,970 | |
5.28%, 10/24/2024(a) | | | 32,489,000 | | | | 32,253,864 | |
5.25%, 10/31/2024(a) | | | 79,986,000 | | | | 79,327,922 | |
5.26%, 11/07/2024(a) | | | 25,223,000 | | | | 24,994,473 | |
5.26%, 11/14/2024(a) | | | 24,738,000 | | | | 24,490,944 | |
5.28%, 11/21/2024(a) | | | 145,687,000 | | | | 144,091,686 | |
5.26%, 11/29/2024(a) | | | 69,407,000 | | | | 68,573,616 | |
5.25%, 12/05/2024(a) | | | 51,085,000 | | | | 50,440,725 | |
5.24%, 12/12/2024(a) | | | 45,669,000 | | | | 45,054,593 | |
5.21%, 12/19/2024(a) | | | 110,416,000 | | | | 108,824,733 | |
5.11%, 01/09/2025(a) | | | 23,576,000 | | | | 23,178,268 | |
5.08%, 01/16/2025(a) | | | 89,603,000 | | | | 88,008,375 | |
5.04%, 01/23/2025(a) | | | 37,555,000 | | | | 36,853,032 | |
4.81%, 01/30/2025(a) | | | 78,275,000 | | | | 76,743,830 | |
4.88%, 02/06/2025(a) | | | 73,591,000 | | | | 72,085,699 | |
4.91%, 02/13/2025(a) | | | 192,104,000 | | | | 188,010,485 | |
4.82%, 02/20/2025(a) | | | 194,044,000 | | | | 189,744,173 | |
4.77%, 02/27/2025(a) | | | 114,930,000 | | | | 112,285,366 | |
TOTAL SHORT-TERM INVESTMENTS (Cost $2,130,402,199) | | | | | | | 2,131,411,644 | |
| | | | | | | | | |
TOTAL INVESTMENTS — 78.5% (Cost $2,130,402,199) | | | | | | | 2,131,411,644 | |
| | | | | | | | | |
Other Assets in Excess of Liabilities — 21.5% | | | | | | | 582,161,025 | |
TOTAL NET ASSETS — 100.0% | | | | | | $ | 2,713,572,669 | |
Percentages are stated as a percent of net assets.
(a) | The rate shown is the effective yield as of August 31, 2024. |
The accompanying notes are an integral part of the consolidated financial statements.
1
Abbey Capital Futures Strategy Fund
Consolidated Portfolio of Investments (Continued)
August 31, 2024
Futures contracts outstanding as of August 31, 2024 were as follows:
Description | | Contracts
Purchased | | | Expiration
Date | | | Notional | | | Value/
Unrealized
Appreciation
(Depreciation) | |
10 Year Japanese Government Bonds | | | 2 | | | | 09/11/2024 | | | $ | 198,030 | | | $ | (376 | ) |
10 Year U.S. Ultra Treasury Notes | | | 154 | | | | 12/19/2024 | | | | 18,085,375 | | | | (125,460 | ) |
3 Month Canadian Overnight Repo Rate Average | | | 377 | | | | 03/18/2025 | | | | 67,369,885 | | | | 162,718 | |
3 Month Canadian Overnight Repo Rate Average | | | 153 | | | | 06/17/2025 | | | | 27,437,595 | | | | (2,810 | ) |
3 Month Canadian Overnight Repo Rate Average | | | 79 | | | | 09/16/2025 | | | | 14,199,366 | | | | 6,048 | |
3 Month Canadian Overnight Repo Rate Average | | | 69 | | | | 12/16/2025 | | | | 12,419,898 | | | | 15,128 | |
3 Month Canadian Overnight Repo Rate Average | | | 49 | | | | 03/17/2026 | | | | 8,829,472 | | | | 10,388 | |
3 Month Canadian Overnight Repo Rate Average | | | 31 | | | | 06/16/2026 | | | | 5,590,593 | | | | 3,478 | |
3 Month Euribor | | | 24 | | | | 12/16/2024 | | | | 6,431,438 | | | | (1,865 | ) |
3 Month Euribor | | | 6 | | | | 03/17/2025 | | | | 1,614,741 | | | | (69 | ) |
3 Month Euribor | | | 1,564 | | | | 06/16/2025 | | | | 421,989,554 | | | | 1,123,570 | |
3 Month Euribor | | | 373 | | | | 09/15/2025 | | | | 100,769,579 | | | | (2,252 | ) |
3 Month Euribor | | | 1,095 | | | | 12/15/2025 | | | | 296,021,597 | | | | 353,203 | |
3 Month Euribor | | | 164 | | | | 03/16/2026 | | | | 44,344,719 | | | | 13,140 | |
3 Month Euribor | | | 304 | | | | 06/15/2026 | | | | 82,199,967 | | | | 29,100 | |
3 Month Euribor | | | 308 | | | | 09/14/2026 | | | | 83,268,778 | | | | 66,531 | |
3 Month Euribor | | | 169 | | | | 12/14/2026 | | | | 45,680,346 | | | | 13,693 | |
3 Month Euribor | | | 389 | | | | 03/15/2027 | | | | 105,119,010 | | | | (30,288 | ) |
3 Month Euribor | | | 626 | | | | 06/14/2027 | | | | 169,119,991 | | | | 80,307 | |
3 Month Euribor | | | 68 | | | | 09/13/2027 | | | | 18,366,164 | | | | 12,311 | |
3 Month New Zealand Treasury Bill | | | 56 | | | | 12/11/2024 | | | | 34,613,999 | | | | 6,883 | |
3 Month New Zealand Treasury Bill | | | 35 | | | | 03/12/2025 | | | | 21,659,096 | | | | (605 | ) |
3 Month Swiss Average Overnight Rate | | | 10 | | | | 03/18/2025 | | | | 2,921,299 | | | | 456 | |
3 Month Swiss Average Overnight Rate | | | 39 | | | | 06/17/2025 | | | | 11,403,962 | | | | 43,203 | |
3MO EURO EURIBOR Dec27 | | | 1 | | | | 12/13/2027 | | | | 270,035 | | | | (14 | ) |
3-Month Secured Overnight Financing Rate | | | 162 | | | | 03/18/2025 | | | | 38,776,725 | | | | (10,100 | ) |
3-Month Secured Overnight Financing Rate | | | 363 | | | | 06/17/2025 | | | | 87,342,338 | | | | (146,838 | ) |
3-Month Secured Overnight Financing Rate | | | 204 | | | | 09/16/2025 | | | | 49,240,500 | | | | 24,300 | |
3-Month Secured Overnight Financing Rate | | | 173 | | | | 12/16/2025 | | | | 41,833,563 | | | | 9,613 | |
3-Month Secured Overnight Financing Rate | | | 972 | | | | 03/17/2026 | | | | 235,284,750 | | | | (75,388 | ) |
3-Month Secured Overnight Financing Rate | | | 482 | | | | 06/16/2026 | | | | 116,740,400 | | | | (25,125 | ) |
3-Month Secured Overnight Financing Rate | | | 191 | | | | 09/15/2026 | | | | 46,272,138 | | | | 22,075 | |
3-Month Secured Overnight Financing Rate | | | 185 | | | | 12/15/2026 | | | | 44,818,563 | | | | 25,038 | |
3-Month Secured Overnight Financing Rate | | | 172 | | | | 03/16/2027 | | | | 41,662,700 | | | | 22,375 | |
3-Month Secured Overnight Financing Rate | | | 710 | | | | 06/15/2027 | | | | 171,935,375 | | | | 114,450 | |
3-Month Secured Overnight Financing Rate | | | 134 | | | | 09/14/2027 | | | | 32,436,150 | | | | 8,263 | |
3-Month Secured Overnight Financing Rate | | | 106 | | | | 12/14/2027 | | | | 25,650,713 | | | | 6,988 | |
3-Month Secured Overnight Financing Rate | | | 55 | | | | 03/14/2028 | | | | 13,308,625 | | | | 16,988 | |
3-Month Secured Overnight Financing Rate | | | 55 | | | | 06/20/2028 | | | | 13,304,500 | | | | 16,213 | |
3-Month Secured Overnight Financing Rate | | | 57 | | | | 09/19/2028 | | | | 13,784,025 | | | | 18,675 | |
3-Month Secured Overnight Financing Rate | | | 57 | | | | 12/19/2028 | | | | 13,780,800 | | | | (9,513 | ) |
Arabica Coffee | | | 392 | | | | 12/18/2024 | | | | 35,875,350 | | | | 724,789 | |
Arabica Coffee | | | 58 | | | | 03/19/2025 | | | | 5,265,675 | | | | 94,556 | |
Arabica Coffee | | | 20 | | | | 05/19/2025 | | | | 1,798,875 | | | | 81,244 | |
ASX SPI 200 Index | | | 685 | | | | 09/19/2024 | | | | 93,296,552 | | | | 1,977,186 | |
AUD/USD Cross Currency Rate | | | 767 | | | | 09/16/2024 | | | | 51,922,065 | | | | (33,959 | ) |
Australian Government 10 Year Bonds | | | 1,693 | | | | 09/16/2024 | | | | 133,585,245 | | | | (132,371 | ) |
Australian Government 3 Year Bonds | | | 2,849 | | | | 09/16/2024 | | | | 206,224,467 | | | | (63,879 | ) |
Australian 90 Day Bank Bills | | | 13 | | | | 09/12/2024 | | | | 8,705,473 | | | | (1,209 | ) |
The accompanying notes are an integral part of the consolidated financial statements.
2
Abbey Capital Futures Strategy Fund
Consolidated Portfolio of Investments (Continued)
August 31, 2024
Description | | Contracts
Purchased | | | Expiration
Date | | | Notional | | | Value/
Unrealized
Appreciation
(Depreciation) | |
Australian 90 Day Bank Bills | | | 793 | | | | 12/12/2024 | | | $ | 531,267,168 | | | $ | 25,356 | |
Australian 90 Day Bank Bills | | | 927 | | | | 03/13/2025 | | | | 621,510,153 | | | | 133,636 | |
Australian 90 Day Bank Bills | | | 171 | | | | 06/12/2025 | | | | 114,714,749 | | | | (3,412 | ) |
Australian 90 Day Bank Bills | | | 138 | | | | 09/11/2025 | | | | 92,606,236 | | | | 5,262 | |
Australian 90 Day Bank Bills | | | 36 | | | | 12/11/2025 | | | | 24,163,465 | | | | 48 | |
Australian 90 Day Bank Bills | | | 26 | | | | 03/12/2026 | | | | 17,454,379 | | | | 935 | |
Brent Crude Oil | | | 163 | | | | 09/30/2024 | | | | 12,539,590 | | | | (290,100 | ) |
British Pound/US Dollar Cross Currency Rate | | | 2,490 | | | | 09/16/2024 | | | | 204,257,813 | | | | 1,059,730 | |
CAC40 10 Euro Index | | | 135 | | | | 09/20/2024 | | | | 11,414,525 | | | | 66,087 | |
Canadian 10 Year Government Bonds | | | 1,232 | | | | 12/18/2024 | | | | 112,499,477 | | | | (891,582 | ) |
Canadian 5 Year Bonds | | | 662 | | | | 12/18/2024 | | | | 56,009,528 | | | | (266,419 | ) |
Canadian Dollar/US Dollar Cross Currency Rate | | | 1,252 | | | | 09/17/2024 | | | | 92,879,620 | | | | (5,685 | ) |
Class III Milk | | | 20 | | | | 10/29/2024 | | | | 914,800 | | | | 1,900 | |
Consumer Discretionary Select Sector Index | | | 2 | | | | 09/20/2024 | | | | 378,500 | | | | 4,930 | |
Copper | | | 52 | | | | 12/27/2024 | | | | 5,474,950 | | | | (54,332 | ) |
Copper | | | 2 | | | | 03/27/2025 | | | | 212,875 | | | | (562 | ) |
Corn No. 2 Yellow | | | 19 | | | | 12/13/2024 | | | | 380,950 | | | | 6,106 | |
Cotton No.2 | | | 105 | | | | 12/06/2024 | | | | 3,674,475 | | | | (247,785 | ) |
Crude Oil | | | 232 | | | | 09/20/2024 | | | | 17,063,600 | | | | (831,710 | ) |
Crude Oil | | | 1 | | | | 10/22/2024 | | | | 72,650 | | | | (1,300 | ) |
Crude Palm Oil | | | 12 | | | | 10/15/2024 | | | | 278,658 | | | | 2,152 | |
Crude Palm Oil | | | 60 | | | | 11/15/2024 | | | | 1,380,104 | | | | 6,645 | |
Crude Palm Oil | | | 2 | | | | 12/13/2024 | | | | 45,633 | | | | 150 | |
Crude Soybean Oil | | | 4 | | | | 12/13/2024 | | | | 100,824 | | | | (220 | ) |
DAX Index | | | 3 | | | | 09/20/2024 | | | | 314,226 | | | | 6,306 | |
Dollar Index | | | 49 | | | | 09/16/2024 | | | | 4,979,576 | | | | (107,059 | ) |
Dow Jones Industrial Average Index | | | 633 | | | | 09/20/2024 | | | | 131,831,745 | | | | 2,604,839 | |
Dow Jones U.S. Micro-Cap Total Stock Index | | | 5 | | | | 09/20/2024 | | | | 104,132 | | | | 3,370 | |
E-mini Consumer Staples Select Sector | | | 10 | | | | 09/20/2024 | | | | 834,000 | | | | 47,160 | |
E-mini Materials Sector | | | 4 | | | | 09/20/2024 | | | | 400,600 | | | | 20,060 | |
Emini S&P 500 ESG Index | | | 20 | | | | 09/20/2024 | | | | 5,026,000 | | | | 51,515 | |
Euro BUXL 30 Year Bonds | | | 92 | | | | 09/06/2024 | | | | 13,680,252 | | | | (264,749 | ) |
Euro Half Dollars | | | 4 | | | | 09/16/2024 | | | | 276,500 | | | | 1,500 | |
Euro STOXX 50 Dividend Index | | | 19 | | | | 12/19/2025 | | | | 341,292 | | | | 3,935 | |
EURO STOXX 50 Index | | | 5 | | | | 09/20/2024 | | | | 252,086 | | | | 8,843 | |
Euro STOXX 50 Quanto Index | | | 1,157 | | | | 09/20/2024 | | | | 63,576,488 | | | | 237,101 | |
Euro STOXX Banks Index | | | 109 | | | | 09/20/2024 | | | | 863,602 | | | | 13,110 | |
Euro/Japanese Yen Cross Currency Rate | | | 38 | | | | 09/16/2024 | | | | 5,238,354 | | | | (176,953 | ) |
Euro/US Dollar Cross Currency Rate | | | 12 | | | | 09/16/2024 | | | | 165,892 | | | | (1,114 | ) |
Euro/US Dollar Cross Currency Rate | | | 1,676 | | | | 09/16/2024 | | | | 231,696,525 | | | | (1,256,873 | ) |
Euro-BOBL | | | 1,064 | | | | 09/06/2024 | | | | 138,397,038 | | | | (791,714 | ) |
Euro-BOBL | | | 2 | | | | 12/06/2024 | | | | 262,997 | | | | (111 | ) |
Euro-BTP Future Dec24 | | | 1 | | | | 12/06/2024 | | | | 131,344 | | | | (243 | ) |
Euro-BTP Italian Government Bonds | | | 758 | | | | 09/06/2024 | | | | 99,600,354 | | | | 712,740 | |
Euro-Bund | | | 892 | | | | 09/06/2024 | | | | 132,037,495 | | | | (675,466 | ) |
Euro-Bund | | | 235 | | | | 12/06/2024 | | | | 34,653,181 | | | | (696 | ) |
Euro-Schatz | | | 846 | | | | 09/06/2024 | | | | 99,342,928 | | | | (32,770 | ) |
EURO-SCHATZ FUT Dec24 | | | 1,125 | | | | 12/06/2024 | | | | 132,627,259 | | | | (1,194 | ) |
Financial Select Sector Index | | | 9 | | | | 09/20/2024 | | | | 1,269,112 | | | | 90,575 | |
French Government Bonds | | | 1,672 | | | | 09/06/2024 | | | | 233,006,179 | | | | 1,121,030 | |
Frozen Concentrated Orange Juice | | | 38 | | | | 11/08/2024 | | | | 2,623,710 | | | | 46,905 | |
The accompanying notes are an integral part of the consolidated financial statements.
3
Abbey Capital Futures Strategy Fund
Consolidated Portfolio of Investments (Continued)
August 31, 2024
Description | | Contracts
Purchased | | | Expiration
Date | | | Notional | | | Value/
Unrealized
Appreciation
(Depreciation) | |
FTSE 100 Index | | | 1,742 | | | | 09/20/2024 | | | $ | 191,886,754 | | | $ | 2,078,330 | |
FTSE Bursa Malaysia KLCI Index | | | 89 | | | | 09/30/2024 | | | | 1,720,804 | | | | 10,648 | |
FTSE China A50 Index | | | 1,477 | | | | 09/27/2024 | | | | 17,354,750 | | | | (140,092 | ) |
FTSE MIB Index | | | 30 | | | | 09/20/2024 | | | | 1,142,630 | | | | 34,407 | |
FTSE/JSE Top 40 Index | | | 618 | | | | 09/19/2024 | | | | 26,394,922 | | | | 769,714 | |
FTSE/MIB Index | | | 75 | | | | 09/20/2024 | | | | 14,282,872 | | | | 289,676 | |
German Stock Index | | | 286 | | | | 09/20/2024 | | | | 149,781,296 | | | | 3,046,362 | |
Gold | | | 614 | | | | 12/27/2024 | | | | 155,194,640 | | | | 2,389,695 | |
Gold | | | 21 | | | | 02/26/2025 | | | | 5,354,580 | | | | 240,180 | |
Hang Seng China Enterprises Index | | | 191 | | | | 09/27/2024 | | | | 7,734,008 | | | | 63,094 | |
Hang Seng China Enterprises Index | | | 22 | | | | 09/27/2024 | | | | 178,166 | | | | 1,649 | |
Hang Seng Index | | | 198 | | | | 09/27/2024 | | | | 22,789,120 | | | | 271,198 | |
Hang Seng Index | | | 62 | | | | 09/27/2024 | | | | 1,427,197 | | | | 13,923 | |
IBEX 35 Composite Index | | | 11 | | | | 09/20/2024 | | | | 139,020 | | | | 7,426 | |
IBEX 35 Index | | | 25 | | | | 09/20/2024 | | | | 3,159,537 | | | | 167,885 | |
ICE 3 Month SONIA Rate | | | 485 | | | | 03/18/2025 | | | | 152,111,870 | | | | (11,196 | ) |
ICE 3 Month SONIA Rate | | | 497 | | | | 06/17/2025 | | | | 156,405,790 | | | | 246,441 | |
ICE 3 Month SONIA Rate | | | 688 | | | | 09/16/2025 | | | | 217,044,284 | | | | (175,883 | ) |
ICE 3 Month SONIA Rate | | | 118 | | | | 12/16/2025 | | | | 37,279,858 | | | | (36,559 | ) |
ICE 3 Month SONIA Rate | | | 449 | | | | 03/17/2026 | | | | 142,000,437 | | | | (160,173 | ) |
ICE 3 Month SONIA Rate | | | 260 | | | | 06/16/2026 | | | | 82,278,643 | | | | (137,913 | ) |
ICE 3 Month SONIA Rate | | | 121 | | | | 09/15/2026 | | | | 38,307,106 | | | | (34,852 | ) |
ICE 3 Month SONIA Rate | | | 118 | | | | 12/15/2026 | | | | 37,367,028 | | | | (37,462 | ) |
ICE 3 Month SONIA Rate | | | 115 | | | | 03/16/2027 | | | | 36,424,571 | | | | (39,990 | ) |
ICE 3 Month SONIA Rate | | | 371 | | | | 06/15/2027 | | | | 117,533,194 | | | | 55,553 | |
ICE 3 Month SONIA Rate | | | 17 | | | | 09/14/2027 | | | | 5,386,176 | | | | (9,013 | ) |
ICE 3 Month SONIA Rate | | | 10 | | | | 12/14/2027 | | | | 3,168,667 | | | | (5,040 | ) |
ICE European Climate Exchange Emissions | | | 26 | | | | 12/16/2024 | | | | 2,020,450 | | | | (64,412 | ) |
ICE European Climate Exchange Emissions | | | 7 | | | | 12/15/2025 | | | | 562,925 | | | | (15,641 | ) |
ICE RTD MONTH COA Dec24 | | | 2 | | | | 12/27/2024 | | | | 248,200 | | | | (300 | ) |
ICE RTD MONTH COA Nov24 | | | 2 | | | | 11/29/2024 | | | | 245,700 | | | | (2,800 | ) |
ICE RTD MONTH COA Oct24 | | | 2 | | | | 10/25/2024 | | | | 243,300 | | | | (5,200 | ) |
Industrial Select Sector Index | | | 6 | | | | 09/20/2024 | | | | 796,320 | | | | 50,740 | |
Japanese 10 Year Government Bonds | | | 123 | | | | 09/12/2024 | | | | 121,763,185 | | | | (255,831 | ) |
Japanese Yen/US Dollar Cross Currency Rate | | | 168 | | | | 09/16/2024 | | | | 14,406,000 | | | | (171,944 | ) |
Lean Hogs | | | 70 | | | | 10/14/2024 | | | | 2,302,300 | | | | 38,940 | |
Lean Hogs | | | 8 | | | | 12/13/2024 | | | | 232,880 | | | | 690 | |
Live Cattle | | | 103 | | | | 10/31/2024 | | | | 7,358,320 | | | | (228,230 | ) |
Live Cattle | | | 70 | | | | 12/31/2024 | | | | 4,971,400 | | | | (152,870 | ) |
LME Aluminum Forward | | | 1 | | | | 09/02/2024 | | | | 60,611 | | | | (1,567 | ) |
LME Aluminum Forward | | | 1 | | | | 09/03/2024 | | | | 60,591 | | | | (1,561 | ) |
LME Aluminum Forward | | | 3 | | | | 09/06/2024 | | | | 182,182 | | | | 7,785 | |
LME Aluminum Forward | | | 2 | | | | 09/09/2024 | | | | 121,493 | | | | 9,363 | |
LME Aluminum Forward | | | 2 | | | | 09/10/2024 | | | | 121,532 | | | | 9,373 | |
LME Aluminum Forward | | | 8 | | | | 09/11/2024 | | | | 486,238 | | | | 12,569 | |
LME Aluminum Forward | | | 3 | | | | 09/13/2024 | | | | 182,502 | | | | (4,574 | ) |
LME Aluminum Forward | | | 142 | | | | 09/16/2024 | | | | 8,640,345 | | | | (271,741 | ) |
LME Aluminum Forward | | | 4 | | | | 09/17/2024 | | | | 243,390 | | | | (5,895 | ) |
LME Aluminum Forward | | | 5 | | | | 09/18/2024 | | | | 304,305 | | | | (7,301 | ) |
LME Aluminum Forward | | | 18 | | | | 09/23/2024 | | | | 1,096,717 | | | | (32,575 | ) |
LME Aluminum Forward | | | 1 | | | | 09/25/2024 | | | | 60,956 | | | | 4,181 | |
The accompanying notes are an integral part of the consolidated financial statements.
4
Abbey Capital Futures Strategy Fund
Consolidated Portfolio of Investments (Continued)
August 31, 2024
Description | | Contracts
Purchased | | | Expiration
Date | | | Notional | | | Value/
Unrealized
Appreciation
(Depreciation) | |
LME Aluminum Forward | | | 2 | | | | 10/02/2024 | | | $ | 122,125 | | | $ | 8,233 | |
LME Aluminum Forward | | | 245 | | | | 10/14/2024 | | | | 15,004,596 | | | | (99,641 | ) |
LME Aluminum Forward | | | 6 | | | | 10/15/2024 | | | | 366,859 | | | | 14,225 | |
LME Aluminum Forward | | | 10 | | | | 10/16/2024 | | | | 610,432 | | | | 34,944 | |
LME Aluminum Forward | | | 3 | | | | 10/18/2024 | | | | 183,012 | | | | 11,534 | |
LME Aluminum Forward | | | 3 | | | | 10/21/2024 | | | | 182,953 | | | | (3,666 | ) |
LME Aluminum Forward | | | 4 | | | | 10/22/2024 | | | | 243,994 | | | | (525 | ) |
LME Aluminum Forward | | | 19 | | | | 10/23/2024 | | | | 1,159,242 | | | | (18,145 | ) |
LME Aluminum Forward | | | 4 | | | | 10/25/2024 | | | | 244,280 | | | | (4,895 | ) |
LME Aluminum Forward | | | 5 | | | | 10/28/2024 | | | | 305,421 | | | | (5,954 | ) |
LME Aluminum Forward | | | 4 | | | | 10/29/2024 | | | | 244,417 | | | | 86 | |
LME Aluminum Forward | | | 4 | | | | 10/30/2024 | | | | 244,497 | | | | (4,903 | ) |
LME Aluminum Forward | | | 5 | | | | 11/01/2024 | | | | 305,611 | | | | (6,139 | ) |
LME Aluminum Forward | | | 2 | | | | 11/04/2024 | | | | 122,242 | | | | (2,382 | ) |
LME Aluminum Forward | | | 2 | | | | 11/06/2024 | | | | 122,165 | | | | (2,385 | ) |
LME Aluminum Forward | | | 1 | | | | 11/08/2024 | | | | 61,106 | | | | 3,032 | |
LME Aluminum Forward | | | 1 | | | | 11/11/2024 | | | | 61,112 | | | | 3,400 | |
LME Aluminum Forward | | | 2 | | | | 11/15/2024 | | | | 122,262 | | | | 250 | |
LME Aluminum Forward | | | 110 | | | | 11/18/2024 | | | | 6,724,437 | | | | (133,867 | ) |
LME Aluminum Forward | | | 6 | | | | 11/19/2024 | | | | 366,607 | | | | (4,005 | ) |
LME Aluminum Forward | | | 10 | | | | 11/20/2024 | | | | 611,012 | | | | (14,738 | ) |
LME Aluminum Forward | | | 5 | | | | 11/25/2024 | | | | 305,787 | | | | (9,988 | ) |
LME Aluminum Forward | | | 14 | | | | 11/27/2024 | | | | 856,450 | | | | (12,425 | ) |
LME Copper Forward | | | 1 | | | | 09/02/2024 | | | | 227,998 | | | | (12,821 | ) |
LME Copper Forward | | | 1 | | | | 09/03/2024 | | | | 227,953 | | | | (12,838 | ) |
LME Copper Forward | | | 1 | | | | 09/04/2024 | | | | 228,087 | | | | (20,913 | ) |
LME Copper Forward | | | 4 | | | | 09/09/2024 | | | | 913,236 | | | | (53,001 | ) |
LME Copper Forward | | | 3 | | | | 09/10/2024 | | | | 685,060 | | | | (38,585 | ) |
LME Copper Forward | | | 9 | | | | 09/11/2024 | | | | 2,055,505 | | | | (115,828 | ) |
LME Copper Forward | | | 3 | | | | 09/13/2024 | | | | 685,600 | | | | (38,708 | ) |
LME Copper Forward | | | 35 | | | | 09/16/2024 | | | | 7,999,923 | | | | (585,974 | ) |
LME Copper Forward | | | 1 | | | | 09/18/2024 | | | | 228,569 | | | | (16,756 | ) |
LME Copper Forward | | | 1 | | | | 09/23/2024 | | | | 228,782 | | | | 1,611 | |
LME Copper Forward | | | 1 | | | | 10/02/2024 | | | | 229,170 | | | | (18,255 | ) |
LME Copper Forward | | | 1 | | | | 10/04/2024 | | | | 229,370 | | | | (20,043 | ) |
LME Copper Forward | | | 1 | | | | 10/08/2024 | | | | 229,451 | | | | 1,783 | |
LME Copper Forward | | | 1 | | | | 10/11/2024 | | | | 229,632 | | | | (15,768 | ) |
LME Copper Forward | | | 43 | | | | 10/14/2024 | | | | 9,875,272 | | | | (419,028 | ) |
LME Copper Forward | | | 1 | | | | 10/15/2024 | | | | 229,657 | | | | 2,108 | |
LME Copper Forward | | | 3 | | | | 10/16/2024 | | | | 688,972 | | | | 6,325 | |
LME Copper Forward | | | 1 | | | | 10/23/2024 | | | | 230,067 | | | | 2,018 | |
LME Copper Forward | | | 2 | | | | 11/04/2024 | | | | 460,996 | | | | (1,195 | ) |
LME Copper Forward | | | 1 | | | | 11/05/2024 | | | | 230,514 | | | | (614 | ) |
LME Copper Forward | | | 2 | | | | 11/06/2024 | | | | 461,060 | | | | (1,260 | ) |
LME Copper Forward | | | 3 | | | | 11/13/2024 | | | | 691,796 | | | | 12,559 | |
LME Copper Forward | | | 5 | | | | 11/18/2024 | | | | 1,153,710 | | | | (17,670 | ) |
LME Copper Forward | | | 1 | | | | 11/19/2024 | | | | 230,642 | | | | (1,121 | ) |
LME Copper Forward | | | 2 | | | | 11/20/2024 | | | | 461,284 | | | | 1,734 | |
LME Copper Forward | | | 1 | | | | 11/25/2024 | | | | 230,808 | | | | (4,454 | ) |
LME Copper Forward | | | 3 | | | | 11/27/2024 | | | | 692,625 | | | | (5,913 | ) |
LME Lead Forward | | | 2 | | | | 09/02/2024 | | | | 101,090 | | | | (12,060 | ) |
The accompanying notes are an integral part of the consolidated financial statements.
5
Abbey Capital Futures Strategy Fund
Consolidated Portfolio of Investments (Continued)
August 31, 2024
Description | | Contracts
Purchased | | | Expiration
Date | | | Notional | | | Value/
Unrealized
Appreciation
(Depreciation) | |
LME Lead Forward | | | 1 | | | | 09/03/2024 | | | $ | 50,558 | | | $ | (5,105 | ) |
LME Lead Forward | | | 2 | | | | 09/03/2024 | | | | 101,065 | | | | (13,560 | ) |
LME Lead Forward | | | 1 | | | | 09/04/2024 | | | | 50,570 | | | | (5,355 | ) |
LME Lead Forward | | | 3 | | | | 09/06/2024 | | | | 151,861 | | | | 1,085 | |
LME Lead Forward | | | 3 | | | | 09/09/2024 | | | | 151,898 | | | | 1,085 | |
LME Lead Forward | | | 3 | | | | 09/10/2024 | | | | 151,936 | | | | (3,838 | ) |
LME Lead Forward | | | 13 | | | | 09/11/2024 | | | | 658,551 | | | | (45,400 | ) |
LME Lead Forward | | | 5 | | | | 09/13/2024 | | | | 253,386 | | | | (22,833 | ) |
LME Lead Forward | | | 46 | | | | 09/16/2024 | | | | 2,331,383 | | | | (181,584 | ) |
LME Lead Forward | | | 7 | | | | 09/17/2024 | | | | 354,688 | | | | (32,237 | ) |
LME Lead Forward | | | 3 | | | | 09/18/2024 | | | | 151,972 | | | | (13,816 | ) |
LME Lead Forward | | | 3 | | | | 09/20/2024 | | | | 152,059 | | | | (13,691 | ) |
LME Lead Forward | | | 1 | | | | 09/23/2024 | | | | 50,694 | | | | (3,889 | ) |
LME Lead Forward | | | 1 | | | | 09/25/2024 | | | | 50,727 | | | | 221 | |
LME Lead Forward | | | 77 | | | | 10/14/2024 | | | | 3,928,251 | | | | (104,549 | ) |
LME Lead Forward | | | 1 | | | | 10/16/2024 | | | | 51,035 | | | | (664 | ) |
LME Lead Forward | | | 3 | | | | 10/18/2024 | | | | 153,202 | | | | (2,180 | ) |
LME Lead Forward | | | 3 | | | | 10/21/2024 | | | | 153,224 | | | | (2,195 | ) |
LME Lead Forward | | | 3 | | | | 10/22/2024 | | | | 153,246 | | | | (2,210 | ) |
LME Lead Forward | | | 20 | | | | 10/23/2024 | | | | 1,021,790 | | | | (8,311 | ) |
LME Lead Forward | | | 7 | | | | 10/25/2024 | | | | 357,833 | | | | 1,971 | |
LME Lead Forward | | | 5 | | | | 10/28/2024 | | | | 255,632 | | | | 1,258 | |
LME Lead Forward | | | 3 | | | | 10/29/2024 | | | | 153,401 | | | | (2,106 | ) |
LME Lead Forward | | | 6 | | | | 10/30/2024 | | | | 306,848 | | | | (4,211 | ) |
LME Lead Forward | | | 4 | | | | 11/12/2024 | | | | 204,949 | | | | 4,699 | |
LME Lead Forward | | | 2 | | | | 11/13/2024 | | | | 102,490 | | | | 927 | |
LME Lead Forward | | | 4 | | | | 11/18/2024 | | | | 205,127 | | | | (6,598 | ) |
LME Lead Forward | | | 1 | | | | 11/20/2024 | | | | 51,257 | | | | (768 | ) |
LME Lead Forward | | | 3 | | | | 11/25/2024 | | | | 153,917 | | | | (5,134 | ) |
LME Lead Forward | | | 3 | | | | 11/27/2024 | | | | 153,975 | | | | (2,275 | ) |
LME Nickel Forward | | | 2 | | | | 09/02/2024 | | | | 198,507 | | | | (5,337 | ) |
LME Nickel Forward | | | 1 | | | | 09/03/2024 | | | | 99,232 | | | | (17,300 | ) |
LME Nickel Forward | | | 2 | | | | 09/03/2024 | | | | 198,549 | | | | 2,887 | |
LME Nickel Forward | | | 3 | | | | 09/04/2024 | | | | 297,883 | | | | 8,439 | |
LME Nickel Forward | | | 1 | | | | 09/06/2024 | | | | 99,373 | | | | 5,554 | |
LME Nickel Forward | | | 2 | | | | 09/09/2024 | | | | 198,790 | | | | 2,880 | |
LME Nickel Forward | | | 1 | | | | 09/10/2024 | | | | 99,416 | | | | (2,679 | ) |
LME Nickel Forward | | | 4 | | | | 09/11/2024 | | | | 397,746 | | | | (2,454 | ) |
LME Nickel Forward | | | 3 | | | | 09/13/2024 | | | | 298,561 | | | | 225 | |
LME Nickel Forward | | | 34 | | | | 09/16/2024 | | | | 3,384,307 | | | | (23,366 | ) |
LME Nickel Forward | | | 1 | | | | 09/17/2024 | | | | 99,538 | | | | 5,556 | |
LME Nickel Forward | | | 3 | | | | 09/18/2024 | | | | 298,615 | | | | 181 | |
LME Nickel Forward | | | 1 | | | | 09/20/2024 | | | | 99,603 | | | | (2,695 | ) |
LME Nickel Forward | | | 1 | | | | 09/24/2024 | | | | 99,635 | | | | (2,701 | ) |
LME Nickel Forward | | | 1 | | | | 09/27/2024 | | | | 99,716 | | | | (1,555 | ) |
LME Nickel Forward | | | 41 | | | | 10/14/2024 | | | | 4,098,308 | | | | (43,060 | ) |
LME Nickel Forward | | | 1 | | | | 10/16/2024 | | | | 99,986 | | | | (1,585 | ) |
LME Nickel Forward | | | 2 | | | | 10/21/2024 | | | | 200,109 | | | | (3,180 | ) |
LME Nickel Forward | | | 1 | | | | 10/22/2024 | | | | 100,068 | | | | (1,591 | ) |
LME Nickel Forward | | | 14 | | | | 10/23/2024 | | | | 1,401,144 | | | | (22,278 | ) |
LME Nickel Forward | | | 2 | | | | 10/25/2024 | | | | 200,229 | | | | (3,165 | ) |
The accompanying notes are an integral part of the consolidated financial statements.
6
Abbey Capital Futures Strategy Fund
Consolidated Portfolio of Investments (Continued)
August 31, 2024
Description | | Contracts
Purchased | | | Expiration
Date | | | Notional | | | Value/
Unrealized
Appreciation
(Depreciation) | |
LME Nickel Forward | | | 1 | | | | 10/28/2024 | | | $ | 100,136 | | | $ | (1,582 | ) |
LME Nickel Forward | | | 3 | | | | 10/29/2024 | | | | 300,457 | | | | 245 | |
LME Nickel Forward | | | 1 | | | | 11/04/2024 | | | | 100,259 | | | | 2,519 | |
LME Nickel Forward | | | 2 | | | | 11/08/2024 | | | | 200,751 | | | | 4,191 | |
LME Nickel Forward | | | 3 | | | | 11/11/2024 | | | | 301,173 | | | | 7,293 | |
LME Nickel Forward | | | 1 | | | | 11/15/2024 | | | | 100,484 | | | | 1,094 | |
LME Nickel Forward | | | 4 | | | | 11/27/2024 | | | | 402,384 | | | | (5,136 | ) |
LME Tin Forward | | | 1 | | | | 09/03/2024 | | | | 162,549 | | | | (4,213 | ) |
LME Tin Forward | | | 2 | | | | 09/23/2024 | | | | 325,348 | | | | (2,724 | ) |
LME Tin Forward | | | 1 | | | | 10/08/2024 | | | | 162,714 | | | | (12,411 | ) |
LME Tin Forward | | | 2 | | | | 10/09/2024 | | | | 325,433 | | | | 9,051 | |
LME Tin Forward | | | 1 | | | | 10/18/2024 | | | | 162,567 | | | | (738 | ) |
LME Tin Forward | | | 1 | | | | 10/22/2024 | | | | 162,486 | | | | (783 | ) |
LME Tin Forward | | | 2 | | | | 10/23/2024 | | | | 324,890 | | | | 15,296 | |
LME Tin Forward | | | 1 | | | | 11/13/2024 | | | | 162,420 | | | | 4,245 | |
LME Tin Forward | | | 1 | | | | 11/20/2024 | | | | 162,230 | | | | (1,595 | ) |
LME Tin Forward | | | 2 | | | | 11/27/2024 | | | | 323,460 | | | | (2,015 | ) |
LME Zinc Forward | | | 1 | | | | 09/02/2024 | | | | 71,192 | | | | (1,437 | ) |
LME Zinc Forward | | | 1 | | | | 09/03/2024 | | | | 71,168 | | | | (3,320 | ) |
LME Zinc Forward | | | 1 | | | | 09/03/2024 | | | | 71,214 | | | | (686 | ) |
LME Zinc Forward | | | 7 | | | | 09/04/2024 | | | | 498,652 | | | | 8,820 | |
LME Zinc Forward | | | 2 | | | | 09/06/2024 | | | | 142,649 | | | | 5,766 | |
LME Zinc Forward | | | 1 | | | | 09/09/2024 | | | | 71,342 | | | | 4,867 | |
LME Zinc Forward | | | 2 | | | | 09/10/2024 | | | | 142,721 | | | | 9,734 | |
LME Zinc Forward | | | 5 | | | | 09/11/2024 | | | | 356,891 | | | | (7,745 | ) |
LME Zinc Forward | | | 3 | | | | 09/13/2024 | | | | 214,350 | | | | (4,359 | ) |
LME Zinc Forward | | | 66 | | | | 09/16/2024 | | | | 4,716,888 | | | | (31,866 | ) |
LME Zinc Forward | | | 11 | | | | 09/23/2024 | | | | 787,155 | | | | 3,284 | |
LME Zinc Forward | | | 3 | | | | 09/25/2024 | | | | 214,757 | | | | (6,819 | ) |
LME Zinc Forward | | | 2 | | | | 09/27/2024 | | | | 143,351 | | | | (3,949 | ) |
LME Zinc Forward | | | 1 | | | | 09/30/2024 | | | | 71,698 | | | | (1,777 | ) |
LME Zinc Forward | | | 7 | | | | 10/02/2024 | | | | 502,105 | | | | (4,358 | ) |
LME Zinc Forward | | | 3 | | | | 10/04/2024 | | | | 215,369 | | | | (8,581 | ) |
LME Zinc Forward | | | 2 | | | | 10/08/2024 | | | | 143,640 | | | | 12,670 | |
LME Zinc Forward | | | 96 | | | | 10/14/2024 | | | | 6,903,432 | | | | (29,597 | ) |
LME Zinc Forward | | | 2 | | | | 10/15/2024 | | | | 143,674 | | | | 12,573 | |
LME Zinc Forward | | | 1 | | | | 10/18/2024 | | | | 71,877 | | | | 464 | |
LME Zinc Forward | | | 1 | | | | 10/21/2024 | | | | 71,887 | | | | 6,256 | |
LME Zinc Forward | | | 9 | | | | 10/23/2024 | | | | 647,159 | | | | 19,157 | |
LME Zinc Forward | | | 8 | | | | 10/25/2024 | | | | 575,722 | | | | 50,020 | |
LME Zinc Forward | | | 6 | | | | 10/28/2024 | | | | 431,880 | | | | 31,739 | |
LME Zinc Forward | | | 3 | | | | 10/29/2024 | | | | 215,984 | | | | 1,391 | |
LME Zinc Forward | | | 1 | | | | 10/30/2024 | | | | 72,009 | | | | 464 | |
LME Zinc Forward | | | 4 | | | | 11/01/2024 | | | | 288,272 | | | | 1,854 | |
LME Zinc Forward | | | 3 | | | | 11/04/2024 | | | | 216,259 | | | | 1,391 | |
LME Zinc Forward | | | 2 | | | | 11/05/2024 | | | | 144,209 | | | | 927 | |
LME Zinc Forward | | | 2 | | | | 11/06/2024 | | | | 144,246 | | | | 8,383 | |
LME Zinc Forward | | | 2 | | | | 11/08/2024 | | | | 144,392 | | | | 6,054 | |
LME Zinc Forward | | | 2 | | | | 11/11/2024 | | | | 144,428 | | | | 9,653 | |
LME Zinc Forward | | | 2 | | | | 11/12/2024 | | | | 144,465 | | | | 7,727 | |
LME Zinc Forward | | | 2 | | | | 11/13/2024 | | | | 144,501 | | | | 7,276 | |
The accompanying notes are an integral part of the consolidated financial statements.
7
Abbey Capital Futures Strategy Fund
Consolidated Portfolio of Investments (Continued)
August 31, 2024
Description | | Contracts
Purchased | | | Expiration
Date | | | Notional | | | Value/
Unrealized
Appreciation
(Depreciation) | |
LME Zinc Forward | | | 1 | | | | 11/15/2024 | | | $ | 72,324 | | | $ | 2,299 | |
LME Zinc Forward | | | 36 | | | | 11/18/2024 | | | | 2,604,303 | | | | (820 | ) |
LME Zinc Forward | | | 4 | | | | 11/19/2024 | | | | 289,367 | | | | 3,630 | |
LME Zinc Forward | | | 7 | | | | 11/20/2024 | | | | 506,392 | | | | 2,255 | |
LME Zinc Forward | | | 3 | | | | 11/25/2024 | | | | 217,204 | | | | (2,246 | ) |
LME Zinc Forward | | | 12 | | | | 11/27/2024 | | | | 869,100 | | | | 4,313 | |
London Cocoa | | | 60 | | | | 12/12/2024 | | | | 4,201,513 | | | | (95,359 | ) |
London Cocoa | | | 19 | | | | 03/14/2025 | | | | 1,160,052 | | | | (44,350 | ) |
London Cocoa | | | 2 | | | | 05/14/2025 | | | | 116,516 | | | | (2,981 | ) |
London Metals - Aluminum | | | 2,991 | | | | 09/16/2024 | | | | 181,994,873 | | | | (4,714,230 | ) |
London Metals - Aluminum | | | 2 | | | | 10/14/2024 | | | | 122,486 | | | | (871 | ) |
London Metals - Aluminum | | | 1,130 | | | | 12/16/2024 | | | | 69,436,240 | | | | 1,954,620 | |
London Metals - Copper | | | 1,072 | | | | 09/16/2024 | | | | 245,026,223 | | | | (20,388,613 | ) |
London Metals - Copper | | | 1 | | | | 10/14/2024 | | | | 229,658 | | | | 7,489 | |
London Metals - Copper | | | 384 | | | | 12/16/2024 | | | | 88,920,187 | | | | 597,295 | |
London Metals - Lead | | | 648 | | | | 09/16/2024 | | | | 32,842,098 | | | | (1,963,558 | ) |
London Metals - Lead | | | 25 | | | | 12/16/2024 | | | | 1,288,256 | | | | (7,017 | ) |
London Metals - Nickel | | | 240 | | | | 09/16/2024 | | | | 23,889,226 | | | | (1,170,699 | ) |
London Metals - Nickel | | | 43 | | | | 12/16/2024 | | | | 4,339,421 | | | | (51,601 | ) |
London Metals - Tin | | | 1 | | | | 09/16/2024 | | | | 162,655 | | | | 2,555 | |
London Metals - Tin | | | 1 | | | | 12/16/2024 | | | | 161,780 | | | | 5,685 | |
London Metals - Zinc | | | 628 | | | | 09/16/2024 | | | | 44,881,904 | | | | (1,072,675 | ) |
London Metals - Zinc | | | 14 | | | | 10/14/2024 | | | | 1,006,751 | | | | 45,238 | |
London Metals - Zinc | | | 209 | | | | 12/16/2024 | | | | 15,173,400 | | | | 402,590 | |
Long Gilt | | | 1,601 | | | | 12/27/2024 | | | | 207,526,135 | | | | (464,646 | ) |
Low Sulphur Gas Oil | | | 24 | | | | 10/10/2024 | | | | 1,681,800 | | | | (70,400 | ) |
Mexican Peso/US Dollar Cross Currency Rate | | | 3 | | | | 09/16/2024 | | | | 76,020 | | | | (845 | ) |
Micro Gold | | | 26 | | | | 12/27/2024 | | | | 657,176 | | | | 27,483 | |
MSCI EAFE Index | | | 110 | | | | 09/20/2024 | | | | 13,521,750 | | | | 463,205 | |
MSCI Emerging Markets ESG Index | | | 2 | | | | 09/20/2024 | | | | 33,220 | | | | (135 | ) |
MSCI Emerging Markets Index | | | 389 | | | | 09/20/2024 | | | | 21,395,000 | | | | 23,735 | |
MSCI Singapore Index | | | 758 | | | | 09/27/2024 | | | | 18,671,911 | | | | 121,155 | |
Nasdaq 100 Index | | | 168 | | | | 09/20/2024 | | | | 65,933,280 | | | | (590,362 | ) |
NASDAQ 100 Micro Index | | | 4 | | | | 09/20/2024 | | | | 156,984 | | | | 2,531 | |
Natural Gas | | | 5 | | | | 09/27/2024 | | | | 163,976 | | | | 9,483 | |
New Zealand Dollar/US Dollar Cross Currency Rate | | | 292 | | | | 09/16/2024 | | | | 18,251,460 | | | | 11,215 | |
Nifty 50 Index | | | 787 | | | | 09/26/2024 | | | | 39,967,008 | | | | 338,947 | |
Nikkei 225 Index | | | 6 | | | | 09/12/2024 | | | | 1,170,450 | | | | 31,475 | |
Nikkei 225 Index | | | 6 | | | | 09/12/2024 | | | | 158,875 | | | | 1,084 | |
Nikkei 225 Index | | | 220 | | | | 09/12/2024 | | | | 29,112,114 | | | | 98,738 | |
Nikkei 225 Index | | | 9 | | | | 09/12/2024 | | | | 1,200,185 | | | | 12,259 | |
Nikkei 225 Index | | | 2 | | | | 09/12/2024 | | | | 529,585 | | | | 2,668 | |
NY Harbor ULSD | | | 49 | | | | 09/30/2024 | | | | 4,688,741 | | | | (42,101 | ) |
NYSE FANG+ Index | | | 3 | | | | 09/20/2024 | | | | 166,923 | | | | (9,187 | ) |
OMXS30 ESG Index | | | 7 | | | | 09/20/2024 | | | | 172,305 | | | | 3,579 | |
OMXS30 Index | | | 768 | | | | 09/20/2024 | | | | 19,444,577 | | | | 568,343 | |
Platinum | | | 244 | | | | 10/29/2024 | | | | 11,372,840 | | | | (413,825 | ) |
Reformulated Gasoline Blendstock | | | 2 | | | | 09/30/2024 | | | | 175,829 | | | | (1,218 | ) |
Robusta Coffee | | | 315 | | | | 11/25/2024 | | | | 15,586,200 | | | | 2,242,760 | |
Robusta Coffee | | | 79 | | | | 01/27/2025 | | | | 3,735,910 | | | | 517,340 | |
Russell 2000 Index | | | 2 | | | | 09/20/2024 | | | | 22,231 | | | | 637 | |
The accompanying notes are an integral part of the consolidated financial statements.
8
Abbey Capital Futures Strategy Fund
Consolidated Portfolio of Investments (Continued)
August 31, 2024
Description | | Contracts
Purchased | | | Expiration
Date | | | Notional | | | Value/
Unrealized
Appreciation
(Depreciation) | |
Russell 2000 Index | | | 421 | | | | 09/20/2024 | | | $ | 46,796,255 | | | $ | 310,388 | |
S&P 500 Index | | | 5 | | | | 09/20/2024 | | | | 141,525 | | | | 6,999 | |
S&P 500 Index | | | 642 | | | | 09/20/2024 | | | | 181,718,100 | | | | 2,633,081 | |
S&P Mid Cap 400 Index | | | 53 | | | | 09/20/2024 | | | | 16,419,930 | | | | 304,785 | |
S&P Real Estate Select Sector Stock Index | | | 9 | | | | 09/20/2024 | | | | 479,925 | | | | 20,125 | |
S&P/Toronto Stock Exchange 60 Index | | | 429 | | | | 09/19/2024 | | | | 89,253,901 | | | | 2,393,457 | |
SGX FTSE Taiwan Index | | | 172 | | | | 09/27/2024 | | | | 12,853,560 | | | | 11,306 | |
SGX Technically Specified Rubber 20 | | | 2 | | | | 09/30/2024 | | | | 18,230 | | | | 775 | |
Short Euro-BTP Fu Dec24 | | | 3 | | | | 12/06/2024 | | | | 354,402 | | | | (88 | ) |
Short-term Euro-BTP | | | 1,973 | | | | 09/06/2024 | | | | 231,486,453 | | | | 506,970 | |
Silver | | | 183 | | | | 12/27/2024 | | | | 26,665,845 | | | | (819,066 | ) |
Silver | | | 6 | | | | 03/27/2025 | | | | 885,990 | | | | (27,075 | ) |
South African Rand/US Dollar Cross Currency Rate | | | 4 | | | | 09/16/2024 | | | | 112,050 | | | | 3,263 | |
Soybean Meal | | | 1,213 | | | | 12/13/2024 | | | | 37,966,900 | | | | 111,456 | |
STOXX 600 Bank Spread Index | | | 15 | | | | 09/20/2024 | | | | 167,344 | | | | 6,428 | |
STOXX 600 Utilities Index | | | 16 | | | | 09/20/2024 | | | | 352,844 | | | | 22,268 | |
STOXX Euro ESG-X Index | | | 57 | | | | 09/20/2024 | | | | 1,234,323 | | | | 13,541 | |
STOXX Europe 600 Index | | | 186 | | | | 09/20/2024 | | | | 5,406,367 | | | | 95,235 | |
Sugar #11 | | | 228 | | | | 09/30/2024 | | | | 4,948,877 | | | | (31,695 | ) |
Swiss Franc/US Dollar Cross Currency Rate | | | 482 | | | | 09/16/2024 | | | | 70,977,513 | | | | 224,509 | |
Swiss Government Bonds | | | 2 | | | | 09/06/2024 | | | | 353,532 | | | | (1,882 | ) |
Technology Select Sector Index | | | 1 | | | | 09/20/2024 | | | | 222,500 | | | | (2,020 | ) |
Tokyo Price Index | | | 13 | | | | 09/12/2024 | | | | 241,477 | | | | 2,952 | |
TOPIX Index | | | 39 | | | | 09/12/2024 | | | | 7,244,305 | | | | 117,518 | |
Two Year Canadian Government Bonds | | | 752 | | | | 12/18/2024 | | | | 58,350,937 | | | | (101,877 | ) |
U.S. Treasury 10 Year Notes | | | 2,247 | | | | 12/19/2024 | | | | 255,174,937 | | | | (1,242,728 | ) |
U.S. Treasury 2 Year Notes | | | 1,679 | | | | 12/31/2024 | | | | 348,471,205 | | | | (404,819 | ) |
U.S. Treasury 5 Year Note | | | 2,263 | | | | 12/31/2024 | | | | 247,568,665 | | | | (687,155 | ) |
U.S. Treasury Long Bonds | | | 823 | | | | 12/19/2024 | | | | 101,331,875 | | | | (1,053,570 | ) |
U.S. Treasury Ultra Bonds | | | 150 | | | | 12/19/2024 | | | | 19,790,625 | | | | (293,648 | ) |
UK Natural Gas | | | 15 | | | | 09/27/2024 | | | | 587,174 | | | | 2,809 | |
UK Natural Gas | | | 15 | | | | 10/30/2024 | | | | 617,225 | | | | 19,148 | |
US 3 Year Notes | | | 3 | | | | 12/31/2024 | | | | 637,430 | | | | (1,453 | ) |
US Cocoa | | | 176 | | | | 12/13/2024 | | | | 13,500,960 | | | | 843,595 | |
US Cocoa | | | 43 | | | | 03/14/2025 | | | | 2,773,070 | | | | 60,450 | |
US Dollar/Chinese Renminbi Cross Currency Rate | | | 6 | | | | 09/16/2024 | | | | 598,455 | | | | (9,192 | ) |
US Dollar/Norwegian Krone Cross Currency Rate | | | 9 | | | | 09/16/2024 | | | | 900,853 | | | | (2,911 | ) |
US Dollar/Swedish Krona Cross Currency Rate | | | 4 | | | | 09/16/2024 | | | | 399,848 | | | | (6,065 | ) |
Utilities Select Sector Index | | | 10 | | | | 09/20/2024 | | | | 770,700 | | | | 59,980 | |
Wheat | | | 382 | | | | 12/13/2024 | | | | 10,533,650 | | | | 326,619 | |
XAV Health Care Select Sector Index | | | 5 | | | | 09/20/2024 | | | | 795,050 | | | | 46,920 | |
| | | | | | | | | | | | | | | $ | (9,610,529 | ) |
Description | | Contracts
Sold | | | Expiration
Date | | | Notional | | | Value/
Unrealized
Appreciation
(Depreciation) | |
1 Month Secured Overnight Financing Rate | | | (12) | | | | 01/31/2025 | | | $ | 4,782,383 | | | $ | 2,125 | |
10 Year Japanese Government Bonds | | | (9) | | | | 09/11/2024 | | | | 891,135 | | | | (1,908 | ) |
3 Month Canadian Overnight Repo Rate Average | | | (158) | | | | 06/17/2025 | | | | 28,334,249 | | | | 4,350 | |
The accompanying notes are an integral part of the consolidated financial statements.
9
Abbey Capital Futures Strategy Fund
Consolidated Portfolio of Investments (Continued)
August 31, 2024
Description | | Contracts
Sold | | | Expiration
Date | | | Notional | | | Value/
Unrealized
Appreciation
(Depreciation) | |
3 Month Euribor | | | (191) | | | | 03/17/2025 | | | $ | 51,402,573 | | | $ | (105,801 | ) |
3 Month Euribor | | | (511) | | | | 12/15/2025 | | | | 138,143,412 | | | | (467,377 | ) |
3-Month Secured Overnight Financing Rate | | | (335) | | | | 09/16/2025 | | | | 80,860,625 | | | | (471,613 | ) |
Arabica Coffee | | | (40) | | | | 12/18/2024 | | | | 3,660,750 | | | | (84,900 | ) |
ASX SPI 200 Index | | | (50) | | | | 09/19/2024 | | | | 6,809,967 | | | | (51,204 | ) |
AUD/USD Cross Currency Rate | | | (1,896) | | | | 09/16/2024 | | | | 128,349,720 | | | | (1,874,290 | ) |
Australian 90 Day Bank Bills | | | (2) | | | | 03/13/2025 | | | | 1,340,906 | | | | 1 | |
BIST 30 Index | | | (550) | | | | 10/31/2024 | | | | 1,855,596 | | | | (48,673 | ) |
Brazilian Real/US Dollar Cross Currency Rate | | | (4) | | | | 09/30/2024 | | | | 70,580 | | | | 1,300 | |
Brent Crude Oil | | | (3) | | | | 09/30/2024 | | | | 230,790 | | | | 1,840 | |
Brent Crude Oil | | | (105) | | | | 09/30/2024 | | | | 8,077,650 | | | | 133,378 | |
Brent Crude Oil | | | (45) | | | | 10/31/2024 | | | | 3,430,800 | | | | 30,020 | |
Brent Crude Oil | | | (33) | | | | 11/29/2024 | | | | 2,498,760 | | | | 24,390 | |
British Pound/US Dollar Cross Currency Rate | | | (139) | | | | 09/16/2024 | | | | 11,402,344 | | | | (310,739 | ) |
CAC40 10 Euro Index | | | (159) | | | | 09/20/2024 | | | | 13,443,774 | | | | (570,892 | ) |
Canadian 10 Year Government Bonds | | | (1,238) | | | | 12/18/2024 | | | | 113,047,364 | | | | 820,495 | |
Canadian Canola Oil | | | (491) | | | | 11/14/2024 | | | | 4,479,170 | | | | (98,487 | ) |
Canadian Canola Oil | | | (54) | | | | 01/14/2025 | | | | 499,910 | | | | (14,832 | ) |
Canadian Dollar/US Dollar Cross Currency Rate | | | (1,655) | | | | 09/17/2024 | | | | 122,776,175 | | | | (1,449,455 | ) |
Copper | | | (538) | | | | 12/27/2024 | | | | 56,644,675 | | | | 54,613 | |
Corn No. 2 Yellow | | | (2,406) | | | | 12/13/2024 | | | | 48,240,300 | | | | 2,878,675 | |
Corn No. 2 Yellow | | | (1,419) | | | | 03/14/2025 | | | | 29,728,050 | | | | 616,538 | |
Corn No. 2 Yellow | | | (82) | | | | 05/14/2025 | | | | 1,755,825 | | | | 96,288 | |
Cotton No.2 | | | (862) | | | | 12/06/2024 | | | | 30,165,690 | | | | 1,326,745 | |
Cotton No.2 | | | (98) | | | | 03/07/2025 | | | | 3,510,850 | | | | 46,625 | |
Crude Oil | | | (124) | | | | 09/20/2024 | | | | 9,120,200 | | | | 201,550 | |
Crude Oil | | | (13) | | | | 10/22/2024 | | | | 944,450 | | | | 6,820 | |
Crude Oil | | | (99) | | | | 11/20/2024 | | | | 7,117,110 | | | | 76,890 | |
Crude Oil | | | (13) | | | | 12/19/2024 | | | | 927,680 | | | | 24,110 | |
Crude Oil | | | (6) | | | | 01/21/2025 | | | | 425,820 | | | | 5,250 | |
Crude Palm Oil | | | (7) | | | | 12/13/2024 | | | | 159,717 | | | | (11,243 | ) |
Crude Soybean Oil | | | (1,267) | | | | 12/13/2024 | | | | 31,936,002 | | | | 680,646 | |
Crude Soybean Oil | | | (162) | | | | 01/14/2025 | | | | 4,088,232 | | | | 140,634 | |
Crude Soybean Oil | | | (11) | | | | 03/14/2025 | | | | 278,520 | | | | 13,500 | |
Dollar Index | | | (420) | | | | 09/16/2024 | | | | 42,682,080 | | | | (83,140 | ) |
Euro STOXX 50 Quanto Index | | | (197) | | | | 09/20/2024 | | | | 10,825,037 | | | | (572,675 | ) |
Euro/Pound Sterling Cross Currency Rate | | | (2) | | | | 09/16/2024 | | | | 276,663 | | | | 1,642 | |
Euro/US Dollar Cross Currency Rate | | | (912) | | | | 09/16/2024 | | | | 126,078,300 | | | | (2,907,247 | ) |
Euro-BOBL | | | (88) | | | | 09/06/2024 | | | | 11,446,372 | | | | 12,767 | |
Euro-BOBL | | | (676) | | | | 12/06/2024 | | | | 88,892,898 | | | | 28,530 | |
Euro-BTP Italian Government Bonds | | | (1) | | | | 09/06/2024 | | | | 131,399 | | | | 107 | |
Euro-Bund | | | (251) | | | | 09/06/2024 | | | | 37,154,049 | | | | (373,526 | ) |
Euro-Bund | | | (182) | | | | 12/06/2024 | | | | 26,837,783 | | | | 17,498 | |
Euro-Schatz | | | (655) | | | | 09/06/2024 | | | | 76,914,442 | | | | (479,698 | ) |
European Rapeseed | | | (126) | | | | 10/31/2024 | | | | 3,274,830 | | | | (110,692 | ) |
European Rapeseed | | | (20) | | | | 01/31/2025 | | | | 521,472 | | | | (12,532 | ) |
Feeder Cattle | | | (74) | | | | 10/31/2024 | | | | 8,796,750 | | | | (3,450 | ) |
Feeder Cattle | | | (15) | | | | 11/21/2024 | | | | 1,764,375 | | | | 475 | |
Feeder Cattle | | | (1) | | | | 01/30/2025 | | | | 116,125 | | | | 938 | |
French Government Bonds | | | (5) | | | | 09/06/2024 | | | | 696,789 | | | | (671 | ) |
FTSE 100 Index | | | (407) | | | | 09/20/2024 | | | | 44,832,324 | | | | 93,323 | |
The accompanying notes are an integral part of the consolidated financial statements.
10
Abbey Capital Futures Strategy Fund
Consolidated Portfolio of Investments (Continued)
August 31, 2024
Description | | Contracts
Sold | | | Expiration
Date | | | Notional | | | Value/
Unrealized
Appreciation
(Depreciation) | |
FTSE China A50 Index | | | (1,821) | | | | 09/27/2024 | | | $ | 21,396,750 | | | $ | (100,940 | ) |
German Stock Index | | | (60) | | | | 09/20/2024 | | | | 31,422,650 | | | | (1,144,255 | ) |
Gold | | | (99) | | | | 12/27/2024 | | | | 25,023,240 | | | | (237,190 | ) |
Hang Seng Index | | | (115) | | | | 09/27/2024 | | | | 13,236,105 | | | | (143,726 | ) |
Hang Seng TECH Index | | | (102) | | | | 09/27/2024 | | | | 2,336,851 | | | | (81,510 | ) |
Hard Red Winter Wheat | | | (552) | | | | 12/13/2024 | | | | 15,600,900 | | | | 119,184 | |
Hard Red Winter Wheat | | | (89) | | | | 03/14/2025 | | | | 2,570,987 | | | | 28,225 | |
ICE 3 Month SONIA Rate | | | (56) | | | | 03/17/2026 | | | | 17,710,522 | | | | (18,485 | ) |
ICE European Climate Exchange Emissions | | | (20) | | | | 12/16/2024 | | | | 1,554,192 | | | | (89,803 | ) |
Indian Rupee/US Dollar Cross Currency Rate | | | (8) | | | | 09/26/2024 | | | | 190,688 | | | | (128 | ) |
Indian Rupee/US Dollar Cross Currency Rate | | | (2) | | | | 09/26/2024 | | | | 119,120 | | | | (40 | ) |
Japanese 10 Year Government Bonds | | | (62) | | | | 09/12/2024 | | | | 61,376,565 | | | | (426,226 | ) |
Japanese Yen/US Dollar Cross Currency Rate | | | (438) | | | | 09/16/2024 | | | | 37,558,500 | | | | (13,089 | ) |
Lean Hogs | | | (15) | | | | 10/14/2024 | | | | 493,350 | | | | (49,590 | ) |
Lean Hogs | | | (168) | | | | 12/13/2024 | | | | 4,890,480 | | | | (229,710 | ) |
Lean Hogs | | | (197) | | | | 02/14/2025 | | | | 5,939,550 | | | | (223,190 | ) |
Light Sweet Crude Oil | | | (8) | | | | 09/19/2024 | | | | 294,200 | | | | 8,838 | |
Live Cattle | | | (5) | | | | 10/31/2024 | | | | 357,200 | | | | (2,090 | ) |
Live Cattle | | | (18) | | | | 12/31/2024 | | | | 1,278,360 | | | | (2,290 | ) |
Live Cattle | | | (99) | | | | 02/28/2025 | | | | 7,066,620 | | | | (250 | ) |
Live Cattle | | | (14) | | | | 04/30/2025 | | | | 1,008,980 | | | | 3,660 | |
LME Aluminum Forward | | | (1) | | | | 09/02/2024 | | | | 60,611 | | | | 5,589 | |
LME Aluminum Forward | | | (1) | | | | 09/03/2024 | | | | 60,591 | | | | (4,239 | ) |
LME Aluminum Forward | | | (3) | | | | 09/06/2024 | | | | 182,182 | | | | 10,831 | |
LME Aluminum Forward | | | (2) | | | | 09/09/2024 | | | | 121,493 | | | | 5,657 | |
LME Aluminum Forward | | | (2) | | | | 09/10/2024 | | | | 121,532 | | | | 5,218 | |
LME Aluminum Forward | | | (8) | | | | 09/11/2024 | | | | 486,238 | | | | 11,594 | |
LME Aluminum Forward | | | (3) | | | | 09/13/2024 | | | | 182,502 | | | | 3,561 | |
LME Aluminum Forward | | | (142) | | | | 09/16/2024 | | | | 8,640,345 | | | | 138,823 | |
LME Aluminum Forward | | | (4) | | | | 09/17/2024 | | | | 243,390 | | | | 6,623 | |
LME Aluminum Forward | | | (5) | | | | 09/18/2024 | | | | 304,305 | | | | 9,133 | |
LME Aluminum Forward | | | (18) | | | | 09/23/2024 | | | | 1,096,717 | | | | (75,672 | ) |
LME Aluminum Forward | | | (1) | | | | 09/25/2024 | | | | 60,956 | | | | 1,782 | |
LME Aluminum Forward | | | (2) | | | | 10/02/2024 | | | | 122,125 | | | | 4,325 | |
LME Aluminum Forward | | | (245) | | | | 10/14/2024 | | | | 15,004,596 | | | | (815,370 | ) |
LME Aluminum Forward | | | (6) | | | | 10/15/2024 | | | | 366,859 | | | | 7,428 | |
LME Aluminum Forward | | | (10) | | | | 10/16/2024 | | | | 610,432 | | | | 9,361 | |
LME Aluminum Forward | | | (3) | | | | 10/18/2024 | | | | 183,012 | | | | (9,637 | ) |
LME Aluminum Forward | | | (3) | | | | 10/21/2024 | | | | 182,953 | | | | (9,153 | ) |
LME Aluminum Forward | | | (4) | | | | 10/22/2024 | | | | 243,994 | | | | (13,626 | ) |
LME Aluminum Forward | | | (19) | | | | 10/23/2024 | | | | 1,159,242 | | | | (78,755 | ) |
LME Aluminum Forward | | | (4) | | | | 10/25/2024 | | | | 244,280 | | | | (17,967 | ) |
LME Aluminum Forward | | | (5) | | | | 10/28/2024 | | | | 305,421 | | | | (27,796 | ) |
LME Aluminum Forward | | | (4) | | | | 10/29/2024 | | | | 244,417 | | | | (14,629 | ) |
LME Aluminum Forward | | | (4) | | | | 10/30/2024 | | | | 244,497 | | | | (15,172 | ) |
LME Aluminum Forward | | | (5) | | | | 11/01/2024 | | | | 305,611 | | | | (23,311 | ) |
LME Aluminum Forward | | | (2) | | | | 11/04/2024 | | | | 122,242 | | | | (8,492 | ) |
LME Aluminum Forward | | | (2) | | | | 11/06/2024 | | | | 122,165 | | | | (6,428 | ) |
LME Aluminum Forward | | | (3) | | | | 11/08/2024 | | | | 183,319 | | | | (632 | ) |
LME Aluminum Forward | | | (1) | | | | 11/11/2024 | | | | 61,112 | | | | 1,200 | |
LME Aluminum Forward | | | (6) | | | | 11/13/2024 | | | | 366,675 | | | | (113 | ) |
The accompanying notes are an integral part of the consolidated financial statements.
11
Abbey Capital Futures Strategy Fund
Consolidated Portfolio of Investments (Continued)
August 31, 2024
Description | | Contracts
Sold | | | Expiration
Date | | | Notional | | | Value/
Unrealized
Appreciation
(Depreciation) | |
LME Aluminum Forward | | | (2) | | | | 11/15/2024 | | | $ | 122,262 | | | $ | 2,438 | |
LME Aluminum Forward | | | (157) | | | | 11/18/2024 | | | | 9,597,606 | | | | 78,642 | |
LME Aluminum Forward | | | (1) | | | | 11/20/2024 | | | | 61,101 | | | | 1,961 | |
LME Aluminum Forward | | | (5) | | | | 11/25/2024 | | | | 305,787 | | | | 6,213 | |
LME Aluminum Forward | | | (15) | | | | 11/27/2024 | | | | 917,625 | | | | 18,738 | |
LME Copper Forward | | | (1) | | | | 09/02/2024 | | | | 227,998 | | | | 21,627 | |
LME Copper Forward | | | (1) | | | | 09/03/2024 | | | | 227,953 | | | | 24,984 | |
LME Copper Forward | | | (1) | | | | 09/04/2024 | | | | 228,087 | | | | (1,610 | ) |
LME Copper Forward | | | (4) | | | | 09/09/2024 | | | | 913,236 | | | | 46,041 | |
LME Copper Forward | | | (3) | | | | 09/10/2024 | | | | 685,060 | | | | 53,177 | |
LME Copper Forward | | | (9) | | | | 09/11/2024 | | | | 2,055,505 | | | | 131,029 | |
LME Copper Forward | | | (3) | | | | 09/13/2024 | | | | 685,600 | | | | 35,250 | |
LME Copper Forward | | | (35) | | | | 09/16/2024 | | | | 7,999,923 | | | | 521,492 | |
LME Copper Forward | | | (1) | | | | 09/18/2024 | | | | 228,569 | | | | (1,672 | ) |
LME Copper Forward | | | (1) | | | | 09/23/2024 | | | | 228,782 | | | | 12,782 | |
LME Copper Forward | | | (1) | | | | 10/02/2024 | | | | 229,170 | | | | (1,693 | ) |
LME Copper Forward | | | (1) | | | | 10/04/2024 | | | | 229,370 | | | | (1,766 | ) |
LME Copper Forward | | | (1) | | | | 10/08/2024 | | | | 229,451 | | | | 15,674 | |
LME Copper Forward | | | (1) | | | | 10/11/2024 | | | | 229,632 | | | | (1,914 | ) |
LME Copper Forward | | | (43) | | | | 10/14/2024 | | | | 9,875,272 | | | | (60,421 | ) |
LME Copper Forward | | | (1) | | | | 10/15/2024 | | | | 229,657 | | | | 11,618 | |
LME Copper Forward | | | (3) | | | | 10/16/2024 | | | | 688,972 | | | | 15,090 | |
LME Copper Forward | | | (1) | | | | 10/23/2024 | | | | 230,067 | | | | 568 | |
LME Copper Forward | | | (2) | | | | 11/04/2024 | | | | 460,996 | | | | (18,208 | ) |
LME Copper Forward | | | (1) | | | | 11/05/2024 | | | | 230,514 | | | | (10,114 | ) |
LME Copper Forward | | | (2) | | | | 11/06/2024 | | | | 461,060 | | | | (18,010 | ) |
LME Copper Forward | | | (1) | | | | 11/08/2024 | | | | 230,580 | | | | (6,443 | ) |
LME Copper Forward | | | (4) | | | | 11/13/2024 | | | | 922,395 | | | | (7,926 | ) |
LME Copper Forward | | | (1) | | | | 11/15/2024 | | | | 230,742 | | | | (143 | ) |
LME Copper Forward | | | (18) | | | | 11/18/2024 | | | | 4,153,356 | | | | 23,454 | |
LME Copper Forward | | | (2) | | | | 11/20/2024 | | | | 461,284 | | | | 1,305 | |
LME Copper Forward | | | (1) | | | | 11/25/2024 | | | | 230,808 | | | | 629 | |
LME Copper Forward | | | (2) | | | | 11/27/2024 | | | | 461,750 | | | | 4,375 | |
LME Lead Forward | | | (2) | | | | 09/02/2024 | | | | 101,090 | | | | 4,293 | |
LME Lead Forward | | | (1) | | | | 09/03/2024 | | | | 50,558 | | | | (362 | ) |
LME Lead Forward | | | (2) | | | | 09/03/2024 | | | | 101,065 | | | | 4,212 | |
LME Lead Forward | | | (1) | | | | 09/04/2024 | | | | 50,570 | | | | (362 | ) |
LME Lead Forward | | | (3) | | | | 09/06/2024 | | | | 151,861 | | | | 14,127 | |
LME Lead Forward | | | (3) | | | | 09/09/2024 | | | | 151,898 | | | | 11,427 | |
LME Lead Forward | | | (3) | | | | 09/10/2024 | | | | 151,936 | | | | 11,427 | |
LME Lead Forward | | | (13) | | | | 09/11/2024 | | | | 658,551 | | | | 40,799 | |
LME Lead Forward | | | (5) | | | | 09/13/2024 | | | | 253,386 | | | | 13,386 | |
LME Lead Forward | | | (46) | | | | 09/16/2024 | | | | 2,331,383 | | | | 149,011 | |
LME Lead Forward | | | (7) | | | | 09/17/2024 | | | | 354,688 | | | | 18,650 | |
LME Lead Forward | | | (3) | | | | 09/18/2024 | | | | 151,972 | | | | (971 | ) |
LME Lead Forward | | | (3) | | | | 09/20/2024 | | | | 152,060 | | | | (947 | ) |
LME Lead Forward | | | (1) | | | | 09/23/2024 | | | | 50,694 | | | | (285 | ) |
LME Lead Forward | | | (1) | | | | 09/25/2024 | | | | 50,727 | | | | 4,348 | |
LME Lead Forward | | | (77) | | | | 10/14/2024 | | | | 3,928,251 | | | | 30,658 | |
LME Lead Forward | | | (1) | | | | 10/16/2024 | | | | 51,035 | | | | 2,565 | |
LME Lead Forward | | | (3) | | | | 10/18/2024 | | | | 153,202 | | | | 4,011 | |
The accompanying notes are an integral part of the consolidated financial statements.
12
Abbey Capital Futures Strategy Fund
Consolidated Portfolio of Investments (Continued)
August 31, 2024
Description | | Contracts
Sold | | | Expiration
Date | | | Notional | | | Value/
Unrealized
Appreciation
(Depreciation) | |
LME Lead Forward | | | (3) | | | | 10/21/2024 | | | $ | 153,224 | | | $ | 1,051 | |
LME Lead Forward | | | (3) | | | | 10/22/2024 | | | | 153,246 | | | | 1,129 | |
LME Lead Forward | | | (20) | | | | 10/23/2024 | | | | 1,021,790 | | | | (2,215 | ) |
LME Lead Forward | | | (7) | | | | 10/25/2024 | | | | 357,833 | | | | 4,655 | |
LME Lead Forward | | | (5) | | | | 10/28/2024 | | | | 255,633 | | | | (683 | ) |
LME Lead Forward | | | (3) | | | | 10/29/2024 | | | | 153,401 | | | | 1,536 | |
LME Lead Forward | | | (7) | | | | 10/30/2024 | | | | 357,989 | | | | 4,786 | |
LME Lead Forward | | | (1) | | | | 11/04/2024 | | | | 51,178 | | | | (2,178 | ) |
LME Lead Forward | | | (1) | | | | 11/05/2024 | | | | 51,186 | | | | (1,911 | ) |
LME Lead Forward | | | (2) | | | | 11/06/2024 | | | | 102,386 | | | | (2,461 | ) |
LME Lead Forward | | | (5) | | | | 11/08/2024 | | | | 256,113 | | | | 3,029 | |
LME Lead Forward | | | (2) | | | | 11/11/2024 | | | | 102,460 | | | | 1,526 | |
LME Lead Forward | | | (6) | | | | 11/12/2024 | | | | 307,424 | | | | 2,754 | |
LME Lead Forward | | | (6) | | | | 11/13/2024 | | | | 307,469 | | | | 4,640 | |
LME Lead Forward | | | (61) | | | | 11/18/2024 | | | | 3,128,187 | | | | 40,269 | |
LME Lead Forward | | | (1) | | | | 11/20/2024 | | | | 51,257 | | | | 550 | |
LME Lead Forward | | | (15) | | | | 11/27/2024 | | | | 769,875 | | | | 11,438 | |
LME Nickel Forward | | | (2) | | | | 09/02/2024 | | | | 198,507 | | | | 31,293 | |
LME Nickel Forward | | | (2) | | | | 09/03/2024 | | | | 198,549 | | | | 25,041 | |
LME Nickel Forward | | | (1) | | | | 09/03/2024 | | | | 99,232 | | | | 18,068 | |
LME Nickel Forward | | | (3) | | | | 09/04/2024 | | | | 297,883 | | | | 31,337 | |
LME Nickel Forward | | | (1) | | | | 09/06/2024 | | | | 99,373 | | | | 8,477 | |
LME Nickel Forward | | | (2) | | | | 09/09/2024 | | | | 198,790 | | | | 15,380 | |
LME Nickel Forward | | | (1) | | | | 09/10/2024 | | | | 99,416 | | | | 8,524 | |
LME Nickel Forward | | | (4) | | | | 09/11/2024 | | | | 397,746 | | | | 25,644 | |
LME Nickel Forward | | | (3) | | | | 09/13/2024 | | | | 298,561 | | | | 13,589 | |
LME Nickel Forward | | | (34) | | | | 09/16/2024 | | | | 3,384,307 | | | | 131,914 | |
LME Nickel Forward | | | (1) | | | | 09/17/2024 | | | | 99,538 | | | | 4,022 | |
LME Nickel Forward | | | (3) | | | | 09/18/2024 | | | | 298,615 | | | | 13,235 | |
LME Nickel Forward | | | (1) | | | | 09/20/2024 | | | | 99,603 | | | | 4,137 | |
LME Nickel Forward | | | (1) | | | | 09/24/2024 | | | | 99,635 | | | | 3,655 | |
LME Nickel Forward | | | (1) | | | | 09/27/2024 | | | | 99,716 | | | | 4,804 | |
LME Nickel Forward | | | (41) | | | | 10/14/2024 | | | | 4,098,308 | | | | (1,243 | ) |
LME Nickel Forward | | | (1) | | | | 10/16/2024 | | | | 99,986 | | | | (1,106 | ) |
LME Nickel Forward | | | (2) | | | | 10/21/2024 | | | | 200,109 | | | | (6,849 | ) |
LME Nickel Forward | | | (1) | | | | 10/22/2024 | | | | 100,068 | | | | (4,368 | ) |
LME Nickel Forward | | | (14) | | | | 10/23/2024 | | | | 1,401,144 | | | | (75,144 | ) |
LME Nickel Forward | | | (2) | | | | 10/25/2024 | | | | 200,229 | | | | (9,579 | ) |
LME Nickel Forward | | | (1) | | | | 10/28/2024 | | | | 100,136 | | | | (4,736 | ) |
LME Nickel Forward | | | (3) | | | | 10/29/2024 | | | | 300,457 | | | | 4,589 | |
LME Nickel Forward | | | (1) | | | | 10/30/2024 | | | | 100,169 | | | | (2,159 | ) |
LME Nickel Forward | | | (1) | | | | 11/04/2024 | | | | 100,259 | | | | 1,576 | |
LME Nickel Forward | | | (2) | | | | 11/05/2024 | | | | 200,556 | | | | (954 | ) |
LME Nickel Forward | | | (3) | | | | 11/06/2024 | | | | 300,893 | | | | (26 | ) |
LME Nickel Forward | | | (4) | | | | 11/08/2024 | | | | 401,503 | | | | 1,687 | |
LME Nickel Forward | | | (5) | | | | 11/11/2024 | | | | 501,956 | | | | 3,388 | |
LME Nickel Forward | | | (2) | | | | 11/13/2024 | | | | 200,844 | | | | (2,003 | ) |
LME Nickel Forward | | | (2) | | | | 11/15/2024 | | | | 200,967 | | | | (56 | ) |
LME Nickel Forward | | | (47) | | | | 11/18/2024 | | | | 4,722,594 | | | | 41,973 | |
LME Nickel Forward | | | (1) | | | | 11/19/2024 | | | | 100,475 | | | | 1,548 | |
LME Nickel Forward | | | (1) | | | | 11/20/2024 | | | | 100,475 | | | | 1,548 | |
The accompanying notes are an integral part of the consolidated financial statements.
13
Abbey Capital Futures Strategy Fund
Consolidated Portfolio of Investments (Continued)
August 31, 2024
Description | | Contracts
Sold | | | Expiration
Date | | | Notional | | | Value/
Unrealized
Appreciation
(Depreciation) | |
LME Nickel Forward | | | (6) | | | | 11/27/2024 | | | $ | 603,576 | | | $ | 8,244 | |
LME Tin Forward | | | (1) | | | | 09/02/2024 | | | | 162,540 | | | | (2,365 | ) |
LME Tin Forward | | | (1) | | | | 09/03/2024 | | | | 162,549 | | | | (3,549 | ) |
LME Tin Forward | | | (2) | | | | 09/23/2024 | | | | 325,348 | | | | (33,138 | ) |
LME Tin Forward | | | (1) | | | | 10/08/2024 | | | | 162,714 | | | | 561 | |
LME Tin Forward | | | (2) | | | | 10/09/2024 | | | | 325,433 | | | | 14,167 | |
LME Tin Forward | | | (1) | | | | 10/18/2024 | | | | 162,567 | | | | (11,292 | ) |
LME Tin Forward | | | (1) | | | | 10/22/2024 | | | | 162,486 | | | | (12,186 | ) |
LME Tin Forward | | | (2) | | | | 10/23/2024 | | | | 324,890 | | | | (30,865 | ) |
LME Tin Forward | | | (1) | | | | 11/20/2024 | | | | 162,230 | | | | 785 | |
LME Tin Forward | | | (1) | | | | 11/27/2024 | | | | 161,730 | | | | 1,295 | |
LME Zinc Forward | | | (1) | | | | 09/02/2024 | | | | 71,192 | | | | 1,758 | |
LME Zinc Forward | | | (1) | | | | 09/03/2024 | | | | 71,214 | | | | 736 | |
LME Zinc Forward | | | (1) | | | | 09/03/2024 | | | | 71,168 | | | | 1,444 | |
LME Zinc Forward | | | (7) | | | | 09/04/2024 | | | | 498,652 | | | | (2,902 | ) |
LME Zinc Forward | | | (2) | | | | 09/06/2024 | | | | 142,649 | | | | (4,864 | ) |
LME Zinc Forward | | | (1) | | | | 09/09/2024 | | | | 71,342 | | | | (1,705 | ) |
LME Zinc Forward | | | (2) | | | | 09/10/2024 | | | | 142,721 | | | | (33 | ) |
LME Zinc Forward | | | (5) | | | | 09/11/2024 | | | | 356,891 | | | | (9,770 | ) |
LME Zinc Forward | | | (3) | | | | 09/13/2024 | | | | 214,350 | | | | (4,413 | ) |
LME Zinc Forward | | | (66) | | | | 09/16/2024 | | | | 4,716,888 | | | | 88,984 | |
LME Zinc Forward | | | (11) | | | | 09/23/2024 | | | | 787,155 | | | | (58,874 | ) |
LME Zinc Forward | | | (3) | | | | 09/25/2024 | | | | 214,757 | | | | (10,392 | ) |
LME Zinc Forward | | | (2) | | | | 09/27/2024 | | | | 143,351 | | | | (3,717 | ) |
LME Zinc Forward | | | (1) | | | | 09/30/2024 | | | | 71,698 | | | | (463 | ) |
LME Zinc Forward | | | (7) | | | | 10/02/2024 | | | | 502,105 | | | | (38,414 | ) |
LME Zinc Forward | | | (3) | | | | 10/04/2024 | | | | 215,369 | | | | (19,007 | ) |
LME Zinc Forward | | | (2) | | | | 10/08/2024 | | | | 143,640 | | | | 3,098 | |
LME Zinc Forward | | | (96) | | | | 10/14/2024 | | | | 6,903,432 | | | | (513,385 | ) |
LME Zinc Forward | | | (2) | | | | 10/15/2024 | | | | 143,674 | | | | (886 | ) |
LME Zinc Forward | | | (1) | | | | 10/18/2024 | | | | 71,877 | | | | (3,252 | ) |
LME Zinc Forward | | | (1) | | | | 10/21/2024 | | | | 71,887 | | | | (4,749 | ) |
LME Zinc Forward | | | (9) | | | | 10/23/2024 | | | | 647,159 | | | | (25,396 | ) |
LME Zinc Forward | | | (8) | | | | 10/25/2024 | | | | 575,722 | | | | (32,485 | ) |
LME Zinc Forward | | | (6) | | | | 10/28/2024 | | | | 431,880 | | | | (38,443 | ) |
LME Zinc Forward | | | (3) | | | | 10/29/2024 | | | | 215,984 | | | | (13,534 | ) |
LME Zinc Forward | | | (1) | | | | 10/30/2024 | | | | 72,009 | | | | (5,109 | ) |
LME Zinc Forward | | | (4) | | | | 11/01/2024 | | | | 288,272 | | | | (29,360 | ) |
LME Zinc Forward | | | (3) | | | | 11/04/2024 | | | | 216,259 | | | | (20,846 | ) |
LME Zinc Forward | | | (2) | | | | 11/05/2024 | | | | 144,209 | | | | (16,659 | ) |
LME Zinc Forward | | | (3) | | | | 11/06/2024 | | | | 216,368 | | | | (13,809 | ) |
LME Zinc Forward | | | (4) | | | | 11/08/2024 | | | | 288,783 | | | | (4,685 | ) |
LME Zinc Forward | | | (1) | | | | 11/11/2024 | | | | 72,214 | | | | (463 | ) |
LME Zinc Forward | | | (1) | | | | 11/12/2024 | | | | 72,232 | | | | (463 | ) |
LME Zinc Forward | | | (1) | | | | 11/13/2024 | | | | 72,251 | | | | (463 | ) |
LME Zinc Forward | | | (1) | | | | 11/15/2024 | | | | 72,324 | | | | (462 | ) |
LME Zinc Forward | | | (33) | | | | 11/18/2024 | | | | 2,387,278 | | | | (64,199 | ) |
LME Zinc Forward | | | (4) | | | | 11/19/2024 | | | | 289,367 | | | | (1,849 | ) |
LME Zinc Forward | | | (3) | | | | 11/20/2024 | | | | 217,025 | | | | (1,387 | ) |
LME Zinc Forward | | | (4) | | | | 11/27/2024 | | | | 289,700 | | | | (1,150 | ) |
London Cocoa | | | (3) | | | | 03/14/2025 | | | | 183,166 | | | | 946 | |
The accompanying notes are an integral part of the consolidated financial statements.
14
Abbey Capital Futures Strategy Fund
Consolidated Portfolio of Investments (Continued)
August 31, 2024
Description | | Contracts
Sold | | | Expiration
Date | | | Notional | | | Value/
Unrealized
Appreciation
(Depreciation) | |
London Metals - Aluminum | | | (2,991) | | | | 09/16/2024 | | | $ | 181,994,873 | | | $ | 3,041,123 | |
London Metals - Aluminum | | | (5) | | | | 10/14/2024 | | | | 306,216 | | | | (17,591 | ) |
London Metals - Aluminum | | | (1,197) | | | | 12/16/2024 | | | | 73,553,256 | | | | (4,277,813 | ) |
London Metals - Copper | | | (1,072) | | | | 09/16/2024 | | | | 245,026,223 | | | | 16,649,814 | |
London Metals - Copper | | | (386) | | | | 12/16/2024 | | | | 89,383,313 | | | | (1,840,434 | ) |
London Metals - Lead | | | (648) | | | | 09/16/2024 | | | | 32,842,098 | | | | 1,842,321 | |
London Metals - Lead | | | (3) | | | | 10/14/2024 | | | | 153,049 | | | | (1,530 | ) |
London Metals - Lead | | | (296) | | | | 12/16/2024 | | | | 15,252,954 | | | | (184,481 | ) |
London Metals - Nickel | | | (240) | | | | 09/16/2024 | | | | 23,889,226 | | | | 1,335,738 | |
London Metals - Nickel | | | (4) | | | | 10/14/2024 | | | | 399,835 | | | | (8,551 | ) |
London Metals - Nickel | | | (161) | | | | 12/16/2024 | | | | 16,247,599 | | | | (235,940 | ) |
London Metals - Tin | | | (1) | | | | 09/16/2024 | | | | 162,655 | | | | (6,655 | ) |
London Metals - Zinc | | | (628) | | | | 09/16/2024 | | | | 44,881,904 | | | | (1,999,651 | ) |
London Metals - Zinc | | | (10) | | | | 10/14/2024 | | | | 719,108 | | | | 27,913 | |
London Metals - Zinc | | | (10) | | | | 11/18/2024 | | | | 723,418 | | | | (33,030 | ) |
London Metals - Zinc | | | (192) | | | | 12/16/2024 | | | | 13,939,200 | | | | (751,351 | ) |
Long Gilt | | | (157) | | | | 12/27/2024 | | | | 20,350,783 | | | | 194,080 | |
Low Sulphur Gas Oil | | | (175) | | | | 10/10/2024 | | | | 12,263,125 | | | | 336,396 | |
Low Sulphur Gas Oil | | | (70) | | | | 11/12/2024 | | | | 4,894,750 | | | | 156,525 | |
Low Sulphur Gas Oil | | | (55) | | | | 12/12/2024 | | | | 3,830,750 | | | | 143,150 | |
Low Sulphur Gas Oil | | | (20) | | | | 01/10/2025 | | | | 1,392,000 | | | | 54,225 | |
Lumber | | | (4) | | | | 11/15/2024 | | | | 56,925 | | | | (434 | ) |
Maize | | | (9) | | | | 11/05/2024 | | | | 99,113 | | | | (1,271 | ) |
Mexican Peso/US Dollar Cross Currency Rate | | | (497) | | | | 09/16/2024 | | | | 12,593,980 | | | | 330,368 | |
Milling Wheat No. 2 | | | (10) | | | | 09/10/2024 | | | | 113,718 | | | | (525 | ) |
Milling Wheat No. 2 | | | (581) | | | | 12/10/2024 | | | | 6,952,219 | | | | 103,023 | |
Milling Wheat No. 2 | | | (661) | | | | 03/10/2025 | | | | 8,165,230 | | | | 135,149 | |
Milling Wheat No. 2 | | | (32) | | | | 05/12/2025 | | | | 402,808 | | | | 4,836 | |
MSCI China A 50 Index | | | (4) | | | | 09/20/2024 | | | | 186,540 | | | | (4,240 | ) |
Natural Gas | | | (15) | | | | 09/25/2024 | | | | 79,762 | | | | 3,850 | |
Natural Gas | | | (813) | | | | 09/26/2024 | | | | 17,292,510 | | | | 1,351,877 | |
Natural Gas | | | (750) | | | | 10/29/2024 | | | | 18,735,000 | | | | 2,084,530 | |
Natural Gas | | | (287) | | | | 11/26/2024 | | | | 8,716,190 | | | | 612,750 | |
Natural Gas | | | (185) | | | | 12/27/2024 | | | | 6,158,650 | | | | 378,570 | |
New Zealand Dollar/US Dollar Cross Currency Rate | | | (73) | | | | 09/16/2024 | | | | 4,562,865 | | | | (162,722 | ) |
Nikkei 225 Index | | | (7) | | | | 09/12/2024 | | | | 1,853,547 | | | | (35,912 | ) |
NY Harbor ULSD | | | (575) | | | | 09/30/2024 | | | | 55,020,945 | | | | 1,598,446 | |
NY Harbor ULSD | | | (70) | | | | 10/31/2024 | | | | 6,743,478 | | | | 205,195 | |
NY Harbor ULSD | | | (71) | | | | 11/29/2024 | | | | 6,862,775 | | | | 252,773 | |
NY Harbor ULSD | | | (34) | | | | 12/31/2024 | | | | 3,296,395 | | | | 92,434 | |
Oats | | | (5) | | | | 12/13/2024 | | | | 84,500 | | | | (4,588 | ) |
OMXS30 Index | | | (59) | | | | 09/20/2024 | | | | 1,493,789 | | | | (39,555 | ) |
Palladium | | | (59) | | | | 12/27/2024 | | | | 5,680,520 | | | | (141,770 | ) |
Phelix DE Baseload Quarterly | | | (1) | | | | 09/26/2024 | | | | 237,712 | | | | 7,081 | |
Platinum | | | (169) | | | | 10/29/2024 | | | | 7,877,090 | | | | 29,080 | |
Red Spring Wheat | | | (187) | | | | 12/13/2024 | | | | 5,614,675 | | | | 34,675 | |
Red Spring Wheat | | | (55) | | | | 03/14/2025 | | | | 1,709,813 | | | | (33,813 | ) |
Reformulated Gasoline Blendstock | | | (233) | | | | 09/30/2024 | | | | 20,484,055 | | | | 399,616 | |
Reformulated Gasoline Blendstock | | | (60) | | | | 10/31/2024 | | | | 5,177,592 | | | | 18,803 | |
Reformulated Gasoline Blendstock | | | (32) | | | | 11/29/2024 | | | | 2,717,030 | | | | 20,630 | |
Reformulated Gasoline Blendstock | | | (25) | | | | 12/31/2024 | | | | 2,108,190 | | | | 34,784 | |
The accompanying notes are an integral part of the consolidated financial statements.
15
Abbey Capital Futures Strategy Fund
Consolidated Portfolio of Investments (Continued)
August 31, 2024
Description | | Contracts
Sold | | | Expiration
Date | | | Notional | | | Value/
Unrealized
Appreciation
(Depreciation) | |
Rough Rice | | | (17) | | | | 11/14/2024 | | | $ | 502,690 | | | $ | 5,950 | |
Russell 2000 Index | | | (1) | | | | 09/20/2024 | | | | 111,155 | | | | (1,390 | ) |
S&P 500 Index | | | (34) | | | | 09/20/2024 | | | | 9,623,700 | | | | (198,950 | ) |
SGX TSI Iron Ore | | | (214) | | | | 09/30/2024 | | | | 2,158,832 | | | | (143,407 | ) |
SGX TSI Iron Ore | | | (300) | | | | 10/30/2024 | | | | 3,030,900 | | | | (46,500 | ) |
SGX TSI Iron Ore | | | (104) | | | | 11/29/2024 | | | | 1,051,232 | | | | (23,580 | ) |
SGX TSI Iron Ore | | | (64) | | | | 12/31/2024 | | | | 646,848 | | | | (20,865 | ) |
Silver | | | (16) | | | | 12/27/2024 | | | | 2,331,440 | | | | 36,810 | |
Soybean Meal | | | (841) | | | | 12/13/2024 | | | | 26,323,300 | | | | 554,540 | |
Soybean Meal | | | (200) | | | | 01/14/2025 | | | | 6,278,000 | | | | 313,800 | |
Soybeans | | | (1,198) | | | | 11/14/2024 | | | | 59,900,000 | | | | 3,859,674 | |
Soybeans | | | (115) | | | | 01/14/2025 | | | | 5,847,750 | | | | 611,438 | |
Soybeans | | | (486) | | | | 03/14/2025 | | | | 25,071,525 | | | | 919,250 | |
Sugar #11 | | | (1,000) | | | | 09/30/2024 | | | | 21,705,600 | | | | (748,669 | ) |
Sugar #11 | | | (448) | | | | 02/28/2025 | | | | 9,864,602 | | | | (426,440 | ) |
Sugar #11 | | | (123) | | | | 04/30/2025 | | | | 2,598,154 | | | | (132,765 | ) |
Sugar #11 | | | (12) | | | | 06/30/2025 | | | | 246,758 | | | | (8,366 | ) |
Swiss Franc/US Dollar Cross Currency Rate | | | (18) | | | | 09/16/2024 | | | | 2,650,613 | | | | (124,975 | ) |
TOPIX Index | | | (3) | | | | 09/12/2024 | | | | 557,254 | | | | (33,792 | ) |
Turkish Dollar | | | (161) | | | | 09/30/2024 | | | | 166,708 | | | | 201 | |
U.S. Treasury 10 Year Notes | | | (1,645) | | | | 12/19/2024 | | | | 186,810,312 | | | | 644,609 | |
U.S. Treasury 2 Year Notes | | | (75) | | | | 12/31/2024 | | | | 15,566,016 | | | | 23,539 | |
U.S. Treasury 5 Year Note | | | (66) | | | | 12/31/2024 | | | | 7,220,297 | | | | 16,406 | |
U.S. Treasury Ultra Bonds | | | (9) | | | | 12/19/2024 | | | | 1,187,438 | | | | 6,561 | |
UK Natural Gas | | | (5) | | | | 09/27/2024 | | | | 195,725 | | | | (4,804 | ) |
Wheat | | | (1,296) | | | | 12/13/2024 | | | | 35,737,200 | | | | 1,913,663 | |
Wheat | | | (161) | | | | 03/14/2025 | | | | 4,606,613 | | | | 53,075 | |
Wheat | | | (23) | | | | 05/14/2025 | | | | 671,313 | | | | (450 | ) |
White Sugar | | | (26) | | | | 09/13/2024 | | | | 710,840 | | | | (21,675 | ) |
White Sugar | | | (221) | | | | 11/15/2024 | | | | 5,889,650 | | | | (221,745 | ) |
White Sugar | | | (74) | | | | 02/13/2025 | | | | 1,954,710 | | | | (69,705 | ) |
WTI Light Sweet Crude Oil | | | (7) | | | | 10/21/2024 | | | | 508,550 | | | | 6,310 | |
WTI Light Sweet Crude Oil | | | (5) | | | | 11/19/2024 | | | | 359,450 | | | | 490 | |
WTI Light Sweet Crude Oil | | | (5) | | | | 12/18/2024 | | | | 356,800 | | | | (1,270 | ) |
WTI Light Sweet Crude Oil | | | (6) | | | | 01/17/2025 | | | | 425,820 | | | | 5,410 | |
| | | | | | | | | | | | | | | $ | 22,814,132 | |
Total Futures Contracts | | | | | | | | | | | | | | $ | 13,203,603 | |
The accompanying notes are an integral part of the consolidated financial statements.
16
Abbey Capital Futures Strategy Fund
Consolidated Portfolio of Investments (Continued)
August 31, 2024
Forward foreign currency contracts outstanding as of August 31, 2024 were as follows:
Settlement
Date | Currency
Purchased | | |
| | Currency
Sold | | |
| | | Counterparty | | | Value/
Unrealized
Appreciation
(Depreciation) | |
09/25/2024 | AUD | | | 30,600,000 | | | | | | CAD | | | 28,042,115 | | | | | | Bank of America | | $ | (100,270 | ) |
09/25/2024 | AUD | | | 4,129,862 | | | | | | EUR | | | 2,500,000 | | | | | | Bank of America | | | 30,340 | |
09/03/2024 | AUD | | | 1,450,756 | | | | | | GBP | | | 750,000 | | | | | | Bank of America | | | (2,970 | ) |
09/25/2024 | AUD | | | 3,648,508 | | | | | | GBP | | | 1,875,000 | | | | | | Bank of America | | | 8,069 | |
09/25/2024 | AUD | | | 9,000,000 | | | | | | JPY | | | 880,896,270 | | | | | | Bank of America | | | 47,131 | |
09/25/2024 | AUD | | | 34,200,000 | | | | | | NZD | | | 37,565,796 | | | | | | Bank of America | | | (322,777 | ) |
09/03/2024 | AUD | | | 89,673,991 | | | | | | USD | | | 60,923,626 | | | | | | Bank of America | | | (220,768 | ) |
09/18/2024 | AUD | | | 134,105,000 | | | | | | USD | | | 90,206,152 | | | | | | Bank of America | | | 607,065 | |
09/25/2024 | AUD | | | 25,200,000 | | | | | | USD | | | 17,119,042 | | | | | | Bank of America | | | (51,259 | ) |
10/17/2024 | AUD | | | 100,089,000 | | | | | | USD | | | 65,083,658 | | | | | | Bank of America | | | 2,738,299 | |
09/04/2024 | BRL | | | 123,585,561 | | | | | | USD | | | 22,082,960 | | | | | | Bank of America | | | (165,020 | ) |
10/02/2024 | BRL | | | 68,828,011 | | | | | | USD | | | 12,500,000 | | | | | | Bank of America | | | (334,523 | ) |
09/25/2024 | CAD | | | 731,715 | | | | | | AUD | | | 800,000 | | | | | | Bank of America | | | 1,573 | |
09/03/2024 | CAD | | | 2,303,057 | | | | | | EUR | | | 1,542,335 | | | | | | Bank of America | | | 3,966 | |
09/25/2024 | CAD | | | 3,944,210 | | | | | | EUR | | | 2,625,000 | | | | | | Bank of America | | | 24,036 | |
09/25/2024 | CAD | | | 4,800,000 | | | | | | JPY | | | 515,832,338 | | | | | | Bank of America | | | 22,849 | |
09/03/2024 | CAD | | | 178,511,938 | | | | | | USD | | | 132,327,638 | | | | | | Bank of America | | | 151,984 | |
09/18/2024 | CAD | | | 163,621,297 | | | | | | USD | | | 120,171,489 | | | | | | Bank of America | | | 1,315,100 | |
09/18/2024 | CHF | | | 9,140,910 | | | | | | EUR | | | 9,700,000 | | | | | | Bank of America | | | 45,762 | |
09/25/2024 | CHF | | | 15,948,714 | | | | | | EUR | | | 16,750,000 | | | | | | Bank of America | | | 282,118 | |
09/25/2024 | CHF | | | 1,254,740 | | | | | | GBP | | | 1,125,000 | | | | | | Bank of America | | | 2,777 | |
09/25/2024 | CHF | | | 10,250,000 | | | | | | JPY | | | 1,746,442,750 | | | | | | Bank of America | | | 103,454 | |
09/03/2024 | CHF | | | 47,307,653 | | | | | | USD | | | 56,202,492 | | | | | | Bank of America | | | (523,391 | ) |
09/18/2024 | CHF | | | 64,006,654 | | | | | | USD | | | 74,676,471 | | | | | | Bank of America | | | 789,667 | |
09/25/2024 | CHF | | | 11,750,000 | | | | | | USD | | | 13,685,032 | | | | | | Bank of America | | | 180,047 | |
10/17/2024 | CHF | | | 10,064,000 | | | | | | USD | | | 11,940,044 | | | | | | Bank of America | | | (31,493 | ) |
09/03/2024 | CLP | | | 191,196,000 | | | | | | USD | | | 202,892 | | | | | | Bank of America | | | 6,343 | |
09/05/2024 | CLP | | | 188,113,299 | | | | | | USD | | | 200,000 | | | | | | Bank of America | | | 5,855 | |
09/06/2024 | CLP | | | 285,011,490 | | | | | | USD | | | 300,000 | | | | | | Bank of America | | | 11,887 | |
09/09/2024 | CLP | | | 286,827,690 | | | | | | USD | | | 300,000 | | | | | | Bank of America | | | 13,860 | |
09/12/2024 | CLP | | | 184,002,820 | | | | | | USD | | | 200,000 | | | | | | Bank of America | | | 1,335 | |
09/13/2024 | CLP | | | 366,741,880 | | | | | | USD | | | 400,000 | | | | | | Bank of America | | | 1,281 | |
09/16/2024 | CLP | | | 182,923,660 | | | | | | USD | | | 200,000 | | | | | | Bank of America | | | 142 | |
09/23/2024 | CLP | | | 6,048,581,684 | | | | | | USD | | | 6,550,000 | | | | | | Bank of America | | | 67,223 | |
09/27/2024 | CLP | | | 274,172,000 | | | | | | USD | | | 300,000 | | | | | | Bank of America | | | (71 | ) |
09/03/2024 | CNH | | | 39,940,360 | | | | | | USD | | | 5,633,748 | | | | | | Bank of America | | | 3,082 | |
09/19/2024 | CNH | | | 242,228,901 | | | | | | USD | | | 33,994,031 | | | | | | Bank of America | | | 258,056 | |
09/25/2024 | CNH | | | 70,386,846 | | | | | | USD | | | 9,900,000 | | | | | | Bank of America | | | 60,316 | |
09/03/2024 | COP | | | 820,394,632 | | | | | | USD | | | 200,000 | | | | | | Bank of America | | | (3,930 | ) |
09/06/2024 | COP | | | 1,648,000,800 | | | | | | USD | | | 400,000 | | | | | | Bank of America | | | (6,361 | ) |
09/18/2024 | COP | | | 18,199,005,645 | | | | | | USD | | | 4,450,000 | | | | | | Bank of America | | | (109,948 | ) |
09/20/2024 | COP | | | 403,272,316 | | | | | | USD | | | 100,000 | | | | | | Bank of America | | | (3,854 | ) |
09/23/2024 | COP | | | 1,209,162,000 | | | | | | USD | | | 300,000 | | | | | | Bank of America | | | (11,834 | ) |
09/27/2024 | COP | | | 832,662,000 | | | | | | USD | | | 200,000 | | | | | | Bank of America | | | (1,666 | ) |
09/18/2024 | CZK | | | 110,384,088 | | | | | | EUR | | | 4,400,000 | | | | | | Bank of America | | | 8,141 | |
09/03/2024 | CZK | | | 4,514,672 | | | | | | USD | | | 200,000 | | | | | | Bank of America | | | (638 | ) |
09/25/2024 | CZK | | | 2,241,657 | | | | | | USD | | | 100,000 | | | | | | Bank of America | | | (961 | ) |
09/25/2024 | EUR | | | 14,125,000 | | | | | | AUD | | | 23,277,390 | | | | | | Bank of America | | | (133,268 | ) |
09/03/2024 | EUR | | | 542,335 | | | | | | CAD | | | 809,791 | | | | | | Bank of America | | | (1,366 | ) |
The accompanying notes are an integral part of the consolidated financial statements.
17
Abbey Capital Futures Strategy Fund
Consolidated Portfolio of Investments (Continued)
August 31, 2024
Settlement
Date | Currency
Purchased | | |
| Currency
Sold | | |
| | | Counterparty | | | Value/
Unrealized
Appreciation
(Depreciation) | |
09/25/2024 | EUR | | | 24,000,000 | | | | | | CAD | | | 36,246,802 | | | | | | Bank of America | | $ | (357,480 | ) |
09/18/2024 | EUR | | | 10,650,000 | | | | | | CHF | | | 10,078,026 | | | | | | Bank of America | | | (99,612 | ) |
09/18/2024 | EUR | | | 5,750,000 | | | | | | CZK | | | 145,067,457 | | | | | | Bank of America | | | (46,664 | ) |
09/03/2024 | EUR | | | 2,744,593 | | | | | | GBP | | | 2,308,569 | | | | | | Bank of America | | | 2,422 | |
09/18/2024 | EUR | | | 650,000 | | | | | | GBP | | | 556,402 | | | | | | Bank of America | | | (11,726 | ) |
09/25/2024 | EUR | | | 8,200,000 | | | | | | GBP | | | 6,970,712 | | | | | | Bank of America | | | (81,816 | ) |
09/18/2024 | EUR | | | 1,300,000 | | | | | | HUF | | | 515,323,473 | | | | | | Bank of America | | | (10,267 | ) |
09/25/2024 | EUR | | | 1,700,000 | | | | | | HUF | | | 673,125,798 | | | | | | Bank of America | | | (10,242 | ) |
09/18/2024 | EUR | | | 9,150,000 | | | | | | JPY | | | 1,473,877,774 | | | | | | Bank of America | | | 13,386 | |
09/25/2024 | EUR | | | 9,200,000 | | | | | | JPY | | | 1,492,956,588 | | | | | | Bank of America | | | (69,325 | ) |
09/03/2024 | EUR | | | 772,863 | | | | | | NOK | | | 9,000,000 | | | | | | Bank of America | | | 5,786 | |
09/18/2024 | EUR | | | 60,271,326 | | | | | | NOK | | | 720,463,129 | | | | | | Bank of America | | | (1,278,879 | ) |
09/25/2024 | EUR | | | 14,375,000 | | | | | | NOK | | | 168,285,207 | | | | | | Bank of America | | | 32,593 | |
09/03/2024 | EUR | | | 649,573 | | | | | | PLN | | | 2,783,793 | | | | | | Bank of America | | | (402 | ) |
09/18/2024 | EUR | | | 4,207,433 | | | | | | PLN | | | 18,238,239 | | | | | | Bank of America | | | (51,772 | ) |
09/03/2024 | EUR | | | 1,586,411 | | | | | | SEK | | | 18,000,000 | | | | | | Bank of America | | | 569 | |
09/18/2024 | EUR | | | 25,822,688 | | | | | | SEK | | | 298,325,587 | | | | | | Bank of America | | | (513,425 | ) |
09/25/2024 | EUR | | | 13,625,000 | | | | | | SEK | | | 155,647,436 | | | | | | Bank of America | | | (100,007 | ) |
09/03/2024 | EUR | | | 62,616,464 | | | | | | USD | | | 69,666,282 | | | | | | Bank of America | | | (437,369 | ) |
09/18/2024 | EUR | | | 136,878,000 | | | | | | USD | | | 151,112,115 | | | | | | Bank of America | | | 324,327 | |
09/25/2024 | EUR | | | 17,875,000 | | | | | | USD | | | 19,849,331 | | | | | | Bank of America | | | (66,805 | ) |
10/17/2024 | EUR | | | 129,983,000 | | | | | | USD | | | 143,218,864 | | | | | | Bank of America | | | 789,707 | |
09/25/2024 | GBP | | | 14,875,000 | | | | | | AUD | | | 28,707,634 | | | | | | Bank of America | | | 96,638 | |
09/03/2024 | GBP | | | 709,246 | | | | | | EUR | | | 841,906 | | | | | | Bank of America | | | 689 | |
09/18/2024 | GBP | | | 39,008,834 | | | | | | EUR | | | 45,750,000 | | | | | | Bank of America | | | 623,967 | |
09/25/2024 | GBP | | | 31,166,036 | | | | | | EUR | | | 36,500,000 | | | | | | Bank of America | | | 545,284 | |
09/25/2024 | GBP | | | 5,625,000 | | | | | | JPY | | | 1,069,016,119 | | | | | | Bank of America | | | 48,926 | |
09/03/2024 | GBP | | | 78,055,314 | | | | | | USD | | | 103,166,708 | | | | | | Bank of America | | | (651,191 | ) |
09/18/2024 | GBP | | | 148,008,000 | | | | | | USD | | | 190,678,149 | | | | | | Bank of America | | | 3,737,444 | |
09/25/2024 | GBP | | | 17,062,500 | | | | | | USD | | | 22,171,401 | | | | | | Bank of America | | | 242,265 | |
10/17/2024 | GBP | | | 780,000 | | | | | | USD | | | 990,465 | | | | | | Bank of America | | | 34,294 | |
09/18/2024 | HUF | | | 2,801,197,898 | | | | | | EUR | | | 7,100,000 | | | | | | Bank of America | | | 18,797 | |
09/25/2024 | HUF | | | 78,849,868 | | | | | | EUR | | | 200,000 | | | | | | Bank of America | | | 246 | |
09/03/2024 | HUF | | | 637,197,023 | | | | | | USD | | | 1,800,000 | | | | | | Bank of America | | | (7,979 | ) |
09/25/2024 | HUF | | | 1,059,925,000 | | | | | | USD | | | 3,000,000 | | | | | | Bank of America | | | (21,337 | ) |
10/17/2024 | HUF | | | 2,737,500,000 | | | | | | USD | | | 7,494,087 | | | | | | Bank of America | | | 193,092 | |
09/18/2024 | IDR | | | 73,212,914,177 | | | | | | USD | | | 4,700,000 | | | | | | Bank of America | | | 33,515 | |
09/27/2024 | IDR | | | 62,049,872,000 | | | | | | USD | | | 4,000,000 | | | | | | Bank of America | | | 10,383 | |
09/03/2024 | ILS | | | 2,541,274 | | | | | | USD | | | 700,000 | | | | | | Bank of America | | | (1,102 | ) |
09/18/2024 | ILS | | | 17,618,036 | | | | | | USD | | | 4,750,000 | | | | | | Bank of America | | | 98,257 | |
09/06/2024 | INR | | | 1,672,493,008 | | | | | | USD | | | 19,936,904 | | | | | | Bank of America | | | 726 | |
09/09/2024 | INR | | | 1,001,074 | | | | | | USD | | | 11,914 | | | | | | Bank of America | | | 19 | |
09/18/2024 | INR | | | 386,249,238 | | | | | | USD | | | 4,600,000 | | | | | | Bank of America | | | 2,651 | |
09/03/2024 | JPY | | | 85,591,264 | | | | | | CHF | | | 500,000 | | | | | | Bank of America | | | (2,658 | ) |
09/25/2024 | JPY | | | 169,635,710 | | | | | | CHF | | | 1,000,000 | | | | | | Bank of America | | | (15,236 | ) |
09/18/2024 | JPY | | | 917,239,146 | | | | | | EUR | | | 5,700,000 | | | | | | Bank of America | | | (14,610 | ) |
09/25/2024 | JPY | | | 23,834,409 | | | | | | GBP | | | 125,000 | | | | | | Bank of America | | | (548 | ) |
09/03/2024 | JPY | | | 354,086,003 | | | | | | USD | | | 2,430,196 | | | | | | Bank of America | | | (6,689 | ) |
09/18/2024 | JPY | | | 12,765,676,584 | | | | | | USD | | | 86,894,758 | | | | | | Bank of America | | | 669,240 | |
10/17/2024 | JPY | | | 14,900,700,000 | | | | | | USD | | | 103,809,801 | | | | | | Bank of America | | | (1,153,731 | ) |
09/05/2024 | KRW | | | 6,813,641,595 | | | | | | USD | | | 5,000,000 | | | | | | Bank of America | | | 102,699 | |
The accompanying notes are an integral part of the consolidated financial statements.
18
Abbey Capital Futures Strategy Fund
Consolidated Portfolio of Investments (Continued)
August 31, 2024
Settlement
Date | Currency
Purchased | | |
| | Currency
Sold | | |
| | | Counterparty | | | Value/
Unrealized
Appreciation
(Depreciation) | |
09/09/2024 | KRW | | | 25,366,131,890 | | | | | | USD | | | 18,600,000 | | | | | | Bank of America | | $ | 401,683 | |
09/19/2024 | KRW | | | 31,715,181,268 | | | | | | USD | | | 23,750,000 | | | | | | Bank of America | | | 23,685 | |
09/23/2024 | KRW | | | 7,858,464,185 | | | | | | USD | | | 5,900,000 | | | | | | Bank of America | | | (7,717 | ) |
09/27/2024 | KRW | | | 2,399,004,000 | | | | | | USD | | | 1,800,000 | | | | | | Bank of America | | | (741 | ) |
09/30/2024 | KRW | | | 3,201,295,090 | | | | | | USD | | | 2,400,000 | | | | | | Bank of America | | | 1,452 | |
10/04/2024 | KRW | | | 4,796,802,724 | | | | | | USD | | | 3,600,000 | | | | | | Bank of America | | | (778 | ) |
09/18/2024 | MXN | | | 328,720,654 | | | | | | USD | | | 17,701,398 | | | | | | Bank of America | | | (1,059,840 | ) |
10/17/2024 | MXN | | | 430,000 | | | | | | USD | | | 21,855 | | | | | | Bank of America | | | (184 | ) |
09/03/2024 | NOK | | | 20,645,554 | | | | | | EUR | | | 1,773,138 | | | | | | Bank of America | | | (13,527 | ) |
09/18/2024 | NOK | | | 534,319,737 | | | | | | EUR | | | 45,607,484 | | | | | | Bank of America | | | (56,379 | ) |
09/03/2024 | NOK | | | 5,500,000 | | | | | | SEK | | | 5,351,029 | | | | | | Bank of America | | | (2,595 | ) |
09/03/2024 | NOK | | | 99,867,446 | | | | | | USD | | | 9,509,851 | | | | | | Bank of America | | | (92,432 | ) |
09/18/2024 | NOK | | | 405,108,987 | | | | | | USD | | | 38,208,790 | | | | | | Bank of America | | | 4,814 | |
09/25/2024 | NOK | | | 56,783,471 | | | | | | USD | | | 5,400,000 | | | | | | Bank of America | | | (42,911 | ) |
09/25/2024 | NZD | | | 3,000,000 | | | | | | JPY | | | 267,584,414 | | | | | | Bank of America | | | 38,288 | |
09/03/2024 | NZD | | | 20,700,000 | | | | | | USD | | | 12,956,599 | | | | | | Bank of America | | | (15,702 | ) |
09/18/2024 | NZD | | | 129,186,000 | | | | | | USD | | | 79,325,337 | | | | | | Bank of America | | | 1,440,736 | |
09/25/2024 | NZD | | | 20,300,000 | | | | | | USD | | | 12,634,785 | | | | | | Bank of America | | | 56,808 | |
09/18/2024 | PEN | | | 7,660,176 | | | | | | USD | | | 2,050,000 | | | | | | Bank of America | | | (6,303 | ) |
09/18/2024 | PHP | | | 333,586,271 | | | | | | USD | | | 5,900,000 | | | | | | Bank of America | | | 40,336 | |
09/27/2024 | PHP | | | 28,126,400 | | | | | | USD | | | 500,000 | | | | | | Bank of America | | | 840 | |
09/03/2024 | PLN | | | 1,500,000 | | | | | | EUR | | | 349,702 | | | | | | Bank of America | | | 559 | |
09/18/2024 | PLN | | | 123,877,580 | | | | | | EUR | | | 28,658,621 | | | | | | Bank of America | | | 262,102 | |
09/25/2024 | PLN | | | 9,406,259 | | | | | | EUR | | | 2,200,000 | | | | | | Bank of America | | | (7,592 | ) |
09/25/2024 | PLN | | | 57,401,919 | | | | | | USD | | | 14,900,000 | | | | | | Bank of America | | | (88,073 | ) |
10/17/2024 | PLN | | | 54,640,000 | | | | | | USD | | | 13,827,949 | | | | | | Bank of America | | | 265,142 | |
09/03/2024 | SEK | | | 107,448,812 | | | | | | EUR | | | 9,475,056 | | | | | | Bank of America | | | (9,114 | ) |
09/18/2024 | SEK | | | 348,793,387 | | | | | | EUR | | | 30,668,921 | | | | | | Bank of America | | | 71,658 | |
09/25/2024 | SEK | | | 63,776,486 | | | | | | EUR | | | 5,612,221 | | | | | | Bank of America | | | 8,461 | |
09/25/2024 | SEK | | | 130,292,663 | | | | | | NOK | | | 133,500,000 | | | | | | Bank of America | | | 111,644 | |
09/03/2024 | SEK | | | 36,022,305 | | | | | | USD | | | 3,522,947 | | | | | | Bank of America | | | (14,034 | ) |
09/18/2024 | SEK | | | 276,686,417 | | | | | | USD | | | 26,935,638 | | | | | | Bank of America | | | 37,474 | |
09/25/2024 | SEK | | | 68,999,335 | | | | | | USD | | | 6,700,000 | | | | | | Bank of America | | | 28,929 | |
10/17/2024 | SEK | | | 37,770,000 | | | | | | USD | | | 3,578,917 | | | | | | Bank of America | | | 109,250 | |
09/18/2024 | SGD | | | 19,978,016 | | | | | | USD | | | 15,200,000 | | | | | | Bank of America | | | 127,254 | |
09/25/2024 | SGD | | | 49,091,700 | | | | | | USD | | | 37,600,000 | | | | | | Bank of America | | | 79,284 | |
09/18/2024 | THB | | | 214,000,024 | | | | | | USD | | | 6,200,000 | | | | | | Bank of America | | | 132,932 | |
09/18/2024 | TRY | | | 36,500,000 | | | | | | USD | | | 1,021,565 | | | | | | Bank of America | | | 24,037 | |
09/18/2024 | TWD | | | 224,797,376 | | | | | | USD | | | 7,050,000 | | | | | | Bank of America | | | (7,974 | ) |
09/27/2024 | TWD | | | 12,735,050 | | | | | | USD | | | 400,000 | | | | | | Bank of America | | | (669 | ) |
09/18/2024 | USD | | | 63,767,743 | | | | | | AUD | | | 96,638,000 | | | | | | Bank of America | | | (1,673,571 | ) |
09/25/2024 | USD | | | 10,436,497 | | | | | | AUD | | | 15,500,000 | | | | | | Bank of America | | | (61,544 | ) |
10/17/2024 | USD | | | 66,384,176 | | | | | | AUD | | | 100,089,000 | | | | | | Bank of America | | | (1,437,781 | ) |
09/04/2024 | USD | | | 21,872,176 | | | | | | BRL | | | 123,603,626 | | | | | | Bank of America | | | (48,968 | ) |
10/02/2024 | USD | | | 25,400,000 | | | | | | BRL | | | 143,582,345 | | | | | | Bank of America | | | 21,558 | |
09/18/2024 | USD | | | 159,728,941 | | | | | | CAD | | | 218,804,163 | | | | | | Bank of America | | | (2,730,177 | ) |
09/25/2024 | USD | | | 25,955,750 | | | | | | CAD | | | 35,300,000 | | | | | | Bank of America | | | (259,742 | ) |
09/03/2024 | USD | | | 5,465,678 | | | | | | CHF | | | 4,599,697 | | | | | | Bank of America | | | 52,030 | |
09/18/2024 | USD | | | 71,483,320 | | | | | | CHF | | | 62,623,283 | | | | | | Bank of America | | | (2,351,773 | ) |
09/25/2024 | USD | | | 2,952,156 | | | | | | CHF | | | 2,500,000 | | | | | | Bank of America | | | 2,139 | |
09/03/2024 | USD | | | 200,000 | | | | | | CLP | | | 191,196,000 | | | | | | Bank of America | | | (9,236 | ) |
The accompanying notes are an integral part of the consolidated financial statements.
19
Abbey Capital Futures Strategy Fund
Consolidated Portfolio of Investments (Continued)
August 31, 2024
Settlement
Date | Currency
Purchased | | |
| | Currency
Sold | | |
| | | Counterparty | | | Value/
Unrealized
Appreciation
(Depreciation) | |
09/05/2024 | USD | | | 200,000 | | | | | | CLP | | | 187,260,000 | | | | | | Bank of America | | $ | (4,921 | ) |
09/06/2024 | USD | | | 300,000 | | | | | | CLP | | | 279,901,815 | | | | | | Bank of America | | | (6,295 | ) |
09/09/2024 | USD | | | 300,000 | | | | | | CLP | | | 280,915,694 | | | | | | Bank of America | | | (7,391 | ) |
09/12/2024 | USD | | | 200,000 | | | | | | CLP | | | 187,887,520 | | | | | | Bank of America | | | (5,586 | ) |
09/13/2024 | USD | | | 400,000 | | | | | | CLP | | | 373,252,340 | | | | | | Bank of America | | | (8,405 | ) |
09/16/2024 | USD | | | 200,000 | | | | | | CLP | | | 186,442,340 | | | | | | Bank of America | | | (3,992 | ) |
09/23/2024 | USD | | | 4,500,000 | | | | | | CLP | | | 4,204,381,950 | | | | | | Bank of America | | | (99,645 | ) |
09/27/2024 | USD | | | 300,000 | | | | | | CLP | | | 277,359,000 | | | | | | Bank of America | | | (3,416 | ) |
10/03/2024 | USD | | | 200,000 | | | | | | CLP | | | 184,050,020 | | | | | | Bank of America | | | (1,325 | ) |
10/04/2024 | USD | | | 600,000 | | | | | | CLP | | | 549,808,000 | | | | | | Bank of America | | | (1,405 | ) |
09/03/2024 | USD | | | 1,834,138 | | | | | | CNH | | | 13,000,000 | | | | | | Bank of America | | | (567 | ) |
09/19/2024 | USD | | | 38,380,642 | | | | | | CNH | | | 276,369,627 | | | | | | Bank of America | | | (699,074 | ) |
09/25/2024 | USD | | | 9,100,000 | | | | | | CNH | | | 64,681,626 | | | | | | Bank of America | | | (52,981 | ) |
09/03/2024 | USD | | | 204,238 | | | | | | COP | | | 820,394,632 | | | | | | Bank of America | | | 8,168 | |
09/06/2024 | USD | | | 400,000 | | | | | | COP | | | 1,655,894,736 | | | | | | Bank of America | | | 4,475 | |
10/03/2024 | USD | | | 200,000 | | | | | | COP | | | 832,755,368 | | | | | | Bank of America | | | 1,802 | |
09/25/2024 | USD | | | 300,000 | | | | | | CZK | | | 6,808,992 | | | | | | Bank of America | | | (830 | ) |
09/03/2024 | USD | | | 1,415,174 | | | | | | EUR | | | 1,274,260 | | | | | | Bank of America | | | 6,349 | |
09/18/2024 | USD | | | 67,429,296 | | | | | | EUR | | | 62,100,000 | | | | | | Bank of America | | | (1,275,704 | ) |
09/25/2024 | USD | | | 278,848 | | | | | | EUR | | | 250,000 | | | | | | Bank of America | | | 2,170 | |
10/17/2024 | USD | | | 347,033,514 | | | | | | EUR | | | 315,688,000 | | | | | | Bank of America | | | (2,718,205 | ) |
09/03/2024 | USD | | | 10,946,490 | | | | | | GBP | | | 8,296,337 | | | | | | Bank of America | | | 50,329 | |
09/18/2024 | USD | | | 39,883,183 | | | | | | GBP | | | 31,146,000 | | | | | | Bank of America | | | (1,028,579 | ) |
09/25/2024 | USD | | | 247,200 | | | | | | GBP | | | 187,500 | | | | | | Bank of America | | | 896 | |
09/25/2024 | USD | | | 1,200,000 | | | | | | HUF | | | 432,441,600 | | | | | | Bank of America | | | (15,273 | ) |
09/18/2024 | USD | | | 3,800,000 | | | | | | IDR | | | 61,484,000,000 | | | | | | Bank of America | | | (175,193 | ) |
09/27/2024 | USD | | | 1,400,000 | | | | | | IDR | | | 21,819,644,000 | | | | | | Bank of America | | | (10,239 | ) |
09/18/2024 | USD | | | 3,800,000 | | | | | | ILS | | | 14,470,439 | | | | | | Bank of America | | | (182,078 | ) |
09/25/2024 | USD | | | 4,800,000 | | | | | | ILS | | | 17,705,021 | | | | | | Bank of America | | | (73,680 | ) |
09/06/2024 | USD | | | 19,936,904 | | | | | | INR | | | 1,671,057,464 | | | | | | Bank of America | | | 16,387 | |
09/09/2024 | USD | | | 11,914 | | | | | | INR | | | 1,001,056 | | | | | | Bank of America | | | (18 | ) |
09/17/2024 | USD | | | 8,743,522 | | | | | | INR | | | 734,814,332 | | | | | | Bank of America | | | (13,009 | ) |
09/18/2024 | USD | | | 1,850,000 | | | | | | INR | | | 155,495,023 | | | | | | Bank of America | | | (2,921 | ) |
09/20/2024 | USD | | | 10,600,000 | | | | | | INR | | | 890,696,800 | | | | | | Bank of America | | | (13,099 | ) |
09/23/2024 | USD | | | 10,765,709 | | | | | | INR | | | 904,260,345 | | | | | | Bank of America | | | (7,959 | ) |
09/27/2024 | USD | | | 24,136,904 | | | | | | INR | | | 2,026,323,598 | | | | | | Bank of America | | | (2,286 | ) |
09/03/2024 | USD | | | 105,542 | | | | | | JPY | | | 15,354,556 | | | | | | Bank of America | | | 449 | |
09/18/2024 | USD | | | 58,686,440 | | | | | | JPY | | | 8,917,947,830 | | | | | | Bank of America | | | (2,484,714 | ) |
09/25/2024 | USD | | | 12,466,294 | | | | | | JPY | | | 1,825,000,000 | | | | | | Bank of America | | | (64,719 | ) |
10/17/2024 | USD | | | 58,025,946 | | | | | | JPY | | | 8,478,600,000 | | | | | | Bank of America | | | (386,059 | ) |
09/05/2024 | USD | | | 5,000,000 | | | | | | KRW | | | 6,846,211,742 | | | | | | Bank of America | | | (127,091 | ) |
09/09/2024 | USD | | | 18,600,000 | | | | | | KRW | | | 25,512,720,083 | | | | | | Bank of America | | | (511,492 | ) |
09/19/2024 | USD | | | 24,200,000 | | | | | | KRW | | | 33,053,835,100 | | | | | | Bank of America | | | (577,139 | ) |
09/23/2024 | USD | | | 13,600,000 | | | | | | KRW | | | 18,110,440,000 | | | | | | Bank of America | | | 20,776 | |
09/27/2024 | USD | | | 6,200,000 | | | | | | KRW | | | 8,327,276,000 | | | | | | Bank of America | | | (45,477 | ) |
09/18/2024 | USD | | | 31,923,233 | | | | | | MXN | | | 604,804,813 | | | | | | Bank of America | | | 1,304,852 | |
09/25/2024 | USD | | | 2,162,327 | | | | | | MXN | | | 41,000,000 | | | | | | Bank of America | | | 88,930 | |
09/18/2024 | USD | | | 33,122,494 | | | | | | NOK | | | 357,974,969 | | | | | | Bank of America | | | (644,997 | ) |
09/25/2024 | USD | | | 10,900,000 | | | | | | NOK | | | 115,001,910 | | | | | | Bank of America | | | 50,443 | |
09/18/2024 | USD | | | 66,198,900 | | | | | | NZD | | | 110,495,000 | | | | | | Bank of America | | | (2,881,707 | ) |
09/25/2024 | USD | | | 9,864,744 | | | | | | NZD | | | 16,100,000 | | | | | | Bank of America | | | (201,003 | ) |
The accompanying notes are an integral part of the consolidated financial statements.
20
Abbey Capital Futures Strategy Fund
Consolidated Portfolio of Investments (Continued)
August 31, 2024
Settlement
Date | Currency
Purchased | | |
| | Currency
Sold | | |
| | | Counterparty | | | Value/
Unrealized
Appreciation
(Depreciation) | |
09/18/2024 | USD | | | 1,050,000 | | | | | | PEN | | | 3,918,705 | | | | | | Bank of America | | $ | 4,509 | |
09/18/2024 | USD | | | 3,700,000 | | | | | | PHP | | | 213,987,876 | | | | | | Bank of America | | | (110,588 | ) |
09/27/2024 | USD | | | 600,000 | | | | | | PHP | | | 34,015,800 | | | | | | Bank of America | | | (5,711 | ) |
09/25/2024 | USD | | | 100,000 | | | | | | PLN | | | 385,745 | | | | | | Bank of America | | | 463 | |
09/18/2024 | USD | | | 9,145,438 | | | | | | SEK | | | 95,939,470 | | | | | | Bank of America | | | (207,338 | ) |
10/17/2024 | USD | | | 3,608,715 | | | | | | SEK | | | 37,770,000 | | | | | | Bank of America | | | (79,452 | ) |
09/18/2024 | USD | | | 1,600,000 | | | | | | SGD | | | 2,100,289 | | | | | | Bank of America | | | (11,354 | ) |
09/18/2024 | USD | | | 3,150,000 | | | | | | THB | | | 110,780,460 | | | | | | Bank of America | | | (128,341 | ) |
09/18/2024 | USD | | | 213,873 | | | | | | TRY | | | 7,500,000 | | | | | | Bank of America | | | (977 | ) |
09/25/2024 | USD | | | 9,400,000 | | | | | | TRY | | | 330,268,803 | | | | | | Bank of America | | | 15,920 | |
09/16/2024 | USD | | | 7,300,000 | | | | | | TWD | | | 234,784,520 | | | | | | Bank of America | | | (53,281 | ) |
09/18/2024 | USD | | | 8,400,000 | | | | | | TWD | | | 273,253,235 | | | | | | Bank of America | | | (159,959 | ) |
09/27/2024 | USD | | | 3,700,000 | | | | | | TWD | | | 117,856,200 | | | | | | Bank of America | | | 4,401 | |
09/03/2024 | USD | | | 282,814 | | | | | | ZAR | | | 5,000,000 | | | | | | Bank of America | | | 2,460 | |
09/18/2024 | USD | | | 1,675,617 | | | | | | ZAR | | | 30,810,110 | | | | | | Bank of America | | | (49,798 | ) |
09/03/2024 | ZAR | | | 5,000,000 | | | | | | USD | | | 282,953 | | | | | | Bank of America | | | (2,598 | ) |
09/18/2024 | ZAR | | | 239,630,086 | | | | | | USD | | | 13,117,727 | | | | | | Bank of America | | | 301,935 | |
09/25/2024 | ZAR | | | 202,147,236 | | | | | | USD | | | 11,300,000 | | | | | | Bank of America | | | 14,020 | |
10/17/2024 | ZAR | | | 20,000 | | | | | | USD | | | 1,074 | | | | | | Bank of America | | | 43 | |
09/03/2024 | AUD | | | 2,957,003 | | | | | | USD | | | 2,007,934 | | | | | | UBS AG | | | (6,255 | ) |
09/18/2024 | AUD | | | 32,545,031 | | | | | | USD | | | 21,438,095 | | | | | | UBS AG | | | 600,747 | |
09/18/2024 | CAD | | | 15,749,561 | | | | | | USD | | | 11,518,444 | | | | | | UBS AG | | | 175,391 | |
09/03/2024 | EUR | | | 2,231,278 | | | | | | USD | | | 2,478,587 | | | | | | UBS AG | | | (11,680 | ) |
09/18/2024 | EUR | | | 30,376,016 | | | | | | USD | | | 33,069,246 | | | | | | UBS AG | | | 537,584 | |
09/03/2024 | GBP | | | 389,578 | | | | | | USD | | | 513,494 | | | | | | UBS AG | | | (1,834 | ) |
09/18/2024 | GBP | | | 8,619,183 | | | | | | USD | | | 11,053,898 | | | | | | UBS AG | | | 267,812 | |
09/03/2024 | JPY | | | 250,967,611 | | | | | | USD | | | 1,734,085 | | | | | | UBS AG | | | (16,361 | ) |
09/18/2024 | JPY | | | 3,905,560,794 | | | | | | USD | | | 25,490,498 | | | | | | UBS AG | | | 1,299,035 | |
09/03/2024 | NOK | | | 524,868 | | | | | | USD | | | 50,000 | | | | | | UBS AG | | | (505 | ) |
09/18/2024 | NOK | | | 232,822,629 | | | | | | USD | | | 21,787,905 | | | | | | UBS AG | | | 174,066 | |
09/03/2024 | NZD | | | 289,662 | | | | | | USD | | | 181,349 | | | | | | UBS AG | | | (262 | ) |
09/18/2024 | NZD | | | 21,279,561 | | | | | | USD | | | 12,831,546 | | | | | | UBS AG | | | 472,268 | |
09/03/2024 | SEK | | | 838,762 | | | | | | USD | | | 82,393 | | | | | | UBS AG | | | (690 | ) |
09/18/2024 | SEK | | | 59,686,991 | | | | | | USD | | | 5,677,136 | | | | | | UBS AG | | | 141,523 | |
09/03/2024 | USD | | | 2,007,365 | | | | | | AUD | | | 2,957,003 | | | | | | UBS AG | | | 5,686 | |
09/18/2024 | USD | | | 40,104,376 | | | | | | AUD | | | 60,202,891 | | | | | | UBS AG | | | (663,814 | ) |
09/18/2024 | USD | | | 9,639,951 | | | | | | CAD | | | 13,120,965 | | | | | | UBS AG | | | (102,188 | ) |
09/03/2024 | USD | | | 2,477,699 | | | | | | EUR | | | 2,231,278 | | | | | | UBS AG | | | 10,792 | |
09/18/2024 | USD | | | 16,194,814 | | | | | | EUR | | | 14,844,691 | | | | | | UBS AG | | | (228,769 | ) |
09/03/2024 | USD | | | 513,410 | | | | | | GBP | | | 389,578 | | | | | | UBS AG | | | 1,750 | |
09/18/2024 | USD | | | 13,067,527 | | | | | | GBP | | | 10,104,229 | | | | | | UBS AG | | | (204,861 | ) |
09/03/2024 | USD | | | 1,734,372 | | | | | | JPY | | | 250,967,611 | | | | | | UBS AG | | | 16,648 | |
09/18/2024 | USD | | | 21,717,335 | | | | | | JPY | | | 3,252,151,880 | | | | | | UBS AG | | | (590,250 | ) |
09/03/2024 | USD | | | 50,033 | | | | | | NOK | | | 524,868 | | | | | | UBS AG | | | 539 | |
09/18/2024 | USD | | | 10,802,510 | | | | | | NOK | | | 117,629,913 | | | | | | UBS AG | | | (293,425 | ) |
09/03/2024 | USD | | | 181,253 | | | | | | NZD | | | 289,662 | | | | | | UBS AG | | | 167 | |
09/18/2024 | USD | | | 16,949,330 | | | | | | NZD | | | 27,899,850 | | | | | | UBS AG | | | (493,437 | ) |
09/03/2024 | USD | | | 82,316 | | | | | | SEK | | | 838,762 | | | | | | UBS AG | | | 613 | |
09/18/2024 | USD | | | 3,254,179 | | | | | | SEK | | | 33,694,169 | | | | | | UBS AG | | | (30,538 | ) |
Total Forward Foreign Currency Contracts | | | | | | | | | | | | | | $ | (11,462,164 | ) |
The accompanying notes are an integral part of the consolidated financial statements.
21
Abbey Capital Futures Strategy Fund
Consolidated Portfolio of Investments (Concluded)
August 31, 2024
AUD | Australian Dollar | | KRW | South Korean Won |
BRL | Brazilian Real | | MXN | Mexican Peso |
CAD | Canadian Dollar | | NOK | Norwegian Krone |
CHF | Swiss Franc | | NZD | New Zealand Dollar |
CLP | Chilean Peso | | PEN | Peruvian Sol |
CNH | Chinese Offshore Renminbi | | PHP | Philippine Peso |
COP | Colombian Peso | | PLN | Polish Zloty |
CZK | Czech Republic Koruna | | SEK | Swedish Krona |
EUR | Euro | | SGD | Singapore Dollar |
GBP | British Pound | | THB | Thai Baht |
HUF | Hungarian Forint | | TRY | Turkish Lira |
IDR | Indonesian Rupiah | | TWD | New Taiwan Dollar |
ILS | Israeli Shekel | | USD | United States Dollar |
INR | Indian Rupee | | ZAR | South African Rand |
JPY | Japanese Yen | | | |
The accompanying notes are an integral part of the consolidated financial statements.
22
Abbey Capital Futures Strategy Fund
Consolidated Statement of Assets And Liabilities
August 31, 2024
ASSETS | | | | |
Investments, at value (cost $2,130,402,199) | | $ | 2,131,411,644 | |
Cash equivalents | | | 133,867,939 | |
Foreign currency deposits with broker for futures contracts (cost $21,440,473) | | | 21,388,021 | |
Deposit with brokers: | | | | |
Forward foreign currency contracts: | | | 48,514,764 | |
Futures contracts | | | 377,429,260 | |
Receivables for: | | | | |
Capital shares sold | | | 4,703,783 | |
Interest receivable | | | 421,191 | |
Unrealized appreciation on forward foreign currency contracts | | | 23,367,173 | |
Unrealized appreciation on futures contracts | | | 87,354,442 | |
Prepaid expenses and other assets | | | 67,020 | |
Total assets | | | 2,828,525,237 | |
| | | | | |
LIABILITIES | | | | |
Payables for: | | | | |
Advisory fees | | | 3,913,690 | |
Capital shares redeemed | | | 1,612,268 | |
Unrealized depreciation on forward foreign currency contracts | | | 34,829,337 | |
Unrealized depreciation on futures contracts | | | 74,150,839 | |
Other accrued expenses and liabilities | | | 446,434 | |
Total liabilities | | | 114,952,568 | |
Net assets | | $ | 2,713,572,669 | |
| | | | | |
NET ASSETS CONSIST OF: | | | | |
Par value | | $ | 242,598 | |
Paid-in capital | | | 3,169,880,365 | |
Total distributable earnings/(losses) | | | (456,550,294 | ) |
Net assets | | $ | 2,713,572,669 | |
| | | | | |
CLASS A SHARES: | | | | |
Net assets | | $ | 22,031,252 | |
Shares outstanding ($0.001 par value, 100,000,000 shares authorized) | | | 1,984,342 | |
Net asset value and redemption price per share | | $ | 11.10 | |
Maximum offering price per share (100/94.25 of $11.10) | | $ | 11.78 | |
| | | | | |
CLASS I SHARES: | | | | |
Net assets | | $ | 2,682,704,829 | |
Shares outstanding ($0.001 par value, 500,000,000 shares authorized) | | | 239,780,130 | |
Net asset value, offering and redemption price per share | | $ | 11.19 | |
| | | | | |
CLASS C SHARES: | | | | |
Net assets | | $ | 8,836,588 | |
Shares outstanding ($0.001 par value, 100,000,000 shares authorized) | | | 833,803 | |
Net asset value, offering and redemption price per share | | $ | 10.60 | |
The accompanying notes are an integral part of the consolidated financial statements.
23
Abbey Capital Futures Strategy Fund
Consolidated Statement of Operations
For the Year Ended August 31, 2024
INVESTMENT INCOME | | | | |
Interest | | $ | 134,203,971 | |
Total investment income | | | 134,203,971 | |
EXPENSES | | | | |
Advisory fees (Note 2) | | | 48,481,345 | |
Administration and accounting services fees (Note 2) | | | 514,692 | |
Directors fees | | | 354,525 | |
Transfer agent fees (Note 2) | | | 293,932 | |
Officers fees | | | 247,602 | |
Distribution fees (Class A Shares) (Note 2) | | | 88,043 | |
Distribution fees (Class C Shares) (Note 2) | | | 71,314 | |
Legal fees | | | 149,690 | |
Printing and shareholder reporting fees | | | 136,077 | |
Registration and filing fees | | | 127,348 | |
Custodian fees (Note 2) | | | 95,768 | |
Audit and tax service fees | | | 81,702 | |
Other expenses | | | 170,885 | |
Total expenses before waivers and/or reimbursements | | | 50,812,923 | |
Less: waivers and/or reimbursements (Note 2) | | | (1,582,258 | ) |
Net expenses after waivers and/or reimbursements | | | 49,230,665 | |
Net investment income/(loss) | | | 84,973,306 | |
NET REALIZED AND UNREALIZED GAIN/(LOSS) FROM INVESTMENTS | | | | |
Net realized gain/(loss) from: | | | | |
Investments | | | (1,034,200 | ) |
Futures contracts | | | (61,194,067 | ) |
Foreign currency transactions | | | (7,067,009 | ) |
Forward foreign currency contracts | | | (37,971,946 | ) |
Net change in unrealized appreciation/(depreciation) on: | | | | |
Investments | | | 1,852,217 | |
Futures contracts | | | (673,549 | ) |
Foreign currency translations | | | 44,679 | |
Forward foreign currency contracts | | | (13,260,049 | ) |
Net realized and unrealized gain/(loss) from investments | | | (119,303,924 | ) |
NET INCREASE/(DECREASE) IN NET ASSETS RESULTING FROM OPERATIONS | | $ | (34,330,618 | ) |
The accompanying notes are an integral part of the consolidated financial statements.
24
Abbey Capital Futures Strategy Fund
Consolidated Statements of Changes in Net Assets
| | | For the
Year Ended
August 31, 2024 | | | For the
Year Ended
August 31, 2023 | |
INCREASE/(DECREASE) IN NET ASSETS FROM OPERATIONS: | | | | | | | | |
Net investment income/(loss) | | $ | 84,973,306 | | | $ | 55,955,657 | |
Net realized gain/(loss) from investments, futures contracts, foreign currency transactions, forward foreign currency contracts | | | (107,267,222 | ) | | | (106,116,882 | ) |
Net change in unrealized appreciation/(depreciation) on investments, futures contracts, foreign currency translations, forward foreign currency contracts | | | (12,036,702 | ) | | | (34,763,504 | ) |
Net increase/(decrease) in net assets resulting from operations | | | (34,330,618 | ) | | | (84,924,729 | ) |
DIVIDENDS AND DISTRIBUTIONS TO SHAREHOLDERS: | | | | | | | | |
Class A | | | (304,919 | ) | | | (17,240,224 | ) |
Class I | | | (49,555,318 | ) | | | (350,326,206 | ) |
Class C | | | (82,852 | ) | | | (1,390,657 | ) |
Net decrease in net assets from dividends and distributions to shareholders | | | (49,943,089 | ) | | | (368,957,087 | ) |
CAPITAL SHARE TRANSACTIONS: | | | | | | | | |
Class A Shares | | | | | | | | |
Proceeds from shares sold | | | 16,588,082 | | | | 72,909,552 | |
Proceeds from reinvestment of distributions | | | 244,603 | | | | 15,458,188 | |
Shares redeemed | | | (79,497,741 | ) | | | (96,518,703 | ) |
Total from Class A Shares | | | (62,665,056 | ) | | | (8,150,963 | ) |
Class I Shares | | | | | | | | |
Proceeds from shares sold | | | 1,078,371,905 | | | | 1,519,244,144 | |
Proceeds from reinvestment of distributions | | | 31,007,633 | | | | 220,037,703 | |
Shares redeemed | | | (992,150,907 | ) | | | (1,223,121,986 | ) |
Total from Class I Shares | | | 117,228,631 | | | | 516,159,861 | |
Class C Shares | | | | | | | | |
Proceeds from shares sold | | | 2,171,689 | | | | 3,837,664 | |
Proceeds from reinvestment of distributions | | | 55,448 | | | | 882,158 | |
Shares redeemed | | | (2,545,271 | ) | | | (2,504,539 | ) |
Total from Class C Shares | | | (318,134 | ) | | | 2,215,283 | |
Net increase/(decrease) in net assets from capital share transactions | | | 54,245,441 | | | | 510,224,181 | |
Total increase/(decrease) in net assets | | | (30,028,266 | ) | | | 56,342,365 | |
NET ASSETS: | | | | | | | | |
Beginning of period | | | 2,743,600,935 | | | | 2,687,258,570 | |
End of period | | $ | 2,713,572,669 | | | $ | 2,743,600,935 | |
The accompanying notes are an integral part of the consolidated financial statements.
25
Abbey Capital Futures Strategy Fund
Consolidated Statements of Changes in Net Assets (Concluded)
| | | For the
Year Ended
August 31, 2024 | | | For the
Year Ended
August 31, 2023 | |
SHARE TRANSACTIONS: | | | | | | | | |
Class A Shares | | | | | | | | |
Shares sold | | | 1,436,355 | | | | 5,947,542 | |
Shares reinvested | | | 22,196 | | | | 1,333,752 | |
Shares redeemed | | | (6,823,094 | ) | | | (8,301,217 | ) |
Total Class A Shares | | | (5,364,543 | ) | | | (1,019,923 | ) |
Class I Shares | | | | | | | | |
Shares sold | | | 93,772,671 | | | | 123,436,456 | |
Shares reinvested | | | 2,795,999 | | | | 18,742,564 | |
Shares redeemed | | | (85,795,101 | ) | | | (100,137,539 | ) |
Total Class I Shares | | | 10,773,569 | | | | 42,041,481 | |
Class C Shares | | | | | | | | |
Shares sold | | | 196,858 | | | | 305,269 | |
Shares reinvested | | | 5,241 | | | | 78,764 | |
Shares redeemed | | | (232,682 | ) | | | (211,397 | ) |
Total Class C Shares | | | (30,583 | ) | | | 172,636 | |
Net increase in shares outstanding | | | 5,378,443 | | | | 41,194,194 | |
The accompanying notes are an integral part of the consolidated financial statements.
26
Abbey Capital Futures Strategy Fund
Consolidated Financial Highlights
Contained below is per share operating performance data for Class A Shares outstanding, total investment return/(loss), ratios to average net assets and other supplemental data for the respective periods. This information has been derived from information provided in the consolidated financial statements. |
| | | Class A Shares | |
| | | For the
Year
Ended
August 31,
2024 | | | For the
Year
Ended
August 31,
2023 | | | For the
Year
Ended
August 31,
2022 | | | For the
Year
Ended
August 31,
2021 | | | For the
Year
Ended
August 31,
2020 | |
Per Share Operating Performance |
Net asset value, beginning of period | | $ | 11.40 | | | $ | 13.56 | | | $ | 11.95 | | | $ | 11.28 | | | $ | 12.45 | |
Net investment income/(loss)(1) | | | 0.33 | | | | 0.22 | | | | (0.19 | ) | | | (0.24 | ) | | | (0.11 | ) |
Net realized and unrealized gain/(loss) from investments | | | (0.52 | ) | | | (0.60 | ) | | | 2.20 | | | | 1.07 | | | | (0.14 | ) |
Net increase/(decrease) in net assets resulting from operations | | | (0.19 | ) | | | (0.38 | ) | | | 2.01 | | | | 0.83 | | | | (0.25 | ) |
Dividends and distributions to shareholders from: | | | | | | | | | | | | | | | | | | | | |
Net investment income | | | (0.11 | ) | | | (1.11 | ) | | | (0.27 | ) | | | (0.16 | ) | | | (0.64 | ) |
Net realized capital gains | | | — | | | | (0.67 | ) | | | (0.13 | ) | | | — | | | | (0.28 | ) |
Total dividends and distributions to shareholders | | | (0.11 | ) | | | (1.78 | ) | | | (0.40 | ) | | | (0.16 | ) | | | (0.92 | ) |
Net asset value, end of period | | $ | 11.10 | | | $ | 11.40 | | | $ | 13.56 | | | $ | 11.95 | | | $ | 11.28 | |
Total investment return/(loss)(2) | | | (1.67 | )% | | | (3.05 | )% | | | 17.40 | % | | | 7.42 | % | | | (1.64 | )% |
Ratios/Supplemental Data | | | | | | | | | | | | | | | | | | | | |
Net assets, end of period (000’s omitted) | | $ | 22,031 | | | $ | 83,783 | | | $ | 113,480 | | | $ | 21,395 | | | $ | 14,469 | |
Ratio of expenses to average net assets with waivers and/or reimbursements (including interest expense)(3) | | | 2.04 | % | | | 2.04 | % | | | 2.04 | % | | | 2.04 | % | | | 2.04 | % |
Ratio of expenses to average net assets with waivers and/or reimbursements (excluding interest expense)(3) | | | 2.04 | % | | | 2.04 | % | | | 2.04 | % | | | 2.04 | % | | | 2.04 | % |
Ratio of expenses to average net assets without waivers and/or reimbursements (including interest expense)(3) | | | 2.10 | % | | | 2.11 | % | | | 2.10 | % | | | 2.14 | % | | | 2.15 | % |
Ratio of net investment income/(loss) to average net assets | | | 2.85 | % | | | 1.80 | % | | | (1.47 | )% | | | (2.03 | )% | | | (0.98 | )% |
Portfolio turnover rate(4) | | | 0 | % | | | 0 | % | | | 0 | % | | | 0 | % | | | 0 | % |
(1) | Calculated based on average shares outstanding for the period. |
(2) | Total investment return/(loss) is calculated assuming a purchase of shares on the first day and a sale of shares on the last day of each period reported and includes reinvestments of dividends and distributions, if any. Total return does not reflect any applicable sales charge. |
(3) | The Adviser has contractually agreed to waive its advisory fee and/or reimburse expenses in order to limit total annual Fund operating expenses (excluding acquired Fund fees and expenses, brokerage commissions, extraordinary items, interest or taxes) to 2.04% of the Fund’s average daily net assets attributable to Class A Shares. |
(4) | Portfolio turnover rate excludes all securities, including options, whose maturities or expiration dates at the time of acquisition were one year or less and is calculated for the Fund, as a whole, for the entire period. |
The accompanying notes are an integral part of the consolidated financial statements.
27
Abbey Capital Futures Strategy Fund
Consolidated Financial Highlights (Continued)
Contained below is per share operating performance data for Class I Shares outstanding, total investment return/(loss), ratios to average net assets and other supplemental data for the respective periods. This information has been derived from information provided in the consolidated financial statements. |
| | | Class I Shares | |
| | | For the
Year
Ended
August 31,
2024 | | | For the
Year
Ended
August 31,
2023 | | | For the
Year
Ended
August 31,
2022 | | | For the
Year
Ended
August 31,
2021 | | | For the
Year
Ended
August 31,
2020 | |
Per Share Operating Performance |
Net asset value, beginning of period | | $ | 11.57 | | | $ | 13.72 | | | $ | 12.07 | | | $ | 11.38 | | | $ | 12.55 | |
Net investment income/(loss)(1) | | | 0.36 | | | | 0.25 | | | | (0.15 | ) | | | (0.21 | ) | | | (0.09 | ) |
Net realized and unrealized gain/(loss) from investments | | | (0.51 | ) | | | (0.61 | ) | | | 2.22 | | | | 1.08 | | | | (0.14 | ) |
Net increase/(decrease) in net assets resulting from operations | | | (0.15 | ) | | | (0.36 | ) | | | 2.07 | | | | 0.87 | | | | (0.23 | ) |
Dividends and distributions to shareholders from: | | | | | | | | | | | | | | | | | | | | |
Net investment income | | | (0.23 | ) | | | (1.12 | ) | | | (0.29 | ) | | | (0.18 | ) | | | (0.66 | ) |
Net realized capital gains | | | — | | | | (0.67 | ) | | | (0.13 | ) | | | — | | | | (0.28 | ) |
Total dividends and distributions to shareholders | | | (0.23 | ) | | | (1.79 | ) | | | (0.42 | ) | | | (0.18 | ) | | | (0.94 | ) |
Net asset value, end of period | | $ | 11.19 | | | $ | 11.57 | | | $ | 13.72 | | | $ | 12.07 | | | $ | 11.38 | |
Total investment return/(loss)(2) | | | (1.32 | )% | | | (2.83 | )% | | | 17.72 | % | | | 7.74 | % | | | (1.39 | )% |
Ratios/Supplemental Data | | | | | | | | | | | | | | | | | | | | |
Net assets, end of period (000’s omitted) | | $ | 2,682,705 | | | $ | 2,650,349 | | | $ | 2,564,701 | | | $ | 1,132,714 | | | $ | 883,997 | |
Ratio of expenses to average net assets with waivers and/or reimbursements (including interest expense)(3) | | | 1.79 | % | | | 1.79 | % | | | 1.79 | % | | | 1.79 | % | | | 1.79 | % |
Ratio of expenses to average net assets with waivers and/or reimbursements (excluding interest expense)(3) | | | 1.79 | % | | | 1.79 | % | | | 1.79 | % | | | 1.79 | % | | | 1.79 | % |
Ratio of expenses to average net assets without waivers and/or reimbursements (including interest expense)(3) | | | 1.85 | % | | | 1.86 | % | | | 1.85 | % | | | 1.89 | % | | | 1.90 | % |
Ratio of net investment income/(loss) to average net assets | | | 3.10 | % | | | 2.05 | % | | | (1.22 | )% | | | (1.78 | )% | | | (0.73 | )% |
Portfolio turnover rate(4) | | | 0 | % | | | 0 | % | | | 0 | % | | | 0 | % | | | 0 | % |
(1) | Calculated based on average shares outstanding for the period. |
(2) | Total investment return/(loss) is calculated assuming a purchase of shares on the first day and a sale of shares on the last day of each period reported and includes reinvestments of dividends and distributions, if any. |
(3) | The Adviser has contractually agreed to waive its advisory fee and/or reimburse expenses in order to limit total annual Fund operating expenses (excluding acquired Fund fees and expenses, brokerage commissions, extraordinary items, interest or taxes) to 1.79% of the Fund’s average daily net assets attributable to Class I Shares. |
(4) | Portfolio turnover rate excludes all securities, including options, whose maturities or expiration dates at the time of acquisition were one year or less and is calculated for the Fund, as a whole, for the entire period. |
The accompanying notes are an integral part of the consolidated financial statements.
28
Abbey Capital Futures Strategy Fund
Consolidated Financial Highlights (Concluded)
Contained below is per share operating performance data for Class C Shares outstanding, total investment return/(loss), ratios to average net assets and other supplemental data for the respective periods. This information has been derived from information provided in the consolidated financial statements. |
| | | Class C Shares | |
| | | For the
Year
Ended
August 31,
2024 | | | For the
Year
Ended
August 31,
2023 | | | For the
Year
Ended
August 31,
2022 | | | For the
Year
Ended
August 31,
2021 | | | For the
Year
Ended
August 31,
2020 | |
Per Share Operating Performance |
Net asset value, beginning of period | | $ | 10.95 | | | $ | 13.12 | | | $ | 11.60 | | | $ | 10.98 | | | $ | 12.11 | |
Net investment income/(loss)(1) | | | 0.23 | | | | 0.12 | | | | (0.27 | ) | | | (0.32 | ) | | | (0.19 | ) |
Net realized and unrealized gain/(loss) from investments | | | (0.48 | ) | | | (0.57 | ) | | | 2.13 | | | | 1.05 | | | | (0.14 | ) |
Net increase/(decrease) in net assets resulting from operations | | | (0.25 | ) | | | (0.45 | ) | | | 1.86 | | | | 0.73 | | | | (0.33 | ) |
Dividends and distributions to shareholders from: | | | | | | | | | | | | | | | | | | | | |
Net investment income | | | (0.10 | ) | | | (1.05 | ) | | | (0.21 | ) | | | (0.11 | ) | | | (0.52 | ) |
Net realized capital gains | | | — | | | | (0.67 | ) | | | (0.13 | ) | | | — | | | | (0.28 | ) |
Total dividends and distributions to shareholders | | | (0.10 | ) | | | (1.72 | ) | | | (0.34 | ) | | | (0.11 | ) | | | (0.80 | ) |
Net asset value, end of period | | $ | 10.60 | | | $ | 10.95 | | | $ | 13.12 | | | $ | 11.60 | | | $ | 10.98 | |
Total investment return/(loss)(2) | | | (2.29 | )% | | | (3.77 | )% | | | 16.48 | % | | | 6.72 | % | | | (2.40 | )% |
Ratios/Supplemental Data | | | | | | | | | | | | | | | | | | | | |
Net assets, end of period (000’s omitted) | | $ | 8,837 | | | $ | 9,469 | | | $ | 9,078 | | | $ | 5,524 | | | $ | 5,151 | |
Ratio of expenses to average net assets with waivers and/or reimbursements (including interest expense)(3) | | | 2.79 | % | | | 2.79 | % | | | 2.79 | % | | | 2.79 | % | | | 2.79 | % |
Ratio of expenses to average net assets with waivers and/or reimbursements (excluding interest expense)(3) | | | 2.79 | % | | | 2.79 | % | | | 2.79 | % | | | 2.79 | % | | | 2.79 | % |
Ratio of expenses to average net assets without waivers and/or reimbursements (including interest expense)(3) | | | 2.85 | % | | | 2.86 | % | | | 2.85 | % | | | 2.89 | % | | | 2.90 | % |
Ratio of net investment income/(loss) to average net assets | | | 2.10 | % | | | 1.05 | % | | | (2.22 | )% | | | (2.78 | )% | | | (1.73 | )% |
Portfolio turnover rate(4) | | | 0 | % | | | 0 | % | | | 0 | % | | | 0 | % | | | 0 | % |
(1) | Calculated based on average shares outstanding for the period. |
(2) | Total investment return/(loss) is calculated assuming a purchase of shares on the first day and a sale of shares on the last day of each period reported and includes reinvestments of dividends and distributions, if any. |
(3) | The Adviser has contractually agreed to waive its advisory fee and/or reimburse expenses in order to limit total annual Fund operating expenses (excluding acquired Fund fees and expenses, brokerage commissions, extraordinary items, interest or taxes) to 2.79% of the Fund’s average daily net assets attributable to Class C Shares. |
(4) | Portfolio turnover rate excludes all securities, including options, whose maturities or expiration dates at the time of acquisition were one year or less and is calculated for the Fund, as a whole, for the entire period. |
The accompanying notes are an integral part of the consolidated financial statements.
29
Abbey Capital Futures Strategy Fund
Notes To Consolidated Financial Statements
August 31, 2024
1. Organization and Significant Accounting Policies
The RBB Fund, Inc. (“RBB” or the “Company”) was incorporated under the laws of the State of Maryland on February 29, 1988 and is registered under the Investment Company Act of 1940, as amended (the “1940 Act”), as an open-end management investment company. RBB is a “series fund,” which is an investment company divided into separate portfolios. Each portfolio is treated as a separate entity for certain matters under the 1940 Act, and for other purposes, and a shareholder of one portfolio is not deemed to be a shareholder of any other portfolio. Currently, RBB has sixty-five separate investment portfolios, including the Abbey Capital Futures Strategy Fund (the “Fund”), which commenced investment operations on July 1, 2014. The Fund is authorized to offer four classes of shares, Class A Shares, Class I Shares, Class C Shares and Class T Shares. Class A Shares are sold subject to a front-end maximum sales charge of 5.75%. Front-end sales charges may be reduced or waived under certain circumstances. Class T Shares are not currently available for sale.
RBB has authorized capital of one hundred billion shares of common stock of which 92.923 billion shares are currently classified into two hundred and thirty-six classes of common stock. Each class represents an interest in an active or inactive RBB investment portfolio.
The Fund seeks to achieve its investment objective by allocating its assets between a “Managed Futures” strategy and a “Fixed Income” strategy.
The Fund is an investment company and follows accounting and reporting guidance in the Financial Accounting Standards Board (“FASB”) Accounting Standards Codification Topic 946 “Financial Services – Investment Companies.”
The end of the reporting period for the Fund is August 31, 2024, and the period covered by these Notes to Consolidated Financial Statements is the fiscal year ended August 31, 2024 (the “current fiscal period”).
CONSOLIDATION OF SUBSIDIARIES – The Managed Futures strategy is achieved by the Fund investing up to 25% of its total assets in Abbey Capital Master Offshore Fund Limited (the “Cayman Subsidiary”), a wholly-owned and controlled subsidiary of the Fund organized under the acts of the Cayman Islands. The Cayman Subsidiary invests all or substantially all of its assets in segregated portfolios of the Abbey Capital Offshore Fund SPC (the “SPC”), a wholly-owned subsidiary of the Cayman Subsidiary organized under the acts of the Cayman Islands. The Cayman Subsidiary serves solely as an intermediate entity through which the Fund invests in the SPC and makes no independent investment decisions and has no investment or other discretion over the Fund’s investable assets.
The Fund may also invest a portion of its assets in segregated series of another wholly-owned subsidiary of the Fund, the Abbey Capital Onshore Series LLC (the “Onshore Subsidiary”), a Delaware series limited liability company.
The consolidated financial statements of the Fund include the financial statements of the Cayman Subsidiary, the Onshore Subsidiary and SPC. The Fund consolidates the results of subsidiaries in which the Fund holds a controlling financial interest. All inter-company accounts and transactions have been eliminated. As of the end of the current fiscal period, the net assets of the Cayman Subsidiary and SPC were $588,829,238, which represented 21.70% of the Fund’s net assets. As of the end of the current fiscal period, the net assets of the Onshore Subsidiary were $720,139,202, which represented 26.54% of the Fund’s net assets.
PORTFOLIO VALUATION — The Fund’s net asset value (“NAV”) is calculated once daily at the close of regular trading hours on the New York Stock Exchange (“NYSE”) (generally 4:00 p.m. Eastern time) on each day the NYSE is open. Securities held by the Fund are valued using the closing price or the last sale price on a national securities exchange or the National Association of Securities Dealers Automatic Quotation System (“NASDAQ”) market system where they are primarily traded. Fixed income securities are valued using an independent pricing service, which considers such factors as security prices, yields, maturities and ratings, and are deemed representative of market values at the close of the market. Forward exchange contracts are valued by interpolating between spot and forward currency rates as quoted by an independent pricing service. Futures contracts are generally valued using the settlement price determined by the relevant exchange. Options for which the primary market is a national securities exchange are valued at the last sale
30
Abbey Capital Futures Strategy Fund
Notes To Consolidated Financial Statements (Continued)
August 31, 2024
price on the exchange on which they are traded, or, in the absence of any sale, will be valued at the mean of the last bid and ask prices prior to the market close. Options not traded on a national securities exchange are valued at the last quoted bid price for long option positions and the closing ask price for short option positions. If market quotations are unavailable or deemed unreliable, securities will be valued by the Valuation Designee (as defined below) in accordance with procedures adopted by the Company’s Board of Directors (the “Board”). Relying on prices supplied by pricing services or dealers or using fair valuation may result in values that are higher or lower than the values used by other investment companies and investors to price the same investments.
The Board has adopted a pricing and valuation policy for use by the Fund and its Valuation Designee (as defined below) in calculating the Fund’s NAV. Pursuant to Rule 2a-5 under the 1940 Act, the Fund has designated Abbey Capital Limited (the “Adviser” or “Abbey Capital”) as its “Valuation Designee” to perform all of the fair value determinations as well as to perform all of the responsibilities that may be performed by the Valuation Designee in accordance with Rule 2a-5. The Valuation Designee is authorized to make all necessary determinations of the fair values of portfolio securities and other assets for which market quotations are not readily available or if it is deemed that the prices obtained from brokers and dealers or independent pricing services are unreliable.
Fair Value Measurements — The inputs and valuation techniques used to measure the fair value of the Fund’s investments are summarized into three levels as described in the hierarchy below:
| | ● Level 1 – | Prices are determined using quoted prices in active markets for identical securities. |
| | ● Level 2 – | Prices are determined using other significant observable inputs (including quoted prices for similar securities, interest rates, prepayment speeds, credit risk, etc.). |
| | ● Level 3 – | Prices are determined using significant unobservable inputs (including the Fund’s own assumptions in determining the fair value of investments). |
The inputs or methodologies used for valuing securities are not necessarily an indication of the risk associated with investing in those securities.
The following is a summary of the inputs used, as of the end of the current fiscal period, in valuing the Fund’s investments carried at fair value:
| | Total | | | Level 1 | | | Level 2 | | | Level 3 | |
Short-Term Investments | | $ | 2,131,411,644 | | | $ | 2,131,411,644 | | | $ | — | | | $ | — | |
Commodity Contracts | | | | | | | | | | | | | | | | |
Futures Contracts | | | 59,169,810 | | | | 59,169,810 | | | | — | | | | — | |
Equity Contracts | | | | | | | | | | | | | | | | |
Futures Contracts | | | 19,746,731 | | | | 19,746,731 | | | | — | | | | — | |
Foreign Currency Contracts | | | | | | | | | | | | | | | | |
Forward Foreign Currency Contracts | | | 23,367,173 | | | | — | | | | 23,367,173 | | | | — | |
Futures Contracts | | | 1,633,728 | | | | 1,633,728 | | | | — | | | | — | |
Interest Rate Contracts | | | | | | | | | | | | | | | | |
Futures Contracts | | | 6,804,173 | | | | 6,804,173 | | | | — | | | | — | |
Total Assets | | $ | 2,242,133,259 | | | $ | 2,218,766,086 | | | $ | 23,367,173 | | | $ | — | |
31
Abbey Capital Futures Strategy Fund
Notes To Consolidated Financial Statements (Continued)
August 31, 2024
| | TOTAL | | | LEVEL 1 | | | LEVEL 2 | | | LEVEL 3 | |
Commodity Contracts | | | | | | | | | | | | | | | | |
Futures Contracts | | $ | (50,625,303 | ) | | $ | (50,625,303 | ) | | $ | — | | | $ | — | |
Equity Contracts | | | | | | | | | | | | | | | | |
Futures Contracts | | | (3,769,510 | ) | | | (3,769,510 | ) | | | — | | | | — | |
Foreign Currency Contracts | | | | | | | | | | | | | | | | |
Forward Foreign Currency Contracts | | | (34,829,337 | ) | | | — | | | | (34,829,337 | ) | | | — | |
Futures Contracts | | | (8,698,425 | ) | | | (8,698,425 | ) | | | — | | | | — | |
Interest Rate Contracts | | | | | | | | | | | | | | | | |
Futures Contracts | | | (11,057,601 | ) | | | (11,057,601 | ) | | | — | | | | — | |
Total Liabilities | | $ | (108,980,176 | ) | | $ | (74,150,839 | ) | | $ | (34,829,337 | ) | | $ | — | |
At the end of each quarter, management evaluates the classification of Levels 1, 2 and 3 assets and liabilities. Various factors are considered, such as changes in liquidity from the prior reporting period; whether or not a broker is willing to execute at the quoted price; the depth and consistency of prices from third party pricing services; and the existence of contemporaneous, observable trades in the market. Additionally, management evaluates the classification of Levels 1, 2 and 3 assets and liabilities on a quarterly basis for changes in listings or delistings on national exchanges.
Due to the inherent uncertainty of determining the fair value of investments that do not have a readily available market value, the fair value of the Fund’s investments may fluctuate from period to period. Additionally, the fair value of investments may differ significantly from the values that would have been used had a ready market existed for such investments and may differ materially from the values the Fund may ultimately realize. Further, such investments may be subject to legal and other restrictions on resale or otherwise less liquid than publicly traded securities.
For fair valuations using significant unobservable inputs, U.S. generally accepted accounting principles (“U.S. GAAP”) requires the Fund to present a reconciliation of the beginning to ending balances for reported market values that presents changes attributable to total realized and unrealized gains or losses, purchase and sales, and transfers in and out of Level 3 during the period. Transfers in and out between levels are based on values at the end of the period. A reconciliation of Level 3 investments is presented only when the Fund had an amount of Level 3 investments at the end of the reporting period that was meaningful in relation to its net assets. The amounts and reasons for all Level 3 transfers are disclosed if the Fund had an amount of total Level 3 transfers during the reporting period that was meaningful in relation to its net assets as of the end of the reporting period.
During the current fiscal period, the Fund had no Level 3 transfers.
Disclosures about Derivative instruments and Hedging Activities — Derivative instruments are defined as financial instruments whose value and performance are based on the value and performance of another security or financial instrument. Derivative instruments that the Fund used during the current fiscal period include forward foreign currency contracts and futures contracts.
During the current fiscal period, the Fund used long and short contracts on U.S. and foreign equity market indices, U.S. and foreign government bonds, foreign currencies, interest rates and commodities (through investment in the Cayman Subsidiary, the SPC and the Onshore Subsidiary), to gain investment exposure in accordance with its investment objective.
The following tables provide quantitative disclosures about fair value amounts of, and gains and losses on, the Fund’s derivative instruments as of and for the current fiscal period.
32
Abbey Capital Futures Strategy Fund
Notes To Consolidated Financial Statements (Continued)
August 31, 2024
The following tables list the fair values and location on the Consolidated Statement of Assets and Liabilities of the Fund’s derivative holdings as of the end of the current fiscal period, grouped by derivative type and primary risk exposure category by contract type.
Derivative Type | | Consolidated
Statement
of Assets and
Liabilities
Location | | | Equity
Contracts | | | Interest
Rate
Contracts | | | Foreign
Currency
Contracts | | | Commodity
Contracts | | | Total | |
Asset Derivatives |
Forward Contracts (a) | | | Unrealized appreciation on forward foreign currency contracts | | | $ | — | | | $ | — | | | $ | 23,367,173 | | | $ | — | | | $ | 23,367,173 | |
Futures Contracts (a) | | | Unrealized appreciation on futures contracts | | | | 19,746,731 | | | | 6,804,173 | | | | 1,633,728 | | | | 59,169,810 | | | | 87,354,442 | |
Total Value- Assets | | | | | | $ | 19,746,731 | | | $ | 6,804,173 | | | $ | 25,000,901 | | | $ | 59,169,810 | | | $ | 110,721,615 | |
Liability Derivatives |
Forward Contracts (a) | | | Unrealized depreciation on forward foreign currency contracts | | | $ | — | | | $ | — | | | $ | (34,829,337 | ) | | $ | — | | | $ | (34,829,337 | ) |
Futures Contracts (a) | | | Unrealized depreciation on futures contracts | | | | (3,769,510 | ) | | | (11,057,601 | ) | | | (8,698,425 | ) | | | (50,625,303 | ) | | | (74,150,839 | ) |
Total Value- Liabilities | | $ | (3,769,510 | ) | | $ | (11,057,601 | ) | | $ | (43,527,762 | ) | | $ | (50,625,303 | ) | | $ | (108,980,176 | ) |
(a) | This amount represents the cumulative appreciation/(depreciation) of forwards and futures contracts as reported on the Consolidated Portfolio of Investments. |
The following table lists the amounts of realized gains/(losses) included in net increase/(decrease) in net assets resulting from operations during the current fiscal period, grouped by derivative type and primary risk exposure category by contract type.
Derivative Type | | Consolidated
Statement of
Operations
Location | | | Equity
Contracts | | | Interest
Rate
Contracts | | | Foreign
Currency
Contracts | | | Commodity
Contracts | | | Total | |
Realized Gain/(Loss) |
Futures Contracts | | | Net realized gain/(loss) from futures contracts | | | $ | 45,178,116 | | | $ | (93,414,890 | ) | | $ | (41,778,238 | ) | | $ | 28,820,945 | | | $ | (61,194,067 | ) |
Forward Contracts | | | Net realized gain/(loss) from forward foreign currency contracts | | | | — | | | | — | | | | (37,971,946 | ) | | | — | | | | (37,971,946 | ) |
Total Realized Gain/(Loss) | | $ | 45,178,116 | | | $ | (93,414,890 | ) | | $ | (79,750,184 | ) | | $ | 28,820,945 | | | $ | (99,166,013 | ) |
33
Abbey Capital Futures Strategy Fund
Notes To Consolidated Financial Statements (Continued)
August 31, 2024
The following table lists the amounts of change in unrealized appreciation/(depreciation) included in net increase/(decrease) in net assets resulting from operations during the current fiscal period, grouped by derivative type and primary risk exposure category by contract type.
Derivative Type | | Consolidated
Statement of
Operations
Location | | | Equity
Contracts | | | Interest
Rate
Contracts | | | Foreign
Currency
Contracts | | | Commodity
Contracts | | | Total | |
Change in Unrealized Appreciation/(Depreciation) |
Futures Contracts | | | Net change in unrealized appreciation/(depreciation) on futures contracts | | | $ | 12,395,156 | | | $ | 8,307,958 | | | $ | (20,973,511 | ) | | $ | (403,152 | ) | | $ | (673,549 | ) |
Forward Contracts | | | Net change in unrealized appreciation/(depreciation) on forward foreign currency contracts | | | | — | | | | — | | | | (13,260,049 | ) | | | — | | | | (13,260,049 | ) |
Total Change in Unrealized Appreciation/(Depreciation) | | $ | 12,395,156 | | | $ | 8,307,958 | | | $ | (34,233,560 | ) | | $ | (403,152 | ) | | $ | (13,933,598 | ) |
During the current fiscal period, the Fund’s quarterly average volume of derivatives was as follows:
Long Futures
Notional
Amount | Short Futures
Notional
Amount | Forward Foreign
Currency
Contracts — Payable
(Value at Trade Date) | Forward Foreign
Currency
Contracts —
Receivable
(Value at Trade Date) |
$5,969,970,116 | $(7,519,862,289) | $(4,929,064,104) | $4,925,433,527 |
For financial reporting purposes, the Fund does not offset fair value amounts recognized for derivative instruments and fair value amounts recognized for the right to reclaim cash collateral (receivables) or the obligation to return cash collateral (payables) arising from derivative instruments recognized at fair value executed with the same counterparty under a master netting arrangement.
34
Abbey Capital Futures Strategy Fund
Notes To Consolidated Financial Statements (Continued)
August 31, 2024
The following is a summary of financial and derivative instruments that are subject to enforceable master netting agreements (or similar arrangements) and collateral received and pledged in connection with the master netting agreements (or similar arrangements).
| | | | | | | Gross Amount Not
Offset in Consolidated
Statement of
Assets and Liabilities | | | | | | | | | | | | | | | Gross Amount Not
Offset in Consolidated
Statement of
Assets and Liabilities | | | | | |
Description | | Gross Amount
Presented
in the
Consolidated
Statement of
Assets and
Liabilities | | | Financial
Instruments | | | Collateral
Received | | | Net
Amount(1) | | | | | | | Gross Amount
Presented
in the
Consolidated
Statement of
Assets and
Liabilities | | | Financial
Instruments | | | Collateral
Pledged(2) | | | Net
Amount(3) | |
| | | Assets | | | | | | | Liabilities | |
Forward Foreign Currency Contracts | | $ | 23,367,173 | | | $ | (23,367,173 | ) | | $ | — | | | $ | — | | | | | | | $ | 34,829,337 | | | $ | (23,367,173 | ) | | $ | (11,462,164 | ) | | $ | — | |
| | (1) | Net amount represents the net amount receivable from the counterparty in the event of default. |
| | (2) | Actual collateral pledged may be more than the amount shown. |
| | (3) | Net amount represents the net amount payable to the counterparty in the event of default. |
Use of Estimates — The preparation of consolidated financial statements in conformity with U.S. GAAP requires management to make estimates and assumptions that affect the reported amounts of assets and liabilities and disclosure of contingent assets and liabilities at the date of the consolidated financial statements and the reported amounts of revenues and expenses during the reporting period. Actual results could differ from those estimates and those differences could be significant.
Investment Transactions, Investment Income and Expenses — The Fund records security transactions based on trade date for financial reporting purposes. The cost of investments sold is determined by use of the specific identification method for both financial reporting and income tax purposes in determining realized gains and losses on investments. Interest income (including amortization of premiums and accretion of discounts) is accrued when earned. Dividend income is recorded on the ex-dividend date. Distributions received on securities that represent a return of capital or capital gain are recorded as a reduction of cost of investments and/or as a realized gain. The Fund’s investment income, expenses (other than class specific expenses) and unrealized and realized gains and losses are allocated daily to each class of shares based upon the relative proportion of net assets of each class at the beginning of the day. Certain expenses are shared with The RBB Fund Trust (the “Trust”), a series trust of affiliated funds. Expenses incurred on behalf of a specific class, fund or fund family of the Company or Trust are charged directly to the class, fund or fund family (in proportion to net assets). Expenses incurred for all funds (such as director or professional fees) are charged to all funds in proportion to their average net assets of RBB and the Trust, or in such other manner as the Board deems fair or equitable. Expenses and fees, including investment advisory and administration fees, are accrued daily and taken into account for the purpose of determining the NAV of the Fund.
Dividends and Distributions to Shareholders — Dividends from net investment income and distributions from net realized capital gains, if any, are declared and paid at least annually to shareholders and recorded on the ex-dividend date. Income dividends and capital gain distributions are determined in accordance with U.S. federal income tax regulations, which may differ from U.S. GAAP.
U.S. Tax Status — No provision is made for U.S. income taxes as it is the Fund’s intention to continue to qualify for and elect the tax treatment applicable to regulated investment companies under Subchapter M of the Internal Revenue Code of 1986, as amended, and make the requisite distributions to its shareholders which will be sufficient to relieve it from U.S. income and excise taxes.
35
Abbey Capital Futures Strategy Fund
Notes To Consolidated Financial Statements (Continued)
August 31, 2024
The Cayman Subsidiary is registered as an “exempted company” and the SPC as an “exempted segregated portfolio company” pursuant to the Companies Act (Revised) of the Cayman Islands (as amended). Each of the Cayman Subsidiary and the SPC has received an undertaking from the Governor in Cabinet of the Cayman Islands to the effect that, for a period of twenty years from the date of the undertaking, no act that thereafter is enacted in the Cayman Islands imposing any tax or duty to be levied on profits, income or on gains or appreciation, or any tax in the nature of estate duty or inheritance tax, will apply to any property comprised in or any income arising under the Cayman Subsidiary or the SPC, or to the shareholders thereof, in respect of any such property or income. For U.S. federal income tax purposes, the Cayman Subsidiary is treated as a “controlled foreign corporation.” The SPC is treated as an entity disregarded from its owner, the Cayman Subsidiary, for U.S. income tax purposes. The Onshore Subsidiary is treated as an entity disregarded from its owner, the Fund, for U.S. income tax purposes.
SEC RULE 18f-4 — Effective August 19, 2022, the U.S. Securities and Exchange Commission (“SEC”) implemented Rule 18f-4 under the 1940 Act (“Rule 18f-4”), providing for the regulation of a registered investment company’s use of derivatives and certain related instruments. Among other things, Rule 18f-4 limits a fund’s derivatives exposure through a value-at-risk test and requires the adoption and implementation of a derivatives risk management program for certain derivatives users. The Fund, as a full derivatives user (as defined in Rule 18f-4), is subject to the full requirements of Rule 18f-4. The Fund is required to comply with Rule18f-4 and has adopted procedures for investing in derivatives and other transactions in compliance with Rule 18f-4.
Foreign Currency Translation — Assets and liabilities initially expressed in non-U.S. currencies are translated into U.S. dollars based on the applicable exchange rates at the date of the last business day of the financial statement period. Purchases and sales of securities, interest income, dividends, variation margin received and expenses denominated in foreign currencies are translated into U.S. dollars at the exchange rates in effect on the transaction date.
The Fund does not separately report the effect of changes in foreign exchange rates from changes in market prices of securities held. Such changes are included with the net realized gain or loss and change in unrealized appreciation or depreciation on investments in the Consolidated Statement of Operations. Other foreign currency transactions resulting in realized and unrealized gain or loss are reported separately as net realized gain or loss and change in unrealized appreciation or depreciation on foreign currencies in the Consolidated Statement of Operations.
Currency Risk —Investment in foreign securities involves currency risk associated with securities that trade or are denominated in currencies other than the U.S. dollar and which may be affected by fluctuations in currency exchange rates. An increase in the strength of the U.S. dollar relative to a foreign currency may cause the U.S. dollar value of an investment in that country to decline. Foreign currencies also are subject to risks caused by inflation, interest rates, budget deficits and low savings rates, political factors and government controls. Forward foreign currency exchange contracts may limit potential gains from a favorable change in value between the U.S. dollar and foreign currencies. Unanticipated changes in currency pricing may result in poorer overall performance for the Fund than if it had not engaged in these contracts.
Commodity Sector Risk — Exposure to the commodities markets may subject the Fund to greater volatility than investments in traditional securities. The value of commodity-linked derivative instruments may be affected by changes in overall market movements, commodity index volatility, changes in interest rates or factors affecting a particular industry or commodity, such as drought, floods, weather, livestock disease, embargoes, tariffs and international economic, political and regulatory developments. The prices of energy, industrial metals, precious metals, agriculture and livestock sector commodities may fluctuate widely due to factors such as changes in value, supply and demand and governmental regulatory policies. The commodity-linked securities in which the Fund invests may be issued by companies in the financial services sector, and events affecting the financial services sector may cause the Fund’s share value to fluctuate.
Foreign Securities Market Risk — A substantial portion of the trades of the Fund are expected to take place on markets or exchanges outside the United States. There is no limit to the amount of assets of the Fund that may be committed to trading on foreign markets. The risk of loss in trading foreign futures and options on futures contracts
36
Abbey Capital Futures Strategy Fund
Notes To Consolidated Financial Statements (Continued)
August 31, 2024
can be substantial. Participation in foreign futures and options on futures contracts involves the execution and clearing of trades on, or subject to the rules of, a foreign board of trade or exchange. Some of these foreign markets, in contrast to U.S. exchanges, are so-called principals’ markets in which performance is the responsibility only of the individual counterparty with whom the trader has entered into a commodity interest transaction and not of the exchange or clearing corporation. In these kinds of markets, there is risk of bankruptcy or other failure or refusal to perform by the counterparty.
Counterparty Risk — The derivative contracts entered into by the Fund, the SPC or Onshore Subsidiary may be privately negotiated in the over-the-counter market. These contracts also involve exposure to credit risk, since contract performance depends in part on the financial condition of the counterparty. Relying on a counterparty exposes the Fund to the risk that a counterparty will not settle a transaction in accordance with its terms and conditions because of a dispute over the terms of the contract (whether or not bona fide) or because of a credit or liquidity problem, thus causing the Fund to suffer a loss. If a counterparty defaults on its payment obligations to the Fund, this default will cause the value of an investment in the Fund to decrease.
Credit Risk — Credit risk refers to the possibility that the issuer of the security or a counterparty in respect of a derivative instrument will not be able to satisfy its payment obligations to the Fund when due. Changes in an issuer’s credit rating or the market’s perception of an issuer’s creditworthiness may also affect the value of the Fund’s investment in that issuer. Securities rated in the four highest categories by the rating agencies are considered investment grade, but they may also have some speculative characteristics. Investment grade ratings do not guarantee that bonds will not lose value or default. In addition, the credit quality of securities may be lowered if an issuer’s financial condition changes.
Options — An option on a futures contract gives the purchaser the right, in exchange for a premium, to assume a position in a futures contract at a specified exercise price during the term of the option. The Fund may use futures contracts and related options for: bona fide hedging; attempting to offset changes in the value of securities held or expected to be acquired or be disposed of; attempting to minimize fluctuations in foreign currencies; attempting to gain exposure to a particular market, index or instrument; or other risk management purposes. The risk associated with purchasing an option is that the Fund pays a premium whether or not the option is exercised. Additionally, the Fund bears the risk of loss of premium and change in market value should the counterparty not perform under the contract. Put and call options are accounted for in the same manner as other securities owned. The cost of securities acquired through the exercise of call options is increased by the premiums paid. The proceeds from securities sold through the exercise of put options are decreased by the premiums paid. As of the end of the current fiscal period, the Fund has no options.
Options Written — The Fund may enter into options written for: bona fide hedging; attempting to offset changes in the value of securities held or expected to be acquired or be disposed of; attempting to minimize fluctuations in foreign currencies; attempting to gain exposure to a particular market, index or instrument; or other risk management purposes. Such options may relate to particular securities or domestic stock indices, and may or may not be listed on exchanges regulated by the Commodity Futures Trading Commission or on other non-U.S. exchanges. An option on a futures contract gives the purchaser the right, in return for the premium paid, to assume a position in the contract (a long position if the option is a call and a short position if the option is a put) at a specified exercise price at any time during the option exercise period. The writer of the option is required upon exercise to assume a short futures position (if the option is a call) or a long futures position (if the option is a put). Upon exercise of the option, the accumulated cash balance in the writer’s futures margin account is delivered to the holder of the option. That balance represents the amount by which the market price of the futures contract at exercise exceeds, in the case of a call, or is less than, in the case of a put, the exercise price of the option. The maximum risk of loss associated with writing put options is limited to the exercised fair value of the option contract. The maximum risk of loss associated with writing call options is potentially unlimited. The Fund also has the additional risk of being unable to enter into a closing transaction at an acceptable price if a liquid secondary market does not exist. The Fund also may write over-the-counter options where completing the obligation depends upon the credit standing of the other party. Option contracts also involve the risk that they may result in loss due to unanticipated developments in market conditions or other causes. Written options are initially recorded as liabilities to the extent of premiums received and subsequently marked to market to reflect the
37
Abbey Capital Futures Strategy Fund
Notes To Consolidated Financial Statements (Continued)
August 31, 2024
current value of the option written. Gains or losses are realized when the option transaction expires or closes. When an option is exercised, the proceeds on sales for a written call option or the purchase cost for a written put option is adjusted by the amount of the premium received. Listed option contracts present minimal counterparty credit risk since they are exchange traded and the exchange’s clearinghouse, as counterparty to all exchange-traded options, guarantees the options against default. As of the end of the current fiscal period, the Fund has no written options.
Futures Contracts — The Fund uses futures contracts in the normal course of pursuing its investment objective. Upon entering into a futures contract, the Fund must deposit initial margin in addition to segregating cash or liquid assets sufficient to meet its obligation to purchase or provide securities, or to pay the amount owed at the expiration of an index-based futures contract. Such liquid assets may consist of cash, cash equivalents, liquid debt or equity securities or other acceptable assets. Pursuant to the futures contract, the Fund agrees to receive from, or pay to the broker, an amount of cash equal to the daily fluctuation in value of the contract. Such a receipt of payment is known as “variation margin” and is recorded by the Fund as an unrealized gain or loss. When the contract is closed, the Fund records a realized gain or loss equal to the difference between the proceeds from (or cost of) the closing transactions and the Fund’s basis in the contract. Futures contracts have market risks, including the risk that the change in the value of the contract may not correlate with changes in the value of the underlying securities. Use of long futures contracts subjects the Fund to risk of loss in excess of the amount shown on the Consolidated Statement of Assets and Liabilities, up to the notional value of the futures contract. Use of short futures contracts subjects the Fund to potentially unlimited risk of loss.
Forward Foreign Currency Contracts — In the normal course of pursuing its investment objectives, the Fund is subject to foreign investment and currency risk. The Fund uses forward foreign currency contracts (“forward contracts”) for purposes of hedging, duration management, as a substitute for securities, to increase returns, for currency hedging or risk management, or to otherwise help achieve the Fund’s investment objective. These contracts are marked-to-market daily at the applicable translation rates. The Fund records realized gains or losses at the time the forward contract is closed. A forward contract is extinguished through a closing transaction or upon delivery of the currency or entering an offsetting contract. Risks may arise upon entering these contracts from the potential inability of a counterparty to meet the terms of their contracts and from unanticipated movements in the value of a foreign currency relative to the U.S. dollar or other currencies. The Fund’s maximum risk of loss from counterparty credit risk related to forward foreign currency contracts is the fair value of the contract. The risk may be mitigated to some extent if a master netting arrangement between the Fund and the counterparty is in place and to the extent the Fund obtains collateral to cover the Fund’s exposure to the counterparty.
Cash and Cash Equivalents — Cash and cash equivalents are valued at cost plus accrued interest, which approximates market value. The Fund considers investments in the U.S Bank Money Market Deposit Account, a U.S. dollar-denominated deposit account offered through U.S. Bank, N.A., to be a cash equivalent. The Fund is exposed to the credit risk of U.S. Bank, N.A. through the holding of this cash equivalent. This cash equivalent is presented on the Consolidated Statement of Assets and Liabilities as “Cash equivalents” and was classified as Level 1 assets as of August 31, 2024. As of August 31, 2024, this balance was $133,867,939.
Other — In the normal course of business, the Fund may enter into contracts that provide general indemnifications. The Fund’s maximum exposure under these arrangements is dependent on claims that may be made against the Fund in the future, and, therefore, cannot be estimated; however, the Fund expects the risk of material loss from such claims to be remote.
2. Investment Adviser and Other Services
Abbey Capital Limited serves as the investment adviser to the Fund and the Cayman Subsidiary, Onshore Subsidiary and SPC. The Adviser allocates the assets of the Onshore Subsidiary and SPC (via the Cayman Subsidiary) to one or more Trading Advisers unaffiliated with the Adviser to manage. The Adviser also has the ultimate responsibility to oversee the Trading Advisers, and to recommend their hiring, termination and replacement, subject to approval by the
38
Abbey Capital Futures Strategy Fund
Notes To Consolidated Financial Statements (Continued)
August 31, 2024
Board. The Fund compensates the Adviser for its services at an annual rate based on the Fund’s average daily net assets (the “Advisory Fee”), payable on a monthly basis in arrears, as shown in the following table. The Adviser compensates the Trading Advisers out of the Advisory Fee.
The Adviser has contractually agreed to waive its advisory fee and/or reimburse expenses in order to limit total annual Fund operating expenses (excluding certain items discussed below) to the rates (“Expense Caps”) shown in the following table of the Fund’s average daily net assets. In determining the Adviser’s obligation to waive advisory fees and/or reimburse expenses, the following expenses are not taken into account and could cause net total annual Fund operating expenses to exceed the Expense Caps as applicable: acquired fund fees and expenses, brokerage commissions, extraordinary expenses, interest and taxes. This contractual limitation is in effect until December 31, 2024 and may not be terminated without the approval of the Board. The Adviser may discontinue these arrangements at any time after December 31, 2024.
Advisory
Fee | Expense Caps |
| | Class A | Class I | Class C | Class T |
1.77% | 2.04% | 1.79% | 2.79% | 2.04% |
During the current fiscal period, investment advisory fees accrued, waived and/or reimbursed were as follows:
Gross
Advisory
Fees | Waivers and/or
Reimbursements | Net
Advisory
Fees |
$48,481,345 | $(1,582,258) | $46,899,087 |
If at any time the Fund’s total annual fund operating expenses (not including acquired fund fees and expenses, brokerage commissions, extraordinary items, interest or taxes) for a year are less than the relevant share class’s Expense Cap, the Adviser may recoup any waived or reimbursed amounts from the Fund within three years from the date on which such waiver or reimbursement was made, provided such reimbursement does not cause the Fund to exceed expense limitations that were in effect at the time of the waiver or reimbursement.
As of the end of the current fiscal period, the Fund had amounts available for recoupment as follows:
Expiration |
August 31,
2025 | August 31,
2026 | August 31,
2027 | Total |
$1,164,300 | $1,932,271 | $1,582,258 | $4,678,829 |
Aspect Capital Limited, Crabel Capital Management, LLC, Eclipse Capital Management, Inc., Episteme Capital Partners (UK), LLP, Graham Capital Management, LP, P/E Global LLC, QMS Capital Management LP, Revolution Capital Management, LLC, R.G. Niederhoffer Capital Management, Inc., Systematica Investments Limited (acting as the general partner of Systematica Investments LP), Tudor Investment Corporation, Welton Investment Partners, LLC and Winton Capital Management Limited each served as a Trading Adviser to the Fund during the current fiscal period.
U.S. Bancorp Fund Services, LLC, doing business as U.S. Bank Global Fund Services (“Fund Services”), serves as administrator for the Fund. For providing administrative and accounting services, Fund Services is entitled to receive a monthly fee, subject to certain minimum and out of pocket expenses.
Fund Services serves as the Fund’s transfer and dividend disbursing agent. For providing transfer agent services, Fund Services is entitled to receive a monthly fee, subject to certain minimum and out of pocket expenses.
39
Abbey Capital Futures Strategy Fund
Notes To Consolidated Financial Statements (Continued)
August 31, 2024
U.S. Bank, N.A. (the “Custodian”) provides certain custodial services to the Fund. The Custodian is entitled to receive a monthly fee, subject to certain minimum and out of pocket expenses.
Quasar Distributors, LLC (the “Distributor”), a wholly-owned broker-dealer subsidiary of Foreside Financial Group, LLC, serves as the principal underwriter and distributor of the Fund’s shares pursuant to a Distribution Agreement with RBB.
The Board has adopted a Plan of Distribution for the Class A Shares, Class C Shares and Class T Shares (the “Plan”) pursuant to Rule 12b-1 under the 1940 Act. Under the Plan, the Fund’s distributor is entitled to receive from the Fund a distribution fee with respect to the Shares, which is accrued daily and paid monthly, of up to 0.25% on an annualized basis of the average daily net assets of the Class A Shares and Class T Shares and up to 1.00% of the Class C Shares. The actual amount of such compensation under the Plan is agreed upon by the Board and by the Distributor. Because these fees are paid out of the Fund’s assets on an ongoing basis, over time these fees will increase the cost of your investment and may cost you more than paying other types of sales charges. Amounts paid to the Distributor under the Plan may be used by the Distributor to cover expenses that are related to (i) the sale of the Shares, (ii) ongoing servicing and/or maintenance of the accounts of shareholders, and (iii) sub-transfer agency services, subaccounting services or administrative services related to the sale of the Shares, all as set forth in the Fund’s 12b-1 Plan.
For compensation amounts paid to Fund Services and the Custodian, please refer to the Consolidated Statement of Operations.
3. Director And Officer Compensation
The Directors of the Company receive an annual retainer and meeting fees for meetings attended. An employee of Vigilant Compliance, LLC serves as Chief Compliance Officer of the Company. Vigilant Compliance, LLC is compensated for the services provided to the Company. Employees of RBB serve as President, Chief Financial Officer, Chief Operating Officer, Secretary and Director of Marketing & Business Development of the Company. They are compensated by the Company for services provided. Certain employees of Fund Services serve as officers of the Company. They are not compensated by the Fund or the Company. For Director and Officer compensation amounts, please refer to the Consolidated Statement of Operations.
4. Purchases and Sales of Investment Securities
During the current fiscal period, there were no purchases or sales of investment securities or long-term U.S. Government securities (excluding short-term investments and derivative transactions) by the Fund.
5. Federal Income Tax Information
The Fund has followed the authoritative guidance on accounting for and disclosure of uncertainty in tax positions, which requires the Fund to determine whether a tax position is more likely than not to be sustained upon examination, including resolution of any related appeals or litigation processes, based on the technical merits of the position. The Fund has determined that there was no effect on the consolidated financial statements from following this authoritative guidance. In the normal course of business, the Fund is subject to examination by federal, state and local jurisdictions, where applicable, for tax years for which applicable statutes of limitations have not expired.
40
Abbey Capital Futures Strategy Fund
Notes To Consolidated Financial Statements (Continued)
August 31, 2024
As of August 31, 2024, the federal tax cost and aggregate gross unrealized appreciation and depreciation of investments held by the Fund were as follows(a):
Federal Tax
Cost | Unrealized
Appreciation | Unrealized
(Depreciation) | Net
Unrealized
Appreciation/
(Depreciation) |
$2,922,564,836 | $881,722 | $(473,955,846) | $(473,074,124) |
(a) | The difference between the book basis and tax basis cost and aggregate gross unrealized appreciation and depreciation of investments is attributable primarily to timing differences related to taxable income from a wholly-owned controlled foreign corporation. |
Distributions to shareholders, if any, from net investment income and realized gains are determined in accordance with federal income tax regulations, which may differ from net investment income and realized gains recognized for financial reporting purposes. Accordingly, the character of distributions and composition of net assets for tax purposes may differ from those reflected in the accompanying consolidated financial statements. To the extent these differences are permanent, such amounts are reclassified within the capital accounts based on the tax treatment; temporary differences do not require such reclassification.
Permanent differences as of August 31, 2024, primarily attributable to disallowed book income from the Cayman Subsidiary, were reclassified to the following accounts:
Distributable
Earnings/(Loss) | Paid-In
Capital |
$66,500,806 | $(66,500,806) |
As of August 31, 2024, the components of distributable earnings/(deficits) on a tax basis were as follows:
Undistributed
Ordinary
Income | Undistributed
Long-Term
Capital Gains | Net Unrealized
Appreciation/
(Depreciation) | Capital Loss
Carryforwards | Qualified
Late-Year
Losses | Other
Temporary
Differences |
$39,501,995 | $— | $(393,727,591) | $(102,324,698) | $— | $— |
The differences between the book and tax basis components of distributable earnings/(deficits) relate principally to the timing of recognition of income and gains of the Cayman Subsidiary for federal income tax purposes.
The tax character of dividends and distributions paid during the fiscal years ended August 31, 2023 and August 31, 2024 was as follows:
| | Ordinary
Income | Long-Term
Gains | Total |
2024 | $49,943,089 | $— | $49,943,089 |
| | Ordinary
Income | Long-Term
Gains | Total |
2023 | $301,432,418 | $67,524,669 | $368,957,087 |
Pursuant to federal income tax rules applicable to regulated investment companies, the Fund may elect to treat certain capital losses between November 1 and August 31 and late year ordinary losses ((i) ordinary losses between January 1 and August 31, and (ii) specified ordinary and currency losses between November 1 and August 31) as occurring on the first day of the following tax year. For the fiscal year ended August 31, 2024, any amount of losses elected within the tax return will not be recognized for federal income tax purposes until September 1, 2024.
41
Abbey Capital Futures Strategy Fund
Notes To Consolidated Financial Statements (Concluded)
August 31, 2024
The Fund is permitted to carry forward capital losses for an unlimited period. Capital losses that are carried forward will retain their character as either short-term or long-term capital losses. As of August 31, 2024, the Fund had $36,927,094 of unlimited short-term and $65,397,604 of unlimited long-term capital loss carryovers to offset future capital gains.
6. Subsequent Events
Management has evaluated the impact of all subsequent events on the Fund through the date the financial statements were issued and has determined that there were no significant events requiring recognition or disclosure in the consolidated financial statements.
42
Abbey Capital Futures Strategy Fund
Report of Independent Registered Public Accounting Firm
To the Shareholders of Abbey Capital Futures Strategy Fund
and Board of Directors of The RBB Fund, Inc.
Opinion on the Financial Statements
We have audited the accompanying consolidated statement of assets and liabilities of Abbey Capital Futures Strategy Fund (the “Fund”) (one of the portfolios constituting The RBB Fund, Inc. (the “Company”)), including the consolidated portfolio of investments, as of August 31, 2024, and the related consolidated statement of operations for the year then ended, the consolidated statements of changes in net assets for each of the two years in the period then ended, the consolidated financial highlights for each of the five years in the period then ended and the related notes (collectively referred to as the “financial statements”). In our opinion, the financial statements present fairly, in all material respects, the consolidated financial position of the Fund (one of the portfolios constituting The RBB Fund, Inc.) at August 31, 2024, the consolidated results of its operations for the year then ended, the consolidated changes in its net assets for each of the two years in the period then ended and its consolidated financial highlights for each of the five years in the period then ended, in conformity with U.S. generally accepted accounting principles.
Basis for Opinion
These financial statements are the responsibility of the Company’s management. Our responsibility is to express an opinion on the Fund’s financial statements based on our audits. We are a public accounting firm registered with the Public Company Accounting Oversight Board (United States) (“PCAOB”) and are required to be independent with respect to the Company in accordance with the U.S. federal securities laws and the applicable rules and regulations of the Securities and Exchange Commission and the PCAOB.
We conducted our audits in accordance with the standards of the PCAOB. Those standards require that we plan and perform the audit to obtain reasonable assurance about whether the financial statements are free of material misstatement, whether due to error or fraud. The Company is not required to have, nor were we engaged to perform, an audit of the Company’s internal control over financial reporting. As part of our audits, we are required to obtain an understanding of internal control over financial reporting but not for the purpose of expressing an opinion on the effectiveness of the Company’s internal control over financial reporting. Accordingly, we express no such opinion.
Our audits included performing procedures to assess the risks of material misstatement of the financial statements, whether due to error or fraud, and performing procedures that respond to those risks. Such procedures included examining, on a test basis, evidence regarding the amounts and disclosures in the financial statements. Our procedures included confirmation of securities owned as of August 31, 2024, by correspondence with the custodian and brokers. Our audits also included evaluating the accounting principles used and significant estimates made by management, as well as evaluating the overall presentation of the financial statements. We believe that our audits provide a reasonable basis for our opinion.

We have served as the auditor of one or more Abbey Capital investment companies since 2014.
Philadelphia, Pennsylvania
October 30, 2024
43
Abbey Capital Futures Strategy Fund
Shareholder Tax Information
(Unaudited)
Certain tax information regarding the Fund is required to be provided to shareholders based upon the Fund’s income and distributions for the taxable year ended August 31, 2024. The information and distribution reported herein may differ from information and distributions taxable to the shareholders for the calendar year ended December 31, 2024. During the fiscal year ended August 31, 2024, the Fund paid no ordinary income dividends that are designated as “qualified dividend income” to its shareholders. Dividends from net investment income and short-term capital gains are treated as ordinary income dividends for federal income tax purposes.
The percentage of taxable ordinary income distributions that are designated as short-term capital gain distributions under Internal Revenue Section 871(k)(2)(c) for the Fund is 0%.
Because the Fund’s fiscal year is not the calendar year, another notification will be sent with respect to calendar year 2024. The second notification, which will reflect the amount, if any, to be used by calendar year taxpayers on their U.S. federal income tax returns, will be made in conjunction with Form 1099-DIV and will be mailed in January 2025.
Foreign shareholders will generally be subject to U.S. withholding tax on the amount of their ordinary income dividends. They will generally not be entitled to a foreign tax credit or deduction for the withholding taxes paid by the Fund, if any.
In general, dividends received by tax exempt recipients (e.g., IRAs and Keoghs) need not be reported as taxable income for U.S. federal income tax purposes. However, some retirement trusts (e.g., corporate, Keogh and 403(b)(7) plans) may need this information for their annual information reporting.
Shareholders are advised to consult their own tax advisers with respect to the tax consequences of their investment in the Fund.
44
Abbey Capital Futures Strategy Fund
Other Information
(Unaudited)
Approval of Investment Advisory Agreements and Trading Advisory Agreements
As required by the 1940 Act, the Board, including all of the Directors who are not “interested persons” of the Company, as that term is defined in the 1940 Act (the “Independent Directors”), considered the renewal of (1) the investment advisory agreement between Abbey Capital and the Company on behalf of the Fund (the “Investment Advisory Agreement”), (2) each of the separate advisory agreements between the Onshore Subsidiary, the Cayman Subsidiary and the SPC (the “Subsidiaries”) and Abbey Capital (collectively, the “Subsidiary Investment Advisory Agreements”), and (3) the trading advisory agreements between Abbey Capital and each of Aspect Capital Limited, Crabel Capital Management, LLC, Eclipse Capital Management, Inc., Episteme Capital Partners (UK), LLP, Graham Capital Management, LP, P/E Global LLC, Revolution Capital Management, LLC, R.G. Niederhoffer Capital Management, Inc., Systematica Investments Limited (acting as the general partner of Systematica Investments LP), Tudor Investment Corporation, Welton Investment Partners LLC, and Winton Capital Management Limited (each, a “Trading Adviser”) (the “Trading Advisory Agreements”), at a meeting of the Board held on May 15-16, 2024 (the “Meeting”). At the Meeting, the Board, including all of the Independent Directors, approved the Investment Advisory Agreement, the Subsidiary Investment Advisory Agreements, and the Trading Advisory Agreements for an additional one-year term ending August 16, 2025. The Board’s decision to approve the Investment Advisory Agreement, the Subsidiary Investment Advisory Agreements, and the Trading Advisory Agreements reflects the exercise of its business judgment to continue the existing arrangement. In approving the Investment Advisory Agreement, Subsidiary Investment Advisory Agreements, and the Trading Advisory Agreements, the Board considered information provided by Abbey Capital and each of the Trading Advisers with the assistance and advice of counsel to the Independent Directors and the Company.
In considering the renewal and approval of the Investment Advisory Agreement, each of the Subsidiary Investment Advisory Agreements, and the Trading Advisory Agreements with respect to the Fund, the Directors took into account all materials provided prior to and during the Meeting and at other meetings throughout the past year, the presentations made during the Meeting, and the discussions held during the Meeting. The Directors reviewed these materials with management of Abbey Capital, and discussed the aforementioned Agreements with counsel in executive sessions, at which no representatives of Abbey Capital, the Subsidiaries, or Trading Advisers were present. Among other things, the Directors considered (i) the nature, extent, and quality of services provided to the Fund by Abbey Capital and each Trading Adviser; (ii) descriptions of the experience and qualifications of the personnel providing those services; (iii) Abbey Capital’s and the Trading Advisers’ investment philosophies and processes; (iv) Abbey Capital’s and the Trading Advisers’ assets under management and client descriptions; (v) Abbey Capital’s and the Trading Advisers’ soft dollar commission and trade allocation policies, including information on the types of research and services obtained in connection with soft dollar commissions; (vi) Abbey Capital’s and the Trading Advisers’ advisory fee arrangements with the Company and other similarly managed clients, as applicable; (vii) Abbey Capital’s and the Trading Advisers’ compliance procedures; (viii) Abbey Capital’s and the Trading Advisers’ financial information and insurance coverage, as applicable, and Abbey Capital’s profitability analysis; (ix) the extent to which economies of scale are relevant to the Fund; (x) a report prepared by Fuse Research Network, LLC comparing the Fund’s management fees and total expense ratios to a group of mutual funds deemed comparable to the Fund based primarily on investment strategy similarity (“Peer Group”) and comparing the performance of the Fund to the performance of its Peer Group; and (xi) a report comparing the performance of the Fund to the performance of its benchmark.
As part of their review, the Directors considered the nature, extent and quality of the services provided by Abbey Capital and each Trading Adviser. The Directors concluded that Abbey Capital and each Trading Adviser had substantial resources to provide services to the Fund and the Subsidiaries, as applicable.
The Directors also considered the investment performance of the Fund, noting that the Fund had underperformed its benchmark, the S&P 500 Total Return Index, for the three-month, one-year, three-year, five-year, and since-inception periods ended December 31, 2023. The Directors considered the Fund’s investment performance in light of its investment objective and investment strategies. The Board noted that the Fund’s total return outperformed the median of its Peer Group for the one-year, five-year, and since-inception periods ended December 31, 2023, and underperformed the median of its Peer Group for the three-month and three-year periods ended December 31, 2023.
45
Abbey Capital Futures Strategy Fund
Other Information
(Unaudited)
The Board also considered the advisory fee rate payable by the Fund under the Investment Advisory Agreement. In this regard, information on the fees paid by the Fund and the Fund’s total operating expense ratios (before and after fee waivers and expense reimbursements) were compared to similar information for mutual funds advised by other, unaffiliated investment advisory firms. The Directors noted that both the Fund’s net advisory fee and total net expenses were above the median and in the 4th quartile (most expensive) of its Peer Group. The Directors also considered the fees payable to each Trading Adviser under the Trading Advisory Agreements and the information provided by Abbey Capital on the services provided by the different Trading Advisers. In this regard, the Directors noted that the fees for each Trading Adviser were paid directly by Abbey Capital and not by the Fund. The Directors noted that Abbey Capital had contractually agreed to waive management fees and reimburse expenses through at least December 31, 2024, to limit total annual operating expenses to agreed upon levels for the Fund.
After reviewing the information regarding Abbey Capital’s and the Trading Advisers’ costs, profitability and economies of scale, and after considering the services to be provided by Abbey Capital and each Trading Adviser, the Directors concluded that the investment advisory fees to be paid by the Fund to Abbey Capital and the trading advisory fees to be paid by Abbey Capital to each Trading Adviser were fair and reasonable and that the Investment Advisory Agreement, Subsidiary Investment Advisory Agreements, and Trading Advisory Agreements should be approved and continued for an additional one-year period ending August 16, 2025.
QMS TRADING ADVISORY AGREEMENT
As required by the 1940 Act, the Board, including all of the Independent Directors, considered the approval of a new trading advisory agreement (the “QMS Trading Advisory Agreement”) by and among Abbey Capital, the Onshore Subsidiary, the SPC and QMS Capital Management LP (“QMS Capital”) at a meeting of the Board held on November 15-16, 2023 (the “November Meeting”). At the November Meeting, the Board, including all of the Independent Directors, approved the QMS Trading Advisory Agreement for an initial period ending August 16, 2025. The Board’s decision to approve the QMS Trading Advisory Agreement reflects the exercise of its business judgment. In approving the QMS Trading Advisory Agreement, the Board considered information provided by Abbey Capital and QMS Capital, with the assistance and advice of counsel to the Independent Directors and the Company.
In considering the approval of the QMS Trading Advisory Agreement, the Board took into account all materials provided prior to and during the November Meeting and at other meetings throughout the past year, the presentations made during the November Meeting, and the discussions held during the November Meeting. The Directors reviewed these materials with management of Abbey Capital, and discussed the QMS Trading Advisory Agreement with counsel in executive sessions, at which no representatives of Abbey Capital or QMS Capital were present. The Directors considered whether approval of the QMS Trading Advisory Agreement would be in the best interests of the Fund and its shareholders and the overall fairness of the QMS Trading Advisory Agreement. Among other things, the Board considered (i) the nature, extent, and quality of services to be provided to the Fund by QMS Capital; (ii) descriptions of the experience and qualifications of the personnel providing those services; (iii) QMS Capital’s investment philosophies and processes; (iv) QMS Capital’s assets under management and client descriptions; (v) QMS Capital’s trade execution and trade allocation policies; (vi) QMS Capital’s advisory fee arrangements with the Company and other similarly managed clients, as applicable; and (vii) QMS Capital’s compliance procedures.
The Board also considered the fees payable to QMS Capital under the proposed QMS Trading Advisory Agreement and the services to be provided by QMS Capital. In this regard, the Board noted that the fees for QMS Capital were payable by Abbey Capital.
After reviewing the information regarding Abbey Capital’s and QMS Capital’s costs, profitability and economies of scale, and after considering the services to be provided by QMS Capital, the Board concluded that the trading advisory fees to be paid by Abbey Capital to QMS Capital were fair and reasonable, that the QMS Trading Advisory Agreement was in the best interests of the Fund and its shareholders and did not involve a conflict of interest from which Abbey Capital would derive an inappropriate advantage, and that the QMS Trading Advisory Agreement should be approved for an initial period ending August 16, 2025.
46
Investment Adviser
Abbey Capital Limited
8 St. Stephen’s Green
Dublin 2, Ireland
Administrator and Transfer Agent
U.S. Bank Global Fund Services
P.O. Box 701
Milwaukee, WI 53201
Principal Underwriter
Quasar Distributors, LLC
3 Canal Plaza, Suite 100
Portland, ME 04101
Custodian
U.S. Bank, N.A.
1555 North Rivercenter Drive, Suite 302
Milwaukee, WI 53212
Independent Registered Public Accounting Firm
Ernst & Young LLP
One Commerce Square
2005 Market Street, Suite 700
Philadelphia, PA 19103
Legal Counsel
Faegre Drinker Biddle & Reath LLP
One Logan Square, Suite 2000
Philadelphia, PA 19103-6996

Abbey Capital Multi Asset Fund
of
THE RBB FUND, INC.
Financial Statements
August 31, 2024
Abbey Capital Multi Asset Fund
Consolidated Portfolio of Investments
August 31, 2024
| | | Par | | | Value | |
SHORT-TERM INVESTMENTS — 77.3% | | | | | | | | |
U.S. Treasury Bills — 77.3% | | | | | | | | |
5.24%, 09/05/2024(a) | | $ | 38,457,000 | | | $ | 38,445,857 | |
5.25%, 09/12/2024(a) | | | 31,111,000 | | | | 31,070,468 | |
5.21%, 09/19/2024(a) | | | 21,927,000 | | | | 21,876,081 | |
5.22%, 09/26/2024(a) | | | 27,335,000 | | | | 27,244,362 | |
5.22%, 10/03/2024(a) | | | 7,142,000 | | | | 7,111,408 | |
5.25%, 10/10/2024(a) | | | 51,321,000 | | | | 51,050,278 | |
5.26%, 10/17/2024(a) | | | 105,248,000 | | | | 104,592,436 | |
5.28%, 10/24/2024(a) | | | 29,587,000 | | | | 29,372,867 | |
5.24%, 10/31/2024(a) | | | 25,031,000 | | | | 24,825,060 | |
5.26%, 11/07/2024(a) | | | 40,331,000 | | | | 39,965,590 | |
5.26%, 11/14/2024(a) | | | 35,154,000 | | | | 34,802,921 | |
5.28%, 11/21/2024(a) | | | 25,659,000 | | | | 25,378,027 | |
5.25%, 11/29/2024(a) | | | 42,616,000 | | | | 42,104,301 | |
5.26%, 12/05/2024(a) | | | 11,333,000 | | | | 11,190,070 | |
5.24%, 12/12/2024(a) | | | 25,736,000 | | | | 25,389,761 | |
5.21%, 12/19/2024(a) | | | 75,193,000 | | | | 74,109,352 | |
5.10%, 01/09/2025(a) | | | 26,473,000 | | | | 26,026,395 | |
5.08%, 01/16/2025(a) | | | 13,503,000 | | | | 13,262,693 | |
5.04%, 01/23/2025(a) | | | 12,269,000 | | | | 12,039,671 | |
4.79%, 01/30/2025(a) | | | 31,542,000 | | | | 30,924,994 | |
4.88%, 02/06/2025(a) | | | 38,469,000 | | | | 37,682,118 | |
4.88%, 02/13/2025(a) | | | 27,185,000 | | | | 26,605,719 | |
4.82%, 02/20/2025(a) | | | 47,467,000 | | | | 46,415,177 | |
4.77%, 02/27/2025(a) | | | 8,857,000 | | | | 8,653,193 | |
TOTAL SHORT-TERM INVESTMENTS (Cost $789,745,235) | | | | | | | 790,138,799 | |
| | | | | | | | | |
TOTAL INVESTMENTS — 77.3% (Cost $789,745,235) | | | | | | | 790,138,799 | |
| | | | | | | | | |
Other Assets in Excess of Liabilities — 22.7% | | | | | | | 231,535,322 | |
TOTAL NET ASSETS — 100.0% | | | | | | $ | 1,021,674,121 | |
Percentages are stated as a percent of net assets.
(a) | The rate shown is the effective yield as of August 31, 2024. |
The accompanying notes are an integral part of the consolidated financial statements.
1
Abbey Capital Multi Asset Fund
Consolidated Portfolio of Investments (Continued)
August 31, 2024
Futures contracts outstanding as of August 31, 2024 were as follows:
Description | | Contracts
Purchased | | | Expiration
Date | | | Notional | | | Value/
Unrealized
Appreciation
(Depreciation) | |
10 Year Japanese Government Bonds | | | 3 | | | | 09/11/2024 | | | $ | 297,045 | | | $ | (493 | ) |
10 Year U.S. Ultra Treasury Notes | | | 19 | | | | 12/19/2024 | | | | 2,231,312 | | | | (16,891 | ) |
3 Month Canadian Overnight Repo Rate Average | | | 103 | | | | 03/18/2025 | | | | 18,406,096 | | | | 23,615 | |
3 Month Canadian Overnight Repo Rate Average | | | 77 | | | | 06/17/2025 | | | | 13,808,463 | | | | (1,660 | ) |
3 Month Canadian Overnight Repo Rate Average | | | 40 | | | | 09/16/2025 | | | | 7,189,552 | | | | 2,263 | |
3 Month Canadian Overnight Repo Rate Average | | | 35 | | | | 12/16/2025 | | | | 6,299,948 | | | | 6,678 | |
3 Month Canadian Overnight Repo Rate Average | | | 25 | | | | 03/17/2026 | | | | 4,504,833 | | | | 4,397 | |
3 Month Canadian Overnight Repo Rate Average | | | 15 | | | | 06/16/2026 | | | | 2,705,126 | | | | 872 | |
3 Month Euribor | | | 12 | | | | 12/16/2024 | | | | 3,215,719 | | | | (746 | ) |
3 Month Euribor | | | 3 | | | | 03/17/2025 | | | | 807,370 | | | | (14 | ) |
3 Month Euribor | | | 470 | | | | 06/16/2025 | | | | 126,812,718 | | | | 224,501 | |
3 Month Euribor | | | 187 | | | | 09/15/2025 | | | | 50,519,870 | | | | (691 | ) |
3 Month Euribor | | | 533 | | | | 12/15/2025 | | | | 144,090,878 | | | | 171,600 | |
3 Month Euribor | | | 82 | | | | 03/16/2026 | | | | 22,172,359 | | | | 6,549 | |
3 Month Euribor | | | 150 | | | | 06/15/2026 | | | | 40,559,194 | | | | 15,310 | |
3 Month Euribor | | | 153 | | | | 09/14/2026 | | | | 41,364,036 | | | | 33,590 | |
3 Month Euribor | | | 84 | | | | 12/14/2026 | | | | 22,705,024 | | | | 6,259 | |
3 Month Euribor | | | 30 | | | | 03/15/2027 | | | | 8,106,865 | | | | (1,713 | ) |
3 Month Euribor | | | 308 | | | | 06/14/2027 | | | | 83,209,197 | | | | 41,646 | |
3 Month Euribor | | | 32 | | | | 09/13/2027 | | | | 8,642,901 | | | | 5,831 | |
3 Month New Zealand Treasury Bill | | | 28 | | | | 12/11/2024 | | | | 17,307,000 | | | | 3,329 | |
3 Month New Zealand Treasury Bill | | | 17 | | | | 03/12/2025 | | | | 10,520,132 | | | | (46 | ) |
3 Month Swiss Average Overnight Rate | | | 5 | | | | 03/18/2025 | | | | 1,460,649 | | | | 662 | |
3 Month Swiss Average Overnight Rate | | | 4 | | | | 06/17/2025 | | | | 1,169,637 | | | | 162 | |
3-Month Secured Overnight Financing Rate | | | 106 | | | | 03/18/2025 | | | | 25,372,425 | | | | (6,525 | ) |
3-Month Secured Overnight Financing Rate | | | 145 | | | | 06/17/2025 | | | | 34,888,812 | | | | (136,112 | ) |
3-Month Secured Overnight Financing Rate | | | 103 | | | | 09/16/2025 | | | | 24,861,625 | | | | 10,850 | |
3-Month Secured Overnight Financing Rate | | | 87 | | | | 12/16/2025 | | | | 21,037,687 | | | | 5,325 | |
3-Month Secured Overnight Financing Rate | | | 443 | | | | 03/17/2026 | | | | 107,233,687 | | | | (34,163 | ) |
3-Month Secured Overnight Financing Rate | | | 239 | | | | 06/16/2026 | | | | 57,885,800 | | | | (13,725 | ) |
3-Month Secured Overnight Financing Rate | | | 95 | | | | 09/15/2026 | | | | 23,014,937 | | | | 10,638 | |
3-Month Secured Overnight Financing Rate | | | 92 | | | | 12/15/2026 | | | | 22,288,150 | | | | 11,000 | |
3-Month Secured Overnight Financing Rate | | | 86 | | | | 03/16/2027 | | | | 20,831,350 | | | | 10,275 | |
3-Month Secured Overnight Financing Rate | | | 226 | | | | 06/15/2027 | | | | 54,728,725 | | | | 68,338 | |
3-Month Secured Overnight Financing Rate | | | 42 | | | | 09/14/2027 | | | | 10,168,200 | | | | (625 | ) |
3-Month Secured Overnight Financing Rate | | | 26 | | | | 12/14/2027 | | | | 6,292,975 | | | | (1,475 | ) |
Arabica Coffee | | | 124 | | | | 12/18/2024 | | | | 11,348,325 | | | | 141,338 | |
Arabica Coffee | | | 29 | | | | 03/19/2025 | | | | 2,631,431 | | | | 42,919 | |
Arabica Coffee | | | 10 | | | | 05/19/2025 | | | | 899,437 | | | | 30,919 | |
The accompanying notes are an integral part of the consolidated financial statements.
2
Abbey Capital Multi Asset Fund
Consolidated Portfolio of Investments (Continued)
August 31, 2024
Description | | Contracts
Purchased | | | Expiration
Date | | | Notional | | | Value/
Unrealized
Appreciation
(Depreciation) | |
ASX SPI 200 Index | | | 126 | | | | 09/19/2024 | | | $ | 17,161,118 | | | $ | 341,295 | |
AUD/USD Cross Currency Rate | | | 406 | | | | 09/16/2024 | | | | 27,484,170 | | | | 32,995 | |
Australian Government 10 Year Bonds | | | 561 | | | | 09/16/2024 | | | | 44,265,401 | | | | (39,658 | ) |
Australian Government 3 Year Bonds | | | 1,010 | | | | 09/16/2024 | | | | 73,108,707 | | | | (14,679 | ) |
Australian 90 Day Bank Bills | | | 7 | | | | 09/12/2024 | | | | 4,687,563 | | | | (670 | ) |
Australian 90 Day Bank Bills | | | 59 | | | | 12/12/2024 | | | | 39,526,813 | | | | (7,687 | ) |
Australian 90 Day Bank Bills | | | 299 | | | | 03/13/2025 | | | | 200,465,519 | | | | 2,091 | |
Australian 90 Day Bank Bills | | | 33 | | | | 06/12/2025 | | | | 22,137,934 | | | | 147 | |
Australian 90 Day Bank Bills | | | 64 | | | | 09/11/2025 | | | | 42,947,820 | | | | 2,377 | |
Australian 90 Day Bank Bills | | | 18 | | | | 12/11/2025 | | | | 12,081,732 | | | | 246 | |
Australian 90 Day Bank Bills | | | 13 | | | | 03/12/2026 | | | | 8,727,189 | | | | 426 | |
Brent Crude Oil | | | 8 | | | | 09/30/2024 | | | | 615,440 | | | | (1,520 | ) |
British Pound/US Dollar Cross Currency Rate | | | 1,369 | | | | 09/16/2024 | | | | 112,300,781 | | | | 409,366 | |
CAC40 10 Euro Index | | | 87 | | | | 09/20/2024 | | | | 7,356,027 | | | | 34,916 | |
Canadian 10 Year Government Bonds | | | 383 | | | | 12/18/2024 | | | | 34,973,457 | | | | (297,043 | ) |
Canadian 5 Year Bonds | | | 92 | | | | 12/18/2024 | | | | 7,783,801 | | | | (37,510 | ) |
Canadian Dollar/US Dollar Cross Currency Rate | | | 833 | | | | 09/17/2024 | | | | 61,796,105 | | | | 59,135 | |
Class III Milk | | | 10 | | | | 10/29/2024 | | | | 457,400 | | | | 2,140 | |
Consumer Discretionary Select Sector Index | | | 2 | | | | 09/20/2024 | | | | 378,500 | | | | 4,870 | |
Copper | | | 23 | | | | 12/27/2024 | | | | 2,421,612 | | | | (24,587 | ) |
Copper | | | 2 | | | | 03/27/2025 | | | | 212,875 | | | | (2,425 | ) |
Corn No. 2 Yellow | | | 3 | | | | 12/13/2024 | | | | 60,150 | | | | 300 | |
Crude Oil | | | 16 | | | | 09/20/2024 | | | | 1,176,800 | | | | (28,950 | ) |
Crude Palm Oil | | | 5 | | | | 10/15/2024 | | | | 116,108 | | | | 1,053 | |
Crude Palm Oil | | | 28 | | | | 11/15/2024 | | | | 644,049 | | | | 3,528 | |
Crude Palm Oil | | | 1 | | | | 12/13/2024 | | | | 22,817 | | | | 278 | |
Crude Soybean Oil | | | 1 | | | | 12/13/2024 | | | | 25,206 | | | | (84 | ) |
Dollar Index | | | 21 | | | | 09/16/2024 | | | | 2,134,104 | | | | (39,681 | ) |
Dow Jones Industrial Average Index | | | 304 | | | | 09/20/2024 | | | | 63,312,560 | | | | 1,087,244 | |
Dow Jones U.S. Micro-Cap Total Stock Index | | | 1 | | | | 09/20/2024 | | | | 20,826 | | | | 1,210 | |
E-mini Consumer Staples Select Sector | | | 6 | | | | 09/20/2024 | | | | 500,400 | | | | 26,340 | |
E-mini Materials Sector | | | 2 | | | | 09/20/2024 | | | | 200,300 | | | | 5,360 | |
Emini S&P 500 ESG Index | | | 4 | | | | 09/20/2024 | | | | 1,005,200 | | | | 9,990 | |
Euro BUXL 30 Year Bonds | | | 36 | | | | 09/06/2024 | | | | 5,353,142 | | | | (108,174 | ) |
Euro STOXX 50 Dividend Index | | | 9 | | | | 12/19/2025 | | | | 161,665 | | | | 2,067 | |
EURO STOXX 50 Index | | | 3 | | | | 09/20/2024 | | | | 151,252 | | | | 4,112 | |
Euro STOXX 50 Quanto Index | | | 602 | | | | 09/20/2024 | | | | 33,079,556 | | | | 141,967 | |
Euro STOXX Banks Index | | | 59 | | | | 09/20/2024 | | | | 467,454 | | | | 8,030 | |
Euro/Japanese Yen Cross Currency Rate | | | 19 | | | | 09/16/2024 | | | | 2,619,177 | | | | (87,634 | ) |
Euro/US Dollar Cross Currency Rate | | | 5 | | | | 09/16/2024 | | | | 69,122 | | | | (712 | ) |
The accompanying notes are an integral part of the consolidated financial statements.
3
Abbey Capital Multi Asset Fund
Consolidated Portfolio of Investments (Continued)
August 31, 2024
Description | | Contracts
Purchased | | | Expiration
Date | | | Notional | | | Value/
Unrealized
Appreciation
(Depreciation) | |
Euro/US Dollar Cross Currency Rate | | | 829 | | | | 09/16/2024 | | | $ | 114,604,069 | | | $ | (647,250 | ) |
Euro-BOBL | | | 463 | | | | 09/06/2024 | | | | 60,223,523 | | | | (348,676 | ) |
Euro-BTP Italian Government Bonds | | | 288 | | | | 09/06/2024 | | | | 37,842,878 | | | | 314,508 | |
Euro-Bund | | | 329 | | | | 09/06/2024 | | | | 48,699,928 | | | | (295,526 | ) |
Euro-Bund | | | 101 | | | | 12/06/2024 | | | | 14,893,495 | | | | 807 | |
Euro-Schatz | | | 278 | | | | 09/06/2024 | | | | 32,644,603 | | | | (26,902 | ) |
EURO-SCHATZ FUT Dec24 | | | 487 | | | | 12/06/2024 | | | | 57,412,867 | | | | (40,452 | ) |
Financial Select Sector Index | | | 2 | | | | 09/20/2024 | | | | 282,025 | | | | 29,050 | |
French Government Bonds | | | 86 | | | | 09/06/2024 | | | | 11,984,768 | | | | (27,613 | ) |
Frozen Concentrated Orange Juice | | | 16 | | | | 11/08/2024 | | | | 1,104,720 | | | | 10,905 | |
FTSE 100 Index | | | 889 | | | | 09/20/2024 | | | | 97,926,133 | | | | 964,961 | |
FTSE Bursa Malaysia KLCI Index | | | 50 | | | | 09/30/2024 | | | | 966,744 | | | | 5,830 | |
FTSE China A50 Index | | | 916 | | | | 09/27/2024 | | | | 10,763,000 | | | | (68,295 | ) |
FTSE MIB Index | | | 16 | | | | 09/20/2024 | | | | 609,403 | | | | 18,073 | |
FTSE/JSE Top 40 Index | | | 110 | | | | 09/19/2024 | | | | 4,698,125 | | | | 85,608 | |
FTSE/MIB Index | | | 24 | | | | 09/20/2024 | | | | 4,570,519 | | | | 101,570 | |
German Stock Index | | | 138 | | | | 09/20/2024 | | | | 72,272,094 | | | | 1,372,105 | |
Gold | | | 250 | | | | 12/27/2024 | | | | 63,183,280 | | | | 996,197 | |
Gold | | | 12 | | | | 02/26/2025 | | | | 3,059,760 | | | | 133,460 | |
Hang Seng China Enterprises Index | | | 66 | | | | 09/27/2024 | | | | 2,672,485 | | | | 32,419 | |
Hang Seng China Enterprises Index | | | 13 | | | | 09/27/2024 | | | | 105,280 | | | | 869 | |
Hang Seng Index | | | 33 | | | | 09/27/2024 | | | | 759,637 | | | | 7,530 | |
Hang Seng Index | | | 84 | | | | 09/27/2024 | | | | 9,668,112 | | | | 148,555 | |
IBEX 35 Composite Index | | | 8 | | | | 09/20/2024 | | | | 101,105 | | | | 5,539 | |
IBEX 35 Index | | | 17 | | | | 09/20/2024 | | | | 2,148,485 | | | | 119,678 | |
ICE 3 Month SONIA Rate | | | 307 | | | | 03/18/2025 | | | | 96,285,246 | | | | (7,289 | ) |
ICE 3 Month SONIA Rate | | | 108 | | | | 06/17/2025 | | | | 33,987,576 | | | | (31,109 | ) |
ICE 3 Month SONIA Rate | | | 185 | | | | 09/16/2025 | | | | 58,362,199 | | | | (110,043 | ) |
ICE 3 Month SONIA Rate | | | 59 | | | | 12/16/2025 | | | | 18,639,929 | | | | (19,749 | ) |
ICE 3 Month SONIA Rate | | | 219 | | | | 03/17/2026 | | | | 69,260,792 | | | | (76,713 | ) |
ICE 3 Month SONIA Rate | | | 130 | | | | 06/16/2026 | | | | 41,139,322 | | | | (70,935 | ) |
ICE 3 Month SONIA Rate | | | 61 | | | | 09/15/2026 | | | | 19,311,847 | | | | (18,222 | ) |
ICE 3 Month SONIA Rate | | | 59 | | | | 12/15/2026 | | | | 18,683,514 | | | | (19,470 | ) |
ICE 3 Month SONIA Rate | | | 57 | | | | 03/16/2027 | | | | 18,053,918 | | | | (21,374 | ) |
ICE 3 Month SONIA Rate | | | 126 | | | | 06/15/2027 | | | | 39,916,934 | | | | 29,631 | |
ICE 3 Month SONIA Rate | | | 8 | | | | 09/14/2027 | | | | 2,534,671 | | | | (4,120 | ) |
ICE 3 Month SONIA Rate | | | 5 | | | | 12/14/2027 | | | | 1,584,334 | | | | (2,200 | ) |
ICE European Climate Exchange Emissions | | | 15 | | | | 12/16/2024 | | | | 1,165,644 | | | | (39,960 | ) |
ICE European Climate Exchange Emissions | | | 2 | | | | 12/15/2025 | | | | 160,836 | | | | (7,108 | ) |
Industrial Select Sector Index | | | 1 | | | | 09/20/2024 | | | | 132,720 | | | | 9,300 | |
Japanese 10 Year Government Bonds | | | 44 | | | | 09/12/2024 | | | | 43,557,562 | | | | (87,420 | ) |
The accompanying notes are an integral part of the consolidated financial statements.
4
Abbey Capital Multi Asset Fund
Consolidated Portfolio of Investments (Continued)
August 31, 2024
Description | | Contracts
Purchased | | | Expiration
Date | | | Notional | | | Value/
Unrealized
Appreciation
(Depreciation) | |
Japanese Yen/US Dollar Cross Currency Rate | | | 85 | | | | 09/16/2024 | | | $ | 7,288,750 | | | $ | (83,081 | ) |
JPNK400 Index | | | 2 | | | | 09/12/2024 | | | | 34,099 | | | | 557 | |
Lean Hogs | | | 47 | | | | 10/14/2024 | | | | 1,545,830 | | | | 33,640 | |
Lean Hogs | | | 3 | | | | 12/13/2024 | | | | 87,330 | | | | 330 | |
Live Cattle | | | 38 | | | | 10/31/2024 | | | | 2,714,720 | | | | (77,650 | ) |
Live Cattle | | | 35 | | | | 12/31/2024 | | | | 2,487,200 | | | | (74,980 | ) |
London Cocoa | | | 25 | | | | 12/12/2024 | | | | 1,754,846 | | | | (41,618 | ) |
London Cocoa | | | 10 | | | | 03/14/2025 | | | | 610,554 | | | | (22,799 | ) |
London Cocoa | | | 1 | | | | 05/14/2025 | | | | 58,258 | | | | (1,038 | ) |
London Metals - Aluminum | | | 1,834 | | | | 09/16/2024 | | | | 111,594,315 | | | | (2,919,906 | ) |
London Metals - Aluminum | | | 696 | | | | 12/16/2024 | | | | 42,767,808 | | | | 1,366,293 | |
London Metals - Copper | | | 661 | | | | 09/16/2024 | | | | 151,084,266 | | | | (12,206,057 | ) |
London Metals - Copper | | | 242 | | | | 12/16/2024 | | | | 56,038,243 | | | | 383,082 | |
London Metals - Lead | | | 277 | | | | 09/16/2024 | | | | 14,038,983 | | | | (622,396 | ) |
London Metals - Lead | | | 14 | | | | 12/16/2024 | | | | 721,423 | | | | (4,241 | ) |
London Metals - Nickel | | | 106 | | | | 09/16/2024 | | | | 10,551,075 | | | | (333,425 | ) |
London Metals - Nickel | | | 21 | | | | 12/16/2024 | | | | 2,119,252 | | | | (27,124 | ) |
London Metals - Tin | | | 3 | | | | 09/16/2024 | | | | 487,965 | | | | 20,879 | |
London Metals - Tin | | | 1 | | | | 12/16/2024 | | | | 161,780 | | | | 3,601 | |
London Metals - Zinc | | | 286 | | | | 09/16/2024 | | | | 20,439,848 | | | | (356,682 | ) |
London Metals - Zinc | | | 102 | | | | 12/16/2024 | | | | 7,405,200 | | | | 184,491 | |
Long Gilt | | | 296 | | | | 12/27/2024 | | | | 38,368,355 | | | | (213,451 | ) |
Low Sulphur Gas Oil | | | 9 | | | | 10/10/2024 | | | | 630,675 | | | | (28,350 | ) |
Micro Gold | | | 15 | | | | 12/27/2024 | | | | 379,140 | | | | 15,812 | |
MSCI EAFE Index | | | 53 | | | | 09/20/2024 | | | | 6,515,025 | | | | 218,700 | |
MSCI Emerging Markets Index | | | 200 | | | | 09/20/2024 | | | | 11,000,000 | | | | 14,150 | |
MSCI Singapore Index | | | 278 | | | | 09/27/2024 | | | | 6,848,009 | | | | 36,352 | |
Nasdaq 100 Index | | | 50 | | | | 09/20/2024 | | | | 19,623,000 | | | | (321,660 | ) |
NASDAQ 100 Micro Index | | | 2 | | | | 09/20/2024 | | | | 78,492 | | | | 2,419 | |
New Zealand Dollar/US Dollar Cross Currency Rate | | | 169 | | | | 09/16/2024 | | | | 10,563,345 | | | | 7,885 | |
Nifty 50 Index | | | 253 | | | | 09/26/2024 | | | | 12,848,352 | | | | 121,947 | |
Nikkei 225 Index | | | 2 | | | | 09/12/2024 | | | | 390,150 | | | | 10,275 | |
Nikkei 225 Index | | | 1 | | | | 09/12/2024 | | | | 26,479 | | | | 109 | |
Nikkei 225 Index | | | 120 | | | | 09/12/2024 | | | | 15,879,335 | | | | 61,447 | |
Nikkei 225 Index | | | 3 | | | | 09/12/2024 | | | | 794,377 | | | | 15,459 | |
NY Harbor ULSD | | | 33 | | | | 09/30/2024 | | | | 3,157,724 | | | | (21,533 | ) |
NYSE FANG+ Index | | | 1 | | | | 09/20/2024 | | | | 55,641 | | | | (5,793 | ) |
OMXS30 ESG Index | | | 4 | | | | 09/20/2024 | | | | 98,460 | | | | 1,913 | |
OMXS30 Index | | | 316 | | | | 09/20/2024 | | | | 8,000,633 | | | | 272,670 | |
Palladium | | | 3 | | | | 12/27/2024 | | | | 288,840 | | | | (1,060 | ) |
Robusta Coffee | | | 114 | | | | 11/25/2024 | | | | 5,618,490 | | | | 794,520 | |
The accompanying notes are an integral part of the consolidated financial statements.
5
Abbey Capital Multi Asset Fund
Consolidated Portfolio of Investments (Continued)
August 31, 2024
Description | | Contracts
Purchased | | | Expiration
Date | | | Notional | | | Value/
Unrealized
Appreciation
(Depreciation) | |
Robusta Coffee | | | 40 | | | | 01/27/2025 | | | $ | 1,881,420 | | | $ | 245,600 | |
Russell 2000 Index | | | 1 | | | | 09/20/2024 | | | | 11,115 | | | | (176 | ) |
Russell 2000 Index | | | 156 | | | | 09/20/2024 | | | | 17,340,180 | | | | 132,725 | |
S&P 500 Index | | | 3 | | | | 09/20/2024 | | | | 84,915 | | | | 2,068 | |
S&P 500 Index | | | 2,110 | | | | 09/20/2024 | | | | 597,235,500 | | | | 11,256,210 | |
S&P Mid Cap 400 Index | | | 15 | | | | 09/20/2024 | | | | 4,647,150 | | | | 57,050 | |
S&P/Toronto Stock Exchange 60 Index | | | 73 | | | | 09/19/2024 | | | | 15,187,727 | | | | 716,502 | |
SET50 Index | | | 16 | | | | 09/27/2024 | | | | 80,697 | | | | (399 | ) |
SGX FTSE Taiwan Index | | | 70 | | | | 09/27/2024 | | | | 5,231,100 | | | | 7,955 | |
SGX Technically Specified Rubber 20 | | | 1 | | | | 09/30/2024 | | | | 9,115 | | | | 500 | |
Short Euro-BTP Fu Dec24 | | | 1 | | | | 12/06/2024 | | | | 118,134 | | | | (33 | ) |
Short-term Euro-BTP | | | 591 | | | | 09/06/2024 | | | | 69,340,342 | | | | 176,742 | |
Silver | | | 45 | | | | 12/27/2024 | | | | 6,553,645 | | | | (192,740 | ) |
Silver | | | 3 | | | | 03/27/2025 | | | | 442,995 | | | | (13,315 | ) |
South African Rand/US Dollar Cross Currency Rate | | | 1 | | | | 09/16/2024 | | | | 28,012 | | | | 488 | |
Soybean Meal | | | 7 | | | | 12/13/2024 | | | | 219,100 | | | | (1,490 | ) |
STOXX 600 Bank Spread Index | | | 3 | | | | 09/20/2024 | | | | 33,469 | | | | 1,338 | |
STOXX 600 Utilities Index | | | 7 | | | | 09/20/2024 | | | | 154,369 | | | | 9,744 | |
STOXX Euro ESG-X Index | | | 16 | | | | 09/20/2024 | | | | 346,477 | | | | 4,698 | |
STOXX Europe 600 Index | | | 2 | | | | 09/20/2024 | | | | 43,608 | | | | 1,813 | |
STOXX Europe 600 Index | | | 105 | | | | 09/20/2024 | | | | 3,051,981 | | | | 56,858 | |
Sugar #11 | | | 86 | | | | 09/30/2024 | | | | 1,866,682 | | | | (14,177 | ) |
Swiss Franc/US Dollar Cross Currency Rate | | | 280 | | | | 09/16/2024 | | | | 41,231,750 | | | | 156,350 | |
Technology Select Sector Index | | | 1 | | | | 09/20/2024 | | | | 222,500 | | | | (5,610 | ) |
Tokyo Price Index | | | 7 | | | | 09/12/2024 | | | | 130,026 | | | | 1,614 | |
TOPIX Index | | | 15 | | | | 09/12/2024 | | | | 2,786,271 | | | | (8,995 | ) |
Two Year Canadian Government Bonds | | | 71 | | | | 12/18/2024 | | | | 5,509,197 | | | | (10,351 | ) |
U.S. Treasury 10 Year Notes | | | 997 | | | | 12/19/2024 | | | | 113,221,812 | | | | (541,977 | ) |
U.S. Treasury 2 Year Notes | | | 645 | | | | 12/31/2024 | | | | 133,867,735 | | | | (154,851 | ) |
U.S. Treasury 5 Year Note | | | 921 | | | | 12/31/2024 | | | | 100,755,961 | | | | (271,507 | ) |
U.S. Treasury Long Bonds | | | 307 | | | | 12/19/2024 | | | | 37,799,375 | | | | (410,602 | ) |
U.S. Treasury Ultra Bonds | | | 55 | | | | 12/19/2024 | | | | 7,256,562 | | | | (104,141 | ) |
UK Natural Gas | | | 10 | | | | 09/27/2024 | | | | 391,449 | | | | 2,504 | |
UK Natural Gas | | | 5 | | | | 10/30/2024 | | | | 205,742 | | | | 6,619 | |
US 3 Year Notes | | | 1 | | | | 12/31/2024 | | | | 212,477 | | | | (484 | ) |
US Cocoa | | | 28 | | | | 12/13/2024 | | | | 2,142,360 | | | | 115,240 | |
US Cocoa | | | 20 | | | | 03/14/2025 | | | | 1,289,800 | | | | 29,290 | |
US Dollar/Chinese Renminbi Cross Currency Rate | | | 2 | | | | 09/16/2024 | | | | 199,485 | | | | (3,208 | ) |
Utilities Select Sector Index | | | 3 | | | | 09/20/2024 | | | | 231,210 | | | | 18,470 | |
White Maize | | | 8 | | | | 12/20/2024 | | | | 245,446 | | | | 10,568 | |
The accompanying notes are an integral part of the consolidated financial statements.
6
Abbey Capital Multi Asset Fund
Consolidated Portfolio of Investments (Continued)
August 31, 2024
Description | | Contracts
Purchased | | | Expiration
Date | | | Notional | | | Value/
Unrealized
Appreciation
(Depreciation) | |
XAV Health Care Select Sector Index | | | 3 | | | | 09/20/2024 | | | $ | 477,030 | | | $ | 23,720 | |
Yellow Maize | | | 1 | | | | 12/20/2024 | | | | 22,694 | | | | (768 | ) |
| | | | | | | | | | | | | | | $ | 2,074,154 | |
Description | | Contracts
Sold | | | Expiration
Date | | | Notional | | | Value/
Unrealized
Appreciation
(Depreciation) | |
1 Month Secured Overnight Financing Rate | | | (7) | | | | 01/31/2025 | | | $ | 2,789,723 | | | $ | 1,292 | |
10 Year Japanese Government Bonds | | | (20) | | | | 09/11/2024 | | | | 1,980,300 | | | | (8,845 | ) |
3 Month Euribor | | | (94) | | | | 03/17/2025 | | | | 25,297,601 | | | | (74,863 | ) |
3 Month Euribor | | | (221) | | | | 12/15/2025 | | | | 59,744,998 | | | | (226,607 | ) |
AUD/USD Cross Currency Rate | | | (373) | | | | 09/16/2024 | | | | 25,250,235 | | | | (3,145 | ) |
Australian 90 Day Bank Bills | | | (1) | | | | 03/13/2025 | | | | 670,453 | | | | (16 | ) |
Brazilian Real/US Dollar Cross Currency Rate | | | (2) | | | | 09/30/2024 | | | | 35,290 | | | | 650 | |
Brent Crude Oil | | | (2) | | | | 09/30/2024 | | | | 153,860 | | | | 1,650 | |
Brent Crude Oil | | | (35) | | | | 09/30/2024 | | | | 2,692,550 | | | | 46,100 | |
Brent Crude Oil | | | (12) | | | | 10/31/2024 | | | | 914,880 | | | | 20,010 | |
Brent Crude Oil | | | (7) | | | | 11/29/2024 | | | | 530,040 | | | | 260 | |
CAC40 10 Euro Index | | | (28) | | | | 09/20/2024 | | | | 2,367,457 | | | | (93,583 | ) |
Canadian Canola Oil | | | (141) | | | | 11/14/2024 | | | | 1,286,560 | | | | (38,589 | ) |
Canadian Canola Oil | | | (29) | | | | 01/14/2025 | | | | 268,567 | | | | (8,971 | ) |
Canadian Dollar/US Dollar Cross Currency Rate | | | (991) | | | | 09/17/2024 | | | | 73,517,335 | | | | (771,695 | ) |
Copper | | | (77) | | | | 12/27/2024 | | | | 8,107,137 | | | | 34,263 | |
Corn No. 2 Yellow | | | (840) | | | | 12/13/2024 | | | | 16,858,887 | | | | 653,287 | |
Corn No. 2 Yellow | | | (700) | | | | 03/14/2025 | | | | 14,665,700 | | | | 302,037 | |
Corn No. 2 Yellow | | | (38) | | | | 05/14/2025 | | | | 813,675 | | | | 41,400 | |
Cotton No.2 | | | (355) | | | | 12/06/2024 | | | | 12,428,675 | | | | 483,610 | |
Cotton No.2 | | | (45) | | | | 03/07/2025 | | | | 1,613,805 | | | | 5,735 | |
Crude Oil | | | (35) | | | | 09/20/2024 | | | | 2,574,250 | | | | 78,340 | |
Crude Oil | | | (5) | | | | 10/22/2024 | | | | 363,250 | | | | 2,480 | |
Crude Oil | | | (43) | | | | 11/20/2024 | | | | 3,091,270 | | | | 30,910 | |
Crude Oil | | | (6) | | | | 12/19/2024 | | | | 428,160 | | | | 21,210 | |
Crude Palm Oil | | | (4) | | | | 12/13/2024 | | | | 91,267 | | | | (6,640 | ) |
Crude Palm Oil | | | (1) | | | | 01/15/2025 | | | | 22,695 | | | | (1,469 | ) |
Crude Soybean Oil | | | (347) | | | | 12/13/2024 | | | | 8,751,588 | | | | (6,816 | ) |
Crude Soybean Oil | | | (82) | | | | 01/14/2025 | | | | 2,071,998 | | | | 55,926 | |
Crude Soybean Oil | | | (7) | | | | 03/14/2025 | | | | 177,240 | | | | 8,592 | |
Dollar Index | | | (205) | | | | 09/16/2024 | | | | 20,832,920 | | | | (42,265 | ) |
Euro/Pound Sterling Cross Currency Rate | | | (4) | | | | 09/16/2024 | | | | 553,327 | | | | 9,029 | |
Euro-BOBL | | | (390) | | | | 12/06/2024 | | | | 51,284,364 | | | | 18,814 | |
Euro-Bund | | | (125) | | | | 12/06/2024 | | | | 18,432,543 | | | | 11,905 | |
Euro-Schatz | | | (265) | | | | 09/06/2024 | | | | 31,118,057 | | | | (234,461 | ) |
European Rapeseed | | | (18) | | | | 10/31/2024 | | | | 467,833 | | | | (13,721 | ) |
European Rapeseed | | | (5) | | | | 01/31/2025 | | | | 130,368 | | | | (4,366 | ) |
Feeder Cattle | | | (19) | | | | 10/31/2024 | | | | 2,258,625 | | | | (17,200 | ) |
Feeder Cattle | | | (7) | | | | 11/21/2024 | | | | 823,375 | | | | 1,438 | |
FTSE China A50 Index | | | (283) | | | | 09/27/2024 | | | | 3,325,250 | | | | 267 | |
The accompanying notes are an integral part of the consolidated financial statements.
7
Abbey Capital Multi Asset Fund
Consolidated Portfolio of Investments (Continued)
August 31, 2024
Description | | Contracts
Sold | | | Expiration
Date | | | Notional | | | Value/
Unrealized
Appreciation
(Depreciation) | |
Gold | | | (42) | | | | 12/27/2024 | | | $ | 10,615,920 | | | $ | 45,020 | |
Hang Seng Index | | | (50) | | | | 09/27/2024 | | | | 5,754,828 | | | | (61,806 | ) |
Hang Seng TECH Index | | | (4) | | | | 09/27/2024 | | | | 91,641 | | | | (2,411 | ) |
Hard Red Winter Wheat | | | (192) | | | | 12/13/2024 | | | | 5,430,650 | | | | 32,688 | |
Hard Red Winter Wheat | | | (45) | | | | 03/14/2025 | | | | 1,300,112 | | | | 12,425 | |
ICE 3 Month SONIA Rate | | | (24) | | | | 03/17/2026 | | | | 7,590,224 | | | | (17,730 | ) |
ICE European Climate Exchange Emissions | | | (10) | | | | 12/16/2024 | | | | 777,096 | | | | (43,884 | ) |
Indian Rupee/US Dollar Cross Currency Rate | | | (6) | | | | 09/26/2024 | | | | 143,016 | | | | (100 | ) |
Japanese 10 Year Government Bonds | | | (25) | | | | 09/12/2024 | | | | 24,748,615 | | | | (201,587 | ) |
Japanese Yen/US Dollar Cross Currency Rate | | | (168) | | | | 09/16/2024 | | | | 14,406,000 | | | | (10,469 | ) |
Lean Hogs | | | (83) | | | | 12/13/2024 | | | | 2,400,120 | | | | (105,580 | ) |
Lean Hogs | | | (95) | | | | 02/14/2025 | | | | 2,852,660 | | | | (90,090 | ) |
Light Sweet Crude Oil | | | (4) | | | | 09/19/2024 | | | | 147,100 | | | | 3,775 | |
Live Cattle | | | (9) | | | | 12/31/2024 | | | | 639,180 | | | | (1,740 | ) |
Live Cattle | | | (53) | | | | 02/28/2025 | | | | 3,783,460 | | | | (260 | ) |
Live Cattle | | | (9) | | | | 04/30/2025 | | | | 648,630 | | | | 2,250 | |
London Metals - Aluminum | | | (1,834) | | | | 09/16/2024 | | | | 111,594,315 | | | | 2,222,445 | |
London Metals - Aluminum | | | (724) | | | | 12/16/2024 | | | | 44,488,352 | | | | (2,637,655 | ) |
London Metals - Copper | | | (661) | | | | 09/16/2024 | | | | 151,084,266 | | | | 10,666,000 | |
London Metals - Copper | | | (242) | | | | 12/16/2024 | | | | 56,038,243 | | | | (1,112,375 | ) |
London Metals - Lead | | | (277) | | | | 09/16/2024 | | | | 14,038,983 | | | | 730,964 | |
London Metals - Lead | | | (148) | | | | 12/16/2024 | | | | 7,626,477 | | | | (94,665 | ) |
London Metals - Nickel | | | (106) | | | | 09/16/2024 | | | | 10,551,075 | | | | 577,892 | |
London Metals - Nickel | | | (80) | | | | 12/16/2024 | | | | 8,073,341 | | | | (118,079 | ) |
London Metals - Tin | | | (3) | | | | 09/16/2024 | | | | 487,965 | | | | (17,276 | ) |
London Metals - Zinc | | | (286) | | | | 09/16/2024 | | | | 20,439,848 | | | | (967,583 | ) |
London Metals - Zinc | | | (94) | | | | 12/16/2024 | | | | 6,824,400 | | | | (371,794 | ) |
Long Gilt | | | (107) | | | | 12/27/2024 | | | | 13,869,642 | | | | 131,461 | |
Low Sulphur Gas Oil | | | (71) | | | | 10/10/2024 | | | | 4,975,325 | | | | 118,550 | |
Low Sulphur Gas Oil | | | (20) | | | | 11/12/2024 | | | | 1,398,500 | | | | 44,325 | |
Low Sulphur Gas Oil | | | (10) | | | | 12/12/2024 | | | | 696,500 | | | | 29,250 | |
Low Sulphur Gas Oil | | | (10) | | | | 01/10/2025 | | | | 696,000 | | | | 29,000 | |
Lumber | | | (4) | | | | 11/15/2024 | | | | 56,925 | | | | (380 | ) |
Maize | | | (3) | | | | 11/05/2024 | | | | 33,038 | | | | (788 | ) |
Mexican Peso/US Dollar Cross Currency Rate | | | (148) | | | | 09/16/2024 | | | | 3,750,320 | | | | 184,900 | |
Mexican Stock Exchange Price & Quotation Index | | | (7) | | | | 09/20/2024 | | | | 185,444 | | | | 6,538 | |
Milling Wheat No. 2 | | | (5) | | | | 09/10/2024 | | | | 56,472 | | | | 1 | |
Milling Wheat No. 2 | | | (291) | | | | 12/10/2024 | | | | 3,492,442 | | | | 32,333 | |
Milling Wheat No. 2 | | | (101) | | | | 03/10/2025 | | | | 1,247,637 | | | | (5,941 | ) |
Milling Wheat No. 2 | | | (19) | | | | 05/12/2025 | | | | 239,167 | | | | 2,625 | |
MSCI China A 50 Index | | | (2) | | | | 09/20/2024 | | | | 93,270 | | | | (2,080 | ) |
Natural Gas | | | (9) | | | | 09/25/2024 | | | | 47,857 | | | | 2,692 | |
Natural Gas | | | (288) | | | | 09/26/2024 | | | | 6,125,760 | | | | 373,960 | |
Natural Gas | | | (302) | | | | 10/29/2024 | | | | 7,549,470 | | | | 776,430 | |
Natural Gas | | | (76) | | | | 11/26/2024 | | | | 2,308,120 | | | | 141,030 | |
Nikkei 225 Index | | | (3) | | | | 09/12/2024 | | | | 794,377 | | | | (17,717 | ) |
NY Harbor ULSD | | | (188) | | | | 09/30/2024 | | | | 17,989,457 | | | | 578,714 | |
NY Harbor ULSD | | | (24) | | | | 10/31/2024 | | | | 2,312,050 | | | | 75,970 | |
NY Harbor ULSD | | | (21) | | | | 11/29/2024 | | | | 2,029,835 | | | | 70,753 | |
NY Harbor ULSD | | | (7) | | | | 12/31/2024 | | | | 678,670 | | | | 12,176 | |
The accompanying notes are an integral part of the consolidated financial statements.
8
Abbey Capital Multi Asset Fund
Consolidated Portfolio of Investments (Continued)
August 31, 2024
Description | | Contracts
Sold | | | Expiration
Date | | | Notional | | | Value/
Unrealized
Appreciation
(Depreciation) | |
Oats | | | (1) | | | | 12/13/2024 | | | $ | 16,900 | | | $ | (588 | ) |
Palladium | | | (12) | | | | 12/27/2024 | | | | 1,155,360 | | | | (24,240 | ) |
Phelix DE Baseload Quarterly | | | (1) | | | | 09/26/2024 | | | | 237,712 | | | | (3,907 | ) |
Platinum | | | (43) | | | | 10/29/2024 | | | | 2,004,230 | | | | 10,675 | |
Platinum | | | (1) | | | | 06/25/2025 | | | | 15,066 | | | | 219 | |
Red Spring Wheat | | | (66) | | | | 12/13/2024 | | | | 1,984,962 | | | | 9,938 | |
Red Spring Wheat | | | (27) | | | | 03/14/2025 | | | | 839,825 | | | | (16,863 | ) |
Reformulated Gasoline Blendstock | | | (105) | | | | 09/30/2024 | | | | 9,231,012 | | | | 156,702 | |
Reformulated Gasoline Blendstock | | | (22) | | | | 10/31/2024 | | | | 1,898,450 | | | | 1,621 | |
Reformulated Gasoline Blendstock | | | (9) | | | | 11/29/2024 | | | | 764,165 | | | | 6,140 | |
Reformulated Gasoline Blendstock | | | (9) | | | | 12/31/2024 | | | | 758,948 | | | | 12,411 | |
Rough Rice | | | (10) | | | | 11/14/2024 | | | | 295,700 | | | | 4,200 | |
SGX TSI Iron Ore | | | (108) | | | | 09/30/2024 | | | | 1,089,504 | | | | (72,294 | ) |
SGX TSI Iron Ore | | | (154) | | | | 10/30/2024 | | | | 1,555,294 | | | | (19,212 | ) |
SGX TSI Iron Ore | | | (52) | | | | 11/29/2024 | | | | 525,349 | | | | (9,641 | ) |
SGX TSI Iron Ore | | | (32) | | | | 12/31/2024 | | | | 322,040 | | | | (8,719 | ) |
Silver | | | (10) | | | | 12/27/2024 | | | | 1,457,150 | | | | 15,250 | |
Soybean Meal | | | (279) | | | | 12/13/2024 | | | | 8,737,590 | | | | (750 | ) |
Soybean Meal | | | (99) | | | | 01/14/2025 | | | | 3,116,430 | | | | 129,790 | |
Soybeans | | | (479) | | | | 11/14/2024 | | | | 23,968,750 | | | | 1,384,713 | |
Soybeans | | | (54) | | | | 01/14/2025 | | | | 2,752,088 | | | | 228,325 | |
Soybeans | | | (237) | | | | 03/14/2025 | | | | 12,226,238 | | | | 430,200 | |
Sugar #11 | | | (136) | | | | 09/30/2024 | | | | 2,951,962 | | | | (118,563 | ) |
Sugar #11 | | | (218) | | | | 02/28/2025 | | | | 4,793,286 | | | | (199,998 | ) |
Sugar #11 | | | (58) | | | | 04/30/2025 | | | | 1,218,672 | | | | (56,168 | ) |
Sugar #11 | | | (4) | | | | 06/30/2025 | | | | 82,253 | | | | (1,534 | ) |
TOPIX Index | | | (1) | | | | 09/12/2024 | | | | 185,751 | | | | (9,884 | ) |
U.S. Treasury 10 Year Notes | | | (24) | | | | 12/19/2024 | | | | 2,725,500 | | | | 2,000 | |
U.S. Treasury 2 Year Notes | | | (37) | | | | 12/31/2024 | | | | 7,679,234 | | | | 11,578 | |
U.S. Treasury 5 Year Note | | | (46) | | | | 12/31/2024 | | | | 5,032,328 | | | | 8,141 | |
Wheat | | | (534) | | | | 12/13/2024 | | | | 14,731,525 | | | | 892,300 | |
Wheat | | | (84) | | | | 03/14/2025 | | | | 2,406,463 | | | | 26,100 | |
Wheat | | | (13) | | | | 05/14/2025 | | | | 379,438 | | | | 650 | |
White Sugar | | | (10) | | | | 09/13/2024 | | | | 273,400 | | | | (8,510 | ) |
White Sugar | | | (106) | | | | 11/15/2024 | | | | 2,816,510 | | | | (97,960 | ) |
White Sugar | | | (37) | | | | 02/13/2025 | | | | 975,735 | | | | (31,715 | ) |
WTI Light Sweet Crude Oil | | | (1) | | | | 09/19/2024 | | | | 73,550 | | | | 410 | |
WTI Light Sweet Crude Oil | | | (3) | | | | 10/21/2024 | | | | 217,950 | | | | 6,380 | |
WTI Light Sweet Crude Oil | | | (2) | | | | 11/19/2024 | | | | 143,780 | | | | 850 | |
WTI Light Sweet Crude Oil | | | (2) | | | | 12/18/2024 | | | | 142,720 | | | | 7,310 | |
| | | | | | | | | | | | | | | | 13,963,486 | |
Total Futures Contracts | | | | | | | | | | | | | | $ | 16,037,640 | |
The accompanying notes are an integral part of the consolidated financial statements.
9
Abbey Capital Multi Asset Fund
Consolidated Portfolio of Investments (Continued)
August 31, 2024
Forward foreign currency contracts outstanding as of August 31, 2024 were as follows:
Settlement Date | | Currency Purchased | | |
| | | Currency Sold | | |
| | | Counterparty | | | Unrealized
Appreciation
(Depreciation) | |
09/25/2024 | AUD | | | 15,400,000 | | | | | | CAD | | | 14,105,722 | | | | | | | SG Americas Securities LLC | | | $ | (45,282 | ) |
09/25/2024 | AUD | | | 2,064,370 | | | | | | EUR | | | 1,250,000 | | | | | | | SG Americas Securities LLC | | | | 14,790 | |
09/03/2024 | AUD | | | 725,339 | | | | | | GBP | | | 375,000 | | | | | | | SG Americas Securities LLC | | | | (1,511 | ) |
09/25/2024 | AUD | | | 1,701,430 | | | | | | GBP | | | 875,000 | | | | | | | SG Americas Securities LLC | | | | 2,948 | |
09/25/2024 | AUD | | | 5,400,000 | | | | | | JPY | | | 528,630,386 | | | | | | | SG Americas Securities LLC | | | | 27,643 | |
09/25/2024 | AUD | | | 17,000,000 | | | | | | NZD | | | 18,650,374 | | | | | | | SG Americas Securities LLC | | | | (146,264 | ) |
09/03/2024 | AUD | | | 40,132,740 | | | | | | USD | | | 27,265,302 | | | | | | | SG Americas Securities LLC | | | | (98,317 | ) |
09/18/2024 | AUD | | | 37,517,000 | | | | | | USD | | | 25,228,286 | | | | | | | SG Americas Securities LLC | | | | 177,475 | |
09/25/2024 | AUD | | | 12,800,000 | | | | | | USD | | | 8,695,527 | | | | | | | SG Americas Securities LLC | | | | (26,177 | ) |
09/04/2024 | BRL | | | 62,616,574 | | | | | | USD | | | 11,187,876 | | | | | | | SG Americas Securities LLC | | | | (82,806 | ) |
10/02/2024 | BRL | | | 33,339,643 | | | | | | USD | | | 6,050,000 | | | | | | | SG Americas Securities LLC | | | | (157,157 | ) |
09/25/2024 | CAD | | | 731,901 | | | | | | AUD | | | 800,000 | | | | | | | SG Americas Securities LLC | | | | 1,711 | |
09/03/2024 | CAD | | | 1,306,555 | | | | | | EUR | | | 875,000 | | | | | | | SG Americas Securities LLC | | | | 2,235 | |
09/25/2024 | CAD | | | 938,346 | | | | | | EUR | | | 625,000 | | | | | | | SG Americas Securities LLC | | | | 5,164 | |
09/25/2024 | CAD | | | 2,200,000 | | | | | | JPY | | | 235,810,714 | | | | | | | SG Americas Securities LLC | | | | 14,678 | |
09/03/2024 | CAD | | | 84,891,038 | | | | | | USD | | | 62,927,406 | | | | | | | SG Americas Securities LLC | | | | 73,045 | |
09/18/2024 | CAD | | | 40,383,109 | | | | | | USD | | | 29,537,531 | | | | | | | SG Americas Securities LLC | | | | 446,379 | |
09/18/2024 | CHF | | | 4,523,334 | | | | | | EUR | | | 4,800,000 | | | | | | | SG Americas Securities LLC | | | | 22,641 | |
09/25/2024 | CHF | | | 7,960,030 | | | | | | EUR | | | 8,375,000 | | | | | | | SG Americas Securities LLC | | | | 124,153 | |
09/25/2024 | CHF | | | 557,023 | | | | | | GBP | | | 500,000 | | | | | | | SG Americas Securities LLC | | | | 480 | |
09/25/2024 | CHF | | | 4,750,000 | | | | | | JPY | | | 808,328,685 | | | | | | | SG Americas Securities LLC | | | | 54,798 | |
09/03/2024 | CHF | | | 22,906,907 | | | | | | USD | | | 27,213,890 | | | | | | | SG Americas Securities LLC | | | | (253,432 | ) |
09/18/2024 | CHF | | | 29,548,041 | | | | | | USD | | | 34,387,222 | | | | | | | SG Americas Securities LLC | | | | 450,978 | |
09/25/2024 | CHF | | | 6,000,000 | | | | | | USD | | | 7,003,489 | | | | | | | SG Americas Securities LLC | | | | 76,551 | |
09/03/2024 | CLP | | | 95,529,000 | | | | | | USD | | | 101,389 | | | | | | | SG Americas Securities LLC | | | | 3,153 | |
09/05/2024 | CLP | | | 94,050,640 | | | | | | USD | | | 100,000 | | | | | | | SG Americas Securities LLC | | | | 2,921 | |
09/06/2024 | CLP | | | 94,995,830 | | | | | | USD | | | 100,000 | | | | | | | SG Americas Securities LLC | | | | 3,954 | |
09/09/2024 | CLP | | | 186,214,640 | | | | | | USD | | | 200,000 | | | | | | | SG Americas Securities LLC | | | | 3,765 | |
09/13/2024 | CLP | | | 91,589,480 | | | | | | USD | | | 100,000 | | | | | | | SG Americas Securities LLC | | | | 215 | |
09/16/2024 | CLP | | | 182,793,660 | | | | | | USD | | | 200,000 | | | | | | | SG Americas Securities LLC | | | | 1 | |
09/23/2024 | CLP | | | 2,954,733,725 | | | | | | USD | | | 3,200,000 | | | | | | | SG Americas Securities LLC | | | | 32,515 | |
09/27/2024 | CLP | | | 183,116,260 | | | | | | USD | | | 200,000 | | | | | | | SG Americas Securities LLC | | | | 319 | |
09/03/2024 | CNH | | | 21,388,440 | | | | | | USD | | | 3,016,874 | | | | | | | SG Americas Securities LLC | | | | 1,702 | |
09/19/2024 | CNH | | | 120,007,946 | | | | | | USD | | | 16,842,745 | | | | | | | SG Americas Securities LLC | | | | 126,835 | |
09/25/2024 | CNH | | | 36,260,262 | | | | | | USD | | | 5,100,000 | | | | | | | SG Americas Securities LLC | | | | 31,124 | |
09/03/2024 | COP | | | 410,197,316 | | | | | | USD | | | 100,000 | | | | | | | SG Americas Securities LLC | | | | (1,965 | ) |
09/06/2024 | COP | | | 412,209,900 | | | | | | USD | | | 100,000 | | | | | | | SG Americas Securities LLC | | | | (1,540 | ) |
09/13/2024 | COP | | | 408,500,000 | | | | | | USD | | | 100,000 | | | | | | | SG Americas Securities LLC | | | | (2,517 | ) |
09/16/2024 | COP | | | 409,043,000 | | | | | | USD | | | 100,000 | | | | | | | SG Americas Securities LLC | | | | (2,427 | ) |
09/18/2024 | COP | | | 9,198,030,680 | | | | | | USD | | | 2,250,000 | | | | | | | SG Americas Securities LLC | | | | (56,477 | ) |
09/23/2024 | COP | | | 1,614,663,000 | | | | | | USD | | | 400,000 | | | | | | | SG Americas Securities LLC | | | | (15,195 | ) |
10/03/2024 | COP | | | 837,759,000 | | | | | | USD | | | 200,000 | | | | | | | SG Americas Securities LLC | | | | (611 | ) |
09/18/2024 | CZK | | | 56,444,593 | | | | | | EUR | | | 2,250,000 | | | | | | | SG Americas Securities LLC | | | | 4,083 | |
09/25/2024 | EUR | | | 6,750,000 | | | | | | AUD | | | 11,121,579 | | | | | | | SG Americas Securities LLC | | | | (62,244 | ) |
09/03/2024 | EUR | | | 500,000 | | | | | | CAD | | | 746,581 | | | | | | | SG Americas Securities LLC | | | | (1,261 | ) |
09/25/2024 | EUR | | | 11,250,000 | | | | | | CAD | | | 16,980,776 | | | | | | | SG Americas Securities LLC | | | | (160,207 | ) |
09/18/2024 | EUR | | | 5,300,000 | | | | | | CHF | | | 5,016,149 | | | | | | | SG Americas Securities LLC | | | | (50,507 | ) |
The accompanying notes are an integral part of the consolidated financial statements.
10
Abbey Capital Multi Asset Fund
Consolidated Portfolio of Investments (Continued)
August 31, 2024
Settlement Date | | Currency Purchased | | |
| | | Currency Sold | | |
| | | Counterparty | | | Unrealized
Appreciation
(Depreciation) | |
09/18/2024 | EUR | | | 2,900,000 | | | | | | CZK | | | 73,162,057 | | | | | | | SG Americas Securities LLC | | | $ | (23,429 | ) |
09/03/2024 | EUR | | | 1,299,488 | | | | | | GBP | | | 1,093,021 | | | | | | | SG Americas Securities LLC | | | | 1,175 | |
09/18/2024 | EUR | | | 300,000 | | | | | | GBP | | | 256,769 | | | | | | | SG Americas Securities LLC | | | | (5,370 | ) |
09/25/2024 | EUR | | | 4,500,000 | | | | | | GBP | | | 3,820,700 | | | | | | | SG Americas Securities LLC | | | | (38,738 | ) |
09/18/2024 | EUR | | | 600,000 | | | | | | HUF | | | 237,884,540 | | | | | | | SG Americas Securities LLC | | | | (4,859 | ) |
09/25/2024 | EUR | | | 900,000 | | | | | | HUF | | | 356,407,417 | | | | | | | SG Americas Securities LLC | | | | (5,554 | ) |
09/18/2024 | EUR | | | 4,600,000 | | | | | | JPY | | | 741,110,931 | | | | | | | SG Americas Securities LLC | | | | 5,734 | |
09/25/2024 | EUR | | | 4,400,000 | | | | | | JPY | | | 711,928,448 | | | | | | | SG Americas Securities LLC | | | | (18,776 | ) |
09/03/2024 | EUR | | | 1,304,498 | | | | | | NOK | | | 15,179,861 | | | | | | | SG Americas Securities LLC | | | | 10,808 | |
09/18/2024 | EUR | | | 29,186,019 | | | | | | NOK | | | 349,001,309 | | | | | | | SG Americas Securities LLC | | | | (630,748 | ) |
09/25/2024 | EUR | | | 6,875,000 | | | | | | NOK | | | 80,476,481 | | | | | | | SG Americas Securities LLC | | | | 16,319 | |
09/03/2024 | EUR | | | 216,524 | | | | | | PLN | | | 927,816 | | | | | | | SG Americas Securities LLC | | | | (104 | ) |
09/18/2024 | EUR | | | 1,784,902 | | | | | | PLN | | | 7,726,968 | | | | | | | SG Americas Securities LLC | | | | (19,340 | ) |
09/03/2024 | EUR | | | 793,205 | | | | | | SEK | | | 9,000,000 | | | | | | | SG Americas Securities LLC | | | | 285 | |
09/18/2024 | EUR | | | 11,997,718 | | | | | | SEK | | | 138,802,628 | | | | | | | SG Americas Securities LLC | | | | (257,540 | ) |
09/25/2024 | EUR | | | 6,625,000 | | | | | | SEK | | | 75,504,533 | | | | | | | SG Americas Securities LLC | | | | (31,342 | ) |
09/03/2024 | EUR | | | 28,963,076 | | | | | | USD | | | 32,230,690 | | | | | | | SG Americas Securities LLC | | | | (209,044 | ) |
09/18/2024 | EUR | | | 46,401,000 | | | | | | USD | | | 51,176,803 | | | | | | | SG Americas Securities LLC | | | | 159,441 | |
09/25/2024 | EUR | | | 8,750,000 | | | | | | USD | | | 9,721,664 | | | | | | | SG Americas Securities LLC | | | | (37,910 | ) |
09/25/2024 | GBP | | | 7,625,000 | | | | | | AUD | | | 14,722,289 | | | | | | | SG Americas Securities LLC | | | | 45,060 | |
09/03/2024 | GBP | | | 348,726 | | | | | | EUR | | | 413,976 | | | | | | | SG Americas Securities LLC | | | | 313 | |
09/18/2024 | GBP | | | 19,610,900 | | | | | | EUR | | | 23,000,000 | | | | | | | SG Americas Securities LLC | | | | 313,559 | |
09/25/2024 | GBP | | | 16,384,180 | | | | | | EUR | | | 19,200,000 | | | | | | | SG Americas Securities LLC | | | | 273,686 | |
09/25/2024 | GBP | | | 2,750,000 | | | | | | JPY | | | 521,314,765 | | | | | | | SG Americas Securities LLC | | | | 32,951 | |
09/03/2024 | GBP | | | 37,165,782 | | | | | | USD | | | 49,125,731 | | | | | | | SG Americas Securities LLC | | | | (313,304 | ) |
09/18/2024 | GBP | | | 51,278,000 | | | | | | USD | | | 66,141,543 | | | | | | | SG Americas Securities LLC | | | | 1,214,565 | |
09/25/2024 | GBP | | | 8,500,000 | | | | | | USD | | | 11,060,078 | | | | | | | SG Americas Securities LLC | | | | 105,704 | |
09/18/2024 | HUF | | | 1,380,838,613 | | | | | | EUR | | | 3,500,000 | | | | | | | SG Americas Securities LLC | | | | 9,172 | |
09/25/2024 | HUF | | | 78,827,270 | | | | | | EUR | | | 200,000 | | | | | | | SG Americas Securities LLC | | | | 182 | |
09/03/2024 | HUF | | | 353,883,399 | | | | | | USD | | | 1,000,000 | | | | | | | SG Americas Securities LLC | | | | (4,756 | ) |
09/25/2024 | HUF | | | 496,072,438 | | | | | | USD | | | 1,400,000 | | | | | | | SG Americas Securities LLC | | | | (5,908 | ) |
09/18/2024 | IDR | | | 36,604,843,901 | | | | | | USD | | | 2,350,000 | | | | | | | SG Americas Securities LLC | | | | 16,653 | |
09/27/2024 | IDR | | | 31,031,082,000 | | | | | | USD | | | 2,000,000 | | | | | | | SG Americas Securities LLC | | | | 5,589 | |
09/03/2024 | ILS | | | 1,451,609 | | | | | | USD | | | 400,000 | | | | | | | SG Americas Securities LLC | | | | (780 | ) |
09/18/2024 | ILS | | | 8,342,731 | | | | | | USD | | | 2,250,000 | | | | | | | SG Americas Securities LLC | | | | 45,812 | |
09/06/2024 | INR | | | 368,022,780 | | | | | | USD | | | 4,387,078 | | | | | | | SG Americas Securities LLC | | | | 87 | |
09/09/2024 | INR | | | 459,953 | | | | | | USD | | | 5,474 | | | | | | | SG Americas Securities LLC | | | | 9 | |
09/12/2024 | INR | | | 33,102,749 | | | | | | USD | | | 394,526 | | | | | | | SG Americas Securities LLC | | | | 12 | |
09/18/2024 | INR | | | 193,114,620 | | | | | | USD | | | 2,300,000 | | | | | | | SG Americas Securities LLC | | | | 1,206 | |
09/25/2024 | JPY | | | 42,458,780 | | | | | | CHF | | | 250,000 | | | | | | | SG Americas Securities LLC | | | | (3,467 | ) |
09/18/2024 | JPY | | | 458,646,347 | | | | | | EUR | | | 2,850,000 | | | | | | | SG Americas Securities LLC | | | | (7,121 | ) |
09/03/2024 | JPY | | | 112,500,000 | | | | | | USD | | | 770,747 | | | | | | | SG Americas Securities LLC | | | | (751 | ) |
09/18/2024 | JPY | | | 5,121,233,520 | | | | | | USD | | | 34,731,545 | | | | | | | SG Americas Securities LLC | | | | 396,689 | |
09/05/2024 | KRW | | | 3,677,856,478 | | | | | | USD | | | 2,700,000 | | | | | | | SG Americas Securities LLC | | | | 54,327 | |
09/09/2024 | KRW | | | 13,087,494,141 | | | | | | USD | | | 9,600,000 | | | | | | | SG Americas Securities LLC | | | | 203,797 | |
09/19/2024 | KRW | | | 15,896,495,589 | | | | | | USD | | | 11,900,000 | | | | | | | SG Americas Securities LLC | | | | 16,006 | |
09/23/2024 | KRW | | | 3,732,067,349 | | | | | | USD | | | 2,800,000 | | | | | | | SG Americas Securities LLC | | | | (1,693 | ) |
09/27/2024 | KRW | | | 1,199,869,000 | | | | | | USD | | | 900,000 | | | | | | | SG Americas Securities LLC | | | | (95 | ) |
09/30/2024 | KRW | | | 1,866,380,972 | | | | | | USD | | | 1,400,000 | | | | | | | SG Americas Securities LLC | | | | 66 | |
The accompanying notes are an integral part of the consolidated financial statements.
11
Abbey Capital Multi Asset Fund
Consolidated Portfolio of Investments (Continued)
August 31, 2024
Settlement Date | | Currency Purchased | | |
| | | Currency Sold | | |
| | | Counterparty | | | Unrealized
Appreciation
(Depreciation) | |
10/04/2024 | KRW | | | 2,530,639,625 | | | | | | USD | | | 1,900,000 | | | | | | | SG Americas Securities LLC | | | $ | (1,166 | ) |
09/18/2024 | MXN | | | 155,625,999 | | | | | | USD | | | 8,372,104 | | | | | | | SG Americas Securities LLC | | | | (493,502 | ) |
09/03/2024 | NOK | | | 18,091,991 | | | | | | EUR | | | 1,554,680 | | | | | | | SG Americas Securities LLC | | | | (12,798 | ) |
09/18/2024 | NOK | | | 256,322,660 | | | | | | EUR | | | 21,864,596 | | | | | | | SG Americas Securities LLC | | | | (11,421 | ) |
09/03/2024 | NOK | | | 2,500,000 | | | | | | SEK | | | 2,431,650 | | | | | | | SG Americas Securities LLC | | | | (1,118 | ) |
09/03/2024 | NOK | | | 30,474,419 | | | | | | USD | | | 2,900,000 | | | | | | | SG Americas Securities LLC | | | | (26,287 | ) |
09/25/2024 | NOK | | | 30,518,796 | | | | | | USD | | | 2,900,000 | | | | | | | SG Americas Securities LLC | | | | (20,783 | ) |
09/25/2024 | NZD | | | 1,600,000 | | | | | | JPY | | | 142,934,074 | | | | | | | SG Americas Securities LLC | | | | 18,893 | |
09/03/2024 | NZD | | | 5,200,000 | | | | | | USD | | | 3,251,218 | | | | | | | SG Americas Securities LLC | | | | (365 | ) |
09/18/2024 | NZD | | | 31,750,000 | | | | | | USD | | | 19,445,964 | | | | | | | SG Americas Securities LLC | | | | 403,885 | |
09/25/2024 | NZD | | | 9,900,000 | | | | | | USD | | | 6,162,345 | | | | | | | SG Americas Securities LLC | | | | 27,152 | |
09/18/2024 | PEN | | | 3,924,135 | | | | | | USD | | | 1,050,000 | | | | | | | SG Americas Securities LLC | | | | (3,060 | ) |
09/18/2024 | PHP | | | 166,773,318 | | | | | | USD | | | 2,950,000 | | | | | | | SG Americas Securities LLC | | | | 19,815 | |
09/27/2024 | PHP | | | 16,866,800 | | | | | | USD | | | 300,000 | | | | | | | SG Americas Securities LLC | | | | 343 | |
09/03/2024 | PLN | | | 500,000 | | | | | | EUR | | | 116,567 | | | | | | | SG Americas Securities LLC | | | | 186 | |
09/18/2024 | PLN | | | 60,395,335 | | | | | | EUR | | | 13,976,660 | | | | | | | SG Americas Securities LLC | | | | 122,893 | |
09/25/2024 | PLN | | | 3,847,771 | | | | | | EUR | | | 900,000 | | | | | | | SG Americas Securities LLC | | | | (3,169 | ) |
09/03/2024 | PLN | | | 385,828 | | | | | | USD | | | 100,000 | | | | | | | SG Americas Securities LLC | | | | (407 | ) |
09/25/2024 | PLN | | | 29,659,380 | | | | | | USD | | | 7,700,000 | | | | | | | SG Americas Securities LLC | | | | (46,727 | ) |
09/03/2024 | SEK | | | 46,587,241 | | | | | | EUR | | | 4,107,687 | | | | | | | SG Americas Securities LLC | | | | (3,430 | ) |
09/18/2024 | SEK | | | 163,748,270 | | | | | | EUR | | | 14,382,143 | | | | | | | SG Americas Securities LLC | | | | 51,361 | |
09/25/2024 | SEK | | | 36,179,298 | | | | | | EUR | | | 3,185,952 | | | | | | | SG Americas Securities LLC | | | | 2,325 | |
09/25/2024 | SEK | | | 69,182,492 | | | | | | NOK | | | 71,000,000 | | | | | | | SG Americas Securities LLC | | | | 48,480 | |
09/25/2024 | SEK | | | 34,912,168 | | | | | | USD | | | 3,400,000 | | | | | | | SG Americas Securities LLC | | | | 4,692 | |
09/18/2024 | SGD | | | 10,053,268 | | | | | | USD | | | 7,650,000 | | | | | | | SG Americas Securities LLC | | | | 62,928 | |
09/25/2024 | SGD | | | 25,070,782 | | | | | | USD | | | 19,200,000 | | | | | | | SG Americas Securities LLC | | | | 42,542 | |
09/18/2024 | THB | | | 105,230,981 | | | | | | USD | | | 3,050,000 | | | | | | | SG Americas Securities LLC | | | | 64,115 | |
09/18/2024 | TRY | | | 17,500,000 | | | | | | USD | | | 491,733 | | | | | | | SG Americas Securities LLC | | | | 9,583 | |
09/18/2024 | TWD | | | 106,788,856 | | | | | | USD | | | 3,350,000 | | | | | | | SG Americas Securities LLC | | | | (4,721 | ) |
09/27/2024 | TWD | | | 6,370,000 | | | | | | USD | | | 200,000 | | | | | | | SG Americas Securities LLC | | | | (257 | ) |
09/18/2024 | USD | | | 20,796,179 | | | | | | AUD | | | 31,453,000 | | | | | | | SG Americas Securities LLC | | | | (503,161 | ) |
09/25/2024 | USD | | | 5,252,794 | | | | | | AUD | | | 7,800,000 | | | | | | | SG Americas Securities LLC | | | | (30,092 | ) |
09/04/2024 | USD | | | 11,086,265 | | | | | | BRL | | | 62,639,847 | | | | | | | SG Americas Securities LLC | | | | (22,933 | ) |
10/02/2024 | USD | | | 12,350,000 | | | | | | BRL | | | 69,796,995 | | | | | | | SG Americas Securities LLC | | | | 13,253 | |
09/18/2024 | USD | | | 50,716,907 | | | | | | CAD | | | 69,340,656 | | | | | | | SG Americas Securities LLC | | | | (767,588 | ) |
09/25/2024 | USD | | | 13,170,357 | | | | | | CAD | | | 17,900,000 | | | | | | | SG Americas Securities LLC | | | | (123,052 | ) |
09/03/2024 | USD | | | 2,646,544 | | | | | | CHF | | | 2,227,226 | | | | | | | SG Americas Securities LLC | | | | 25,194 | |
09/18/2024 | USD | | | 32,203,811 | | | | | | CHF | | | 28,312,220 | | | | | | | SG Americas Securities LLC | | | | (1,177,310 | ) |
09/25/2024 | USD | | | 1,624,988 | | | | | | CHF | | | 1,375,000 | | | | | | | SG Americas Securities LLC | | | | 2,478 | |
09/03/2024 | USD | | | 100,000 | | | | | | CLP | | | 95,529,000 | | | | | | | SG Americas Securities LLC | | | | (4,542 | ) |
09/05/2024 | USD | | | 100,000 | | | | | | CLP | | | 95,399,000 | | | | | | | SG Americas Securities LLC | | | | (4,396 | ) |
09/06/2024 | USD | | | 100,000 | | | | | | CLP | | | 93,631,000 | | | | | | | SG Americas Securities LLC | | | | (2,460 | ) |
09/09/2024 | USD | | | 200,000 | | | | | | CLP | | | 187,586,832 | | | | | | | SG Americas Securities LLC | | | | (5,266 | ) |
09/13/2024 | USD | | | 100,000 | | | | | | CLP | | | 93,342,170 | | | | | | | SG Americas Securities LLC | | | | (2,133 | ) |
09/16/2024 | USD | | | 200,000 | | | | | | CLP | | | 186,444,483 | | | | | | | SG Americas Securities LLC | | | | (3,994 | ) |
09/23/2024 | USD | | | 2,150,000 | | | | | | CLP | | | 2,008,760,265 | | | | | | | SG Americas Securities LLC | | | | (47,608 | ) |
09/27/2024 | USD | | | 200,000 | | | | | | CLP | | | 184,906,000 | | | | | | | SG Americas Securities LLC | | | | (2,277 | ) |
09/30/2024 | USD | | | 100,000 | | | | | | CLP | | | 90,691,000 | | | | | | | SG Americas Securities LLC | | | | 793 | |
10/04/2024 | USD | | | 300,000 | | | | | | CLP | | | 274,453,500 | | | | | | | SG Americas Securities LLC | | | | (209 | ) |
The accompanying notes are an integral part of the consolidated financial statements.
12
Abbey Capital Multi Asset Fund
Consolidated Portfolio of Investments (Continued)
August 31, 2024
Settlement Date | | Currency Purchased | | |
| | | Currency Sold | | |
| | | Counterparty | | | Unrealized
Appreciation
(Depreciation) | |
09/03/2024 | USD | | | 917,069 | | | | | | CNH | | | 6,500,000 | | | | | | | SG Americas Securities LLC | | | $ | (284 | ) |
09/19/2024 | USD | | | 18,990,603 | | | | | | CNH | | | 136,818,645 | | | | | | | SG Americas Securities LLC | | | | (356,074 | ) |
09/25/2024 | USD | | | 4,600,000 | | | | | | CNH | | | 32,700,853 | | | | | | | SG Americas Securities LLC | | | | (27,439 | ) |
09/03/2024 | USD | | | 102,095 | | | | | | COP | | | 410,197,316 | | | | | | | SG Americas Securities LLC | | | | 4,060 | |
09/06/2024 | USD | | | 100,000 | | | | | | COP | | | 413,006,060 | | | | | | | SG Americas Securities LLC | | | | 1,350 | |
09/13/2024 | USD | | | 100,000 | | | | | | COP | | | 416,689,684 | | | | | | | SG Americas Securities LLC | | | | 563 | |
09/16/2024 | USD | | | 100,000 | | | | | | COP | | | 418,803,684 | | | | | | | SG Americas Securities LLC | | | | 98 | |
10/03/2024 | USD | | | 200,000 | | | | | | COP | | | 832,669,368 | | | | | | | SG Americas Securities LLC | | | | 1,823 | |
09/03/2024 | USD | | | 524,151 | | | | | | EUR | | | 471,748 | | | | | | | SG Americas Securities LLC | | | | 2,585 | |
09/18/2024 | USD | | | 30,420,871 | | | | | | EUR | | | 28,025,000 | | | | | | | SG Americas Securities LLC | | | | (584,888 | ) |
09/03/2024 | USD | | | 4,533,862 | | | | | | GBP | | | 3,436,128 | | | | | | | SG Americas Securities LLC | | | | 20,954 | |
09/18/2024 | USD | | | 17,432,980 | | | | | | GBP | | | 13,624,000 | | | | | | | SG Americas Securities LLC | | | | (462,796 | ) |
09/25/2024 | USD | | | 164,123 | | | | | | GBP | | | 125,000 | | | | | | | SG Americas Securities LLC | | | | (80 | ) |
09/25/2024 | USD | | | 400,000 | | | | | | HUF | | | 144,183,240 | | | | | | | SG Americas Securities LLC | | | | (5,192 | ) |
09/18/2024 | USD | | | 1,900,000 | | | | | | IDR | | | 30,717,223,124 | | | | | | | SG Americas Securities LLC | | | | (85,994 | ) |
09/27/2024 | USD | | | 700,000 | | | | | | IDR | | | 10,909,822,000 | | | | | | | SG Americas Securities LLC | | | | (5,119 | ) |
09/18/2024 | USD | | | 1,800,000 | | | | | | ILS | | | 6,855,015 | | | | | | | SG Americas Securities LLC | | | | (86,412 | ) |
09/25/2024 | USD | | | 2,400,000 | | | | | | ILS | | | 8,847,638 | | | | | | | SG Americas Securities LLC | | | | (35,499 | ) |
09/06/2024 | USD | | | 4,387,078 | | | | | | INR | | | 367,738,039 | | | | | | | SG Americas Securities LLC | | | | 3,308 | |
09/09/2024 | USD | | | 5,474 | | | | | | INR | | | 459,898 | | | | | | | SG Americas Securities LLC | | | | (8 | ) |
09/12/2024 | USD | | | 394,526 | | | | | | INR | | | 33,149,534 | | | | | | | SG Americas Securities LLC | | | | (570 | ) |
09/17/2024 | USD | | | 7,389,055 | | | | | | INR | | | 621,005,738 | | | | | | | SG Americas Securities LLC | | | | (11,258 | ) |
09/18/2024 | USD | | | 900,000 | | | | | | INR | | | 75,646,007 | | | | | | | SG Americas Securities LLC | | | | (1,418 | ) |
09/20/2024 | USD | | | 5,400,000 | | | | | | INR | | | 453,768,372 | | | | | | | SG Americas Securities LLC | | | | (6,877 | ) |
09/23/2024 | USD | | | 5,422,565 | | | | | | INR | | | 455,460,756 | | | | | | | SG Americas Securities LLC | | | | (3,951 | ) |
09/27/2024 | USD | | | 6,487,078 | | | | | | INR | | | 544,647,708 | | | | | | | SG Americas Securities LLC | | | | (1,202 | ) |
10/03/2024 | USD | | | 394,526 | | | | | | INR | | | 33,125,078 | | | | | | | SG Americas Securities LLC | | | | 1 | |
09/18/2024 | USD | | | 26,208,260 | | | | | | JPY | | | 4,006,259,925 | | | | | | | SG Americas Securities LLC | | | | (1,272,002 | ) |
09/25/2024 | USD | | | 5,575,895 | | | | | | JPY | | | 812,500,000 | | | | | | | SG Americas Securities LLC | | | | (2,981 | ) |
09/05/2024 | USD | | | 2,700,000 | | | | | | KRW | | | 3,696,546,640 | | | | | | | SG Americas Securities LLC | | | | (68,324 | ) |
09/09/2024 | USD | | | 9,600,000 | | | | | | KRW | | | 13,171,760,626 | | | | | | | SG Americas Securities LLC | | | | (266,921 | ) |
09/19/2024 | USD | | | 12,150,000 | | | | | | KRW | | | 16,587,448,825 | | | | | | | SG Americas Securities LLC | | | | (283,944 | ) |
09/27/2024 | USD | | | 3,100,000 | | | | | | KRW | | | 4,162,146,000 | | | | | | | SG Americas Securities LLC | | | | (21,619 | ) |
09/30/2024 | USD | | | 6,900,000 | | | | | | KRW | | | 9,192,756,081 | | | | | | | SG Americas Securities LLC | | | | 4,054 | |
09/18/2024 | USD | | | 14,624,747 | | | | | | MXN | | | 277,031,875 | | | | | | | SG Americas Securities LLC | | | | 599,946 | |
09/25/2024 | USD | | | 1,026,665 | | | | | | MXN | | | 19,500,000 | | | | | | | SG Americas Securities LLC | | | | 40,537 | |
09/25/2024 | USD | | | 5,400,000 | | | | | | NOK | | | 56,960,647 | | | | | | | SG Americas Securities LLC | | | | 26,195 | |
09/18/2024 | USD | | | 18,359,539 | | | | | | NZD | | | 30,663,000 | | | | | | | SG Americas Securities LLC | | | | (810,728 | ) |
09/25/2024 | USD | | | 4,726,145 | | | | | | NZD | | | 7,700,000 | | | | | | | SG Americas Securities LLC | | | | (87,908 | ) |
09/18/2024 | USD | | | 550,000 | | | | | | PEN | | | 2,052,760 | | | | | | | SG Americas Securities LLC | | | | 2,334 | |
09/18/2024 | USD | | | 1,850,000 | | | | | | PHP | | | 106,952,623 | | | | | | | SG Americas Securities LLC | | | | (54,558 | ) |
09/27/2024 | USD | | | 300,000 | | | | | | PHP | | | 17,007,900 | | | | | | | SG Americas Securities LLC | | | | (2,855 | ) |
09/18/2024 | USD | | | 800,000 | | | | | | SGD | | | 1,049,690 | | | | | | | SG Americas Securities LLC | | | | (5,328 | ) |
09/18/2024 | USD | | | 1,500,000 | | | | | | THB | | | 52,752,600 | | | | | | | SG Americas Securities LLC | | | | (61,115 | ) |
09/18/2024 | USD | | | 85,737 | | | | | | TRY | | | 3,000,000 | | | | | | | SG Americas Securities LLC | | | | (203 | ) |
09/25/2024 | USD | | | 4,300,000 | | | | | | TRY | | | 150,935,415 | | | | | | | SG Americas Securities LLC | | | | 11,402 | |
09/18/2024 | USD | | | 4,050,000 | | | | | | TWD | | | 131,747,095 | | | | | | | SG Americas Securities LLC | | | | (77,123 | ) |
09/19/2024 | USD | | | 3,500,000 | | | | | | TWD | | | 112,579,950 | | | | | | | SG Americas Securities LLC | | | | (27,075 | ) |
09/27/2024 | USD | | | 1,800,000 | | | | | | TWD | | | 57,309,100 | | | | | | | SG Americas Securities LLC | | | | 2,967 | |
The accompanying notes are an integral part of the consolidated financial statements.
13
Abbey Capital Multi Asset Fund
Consolidated Portfolio of Investments (Concluded)
August 31, 2024
Settlement Date | | Currency Purchased | | |
| | | Currency Sold | | |
| | | Counterparty | | | Unrealized
Appreciation
(Depreciation) | |
09/03/2024 | USD | | | 113,101 | | | | | | ZAR | | | 2,000,000 | | | | | | | SG Americas Securities LLC | | | $ | 959 | |
09/18/2024 | USD | | | 733,268 | | | | | | ZAR | | | 13,500,324 | | | | | | | SG Americas Securities LLC | | | | (22,771 | ) |
09/25/2024 | USD | | | 100,000 | | | | | | ZAR | | | 1,783,981 | | | | | | | SG Americas Securities LLC | | | | 152 | |
09/03/2024 | ZAR | | | 2,000,000 | | | | | | USD | | | 113,150 | | | | | | | SG Americas Securities LLC | | | | (1,008 | ) |
09/18/2024 | ZAR | | | 117,825,904 | | | | | | USD | | | 6,462,099 | | | | | | | SG Americas Securities LLC | | | | 136,337 | |
09/25/2024 | ZAR | | | 101,960,808 | | | | | | USD | | | 5,700,000 | | | | | | | SG Americas Securities LLC | | | | 6,665 | |
Total Forward Foreign Currency Contracts | | | | | | | | | | | | | | | | | | | | | $ | (4,431,618 | ) |
AUD | Australian Dollar | | LME | London Mercantile Exchange |
BRL | Brazilian Real | | MIB | Milano Indice di Borsa |
CAD | Canadian Dollar | | MXN | Mexican Peso |
CHF | Swiss Franc | | NOK | Norwegian Krone |
CLP | Chilean Peso | | NZD | New Zealand Dollar |
CNH | Chinese Yuan Renminbi | | OMX | Stockholm Stock Exchange |
COP | Colombian Peso | | PHP | Philippine Peso |
CZK | Czech Koruna | | PLN | Polish Zloty |
DAX | Deutscher Aktienindex | | RBOB | Reformulated Blendstock for Oxygenate Blending |
DJIA | Dow Jones Industrial Average | | SEK | Swedish Krona |
EUR | Euro | | SGD | Singapore Dollar |
FTSE | Financial Times Stock Exchange | | THB | Thai Baht |
GBP | British Pound | | TRY | Turkish Lira |
HUF | Hungarian Forint | | TWD | Taiwan Dollar |
IDR | Indonesian Rupiah | | USD | United States Dollar |
ILS | Israeli New Shekel | | WTI | West Texas Intermediate |
INR | Indian Rupee | | ZAR | South African Rand |
JPY | Japanese Yen | | | |
KRW | Korean Won | | | |
The accompanying notes are an integral part of the consolidated financial statements.
14
Abbey Capital Multi Asset Fund
Consolidated Statement of Assets And Liabilities
August 31, 2024
ASSETS | | | | |
Investments, at value (cost $789,745,235) | | $ | 790,138,799 | |
Cash equivalents | | | 66,138,528 | |
Foreign currency deposits with broker for futures contracts (cost $4,952,987) | | | 4,938,998 | |
Deposit with brokers: | | | | |
Forward foreign currency contracts | | | 17,749,657 | |
Futures contracts | | | 125,542,494 | |
Receivables for: | | | | |
Capital shares sold | | | 7,686,103 | |
Interest receivable | | | 223,196 | |
Unrealized appreciation on forward foreign currency contracts | | | 6,422,664 | |
Unrealized appreciation on futures contracts | | | 46,127,418 | |
Prepaid expenses and other assets | | | 77,894 | |
Total assets | | $ | 1,065,045,751 | |
| | | | | |
LIABILITIES | | | | |
Payables for: | | | | |
Advisory fees | | | 1,425,848 | |
Capital shares redeemed | | | 766,490 | |
Unrealized depreciation on forward foreign currency contracts | | | 10,854,282 | |
Unrealized depreciation on futures contracts | | | 30,089,778 | |
Other accrued expenses and liabilities | | | 235,232 | |
Total liabilities | | | 43,371,630 | |
Net assets | | $ | 1,021,674,121 | |
| | | | | |
NET ASSETS CONSIST OF: | | | | |
Par value | | $ | 86,100 | |
Paid-in capital | | | 998,808,849 | |
Total distributable earnings/(losses) | | | 22,779,172 | |
Net assets | | $ | 1,021,674,121 | |
| | | | | |
CLASS A SHARES: | | | | |
Net assets | | $ | 6,671,652 | |
Shares outstanding ($0.001 par value, 100,000,000 shares authorized) | | | 564,631 | |
Net asset value and redemption price per share | | $ | 11.82 | |
Maximum offering price per share (100/94.25 of 11.82) | | $ | 12.54 | |
| | | | | |
CLASS I SHARES: | | | | |
Net assets | | $ | 1,000,318,558 | |
Shares outstanding ($0.001 par value, 100,000,000 shares authorized) | | | 84,267,130 | |
Net asset value, offering and redemption price per share | | $ | 11.87 | |
| | | | | |
CLASS C SHARES: | | | | |
Net assets | | $ | 14,683,911 | |
Shares outstanding ($0.001 par value, 100,000,000 shares authorized) | | | 1,267,819 | |
Net asset value, offering and redemption price per share | | $ | 11.59 | |
The accompanying notes are an integral part of the consolidated financial statements.
15
Abbey Capital Multi Asset Fund
Consolidated Statement of Operations
For the Year Ended August 31, 2024
INVESTMENT INCOME | | | | |
Interest | | $ | 37,758,392 | |
Total investment income | | | 37,758,392 | |
EXPENSES | | | | |
Advisory fees (Note 2) | | | 13,269,062 | |
Administration and accounting services fees (Note 2) | | | 181,367 | |
Transfer agent fees (Note 2) | | | 106,601 | |
Director fees | | | 103,952 | |
Registration and filing fees | | | 93,149 | |
Audit and tax service fees | | | 73,181 | |
Printing and shareholder reporting fees | | | 65,922 | |
Other expenses | | | 63,412 | |
Distribution fees (Class A Shares) (Note 2) | | | 8,910 | |
Distribution fees (Class C Shares) (Note 2) | | | 61,316 | |
Officer fees | | | 53,355 | |
Legal fees | | | 46,802 | |
Custodian fees (Note 2) | | | 39,772 | |
Total expenses before waivers and/or reimbursements | | | 14,166,801 | |
Less: waivers and/or reimbursements (Note 2) | | | (647,218 | ) |
Net expenses after waivers and/or reimbursements | | | 13,519,583 | |
Net investment income/(loss) | | | 24,238,809 | |
NET REALIZED AND UNREALIZED GAIN/(LOSS) FROM INVESTMENTS | | | | |
Net realized gain/(loss) from: | | | | |
Investments | | | 17,178 | |
Futures contracts | | | 18,577,595 | |
Foreign currency transactions | | | (2,444,167 | ) |
Forward foreign currency contracts | | | (18,235,878 | ) |
Net change in unrealized appreciation/(depreciation) on: | | | | |
Investments | | | 546,766 | |
Futures contracts | | | 9,972,094 | |
Foreign currency translations | | | (20,936 | ) |
Forward foreign currency contracts | | | (4,699,559 | ) |
Net realized and unrealized gain/(loss) from investments | | | 3,713,093 | |
NET INCREASE/(DECREASE) IN NET ASSETS RESULTING FROM OPERATIONS | | $ | 27,951,902 | |
The accompanying notes are an integral part of the consolidated financial statements.
16
Abbey Capital Multi Asset Fund
Consolidated Statements of Changes in Net Assets
| | | For the
Year Ended
August 31, 2024 | | | For the
Year Ended
August 31, 2023 | |
INCREASE/(DECREASE) IN NET ASSETS FROM OPERATIONS: | | | | | | | | |
Net investment income/(loss) | | $ | 24,238,809 | | | $ | 9,783,631 | |
Net realized gain/(loss) from investments, futures contracts, foreign currency transactions and forward foreign currency contracts | | | (2,085,272 | ) | | | (5,805,613 | ) |
Net change in unrealized appreciation/(depreciation) on investments, futures contracts, foreign currency translations and forward foreign currency contracts | | | 5,798,365 | | | | (2,284,465 | ) |
Net increase/(decrease) in net assets resulting from operations | | | 27,951,902 | | | | 1,693,553 | |
DIVIDENDS AND DISTRIBUTIONS TO SHAREHOLDERS: | | | | | | | | |
Class A | | $ | (80,502 | ) | | $ | (56,337 | ) |
Class I | | | (21,476,557 | ) | | | (15,883,994 | ) |
Class C | | | (194,878 | ) | | | (167,553 | ) |
Net decrease in net assets from dividends and distributions to shareholders | | | (21,751,937 | ) | | | (16,107,884 | ) |
CAPITAL SHARE TRANSACTIONS: | | | | | | | | |
Class A Shares | | | | | | | | |
Proceeds from shares sold | | | 8,280,971 | | | | 3,555,040 | |
Proceeds from reinvestment of distributions | | | 58,480 | | | | 35,007 | |
Shares redeemed | | | (3,272,101 | ) | | | (2,652,964 | ) |
Total from Class A Shares | | | 5,067,350 | | | | 937,083 | |
Class I Shares | | | | | | | | |
Proceeds from shares sold | | | 732,653,887 | | | | 379,787,638 | |
Proceeds from reinvestment of distributions | | | 12,529,698 | | | | 10,506,767 | |
Shares redeemed | | | (248,071,786 | ) | | | (221,232,417 | ) |
Total from Class I Shares | | | 497,111,799 | | | | 169,061,988 | |
Class C Shares | | | | | | | | |
Proceeds from shares sold | | | 10,903,723 | | | | 5,762,438 | |
Proceeds from reinvestment of distributions | | | 122,506 | | | | 108,350 | |
Shares redeemed | | | (1,745,933 | ) | | | (688,103 | ) |
Total from Class C Shares | | | 9,280,296 | | | | 5,182,685 | |
Net increase/(decrease) in net assets from capital share transactions | | | 511,459,445 | | | | 175,181,756 | |
Total increase/(decrease) in net assets | | | 517,659,410 | | | | 160,767,425 | |
NET ASSETS: | | | | | | | | |
Beginning of period | | | 504,014,711 | | | | 343,247,286 | |
End of period | | $ | 1,021,674,121 | | | $ | 504,014,711 | |
The accompanying notes are an integral part of the consolidated financial statements.
17
Abbey Capital Multi Asset Fund
Consolidated Statements of Changes in Net Assets (Concluded)
| | | For the
Year Ended
August 31, 2024 | | | For the
Year Ended
August 31, 2023 | |
SHARE TRANSACTIONS: | | | | | | | | |
Class A Shares | | | | | | | | |
Shares sold | | | 691,208 | | | | 304,780 | |
Shares reinvested | | | 5,390 | | | | 3,095 | |
Shares redeemed | | | (276,345 | ) | | | (231,142 | ) |
Total Class A Shares | | | 420,253 | | | | 76,733 | |
Class I Shares | | | | | | | | |
Shares sold | | | 61,322,625 | | | | 32,917,512 | |
Shares reinvested | | | 1,151,627 | | | | 927,341 | |
Shares redeemed | | | (21,252,768 | ) | | | (19,386,275 | ) |
Total Class I Shares | | | 41,221,484 | | | | 14,458,578 | |
Class C Shares | | | | | | | | |
Shares sold | | | 914,951 | | | | 491,570 | |
Shares reinvested | | | 11,460 | | | | 9,673 | |
Shares redeemed | | | (151,257 | ) | | | (61,266 | ) |
Total Class C Shares | | | 775,154 | | | | 439,977 | |
Net increase/(decrease) in shares outstanding | | | 42,416,891 | | | | 14,975,288 | |
The accompanying notes are an integral part of the consolidated financial statements.
18
Abbey Capital Multi Asset Fund
Consolidated Financial Highlights
Contained below is per share operating performance data for Class A Shares outstanding, total investment return/(loss), ratios to average net assets and other supplemental data for the respective periods. This information has been derived from information provided in the consolidated financial statements. |
| | | For the
Year Ended
August 31,
2024 | | | For the
Year Ended
August 31,
2023 | | | For The
Period
February 16,
2022
to august
31,
2022(1) | |
Per Share Operating Performance | | | | | | | | | | | | |
Net asset value, beginning of period | | $ | 11.51 | | | $ | 11.94 | | | $ | 11.21 | |
Net investment income/(loss)(2) | | | 0.34 | | | | 0.23 | | | | (0.06 | ) |
Net realized and unrealized gain/(loss) from investments | | | 0.38 | | | | (0.21 | ) | | | 0.79 | |
Net increase/(decrease) in net assets resulting from operations | | | 0.72 | | | | 0.02 | | | | 0.73 | |
Dividends and distributions to shareholders from: | | | | | | | | | | | | |
Net investment income | | | (0.10 | ) | | | (0.42 | ) | | | — | |
Net realized capital gains | | | (0.31 | ) | | | (0.03 | ) | | | — | |
Total dividends and distributions to shareholders | | | (0.41 | ) | | | (0.45 | ) | | | — | |
Net asset value, end of period | | $ | 11.82 | | | $ | 11.51 | | | $ | 11.94 | |
Total investment return/(loss)(3) | | | 6.61 | % | | | 0.24 | % | | | 6.51 | %(4) |
Ratios/Supplemental Data | | | | | | | | | | | | |
Net assets, end of period (000’s omitted) | | $ | 6,672 | | | $ | 1,661 | | | $ | 808 | |
Ratio of expenses to average net assets with waivers and/or reimbursements (including interest expense)(6) | | | 2.04 | % | | | 2.04 | % | | | 2.04 | %(5) |
Ratio of expenses to average net assets with waivers and/or reimbursements (excluding interest expense)(6) | | | 2.04 | % | | | 2.04 | % | | | 2.04 | %(5) |
Ratio of expenses to average net assets without waivers and/or reimbursements (including interest expense)(6) | | | 2.12 | % | | | 2.16 | % | | | 2.23 | %(5) |
Ratio of net investment income/(loss) to average net assets | | | 2.88 | % | | | 1.99 | % | | | (0.87 | )%(5) |
Portfolio turnover rate(7) | | | 0 | % | | | 0 | % | | | 0 | %(4) |
(1) | Inception date of Class A Shares of the Fund was February 16, 2022. |
(2) | Calculated based on average shares outstanding for the period. |
(3) | Total investment return/(loss) is calculated assuming a purchase of shares on the first day and a sale of shares on the last day of each period reported and includes reinvestments of dividends and distributions, if any. Total return does not reflect any applicable sales charge. |
(6) | The Adviser has contractually agreed to waive its advisory fee and/or reimburse expenses in order to limit total annual Fund operating expenses (excluding acquired Fund fees and expenses, brokerage commissions, extraordinary items, interest or taxes) to 2.04% of the Fund’s average daily net assets attributable to Class A Shares. |
(7) | Portfolio turnover rate excludes all securities, including options, whose maturities or expiration dates at the time of acquisition were one year or less and is calculated for the Fund, as a whole, for the entire period. |
The accompanying notes are an integral part of the consolidated financial statements.
19
Abbey Capital Multi Asset Fund
Consolidated Financial Highlights (Continued)
Contained below is per share operating performance data for Class I Shares outstanding, total investment return/(loss), ratios to average net assets and other supplemental data for the respective periods. This information has been derived from information provided in the consolidated financial statements. |
| | | For the
Year
Ended
August 31,
2024 | | | For the
Year
Ended
August 31,
2023 | | | For the
Year
Ended
August 31,
2022 | | | For the
Year
Ended
August 31,
2021 | | | For the
Year
Ended
August 31,
2020 | |
Per Share Operating Performance | | | | | | | | | | | | | | | | | | | | |
Net asset value, beginning of period | | $ | 11.54 | | | $ | 11.96 | | | $ | 11.98 | | | $ | 11.07 | | | $ | 10.94 | |
Net investment income/(loss)(1) | | | 0.38 | | | | 0.26 | | | | (0.13 | ) | | | (0.21 | ) | | | (0.08 | ) |
Net realized and unrealized gain/(loss) from investments | | | 0.37 | | | | (0.23 | ) | | | 1.29 | | | | 2.21 | | | | 1.38 | |
Net increase/(decrease) in net assets resulting from operations | | | 0.75 | | | | 0.03 | | | | 1.16 | | | | 2.00 | | | | 1.30 | |
Dividends and distributions to shareholders from: | | | | | | | | | | | | | | | | | | | | |
Net investment income | | | (0.11 | ) | | | (0.42 | ) | | | (0.34 | ) | | | (0.17 | ) | | | (0.96 | ) |
Net realized capital gains | | | (0.31 | ) | | | (0.03 | ) | | | (0.84 | ) | | | (0.92 | ) | | | (0.21 | ) |
Total dividends and distributions to shareholders | | | (0.42 | ) | | | (0.45 | ) | | | (1.18 | ) | | | (1.09 | ) | | | (1.17 | ) |
Net asset value, end of period | | $ | 11.87 | | | $ | 11.54 | | | $ | 11.96 | | | $ | 11.98 | | | $ | 11.07 | |
Total investment return/(loss)(2) | | | 6.88 | % | | | 0.38 | % | | | 10.40 | % | | | 19.72 | % | | | 13.97 | % |
Ratios/Supplemental Data | | | | | | | | | | | | | | | | | | | | |
Net assets, end of period (000’s omitted) | | $ | 1,000,319 | | | $ | 496,775 | | | $ | 341,815 | | | $ | 94,948 | | | $ | 37,572 | |
Ratio of expenses to average net assets with waivers and/or reimbursements (including interest expense)(3) | | | 1.79 | % | | | 1.79 | % | | | 1.79 | % | | | 1.84 | % | | | 1.79 | % |
Ratio of expenses to average net assets with waivers and/or reimbursements (excluding interest expense)(3) | | | 1.79 | % | | | 1.79 | % | | | 1.79 | % | | | 1.79 | % | | | 1.79 | % |
Ratio of expenses to average net assets without waivers and/or reimbursements (including interest expense)(3) | | | 1.87 | % | | | 1.91 | % | | | 1.98 | % | | | 2.28 | % | | | 2.45 | % |
Ratio of net investment income/(loss) to average net assets | | | 3.13 | % | | | 2.24 | % | | | (1.12 | )% | | | (1.80 | )% | | | (0.76 | )% |
Portfolio turnover rate(4) | | | 0 | % | | | 0 | % | | | 0 | % | | | 0 | % | | | 0 | % |
(1) | Calculated based on average shares outstanding for the period. |
(2) | Total investment return is calculated assuming a purchase of shares on the first day and a sale of shares on the last day of the period reported and includes reinvestments of dividends and distributions, if any. |
(3) | The Adviser has contractually agreed to waive its advisory fee and/or reimburse expenses in order to limit total annual Fund operating expenses (excluding acquired Fund fees and expenses, brokerage commissions, extraordinary items, interest or taxes) to 1.79% of the Fund’s average daily net assets attributable to Class A Shares. |
(4) | Portfolio turnover rate excludes all securities, including options, whose maturities or expiration dates at the time of acquisition were one year or less and is calculated for the Fund, as a whole, for the entire period. |
The accompanying notes are an integral part of the consolidated financial statements.
20
Abbey Capital Multi Asset Fund
Consolidated Financial Highlights (Concluded)
Contained below is per share operating performance data for Class C Shares outstanding, total investment return/(loss), ratios to average net assets and other supplemental data for the respective periods. This information has been derived from information provided in the consolidated financial statements. |
| | | For the
Year
Ended
August 31,
2024 | | | For the
Year
Ended
August 31,
2023 | | | For The
Period
November 8,
2021
To August 31,
2022(1) | |
Per Share Operating Performance | | | | | | | | | | | | |
Net asset value, beginning of period | | $ | 11.32 | | | $ | 11.85 | | | $ | 12.51 | |
Net investment income/(loss)(2) | | | 0.26 | | | | 0.14 | | | | (0.18 | ) |
Net realized and unrealized gain/(loss) from investments | | | 0.38 | | | | (0.22 | ) | | | 0.70 | |
Net increase/(decrease) in net assets resulting from operations | | | 0.64 | | | | (0.08 | ) | | | 0.52 | |
Dividends and distributions to shareholders from: | | | | | | | | | | | | |
Net investment income | | | (0.06 | ) | | | (0.42 | ) | | | (0.34 | ) |
Net realized capital gains | | | (0.31 | ) | | | (0.03 | ) | | | (0.84 | ) |
Total dividends and distributions to shareholders | | | (0.37 | ) | | | (0.45 | ) | | | (1.18 | ) |
Net asset value, end of period | | $ | 11.59 | | | $ | 11.32 | | | $ | 11.85 | |
Total investment return/(loss)(3) | | | 5.93 | % | | | (0.63 | )% | | | 4.84 | %(4) |
Ratios/Supplemental Data | | | | | | | | | | | | |
Net assets, end of period (000’s omitted) | | $ | 14,684 | | | $ | 5,578 | | | $ | 624 | |
Ratio of expenses to average net assets with waivers and/or reimbursements (including interest expense)(6) | | | 2.79 | % | | | 2.79 | % | | | 2.79 | %(5) |
Ratio of expenses to average net assets with waivers and/or reimbursements (excluding interest expense)(6) | | | 2.79 | % | | | 2.79 | % | | | 2.79 | %(5) |
Ratio of expenses to average net assets without waivers and/or reimbursements (including interest expense)(6) | | | 2.87 | % | | | 2.91 | % | | | 2.98 | %(5) |
Ratio of net investment income/(loss) to average net assets | | | 2.13 | % | | | 1.24 | % | | | (1.88 | )%(5) |
Portfolio turnover rate(7) | | | 0 | % | | | 0 | % | | | 0 | %(4) |
(1) | Inception date of Class C Shares of the Fund was November 8, 2021. |
(2) | Calculated based on average shares outstanding for the period. |
(3) | Total investment return/(loss) is calculated assuming a purchase of shares on the first day and a sale of shares on the last day of each period reported and includes reinvestments of dividends and distributions, if any. |
(6) | The Adviser has contractually agreed to waive its advisory fee and/or reimburse expenses in order to limit total annual Fund operating expenses (excluding acquired Fund fees and expenses, brokerage commissions, extraordinary items, interest or taxes) to 2.79% of the Fund’s average daily net assets attributable to Class C Shares. |
(7) | Portfolio turnover rate excludes all securities, including options, whose maturities or expiration dates at the time of acquisition were one year or less and is calculated for the Fund, as a whole, for the entire period. |
The accompanying notes are an integral part of the consolidated financial statements.
21
Abbey Capital Multi Asset Fund
Notes To Consolidated Financial Statements
August 31, 2024
1. Organization and Significant Accounting Policies
The RBB Fund, Inc. (“RBB” or the “Company”) was incorporated under the laws of the State of Maryland on February 29, 1988 and is registered under the Investment Company Act of 1940, as amended (the “1940 Act”), as an open-end management investment company. RBB is a “series fund,” which is an investment company divided into separate portfolios. Each portfolio is treated as a separate entity for certain matters under the 1940 Act, and for other purposes, and a shareholder of one portfolio is not deemed to be a shareholder of any other portfolio. Currently, RBB has sixty-five separate investment portfolios, including the Abbey Capital Multi Asset Fund (the “Fund”), which commenced investment operations on April 11, 2018. The Fund is authorized to offer three classes of shares, Class A Shares, Class I Shares and Class C Shares. Class A Shares are sold subject to a front-end maximum sales charge of 5.75%. Front-end sales charges may be reduced or waived under certain circumstances.
RBB has authorized capital of one hundred billion shares of common stock of which 92.923 billion shares are currently classified into two hundred and thirty-six classes of common stock. Each class represents an interest in an active or inactive RBB investment portfolio.
The Fund seeks to achieve its investment objective by allocating its assets between a “Managed Futures” strategy, a “Long U.S. Equity” strategy and a “Fixed Income” strategy.
The Fund is an investment company and follows accounting and reporting guidance in the Financial Accounting Standards Board (“FASB”) Accounting Standards Codification Topic 946 “Financial Services – Investment Companies.”
The end of the reporting period for the Fund is August 31, 2024, and the period covered by these Notes to Consolidated Financial Statements is the fiscal year ended August 31, 2024 (the “current fiscal period”).
Consolidation of Subsidiaries — The Managed Futures strategy is achieved by the Fund investing up to 25% of its total assets in ACMAF Master Offshore Limited (the “Cayman Subsidiary”), a wholly-owned and controlled subsidiary of the Fund organized under the acts of the Cayman Islands. Effective on or about November 12, 2020, the Fund’s previous wholly-owned subsidiary, the Abbey Capital Multi Asset Offshore Fund Limited, became a wholly-owned subsidiary of the Cayman Subsidiary through a share exchange between the Fund and the Cayman Subsidiary and registered as a segregated portfolio company under the acts of the Cayman Islands under the name ACMAF Offshore SPC (the “SPC”). The Cayman Subsidiary invests all or substantially all of its assets in segregated portfolios of the SPC. The Cayman Subsidiary serves solely as an intermediate entity through which the Fund invests in the SPC and makes no independent investment decisions and has no investment or other discretion over the Fund’s investable assets.
Effective on or about July 8, 2021, the Fund may also invest a portion of its assets in segregated series of another wholly-owned subsidiary of the Fund, the ACMAF Onshore Series LLC (the “Onshore Subsidiary”), a Delaware series limited liability company.
The consolidated financial statements of the Fund include the financial statements of the Cayman Subsidiary, the Onshore Subsidiary and SPC. The Fund consolidates the results of subsidiaries in which the Fund holds a controlling financial interest. All inter-company accounts and transactions have been eliminated. As of the end of the current fiscal period, the net assets of the Cayman Subsidiary and SPC were $225,321,920, which represented 22.05% of the Fund’s net assets. As of the end of the current fiscal period, the net assets of the Onshore Subsidiary were $175,004,414, which represented 17.13% of the Fund’s net assets.
Portfolio Valuation — The Fund’s net asset value (“NAV”) is calculated once daily at the close of regular trading hours on the New York Stock Exchange (“NYSE”) (generally 4:00 p.m. Eastern time) on each day the NYSE is open. Securities held by the Fund are valued using the closing price or the last sale price on a national securities exchange or the National Association of Securities Dealers Automatic Quotation System (“NASDAQ”) market system where they are primarily traded. Fixed income securities are valued using an independent pricing service, which considers such factors as security prices, yields, maturities and ratings, and are deemed representative of market values at the close
22
Abbey Capital Multi Asset Fund
Notes To Consolidated Financial Statements (Continued)
August 31, 2024
of the market. Forward exchange contracts are valued by interpolating between spot and forward currency rates as quoted by an independent pricing service. Futures contracts are generally valued using the settlement price determined by the relevant exchange. If market quotations are unavailable or deemed unreliable, securities will be valued by the Valuation Designee (as defined below) in accordance with procedures adopted by the Company’s Board of Directors (the “Board”). Relying on prices supplied by pricing services or dealers or using fair valuation may result in values that are higher or lower than the values used by other investment companies and investors to price the same investments.
The Board has adopted a pricing and valuation policy for use by the Fund and its Valuation Designee (as defined below) in calculating the Fund’s NAV. Pursuant to Rule 2a-5 under the 1940 Act, the Fund has designated Abbey Capital Limited (the “Adviser” or “Abbey Capital”) as its “Valuation Designee” to perform all of the fair value determinations as well as to perform all of the responsibilities that may be performed by the Valuation Designee in accordance with Rule 2a-5. The Valuation Designee is authorized to make all necessary determinations of the fair values of portfolio securities and other assets for which market quotations are not readily available or if it is deemed that the prices obtained from brokers and dealers or independent pricing services are unreliable.
Fair Value Measurements — The inputs and valuation techniques used to measure the fair value of the Fund’s investments are summarized into three levels as described in the hierarchy below:
| | ● Level 1 – | Prices are determined using quoted prices in active markets for identical securities. |
| | ● Level 2 – | Prices are determined using other significant observable inputs (including quoted prices for similar securities, interest rates, prepayment speeds, credit risk, etc.). |
| | ● Level 3 – | Prices are determined using significant unobservable inputs (including the Fund’s own assumptions in determining the fair value of investments). |
The inputs or methodologies used for valuing securities are not necessarily an indication of the risk associated with investing in those securities.
The following is a summary of the inputs used, as of the end of the current fiscal period, in valuing the Fund’s investments carried at fair value:
| | Total | | | Level 1 | | | Level 2 | | | Level 3 | |
Short-Term Investments | | $ | 790,138,799 | | | $ | 790,138,799 | | | | | | | $ | — | |
Commodity Contracts | | | | | | | | | | | | | | | | |
Futures Contracts | | | 26,268,708 | | | | 26,268,708 | | | | — | | | | — | |
Equity Contracts | | | | | | | | | | | | | | | | |
Futures Contracts | | | 17,622,056 | | | | 17,622,056 | | | | — | | | | — | |
Foreign Currency Contracts | | | | | | | | | | | | | | | | |
Forward Foreign Currency Contracts | | | 6,422,664 | | | | — | | | | 6,422,664 | | | | — | |
Futures Contracts | | | 860,798 | | | | 860,798 | | | | — | | | | — | |
Interest Rate Contracts | | | | | | | | | | | | | | | | |
Futures Contracts | | | 1,375,856 | | | | 1,375,856 | | | | — | | | | — | |
Total Assets | | $ | 842,688,881 | | | $ | 836,266,217 | | | $ | 6,422,664 | | | $ | — | |
23
Abbey Capital Multi Asset Fund
Notes To Consolidated Financial Statements (Continued)
August 31, 2024
| | Total | | | Level 1 | | | Level 2 | | | Level 3 | |
Commodity Contracts | | | | | | | | | | | | | | | | |
Futures Contracts | | $ | (23,402,508 | ) | | $ | (23,402,508 | ) | | $ | — | | | $ | — | |
Equity Contracts | | | | | | | | | | | | | | | | |
Futures Contracts | | | (598,409 | ) | | | (598,409 | ) | | | — | | | | — | |
Foreign Currency Contracts | | | | | | | | | | | | | | | | |
Forward Foreign Currency Contracts | | | (10,854,282 | ) | | | — | | | | (10,854,282 | ) | | | — | |
Futures Contracts | | | (1,689,240 | ) | | | (1,689,240 | ) | | | — | | | | — | |
Interest Rate Contracts | | | | | | | | | | | | | | | | |
Futures Contracts | | | (4,399,621 | ) | | | (4,399,621 | ) | | | — | | | | — | |
Total Liabilities | | $ | (40,944,060 | ) | | $ | (30,089,778 | ) | | $ | (10,854,282 | ) | | $ | — | |
At the end of each quarter, management evaluates the classification of Levels 1, 2 and 3 assets and liabilities. Various factors are considered, such as changes in liquidity from the prior reporting period; whether or not a broker is willing to execute at the quoted price; the depth and consistency of prices from third party pricing services; and the existence of contemporaneous, observable trades in the market. Additionally, management evaluates the classification of Levels 1, 2 and 3 assets and liabilities on a quarterly basis for changes in listings or delistings on national exchanges.
Due to the inherent uncertainty of determining the fair value of investments that do not have a readily available market value, the fair value of the Fund’s investments may fluctuate from period to period. Additionally, the fair value of investments may differ significantly from the values that would have been used had a ready market existed for such investments and may differ materially from the values the Fund may ultimately realize. Further, such investments may be subject to legal and other restrictions on resale or otherwise less liquid than publicly traded securities.
For fair valuations using significant unobservable inputs, U.S. generally accepted accounting principles (“U.S. GAAP”) requires the Fund to present a reconciliation of the beginning to ending balances for reported market values that presents changes attributable to total realized and unrealized gains or losses, purchase and sales, and transfers in and out of Level 3 during the period. Transfers in and out between levels are based on values at the end of the period. A reconciliation of Level 3 investments is presented only when the Fund had an amount of Level 3 investments at the end of the reporting period that was meaningful in relation to its net assets. The amounts and reasons for Level 3 transfers are disclosed if the Fund had an amount of total Level 3 transfers during the reporting period that was meaningful in relation to its net assets as of the end of the reporting period.
During the current fiscal period, the Fund had no Level 3 transfers.
Disclosures about Derivative instruments and Hedging Activities — Derivative instruments are defined as financial instruments whose value and performance are based on the value and performance of another security or financial instrument. Derivative instruments that the Fund used during the current fiscal period include forward foreign currency contracts and futures contracts.
During the current fiscal period, the Fund used long and short contracts on U.S. and foreign equity market indices, U.S. and foreign government bonds, foreign currencies, interest rates and commodities (through investment in the Cayman Subsidiary, the SPC and the Onshore Subsidiary), to gain investment exposure in accordance with its investment objective.
The following tables provide quantitative disclosures about fair value amounts of, and gains and losses on, the Fund’s derivative instruments as of and for the current fiscal period.
24
Abbey Capital Multi Asset Fund
Notes To Consolidated Financial Statements (Continued)
August 31, 2024
The following tables list the fair values of the Fund’s derivative holdings and location on the Consolidated Statement of Assets and Liabilities as of the end of the current fiscal period, grouped by derivative type and primary risk exposure category by contract type.
Derivative Type | | Consolidated
Statement
of Assets and
Liabilities
Location | | | Equity
Contracts | | | Interest
Rate
Contracts | | | Foreign
Currency
Contracts | | | Commodity
Contracts | | | Total | |
Asset Derivatives |
Forward Contracts (a) | | | Unrealized appreciation on forward foreign currency contracts | | | $ | — | | | $ | — | | | $ | 6,422,664 | | | $ | — | | | $ | 6,422,664 | |
Futures Contracts (a) | | | Unrealized appreciation on futures contracts | | | | 17,622,056 | | | | 1,375,856 | | | | 860,798 | | | | 26,268,708 | | | | 46,127,418 | |
Total Value- Assets | | | | | | $ | 17,622,056 | | | $ | 1,375,856 | | | $ | 7,283,462 | | | $ | 26,268,708 | | | $ | 52,550,082 | |
Liability Derivatives |
Forward Contracts (a) | | | Unrealized depreciation on forward foreign currency contracts | | | $ | — | | | $ | — | | | $ | (10,854,282 | ) | | $ | — | | | $ | (10,854,282 | ) |
Futures Contracts (a) | | | Unrealized depreciation on futures contracts | | | | (598,409 | ) | | | (4,399,621 | ) | | | (1,689,240 | ) | | | (23,402,508 | ) | | | (30,089,778 | ) |
Total Value- Liabilities | | $ | (598,409 | ) | | $ | (4,399,621 | ) | | $ | (12,543,522 | ) | | $ | (23,402,508 | ) | | $ | (40,944,060 | ) |
(a) | This amount represents the cumulative appreciation/(depreciation) of forwards and futures contracts as reported on the Consolidated Portfolio of Investments. |
The following table lists the amounts of realized gains/(losses) included in net increase/(decrease) in net assets resulting from operations during the current fiscal period, grouped by derivative type and primary risk exposure category by contract type.
Derivative Type | | Consolidated
Statement of
Operations
Location | | | Equity
Contracts | | | Interest
Rate
Contracts | | | Foreign
Currency
Contracts | | | Commodity
Contracts | | | Total | |
Realized Gain/(Loss) |
Futures Contracts | | | Net realized gain/(loss) from Futures Contracts | | | $ | 62,625,668 | | | $ | (26,243,028 | ) | | $ | (19,606,166 | ) | | $ | 1,801,121 | | | $ | 18,577,595 | |
Forward Contracts | | | Net realized gain/(loss) from Forward Foreign Currency Contracts | | | | — | | | | — | | | | (18,235,878 | ) | | | — | | | | (18,235,878 | ) |
Total Realized Gain/(Loss) | | $ | 62,625,668 | | | $ | (26,243,028 | ) | | $ | (37,842,044 | ) | | $ | 1,801,121 | | | $ | 341,717 | |
25
Abbey Capital Multi Asset Fund
Notes To Consolidated Financial Statements (Continued)
August 31, 2024
The following table lists the amounts of change in unrealized appreciation/(depreciation) included in net increase/(decrease) in net assets resulting from operations during the current fiscal period, grouped by derivative type and primary risk exposure category by contract type.
Derivative Type | | Consolidated
Statement of
Operations
Location | | | Equity
Contracts | | | Interest
Rate
Contracts | | | Foreign
Currency
Contracts | | | Commodity
Contracts | | | Total | |
Change in Unrealized Appreciation/(Depreciation) |
Futures Contracts | | | Net change in unrealized appreciation/(depreciation) on futures contracts | | | $ | 11,196,800 | | | $ | 261,274 | | | $ | (3,327,814 | ) | | $ | 1,841,834 | | | $ | 9,972,094 | |
Forward Contracts | | | Net change in unrealized appreciation/(depreciation) on forward foreign currency contracts | | | | — | | | | — | | | | (4,699,559 | ) | | | — | | | | (4,699,559 | ) |
Total Change in Unrealized Appreciation/(Depreciation) | | $ | 11,196,800 | | | $ | 261,274 | | | $ | (8,027,373 | ) | | $ | 1,841,834 | | | $ | 5,272,535 | |
During the current fiscal period, the Fund’s quarterly average volume of derivatives was as follows:
Long Futures
Notional
Amount | Short Futures
Notional
Amount | Forward Foreign
Currency
Contracts — Payable
(Value at Trade Date) | Forward Foreign
Currency
Contracts —
Receivable
(Value at Trade Date) |
$2,115,698,162 | $(2,101,714,085) | $(1,271,316,173) | $1,270,103,403 |
For financial reporting purposes, the Fund does not offset fair value amounts recognized for derivative instruments and fair value amounts recognized for the right to reclaim cash collateral (receivables) or the obligation to return cash collateral (payables) arising from derivative instruments recognized at fair value executed with the same counterparty under a master netting arrangement.
26
Abbey Capital Multi Asset Fund
Notes To Consolidated Financial Statements (Continued)
August 31, 2024
The following is a summary of financial and derivative instruments that are subject to enforceable master netting agreements (or similar arrangements) and collateral received and pledged in connection with the master netting agreements (or similar arrangements).
| | | | | | | Gross Amount Not
Offset in Consolidated
Statement of
Assets and Liabilities | | | | | | | | | | Gross Amount Not
Offset in Consolidated
Statement of
Assets and Liabilities | | | | | |
Description | | Gross Amount
Presented
in the
Consolidated
Statement of
Assets and
Liabilities | | | Financial
Instruments | | | Collateral
Received | | | Net
Amount(1) | | Gross Amount
Presented
in the
Consolidated
Statement of
Assets and
Liabilities | | | Financial
Instruments | | | Collateral
Pledged(2) | | | Net
Amount(3) | |
| | | Assets | | Liabilities | |
Forward Foreign Currency Contracts | | $ | 6,422,664 | | | $ | (10,854,282 | ) | | $ | — | | | $ | (4,431,618 | ) | $ | 10,854,282 | | | $ | (10,854,282 | ) | | $ | — | | | $ | — | |
| | (1) | Net amount represents the net amount receivable from the counterparty in the event of default. |
| | (2) | Actual collateral pledged may be more than the amount shown. |
| | (3) | Net amount represents the net amount payable to the counterparty in the event of default. |
Use of Estimates — The preparation of consolidated financial statements in conformity with U.S. GAAP requires management to make estimates and assumptions that affect the reported amounts of assets and liabilities and disclosure of contingent assets and liabilities at the date of the consolidated financial statements and the reported amounts of revenues and expenses during the reporting period. Actual results could differ from those estimates and those differences could be significant.
Investment Transactions, Investment Income and Expenses — The Fund records security transactions based on trade date for financial reporting purposes. The cost of investments sold is determined by use of the specific identification method for both financial reporting and income tax purposes in determining realized gains and losses on investments. Interest income (including amortization of premiums and accretion of discounts) is accrued when earned. Dividend income is recorded on the ex-dividend date. Distributions received on securities that represent a return of capital or capital gain are recorded as a reduction of cost of investments and/or as a realized gain. The Fund’s investment income, expenses (other than class specific expenses) and unrealized and realized gains and losses are allocated daily to each class of shares based upon the relative proportion of net assets of each class at the beginning of the day. Certain expenses are shared with The RBB Fund Trust (the “Trust”), a series trust of affiliated funds. Expenses incurred on behalf of a specific class, fund or fund family of the Company or Trust are charged directly to the class, fund or fund family (in proportion to net assets). Expenses incurred for all funds (such as director or professional fees) are charged to all funds in proportion to their average net assets of RBB and the Trust, or in such other manner as the Board deems fair or equitable. Expenses and fees, including investment advisory and administration fees, are accrued daily and taken into account for the purpose of determining the NAV of the Fund.
Dividends and Distributions to Shareholders — Dividends from net investment income and distributions from net realized capital gains, if any, are declared and paid at least annually to shareholders and recorded on the ex-dividend date. Income dividends and capital gain distributions are determined in accordance with U.S. federal income tax regulations, which may differ from U.S. GAAP.
U.S. Tax Status —No provision is made for U.S. income taxes as it is the Fund’s intention to continue to qualify for and elect the tax treatment applicable to regulated investment companies under Subchapter M of the Internal Revenue Code of 1986, as amended, and make the requisite distributions to its shareholders which will be sufficient to relieve it from U.S. income and excise taxes.
27
Abbey Capital Multi Asset Fund
Notes To Consolidated Financial Statements (Continued)
August 31, 2024
The Cayman Subsidiary is registered as an “exempted company” and the SPC as an “exempted segregated portfolio company” pursuant to the Companies Act (Revised) of the Cayman Islands (as amended). Each of the Cayman Subsidiary and the SPC has received an undertaking from the Governor in Cabinet of the Cayman Islands to the effect that, for a period of twenty years from the date of the undertaking, no act that thereafter is enacted in the Cayman Islands imposing any tax or duty to be levied on profits, income or on gains or appreciation, or any tax in the nature of estate duty or inheritance tax, will apply to any property comprised in or any income arising under the Cayman Subsidiary or the SPC, or to the shareholders thereof, in respect of any such property or income. For U.S. federal income tax purposes, the Cayman Subsidiary is treated as a “controlled foreign corporation” and the SPC is treated as disregarded from its owner, the Cayman Subsidiary, for U.S. income tax purposes. The Onshore Subsidiary is treated as an entity disregarded from its owner, the Fund, for U.S. income tax purposes.
SEC RULE 18f-4 — Effective August 19, 2022, the U.S. Securities and Exchange Commission (“SEC”) implemented Rule 18f-4 under the 1940 Act (“Rule 18f-4”), providing for the regulation of a registered investment company’s use of derivatives and certain related instruments. Among other things, Rule 18f-4 limits a fund’s derivatives exposure through a value-at-risk test and requires the adoption and implementation of a derivatives risk management program for certain derivatives users. The Fund, as a full derivatives user (as defined in Rule 18f-4), is subject to the full requirements of Rule 18f-4. The Fund is required to comply with Rule18f-4 and has adopted procedures for investing in derivatives and other transactions in compliance with Rule 18f-4.
Foreign Currency Translation — Assets and liabilities initially expressed in non-U.S. currencies are translated into U.S. dollars based on the applicable exchange rates at the date of the last business day of the financial statement period. Purchases and sales of securities, interest income, dividends, variation margin received and expenses denominated in foreign currencies are translated into U.S. dollars at the exchange rates in effect on the transaction date.
The Fund does not separately report the effect of changes in foreign exchange rates from changes in market prices of securities held. Such changes are included with the net realized gain or loss and change in unrealized appreciation or depreciation on investments in the Consolidated Statement of Operations. Other foreign currency transactions resulting in realized and unrealized gain or loss are reported separately as net realized gain or loss and change in unrealized appreciation or depreciation on foreign currencies in the Consolidated Statement of Operations.
Currency Risk —Investment in foreign securities involves currency risk associated with securities that trade or are denominated in currencies other than the U.S. dollar and which may be affected by fluctuations in currency exchange rates. An increase in the strength of the U.S. dollar relative to a foreign currency may cause the U.S. dollar value of an investment in that country to decline. Foreign currencies also are subject to risks caused by inflation, interest rates, budget deficits and low savings rates, political factors and government controls. Forward foreign currency exchange contracts may limit potential gains from a favorable change in value between the U.S. dollar and foreign currencies. Unanticipated changes in currency pricing may result in poorer overall performance for the Fund than if it had not engaged in these contracts.
Commodity Sector Risk — Exposure to the commodities markets may subject the Fund to greater volatility than investments in traditional securities. The value of commodity-linked derivative instruments may be affected by changes in overall market movements, commodity index volatility, changes in interest rates or factors affecting a particular industry or commodity, such as drought, floods, weather, livestock disease, embargoes, tariffs and international economic, political and regulatory developments. The prices of energy, industrial metals, precious metals, agriculture and livestock sector commodities may fluctuate widely due to factors such as changes in value, supply and demand and governmental regulatory policies. The commodity-linked securities in which the Fund invests may be issued by companies in the financial services sector, and events affecting the financial services sector may cause the Fund’s share value to fluctuate.
Foreign Securities Market Risk — A substantial portion of the trades of the Fund are expected to take place on markets or exchanges outside the United States. There is no limit to the amount of assets of the Fund that may be committed to trading on foreign markets. The risk of loss in trading foreign futures and options on futures contracts
28
Abbey Capital Multi Asset Fund
Notes To Consolidated Financial Statements (Continued)
August 31, 2024
can be substantial. Participation in foreign futures and options on futures contracts involves the execution and clearing of trades on, or subject to the rules of, a foreign board of trade or exchange. Some of these foreign markets, in contrast to U.S. exchanges, are so-called principals’ markets in which performance is the responsibility only of the individual counterparty with whom the trader has entered into a commodity interest transaction and not of the exchange or clearing corporation. In these kinds of markets, there is risk of bankruptcy or other failure or refusal to perform by the counterparty.
Counterparty Risk — The derivative contracts entered into by the Fund, the Cayman Subsidiary, Onshore Subsidiary or the SPC may be privately negotiated in the over-the-counter market. These contracts also involve exposure to credit risk, since contract performance depends in part on the financial condition of the counterparty. Relying on a counterparty exposes the Fund to the risk that a counterparty will not settle a transaction in accordance with its terms and conditions because of a dispute over the terms of the contract (whether or not bona fide) or because of a credit or liquidity problem, thus causing the Fund to suffer a loss. If a counterparty defaults on its payment obligations to the Fund, this default will cause the value of an investment in the Fund to decrease.
Credit Risk — Credit risk refers to the possibility that the issuer of the security or a counterparty in respect of a derivative instrument will not be able to satisfy its payment obligations to the Fund when due. Changes in an issuer’s credit rating or the market’s perception of an issuer’s creditworthiness may also affect the value of the Fund’s investment in that issuer. Securities rated in the four highest categories by the rating agencies are considered investment grade, but they may also have some speculative characteristics. Investment grade ratings do not guarantee that bonds will not lose value or default. In addition, the credit quality of securities may be lowered if an issuer’s financial condition changes.
Futures Contracts — The Fund uses futures contracts in the normal course of pursuing its investment objective. Upon entering into a futures contract, the Fund must deposit initial margin in addition to segregating cash or liquid assets sufficient to meet its obligation to purchase or provide securities, or to pay the amount owed at the expiration of an index-based futures contract. Such liquid assets may consist of cash, cash equivalents, liquid debt or equity securities or other acceptable assets. Pursuant to the futures contract, the Fund agrees to receive from, or pay to the broker, an amount of cash equal to the daily fluctuation in value of the contract. Such a receipt of payment is known as “variation margin” and is recorded by the Fund as an unrealized gain or loss. When the contract is closed, the Fund records a realized gain or loss equal to the difference between the proceeds from (or cost of) the closing transactions and the Fund’s basis in the contract. Futures contracts have market risks, including the risk that the change in the value of the contract may not correlate with changes in the value of the underlying securities. Use of long futures contracts subjects the Fund to risk of loss in excess of the amount shown on the Consolidated Statement of Assets and Liabilities, up to the notional value of the futures contract. Use of short futures contracts subjects the Fund to potentially unlimited risk of loss.
Forward Foreign Currency Contracts — In the normal course of pursuing its investment objectives, the Fund is subject to foreign investment and currency risk. The Fund uses forward foreign currency contracts (“forward contracts”) for purposes of hedging, duration management, as a substitute for securities, to increase returns, for currency hedging or risk management, or to otherwise help achieve the Fund’s investment objective. These contracts are marked-to-market daily at the applicable translation rates. The Fund records realized gains or losses at the time the forward contract is closed. A forward contract is extinguished through a closing transaction or upon delivery of the currency or entering an offsetting contract. Risks may arise upon entering these contracts from the potential inability of a counterparty to meet the terms of their contracts and from unanticipated movements in the value of a foreign currency relative to the U.S. dollar or other currencies. The Fund’s maximum risk of loss from counterparty credit risk related to forward foreign currency contracts is the fair value of the contract. The risk may be mitigated to some extent if a master netting arrangement between the Fund and the counterparty is in place and to the extent the Fund obtains collateral to cover the Fund’s exposure to the counterparty.
Cash and Cash Equivalents — Cash and cash equivalents are valued at cost plus accrued interest, which approximates market value. The Fund considers investments in the U.S Bank Money Market Deposit Account, a U.S. dollar-denominated deposit account offered through U.S. Bank, N.A. to be a cash equivalent. The Fund is exposed to
29
Abbey Capital Multi Asset Fund
Notes To Consolidated Financial Statements (Continued)
August 31, 2024
the credit risk of U.S. Bank, N.A. through the holding of this cash equivalent. This cash equivalent is presented on the Consolidated Statement of Assets and Liabilities as “Cash equivalents” and was classified as Level 1 assets as of August 31, 2024. As of August 31, 2024, this balance was $66,138,528.
Other — In the normal course of business, the Fund may enter into contracts that provide general indemnifications. The Fund’s maximum exposure under these arrangements is dependent on claims that may be made against the Fund in the future, and, therefore, cannot be estimated; however, the Fund expects the risk of material loss from such claims to be remote.
2. Investment Adviser and Other Services
Abbey Capital Limited serves as the investment adviser to the Fund, the Cayman Subsidiary, Onshore Subsidiary and the SPC. The Adviser allocates the assets of the Onshore Subsidiary and SPC (via the Cayman Subsidiary) to one or more Trading Advisers unaffiliated with the Adviser to manage. The Adviser also has the ultimate responsibility to oversee the Trading Advisers, and to recommend their hiring, termination and replacement, subject to approval by the Board. The Fund compensates the Adviser for its services at an annual rate based on the Fund’s average daily net assets (the “Advisory Fee”), payable on a monthly basis in arrears, as shown in the following table. The Adviser compensates the Trading Advisers out of the Advisory Fee.
The Adviser has contractually agreed to waive its advisory fee and/or reimburse expenses in order to limit total annual Fund operating expenses (excluding certain items discussed below) to the rates (“Expense Caps”) shown in the following table of the Fund’s average daily net assets. In determining the Adviser’s obligation to waive advisory fees and/or reimburse expenses, the following expenses are not taken into account and could cause net total annual Fund operating expenses to exceed the Expense Caps as applicable: acquired fund fees and expenses, brokerage commissions, extraordinary expenses, interest and taxes. This contractual limitation is in effect until December 31, 2024 and may not be terminated without the approval of the Board. The Adviser may discontinue these arrangements at any time after December 31, 2024.
Advisory
Fee | Expense Caps |
| | Class A | Class I | Class C |
1.77% | 2.04% | 1.79% | 2.79% |
During the current fiscal period, investment advisory fees accrued, waived and/or reimbursed were as follows:
Gross
Advisory
Fees | Waivers and/or
Reimbursements | Net
Advisory
Fees |
$13,269,062 | $(647,218) | $12,621,844 |
If at any time the Fund’s total annual fund operating expenses (not including acquired fund fees and expenses, brokerage commissions, extraordinary items, interest or taxes) for a year are less than the relevant share class’s Expense Cap, the Adviser may recoup any waived or reimbursed amounts from the Fund within three years from the date on which such waiver or reimbursement was made, provided such reimbursement does not cause the Fund to exceed expense limitations that were in effect at the time of the waiver or reimbursement.
30
Abbey Capital Multi Asset Fund
Notes To Consolidated Financial Statements (Continued)
August 31, 2024
As of the end of the current fiscal period, the Fund had amounts available for recoupment as follows:
Expiration |
August 31,
2025 | August 31,
2026 | August 31,
2027 | Total |
$312,567 | $495,671 | $647,218 | $1,455,456 |
Aspect Capital Limited, Crabel Capital Management, LLC, Eclipse Capital Management, Inc., Graham Capital Management L.P., Revolution Capital Management, LLC, Tudor Investment Corporation, Welton Investment Partners, LLC and Winton Capital Management Limited each served as a Trading Adviser to the Fund during the current fiscal period.
U.S. Bancorp Fund Services, LLC, doing business as U.S. Bank Global Fund Services (“Fund Services”), serves as administrator for the Fund. For providing administrative and accounting services, Fund Services is entitled to receive a monthly fee, subject to certain minimum and out of pocket expenses.
Fund Services serves as the Fund’s transfer and dividend disbursing agent. For providing transfer agent services, Fund Services is entitled to receive a monthly fee, subject to certain minimum and out of pocket expenses.
U.S. Bank, N.A. (the “Custodian”) provides certain custodial services to the Fund. The Custodian is entitled to receive a monthly fee, subject to certain minimum and out of pocket expenses.
Quasar Distributors, LLC (the “Distributor”), a wholly-owned broker-dealer subsidiary of Foreside Financial Group, LLC, serves as the principal underwriter and distributor of the Fund’s shares pursuant to a Distribution Agreement with RBB.
For compensation amounts paid to Fund Services and the Custodian, please refer to the Consolidated Statement of Operations.
The Board has adopted a Plan of Distribution for the Class A Shares and Class C Shares (the “Plan”) pursuant to Rule 12b-1 under the 1940 Act. Under the Plan, the Fund’s distributor is entitled to receive from the Fund a distribution fee with respect to the Shares, which is accrued daily and paid monthly, of up to 0.25% on an annualized basis of the average daily net assets of the Class A Shares and up to 1.00% of the Class C Shares. The actual amount of such compensation under the Plan is agreed upon by the Board and by the Distributor. Because these fees are paid out of the Fund’s assets on an ongoing basis, over time these fees will increase the cost of your investment and may cost you more than paying other types of sales charges. Amounts paid to the Distributor under the Plan may be used by the Distributor to cover expenses that are related to (i) the sale of the Shares, (ii) ongoing servicing and/or maintenance of the accounts of shareholders, and (iii) sub-transfer agency services, subaccounting services or administrative services related to the sale of the Shares, all as set forth in the Fund’s 12b-1 Plan.
3. Director And Officer Compensation
The Directors of the Company receive an annual retainer and meeting fees for meetings attended. An employee of Vigilant Compliance, LLC serves as Chief Compliance Officer of the Company. Vigilant Compliance, LLC is compensated for the services provided to the Company. Employees of RBB serve as President, Chief Financial Officer, Chief Operating Officer, Secretary and Director of Marketing & Business Development of the Company. They are compensated by the Company for services provided. Certain employees of Fund Services serve as officers of the Company. They are not compensated by the Fund or the Company. For Director and Officer compensation amounts, please refer to the Consolidated Statement of Operations.
31
Abbey Capital Multi Asset Fund
Notes To Consolidated Financial Statements (Continued)
August 31, 2024
4. Purchases and Sales of Investment Securities
During the current fiscal period, there were no purchases or sales of investment securities or long-term U.S. Government securities (excluding short-term investments and derivative transactions) by the Fund.
5. Federal Income Tax Information
The Fund has followed the authoritative guidance on accounting for and disclosure of uncertainty in tax positions, which requires the Fund to determine whether a tax position is more likely than not to be sustained upon examination, including resolution of any related appeals or litigation processes, based on the technical merits of the position. The Fund has determined that there was no effect on the consolidated financial statements from following this authoritative guidance. In the normal course of business, the Fund is subject to examination by federal, state and local jurisdictions, where applicable, for tax years for which applicable statutes of limitations have not expired.
As of August 31, 2024, the federal tax cost and aggregate gross unrealized appreciation and depreciation of investments held by the Fund were as follows(a):
Federal Tax
Cost | Unrealized
Appreciation | Unrealized
(Depreciation) | Net
Unrealized
Appreciation/
(Depreciation) |
$946,169,111 | $1,028,765 | $(49,994,982) | $(48,966,217) |
(a) | The difference between the book basis and tax basis cost and aggregate gross unrealized appreciation and depreciation of investments is attributable primarily to timing differences related to taxable income from a wholly-owned controlled foreign corporation. |
Distributions to shareholders, if any, from net investment income and realized gains are determined in accordance with federal income tax regulations, which may differ from net investment income and realized gains recognized for financial reporting purposes. Accordingly, the character of distributions and composition of net assets for tax purposes may differ from those reflected in the accompanying consolidated financial statements. To the extent these differences are permanent, such amounts are reclassified within the capital accounts based on the tax treatment; temporary differences do not require such reclassification.
Permanent differences as of August 31, 2024, primarily attributable to disallowed book income from the Cayman Subsidiary, were reclassified to the following accounts:
Distributable
Earnings/(Loss) | Paid-In
Capital |
$21,656,471 | $(21,656,471) |
As of August 31, 2024, the components of distributable earnings on a tax basis were as follows:
Undistributed
Ordinary
Income | Undistributed
Long-Term
Capital Gains | Net Unrealized
Appreciation/
(Depreciation) | Capital Loss
Carryforwards | Qualified
Late-Year
Losses | Other
Temporary
Differences |
$31,857,582 | $16,271,710 | $(25,350,120) | $— | $— | $— |
The differences between the book and tax basis components of distributable earnings relate principally to the timing of recognition of income and gains of the Cayman Subsidiary for federal income tax purposes.
32
Abbey Capital Multi Asset Fund
Notes To Consolidated Financial Statements (Concluded)
August 31, 2024
The tax character of dividends and distributions paid during the fiscal years ended August 31, 2023 and August 31, 2024 was as follows:
| | Ordinary
Income | Long-Term
Gains | Total |
2024 | $13,460,205 | $8,291,732 | $21,751,937 |
| | Ordinary
Income | Long-Term
Gains | Total |
2023 | $16,071,575 | $36,309 | $16,107,884 |
The Fund is permitted to carry forward capital losses for an unlimited period. Capital losses that are carried forward will retain their character as either short-term or long-term capital losses. As of August 31, 2024, the Fund had no unlimited short-term or long-term capital loss carryovers to offset future capital gains.
6. Subsequent Events
Management has evaluated the impact of all subsequent events on the Fund through the date the financial statements were issued and has determined that there was the following subsequent event:
Effective October 22, 2024 (subsequent to the end of the current fiscal period), Systematica Investments Limited (acting as the general partner of Systematica Investments LP) serves as a Trading Adviser to the Fund.
33
Abbey Capital Multi Asset Fund
Report of Independent Registered Public Accounting Firm
To the Shareholders of Abbey Capital Multi Asset Fund
and Board of Directors of The RBB Fund, Inc.
Opinion on the Financial Statements
We have audited the accompanying consolidated statement of assets and liabilities of Abbey Capital Multi Asset Fund (the “Fund”) (one of the portfolios constituting The RBB Fund, Inc. (the “Company”)), including the consolidated portfolio of investments, as of August 31, 2024, and the related consolidated statement of operations for the year then ended, the consolidated statements of changes in net assets for each of the two years in the period then ended, the consolidated financial highlights for each of the five years in the period then ended and the related notes (collectively referred to as the “financial statements”). In our opinion, the financial statements present fairly, in all material respects, the consolidated financial position of the Fund (one of the portfolios constituting The RBB Fund, Inc.) at August 31, 2024, the consolidated results of its operations for the year then ended, the consolidated changes in its net assets for each of the two years in the period then ended and its consolidated financial highlights for each of the five years in the period then ended, in conformity with U.S. generally accepted accounting principles.
Basis for Opinion
These financial statements are the responsibility of the Company’s management. Our responsibility is to express an opinion on the Fund’s financial statements based on our audits. We are a public accounting firm registered with the Public Company Accounting Oversight Board (United States) (“PCAOB”) and are required to be independent with respect to the Company in accordance with the U.S. federal securities laws and the applicable rules and regulations of the Securities and Exchange Commission and the PCAOB.
We conducted our audits in accordance with the standards of the PCAOB. Those standards require that we plan and perform the audit to obtain reasonable assurance about whether the financial statements are free of material misstatement, whether due to error or fraud. The Company is not required to have, nor were we engaged to perform, an audit of the Company’s internal control over financial reporting. As part of our audits, we are required to obtain an understanding of internal control over financial reporting but not for the purpose of expressing an opinion on the effectiveness of the Company’s internal control over financial reporting. Accordingly, we express no such opinion.
Our audits included performing procedures to assess the risks of material misstatement of the financial statements, whether due to error or fraud, and performing procedures that respond to those risks. Such procedures included examining, on a test basis, evidence regarding the amounts and disclosures in the financial statements. Our procedures included confirmation of securities owned as of August 31, 2024, by correspondence with the custodian and brokers. Our audits also included evaluating the accounting principles used and significant estimates made by management, as well as evaluating the overall presentation of the financial statements. We believe that our audits provide a reasonable basis for our opinion.

We have served as the auditor of one or more Abbey Capital investment companies since 2014.
Philadelphia, Pennsylvania
October 30, 2024
34
Abbey Capital Multi Asset Fund
Shareholder Tax Information
(Unaudited)
Certain tax information regarding the Fund is required to be provided to shareholders based upon the Fund’s income and distributions for the taxable year ended August 31, 2024. The information and distribution reported herein may differ from information and distributions taxable to the shareholders for the calendar year ended December 31, 2024. During the fiscal year ended August 31, 2024, the Fund paid no ordinary income dividends that are designated as “qualified dividend income” to its shareholders. Dividends from net investment income and short-term capital gains are treated as ordinary income dividends for federal income tax purposes.
The percentage of taxable ordinary income distributions that are designated as short-term capital gain distributions under Internal Revenue Section 871(k)(2)(c) for the Fund is 58.02%.
Because the Fund’s fiscal year is not the calendar year, another notification will be sent with respect to calendar year 2024. The second notification, which will reflect the amount, if any, to be used by calendar year taxpayers on their U.S. federal income tax returns, will be made in conjunction with Form 1099-DIV and will be mailed in January 2025.
Foreign shareholders will generally be subject to U.S. withholding tax on the amount of their ordinary income dividends. They will generally not be entitled to a foreign tax credit or deduction for the withholding taxes paid by the Fund, if any.
In general, dividends received by tax exempt recipients (e.g., IRAs and Keoghs) need not be reported as taxable income for U.S. federal income tax purposes. However, some retirement trusts (e.g., corporate, Keogh and 403(b)(7) plans) may need this information for their annual information reporting.
Shareholders are advised to consult their own tax advisers with respect to the tax consequences of their investment in the Fund.
35
Abbey Capital Multi Asset Fund
Other Information
(Unaudited)
APPROVAL OF INVESTMENT ADVISORY AGREEMENTS AND TRADING ADVISORY AGREEMENTS
As required by the 1940 Act, the Board, including all of the Directors who are not “interested persons” of the Company, as that term is defined in the 1940 Act (the “Independent Directors”), considered the renewals of (1) the investment advisory agreement between Abbey Capital and the Company on behalf of the Fund (the “Investment Advisory Agreement”), (2) each of the separate advisory agreements between the Onshore Subsidiary, the Cayman Subsidiary and the SPC (the “Subsidiaries”) and Abbey Capital (collectively, the “Subsidiary Investment Advisory Agreements”), and (3) the trading advisory agreements between Abbey Capital and each of Aspect Capital Limited, Crabel Capital Management, LLC, Eclipse Capital Management, Inc., Revolution Capital Management, LLC, Tudor Investment Corporation and Welton Investment Partners LLC (each, a “Trading Adviser”) (the “Trading Advisory Agreements”), at a meeting of the Board held on May 15-16, 2024 (the “Meeting”). At the Meeting, the Board, including all of the Independent Directors, approved the Investment Advisory Agreement, the Subsidiary Investment Advisory Agreements, and the Trading Advisory Agreements for an additional one-year term ending August 16, 2025. The Board’s decision to approve the Investment Advisory Agreement, the Subsidiary Investment Advisory Agreements, and the Trading Advisory Agreements reflects the exercise of its business judgment to continue the existing arrangement. In approving the Investment Advisory Agreement, Subsidiary Investment Advisory Agreements, and the Trading Advisory Agreements, the Board considered information provided by Abbey Capital and each of the Trading Advisers with the assistance and advice of counsel to the Independent Directors and the Company.
In considering the renewal and approval of the Investment Advisory Agreement, each of the Subsidiary Investment Advisory Agreements and the Trading Advisory Agreements with respect to the Fund, the Directors took into account all materials provided prior to and during the Meeting and at other meetings throughout the past year, the presentations made during the Meeting, and the discussions held during the Meeting. The Directors reviewed these materials with management of Abbey Capital, and discussed the aforementioned Agreements with counsel in executive sessions, at which no representatives of Abbey Capital, the Subsidiaries, or Trading Advisers were present. Among other things, the Directors considered (i) the nature, extent, and quality of services provided to the Fund by Abbey Capital and each Trading Adviser; (ii) descriptions of the experience and qualifications of the personnel providing those services; (iii) Abbey Capital’s and the Trading Advisers’ investment philosophies and processes; (iv) Abbey Capital’s and the Trading Advisers’ assets under management and client descriptions; (v) Abbey Capital’s and the Trading Advisers’ soft dollar commission and trade allocation policies, including information on the types of research and services obtained in connection with soft dollar commissions; (vi) Abbey Capital’s and the Trading Advisers’ advisory fee arrangements with the Company and other similarly managed clients, as applicable; (vii) Abbey Capital’s and the Trading Advisers’ compliance procedures; (viii) Abbey Capital’s and the Trading Advisers’ financial information and insurance coverage, as applicable, and Abbey Capital’s profitability analysis; (ix) the extent to which economies of scale are relevant to the Fund; (x) a report prepared by Fuse Research Network, LLC comparing the Fund’s management fees and total expense ratios to a group of mutual funds deemed comparable to the Fund based primarily on investment strategy similarity (“Peer Group”) and comparing the performance of the Fund to the performance of its Peer Group; and (xi) a report comparing the performance of the Fund to the performance of its benchmark.
As part of their review, the Directors considered the nature, extent and quality of the services provided by Abbey Capital and each Trading Adviser. The Directors concluded that Abbey Capital and each Trading Adviser had substantial resources to provide services to the Fund and the Subsidiaries, as applicable.
The Directors also considered the investment performance of the Fund, noting that the Fund had underperformed its benchmark, the S&P 500 Total Return Index, for the three-month, one-year, three-year, five-year and since-inception periods ended December 31, 2023. The Directors considered the Fund’s investment performance in light of its investment objective and investment strategies. The Board noted that the Fund’s total return outperformed the median of its Peer Group for the three-month, one-year, three-year, five-year and since-inception periods ended December 31, 2023.
The Board also considered the advisory fee rate payable by the Fund under the Investment Advisory Agreement. In this regard, information on the fees paid by the Fund and the Fund’s total operating expense ratios (before and after fee waivers and expense reimbursements) were compared to similar information for mutual funds advised by other,
36
Abbey Capital Multi Asset Fund
Other Information (Continued)
(Unaudited)
unaffiliated investment advisory firms. The Directors noted that the Fund’s net advisory fee was above the median and in the 4th quartile (most expensive) of its Peer Group, and the Fund’s total net expenses were above the median and in the 3rd quartile (second most expensive) of its Peer Group. The Directors also considered the fees payable to each Trading Adviser under the Trading Advisory Agreements and the information provided by Abbey Capital on the services provided by the different Trading Advisers. In this regard, the Directors noted that the fees for each Trading Adviser were payable by Abbey Capital. The Directors noted that Abbey Capital had contractually agreed to waive management fees and reimburse expenses through at least December 31, 2024 to limit total annual operating expenses to agreed upon levels for the Fund.
After reviewing the information regarding Abbey Capital’s and the Trading Advisers’ costs, profitability and economies of scale, and after considering the services to be provided by Abbey Capital and each Trading Adviser, the Directors concluded that the investment advisory fees to be paid by the Fund to Abbey Capital and the trading advisory fees to be paid by Abbey Capital to each Trading Adviser were fair and reasonable and that the Investment Advisory Agreement, the Subsidiary Investment Advisory Agreements, and Trading Advisory Agreements should be approved and continued for an additional one-year period ending August 16, 2025.
SYSTEMATICA TRADING ADVISORY AGREEMENT
As required by the 1940 Act, the Board, including a majority of the Independent Directors, considered the approval of a new trading advisory agreement (the “Systematica Trading Advisory Agreement”) by and among Abbey Capital, the Onshore Subsidiary, the SPC and Systematica Investments Limited (acting as the general partner of Systematica Investments LP) (“Systematica”) at a meeting of the Board held on September 11-12, 2024 (the “September Meeting”). At the September Meeting, the Board, including a majority of the Independent Directors, approved the Systematica Trading Advisory Agreement for an initial period ending August 16, 2025. The Board’s decision to approve the Systematica Trading Advisory Agreement reflects the exercise of its business judgment. In approving the Systematica Trading Advisory Agreement, the Board considered information provided by Abbey Capital and Systematica, with the assistance and advice of counsel to the Independent Directors and the Company.
In considering the approval of the Systematica Trading Advisory Agreement, the Board took into account all materials provided prior to and during the September Meeting and at other meetings throughout the past year, the presentations made during the September Meeting, and the discussions held during the September Meeting. The Directors reviewed these materials with management of Abbey Capital, and discussed the Systematica Trading Advisory Agreement with counsel in executive sessions, at which no representatives of Abbey Capital or Systematica were present. The Directors considered whether approval of the Systematica Trading Advisory Agreement would be in the best interests of the Fund and its shareholders and the overall fairness of the Systematica Trading Advisory Agreement. The Directors noted their familiarity with Systematica given Systematica’s current service as a Trading Adviser of the Abbey Capital Futures Strategy Fund, another series of the Company. Among other things, the Board considered (i) the nature, extent, and quality of services to be provided to the Fund by Systematica; (ii) descriptions of the experience and qualifications of the personnel providing those services; (iii) Systematica’s investment philosophies and processes; (iv) Systematica’s assets under management and client descriptions; (v) Systematica’s trade execution and trade allocation policies; (vi) Systematica’s advisory fee arrangements with the Company and other similarly managed clients, as applicable; (vii) Systematica’s compliance procedures; and (viii) Systematica’s financial information and insurance coverage.
The Board also considered the fees payable to Systematica under the proposed Systematica Trading Advisory Agreement and the services to be provided by Systematica. In this regard, the Board noted that the fees for Systematica were payable by Abbey Capital.
After reviewing the information regarding Abbey Capital’s and Systematica’s costs, profitability and economies of scale, and after considering the services to be provided by Systematica, the Board concluded that the trading advisory fees to be paid by Abbey Capital to Systematica were fair and reasonable, that the Systematica Trading Advisory
37
Abbey Capital Multi Asset Fund
Other Information (Concluded)
(Unaudited)
Agreement was in the best interests of the Fund and its shareholders and did not involve a conflict of interest from which Abbey Capital would derive an inappropriate advantage, and that the Systematica Trading Advisory Agreement should be approved for an initial period ending August 16, 2025.
WINTON TRADING ADVISORY AGREEMENT
As required by the 1940 Act, the Board, including a majority of the Independent Directors, considered the approval of a new trading advisory agreement (the “Winton Trading Advisory Agreement”) by and among Abbey Capital, the Onshore Subsidiary, the SPC and Winton Capital Management Limited (“Winton”) at a meeting of the Board held on February 12-13, 2024 (the “February Meeting”). At the February Meeting, the Board, including a majority of the Independent Directors, approved the Winton Trading Advisory Agreement for an initial period ending August 16, 2025. The Board’s decision to approve the Winton Trading Advisory Agreement reflects the exercise of its business judgment. In approving the Winton Trading Advisory Agreement, the Board considered information provided by Abbey Capital and Winton, with the assistance and advice of counsel to the Independent Directors and the Company.
In considering the approval of the Winton Trading Advisory Agreement, the Board took into account all materials provided prior to and during the February Meeting and at other meetings throughout the past year, the presentations made during the February Meeting, and the discussions held during the February Meeting. The Directors reviewed these materials with management of Abbey Capital, and discussed the Winton Trading Advisory Agreement with counsel in executive sessions, at which no representatives of Abbey Capital or Winton were present. The Directors considered whether approval of the Winton Trading Advisory Agreement would be in the best interests of the Fund and its shareholders and the overall fairness of the Winton Trading Advisory Agreement. The Directors noted their familiarity with Winton given Winton’s current service as a Trading Adviser of the Abbey Capital Futures Strategy Fund, another series of the Company. Among other things, the Board considered (i) the nature, extent, and quality of services to be provided to the Fund by Winton; (ii) descriptions of the experience and qualifications of the personnel providing those services; (iii) Winton’s investment philosophies and processes; (iv) Winton’s assets under management and client descriptions; (v) Winton’s trade execution and trade allocation policies; (vi) Winton’s advisory fee arrangements with the Company and other similarly managed clients, as applicable; (vii) Winton’s compliance procedures; and (viii) Winton’s financial information and insurance coverage.
The Board also considered the fees payable to Winton under the proposed Winton Trading Advisory Agreement and the services to be provided by Winton. In this regard, the Board noted that the fees for Winton were payable by Abbey Capital.
After reviewing the information regarding Abbey Capital’s and Winton’s costs, profitability and economies of scale, and after considering the services to be provided by Winton, the Board concluded that the trading advisory fees to be paid by Abbey Capital to Winton were fair and reasonable, that the Winton Trading Advisory Agreement was in the best interests of the Fund and its shareholders and did not involve a conflict of interest from which Abbey Capital would derive an inappropriate advantage, and that the Winton Trading Advisory Agreement should be approved for an initial period ending August 16, 2025.
38
Investment Adviser
Abbey Capital Limited
8 St. Stephen’s Green
Dublin 2, Ireland
Administrator and Transfer Agent
U.S. Bank Global Fund Services
P.O. Box 701
Milwaukee, WI 53201
Principal Underwriter
Quasar Distributors, LLC
3 Canal Plaza, Suite 100
Portland, ME 04101
Custodian
U.S. Bank, N.A.
1555 North Rivercenter Drive, Suite 302
Milwaukee, WI 53212
Independent Registered Public Accounting Firm
Ernst & Young LLP
One Commerce Square
2005 Market Street, Suite 700
Philadelphia, PA 19103
Legal Counsel
Faegre Drinker Biddle & Reath LLP.
One Logan Square, Suite 2000
Philadelphia, PA 19103-6996

ADARA SMALLER COMPANIES FUND
of
The RBB Fund, Inc.
FINANCIAL STATEMENTS
August 31, 2024
This report is submitted for the general information of the shareholders of the Fund. It is not authorized for distribution unless preceded or accompanied by a current prospectus for the Fund.
ADARA SMALLER COMPANIES FUND
Schedule of Investments
as of August 31, 2024
| | | Shares | | | Value | |
COMMON STOCKS — 93.2% |
Aerospace/Defense — 1.1% |
AAR Corp. (a) | | | 11,755 | | | $ | 773,244 | |
Aerovironment, Inc. (a) | | | 7,224 | | | | 1,471,962 | |
Curtiss-Wright Corp. | | | 2,004 | | | | 632,984 | |
Hexcel Corp. | | | 15,634 | | | | 989,476 | |
Kratos Defense & Security Solutions, Inc. (a) | | | 91,060 | | | | 2,088,916 | |
Mercury Systems, Inc. (a) | | | 2,290 | | | | 86,791 | |
Moog, Inc. - Class A | | | 1,762 | | | | 347,819 | |
National Presto Industries, Inc. | | | 615 | | | | 48,148 | |
| | | | | | | | 6,439,340 | |
Agriculture — 1.1% |
Alico, Inc. | | | 73,180 | | | | 2,144,174 | |
Darling Ingredients, Inc. (a) | | | 8,943 | | | | 373,191 | |
Dole PLC | | | 123,066 | | | | 1,982,593 | |
Fresh Del Monte Produce, Inc. | | | 5,120 | | | | 149,709 | |
Vector Group Ltd. | | | 9,371 | | | | 140,378 | |
Vital Farms, Inc. (a) | | | 62,452 | | | | 1,964,115 | |
| | | | | | | | 6,754,160 | |
Airlines — 0.1% |
SkyWest, Inc. (a) | | | 8,137 | | | | 630,943 | |
| | | | | | | | | |
Apparel — 0.9% |
Capri Holdings, Ltd. (a) | | | 5,836 | | | | 208,462 | |
Crocs, Inc. (a) | | | 8,621 | | | | 1,260,132 | |
Hanesbrands, Inc. (a) | | | 26,344 | | | | 167,284 | |
Kontoor Brands, Inc. | | | 4,168 | | | | 311,975 | |
Lakeland Industries, Inc. | | | 110,440 | | | | 2,661,604 | |
Levi Strauss & Co. - Class A | | | 37,813 | | | | 728,656 | |
Skechers USA, Inc. - Class A (a) | | | 3,666 | | | | 251,048 | |
VF Corp. | | | 7,775 | | | | 141,583 | |
| | | | | | | | 5,730,744 | |
Auto Manufacturers — 0.7% |
Blue Bird Corp. (a) | | | 43,396 | | | | 2,221,008 | |
REV Group, Inc. | | | 61,805 | | | | 1,967,871 | |
Wabash National Corp. | | | 9,020 | | | | 175,529 | |
| | | | | | | | 4,364,408 | |
Auto Parts & Equipment — 1.3% |
Cooper-Standard Holdings, Inc. (a) | | | 98,370 | | | | 1,519,817 | |
Dorman Products, Inc. (a) | | | 1,368 | | | | 155,159 | |
Douglas Dynamics, Inc. | | | 11,675 | | | | 325,032 | |
Gentherm, Inc. (a) | | | 4,376 | | | | 221,163 | |
Miller Industries, Inc. | | | 37,210 | | | | 2,259,019 | |
Motorcar Parts of America, Inc. (a) | | | 158,610 | | | | 1,051,584 | |
Shyft Group, Inc. | | | 29,704 | | | | 421,500 | |
Standard Motor Products, Inc. | | | 1,956 | | | | 63,198 | |
Strattec Security Corp. (a) | | | 44,660 | | | | 1,584,090 | |
| | | | | | | | 7,600,562 | |
Banks — 9.0% |
Ameris Bancorp | | | 2,245 | | | | 138,359 | |
Bankwell Financial Group, Inc. | | | 49,840 | | | | 1,519,123 | |
| | | Shares | | | Value | |
Banks — (Continued) |
Banner Corp. | | | 1,733 | | | $ | 103,235 | |
Cadence Bank | | | 22,282 | | | | 719,263 | |
Capital Bancorp, Inc. | | | 91,230 | | | | 2,333,663 | |
Central Pacific Financial Corp. | | | 3,784 | | | | 104,098 | |
City Holding Co. | | | 4,208 | | | | 499,658 | |
Civista Bancshares, Inc. | | | 76,800 | | | | 1,303,296 | |
Colony Bankcorp, Inc. | | | 164,697 | | | | 2,472,102 | |
Community Financial System, Inc. | | | 1,997 | | | | 122,137 | |
ConnectOne Bancorp, Inc. | | | 5,049 | | | | 126,225 | |
Customers Bancorp, Inc. (a) | | | 27,027 | | | | 1,400,539 | |
Dime Community Bancshares, Inc. | | | 1,047 | | | | 27,232 | |
Eastern Bankshares, Inc. | | | 5,441 | | | | 92,334 | |
Esquire Financial Holdings, Inc. | | | 35,005 | | | | 2,153,858 | |
Farmers National Bancorp | | | 93,820 | | | | 1,458,901 | |
First BanCorp | | | 38,999 | | | | 833,799 | |
First Business Financial Services, Inc. | | | 57,829 | | | | 2,623,702 | |
First Commonwealth Financial Corp. | | | 18,699 | | | | 321,997 | |
First Financial Bancorp | | | 24,036 | | | | 636,233 | |
First Financial Bankshares, Inc. | | | 13,162 | | | | 481,334 | |
First Hawaiian, Inc. | | | 13,502 | | | | 328,504 | |
First Interstate BancSystem, Inc. - Class A | | | 7,996 | | | | 248,276 | |
First Merchants Corp. | | | 2,329 | | | | 90,831 | |
First Northwest Bancorp | | | 83,950 | | | | 970,462 | |
Five Star Bancorp | | | 88,850 | | | | 2,589,977 | |
Glacier Bancorp, Inc. | | | 25,249 | | | | 1,194,278 | |
Heartland Financial USA, Inc. | | | 3,173 | | | | 176,926 | |
Heritage Commerce Corp. | | | 7,938 | | | | 80,809 | |
Hope Bancorp, Inc. | | | 27,648 | | | | 353,618 | |
Horizon Bancorp, Inc. | | | 160,487 | | | | 2,571,002 | |
Independent Bank Corp. | | | 1,193 | | | | 75,529 | |
Kearny Financial Corp. | | | 10,015 | | | | 68,202 | |
Metropolitan Bank Holding Corp. (a) | | | 68,426 | | | | 3,538,308 | |
Midland States Bancorp, Inc. | | | 2,458 | | | | 55,969 | |
NBT Bancorp, Inc. | | | 1,326 | | | | 64,921 | |
Northeast Bank | | | 53,520 | | | | 3,800,455 | |
OFG Bancorp | | | 7,960 | | | | 366,080 | |
Old National Bancorp | | | 10,450 | | | | 207,432 | |
Orrstown Financial Services, Inc. | | | 63,766 | | | | 2,282,823 | |
Park National Corp. | | | 737 | | | | 129,557 | |
Parke Bancorp, Inc. | | | 126,461 | | | | 2,592,450 | |
Peapack-Gladstone Financial Corp. | | | 2,621 | | | | 74,856 | |
Pinnacle Financial Partners, Inc. | | | 14,447 | | | | 1,438,488 | |
Preferred Bank | | | 1,314 | | | | 108,865 | |
Premier Financial Corp. | | | 6,412 | | | | 160,685 | |
S&T Bancorp, Inc. | | | 8,702 | | | | 373,925 | |
Sandy Spring Bancorp, Inc. | | | 21,902 | | | | 685,533 | |
Seacoast Banking Corp. of Florida | | | 52,039 | | | | 1,423,787 | |
The accompanying notes are an integral part of the financial statements.
1
ADARA SMALLER COMPANIES FUND
Schedule of Investments (Continued)
as of August 31, 2024
| | | Shares | | | Value | |
Banks — (Continued) |
Southside Bancshares, Inc. | | | 4,513 | | | $ | 154,480 | |
Stellar Bancorp, Inc. | | | 2,051 | | | | 55,931 | |
Stock Yards Bancorp, Inc. | | | 1,084 | | | | 65,690 | |
TriCo Bancshares | | | 3,184 | | | | 144,745 | |
Triumph Bancorp, Inc. (a) | | | 8,009 | | | | 672,596 | |
UMB Financial Corp. | | | 3,164 | | | | 327,759 | |
United Community Banks, Inc. | | | 12,730 | | | | 387,883 | |
Unity Bancorp, Inc. | | | 72,830 | | | | 2,471,122 | |
USCB Financial Holdings, Inc. | | | 147,860 | | | | 2,207,550 | |
Veritex Holdings, Inc. | | | 11,815 | | | | 297,620 | |
Walker & Dunlop, Inc. | | | 1,925 | | | | 206,090 | |
Washington Trust Bancorp, Inc. | | | 7,081 | | | | 232,257 | |
WesBanco, Inc. | | | 6,869 | | | | 221,250 | |
West Bancorporation, Inc. | | | 68,770 | | | | 1,371,961 | |
| | | | | | | | 54,340,570 | |
Beverages — 0.4% |
Coca-Cola Consolidated, Inc. | | | 279 | | | | 374,530 | |
Duckhorn Portfolio, Inc. (a) | | | 131,702 | | | | 833,674 | |
MGP Ingredients, Inc. | | | 931 | | | | 83,408 | |
Vita Coco Co., Inc. (a) | | | 41,395 | | | | 1,081,237 | |
| | | | | | | | 2,372,849 | |
Biotechnology — 6.0% |
4D Molecular Therapeutics, Inc. (a) | | | 3,970 | | | | 59,590 | |
ADMA Biologics, Inc. (a) | | | 177,092 | | | | 3,065,462 | |
ANI Pharmaceuticals, Inc. (a) | | | 5,276 | | | | 336,345 | |
Apogee Therapeutics, Inc. (a) | | | 40,582 | | | | 2,076,581 | |
Astria Therapeutics, Inc. (a) | | | 104,011 | | | | 1,272,055 | |
Biohaven Ltd. (a) | | | 14,121 | | | | 556,367 | |
CG oncology, Inc. (a) | | | 7,728 | | | | 285,009 | |
Crinetics Pharmaceuticals, Inc. (a) | | | 105,243 | | | | 5,584,194 | |
Cytokinetics, Inc. (a) | | | 5,803 | | | | 331,235 | |
Day One Biopharmaceuticals, Inc. (a) | | | 51,462 | | | | 712,234 | |
Denali Therapeutics, Inc. (a) | | | 19,751 | | | | 482,714 | |
Edgewise Therapeutics, Inc. (a) | | | 63,419 | | | | 1,189,106 | |
Guardant Health, Inc. (a) | | | 18,768 | | | | 480,085 | |
Halozyme Therapeutics, Inc. (a) | | | 16,935 | | | | 1,081,300 | |
Ideaya Biosciences, Inc. (a) | | | 20,374 | | | | 804,773 | |
Immunocore Holdings PLC - ADR (a) | | | 10,217 | | | | 366,586 | |
Intra-Cellular Therapies, Inc. (a) | | | 7,938 | | | | 581,697 | |
Keros Therapeutics, Inc. (a) | | | 1,506 | | | | 68,297 | |
Kiniksa Pharmaceuticals International PLC (a) | | | 52,597 | | | | 1,406,444 | |
Larimar Therapeutics, Inc. (a) | | | 66,450 | | | | 525,619 | |
Ligand Pharmaceuticals, Inc. (a) | | | 7,862 | | | | 831,800 | |
Maravai LifeSciences Holdings, Inc. - Class A (a) | | | 48,288 | | | | 437,006 | |
Mind Medicine MindMed, Inc. (a) | | | 124,213 | | | | 752,731 | |
Myriad Genetics, Inc. (a) | | | 2,914 | | | | 82,554 | |
| | | Shares | | | Value | |
Biotechnology — (Continued) |
NeoGenomics, Inc. (a) | | | 27,749 | | | $ | 458,413 | |
Nurix Therapeutics, Inc. (a) | | | 63,632 | | | | 1,603,526 | |
Nuvalent, Inc. - Class A (a) | | | 16,605 | | | | 1,413,584 | |
OmniAb Operations, Inc. (a)(b) | | | 370 | | | | 0 | |
OmniAb Operations, Inc. (a)(b) | | | 370 | | | | 0 | |
Praxis Precision Medicines, Inc. (a) | | | 11,973 | | | | 636,365 | |
Roivant Sciences Ltd. (a) | | | 85,529 | | | | 1,046,020 | |
Soleno Therapeutics, Inc. (a) | | | 10,481 | | | | 513,045 | |
Structure Therapeutics, Inc. - ADR (a) | | | 57,306 | | | | 2,185,078 | |
Vera Therapeutics, Inc. (a) | | | 26,373 | | | | 997,427 | |
Veracyte, Inc. (a) | | | 25,913 | | | | 817,555 | |
Vericel Corp. (a) | | | 1,632 | | | | 84,293 | |
Viking Therapeutics, Inc. (a) | | | 10,699 | | | | 686,020 | |
Xenon Pharmaceuticals, Inc. (a) | | | 63,492 | | | | 2,561,267 | |
| | | | | | | | 36,372,377 | |
Building Materials — 2.8% |
AAON, Inc. | | | 6,180 | | | | 590,252 | |
American Woodmark Corp. (a) | | | 1,043 | | | | 93,463 | |
Apogee Enterprises, Inc. | | | 7,722 | | | | 515,675 | |
Armstrong World Industries, Inc. | | | 10,255 | | | | 1,299,924 | |
Aspen Aerogels, Inc. (a) | | | 87,654 | | | | 2,514,793 | |
AZEK Co., Inc. (a) | | | 11,831 | | | | 504,356 | |
Boise Cascade Co. | | | 3,571 | | | | 484,299 | |
Gauzy Ltd. (a) | | | 19,459 | | | | 206,849 | |
Gibraltar Industries, Inc. (a) | | | 4,141 | | | | 288,503 | |
Knife River Corp. (a) | | | 16,553 | | | | 1,305,535 | |
MDU Resources Group, Inc. | | | 40,242 | | | | 1,033,817 | |
Modine Manufacturing Co. (a) | | | 28,797 | | | | 3,500,275 | |
Simpson Manufacturing Co., Inc. | | | 2,069 | | | | 378,751 | |
SPX Technologies, Inc. (a) | | | 4,521 | | | | 737,556 | |
Summit Materials, Inc. - Class A (a) | | | 62,991 | | | | 2,551,136 | |
UFP Industries, Inc. | | | 8,103 | | | | 985,892 | |
| | | | | | | | 16,991,076 | |
Chemicals — 0.3% |
AdvanSix, Inc. | | | 3,917 | | | | 115,786 | |
Balchem Corp. | | | 1,142 | | | | 202,168 | |
Chemours Co. | | | 9,276 | | | | 180,325 | |
Innospec, Inc. | | | 1,121 | | | | 129,206 | |
Koppers Holdings, Inc. | | | 7,974 | | | | 315,611 | |
Perimeter Solutions SA (a) | | | 31,536 | | | | 369,287 | |
Quaker Chemical Corp. | | | 568 | | | | 96,145 | |
Rogers Corp. (a) | | | 1,868 | | | | 200,362 | |
Sensient Technologies Corp. | | | 1,928 | | | | 150,076 | |
Stepan Co. | | | 2,701 | | | | 209,679 | |
| | | | | | | | 1,968,645 | |
Coal — 0.3% |
Warrior Met Coal, Inc. | | | 26,206 | | | | 1,606,690 | |
| | | | | | | | | |
The accompanying notes are an integral part of the financial statements.
2
ADARA SMALLER COMPANIES FUND
Schedule of Investments (Continued)
as of August 31, 2024
| | | Shares | | | Value | |
Commercial Services — 6.6% |
Acacia Research Corp. (a) | | | 320,940 | | | $ | 1,543,721 | |
Adtalem Global Education, Inc. (a) | | | 3,449 | | | | 261,124 | |
Alight, Inc. - Class A (a) | | | 199,372 | | | | 1,487,315 | |
AMN Healthcare Services, Inc. (a) | | | 3,294 | | | | 174,681 | |
ARC Document Solutions, Inc. | | | 449,990 | | | | 1,502,967 | |
Arlo Technologies, Inc. (a) | | | 198,056 | | | | 2,325,177 | |
Barrett Business Services, Inc. | | | 105,876 | | | | 3,865,533 | |
BrightView Holdings, Inc. (a) | | | 134,423 | | | | 2,146,735 | |
Brink’s Co. | | | 4,054 | | | | 449,710 | |
CompoSecure, Inc. | | | 142,210 | | | | 1,668,123 | |
CoreCivic, Inc. (a) | | | 231,877 | | | | 3,195,265 | |
Cross Country Healthcare, Inc. (a) | | | 6,965 | | | | 103,918 | |
Deluxe Corp. | | | 4,893 | | | | 100,747 | |
EVERTEC, Inc. | | | 46,427 | | | | 1,590,125 | |
FTI Consulting, Inc. (a) | | | 2,819 | | | | 643,606 | |
GEO Group, Inc. (a) | | | 187,003 | | | | 2,593,732 | |
Heidrick & Struggles International, Inc. | | | 2,031 | | | | 78,397 | |
Herc Holdings, Inc. | | | 5,765 | | | | 843,823 | |
ICF International, Inc. | | | 4,121 | | | | 683,097 | |
Insperity, Inc. | | | 2,292 | | | | 215,425 | |
Kelly Services, Inc. - Class A | | | 29,276 | | | | 618,016 | |
Lincoln Educational Services Corp. (a) | | | 130,970 | | | | 1,630,576 | |
MarketAxess Holdings, Inc. | | | 1,203 | | | | 291,595 | |
Matthews International Corp. - Class A | | | 5,499 | | | | 139,290 | |
Moneylion, Inc. (a) | | | 10,277 | | | | 477,058 | |
Perdoceo Education Corp. | | | 10,039 | | | | 225,275 | |
Rent-A-Center, Inc. | | | 3,409 | | | | 113,520 | |
Repay Holdings Corp. (a) | | | 112,981 | | | | 955,819 | |
Sezzle, Inc. (a) | | | 4,382 | | | | 596,960 | |
Shift4 Payments, Inc. - Class A (a) | | | 13,838 | | | | 1,149,938 | |
Strategic Education, Inc. | | | 1,789 | | | | 172,638 | |
Stride, Inc. (a) | | | 29,446 | | | | 2,424,584 | |
Universal Technical Institute, Inc. (a) | | | 136,507 | | | | 2,382,047 | |
Vestis Corp. | | | 6,823 | | | | 96,000 | |
Viad Corp. (a) | | | 56,607 | | | | 1,947,847 | |
WillScot Holdings Corp. (a) | | | 27,801 | | | | 1,071,451 | |
| | | | | | | | 39,765,835 | |
Computers — 1.4% |
ASGN, Inc. (a) | | | 2,386 | | | | 229,438 | |
CACI International, Inc. - Class A (a) | | | 1,145 | | | | 558,897 | |
Cantaloupe, Inc. (a) | | | 9,881 | | | | 68,376 | |
DXC Technology Co. (a) | | | 15,728 | | | | 325,098 | |
ExlService Holdings, Inc. (a) | | | 34,087 | | | | 1,245,539 | |
Globant S.A. (a) | | | 4,704 | | | | 951,337 | |
Insight Enterprises, Inc. (a) | | | 2,176 | | | | 472,344 | |
MAXIMUS, Inc. | | | 6,315 | | | | 582,622 | |
NCR Voyix Corp. (a) | | | 49,502 | | | | 667,782 | |
One Stop Systems, Inc. (a) | | | 185,588 | | | | 463,970 | |
| | | Shares | | | Value | |
Computers — (Continued) |
Rapid7, Inc. (a) | | | 22,242 | | | $ | 840,970 | |
Rimini Street, Inc. (a) | | | 394,110 | | | | 693,634 | |
Science Applications International Corp. | | | 1,681 | | | | 219,522 | |
Varonis Systems, Inc. (a) | | | 21,504 | | | | 1,217,126 | |
| | | | | | | | 8,536,655 | |
Cosmetics/Personal Care — 0.4% |
elf Beauty, Inc. (a) | | | 4,323 | | | | 647,542 | |
Inter Parfums, Inc. | | | 10,168 | | | | 1,310,045 | |
Prestige Brands Holdings, Inc. (a) | | | 3,474 | | | | 259,300 | |
| | | | | | | | 2,216,887 | |
Distribution/Wholesale — 0.9% | | | | | | | | |
A-Mark Precious Metals, Inc. | | | 12,720 | | | | 495,698 | |
G-III Apparel Group Ltd. (a) | | | 19,012 | | | | 503,248 | |
Manitex International, Inc. (a) | | | 325,050 | | | | 1,358,709 | |
MRC Global, Inc. (a) | | | 7,000 | | | | 92,120 | |
OPENLANE, Inc. (a) | | | 113,393 | | | | 1,965,101 | |
Pool Corp. | | | 2,106 | | | | 740,512 | |
SiteOne Landscape Supply, Inc. (a) | | | 3,217 | | | | 456,363 | |
WESCO International, Inc. | | | 371 | | | | 61,356 | |
| | | | | | | | 5,673,107 | |
Diversified Financial Services — 2.0% |
Encore Capital Group, Inc. (a) | | | 3,458 | | | | 173,177 | |
Enova International, Inc. (a) | | | 3,612 | | | | 309,657 | |
Evercore, Inc. - Class A | | | 4,027 | | | | 989,595 | |
FTAI Aviation Ltd. | | | 17,871 | | | | 2,284,092 | |
Houlihan Lokey, Inc. | | | 9,196 | | | | 1,440,277 | |
Interactive Brokers Group, Inc. - Class A | | | 3,063 | | | | 394,790 | |
LendingClub Corp. (a) | | | 78,017 | | | | 947,906 | |
Moelis & Co., Class A - Class A | | | 14,572 | | | | 973,264 | |
Navient Corp. | | | 14,452 | | | | 244,672 | |
Perella Weinberg Partners | | | 46,596 | | | | 910,952 | |
PRA Group, Inc. (a) | | | 2,655 | | | | 61,915 | |
Radian Group, Inc. | | | 35,274 | | | | 1,275,155 | |
Silvercrest Asset Management Group, Inc. - Class A | | | 89,226 | | | | 1,445,461 | |
Virtus Investment Partners, Inc. | | | 807 | | | | 170,810 | |
World Acceptance Corp. (a) | | | 2,155 | | | | 253,967 | |
| | | | | | | | 11,875,690 | |
Electric — 1.4% |
Hawaiian Electric Industries, Inc. | | | 39,161 | | | | 420,198 | |
Northwestern Energy Group, Inc. | | | 38,213 | | | | 2,078,405 | |
Talen Energy Corp. (a) | | | 26,343 | | | | 3,941,176 | |
TXNM Energy, Inc. | | | 39,284 | | | | 1,609,858 | |
Unitil Corp. | | | 2,272 | | | | 137,002 | |
| | | | | | | | 8,186,639 | |
Electrical Components & Equipment — 0.4% |
American Superconductor Corp. (a) | | | 57,211 | | | | 1,156,806 | |
The accompanying notes are an integral part of the financial statements.
3
ADARA SMALLER COMPANIES FUND
Schedule of Investments (Continued)
as of August 31, 2024
| | | Shares | | | Value | |
Electrical Components & Equipment — (Continued) |
Littelfuse, Inc. | | | 1,079 | | | $ | 293,704 | |
Powell Industries, Inc. | | | 4,109 | | | | 688,011 | |
| | | | | | | | 2,138,521 | |
Electronics — 2.8% |
Applied Optoelectronics, Inc. (a) | | | 102,678 | | | | 1,165,395 | |
Atkore International Group, Inc. | | | 21,166 | | | | 1,975,423 | |
Atmus Filtration Technologies, Inc. | | | 36,789 | | | | 1,318,886 | |
Badger Meter, Inc. | | | 2,217 | | | | 458,786 | |
Benchmark Electronics, Inc. | | | 4,446 | | | | 188,999 | |
Brady Corp. - Class A | | | 12,340 | | | | 913,654 | |
Camtek Ltd. | | | 19,200 | | | | 1,747,584 | |
Celestica, Inc. (a) | | | 9,228 | | | | 469,890 | |
Coherent Corp. (a) | | | 3,416 | | | | 266,277 | |
Enovix Corp. (a) | | | 99,832 | | | | 950,401 | |
ESCO Technologies, Inc. | | | 1,920 | | | | 230,227 | |
Itron, Inc. (a) | | | 4,655 | | | | 475,834 | |
Ituran Location and Control Ltd. | | | 21,933 | | | | 619,607 | |
Kimball Electronics, Inc. (a) | | | 119,020 | | | | 2,195,919 | |
Knowles Corp. (a) | | | 7,352 | | | | 135,644 | |
NEXTracker, Inc. - Class A (a) | | | 21,504 | | | | 874,568 | |
OSI Systems, Inc. (a) | | | 1,136 | | | | 170,252 | |
Plexus Corp. (a) | | | 2,641 | | | | 338,338 | |
Sanmina Corp. (a) | | | 6,648 | | | | 461,238 | |
SYNNEX Corp. | | | 830 | | | | 100,779 | |
TTM Technologies, Inc. (a) | | | 8,548 | | | | 166,259 | |
Vontier Corp. | | | 46,541 | | | | 1,630,331 | |
| | | | | | | | 16,854,291 | |
Energy-Alternate Sources — 0.0%(c) |
REX American Resources Corp. (a) | | | 2,520 | | | | 114,282 | |
| | | | | | | | | |
Engineering & Construction — 2.4% |
Bowman Consulting Group Ltd. (a) | | | 97,470 | | | | 2,339,280 | |
Comfort Systems USA, Inc. | | | 4,006 | | | | 1,416,201 | |
Construction Partners, Inc. - Class A (a) | | | 26,693 | | | | 1,761,204 | |
EMCOR Group, Inc. | | | 4,741 | | | | 1,863,497 | |
Exponent, Inc. | | | 12,554 | | | | 1,359,222 | |
Mistras Group, Inc. (a) | | | 109,200 | | | | 1,306,032 | |
MYR Group, Inc. (a) | | | 9,249 | | | | 932,299 | |
Shimmick Corp. (a) | | | 130,980 | | | | 421,756 | |
Sterling Construction Co., Inc. (a) | | | 15,151 | | | | 1,810,999 | |
TopBuild Corp. (a) | | | 2,707 | | | | 1,063,905 | |
| | | | | | | | 14,274,395 | |
Entertainment — 0.5% |
Atlanta Braves Holdings, Inc. - Class A (a) | | | 1,183 | | | | 53,945 | |
Bally’s Corp. (a) | | | 4,405 | | | | 75,766 | |
Cinemark Holdings, Inc. (a) | | | 7,468 | | | | 204,474 | |
Genius Sports Ltd. (a) | | | 80,367 | | | | 612,396 | |
Monarch Casino & Resort, Inc. | | | 3,215 | | | | 244,083 | |
Rush Street Interactive, Inc. (a) | | | 101,024 | | | | 946,595 | |
| | | Shares | | | Value | |
Entertainment — (Continued) | | | | | | | | |
Scientific Games Corp. - Class A (a) | | | 6,167 | | | $ | 677,260 | |
United Parks & Resorts, Inc. (a) | | | 10,819 | | | | 532,511 | |
| | | | | | | | 3,347,030 | |
Environmental Control — 0.6% |
CECO Environmental Corp. (a) | | | 42,316 | | | | 1,225,048 | |
Energy Recovery, Inc. (a) | | | 33,444 | | | | 543,131 | |
Montrose Environmental Group, Inc. (a) | | | 29,896 | | | | 983,578 | |
PureCycle Technologies, Inc. (a) | | | 15,408 | | | | 93,989 | |
Tetra Tech, Inc. | | | 3,198 | | | | 760,292 | |
| | | | | | | | 3,606,038 | |
Food — 0.9% |
B&G Foods, Inc. | | | 6,569 | | | | 55,639 | |
Hain Celestial Group, Inc. (a) | | | 41,732 | | | | 333,856 | |
Ingles Markets, Inc. - Class A | | | 26,982 | | | | 1,996,668 | |
J&J Snack Foods Corp. | | | 578 | | | | 98,370 | |
John B Sanfilippo & Son, Inc. | | | 1,789 | | | | 169,722 | |
Nomad Foods Ltd. | | | 90,610 | | | | 1,703,468 | |
SpartanNash Co. | | | 7,613 | | | | 168,171 | |
Sprouts Farmers Market, Inc. (a) | | | 5,410 | | | | 562,911 | |
United Natural Foods, Inc. (a) | | | 19,944 | | | | 301,753 | |
Weis Markets, Inc. | | | 1,995 | | | | 134,822 | |
| | | | | | | | 5,525,380 | |
Gas — 0.4% |
Northwest Natural Holding, Co. | | | 10,869 | | | | 437,151 | |
Southwest Gas Holdings, Inc. | | | 24,526 | | | | 1,783,531 | |
| | | | | | | | 2,220,682 | |
Hand/Machine Tools — 0.4% |
Cadre Holdings, Inc. | | | 34,266 | | | | 1,242,142 | |
Franklin Electric Co., Inc. | | | 1,896 | | | | 196,919 | |
MSA Safety, Inc. | | | 5,199 | | | | 949,493 | |
| | | | | | | | 2,388,554 | |
Healthcare-Products — 4.6% |
ABIOMED Inc. (a)(b) | | | 1,453 | | | | 0 | |
Adaptive Biotechnologies Corp. (a) | | | 133,159 | | | | 625,847 | |
Albireo Pharma Inc. (a)(b) | | | 1,908 | | | | 0 | |
Avanos Medical, Inc. (a) | | | 2,367 | | | | 57,329 | |
AxoGen, Inc. (a) | | | 10,011 | | | | 131,645 | |
Bioventus, Inc. - Class A (a) | | | 45,903 | | | | 461,325 | |
Brooks Automation, Inc. (a) | | | 2,595 | | | | 128,504 | |
CareDx, Inc. (a) | | | 52,167 | | | | 1,603,092 | |
CryoLife, Inc. (a) | | | 3,328 | | | | 90,322 | |
Embecta Corp. | | | 91,863 | | | | 1,501,041 | |
Enovis Corp. (a) | | | 34,807 | | | | 1,622,006 | |
Envista Holdings Corp. (a) | | | 20,054 | | | | 366,186 | |
Exact Sciences Corp. (a) | | | 9,826 | | | | 606,166 | |
Glaukos Corp. (a) | | | 2,161 | | | | 289,336 | |
Haemonetics Corp. (a) | | | 3,260 | | | | 246,391 | |
ICU Medical, Inc. (a) | | | 1,637 | | | | 270,645 | |
The accompanying notes are an integral part of the financial statements.
4
ADARA SMALLER COMPANIES FUND
Schedule of Investments (Continued)
as of August 31, 2024
| | | Shares | | | Value | |
Healthcare-Products — (Continued) |
Lantheus Holdings, Inc. (a) | | | 7,694 | | | $ | 819,180 | |
LeMaitre Vascular, Inc. | | | 20,021 | | | | 1,807,696 | |
Masimo Corp. (a) | | | 2,530 | | | | 297,326 | |
Merit Medical Systems, Inc. (a) | | | 3,088 | | | | 298,548 | |
Omnicell, Inc. (a) | | | 26,926 | | | | 1,197,668 | |
OrthoPediatrics Corp. (a) | | | 1,874 | | | | 59,874 | |
Patterson Cos., Inc. | | | 42,763 | | | | 961,740 | |
PROCEPT BioRobotics Corp. (a) | | | 25,235 | | | | 1,993,565 | |
Quanterix Corp. (a) | | | 55,901 | | | | 728,390 | |
QuidelOrtho Corp. (a) | | | 1,265 | | | | 53,446 | |
Repligen Corp. (a) | | | 9,406 | | | | 1,419,648 | |
RxSight, Inc. (a) | | | 16,602 | | | | 936,187 | |
SI-BONE, Inc. (a) | | | 55,882 | | | | 928,759 | |
Stevanato Group SpA | | | 32,936 | | | | 720,640 | |
Surmodics, Inc. (a) | | | 2,311 | | | | 91,585 | |
Tandem Diabetes Care, Inc. (a) | | | 25,674 | | | | 1,116,819 | |
TransMedics Group, Inc. (a) | | | 28,131 | | | | 4,727,696 | |
Twist Bioscience Corp. (a) | | | 22,009 | | | | 951,669 | |
West Pharmaceutical Services, Inc. | | | 2,836 | | | | 889,455 | |
| | | | | | | | 27,999,726 | |
Healthcare-Services — 1.0% |
Amedisys, Inc. (a) | | | 2,182 | | | | 213,858 | |
Chemed Corp. | | | 621 | | | | 364,012 | |
CorVel Corp. (a) | | | 432 | | | | 138,555 | |
Ensign Group, Inc. | | | 2,982 | | | | 451,355 | |
GeneDx Holdings Corp. (a) | | | 33,844 | | | | 1,080,977 | |
HealthEquity, Inc. (a) | | | 1,801 | | | | 143,288 | |
MEDNAX, Inc. (a) | | | 54,613 | | | | 593,097 | |
National HealthCare Corp. | | | 3,006 | | | | 412,213 | |
RadNet, Inc. (a) | | | 17,713 | | | | 1,174,195 | |
Surgery Partners, Inc. (a) | | | 45,509 | | | | 1,454,013 | |
US Physical Therapy, Inc. | | | 2,284 | | | | 195,510 | |
| | | | | | | | 6,221,073 | |
Home Builders — 1.4% |
Cavco Industries, Inc. (a) | | | 624 | | | | 257,912 | |
Century Communities, Inc. | | | 26,904 | | | | 2,692,283 | |
Champion Homes, Inc. (a) | | | 7,793 | | | | 727,944 | |
Installed Building Products, Inc. | | | 7,526 | | | | 1,673,105 | |
LCI Industries | | | 2,012 | | | | 237,094 | |
LGI Homes, Inc. (a) | | | 17,409 | | | | 1,878,083 | |
M/I Homes, Inc. (a) | | | 5,874 | | | | 936,139 | |
Winnebago Industries, Inc. | | | 5,231 | | | | 312,082 | |
| | | | | | | | 8,714,642 | |
Home Furnishings — 1.1% |
Ethan Allen Interiors, Inc. | | | 3,342 | | | | 105,206 | |
Hamilton Beach Brands Holding Co. - Class A | | | 130,070 | | | | 3,809,750 | |
Leggett & Platt, Inc. | | | 19,427 | | | | 245,557 | |
Sleep Number Corp. (a) | | | 151,370 | | | | 2,302,338 | |
Universal Electronics, Inc. (a) | | | 12,430 | | | | 115,848 | |
| | | | | | | | 6,578,699 | |
| | | Shares | | | Value | |
Household Products/Wares — 0.1% |
Central Garden & Pet Co. (a) | | | 1,215 | | | $ | 47,956 | |
Central Garden & Pet Co. - Class A (a) | | | 303 | | | | 10,363 | |
Quanex Building Products Corp. | | | 1,957 | | | | 54,072 | |
WD-40 Co. | | | 1,574 | | | | 413,710 | |
| | | | | | | | 526,101 | |
Housewares — 0.2% |
Lifetime Brands, Inc. | | | 204,693 | | | | 1,463,555 | |
| | | | | | | | | |
Insurance — 4.0% |
Axis Capital Holdings Ltd. | | | 32,809 | | | | 2,620,783 | |
Bowhead Specialty Holdings, Inc. (a) | | | 22,415 | | | | 694,417 | |
Employers Holdings, Inc. | | | 3,627 | | | | 173,915 | |
Genworth Financial, Inc. - Class A (a) | | | 386,192 | | | | 2,695,620 | |
HCI Group, Inc. | | | 19,822 | | | | 1,899,542 | |
Heritage Insurance Holdings, Inc. (a) | | | 218,145 | | | | 3,518,679 | |
Mercury General Corp. | | | 29,514 | | | | 1,954,712 | |
NMI Holdings, Inc. - Class A (a) | | | 20,517 | | | | 842,633 | |
Palomar Holdings, Inc. (a) | | | 21,706 | | | | 2,153,669 | |
RLI Corp. | | | 1,478 | | | | 227,760 | |
Root, Inc./OH (a) | | | 13,259 | | | | 574,910 | |
Safety Insurance Group, Inc. | | | 2,323 | | | | 205,702 | |
Selective Insurance Group, Inc. | | | 3,866 | | | | 351,729 | |
Skyward Specialty Insurance Group, Inc. (a) | | | 36,869 | | | | 1,506,836 | |
Stewart Information Services Corp. | | | 2,200 | | | | 162,602 | |
TWFG, Inc. (a) | | | 27,578 | | | | 790,661 | |
White Mountains Insurance Group Ltd. | | | 2,104 | | | | 3,880,281 | |
| | | | | | | | 24,254,451 | |
Internet — 1.9% |
Bandwidth, Inc. - Class A (a) | | | 3,584 | | | | 61,502 | |
Bumble, Inc. - Class A (a) | | | 19,547 | | | | 131,160 | |
ePlus, Inc. (a) | | | 16,707 | | | | 1,603,204 | |
EverQuote, Inc. - Class A (a) | | | 36,362 | | | | 898,141 | |
HealthStream, Inc. | | | 2,700 | | | | 78,408 | |
Magnite, Inc. (a) | | | 130,299 | | | | 1,796,823 | |
Maplebear, Inc. (a) | | | 18,454 | | | | 662,314 | |
MediaAlpha, Inc. - Class A (a) | | | 69,663 | | | | 1,240,001 | |
Q2 Holdings, Inc. (a) | | | 15,808 | | | | 1,173,112 | |
QuinStreet, Inc. (a) | | | 83,054 | | | | 1,587,162 | |
TripAdvisor, Inc. (a) | | | 77,819 | | | | 1,129,154 | |
Yelp, Inc. (a) | | | 27,842 | | | | 972,521 | |
| | | | | | | | 11,333,502 | |
Investment Companies — 0.9% |
Cannae Holdings, Inc. | | | 115,910 | | | | 2,320,518 | |
Core Scientific, Inc. (a) | | | 101,881 | | | | 1,051,412 | |
The accompanying notes are an integral part of the financial statements.
5
ADARA SMALLER COMPANIES FUND
Schedule of Investments (Continued)
as of August 31, 2024
| | | Shares | | | Value | |
Investment Companies — (Continued) |
HA Sustainable Infrastructure Capital, Inc. | | | 2,522 | | | $ | 81,663 | |
Terawulf, Inc. (a) | | | 409,223 | | | | 1,784,212 | |
| | | | | | | | 5,237,805 | |
Iron/Steel — 0.4% |
ATI, Inc. (a) | | | 7,199 | | | | 459,872 | |
Carpenter Technology Corp. | | | 11,908 | | | | 1,723,921 | |
| | | | | | | | 2,183,793 | |
Leisure Time — 0.8% |
Callaway Golf Co. (a) | | | 4,678 | | | | 47,061 | |
Lindblad Expeditions Holdings, Inc. (a) | | | 110,663 | | | | 1,097,777 | |
OneSpaWorld Holdings Ltd. | | | 192,698 | | | | 3,058,117 | |
Vista Outdoor, Inc. (a) | | | 14,337 | | | | 574,053 | |
| | | | | | | | 4,777,008 | |
Lodging — 0.1% |
Boyd Gaming Corp. | | | 4,776 | | | | 286,656 | |
Marcus Corp. | | | 4,068 | | | | 57,562 | |
| | | | | | | | 344,218 | |
Machinery-Construction & Mining — 0.6% |
Argan, Inc. | | | 17,226 | | | | 1,366,194 | |
Bloom Energy Corp. - Class A (a) | | | 56,664 | | | | 674,868 | |
BWX Technologies, Inc. | | | 13,301 | | | | 1,370,003 | |
| | | | | | | | 3,411,065 | |
Machinery-Diversified — 1.7% |
Albany International Corp. - Class A | | | 1,126 | | | | 106,024 | |
Applied Industrial Technologies, Inc. | | | 9,309 | | | | 1,909,462 | |
Chart Industries, Inc. (a) | | | 10,418 | | | | 1,275,163 | |
Flowserve Corp. | | | 18,736 | | | | 934,552 | |
Kornit Digital Ltd. (a) | | | 22,417 | | | | 416,508 | |
Lindsay Corp. | | | 8,905 | | | | 1,104,665 | |
Mueller Water Products, Inc. - Class A | | | 68,820 | | | | 1,477,566 | |
Tennant Co. | | | 2,414 | | | | 235,775 | |
Toro Co. | | | 5,348 | | | | 495,225 | |
Twin Disc, Inc. | | | 185,495 | | | | 2,441,114 | |
| | | | | | | | 10,396,054 | |
Media — 0.2% |
Cable One, Inc. | | | 2,021 | | | | 712,847 | |
Scholastic Corp. | | | 3,196 | | | | 101,889 | |
Sinclair, Inc. | | | 17,962 | | | | 250,031 | |
| | | | | | | | 1,064,767 | |
Metal Fabricate/Hardware — 1.0% |
AZZ, Inc. | | | 1,964 | | | | 163,346 | |
Mueller Industries, Inc. | | | 11,950 | | | | 868,885 | |
NN, Inc. (a) | | | 179,350 | | | | 706,639 | |
Northwest Pipe Co. (a) | | | 90,440 | | | | 3,977,551 | |
Standex International Corp. | | | 1,485 | | | | 265,295 | |
| | | | | | | | 5,981,716 | |
| | | Shares | | | Value | |
Mining — 0.4% |
Century Aluminum Co. (a) | | | 18,637 | | | $ | 267,627 | |
Hudbay Minerals, Inc. | | | 117,450 | | | | 958,392 | |
Uranium Energy Corp. (a) | | | 186,285 | | | | 974,271 | |
| | | | | | | | 2,200,290 | |
Miscellaneous Manufacturing — 1.3% |
Axon Enterprise, Inc. (a) | | | 5,340 | | | | 1,948,940 | |
Enpro, Inc. | | | 4,961 | | | | 797,878 | |
Fabrinet (a) | | | 6,565 | | | | 1,599,562 | |
Federal Signal Corp. | | | 19,386 | | | | 1,831,783 | |
John Bean Technologies Corp. | | | 2,493 | | | | 223,971 | |
Materion Corp. | | | 2,877 | | | | 333,847 | |
Myers Industries, Inc. | | | 2,441 | | | | 37,323 | |
Park Aerospace Corp. | | | 92,759 | | | | 1,253,174 | |
| | | | | | | | 8,026,478 | |
Office Furnishings — 0.0%(c) |
Interface, Inc. | | | 11,644 | | | | 219,839 | |
| | | | | | | | | |
Office-Business Equipment — 0.0%(c) |
Pitney Bowes, Inc. | | | 13,705 | | | | 96,894 | |
Xerox Holdings Corp. | | | 5,285 | | | | 59,879 | |
| | | | | | | | 156,773 | |
Oil & Gas — 1.4% |
Delek US Holdings, Inc. | | | 74,046 | | | | 1,512,019 | |
Evolution Petroleum Corp. | | | 97,583 | | | | 502,552 | |
Gulfport Energy Corp. (a) | | | 4,653 | | | | 674,964 | |
Helmerich & Payne, Inc. | | | 4,567 | | | | 149,021 | |
Patterson-UTI Energy, Inc. | | | 112,890 | | | | 1,039,717 | |
PBF Energy, Inc. - Class A | | | 5,245 | | | | 178,645 | |
Range Resources Corp. | | | 29,237 | | | | 873,602 | |
SM Energy Co. | | | 50,967 | | | | 2,325,624 | |
Southwestern Energy Co. (a) | | | 112,602 | | | | 718,401 | |
Talos Energy, Inc. (a) | | | 23,929 | | | | 274,466 | |
| | | | | | | | 8,249,011 | |
Oil & Gas Services — 2.1% |
Atlas Energy Solutions, Inc. | | | 46,686 | | | | 984,608 | |
Bristow Group, Inc. (a) | | | 14,268 | | | | 568,009 | |
DMC Global, Inc. (a) | | | 141,490 | | | | 1,750,231 | |
DNOW, Inc. (a) | | | 49,547 | | | | 645,102 | |
Dril-Quip, Inc. (a) | | | 3,691 | | | | 60,200 | |
Helix Energy Solutions Group, Inc. (a) | | | 41,891 | | | | 470,017 | |
Kodiak Gas Services, Inc. | | | 38,328 | | | | 1,063,602 | |
Natural Gas Services Group, Inc. (a) | | | 172,070 | | | | 3,773,495 | |
Oceaneering International, Inc. (a) | | | 35,309 | | | | 952,990 | |
Oil States International, Inc. (a) | | | 10,966 | | | | 58,010 | |
Profire Energy, Inc. (a) | | | 616,440 | | | | 1,146,578 | |
Tidewater, Inc. (a) | | | 11,945 | | | | 1,059,522 | |
| | | | | | | | 12,532,364 | |
The accompanying notes are an integral part of the financial statements.
6
ADARA SMALLER COMPANIES FUND
Schedule of Investments (Continued)
as of August 31, 2024
| | | Shares | | | Value | |
Packaging & Containers — 0.3% |
Clearwater Paper Corp. (a) | | | 2,737 | | | $ | 91,060 | |
Ranpak Holdings Corp. (a) | | | 61,877 | | | | 438,708 | |
TriMas Corp. | | | 49,490 | | | | 1,262,490 | |
| | | | | | | | 1,792,258 | |
Pharmaceuticals — 2.2% |
Amphastar Pharmaceuticals, Inc. (a) | | | 6,771 | | | | 330,019 | |
Avadel Pharmaceuticals PLC (a) | | | 34,030 | | | | 516,235 | |
Centessa Pharmaceuticals PLC - ADR (a) | | | 84,356 | | | | 1,138,806 | |
Collegium Pharmaceutical, Inc. (a) | | | 2,619 | | | | 100,727 | |
Corcept Therapeutics, Inc. (a) | | | 3,332 | | | | 117,620 | |
GoodRx Holdings, Inc. - Class A (a) | | | 26,236 | | | | 207,264 | |
KalVista Pharmaceuticals Inc. (a) | | | 39,035 | | | | 522,679 | |
Longboard Pharmaceuticals, Inc. (a) | | | 38,635 | | | | 1,393,951 | |
Madrigal Pharmaceuticals, Inc. (a) | | | 334 | | | | 82,541 | |
MERUS NV (a) | | | 25,656 | | | | 1,308,199 | |
Option Care Health, Inc. (a) | | | 27,715 | | | | 887,434 | |
Organon & Co. | | | 24,924 | | | | 557,051 | |
Owens & Minor, Inc. (a) | | | 3,772 | | | | 58,617 | |
Premier, Inc. - Class A | | | 15,550 | | | | 316,754 | |
Protagonist Therapeutics, Inc. (a) | | | 24,673 | | | | 1,058,225 | |
Rhythm Pharmaceuticals, Inc. (a) | | | 46,170 | | | | 2,183,379 | |
Vaxcyte, Inc. (a) | | | 30,021 | | | | 2,424,496 | |
| | | | | | | | 13,203,997 | |
Pipelines — 0.1% |
Golar LNG Ltd. | | | 24,280 | | | | 808,281 | |
| | | | | | | | | |
Private Equity — 0.3% |
P10, Inc. - Class A | | | 202,622 | | | | 2,036,351 | |
| | | | | | | | | |
Real Estate — 0.7% |
Marcus & Millichap, Inc. | | | 2,121 | | | | 84,140 | |
McGrath RentCorp | | | 31,732 | | | | 3,431,816 | |
Newmark Group, Inc. - Class A | | | 50,432 | | | | 697,474 | |
| | | | | | | | 4,213,430 | |
REITS — 2.4% |
Agree Realty Corp. | | | 1,641 | | | | 119,809 | |
Alexander & Baldwin, Inc. | | | 4,543 | | | | 89,906 | |
Alpine Income Property Trust, Inc. | | | 106,224 | | | | 2,022,505 | |
American Assets Trust, Inc. | | | 14,803 | | | | 403,382 | |
Apollo Commercial Real Estate Finance, Inc. | | | 44,054 | | | | 466,532 | |
Ares Commercial Real Estate Corp. | | | 9,618 | | | | 67,903 | |
| | | Shares | | | Value | |
REITS — (Continued) |
Blackstone Mortgage Trust, Inc. - Class A | | | 6,106 | | | $ | 112,717 | |
CareTrust REIT, Inc. | | | 7,113 | | | | 212,536 | |
Centerspace | | | 2,329 | | | | 174,209 | |
Chatham Lodging Trust | | | 17,141 | | | | 146,727 | |
DiamondRock Hospitality Co. | | | 13,130 | | | | 115,413 | |
EastGroup Properties, Inc. | | | 2,590 | | | | 482,776 | |
Getty Realty Corp. | | | 5,173 | | | | 164,398 | |
Gladstone Commercial Corp. | | | 10,245 | | | | 156,646 | |
Global Medical REIT, Inc. | | | 179,420 | | | | 1,670,400 | |
Global Net Lease, Inc. | | | 24,433 | | | | 210,613 | |
Great Ajax Corp. | | | 1 | | | | 3 | |
Highwoods Properties, Inc. | | | 6,502 | | | | 209,494 | |
Hudson Pacific Properties, Inc. | | | 40,168 | | | | 206,865 | |
Kite Realty Group Trust | | | 7,450 | | | | 194,296 | |
KKR Real Estate Finance Trust, Inc. | | | 8,788 | | | | 104,841 | |
Lexington Realty Trust | | | 12,112 | | | | 125,480 | |
New York Mortgage Trust, Inc. | | | 54,936 | | | | 366,423 | |
NexPoint Residential Trust, Inc. | | | 2,074 | | | | 98,100 | |
Office Properties Income Trust | | | 471,600 | | | | 1,037,520 | |
Outfront Media, Inc. | | | 50,443 | | | | 860,053 | |
PennyMac Mortgage Investment Trust | | | 24,404 | | | | 346,781 | |
Piedmont Office Realty Trust, Inc. - Class A | | | 69,495 | | | | 678,271 | |
PotlatchDeltic Corp. | | | 1,462 | | | | 63,539 | |
Ready Capital Corp. | | | 6,588 | | | | 54,615 | |
Redwood Trust, Inc. | | | 77,920 | | | | 589,854 | |
Regency Centers Corp. | | | 2,758 | | | | 200,479 | |
Retail Opportunity Investments Corp. | | | 28,261 | | | | 432,111 | |
Saul Centers, Inc. | | | 3,903 | | | | 159,321 | |
Tanger, Inc. | | | 33,410 | | | | 1,017,000 | |
TPG RE Finance Trust, Inc. | | | 8,617 | | | | 78,070 | |
Two Harbors Investment Corp. | | | 32,432 | | | | 459,237 | |
Uniti Group, Inc. | | | 49,540 | | | | 215,994 | |
Universal Health Realty Income Trust | | | 1,240 | | | | 55,676 | |
Whitestone REIT | | | 14,111 | | | | 189,370 | |
| | | | | | | | 14,359,865 | |
Retail — 5.2% |
Abercrombie & Fitch Co. - Class A (a) | | | 6,754 | | | | 996,688 | |
Advance Auto Parts, Inc. | | | 37,906 | | | | 1,717,521 | |
Asbury Automotive Group, Inc. (a) | | | 5,805 | | | | 1,425,940 | |
Beacon Roofing Supply, Inc. (a) | | | 2,386 | | | | 216,172 | |
BJ’s Restaurants, Inc. (a) | | | 7,047 | | | | 215,850 | |
BJ’s Wholesale Club Holdings, Inc. (a) | | | 16,361 | | | | 1,308,226 | |
Bloomin’ Brands, Inc. | | | 20,453 | | | | 357,927 | |
Boot Barn Holdings, Inc. (a) | | | 12,397 | | | | 1,663,305 | |
Buckle, Inc. | | | 2,951 | | | | 123,647 | |
The accompanying notes are an integral part of the financial statements.
7
ADARA SMALLER COMPANIES FUND
Schedule of Investments (Continued)
as of August 31, 2024
| | | Shares | | | Value | |
Retail — (Continued) |
Build-A-Bear Workshop, Inc. | | | 123,830 | | | $ | 4,133,445 | |
Casey’s General Stores, Inc. | | | 1,888 | | | | 684,041 | |
Chuy’s Holdings, Inc. (a) | | | 3,285 | | | | 122,202 | |
Dine Brands Global, Inc. | | | 1,749 | | | | 55,303 | |
Dutch Bros, Inc. - Class A (a) | | | 20,138 | | | | 624,278 | |
FirstCash Holdings, Inc. | | | 2,930 | | | | 351,864 | |
Five Below, Inc. (a) | | | 3,696 | | | | 278,789 | |
Foot Locker, Inc. | | | 10,261 | | | | 319,527 | |
Freshpet, Inc. (a) | | | 7,016 | | | | 954,176 | |
Group 1 Automotive, Inc. | | | 2,270 | | | | 855,245 | |
Guess?, Inc. | | | 12,246 | | | | 253,737 | |
Lithia Motors, Inc. | | | 382 | | | | 115,013 | |
MSC Industrial Direct Co., Inc. - Class A | | | 9,537 | | | | 784,323 | |
Murphy USA, Inc. | | | 5,937 | | | | 3,085,043 | |
Nu Skin Enterprises, Inc. - Class A | | | 15,436 | | | | 137,843 | |
Ollie’s Bargain Outlet Holdings, Inc. (a) | | | 11,755 | | | | 1,052,778 | |
Papa John’s International, Inc. | | | 35,361 | | | | 1,675,051 | |
PriceSmart, Inc. | | | 1,079 | | | | 96,657 | |
Red Robin Gourmet Burgers, Inc. (a) | | | 374,550 | | | | 1,310,925 | |
RH (a) | | | 2,399 | | | | 608,626 | |
Shoe Carnival, Inc. | | | 6,304 | | | | 254,934 | |
Signet Jewelers Ltd. | | | 5,100 | | | | 428,910 | |
Sweetgreen, Inc. - Class A (a) | | | 72,355 | | | | 2,287,142 | |
Texas Roadhouse, Inc. | | | 10,485 | | | | 1,769,344 | |
Warby Parker, Inc. - Class A (a) | | | 58,227 | | | | 868,747 | |
Zumiez, Inc. (a) | | | 3,290 | | | | 91,265 | |
| | | | | | | | 31,224,484 | |
Savings & Loans — 1.3% |
Axos Financial, Inc. (a) | | | 3,461 | | | | 240,297 | |
Banc of California, Inc. | | | 1,873 | | | | 26,634 | |
Berkshire Hills Bancorp, Inc. | | | 17,583 | | | | 484,236 | |
Eagle Bancorp Montana, Inc. | | | 63,570 | | | | 953,550 | |
Flushing Financial Corp. | | | 4,361 | | | | 63,671 | |
FS Bancorp, Inc. | | | 86,404 | | | | 3,787,087 | |
Home Bancorp, Inc. | | | 9,600 | | | | 428,736 | |
Northfield Bancorp, Inc. | | | 9,880 | | | | 119,746 | |
Northwest Bancshares, Inc. | | | 5,826 | | | | 80,690 | |
OceanFirst Financial Corp. | | | 11,427 | | | | 204,201 | |
Pacific Premier Bancorp, Inc. | | | 8,033 | | | | 206,448 | |
Provident Financial Services, Inc. | | | 15,571 | | | | 296,939 | |
Riverview Bancorp, Inc. | | | 242,220 | | | | 1,119,056 | |
| | | | | | | | 8,011,291 | |
Semiconductors — 3.3% |
Advanced Energy Industries, Inc. | | | 2,466 | | | | 261,618 | |
Aehr Test Systems (a) | | | 50,293 | | | | 764,957 | |
Allegro MicroSystems, Inc. (a) | | | 33,952 | | | | 832,843 | |
Amtech Systems, Inc. (a) | | | 251,750 | | | | 1,601,130 | |
Astera Labs, Inc. (a) | | | 10,085 | | | | 434,260 | |
| | | Shares | | | Value | |
Semiconductors — (Continued) |
Axcelis Technologies, Inc. (a) | | | 4,011 | | | $ | 438,523 | |
AXT, Inc. (a) | | | 445,790 | | | | 1,181,344 | |
CEVA, Inc. (a) | | | 2,534 | | | | 60,664 | |
Cirrus Logic, Inc. (a) | | | 3,525 | | | | 513,557 | |
FormFactor, Inc. (a) | | | 27,224 | | | | 1,327,715 | |
inTEST Corp. (a) | | | 191,070 | | | | 1,368,061 | |
Kulicke & Soffa Industries, Inc. | | | 6,419 | | | | 281,216 | |
Lattice Semiconductor Corp. (a) | | | 7,687 | | | | 364,056 | |
MKS Instruments, Inc. | | | 1,371 | | | | 163,464 | |
Monolithic Power Systems, Inc. | | | 1,952 | | | | 1,824,495 | |
Onto Innovation, Inc. (a) | | | 3,032 | | | | 646,483 | |
Photronics, Inc. (a) | | | 7,595 | | | | 196,407 | |
Power Integrations, Inc. | | | 22,307 | | | | 1,496,800 | |
Semtech Corp. (a) | | | 38,142 | | | | 1,671,382 | |
SiTime Corp. (a) | | | 15,324 | | | | 2,216,770 | |
SkyWater Technology, Inc. (a) | | | 50,552 | | | | 453,451 | |
Veeco Instruments, Inc. (a) | | | 45,943 | | | | 1,630,517 | |
| | | | | | | | 19,729,713 | |
Software — 4.1% |
ACI Worldwide, Inc. (a) | | | 33,768 | | | | 1,700,557 | |
ACV Auctions, Inc. - Class A (a) | | | 88,968 | | | | 1,664,591 | |
Agilysys, Inc. (a) | | | 15,762 | | | | 1,782,682 | |
Alkami Technology, Inc. (a) | | | 78,783 | | | | 2,626,625 | |
Appfolio, Inc. - Class A (a) | | | 2,368 | | | | 549,352 | |
Asure Software, Inc. (a) | | | 238,760 | | | | 2,050,949 | |
AvePoint, Inc. (a) | | | 134,796 | | | | 1,556,894 | |
BILL Holdings, Inc. (a) | | | 12,279 | | | | 669,942 | |
Blackbaud, Inc. (a) | | | 799 | | | | 66,796 | |
BlackLine, Inc. (a) | | | 18,735 | | | | 928,319 | |
Blend Labs, Inc. - Class A (a) | | | 183,975 | | | | 675,188 | |
BM Technologies, Inc. (a) | | | 215,920 | | | | 654,367 | |
Cogent Communications Holdings, Inc. | | | 1,297 | | | | 90,764 | |
Concentrix Corp. | | | 830 | | | | 62,441 | |
Confluent, Inc. - Class A (a) | | | 18,205 | | | | 386,310 | |
CSG Systems International, Inc. | | | 2,939 | | | | 142,600 | |
DoubleVerify Holdings, Inc. (a) | | | 28,360 | | | | 558,692 | |
Five9, Inc. (a) | | | 14,318 | | | | 461,756 | |
Genasys, Inc. (a) | | | 350,770 | | | | 1,094,402 | |
Gitlab, Inc. - Class A (a) | | | 10,369 | | | | 491,491 | |
Global-e Online Ltd. (a) | | | 16,785 | | | | 577,740 | |
JFrog Ltd. (a) | | | 30,890 | | | | 857,506 | |
LiveRamp Holdings, Inc. (a) | | | 5,117 | | | | 132,633 | |
PDF Solutions, Inc. (a) | | | 1,842 | | | | 58,115 | |
Privia Health Group, Inc. (a) | | | 48,904 | | | | 984,927 | |
Procore Technologies, Inc. (a) | | | 8,529 | | | | 505,514 | |
Progress Software Corp. | | | 5,306 | | | | 308,544 | |
Smartsheet, Inc. - Class A (a) | | | 19,548 | | | | 953,942 | |
SPS Commerce, Inc. (a) | | | 800 | | | | 159,792 | |
Take-Two Interactive Software, Inc. (a) | | | 3,504 | | | | 566,632 | |
Vertex, Inc. - Class A (a) | | | 30,793 | | | | 1,191,381 | |
| | | | | | | | 24,511,444 | |
The accompanying notes are an integral part of the financial statements.
8
ADARA SMALLER COMPANIES FUND
Schedule of Investments (Concluded)
as of August 31, 2024
| | | Shares | | | Value | |
Telecommunications — 0.9% |
Calix, Inc. (a) | | | 43,743 | | | $ | 1,628,989 | |
Credo Technology Group Holding Ltd. (a) | | | 57,629 | | | | 2,011,828 | |
IDT Corp. - Class B | | | 3,111 | | | | 119,338 | |
InterDigital, Inc. | | | 869 | | | | 120,409 | |
Iridium Communications, Inc. | | | 9,628 | | | | 248,403 | |
Lumen Technologies, Inc. (a) | | | 73,749 | | | | 387,182 | |
NetGear, Inc. (a) | | | 7,443 | | | | 120,800 | |
Telephone & Data Systems, Inc. | | | 10,347 | | | | 244,396 | |
United States Cellular Corp. (a) | | | 8,331 | | | | 463,370 | |
Viavi Solutions, Inc. (a) | | | 23,640 | | | | 203,541 | |
| | | | | | | | 5,548,256 | |
Textiles — 0.5% |
UniFirst Corp. | | | 17,613 | | | | 3,341,010 | |
| | | | | | | | | |
Toys/Games/Hobbies — 0.4% |
Funko, Inc. - Class A (a) | | | 7,565 | | | | 79,205 | |
JAKKS Pacific, Inc. (a) | | | 87,670 | | | | 2,160,189 | |
| | | | | | | | 2,239,394 | |
Transportation — 1.2% |
Air Transport Services Group, Inc. (a) | | | 144,919 | | | | 2,443,334 | |
ArcBest Corp. | | | 7,779 | | | | 826,908 | |
Knight-Swift Transportation Holdings, Inc. | | | 1,873 | | | | 98,108 | |
Marten Transport Ltd. | | | 7,327 | | | | 127,856 | |
PAM Transportation Services, Inc. (a) | | | 41,286 | | | | 748,928 | |
RXO, Inc. (a) | | | 28,489 | | | | 810,797 | |
Saia, Inc. (a) | | | 4,008 | | | | 1,506,327 | |
Scorpio Tankers, Inc. | | | 4,242 | | | | 303,473 | |
World Kinect Corp. | | | 22,898 | | | | 659,233 | |
| | | | | | | | 7,524,964 | |
Water — 0.0%(c) | | | | | | | | |
American States Water Co. | | | 1,758 | | | | 143,137 | |
California Water Service Group | | | 1,969 | | | | 108,946 | |
| | | | | | | | 252,083 | |
TOTAL COMMON STOCKS (Cost $372,531,459) | | | | | | | 562,566,101 | |
| | | | | | | | | |
| | | Shares | | | Value | |
SHORT-TERM INVESTMENTS — 6.8% |
Money Market Funds — 6.8% | | | | | | | | |
First American Treasury Obligations Fund - Class X, 5.18% (d) | | | 41,234,687 | | | $ | 41,234,687 | |
TOTAL SHORT-TERM INVESTMENTS (Cost $41,234,687) | | | | | | | 41,234,687 | |
| | | | | | | | | |
TOTAL INVESTMENTS — 100.0% (Cost $413,766,146) | | | | | | | 603,800,788 | |
Other Assets in Excess of Liabilities — 0.0% (c) | | | | | | | 95,017 | |
TOTAL NET ASSETS — 100.0% | | | | | | $ | 603,895,805 | |
Percentages are stated as a percent of net assets.
ADR | American Depositary Receipt |
PLC | Public Limited Company |
REIT | Real Estate Investment Trust |
(a) | Non-income producing security. |
(b) | Fair value determined using significant unobservable inputs in accordance with procedures established by and under the supervision of the Adviser, acting as Valuation Designee. These securities represented $0 or 0.0% of net assets as of August 31, 2024. |
(c) | Represents less than 0.05% of net assets. |
(d) | The rate shown represents the 7-day annualized effective yield as of August 31, 2024. |
The accompanying notes are an integral part of the financial statements.
9
ADARA SMALLER COMPANIES FUND
STATEMENT of Assets and Liabilities
August 31, 2024
ASSETS | | | | |
Investments, at value (cost $372,531,459) | | $ | 562,566,101 | |
Short-term investments, at value (cost $41,234,687) | | | 41,234,687 | |
Receivables for: | | | | |
Investments sold | | | 1,138,778 | |
Dividends and interest | | | 410,753 | |
Capital shares sold | | | 144,940 | |
Prepaid expenses and other assets | | | 24,727 | |
Total assets | | | 605,519,986 | |
| | | | | |
LIABILITIES | | | | |
Payables for: | | | | |
Investments purchased | | | 1,089,480 | |
Capital shares redeemed | | | 40,020 | |
Sub-advisory fees | | | 321,947 | |
Other accrued expenses and liabilities | | | 172,734 | |
Total liabilities | | | 1,624,181 | |
Net assets | | $ | 603,895,805 | |
| | | | | |
NET ASSETS CONSIST OF: | | | | |
Par value | | $ | 34,110 | |
Paid-in capital | | | 405,659,342 | |
Total distributable earnings/(loss) | | | 198,202,353 | |
Net assets | | $ | 603,895,805 | |
| | | | | |
CAPITAL SHARES: | | | | |
Net Assets | | | 603,895,805 | |
Shares outstanding ($0.001 par value, 100,000,000 shares authorized) | | | 34,109,721 | |
Net asset value, offering and redemption price per share | | $ | 17.70 | |
The accompanying notes are an integral part of the financial statements.
10
ADARA SMALLER COMPANIES FUND
Statement of Operations
FOR THE year ENDED August 31, 2024
INVESTMENT INCOME | | | | |
Dividends (net of foreign taxes withheld of $23,927) | | $ | 5,064,875 | |
Interest income | | | 1,338,131 | |
Total investment income | | | 6,403,006 | |
| | | | | |
EXPENSES | | | | |
Sub-advisory fees (Note 2) | | | 3,593,122 | |
Administration and accounting services fees (Note 2) | | | 162,187 | |
Director fees | | | 67,884 | |
Investment management fees (Note 2) | | | 65,747 | |
Officer fees | | | 49,455 | |
Legal fees | | | 41,542 | |
Custodian fees (Note 2) | | | 40,672 | |
Transfer agent fees (Note 2) | | | 38,362 | |
Audit fees and tax services | | | 36,648 | |
Registration and filing fees | | | 26,911 | |
Printing and shareholder reporting fees | | | 7,983 | |
Other expenses | | | 50,538 | |
Total expenses | | | 4,181,051 | |
Net investment income/(loss) | | | 2,221,955 | |
| | | | | |
NET REALIZED AND UNREALIZED GAIN/(LOSS) FROM INVESTMENTS | | | | |
Net realized gain/(loss) from investments | | | 16,525,110 | |
Net change in unrealized appreciation/(depreciation) on investments | | | 64,759,495 | |
Net realized and unrealized gain/(loss) on investments | | | 81,284,605 | |
NET INCREASE/(DECREASE) IN NET ASSETS RESULTING FROM OPERATIONS | | $ | 83,506,560 | |
The accompanying notes are an integral part of the financial statements.
11
ADARA SMALLER COMPANIES FUND
Statements of Changes in Net Assets
| | | For the
Year Ended
August 31, 2024 | | | For the
Year Ended
August 31, 2023 | |
INCREASE/(DECREASE) IN NET ASSETS FROM OPERATIONS | | | | | | | | |
Net investment income/(loss) | | $ | 2,221,955 | | | $ | 2,272,289 | |
Net realized gain/(loss) from investments | | | 16,525,110 | | | | (1,023,542 | ) |
Net change in unrealized appreciation/(depreciation) on investments | | | 64,759,495 | | | | 27,357,651 | |
Net increase/(decrease) in net assets resulting from operations | | | 83,506,560 | | | | 28,606,398 | |
| | | | | | | | | |
DIVIDENDS AND DISTRIBUTIONS TO SHAREHOLDERS FROM: | | | | | | | | |
Total distributable earnings | | | (3,000,495 | ) | | | (1,462,252 | ) |
Net decrease in net assets from dividends and distributions to shareholders | | | (3,000,495 | ) | | | (1,462,252 | ) |
| | | | | | | | | |
CAPITAL SHARE TRANSACTIONS: | | | | | | | | |
Proceeds from shares sold | | | 59,868,759 | | | | 48,697,828 | |
Reinvestment of distributions | | | 2,676,590 | | | | 1,335,449 | |
Shares redeemed | | | (21,595,709 | ) | | | (36,215,013 | ) |
Net increase/(decrease) in net assets resulting from capital share transactions | | | 40,949,640 | | | | 13,818,264 | |
Total increase/(decrease) in net assets | | | 121,455,705 | | | | 40,962,410 | |
| | | | | | | | | |
NET ASSETS: | | | | | | | | |
Beginning of period | | $ | 482,440,100 | | | $ | 441,477,690 | |
End of period | | $ | 603,895,805 | | | $ | 482,440,100 | |
| | | | | | | | | |
SHARE TRANSACTIONS: | | | | | | | | |
Shares sold | | | 3,700,174 | | | | 3,378,762 | |
Shares reinvested | | | 178,202 | | | | 93,193 | |
Shares redeemed | | | (1,393,206 | ) | | | (2,526,832 | ) |
Net increase/(decrease) in shares | | | 2,485,170 | | | | 945,123 | |
The accompanying notes are an integral part of the financial statements.
12
ADARA SMALLER COMPANIES FUND
Financial Highlights
Contained below is per share operating performance data for shares outstanding, total investment return/(loss), ratios to average net assets and other supplemental data for the respective periods. This information has been derived from information provided in the financial statements. |
| | | For the
Year
Ended
August 31,
2024 | | | For the
Year
Ended
August 31,
2023 | | | For the
Year
Ended
August 31,
2022 | | | For the
Year
Ended
August 31,
2021 | | | For the
Year
Ended
August 31,
2020 | |
Per Share Operating Performance | | | | | | | | | | | | | | | | | | | | |
Net asset value, beginning of period | | $ | 15.26 | | | $ | 14.39 | | | $ | 21.47 | | | $ | 13.73 | | | $ | 12.89 | |
Net investment income/(loss)(1) | | | 0.07 | | | | 0.07 | | | | 0.02 | | | | (0.03 | ) | | | (0.01 | ) |
Net realized and unrealized gain/(loss) from investments | | | 2.46 | | | | 0.85 | | | | (2.88 | ) | | | 7.99 | | | | 1.33 | |
Net increase/(decrease) in net assets resulting from operations | | | 2.53 | | | | 0.92 | | | | (2.86 | ) | | | 7.96 | | | | 1.32 | |
Dividends and distributions to shareholders from: | | | | | | | | | | | | | | | | | | | | |
Net investment income | | | (0.09 | ) | | | (0.05 | ) | | | — | | | | — | | | | — | |
Net realized capital gains | | | — | | | | — | | | | (4.22 | ) | | | (0.22 | ) | | | (0.48 | ) |
Total dividends and distributions to shareholders | | | (0.09 | ) | | | (0.05 | ) | | | (4.22 | ) | | | (0.22 | ) | | | (0.48 | ) |
Net asset value, end of period | | $ | 17.70 | | | $ | 15.26 | | | $ | 14.39 | | | $ | 21.47 | | | $ | 13.73 | |
Total investment return/(loss)(2) | | | 16.72 | % | | | 6.40 | % | | | (16.93 | )% | | | 58.41 | % | | | 10.47 | % |
| | | | | | | | | | | | | | | | | | | | | |
Ratios/Supplemental Data | | | | | | | | | | | | | | | | | | | | |
Net assets, end of period (000’s omitted) | | $ | 603,896 | | | $ | 482,440 | | | $ | 441,478 | | | $ | 536,177 | | | $ | 361,442 | |
Ratio of expenses to average net assets | | | 0.80 | % | | | 0.82 | % | | | 0.84 | % | | | 0.84 | % | | | 0.90 | % |
Ratio of net investment income/(loss) to average net assets | | | 0.43 | % | | | 0.50 | % | | | 0.10 | % | | | (0.18 | )% | | | (0.08 | )% |
Portfolio turnover rate | | | 58 | % | | | 56 | % | | | 56 | % | | | 75 | % | | | 101 | % |
(1) | Calculated based on average shares outstanding for the period. |
(2) | Total investment return/(loss) is calculated assuming a purchase of shares on the first day and a sale of shares on the last day of each period reported and includes reinvestments of dividends and distributions, if any. |
The accompanying notes are an integral part of the financial statements.
13
ADARA SMALLER COMPANIES FUND
NOTES TO FINANCIAL STATEMENTS
August 31, 2024
1. Organization and Significant Accounting Policies
The RBB Fund, Inc. (“RBB” or the “Company”) was incorporated under the laws of the State of Maryland on February 29, 1988 and is registered under the Investment Company Act of 1940, as amended (the “1940 Act”), as an open-end management investment company. RBB is a “series fund,” which is an investment company divided into separate portfolios. Each portfolio is treated as a separate entity for certain matters under the 1940 Act, and for other purposes, and a shareholder of one portfolio is not deemed to be a shareholder of any other portfolio. Currently, RBB has sixty-five separate investment portfolios, including the Adara Smaller Companies Fund (the “Fund”), which commenced investment operations on October 21, 2014.
RBB has authorized capital of one hundred billion shares of common stock of which 92.923 billion shares are currently classified into two hundred and thirty-six classes of common stock. Each class represents an interest in an active or inactive RBB investment portfolio.
The Fund’s investment objective seeks capital appreciation.
The Fund is an investment company and follows accounting and reporting guidance in the Financial Accounting Standards Board (“FASB”) Accounting Standards Codification Topic 946 “Financial Services - Investment Companies”.
The end of the reporting period for the Fund is August 31, 2024, and the period covered by these Notes to Financial Statements is the fiscal year ended August 31, 2024 (the “current fiscal period”).
PORTFOLIO VALUATION – The Fund’s net asset value (“NAV”) is calculated once daily at the close of regular trading hours on the New York Stock Exchange (“NYSE”) (generally 4:00 p.m. Eastern time) on each day the NYSE is open. Securities held by the Fund are valued using the closing price or the last sale price on a national securities exchange or the National Association of Securities Dealers Automatic Quotation System (“NASDAQ”) market system where they are primarily traded. Equity securities traded in the over-the-counter (“OTC”) market are valued at their closing prices. If there were no transactions on that day, securities traded principally on an exchange or on NASDAQ will be valued at the mean of the last bid and ask prices prior to the market close. Fixed income securities are valued using an independent pricing service, which considers such factors as security prices, yields, maturities and ratings, and are deemed representative of market values at the close of the market. Investments in Exchange-Traded Funds (“ETFs”) are valued at their last reported sale price. Foreign securities are valued based on prices from the primary market in which they are traded, and are translated from the local currency into U.S. dollars using current exchange rates. Investments in other open-end investment companies, if any, are valued based on the NAV of those investment companies (which may use fair value pricing as disclosed in their prospectuses). If market quotations are unavailable or deemed unreliable, securities will be valued by the Adviser, as Valuation Designee, in accordance with procedures adopted by the Company’s Board of Directors (the “Board”). Relying on prices supplied by pricing services or dealers or using fair valuation may result in values that are higher or lower than the values used by other investment companies and investors to price the same investments.
FAIR VALUE MEASUREMENTS – The inputs and valuation techniques used to measure the fair value of the Fund’s investments are summarized into three levels as described in the hierarchy below:
| | ● Level 1 — | Prices are determined using quoted prices in active markets for identical securities. |
| | ● Level 2 — | Prices are determined using other significant observable inputs (including quoted prices for similar securities, interest rates, prepayment speeds, credit risk, etc.). |
| | ● Level 3 — | Prices are determined using significant unobservable inputs (including the Fund’s own assumptions in determining the fair value of investments). |
The inputs or methodologies used for valuing securities are not necessarily an indication of the risk associated with investing in those securities.
14
ADARA SMALLER COMPANIES FUND
NOTES TO FINANCIAL STATEMENTS (CONTINUED)
August 31, 2024
The following is a summary of the inputs used, as of the end of the current fiscal period, in valuing the Fund’s investments carried at fair value:
| | | Level 1 | | | Level 2 | | | Level 3 | | | Total | |
Investments: | | | | | | | | | | | | | | | | |
Common Stocks | | $ | 562,566,101 | | | $ | — | | | $ | — | (a) | | $ | 562,566,101 | |
Money Market Funds | | | 41,234,687 | | | | — | | | | — | | | | 41,234,687 | |
Total Investments | | $ | 603,800,788 | | | $ | — | | | $ | — | (a) | | $ | 603,800,788 | |
(a) | Amount is less than $0.50. |
| Refer to the Schedule of Investments for further disaggregation of investment categories. |
At the end of each quarter, management evaluates the classification of Levels 1, 2 and 3 assets and liabilities. Various factors are considered, such as changes in liquidity from the prior reporting period; whether or not a broker is willing to execute at the quoted price; the depth and consistency of prices from third party pricing services; and the existence of contemporaneous, observable trades in the market. Additionally, management evaluates the classification of Levels 1, 2 and 3 assets and liabilities on a quarterly basis for changes in listings or delistings on national exchanges.
Due to the inherent uncertainty of determining the fair value of investments that do not have a readily available market value, the fair value of the Fund’s investments may fluctuate from period to period. Additionally, the fair value of investments may differ significantly from the values that would have been used had a ready market existed for such investments and may differ materially from the values the Fund may ultimately realize. Further, such investments may be subject to legal and other restrictions on resale or otherwise less liquid than publicly traded securities.
For fair valuations using significant unobservable inputs, U.S. generally accepted accounting principles (“U.S. GAAP”) requires the Fund to present a reconciliation of the beginning to ending balances for reported market values that presents changes attributable to total realized and unrealized gains or losses, purchase and sales, and transfers in and out of Level 3 during the period. Transfers in and out between levels are based on values at the end of the period. A reconciliation of Level 3 investments is presented only when the Fund had an amount of Level 3 investments at the end of the reporting period that was meaningful in relation to its net assets. The amounts and reasons for Level 3 transfers are disclosed if the Fund had an amount of total Level 3 transfers during the reporting period that was meaningful in relation to its net assets as of the end of the reporting period.
During the current fiscal period, the Fund had no significant Level 3 transfers.
REITS — The Fund has made certain investments in real estate investment trusts (“REITs”) which pay dividends to their shareholders based upon available funds from operations. It is quite common for these dividends to exceed the REITs’ taxable earnings and profits resulting in the excess portion being designated as a return of capital. The Fund intends to include the gross dividends from such REITs in its annual distributions to shareholders and, accordingly, a portion of the Fund’s distributions may also be designated as a return of capital.
USE OF ESTIMATES — The preparation of financial statements in conformity with U.S. GAAP requires management to make estimates and assumptions that affect the reported amounts of assets and liabilities and disclosure of contingent assets and liabilities at the date of the financial statements and the reported amounts of revenues and expenses during the reporting period. Actual results could differ from those estimates and those differences could be significant.
INVESTMENT TRANSACTIONS, INVESTMENT INCOME AND EXPENSES — The Fund records security transactions based on trade date for financial reporting purposes. The cost of investments sold is determined by use of the specific identification method for both financial reporting and income tax purposes in determining realized gains and losses on investments. Interest income (including amortization of premiums and accretion of discounts) is accrued when earned. Dividend income is recorded on the ex-dividend date. Distributions received on securities that represent a return of capital or capital gain are recorded as a reduction of cost of investments and/or as a realized gain. The Fund’s
15
ADARA SMALLER COMPANIES FUND
NOTES TO FINANCIAL STATEMENTS (CONTINUED)
August 31, 2024
investment income, expenses (other than class specific expenses) and unrealized and realized gains and losses are allocated daily to each class of shares based upon the relative proportion of net assets of each class at the beginning of the day. Certain expenses are shared with The RBB Fund Trust (the “Trust”), a series trust of affiliated funds. Expenses incurred on behalf of a specific class, fund or fund family of the Company or Trust are charged directly to the class, fund or fund family (in proportion to net assets). Expenses incurred for all funds (such as director or professional fees) are charged to all funds in proportion to their average net assets of RBB and the Trust, or in such other manner as the Board deems fair or equitable. Expenses and fees, including investment advisory and administration fees, are accrued daily and taken into account for the purpose of determining the NAV of the Fund.
DIVIDENDS AND DISTRIBUTIONS TO SHAREHOLDERS — Dividends from net investment income and distributions from net realized capital gains (including net short-term capital gains), if any, are declared and paid at least annually to shareholders recorded on the ex-dividend date. Income dividends and capital gain distributions are determined in accordance with U.S. federal income tax regulations, which may differ from U.S. GAAP.
U.S. TAX STATUS — No provision is made for U.S. income taxes as it is the Fund’s intention to continue to qualify for and elect the tax treatment applicable to regulated investment companies under Subchapter M of the Internal Revenue Code of 1986, as amended, and make the requisite distributions to its shareholders which will be sufficient to relieve it from U.S. income and excise taxes.
CASH AND CASH EQUIVALENTS — Cash and cash equivalents are valued at cost plus accrued interest, which approximates market value.
OTHER — In the normal course of business, the Fund may enter into contracts that provide general indemnifications. The Fund’s maximum exposure under these arrangements is dependent on claims that may be made against the Fund in the future, and, therefore, cannot be estimated; however, the Fund expects the risk of material loss from such claims to be remote.
2. Investment Adviser and Other Services
Altair Advisers, LLC (“Altair” or the “Adviser”) serves as the investment adviser to the Fund. Aperio Group, LLC, Driehaus Capital Management, LLC, Pacific Ridge Capital Partners, LLC, Pier Capital, LLC and River Road Asset Management, LLC each serve as an investment sub-adviser (“Sub-Adviser”) to the Fund.
The Fund is managed by the Adviser and one or more Sub-Advisers unaffiliated with the Adviser. The Adviser also has the ultimate responsibility to oversee the Sub-Advisers, and to recommend their hiring, termination and replacement, subject to approval by the Board. The Adviser has an investment team that is jointly responsible for the day-to-day management of the Fund. The Sub-Advisers provide investment advisory services to the portion of the Fund’s portfolio allocated to them by the Adviser. The Adviser and the Company on behalf of the Fund have entered into sub-advisory agreements with the Sub-Advisers to manage the Fund, subject to supervision of the Adviser and the Board, and in accordance with the investment objective and restrictions of the Fund. The Fund compensates the Sub-Advisers for their services at an annual rate based on the Fund’s sub-advised average daily net assets (the “Sub-Advisory Fee”), not to exceed 1.00%, payable on a monthly basis in arrears.
During the current fiscal period, collectively, sub-advisory fees accrued were $3,593,122, or the rate of 0.69%.
The Fund is currently only available to clients of the Adviser and to other investors at the Fund’s discretion. The Adviser does not receive a separate management fee from the Fund. However, pursuant to the Fund’s investment advisory agreement with the Adviser, the Adviser is entitled to receive reimbursement for out-of-pocket expenses it incurs in connection with its compliance monitoring of Fund trading, up to 0.01% of the Fund’s average daily net assets. During the current fiscal period, the Fund paid the Adviser $65,747. This amount is included in Investment management fees on the Statement of Operations.
16
ADARA SMALLER COMPANIES FUND
NOTES TO FINANCIAL STATEMENTS (CONTINUED)
August 31, 2024
U.S. Bancorp Fund Services, LLC, doing business as U.S. Bank Global Fund Services (“Fund Services”), serves as administrator for the Fund. For providing administrative and accounting services, Fund Services is entitled to receive a monthly fee, subject to certain minimum and out of pocket expenses.
Fund Services serves as the Fund’s transfer and dividend disbursing agent. For providing transfer agent services, Fund Services is entitled to receive a monthly fee, subject to certain minimum and out of pocket expenses.
U.S. Bank, N.A. (the “Custodian”) provides certain custodial services to the Fund. The Custodian is entitled to receive a monthly fee, subject to certain minimum and out of pocket expenses.
Quasar Distributors, LLC (the “Distributor”), a wholly-owned broker-dealer subsidiary of Foreside Financial Group, LLC, serves as the principal underwriter and distributor of the Fund’s shares pursuant to a Distribution Agreement with RBB.
For compensation amounts paid to Fund Services and the Custodian, please refer to the Statement of Operations.
3. Director and Officer Compensation
The Directors of the Company receive an annual retainer and meeting fees for meetings attended. An employee of Vigilant Compliance, LLC serves as Chief Compliance Officer of the Company. Vigilant Compliance, LLC is compensated for the services provided to the Company. Employees of RBB serve as President, Chief Financial Officer, Chief Operating Officer, Secretary and Director of Marketing & Business Development of the Company. They are compensated by the Company for services provided. Certain employees of Fund Services serve as officers of the Company. They are not compensated by the Fund or the Company. For Director and Officer compensation amounts, please refer to the Statement of Operations.
4. Purchases and Sales of Investment Securities
During the current fiscal period, aggregate purchases and sales of investment securities (excluding short-term investments) of the Fund were as follows:
PURCHASES | SALES |
$318,051,378 | $281,438,473 |
There were no purchases or sales of long-term U.S. Government securities during the current fiscal period.
5. Federal Income Tax Information
The Fund has followed the authoritative guidance on accounting for and disclosure of uncertainty in tax positions, which requires the Fund to determine whether a tax position is more likely than not to be sustained upon examination, including resolution of any related appeals or litigation processes, based on the technical merits of the position. The Fund has determined that there was no effect on the financial statements from following this authoritative guidance. In the normal course of business, the Fund is subject to examination by federal, state and local jurisdictions, where applicable, for tax years for which applicable statutes of limitations have not expired.
As of August 31, 2024, the federal tax cost and aggregate gross unrealized appreciation and depreciation of investments held by the Fund were as follows:
FEDERAL
TAX COST | UNREALIZED
APPRECIATION | UNREALIZED
(DEPRECIATION) | Net Unrealized
Appreciation/
(Depreciation) |
$419,504,658 | $208,035,895 | $(22,223,468) | $185,812,427 |
17
ADARA SMALLER COMPANIES FUND
NOTES TO FINANCIAL STATEMENTS (CONCLUDED)
August 31, 2024
Distributions to shareholders, if any, from net investment income and realized gains are determined in accordance with federal income tax regulations, which may differ from net investment income and realized gains recognized for financial reporting purposes. Accordingly, the character of distributions and composition of net assets for tax purposes may differ from those reflected in the accompanying financial statements. To the extent these differences are permanent, such amounts are reclassified within the capital accounts based on the tax treatment; temporary differences do not require such reclassification.
As of August 31, 2024, the components of distributable earnings on a tax basis were as follows:
UNDISTRIBUTED
ORDINARY
INCOME | UNDISTRIBUTED
LONG-TERM
CAPITAL GAINS | CAPITAL LOSS
CARRYFORWARDS | NET UNREALIZED
APPRECIATION/
(DEPRECIATION) | QUALIFIED
LATE-YEAR
LOSSES |
$4,347,162 | $8,042,764 | $— | $185,812,427 | $— |
The differences between the book and tax basis components of distributable earnings relate primarily to the timing of recognition of income and gains for federal income tax purposes. Short-term and foreign currency gains, if applicable, are reported as ordinary income for federal income tax purposes.
The tax character of dividends and distributions paid during the fiscal years ended August 31, 2024 and August 31, 2023 was as follows:
| | | | | | ORDINARY
INCOME | | | LONG-TERM
GAINS | | | TOTAL | |
| | | 2024 | | | $ | 3,000,495 | | | $ | — | | | $ | 3,000,495 | |
| | | 2023 | | | $ | 1,462,252 | | | $ | — | | | $ | 1,462,252 | |
Pursuant to federal income tax rules applicable to regulated investment companies, the Fund may elect to treat certain capital losses between November 1 and August 31 and late year ordinary losses ((i) ordinary losses between January 1 and August 31, and (ii) specified ordinary and currency losses between November 1 and August 31) as occurring on the first day of the following tax year. For the fiscal year ended August 31, 2024, any amount of losses elected within the tax return will not be recognized for federal income tax purposes until September 1, 2024.
Under the Regulated Investment Company Modernization Act of 2010, the Fund is permitted to carry forward capital losses incurred in taxable years beginning after December 22, 2010 for an unlimited period. Additionally, capital losses that are carried forward will retain their character as either short-term or long-term capital losses rather than being considered all short-term as under the previous law. As of August 31, 2024, the Fund had short-term capital loss carryforwards of $0.
6. SUBSEQUENT EVENTS
Management has evaluated the impact of all subsequent events on the Fund through the date the financial statements were issued, and has determined that there were no subsequent events.
18
ADARA SMALLER COMPANIES FUND
Report of Independent Registered Public Accounting Firm
To the Board of Directors of The RBB Fund, Inc. and Shareholders of Adara Smaller Companies Fund
Opinion on the Financial Statements
We have audited the accompanying statement of assets and liabilities, including the schedule of investments, of Adara Smaller Companies Fund (one of the funds constituting The RBB Fund, Inc., hereafter referred to as the “Fund”) as of August 31, 2024, the related statement of operations for the year ended August 31, 2024, the statement of changes in net assets for each of the two years in the period ended August 31, 2024, including the related notes, and the financial highlights for each of the five years in the period ended August 31, 2024 (collectively referred to as the “financial statements”). In our opinion, the financial statements present fairly, in all material respects, the financial position of the Fund as of August 31, 2024, the results of its operations for the year then ended, the changes in its net assets for each of the two years in the period ended August 31, 2024 and the financial highlights for each of the five years in the period ended August 31, 2024 in conformity with accounting principles generally accepted in the United States of America.
Basis for Opinion
These financial statements are the responsibility of the Fund’s management. Our responsibility is to express an opinion on the Fund’s financial statements based on our audits. We are a public accounting firm registered with the Public Company Accounting Oversight Board (United States) (PCAOB) and are required to be independent with respect to the Fund in accordance with the U.S. federal securities laws and the applicable rules and regulations of the Securities and Exchange Commission and the PCAOB.
We conducted our audits of these financial statements in accordance with the standards of the PCAOB. Those standards require that we plan and perform the audit to obtain reasonable assurance about whether the financial statements are free of material misstatement, whether due to error or fraud.
Our audits included performing procedures to assess the risks of material misstatement of the financial statements, whether due to error or fraud, and performing procedures that respond to those risks. Such procedures included examining, on a test basis, evidence regarding the amounts and disclosures in the financial statements. Our audits also included evaluating the accounting principles used and significant estimates made by management, as well as evaluating the overall presentation of the financial statements. Our procedures included confirmation of securities owned as of August 31, 2024 by correspondence with the custodian and brokers; when replies were not received from brokers, we performed other auditing procedures. We believe that our audits provide a reasonable basis for our opinion.
/s/PricewaterhouseCoopers LLP
Philadelphia, Pennsylvania
October 29, 2024
We have served as the auditor of one or more Altair Advisers, LLC investment companies since 2015.
19
ADARA SMALLER COMPANIES FUND
SHAREHOLDER TAX INFORMATION (UNAUDITED)
Certain tax information regarding the Fund is required to be provided to shareholders based upon the Fund’s income and distributions for the taxable period ended August 31, 2024. The information and distributions reported herein may differ from information and distributions taxable to the shareholders for the calendar year ending December 31, 2024. During the fiscal year ended August 31, 2024, the following dividends and distributions were paid by the Fund:
Ordinary
income | long-term
gains |
$3,000,495 | $— |
Dividends from net investment income and short-term capital gains are treated as ordinary income dividends for federal income tax purposes.
Under the Jobs and Growth Tax relief Reconciliation Act of 2003 the following percentages of ordinary dividends paid during the fiscal year ended August 31, 2024 are designated as “qualified dividend income,” as defined in the Act, and are subject to reduced tax rates:
Adara Smaller Companies Fund | 78.62% |
The percentage of total ordinary income dividends paid qualifying for the corporate dividends received deduction for the Fund is as follows:
Adara Smaller Companies Fund | 77.47% |
The percentage of ordinary income distributions designated as qualified short-term gains pursuant to the American Job Creation Act of 2004 is as follows:
Adara Smaller Companies Fund | 0% |
Because the Fund’s fiscal year is not the calendar year, another notification will be sent with respect to calendar year 2024. The second notification, which will reflect the amount, if any, to be used by calendar year taxpayers on their U.S. federal income tax returns, will be made in conjunction with Form 1099-DIV and will be mailed in January 2025.
Foreign shareholders will generally be subject to U.S. withholding tax on the amount of their ordinary income dividends. They will generally not be entitled to a foreign tax credit or deduction for the withholding taxes paid by the Fund, if any.
In general, dividends received by tax-exempt recipients (e.g., IRAs and Keoghs) need not be reported as taxable income for U.S. federal income tax purposes. However, some retirement trusts (e.g., corporate, Keogh and 403(b)(7) plans) may need this information for their annual information reporting.
Shareholders are advised to consult their own tax advisers with respect to the tax consequences of their investment in the Fund.
20
ADARA SMALLER COMPANIES FUND
Other Information (Unaudited)
APPROVAL OF INVESTMENT ADVISORY AND SUB-ADVISORY AGREEMENTS
As required by the 1940 Act, the Board, including all of the Directors who are not “interested persons” of the Company, as that term is defined in the 1940 Act (the “Independent Directors”), considered (1) the renewal of the investment advisory agreement between Altair and the Company (the “Investment Advisory Agreement”) on behalf of the Fund, and (2) the renewal of the sub-advisory agreements among Altair, the Company and each of Aperio Group, LLC, Driehaus Capital Management, LLC, Pacific Ridge Capital Partners, LLC, Pier Capital, LLC, and River Road Asset Management, LLC (collectively, the “Sub-Advisers”) (together, the “Sub-Advisory Agreements”), at a meeting of the Board held on May 15-16, 2024 (the “Meeting”). At the Meeting, the Board, including all of the Independent Directors, approved the Investment Advisory Agreement and the Sub-Advisory Agreements for an additional one-year term ending August 16, 2025. The Board’s decision to approve the Investment Advisory Agreement and the Sub-Advisory Agreements reflects the exercise of its business judgment to continue the existing arrangements. In approving the Investment Advisory Agreement and the Sub-Advisory Agreements, the Board considered information provided by Altair and each of the Sub-Advisers with the assistance and advice of counsel to the Independent Directors and the Company.
In considering the renewal and approval of the Investment Advisory Agreement between the Company and Altair with respect to the Fund, and the renewal and approval of the Sub-Advisory Agreements among the Company, Altair and each of the Sub-Advisers with respect to the Fund, the Directors took into account all materials provided prior to and during the Meeting and at other meetings throughout the past year, the presentations made during the Meeting, and the discussions held during the Meeting. The Directors reviewed these materials with management of Altair, and discussed the aforementioned Agreements with counsel in executive sessions, at which no representatives of Altair or the Sub-Advisers were present. Among other things, the Directors considered (i) the nature, extent, and quality of services provided to the Fund by Altair and each Sub-Adviser; (ii) descriptions of the experience and qualifications of the personnel providing those services; (iii) Altair’s and the Sub-Advisers’ investment philosophies and processes; (iv) Altair’s and the Sub-Advisers’ assets under management and client descriptions; (v) Altair’s and the Sub-Advisers’ soft dollar commission and trade allocation policies, including information on the types of research and services obtained in connection with soft dollar commissions; (vi) Altair’s and the Sub-Advisers’ advisory fee arrangements and other similarly managed clients, as applicable; (vii) Altair’s and the Sub-Advisers’ compliance procedures; (viii) Altair’s and the Sub-Advisers’ financial information and insurance coverage, as applicable; (ix) the extent to which economies of scale are relevant to the Fund; (x) a report prepared by Fuse Research Network, LLC comparing the Fund’s management fees and total expense ratios to a group of mutual funds deemed comparable to the Fund based primarily on investment strategy similarity (“Peer Group”) and comparing the performance of the Fund to the performance of its Peer Group; and (xi) a report comparing the performance of the Fund to the performance of its benchmark.
As part of their review, the Directors considered the nature, extent and quality of the services provided by Altair and each Sub-Adviser. The Directors concluded that Altair and each Sub-Adviser had substantial resources to provide services to the Fund, and that Altair’s and the Sub-Advisers’ services had been acceptable.
The Directors also considered the investment performance of the Fund, noting that the Fund had outperformed its benchmark, the Russell 2000 Index, for the three-year, five-year, and since-inception periods ended December 31, 2023, and underperformed the benchmark for the three-month and one-year periods ended December 31, 2023. The Directors considered the Fund’s investment performance in light of its investment objective and investment strategies. The Board noted that the Fund’s total return outperformed the median of its Peer Group for the three-year, five-year, and since-inception periods ended December 31, 2023, and underperformed the median of its Peer Group for the three-month and one-year periods ended December 31, 2023.
The Board also considered the advisory fee rate payable by the Fund under the Investment Advisory Agreement and Sub-Advisory Agreements. In this regard, information on the fees paid by the Fund and the Fund’s total operating expense ratios were compared to similar information for mutual funds advised by other, unaffiliated investment advisory firms. The Directors noted that the Fund’s net advisory fee was below the median and in the 2nd quartile of its Peer Group and the Fund’s total net expenses were below the median and in the 1st quartile (least expensive) of its Peer Group. The Directors considered that the Fund does not pay a contractual management fee to Altair, but instead
21
ADARA SMALLER COMPANIES FUND
Other Information (Unaudited) (CONCLUDED)
reimburses for out-of-pocket expenses in connection with its compliance monitoring of the Fund’s trading, up to 0.01% of the Fund’s average daily net assets. The Directors also considered the fees payable to each Sub-Adviser under the Sub-Advisory Agreement.
After reviewing the information regarding Altair’s and the Sub-Advisers’ costs, profitability and economies of scale, and after considering the services to be provided by Altair and the Sub-Advisers, the Directors concluded that the reimbursement to be made by the Fund to Altair and the sub-advisory fees to be paid to each Sub-Adviser were fair and reasonable and that the Investment Advisory Agreement and Sub-Advisory Agreements should be approved and continued for an additional one-year period ending August 16, 2025.
22
Investment Adviser
Altair Advisers, LLC
303 West Madison Street, Suite 600
Chicago, IL 60606
Administrator and Transfer Agent
U.S. Bank Global Fund Services, LLC
P.O. Box 701
Milwaukee, WI 53201
Principal Underwriter
Quasar Distributors, LLC
3 Canal Plaza, Suite 100
Portland, ME 04101
Custodian
U.S. Bank, N.A.
1555 North Rivercenter Drive, Suite 302
Milwaukee, WI 53212
Independent Registered Public Accounting Firm
PricewaterhouseCoopers LLP
Two Commerce Square
2001 Market Street, Suite 1800
Philadelphia, PA 19103
Legal Counsel
Faegre Drinker Biddle & Reath LLP
One Logan Square, Suite 2000
Philadelphia, PA 19103-6996

AQUARIUS INTERNATIONAL FUND
of
The RBB Fund, Inc.
FINANCIAL STATEMENTS
August 31, 2024
This report is submitted for the general information of the shareholders of the Fund. It is not authorized for distribution unless preceded or accompanied by a current prospectus for the Fund.
AQUARIUS INTERNATIONAL FUND
SCHEDULE HOLDINGS SUMMARY TABLE
AUGUST 31, 2024
The following table presents a summary by country of the schedule holdings of the Fund:
Country | | % of Net
Assets | | | Value | |
COMMON STOCKS | | | | | | | | |
Argentina | | | 0.1 | % | | $ | 579,324 | |
Australia | | | 0.6 | | | | 3,612,454 | |
Austria | | | 0.3 | | | | 1,727,788 | |
Belgium | | | 0.5 | | | | 3,137,548 | |
Bermuda | | | 1.1 | | | | 6,622,692 | |
Brazil | | | 1.5 | | | | 8,477,658 | |
Canada | | | 3.4 | | | | 19,890,807 | |
Cayman Islands | | | 0.1 | | | | 542,609 | |
Chile | | | 0.0 | | | | 261,291 | |
China | | | 3.2 | | | | 18,800,522 | |
Colombia | | | 0.0 | | | | 46,789 | |
Denmark | | | 2.2 | | | | 12,758,164 | |
Finland | | | 1.6 | | | | 9,492,991 | |
France | | | 7.0 | | | | 40,504,802 | |
Germany | | | 4.7 | | | | 27,300,484 | |
Greece | | | 0.3 | | | | 1,583,432 | |
Hong Kong | | | 0.4 | | | | 2,143,989 | |
Hungary | | | 0.1 | | | | 714,688 | |
India | | | 4.4 | | | | 25,780,331 | |
Indonesia | | | 0.4 | | | | 2,232,978 | |
Ireland | | | 2.4 | | | | 13,856,161 | |
Israel | | | 0.3 | | | | 1,471,978 | |
Italy | | | 2.6 | | | | 15,285,549 | |
Japan | | | 11.6 | | | | 67,305,144 | |
Jordan | | | 0.2 | | | | 1,285,982 | |
Kazakhstan | | | 0.3 | | | | 1,548,247 | |
Luxembourg | | | 0.2 | | | | 1,059,244 | |
Malaysia | | | 0.1 | | | | 600,645 | |
Mexico | | | 0.7 | | | | 3,844,342 | |
Netherlands | | | 5.4 | | | | 31,630,490 | |
New Zealand | | | 0.0 | | | | 206,522 | |
Norway | | | 0.9 | | | | 5,054,958 | |
Peru | | | 0.2 | | | | 1,034,430 | |
Philippines | | | 0.2 | | | | 1,172,593 | |
Poland | | | 0.2 | | | | 978,596 | |
Portugal | | | 0.1 | | | | 635,973 | |
Russia | | | 0.0 | | | | 20 | |
Saudi Arabia | | | 0.3 | | | | 1,767,660 | |
Singapore | | | 0.7 | | | | 4,323,842 | |
South Africa | | | 0.5 | | | | 2,773,586 | |
South Korea | | | 5.1 | | | | 29,524,910 | |
Spain | | | 0.5 | | | | 2,734,041 | |
Sweden | | | 0.4 | | | | 2,223,238 | |
Switzerland | | | 3.7 | | | | 21,586,783 | |
Taiwan | | | 4.1 | | | | 23,575,469 | |
Turkey | | | 0.3 | | | | 2,018,508 | |
United Arab Emirates | | | 0.4 | | | | 2,277,575 | |
United Kingdom | | | 17.6 | | | | 102,186,076 | |
United States | | | 2.0 | | | | 11,573,554 | |
Uruguay | | | 0.4 | | | | 2,168,320 | |
PREFERRED STOCKS | | | | | | | | |
Germany | | | 0.0 | | | | 36,584 | |
RIGHTS | | | | | | | | |
South Korea | | | 0.0 | | | | 1,733 | |
SHORT-TERM INVESTMENTS | | | | | | | | |
United States | | | 6.0 | | | | 35,103,660 | |
OTHERS ASSETS IN EXCESS OF LIABILITIES | | | 0.8 | | | | 4,376,548 | |
| | | | 100.0 | % | | $ | 581,434,302 | |
Schedule holdings are subject to change at any time.
The accompanying notes are an integral part of the financial statements.
1
AQUARIUS INTERNATIONAL FUND
Schedule of Investments
as of AUGUST 31, 2024
| | | Shares | | | Value | |
COMMON STOCKS — 93.2% | | | | | | | | |
Advertising — 0.1% | | | | | | | | |
Dentsu Group, Inc. | | | 1,800 | | | $ | 55,357 | |
Publicis Groupe SA | | | 2,188 | | | | 241,322 | |
WPP PLC | | | 3,536 | | | | 33,871 | |
| | | | | | | | 330,550 | |
Aerospace/Defense — 4.0% | | | | | | | | |
Airbus Group SE | | | 9,103 | | | | 1,398,353 | |
BAE Systems PLC | | | 589,333 | | | | 10,596,093 | |
BAE Systems PLC - ADR | | | 1,742 | | | | 124,588 | |
CAE, Inc.(a) | | | 1,578 | | | | 28,214 | |
Dassault Aviation SA | | | 263 | | | | 56,664 | |
Elbit Systems Ltd. | | | 666 | | | | 136,104 | |
Embraer SA, SP ADR - ADR(a) | | | 8,603 | | | | 285,878 | |
Hanwha Aerospace Co. Ltd. | | | 1,699 | | | | 369,711 | |
Hindustan Aeronautics Ltd. | | | 7,981 | | | | 445,761 | |
MTU Aero Engines AG - ADR | | | 562 | | | | 83,772 | |
Rheinmetall AG | | | 9,546 | | | | 5,734,763 | |
Rolls-Royce Holdings PLC(a) | | | 6,406 | | | | 42,000 | |
Safran SA | | | 580 | | | | 127,099 | |
Thales SA | | | 22,874 | | | | 3,843,084 | |
| | | | | | | | 23,272,084 | |
Agriculture — 0.1% | | | | | | | | |
British American Tobacco PLC - ADR | | | 7,782 | | | | 292,370 | |
Imperial Brands PLC - ADR | | | 3,146 | | | | 90,290 | |
Japan Tobacco, Inc. | | | 6,900 | | | | 199,205 | |
RLX Technology, Inc. - ADR | | | 23,295 | | | | 39,368 | |
Wilmar International Ltd. | | | 16,500 | | | | 39,686 | |
| | | | | | | | 660,919 | |
Airlines — 0.1% | | | | | | | | |
ANA Holdings, Inc. | | | 1,800 | | | | 36,385 | |
InterGlobe Aviation Ltd.(a)(b) | | | 6,327 | | | | 363,950 | |
Japan Airlines Co. Ltd. | | | 3,000 | | | | 50,370 | |
| | | | | | | | 450,705 | |
Apparel — 0.8% | | | | | | | | |
Adidas AG | | | 273 | | | | 70,042 | |
Gildan Activewear, Inc. | | | 5,757 | | | | 262,692 | |
Hermes International SCA | | | 80 | | | | 191,477 | |
Kering SA | | | 127 | | | | 36,418 | |
LVMH Moet Hennessy Louis Vuitton SE - ADR | | | 2,000 | | | | 298,140 | |
LVMH Moet Hennessy Louis Vuitton SE | | | 4,940 | | | | 3,676,924 | |
| | | | | | | | 4,535,693 | |
Auto Manufacturers — 1.7% | | | | | | | | |
Bayerische Motoren Werke AG - ADR | | | 3,309 | | | | 102,215 | |
Bayerische Motoren Werke AG | | | 369 | | | | 34,245 | |
BYD Co. Ltd. - Class H | | | 4,000 | | | | 122,508 | |
Daimler AG | | | 3,623 | | | | 249,716 | |
| | | Shares | | | Value | |
Auto Manufacturers — (Continued) | | | | |
Daimler Truck Holding AG | | | 1,811 | | | $ | 69,619 | |
Ferrari NV | | | 642 | | | | 318,939 | |
Ferrari NV | | | 141 | | | | 70,064 | |
Geely Automobile Holdings, Ltd. | | | 31,000 | | | | 34,693 | |
Honda Motor Co. Ltd. | | | 197,800 | | | | 2,182,773 | |
Honda Motor Co. Ltd. - ADR | | | 1,291 | | | | 42,538 | |
Hyundai Motor Co. | | | 529 | | | | 101,473 | |
Isuzu Motors Ltd. | | | 2,700 | | | | 40,993 | |
Iveco Group NV | | | 132,017 | | | | 1,398,170 | |
Kia Corp. | | | 11,801 | | | | 937,576 | |
Li Auto, Inc. - ADR(a) | | | 3,672 | | | | 71,457 | |
Mahindra & Mahindra Ltd. | | | 15,330 | | | | 513,514 | |
Stellantis NV | | | 58,765 | | | | 986,377 | |
Stellantis NV | | | 2,278 | | | | 38,225 | |
Subaru Corp. | | | 1,800 | | | | 34,525 | |
Suzuki Motor Corp. | | | 178,900 | | | | 2,103,437 | |
Toyota Motor Corp. - ADR | | | 1,862 | | | | 353,408 | |
Toyota Motor Corp. | | | 7,100 | | | | 135,560 | |
Volvo AB - Class B | | | 3,636 | | | | 96,683 | |
XPeng, Inc. - ADR(a) | | | 2,396 | | | | 19,288 | |
| | | | | | | | 10,057,996 | |
Auto Parts & Equipment — 0.2% | | | | |
Aisin Corp. | | | 1,100 | | | | 38,656 | |
Bridgestone Corp. | | | 900 | | | | 35,181 | |
Cie Generale des Etablissements Michelin SCA | | | 1,852 | | | | 72,718 | |
Continental AG | | | 570 | | | | 38,541 | |
Denso Corp. | | | 3,600 | | | | 55,886 | |
Fuyao Glass Industry Group Co. Ltd. - Class A | | | 28,900 | | | | 195,257 | |
Hankook Tire & Technology Co. Ltd. | | | 17,270 | | | | 562,169 | |
Hyundai Mobis Co. Ltd. | | | 302 | | | | 49,278 | |
Magna International, Inc. | | | 3,010 | | | | 126,510 | |
Vitesco Technologies Group AG | | | 88 | | | | 5,093 | |
Weichai Power Co. Ltd. - Class H | | | 24,000 | | | | 36,709 | |
| | | | | | | | 1,215,998 | |
Banks — 10.8% | | | | | | | | |
AIB Group PLC | | | 376,315 | | | | 2,266,130 | |
Al Rajhi Bank | | | 29,670 | | | | 698,691 | |
ANZ Group Holdings Ltd. | | | 5,980 | | | | 122,742 | |
Axis Bank Ltd. | | | 38,764 | | | | 543,647 | |
Banco do Brasil SA | | | 442,300 | | | | 2,203,672 | |
Banco do Brasil SA - ADR | | | 22,592 | | | | 113,638 | |
Banco Santander SA | | | 37,238 | | | | 185,167 | |
Bancolombia SA - ADR | | | 1,414 | | | | 46,789 | |
Bank Central Asia Tbk PT | | | 1,226,000 | | | | 819,052 | |
Bank Mandiri Persero Tbk PT - ADR | | | 5,112 | | | | 91,965 | |
Bank Mandiri Persero Tbk PT | | | 2,759,400 | | | | 1,275,108 | |
The accompanying notes are an integral part of the financial statements.
2
AQUARIUS INTERNATIONAL FUND
Schedule of Investments (Continued)
As of AUGUST 31, 2024
| | | Shares | | | Value | |
Banks — (Continued) | | | | | | | | |
Bank Montreal | | | 1,282 | | | $ | 107,201 | |
Bank of Nova Scotia | | | 2,673 | | | | 133,329 | |
Bank Rakyat Indonesia Persero Tbk PT - ADR | | | 1,382 | | | | 22,741 | |
Barclays PLC | | | 126,063 | | | | 381,162 | |
BDO Unibank, Inc. | | | 181,150 | | | | 493,325 | |
Bendigo & Adelaide Bank Ltd. | | | 12,614 | | | | 102,708 | |
BNP Paribas SA | | | 76,770 | | | | 5,309,997 | |
CaixaBank SA | | | 65,952 | | | | 397,240 | |
Canadian Imperial Bank of Commerce | | | 1,139 | | | | 66,563 | |
Chiba Bank Ltd. | | | 4,900 | | | | 41,505 | |
China Merchants Bank Co. Ltd. - Class H | | | 176,563 | | | | 724,562 | |
Commerzbank AG | | | 157,150 | | | | 2,330,029 | |
Commonwealth Bank Of Australia | | | 4,512 | | | | 424,951 | |
Computershare Ltd. | | | 2,023 | | | | 38,893 | |
Concordia Financial Group Ltd. | | | 11,723 | | | | 66,524 | |
Credicorp Ltd. | | | 5,800 | | | | 1,034,430 | |
DBS Group Holdings Ltd. - ADR | | | 2,449 | | | | 272,182 | |
DBS Group Holdings Ltd. | | | 116,510 | | | | 3,253,460 | |
Deutsche Bank AG | | | 8,776 | | | | 143,926 | |
DNB Bank ASA | | | 128,214 | | | | 2,708,429 | |
Emirates NBD Bank PJSC | | | 92,932 | | | | 498,458 | |
Erste Group Bank AG | | | 8,036 | | | | 439,849 | |
FinecoBank Banca Fineco SpA | | | 319,325 | | | | 5,478,498 | |
FirstRand Ltd. | | | 273,142 | | | | 1,313,371 | |
Fukuoka Financial Group, Inc. | | | 3,000 | | | | 79,480 | |
Grupo Financiero Banorte SAB de CV | | | 76,985 | | | | 533,775 | |
Grupo Financiero Galicia SA - ADR | | | 14,790 | | | | 579,324 | |
Hana Financial Group, Inc. | | | 3,344 | | | | 155,244 | |
Hang Seng Bank, Ltd. | | | 3,000 | | | | 36,124 | |
HDFC Bank Ltd. | | | 218,828 | | | | 4,279,159 | |
HDFC Bank Ltd. - ADR | | | 12,962 | | | | 792,108 | |
HSBC Holdings PLC - ADR | | | 9,910 | | | | 440,599 | |
ICICI Bank Ltd. - ADR | | | 90,133 | | | | 2,641,798 | |
Industrial & Commercial Bank of China Ltd. - Class H | | | 1,597,000 | | | | 913,354 | |
ING Groep NV | | | 193,935 | | | | 3,526,152 | |
Intesa Sanpaolo | | | 14,336 | | | | 59,916 | |
Itau Unibanco Holdings, SP ADR - ADR | | | 170,642 | | | | 1,112,586 | |
Japan Post Bank Co. Ltd. | | | 3,700 | | | | 34,774 | |
KBC Group NV | | | 799 | | | | 62,216 | |
Macquarie Group Ltd. | | | 1,021 | | | | 148,610 | |
Macquarie Group, Ltd. - ADR | | | 1,203 | | | | 175,434 | |
Mediobanca Banca di Credito Finanziario SpA | | | 3,974 | | | | 67,312 | |
| | | Shares | | | Value | |
Banks — (Continued) | | | | | | | | |
Mitsubishi UFJ Financial Group, Inc. - ADR | | | 53,334 | | | $ | 561,607 | |
National Australia Bank Ltd. | | | 7,689 | | | | 198,162 | |
National Australia Bank Ltd. - ADR | | | 11,208 | | | | 145,368 | |
National Bank of Greece SA | | | 138,971 | | | | 1,207,979 | |
NatWest Group PLC | | | 544,658 | | | | 2,481,294 | |
Nedbank Group Ltd. - ADR | | | 2,666 | | | | 44,536 | |
Nordea Bank Abp | | | 11,504 | | | | 135,850 | |
Nordea Bank Abp | | | 93 | | | | 1,099 | |
NU Holdings Ltd. - Class A(a) | | | 35,017 | | | | 524,204 | |
OTP Bank, PLC | | | 13,881 | | | | 714,688 | |
Oversea-Chinese Banking Corp. Ltd. | | | 9,000 | | | | 100,318 | |
Royal Bank Canada | | | 3,116 | | | | 376,350 | |
Saudi National Bank | | | 72,743 | | | | 682,126 | |
Shinhan Financial Group Co. Ltd. - ADR | | | 9,162 | | | | 388,927 | |
Shizuoka Financial Group, Inc. | | | 3,900 | | | | 34,815 | |
Societe Generale SA | | | 2,392 | | | | 57,822 | |
Standard Bank Group Ltd. | | | 9,099 | | | | 122,217 | |
Sumitomo Mitsui Financial Group, Inc. | | | 19,100 | | | | 1,260,471 | |
Sumitomo Mitsui Financial Group, Inc. - ADR | | | 56,610 | | | | 748,950 | |
Sumitomo Mitsui Trust Holdings, Inc. | | | 1,600 | | | | 39,872 | |
Svenska Handelsbanken AB - Class A | | | 112,598 | | | | 1,161,567 | |
TCS Group Holding PLC - GDR(a)(c) | | | 3,732 | | | | 0 | |
Toronto-Dominion Bank | | | 4,118 | | | | 246,751 | |
UBS Group AG | | | 13,717 | | | | 422,697 | |
UniCredit SpA | | | 2,917 | | | | 121,245 | |
United Overseas Bank Ltd. | | | 6,000 | | | | 144,234 | |
Woori Financial Group, Inc. - ADR | | | 4,696 | | | | 170,136 | |
Yapi ve Kredi Bankasi AS | | | 926,035 | | | | 848,454 | |
| | | | | | | | 62,729,638 | |
Beverages — 1.3% | | | | | | | | |
Anheuser-Busch InBev SA/NV - ADR | | | 3,181 | | | | 195,441 | |
Arca Continental SAB de CV | | | 60,200 | | | | 542,845 | |
Asahi Group Holdings Ltd. | | | 148,400 | | | | 5,539,129 | |
Carlsberg A/S - Class B | | | 499 | | | | 58,621 | |
Cia Cervecerias Unidas SA - ADR | | | 4,167 | | | | 46,671 | |
Coca-Cola Europacific Partners PLC | | | 476 | | | | 38,313 | |
Coca-Cola HBC AG | | | 1,058 | | | | 39,284 | |
Davide Campari-Milano NV | | | 5,538 | | | | 51,203 | |
The accompanying notes are an integral part of the financial statements.
3
AQUARIUS INTERNATIONAL FUND
Schedule of Investments (Continued)
as of AUGUST 31, 2024
| | | Shares | | | Value | |
Beverages — (Continued) | | | | | | | | |
Diageo PLC - ADR | | | 1,459 | | | $ | 190,779 | |
Endeavour Group Ltd. | | | 2,137 | | | | 7,705 | |
Fomento Economico Mexicano SAB de CV - ADR | | | 461 | | | | 47,382 | |
Heineken Holding NV | | | 434 | | | | 32,730 | |
Heineken NV - ADR | | | 2,666 | | | | 120,050 | |
Pernod Ricard SA - ADR | | | 2,755 | | | | 78,600 | |
Remy Cointreau SA | | | 453 | | | | 36,927 | |
United Spirits Ltd. | | | 38,758 | | | | 681,297 | |
| | | | | | | | 7,706,977 | |
Biotechnology — 0.5% | | | | | | | | |
Argenx SE - ADR(a) | | | 238 | | | | 123,122 | |
BeiGene Ltd.(a) | | | 10,100 | | | | 149,475 | |
CSL Ltd. - ADR | | | 3,938 | | | | 410,655 | |
CSL Ltd. | | | 628 | | | | 130,420 | |
Genmab AS(a) | | | 6,810 | | | | 1,893,947 | |
| | | | | | | | 2,707,619 | |
Building Materials — 1.0% | | | | | | | | |
Ambuja Cements Ltd. | | | 70,612 | | | | 519,637 | |
Cie de Saint-Gobain SA | | | 519 | | | | 45,353 | |
CRH PLC | | | 44,963 | | | | 4,013,800 | |
CRH PLC | | | 1,441 | | | | 130,799 | |
Daikin Industries Ltd. | | | 149 | | | | 19,036 | |
Geberit AG | | | 202 | | | | 129,214 | |
James Hardie Industries PLC(a) | | | 2,896 | | | | 108,030 | |
Kingspan Group PLC | | | 554 | | | | 48,238 | |
LafargeHolcim Ltd. | | | 2,013 | | | | 195,005 | |
Sika AG | | | 437 | | | | 140,685 | |
Svenska Cellulosa AB SCA - Class B | | | 4,527 | | | | 62,847 | |
UltraTech Cement Ltd. | | | 3,463 | | | | 466,908 | |
West Fraser Timber Co. Ltd. | | | 446 | | | | 39,480 | |
| | | | | | | | 5,919,032 | |
Chemicals — 2.8% | | | | | | | | |
Air Liquide SA | | | 17,844 | | | | 3,330,548 | |
Air Liquide SA - ADR | | | 2,142 | | | | 79,854 | |
Akzo Nobel NV | | | 7,468 | | | | 476,321 | |
Asahi Kasei Corp. | | | 6,000 | | | | 42,492 | |
BASF SE | | | 1,905 | | | | 96,829 | |
Croda International PLC | | | 565 | | | | 30,611 | |
EMS-Chemie Holding AG | | | 143 | | | | 120,016 | |
Evonik Industries AG | | | 150,511 | | | | 3,339,774 | |
Givaudan SA | | | 27 | | | | 138,682 | |
Givaudan SA - ADR | | | 600 | | | | 61,452 | |
ICL Group Ltd. | | | 12,592 | | | | 57,797 | |
Kansai Paint Co. Ltd. | | | 140,200 | | | | 2,510,051 | |
Kumho Petrochemical Co. Ltd. | | | 11,091 | | | | 1,137,394 | |
LG Chem Ltd. | | | 164 | | | | 39,565 | |
Mitsubishi Chemical Group Corp. | | | 273,100 | | | | 1,596,056 | |
Nippon Sanso Holdings Corp. | | | 64,500 | | | | 2,222,563 | |
| | | Shares | | | Value | |
Chemicals — (Continued) | | | | | | | | |
Nissan Chemical Corp. | | | 1,100 | | | $ | 37,811 | |
Novonesis (Novozymes) B | | | 673 | | | | 46,712 | |
OCI NV | | | 1,417 | | | | 44,969 | |
Shin-Etsu Chemical Co. Ltd. - ADR | | | 6,860 | | | | 150,920 | |
Shin-Etsu Chemical Co. Ltd. | | | 3,270 | | | | 144,757 | |
Supreme Industries Ltd. | | | 2,993 | | | | 188,680 | |
Syensqo SA | | | 373 | | | | 30,714 | |
Symrise AG | | | 500 | | | | 65,979 | |
| | | | | | | | 15,990,547 | |
Coal — 0.6% | | | | | | | | |
China Shenhua Energy Co. Ltd. - Class H | | | 39,000 | | | | 167,610 | |
Teck Resources Ltd. - Class B | | | 8,215 | | | | 393,498 | |
Teck Resources Ltd. - Class B | | | 62,140 | | | | 2,975,472 | |
| | | | | | | | 3,536,580 | |
Commercial Services — 4.9% | | | | | | | | |
Abu Dhabi Ports Co. PJSC(a) | | | 44,586 | | | | 58,147 | |
Adani Ports & Special Economic Zone Ltd. | | | 47,921 | | | | 847,053 | |
Adyen NV(a)(b) | | | 1,369 | | | | 2,020,375 | |
Amadeus IT Holdings SA | | | 20,727 | | | | 1,398,575 | |
Ashtead Group PLC | | | 68,356 | | | | 4,867,233 | |
Bidvest Group Ltd. | | | 3,146 | | | | 51,191 | |
Bureau Veritas SA | | | 43,870 | | | | 1,444,239 | |
China Merchants Port Holdings Co. Ltd. | | | 60,000 | | | | 89,821 | |
Edenred SE | | | 52,463 | | | | 2,208,133 | |
Experian PLC | | | 2,543 | | | | 123,560 | |
International Container Terminal Services, Inc. | | | 76,047 | | | | 536,595 | |
Intertek Group PLC | | | 1,279 | | | | 83,571 | |
Localiza Rent a Car SA - ADR | | | 4,006 | | | | 31,407 | |
New Oriental Education & Technology Group, Inc. - ADR(a) | | | 2,260 | | | | 138,945 | |
RB Global, Inc. | | | 1,064 | | | | 91,642 | |
Recruit Holdings Co. Ltd. | | | 3,292 | | | | 205,296 | |
RELX PLC | | | 146,091 | | | | 6,819,561 | |
Rentokil Initial PLC | | | 7,414 | | | | 47,335 | |
Santos Brasil Participacoes SA | | | 131,000 | | | | 306,119 | |
Secom Co. Ltd. | | | 500 | | | | 36,484 | |
TAL Education Group - ADR(a) | | | 7,594 | | | | 61,056 | |
Wolters Kluwer | | | 41,238 | | | | 7,051,996 | |
Wolters Kluwer NV - ADR | | | 667 | | | | 113,150 | |
| | | | | | | | 28,631,484 | |
Computers — 2.3% | | | | | | | | |
AutoStore Holdings Ltd.(a)(b) | | | 33,295 | | | | 35,279 | |
BayCurrent, Inc. | | | 108,500 | | | | 3,458,950 | |
Capgemini SE | | | 13,246 | | | | 2,744,090 | |
The accompanying notes are an integral part of the financial statements.
4
AQUARIUS INTERNATIONAL FUND
Schedule of Investments (Continued)
as of AUGUST 31, 2024
| | | Shares | | | Value | |
Computers — (Continued) | | | | | | | | |
CGI, Inc.(a) | | | 1,307 | | | $ | 147,207 | |
Check Point Software Technologies Ltd.(a) | | | 499 | | | | 96,058 | |
CyberArk Software Ltd.(a) | | | 576 | | | | 165,162 | |
Globant S.A.(a) | | | 3,290 | | | | 665,370 | |
Infosys Ltd. - ADR | | | 28,588 | | | | 665,529 | |
Lenovo Group Ltd. | | | 32,000 | | | | 39,074 | |
Logitech International SA | | | 444 | | | | 40,408 | |
Nomura Research Institute Ltd. | | | 72,700 | | | | 2,445,428 | |
NTT Data Group Corp. | | | 3,100 | | | | 47,276 | |
Quanta Computer, Inc. | | | 50,000 | | | | 420,049 | |
Tata Consultancy Services Ltd. | | | 12,476 | | | | 677,784 | |
Teleperformance SE | | | 9,184 | | | | 1,000,725 | |
Wipro Ltd. - ADR | | | 106,432 | | | | 684,358 | |
| | | | | | | | 13,332,747 | |
Cosmetics/Personal Care — 0.4% | | | | |
Beiersdorf AG | | | 432 | | | | 62,467 | |
Colgate-Palmolive India Ltd. | | | 10,032 | | | | 435,413 | |
Essity AB - Class B | | | 5,178 | | | | 157,246 | |
Godrej Consumer Products Ltd. | | | 42,469 | | | | 749,495 | |
Haleon PLC - ADR | | | 9,632 | | | | 98,054 | |
Kao Corp. | | | 800 | | | | 35,849 | |
L’Oreal SA - ADR | | | 3,400 | | | | 297,772 | |
L’Oreal SA | | | 148 | | | | 64,936 | |
Unicharm Corp. | | | 1,487 | | | | 51,593 | |
Unilever PLC - ADR | | | 9,303 | | | | 602,742 | |
| | | | | | | | 2,555,567 | |
Distribution/Wholesale — 2.2% | | | | | | | | |
Azelis Group NV | | | 123,217 | | | | 2,574,945 | |
Bunzl PLC | | | 144,642 | | | | 6,752,749 | |
IMCD NV | | | 12,250 | | | | 2,006,028 | |
ITOCHU Corp. | | | 3,700 | | | | 197,003 | |
ITOCHU Corp. - ADR | | | 426 | | | | 45,062 | |
Mitsubishi Corp. | | | 2,300 | | | | 47,882 | |
Mitsui & Co. Ltd. | | | 6,318 | | | | 136,559 | |
Rexel SA | | | 46,159 | | | | 1,164,697 | |
Sendas Distribuidora S/A - ADR(a) | | | 2,775 | | | | 23,255 | |
| | | | | | | | 12,948,180 | |
Diversified Financial Services — 2.7% | | | | |
Deutsche Boerse AG | | | 25,090 | | | | 5,640,770 | |
Deutsche Boerse AG - ADR | | | 2,810 | | | | 62,944 | |
Euronext NV(b) | | | 25,139 | | | | 2,684,705 | |
Futu Holdings Ltd. - ADR(a) | | | 852 | | | | 54,153 | |
Hong Kong Exchanges & Clearing Ltd. | | | 38,780 | | | | 1,183,303 | |
Japan Exchange Group, Inc. | | | 72,400 | | | | 1,680,048 | |
KB Financial Group, Inc. - ADR | | | 6,431 | | | | 417,243 | |
KB Financial Group, Inc. | | | 40,670 | | | | 2,622,605 | |
| | | Shares | | | Value | |
Diversified Financial Services — (Continued) |
London Stock Exchange Group PLC | | | 791 | | | $ | 106,771 | |
London Stock Exchange Group PLC - ADR | | | 2,464 | | | | 83,702 | |
Power Finance Corp. Ltd. | | | 128,712 | | | | 843,684 | |
Sanlam Ltd. - ADR | | | 5,156 | | | | 52,282 | |
SBI Holdings, Inc. | | | 2,600 | | | | 63,987 | |
Singapore Exchange Ltd. | | | 6,000 | | | | 49,776 | |
| | | | | | | | 15,545,973 | |
Electric — 2.6% | | | | | | | | |
Adani Energy Solutions Ltd.(a) | | | 31,499 | | | | 378,349 | |
Centrais Eletricas Brasileiras SA - ADR | | | 12,310 | | | | 91,463 | |
China Resources Power Holdings Co. Ltd. | | | 14,000 | | | | 37,958 | |
CLP Holdings Ltd. | | | 13,500 | | | | 120,452 | |
Dubai Electricity & Water Authority PJSC | | | 728,813 | | | | 474,254 | |
E.ON SE | | | 4,732 | | | | 67,082 | |
Enel SpA | | | 555,541 | | | | 4,222,502 | |
Engie SA - ADR | | | 8,968 | | | | 157,568 | |
Fortis, Inc. | | | 5,886 | | | | 258,984 | |
Fortum Oyj | | | 179,063 | | | | 2,855,166 | |
Iberdrola SA - ADR | | | 1,618 | | | | 92,032 | |
Iberdrola SA | | | 11,895 | | | | 168,774 | |
JSW Energy Ltd. | | | 98,497 | | | | 835,058 | |
Mercury NZ Ltd. | | | 7,755 | | | | 30,377 | |
Meridian Energy Ltd. | | | 15,956 | | | | 63,241 | |
National Grid PLC - ADR | | | 2,605 | | | | 173,493 | |
National Grid PLC | | | 5,579 | | | | 73,488 | |
NTPC Ltd. | | | 110,388 | | | | 547,405 | |
Orsted A/S(a)(b) | | | 622 | | | | 35,946 | |
Power Assets Holdings Ltd. | | | 11,000 | | | | 76,559 | |
RWE AG | | | 719 | | | | 25,936 | |
SSE PLC - ADR | | | 5,415 | | | | 136,296 | |
SSE PLC | | | 176,597 | | | | 4,392,372 | |
Tokyo Electric Power Co. Holdings, Inc.(a) | | | 7,500 | | | | 35,773 | |
| | | | | | | | 15,350,528 | |
Electrical Components & Equipment — 0.3% | | | | |
Delta Electronics, Inc. | | | 36,000 | | | | 448,804 | |
KEI Industries Ltd. | | | 8,594 | | | | 472,160 | |
Legrand SA | | | 942 | | | | 105,507 | |
Schneider Electric SE - ADR | | | 4,025 | | | | 204,309 | |
Schneider Electric SE | | | 698 | | | | 178,060 | |
| | | | | | | | 1,408,840 | |
Electronics — 0.6% | | | | | | | | |
AAC Technologies Holdings, Inc. | | | 126,500 | | | | 537,407 | |
ABB Ltd. | | | 4,533 | | | | 260,678 | |
The accompanying notes are an integral part of the financial statements.
5
AQUARIUS INTERNATIONAL FUND
Schedule of Investments (Continued)
as of AUGUST 31, 2024
| | | Shares | | | Value | |
Electronics — (Continued) | | | | |
BYD Electronic International Co. Ltd. | | | 23,500 | | | $ | 86,093 | |
Hirose Electric Co. Ltd. | | | 327 | | | | 43,155 | |
Hon Hai Precision Industry Co. Ltd. | | | 87,353 | | | | 504,266 | |
Hoya Corp. | | | 670 | | | | 95,091 | |
Hoya Corp. - ADR | | | 487 | | | | 69,193 | |
Lotes Co. Ltd. | | | 6,000 | | | | 287,641 | |
Luxshare Precision Industry Co. Ltd. - Class A | | | 175,600 | | | | 977,022 | |
Murata Manufacturing Co. Ltd. | | | 4,857 | | | | 101,805 | |
Murata Manufacturing Co. Ltd. - ADR | | | 7,572 | | | | 78,976 | |
NIDEC CORP | | | 1,000 | | | | 40,774 | |
TDK Corp. | | | 800 | | | | 54,529 | |
Yageo Corp. | | | 17,676 | | | | 363,850 | |
| | | | | | | | 3,500,480 | |
Energy-Alternate Sources — 0.0%(d) | | | | |
Vestas Wind Systems AS(a) | | | 2,480 | | | | 56,663 | |
| | | | | | | | | |
Engineering & Construction — 1.2% | | | | | | | | |
Acciona SA | | | 580 | | | | 78,203 | |
Auckland International Airport Ltd. | | | 13,450 | | | | 63,777 | |
Eiffage SA | | | 14,358 | | | | 1,507,090 | |
Ferrovial SE | | | 3,085 | | | | 128,994 | |
GMR Airports Infrastructure Ltd.(a) | | | 418,735 | | | | 472,365 | |
Grupo Aeroportuario del Pacifico SAB de CV - ADR | | | 392 | | | | 69,651 | |
Grupo Aeroportuario del Sureste SAB de CV - ADR | | | 471 | | | | 126,883 | |
Samsung C&T Corp. | | | 10,473 | | | | 1,158,981 | |
SPIE SA | | | 78,542 | | | | 3,170,665 | |
Stantec, Inc. | | | 424 | | | | 34,764 | |
Taisei Corp. | | | 900 | | | | 40,893 | |
Vinci SA | | | 905 | | | | 108,161 | |
Vinci SA - ADR | | | 1,124 | | | | 33,495 | |
| | | | | | | | 6,993,922 | |
Entertainment — 0.1% | | | | | | | | |
Evolution AB - ADR | | | 336 | | | | 35,001 | |
Flutter Entertainment PLC(a) | | | 244 | | | | 52,121 | |
Lottery Corp. Ltd. | | | 8,950 | | | | 30,142 | |
OPAP SA | | | 21,717 | | | | 375,453 | |
Oriental Land Co., Ltd. | | | 3,065 | | | | 83,820 | |
Toho Co. Ltd./Tokyo | | | 1,100 | | | | 42,286 | |
| | | | | | | | 618,823 | |
Environmental Control — 0.0%(d) | | | | |
China Conch Environment Protection Holdings Ltd. | | | 21,500 | | | | 1,955 | |
| | | Shares | | | Value | |
Environmental Control — (Continued) | | | | |
GFL Environmental, Inc. | | | 1,083 | | | $ | 46,905 | |
| | | | | | | | 48,860 | |
Food — 2.0% | | | | | | | | |
Aeon Co. Ltd. | | | 5,200 | | | | 130,260 | |
Ajinomoto Co., Inc. | | | 1,500 | | | | 57,739 | |
Barry Callebaut AG | | | 49 | | | | 79,318 | |
BIM Birlesik Magazalar AS | | | 67,192 | | | | 1,064,177 | |
Chocoladefabriken Lindt & Spruengli AG | | | 6 | | | | 79,289 | |
Coles Group Ltd. | | | 4,059 | | | | 51,533 | |
Danone SA | | | 3,030 | | | | 210,546 | |
Gruma SAB de CV - Class B | | | 18,750 | | | | 345,082 | |
Kerry Group PLC - ADR | | | 451 | | | | 45,172 | |
Koninklijke Ahold Delhaize NV - ADR | | | 4,031 | | | | 138,142 | |
Koninklijke Ahold Delhaize NV | | | 118,982 | | | | 4,085,095 | |
MEIJI Holdings Co. Ltd. | | | 1,500 | | | | 37,250 | |
Nestle SA - ADR | | | 5,773 | | | | 617,249 | |
Nisshin Seifun Group, Inc. | | | 2,700 | | | | 34,961 | |
Nomad Foods Ltd. | | | 79,873 | | | | 1,501,612 | |
Seven & i Holdings Co. Ltd. - ADR | | | 2,700 | | | | 39,042 | |
Tesco PLC | | | 615,426 | | | | 2,869,334 | |
Woolworths Group Ltd. | | | 3,247 | | | | 78,328 | |
Yakult Honsha Co. Ltd. | | | 1,800 | | | | 38,029 | |
| | | | | | | | 11,502,158 | |
Food Service — 1.1% | | | | | | | | |
Compass Group PLC | | | 200,566 | | | | 6,338,954 | |
Compass Group PLC - ADR | | | 7,353 | | | | 234,928 | |
| | | | | | | | 6,573,882 | |
Forest Products & Paper — 0.0%(d) | | | | |
Suzano Papel e Celulose SA - ADR | | | 6,573 | | | | 64,021 | |
UPM-Kymmene Corp. | | | 1,590 | | | | 53,594 | |
| | | | | | | | 117,615 | |
Gas — 0.0%(d) | | | | | | | | |
ENN Energy Holdings Ltd. | | | 4,400 | | | | 28,329 | |
Hand/Machine Tools — 0.3% | | | | | | | | |
Alleima AB | | | 657 | | | | 4,925 | |
Fuji Electric Co. Ltd. | | | 24,900 | | | | 1,502,982 | |
Schindler Holding AG | | | 651 | | | | 176,090 | |
Techtronic Industries Co. Ltd. | | | 4,500 | | | | 60,295 | |
| | | | | | | | 1,744,292 | |
Healthcare-Products — 0.6% | | | | | | | | |
Alcon, Inc. | | | 1,673 | | | | 163,419 | |
Asahi Intecc Co. Ltd. | | | 1,900 | | | | 34,907 | |
Carl Zeiss Meditec AG | | | 533 | | | | 39,128 | |
Cochlear Ltd. | | | 376 | | | | 76,337 | |
Coloplast AS - Class B | | | 327 | | | | 44,523 | |
The accompanying notes are an integral part of the financial statements.
6
AQUARIUS INTERNATIONAL FUND
Schedule of Investments (Continued)
as of AUGUST 31, 2024
| | | Shares | | | Value | |
Healthcare-Products — (Continued) | | | | |
Essilor International Cie Generale d’Opitque SA | | | 608 | | | $ | 144,177 | |
EssilorLuxottica SA - ADR | | | 144 | | | | 17,061 | |
Fisher & Paykel Healthcare Corp. Ltd. | | | 2,201 | | | | 49,128 | |
FUJIFILM Holdings Corp. | | | 5,400 | | | | 145,636 | |
Getinge AB - Class B | | | 1,494 | | | | 31,094 | |
Olympus Corp. | | | 1,400 | | | | 25,603 | |
Sartorius Stedim Biotech | | | 191 | | | | 38,807 | |
Smith & Nephew PLC | | | 135,139 | | | | 2,081,049 | |
Sonova Holding AG | | | 143 | | | | 49,998 | |
Terumo Corp. | | | 324 | | | | 6,024 | |
Thermo Fisher Scientific, Inc. | | | 900 | | | | 553,563 | |
| | | | | | | | 3,500,454 | |
Healthcare-Services — 0.7% | | | | | | | | |
BioMerieux | | | 307 | | | | 35,528 | |
Dr Sulaiman Al Habib Medical Services Group Co. | | | 4,744 | | | | 386,842 | |
Fresenius Medical Care AG | | | 918 | | | | 35,438 | |
ICON PLC(a) | | | 8,600 | | | | 2,769,716 | |
Lonza Group AG | | | 182 | | | | 119,720 | |
Lonza Group AG - ADR | | | 370 | | | | 24,183 | |
Max Healthcare Institute Ltd. | | | 35,580 | | | | 366,006 | |
Ramsay Health Care Ltd. | | | 1,132 | | | | 31,777 | |
Sonic Healthcare Ltd. - ADR | | | 1,106 | | | | 20,663 | |
| | | | | | | | 3,789,873 | |
Holding Companies-Diversified — 0.1% | | | | |
Jardine Matheson Holdings, Ltd. | | | 3,800 | | | | 136,952 | |
YTL Corp. Bhd | | | 891,600 | | | | 600,645 | |
| | | | | | | | 737,597 | |
Home Builders — 0.5% | | | | | | | | |
Barratt Developments PLC | | | 431,546 | | | | 2,887,640 | |
Sekisui House Ltd. | | | 4,000 | | | | 103,388 | |
| | | | | | | | 2,991,028 | |
Home Furnishings — 0.7% | | | | | | | | |
Electrolux AB - Class B(a) | | | 972 | | | | 9,356 | |
Hoshizaki Corp. | | | 800 | | | | 25,876 | |
Sharp Corp.(a) | | | 6,400 | | | | 44,027 | |
Sony Group Corp. - ADR | | | 4,806 | | | | 468,873 | |
Sony Group Corp. | | | 36,400 | | | | 3,545,148 | |
| | | | | | | | 4,093,280 | |
Household Products/Wares — 0.0%(d) | | | | |
Henkel AG & Co. KGaA | | | 889 | | | | 73,924 | |
Reckitt Benckiser Group PLC - ADR | | | 12,375 | | | | 143,055 | |
| | | | | | | | 216,979 | |
Insurance — 5.9% | | | | | | | | |
Admiral Group PLC | | | 63,297 | | | | 2,431,035 | |
| | | Shares | | | Value | |
Insurance — (Continued) | | | | | | | | |
Aegon Ltd. | | | 14,288 | | | $ | 87,506 | |
Ageas SA NV | | | 2,481 | | | | 127,530 | |
AIA Group Ltd. - ADR | | | 4,702 | | | | 133,490 | |
Allianz SE - ADR | | | 4,740 | | | | 146,940 | |
Allianz SE | | | 132 | | | | 41,007 | |
Aon PLC - Class A | | | 23,749 | | | | 8,163,006 | |
AXA SA | | | 38,009 | | | | 1,446,589 | |
Baloise Holding AG | | | 522 | | | | 100,968 | |
Beazley PLC | | | 501,387 | | | | 4,964,574 | |
Cathay Financial Holding Co. Ltd. | | | 24,000 | | | | 47,712 | |
China Pacific Insurance Group Co. Ltd. - Class H | | | 40,400 | | | | 104,709 | |
Dai-ichi Life Holdings, Inc. | | | 6,692 | | | | 193,244 | |
Everest Group Ltd. | | | 9,304 | | | | 3,649,401 | |
Hannover Rueck SE | | | 421 | | | | 119,444 | |
Hiscox Ltd. | | | 192,352 | | | | 2,973,291 | |
ICICI Lombard General Insurance Co. Ltd.(b) | | | 39,019 | | | | 998,034 | |
Legal & General Group PLC | | | 36,815 | | | | 108,728 | |
M&G PLC | | | 12,144 | | | | 34,319 | |
Mandatum Oyj | | | 2,616 | | | | 12,379 | |
Manulife Financial Corp. | | | 6,860 | | | | 189,405 | |
MS&AD Insurance Group Holdings, Inc. | | | 2,700 | | | | 62,237 | |
Muenchener Rueckversicherungs-Gesellschaft AG | | | 295 | | | | 159,608 | |
New China Life Insurance Co. Ltd. - Class H | | | 45,800 | | | | 99,130 | |
NN Group NV | | | 3,039 | | | | 149,052 | |
PICC Property & Casualty Co. Ltd. - Class H | | | 48,000 | | | | 62,165 | |
Ping An Insurance Group Co. of China Ltd. - Class H | | | 24,500 | | | | 115,989 | |
Powszechny Zaklad Ubezpieczen SA | | | 81,270 | | | | 978,596 | |
Sampo Oyj | | | 61,296 | | | | 2,732,657 | |
Samsung Fire & Marine Insurance Co. Ltd. | | | 1,360 | | | | 353,289 | |
Samsung Life Insurance Co. Ltd. | | | 11,151 | | | | 814,498 | |
Sompo Holdings, Inc. | | | 1,800 | | | | 42,502 | |
Sun Life Financial, Inc. | | | 2,753 | | | | 150,094 | |
Suncorp Group Ltd. | | | 18,597 | | | | 222,097 | |
Swiss Re AG | | | 544 | | | | 74,324 | |
T&D Holdings, Inc. | | | 5,200 | | | | 88,104 | |
Tokio Marine Holdings, Inc. | | | 4,200 | | | | 159,829 | |
Topdanmark AS | | | 33,242 | | | | 1,839,416 | |
Zurich Insurance Group AG - ADR | | | 7,180 | | | | 208,794 | |
The accompanying notes are an integral part of the financial statements.
7
AQUARIUS INTERNATIONAL FUND
Schedule of Investments (Continued)
as of AUGUST 31, 2024
| | | Shares | | | Value | |
Insurance — (Continued) | | | | | | | | |
Zurich Insurance Group AG | | | 270 | | | $ | 156,729 | |
| | | | | | | | 34,542,421 | |
Internet — 3.0% | | | | | | | | |
Alibaba Group Holding Ltd. - ADR | | | 4,499 | | | | 374,947 | |
Alibaba Group Holding Ltd. | | | 217,400 | | | | 2,253,258 | |
Auto Trader Group PLC(b) | | | 5,141 | | | | 57,743 | |
Bilibili, Inc. - ADR(a) | | | 4,363 | | | | 62,740 | |
Delivery Hero SE(a)(b) | | | 1,653 | | | | 52,058 | |
iQIYI, Inc. - ADR(a) | | | 12,194 | | | | 26,217 | |
JD.com, Inc. - ADR | | | 5,286 | | | | 142,722 | |
JOYY, Inc. - ADR | | | 2,046 | | | | 70,362 | |
LY Corp. | | | 14,900 | | | | 40,834 | |
Meituan - ADR(a) | | | 4,650 | | | | 140,942 | |
Meituan - Class B(a)(b) | | | 32,800 | | | | 496,310 | |
MercadoLibre, Inc.(a) | | | 729 | | | | 1,502,950 | |
MonotaRO Co. Ltd. | | | 116,900 | | | | 1,849,031 | |
Naspers Ltd. - ADR | | | 4,780 | | | | 196,458 | |
Naspers Ltd. | | | 3,798 | | | | 783,459 | |
NAVER Corp. | | | 688 | | | | 87,280 | |
Ocado Group PLC(a) | | | 7,857 | | | | 35,536 | |
PDD Holdings, Inc. - ADR(a) | | | 2,583 | | | | 248,252 | |
Prosus NV | | | 4,876 | | | | 180,733 | |
Rakuten Group, Inc.(a) | | | 7,200 | | | | 51,174 | |
Sea Ltd. - ADR(a) | | | 924 | | | | 72,358 | |
SEEK Ltd. | | | 4,272 | | | | 66,520 | |
Shopify, Inc. - Class A(a) | | | 2,370 | | | | 175,546 | |
Tencent Holdings Ltd. - ADR | | | 16,139 | | | | 782,903 | |
Tencent Holdings Ltd. | | | 131,930 | | | | 6,398,593 | |
Trip.com Group Ltd. - ADR(a) | | | 21,882 | | | | 1,031,518 | |
Wix.com Ltd.(a) | | | 389 | | | | 64,815 | |
| | | | | | | | 17,245,259 | |
Investment Companies — 0.0%(d) | | | | |
L E Lundbergforetagen AB - Class B | | | 1,867 | | | | 102,373 | |
| | | | | | | | | |
Iron/Steel — 0.1% | | | | | | | | |
BlueScope Steel Ltd. | | | 6,357 | | | | 88,565 | |
Cia Siderurgica Nacional SA - ADR | | | 41,580 | | | | 88,565 | |
Fortescue Ltd. | | | 5,658 | | | | 69,704 | |
Nippon Steel Corp. | | | 8,000 | | | | 182,566 | |
POSCO Holdings, Inc. - ADR | | | 3,580 | | | | 228,476 | |
Vale SA - ADR | | | 12,347 | | | | 129,890 | |
| | | | | | | | 787,766 | |
Leisure Time — 0.2% | | | | | | | | |
Amadeus IT Group SA - ADR | | | 1,437 | | | | 96,997 | |
Bajaj Auto Ltd. | | | 5,704 | | | | 740,583 | |
Shimano, Inc. | | | 236 | | | | 44,588 | |
| | | Shares | | | Value | |
Leisure Time — (Continued) | | | | |
Yamaha Corp. | | | 1,300 | | | $ | 31,377 | |
| | | | | | | | 913,545 | |
Lodging — 0.1% | | | | | | | | |
H World Group Ltd. - ADR | | | 1,879 | | | | 57,197 | |
Indian Hotels Co. Ltd. | | | 50,064 | | | | 387,015 | |
InterContinental Hotels Group PLC | | | 1,515 | | | | 151,628 | |
| | | | | | | | 595,840 | |
Machinery-Construction & Mining — 2.8% | | | | |
HD Hyundai Electric Co. Ltd. | | | 2,806 | | | | 642,385 | |
Hitachi Ltd. - ADR | | | 9,150 | | | | 448,167 | |
Hitachi Ltd. | | | 250,205 | | | | 6,172,564 | |
Komatsu Ltd. | | | 4,400 | | | | 123,123 | |
Mitsubishi Electric Corp. | | | 179,800 | | | | 3,028,919 | |
Mitsubishi Heavy Industries Ltd. | | | 6,000 | | | | 80,894 | |
Siemens Energy AG(a) | | | 960 | | | | 27,726 | |
Weir Group PLC | | | 214,649 | | | | 5,691,089 | |
| | | | | | | | 16,214,867 | |
Machinery-Diversified — 1.5% | | | | | | | | |
Accelleron Industries AG | | | 226 | | | | 11,832 | |
ANDRITZ AG | | | 16,332 | | | | 1,076,707 | |
Atlas Copco AB - ADR | | | 6,624 | | | | 120,491 | |
Atlas Copco AB - Class A | | | 6,804 | | | | 123,786 | |
FANUC Corp. | | | 1,000 | | | | 29,519 | |
Haitian International Holdings Ltd. | | | 31,000 | | | | 86,610 | |
Husqvarna AB - Class B | | | 4,490 | | | | 30,353 | |
IMI PLC | | | 107,649 | | | | 2,607,074 | |
Keyence Corp. | | | 500 | | | | 240,210 | |
KION Group AG | | | 1,235 | | | | 48,099 | |
Kone Oyj - Class B | | | 66,226 | | | | 3,572,131 | |
Kubota Corp. - ADR | | | 883 | | | | 61,863 | |
NARI Technology Co. Ltd. - Class A | | | 115,620 | | | | 400,448 | |
SMC Corp. - ADR | | | 2,280 | | | | 52,668 | |
SMC Corp. | | | 110 | | | | 51,014 | |
| | | | | | | | 8,512,805 | |
Media — 0.4% | | | | | | | | |
Informa PLC | | | 149,777 | | | | 1,649,015 | |
Pearson PLC - ADR | | | 15,198 | | | | 210,948 | |
Thomson Reuters Corp. | | | 1,367 | | | | 234,003 | |
Vivendi SE | | | 3,398 | | | | 38,118 | |
| | | | | | | | 2,132,084 | |
Metal Fabricate/Hardware — 0.6% | | | | |
Tenaris SA | | | 71,773 | | | | 1,056,266 | |
Vallourec SACA(a) | | | 157,587 | | | | 2,518,316 | |
| | | | | | | | 3,574,582 | |
The accompanying notes are an integral part of the financial statements.
8
AQUARIUS INTERNATIONAL FUND
Schedule of Investments (Continued)
as of AUGUST 31, 2024
| | | Shares | | | Value | |
Mining — 2.2% | | | | | | | | |
Agnico Eagle Mines Ltd./Mines Agnico Eagle Limitee | | | 1,485 | | | $ | 120,983 | |
Alamos Gold, Inc. - Class A | | | 32,914 | | | | 634,582 | |
Allied Gold Corp.(a) | | | 298,126 | | | | 676,931 | |
Antofagasta PLC | | | 8,790 | | | | 214,621 | |
Barrick Gold Corp. | | | 6,196 | | | | 125,097 | |
BHP Group Ltd. - ADR | | | 3,707 | | | | 204,367 | |
Boliden AB | | | 2,900 | | | | 88,591 | |
Cameco Corp. | | | 3,460 | | | | 141,306 | |
Capstone Copper Corp.(a) | | | 68,402 | | | | 490,815 | |
Endeavour Mining PLC | | | 72,489 | | | | 1,528,151 | |
Franco-Nevada Corp. | | | 1,038 | | | | 126,792 | |
GMK Norilskiy Nickel PAO - ADR(a)(c) | | | 2,034 | | | | 20 | |
Kinross Gold Corp. | | | 445,873 | | | | 4,029,780 | |
Norsk Hydro ASA | | | 15,202 | | | | 84,829 | |
Polyus PJSC(a)(c) | | | 1,719 | | | | 0 | |
Rio Tinto PLC - ADR | | | 1,210 | | | | 76,557 | |
South32 Ltd. | | | 44,192 | | | | 93,064 | |
Southern Copper Corp. | | | 35,599 | | | | 3,621,155 | |
Sumitomo Metal Mining Co. Ltd. | | | 2,000 | | | | 55,427 | |
Wheaton Precious Metals Corp. | | | 2,998 | | | | 185,306 | |
Zijin Mining Group Co. Ltd. - Class H | | | 24,000 | | | | 48,278 | |
| | | | | | | | 12,546,652 | |
Miscellaneous Manufacturing — 1.2% | | | | |
Aalberts NV | | | 35,667 | | | | 1,394,315 | |
Diploma PLC | | | 18,668 | | | | 1,099,480 | |
Fabrinet(a) | | | 2,227 | | | | 542,608 | |
Knorr-Bremse AG | | | 679 | | | | 55,834 | |
Orica Ltd. | | | 5,536 | | | | 66,405 | |
Siemens AG | | | 19,121 | | | | 3,596,765 | |
Sumitomo Heavy Industries Ltd. | | | 2,000 | | | | 46,847 | |
| | | | | | | | 6,802,254 | |
Office-Business Equipment — 0.0%(d) | | | | |
Canon, Inc. | | | 2,700 | | | | 92,730 | |
| | | | | | | | | |
Oil & Gas — 4.3% | | | | | | | | |
Aker BP ASA | | | 841 | | | | 20,147 | |
BP PLC | | | 267,887 | | | | 1,516,585 | |
BP PLC - ADR | | | 1 | | | | 34 | |
Canadian Natural Resources Ltd. | | | 8,670 | | | | 313,941 | |
Cenovus Energy, Inc. | | | 198,279 | | | | 3,676,765 | |
DCC PLC | | | 452 | | | | 31,936 | |
Equinor ASA | | | 79,080 | | | | 2,121,920 | |
Equinor ASA - ADR | | | 3,137 | | | | 84,354 | |
Galp Energia SGPS SA | | | 30,614 | | | | 635,973 | |
Imperial Oil Ltd. | | | 2,792 | | | | 210,042 | |
Inpex Corp. | | | 6,228 | | | | 91,808 | |
MEG Energy Corp.(a) | | | 80,745 | | | | 1,608,129 | |
| | | Shares | | | Value | |
Oil & Gas — (Continued) | | | | |
Neste Oyj | | | 2,991 | | | $ | 69,793 | |
OMV AG | | | 4,843 | | | | 211,232 | |
PetroChina Co. Ltd. - Class H | | | 1,084,000 | | | | 977,679 | |
Petroleo Brasileiro SA - ADR | | | 46,463 | | | | 707,631 | |
Reliance Industries Ltd. | | | 41,391 | | | | 1,489,216 | |
Repsol SA | | | 7,844 | | | | 107,714 | |
Santos Ltd. | | | 19,946 | | | | 97,243 | |
Shell PLC | | | 39,542 | | | | 1,408,956 | |
Shell PLC | | | 55,926 | | | | 1,981,659 | |
Shell PLC - ADR | | | 88,343 | | | | 6,330,659 | |
TotalEnergies SE - ADR | | | 7,259 | | | | 500,871 | |
Ultrapar Participacoes SA - ADR | | | 10,793 | | | | 44,899 | |
Vista Energy SAB de CV - ADR(a) | | | 16,413 | | | | 855,610 | |
Woodside Energy Group Ltd. | | | 7,291 | | | | 133,566 | |
| | | | | | | | 25,228,362 | |
Pharmaceuticals — 8.7% | | | | | | | | |
Aspen Pharmacare Holdings Ltd. - ADR | | | 6,986 | | | | 94,241 | |
Astellas Pharma, Inc. | | | 3,500 | | | | 43,494 | |
AstraZeneca PLC - ADR | | | 9,096 | | | | 796,992 | |
AstraZeneca PLC | | | 56,606 | | | | 9,921,095 | |
Bayer AG | | | 1,167 | | | | 36,033 | |
Celltrion, Inc. | | | 567 | | | | 86,258 | |
Chugai Pharmaceutical Co. Ltd. | | | 66,800 | | | | 3,372,233 | |
Cipla Ltd. | | | 13,082 | | | | 258,349 | |
Daiichi Sankyo Co. Ltd. | | | 3,548 | | | | 148,937 | |
Daiichi Sankyo Co. Ltd. - ADR | | | 876 | | | | 36,678 | |
Dr Reddy’s Laboratories Ltd. - ADR | | | 7,475 | | | | 623,938 | |
GSK PLC | | | 91,763 | | | | 1,998,561 | |
GSK PLC - ADR | | | 3,067 | | | | 134,672 | |
Hansoh Pharmaceutical Group Co. Ltd.(b) | | | 182,000 | | | | 464,188 | |
Hikma Pharmaceuticals PLC | | | 49,199 | | | | 1,285,982 | |
Merck KGaA | | | 587 | | | | 114,558 | |
Novartis AG - ADR | | | 5,833 | | | | 705,151 | |
Novartis AG | | | 61,268 | | | | 7,402,287 | |
Novo Nordisk AS - ADR | | | 12,898 | | | | 1,794,886 | |
Novo Nordisk AS | | | 36,415 | | | | 5,058,414 | |
Orion Oyj - Class B | | | 672 | | | | 35,633 | |
Recordati SPA | | | 59,572 | | | | 3,497,699 | |
Roche Holding AG - ADR | | | 14,560 | | | | 616,325 | |
Roche Holdings AG | | | 13,379 | | | | 4,529,070 | |
Sandoz Group AG | | | 100,955 | | | | 4,415,650 | |
Sandoz Group AG - ADR | | | 1,166 | | | | 51,327 | |
Sanofi SA - ADR | | | 5,762 | | | | 324,170 | |
Sinopharm Group Co. Ltd. - Class H | | | 36,400 | | | | 84,239 | |
Sun Pharmaceutical Industries Ltd. | | | 20,864 | | | | 453,285 | |
The accompanying notes are an integral part of the financial statements.
9
AQUARIUS INTERNATIONAL FUND
Schedule of Investments (Continued)
as of AUGUST 31, 2024
| | | Shares | | | Value | |
Pharmaceuticals — (Continued) | | | | |
Suzuken Co Ltd. | | | 33,300 | | | $ | 1,180,134 | |
Teva Pharmaceutical Industries, Ltd., SP ADR - ADR(a) | | | 47,801 | | | | 902,005 | |
UCB SA | | | 810 | | | | 146,702 | |
| | | | | | | | 50,613,186 | |
Pipelines — 0.1% | | | | | | | | |
Enbridge, Inc. | | | 6,937 | | | | 278,729 | |
Pembina Pipeline Corp. | | | 936 | | | | 37,702 | |
TC Energy Corp. | | | 2,920 | | | | 135,313 | |
| | | | | | | | 451,744 | |
Private Equity — 0.4% | | | | | | | | |
3i Group PLC | | | 3,463 | | | | 145,462 | |
Antin Infrastructure Partners SA | | | 15,748 | | | | 217,824 | |
Eurazeo SA | | | 17,292 | | | | 1,362,181 | |
Macquarie Korea Infrastructure Fund | | | 49,750 | | | | 448,382 | |
Partners Group Holding AG | | | 95 | | | | 137,440 | |
| | | | | | | | 2,311,289 | |
Real Estate — 0.6% | | | | | | | | |
Aldar Properties PJSC | | | 316,803 | | | | 633,329 | |
Corp. Inmobiliaria Vesta SAB de CV | | | 157,500 | | | | 431,692 | |
Daito Trust Construction Co. Ltd. | | | 300 | | | | 37,027 | |
Direcional Engenharia SA | | | 68,338 | | | | 348,847 | |
DLF Ltd. | | | 61,677 | | | | 621,767 | |
Emaar Properties PJSC | | | 266,841 | | | | 613,386 | |
FirstService Corp. | | | 230 | | | | 41,412 | |
Henderson Land Development Co. Ltd. | | | 23,000 | | | | 71,459 | |
Hongkong Land Holdings Ltd. | | | 7,900 | | | | 29,642 | |
Iguatemi SA | | | 112,300 | | | | 440,158 | |
KE Holdings, Inc. - ADR | | | 4,582 | | | | 67,997 | |
REA Group Ltd. | | | 633 | | | | 93,761 | |
Sunac Services Holdings Ltd.(b) | | | 619 | | | | 133 | |
Swire Pacific Ltd. - Class A | | | 5,000 | | | | 42,441 | |
Vonovia SE | | | 1,074 | | | | 37,123 | |
Wharf Holdings Ltd. | | | 14,000 | | | | 36,646 | |
| | | | | | | | 3,546,820 | |
REITS — 0.2% | | | | | | | | |
Ascendas Real Estate Investment Trust | | | 23,000 | | | | 50,708 | |
CapitaLand Mall Trust | | | 25,000 | | | | 40,620 | |
Fibra Uno Administracion SAB de CV | | | 245,700 | | | | 289,686 | |
Gecina SA | | | 370 | | | | 40,659 | |
Goodman Group | | | 6,677 | | | | 150,632 | |
GPT Group | | | 9,864 | | | | 32,646 | |
Japan Real Estate Investment Corp. | | | 34 | | | | 136,601 | |
Mirvac Group | | | 19,373 | | | | 26,602 | |
| | | Shares | | | Value | |
REITS — (Continued) | | | | | | | | |
Nippon Building Fund Inc. | | | 23 | | | $ | 103,210 | |
Nippon Prologis REIT, Inc. | | | 31 | | | | 54,611 | |
Nomura Real Estate Master Fund, Inc. | | | 65 | | | | 65,833 | |
Scentre Group | | | 14,492 | | | | 33,580 | |
Segro PLC | | | 2,361 | | | | 27,182 | |
Stockland | | | 11,630 | | | | 39,276 | |
Unibail-Rodamco-Westfield | | | 938 | | | | 75,006 | |
United Urban Investment Corp. | | | 51 | | | | 50,255 | |
| | | | | | | | 1,217,107 | |
Retail — 2.2% | | | | | | | | |
ANTA Sports Products Ltd. | | | 5,561 | | | | 54,254 | |
Associated British Foods PLC | | | 1,593 | | | | 52,258 | |
Astra International Tbk PT - ADR | | | 3,615 | | | | 24,112 | |
BBB Foods, Inc. - Class A(a) | | | 14,428 | | | | 458,522 | |
Cie Financiere Richemont SA - ADR | | | 12,160 | | | | 191,277 | |
Fast Retailing Co. Ltd. | | | 441 | | | | 141,921 | |
Ferguson Enterprises, Inc. | | | 14,802 | | | | 3,013,120 | |
H & M Hennes & Mauritz AB - Class B | | | 6,863 | | | | 108,549 | |
Industria de Diseno Textil SA | | | 3,052 | | | | 165,344 | |
Jardine Cycle & Carriage Ltd. | | | 4,000 | | | | 84,804 | |
McDonald’s Holdings Co. Japan Ltd. | | | 2,600 | | | | 114,201 | |
Next PLC | | | 952 | | | | 127,661 | |
Nitori Holdings Co. Ltd. | | | 300 | | | | 43,959 | |
Pan Pacific International Holdings Corp. | | | 1,500 | | | | 38,398 | |
Raia Drogasil SA | | | 101,100 | | | | 491,154 | |
Restaurant Brands International, Inc. | | | 3,260 | | | | 226,505 | |
Ryohin Keikaku Co. Ltd. | | | 94,800 | | | | 1,785,158 | |
Shanghai Pharmaceuticals Holding Co. Ltd. - Class H | | | 39,800 | | | | 54,908 | |
Sugi Holdings Co. Ltd. | | | 53,100 | | | | 918,310 | |
Sundrug Co. Ltd. | | | 26,700 | | | | 777,287 | |
Swatch Group AG | | | 184 | | | | 38,548 | |
Tsuruha Holdings, Inc. | | | 32,600 | | | | 1,972,954 | |
USS Co. Ltd. | | | 3,400 | | | | 31,220 | |
Wal-Mart de Mexico SAB de CV - ADR | | | 720 | | | | 23,040 | |
WH Smith PLC | | | 120,273 | | | | 2,026,558 | |
| | | | | | | | 12,964,022 | |
Semiconductors — 8.3% | | | | | | | | |
ASE Technology Holding Co. Ltd. - ADR | | | 6,033 | | | | 60,270 | |
ASM International NV | | | 3,435 | | | | 2,338,819 | |
ASML Holding NV | | | 1,129 | | | | 1,020,469 | |
ASML Holding NV | | | 3,197 | | | | 2,883,163 | |
The accompanying notes are an integral part of the financial statements.
10
AQUARIUS INTERNATIONAL FUND
Schedule of Investments (Continued)
as of AUGUST 31, 2024
| | | Shares | | | Value | |
Semiconductors — (Continued) | | | | |
ASPEED Technology, Inc. | | | 6,000 | | | $ | 925,644 | |
Gudeng Precision Industrial Co. Ltd. | | | 17,000 | | | | 290,909 | |
Infineon Technologies AG | | | 91,288 | | | | 3,350,196 | |
MediaTek, Inc. | | | 10,000 | | | | 388,168 | |
Renesas Electronics Corp. | | | 50,100 | | | | 872,215 | |
Samsung Electronics Co. Ltd. | | | 270,845 | | | | 15,042,277 | |
SK Hynix, Inc. | | | 10,465 | | | | 1,371,352 | |
SUMCO Corp. | | | 34 | | | | 393 | |
Taiwan Semiconductor Manufacturing Co. Ltd. - ADR | | | 59,034 | | | | 10,136,138 | |
Taiwan Semiconductor Manufacturing Co. Ltd. | | | 298,122 | | | | 8,826,013 | |
Tokyo Electron Ltd. | | | 1,200 | | | | 215,976 | |
Tokyo Electron Ltd. - ADR | | | 1,572 | | | | 140,898 | |
United Microelectronics Corp. - ADR | | | 36,418 | | | | 319,386 | |
| | | | | | | | 48,182,286 | |
Shipbuilding — 0.1% | | | | | | | | |
Samsung Heavy Industries Co. Ltd.(a) | | | 71,867 | | | | 566,550 | |
| | | | | | | | | |
Software — 0.5% | | | | | | | | |
Dassault Systemes SE - ADR | | | 2,450 | | | | 95,477 | |
Dassault Systemes SE | | | 2,375 | | | | 92,815 | |
Kaspi.KZ JSC - ADR | | | 11,825 | | | | 1,548,247 | |
NetEase, Inc. - ADR | | | 2,660 | | | | 213,970 | |
Nexon Co. Ltd. | | | 2,300 | | | | 45,450 | |
Open Text Corp. | | | 1,156 | | | | 36,784 | |
SAP SE - ADR | | | 3,821 | | | | 839,512 | |
TeamViewer SE - ADR(a) | | | 4,442 | | | | 30,428 | |
| | | | | | | | 2,902,683 | |
Telecommunications — 1.7% | | | | | | | | |
America Movil SAB de CV - ADR | | | 7,257 | | | | 120,176 | |
BCE, Inc. | | | 5,373 | | | | 188,055 | |
Bharti Airtel Ltd. | | | 42,056 | | | | 797,027 | |
Chunghwa Telecom Co. Ltd. | | | 102,000 | | | | 395,410 | |
Chunghwa Telecom Co. Ltd. - ADR | | | 4,171 | | | | 161,209 | |
Deutsche Telekom AG - ADR | | | 5,690 | | | | 161,767 | |
Deutsche Telekom AG | | | 1,461 | | | | 41,570 | |
Elisa OYJ | | | 493 | | | | 24,688 | |
Hikari Tsushin, Inc. | | | 200 | | | | 42,240 | |
KDDI Corp. | | | 122,848 | | | | 4,144,541 | |
KT Corp. | | | 61,210 | | | | 1,773,838 | |
Millicom International Cellular SA, SDR(a) | | | 116 | | | | 2,978 | |
MTN Group Ltd. | | | 23,254 | | | | 115,831 | |
Nice Ltd. - ADR(a) | | | 288 | | | | 50,037 | |
Nippon Telegraph & Telephone Corp. - ADR | | | 984 | | | | 26,305 | |
| | | Shares | | | Value | |
Telecommunications — (Continued) | | | | |
Nippon Telegraph & Telephone Corp. | | | 39,600 | | | $ | 42,324 | |
Orange SA | | | 4,154 | | | | 47,380 | |
PLDT, Inc. - ADR | | | 5,294 | | | | 142,673 | |
Rogers Communications, Inc. - Class B | | | 3,057 | | | | 123,961 | |
Singapore Telecommunications Ltd. | | | 60,600 | | | | 145,333 | |
SK Telecom Co. Ltd. - ADR | | | 1 | | | | 23 | |
SoftBank Corp. | | | 2,800 | | | | 39,177 | |
SoftBank Group Corp. | | | 1,100 | | | | 63,863 | |
Swisscom AG | | | 80 | | | | 50,574 | |
Tele2 AB - Class B | | | 3,689 | | | | 41,854 | |
Telefonaktiebolaget LM Ericsson - Class B | | | 6,504 | | | | 48,521 | |
Telefonica Brasil SA | | | 53,600 | | | | 494,159 | |
Telefonica Brasil SA - ADR | | | 40,977 | | | | 379,037 | |
Telefonica SA | | | 9,725 | | | | 43,997 | |
Turkcell Iletisim Hizmetleri AS - ADR | | | 15,018 | | | | 105,877 | |
| | | | | | | | 9,814,425 | |
Toys/Games/Hobbies — 0.0%(d) | | | | |
Bandai Namco Holdings, Inc. | | | 2,400 | | | | 51,560 | |
Nintendo Co. Ltd. - ADR | | | 5,760 | | | | 78,336 | |
Nintendo Co. Ltd. | | | 700 | | | | 38,069 | |
| | | | | | | | 167,965 | |
Transportation — 0.7% | | | | | | | | |
Canadian National Railway Co. | | | 3,433 | | | | 404,476 | |
Canadian Pacific Kansas City Ltd. | | | 1,018 | | | | 84,433 | |
Deutsche Post AG - ADR | | | 1,603 | | | | 69,586 | |
DSV AS | | | 10,381 | | | | 1,855,152 | |
DSV AS - ADR | | | 826 | | | | 73,886 | |
East Japan Railway Co. | | | 1,500 | | | | 28,758 | |
Getlink SE | | | 1,582 | | | | 28,531 | |
Hankyu Hanshin Holdings, Inc. | | | 1,300 | | | | 39,947 | |
Keisei Electric Railway Co. Ltd. | | | 25,400 | | | | 803,583 | |
Kintetsu Group Holdings Co. Ltd. | | | 2,600 | | | | 60,622 | |
Kuehne + Nagel International AG | | | 126 | | | | 39,099 | |
Mitsui OSK Lines Ltd. | | | 9,000 | | | | 324,679 | |
ZTO Express Cayman, Inc. - ADR | | | 1,795 | | | | 38,485 | |
| | | | | | | | 3,851,237 | |
Water — 0.1% | | | | | | | | |
Cia de Saneamento Basico do Estado de Sao Paulo SABESP | | | 31,100 | | | | 519,975 | |
Cia de Saneamento Basico do Estado de Sao Paulo SABESP - ADR | | | 4,592 | | | | 77,100 | |
The accompanying notes are an integral part of the financial statements.
11
AQUARIUS INTERNATIONAL FUND
Schedule of Investments (Concluded)
as of AUGUST 31, 2024
| | | Shares | | | Value | |
Water — (Continued) | | | | | | | | |
Severn Trent PLC | | | 1,062 | | | $ | 35,956 | |
| | | | | | | | 633,031 | |
TOTAL COMMON STOCKS (Cost $422,800,174) | | | | | | | 541,915,777 | |
| | | | | |
PREFERRED STOCKS — 0.0%(d) | | | | |
Auto Manufacturers — 0.0%(d) | | | | |
Porsche Auto SE | | | 813 | | | | 36,584 | |
TOTAL PREFERRED STOCKS (Cost $33,156) | | | | | | | 36,584 | |
| | | | | | | | | |
| | | Contracts | | | | | |
RIGHTS — 0.0%(d) | | | | |
Private Equity — 0.0%(d) | | | | |
Macquarie Korea Infrastructure Fund, Expires 10/08/2024, Exercise Price $11,570.00(a)(c) | | | 4,925 | | | | 1,733 | |
TOTAL RIGHTS (Cost $783) | | | | | | | 1,733 | |
| | | | | | | | | |
| | | Shares | | | | | |
SHORT-TERM INVESTMENTS — 6.0% | | | | |
Money Market Funds — 6.0% | | | | |
First American Treasury Obligations Fund - Class X, 5.18%(e) | | | 35,103,660 | | | | 35,103,660 | |
TOTAL SHORT-TERM INVESTMENTS (Cost $35,103,660) | | | | | | | 35,103,660 | |
TOTAL INVESTMENTS — 99.2% (Cost $457,937,773) | | | | | | | 577,057,754 | |
Other Assets in Excess of Liabilities — 0.8% | | | | | | | 4,376,548 | |
TOTAL NET ASSETS — 100.0% | | | | | | $ | 581,434,302 | |
Percentages are stated as a percent of net assets.
ADR - American Depositary Receipt
AG - Aktiengesellschaft
ASA - Advanced Subscription Agreement
GDR - Global Depositary Receipt
NV - Naamloze Vennootschap
PJSC - Public Joint Stock Company
PLC - Public Limited Company
REIT - Real Estate Investment Trust
SA - Sociedad Anónima
SA/NV - Societe Anonime/Naamloze Vennootschap
SAB de CV - Sociedad Anónima Bursátil de Capital Variable
| (a) | Non-income producing security. |
(b) | Security is exempt from registration pursuant to Rule 144A under the Securities Act of 1933, as amended. These securities may only be resold in transactions exempt from registration to qualified institutional investors. As of August 31, 2024, the value of these securities total $7,208,721 or 1.2% of the Fund’s net assets. |
(c) | Fair value determined using significant unobservable inputs in accordance with procedures established by and under the supervision of the Adviser, acting as Valuation Designee. These securities represented $1,753 or 0.0% of net assets as of August 31, 2024. |
(d) | Represents less than 0.05% of net assets. |
(e) | The rate shown represents the 7-day annualized effective yield as of August 31, 2024. |
The accompanying notes are an integral part of the financial statements.
12
AQUARIUS INTERNATIONAL FUND
STATEMENT of Assets and Liabilities
AUGUST 31, 2024
ASSETS | | | | |
Investments, at value (cost $422,834,113) | | $ | 541,954,094 | |
Short-term investments, at value (cost $35,103,660) | | | 35,103,660 | |
Foreign currency, at value (Cost $267,759) | | | 288,401 | |
Receivables for: | | | | |
Investments sold | | | 3,664,484 | |
Dividends and interest | | | 1,932,781 | |
Capital shares sold | | | 204,940 | |
Prepaid expenses and other assets | | | 23,486 | |
Total assets | | | 583,171,846 | |
| | | | | |
LIABILITIES | | | | |
Payables for: | | | | |
Investments purchased | | | 1,247,744 | |
Capital shares redeemed | | | 65,040 | |
Sub-advisory fees | | | 232,555 | |
Other accrued expenses and liabilities | | | 192,205 | |
Total liabilities | | | 1,737,544 | |
Net assets | | $ | 581,434,302 | |
| | | | | |
NET ASSETS CONSIST OF: | | | | |
Par value | | $ | 48,361 | |
Paid-in capital | | | 485,560,850 | |
Total distributable earnings/(loss) | | | 95,825,091 | |
Net assets | | $ | 581,434,302 | |
| | | | | |
CAPITAL SHARES: | | | | |
Net Assets | | $ | 581,434,302 | |
Shares outstanding ($0.001 par value, 100,000,000 shares authorized) | | | 48,361,223 | |
Net asset value, offering and redemption price per share | | $ | 12.02 | |
The accompanying notes are an integral part of the financial statements.
13
AQUARIUS INTERNATIONAL FUND
Statement of Operations
FOR THE year ENDED AUGUST 31, 2024
INVESTMENT INCOME | | | | |
Dividends (net of foreign taxes withheld of $1,328,897) | | $ | 11,460,968 | |
Interest income | | | 1,904,752 | |
Total investment income | | | 13,365,720 | |
| | | | | |
EXPENSES | | | | |
Sub-advisory fees (Note 2) | | | 2,436,424 | |
Administration and accounting services fees (Note 2) | | | 303,742 | |
Custodian fees (Note 2) | | | 233,752 | |
Investment management fees (Note 2) | | | 154,075 | |
Transfer agent fees (Note 2) | | | 67,320 | |
Director fees | | | 64,776 | |
Legal fees | | | 52,376 | |
Officer fees | | | 48,827 | |
Audit fees | | | 45,927 | |
Registration and filing fees | | | 30,460 | |
Printing and shareholder reporting fees | | | 8,985 | |
Other expenses | | | 44,091 | |
Total expenses | | | 3,490,755 | |
Net investment income/(loss) | | | 9,874,965 | |
| | | | | |
NET REALIZED AND UNREALIZED GAIN/(LOSS) FROM INVESTMENTS | | | | |
Net Realized Gain (Loss) on: | | | | |
Investments | | | 6,750,444 | |
Foreign Currency Transactions | | | (670,707 | ) |
Net Realized Gain (Loss) | | | 6,079,737 | |
Net Change in Unrealized Appreciation (Depreciation) on: | | | | |
Investments | | | 75,318,446 | |
Foreign Currency Transactions | | | 36,365 | |
Net Change in Unrealized Appreciation (Depreciation) | | | 75,354,811 | |
NET INCREASE/(DECREASE) IN NET ASSETS RESULTING FROM OPERATIONS | | $ | 91,309,513 | |
The accompanying notes are an integral part of the financial statements.
14
AQUARIUS INTERNATIONAL FUND
Statements of Changes in Net Assets
| | | For the
Year Ended
August 31, 2024 | | | For the
Year Ended
August 31, 2023 | |
INCREASE/(DECREASE) IN NET ASSETS FROM OPERATIONS | | | | | | | | |
Net investment income/(loss) | | $ | 9,874,965 | | | $ | 8,640,137 | |
Net realized gain/(loss) from investments | | | 6,079,737 | | | | (14,105,508 | ) |
Net change in unrealized appreciation/(depreciation) on investments and foreign currency transactions | | | 75,354,811 | | | | 49,676,775 | |
Net increase/(decrease) in net assets resulting from operations | | | 91,309,513 | | | | 44,211,404 | |
| | | | | | | | | |
DIVIDENDS AND DISTRIBUTIONS TO SHAREHOLDERS FROM: | | | | | | | | |
Total distributable earnings | | | (10,001,068 | ) | | | (4,179,382 | ) |
Net decrease in net assets from dividends and distributions to shareholders | | | (10,001,068 | ) | | | (4,179,382 | ) |
| | | | | | | | | |
CAPITAL SHARE TRANSACTIONS: | | | | | | | | |
Proceeds from shares sold | | | 78,989,579 | | | | 88,275,263 | |
Reinvestment of distributions | | | 8,459,172 | | | | 3,505,305 | |
Shares redeemed | | | (38,919,822 | ) | | | (35,881,611 | ) |
Net increase/(decrease) in net assets resulting from capital share transactions | | | 48,528,929 | | | | 55,898,957 | |
Total increase/(decrease) in net assets | | | 129,837,374 | | | | 95,930,979 | |
| | | | | | | | | |
NET ASSETS: | | | | | | | | |
Beginning of period | | | 451,596,928 | | | | 355,665,949 | |
End of period | | $ | 581,434,302 | | | $ | 451,596,928 | |
| | | | | | | | | |
SHARE TRANSACTIONS: | | | | | | | | |
Shares sold | | | 7,264,867 | | | | 8,971,636 | |
Shares reinvested | | | 826,091 | | | | 366,281 | |
Shares redeemed | | | (3,648,054 | ) | | | (3,684,160 | ) |
Net increase/(decrease) in shares | | | 4,442,904 | | | | 5,653,757 | |
The accompanying notes are an integral part of the financial statements.
15
AQUARIUS INTERNATIONAL FUND
Financial Highlights
Contained below is per share operating performance data for shares outstanding, total investment return/(loss), ratios to average net assets and other supplemental data for the respective periods. This information has been derived from information provided in the financial statements. |
| | | For the
Year Ended
August 31,
2024 | | | For the
Year Ended
August 31,
2023 | | | For the
Year Ended
August 31,
2022 | | | For the
Year Ended
August 31,
2021 | | | For the
Year Ended
August 31,
2020 | |
Per Share Operating Performance | | | | | | | | | | | | | | | | | | | | |
Net asset value, beginning of period | | $ | 10.28 | | | $ | 9.29 | | | $ | 11.97 | | | $ | 9.93 | | | $ | 9.27 | |
Net investment income/(loss)(1) | | | 0.21 | | | | 0.21 | | | | 0.16 | | | | 0.12 | | | | 0.12 | |
Net realized and unrealized gain/(loss) from investments | | | 1.76 | | | | 0.89 | | | | (2.69 | ) | | | 2.00 | | | | 0.67 | |
Net increase/(decrease) in net assets resulting from operations | | | 1.97 | | | | 1.10 | | | | (2.53 | ) | | | 2.12 | | | | 0.79 | |
Dividends and distributions to shareholders from: | | | | | | | | | | | | | | | | | | | | |
Net Investment Income | | | (0.23 | ) | | | (0.11 | ) | | | (0.15 | ) | | | (0.08 | ) | | | (0.13 | ) |
Total dividends and distributions to shareholders | | | (0.23 | ) | | | (0.11 | ) | | | (0.15 | ) | | | (0.08 | ) | | | (0.13 | ) |
Net asset value, end of period | | $ | 12.02 | | | $ | 10.28 | | | $ | 9.29 | | | $ | 11.97 | | | $ | 9.93 | |
Total investment return/(loss)(2) | | | 19.53 | % | | | 11.89 | % | | | (21.38 | )% | | | 21.46 | % | | | 8.61 | % |
| | | | | | | | | | | | | | | | | | | | | |
Ratios/Supplemental Data | | | | | | | | | | | | | | | | | | | | |
Net assets, end of period (000’s omitted) | | $ | 581,434 | | | $ | 451,597 | | | $ | 355,666 | | | $ | 382,824 | | | $ | 278,956 | |
Ratio of expenses to average net assets | | | 0.69 | % | | | 0.70 | % | | | 0.73 | % | | | 0.75 | % | | | 0.75 | % |
Ratio of net investment income/(loss) to average net assets | | | 1.97 | % | | | 2.16 | % | | | 1.48 | % | | | 1.08 | % | | | 1.24 | % |
Portfolio turnover rate | | | 59 | % | | | 78 | % | | | 52 | % | | | 48 | % | | | 55 | % |
(1) | Calculated based on average shares outstanding for the period. |
(2) | Total investment return/(loss) is calculated assuming a purchase of shares on the first day and a sale of shares on the last day of each period reported and includes reinvestments of dividends and distributions, if any. |
The accompanying notes are an integral part of the financial statements.
16
AQUARIUS INTERNATIONAL FUND
NOTES TO FINANCIAL STATEMENTS
AUGUST 31, 2024
1. Organization and Significant Accounting Policies
The RBB Fund, Inc. (“RBB” or the “Company”) was incorporated under the laws of the State of Maryland on February 29, 1988 and is registered under the Investment Company Act of 1940, as amended (the “1940 Act”), as an open-end management investment company. RBB is a “series fund,” which is an investment company divided into separate portfolios. Each portfolio is treated as a separate entity for certain matters under the 1940 Act, and for other purposes, and a shareholder of one portfolio is not deemed to be a shareholder of any other portfolio. Currently, RBB has sixty-five separate investment portfolios, including the Aquarius International Fund (the “Fund”), which commenced investment operations on April 17, 2018.
RBB has authorized capital of one hundred billion shares of common stock of which 92.923 billion shares are currently classified into two hundred and thirty-six classes of common stock. Each class represents an interest in an active or inactive RBB investment portfolio.
The Fund’s investment objective seeks capital appreciation.
The Fund is an investment company and follows accounting and reporting guidance in the Financial Accounting Standards Board (“FASB”) Accounting Standards Codification Topic 946 “Financial Services - Investment Companies”.
The end of the reporting period for the Fund is August 31, 2024, and the period covered by these Notes to Financial Statements is the fiscal year ended August 31, 2024 (the “current fiscal period”).
PORTFOLIO VALUATION – The Fund’s net asset value (“NAV”) is calculated once daily at the close of regular trading hours on the New York Stock Exchange (“NYSE”) (generally 4:00 p.m. Eastern time) on each day the NYSE is open. Securities held by the Fund are valued using the closing price or the last sale price on a national securities exchange or the National Association of Securities Dealers Automatic Quotation System (“NASDAQ”) market system where they are primarily traded. Equity securities traded in the over-the-counter (“OTC”) market are valued at their closing prices. If there were no transactions on that day, securities traded principally on an exchange or on NASDAQ will be valued at the mean of the last bid and ask prices prior to the market close. Fixed income securities are valued using an independent pricing service, which considers such factors as security prices, yields, maturities and ratings, and are deemed representative of market values at the close of the market. Investments in Exchange-Traded Funds (“ETFs”) are valued at their last reported sale price. Foreign securities are valued based on prices from the primary market in which they are traded, and are translated from the local currency into U.S. dollars using current exchange rates. Investments in other open-end investment companies, if any, are valued based on the NAV of those investment companies (which may use fair value pricing as disclosed in their prospectuses). If market quotations are unavailable or deemed unreliable, securities will be valued by the Adviser, as Valuation Designee, in accordance with procedures adopted by the Company’s Board of Directors (the “Board”). Relying on prices supplied by pricing services or dealers or using fair valuation may result in values that are higher or lower than the values used by other investment companies and investors to price the same investments. Such procedures use fundamental valuation methods, which may include, but are not limited to, an analysis of the effect of any restrictions on the resale of the security, industry analysis and trends, significant changes in the issuer’s financial position, and any other event which could have a significant impact on the value of the security. Determination of fair value involves subjective judgment as the actual market value of a particular security can be established only by negotiations between the parties in a sales transaction, and the difference between the recorded fair value and the value that would be received in a sale could be significant. The Valuation Designee may use fair value pricing more frequently for securities traded primarily in non-U.S. markets because, among other things, most foreign markets close well before the Fund values its securities, generally as of 4:00 p.m. Eastern time. The earlier close of these foreign markets gives rise to the possibility that significant events, including broad market moves, government actions or pronouncements, aftermarket trading, or news events may have occurred in the interim. To account for this, the Valuation Designee may value foreign securities using fair value prices based on third-party vendor modeling tools (international fair value pricing).
17
AQUARIUS INTERNATIONAL FUND
NOTES TO FINANCIAL STATEMENTS (CONTINUED)
AUGUST 31, 2024
FAIR VALUE MEASUREMENTS – The inputs and valuation techniques used to measure the fair value of the Fund’s investments are summarized into three levels as described in the hierarchy below:
| | ● Level 1 — | Prices are determined using quoted prices in active markets for identical securities. |
| | ● Level 2 — | Prices are determined using other significant observable inputs (including quoted prices for similar securities, interest rates, prepayment speeds, credit risk, etc.). |
| | ● Level 3 — | Prices are determined using significant unobservable inputs (including the Fund’s own assumptions in determining the fair value of investments). |
The inputs or methodologies used for valuing securities are not necessarily an indication of the risk associated with investing in those securities.
The following is a summary of the inputs used, as of the end of the current fiscal period, in valuing the Fund’s investments carried at fair value:
| | | Level 1 | | | Level 2 | | | Level 3 | | | Total | |
Investments: | | | | | | | | | | | | | | | | |
Common Stocks | | $ | 128,311,959 | | | $ | 413,603,798 | | | $ | 20 | | | $ | 541,915,777 | |
Preferred Stocks | | | — | | | | 36,584 | | | | — | | | | 36,584 | |
Rights | | | — | | | | — | | | | 1,733 | | | | 1,733 | |
Money Market Funds | | | 35,103,660 | | | | — | | | | — | | | | 35,103,660 | |
Total Investments | | $ | 163,415,619 | | | $ | 413,640,382 | | | $ | 1,753 | | | $ | 577,057,754 | |
Refer to the Schedule of Investments for further disaggregation of investment categories.
At the end of each quarter, management evaluates the classification of Levels 1, 2 and 3 assets and liabilities. Various factors are considered, such as changes in liquidity from the prior reporting period; whether or not a broker is willing to execute at the quoted price; the depth and consistency of prices from third party pricing services; and the existence of contemporaneous, observable trades in the market. Additionally, management evaluates the classification of Levels 1, 2 and 3 assets and liabilities on a quarterly basis for changes in listings or delistings on national exchanges.
Due to the inherent uncertainty of determining the fair value of investments that do not have a readily available market value, the fair value of the Fund’s investments may fluctuate from period to period. Additionally, the fair value of investments may differ significantly from the values that would have been used had a ready market existed for such investments and may differ materially from the values the Fund may ultimately realize. Further, such investments may be subject to legal and other restrictions on resale or otherwise less liquid than publicly traded securities.
For fair valuations using significant unobservable inputs, U.S. generally accepted accounting principles (“U.S. GAAP”) requires the Fund to present a reconciliation of the beginning to ending balances for reported market values that presents changes attributable to total realized and unrealized gains or losses, purchase and sales, and transfers in and out of Level 3 during the period. Transfers in and out between levels are based on values at the end of the period. A reconciliation of Level 3 investments is presented only when the Fund had an amount of Level 3 investments at the end of the reporting period that was meaningful in relation to its net assets. The amounts and reasons for Level 3 transfers are disclosed if the Fund had an amount of total Level 3 transfers during the reporting period that was meaningful in relation to its net assets as of the end of the reporting period.
During the current fiscal period, the Fund had no significant Level 3 transfers.
18
AQUARIUS INTERNATIONAL FUND
NOTES TO FINANCIAL STATEMENTS (CONTINUED)
AUGUST 31, 2024
REITS — The Fund has made certain investments in real estate investment trusts (“REITs”) which pay dividends to their shareholders based upon available funds from operations. It is quite common for these dividends to exceed the REITs’ taxable earnings and profits resulting in the excess portion being designated as a return of capital. The Fund intends to include the gross dividends from such REITs in its annual distributions to shareholders and, accordingly, a portion of the Fund’s distributions may also be designated as a return of capital.
USE OF ESTIMATES — The preparation of financial statements in conformity with U.S. GAAP requires management to make estimates and assumptions that affect the reported amounts of assets and liabilities and disclosure of contingent assets and liabilities at the date of the financial statements and the reported amounts of revenues and expenses during the reporting period. Actual results could differ from those estimates and those differences could be significant.
INVESTMENT TRANSACTIONS, INVESTMENT INCOME AND EXPENSES — The Fund records security transactions based on trade date for financial reporting purposes. The cost of investments sold is determined by use of the specific identification method for both financial reporting and income tax purposes in determining realized gains and losses on investments. Interest income (including amortization of premiums and accretion of discounts) is accrued when earned. Dividend income is recorded on the ex-dividend date. Distributions received on securities that represent a return of capital or capital gain are recorded as a reduction of cost of investments and/or as a realized gain. The Fund’s investment income, expenses (other than class specific expenses) and unrealized and realized gains and losses are allocated daily to each class of shares based upon the relative proportion of net assets of each class at the beginning of the day. Certain expenses are shared with The RBB Fund Trust (the “Trust”), a series trust of affiliated funds. Expenses incurred on behalf of a specific class, fund or fund family of the Company or Trust are charged directly to the class, fund or fund family (in proportion to net assets). Expenses incurred for all funds (such as director or professional fees) are charged to all funds in proportion to their average net assets of RBB and the Trust, or in such other manner as the Board deems fair or equitable. Expenses and fees, including investment advisory and administration fees, are accrued daily and taken into account for the purpose of determining the NAV of the Fund.
DIVIDENDS AND DISTRIBUTIONS TO SHAREHOLDERS — Dividends from net investment income and distributions from net realized capital gains (including net short-term capital gains), if any, are declared and paid at least annually to shareholders recorded on the ex-dividend date. Income dividends and capital gain distributions are determined in accordance with U.S. federal income tax regulations, which may differ from U.S. GAAP.
U.S. TAX STATUS — No provision is made for U.S. income taxes as it is the Fund’s intention to continue to qualify for and elect the tax treatment applicable to regulated investment companies under Subchapter M of the Internal Revenue Code of 1986, as amended, and make the requisite distributions to its shareholders which will be sufficient to relieve it from U.S. income and excise taxes.
FOREIGN CURRENCY TRANSLATION — Assets and liabilities initially expressed in non-U.S. currencies are translated into U.S. dollars based on the applicable exchange rates at the date of the last business day of the financial statement period. Purchases and sales of securities, interest income, dividends, variation margin received and expenses denominated in foreign currencies are translated into U.S. dollars at the exchange rates in effect on the transaction date.
The Fund does not separately report the effect of changes in foreign exchange rates from changes in market prices of securities held. Such changes are included with the net realized gain or loss and change in unrealized appreciation or depreciation on investments in the Statement of Operations. Other foreign currency transactions resulting in realized and unrealized gain or loss are reported separately as net realized gain or loss and change in unrealized appreciation or depreciation on foreign currencies in the Statement of Operations.
CASH AND CASH EQUIVALENTS — Cash and cash equivalents are valued at cost plus accrued interest, which approximates market value.
19
AQUARIUS INTERNATIONAL FUND
NOTES TO FINANCIAL STATEMENTS (CONTINUED)
AUGUST 31, 2024
OTHER — In the normal course of business, the Fund may enter into contracts that provide general indemnifications. The Fund’s maximum exposure under these arrangements is dependent on claims that may be made against the Fund in the future, and, therefore, cannot be estimated; however, the Fund expects the risk of material loss from such claims to be remote.
The Fund may be subject to taxes imposed by countries in which it invests, with respect to its investments in issuers existing or operating in such countries. Such taxes are generally based on income earned or repatriated and capital gains realized on the sale of such investments. The Fund accrues such taxes when the related income or capital gains are earned or throughout the holding period. Some countries require governmental approval for the repatriation of investment income, capital or the proceeds of sales earned by foreign investors. Additionally, if there is a deterioration in a country’s balance of payments or for other reasons, a country may impose temporary restrictions on foreign capital remittances abroad.
MARKET RISK — Investments in foreign markets may involve certain considerations and risks not typically associated with investments in the United States of America, including the possibility of future political and economic developments and the level of foreign governmental supervision and regulation of foreign securities markets. These markets are generally smaller, less liquid and more volatile than the major securities markets in the United States of America. Consequently, acquisition and disposition of international securities held by the Fund may be inhibited.
INTERNATIONAL CONFLICT RISK — In February 2022, Russia commenced a military attack on Ukraine. The outbreak of hostilities between the two countries and the threat of wider-spread hostilities could have a severe adverse effect on the region and global economies, including significant negative impacts on the markets for certain securities and commodities, such as oil and natural gas. In addition, sanctions imposed on Russia by the United States and other countries, and any sanctions imposed in the future, could have a significant adverse impact on the Russian economy and related markets. Additionally, armed conflict between Israel and Hamas and other militant groups in the Middle East and related events could cause significant impacts on global markets. The price and liquidity of investments may fluctuate widely as a result of these conflicts and related events. How long the armed conflicts and related events will last cannot be predicted. These tensions and any related events could have a significant impact on Fund performance and the value of Fund investments, even beyond any direct exposure the Fund may have to issuers located in these countries.
2. INVESTMENT ADVISER AND OTHER SERVICES
Altair Advisers, LLC (“Altair” or the “Adviser”) serves as the investment adviser to the Fund. Aperio Group, LLC, Boston Partners Global Investors, Inc., Driehaus Capital Management, LLC, and Mawer Investment Management, Ltd. each served as an investment sub-adviser (“Sub-Adviser”) to the Fund during the current fiscal period.
The Fund is managed by the Adviser and one or more Sub-Advisers unaffiliated with the Adviser. The Adviser also has the ultimate responsibility to oversee the Sub-Advisers, and to recommend their hiring, termination and replacement, subject to approval by the Board. The Adviser has an investment team that is jointly responsible for the day-to-day management of the Fund. The Sub-Advisers provide investment advisory services to the portion of the Fund’s portfolio allocated to them by the Adviser. The Adviser and the Company on behalf of the Fund have entered into sub-advisory agreements with the Sub-Advisers to manage the Fund, subject to supervision of the Adviser and the Board, and in accordance with the investment objective and restrictions of the Fund. The Fund compensates the Sub-Advisers for their services at an annual rate based on the Fund’s sub-advised average daily net assets (the “Sub-Advisory Fee”), not to exceed 0.90%, payable on a monthly basis in arrears.
20
AQUARIUS INTERNATIONAL FUND
NOTES TO FINANCIAL STATEMENTS (CONTINUED)
AUGUST 31, 2024
During the current fiscal period, collectively, sub-advisory fees accrued were $2,436,424, or the rate of 0.48%.
The Fund is currently only available to clients of the Adviser and to other investors at the Fund’s discretion. The Adviser does not receive a separate management fee from the Fund. However, pursuant to the Fund’s investment advisory agreement with the Adviser, the Adviser is entitled to receive reimbursement for compliance expenses in connection with managing the Fund, up to 0.03% of the Fund’s average daily net assets. During the current fiscal period, the Fund paid the Adviser $154,075. This amount is included in Investment management fees on the Statement of Operations.
U.S. Bancorp Fund Services, LLC, doing business as U.S. Bank Global Fund Services (“Fund Services”), serves as administrator for the Fund. For providing administrative and accounting services, Fund Services is entitled to receive a monthly fee, subject to certain minimum and out of pocket expenses.
Fund Services serves as the Fund’s transfer and dividend disbursing agent. For providing transfer agent services, Fund Services is entitled to receive a monthly fee, subject to certain minimum and out of pocket expenses.
U.S. Bank, N.A. (the “Custodian”) provides certain custodial services to the Fund. The Custodian is entitled to receive a monthly fee, subject to certain minimum and out of pocket expenses.
Quasar Distributors, LLC (the “Distributor”), a wholly-owned broker-dealer subsidiary of Foreside Financial Group, LLC, serves as the principal underwriter and distributor of the Fund’s shares pursuant to a Distribution Agreement with RBB.
For compensation amounts paid to Fund Services and the Custodian, please refer to the Statement of Operations.
3. DIRECTOR AND OFFICER COMPENSATION
The Directors of the Company receive an annual retainer and meeting fees for meetings attended. An employee of Vigilant Compliance, LLC serves as Chief Compliance Officer of the Company. Vigilant Compliance, LLC is compensated for the services provided to the Company. Employees of RBB serve as President, Chief Financial Officer, Chief Operating Officer, Secretary and Director of Marketing & Business Development of the Company. They are compensated by the Company for services provided. Certain employees of Fund Services serve as officers of the Company. They are not compensated by the Fund or the Company. For Director and Officer compensation amounts, please refer to the Statement of Operations.
4. PURCHASES AND SALES OF INVESTMENT SECURITIES
During the current fiscal period, aggregate purchases and sales of investment securities (excluding short-term investments) of the Fund were as follows:
PURCHASES | SALES |
$318,415,918 | $272,279,226 |
There were no purchases or sales of long-term U.S. Government securities during the current fiscal period.
5. FEDERAL INCOME TAX INFORMATION
The Fund has followed the authoritative guidance on accounting for and disclosure of uncertainty in tax positions, which requires the Fund to determine whether a tax position is more likely than not to be sustained upon examination, including resolution of any related appeals or litigation processes, based on the technical merits of the position. The Fund has determined that there was no effect on the financial statements from following this authoritative guidance. In the normal course of business, the Fund is subject to examination by federal, state and local jurisdictions, where applicable, for tax years for which applicable statutes of limitations have not expired.
21
AQUARIUS INTERNATIONAL FUND
NOTES TO FINANCIAL STATEMENTS (CONCLUDED)
AUGUST 31, 2024
As of August 31, 2024, the federal tax cost, which includes foreign currency, and aggregate gross unrealized appreciation and depreciation of investments held by the Fund were as follows:
FEDERAL
TAX COST | UNREALIZED
APPRECIATION | UNREALIZED
(DEPRECIATION) | Net Unrealized
Appreciation/
(Depreciation) |
$463,617,192 | $130,695,652 | $(16,940,503) | $113,755,149 |
Distributions to shareholders, if any, from net investment income and realized gains are determined in accordance with federal income tax regulations, which may differ from net investment income and realized gains recognized for financial reporting purposes. Accordingly, the character of distributions and composition of net assets for tax purposes may differ from those reflected in the accompanying financial statements. To the extent these differences are permanent, such amounts are reclassified within the capital accounts based on the tax treatment; temporary differences do not require such reclassification.
Permanent differences as of August 31, 2024, primarily attributed to foreign currency. There were no permanent differences between distributable earnings/(loss) and paid in capital.
As of August 31, 2024, the components of distributable earnings on a tax basis were as follows:
UNDISTRIBUTED
ORDINARY
INCOME | UNDISTRIBUTED
LONG-TERM
CAPITAL GAINS | CAPITAL LOSS
CARRYFORWARDS | NET UNREALIZED
APPRECIATION/
(DEPRECIATION) | QUALIFIED
LATE-YEAR
LOSSES |
$8,210,212 | $— | $(26,140,270) | $113,755,149 | $— |
The differences between the book and tax basis components of distributable earnings relate primarily to the timing of recognition of income and gains for federal income tax purposes. Short-term and foreign currency gains are reported as ordinary income for federal income tax purposes.
The tax character of dividends and distributions paid during the fiscal years ended August 31, 2024 and August 31, 2023 was as follows:
| | | | | | ORDINARY
INCOME | | | LONG-TERM
GAINS | | | TOTAL | |
| | | 2024 | | | $ | 10,001,068 | | | $ | — | | | $ | 10,001,068 | |
| | | 2023 | | | $ | 4,179,382 | | | $ | — | | | $ | 4,179,382 | |
Pursuant to federal income tax rules applicable to regulated investment companies, the Fund may elect to treat certain capital losses between November 1 and August 31 and late year ordinary losses ((i) ordinary losses between January 1 and August 31, and (ii) specified ordinary and currency losses between November 1 and August 31) as occurring on the first day of the following tax year. For the fiscal year ended August 31, 2024, any amount of losses elected within the tax return will not be recognized for federal income tax purposes until September 1, 2024.
Under the Regulated Investment Company Modernization Act of 2010, the Fund is permitted to carry forward capital losses incurred in taxable years beginning after December 22, 2010 for an unlimited period. Additionally, capital losses that are carried forward will retain their character as either short-term or long-term capital losses rather than being considered all short-term as under the previous law. As of August 31, 2024, the Fund had short-term capital loss carryforwards of $20,488,017 and long-term carryforwards of $5,652,253. During the fiscal year, the Fund utilized $5,127,646 of carryforward capital losses.
6. SUBSEQUENT EVENTS
Management has evaluated the impact of all subsequent events on the Fund through the date the financial statements were issued, and has determined that there were no subsequent events.
22
AQUARIUS INTERNATIONAL FUND
REPORT OF INDEPENDENT REGISTERED PUBLIC ACCOUNTING FIRM
To the Board of Directors of The RBB Fund, Inc. and Shareholders of Aquarius International Fund
Opinion on the Financial Statements
We have audited the accompanying statement of assets and liabilities, including the schedule of investments, of Aquarius International Fund (one of the funds constituting The RBB Fund, Inc., hereafter referred to as the “Fund”) as of August 31, 2024, the related statement of operations for the year ended August 31, 2024, the statement of changes in net assets for each of the two years in the period ended August 31, 2024, including the related notes, and the financial highlights for each of the five years in the period ended August 31, 2024 (collectively referred to as the “financial statements”). In our opinion, the financial statements present fairly, in all material respects, the financial position of the Fund as of August 31, 2024, the results of its operations for the year then ended, the changes in its net assets for each of the two years in the period ended August 31, 2024 and the financial highlights for each of the five years in the period ended August 31, 2024 in conformity with accounting principles generally accepted in the United States of America.
Basis for Opinion
These financial statements are the responsibility of the Fund’s management. Our responsibility is to express an opinion on the Fund’s financial statements based on our audits. We are a public accounting firm registered with the Public Company Accounting Oversight Board (United States) (PCAOB) and are required to be independent with respect to the Fund in accordance with the U.S. federal securities laws and the applicable rules and regulations of the Securities and Exchange Commission and the PCAOB.
We conducted our audits of these financial statements in accordance with the standards of the PCAOB. Those standards require that we plan and perform the audit to obtain reasonable assurance about whether the financial statements are free of material misstatement, whether due to error or fraud.
Our audits included performing procedures to assess the risks of material misstatement of the financial statements, whether due to error or fraud, and performing procedures that respond to those risks. Such procedures included examining, on a test basis, evidence regarding the amounts and disclosures in the financial statements. Our audits also included evaluating the accounting principles used and significant estimates made by management, as well as evaluating the overall presentation of the financial statements. Our procedures included confirmation of securities owned as of August 31, 2024 by correspondence with the custodian and brokers; when replies were not received from brokers, we performed other auditing procedures. We believe that our audits provide a reasonable basis for our opinion.
/s/PricewaterhouseCoopers LLP
Philadelphia, Pennsylvania
October 29, 2024
We have served as the auditor of one or more Altair Advisers, LLC investment companies since 2015.
23
AQUARIUS INTERNATIONAL FUND
SHAREHOLDER TAX INFORMATION
Certain tax information regarding the Fund is required to be provided to shareholders based upon the Fund’s income and distributions for the taxable period ended August 31, 2024. The information and distributions reported herein may differ from information and distributions taxable to the shareholders for the calendar year ending December 31, 2024. During the fiscal year ended August 31, 2024, the following dividends and distributions were paid by the Fund:
Ordinary
Income | Long-Term
Gains |
$10,001,068 | $— |
Dividends from net investment income and short-term capital gains are treated as ordinary income dividends for federal income tax purposes.
Under the Jobs and Growth Tax relief Reconciliation Act of 2003 the following percentages of ordinary dividends paid during the fiscal year ended August 31, 2024 are designated as “qualified dividend income,” as defined in the Act, and are subject to reduced tax rates:
Aquarius International Fund | 90.32% |
The percentage of total ordinary income dividends paid qualifying for the corporate dividends received deduction for the Fund is as follows:
Aquarius International Fund | 0% |
The percentage of ordinary income distributions designated as qualified short-term gains pursuant to the American Job Creation Act of 2004 is as follows:
Aquarius International Fund | 0% |
Because the Fund’s fiscal year is not the calendar year, another notification will be sent with respect to calendar year 2024. The second notification, which will reflect the amount, if any, to be used by calendar year taxpayers on their U.S. federal income tax returns, will be made in conjunction with Form 1099-DIV and will be mailed in January 2025.
Foreign shareholders will generally be subject to U.S. withholding tax on the amount of their ordinary income dividends. They will generally not be entitled to a foreign tax credit or deduction for the withholding taxes paid by the Fund, if any. The Fund passed through foreign tax credits of $1,314,021 and earned $12,642,809 of gross foreign source income during the fiscal year.
In general, dividends received by tax-exempt recipients (e.g., IRAs and Keoghs) need not be reported as taxable income for U.S. federal income tax purposes. However, some retirement trusts (e.g., corporate, Keogh and 403(b)(7) plans) may need this information for their annual information reporting.
Shareholders are advised to consult their own tax advisers with respect to the tax consequences of their investment in the Fund.
24
AQUARIUS INTERNATIONAL FUND
Other Information
APPROVAL OF INVESTMENT ADVISORY AND SUB-ADVISORY AGREEMENTS
As required by the 1940 Act, the Board, including all of the Directors who are not “interested persons” of the Company, as that term is defined in the 1940 Act (the “Independent Directors”), considered (1) the renewal of the investment advisory agreement between Altair and the Company (the “Investment Advisory Agreement”) on behalf of the Fund, and (2) the renewal of the sub-advisory agreements among Altair, the Company and each of Aperio Group, LLC, Boston Partners Global Investors, Inc., Driehaus Capital Management, LLC, and Mawer Investment Management, Ltd. (collectively, the “Sub-Advisers”) (together, the “Sub-Advisory Agreements”), at a meeting of the Board held on May 15-16, 2024 (the “Meeting”). At the Meeting, the Board, including all of the Independent Directors, approved the Investment Advisory Agreement and the Sub-Advisory Agreements for an additional one-year term ending August 16, 2025. The Board’s decision to approve the Investment Advisory Agreement and the Sub-Advisory Agreements reflects the exercise of its business judgment to continue the existing arrangements. In approving the Investment Advisory Agreement and the Sub-Advisory Agreements, the Board considered information provided by Altair and each of the Sub-Advisers with the assistance and advice of counsel to the Independent Directors and the Company.
In considering the renewal and approval of the Investment Advisory Agreement between the Company and Altair with respect to the Fund, and the Sub-Advisory Agreements among the Company, Altair and each of the Sub-Advisers with respect to the Fund, the Directors took into account all materials provided prior to and during the Meeting and at other meetings throughout the past year, the presentations made during the Meeting, and the discussions held during the Meeting. The Directors reviewed these materials with management of Altair and discussed the aforementioned Agreements with counsel in executive sessions, at which no representatives of Altair or the Sub-Advisers were present. Among other things, the Directors considered (i) the nature, extent, and quality of services provided to the Fund by Altair and each Sub-Adviser; (ii) descriptions of the experience and qualifications of the personnel providing those services; (iii) Altair’s and the Sub-Advisers’ investment philosophies and processes; (iv) Altair’s and the Sub-Advisers’ assets under management and client descriptions; (v) Altair’s and the Sub-Advisers’ soft dollar commission and trade allocation policies, including information on the types of research and services obtained in connection with soft dollar commissions; (vi) Altair’s and the Sub-Advisers’ advisory fee arrangements and other similarly managed clients, as applicable; (vii) Altair’s and the Sub-Advisers’ compliance procedures; (viii) Altair’s and the Sub-Advisers’ financial information and insurance coverage, as applicable; (ix) the extent to which economies of scale are relevant to the Fund; (x) a report prepared by Fuse Research Network, LLC comparing the Fund’s management fees and total expense ratios to a group of mutual funds deemed comparable to the Fund based primarily on investment strategy similarity (“Peer Group”) and comparing the performance of the Fund to the performance of its Peer Group; and (xi) a report comparing the performance of the Fund to the performance of its benchmark.
As part of their review, the Directors considered the nature, extent and quality of the services provided by Altair and each Sub-Adviser. The Directors concluded that Altair and each Sub-Adviser had substantial resources to provide services to the Fund, and that Altair’s and the Sub-Advisers’ services had been acceptable.
The Directors also considered the investment performance of the Fund, noting that the Fund had underperformed its benchmark, the MSCI ACWI ex USA Gross Index, for the three-month, one-year, three-year, five-year, and since-inception periods ended December 31, 2023. The Directors considered the Fund’s investment performance in light of its investment objective and investment strategies. The Board noted that the Fund’s total return outperformed the median of its Peer Group for the one-year, three-year and since-inception periods ended December 31, 2023, and underperformed the median of its Peer Group for the three-month and five-year periods ended December 31, 2023.
The Board also considered the advisory fee rate payable by the Fund under the Investment Advisory Agreement and Sub-Advisory Agreements. In this regard, information on the fees paid by the Fund and the Fund’s total operating expense ratios were compared to similar information for mutual funds advised by other, unaffiliated investment advisory firms. The Directors noted that both the Fund’s net advisory fee and total net expenses were below the median and in the 1st quartile (least expensive) of its Peer Group. The Directors considered that the Fund does not pay a contractual
25
AQUARIUS INTERNATIONAL FUND
Other Information (CONCLUDED)
management fee to Altair, but instead reimburses for out-of-pocket expenses in connection with its compliance monitoring of the Fund’s trading, up to 0.03% of the Fund’s average daily net assets. The Directors also considered the fees payable to each Sub-Adviser under the Sub-Advisory Agreement.
After reviewing the information regarding Altair’s and the Sub-Advisers’ costs, profitability and economies of scale, and after considering the services to be provided by Altair and the Sub-Advisers, the Directors concluded that the reimbursement to be made by the Fund to Altair and the sub-advisory fees to be paid to each Sub-Adviser were fair and reasonable and that the Investment Advisory Agreement and Sub-Advisory Agreements should be approved and continued for an additional one-year period ending August 16, 2025.
26
Investment Adviser
Altair Advisers, LLC
303 West Madison Street, Suite 600
Chicago, IL 60606
Administrator and Transfer Agent
U.S. Bank Global Fund Services, LLC
P.O. Box 701
Milwaukee, WI 53201
Principal Underwriter
Quasar Distributors, LLC
3 Canal Plaza, Suite 100
Portland, ME 04101
Custodian
U.S. Bank, N.A.
1555 North Rivercenter Drive, Suite 302
Milwaukee, WI 53212
Independent Registered Public Accounting Firm
PricewaterhouseCoopers LLP
Two Commerce Square
2001 Market Street, Suite 1800
Philadelphia, PA 19103
Legal Counsel
Faegre Drinker Biddle & Reath LLP
One Logan Square, Suite 2000
Philadelphia, PA 19103-6996
BOSTON PARTNERS INVESTMENT FUNDS | |
Table of Contents
| | | |
Schedules of Investments | 1 |
Statements of Assets and Liabilities | 55 |
Statements of Operations | 61 |
Statements of Changes in Net Assets | 64 |
Financial Highlights | 70 |
Notes to Financial Statements | 76 |
Report of Independent Registered Public Accounting Firm | 89 |
Shareholder Tax Information | 91 |
Other Information | 93 |
BOSTON PARTNERS INVESTMENT FUNDS | August 31, 2024 |
BOSTON PARTNERS ALL-CAP VALUE FUND | Schedule of Investments |
| | | Shares | | | Value | |
COMMON STOCKS — 98.8% | | | | |
Communication Services — 4.9% | | | | | | | | |
Alphabet, Inc. - Class A | | | 223,756 | | | $ | 36,557,255 | |
Electronic Arts, Inc. | | | 17,788 | | | | 2,700,574 | |
Interpublic Group of Cos., Inc. (a) | | | 191,779 | | | | 6,253,913 | |
Match Group, Inc. (b) | | | 187,684 | | | | 6,983,722 | |
Omnicom Group, Inc. (a) | | | 65,735 | | | | 6,601,766 | |
Take-Two Interactive Software, Inc. (b) | | | 84,705 | | | | 13,697,646 | |
| | | | | | | | 72,794,876 | |
Consumer Discretionary — 7.2% | | | | | | | | |
AutoZone, Inc. (b) | | | 4,460 | | | | 14,189,401 | |
Booking Holdings, Inc. | | | 7,033 | | | | 27,493,615 | |
Harley-Davidson, Inc. (a) | | | 330,369 | | | | 12,369,015 | |
LKQ Corp. | | | 180,500 | | | | 7,506,995 | |
NVR, Inc. (b) | | | 3,144 | | | | 28,838,214 | |
Tempur Sealy International, Inc. (a) | | | 180,717 | | | | 9,474,992 | |
Wyndham Hotels & Resorts, Inc. | | | 101,025 | | | | 7,950,668 | |
| | | | | | | | 107,822,900 | |
Consumer Staples — 3.4% | | | | | | | | |
Coca-Cola Europacific Partners PLC | | | 59,516 | | | | 4,790,443 | |
J M Smucker Co. | | | 70,107 | | | | 8,039,871 | |
Kenvue, Inc. | | | 376,813 | | | | 8,271,045 | |
Keurig Dr Pepper, Inc. | | | 325,764 | | | | 11,926,220 | |
Philip Morris International, Inc. | | | 145,469 | | | | 17,934,873 | |
| | | | | | | | 50,962,452 | |
Energy — 4.3% | | | | | | | | |
BP PLC - ADR | | | 117,224 | | | | 3,980,927 | |
Canadian Natural Resources Ltd. | | | 223,888 | | | | 8,106,984 | |
Chord Energy Corp. | | | 59,616 | | | | 8,848,803 | |
ConocoPhillips | | | 58,192 | | | | 6,621,668 | |
Exxon Mobil Corp. (a) | | | 60,588 | | | | 7,145,749 | |
Halliburton Co. | | | 238,698 | | | | 7,421,121 | |
Phillips 66 | | | 42,094 | | | | 5,906,209 | |
Schlumberger Ltd. | | | 218,701 | | | | 9,620,657 | |
Shell PLC - ADR | | | 83,247 | | | | 5,965,480 | |
| | | | | | | | 63,617,598 | |
Financials — 25.4% | | | | | | | | |
Aflac, Inc. (a) | | | 84,647 | | | | 9,341,643 | |
Allstate Corp. | | | 50,019 | | | | 9,450,590 | |
American International Group, Inc. | | | 316,389 | | | | 24,377,773 | |
Aon PLC - Class A | | | 22,426 | | | | 7,708,265 | |
Bank of America Corp. | | | 625,590 | | | | 25,492,793 | |
Charles Schwab Corp. | | | 101,654 | | | | 6,617,675 | |
Chubb Ltd. | | | 73,518 | | | | 20,892,345 | |
Citigroup, Inc. | | | 234,196 | | | | 14,670,037 | |
Corpay, Inc. (b) | | | 94,262 | | | | 29,744,374 | |
Discover Financial Services | | | 101,333 | | | | 14,055,900 | |
Fidelity National Information Services, Inc. | | | 120,701 | | | | 9,951,797 | |
First American Financial Corp. | | | 180,086 | | | | 11,489,487 | |
Global Payments, Inc. | | | 108,367 | | | | 12,029,821 | |
Goldman Sachs Group, Inc. | | | 39,199 | | | | 20,001,290 | |
JPMorgan Chase & Co. | | | 148,671 | | | | 33,421,241 | |
Loews Corp. | | | 179,070 | | | | 14,672,996 | |
Markel Group, Inc. (b) | | | 11,429 | | | | 18,294,172 | |
Renaissance Holdings Ltd. | | | 71,498 | | | | 18,216,975 | |
Shift4 Payments, Inc. - Class A (a)(b) | | | 99,104 | | | | 8,235,542 | |
Synchrony Financial | | | 139,539 | | | | 7,013,230 | |
Travelers Cos., Inc. | | | 56,348 | | | | 12,851,288 | |
Visa, Inc. - Class A | | | 75,044 | | | | 20,739,910 | |
Financials — (continued) | | | | | | | | |
Wells Fargo & Co. | | | 228,851 | | | | 13,380,918 | |
White Mountains Insurance Group Ltd. | | | 8,661 | | | | 15,972,963 | |
| | | | | | | | 378,623,025 | |
Health Care — 20.0% | | | | | | | | |
AbbVie, Inc. | | | 153,728 | | | | 30,178,344 | |
Amgen, Inc. | | | 57,430 | | | | 19,171,857 | |
AMN Healthcare Services, Inc. (a)(b) | | | 190,288 | | | | 10,090,973 | |
Avantor, Inc. (a)(b) | | | 491,740 | | | | 12,706,561 | |
Bristol-Myers Squibb Co. | | | 467,215 | | | | 23,337,389 | |
Cencora, Inc. | | | 64,678 | | | | 15,494,908 | |
Centene Corp. (b) | | | 171,090 | | | | 13,487,025 | |
Cigna Group | | | 25,470 | | | | 9,215,301 | |
Elevance Health, Inc. | | | 39,298 | | | | 21,884,663 | |
Humana, Inc. | | | 27,783 | | | | 9,848,240 | |
Johnson & Johnson | | | 185,938 | | | | 30,839,677 | |
McKesson Corp. | | | 24,101 | | | | 13,522,589 | |
Medtronic PLC | | | 194,155 | | | | 17,198,250 | |
Merck & Co., Inc. | | | 168,592 | | | | 19,969,722 | |
Sanofi SA - ADR | | | 409,731 | | | | 23,051,466 | |
UnitedHealth Group, Inc. | | | 37,666 | | | | 22,230,473 | |
Zimmer Biomet Holdings, Inc. | | | 51,313 | | | | 5,924,599 | |
| | | | | | | | 298,152,037 | |
Industrials — 14.2% | | | | | | | | |
Acuity Brands, Inc. | | | 44,666 | | | | 11,376,430 | |
Advanced Drainage Systems, Inc. | | | 31,248 | | | | 4,898,437 | |
Allegion PLC | | | 110,943 | | | | 15,403,326 | |
Allison Transmission Holdings, Inc. | | | 110,299 | | | | 10,230,232 | |
AMETEK, Inc. | | | 46,210 | | | | 7,904,221 | |
Beacon Roofing Supply, Inc. (b) | | | 102,556 | | | | 9,291,574 | |
Curtiss-Wright Corp. | | | 28,842 | | | | 9,110,034 | |
EnerSys | | | 36,902 | | | | 3,739,280 | |
Equifax, Inc. | | | 30,796 | | | | 9,458,375 | |
Expeditors International of Washington, Inc. | | | 109,570 | | | | 13,522,034 | |
Huron Consulting Group, Inc. (b) | | | 81,888 | | | | 9,043,711 | |
Landstar System, Inc. | | | 56,435 | | | | 10,302,774 | |
Leidos Holdings, Inc. | | | 53,477 | | | | 8,476,639 | |
Masco Corp. | | | 91,674 | | | | 7,293,583 | |
Middleby Corp. (b) | | | 60,545 | | | | 8,513,838 | |
Resideo Technologies, Inc. (b) | | | 132,010 | | | | 2,661,322 | |
Robert Half, Inc. (a) | | | 115,987 | | | | 7,268,905 | |
Science Applications International Corp. | | | 108,020 | | | | 14,106,332 | |
Sensata Technologies Holding PLC | | | 238,057 | | | | 9,177,097 | |
SS&C Technologies Holdings, Inc. | | | 177,727 | | | | 13,345,520 | |
Textron, Inc. | | | 108,821 | | | | 9,924,475 | |
Westinghouse Air Brake Technologies Corp. | | | 102,648 | | | | 17,406,021 | |
| | | | | | | | 212,454,160 | |
Information Technology — 16.5% | | | | | | | | |
Analog Devices, Inc. | | | 73,573 | | | | 17,277,883 | |
Applied Materials, Inc. | | | 45,139 | | | | 8,904,119 | |
Arrow Electronics, Inc. (b) | | | 69,846 | | | | 9,434,798 | |
CDW Corp. | | | 34,042 | | | | 7,681,237 | |
Check Point Software Technologies Ltd. (b) | | | 151,409 | | | | 29,146,233 | |
Cisco Systems, Inc. | | | 328,857 | | | | 16,620,433 | |
Cognizant Technology Solutions Corp. - Class A | | | 196,119 | | | | 15,252,175 | |
Dell Technologies, Inc. - Class C | | | 122,340 | | | | 14,135,164 | |
The accompanying notes are an integral part of the financial statements.
Financial Statements 2024 | 1 |
BOSTON PARTNERS INVESTMENT FUNDS | August 31, 2024 |
BOSTON PARTNERS ALL-CAP VALUE FUND | Schedule of Investments (continued) |
| | | Shares | | | Value | |
Information Technology — (continued) | | | | | | | | |
Flex Ltd. (b) | | | 415,372 | | | $ | 13,495,436 | |
Gen Digital, Inc. | | | 133,875 | | | | 3,542,332 | |
Hewlett Packard Enterprise Co. | | | 234,678 | | | | 4,545,713 | |
Jabil, Inc. | | | 83,169 | | | | 9,088,708 | |
KLA Corp. | | | 13,063 | | | | 10,704,214 | |
Lam Research Corp. | | | 9,970 | | | | 8,185,470 | |
Microchip Technology, Inc. | | | 281,902 | | | | 23,161,068 | |
Nice Ltd. - ADR (a)(b) | | | 35,170 | | | | 6,110,436 | |
Oracle Corp. | | | 209,196 | | | | 29,557,303 | |
QUALCOMM, Inc. | | | 76,434 | | | | 13,398,880 | |
TE Connectivity Ltd. | | | 38,372 | | | | 5,893,939 | |
| | | | | | | | 246,135,541 | |
Materials — 2.9% | | | | | | | | |
Corteva, Inc. | | | 145,667 | | | | 8,346,719 | |
CRH PLC | | | 319,472 | | | | 28,998,474 | |
FMC Corp. | | | 105,783 | | | | 6,831,466 | |
| | | | | | | | 44,176,659 | |
TOTAL COMMON STOCKS (Cost $836,775,877) | | | | | | | 1,474,739,248 | |
| | | Units | | | | | |
SHORT-TERM INVESTMENTS — 5.1% | | | | | | | | |
Investments Purchased with Proceeds from Securities Lending — 5.1% | | | | | | | | |
| Mount Vernon Liquid Assets Portfolio, LLC, 5.50% (c) | | | 75,809,274 | | | $ | 75,809,274 | |
TOTAL SHORT-TERM INVESTMENTS (Cost $75,809,274) | | | | | | | 75,809,274 | |
TOTAL INVESTMENTS — 103.9% (Cost $912,585,151) | | | | | | | 1,550,548,522 | |
Liabilities in Excess of Other Assets — (3.9)% | | | | | | | (57,584,292 | ) |
TOTAL NET ASSETS — 100.0% | | | | | | $ | 1,492,964,230 | |
Percentages are stated as a percent of net assets.
The Global Industry Classification Standard (“GICS®”) was developed by and/or is the exclusive property of MSCI, Inc. (“MSCI”) and Standard & Poor’s Financial Services LLC (“S&P”). GICS® is a service mark of MSCI and S&P and has been licensed for use by U.S. Bank Global Fund Services.
ADR | American Depositary Receipt |
PLC | Public Limited Company |
(a) | All or a portion of this security is on loan as of August 31, 2024. The total market value of these securities was $74,254,911 which represented 5.0% of net assets. |
(b) | Non-income producing security. |
(c) | The rate shown represents the 7-day annualized effective yield as of August 31, 2024. |
The accompanying notes are an integral part of the financial statements.
Financial Statements 2024 | 2 |
BOSTON PARTNERS INVESTMENT FUNDS | August 31, 2024 |
BOSTON PARTNERS ALL-CAP VALUE FUND | Schedule of Investments (concluded) |
A summary of the inputs used to value the Fund’s investments carried at fair value as of August 31, 2024 is as follows (see Notes to Schedule of Investments):
| | | LEVEL 1 | | | LEVEL 2 | | | LEVEL 3 | | | Total | |
Investments: | | | | | | | | | | | | | | | | |
Common Stocks | | $ | 1,474,739,248 | | | $ | — | | | $ | — | | | $ | 1,474,739,248 | |
Investments Purchased with Proceeds from Securities Lending(a) | | | — | | | | — | | | | — | | | | 75,809,274 | |
Total Investments | | $ | 1,474,739,248 | | | $ | — | | | $ | — | | | $ | 1,550,548,522 | |
Refer to the Schedule of Investments for further disaggregation of investment categories.
(a) | Certain investments that are measured at fair value using the net asset value per share (or its equivalent) practical expedient have not been categorized in the fair value hierarchy. These investments can be classified as Investments Purchased with Proceeds from Securities Lending and their fair value totals to $75,809,274. The fair value amounts presented in the table are intended to permit reconciliation of the fair value hierarchy to the amounts listed in the Schedule of Investments. |
The accompanying notes are an integral part of the financial statements.
Financial Statements 2024 | 3 |
BOSTON PARTNERS INVESTMENT FUNDS | August 31, 2024 |
BOSTON PARTNERS EMERGING MARKETS DYNAMIC EQUITY FUND | Schedule of Investments |
| | | Shares | | | Value | |
COMMON STOCKS — 61.9% | | | | |
Austria — 0.8% | | | | | | | | |
Erste Group Bank AG | | | 9,025 | | | $ | 493,982 | |
Brazil — 6.4% | | | | | | | | |
BRF SA (a) | | | 152,900 | | | | 701,838 | |
Eletromidia SA | | | 151,278 | | | | 475,902 | |
Embraer SA (a) | | | 65,300 | | | | 537,258 | |
Itau Unibanco Holding SA - ADR (b) | | | 135,135 | | | | 881,080 | |
| Lojas Renner SA | | | 117,400 | | | | 359,535 | |
Marfrig Global Foods SA (a) | | | 80,500 | | | | 206,394 | |
Minerva SA | | | 97,400 | | | | 129,442 | |
TIM SA | | | 177,500 | | | | 561,227 | |
| | | | | | | | 3,852,676 | |
Chile — 0.3% | | | | | | | | |
Cencosud SA | | | 98,645 | | | | 199,726 | |
China — 22.2% | | | | | | | | |
Angel Yeast Co., Ltd. - Class A (b) | | | 104,400 | | | | 459,576 | |
Chengxin Lithium Group Co., Ltd. - Class A (b) | | | 102,300 | | | | 172,758 | |
China Merchants Expressway Network & Technology Holdings Co., Ltd. - Class A (b) | | | 251,500 | | | | 427,197 | |
Chongqing Baiya Sanitary Products Co., Ltd. - Class A (b) | | | 100,400 | | | | 319,238 | |
Contemporary Amperex Technology Co., Ltd. - Class A (b) | | | 5,200 | | | | 134,773 | |
COSCO SHIPPING Holdings Co., Ltd. - Class A (b) | | | 550,600 | | | | 971,938 | |
GDS Holdings Ltd. - ADR (a)(b) | | | 44,985 | | | | 766,095 | |
Ginlong Technologies Co., Ltd. - Class A (b) | | | 44,000 | | | | 369,112 | |
Gree Electric Appliances, Inc. of Zhuhai - Class A (b) | | | 26,100 | | | | 145,905 | |
Hangzhou Chang Chuan Technology Co., Ltd. - Class A (b) | | | 71,300 | | | | 307,306 | |
Hangzhou Great Star Industrial Co., Ltd. - Class A (b) | | | 179,400 | | | | 675,001 | |
Hoymiles Power Electronics, Inc. - Class A (b) | | | 40,264 | | | | 750,188 | |
JD.com, Inc. - ADR (b) | | | 53,545 | | | | 1,445,715 | |
Jiangsu Jiejie Microelectronics Co., Ltd. - Class A (b) | | | 240,800 | | | | 637,686 | |
Luxi Chemical Group Co., Ltd. - Class A (b) | | | 485,800 | | | | 735,817 | |
Ningbo Deye Technology Co., Ltd. - Class A (b) | | | 26,900 | | | | 343,260 | |
Quectel Wireless Solutions Co., Ltd. - Class A (b) | | | 39,900 | | | | 245,803 | |
Shengyi Technology Co., Ltd. - Class A (b) | | | 108,300 | | | | 269,822 | |
Shenzhen Topband Co., Ltd. - Class A (b) | | | 318,600 | | | | 442,398 | |
Sunwoda Electronic Co., Ltd. - Class A (b) | | | 182,200 | | | | 430,624 | |
Tianqi Lithium Corp. - Class A (b) | | | 46,200 | | | | 171,057 | |
Will Semiconductor Co., Ltd. - Class A (b) | | | 14,400 | | | | 183,643 | |
Wuxi NCE Power Co., Ltd. - Class A (b) | | | 304,800 | | | | 1,281,233 | |
Yunnan Yuntianhua Co., Ltd. - Class A (b) | | | 269,600 | | | | 784,321 | |
Zhejiang NHU Co., Ltd. - Class A (b) | | | 201,200 | | | | 548,041 | |
Zhejiang Taihua New Material Group Co., Ltd. - Class A (b) | | | 217,500 | | | | 321,199 | |
| | | | | | | | 13,339,706 | |
Cyprus — 0.0%(c) | | | | | | | | |
Fix Price Group PLC - GDR (d) | | | 21,704 | | | | 0 | |
Greece — 1.1% | | | | | | | | |
Hellenic Telecommunications Organization SA | | | 41,633 | | | | 675,005 | |
Hungary — 0.3% | | | | | | | | |
Richter Gedeon Nyrt | | | 5,515 | | | | 167,066 | |
India — 5.5% | | | | | | | | |
Adani Wilmar Ltd. (a) | | | 104,859 | | | | 452,513 | |
Bajaj Auto Ltd. | | | 1,590 | | | | 206,439 | |
Bandhan Bank Ltd. (e) | | | 314,077 | | | | 750,895 | |
Chambal Fertilisers and Chemicals Ltd. | | | 60,279 | | | | 373,958 | |
Natco Pharma Ltd. | | | 38,713 | | | | 711,126 | |
UPL Ltd. | | | 47,317 | | | | 337,411 | |
Zydus Lifesciences Ltd. | | | 32,423 | | | | 436,168 | |
| | | | | | | | 3,268,510 | |
Indonesia — 0.3% | | | | | | | | |
Kalbe Farma Tbk PT | | | 1,439,700 | | | | 153,705 | |
Mexico — 6.5% | | | | | | | | |
America Movil SAB de CV (a) | | | 1,828,500 | | | | 1,511,506 | |
Fibra Uno Administracion SAB de CV | | | 475,500 | | | | 560,626 | |
Gruma SAB de CV - Class B | | | 9,325 | | | | 171,621 | |
Grupo Comercial Chedraui SAB de CV | | | 24,000 | | | | 182,587 | |
Kimberly-Clark de Mexico SAB de CV - Class A | | | 451,000 | | | | 740,360 | |
Prologis Property Mexico SAB de CV | | | 237,000 | | | | 753,206 | |
| | | | | | | | 3,919,906 | |
South Africa — 1.8% | | | | | | | | |
Life Healthcare Group Holdings Ltd. | | | 94,465 | | | | 76,139 | |
Mr Price Group Ltd. | | | 27,208 | | | | 369,920 | |
Sasol Ltd. | | | 19,242 | | | | 147,750 | |
Vodacom Group Ltd. | | | 78,822 | | | | 487,102 | |
| | | | | | | | 1,080,911 | |
South Korea — 6.0% | | | | | | | | |
Amorepacific Corp. | | | 4,099 | | | | 380,808 | |
Chunbo Co., Ltd. (a) | | | 2,918 | | | | 131,150 | |
CJ ENM Co., Ltd. (a) | | | 3,113 | | | | 169,336 | |
GS Engineering & Construction Corp. (a) | | | 12,089 | | | | 185,913 | |
Hana Financial Group, Inc. | | | 3,196 | | | | 148,374 | |
Hansol Chemical Co., Ltd. | | | 3,024 | | | | 327,244 | |
HD Hyundai Co., Ltd. | | | 3,031 | | | | 183,734 | |
Hyundai Rotem Co., Ltd. | | | 5,257 | | | | 212,641 | |
KCC Corp. | | | 202 | | | | 43,376 | |
KEPCO Plant Service & Engineering Co., Ltd. | | | 4,839 | | | | 150,828 | |
Kumho Petrochemical Co., Ltd. | | | 11,164 | | | | 1,144,880 | |
LG H&H Co., Ltd. | | | 746 | | | | 198,070 | |
Samsung E&A Co., Ltd. (a) | | | 17,414 | | | | 331,569 | |
| | | | | | | | 3,607,923 | |
Taiwan — 6.0% | | | | | | | | |
Evergreen Marine Corp. Taiwan Ltd. | | | 92,000 | | | | 541,102 | |
Goldsun Building Materials Co., Ltd. | | | 518,000 | | | | 887,428 | |
The accompanying notes are an integral part of the financial statements.
Financial Statements 2024 | 4 |
BOSTON PARTNERS INVESTMENT FUNDS | August 31, 2024 |
BOSTON PARTNERS EMERGING MARKETS DYNAMIC EQUITY FUND | Schedule of Investments (continued) |
| | | Shares | | | Value | |
Taiwan — (continued) | | | | | | | | |
Nien Made Enterprise Co., Ltd. | | | 15,000 | | | $ | 219,526 | |
Taiwan Semiconductor Manufacturing Co., Ltd. | | | 40,000 | | | | 1,184,215 | |
Walsin Technology Corp. | | | 44,000 | | | | 152,647 | |
Yang Ming Marine Transport Corp. | | | 301,000 | | | | 607,526 | |
| | | | | | | | 3,592,444 | |
Thailand — 3.0% | | | | | | | | |
Com7 PCL - NVDR | | | 700,500 | | | | 507,028 | |
Kasikornbank PCL - NVDR | | | 209,500 | | | | 885,062 | |
Thai Beverage PCL | | | 968,800 | | | | 393,848 | |
| | | | | | | | 1,785,938 | |
United Arab Emirates — 0.4% | | | | | | | | |
Abu Dhabi Islamic Bank PJSC | | | 68,251 | | | | 234,512 | |
United Kingdom — 1.0% | | | | | | | | |
Hikma Pharmaceuticals PLC | | | 13,515 | | | | 353,260 | |
Pepco Group NV (a) | | | 50,296 | | | | 235,107 | |
| | | | | | | | 588,367 | |
United States — 0.3% | | | | | | | | |
Diodes, Inc. (a) | | | 2,551 | | | | 177,779 | |
TOTAL COMMON STOCKS (Cost $34,546,700) | | | | | | | 37,138,156 | |
| | | | | | | | | |
PREFERRED STOCKS — 0.3% | | | | | | | | |
South Korea — 0.3% | | | | | | | | |
Samsung Electronics Co., Ltd. | | | 3,440 | | | | 154,564 | |
TOTAL PREFERRED STOCKS (Cost $56,872) | | | | | | | 154,564 | |
| | | | | | | | | |
| | | UNITS | | | | | |
SHORT-TERM INVESTMENTS — 17.6% | | | | | | | | |
Money Market Funds — 17.6% | | | | | | | | |
BlackRock Liquidity Funds Treasury Trust Fund Portfolio - Class Institutional, 5.15% (b)(f) | | | 2,641,656 | | | | 2,641,656 | |
Federated Hermes U.S. Treasury Cash Reserves - Class Institutional, 5.11% (b)(f) | | | 2,641,656 | | | | 2,641,656 | |
Fidelity Treasury Portfolio - Class I, 5.16% (b)(f) | | | 2,641,656 | | | | 2,641,656 | |
Goldman Sachs Financial Square Funds - Treasury Instruments Fund - Class Institutional, 5.12% (b)(f) | | | 2,641,656 | | | | 2,641,656 | |
TOTAL SHORT-TERM INVESTMENTS (Cost $10,566,624) | | | | | | | 10,566,624 | |
TOTAL INVESTMENTS — 79.8% (Cost $45,170,196) | | | | | | | 47,859,344 | |
Other Assets in Excess of Liabilities — 20.2% | | | | | | | 12,108,261 | |
TOTAL NET ASSETS — 100.0% | | | | | | $ | 59,967,605 | |
Percentages are stated as a percent of net assets.
ADR | American Depositary Receipt |
GDR | Global Depositary Receipt |
NVDR | Non-Voting Depositary Receipt |
PJSC | Public Joint Stock Company |
PLC | Public Limited Company |
SAB de CV | Sociedad Anónima Bursátil de Capital Variable |
(a) | Non-income producing security. |
(b) | Security position is either entirely or partially held in a segregated account as collateral for securities sold short. |
(c) | Represents less than 0.05% of net assets. |
(d) | Fair value determined using significant unobservable inputs in accordance with procedures established by and under the supervision of the Adviser, acting as valuation designee. These securities represented $0 or 0.0% of net assets as of August 31, 2024. |
(e) | Security is exempt from registration pursuant to Rule 144A under the Securities Act of 1933, as amended. These securities may only be resold in transactions exempt from registration to qualified institutional investors. As of August 31, 2024, the value of these securities total $750,895 or 1.3% of the Fund’s net assets. |
(f) | The rate shown represents the 7-day annualized effective yield as of August 31, 2024. |
The accompanying notes are an integral part of the financial statements.
Financial Statements 2024 | 5 |
BOSTON PARTNERS INVESTMENT FUNDS | August 31, 2024 |
BOSTON PARTNERS EMERGING MARKETS DYNAMIC EQUITY FUND | Schedule of Investments (continued) |
Schedule Of Securities Sold Short | | Shares | | | Value | |
COMMON STOCKS — (2.1)% | | | | |
Greece — (1.0)% | | | | | | | | |
Metlen Energy & Metals SA | | | (16,000 | ) | | $ | (600,829 | ) |
India — (0.7)% | | | | | | | | |
HDFC Bank Ltd. - ADR | | | (7,317 | ) | | | (447,142 | ) |
South Korea — (0.4)% | | | | | | | | |
Hyundai Motor Co. - GDR | | | (3,189 | ) | | | (213,934 | ) |
TOTAL COMMON STOCKS (Proceeds $1,208,836) | | | | | | | (1,261,905 | ) |
TOTAL SECURITIES SOLD SHORT — (2.1)% (Proceeds $1,208,836) | | | | | | $ | (1,261,905 | ) |
Percentages are stated as a percent of net assets.
The accompanying notes are an integral part of the financial statements.
Financial Statements 2024 | 6 |
BOSTON PARTNERS INVESTMENT FUNDS | August 31, 2024 |
BOSTON PARTNERS EMERGING MARKETS DYNAMIC EQUITY FUND | Schedule of Investments (continued) |
Contracts For Difference held by the Fund at August 31, 2024, are as follows:
Reference
Entity | | Counterparty | | | Pay/
Receive
Reference
Entity | | | Financing
Rate | | | Payment
Frequency | | | Maturity
Date | | Notional
Amount | | | VALUE/
UNREALIZED
APPRECIATION
(DEPRECIATION) | |
AAC Technologies Holdings, Inc. | Morgan Stanley | Receive | 1 mo. HIBOR HKD + 0.50% = 5.12% | Termination | | | 07/30/2027 | | HKD | | | 2,635,425 | | | $ | 41,336 | |
Alibaba Group Holding Ltd. | Goldman Sachs | Receive | 1 mo. HIBOR HKD + 0.50% = 5.04% | Termination | | | 08/02/2027 | | HKD | | | 18,350,685 | | | | 114,153 | |
Alpek SAB de CV | Morgan Stanley | Receive | EFFR + 0.65% = 5.98% | Termination | | | 12/02/2025 | | | | | | | 44,490 | | | | (10,523 | ) |
Alpek SAB de CV | Morgan Stanley | Receive | EFFR + 0.65% = 5.88% | Termination | | | 11/23/2026 | | | | | | | 260,112 | | | | (74,847 | ) |
Atacadao SA | J.P. Morgan Securities, Inc. | Receive | OBFR + 0.60% = 5.92% | Termination | | | 05/10/2027 | | | | | | | 703,493 | | | | (183,076 | ) |
Chervon Holdings Ltd. | Goldman Sachs | Receive | 1 mo. HIBOR HKD + 0.50% = 5.06% | Termination | | | 01/19/2027 | | HKD | | | 2,557,250 | | | | (46,020 | ) |
CJ ENM Co. Ltd. | Morgan Stanley | Receive | EFFR + 0.63% = 5.96% | Termination | | | 04/26/2027 | | | | | | | 359,563 | | | | (12,116 | ) |
Coca-Cola Femsa SAB de CV | Goldman Sachs | Receive | EFFR + 0.40% = 5.73% | Termination | | | 08/06/2027 | | | | | | | 356,756 | | | | (5,334 | ) |
Controladora Vuela Cia de Aviacion SAB de CV | J.P. Morgan Securities, Inc. | Receive | EFFR + 0.60% = 5.93% | Termination | | | 06/07/2027 | | | | | | | 211,914 | | | | (59,453 | ) |
DBS Group Holdings Ltd. | Goldman Sachs | Receive | SORA + 1.00% = 4.06% | Termination | | | 12/08/2025 | | SGD | | | 170,023 | | | | 25,778 | |
Detsky Mir PJSC | Goldman Sachs | Receive | 1 mo. LIBOR US + 0.85% = 0.16% | Monthly | | | 09/18/2025 | | | | | | | 0 | | | | (178,548 | ) |
Ecopro BM Co. Ltd. | J.P. Morgan Securities, Inc. | Receive | OBFR + 0.50% = 5.82% | Termination | | | 10/19/2026 | | | | | | | 79,246 | | | | (5,115 | ) |
Geely Automobile Holdings Ltd. | Goldman Sachs | Receive | 1 mo. HIBOR HKD + 0.50% = 4.42% | Termination | | | 08/30/2027 | | HKD | | | 3,007,620 | | | | 11,693 | |
Genius Electronic Optical Co. Ltd. | Morgan Stanley | Receive | EFFR + 0.65% = 5.98% | Termination | | | 12/10/2025 | | | | | | | 282,588 | | | | 67,134 | |
Genomma Lab Internacional SAB de CV | J.P. Morgan Securities, Inc. | Receive | OBFR + 0.60% = 5.92% | Termination | | | 08/06/2027 | | | | | | | 148,590 | | | | 1,075 | |
Giant Manufacturing Co. Ltd. | Morgan Stanley | Receive | EFFR + 0.65% = 5.98% | Termination | | | 08/02/2027 | | | | | | | 261,488 | | | | 23,096 | |
Greentown China Holdings Ltd. | Goldman Sachs | Receive | 1 mo. HIBOR HKD + 0.50% = 5.07% | Termination | | | 12/14/2026 | | HKD | | | 3,043,650 | | | | (74,672 | ) |
Grupo Bimbo SAB de CV | Morgan Stanley | Receive | EFFR + 0.65% = 5.98% | Termination | | | 08/02/2027 | | | | | | | 438,386 | | | | 2,640 | |
HD Korea Shipbuilding & Offshore Engineering Co. Ltd. | Morgan Stanley | Receive | EFFR + 0.63% = 5.96% | Termination | | | 07/30/2027 | | | | | | | 196,006 | | | | 6,779 | |
HeadHunter Group PLC | Morgan Stanley | Receive | EFFR + 0.55% = 5.88% | Monthly | | | 09/23/2026 | | | | | | | 0 | | | | (116,107 | ) |
Hypera SA | J.P. Morgan Securities, Inc. | Receive | OBFR + 0.60% = 5.92% | Termination | | | 08/09/2027 | | | | | | | 460,945 | | | | (7,761 | ) |
Hyundai Glovis Co. Ltd. | Goldman Sachs | Receive | EFFR + 0.65% = 5.98% | Termination | | | 07/12/2027 | | | | | | | 295,123 | | | | (17,218 | ) |
ICL Group Ltd. | Goldman Sachs | Receive | TELBOR01 INDEX + 0.70% = 5.20% | Termination | | | 08/25/2027 | | ILS | | | 931,692 | | | | 15,208 | |
JBS S/A | Morgan Stanley | Receive | EFFR + 0.63% = 5.96% | Termination | | | 07/26/2027 | | | | | | | 343,829 | | | | 56,390 | |
Kangwon Land, Inc. | Morgan Stanley | Receive | EFFR + 0.63% = 5.96% | Termination | | | 05/03/2027 | | | | | | | 528,591 | | | | 28,204 | |
KCC Corp. | Morgan Stanley | Receive | EFFR + 0.63% = 5.96% | Termination | | | 07/30/2027 | | | | | | | 137,904 | | | | (17,692 | ) |
Korea Zinc Co. Ltd. | Morgan Stanley | Receive | EFFR + 0.63% = 5.96% | Termination | | | 05/31/2027 | | | | | | | 497,814 | | | | 41,969 | |
Korean Air Lines Co. Ltd. | Morgan Stanley | Receive | EFFR + 0.63% = 5.96% | Termination | | | 07/29/2027 | | | | | | | 497,419 | | | | 35,460 | |
Krafton, Inc. | Goldman Sachs | Receive | EFFR + 0.65% = 5.98% | Termination | | | 08/02/2027 | | | | | | | 583,819 | | | | 41,880 | |
KT Corp. | Morgan Stanley | Receive | EFFR + 0.63% = 5.96% | Termination | | | 08/09/2027 | | | | | | | 478,913 | | | | 28,601 | |
Kumho Petrochemical Co. Ltd. | Goldman Sachs | Receive | EFFR + 0.65% = 5.98% | Termination | | | 07/30/2027 | | | | | | | 146,856 | | | | (7,375 | ) |
Largan Precision Co. Ltd. | Goldman Sachs | Receive | EFFR + 0.65% = 5.98% | Termination | | | 08/02/2027 | | | | | | | 390,122 | | | | 48,778 | |
The accompanying notes are an integral part of the financial statements.
Financial Statements 2024 | 7 |
BOSTON PARTNERS INVESTMENT FUNDS | August 31, 2024 |
BOSTON PARTNERS EMERGING MARKETS DYNAMIC EQUITY FUND | Schedule of Investments (continued) |
Reference
Entity | | Counterparty | | | Pay/
Receive
Reference
Entity | | | Financing
Rate | | | Payment
Frequency | | | Maturity
Date | | Notional
Amount | | | VALUE/
UNREALIZED
APPRECIATION
(DEPRECIATION) | |
LG Electronics, Inc. | Goldman Sachs | Receive | EFFR + 0.65% = 5.98% | Termination | | | 07/30/2027 | | $ | | | 475,626 | | | $ | (21,714 | ) |
LG Energy Solution Ltd. | Goldman Sachs | Receive | EFFR + 0.65% = 5.98% | Termination | | | 10/19/2026 | | | | | 232,361 | | | | 37,061 | |
LG Innotek Co. Ltd. | Goldman Sachs | Receive | EFFR + 0.65% = 5.98% | Termination | | | 07/26/2027 | | | | | 331,515 | | | | 16,123 | |
Lojas Renner SA | Morgan Stanley | Receive | EFFR + 0.63% = 5.96% | Termination | | | 04/30/2027 | | | | | 325,236 | | | | (5,951 | ) |
Magazine Luiza SA | Morgan Stanley | Receive | EFFR + 0.63% = 5.96% | Termination | | | 04/30/2027 | | | | | 255,482 | | | | (80,508 | ) |
Millicom International Cellular SA | Goldman Sachs | Receive | STIB1D INDEX + 1.00% = 4.75% | Termination | | | 08/23/2027 | | SEK | | | 1,452,549 | | | | (2,016 | ) |
Millicom International Cellular SA | Morgan Stanley | Receive | STIB1D INDEX + 0.40% = 4.15% | Termination | | | 06/11/2027 | | SEK | | | 3,409,269 | | | | (1,551 | ) |
Mosaic Co. | Goldman Sachs | Receive | EFFR + 0.40% = 5.84% | Termination | | | 11/10/2026 | | | | | 181,391 | | | | (35,618 | ) |
Rede D’Or Sao Luiz SA | J.P. Morgan Securities, Inc. | Receive | OBFR + 0.60% = 5.92% | Termination | | | 06/14/2027 | | | | | 752,109 | | | | 75,817 | |
Samsung Electro-Mechanics Co. Ltd. | Morgan Stanley | Receive | EFFR + 0.63% = 5.96% | Termination | | | 07/01/2027 | | | | | 746,150 | | | | (78,336 | ) |
Samsung Electronics Co. Ltd. | Goldman Sachs | Receive | SONIA + 0.40% = 6.29% | Termination | | | 03/30/2026 | | | | | 613,431 | | | | 19,070 | |
Samsung Electronics Co. Ltd. | Morgan Stanley | Receive | EFFR + 0.63% = 5.96% | Termination | | | 04/29/2027 | | | | | 464,109 | | | | (26,419 | ) |
Samsung Securities Co. Ltd. | Morgan Stanley | Receive | EFFR + 0.63% = 5.96% | Termination | | | 08/02/2027 | | | | | 335,421 | | | | 27,167 | |
Sberbank of Russia PJSC | Goldman Sachs | Receive | EFFR + 0.96% = 6.29% | Monthly | | | 09/16/2025 | | | | | 0 | | | | (1,057 | ) |
Silergy Corp. | Goldman Sachs | Receive | EFFR + 0.65% = 5.98% | Termination | | | 08/02/2027 | | | | | 1,208,596 | | | | 84,279 | |
Sino Biopharmaceutical Ltd. | Morgan Stanley | Receive | 1 mo. HIBOR HKD + 0.50% = 4.83% | Termination | | | 08/06/2027 | | HKD | | | 2,739,040 | | | | 46,143 | |
SK Telecom Co. Ltd. | Goldman Sachs | Receive | EFFR + 0.65% = 5.98% | Termination | | | 08/02/2027 | | | | | 1,234,578 | | | | 31,519 | |
SOOP Co. Ltd. | Morgan Stanley | Receive | EFFR + 0.63% = 5.96% | Termination | | | 08/02/2027 | | | | | 226,114 | | | | (2,117 | ) |
STO Express Co. Ltd. | HSBC Bank | Receive | SOFR + 0.85% = 6.25% | Termination | | | 07/05/2027 | | | | | 354,715 | | | | 38,008 | |
Sunny Optical Technology Group Co. Ltd. | Goldman Sachs | Receive | 1 mo. HIBOR HKD + 0.50% = 5.12% | Termination | | | 07/30/2027 | | HKD | | | 2,463,300 | | | | 11,190 | |
Techtronic Industries Co. Ltd. | Goldman Sachs | Receive | 1 mo. HIBOR HKD + 0.50% = 5.06% | Termination | | | 01/19/2027 | | HKD | | | 7,987,600 | | | | 182,912 | |
Tencent Holdings Ltd. | Goldman Sachs | Receive | 1 mo. HIBOR HKD + 0.50% = 4.58% | Termination | | | 08/23/2027 | | HKD | | | 14,057,600 | | | | 22,098 | |
Teva Pharmaceutical Industries Ltd. | Morgan Stanley | Receive | EFFR + 0.40% = 5.73% | Termination | | | 09/23/2026 | | | | | 698,624 | | | | 73,637 | |
Teva Pharmaceutical Industries Ltd. | Morgan Stanley | Receive | EFFR + 0.40% = 5.88% | Termination | | | 10/19/2026 | | | | | 168,226 | | | | 44,177 | |
WH Group Ltd. | Goldman Sachs | Receive | 1 mo. HIBOR HKD + 0.50% = 5.12% | Termination | | | 07/30/2027 | | HKD | | | 7,276,080 | | | | 58,938 | |
Zhen Ding Technology Holding Ltd. | Goldman Sachs | Receive | EFFR + 0.76% = 6.09% | Termination | | | 08/02/2027 | | | | | 309,206 | | | | 493 | |
Zhen Ding Technology Holding Ltd. | Morgan Stanley | Receive | EFFR + 0.85% = 6.18% | Termination | | | 08/02/2027 | | | | | 144,014 | | | | 11 | |
Accton Technology Corp. | Goldman Sachs | Pay | EFFR + (1.25)% = 2.83% | Termination | | | 03/19/2027 | | | | | (476,399 | ) | | | (62,465 | ) |
Acer, Inc. | J.P. Morgan Securities, Inc. | Pay | OBFR + (0.60)% = 2.15% | Termination | | | 11/16/2026 | | | | | (289,934 | ) | | | (71,891 | ) |
Adient PLC | Goldman Sachs | Pay | EFFR + (0.25)% = 5.08% | Termination | | | 08/13/2027 | | | | | (257,823 | ) | | | (22,456 | ) |
Adient PLC | Morgan Stanley | Pay | EFFR + (0.25)% = 5.08% | Termination | | | 08/23/2027 | | | | | (246,943 | ) | | | (10,637 | ) |
Advantech Co. Ltd. | Goldman Sachs | Pay | EFFR + (1.25)% = 4.08% | Termination | | | 10/13/2026 | | | | | (54,548 | ) | | | (926 | ) |
Advantech Co. Ltd. | Morgan Stanley | Pay | EFFR + (1.25)% = 3.71% | Termination | | | 11/09/2026 | | | | | (98,187 | ) | | | (1,642 | ) |
Aerospace Industrial Development Corp. | Goldman Sachs | Pay | EFFR + (1.25)% = 4.08% | Termination | | | 08/23/2027 | | | | | (229,472 | ) | | | (4,833 | ) |
The accompanying notes are an integral part of the financial statements.
Financial Statements 2024 | 8 |
BOSTON PARTNERS INVESTMENT FUNDS | August 31, 2024 |
BOSTON PARTNERS EMERGING MARKETS DYNAMIC EQUITY FUND | Schedule of Investments (continued) |
Reference
Entity | | Counterparty | | | Pay/
Receive
Reference
Entity | | | Financing
Rate | | | Payment
Frequency | | | Maturity
Date | | Notional
Amount | | | VALUE/
UNREALIZED
APPRECIATION
(DEPRECIATION) | |
Aerospace Industrial Development Corp. | J.P. Morgan Securities, Inc. | Pay | OBFR + (0.60)% = (2.17)% | Termination | | | 02/22/2027 | | $ | | | (68,221 | ) | | $ | (1,844 | ) |
Airports of Thailand PCL | Goldman Sachs | Pay | EFFR + (0.65)% = 4.68% | Termination | | | 08/16/2027 | | | | | (541,625 | ) | | | (38,983 | ) |
Airtac International Group | J.P. Morgan Securities, Inc. | Pay | OBFR + (0.60)% = 4.72% | Termination | | | 08/09/2027 | | | | | (351,516 | ) | | | (49,025 | ) |
AKR Corporindo Tbk PT | Bank of America Securities, Inc. | Pay | EFFR + (3.00)% = 2.33% | Termination | | | 02/22/2027 | | | | | (45,222 | ) | | | 2,456 | |
AKR Corporindo Tbk PT | J.P. Morgan Securities, Inc. | Pay | OBFR + (0.60)% = 2.92% | Termination | | | 04/05/2027 | | | | | (119,474 | ) | | | 13,070 | |
AKR Corporindo Tbk PT | Morgan Stanley | Pay | EFFR + (0.75)% = 4.58% | Termination | | | 08/12/2027 | | | | | (9,818 | ) | | | (651 | ) |
Al Hammadi Co. for Development and Investment | J.P. Morgan Securities, Inc. | Pay | EFFR + (0.35)% = 4.98% | Termination | | | 08/23/2027 | | | | | (175,424 | ) | | | 2,461 | |
AMATA CORP | Morgan Stanley | Pay | EFFR + (1.55)% = 3.78% | Termination | | | 08/26/2027 | | | | | (157,432 | ) | | | (14,246 | ) |
Amorepacific Corp. | Goldman Sachs | Pay | EFFR + (0.37)% = 4.83% | Termination | | | 12/08/2025 | | | | | (381,716 | ) | | | 23,400 | |
Antofagasta PLC | Goldman Sachs | Pay | 0.00% | Termination | | | 09/03/2027 | | GBP | | | (157,251 | ) | | | 0 | |
Arcos Dorados Holdings, Inc. | Goldman Sachs | Pay | EFFR + (0.25)% = 5.08% | Termination | | | 08/16/2027 | | | | | (428,516 | ) | | | 46,313 | |
Arcos Dorados Holdings, Inc. | Morgan Stanley | Pay | EFFR + (0.25)% = 5.08% | Termination | | | 08/23/2027 | | | | | (59,136 | ) | | | 262 | |
ASMedia Technology, Inc. | Goldman Sachs | Pay | EFFR + (1.25)% = 4.08% | Termination | | | 08/23/2027 | | | | | (110,660 | ) | | | (5,298 | ) |
ASMedia Technology, Inc. | J.P. Morgan Securities, Inc. | Pay | OBFR + (0.60)% = (5.05)% | Termination | | | 08/09/2027 | | | | | (387,309 | ) | | | (77,399 | ) |
ASMedia Technology, Inc. | Morgan Stanley | Pay | EFFR + (12.75)% = (19.69)% | Termination | | | 08/27/2027 | | | | | (442,638 | ) | | | (39,598 | ) |
Axis Bank Ltd. | Morgan Stanley | Pay | EFFR + (0.25)% = 4.83% | Termination | | | 02/16/2027 | | | | | (513,578 | ) | | | (2,638 | ) |
Bid Corp. Ltd. | Morgan Stanley | Pay | South Africa Rand Overnight Deposit Rate + (0.75)% = 7.32% | Termination | | | 08/06/2027 | | ZAR | | | (5,572,031 | ) | | | (1,840 | ) |
Bora Pharmaceuticals Co. Ltd. | Goldman Sachs | Pay | EFFR + (1.25)% = (1.17)% | Termination | | | 07/23/2027 | | | | | (327,352 | ) | | | 30,651 | |
Budimex SA | Morgan Stanley | Pay | EFFR + (0.25)% = 5.08% | Termination | | | 08/23/2027 | | | | | (294,481 | ) | | | (366 | ) |
Budweiser Brewing Co. APAC Ltd. | Goldman Sachs | Pay | HONIA + (0.50)% = 2.99% | Termination | | | 02/22/2027 | | HKD | | | (4,070,528 | ) | | | 178,071 | |
Budweiser Brewing Co. APAC Ltd. | Morgan Stanley | Pay | HONIA + (0.50)% = 3.34% | Termination | | | 05/10/2027 | | HKD | | | (262,528 | ) | | | 7,859 | |
Camtek Ltd. | Morgan Stanley | Pay | EFFR + (0.25)% = 5.08% | Termination | | | 02/16/2026 | | | | | (83,829 | ) | | | (32,397 | ) |
Camtek Ltd. | Morgan Stanley | Pay | EFFR + (0.25)% = 5.08% | Termination | | | 04/14/2026 | | | | | (194,510 | ) | | | (13,764 | ) |
Cemex SAB de CV | Goldman Sachs | Pay | EFFR + (0.25)% = 5.08% | Termination | | | 08/05/2027 | | | | | (309,927 | ) | | | (4,745 | ) |
Central Retail Corp. PCL | HSBC Bank | Pay | SOFR + (0.80)% = 2.55% | Termination | | | 02/22/2027 | | | | | (202,303 | ) | | | 18,329 | |
Chenbro Micom Co. Ltd. | J.P. Morgan Securities, Inc. | Pay | OBFR + (0.60)% = (7.67)% | Termination | | | 08/09/2027 | | | | | (274,304 | ) | | | (34,250 | ) |
China Coal Energy Co. Ltd. | Goldman Sachs | Pay | HONIA + (0.50)% = 2.99% | Termination | | | 07/28/2026 | | HKD | | | (1,780,120 | ) | | | (98,460 | ) |
China Motor Corp. | Morgan Stanley | Pay | EFFR + (1.25)% = 4.08% | Termination | | | 08/12/2027 | | | | | (221,413 | ) | | | 6,250 | |
China Shenhua Energy Co. Ltd. | Goldman Sachs | Pay | HONIA + (0.50)% = 3.39% | Termination | | | 07/28/2026 | | HKD | | | (1,718,700 | ) | | | (78,124 | ) |
Chunbo Co. Ltd. | Goldman Sachs | Pay | EFFR + (0.37)% = 1.08% | Termination | | | 12/12/2025 | | | | | (29,411 | ) | | | 90,032 | |
Chunbo Co. Ltd. | J.P. Morgan Securities, Inc. | Pay | OBFR + (0.50)% = (2.94)% | Termination | | | 08/07/2026 | | | | | (19,563 | ) | | | 38,641 | |
Chunbo Co. Ltd. | Morgan Stanley | Pay | EFFR + (0.62)% = 0.33% | Termination | | | 12/08/2025 | | | | | (81,652 | ) | | | 251,841 | |
Cie Financiere Richemont SA | Morgan Stanley | Pay | SARON + 0.35% = 1.56% | Termination | | | 08/12/2027 | | CHF | | | (222,593 | ) | | | (12,011 | ) |
The accompanying notes are an integral part of the financial statements.
Financial Statements 2024 | 9 |
BOSTON PARTNERS INVESTMENT FUNDS | August 31, 2024 |
BOSTON PARTNERS EMERGING MARKETS DYNAMIC EQUITY FUND | Schedule of Investments (continued) |
Reference
Entity | | Counterparty | | | Pay/
Receive
Reference
Entity | | | Financing
Rate | | | Payment
Frequency | | | Maturity
Date | | Notional
Amount | | | VALUE/
UNREALIZED
APPRECIATION
(DEPRECIATION) | |
Compal Electronics, Inc. | J.P. Morgan Securities, Inc. | Pay | OBFR + (0.60)% = 4.20% | Termination | | | 11/13/2026 | | $ | | | (412,016 | ) | | $ | (38,366 | ) |
Corp. Inmobiliaria Vesta SAB de CV | J.P. Morgan Securities, Inc. | Pay | OBFR + (0.75)% = 4.57% | Termination | | | 08/09/2027 | | | | | (225,028 | ) | | | 11,481 | |
COSCO SHIPPING Energy Transportation Co. Ltd. | HSBC Bank | Pay | 1 mo. HIBOR HKD + (0.35)% = 4.03% | Termination | | | 04/02/2027 | | HKD | | | (3,650,820 | ) | | | (41,127 | ) |
Cowell e Holdings, Inc. | Goldman Sachs | Pay | HONIA + (0.50)% = (4.67)% | Termination | | | 04/09/2027 | | HKD | | | (2,386,800 | ) | | | (83,934 | ) |
Cowell e Holdings, Inc. | Morgan Stanley | Pay | HONIA + (0.50)% = 3.30% | Termination | | | 08/27/2027 | | HKD | | | (1,147,500 | ) | | | 714 | |
CSPC Innovation Pharmaceutical Co. Ltd. | J.P. Morgan Securities, Inc. | Pay | OBFR + (0.30)% = (8.28)% | Termination | | | 04/02/2027 | | | | | (167,842 | ) | | | 38,124 | |
CSPC Innovation Pharmaceutical Co. Ltd. | Morgan Stanley | Pay | EFFR + (15.65)% = (10.32)% | Termination | | | 05/13/2027 | | | | | (29,752 | ) | | | 10,619 | |
Dino Polska SA | Goldman Sachs | Pay | EFFR + (0.25)% = 5.08% | Termination | | | 05/10/2027 | | | | | (455,125 | ) | | | 51,079 | |
EcoPro BM Co. Ltd. | Goldman Sachs | Pay | EFFR + (0.37)% = 0.33% | Termination | | | 05/04/2026 | | | | | (212,792 | ) | | | 94,476 | |
EcoPro Co. Ltd. | Goldman Sachs | Pay | EFFR + (0.37)% = (4.67)% | Termination | | | 11/09/2026 | | | | | (80,419 | ) | | | 38,957 | |
Elan Microelectronics Corp. | Goldman Sachs | Pay | EFFR + (1.25)% = 1.83% | Termination | | | 02/22/2027 | | | | | (900,656 | ) | | | (28,715 | ) |
Elan Microelectronics Corp. | J.P. Morgan Securities, Inc. | Pay | OBFR + (0.60)% = 4.72% | Termination | | | 05/10/2027 | | | | | (45,952 | ) | | | 2,944 | |
Elite Material Co. Ltd. | Goldman Sachs | Pay | EFFR + (1.25)% = 0.33% | Termination | | | 02/22/2027 | | | | | (58,143 | ) | | | 8,767 | |
Elite Material Co. Ltd. | J.P. Morgan Securities, Inc. | Pay | OBFR + (0.60)% = 0.31% | Termination | | | 11/13/2026 | | | | | (116,286 | ) | | | (16,187 | ) |
Ennoconn Corp. | Goldman Sachs | Pay | EFFR + (1.25)% = 4.08% | Termination | | | 09/03/2027 | | | | | (238,501 | ) | | | 0 | |
Estun Automation Co. Ltd. | Bank of America Securities, Inc. | Pay | EFFR + (0.90)% = 4.44% | Termination | | | 09/06/2027 | | | | | (5,122 | ) | | | 0 | |
Estun Automation Co. Ltd. | HSBC Bank | Pay | SOFR + (0.85)% = 2.33% | Termination | | | 09/02/2027 | | | | | (28,945 | ) | | | (1,024 | ) |
Estun Automation Co. Ltd. | J.P. Morgan Securities, Inc. | Pay | OBFR + (0.30)% = 5.02% | Termination | | | 08/16/2027 | | | | | (17,470 | ) | | | 1,044 | |
Estun Automation Co. Ltd. | Morgan Stanley | Pay | OBFR + (0.30)% = 5.02% | Termination | | | 08/16/2027 | | | | | (83,066 | ) | | | 966 | |
Faraday Technology Corp. | Goldman Sachs | Pay | EFFR + (1.25)% = (5.67)% | Termination | | | 12/08/2025 | | | | | (38,012 | ) | | | (3,605 | ) |
Faraday Technology Corp. | J.P. Morgan Securities, Inc. | Pay | OBFR + (0.60)% = 4.72% | Termination | | | 08/06/2027 | | | | | (123,539 | ) | | | (8,709 | ) |
Faraday Technology Corp. | Morgan Stanley | Pay | EFFR + (1.25)% = (0.67)% | Termination | | | 05/06/2027 | | | | | (186,809 | ) | | | (13,844 | ) |
Fortune Electric Co. Ltd. | J.P. Morgan Securities, Inc. | Pay | OBFR + (0.60)% = (6.54)% | Termination | | | 08/12/2027 | | | | | (166,802 | ) | | | (19,263 | ) |
Fortune Electric Co. Ltd. | Morgan Stanley | Pay | EFFR + (1.25)% = 4.08% | Termination | | | 08/27/2027 | | | | | (104,251 | ) | | | (637 | ) |
Fositek Corp. | Morgan Stanley | Pay | EFFR + (34.75)% = (29.42)% | Termination | | | 05/06/2027 | | | | | (550,860 | ) | | | (53,885 | ) |
Gamuda Bhd | HSBC Bank | Pay | SOFR + (0.85)% = 2.33% | Termination | | | 05/06/2027 | | | | | (196,067 | ) | | | (70,725 | ) |
GCC SAB de CV | Morgan Stanley | Pay | EFFR + (0.50)% = 4.83% | Termination | | | 12/02/2025 | | | | | (174,812 | ) | | | 22,653 | |
GCC SAB de CV | Morgan Stanley | Pay | EFFR + (0.50)% = 4.78% | Termination | | | 02/09/2027 | | | | | (118,688 | ) | | | 67,303 | |
Global Unichip Corp. | Goldman Sachs | Pay | EFFR + (1.25)% = (1.92)% | Termination | | | 11/13/2026 | | | | | (139,419 | ) | | | 26,998 | |
Global Unichip Corp. | J.P. Morgan Securities, Inc. | Pay | OBFR + (0.60)% = (2.31)% | Termination | | | 05/10/2027 | | | | | (34,855 | ) | | | 4,959 | |
Great Tree Pharmacy Co. Ltd. | Goldman Sachs | Pay | EFFR + (1.25)% = (0.17)% | Termination | | | 10/19/2026 | | | | | (210,642 | ) | | | 100,562 | |
Great Tree Pharmacy Co. Ltd. | J.P. Morgan Securities, Inc. | Pay | OBFR + (0.60)% = 1.56% | Termination | | | 11/10/2026 | | | | | (175,531 | ) | | | 86,769 | |
Grupo Aeroportuario del Pacifico SAB de CV | Morgan Stanley | Pay | EFFR + (0.25)% = 5.08% | Termination | | | 04/14/2026 | | | | | (204,154 | ) | | | (22,938 | ) |
The accompanying notes are an integral part of the financial statements.
Financial Statements 2024 | 10 |
BOSTON PARTNERS INVESTMENT FUNDS | August 31, 2024 |
BOSTON PARTNERS EMERGING MARKETS DYNAMIC EQUITY FUND | Schedule of Investments (continued) |
Reference
Entity | | Counterparty | | | Pay/
Receive
Reference
Entity | | | Financing
Rate | | | Payment
Frequency | | | Maturity
Date | Notional
Amount | | | VALUE/
UNREALIZED
APPRECIATION
(DEPRECIATION) | |
Grupo Aeroportuario del Pacifico SAB de CV | Morgan Stanley | Pay | EFFR + (0.25)% = 5.08% | Termination | | | 12/14/2026 | $ | | | (130,950 | ) | | $ | (23,838 | ) |
Grupo Aeroportuario del Sureste SAB de CV | Goldman Sachs | Pay | EFFR + (0.25)% = 5.08% | Termination | | | 08/23/2027 | | | | | | (405,163 | ) | | | 6,391 | |
Guanghui Energy Co. Ltd. | Bank of America Securities, Inc. | Pay | EFFR + (25.00)% = (19.67)% | Termination | | | 09/14/2026 | | | | | | (229,464 | ) | | | (41,606 | ) |
Guanghui Energy Co. Ltd. | Goldman Sachs | Pay | EFFR + (17.25)% = (11.92)% | Termination | | | 09/11/2026 | | | | | | (90,221 | ) | | | (6,150 | ) |
Hansol Chemical Co. Ltd. | Goldman Sachs | Pay | EFFR + (0.37)% = 4.83% | Termination | | | 12/12/2025 | | | | | | (103,844 | ) | | | 52,451 | |
Hansol Chemical Co. Ltd. | J.P. Morgan Securities, Inc. | Pay | OBFR + (0.50)% = 4.31% | Termination | | | 08/07/2026 | | | | | | (45,877 | ) | | | 21,437 | |
Hansol Chemical Co. Ltd. | Morgan Stanley | Pay | EFFR + (0.62)% = 4.78% | Termination | | | 12/08/2025 | | | | | | (176,708 | ) | | | 93,501 | |
Hanwha Solutions Corp. | Goldman Sachs | Pay | EFFR + (0.37)% = 4.83% | Termination | | | 11/09/2026 | | | | | | (151,360 | ) | | | 37,454 | |
Hanwha Solutions Corp. | Morgan Stanley | Pay | EFFR + (0.62)% = 4.58% | Termination | | | 10/20/2026 | | | | | | (81,175 | ) | | | 21,040 | |
Home Product Center PCL | Morgan Stanley | Pay | EFFR + (1.55)% = 4.08% | Termination | | | 08/13/2027 | | | | | | (481,579 | ) | | | (45,886 | ) |
Huizhou Desay Sv Automotive Co. Ltd. | Bank of America Securities, Inc. | Pay | EFFR + (0.90)% = 4.43% | Termination | | | 08/13/2027 | | | | | | (29,590 | ) | | | (1,972 | ) |
Huizhou Desay Sv Automotive Co. Ltd. | J.P. Morgan Securities, Inc. | Pay | OBFR + (17.25)% = (12.06)% | Termination | | | 08/16/2027 | | | | | | (156,954 | ) | | | (7,172 | ) |
Hyundai Motor Co. | Goldman Sachs | Pay | EFFR + (0.37)% = 4.83% | Termination | | | 04/14/2026 | | | | | | (1,721 | ) | | | (416 | ) |
Hyundai Motor Co. | Morgan Stanley | Pay | EFFR + (0.62)% = 4.78% | Termination | | | 12/08/2025 | | | | | | (201,210 | ) | | | (76,004 | ) |
Jiangsu Pacific Quartz Co. Ltd. | Bank of America Securities, Inc. | Pay | EFFR + (0.90)% = (5.08)% | Termination | | | 04/05/2027 | | | | | | (98,509 | ) | | | 115,824 | |
Jiangsu Pacific Quartz Co. Ltd. | J.P. Morgan Securities, Inc. | Pay | OBFR + (0.30)% = 5.02% | Termination | | | 05/13/2027 | | | | | | (8,295 | ) | | | 6,638 | |
Jiumaojiu International Holdings Ltd. | Goldman Sachs | Pay | HONIA + (0.50)% = 2.89% | Termination | | | 10/19/2026 | HKD | | | (121,730 | ) | | | 34,217 | |
Jiumaojiu International Holdings Ltd. | J.P. Morgan Securities, Inc. | Pay | HONIA + (0.40)% = 2.43% | Termination | | | 11/10/2026 | HKD | | | (549,080 | ) | | | 173,059 | |
Jiumaojiu International Holdings Ltd. | Morgan Stanley | Pay | HONIA + (0.50)% = 3.30% | Termination | | | 07/30/2027 | HKD | | | (1,326,080 | ) | | | 9,334 | |
JUMBO SA | Morgan Stanley | Pay | EONIA + (0.40)% = 3.26% | Termination | | | 08/16/2027 | EUR | | | (403,168 | ) | | | 335 | |
Kakao Games Corp. | Goldman Sachs | Pay | EFFR + (0.37)% = (4.17)% | Termination | | | 10/19/2026 | | | | | | (216,557 | ) | | | 62,489 | |
Kia Corp. | Morgan Stanley | Pay | EFFR + (0.62)% = 5.28% | Termination | | | 12/08/2025 | | | | | | (129,622 | ) | | | (48,430 | ) |
King Slide Works Co. Ltd. | Goldman Sachs | Pay | EFFR + (1.25)% = (7.92)% | Termination | | | 08/09/2027 | | | | | | (355,892 | ) | | | (61,297 | ) |
Kum Yang Co. Ltd. | Goldman Sachs | Pay | EFFR + (18.50)% = (13.17)% | Termination | | | 11/09/2026 | | | | | | (61,625 | ) | | | 49,092 | |
Land & Houses PCL | Morgan Stanley | Pay | EFFR + (28.88)% = (23.55)% | Termination | | | 08/26/2027 | | | | | | (155,753 | ) | | | (8,734 | ) |
Lasertec Corp. | Goldman Sachs | Pay | TONA + (0.45)% = (0.22)% | Termination | | | 08/06/2027 | | JPY | | | | (30,888,000 | ) | | | (34,057 | ) |
Lasertec Corp. | HSBC Bank | Pay | TONA + (0.43)% = (0.40)% | Termination | | | 08/07/2026 | | JPY | | | | (14,040,000 | ) | | | (24,353 | ) |
Lattice Semiconductor Corp. | Morgan Stanley | Pay | EFFR + (0.25)% = 5.08% | Termination | | | 08/20/2027 | | | | | | (459,203 | ) | | | 15,646 | |
Leejam Sports Co. JSC | Morgan Stanley | Pay | EFFR + (0.25)% = 0.39% | Termination | | | 11/12/2026 | | | | | | (347,384 | ) | | | (47,629 | ) |
Leejam Sports Co. JSC | Morgan Stanley | Pay | EFFR + (0.25)% = 0.39% | Termination | | | 03/01/2027 | | | | | | (110,951 | ) | | | (2,684 | ) |
Legend Biotech Corp. | Goldman Sachs | Pay | EFFR + (0.25)% = 5.08% | Termination | | | 12/07/2026 | | | | | | (118,841 | ) | | | (22,787 | ) |
LG Energy Solution Ltd. | Goldman Sachs | Pay | EFFR + (0.37)% = 4.83% | Termination | | | 10/19/2026 | | | | | | (358,708 | ) | | | 71,937 | |
LG H&H Co. Ltd. | Goldman Sachs | Pay | EFFR + (0.37)% = 4.83% | Termination | | | 12/08/2025 | | | | | | (197,969 | ) | | | 159,884 | |
Localiza Rent a Car SA | J.P. Morgan Securities, Inc. | Pay | OBFR + (0.60)% = 4.72% | Termination | | | 05/15/2026 | | | | | | (27,752 | ) | | | 9,401 | |
The accompanying notes are an integral part of the financial statements.
Financial Statements 2024 | 11 |
BOSTON PARTNERS INVESTMENT FUNDS | August 31, 2024 |
BOSTON PARTNERS EMERGING MARKETS DYNAMIC EQUITY FUND | Schedule of Investments (continued) |
Reference
Entity | | Counterparty | | | Pay/
Receive
Reference
Entity | | | Financing
Rate | | | Payment
Frequency | | | Maturity
Date | | Notional
Amount | | | VALUE/
UNREALIZED
APPRECIATION
(DEPRECIATION) | |
Localiza Rent a Car SA | J.P. Morgan Securities, Inc. | Pay | OBFR + (0.60)% = 5.06% | Termination | | | 05/18/2026 | | $ | | | | | (370,699 | ) | | $ | 266,694 | |
Localiza Rent a Car SA | J.P. Morgan Securities, Inc. | Pay | OBFR + (0.60)% = 4.72% | Termination | | | 08/18/2026 | | | | | | | (4,009 | ) | | | (774 | ) |
Localiza Rent a Car SA | J.P. Morgan Securities, Inc. | Pay | EFFR + (0.27)% = 5.04% | Termination | | | 11/29/2030 | | | | | | | (1,329 | ) | | | (1,354 | ) |
Lotus Pharmaceutical Co. Ltd. | Goldman Sachs | Pay | EFFR + (1.25)% = 4.08% | Termination | | | 08/23/2027 | | | | | | | (197,374 | ) | | | (6,568 | ) |
Lotus Pharmaceutical Co., Ltd. | J.P. Morgan Securities, Inc. | Pay | OBFR + (0.60)% = 0.06% | Termination | | | 11/10/2026 | | | | | | | (260,175 | ) | | | (34,364 | ) |
Lumi Rental Co. | Morgan Stanley | Pay | EFFR + (0.25)% = (3.48)% | Termination | | | 11/13/2026 | | | | | | | (395,907 | ) | | | 52,574 | |
MediaTek, Inc. | J.P. Morgan Securities, Inc. | Pay | OBFR + (0.60)% = 4.72% | Termination | | | 08/09/2027 | | | | | | | (736,480 | ) | | | (79,120 | ) |
Melco Resorts & Entertainment Ltd. | Goldman Sachs | Pay | EFFR + (0.25)% = 5.08% | Termination | | | 08/23/2027 | | | | | | | (82,555 | ) | | | 8,342 | |
Melco Resorts & Entertainment Ltd. | Morgan Stanley | Pay | EFFR + (0.25)% = 5.08% | Termination | | | 04/05/2027 | | | | | | | (321,413 | ) | | | 58,240 | |
MGI Tech Co. Ltd. | Bank of America Securities, Inc. | Pay | EFFR + (25.00)% = (19.67)% | Termination | | | 04/09/2027 | | | | | | | (122,045 | ) | | | 30,582 | |
MGI Tech Co. Ltd. | HSBC Bank | Pay | SOFR + (0.85)% = 4.46% | Termination | | | 05/10/2027 | | | | | | | (2,260 | ) | | | 977 | |
MGI Tech Co. Ltd. | J.P. Morgan Securities, Inc. | Pay | OBFR + (18.95)% = (12.52)% | Termination | | | 04/23/2027 | | | | | | | (23,731 | ) | | | 5,351 | |
MGI Tech Co. Ltd. | Morgan Stanley | Pay | EFFR + (30.00)% = (24.67)% | Termination | | | 05/13/2027 | | | | | | | (32,302 | ) | | | 12,345 | |
Middle East Healthcare Co. | Morgan Stanley | Pay | EFFR + (0.25)% = (0.92)% | Termination | | | 05/13/2027 | | | | | | | (187,080 | ) | | | 38,211 | |
Mitra Adiperkasa Tbk PT | J.P. Morgan Securities, Inc. | Pay | OBFR + (0.60)% = (0.44)% | Termination | | | 04/05/2027 | | | | | | | (259,224 | ) | | | (14,971 | ) |
Mitra Adiperkasa Tbk PT | Morgan Stanley | Pay | EFFR + (0.75)% = 1.28% | Termination | | | 02/23/2027 | | | | | | | (55,757 | ) | | | 1,163 | |
Mobileye Global, Inc. | Goldman Sachs | Pay | EFFR + (0.25)% = 5.08% | Termination | | | 08/23/2027 | | | | | | | (225,053 | ) | | | 12,731 | |
Nanya Technology Corp. | Morgan Stanley | Pay | EFFR + (1.25)% = 4.08% | Termination | | | 08/16/2027 | | | | | | | (408,553 | ) | | | 811 | |
New Oriental Education & Technology Group, Inc. | Goldman Sachs | Pay | EFFR + (0.25)% = 5.08% | Termination | | | 08/13/2027 | | | | | | | (257,232 | ) | | | 38,149 | |
New Oriental Education & Technology Group, Inc. | Morgan Stanley | Pay | EFFR + (0.25)% = 5.08% | Termination | | | 08/23/2027 | | | | | | | (112,754 | ) | | | 14,133 | |
Nongfu Spring Co. Ltd. | Goldman Sachs | Pay | HONIA + (0.50)% = 3.30% | Termination | | | 08/12/2027 | | HKD | | | (1,743,760 | ) | | | 145 | |
Nova Ltd. | Goldman Sachs | Pay | EFFR + (0.25)% = 5.08% | Termination | | | 10/19/2026 | | | | | | | (330,854 | ) | | | (110,587 | ) |
Novatek Microelectronics Corp. | Goldman Sachs | Pay | EFFR + (1.25)% = (0.67)% | Termination | | | 11/13/2026 | | | | | | | (573,929 | ) | | | (57,042 | ) |
Novatek Microelectronics Corp. | Morgan Stanley | Pay | EFFR + (1.25)% = 4.08% | Termination | | | 08/06/2027 | | | | | | | (118,162 | ) | | | (6,816 | ) |
Nuvoton Technology Corp. | Goldman Sachs | Pay | EFFR + (1.25)% = (1.17)% | Termination | | | 02/22/2027 | | | | | | | (144,833 | ) | | | 59,940 | |
Nuvoton Technology Corp. | J.P. Morgan Securities, Inc. | Pay | OBFR + (0.60)% = (1.69)% | Termination | | | 05/10/2027 | | | | | | | (367,652 | ) | | | (19,196 | ) |
Nuvoton Technology Corp. | Morgan Stanley | Pay | EFFR + (1.25)% = (1.42)% | Termination | | | 08/02/2027 | | | | | | | (259,028 | ) | | | 37,233 | |
Ozon Holdings PLC | Goldman Sachs | Pay | EFFR + (0.25)% = 5.08% | Monthly | | | 09/16/2025 | | | | | | | 0 | | | | 314,150 | |
Pegavision Corp. | J.P. Morgan Securities, Inc. | Pay | OBFR + (0.60)% = (3.81)% | Termination | | | 08/09/2027 | | | | | | | (354,361 | ) | | | (43,024 | ) |
Perfect World Co. Ltd. | Morgan Stanley | Pay | EFFR + (0.62)% = (8.02)% | Termination | | | 08/13/2027 | | | | | | | (226,557 | ) | | | 2,552 | |
Phison Electronics Corp. | Goldman Sachs | Pay | EFFR + (1.25)% = 4.08% | Termination | | | 08/09/2027 | | | | | | | (349,234 | ) | | | (46,947 | ) |
The accompanying notes are an integral part of the financial statements.
Financial Statements 2024 | 12 |
BOSTON PARTNERS INVESTMENT FUNDS | August 31, 2024 |
BOSTON PARTNERS EMERGING MARKETS DYNAMIC EQUITY FUND | Schedule of Investments (continued) |
Reference
Entity | | Counterparty | | | Pay/
Receive
Reference
Entity | | | Financing
Rate | | | Payment
Frequency | | | Maturity
Date | | Notional
Amount | | | VALUE/
UNREALIZED
APPRECIATION
(DEPRECIATION) | |
Pingdingshan Tianan Coal Mining Co. Ltd. | Goldman Sachs | Pay | EFFR + (0.90)% = (5.92)% | Termination | | | 10/16/2026 | | $ | | | | | (61,075 | ) | | $ | (7,585 | ) |
Pingdingshan Tianan Coal Mining Co. Ltd. | Morgan Stanley | Pay | EFFR + (0.62)% = (0.62)% | Termination | | | 07/31/2026 | | | | | | | (63,673 | ) | | | (18,448 | ) |
POSCO Future M Co. Ltd. | Bank of America Securities, Inc. | Pay | EFFR + (0.40)% = (4.67)% | Termination | | | 11/09/2026 | | | | | | | (147,405 | ) | | | 28,222 | |
POSCO Future M Co. Ltd. | Goldman Sachs | Pay | EFFR + (0.37)% = 2.08% | Termination | | | 10/19/2026 | | | | | | | (92,329 | ) | | | 51,983 | |
Raia Drogasil SA | Goldman Sachs | Pay | EFFR + (35.45)% = (30.12)% | Termination | | | 03/18/2027 | | | | | | | (430,428 | ) | | | 29,631 | |
Reliance Industries Ltd. | Goldman Sachs | Pay | EFFR + (0.25)% = 5.08% | Termination | | | 08/09/2027 | | | | | | | (499,989 | ) | | | (4,503 | ) |
Remegen Co. Ltd. | Goldman Sachs | Pay | HONIA + (16.00)% = (12.50)% | Termination | | | 04/19/2027 | | HKD | | | (784,980 | ) | | | 107,623 | |
Rohm Co. Ltd. | Goldman Sachs | Pay | TONA + (0.45)% = (0.37)% | Termination | | | 06/04/2027 | | JPY | | | (37,595,000 | ) | | | 25,617 | |
Samsonite International SA | Goldman Sachs | Pay | HONIA + (0.50)% = 3.30% | Termination | | | 08/09/2027 | | HKD | | | (1,720,128 | ) | | | 17,889 | |
Samsonite International SA | Morgan Stanley | Pay | HONIA + (0.50)% = 3.30% | Termination | | | 08/02/2027 | | HKD | | | (2,291,520 | ) | | | 13,814 | |
Santos Brasil Participacoes SA | J.P. Morgan Securities, Inc. | Pay | OBFR + (0.60)% = 4.72% | Termination | | | 08/09/2027 | | | | | | | (333,225 | ) | | | 12,544 | |
Santos Brasil Participacoes SA | Morgan Stanley | Pay | EFFR + (0.62)% = 4.71% | Termination | | | 08/23/2027 | | | | | | | (161,004 | ) | | | 17,962 | |
Sercomm Corp. | Bank of America Securities, Inc. | Pay | EFFR + (0.40)% = 4.93% | Termination | | | 09/02/2027 | | | | | | | (240,497 | ) | | | (4,820 | ) |
Sercomm Corp. | Goldman Sachs | Pay | EFFR + (1.25)% = 4.08% | Termination | | | 08/23/2027 | | | | | | | (243,982 | ) | | | (7,059 | ) |
Sercomm Corp. | J.P. Morgan Securities, Inc. | Pay | OBFR + (0.60)% = 4.72% | Termination | | | 08/09/2027 | | | | | | | (268,381 | ) | | | (28,656 | ) |
Shanxi Coking Coal Energy Group Co., Ltd. | Goldman Sachs | Pay | EFFR + (0.90)% = (8.42)% | Termination | | | 09/11/2026 | | | | | | | (252,408 | ) | | | 266 | |
Shanxi Coking Coal Energy Group Co., Ltd. | Morgan Stanley | Pay | EFFR + (0.62)% = (7.32)% | Termination | | | 09/14/2026 | | | | | | | (66,085 | ) | | | (1,282 | ) |
Shenzhen Inovance Technology Co. Ltd. | Morgan Stanley | Pay | EFFR + (0.62)% = 4.71% | Termination | | | 08/30/2027 | | | | | | | (129,505 | ) | | | (11,858 | ) |
Shenzhen Inovance Technology Co., Ltd. | J.P. Morgan Securities, Inc. | Pay | OBFR + (0.30)% = (0.13)% | Termination | | | 11/10/2026 | | | | | | | (532,682 | ) | | | 216,695 | |
SLC Agricola SA | Goldman Sachs | Pay | EFFR + (0.75)% = 4.58% | Termination | | | 02/09/2027 | | | | | | | (227,319 | ) | | | 54,771 | |
Sonoscape Medical Corp. | J.P. Morgan Securities, Inc. | Pay | OBFR + (20.35)% = (15.02)% | Termination | | | 04/09/2027 | | | | | | | (23,744 | ) | | | 2,562 | |
Sonoscape Medical Corp. | Morgan Stanley | Pay | EFFR + (30.00)% = (24.67)% | Termination | | | 12/02/2025 | | | | | | | (128,648 | ) | | | 771 | |
Sonoscape Medical Corp. - A | J.P. Morgan Securities, Inc. | Pay | EFFR + (30.00)% = (24.67)% | Termination | | | 04/12/2027 | | | | | | | (100,587 | ) | | | 17,412 | |
Sonoscape Medical Corp. - A | Morgan Stanley | Pay | EFFR + (30.00)% = (24.67)% | Termination | | | 04/12/2027 | | | | | | | (44,034 | ) | | | 1,430 | |
StarPower Semiconductor Ltd. | Bank of America Securities, Inc. | Pay | EFFR + (25.00)% = (13.42)% | Termination | | | 08/06/2027 | | | | | | | (49,808 | ) | | | 7,176 | |
StarPower Semiconductor Ltd. | Goldman Sachs | Pay | EFFR + (25.00)% = (13.42)% | Termination | | | 08/06/2027 | | | | | | | (138,597 | ) | | | 19,799 | |
Sumber Alfaria Trijaya Tbk PT | HSBC Bank | Pay | SOFR + (0.85)% = 1.83% | Termination | | | 03/15/2027 | | | | | | | (130,317 | ) | | | (6,103 | ) |
Sumber Alfaria Trijaya Tbk PT | J.P. Morgan Securities, Inc. | Pay | OBFR + (0.60)% = 4.73% | Termination | | | 02/22/2027 | | | | | | | (412,586 | ) | | | (20,221 | ) |
Taiwan Semiconductor Co. Ltd. | Goldman Sachs | Pay | EFFR + (1.25)% = 1.58% | Termination | | | 05/10/2027 | | | | | | | (36,968 | ) | | | 1,007 | |
The accompanying notes are an integral part of the financial statements.
Financial Statements 2024 | 13 |
BOSTON PARTNERS INVESTMENT FUNDS | August 31, 2024 |
BOSTON PARTNERS EMERGING MARKETS DYNAMIC EQUITY FUND | Schedule of Investments (continued) |
Reference
Entity | | Counterparty | | | Pay/
Receive
Reference
Entity | | | Financing
Rate | | | Payment
Frequency | | | Maturity
Date | | Notional
Amount | | | VALUE/
UNREALIZED
APPRECIATION
(DEPRECIATION) | |
Taiwan Semiconductor Co. Ltd. | Morgan Stanley | Pay | EFFR + (1.25)% = (0.17)% | Termination | | | 05/06/2027 | | $ | | | | | (104,742 | ) | | $ | 4,263 | |
Tokyo Electron Ltd. | Goldman Sachs | Pay | TONA + (0.45)% = (0.46)% | Termination | | | 05/11/2026 | | | JPY | | | | (12,902,500 | ) | | | (36,382 | ) |
Tong Yang Industry Co. Ltd. | J.P. Morgan Securities, Inc. | Pay | OBFR + (0.60)% = 4.72% | Termination | | | 08/09/2027 | | | | | | | (470,656 | ) | | | (36,431 | ) |
Tsingtao Brewery Co. Ltd. | Goldman Sachs | Pay | HONIA + (0.50)% = 3.35% | Termination | | | 04/09/2027 | | HKD | | | (1,717,600 | ) | | | 22,842 | |
Unigroup Guoxin Microelectronics Co. Ltd. | Bank of America Securities, Inc. | Pay | EFFR + (0.90)% = (5.46)% | Termination | | | 05/10/2027 | | | | | | | (89,986 | ) | | | 16,265 | |
Unigroup Guoxin Microelectronics Co. Ltd. | J.P. Morgan Securities, Inc. | Pay | OBFR + (0.30)% = (5.67)% | Termination | | | 11/16/2026 | | | | | | | (116,848 | ) | | | 59,581 | |
Unilever Indonesia Tbk PT | Bank of America Securities, Inc. | Pay | EFFR + (5.00)% = 0.33% | Termination | | | 08/31/2026 | | | | | | | (375,068 | ) | | | 93,301 | |
Unilever Indonesia Tbk PT | J.P. Morgan Securities, Inc. | Pay | OBFR + (0.60)% = 3.08% | Termination | | | 03/15/2027 | | | | | | | (107,001 | ) | | | 16,142 | |
Unilever Indonesia Tbk PT | Morgan Stanley | Pay | EFFR + (0.75)% = 4.58% | Termination | | | 05/17/2027 | | | | | | | (35,486 | ) | | | 3,518 | |
United Electronics Co. | Goldman Sachs | Pay | EFFR + (0.35)% = 4.98% | Termination | | | 08/12/2027 | | | | | | | (295,842 | ) | | | (5,387 | ) |
United International Transportation Co. | Goldman Sachs | Pay | EFFR + (0.35)% = 4.33% | Termination | | | 11/09/2026 | | | | | | | (274,605 | ) | | | (22,749 | ) |
United International Transportation Co. | Morgan Stanley | Pay | EFFR + (0.25)% = 3.83% | Termination | | | 12/17/2026 | | | | | | | (158,618 | ) | | | (29,264 | ) |
United Microelectronics Corp. | Goldman Sachs | Pay | EFFR + (1.25)% = 4.08% | Termination | | | 05/06/2027 | | | | | | | (126,649 | ) | | | (19,330 | ) |
VK Co. Ltd. | Morgan Stanley | Pay | EFFR + (6.50)% = (1.17)% | Monthly | | | 09/23/2026 | | | | | | | 0 | | | | 140,169 | |
Wafer Works Corp. | J.P. Morgan Securities, Inc. | Pay | OBFR + (0.60)% = 1.31% | Termination | | | 11/10/2026 | | | | | | | (71,421 | ) | | | 13,421 | |
Wal-Mart de Mexico SAB de CV | Morgan Stanley | Pay | EFFR + (0.50)% = 4.78% | Termination | | | 02/16/2027 | | | | | | | (259,705 | ) | | | 82,577 | |
WHA Corp. PCL | Morgan Stanley | Pay | EFFR + (21.38)% = (16.05)% | Termination | | | 08/26/2027 | | | | | | | (247,375 | ) | | | (12,381 | ) |
Wipro Ltd. | Morgan Stanley | Pay | EFFR + (0.25)% = 5.08% | Termination | | | 05/03/2027 | | | | | | | (181,512 | ) | | | (26,960 | ) |
Wistron NeWeb Corp. | Morgan Stanley | Pay | EFFR + (1.25)% = 1.58% | Termination | | | 12/10/2025 | | | | | | | (240,263 | ) | | | (2,739 | ) |
Wistron NeWeb Corp. | Morgan Stanley | Pay | EFFR + (1.25)% = 1.58% | Termination | | | 05/06/2027 | | | | | | | (404,251 | ) | | | 67,974 | |
Wizz Air Holdings PLC | Goldman Sachs | Pay | SONIA + (0.40)% = 4.55% | Termination | | | 08/12/2027 | | GBP | | | (334,167 | ) | | | 2,870 | |
Woolworths Holdings Ltd. | Goldman Sachs | Pay | South Africa Rand Overnight Deposit Rate + (0.75)% = 7.32% | Termination | | | 08/16/2027 | | ZAR | | | (5,705,210 | ) | | | (18,958 | ) |
Yadea Group Holdings Ltd. | Goldman Sachs | Pay | HONIA + (0.50)% = 3.30% | Termination | | | 08/12/2027 | | HKD | | | (1,474,000 | ) | | | (15,926 | ) |
Yankuang Energy Group Co. Ltd. | Goldman Sachs | Pay | EFFR + (0.90)% = (4.67)% | Termination | | | 10/16/2026 | | | | | | | (168,500 | ) | | | 5,185 | |
Yankuang Energy Group Co. Ltd. | HSBC Bank | Pay | 1 mo. HIBOR HKD + (0.35)% = 3.83% | Termination | | | 04/13/2026 | | HKD | | | (1,447,160 | ) | | | (51,108 | ) |
Yulon Motor Co. Ltd. | Bank of America Securities, Inc. | Pay | EFFR + (0.40)% = 2.43% | Termination | | | 02/22/2027 | | | | | | | (69,850 | ) | | | 20,533 | |
Yulon Motor Co. Ltd. | Goldman Sachs | Pay | EFFR + (1.25)% = 1.83% | Termination | | | 02/01/2027 | | | | | | | (134,589 | ) | | | 39,577 | |
Yulon Motor Co. Ltd. | J.P. Morgan Securities, Inc. | Pay | OBFR + (0.60)% = 4.72% | Termination | | | 05/10/2027 | | | | | | | (44,295 | ) | | | 13,956 | |
Yulon Motor Co. Ltd. | Morgan Stanley | Pay | EFFR + (1.25)% = 1.83% | Termination | | | 12/14/2026 | | | | | | | (253,845 | ) | | | 111,127 | |
Zhejiang Sanhua Intelligent Controls Co. Ltd. | J.P. Morgan Securities, Inc. | Pay | OBFR + (0.30)% = 2.09% | Termination | | | 05/10/2027 | | | | | | | (73,634 | ) | | | 19,331 | |
Zhejiang Sanhua Intelligent Controls Co. Ltd. | Morgan Stanley | Pay | EFFR + (0.62)% = (5.92)% | Termination | | | 03/29/2027 | | | | | | | (439,114 | ) | | | 94,433 | |
The accompanying notes are an integral part of the financial statements.
Financial Statements 2024 | 14 |
BOSTON PARTNERS INVESTMENT FUNDS | August 31, 2024 |
BOSTON PARTNERS EMERGING MARKETS DYNAMIC EQUITY FUND | Schedule of Investments (continued) |
Reference
Entity | | Counterparty | | | Pay/
Receive
Reference
Entity | | | Financing
Rate | | | Payment
Frequency | | | Maturity
Date | | Notional
Amount | | | VALUE/
UNREALIZED
APPRECIATION
(DEPRECIATION) | |
Zhejiang Shuanghuan Driveline Co. Ltd. | Goldman Sachs | Pay | EFFR + (17.50)% = (12.17)% | Termination | | | 04/02/2027 | | $ | | | | | (416,252 | ) | | $ | 24,682 | |
Zhejiang Shuanghuan Driveline Co. Ltd. | J.P. Morgan Securities, Inc. | Pay | OBFR + (0.30)% = (3.42)% | Termination | | | 05/10/2027 | | | | | | | (97,628 | ) | | | 12,342 | |
Total Unrealized Appreciation (Depreciation) | | | | | | | | | | | | | | | | | $ | 2,606,064 | |
There are no upfront payments or receipts associated with contracts for difference in the Fund as of August 31, 2024.
Notional Amount is in USD unless otherwise indicated.
OBFR - Overnight Bank Funding Rate
EFFR - Effective Federal Funds Rate
EONIA - European Overnight Index Average
HIBOR - Hong Kong Inter-Bank Offered Rate
HONIA - Hong Kong Overnight Index Average
LIBOR - London Inter-Bank Offered Rate
SARON - Swiss Average Rate Overnight
SOFR - Secured Overnight Financing Rate
SONIA - Sterling Overnight Index Average
SORA - Singapore Overnight Rate Average
STIB - Stockholm Interbank
TELBOR - Tel Aviv Interbank Offer Rate
TONA - Tokyo Overnight Average Rate
The accompanying notes are an integral part of the financial statements.
Financial Statements 2024 | 15 |
BOSTON PARTNERS INVESTMENT FUNDS | August 31, 2024 |
BOSTON PARTNERS EMERGING MARKETS DYNAMIC EQUITY FUND | Schedule of Investments (concluded) |
A summary of the inputs used to value the Fund’s investments carried at fair value as of August 31, 2024 is as follows (see Notes to Schedule of Investments):
| | | LEVEL 1 | | | LEVEL 2 | | | LEVEL 3 | | | Total | |
Assets: | | | | | | | | | | | | | | | | |
Investments | | | | | | | | | | | | | | | | |
Common Stocks | | $ | 11,790,436 | | | $ | 25,347,720 | | | $ | — | (a) | | $ | 37,138,156 | |
Preferred Stocks | | | — | | | | 154,564 | | | | — | | | | 154,564 | |
Money Market Funds | | | 10,566,624 | | | | — | | | | — | | | | 10,566,624 | |
Total Investments | | $ | 22,357,060 | | | $ | 25,502,284 | | | $ | — | (a) | | $ | 47,859,344 | |
| | | | | | | | | | | | | | | | | |
Other Financial Instruments*: | | | | | | | | | | | | | | | | |
Contracts For Difference | | | 5,549,936 | | | | — | (a) | | | 472,648 | | | | 6,022,584 | |
Total Other Financial Instruments | | $ | 5,549,936 | | | $ | — | (a) | | $ | 472,648 | | | $ | 6,022,584 | |
| | | | | | | | | | | | | | | | | |
Liabilities: | | | | | | | | | | | | | | | | |
Investments: | | | | | | | | | | | | | | | | |
Common Stocks | | | (661,076 | ) | | | (600,829 | ) | | | — | | | | (1,261,905 | ) |
Total Investments | | $ | (661,076 | ) | | $ | (600,829 | ) | | $ | — | | | $ | (1,261,905 | ) |
| | | | | | | | | | | | | | | | | |
Other Financial Instruments*: | | | | | | | | | | | | | | | | |
Contracts For Difference | | | (3,120,808 | ) | | | — | | | | (295,712 | ) | | | (3,416,520 | ) |
Total Other Financial Instruments | | $ | (3,120,808 | ) | | $ | — | | | $ | (295,712 | ) | | $ | (3,416,520 | ) |
* | The fair value of the Fund’s investment represents the net unrealized appreciation (depreciation) as of August 31, 2024. |
Refer to the Schedule of Investments for further disaggregation of investment categories.
(a) | Amount is less than $0.50. |
The accompanying notes are an integral part of the financial statements.
Financial Statements 2024 | 16 |
BOSTON PARTNERS INVESTMENT FUNDS | August 31, 2024 |
BOSTON PARTNERS GLOBAL EQUITY FUND | Schedule of Investments |
| | | Shares | | | Value | |
COMMON STOCKS — 95.4% | | | | |
Bermuda — 3.2% | | | | | | | | |
Everest Group Ltd. | | | 8,334 | | | $ | 3,268,928 | |
Hiscox Ltd. | | | 99,764 | | | | 1,542,108 | |
RenaissanceRe Holdings Ltd. | | | 12,313 | | | | 3,137,229 | |
| | | | | | | | 7,948,265 | |
Canada — 0.9% | | | | | | | | |
Cenovus Energy, Inc. | | | 59,352 | | | | 1,100,587 | |
Teck Resources Ltd. - Class B | | | 22,145 | | | | 1,060,746 | |
| | | | | | | | 2,161,333 | |
Finland — 1.5% | | | | | | | | |
Fortum Oyj | | | 79,762 | | | | 1,271,808 | |
Nordea Bank Abp | | | 210,952 | | | | 2,491,120 | |
| | | | | | | | 3,762,928 | |
France — 12.8% | | | | | | | | |
Airbus Group SE | | | 19,817 | | | | 3,044,178 | |
Alten SA | | | 9,872 | | | | 1,107,847 | |
BNP Paribas SA | | | 42,798 | | | | 2,960,235 | |
Capgemini SE | | | 14,075 | | | | 2,915,828 | |
Cie de Saint-Gobain SA | | | 39,398 | | | | 3,442,829 | |
Cie Generale des Etablissements Michelin SCA | | | 30,279 | | | | 1,188,887 | |
Eiffage SA | | | 25,005 | | | | 2,624,655 | |
Rexel SA | | | 130,518 | | | | 3,293,266 | |
Sanofi SA | | | 27,752 | | | | 3,114,832 | |
Sodexo SA | | | 9,152 | | | | 814,388 | |
SPIE SA | | | 52,025 | | | | 2,100,199 | |
TotalEnergies SE | | | 47,907 | | | | 3,295,610 | |
Vallourec SACA (a) | | | 85,529 | | | | 1,366,795 | |
| | | | | | | | 31,269,549 | |
Germany — 7.7% | | | | | | | | |
Brenntag SE | | | 13,865 | | | | 1,031,047 | |
Commerzbank AG | | | 234,309 | | | | 3,474,048 | |
Daimler Truck Holding AG | | | 24,835 | | | | 954,720 | |
Deutsche Telekom AG | | | 122,385 | | | | 3,482,222 | |
Evonik Industries AG | | | 61,120 | | | | 1,356,227 | |
Infineon Technologies AG | | | 49,152 | | | | 1,803,839 | |
Rheinmetall AG | | | 3,524 | | | | 2,117,044 | |
Siemens AG | | | 23,931 | | | | 4,501,552 | |
| | | | | | | | 18,720,699 | |
Greece — 0.5% | | | | | | | | |
Hellenic Telecommunications Organization SA | | | 72,312 | | | | 1,172,410 | |
Ireland — 4.2% | | | | | | | | |
AIB Group PLC | | | 378,002 | | | | 2,276,289 | |
CRH PLC | | | 67,098 | | | | 5,989,768 | |
Ryanair Holdings PLC - ADR (b) | | | 18,600 | | | | 2,073,156 | |
| | | | | | | | 10,339,213 | |
Italy — 1.0% | | | | | | | | |
Enel SpA | | | 306,966 | | | | 2,333,157 | |
Japan — 7.3% | | | | | | | | |
Asahi Group Holdings Ltd. | | | 85,600 | | | | 3,195,077 | |
Fuji Electric Co., Ltd. | | | 20,900 | | | | 1,261,540 | |
Kansai Paint Co., Ltd. | | | 122,900 | | | | 2,200,323 | |
Mitsubishi Chemical Group Corp. | | | 206,900 | | | | 1,209,169 | |
Mitsubishi UFJ Financial Group, Inc. | | | 107,900 | | | | 1,138,369 | |
Renesas Electronics Corp. | | | 96,700 | | | | 1,683,497 | |
Sony Group Corp. | | | 38,600 | | | | 3,759,415 | |
Sugi Holdings Co., Ltd. | | | 66,300 | | | | 1,146,590 | |
Sumitomo Mitsui Financial Group, Inc. | | | 22,000 | | | | 1,451,851 | |
Suzuki Motor Corp. | | | 74,800 | | | | 879,469 | |
| | | | | | | | 17,925,300 | |
Netherlands — 3.9% | | | | | | | | |
Aalberts NV | | | 37,894 | | | | 1,481,374 | |
Heineken NV | | | 17,022 | | | | 1,535,795 | |
ING Groep NV | | | 210,119 | | | | 3,820,412 | |
Koninklijke Ahold NV | | | 37,917 | | | | 1,301,832 | |
Stellantis NV | | | 79,479 | | | | 1,334,069 | |
| | | | | | | | 9,473,482 | |
Singapore — 1.3% | | | | | | | | |
United Overseas Bank Ltd. | | | 133,300 | | | | 3,204,399 | |
South Korea — 3.6% | | | | | | | | |
Hana Financial Group, Inc. | | | 27,015 | | | | 1,254,166 | |
KB Financial Group, Inc. | | | 20,837 | | | | 1,343,674 | |
KT Corp. | | | 66,721 | | | | 1,933,544 | |
Samsung Electronics Co., Ltd. | | | 75,002 | | | | 4,165,485 | |
| | | | | | | | 8,696,869 | |
Spain — 0.7% | | | | | | | | |
Bankinter SA | | | 193,001 | | | | 1,704,400 | |
Sweden — 1.2% | | | | | | | | |
Loomis AB | | | 40,309 | | | | 1,371,915 | |
Svenska Handelsbanken AB - Class A | | | 161,817 | | | | 1,669,314 | |
| | | | | | | | 3,041,229 | |
Switzerland — 1.9% | | | | | | | | |
Glencore PLC | | | 289,670 | | | | 1,528,315 | |
Sandoz Group AG | | | 72,459 | | | | 3,169,269 | |
| | | | | | | | 4,697,584 | |
United Kingdom — 17.2% | | | | | | | | |
Barratt Developments PLC | | | 306,257 | | | | 2,049,283 | |
Beazley PLC | | | 264,564 | | | | 2,619,628 | |
BP PLC | | | 495,660 | | | | 2,806,073 | |
Coca-Cola Europacific Partners PLC | | | 39,650 | | | | 3,191,428 | |
Hikma Pharmaceuticals PLC | | | 53,920 | | | | 1,409,381 | |
IMI PLC | | | 126,754 | | | | 3,069,764 | |
Inchcape PLC | | | 195,653 | | | | 2,196,955 | |
Informa PLC | | | 111,062 | | | | 1,222,770 | |
JD Sports Fashion PLC | | | 781,140 | | | | 1,423,823 | |
Marks & Spencer Group PLC | | | 544,589 | | | | 2,457,662 | |
NatWest Group PLC | | | 665,424 | | | | 3,031,467 | |
Nomad Foods Ltd. | | | 97,105 | | | | 1,825,574 | |
Shell PLC | | | 101,805 | | | | 3,607,317 | |
SSE PLC | | | 122,023 | | | | 3,034,992 | |
Tesco PLC | | | 983,079 | | | | 4,583,463 | |
Weir Group PLC | | | 80,554 | | | | 2,135,766 | |
WH Smith PLC | | | 83,735 | | | | 1,410,906 | |
| | | | | | | | 42,076,252 | |
United States — 26.5%(c) | | | | | | | | |
AbbVie, Inc. (b) | | | 16,219 | | | | 3,183,952 | |
Amgen, Inc. | | | 9,399 | | | | 3,137,668 | |
Beacon Roofing Supply, Inc. (a) | | | 12,718 | | | | 1,152,251 | |
Centene Corp. (a) | | | 14,702 | | | | 1,158,959 | |
Chubb Ltd. | | | 11,303 | | | | 3,212,087 | |
Cigna Group | | | 6,866 | | | | 2,484,187 | |
Cisco Systems, Inc. | | | 32,394 | | | | 1,637,193 | |
ConocoPhillips | | | 13,680 | | | | 1,556,647 | |
Elevance Health, Inc. | | | 2,252 | | | | 1,254,116 | |
Expedia Group, Inc. (a) | | | 6,207 | | | | 863,332 | |
The accompanying notes are an integral part of the financial statements.
Financial Statements 2024 | 17 |
BOSTON PARTNERS INVESTMENT FUNDS | August 31, 2024 |
BOSTON PARTNERS GLOBAL EQUITY FUND | Schedule of Investments (continued) |
| | | Shares | | | Value | |
United States — (continued) | | | | | | | | |
Fidelity National Information Services, Inc. | | | 43,638 | | | $ | 3,597,953 | |
Fifth Third Bancorp | | | 60,299 | | | | 2,574,164 | |
Gen Digital, Inc. | | | 74,657 | | | | 1,975,424 | |
Goldman Sachs Group, Inc. | | | 6,310 | | | | 3,219,677 | |
HCA Healthcare, Inc. (b) | | | 3,365 | | | | 1,331,160 | |
Huntington Bancshares, Inc. | | | 161,212 | | | | 2,413,344 | |
J M Smucker Co. | | | 14,581 | | | | 1,672,149 | |
Jacobs Solutions, Inc. | | | 8,374 | | | | 1,263,469 | |
Johnson & Johnson | | | 9,879 | | | | 1,638,531 | |
JPMorgan Chase & Co. | | | 20,786 | | | | 4,672,693 | |
Kellanova | | | 15,301 | | | | 1,233,414 | |
McKesson Corp. | | | 2,499 | | | | 1,402,139 | |
Schlumberger Ltd. | | | 56,152 | | | | 2,470,126 | |
Southern Co. | | | 26,332 | | | | 2,275,085 | |
TE Connectivity Ltd. | | | 7,298 | | | | 1,120,973 | |
Textron, Inc. | | | 35,700 | | | | 3,255,840 | |
United Rentals, Inc. | | | 2,288 | | | | 1,696,003 | |
US Foods Holding Corp. (a) | | | 63,332 | | | | 3,749,888 | |
WillScot Holdings Corp. (a)(b) | | | 28,934 | | | | 1,115,116 | |
Zimmer Biomet Holdings, Inc. | | | 22,637 | | | | 2,613,668 | |
| | | | | | | | 64,931,208 | |
TOTAL COMMON STOCKS (Cost $179,429,615) | | | | | | | 233,458,277 | |
| | | | | | | | | |
| | | Units | | | | | |
SHORT-TERM INVESTMENTS — 1.8% | | | | | | | | |
Investments Purchased with Proceeds from Securities Lending — 1.8% | | | | | | | | |
Mount Vernon Liquid Assets Portfolio, LLC, 5.50% (d) | | | 4,427,880 | | | | 4,427,880 | |
TOTAL SHORT-TERM INVESTMENTS (Cost $4,427,880) | | | | | | | 4,427,880 | |
TOTAL INVESTMENTS — 97.2% (Cost $183,857,495) | | | | | | | 237,886,157 | |
Other Assets in Excess of Liabilities — 2.8% | | | | | | | 6,761,338 | |
TOTAL NET ASSETS — 100.0% | | | | | | $ | 244,647,495 | |
Percentages are stated as a percent of net assets.
ADR | American Depositary Receipt |
PLC | Public Limited Company |
(a) | Non-income producing security. |
(b) | All or a portion of this security is on loan as of August 31, 2024. The total market value of these securities was $4,366,972 which represented 1.8% of net assets. |
(c) | To the extent that the Fund invests a significant portion of its assets in the securities of companies of a single country or region, it is more likely to be impacted by events or conditions affecting the country or region. |
(d) | The rate shown represents the 7-day annualized effective yield as of August 31, 2024. |
The accompanying notes are an integral part of the financial statements.
Financial Statements 2024 | 18 |
BOSTON PARTNERS INVESTMENT FUNDS | August 31, 2024 |
BOSTON PARTNERS GLOBAL EQUITY FUND | Schedule of Investments (concluded) |
A summary of the inputs used to value the Fund’s investments carried at fair value as of August 31, 2024 is as follows (see Notes to Schedule of Investments):
| | | LEVEL 1 | | | LEVEL 2 | | | LEVEL 3 | | | Total | |
Investments: | | | | | | | | | | | | | | | | |
Common Stocks | | $ | 85,658,090 | | | $ | 147,800,187 | | | $ | — | | | $ | 233,458,277 | |
Investments Purchased with Proceeds from Securities Lending(a) | | | — | | | | — | | | | — | | | | 4,427,880 | |
Total Investments | | $ | 85,658,090 | | | $ | 147,800,187 | | | $ | — | | | $ | 237,886,157 | |
Refer to the Schedule of Investments for further disaggregation of investment categories.
(a) | Certain investments that are measured at fair value using the net asset value per share (or its equivalent) practical expedient have not been categorized in the fair value hierarchy. These investments can be classified as Investments Purchased with Proceeds from Securities Lending and their fair value totals to $4,427,880. The fair value amounts presented in the table are intended to permit reconciliation of the fair value hierarchy to the amounts listed in the Schedule of Investments. |
The accompanying notes are an integral part of the financial statements.
Financial Statements 2024 | 19 |
BOSTON PARTNERS INVESTMENT FUNDS | August 31, 2024 |
BOSTON PARTNERS GLOBAL LONG/SHORT FUND | Schedule of Investments |
| | | Shares | | | Value | |
COMMON STOCKS — 68.5% | | | | | | | | |
Australia — 0.9% | | | | | | | | |
Empire Energy Group Ltd. (a) | | | 8,414,266 | | | $ | 1,537,705 | |
Bermuda — 4.6% | | | | | | | | |
Everest Group Ltd. (b) | | | 11,222 | | | | 4,401,717 | |
Hiscox Ltd. | | | 170,570 | | | | 2,636,595 | |
Lancashire Holdings Ltd. | | | 129,710 | | | | 1,144,741 | |
| | | | | | | | 8,183,053 | |
Canada — 8.1% | | | | | | | | |
Allied Gold Corp. (a) | | | 267,039 | | | | 606,344 | |
Cenovus Energy, Inc. | | | 268,429 | | | | 4,976,674 | |
Kinross Gold Corp. | | | 398,538 | | | | 3,602,783 | |
McEwen Mining, Inc. (a) | | | 90,695 | | | | 825,324 | |
MEG Energy Corp. (a) | | | 53,858 | | | | 1,072,644 | |
Teck Resources Ltd. - Class B | | | 71,731 | | | | 3,435,915 | |
| | | | | | | | 14,519,684 | |
China — 0.6% | | | | | | | | |
Alibaba Group Holding Ltd. - ADR | | | 12,096 | | | | 1,008,081 | |
France — 5.3% | | | | | | | | |
BNP Paribas SA | | | 39,945 | | | | 2,762,900 | |
Capgemini SE | | | 5,878 | | | | 1,217,708 | |
Eurazeo SE | | | 14,581 | | | | 1,148,622 | |
Rexel SA | | | 33,439 | | | | 843,742 | |
SPIE SA | | | 35,434 | | | | 1,430,437 | |
Vallourec SACA (a) | | | 126,174 | | | | 2,016,321 | |
| | | | | | | | 9,419,730 | |
Germany — 3.0% | | | | | | | | |
Commerzbank AG | | | 111,972 | | | | 1,660,184 | |
Evonik Industries AG | | | 112,400 | | | | 2,494,108 | |
Infineon Technologies AG | | | 34,946 | | | | 1,282,490 | |
| | | | | | | | 5,436,782 | |
Ireland — 1.6% | | | | | | | | |
CRH PLC | | | 19,923 | | | | 1,778,505 | |
ICON PLC (a) | | | 3,163 | | | | 1,018,676 | |
| | | | | | | | 2,797,181 | |
Israel — 1.5% | | | | | | | | |
Check Point Software Technologies Ltd. (a) | | | 14,097 | | | | 2,713,672 | |
Italy — 2.3% | | | | | | | | |
Enel SpA | | | 404,893 | | | | 3,077,471 | |
Iveco Group NV | | | 107,182 | | | | 1,135,147 | |
| | | | | | | | 4,212,618 | |
Japan — 1.1% | | | | | | | | |
Sony Group Corp. | | | 20,800 | | | | 2,025,799 | |
Netherlands — 1.3% | | | | | | | | |
Euronext NV (c) | | | 21,155 | | | | 2,259,236 | |
South Korea — 4.9% | | | | | | | | |
Hyundai Marine & Fire Insurance Co., Ltd. | | | 33,148 | | | | 863,673 | |
KT Corp. - ADR (b) | | | 128,761 | | | | 1,886,349 | |
Kumho Petrochemical Co., Ltd. | | | 9,774 | | | | 1,002,334 | |
Samsung Electronics Co., Ltd. | | | 89,389 | | | | 4,964,515 | |
| | | | | | | | 8,716,871 | |
Switzerland — 3.2% | | | | | | | | |
Novartis AG - ADR | | | 13,390 | | | | 1,618,717 | |
Sandoz Group AG | | | 92,805 | | | | 4,059,179 | |
| | | | | | | | 5,677,896 | |
United Kingdom — 13.5% | | | | | | | | |
Andrada Mining Ltd. (a) | | | 4,062,358 | | | | 181,393 | |
AstraZeneca PLC - ADR | | | 22,640 | | | | 1,983,717 | |
Barratt Developments PLC | | | 366,958 | | | | 2,455,457 | |
Beazley PLC | | | 407,270 | | | | 4,032,658 | |
Endeavour Mining PLC | | | 75,014 | | | | 1,581,381 | |
Hikma Pharmaceuticals PLC | | | 50,431 | | | | 1,318,184 | |
IMI PLC | | | 47,931 | | | | 1,160,807 | |
Marex Group PLC | | | 52,586 | | | | 1,297,297 | |
Nomad Foods Ltd. | | | 74,095 | | | | 1,392,986 | |
SSE PLC | | | 109,680 | | | | 2,727,993 | |
Unilever PLC | | | 33,080 | | | | 2,144,455 | |
Weir Group PLC | | | 86,684 | | | | 2,298,293 | |
WH Smith PLC | | | 97,658 | | | | 1,645,503 | |
| | | | | | | | 24,220,124 | |
United States — 16.6% | | | | | | | | |
Advanced Micro Devices, Inc. (a) | | | 6,344 | | | | 942,465 | |
Alphabet, Inc. - Class C (b) | | | 12,041 | | | | 1,988,089 | |
Amgen, Inc. | | | 9,126 | | | | 3,046,532 | |
Applied Materials, Inc. (b) | | | 3,986 | | | | 786,278 | |
Booking Holdings, Inc. (b) | | | 399 | | | | 1,559,783 | |
Centene Corp. (a)(b) | | | 24,105 | | | | 1,900,197 | |
Dell Technologies, Inc. - Class C | | | 13,698 | | | | 1,582,667 | |
Elevance Health, Inc. | | | 1,658 | | | | 923,324 | |
Jacobs Solutions, Inc. (b) | | | 13,069 | | | | 1,971,851 | |
Lennar Corp. - Class A (b) | | | 5,030 | | | | 915,762 | |
Micron Technology, Inc. | | | 14,162 | | | | 1,362,951 | |
Norfolk Southern Corp. | | | 5,662 | | | | 1,450,378 | |
Oracle Corp. (b) | | | 43,336 | | | | 6,122,943 | |
QUALCOMM, Inc. | | | 6,043 | | | | 1,059,338 | |
Textron, Inc. | | | 14,394 | | | | 1,312,733 | |
US Foods Holding Corp. (a)(b) | | | 17,298 | | | | 1,024,214 | |
Zimmer Biomet Holdings, Inc. (b) | | | 15,295 | | | | 1,765,961 | |
| | | | | | | | 29,715,466 | |
TOTAL COMMON STOCKS (Cost $103,067,832) | | | | | | | 122,443,898 | |
| | | | | | | | | |
EXCHANGE TRADED FUNDS — 4.5% | | | | | | | | |
iShares 1-3 Year Treasury Bond ETF | | | 96,721 | | | | 8,008,499 | |
TOTAL EXCHANGE TRADED FUNDS (Cost $8,011,158) | | | | | | | 8,008,499 | |
| | | | | | | | | |
| | | Contracts | | | | | |
WARRANTS — 0.0%(d) | | | | | | | | |
United Kingdom — 0.0%(d) | | | | | | | | |
Andrada Mining Ltd., Expires 07/17/2025, Exercise Price $0.10 (a)(e) | | | 2,200,000 | | | | 9 | |
TOTAL WARRANTS (Cost $28,772) | | | | | | | 9 | |
| | | | | | | | | |
| | | Par | | | | | |
CONVERTIBLE NOTES — 0.8% | | | | | | | | |
United Kingdom — 0.8% | | | | | | | | |
Andrada Mining Ltd., 12.00%, 07/31/2026 (e) | | GBP | 1,100,000 | | | | 1,322,271 | |
TOTAL CONVERTIBLE NOTES (Cost $1,438,585) | | | | | | | 1,322,271 | |
The accompanying notes are an integral part of the financial statements.
Financial Statements 2024 | 20 |
BOSTON PARTNERS INVESTMENT FUNDS | August 31, 2024 |
BOSTON PARTNERS GLOBAL LONG/SHORT FUND | Schedule of Investments (continued) |
| | | Shares | | | Value | |
SHORT-TERM INVESTMENTS — 0.1% | | | | | | | | |
Money Market Funds — 0.1% | | | | | | | | |
BlackRock Liquidity Funds Treasury Trust Fund Portfolio - Class Institutional, 5.15% (b)(f) | | | 57,398 | | | $ | 57,398 | |
Federated Hermes U.S. Treasury Cash Reserves - Class Institutional, 5.11% (b)(f) | | | 57,398 | | | | 57,398 | |
Fidelity Treasury Portfolio - Class I, 5.16% (b)(f) | | | 57,398 | | | | 57,398 | |
Goldman Sachs Financial Square Funds - Treasury Instruments Fund - Class Institutional, 5.12% (b)(f) | | | 57,398 | | | | 57,398 | |
TOTAL SHORT-TERM INVESTMENTS (Cost $229,592) | | | | | | | 229,592 | |
TOTAL INVESTMENTS — 73.9% (Cost $112,775,939) | | | | | | | 132,004,269 | |
Other Assets in Excess of Liabilities — 26.1% | | | | | | | 46,644,104 | |
TOTAL NET ASSETS — 100.0% | | | | | | $ | 178,648,373 | |
Percentages are stated as a percent of net assets.
Par amount is in USD unless otherwise indicated. |
ADR | American Depositary Receipt |
PLC | Public Limited Company |
(a) | Non-income producing security. |
(b) | Security position is either entirely or partially held in a segregated account as collateral for securities sold short. |
(c) | Security is exempt from registration pursuant to Rule 144A under the Securities Act of 1933, as amended. These securities may only be resold in transactions exempt from registration to qualified institutional investors. As of August 31, 2024, the value of these securities total $2,259,236 or 1.3% of the Fund’s net assets. |
(d) | Represents less than 0.05% of net assets. |
(e) | Fair value determined using significant unobservable inputs in accordance with procedures established by and under the supervision of the Adviser, acting as valuation designee. These securities represented $1,322,280 or 0.8% of net assets as of August 31, 2024. |
(f) | The rate shown represents the 7-day annualized effective yield as of August 31, 2024. |
The accompanying notes are an integral part of the financial statements.
Financial Statements 2024 | 21 |
BOSTON PARTNERS INVESTMENT FUNDS | August 31, 2024 |
BOSTON PARTNERS GLOBAL LONG/SHORT FUND | Schedule of Investments (continued) |
Contracts For Difference held by the Fund at August 31, 2024, are as follows:
Reference
Entity | | counterparty | | | Pay/
Receive
Reference
Entity | | | Financing
Rate | | | Payment
Frequency | | | Maturity
Date | | Notional
Amount | | | VALUE/
UNREALIZED
APPRECIATION
(DEPRECIATION) | |
Asahi Group Holdings Ltd. | Goldman Sachs | Receive | TONA + 0.50% = 0.73% | Termination | | | 08/13/2027 | | JPY | | | 533,474,100 | | | $ | 76,904 | |
abrdn PLC | Goldman Sachs | Pay | SONIA + (0.40)% = 4.79% | Termination | | | 02/23/2026 | | GBP | | | (290,184 | ) | | | 29,349 | |
abrdn PLC | Morgan Stanley | Pay | SONIA + (0.25)% = 4.74% | Termination | | | 02/09/2027 | | GBP | | | (52,692 | ) | | | 1,177 | |
Acushnet Holdings Corp. | Goldman Sachs | Pay | EFFR + (0.25)% = 5.08% | Termination | | | 06/29/2026 | | | | | | | (413,395 | ) | | | (39,002 | ) |
Adecco Group AG | Morgan Stanley | Pay | SARON + 0.35% = 0.76% | Termination | | | 06/24/2026 | | CHF | | | (145,411 | ) | | | 14,822 | |
Adecco Group AG | Morgan Stanley | Pay | SARON + 0.35% = 0.76% | Termination | | | 01/29/2027 | | CHF | | | (413,854 | ) | | | 98,614 | |
Ades Holding Co. | Goldman Sachs | Pay | EFFR + (6.00)% = (0.67)% | Termination | | | 04/19/2027 | | | | | | | (734,357 | ) | | | (19,062 | ) |
Adient PLC | Goldman Sachs | Pay | EFFR + (0.25)% = 5.08% | Termination | | | 02/08/2027 | | | | | | | (35,604 | ) | | | 22,349 | |
Adient PLC | HSBC Bank | Pay | SOFR + (0.05)% = 5.26% | Termination | | | 01/25/2027 | | | | | | | (287,500 | ) | | | 165,877 | |
Alpha & Omega Semiconductor Ltd. | Goldman Sachs | Pay | EFFR + (0.25)% = 5.08% | Termination | | | 07/19/2027 | | | | | | | (321,226 | ) | | | 37,578 | |
Antofagasta PLC | Goldman Sachs | Pay | SONIA + (0.40)% = 4.79% | Termination | | | 01/19/2027 | | GBP | | | (700,193 | ) | | | 75,201 | |
Antofagasta PLC | Morgan Stanley | Pay | SONIA + (0.25)% = 4.74% | Termination | | | 02/08/2027 | | GBP | | | (482,855 | ) | | | (32,238 | ) |
Avangrid, Inc. | Goldman Sachs | Pay | EFFR + (0.25)% = 5.08% | Termination | | | 02/08/2027 | | | | | | | (30,122 | ) | | | (4,827 | ) |
Avangrid, Inc. | HSBC Bank | Pay | SOFR + (0.05)% = 5.26% | Termination | | | 01/25/2027 | | | | | | | (242,942 | ) | | | (34,532 | ) |
Avanza Bank Holding AB | Goldman Sachs | Pay | STIB1D INDEX + (1.00)% = 3.31% | Termination | | | 06/29/2026 | | SEK | | | (2,432,825 | ) | | | (41,451 | ) |
Bank of Hawaii Corp. | Goldman Sachs | Pay | EFFR + (0.25)% = 4.97% | Termination | | | 07/21/2026 | | | | | | | (457,356 | ) | | | (28,838 | ) |
Bank of Hawaii Corp. | Morgan Stanley | Pay | EFFR + (0.25)% = 4.75% | Termination | | | 02/08/2027 | | | | | | | (393,640 | ) | | | (36,290 | ) |
BlackLine, Inc. | Goldman Sachs | Pay | EFFR + (0.25)% = 5.08% | Termination | | | 06/29/2026 | | | | | | | (295,169 | ) | | | 46,611 | |
Block, Inc. | Goldman Sachs | Pay | EFFR + (0.25)% = 5.08% | Termination | | | 04/19/2027 | | | | | | | (229,628 | ) | | | 29,844 | |
Block, Inc. | Morgan Stanley | Pay | EFFR + (0.25)% = 5.08% | Termination | | | 02/22/2027 | | | | | | | (222,624 | ) | | | 8,271 | |
Boliden AB | Goldman Sachs | Pay | STIB1D INDEX + (1.00)% = 3.60% | Termination | | | 11/02/2026 | | SEK | | | (12,906,656 | ) | | | 33,768 | |
Boliden AB | Morgan Stanley | Pay | STIB1D INDEX + (0.30)% = 3.46% | Termination | | | 02/09/2027 | | SEK | | | (1,073,252 | ) | | | (14,879 | ) |
Carl Zeiss Meditec AG | Goldman Sachs | Pay | EONIA + (0.40)% = 3.26% | Termination | | | 06/21/2027 | | EUR | | | (596,088 | ) | | | 48,924 | |
Carvana Co. | Goldman Sachs | Pay | EFFR + (0.25)% = 5.08% | Termination | | | 05/10/2027 | | | | | | | (265,242 | ) | | | (36,439 | ) |
Comet Holding AG | Goldman Sachs | Pay | SARON + (0.40)% = 0.81% | Termination | | | 07/19/2027 | | CHF | | | (431,393 | ) | | | 43,021 | |
Credit Acceptance Corp. | Goldman Sachs | Pay | EFFR + (0.25)% = 5.08% | Termination | | | 10/26/2026 | | | | | | | (204,340 | ) | | | 30,593 | |
Credit Acceptance Corp. | HSBC Bank | Pay | SOFR + (0.05)% = 5.28% | Termination | | | 10/13/2026 | | | | | | | (1,021,234 | ) | | | (20,477 | ) |
CVR Energy, Inc. | Goldman Sachs | Pay | EFFR + (0.25)% = 5.08% | Termination | | | 05/03/2027 | | | | | | | (745,416 | ) | | | 28,677 | |
Dayforce, Inc. | Goldman Sachs | Pay | EFFR + (0.25)% = 5.08% | Termination | | | 06/29/2026 | | | | | | | (370,004 | ) | | | 86,277 | |
Deckers Outdoor Corp. | Goldman Sachs | Pay | EFFR + (0.25)% = 5.08% | Termination | | | 04/23/2027 | | | | | | | (754,961 | ) | | | (83,390 | ) |
Doximity, Inc. | Goldman Sachs | Pay | EFFR + (0.25)% = 5.08% | Termination | | | 06/29/2026 | | | | | | | (619,780 | ) | | | (152,025 | ) |
Dr Ing hc F Porsche AG | Goldman Sachs | Pay | EONIA + (0.40)% = 3.51% | Termination | | | 05/03/2027 | | EUR | | | (487,379 | ) | | | 76,980 | |
EQT AB | Goldman Sachs | Pay | STIB1D INDEX + (1.00)% = 3.35% | Termination | | | 05/31/2027 | | SEK | | | (16,553,812 | ) | | | (100,244 | ) |
Fastenal Co. | Goldman Sachs | Pay | EFFR + (0.25)% = 5.08% | Termination | | | 06/11/2027 | | | | | | | (1,049,395 | ) | | | (79,669 | ) |
Fastighets AB Balder | Goldman Sachs | Pay | STIB1D INDEX + (1.00)% = 3.60% | Termination | | | 06/29/2026 | | SEK | | | (5,210,202 | ) | | | (184,512 | ) |
Floor & Decor Holdings, Inc. | Goldman Sachs | Pay | EFFR + (0.25)% = 5.08% | Termination | | | 01/18/2027 | | | | | | | (429,071 | ) | | | (23,223 | ) |
Fortescue Ltd. | Goldman Sachs | Pay | 1 Month Australian Bank Bill Swap Rate INDEX + (0.50)% = 3.82% | Termination | | | 01/15/2027 | | AUD | | | (1,131,004 | ) | | | 290,451 | |
The accompanying notes are an integral part of the financial statements.
Financial Statements 2024 | 22 |
BOSTON PARTNERS INVESTMENT FUNDS | August 31, 2024 |
BOSTON PARTNERS GLOBAL LONG/SHORT FUND | Schedule of Investments (continued) |
Reference
Entity | | counterparty | | | Pay/
Receive
Reference
Entity | | | Financing
Rate | | | Payment
Frequency | | | Maturity
Date | | Notional
Amount | | | VALUE/
UNREALIZED
APPRECIATION
(DEPRECIATION) | |
Fortescue Ltd. | Morgan Stanley | Pay | RBA Cash Rate Overnight + (0.55)% = 3.77% | Termination | | | 02/09/2027 | | AUD | | | (85,102 | ) | | $ | 30,498 | |
Glacier Bancorp, Inc. | Goldman Sachs | Pay | EFFR + (0.25)% = 5.08% | Termination | | | 06/29/2026 | | | | | (882,287 | ) | | | (180,403 | ) |
HF Sinclair Corp. | Goldman Sachs | Pay | EFFR + (0.25)% = 5.08% | Termination | | | 06/28/2027 | | | | | (1,336,215 | ) | | | 46,616 | |
Husqvarna AB | Goldman Sachs | Pay | STIB1D INDEX + (1.00)% = 2.75% | Termination | | | 07/22/2027 | | SEK | | | (3,975,229 | ) | | | 63,602 | |
Legend Biotech Corp. | Goldman Sachs | Pay | EFFR + (0.25)% = 5.33% | Termination | | | 03/25/2027 | | | | | (406,591 | ) | | | 15,841 | |
LGI Homes, Inc. | Goldman Sachs | Pay | EFFR + (0.25)% = 5.08% | Termination | | | 06/29/2026 | | | | | (514,911 | ) | | | 52,257 | |
LGI Homes, Inc. | Morgan Stanley | Pay | EFFR + (0.25)% = 5.08% | Termination | | | 02/08/2027 | | | | | (290,521 | ) | | | 32,646 | |
Matador Resources Co. | Goldman Sachs | Pay | EFFR + (0.25)% = 5.08% | Termination | | | 06/29/2026 | | | | | (585,180 | ) | | | (3,869 | ) |
Melexis NV | Goldman Sachs | Pay | EONIA + (0.40)% = 3.59% | Termination | | | 01/08/2027 | | EUR | | | (554,309 | ) | | | 1,781 | |
Monolithic Power Systems, Inc. | Goldman Sachs | Pay | EFFR + (0.25)% = 5.08% | Termination | | | 06/25/2027 | | | | | (677,643 | ) | | | (72,286 | ) |
National Beverage Corp. | Goldman Sachs | Pay | EFFR + (0.25)% = 5.08% | Termination | | | 06/29/2026 | | | | | (498,521 | ) | | | 36,227 | |
Nokian Renkaat Oyj | Goldman Sachs | Pay | EONIA + (0.40)% = 3.59% | Termination | | | 06/29/2026 | | EUR | | | (368,948 | ) | | | (39,329 | ) |
Nokian Renkaat Oyj | Morgan Stanley | Pay | EONIA + (0.40)% = 3.44% | Termination | | | 02/09/2027 | | EUR | | | (65,171 | ) | | | (236 | ) |
Novanta, Inc. | Goldman Sachs | Pay | EFFR + (0.25)% = 5.08% | Termination | | | 08/24/2026 | | | | | (208,939 | ) | | | (25,973 | ) |
Novanta, Inc. | Morgan Stanley | Pay | EFFR + (0.25)% = 5.08% | Termination | | | 08/10/2026 | | | | | (171,917 | ) | | | (21,548 | ) |
Ocado Group PLC | Goldman Sachs | Pay | SONIA + (0.40)% = 4.79% | Termination | | | 01/11/2027 | | GBP | | | (77,695 | ) | | | 118,527 | |
Ocado Group PLC | Morgan Stanley | Pay | SONIA + (0.25)% = 4.74% | Termination | | | 02/09/2027 | | GBP | | | (18,009 | ) | | | 13,763 | |
Occidental Petroleum Corp. | Goldman Sachs | Pay | EFFR + (0.25)% = 5.08% | Termination | | | 12/14/2026 | | | | | (787,008 | ) | | | 32,962 | |
ON Semiconductor Corp. | Goldman Sachs | Pay | EFFR + (0.25)% = 5.08% | Termination | | | 01/11/2027 | | | | | (1,068,454 | ) | | | 2,801 | |
PBF Energy, Inc. | Goldman Sachs | Pay | EFFR + (0.25)% = 5.08% | Termination | | | 08/30/2027 | | | | | (924,014 | ) | | | (37,991 | ) |
Playa Hotels & Resorts NV | Goldman Sachs | Pay | EFFR + (0.25)% = 5.08% | Termination | | | 04/05/2027 | | | | | (532,893 | ) | | | 115,889 | |
Power Integrations, Inc. | Goldman Sachs | Pay | EFFR + (0.25)% = 5.08% | Termination | | | 07/26/2027 | | | | | (543,778 | ) | | | 57,291 | |
Rumble, Inc. | Goldman Sachs | Pay | EFFR + (13.97)% = (9.01)% | Termination | | | 08/31/2026 | | | | | (104,018 | ) | | | (3,089 | ) |
Rumble, Inc. | Morgan Stanley | Pay | EFFR + (12.83)% = (8.25)% | Termination | | | 06/29/2026 | | | | | (118,795 | ) | | | 18,651 | |
Sagax AB | Goldman Sachs | Pay | STIB1D INDEX + (1.00)% = 3.60% | Termination | | | 06/29/2026 | | SEK | | | (3,905,029 | ) | | | (68,372 | ) |
Sagax AB | Morgan Stanley | Pay | STIB1D INDEX + (0.30)% = 3.46% | Termination | | | 02/09/2027 | | SEK | | | (1,102,695 | ) | | | (7,340 | ) |
SEEK Ltd. | Morgan Stanley | Pay | RBA Cash Rate Overnight + (0.55)% = 3.77% | Termination | | | 05/03/2027 | | AUD | | | (980,685 | ) | | | 45,748 | |
Severn Trent PLC | Goldman Sachs | Pay | SONIA + (0.40)% = 4.79% | Termination | | | 08/17/2026 | | GBP | | | (598,400 | ) | | | (63,888 | ) |
Severn Trent PLC | Morgan Stanley | Pay | SONIA + (0.25)% = 4.74% | Termination | | | 02/09/2027 | | GBP | | | (74,071 | ) | | | (1,349 | ) |
Shopify, Inc. | Goldman Sachs | Pay | EFFR + (0.25)% = 5.08% | Termination | | | 05/24/2027 | | | | | (763,514 | ) | | | (141,423 | ) |
Sika AG | Goldman Sachs | Pay | SARON + (0.46)% = 0.75% | Termination | | | 10/19/2026 | | CHF | | | (430,304 | ) | | | (80,774 | ) |
Sika AG | Morgan Stanley | Pay | SARON + (0.45)% = 0.76% | Termination | | | 10/20/2026 | | CHF | | | (340,816 | ) | | | (73,252 | ) |
SK Bioscience Co., Ltd. | Morgan Stanley | Pay | EFFR + (2.38)% = (1.42)% | Termination | | | 10/26/2026 | | | | | (478,035 | ) | | | 10,450 | |
SKF AB | Goldman Sachs | Pay | STIB1D INDEX + (1.00)% = 2.75% | Termination | | | 07/15/2027 | | SEK | | | (11,433,944 | ) | | | 61,614 | |
Soho House & Co., Inc. | Morgan Stanley | Pay | EFFR + (2.88)% = 2.65% | Termination | | | 02/09/2027 | | | | | (511,685 | ) | | | (105,528 | ) |
Spectris PLC | Goldman Sachs | Pay | SONIA + (0.40)% = 4.79% | Termination | | | 01/25/2027 | | GBP | | | (748,583 | ) | | | 162,523 | |
Spectris PLC | Morgan Stanley | Pay | SONIA + (0.25)% = 4.74% | Termination | | | 02/09/2027 | | GBP | | | (49,699 | ) | | | 15,408 | |
Steel Dynamics, Inc. | Goldman Sachs | Pay | EFFR + (0.25)% = 5.08% | Termination | | | 06/11/2027 | | | | | (753,511 | ) | | | 26,427 | |
The accompanying notes are an integral part of the financial statements.
Financial Statements 2024 | 23 |
BOSTON PARTNERS INVESTMENT FUNDS | August 31, 2024 |
BOSTON PARTNERS GLOBAL LONG/SHORT FUND | Schedule of Investments (continued) |
Reference
Entity | | counterparty | | | Pay/
Receive
Reference
Entity | | | Financing
Rate | | | Payment
Frequency | | | Maturity
Date | | Notional
Amount | | | VALUE/
UNREALIZED
APPRECIATION
(DEPRECIATION) | |
Summit Materials, Inc. | Goldman Sachs | Pay | EFFR + (0.25)% = 5.08% | Termination | | | 02/08/2027 | | $ | | | (79,785 | ) | | $ | (6,252 | ) |
Summit Materials, Inc. | HSBC Bank | Pay | SOFR + (0.05)% = 5.58% | Termination | | | 01/25/2027 | | | | | (644,396 | ) | | | (55,258 | ) |
T Rowe Price Group, Inc. | Goldman Sachs | Pay | EFFR + (0.25)% = 5.08% | Termination | | | 10/26/2026 | | | | | (155,667 | ) | | | 1,381 | |
T Rowe Price Group, Inc. | HSBC Bank | Pay | SOFR + (0.05)% = 5.53% | Termination | | | 10/13/2026 | | | | | (775,364 | ) | | | (3,764 | ) |
Tesla, Inc. | Goldman Sachs | Pay | EFFR + (0.25)% = 5.08% | Termination | | | 10/26/2026 | | | | | (858,795 | ) | | | (80,432 | ) |
Texas Capital Bancshares, Inc. | Goldman Sachs | Pay | EFFR + (0.25)% = 5.08% | Termination | | | 06/29/2026 | | | | | (990,688 | ) | | | (180,753 | ) |
Toro Co. | Goldman Sachs | Pay | EFFR + (0.25)% = 5.08% | Termination | | | 05/31/2027 | | | | | (807,935 | ) | | | (126,174 | ) |
Tractor Supply Co. | Goldman Sachs | Pay | EFFR + (0.25)% = 5.08% | Termination | | | 07/26/2027 | | | | | (687,336 | ) | | | 3,123 | |
TreeHouse Foods, Inc. | Goldman Sachs | Pay | EFFR + (0.25)% = 5.08% | Termination | | | 11/23/2026 | | | | | (866,711 | ) | | | (1,114 | ) |
United Utilities Group PLC | Goldman Sachs | Pay | SONIA + (0.40)% = 4.80% | Termination | | | 05/28/2027 | | GBP | | | (727,903 | ) | | | (12,233 | ) |
Valmet Oyj | Goldman Sachs | Pay | EONIA + (0.40)% = 3.33% | Termination | | | 06/29/2026 | | EUR | | | (443,538 | ) | | | (23,511 | ) |
Valmet Oyj | Morgan Stanley | Pay | EONIA + (0.40)% = 3.44% | Termination | | | 02/08/2027 | | EUR | | | (315,384 | ) | | | (6,393 | ) |
VAT Group AG | Goldman Sachs | Pay | SARON + (0.40)% = 0.81% | Termination | | | 06/28/2027 | | CHF | | | (267,129 | ) | | | 47,058 | |
VAT Group AG | Morgan Stanley | Pay | SARON + (0.45)% = 0.76% | Termination | | | 04/19/2027 | | CHF | | | (348,448 | ) | | | 36,985 | |
Xero Ltd. | Goldman Sachs | Pay | RBA Cash Rate Overnight + (0.45)% = 3.82% | Termination | | | 06/29/2026 | | AUD | | | (582,216 | ) | | | (70,736 | ) |
Xero Ltd. | Morgan Stanley | Pay | RBA Cash Rate Overnight + (0.55)% = 3.77% | Termination | | | 11/30/2026 | | AUD | | | (555,505 | ) | | | (100,157 | ) |
Yankuang Energy Group Co. Ltd. | Goldman Sachs | Pay | HONIA + (0.50)% = 2.99% | Termination | | | 06/04/2027 | | HKD | | | (4,307,072 | ) | | | 107,551 | |
Total Unrealized Appreciation (Depreciation) | | | | | | | | | | | | | | | $ | (121,617 | ) |
There are no upfront payments or receipts associated with contracts for difference in the Fund as of August 31, 2024.
Notional Amount is in USD unless otherwise indicated.
EFFR - Effective Federal Funds Rate
EONIA - European Overnight Index Average
HONIA - Hong Kong Overnight Index Average
SARON - Swiss Average Rate Overnight
SOFR - Secured Overnight Financing Rate
SONIA - Sterling Overnight Index Average
TONA - Tokyo Overnight Average Rate
The accompanying notes are an integral part of the financial statements.
Financial Statements 2024 | 24 |
BOSTON PARTNERS INVESTMENT FUNDS | August 31, 2024 |
BOSTON PARTNERS GLOBAL LONG/SHORT FUND | Schedule of Investments (concluded) |
A summary of the inputs used to value the Fund’s investments carried at fair value as of August 31, 2024 is as follows (see Notes to Schedule of Investments):
| | | LEVEL 1 | | | LEVEL 2 | | | LEVEL 3 | | | Total | |
Assets: | | | | | | | | | | | | | | | | |
Investments | | | | | | | | | | | | | | | | |
Common Stocks | | $ | 70,283,680 | | | $ | 52,160,218 | | | $ | — | | | $ | 122,443,898 | |
Exchange Traded Funds | | | 8,008,499 | | | | — | | | | — | | | | 8,008,499 | |
Convertible Notes | | | — | | | | — | | | | 1,322,271 | | | | 1,322,271 | |
Warrants | | | — | | | | — | | | | 9 | | | | 9 | |
Money Market Funds | | | 229,592 | | | | — | | | | — | | | | 229,592 | |
Total Investments | | $ | 78,521,771 | | | $ | 52,160,218 | | | $ | 1,322,280 | | | $ | 132,004,269 | |
| | | | | | | | | | | | | | | | | |
Other Financial Instruments*: | | | | | | | | | | | | | | | | |
Contracts For Difference | | | 2,402,908 | | | | — | | | | — | | | | 2,402,908 | |
Total Other Financial Instruments | | $ | 2,402,908 | | | $ | — | | | $ | — | | | $ | 2,402,908 | |
| | | | | | | | | | | | | | | | | |
Liabilities: | | | | | | | | | | | | | | | | |
Other Financial Instruments*: | | | | | | | | | | | | | | | | |
Contracts For Difference | | | (2,524,525 | ) | | | — | | | | — | | | | (2,524,525 | ) |
Total Other Financial Instruments | | $ | (2,524,525 | ) | | $ | — | | | $ | — | | | $ | (2,524,525 | ) |
* | The fair value of the Fund’s investment represents the net unrealized appreciation (depreciation) as of August 31, 2024. |
Refer to the Schedule of Investments for further disaggregation of investment categories.
The accompanying notes are an integral part of the financial statements.
Financial Statements 2024 | 25 |
BOSTON PARTNERS INVESTMENT FUNDS | August 31, 2024 |
BOSTON PARTNERS GLOBAL SUSTAINABILITY FUND | Schedule of Investments |
| | | Shares | | | Value | |
COMMON STOCKS — 98.2% | | | | | | | | |
Austria — 0.8% | | | | | | | | |
ANDRITZ AG | | | 1,322 | | | $ | 87,155 | |
Bermuda — 2.6% | | | | | | | | |
Everest Group Ltd. | | | 445 | | | | 174,547 | |
Renaissance Holdings Ltd. | | | 470 | | | | 119,751 | |
| | | | | | | | 294,298 | |
Canada — 0.5% | | | | | | | | |
Teck Resources Ltd. - Class B | | | 1,116 | | | | 53,456 | |
Finland — 0.2% | | | | | | | | |
Nordea Bank Abp | | | 2,434 | | | | 28,743 | |
France — 11.3% | | | | | | | | |
Airbus Group SE | | | 1,161 | | | | 178,346 | |
Alten SA | | | 527 | | | | 59,141 | |
BNP Paribas SA | | | 857 | | | | 59,277 | |
Capgemini SE | | | 424 | | | | 87,837 | |
Cie de Saint-Gobain SA | | | 2,493 | | | | 217,853 | |
Eiffage SA | | | 1,349 | | | | 141,598 | |
Rexel SA | | | 7,474 | | | | 188,586 | |
SPIE SA | | | 6,836 | | | | 275,963 | |
TotalEnergies SE | | | 1,236 | | | | 85,027 | |
| | | | | | | | 1,293,628 | |
Germany — 8.6% | | | | | | | | |
Commerzbank AG | | | 10,991 | | | | 162,961 | |
Deutsche Telekom AG | | | 8,744 | | | | 248,793 | |
Evonik Industries AG | | | 2,681 | | | | 59,490 | |
Infineon Technologies AG | | | 2,771 | | | | 101,693 | |
Rheinmetall AG | | | 370 | | | | 222,278 | |
Siemens AG | | | 1,000 | | | | 188,106 | |
| | | | | | | | 983,321 | |
Greece — 1.7% | | | | | | | | |
Hellenic Telecommunications Organization SA | | | 11,757 | | | | 190,619 | |
Ireland — 2.2% | | | | | | | | |
AIB Group PLC | | | 22,101 | | | | 133,090 | |
ICON PLC (a) | | | 372 | | | | 119,806 | |
| | | | | | | | 252,896 | |
Italy — 1.1% | | | | | | | | |
Iveco Group NV | | | 11,695 | | | | 123,860 | |
Japan — 8.5% | | | | | | | | |
Asahi Group Holdings Ltd. | | | 4,200 | | | | 156,768 | |
Fuji Electric Co., Ltd. | | | 1,100 | | | | 66,397 | |
Hitachi Ltd. | | | 5,900 | | | | 145,553 | |
Kansai Paint Co., Ltd. | | | 11,900 | | | | 213,050 | |
Mitsubishi Heavy Industries Ltd. | | | 6,500 | | | | 87,635 | |
Renesas Electronics Corp. | | | 3,900 | | | | 67,897 | |
Sumitomo Mitsui Financial Group, Inc. | | | 3,500 | | | | 230,976 | |
| | | | | | | | 968,276 | |
Netherlands — 2.7% | | | | | | | | |
Heineken NV | | | 650 | | | | 58,646 | |
ING Groep NV | | | 9,813 | | | | 178,421 | |
Stellantis NV | | | 4,275 | | | | 71,757 | |
| | | | | | | | 308,824 | |
Singapore — 0.3% | | | | | | | | |
United Overseas Bank Ltd. | | | 1,500 | | | | 36,059 | |
South Korea — 4.1% | | | | | | | | |
Hana Financial Group, Inc. | | | 2,166 | | | | 100,556 | |
KB Financial Group, Inc. | | | 937 | | | | 60,422 | |
KT Corp. | | | 4,228 | | | | 122,526 | |
Samsung Electronics Co., Ltd. | | | 3,357 | | | | 186,442 | |
| | | | | | | | 469,946 | |
Spain — 0.5% | | | | | | | | |
Bankinter SA | | | 6,332 | | | | 55,918 | |
Switzerland — 3.1% | | | | | | | | |
Novartis AG | | | 1,248 | | | | 150,781 | |
Sandoz Group AG | | | 4,545 | | | | 198,793 | |
| | | | | | | | 349,574 | |
United Kingdom — 12.6% | | | | | | | | |
Hikma Pharmaceuticals PLC | | | 4,298 | | | | 112,343 | |
IMI PLC | | | 2,457 | | | | 59,504 | |
Informa PLC | | | 19,270 | | | | 212,159 | |
Marks & Spencer Group PLC | | | 43,413 | | | | 195,917 | |
Melrose Industries PLC | | | 33,073 | | | | 210,088 | |
NatWest Group PLC | | | 27,731 | | | | 126,334 | |
Nomad Foods Ltd. | | | 10,951 | | | | 205,879 | |
Tesco PLC | | | 48,581 | | | | 226,502 | |
Weir Group PLC | | | 3,129 | | | | 82,960 | |
| | | | | | | | 1,431,686 | |
United States — 37.4%(b) | | | | | | | | |
Abbott Laboratories | | | 526 | | | | 59,580 | |
AbbVie, Inc. | | | 811 | | | | 159,207 | |
Alphabet, Inc. - Class A | | | 1,336 | | | | 218,276 | |
American Express Co. | | | 775 | | | | 200,454 | |
Amgen, Inc. | | | 403 | | | | 134,533 | |
AutoZone, Inc. (a) | | | 47 | | | | 149,530 | |
Bank of America Corp. | | | 2,406 | | | | 98,044 | |
Booking Holdings, Inc. | | | 38 | | | | 148,551 | |
Brinker International, Inc. (a) | | | 1,426 | | | | 101,987 | |
Cencora, Inc. | | | 866 | | | | 207,468 | |
Chubb Ltd. | | | 632 | | | | 179,602 | |
Cigna Group | | | 427 | | | | 154,493 | |
Dell Technologies, Inc. - Class C | | | 1,075 | | | | 124,205 | |
Elevance Health, Inc. | | | 279 | | | | 155,372 | |
Emerson Electric Co. | | | 507 | | | | 53,433 | |
Expedia Group, Inc. (a) | | | 308 | | | | 42,840 | |
Fidelity National Information Services, Inc. | | | 1,859 | | | | 153,275 | |
Halliburton Co. | | | 4,502 | | | | 139,967 | |
J M Smucker Co. | | | 844 | | | | 96,790 | |
Johnson & Johnson | | | 371 | | | | 61,534 | |
JPMorgan Chase & Co. | | | 1,162 | | | | 261,218 | |
Kenvue, Inc. | | | 3,829 | | | | 84,047 | |
Keysight Technologies, Inc. (a) | | | 421 | | | | 64,884 | |
McKesson Corp. | | | 145 | | | | 81,357 | |
Morgan Stanley | | | 1,274 | | | | 131,999 | |
NOV, Inc. | | | 3,750 | | | | 66,637 | |
Schlumberger Ltd. | | | 3,405 | | | | 149,786 | |
Starbucks Corp. | | | 1,027 | | | | 97,123 | |
Target Corp. | | | 729 | | | | 111,989 | |
TE Connectivity Ltd. | | | 530 | | | | 81,408 | |
UnitedHealth Group, Inc. | | | 229 | | | | 135,156 | |
US Foods Holding Corp. (a) | | | 3,331 | | | | 197,228 | |
The accompanying notes are an integral part of the financial statements.
Financial Statements 2024 | 26 |
BOSTON PARTNERS INVESTMENT FUNDS | August 31, 2024 |
BOSTON PARTNERS GLOBAL SUSTAINABILITY FUND | Schedule of Investments (continued) |
| | | Shares | | | Value | |
United States — (continued) | | | | | | | | |
Voya Financial, Inc. | | | 966 | | | $ | 68,422 | |
Zimmer Biomet Holdings, Inc. | | | 844 | | | | 97,448 | |
| | | | | | | | 4,267,843 | |
TOTAL COMMON STOCKS (Cost $8,679,189) | | | | | | | 11,196,102 | |
TOTAL INVESTMENTS — 98.2% (Cost $8,679,189) | | | | | | | 11,196,102 | |
Other Assets in Excess of Liabilities — 1.8% | | | | | | | 201,366 | |
TOTAL NET ASSETS — 100.0% | | | | | | $ | 11,397,468 | |
Percentages are stated as a percent of net assets.
PLC | Public Limited Company |
(a) | Non-income producing security. |
(b) | To the extent that the Fund invests a significant portion of its assets in the securities of companies of a single country or region, it is more likely to be impacted by events or conditions affecting the country or region. |
The accompanying notes are an integral part of the financial statements.
Financial Statements 2024 | 27 |
BOSTON PARTNERS INVESTMENT FUNDS | August 31, 2024 |
BOSTON PARTNERS GLOBAL SUSTAINABILITY FUND | Schedule of Investments (concluded) |
A summary of the inputs used to value the Fund’s investments carried at fair value as of August 31, 2024 is as follows (see Notes to Schedule of Investments):
| | | LEVEL 1 | | | LEVEL 2 | | | LEVEL 3 | | | Total | |
Investments: | | | | | | | | | | | | | | | | |
Common Stocks | | $ | 4,941,283 | | | $ | 6,254,819 | | | $ | — | | | $ | 11,196,102 | |
Total Investments | | $ | 4,941,283 | | | $ | 6,254,819 | | | $ | — | | | $ | 11,196,102 | |
Refer to the Schedule of Investments for further disaggregation of investment categories.
The accompanying notes are an integral part of the financial statements.
Financial Statements 2024 | 28 |
BOSTON PARTNERS INVESTMENT FUNDS | August 31, 2024 |
BOSTON PARTNERS LONG/SHORT EQUITY FUND | Schedule of Investments |
| | | Shares | | | Value | |
COMMON STOCKS — 96.5% | | | | | | | | |
Communication Services — 4.4% | | | | | | | | |
Alphabet, Inc. - Class A (a) | | | 7,836 | | | $ | 1,280,246 | |
Baidu, Inc. - Class A (b) | | | 50,048 | | | | 528,072 | |
John Wiley & Sons, Inc. - Class A | | | 8,080 | | | | 390,345 | |
Nexstar Media Group, Inc. (c) | | | 1,557 | | | | 266,060 | |
Vivid Seats, Inc. - Class A (b)(c) | | | 60,757 | | | | 282,520 | |
| | | | | | | | 2,747,243 | |
Consumer Discretionary — 10.9% | | | | | | | | |
Arcos Dorados Holdings, Inc. - Class A (c) | | | 88,715 | | | | 780,692 | |
BYD Co., Ltd. - ADR | | | 3,209 | | | | 195,629 | |
Carriage Services, Inc. (a) | | | 14,161 | | | | 469,437 | |
Cavco Industries, Inc. (b)(c) | | | 1,707 | | | | 705,537 | |
Frontdoor, Inc. (b) | | | 11,711 | | | | 563,065 | |
Italian Sea Group SPA | | | 23,224 | | | | 237,551 | |
JD.com, Inc. - Class A | | | 23,986 | | | | 324,198 | |
Leon’s Furniture Ltd. | | | 9,306 | | | | 203,984 | |
MGM Resorts International (b)(c) | | | 6,919 | | | | 260,085 | |
Monarch Casino & Resort, Inc. (c) | | | 3,433 | | | | 260,633 | |
PDD Holdings, Inc. - ADR (b)(c) | | | 2,719 | | | | 261,323 | |
Perdoceo Education Corp. (a) | | | 16,192 | | | | 363,349 | |
Phinia, Inc. | | | 7,093 | | | | 340,180 | |
Pinstripes Holdings, Inc. (b)(c) | | | 67,473 | | | | 158,562 | |
Potbelly Corp. (a)(b) | | | 24,456 | | | | 195,159 | |
Quantasing Group Ltd. - ADR (b) | | | 45,644 | | | | 80,334 | |
Stellantis NV (c) | | | 33,922 | | | | 569,211 | |
Stride, Inc. (a)(b) | | | 5,727 | | | | 471,561 | |
Super Group SGHC Ltd. | | | 115,828 | | | | 399,607 | |
| | | | | | | | 6,840,097 | |
Consumer Staples — 5.4% | | | | | | | | |
British American Tobacco PLC - ADR (c) | | | 25,814 | | | | 969,832 | |
Coca-Cola Europacific Partners PLC | | | 6,630 | | | | 533,649 | |
Kenvue, Inc. (a) | | | 21,929 | | | | 481,341 | |
Lifeway Foods, Inc. (a)(b) | | | 20,488 | | | | 392,960 | |
Molson Coors Beverage Co. - Class B (c) | | | 8,761 | | | | 472,831 | |
Turning Point Brands, Inc. | | | 13,422 | | | | 532,048 | |
| | | | | | | | 3,382,661 | |
Energy — 5.2% | | | | | | | | |
BP PLC - ADR (a) | | | 17,027 | | | | 578,237 | |
Canadian Natural Resources Ltd. | | | 46,804 | | | | 1,694,773 | |
Marathon Petroleum Corp. (a) | | | 2,619 | | | | 463,877 | |
Schlumberger Ltd. | | | 12,111 | | | | 532,763 | |
| | | | | | | | 3,269,650 | |
Financials — 20.6% | | | | | | | | |
Bank of America Corp. (a) | | | 19,156 | | | | 780,607 | |
BGC Group, Inc. - Class A (c) | | | 201,172 | | | | 1,987,579 | |
Citigroup, Inc. (a) | | | 11,393 | | | | 713,658 | |
Crawford & Co. - Class A (a) | | | 18,500 | | | | 195,545 | |
Fairfax Financial Holdings Ltd. (c) | | | 1,533 | | | | 1,847,265 | |
Fidelis Insurance Holdings Ltd. | | | 29,516 | | | | 546,636 | |
Greenlight Capital Re Ltd. - Class A (b) | | | 30,388 | | | | 424,520 | |
Heritage Insurance Holdings, Inc. (b) | | | 35,287 | | | | 569,179 | |
Intercorp Financial Services, Inc. | | | 11,859 | | | | 301,219 | |
International General Insurance Holdings Ltd. | | | 23,631 | | | | 436,701 | |
Jefferies Financial Group, Inc. (a) | | | 8,700 | | | | 521,565 | |
Jiayin Group, Inc. - ADR | | | 30,135 | | | | 160,318 | |
KB Financial Group, Inc. - ADR (c) | | | 12,039 | | | | 781,090 | |
Northeast Bank | | | 5,330 | | | | 378,483 | |
Northeast Community Bancorp, Inc. | | | 11,309 | | | | 258,298 | |
PayPal Holdings, Inc. (b) | | | 4,882 | | | | 353,603 | |
Shift4 Payments, Inc. - Class A (b)(c) | | | 8,011 | | | | 665,714 | |
Stifel Financial Corp. (a) | | | 9,032 | | | | 796,081 | |
Wells Fargo & Co. (a) | | | 10,198 | | | | 596,277 | |
Willis Towers Watson PLC | | | 2,178 | | | | 636,216 | |
| | | | | | | | 12,950,554 | |
Health Care — 16.7% | | | | | | | | |
Amgen, Inc. (a) | | | 2,173 | | | | 725,413 | |
Bristol-Myers Squibb Co. | | | 12,509 | | | | 624,825 | |
Catalyst Pharmaceuticals, Inc. (a)(b) | | | 55,746 | | | | 1,128,856 | |
Centene Corp. (a)(b) | | | 7,828 | | | | 617,081 | |
Cigna Group (a) | | | 1,768 | | | | 639,680 | |
Elevance Health, Inc. (a) | | | 701 | | | | 390,380 | |
HCA Healthcare, Inc. (a) | | | 1,282 | | | | 507,146 | |
Jazz Pharmaceuticals PLC (b) | | | 4,234 | | | | 491,059 | |
Johnson & Johnson (a) | | | 5,337 | | | | 885,195 | |
Lantheus Holdings, Inc. (b)(c) | | | 9,161 | | | | 975,372 | |
Medtronic PLC (a) | | | 7,982 | | | | 707,046 | |
Novartis AG - ADR (c) | | | 6,152 | | | | 743,715 | |
PetIQ, Inc. (b) | | | 32,238 | | | | 984,871 | |
Quipt Home Medical Corp. (b) | | | 81,822 | | | | 234,011 | |
UnitedHealth Group, Inc. | | | 1,459 | | | | 861,102 | |
| | | | | | | | 10,515,752 | |
Industrials — 11.7% | | | | | | | | |
Alaska Air Group, Inc. (b) | | | 6,754 | | | | 243,887 | |
Barrett Business Services, Inc. (a) | | | 24,417 | | | | 891,465 | |
Brady Corp. - Class A | | | 3,696 | | | | 273,652 | |
Builders FirstSource, Inc. (a)(b) | | | 2,573 | | | | 447,702 | |
CACI International, Inc. - Class A (b) | | | 1,456 | | | | 710,703 | |
Euroseas Ltd. | | | 13,769 | | | | 622,910 | |
Galliford Try Holdings PLC | | | 197,101 | | | | 776,559 | |
Lyft, Inc. - Class A (b) | | | 22,369 | | | | 261,046 | |
NEXTracker, Inc. - Class A (b) | | | 3,742 | | | | 152,187 | |
Quanta Services, Inc. (a) | | | 1,085 | | | | 298,516 | |
RCM Technologies, Inc. (b) | | | 11,613 | | | | 236,673 | |
REV Group, Inc. | | | 7,598 | | | | 241,920 | |
Sterling Infrastructure, Inc. (a)(b) | | | 9,067 | | | | 1,083,779 | |
Textron, Inc. | | | 8,912 | | | | 812,774 | |
V2X, Inc. (b) | | | 5,485 | | | | 310,725 | |
| | | | | | | | 7,364,498 | |
Information Technology — 15.4% | | | | | | | | |
Adeia, Inc. | | | 36,066 | | | | 454,432 | |
Check Point Software Technologies Ltd. (b) | | | 6,978 | | | | 1,343,265 | |
Cognizant Technology Solutions Corp. - Class A (a) | | | 8,364 | | | | 650,468 | |
Dropbox, Inc. - Class A (a)(b) | | | 9,067 | | | | 227,944 | |
Hackett Group, Inc. (a) | | | 22,615 | | | | 599,298 | |
InterDigital, Inc. (c) | | | 6,659 | | | | 922,671 | |
Nano Dimension Ltd. - ADR (b)(c) | | | 92,902 | | | | 203,455 | |
Nice Ltd. - ADR (b)(c) | | | 2,677 | | | | 465,102 | |
Open Text Corp. (a) | | | 21,522 | | | | 684,830 | |
Oracle Corp. (a) | | | 2,356 | | | | 332,879 | |
Photronics, Inc. (a)(b) | | | 27,930 | | | | 722,270 | |
QUALCOMM, Inc. (a) | | | 3,175 | | | | 556,578 | |
RingCentral, Inc. - Class A (b) | | | 10,892 | | | | 363,030 | |
Samsung Electronics Co., Ltd. | | | 7,475 | | | | 415,149 | |
Silicon Motion Technology Corp. - ADR | | | 5,395 | | | | 342,960 | |
The accompanying notes are an integral part of the financial statements.
Financial Statements 2024 | 29 |
BOSTON PARTNERS INVESTMENT FUNDS | August 31, 2024 |
BOSTON PARTNERS LONG/SHORT EQUITY FUND | Schedule of Investments (continued) |
| | | Shares | | | Value | |
Information Technology — (continued) | | | | | | | | |
Telefonaktiebolaget LM Ericsson - ADR (a)(c) | | | 86,551 | | | $ | 644,805 | |
Twilio, Inc., Class A - Class A (b) | | | 7,927 | | | | 497,499 | |
Zoom Video Communications, Inc. - Class A (b)(c) | | | 4,079 | | | | 281,777 | |
| | | | | | | | 9,708,412 | |
Materials — 3.3% | | | | | | | | |
Dundee Precious Metals, Inc. | | | 43,413 | | | | 422,968 | |
Ferroglobe PLC | | | 92,295 | | | | 407,944 | |
Glencore PLC - ADR | | | 43,477 | | | | 456,508 | |
Rio Tinto PLC - ADR (a) | | | 4,226 | | | | 267,379 | |
Taseko Mines Ltd. (b) | | | 108,022 | | | | 244,130 | |
Ternium SA - ADR (a) | | | 9,390 | | | | 316,161 | |
| | | | | | | | 2,115,090 | |
Real Estate — 2.9% | | | | | | | | |
CTO Realty Growth, Inc. | | | 19,518 | | | | 371,232 | |
Newmark Group, Inc. - Class A (a) | | | 90,917 | | | | 1,257,382 | |
Star Holdings (b) | | | 13,692 | | | | 183,473 | |
| | | | | | | | 1,812,087 | |
TOTAL COMMON STOCKS (Cost $40,196,351) | | | | | | | 60,706,044 | |
| | | | | | | | | |
| | | Units | | | | | |
SHORT-TERM INVESTMENTS — 15.7% | | | | | | | | |
Investments Purchased with Proceeds from Securities Lending — 14.7% | | | | | | | | |
Mount Vernon Liquid Assets Portfolio, LLC, 5.50% (d) | | | 9,268,044 | | | | 9,268,044 | |
| | | | | | | | | |
| | | Shares | | | | | |
Money Market Funds — 1.0% | | | | | | | | |
BlackRock Liquidity Funds Treasury Trust Fund Portfolio - Class Institutional, 5.15% (a)(d) | | | 1,098 | | | | 1,098 | |
Federated Hermes U.S. Treasury Cash Reserves - Class Institutional, 5.11% (a)(d) | | | 1,098 | | | | 1,098 | |
Fidelity Treasury Portfolio - Class I, 5.16% (a)(d) | | | 1,098 | | | | 1,098 | |
Goldman Sachs Financial Square Funds - Treasury Instruments Fund - Class Institutional, 5.12% (a)(d) | | | 1,098 | | | | 1,098 | |
MSILF Prime Portfolio - Class Institutional, 5.31% (d) | | | 603,416 | | | | 603,555 | |
| | | | | | | | 607,947 | |
TOTAL SHORT-TERM INVESTMENTS (Cost $9,875,991) | | | | | | | 9,875,991 | |
TOTAL INVESTMENTS — 112.2% (Cost $50,072,342) | | | | | | | 70,582,035 | |
Liabilities in Excess of Other Assets — (12.2)% | | | | | | | (7,688,319 | ) |
TOTAL NET ASSETS — 100.0% | | | | | | $ | 62,893,716 | |
Percentages are stated as a percent of net assets.
The Global Industry Classification Standard (“GICS®”) was developed by and/or is the exclusive property of MSCI, Inc. (“MSCI”) and Standard & Poor’s Financial Services LLC (“S&P”). GICS® is a service mark of MSCI and S&P and has been licensed for use by U.S. Bank Global Fund Services.
ADR | American Depositary Receipt |
PLC | Public Limited Company |
(a) | Security position is either entirely or partially held in a segregated account as collateral for securities sold short. |
(b) | Non-income producing security. |
(c) | All or a portion of this security is on loan as of August 31, 2024. The total market value of these securities was $9,085,498 which represented 14.4% of net assets. |
(d) | The rate shown represents the 7-day annualized effective yield as of August 31, 2024. |
The accompanying notes are an integral part of the financial statements.
Financial Statements 2024 | 30 |
BOSTON PARTNERS INVESTMENT FUNDS | August 31, 2024 |
BOSTON PARTNERS LONG/SHORT EQUITY FUND | Schedule of Investments (continued) |
Schedule Of Securities Sold Short | | Shares | | | Value | |
COMMON STOCKS — (18.8)% | | | | | | | | |
Communication Services — (1.6)% | | | | | | | | |
Boston Omaha Corp. - Class A | | | (11,224 | ) | | $ | (160,391 | ) |
Clear Channel Outdoor Holdings, Inc. | | | (177,786 | ) | | | (266,679 | ) |
CTC Communications Group, Inc.(a) | | | (98,900 | ) | | | 0 | |
PSQ Holdings, Inc. | | | (25,877 | ) | | | (69,609 | ) |
QuinStreet, Inc. | | | (9,486 | ) | | | (181,277 | ) |
Rumble, Inc. | | | (52,676 | ) | | | (302,887 | ) |
| | | | | | | | (980,843 | ) |
Consumer Discretionary — (5.9)% | | | | | | | | |
Birkenstock Holding PLC | | | (5,287 | ) | | | (263,821 | ) |
Boot Barn Holdings, Inc. | | | (1,368 | ) | | | (183,545 | ) |
Brunswick Corp. | | | (4,970 | ) | | | (392,878 | ) |
Cava Group, Inc. | | | (2,007 | ) | | | (228,878 | ) |
Dutch Bros, Inc. - Class A | | | (6,984 | ) | | | (216,504 | ) |
EVgo, Inc. | | | (31,850 | ) | | | (144,281 | ) |
First Watch Restaurant Group, Inc. | | | (14,756 | ) | | | (243,622 | ) |
Floor & Decor Holdings, Inc. - Class A | | | (3,507 | ) | | | (394,327 | ) |
Goodyear Tire & Rubber Co. | | | (17,757 | ) | | | (156,617 | ) |
Groupon, Inc. | | | (11,086 | ) | | | (153,763 | ) |
Krispy Kreme, Inc. | | | (23,579 | ) | | | (265,735 | ) |
Kura Sushi USA, Inc. - Class A | | | (2,089 | ) | | | (137,853 | ) |
Qsound Labs, Inc.(a) | | | (4,440 | ) | | | 0 | |
QuantumScape Corp. | | | (24,091 | ) | | | (139,969 | ) |
Tesla, Inc. | | | (2,429 | ) | | | (520,073 | ) |
Warby Parker, Inc. - Class A | | | (17,493 | ) | | | (260,996 | ) |
| | | | | | | | (3,702,862 | ) |
Consumer Staples — (0.6)% | | | | | | | | |
Amish Naturals, Inc.(a) | | | (25,959 | ) | | | 0 | |
Duckhorn Portfolio, Inc. | | | (10,951 | ) | | | (69,320 | ) |
Westrock Coffee Co. | | | (35,462 | ) | | | (283,518 | ) |
| | | | | | | | (352,838 | ) |
Energy — (0.0)%(b) | | | | | | | | |
Beard Co.(a) | | | (9,710 | ) | | | (1 | ) |
Financials — (1.8)% | | | | | | | | |
AvidXchange Holdings, Inc. | | | (11,916 | ) | | | (96,162 | ) |
Credit Acceptance Corp. | | | (577 | ) | | | (269,188 | ) |
Nelnet, Inc. - Class A | | | (2,279 | ) | | | (263,407 | ) |
Upstart Holdings, Inc. | | | (12,125 | ) | | | (515,312 | ) |
| | | | | | | | (1,144,069 | ) |
Health Care — (2.2)% | | | | | | | | |
BodyTel Scientific, Inc.(a) | | | (4,840 | ) | | | 0 | |
CareView Communications, Inc. | | | (165,489 | ) | | | (8,299 | ) |
Cibus, Inc. | | | (17,489 | ) | | | (118,401 | ) |
Establishment Labs Holdings, Inc. | | | (5,527 | ) | | | (253,247 | ) |
Legend Biotech Corp. - ADR | | | (2,750 | ) | | | (158,263 | ) |
LifeStance Health Group, Inc. | | | (37,744 | ) | | | (238,165 | ) |
Neogen Corp. | | | (14,396 | ) | | | (248,331 | ) |
PROCEPT BioRobotics Corp. | | | (4,876 | ) | | | (385,204 | ) |
| | | | | | | | (1,409,910 | ) |
Industrials — (2.0)% | | | | | | | | |
ACV Auctions, Inc. - Class A | | | (11,451 | ) | | | (214,248 | ) |
Ameresco, Inc. - Class A | | | (5,730 | ) | | | (174,478 | ) |
Applied Energetics, Inc. | | | (54,756 | ) | | | (54,756 | ) |
Corporate Resource Services, Inc.(a) | | | (218,896 | ) | | | (22 | ) |
Custom Truck One Source, Inc. | | | (28,940 | ) | | | (118,654 | ) |
Driven Brands Holdings, Inc. | | | (19,210 | ) | | | (275,471 | ) |
DynaMotive Energy Systems Corp.(a) | | | (72,185 | ) | | | (7 | ) |
Ener1, Inc.(a) | | | (102,820 | ) | | | (10 | ) |
Hyliion Holdings Corp. | | | (47,992 | ) | | | (89,745 | ) |
LanzaTech Global, Inc. | | | (46,248 | ) | | | (68,910 | ) |
Spire Global, Inc. | | | (14,089 | ) | | | (120,884 | ) |
Sunrun, Inc. | | | (6,004 | ) | | | (123,202 | ) |
Valence Technology, Inc.(a) | | | (27,585 | ) | | | (3 | ) |
| | | | | | | | (1,240,390 | ) |
Information Technology — (4.0)% | | | | | | | | |
Alpha & Omega Semiconductor Ltd. | | | (3,772 | ) | | | (157,707 | ) |
Amplitude, Inc. - Class A | | | (16,279 | ) | | | (143,418 | ) |
ANTs software, Inc.(a) | | | (10,334 | ) | | | (1 | ) |
Astera Labs, Inc. | | | (3,891 | ) | | | (167,547 | ) |
Consygen, Inc.(a) | | | (200 | ) | | | 0 | |
Entegris, Inc. | | | (2,477 | ) | | | (287,010 | ) |
Evolv Technologies Holdings, Inc. | | | (44,974 | ) | | | (177,198 | ) |
Impinj, Inc. | | | (2,232 | ) | | | (375,199 | ) |
Interliant, Inc.(a) | | | (600 | ) | | | 0 | |
IonQ, Inc. | | | (16,516 | ) | | | (122,549 | ) |
Lightwave Logic, Inc. | | | (54,237 | ) | | | (159,999 | ) |
MicroVision, Inc. | | | (85,226 | ) | | | (80,811 | ) |
Nestor, Inc.(a) | | | (15,200 | ) | | | (2 | ) |
NextNav, Inc. | | | (21,152 | ) | | | (162,236 | ) |
Novanta, Inc. | | | (1,079 | ) | | | (197,759 | ) |
Samsara, Inc. - Class A | | | (4,600 | ) | | | (188,922 | ) |
Snowflake, Inc. - Class A | | | (817 | ) | | | (93,326 | ) |
Sprout Social, Inc. - Class A | | | (6,472 | ) | | | (201,279 | ) |
Tiger Telematics, Inc.(a) | | | (6,510 | ) | | | 0 | |
Uni-Pixel, Inc.(a) | | | (19,665 | ) | | | 0 | |
Worldgate Communications, Inc.(a) | | | (582,655 | ) | | | (58 | ) |
XRiver Corp.(a) | | | (34,156 | ) | | | 0 | |
| | | | | | | | (2,515,021 | ) |
Materials — (0.7)% | | | | | | | | |
ASP Isotopes, Inc. | | | (48,430 | ) | | | (114,779 | ) |
Coeur Mining, Inc. | | | (57,619 | ) | | | (353,781 | ) |
| | | | | | | | (468,560 | ) |
TOTAL COMMON STOCKS (Proceeds $16,642,562) | | | | | | | (11,814,494 | ) |
TOTAL SECURITIES SOLD SHORT — (18.8)% (Proceeds $16,642,562) | | | | | | $ | (11,814,494 | ) |
Percentages are stated as a percent of net assets.
The Global Industry Classification Standard (“GICS®”) was developed by and/or is the exclusive property of MSCI, Inc. (“MSCI”) and Standard & Poor’s Financial Services LLC (“S&P”). GICS® is a service mark of MSCI and S&P and has been licensed for use by U.S. Bank Global Fund Services.
(a) | Fair value determined using significant unobservable inputs in accordance with procedures established by and under the supervision of the Adviser, acting as valuation designee. These securities represented $(104) or 0.0% of net assets as of August 31, 2024. |
(b) | Represents less than 0.05% of net assets. |
The accompanying notes are an integral part of the financial statements.
Financial Statements 2024 | 31 |
BOSTON PARTNERS INVESTMENT FUNDS | August 31, 2024 |
BOSTON PARTNERS LONG/SHORT EQUITY FUND | Schedule of Investments (continued) |
Contracts For Difference held by the Fund at August 31, 2024, are as follows:
Reference
Entity | | counterparty | | | Pay/
Receive
Reference
Entity | | | Financing
Rate | | | Payment
Frequency | | | Maturity
Date | | | Notional
Amount | | | VALUE/
UNREALIZED
APPRECIATION
(DEPRECIATION) | |
Fositek Corp. | Morgan Stanley | Pay | EFFR + (34.75)% = (29.42)% | Termination | | | 07/16/2027 | | | $ | (150,234 | ) | | $ | (18,603 | ) |
Total Unrealized Appreciation (Depreciation) | | | | | | | | | | | | | | $ | (18,603 | ) |
There are no upfront payments or receipts associated with contracts for difference in the Fund as of August 31, 2024.
EFFR - Effective Federal Funds Rate
The accompanying notes are an integral part of the financial statements.
Financial Statements 2024 | 32 |
BOSTON PARTNERS INVESTMENT FUNDS | August 31, 2024 |
BOSTON PARTNERS LONG/SHORT EQUITY FUND | Schedule of Investments (concluded) |
A summary of the inputs used to value the Fund’s investments carried at fair value as of August 31, 2024 is as follows (see Notes to Schedule of Investments):
| | | LEVEL 1 | | | LEVEL 2 | | | LEVEL 3 | | | Total | |
Assets: | | | | | | | | | | | | | | | | |
Investments: | | | | | | | | | | | | | | | | |
Common Stocks | | $ | 59,201,073 | | | $ | 1,504,971 | | | $ | — | | | $ | 60,706,044 | |
Investments Purchased with Proceeds from Securities Lending(a) | | | — | | | | — | | | | — | | | | 9,268,044 | |
Money Market Funds | | | 607,947 | | | | — | | | | — | | | | 607,947 | |
Total Investments | | $ | 59,809,020 | | | $ | 1,504,971 | | | $ | — | | | $ | 70,582,035 | |
| | | | | | | | | | | | | | | | | |
Liabilities: | | | | | | | | | | | | | | | | |
Investments: | | | | | | | | | | | | | | | | |
Common Stocks | | | (11,806,090 | ) | | | (8,300 | ) | | | (104 | ) | | | (11,814,494 | ) |
Total Investments | | $ | (11,806,090 | ) | | $ | (8,300 | ) | | $ | (104 | ) | | $ | (11,814,494 | ) |
| | | | | | | | | | | | | | | | | |
Other Financial Instruments*: | | | | | | | | | | | | | | | | |
Contracts For Difference | | | (18,603 | ) | | | — | | | | — | | | | (18,603 | ) |
Total Other Financial Instruments | | $ | (18,603 | ) | | $ | — | | | $ | — | | | $ | (18,603 | ) |
* | The fair value of the Fund’s investment represents the net unrealized appreciation (depreciation) as of August 31, 2024. |
Refer to the Schedule of Investments for further disaggregation of investment categories.
(a) | Certain investments that are measured at fair value using the net asset value per share (or its equivalent) practical expedient have not been categorized in the fair value hierarchy. These investments can be classified as Investments Purchased with Proceeds from Securities Lending and their fair value totals to $9,268,044. The fair value amounts presented in the table are intended to permit reconciliation of the fair value hierarchy to the amounts listed in the Schedule of Investments. |
The accompanying notes are an integral part of the financial statements.
Financial Statements 2024 | 33 |
BOSTON PARTNERS INVESTMENT FUNDS | August 31, 2024 |
BOSTON PARTNERS LONG/SHORT RESEARCH FUND | Schedule of Investments |
| | | Shares | | | Value | |
COMMON STOCKS — 94.0% | | | | | | | | |
Communication Services — 5.0% | | | | | | | | |
Alphabet, Inc. - Class A (a) | | | 47,267 | | | $ | 7,722,482 | |
Cars.com, Inc. (b) | | | 38,114 | | | | 679,954 | |
Deutsche Telekom AG | | | 99,060 | | | | 2,818,556 | |
Informa PLC | | | 377,194 | | | | 4,152,830 | |
Live Nation Entertainment, Inc. (b) | | | 37,961 | | | | 3,707,651 | |
Omnicom Group, Inc. | | | 30,660 | | | | 3,079,184 | |
Take-Two Interactive Software, Inc. (a)(b) | | | 22,221 | | | | 3,593,358 | |
T-Mobile US, Inc. (a) | | | 20,095 | | | | 3,993,278 | |
| | | | | | | | 29,747,293 | |
Consumer Discretionary — 7.5% | | | | | | | | |
AutoNation, Inc. (b) | | | 10,724 | | | | 1,908,658 | |
AutoZone, Inc. (b)(c) | | | 761 | | | | 2,421,106 | |
Booking Holdings, Inc. | | | 1,831 | | | | 7,157,800 | |
Churchill Downs, Inc. | | | 26,341 | | | | 3,660,609 | |
eBay, Inc. | | | 18,510 | | | | 1,093,941 | |
Flutter Entertainment PLC (b) | | | 19,172 | | | | 4,095,362 | |
Frontdoor, Inc. (a)(b) | | | 141,090 | | | | 6,783,607 | |
Genting Singapore Ltd. | | | 151,200 | | | | 93,313 | |
Lennar Corp. - Class A | | | 10,978 | | | | 1,998,655 | |
LKQ Corp. (a) | | | 20,633 | | | | 858,127 | |
MGM Resorts International (b) | | | 26,814 | | | | 1,007,938 | |
Restaurant Brands International, Inc. | | | 35,721 | | | | 2,481,895 | |
Ross Stores, Inc. | | | 10,438 | | | | 1,572,067 | |
Starbucks Corp. | | | 11,451 | | | | 1,082,921 | |
Tempur Sealy International, Inc. (a) | | | 34,168 | | | | 1,791,428 | |
TJX Cos., Inc. (a) | | | 24,890 | | | | 2,918,850 | |
Wyndham Hotels & Resorts, Inc. | | | 40,333 | | | | 3,174,207 | |
| | | | | | | | 44,100,484 | |
Consumer Staples — 4.2% | | | | | | | | |
Albertsons Cos., Inc. - Class A (a) | | | 117,848 | | | | 2,312,178 | |
BJ’s Wholesale Club Holdings, Inc. (b) | | | 23,214 | | | | 1,856,192 | |
Constellation Brands, Inc. - Class A | | | 8,578 | | | | 2,064,810 | |
J M Smucker Co. | | | 8,613 | | | | 987,739 | |
Nomad Foods Ltd. | | | 109,354 | | | | 2,055,855 | |
Philip Morris International, Inc. | | | 42,518 | | | | 5,242,044 | |
Simply Good Foods Co. (a)(b) | | | 56,638 | | | | 1,789,195 | |
Target Corp. | | | 18,323 | | | | 2,814,779 | |
US Foods Holding Corp. (a)(b) | | | 34,713 | | | | 2,055,357 | |
Walmart, Inc. | | | 48,693 | | | | 3,760,560 | |
| | | | | | | | 24,938,709 | |
Energy — 6.8% | | | | | | | | |
Canadian Natural Resources Ltd. | | | 77,804 | | | | 2,817,283 | |
Cenovus Energy, Inc. | | | 254,252 | | | | 4,713,832 | |
Cheniere Energy, Inc. | | | 28,673 | | | | 5,311,960 | |
Diamondback Energy, Inc. | | | 27,616 | | | | 5,388,158 | |
Enterprise Products Partners LP | | | 109,298 | | | | 3,206,803 | |
Kosmos Energy Ltd. (a)(b) | | | 193,121 | | | | 940,499 | |
Marathon Petroleum Corp. (a) | | | 20,795 | | | | 3,683,211 | |
MEG Energy Corp. (b) | | | 164,900 | | | | 3,284,173 | |
Noble Corp. PLC | | | 17,829 | | | | 680,177 | |
Phillips 66 | | | 24,507 | | | | 3,438,577 | |
Schlumberger Ltd. | | | 110,371 | | | | 4,855,220 | |
Scorpio Tankers, Inc. | | | 9,441 | | | | 675,409 | |
Weatherford International PLC | | | 13,784 | | | | 1,446,493 | |
| | | | | | | | 40,441,795 | |
Financials — 18.8% | | | | | | | | |
AIB Group PLC | | | 197,995 | | | | 1,192,305 | |
American Express Co. | | | 11,155 | | | | 2,885,241 | |
Ameriprise Financial, Inc. (a) | | | 10,381 | | | | 4,665,637 | |
Aon PLC - Class A | | | 11,556 | | | | 3,972,028 | |
Arthur J Gallagher & Co. | | | 7,129 | | | | 2,085,731 | |
Bank of America Corp. (a) | | | 145,977 | | | | 5,948,563 | |
Bankinter SA | | | 104,718 | | | | 924,769 | |
Beazley PLC | | | 229,950 | | | | 2,276,892 | |
Berkshire Hathaway, Inc. - Class B (a)(b) | | | 6,189 | | | | 2,945,469 | |
Blue Owl Capital, Inc. - Class A | | | 94,762 | | | | 1,671,602 | |
BNP Paribas SA | | | 15,692 | | | | 1,085,378 | |
Charles Schwab Corp. | | | 12,800 | | | | 833,280 | |
Chubb Ltd. | | | 11,466 | | | | 3,258,408 | |
Commerzbank AG | | | 60,725 | | | | 900,356 | |
Corpay, Inc. (b) | | | 4,279 | | | | 1,350,238 | |
Discover Financial Services | | | 20,743 | | | | 2,877,261 | |
East West Bancorp, Inc. (a) | | | 38,041 | | | | 3,198,107 | |
Evercore, Inc. - Class A | | | 5,081 | | | | 1,248,605 | |
Everest Group Ltd. | | | 8,223 | | | | 3,225,389 | |
Fidelity National Information Services, Inc. | | | 17,624 | | | | 1,453,099 | |
Fifth Third Bancorp (a) | | | 52,863 | | | | 2,256,721 | |
First American Financial Corp. | | | 25,343 | | | | 1,616,883 | |
Fiserv, Inc. (b) | | | 8,643 | | | | 1,509,068 | |
Goldman Sachs Group, Inc. (a) | | | 2,789 | | | | 1,423,087 | |
Hana Financial Group, Inc. | | | 28,115 | | | | 1,305,233 | |
Huntington Bancshares, Inc. (a) | | | 268,219 | | | | 4,015,238 | |
Hyundai Marine & Fire Insurance Co., Ltd. | | | 44,479 | | | | 1,158,903 | |
ING Groep NV | | | 166,046 | | | | 3,019,071 | |
JPMorgan Chase & Co. (a) | | | 46,097 | | | | 10,362,606 | |
Lancashire Holdings Ltd. | | | 144,888 | | | | 1,278,692 | |
LPL Financial Holdings, Inc. | | | 10,234 | | | | 2,295,896 | |
Markel Group, Inc. (a)(b) | | | 1,657 | | | | 2,652,327 | |
Morgan Stanley | | | 25,133 | | | | 2,604,030 | |
NatWest Group PLC | | | 367,777 | | | | 1,675,479 | |
Nordea Bank Abp | | | 205,697 | | | | 2,429,064 | |
Progressive Corp. (c) | | | 12,200 | | | | 3,076,840 | |
Renaissance Holdings Ltd. | | | 11,180 | | | | 2,848,552 | |
SLM Corp. (a) | | | 55,294 | | | | 1,219,786 | |
Sumitomo Mitsui Financial Group, Inc. | | | 12,200 | | | | 805,118 | |
Synchrony Financial (a) | | | 11,854 | | | | 595,782 | |
Travelers Cos., Inc. | | | 9,058 | | | | 2,065,858 | |
United Overseas Bank Ltd. | | | 50,900 | | | | 1,223,585 | |
Voya Financial, Inc. | | | 18,905 | | | | 1,339,041 | |
W R Berkley Corp. (a) | | | 11,071 | | | | 660,939 | |
Wells Fargo & Co. (a) | | | 140,449 | | | | 8,212,053 | |
White Mountains Insurance Group Ltd. | | | 1,049 | | | | 1,934,608 | |
| | | | | | | | 111,582,818 | |
Health Care — 12.6% | | | | | | | | |
Abbott Laboratories (a) | | | 42,937 | | | | 4,863,474 | |
AbbVie, Inc. (a) | | | 46,580 | | | | 9,144,120 | |
Amgen, Inc. | | | 18,976 | | | | 6,334,758 | |
AstraZeneca PLC | | | 15,477 | | | | 2,712,589 | |
Avantor, Inc. (a)(b) | | | 49,485 | | | | 1,278,692 | |
Boston Scientific Corp. (a)(b) | | | 19,913 | | | | 1,628,684 | |
Cencora, Inc. | | | 12,346 | | | | 2,957,731 | |
Centene Corp. (a)(b) | | | 35,977 | | | | 2,836,067 | |
Cigna Group (a) | | | 8,027 | | | | 2,904,249 | |
The accompanying notes are an integral part of the financial statements.
Financial Statements 2024 | 34 |
BOSTON PARTNERS INVESTMENT FUNDS | August 31, 2024 |
BOSTON PARTNERS LONG/SHORT RESEARCH FUND | Schedule of Investments (continued) |
| | | Shares | | | Value | |
Health Care — (continued) | | | | | | | | |
Cross Country Healthcare, Inc. (b) | | | 83,635 | | | $ | 1,247,834 | |
CVS Health Corp. (a) | | | 6,055 | | | | 346,588 | |
Elevance Health, Inc. (a) | | | 7,735 | | | | 4,307,544 | |
HCA Healthcare, Inc. | | | 4,999 | | | | 1,977,554 | |
Henry Schein, Inc. (b) | | | 6,338 | | | | 447,146 | |
Humana, Inc. | | | 6,354 | | | | 2,252,302 | |
ICON PLC (b) | | | 12,122 | | | | 3,904,011 | |
IQVIA Holdings, Inc. (b) | | | 1,392 | | | | 350,158 | |
Johnson & Johnson | | | 14,802 | | | | 2,455,060 | |
McKesson Corp. | | | 6,162 | | | | 3,457,375 | |
Medtronic PLC | | | 28,698 | | | | 2,542,069 | |
Merck & Co., Inc. | | | 2,664 | | | | 315,551 | |
Molina Healthcare, Inc. (a)(b) | | | 1,980 | | | | 692,584 | |
Novo Nordisk AS | | | 4,952 | | | | 687,883 | |
Pfizer, Inc. | | | 3,582 | | | | 103,914 | |
Sandoz Group AG | | | 47,497 | | | | 2,077,461 | |
Sanofi SA | | | 12,107 | | | | 1,358,867 | |
Stryker Corp. | | | 1,453 | | | | 523,690 | |
Thermo Fisher Scientific, Inc. | | | 396 | | | | 243,568 | |
UCB SA | | | 7,973 | | | | 1,444,014 | |
UnitedHealth Group, Inc. | | | 15,326 | | | | 9,045,405 | |
| | | | | | | | 74,440,942 | |
Industrials — 17.0% | | | | | | | | |
AAR Corp. (b) | | | 38,387 | | | | 2,525,097 | |
Acuity Brands, Inc. | | | 7,249 | | | | 1,846,320 | |
Advanced Drainage Systems, Inc. | | | 17,918 | | | | 2,808,826 | |
Airbus Group SE | | | 17,094 | | | | 2,625,886 | |
Allegion PLC | | | 18,065 | | | | 2,508,145 | |
Allison Transmission Holdings, Inc. (a) | | | 32,852 | | | | 3,047,023 | |
AMETEK, Inc. (a) | | | 14,466 | | | | 2,474,409 | |
ANDRITZ AG | | | 22,795 | | | | 1,502,788 | |
Atmus Filtration Technologies, Inc. | | | 34,265 | | | | 1,228,400 | |
Beacon Roofing Supply, Inc. (a)(b) | | | 32,031 | | | | 2,902,009 | |
Brink’s Co. | | | 28,409 | | | | 3,151,410 | |
Builders FirstSource, Inc. (b) | | | 26,245 | | | | 4,566,630 | |
Carlisle Cos., Inc. | | | 3,090 | | | | 1,309,542 | |
Clean Harbors, Inc. (b) | | | 12,569 | | | | 3,090,717 | |
Curtiss-Wright Corp. | | | 9,253 | | | | 2,922,653 | |
Dover Corp. (a) | | | 13,403 | | | | 2,493,360 | |
Eiffage SA | | | 12,467 | | | | 1,308,601 | |
Embraer SA - ADR (b) | | | 90,590 | | | | 3,010,306 | |
Emerson Electric Co. | | | 10,704 | | | | 1,128,094 | |
Equifax, Inc. | | | 7,963 | | | | 2,445,676 | |
Ferguson Enterprises, Inc. | | | 9,696 | | | | 1,994,564 | |
Fortive Corp. (a) | | | 20,336 | | | | 1,512,998 | |
General Dynamics Corp. | | | 5,033 | | | | 1,506,679 | |
Honeywell International, Inc. | | | 16,501 | | | | 3,430,723 | |
Howmet Aerospace, Inc. (a) | | | 18,356 | | | | 1,774,291 | |
Huron Consulting Group, Inc. (b) | | | 26,555 | | | | 2,932,734 | |
Jacobs Solutions, Inc. | | | 24,394 | | | | 3,680,567 | |
Leidos Holdings, Inc. (a) | | | 16,184 | | | | 2,565,326 | |
Masco Corp. (a) | | | 39,944 | | | | 3,177,945 | |
NEXTracker, Inc. - Class A (b) | | | 25,274 | | | | 1,027,894 | |
nVent Electric PLC | | | 18,265 | | | | 1,241,289 | |
Otis Worldwide Corp. | | | 26,614 | | | | 2,520,080 | |
Parker-Hannifin Corp. (a) | | | 2,637 | | | | 1,582,727 | |
Resideo Technologies, Inc. (b) | | | 99,835 | | | | 2,012,674 | |
Robert Half, Inc. (a) | | | 40,090 | | | | 2,512,440 | |
Ryanair Holdings PLC - ADR | | | 4,067 | | | | 453,308 | |
Science Applications International Corp. (a) | | | 19,463 | | | | 2,541,673 | |
Siemens AG | | | 10,627 | | | | 1,998,997 | |
SS&C Technologies Holdings, Inc. (a) | | | 47,763 | | | | 3,586,524 | |
Textron, Inc. | | | 25,039 | | | | 2,283,557 | |
Valmont Industries, Inc. (a) | | | 6,837 | | | | 1,953,741 | |
WESCO International, Inc. | | | 13,212 | | | | 2,185,000 | |
Westinghouse Air Brake Technologies Corp. | | | 18,787 | | | | 3,185,712 | |
| | | | | | | | 100,557,335 | |
Information Technology — 12.0% | | | | | | | | |
Adeia, Inc. | | | 269,091 | | | | 3,390,547 | |
Advanced Micro Devices, Inc. (b) | | | 14,843 | | | | 2,205,076 | |
Applied Materials, Inc. | | | 12,000 | | | | 2,367,120 | |
Arrow Electronics, Inc. (a)(b) | | | 14,515 | | | | 1,960,686 | |
Broadcom, Inc. | | | 26,200 | | | | 4,265,884 | |
Capgemini SE | | | 12,063 | | | | 2,499,015 | |
CDW Corp. | | | 8,889 | | | | 2,005,714 | |
Celestica, Inc. (b) | | | 44,133 | | | | 2,247,252 | |
Check Point Software Technologies Ltd. (b) | | | 26,209 | | | | 5,045,233 | |
Dell Technologies, Inc. - Class C | | | 27,176 | | | | 3,139,915 | |
Flex Ltd. (b) | | | 145,105 | | | | 4,714,461 | |
Gen Digital, Inc. (a) | | | 135,342 | | | | 3,581,149 | |
Hewlett Packard Enterprise Co. | | | 84,905 | | | | 1,644,610 | |
InterDigital, Inc. | | | 20,336 | | | | 2,817,756 | |
Jabil, Inc. (a) | | | 12,863 | | | | 1,405,669 | |
Keysight Technologies, Inc. (b) | | | 13,111 | | | | 2,020,667 | |
Lam Research Corp. | | | 2,807 | | | | 2,304,575 | |
Microchip Technology, Inc. (a) | | | 31,319 | | | | 2,573,169 | |
Micron Technology, Inc. | | | 14,576 | | | | 1,402,794 | |
NetApp, Inc. | | | 10,380 | | | | 1,253,074 | |
Nice Ltd. - ADR (b) | | | 20,961 | | | | 3,641,764 | |
NXP Semiconductors NV | | | 6,925 | | | | 1,775,293 | |
Oracle Corp. (a) | | | 21,311 | | | | 3,011,031 | |
QUALCOMM, Inc. | | | 6,285 | | | | 1,101,761 | |
Samsung Electronics Co., Ltd. | | | 72,982 | | | | 4,053,298 | |
Teradyne, Inc. | | | 9,866 | | | | 1,348,978 | |
Zebra Technologies Corp. - Class A (b) | | | 8,685 | | | | 2,999,625 | |
| | | | | | | | 70,776,116 | |
Materials — 4.2% | | | | | | | | |
Andrada Mining Ltd. (b) | | | 2,585,137 | | | | 115,432 | |
CRH PLC | | | 51,326 | | | | 4,658,861 | |
DuPont de Nemours, Inc. (a) | | | 30,382 | | | | 2,559,683 | |
FMC Corp. | | | 15,213 | | | | 982,456 | |
Kinross Gold Corp. | | | 616,799 | | | | 5,575,863 | |
Methanex Corp. | | | 52,885 | | | | 2,469,201 | |
Mosaic Co. | | | 89,483 | | | | 2,556,529 | |
Reliance, Inc. | | | 2,647 | | | | 758,763 | |
Teck Resources Ltd. - Class B | | | 87,274 | | | | 4,180,425 | |
United States Steel Corp. | | | 29,328 | | | | 1,111,824 | |
| | | | | | | | 24,969,037 | |
Real Estate — 2.2% | | | | | | | | |
Americold Realty Trust, Inc. (a) | | | 56,661 | | | | 1,643,169 | |
Essex Property Trust, Inc. | | | 6,198 | | | | 1,870,494 | |
Extra Space Storage, Inc. | | | 7,557 | | | | 1,337,589 | |
Kimco Realty Corp. | | | 91,104 | | | | 2,119,079 | |
Lamar Advertising Co. - Class A (a) | | | 10,555 | | | | 1,327,608 | |
Regency Centers Corp. (a) | | | 18,202 | | | | 1,323,103 | |
VICI Properties, Inc. (a) | | | 63,198 | | | | 2,115,869 | |
Weyerhaeuser Co. | | | 48,101 | | | | 1,466,600 | |
| | | | | | | | 13,203,511 | |
The accompanying notes are an integral part of the financial statements.
Financial Statements 2024 | 35 |
BOSTON PARTNERS INVESTMENT FUNDS | August 31, 2024 |
BOSTON PARTNERS LONG/SHORT RESEARCH FUND | Schedule of Investments (continued) |
| | | Shares | | | Value | |
Utilities — 3.7% | | | | | | | | |
American Electric Power Co., Inc. | | | 12,273 | | | $ | 1,230,736 | |
CenterPoint Energy, Inc. (a) | | | 90,023 | | | | 2,457,628 | |
FirstEnergy Corp. (a) | | | 55,253 | | | | 2,426,712 | |
New Jersey Resources Corp. | | | 13,692 | | | | 634,077 | |
NiSource, Inc. (a) | | | 95,987 | | | | 3,173,330 | |
OGE Energy Corp. | | | 64,415 | | | | 2,548,257 | |
PPL Corp. (a) | | | 95,308 | | | | 3,041,278 | |
Southern Co. | | | 32,090 | | | | 2,772,576 | |
SSE PLC | | | 69,624 | | | | 1,731,709 | |
Talen Energy Corp. (b) | | | 12,624 | | | | 1,888,677 | |
| | | | | | | | 21,904,980 | |
TOTAL COMMON STOCKS (Cost $373,208,800) | | | | | | | 556,663,020 | |
| | | | | | | | | |
| | | Contracts | | | | | |
WARRANTS — 0.0%(d) | | | | | | | | |
Andrada Mining Ltd., Expires 07/17/2025, Exercise Price $0.10 (b)(e) | | | 1,400,000 | | | | 5 | |
TOTAL WARRANTS (Cost $18,309) | | | | | | | 5 | |
| | | | | | | | | |
| | | Par | | | | | |
CONVERTIBLE NOTES — 0.2% | | | | | | | | |
Andrada Mining Ltd., 12.00%, 07/31/2026 (e) | | | GBP 700,000 | | | | 841,446 | |
TOTAL CONVERTIBLE NOTES (Cost $915,464) | | | | | | | 841,446 | |
| | | | | | | | | |
| | | Shares | | | | | |
SHORT-TERM INVESTMENTS — 0.0%(d) | | | | | | | | |
Money Market Funds — 0.0%(d) | | | | | | | | |
BlackRock Liquidity Funds Treasury Trust Fund Portfolio - Class Institutional, 5.15% (a)(f) | | | 2,039 | | | | 2,039 | |
Federated Hermes U.S. Treasury Cash Reserves - Class Institutional, 5.11% (a)(f) | | | 2,039 | | | | 2,039 | |
Fidelity Treasury Portfolio - Class I, 5.16% (a)(f) | | | 2,038 | | | | 2,038 | |
Goldman Sachs Financial Square Funds - Treasury Instruments Fund - Class Institutional, 5.12% (a)(f) | | | 2,039 | | | | 2,039 | |
TOTAL SHORT-TERM INVESTMENTS (Cost $8,155) | | | | | | | 8,155 | |
TOTAL INVESTMENTS — 94.2% (Cost $374,150,728) | | | | | | | 557,512,626 | |
Other Assets in Excess of Liabilities — 5.8% | | | | | | | 34,439,190 | |
TOTAL NET ASSETS — 100.0% | | | | | | $ | 591,951,816 | |
Percentages are stated as a percent of net assets.
Par amount is in USD unless otherwise indicated.
The Global Industry Classification Standard (“GICS®”) was developed by and/or is the exclusive property of MSCI, Inc. (“MSCI”) and Standard & Poor’s Financial Services LLC (“S&P”). GICS® is a service mark of MSCI and S&P and has been licensed for use by U.S. Bank Global Fund Services.
ADR | American Depositary Receipt |
PLC | Public Limited Company |
(a) | Security position is either entirely or partially held in a segregated account as collateral for securities sold short. |
(b) | Non-income producing security. |
(c) | Held in connection with written option contracts. See Schedule of Options Written for further information. |
(d) | Represents less than 0.05% of net assets. |
(e) | Fair value determined using significant unobservable inputs in accordance with procedures established by and under the supervision of the Adviser, acting as valuation designee. These securities represented $841,451 or 0.2% of net assets as of August 31, 2024. |
(f) | The rate shown represents the 7-day annualized effective yield as of August 31, 2024. |
The accompanying notes are an integral part of the financial statements.
Financial Statements 2024 | 36 |
BOSTON PARTNERS INVESTMENT FUNDS | August 31, 2024 |
BOSTON PARTNERS LONG/SHORT RESEARCH FUND | Schedule of Investments (continued) |
Schedule of Written Options | | Notional
Amount | | | Number of
Contracts | | | Value | |
WRITTEN OPTIONS — 0.0% (a)(b)(c) | | | | |
Call Options — 0.0% (a)(b)(c) | | | | | | | | |
AutoZone, Inc., Expiration: 09/20/2024; Exercise Price: $3,300.00 | | $ | (1,590,740 | ) | | | (5 | ) | | $ | (7,500 | ) |
Progressive Corp., Expiration: 09/20/2024; Exercise Price: $240.00 | | | (1,992,380 | ) | | | (79 | ) | | | (106,097 | ) |
Total Call Options | | | | | | | | | | | (113,597 | ) |
TOTAL WRITTEN OPTIONS (Premiums received $69,105) | | | | | | | | | | | (113,597 | ) |
Percentages are stated as a percent of net assets.
(a) | Represents less than 0.05% of net assets. |
(b) | 100 shares per contract. |
The accompanying notes are an integral part of the financial statements.
Financial Statements 2024 | 37 |
BOSTON PARTNERS INVESTMENT FUNDS | August 31, 2024 |
BOSTON PARTNERS LONG/SHORT RESEARCH FUND | Schedule of Investments (continued) |
Schedule Of Securities Sold Short | | Shares | | | Value | |
COMMON STOCKS — (18.9)% | | | | | | | | |
Communication Services — (1.3)% | | | | | | | | |
Angi, Inc. | | | (218,301 | ) | | $ | (589,413 | ) |
Cable One, Inc. | | | (2,126 | ) | | | (749,883 | ) |
Clear Channel Outdoor Holdings, Inc. | | | (698,475 | ) | | | (1,047,712 | ) |
Dentsu Group, Inc. | | | (56,400 | ) | | | (1,734,500 | ) |
Lions Gate Entertainment Corp. - Class A | | | (79,690 | ) | | | (619,191 | ) |
Roblox Corp. - Class A | | | (22,874 | ) | | | (1,006,227 | ) |
Rumble, Inc. | | | (138,628 | ) | | | (797,111 | ) |
TELUS Corp. | | | (54,709 | ) | | | (883,772 | ) |
| | | | | | | | (7,427,809 | ) |
Consumer Discretionary — (3.5)% | | | | | | | | |
Accor SA | | | (27,945 | ) | | | (1,178,296 | ) |
Birkenstock Holding PLC | | | (15,294 | ) | | | (763,171 | ) |
Canada Goose Holdings, Inc. | | | (26,466 | ) | | | (308,858 | ) |
Choice Hotels International, Inc. | | | (15,309 | ) | | | (1,953,275 | ) |
Deckers Outdoor Corp. | | | (1,552 | ) | | | (1,488,818 | ) |
Krispy Kreme, Inc. | | | (37,494 | ) | | | (422,557 | ) |
LGI Homes, Inc. | | | (22,840 | ) | | | (2,463,979 | ) |
Lowe’s Cos., Inc. | | | (3,633 | ) | | | (902,801 | ) |
Marriott Vacations Worldwide Corp. | | | (4,477 | ) | | | (331,298 | ) |
NIKE, Inc. - Class B | | | (5,410 | ) | | | (450,761 | ) |
Nokian Renkaat Oyj | | | (281,919 | ) | | | (2,672,443 | ) |
Playa Hotels & Resorts NV | | | (196,904 | ) | | | (1,551,604 | ) |
QuantumScape Corp. | | | (335,146 | ) | | | (1,947,198 | ) |
Revolve Group, Inc. | | | (46,490 | ) | | | (1,065,551 | ) |
Sabre Corp. | | | (398,199 | ) | | | (1,214,507 | ) |
SJM Holdings Ltd. | | | (3,233,000 | ) | | | (982,467 | ) |
Soho House & Co., Inc. | | | (142,858 | ) | | | (898,577 | ) |
| | | | | | | | (20,596,161 | ) |
Consumer Staples — (1.1)% | | | | | | | | |
Barry Callebaut AG | | | (690 | ) | | | (1,116,923 | ) |
Church & Dwight Co., Inc. | | | (13,758 | ) | | | (1,401,665 | ) |
Davide Campari-Milano NV | | | (86,443 | ) | | | (799,232 | ) |
Duckhorn Portfolio, Inc. | | | (101,897 | ) | | | (645,008 | ) |
Hormel Foods Corp. | | | (43,474 | ) | | | (1,415,079 | ) |
TreeHouse Foods, Inc. | | | (35,192 | ) | | | (1,446,039 | ) |
| | | | | | | | (6,823,946 | ) |
Energy — (2.0)% | | | | | | | | |
Core Laboratories, Inc. | | | (43,726 | ) | | | (855,281 | ) |
CVR Energy, Inc. | | | (78,370 | ) | | | (1,992,165 | ) |
Matador Resources Co. | | | (35,861 | ) | | | (2,034,036 | ) |
Neste Oyj | | | (50,253 | ) | | | (1,172,616 | ) |
New Fortress Energy, Inc. | | | (85,580 | ) | | | (1,054,346 | ) |
Occidental Petroleum Corp. | | | (67,740 | ) | | | (3,859,825 | ) |
PBF Energy, Inc. - Class A | | | (26,238 | ) | | | (893,666 | ) |
| | | | | | | | (11,861,935 | ) |
Financials — (3.2)% | | | | | | | | |
Aozora Bank Ltd. | | | (129,600 | ) | | | (2,396,749 | ) |
Ashmore Group PLC | | | (456,739 | ) | | | (1,053,807 | ) |
AssetMark Financial Holdings, Inc. | | | (70,101 | ) | | | (2,464,050 | ) |
EQT AB | | | (94,530 | ) | | | (3,168,906 | ) |
Hang Seng Bank Ltd. | | | (211,400 | ) | | | (2,545,551 | ) |
Kinsale Capital Group, Inc. | | | (2,706 | ) | | | (1,328,889 | ) |
T Rowe Price Group, Inc. | | | (22,573 | ) | | | (2,393,641 | ) |
Texas Capital Bancshares, Inc. | | | (26,166 | ) | | | (1,758,878 | ) |
Trupanion, Inc. | | | (8,076 | ) | | | (369,315 | ) |
United Bankshares, Inc. | | | (34,931 | ) | | | (1,357,768 | ) |
| | | | | | | | (18,837,554 | ) |
Health Care — (1.4)% | | | | | | | | |
10X Genomics, Inc. - Class A | | | (19,618 | ) | | | (458,080 | ) |
agilon health, Inc. | | | (99,578 | ) | | | (406,278 | ) |
Ambu AS - Class B | | | (21,027 | ) | | | (399,031 | ) |
Carl Zeiss Meditec AG | | | (9,672 | ) | | | (710,032 | ) |
Cassava Sciences, Inc. | | | (12,417 | ) | | | (356,492 | ) |
Dexcom, Inc. | | | (10,344 | ) | | | (717,253 | ) |
GRAIL, Inc. | | | (915 | ) | | | (12,911 | ) |
Guardant Health, Inc. | | | (19,963 | ) | | | (510,653 | ) |
Illumina, Inc. | | | (5,490 | ) | | | (721,386 | ) |
Legend Biotech Corp. - ADR | | | (16,104 | ) | | | (926,785 | ) |
Moderna, Inc. | | | (3,907 | ) | | | (302,402 | ) |
MoonLake Immunotherapeutics | | | (6,323 | ) | | | (295,853 | ) |
Neogen Corp. | | | (35,596 | ) | | | (614,031 | ) |
Oxford Nanopore Technologies PLC | | | (434,490 | ) | | | (669,333 | ) |
Privia Health Group, Inc. | | | (40,021 | ) | | | (806,023 | ) |
Recursion Pharmaceuticals, Inc. - Class A | | | (65,617 | ) | | | (477,692 | ) |
| | | | | | | | (8,384,235 | ) |
Industrials — (2.5)% | | | | | | | | |
Atlas Arteria Ltd. | | | (727,378 | ) | | | (2,502,954 | ) |
Fastenal Co. | | | (28,477 | ) | | | (1,944,410 | ) |
Husqvarna AB - Class B | | | (296,538 | ) | | | (2,004,661 | ) |
Kornit Digital Ltd. | | | (61,585 | ) | | | (1,144,249 | ) |
Montrose Environmental Group, Inc. | | | (71,762 | ) | | | (2,360,970 | ) |
Nidec Corp. | | | (34,700 | ) | | | (1,414,850 | ) |
Proto Labs, Inc. | | | (59,818 | ) | | | (1,829,234 | ) |
SiteOne Landscape Supply, Inc. | | | (11,935 | ) | | | (1,693,099 | ) |
| | | | | | | | (14,894,427 | ) |
Information Technology — (1.3)% | | | | | | | | |
Amdocs Ltd. | | | (18,472 | ) | | | (1,606,510 | ) |
Cognex Corp. | | | (58,626 | ) | | | (2,367,318 | ) |
Palantir Technologies, Inc. - Class A | | | (51,217 | ) | | | (1,612,311 | ) |
Power Integrations, Inc. | | | (23,786 | ) | | | (1,596,040 | ) |
Snowflake, Inc. - Class A | | | (6,134 | ) | | | (700,687 | ) |
| | | | | | | | (7,882,866 | ) |
Materials — (2.0)% | | | | | | | | |
Axalta Coating Systems Ltd. | | | (21,454 | ) | | | (783,071 | ) |
Boliden AB | | | (71,765 | ) | | | (2,192,320 | ) |
Compass Minerals International, Inc. | | | (22,111 | ) | | | (195,240 | ) |
Ganfeng Lithium Group Co., Ltd. - Class H(a) | | | (267,400 | ) | | | (589,046 | ) |
Huntsman Corp. | | | (38,925 | ) | | | (858,296 | ) |
Lynas Rare Earths Ltd. | | | (174,181 | ) | | | (823,171 | ) |
MP Materials Corp. | | | (79,194 | ) | | | (1,021,603 | ) |
Ryerson Holding Corp. | | | (113,533 | ) | | | (2,272,931 | ) |
Sumitomo Chemical Co., Ltd. | | | (485,800 | ) | | | (1,398,632 | ) |
Summit Materials, Inc. - Class A | | | (36,981 | ) | | | (1,497,730 | ) |
| | | | | | | | (11,632,040 | ) |
Real Estate — (0.6)% | | | | | | | | |
Camden Property Trust | | | (3,959 | ) | | | (495,667 | ) |
Compass, Inc. - Class A | | | (129,674 | ) | | | (665,228 | ) |
Mid-America Apartment Communities, Inc. | | | (3,516 | ) | | | (570,893 | ) |
Nomura Real Estate Master Fund, Inc. | | | (503 | ) | | | (509,448 | ) |
Segro PLC | | | (44,077 | ) | | | (507,460 | ) |
The accompanying notes are an integral part of the financial statements.
Financial Statements 2024 | 38 |
BOSTON PARTNERS INVESTMENT FUNDS | August 31, 2024 |
BOSTON PARTNERS LONG/SHORT RESEARCH FUND | Schedule of Investments (continued) |
| | | Shares | | | Value | |
Real Estate — (continued) | | | | | | | | |
Unibail-Rodamco-Westfield | | | (10,708 | ) | | $ | (856,255 | ) |
| | | | | | | | (3,604,951 | ) |
TOTAL COMMON STOCKS (Proceeds $124,116,801) | | | | | | | (111,945,924 | ) |
| | | | | | | | | |
PREFERRED STOCKS — (0.3)% | | | | | | | | |
Consumer Discretionary — (0.3)% | | | | | | | | |
Dr Ing hc F Porsche AG(a) | | | (23,602 | ) | | | (1,851,091 | ) |
TOTAL PREFERRED STOCKS (Proceeds $2,115,269) | | | | | | | (1,851,091 | ) |
TOTAL SECURITIES SOLD SHORT — (19.2)% (Proceeds $126,232,070) | | | | | | $ | (113,797,015 | ) |
Percentages are stated as a percent of net assets.
The Global Industry Classification Standard (“GICS®”) was developed by and/or is the exclusive property of MSCI, Inc. (“MSCI”) and Standard & Poor’s Financial Services LLC (“S&P”). GICS® is a service mark of MSCI and S&P and has been licensed for use by U.S. Bank Global Fund Services.
(a) | Security is exempt from registration pursuant to Rule 144A under the Securities Act of 1933, as amended. These securities may only be resold in transactions exempt from registration to qualified institutional investors. As of August 31, 2024, the value of these securities total $(2,440,137) or -0.4% of the Fund’s net assets. |
The accompanying notes are an integral part of the financial statements.
Financial Statements 2024 | 39 |
BOSTON PARTNERS INVESTMENT FUNDS | August 31, 2024 |
BOSTON PARTNERS LONG/SHORT RESEARCH FUND | Schedule of Investments (continued) |
Contracts For Difference held by the Fund at August 31, 2024, are as follows:
Reference
Entity | | counterparty | | | Pay/
Receive
Reference
Entity | | | Financing
Rate | | | Payment
Frequency | | | Maturity
Date | | Notional
Amount | | | VALUE/
UNREALIZED
APPRECIATION
(DEPRECIATION) | |
Acer, Inc. | Goldman Sachs | Pay | EFFR + (2.50)% = 1.33% | Termination | | | 12/08/2025 | | $ | | | (1,136,488 | ) | | $ | (542,329 | ) |
Acushnet Holdings Corp. | Morgan Stanley | Pay | EFFR + (0.25)% = 5.08% | Termination | | | 08/23/2027 | | | | | (1,255,594 | ) | | | (18,674 | ) |
Amcor PLC | Morgan Stanley | Pay | EFFR + (0.25)% = 5.08% | Termination | | | 08/23/2027 | | | | | (634,977 | ) | | | (27,537 | ) |
Antero Resources Corp. | Morgan Stanley | Pay | EFFR + (0.25)% = 5.08% | Termination | | | 08/23/2027 | | | | | (1,993,104 | ) | | | (4,863 | ) |
Ascendis Pharma AS | Morgan Stanley | Pay | EFFR + (0.25)% = 5.08% | Termination | | | 08/23/2027 | | | | | (713,710 | ) | | | 5,758 | |
Avanza Bank Holding AB | Morgan Stanley | Pay | STIB1D INDEX + (0.30)% = 3.19% | Termination | | | 08/27/2027 | | SEK | | | (10,951,595 | ) | | | (846 | ) |
Bank of Hawaii Corp. | Goldman Sachs | Pay | EFFR + (0.25)% = 4.97% | Termination | | | 03/02/2026 | | | | | (928,782 | ) | | | (27,938 | ) |
Bank of Hawaii Corp. | Morgan Stanley | Pay | EFFR + (0.25)% = 4.80% | Termination | | | 12/08/2025 | | | | | (2,197,179 | ) | | | 415,833 | |
BlackLine, Inc. | Morgan Stanley | Pay | EFFR + (0.25)% = 5.08% | Termination | | | 12/08/2025 | | | | | (1,001,851 | ) | | | 368,182 | |
CBRE Group, Inc. | Morgan Stanley | Pay | EFFR + (0.25)% = 5.08% | Termination | | | 08/23/2027 | | | | | (2,099,002 | ) | | | (39,134 | ) |
Cincinnati Financial Corp. | Morgan Stanley | Pay | EFFR + (0.25)% = 5.08% | Termination | | | 08/23/2027 | | | | | (1,558,853 | ) | | | (55,656 | ) |
Commerce Bancshares, Inc. | Goldman Sachs | Pay | EFFR + (0.25)% = 5.08% | Termination | | | 10/06/2026 | | | | | (368,765 | ) | | | (108,922 | ) |
Commerce Bancshares, Inc. | Morgan Stanley | Pay | EFFR + (0.25)% = 5.08% | Termination | | | 12/08/2025 | | | | | (2,087,095 | ) | | | 144,446 | |
Commonwealth Bank of Australia | Morgan Stanley | Pay | RBA Cash Rate Overnight + (0.55)% = 3.79% | Termination | | | 12/08/2025 | | AUD | | | (6,005,196 | ) | | | (1,046,593 | ) |
Community Financial System, Inc. | Goldman Sachs | Pay | EFFR + (0.25)% = 5.08% | Termination | | | 10/06/2026 | | | | | (369,284 | ) | | | (112,452 | ) |
Community Financial System, Inc. | Morgan Stanley | Pay | EFFR + (0.25)% = 5.08% | Termination | | | 12/08/2025 | | | | | (2,998,552 | ) | | | 167,973 | |
Compal Electronics, Inc. | Goldman Sachs | Pay | EFFR + (1.25)% = 4.83% | Termination | | | 12/08/2025 | | | | | (822,995 | ) | | | (243,278 | ) |
Corcept Therapeutics, Inc. | Morgan Stanley | Pay | EFFR + (0.25)% = 5.08% | Termination | | | 08/23/2027 | | | | | (776,106 | ) | | | (21,469 | ) |
Credit Acceptance Corp. | Goldman Sachs | Pay | EFFR + (0.25)% = 5.08% | Termination | | | 03/02/2026 | | | | | (571,499 | ) | | | 1,738 | |
Credit Acceptance Corp. | Morgan Stanley | Pay | EFFR + (0.25)% = 5.08% | Termination | | | 12/08/2025 | | | | | (1,351,537 | ) | | | 80,607 | |
Cullen/Frost Bankers, Inc. | Goldman Sachs | Pay | EFFR + (0.25)% = 5.08% | Termination | | | 04/06/2026 | | | | | (523,441 | ) | | | (39,081 | ) |
Cullen/Frost Bankers, Inc. | Morgan Stanley | Pay | EFFR + (0.25)% = 5.08% | Termination | | | 12/08/2025 | | | | | (907,941 | ) | | | 257,419 | |
CVB Financial Corp. | Goldman Sachs | Pay | EFFR + (0.25)% = 5.08% | Termination | | | 10/06/2026 | | | | | (852,441 | ) | | | (79,486 | ) |
CVB Financial Corp. | Morgan Stanley | Pay | EFFR + (0.25)% = 5.08% | Termination | | | 12/08/2025 | | | | | (348,617 | ) | | | 184,367 | |
Dayforce, Inc. | Morgan Stanley | Pay | EFFR + (0.25)% = 5.08% | Termination | | | 12/08/2025 | | | | | (550,604 | ) | | | 105,261 | |
Digital Realty Trust, Inc. | Morgan Stanley | Pay | EFFR + (0.25)% = 5.08% | Termination | | | 08/23/2027 | | | | | (597,192 | ) | | | (2,870 | ) |
Dun & Bradstreet Holdings, Inc. | Morgan Stanley | Pay | EFFR + (0.25)% = 5.08% | Termination | | | 08/23/2027 | | | | | (1,199,508 | ) | | | (11,488 | ) |
EcoPro BM Co., Ltd. | Morgan Stanley | Pay | EFFR + (0.62)% = 1.96% | Termination | | | 10/20/2026 | | | | | (828,744 | ) | | | 391,764 | |
EcoPro Co., Ltd. | Bank of America Securities, Inc. | Pay | EFFR + (0.40)% = 5.24% | Termination | | | 10/23/2026 | | | | | (538,905 | ) | | | 441,299 | |
EcoPro Co., Ltd. | Goldman Sachs | Pay | EFFR + (10.00)% = (4.97)% | Termination | | | 10/30/2026 | | | | | (378,066 | ) | | | 167,230 | |
Entegris, Inc. | Morgan Stanley | Pay | EFFR + (0.25)% = 5.08% | Termination | | | 08/23/2027 | | | | | (3,313,303 | ) | | | (106,309 | ) |
Erie Indemnity Co. | Morgan Stanley | Pay | EFFR + (0.25)% = 5.08% | Termination | | | 08/23/2027 | | | | | (1,391,534 | ) | | | (60,355 | ) |
Exponent, Inc. | Morgan Stanley | Pay | EFFR + (0.25)% = 5.08% | Termination | | | 08/23/2027 | | | | | (2,402,403 | ) | | | (98,704 | ) |
First Financial Bankshares, Inc. | Goldman Sachs | Pay | EFFR + (0.25)% = 5.08% | Termination | | | 03/02/2026 | | | | | (1,776,132 | ) | | | (188,923 | ) |
First Financial Bankshares, Inc. | Morgan Stanley | Pay | EFFR + (0.25)% = 5.08% | Termination | | | 12/08/2025 | | | | | (1,496,371 | ) | | | 29,317 | |
Floor & Decor Holdings, Inc. | Goldman Sachs | Pay | EFFR + (0.25)% = 5.08% | Termination | | | 04/13/2026 | | | | | (304,825 | ) | | | (20,141 | ) |
Floor & Decor Holdings, Inc. | Morgan Stanley | Pay | EFFR + (0.25)% = 5.08% | Termination | | | 12/08/2025 | | | | | (708,260 | ) | | | (216,434 | ) |
The accompanying notes are an integral part of the financial statements.
Financial Statements 2024 | 40 |
BOSTON PARTNERS INVESTMENT FUNDS | August 31, 2024 |
BOSTON PARTNERS LONG/SHORT RESEARCH FUND | Schedule of Investments (continued) |
Reference
Entity | | counterparty | | | Pay/
Receive
Reference
Entity | | | Financing
Rate | | | Payment
Frequency | | | Maturity
Date | | Notional
Amount | | | VALUE/
UNREALIZED
APPRECIATION
(DEPRECIATION) | |
Fox Corp. | Morgan Stanley | Pay | EFFR + (0.25)% = 5.08% | Termination | | | 08/23/2027 | | $ | | | (1,342,787 | ) | | $ | (17,794 | ) |
Furukawa Electric Co. Ltd. | Morgan Stanley | Pay | TONA + (0.45)% = (0.22)% | Termination | | | 08/27/2027 | | JPY | | | (403,200,000 | ) | | | 4,512 | |
Glacier Bancorp, Inc. | Goldman Sachs | Pay | EFFR + (0.25)% = 5.08% | Termination | | | 03/02/2026 | | | | | (1,927,333 | ) | | | (429,080 | ) |
Glacier Bancorp, Inc. | Morgan Stanley | Pay | EFFR + (0.25)% = 5.08% | Termination | | | 12/08/2025 | | | | | (2,144,582 | ) | | | 464,112 | |
GoodRx Holdings, Inc. | Morgan Stanley | Pay | EFFR + (0.25)% = 5.08% | Termination | | | 08/23/2027 | | | | | (935,866 | ) | | | (39,140 | ) |
Infosys Ltd. | Morgan Stanley | Pay | EFFR + (0.25)% = 5.08% | Termination | | | 08/23/2027 | | | | | (1,408,161 | ) | | | (55,143 | ) |
KakaoBank Corp. | Goldman Sachs | Pay | EFFR + (0.37)% = 4.33% | Termination | | | 12/08/2025 | | | | | (445,209 | ) | | | 158,084 | |
KakaoBank Corp. | Bank of America Securities, Inc. | Pay | OBFR + (0.50)% = 3.31% | Termination | | | 10/12/2026 | | | | | (45,462 | ) | | | 1,718 | |
KB Home | Morgan Stanley | Pay | EFFR + (0.25)% = 5.08% | Termination | | | 08/23/2027 | | | | | (1,432,446 | ) | | | (31,249 | ) |
Kimberly-Clark Corp. | Morgan Stanley | Pay | EFFR + (0.25)% = 5.08% | Termination | | | 08/23/2027 | | | | | (2,196,083 | ) | | | 1,877 | |
Kinsale Capital Group, Inc. | Goldman Sachs | Pay | EFFR + (0.25)% = 5.08% | Termination | | | 09/21/2026 | | | | | (171,390 | ) | | | (19,038 | ) |
Kinsale Capital Group, Inc. | Morgan Stanley | Pay | EFFR + (0.25)% = 5.08% | Termination | | | 12/08/2025 | | | | | (671,811 | ) | | | (242,232 | ) |
Liberty Global Ltd. | Morgan Stanley | Pay | EFFR + (0.25)% = 5.08% | Termination | | | 08/23/2027 | | | | | (1,534,653 | ) | | | (24,611 | ) |
Life Time Group Holdings, Inc. | Morgan Stanley | Pay | EFFR + (0.25)% = 5.08% | Termination | | | 08/23/2027 | | | | | (1,149,869 | ) | | | 5,376 | |
Madrigal Pharmaceuticals, Inc. | Morgan Stanley | Pay | EFFR + (0.25)% = 5.08% | Termination | | | 08/23/2027 | | | | | (695,177 | ) | | | 5,249 | |
Moelis & Co. | Morgan Stanley | Pay | EFFR + (0.25)% = 5.08% | Termination | | | 08/23/2027 | | | | | (1,714,900 | ) | | | (33,300 | ) |
Myriad Genetics, Inc. | Morgan Stanley | Pay | EFFR + (0.25)% = 5.08% | Termination | | | 12/08/2025 | | | | | (753,691 | ) | | | (190,483 | ) |
National Beverage Corp. | Goldman Sachs | Pay | EFFR + (0.25)% = 5.08% | Termination | | | 12/15/2025 | | | | | (114,435 | ) | | | 16,945 | |
National Beverage Corp. | Morgan Stanley | Pay | EFFR + (0.25)% = 5.08% | Termination | | | 12/08/2025 | | | | | (1,323,730 | ) | | | 164,516 | |
Netmarble Corp. | Goldman Sachs | Pay | EFFR + (2.75)% = 2.58% | Termination | | | 03/10/2026 | | | | | (214,724 | ) | | | 5,645 | |
Netmarble Corp. | Morgan Stanley | Pay | EFFR + (0.62)% = (2.42)% | Termination | | | 03/16/2026 | | | | | (1,150,711 | ) | | | (88,939 | ) |
Northrop Grumman Corp. | Morgan Stanley | Pay | EFFR + (0.25)% = 5.08% | Termination | | | 08/23/2027 | | | | | (1,812,399 | ) | | | (44,799 | ) |
Novanta, Inc. | Goldman Sachs | Pay | EFFR + (0.25)% = 5.08% | Termination | | | 08/31/2026 | | | | | (1,943,684 | ) | | | (411,459 | ) |
Novanta, Inc. | Morgan Stanley | Pay | EFFR + (0.25)% = 5.08% | Termination | | | 12/08/2025 | | | | | (1,277,278 | ) | | | (150,082 | ) |
Pan Jit International, Inc. | Goldman Sachs | Pay | EFFR + (5.25)% = (0.17)% | Termination | | | 12/08/2025 | | | | | (1,477,337 | ) | | | 160,676 | |
Permian Resources Corp. | Morgan Stanley | Pay | EFFR + (0.25)% = 5.08% | Termination | | | 08/23/2027 | | | | | (1,718,241 | ) | | | (6,275 | ) |
Posco Future M Co., Ltd. | Bank of America Securities, Inc. | Pay | EFFR + (0.40)% = 5.32% | Termination | | | 10/23/2026 | | | | | (1,409,982 | ) | | | 577,423 | |
Rhythm Pharmaceuticals, Inc. | Morgan Stanley | Pay | EFFR + (0.25)% = 5.08% | Termination | | | 08/23/2027 | | | | | (661,729 | ) | | | (42,593 | ) |
RLI Corp. | Morgan Stanley | Pay | EFFR + (0.25)% = 5.08% | Termination | | | 12/08/2025 | | | | | (1,339,900 | ) | | | (163,946 | ) |
Sagax AB | Morgan Stanley | Pay | STIB1D INDEX + (0.30)% = 3.19% | Termination | | | 08/27/2027 | | SEK | | | (12,372,644 | ) | | | 29,937 | |
SDI Corp. | Goldman Sachs | Pay | EFFR + (7.00)% = (2.42)% | Termination | | | 12/08/2025 | | | | | (485,699 | ) | | | (113,678 | ) |
Shenzhen Dynanonic Co. Ltd. | Morgan Stanley | Pay | EFFR + (0.62)% = 4.71% | Termination | | | 08/06/2026 | | | | | (119,432 | ) | | | 45,225 | |
Shenzhen Dynanonic Co., Ltd. | Bank of America Securities, Inc. | Pay | EFFR + (14.25)% = (5.19)% | Termination | | | 10/20/2026 | | | | | (54,287 | ) | | | 104,470 | |
Shenzhen Dynanonic Co., Ltd. | Morgan Stanley | Pay | EFFR + (14.25)% = (5.19)% | Termination | | | 10/20/2026 | | | | | (192,720 | ) | | | 374,615 | |
Shenzhen Goodix Technology Co., Ltd. | Morgan Stanley | Pay | EFFR + (4.45)% = 0.88% | Termination | | | 08/03/2026 | | | | | (881,861 | ) | | | (145,131 | ) |
SL Green Realty Corp. | Morgan Stanley | Pay | EFFR + (0.25)% = 5.08% | Termination | | | 08/23/2027 | | | | | (2,188,391 | ) | | | (84,344 | ) |
Tandem Diabetes Care, Inc. | Morgan Stanley | Pay | EFFR + (0.25)% = 5.08% | Termination | | | 08/23/2027 | | | | | (1,120,169 | ) | | | (24,619 | ) |
TG Therapeutics, Inc. | Morgan Stanley | Pay | EFFR + (0.25)% = 5.08% | Termination | | | 08/23/2027 | | | | | (838,029 | ) | | | 33,571 | |
The accompanying notes are an integral part of the financial statements.
Financial Statements 2024 | 41 |
BOSTON PARTNERS INVESTMENT FUNDS | August 31, 2024 |
BOSTON PARTNERS LONG/SHORT RESEARCH FUND | Schedule of Investments (continued) |
Reference
Entity | | counterparty | | | Pay/
Receive
Reference
Entity | | | Financing
Rate | | | Payment
Frequency | | | Maturity
Date | | Notional
Amount | | | VALUE/
UNREALIZED
APPRECIATION
(DEPRECIATION) | |
Toro Co. | Morgan Stanley | Pay | EFFR + (0.25)% = 5.08% | Termination | | | 08/23/2027 | | $ | | | (1,713,378 | ) | | $ | (43,770 | ) |
Tractor Supply Co. | Morgan Stanley | Pay | EFFR + (0.25)% = 5.08% | Termination | | | 08/23/2027 | | | | | (1,136,820 | ) | | | (12,888 | ) |
Treasury Wine Estates Ltd. | Morgan Stanley | Pay | RBA Cash Rate Overnight + (0.55)% = 3.79% | Termination | | | 08/27/2027 | | AUD | | | (1,743,749 | ) | | | 26,451 | |
Twist Bioscience Corp. | Morgan Stanley | Pay | EFFR + (0.25)% = 5.08% | Termination | | | 08/23/2027 | | | | | (756,484 | ) | | | (12,703 | ) |
VAT Group AG | Morgan Stanley | Pay | SARON + 0.35% = 0.76% | Termination | | | 12/08/2025 | | CHF | | | (2,746,053 | ) | | | (1,077,258 | ) |
Wolfspeed, Inc. | Goldman Sachs | Pay | EFFR + (0.25)% = 5.08% | Termination | | | 08/31/2026 | | | | | (367,419 | ) | | | 1,243,511 | |
Wolfspeed, Inc. | Morgan Stanley | Pay | EFFR + (0.25)% = 5.08% | Termination | | | 12/08/2025 | | | | | (92,869 | ) | | | 745,185 | |
Total Unrealized Appreciation (Depreciation) | | | | | | | | | | | | | | | $ | 352,256 | |
There are no upfront payments or receipts associated with contracts for difference in the Fund as of August 31, 2024.
OBFR - Overnight Bank Funding Rate
EFFR - Effective Federal Funds Rate
SARON - Swiss Average Rate Overnight
TONA - Tokyo Overnight Average Rate
The accompanying notes are an integral part of the financial statements.
Financial Statements 2024 | 42 |
BOSTON PARTNERS INVESTMENT FUNDS | August 31, 2024 |
BOSTON PARTNERS LONG/SHORT RESEARCH FUND | Schedule of Investments (concluded) |
A summary of the inputs used to value the Fund’s investments carried at fair value as of August 31, 2024 is as follows (see Notes to Schedule of Investments):
| | | LEVEL 1 | | | LEVEL 2 | | | LEVEL 3 | | | Total | |
Assets: | | | | | | | | | | | | | | | | |
Investments: | | | | | | | | | | | | | | | | |
Common Stocks | | $ | 503,505,700 | | | $ | 53,157,320 | | | $ | — | | | $ | 556,663,020 | |
Convertible Notes | | | — | | | | — | | | | 841,446 | | | | 841,446 | |
Warrants | | | — | | | | — | | | | 5 | | | | 5 | |
Money Market Funds | | | 8,155 | | | | — | | | | — | | | | 8,155 | |
Total Investments | | $ | 503,513,855 | | | $ | 53,157,320 | | | $ | 841,451 | | | $ | 557,512,626 | |
| | | | | | | | | | | | | | | | | |
Other Financial Instruments*: | | | | | | | | | | | | | | | | |
Contracts For Difference | | | 6,930,292 | | | | — | | | | — | | | | 6,930,292 | |
Total Other Financial Instruments | | $ | 6,930,292 | | | $ | — | | | $ | — | | | $ | 6,930,292 | |
| | | | | | | | | | | | | | | | | |
Liabilities: | | | | | | | | | | | | | | | | |
Investments: | | | | | | | | | | | | | | | | |
Common Stocks | | | (80,333,499 | ) | | | (31,612,425 | ) | | | — | | | | (111,945,924 | ) |
Preferred Stocks | | | — | | | | (1,851,091 | ) | | | — | | | | (1,851,091 | ) |
Written Options | | | (113,597 | ) | | | — | | | | — | | | | (113,597 | ) |
Total Investments | | $ | (80,447,096 | ) | | $ | (33,463,516 | ) | | $ | — | | | $ | (113,910,612 | ) |
| | | | | | | | | | | | | | | | | |
Other Financial Instruments*: | | | | | | | | | | | | | | | | |
Contracts For Difference | | | (6,578,036 | ) | | | — | | | | — | | | | (6,578,036 | ) |
Total Other Financial Instruments | | $ | (6,578,036 | ) | | $ | — | | | $ | — | | | $ | (6,578,036 | ) |
* | The fair value of the Fund’s investment represents the net unrealized appreciation (depreciation) as of August 31, 2024. |
Refer to the Schedule of Investments for further disaggregation of investment categories.
The accompanying notes are an integral part of the financial statements.
Financial Statements 2024 | 43 |
BOSTON PARTNERS INVESTMENT FUNDS | August 31, 2024 |
BOSTON PARTNERS SMALL CAP VALUE FUND II | Schedule of Investments |
| | | Shares | | | Value | |
COMMON STOCKS — 96.8% | | | | | | | | |
Communication Services — 3.8% | | | | | | | | |
Cars.com, Inc. (a) | | | 206,060 | | | $ | 3,676,110 | |
Liberty Media Corp.-Liberty Live - Class A (a) | | | 83,519 | | | | 3,307,352 | |
Magnite, Inc. (a) | | | 299,569 | | | | 4,131,057 | |
Nexstar Media Group, Inc. (b) | | | 17,631 | | | | 3,012,785 | |
Stagwell, Inc. (a)(b) | | | 394,926 | | | | 2,839,518 | |
TEGNA, Inc. | | | 301,995 | | | | 4,191,691 | |
Vivid Seats, Inc. - Class A (a)(b) | | | 397,510 | | | | 1,848,422 | |
| | | | | | | | 23,006,935 | |
Consumer Discretionary — 12.6% | | | | | | | | |
Beazer Homes USA, Inc. (a) | | | 185,499 | | | | 5,802,409 | |
Bowlero Corp. (b) | | | 352,736 | | | | 3,897,733 | |
Boyd Gaming Corp. | | | 61,232 | | | | 3,675,145 | |
Brinker International, Inc. (a) | | | 49,674 | | | | 3,552,684 | |
Build-A-Bear Workshop, Inc. (b) | | | 51,991 | | | | 1,735,460 | |
Caleres, Inc. (b) | | | 82,459 | | | | 3,473,998 | |
Carriage Services, Inc. | | | 136,448 | | | | 4,523,251 | |
Frontdoor, Inc. (a) | | | 130,764 | | | | 6,287,133 | |
Grand Canyon Education, Inc. (a) | | | 27,071 | | | | 3,925,566 | |
Group 1 Automotive, Inc. (b) | | | 12,584 | | | | 4,741,148 | |
Guess?, Inc. (b) | | | 107,676 | | | | 2,231,047 | |
Installed Building Products, Inc. (b) | | | 8,629 | | | | 1,918,313 | |
J Jill, Inc. | | | 119,607 | | | | 3,890,816 | |
Laureate Education, Inc. | | | 232,072 | | | | 3,578,550 | |
Movado Group, Inc. | | | 93,511 | | | | 2,231,172 | |
Perdoceo Education Corp. | | | 144,901 | | | | 3,251,578 | |
Phinia, Inc. (b) | | | 68,938 | | | | 3,306,266 | |
Steven Madden Ltd. (b) | | | 73,632 | | | | 3,320,803 | |
Taylor Morrison Home Corp. (a) | | | 38,028 | | | | 2,560,425 | |
Unifi, Inc. (a) | | | 291,042 | | | | 1,987,817 | |
United Homes Group, Inc. (a)(b) | | | 226,618 | | | | 1,380,104 | |
Universal Technical Institute, Inc. (a) | | | 256,762 | | | | 4,480,497 | |
| | | | | | | | 75,751,915 | |
Consumer Staples — 2.3% | | | | | | | | |
Nomad Foods Ltd. | | | 190,319 | | | | 3,577,997 | |
Simply Good Foods Co. (a)(b) | | | 61,293 | | | | 1,936,246 | |
Universal Corp. | | | 55,189 | | | | 2,996,763 | |
Utz Brands, Inc. (b) | | | 158,411 | | | | 2,675,562 | |
Vector Group Ltd. | | | 192,620 | | | | 2,885,447 | |
| | | | | | | | 14,072,015 | |
Energy — 6.8% | | | | | | | | |
Archrock, Inc. | | | 150,883 | | | | 3,052,363 | |
ChampionX Corp. | | | 75,516 | | | | 2,350,813 | |
Expro Group Holdings NV (a) | | | 190,103 | | | | 3,775,446 | |
Kosmos Energy Ltd. (a)(b) | | | 286,299 | | | | 1,394,276 | |
Newpark Resources, Inc. (a) | | | 358,790 | | | | 2,952,842 | |
Noble Corp., PLC (b) | | | 61,929 | | | | 2,362,591 | |
Par Pacific Holdings, Inc. (a) | | | 102,688 | | | | 2,304,319 | |
Select Water Solutions, Inc. (b) | | | 233,669 | | | | 2,694,203 | |
Vermilion Energy, Inc. (b) | | | 129,062 | | | | 1,326,757 | |
Viper Energy, Inc. | | | 165,361 | | | | 7,871,184 | |
Weatherford International PLC | | | 50,160 | | | | 5,263,790 | |
World Kinect Corp. | | | 179,102 | | | | 5,156,347 | |
| | | | | | | | 40,504,931 | |
Financials — 29.9% | | | | | | | | |
AllianceBernstein Holding LP | | | 42,789 | | | | 1,473,653 | |
AMERISAFE, Inc. | | | 32,426 | | | | 1,625,191 | |
Assured Guaranty Ltd. (b) | | | 55,536 | | | | 4,447,323 | |
Axis Capital Holdings Ltd. | | | 74,632 | | | | 5,961,604 | |
Baldwin Insurance Group, Inc. - Class A (a)(b) | | | 122,020 | | | | 5,721,518 | |
Bar Harbor Bankshares | | | 60,963 | | | | 1,954,474 | |
BGC Group, Inc. - Class A | | | 556,206 | | | | 5,495,315 | |
Blue Owl Capital Corp. III (b) | | | 182,608 | | | | 2,695,294 | |
Byline Bancorp, Inc. | | | 67,305 | | | | 1,867,714 | |
Cass Information Systems, Inc. (b) | | | 47,255 | | | | 2,052,757 | |
Diamond Hill Investment Group, Inc. | | | 12,393 | | | | 1,958,466 | |
Dime Community Bancshares, Inc. | | | 71,231 | | | | 1,852,718 | |
Employers Holdings, Inc. | | | 36,106 | | | | 1,731,283 | |
Enact Holdings, Inc. | | | 84,104 | | | | 2,989,897 | |
Essent Group Ltd. | | | 73,986 | | | | 4,756,560 | |
Evercore, Inc. - Class A | | | 9,873 | | | | 2,426,191 | |
EZCORP, Inc. - Class A (a)(b) | | | 304,405 | | | | 3,719,829 | |
Federal Agricultural Mortgage Corp. - Class C | | | 53,726 | | | | 10,609,273 | |
First American Financial Corp. | | | 62,517 | | | | 3,988,585 | |
First Merchants Corp. | | | 69,206 | | | | 2,699,034 | |
First Mid Bancshares, Inc. | | | 65,876 | | | | 2,653,485 | |
FirstCash Holdings, Inc. | | | 59,265 | | | | 7,117,134 | |
Global Indemnity Group LLC - Class A | | | 61,626 | | | | 1,975,422 | |
Hancock Whitney Corp. | | | 63,040 | | | | 3,387,139 | |
Heritage Commerce Corp. | | | 180,926 | | | | 1,841,827 | |
Heritage Financial Corp. | | | 45,985 | | | | 1,050,297 | |
Hope Bancorp, Inc. | | | 210,678 | | | | 2,694,572 | |
International Money Express, Inc. (a) | | | 113,575 | | | | 2,061,386 | |
Merchants Bancorp | | | 74,999 | | | | 3,438,704 | |
Northeast Bank | | | 59,542 | | | | 4,228,077 | |
OceanFirst Financial Corp. | | | 94,462 | | | | 1,688,036 | |
Old National Bancorp | | | 194,315 | | | | 3,857,153 | |
Peapack-Gladstone Financial Corp. | | | 106,887 | | | | 3,052,693 | |
PennyMac Financial Services, Inc. | | | 39,323 | | | | 4,246,884 | |
Preferred Bank (b) | | | 84,061 | | | | 6,964,454 | |
Primis Financial Corp. | | | 257,694 | | | | 3,130,982 | |
Redwood Trust, Inc. (b) | | | 433,115 | | | | 3,278,681 | |
S&T Bancorp, Inc. (b) | | | 89,112 | | | | 3,829,143 | |
Shift4 Payments, Inc. - Class A (a)(b) | | | 54,282 | | | | 4,510,834 | |
Silvercrest Asset Management Group, Inc. - Class A | | | 181,822 | | | | 2,945,516 | |
SLM Corp. | | | 457,055 | | | | 10,082,633 | |
SouthState Corp. | | | 22,867 | | | | 2,220,157 | |
Stewart Information Services Corp. | | | 61,810 | | | | 4,568,377 | |
StoneX Group, Inc. (a) | | | 47,567 | | | | 3,941,402 | |
Voya Financial, Inc. | | | 42,621 | | | | 3,018,845 | |
Western Alliance Bancorp | | | 89,225 | | | | 7,287,898 | |
White Mountains Insurance Group Ltd. | | | 1,848 | | | | 3,408,156 | |
Wintrust Financial Corp. | | | 61,119 | | | | 6,649,747 | |
| | | | | | | | 179,156,313 | |
Health Care — 5.5% | | | | | | | | |
Addus HomeCare Corp. (a) | | | 22,191 | | | | 2,951,625 | |
AMN Healthcare Services, Inc. (a) | | | 44,002 | | | | 2,333,426 | |
Biote Corp. (a)(b) | | | 526,785 | | | | 3,308,210 | |
Catalyst Pharmaceuticals, Inc. (a) | | | 139,123 | | | | 2,817,241 | |
Cross Country Healthcare, Inc. (a) | | | 100,269 | | | | 1,496,013 | |
Evolent Health, Inc. - Class A (a)(b) | | | 154,082 | | | | 4,927,542 | |
Fortrea Holdings, Inc. (a)(b) | | | 98,988 | | | | 2,282,663 | |
Haemonetics Corp. (a)(b) | | | 32,238 | | | | 2,436,548 | |
Halozyme Therapeutics, Inc. (a) | | | 43,920 | | | | 2,804,292 | |
Lantheus Holdings, Inc. (a)(b) | | | 24,423 | | | | 2,600,317 | |
The accompanying notes are an integral part of the financial statements.
Financial Statements 2024 | 44 |
BOSTON PARTNERS INVESTMENT FUNDS | August 31, 2024 |
BOSTON PARTNERS SMALL CAP VALUE FUND II | Schedule of Investments (continued) |
| | | Shares | | | Value | |
Health Care — (continued) | | | | | | | | |
Organon & Co. | | | 103,404 | | | $ | 2,311,079 | |
Pediatrix Medical Group, Inc. (a) | | | 232,203 | | | | 2,521,725 | |
| | | | | | | | 32,790,681 | |
Industrials — 22.2% | | | | | | | | |
Acuity Brands, Inc. | | | 14,660 | | | | 3,733,902 | |
Allison Transmission Holdings, Inc. | | | 61,498 | | | | 5,703,939 | |
Asure Software, Inc. (a)(b) | | | 182,170 | | | | 1,564,840 | |
Atmus Filtration Technologies, Inc. | | | 82,022 | | | | 2,940,489 | |
AZZ, Inc. | | | 35,618 | | | | 2,962,349 | |
Beacon Roofing Supply, Inc. (a) | | | 72,452 | | | | 6,564,151 | |
Blue Bird Corp. (a) | | | 78,034 | | | | 3,993,780 | |
Brady Corp. - Class A | | | 42,863 | | | | 3,173,577 | |
Brink’s Co. | | | 94,789 | | | | 10,514,944 | |
Civeo Corp. | | | 97,295 | | | | 2,768,043 | |
Concentrix Corp. (b) | | | 41,374 | | | | 3,112,566 | |
CoreCivic, Inc. (a) | | | 123,457 | | | | 1,701,237 | |
CRA International, Inc. | | | 27,454 | | | | 4,628,744 | |
DNOW, Inc. (a) | | | 129,409 | | | | 1,684,905 | |
DXP Enterprises, Inc. (a) | | | 61,568 | | | | 3,386,240 | |
EnerSys | | | 33,688 | | | | 3,413,605 | |
First Advantage Corp. (a)(b) | | | 253,971 | | | | 4,863,545 | |
Granite Construction, Inc. (b) | | | 64,817 | | | | 4,871,646 | |
Griffon Corp. | | | 63,595 | | | | 4,209,353 | |
Heidrick & Struggles International, Inc. | | | 72,163 | | | | 2,785,492 | |
Huron Consulting Group, Inc. (a) | | | 32,758 | | | | 3,617,794 | |
IBEX Holdings Ltd. (a) | | | 174,384 | | | | 3,006,380 | |
ICF International, Inc. | | | 28,423 | | | | 4,711,396 | |
Janus International Group, Inc. (a)(b) | | | 347,385 | | | | 3,817,761 | |
Karat Packaging, Inc. | | | 95,654 | | | | 2,423,872 | |
Kelly Services, Inc. - Class A | | | 126,754 | | | | 2,675,777 | |
Liquidity Services, Inc. (a) | | | 103,360 | | | | 2,250,147 | |
LSI Industries, Inc. | | | 171,012 | | | | 2,720,801 | |
Matson, Inc. | | | 21,184 | | | | 2,929,747 | |
Primoris Services Corp. | | | 76,156 | | | | 4,298,245 | |
Resideo Technologies, Inc. (a) | | | 121,232 | | | | 2,444,037 | |
Science Applications International Corp. | | | 20,356 | | | | 2,658,290 | |
Sensata Technologies Holding PLC | | | 59,856 | | | | 2,307,449 | |
Sterling Infrastructure, Inc. (a) | | | 19,088 | | | | 2,281,589 | |
V2X, Inc. (a) | | | 59,166 | | | | 3,351,754 | |
Valmont Industries, Inc. | | | 10,938 | | | | 3,125,643 | |
Viad Corp. (a) | | | 108,825 | | | | 3,744,668 | |
WillScot Holdings Corp. (a)(b) | | | 61,581 | | | | 2,373,332 | |
| | | | | | | | 133,316,029 | |
Information Technology — 8.8% | | | | | | | | |
Adeia, Inc. | | | 354,464 | | | | 4,466,246 | |
Avnet, Inc. | | | 83,295 | | | | 4,596,218 | |
Axcelis Technologies, Inc. (a) | | | 32,338 | | | | 3,535,513 | |
Bel Fuse, Inc. - Class B (b) | | | 34,152 | | | | 2,316,530 | |
Belden, Inc. (b) | | | 22,139 | | | | 2,375,072 | |
Benchmark Electronics, Inc. | | | 53,305 | | | | 2,265,996 | |
Clearfield, Inc. (a)(b) | | | 85,747 | | | | 3,198,363 | |
CompoSecure, Inc. (b) | | | 477,871 | | | | 5,605,427 | |
Hackett Group, Inc. | | | 88,461 | | | | 2,344,216 | |
Insight Enterprises, Inc. (a) | | | 11,009 | | | | 2,389,724 | |
InterDigital, Inc. (b) | | | 54,394 | | | | 7,536,833 | |
LiveRamp Holdings, Inc. (a) | | | 58,675 | | | | 1,520,856 | |
NCR Voyix Corp. (a)(b) | | | 137,895 | | | | 1,860,204 | |
OSI Systems, Inc. (a)(b) | | | 26,842 | | | | 4,022,811 | |
Photronics, Inc. (a) | | | 123,618 | | | | 3,196,761 | |
Ultra Clean Holdings, Inc. (a) | | | 45,048 | | | | 1,698,310 | |
| | | | | | | | 52,929,080 | |
Materials — 2.9% | | | | | | | | |
Ashland, Inc. (b) | | | 24,177 | | | | 2,163,842 | |
Ecovyst, Inc. (a) | | | 209,695 | | | | 1,505,610 | |
Eldorado Gold Corp. (a) | | | 200,932 | | | | 3,466,077 | |
Knife River Corp. (a) | | | 27,751 | | | | 2,188,721 | |
Methanex Corp. | | | 75,571 | | | | 3,528,410 | |
Myers Industries, Inc. | | | 77,988 | | | | 1,192,437 | |
Orion SA | | | 179,900 | | | | 3,355,135 | |
| | | | | | | | 17,400,232 | |
Real Estate — 1.2% | | | | | | | | |
BRT Apartments Corp. | | | 94,922 | | | | 1,802,569 | |
Cousins Properties, Inc. | | | 93,921 | | | | 2,677,688 | |
First Industrial Realty Trust, Inc. | | | 47,287 | | | | 2,682,591 | |
| | | | | | | | 7,162,848 | |
Utilities — 0.8% | | | | | | | | |
New Jersey Resources Corp. | | | 46,418 | | | | 2,149,617 | |
Portland General Electric Co. | | | 25,407 | | | | 1,222,331 | |
Pure Cycle Corp. (a) | | | 109,257 | | | | 1,163,587 | |
| | | | | | | | 4,535,535 | |
TOTAL COMMON STOCKS (Cost $428,586,377) | | | | | | | 580,626,514 | |
| | | | | | | | | |
CLOSED END FUNDS — 0.3% | | | | | | | | |
Golub Capital BDC, Inc. (b) | | | 134,862 | | | | 2,008,095 | |
TOTAL CLOSED END FUNDS (Cost $2,158,074) | | | | | | | 2,008,095 | |
| | | | | | | | | |
| | | Units | | | | | |
SHORT-TERM INVESTMENTS — 18.6% | | | | | | | | |
Investments Purchased with Proceeds from Securities Lending — 18.6% | | | | | | | | |
Mount Vernon Liquid Assets Portfolio, LLC, 5.50% (c) | | | 111,608,773 | | | | 111,608,773 | |
TOTAL SHORT-TERM INVESTMENTS (Cost $111,608,773) | | | | | | | 111,608,773 | |
TOTAL INVESTMENTS — 115.7% (Cost $542,353,224) | | | | | | | 694,243,382 | |
Liabilities in Excess of Other Assets — (15.7)% | | | | | | | (94,069,180 | ) |
TOTAL NET ASSETS — 100.0% | | | | | | $ | 600,174,202 | |
Percentages are stated as a percent of net assets.
The Global Industry Classification Standard (“GICS®”) was developed by and/or is the exclusive property of MSCI, Inc. (“MSCI”) and Standard & Poor’s Financial Services LLC (“S&P”). GICS® is a service mark of MSCI and S&P and has been licensed for use by U.S. Bank Global Fund Services.
PLC | Public Limited Company |
(a) | Non-income producing security. |
(b) | All or a portion of this security is on loan as of August 31, 2024. The total market value of these securities was $109,500,196 which represented 18.2% of net assets. |
(c) | The rate shown represents the 7-day annualized effective yield as of August 31, 2024. |
The accompanying notes are an integral part of the financial statements.
Financial Statements 2024 | 45 |
BOSTON PARTNERS INVESTMENT FUNDS | August 31, 2024 |
BOSTON PARTNERS SMALL CAP VALUE FUND II | Schedule of Investments (concluded) |
A summary of the inputs used to value the Fund’s investments carried at fair value as of August 31, 2024 is as follows (see Notes to Schedule of Investments):
| | | LEVEL 1 | | | LEVEL 2 | | | LEVEL 3 | | | Total | |
Investments: | | | | | | | | | | | | | | | | |
Common Stocks | | $ | 578,651,092 | | | $ | 1,975,422 | | | $ | — | | | $ | 580,626,514 | |
Closed End Funds | | | 2,008,095 | | | | — | | | | — | | | | 2,008,095 | |
Investments Purchased with Proceeds from Securities Lending(a) | | | — | | | | — | | | | — | | | | 111,608,773 | |
Total Investments | | $ | 580,659,187 | | | $ | 1,975,422 | | | $ | — | | | $ | 694,243,382 | |
Refer to the Schedule of Investments for further disaggregation of investment categories.
(a) | Certain investments that are measured at fair value using the net asset value per share (or its equivalent) practical expedient have not been categorized in the fair value hierarchy. These investments can be classified as Investments Purchased with Proceeds from Securities Lending and their fair value totals to $111,608,773. The fair value amounts presented in the table are intended to permit reconciliation of the fair value hierarchy to the amounts listed in the Schedule of Investments. |
The accompanying notes are an integral part of the financial statements.
Financial Statements 2024 | 46 |
BOSTON PARTNERS INVESTMENT FUNDS | August 31, 2024 |
WPG Partners Select Hedged Fund | Schedule of Investments |
| | | Shares | | | Value | |
COMMON STOCKS — 97.7% | | | | | | | | |
Communication Services — 2.2% | | | | | | | | |
Cars.com, Inc. (a)(b) | | | 65,310 | | | $ | 1,165,130 | |
Consumer Discretionary — 7.1% | | | | | | | | |
Gildan Activewear, Inc. (b) | | | 42,298 | | | | 1,930,058 | |
PlayAGS, Inc. (a)(b) | | | 89,254 | | | | 1,010,355 | |
Wayfair, Inc. - Class A (a)(b) | | | 20,330 | | | | 865,042 | |
| | | | | | | | 3,805,455 | |
Consumer Staples — 4.9% | | | | | | | | |
Grocery Outlet Holding Corp. (a)(b) | | | 33,912 | | | | 642,293 | |
Nomad Foods Ltd. | | | 107,887 | | | | 2,028,276 | |
| | | | | | | | 2,670,569 | |
Energy — 3.0% | | | | | | | | |
International Seaways, Inc. (b) | | | 10,807 | | | | 560,127 | |
Kosmos Energy Ltd. (a)(b) | | | 220,950 | | | | 1,076,026 | |
| | | | | | | | 1,636,153 | |
Financials — 26.5% | | | | | | | | |
BGC Group, Inc. - Class A (b) | | | 257,144 | | | | 2,540,583 | |
Dime Community Bancshares, Inc. (b) | | | 52,920 | | | | 1,376,449 | |
Federal Agricultural Mortgage Corp. - Class C (b) | | | 1,864 | | | | 368,084 | |
Fidelis Insurance Holdings Ltd. (b) | | | 86,388 | | | | 1,599,906 | |
FirstCash Holdings, Inc. (b) | | | 11,926 | | | | 1,432,193 | |
Independent Bank Corp./MI | | | 18,110 | | | | 613,567 | |
Kemper Corp. (b) | | | 40,807 | | | | 2,550,846 | |
National Bank Holdings Corp. - Class A (b) | | | 12,670 | | | | 555,073 | |
Perella Weinberg Partners (b) | | | 38,757 | | | | 757,699 | |
Popular, Inc. | | | 15,093 | | | | 1,547,032 | |
Prosperity Bancshares, Inc. | | | 12,857 | | | | 946,018 | |
| | | | | | | | 14,287,450 | |
Health Care — 12.5% | | | | | | | | |
CareDx, Inc. (a) | | | 27,578 | | | | 847,472 | |
Enovis Corp. (a)(b) | | | 53,387 | | | | 2,487,834 | |
Halozyme Therapeutics, Inc. (a)(b) | | | 15,279 | | | | 975,564 | |
Innoviva, Inc. (a)(b) | | | 31,863 | | | | 617,505 | |
Tenet Healthcare Corp. (a)(b) | | | 10,807 | | | | 1,792,233 | |
| | | | | | | | 6,720,608 | |
Industrials — 13.5% | | | | | | | | |
Air Lease Corp. (b) | | | 40,808 | | | | 1,888,186 | |
Arcosa, Inc. (b) | | | 27,723 | | | | 2,536,377 | |
Clarivate PLC (a)(b) | | | 338,090 | | | | 2,319,298 | |
V2X, Inc. (a) | | | 9,837 | | | | 557,266 | |
| | | | | | | | 7,301,127 | |
Information Technology — 12.8% | | | | | | | | |
8x8, Inc. (a)(b) | | | 528,454 | | | | 993,493 | |
Ooma, Inc. (a)(b) | | | 52,173 | | | | 542,599 | |
Silicon Motion Technology Corp. - ADR | | | 8,351 | | | | 530,873 | |
Silvaco Group, Inc. (a)(b) | | | 27,739 | | | | 428,568 | |
SMART Global Holdings, Inc. (a) | | | 26,025 | | | | 539,238 | |
Teradata Corp. (a)(b) | | | 26,459 | | | | 747,202 | |
Tower Semiconductor Ltd. (a) | | | 40,993 | | | | 1,811,481 | |
Verint Systems, Inc. (a)(b) | | | 40,993 | | | | 1,293,329 | |
| | | | | | | | 6,886,783 | |
Materials — 8.8% | | | | | | | | |
Ashland, Inc. (b) | | | 11,988 | | | | 1,072,926 | |
ERO Copper Corp. (a)(b) | | | 59,255 | | | | 1,217,690 | |
Kronos Worldwide, Inc. | | | 52,732 | | | | 609,582 | |
Rayonier Advanced Materials, Inc. (a)(b) | | | 230,768 | | | | 1,841,529 | |
| | | | | | | | 4,741,727 | |
Real Estate — 6.4% | | | | | | | | |
Brixmor Property Group, Inc. (b) | | | 64,845 | | | | 1,776,104 | |
Equity Commonwealth (a)(b) | | | 83,866 | | | | 1,699,964 | |
| | | | | | | | 3,476,068 | |
TOTAL COMMON STOCKS (Cost $48,629,964) | | | | | | | 52,691,070 | |
| | | | | | | | | |
SHORT-TERM INVESTMENTS — 0.0%(c) | | | | | | | | |
Money Market Funds — 0.0%(c) | | | | | | | | |
BlackRock Liquidity Funds Treasury Trust Fund Portfolio - Class Institutional, 5.15% (b)(d) | | | 676 | | | | 676 | |
Federated Hermes U.S. Treasury Cash Reserves - Class Institutional, 5.11% (b)(d) | | | 675 | | | | 675 | |
Fidelity Treasury Portfolio - Class I, 5.16% (b)(d) | | | 676 | | | | 676 | |
Goldman Sachs Financial Square Funds - Treasury Instruments Fund - Class Institutional, 5.12% (b)(d) | | | 675 | | | | 675 | |
TOTAL SHORT-TERM INVESTMENTS (Cost $2,702) | | | | | | | 2,702 | |
TOTAL INVESTMENTS — 97.7% (Cost $48,632,666) | | | | | | | 52,693,772 | |
Other Assets in Excess of Liabilities — 2.3% | | | | | | | 1,231,653 | |
TOTAL NET ASSETS — 100.0% | | | | | | $ | 53,925,425 | |
Percentages are stated as a percent of net assets.
The Global Industry Classification Standard (“GICS®”) was developed by and/or is the exclusive property of MSCI, Inc. (“MSCI”) and Standard & Poor’s Financial Services LLC (“S&P”). GICS® is a service mark of MSCI and S&P and has been licensed for use by U.S. Bank Global Fund Services.
ADR | American Depositary Receipt |
PLC | Public Limited Company |
(a) | Non-income producing security. |
(b) | Security position is either entirely or partially held in a segregated account as collateral for securities sold short. |
(c) | Represents less than 0.05% of net assets. |
(d) | The rate shown represents the 7-day annualized effective yield as of August 31, 2024. |
The accompanying notes are an integral part of the financial statements.
Financial Statements 2024 | 47 |
BOSTON PARTNERS INVESTMENT FUNDS | August 31, 2024 |
WPG Partners Select Hedged Fund | Schedule of Investments (continued) |
Schedule of Securities Sold Short | | Shares | | | Value | |
COMMON STOCKS — (66.3)% | | | | | | | | |
Communication Services — (0.1)% | | | | | | | | |
AST SpaceMobile, Inc. | | | (1,582 | ) | | $ | (45,941 | ) |
Consumer Discretionary — (12.4)% | | | | | | | | |
Boot Barn Holdings, Inc. | | | (2,430 | ) | | | (326,033 | ) |
Crocs, Inc. | | | (2,941 | ) | | | (429,886 | ) |
Latham Group, Inc. | | | (66,019 | ) | | | (412,619 | ) |
Lithia Motors, Inc. | | | (2,286 | ) | | | (688,269 | ) |
Newell Brands, Inc. | | | (17,428 | ) | | | (123,564 | ) |
Restaurant Brands International, Inc. | | | (8,447 | ) | | | (586,898 | ) |
RH | | | (466 | ) | | | (118,224 | ) |
Signet Jewelers Ltd. | | | (3,317 | ) | | | (278,960 | ) |
Thor Industries, Inc. | | | (6,630 | ) | | | (711,134 | ) |
Vail Resorts, Inc. | | | (3,793 | ) | | | (689,188 | ) |
Williams-Sonoma, Inc. | | | (4,544 | ) | | | (610,395 | ) |
Wingstop, Inc. | | | (1,429 | ) | | | (551,751 | ) |
Winmark Corp. | | | (1,386 | ) | | | (499,792 | ) |
XPEL, Inc. | | | (15,610 | ) | | | (675,757 | ) |
| | | | | | | | (6,702,470 | ) |
Consumer Staples — (6.1)% | | | | | | | | |
Andersons, Inc. | | | (18,861 | ) | | | (961,345 | ) |
Archer-Daniels-Midland Co. | | | (17,649 | ) | | | (1,076,413 | ) |
Central Garden & Pet Co. - Class A | | | (8,207 | ) | | | (280,679 | ) |
Hershey Co. | | | (3,162 | ) | | | (610,456 | ) |
J & J Snack Foods Corp. | | | (2,249 | ) | | | (382,757 | ) |
| | | | | | | | (3,311,650 | ) |
Financials — (8.6)% | | | | | | | | |
Blackstone Mortgage Trust, Inc. - Class A | | | (24,548 | ) | | | (453,156 | ) |
CVB Financial Corp. | | | (18,818 | ) | | | (346,628 | ) |
Encore Capital Group, Inc. | | | (8,321 | ) | | | (416,716 | ) |
FactSet Research Systems, Inc. | | | (1,266 | ) | | | (535,315 | ) |
Live Oak Bancshares, Inc. | | | (12,016 | ) | | | (516,568 | ) |
Moelis & Co. - Class A | | | (10,342 | ) | | | (690,742 | ) |
MSCI, Inc. | | | (971 | ) | | | (563,753 | ) |
US Bancorp | | | (23,924 | ) | | | (1,129,930 | ) |
| | | | | | | | (4,652,808 | ) |
Health Care — (4.4)% | | | | | | | | |
Fortrea Holdings, Inc. | | | (22,734 | ) | | | (524,246 | ) |
Inspire Medical Systems, Inc. | | | (3,666 | ) | | | (659,220 | ) |
Option Care Health, Inc. | | | (24,774 | ) | | | (793,264 | ) |
Owens & Minor, Inc. | | | (17,504 | ) | | | (272,012 | ) |
US Physical Therapy, Inc. | | | (1,534 | ) | | | (131,310 | ) |
| | | | | | | | (2,380,052 | ) |
Industrials — (22.6)% | | | | | | | | |
American Airlines Group, Inc. | | | (36,576 | ) | | | (388,437 | ) |
ArcBest Corp. | | | (7,706 | ) | | | (819,148 | ) |
Boise Cascade Co. | | | (5,849 | ) | | | (793,241 | ) |
Core & Main, Inc. - Class A | | | (14,612 | ) | | | (701,814 | ) |
Griffon Corp. | | | (15,645 | ) | | | (1,035,543 | ) |
H&E Equipment Services, Inc. | | | (2,717 | ) | | | (130,824 | ) |
Herc Holdings, Inc. | | | (7,381 | ) | | | (1,080,357 | ) |
Hillenbrand, Inc. | | | (7,747 | ) | | | (255,341 | ) |
Mercury Systems, Inc. | | | (7,557 | ) | | | (286,410 | ) |
MillerKnoll, Inc. | | | (35,034 | ) | | | (1,031,751 | ) |
PACCAR, Inc. | | | (11,275 | ) | | | (1,084,430 | ) |
Paychex, Inc. | | | (8,225 | ) | | | (1,079,120 | ) |
Rockwell Automation, Inc. | | | (4,868 | ) | | | (1,324,242 | ) |
Spirit AeroSystems Holdings, Inc. - Class A | | | (26,148 | ) | | | (920,671 | ) |
Symbotic, Inc. | | | (25,772 | ) | | | (494,823 | ) |
Terex Corp. | | | (9,377 | ) | | | (532,332 | ) |
Triumph Group, Inc. | | | (14,487 | ) | | | (201,804 | ) |
| | | | | | | | (12,160,288 | ) |
Information Technology — (9.1)% | | | | | | | | |
Amdocs Ltd. | | | (7,360 | ) | | | (640,099 | ) |
Dolby Laboratories, Inc. - Class A | | | (6,892 | ) | | | (491,813 | ) |
EPAM Systems, Inc. | | | (1,220 | ) | | | (244,927 | ) |
HubSpot, Inc. | | | (749 | ) | | | (373,803 | ) |
Klaviyo, Inc. - Class A | | | (16,599 | ) | | | (522,205 | ) |
Lumentum Holdings, Inc. | | | (14,748 | ) | | | (849,632 | ) |
Methode Electronics, Inc. | | | (37,715 | ) | | | (392,990 | ) |
MKS Instruments, Inc. | | | (2,285 | ) | | | (272,441 | ) |
Snowflake, Inc. - Class A | | | (3,120 | ) | | | (356,398 | ) |
Synopsys, Inc. | | | (1,472 | ) | | | (764,822 | ) |
| | | | | | | | (4,909,130 | ) |
Materials — (1.8)% | | | | | | | | |
Alpha Metallurgical Resources, Inc. | | | (3,427 | ) | | | (819,567 | ) |
Eagle Materials, Inc. | | | (498 | ) | | | (128,360 | ) |
| | | | | | | | (947,927 | ) |
Real Estate — (1.2)% | | | | | | | | |
Rexford Industrial Realty, Inc. | | | (12,223 | ) | | | (622,395 | ) |
TOTAL COMMON STOCKS (Proceeds $35,139,888) | | | | | | | (35,732,661 | ) |
TOTAL SECURITIES SOLD SHORT — (66.3)% (Proceeds $35,139,888) | | | | | | $ | (35,732,661 | ) |
Percentages are stated as a percent of net assets.
The Global Industry Classification Standard (“GICS®”) was developed by and/or is the exclusive property of MSCI, Inc. (“MSCI”) and Standard & Poor’s Financial Services LLC (“S&P”). GICS® is a service mark of MSCI and S&P and has been licensed for use by U.S. Bank Global Fund Services.
The accompanying notes are an integral part of the financial statements.
Financial Statements 2024 | 48 |
BOSTON PARTNERS INVESTMENT FUNDS | August 31, 2024 |
WPG Partners Select Hedged Fund | Schedule of Investments (concluded) |
A summary of the inputs used to value the Fund’s investments carried at fair value as of August 31, 2024 is as follows (see Notes to Schedule of Investments):
| | | LEVEL 1 | | | LEVEL 2 | | | LEVEL 3 | | | Total | |
Assets: | | | | | | | | | | | | | | | | |
Investments: | | | | | | | | | | | | | | | | |
Common Stocks | | $ | 52,691,070 | | | $ | — | | | $ | — | | | $ | 52,691,070 | |
Money Market Funds | | | 2,702 | | | | — | | | | — | | | | 2,702 | |
Total Investments | | $ | 52,693,772 | | | $ | — | | | $ | — | | | $ | 52,693,772 | |
| | | | | | | | | | | | | | | | | |
Liabilities: | | | | | | | | | | | | | | | | |
Investments: | | | | | | | | | | | | | | | | |
Common Stocks | | | (35,732,661 | ) | | | — | | | | — | | | | (35,732,661 | ) |
Total Investments | | $ | (35,732,661 | ) | | $ | — | | | $ | — | | | $ | (35,732,661 | ) |
Refer to the Schedule of Investments for further disaggregation of investment categories.
The accompanying notes are an integral part of the financial statements.
Financial Statements 2024 | 49 |
BOSTON PARTNERS INVESTMENT FUNDS | August 31, 2024 |
WPG PARTNERS SELECT SMALL CAP VALUE FUND | Schedule of Investments |
| | | Shares | | | Value | |
COMMON STOCKS — 96.8% | | | | | | | | |
Communication Services — 2.1% | | | | | | | | |
Cars.com, Inc. (a) | | | 146,987 | | | $ | 2,622,248 | |
Consumer Discretionary — 7.0% | | | | | | | | |
Gildan Activewear, Inc. | | | 96,244 | | | | 4,391,614 | |
PlayAGS, Inc. (a) | | | 203,086 | | | | 2,298,933 | |
Wayfair, Inc. - Class A (a) | | | 45,789 | | | | 1,948,322 | |
| | | | | | | | 8,638,869 | |
Consumer Staples — 4.9% | | | | | | | | |
Grocery Outlet Holding Corp. (a) | | | 77,165 | | | | 1,461,505 | |
Nomad Foods Ltd. | | | 245,484 | | | | 4,615,099 | |
| | | | | | | | 6,076,604 | |
Energy — 3.0% | | | | | | | | |
International Seaways, Inc. | | | 24,590 | | | | 1,274,500 | |
Kosmos Energy Ltd. (a) | | | 504,112 | | | | 2,455,025 | |
| | | | | | | | 3,729,525 | |
Financials — 26.3% | | | | | | | | |
BGC Group, Inc. - Class A | | | 585,094 | | | | 5,780,729 | |
Dime Community Bancshares, Inc. | | | 120,411 | | | | 3,131,890 | |
Federal Agricultural Mortgage Corp. - Class C | | | 4,240 | | | | 837,273 | |
Fidelis Insurance Holdings Ltd. | | | 197,575 | | | | 3,659,089 | |
FirstCash Holdings, Inc. | | | 27,135 | | | | 3,258,642 | |
Independent Bank Corp. | | | 40,703 | | | | 1,379,018 | |
Kemper Corp. | | | 92,851 | | | | 5,804,116 | |
National Bank Holdings Corp. - Class A | | | 28,830 | | | | 1,263,042 | |
Perella Weinberg Partners | | | 88,187 | | | | 1,724,056 | |
Popular, Inc. | | | 34,342 | | | | 3,520,055 | |
Prosperity Bancshares, Inc. | | | 29,254 | | | | 2,152,509 | |
| | | | | | | | 32,510,419 | |
Health Care — 12.4% | | | | | | | | |
CareDx, Inc. (a) | | | 62,750 | | | | 1,928,308 | |
Enovis Corp. (a) | | | 120,835 | | | | 5,630,911 | |
Halozyme Therapeutics, Inc. (a) | | | 34,767 | | | | 2,219,873 | |
Innoviva, Inc. (a) | | | 72,501 | | | | 1,405,069 | |
Tenet Healthcare Corp. (a) | | | 24,590 | | | | 4,078,006 | |
| | | | | | | | 15,262,167 | |
Industrials — 13.4% | | | | | | | | |
Air Lease Corp. | | | 92,852 | | | | 4,296,262 | |
Arcosa, Inc. | | | 63,174 | | | | 5,779,790 | |
Clarivate PLC (a) | | | 769,949 | | | | 5,281,850 | |
V2X, Inc. (a) | | | 22,194 | | | | 1,257,290 | |
| | | | | | | | 16,615,192 | |
Information Technology — 12.6% | | | | | | | | |
8x8, Inc. (a) | | | 1,202,409 | | | | 2,260,529 | |
Ooma, Inc. (a) | | | 118,714 | | | | 1,234,626 | |
Silicon Motion Technology Corp. - ADR | | | 18,655 | | | | 1,185,899 | |
Silvaco Group, Inc. (a) | | | 62,325 | | | | 962,921 | |
SMART Global Holdings, Inc. (a) | | | 57,661 | | | | 1,194,736 | |
Teradata Corp. (a) | | | 60,205 | | | | 1,700,189 | |
Tower Semiconductor Ltd. (a) | | | 93,275 | | | | 4,121,822 | |
Verint Systems, Inc. (a) | | | 93,275 | | | | 2,942,826 | |
| | | | | | | | 15,603,548 | |
Materials — 8.7% | | | | | | | | |
Ashland, Inc. | | | 27,135 | | | | 2,428,583 | |
ERO Copper Corp. (a) | | | 134,826 | �� | | | 2,770,674 | |
Kronos Worldwide, Inc. | | | 119,986 | | | | 1,387,038 | |
Rayonier Advanced Materials, Inc. (a) | | | 518,527 | | | | 4,137,845 | |
| | | | | | | | 10,724,140 | |
Real Estate — 6.4% | | | | | | | | |
Brixmor Property Group, Inc. | | | 147,546 | | | | 4,041,285 | |
Equity Commonwealth (a) | | | 191,215 | | | | 3,875,928 | |
| | | | | | | | 7,917,213 | |
TOTAL COMMON STOCKS (Cost $102,060,756) | | | | | | | 119,699,925 | |
TOTAL INVESTMENTS — 96.8% (Cost $102,060,756) | | | | | | | 119,699,925 | |
Other Assets in Excess of Liabilities — 3.2% | | | | | | | 3,929,711 | |
TOTAL NET ASSETS — 100.0% | | | | | | $ | 123,629,636 | |
Percentages are stated as a percent of net assets.
The Global Industry Classification Standard (“GICS®”) was developed by and/or is the exclusive property of MSCI, Inc. (“MSCI”) and Standard & Poor’s Financial Services LLC (“S&P”). GICS® is a service mark of MSCI and S&P and has been licensed for use by U.S. Bank Global Fund Services.
ADR | American Depositary Receipt |
PLC | Public Limited Company |
(a) | Non-income producing security. |
The accompanying notes are an integral part of the financial statements.
Financial Statements 2024 | 50 |
BOSTON PARTNERS INVESTMENT FUNDS | August 31, 2024 |
WPG PARTNERS SELECT SMALL CAP VALUE FUND | Schedule of Investments (concluded) |
A summary of the inputs used to value the Fund’s investments carried at fair value as of August 31, 2024 is as follows (see Notes to Schedule of Investments):
| | | LEVEL 1 | | | LEVEL 2 | | | LEVEL 3 | | | Total | |
Investments: | | | | | | | | | | | | | | | | |
Common Stocks | | $ | 119,699,925 | | | $ | — | | | $ | — | | | $ | 119,699,925 | |
Total Investments | | $ | 119,699,925 | | | $ | — | | | $ | — | | | $ | 119,699,925 | |
Refer to the Schedule of Investments for further disaggregation of investment categories.
The accompanying notes are an integral part of the financial statements.
Financial Statements 2024 | 51 |
BOSTON PARTNERS INVESTMENT FUNDS | August 31, 2024 |
WPG PARTNERS SMALL CAP VALUE DIVERSIFIED FUND | Schedule of Investments |
| | | Shares | | | Value | |
COMMON STOCKS — 97.2% | | | | | | | | |
Communication Services — 0.8% | | | | | | | | |
Cargurus, Inc. (a) | | | 9,420 | | | $ | 272,992 | |
Consumer Discretionary — 8.4% | | | | | | | | |
Academy Sports & Outdoors, Inc. (b) | | | 1,482 | | | | 82,221 | |
ADT, Inc. (b) | | | 57,319 | | | | 417,856 | |
Bowlero Corp. (b) | | | 10,880 | | | | 120,224 | |
Dave & Buster’s Entertainment, Inc. (a) | | | 5,332 | | | | 167,105 | |
Frontdoor, Inc. (a) | | | 1,612 | | | | 77,505 | |
Gentherm, Inc. (a) | | | 3,675 | | | | 185,735 | |
Gildan Activewear, Inc. | | | 18,242 | | | | 832,382 | |
Savers Value Village, Inc. (a)(b) | | | 20,057 | | | | 177,504 | |
Stride, Inc. (a)(b) | | | 4,483 | | | | 369,130 | |
Wayfair, Inc. - Class A (a)(b) | | | 7,811 | | | | 332,358 | |
| | | | | | | | 2,762,020 | |
Consumer Staples — 3.9% | | | | | | | | |
Grocery Outlet Holding Corp. (a)(b) | | | 16,234 | | | | 307,472 | |
Lamb Weston Holdings, Inc. | | | 1,390 | | | | 86,069 | |
Nomad Foods Ltd. | | | 33,769 | | | | 634,857 | |
TreeHouse Foods, Inc. (a) | | | 6,705 | | | | 275,508 | |
| | | | | | | | 1,303,906 | |
Energy — 8.4% | | | | | | | | |
Antero Resources Corp. (a) | | | 9,401 | | | | 253,733 | |
Atlas Energy Solutions, Inc. (b) | | | 14,889 | | | | 314,009 | |
DHT Holdings, Inc. | | | 36,293 | | | | 393,053 | |
Kodiak Gas Services, Inc. (b) | | | 13,600 | | | | 377,400 | |
Kosmos Energy Ltd. (a)(b) | | | 68,719 | | | | 334,661 | |
Scorpio Tankers, Inc. | | | 6,472 | | | | 463,007 | |
SM Energy Co. (b) | | | 5,405 | | | | 246,630 | |
Tidewater, Inc. (a) | | | 2,091 | | | | 185,472 | |
Transocean Ltd. (a)(b) | | | 41,289 | | | | 195,710 | |
| | | | | | | | 2,763,675 | |
Financials — 19.1% | | | | | | | | |
AGNC Investment Corp. (b) | | | 30,556 | | | | 311,977 | |
Axis Capital Holdings Ltd. | | | 3,354 | | | | 267,917 | |
BGC Group, Inc. - Class A (b) | | | 62,684 | | | | 619,318 | |
Enterprise Financial Services Corp. | | | 3,253 | | | | 172,116 | |
Essent Group Ltd. | | | 6,896 | | | | 443,344 | |
Fidelis Insurance Holdings Ltd. | | | 26,677 | | | | 494,058 | |
First American Financial Corp. | | | 2,550 | | | | 162,690 | |
First BanCorp | | | 22,935 | | | | 490,350 | |
First Commonwealth Financial Corp. | | | 22,944 | | | | 395,096 | |
FirstCash Holdings, Inc. | | | 3,572 | | | | 428,961 | |
Hanover Insurance Group, Inc. | | | 3,234 | | | | 475,366 | |
Kemper Corp. (b) | | | 12,278 | | | | 767,498 | |
National Bank Holdings Corp. - Class A (b) | | | 6,685 | | | | 292,870 | |
Popular, Inc. | | | 5,124 | | | | 525,210 | |
Prosperity Bancshares, Inc. | | | 3,891 | | | | 286,300 | |
Webster Financial Corp. | | | 3,791 | | | | 179,807 | |
| | | | | | | | 6,312,878 | |
Health Care — 8.1% | | | | | | | | |
Enovis Corp. (a)(b) | | | 14,534 | | | | 677,284 | |
Halozyme Therapeutics, Inc. (a)(b) | | | 5,408 | | | | 345,301 | |
Phreesia, Inc. (a) | | | 12,414 | | | | 319,164 | |
Teleflex, Inc. | | | 1,644 | | | | 403,059 | |
Tenet Healthcare Corp. (a) | | | 5,715 | | | | 947,776 | |
| | | | | | | | 2,692,584 | |
Industrials — 20.6% | | | | | | | | |
ABM Industries, Inc. | | | 4,678 | | | | 267,348 | |
Air Lease Corp. (b) | | | 13,048 | | | | 603,731 | |
Allison Transmission Holdings, Inc. | | | 2,511 | | | | 232,895 | |
Arcosa, Inc. | | | 7,933 | | | | 725,790 | |
Atkore, Inc. | | | 2,109 | | | | 196,833 | |
BrightView Holdings, Inc. (a) | | | 16,294 | | | | 260,215 | |
Clarivate PLC (a)(b) | | | 103,062 | | | | 707,005 | |
Driven Brands Holdings, Inc. (a) | | | 5,850 | | | | 83,889 | |
Embraer SA - ADR (a) | | | 4,743 | | | | 157,610 | |
Fluor Corp. (a) | | | 7,547 | | | | 377,878 | |
Frontier Group Holdings, Inc. (a)(b) | | | 40,143 | | | | 145,719 | |
ICF International, Inc. | | | 2,162 | | | | 358,373 | |
IES Holdings, Inc. (a) | | | 505 | | | | 94,198 | |
Janus International Group, Inc. (a)(b) | | | 11,620 | | | | 127,704 | |
KBR, Inc. | | | 4,803 | | | | 333,136 | |
Knight-Swift Transportation Holdings, Inc. (b) | | | 7,122 | | | | 373,050 | |
Leonardo DRS, Inc. (a) | | | 11,821 | | | | 337,371 | |
MasTec, Inc. (a)(b) | | | 3,135 | | | | 354,663 | |
Moog, Inc. - Class A | | | 916 | | | | 180,819 | |
RXO, Inc. (a) | | | 4,219 | | | | 120,073 | |
Star Bulk Carriers Corp. | | | 23,917 | | | | 511,106 | |
Stericycle, Inc. (a) | | | 4,373 | | | | 259,144 | |
| | | | | | | | 6,808,550 | |
Information Technology — 7.7% | | | | | | | | |
BlackBerry Ltd. (a)(b) | | | 55,765 | | | | 131,048 | |
Extreme Networks, Inc. (a) | | | 6,634 | | | | 104,486 | |
Harmonic, Inc. (a) | | | 25,107 | | | | 362,796 | |
LiveRamp Holdings, Inc. (a) | | | 5,121 | | | | 132,736 | |
Mirion Technologies, Inc. (a) | | | 17,991 | | | | 195,022 | |
NCR Voyix Corp. (a) | | | 6,460 | | | | 87,145 | |
Silicon Motion Technology Corp. - ADR (b) | | | 4,433 | | | | 281,806 | |
Teradata Corp. (a) | | | 8,629 | | | | 243,683 | |
Tower Semiconductor Ltd. (a)(b) | | | 13,651 | | | | 603,238 | |
Verint Systems, Inc. (a) | | | 13,153 | | | | 414,977 | |
| | | | | | | | 2,556,937 | |
Materials — 10.3% | | | | | | | | |
Alcoa Corp. | | | 4,730 | | | | 151,833 | |
Ashland, Inc. (b) | | | 3,685 | | | | 329,807 | |
Capstone Copper Corp. (a) | | | 40,140 | | | | 288,023 | |
Commercial Metals Co. (b) | | | 3,598 | | | | 192,817 | |
Constellium SE (a) | | | 19,056 | | | | 319,569 | |
ERO Copper Corp. (a)(b) | | | 17,745 | | | | 364,660 | |
Huntsman Corp. | | | 11,017 | | | | 242,925 | |
Stelco Holdings, Inc. | | | 12,840 | | | | 624,064 | |
Summit Materials, Inc. - Class A (a) | | | 7,269 | | | | 294,395 | |
Tronox Holdings PLC | | | 24,716 | | | | 344,294 | |
Warrior Met Coal, Inc. | | | 4,007 | | | | 245,669 | |
| | | | | | | | 3,398,056 | |
Real Estate — 5.9% | | | | | | | | |
Brixmor Property Group, Inc. | | | 28,021 | | | | 767,495 | |
DigitalBridge Group, Inc. | | | 15,238 | | | | 190,323 | |
Equity Commonwealth (a) | | | 24,077 | | | | 488,041 | |
Getty Realty Corp. (b) | | | 15,928 | | | | 506,192 | |
| | | | | | | | 1,952,051 | |
The accompanying notes are an integral part of the financial statements.
Financial Statements 2024 | 52 |
BOSTON PARTNERS INVESTMENT FUNDS | August 31, 2024 |
WPG PARTNERS SMALL CAP VALUE DIVERSIFIED FUND | Schedule of Investments (continued) |
| | | Shares | | | Value | |
Utilities — 4.0% | | | | | | | | |
ALLETE, Inc. | | | 7,020 | | | $ | 446,121 | |
Portland General Electric Co. | | | 9,407 | | | | 452,571 | |
Spire, Inc. (b) | | | 6,622 | | | | 436,853 | |
| | | | | | | | 1,335,545 | |
TOTAL COMMON STOCKS (Cost $24,896,739) | | | | | | | 32,159,194 | |
| | | | | | | | | |
| | | Units | | | | | |
SHORT-TERM INVESTMENTS — 27.3% | | | | | | | | |
Investments Purchased with Proceeds from Securities Lending — 27.3% | | | | | | | | |
Mount Vernon Liquid Assets Portfolio, LLC, 5.50% (c) | | | 9,020,061 | | | | 9,020,061 | |
TOTAL SHORT-TERM INVESTMENTS (Cost $9,020,061) | | | | | | | 9,020,061 | |
TOTAL INVESTMENTS — 124.5% (Cost $33,916,800) | | | | | | | 41,179,255 | |
Liabilities in Excess of Other Assets — (24.5)% | | | | | | | (8,101,102 | ) |
TOTAL NET ASSETS — 100.0% | | $ | 33,078,153 | |
Percentages are stated as a percent of net assets.
The Global Industry Classification Standard (“GICS®”) was developed by and/or is the exclusive property of MSCI, Inc. (“MSCI”) and Standard & Poor’s Financial Services LLC (“S&P”). GICS® is a service mark of MSCI and S&P and has been licensed for use by U.S. Bank Global Fund Services.
ADR | American Depositary Receipt |
PLC | Public Limited Company |
(a) | Non-income producing security. |
(b) | All or a portion of this security is on loan as of August 31, 2024. The total market value of these securities was $8,825,663 which represented 26.7% of net assets. |
(c) | The rate shown represents the 7-day annualized effective yield as of August 31, 2024. |
The accompanying notes are an integral part of the financial statements.
Financial Statements 2024 | 53 |
BOSTON PARTNERS INVESTMENT FUNDS | August 31, 2024 |
WPG PARTNERS SMALL CAP VALUE DIVERSIFIED FUND | Schedule of Investments (concluded) |
A summary of the inputs used to value the Fund’s investments carried at fair value as of August 31, 2024 is as follows (see Notes to Schedule of Investments):
| | | LEVEL 1 | | | LEVEL 2 | | | LEVEL 3 | | | Total | |
Investments: | | | | | | | | | | | | | | | | |
Common Stocks | | $ | 32,159,194 | | | $ | — | | | $ | — | | | $ | 32,159,194 | |
Investments Purchased with Proceeds from Securities Lending(a) | | | — | | | | — | | | | — | | | | 9,020,061 | |
Total Investments | | $ | 32,159,194 | | | $ | — | | | $ | — | | | $ | 41,179,255 | |
Refer to the Schedule of Investments for further disaggregation of investment categories.
(a) | Certain investments that are measured at fair value using the net asset value per share (or its equivalent) practical expedient have not been categorized in the fair value hierarchy. These investments can be classified as Investments Purchased with Proceeds from Securities Lending and their fair value totals to $9,020,061. The fair value amounts presented in the table are intended to permit reconciliation of the fair value hierarchy to the amounts listed in the Schedule of Investments. |
The accompanying notes are an integral part of the financial statements.
Financial Statements 2024 | 54 |
BOSTON PARTNERS INVESTMENT FUNDS | August 31, 2024 |
Statements of Assets and Liabilities | |
| | | Boston
Partners
All-Cap
Value Fund | | | Boston
Partners
Emerging Markets
Dynamic Equity Fund | | | Boston
Partners Global
Equity Fund | | | Boston
Partners
Global
Long/Short Fund | |
ASSETS | | | | | | | | | | | | | | | | |
Investments in securities, at value †^ | | $ | 1,474,739,248 | | | $ | 37,292,720 | | | $ | 233,458,277 | | | $ | 131,774,677 | |
Investments purchased with proceeds from securities lending collateral, at value * | | | 75,809,274 | | | | — | | | | 4,427,880 | | | | — | |
Short-term investments, at value ** | | | — | | | | 10,566,624 | | | | — | | | | 229,592 | |
Cash and cash equivalents | | | 17,549,782 | | | | 9,637,679 | | | | 10,575,209 | | | | 44,974,864 | |
Foreign currencies, at value # | | | — | | | | — | | | | — | | | | — | |
Offering costs | | | — | | | | — | | | | — | | | | — | |
Receivables | | | | | | | | | | | | | | | | |
Investments sold | | | — | | | | 106,664 | | | | — | | | | 1,333,575 | |
Foreign currency deposits with brokers for securities sold short# | | | — | | | | 4,938 | | | | — | | | | 1,517,524 | |
Deposits with brokers for contracts for difference | | | — | | | | 1,698,030 | | | | — | | | | 610,000 | |
Deposits with brokers for securities sold short | | | — | | | | 74,227 | | | | — | | | | — | |
Capital shares sold | | | 171,900 | | | | — | | | | — | | | | 83,601 | |
Dividends and interest | | | 2,097,772 | | | | 846,869 | | | | 892,209 | | | | 341,260 | |
Due from advisor | | | — | | | | — | | | | — | | | | — | |
Unrealized appreciation on contracts for difference ◊ | | | — | | | | 6,022,584 | | | | — | | | | 2,402,908 | |
Prepaid expenses and other assets | | | 54,486 | | | | 238,746 | | | | 15,908 | | | | 1,034,061 | |
Total assets | | | 1,570,422,462 | | | | 66,489,081 | | | | 249,369,483 | | | | 184,302,062 | |
LIABILITIES | | | | | | | | | | | | | | | | |
Securities sold short, at value ‡ | | | — | | | | 1,261,905 | | | | — | | | | — | |
Options written, at value +◊ | | | — | | | | — | | | | — | | | | — | |
Foreign currency overdraft | | | — | | | | 78,823 | | | | — | | | | — | |
Payables | | | | | | | | | | | | | | | | |
Securities lending collateral | | | 75,809,274 | | | | — | | | | 4,427,880 | | | | — | |
Investments purchased | | | — | | | | 809,269 | | | | — | | | | 228,230 | |
Capital shares redeemed | | | 399,302 | | | | 3,803 | | | | 20,588 | | | | 102,833 | |
Due to prime broker | | | — | | | | — | | | | — | | | | 1,851,679 | |
Investment advisory fees | | | 913,930 | | | | 85,226 | | | | 182,729 | | | | 178,531 | |
Custodian fees | | | 6,782 | | | | 3,056 | | | | 466 | | | | 2,585 | |
Distribution and service fees | | | 52,297 | | | | — | | | | — | | | | 12,625 | |
Dividends on securities sold short | | | — | | | | — | | | | — | | | | — | |
Administration and accounting fees | | | 89,998 | | | | 14,510 | | | | 24,662 | | | | 20,725 | |
Transfer agent fees | | | 164,965 | | | | 3,742 | | | | 25,651 | | | | 30,772 | |
Unrealized depreciation on contracts for difference ◊ | | | — | | | | 3,416,520 | | | | — | | | | 2,524,525 | |
Other accrued expenses and liabilities | | | 21,684 | | | | 844,622 | | | | 40,012 | | | | 701,184 | |
Total liabilities | | | 77,458,232 | | | | 6,521,476 | | | | 4,721,988 | | | | 5,653,689 | |
Net Assets | | $ | 1,492,964,230 | | | $ | 59,967,605 | | | $ | 244,647,495 | | | $ | 178,648,373 | |
NET ASSETS CONSIST OF: | | | | | | | | | | | | | | | | |
Par value | | $ | 44,002 | | | $ | 6,886 | | | $ | 9,616 | | | $ | 10,496 | |
Paid-in Capital | | | 758,577,233 | | | | 72,066,508 | | | | 184,819,851 | | | | 143,334,625 | |
Total Distributable earnings/(loss) | | | 734,342,995 | | | | (12,105,789 | ) | | | 59,818,028 | | | | 35,303,252 | |
Net Assets | | $ | 1,492,964,230 | | | $ | 59,967,605 | | | $ | 244,647,495 | | | $ | 178,648,373 | |
The accompanying notes are an integral part of the financial statements.
Financial Statements 2024 | 55 |
BOSTON PARTNERS INVESTMENT FUNDS | August 31, 2024 |
Statements of Assets and Liabilities (continued) | |
| | | Boston
Partners
All-Cap
Value Fund | | | Boston
Partners
Emerging Markets
Dynamic Equity Fund | | | Boston
Partners Global
Equity Fund | | | Boston
Partners
Global
Long/Short Fund | |
INSTITUTIONAL CLASS | | | | | | | | | | | | | | | | |
Net assets | | $ | 1,272,666,440 | | | $ | 59,967,605 | | | $ | 244,647,495 | | | $ | 164,903,317 | |
Shares outstanding | | | 37,466,409 | | | | 6,885,799 | | | | 9,616,031 | | | | 9,673,597 | |
Net asset value, offering and redemption price per share | | $ | 33.97 | | | $ | 8.71 | | | $ | 25.44 | | | $ | 17.05 | |
INVESTOR CLASS | | | | | | | | | | | | | | | | |
Net assets | | $ | 220,297,790 | | | $ | — | | | $ | — | | | $ | 13,745,056 | |
Shares outstanding | | | 6,535,297 | | | | — | | | | — | | | | 822,072 | |
Net asset value, offering and redemption price per share | | $ | 33.71 | | | $ | — | | | $ | — | | | $ | 16.72 | |
† Investments in securities, at cost | | $ | 836,775,877 | | | $ | 34,603,572 | | | $ | 179,429,615 | | | $ | 112,546,347 | |
^ Includes market value of securities on loan | | $ | 74,254,911 | | | $ | — | | | $ | 4,366,972 | | | $ | — | |
* Investments purchased with proceeds from securities lending collateral, at cost | | $ | 75,809,274 | | | $ | — | | | $ | 4,427,880 | | | $ | — | |
** Short-term investments, at cost | | $ | — | | | $ | 10,566,624 | | | $ | — | | | $ | 229,592 | |
# Foreign currencies, at cost | | $ | — | | | $ | — | | | $ | — | | | $ | 1,480,649 | |
‡ Proceeds received, securities sold short | | $ | — | | | $ | 1,208,836 | | | $ | — | | | $ | — | |
+ Premiums received, options written | | $ | — | | | $ | — | | | $ | — | | | $ | — | |
◊ Primary risk exposure is equity contracts | | | | | | | | | | | | | | | | |
The accompanying notes are an integral part of the financial statements.
Financial Statements 2024 | 56 |
BOSTON PARTNERS INVESTMENT FUNDS | August 31, 2024 |
Statements of Assets and Liabilities (continued) | |
| | | Boston
Partners
Global
Sustainability Fund | | | Boston
Partners
Long/Short
Equity Fund | | | Boston
Partners
Long/Short
Research Fund | | | Boston
Partners
Small Cap
Value Fund II | |
ASSETS | | | | | | | | | | | | | | | | |
Investments in securities, at value †^ | | $ | 11,196,102 | | | $ | 60,706,044 | | | $ | 557,504,471 | | | $ | 582,634,609 | |
Investments purchased with proceeds from securities lending collateral, at value * | | | — | | | | 9,268,044 | | | | — | | | | 111,608,773 | |
Short-term investments, at value ** | | | — | | | | 607,947 | | | | 8,155 | | | | — | |
Cash and cash equivalents | | | 213,900 | | | | 1,613,171 | | | | 28,309,504 | | | | 17,403,785 | |
Foreign currencies, at value # | | | — | | | | — | | | | — | | | | — | |
Offering costs | | | — | | | | — | | | | — | | | | — | |
Receivables | | | | | | | | | | | | | | | — | |
Investments sold | | | — | | | | — | | | | — | | | | — | |
Foreign currency deposits with brokers for securities sold short | | | — | | | | 2,973,196 | | | | 45,979,169 | | | | — | |
Deposits with brokers for contracts for difference | | | — | | | | — | | | | 530,000 | | | | — | |
Deposits with brokers for securities sold short | | | — | | | | 8,853,659 | | | | 73,161,453 | | | | — | |
Capital shares sold | | | — | | | | 14,942 | | | | 69,809 | | | | 376,924 | |
Dividends and interest | | | 44,824 | | | | 122,984 | | | | 1,555,976 | | | | 607,986 | |
Due from advisor | | | 2,327 | | | | — | | | | — | | | | — | |
Unrealized appreciation on contracts for difference ◊ | | | — | | | | — | | | | 6,930,292 | | | | — | |
Prepaid expenses and other assets | | | 463 | | | | 18,629 | | | | 1,992,530 | | | | 35,370 | |
Total assets | | | 11,457,616 | | | | 84,178,616 | | | | 716,041,359 | | | | 712,667,447 | |
LIABILITIES | | | | | | | | | | | | | | | | |
Securities sold short, at value ‡ | | | — | | | | 11,814,494 | | | | 113,797,015 | | | | — | |
Options written, at value +◊ | | | — | | | | — | | | | 113,597 | | | | — | |
Foreign currency overdraft | | | — | | | | — | | | | — | | | | — | |
Payables | | | | | | | | | | | | | | | | |
Securities lending collateral | | | — | | | | 9,268,044 | | | | — | | | | 111,608,773 | |
Investments purchased | | | — | | | | — | | | | 18,386 | | | | — | |
Capital shares redeemed | | | — | | | | 1,277 | | | | 773,024 | | | | 115,977 | |
Due to prime broker | | | — | | | | — | | | | — | | | | — | |
Investment advisory fees | | | — | | | | 79,348 | | | | 558,464 | | | | 444,538 | |
Custodian fees | | | 518 | | | | 2,285 | | | | 8,031 | | | | 4,339 | |
Distribution and service fees | | | — | | | | 7,892 | | | | 3,878 | | | | 86,827 | |
Dividends on securities sold short | | | — | | | | 2,726 | | | | 131,137 | | | | — | |
Administration and accounting fees | | | 13,910 | | | | 15,121 | | | | 59,341 | | | | 43,373 | |
Transfer agent fees | | | 446 | | | | 16,566 | | | | 79,368 | | | | 105,987 | |
Unrealized depreciation on contracts for difference ◊ | | | — | | | | 18,603 | | | | 6,578,036 | | | | — | |
Other accrued expenses and liabilities | | | 45,274 | | | | 58,544 | | | | 1,969,266 | | | | 83,431 | |
Total liabilities | | | 60,148 | | | | 21,284,900 | | | | 124,089,543 | | | | 112,493,245 | |
Net Assets | | $ | 11,397,468 | | | $ | 62,893,716 | | | $ | 591,951,816 | | | $ | 600,174,202 | |
NET ASSETS CONSIST OF: | | | | | | | | | | | | | | | | |
Par value | | $ | 954 | | | $ | 4,451 | | | $ | 39,264 | | | $ | 20,890 | |
Paid-in Capital | | | 9,169,646 | | | | 28,060,885 | | | | 336,509,009 | | | | 394,259,371 | |
Total Distributable earnings/(loss) | | | 2,226,868 | | | | 34,828,380 | | | | 255,403,543 | | | | 205,893,941 | |
Net Assets | | $ | 11,397,468 | | | $ | 62,893,716 | | | $ | 591,951,816 | | | $ | 600,174,202 | |
The accompanying notes are an integral part of the financial statements.
Financial Statements 2024 | 57 |
BOSTON PARTNERS INVESTMENT FUNDS | August 31, 2024 |
Statements of Assets and Liabilities (continued) | |
| | | Boston
Partners
Global
Sustainability Fund | | | Boston
Partners
Long/Short
Equity Fund | | | Boston
Partners
Long/Short
Research Fund | | | Boston
Partners
Small Cap
Value Fund II | |
INSTITUTIONAL CLASS | | | | | | | | | | | | | | | | |
Net assets | | $ | 11,397,468 | | | $ | 47,562,523 | | | $ | 584,044,333 | | | $ | 542,807,486 | |
Shares outstanding | | | 954,052 | | | | 3,162,039 | | | | 38,716,428 | | | | 18,777,323 | |
Net asset value, offering and redemption price per share | | $ | 11.95 | | | $ | 15.04 | | | $ | 15.09 | | | $ | 28.91 | |
INVESTOR CLASS | | | | | | | | | | | | | | | | |
Net assets | | $ | — | | | $ | 15,331,193 | | | $ | 7,907,483 | | | $ | 57,366,716 | |
Shares outstanding | | | — | | | | 1,288,818 | | | | 547,244 | | | | 2,112,487 | |
Net asset value, offering and redemption price per share | | $ | — | | | $ | 11.90 | | | $ | 14.45 | | | $ | 27.16 | |
† Investments in securities, at cost | | $ | 8,679,189 | | | $ | 40,196,351 | | | $ | 374,090,238 | | | $ | 430,724,463 | |
^ Includes market value of securities on loan | | $ | — | | | $ | 9,085,498 | | | $ | — | | | $ | 109,500,196 | |
* Investments purchased with proceeds from securities lending collateral, at cost | | $ | — | | | $ | 9,268,044 | | | $ | — | | | $ | 111,608,773 | |
** Short-term investments, at cost | | $ | — | | | $ | 607,947 | | | $ | 8,155 | | | $ | — | |
# Foreign currencies, at cost | | $ | — | | | $ | 3,228,543 | | | $ | 44,452,925 | | | $ | — | |
‡ Proceeds received, securities sold short | | $ | — | | | $ | 16,642,562 | | | $ | 126,232,070 | | | $ | — | |
+ Premiums received, options written | | $ | — | | | $ | — | | | $ | 69,105 | | | $ | — | |
◊ Primary risk exposure is equity contracts | | | | | | | | | | | | | | | | |
The accompanying notes are an integral part of the financial statements.
Financial Statements 2024 | 58 |
BOSTON PARTNERS INVESTMENT FUNDS | August 31, 2024 |
Statements of Assets and Liabilities (continued) | |
| | | WPG Partners
Select Hedged
Fund | | | WPG Partners
Select Small Cap
Value Fund | | | WPG Partners
Small Cap Value
Diversified Fund | |
ASSETS | | | | | | | | | | | | |
Investments in securities, at value †^ | | $ | 52,691,070 | | | $ | 119,699,925 | | | $ | 32,159,194 | |
Investments purchased with proceeds from securities lending collateral, at value * | | | — | | | | — | | | | 9,020,061 | |
Short-term investments, at value ** | | | 2,702 | | | | — | | | | — | |
Cash and cash equivalents | | | 1,382,012 | | | | 5,673,429 | | | | 868,553 | |
Foreign currencies, at value # | | | — | | | | — | | | | 49,226 | |
Offering costs | | | 37,853 | | | | — | | | | — | |
Receivables | | | | | | | | | | | | |
Investments sold | | | 308,035 | | | | 71,988 | | | | — | |
Foreign currency deposits with brokers for securities sold short | | | — | | | | — | | | | — | |
Deposits with brokers for contracts for difference | | | — | | | | — | | | | — | |
Deposits with brokers for securities sold short | | | 35,249,641 | | | | — | | | | — | |
Capital shares sold | | | 2,567 | | | | 1,023,807 | | | | 15,300 | |
Dividends and interest | | | 188,805 | | | | 94,513 | | | | 54,491 | |
Due from advisor | | | — | | | | — | | | | — | |
Unrealized appreciation on contracts for difference ◊ | | | — | | | | — | | | | — | |
Prepaid expenses and other assets | | | — | | | | 1,788 | | | | 8,186 | |
Total assets | | | 89,862,685 | | | | 126,565,450 | | | | 42,175,011 | |
LIABILITIES | | | | | | | | | | | | |
Securities sold short, at value ‡ | | | 35,732,661 | | | | — | | | | — | |
Options written, at value +◊ | | | — | | | | — | | | | — | |
Foreign currency overdraft | | | — | | | | — | | | | — | |
Payables | | | | | | | | | | | | |
Securities lending collateral | | | — | | | | — | | | | 9,020,061 | |
Investments purchased | | | 24,815 | | | | 2,638,469 | | | | — | |
Capital shares redeemed | | | 21,795 | | | | 116,161 | | | | — | |
Due to prime broker | | | — | | | | — | | | | — | |
Investment advisory fees | | | 42,430 | | | | 90,379 | | | | 18,278 | |
Custodian fees | | | 1,174 | | | | 5,191 | | | | 882 | |
Distribution and service fees | | | — | | | | — | | | | — | |
Dividends on securities sold short | | | 47,068 | | | | — | | | | — | |
Administration and accounting fees | | | 8,351 | | | | 12,625 | | | | 10,692 | |
Transfer agent fees | | | 4,773 | | | | 30,297 | | | | 4,929 | |
Unrealized depreciation on contracts for difference ◊ | | | — | | | | — | | | | — | |
Other accrued expenses and liabilities | | | 54,193 | | | | 42,692 | | | | 42,016 | |
Total liabilities | | | 35,937,260 | | | | 2,935,814 | | | | 9,096,858 | |
Net Assets | | $ | 53,925,425 | | | $ | 123,629,636 | | | $ | 33,078,153 | |
NET ASSETS CONSIST OF: | | | | | | | | | | | | |
Par value | | $ | 5,180 | | | $ | 10,229 | | | $ | 1,566 | |
Paid-in Capital | | | 52,006,174 | | | | 102,362,362 | | | | 24,066,496 | |
Total Distributable earnings/(loss) | | | 1,914,071 | | | | 21,257,045 | | | | 9,010,091 | |
Net Assets | | $ | 53,925,425 | | | $ | 123,629,636 | | | $ | 33,078,153 | |
The accompanying notes are an integral part of the financial statements.
Financial Statements 2024 | 59 |
BOSTON PARTNERS INVESTMENT FUNDS | August 31, 2024 |
Statements of Assets and Liabilities (concluded) | |
| | | WPG Partners
Select Hedged
Fund | | | WPG Partners
Select Small Cap
Value Fund | | | WPG Partners
Small Cap Value
Diversified Fund | |
INSTITUTIONAL CLASS | | | | | | | | | | | | |
Net assets | | $ | 53,925,425 | | | $ | 123,629,636 | | | $ | 33,078,153 | |
Shares outstanding | | | 5,179,911 | | | | 10,228,542 | | | | 1,565,784 | |
Net asset value, offering and redemption price per share | | $ | 10.41 | | | $ | 12.09 | | | $ | 21.13 | |
INVESTOR CLASS | | | | | | | | | | | | |
Net assets | | $ | — | | | $ | — | | | $ | — | |
Shares outstanding | | | — | | | | — | | | | — | |
Net asset value, offering and redemption price per share | | $ | — | | | $ | — | | | $ | — | |
† Investments in securities, at cost | | $ | 48,629,964 | | | $ | 102,060,756 | | | $ | 24,880,141 | |
^ Includes market value of securities on loan | | $ | — | | | $ | — | | | $ | 8,825,663 | |
* Investments purchased with proceeds from securities lending collateral, at cost | | $ | — | | | $ | — | | | $ | 9,020,061 | |
** Short-term investments, at cost | | $ | 2,702 | | | $ | — | | | $ | — | |
# Foreign currencies, at cost | | $ | — | | | $ | — | | | $ | 48,707 | |
‡ Proceeds received, securities sold short | | $ | 35,139,888 | | | $ | — | | | $ | — | |
+ Premiums received, options written | | $ | — | | | $ | — | | | $ | — | |
◊ Primary risk exposure is equity contracts | | | | | | | | | | | | |
The accompanying notes are an integral part of the financial statements.
Financial Statements 2024 | 60 |
BOSTON PARTNERS INVESTMENT FUNDS | For the Year Ended August 31, 2024 |
Statements of Operations | |
| | | Boston
Partners
All-Cap
Value Fund | | | Boston
Partners
Emerging Markets
Dynamic Equity Fund | | | Boston
Partners Global
Equity Fund | | | Boston
Partners
Global
Long/Short Fund | |
Investment Income | | | | | | | | | | | | | | | | |
Dividends † | | $ | 23,392,062 | | | $ | 1,674,353 | | | $ | 6,106,839 | | | $ | 2,337,143 | |
Interest | | | 1,297,678 | | | | 267,653 | | | | 341,748 | | | | 2,382,795 | |
Income from securities loaned (Note 8) | | | 104,863 | | | | — | | | | 18,416 | | | | — | |
Prime broker interest income | | | — | | | | 35,994 | | | | — | | | | — | |
Total investment income | | | 24,794,603 | | | | 1,978,000 | | | | 6,467,003 | | | | 4,719,938 | |
Expenses | | | | | | | | | | | | | | | | |
Advisory fees (Note 2) | | | 9,869,819 | | | | 776,677 | | | | 1,985,400 | | | | 2,462,427 | |
Transfer agent fees (Note 2) | | | 938,813 | | | | 13,737 | | | | 161,969 | | | | 175,471 | |
Distribution fees (Investor Class) (Note 2) | | | 552,418 | | | | — | | | | — | | | | 27,542 | |
Administration and accounting fees (Note 2) | | | 315,910 | | | | 38,644 | | | | 86,173 | | | | 68,208 | |
Director’s fees | | | 172,261 | | | | 7,886 | | | | 26,651 | | | | 20,021 | |
Officer’s fees | | | 162,459 | | | | 7,237 | | | | 25,289 | | | | 19,428 | |
Legal fees | | | 159,194 | | | | 12,305 | | | | 24,254 | | | | 18,056 | |
Custodian fees (Note 2) | | | 69,552 | | | | 31,267 | | | | 48,462 | | | | 28,026 | |
Registration fees | | | 61,118 | | | | 23,176 | | | | 23,340 | | | | 40,955 | |
Printing and shareholder reporting fees | | | 56,997 | | | | 2,004 | | | | 6,439 | | | | 23,157 | |
Audit and tax service fees | | | 40,400 | | | | 66,021 | | | | 51,824 | | | | 57,919 | |
Offering expenses | | | — | | | | — | | | | — | | | | — | |
Other expense | | | 120,964 | | | | 5,059 | | | | 14,781 | | | | 10,410 | |
Dividend expense on securities sold short | | | — | | | | 28,554 | | | | — | | | | — | |
Prime broker interest expense | | | — | | | | — | | | | — | | | | 8,201 | |
Total expenses before waivers and/or reimbursements | | | 12,519,905 | | | | 1,012,567 | | | | 2,454,582 | | | | 2,959,821 | |
Less: waivers and/or reimbursements net of amounts recouped (Note 2) | | | (650,637 | ) | | | (113,783 | ) | | | (357,823 | ) | | | — | |
Net expenses after waivers and/or reimbursements net of amounts recouped | | | 11,869,268 | | | | 898,784 | | | | 2,096,759 | | | | 2,959,821 | |
Net investment income/(loss) | | | 12,925,335 | | | | 1,079,216 | | | | 4,370,244 | | | | 1,760,117 | |
| | | | | | | | | | | | | | | | | |
Net realized gain/(loss) from: | | | | | | | | | | | | | | | | |
Investment securities | | | 111,488,816 | | | | 3,363,123 | | | | 17,634,356 | | | | 19,825,860 | |
Securities sold short | | | — | | | | 14,659 | | | | — | | | | (203,466 | ) |
Options written ** | | | — | | | | — | | | | — | | | | (280,360 | ) |
Contracts for difference ** | | | — | | | | (2,809,685 | ) | | | — | | | | (1,458,476 | ) |
Foreign currency transactions | | | — | | | | (301,978 | ) | | | 30,340 | | | | 199,925 | |
Net change in unrealized appreciation/(depreciation) on: | | | | | | | | | | | | | | | | |
Investment securities | | | 121,716,433 | | | | (948,776 | ) | | | 22,684,893 | | | | 3,666,400 | |
Securities sold short | | | — | | | | (48,194 | ) | | | — | | | | — | |
Options written ** | | | (731,254 | ) | | | — | | | | — | | | | 511,061 | |
Contracts for difference ** | | | — | | | | 279,582 | | | | — | | | | 1,896,332 | |
Foreign currency translation | | | 1,324 | | | | 10,485 | | | | 15,783 | | | | 181,337 | |
Net realized and unrealized gain/(loss) | | | 232,475,319 | | | | (440,784 | ) | | | 40,365,372 | | | | 24,338,613 | |
Net increase/(decrease) in net assets resulting from operations | | $ | 245,400,654 | | | $ | 638,432 | | | $ | 44,735,616 | | | $ | 26,098,730 | |
† Net of foreign withholding taxes of | | $ | (181,604 | ) | | $ | (156,781 | ) | | $ | (439,830 | ) | | $ | (228,396 | ) |
** Primary risk exposure is equity contracts | | | | | | | | | | | | | | | | |
The accompanying notes are an integral part of the financial statements.
Financial Statements 2024 | 61 |
BOSTON PARTNERS INVESTMENT FUNDS | For the Year Ended August 31, 2024 |
Statements of Operations (continued) | |
| | | Boston
Partners
Global
Sustainability Fund | | | Boston
Partners
Long/Short
Equity Fund | | | Boston
Partners
Long/Short
Research Fund | | | Boston
Partners
Small Cap
Value Fund II | |
Investment Income | | | | | | | | | | | | | | | | |
Dividends † | | $ | 301,140 | | | $ | 1,146,829 | | | $ | 9,967,614 | | | $ | 9,093,837 | |
Interest | | | 23,883 | | | | 51,770 | | | | 600,406 | | | | 674,850 | |
Income from securities loaned (Note 8) | | | — | | | | 56,809 | | | | — | | | | 655,153 | |
Prime broker interest income | | | — | | | | 263,697 | | | | 6,005,942 | | | | — | |
Total investment income | | | 325,023 | | | | 1,519,105 | | | | 16,573,962 | | | | 10,423,840 | |
Expenses | | | | | | | | | | | | | | | | |
Advisory fees (Note 2) | | | 121,573 | | | | 1,379,392 | | | | 7,466,784 | | | | 4,839,419 | |
Transfer agent fees (Note 2) | | | 944 | | | | 55,659 | | | | 309,062 | | | | 471,765 | |
Distribution fees (Investor Class) (Note 2) | | | — | | | | 33,228 | | | | 18,017 | | | | 141,866 | |
Administration and accounting fees (Note 2) | | | 19,150 | | | | 39,373 | | | | 192,523 | | | | 139,214 | |
Director’s fees | | | 1,500 | | | | 8,013 | | | | 76,123 | | | | 76,217 | |
Officer’s fees | | | 1,618 | | | | 7,673 | | | | 80,481 | | | | 71,037 | |
Legal fees | | | 1,228 | | | | 7,248 | | | | 68,104 | | | | 64,332 | |
Custodian fees (Note 2) | | | 25,646 | | | | 19,200 | | | | 55,076 | | | | 33,310 | |
Registration fees | | | 15,459 | | | | 34,872 | | | | 42,139 | | | | 46,325 | |
Printing and shareholder reporting fees | | | 580 | | | | 4,441 | | | | 105 | | | | 45,580 | |
Audit and tax service fees | | | 41,023 | | | | 54,419 | | | | 62,619 | | | | 40,150 | |
Offering expenses | | | — | | | | — | | | | — | | | | — | |
Other expense | | | 3,762 | | | | 31,786 | | | | 85,795 | | | | 52,149 | |
Dividend expense on securities sold short | | | — | | | | 25,777 | | | | 2,895,572 | | | | — | |
Prime broker interest expense | | | — | | | | — | | | | — | | | | — | |
Total expenses before waivers and/or reimbursements | | | 232,483 | | | | 1,701,081 | | | | 11,352,400 | | | | 6,021,364 | |
Less: waivers and/or reimbursements net of amounts recouped (Note 2) | | | (94,610 | ) | | | (414,321 | ) | | | — | | | | (231,173 | ) |
Net expenses after waivers and/or reimbursements net of amounts recouped | | | 137,873 | | | | 1,286,760 | | | | 11,352,400 | | | | 5,790,191 | |
Net investment income/(loss) | | | 187,150 | | | | 232,345 | | | | 5,221,562 | | | | 4,633,649 | |
| | | | | | | | | | | | | | | | | |
Net realized gain/(loss) from: | | | | | | | | | | | | | | | | |
Investment securities | | | 2,348,085 | | | | 7,853,514 | | | | 73,186,709 | | | | 80,780,984 | |
Securities sold short | | | — | | | | 3,324,306 | | | | (11,859,126 | ) | | | — | |
Options written ** | | | — | | | | (65,618 | ) | | | 426,133 | | | | — | |
Contracts for difference ** | | | — | | | | 558,966 | | | | (1,720,952 | ) | | | — | |
Foreign currency transactions | | | 27,196 | | | | (11,926 | ) | | | (661,277 | ) | | | — | |
Net change in unrealized appreciation/(depreciation) on: | | | | | | | | | | | | | | | | |
Investment securities | | | 433,314 | | | | 3,574,411 | | | | 35,222,110 | | | | 14,384,396 | |
Securities sold short | | | — | | | | (2,813,166 | ) | | | 2,270,614 | | | | — | |
Options written ** | | | — | | | | (50,952 | ) | | | (303,237 | ) | | | — | |
Contracts for difference ** | | | — | | | | (18,603 | ) | | | (3,758,857 | ) | | | — | |
Foreign currency translation | | | 1,036 | | | | 21,775 | | | | 2,100,798 | | | | — | |
Net realized and unrealized gain/(loss) | | | 2,809,631 | | | | 12,372,707 | | | | 94,902,915 | | | | 95,165,380 | |
Net increase/(decrease) in net assets resulting from operations | | $ | 2,996,781 | | | $ | 12,605,052 | | | $ | 100,124,477 | | | $ | 99,799,029 | |
† Net of foreign withholding taxes of | | $ | (27,528 | ) | | $ | (42,304 | ) | | $ | (271,206 | ) | | $ | (33,484 | ) |
** Primary risk exposure is equity contracts | | | | | | | | | | | | | | | | |
The accompanying notes are an integral part of the financial statements.
Financial Statements 2024 | 62 |
BOSTON PARTNERS INVESTMENT FUNDS | For the Year Ended August 31, 2024 |
Statements of Operations (concluded) | |
| | | WPG Partners
Select Hedged
Fund^ | | | WPG Partners
Select Small Cap
Value Fund | | | WPG Partners
Small Cap Value
Diversified Fund | |
Investment Income | | | | | | | | | | | | |
Dividends † | | $ | 230,852 | | | $ | 861,175 | | | $ | 508,489 | |
Interest | | | 29,818 | | | | 273,754 | | | | 54,812 | |
Income from securities loaned (Note 8) | | | — | | | | — | | | | 21,492 | |
Prime broker interest income | | | 606,348 | | | | — | | | | — | |
Total investment income | | | 867,018 | | | | 1,134,929 | | | | 584,793 | |
Expenses | | | | | | | | | | | | |
Advisory fees (Note 2) | | | 201,245 | | | | 902,977 | | | | 240,939 | |
Transfer agent fees (Note 2) | | | 4,773 | | | | 69,933 | | | | 13,762 | |
Distribution fees (Investor Class) (Note 2) | | | — | | | | — | | | | — | |
Administration and accounting fees (Note 2) | | | 9,143 | | | | 40,211 | | | | 24,183 | |
Director’s fees | | | — | | | | 10,094 | | | | 3,872 | |
Officer’s fees | | | — | | | | 8,100 | | | | 3,558 | |
Legal fees | | | 2 | | | | 10,032 | | | | 3,228 | |
Custodian fees (Note 2) | | | 4,860 | | | | 17,087 | | | | 16,734 | |
Registration fees | | | 24,522 | | | | 19,015 | | | | 23,389 | |
Printing and shareholder reporting fees | | | 972 | | | | 9,063 | | | | 10,435 | |
Audit and tax service fees | | | 30,683 | | | | 35,367 | | | | 39,475 | |
Offering expenses | | | 9,195 | | | | — | | | | — | |
Other expense | | | 1,829 | | | | 16,562 | | | | 3,178 | |
Dividend expense on securities sold short | | | 170,181 | | | | — | | | | — | |
Prime broker interest expense | | | 83,095 | | | | — | | | | — | |
Total expenses before waivers and/or reimbursements | | | 540,500 | | | | 1,138,441 | | | | 382,753 | |
Less: waivers and/or reimbursements net of amounts recouped (Note 2) | | | (45,730 | ) | | | (25,358 | ) | | | (51,465 | ) |
Net expenses after waivers and/or reimbursements net of amounts recouped | | | 494,770 | | | | 1,113,083 | | | | 331,288 | |
Net investment income/(loss) | | | 372,248 | | | | 21,846 | | | | 253,505 | |
| | | | | | | | | | | | | |
Net realized gain/(loss) from: | | | | | | | | | | | | |
Investment securities | | | (817,758 | ) | | | 4,373,965 | | | | 1,849,511 | |
Securities sold short | | | (1,108,752 | ) | | | — | | | | — | |
Options written ** | | | — | | | | — | | | | — | |
Contracts for difference ** | | | — | | | | — | | | | — | |
Foreign currency transactions | | | — | | | | — | | | | (555 | ) |
Net change in unrealized appreciation/(depreciation) on: | | | | | | | | | | | | |
Investment securities | | | 4,061,106 | | | | 10,778,980 | | | | 3,647,050 | |
Securities sold short | | | (592,773 | ) | | | — | | | | — | |
Options written ** | | | — | | | | — | | | | — | |
Contracts for difference ** | | | — | | | | — | | | | — | |
Foreign currency translation | | | — | | | | — | | | | 601 | |
Net realized and unrealized gain/(loss) | | | 1,541,823 | | | | 15,152,945 | | | | 5,496,607 | |
Net increase/(decrease) in net assets resulting from operations | | $ | 1,914,071 | | | $ | 15,174,791 | | | $ | 5,750,112 | |
† Net of foreign withholding taxes of | | $ | (4,033 | ) | | $ | (24,280 | ) | | $ | (10,378 | ) |
^ The Fund commenced operations on May 3, 2024. | | | | | | | | | | | | |
** Primary risk exposure is equity contracts | | | | | | | | | | | | |
The accompanying notes are an integral part of the financial statements.
Financial Statements 2024 | 63 |
BOSTON PARTNERS INVESTMENT FUNDS | |
Statements of Changes in Net Assets | |
| | | Boston Partners
All-Cap Value Fund | | | Boston Partners
Emerging Markets Dynamic Equity Fund | |
| | | For the
Year Ended
August 31, 2024 | | | For the
Year Ended
August 31, 2023 | | | For the
Year Ended
August 31, 2024 | | | For the
Year Ended
August 31, 2023 | |
Increase/(decrease) in net assets from operations: | | | | | | | | | | | | | | | | |
Net investment income/(loss) | | $ | 12,925,335 | | | $ | 18,074,085 | | | $ | 1,079,216 | | | $ | 904,310 | |
Net realized gain/(loss) from investments and foreign currencies | | | 111,488,816 | | | | 124,443,037 | | | | 266,119 | | | | (2,511,765 | ) |
Net change in unrealized appreciation/(depreciation) on investments and foreign currency translation | | | 120,986,503 | | | | 13,885,190 | | | | (706,903 | ) | | | 4,575,484 | |
Net increase/(decrease) in net assets resulting from operations | | | 245,400,654 | | | | 156,402,312 | | | | 638,432 | | | | 2,968,029 | |
| | | | | | | | | | | | | | | | | |
Dividends and distributions to shareholders: | | | | | | | | | | | | | | | | |
Institutional Class | | | (113,490,263 | ) | | | (96,713,599 | ) | | | — | | | | (11,778,440 | ) |
Investor Class | | | (23,113,027 | ) | | | (18,398,789 | ) | | | — | | | | — | |
Net decrease in net assets from dividends and distributions to shareholders | | | (136,603,290 | ) | | | (115,112,388 | ) | | | — | | | | (11,778,440 | ) |
| | | | | | | | | | | | | | | | | |
Capital transactions: | | | | | | | | | | | | | | | | |
Institutional Class | | | | | | | | | | | | | | | | |
Proceeds from shares sold | | | 240,527,804 | | | | 227,017,126 | | | | 1,484,132 | | | | 6,194,044 | |
Reinvestment of distributions | | | 89,167,313 | | | | 75,831,183 | | | | — | | | | 11,469,531 | |
Shares redeemed | | | (314,817,112 | ) | | | (373,447,509 | ) | | | (3,979,687 | ) | | | (7,644,051 | ) |
Investor Class | | | | | | | | | | | | | | | | |
Proceeds from shares sold | | | 11,463,927 | | | | 16,752,630 | | | | — | | | | — | |
Reinvestment of distributions | | | 22,007,650 | | | | 17,605,766 | | | | — | | | | — | |
Shares redeemed | | | (57,211,482 | ) | | | (43,086,278 | ) | | | — | | | | — | |
Net increase/(decrease) in net assets from capital transactions | | | (8,861,900 | ) | | | (79,327,082 | ) | | | (2,495,555 | ) | | | 10,019,524 | |
Total increase/(decrease) in net assets | | | 99,935,464 | | | | (38,037,158 | ) | | | (1,857,123 | ) | | | 1,209,113 | |
| | | | | | | | | | | | | | | | | |
Net assets: | | | | | | | | | | | | | | | | |
Beginning of period | | | 1,393,028,766 | | | | 1,431,065,924 | | | | 61,824,728 | | | | 60,615,615 | |
End of period | | $ | 1,492,964,230 | | | $ | 1,393,028,766 | | | $ | 59,967,605 | | | $ | 61,824,728 | |
| | | | | | | | | | | | | | | | | |
Share transactions: | | | | | | | | | | | | | | | | |
Institutional Class | | | | | | | | | | | | | | | | |
Shares sold | | | 7,740,493 | | | | 7,348,008 | | | | 166,306 | | | | 727,968 | |
Shares reinvested | | | 2,986,179 | | | | 2,498,556 | | | | — | | | | 1,402,143 | |
Shares redeemed | | | (9,927,991 | ) | | | (12,182,535 | ) | | | (453,041 | ) | | | (882,460 | ) |
Net increase/(decrease) | | | 798,681 | | | | (2,335,971 | ) | | | (286,735 | ) | | | 1,247,651 | |
Investor Class | | | | | | | | | | | | | | | | |
Shares sold | | | 367,862 | | | | 546,307 | | | | — | | | | — | |
Shares reinvested | | | 741,248 | | | | 583,165 | | | | — | | | | — | |
Shares redeemed | | | (1,824,011 | ) | | | (1,414,790 | ) | | | — | | | | — | |
Net increase/(decrease) | | | (714,901 | ) | | | (285,318 | ) | | | — | | | | — | |
The accompanying notes are an integral part of the financial statements.
Financial Statements 2024 | 64 |
BOSTON PARTNERS INVESTMENT FUNDS | |
Statements of Changes in Net Assets (continued) | |
| | | Boston Partners
Global Equity Fund | | | Boston Partners
Global Long/Short Fund | |
| | | For the
Year Ended
August 31, 2024 | | | For the
Year Ended
August 31, 2023 | | | For the
Year Ended
August 31, 2024 | | | For the
Year Ended
August 31, 2023 | |
Increase/(decrease) in net assets from operations: | | | | | | | | | | | | | | | | |
Net investment income/(loss) | | $ | 4,370,244 | | | $ | 4,257,210 | | | $ | 1,760,117 | | | $ | 2,054,587 | |
Net realized gain/(loss) from investments and foreign currencies | | | 17,664,696 | | | | 8,115,011 | | | | 18,083,483 | | | | 13,070,954 | |
Net change in unrealized appreciation/(depreciation) on investments and foreign currency translation | | | 22,700,676 | | | | 14,265,482 | | | | 6,255,130 | | | | (1,128,440 | ) |
Net increase/(decrease) in net assets resulting from operations | | | 44,735,616 | | | | 26,637,703 | | | | 26,098,730 | | | | 13,997,101 | |
| | | | | | | | | | | | | | | | | |
Dividends and distributions to shareholders: | | | | | | | | | | | | | | | | |
Institutional Class | | | (4,137,287 | ) | | | (2,771,850 | ) | | | (2,188,902 | ) | | | (2,998,432 | ) |
Investor Class | | | — | | | | — | | | | (124,802 | ) | | | (245,884 | ) |
Net decrease in net assets from dividends and distributions to shareholders | | | (4,137,287 | ) | | | (2,771,850 | ) | | | (2,313,704 | ) | | | (3,244,316 | ) |
| | | | | | | | | | | | | | | | | |
Capital transactions: | | | | | | | | | | | | | | | | |
Institutional Class | | | | | | | | | | | | | | | | |
Proceeds from shares sold | | | 14,745,831 | | | | 27,113,250 | | | | 43,050,758 | | | | 96,861,537 | |
Reinvestment of distributions | | | 3,944,599 | | | | 2,760,443 | | | | 2,120,859 | | | | 2,776,329 | |
Shares redeemed | | | (26,805,073 | ) | | | (12,982,701 | ) | | | (47,668,390 | ) | | | (79,750,344 | ) |
Investor Class | | | | | | | | | | | | | | | | |
Proceeds from shares sold | | | — | | | | — | | | | 7,409,646 | | | | 11,778,290 | |
Reinvestment of distributions | | | — | | | | — | | | | 109,781 | | | | 223,590 | |
Shares redeemed | | | — | | | | — | | | | (4,458,835 | ) | | | (9,580,249 | ) |
Net increase/(decrease) in net assets from capital transactions | | | (8,114,643 | ) | | | 16,890,992 | | | | 563,819 | | | | 22,309,153 | |
Total increase/(decrease) in net assets | | | 32,483,686 | | | | 40,756,845 | | | | 24,348,845 | | | | 33,061,938 | |
| | | | | | | | | | | | | | | | | |
Net assets: | | | | | | | | | | | | | | | | |
Beginning of period | | | 212,163,809 | | | | 171,406,964 | | | | 154,299,528 | | | | 121,237,590 | |
End of period | | $ | 244,647,495 | | | $ | 212,163,809 | | | $ | 178,648,373 | | | $ | 154,299,528 | |
| | | | | | | | | | | | | | | | | |
Share transactions: | | | | | | | | | | | | | | | | |
Institutional Class | | | | | | | | | | | | | | | | |
Shares sold | | | 654,463 | | | | 1,317,841 | | | | 2,718,812 | | | | 6,785,859 | |
Shares reinvested | | | 178,005 | | | | 136,453 | | | | 139,164 | | | | 194,557 | |
Shares redeemed | | | (1,210,800 | ) | | | (633,039 | ) | | | (3,031,839 | ) | | | (5,564,380 | ) |
Net increase/(decrease) | | | (378,332 | ) | | | 821,255 | | | | (173,863 | ) | | | 1,416,036 | |
Investor Class | | | | | | | | | | | | | | | | |
Shares sold | | | — | | | | — | | | | 474,050 | | | | 825,447 | |
Shares reinvested | | | — | | | | — | | | | 7,329 | | | | 15,925 | |
Shares redeemed | | | — | | | | — | | | | (288,367 | ) | | | (670,848 | ) |
Net increase/(decrease) | | | — | | | | — | | | | 193,012 | | | | 170,524 | |
The accompanying notes are an integral part of the financial statements.
Financial Statements 2024 | 65 |
BOSTON PARTNERS INVESTMENT FUNDS | |
Statements of Changes in Net Assets (continued) | |
| | | Boston Partners
Global Sustainability Fund | | | Boston Partners
Long/Short Equity Fund | |
| | | For the
Year Ended
August 31, 2024 | | | For the
Year Ended
August 31, 2023 | | | For the
Year Ended
August 31, 2024 | | | For the
Year Ended
August 31, 2023 | |
Increase/(decrease) in net assets from operations: | | | | | | | | | | | | | | | | |
Net investment income/(loss) | | $ | 187,150 | | | $ | 404,279 | | | $ | 232,345 | | | $ | 308,147 | |
Net realized gain/(loss) from investments and foreign currencies | | | 2,375,281 | | | | (1,521,647 | ) | | | 11,659,242 | | | | 11,945,536 | |
Net change in unrealized appreciation/(depreciation) on investments and foreign currency translation | | | 434,350 | | | | 4,623,906 | | | | 713,465 | | | | (2,920,874 | ) |
Net increase/(decrease) in net assets resulting from operations | | | 2,996,781 | | | | 3,506,538 | | | | 12,605,052 | | | | 9,332,809 | |
| | | | | | | | | | | | | | | | | |
Dividends and distributions to shareholders: | | | | | | | | | | | | | | | | |
Institutional Class | | | (383,298 | ) | | | (313,835 | ) | | | (9,339,469 | ) | | | (6,481,806 | ) |
Investor Class | | | — | | | | — | | | | (2,682,662 | ) | | | (1,588,742 | ) |
Net decrease in net assets from dividends and distributions to shareholders | | | (383,298 | ) | | | (313,835 | ) | | | (12,022,131 | ) | | | (8,070,548 | ) |
| | | | | | | | | | | | | | | | | |
Capital transactions: | | | | | | | | | | | | | | | | |
Institutional Class | | | | | | | | | | | | | | | | |
Proceeds from shares sold | | | 1,000,184 | | | | 600,673 | | | | 3,592,766 | | | | 10,379,630 | |
Reinvestment of distributions | | | 383,298 | | | | 313,835 | | | | 9,007,246 | | | | 6,315,049 | |
Shares redeemed | | | (16,496,527 | ) | | | (2,850,030 | ) | | | (21,774,134 | ) | | | (16,446,258 | ) |
Investor Class | | | | | | | | | | | | | | | | |
Proceeds from shares sold | | | — | | | | — | | | | 3,797,621 | | | | 1,769,405 | |
Reinvestment of distributions | | | — | | | | — | | | | 2,626,901 | | | | 1,538,484 | |
Shares redeemed | | | — | | | | — | | | | (2,990,895 | ) | | | (3,220,281 | ) |
Net increase/(decrease) in net assets from capital transactions | | | (15,113,045 | ) | | | (1,935,522 | ) | | | (5,740,495 | ) | | | 336,029 | |
Total increase/(decrease) in net assets | | | (12,499,562 | ) | | | 1,257,181 | | | | (5,157,574 | ) | | | 1,598,290 | |
| | | | | | | | | | | | | | | | | |
Net assets: | | | | | | | | | | | | | | | | |
Beginning of period | | | 23,897,030 | | | | 22,639,849 | | | | 68,051,290 | | | | 66,453,000 | |
End of period | | $ | 11,397,468 | | | $ | 23,897,030 | | | $ | 62,893,716 | | | $ | 68,051,290 | |
| | | | | | | | | | | | | | | | | |
Share transactions: | | | | | | | | | | | | | | | | |
Institutional Class | | | | | | | | | | | | | | | | |
Shares sold | | | 95,216 | | | | 64,724 | | | | 254,300 | | | | 716,103 | |
Shares reinvested | | | 36,785 | | | | 33,673 | | | | 701,499 | | | | 453,016 | |
Shares redeemed | | | (1,568,110 | ) | | | (335,011 | ) | | | (1,549,426 | ) | | | (1,129,589 | ) |
Net increase/(decrease) | | | (1,436,109 | ) | | | (236,614 | ) | | | (593,627 | ) | | | 39,530 | |
Investor Class | | | | | | | | | | | | | | | | |
Shares sold | | | — | | | | — | | | | 354,242 | | | | 143,479 | |
Shares reinvested | | | — | | | | — | | | | 258,299 | | | | 132,628 | |
Shares redeemed | | | — | | | | — | | | | (267,373 | ) | | | (267,020 | ) |
Net increase/(decrease) | | | — | | | | — | | | | 345,168 | | | | 9,087 | |
The accompanying notes are an integral part of the financial statements.
Financial Statements 2024 | 66 |
BOSTON PARTNERS INVESTMENT FUNDS | |
Statements of Changes in Net Assets (continued) | |
| | | Boston Partners
Long/Short Research Fund | | | Boston Partners
Small Cap Value Fund II | |
| | | For the
Year Ended
August 31, 2024 | | | For the
Year Ended
August 31, 2023 | | | For the
Year Ended
August 31, 2024 | | | For the
Year Ended
August 31, 2023 | |
Increase/(decrease) in net assets from operations: | | | | | | | | | | | | | | | | |
Net investment income/(loss) | | $ | 5,221,562 | | | $ | 8,419,000 | | | $ | 4,633,649 | | | $ | 6,160,708 | |
Net realized gain/(loss) from investments and foreign currencies | | | 59,371,487 | | | | 72,632,937 | | | | 80,780,984 | | | | 73,771,623 | |
Net change in unrealized appreciation/(depreciation) on investments and foreign currency translation | | | 35,531,428 | | | | (25,356,255 | ) | | | 14,384,396 | | | | (33,832,805 | ) |
Net increase/(decrease) in net assets resulting from operations | | | 100,124,477 | | | | 55,695,682 | | | | 99,799,029 | | | | 46,099,526 | |
| | | | | | | | | | | | | | | | | |
Dividends and distributions to shareholders: | | | | | | | | | | | | | | | | |
Institutional Class | | | (66,527,383 | ) | | | (144,215,120 | ) | | | (60,315,331 | ) | | | (46,030,717 | ) |
Investor Class | | | (732,348 | ) | | | (2,234,372 | ) | | | (7,258,207 | ) | | | (5,861,952 | ) |
Net decrease in net assets from dividends and distributions to shareholders | | | (67,259,731 | ) | | | (146,449,492 | ) | | | (67,573,538 | ) | | | (51,892,669 | ) |
| | | | | | | | | | | | | | | | | |
Capital transactions: | | | | | | | | | | | | | | | | |
Institutional Class | | | | | | | | | | | | | | | | |
Proceeds from shares sold | | | 119,238,251 | | | | 307,344,480 | | | | 66,178,718 | | | | 87,714,164 | |
Reinvestment of distributions | | | 32,190,431 | | | | 71,158,668 | | | | 58,874,147 | | | | 43,911,312 | |
Shares redeemed | | | (288,736,079 | ) | | | (402,250,403 | ) | | | (145,635,464 | ) | | | (282,284,621 | ) |
Investor Class | | | | | | | | | | | | | | | | |
Proceeds from shares sold | | | 1,584,296 | | | | 1,843,386 | | | | 3,760,286 | | | | 5,373,916 | |
Reinvestment of distributions | | | 731,513 | | | | 2,215,329 | | | | 7,055,068 | | | | 5,743,917 | |
Shares redeemed | | | (2,348,054 | ) | | | (7,033,192 | ) | | | (16,957,577 | ) | | | (31,265,355 | ) |
Net increase/(decrease) in net assets from capital transactions | | | (137,339,642 | ) | | | (26,721,732 | ) | | | (26,724,822 | ) | | | (170,806,667 | ) |
Total increase/(decrease) in net assets | | | (104,474,896 | ) | | | (117,475,542 | ) | | | 5,500,669 | | | | (176,599,810 | ) |
| | | | | | | | | | | | | | | | | |
Net assets: | | | | | | | | | | | | | | | | |
Beginning of period | | | 696,426,712 | | | | 813,902,254 | | | | 594,673,533 | | | | 771,273,343 | |
End of period | | $ | 591,951,816 | | | $ | 696,426,712 | | | $ | 600,174,202 | | | $ | 594,673,533 | |
| | | | | | | | | | | | | | | | | |
Share transactions: | | | | | | | | | | | | | | | | |
Institutional Class | | | | | | | | | | | | | | | | |
Shares sold | | | 8,521,172 | | | | 21,262,036 | | | | 2,513,191 | | | | 3,339,693 | |
Shares reinvested | | | 2,455,410 | | | | 5,086,395 | | | | 2,307,885 | | | | 1,711,942 | |
Shares redeemed | | | (20,947,454 | ) | | | (27,847,305 | ) | | | (5,501,460 | ) | | | (10,620,746 | ) |
Net increase/(decrease) | | | (9,970,872 | ) | | | (1,498,874 | ) | | | (680,384 | ) | | | (5,569,111 | ) |
Investor Class | | | | | | | | | | | | | | | | |
Shares sold | | | 115,490 | | | | 125,654 | | | | 151,193 | | | | 214,612 | |
Shares reinvested | | | 58,149 | | | | 164,220 | | | | 293,839 | | | | 236,278 | |
Shares redeemed | | | (175,931 | ) | | | (514,853 | ) | | | (685,234 | ) | | | (1,272,538 | ) |
Net increase/(decrease) | | | (2,292 | ) | | | (224,979 | ) | | | (240,202 | ) | | | (821,648 | ) |
The accompanying notes are an integral part of the financial statements.
Financial Statements 2024 | 67 |
BOSTON PARTNERS INVESTMENT FUNDS | |
Statements of Changes in Net Assets (continued) | |
| | | WPG Partners
Select Hedged Fund | | | WPG Partners
Select Small Cap Value Fund | |
| | | For the
Period Ended
August 31, 2024* | | | For the
Year Ended
August 31, 2024 | | | For the
Year Ended
August 31, 2023 | |
Increase/(decrease) in net assets from operations: | | | | | | | | | | | | |
Net investment income/(loss) | | $ | 372,248 | | | $ | 21,846 | | | $ | 529,691 | |
Net realized gain/(loss) from investments and foreign currencies | | | (1,926,510 | ) | | | 4,373,965 | | | | 13,714,809 | |
Net change in unrealized appreciation/(depreciation) on investments and foreign currency translation | | | 3,468,333 | | | | 10,778,980 | | | | 7,711,422 | |
Net increase/(decrease) in net assets resulting from operations | | | 1,914,071 | | | | 15,174,791 | | | | 21,955,922 | |
| | | | | | | | | | | | | |
Dividends and distributions to shareholders: | | | | | | | | | | | | |
Institutional Class | | | — | | | | (14,373,145 | ) | | | (111,741 | ) |
Net decrease in net assets from dividends and distributions to shareholders | | | — | | | | (14,373,145 | ) | | | (111,741 | ) |
| | | | | | | | | | | | | |
Capital transactions: | | | | | | | | | | | | |
Institutional Class | | | | | | | | | | | | |
Proceeds from shares sold | | | 52,528,063 | | | | 69,842,753 | | | | 74,949,673 | |
Reinvestment of distributions | | | — | | | | 14,245,244 | | | | 111,438 | |
Shares redeemed | | | (516,709 | ) | | | (68,589,373 | ) | | | (7,420,975 | ) |
Net increase/(decrease) in net assets from capital transactions | | | 52,011,354 | | | | 15,498,624 | | | | 67,640,136 | |
Total increase/(decrease) in net assets | | | 53,925,425 | | | | 16,300,270 | | | | 89,484,317 | |
| | | | | | | | | | | | | |
Net assets: | | | | | | | | | | | | |
Beginning of period | | | — | | | | 107,329,366 | | | | 17,845,049 | |
End of period | | $ | 53,925,425 | | | $ | 123,629,636 | | | $ | 107,329,366 | |
| | | | | | | | | | | | | |
Share transactions: | | | | | | | | | | | | |
Institutional Class | | | | | | | | | | | | |
Shares sold | | | 5,230,787 | | | | 6,367,546 | | | | 7,856,153 | |
Shares reinvested | | | — | | | | 1,428,811 | | | | 11,155 | |
Shares redeemed | | | (50,876 | ) | | | (6,651,263 | ) | | | (682,918 | ) |
Net increase/(decrease) | | | 5,179,911 | | | | 1,145,094 | | | | 7,184,390 | |
* The Fund commenced operations on May 3, 2024. | | | | | | | | | | | | |
The accompanying notes are an integral part of the financial statements.
Financial Statements 2024 | 68 |
BOSTON PARTNERS INVESTMENT FUNDS | |
Statements of Changes in Net Assets (concluded) | |
| | | WPG Partners
Small Cap Value Diversified Fund | |
| | | For the
Year Ended
August 31, 2024 | | | For the
Year Ended
August 31, 2023 | |
Increase/(decrease) in net assets from operations: | | | | | | | | |
Net investment income/(loss) | | $ | 253,505 | | | $ | 323,469 | |
Net realized gain/(loss) from investments and foreign currencies | | | 1,848,956 | | | | 1,888,510 | |
Net change in unrealized appreciation/(depreciation) on investments and foreign currency translation | | | 3,647,651 | | | | 885,261 | |
Net increase/(decrease) in net assets resulting from operations | | | 5,750,112 | | | | 3,097,240 | |
| | | | | | | | | |
Dividends and distributions to shareholders: | | | | | | | | |
Institutional Class | | | (2,113,959 | ) | | | (4,669,593 | ) |
Net decrease in net assets from dividends and distributions to shareholders | | | (2,113,959 | ) | | | (4,669,593 | ) |
| | | | | | | | | |
Capital transactions: | | | | | | | | |
Institutional Class | | | | | | | | |
Proceeds from shares sold | | | 863,166 | | | | 1,560,898 | |
Reinvestment of distributions | | | 1,990,247 | | | | 4,416,593 | |
Shares redeemed | | | (2,674,828 | ) | | | (7,405,913 | ) |
Net increase/(decrease) in net assets from capital transactions | | | 178,585 | | | | (1,428,422 | ) |
Total increase/(decrease) in net assets | | | 3,814,738 | | | | (3,000,775 | ) |
| | | | | | | | | |
Net assets: | | | | | | | | |
Beginning of period | | | 29,263,415 | | | | 32,264,190 | |
End of period | | $ | 33,078,153 | | | $ | 29,263,415 | |
| | | | | | | | | |
Share transactions: | | | | | | | | |
Institutional Class | | | | | | | | |
Shares sold | | | 44,741 | | | | 83,597 | |
Shares reinvested | | | 109,055 | | | | 253,245 | |
Shares redeemed | | | (143,343 | ) | | | (400,952 | ) |
Net increase/(decrease) | | | 10,453 | | | | (64,110 | ) |
The accompanying notes are an integral part of the financial statements.
Financial Statements 2024 | 69 |
BOSTON PARTNERS INVESTMENT FUNDS | |
Financial Highlights | Per Share Operating Performance |
Contained below is per share operating performance data for each class of shares outstanding, total investment return, ratios to average net assets and other supplemental data for the respective periods. This information has been derived from information provided in the financial statements.
| | Net Asset
Value,
Beginning
of Period | | | Net
Investment
Income/
(Loss)* | | | Net Realized
and
Unrealized
Gain/
(Loss) on
Investments | | | Net Increase/
(Decrease)
in Net Assets
Resulting
from
Operations | | | Dividends to
Shareholders
from Net
Investment
Income | | | Distributions
to
Shareholders
from Net
Realized
Gains | | | Total
Dividend and
Distributions
to
Shareholders | |
Boston Partners All-Cap Value Fund | | | | | | | | | | | | | | | | | | | | | | | | |
Institutional Class | | | | | | | | | | | | | | | | | | | | | | | | | | | | |
8/31/24 | | $ | 31.76 | | | $ | 0.30 | | | $ | 5.29 | | | $ | 5.59 | | | $ | (0.52 | ) | | $ | (2.86 | ) | | $ | (3.38 | ) |
8/31/23 | | | 30.78 | | | | 0.41 | | | | 3.16 | | | | 3.57 | | | | (0.31 | ) | | | (2.28 | ) | | | (2.59 | ) |
8/31/22 | | | 33.77 | | | | 0.33 | | | | (1.51 | ) | | | (1.18 | ) | | | (0.33 | ) | | | (1.48 | ) | | | (1.81 | ) |
8/31/21 | | | 24.53 | | | | 0.26 | | | | 9.43 | | | | 9.69 | | | | (0.21 | ) | | | (0.24 | ) | | | (0.45 | ) |
8/31/20 | | | 24.97 | | | | 0.36 | | | | (0.08 | ) | | | 0.28 | | | | (0.37 | ) | | | (0.35 | ) | | | (0.72 | ) |
Investor Class | | | | | | | | | | | | | | | | | | | | | | | | | | | | |
8/31/24 | | $ | 31.53 | | | $ | 0.22 | | | $ | 5.26 | | | $ | 5.48 | | | $ | (0.44 | ) | | $ | (2.86 | ) | | $ | (3.30 | ) |
8/31/23 | | | 30.58 | | | | 0.33 | | | | 3.13 | | | | 3.46 | | | | (0.23 | ) | | | (2.28 | ) | | | (2.51 | ) |
8/31/22 | | | 33.56 | | | | 0.25 | | | | (1.51 | ) | | | (1.26 | ) | | | (0.24 | ) | | | (1.48 | ) | | | (1.72 | ) |
8/31/21 | | | 24.39 | | | | 0.18 | | | | 9.38 | | | | 9.56 | | | | (0.15 | ) | | | (0.24 | ) | | | (0.39 | ) |
8/31/20 | | | 24.82 | | | | 0.30 | | | | (0.09 | ) | | | 0.21 | | | | (0.29 | ) | | | (0.35 | ) | | | (0.64 | ) |
Boston Partners Emerging Markets Dynamic Equity Fund | | | | | | | | | | | | | | | | | | | | |
Institutional Class | | | | | | | | | | | | | | | | | | | | | | | | | | | | |
8/31/24 | | $ | 8.62 | | | $ | 0.16 | | | $ | (0.07 | ) | | $ | 0.09 | | | $ | — | | | $ | — | | | $ | — | |
8/31/23 | | | 10.23 | | | | 0.13 | | | | 0.27 | | | | 0.40 | | | | (2.01 | ) | | | — | | | | (2.01 | ) |
8/31/22 | | | 11.44 | | | | 0.07 | | | | (1.27 | ) | | | (1.20 | ) | | | (0.01 | ) | | | — | | | | (0.01 | ) |
8/31/21 | | | 11.23 | | | | (0.02 | ) | | | 1.17 | | | | 1.15 | | | | (0.94 | ) | | | — | | | | (0.94 | ) |
8/31/20 | | | 10.45 | | | | 0.19 | | | | 0.82 | | | | 1.01 | | | | (0.23 | ) | | | — | | | | (0.23 | ) |
Boston Partners Global Equity Fund | | | | | | | | | | | | | | | | | | | | | | | | |
Institutional Class | | | | | | | | | | | | | | | | | | | | | | | | | | | | |
8/31/24 | | $ | 21.23 | | | $ | 0.45 | | | $ | 4.19 | | | $ | 4.64 | | | $ | (0.43 | ) | | $ | — | | | $ | (0.43 | ) |
8/31/23 | | | 18.69 | | | | 0.45 | | | | 2.39 | | | | 2.84 | | | | (0.30 | ) | | | — | | | | (0.30 | ) |
8/31/22 | | | 20.74 | | | | 0.39 | | | | (2.08 | ) | | | (1.69 | ) | | | (0.36 | ) | | | — | | | | (0.36 | ) |
8/31/21 | | | 15.15 | | | | 0.25 | | | | 5.69 | | | | 5.94 | | | | (0.35 | ) | | | — | | | | (0.35 | ) |
8/31/20 | | | 15.91 | | | | 0.15 | | | | (0.67 | ) | | | (0.52 | ) | | | (0.24 | ) | | | — | | | | (0.24 | ) |
* | Calculated based on average shares outstanding for the period. |
The accompanying notes are an integral part of the financial statements.
Financial Statements 2024 | 70 |
BOSTON PARTNERS INVESTMENT FUNDS | |
Financial HIghlights (continued) | Per Share Operating Performance |
| | Net Asset
Value, End
of Period | | | Total
Investment
Return1 | | | Net Assets,
End of Period
(000) | | | Ratio of Expenses
to Average
Net Assets
With Waivers,
Reimbursements
and Recoupment
if any2 | | | Ratio of Expenses
to Average
Net Assets
With Waivers,
Reimbursements
and Recoupments
if any (Excluding
Dividend and
Interest Expense) | | | Ratio of Expenses
to Average Net
Assets Without
Waivers,
Reimbursements
and Recoupments
if any | | | Ratio of Net
Investment
Income/(Loss)
to Average Net
Assets With
Waivers and
Reimbursements | | | Portfolio
Turnover Rate | |
| | | | | | | | | | | | | | | | | | | | | | | | | | | | | | | | |
| | | | | | | | | | | | | | | | | | | | | | | | | | | | | | | | |
| | $ | 33.97 | | | | 19.04 | % | | $ | 1,272,666 | | | | 0.80 | % | | | N/A | | | | 0.85 | % | | | 0.96 | % | | | 24 | % |
| | | 31.76 | | | | 12.00 | | | | 1,164,397 | | | | 0.80 | | | | N/A | | | | 0.84 | | | | 1.35 | | | | 33 | |
| | | 30.78 | | | | (3.76 | ) | | | 1,200,629 | | | | 0.80 | | | | N/A | | | | 0.86 | | | | 1.00 | | | | 29 | |
| | | 33.77 | | | | 39.91 | | | | 1,653,698 | | | | 0.80 | | | | N/A | | | | 0.83 | | | | 0.86 | | | | 33 | |
| | | 24.53 | | | | 0.84 | | | | 1,053,301 | | | | 0.80 | | | | N/A | | | | 0.84 | | | | 1.46 | | | | 37 | |
| | | | | | | | | | | | | | | | | | | | | | | | | | | | | | | | |
| | $ | 33.71 | | | | 18.77 | % | | $ | 220,298 | | | | 1.05 | % | | | N/A | | | | 1.10 | % | | | 0.71 | % | | | 24 | % |
| | | 31.53 | | | | 11.68 | | | | 228,631 | | | | 1.05 | | | | N/A | | | | 1.09 | | | | 1.10 | | | | 33 | |
| | | 30.58 | | | | (4.00 | ) | | | 230,437 | | | | 1.05 | | | | N/A | | | | 1.11 | | | | 0.75 | | | | 29 | |
| | | 33.56 | | | | 39.57 | | | | 279,306 | | | | 1.05 | | | | N/A | | | | 1.08 | | | | 0.61 | | | | 33 | |
| | | 24.39 | | | | 0.59 | | | | 220,927 | | | | 1.05 | | | | N/A | | | | 1.09 | | | | 1.21 | | | | 37 | |
| | | | | | | | | | | | | | | | | | | | | | | | | | | | | | | | |
| | | | | | | | | | | | | | | | | | | | | | | | | | | | | | | | |
| | $ | 8.71 | | | | 1.04 | % | | $ | 59,968 | | | | 1.45 | % | | | 1.40 | % | | | 1.63 | % | | | 1.74 | % | | | 202 | % |
| | | 8.62 | | | | 4.98 | | | | 61,825 | | | | 1.42 | | | | 1.40 | | | | 1.67 | | | | 1.52 | | | | 132 | |
| | | 10.23 | | | | (10.52 | ) | | | 60,616 | | | | 1.42 | | | | 1.40 | | | | 1.73 | | | | 0.63 | | | | 136 | |
| | | 11.44 | | | | 10.38 | | | | 61,430 | | | | 1.75 | | | | 1.40 | | | | 2.00 | | | | (0.14 | ) | | | 125 | |
| | | 11.23 | | | | 9.75 | | | | 60,176 | | | | 1.66 | | | | 1.49 | | | | 2.19 | | | | 1.81 | | | | 219 | |
| | | | | | | | | | | | | | | | | | | | | | | | | | | | | | | | |
| | | | | | | | | | | | | | | | | | | | | | | | | | | | | | | | |
| | $ | 25.44 | | | | 22.17 | % | | $ | 244,647 | | | | 0.95 | % | | | N/A | | | | 1.11 | % | | | 1.98 | % | | | 48 | % |
| | | 21.23 | | | | 15.28 | | | | 212,164 | | | | 0.95 | | | | N/A | | | | 1.11 | | | | 2.20 | | | | 51 | |
| | | 18.69 | | | | (8.27 | ) | | | 171,407 | | | | 0.95 | | | | N/A | | | | 1.13 | | | | 1.94 | | | | 59 | |
| | | 20.74 | | | | 39.66 | | | | 183,433 | | | | 0.95 | | | | N/A | | | | 1.04 | | | | 1.38 | | | | 88 | |
| | | 15.15 | | | | (3.40 | ) | | | 177,470 | | | | 0.95 | | | | N/A | | | | 1.22 | | | | 0.96 | | | | 118 | |
1 | Total return is calculated by assuming a purchase of shares on the first day and a sale of shares on the last day of the period and is not annualized if period is less than one year. |
2 | Beginning on September 1, 2018, the expense limitation includes acquired fund fees and expenses (AFFE). AFFE are not reflected as expenses in these financial statements and therefore this may cause the net expense ratios after waivers/reimbursements to be lower than the expense limitation in place. |
The accompanying notes are an integral part of the financial statements.
Financial Statements 2024 | 71 |
BOSTON PARTNERS INVESTMENT FUNDS | |
Financial HIghlights (continued) | Per Share Operating Performance |
Contained below is per share operating performance data for each class of shares outstanding, total investment return, ratios to average net assets and other supplemental data for the respective periods. This information has been derived from information provided in the financial statements.
| | Net Asset
Value,
Beginning
of Period | | | Net
Investment
Income/
(Loss)* | | | Net Realized
and
Unrealized
Gain/
(Loss) on
Investments | | | Net Increase/
(Decrease)
in Net Assets
Resulting
from
Operations | | | Dividends to
Shareholders
from Net
Investment
Income | | | Distributions
to
Shareholders
from Net
Realized
Gains | | | Total
Dividend and
Distributions
to
Shareholders | |
Boston Partners Global Long/Short Fund | | | | | | | | | | | | | | | | | | | | | | | | |
Institutional Class | | | | | | | | | | | | | | | | | | | | | | | | | | | | |
8/31/24 | | $ | 14.74 | | | $ | 0.17 | | | $ | 2.36 | | | $ | 2.53 | | | $ | (0.22 | ) | | $ | — | | | $ | (0.22 | ) |
8/31/23 | | | 13.65 | | | | 0.19 | | | | 1.22 | | | | 1.41 | | | | (0.32 | ) | | | — | | | | (0.32 | ) |
8/31/22 | | | 12.18 | | | | 0.05 | | | | 1.42 | | | | 1.47 | | | | — | | | | — | | | | — | |
8/31/21 | | | 9.72 | | | | (0.01 | ) | | | 2.48 | | | | 2.47 | | | | (0.01 | ) | | | — | | | | (0.01 | ) |
8/31/20 | | | 10.74 | | | | 0.01 | | | | (0.89 | ) | | | (0.88 | ) | | | (0.14 | ) | | | — | | | | (0.14 | ) |
Investor Class | | | | | | | | | | | | | | | | | | | | | | | | | | | | |
8/31/24 | | $ | 14.48 | | | $ | 0.14 | | | $ | 2.30 | | | $ | 2.44 | | | $ | (0.20 | ) | | $ | — | | | $ | (0.20 | ) |
8/31/23 | | | 13.43 | | | | 0.15 | | | | 1.20 | | | | 1.35 | | | | (0.30 | ) | | | — | | | | (0.30 | ) |
8/31/22 | | | 12.01 | | | | 0.01 | | | | 1.41 | | | | 1.42 | | | | — | | | | — | | | | — | |
8/31/21 | | | 9.61 | | | | (0.03 | ) | | | 2.43 | | | | 2.40 | | | | — | | | | — | | | | — | |
8/31/20 | | | 10.61 | | | | (0.02 | ) | | | (0.88 | ) | | | (0.90 | ) | | | (0.10 | ) | | | — | | | | (0.10 | ) |
Boston Partners Global Sustainability Fund | | | | | | | | | | | | | | | | | | | | | | | | |
Institutional Class | | | | | | | | | | | | | | | | | | | | | | | | | | | | |
8/31/24 | | $ | 10.00 | | | $ | 0.13 | | | $ | 1.98 | | | $ | 2.11 | | | $ | (0.16 | ) | | $ | — | | | $ | (0.16 | ) |
8/31/23 | | | 8.62 | | | | 0.17 | | | | 1.35 | | | | 1.52 | | | | (0.14 | ) | | | — | | | | (0.14 | ) |
12/29/21** through 8/31/22 | | | 10.00 | | | | 0.11 | | | | (1.49 | ) | | | (1.38 | ) | | | — | | | | — | | | | — | |
Boston Partners Long/Short Equity Fund | | | | | | | | | | | | | | | | | | | | | | | | |
Institutional Class | | | | | | | | | | | | | | | | | | | | | | | | | | | | |
8/31/24 | | $ | 14.99 | | | $ | 0.06 | | | $ | 2.96 | | | $ | 3.02 | | | $ | (0.27 | ) | | $ | (2.70 | ) | | $ | (2.97 | ) |
8/31/23 | | | 14.73 | | | | 0.07 | | | | 1.96 | | | | 2.03 | | | | — | | | | (1.77 | ) | | | (1.77 | ) |
8/31/22 | | | 14.21 | | | | (0.13 | ) | | | 1.29 | | | | 1.16 | | | | — | | | | (0.64 | ) | | | (0.64 | ) |
8/31/21 | | | 15.15 | | | | (0.12 | ) | | | 3.69 | | | | 3.57 | | | | — | | | | (4.51 | ) | | | (4.51 | ) |
8/31/20 | | | 17.74 | | | | (0.14 | ) | | | (0.70 | ) | | | (0.84 | ) | | | — | | | | (1.75 | ) | | | (1.75 | ) |
Investor Class | | | | | | | | | | | | | | | | | | | | | | | | | | | | |
8/31/24 | | $ | 12.45 | | | $ | 0.02 | | | $ | 2.38 | | | $ | 2.40 | | | $ | (0.25 | ) | | $ | (2.70 | ) | | $ | (2.95 | ) |
8/31/23 | | | 12.54 | | | | 0.03 | | | | 1.65 | | | | 1.68 | | | | — | | | | (1.77 | ) | | | (1.77 | ) |
8/31/22 | | | 12.22 | | | | (0.14 | ) | | | 1.10 | | | | 0.96 | | | | — | | | | (0.64 | ) | | | (0.64 | ) |
8/31/21 | | | 13.64 | | | | (0.14 | ) | | | 3.23 | | | | 3.09 | | | | — | | | | (4.51 | ) | | | (4.51 | ) |
8/31/20 | | | 16.17 | | | | (0.16 | ) | | | (0.62 | ) | | | (0.78 | ) | | | — | | | | (1.75 | ) | | | (1.75 | ) |
* | Calculated based on average shares outstanding. |
** | Commencement of operations. |
The accompanying notes are an integral part of the financial statements.
Financial Statements 2024 | 72 |
BOSTON PARTNERS INVESTMENT FUNDS | |
Financial HIghlights (continued) | Per Share Operating Performance |
| | Net Asset
Value, End
of Period | | | Total
Investment
Return1 | | | Net Assets,
End of Period
(000) | | | Ratio of Expenses
to Average
Net Assets
With Waivers,
Reimbursements
and Recoupment
if any2 | | | Ratio of Expenses
to Average
Net Assets
With Waivers,
Reimbursements
and Recoupments
if any (Excluding
Dividend and
Interest Expense) | | | Ratio of Expenses
to Average Net
Assets Without
Waivers,
Reimbursements
and Recoupments
if any | | | Ratio of Net
Investment
Income/(Loss)
to Average Net
Assets With
Waivers and
Reimbursements | | | Portfolio
Turnover Rate | |
| | | | | | | | | | | | | | | | | | | | | | | | | | | | | | | | |
| | | | | | | | | | | | | | | | | | | | | | | | | | | | | | | | |
| | $ | 17.05 | | | | 17.38 | % | | $ | 164,903 | | | | 1.78 | % | | | 1.78 | % | | | 1.78 | % | | | 1.09 | % | | | 198 | % |
| | | 14.74 | | | | 10.38 | | | | 145,192 | | | | 2.39 | | | | 1.80 | | | | 2.39 | | | | 1.34 | | | | 172 | |
| | | 13.65 | | | | 12.07 | | | | 115,079 | | | | 2.56 | | | | 1.81 | | | | 2.56 | | | | 0.34 | | | | 161 | |
| | | 12.18 | | | | 25.39 | | | | 102,691 | | | | 2.29 | | | | 1.83 | | | | 2.29 | | | | (0.07 | ) | | | 102 | |
| | | 9.72 | | | | (8.30 | ) | | | 130,857 | | | | 2.46 | | | | 1.75 | | | | 2.46 | | | | 0.07 | | | | 125 | |
| | | | | | | | | | | | | | | | | | | | | | | | | | | | | | | | |
| | $ | 16.72 | | | | 17.02 | % | | $ | 13,745 | | | | 2.03 | % | | | 2.03 | % | | | 2.03 | % | | | 0.84 | % | | | 198 | % |
| | | 14.48 | | | | 10.16 | | | | 9,108 | | | | 2.64 | | | | 2.05 | | | | 2.64 | | | | 1.09 | | | | 172 | |
| | | 13.43 | | | | 11.82 | | | | 6,159 | | | | 2.81 | | | | 2.06 | | | | 2.81 | | | | 0.09 | | | | 161 | |
| | | 12.01 | | | | 24.97 | | | | 4,960 | | | | 2.54 | | | | 2.08 | | | | 2.54 | | | | (0.32 | ) | | | 102 | |
| | | 9.61 | | | | (8.55 | ) | | | 6,308 | | | | 2.71 | | | | 2.00 | | | | 2.71 | | | | (0.18 | ) | | | 125 | |
| | | | | | | | | | | | | | | | | | | | | | | | | | | | | | | | |
| | | | | | | | | | | | | | | | | | | | | | | | | | | | | | | | |
| | $ | 11.95 | | | | 21.34 | % | | $ | 11,397 | | | | 0.90 | % | | | N/A | | | | 1.53 | % | | | 1.23 | % | | | 73 | % |
| | | 10.00 | | | | 17.71 | | | | 23,897 | | | | 0.90 | | | | N/A | | | | 1.36 | | | | 1.80 | | | | 77 | |
| | | 8.62 | | | | (13.80 | ) | | | 22,640 | | | | 0.90 | 3 | | | N/A | | | | 1.73 | 3 | | | 1.75 | 3 | | | 55 | 4 |
| | | | | | | | | | | | | | | | | | | | | | | | | | | | | | | | |
| | | | | | | | | | | | | | | | | | | | | | | | | | | | | | | | |
| | $ | 15.04 | | | | 23.51 | % | | $ | 47,563 | | | | 2.04 | % | | | 1.96 | % | | | 2.72 | % | | | 0.43 | % | | | 35 | % |
| | | 14.99 | | | | 14.69 | | | | 56,303 | | | | 2.02 | | | | 1.96 | | | | 2.67 | | | | 0.50 | | | | 44 | |
| | | 14.73 | | | | 8.35 | | | | 54,733 | | | | 2.55 | | | | 1.96 | | | | 3.18 | | | | (0.87 | ) | | | 40 | |
| | | 14.21 | | | | 29.08 | | | | 49,551 | | | | 2.60 | | | | 1.97 | | | | 3.14 | | | | (0.91 | ) | | | 31 | |
| | | 15.15 | | | | (5.78 | ) | | | 68,780 | | | | 2.57 | | | | 2.25 | | | | 2.74 | | | | (0.81 | ) | | | 46 | |
| | | | | | | | | | | | | | | | | | | | | | | | | | | | | | | | |
| | $ | 11.90 | | | | 23.26 | % | | $ | 15,331 | | | | 2.29 | % | | | 2.21 | % | | | 2.97 | % | | | 0.18 | % | | | 35 | % |
| | | 12.45 | | | | 14.44 | | | | 11,748 | | | | 2.27 | | | | 2.21 | | | | 2.92 | | | | 0.25 | | | | 44 | |
| | | 12.54 | | | | 8.07 | | | | 11,720 | | | | 2.80 | | | | 2.21 | | | | 3.43 | | | | (1.12 | ) | | | 40 | |
| | | 12.22 | | | | 28.71 | | | | 11,571 | | | | 2.85 | | | | 2.22 | | | | 3.39 | | | | (1.16 | ) | | | 31 | |
| | | 13.64 | | | | (5.99 | ) | | | 14,484 | | | | 2.82 | | | | 2.50 | | | | 2.99 | | | | (1.06 | ) | | | 46 | |
1 | Total return is calculated by assuming a purchase of shares on the first day and a sale of shares on the last day of the period and is not annualized if period is less than one year. |
2 | Beginning on September 1, 2018, the expense limitation includes acquired fund fees and expenses (AFFE). AFFE are not reflected as expenses in these financial statements and therefore this may cause the net expense ratios after waivers/reimbursements to be lower than the expense limitation in place. |
The accompanying notes are an integral part of the financial statements.
Financial Statements 2024 | 73 |
BOSTON PARTNERS INVESTMENT FUNDS | |
Financial HIghlights (continued) | Per Share Operating Performance |
Contained below is per share operating performance data for each class of shares outstanding, total investment return, ratios to average net assets and other supplemental data for the respective periods. This information has been derived from information provided in the financial statements.
| | Net Asset
Value,
Beginning
of Period | | | Net
Investment
Income/
(Loss)* | | | Net Realized
and
Unrealized
Gain/
(Loss) on
Investments | | | Net Increase/
(Decrease)
in Net Assets
Resulting
from
Operations | | | Dividends to
Shareholders
from Net
Investment
Income | | | Distributions
to
Shareholders
from Net
Realized
Gains | | | Total
Dividend and
Distributions
to
Shareholders | |
Boston Partners Long/Short Research Fund | | | | | | | | | | | | | | | | | | | | | | | | |
Institutional Class | | | | | | | | | | | | | | | | | | | | | | | | | | | | |
8/31/24 | | $ | 14.15 | | | $ | 0.12 | | | $ | 2.32 | | | $ | 2.44 | | | $ | (0.34 | ) | | $ | (1.16 | ) | | $ | (1.50 | ) |
8/31/23 | | | 15.98 | | | | 0.16 | | | | 0.95 | | | | 1.11 | | | | (0.22 | ) | | | (2.72 | ) | | | (2.94 | ) |
8/31/22 | | | 16.82 | | | | (0.02 | ) | | | 1.18 | | | | 1.16 | | | | — | | | | (2.00 | ) | | | (2.00 | ) |
8/31/21 | | | 13.31 | | | | (0.10 | ) | | | 3.61 | | | | 3.51 | | | | — | | | | — | | | | — | |
8/31/20 | | | 15.15 | | | | (0.00 | ) | | | (1.48 | ) | | | (1.48 | ) | | | (0.21 | ) | | | (0.15 | ) | | | (0.36 | ) |
Investor Class | | | | | | | | | | | | | | | | | | | | | | | | | | | | |
8/31/24 | | $ | 13.62 | | | $ | 0.09 | | | $ | 2.21 | | | $ | 2.30 | | | $ | (0.31 | ) | | $ | (1.16 | ) | | $ | (1.47 | ) |
8/31/23 | | | 15.48 | | | | 0.12 | | | | 0.92 | | | | 1.04 | | | | (0.18 | ) | | | (2.72 | ) | | | (2.90 | ) |
8/31/22 | | | 16.39 | | | | (0.05 | ) | | | 1.14 | | | | 1.09 | | | | — | | | | (2.00 | ) | | | (2.00 | ) |
8/31/21 | | | 13.01 | | | | (0.13 | ) | | | 3.51 | | | | 3.38 | | | | — | | | | — | | | | — | |
8/31/20 | | | 14.81 | | | | (0.04 | ) | | | (1.44 | ) | | | (1.48 | ) | | | (0.17 | ) | | | (0.15 | ) | | | (0.32 | ) |
Boston Partners Small Cap Value Fund II | | | | | | | | | | | | | | | | | | | | | | | | |
Institutional Class | | | | | | | | | | | | | | | | | | | | | | | | | | | | |
8/31/24 | | $ | 27.43 | | | $ | 0.22 | | | $ | 4.57 | | | $ | 4.79 | | | $ | (0.25 | ) | | $ | (3.06 | ) | | $ | (3.31 | ) |
8/31/23 | | | 27.51 | | | | 0.24 | | | | 1.60 | | | | 1.84 | | | | (0.26 | ) | | | (1.66 | ) | | | (1.92 | ) |
8/31/22 | | | 32.34 | | | | 0.18 | | | | (2.86 | ) | | | (2.68 | ) | | | (0.12 | ) | | | (2.03 | ) | | | (2.15 | ) |
8/31/21 | | | 21.06 | | | | 0.15 | | | | 11.27 | | | | 11.42 | | | | (0.14 | ) | | | — | | | | (0.14 | ) |
8/31/20 | | | 23.42 | | | | 0.20 | | | | (1.94 | ) | | | (1.74 | ) | | | (0.28 | ) | | | (0.34 | ) | | | (0.62 | ) |
Investor Class | | | | | | | | | | | | | | | | | | | | | | | | | | | | |
8/31/24 | | $ | 25.95 | | | $ | 0.15 | | | $ | 4.30 | | | $ | 4.45 | | | $ | (0.18 | ) | | $ | (3.06 | ) | | $ | (3.24 | ) |
8/31/23 | | | 26.12 | | | | 0.17 | | | | 1.51 | | | | 1.68 | | | | (0.19 | ) | | | (1.66 | ) | | | (1.85 | ) |
8/31/22 | | | 30.81 | | | | 0.10 | | | | (2.72 | ) | | | (2.62 | ) | | | (0.04 | ) | | | (2.03 | ) | | | (2.07 | ) |
8/31/21 | | | 20.07 | | | | 0.07 | | | | 10.75 | | | | 10.82 | | | | (0.08 | ) | | | — | | | | (0.08 | ) |
8/31/20 | | | 22.33 | | | | 0.15 | | | | (1.85 | ) | | | (1.70 | ) | | | (0.22 | ) | | | (0.34 | ) | | | (0.56 | ) |
WPG Partners Select Hedged Fund | | | | | | | | | | | | | | | | | | | | | | | | |
Institutional Class | | | | | | | | | | | | | | | | | | | | | | | | | | | | |
5/3/24** through 8/31/24 | | $ | 10.00 | | | $ | 0.08 | | | $ | 1.88 | | | $ | 1.96 | | | $ | (0.06 | ) | | $ | (1.49 | ) | | $ | (1.55 | ) |
WPG Partners Select Small Cap Value Fund | | | | | | | | | | | | | | | | | | | | | | | | |
Institutional Class | | | | | | | | | | | | | | | | | | | | | | | | | | | | |
8/31/24 | | $ | 11.82 | | | $ | — | | | $ | 1.82 | | | $ | 1.82 | | | $ | (0.06 | ) | | $ | (1.49 | ) | | $ | (1.55 | ) |
8/31/23 | | | 9.40 | | | | 0.07 | | | | 2.37 | | | | 2.44 | | | | — | | | | (0.02 | ) | | | (0.02 | ) |
12/29/21** through 8/31/22 | | | 10.00 | | | | (0.01 | ) | | | (0.59 | ) | | | (0.60 | ) | | | — | | | | — | | | | — | |
WPG Partners Small Cap Value Diversified Fund | | | | | | | | | | | | | | | | | | | | | | | | |
Institutional Class | | | | | | | | | | | | | | | | | | | | | | | | | | | | |
8/31/24 | | $ | 18.81 | | | $ | 0.16 | | | $ | 3.56 | | | $ | 3.72 | | | $ | (0.21 | ) | | $ | (1.19 | ) | | $ | (1.40 | ) |
8/31/23 | | | 19.92 | | | | 0.20 | | | | 1.80 | | | | 2.00 | | | | (0.09 | ) | | | (3.02 | ) | | | (3.11 | ) |
8/31/22 | | | 19.33 | | | | 0.09 | | | | 0.80 | | | | 0.89 | | | | (0.07 | ) | | | (0.23 | ) | | | (0.30 | ) |
8/31/21 | | | 11.96 | | | | 0.07 | | | | 7.39 | | | | 7.46 | | | | (0.09 | ) | | | — | | | | (0.09 | ) |
8/31/20 | | | 13.19 | | | | 0.09 | | | | (1.26 | ) | | | (1.17 | ) | | | (0.06 | ) | | | — | | | | (0.06 | ) |
* | Calculated based on average shares outstanding, unless otherwise noted. |
** | Commencement of operations. |
The accompanying notes are an integral part of the financial statements.
Financial Statements 2024 | 74 |
BOSTON PARTNERS INVESTMENT FUNDS | |
Financial HIghlights (concluded) | Per Share Operating Performance |
| | Net Asset
Value, End
of Period | | | Total
Investment
Return1 | | | Net Assets,
End of Period
(000) | | | Ratio of Expenses
to Average
Net Assets
With Waivers,
Reimbursements
and Recoupment
if any2 | | | Ratio of Expenses
to Average
Net Assets
With Waivers,
Reimbursements
and Recoupments
if any (Excluding
Dividend and
Interest Expense) | | | Ratio of Expenses
to Average Net
Assets Without
Waivers,
Reimbursements
and Recoupments
if any | | | Ratio of Net
Investment
Income/(Loss)
to Average Net
Assets With
Waivers and
Reimbursements | | | Portfolio
Turnover Rate | |
| | | | | | | | | | | | | | | | | | | | | | | | | | | | | | | | |
| | | | | | | | | | | | | | | | | | | | | | | | | | | | | | | | |
| | $ | 15.09 | | | | 18.79 | % | | $ | 584,044 | | | | 1.90 | % | | | 1.40 | % | | | 1.90 | % | | | 0.88 | % | | | 53 | % |
| | | 14.15 | | | | 7.16 | | | | 688,944 | | | | 1.88 | | | | 1.40 | | | | 1.88 | | | | 1.12 | | | | 54 | |
| | | 15.98 | | | | 7.17 | | | | 801,913 | | | | 1.95 | | | | 1.40 | | | | 1.95 | | | | (0.10 | ) | | | 85 | |
| | | 16.82 | | | | 26.37 | | | | 808,565 | | | | 2.15 | | | | 1.40 | | | | 2.15 | | | | (0.66 | ) | | | 61 | |
| | | 13.31 | | | | (10.13 | ) | | | 1,082,963 | | | | 2.21 | | | | 1.37 | | | | 2.21 | | | | (0.01 | ) | | | 66 | |
| | | | | | | | | | | | | | | | | | | | | | | | | | | | | | | | |
| | $ | 14.45 | | | | 18.43 | % | | $ | 7,907 | | | | 2.15 | % | | | 1.65 | % | | | 2.15 | % | | | 0.63 | % | | | 53 | % |
| | | 13.62 | | | | 6.92 | | | | 7,483 | | | | 2.13 | | | | 1.65 | | | | 2.13 | | | | 0.87 | | | | 54 | |
| | | 15.48 | | | | 6.91 | | | | 11,989 | | | | 2.20 | | | | 1.65 | | | | 2.20 | | | | (0.35 | ) | | | 85 | |
| | | 16.39 | | | | 25.98 | | | | 10,220 | | | | 2.40 | | | | 1.65 | | | | 2.40 | | | | (0.91 | ) | | | 61 | |
| | | 13.01 | | | | (10.32 | ) | | | 24,436 | | | | 2.46 | | | | 1.62 | | | | 2.46 | | | | (0.26 | ) | | | 66 | |
| | | | | | | | | | | | | | | | | | | | | | | | | | | | | | | | |
| | | | | | | | | | | | | | | | | | | | | | | | | | | | | | | | |
| | $ | 28.91 | | | | 19.09 | % | | $ | 542,807 | | | | 0.99 | % | | | N/A | | | | 1.03 | % | | | 0.84 | % | | | 55 | % |
| | | 27.43 | | | | 7.17 | | | | 533,633 | | | | 0.99 | | | | N/A | | | | 1.04 | | | | 0.91 | | | | 65 | |
| | | 27.51 | | | | (8.88 | ) | | | 688,375 | | | | 0.99 | | | | N/A | | | | 1.02 | | | | 0.61 | | | | 24 | |
| | | 32.34 | | | | 54.40 | | | | 776,442 | | | | 0.99 | | | | N/A | | | | 1.01 | | | | 0.52 | | | | 33 | |
| | | 21.06 | | | | (7.88 | ) | | | 503,349 | | | | 1.07 | | | | N/A | | | | 1.09 | | | | 0.94 | | | | 46 | |
| | | | | | | | | | | | | | | | | | | | | | | | | | | | | | | | |
| | $ | 27.16 | | | | 18.80 | % | | $ | 57,367 | | | | 1.24 | % | | | N/A | | | | 1.28 | % | | | 0.59 | % | | | 55 | % |
| | | 25.95 | | | | 6.90 | | | | 61,041 | | | | 1.24 | | | | N/A | | | | 1.29 | | | | 0.66 | | | | 65 | |
| | | 26.12 | | | | (9.11 | ) | | | 82,898 | | | | 1.24 | | | | N/A | | | | 1.27 | | | | 0.36 | | | | 24 | |
| | | 30.81 | | | | 54.01 | | | | 104,282 | | | | 1.24 | | | | N/A | | | | 1.26 | | | | 0.27 | | | | 33 | |
| | | 20.07 | | | | (8.07 | ) | | | 77,032 | | | | 1.32 | | | | N/A | | | | 1.34 | | | | 0.69 | | | | 46 | |
| | | | | | | | | | | | | | | | | | | | | | | | | | | | | | | | |
| | | | | | | | | | | | | | | | | | | | | | | | | | | | | | | | |
| | $ | 10.41 | | | | 4.10 | % | | $ | 53,925 | | | | 2.54 | %3 | | | 1.50 | % | | | 2.82 | %3 | | | 2.29 | %3 | | | 36 | %4 |
| | | | | | | | | | | | | | | | | | | | | | | | | | | | | | | | |
| | | | | | | | | | | | | | | | | | | | | | | | | | | | | | | | |
| | $ | 12.09 | | | | 18.12 | % | | $ | 123,630 | | | | 1.10 | % | | | N/A | | | | 1.13 | % | | | 0.02 | % | | | 160 | % |
| | | 11.82 | | | | 25.94 | | | | 107,329 | | | | 1.10 | | | | N/A | | | | 1.16 | | | | 0.65 | | | | 118 | |
| | | 9.40 | | | | (6.00 | ) | | | 17,845 | | | | 1.10 | 3 | | | N/A | | | | 2.93 | 3 | | | (0.22 | )3 | | | 70 | 4 |
| | | | | | | | | | | | | | | | | | | | | | | | | | | | | | | | |
| | | | | | | | | | | | | | | | | | | | | | | | | | | | | | | | |
| | $ | 21.13 | | | | 20.99 | % | | $ | 33,078 | | | | 1.10 | % | | | N/A | | | | 1.27 | % | | | 0.84 | % | | | 74 | % |
| | | 18.81 | | | | 11.35 | | | | 29,263 | | | | 1.10 | | | | N/A | | | | 1.32 | | | | 1.06 | | | | 90 | |
| | | 19.92 | | | | 4.59 | | | | 32,264 | | | | 1.10 | | | | N/A | | | | 1.26 | | | | 0.44 | | | | 92 | |
| | | 19.33 | | | | 62.66 | | | | 27,602 | | | | 1.10 | | | | N/A | | | | 1.28 | | | | 0.40 | | | | 114 | |
| | | 11.96 | | | | (8.92 | ) | | | 19,150 | | | | 1.10 | | | | N/A | | | | 1.31 | | | | 0.74 | | | | 123 | |
1 | Total return is calculated by assuming a purchase of shares on the first day and a sale of shares on the last day of the period and is not annualized if period is less than one year. |
2 | Beginning on September 1, 2018, the expense limitation includes acquired fund fees and expenses (AFFE). AFFE are not reflected as expenses in these financial statements and therefore this may cause the net expense ratios after waivers/reimbursements to be lower than the expense limitation in place. |
The accompanying notes are an integral part of the financial statements.
Financial Statements 2024 | 75 |
BOSTON PARTNERS INVESTMENT FUNDS | |
Notes to Financial Statements August 31, 2024 | |
1. | ORGANIZATION AND SIGNIFICANT ACCOUNTING POLICIES |
The RBB Fund, Inc. (“RBB” or the “Company”) was incorporated under the laws of the State of Maryland on February 29, 1988 and is registered under the Investment Company Act of 1940, as amended (the “1940 Act”), as an open-end management investment company. RBB is a “series fund,” which is an investment company divided into separate portfolios. Each portfolio is treated as a separate entity for certain matters under the 1940 Act, and for other purposes, and a shareholder of one portfolio is not deemed to be a shareholder of any other portfolio. Currently, RBB has sixty-five separate investment portfolios, including Boston Partners All-Cap Value Fund (“BP All-Cap Value Fund”), Boston Partners Emerging Markets Dynamic Equity Fund (“BP Emerging Markets Dynamic Equity Fund”), Boston Partners Global Equity Fund (“BP Global Equity Fund”), Boston Partners Global Long/Short Fund (“BP Global Long/Short Fund”), Boston Partners Global Sustainability Fund (“BP Global Sustainability Fund”), Boston Partners Long/Short Equity Fund (“BP Long/Short Equity Fund”), Boston Partners Long/Short Research Fund (“BP Long/Short Research Fund”), Boston Partners Small Cap Value Fund II (“BP Small Cap Value Fund II”), WPG Partners Select Hedged Fund (“WPG Select Hedged Fund”), WPG Partners Select Small Cap Value Fund (“WPG Select Small Cap Value Fund”) and WPG Partners Small Cap Value Diversified Fund (“WPG Small Cap Value Diversified Fund”) (each, a “Fund” and collectively, the “Funds”). As of the end of the reporting period, the Funds (other than the BP Emerging Markets Dynamic Equity Fund, BP Global Sustainability Fund, WPG Select Hedged Fund, WPG Select Small Cap Value Fund and WPG Small Cap Value Diversified Fund) each offer two classes of shares, Institutional Class and Investor Class. As of the end of the reporting period, Investor Class shares of the BP Global Equity Fund have not been issued. The BP Emerging Markets Dynamic Equity Fund, BP Global Sustainability Fund, WPG Select Hedged Fund, WPG Select Small Cap Value Fund and WPG Small Cap Value Diversified Fund are single class funds, offering only the Institutional Class of shares.
RBB has authorized capital of one hundred billion shares of common stock of which 92.923 billion shares are currently classified into two hundred and thirty-six classes of common stock. Each class represents an interest in an active or inactive RBB investment portfolio.
The investment objective of BP All-Cap Value Fund and BP Small Cap Value Fund II is to seek long-term growth of capital primarily through investment in equity securities. The investment objective of BP Emerging Markets Dynamic Equity Fund, BP Global Equity Fund and BP Global/Long Short Fund is to seek long-term capital growth. The investment objective of BP Global Sustainability Fund, WPG Select Hedged Fund and WPG Select Small Cap Value Fund is to seek long-term capital appreciation. The investment objective of BP Long/Short Equity Fund is to seek long-term capital appreciation while reducing exposure to general equity market risk. The investment objective of WPG Small Cap Value Diversified Fund is to seek capital appreciation by investing primarily in common stocks, securities convertible into common stocks and in special situations. The investment objective of BP Long/Short Research Fund is to seek long-term total return.
At a meeting of the Board of Directors of the Company (the “Board”) held on May 15-16, 2024, the Board unanimously voted to approve, subject to shareholder approval, an Agreement and Plan of Reorganization (the “Plan of Reorganization”) whereby the BP Global Long/Short Fund would be reorganized into the John Hancock Disciplined Value Global Long/Short Fund, a newly-organized series of John Hancock Investment Trust. See Note 10 in these Notes to Financial Statements.
The Funds are investment companies and follow accounting and reporting guidance in the Financial Accounting Standards Board (“FASB”) Accounting Standards Codification Topic 946 “Financial Services-Investment Companies.”
The end of the reporting period for the Funds is August 31, 2024, and the period covered by these Notes to Financial Statements is the fiscal year ended August 31, 2024 (the “current fiscal period” or the “reporting period”).
PORTFOLIO VALUATION — Each Fund’s net asset value (“NAV”) is calculated once daily at the close of regular trading hours on the New York Stock Exchange (“NYSE”) (generally 4:00 p.m Eastern time) on each day the NYSE is open. Securities held by a Fund are valued using the closing price or the last sale price on a national securities exchange or the National Association of Securities Dealers Automatic Quotation System (“NASDAQ”) market system where they are primarily traded. Equity securities traded in the over-the-counter (“OTC”) market are valued at their closing prices. If there were no transactions on that day, securities traded principally on an exchange or on NASDAQ will be valued at the mean of the last bid and ask prices prior to the market close. Fixed income securities are valued using an independent pricing service, which considers such factors as security prices, yields, maturities and ratings, and are deemed representative of market values at the close of the market. Foreign securities are valued based on prices from the primary market in which they are traded, and are translated from the local currency into U.S. dollars using current exchange rates. Investments in other open-end investment companies, if any, are valued based on the NAV of the investment companies (which may use fair value pricing as disclosed in their prospectuses). Options for which the primary market is a national securities exchange are valued at the last sale price on the exchange on which they are traded, or, in the absence of any sale, will be valued at the mean of the last bid and ask prices prior to the market close. Options not traded on a national securities exchange are valued at the last quoted bid price for long option positions and the closing ask price for short option positions. If market quotations are unavailable or deemed unreliable, securities will be valued by the Valuation Designee (as defined below) in accordance with procedures adopted by the Company’s Board of Directors (the “Board”). Relying on prices supplied by pricing services or dealers or using fair valuation may result in values that are higher or lower than the values used by other investment companies and investors to price the same investments. Such procedures use fundamental valuation methods, which may include, but are not limited to, an analysis of the effect of any restrictions on the resale of the security, industry analysis and trends, significant changes in the issuer’s financial position, and any other event which could have a significant impact on the value of the security. Determination of fair value involves
Financial Statements 2024 | 76 |
BOSTON PARTNERS INVESTMENT FUNDS | |
Notes to Financial Statements (continued) August 31, 2024 | |
subjective judgment as the actual market value of a particular security can be established only by negotiations between the parties in a sales transaction, and the difference between the recorded fair value and the value that would be received in a sale could be significant. The Funds may use fair value pricing more frequently for securities traded primarily in non-U.S. markets because, among other things, most foreign markets close well before the Funds value their securities, generally as of 4:00 p.m. Eastern time. The earlier close of these foreign markets gives rise to the possibility that significant events, including broad market moves, government actions or pronouncements, aftermarket trading, or news events may have occurred in the interim. To account for this, the Funds may value foreign securities using fair value prices based on third-party vendor modeling tools (international fair value pricing).
The Board has adopted a pricing and valuation policy for use by the Fund and its Valuation Designee (as defined below) in calculating the Fund’s NAV. Pursuant to Rule 2a-5 under the 1940 Act, the Board has designated Boston Partners Global Investors, Inc. (“Boston Partners” or the “Adviser”) as its “Valuation Designee” to perform all of the fair value determinations as well as to perform all of the responsibilities that may be performed by the Valuation Designee in accordance with Rule 2a-5. The Valuation Designee is authorized to make all necessary determinations of the fair values of portfolio securities and other assets for which market quotations are not readily available or if it is deemed that the prices obtained from brokers and dealers or independent pricing services are unreliable.
FAIR VALUE MEASUREMENTS — The inputs and valuation techniques used to measure the fair value of the Funds’ investments are summarized into three levels as described in the hierarchy below:
| | ● | Level 1 — Prices are determined using quoted prices in active markets for identical securities. |
| | ● | Level 2 — Prices are determined using other significant observable inputs (including quoted prices for similar securities, interest rates, prepayment speeds, credit risk, etc.). |
| | ● | Level 3 — Prices are determined using significant unobservable inputs (including the Funds’ own assumptions in determining the fair value of investments). |
The inputs or methodologies used for valuing securities are not necessarily an indication of the risk associated with investing in those securities.
A summary of the inputs used to value each Fund’s investments as of the end of the reporting period is included in each Fund’s Schedule of Investments.
At the end of each quarter, management evaluates the classification of Levels 1, 2 and 3 assets and liabilities. Various factors are considered, such as changes in liquidity from the prior reporting period; whether or not a broker is willing to execute at the quoted price; the depth and consistency of prices from third party pricing services; and the existence of contemporaneous, observable trades in the market. Additionally, management evaluates the classification of Level 1, 2 and 3 assets and liabilities on a quarterly basis for changes in listings or delistings on national exchanges.
Due to the inherent uncertainty of determining the fair value of investments that do not have a readily available market value, the fair value of the Funds’ investments may fluctuate from period to period. Additionally, the fair value of investments may differ significantly from the values that would have been used had a ready market existed for such investments and may differ materially from the values the Funds may ultimately realize. Further, such investments may be subject to legal and other restrictions on resale or otherwise less liquid than publicly traded securities.
The following is a summary of quantitative information about Level 3 Fair Value Measurements:
FUND | TYPE OF SECURITY | UNREALIZED
APPRECIATION/
(DEPRECIATION)
AS OF 8/31/2024 | VALUATION
TECHNIQUES | UNOBSERVABLE
INPUT | UNOBSERVABLE
INPUT
VALUES (USD) | IMPACT TO
VALUATION FROM
AN INCREASE
TO INPUT |
BP Emerging Markets Dynamic Equity Fund | Contracts For Difference – Total Short – Russia | 314,150 | Market Approach & Concensus Pricing | Discount for lack of marketability as a result of geopolitical event and sanction | 100% | Significant changes in the market quotes would have resulted in direct and proportional changes in the fair value of the security |
BP Emerging Markets Dynamic Equity Fund | Contracts For Difference – Total Short – Russia | 140,169 | Market Approach & Concensus Pricing | Discount for lack of marketability as a result of geopolitical event and sanction | 100% | Significant changes in the market quotes would have resulted in direct and proportional changes in the fair value of the security |
Financial Statements 2024 | 77 |
BOSTON PARTNERS INVESTMENT FUNDS | |
Notes to Financial Statements (continued) August 31, 2024 | |
For fair valuations using significant unobservable inputs, U.S. generally accepted accounting principles (“U.S. GAAP”) requires each Fund to present a reconciliation of the beginning to ending balances for reported market values that presents changes attributable to total realized and unrealized gains or losses, purchase and sales, and transfers in and out of Level 3 during the period. Transfers in and out between levels are based on values at the end of the period. A reconciliation of Level 3 investments is presented only when a Fund had an amount of Level 3 investments at the end of the reporting period that was meaningful in relation to its net assets. The amounts and reasons for all Level 3 transfers are disclosed if a Fund had an amount of total Level 3 transfers during the reporting period that was meaningful in relation to its net assets as of the end of the reporting period.
During the current fiscal period, the Funds had no significant level 3 investments or transfers.
USE OF ESTIMATES — The preparation of financial statements in conformity with U.S. GAAP requires management to make estimates and assumptions that affect the reported amounts of assets and liabilities and disclosure of contingent assets and liabilities at the date of the financial statements and the reported amounts of revenues and expenses during the reporting period. Actual results could differ from those estimates and those differences could be significant.
INVESTMENT TRANSACTIONS, INVESTMENT INCOME AND EXPENSES — The Funds record security transactions based on trade date for financial reporting purposes. The cost of investments sold is determined by use of the specific identification method for both financial reporting and income tax purposes in determining realized gains and losses on investments. Interest income (including amortization of premiums and accretion of discounts) is accrued when earned. Dividend income is recorded on the ex-dividend date. Distributions received on securities that represent a return of capital or capital gain are recorded as a reduction of cost of investments and/or as a realized gain. The Funds’ investment income, expenses (other than class specific expenses) and unrealized and realized gains and losses are allocated daily to each class of shares based upon the relative proportion of net assets of each class at the beginning of the day. Certain expenses are shared with The RBB Fund Trust (the “Trust”), a series trust of affiliated funds. Expenses incurred on behalf of a specific class, fund or fund family of the Company or Trust are charged directly to the class, fund or fund family (in proportion to net assets). Expenses incurred for all funds (such as director or professional fees) are charged to all funds in proportion to their average net assets of RBB and the Trust, or in such other manner as the Board deems fair or equitable. Offering costs are amortized for a new fund and accrued over a 12-month period from the inception date of the fund. Offering costs are charged directly to the fund in which they are incurred. Expenses and fees, including investment advisory, offering costs, and administration fees, are accrued daily and taken into account for the purpose of determining the NAV of the Funds.
DIVIDENDS AND DISTRIBUTIONS TO SHAREHOLDERS — Dividends from net investment income and distributions from net realized capital gains, if any, are declared and paid at least annually to shareholders and recorded on the ex-dividend date. Income dividends and capital gain distributions are determined in accordance with U.S. federal income tax regulations which may differ from U.S. GAAP.
U.S. TAX STATUS — No provision is made for U.S. income taxes as it is each Fund’s intention to qualify or continue to qualify for and elect the tax treatment applicable to regulated investment companies under Subchapter M of the Internal Revenue Code of 1986, as amended, and make the requisite distributions to its shareholders which will be sufficient to relieve it from U.S. income and excise taxes.
SEC RULE 18f-4 — Effective August 19, 2022, the Securities and Exchange Commission (the “SEC”) implemented Rule 18f-4 under the 1940 Act (“Rule 18f-4”), providing for the regulation of a registered investment company’s use of derivatives and certain related instruments. Among other things, Rule 18f-4 limits a fund’s derivatives exposure through a value-at-risk test and requires the adoption and implementation of a derivatives risk management program for certain derivatives users. Each of the BP Emerging Markets Dynamic Equity Fund, BP Global Long/Short Fund, BP Long/Short Equity Fund, BP Long/Short Research Fund and WPG Select Hedged Fund, as a full derivatives user (as defined in Rule 18f-4), is subject to the full requirements of Rule 18f-4. Each of the BP All-Cap Value Fund, BP Small Cap Value Fund II, WPG Select Small Cap Value Fund, WPG Small Cap Value Diversified Fund, BP Global Sustainability Fund, and BP Global Equity Fund, as a limited derivatives user (as defined in Rule 18f-4), is not subject to the full requirements of Rule 18f-4. The Funds are required to comply with Rule18f-4 and have adopted procedures for investing in derivatives and other transactions in compliance with Rule 18f-4.
FOREIGN CURRENCY TRANSLATION — Assets and liabilities initially expressed in non-U.S. currencies are translated into U.S. dollars based on the applicable exchange rates at the date of the last business day of the financial statement period. Purchases and sales of securities, interest income, dividends, variation margin received and expenses denominated in foreign currencies are translated into U.S. dollars at the exchange rates in effect on the transaction date.
The Funds do not separately report the effect of changes in foreign exchange rates from changes in market prices of securities held. Such changes are included with the net realized gain or loss and change in unrealized appreciation or depreciation on investments in the Statements of Operations. Other foreign currency transactions resulting in realized and unrealized gain or loss are reported separately as net realized gain or loss and change in unrealized appreciation or depreciation on foreign currencies in the Statements of Operations.
CASH AND CASH EQUIVALENTS — Cash and cash equivalents are valued at cost plus accrued interest, which approximates market value. The Funds consider investments in the U.S Bank Money Market Deposit Account, a U.S. dollar-denominated deposit account offered through U.S. Bank, to be a cash equivalent. The Funds are exposed to the credit risk of U.S. Bank through the holding of this cash equivalent. This cash equivalent is presented on the Statements of Assets and Liabilities as “Cash equivalents” and was classified as Level 1 assets as of August 31, 2024.
Financial Statements 2024 | 78 |
BOSTON PARTNERS INVESTMENT FUNDS | |
Notes to Financial Statements (continued) August 31, 2024 | |
OTHER — In the normal course of business, the Funds may enter into contracts that provide general indemnifications. Each Fund’s maximum exposure under these arrangements is dependent on claims that may be made against the Funds in the future, and, therefore, cannot be estimated; however, the Funds expect the risk of material loss from such claims to be remote.
CURRENCY RISK — The Funds invest in securities of foreign issuers, including American Depositary Receipts. These markets are subject to special risks associated with foreign investments not typically associated with investing in U.S. markets. Because the foreign securities in which the Funds may invest generally trade in currencies other than the U.S. dollar, changes in currency exchange rates will affect the Funds’ NAV, the value of dividends and interest earned and gains and losses realized on the sale of securities. Because the NAV for the Funds are determined on the basis of U.S. dollars, the Funds may lose money by investing in a foreign security if the local currency of a foreign market depreciates against the U.S. dollar, even if the local currency value of the Funds’ holdings goes up. Generally, a strong U.S. dollar relative to these other currencies will adversely affect the value of the Funds’ holdings in foreign securities.
EMERGING MARKETS RISK — The BP Global Sustainability Fund and the BP Emerging Markets Dynamic Equity Fund invest in emerging market instruments which are subject to certain credit and market risks. The securities and currency markets of emerging market countries are generally smaller, less developed, less liquid and more volatile than the securities and currency markets of the United States and other developed markets. Disclosure and regulatory standards in many respects are less stringent than in other developed markets. There also may be a lower level of monitoring and regulation of securities markets in emerging market countries and the activities of investors in such markets and enforcement of existing regulations may be extremely limited. Political and economic structures in many of these countries may be in their infancy and developing rapidly, and such countries may lack the social, political and economic stability characteristics of more developed countries.
FOREIGN SECURITIES MARKET RISK — Securities of many non-U.S. companies may be less liquid and their prices more volatile than securities of comparable U.S. companies. Securities of companies traded in many countries outside the U.S., particularly emerging markets countries, may be subject to further risks due to the inexperience of local investment professionals and financial institutions, the possibility of permanent or temporary termination of trading and greater spreads between bid and asked prices of securities. In addition, non-U.S. stock exchanges and investment professionals are subject to less governmental regulation, and commissions may be higher than in the United States. Also, there may be delays in the settlement of non-U.S. stock exchange transactions.
INTERNATIONAL CONFLICT RISK — In February 2022, Russia commenced a military attack on Ukraine. The outbreak of hostilities between the two countries and the threat of wider-spread hostilities could have a severe adverse effect on the region and global economies, including significant negative impacts on the markets for certain securities and commodities, such as oil and natural gas. In addition, sanctions imposed on Russia by the United States and other countries, and any sanctions imposed in the future, could have a significant adverse impact on the Russian economy and related markets. Additionally, armed conflict between Israel and Hamas and other militant groups in the Middle East and related events could cause significant impacts on global markets. The price and liquidity of investments may fluctuate widely as a result of these conflicts and related events. How long the armed conflicts and related events will last cannot be predicted. These tensions and any related events could have a significant impact on a Fund’s performance and the value of a Fund’s investments, even beyond any direct exposure that the Funds may have to issuers located in these countries.
SUSTAINABLE INVESTMENT RISK — The sustainability criterion required for investment by the BP Global Sustainability Fund may cause the Fund to not invest in certain industries or issuers. As a result, the BP Global Sustainability Fund may be overweight or underweight in certain industries or issuers relative to its benchmark index, which may cause the Fund’s performance to be more or less sensitive to developments affecting those industries or issuers. Sustainability information provided by issuers, upon which the portfolio managers may rely, continues to develop, and may be incomplete, inaccurate, use different methodologies, or be applied differently across companies and industries. Further, the regulatory landscape for sustainable investing in the United States is still developing and future rules and regulations may require the BP Global Sustainability Fund to modify or alter its investment process. Similarly, government policies incentivizing issuers to engage in sustainable practices may fall out of favor, which could potentially limit the BP Global Sustainability Fund’s investment universe. There is also a risk that the companies identified through the investment process may fail to adhere to sustainable business practices, which may result in the BP Global Sustainability Fund selling a security when it might otherwise be disadvantageous to do so. There is no guarantee that sustainable investments will outperform the broader market on either an absolute or relative basis.
OPTIONS WRITTEN — The Funds may enter into options written for: bona fide hedging; attempting to offset changes in the value of securities held or expected to be acquired or be disposed of; attempting to minimize fluctuations in foreign currencies; attempting to gain exposure to a particular market, index or instrument; or other risk management purposes. Such options may relate to particular securities or domestic stock indices, and may or may not be listed on exchanges regulated by the Commodity Futures Trading Commission or on other non-U.S. exchanges. An option on a futures contract gives the purchaser the right, in return for the premium paid, to assume a position in the contract (a long position if the option is a call and a short position if the option is a put) at a specified exercise price at any time during the option exercise period. The writer of the option is required upon exercise to assume a short futures position (if the option is a call) or a long futures position (if the option is a put). Upon exercise of the option, the accumulated cash balance in the writer’s futures margin account is delivered to the holder of the option. That balance represents the amount by which the market price of the futures contract at exercise exceeds, in the case of a call, or is less than, in the case of a put, the exercise price of the option. The maximum risk of loss associated with writing put options is limited to the exercised fair value of the option contract. The maximum risk of loss associated with writing call
Financial Statements 2024 | 79 |
BOSTON PARTNERS INVESTMENT FUNDS | |
Notes to Financial Statements (continued) August 31, 2024 | |
options is potentially unlimited. The Funds also have the additional risk of being unable to enter into a closing transaction at an acceptable price if a liquid secondary market does not exist. The Funds also may write OTC options where completing the obligation depends upon the credit standing of the other party. Option contracts also involve the risk that they may result in loss due to unanticipated developments in market conditions or other causes. Written options are initially recorded as liabilities to the extent of premiums received and subsequently marked to market to reflect the current value of the option written. Gains or losses are realized when the option transaction expires or closes. When an option is exercised, the proceeds on sales for a written call option or the purchase cost for a written put option is adjusted by the amount of the premium received. Listed option contracts present minimal counterparty credit risk since they are exchange traded and the exchange’s clearinghouse, as counterparty to all exchange-traded options, guarantees the options against default. As of the end of the reporting period, all of the Funds’ written options are exchange-traded options.
During the current fiscal period, the Funds’ average quarterly volume of options transactions was as follows:
FUND | | PURCHASED OPTIONS
(COST) | | | WRITTEN OPTIONS
(PROCEEDS) | |
BP All-Cap Value Fund | | $ | — | | | $ | 1,506,083 | |
BP Global Long/Short Fund | | | — | | | | 1,390,441 | |
BP Long/Short Equity Fund | | | — | | | | 122,399 | |
BP Long/Short Research Fund | | | — | | | | 260,508 | |
SHORT SALES — When the Adviser believes that a security is overvalued, the BP Emerging Markets Dynamic Equity Fund, BP Global Long/Short Fund, BP Long/Short Equity Fund, BP Long/Short Research Fund and WPG Select Hedged Fund may sell the security short by borrowing the same security from a broker or other institution and selling the security. A Fund will incur a loss as a result of a short sale if the price of the borrowed security increases between the date of the short sale and the date on which the Fund buys and replaces such borrowed security. A Fund will realize a gain if there is a decline in price of the security between those dates where the decline in price exceeds the costs of borrowing the security and other transaction costs. There can be no assurance that a Fund will be able to close out a short position at any particular time or at an acceptable price. Although a Fund’s gain is limited to the amount at which it sold a security short, its potential loss is unlimited. Until a Fund replaces a borrowed security, it will maintain at all times cash, U.S. Government securities, or other liquid securities in an amount which, when added to any amount deposited with a broker as collateral, will at least equal the current market value of the security sold short. Depending on arrangements made with brokers, a Fund may not receive any payments (including interest) on collateral deposited with them.
In accordance with the terms of its prime brokerage agreements, a Fund may receive rebate income or be charged a fee for borrowed securities. Such income or fee is calculated on a daily basis based upon the market value of each borrowed security and a variable rate that is dependent upon the availability of such security. The Funds record these prime broker charges on a net basis as interest income or interest expense. During the current fiscal period, the BP Emerging Markets Dynamic Equity Fund, BP Global Long/Short Fund, BP Long/Short Equity Fund and BP Long/Short Research Fund had net income/(charges) of $36,304, $(14,588), $393,139 and $6,132,443, respectively, on borrowed securities. Such amounts are included in prime broker interest income on the Statements of Operations.
As of the end of the reporting period, the BP Emerging Markets Dynamic Equity Fund, BP Global Long/Short Fund, BP Long/Short Equity Fund, BP Long/Short Research Fund and WPG Select Hedged Fund had securities sold short valued at $1,261,905, $0, $11,814,494, $113,797,015 and $35,732,661, respectively, for which securities of $24,177,846, $18,352,967, $21,549,675, $159,355,321 and $34,663,248 and deposits of $79,165, $1,517,524, $11,826,855, $119,140,622 and $35,249,641, respectively, were pledged as collateral.
In accordance with Special Custody and Pledge Agreements with Goldman Sachs & Co. (“Goldman Sachs”) (the Funds’ prime broker), BP Emerging Markets Dynamic Equity Fund, BP Global Long/Short Fund, BP Long/Short Equity Fund and BP Long/Short Research Fund may borrow from Goldman Sachs to the extent necessary to maintain required margin cash deposits on short positions. Interest on such borrowings is charged to the Fund based on the overnight rate plus an agreed upon spread.
The BP Emerging Markets Dynamic Equity Fund, BP Global Long/Short Fund, BP Long/Short Equity Fund and BP Long/Short Research Fund utilized cash borrowings from Goldman Sachs to meet required margin cash deposits as follows during the current fiscal period:
BP EMERGING MARKETS DYNAMIC EQUITY FUND | BP GLOBAL LONG/SHORT FUND |
DAYS
UTILIZED | AVERAGE DAILY
BORROWINGS | WEIGHTED AVERAGE
INTEREST RATE | DAYS
UTILIZED | AVERAGE DAILY
BORROWINGS | WEIGHTED AVERAGE
INTEREST RATE |
54 | EUR 9,316 | 4.10% | 60 | CHF 3,205 | 1.87% |
58 | JPY 6,659,401 | 0.52% | 51 | JPY 5,290,141 | 0.45% |
9 | USD 146,873 | 5.77% | 60 | SEK 491,132 | 4.24% |
| | | | 313 | USD 447,084 | 5.77% |
Financial Statements 2024 | 80 |
BOSTON PARTNERS INVESTMENT FUNDS | |
Notes to Financial Statements (continued) August 31, 2024 | |
BP LONG/SHORT EQUITY FUND | BP LONG/SHORT RESEARCH FUND |
DAYS
UTILIZED | AVERAGE DAILY
BORROWINGS | WEIGHTED AVERAGE
INTEREST RATE | DAYS
UTILIZED | AVERAGE DAILY
BORROWINGS | WEIGHTED AVERAGE
INTEREST RATE |
333 | | USD 2,425,256 | 5.77% | 72 | AUD 31,426 | 4.68% |
| | | | | 271 | CHF 6,106 | 2.14% |
| | | | | 216 | DKK 293,778 | 4.12% |
| | | | | 156 | EUR 347,814 | 4.34% |
| | | | | 189 | GBP 319,788 | 5.55% |
| | | | | 92 | HKD 1,634,509 | 4.68% |
| | | | | 168 | JPY 51,415,960 | 0.45% |
| | | | | 192 | SEK 2,826,027 | 4.37% |
| | | | | 133 | THB 28,042,508 | 2.81% |
| | | | | 224 | USD 2,460,951 | 5.77% |
The BP Emerging Markets Dynamic Equity Fund, BP Global Long/Short Fund, BP Long/Short Equity Fund and BP Long/Short Research Fund incurred interest expense during the current fiscal period on such borrowings in the amount of $310, $22,789, $129,442, and $126,501, respectively.
CONTRACTS FOR DIFFERENCE — The BP Emerging Markets Dynamic Equity Fund, BP Global Long/Short Fund, BP Long/Short Equity Fund and BP Long/Short Research Fund (for this section only, each a “Fund”) may enter into Contracts for Differences (“CFDs”). CFDs are leveraged derivative instruments that allow a Fund to take a position on the change in the market price of an underlying asset, such as a stock, or the value of an index or currency exchange rate. With a short CFD, a Fund is seeking to profit from falls in the market price of the asset. CFDs are subject to liquidity risk because the liquidity of CFDs is based on the liquidity of the underlying instrument, and are subject to counterparty risk, i.e., the risk that the counterparty to the CFD transaction may be unable or unwilling to make payments or to otherwise honor its financial obligations under the terms of the contract. It is also possible that the market price of a CFD will move between the time the order is placed by a Fund and when it is executed by the issuer, which can result in the trade being executed at a less favorable price. CFDs, like many other derivative instruments, involve the risk that, if the derivative security declines in value, additional margin would be required to maintain the margin level. The seller may require a Fund to deposit additional sums to cover this decline in value, and the margin call may be at short notice. If additional margin is not provided in time, the seller may liquidate the positions at a loss for which a Fund is liable. The potential for margin calls and large losses are much greater in CFDs than in other leveraged products. Most CFDs are traded OTC. CFDs are not registered with the SEC or any U.S. regulator, and are not subject to U.S. regulation. In a short position, the Fund will receive or pay an amount based upon the amount, if any, by which the notional amount of a CFD would have decreased or increased in value had it sold the particular stocks short, less the dividends that would have been paid on those stocks, plus a floating rate of interest on the notional amount of the CFD. All of these components are reflected in the market value of the CFDs.
CFDs are marked-to-market daily based upon quotations from market makers and the resulting changes in market values, if any, are recorded as an unrealized gain or loss in the Statements of Operations. Periodic payments made or received are recorded as realized gains or losses. Entering into CFDs involves, to varying degrees, elements of credit and market risk in excess of the amounts recognized on the Statements of Assets and Liabilities. Such risks involve the possibility that there will be no liquid market for these contracts, that the counterparty to the contract may default on its obligation to perform and that there may be unfavorable changes in market conditions. CFDs outstanding at period end, if any, are listed on the Schedule of Investments. As of the end of the reporting period, BP Emerging Markets Dynamic Equity Fund, BP Global Long/Short Fund, BP Long/Short Equity Fund and BP Long/Short Research Fund had cash deposits for CFDs of $1,698,030, $610,000, $0 and $530,000, respectively, which were pledged as collateral. In connection with CFDs, cash or securities may be segregated as collateral by the Funds’ custodian. As of the end of the reporting period, the BP Emerging Markets Dynamic Equity Fund, BP Global Long/Short Fund, BP Long/Short Equity Fund and BP Long/Short Research Fund held CFDs.
During the current fiscal period, the average volume of CFDs was as follows:
FUND | | NOTIONAL AMOUNT
LONG | | | NOTIONAL AMOUNT
Short | |
BP Emerging Markets Dynamic Equity Fund | | $ | 22,268,477 | | | $ | 40,533,755 | |
BP Global Long/Short Fund | | | 24,154,292 | | | | 62,377,127 | |
BP Long/Short Equity Fund | | | — | | | | 1,030,661 | |
BP Long/Short Research Fund | | | 436,874 | | | | 69,801,466 | |
Financial Statements 2024 | 81 |
BOSTON PARTNERS INVESTMENT FUNDS | |
Notes to Financial Statements (continued) August 31, 2024 | |
The following is a summary of CFDs that are subject to enforceable master netting agreements (or similar arrangements) and collateral received and pledged in connection with the master netting agreements (or similar arrangements) as of the end of the reporting period:
| | | | | | | GROSS AMOUNT
NOT OFFSET IN
THE STATEMENTS OF
ASSETS AND LIABILITIES | | | | | | | | | | | GROSS AMOUNT
NOT OFFSET IN
THE STATEMENTS OF
ASSETS AND LIABILITIES | | | | | |
FUND | | GROSS
AMOUNTS OF
RECOGNIZED
ASSETS | | | FINANCIAL
INSTRUMENTS | | | CASH
COLLATERAL
RECEIVED | | | NET
AMOUNT1 | | | GROSS
AMOUNTS OF
RECOGNIZED
LIABILITIES | | | FINANCIAL
INSTRUMENTS | | | CASH
COLLATERAL
PLEDGED2 | | | NET
AMOUNT3 | |
BP Emerging Markets Dynamic Equity Fund | | | | | | | | | | | | | | | | | | | | | | | | | | | | | | | | |
Bank of America Securities, Inc. | | $ | 314,359 | | | $ | 48,398 | | | $ | — | | | $ | 265,961 | | | $ | 48,398 | | | $ | 48,398 | | | $ | — | | | $ | — | |
Goldman Sachs | | | 2,721,593 | | | | 1,305,846 | | | | — | | | | 1,415,747 | | | | 1,305,846 | | | | 1,305,846 | | | | — | | | | — | |
HSBC Bank | | | 57,314 | | | | 57,314 | | | | — | | | | — | | | | 194,440 | | | | 57,314 | | | | 137,126 | | | | — | |
J.P. Morgan Securities, Inc. | | | 1,142,951 | | | | 857,622 | | | | — | | | | 285,329 | | | | 857,622 | | | | 857,622 | | | | — | | | | — | |
Morgan Stanley | | | 1,786,367 | | | | 1,010,214 | | | | — | | | | 776,153 | | | | 1,010,214 | | | | 1,010,214 | | | | — | | | | — | |
Total | | $ | 6,022,584 | | | $ | 3,279,394 | | | $ | — | | | $ | 2,743,190 | | | $ | 3,416,520 | | | $ | 3,279,394 | | | $ | 137,126 | | | $ | — | |
BP Global Long/Short Fund | | | | | | | | | | | | | | | | | | | | | | | | | | | | | | | | |
Goldman Sachs | | $ | 1,909,998 | | | $ | 1,909,998 | | | $ | — | | | $ | — | | | $ | 2,011,284 | | | $ | 1,909,998 | | | $ | — | | | $ | 101,286 | |
HSBC Bank | | | 165,877 | | | | 114,031 | | | | — | | | $ | 51,846 | | | | 114,031 | | | | 114,031 | | | | — | | | | — | |
Morgan Stanley | | | 327,033 | | | | 327,033 | | | | — | | | | — | | | | 399,210 | | | | 327,033 | | | | — | | | | 72,177 | |
Total | | $ | 2,402,908 | | | $ | 2,351,062 | | | $ | — | | | $ | 51,846 | | | $ | 2,524,525 | | | $ | 2,351,062 | | | $ | — | | | $ | 173,463 | |
BP Long/Short Equity Fund | | | | | | | | | | | | | | | | | | | | | | | | | | | | | | | | |
Morgan Stanley | | $ | — | | | $ | — | | | $ | — | | | $ | — | | | $ | 18,603 | | | $ | — | | | $ | — | | | $ | 18,603 | |
Total | | $ | — | | | $ | — | | | $ | — | | | $ | — | | | $ | 18,603 | | | $ | — | | | $ | — | | | $ | 18,603 | |
BP Long/Short Research Fund | | | | | | | | | | | | | | | | | | | | | | | | | | | | | | | | |
Bank of America Securities, Inc. | | $ | 1,123,192 | | | $ | — | | | $ | — | | | $ | 1,123,192 | | | $ | — | | | $ | — | | | $ | — | | | $ | — | |
Goldman Sachs | | | 1,753,829 | | | | 1,753,829 | | | | — | | | | — | | | | 2,335,805 | | | | 1,753,829 | | | | 530,000 | | | | 51,976 | |
J.P. Morgan Securities, Inc. | | | 1,718 | | | | — | | | | — | | | | — | | | | — | | | | — | | | | — | | | | — | |
Morgan Stanley | | | 4,051,553 | | | | 4,051,553 | | | | — | | | | — | | | | 4,242,231 | | | | 4,051,553 | | | | — | | | | 190,678 | |
Total | | $ | 6,930,292 | | | $ | 5,805,382 | | | $ | — | | | $ | 1,124,910 | | | $ | 6,578,036 | | | $ | 5,805,382 | | | $ | 530,000 | | | $ | 242,654 | |
1 | Net amount represents the net amount receivable from the counterparty in the event of default. |
2 | Actual collateral pledged may be more than the amount shown. |
3 | Net amount represents the net amount payable to the counterparty in the event of default. |
2. INVESTMENT ADVISERS AND OTHER SERVICES
Boston Partners Global Investors, Inc. (“Boston Partners” or the “Adviser”) serves as the investment adviser to each Fund. Each Fund compensates the Adviser for its services at an annual rate based on the Fund’s average daily net assets (the “Advisory Fee”), payable on a monthly basis in arrears, as shown in the following table.
The Adviser has contractually agreed to waive advisory fees and/or reimburse expenses to the extent that total annual Fund operating expenses (excluding certain items discussed below) exceed the rates (“Expense Caps”) shown in the following table of each Fund’s average daily net assets. In determining the Adviser’s obligation to waive advisory fees and/or reimburse expenses, the following expenses are not
Financial Statements 2024 | 82 |
BOSTON PARTNERS INVESTMENT FUNDS | |
Notes to Financial Statements (continued) August 31, 2024 | |
taken into account and could cause total annual Fund operating expenses to exceed the Expense Caps as applicable: short sale dividend expense, brokerage commissions, extraordinary expenses, interest and taxes. This contractual limitation for all the Funds is in effect until December 31, 2024 and may not be terminated without the approval of the Board.
| | | | | | | EXPENSE CAPS | |
FUND | | ADVISORY FEE | | | INSTITUTIONAL
CLASS | | | INVESTOR
CLASS | |
BP All-Cap Value Fund | | | 0.70 | % | | | 0.80 | % | | | 1.05 | % |
BP Emerging Markets Dynamic Equity Fund | | | 1.25 | | | | 1.40 | | | | N/A | |
BP Global Equity Fund | | | 0.90 | | | | 0.95 | | | | 1.20 | |
BP Global Long/Short Fund | | | 1.50 | | | | 2.00 | | | | 2.25 | |
BP Global Sustainability Fund | | | 0.80 | | | | 0.90 | | | | N/A | |
BP Long/Short Equity Fund | | | 2.25 | | | | 1.96 | | | | 2.21 | |
BP Long/Short Research Fund | | | 1.25 | | | | 1.50 | | | | 1.75 | |
BP Small Cap Value Fund II | | | 0.85 | | | | 0.99 | | | | 1.24 | |
WPG Select Hedged Fund | | | 1.25 | | | | 1.50 | | | | N/A | |
WPG Select Small Cap Value Fund | | | 0.90 | | | | 1.10 | | | | N/A | |
WPG Small Cap Value Diversified Fund* | | | 0.80 | | | | 1.10 | | | | N/A | |
| | * | 0.80% of net asset up to $500 million, 0.75% of net assets in excess of $500 million. |
The Adviser may recoup from each Fund fees and expenses previously paid, waived, or absorbed for a period of three years after such fees or expenses were incurred, provided that the repayments do not cause the Funds’ operating expenses (excluding brokerage commissions, short sale dividend expense, taxes, interest expense, and any extraordinary expenses) to exceed the Expense Caps of each class of each Fund that were in effect at the time the fees and expenses were paid, waived, or absorbed by the Adviser, as well as the Expense Caps that are currently in effect, if different.
During the current fiscal period, investment advisory fees accrued, waived and/or reimbursed were as follows:
FUND | | GROSS
ADVISORY FEES | | | WAIVERS AND/OR
REIMBURSEMENTS* | | | RECOUPMENTS | | | NET
ADVISORY FEES | |
BP All-Cap Value Fund | | $ | 9,869,819 | | | $ | (650,637 | ) | | $ | — | | | $ | 9,219,182 | |
BP Emerging Markets Dynamic Equity Fund | | | 776,677 | | | | (113,783 | ) | | | — | | | | 662,894 | |
BP Global Equity Fund | | | 1,985,400 | | | | (357,823 | ) | | | — | | | | 1,627,577 | |
BP Global Long/Short Fund | | | 2,462,427 | | | | — | | | | — | | | | 2,462,427 | |
BP Global Sustainability Fund | | | 121,573 | | | | (94,610 | ) | | | — | | | | 26,963 | |
BP Long/Short Equity Fund | | | 1,379,392 | | | | (414,321 | ) | | | — | | | | 965,071 | |
BP Long/Short Research Fund | | | 7,466,784 | | | | — | | | | — | | | | 7,466,784 | |
BP Small Cap Value Fund II | | | 4,839,419 | | | | (231,790 | ) | | | 618 | | | | 4,608,247 | |
WPG Select Hedged Fund | | | 201,245 | | | | (45,730 | ) | | | — | | | | 155,515 | |
WPG Select Small Cap Value Fund | | | 902,977 | | | | (39,014 | ) | | | 13,656 | | | | 877,619 | |
WPG Small Cap Value Diversified Fund | | | 240,939 | | | | (51,465 | ) | | | — | | | | 189,474 | |
As of the end of the reporting period, the Funds had amounts available for recoupment as follows:
| | | Expiration | | | | | |
FUND | | August 31,
2025 | | | August 31,
2026 | | | August 31,
2027 | | | Total | |
BP All-Cap Value Fund | | $ | 1,054,852 | | | $ | 581,154 | | | $ | 650,637 | | | $ | 2,286,643 | |
BP Emerging Markets Dynamic Equity Fund | | | 194,970 | | | | 150,185 | | | | 113,783 | | | | 458,938 | |
BP Global Equity Fund | | | 327,392 | | | | 312,531 | | | | 357,823 | | | | 997,746 | |
BP Global Sustainability Fund | | | 125,165 | | | | 102,575 | | | | 94,610 | | | | 322,350 | |
BP Long/Short Equity Fund | | | 404,556 | | | | 440,825 | | | | 414,321 | | | | 1,259,702 | |
BP Small Cap Value Fund II | | | 274,029 | | | | 313,733 | | | | 231,790 | | | | 819,552 | |
WPG Select Hedged Fund | | | — | | | | — | | | | 45,730 | | | | 45,730 | |
WPG Select Small Cap Value Fund | | | 94,396 | | | | 52,965 | | | | 39,014 | | | | 186,375 | |
WPG Small Cap Value Diversified Fund | | | 49,003 | | | | 64,117 | | | | 51,465 | | | | 164,585 | |
| | * | Includes acquired fund fees and expenses. Acquired fund fees and expenses are indirect fees and expenses that the Fund incurs from investing in the shares of other mutual funds, including money market funds and exchange traded funds. |
Financial Statements 2024 | 83 |
BOSTON PARTNERS INVESTMENT FUNDS | |
Notes to Financial Statements (continued) August 31, 2024 | |
U.S. Bancorp Fund Services, LLC, doing business as U.S. Bank Global Fund Services (“Fund Services”), serves as administrator for the Funds. For providing administrative and accounting services, Fund Services is entitled to receive a monthly fee, subject to certain minimum and out of pocket expenses.
Fund Services serves as the Funds’ transfer and dividend disbursing agent. For providing transfer agent services, Fund Services is entitled to receive a monthly fee, subject to certain minimum and out of pocket expenses.
U.S. Bank, N.A. (the “Custodian”) provides certain custodial services to the Funds. The Custodian is entitled to receive a monthly fee, subject to certain minimum and out of pocket expenses.
Quasar Distributors, LLC (the “Distributor”), a wholly-owned broker-dealer subsidiary of Foreside Financial Group, LLC, serves as the principal underwriter and distributor of the Funds’ shares pursuant to a Distribution Agreement with RBB.
For compensation amounts paid to Fund Services and the Custodian, please refer to the Statements of Operations.
The Board has approved a Distribution Agreement for the Funds and adopted separate Plans of Distribution for the Investor Class Shares of each Fund (the “Plans”) pursuant to Rule 12b-1 under the 1940 Act. Under the Plans, Quasar Distributors, LLC (the “Underwriter”) is entitled to receive from each Fund a distribution fee with respect to the Investor Class Shares, which is accrued daily and paid monthly, of up to 0.25% on an annualized basis of the average daily net assets of the Investor Class Shares. Amounts paid to the Distributor under the Plans may be used by the Distributor to cover expenses that are related to (i) the sale of the Investor Class Shares, (ii) ongoing servicing and/or maintenance of the accounts of shareholders, and (iii) sub-transfer agency services, subaccounting services or administrative services related to the sale of the Investor Class Shares, all as set forth in the Plans.
3. | DIRECTOR AND OFFICER COMPENSATION |
The Directors of the Company receive an annual retainer and meeting fees for meetings attended. An employee of Vigilant Compliance, LLC serves as Chief Compliance Officer of the Company. Vigilant Compliance, LLC is compensated for the services provided to the Company. Employees of RBB serve as President, Chief Financial Officer, Chief Operating Officer, Secretary and Director of Marketing & Business Development of the Company. They are compensated by the Company for services provided. Certain employees of Fund Services serve as officers of the Company. They are not compensated by the Funds or the Company. For Director and Officer compensation amounts, please refer to the Statements of Operations.
| 4. | PURCHASES AND SALES OF INVESTMENT SECURITIES |
During the current fiscal period, aggregate purchases and sales of investment securities (excluding short-term investments and derivative transactions) of the Funds were as follows:
FUND | | PURCHASES | | | SALES | |
BP All-Cap Value Fund | | $ | 337,189,278 | | | $ | 445,763,518 | |
BP Emerging Markets Dynamic Equity Fund | | | 83,522,222 | | | | 85,690,167 | |
BP Global Equity Fund | | | 102,464,368 | | | | 116,020,813 | |
BP Global Long/Short Fund | | | 237,047,141 | | | | 240,237,171 | |
BP Global Sustainability Fund | | | 11,215,337 | | | | 25,916,043 | |
BP Long/Short Equity Fund | | | 20,624,893 | | | | 35,262,393 | |
BP Long/Short Research Fund | | | 304,754,169 | | | | 527,657,515 | |
BP Small Cap Value Fund II | | | 310,944,627 | | | | 418,753,640 | |
WPG Select Hedged Fund | | | 67,491,711 | | | | 18,044,039 | |
WPG Select Small Cap Value Fund | | | 161,261,774 | | | | 156,976,827 | |
WPG Small Cap Value Diversified Fund | | | 21,752,797 | | | | 23,353,543 | |
There were no purchases or sales of long-term U.S. Government securities during the current fiscal period.
5. | CAPITAL SHARE TRANSACTIONS |
As of the end of the reporting period, each class of each Fund has 100,000,000 shares of $0.001 par value common stock authorized except for the Institutional Class Shares of the BP Long/Short Research Fund, BP Global Long/Short Fund and WPG Small Cap Value Diversified Fund, which have 750,000,000 shares, 300,000,000 shares and 50,000,000 shares, respectively, of $0.001 par value common stock authorized.
Financial Statements 2024 | 84 |
BOSTON PARTNERS INVESTMENT FUNDS | |
Notes to Financial Statements (continued) August 31, 2024 | |
Each Fund may invest in securities that are subject to legal or contractual restrictions on resale. These securities generally may be resold in transactions exempt from registration or to the public if the securities are registered. Disposal of these securities may involve time-consuming negotiations and expense, and prompt sale at an acceptable price may be difficult. Information regarding restricted securities, if applicable, is included at the end of each Fund’s Schedule of Investments.
As of the end of the reporting period, the Funds did not hold any restricted securities that were illiquid.
7. | FEDERAL INCOME TAX INFORMATION |
The Funds have followed the authoritative guidance on accounting for and disclosure of uncertainty in tax positions, which requires the Funds to determine whether a tax position is more likely than not to be sustained upon examination, including resolution of any related appeals or litigation processes, based on the technical merits of the position. The Funds have determined that there was no effect on the financial statements from following this authoritative guidance. In the normal course of business, the Funds are subject to examination by federal, state and local jurisdictions, where applicable, for tax years for which applicable statutes of limitations have not expired.
As of August 31, 2024, the federal tax cost and aggregate gross unrealized appreciation and depreciation of investments held by each Fund were as follows:
FUND | | FEDERAL
TAX COST | | | UNREALIZED
APPRECIATION | | | UNREALIZED
(DEPRECIATION) | | | NET UNREALIZED
APPRECIATION/
(DEPRECIATION) | |
BP All-Cap Value Fund | | $ | 917,384,822 | | | $ | 648,857,176 | | | $ | (15,693,476 | ) | | $ | 633,163,700 | |
BP Emerging Markets Dynamic Equity Fund | | | 46,031,445 | | | | 9,930,624 | | | | (5,793,747 | ) | | | 4,136,877 | |
BP Global Equity Fund | | | 186,471,917 | | | | 57,548,732 | | | | (6,134,492 | ) | | | 51,414,240 | |
BP Global Long/Short Fund | | | 113,408,066 | | | | 22,743,568 | | | | (4,995,220 | ) | | | 17,748,348 | |
BP Global Sustainability Fund | | | 8,801,699 | | | | 2,464,717 | | | | (70,314 | ) | | | 2,394,403 | |
BP Long/Short Equity Fund | | | 50,979,802 | | | | 28,469,814 | | | | (4,067,053 | ) | | | 24,402,761 | |
BP Long/Short Research Fund | | | 375,953,027 | | | | 209,712,082 | | | | (15,664,210 | ) | | | 194,047,872 | |
BP Small Cap Value Fund II | | | 546,571,740 | | | | 165,921,197 | | | | (18,249,555 | ) | | | 147,671,642 | |
WPG Select Small Cap Value Fund | | | 103,774,256 | | | | 21,070,935 | | | | (5,145,266 | ) | | | 15,925,669 | |
WPG Partners Select Hedged Fund | | | 48,844,045 | | | | 6,893,947 | | | | (3,871,338 | ) | | | 3,022,609 | |
WPG Small Cap Value Diversified Fund | | | 34,139,631 | | | | 8,249,841 | | | | (1,216,558 | ) | | | 7,033,283 | |
Distributions to shareholders, if any, from net investment income and realized gains are determined in accordance with federal income tax regulations, which may differ from net investment income and realized gains recognized for financial reporting purposes. Accordingly, the character of distributions and composition of net assets for tax purposes may differ from those reflected in the accompanying financial statements. To the extent these differences are permanent, such amounts are reclassified within the capital accounts based on the tax treatment; temporary differences do not require such reclassification.
The following permanent differences as of August 31, 2024 were reclassified among the following accounts. They are primarily attributable to net investment loss, deemed distributions due to shareholder redemptions and investments in partnerships.
FUND | | DISTRIBUTABLE
EARNINGS/(LOSS) | | | PAID-IN
CAPITAL | |
BP All-Cap Value Fund | | $ | (13,494,402 | ) | | $ | 13,494,402 | |
BP Emerging Markets Dynamic Equity Fund | | | 641,144 | | | | (641,144 | ) |
BP Global Equity Fund | | | — | | | | — | |
BP Global Long/Short Fund | | | — | | | | — | |
BP Global Sustainability Fund | | | — | | | | — | |
BP Long/Short Equity Fund | | | — | | | | — | |
BP Long/Short Research Fund | | | — | | | | — | |
BP Small Cap Value Fund II | | | (8,364,578 | ) | | | 8,364,578 | |
WPG Select Small Cap Value Fund | | | (239,552 | ) | | | 239,552 | |
WPG Partners Select Hedged Fund | | | — | | | | — | |
WPG Small Cap Value Diversified Fund | | | (54,024 | ) | | | 54,024 | |
Financial Statements 2024 | 85 |
BOSTON PARTNERS INVESTMENT FUNDS | |
Notes to Financial Statements (continued) August 31, 2024 | |
As of August 31, 2024, the components of distributable earnings on a tax basis were as follows:
FUND | | UNDISTRIBUTED
ORDINARY
INCOME | | | UNDISTRIBUTED
LONG-TERM
CAPITAL GAINS | | | CAPITAL LOSS
CARRYFORWARDS | | | QUALIFIED
LATE-YEAR LOSS
DEFERRAL | | | OTHER
TEMPORARY
DIFFERENCES | | | UNREALIZED
APPRECIATION/
(DEPRECIATION) | |
BP All-Cap Value Fund | | $ | 8,831,422 | | | $ | 92,344,942 | | | $ | — | | | $ | — | | | $ | — | | | $ | 633,166,631 | |
BP Emerging Markets Dynamic Equity Fund | | | — | | | | — | | | | (16,177,291 | ) | | | — | | | | (73,380 | ) | | | 4,144,882 | |
BP Global Equity Fund | | | 3,816,950 | | | | 4,584,579 | | | | — | | | | — | | | | — | | | | 51,416,499 | |
BP Global Long/Short Fund | | | 13,487,710 | | | | 7,260,012 | | | | — | | | | — | | | | (3,222,464 | ) | | | 17,777,994 | |
BP Global Sustainability Fund | | | 143,600 | | | | — | | | | (312,071 | ) | | | — | | | | — | | | | 2,395,339 | |
BP Long/Short Equity Fund | | | 5,323,400 | | | | 5,461,848 | | | | — | | | | — | | | | (104,282 | ) | | | 24,147,414 | |
BP Long/Short Research Fund | | | 4,595,812 | | | | 55,793,794 | | | | — | | | | — | | | | (560,311 | ) | | | 195,574,249 | |
BP Small Cap Value Fund II | | | 4,032,878 | | | | 54,189,421 | | | | — | | | | — | | | | — | | | | 147,671,642 | |
WPG Select Small Cap Value Fund | | | 3,800,187 | | | | 1,531,189 | | | | — | | | | — | | | | — | | | | 15,925,669 | |
WPG Partners Select Hedged Fund | | | 386,199 | | | | — | | | | (1,494,737 | ) | | | — | | | | — | | | | 3,022,609 | |
WPG Small Cap Value Diversified Fund | | | 898,984 | | | | 1,077,305 | | | | — | | | | — | | | | — | | | | 7,033,802 | |
The differences between the book and tax basis components of distributable earnings relate principally to the timing of recognition of income and gains for federal income tax purposes.
The tax character of dividends and distributions paid during the fiscal years ended August 31, 2024 and August 31, 2023 was as follows:
| | | 2024 | | | 2023 | |
FUND | | ORDINARY
INCOME | | | LONG-TERM
GAINS | | | TOTAL | | | ORDINARY
INCOME | | | LONG-TERM
GAINS | | | TOTAL | |
BP All-Cap Value Fund | | $ | 20,422,209 | | | $ | 116,181,081 | | | $ | 136,603,290 | | | $ | 24,105,403 | | | $ | 91,006,985 | | | $ | 115,112,388 | |
BP Emerging Markets Dynamic Equity Fund | | | — | | | | — | | | | — | | | | 11,778,440 | | | | — | | | | 11,778,440 | |
BP Global Equity Fund | | | 4,137,287 | | | | — | | | | 4,137,287 | | | | 2,771,850 | | | | — | | | | 2,771,850 | |
BP Global Long/Short Fund | | | 2,313,704 | | | | — | | | | 2,313,704 | | | | 3,244,316 | | | | — | | | | 3,244,316 | |
BP Global Sustainability Fund | | | 383,298 | | | | — | | | | 383,298 | | | | 313,835 | | | | — | | | | 313,835 | |
BP Long/Short Equity Fund | | | 5,479,195 | | | | 6,542,936 | | | | 12,022,131 | | | | 3,983,135 | | | | 4,087,413 | | | | 8,070,548 | |
BP Long/Short Research Fund | | | 25,433,392 | | | | 41,826,339 | | | | 67,259,731 | | | | 59,860,157 | | | | 86,589,335 | | | | 146,449,492 | |
BP Small Cap Value Fund II | | | 7,336,862 | | | | 60,236,676 | | | | 67,573,538 | | | | 6,797,983 | | | | 45,094,686 | | | | 51,892,669 | |
WPG Partners Select Hedged Fund | | | — | | | | — | | | | — | | | | | | | | | | | | | |
WPG Select Small Cap Value Fund | | | 13,481,054 | | | | 892,091 | | | | 14,373,145 | | | | 111,741 | | | | — | | | | 111,741 | |
WPG Small Cap Value Diversified Fund | | | 469,112 | | | | 1,644,847 | | | | 2,113,959 | | | | 1,862,975 | | | | 2,806,618 | | | | 4,669,593 | |
Dividends from net investment income and short-term capital gains are treated as ordinary income dividends for federal income tax purposes.
Financial Statements 2024 | 86 |
BOSTON PARTNERS INVESTMENT FUNDS | |
Notes to Financial Statements (continued) August 31, 2024 | |
Pursuant to federal income tax rules applicable to regulated investment companies, the Funds may elect to treat certain capital losses between November 1 and August 31 and late year ordinary losses ((i) ordinary losses between January 1 and August 31, and (ii) specified ordinary and currency losses between November 1 and August 31) as occurring on the first day of the following tax year. For the year ended August 31, 2024, any amount of losses elected within the tax return will not be recognized for federal income tax purposes until September 1, 2024.
For the fiscal year ended August 31, 2024, the Funds deferred to September 1, 2024, the following qualified late-year losses.
FUND | | LATE-YEAR
ORDINARY LOSS
DEFERRAL | | | POST-OCTOBER
CAPITAL LOSS
DEFERRAL | |
BP All-Cap Value Fund | | $ | — | | | $ | — | |
BP Emerging Markets Dynamic Equity Fund | | | — | | | | — | |
BP Global Equity Fund | | | — | | | | — | |
BP Global Long/Short Fund | | | — | | | | — | |
BP Global Sustainability Fund | | | — | | | | — | |
BP Long/Short Equity Fund | | | — | | | | — | |
BP Long/Short Research Fund | | | — | | | | — | |
BP Small Cap Value Fund II | | | — | | | | — | |
WPG Partners Select Small Cap Value Fund | | | — | | | | — | |
WPG Partners Select Hedged Fund | | | — | | | | — | |
WPG Partners Small Cap Value Diversified Fund | | | — | | | | — | |
Accumulated capital losses represent net capital loss carryforwards as of August 31, 2024 that may be available to offset future realized capital gains and thereby reduce future capital gains distributions. Under the Regulated Investment Company Modernization Act of 2010, the Funds are permitted to carry forward capital losses incurred in taxable years beginning after December 22, 2010 for an unlimited period. Any losses incurred during those future taxable years will be required to be utilized prior to any losses incurred in pre-enactment taxable years. Additionally, post-enactment capital losses that are carried forward will retain their character as either short-term or long-term capital losses rather than being considered all short-term as under the previous law. During the current fiscal period, the BP Global Equity Fund had utilized $12,623,653, BP Global Long/Short Fund had utilized $141,607, and BP Global Sustainability had utilized $2,330,507 of carry forward capital losses.
As of August 31, 2024, the BP Emerging Markets Dynamic Equity Fund had short-term post-enactment capital losses of $16,177,291. The BP Global Sustainability Fund had short-term post-enactment capital losses of $312,071. The WPG Partners Select Hedged Fund had short-term post-enactment capital losses of $1,494,737.
Securities may be loaned to financial institutions, such as broker-dealers, and are required to be secured continuously by collateral in cash, cash equivalents, letter of credit or U.S. Government securities maintained on a current basis at an amount at least equal to the market value of the securities loaned. Cash collateral received, pursuant to investment guidelines established by the Funds and approved by the Board, is invested in short-term investments. All such investments are made at the risk of the Funds and, as such, the Funds are liable for investment losses. Such loans would involve risks of delay in receiving additional collateral in the event the value of the collateral decreased below the value of the securities loaned or of delay in recovering the securities loaned or even loss of rights in the collateral should the borrower of the securities fail financially. However, loans will be made only to borrowers deemed by Boston Partners to be of good standing and only when, in Boston Partners’ judgment, the income to be earned from the loans justifies the attendant risks. Any loans of a Fund’s securities will be fully collateralized and marked to market daily. Investments purchased with proceeds from securities lending are overnight and continuous. During the current fiscal period, the Funds participated in securities lending. The market value of securities on loan and cash collateral as of the end of the reporting period and the income generated from the program during the current fiscal period with respect to such loans were as follows:
FUND | | MARKET VALUE OF
SECURITIES LOANED | | | MARKET VALUE
OF COLLATERAL | | | INCOME RECEIVED
FROM SECURITIES
LENDING | |
BP All-Cap Value Fund | | $ | 74,254,911 | | | $ | 75,809,274 | | | $ | 104,863 | |
BP Global Equity Fund | | | 4,366,972 | | | | 4,427,880 | | | | 18,416 | |
BP Long/Short Equity Fund | | | 9,085,498 | | | | 9,268,044 | | | | 56,809 | |
BP Small Cap Value Fund II | | | 109,500,196 | | | | 111,608,773 | | | | 655,153 | |
WPG Small Cap Value Diversified Fund | | | 8,825,663 | | | | 9,020,061 | | | | 21,492 | |
Financial Statements 2024 | 87 |
BOSTON PARTNERS INVESTMENT FUNDS | |
Notes to Financial Statements (concluded) August 31, 2024 | |
Securities lending transactions are entered into by the Funds’ securities lending agent on behalf of the Funds under a Master Securities Lending Agreement (“MSLA”) which permits the Funds’ securities lending agent on behalf of the Funds, under certain circumstances including an event of default (such as bankruptcy or insolvency), to offset amounts payable on behalf of the Funds to the same counterparty against amounts to be received and create one single net payment due to or from the Funds. The following table is a summary of the Funds’ open securities lending transactions which are subject to a MSLA as of the end of the reporting period:
| | | | | | | | | | | | | | | GROSS AMOUNT NOT OFFSET IN THE
STATEMENTS OF ASSETS AND LIABILITIES | |
FUND | | GROSS AMOUNT
OF RECOGNIZED
ASSETS | | | GROSS AMOUNTS
OFFSET IN
THE STATEMENT
OF ASSETS
AND LIABILITIES | | | NET AMOUNT
OF ASSETS
PRESENTED IN
THE STATEMENT
OF ASSETS
AND LIABILITIES | | | FINANCIAL
INSTRUMENTS1 | | | CASH
COLLATERAL
RECEIVED | | | NET AMOUNT | |
BP All-Cap Value Fund | | $ | 74,254,911 | | | | — | | | $ | 74,254,911 | | | $ | (74,254,911 | ) | | | — | | | | — | |
BP Global Equity Fund | | | 4,366,972 | | | | — | | | | 4,366,972 | | | | (4,366,972 | ) | | | — | | | | — | |
BP Long/Short Equity Fund | | | 9,085,498 | | | | — | | | | 9,085,498 | | | | (9,085,498 | ) | | | — | | | | — | |
BP Small Cap Value Fund II | | | 109,500,196 | | | | — | | | | 109,500,196 | | | | (109,500,196 | ) | | | — | | | | — | |
WPG Small Cap Value Diversified Fund | | | 8,825,663 | | | | — | | | | 8,825,663 | | | | (8,825,663 | ) | | | — | | | | — | |
| | 1 | Amount disclosed is limited to the amount of assets presented in the Statement of Assets and Liabilites. Actual collateral received may be more than the amount shown. |
The Company, on behalf of the Funds, has established a line of credit (“LoC”) with the Custodian to be used for temporary or emergency purposes, primarily for financing redemption payments. Any loan issued to a Fund utilizing the LoC (each, a “Borrowing Fund” and together, the “Borrowing Funds”) is secured by securities held in the Borrowing Fund’s portfolio. The LoC was renewed on September 10, 2024. The LoC will mature, unless renewed, on November 6, 2024. Borrowing under the LoC is limited to the lesser of (i) $100,000,000, (ii) 20.0% of the gross market value of a Borrowing Fund, or (iii) 33 1/3% of the net market value of the unencumbered assets of a Borrowing Fund. The interest rate paid by the Borrowing Funds on outstanding borrowings is equal to the prime lending rate of the Custodian, which was 8.50% at August 31, 2024.
During the current fiscal period, the Funds’ LoC borrowing activity was as follows:
| | | TOTAL
AMOUNT OF
DAYS BORROWED | | | AVERAGE
BORROWINGS | | | MAXIMUM
AMOUNT
OUTSTANDING | | | INTEREST
EXPENSE | | | AVERAGE
INTEREST RATE | |
BP All-Cap Value Fund | | | 8 | | | $ | 19,617,000 | | | $ | 40,166,000 | | | $ | 37,054 | | | | 8.50 | % |
BP Emerging Markets Dynamic Equity Fund | | | 9 | | | | 124,222 | | | | 559,000 | | | | 264 | | | | 8.50 | % |
BP Global Equity Fund | | | 3 | | | | 1,497,000 | | | | 1,497,000 | | | | 1,060 | | | | 8.50 | % |
BP Global Long/Short Fund | | | 1 | | | | 817,000 | | | | 817,000 | | | | 193 | | | | 8.50 | % |
BP Global Sustainability Fund | | | 1 | | | | 4,667,000 | | | | 4,667,000 | | | | 1,102 | | | | 8.50 | % |
BP Long/Short Equity Fund | | | 181 | | | | 602,398 | | | | 2,883,000 | | | | 25,744 | | | | 8.50 | % |
BP Long/Short Research Fund | | | 42 | | | | 5,447,024 | | | | 18,722,000 | | | | 54,016 | | | | 8.50 | % |
BP Small Cap Value Fund II | | | 8 | | | | 2,141,625 | | | | 4,264,000 | | | | 4,045 | | | | 8.50 | % |
WPG Select Small Cap Value Fund | | | 2 | | | | 20,000,000 | | | | 20,000,000 | | | | 9,444 | | | | 8.50 | % |
Management has evaluated the impact of all subsequent events on the Funds through the date the financial statements were issued and has determined that there was the following subsequent event:
At a special meeting of shareholders of the BP Global Long/Short Fund held on September 17, 2024, shareholders approved the Plan of Reorganization between the Company, on behalf of the BP Global Long/Short Fund, and John Hancock Investment Trust, on behalf of the John Hancock Disciplined Value Global Long/Short Fund (the “Acquiring Fund”). Pursuant to the Plan of Reorganization, on October 18, 2024, the BP Global Long/Short Fund transferred all of its assets to the Acquiring Fund in exchange for corresponding shares of the Acquiring Fund which were distributed pro rata to shareholders of the BP Global Long/Short Fund, in redemption of, and in exchange for the shares of the BP Global Long/Short Fund.
Financial Statements 2024 | 88 |
BOSTON PARTNERS INVESTMENT FUNDS |
Report of Independent Registered Public Accounting Firm |
To the Shareholders of Boston Partners All-Cap Value Fund, Boston Partners Emerging Markets Dynamic Equity Fund, Boston Partners Global Equity Fund, Boston Partners Global Long/Short Fund, Boston Partners Global Sustainability Fund, Boston Partners Long/Short Equity Fund, Boston Partners Long/Short Research Fund, Boston Partners Small Cap Value Fund II, WPG Partners Select Hedged Fund, WPG Partners Select Small Cap Value Fund, and WPG Partners Small Cap Value Diversified Fund and Board of Directors of The RBB Fund, Inc.
Opinion on the Financial Statements
We have audited the accompanying statements of assets and liabilities of Boston Partners All-Cap Value Fund, Boston Partners Emerging Markets Dynamic Equity Fund, Boston Partners Global Equity Fund, Boston Partners Global Long/Short Fund, Boston Partners Global Sustainability Fund, Boston Partners Long/Short Equity Fund, Boston Partners Long/Short Research Fund, Boston Partners Small Cap Value Fund II, WPG Partners Select Hedged Fund, WPG Partners Select Small Cap Value Fund, and WPG Partners Small Cap Value Diversified Fund (collectively referred to as the “Funds”) (eleven of the portfolios constituting The RBB Fund, Inc. (the “Company”)), including the schedules of investments, as of August 31, 2024, and the related statements of operations and changes in net assets, and the financial highlights for each of the periods indicated in the table below and the related notes (collectively referred to as the “financial statements”). In our opinion, the financial statements present fairly, in all material respects, the financial position of each of the Funds (eleven of the portfolios constituting The RBB Fund, Inc.) at August 31, 2024, and the results of their operations, changes in net assets and financial highlights for each of the periods indicated in the table below, in conformity with U.S. generally accepted accounting principles.
Individual portfolio constituting The RBB Fund, Inc. | Statement of operations | Statements of changes in net assets | Financial highlights |
Boston Partners All-Cap Value Fund Boston Partners Emerging Markets Dynamic Equity Fund Boston Partners Global Equity Fund Boston Partners Global Long/Short Fund Boston Partners Long/Short Equity Fund Boston Partners Long/Short Research Fund Boston Partners Small Cap Value Fund II WPG Partners Small Cap Value Diversified Fund | For the year ended
August 31, 2024 | For each of the two
years in the period
ended August 31, 2024 | For each of the five years
in the period ended
August 31, 2024 |
WPG Partners Select Small Cap Value Fund Boston Partners Global Sustainability Fund | For the year ended
August 31, 2024 | For each of the two
years in the period
ended August 31, 2024 | For each of the two years
in the period ended
August 31, 2024, and the
period from December 29,
2021 (commencement of
operations) through
August 31, 2022 |
WPG Partners Select Hedged Fund | For the period from May 3, 2024 (commencement of operations) through
August 31, 2024 |
Basis for Opinion
These financial statements are the responsibility of the Company’s management. Our responsibility is to express an opinion on each of the Funds’ financial statements based on our audits. We are a public accounting firm registered with the Public Company Accounting Oversight Board (United States) (“PCAOB”) and are required to be independent with respect to the Company in accordance with the U.S. federal securities laws and the applicable rules and regulations of the Securities and Exchange Commission and the PCAOB.
We conducted our audits in accordance with the standards of the PCAOB. Those standards require that we plan and perform the audit to obtain reasonable assurance about whether the financial statements are free of material misstatement, whether due to error or fraud. The Company is not required to have, nor were we engaged to perform, an audit of the Company’s internal control over financial reporting. As part of our audits, we are required to obtain an understanding of internal control over financial reporting but not for the purpose of expressing an opinion on the effectiveness of the Company’s internal control over financial reporting. Accordingly, we express no such opinion.
Our audits included performing procedures to assess the risks of material misstatement of the financial statements, whether due to error or fraud, and performing procedures that respond to those risks. Such procedures included examining, on a test basis, evidence regarding the amounts and disclosures in the financial statements. Our procedures included confirmation of securities owned as of August 31, 2024, by correspondence with the custodian and brokers; when replies were not received from brokers, we performed other auditing procedures.
Financial Statements 2024 | 89 |
BOSTON PARTNERS INVESTMENT FUNDS |
Report of Independent registered Public Accounting Firm (concluded) |
Our audits also included evaluating the accounting principles used and significant estimates made by management, as well as evaluating the overall presentation of the financial statements. We believe that our audits provide a reasonable basis for our opinion.

We have served as the auditor of one or more Boston Partners investment companies since 2007.
Philadelphia, Pennsylvania
October 30, 2024
Financial Statements 2024 | 90 |
BOSTON PARTNERS INVESTMENT FUNDS |
Shareholder Tax Information |
Certain tax information regarding each Fund is required to be provided to shareholders based upon each Fund’s income and distributions for the taxable year ended August 31, 2024. The information and distributions reported herein may differ from information and distributions taxable to the shareholders for the calendar year ending December 31, 2024. During the fiscal year ended August 31, 2024, the following dividends and distributions were paid by each of the Funds:
FUND | | ORDINARY
INCOME | | | LONG-TERM
GAINS | |
BP All-Cap Value Fund | | $ | 20,422,209 | | | $ | 116,181,081 | |
BP Emerging Markets Dynamic Equity Fund | | | — | | | | — | |
BP Global Equity Fund | | | 4,137,287 | | | | — | |
BP Global Long/Short Fund | | | 2,313,704 | | | | — | |
BP Global Sustainability Fund | | | 383,298 | | | | — | |
BP Long/Short Equity Fund | | | 5,479,195 | | | | 6,542,936 | |
BP Long/Short Research Fund | | | 25,433,392 | | | | 41,826,339 | |
BP Small Cap Value Fund II | | | 7,336,862 | | | | 60,236,676 | |
WPG Select Hedged Fund | | | — | | | | — | |
WPG Select Small Cap Value Fund | | | 13,481,054 | | | | 892,091 | |
WPG Small Cap Value Diversified Fund | | | 469,112 | | | | 1,644,847 | |
Distributions from net investment income and short-term capital gains are treated as ordinary income for federal income tax purposes.
Under the Jobs and Growth Tax relief Reconciliation Act of 2003 (the “Act”) the following percentages of ordinary dividends paid during the fiscal year ended August 31, 2024 are designated as “qualified dividend income,” as defined in the Act, and are subject to reduced tax rates:
FUND | |
BP All-Cap Value Fund | 100.00% |
BP Emerging Markets Dynamic Equity Fund | 0.00% |
BP Global Equity Fund | 100.00% |
BP Global Long/Short Fund | 100.00% |
BP Global Sustainability Fund | 100.00% |
BP Long/Short Equity Fund | 21.46% |
BP Long/Short Research Fund | 54.84% |
BP Small Cap Value Fund II | 100.00% |
WPG Select Hedged Fund | 0.00% |
WPG Select Small Cap Value Fund | 4.67% |
WPG Small Cap Value Diversified Fund | 65.26% |
The percentage of total ordinary income dividends paid qualifying for the corporate dividends received deduction for each Fund is as follows:
FUND | |
BP All-Cap Value Fund | 100.00% |
BP Emerging Markets Dynamic Equity Fund | 0.00% |
BP Global Equity Fund | 34.25% |
BP Global Long/Short Fund | 35.76% |
BP Global Sustainability Fund | 44.93% |
BP Long/Short Equity Fund | 14.28% |
BP Long/Short Research Fund | 40.43% |
BP Small Cap Value Fund II | 97.38% |
WPG Select Hedged Fund | 0.00% |
WPG Select Small Cap Value Fund | 3.03% |
WPG Small Cap Value Diversified Fund | 57.55% |
Financial Statements 2024 | 91 |
BOSTON PARTNERS INVESTMENT FUNDS |
Shareholder Tax Information (concluded) |
The percentage of qualified interest income related dividends not subject to withholding tax for non-resident aliens and foreign corporations is as follows:
FUND | |
BP All-Cap Value Fund | 0.00% |
BP Emerging Markets Dynamic Equity Fund | 0.00% |
BP Long/Short Equity Fund | 2.54% |
BP Long/Short Research Fund | 2.73% |
BP Global Equity Fund | 0.95% |
BP Global Long/Short Fund | 18.82% |
BP Global Sustainability Fund | 6.59% |
BP Small Cap Value Fund II | 0.00% |
WPG Select Hedged Fund | 0.00% |
WPG Select Small Cap Value Fund | 0.00% |
WPG Small Cap Value Diversified Fund | 0.00% |
The percentage of ordinary income distributions designated as qualified short-term gains pursuant to the American Job Creation Act of 2004 is as follows:
FUND | |
BP All-Cap Value Fund | 0.00% |
BP Emerging Markets Dynamic Equity Fund | 0.00% |
BP Long/Short Equity Fund | 80.53 |
BP Long/Short Research Fund | 40.35 |
BP Global Equity Fund | 0.00% |
BP Global Long/Short Fund | 0.00% |
BP Global Sustainability Fund | 0.00% |
BP Small Cap Value Fund II | 32.25% |
WPG Select Hedged Fund | 0.00% |
WPG Select Small Cap Value Fund | 96.11% |
WPG Small Cap Value Diversified Fund | 46.13% |
Pursuant to Section 853 of the Internal Revenue Code, as amended, the following Portfolios elect to pass-through to shareholders the credit for taxes paid to eligible foreign countries, which may be less than the actual amount paid for financial statement purposes.
| | | | Per Share | |
FUND | GROSS FOREIGN
SOURCE INCOME | FOREIGN TAXES
PASSTHROUGH | GROSS FOREIGN
SOURCE INCOME | FOREIGN TAXES
PASSTHROUGH | SHARES
OUTSTANDING
AT 8/31/2024 |
BP Global Equity Fund | 5,430,217 | 538,620 | 0.56465704 | 0.05600800 | 9,616,841 |
BP Global Sustainability Fund | 245,589 | 27,406 | 0.25741705 | 0.02872590 | 954,052 |
BP Global Long Short Fund | 1,912,272 | 246,988 | 0.18219628 | 0.02353233 | 10,495,669 |
Because each Fund’s fiscal year is not the calendar year, another notification will be sent with respect to calendar year 2024. The second notification, which will reflect the amount, if any, to be used by calendar year taxpayers on their U.S. federal income tax returns, will be made in conjunction with Form 1099-DIV and will be mailed in January 2025.
In general, dividends received by tax exempt recipients (e.g., IRAs and Keoghs) need not be reported as taxable income for U.S. federal income tax purposes. However, some retirement trusts (e.g., corporate, Keogh and 403(b)(7) plans) may need this information for their annual information reporting.
Shareholders are advised to consult their own tax advisers with respect to the tax consequences of their investment in the Funds.
Financial Statements 2024 | 92 |
BOSTON PARTNERS INVESTMENT FUNDS |
Other Information |
Investment Advisory Agreement Renewal
As required by the 1940 Act, the Board, including all of the Directors who are not “interested persons” of the Company, as that term is defined in the 1940 Act (the “Independent Directors”), considered the renewal of the investment advisory agreement between Boston Partners and the Company (the “Investment Advisory Agreement”) on behalf of the Boston Partners Small Cap Value Fund II, Boston Partners All-Cap Value Fund, Boston Partners Long/Short Equity Fund, Boston Partners Long/Short Research Fund, WPG Partners Small Cap Value Diversified Fund, Boston Partners Global Equity Fund, Boston Partners Global Sustainability Fund, Boston Partners Global Long/Short Fund, Boston Partners Emerging Markets Dynamic Equity Fund and WPG Partners Select Small Cap Value Fund (each a “Fund” and collectively the “Funds”), and the advisory agreement between Boston Partners and BP Emerging Markets Long/Short Offshore Ltd. with respect to the Boston Partners Emerging Markets Dynamic Equity Fund (the “Cayman Subsidiary Investment Advisory Agreement” and together with the Investment Advisory Agreement, the “Investment Advisory Agreements”), at a meeting of the Board held on May 15-16, 2024 (the “Meeting”). At the Meeting, the Board, including all of the Independent Directors, approved the Investment Advisory Agreements for an additional one-year term ending August 16, 2025. The Board’s decision to approve the Investment Advisory Agreements reflects the exercise of its business judgment to continue the existing arrangement. In approving the Investment Advisory Agreements, the Board considered information provided by Boston Partners with the assistance and advice of counsel to the Independent Directors and the Company.
In considering the renewal and approval of the Investment Advisory Agreements with respect to the Funds, the Directors took into account all the materials provided prior to and during the Meeting and at other meetings throughout the past year, the presentations made during the Meeting, and the discussions held during the Meeting. The Directors reviewed these materials with management of Boston Partners and discussed the Investment Advisory Agreements with counsel in executive sessions at which no representatives of Boston Partners were present. Among other things, the Directors considered (i) the nature, extent and quality of Boston Partners’ services provided to the Funds; (ii) descriptions of the experience and qualifications of Boston Partners personnel providing those services; (iii) Boston Partners’ investment philosophies and processes; (iv) Boston Partners’ assets under management and client descriptions; (v) Boston Partners’ soft dollar commission and trade allocation policies, including information on the types of research and services obtained in connection with soft dollar commissions; (vi) Boston Partners’ current advisory fee arrangements with the Company and other similarly managed clients; (vii) Boston Partners’ compliance procedures; (viii) Boston Partners’ financial information, insurance coverage and profitability analysis related to providing advisory services to the Funds; (ix) the extent to which economies of scale are relevant to the Funds; (x) a report prepared by Fuse Research Network, LLC comparing each Fund’s management fees and total expense ratios to a group of mutual funds deemed comparable to such Fund based primarily on investment strategy similarity (“Peer Group”) and comparing the performance of each Fund to the performance of its Peer Group; and (xi) a report comparing the performance of each Fund to the performance of its benchmark.
As part of their review, the Directors considered the nature, extent and quality of the services provided by Boston Partners. The Directors concluded that Boston Partners had substantial resources to provide services to the Funds and that Boston Partners’ services had been acceptable.
The Directors also considered the investment performance of the Funds. Information on the Funds’ investment performance was provided for the three-month, one-year, three-year, five-year, ten-year and since-inception periods ended December 31, 2023, as applicable. The Directors considered the Funds’ investment performance in light of their respective investment objectives and investment strategies. The Directors concluded that the investment performance of each of the Funds as compared to its respective benchmark and Peer Group was acceptable.
In reaching this conclusion, the Directors noted that the Boston Partners All-Cap Value Fund outperformed its benchmark, the Russell 3000 Value Index, for the one-year, three-year, five-year, ten-year and since-inception periods ended December 31, 2023, and underperformed its benchmark for the three-month period ended December 31, 2023. The Board noted that the Fund’s total return outperformed the median of its Peer Group for the three-year, five-year, ten-year and since-inception periods ended December 31, 2023, and underperformed the median of its Peer Group for the three-month and one-year periods ended December 31, 2023.
The Directors noted that the Boston Partners Long/Short Equity Fund outperformed its primary benchmark, the S&P 500 Index, for the three-year and since-inception periods ended December 31, 2023, and underperformed its benchmark for the three-month, one-year, five-year and ten-year periods ended December 31, 2023. The Directors noted that the Boston Partners Long/Short Equity Fund outperformed the median of its Peer Group for the three-month, one-year, three-year, five-year and ten-year periods ended December 31, 2023, and performed at the median of its Peer Group for the since-inception period ended December 31, 2023.
The Directors noted that the WPG Partners Small Cap Value Diversified Fund outperformed its primary benchmark, the Russell 2000 Value Index, for the three-year and five-year periods ended December 31, 2023, and underperformed its benchmark for the three-month, one-year and ten-year periods ended December 31, 2023. The Directors noted that the WPG Partners Small Cap Value Diversified Fund outperformed the median of its Peer Group for the three-year and five-year periods ended December 31, 2023, performed at the median of its Peer Group for the one-year and since-inception periods ended December 31, 2023, and underperformed its Peer Group for the three-month and ten-year periods ended December 31, 2023.
Financial Statements 2024 | 93 |
BOSTON PARTNERS INVESTMENT FUNDS |
Other Information (continued) |
Next, the Directors also reviewed the performance of the Boston Partners Long/Short Research Fund, noting that the Fund had outperformed its benchmark, the S&P 500 Index, for the three-year period ended December 31, 2023, and underperformed its benchmark for the three-month, one-year, five-year, ten-year and since-inception periods ended December 31, 2023. The Directors noted that the Boston Partners Long/Short Research Fund outperformed the median of its Peer Group for the three-year and since-inception periods ended December 31, 2023, and underperformed the median of its Peer Group for the three-month, one-year, five-year and ten-year periods ended December 31, 2023.
The Directors next reviewed the performance of the Boston Partners Small Cap Value Fund II, which outperformed its benchmark, the Russell 2000 Value Index, for the one-year, three-year, five-year, ten-year and since-inception periods ended December 31, 2023, and underperformed its benchmark for the three-month period ended December 31, 2023. The Directors noted that the Boston Partners Small Cap Value Fund II outperformed the median of its Peer Group for the one-year, five-year and since-inception periods ended December 31, 2023, performed at the median of its Peer Group for the three-year period ended December 31, 2023, and underperformed the median of its Peer Group for the three-month and ten-year periods ended December 31, 2023.
The Directors also considered the performance of the Boston Partners Global Equity Fund, which outperformed its benchmark, the MSCI World Net Return Index, for the three-year period ended December 31, 2023, and underperformed its benchmark for the three-month, one-year, five-year, ten-year and since-inception periods ended December 31, 2023. The Directors noted that the Boston Partners Global Equity Fund outperformed the median of its Peer Group for the three-month, three-year, five-year, ten-year and since-inception periods ended December 31, 2023, and matched the performance of the median of its Peer Group for the one-year period ended December 31, 2023.
The Directors also considered the performance of the Boston Partners Global Sustainability Fund, which outperformed its benchmark, the MSCI World Net Return Index, for the since-inception period ended December 31, 2023, and underperformed its benchmark for the three-month and one-year periods ended December 31, 2023. The Directors noted that the Boston Partners Global Sustainability Fund outperformed the median of its Peer Group for the since-inception period ended December 31, 2023, and underperformed the median of its Peer Group for the three-month and one-year periods ended December 31, 2023.
The Directors noted that the Boston Partners Global Long/Short Fund had outperformed its benchmark, the MSCI World Net Return Index, for the three-year period ended December 31, 2023, and underperformed its benchmark for the three-month, one-year, five-year, ten-year and since-inception periods ended December 31, 2023. The Directors noted that the Boston Partners Global Long/Short Fund outperformed the median of its Peer Group for the one-year, three-year, five-year, ten-year and since-inception periods ended December 31, 2023, and underperformed the median of its Peer Group for the three-month period ended December 31, 2023.
The Directors then reviewed the performance of the Boston Partners Emerging Markets Dynamic Equity Fund, which outperformed its benchmark, the MSCI Emerging Markets Index, for the three-year, five-year and since-inception periods ended December 31, 2023, and underperformed its benchmark for the three-month and one-year periods ended December 31, 2023. The Directors also noted that the Boston Partners Emerging Markets Dynamic Equity Fund underperformed the median of its Peer Group for the three-month, one-year, three-year, five-year and since-inception periods ended December 31, 2023.
The Directors noted that the WPG Partners Select Small Cap Value Fund outperformed its primary benchmark, the Russell 2000 Value Index, for the one-year and since-inception periods ended December 31, 2023, and underperformed its benchmark for the three-month period ended December 31, 2023. The Directors noted that the WPG Partners Select Small Cap Value Fund outperformed the median of its Peer Group for the one-year and since-inception periods ended December 31, 2023, and underperformed the median of its Peer Group for the three-month period ended December 31, 2023.
The Board also considered the advisory fee rates payable by the Funds under the Investment Advisory Agreements. In this regard, information on the fees paid by the Funds and the Funds’ total operating expense ratios (before and after fee waivers and expense reimbursements) were compared to similar information for mutual funds advised by other, unaffiliated investment advisory firms. The Directors noted that Boston Partners had contractually agreed to waive management fees and reimburse expenses through at least December 31, 2025 for the Funds to limit total annual operating expenses to agreed upon levels for each Fund.
The Directors noted that the Boston Partners Small Cap Value Fund II’s net advisory fee was above the median and ranked in the 3rd quartile of its Peer Group, and the Fund’s total net expenses were above the median and ranked in the 3rd quartile of its Peer Group.
The Directors noted that the Boston Partners Long/Short Equity Fund’s net advisory fee was above the median and ranked in the 4th quartile of its Peer Group, and the Fund’s total net expenses equaled the median of its Peer Group.
The Directors noted that the Boston Partners Long/Short Research Fund’s net advisory fee was above the median and ranked in the 3rd quartile of its Peer Group, and the Fund’s total net expenses were below the median and ranked in the 2nd quartile of its Peer Group.
The Directors noted that the Boston Partners All-Cap Value Fund’s net advisory fee equaled the median of its Peer Group, and the Fund’s total net expenses were below the median and ranked in the 1st quartile of its Peer Group.
Financial Statements 2024 | 94 |
BOSTON PARTNERS INVESTMENT FUNDS |
Other Information (continued) |
The Directors noted that the Boston Partners Global Equity Fund’s net advisory fee and total net expenses were both above the median and each ranked in the 3rd quartile of its Peer Group.
The Directors noted that the Boston Partners Global Sustainability Fund’s net advisory fee was below the median and in the 2nd quartile of its Peer Group, and the Fund’s total net expenses matched the median of its Peer Group.
The Directors noted that the Boston Partners Global Long/Short Fund’s net advisory fee was above the median and in the 4th quartile of its Peer Group, and the Fund’s total net expenses were above the median and in the 3rd quartile of its Peer Group.
The Directors noted that the Boston Partners Emerging Markets Dynamic Equity Fund’s net advisory fee was below the median and in the 2nd quartile of its Peer Group, and the Fund’s total net expenses matched the median of its Peer Group.
The Directors noted that the WPG Partners Select Small Cap Value Fund’s net advisory fee was above the median and in the 4th quartile of its Peer Group, and the Fund’s total net expenses were above the median and in the 4th quartile of its Peer Group.
The Directors noted that the WPG Partners Small Cap Value Diversified Fund’s net advisory fee matched the median of its Peer Group, and the Fund’s total net expenses matched the median of its Peer Group.
After reviewing the information regarding the Funds’ costs, profitability and economies of scale, and after considering Boston Partners’ services, the Directors concluded that the investment advisory fees to be paid by the Funds were fair and reasonable and that the Investment Advisory Agreements should be approved and continued for an additional one-year period ending August 16, 2025.
Approval of Investment Advisory Agreement – WPG Partners Select Hedged Fund
As required by the 1940 Act, the Board, including all of the Independent Directors, considered the approval of the investment advisory agreement between Boston Partners and the Company (the “New Investment Advisory Agreement”) on behalf of the WPG Partners Select Hedged Fund (for this section only, the “Fund”) at a meeting of the Board held on February 12-13, 2024 (the “February Meeting”). At the February Meeting, the Board, including all of the Independent Directors, approved the New Investment Advisory Agreement for an initial one-year term ending August 16, 2025. The Board’s decision to approve the New Investment Advisory Agreement reflects the exercise of its business judgment. In approving the New Investment Advisory Agreement, the Board considered information provided by Boston Partners with the assistance and advice of counsel to the Independent Directors and the Company.
In considering the approval of the New Investment Advisory Agreement with respect to the Fund, the Directors took into account all materials provided prior to and during the February Meeting and at other meetings throughout the past year, the presentations made during the February Meeting, and the discussions held during the February Meeting. The Directors reviewed these materials with management of Boston Partners and discussed the New Investment Advisory Agreement with counsel in executive sessions, at which no representatives of Boston Partners were present. The Directors considered whether approval of the New Investment Advisory Agreement would be in the best interests of the Fund and its shareholders and the overall fairness of the New Investment Advisory Agreement. The Directors noted their familiarity with Boston Partners given its current service as the investment adviser to certain other series of the Company. Among other things, the Directors considered (i) the nature, extent and quality of services to be provided to the Fund by Boston Partners; (ii) descriptions of the experience and qualifications of the personnel providing those services; (iii) Boston Partners’ investment philosophy and process; (iv) Boston Partners’ assets under management and client descriptions; (v) Boston Partners’ soft dollar commission and trade allocation policies, as applicable; (vi) Boston Partners’ advisory fee arrangements with the Company and other similarly managed clients, as applicable; (vii) Boston Partners’ compliance procedures; (viii) Boston Partners’ financial information and insurance coverage; (ix) Boston Partners’ profitability analysis relating to its proposed provision of services to the Fund; and (x) the extent to which economies of scale would be relevant to the Fund. The Directors noted that the Fund had not yet commenced operations and, consequently, there was no performance information to review with respect to the Fund.
As part of their review, the Directors considered the nature, extent and quality of the services to be provided by Boston Partners. The Directors concluded that Boston Partners had sufficient resources to provide services to the Fund.
The Board also considered the advisory fee rates payable by the Fund under the proposed New Investment Advisory Agreement. In this regard, information on the fees to be paid by the Fund and the Fund’s expected total operating expense ratios (before and after fee waivers and expense reimbursements) were compared to similar information for mutual funds advised by other unaffiliated investment advisory firms, as well as fee structures of Boston Partners’ other products, both mutual funds and separately managed accounts. The Directors noted that Boston Partners had contractually agreed to waive management fees and reimburse expenses of the Fund for at least one year to limit total annual operating expenses to agreed upon levels for the Fund.
After reviewing the information regarding Boston Partners’ estimated costs, profitability and economies of scale, and after considering the services to be provided by Boston Partners, the Directors concluded that the investment advisory fees to be paid by the Fund to Boston Partners were fair and reasonable and that the New Investment Advisory Agreement should be approved for an initial period ending August 16, 2025.
Financial Statements 2024 | 95 |
BOSTON PARTNERS INVESTMENT FUNDS |
Other Information (concluded) |
Approval of Plan of Reorganization and Report of Special Meeting of Shareholders
A special meeting of shareholders of the BP Global Long/Short Fund (the “Special Meeting”) was held on September 17, 2024. At the Special Meeting, shareholders of the BP Global Long/Short Fund voted on a proposal to approve the Plan of Reorganization between the Company, on behalf of the BP Global Long/Short Fund, and John Hancock Investment Trust, on behalf of the John Hancock Disciplined Value Global Long/Short Fund (the “Acquiring Fund”). Under the Plan of Reorganization, the BP Global Long/Short Fund would transfer all of its assets to the Acquiring Fund in exchange for corresponding shares of the Acquiring Fund to be distributed pro rata to shareholders of the BPGlobal Long/Short Fund, in redemption of, and in exchange for the shares of the BP Global Long/Short Fund.
All shareholders of record of the BP Global Long/Short Fund at the close of business on July 23, 2024 (the “Record Date”) were entitled to vote at the Special Meeting. As of the Record Date, the BP Global Long/Short Fund had 10,351,143 shares outstanding.
Of the 6,551,104 shares of the BP Global Long/Short Fund present in person or by proxy at the Special Meeting, 6,453,965 shares or 98.52% voted in favor of the proposal to approve the Plan of Reorganization; 12,704 shares or 0.19% voted against the proposal to approve the Plan of Reorganization; and 84,435 shares or 1.29% abstained from voting on the proposal to approve the Plan of Reorganization.
Accordingly, shareholders of the BP Global Long/Short Fund approved the Plan of Reorganization at the Special Meeting on September17, 2024.
The reorganization contemplated by the Plan of Reorganization occurred as of 4:00 p.m. Eastern time on October 18, 2024.
Financial Statements 2024 | 96 |
(THIS PAGE INTENTIONALLY LEFT BLANK.)


Campbell Systematic Macro Fund
of
THE RBB FUND, INC.
Class A (TICKER: EBSAX)
Class C (TICKER: EBSCX)
Class I (TICKER: EBSIX)
Financial Statements
August 31, 2024
This report is submitted for the general information of the shareholders of the Fund. It is not authorized for distribution unless preceded or accompanied by a current prospectus for the Fund.
Campbell Systematic Macro Fund
Consolidated Portfolio of Investments
August 31, 2024
| | | PAR | | | Value | |
SHORT-TERM INVESTMENTS — 73.1% | | | | | | | | |
U.S. Treasury Bills — 73.1% | | | | | | | | |
5.20%, 09/05/2024 (a) | | | 150,000,000 | | | $ | 149,956,537 | |
5.24%, 10/10/2024 (a) | | | 160,000,000 | | | | 159,155,989 | |
5.25%, 11/14/2024 (a) | | | 140,000,000 | | | | 138,601,837 | |
5.25%, 12/05/2024 (a) | | | 175,000,000 | | | | 172,792,929 | |
5.21%, 01/02/2025 (a) | | | 145,000,000 | | | | 142,672,850 | |
4.86%, 02/06/2025 (a) | | | 150,000,000 | | | | 146,931,756 | |
TOTAL SHORT-TERM INVESTMENTS (Cost $909,556,812) | | | | | | | 910,111,898 | |
| | | | | | | | | |
TOTAL INVESTMENTS — 73.1% (Cost $909,556,812) | | | 910,111,898 | |
Other Assets in Excess of Liabilities — 26.9% | | | 334,766,985 | |
TOTAL NET ASSETS — 100.0% | | $ | 1,244,878,883 | |
Percentages are stated as a percent of net assets.
(a) | The rate shown is the effective yield as of August 31, 2024. |
The accompanying notes are an integral part of the consolidated financial statements.
1
Campbell Systematic Macro Fund
Consolidated Portfolio of Investments
August 31, 2024
Futures contracts outstanding as of August 31, 2024 were as follows:
Description | Contracts
Purchased | Expiration
Date | | Notional | | | Value / Unrealized
Appreciation
(Depreciation) | |
3 Month Canadian Overnight Repo Rate Average | 1,592 | 03/17/2026 | | $ | 286,867,733 | | | $ | (351,665 | ) |
Arabica Coffee | 90 | 12/18/2024 | | | 8,236,688 | | | | (227,691 | ) |
ASX SPI 200 Index | 223 | 09/19/2024 | | | 30,372,454 | | | | 202,345 | |
Australian Government 10 Year Bonds | 2,420 | 09/16/2024 | | | 190,948,290 | | | | (896,165 | ) |
Australian Government 3 Year Bonds | 1,657 | 09/16/2024 | | | 119,941,707 | | | | 174,760 | |
Australian 90 Day Bank Bills | 1,106 | 09/11/2025 | | | 742,190,406 | | | | 766,855 | |
Brent Crude Oil | 155 | 10/31/2024 | | | 11,817,200 | | | | (201,867 | ) |
Canadian 10 Year Government Bonds | 6,648 | 12/18/2024 | | | 607,058,865 | | | | (5,766,033 | ) |
Copper | 174 | 12/27/2024 | | | 18,320,025 | | | | (50,292 | ) |
Crude Oil | 461 | 09/20/2024 | | | 33,906,550 | | | | (1,087,036 | ) |
Dow Jones Industrial Average Index | 99 | 09/20/2024 | | | 20,618,235 | | | | 351,877 | |
Euro STOXX 50 Quanto Index | 795 | 09/20/2024 | | | 43,684,795 | | | | 514,407 | |
Euro-BTP Future Dec24 | 143 | 12/06/2024 | | | 18,782,137 | | | | (38,520 | ) |
Euro-Bund | 1,844 | 12/06/2024 | | | 271,916,874 | | | | (565,091 | ) |
EURO-BUXL 30Y BND Dec24 | 34 | 12/06/2024 | | | 5,060,255 | | | | (15,824 | ) |
EURO-SCHATZ FUT Dec24 | 7,398 | 12/06/2024 | | | 872,156,856 | | | | (327,657 | ) |
FTSE 100 Index | 318 | 09/20/2024 | | | 35,028,696 | | | | 88,045 | |
FTSE China A50 Index | 2,403 | 09/27/2024 | | | 28,235,250 | | | | (63,782 | ) |
FTSE/JSE Top 40 Index | 915 | 09/19/2024 | | | 39,079,860 | | | | 542,880 | |
FTSE/MIB Index | 214 | 09/20/2024 | | | 40,753,794 | | | | 998,935 | |
German Stock Index | 5 | 09/20/2024 | | | 2,618,554 | | | | (2,360 | ) |
Hang Seng China Enterprises Index | 168 | 09/27/2024 | | | 6,802,688 | | | | 78,709 | |
Hang Seng Index | 385 | 09/27/2024 | | | 44,312,178 | | | | 473,364 | |
Hard Red Winter Wheat | 128 | 12/13/2024 | | | 3,617,600 | | | | 62,801 | |
IBEX 35 Index | 153 | 09/20/2024 | | | 19,336,365 | | | | 593,818 | |
ICE 3 Month SONIA Rate | 1,516 | 12/16/2025 | | | 478,951,395 | | | | (291,481 | ) |
Lean Hogs | 54 | 10/14/2024 | | | 1,776,060 | | | | (74 | ) |
Live Cattle | 1,063 | 10/31/2024 | | | 75,940,720 | | | | (1,899,830 | ) |
London Metals - Aluminum | 1,225 | 09/16/2024 | | | 74,538,188 | | | | (2,248,189 | ) |
London Metals - Aluminum | 541 | 12/16/2024 | | | 33,243,368 | | | | 32,598 | |
London Metals - Copper | 347 | 09/16/2024 | | | 79,313,525 | | | | (1,271,922 | ) |
London Metals - Copper | 23 | 12/16/2024 | | | 5,325,949 | | | | (31,956 | ) |
London Metals - Lead | 750 | 09/16/2024 | | | 38,011,688 | | | | (440,814 | ) |
London Metals - Lead | 214 | 12/16/2024 | | | 11,027,474 | | | | (97,329 | ) |
London Metals - Nickel | 346 | 09/16/2024 | | | 34,440,300 | | | | 932,831 | |
London Metals - Nickel | 88 | 12/16/2024 | | | 8,880,675 | | | | (82,041 | ) |
London Metals - Zinc | 1,032 | 09/16/2024 | | | 73,754,976 | | | | 1,710,632 | |
London Metals - Zinc | 137 | 12/16/2024 | | | 9,946,200 | | | | 363,760 | |
MSCI EAFE Index | 30 | 09/20/2024 | | | 3,687,750 | | | | 59,701 | |
MSCI Emerging Markets Index | 4 | 09/20/2024 | | | 220,000 | | | | (329 | ) |
MSCI Singapore Index | 1,529 | 09/27/2024 | | | 37,664,052 | | | | 243,058 | |
Nasdaq 100 Index | 178 | 09/20/2024 | | | 69,857,880 | | | | (204,231 | ) |
Nifty 50 Index | 1,177 | 09/26/2024 | | | 59,772,768 | | | | 531,723 | |
OMXS30 Index | 1,658 | 09/20/2024 | | | 41,978,005 | | | | 1,449,941 | |
Palladium | 183 | 12/27/2024 | | | 17,619,240 | | | | 441,298 | |
Russell 2000 Index | 2 | 09/20/2024 | | | 222,310 | | | | 1,155 | |
S&P 500 Index | 362 | 09/20/2024 | | | 102,464,100 | | | | 585,935 | |
S&P Mid Cap 400 Index | 14 | 09/20/2024 | | | 4,337,340 | | | | 23,458 | |
S&P/Toronto Stock Exchange 60 Index | 292 | 09/19/2024 | | | 60,750,907 | | | | 1,010,123 | |
The accompanying notes are an integral part of the consolidated financial statements.
2
Campbell Systematic Macro Fund
Consolidated Portfolio of Investments (Continued)
August 31, 2024
Description | Contracts
Purchased | Expiration
Date | | Notional | | | Value / Unrealized
Appreciation
(Depreciation) | |
SGX FTSE Taiwan Index | 235 | 09/27/2024 | | $ | 17,561,550 | | | $ | 169,716 | |
Silver | 2 | 12/27/2024 | | | 291,430 | | | | (7,475 | ) |
Sugar #11 | 797 | 09/30/2024 | | | 17,299,363 | | | | 759,070 | |
TOPIX Index | 124 | 09/12/2024 | | | 23,033,176 | | | | (835,364 | ) |
U.S. Treasury 2 Year Notes | 2,283 | 12/31/2024 | | | 473,829,518 | | | | (689,004 | ) |
U.S. Treasury 5 Year Note | 422 | 12/31/2024 | | | 46,166,141 | | | | (64,334 | ) |
U.S. Treasury Long Bonds | 458 | 12/19/2024 | | | 56,391,250 | | | | (421,945 | ) |
U.S. Treasury Ultra Bonds | 336 | 12/19/2024 | | | 44,331,000 | | | | (695,683 | ) |
US Cocoa | 565 | 12/13/2024 | | | 43,341,150 | | | | 3,010,204 | |
| | | | | | | | | $ | (2,701,985 | ) |
Description | Contracts
Sold | Expiration
Date | | Notional | | | Value / Unrealized
Appreciation
(Depreciation) | |
3 Month Euribor | (1,627) | 09/15/2025 | | $ | 439,549,881 | | | $ | (66,961 | ) |
3-Month Secured Overnight Financing Rate | (312) | 03/17/2026 | | | 75,523,500 | | | | 51,254 | |
CAC40 10 Euro Index | (28) | 09/20/2024 | | | 2,367,457 | | | | 15,336 | |
Canadian Canola Oil | (1,643) | 11/14/2024 | | | 14,988,344 | | | | 68,510 | |
Corn No. 2 Yellow | (1,408) | 12/13/2024 | | | 28,230,400 | | | | (550,427 | ) |
Cotton No.2 | (1,201) | 12/06/2024 | | | 42,028,995 | | | | 557,603 | |
Crude Soybean Oil | (1,484) | 12/13/2024 | | | 37,405,704 | | | | 315,786 | |
Euro-BOBL | (1,109) | 12/06/2024 | | | 145,831,692 | | | | 32,596 | |
Feeder Cattle | (64) | 10/31/2024 | | | 7,608,000 | | | | (67,556 | ) |
French Government Bonds | (165) | 12/06/2024 | | | 23,003,150 | | | | 35,594 | |
Gold | (240) | 12/27/2024 | | | 60,662,400 | | | | (1,062,653 | ) |
ICE European Climate Exchange Emissions | (75) | 12/16/2024 | | | 5,828,221 | | | | 87,371 | |
Japanese 10 Year Government Bonds | (572) | 09/12/2024 | | | 566,248,307 | | | | (39,720 | ) |
London Metals - Aluminum | (1,225) | 09/16/2024 | | | 74,538,188 | | | | (491,579 | ) |
London Metals - Aluminum | (164) | 12/16/2024 | | | 10,077,472 | | | | (564,262 | ) |
London Metals - Copper | (347) | 09/16/2024 | | | 79,313,525 | | | | 5,040,696 | |
London Metals - Copper | (195) | 12/16/2024 | | | 45,154,783 | | | | (578,963 | ) |
London Metals - Lead | (750) | 09/16/2024 | | | 38,011,688 | | | | 1,498,273 | |
London Metals - Lead | (685) | 12/16/2024 | | | 35,298,221 | | | | 244,440 | |
London Metals - Nickel | (346) | 09/16/2024 | | | 34,440,300 | | | | (644,076 | ) |
London Metals - Nickel | (370) | 12/16/2024 | | | 37,339,203 | | | | (949,707 | ) |
London Metals - Zinc | (1,032) | 09/16/2024 | | | 73,754,976 | | | | 192,551 | |
London Metals - Zinc | (535) | 12/16/2024 | | | 38,841,000 | | | | (1,715,126 | ) |
Long Gilt | (1,825) | 12/27/2024 | | | 236,561,646 | | | | 253,177 | |
Low Sulphur Gas Oil | (521) | 10/10/2024 | | | 36,509,075 | | | | (145,971 | ) |
Natural Gas | (1,912) | 09/26/2024 | | | 40,668,240 | | | | 2,688,183 | |
Nikkei 225 Index | (30) | 09/12/2024 | | | 7,943,772 | | | | (93,409 | ) |
NY Harbor ULSD | (328) | 09/30/2024 | | | 31,385,861 | | | | 1,135,327 | |
Phelix DE Base M Oct24 | (245) | 10/30/2024 | | | 18,324,126 | | | | (41,928 | ) |
Platinum | (147) | 10/29/2024 | | | 6,851,670 | | | | 225,817 | |
Reformulated Gasoline Blendstock | (399) | 09/30/2024 | | | 35,077,846 | | | | (37,052 | ) |
Robusta Coffee | (12) | 11/25/2024 | | | 593,760 | | | | (22,880 | ) |
SGX TSI Iron Ore | (660) | 10/30/2024 | | | 6,667,980 | | | | (291,720 | ) |
Soybean Meal | (484) | 12/13/2024 | | | 15,149,200 | | | | (330,182 | ) |
The accompanying notes are an integral part of the consolidated financial statements.
3
Campbell Systematic Macro Fund
Consolidated Portfolio of Investments (Concluded)
August 31, 2024
Description | Contracts
Sold | Expiration
Date | | Notional | | | Value / Unrealized
Appreciation
(Depreciation) | |
Soybeans | (1,042) | 11/14/2024 | | $ | 52,100,000 | | | $ | (243,134 | ) |
U.S. Treasury 10 Year Notes | (951) | 12/19/2024 | | | 107,997,937 | | | | 607,239 | |
Wheat | (829) | 12/13/2024 | | | 22,859,675 | | | | 213,759 | |
| | | | | | | | | $ | 5,326,206 | |
Total Unrealized Appreciation (Depreciation) | | | | | | | | $ | 2,624,221 | |
The accompanying notes are an integral part of the consolidated financial statements.
4
Campbell Systematic Macro Fund
Consolidated Portfolio of Investments
August 31, 2024
Forward foreign currency contracts outstanding as of August 31, 2024 were as follows:
Counterparty | | Settlement Date | | |
| | Currency Purchased | |
| | Currency Sold | | Unrealized
Appreciation
(Depreciation) | |
UBS AG | | | 09/18/2024 | | | | | | AUD | | | 3,006,900,000 | | | | | | USD | 2,004,442,834 | | $ | 31,769,510 | |
UBS AG | | | 09/18/2024 | | | | | | BRL | | | 1,028,800,000 | | | | | | USD | 186,309,669 | | | (4,159,219 | ) |
UBS AG | | | 09/18/2024 | | | | | | CAD | | | 2,229,650,000 | | | | | | USD | 1,631,378,556 | | | 24,106,266 | |
UBS AG | | | 09/18/2024 | | | | | | CHF | | | 41,200,000 | | | | | | USD | 47,688,476 | | | 887,799 | |
UBS AG | | | 09/23/2024 | | | | | | CLP | | | 65,590,000,000 | | | | | | USD | 70,392,719 | | | 1,363,546 | |
UBS AG | | | 09/19/2024 | | | | | | CNH | | | 23,700,000 | | | | | | USD | 3,312,604 | | | 38,666 | |
UBS AG | | | 09/18/2024 | | | | | | COP | | | 569,520,000,000 | | | | | | USD | 141,016,152 | | | (5,198,486 | ) |
UBS AG | | | 09/18/2024 | | | | | | CZK | | | 4,237,200,000 | | | | | | USD | 183,590,768 | | | 3,584,132 | |
UBS AG | | | 09/18/2024 | | | | | | EUR | | | 2,918,350,000 | | | | | | USD | 3,187,130,145 | | | 41,617,628 | |
UBS AG | | | 09/18/2024 | | | | | | GBP | | | 1,422,150,000 | | | | | | USD | 1,821,211,866 | | | 46,850,246 | |
UBS AG | | | 09/18/2024 | | | | | | HUF | | | 69,213,000,000 | | | | | | USD | 191,112,744 | | | 3,439,839 | |
UBS AG | | | 09/18/2024 | | | | | | IDR | | | 2,622,725,000,000 | | | | | | USD | 162,370,368 | | | 7,210,864 | |
UBS AG | | | 09/18/2024 | | | | | | INR | | | 19,708,000,000 | | | | | | USD | 235,117,152 | | | (271,250 | ) |
UBS AG | | | 09/18/2024 | | | | | | JPY | | | 105,525,000,000 | | | | | | USD | 688,547,597 | | | 35,283,281 | |
UBS AG | | | 09/19/2024 | | | | | | KRW | | | 66,240,000,000 | | | | | | USD | 48,365,224 | | | 1,288,249 | |
UBS AG | | | 09/18/2024 | | | | | | MXN | | | 4,002,600,000 | | | | | | USD | 216,324,476 | | | (13,691,942 | ) |
UBS AG | | | 09/18/2024 | | | | | | NOK | | | 3,349,050,000 | | | | | | USD | 311,684,447 | | | 4,228,738 | |
UBS AG | | | 09/18/2024 | | | | | | NZD | | | 1,248,050,000 | | | | | | USD | 757,072,293 | | | 23,198,763 | |
UBS AG | | | 09/18/2024 | | | | | | PHP | | | 4,373,250,000 | | | | | | USD | 74,813,874 | | | 3,062,752 | |
UBS AG | | | 09/18/2024 | | | | | | PLN | | | 1,165,725,000 | | | | | | USD | 295,400,176 | | | 5,436,466 | |
UBS AG | | | 09/18/2024 | | | | | | SEK | | | 2,212,800,000 | | | | | | USD | 211,148,433 | | | 4,569,065 | |
UBS AG | | | 09/18/2024 | | | | | | SGD | | | 196,095,000 | | | | | | USD | 146,548,743 | | | 3,896,519 | |
UBS AG | | | 09/18/2024 | | | | | | TWD | | | 2,785,050,000 | | | | | | USD | 86,390,308 | | | 854,452 | |
UBS AG | | | 09/18/2024 | | | | | | ZAR | | | 4,075,600,000 | | | | | | USD | 222,249,405 | | | 5,990,614 | |
UBS AG | | | 09/18/2024 | | | | | | USD | | | 1,857,586,105 | | | | | | AUD | 2,782,050,000 | | | (26,362,331 | ) |
UBS AG | | | 09/18/2024 | | | | | | USD | | | 91,500,084 | | | | | | BRL | 503,800,000 | | | 2,301,603 | |
UBS AG | | | 09/18/2024 | | | | | | USD | | | 1,603,143,340 | | | | | | CAD | 2,193,350,000 | | | (25,389,225 | ) |
UBS AG | | | 09/18/2024 | | | | | | USD | | | 85,051,930 | | | | | | CHF | 74,950,000 | | | (3,316,804 | ) |
UBS AG | | | 09/23/2024 | | | | | | USD | | | 80,031,786 | | | | | | CLP | 74,620,000,000 | | | (1,603,410 | ) |
UBS AG | | | 09/19/2024 | | | | | | USD | | | 75,208,872 | | | | | | CNH | 540,700,000 | | | (1,248,163 | ) |
UBS AG | | | 09/18/2024 | | | | | | USD | | | 116,831,991 | | | | | | COP | 479,970,000,000 | | | 2,369,978 | |
UBS AG | | | 09/18/2024 | | | | | | USD | | | 227,135,678 | | | | | | CZK | 5,223,600,000 | | | (3,612,649 | ) |
UBS AG | | | 09/18/2024 | | | | | | USD | | | 2,828,135,703 | | | | | | EUR | 2,604,550,000 | | | (53,436,080 | ) |
UBS AG | | | 09/18/2024 | | | | | | USD | | | 1,428,845,061 | | | | | | GBP | 1,120,550,000 | | | (43,051,011 | ) |
UBS AG | | | 09/18/2024 | | | | | | USD | | | 111,434,377 | | | | | | HUF | 40,422,000,000 | | | (2,188,852 | ) |
UBS AG | | | 09/18/2024 | | | | | | USD | | | 69,468,833 | | | | | | IDR | 1,099,350,000,000 | | | (1,608,649 | ) |
UBS AG | | | 09/18/2024 | | | | | | USD | | | 122,034,634 | | | | | | INR | 10,229,000,000 | | | 143,081 | |
UBS AG | | | 09/18/2024 | | | | | | USD | | | 747,914,835 | | | | | | JPY | 114,027,000,000 | | | (34,234,072 | ) |
UBS AG | | | 09/19/2024 | | | | | | USD | | | 112,050,408 | | | | | | KRW | 152,745,000,000 | | | (2,447,173 | ) |
UBS AG | | | 09/18/2024 | | | | | | USD | | | 203,667,943 | | | | | | MXN | 3,815,700,000 | | | 10,497,264 | |
UBS AG | | | 09/18/2024 | | | | | | USD | | | 335,346,683 | | | | | | NOK | 3,549,900,000 | | | 487,479 | |
UBS AG | | | 09/18/2024 | | | | | | USD | | | 588,693,619 | | | | | | NZD | 965,800,000 | | | (15,116,954 | ) |
UBS AG | | | 09/18/2024 | | | | | | USD | | | 103,321,673 | | | | | | PHP | 6,001,500,000 | | | (3,550,007 | ) |
UBS AG | | | 09/18/2024 | | | | | | USD | | | 193,556,451 | | | | | | PLN | 769,875,000 | | | (5,123,864 | ) |
UBS AG | | | 09/18/2024 | | | | | | USD | | | 269,022,347 | | | | | | SEK | 2,811,150,000 | | | (5,026,028 | ) |
UBS AG | | | 09/18/2024 | | | | | | USD | | | 239,555,399 | | | | | | SGD | 321,045,000 | | | (6,752,255 | ) |
UBS AG | | | 09/18/2024 | | | | | | USD | | | 230,796,347 | | | | | | TWD | 7,438,500,000 | | | (2,222,863 | ) |
The accompanying notes are an integral part of the consolidated financial statements.
5
Campbell Systematic Macro Fund
Consolidated Portfolio of Investments (concluded)
August 31, 2024
Counterparty | | Settlement Date | | |
| | Currency Purchased | |
| | Currency Sold | | Unrealized
Appreciation
(Depreciation) | |
UBS AG | | | 09/18/2024 | | | | | | USD | | | 113,684,848 | | | | | | ZAR | 2,105,400,000 | | $ | (4,220,868 | ) |
Total Unrealized Appreciation (Depreciation) | | $ | 644,645 | |
AUD | Australian Dollar | | JPY | Japanese Yen |
BRL | Brazilian Real | | KRW | South Korean Won |
CAD | Canadian Dollar | | MXN | Mexican Peso |
CHF | Swiss Franc | | NOK | Norwegian Krone |
CLP | Chilean Peso | | NZD | New Zealand Dollar |
CNH | Chinese Yuan Renminbi | | PHP | Philippine Peso |
COP | Columbian Peso | | PLN | Polish Zloty |
CZK | Czech Koruna | | SEK | Swedish Krona |
EUR | Euro | | SGD | Singapore Dollar |
GBP | British Pound | | TWD | New Taiwan Dollar |
HUF | Hungarian Forint | | USD | United States Dollar |
IDR | Indonesian Rupiah | | ZAR | South African Rand |
INR | Indian Rupee | | | |
The accompanying notes are an integral part of the consolidated financial statements.
6
Campbell Systematic Macro Fund
Consolidated Statement of Assets and Liabilities
August 31, 2024
ASSETS | | | | |
Investments, at value (cost $909,556,812) | | $ | 910,111,898 | |
Cash and cash equivalents | | | 87,639,100 | |
Deposits with brokers: | | | | |
Futures contracts | | | 153,810,471 | |
Forward foreign currency contracts | | | 90,254,702 | |
Unrealized appreciation on forward foreign currency contracts | | | 264,476,800 | |
Unrealized appreciation on futures contracts | | | 29,437,511 | |
Receivable for capital shares sold | | | 1,141,397 | |
Interest receivable | | | 624,873 | |
Prepaid expenses and other assets | | | 218,642 | |
Total assets | | | 1,537,715,394 | |
LIABILITIES | | | | |
Unrealized depreciation on forward foreign currency contracts | | $ | 263,832,155 | |
Unrealized depreciation on futures contracts | | | 26,813,290 | |
Payable for: | | | | |
Advisory fees | | | 1,612,167 | |
Capital shares redeemed | | | 290,191 | |
Other accrued expenses and liabilities | | | 288,708 | |
Total liabilities | | | 292,836,511 | |
Net assets | | $ | 1,244,878,883 | |
NET ASSETS CONSIST OF: | | | | |
Par value | | $ | 129,084 | |
Paid-in capital | | | 1,264,265,532 | |
Total distributable earnings/(loss) | | | (19,515,733 | ) |
Net assets | | $ | 1,244,878,883 | |
CAPITAL SHARES: | | | | |
Class A Shares: | | | | |
Net assets applicable to Class A Shares | | $ | 53,941,639 | |
Shares outstanding ($0.001 par value, 100,000,000 shares authorized) | | | 5,661,751 | |
Net asset value and redemption price per share | | $ | 9.53 | |
Maximum offering price per share (100/96.5 of $9.53) | | $ | 9.87 | |
| | | | | |
Class C Shares: | | | | |
Net assets applicable to Class C Shares | | $ | 18,204,959 | |
Shares outstanding ($0.001 par value, 100,000,000 shares authorized) | | | 2,050,933 | |
Net asset value, offering and redemption price per share | | $ | 8.88 | |
| | | | | |
Class I Shares: | | | | |
Net assets applicable to Class I Shares | | $ | 1,172,732,285 | |
Shares outstanding ($0.001 par value, 300,000,000 shares authorized) | | | 121,371,493 | |
Net asset value, offering and redemption price per share | | $ | 9.66 | |
The accompanying notes are an integral part of the consolidated financial statements.
7
Campbell Systematic Macro Fund
Consolidated Statement of Operations
For the Year Ended August 31, 2024
INVESTMENT INCOME | | | | |
Interest | | $ | 48,065,857 | |
Total investment income | | | 48,065,857 | |
EXPENSES | | | | |
Advisory fees (Note 2) | | | 16,918,761 | |
Transfer agent fees (Note 2) | | | 1,288,701 | |
Administration and accounting fees (Note 2) | | | 193,237 | |
Distribution fees - Class A Shares | | | 143,213 | |
Distribution fees - Class C Shares | | | 178,246 | |
Registration and filing fees | | | 122,871 | |
Director fees | | | 103,871 | |
Printing and shareholder reporting fees | | | 82,254 | |
Officer fees | | | 78,050 | |
Legal fees | | | 68,304 | |
Audit and tax service fees | | | 64,758 | |
Custodian fees (Note 2) | | | 31,987 | |
Other expenses | | | 44,911 | |
Total expenses before waivers and/or reimbursements | | | 19,319,164 | |
Less: waivers and reimbursements (Note 2) | | | (944,150 | ) |
Net expenses after waivers and/or reimbursements | | | 18,375,014 | |
Net investment income/(loss) | | | 29,690,843 | |
NET REALIZED AND UNREALIZED GAIN/(LOSS) FROM INVESTMENTS |
Net realized gain/(loss) from: | | | | |
Investments | | | (1,111 | ) |
Futures contracts | | | 38,295,686 | |
Foreign currency transactions | | | (8,330,706 | ) |
Forward foreign currency contracts | | | (42,645,617 | ) |
Net change in unrealized appreciation/(depreciation) on: | | | | |
Investments | | | 829,028 | |
Futures contracts | | | 9,520,318 | |
Foreign currency translations | | | (1,033,359 | ) |
Forward foreign currency contracts | | | 8,178,880 | |
Net realized and unrealized gain/(loss) on investments | | | 4,813,119 | |
NET INCREASE/(DECREASE) IN NET ASSETS RESULTING FROM OPERATIONS | | $ | 34,503,962 | |
The accompanying notes are an integral part of the consolidated financial statements.
8
Campbell Systematic Macro Fund
Consolidated Statements of Changes in Net Assets
| | | For the
Year Ended
August 31,
2024 | | | For the
Year Ended
August 31,
2023 | |
INCREASE/(DECREASE) IN NET ASSETS FROM OPERATIONS: | | | | | | | | |
Net investment income/(loss) | | $ | 29,690,843 | | | $ | 15,272,844 | |
Net realized gain/(loss) from investments, futures contracts, foreign currency transactions and forward foreign currency contracts | | | (12,681,748 | ) | | | 16,880,850 | |
Net change in unrealized appreciation/(depreciation) on investments, futures contracts, foreign currency translations and forward foreign currency contracts | | | 17,494,867 | | | | (31,214,109 | ) |
Net increase/(decrease) in net assets resulting from operations | | | 34,503,962 | | | | 939,585 | |
| | | | | | | | | |
DIVIDENDS AND DISTRIBUTIONS TO SHAREHOLDERS FROM: | | | | | | | | |
Distributable earnings | | | | | | | | |
Class A Shares | | | (826,673 | ) | | | (9,548,573 | ) |
Class C Shares | | | (98,765 | ) | | | (2,517,507 | ) |
Class I Shares | | | (15,128,997 | ) | | | (88,730,836 | ) |
Total distributable earnings | | | (16,054,435 | ) | | | (100,796,916 | ) |
Net decrease in net assets from dividends and distributions to shareholders | | | (16,054,435 | ) | | | (100,796,916 | ) |
| | | | | | | | | |
CAPITAL SHARE TRANSACTIONS: | | | | | | | | |
Class A Shares | | | | | | | | |
Proceeds from shares sold | | | 11,201,253 | | | | 34,402,233 | |
Proceeds from reinvestment of distributions | | | 798,911 | | | | 9,286,917 | |
Shares redeemed | | | (20,737,101 | ) | | | (38,161,798 | ) |
Total from Class A Shares | | | (8,736,937 | ) | | | 5,527,352 | |
Class C Shares | | | | | | | | |
Proceeds from shares sold | | | 3,003,962 | | | | 6,816,942 | |
Proceeds from reinvestment of distributions | | | 92,450 | | | | 2,388,732 | |
Shares redeemed | | | (3,796,719 | ) | | | (3,668,971 | ) |
Total from Class C Shares | | | (700,307 | ) | | | 5,536,703 | |
Class I Shares | | | | | | | | |
Proceeds from shares sold | | | 765,144,923 | | | | 703,679,347 | |
Proceeds from reinvestment of distributions | | | 13,897,674 | | | | 85,541,786 | |
Shares redeemed | | | (406,608,214 | ) | | | (473,269,758 | ) |
Total from Class I Shares | | | 372,434,383 | | | | 315,951,375 | |
Net increase/(decrease) in net assets from capital share transactions | | | 362,997,139 | | | | 327,015,430 | |
Total increase/(decrease) in net assets | | | 381,446,666 | | | | 227,158,099 | |
The accompanying notes are an integral part of the consolidated financial statements.
9
Campbell Systematic Macro Fund
Consolidated Statements of Changes in Net Assets (Concluded)
| | | For the
Year Ended
August 31,
2024 | | | For the
Year Ended
August 31,
2023 | |
NET ASSETS: | | | | | | | | |
Beginning of period | | $ | 863,432,217 | | | $ | 636,274,118 | |
End of period | | $ | 1,244,878,883 | | | $ | 863,432,217 | |
| | | | | | | | | |
SHARE TRANSACTIONS: | | | | | | | | |
Class A Shares | | | | | | | | |
Shares sold | | | 1,206,997 | | | | 3,439,596 | |
Shares reinvested | | | 87,312 | | | | 979,633 | |
Shares redeemed | | | (2,231,994 | ) | | | (3,977,081 | ) |
Total from Class A Shares | | | (937,685 | ) | | | 442,148 | |
Class C Shares | | | | | | | | |
Shares sold | | | 343,292 | | | | 704,756 | |
Shares reinvested | | | 10,775 | | | | 269,001 | |
Shares redeemed | | | (438,071 | ) | | | (401,028 | ) |
Total from Class C Shares | | | (84,004 | ) | | | 572,729 | |
Class I Shares | | | | | | | | |
Shares sold | | | 81,023,773 | | | | 70,564,733 | |
Shares reinvested | | | 1,500,829 | | | | 8,901,331 | |
Shares redeemed | | | (43,506,352 | ) | | | (48,628,923 | ) |
Total from Class I Shares | | | 39,018,250 | | | | 30,837,141 | |
Net increase/(decrease) in shares outstanding | | | 37,996,561 | | | | 31,852,018 | |
The accompanying notes are an integral part of the consolidated financial statements.
10
Campbell Systematic Macro Fund
Consolidated Financial Highlights
Contained below is per share operating performance data for shares outstanding, total investment return/(loss), ratios to average net assets and other supplemental data for the respective periods. This information has been derived from information provided in the consolidated financial statements. |
| | | Class A | |
| | | For the
Year
Ended
August 31,
2024 | | | For the
Year
Ended
August 31,
2023 | | | For the
Year
Ended
August 31,
2022 | | | For the
Year
Ended
August 31,
2021 | | | For the
Period
Ended
August 31,
2020(1)(2) | | | For the
Year
Ended
Sept. 30,
2019 | |
Per Share Operating Performance | | | | | | | | | | | | | | | | | | | | | | | | |
Net asset value, beginning of period | | $ | 9.37 | | | $ | 10.65 | | | $ | 8.76 | | | $ | 7.55 | | | $ | 9.81 | | | $ | 9.49 | |
Net investment income/(loss)(3) | | | 0.25 | | | | 0.16 | | | | (0.11 | ) | | | (0.16 | ) | | | (0.07 | ) | | | — | (4) |
Net realized and unrealized gain/(loss) on investments, futures, forward currency and swap contracts (5) | | | 0.04 | | | | (0.05 | ) | | | 2.57 | | | | 1.37 | | | | (0.76 | ) | | | 1.45 | |
Net increase/(decrease) in net assets resulting from operations | | | 0.29 | | | | 0.11 | | | | 2.46 | | | | 1.21 | | | | (0.83 | ) | | | 1.45 | |
Dividends and distributions to shareholders from: | | | | | | | | | | | | | | | | | | | | | | | | |
Net investment income | | | (0.13 | ) | | | (0.20 | ) | | | (0.48 | ) | | | — | | | | (0.79 | ) | | | (1.13 | ) |
Net realized capital gain | | | — | | | | (1.19 | ) | | | (0.09 | ) | | | — | | | | (0.64 | ) | | | — | |
Total dividends and distributions to shareholders | | | (0.13 | ) | | | (1.39 | ) | | | (0.57 | ) | | | — | | | | (1.43 | ) | | | (1.13 | ) |
Net asset value, end of period | | $ | 9.53 | | | $ | 9.37 | | | $ | 10.65 | | | $ | 8.76 | | | $ | 7.55 | | | $ | 9.81 | |
Total investment return (6) | | | 3.15 | % | | | 0.93 | % | | | 30.09 | % | | | 16.03 | % | | | (8.86 | )%(7) | | | 17.73 | % |
Ratios/Supplemental Data | | | | | | | | | | | | | | | | | | | | | | | | |
Net assets, end of period (000’s omitted) | | $ | 53,942 | | | $ | 61,813 | | | $ | 65,549 | | | $ | 12,613 | | | $ | 10,365 | | | $ | 12,895 | |
Ratio of expenses to average net assets with waivers and reimbursements and/or recoupments (10) | | | 2.00 | % | | | 2.00 | % | | | 2.00 | % | | | 2.03 | % | | | 2.15 | %(8) | | | 2.12 | % |
Ratio of expenses to average net assets without waivers and reimbursements and/or recoupments (9)(11) | | | 2.09 | % | | | 2.12 | % | | | 2.16 | % | | | 2.36 | % | | | 2.51 | %(8) | | | 2.54 | % |
Ratio of net investment income/(loss) to average net assets | | | 2.67 | % | | | 1.71 | % | | | (1.32 | )% | | | (1.93 | )% | | | (0.93 | )%(8) | | | (0.03 | )% |
Portfolio turnover rate (12) | | | 0 | % | | | 0 | % | | | 0 | % | | | 0 | % | | | 0 | %(7) | | | 15 | % |
(1) | The fiscal year end of the Predecessor Fund was September 30. The Fund changed its fiscal year end to August 31 to reflect the fiscal year end of the other series of the Company. The period ended is from October 1, 2019 to August 31, 2020. |
(2) | Prior to May 29, 2020, the Fund was a diversified series (the “Predecessor Fund”) of Equinox Funds Trust, an open-end management investment company (or mutual fund) organized on June 2, 2010, as a statutory trust under the laws of the State of Delaware. The Predecessor Fund was reorganized into the Fund following the close of business on May 29, 2020 (the “Reorganization”). As a result of the Reorganization, the performance and accounting history of the Predecessor Fund was assumed by the Fund. Performance and accounting information prior to May 29, 2020 included herein is that of the Predecessor Fund. |
(3) | Calculated based on average shares outstanding for the period. |
(4) | Less than $0.005 per share. |
(5) | The amount shown may not correlate with the change in the aggregate gains and losses due to the timing of sales and purchases of the Fund’s shares in relation to fluctuating market values for the Fund’s portfolio. |
(6) | Total returns are historical and assume changes in share price and reinvestment of dividends and distributions. Total returns for periods of less than one year are not annualized. Had the Adviser not waived its fees or reimbursed a portion of the Fund’s expenses, the returns would have been lower. |
(9) | Represents the ratio of expenses to average net assets absent fee waivers and/or expense reimbursements by the Adviser. |
(10) Ratio of net expenses to average net assets excluding interest expense | 2.00% | 2.00% | 2.00% | 2.00% | 2.12% | 2.07% |
(11) Ratio of gross expenses to average net assets excluding interest expense(9) | 2.09% | 2.12% | 2.16% | 2.33% | 2.48% | 2.49% |
(12) | Portfolio turnover is calculated on the basis of the Fund as a whole without distinguishing between the classes of shares issued. |
The accompanying notes are an integral part of the consolidated financial statements.
11
Campbell Systematic Macro Fund
Consolidated Financial Highlights (Continued)
Contained below is per share operating performance data for shares outstanding, total investment return/(loss), ratios to average net assets and other supplemental data for the respective periods. This information has been derived from information provided in the consolidated financial statements. |
| | | Class C | |
| | | For the
Year
Ended
August 31,
2024 | | | For the
Year
Ended
August 31,
2023 | | | For the
Year
Ended
August 31,
2022 | | | For the
Year
Ended
August 31,
2021 | | | For the
Period
Ended
August 31,
2020(1)(2) | | | For the
Year
Ended
Sept. 30,
2019 | |
Per Share Operating Performance | | | | | | | | | | | | | | | | | | | | | | | | |
Net asset value, beginning of period | | $ | 8.72 | | | $ | 10.02 | | | $ | 8.38 | | | $ | 7.28 | | | $ | 9.51 | | | $ | 9.20 | |
Net investment income/(loss)(3) | | | 0.17 | | | | 0.09 | | | | (0.20 | ) | | | (0.21 | ) | | | (0.12 | ) | | | (0.07 | ) |
Net realized and unrealized gain/(loss) on investments, futures, forward currency and swap contracts (4) | | | 0.04 | | | | (0.05 | ) | | | 2.45 | | | | 1.31 | | | | (0.74 | ) | | | 1.42 | |
Net increase/(decrease) in net assets resulting from operations | | | 0.21 | | | | 0.04 | | | | 2.25 | | | | 1.10 | | | | (0.86 | ) | | | 1.35 | |
Dividends and distributions to shareholders from: | | | | | | | | | | | | | | | | | | | | | | | | |
Net investment income | | | (0.05 | ) | | | (0.15 | ) | | | (0.52 | ) | | | — | | | | (0.73 | ) | | | (1.04 | ) |
Net realized capital gain | | | — | | | | (1.19 | ) | | | (0.09 | ) | | | — | | | | (0.64 | ) | | | — | |
Total dividends and distributions to shareholders | | | (0.05 | ) | | | (1.34 | ) | | | (0.61 | ) | | | — | | | | (1.37 | ) | | | (1.04 | ) |
Net asset value, end of period | | $ | 8.88 | | | $ | 8.72 | | | $ | 10.02 | | | $ | 8.38 | | | $ | 7.28 | | | $ | 9.51 | |
Total investment return (5) | | | 2.38 | % | | | 0.22 | % | | | 29.13 | % | | | 15.11 | % | | | (9.49 | )%(6) | | | 16.88 | % |
Ratios/Supplemental Data | | | | | | | | | | | | | | | | | | | | | | | | |
Net assets, end of period (000’s omitted) | | $ | 18,205 | | | $ | 18,610 | | | $ | 15,654 | | | $ | 9,079 | | | $ | 9,087 | | | $ | 13,237 | |
Ratio of expenses to average net assets with waivers and reimbursements and/or recoupments (9) | | | 2.75 | % | | | 2.75 | % | | | 2.75 | % | | | 2.78 | % | | | 2.88 | %(7) | | | 2.87 | % |
Ratio of expenses to average net assets without waivers and reimbursements and/or recoupments (8)(10) | | | 2.84 | % | | | 2.87 | % | | | 2.91 | % | | | 3.11 | % | | | 3.27 | %(7) | | | 3.29 | % |
Ratio of net investment income/(loss) to average net assets | | | 1.92 | % | | | 0.96 | % | | | (2.07 | )% | | | (2.67 | )% | | | (1.65 | )%(7) | | | (0.78 | )% |
Portfolio turnover rate (11) | | | 0 | % | | | 0 | % | | | 0 | % | | | 0 | % | | | 0 | %(6) | | | 15 | % |
(1) | The fiscal year end of the Predecessor Fund was September 30. The Fund changed its fiscal year end to August 31 to reflect the fiscal year end of the other series of the Company. The period ended is from October 1, 2019 to August 31, 2020. |
(2) | Prior to May 29, 2020, the Fund was a diversified series (the “Predecessor Fund”) of Equinox Funds Trust, an open-end management investment company (or mutual fund) organized on June 2, 2010, as a statutory trust under the laws of the State of Delaware. The Predecessor Fund was reorganized into the Fund following the close of business on May 29, 2020 (the “Reorganization”). As a result of the Reorganization, the performance and accounting history of the Predecessor Fund was assumed by the Fund. Performance and accounting information prior to May 29, 2020 included herein is that of the Predecessor Fund. |
(3) | Calculated based on average shares outstanding for the period. |
(4) | The amount shown may not correlate with the change in the aggregate gains and losses due to the timing of sales and purchases of the Fund’s shares in relation to fluctuating market values for the Fund’s portfolio. |
(5) | Total returns are historical and assume changes in share price and reinvestment of dividends and distributions. Total returns for periods of less than one year are not annualized. Had the Adviser not waived its fees or reimbursed a portion of the Fund’s expenses, the returns would have been lower. |
(8) | Represents the ratio of expenses to average net assets absent fee waivers and/or expense reimbursements by the Adviser. |
(9) Ratio of net expenses to average net assets excluding interest expense | 2.75% | 2.75% | 2.75% | 2.75% | 2.85% | 2.82% |
(10) Ratio of gross expenses to average net assets excluding interest expense(8) | 2.84% | 2.87% | 2.91% | 3.08% | 3.24% | 3.24% |
(11) | Portfolio turnover is calculated on the basis of the Fund as a whole without distinguishing between the classes of shares issued. |
The accompanying notes are an integral part of the consolidated financial statements.
12
Campbell Systematic Macro Fund
Consolidated Financial Highlights (Concluded)
Contained below is per share operating performance data for shares outstanding, total investment return/(loss), ratios to average net assets and other supplemental data for the respective periods. This information has been derived from information provided in the consolidated financial statements. |
| | | Class I | |
| | | For the
Year
Ended
August 31,
2024 | | | For the
Year
Ended
August 31,
2023 | | | For the
Year
Ended
August 31,
2022 | | | For the
Year
Ended
August 31,
2021 | | | For the
Period
Ended
August 31,
2020(1)(2) | | | For the
Year
Ended
Sept. 30,
2019 | |
Per Share Operating Performance | | | | | | | | | | | | | | | | | | | | | | | | |
Net asset value, beginning of period | | $ | 9.51 | | | $ | 10.77 | | | $ | 8.90 | | | $ | 7.65 | | | $ | 9.93 | | | $ | 9.59 | |
Net investment income/(loss)(3) | | | 0.27 | | | | 0.20 | | | | (0.09 | ) | | | (0.14 | ) | | | (0.07 | ) | | | 0.02 | |
Net realized and unrealized gain/(loss) on investments, futures, forward currency and swap contracts (4) | | | 0.04 | | | | (0.05 | ) | | | 2.59 | | | | 1.39 | | | | (0.77 | ) | | | 1.48 | |
Net increase/(decrease) in net assets resulting from operations | | | 0.31 | | | | 0.15 | | | | 2.50 | | | | 1.25 | | | | (0.84 | ) | | | 1.50 | |
Dividends and distributions to shareholders from: | | | | | | | | | | | | | | | | | | | | | | | | |
Net investment income | | | (0.16 | ) | | | (0.22 | ) | | | (0.54 | ) | | | — | | | | (0.80 | ) | | | (1.16 | ) |
Net realized capital gain | | | — | | | | (1.19 | ) | | | (0.09 | ) | | | — | | | | (0.64 | ) | | | — | |
Total dividends and distributions to shareholders | | | (0.16 | ) | | | (1.41 | ) | | | (0.63 | ) | | | — | | | | (1.44 | ) | | | (1.16 | ) |
Net asset value, end of period | | $ | 9.66 | | | $ | 9.51 | | | $ | 10.77 | | | $ | 8.90 | | | $ | 7.65 | | | $ | 9.93 | |
Total investment return (5) | | | 3.42 | % | | | 1.25 | % | | | 30.35 | % | | | 16.34 | % | | | (8.75 | )%(6) | | | 18.17 | % |
Ratios/Supplemental Data | | | | | | | | | | | | | | | | | | | | | | | | |
Net assets, end of period (000’s omitted) | | $ | 1,172,732 | | | $ | 783,009 | | | $ | 555,072 | | | $ | 119,324 | | | $ | 115,431 | | | $ | 51,067 | |
Ratio of expenses to average net assets with waivers and reimbursements and/or recoupments (9) | | | 1.75 | % | | | 1.75 | % | | | 1.75 | % | | | 1.78 | % | | | 1.88 | %(7) | | | 1.84 | % |
Ratio of expenses to average net assets without waivers and reimbursements and/or recoupments (8)(10) | | | 1.84 | % | | | 1.87 | % | | | 1.91 | % | | | 2.11 | % | | | 2.24 | %(7) | | | 2.28 | % |
Ratio of net investment income/(loss) to average net assets | | | 2.92 | % | | | 1.96 | % | | | (1.07 | )% | | | (1.68 | )% | | | (0.91 | )%(7) | | | 0.23 | % |
Portfolio turnover rate (11) | | | 0 | % | | | 0 | % | | | 0 | % | | | 0 | % | | | 0 | %(6) | | | 15 | % |
(1) | The fiscal year end of the Predecessor Fund was September 30. The Fund changed its fiscal year end to August 31 to reflect the fiscal year end of the other series of the Company. The period ended is from October 1, 2019 to August 31, 2020. |
(2) | Prior to May 29, 2020, the Fund was a diversified series (the “Predecessor Fund”) of Equinox Funds Trust, an open-end management investment company (or mutual fund) organized on June 2, 2010, as a statutory trust under the laws of the State of Delaware. The Predecessor Fund was reorganized into the Fund following the close of business on May 29, 2020 (the “Reorganization”). As a result of the Reorganization, the performance and accounting history of the Predecessor Fund was assumed by the Fund. Performance and accounting information prior to May 29, 2020 included herein is that of the Predecessor Fund. |
(3) | Calculated based on average shares outstanding for the period. |
(4) | The amount shown may not correlate with the change in the aggregate gains and losses due to the timing of sales and purchases of the Fund’s shares in relation to fluctuating market values for the Fund’s portfolio. |
(5) | Total returns are historical and assume changes in share price and reinvestment of dividends and distributions. Total returns for periods of less than one year are not annualized. Had the Adviser not waived its fees or reimbursed a portion of the Fund’s expenses, the returns would have been lower. |
(8) | Represents the ratio of expenses to average net assets absent fee waivers and/or expense reimbursements by the Adviser. |
(9) Ratio of net expenses to average net assets excluding interest expense | 1.75% | 1.75% | 1.75% | 1.75% | 1.85% | 1.80% |
(10) Ratio of gross expenses to average net assets excluding interest expense(8) | 1.84% | 1.87% | 1.91% | 2.08% | 2.21% | 2.24% |
(11) | Portfolio turnover is calculated on the basis of the Fund as a whole without distinguishing between the classes of shares issued. |
The accompanying notes are an integral part of the consolidated financial statements.
13
Campbell Systematic Macro Fund
Notes To Consolidated Financial Statements
August 31, 2024
1. ORGANIZATION AND SIGNIFICANT ACCOUNTING POLICIES
The RBB Fund, Inc. (“RBB” or the “Company”) was incorporated under the laws of the State of Maryland on February 29, 1988 and is registered under the Investment Company Act of 1940, as amended (the “1940 Act”), as an open-end management investment company. RBB is a “series fund,” which is an investment company divided into separate portfolios. Each portfolio is treated as a separate entity for certain matters under the 1940 Act, and for other purposes, and a shareholder of one portfolio is not deemed to be a shareholder of any other portfolio. Currently, RBB has sixty-five separate investment portfolios, including the Campbell Systematic Macro Fund (the “Fund”), which commenced investment operations on March 4, 2013. The Fund currently offers Class A, Class C and Class I shares. Class A and Class I shares commenced operations on March 4, 2013. Class C commenced operations on February 11, 2014.
RBB has authorized capital of one hundred billion shares of common stock of which 92.923 billion shares are currently classified into two hundred and thirty-six classes of common stock. Each class represents an interest in an active or inactive RBB investment portfolio.
Class C and Class I shares are offered at net asset value. Class A shares are offered at net asset value plus a maximum sales charge of 3.50%. Prior to February 16, 2021, Class A shares were offered at net asset value plus a maximum sales charge of 5.75%. A contingent deferred sales charge (“CDSC”) of 1.00% is assessed on certain redemptions of Class A shares made within twelve months after a purchase of Class A shares where no initial sales charge was paid at the time of purchase as part of an investment of $1,000,000 or more. A CDSC of 1.00% is assessed on redemptions of Class C shares made within twelve months after a purchase of such shares. Each class represents an interest in the same assets of the Fund and classes are identical except for differences in their sales charge structures and ongoing service and distribution charges. All classes of shares have equal voting privileges except that each class has exclusive voting rights with respect to its service and/or distribution plans. The Fund’s income, expenses (other than class specific distribution fees) and realized and unrealized gains and losses are allocated proportionately each day based upon the relative net assets of each class.
Prior to May 29, 2020, the Fund was a diversified series (the “Predecessor Fund”) of Equinox Funds Trust, an open-end management investment company (or mutual fund) organized on June 2, 2010, as a statutory trust under the laws of the State of Delaware. The Predecessor Fund was reorganized into the Fund following the close of business on May 29, 2020 (the “Reorganization”). As a result of the Reorganization, the performance and accounting history of the Predecessor Fund was assumed by the Fund. Performance and accounting information prior to May 29, 2020 included herein is that of the Predecessor Fund.
The fiscal year end of the Predecessor Fund was September 30. The Fund changed its fiscal year end to August 31 to reflect the fiscal year end of the other series of the Company.
The Fund’s investment objective is to seek capital appreciation.
The Fund is an investment company and follows accounting and reporting guidance in the Financial Accounting Standards Board (“FASB”) Accounting Standards Codification Topic 946 “Financial Services - Investment Companies.”
The end of the reporting period for the Fund is August 31, 2024, and the period covered by these Notes to Consolidated Financial Statements is the fiscal year ended August 31, 2024 (the “current fiscal period”).
CONSOLIDATION OF SUBSIDIARY — The Campbell Systematic Macro Program is achieved by the Fund investing up to 25% of its total assets in the Campbell Systematic Macro Offshore Limited Fund (the “Subsidiary”), a wholly-owned and controlled subsidiary of the Fund organized under the acts of the Cayman Islands. The consolidated financial statements of the Fund include the financial statements of the Subsidiary. The Fund consolidates the results of the Subsidiary in which the Fund holds a controlling financial interest. All inter-company accounts and transactions have been eliminated. As of the end of the reporting period, the net assets of the Subsidiary were $70,197,905, which represented 5.64% of the Fund’s net assets.
14
Campbell Systematic Macro Fund
Notes To Consolidated Financial Statements (Continued)
August 31, 2024
PORTFOLIO VALUATION — The Fund’s net asset value (“NAV”) is calculated once daily at the close of regular trading hours on the New York Stock Exchange (“NYSE”) (generally 4:00 p.m. Eastern time) on each day the NYSE is open. Securities held by the Fund are valued using the closing price or the last sales price on a national securities exchange or the National Association of Securities Dealers Automatic Quotation System (“NASDAQ”) market system where they are primarily traded. Fixed income securities are valued using an independent pricing service, which considers such factors as security prices, yields, maturities and ratings, and are deemed representative of market values at the close of the market. Investments in other open-end investment companies are valued based on the NAV of those investment companies (which may use fair value pricing as discussed in their prospectuses). Forward currency exchange contracts are valued by interpolating between spot and forward currency rates as quoted by an independent pricing service. Futures contracts are generally valued using the settlement price determined by the relevant exchange. If market quotations are unavailable or deemed unreliable, securities will be valued by the Valuation Designee (as defined below) in accordance with procedures adopted by the Company’s Board of Directors (the “Board”). Relying on prices supplied by pricing services or dealers or using fair valuation may result in values that are higher or lower than the values used by other investment companies and investors to price the same investments.
The Board has adopted a pricing and valuation policy for use by the Fund and its Valuation Designee (as defined below) in calculating the Fund’s NAV. Pursuant to Rule 2a-5 under the 1940 Act, the Fund has designated the Adviser as its “Valuation Designee” to perform all of the fair value determinations as well as to perform all of the responsibilities that may be performed by the Valuation Designee in accordance with Rule 2a-5. The Valuation Designee is authorized to make all necessary determinations of the fair values of portfolio securities and other assets for which market quotations are not readily available or if it is deemed that the prices obtained from brokers and dealers or independent pricing services are unreliable.
FAIR VALUE MEASUREMENTS — The inputs and valuation techniques used to measure the fair value of the Fund’s investments are summarized into three levels as described in the hierarchy below:
| | ● | Level 1 – Prices are determined using quoted prices in active markets for identical securities. |
| | ● | Level 2 – Prices are determined using other significant observable inputs (including quoted prices for similar securities, interest rates, prepayment speeds, credit risk, etc.). |
| | ● | Level 3 – Prices are determined using significant unobservable inputs (including the Fund’s own assumptions in determining the fair value of investments). |
The inputs or methodologies used for valuing securities are not necessarily an indication of the risk associated with investing in those securities.
The following is a summary of the inputs used, as of the end of the reporting period, in valuing the Fund’s investments carried at fair value:
| | LEVEL 1 | | | LEVEL 2 | | | LEVEL 3 | | | Total | |
Short-Term Investments | | $ | 910,111,898 | | | $ | — | | | $ | — | | | $ | 910,111,898 | |
Commodity Contracts | | | | | | | | | | | | | | | | |
Futures Contracts | | | 19,581,510 | | | | — | | | | — | | | | 19,581,510 | |
Equity Contracts | | | | | | | | | | | | | | | | |
Futures Contracts | | | 7,934,526 | | | | — | | | | — | | | | 7,934,526 | |
Interest Rate Contracts | | | | | | | | | | | | | | | | |
Futures Contracts | | | 1,921,475 | | | | — | | | | — | | | | 1,921,475 | |
Foreign Currency Contracts | | | | | | | | | | | | | | | | |
Forward Foreign Currency Contracts | | | — | | | | 264,476,800 | | | | — | | | | 264,476,800 | |
Total Assets | | $ | 939,549,409 | | | $ | 264,476,800 | | | $ | — | | | $ | 1,204,026,209 | |
15
Campbell Systematic Macro Fund
Notes To Consolidated Financial Statements (Continued)
August 31, 2024
| | LEVEL 1 | | | LEVEL 2 | | | LEVEL 3 | | | Total | |
Commodity Contracts | | | | | | | | | | | | | | | | |
Futures Contracts | | $ | (15,383,732 | ) | | $ | — | | | $ | — | | | $ | (15,383,732 | ) |
Equity Contracts | | | | | | | | | | | | | | | | |
Futures Contracts | | | (1,199,475 | ) | | | — | | | | — | | | | (1,199,475 | ) |
Interest Rate Contracts | | | | | | | | | | | | | | | | |
Futures Contracts | | | (10,230,083 | ) | | | — | | | | — | | | | (10,230,083 | ) |
Foreign Currency Contracts | | | | | | | | | | | | | | | | |
Forward Foreign Currency Contracts | | | — | | | | (263,832,155 | ) | | | — | | | | (263,832,155 | ) |
Total Liabilities | | $ | (26,813,290 | ) | | $ | (263,832,155 | ) | | $ | — | | | $ | (290,645,445 | ) |
At the end of each quarter, management evaluates the classification of Levels 1, 2 and 3 assets and liabilities. Various factors are considered, such as changes in liquidity from the prior reporting period; whether or not a broker is willing to execute at the quoted price; the depth and consistency of prices from third party pricing services; and the existence of contemporaneous, observable trades in the market. Additionally, management evaluates the classification of Levels 1, 2 and 3 assets and liabilities on a quarterly basis for changes in listings or delistings on national exchanges.
Due to the inherent uncertainty of determining the fair value of investments that do not have a readily available market value, the fair value of the Fund’s investments may fluctuate from period to period. Additionally, the fair value of investments may differ significantly from the values that would have been used had a ready market existed for such investments and may differ materially from the values the Fund may ultimately realize. Further, such investments may be subject to legal and other restrictions on resale or otherwise less liquid than publicly traded securities.
For fair valuations using significant unobservable inputs, U.S. generally accepted accounting principles (“U.S. GAAP”) requires the Fund to present a reconciliation of the beginning to ending balances for reported market values that presents changes attributable to total realized and unrealized gains or losses, purchase and sales, and transfers in and out of Level 3 during the period. Transfers in and out between levels are based on values at the end of the period. A reconciliation of Level 3 investments is presented only when the Fund had an amount of Level 3 investments at the end of the reporting period that was meaningful in relation to its net assets. The amounts and reasons for Level 3 transfers are disclosed if the Fund had an amount of total transfers during the reporting period that was meaningful in relation to its net assets as of the end of the reporting period.
During the current fiscal period, the Fund had no Level 3 purchases, sales, or transfers.
DISCLOSURES ABOUT DERIVATIVE INSTRUMENTS AND HEDGING ACTIVITIES
Derivative instruments are defined as financial instruments whose value and performance are based on the value and performance of another security or financial instrument. Derivative instruments that the Fund used during the current fiscal period include forward foreign currency contracts and futures contracts.
During the current fiscal period, the Fund used long and short contracts on U.S. and foreign equity market indices, U.S. and foreign government bonds, foreign currencies and commodities (through investment in the Subsidiary), to gain investment exposure in accordance with its investment objective.
The following tables provide quantitative disclosures about fair value amounts of, and gains and losses on, the Fund’s derivative instruments as of and for the current fiscal period.
16
Campbell Systematic Macro Fund
Notes To Consolidated Financial Statements (Continued)
August 31, 2024
The following table lists the fair values of the Fund’s derivative holdings as of the end of the current fiscal period, grouped by contract type and risk exposure category.
Derivative Type | | CONSOLIDATED
STATEMENT OF
ASSETS AND
LIABILITIES
LOCATION | | | Commodity
Contracts | | | Equity
Contracts | | | Interest
Rate
Contracts | | | Foreign
Currency
Contracts | | | Total | |
Asset Derivatives |
Futures Contracts (a) | | | Unrealized appreciation on futures contracts | | | $ | 19,581,510 | | | $ | 7,934,526 | | | $ | 1,921,475 | | | $ | — | | | $ | 29,437,511 | |
Forward Contracts (a) | | | Unrealized appreciation on forward foreign currency contracts | | | | — | | | | — | | | | — | | | | 264,476,800 | | | | 264,476,800 | |
Total Value - Assets | | | | | | $ | 19,581,510 | | | $ | 7,934,526 | | | $ | 1,921,475 | | | $ | 264,476,800 | | | $ | 293,914,311 | |
Liability Derivatives |
Futures Contracts (a) | | | Unrealized depreciation on futures contracts | | | $ | (15,383,732 | ) | | $ | (1,199,475 | ) | | $ | (10,230,083 | ) | | $ | — | | | $ | (26,813,290 | ) |
Forward Contracts (a) | | | Unrealized depreciation on forward foreign currency contracts | | | | — | | | | — | | | | — | | | | (263,832,155 | ) | | | (263,832,155 | ) |
Total Value - Liabilities | | | | | | $ | (15,383,732 | ) | | $ | (1,199,475 | ) | | $ | (10,230,083 | ) | | $ | (263,832,155 | ) | | $ | (290,645,445 | ) |
(a) | This amount represents the cumulative appreciation/(depreciation) of forward and futures contracts as reported in the Consolidated Portfolio of Investments. |
The following table lists the amounts of realized gains/(losses) included in net increase/(decrease) in net assets resulting from operations during the current fiscal period, grouped by derivative type and primary risk exposure category by contract type.
Derivative Type | | Consolidated
Statement of
Operations
Location | | | Commodity
Contracts | | | Equity
Contracts | | | Interest
Rate
Contracts | | | Foreign
Currency
Contracts | | | Total | |
Realized Gain (Loss) |
Futures Contracts | | | Net realized gain/(loss) from futures contracts | | | $ | (19,324,537 | ) | | $ | 67,586,005 | | | $ | (9,965,782 | ) | | $ | — | | | $ | 38,295,686 | |
Forward Contracts | | | Net realized gain/(loss) from forward foreign currency contracts | | | | — | | | | — | | | | — | | | | (42,645,617 | ) | | | (42,645,617 | ) |
Total Realized Gain/(Loss) | | | $ | (19,324,537 | ) | | $ | 67,586,005 | | | $ | (9,965,782 | ) | | $ | (42,645,617 | ) | | $ | (4,349,931 | ) |
17
Campbell Systematic Macro Fund
Notes To Consolidated Financial Statements (Continued)
August 31, 2024
The following table lists the amounts of change in unrealized appreciation/(depreciation) included in net increase/(decrease) in net assets resulting from operations during the current fiscal period, grouped by derivative type and primary risk exposure category by contract type.
Derivative Type | | Consolidated
Statement of
Operations
Location | | | Commodity
Contracts | | | Equity
Contracts | | | Interest
Rate
Contracts | | | Foreign
Currency
Contracts | | | Total | |
Change in Unrealized Appreciation/(Depreciation) |
Futures Contracts | | | Net change in unrealized appreciation/(depreciation) on futures contracts | | | $ | 6,134,269 | | | $ | 6,688,030 | | | $ | (3,301,981 | ) | | $ | — | | | $ | 9,520,318 | |
Forward Contracts | | | Net change in unrealized appreciation/(depreciation) on forward foreign currency contracts | | | | — | | | | — | | | | — | | | | 8,178,880 | | | | 8,178,880 | |
Total Change in Unrealized Appreciation/(Depreciation) | | | | | | $ | 6,134,269 | | | $ | 6,688,030 | | | $ | (3,301,981 | ) | | $ | 8,178,880 | | | $ | 17,699,198 | |
During the current fiscal period, the Fund’s quarterly average volume of derivatives was as follows:
| | Long Futures
Notional
Amount | | | Short Futures
Notional
Amount | | | Forward Foreign
Currency Contracts-
Payable
(Value At Trade Date) | | | Forward Foreign
Currency Contracts-
Receivable (Value At
Trade Date) | |
| | | $2,819,887,147 | | | | $(3,533,398,756) | | | | $(20,109,114,968) | | | | $20,098,692,038 | |
For financial reporting purposes, the Fund does not offset fair value amounts recognized for derivative instruments and fair value amounts recognized for the right to reclaim cash collateral (receivables) or the obligation to return cash collateral (payables) arising from derivative instruments recognized at fair value executed with the same counterparty under a master netting arrangement.
18
Campbell Systematic Macro Fund
Notes To Consolidated Financial Statements (Continued)
August 31, 2024
The following is a summary of financial and derivative instruments that are subject to enforceable master netting agreements (or similar arrangements) and collateral received and pledged in connection with the master netting agreements (or similar arrangements).
| | | | | | | Gross Amount Not
Offset in Consolidated
Statement of Assets and
Liabilities | | | | | | | | | | | | Gross Amount Not
Offset in Consolidated
Statement of Assets and
Liabilities | | | | | |
Description | | Gross Amount
Presented in
the
Consolidated
Statement of
Assets and
Liabilities | | | Financial
Instruments | | | Collateral
Received | | | Net
Amount(1) | | | | Gross Amount
Presented in
the
Consolidated
Statement of
Assets and
Liabilities | | | Financial
Instruments | | | Collateral
Pledged(2) | | | Net
Amount(3) | |
| | | Assets | | | | Liabilities | |
Forward Foreign Currency Contracts | | $ | 264,476,800 | | | $ | (263,832,155 | ) | | $ | — | | | $ | 644,645 | | | | $ | 263,832,155 | | | $ | (263,832,155 | ) | | $ | — | | | $ | — | |
(1) | Net amount represents the net amount receivable from the counterparty in the event of default. |
(2) | Actual collateral pledged may be more than the amount shown. |
(3) | Net amount represents the net amount payable to the counterparty in the event of default. |
Use of Estimates — The preparation of consolidated financial statements in conformity with U.S. GAAP requires management to make estimates and assumptions that affect the reported amounts of assets and liabilities and disclosure of contingent assets and liabilities at the date of the consolidated financial statements and the reported amounts of revenues and expenses during the reporting period. Actual results could differ from those estimates and those differences could be significant.
Investment Transactions, Investment Income and Expenses — The Fund records security transactions based on trade date for financial reporting purposes. The cost of investments sold is determined by use of the specific identification method for both financial reporting and income tax purposes in determining realized gains and losses on investments. Interest income (including amortization of premiums and accretion of discounts) is accrued when earned. Dividend income is recorded on the ex-dividend date. Distributions received on securities that represent a return of capital or capital gain are recorded as a reduction of cost of investments and/or as a realized gain. The Fund’s investment income, expenses (other than class specific expenses) and unrealized and realized gains and losses are allocated daily to each class of shares based upon the relative proportion of net assets of each class at the beginning of the day. Certain expenses are shared with The RBB Fund Trust (the “Trust”), a series trust of affiliated funds. Expenses incurred on behalf of a specific class, fund or fund family of the Company or Trust are charged directly to the class, fund or fund family (in proportion to net assets). Expenses incurred for all funds (such as director or professional fees) are charged to all funds in proportion to their average net assets of RBB and the Trust, or in such other manner as the Board deems fair or equitable. Expenses and fees, including investment advisory and administration fees, are accrued daily and taken into account for the purpose of determining the NAV of the Fund.
Dividends and Distributions to Shareholders — Dividends from net investment income and distributions from net realized capital gains, if any, are declared and paid at least annually to shareholders and recorded on the ex-dividend date. Income dividends and capital gain distributions are determined in accordance with U.S. federal income tax regulations, which may differ from U.S. GAAP.
U.S. Tax Status — No provision is made for U.S. income taxes as it is the Fund’s intention to continue to qualify for and elect the tax treatment applicable to regulated investment companies under Subchapter M of the Internal Revenue Code of 1986, as amended, and make the requisite distributions to its shareholders which will be sufficient to relieve it from U.S. income and excise taxes.
19
Campbell Systematic Macro Fund
Notes To Consolidated Financial Statements (Continued)
August 31, 2024
For tax purposes, the Subsidiary is an exempted Cayman Islands investment company. The Subsidiary has received an undertaking from the Government of the Cayman Islands exempting it from all local income, profits and capital gains taxes. No such taxes are levied in the Cayman Islands at the present time. For U.S. income tax purposes, the Subsidiary is a Controlled Foreign Corporation and as such is not subject to U.S. income tax.
SEC RULE 18f-4 — Effective August 19, 2022, the U.S. Securities and Exchange Commission (the “SEC”) implemented Rule 18f-4 under the 1940 Act (“Rule 18f-4”), providing for the regulation of a registered investment company’s use of derivatives and certain related instruments. Among other things, Rule 18f-4 limits a fund’s derivatives exposure through a value-at-risk test and requires the adoption and implementation of a derivatives risk management program for certain derivatives users. The Fund, as a full derivatives user (as defined in Rule 18f-4), is subject to the full requirements of Rule 18f-4. The Fund is required to comply with Rule18f-4 and has adopted procedures for investing in derivatives and other transactions in compliance with Rule 18f-4.
Foreign Currency Translation — Assets and liabilities initially expressed in non-U.S. currencies are translated into U.S. dollars based on the applicable exchange rates at the date of the last business day of the consolidated financial statement period. Purchases and sales of securities, interest income, dividends, variation margin received and expenses denominated in foreign currencies are translated into U.S. dollars at the exchange rates in effect on the transaction date.
The Fund does not separately report the effect of changes in foreign exchange rates from changes in market prices of securities held. Such changes are included with the net realized gain or loss and change in unrealized appreciation or depreciation on investments in the Consolidated Statement of Operations. Other foreign currency transactions resulting in realized and unrealized gain or loss are reported separately as net realized gain or loss and change in unrealized appreciation or depreciation on foreign currencies in the Consolidated Statement of Operations.
Currency Risk — Investment in foreign securities involves currency risk associated with securities that trade or are denominated in currencies other than the U.S. dollar and which may be affected by fluctuations in currency exchange rates. An increase in the strength of the U.S. dollar relative to a foreign currency may cause the U.S. dollar value of an investment in that country to decline. Foreign currencies also are subject to risks caused by inflation, interest rates, budget deficits and low savings rates, political factors and government controls. Forward foreign currency exchange contracts may limit potential gains from a favorable change in value between the U.S. dollar and foreign currencies. Unanticipated changes in currency pricing may result in poorer overall performance for the Fund than if it had not engaged in these contracts.
Commodity Sector Risk — Exposure to the commodities markets may subject the Fund to greater volatility than investments in traditional securities. The value of commodity-linked derivative instruments may be affected by changes in overall market movements, commodity index volatility, changes in interest rates or factors affecting a particular industry or commodity, such as drought, floods, weather, livestock disease, embargoes, tariffs and international economic, political and regulatory developments. The prices of energy, industrial metals, precious metals, agriculture and livestock sector commodities may fluctuate widely due to factors such as changes in value, supply and demand and governmental regulatory policies. The commodity-linked securities in which the Fund invests may be issued by companies in the financial services sector, and events affecting the financial services sector may cause the Fund’s share value to fluctuate.
Foreign Securities Market Risk — A substantial portion of the trades of the Fund are expected to take place on markets or exchanges outside the United States. There is no limit to the amount of assets of the Fund that may be committed to trading on foreign markets. The risk of loss in trading foreign futures and options on futures contracts can be substantial. Participation in foreign futures and options on futures contracts involves the execution and clearing of trades on, or subject to the rules of, a foreign board of trade or exchange. Some of these foreign markets, in contrast to U.S. exchanges, are so-called principals’ markets in which performance is the responsibility only of the individual
20
Campbell Systematic Macro Fund
Notes To Consolidated Financial Statements (Continued)
August 31, 2024
counterparty with whom the trader has entered into a commodity interest transaction and not of the exchange or clearing corporation. In these kinds of markets, there is risk of bankruptcy or other failure or refusal to perform by the counterparty.
Counterparty Risk — The derivative contracts entered into by the Fund or its Subsidiary may be privately negotiated in the over-the-counter market. These contracts also involve exposure to credit risk, since contract performance depends in part on the financial condition of the counterparty. Relying on a counterparty exposes the Fund to the risk that a counterparty will not settle a transaction in accordance with its terms and conditions because of a dispute over the terms of the contract (whether or not bona fide) or because of a credit or liquidity problem, thus causing the Fund to suffer a loss. If a counterparty defaults on its payment obligations to the Fund, this default will cause the value of an investment in the Fund to decrease.
Futures Contracts — The Fund uses futures contracts in the normal course of pursuing its investment objective. Upon entering into a futures contract, the Fund must deposit initial margin in addition to segregating cash or liquid assets sufficient to meet its obligation to purchase or provide securities, or to pay the amount owed at the expiration of an index-based futures contract. Such liquid assets may consist of cash, cash equivalents, liquid debt or equity securities or other acceptable assets. Pursuant to the futures contract, the Fund agrees to receive from, or pay to the broker, an amount of cash equal to the daily fluctuation in value of the contract. Such a receipt of payment is known as “variation margin” and is recorded by the Fund as an unrealized gain or loss. When the contract is closed, the Fund records a realized gain or loss equal to the difference between the proceeds from (or cost of) the closing transactions and the Fund’s basis in the contract. Futures contracts have market risks, including the risk that the change in the value of the contract may not correlate with changes in the value of the underlying securities. Use of long futures contracts subjects the Fund to risk of loss in excess of the amount shown on the Consolidated Statement of Assets and Liabilities, up to the notional value of the futures contract. Use of short futures contracts subjects the Fund to unlimited risk of loss.
Forward Foreign Currency Contracts —The Fund uses forward foreign currency contracts (“forward contracts”) in the normal course of pursuing its investment objectives. These contracts are marked-to-market daily at the applicable translation rates. The Fund records realized gains or losses at the time the forward contract is closed. A forward contract is extinguished through a closing transaction or upon delivery of the currency or entering an off setting contract. Risks may arise upon entering these contracts from the potential inability of a counterparty to meet the terms of their contracts and from unanticipated movements in the value of a foreign currency relative to the U.S. dollar or other currencies. The Fund’s maximum risk of loss from counterparty credit risk related to forward foreign currency contracts is the fair value of the contract. The risk may be mitigated to some extent if a master netting arrangement between the Fund and the counterparty is in place and to the extent the Fund obtains collateral to cover the Fund’s exposure to the counterparty.
Credit Risk — Credit risk refers to the possibility that the issuer of the security or a counterparty in respect of a derivative instrument will not be able to satisfy its payment obligations to the Fund when due. Changes in an issuer’s credit rating or the market’s perception of an issuer’s creditworthiness may also affect the value of the Fund’s investment in that issuer. Securities rated in the four highest categories by the rating agencies are considered investment grade but they may also have some speculative characteristics. Investment grade ratings do not guarantee that bonds will not lose value or default. In addition, the credit quality of securities may be lowered if an issuer’s financial condition changes.
Cash and Cash Equivalents — Cash and cash equivalents are valued at cost plus accrued interest, which approximates market value.
Other — In the normal course of business, the Fund may enter into contracts that provide general indemnifications. The Fund’s maximum exposure under these arrangements is dependent on claims that may be made against the Fund in the future, and, therefore, cannot be estimated; however, the Fund expects the risk of material loss from such claims to be remote.
21
Campbell Systematic Macro Fund
Notes To Consolidated Financial Statements (Continued)
August 31, 2024
2. Investment Adviser and Other Services
Campbell & Company Investment Adviser LLC (“Campbell” or the “Adviser”) serves as the investment adviser to the Fund. The Adviser is a wholly-owned subsidiary of Campbell & Company, LP The Fund compensates the Adviser for its services at an annual rate based on the Fund’s average daily net assets (the “Advisory Fee”), payable on a monthly basis in arrears, as shown in the following table.
Prior to May 29, 2020, Equinox Institutional Asset Management, LP (“Equinox”) served as adviser to the Predecessor Fund and Campbell served as a sub-adviser to the Predecessor Fund. Equinox was entitled to an advisory fee from the Predecessor Fund at the same rate payable to Campbell as Adviser to the Fund. Equinox, not the Predecessor Fund, paid a sub-advisory fee to Campbell.
The Adviser has contractually agreed to waive advisory fees and/or reimburse expenses to the extent that total annual Fund operating expenses (excluding certain items discussed below) exceed the rate (“Expense Cap”) shown in the following table of the Fund’s average daily net assets. In determining the Adviser’s obligation to waive advisory fees and/or reimburse expenses, the following expenses are not taken into account and could cause total annual Fund operating expenses to exceed the Expense Cap as applicable: acquired fund fees and expenses, brokerage commissions, extraordinary expenses, interest and taxes. This contractual limitation is in effect until December 31, 2024 and may not be terminated without the approval of the Board. The Adviser may discontinue this arrangement at any time after December 31, 2024.
| | Expense Cap |
Advisory Fee | Class A | Class C | Class I |
1.64% | 2.00% | 2.75% | 1.75% |
Prior to May 29, 2020, Equinox and Campbell had contractually agreed to reduce their advisory fees and/or reimburse certain expenses of the Predecessor Fund, to ensure that the Predecessor Fund’s total annual operating expenses, excluding (i) taxes, (ii) interest, (iii) extraordinary items, (iv) acquired fund fees and expenses, and (v) brokerage commissions, did not exceed, on an annual basis, 2.14% with respect to Class A shares, 2.89% with respect to Class C shares, and 1.89% with respect to Class I shares of the Predecessor Fund’s average daily net assets.
During the current fiscal period, investment advisory fees accrued, waived and/or reimbursed by the Adviser were as follows:
Gross
Advisory Fees | Waivers and/or
Reimbursements | Net
Advisory Fees |
$16,918,761 | $(944,150) | $15,974,611 |
If at any time the Fund’s total annual Fund operating expenses for a year are less than the Expense Cap, the Adviser is entitled to reimbursement by the Fund of the advisory fees forgone and other payments remitted by the Adviser to the Fund within three years from the date on which such waiver or reimbursement was made, provided such reimbursement does not cause the Fund to exceed the Expense Cap that was in effect at the time of the waiver or reimbursement.
As of the end of the current fiscal period, the Fund had amounts available for recoupment as follows:
Expiration |
August 31,
2025 | August 31,
2026 | August 31,
2027 | Total |
$392,091 | $951,565 | $944,150 | $2,287,806 |
22
Campbell Systematic Macro Fund
Notes To Consolidated Financial Statements (Continued)
August 31, 2024
U.S. Bancorp Fund Services, LLC, doing business as U.S. Bank Global Fund Services (“Fund Services”), serves as administrator for the Fund. For providing administrative and accounting services, Fund Services is entitled to receive a monthly fee, subject to certain minimum and out of pocket expenses.
Fund Services serves as the Fund’s transfer and dividend disbursing agent. For providing transfer agent services, Fund Services is entitled to receive a monthly fee, subject to certain minimum and out of pocket expenses.
U.S. Bank, N.A. (the “Custodian”) provides certain custodial services to the Fund. The Custodian is entitled to receive a monthly fee, subject to certain minimum and out of pocket expenses.
Quasar Distributors, LLC (the “Distributor”), a wholly-owned broker-dealer subsidiary of Foreside Financial Group, LLC, serves as the principal underwriter and distributor of the Fund’s shares pursuant to a Distribution Agreement with RBB.
The Board has adopted a Plan of Distribution (the “Plan”) for the Class A Shares and Class C Shares of the Fund pursuant to Rule 12b-1 under the 1940 Act. Under the Plan, the Distributor is entitled to receive from the Fund a distribution fee with respect to the Shares, which is accrued daily and paid monthly, of up to 0.25% on an annualized basis of the average daily net assets of the Class A Shares and up to 1.00% on an annualized basis of the average daily net assets of the Class C Shares. The actual amount of such compensation under the Plan is agreed upon by the Board and by the Distributor. Because these fees are paid out of each Fund’s assets on an ongoing basis, over time these fees will increase the cost of your investment and may cost you more than paying other types of sales charges. Amounts paid to the Distributor under the Plan may be used by the Distributor to cover expenses that are related to (i) the sale of the Shares, (ii) ongoing servicing and/or maintenance of the accounts of shareholders, and (iii) sub-transfer agency services, subaccounting services or administrative services related to the sale of the Shares, all as set forth in the Fund’s 12b-1 Plan.
For compensation amounts paid to Fund Services and the Custodian, please refer to the Consolidated Statement of Operations.
3. Director and Officer Compensation
The Directors of the Company receive an annual retainer and meeting fees for meetings attended. An employee of Vigilant Compliance, LLC serves as Chief Compliance Officer of the Company. Vigilant Compliance, LLC is compensated for the services provided to the Company. Employees of RBB serve as President, Chief Financial Officer, Chief Operating Officer, Secretary and Director of Marketing & Business Development of the Company. They are compensated by the Company for services provided. Certain employees of Fund Services serve as officers of the Company. They are not compensated by the Fund or the Company. For Director and Officer compensation amounts, please refer to the Consolidated Statement of Operations.
4. Purchases and Sales of Investment Securities
During the current fiscal period, there were no purchases and sales of investment securities (excluding short-term investments and derivative transactions) or long-term U.S. Government securities by the Fund.
5. Federal Income Tax Information
The Fund has followed the authoritative guidance on accounting for and disclosure of uncertainty in tax positions, which requires the Fund to determine whether a tax position is more likely than not to be sustained upon examination, including resolution of any related appeals or litigation processes, based on the technical merits of the position. The Fund has determined that there was no effect on the consolidated financial statements from following this authoritative guidance. In the normal course of business, the Fund is subject to examination by federal, state and local jurisdictions, where applicable, for tax years for which applicable statutes of limitations have not expired.
23
Campbell Systematic Macro Fund
Notes To Consolidated Financial Statements (Continued)
August 31, 2024
As of August 31, 2024, the federal tax cost and aggregate gross unrealized appreciation and depreciation of investments held by the Fund were as follows(a):
Federal Tax
Cost | Unrealized
Appreciation | Unrealized
(Depreciation) | Net
Unrealized
Appreciation/
(Depreciation) |
$1,009,555,172 | $26,964,600 | $(59,185,744) | $(32,221,144) |
(a) | The difference between the book basis and tax basis cost and aggregate gross unrealized appreciation and depreciation of investments is attributable primarily to futures and forwards not regulated by Section 1256 of the Internal Revenue Code and timing difference related to taxable income from a wholly owned controlled foreign corporation. |
Distributions to shareholders, if any, from net investment income and realized gains are determined in accordance with federal income tax regulations, which may differ from net investment income and realized gains recognized for financial reporting purposes. Accordingly, the character of distributions and composition of net assets for tax purposes may differ from those reflected in the accompanying consolidated financial statements. To the extent these differences are permanent, such amounts are reclassified within the capital accounts based on the tax treatment; temporary differences do not require such reclassification.
The following permanent differences as of August 31, 2024, primarily attributable to investments in wholly-owned controlled foreign corporation were reclassified among the following accounts:
Distributable
Earnings/(Loss) | PAID-IN
CAPITAL |
$16,512,923 | $(16,512,923) |
As of August 31, 2024, the components of distributable earnings on a tax basis were as follows:
Undistributed
Ordinary
Income | Undistributed
Long-Term
Capital Gains | Capital
Loss
Carryforwards | Other
Temporary
Differences | Unrealized
Appreciation/
(Depreciation) |
$15,894,051 | $— | $(4,677,037) | $(389,353) | $(30,343,394) |
The differences between the book and tax basis components of distributable earnings relate principally to the timing of recognition of income and gains of the Subsidiary for federal income tax purposes. Short-term and foreign currency gains are reported as ordinary income for federal income tax purposes.
The tax character of dividends and distributions paid during the fiscal years ended August 31, 2024 and August 31, 2023 was as follows:
| | Ordinary
Income | Long-Term
Gains | Total |
2024 | $16,054,435 | $— | $16,054,435 |
2023 | 51,700,811 | 49,096,105 | 100,796,916 |
Pursuant to federal income tax rules applicable to regulated investment companies, the Fund may elect to treat certain capital losses between November 1 and August 31 and late year ordinary losses ((i) ordinary losses between January 1 and August 31, and (ii) specified ordinary and currency losses between November 1 and August 31) as occurring on the first day of the following tax year. For the fiscal year ended August 31, 2024, the Fund had $(4,677,037) of long-term loss carryovers. For the fiscal year ended August 31, 2024, the Fund did not have any deferred post-October losses.
24
Campbell Systematic Macro Fund
Notes To Consolidated Financial Statements (Concluded)
August 31, 2024
6. Subsequent Events
Management has evaluated the impact of all subsequent events on the Fund through the date the consolidated financial statements were issued and has determined that there was the following subsequent event:
On September 27, 2024, a special meeting of shareholders of the Fund (the “Special Meeting”) was convened for the purpose of obtaining shareholder approval of (i) a new investment advisory agreement between the Company, on behalf of the Fund, and the Adviser (the “New Investment Advisory Agreement”), and (ii) a new investment advisory agreement between the Subsidiary and the Adviser (the “New Subsidiary Advisory Agreement,” and together with the New Investment Advisory Agreement, the “New Investment Advisory Agreements”). As described in the proxy statement filed on behalf of the Fund with the SEC on August 13, 2024, the Fund sought shareholder approval of the New Investment Advisory Agreements in connection with the long-planned transition of majority ownership (the “Transition”) of the Adviser’s parent company, Campbell & Company, LP.
There were not sufficient shareholder votes present to approve the New Investment Advisory Agreements at the Special Meeting convened on September 27, 2024 and, as a result, the Special Meeting was adjourned to October 25, 2024. At the re-convened Shareholder Meeting held on October 25, 2024, shareholders of the Fund approved each of the New Investment Advisory Agreements.
25
Campbell Systematic Macro Fund
Report of Independent Registered Public Accounting Firm
To the Shareholders of Campbell Systematic Macro Fund
and Board of Directors of The RBB Fund, Inc.
Opinion on the Financial Statements
We have audited the accompanying consolidated statement of assets and liabilities of Campbell Systematic Macro Fund (the “Fund”) (one of the portfolios constituting The RBB Fund, Inc. (the “Company”)), including the consolidated portfolio of investments, as of August 31, 2024, and the related consolidated statement of operations for the year then ended, the consolidated statements of changes in net assets for each of the two years in the period then ended, the consolidated financial highlights for each of the four years in the period then ended and the period from October 1, 2019 through August 31, 2020 and the related notes (collectively referred to as the “financial statements”). In our opinion, the financial statements present fairly, in all material respects, the consolidated financial position of the Fund (one of the portfolios constituting The RBB Fund, Inc.) at August 31, 2024, the consolidated results of its operations for the year then ended, the consolidated changes in its net assets for each of the two years in the period then ended and its consolidated financial highlights for each of the four years in the period then ended and the period from October 1, 2019 through August 31, 2020, in conformity with U.S. generally accepted accounting principles.
The consolidated financial highlights of the Fund for each of the periods presented through September 30, 2019, were audited by other auditors whose report dated November 27, 2019, expressed an unqualified opinion on those financial statements.
Basis for Opinion
These financial statements are the responsibility of the Company’s management. Our responsibility is to express an opinion on the Fund’s financial statements based on our audits. We are a public accounting firm registered with the Public Company Accounting Oversight Board (United States) (“PCAOB”) and are required to be independent with respect to the Company in accordance with the U.S. federal securities laws and the applicable rules and regulations of the Securities and Exchange Commission and the PCAOB.
We conducted our audits in accordance with the standards of the PCAOB. Those standards require that we plan and perform the audit to obtain reasonable assurance about whether the financial statements are free of material misstatement, whether due to error or fraud. The Company is not required to have, nor were we engaged to perform, an audit of the Company’s internal control over financial reporting. As part of our audits, we are required to obtain an understanding of internal control over financial reporting but not for the purpose of expressing an opinion on the effectiveness of the Company’s internal control over financial reporting. Accordingly, we express no such opinion.
Our audits included performing procedures to assess the risks of material misstatement of the financial statements, whether due to error or fraud, and performing procedures that respond to those risks. Such procedures included examining, on a test basis, evidence regarding the amounts and disclosures in the financial statements. Our procedures included confirmation of securities owned as of August 31, 2024, by correspondence with the custodian and brokers. Our audits also included evaluating the accounting principles used and significant estimates made by management, as well as evaluating the overall presentation of the financial statements. We believe that our audits provide a reasonable basis for our opinion.

We have served as the auditor of one or more Campbell & Company investment companies since 2015.
Philadelphia, Pennsylvania
October 30, 2024
26
Campbell Systematic Macro Fund
Shareholder Tax Information
(Unaudited)
Certain tax information regarding the Fund is required to be provided to shareholders based upon the Fund’s income and distributions for the taxable year ended August 31, 2024. The information and distributions reported herein may differ from information and distributions taxable to the shareholders for the calendar year ended December 31, 2024. During the year ended August 31, 2024, the Fund paid $16,054,435 of ordinary income distributions. Dividends from net investment income and short-term capital gains are treated as ordinary income dividends for federal tax purposes.
The percentage of ordinary income dividends qualifying for the 15% dividend tax rate is 0.00%.
The percentage of ordinary income dividends qualifying for the corporate dividends received deduction is 0.00%.
The Fund designates 0% of the ordinary income distributions as qualified short-term gain pursuant to the American Job Creation Act of 2004.
Because the Fund’s fiscal year is not the calendar year, another notification will be sent with respect to calendar year 2024. The second notification, which will reflect the amount, if any, to be used by calendar year taxpayers on their U.S. federal income tax returns, will be made in conjunction with Form 1099-DIV and will be mailed in January 2025.
Foreign shareholders will generally be subject to U.S. withholding tax on the amount of their ordinary income dividends. They will generally not be entitled to a foreign tax credit or deduction for the withholding taxes paid by the Fund, if any.
In general, dividends received by tax exempt recipients (e.g., IRAs and Keoghs) need not be reported as taxable income for U.S. federal income tax purposes. However, some retirement trusts (e.g., corporate, Keogh and 403(b)(7) plans) may need this information for their annual information reporting.
Shareholders are advised to consult their own tax advisers with respect to the tax consequences of their investment in the Fund.
27
Campbell Systematic Macro Fund
Other Information
(Unaudited)
APPROVAL OF CURRENT INVESTMENT ADVISORY AGREEMENTS
As required by the 1940 Act, the Board, including all of the Directors who are not “interested persons” of the Company, as that term is defined in the 1940 Act (the “Independent Directors”), considered the renewal of the investment advisory agreement between Campbell and the Company, on behalf of the Fund (the “Investment Advisory Agreement”), and the investment advisory agreement between Campbell and the Subsidiary (the “Subsidiary Advisory Agreement,” and together with the Investment Advisory Agreement, the “Current Investment Advisory Agreements”) at a meeting of the Board held on May 15-16, 2024 (the “Meeting”). At the Meeting, the Board, including all of the Independent Directors, approved the Current Investment Advisory Agreements for an additional one-year term. The Board’s decision to approve the Current Investment Advisory Agreements reflects the exercise of its business judgment to continue the existing arrangements. In approving the Current Investment Advisory Agreements, the Board considered information provided by Campbell with the assistance and advice of counsel to the Independent Directors and the Company.
In considering the renewal of the Investment Advisory Agreement and the Subsidiary Advisory Agreement, the Directors took into account all the materials provided prior to and during the Meeting and at other meetings throughout the past year, the presentations made during the Meeting, and the discussions held during the Meeting. The Directors reviewed these materials with management of Campbell and discussed the Current Investment Advisory Agreements with counsel in executive sessions, at which no representatives of Campbell were present. Among other things, the Directors considered (i) the nature, extent, and quality of services provided by Campbell; (ii) descriptions of the experience and qualifications of Campbell’s personnel providing those services; (iii) Campbell’s investment philosophies and processes; (iv) Campbell’s assets under management and client descriptions; (v) Campbell’s soft dollar commission and trade allocation policies, including information on the types of research and services obtained in connection with soft dollar commissions; (vi) Campbell’s advisory fee arrangement with the Company and other similarly managed clients; (vii) Campbell’s compliance policies and procedures; (viii) Campbell’s financial information, insurance coverage and profitability analysis related to providing advisory services to the Fund; (ix) the extent to which economies of scale are relevant to the Fund; (x) a report prepared by Fuse Research Network, LLC comparing the Fund’s management fees and total expense ratios to a group of mutual funds deemed comparable to the Fund based primarily on investment strategy similarity (“Peer Group”) and comparing the performance of the Fund to the performance of its Peer Group; and (xi) a report comparing the performance of the Fund to the performance of its benchmark.
The Directors evaluated the nature, extent and quality of the services provided by Campbell under the Current Investment Advisory Agreements, on the basis of the functions that Campbell performed, and the quality and stability of the staff committed to those functions, Campbell’s compliance record and financial condition and its background and history in providing services to the Fund. The Directors considered Campbell’s disciplined investment decision-making process used for the Fund and the Subsidiary. The Directors also considered the fact that Campbell had not experienced any significant legal, compliance or regulatory difficulties. Based on the information provided and the Directors’ prior experience with Campbell, the Directors concluded that the nature and extent of the services that Campbell provided, as well as the quality of those services, were satisfactory.
The Directors also considered the investment performance of the Fund and considered the Fund’s investment performance in light of its investment objective and investment strategies. Information on the Fund’s investment performance was provided for the three-month, one-year, three-year, five-year, ten-year, and since inception periods ended December 31, 2023. The Directors noted that the Fund outperformed its primary benchmark, the S&P 500 Index, for the three-year period ended December 31, 2023, and underperformed its benchmark for the three-month, one-year, five-year, ten-year and since-inception periods ended December 31, 2023. The Directors noted that the Fund outperformed the median of its Peer Group for the three-year, five-year, ten-year, and since-inception periods ended December 31, 2023, and underperformed the median of its Peer Group for the three-month and one-year periods ended December 31, 2023.
The Board also considered the advisory fee rate payable by the Fund under the Investment Advisory Agreement. In this regard, information on the fees paid by the Fund and the Fund’s total operating expense ratios (before and after fee waivers and expense reimbursements) were compared to similar information for mutual funds advised by other,
28
Campbell Systematic Macro Fund
Other Information (Continued)
(Unaudited)
unaffiliated investment advisory firms. The Directors noted that both the Fund’s net advisory fee and Fund’s total net expenses were above the median and in the 4th quartile of its Peer Group. The Directors noted that Campbell had contractually agreed to waive management fees and reimburse expenses through at least December 31, 2024 to limit total annual operating expenses to agreed upon levels for the Fund.
Based on the information provided, the Directors concluded that the amount of advisory fees that the Fund paid under the Investment Advisory Agreement to Campbell was reasonable in light of the nature and quality of the services provided.
In considering the overall fairness of the Current Investment Advisory Agreements, the Directors assessed the degree to which economies of scale would be expected to be realized if the Fund’s assets increased, as well as the extent to which fee levels would reflect those economies of scale for the benefit of the Fund’s shareholders. The Directors determined that the fee schedules in the Current Investment Advisory Agreements were reasonable and appropriate.
In addition to the above factors, the Directors also considered other benefits received by Campbell from its management of the Fund, including, without limitation, the ability to market its advisory services for similar products in the future.
After reviewing the information regarding the Fund’s costs, Campbell’s estimated profitability and economies of scale, and after considering Campbell’s services, the Directors concluded that the investment advisory fees to be paid by the Fund were fair and reasonable in light of the nature and quality of the services provided and that the Current Investment Advisory Agreements should be approved for an additional annual period ending August 16, 2025.
APPROVAL OF NEW INVESTMENT ADVISORY AGREEMENTS
At the Meeting, the Board, including a majority of the Independent Directors, also approved the New Investment Advisory Agreements. The Board’s decision to approve the New Investment Advisory Agreements reflects the exercise of its business judgment.
In the course of the Board’s review, the Directors, with the assistance and advice of independent counsel, considered their legal responsibilities with regard to all factors deemed to be relevant to the Fund, including, but not limited to the following: (i) the quality of services expected to be provided to the Fund and the Subsidiary; (ii) the performance of the Fund; (iii) the fact that the Transition was not expected to affect the manner in which the Fund or Subsidiary was advised; (iv) the fact that the current investment management team would continue to manage the Fund and the Subsidiary; (v) the fact that the fee structure under the New Investment Advisory Agreements would be identical to the fee structure under the Current Investment Advisory Agreements; and (vi) other factors deemed relevant.
The Directors also evaluated the New Investment Advisory Agreements in light of information they had requested and received from the Adviser prior to the Meeting. The Directors reviewed these materials with management of the Adviser and independent counsel to the Independent Directors. The Independent Directors also discussed the New Investment Advisory Agreements with counsel in an executive session, at which no representatives of the Adviser were present. The Directors considered whether the New Investment Advisory Agreements would be in the best interests of the Fund and its shareholders and the overall fairness of the New Investment Advisory Agreements. Among other things, the Directors reviewed information concerning: (i) the nature, extent and quality of the services provided by the Adviser; (ii) the Fund’s investment performance; (iii) the cost of the services provided and the profits realized by the Adviser and its affiliates from their relationship with the Fund; (iv) the extent to which economies of scale had been or would be realized as the Fund grows; and (v) the extent to which fee levels reflect the economies of scale, if any, for the benefit of the Fund’s shareholders. In their deliberations, the Directors did not rank the importance of any particular piece of information or factor considered, and it is presumed that each Director attributed different weights to the various factors.
29
Campbell Systematic Macro Fund
Other Information (Continued)
(Unaudited)
Nature, Extent and Quality of Services Provided to the Fund. The Directors evaluated the nature, extent and quality of the services that the Adviser would provide under the New Investment Advisory Agreements, which were the same services that the Adviser provided under the Current Investment Advisory Agreements, on the basis of the functions that the Adviser performed, and the quality and stability of the staff committed to those functions, the Adviser’s compliance record and financial condition and its background and history in providing services to the Fund under the Current Investment Advisory Agreements. The Directors considered the Adviser’s disciplined investment decision-making process used for the Fund and the Subsidiary. The Directors also considered the fact that the Adviser had not experienced any significant legal, compliance or regulatory difficulties. Based on the information provided and the Directors’ prior experience with the Adviser, the Directors concluded that the nature and extent of the services that the Adviser would provide under the New Investment Advisory Agreements, as well as the quality of those services, was satisfactory.
In this regard, the Directors considered representations by the Adviser that the Transition would not lead to a reduction in the quality or scope of services provided to the Fund or the Subsidiary. The Directors took into account that there would be no change that would adversely impact the Adviser’s ability to provide the same quality of services as were provided in the past; that the New Investment Advisory Agreements were materially the same as the Current Investment Advisory Agreements; that there were no material litigation, or regulatory or administrative proceedings pending against the Adviser or its principal executive officers related to services that the Adviser provided to the Fund alleging violations of securities or related laws, fraudulent conduct, breach of fiduciary duty, or similar violations; that there were no pending regulatory inquiries by the SEC or other regulators involving the Adviser related to services that the Adviser provided to the Fund; that the Fund would not bear any expenses related to the Transition, including expenses related to the proxy statement; and that there were no planned fee increases for the Fund over the next two years.
Section 15(f) of the Investment Company Act. The Directors also considered whether the arrangements between the Adviser and the Fund complied with the conditions of Section 15(f) of the 1940 Act. Section 15(f) provides a non-exclusive safe harbor for an investment adviser to an investment company or any of its affiliated persons to receive any amount or benefit in connection with a change in control of the investment adviser so long as two conditions are met. First, for a period of three years after closing of the applicable transaction, at least 75% of the board members of the investment company cannot be “interested persons” (as defined in the 1940 Act) of the investment adviser or predecessor adviser. Second, an “unfair burden” must not be imposed upon a Fund as a result of the transaction or any express or implied terms, conditions or understandings applicable thereto. The term “unfair burden” is defined in Section 15(f) to include any arrangement during the two-year period after the closing of the transaction whereby the investment adviser (or predecessor or successor adviser) or any interested person of any such investment adviser, receives or is entitled to receive any compensation, directly or indirectly, from a Fund or its shareholders (other than fees for bona fide investment advisory or other services) or from any person in connection with the purchase or sale of securities or other property to, from or on behalf of a Fund (other than bona fide ordinary compensation as principal underwriter for the Fund).
Consistent with the first condition of Section 15(f), the Adviser represented that it was not aware of any current plans to reconstitute the Board following the Transition. Thus, at least 75% of the Directors of the Company would not be “interested persons” (as defined in the 1940 Act) of the Adviser for a period of three years after closing of the Transition and would be in compliance with this provision of Section 15(f). With respect to the second condition of Section 15(f), the Adviser represented that the Transition would not have an economic impact on the Adviser’s ability to provide services to the Fund and no fee increases were contemplated. Thus, the Directors found that the Transition would not result in an “unfair burden” (as defined in Section 15(f)) during the two-year period following the closing of the Transition. The Adviser represented that neither it nor any interested person of the Adviser would receive any compensation from the Fund or its shareholders, except as permitted pursuant to Section 15(f).
30
Campbell Systematic Macro Fund
Other Information (Concluded)
(Unaudited)
Costs of Services Provided and Profits Realized by the Adviser. The Board also considered the advisory fee rate payable by the Fund under the New Investment Advisory Agreements. In this regard, information on the fees paid by the Fund and the Fund’s total operating expense ratios (before and after fee waivers and expense reimbursements) were compared to similar information for mutual funds advised by other, unaffiliated investment advisory firms. The Directors noted that both the Fund’s net advisory fee and Fund’s total net expenses were above the median and in the 4th quintile of its Peer Group. The Directors also noted that Campbell had contractually agreed to waive management fees and reimburse expenses through at least December 31, 2024 to limit total annual operating expenses to agreed upon levels for the Fund. The Board further noted that the management fees and total expenses of the Fund were not expected to change as a result of the Transition or approval of the New Investment Advisory Agreements. The Directors also reviewed analyses of the Adviser’s estimated profitability related to its provision of advisory services to the Fund. Based on the information provided, the Directors concluded that the amount of management fees that the Fund currently pays, and would pay under the New Investment Advisory Agreements, to the Adviser were reasonable in light of the nature and quality of the services provided.
Investment Performance of the Fund. The Directors also considered the investment performance of the Fund, and considered the Fund’s investment performance in light of its investment objective and investment strategies. Information on the Fund’s investment performance was provided for the three-month, one-year, three-year, five-year, ten-year, and since inception periods ended December 31, 2023. The Directors noted that the Fund outperformed its primary benchmark, the S&P 500 Index, for the three-year period ended December 31, 2023, and underperformed its benchmark for the three-month, one-year, five-year, ten-year and since-inception periods ended December 31, 2023. The Directors noted that the Fund outperformed the median of its Peer Group for the three-year, five-year, ten-year, and since-inception periods ended December 31, 2023, and underperformed the median of its Peer Group for the three-month and one-year periods ended December 31, 2023. After considering all of the information, the Directors concluded that, although past performance is not a guarantee of future results, the Fund and their shareholders were likely to benefit from the Adviser’s continued provision of investment management services.
Economies of Scale and Fee Levels Reflecting Those Economies. In considering the overall fairness of the New Investment Advisory Agreements, the Directors assessed the degree to which economies of scale would be expected to be realized if the Fund’s assets increased as well as the extent to which fee levels would reflect those economies of scale for the benefit of the Fund’s shareholders. The Directors noted that the Fund’s management fee structure did not contain any breakpoint reductions as the Fund’s assets grew in size, but that the feasibility of incorporating breakpoints would continue to be reviewed on a regular basis. The Directors determined that the fee schedules in the New Investment Advisory Agreements were reasonable and appropriate.
Other Benefits to the Adviser. In addition to the above factors, the Directors also considered other benefits received by the Adviser from its management of the Fund and the Subsidiary, including, without limitation, the ability to market its advisory services for similar products in the future.
Based on all of the information presented to and considered by the Directors and the conclusions that it reached, the Board approved the New Investment Advisory Agreements for an initial period ending August 16, 2025, on the basis that their terms and conditions were fair to, and in the best interests of, the Fund and its shareholders.
31
Campbell Systematic Macro Fund
Affirmation of the Commodity Pool Operator
August 31, 2024
To the best of the knowledge and belief of the undersigned, the information contained in the Annual Report for the year ended August 31, 2024 is accurate and complete.
| | 
|
| | Kevin D. Cole, Chief Executive Officer &
Chief Investment Officer
Campbell & Company, LP
CAMPBELL SYSTEMATIC MACRO FUND |
32
Investment Adviser
Campbell & Company Investment Adviser LLC
2850 Quarry Lake Drive
Baltimore, Maryland 21209
Administrator and Transfer Agent
U.S. Bancorp Fund Services, LLC
P.O. Box 701
Milwaukee, WI 53201
Principal Underwriter
Quasar Distributors, LLC
3 Canal Plaza, Suite 100
Portland, ME 04101
Custodian
U.S. Bank, N.A.
1555 North Rivercenter Drive, Suite 302
Milwaukee, WI 53212
Independent Registered Public Accounting Firm
Ernst & Young LLP
One Commerce Square
2005 Market Street, Suite 700
Philadelphia, PA 19103
Legal Counsel
Faegre Drinker Biddle & Reath LLP
One Logan Square, Suite 2000
Philadelphia, PA 19103-6996

Financial Statements
August 31, 2024
US Treasury 3 Month Bill ETF | (Nasdaq: TBIL)
US Treasury 6 Month Bill ETF | (Nasdaq: XBIL)
US Treasury 12 Month Bill ETF | (Nasdaq: OBIL)
US Treasury 2 Year Note ETF | (Nasdaq: UTWO)
US Treasury 3 Year Note ETF | (Nasdaq: UTRE)
US Treasury 5 Year Note ETF | (Nasdaq: UFIV)
US Treasury 7 Year Note ETF | (Nasdaq: USVN)
US Treasury 10 Year Note ETF | (Nasdaq: UTEN)
US Treasury 20 Year Bond ETF | (Nasdaq: UTWY)
US Treasury 30 Year Bond ETF | (Nasdaq: UTHY)
Each a series of The RBB Fund, Inc.
F/m Investments, LLC d/b/a North Slope Capital, LLC
Table of Contents | 
|
| | |
Schedules of Investments | 1 |
Financial Statements | 11 |
Notes to Financial Statements | 37 |
Report of Independent Registered Public Accounting Firm | 50 |
Shareholder Tax Information | 52 |
Other Information | 53 |
Approval of Investment Advisory Agreement | 54 |
US Treasury 3 Month Bill ETF
Schedule of Investments
August 31, 2024
| | Par | | | Value | |
| | | | | | | | | |
SHORT-TERM INVESTMENTS — 100.0% | | | | | | | | |
U.S. Treasury Bills — 100.0% | | | | | | | | |
5.21%, 09/03/2024(a) | | $ | 18,000,000 | | | $ | 18,000,000 | |
5.07%, 11/29/2024(a) | | | 4,136,218,000 | | | | 4,086,588,554 | |
TOTAL SHORT-TERM INVESTMENTS (Cost $4,103,035,203) | | | | | | | 4,104,588,554 | |
| | | | | | | | | |
TOTAL INVESTMENTS — 100.0% (Cost $4,103,035,203) | | | | | | $ | 4,104,588,554 | |
Liabilities in Excess of Other Assets — (0.0)%(b) | | | | | | | (81,468 | ) |
TOTAL NET ASSETS — 100.0% | | | | | | $ | 4,104,507,086 | |
Percentages are stated as a percent of net assets.
(a) | The rate shown is the effective yield as of August 31, 2024. |
(b) | Represents less than 0.05% of net assets. |
The accompanying notes are an integral part of these financial statements.
US Treasury 6 Month Bill ETF
Schedule of Investments
August 31, 2024
| | Par | | | Value | |
| | | | | | | | | |
SHORT-TERM INVESTMENTS — 100.0% | | | | | | | | |
U.S. Treasury Bills — 100.0% | | | | | | | | |
5.21%, 09/03/2024(a) | | $ | 2,500,000 | | | $ | 2,500,000 | |
4.76%, 02/27/2025(a) | | | 609,859,000 | | | | 595,803,653 | |
TOTAL SHORT-TERM INVESTMENTS (Cost $598,251,173) | | | | | | | 598,303,653 | |
| | | | | | | | | |
TOTAL INVESTMENTS — 100.0% (Cost $598,251,173) | | | | | | $ | 598,303,653 | |
Liabilities in Excess of Other Assets — (0.0)%(b) | | | | | | | 190,172 | |
TOTAL NET ASSETS — 100.0% | | | | | | $ | 598,493,825 | |
Percentages are stated as a percent of net assets.
(a) | The rate shown is the effective yield as of August 31, 2024. |
(b) | Represents less than 0.05% of net assets. |
The accompanying notes are an integral part of these financial statements.
US Treasury 12 Month Bill ETF
Schedule of Investments
August 31, 2024
| | Par | | | Value | |
| | | | | | | | | |
SHORT-TERM INVESTMENTS — 100.0% | | | | | | | | |
U.S. Treasury Bills — 100.0% | | | | | | | | |
5.23%, 09/03/2024(a) | | $ | 1,000,000 | | | $ | 1,000,000 | |
4.44%, 08/07/2025(a) | | | 245,802,000 | | | | 236,043,820 | |
TOTAL SHORT-TERM INVESTMENTS (Cost $236,946,333) | | | | | | | 237,043,820 | |
| | | | | | | | | |
TOTAL INVESTMENTS — 100.0% (Cost $236,946,333) | | | | | | $ | 237,043,820 | |
Liabilities in Excess of Other Assets — (0.0)%(b) | | | | | | | 53,762 | |
TOTAL NET ASSETS — 100.0% | | | | | | $ | 237,097,582 | |
Percentages are stated as a percent of net assets.
(a) | The rate shown is the effective yield as of August 31, 2024. |
(b) | Represents less than 0.05% of net assets. |
The accompanying notes are an integral part of these financial statements.
US Treasury 2 Year Note ETF
Schedule of Investments
August 31, 2024
| | Par | | | Value | |
| | | | | | | | | |
U.S. TREASURY SECURITIES — 99.6% | | | | | | | | |
United States Treasury Note/Bond, 4.38%, 07/31/2026 | | $ | 447,462,000 | | | $ | 450,817,965 | |
TOTAL U.S. TREASURY SECURITIES (Cost $447,635,077) | | | | | | | 450,817,965 | |
| | | | | | | | | |
TOTAL INVESTMENTS — 99.6% (Cost $447,635,077) | | | | | | $ | 450,817,965 | |
Other Assets in Excess of Liabilities — 0.4% | | | | | | | 1,656,201 | |
TOTAL NET ASSETS — 100.0% | | | | | | $ | 452,474,166 | |
Percentages are stated as a percent of net assets.
The accompanying notes are an integral part of these financial statements.
US Treasury 3 Year Note ETF
Schedule of Investments
August 31, 2024
| | Par | | | Value | |
| | | | | | | | | |
U.S. TREASURY SECURITIES — 99.8% | | | | | | | | |
United States Treasury Note/Bond, 3.75%, 08/15/2027 | | $ | 7,450,000 | | | $ | 7,441,852 | |
TOTAL U.S. TREASURY SECURITIES (Cost $7,448,718) | | | | | | | 7,441,852 | |
| | | | | | | | | |
TOTAL INVESTMENTS — 99.8% (Cost $7,448,718) | | | | | | $ | 7,441,852 | |
Other Assets in Excess of Liabilities — 0.2% | | | | | | | 12,693 | |
TOTAL NET ASSETS — 100.0% | | | | | | $ | 7,454,545 | |
Percentages are stated as a percent of net assets.
The accompanying notes are an integral part of these financial statements.
US Treasury 5 Year Note ETF
Schedule of Investments
August 31, 2024
| | Par | | | Value | |
| | | | | | | | | |
U.S. TREASURY SECURITIES — 99.6% | | | | | | | | |
United States Treasury Note/Bond, 3.63%, 08/31/2029 | | $ | 24,200,000 | | | $ | 24,101,687 | |
TOTAL U.S. TREASURY SECURITIES (Cost $24,148,744) | | | | | | | 24,101,687 | |
| | | | | | | | | |
TOTAL INVESTMENTS — 99.6% (Cost $24,148,744) | | | | | | $ | 24,101,687 | |
Other Assets in Excess of Liabilities — 0.4% | | | | | | | 106,755 | |
TOTAL NET ASSETS — 100.0% | | | | | | $ | 24,208,442 | |
Percentages are stated as a percent of net assets.
The accompanying notes are an integral part of these financial statements.
US Treasury 7 Year Note ETF
Schedule of Investments
August 31, 2024
| | Par | | | Value | |
| | | | | | | | | |
U.S. TREASURY SECURITIES — 99.5% | | | | | | | | |
United States Treasury Note/Bond, 3.75%, 08/31/2031 | | $ | 5,385,000 | | | $ | 5,363,965 | |
TOTAL U.S. TREASURY SECURITIES (Cost $5,378,856) | | | | | | | 5,363,965 | |
| | | | | | | | | |
TOTAL INVESTMENTS — 99.5% (Cost $5,378,856) | | | | | | $ | 5,363,965 | |
Other Assets in Excess of Liabilities — 0.5% | | | | | | | 27,729 | |
TOTAL NET ASSETS — 100.0% | | | | | | $ | 5,391,694 | |
Percentages are stated as a percent of net assets.
The accompanying notes are an integral part of these financial statements.
US Treasury 10 Year Note ETF
Schedule of Investments
August 31, 2024
| | Par | | | Value | |
| | | | | | | | | |
U.S. TREASURY SECURITIES — 99.8% | | | | | | | | |
United States Treasury Note/Bond, 3.88%, 08/15/2034 | | $ | 157,272,000 | | | $ | 156,706,804 | |
TOTAL U.S. TREASURY SECURITIES (Cost $157,598,404) | | | | | | | 156,706,804 | |
| | | | | | | | | |
TOTAL INVESTMENTS — 99.8% (Cost $157,598,404) | | | | | | $ | 156,706,804 | |
Other Assets in Excess of Liabilities — 0.2% | | | | | | | 267,922 | |
TOTAL NET ASSETS — 100.0% | | | | | | $ | 156,974,726 | |
Percentages are stated as a percent of net assets.
The accompanying notes are an integral part of these financial statements.
US Treasury 20 Year Bond ETF
Schedule of Investments
August 31, 2024
| | Par | | | Value | |
| | | | | | | | | |
U.S. TREASURY SECURITIES — 99.7% | | | | | | | | |
United States Treasury Note/Bond, 4.13%, 08/15/2044 | | $ | 26,824,000 | | | $ | 26,174,356 | |
TOTAL U.S. TREASURY SECURITIES (Cost $26,389,961) | | | | | | | 26,174,356 | |
| | | | | | | | | |
| | | | | | |
| | | | | | | | | |
SHORT-TERM INVESTMENTS — 0.3% | | | | | | | | |
U.S. Treasury Bills — 0.3% | | | | | | | | |
5.22%, 09/03/2024(a) | | | 83,000 | | | $ | 83,000 | |
TOTAL SHORT-TERM INVESTMENTS (Cost $82,975) | | | | | | | 83,000 | |
| | | | | | | | | |
TOTAL INVESTMENTS — 100.0% (Cost $26,472,936) | | | | | | $ | 26,257,356 | |
Liabilities in Excess of Other Assets — (0.0)%(b) | | | | | | | (7,786 | ) |
TOTAL NET ASSETS — 100.0% | | | | | | $ | 26,249,570 | |
Percentages are stated as a percent of net assets.
(a) | The rate shown is the effective yield as of August 31, 2024. |
(b) | Represents less than 0.05% of net assets. |
The accompanying notes are an integral part of these financial statements.
US Treasury 30 Year Bond ETF
Schedule of Investments
August 31, 2024
| | Par | | | Value | |
| | | | | | | | | |
U.S. TREASURY SECURITIES — 99.4% | | | | | | | | |
United States Treasury Note/Bond, 4.25%, 08/15/2054 | | $ | 17,744,000 | | | $ | 17,854,900 | |
TOTAL U.S. TREASURY SECURITIES (Cost $18,024,699) | | | | | | | 17,854,900 | |
| | | | | | | | | |
| | | | | | |
| | | | | | | | | |
SHORT-TERM INVESTMENTS — 0.4% | | | | | | | | |
U.S. Treasury Bills — 0.4% | | | | | | | | |
5.23%, 09/03/2024(a) | | | 65,000 | | | $ | 65,000 | |
TOTAL SHORT-TERM INVESTMENTS (Cost $64,981) | | | | | | | 65,000 | |
| | | | | | | | | |
TOTAL INVESTMENTS — 99.8% (Cost $18,089,680) | | | | | | $ | 17,919,900 | |
Other Assets in Excess of Liabilities — 0.2% | | | | | | | 34,768 | |
TOTAL NET ASSETS — 100.0% | | | | | | $ | 17,954,668 | |
Percentages are stated as a percent of net assets.
(a) | The rate shown is the effective yield as of August 31, 2024. |
The accompanying notes are an integral part of these financial statements.
US Benchmark Series
Statements of Assets and Liabilities
August 31, 2024
| | US Treasury
3 Month
Bill ETF | | | US Treasury
6 Month
Bill ETF | | | US Treasury
12 Month
Bill ETF | | | US Treasury
2 Year
Note ETF | |
ASSETS | | | | | | | | | | | | | | | | |
Investments in securities of unaffiliated issuers, at value (cost $—, $—, $—, and $447,635,077, respectively) | | $ | — | | | $ | — | | | $ | — | | | $ | 450,817,965 | |
Short-term investments, at value (cost $4,103,035,203, $598,251,173, $236,946,333, and $—, respectively) | | | 4,104,588,554 | | | | 598,303,653 | | | | 237,043,820 | | | | — | |
Cash equivalents | | | 8,828,184 | | | | 1,093,937 | | | | 80,660 | | | | 8,704 | |
Receivables for: | | | | | | | | | | | | | | | | |
Investments sold | | | 3,999,429 | | | | — | | | | — | | | | — | |
Capital shares sold | | | — | | | | — | | | | 1,002,526 | | | | — | |
Interest | | | 19,124 | | | | 3,882 | | | | 392 | | | | 1,704,123 | |
Total assets | | | 4,117,435,291 | | | | 599,401,472 | | | | 238,127,398 | | | | 452,530,792 | |
| | | | | | | | | | | | | | | | | |
LIABILITIES | | | | | | | | | | | | | | | | |
Payables for: | | | | | | | | | | | | | | | | |
Investments purchased | | | 8,397,855 | | | | 830,441 | | | | 1,000,633 | | | | - | |
Capital shares redeemed | | | 4,002,936 | | | | - | | | | - | | | | - | |
Advisory fees | | | 527,414 | | | | 77,206 | | | | 29,183 | | | | 56,626 | |
Total liabilities | | | 12,928,205 | | | | 907,647 | | | | 1,029,816 | | | | 56,626 | |
Net assets | | $ | 4,104,507,086 | | | $ | 598,493,825 | | | $ | 237,097,582 | | | $ | 452,474,166 | |
| | | | | | | | | | | | | | | | | |
NET ASSETS CONSIST OF: | | | | | | | | | | | | | | | | |
Par value | | $ | 82,030 | | | $ | 11,930 | | | $ | 4,730 | | | $ | 9,320 | |
Paid-in capital | | | 4,094,391,342 | | | | 597,801,623 | | | | 237,261,787 | | | | 457,859,456 | |
Total distributable earnings/(losses) | | | 10,033,714 | | | | 680,272 | | | | (168,935 | ) | | | (5,394,610 | ) |
Net assets | | $ | 4,104,507,086 | | | $ | 598,493,825 | | | $ | 237,097,582 | | | $ | 452,474,166 | |
| | | | | | | | | | | | | | | | | |
Shares outstanding ($0.001 par value, 100,000,000 shares authorized) | | | 82,030,000 | | | | 11,930,000 | | | | 4,730,000 | | | | 9,320,000 | |
Net asset value and redemption price per share | | $ | 50.04 | | | $ | 50.17 | | | $ | 50.13 | | | $ | 48.55 | |
The accompanying notes are an integral part of these financial statements.
US Benchmark Series
Statements of Assets and Liabilities (CONTINUED)
AUGUST 31, 2024
| | US Treasury
3 Year
Note ETF | | | US Treasury
5 Year
Note ETF | | | US Treasury
7 Year
Note ETF | | | US Treasury
10 Year
Note ETF | |
ASSETS | | | | | | | | | | | | | | | | |
Investments in securities of unaffiliated issuers, at value (cost $7,448,718, $24,148,744, $5,378,856, and $157,598,404, respectively) | | $ | 7,441,852 | | | $ | 24,101,687 | | | $ | 5,363,965 | | | $ | 156,706,804 | |
Short-term investments, at value (cost $—, $—, $—, and $—, respectively) | | | — | | | | — | | | | — | | | | — | |
Cash equivalents | | | 749 | | | | 10,617 | | | | 2,185 | | | | 5,921 | |
Receivables for: | | | | | | | | | | | | | | | | |
Investments sold | | | — | | | | 24,211,373 | | | | 5,391,965 | | | | — | |
Capital shares sold | | | — | | | | 24,249,953 | | | | 5,405,983 | | | | — | |
Interest | | | 12,919 | | | | 2,112 | | | | 504 | | | | 282,325 | |
Total assets | | | 7,455,520 | | | | 72,575,742 | | | | 16,164,602 | | | | 156,995,050 | |
| | | | | | | | | | | | | | | | | |
LIABILITIES | | | | | | | | | | | | | | | | |
Payables for: | | | | | | | | | | | | | | | | |
Investments purchased | | | — | | | | 24,156,014 | | | | 5,380,529 | | | | — | |
Capital shares redeemed | | | — | | | | 24,208,401 | | | | 5,391,694 | | | | — | |
Advisory fees | | | 975 | | | | 2,885 | | | | 685 | | | | 20,324 | |
Total liabilities | | | 975 | | | | 48,367,300 | | | | 10,772,908 | | | | 20,324 | |
Net assets | | $ | 7,454,545 | | | $ | 24,208,442 | | | $ | 5,391,694 | | | $ | 156,974,726 | |
| | | | | | | | | | | | | | | | | |
NET ASSETS CONSIST OF: | | | | | | | | | | | | | | | | |
Par value | | $ | 150 | | | $ | 490 | | | $ | 110 | | | $ | 3,490 | |
Paid-in capital | | | 7,557,933 | | | | 24,246,734 | | | | 5,433,511 | | | | 161,320,078 | |
Total distributable earnings/(losses) | | | (103,538 | ) | | | (38,782 | ) | | | (41,927 | ) | | | (4,348,842 | ) |
Net assets | | $ | 7,454,545 | | | $ | 24,208,442 | | | $ | 5,391,694 | | | $ | 156,974,726 | |
| | | | | | | | | | | | | | | | | |
Shares outstanding ($0.001 par value, 100,000,000 shares authorized) | | | 150,000 | | | | 490,000 | | | | 110,000 | | | | 3,490,000 | |
Net asset value and redemption price per share | | $ | 49.70 | | | $ | 49.40 | | | $ | 49.02 | | | $ | 44.98 | |
The accompanying notes are an integral part of these financial statements.
US Benchmark Series
Statements of Assets and Liabilities (Concluded)
AUGUST 31, 2024
| | US Treasury
20 Year
BOND ETF | | | US Treasury
30 Year
BOND ETF | |
ASSETS | | | | | | | | |
Investments in securities of unaffiliated issuers, at value (cost $26,389,961, $18,024,699, respectively) | | $ | 26,174,356 | | | $ | 17,854,900 | |
Short-term investments, at value (cost $82,975, $64,981, respectively) | | | 83,000 | | | | 65,000 | |
Cash | | | — | | | | — | |
Cash equivalents | | | 831 | | | | 2,357 | |
Receivables for: | | | | | | | | |
Investments sold | | | 26,192,897 | | | | — | |
Capital shares sold | | | 26,447,400 | | | | — | |
Interest | | | 50,930 | | | | 34,892 | |
Total assets | | | 78,949,414 | | | | 17,957,149 | |
| | | | | | | | | |
LIABILITIES | | | | | | | | |
Payables for: | | | | | | | | |
Investments purchased | | | 26,447,088 | | | | — | |
Capital shares redeemed | | | 26,249,552 | | | | — | |
Advisory fees | | | 3,204 | | | | 2,481 | |
Total liabilities | | | 52,699,844 | | | | 2,481 | |
Net assets | | $ | 26,249,570 | | | $ | 17,954,668 | |
| | | | | | | | | |
NET ASSETS CONSIST OF: | | | | | | | | |
Par value | | $ | 560 | | | $ | 390 | |
Paid-in capital | | | 27,099,495 | | | | 18,970,654 | |
Total distributable earnings/(losses) | | | (850,485 | ) | | | (1,016,376 | ) |
Net assets | | $ | 26,249,570 | | | $ | 17,954,668 | |
| | | | | | | | | |
Shares outstanding ($0.001 par value, 100,000,000 shares authorized) | | | 560,000 | | | | 390,000 | |
Net asset value and redemption price per share | | $ | 46.87 | | | $ | 46.04 | |
The accompanying notes are an integral part of these financial statements.
US Benchmark Series
Statements of Operations
FOR THE Year ENDED AUGUST 31, 2024
| | US Treasury
3 Month
Bill ETF | | | US Treasury
6 Month
Bill ETF | | | US Treasury
12 Month
Bill ETF | | | US Treasury
2 Year
Note ETF | |
INVESTMENT INCOME | | | | | | | | | | | | | | | | |
Interest income | | $ | 165,669,041 | | | $ | 28,291,808 | | | $ | 10,551,527 | | | $ | 16,928,392 | |
Securities lending income, net | | | 46,179 | | | | 16,508 | | | | 1,989 | | | | 9,238 | |
Total investment income | | | 165,715,220 | | | | 28,308,316 | | | | 10,553,516 | | | | 16,937,630 | |
| | | | | | | | | | | | | | | | | |
EXPENSES | | | | | | | | | | | | | | | | |
Advisory fees (Note 3) | | | 4,625,006 | | | | 800,012 | | | | 310,472 | | | | 545,743 | |
Total expenses | | | 4,625,006 | | | | 800,012 | | | | 310,472 | | | | 545,743 | |
Net investment income/(loss) | | | 161,090,214 | | | | 27,508,304 | | | | 10,243,044 | | | | 16,391,887 | |
| | | | | | | | | | | | | | | | | |
NET REALIZED AND UNREALIZED GAIN/(LOSS) FROM INVESTMENTS | | | | | | | | | | | | | | | | |
Net realized gain/(loss) from investments | | | (914,375 | ) | | | (99,011 | ) | | | 231,308 | | | | 1,387,377 | |
Net realized gain from redemption in-kind | | | 89,768 | | | | 1,040,648 | | | | 576,414 | | | | 45,934 | |
Net change in unrealized appreciation/ (depreciation) on investments | | | 1,563,232 | | | | 32,186 | | | | 162,196 | | | | 2,968,793 | |
Net realized and unrealized gain/(loss) | | | 738,625 | | | | 973,823 | | | | 969,918 | | | | 4,402,104 | |
NET INCREASE/(DECREASE) IN NET ASSETS RESULTING FROM OPERATIONS | | $ | 161,828,839 | | | $ | 28,482,127 | | | $ | 11,212,962 | | | $ | 20,793,991 | |
The accompanying notes are an integral part of these financial statements.
US Benchmark Series
Statements of Operations (CONTINUED)
FOR THE Year ENDED AUGUST 31, 2024
| | US Treasury
3 Year
Note ETF | | | US Treasury
5 Year
Note ETF | | | US Treasury
7 Year
Note ETF | | | US Treasury
10 Year
Note ETF | |
INVESTMENT INCOME | | | | | | | | | | | | | | | | |
Interest income | | $ | 245,373 | | | $ | 608,870 | | | $ | 186,138 | | | $ | 4,763,502 | |
Securities lending income, net | | | — | | | | — | | | | — | | | | 5,260 | |
Total investment income | | | 245,373 | | | | 608,870 | | | | 186,138 | | | | 4,768,762 | |
| | | | | | | | | | | | | | | | | |
EXPENSES | | | | | | | | | | | | | | | | |
Advisory fees (Note 3) | | | 8,651 | | | | 21,494 | | | | 6,540 | | | | 168,751 | |
Total expenses | | | 8,651 | | | | 21,494 | | | | 6,540 | | | | 168,751 | |
Net investment income/(loss) | | | 236,722 | | | | 587,376 | | | | 179,598 | | | | 4,600,011 | |
| | | | | | | | | | | | | | | | | |
NET REALIZED AND UNREALIZED GAIN/(LOSS) FROM INVESTMENTS | | | | | | | | | | | | | | | | |
Net realized gain/(loss) from investments | | | (62,004 | ) | | | 50,622 | | | | 18,609 | | | | (950,075 | ) |
Net realized gain from redemption in-kind | | | 130,318 | | | | 422,481 | | | | 152,959 | | | | 8,435,681 | |
Net change in unrealized appreciation/(depreciation) on investments | | | (11,081 | ) | | | (54,206 | ) | | | (16,332 | ) | | | (1,296,293 | ) |
Net realized and unrealized gain/(loss) | | | 57,233 | | | | 418,897 | | | | 155,236 | | | | 6,189,313 | |
NET INCREASE/(DECREASE) IN NET ASSETS RESULTING FROM OPERATIONS | | $ | 293,955 | | | $ | 1,006,273 | | | $ | 334,834 | | | $ | 10,789,324 | |
The accompanying notes are an integral part of these financial statements.
US Benchmark Series
Statements of Operations (Concluded)
FOR THE Year ENDED AUGUST 31, 2024
| | US Treasury
20 Year
Bond ETF | | | US Treasury
30 Year
Bond ETF | |
INVESTMENT INCOME | | | | | | | | |
Interest income | | $ | 626,369 | | | $ | 604,912 | |
Securities lending income, net | | | 2,089 | | | | — | |
Total investment income | | | 628,458 | | | | 604,912 | |
| | | | | | | | | |
EXPENSES | | | | | | | | |
Advisory fees (Note 3) | | | 20,746 | | | | 20,561 | |
Total expenses | | | 20,746 | | | | 20,561 | |
Net investment income/(loss) | | | 607,712 | | | | 584,351 | |
| | | | | | | | | |
NET REALIZED AND UNREALIZED GAIN/(LOSS) FROM INVESTMENTS | | | | | | | | |
Net realized gain/(loss) from investments | | | (524,217 | ) | | | (614,004 | ) |
Net realized gain from redemption in-kind | | | 2,868,123 | | | | 2,226,756 | |
Net change in unrealized appreciation/(depreciation) on investments | | | (221,457 | ) | | | (208,473 | ) |
Net realized and unrealized gain/(loss) | | | 2,122,449 | | | | 1,404,279 | |
NET INCREASE/(DECREASE) IN NET ASSETS RESULTING FROM OPERATIONS | | $ | 2,730,161 | | | $ | 1,988,630 | |
The accompanying notes are an integral part of these financial statements.
US Treasury 3 Month Bill ETF
Statements of Changes in Net Assets
| | FOR THE
Year ENDED
AUGUST 31,
2024 | | | FOR THE
Year ENDED
AUGUST 31,
2023 | |
INCREASE/(DECREASE) IN NET ASSETS RESULTING FROM OPERATIONS | | | | | | | | |
Net investment income/(loss) | | $ | 161,090,214 | | | $ | 28,135,880 | |
Net realized gain/(loss) from investments | | | (824,607 | ) | | | (193,513 | ) |
Net change in unrealized appreciation/(depreciation) on investments | | | 1,563,232 | | | | (10,665 | ) |
NET INCREASE/(DECREASE) IN NET ASSETS RESULTING FROM OPERATIONS | | | 161,828,839 | | | | 27,931,702 | |
| | | | | | | | | |
DIVIDENDS AND DISTRIBUTIONS TO SHAREHOLDERS FROM: | | | | | | | | |
Total distributable earnings | | | (155,670,454 | ) | | | (23,559,224 | ) |
Net decrease in net assets from dividends and distributions to shareholders | | | (155,670,454 | ) | | | (23,559,224 | ) |
| | | | | | | | | |
CAPITAL SHARE TRANSACTIONS: | | | | | | | | |
Proceeds from shares sold | | | 12,999,111,483 | | | | 2,413,134,681 | |
Shares redeemed | | | (10,677,346,091 | ) | | | (679,767,752 | ) |
Net increase/(decrease) in net assets from capital share transactions | | | 2,321,765,392 | | | | 1,733,366,929 | |
TOTAL INCREASE/(DECREASE) IN NET ASSETS | | | 2,327,923,777 | | | | 1,737,739,407 | |
| | | | | | | | | |
NET ASSETS: | | | | | | | | |
Beginning of period | | $ | 1,776,583,309 | | | $ | 38,843,902 | |
End of period | | $ | 4,104,507,086 | | | $ | 1,776,583,309 | |
| | | | | | | | | |
SHARE TRANSACTIONS: | | | | | | | | |
Shares sold | | | 260,270,000 | | | | 48,300,000 | |
Shares redeemed | | | (213,730,000 | ) | | | (13,590,000 | ) |
Net increase/(decrease) in shares | | | 46,540,000 | | | | 34,710,000 | |
The accompanying notes are an integral part of these financial statements.
US Treasury 6 Month Bill ETF
STATEMENTS of Changes in Net Assets
| | FOR THE
YEAR ENDED
AUGUST 31,
2024 | | | FOR THE
PERIOD ENDED
AUGUST 31,
2023(1) | |
INCREASE/(DECREASE) IN NET ASSETS RESULTING FROM OPERATIONS | | | | | | | | |
Net investment income/(loss) | | $ | 27,508,304 | | | $ | 3,466,353 | |
Net realized gain/(loss) from investments | | | 941,637 | | | | (273,097 | ) |
Net change in unrealized appreciation/(depreciation) on investments | | | 32,186 | | | | 20,294 | |
NET INCREASE/(DECREASE) IN NET ASSETS RESULTING FROM OPERATIONS | | | 28,482,127 | | | | 3,213,550 | |
| | | | | | | | | |
DIVIDENDS AND DISTRIBUTIONS TO SHAREHOLDERS FROM: | | | | | | | | |
Total distributable earnings | | | (27,247,652 | ) | | | (2,720,580 | ) |
Net decrease in net assets from dividends and distributions to shareholders | | | (27,247,652 | ) | | | (2,720,580 | ) |
| | | | | | | | | |
CAPITAL SHARE TRANSACTIONS: | | | | | | | | |
Proceeds from shares sold | | | 2,381,621,708 | | | | 353,006,880 | |
Shares redeemed | | | (2,095,680,768 | ) | | | (42,181,440 | ) |
Net increase/(decrease) in net assets from capital share transactions | | | 285,940,940 | | | | 310,825,440 | |
TOTAL INCREASE/(DECREASE) IN NET ASSETS | | | 287,175,415 | | | | 311,318,410 | |
| | | | | | | | | |
NET ASSETS: | | | | | | | | |
Beginning of period | | $ | 311,318,410 | | | $ | — | |
End of period | | $ | 598,493,825 | | | $ | 311,318,410 | |
| | | | | | | | | |
SHARE TRANSACTIONS: | | | | | | | | |
Shares sold | | | 47,590,000 | | | | 7,050,000 | |
Shares redeemed | | | (41,870,000 | ) | | | (840,000 | ) |
Net increase/(decrease) in shares | | | 5,720,000 | | | | 6,210,000 | |
(1) | Inception date of the Fund was March 6, 2023. |
The accompanying notes are an integral part of these financial statements.
US Treasury 12 Month Bill ETF
STATEMENTS of Changes in Net Assets
| | FOR THE
YEAR ENDED
AUGUST 31,
2024 | | | For the
Period Ended
August 31,
2023(1) | |
INCREASE/(DECREASE) IN NET ASSETS RESULTING FROM OPERATIONS | | | | | | | | |
Net investment income/(loss) | | $ | 10,243,044 | | | $ | 2,560,805 | |
Net realized gain/(loss) from investments | | | 807,722 | | | | (559,463 | ) |
Net change in unrealized appreciation/(depreciation) on investments | | | 162,196 | | | | (64,709 | ) |
NET INCREASE/(DECREASE) IN NET ASSETS RESULTING FROM OPERATIONS | | | 11,212,962 | | | | 1,936,633 | |
| | | | | | | | | |
DIVIDENDS AND DISTRIBUTIONS TO SHAREHOLDERS FROM: | | | | | | | | |
Total distributable earnings | | | (10,123,493 | ) | | | (2,206,389 | ) |
Net decrease in net assets from dividends and distributions to shareholders | | | (10,123,493 | ) | | | (2,206,389 | ) |
| | | | | | | | | |
CAPITAL SHARE TRANSACTIONS: | | | | | | | | |
Proceeds from shares sold | | | 399,728,007 | | | | 208,609,456 | |
Shares redeemed | | | (290,001,787 | ) | | | (82,057,807 | ) |
Net increase/(decrease) in net assets from capital share transactions | | | 109,726,220 | | | | 126,551,649 | |
TOTAL INCREASE/(DECREASE) IN NET ASSETS | | | 110,815,689 | | | | 126,281,893 | |
| | | | | | | | | |
NET ASSETS: | | | | | | | | |
Beginning of period | | $ | 126,281,893 | | | $ | — | |
End of period | | $ | 237,097,582 | | | $ | 126,281,893 | |
| | | | | | | | | |
SHARE TRANSACTIONS: | | | | | | | | |
Shares sold | | | 8,010,000 | | | | 4,160,000 | |
Shares redeemed | | | (5,810,000 | ) | | | (1,630,000 | ) |
Net increase/(decrease) in shares | | | 2,200,000 | | | | 2,530,000 | |
(1) | Inception date of the Fund was November 14, 2022. |
The accompanying notes are an integral part of these financial statements.
US Treasury 2 Year Note ETF
Statements of Changes in Net Assets
| | FOR THE
YEAR ENDED
AUGUST 31,
2024 | | | FOR THE
Year ENDED
AUGUST 31,
2023 | |
INCREASE/(DECREASE) IN NET ASSETS RESULTING FROM OPERATIONS | | | | | | | | |
Net investment income/(loss) | | $ | 16,391,887 | | | $ | 9,978,594 | |
Net realized gain/(loss) from investments | | | 1,433,311 | | | | (6,349,565 | ) |
Net change in unrealized appreciation/(depreciation) on investments | | | 2,968,793 | | | | 219,991 | |
NET INCREASE/(DECREASE) IN NET ASSETS RESULTING FROM OPERATIONS | | | 20,793,991 | | | | 3,849,020 | |
| | | | | | | | | |
DIVIDENDS AND DISTRIBUTIONS TO SHAREHOLDERS FROM: | | | | | | | | |
Total distributable earnings | | | (16,431,423 | ) | | | (9,134,861 | ) |
Net decrease in net assets from dividends and distributions to shareholders | | | (16,431,423 | ) | | | (9,134,861 | ) |
| | | | | | | | | |
CAPITAL SHARE TRANSACTIONS: | | | | | | | | |
Proceeds from shares sold | | | 214,457,600 | | | | 949,817,059 | |
Shares redeemed | | | (71,688,277 | ) | | | (657,095,514 | ) |
Net increase/(decrease) in net assets from capital share transactions | | | 142,769,323 | | | | 292,721,545 | |
TOTAL INCREASE/(DECREASE) IN NET ASSETS | | | 147,131,891 | | | | 287,435,704 | |
| | | | | | | | | |
NET ASSETS: | | | | | | | | |
Beginning of period | | $ | 305,342,275 | | | $ | 17,906,571 | |
End of period | | $ | 452,474,166 | | | $ | 305,342,275 | |
| | | | | | | | | |
SHARE TRANSACTIONS: | | | | | | | | |
Shares sold | | | 4,470,000 | | | | 19,390,000 | |
Shares redeemed | | | (1,490,000 | ) | | | (13,410,000 | ) |
Net increase/(decrease) in shares | | | 2,980,000 | | | | 5,980,000 | |
The accompanying notes are an integral part of these financial statements.
US Treasury 3 Year Note ETF
STATEMENTS of Changes in Net Assets
| | FOR THE
YEAR ENDED
AUGUST 31,
2024 | | | For the
Period Ended
August 31,
2023(1) | |
INCREASE/(DECREASE) IN NET ASSETS RESULTING FROM OPERATIONS | | | | | | | | |
Net investment income/(loss) | | $ | 236,722 | | | $ | 23,851 | |
Net realized gain/(loss) from investments | | | 68,314 | | | | (39,008 | ) |
Net change in unrealized appreciation/(depreciation) on investments | | | (11,081 | ) | | | 4,215 | |
NET INCREASE/(DECREASE) IN NET ASSETS RESULTING FROM OPERATIONS | | | 293,955 | | | | (10,942 | ) |
| | | | | | | | | |
DIVIDENDS AND DISTRIBUTIONS TO SHAREHOLDERS FROM: | | | | | | | | |
Total distributable earnings | | | (233,355 | ) | | | (19,629 | ) |
Net decrease in net assets from dividends and distributions to shareholders | | | (233,355 | ) | | | (19,629 | ) |
| | | | | | | | | |
CAPITAL SHARE TRANSACTIONS: | | | | | | | | |
Proceeds from shares sold | | | 37,055,893 | | | | 3,006,457 | |
Shares redeemed | | | (31,132,512 | ) | | | (1,505,322 | ) |
Net increase/(decrease) in net assets from capital share transactions | | | 5,923,381 | | | | 1,501,135 | |
TOTAL INCREASE/(DECREASE) IN NET ASSETS | | | 5,983,981 | | | | 1,470,564 | |
| | | | | | | | | |
NET ASSETS: | | | | | | | | |
Beginning of period | | $ | 1,470,564 | | | $ | — | |
End of period | | $ | 7,454,545 | | | $ | 1,470,564 | |
| | | | | | | | | |
SHARE TRANSACTIONS: | | | | | | | | |
Shares sold | | | 750,000 | | | | 60,000 | |
Shares redeemed | | | (630,000 | ) | | | (30,000 | ) |
Net increase/(decrease) in shares | | | 120,000 | | | | 30,000 | |
(1) | Inception date of the Fund was March 27, 2023. |
The accompanying notes are an integral part of these financial statements.
US Treasury 5 Year Note ETF
STATEMENTS of Changes in Net Assets
| | FOR THE
YEAR ENDED
AUGUST 31,
2024 | | | For the
Period Ended
August 31,
2023(1) | |
INCREASE/(DECREASE) IN NET ASSETS RESULTING FROM OPERATIONS | | | | | | | | |
Net investment income/(loss) | | $ | 587,376 | | | $ | 28,549 | |
Net realized gain/(loss) from investments | | | 473,103 | | | | (64,395 | ) |
Net change in unrealized appreciation/(depreciation) on investments | | | (54,206 | ) | | | 7,114 | |
NET INCREASE/(DECREASE) IN NET ASSETS RESULTING FROM OPERATIONS | | | 1,006,273 | | | | (28,732 | ) |
| | | | | | | | | |
DIVIDENDS AND DISTRIBUTIONS TO SHAREHOLDERS FROM: | | | | | | | | |
Total distributable earnings | | | (563,162 | ) | | | (19,503 | ) |
Net decrease in net assets from dividends and distributions to shareholders | | | (563,162 | ) | | | (19,503 | ) |
| | | | | | | | | |
CAPITAL SHARE TRANSACTIONS: | | | | | | | | |
Proceeds from shares sold | | | 56,333,058 | | | | 5,428,657 | |
Shares redeemed | | | (36,939,589 | ) | | | (1,008,560 | ) |
Net increase/(decrease) in net assets from capital share transactions | | | 19,393,469 | | | | 4,420,097 | |
TOTAL INCREASE/(DECREASE) IN NET ASSETS | | | 19,836,580 | | | | 4,371,862 | |
| | | | | | | | | |
NET ASSETS: | | | | | | | | |
Beginning of period | | $ | 4,371,862 | | | $ | — | |
End of period | | $ | 24,208,442 | | | $ | 4,371,862 | |
| | | | | | | | | |
SHARE TRANSACTIONS: | | | | | | | | |
Shares sold | | | 1,150,000 | | | | 110,000 | |
Shares redeemed | | | (750,000 | ) | | | (20,000 | ) |
Net increase/(decrease) in shares | | | 400,000 | | | | 90,000 | |
(1) | Inception date of the Fund was March 27, 2023. |
The accompanying notes are an integral part of these financial statements.
US Treasury 7 Year Note ETF
STATEMENTS of Changes in Net Assets
| | FOR THE
YEAR ENDED
AUGUST 31,
2024 | | | For the
Period Ended
August 31,
2023(1) | |
INCREASE/(DECREASE) IN NET ASSETS RESULTING FROM OPERATIONS | | | | | | | | |
Net investment income/(loss) | | $ | 179,598 | | | $ | 15,045 | |
Net realized gain/(loss) from investments | | | 171,568 | | | | (47,170 | ) |
Net change in unrealized appreciation/(depreciation) on investments | | | (16,332 | ) | | | 1,429 | |
NET INCREASE/(DECREASE) IN NET ASSETS RESULTING FROM OPERATIONS | | | 334,834 | | | | (30,696 | ) |
| | | | | | | | | |
DIVIDENDS AND DISTRIBUTIONS TO SHAREHOLDERS FROM: | | | | | | | | |
Total distributable earnings | | | (169,345 | ) | | | (11,541 | ) |
Net decrease in net assets from dividends and distributions to shareholders | | | (169,345 | ) | | | (11,541 | ) |
| | | | | | | | | |
CAPITAL SHARE TRANSACTIONS: | | | | | | | | |
Proceeds from shares sold | | | 14,998,698 | | | | 2,014,762 | |
Shares redeemed | | | (10,735,308 | ) | | | (1,009,710 | ) |
Net increase/(decrease) in net assets from capital share transactions | | | 4,263,390 | | | | 1,005,052 | |
TOTAL INCREASE/(DECREASE) IN NET ASSETS | | | 4,428,879 | | | | 962,815 | |
| | | | | | | | | |
NET ASSETS: | | | | | | | | |
Beginning of period | | $ | 962,815 | | | $ | — | |
End of period | | $ | 5,391,694 | | | $ | 962,815 | |
| | | | | | | | | |
SHARE TRANSACTIONS: | | | | | | | | |
Shares sold | | | 310,000 | | | | 40,000 | |
Shares redeemed | | | (220,000 | ) | | | (20,000 | ) |
Net increase/(decrease) in shares | | | 90,000 | | | | 20,000 | |
(1) | Inception date of the Fund was March 27, 2023. |
The accompanying notes are an integral part of these financial statements.
US Treasury 10 Year Note ETF
Statements of Changes in Net Assets
| | FOR THE
YEAR ENDED
AUGUST 31,
2024 | | | FOR THE
Year ENDED
AUGUST 31,
2023 | |
INCREASE/(DECREASE) IN NET ASSETS RESULTING FROM OPERATIONS | | | | | | | | |
Net investment income/(loss) | | $ | 4,600,011 | | | $ | 753,933 | |
Net realized gain/(loss) from investments | | | 7,485,606 | | | | (3,708,055 | ) |
Net change in unrealized appreciation/(depreciation) on investments | | | (1,296,293 | ) | | | 906,748 | |
NET INCREASE/(DECREASE) IN NET ASSETS RESULTING FROM OPERATIONS | | | 10,789,324 | | | | (2,047,374 | ) |
| | | | | | | | | |
DIVIDENDS AND DISTRIBUTIONS TO SHAREHOLDERS FROM: | | | | | | | | |
Total distributable earnings | | | (4,342,882 | ) | | | (679,725 | ) |
Net decrease in net assets from dividends and distributions to shareholders | | | (4,342,882 | ) | | | (679,725 | ) |
| | | | | | | | | |
CAPITAL SHARE TRANSACTIONS: | | | | | | | | |
Proceeds from shares sold | | | 325,251,999 | | | | 82,290,461 | |
Shares redeemed | | | (230,817,259 | ) | | | (43,803,707 | ) |
Net increase/(decrease) in net assets from capital share transactions | | | 94,434,740 | | | | 38,486,754 | |
TOTAL INCREASE/(DECREASE) IN NET ASSETS | | | 100,881,182 | | | | 35,759,655 | |
| | | | | | | | | |
NET ASSETS: | | | | | | | | |
Beginning of period | | $ | 56,093,544 | | | $ | 20,333,889 | |
End of period | | $ | 156,974,726 | | | $ | 56,093,544 | |
| | | | | | | | | |
SHARE TRANSACTIONS: | | | | | | | | |
Shares sold | | | 7,370,000 | | | | 1,790,000 | |
Shares redeemed | | | (5,140,000 | ) | | | (950,000 | ) |
Net increase/(decrease) in shares | | | 2,230,000 | | | | 840,000 | |
The accompanying notes are an integral part of these financial statements.
US Treasury 20 Year Bond ETF
STATEMENTS of Changes in Net Assets
| | FOR THE
YEAR ENDED
AUGUST 31,
2024 | | | For the
Period Ended
August 31,
2023(1) | |
INCREASE/(DECREASE) IN NET ASSETS RESULTING FROM OPERATIONS | | | | | | | | |
Net investment income/(loss) | | $ | 607,712 | | | $ | 20,666 | |
Net realized gain/(loss) from investments | | | 2,343,906 | | | | (110,655 | ) |
Net change in unrealized appreciation/(depreciation) on investments | | | (221,457 | ) | | | 5,844 | |
NET INCREASE/(DECREASE) IN NET ASSETS RESULTING FROM OPERATIONS | | | 2,730,161 | | | | (84,145 | ) |
| | | | | | | | | |
DIVIDENDS AND DISTRIBUTIONS TO SHAREHOLDERS FROM: | | | | | | | | |
Total distributable earnings | | | (615,765 | ) | | | (15,177 | ) |
Net decrease in net assets from dividends and distributions to shareholders | | | (615,765 | ) | | | (15,177 | ) |
| | | | | | | | | |
CAPITAL SHARE TRANSACTIONS: | | | | | | | | |
Proceeds from shares sold | | | 107,378,565 | | | | 1,973,766 | |
Shares redeemed | | | (85,117,835 | ) | | | — | |
Net increase/(decrease) in net assets from capital share transactions | | | 22,260,730 | | | | 1,973,766 | |
TOTAL INCREASE/(DECREASE) IN NET ASSETS | | | 24,375,126 | | | | 1,874,444 | |
| | | | | | | | | |
NET ASSETS: | | | | | | | | |
Beginning of period | | $ | 1,874,444 | | | $ | — | |
End of period | | $ | 26,249,570 | | | $ | 1,874,444 | |
| | | | | | | | | |
SHARE TRANSACTIONS: | | | | | | | | |
Shares sold | | | 2,340,000 | | | | 40,000 | |
Shares redeemed | | | (1,820,000 | ) | | | — | |
Net increase/(decrease) in shares | | | 520,000 | | | | 40,000 | |
(1) | Inception date of the Fund was March 27, 2023. |
The accompanying notes are an integral part of these financial statements.
US Treasury 30 Year Bond ETF
STATEMENTS of Changes in Net Assets
| | FOR THE
YEAR ENDED
AUGUST 31,
2024 | | | For the
Period Ended
August 31,
2023(1) | |
INCREASE/(DECREASE) IN NET ASSETS RESULTING FROM OPERATIONS | | | | | | | | |
Net investment income/(loss) | | $ | 584,351 | | | $ | 35,783 | |
Net realized gain/(loss) from investments | | | 1,612,752 | | | | (241,154 | ) |
Net change in unrealized appreciation/(depreciation) on investments | | | (208,473 | ) | | | 38,693 | |
NET INCREASE/(DECREASE) IN NET ASSETS RESULTING FROM OPERATIONS | | | 1,988,630 | | | | (166,678 | ) |
| | | | | | | | | |
DIVIDENDS AND DISTRIBUTIONS TO SHAREHOLDERS FROM: | | | | | | | | |
Total distributable earnings | | | (582,433 | ) | | | (29,955 | ) |
Net decrease in net assets from dividends and distributions to shareholders | | | (582,433 | ) | | | (29,955 | ) |
| | | | | | | | | |
CAPITAL SHARE TRANSACTIONS: | | | | | | | | |
Proceeds from shares sold | | | 48,337,298 | | | | 2,978,700 | |
Shares redeemed | | | (34,570,894 | ) | | | — | |
Net increase/(decrease) in net assets from capital share transactions | | | 13,766,404 | | | | 2,978,700 | |
TOTAL INCREASE/(DECREASE) IN NET ASSETS | | | 15,172,601 | | | | 2,782,067 | |
| | | | | | | | | |
NET ASSETS: | | | | | | | | |
Beginning of period | | $ | 2,782,067 | | | $ | — | |
End of period | | $ | 17,954,668 | | | $ | 2,782,067 | |
| | | | | | | | | |
SHARE TRANSACTIONS: | | | | | | | | |
Shares sold | | | 1,070,000 | | | | 60,000 | |
Shares redeemed | | | (740,000 | ) | | | — | |
Net increase/(decrease) in shares | | | 330,000 | | | | 60,000 | |
(1) | Inception date of the Fund was March 27, 2023. |
The accompanying notes are an integral part of these financial statements.
US Treasury 3 Month Bill ETF
Financial Highlights
Contained below is per share operating performance data for shares outstanding, total investment return/(loss), ratios to average net assets and other supplemental data for the respective periods. This information has been derived from information provided in the financial statements.
| | FOR THE
YEAR
ENDED
AUGUST 31, | | | FOR THE
YEAR
ENDED
AUGUST 31, | | | FOR THE
PERIOD
ENDED
AUGUST 31, | |
| | 2024 | | | 2023 | | | 2022(1) | |
PER SHARE OPERATING PERFORMANCE | | | | | | | | | | | | |
Net asset value, beginning of period | | $ | 50.06 | | | $ | 49.80 | | | $ | 49.75 | |
Net investment income/(loss)(2) | | | 2.61 | | | | 2.49 | | | | 0.09 | |
Net realized and unrealized gain/(loss) from investments | | | — | (3) | | | (0.29 | ) | | | (0.04 | ) |
Net increase/(decrease) in net assets resulting from operations | | | 2.61 | | | | 2.20 | | | | 0.05 | |
Dividends and distributions to shareholders from: | | | | | | | | | | | | |
Net investment income | | | (2.63 | ) | | | (1.94 | ) | | | — | |
Total dividends and distributions to shareholders | | | (2.63 | ) | | | (1.94 | ) | | | — | |
Net asset value, end of period | | $ | 50.04 | | | $ | 50.06 | | | $ | 49.80 | |
Market value, end of period | | $ | 50.03 | | | $ | 50.10 | | | $ | 49.81 | |
Total investment return/(loss) on net asset value(4) | | | 5.37 | % | | | 4.50 | % | | | 0.10 | %(6) |
Total investment return/(loss) on market price(5) | | | 5.27 | % | | | 4.56 | % | | | 0.12 | %(6) |
RATIOS/SUPPLEMENTAL DATA | | | | | | | | | | | | |
Net assets, end of period (000’s omitted) | | $ | 4,104,507 | | | $ | 1,776,583 | | | $ | 38,844 | |
Ratio of expenses to average net assets | | | 0.15 | % | | | 0.15 | % | | | 0.15 | %(7) |
Ratio of net investment income/(loss) to average net assets | | | 5.21 | % | | | 4.98 | % | | | 2.61 | %(7) |
Portfolio turnover rate | | | 0 | % | | | 0 | % | | | 0 | %(6) |
(1) | Inception date of the Fund was August 8, 2022. |
(2) | Per share data calculated using average shares outstanding method. |
(3) | Rounds to less than $0.005 per share. |
(4) | Total investment return/(loss) on net asset value is calculated assuming a purchase of shares on the first day and a sale of shares on the last day of each period reported and includes reinvestments of dividends and distributions, if any. |
(5) | Total investment return/(loss) on market price is calculated assuming an initial investment made at the market price on the first day of the period, reinvestment of dividends and distributions at market price during the period and redemption at market price on the last day of the period. |
The accompanying notes are an integral part of these financial statements.
US Treasury 6 Month Bill ETF
Financial Highlights
Contained below is per share operating performance data for shares outstanding, total investment return/(loss), ratios to average net assets and other supplemental data for the respective periods. This information has been derived from information provided in the financial statements.
| | FOR THE
YEAR
ENDED
AUGUST 31, | | | FOR THE
PERIOD
ENDED
AUGUST 31, | |
| | 2024 | | | 2023(1) | |
PER SHARE OPERATING PERFORMANCE | | | | | | | | |
Net asset value, beginning of period | | $ | 50.13 | | | $ | 50.00 | |
Net investment income/(loss)(2) | | | 2.58 | | | | 1.28 | |
Net realized and unrealized gain/(loss) from investments | | | 0.09 | | | | (0.12 | ) |
Net increase/(decrease) in net assets resulting from operations | | | 2.67 | | | | 1.16 | |
Dividends and distributions to shareholders from: | | | | | | | | |
Net investment income | | | (2.63 | ) | | | (1.03 | ) |
Total dividends and distributions to shareholders | | | (2.63 | ) | | | (1.03 | ) |
Net asset value, end of period | | $ | 50.17 | | | $ | 50.13 | |
Market value, end of period | | $ | 50.17 | | | $ | 50.17 | |
Total investment return/(loss) on net asset value(3) | | | 5.48 | % | | | 2.35 | %(5) |
Total investment return/(loss) on market price(4) | | | 5.41 | % | | | 2.42 | %(5) |
RATIOS/SUPPLEMENTAL DATA | | | | | | | | |
Net assets, end of period (000’s omitted) | | $ | 598,494 | | | $ | 311,318 | |
Ratio of expenses to average net assets | | | 0.15 | % | | | 0.15 | %(6) |
Ratio of net investment income/(loss) to average net assets | | | 5.14 | % | | | 5.26 | %(6) |
Portfolio turnover rate | | | 0 | % | | | 0 | %(5) |
(1) | Inception date of the Fund was March 6, 2023. |
(2) | Per share data calculated using average shares outstanding method. |
(3) | Total investment return/(loss) on net asset value is calculated assuming a purchase of shares on the first day and a sale of shares on the last day of each period reported and includes reinvestments of dividends and distributions, if any. |
(4) | Total investment return/(loss) on market price is calculated assuming an initial investment made at the market price on the first day of the period, reinvestment of dividends and distributions at market price during the period and redemption at market price on the last day of the period. |
The accompanying notes are an integral part of these financial statements.
US Treasury 12 Month Bill ETF
Financial Highlights
Contained below is per share operating performance data for shares outstanding, total investment return/(loss), ratios to average net assets and other supplemental data for the respective periods. This information has been derived from information provided in the financial statements.
| | FOR THE
YEAR
ENDED
AUGUST 31, | | | FOR THE
Period
ENDED
AUGUST 31, | |
| | 2024 | | | 2023(1) | |
PER SHARE OPERATING PERFORMANCE | | | | | | | | |
Net asset value, beginning of period | | $ | 49.91 | | | $ | 50.07 | |
Net investment income/(loss)(2) | | | 2.47 | | | | 1.96 | |
Net realized and unrealized gain/(loss) from investments | | | 0.25 | | | | (0.48 | ) |
Net increase/(decrease) in net assets resulting from operations | | | 2.72 | | | | 1.48 | |
Dividends and distributions to shareholders from: | | | | | | | | |
Net investment income | | | (2.50 | ) | | | (1.64 | ) |
Total dividends and distributions to shareholders | | | (2.50 | ) | | | (1.64 | ) |
Net asset value, end of period | | $ | 50.13 | | | $ | 49.91 | |
Market value, end of period | | $ | 50.14 | | | $ | 49.94 | |
Total investment return/(loss) on net asset value(3) | | | 5.58 | % | | | 3.01 | %(5) |
Total investment return/(loss) on market price(4) | | | 5.54 | % | | | 3.08 | %(5) |
RATIOS/SUPPLEMENTAL DATA | | | | | | | | |
Net assets, end of period (000’s omitted) | | $ | 237,098 | | | $ | 126,282 | |
Ratio of expenses to average net assets | | | 0.15 | % | | | 0.15 | %(6) |
Ratio of net investment income/(loss) to average net assets | | | 4.94 | % | | | 4.93 | %(6) |
Portfolio turnover rate | | | 0 | % | | | 0 | %(5) |
(1) | Inception date of the Fund was November 14, 2022. |
(2) | Per share data calculated using average shares outstanding method. |
(3) | Total investment return/(loss) on net asset value is calculated assuming a purchase of shares on the first day and a sale of shares on the last day of each period reported and includes reinvestments of dividends and distributions, if any. |
(4) | Total investment return/(loss) on market price is calculated assuming an initial investment made at the market price on the first day of the period, reinvestment of dividends and distributions at market price during the period and redemption at market price on the last day of the period. |
The accompanying notes are an integral part of these financial statements.
US Treasury 2 Year Note ETF
Financial Highlights
Contained below is per share operating performance data for shares outstanding, total investment return/(loss), ratios to average net assets and other supplemental data for the respective periods. This information has been derived from information provided in the financial statements.
| | FOR THE
YEAR
ENDED
AUGUST 31, | | | FOR THE
YEAR
ENDED
AUGUST 31, | | | FOR THE
PERIOD
ENDED
AUGUST 31, | |
| | 2024 | | | 2023 | | | 2022(1) | |
PER SHARE OPERATING PERFORMANCE | | | | | | | | | | | | |
Net asset value, beginning of period | | $ | 48.16 | | | $ | 49.74 | | | $ | 49.84 | |
Net investment income/(loss)(2) | | | 2.16 | | | | 2.02 | | | | 0.11 | |
Net realized and unrealized gain/(loss) from investments | | | 0.43 | | | | (1.84 | ) | | | (0.21 | ) |
Net increase/(decrease) in net assets resulting from operations | | | 2.59 | | | | 0.18 | | | | (0.10 | ) |
Dividends and distributions to shareholders from: | | | | | | | | | | | | |
Net investment income | | | (2.20 | ) | | | (1.76 | ) | | | — | |
Total dividends and distributions to shareholders | | | (2.20 | ) | | | (1.76 | ) | | | — | |
Net asset value, end of period | | $ | 48.55 | | | $ | 48.16 | | | $ | 49.74 | |
Market value, end of period | | $ | 48.56 | | | $ | 48.19 | | | $ | 49.74 | |
Total investment return/(loss) on net asset value(3) | | | 5.54 | % | | | 0.38 | % | | | (0.20 | )%(5) |
Total investment return/(loss) on market price(4) | | | 5.51 | % | | | 0.44 | % | | | (0.20 | )%(5) |
RATIOS/SUPPLEMENTAL DATA | | | | | | | | | | | | |
Net assets, end of period (000’s omitted) | | $ | 452,474 | | | $ | 305,342 | | | $ | 17,907 | |
Ratio of expenses to average net assets | | | 0.15 | % | | | 0.15 | % | | | 0.15 | %(6) |
Ratio of net investment income/(loss) to average net assets | | | 4.49 | % | | | 4.15 | % | | | 3.54 | %(6) |
Portfolio turnover rate | | | 1091 | % | | | 1048 | % | | | 100 | %(5) |
(1) | Inception date of the Fund was August 8, 2022. |
(2) | Per share data calculated using average shares outstanding method. |
(3) | Total investment return/(loss) on net asset value is calculated assuming a purchase of shares on the first day and a sale of shares on the last day of each period reported and includes reinvestments of dividends and distributions, if any. |
(4) | Total investment return/(loss) on market price is calculated assuming an initial investment made at the market price on the first day of the period, reinvestment of dividends and distributions at market price during the period and redemption at market price on the last day of the period. |
The accompanying notes are an integral part of these financial statements.
US Treasury 3 Year Note ETF
Financial Highlights
Contained below is per share operating performance data for shares outstanding, total investment return/(loss), ratios to average net assets and other supplemental data for the respective periods. This information has been derived from information provided in the financial statements.
| | FOR THE
YEAR
ENDED
AUGUST 31, | | | FOR THE
PERIOD
ENDED
AUGUST 31, | |
| | 2024 | | | 2023(1) | |
PER SHARE OPERATING PERFORMANCE | | | | | | | | |
Net asset value, beginning of period | | $ | 49.02 | | | $ | 50.00 | |
Net investment income/(loss)(2) | | | 2.01 | | | | 0.82 | |
Net realized and unrealized gain/(loss) from investments | | | 0.76 | | | | (1.15 | ) |
Net increase/(decrease) in net assets resulting from operations | | | 2.77 | | | | (0.33 | ) |
Dividends and distributions to shareholders from: | | | | | | | | |
Net investment income | | | (2.09 | ) | | | (0.65 | ) |
Total dividends and distributions to shareholders | | | (2.09 | ) | | | (0.65 | ) |
Net asset value, end of period | | $ | 49.70 | | | $ | 49.02 | |
Market value, end of period | | $ | 49.70 | | | $ | 49.04 | |
Total investment return/(loss) on net asset value(3) | | | 5.82 | % | | | (0.66 | )%(5) |
Total investment return/(loss) on market price(4) | | | 5.78 | % | | | (0.62 | )%(5) |
RATIOS/SUPPLEMENTAL DATA | | | | | | | | |
Net assets, end of period (000’s omitted) | | $ | 7,455 | | | $ | 1,471 | |
Ratio of expenses to average net assets | | | 0.15 | % | | | 0.15 | %(6) |
Ratio of net investment income/(loss) to average net assets | | | 4.09 | % | | | 3.86 | %(6) |
Portfolio turnover rate | | | 905 | % | | | 422 | %(5) |
(1) | Inception date of the Fund was March 27, 2023. |
(2) | Per share data calculated using average shares outstanding method. |
(3) | Total investment return/(loss) on net asset value is calculated assuming a purchase of shares on the first day and a sale of shares on the last day of each period reported and includes reinvestments of dividends and distributions, if any. |
(4) | Total investment return/(loss) on market price is calculated assuming an initial investment made at the market price on the first day of the period, reinvestment of dividends and distributions at market price during the period and redemption at market price on the last day of the period. |
The accompanying notes are an integral part of these financial statements.
US Treasury 5 Year Note ETF
Financial Highlights
Contained below is per share operating performance data for shares outstanding, total investment return/(loss), ratios to average net assets and other supplemental data for the respective periods. This information has been derived from information provided in the financial statements.
| | FOR THE
YEAR
ENDED
AUGUST 31, | | | FOR THE
PERIOD
ENDED
AUGUST 31, | |
| | 2024 | | | 2023(1) | |
PER SHARE OPERATING PERFORMANCE | | | | | | | | |
Net asset value, beginning of period | | $ | 48.58 | | | $ | 50.00 | |
Net investment income/(loss)(2) | | | 1.98 | | | | 0.79 | |
Net realized and unrealized gain/(loss) from investments | | | 0.86 | | | | (1.63 | ) |
Net increase/(decrease) in net assets resulting from operations | | | 2.84 | | | | (0.84 | ) |
Dividends and distributions to shareholders from: | | | | | | | | |
Net investment income | | | (2.02 | ) | | | (0.58 | ) |
Total dividends and distributions to shareholders | | | (2.02 | ) | | | (0.58 | ) |
Net asset value, end of period | | $ | 49.40 | | | $ | 48.58 | |
Market value, end of period | | $ | 49.40 | | | $ | 48.61 | |
Total investment return/(loss) on net asset value(3) | | | 6.06 | % | | | (1.69 | )%(5) |
Total investment return/(loss) on market price(4) | | | 5.97 | % | | | (1.62 | )%(5) |
RATIOS/SUPPLEMENTAL DATA | | | | | | | | |
Net assets, end of period (000’s omitted) | | $ | 24,208 | | | $ | 4,372 | |
Ratio of expenses to average net assets | | | 0.15 | % | | | 0.15 | %(6) |
Ratio of net investment income/(loss) to average net assets | | | 4.09 | % | | | 3.77 | %(6) |
Portfolio turnover rate | | | 1036 | % | | | 548 | %(5) |
(1) | Inception date of the Fund was March 27, 2023. |
(2) | Per share data calculated using average shares outstanding method. |
(3) | Total investment return/(loss) on net asset value is calculated assuming a purchase of shares on the first day and a sale of shares on the last day of each period reported and includes reinvestments of dividends and distributions, if any. |
(4) | Total investment return/(loss) on market price is calculated assuming an initial investment made at the market price on the first day of the period, reinvestment of dividends and distributions at market price during the period and redemption at market price on the last day of the period. |
The accompanying notes are an integral part of these financial statements.
US Treasury 7 Year Note ETF
Financial Highlights
Contained below is per share operating performance data for shares outstanding, total investment return/(loss), ratios to average net assets and other supplemental data for the respective periods. This information has been derived from information provided in the financial statements.
| | FOR THE
YEAR
ENDED
AUGUST 31, | | | FOR THE
PERIOD
ENDED
AUGUST 31, | |
| | 2024 | | | 2023(1) | |
PER SHARE OPERATING PERFORMANCE | | | | | | | | |
Net asset value, beginning of period | | $ | 48.14 | | | $ | 50.00 | |
Net investment income/(loss)(2) | | | 1.97 | | | | 0.75 | |
Net realized and unrealized gain/(loss) from investments | | | 0.90 | | | | (2.03 | ) |
Net increase/(decrease) in net assets resulting from operations | | | 2.87 | | | | (1.28 | ) |
Dividends and distributions to shareholders from: | | | | | | | | |
Net investment income | | | (1.99 | ) | | | (0.58 | ) |
Total dividends and distributions to shareholders | | | (1.99 | ) | | | (0.58 | ) |
Net asset value, end of period | | $ | 49.02 | | | $ | 48.14 | |
Market value, end of period | | $ | 49.02 | | | $ | 48.16 | |
Total investment return/(loss) on net asset value(3) | | | 6.15 | % | | | (2.58 | )%(5) |
Total investment return/(loss) on market price(4) | | | 6.11 | % | | | (2.55 | )%(5) |
RATIOS/SUPPLEMENTAL DATA | | | | | | | | |
Net assets, end of period (000’s omitted) | | $ | 5,392 | | | $ | 963 | |
Ratio of expenses to average net assets | | | 0.15 | % | | | 0.15 | %(6) |
Ratio of net investment income/(loss) to average net assets | | | 4.11 | % | | | 3.55 | %(6) |
Portfolio turnover rate | | | 1064 | % | | | 497 | %(5) |
(1) | Inception date of the Fund was March 27, 2023. |
(2) | Per share data calculated using average shares outstanding method. |
(3) | Total investment return/(loss) on net asset value is calculated assuming a purchase of shares on the first day and a sale of shares on the last day of each period reported and includes reinvestments of dividends and distributions, if any. |
(4) | Total investment return/(loss) on market price is calculated assuming an initial investment made at the market price on the first day of the period, reinvestment of dividends and distributions at market price during the period and redemption at market price on the last day of the period. |
The accompanying notes are an integral part of these financial statements.
US Treasury 10 Year Note ETF
Financial Highlights
Contained below is per share operating performance data for shares outstanding, total investment return/(loss), ratios to average net assets and other supplemental data for the respective periods. This information has been derived from information provided in the financial statements.
| | FOR THE
YEAR
ENDED
AUGUST 31, | | | FOR THE
YEAR
ENDED
AUGUST 31, | | | FOR THE
PERIOD
ENDED
AUGUST 31, | |
| | 2024 | | | 2023 | | | 2022(1) | |
PER SHARE OPERATING PERFORMANCE | | | | | | | | | | | | |
Net asset value, beginning of period | | $ | 44.52 | | | $ | 48.41 | | | $ | 49.91 | |
Net investment income/(loss)(2) | | | 1.79 | | | | 1.55 | | | | 0.09 | |
Net realized and unrealized gain/(loss) from investments | | | 0.42 | | | | (3.88 | ) | | | (1.59 | ) |
Net increase/(decrease) in net assets resulting from operations | | | 2.21 | | | | (2.33 | ) | | | (1.50 | ) |
Dividends and distributions to shareholders from: | | | | | | | | | | | | |
Net investment income | | | (1.75 | ) | | | (1.56 | ) | | | — | |
Total dividends and distributions to shareholders | | | (1.75 | ) | | | (1.56 | ) | | | — | |
Net asset value, end of period | | $ | 44.98 | | | $ | 44.52 | | | $ | 48.41 | |
Market value, end of period | | $ | 45.00 | | | $ | 44.55 | | | $ | 48.26 | |
Total investment return/(loss) on net asset value(3) | | | 5.15 | % | | | (4.87 | )% | | | (3.00 | )%(5) |
Total investment return/(loss) on market price(4) | | | 5.12 | % | | | (4.49 | )% | | | (3.31 | )%(5) |
RATIOS/SUPPLEMENTAL DATA | | | | | | | | | | | | |
Net assets, end of period (000’s omitted) | | $ | 156,975 | | | $ | 56,094 | | | $ | 20,334 | |
Ratio of expenses to average net assets | | | 0.15 | % | | | 0.15 | % | | | 0.15 | %(6) |
Ratio of net investment income/(loss) to average net assets | | | 4.08 | % | | | 3.40 | % | | | 2.77 | %(6) |
Portfolio turnover rate | | | 317 | % | | | 289 | % | | | 97 | %(5) |
(1) | Inception date of the Fund was August 8, 2022. |
(2) | Per share data calculated using average shares outstanding method. |
(3) | Total investment return/(loss) on net asset value is calculated assuming a purchase of shares on the first day and a sale of shares on the last day of each period reported and includes reinvestments of dividends and distributions, if any. |
(4) | Total investment return/(loss) on market price is calculated assuming an initial investment made at the market price on the first day of the period, reinvestment of dividends and distributions at market price during the period and redemption at market price on the last day of the period. |
The accompanying notes are an integral part of these financial statements.
US Treasury 20 Year Bond ETF
Financial Highlights
Contained below is per share operating performance data for shares outstanding, total investment return/(loss), ratios to average net assets and other supplemental data for the respective periods. This information has been derived from information provided in the financial statements.
| | FOR THE
YEAR
ENDED
AUGUST 31, | | | FOR THE
PERIOD
ENDED
AUGUST 31, | |
| | 2024 | | | 2023(1) | |
PER SHARE OPERATING PERFORMANCE | | | | | | | | |
Net asset value, beginning of period | | $ | 46.86 | | | $ | 50.00 | |
Net investment income/(loss)(2) | | | 2.00 | | | | 0.81 | |
Net realized and unrealized gain/(loss) from investments | | | (0.01 | )(7) | | | (3.34 | ) |
Net increase/(decrease) in net assets resulting from operations | | | 1.99 | | | | (2.53 | ) |
Dividends and distributions to shareholders from: | | | | | | | | |
Net investment income | | | (1.98 | ) | | | (0.61 | ) |
Total dividends and distributions to shareholders | | | (1.98 | ) | | | (0.61 | ) |
Net asset value, end of period | | $ | 46.87 | | | $ | 46.86 | |
Market value, end of period | | $ | 46.87 | | | $ | 46.89 | |
Total investment return/(loss) on net asset value(3) | | | 4.47 | % | | | (5.10 | )%(5) |
Total investment return/(loss) on market price(4) | | | 4.39 | % | | | (5.04 | )%(5) |
RATIOS/SUPPLEMENTAL DATA | | | | | | | | |
Net assets, end of period (000’s omitted) | | $ | 26,250 | | | $ | 1,874 | |
Ratio of expenses to average net assets | | | 0.15 | % | | | 0.15 | %(6) |
Ratio of net investment income/(loss) to average net assets | | | 4.38 | % | | | 3.87 | %(6) |
Portfolio turnover rate | | | 344 | % | | | 219 | %(5) |
(1) | Inception date of the Fund was March 27, 2023. |
(2) | Per share data calculated using average shares outstanding method. |
(3) | Total investment return/(loss) on net asset value is calculated assuming a purchase of shares on the first day and a sale of shares on the last day of each period reported and includes reinvestments of dividends and distributions, if any. |
(4) | Total investment return/(loss) on market price is calculated assuming an initial investment made at the market price on the first day of the period, reinvestment of dividends and distributions at market price during the period and redemption at market price on the last day of the period. |
(7) | The amount shown for a share outstanding does not correspond with the aggregate net realized and unrealized gain (loss) on investments due to the timing of purchases and redemptions of the Fund shares in relation to fluctuating market values of the investments of the Fund. |
The accompanying notes are an integral part of these financial statements.
US Treasury 30 Year Bond ETF
Financial Highlights
Contained below is per share operating performance data for shares outstanding, total investment return/(loss), ratios to average net assets and other supplemental data for the respective periods. This information has been derived from information provided in the financial statements.
| | FOR THE
YEAR
ENDED
AUGUST 31, | | | FOR THE
PERIOD
ENDED
AUGUST 31, | |
| | 2024 | | | 2023(1) | |
PER SHARE OPERATING PERFORMANCE | | | | | | | | |
Net asset value, beginning of period | | $ | 46.37 | | | $ | 50.00 | |
Net investment income/(loss)(2) | | | 1.89 | | | | 0.77 | |
Net realized and unrealized gain/(loss) from investments | | | (0.34 | )(7) | | | (3.83 | ) |
Net increase/(decrease) in net assets resulting from operations | | | 1.55 | | | | (3.06 | ) |
Dividends and distributions to shareholders from: | | | | | | | | |
Net investment income | | | (1.88 | ) | | | (0.57 | ) |
Total dividends and distributions to shareholders | | | (1.88 | ) | | | (0.57 | ) |
Net asset value, end of period | | $ | 46.04 | | | $ | 46.37 | |
Market value, end of period | | $ | 46.07 | | | $ | 46.38 | |
Total investment return/(loss) on net asset value(3) | | | 3.59 | % | | | (6.17 | )%(5) |
Total investment return/(loss) on market price(4) | | | 3.61 | % | | | (6.12 | )%(5) |
RATIOS/SUPPLEMENTAL DATA | | | | | | | | |
Net assets, end of period (000’s omitted) | | $ | 17,955 | | | $ | 2,782 | |
Ratio of expenses to average net assets | | | 0.15 | % | | | 0.15 | %(6) |
Ratio of net investment income/(loss) to average net assets | | | 4.25 | % | | | 3.72 | %(6) |
Portfolio turnover rate | | | 286 | % | | | 180 | %(5) |
(1) | Inception date of the Fund was March 27, 2023. |
(2) | Per share data calculated using average shares outstanding method. |
(3) | Total investment return/(loss) on net asset value is calculated assuming a purchase of shares on the first day and a sale of shares on the last day of each period reported and includes reinvestments of dividends and distributions, if any. |
(4) | Total investment return/(loss) on market price is calculated assuming an initial investment made at the market price on the first day of the period, reinvestment of dividends and distributions at market price during the period and redemption at market price on the last day of the period. |
(7) | The amount shown for a share outstanding does not correspond with the aggregate net realized and unrealized gain (loss) on investments due to the timing of purchases and redemptions of the Fund shares in relation to fluctuating market values of the investments of the Fund. |
The accompanying notes are an integral part of these financial statements.
US Benchmark Series
Notes to Financial Statements
AUGUST 31, 2024
1. ORGANIZATION AND SIGNIFICANT ACCOUNTING POLICIES
The RBB Fund, Inc. (“RBB” or the “Company”) was incorporated under the laws of the State of Maryland on February 29, 1988 and is registered under the Investment Company Act of 1940, as amended, (the “1940 Act”), as an open-end management investment company. RBB is a “series fund,” which is an investment company divided into separate portfolios. Each portfolio is treated as a separate entity for certain matters under the 1940 Act, and for other purposes, and a shareholder of one portfolio is not deemed to be a shareholder of any other portfolio. Currently, RBB has sixty-five separate investment portfolios, including the US Treasury 3 Month Bill ETF, the US Treasury 6 Month Bill ETF, the US Treasury 12 Month Bill ETF, the US Treasury 2 Year Note ETF, the US Treasury 3 Year Note ETF, the US Treasury 5 Year Note ETF, the US Treasury 7 Year Note ETF, the US Treasury 10 Year Note ETF, the US Treasury 20 Year Bond ETF, and the US Treasury 30 Year Bond ETF (each a “Fund” and together the “Funds” or “US Benchmark Series”).
RBB has authorized capital of one hundred billion shares of common stock of which 92.923 billion shares are currently classified into two hundred and thirty-six classes of common stock. Each class represents an interest in an active or inactive RBB investment portfolio.
The investment objective of the US Treasury 3 Month Bill ETF, the US Treasury 6 Month Bill ETF, the US Treasury 12 Month Bill ETF, the US Treasury 2 Year Note ETF, the US Treasury 3 Year Note ETF, the US Treasury 5 Year Note ETF, the US Treasury 7 Year Note ETF, the US Treasury 10 Year Note ETF, the US Treasury 20 Year Bond ETF, and the US Treasury 30 Year Bond ETF is to seek investment results that correspond (before fees and expenses) generally to the price and yield of its corresponding benchmark index (“Underlying Index”): the ICE BofA US 3-Month Treasury Bill Index, the ICE BofA US 6-Month Treasury Bill Index, the ICE BofA US 12-Month Treasury Bill Index, the ICE BofA Current 2-Year US Treasury Index, the ICE BofA Current 3-Year US Treasury Index, the ICE BofA Current 5-Year US Treasury Index, the ICE BofA Current 7-Year US Treasury Index, the ICE BofA Current 10-Year US Treasury Index, the ICE BofA Current 20-Year US Treasury Index, the ICE BofA Current 30-Year US Treasury Index, respectively.
The Funds are investment companies and follow accounting and reporting guidance in the Financial Accounting Standards Board (“FASB”) Accounting Standards Codification Topic 946 “Financial Services - Investment Companies.”
The end of the reporting period for the Funds is August 31, 2024, and the period covered by these Notes to Financial Statements is the fiscal year ended August 31, 2024 (the “current fiscal period”).
PORTFOLIO VALUATION — The Funds value their investments at fair value. Each Fund’s net asset value (“NAV”) is calculated once daily at the close of regular trading hours on the New York Stock Exchange (“NYSE”) (generally 4:00 p.m. Eastern time) on each day the NYSE is open. Securities held by the Funds are valued using the closing price or the last sale price on a national securities exchange or the National Association of Securities Dealers Automatic Quotation System (“NASDAQ”) market system where they are primarily traded. Equity securities traded in the over-the-counter (“OTC”) market are valued at their closing prices. If there were no transactions on that day, securities traded principally on an exchange or on NASDAQ will be valued at the mean of the last bid and ask prices prior to the market close. Fixed income securities are valued using an independent pricing service, which considers such factors as security prices, yields, maturities and ratings, and are deemed representative of market values at the close of the market. If market quotations are unavailable or deemed unreliable, securities will be valued in accordance with procedures adopted by the Company’s Board of Directors (the “Board”). Relying on prices supplied by pricing services or dealers or using fair valuation may result in values that are higher or lower than the values used by other investment companies and investors to price the same investments.
The Board has adopted a pricing and valuation policy for use by the Fund and its Valuation Designee (as defined below) in calculating the Fund’s NAV. Pursuant to Rule 2a-5 under the 1940 Act, the Fund has designated F/m Investments, LLC d/b/a North Slope Capital, LLC (the “Adviser”) as its “Valuation Designee” to perform all of the fair value determinations as well as to perform all of the responsibilities that may be performed by the Valuation Designee in accordance with Rule 2a-5. The Valuation Designee is authorized to make all necessary determinations of the fair values of portfolio securities and other assets for which market quotations are not readily available or if it is deemed that the prices obtained from brokers and dealers or independent pricing services are unreliable.
US Benchmark Series
Notes to Financial Statements (continued)
AUGUST 31, 2024
FAIR VALUE MEASUREMENTS — The inputs and valuation techniques used to measure the fair value of the Funds’ investments are summarized into three levels as described in the hierarchy below:
| | ● | Level 1 – Prices are determined using quoted prices in active markets for identical securities. |
| | ● | Level 2 – Prices are determined using other significant observable inputs (including quoted prices for similar securities, interest rates, prepayment speeds, credit risk, etc.). |
| | ● | Level 3 – Prices are determined using significant unobservable inputs (including the Funds’ own assumptions in determining the fair value of investments). |
The inputs or methodologies used for valuing securities are not necessarily an indication of the risk associated with investing in those securities.
The following is a summary of the inputs used, as of the end of the current fiscal period, in valuing the Funds’ investments carried at fair value:
US TREASURY 3 MONTH BILL ETF | | TOTAL | | | LEVEL 1 | | | LEVEL 2 | | | LEVEL 3 | |
U.S. Treasury Bills | | $ | 4,104,588,554 | | | $ | — | | | $ | 4,104,588,554 | | | $ | — | |
Total Investments* | | $ | 4,104,588,554 | | | $ | — | | | $ | 4,104,588,554 | | | $ | — | |
US TREASURY 6 MONTH BILL ETF | | TOTAL | | | LEVEL 1 | | | LEVEL 2 | | | LEVEL 3 | |
U.S. Treasury Bills | | $ | 598,303,653 | | | $ | — | | | $ | 598,303,653 | | | $ | — | |
Total Investments* | | $ | 598,303,653 | | | $ | — | | | $ | 598,303,653 | | | $ | — | |
US TREASURY 12 MONTH BILL ETF | | TOTAL | | | LEVEL 1 | | | LEVEL 2 | | | LEVEL 3 | |
U.S. Treasury Bills | | $ | 237,043,820 | | | $ | — | | | $ | 237,043,820 | | | $ | — | |
Total Investments* | | $ | 237,043,820 | | | $ | — | | | $ | 237,043,820 | | | $ | — | |
US TREASURY 2 YEAR NOTE ETF | | TOTAL | | | LEVEL 1 | | | LEVEL 2 | | | LEVEL 3 | |
U.S. Treasury Securities | | $ | 450,817,965 | | | $ | — | | | $ | 450,817,965 | | | $ | — | |
Total Investments* | | $ | 450,817,965 | | | $ | — | | | $ | 450,817,965 | | | $ | — | |
US TREASURY 3 YEAR NOTE ETF | | TOTAL | | | LEVEL 1 | | | LEVEL 2 | | | LEVEL 3 | |
U.S. Treasury Securities | | $ | 7,441,852 | | | $ | — | | | $ | 7,441,852 | | | $ | — | |
Total Investments* | | $ | 7,441,852 | | | $ | — | | | $ | 7,441,852 | | | $ | — | |
US TREASURY 5 YEAR NOTE ETF | | TOTAL | | | LEVEL 1 | | | LEVEL 2 | | | LEVEL 3 | |
U.S. Treasury Securities | | $ | 24,101,687 | | | $ | — | | | $ | 24,101,687 | | | $ | — | |
Total Investments* | | $ | 24,101,687 | | | $ | — | | | $ | 24,101,687 | | | $ | — | |
US Benchmark Series
Notes to Financial Statements (continued)
AUGUST 31, 2024
US TREASURY 7 YEAR NOTE ETF | | TOTAL | | | LEVEL 1 | | | LEVEL 2 | | | LEVEL 3 | |
U.S. Treasury Securities | | $ | 5,363,965 | | | $ | — | | | $ | 5,363,965 | | | $ | — | |
Total Investments* | | $ | 5,363,965 | | | $ | — | | | $ | 5,363,965 | | | $ | — | |
US TREASURY 10 YEAR NOTE ETF | | TOTAL | | | LEVEL 1 | | | LEVEL 2 | | | LEVEL 3 | |
U.S. Treasury Securities | | $ | 156,706,804 | | | $ | — | | | $ | 156,706,804 | | | $ | — | |
Total Investments* | | $ | 156,706,804 | | | $ | — | | | $ | 156,706,804 | | | $ | — | |
US TREASURY 20 YEAR BOND ETF | | TOTAL | | | LEVEL 1 | | | LEVEL 2 | | | LEVEL 3 | |
U.S. Treasury Securities | | $ | 26,174,356 | | | $ | — | | | $ | 26,174,356 | | | $ | — | |
U.S. Treasury Bills | | $ | 83,000 | | | $ | — | | | $ | 83,000 | | | $ | — | |
Total Investments* | | $ | 26,257,356 | | | $ | — | | | $ | 26,257,356 | | | $ | — | |
US TREASURY 30 YEAR BOND ETF | | TOTAL | | | LEVEL 1 | | | LEVEL 2 | | | LEVEL 3 | |
U.S. Treasury Securities | | $ | 17,854,900 | | | $ | — | | | $ | 17,854,900 | | | $ | — | |
U.S. Treasury Bills | | $ | 65,000 | | | $ | — | | | $ | 65,000 | | | $ | — | |
Total Investments* | | $ | 17,919,900 | | | $ | — | | | $ | 17,919,900 | | | $ | — | |
* | Please refer to the Schedule of Investments for further details. |
At the end of each quarter, management evaluates the classification of Levels 1, 2 and 3 assets and liabilities. Various factors are considered, such as changes in liquidity from the prior reporting period; whether or not a broker is willing to execute at the quoted price; the depth and consistency of prices from third party pricing services; and the existence of contemporaneous, observable trades in the market. Additionally, management evaluates the classification of Levels 1, 2 and 3 assets and liabilities on a quarterly basis for changes in listings or delistings on national exchanges.
Due to the inherent uncertainty of determining the fair value of investments that do not have a readily available market value, the fair value of the Funds’ investments may fluctuate from period to period. Additionally, the fair value of investments may differ significantly from the values that would have been used had a ready market existed for such investments and may differ materially from the values the Fund may ultimately realize. Further, such investments may be subject to legal and other restrictions on resale or otherwise less liquid than publicly traded securities.
For fair valuations using significant unobservable inputs, U.S. generally accepted accounting principles (“U.S. GAAP”) requires each Fund to present a reconciliation of the beginning to ending balances for reported market values that presents changes attributable to total realized and unrealized gains or losses, purchase and sales, and transfers in and out of Level 3 during the period. Transfers in and out between levels are based on values at the end of the period. A reconciliation of Level 3 investments is presented only if a Fund had an amount of Level 3 investments at the end of the reporting period that was meaningful in relation to its net assets. The amounts and reasons for Level 3 transfers in and out of each level is disclosed when a Fund had an amount of total Level 3 transfers during the reporting period that was meaningful in relation to its net assets as of the end of the reporting period.
The Funds did not have any significant Level 3 transfers during the current fiscal period.
US Benchmark Series
Notes to Financial Statements (continued)
AUGUST 31, 2024
USE OF ESTIMATES — The preparation of financial statements in conformity with U.S. GAAP requires management to make estimates and assumptions that affect the reported amounts of assets and liabilities and disclosure of contingent assets and liabilities at the date of the financial statements and the reported amounts of revenues and expenses during the reporting period. Actual results could differ from those estimates and those differences could be significant.
INVESTMENT TRANSACTIONS, INVESTMENT INCOME AND EXPENSES — The Funds record security transactions based on trade date for financial reporting purposes. The cost of investments sold is determined by use of the specific identification method for both financial reporting and income tax purposes in determining realized gains and losses on investments. Interest income (including amortization of premiums and accretion of discounts) is accrued when earned. Dividend income is recorded on the ex-dividend date. Distributions received on securities that represent a return of capital or capital gains are recorded as a reduction of cost of investments and/or as a realized gain. The Funds’ investment income, expenses (other than class specific expenses) and unrealized and realized gains and losses are allocated daily to each class of shares based upon the relative proportion of net assets of each class at the beginning of the day. Certain expenses are shared with The RBB Fund Trust (the “Trust”), a series trust of affiliated funds. Expenses incurred on behalf of a specific class, fund or fund family of the Company or Trust are charged directly to the class, fund or fund family (in proportion to net assets). Expenses incurred for all funds (such as director or professional fees) are charged to all funds in proportion to their average net assets of RBB and the Trust, or in such other manner as the Board deems fair or equitable. Expenses and fees, including investment advisory and administration fees, are accrued daily and taken into account for the purpose of determining the NAV of the Funds.
DIVIDENDS AND DISTRIBUTIONS TO SHAREHOLDERS — Each Fund will distribute substantially all of its net investment income and net realized capital gains, if any, to its shareholders. Each Fund expects to declare and pay distributions, if any, monthly, however it may declare and pay distributions more or less frequently. Net realized capital gains (including net short-term capital gains), if any, will be distributed by each Fund at least annually. Brokers may make the DTC book-entry dividend reinvestment service available to their customers who own a Fund’s Shares. If this service is available and used, dividend distributions of both income and capital gains will automatically be reinvested in additional whole Shares of that Fund purchased on the secondary market. Without this service, investors would receive their distributions in cash. In order to achieve the maximum total return on their investments, investors are encouraged to use the dividend reinvestment service. To determine whether the dividend reinvestment service is available and whether there is a commission or other charge for using this service, consult your broker. Brokers may require a Fund’s shareholders to adhere to specific procedures and timetables.
U.S. TAX STATUS — No provision is made for U.S. income taxes as it is each Fund’s intention to continue to qualify for and elect the tax treatment applicable to regulated investment companies under Subchapter M of the Internal Revenue Code of 1986, as amended, and make the requisite distributions to its shareholders which will be sufficient to relieve it from U.S. income and excise taxes.
OTHER — In the normal course of business, the Funds may enter into contracts that provide general indemnifications. Each Fund’s maximum exposure under these arrangements is dependent on claims that may be made against the Funds in the future, and, therefore, cannot be estimated; however, based on experience, the risk of material loss from such claims is considered remote.
2. INVESTMENT POLICIES AND PRACTICES
The sections below describe some of the different types of investments that may be made by the Funds and the investment practices in which the Funds may engage.
Cash Equivalents and Short-Term InvestmentS - The Funds may invest in cash, cash equivalents, and a variety of short-term instruments in such proportions as warranted by prevailing market conditions and the Funds’ principal investment strategies. The Funds may temporarily invest without limit in such instruments for liquidity purposes, or in an attempt to respond to adverse market, economic, political or other conditions. During such periods, a Fund may not be able to achieve its investment objective.
Illiquid Investments - Pursuant to Rule 22e-4 under the 1940 Act, a Fund may invest up to 15% of its net assets in illiquid investments. An illiquid investment as defined in Rule 22e-4 is an investment that a Fund reasonably expects cannot be sold or disposed of in current market conditions within 7 calendar days or less without the sale or disposition significantly changing the market value of the investment. These investments may include restricted securities and repurchase agreements maturing in more than 7 days. Restricted securities are securities that may not be sold to the public without an effective registration
US Benchmark Series
Notes to Financial Statements (continued)
AUGUST 31, 2024
statement under the Securities Act of 1933, as amended (the “1933 Act”), and thus may be sold only in privately negotiated transactions or pursuant to an exemption from registration. Subject to the adoption of guidelines by the Board, certain restricted securities that may be sold to institutional investors pursuant to Rule 144A under the 1933 Act and non-exempt commercial paper may be determined to be liquid by the Adviser. Illiquid investments involve the risk that the investments will not be able to be sold at the time the Adviser desires or at prices approximating the value at which a Fund is carrying the investments. To the extent an investment held by a Fund is deemed to be an illiquid investment or a less liquid investment, a Fund will be exposed to a greater liquidity risk.
Inflation Protected Securities - Each Fund may invest in inflation protected securities. Inflation protected securities are fixed income securities designed to provide protection against the negative effects of inflation. Two structures are common. The U.S. Treasury and some other issuers use a structure that accrues inflation into the principal value of the bond. Most other issuers pay out the inflation accruals as part of a semiannual coupon.
Other Investment Companies - Each Fund may invest in other investment companies, including open-end funds, closed-end funds, unit investment trusts, and exchange-traded funds (“ETFs”) registered under the 1940 Act that invest primarily in Fund eligible investments. Under the 1940 Act, a Fund’s investment in such securities is generally limited to 3% of the total voting stock of any one investment company; 5% of such Fund’s total assets with respect to any one investment company; and 10% of such Fund’s total assets in the aggregate. A Fund’s investments in other investment companies may include money market mutual funds. Investments in money market funds are not subject to the percentage limitations set forth above. The SEC has adopted revisions to the rules permitting funds to invest in other investment companies in excess of the limits described above. While Rule 12d1-4 permits more types of fund of fund arrangements without reliance on an exemptive order or no-action letters, it imposes new conditions, including limits on control and voting of acquired funds’ shares, evaluations and findings by investment advisers, fund investment agreements, and limits on most three-tier fund structures. Rule 12d1-4 went into effect on January 19, 2021. The rescission of the applicable exemptive orders and the withdrawal of the applicable no-action letters was effective on January 19, 2022. These regulatory changes may adversely impact a Fund’s investment strategies and operations.
U.S. Government Securities - Each Fund may invest in U.S. government securities, including bills, notes and bonds differing as to maturity and rates of interest, which are either issued or guaranteed by the U.S. Treasury or by U.S. government agencies or instrumentalities. U.S. government agency securities include securities issued by (a) the Federal Housing Administration, Farmers Home Administration, Export-Import Bank of the United States, Small Business Administration, and the Government National Mortgage Association, whose securities are supported by the full faith and credit of the United States; (b) the Federal Home Loan Banks, Federal Intermediate Credit Banks, and the Tennessee Valley Authority, whose securities are supported by the right of the agency to borrow from the U.S. Treasury; (c) the Federal National Mortgage Association, whose securities are supported by the discretionary authority of the U.S. government to purchase certain obligations of the agency or instrumentality; and (d) the Student Loan Marketing Association, whose securities are supported only by its credit. While the U.S. government provides financial support to such U.S. government-sponsored agencies or instrumentalities, no assurance can be given that it always will do so since it is not so obligated by law. The U.S. government, its agencies and instrumentalities do not guarantee the market value of their securities, and consequently, the value of such securities may fluctuate.
Zero-Coupon and Step Coupon Securities - Each Fund may invest in zero-coupon and step coupon securities. Zero-coupon securities pay no cash income to their holders until they mature. When held to maturity, their entire return comes from the difference between their purchase price and their maturity value. Step coupon securities are debt securities that may not pay interest for a specified period of time and then, after the initial period, may pay interest at a series of different rates. Both zero-coupon and step coupon securities are issued at substantial discounts from their value at maturity. Because interest on these securities is not paid on a current basis, the values of securities of this type are subject to greater fluctuations than are the value of securities that distribute income regularly and may be more speculative than such securities. Accordingly, the values of these securities may be highly volatile as interest rates rise or fall. In addition, while such securities generate income for purposes of generally accepted accounting standards, they do not generate cash flow and thus could cause a Fund to be forced to liquidate securities at an inopportune time in order to distribute cash, as required by the Code.
Temporary Investments - During periods of adverse market or economic conditions, a Fund may temporarily invest all or a substantial portion of its assets in high-quality, fixed-income securities, money market instruments, and shares of money market mutual funds, or it may hold cash. At such times, a Fund would not be pursuing its stated investment objective with its usual investment strategies. A Fund may also hold these investments for liquidity purposes. Fixed-income securities will be
US Benchmark Series
Notes to Financial Statements (continued)
AUGUST 31, 2024
deemed to be of high quality if they are rated “A” or better by S&P or Moody’s or, if unrated, are determined to be of comparable quality by the Adviser. Money market instruments are high-quality, short-term fixed-income obligations (which generally have remaining maturities of one year or less) and may include U.S. Government Securities, commercial paper, certificates of deposit and banker’s acceptances issued by domestic branches of U.S. banks that are members of the Federal Deposit Insurance Corporation, and repurchase agreements for U.S. Government Securities.
In lieu of purchasing money market instruments, the Fund may purchase shares of money market mutual funds that invest primarily in U.S. Government Securities and repurchase agreements involving those securities, subject to certain limitations imposed by the 1940 Act. A Fund, as an investor in a money market fund, will indirectly bear that fund’s fees and expenses, which will be in addition to the fees and expenses of the Fund. Repurchase agreements involve certain risks not associated with direct investments in debt securities.
Reverse Repurchase Agreement - Reverse repurchase agreements are a form of secured borrowing and subject a Fund to the risks associated with leverage, including exposure to potential gains and losses in excess of the amount invested, resulting in an increase in the speculative character of the Fund’s outstanding shares. If the securities held by a Fund decline in value while these transactions are outstanding, the NAV of a Fund’s outstanding shares will decline in value by proportionately more than the decline in value of the securities. In addition, reverse repurchase agreements involve the risk that the investment return earned by a Fund (from the investment of the proceeds) will be less than the interest expense of the transaction, that the market value of the securities sold by a Fund will decline below the price the Fund is obligated to pay to repurchase the securities, and that the other party may fail to return the securities in a timely manner or at all.
When a Fund enters into a reverse repurchase agreement, it is subject to the risk that the buyer under the agreement may file for bankruptcy, become insolvent or otherwise default on its obligations to the Fund. In the event of a default by the counterparty, there may be delays, costs and risks of loss involved in a Fund’s exercising its rights under the agreement, or those rights may be limited by other contractual agreements or obligations or by applicable law. Such an insolvency may result in a loss equal to the amount by which the value of the securities or other assets sold by the Fund exceeds the repurchase price payable by the Fund; if the value of the purchased securities or other assets increases during such a delay, that loss may also be increased. A Fund could lose money if it is unable to recover the securities or if the value of investments made by the Fund using the proceeds of the transaction is less than the value of securities. When a Fund enters into a reverse repurchase agreement, it must identify on its books cash or liquid assets that have a value equal to or greater than the repurchase price.
3. INVESTMENT ADVISER AND OTHER SERVICES
Each Fund pays all of its expenses other than those expressly assumed by the Adviser. Expenses of each Fund are deducted from the Fund’s total income before dividends are paid. Subject to the supervision of the Board, the Adviser manages the overall investment operations of each Fund in accordance with the Fund’s respective investment objective and policies and formulates a continuing investment strategy for each Fund pursuant to the terms of the investment advisory agreement (the “Advisory Agreement”) between the Adviser and the Company on behalf of each Fund. The Adviser is controlled by Diffractive Managers Group, LLC, a Delaware limited liability company, and EQSF Holdings, LLC, a Delaware limited liability company owned by three officers of the Company. The Funds compensate the Adviser with a unitary management fee for its services at an annual rate of 0.15% of each Fund’s average daily net assets during the month. From the unitary management fee, the Adviser pays most of the expenses of each Fund, including transfer agency, custody, fund administration, legal, audit and other services. However, under the Advisory Agreement, the Adviser is not responsible for interest expenses, brokerage commissions and other trading expenses, taxes, distribution fees and expenses paid by each Fund under any distribution plan adopted, and other extraordinary costs such as litigation and other expenses not incurred in the ordinary course of business. The Adviser will not be liable for any error of judgment, mistake of law, or for any loss suffered by a Fund in connection with the performance of the Advisory Agreement, except a loss resulting from a breach of fiduciary duty with respect to the receipt of compensation for services or a loss resulting from willful misfeasance, bad faith or gross negligence on the part of the Adviser in the performance of its duties, or from reckless disregard of its obligations and duties under the Advisory Agreement.
US Benchmark Series
Notes to Financial Statements (continued)
AUGUST 31, 2024
During the current fiscal period, investment advisory fees accrued were as follows:
FUND | | ADVISORY FEES | |
US Treasury 3 Month Bill ETF | | $ | 4,625,006 | |
US Treasury 6 Month Bill ETF | | | 800,012 | |
US Treasury 12 Month Bill ETF | | | 310,472 | |
US Treasury 2 Year Note ETF | | | 545,743 | |
US Treasury 3 Year Note ETF | | | 8,651 | |
US Treasury 5 Year Note ETF | | | 21,494 | |
US Treasury 7 Year Note ETF | | | 6,540 | |
US Treasury 10 Year Note ETF | | | 168,751 | |
US Treasury 20 Year Bond ETF | | | 20,746 | |
US Treasury 30 Year Bond ETF | | | 20,561 | |
U.S. Bancorp Fund Services, LLC (“Fund Services”), doing business as U.S. Bank Global Fund Services, serves as administrator for the Funds. For providing administrative and accounting services, Fund Services is entitled to receive a monthly fee, subject to certain minimum and out of pocket expenses.
Fund Services serves as the Funds’ transfer and dividend disbursing agent. For providing transfer agent services, Fund Services is entitled to receive a monthly fee, subject to certain minimum and out of pocket expenses.
U.S. Bank, N.A. (the “Custodian”) provides certain custodial services to the Funds. The Custodian is entitled to receive a monthly fee, subject to certain minimum and out of pocket expenses.
Quasar Distributors, LLC (“Quasar”), a wholly-owned broker-dealer subsidiary of Foreside Financial Group, LLC, serves as the principal underwriter and distributor of the Funds’ shares pursuant to a Distribution Agreement with RBB.
Under the Funds’ unitary fee, the Adviser compensates Fund Services and the Custodian for services provided.
DIRECTOR AND OFFICER COMPENSATION — The Directors of the Company receive an annual retainer and meeting fees for meetings attended. An employee of Vigilant Compliance, LLC serves as Chief Compliance Officer of the Company. Vigilant Compliance, LLC is compensated for the services provided to the Company. Employees of RBB serve as President, Chief Financial Officer, Chief Operating Officer, Secretary and Director of Marketing & Business Development of the Company. They are compensated by the Company for services provided. Certain employees of Fund Services serve as officers of the Company. They are not compensated by the Funds or the Company. As of the end of the current fiscal period, there were no director and officer fees charged or paid by the Funds.
4. PURCHASES AND SALES OF INVESTMENT SECURITIES
During the current fiscal period, aggregate purchases and sales and maturities of investment securities (excluding in-kind transactions and short-term investments) of the Funds were as follows:
FUND | | U.S. GOVERNMENT
PURCHASES | | | U.S. GOVERNMENT
SALES | |
US Treasury 3 Month Bill ETF | | $ | — | | | $ | — | |
US Treasury 6 Month Bill ETF | | | — | | | | — | |
US Treasury 12 Month Bill ETF | | | — | | | | — | |
US Treasury 2 Year Note ETF | | | 4,001,132,966 | | | | 3,973,848,857 | |
US Benchmark Series
Notes to Financial Statements (continued)
AUGUST 31, 2024
FUND | | U.S. GOVERNMENT
PURCHASES | | | U.S. GOVERNMENT
SALES | |
US Treasury 3 Year Note ETF | | $ | 69,522,241 | | | $ | 50,775,824 | |
US Treasury 5 Year Note ETF | | | 191,732,469 | | | | 148,160,503 | |
US Treasury 7 Year Note ETF | | | 56,159,602 | | | | 44,069,085 | |
US Treasury 10 Year Note ETF | | | 531,871,655 | | | | 350,102,750 | |
US Treasury 20 Year Bond ETF | | | 89,398,746 | | | | 50,521,652 | |
US Treasury 30 Year Bond ETF | | | 70,195,543 | | | | 39,223,872 | |
During the current fiscal period, aggregate purchases and sales of in-kind transactions (excluding short-term investments) of the Funds were as follows:
FUND | | U.S. GOVERNMENT
IN-KIND PURCHASES | | | U.S. GOVERNMENT
IN-KIND SALES | |
US Treasury 3 Month Bill ETF | | $ | — | | | $ | — | |
US Treasury 6 Month Bill ETF | | | — | | | | — | |
US Treasury 12 Month Bill ETF | | | — | | | | — | |
US Treasury 2 Year Note ETF | | | 181,325,110 | | | | 66,245,734 | |
US Treasury 3 Year Note ETF | | | 12,791,583 | | | | 25,617,153 | |
US Treasury 5 Year Note ETF | | | 9,655,562 | | | | 33,899,414 | |
US Treasury 7 Year Note ETF | | | 2,857,011 | | | | 10,697,374 | |
US Treasury 10 Year Note ETF | | | 137,943,382 | | | | 225,030,174 | |
US Treasury 20 Year Bond ETF | | | 67,670,832 | | | | 84,358,737 | |
US Treasury 30 Year Bond ETF | | | 16,903,688 | | | | 34,199,225 | |
5. FEDERAL INCOME TAX INFORMATION
The Funds have followed the authoritative guidance on accounting for and disclosure of uncertainty in tax positions, which requires the Funds to determine whether a tax position is more likely than not to be sustained upon examination, including resolution of any related appeals or litigation processes, based on the technical merits of the position. The Funds have determined that there was no effect on the financial statements from following this authoritative guidance. In the normal course of business, the Funds are subject to examination by federal, state and local jurisdictions, where applicable, for tax years for which applicable statutes of limitations have not expired.
As of August 31, 2024, the federal tax cost, aggregate gross unrealized appreciation and depreciation of securities held by each Fund were as follows:
FUND | | FEDERAL
TAX COST | | | UNREALIZED
APPRECIATION | | | UNREALIZED
(DEPRECIATION) | | | NET UNREALIZED
APPRECIATION/
(DEPRECIATION) | |
US Treasury 3 Month Bill ETF | | $ | 4,103,035,203 | | | $ | 1,553,351 | | | $ | — | | | $ | 1,553,351 | |
US Treasury 6 Month Bill ETF | | | 598,251,173 | | | | 52,480 | | | | — | | | | 52,480 | |
US Treasury 12 Month Bill ETF | | | 236,946,333 | | | | 97,487 | | | | — | | | | 97,487 | |
US Benchmark Series
Notes to Financial Statements (continued)
AUGUST 31, 2024
FUND | | FEDERAL
TAX COST | | | UNREALIZED
APPRECIATION | | | UNREALIZED
(DEPRECIATION) | | | NET UNREALIZED
APPRECIATION/
(DEPRECIATION) | |
US Treasury 2 Year Note ETF | | $ | 447,635,077 | | | $ | 3,182,888 | | | $ | — | | | $ | 3,182,888 | |
US Treasury 3 Year Note ETF | | | 7,448,718 | | | | — | | | | (6,866 | ) | | | (6,866 | ) |
US Treasury 5 Year Note ETF | | | 24,148,779 | | | | — | | | | (47,092 | ) | | | (47,092 | ) |
US Treasury 7 Year Note ETF | | | 5,378,868 | | | | — | | | | (14,903 | ) | | | (14,903 | ) |
US Treasury 10 Year Note ETF | | | 157,598,404 | | | | — | | | | (891,600 | ) | | | (891,600 | ) |
US Treasury 20 Year Bond ETF | | | 26,472,968 | | | | 24 | | | | (215,637 | ) | | | (215,613 | ) |
US Treasury 30 Year Bond ETF | | | 18,089,680 | | | | 19 | | | | (169,799 | ) | | | (169,780 | ) |
Distributions to shareholders, if any, from net investment income and realized gains are determined in accordance with federal income tax regulations, which may differ from net investment income and realized gains recognized for financial reporting purposes. Accordingly, the character of distributions and composition of net assets for tax purposes may differ from those reflected in the accompanying financial statements. To the extent these differences are permanent, such amounts are reclassified within the capital accounts based on the tax treatment; temporary differences do not require such reclassification.
As of August 31, 2024, there were permanent differences related to redemptions in-kind between distributable earnings/(loss) and paid-in capital, respectively for the following funds:
FUND | | Distributable
Earnings/(Loss) | | | Paid-In-Capital | |
US Treasury 3 Month Bill ETF | | $ | (89,721 | ) | | $ | 89,721 | |
US Treasury 6 Month Bill ETF | | | (1,040,649 | ) | | | 1,040,649 | |
US Treasury 12 Month Bill ETF | | | (575,737 | ) | | | 575,737 | |
US Treasury 2 Year Note ETF | | | (45,880 | ) | | | 45,880 | |
US Treasury 3 Year Note ETF | | | (125,410 | ) | | | 125,410 | |
US Treasury 5 Year Note ETF | | | (422,464 | ) | | | 422,464 | |
US Treasury 7 Year Note ETF | | | (152,952 | ) | | | 152,952 | |
US Treasury 10 Year Note ETF | | | (8,405,079 | ) | | | 8,405,079 | |
US Treasury 20 Year Bond ETF | | | (2,865,559 | ) | | | 2,865,559 | |
US Treasury 30 Year Bond ETF | | | (2,225,941 | ) | | | 2,225,941 | |
US Benchmark Series
Notes to Financial Statements (continued)
AUGUST 31, 2024
As of August 31, 2024, the components of distributable earnings on a tax basis were as follows:
FUND | | UNDISTRIBUTED
ORDINARY
INCOME | | | UNDISTRIBUTED
LONG-TERM
CAPITAL GAINS | | | Net UNREALIZED
APPRECIATION/
(DEPRECIATION) | | | Capital
loss
carryover | | | Qualified late-
year loss | |
US Treasury 3 Month Bill ETF | | $ | 10,050,654 | | | $ | — | | | $ | 1,553,351 | | | $ | (1,570,291 | ) | | $ | — | |
US Treasury 6 Month Bill ETF | | | 1,006,425 | | | | — | | | | 52,480 | | | | (378,633 | ) | | | — | |
US Treasury 12 Month Bill ETF | | | 473,967 | | | | — | | | | 97,487 | | | | (740,389 | ) | | | — | |
US Treasury 2 Year Note ETF | | | 821,844 | | | | — | | | | 3,182,888 | | | | (9,399,342 | ) | | | — | |
US Treasury 3 Year Note ETF | | | 7,588 | | | | — | | | | (6,866 | ) | | | (104,260 | ) | | | — | |
US Treasury 5 Year Note ETF | | | 33,260 | | | | — | | | | (47,092 | ) | | | (24,950 | ) | | | — | |
US Treasury 7 Year Note ETF | | | 13,757 | | | | — | | | | (14,903 | ) | | | (40,781 | ) | | | — | |
US Treasury 10 Year Note ETF | | | 364,380 | | | | — | | | | (891,600 | ) | | | (3,821,622 | ) | | | — | |
US Treasury 20 Year Bond ETF | | | — | | | | — | | | | (215,613 | ) | | | (634,872 | ) | | | — | |
US Treasury 30 Year Bond ETF | | | 7,747 | | | | — | | | | (169,780 | ) | | | (854,343 | ) | | | — | |
The differences between the book and tax basis components of distributable earnings relate primarily to the timing of recognition of income and gains for federal income tax purposes.
The tax character of dividends and distributions paid during the fiscal years ended August 31, 2024 and August 31, 2023 were as follows:
FUND | | Ordinary
Income | | | Long-Term
Capital Gains | |
US Treasury 3 Month Bill ETF | | | | | | | | |
August 31, 2023 | | $ | 23,559,224 | | | $ | — | |
August 31, 2024 | | | 155,670,454 | | | | — | |
US Treasury 6 Month Bill ETF | | | | | | | | |
August 31, 2023 | | | 2,720,580 | | | | — | |
August 31, 2024 | | | 27,247,652 | | | | — | |
US Treasury 12 Month Bill ETF | | | | | | | | |
August 31, 2023 | | | 2,206,389 | | | | — | |
August 31, 2024 | | | 10,123,493 | | | | — | |
US Treasury 2 Year Note ETF | | | | | | | | |
August 31, 2023 | | | 9,134,861 | | | | — | |
August 31, 2024 | | | 16,431,423 | | | | — | |
US Treasury 3 Year Note ETF | | | | | | | | |
August 31, 2023 | | | 19,629 | | | | — | |
August 31, 2024 | | | 233,355 | | | | — | |
US Treasury 5 Year Note ETF | | | | | | | | |
August 31, 2023 | | | 19,503 | | | | — | |
August 31, 2024 | | | 563,162 | | | | — | |
US Benchmark Series
Notes to Financial Statements (continued)
AUGUST 31, 2024
FUND | | Ordinary
Income | | | Long-Term
Capital Gains | |
US Treasury 7 Year Note ETF | | | | | | | | |
August 31, 2023 | | $ | 11,541 | | | $ | — | |
August 31, 2024 | | | 169,345 | | | | — | |
US Treasury 10 Year Note ETF | | | | | | | | |
August 31, 2023 | | | 679,725 | | | | — | |
August 31, 2024 | | | 4,342,882 | | | | — | |
US Treasury 20 Year Bond ETF | | | | | | | | |
August 31, 2023 | | | 15,177 | | | | — | |
August 31, 2024 | | | 615,765 | | | | — | |
US Treasury 30 Year Bond ETF | | | | | | | | |
August 31, 2023 | | | 29,955 | | | | — | |
August 31, 2024 | | | 582,433 | | | | — | |
The Funds are permitted to carry forward capital losses for an unlimited period. Additionally, capital losses that are carried forward will retain their character as either short-term or long-term capital losses. As of August 31, 2024, the US Treasury 3 Month Bill ETF had unexpiring short-term losses of $1,570,291, the US Treasury 6 Month Bill ETF had unexpiring short-term losses of $378,633, the US Treasury 12 Month Bill ETF had unexpiring short-term losses of $740,389, the US Treasury 2 Year Note ETF had unexpiring short-term losses of $9,399,342, the US Treasury 3 Year Note ETF had unexpiring short-term losses of $104,260, the US Treasury 5 Year Note ETF had unexpiring short-term losses of $24,950, the US Treasury 7 Year Note ETF had unexpiring short-term losses of $40,781, the US Treasury 10 Year Note ETF had unexpiring short-term losses of $3,821,622, the US Treasury 20 Year Bond ETF had unexpiring short-term losses of $634,872, and the US Treasury 30 Year Bond ETF had unexpiring short-term losses of $854,343.
During the tax year ended August 31, 2024 the following Funds utilized capital loss carryforwards:
FUND | | Capital Loss
Carryforward Used | |
US Treasury 12 Month Bill ETF | | $ | 231,986 | |
US Treasury 2 Year Note ETF | | | 1,387,432 | |
US Treasury 5 Year Note ETF | | | 50,639 | |
US Treasury 7 Year Note ETF | | | 18,616 | |
6. SECURITIES LENDING
The Funds may make secured loans of their portfolio securities to brokers, dealers and other financial institutions to earn additional income and receive cash collateral equal to at least 102% of the current market value of the loaned domestic securities, as marked to market each day that the NAV of the Funds is determined. When the collateral falls below specified amounts, the Funds’ lending agent will use its best effort to obtain additional collateral on the next business day to meet required amounts under the security lending agreement. The Funds receive compensation in the form of loan fees owed by borrowers and income earned on collateral investments. A portion of the interest received on the loan collateral is retained by the Funds and the remainder is rebated to the borrower of the securities. Pursuant to the securities lending agreement between the Trust, on behalf of the Funds, and the Custodian, each Fund pays a fee to the Custodian for administrative and custodial fees, which is calculated daily and paid monthly, in the amount of 20% of the Fund’s net income. The net amount of interest earned, after the interest rebate and the
US Benchmark Series
Notes to Financial Statements (conTINUed)
AUGUST 31, 2024
allocation to the Custodian, is shown below. Collateral is invested in short-term investments and the Funds will bear the risk of loss of the invested collateral. Investments purchased with collateral are overnight and continuous. Securities lending will expose the Funds to the risk of loss should a borrower default on its obligation to return the borrowed securities. The market value of the securities on loan and cash collateral as of the end of the reporting period and the net income generated from the program during the current fiscal period with respect to such secured loans were as follows:
FUND | | MARKET VALUE OF
SECURITIES LOANED | | | MARKET VALUE OF
COLLATERAL | | | INCOME RECEIVED
FROM SECURITIES
LENDING | |
US Treasury 3 Month Bill ETF | | $ | — | | | $ | — | | | $ | 46,179 | |
US Treasury 6 Month Bill ETF | | | — | | | | — | | | | 16,508 | |
US Treasury 12 Month Bill ETF | | | — | | | | — | | | | 1,989 | |
US Treasury 2 Year Note ETF | | | — | | | | — | | | | 9,238 | |
US Treasury 3 Year Note ETF | | | — | | | | — | | | | — | |
US Treasury 5 Year Note ETF | | | — | | | | — | | | | — | |
US Treasury 7 Year Note ETF | | | — | | | | — | | | | — | |
US Treasury 10 Year Note ETF | | | — | | | | — | | | | 5,260 | |
US Treasury 20 Year Bond ETF | | | — | | | | — | | | | 2,089 | |
US Treasury 30 Year Bond ETF | | | — | | | | — | | | | — | |
Securities lending transactions are entered into by the Funds’ securities lending agent on behalf of the Funds under a Master Securities Lending Agreement (“MSLA”) which permits the Funds’ securities lending agent on behalf of the Funds under certain circumstances including an event of default (such as bankruptcy or insolvency), to offset amounts payable on behalf of the Funds to the same counterparty against amounts to be received and create one single net payment due to or from the Funds. As of August 31, 2024, there are no open lending transactions to report.
7. SHARE TRANSACTIONS
Shares of the Funds are listed and traded on the NASDAQ, Inc. (the “Exchange”). Market prices for the shares may be different from their NAV. Each Fund issues and redeems shares on a continuous basis at NAV only in blocks of 10,000 shares, called “Creation Units.” Creation Units are issued and redeemed principally in-kind for securities included in a specified universe. Once created, shares generally trade in the secondary market at market prices that change throughout the day. Except when aggregated in Creation Units, shares are not redeemable securities of each Fund. Creation Units may only be purchased or redeemed by certain financial institutions (“Authorized Participants”). An Authorized Participant is either (i) a broker-dealer or other participant in the clearing process through the Continuous Net Settlement System of the National Securities Clearing Corporation or (ii) a Depository Trust Company participant and, in each case, must have executed a Participant Agreement with Quasar. Most retail investors do not qualify as Authorized Participants nor have the resources to buy and sell whole Creation Units. Therefore, they are unable to purchase or redeem shares directly from each Fund. Rather, most retail investors may purchase shares in the secondary market with the assistance of a broker and are subject to customary brokerage commissions or fees.
Each Fund currently offers one class of shares, which has no front-end sales load, no deferred sales charge, and no redemption fee. A fixed transaction fee is imposed for the transfer and other transaction costs associated with the purchase or sale of Creation Units. The standard fixed transaction fee for each Fund is $300, payable to the custodian. In addition, a variable fee may be charged on all cash transactions or substitutes for Creation Units of up to a maximum of 2% as a percentage of the value of the Creation Units subject to the transaction. Variable fees are imposed to compensate each Fund for the transaction costs associated with the cash transactions. Variable fees received by each Fund, if any, are displayed in the capital shares transactions section of the Statements of Changes in Net Assets.
US Benchmark Series
Notes to Financial Statements (conCLuded)
AUGUST 31, 2024
8. SUBSEQUENT EVENTS
In preparing these financial statements, management has evaluated events and transactions for potential recognition or disclosure through the date the financial statements were issued.
Subsequent to August 31, 2024, the Funds paid the following distributions:
Fund | Record Date | Ex-Date | Pay Date | Distribution
Rate Per Share |
US Treasury 3 Month Bill ETF | 9/3/2024 | 9/3/2024 | 9/4/2024 | $0.21517188 |
US Treasury 6 Month Bill ETF | 9/3/2024 | 9/3/2024 | 9/4/2024 | $0.20928230 |
US Treasury 12 Month Bill ETF | 9/3/2024 | 9/3/2024 | 9/4/2024 | $0.18580548 |
US Treasury 2 Year Note ETF | 9/3/2024 | 9/3/2024 | 9/4/2024 | $0.17097167 |
US Treasury 3 Year Note ETF | 9/3/2024 | 9/3/2024 | 9/4/2024 | $0.16210533 |
US Treasury 5 Year Note ETF | 9/3/2024 | 9/3/2024 | 9/4/2024 | $0.15856641 |
US Treasury 7 Year Note ETF | 9/3/2024 | 9/3/2024 | 9/4/2024 | $0.16280936 |
US Treasury 10 Year Note ETF | 9/3/2024 | 9/3/2024 | 9/4/2024 | $0.14909562 |
US Treasury 20 Year Bond ETF | 9/3/2024 | 9/3/2024 | 9/4/2024 | $0.17534541 |
US Treasury 30 Year Bond ETF | 9/3/2024 | 9/3/2024 | 9/4/2024 | $0.16489010 |
| | | | | |
US Treasury 3 Month Bill ETF | 10/1/2024 | 10/1/2024 | 10/2/2024 | $0.20593852 |
US Treasury 6 Month Bill ETF | 10/1/2024 | 10/1/2024 | 10/2/2024 | $0.19329910 |
US Treasury 12 Month Bill ETF | 10/1/2024 | 10/1/2024 | 10/2/2024 | $0.17220435 |
US Treasury 2 Year Note ETF | 10/1/2024 | 10/1/2024 | 10/2/2024 | $0.15036067 |
US Treasury 3 Year Note ETF | 10/1/2024 | 10/1/2024 | 10/2/2024 | $0.14283260 |
US Treasury 5 Year Note ETF | 10/1/2024 | 10/1/2024 | 10/2/2024 | $0.14600416 |
US Treasury 7 Year Note ETF | 10/1/2024 | 10/1/2024 | 10/2/2024 | $0.15037436 |
US Treasury 10 Year Note ETF | 10/1/2024 | 10/1/2024 | 10/2/2024 | $0.14108438 |
US Treasury 20 Year Bond ETF | 10/1/2024 | 10/1/2024 | 10/2/2024 | $0.16104204 |
US Treasury 30 Year Bond ETF | 10/1/2024 | 10/1/2024 | 10/2/2024 | $0.15969500 |
US BENCHMARK SERIES
Report of Independent Registered
Public Accounting Firm
To the Shareholders and Board of Directors of
The RBB Fund, Inc.
Opinion on the Financial Statements
We have audited the accompanying statements of assets and liabilities, including the schedules of investments, of The RBB Fund, Inc. comprising the funds listed below (the “Funds”) as of August 31, 2024, the related statements of operations and changes in net assets, and the financial highlights for each of the periods indicated below, and the related notes (collectively referred to as the “financial statements”). In our opinion, the financial statements present fairly, in all material respects, the financial position of each of the Funds as of August 31, 2024, the results of their operations, the changes in net assets, and the financial highlights for each of the periods indicated below in conformity with accounting principles generally accepted in the United States of America.
Fund Name | | Statements of
Operations | | | Statement(s) of
Changes in Net
Assets | | | Financial
Highlights | |
US Treasury 3 Month Bill ETF, US Treasury 2 Year Note ETF, and US Treasury 10 year Note ETF | For the year ended August 31, 2024 | For the years ended August 31, 2024 and 2023 | For the years ended August 31, 2024 and 2023 and for the period from August 8, 2022 (commencement of operations) through August 31, 2022 |
US Treasury 12 Month Bill ETF | For the year ended August 31, 2024 | For the year ended August 31, 2024 and for the period from November 14, 2022 (commencement of operations) through August 31, 2023 |
US Treasury 6 Month Bill ETF | For the year ended August 31, 2024 | For the year ended August 31, 2024 and for the period from March 6, 2023 (commencement of operations) through August 31, 2023 |
US Treasury 3 Year Note ETF, US Treasury 5 Year Note ETF, US Treasury 7 Year Note ETF, US Treasury 20 Year Bond ETF, and US Treasury 30 Year Bond ETF | For the year ended August 31, 2024 | For the year ended August 31, 2024 and for the period from March 27, 2023 (commencement of operations) through August 31, 2023 |
Basis for Opinion
These financial statements are the responsibility of the Funds’ management. Our responsibility is to express an opinion on the Funds’ financial statements based on our audits. We are a public accounting firm registered with the Public Company Accounting Oversight Board (United States) (“PCAOB”) and are required to be independent with respect to the Funds in accordance with the U.S. federal securities laws and the applicable rules and regulations of the Securities and Exchange Commission and the PCAOB.
We conducted our audits in accordance with the standards of the PCAOB. Those standards require that we plan and perform the audit to obtain reasonable assurance about whether the financial statements are free of material misstatement whether due to error or fraud.
Our audits included performing procedures to assess the risks of material misstatement of the financial statements, whether due to error or fraud, and performing procedures that respond to those risks. Such procedures included examining, on a test basis, evidence regarding the amounts and disclosures in the financial statements. Our procedures included confirmation of securities owned as of August 31, 2024, by correspondence with the custodian and brokers; when replies were not received from brokers, we
US BENCHMARK SERIES
Report of Independent Registered
Public Accounting Firm (Concluded)
performed other auditing procedures. Our audits also included evaluating the accounting principles used and significant estimates made by management, as well as evaluating the overall presentation of the financial statements. We believe that our audits provide a reasonable basis for our opinion.
We have served as the auditor of one or more investment companies advised by F/M Investments, LLC since 2021.

COHEN & COMPANY, LTD.
Cleveland, Ohio
October 29, 2024
US BENCHMARK SERIES
Shareholder Tax Information
(UNAUDITED)
Certain tax information regarding the Fund is required to be provided to shareholders based upon the Fund’s income and distributions for the taxable period ended August 31, 2024. The information and distributions reported herein may differ from information and distributions taxable to the shareholders for the calendar year ending December 31, 2024. During the fiscal year ended August 31, 2024, the Fund paid ordinary income dividends, and did not pay long-term capital gains dividends to its shareholders.
Dividends from net investment income and short-term capital gains are treated as ordinary income dividends for federal income tax purposes.
Because the Fund’s fiscal year is not the calendar year, another notification will be sent with respect to calendar year 2024. The second notification, which will reflect the amount, if any, to be used by calendar year taxpayers on their U.S. federal income tax returns, will be made in conjunction with Form 1099-DIV and will be mailed in January 2025.
Foreign shareholders will generally be subject to U.S. withholding tax on the amount of their ordinary income dividends. They will generally not be entitled to a foreign tax credit or deduction for the withholding taxes paid by the Fund, if any. In general, dividends received by tax-exempt recipients (e.g., IRAs and Keoghs) need not be reported as taxable income for U.S. federal income tax purposes. However, some retirement trusts (e.g., corporate, Keogh and 403(b)(7) plans) may need this information for their annual information reporting. Shareholders are advised to consult their own tax advisers with respect to the tax consequences of their investment in the Fund.
US BENCHMARK SERIES
Other Information
(UNAUDITED)
FREQUENCY DISTRIBUTIONS OF PREMIUMS AND DISCOUNTS
Information regarding how often shares of the Funds trade on an exchange at a price above (i.e., at a premium) or below (i.e., at a discount) the NAV of the Funds is available, without charge, on the Funds’ website at www.ustreasuryetf.com.
US BENCHMARK SERIES
Approval of Investment Advisory Agreement
(UNAUDITED)
As required by the 1940 Act, the Board of the Company, including all of the Directors who are not “interested persons” of the Company, as that term is defined in the 1940 Act (the “Independent Directors”), considered the renewal of the investment advisory agreement between F/m Investments, LLC (“F/m”) and the Company (the “Investment Advisory Agreement”) on behalf of the US Treasury 3 Month Bill ETF, US Treasury 6 Month Bill ETF, US Treasury 12 Month Bill ETF, US Treasury 2 Year Note ETF, US Treasury 3 Year Note ETF, US Treasury 5 Year Note ETF, US Treasury 7 Year Note ETF, US Treasury 10 Year Note ETF, US Treasury 20 Year Bond ETF, and US Treasury 30 Year Bond ETF (for this section only, each a “Fund” and collectively the “Funds”), at a meeting of the Board held on May 15-16, 2024 (the “Meeting”). At the Meeting, the Board, including all of the Independent Directors, approved the Investment Advisory Agreement for an additional one-year term ending August 16, 2025. The Board’s decision to approve the Investment Advisory Agreement reflects the exercise of its business judgment to continue the existing arrangements. In approving the Investment Advisory Agreement, the Board considered information provided by F/m with the assistance and advice of counsel to the Independent Directors and the Company.
In considering the renewal and approval of the Investment Advisory Agreement between the Company and F/m with respect to the Funds, the Directors took into account all the materials provided prior to and during the Meeting and at other meetings throughout the past year, the presentations made during the Meeting, and the discussions held during the Meeting. The Directors reviewed these materials with management of F/m and discussed the Investment Advisory Agreement with counsel in executive sessions, at which no representatives of F/m were present. Among other things, the Directors considered (i) the nature, extent, and quality of F/m’s services provided to the Funds; (ii) descriptions of the experience and qualifications of F/m’s personnel providing those services; (iii) F/m’s investment philosophies and processes; (iv) F/m’s assets under management and client descriptions; (v) F/m’s soft dollar commission and trade allocation policies, including information on the types of research and services obtained in connection with soft dollar commissions; (vi) F/m’s advisory fee arrangement with the Company and other similarly managed clients; (vii) F/m’s compliance policies and procedures; (viii) F/m’s financial information, insurance coverage and profitability analysis related to providing advisory services to the Funds; (ix) the extent to which economies of scale are relevant to the Funds; (x) a report prepared by Fuse Research Network, LLC comparing each Fund’s management fees and total expense ratios to a group of mutual funds deemed comparable to each Fund based primarily on investment strategy similarity (“Peer Group”) and comparing the performance of each Fund to the performance of its Peer Group; and (xi) a report comparing the performance of the Funds to the performance of their respective benchmark.
As part of their review, the Directors considered the nature, extent and quality of the services provided by F/m. The Directors concluded that F/m had substantial resources to provide services to the Funds and that F/m’s services had been acceptable.
The Directors also considered the investment performance of the Funds. Information on the Funds’ investment performance was provided for the three-month, one-year, and since inception periods ended December 31, 2023, as applicable. The Directors considered the Funds’ investment performance in light of their respective investment objectives and investment strategies. The Directors concluded that the investment performance of each of the Funds as compared to their respective benchmarks and Peer Groups was acceptable.
The Directors considered that because each of the Funds was designed to track the performance of its respective index, a relevant consideration was the extent to which such Fund tracked its index before fees and expenses. The Board also noted that the performance of the index did not take into account the expenses incurred when purchasing or selling securities, which expenses would lower the performance of a fund seeking to replicate some or all of the holdings of the index. The Board noted that for the three-month, one-year, and since-inception periods ended December 31, 2023, as applicable, each of the aforementioned Fund’s performance was in line with its index before fees and expenses.
The Directors noted that the US Treasury 3 Month Bill ETF outperformed the median of its Peer Group for the one-year and since-inception periods ended December 31, 2023, and underperformed the median of its Peer Group for the three-month period ended December 31, 2023.
The Directors noted that the US Treasury 6 Month Bill ETF matched the median of its Peer Group for the since-inception period ended December 31, 2023, and underperformed the median of its Peer Group for the three-month period ended December 31, 2023.
US BENCHMARK SERIES
APPROVAL OF INVESTMENT ADVISORY AGREEMENT (continued)
(UNAUDITED)
The Directors noted that the US Treasury 12 Month Bill ETF outperformed the median of its Peer Group for the one-year and since-inception periods ended December 31, 2023, and underperformed the median of its Peer Group for the three-month period ended December 31, 2023.
The Directors noted that the US Treasury 2 Year Note ETF underperformed the median of its Peer Group for the three-month, one-year, and since-inception periods ended December 31, 2023.
The Directors noted that the US Treasury 3 Year Note ETF outperformed the median of its Peer Group for the three-month period ended December 31, 2023, and underperformed the median of its Peer Group for the since-inception period ended December 31, 2023.
The Directors noted that the US Treasury 5 Year Note ETF underperformed the median of its Peer Group for the three-month and since-inception periods ended December 31, 2023.
The Directors noted that the US Treasury 7 Year Note ETF outperformed the median of its Peer Group for the three-month period ended December 31, 2023, and underperformed the median of its Peer Group for the since-inception period ended December 31, 2023.
The Directors noted that the US Treasury 10 Year Note ETF outperformed the median of its Peer Group for the since-inception period ended December 31, 2023, and underperformed the median of its Peer Group for the three-month and one-year periods ended December 31, 2023.
The Directors noted that the US Treasury 20 Year Bond ETF outperformed the median of its Peer Group for the since-inception period ended December 31, 2023, and underperformed the median of its Peer Group for the three-month period ended December 31, 2023.
The Directors noted that the US Treasury 30 Year Bond ETF underperformed the median of its Peer Group for the three-month and since-inception periods ended December 31, 2023.
The Board also considered the advisory fee rates payable by the Funds under the Investment Advisory Agreement. In this regard, information on the fees paid by the Funds and the Funds’ total operating expense ratios were compared to similar information for ETFs advised by other, unaffiliated investment advisory firms.
The Directors noted that the net advisory fee of the US Treasury 3 Month Bill ETF ranked above the median and in the 5th quintile of its Peer Group, and the Fund’s total net expenses were above the median and in the 5th quintile of its Peer Group.
The Directors noted that the net advisory fee of the US Treasury 6 Month Bill ETF ranked above the median and in the 5th quintile of its Peer Group, and the Fund’s total net expenses were above the median and in the 5th quintile of its Peer Group.
The Directors noted that the net advisory fee of the US Treasury 12 Month Bill ETF ranked above the median and in the 4th quintile of its Peer Group, and the Fund’s total net expenses were above the median and in the 4th quintile of its Peer Group.
The Directors noted that the net advisory fee of the US Treasury 2 Year Note ETF ranked above the median and in the 4th quintile of its Peer Group, and the Fund’s total net expenses were above the median and in the 4th quintile of its Peer Group.
The Directors noted that the net advisory fee of the US Treasury 3 Year Note ETF ranked above the median and in the 4th quintile of its Peer Group, and the Fund’s total net expenses were above the median and in the 4th quintile of its Peer Group.
The Directors noted that the net advisory fee of the US Treasury 5 Year Note ETF ranked above the median and in the 4th quintile of its Peer Group, and the Fund’s total net expenses were above the median and in the 4th quintile of its Peer Group.
The Directors noted that the net advisory fee of the US Treasury 7 Year Note ETF ranked above the median and in the 4th quintile of its Peer Group, and the Fund’s total net expenses were above the median and in the 4th quintile of its Peer Group.
The Directors noted that the net advisory fee of the US Treasury 10 Year Note ETF ranked above the median and in the 3rd quintile of its Peer Group, and the Fund’s total net expenses were above the median and in the 3rd quintile of its Peer Group.
US BENCHMARK SERIES
APPROVAL OF INVESTMENT ADVISORY AGREEMENT (concluded)
(UNAUDITED)
The Directors noted that the net advisory fee of the US Treasury 20 Year Bond ETF ranked above the median and in the 3rd quintile of its Peer Group, and the Fund’s total net expenses were above the median and in the 3rd quintile of its Peer Group.
The Directors noted that the net advisory fee of the US Treasury 30 Year Bond ETF ranked above the median and in the 3rd quintile of its Peer Group, and the Fund’s total net expenses were above the median and in the 3rd quintile of its Peer Group.
The Board also took into consideration that the advisory fee for each Fund was a “unitary fee,” meaning the Funds paid no expenses other than the advisory fee and certain other costs such as interest, brokerage and extraordinary expenses. The Board noted that F/m continued to be responsible for compensating the Funds’ other service providers and paying other expenses of the Funds out of its own fees and resources.
After reviewing the information regarding the Funds’ costs, profitability and economies of scale, and after considering F/m’s services, the Directors concluded that the investment advisory fees to be paid by the Funds were fair and reasonable and that the Investment Advisory Agreement should be approved and continued for an additional one year period ending August 16, 2025.
Investment Adviser
F/m Investments, LLC d/b/a North Slope Capital, LLC
3050 K Street NW, Suite W-201
Washington, DC 20007
Administrator and Transfer Agent
U.S. Bank Global Fund Services
P.O. Box 701
Milwaukee, Wisconsin 53201-0701
Principal Underwriter
Quasar Distributors, LLC
3 Canal Plaza, Suite 100
Portland, ME 04101
Custodian
U.S. Bank, N.A.
1555 North River Center Drive, Suite 302
Milwaukee, Wisconsin 53212
Independent Registered Public Accounting Firm
Cohen & Company, Ltd.
1350 Euclid Avenue, Suite 800
Cleveland, Ohio 44115
Legal Counsel
Faegre Drinker Biddle & Reath LLP
One Logan Square, Suite 2000
Philadelphia, Pennsylvania 19103-6996

F/m Corporate Bond ETFs
Financial Statements
August 31, 2024
F/m 2-Year Investment Grade Corporate Bond ETF | (NYSE: ZTWO)
F/m 3-Year Investment Grade Corporate Bond ETF | (NYSE: ZTRE)
F/m 10-Year Investment Grade Corporate Bond ETF | (NYSE: ZTEN)
Each a series of The RBB Fund, Inc.
F/m Investments, LLC d/b/a North Slope Capital, LLC
Table of Contents | 
|
| | |
Schedules of Investments | 1 |
Financial Statements | 36 |
Notes to Financial Statements | 44 |
Report of Independent Registered Public Accounting Firm | 56 |
Shareholder Tax Information | 57 |
Other Information | 58 |
F/m 2-Year Investment Grade Corporate Bond ETF
Schedule of Investments
August 31, 2024
| | Par | | | Value | |
| | | | | | | | | |
CORPORATE BONDS — 87.3% | | | | | | | | |
Administrative and Support and Waste Management and Remediation Services — 0.2% | | | | | | | | |
Enstar Finance LLC, 5.50% to 01/15/2027 then 5 yr. CMT Rate + 4.01%, 01/15/2042 | | $ | 28,000 | | | $ | 25,756 | |
| | | | | | | | | |
Communications — 3.5% | | | | | | | | |
Alphabet, Inc., 2.00%, 08/15/2026 | | | 27,000 | | | | 25,973 | |
AT&T, Inc., 1.70%, 03/25/2026 | | | 27,000 | | | | 25,812 | |
Booking Holdings, Inc., 3.60%, 06/01/2026 | | | 25,000 | | | | 24,665 | |
Charter Communications Operating LLC / Charter Communications Operating Capital, 6.15%, 11/10/2026 | | | 25,000 | | | | 25,612 | |
Comcast Corp., 3.15%, 03/01/2026 | | | 26,000 | | | | 25,511 | |
Cox Communications, Inc., 3.35%, 09/15/2026 (a) | | | 26,000 | | | | 25,285 | |
Netflix, Inc., 4.38%, 11/15/2026 | | | 26,000 | | | | 26,013 | |
Omnicom Group, Inc. / Omnicom Capital, Inc., 3.60%, 04/15/2026 | | | 26,000 | | | | 25,536 | |
Paramount Global, 2.90%, 01/15/2027 | | | 27,000 | | | | 25,596 | |
Sprint LLC, 7.63%, 03/01/2026 | | | 24,000 | | | | 24,743 | |
T-Mobile USA, Inc., 2.63%, 04/15/2026 | | | 26,000 | | | | 25,192 | |
TWDC Enterprises 18 Corp., 1.85%, 07/30/2026 | | | 27,000 | | | | 25,796 | |
Verizon Communications, Inc., 2.63%, 08/15/2026 | | | 26,000 | | | | 25,127 | |
Warnermedia Holdings, Inc., 6.41%, 03/15/2026 | | | 24,000 | | | | 23,998 | |
| | | | | | | | 354,859 | |
| | | | | | | | | |
Consumer Discretionary — 7.5% | | | | | | | | |
Amazon.com, Inc., 1.00%, 05/12/2026 | | | 27,000 | | | | 25,614 | |
American Honda Finance Corp., 5.25%, 07/07/2026 | | | 25,000 | | | | 25,372 | |
AutoZone, Inc., 5.05%, 07/15/2026 | | | 25,000 | | | | 25,239 | |
BMW US Capital LLC, 2.80%, 04/11/2026 (a) | | | 26,000 | | | | 25,336 | |
DR Horton, Inc., 1.30%, 10/15/2026 | | | 28,000 | | | | 26,224 | |
eBay, Inc., 1.40%, 05/10/2026 | | | 27,000 | | | | 25,592 | |
ERAC USA Finance LLC, 3.30%, 12/01/2026 (a) | | | 26,000 | | | | 25,366 | |
General Motors Financial Co., Inc., 5.40%, 04/06/2026 | | | 25,000 | | | | 25,230 | |
GXO Logistics, Inc., 1.65%, 07/15/2026 | | | 27,000 | | | | 25,461 | |
Harley-Davidson Financial Services, Inc., 3.05%, 02/14/2027 (a) | | | 26,000 | | | | 24,837 | |
Hasbro, Inc., 3.55%, 11/19/2026 | | | 26,000 | | | | 25,293 | |
Home Depot, Inc., 5.15%, 06/25/2026 | | | 25,000 | | | | 25,395 | |
Hyatt Hotels Corp., 5.75%, 01/30/2027 | | | 24,000 | | | | 24,473 | |
Hyundai Capital America, 5.50%, 03/30/2026 (a) | | | 24,000 | | | | 24,238 | |
Las Vegas Sands Corp., 3.50%, 08/18/2026 | | | 26,000 | | | | 25,254 | |
Lennar Corp., 5.25%, 06/01/2026 | | | 24,000 | | | | 24,147 | |
Lowe’s Cos., Inc., 2.50%, 04/15/2026 | | | 26,000 | | | | 25,194 | |
The accompanying notes are an integral part of these financial statements.
F/m 2-Year Investment Grade Corporate Bond ETF
Schedule of Investments (Continued)
August 31, 2024
| | Par | | | Value | |
| | | | | | | | | |
CORPORATE BONDS — 87.3% (continued) | | | | | | | | |
Consumer Discretionary — 7.5% (continued) | | | | | | | | |
Marriott International, Inc., 3.13%, 06/15/2026 | | $ | 26,000 | | | $ | 25,318 | |
Mattel, Inc., 3.38%, 04/01/2026 (a) | | | 25,000 | | | | 24,288 | |
NIKE, Inc., 2.38%, 11/01/2026 | | | 27,000 | | | | 25,972 | |
Nissan Motor Acceptance Co. LLC, 1.85%, 09/16/2026 (a) | | | 26,000 | | | | 24,234 | |
O’Reilly Automotive, Inc., 5.75%, 11/20/2026 | | | 25,000 | | | | 25,608 | |
PulteGroup, Inc., 5.00%, 01/15/2027 | | | 25,000 | | | | 25,229 | |
Ross Stores, Inc., 0.88%, 04/15/2026 | | | 27,000 | | | | 25,423 | |
Southwest Airlines Co., 3.00%, 11/15/2026 | | | 27,000 | | | | 26,020 | |
Stanley Black & Decker, Inc., 3.40%, 03/01/2026 | | | 26,000 | | | | 25,508 | |
Starbucks Corp., 4.85%, 02/08/2027 | | | 26,000 | | | | 26,253 | |
Tapestry, Inc., 7.00%, 11/27/2026 | | | 24,000 | | | | 24,756 | |
TJX Cos., Inc., 2.25%, 09/15/2026 | | | 25,000 | | | | 24,018 | |
Toyota Motor Credit Corp., 4.45%, 05/18/2026 | | | 25,000 | | | | 25,027 | |
| | | | | | | | 755,919 | |
| | | | | | | | | |
Consumer Staples — 6.8% | | | | | | | | |
Altria Group, Inc., 2.63%, 09/16/2026 | | | 26,000 | | | | 25,027 | |
Archer-Daniels-Midland Co., 2.50%, 08/11/2026 | | | 27,000 | | | | 26,061 | |
Bunge Ltd. Finance Corp., 3.25%, 08/15/2026 | | | 24,000 | | | | 23,399 | |
Campbell Soup Co., 5.30%, 03/20/2026 | | | 25,000 | | | | 25,293 | |
Cargill, Inc., 4.50%, 06/24/2026 (a) | | | 25,000 | | | | 25,059 | |
Colgate-Palmolive Co., 4.80%, 03/02/2026 | | | 24,000 | | | | 24,213 | |
Conagra Brands, Inc., 5.30%, 10/01/2026 | | | 25,000 | | | | 25,341 | |
Conopco, Inc., 7.25%, 12/15/2026 | | | 24,000 | | | | 25,491 | |
Constellation Brands, Inc., 3.70%, 12/06/2026 | | | 26,000 | | | | 25,536 | |
Flowers Foods, Inc., 3.50%, 10/01/2026 | | | 26,000 | | | | 25,407 | |
General Mills, Inc., 3.20%, 02/10/2027 | | | 26,000 | | | | 25,233 | |
Hershey Co., 2.30%, 08/15/2026 | | | 27,000 | | | | 26,018 | |
Ingredion, Inc., 3.20%, 10/01/2026 | | | 26,000 | | | | 25,310 | |
Kellanova, 3.25%, 04/01/2026 | | | 26,000 | | | | 25,481 | |
Kenvue, Inc., 5.35%, 03/22/2026 | | | 25,000 | | | | 25,361 | |
Keurig Dr Pepper, Inc., 2.55%, 09/15/2026 | | | 27,000 | | | | 25,978 | |
Kraft Heinz Foods Co., 3.00%, 06/01/2026 | | | 26,000 | | | | 25,319 | |
Kroger Co., 4.70%, 08/15/2026 | | | 25,000 | | | | 25,074 | |
Mars, Inc., 0.88%, 07/16/2026 (a) | | | 27,000 | | | | 25,283 | |
Molson Coors Beverage Co., 3.00%, 07/15/2026 | | | 26,000 | | | | 25,289 | |
PepsiCo, Inc., 2.38%, 10/06/2026 | | | 27,000 | | | | 26,078 | |
Philip Morris International, Inc., 4.75%, 02/12/2027 | | | 26,000 | | | | 26,234 | |
The accompanying notes are an integral part of these financial statements.
F/m 2-Year Investment Grade Corporate Bond ETF
Schedule of Investments (Continued)
August 31, 2024
| | Par | | | Value | |
| | | | | | | | | |
CORPORATE BONDS — 87.3% (continued) | | | | | | | | |
Consumer Staples — 6.8% (continued) | | | | | | | | |
Smithfield Foods, Inc., 4.25%, 02/01/2027 (a) | | $ | 26,000 | | | $ | 25,467 | |
Sysco Corp., 3.30%, 07/15/2026 | | | 26,000 | | | | 25,429 | |
Target Corp., 1.95%, 01/15/2027 | | | 26,000 | | | | 24,827 | |
Tyson Foods, Inc., 4.00%, 03/01/2026 | | | 26,000 | | | | 25,737 | |
Walmart, Inc., 1.05%, 09/17/2026 | | | 27,000 | | | | 25,435 | |
| | | | | | | | 684,380 | |
| | | | | | | | | |
Energy — 6.2% | | | | | | | | |
Baker Hughes Holdings LLC / Baker Hughes Co.-Obligor, Inc., 2.06%, 12/15/2026 | | | 27,000 | | | | 25,664 | |
Boardwalk Pipelines LP, 5.95%, 06/01/2026 | | | 25,000 | | | | 25,392 | |
BP Capital Markets America, Inc., 3.12%, 05/04/2026 | | | 25,000 | | | | 24,465 | |
Chevron Corp., 2.95%, 05/16/2026 | | | 26,000 | | | | 25,452 | |
Columbia Pipelines Holding Co. LLC, 6.06%, 08/15/2026 (a) | | | 25,000 | | | | 25,516 | |
Continental Resources, Inc., 2.27%, 11/15/2026 (a) | | | 27,000 | | | | 25,503 | |
Diamondback Energy, Inc., 3.25%, 12/01/2026 | | | 26,000 | | | | 25,302 | |
Energy Transfer LP, 6.05%, 12/01/2026 | | | 25,000 | | | | 25,738 | |
EnLink Midstream Partners LP, 4.85%, 07/15/2026 | | | 25,000 | | | | 24,924 | |
Enterprise Products Operating LLC, 4.60%, 01/11/2027 | | | 26,000 | | | | 26,212 | |
EQT Corp., 3.13%, 05/15/2026 (a) | | | 26,000 | | | | 25,239 | |
Exxon Mobil Corp., 3.04%, 03/01/2026 | | | 25,000 | | | | 24,555 | |
HF Sinclair Corp., 5.88%, 04/01/2026 | | | 24,000 | | | | 24,250 | |
Kinder Morgan, Inc., 1.75%, 11/15/2026 | | | 27,000 | | | | 25,445 | |
Marathon Petroleum Corp., 5.13%, 12/15/2026 | | | 24,000 | | | | 24,278 | |
MPLX LP, 1.75%, 03/01/2026 | | | 27,000 | | | | 25,814 | |
Occidental Petroleum Corp., 5.55%, 03/15/2026 | | | 24,000 | | | | 24,197 | |
ONEOK, Inc., 5.55%, 11/01/2026 | | | 25,000 | | | | 25,470 | |
Phillips 66 Co., 3.55%, 10/01/2026 | | | 25,000 | | | | 24,498 | |
Pioneer Natural Resources Co., 5.10%, 03/29/2026 | | | 24,000 | | | | 24,230 | |
Plains All American Pipeline LP / PAA Finance Corp., 4.50%, 12/15/2026 | | | 26,000 | | | | 25,875 | |
Sabine Pass Liquefaction LLC, 5.88%, 06/30/2026 | | | 24,000 | | | | 24,318 | |
Valero Energy Corp., 3.40%, 09/15/2026 | | | 24,000 | | | | 23,422 | |
Western Midstream Operating LP, 4.65%, 07/01/2026 | | | 25,000 | | | | 24,872 | |
Williams Cos., Inc., 5.40%, 03/02/2026 | | | 24,000 | | | | 24,232 | |
| | | | | | | | 624,863 | |
| | | | | | | | | |
Financials — 27.9% | | | | | | | | |
Aflac, Inc., 1.13%, 03/15/2026 | | | 27,000 | | | | 25,649 | |
Air Lease Corp., 1.88%, 08/15/2026 | | | 26,000 | | | | 24,652 | |
The accompanying notes are an integral part of these financial statements.
F/m 2-Year Investment Grade Corporate Bond ETF
Schedule of Investments (Continued)
August 31, 2024
| | Par | | | Value | |
| | | | | | | | | |
CORPORATE BONDS — 87.3% (continued) | | | | | | | | |
Financials — 27.9% (continued) | | | | | | | | |
Alexandria Real Estate Equities, Inc., 3.80%, 04/15/2026 | | $ | 26,000 | | | $ | 25,638 | |
Allstate Corp., 3.28%, 12/15/2026 | | | 26,000 | | | | 25,356 | |
American Express Co., 5.10% to 02/16/2027 then SOFR + 1.00%, 02/16/2028 | | | 25,000 | | | | 25,333 | |
American Tower Corp., 3.38%, 10/15/2026 | | | 26,000 | | | | 25,347 | |
Ameriprise Financial, Inc., 2.88%, 09/15/2026 | | | 26,000 | | | | 25,213 | |
Apollo Management Holdings LP, 4.40%, 05/27/2026 (a) | | | 24,000 | | | | 23,898 | |
Arch Capital Finance LLC, 4.01%, 12/15/2026 | | | 26,000 | | | | 25,645 | |
Ares Capital Corp., 2.15%, 07/15/2026 | | | 26,000 | | | | 24,519 | |
Ares Finance Co. III LLC, 4.13% to 06/30/2026 then 5 yr. CMT Rate + 3.24%, 06/30/2051 (a) | | | 25,000 | | | | 23,516 | |
Athene Global Funding, 2.95%, 11/12/2026 (a) | | | 27,000 | | | | 25,980 | |
AvalonBay Communities, Inc., 2.95%, 05/11/2026 | | | 26,000 | | | | 25,331 | |
Aviation Capital Group LLC, 1.95%, 09/20/2026 (a) | | | 27,000 | | | | 25,375 | |
Bain Capital Specialty Finance, Inc., 2.55%, 10/13/2026 | | | 27,000 | | | | 25,374 | |
Bank of New York Mellon Corp., 4.95% to 04/26/2026 then SOFR + 1.03%, 04/26/2027 | | | 25,000 | | | | 25,137 | |
Barings BDC, Inc., 3.30%, 11/23/2026 | | | 27,000 | | | | 25,586 | |
Berkshire Hathaway, Inc., 3.13%, 03/15/2026 | | | 26,000 | | | | 25,632 | |
Blackstone Private Credit Fund, 2.63%, 12/15/2026 | | | 27,000 | | | | 25,338 | |
Blackstone Secured Lending Fund, 2.75%, 09/16/2026 | | | 26,000 | | | | 24,676 | |
Blue Owl Capital Corp., 3.40%, 07/15/2026 | | | 27,000 | | | | 26,000 | |
Blue Owl Capital Corp. II, 8.45%, 11/15/2026 (a) | | | 24,000 | | | | 25,157 | |
Blue Owl Credit Income Corp., 4.70%, 02/08/2027 | | | 26,000 | | | | 25,388 | |
Blue Owl Technology Finance Corp., 3.75%, 06/17/2026 (a) | | | 26,000 | | | | 24,814 | |
Boston Properties LP, 2.75%, 10/01/2026 | | | 27,000 | | | | 25,724 | |
Brighthouse Financial Global Funding, 1.55%, 05/24/2026 (a) | | | 27,000 | | | | 25,521 | |
Brixmor Operating Partnership LP, 4.13%, 06/15/2026 | | | 26,000 | | | | 25,688 | |
Camden Property Trust, 5.85%, 11/03/2026 | | | 25,000 | | | | 25,786 | |
Capital One Financial Corp., 3.75%, 07/28/2026 | | | 26,000 | | | | 25,471 | |
Cboe Global Markets, Inc., 3.65%, 01/12/2027 | | | 25,000 | | | | 24,566 | |
CBRE Services, Inc., 4.88%, 03/01/2026 | | | 24,000 | | | | 24,028 | |
Charles Schwab Corp., 0.90%, 03/11/2026 | | | 27,000 | | | | 25,515 | |
Chubb INA Holdings LLC, 3.35%, 05/03/2026 | | | 26,000 | | | | 25,536 | |
Citizens Financial Group, Inc., 2.85%, 07/27/2026 | | | 26,000 | | | | 24,989 | |
CNA Financial Corp., 4.50%, 03/01/2026 | | | 25,000 | | | | 24,918 | |
COPT Defense Properties LP, 2.25%, 03/15/2026 | | | 27,000 | | | | 25,887 | |
Corebridge Global Funding, 5.35%, 06/24/2026 (a) | | | 25,000 | | | | 25,343 | |
Crown Castle, Inc., 1.05%, 07/15/2026 | | | 28,000 | | | | 26,256 | |
CubeSmart LP, 3.13%, 09/01/2026 | | | 26,000 | | | | 25,219 | |
Discover Financial Services, 4.10%, 02/09/2027 | | | 26,000 | | | | 25,552 | |
The accompanying notes are an integral part of these financial statements.
F/m 2-Year Investment Grade Corporate Bond ETF
Schedule of Investments (Continued)
August 31, 2024
| | Par | | | Value | |
| | | | | | | | | |
CORPORATE BONDS — 87.3% (continued) | | | | | | | | |
Financials — 27.9% (continued) | | | | | | | | |
EPR Properties, 4.75%, 12/15/2026 | | $ | 26,000 | | | $ | 25,687 | |
Equinix, Inc., 1.45%, 05/15/2026 | | | 27,000 | | | | 25,577 | |
Equitable Financial Life Global Funding, 1.70%, 11/12/2026 (a) | | | 26,000 | | | | 24,427 | |
ERP Operating LP, 2.85%, 11/01/2026 | | | 27,000 | | | | 26,143 | |
Essex Portfolio LP, 3.38%, 04/15/2026 | | | 26,000 | | | | 25,406 | |
Extra Space Storage LP, 3.50%, 07/01/2026 | | | 26,000 | | | | 25,486 | |
F&G Global Funding, 1.75%, 06/30/2026 (a) | | | 27,000 | | | | 25,360 | |
Fidelity National Information Services, Inc., 1.15%, 03/01/2026 | | | 27,000 | | | | 25,620 | |
Fiserv, Inc., 3.20%, 07/01/2026 | | | 26,000 | | | | 25,386 | |
FS KKR Capital Corp., 2.63%, 01/15/2027 | | | 26,000 | | | | 24,261 | |
GATX Corp., 3.25%, 09/15/2026 | | | 26,000 | | | | 25,221 | |
Global Payments, Inc., 1.20%, 03/01/2026 | | | 27,000 | | | | 25,603 | |
GLP Capital LP / GLP Financing II, Inc., 5.38%, 04/15/2026 | | | 24,000 | | | | 24,016 | |
Goldman Sachs Bank USA/New York NY, 5.41% to 05/21/2026 then SOFR + 0.75%, 05/21/2027 | | | 25,000 | | | | 25,282 | |
Golub Capital BDC, Inc., 2.50%, 08/24/2026 | | | 27,000 | | | | 25,422 | |
Guardian Life Global Funding, 1.25%, 05/13/2026 (a) | | | 27,000 | | | | 25,571 | |
Hanover Insurance Group, Inc., 4.50%, 04/15/2026 | | | 26,000 | | | | 25,905 | |
HAT Holdings I LLC / HAT Holdings II LLC, 3.38%, 06/15/2026 (a) | | | 26,000 | | | | 24,907 | |
Healthcare Realty Holdings LP, 3.50%, 08/01/2026 | | | 26,000 | | | | 25,402 | |
Healthpeak OP LLC, 3.25%, 07/15/2026 | | | 26,000 | | | | 25,368 | |
Hercules Capital, Inc., 3.38%, 01/20/2027 | | | 26,000 | | | | 24,595 | |
Jefferies Financial Group, Inc., 4.85%, 01/15/2027 | | | 26,000 | | | | 26,054 | |
Kimco Realty OP LLC, 2.80%, 10/01/2026 | | | 27,000 | | | | 26,022 | |
Kite Realty Group LP, 4.00%, 10/01/2026 | | | 26,000 | | | | 25,517 | |
Legg Mason, Inc., 4.75%, 03/15/2026 | | | 24,000 | | | | 24,056 | |
Lincoln National Corp., 3.63%, 12/12/2026 | | | 24,000 | | | | 23,532 | |
Loews Corp., 3.75%, 04/01/2026 | | | 26,000 | | | | 25,702 | |
Main Street Capital Corp., 3.00%, 07/14/2026 | | | 27,000 | | | | 25,738 | |
Marsh & McLennan Cos., Inc., 3.75%, 03/14/2026 | | | 26,000 | | | | 25,719 | |
Mastercard, Inc., 2.95%, 11/21/2026 | | | 26,000 | | | | 25,315 | |
Mid-America Apartments LP, 1.10%, 09/15/2026 | | | 28,000 | | | | 26,124 | |
Morgan Stanley, 1.59% to 05/04/2026 then SOFR + 0.88%, 05/04/2027 | | | 27,000 | | | | 25,651 | |
Morgan Stanley Direct Lending Fund, 4.50%, 02/11/2027 | | | 25,000 | | | | 24,626 | |
Mutual of Omaha Cos. Global Funding, 5.80%, 07/27/2026 (a) | | | 25,000 | | | | 25,436 | |
Nasdaq, Inc., 3.85%, 06/30/2026 | | | 24,000 | | | | 23,742 | |
New York Life Global Funding, 5.45%, 09/18/2026 (a) | | | 25,000 | | | | 25,523 | |
NNN REIT, Inc., 3.60%, 12/15/2026 | | | 26,000 | | | | 25,471 | |
The accompanying notes are an integral part of these financial statements.
F/m 2-Year Investment Grade Corporate Bond ETF
Schedule of Investments (Continued)
August 31, 2024
| | Par | | | Value | |
| | | | | | | | | |
CORPORATE BONDS — 87.3% (continued) | | | | | | | | |
Financials — 27.9% (continued) | | | | | | | | |
Northwestern Mutual Global Funding, 1.75%, 01/11/2027 (a) | | $ | 27,000 | | | $ | 25,482 | |
Oaktree Specialty Lending Corp., 2.70%, 01/15/2027 | | | 27,000 | | | | 25,258 | |
Old Republic International Corp., 3.88%, 08/26/2026 | | | 26,000 | | | | 25,564 | |
Pacific Life Global Funding II, 1.38%, 04/14/2026 (a) | | | 27,000 | | | | 25,692 | |
PayPal Holdings, Inc., 2.65%, 10/01/2026 | | | 27,000 | | | | 26,087 | |
Penske Truck Leasing Co. Lp / PTL Finance Corp., 1.70%, 06/15/2026 (a) | | | 27,000 | | | | 25,582 | |
PNC Financial Services Group, Inc., 6.62% to 10/20/2026 then SOFR + 1.73%, 10/20/2027 | | | 23,000 | | | | 23,922 | |
Principal Financial Group, Inc., 3.10%, 11/15/2026 | | | 26,000 | | | | 25,167 | |
Progressive Corp., 2.45%, 01/15/2027 | | | 26,000 | | | | 24,943 | |
Prologis LP, 3.25%, 10/01/2026 | | | 26,000 | | | | 25,456 | |
Prospect Capital Corp., 3.36%, 11/15/2026 | | | 28,000 | | | | 25,429 | |
Public Storage Operating Co., 1.50%, 11/09/2026 | | | 27,000 | | | | 25,402 | |
Realty Income Corp., 4.13%, 10/15/2026 | | | 26,000 | | | | 25,782 | |
Regency Centers LP, 3.60%, 02/01/2027 | | | 26,000 | | | | 25,423 | |
Reinsurance Group of America, Inc., 3.95%, 09/15/2026 | | | 24,000 | | | | 23,709 | |
Reliance Standard Life Global Funding II, 1.51%, 09/28/2026 (a) | | | 28,000 | | | | 25,970 | |
Sabra Health Care LP, 5.13%, 08/15/2026 | | | 26,000 | | | | 26,054 | |
Santander Holdings USA, Inc., 2.49% to 01/06/2027 then SOFR + 1.25%, 01/06/2028 | | | 27,000 | | | | 25,339 | |
SBL Holdings, Inc., 5.13%, 11/13/2026 (a) | | | 26,000 | | | | 25,535 | |
Simon Property Group LP, 3.25%, 11/30/2026 | | | 25,000 | | | | 24,371 | |
Sixth Street Specialty Lending, Inc., 2.50%, 08/01/2026 | | | 25,000 | | | | 23,701 | |
State Street Corp., 5.27%, 08/03/2026 | | | 25,000 | | | | 25,391 | |
Synchrony Financial, 3.70%, 08/04/2026 | | | 26,000 | | | | 25,404 | |
Tanger Properties LP, 3.13%, 09/01/2026 | | | 25,000 | | | | 24,044 | |
Truist Financial Corp., 6.05% to 06/08/2026 then SOFR + 2.05%, 06/08/2027 | | | 25,000 | | | | 25,515 | |
UDR, Inc., 2.95%, 09/01/2026 | | | 26,000 | | | | 25,093 | |
US Bancorp, 2.38%, 07/22/2026 | | | 26,000 | | | | 25,108 | |
Ventas Realty LP, 3.25%, 10/15/2026 | | | 26,000 | | | | 25,214 | |
VICI Properties LP / VICI Note Co., Inc., 4.25%, 12/01/2026 (a) | | | 24,000 | | | | 23,692 | |
Voya Financial, Inc., 3.65%, 06/15/2026 | | | 25,000 | | | | 24,565 | |
WEA Finance LLC, 2.88%, 01/15/2027 (a) | | | 27,000 | | | | 25,671 | |
Welltower OP LLC, 4.25%, 04/01/2026 | | | 26,000 | | | | 25,824 | |
Western Union Co., 1.35%, 03/15/2026 | | | 27,000 | | | | 25,587 | |
Weyerhaeuser Co., 4.75%, 05/15/2026 | | | 26,000 | | | | 26,028 | |
WP Carey, Inc., 4.25%, 10/01/2026 | | | 26,000 | | | | 25,714 | |
| | | | | | | | 2,828,144 | |
| | | | | | | | | |
The accompanying notes are an integral part of these financial statements.
F/m 2-Year Investment Grade Corporate Bond ETF
Schedule of Investments (Continued)
August 31, 2024
| | Par | | | Value | |
| | | | | | | | | |
CORPORATE BONDS — 87.3% (continued) | | | | | | | | |
Health Care — 6.0% | | | | | | | | |
Abbott Laboratories, 3.75%, 11/30/2026 | | $ | 24,000 | | | $ | 23,789 | |
AbbVie, Inc., 2.95%, 11/21/2026 | | | 26,000 | | | | 25,270 | |
Agilent Technologies, Inc., 3.05%, 09/22/2026 | | | 26,000 | | | | 25,194 | |
Amgen, Inc., 2.20%, 02/21/2027 | | | 26,000 | | | | 24,667 | |
Astrazeneca Finance LLC, 4.80%, 02/26/2027 | | | 25,000 | | | | 25,342 | |
Baxter International, Inc., 1.92%, 02/01/2027 | | | 27,000 | | | | 25,349 | |
Bristol-Myers Squibb Co., 3.20%, 06/15/2026 | | | 26,000 | | | | 25,512 | |
Cigna Group, 5.69%, 03/15/2026 | | | 26,000 | | | | 25,995 | |
CVS Health Corp., 2.88%, 06/01/2026 | | | 27,000 | | | | 26,182 | |
Elevance Health, Inc., 1.50%, 03/15/2026 | | | 27,000 | | | | 25,782 | |
Eli Lilly & Co., 4.50%, 02/09/2027 | | | 25,000 | | | | 25,223 | |
Gilead Sciences, Inc., 3.65%, 03/01/2026 | | | 24,000 | | | | 23,678 | |
HCA, Inc., 5.38%, 09/01/2026 | | | 26,000 | | | | 26,179 | |
Highmark, Inc., 1.45%, 05/10/2026 (a) | | | 27,000 | | | | 25,389 | |
Johnson & Johnson, 2.45%, 03/01/2026 | | | 26,000 | | | | 25,363 | |
Laboratory Corp. of America Holdings, 1.55%, 06/01/2026 | | | 27,000 | | | | 25,581 | |
Novartis Capital Corp., 2.00%, 02/14/2027 | | | 26,000 | | | | 24,725 | |
Providence St Joseph Health Obligated Group, 2.75%, 10/01/2026 | | | 27,000 | | | | 25,890 | |
Quest Diagnostics, Inc., 3.45%, 06/01/2026 | | | 26,000 | | | | 25,460 | |
Solventum Corp., 5.45%, 02/25/2027 (a) | | | 25,000 | | | | 25,350 | |
Stryker Corp., 3.50%, 03/15/2026 | | | 24,000 | | | | 23,599 | |
Thermo Fisher Scientific, Inc., 5.00%, 12/05/2026 | | | 25,000 | | | | 25,403 | |
UnitedHealth Group, Inc., 1.15%, 05/15/2026 | | | 27,000 | | | | 25,617 | |
Universal Health Services, Inc., 1.65%, 09/01/2026 | | | 27,000 | | | | 25,360 | |
| | | | | | | | 605,899 | |
| | | | | | | | | |
Industrials — 8.0% | | | | | | | | |
3M Co., 2.25%, 09/19/2026 | | | 27,000 | | | | 25,799 | |
Amphenol Corp., 4.75%, 03/30/2026 | | | 25,000 | | | | 25,062 | |
Boeing Co., 2.70%, 02/01/2027 | | | 26,000 | | | | 24,647 | |
Carrier Global Corp., 2.49%, 02/15/2027 | | | 26,000 | | | | 24,920 | |
Caterpillar Financial Services Corp., 4.35%, 05/15/2026 | | | 26,000 | | | | 25,996 | |
CNH Industrial Capital LLC, 1.45%, 07/15/2026 | | | 27,000 | | | | 25,472 | |
CSX Corp., 2.60%, 11/01/2026 | | | 27,000 | | | | 26,059 | |
Emerson Electric Co., 0.88%, 10/15/2026 | | | 28,000 | | | | 26,108 | |
FedEx Corp., 3.25%, 04/01/2026 | | | 26,000 | | | | 25,472 | |
Fortive Corp., 3.15%, 06/15/2026 | | | 26,000 | | | | 25,297 | |
General Dynamics Corp., 1.15%, 06/01/2026 | | | 27,000 | | | | 25,613 | |
The accompanying notes are an integral part of these financial statements.
F/m 2-Year Investment Grade Corporate Bond ETF
Schedule of Investments (Continued)
August 31, 2024
| | Par | | | Value | |
| | | | | | | | | |
CORPORATE BONDS — 87.3% (continued) | | | | | | | | |
Industrials — 8.0% (continued) | | | | | | | | |
Hexcel Corp., 4.20%, 02/15/2027 | | $ | 25,000 | | | $ | 24,402 | |
Honeywell International, Inc., 2.50%, 11/01/2026 | | | 27,000 | | | | 26,064 | |
Howmet Aerospace, Inc., 5.90%, 02/01/2027 | | | 26,000 | | | | 26,799 | |
Hubbell, Inc., 3.35%, 03/01/2026 | | | 24,000 | | | | 23,519 | |
Illinois Tool Works, Inc., 2.65%, 11/15/2026 | | | 27,000 | | | | 26,184 | |
JB Hunt Transport Services, Inc., 3.88%, 03/01/2026 | | | 26,000 | | | | 25,679 | |
John Deere Capital Corp., 4.50%, 01/08/2027 | | | 26,000 | | | | 26,231 | |
L3Harris Technologies, Inc., 5.40%, 01/15/2027 | | | 24,000 | | | | 24,500 | |
Norfolk Southern Corp., 2.90%, 06/15/2026 | | | 26,000 | | | | 25,285 | |
Northrop Grumman Corp., 3.20%, 02/01/2027 | | | 26,000 | | | | 25,311 | |
PACCAR Financial Corp., 5.20%, 11/09/2026 | | | 25,000 | | | | 25,482 | |
Republic Services, Inc., 2.90%, 07/01/2026 | | | 26,000 | | | | 25,286 | |
RTX Corp., 5.75%, 11/08/2026 | | | 25,000 | | | | 25,646 | |
Ryder System, Inc., 2.90%, 12/01/2026 | | | 26,000 | | | | 25,084 | |
Textron, Inc., 4.00%, 03/15/2026 | | | 26,000 | | | | 25,718 | |
Union Pacific Corp., 2.75%, 03/01/2026 | | | 26,000 | | | | 25,352 | |
United Parcel Service, Inc., 2.40%, 11/15/2026 | | | 27,000 | | | | 25,921 | |
Veralto Corp., 5.50%, 09/18/2026 (a) | | | 25,000 | | | | 25,324 | |
Vontier Corp., 1.80%, 04/01/2026 | | | 27,000 | | | | 25,678 | |
Westinghouse Air Brake Technologies Corp., 3.45%, 11/15/2026 | | | 26,000 | | | | 25,361 | |
Xylem, Inc., 3.25%, 11/01/2026 | | | 26,000 | | | | 25,300 | |
| | | | | | | | 814,571 | |
| | | | | | | | | |
Materials — 5.0% | | | | | | | | |
Amcor Finance USA, Inc., 3.63%, 04/28/2026 | | | 26,000 | | | | 25,482 | |
Berry Global, Inc., 4.88%, 07/15/2026 (a) | | | 25,000 | | | | 24,737 | |
Celanese US Holdings LLC, 1.40%, 08/05/2026 | | | 27,000 | | | | 25,242 | |
CF Industries, Inc., 4.50%, 12/01/2026 (a) | | | 26,000 | | | | 25,806 | |
Chevron Phillips Chemical Co. LLC / Chevron Phillips Chemical Co. LP, 3.40%, 12/01/2026 (a) | | | 26,000 | | | | 25,320 | |
Ecolab, Inc., 2.70%, 11/01/2026 | | | 26,000 | | | | 25,125 | |
EIDP, Inc., 4.50%, 05/15/2026 | | | 26,000 | | | | 26,030 | |
FMC Corp., 5.15%, 05/18/2026 | | | 24,000 | | | | 24,145 | |
Georgia-Pacific LLC, 0.95%, 05/15/2026 (a) | | | 27,000 | | | | 25,454 | |
Glencore Funding LLC, 1.63%, 04/27/2026 (a) | | | 27,000 | | | | 25,703 | |
Graphic Packaging International LLC, 1.51%, 04/15/2026 (a) | | | 27,000 | | | | 25,403 | |
Newmont Corp. / Newcrest Finance Pty Ltd., 5.30%, 03/15/2026 (a) | | | 25,000 | | | | 25,231 | |
Owens Corning, 3.40%, 08/15/2026 | | | 26,000 | | | | 25,430 | |
PPG Industries, Inc., 1.20%, 03/15/2026 | | | 27,000 | | | | 25,607 | |
The accompanying notes are an integral part of these financial statements.
F/m 2-Year Investment Grade Corporate Bond ETF
Schedule of Investments (Continued)
August 31, 2024
| | Par | | | Value | |
| | | | | | | | | |
CORPORATE BONDS — 87.3% (continued) | | | | | | | | |
Materials — 5.0% (continued) | | | | | | | | |
Sealed Air Corp., 1.57%, 10/15/2026 (a) | | $ | 28,000 | | | $ | 26,034 | |
Silgan Holdings, Inc., 1.40%, 04/01/2026 (a) | | | 27,000 | | | | 25,413 | |
Sonoco Products Co., 2.25%, 02/01/2027 | | | 26,000 | | | | 24,608 | |
Steel Dynamics, Inc., 5.00%, 12/15/2026 | | | 26,000 | | | | 25,966 | |
Westlake Corp., 3.60%, 08/15/2026 | | | 26,000 | | | | 25,484 | |
WRKCo, Inc., 4.65%, 03/15/2026 | | | 26,000 | | | | 25,883 | |
| | | | | | | | 508,103 | |
| | | | | | | | | |
Technology — 8.2% | | | | | | | | |
Adobe, Inc., 2.15%, 02/01/2027 | | | 26,000 | | | | 24,806 | |
Analog Devices, Inc., 3.50%, 12/05/2026 | | | 24,000 | | | | 23,611 | |
Apple, Inc., 3.35%, 02/09/2027 | | | 25,000 | | | | 24,615 | |
Avnet, Inc., 4.63%, 04/15/2026 | | | 26,000 | | | | 25,840 | |
Broadcom Corp. / Broadcom Cayman Finance Ltd., 3.88%, 01/15/2027 | | | 25,000 | | | | 24,656 | |
Broadridge Financial Solutions, Inc., 3.40%, 06/27/2026 | | | 26,000 | | | | 25,408 | |
CDW LLC / CDW Finance Corp., 2.67%, 12/01/2026 | | | 26,000 | | | | 24,805 | |
Cisco Systems, Inc., 4.80%, 02/26/2027 | | | 26,000 | | | | 26,421 | |
Concentrix Corp., 6.65%, 08/02/2026 | | | 25,000 | | | | 25,693 | |
Dell International LLC / EMC Corp., 6.02%, 06/15/2026 | | | 25,000 | | | | 25,534 | |
DXC Technology Co., 1.80%, 09/15/2026 | | | 27,000 | | | | 25,356 | |
Electronic Arts, Inc., 4.80%, 03/01/2026 | | | 24,000 | | | | 24,014 | |
Fortinet, Inc., 1.00%, 03/15/2026 | | | 27,000 | | | | 25,546 | |
Hewlett Packard Enterprise Co., 1.75%, 04/01/2026 | | | 27,000 | | | | 25,792 | |
HP, Inc., 1.45%, 06/17/2026 | | | 27,000 | | | | 25,569 | |
Intel Corp., 2.60%, 05/19/2026 | | | 26,000 | | | | 24,983 | |
Intuit, Inc., 5.25%, 09/15/2026 | | | 25,000 | | | | 25,479 | |
Jabil, Inc., 1.70%, 04/15/2026 | | | 27,000 | | | | 25,661 | |
Kyndryl Holdings, Inc., 2.05%, 10/15/2026 | | | 27,000 | | | | 25,368 | |
Lam Research Corp., 3.75%, 03/15/2026 | | | 26,000 | | | | 25,725 | |
Marvell Technology, Inc., 1.65%, 04/15/2026 | | | 27,000 | | | | 25,714 | |
Micron Technology, Inc., 4.19%, 02/15/2027 | | | 25,000 | | | | 24,751 | |
Microsoft Corp., 3.30%, 02/06/2027 | | | 25,000 | | | | 24,612 | |
NVIDIA Corp., 3.20%, 09/16/2026 | | | 26,000 | | | | 25,548 | |
Oracle Corp., 2.65%, 07/15/2026 | | | 26,000 | | | | 25,104 | |
Roper Technologies, Inc., 3.80%, 12/15/2026 | | | 24,000 | | | | 23,651 | |
S&P Global, Inc., 2.95%, 01/22/2027 | | | 27,000 | | | | 26,183 | |
Skyworks Solutions, Inc., 1.80%, 06/01/2026 | | | 27,000 | | | | 25,609 | |
Take-Two Interactive Software, Inc., 5.00%, 03/28/2026 | | | 24,000 | | | | 24,112 | |
The accompanying notes are an integral part of these financial statements.
F/m 2-Year Investment Grade Corporate Bond ETF
Schedule of Investments (Continued)
August 31, 2024
| | Par | | | Value | |
| | | | | | | | | |
CORPORATE BONDS — 87.3% (continued) | | | | | | | | |
Technology — 8.2% (continued) | | | | | | | | |
TD SYNNEX Corp., 1.75%, 08/09/2026 | | $ | 27,000 | | | $ | 25,434 | |
Teledyne Technologies, Inc., 1.60%, 04/01/2026 | | | 27,000 | | | | 25,709 | |
Texas Instruments, Inc., 4.60%, 02/08/2027 | | | 26,000 | | | | 26,277 | |
VMware LLC, 1.40%, 08/15/2026 | | | 27,000 | | | | 25,397 | |
| | | | | | | | 832,983 | |
| | | | | | | | | |
Utilities — 8.0% | | | | | | | | |
Ameren Corp., 5.70%, 12/01/2026 | | | 25,000 | | | | 25,574 | |
Black Hills Corp., 3.15%, 01/15/2027 | | | 27,000 | | | | 26,134 | |
CenterPoint Energy, Inc., 1.45%, 06/01/2026 | | | 27,000 | | | | 25,487 | |
Cleco Corporate Holdings LLC, 3.74%, 05/01/2026 | | | 26,000 | | | | 25,470 | |
CMS Energy Corp., 3.00%, 05/15/2026 | | | 26,000 | | | | 25,241 | |
Dominion Energy, Inc., 1.45%, 04/15/2026 | | | 26,000 | | | | 24,696 | |
DTE Energy Co., 2.85%, 10/01/2026 | | | 25,000 | | | | 24,184 | |
Duke Energy Corp., 2.65%, 09/01/2026 | | | 25,000 | | | | 24,118 | |
Emera US Finance LP, 3.55%, 06/15/2026 | | | 26,000 | | | | 25,318 | |
Entergy Corp., 2.95%, 09/01/2026 | | | 25,000 | | | | 24,235 | |
Evergy Kansas Central, Inc., 2.55%, 07/01/2026 | | | 26,000 | | | | 25,141 | |
Eversource Energy, 4.75%, 05/15/2026 | | | 26,000 | | | | 26,008 | |
Exelon Corp., 3.40%, 04/15/2026 | | | 26,000 | | | | 25,520 | |
FirstEnergy Pennsylvania Electric Co., 5.15%, 03/30/2026 (a) | | | 24,000 | | | | 24,086 | |
ITC Holdings Corp., 3.25%, 06/30/2026 | | | 26,000 | | | | 25,336 | |
KeySpan Gas East Corp., 2.74%, 08/15/2026 (a) | | | 27,000 | | | | 25,867 | |
National Fuel Gas Co., 5.50%, 10/01/2026 | | | 24,000 | | | | 24,353 | |
National Rural Utilities Cooperative Finance Corp., 4.80%, 02/05/2027 | | | 26,000 | | | | 26,317 | |
New York State Electric & Gas Corp., 3.25%, 12/01/2026 (a) | | | 26,000 | | | | 25,109 | |
NextEra Energy Capital Holdings, Inc., 1.88%, 01/15/2027 | | | 27,000 | | | | 25,441 | |
Pacific Gas and Electric Co., 2.95%, 03/01/2026 | | | 26,000 | | | | 25,225 | |
PPL Capital Funding, Inc., 3.10%, 05/15/2026 | | | 26,000 | | | | 25,308 | |
Public Service Electric and Gas Co., 0.95%, 03/15/2026 | | | 27,000 | | | | 25,581 | |
Sempra, 5.40%, 08/01/2026 | | | 25,000 | | | | 25,368 | |
Sierra Pacific Power Co., 2.60%, 05/01/2026 | | | 26,000 | | | | 25,170 | |
Southern California Edison Co., 5.35%, 03/01/2026 | | | 25,000 | | | | 25,298 | |
Southern Co., 3.25%, 07/01/2026 | | | 26,000 | | | | 25,378 | |
Southwestern Electric Power Co., 1.65%, 03/15/2026 | | | 27,000 | | | | 25,834 | |
Spire, Inc., 5.30%, 03/01/2026 | | | 24,000 | | | | 24,154 | |
The accompanying notes are an integral part of these financial statements.
F/m 2-Year Investment Grade Corporate Bond ETF
Schedule of Investments (Continued)
August 31, 2024
| | Par | | | Value | |
| | | | | | | | | |
CORPORATE BONDS — 87.3% (continued) | | | | | | | | |
Utilities — 8.0% (continued) | | | | | | | | |
Vistra Operations Co. LLC, 3.70%, 01/30/2027 (a) | | $ | 27,000 | | | $ | 26,274 | |
WEC Energy Group, Inc., 5.60%, 09/12/2026 | | | 24,000 | | | | 24,481 | |
Xcel Energy, Inc., 3.35%, 12/01/2026 | | | 26,000 | | | | 25,291 | |
| | | | | | | | 806,997 | |
TOTAL CORPORATE BONDS (Cost $8,764,476) | | | | | | | 8,842,474 | |
| | | | | | | | | |
FOREIGN CORPORATE BONDS — 11.2% | | | | | | | | |
Communications — 0.5% | | | | | | | | |
Rogers Communications, Inc., 2.90%, 11/15/2026 | | | 26,000 | | | | 25,067 | |
TELUS Corp., 2.80%, 02/16/2027 | | | 26,000 | | | | 24,915 | |
| | | | | | | | 49,982 | |
| | | | | | | | | |
Consumer Discretionary — 0.2% | | | | | | | | |
Magna International, Inc., 5.98%, 03/21/2026 | | | 24,000 | | | | 24,001 | |
| | | | | | | | | |
Consumer Staples — 0.5% | | | | | | | | |
BAT International Finance PLC, 1.67%, 03/25/2026 | | | 27,000 | | | | 25,770 | |
JBS USA LUX SA / JBS USA Food Co. / JBS USA Finance, Inc., 2.50%, 01/15/2027 | | | 27,000 | | | | 25,635 | |
| | | | | | | | 51,405 | |
| | | | | | | | | |
Energy — 1.0% | | | | | | | | |
Enbridge, Inc., 5.90%, 11/15/2026 | | | 25,000 | | | | 25,700 | |
Shell International Finance BV, 2.88%, 05/10/2026 | | | 26,000 | | | | 25,419 | |
TransCanada PipeLines Ltd., 6.20%, 03/09/2026 | | | 24,000 | | | | 24,003 | |
Woodside Finance Ltd., 3.70%, 09/15/2026 (a) | | | 26,000 | | | | 25,405 | |
| | | | | | | | 100,527 | |
| | | | | | | | | |
Financials — 3.8% | | | | | | | | |
Aircastle Ltd., 4.25%, 06/15/2026 | | | 26,000 | | | | 25,649 | |
Avolon Holdings Funding Ltd., 4.25%, 04/15/2026 (a) | | | 26,000 | | | | 25,597 | |
Bank of Montreal, 5.30%, 06/05/2026 | | | 25,000 | | | | 25,341 | |
Bank of Nova Scotia, 2.70%, 08/03/2026 | | | 26,000 | | | | 25,148 | |
Brookfield Finance, Inc., 4.25%, 06/02/2026 | | | 25,000 | | | | 24,788 | |
Canadian Imperial Bank of Commerce, 5.93%, 10/02/2026 | | | 25,000 | | | | 25,702 | |
Commonwealth Bank of Australia, 1.13%, 06/15/2026 (a) | | | 27,000 | | | | 25,530 | |
GAIF Bond Issuer Pty Ltd., 3.40%, 09/30/2026 (a) | | | 26,000 | | | | 25,281 | |
Macquarie Group Ltd., 1.63% to 09/23/2026 then SOFR + 0.91%, 09/23/2027 (a) | | | 26,000 | | | | 24,394 | |
The accompanying notes are an integral part of these financial statements.
F/m 2-Year Investment Grade Corporate Bond ETF
Schedule of Investments (Continued)
August 31, 2024
| | Par | | | Value | |
| | | | | | | | | |
FOREIGN CORPORATE BONDS — 11.2% (continued) | | | | | | | | |
Financials — 3.8% (continued) | | | | | | | | |
Manulife Financial Corp., 4.15%, 03/04/2026 | | $ | 26,000 | | | $ | 25,869 | |
Royal Bank of Canada, 1.20%, 04/27/2026 | | | 27,000 | | | | 25,643 | |
Sumitomo Mitsui Financial Group, Inc., 2.63%, 07/14/2026 | | | 26,000 | | | | 25,115 | |
Toronto-Dominion Bank, 5.53%, 07/17/2026 | | | 25,000 | | | | 25,465 | |
Trinity Acquisition PLC, 4.40%, 03/15/2026 | | | 26,000 | | | | 25,824 | |
Westpac Banking Corp., 2.85%, 05/13/2026 | | | 26,000 | | | | 25,347 | |
| | | | | | | | 380,693 | |
| | | | | | | | | |
Health Care — 0.7% | | | | | | | | |
Pfizer Investment Enterprises Pte Ltd., 4.45%, 05/19/2026 | | | 25,000 | | | | 25,014 | |
Shire Acquisitions Investments Ireland DAC, 3.20%, 09/23/2026 | | | 26,000 | | | | 25,434 | |
Utah Acquisition Sub, Inc., 3.95%, 06/15/2026 | | | 26,000 | | | | 25,630 | |
| | | | | | | | 76,078 | |
| | | | | | | | | |
Industrials — 1.5% | | | | | | | | |
Canadian National Railway Co., 2.75%, 03/01/2026 | | | 26,000 | | | | 25,377 | |
Canadian Pacific Railway Co., 1.75%, 12/02/2026 | | | 27,000 | | | | 25,480 | |
Element Fleet Management Corp., 6.27%, 06/26/2026 (a) | | | 25,000 | | | | 25,570 | |
Sydney Airport Finance Co. Pty Ltd., 3.63%, 04/28/2026 (a) | | | 24,000 | | | | 23,562 | |
Trane Technologies Financing Ltd., 3.50%, 03/21/2026 | | | 26,000 | | | | 25,543 | |
Triton Container International Ltd., 2.05%, 04/15/2026 (a) | | | 27,000 | | | | 25,689 | |
| | | | | | | | 151,221 | |
| | | | | | | | | |
Materials — 1.5% | | | | | | | | |
ArcelorMittal SA, 4.55%, 03/11/2026 | | | 26,000 | | | | 25,863 | |
BHP Billiton Finance USA Ltd., 5.25%, 09/08/2026 | | | 26,000 | | | | 26,415 | |
CCL Industries, Inc., 3.25%, 10/01/2026 (a) | | | 25,000 | | | | 24,217 | |
Nutrien Ltd., 4.00%, 12/15/2026 | | | 26,000 | | | | 25,691 | |
Suzano International Finance BV, 5.50%, 01/17/2027 | | | 25,000 | | | | 25,201 | |
Yara International ASA, 3.80%, 06/06/2026 (a) | | | 26,000 | | | | 25,493 | |
| | | | | | | | 152,880 | |
| | | | | | | | | |
Technology — 1.0% | | | | | | | | |
CGI, Inc., 1.45%, 09/14/2026 | | | 27,000 | | | | 25,283 | |
Genpact Luxembourg SARL/Genpact USA, Inc., 1.75%, 04/10/2026 | | | 27,000 | | | | 25,731 | |
NXP BV / NXP Funding LLC / NXP USA, Inc., 3.88%, 06/18/2026 | | | 26,000 | | | | 25,631 | |
Thomson Reuters Corp., 3.35%, 05/15/2026 | | | 26,000 | | | | 25,418 | |
| | | | | | | | 102,063 | |
The accompanying notes are an integral part of these financial statements.
F/m 2-Year Investment Grade Corporate Bond ETF
Schedule of Investments (Concluded)
August 31, 2024
| | Par | | | Value | |
| | | | | | | | | |
FOREIGN CORPORATE BONDS — 11.2% (continued) | | | | | | | | |
Utilities — 0.5% | | | | | | | | |
Algonquin Power & Utilities Corp., 5.37%, 06/15/2026 (b) | | $ | 25,000 | | | $ | 25,179 | |
Fortis, Inc., 3.06%, 10/04/2026 | | | 26,000 | | | | 25,081 | |
| | | | | | | | 50,260 | |
TOTAL FOREIGN CORPORATE BONDS (Cost $1,129,237) | | | | | | | 1,139,110 | |
| | | | | | | | | |
TOTAL INVESTMENTS — 98.5% (Cost $9,893,713) | | | | | | $ | 9,981,584 | |
Other Assets in Excess of Liabilities — 1.5% | | | | | | | 143,876 | |
TOTAL NET ASSETS — 100.0% | | | | | | $ | 10,125,460 | |
Percentages are stated as a percent of net assets.
ASA - Advanced Subscription Agreement
CMT - Constant Maturity Treasury Rate
PLC - Public Limited Company
SA - Sociedad Anónima
SOFR - Secured Overnight Financing Rate
(a) | Security is exempt from registration pursuant to Rule 144A under the Securities Act of 1933, as amended. These securities may only be resold in transactions exempt from registration to qualified institutional investors. As of August 31, 2024, the value of these securities total $1,511,341 or 14.9% of the Fund’s net assets. |
(b) | Step coupon bond. The rate disclosed is as of August 31, 2024. |
The accompanying notes are an integral part of these financial statements.
F/m 3-Year Investment Grade Corporate Bond ETF
Schedule of Investments
August 31, 2024
| | Par | | | Value | |
| | | | | | | | | |
CORPORATE BONDS — 88.0% | | | | | | | | |
Communications — 2.2% | | | | | | | | |
Alphabet, Inc., 0.80%, 08/15/2027 | | $ | 60,000 | | | $ | 55,012 | |
AT&T, Inc., 2.30%, 06/01/2027 | | | 58,000 | | | | 54,859 | |
Comcast Corp., 3.30%, 02/01/2027 | | | 57,000 | | | | 55,694 | |
Cox Communications, Inc., 3.50%, 08/15/2027 (a) | | | 57,000 | | | | 55,180 | |
Expedia Group, Inc., 4.63%, 08/01/2027 | | | 57,000 | | | | 57,162 | |
Meta Platforms, Inc., 3.50%, 08/15/2027 | | | 57,000 | | | | 56,147 | |
T-Mobile USA, Inc., 3.75%, 04/15/2027 | | | 57,000 | | | | 55,965 | |
Walt Disney Co., 2.20%, 01/13/2028 | | | 59,000 | | | | 55,394 | |
Warnermedia Holdings, Inc., 3.76%, 03/15/2027 | | | 59,000 | | | | 56,525 | |
| | | | | | | | 501,938 | |
| | | | | | | | | |
Consumer Discretionary — 8.6% | | | | | | | | |
Amazon.com, Inc., 3.15%, 08/22/2027 | | | 55,000 | | | | 53,660 | |
AutoNation, Inc., 3.80%, 11/15/2027 | | | 57,000 | | | | 55,072 | |
AutoZone, Inc., 3.75%, 06/01/2027 | | | 57,000 | | | | 55,942 | |
BMW US Capital LLC, 4.90%, 04/02/2027 (a) | | | 54,000 | | | | 54,684 | |
BorgWarner, Inc., 2.65%, 07/01/2027 (b) | | | 58,000 | | | | 55,258 | |
Cintas Corp. No 2, 3.70%, 04/01/2027 | | | 56,000 | | | | 55,197 | |
Darden Restaurants, Inc., 3.85%, 05/01/2027 | | | 57,000 | | | | 55,912 | |
DR Horton, Inc., 1.40%, 10/15/2027 | | | 59,000 | | | | 53,882 | |
eBay, Inc., 3.60%, 06/05/2027 | | | 55,000 | | | | 53,881 | |
General Motors Financial Co., Inc., 5.00%, 04/09/2027 | | | 55,000 | | | | 55,476 | |
Harley-Davidson Financial Services, Inc., 3.05%, 02/14/2027 (a) | | | 56,000 | | | | 53,494 | |
Hasbro, Inc., 3.50%, 09/15/2027 | | | 57,000 | | | | 54,852 | |
Home Depot, Inc., 4.88%, 06/25/2027 | | | 54,000 | | | | 55,045 | |
Hyundai Capital America, 5.30%, 03/19/2027 (a) | | | 54,000 | | | | 54,793 | |
Las Vegas Sands Corp., 5.90%, 06/01/2027 | | | 54,000 | | | | 55,123 | |
Lear Corp., 3.80%, 09/15/2027 | | | 55,000 | | | | 53,520 | |
Leggett & Platt, Inc., 3.50%, 11/15/2027 | | | 57,000 | | | | 54,226 | |
Leland Stanford Junior University, 1.29%, 06/01/2027 | | | 58,000 | | | | 53,832 | |
Lennar Corp., 4.75%, 11/29/2027 | | | 55,000 | | | | 55,489 | |
Lowe’s Cos., Inc., 3.10%, 05/03/2027 | | | 59,000 | | | | 57,052 | |
Marriott International, Inc./MD, 5.00%, 10/15/2027 | | | 54,000 | | | | 54,844 | |
Masco Corp., 3.50%, 11/15/2027 | | | 57,000 | | | | 55,183 | |
Mattel, Inc., 5.88%, 12/15/2027 (a) | | | 54,000 | | | | 54,578 | |
McDonald’s Corp., 3.50%, 07/01/2027 | | | 56,000 | | | | 54,799 | |
Meritage Homes Corp., 5.13%, 06/06/2027 | | | 55,000 | | | | 55,340 | |
The accompanying notes are an integral part of these financial statements.
F/m 3-Year Investment Grade Corporate Bond ETF
Schedule of Investments (continued)
August 31, 2024
| | Par | | | Value | |
| | | | | | | | | |
CORPORATE BONDS — 88.0% (continued) | | | | | | | | |
Consumer Discretionary — 8.6% (continued) | | | | | | | | |
Mileage Plus Holdings LLC / Mileage Plus Intellectual Property Assets Ltd., 6.50%, 06/20/2027 (a) | | $ | 55,200 | | | $ | 55,712 | |
NIKE, Inc., 2.75%, 03/27/2027 | | | 59,000 | | | | 56,989 | |
O’Reilly Automotive, Inc., 3.60%, 09/01/2027 | | | 56,000 | | | | 54,698 | |
Snap-on, Inc., 3.25%, 03/01/2027 | | | 56,000 | | | | 54,643 | |
Southwest Airlines Co., 5.13%, 06/15/2027 | | | 57,000 | | | | 57,481 | |
Starbucks Corp., 4.85%, 02/08/2027 | | | 56,000 | | | | 56,544 | |
Tapestry, Inc., 4.13%, 07/15/2027 | | | 60,000 | | | | 58,619 | |
Toll Brothers Finance Corp., 4.88%, 03/15/2027 | | | 55,000 | | | | 55,055 | |
Toyota Motor Credit Corp., 3.05%, 03/22/2027 | | | 57,000 | | | | 55,425 | |
VF Corp., 2.80%, 04/23/2027 | | | 61,000 | | | | 57,115 | |
| | | | | | | | 1,933,415 | |
| | | | | | | | | |
Consumer Staples — 7.5% | | | | | | | | |
BAT Capital Corp., 3.56%, 08/15/2027 | | | 57,000 | | | | 55,603 | |
Bunge Ltd. Finance Corp., 3.75%, 09/25/2027 | | | 55,000 | | | | 53,897 | |
Campbell Soup Co., 5.20%, 03/19/2027 | | | 54,000 | | | | 55,128 | |
Cargill, Inc., 3.63%, 04/22/2027 (a) | | | 57,000 | | | | 55,987 | |
Church & Dwight Co., Inc., 3.15%, 08/01/2027 | | | 57,000 | | | | 55,358 | |
Clorox Co., 3.10%, 10/01/2027 | | | 56,000 | | | | 53,863 | |
Coca-Cola Co., 1.45%, 06/01/2027 | | | 61,000 | | | | 56,994 | |
Colgate-Palmolive Co., 3.10%, 08/15/2027 | | | 57,000 | | | | 55,657 | |
Conagra Brands, Inc., 1.38%, 11/01/2027 | | | 61,000 | | | | 55,362 | |
Constellation Brands, Inc., 4.35%, 05/09/2027 | | | 55,000 | | | | 54,796 | |
Costco Wholesale Corp., 1.38%, 06/20/2027 | | | 59,000 | | | | 54,897 | |
Dollar General Corp., 3.88%, 04/15/2027 | | | 57,000 | | | | 55,692 | |
Estee Lauder Cos., Inc., 3.15%, 03/15/2027 | | | 55,000 | | | | 53,500 | |
General Mills, Inc., 3.20%, 02/10/2027 | | | 57,000 | | | | 55,319 | |
Hormel Foods Corp., 4.80%, 03/30/2027 | | | 57,000 | | | | 57,771 | |
J M Smucker Co., 3.38%, 12/15/2027 | | | 59,000 | | | | 57,332 | |
Kellanova, 3.40%, 11/15/2027 | | | 57,000 | | | | 55,311 | |
Keurig Dr Pepper, Inc., 5.10%, 03/15/2027 | | | 54,000 | | | | 54,900 | |
Kimberly-Clark Corp., 1.05%, 09/15/2027 | | | 62,000 | | | | 56,514 | |
Kraft Heinz Foods Co., 3.88%, 05/15/2027 | | | 57,000 | | | | 56,207 | |
Kroger Co., 3.70%, 08/01/2027 | | | 56,000 | | | | 54,873 | |
McCormick & Co., Inc., 3.40%, 08/15/2027 | | | 57,000 | | | | 55,554 | |
Mondelez International, Inc., 2.63%, 03/17/2027 | | | 56,000 | | | | 53,592 | |
PepsiCo, Inc., 3.00%, 10/15/2027 | | | 58,000 | | | | 56,235 | |
The accompanying notes are an integral part of these financial statements.
F/m 3-Year Investment Grade Corporate Bond ETF
Schedule of Investments (continued)
August 31, 2024
| | Par | | | Value | |
| | | | | | | | | |
CORPORATE BONDS — 88.0% (continued) | | | | | | | | |
Consumer Staples — 7.5% (continued) | | | | | | | | |
Philip Morris International, Inc., 5.13%, 11/17/2027 | | $ | 54,000 | | | $ | 55,205 | |
Procter & Gamble Co., 1.90%, 02/01/2027 | | | 58,000 | | | | 55,130 | |
Smithfield Foods, Inc., 4.25%, 02/01/2027 (a) | | | 58,000 | | | | 56,811 | |
Sysco Corp., 3.25%, 07/15/2027 | | | 59,000 | | | | 57,070 | |
Tyson Foods, Inc., 3.55%, 06/02/2027 | | | 59,000 | | | | 57,578 | |
Walmart, Inc., 3.95%, 09/09/2027 | | | 55,000 | | | | 55,094 | |
| | | | | | | | 1,667,230 | |
| | | | | | | | | |
Energy — 7.9% | | | | | | | | |
Baker Hughes Holdings LLC / Baker Hughes Co.-Obligor, Inc., 3.34%, 12/15/2027 | | | 57,000 | | | | 55,292 | |
Boardwalk Pipelines LP, 4.45%, 07/15/2027 | | | 58,000 | | | | 57,700 | |
Cheniere Corpus Christi Holdings LLC, 5.13%, 06/30/2027 | | | 54,000 | | | | 54,543 | |
Chevron Corp., 2.00%, 05/11/2027 | | | 58,000 | | | | 54,940 | |
Continental Resources, Inc./OK, 4.38%, 01/15/2028 | | | 56,000 | | | | 54,941 | |
Coterra Energy, Inc., 3.90%, 05/15/2027 | | | 57,000 | | | | 55,869 | |
DCP Midstream Operating LP, 5.63%, 07/15/2027 | | | 55,000 | | | | 56,428 | |
Devon Energy Corp., 5.25%, 10/15/2027 | | | 54,000 | | | | 54,330 | |
Diamondback Energy, Inc., 5.20%, 04/18/2027 | | | 54,000 | | | | 54,910 | |
Energy Transfer LP, 5.50%, 06/01/2027 | | | 54,000 | | | | 55,062 | |
Eni USA, Inc., 7.30%, 11/15/2027 | | | 52,000 | | | | 56,208 | |
EnLink Midstream LLC, 5.63%, 01/15/2028 (a) | | | 55,000 | | | | 56,013 | |
Enterprise Products Operating LLC, 3.95%, 02/15/2027 | | | 57,000 | | | | 56,543 | |
EQT Corp., 3.90%, 10/01/2027 | | | 57,000 | | | | 55,695 | |
Exxon Mobil Corp., 3.29%, 03/19/2027 | | | 58,000 | | | | 57,164 | |
Gray Oak Pipeline LLC, 3.45%, 10/15/2027 (a) | | | 56,000 | | | | 53,707 | |
Hess Corp., 4.30%, 04/01/2027 | | | 56,000 | | | | 55,617 | |
HF Sinclair Corp., 6.38%, 04/15/2027 (a) | | | 55,000 | | | | 55,425 | |
Marathon Oil Corp., 4.40%, 07/15/2027 | | | 55,000 | | | | 54,794 | |
MPLX LP, 4.13%, 03/01/2027 | | | 56,000 | | | | 55,384 | |
NGPL PipeCo LLC, 4.88%, 08/15/2027 (a) | | | 56,000 | | | | 55,894 | |
Occidental Petroleum Corp., 5.00%, 08/01/2027 | | | 55,000 | | | | 55,456 | |
ONEOK, Inc., 4.00%, 07/13/2027 | | | 59,000 | | | | 58,244 | |
Phillips 66 Co., 4.95%, 12/01/2027 | | | 54,000 | | | | 54,843 | |
Sabine Pass Liquefaction LLC, 5.00%, 03/15/2027 | | | 55,000 | | | | 55,378 | |
Schlumberger Holdings Corp., 5.00%, 05/29/2027 (a) | | | 54,000 | | | | 54,788 | |
Targa Resources Corp., 5.20%, 07/01/2027 | | | 54,000 | | | | 54,795 | |
TC PipeLines LP, 3.90%, 05/25/2027 | | | 55,000 | | | | 53,763 | |
Tennessee Gas Pipeline Co. LLC, 7.00%, 03/15/2027 | | | 54,000 | | | | 56,816 | |
The accompanying notes are an integral part of these financial statements.
F/m 3-Year Investment Grade Corporate Bond ETF
Schedule of Investments (continued)
August 31, 2024
| | Par | | | Value | |
| | | | | | | | | |
CORPORATE BONDS — 88.0% (continued) | | | | | | | | |
Energy — 7.9% (continued) | | | | | | | | |
Texas Eastern Transmission LP, 3.50%, 01/15/2028 (a) | | $ | 57,000 | | | $ | 54,785 | |
Valero Energy Corp., 2.15%, 09/15/2027 | | | 59,000 | | | | 55,232 | |
Williams Cos., Inc., 3.75%, 06/15/2027 | | | 55,000 | | | | 53,863 | |
| | | | | | | | 1,774,422 | |
| | | | | | | | | |
Financials — 25.4% | | | | | | | | |
Air Lease Corp., 5.85%, 12/15/2027 | | | 53,000 | | | | 54,903 | |
Alexandria Real Estate Equities, Inc., 3.95%, 01/15/2028 | | | 56,000 | | | | 54,832 | |
Ally Financial, Inc., 7.10%, 11/15/2027 | | | 54,000 | | | | 57,347 | |
American Equity Investment Life Holding Co., 5.00%, 06/15/2027 | | | 55,000 | | | | 54,929 | |
American Express Credit Corp., 3.30%, 05/03/2027 | | | 57,000 | | | | 55,899 | |
American Tower Corp., 3.55%, 07/15/2027 | | | 57,000 | | | | 55,335 | |
Andrew W Mellon Foundation, 0.95%, 08/01/2027 | | | 58,000 | | | | 53,076 | |
Aon North America, Inc., 5.13%, 03/01/2027 | | | 54,000 | | | | 54,979 | |
Ares Capital Corp., 2.88%, 06/15/2027 | | | 59,000 | | | | 55,363 | |
Athene Holding Ltd., 4.13%, 01/12/2028 | | | 56,000 | | | | 54,899 | |
AvalonBay Communities, Inc., 3.20%, 01/15/2028 | | | 57,000 | | | | 54,777 | |
Aviation Capital Group LLC, 3.50%, 11/01/2027 (a) | | | 57,000 | | | | 54,635 | |
Bank of America Corp., 3.42% to 12/20/2027 then 3 mo. Term SOFR + 1.30%, 12/20/2028 | | | 57,000 | | | | 54,960 | |
Bank of New York Mellon Corp., 5.80% to 10/25/2027 then SOFR + 1.80%, 10/25/2028 | | | 55,000 | | | | 57,326 | |
Berkshire Hathaway Finance Corp., 2.30%, 03/15/2027 | | | 57,000 | | | | 54,691 | |
BlackRock Funding, Inc., 4.60%, 07/26/2027 | | | 55,000 | | | | 55,789 | |
Blackstone Holdings Finance Co. LLC, 5.90%, 11/03/2027 (a) | | | 53,000 | | | | 55,070 | |
Blackstone Private Credit Fund, 3.25%, 03/15/2027 | | | 59,000 | | | | 55,871 | |
Blackstone Secured Lending Fund, 2.13%, 02/15/2027 | | | 59,000 | | | | 54,623 | |
Blue Owl Capital Corp. III, 3.13%, 04/13/2027 | | | 61,000 | | | | 57,167 | |
Blue Owl Credit Income Corp., 7.75%, 09/16/2027 | | | 54,000 | | | | 56,852 | |
Boston Properties LP, 6.75%, 12/01/2027 | | | 55,000 | | | | 57,487 | |
Brighthouse Financial, Inc., 3.70%, 06/22/2027 | | | 56,000 | | | | 54,167 | |
Brixmor Operating Partnership LP, 3.90%, 03/15/2027 | | | 55,000 | | | | 53,790 | |
Cantor Fitzgerald LP, 4.50%, 04/14/2027 (a) | | | 55,000 | | | | 54,210 | |
Capital One Financial Corp., 4.93% to 05/10/2027 then SOFR + 2.06%, 05/10/2028 | | | 55,000 | | | | 55,270 | |
Charles Schwab Corp., 2.45%, 03/03/2027 | | | 58,000 | | | | 55,233 | |
Citigroup, Inc., 4.45%, 09/29/2027 | | | 55,000 | | | | 54,741 | |
CNA Financial Corp., 3.45%, 08/15/2027 | | | 57,000 | | | | 55,423 | |
CNO Global Funding, 5.88%, 06/04/2027 (a) | | | 54,000 | | | | 55,330 | |
Corebridge Financial, Inc., 3.65%, 04/05/2027 | | | 55,000 | | | | 53,851 | |
Crown Castle, Inc., 5.00%, 01/11/2028 | | | 55,000 | | | | 55,496 | |
The accompanying notes are an integral part of these financial statements.
F/m 3-Year Investment Grade Corporate Bond ETF
Schedule of Investments (continued)
August 31, 2024
| | Par | | | Value | |
| | | | | | | | | |
CORPORATE BONDS — 88.0% (continued) | | | | | | | | |
Financials — 25.4% (continued) | | | | | | | | |
Digital Realty Trust LP, 3.70%, 08/15/2027 | | $ | 57,000 | | | $ | 55,599 | |
Discover Financial Services, 4.10%, 02/09/2027 | | | 58,000 | | | | 57,000 | |
Eaton Vance Corp., 3.50%, 04/06/2027 | | | 55,000 | | | | 53,775 | |
Empower Finance 2020 LP, 1.36%, 09/17/2027 (a) | | | 60,000 | | | | 54,464 | |
EPR Properties, 4.50%, 06/01/2027 | | | 59,000 | | | | 57,740 | |
Equinix, Inc., 1.80%, 07/15/2027 | | | 59,000 | | | | 54,834 | |
Equitable Financial Life Global Funding, 1.40%, 08/27/2027 (a) | | | 59,000 | | | | 53,916 | |
ERP Operating LP, 3.25%, 08/01/2027 | | | 57,000 | | | | 55,376 | |
Essex Portfolio LP, 3.63%, 05/01/2027 | | | 55,000 | | | | 53,672 | |
Extra Space Storage LP, 3.88%, 12/15/2027 | | | 56,000 | | | | 54,781 | |
F&G Annuities & Life, Inc., 7.40%, 01/13/2028 | | | 53,000 | | | | 55,534 | |
Federal Realty OP LP, 3.25%, 07/15/2027 | | | 59,000 | | | | 56,768 | |
Fiserv, Inc., 2.25%, 06/01/2027 | | | 59,000 | | | | 55,673 | |
FS KKR Capital Corp., 3.25%, 07/15/2027 | | | 61,000 | | | | 57,264 | |
GATX Corp., 5.40%, 03/15/2027 | | | 56,000 | | | | 57,042 | |
Global Payments, Inc., 4.95%, 08/15/2027 | | | 55,000 | | | | 55,605 | |
Goldman Sachs BDC, Inc., 6.38%, 03/11/2027 | | | 57,000 | | | | 58,624 | |
Goldman Sachs Group, Inc., 3.62% to 03/15/2027 then SOFR + 1.85%, 03/15/2028 | | | 55,000 | | | | 53,693 | |
Golub Capital BDC, Inc., 2.05%, 02/15/2027 | | | 59,000 | | | | 54,297 | |
Guardian Life Global Funding, 1.25%, 11/19/2027 (a) | | | 62,000 | | | | 56,186 | |
HAT Holdings I LLC / HAT Holdings II LLC, 8.00%, 06/15/2027 (a) | | | 53,000 | | | | 55,533 | |
Healthcare Realty Holdings LP, 3.75%, 07/01/2027 | | | 56,000 | | | | 54,466 | |
Healthpeak OP LLC, 1.35%, 02/01/2027 | | | 60,000 | | | | 55,613 | |
Highwoods Realty LP, 3.88%, 03/01/2027 | | | 55,000 | | | | 53,228 | |
Jackson Financial, Inc., 5.17%, 06/08/2027 | | | 57,000 | | | | 57,775 | |
Jefferies Financial Group, Inc., 6.45%, 06/08/2027 | | | 56,000 | | | | 58,608 | |
JPMorgan Chase & Co., 4.85% to 07/25/2027 then SOFR + 1.99%, 07/25/2028 | | | 58,000 | | | | 58,521 | |
Kimco Realty OP LLC, 3.80%, 04/01/2027 | | | 57,000 | | | | 55,853 | |
Lazard Group LLC, 3.63%, 03/01/2027 | | | 56,000 | | | | 54,629 | |
LPL Holdings, Inc., 5.70%, 05/20/2027 | | | 54,000 | | | | 54,973 | |
Main Street Capital Corp., 6.50%, 06/04/2027 | | | 54,000 | | | | 55,190 | |
Markel Group, Inc., 3.50%, 11/01/2027 | | | 59,000 | | | | 57,191 | |
Mastercard, Inc., 3.30%, 03/26/2027 | | | 57,000 | | | | 55,875 | |
Mercury General Corp., 4.40%, 03/15/2027 | | | 58,000 | | | | 56,994 | |
Mid-America Apartments LP, 3.60%, 06/01/2027 | | | 55,000 | | | | 53,785 | |
Morgan Stanley Direct Lending Fund, 4.50%, 02/11/2027 | | | 57,000 | | | | 56,148 | |
Mutual of Omaha Cos. Global Funding, 5.35%, 04/09/2027 (a) | | | 54,000 | | | | 55,026 | |
New York Life Global Funding, 4.85%, 01/09/2028 (a) | | | 55,000 | | | | 55,810 | |
The accompanying notes are an integral part of these financial statements.
F/m 3-Year Investment Grade Corporate Bond ETF
Schedule of Investments (continued)
August 31, 2024
| | Par | | | Value | |
| | | | | | | | | |
CORPORATE BONDS — 88.0% (continued) | | | | | | | | |
Financials — 25.4% (continued) | | | | | | | | |
NNN REIT, Inc., 3.50%, 10/15/2027 | | $ | 59,000 | | | $ | 57,245 | |
Northern Trust Corp., 4.00%, 05/10/2027 | | | 55,000 | | | | 54,775 | |
Northwestern Mutual Global Funding, 5.07%, 03/25/2027 (a) | | | 55,000 | | | | 56,187 | |
Omega Healthcare Investors, Inc., 4.50%, 04/01/2027 | | | 58,000 | | | | 57,308 | |
Pacific Life Global Funding II, 1.45%, 01/20/2028 (a) | | | 61,000 | | | | 55,211 | |
PayPal Holdings, Inc., 3.90%, 06/01/2027 | | | 56,000 | | | | 55,545 | |
Penske Truck Leasing Co. Lp / PTL Finance Corp., 4.40%, 07/01/2027 (a) | | | 56,000 | | | | 55,655 | |
Progressive Corp., 2.50%, 03/15/2027 | | | 57,000 | | | | 54,545 | |
Prologis LP, 2.13%, 04/15/2027 | | | 58,000 | | | | 54,891 | |
Prudential Financial, Inc., 4.50% to 09/15/2027 then 3 mo. LIBOR US + 2.38%, 09/15/2047 (c) | | | 59,000 | | | | 56,445 | |
Public Storage Operating Co., 3.09%, 09/15/2027 | | | 57,000 | | | | 54,993 | |
Radian Group, Inc., 4.88%, 03/15/2027 | | | 55,000 | | | | 54,770 | |
Realty Income Corp., 3.40%, 01/15/2028 | | | 57,000 | | | | 55,033 | |
Regency Centers LP, 3.60%, 02/01/2027 | | | 58,000 | | | | 56,712 | |
Reliance Standard Life Global Funding II, 4.93%, 09/01/2027 (a) | | | 5,000 | | | | 5,003 | |
RenaissanceRe Finance, Inc., 3.45%, 07/01/2027 | | | 56,000 | | | | 54,295 | |
Sammons Financial Group, Inc., 4.45%, 05/12/2027 (a) | | | 57,000 | | | | 55,973 | |
Santander Holdings USA, Inc., 4.40%, 07/13/2027 | | | 59,000 | | | | 58,284 | |
Simon Property Group LP, 3.38%, 12/01/2027 | | | 59,000 | | | | 57,208 | |
State Street Corp., 4.99%, 03/18/2027 | | | 54,000 | | | | 54,861 | |
Synchrony Financial, 3.95%, 12/01/2027 | | | 57,000 | | | | 54,922 | |
Tanger Properties LP, 3.88%, 07/15/2027 | | | 56,000 | | | | 54,392 | |
Truist Financial Corp., 4.87% to 01/26/2028 then SOFR + 1.44%, 01/26/2029 | | | 55,000 | | | | 55,131 | |
UDR, Inc., 3.50%, 01/15/2028 | | | 57,000 | | | | 54,987 | |
US Bancorp, 4.55% to 07/22/2027 then SOFR + 1.66%, 07/22/2028 | | | 57,000 | | | | 57,019 | |
Ventas Realty LP, 3.85%, 04/01/2027 | | | 57,000 | | | | 55,872 | |
VICI Properties LP / VICI Note Co., Inc., 3.75%, 02/15/2027 (a) | | | 56,000 | | | | 54,297 | |
Visa, Inc., 1.90%, 04/15/2027 | | | 58,000 | | | | 54,971 | |
Voya Financial, Inc., 4.70% to 01/23/2028 then 3 mo. LIBOR US + 2.08%, 01/23/2048 (c) | | | 64,000 | | | | 56,548 | |
Wells Fargo & Co., 3.53% to 03/24/2027 then SOFR + 1.51%, 03/24/2028 | | | 56,000 | | | | 54,529 | |
Welltower OP LLC, 2.70%, 02/15/2027 | | | 59,000 | | | | 56,757 | |
Weyerhaeuser Co., 6.95%, 10/01/2027 | | | 54,000 | | | | 57,490 | |
Willis North America, Inc., 4.65%, 06/15/2027 | | | 58,000 | | | | 58,095 | |
| | | | | | | | 5,675,331 | |
The accompanying notes are an integral part of these financial statements.
F/m 3-Year Investment Grade Corporate Bond ETF
Schedule of Investments (continued)
August 31, 2024
| | Par | | | Value | |
| | | | | | | | | |
CORPORATE BONDS — 88.0% (continued) | | | | | | | | |
Health Care — 7.7% | | | | | | | | |
Abbott Laboratories, 1.15%, 01/30/2028 | | $ | 61,000 | | | $ | 55,466 | |
AbbVie, Inc., 4.80%, 03/15/2027 | | | 54,000 | | | | 54,724 | |
Amgen, Inc., 2.20%, 02/21/2027 | | | 58,000 | | | | 55,027 | |
Astrazeneca Finance LLC, 4.80%, 02/26/2027 | | | 54,000 | | | | 54,738 | |
Baxter International, Inc., 1.92%, 02/01/2027 | | | 59,000 | | | | 55,392 | |
Becton Dickinson & Co., 3.70%, 06/06/2027 | | | 57,000 | | | | 55,855 | |
Bio-Rad Laboratories, Inc., 3.30%, 03/15/2027 | | | 59,000 | | | | 56,992 | |
Bristol-Myers Squibb Co., 4.90%, 02/22/2027 | | | 54,000 | | | | 54,862 | |
Cardinal Health, Inc., 3.41%, 06/15/2027 | | | 59,000 | | | | 57,400 | |
Cencora, Inc., 3.45%, 12/15/2027 | | | 59,000 | | | | 57,190 | |
Centene Corp., 4.25%, 12/15/2027 | | | 56,000 | | | | 54,751 | |
Cigna Group, 3.40%, 03/01/2027 | | | 56,000 | | | | 54,585 | |
CommonSpirit Health, 6.07%, 11/01/2027 | | | 55,000 | | | | 57,551 | |
CVS Health Corp., 1.30%, 08/21/2027 | | | 60,000 | | | | 54,735 | |
Elevance Health, Inc., 3.65%, 12/01/2027 | | | 56,000 | | | | 54,790 | |
Eli Lilly & Co., 4.50%, 02/09/2027 | | | 57,000 | | | | 57,508 | |
Gilead Sciences, Inc., 2.95%, 03/01/2027 | | | 55,000 | | | | 53,257 | |
HCA, Inc., 4.50%, 02/15/2027 | | | 56,000 | | | | 55,784 | |
Humana, Inc., 1.35%, 02/03/2027 | | | 60,000 | | | | 55,581 | |
Illumina, Inc., 5.75%, 12/13/2027 | | | 55,000 | | | | 56,699 | |
Johnson & Johnson, 0.95%, 09/01/2027 | | | 60,000 | | | | 55,016 | |
Kaiser Foundation Hospitals, 3.15%, 05/01/2027 | | | 55,000 | | | | 53,636 | |
Laboratory Corp. of America Holdings, 3.60%, 09/01/2027 | | | 55,000 | | | | 53,529 | |
Merck & Co., Inc., 1.70%, 06/10/2027 | | | 59,000 | | | | 55,288 | |
Novartis Capital Corp., 2.00%, 02/14/2027 | | | 58,000 | | | | 55,155 | |
Solventum Corp., 5.45%, 02/25/2027 (a) | | | 54,000 | | | | 54,756 | |
SSM Health Care Corp., 3.82%, 06/01/2027 | | | 57,000 | | | | 56,203 | |
Thermo Fisher Scientific, Inc., 4.80%, 11/21/2027 | | | 54,000 | | | | 54,987 | |
UnitedHealth Group, Inc., 2.95%, 10/15/2027 | | | 56,000 | | | | 54,056 | |
Viatris, Inc., 2.30%, 06/22/2027 | | | 58,000 | | | | 54,217 | |
Zoetis, Inc., 3.00%, 09/12/2027 | | | 57,000 | | | | 54,724 | |
| | | | | | | | 1,714,454 | |
| | | | | | | | | |
Industrials — 8.7% | | | | | | | | |
3M Co., 2.88%, 10/15/2027 | | | 58,000 | | | | 55,505 | |
AGCO Corp., 5.45%, 03/21/2027 | | | 54,000 | | | | 54,829 | |
Allegion US Holding Co., Inc., 3.55%, 10/01/2027 | | | 59,000 | | | | 57,289 | |
Amphenol Corp., 5.05%, 04/05/2027 | | | 54,000 | | | | 55,014 | |
The accompanying notes are an integral part of these financial statements.
F/m 3-Year Investment Grade Corporate Bond ETF
Schedule of Investments (continued)
August 31, 2024
| | Par | | | Value | |
| | | | | | | | | |
CORPORATE BONDS — 88.0% (continued) | | | | | | | | |
Industrials — 8.7% (continued) | | | | | | | | |
Boeing Co., 5.04%, 05/01/2027 | | $ | 56,000 | | | $ | 56,074 | |
Burlington Northern Santa Fe LLC, 3.25%, 06/15/2027 | | | 55,000 | | | | 53,680 | |
Carrier Global Corp., 2.49%, 02/15/2027 | | | 56,000 | | | | 53,674 | |
Caterpillar Financial Services Corp., 5.00%, 05/14/2027 | | | 54,000 | | | | 55,116 | |
CSX Corp., 3.25%, 06/01/2027 | | | 55,000 | | | | 53,619 | |
Eaton Corp., 3.10%, 09/15/2027 | | | 59,000 | | | | 57,187 | |
Emerson Electric Co., 1.80%, 10/15/2027 | | | 58,000 | | | | 53,936 | |
General Dynamics Corp., 3.50%, 04/01/2027 | | | 57,000 | | | | 56,027 | |
Hexcel Corp., 4.20%, 02/15/2027 | | | 56,000 | | | | 54,661 | |
Honeywell International, Inc., 1.10%, 03/01/2027 | | | 59,000 | | | | 54,773 | |
Howmet Aerospace, Inc., 5.90%, 02/01/2027 | | | 54,000 | | | | 55,659 | |
Hubbell, Inc., 3.15%, 08/15/2027 | | | 59,000 | | | | 56,743 | |
Huntington Ingalls Industries, Inc., 3.48%, 12/01/2027 | | | 57,000 | | | | 55,028 | |
Ingersoll Rand, Inc., 5.20%, 06/15/2027 | | | 54,000 | | | | 54,947 | |
John Deere Capital Corp., 4.75%, 01/20/2028 | | | 54,000 | | | | 54,856 | |
Keysight Technologies, Inc., 4.60%, 04/06/2027 | | | 55,000 | | | | 54,897 | |
Lennox International, Inc., 1.70%, 08/01/2027 | | | 60,000 | | | | 55,546 | |
Lockheed Martin Corp., 5.10%, 11/15/2027 | | | 54,000 | | | | 55,514 | |
Norfolk Southern Corp., 7.80%, 05/15/2027 | | | 53,000 | | | | 57,517 | |
Northrop Grumman Corp., 3.25%, 01/15/2028 | | | 57,000 | | | | 54,999 | |
Otis Worldwide Corp., 2.29%, 04/05/2027 | | | 60,000 | | | | 56,837 | |
PACCAR Financial Corp., 5.00%, 05/13/2027 | | | 54,000 | | | | 55,209 | |
Parker-Hannifin Corp., 4.25%, 09/15/2027 | | | 55,000 | | | | 54,715 | |
Republic Services, Inc., 3.38%, 11/15/2027 | | | 59,000 | | | | 57,346 | |
RTX Corp., 3.50%, 03/15/2027 | | | 56,000 | | | | 54,795 | |
Ryder System, Inc., 2.85%, 03/01/2027 | | | 57,000 | | | | 54,682 | |
Textron, Inc., 3.65%, 03/15/2027 | | | 55,000 | | | | 53,798 | |
Union Pacific Corp., 2.15%, 02/05/2027 | | | 58,000 | | | | 55,200 | |
United Parcel Service, Inc., 3.05%, 11/15/2027 | | | 57,000 | | | | 54,989 | |
Waste Management, Inc., 4.95%, 07/03/2027 | | | 54,000 | | | | 55,051 | |
Xylem, Inc./NY, 1.95%, 01/30/2028 | | | 61,000 | | | | 56,253 | |
| | | | | | | | 1,935,965 | |
| | | | | | | | | |
Information Technology — 0.2% | | | | | | | | |
VeriSign, Inc., 4.75%, 07/15/2027 | | | 55,000 | | | | 54,826 | |
The accompanying notes are an integral part of these financial statements.
F/m 3-Year Investment Grade Corporate Bond ETF
Schedule of Investments (continued)
August 31, 2024
| | Par | | | Value | |
| | | | | | | | | |
CORPORATE BONDS — 88.0% (continued) | | | | | | | | |
Materials — 5.2% | | | | | | | | |
Air Products and Chemicals, Inc., 1.85%, 05/15/2027 | | $ | 58,000 | | | $ | 54,626 | |
Albemarle Corp., 4.65%, 06/01/2027 | | | 58,000 | | | | 57,845 | |
Bayport Polymers LLC, 4.74%, 04/14/2027 (a) | | | 57,000 | | | | 56,006 | |
Carlisle Cos., Inc., 3.75%, 12/01/2027 | | | 56,000 | | | | 54,623 | |
Celanese US Holdings LLC, 6.17%, 07/15/2027 | | | 55,000 | | | | 56,753 | |
Ecolab, Inc., 5.25%, 01/15/2028 | | | 54,000 | | | | 55,781 | |
Freeport-McMoRan, Inc., 5.00%, 09/01/2027 | | | 54,000 | | | | 54,076 | |
Georgia-Pacific LLC, 2.10%, 04/30/2027 (a) | | | 57,000 | | | | 53,834 | |
Glencore Funding LLC, 4.00%, 03/27/2027 (a) | | | 58,000 | | | | 56,960 | |
International Flavors & Fragrances, Inc., 1.83%, 10/15/2027 (a) | | | 60,000 | | | | 55,042 | |
Martin Marietta Materials, Inc., 3.50%, 12/15/2027 | | | 56,000 | | | | 54,512 | |
Mosaic Co., 4.05%, 11/15/2027 | | | 56,000 | | | | 55,024 | |
Nucor Corp., 4.30%, 05/23/2027 | | | 58,000 | | | | 57,961 | |
Owens Corning, 5.50%, 06/15/2027 | | | 54,000 | | | | 55,348 | |
Packaging Corp. of America, 3.40%, 12/15/2027 | | | 57,000 | | | | 55,104 | |
RPM International, Inc., 3.75%, 03/15/2027 | | | 55,000 | | | | 53,742 | |
Sherwin-Williams Co., 3.45%, 06/01/2027 | | | 59,000 | | | | 57,520 | |
Sonoco Products Co., 2.25%, 02/01/2027 | | | 58,000 | | | | 54,896 | |
Steel Dynamics, Inc., 1.65%, 10/15/2027 | | | 61,000 | | | | 55,886 | |
Vulcan Materials Co., 3.90%, 04/01/2027 | | | 56,000 | | | | 55,292 | |
WRKCo, Inc., 3.38%, 09/15/2027 | | | 59,000 | | | | 56,977 | |
| | | | | | | | 1,167,808 | |
| | | | | | | | | |
Technology — 6.4% | | | | | | | | |
Adobe, Inc., 2.15%, 02/01/2027 | | | 58,000 | | | | 55,336 | |
Apple, Inc., 3.35%, 02/09/2027 | | | 56,000 | | | | 55,138 | |
Applied Materials, Inc., 3.30%, 04/01/2027 | | | 55,000 | | | | 53,763 | |
Arrow Electronics, Inc., 3.88%, 01/12/2028 | | | 57,000 | | | | 55,267 | |
Autodesk, Inc., 3.50%, 06/15/2027 | | | 55,000 | | | | 53,675 | |
Broadcom, Inc., 5.05%, 07/12/2027 | | | 55,000 | | | | 55,842 | |
Cisco Systems, Inc., 4.80%, 02/26/2027 | | | 54,000 | | | | 54,875 | |
Dell International LLC / EMC Corp., 6.10%, 07/15/2027 | | | 55,000 | | | | 57,439 | |
Equifax, Inc., 5.10%, 12/15/2027 | | | 54,000 | | | | 54,937 | |
FactSet Research Systems, Inc., 2.90%, 03/01/2027 | | | 56,000 | | | | 53,733 | |
HP, Inc., 3.00%, 06/17/2027 | | | 58,000 | | | | 55,680 | |
Intel Corp., 3.75%, 08/05/2027 | | | 57,000 | | | | 55,345 | |
Intuit, Inc., 1.35%, 07/15/2027 | | | 60,000 | | | | 55,491 | |
Jabil, Inc., 4.25%, 05/15/2027 | | | 59,000 | | | | 58,343 | |
The accompanying notes are an integral part of these financial statements.
F/m 3-Year Investment Grade Corporate Bond ETF
Schedule of Investments (continued)
August 31, 2024
| | Par | | | Value | |
| | | | | | | | | |
CORPORATE BONDS — 88.0% (continued) | | | | | | | | |
Technology — 6.4% (continued) | | | | | | | | |
Micron Technology, Inc., 4.19%, 02/15/2027 | | $ | 57,000 | | | $ | 56,432 | |
Microsoft Corp., 3.30%, 02/06/2027 | | | 56,000 | | | | 55,131 | |
Moody’s Corp., 3.25%, 01/15/2028 | | | 57,000 | | | | 55,214 | |
NetApp, Inc., 2.38%, 06/22/2027 | | | 58,000 | | | | 54,821 | |
Oracle Corp., 3.25%, 11/15/2027 | | | 57,000 | | | | 55,076 | |
QUALCOMM, Inc., 3.25%, 05/20/2027 | | | 56,000 | | | | 54,623 | |
Roper Technologies, Inc., 1.40%, 09/15/2027 | | | 60,000 | | | | 54,919 | |
S&P Global, Inc., 2.45%, 03/01/2027 | | | 56,000 | | | | 53,587 | |
Take-Two Interactive Software, Inc., 3.70%, 04/14/2027 | | | 57,000 | | | | 55,892 | |
Texas Instruments, Inc., 4.60%, 02/08/2027 | | | 56,000 | | | | 56,596 | |
VMware LLC, 3.90%, 08/21/2027 | | | 57,000 | | | | 56,020 | |
Workday, Inc., 3.50%, 04/01/2027 | | | 55,000 | | | | 53,795 | |
| | | | | | | | 1,436,970 | |
| | | | | | | | | |
Utilities — 8.2% | | | | | | | | |
Alabama Power Co., 3.75%, 09/01/2027 | | | 56,000 | | | | 55,276 | |
Alliant Energy Finance LLC, 5.40%, 06/06/2027 (a) | | | 54,000 | | | | 55,140 | |
Ameren Corp., 1.95%, 03/15/2027 | | | 59,000 | | | | 55,282 | |
American Electric Power Co., Inc., 5.75%, 11/01/2027 | | | 55,000 | | | | 57,016 | |
American Water Capital Corp., 2.95%, 09/01/2027 | | | 56,000 | | | | 53,926 | |
Arizona Public Service Co., 2.95%, 09/15/2027 | | | 57,000 | | | | 54,413 | |
Atmos Energy Corp., 3.00%, 06/15/2027 | | | 56,000 | | | | 54,140 | |
Boston Gas Co., 3.15%, 08/01/2027 (a) | | | 58,000 | | | | 55,632 | |
CenterPoint Energy Houston Electric LLC, 3.00%, 02/01/2027 | | | 57,000 | | | | 55,275 | |
CMS Energy Corp., 3.45%, 08/15/2027 | | | 57,000 | | | | 55,627 | |
Consolidated Edison Co. of New York, Inc., 3.13%, 11/15/2027 | | | 57,000 | | | | 54,925 | |
Duke Energy Corp., 3.15%, 08/15/2027 | | | 59,000 | | | | 56,893 | |
Duquesne Light Holdings, Inc., 3.62%, 08/01/2027 (a) | | | 57,000 | | | | 55,213 | |
Edison International, 5.75%, 06/15/2027 | | | 54,000 | | | | 55,334 | |
Entergy Louisiana LLC, 3.12%, 09/01/2027 | | | 59,000 | | | | 56,905 | |
Evergy Missouri West, Inc., 5.15%, 12/15/2027 (a) | | | 57,000 | | | | 58,023 | |
Exelon Corp., 2.75%, 03/15/2027 | | | 56,000 | | | | 53,790 | |
FirstEnergy Corp., 3.90%, 07/15/2027 | | | 56,000 | | | | 54,934 | |
ITC Holdings Corp., 4.95%, 09/22/2027 (a) | | | 57,000 | | | | 57,543 | |
MidAmerican Energy Co., 3.10%, 05/01/2027 | | | 59,000 | | | | 57,326 | |
National Fuel Gas Co., 3.95%, 09/15/2027 | | | 55,000 | | | | 53,614 | |
National Rural Utilities Cooperative Finance Corp., 4.80%, 02/05/2027 | | | 56,000 | | | | 56,682 | |
NextEra Energy Capital Holdings, Inc., 3.55%, 05/01/2027 | | | 55,000 | | | | 53,721 | |
The accompanying notes are an integral part of these financial statements.
F/m 3-Year Investment Grade Corporate Bond ETF
Schedule of Investments (continued)
August 31, 2024
| | Par | | | Value | |
| | | | | | | | | |
CORPORATE BONDS — 88.0% (continued) | | | | | | | | |
Utilities — 8.2% (continued) | | | | | | | | |
NiSource, Inc., 3.49%, 05/15/2027 | | $ | 55,000 | | | $ | 53,580 | |
NRG Energy, Inc., 2.45%, 12/02/2027 (a) | | | 61,000 | | | | 56,613 | |
NSTAR Electric Co., 3.20%, 05/15/2027 | | | 59,000 | | | | 57,221 | |
Public Service Enterprise Group, Inc., 5.85%, 11/15/2027 | | | 55,000 | | | | 57,155 | |
Rochester Gas and Electric Corp., 3.10%, 06/01/2027 (a) | | | 59,000 | | | | 56,740 | |
Sempra, 3.25%, 06/15/2027 | | | 58,000 | | | | 56,088 | |
Southwest Gas Corp., 5.80%, 12/01/2027 | | | 56,000 | | | | 57,842 | |
Virginia Electric and Power Co., 3.50%, 03/15/2027 | | | 55,000 | | | | 53,874 | |
WEC Energy Group, Inc., 1.38%, 10/15/2027 | | | 61,000 | | | | 55,574 | |
Xcel Energy, Inc., 1.75%, 03/15/2027 | | | 59,000 | | | | 55,034 | |
| | | | | | | | 1,836,351 | |
TOTAL CORPORATE BONDS (Cost $19,430,137) | | | | | | | 19,698,710 | |
| | | | | | | | | |
FOREIGN CORPORATE BONDS — 10.9% | | | | | | | | |
Communications — 0.7% | | | | | | | | |
Rogers Communications, Inc., 3.20%, 03/15/2027 | | | 55,000 | | | | 53,209 | |
TELUS Corp., 2.80%, 02/16/2027 | | | 58,000 | | | | 55,580 | |
Videotron Ltd., 5.13%, 04/15/2027 (a) | | | 54,000 | | | | 53,915 | |
| | | | | | | | 162,704 | |
| | | | | | | | | |
Consumer Discretionary — 0.2% | | | | | | | | |
Honda Motor Co. Ltd., 2.53%, 03/10/2027 | | | 56,000 | | | | 53,669 | |
| | | | | | | | | |
Consumer Staples — 0.5% | | | | | | | | |
Alimentation Couche-Tard, Inc., 3.55%, 07/26/2027 (a) | | | 59,000 | | | | 57,231 | |
Heineken NV, 3.50%, 01/29/2028 (a) | | | 57,000 | | | | 55,544 | |
| | | | | | | | 112,775 | |
| | | | | | | | | |
Energy — 1.5% | | | | | | | | |
BP Capital Markets PLC, 3.28%, 09/19/2027 | | | 55,000 | | | | 53,538 | |
Canadian Natural Resources Ltd., 3.85%, 06/01/2027 | | | 57,000 | | | | 55,901 | |
Cenovus Energy, Inc., 4.25%, 04/15/2027 | | | 55,000 | | | | 54,395 | |
Enbridge, Inc., 5.25%, 04/05/2027 | | | 54,000 | | | | 55,015 | |
Equinor ASA, 3.00%, 04/06/2027 | | | 55,000 | | | | 53,315 | |
Transcanada Trust, 5.30% to 03/15/2027 then 3 mo. LIBOR US + 3.21%, 03/15/2077 (c) | | | 57,000 | | | | 54,548 | |
| | | | | | | | 326,712 | |
| | | | | | | | | |
The accompanying notes are an integral part of these financial statements.
F/m 3-Year Investment Grade Corporate Bond ETF
Schedule of Investments (continued)
August 31, 2024
| | Par | | | Value | |
| | | | | | | | | |
FOREIGN CORPORATE BONDS — 10.9% (continued) | | | | | | | | |
Financials — 3.5% | | | | | | | | |
Aircastle Ltd., 2.85%, 01/26/2028 (a) | | $ | 60,000 | | | $ | 55,530 | |
Avolon Holdings Funding Ltd., 2.53%, 11/18/2027 (a) | | | 58,000 | | | | 53,660 | |
AXIS Specialty Finance PLC, 4.00%, 12/06/2027 | | | 56,000 | | | | 54,718 | |
Bank of Montreal, 2.65%, 03/08/2027 | | | 56,000 | | | | 53,789 | |
Bank of Nova Scotia, 5.40%, 06/04/2027 | | | 54,000 | | | | 55,386 | |
Brookfield Finance, Inc., 3.90%, 01/25/2028 | | | 56,000 | | | | 54,705 | |
Canadian Imperial Bank of Commerce, 5.24%, 06/28/2027 | | | 54,000 | | | | 55,172 | |
Commonwealth Bank of Australia, 2.55%, 03/14/2027 (a) | | | 56,000 | | | | 53,631 | |
Macquarie Bank Ltd., 5.27%, 07/02/2027 (a) | | | 54,000 | | | | 55,386 | |
Manulife Financial Corp., 2.48%, 05/19/2027 | | | 58,000 | | | | 55,334 | |
ORIX Corp., 5.00%, 09/13/2027 | | | 55,000 | | | | 55,735 | |
Royal Bank of Canada, 6.00%, 11/01/2027 | | | 55,000 | | | | 57,644 | |
Scentre Group Trust 1 / Scentre Group Trust 2, 3.75%, 03/23/2027 (a) | | | 56,000 | | | | 54,754 | |
Westpac Banking Corp., 5.46%, 11/18/2027 | | | 54,000 | | | | 55,806 | |
| | | | | | | | 771,250 | |
| | | | | | | | | |
Health Care — 0.7% | | | | | | | | |
CSL Finance PLC, 3.85%, 04/27/2027 (a) | | | 57,000 | | | | 56,036 | |
Royalty Pharma PLC, 1.75%, 09/02/2027 | | | 60,000 | | | | 55,355 | |
Smith & Nephew PLC, 5.15%, 03/20/2027 | | | 54,000 | | | | 54,772 | |
| | | | | | | | 166,163 | |
| | | | | | | | | |
Industrials — 1.0% | | | | | | | | |
CNH Industrial NV, 3.85%, 11/15/2027 | | | 56,000 | | | | 54,882 | |
Element Fleet Management Corp., 5.64%, 03/13/2027 (a) | | | 54,000 | | | | 55,094 | |
Transurban Finance Co. Pty Ltd., 3.38%, 03/22/2027 (a) | | | 57,000 | | | | 55,248 | |
Tyco Electronics Group SA, 3.13%, 08/15/2027 | | | 57,000 | | | | 55,153 | |
| | | | | | | | 220,377 | |
| | | | | | | | | |
Materials — 1.5% | | | | | | | | |
ArcelorMittal SA, 6.55%, 11/29/2027 | | | 54,000 | | | | 56,929 | |
Kinross Gold Corp., 4.50%, 07/15/2027 | | | 56,000 | | | | 55,762 | |
LYB International Finance II BV, 3.50%, 03/02/2027 | | | 56,000 | | | | 54,617 | |
Newcastle Coal Infrastructure Group Pty Ltd., 4.40%, 09/29/2027 (a) | | | 56,672 | | | | 55,160 | |
Nutrien Ltd., 5.20%, 06/21/2027 | | | 54,000 | | | | 55,000 | |
UPM-Kymmene Oyj, 7.45%, 11/26/2027 (a) | | | 54,000 | | | | 57,542 | |
| | | | | | | | 335,010 | |
| | | | | | | | | |
The accompanying notes are an integral part of these financial statements.
F/m 3-Year Investment Grade Corporate Bond ETF
Schedule of Investments (Concluded)
August 31, 2024
| | Par | | | Value | |
| | | | | | | | | |
FOREIGN CORPORATE BONDS — 10.9% (continued) | | | | | | | | |
Technology — 1.0% | | | | | | | | |
Flex Ltd., 6.00%, 01/15/2028 | | $ | 54,000 | | | $ | 55,722 | |
Nokia Oyj, 4.38%, 06/12/2027 | | | 59,000 | | | | 58,340 | |
NXP BV / NXP Funding LLC / NXP USA, Inc., 4.40%, 06/01/2027 (b) | | | 58,000 | | | | 57,821 | |
Open Text Corp., 6.90%, 12/01/2027 (a) | | | 55,000 | | | | 57,749 | |
| | | | | | | | 229,632 | |
| | | | | | | | | |
Utilities — 0.3% | | | | | | | | |
APA Infrastructure Ltd., 4.25%, 07/15/2027 (a) | | | 59,000 | | | | 58,749 | |
TOTAL FOREIGN CORPORATE BONDS (Cost $2,403,302) | | | | | | | 2,437,041 | |
| | Units | | | | |
| | | | | | | | | |
SHORT-TERM INVESTMENTS — 0.5% | | | | | | | | |
Investments Purchased with Proceeds from Securities Lending — 0.5% | | | | | | | | |
Mount Vernon Liquid Assets Portfolio, LLC, 5.42%(d) | | | 99,470 | | | $ | 99,470 | |
TOTAL SHORT-TERM INVESTMENTS (Cost $99,470) | | | | | | | 99,470 | |
| | | | | | | | | |
TOTAL INVESTMENTS — 99.4% (Cost $21,932,909) | | | | | | $ | 22,235,221 | |
Other Assets in Excess of Liabilities — 0.6% | | | | | | | 142,091 | |
TOTAL NET ASSETS — 100.0% | | | | | | $ | 22,377,312 | |
Percentages are stated as a percent of net assets.
ASA - Advanced Subscription Agreement
LIBOR - London Interbank Offered Rate
NV - Naamloze Vennootschap
PLC - Public Limited Company
SA - Sociedad Anónima
SOFR - Secured Overnight Financing Rate
(a) | Security is exempt from registration pursuant to Rule 144A under the Securities Act of 1933, as amended. These securities may only be resold in transactions exempt from registration to qualified institutional investors. As of August 31, 2024, the value of these securities total $3,111,088 or 13.9% of the Fund’s net assets. |
(b) | All or a portion of this security is on loan as of August 31, 2024. The total market value of these securities was $97,363 which represented 0.5% of net assets. |
(c) | Securities referencing LIBOR are expected to transition to an alternative reference rate by the security’s next scheduled coupon reset date. |
(d) | The rate shown represents the 7-day annualized effective yield as of August 31, 2024. |
The accompanying notes are an integral part of these financial statements.
F/m 10-Year Investment Grade Corporate Bond ETF
Schedule of Investments
August 31, 2024
| | Par | | | Value | |
| | | | | | | | | |
CORPORATE BONDS — 89.2% | | | | | | | | |
Communications — 2.5% | | | | | | | | |
AT&T, Inc., 5.40%, 02/15/2034 | | $ | 64,000 | | | $ | 66,090 | |
Charter Communications Operating LLC / Charter Communications Operating Capital, 6.55%, 06/01/2034 | | | 64,000 | | | | 66,297 | |
Comcast Corp., 5.30%, 06/01/2034 | | | 65,000 | | | | 67,383 | |
T-Mobile USA, Inc., 5.15%, 04/15/2034 | | | 66,000 | | | | 67,191 | |
Verizon Communications, Inc., 4.40%, 11/01/2034 | | | 70,000 | | | | 67,191 | |
Walt Disney Co., 6.20%, 12/15/2034 | | | 60,000 | | | | 67,371 | |
| | | | | | | | 401,523 | |
| | | | | | | | | |
Consumer Discretionary — 6.6% | | | | | | | | |
Amazon.com, Inc., 4.80%, 12/05/2034 | | | 65,000 | | | | 66,905 | |
AutoZone, Inc., 5.40%, 07/15/2034 | | | 68,000 | | | | 69,663 | |
BMW US Capital LLC, 5.15%, 04/02/2034 (a) | | | 65,000 | | | | 66,010 | |
Choice Hotels International, Inc., 5.85%, 08/01/2034 | | | 68,000 | | | | 69,515 | |
Cornell University, 4.84%, 06/15/2034 | | | 65,000 | | | | 66,544 | |
ERAC USA Finance LLC, 5.20%, 10/30/2034 (a) | | | 65,000 | | | | 66,529 | |
General Motors Financial Co., Inc., 5.95%, 04/04/2034 | | | 65,000 | | | | 67,268 | |
GXO Logistics, Inc., 6.50%, 05/06/2034 | | | 63,000 | | | | 65,443 | |
Hasbro, Inc., 6.05%, 05/14/2034 | | | 66,000 | | | | 68,312 | |
Home Depot, Inc., 4.95%, 06/25/2034 | | | 66,000 | | | | 67,634 | |
Hyatt Hotels Corp., 5.50%, 06/30/2034 | | | 68,000 | | | | 68,957 | |
Las Vegas Sands Corp., 6.20%, 08/15/2034 | | | 65,000 | | | | 66,568 | |
Marriott International, Inc., 5.30%, 05/15/2034 | | | 66,000 | | | | 67,119 | |
McDonald’s Corp., 5.20%, 05/17/2034 | | | 65,000 | | | | 67,790 | |
Starbucks Corp., 5.00%, 02/15/2034 | | | 65,000 | | | | 65,971 | |
Whirlpool Corp., 5.75%, 03/01/2034 | | | 65,000 | | | | 65,822 | |
| | | | | | | | 1,076,050 | |
| | | | | | | | | |
Consumer Staples — 4.9% | | | | | | | | |
Anheuser-Busch InBev Worldwide, Inc., 5.00%, 06/15/2034 | | | 65,000 | | | | 66,662 | |
BAT Capital Corp., 6.00%, 02/20/2034 | | | 64,000 | | | | 67,481 | |
Campbell Soup Co., 5.40%, 03/21/2034 | | | 64,000 | | | | 66,098 | |
Coca-Cola Co., 5.00%, 05/13/2034 | | | 64,000 | | | | 66,537 | |
Coca-Cola Consolidated, Inc., 5.45%, 06/01/2034 | | | 64,000 | | | | 66,592 | |
Estee Lauder Cos., Inc., 5.00%, 02/14/2034 | | | 65,000 | | | | 66,192 | |
Keurig Dr Pepper, Inc., 5.30%, 03/15/2034 | | | 64,000 | | | | 65,967 | |
Mars, Inc., 3.60%, 04/01/2034 (a) | | | 73,000 | | | | 66,281 | |
PepsiCo, Inc., 4.80%, 07/17/2034 | | | 68,000 | | | | 69,312 | |
The accompanying notes are an integral part of these financial statements.
F/m 10-Year Investment Grade Corporate Bond ETF
Schedule of Investments (continued)
August 31, 2024
| | Par | | | Value | |
| | | | | | | | | |
CORPORATE BONDS — 89.2% (continued) | | | | | | | | |
Consumer Staples — 4.9% (continued) | | | | | | | | |
Philip Morris International, Inc., 5.25%, 02/13/2034 | | $ | 65,000 | | | $ | 66,462 | |
Procter & Gamble Co., 5.80%, 08/15/2034 | | | 63,000 | | | | 70,293 | |
Tyson Foods, Inc., 5.70%, 03/15/2034 | | | 64,000 | | | | 66,585 | |
| | | | | | | | 804,462 | |
| | | | | | | | | |
Energy — 8.2% | | | | | | | | |
Boardwalk Pipelines LP, 5.63%, 08/01/2034 (b) | | | 67,000 | | | | 68,400 | |
BP Capital Markets America, Inc., 5.23%, 11/17/2034 | | | 65,000 | | | | 66,883 | |
Cameron LNG LLC, 3.30%, 01/15/2035 (a) | | | 78,000 | | | | 66,402 | |
Cheniere Energy Partners LP, 5.75%, 08/15/2034 (a) | | | 64,000 | | | | 66,262 | |
Cheniere Energy, Inc., 5.65%, 04/15/2034 (a) | | | 64,000 | | | | 65,859 | |
Coterra Energy, Inc., 5.60%, 03/15/2034 | | | 64,000 | | | | 65,502 | |
Diamondback Energy, Inc., 5.40%, 04/18/2034 | | | 65,000 | | | | 66,159 | |
Energy Transfer LP, 5.60%, 09/01/2034 | | | 65,000 | | | | 66,906 | |
Enterprise Products Operating LLC, 4.85%, 01/31/2034 | | | 66,000 | | | | 66,264 | |
EQT Corp., 5.75%, 02/01/2034 | | | 66,000 | | | | 67,404 | |
Kinder Morgan, Inc., 5.40%, 02/01/2034 | | | 66,000 | | | | 66,981 | |
Marathon Oil Corp., 5.70%, 04/01/2034 | | | 63,000 | | | | 66,472 | |
MPLX LP, 5.50%, 06/01/2034 | | | 66,000 | | | | 67,153 | |
Occidental Petroleum Corp., 5.55%, 10/01/2034 | | | 68,000 | | | | 69,097 | |
Ovintiv, Inc., 6.50%, 08/15/2034 | | | 63,000 | | | | 68,252 | |
Phillips 66, 4.65%, 11/15/2034 | | | 69,000 | | | | 66,772 | |
Plains All American Pipeline LP / PAA Finance Corp., 5.70%, 09/15/2034 | | | 65,000 | | | | 66,480 | |
Targa Resources Corp., 6.50%, 03/30/2034 | | | 60,000 | | | | 65,469 | |
Whistler Pipeline LLC, 5.95%, 09/30/2034 (a) | | | 68,000 | | | | 69,285 | |
Williams Cos., Inc., 5.15%, 03/15/2034 | | | 65,000 | | | | 65,283 | |
| | | | | | | | 1,337,285 | |
| | | | | | | | | |
Financials — 26.7% | | | | | | | | |
Agree LP, 5.63%, 06/15/2034 | | | 65,000 | | | | 67,043 | |
Alexandria Real Estate Equities, Inc., 2.95%, 03/15/2034 | | | 79,000 | | | | 66,787 | |
Ally Financial, Inc., 6.18% to 07/26/2034 then SOFR + 2.29%, 07/26/2035 | | | 68,000 | | | | 69,254 | |
American Express Co., 5.28% to 07/26/2034 then SOFR + 1.42%, 07/26/2035 | | | 68,000 | | | | 69,491 | |
American Homes 4 Rent LP, 5.50%, 02/01/2034 | | | 67,000 | | | | 68,231 | |
American International Group, Inc., 3.88%, 01/15/2035 | | | 72,000 | | | | 66,483 | |
American Tower Corp., 5.45%, 02/15/2034 | | | 66,000 | | | | 68,158 | |
Aon North America, Inc., 5.45%, 03/01/2034 | | | 64,000 | | | | 66,228 | |
Arthur J Gallagher & Co., 5.45%, 07/15/2034 | | | 65,000 | | | | 66,817 | |
The accompanying notes are an integral part of these financial statements.
F/m 10-Year Investment Grade Corporate Bond ETF
Schedule of Investments (continued)
August 31, 2024
| | Par | | | Value | |
| | | | | | | | | |
CORPORATE BONDS — 89.2% (continued) | | | | | | | | |
Financials — 26.7% (continued) | | | | | | | | |
AvalonBay Communities, Inc., 5.35%, 06/01/2034 | | $ | 65,000 | | | $ | 67,262 | |
Bank of New York Mellon Corp., 5.61% to 07/21/2034 then SOFR + 1.77%, 07/21/2039 | | | 68,000 | | | | 70,482 | |
BlackRock Funding, Inc., 5.00%, 03/14/2034 | | | 65,000 | | | | 67,045 | |
Blue Owl Finance LLC, 6.25%, 04/18/2034 (a) | | | 64,000 | | | | 66,310 | |
Brixmor Operating Partnership LP, 5.50%, 02/15/2034 | | | 67,000 | | | | 67,766 | |
Brown & Brown, Inc., 5.65%, 06/11/2034 | | | 65,000 | | | | 67,002 | |
Capital One Financial Corp., 5.88% to 07/26/2034 then SOFR + 1.99%, 07/26/2035 | | | 68,000 | | | | 69,751 | |
CBRE Services, Inc., 5.95%, 08/15/2034 | | | 64,000 | | | | 67,622 | |
Chubb INA Holdings LLC, 5.00%, 03/15/2034 | | | 65,000 | | | | 66,607 | |
Cincinnati Financial Corp., 6.13%, 11/01/2034 | | | 62,000 | | | | 66,249 | |
Citizens Financial Group, Inc., 6.65% to 04/25/2034 then SOFR + 2.33%, 04/25/2035 | | | 62,000 | | | | 67,003 | |
CNA Financial Corp., 5.13%, 02/15/2034 | | | 68,000 | | | | 68,507 | |
CNO Financial Group, Inc., 6.45%, 06/15/2034 | | | 65,000 | | | | 67,803 | |
Crown Castle, Inc., 5.80%, 03/01/2034 | | | 64,000 | | | | 67,000 | |
Equinix Europe 2 Financing Corp. LLC, 5.50%, 06/15/2034 | | | 65,000 | | | | 67,272 | |
Essex Portfolio LP, 5.50%, 04/01/2034 | | | 65,000 | | | | 66,717 | |
Extra Space Storage LP, 5.40%, 02/01/2034 | | | 67,000 | | | | 68,204 | |
Fiserv, Inc., 5.45%, 03/15/2034 | | | 64,000 | | | | 65,961 | |
GATX Corp., 6.05%, 03/15/2034 | | | 62,000 | | | | 65,901 | |
Goldman Sachs Group, Inc., 5.33% to 07/23/2034 then SOFR + 1.55%, 07/23/2035 (b) | | | 68,000 | | | | 69,278 | |
HA Sustainable Infrastructure Capital, Inc., 6.38%, 07/01/2034 (a) | | | 69,000 | | | | 69,478 | |
Highwoods Realty LP, 7.65%, 02/01/2034 | | | 61,000 | | | | 68,513 | |
Host Hotels & Resorts LP, 5.70%, 07/01/2034 | | | 67,000 | | | | 67,922 | |
Huntington Bancshares, Inc., 5.71% to 02/02/2034 then SOFR + 1.87%, 02/02/2035 | | | 66,000 | | | | 67,648 | |
Jefferies Financial Group, Inc., 6.20%, 04/14/2034 | | | 64,000 | | | | 67,342 | |
JPMorgan Chase & Co., 5.29% to 07/22/2034 then SOFR + 1.46%, 07/22/2035 | | | 66,000 | | | | 67,731 | |
KeyCorp, 6.40% to 03/06/2034 then SOFR + 2.42%, 03/06/2035 | | | 62,000 | | | | 66,432 | |
Kimco Realty OP LLC, 6.40%, 03/01/2034 | | | 60,000 | | | | 66,086 | |
Kite Realty Group LP, 5.50%, 03/01/2034 | | | 65,000 | | | | 65,893 | |
Lincoln National Corp., 5.85%, 03/15/2034 | | | 64,000 | | | | 66,709 | |
LPL Holdings, Inc., 6.00%, 05/20/2034 | | | 66,000 | | | | 67,824 | |
Marsh & McLennan Cos., Inc., 5.15%, 03/15/2034 | | | 64,000 | | | | 66,307 | |
Mastercard, Inc., 4.88%, 05/09/2034 | | | 65,000 | | | | 66,713 | |
MetLife, Inc., 6.38%, 06/15/2034 | | | 60,000 | | | | 67,023 | |
Mid-America Apartments LP, 5.00%, 03/15/2034 (b) | | | 65,000 | | | | 65,116 | |
Morgan Stanley, 5.32% to 07/19/2034 then SOFR + 1.56%, 07/19/2035 | | | 68,000 | | | | 69,462 | |
Nasdaq, Inc., 5.55%, 02/15/2034 | | | 66,000 | | | | 68,743 | |
NNN REIT, Inc., 5.50%, 06/15/2034 | | | 65,000 | | | | 66,478 | |
The accompanying notes are an integral part of these financial statements.
F/m 10-Year Investment Grade Corporate Bond ETF
Schedule of Investments (continued)
August 31, 2024
| | Par | | | Value | |
| | | | | | | | | |
CORPORATE BONDS — 89.2% (continued) | | | | | | | | |
Financials — 26.7% (continued) | | | | | | | | |
Nuveen LLC, 5.85%, 04/15/2034 (a) | | $ | 64,000 | | | $ | 66,995 | |
Old Republic International Corp., 5.75%, 03/28/2034 | | | 65,000 | | | | 67,245 | |
PayPal Holdings, Inc., 5.15%, 06/01/2034 | | | 66,000 | | | | 67,788 | |
Phillips Edison Grocery Center Operating Partnership I LP, 5.75%, 07/15/2034 | | | 65,000 | | | | 66,928 | |
PNC Financial Services Group, Inc., 5.40% to 07/23/2034 then SOFR + 1.60%, 07/23/2035 | | | 68,000 | | | | 69,643 | |
Prologis LP, 5.00%, 03/15/2034 | | | 65,000 | | | | 65,720 | |
Prologis Targeted US Logistics Fund LP, 5.50%, 04/01/2034 (a) | | | 64,000 | | | | 66,116 | |
Prudential Financial, Inc., 6.50% to 03/15/2034 then 5 yr. CMT Rate + 2.40%, 03/15/2054 | | | 66,000 | | | | 68,257 | |
Realty Income Corp., 5.13%, 02/15/2034 | | | 67,000 | | | | 67,603 | |
Reinsurance Group of America, Inc., 5.75%, 09/15/2034 | | | 65,000 | | | | 67,514 | |
Safehold GL Holdings LLC, 6.10%, 04/01/2034 | | | 64,000 | | | | 66,571 | |
Sammons Financial Group, Inc., 6.88%, 04/15/2034 (a) | | | 63,000 | | | | 66,614 | |
Santander Holdings USA, Inc., 6.34% to 05/31/2034 then SOFR + 2.14%, 05/31/2035 | | | 66,000 | | | | 68,438 | |
TPG Operating Group II LP, 5.88%, 03/05/2034 | | | 64,000 | | | | 67,282 | |
UDR, Inc., 3.10%, 11/01/2034 | | | 80,000 | | | | 67,057 | |
Ventas Realty LP, 5.63%, 07/01/2034 | | | 65,000 | | | | 67,308 | |
VICI Properties LP, 5.75%, 04/01/2034 | | | 65,000 | | | | 66,954 | |
WP Carey, Inc., 5.38%, 06/30/2034 | | | 67,000 | | | | 67,490 | |
| | | | | | | | 4,381,177 | |
| | | | | | | | | |
Health Care — 9.0% | | | | | | | | |
AbbVie, Inc., 5.05%, 03/15/2034 | | | 64,000 | | | | 65,950 | |
Adventist Health System/West, 5.76%, 12/01/2034 | | | 65,000 | | | | 66,598 | |
Astrazeneca Finance LLC, 5.00%, 02/26/2034 | | | 65,000 | | | | 66,936 | |
Bayer US Finance II LLC, 4.20%, 07/15/2034 (a) | | | 76,000 | | | | 68,226 | |
Becton Dickinson & Co., 5.11%, 02/08/2034 | | | 65,000 | | | | 66,005 | |
Bristol-Myers Squibb Co., 5.20%, 02/22/2034 | | | 64,000 | | | | 66,384 | |
Cardinal Health, Inc., 5.45%, 02/15/2034 | | | 66,000 | | | | 68,212 | |
Cencora, Inc., 5.13%, 02/15/2034 | | | 65,000 | | | | 66,112 | |
Cigna Group, 5.25%, 02/15/2034 | | | 66,000 | | | | 67,408 | |
CommonSpirit Health, 5.32%, 12/01/2034 | | | 66,000 | | | | 67,498 | |
CVS Health Corp., 5.70%, 06/01/2034 (b) | | | 65,000 | | | | 66,592 | |
Elevance Health, Inc., 5.38%, 06/15/2034 | | | 65,000 | | | | 67,357 | |
Eli Lilly & Co., 4.70%, 02/09/2034 | | | 65,000 | | | | 65,827 | |
GlaxoSmithKline Capital, Inc., 5.38%, 04/15/2034 | | | 62,000 | | | | 65,994 | |
HCA, Inc., 5.60%, 04/01/2034 | | | 64,000 | | | | 65,769 | |
Health Care Service Corp. A Mutual Legal Reserve Co., 5.45%, 06/15/2034 (a) | | | 65,000 | | | | 66,653 | |
Humana, Inc., 5.95%, 03/15/2034 | | | 62,000 | | | | 65,557 | |
The accompanying notes are an integral part of these financial statements.
F/m 10-Year Investment Grade Corporate Bond ETF
Schedule of Investments (continued)
August 31, 2024
| | Par | | | Value | |
| | | | | | | | | |
CORPORATE BONDS — 89.2% (continued) | | | | | | | | |
Health Care — 9.0% (continued) | | | | | | | | |
Johnson & Johnson, 4.95%, 06/01/2034 | | $ | 64,000 | | | $ | 66,944 | |
Solventum Corp., 5.60%, 03/23/2034 (a) | | | 65,000 | | | | 66,266 | |
Thermo Fisher Scientific, Inc., 5.20%, 01/31/2034 | | | 65,000 | | | | 67,734 | |
UnitedHealth Group, Inc., 5.15%, 07/15/2034 | | | 68,000 | | | | 69,871 | |
Wyeth LLC, 6.50%, 02/01/2034 | | | 60,000 | | | | 67,942 | |
| | | | | | | | 1,471,835 | |
| | | | | | | | | |
Industrials — 7.7% | | | | | | | | |
AGCO Corp., 5.80%, 03/21/2034 | | | 64,000 | | | | 65,824 | |
Allegion US Holding Co., Inc., 5.60%, 05/29/2034 | | | 65,000 | | | | 67,396 | |
Amphenol Corp., 5.25%, 04/05/2034 | | | 65,000 | | | | 66,881 | |
Boeing Co., 6.53%, 05/01/2034 (a) | | | 63,000 | | | | 66,724 | |
Carrier Global Corp., 5.90%, 03/15/2034 | | | 61,000 | | | | 65,800 | |
Cummins, Inc., 5.15%, 02/20/2034 (b) | | | 64,000 | | | | 66,381 | |
Ingersoll Rand, Inc., 5.45%, 06/15/2034 | | | 64,000 | | | | 66,562 | |
John Deere Capital Corp., 5.10%, 04/11/2034 | | | 65,000 | | | | 67,172 | |
L3Harris Technologies, Inc., 5.35%, 06/01/2034 | | | 65,000 | | | | 66,666 | |
Lockheed Martin Corp., 4.75%, 02/15/2034 | | | 66,000 | | | | 66,843 | |
Norfolk Southern Corp., 5.55%, 03/15/2034 | | | 63,000 | | | | 66,565 | |
Northrop Grumman Corp., 4.90%, 06/01/2034 | | | 66,000 | | | | 66,625 | |
PACCAR Financial Corp., 5.00%, 03/22/2034 | | | 64,000 | | | | 65,931 | |
Parker-Hannifin Corp., 4.20%, 11/21/2034 | | | 71,000 | | | | 67,829 | |
Republic Services, Inc., 5.00%, 04/01/2034 | | | 66,000 | | | | 67,146 | |
RTX Corp., 6.10%, 03/15/2034 | | | 61,000 | | | | 66,408 | |
United Parcel Service, Inc., 5.15%, 05/22/2034 | | | 65,000 | | | | 67,402 | |
Waste Management, Inc., 4.88%, 02/15/2034 | | | 65,000 | | | | 65,982 | |
Westinghouse Air Brake Technologies Corp., 5.61%, 03/11/2034 | | | 64,000 | | | | 66,650 | |
| | | | | | | | 1,266,787 | |
| | | | | | | | | |
Information Technology — 0.4% | | | | | | | | |
Kyndryl Holdings, Inc., 6.35%, 02/20/2034 | | | 64,000 | | | | 67,366 | |
| | | | | | | | | |
Materials — 4.5% | | | | | | | | |
Air Products and Chemicals, Inc., 4.85%, 02/08/2034 (b) | | | 65,000 | | | | 65,981 | |
CF Industries, Inc., 5.15%, 03/15/2034 | | | 66,000 | | | | 65,807 | |
Dow Chemical Co., 5.15%, 02/15/2034 | | | 67,000 | | | | 67,720 | |
Eastman Chemical Co., 5.63%, 02/20/2034 | | | 64,000 | | | | 65,884 | |
Freeport-McMoRan, Inc., 5.40%, 11/14/2034 | | | 66,000 | | | | 67,283 | |
The accompanying notes are an integral part of these financial statements.
F/m 10-Year Investment Grade Corporate Bond ETF
Schedule of Investments (continued)
August 31, 2024
| | Par | | | Value | |
| | | | | | | | | |
CORPORATE BONDS — 89.2% (continued) | | | | | | | | |
Materials — 4.5% (continued) | | | | | | | | |
Glencore Funding LLC, 5.63%, 04/04/2034 (a) | | $ | 65,000 | | | $ | 66,187 | |
Lubrizol Corp., 6.50%, 10/01/2034 | | | 57,000 | | | | 65,716 | |
LYB International Finance III LLC, 5.50%, 03/01/2034 | | | 64,000 | | | | 65,607 | |
Newmont Corp. / Newcrest Finance Pty Ltd., 5.35%, 03/15/2034 (a) | | | 64,000 | | | | 66,218 | |
Owens Corning, 5.70%, 06/15/2034 | | | 64,000 | | | | 66,796 | |
Steel Dynamics, Inc., 5.38%, 08/15/2034 | | | 68,000 | | | | 68,965 | |
| | | | | | | | 732,164 | |
| | | | | | | | | |
Technology — 6.1% | | | | | | | | |
Adobe, Inc., 4.95%, 04/04/2034 | | | 65,000 | | | | 67,166 | |
Analog Devices, Inc., 5.05%, 04/01/2034 | | | 65,000 | | | | 67,055 | |
Arrow Electronics, Inc., 5.88%, 04/10/2034 | | | 65,000 | | | | 66,495 | |
Atlassian Corp., 5.50%, 05/15/2034 | | | 65,000 | | | | 66,590 | |
Broadcom, Inc., 3.47%, 04/15/2034 (a) | | | 76,000 | | | | 67,155 | |
Cisco Systems, Inc., 5.05%, 02/26/2034 | | | 64,000 | | | | 66,305 | |
Dell International LLC / EMC Corp., 5.40%, 04/15/2034 | | | 65,000 | | | | 66,691 | |
Intel Corp., 5.15%, 02/21/2034 | | | 67,000 | | | | 66,361 | |
KLA Corp., 4.70%, 02/01/2034 | | | 66,000 | | | | 66,373 | |
Motorola Solutions, Inc., 5.40%, 04/15/2034 | | | 65,000 | | | | 67,061 | |
Oracle Corp., 4.30%, 07/08/2034 | | | 71,000 | | | | 67,133 | |
Take-Two Interactive Software, Inc., 5.60%, 06/12/2034 | | | 65,000 | | | | 67,114 | |
TD SYNNEX Corp., 6.10%, 04/12/2034 | | | 64,000 | | | | 66,537 | |
Texas Instruments, Inc., 4.85%, 02/08/2034 | | | 66,000 | | | | 67,957 | |
Verisk Analytics, Inc., 5.25%, 06/05/2034 | | | 66,000 | | | | 67,227 | |
| | | | | | | | 1,003,220 | |
| | | | | | | | | |
Utilities — 12.6% | | | | | | | | |
AEP Transmission Co. LLC, 5.15%, 04/01/2034 | | | 66,000 | | | | 67,160 | |
American Water Capital Corp., 5.15%, 03/01/2034 | | | 64,000 | | | | 65,743 | |
Arizona Public Service Co., 5.70%, 08/15/2034 | | | 66,000 | | | | 68,717 | |
Black Hills Corp., 6.00%, 01/15/2035 | | | 64,000 | | | | 66,855 | |
CenterPoint Energy Resources Corp., 5.40%, 07/01/2034 | | | 66,000 | | | | 67,314 | |
Consolidated Edison Co. of New York, Inc., 5.50%, 03/15/2034 | | | 63,000 | | | | 66,283 | |
Dominion Energy, Inc., 7.00% to 06/01/2034 then 5 yr. CMT Rate + 2.51%, 06/01/2054 | | | 64,000 | | | | 68,079 | |
DTE Energy Co., 5.85%, 06/01/2034 | | | 63,000 | | | | 66,355 | |
Duke Energy Corp., 5.45%, 06/15/2034 | | | 65,000 | | | | 66,970 | |
Entergy Louisiana LLC, 5.35%, 03/15/2034 | | | 64,000 | | | | 65,815 | |
Evergy Missouri West, Inc., 5.65%, 06/01/2034 (a) | | | 65,000 | | | | 67,514 | |
The accompanying notes are an integral part of these financial statements.
F/m 10-Year Investment Grade Corporate Bond ETF
Schedule of Investments (continued)
August 31, 2024
| | Par | | | Value | |
| | | | | | | | | |
CORPORATE BONDS — 89.2% (continued) | | | | | | | | |
Utilities — 12.6% (continued) | | | | | | | | |
Eversource Energy, 5.95%, 07/15/2034 | | $ | 64,000 | | | $ | 67,347 | |
Exelon Corp., 5.45%, 03/15/2034 | | | 65,000 | | | | 67,121 | |
IPALCO Enterprises, Inc., 5.75%, 04/01/2034 | | | 64,000 | | | | 65,865 | |
ITC Holdings Corp., 5.65%, 05/09/2034 (a) | | | 64,000 | | | | 66,260 | |
Liberty Utilities Co., 5.87%, 01/31/2034 (a) | | | 65,000 | | | | 66,855 | |
Monongahela Power Co., 5.85%, 02/15/2034 (a) | | | 65,000 | | | | 68,603 | |
Narragansett Electric Co., 5.35%, 05/01/2034 (a) | | | 65,000 | | | | 66,569 | |
NextEra Energy Capital Holdings, Inc., 5.25%, 03/15/2034 | | | 64,000 | | | | 65,074 | |
Niagara Mohawk Power Corp., 4.28%, 10/01/2034 (a) | | | 72,000 | | | | 66,107 | |
NiSource, Inc., 5.35%, 04/01/2034 | | | 65,000 | | | | 66,351 | |
Pacific Gas and Electric Co., 5.80%, 05/15/2034 | | | 64,000 | | | | 65,869 | |
PacifiCorp, 5.45%, 02/15/2034 | | | 66,000 | | | | 67,436 | |
Public Service Enterprise Group, Inc., 5.45%, 04/01/2034 | | | 65,000 | | | | 66,825 | |
Puget Sound Energy, Inc., 5.33%, 06/15/2034 | | | 65,000 | | | | 67,083 | |
Southern California Edison Co., 5.20%, 06/01/2034 | | | 66,000 | | | | 67,059 | |
Southern Co., 5.70%, 03/15/2034 | | | 63,000 | | | | 66,469 | |
Union Electric Co., 5.20%, 04/01/2034 | | | 65,000 | | | | 66,638 | |
Vistra Operations Co. LLC, 6.00%, 04/15/2034 (a) | | | 64,000 | | | | 66,884 | |
Wisconsin Power and Light Co., 5.38%, 03/30/2034 | | | 64,000 | | | | 65,996 | |
Xcel Energy, Inc., 5.50%, 03/15/2034 | | | 64,000 | | | | 65,535 | |
| | | | | | | | 2,068,751 | |
TOTAL CORPORATE BONDS (Cost $14,206,462) | | | | | | | 14,610,620 | |
| | | | | | | | | |
FOREIGN CORPORATE BONDS — 9.4% | | | | | | | | |
Communications — 0.8% | | | | | | | | |
Bell Telephone Co. of Canada or Bell Canada, 5.20%, 02/15/2034 | | | 65,000 | | | | 66,076 | |
Rogers Communications, Inc., 5.30%, 02/15/2034 | | | 67,000 | | | | 67,596 | |
| | | | | | | | 133,672 | |
| | | | | | | | | |
Consumer Staples — 0.8% | | | | | | | | |
Alimentation Couche-Tard, Inc., 5.27%, 02/12/2034 (a) | | | 67,000 | | | | 67,872 | |
JBS USA LUX SA / JBS USA Food Co. / JBS Luxembourg SARL, 6.75%, 03/15/2034 (a) | | | 61,000 | | | | 66,876 | |
| | | | | | | | 134,748 | |
| | | | | | | | | |
Energy — 2.0% | | | | | | | | |
Enbridge, Inc., 5.63%, 04/05/2034 | | | 64,000 | | | | 66,035 | |
Schlumberger Investment SA, 5.00%, 06/01/2034 | | | 66,000 | | | | 67,277 | |
Suncor Energy, Inc., 5.95%, 12/01/2034 | | | 63,000 | | | | 66,693 | |
The accompanying notes are an integral part of these financial statements.
F/m 10-Year Investment Grade Corporate Bond ETF
Schedule of Investments (continued)
August 31, 2024
| | Par | | | Value | |
| | | | | | | | | |
FOREIGN CORPORATE BONDS — 9.4% (continued) | | | | | | | | |
Energy — 2.0% (continued) | | | | | | | | |
TotalEnergies Capital SA, 5.15%, 04/05/2034 | | $ | 65,000 | | | $ | 67,201 | |
TransCanada PipeLines Ltd., 4.63%, 03/01/2034 | | | 68,000 | | | | 66,079 | |
| | | | | | | | 333,285 | |
| | | | | | | | | |
Financials — 1.7% | | | | | | | | |
Arch Capital Group Ltd., 7.35%, 05/01/2034 | | | 57,000 | | | | 66,810 | |
Bank of Nova Scotia, 5.65%, 02/01/2034 | | | 64,000 | | | | 67,450 | |
Brookfield Finance, Inc., 5.68%, 01/15/2035 | | | 68,000 | | | | 70,038 | |
Royal Bank of Canada, 5.15%, 02/01/2034 | | | 66,000 | | | | 67,644 | |
| | | | | | | | 271,942 | |
| | | | | | | | | |
Health Care — 1.2% | | | | | | | | |
CSL Finance PLC, 5.11%, 04/03/2034 (a) | | | 65,000 | | | | 66,365 | |
Royalty Pharma PLC, 5.40%, 09/02/2034 | | | 66,000 | | | | 66,739 | |
Smith & Nephew PLC, 5.40%, 03/20/2034 | | | 65,000 | | | | 66,338 | |
| | | | | | | | 199,442 | |
| | | | | | | | | |
Industrials — 1.7% | | | | | | | | |
Canadian National Railway Co., 6.25%, 08/01/2034 | | | 61,000 | | | | 68,595 | |
CIMIC Finance USA Pty Ltd., 7.00%, 03/25/2034 (a) | | | 63,000 | | | | 66,917 | |
Trane Technologies Financing Ltd., 5.10%, 06/13/2034 | | | 65,000 | | | | 66,765 | |
Waste Connections, Inc., 5.00%, 03/01/2034 | | | 65,000 | | | | 65,989 | |
| | | | | | | | 268,266 | |
| | | | | | | | | |
Materials — 0.8% | | | | | | | | |
ArcelorMittal SA, 6.00%, 06/17/2034 | | | 65,000 | | | | 67,333 | |
Nutrien Ltd., 5.40%, 06/21/2034 | | | 66,000 | | | | 67,255 | |
| | | | | | | | 134,588 | |
| | | | | | | | | |
Technology — 0.4% | | | | | | | | |
Constellation Software, Inc., 5.46%, 02/16/2034 (a) | | | 64,000 | | | | 65,952 | |
TOTAL FOREIGN CORPORATE BONDS (Cost $1,496,500) | | | | | | | 1,541,895 | |
The accompanying notes are an integral part of these financial statements.
F/m 10-Year Investment Grade Corporate Bond ETF
Schedule of Investments (Concluded)
August 31, 2024
| | Units | | | Value | |
| | | | | | | | | |
SHORT-TERM INVESTMENTS — 2.4% | | | | | | | | |
Investments Purchased with Proceeds from Securities Lending — 2.4% | | | | | | | | |
Mount Vernon Liquid Assets Portfolio, LLC, 5.42%(c) | | | 395,625 | | | $ | 395,625 | |
TOTAL SHORT-TERM INVESTMENTS (Cost $395,625) | | | | | | | 395,625 | |
| | | | | | | | | |
TOTAL INVESTMENTS — 101.0% (Cost $16,098,587) | | | | | | $ | 16,548,140 | |
Liabilities in Excess of Other Assets — (1.0)% | | | | | | | (153,126 | ) |
TOTAL NET ASSETS — 100.0% | | | | | | $ | 16,395,014 | |
Percentages are stated as a percent of net assets.
CMT - Constant Maturity Treasury Rate
PLC - Public Limited Company
SA - Sociedad Anónima
SOFR - Secured Overnight Financing Rate
(a) | Security is exempt from registration pursuant to Rule 144A under the Securities Act of 1933, as amended. These securities may only be resold in transactions exempt from registration to qualified institutional investors. As of August 31, 2024, the value of these securities total $2,072,344 or 12.6% of the Fund’s net assets. |
(b) | All or a portion of this security is on loan as of August 31, 2024. The total market value of these securities was $385,686 which represented 2.4% of net assets. |
(c) | The rate shown represents the 7-day annualized effective yield as of August 31, 2024. |
The accompanying notes are an integral part of these financial statements.
F/m Corporate Bond ETFs
Statements of Assets and Liabilities
August 31, 2024
| | F/m 2-Year
Investment
Grade
Corporate
Bond ETF | | | F/m 3-Year
Investment
Grade
Corporate
Bond ETF | | | F/m 10-Year
Investment
Grade
Corporate
Bond ETF | |
ASSETS | | | | | | | | | | | | |
Investments in securities of unaffiliated issuers, at value (cost $9,893,713, $21,833,439, and 15,702,962, respectively)(1) | | $ | 9,981,584 | | | $ | 22,135,751 | | | $ | 16,152,515 | |
Investments purchased with proceeds from securities lending collateral (cost $—, $99,470 and $395,625, respectively) | | | — | | | | 99,470 | | | | 395,625 | |
Cash equivalents | | | 46,962 | | | | 6,106 | | | | 3,646 | |
Receivables for: | | | | | | | | | | | | |
Interest | | | 98,196 | | | | 238,286 | | | | 240,929 | |
Total assets | | | 10,126,742 | | | | 22,479,613 | | | | 16,792,715 | |
| | | | | | | | | | | | | |
LIABILITIES | | | | | | | | | | | | |
Payables for: | | | | | | | | | | | | |
Investments purchased | | | — | | | | — | | | | — | |
Advisory fees | | | 1,282 | | | | 2,831 | | | | 2,076 | |
Securities lending collateral (see Note 6) | | | — | | | | 99,470 | | | | 395,625 | |
Total liabilities | | | 1,282 | | | | 102,301 | | | | 397,701 | |
Net assets | | $ | 10,125,460 | | | $ | 22,377,312 | | | $ | 16,395,014 | |
| | | | | | | | | | | | | |
NET ASSETS CONSIST OF: | | | | | | | | | | | | |
Par value | | $ | 200 | | | $ | 440 | | | $ | 320 | |
Paid-in capital | | | 10,007,035 | | | | 22,069,984 | | | | 16,037,026 | |
Total distributable earnings/(losses) | | | 118,225 | | | | 306,888 | | | | 357,668 | |
Net assets | | $ | 10,125,460 | | | $ | 22,377,312 | | | $ | 16,395,014 | |
| | | | | | | | | | | | | |
Shares outstanding ($0.001 par value, 100,000,000 shares authorized) | | | 200,000 | | | | 440,000 | | | | 320,000 | |
Net asset value and redemption price per share | | $ | 50.63 | | | $ | 50.86 | | | $ | 51.23 | |
(1) | Includes market value of securities on loan of $—, $97,363, and $385,686, respectively. |
The accompanying notes are an integral part of these financial statements.
F/m Corporate Bond ETFs
Statements of Operations
FOR THE Period ENDED August 31, 2024
| | F/m 2-Year
Investment
Grade
Corporate
Bond ETF(1) | | | F/m 3-Year
Investment
Grade
Corporate
Bond ETF(1) | | | F/m 10-Year
Investment
Grade
Corporate
Bond ETF(1) | |
INVESTMENT INCOME | | | | | | | | | | | | |
Interest income | | $ | 315,106 | | | $ | 551,757 | | | $ | 477,392 | |
Securities lending income, net | | | 139 | | | | 126 | | | | 3,237 | |
Total investment income | | | 315,245 | | | | 551,883 | | | | 480,629 | |
| | | | | | | | | | | | | |
EXPENSES | | | | | | | | | | | | |
Advisory fees (Note 3) | | | 9,200 | | | | 16,566 | | | | 13,424 | |
Total expenses | | | 9,200 | | | | 16,566 | | | | 13,424 | |
Net investment income/(loss) | | | 306,045 | | | | 535,317 | | | | 467,205 | |
| | | | | | | | | | | | | |
NET REALIZED AND UNREALIZED GAIN/ (LOSS) FROM INVESTMENTS | | | | | | | | | | | | |
Net realized gain/(loss) from investments in unaffiliated issuers | | | (12,155 | ) | | | (74,997 | ) | | | (183,923 | ) |
Net realized gain/(loss) from investments in affiliated issuers (See Note 9) | | | (35 | ) | | | 2,720 | | | | 7,440 | |
Net realized gain from redemption in-kind | | | — | | | | — | | | | (3,330 | ) |
Net change in unrealized appreciation/(depreciation) on investments of unaffiliated issuers | | | 87,870 | | | | 302,311 | | | | 449,553 | |
Net realized and unrealized gain/(loss) | | | 75,680 | | | | 230,034 | | | | 269,740 | |
NET INCREASE/(DECREASE) IN NET ASSETS RESULTING FROM OPERATIONS | | $ | 381,725 | | | $ | 765,351 | | | $ | 736,945 | |
(1) | Inception date of the Fund was January 10, 2024. |
The accompanying notes are an integral part of these financial statements.
F/m 2-Year Investment Grade Corporate Bond ETF
Statement of Changes in Net Assets
| | FOR THE
Period ENDED
August 31,
2024(1) | |
INCREASE/(DECREASE) IN NET ASSETS RESULTING FROM OPERATIONS | | | | |
Net investment income/(loss) | | $ | 306,045 | |
Net realized gain/(loss) from investments | | | (12,190 | ) |
Net change in unrealized appreciation/(depreciation) on investments | | | 87,870 | |
NET INCREASE/(DECREASE) IN NET ASSETS RESULTING FROM OPERATIONS | | | 381,725 | |
| | | | | |
DIVIDENDS AND DISTRIBUTIONS TO SHAREHOLDERS FROM: | | | | |
Total distributable earnings | | | (263,500 | ) |
Net decrease in net assets from dividends and distributions to shareholders | | | (263,500 | ) |
| | | | | |
CAPITAL SHARE TRANSACTIONS: | | | | |
Proceeds from shares sold | | | 10,007,235 | |
Net increase/(decrease) in net assets from capital share transactions | | | 10,007,235 | |
TOTAL INCREASE/(DECREASE) IN NET ASSETS | | | 10,125,460 | |
| | | | | |
NET ASSETS: | | | | |
Beginning of period | | $ | — | |
End of period | | $ | 10,125,460 | |
| | | | | |
SHARE TRANSACTIONS: | | | | |
Shares sold | | | 200,000 | |
Shares redeemed | | | — | |
Net increase/(decrease) in shares | | | 200,000 | |
(1) | Inception date of the Fund was January 10, 2024. |
The accompanying notes are an integral part of these financial statements.
F/m 3-Year Investment Grade Corporate Bond ETF
Statement of Changes in Net Assets
| | FOR THE
Period ENDED
August 31,
2024(1) | |
INCREASE/(DECREASE) IN NET ASSETS RESULTING FROM OPERATIONS | | | | |
Net investment income/(loss) | | $ | 535,317 | |
Net realized gain/(loss) from investments | | | (72,277 | ) |
Net change in unrealized appreciation/(depreciation) on investments | | | 302,311 | |
NET INCREASE/(DECREASE) IN NET ASSETS RESULTING FROM OPERATIONS | | | 765,351 | |
| | | | | |
DIVIDENDS AND DISTRIBUTIONS TO SHAREHOLDERS FROM: | | | | |
Total distributable earnings | | | (458,463 | ) |
Net decrease in net assets from dividends and distributions to shareholders | | | (458,463 | ) |
| | | | | |
CAPITAL SHARE TRANSACTIONS: | | | | |
Proceeds from shares sold | | | 22,070,424 | |
Net increase/(decrease) in net assets from capital share transactions | | | 22,070,424 | |
TOTAL INCREASE/(DECREASE) IN NET ASSETS | | | 22,377,312 | |
| | | | | |
NET ASSETS: | | | | |
Beginning of period | | $ | — | |
End of period | | $ | 22,377,312 | |
| | | | | |
SHARE TRANSACTIONS: | | | | |
Shares sold | | | 440,000 | |
Shares redeemed | | | — | |
Net increase/(decrease) in shares | | | 440,000 | |
(1) | Inception date of the Fund was January 10, 2024. |
The accompanying notes are an integral part of these financial statements.
F/m 10-Year Investment Grade Corporate Bond ETF
Statement of Changes in Net Assets
| | FOR THE
Period ENDED
August 31,
2024(1) | |
INCREASE/(DECREASE) IN NET ASSETS RESULTING FROM OPERATIONS | | | | |
Net investment income/(loss) | | $ | 467,205 | |
Net realized gain/(loss) from investments | | | (179,813 | ) |
Net change in unrealized appreciation/(depreciation) on investments | | | 449,553 | |
NET INCREASE/(DECREASE) IN NET ASSETS RESULTING FROM OPERATIONS | | | 736,945 | |
| | | | | |
DIVIDENDS AND DISTRIBUTIONS TO SHAREHOLDERS FROM: | | | | |
Total distributable earnings | | | (396,142 | ) |
Net decrease in net assets from dividends and distributions to shareholders | | | (396,142 | ) |
| | | | | |
CAPITAL SHARE TRANSACTIONS: | | | | |
Proceeds from shares sold | | | 18,028,159 | |
Shares redeemed | | | (1,973,948 | ) |
Net increase/(decrease) in net assets from capital share transactions | | | 16,054,211 | |
TOTAL INCREASE/(DECREASE) IN NET ASSETS | | | 16,395,014 | |
| | | | | |
NET ASSETS: | | | | |
Beginning of period | | $ | — | |
End of period | | $ | 16,395,014 | |
| | | | | |
SHARE TRANSACTIONS: | | | | |
Shares sold | | | 360,000 | |
Shares redeemed | | | (40,000 | ) |
Net increase/(decrease) in shares | | | 320,000 | |
(1) | Inception date of the Fund was January 10, 2024. |
The accompanying notes are an integral part of these financial statements.
F/m 2-Year Investment Grade Corporate Bond ETF
Financial Highlights
Contained below is per share operating performance data for shares outstanding, total investment return/(loss), ratios to average net assets and other supplemental data for the period. This information has been derived from information provided in the financial statements.
| | FOR THE
PERIOD
ENDED
August 31, | |
| | 2024(1) | |
PER SHARE OPERATING PERFORMANCE | | | | |
Net asset value, beginning of period | | $ | 50.00 | |
Net investment income/(loss)(2) | | | 1.60 | |
Net realized and unrealized gain/(loss) from investments | | | 0.35 | |
Net increase/(decrease) in net assets resulting from operations | | | 1.95 | |
Dividends and distributions to shareholders from: | | | | |
Net investment income | | | (1.32 | ) |
Total dividends and distributions to shareholders | | | (1.32 | ) |
Net asset value, end of period | | $ | 50.63 | |
Market value, end of period | | $ | 50.69 | |
Total investment return/(loss) on net asset value(3) | | | 3.96 | %(5) |
Total investment return/(loss) on market price(4) | | | 4.09 | %(5) |
RATIOS/SUPPLEMENTAL DATA | | | | |
Net assets, end of period (000’s omitted) | | $ | 10,125 | |
Ratio of expenses to average net assets | | | 0.15 | %(6) |
Ratio of net investment income/(loss) to average net assets | | | 4.99 | %(6) |
Portfolio turnover rate | | | 110 | %(5) |
(1) | Inception date of the Fund was January 10, 2024. |
(2) | Per share data calculated using average shares outstanding method. |
(3) | Total investment return/(loss) on net asset value is calculated assuming a purchase of shares on the first day and a sale of shares on the last day of each period reported and includes reinvestments of dividends and distributions, if any. |
(4) | Total investment return/(loss) on market price is calculated assuming an initial investment made at the market price on the first day of the period, reinvestment of dividends and distributions at market price during the period and redemption at market price on the last day of the period. |
The accompanying notes are an integral part of these financial statements.
F/m 3-Year Investment Grade Corporate Bond ETF
Financial Highlights
Contained below is per share operating performance data for shares outstanding, total investment return/(loss), ratios to average net assets and other supplemental data for the period. This information has been derived from information provided in the financial statements.
| | FOR THE
PERIOD
ENDED
August 31, | |
| | 2024(1) | |
PER SHARE OPERATING PERFORMANCE | | | | |
Net asset value, beginning of period | | $ | 50.00 | |
Net investment income/(loss)(2) | | | 1.55 | |
Net realized and unrealized gain/(loss) from investments | | | 0.62 | |
Net increase/(decrease) in net assets resulting from operations | | | 2.17 | |
Dividends and distributions to shareholders from: | | | | |
Net investment income | | | (1.31 | ) |
Total dividends and distributions to shareholders | | | (1.31 | ) |
Net asset value, end of period | | $ | 50.86 | |
Market value, end of period | | $ | 50.93 | |
Total investment return/(loss) on net asset value(3) | | | 4.41 | %(5) |
Total investment return/(loss) on market price(4) | | | 4.55 | %(5) |
RATIOS/SUPPLEMENTAL DATA | | | | |
Net assets, end of period (000’s omitted) | | $ | 22,377 | |
Ratio of expenses to average net assets | | | 0.15 | %(6) |
Ratio of net investment income/(loss) to average net assets | | | 4.85 | %(6) |
Portfolio turnover rate | | | 86 | %(5) |
(1) | Inception date of the Fund was January 10, 2024. |
(2) | Per share data calculated using average shares outstanding method. |
(3) | Total investment return/(loss) on net asset value is calculated assuming a purchase of shares on the first day and a sale of shares on the last day of each period reported and includes reinvestments of dividends and distributions, if any. |
(4) | Total investment return/(loss) on market price is calculated assuming an initial investment made at the market price on the first day of the period, reinvestment of dividends and distributions at market price during the period and redemption at market price on the last day of the period. |
The accompanying notes are an integral part of these financial statements.
F/m 10-Year Investment Grade Corporate Bond ETF
Financial Highlights
Contained below is per share operating performance data for shares outstanding, total investment return/(loss), ratios to average net assets and other supplemental data for the period. This information has been derived from information provided in the financial statements.
| | FOR THE
PERIOD
ENDED
August 31, | |
| | 2024(1) | |
PER SHARE OPERATING PERFORMANCE | | | | |
Net asset value, beginning of period | | $ | 50.00 | |
Net investment income/(loss)(2) | | | 1.66 | |
Net realized and unrealized gain/(loss) from investments | | | 0.93 | |
Net increase/(decrease) in net assets resulting from operations | | | 2.59 | |
Dividends and distributions to shareholders from: | | | | |
Net investment income | | | (1.36 | ) |
Total dividends and distributions to shareholders | | | (1.36 | ) |
Net asset value, end of period | | $ | 51.23 | |
Market value, end of period | | $ | 51.42 | |
Total investment return/(loss) on net asset value(3) | | | 5.32 | %(5) |
Total investment return/(loss) on market price(4) | | | 5.68 | %(5) |
RATIOS/SUPPLEMENTAL DATA | | | | |
Net assets, end of period (000’s omitted) | | $ | 16,395 | |
Ratio of expenses to average net assets | | | 0.15 | %(6) |
Ratio of net investment income/(loss) to average net assets | | | 5.22 | %(6) |
Portfolio turnover rate | | | 131 | %(5) |
(1) | Inception date of the Fund was January 10, 2024. |
(2) | Per share data calculated using average shares outstanding method. |
(3) | Total investment return/(loss) on net asset value is calculated assuming a purchase of shares on the first day and a sale of shares on the last day of each period reported and includes reinvestments of dividends and distributions, if any. |
(4) | Total investment return/(loss) on market price is calculated assuming an initial investment made at the market price on the first day of the period, reinvestment of dividends and distributions at market price during the period and redemption at market price on the last day of the period. |
The accompanying notes are an integral part of these financial statements.
F/m Corporate Bond ETFs
Notes to Financial Statements
August 31, 2024
1. ORGANIZATION AND SIGNIFICANT ACCOUNTING POLICIES
The RBB Fund, Inc. (“RBB” or the “Company”) was incorporated under the laws of the State of Maryland on February 29, 1988 and is registered under the Investment Company Act of 1940, as amended (the “1940 Act”), as an open-end management investment company. RBB is a “series fund,” which is an investment company divided into separate portfolios. Each portfolio is treated as a separate entity for certain matters under the 1940 Act, and for other purposes, and a shareholder of one portfolio is not deemed to be a shareholder of any other portfolio. Currently, RBB has sixty-five separate investment portfolios, including the F/m 2-Year Investment Grade Corporate Bond ETF, the F/m 3-Year Investment Grade Corporate Bond ETF, and the F/m 10-Year Investment Grade Corporate Bond ETF (each a “Fund” and together the “Funds” or “F/m Corporate Bond ETFs”). The F/m 2-Year Investment Grade Corporate Bond ETF, the F/m 3-Year Investment Grade Corporate Bond ETF, and the F/m 10-Year Investment Grade Corporate Bond ETF commenced investment operations on January 10, 2024.
RBB has authorized capital of one hundred billion shares of common stock of which 92.923 billion shares are currently classified into two hundred and thirty-six classes of common stock. Each class represents an interest in an active or inactive RBB investment portfolio.
The investment objective of the F/m 2-Year Investment Grade Corporate Bond ETF, the F/m 3-Year Investment Grade Corporate Bond ETF, and the F/m 10-Year Investment Grade Corporate Bond ETF is to seek investment results that correspond (before fees and expenses) generally to the price and yield of its corresponding benchmark index (“Underlying Index”): the ICE 2-Year Target Maturity Index, the ICE 3-Year Target Maturity Index, and the ICE 10-Year Target Maturity Index, respectively.
The Funds are investment companies and follow accounting and reporting guidance in the Financial Accounting Standards Board (“FASB”) Accounting Standards Codification Topic 946 “Financial Services - Investment Companies.”
The end of the reporting period for the Funds is August 31, 2024, and the period covered by these Notes to Financial Statements is the fiscal period since the Funds’ inception from January 10, 2024 through August 31, 2024 (the “current fiscal period”).
PORTFOLIO VALUATION — The Funds value their investments at fair value. Each Fund’s net asset value (“NAV”) is calculated once daily at the close of regular trading hours on the New York Stock Exchange (“NYSE”) (generally 4:00 p.m. Eastern time) on each day the NYSE is open. Securities held by the Funds are valued using the closing price or the last sale price on a national securities exchange or the National Association of Securities Dealers Automatic Quotation System (“NASDAQ”) market system where they are primarily traded. Equity securities traded in the over-the-counter (“OTC”) market are valued at their closing prices. If there were no transactions on that day, securities traded principally on an exchange or on NASDAQ will be valued at the mean of the last bid and ask prices prior to the market close. Fixed income securities are valued using an independent pricing service, which considers such factors as security prices, yields, maturities and ratings, and are deemed representative of market values at the close of the market. If market quotations are unavailable or deemed unreliable, securities will be valued in accordance with procedures adopted by the Company’s Board of Directors (the “Board” or “Directors”). Relying on prices supplied by pricing services or dealers or using fair valuation may result in values that are higher or lower than the values used by other investment companies and investors to price the same investments. Units of Mount Vernon Liquid Assets Portfolio are not traded on an exchange and are valued at the investment company’s NAV per share.
The Board has adopted a pricing and valuation policy for use by the Funds and their Valuation Designee (as defined below) in calculating the Funds’ NAV. Pursuant to Rule 2a-5 under the 1940 Act, the Funds have designated F/m Investments, LLC d/b/a North Slope Capital, LLC (the “Adviser” or “F/m”) as their “Valuation Designee” to perform all of the fair value determinations as well as to perform all of the responsibilities that may be performed by the Valuation Designee in accordance with Rule 2a-5. The Valuation Designee is authorized to make all necessary determinations of the fair values of portfolio securities and other assets for which market quotations are not readily available or if it is deemed that the prices obtained from brokers and dealers or independent pricing services are unreliable.
FAIR VALUE MEASUREMENTS — The inputs and valuation techniques used to measure the fair value of each Fund’s investments are summarized into three levels as described in the hierarchy below:
| | ● | Level 1 – Prices are determined using quoted prices in active markets for identical securities. |
| | ● | Level 2 – Prices are determined using other significant observable inputs (including quoted prices for similar securities, interest rates, prepayment speeds, credit risk, etc.). |
F/m Corporate Bond ETFs
Notes to Financial Statements (continued)
August 31, 2024
| | ● | Level 3 – Prices are determined using significant unobservable inputs (including each Fund’s own assumptions in determining the fair value of investments). |
The inputs or methodologies used for valuing securities are not necessarily an indication of the risk associated with investing in those securities.
The following is a summary of the inputs used, as of the end of the current fiscal period, in valuing each Fund’s investments carried at fair value:
F/M 2-YEAR INVESTMENT GRADE CORPORATE
BOND ETF | | TOTAL | | | LEVEL 1 | | | LEVEL 2 | | | LEVEL 3 | |
Corporate Bonds | | $ | 8,842,474 | | | $ | — | | | $ | 8,842,474 | | | $ | — | |
Foreign Corporate Bonds | | | 1,139,110 | | | | — | | | | 1,139,110 | | | | — | |
Total Investments | | $ | 9,981,584 | | | $ | — | | | $ | 9,981,584 | | | $ | — | |
F/M 3-YEAR INVESTMENT GRADE CORPORATE
BOND ETF | | TOTAL | | | LEVEL 1 | | | LEVEL 2 | | | LEVEL 3 | |
Corporate Bonds | | $ | 19,698,710 | | | $ | — | | | $ | 19,698,710 | | | $ | — | |
Foreign Corporate Bonds | | | 2,437,041 | | | | — | | | | 2,437,041 | | | | — | |
Investments Purchased with Proceeds from Securities Lending* | | | 99,470 | | | | — | | | | — | | | | — | |
Total Investments | | $ | 22,235,221 | | | $ | — | | | $ | 22,135,751 | | | $ | — | |
F/M 10-YEAR INVESTMENT GRADE CORPORATE
BOND ETF | | TOTAL | | | LEVEL 1 | | | LEVEL 2 | | | LEVEL 3 | |
Corporate Bonds | | $ | 14,610,620 | | | $ | — | | | $ | 14,610,620 | | | $ | — | |
Foreign Corporate Bonds | | | 1,541,895 | | | | — | | | | 1,541,895 | | | | — | |
Investments Purchased with Proceeds from Securities Lending* | | | 395,625 | | | | — | | | | — | | | | — | |
Total Investments | | $ | 16,548,140 | | | $ | — | | | $ | 16,152,515 | | | $ | — | |
* | Certain investments that are measured at fair value using the net asset value per share (or its equivalent) practical expedient have not been categorized in the fair value hierarchy. The fair value amounts presented in the table are intended to permit reconciliation of the fair value hierarchy to the amounts presented in the Statements of Assets and Liabilities |
** | Please refer to the Schedule of Investments for further details. |
At the end of each quarter, management evaluates the classification of Levels 1, 2 and 3 assets and liabilities. Various factors are considered, such as changes in liquidity from the prior reporting period; whether or not a broker is willing to execute at the quoted price; the depth and consistency of prices from third party pricing services; and the existence of contemporaneous, observable trades in the market. Additionally, management evaluates the classification of Levels 1, 2 and 3 assets and liabilities on a quarterly basis for changes in listings or delistings on national exchanges.
Due to the inherent uncertainty of determining the fair value of investments that do not have a readily available market value, the fair value of each Fund’s investments may fluctuate from period to period. Additionally, the fair value of investments may differ significantly from the values that would have been used had a ready market existed for such investments and may differ materially from the values the Fund may ultimately realize. Further, such investments may be subject to legal and other restrictions on resale or otherwise less liquid than publicly traded securities.
F/m Corporate Bond ETFs
Notes to Financial Statements (continued)
August 31, 2024
For fair valuations using significant unobservable inputs, U.S. generally accepted accounting principles (“U.S. GAAP”) requires each Fund to present a reconciliation of the beginning to ending balances for reported market values that presents changes attributable to total realized and unrealized gains or losses, purchase and sales, and transfers in and out of Level 3 during the period. Transfers in and out between levels are based on values at the end of the period. A reconciliation of Level 3 investments is presented only if a Fund had an amount of Level 3 investments at the end of the reporting period that was meaningful in relation to its net assets. The amounts and reasons for Level 3 transfers in and out of each level is disclosed when a Fund had an amount of total Level 3 transfers during the reporting period that was meaningful in relation to its net assets as of the end of the reporting period.
The Funds did not have any significant Level 3 transfers during the current fiscal period.
USE OF ESTIMATES — The preparation of financial statements in conformity with U.S. GAAP requires management to make estimates and assumptions that affect the reported amounts of assets and liabilities and disclosure of contingent assets and liabilities at the date of the financial statements and the reported amounts of revenues and expenses during the reporting period. Actual results could differ from those estimates and those differences could be significant.
INVESTMENT TRANSACTIONS, INVESTMENT INCOME AND EXPENSES — The Funds record security transactions based on trade date for financial reporting purposes. The cost of investments sold is determined by use of the specific identification method for both financial reporting and income tax purposes in determining realized gains and losses on investments. Interest income (including amortization of premiums and accretion of discounts) is accrued when earned. Dividend income is recorded on the ex-dividend date. Distributions received on securities that represent a return of capital or capital gains are recorded as a reduction of cost of investments and/or as a realized gain. Each Fund’s investment income, expenses (other than class specific expenses) and unrealized and realized gains and losses are allocated daily to each class of shares based upon the relative proportion of net assets of each class at the beginning of the day. Certain expenses are shared with The RBB Fund Trust (the “Trust”), a series trust of affiliated funds. Expenses incurred on behalf of a specific class, fund or fund family of the Company or Trust are charged directly to the class, fund or fund family (in proportion to net assets). Expenses incurred for all funds (such as director or professional fees) are charged to all funds in proportion to their average net assets of RBB and the Trust, or in such other manner as the Board deems fair or equitable. Expenses and fees, including investment advisory and administration fees, are accrued daily and taken into account for the purpose of determining the NAV of the Funds.
DIVIDENDS AND DISTRIBUTIONS TO SHAREHOLDERS — Each Fund will distribute substantially all of its net investment income and net realized capital gains, if any, to its shareholders. Each Fund expects to declare and pay distributions, if any, monthly, however it may declare and pay distributions more or less frequently. Net realized capital gains (including net short-term capital gains), if any, will be distributed by each Fund at least annually. Brokers may make the DTC book-entry dividend reinvestment service available to their customers who own a Fund’s Shares. If this service is available and used, dividend distributions of both income and capital gains will automatically be reinvested in additional whole Shares of that Fund purchased on the secondary market. Without this service, investors would receive their distributions in cash. In order to achieve the maximum total return on their investments, investors are encouraged to use the dividend reinvestment service. To determine whether the dividend reinvestment service is available and whether there is a commission or other charge for using this service, consult your broker. Brokers may require a Fund’s shareholders to adhere to specific procedures and timetables.
U.S. TAX STATUS — No provision is made for U.S. income taxes as it is each Fund’s intention to continue to qualify for and elect the tax treatment applicable to regulated investment companies under Subchapter M of the Internal Revenue Code of 1986, as amended, and make the requisite distributions to its shareholders which will be sufficient to relieve it from U.S. income and excise taxes.
OTHER — In the normal course of business, the Funds may enter into contracts that provide general indemnifications. Each Fund’s maximum exposure under these arrangements is dependent on claims that may be made against the Funds in the future, and, therefore, cannot be estimated; however, based on experience, the risk of material loss from such claims is considered remote.
2. INVESTMENT POLICIES AND PRACTICES
The sections below describe some of the different types of investments that may be made by the Funds and the investment practices in which the Funds may engage.
F/m Corporate Bond ETFs
Notes to Financial Statements (continued)
August 31, 2024
Cash Equivalents and Short-Term InvestmentS - The Funds may invest in cash, cash equivalents, and a variety of short-term instruments in such proportions as warranted by prevailing market conditions and each Fund’s principal investment strategies. The Funds may temporarily invest without limit in such instruments for liquidity purposes, or in an attempt to respond to adverse market, economic, political or other conditions. During such periods, a Fund may not be able to achieve its investment objective.
Illiquid Investments - Pursuant to Rule 22e-4 under the 1940 Act, a Fund may invest up to 15% of its net assets in illiquid investments. An illiquid investment as defined in Rule 22e-4 is an investment that a Fund reasonably expects cannot be sold or disposed of in current market conditions within 7 calendar days or less without the sale or disposition significantly changing the market value of the investment. These investments may include restricted securities and repurchase agreements maturing in more than 7 days. Restricted securities are securities that may not be sold to the public without an effective registration statement under the Securities Act of 1933, as amended (the “1933 Act”), and thus may be sold only in privately negotiated transactions or pursuant to an exemption from registration. Subject to the adoption of guidelines by the Board, certain restricted securities that may be sold to institutional investors pursuant to Rule 144A under the 1933 Act and non-exempt commercial paper may be determined to be liquid by the Adviser. Illiquid investments involve the risk that the investments will not be able to be sold at the time the Adviser desires or at prices approximating the value at which a Fund is carrying the investments. To the extent an investment held by a Fund is deemed to be an illiquid investment or a less liquid investment, a Fund will be exposed to a greater liquidity risk.
Inflation Protected Securities - Each Fund may invest in inflation protected securities. Inflation protected securities are fixed income securities designed to provide protection against the negative effects of inflation. Two structures are common. The U.S. Treasury and some other issuers use a structure that accrues inflation into the principal value of the bond. Most other issuers pay out the inflation accruals as part of a semiannual coupon.
Other Investment Companies - Each Fund may invest in other investment companies, including open-end funds, closed-end funds, unit investment trusts, and exchange-traded funds (“ETFs”) registered under the 1940 Act that invest primarily in Fund eligible investments. Under the 1940 Act, a Fund’s investment in such securities is generally limited to 3% of the total voting stock of any one investment company; 5% of such Fund’s total assets with respect to any one investment company; and 10% of such Fund’s total assets in the aggregate. A Fund’s investments in other investment companies may include money market mutual funds. Investments in money market funds are not subject to the percentage limitations set forth above. The SEC has adopted revisions to the rules permitting funds to invest in other investment companies in excess of the limits described above. While Rule 12d1-4 permits more types of fund of fund arrangements without reliance on an exemptive order or no-action letters, it imposes new conditions, including limits on control and voting of acquired funds’ shares, evaluations and findings by investment advisers, fund investment agreements, and limits on most three-tier fund structures. Rule 12d1-4 went into effect on January 19, 2021. The rescission of the applicable exemptive orders and the withdrawal of the applicable no-action letters was effective on January 19, 2022. These regulatory changes may adversely impact a Fund’s investment strategies and operations.
U.S. Government Securities - Each Fund may invest in U.S. government securities, including bills, notes and bonds differing as to maturity and rates of interest, which are either issued or guaranteed by the U.S. Treasury or by U.S. government agencies or instrumentalities. U.S. government agency securities include securities issued by (a) the Federal Housing Administration, Farmers Home Administration, Export-Import Bank of the United States, Small Business Administration, and the Government National Mortgage Association, whose securities are supported by the full faith and credit of the United States; (b) the Federal Home Loan Banks, Federal Intermediate Credit Banks, and the Tennessee Valley Authority, whose securities are supported by the right of the agency to borrow from the U.S. Treasury; (c) the Federal National Mortgage Association, whose securities are supported by the discretionary authority of the U.S. government to purchase certain obligations of the agency or instrumentality; and (d) the Student Loan Marketing Association, whose securities are supported only by its credit. While the U.S. government provides financial support to such U.S. government-sponsored agencies or instrumentalities, no assurance can be given that it always will do so since it is not so obligated by law. The U.S. government, its agencies and instrumentalities do not guarantee the market value of their securities, and consequently, the value of such securities may fluctuate.
Zero-Coupon and Step Coupon Securities - Each Fund may invest in zero-coupon and step coupon securities. Zero-coupon securities pay no cash income to their holders until they mature. When held to maturity, their entire return comes from the difference between their purchase price and their maturity value. Step coupon securities are debt securities that may not pay interest for a specified period of time and then, after the initial period, may pay interest at a series of different rates. Both
F/m Corporate Bond ETFs
Notes to Financial Statements (continued)
August 31, 2024
zero-coupon and step coupon securities are issued at substantial discounts from their value at maturity. Because interest on these securities is not paid on a current basis, the values of securities of this type are subject to greater fluctuations than are the value of securities that distribute income regularly and may be more speculative than such securities. Accordingly, the values of these securities may be highly volatile as interest rates rise or fall. In addition, while such securities generate income for purposes of generally accepted accounting standards, they do not generate cash flow and thus could cause a Fund to be forced to liquidate securities at an inopportune time in order to distribute cash, as required by the Code.
CREDIT RISK - The value of your investment in each Fund may change in response to changes in the credit ratings of the Fund’s portfolio securities, including with respect to the underlying funds. Generally, investment risk and price volatility increase as a security’s credit rating declines. The financial condition of an issuer of a fixed income security held by each Fund may cause it to default or become unable to pay interest or principal due on the security.
144A SECURITIES RISK- Rule 144A securities are securities that are exempt from registration in compliance with the 1933 Act, and the rules thereunder, and may have legal restrictions on resale. Under Rule 144A under the 1933 Act these privately placed securities may be resold to qualified institutional buyers (“QIBs”), subject to certain conditions. An insufficient number of QIBs interested in purchasing Rule 144A securities at a particular time could adversely affect the marketability of the securities and a Fund might be unable to dispose of the securities promptly or at a reasonable price. Please refer to the Schedule of Investments for further details regarding each Fund’s investments in Rule 144A securities.
Temporary Investments - During periods of adverse market or economic conditions, a Fund may temporarily invest all or a substantial portion of its assets in high-quality, fixed-income securities, money market instruments, and shares of money market mutual funds, or it may hold cash. At such times, a Fund would not be pursuing its stated investment objective with its usual investment strategies. A Fund may also hold these investments for liquidity purposes. Fixed-income securities will be deemed to be of high quality if they are rated “A” or better by S&P or Moody’s or, if unrated, are determined to be of comparable quality by the Adviser. Money market instruments are high-quality, short-term fixed-income obligations (which generally have remaining maturities of one year or less) and may include U.S. Government Securities, commercial paper, certificates of deposit and banker’s acceptances issued by domestic branches of U.S. banks that are members of the Federal Deposit Insurance Corporation, and repurchase agreements for U.S. Government Securities.
In lieu of purchasing money market instruments, the Fund may purchase shares of money market mutual funds that invest primarily in U.S. Government Securities and repurchase agreements involving those securities, subject to certain limitations imposed by the 1940 Act. A Fund, as an investor in a money market fund, will indirectly bear that fund’s fees and expenses, which will be in addition to the fees and expenses of the Fund. Repurchase agreements involve certain risks not associated with direct investments in debt securities.
3. INVESTMENT ADVISER AND OTHER SERVICES
Each Fund pays all of its expenses other than those expressly assumed by the Adviser. Expenses of each Fund are deducted from the Fund’s total income before dividends are paid. Subject to the supervision of the Board, the Adviser manages the overall investment operations of each Fund in accordance with the Fund’s respective investment objective and policies and formulates a continuing investment strategy for each Fund pursuant to the terms of the investment advisory agreement (the “Advisory Agreement”) between the Adviser and the Company on behalf of each Fund. The Adviser is controlled by Diffractive Managers Group, LLC, a Delaware limited liability company, and EQSF Holdings, LLC, a Delaware limited liability company owned by three officers of the Company. The Funds compensate the Adviser with a unitary management fee for its services at an annual rate of 0.15% of each Fund’s average daily net assets during the month. From the unitary management fee, the Adviser pays most of the expenses of each Fund, including transfer agency, custody, fund administration, legal, audit and other services. However, under the Advisory Agreement, the Adviser is not responsible for interest expenses, brokerage commissions and other trading expenses, taxes, distribution fees and expenses paid by each Fund under any distribution plan adopted, and other extraordinary costs such as litigation and other expenses not incurred in the ordinary course of business. The Adviser will not be liable for any error of judgment, mistake of law, or for any loss suffered by a Fund in connection with the performance of the Advisory Agreement, except a loss resulting from a breach of fiduciary duty with respect to the receipt of compensation for services or a loss resulting from willful misfeasance, bad faith or gross negligence on the part of the Adviser in the performance of its duties, or from reckless disregard of its obligations and duties under the Advisory Agreement.
F/m Corporate Bond ETFs
Notes to Financial Statements (continued)
August 31, 2024
During the current fiscal period, investment advisory fees accrued were as follows:
FUND | | ADVISORY FEES | |
F/m 2-Year Investment Grade Corporate Bond ETF | | $ | 9,200 | |
F/m 3-Year Investment Grade Corporate Bond ETF | | | 16,566 | |
F/m 10-Year Investment Grade Corporate Bond ETF | | | 13,424 | |
U.S. Bancorp Fund Services, LLC (“Fund Services”), doing business as U.S. Bank Global Fund Services, serves as administrator for the Funds. For providing administrative and accounting services, Fund Services is entitled to receive a monthly fee, subject to certain minimum and out of pocket expenses.
Fund Services serves as each Fund’s transfer and dividend disbursing agent. For providing transfer agent services, Fund Services is entitled to receive a monthly fee, subject to certain minimum and out of pocket expenses.
U.S. Bank, N.A. (the “Custodian”) provides certain custodial services to the Funds. The Custodian is entitled to receive a monthly fee, subject to certain minimum and out of pocket expenses.
Quasar Distributors, LLC (“Quasar”), a wholly-owned broker-dealer subsidiary of Foreside Financial Group, LLC, serves as the principal underwriter and distributor of each Fund’s shares pursuant to a Distribution Agreement with RBB.
Under each Fund’s unitary fee, the Adviser compensates Fund Services and the Custodian for services provided.
DIRECTOR AND OFFICER COMPENSATION — The Directors of the Company receive an annual retainer and meeting fees for meetings attended. An employee of Vigilant Compliance, LLC serves as Chief Compliance Officer of the Company. Vigilant Compliance, LLC is compensated for the services provided to the Company. Employees of RBB serve as President, Chief Financial Officer, Chief Operating Officer, Secretary and Director of Marketing & Business Development of the Company. They are compensated by the Company for services provided. Certain employees of Fund Services serve as officers of the Company. They are not compensated by the Funds or the Company. As of the end of the current fiscal period, there were no director and officer fees charged or paid by the Funds.
4. PURCHASES AND SALES OF INVESTMENT SECURITIES
During the current fiscal period, aggregate purchases and sales of investment securities (excluding in-kind transactions and short-term investments) of the Funds were as follows:
| | F/m 2-Year
Investment
Grade
Corporate
Bond ETF | | | F/m 3-Year
Investment
Grade
Corporate
Bond ETF | | | F/m 10-Year
Investment
Grade
Corporate
Bond ETF | |
Purchases of investment securities | | $ | 10,589,786 | | | $ | 15,580,999 | | | $ | 19,016,239 | |
Proceeds from sales of investment securities | | | 10,602,647 | | | | 15,401,977 | | | | 18,683,589 | |
F/m Corporate Bond ETFs
Notes to Financial Statements (continued)
August 31, 2024
During the current fiscal period, aggregate purchases and sales of in-kind transactions (excluding short-term investments) of the Funds were as follows:
| | F/m 2-Year
Investment
Grade
Corporate
Bond ETF | | | F/m 3-Year
Investment
Grade
Corporate
Bond ETF | | | F/m 10-Year
Investment
Grade
Corporate
Bond ETF | |
In-kind purchases of investment securities | | $ | 9,819,212 | | | $ | 21,594,187 | | | $ | 17,522,491 | |
Proceeds from in-kind sales of investment securities | | | — | | | | — | | | | 1,965,949 | |
There were no purchases or sales of long-term U.S. Government securities during the current fiscal period.
5. FEDERAL INCOME TAX INFORMATION
Each Fund has followed the authoritative guidance on accounting for and disclosure of uncertainty in tax positions, which requires the Fund to determine whether a tax position is more likely than not to be sustained upon examination, including resolution of any related appeals or litigation processes, based on the technical merits of the position. Each Fund has determined that there was no effect on the financial statements from following this authoritative guidance. In the normal course of business, each Fund is subject to examination by federal, state and local jurisdictions, where applicable, for tax years for which applicable statutes of limitations have not expired.
As of August 31, 2024, the federal tax cost, aggregate gross unrealized appreciation and depreciation of securities held by each Fund were as follows:
| | | FEDERAL
Tax Cost | | | Unrealized
appreciation | | | Unrealized
(depreciation) | | | net unrealized
appreciation/
depreciation | |
F/m 2-Year Investment Grade Corporate Bond ETF | | $ | 9,894,086 | | | $ | 89,749 | | | $ | (2,251 | ) | | $ | 87,498 | |
F/m 3-Year Investment Grade Corporate Bond ETF | | $ | 21,937,864 | | | $ | 302,485 | | | $ | (5,129 | ) | | $ | 297,356 | |
F/m 10-Year Investment Grade Corporate Bond ETF | | $ | 16,111,177 | | | $ | 449,800 | | | $ | (12,838 | ) | | $ | 436,962 | |
Distributions to shareholders, if any, from net investment income and realized gains are determined in accordance with federal income tax regulations, which may differ from net investment income and realized gains recognized for financial reporting purposes. Accordingly, the character of distributions and composition of net assets for tax purposes may differ from those reflected in the accompanying financial statements. To the extent these differences are permanent, such amounts are reclassified within the capital accounts based on the tax treatment; temporary differences do not require such reclassification.
F/m Corporate Bond ETFs
Notes to Financial Statements (continued)
August 31, 2024
As of August 31, 2024, there were permanent differences related to redemptions in-kind between distributable earnings/(loss) and paid-in capital, respectively for the Fund:
| | | Distributable
earnings/(loss) | | | PAID-IN-CAPITAL | |
F/m 2-Year Investment Grade Corporate Bond ETF | | $ | — | | | $ | — | |
F/m 3-Year Investment Grade Corporate Bond ETF | | $ | — | | | $ | — | |
F/m 10-Year Investment Grade Corporate Bond ETF | | $ | 16,865 | | | $ | (16,865 | ) |
As of August 31, 2024, the components of distributable earnings on a tax basis were as follows:
| | | undistributed
ordinary
income | | | undistributed
long-term
capital gains | | | net unrealized
appreciation/
(depreciation) | | | capital
loss
carryover | | | qualified
late-year
loss | |
F/m 2-Year Investment Grade Corporate Bond ETF | | $ | 42,545 | | | $ | 0 | | | $ | 87,498 | | | $ | (11,818 | ) | | $ | 0 | |
F/m 3-Year Investment Grade Corporate Bond ETF | | $ | 76,854 | | | $ | 0 | | | $ | 297,356 | | | $ | (67,322 | ) | | $ | 0 | |
F/m 10-Year Investment Grade Corporate Bond ETF | | $ | 71,063 | | | $ | 0 | | | $ | 436,962 | | | $ | (150,357 | ) | | $ | 0 | |
The difference between the book and tax basis components of distributable earnings relate primarily to the timing of recognition of income and gains for federal income tax purposes.
The tax character of dividends and distributions paid during the fiscal year ended August 31, 2024 was as follows:
| | | Ordinary
income | | | long-term
capital gains | |
F/m 2-Year Investment Grade Corporate Bond ETF | | $ | 263,500 | | | $ | 0 | |
F/m 3-Year Investment Grade Corporate Bond ETF | | $ | 458,463 | | | $ | 0 | |
F/m 10-Year Investment Grade Corporate Bond ETF | | $ | 396,142 | | | $ | 0 | |
The Fund is permitted to carry forward capital losses for an unlimited period. Additionally, capital losses that are carried forward will retain their character as either short-term or long-term capital losses. As of August 31, 2024, the F/m 2-Year Investment Grade Corporate Bond ETF, F/m 3-Year Investment Grade Corporate Bond ETF, and F/m 10-Year Investment Grade Corporate Bond ETF had unexpiring short-term losses of $11,818, $67,322, and $150,357, respectfully.
6. SECURITIES LENDING
The Funds may make secured loans of their Fund securities to brokers, dealers and other financial institutions to earn additional income and receive cash collateral equal to at least 102% of the current market value of the loaned domestic securities, and 105% of the current market value of the loaned foreign securities, as marked to market each day that the NAV of the Funds is determined. When the collateral falls below specified amounts, each Fund’s lending agent will use its best effort to obtain additional collateral on the next business day to meet required amounts under the security lending agreement. The Funds receive compensation in the form of loan fees owed by borrowers and income earned on collateral investments. A portion of the interest
F/m Corporate Bond ETFs
Notes to Financial Statements (continued)
August 31, 2024
received on the loan collateral is retained by the Funds and the remainder is rebated to the borrower of the securities. Pursuant to the securities lending agreement between the Trust, on behalf of the Funds, and the Custodian, each Fund pays a fee to the Custodian for administrative and custodial fees, which is calculated daily and paid monthly, in the amount of 20% of the Fund’s net income. The net amount of interest earned, after the interest rebate and the allocation to the Custodian, is shown below. Collateral is invested in the Mount Vernon Liquid Assets Portfolio, LLC of which the investment objective is to seek to maximize income to the extent consistent with the preservation of capital and liquidity and maintain a stable Net Asset Value of $1.00. The Funds will bear the risk of loss of the invested collateral. Investments purchased with collateral are overnight and continuous. Securities lending will expose the Funds to the risk of loss should a borrower default on its obligation to return the borrowed securities. The market value of the securities on loan and cash collateral as of the end of the reporting period and the net income generated from the program during the current fiscal period with respect to such secured loans were as follows:
FUND | | MARKET VALUE
OF SECURITIES
LOANED | | | MARKET VALUE
OF COLLATERAL | | | INCOME
RECEIVED FROM
SECURITIES
LENDING | |
F/m 2-Year Investment Grade Corporate Bond ETF | | $ | — | | | $ | — | | | $ | 139 | |
F/m 3-Year Investment Grade Corporate Bond ETF | | | 97,363 | | | | 99,470 | | | | 126 | |
F/m 10-Year Investment Grade Corporate Bond ETF | | | 385,686 | | | | 395,625 | | | | 3,237 | |
Securities lending transactions are entered into by the Funds’ securities lending agent on behalf of the Funds under a Master Securities Lending Agreement (“MSLA”) which permits the Funds’ securities lending agent on behalf of the Funds under certain circumstances including an event of default (such as bankruptcy or insolvency), to offset amounts payable on behalf of the Funds to the same counterparty against amounts to be received and create one single net payment due to or from the Funds. The following table is a summary of the Funds’ open securities lending transactions which are subject to a MSLA as of the end of the reporting period:
| | | | | | | | | | | | | | | GROSS AMOUNTS NOT OFFSET IN
THE STATEMENTS OF ASSETS AND LIABILITIES | |
FUND | | GROSS AMOUNTS
OF RECOGNIZED
ASSETS | | | GROSS AMOUNTS
OFFSET IN THE
STATEMENTS
OF ASSETS AND
LIABILITIES | | | NET AMOUNTS
OF ASSETS
PRESENTED IN
THE STATEMENTS
OF ASSETS AND
LIABILITIES | | | FINANCIAL
INSTRUMENTS1 | | | CASH
COLLATERAL
RECEIVED | | | NET AMOUNT2 | |
F/m 2-Year Investment Grade Corporate Bond ETF | | $ | — | | | $ | — | | | $ | — | | | $ | — | | | $ | — | | | $ | — | |
F/m 3-Year Investment Grade Corporate Bond ETF | | | 97,363 | | | | — | | | | 97,363 | | | | (97,363 | ) | | | — | | | | — | |
F/m 10-Year Investment Grade Corporate Bond ETF | | | 385,686 | | | | — | | | | 385,686 | | | | (385,686 | ) | | | — | | | | — | |
1 | Amount disclosed is limited to the amount of assets presented in the Statements of Assets and Liabilities. Actual collateral received may be more than the amount shown. |
2 | Net amount represents the net amount receivable from the counterparty in the event of default. |
F/m Corporate Bond ETFs
Notes to Financial Statements (continued)
August 31, 2024
7. SHARE TRANSACTIONS
Shares of the Funds are listed and traded on the NYSE Arca, Inc. (the “Exchange”). Market prices for the shares may be different from their NAV. Each Fund issues and redeems shares on a continuous basis at NAV only in blocks of 10,000 shares, called “Creation Units.” Creation Units are issued and redeemed principally in-kind for securities included in a specified universe. Once created, shares generally trade in the secondary market at market prices that change throughout the day. Except when aggregated in Creation Units, shares are not redeemable securities of each Fund. Creation Units may only be purchased or redeemed by certain financial institutions (“Authorized Participants”). An Authorized Participant is either (i) a broker-dealer or other participant in the clearing process through the Continuous Net Settlement System of the National Securities Clearing Corporation or (ii) a Depository Trust Company participant and, in each case, must have executed a Participant Agreement with Quasar. Most retail investors do not qualify as Authorized Participants nor have the resources to buy and sell whole Creation Units. Therefore, they are unable to purchase or redeem shares directly from each Fund. Rather, most retail investors may purchase shares in the secondary market with the assistance of a broker and are subject to customary brokerage commissions or fees.
Each Fund currently offers one class of shares, which has no front-end sales load, no deferred sales charge, and no redemption fee. A fixed transaction fee is imposed for the transfer and other transaction costs associated with the purchase or sale of Creation Units. The standard fixed transaction fee for each Fund is $500, payable to the custodian. In addition, a variable fee may be charged on all cash transactions or substitutes for Creation Units of up to a maximum of 2% as a percentage of the value of the Creation Units subject to the transaction. Variable fees are imposed to compensate each Fund for the transaction costs associated with the cash transactions. Variable fees received by each Fund, if any, are displayed in the capital shares transactions section of the Statements of Changes in Net Assets.
8. TRANSACTIONS WITH AFFILIATES
The following issuers are affiliated with the Funds. Fund of funds are allowed to invest in other investment companies in excess of the limits imposed, if certain requirements, such as being part of the same group of investment companies, are met. As defined in Section (2)(a)(3) of the 1940 Act, such affiliated issuers are:
| | | January 10, 2024* | | | Additions | | | Reductions | |
Issuer Name | | Share
Balance | | | Cost | | | Share
Balance | | | Cost | | | Share
Balance | | | PROCEEDS | |
F/m 2-Year Investment Grade Corporate Bond ETF U.S. Treasury 2 Year Note ETF | | | — | | | $ | — | | | | 55,667 | | | $ | 2,691,959 | | | | (55,667 | ) | | $ | (2,691,924 | ) |
F/m 3-Year Investment Grade Corporate Bond ETF U.S. Treasury 3 Year Note ETF | | | — | | | | — | | | | 21,783 | | | | 1,074,011 | | | | (21,783 | ) | | | (1,076,731 | ) |
F/m 10-Year Investment Grade Corporate Bond ETF U.S. Treasury 10 Year Note ETF | | | — | | | | — | | | | 32,262 | | | | 1,438,527 | | | | (32,262 | ) | | | (1,445,967 | ) |
* | Inception date of the Funds was January 10, 2024. |
F/m Corporate Bond ETFs
Notes to Financial Statements (continued)
August 31, 2024
| | | August 31, 2024 | |
Issuer Name | | Dividend
Income | | | Capital Gain
Distribution | | | Net Change in
Unrealized
Appreciation/
(Depreciation) | | | Realized
Gain/(Loss) | | | Share
Balance | | | Value | | | Cost | |
F/m 2-Year Investment Grade Corporate Bond ETF U.S. Treasury 2 Year Note ETF | | $ | — | | | $ | — | | | $ | — | | | $ | (35 | ) | | $ | — | | | $ | — | | | $ | — | |
F/m 3-Year Investment Grade Corporate Bond ETF U.S. Treasury 3 Year Note ETF | | | — | | | | — | | | | — | | | | 2,720 | | | | — | | | | — | | | | — | |
F/m 10-Year Investment Grade Corporate Bond ETF U.S. Treasury 10 Year Note ETF | | | — | | | | — | | | | — | | | | 7,440 | | | | — | | | | — | | | | — | |
9. SUBSEQUENT EVENTS
In preparing these financial statements, the Funds have evaluated events and transactions for potential recognition or disclosure through the date the financial statements were issued.
Subsequent to the end of the current fiscal period, the Funds paid the following distributions:
Fund | Record Date | Ex-Date | Pay Date | Distribution
Rate Per Share |
F/m 2-Year Investment Grade Corporate Bond ETF | 9/3/2024 | 9/3/2024 | 9/4/2024 | $0.21100080 |
F/m 3-Year Investment Grade Corporate Bond ETF | 9/3/2024 | 9/3/2024 | 9/4/2024 | $0.19416452 |
F/m 10-Year Investment Grade Corporate Bond ETF | 9/3/2024 | 9/3/2024 | 9/4/2024 | $0.22246050 |
F/m Corporate Bond ETFs
Notes to Financial Statements (Concluded)
August 31, 2024
Fund | Record Date | Ex-Date | Pay Date | Distribution
Rate Per Share |
F/m 2-Year Investment Grade Corporate Bond ETF | 10/1/2024 | 10/1/2024 | 10/2/2024 | $0.18727575 |
F/m 3-Year Investment Grade Corporate Bond ETF | 10/1/2024 | 10/1/2024 | 10/2/2024 | $0.18403575 |
F/m 10-Year Investment Grade Corporate Bond ETF | 10/1/2024 | 10/1/2024 | 10/2/2024 | $0.21168219 |
US CREDIT SERIES
Report of Independent Registered
Public Accounting Firm
To the Shareholders and Board of Directors of
The RBB Fund, Inc.
Opinion on the Financial Statements
We have audited the accompanying statements of assets and liabilities, including the schedules of investments, of The RBB Fund, Inc. comprising the funds listed below (the “Funds”) as of August 31, 2024, the related statements of operations and changes in net assets, and the financial highlights for each of the periods indicated below, and the related notes (collectively referred to as the “financial statements”). In our opinion, the financial statements present fairly, in all material respects, the financial position of each of the Funds as of August 31, 2024, the results of their operations, the changes in net assets, and the financial highlights for each of the periods indicated below in conformity with accounting principles generally accepted in the United States of America.
| FUND NAME | | STATEMENTS OF OPERATIONS | STATEMENT OF CHANGES IN NET ASSETS | FINANCIAL HIGHLIGHTS |
F/m 2-Year Investment Grade Corporate Bond ETF, F/m 3-Year Investment Grade Corporate Bond ETF, and F/m 10- Year Investment Grade Corporate Bond ETF | | For the period from January 10, 2024 (commencement of operations) through August 31, 2024 |
Basis for Opinion
These financial statements are the responsibility of the Funds’ management. Our responsibility is to express an opinion on the Funds’ financial statements based on our audits. We are a public accounting firm registered with the Public Company Accounting Oversight Board (United States) (“PCAOB”) and are required to be independent with respect to the Funds in accordance with the U.S. federal securities laws and the applicable rules and regulations of the Securities and Exchange Commission and the PCAOB.
We conducted our audits in accordance with the standards of the PCAOB. Those standards require that we plan and perform the audit to obtain reasonable assurance about whether the financial statements are free of material misstatement whether due to error or fraud.
Our audits included performing procedures to assess the risks of material misstatement of the financial statements, whether due to error or fraud, and performing procedures that respond to those risks. Such procedures included examining, on a test basis, evidence regarding the amounts and disclosures in the financial statements. Our procedures included confirmation of securities owned as of August 31, 2024, by correspondence with the custodian. Our audits also included evaluating the accounting principles used and significant estimates made by management, as well as evaluating the overall presentation of the financial statements. We believe that our audits provide a reasonable basis for our opinion.
We have served as the auditor of one or more investment companies advised by F/M Investments, LLC since 2021.

COHEN & COMPANY, LTD.
Cleveland, Ohio
October 29, 2024
US CREDIT SERIES
Shareholder Tax Information
(Unaudited)
Certain tax information regarding the Funds is required to be provided to shareholders based upon the Funds’ income and distributions for the taxable period ended August 31, 2024. The information and distributions reported herein may differ from information and distributions taxable to the shareholders for the calendar year ending December 31, 2024. During the fiscal year ended August 31, 2024, the Funds paid ordinary income dividends, and did not pay long-term capital gains dividends to its shareholders.
Dividends from net investment income and short-term capital gains are treated as ordinary income dividends for federal income tax purposes.
Because the Funds’ fiscal year is not the calendar year, another notification will be sent with respect to calendar year 2024. The second notification, which will reflect the amount, if any, to be used by calendar year taxpayers on their U.S. federal income tax returns, will be made in conjunction with Form 1099-DIV and will be mailed in January 2025.
Foreign shareholders will generally be subject to U.S. withholding tax on the amount of their ordinary income dividends. They will generally not be entitled to a foreign tax credit or deduction for the withholding taxes paid by the Funds, if any. In general, dividends received by tax-exempt recipients (e.g., IRAs and Keoghs) need not be reported as taxable income for U.S. federal income tax purposes. However, some retirement trusts (e.g., corporate, Keogh and 403(b)(7) plans) may need this information for their annual information reporting. Shareholders are advised to consult their own tax advisers with respect to the tax consequences of their investment in the Funds.
US CREDIT SERIES
Other Information
(UNAUDITED)
Frequency Distributions of Premiums and Discounts
Information regarding how often shares of the Fund trade on an exchange at price above (i.e., at a premium) or below (i.e., at a discount) the NAV of the Fund is available, without charge, on the Fund’s website at www.fminvest.com/etfs/us-credit-series/.
Investment Adviser
F/m Investments, LLC d/b/a North Slope Capital, LLC
3050 K Street NW, Suite W-201
Washington, DC 20007
Administrator and Transfer Agent
U.S. Bank Global Fund Services
P.O. Box 701
Milwaukee, Wisconsin 53201-0701
Principal Underwriter
Quasar Distributors, LLC
3 Canal Plaza, Suite 100
Portland, ME 04101
Custodian
U.S. Bank, N.A.
1555 North River Center Drive, Suite 302
Milwaukee, Wisconsin 53212
Independent Registered Public Accounting Firm
Cohen & Company, Ltd.
1350 Euclid Avenue, Suite 800
Cleveland, Ohio 44115
Legal Counsel
Faegre Drinker Biddle & Reath LLP
One Logan Square, Suite 2000
Philadelphia, Pennsylvania 19103-6996

Financial Statements
August 31, 2024
F/m Investments
Large Cap Focused Fund
of
The RBB Fund, Inc.
Investor Class Shares (IAFMX)
Institutional Class Shares (IAFLX)
Table of Contents | 
|
| | |
Schedule of Investments | 1 |
Financial Statements | 3 |
Financial Highlights | 6 |
Notes to Financial Statements | 8 |
Report of Independent Registered Public Accounting Firm | 14 |
F/m Investments Large Cap Focused Fund
Schedule of Investments
AUGUST 31, 2024
| | Shares | | | Value | |
| | | | | | | | | |
COMMON STOCKS — 92.1% | | | | | | | | |
Communication Services — 16.3% | | | | | | | | |
Alphabet, Inc. - Class A | | | 17,901 | | | $ | 2,924,666 | |
Meta Platforms, Inc. - Class A | | | 8,214 | | | | 4,282,040 | |
Netflix, Inc.(a) | | | 4,911 | | | | 3,444,330 | |
| | | | | | | | 10,651,036 | |
Consumer Discretionary — 12.0% | | | | | | | | |
Amazon.com, Inc.(a) | | | 24,805 | | | | 4,427,693 | |
Burlington Stores, Inc.(a) | | | 6,527 | | | | 1,750,802 | |
Home Depot, Inc. (The) | | | 4,659 | | | | 1,716,842 | |
| | | | | | | | 7,895,337 | |
Consumer Staples — 2.4% | | | | | | | | |
Target Corp. | | | 10,042 | | | | 1,542,652 | |
| | | | | | | | | |
Health Care — 2.4% | | | | | | | | |
BioMarin Pharmaceutical, Inc.(a) | | | 17,588 | | | | 1,604,201 | |
| | | | | | | | | |
Industrials — 4.4% | | | | | | | | |
L3Harris Technologies, Inc. | | | 7,136 | | | | 1,688,877 | |
Veralto Corp. | | | 10,391 | | | | 1,168,260 | |
| | | | | | | | 2,857,137 | |
Information Technology — 54.6%(c) | | | | | | | | |
Adobe, Inc.(a) | | | 3,703 | | | | 2,127,040 | |
Advanced Micro Devices, Inc.(a) | | | 18,972 | | | | 2,818,480 | |
Analog Devices, Inc. | | | 6,870 | | | | 1,613,351 | |
Apple, Inc. | | | 31,564 | | | | 7,228,156 | |
Broadcom, Inc. | | | 9,090 | | | | 1,480,034 | |
First Solar, Inc.(a) | | | 7,911 | | | | 1,798,724 | |
Keysight Technologies, Inc.(a) | | | 10,009 | | | | 1,542,587 | |
Microsoft Corp. | | | 11,491 | | | | 4,793,356 | |
NVIDIA Corp. | | | 55,080 | | | | 6,574,900 | |
Palo Alto Networks, Inc.(a) | | | 4,197 | | | | 1,522,336 | |
Salesforce, Inc. | | | 4,836 | | | | 1,223,024 | |
ServiceNow, Inc.(a) | | | 2,253 | | | | 1,926,315 | |
Zebra Technologies Corp. - Class A(a) | | | 3,354 | | | | 1,158,404 | |
| | | | | | | | 35,806,707 | |
TOTAL COMMON STOCKS (Cost $42,417,405) | | | | | | | 60,357,070 | |
| | | | | | | | | |
The accompanying notes are an integral part of these financial statements.
F/m Investments Large Cap Focused Fund
Schedule of Investments (Continued)
AUGUST 31, 2024
| | Shares | | | Value | |
| | | | | | | | | |
SHORT-TERM INVESTMENTS — 8.0% | | | | | | | | |
Money Market Funds — 8.0% | | | | | | | | |
First American Treasury Obligations Fund - Class X, 5.18%(b) | | | 5,265,183 | | | $ | 5,265,183 | |
TOTAL SHORT-TERM INVESTMENTS (Cost $5,265,183) | | | | | | | 5,265,183 | |
| | | | | | | | | |
TOTAL INVESTMENTS — 100.1% (Cost $47,682,588) | | | | | | $ | 65,622,253 | |
Liabilities in Excess of Other Assets — (0.1)% | | | | | | | (78,314 | ) |
TOTAL NET ASSETS — 100.0% | | | | | | $ | 65,543,939 | |
Percentages are stated as a percent of net assets.
The Global Industry Classification Standard (“GICS®”) was developed by and/or is the exclusive property of MSCI, Inc. (“MSCI”) and Standard & Poor’s Financial Services LLC (“S&P”). GICS® is a service mark of MSCI and S&P and has been licensed for use by U.S. Bank Global Fund Services.
(a) | Non-income producing security. |
(b) | The rate shown represents the 7-day annualized effective yield as of August 31, 2024. |
(c) | As of August 31, 2024, the Fund had a significant portion of its assets invested in this sector. See Note 4 in the Notes to the Financial Statements. |
The accompanying notes are an integral part of these financial statements.
F/m Investments Large Cap Focused Fund
Statement of Assets and Liabilities
AUGUST 31, 2024
ASSETS | | | | |
Investments in securities, at value (cost $47,682,588) | | $ | 65,622,253 | |
Receivables for: | | | | |
Interest | | | 34,230 | |
Prepaid expenses and other assets | | | 6,808 | |
Total assets | | | 65,663,291 | |
| | | | | |
LIABILITIES | | | | |
Payables for: | | | | |
Advisory fees | | | 39,545 | |
Distribution fees - Investor Class | | | 24,807 | |
Transfer agent fees | | | 32,289 | |
Administration and accounting fees | | | 4,252 | |
Other accrued expenses and liabilities | | | 18,459 | |
Total liabilities | | | 119,352 | |
| | | | | |
Net assets | | $ | 65,543,939 | |
| | | | | |
Net assets consist of: | | | | |
Par value | | $ | 3,759 | |
Paid-in capital | | | 49,469,954 | |
Total distributable earnings/(losses) | | | 16,070,226 | |
Net assets | | $ | 65,543,939 | |
| | | | | |
Investor Class Shares: | | | | |
Net assets | | $ | 14,157,011 | |
Shares outstanding ($0.001 par value, 100,000,000 shares authorized) | | | 824,546 | |
Net asset value, offering and redemption price per share | | $ | 17.17 | |
| | | | | |
Institutional Class Shares: | | | | |
Net assets | | $ | 51,386,928 | |
Shares outstanding ($0.001 par value, 100,000,000 shares authorized) | | | 2,934,821 | |
Net asset value, offering and redemption price per share | | $ | 17.51 | |
The accompanying notes are an integral part of these financial statements.
F/m Investments Large Cap Focused Fund
Statements of Operations
| | For the
period Ended
august 31,
2024^ | | | For the
Year Ended
June 30,
2024 | |
INVESTMENT INCOME | | | | | | | | |
Dividends | | $ | 30,535 | | | $ | 278,192 | |
Interest income | | | 21,615 | | | | 88,651 | |
Total investment income | | | 52,150 | | | | 366,843 | |
| | | | | | | | | |
EXPENSES | | | | | | | | |
Advisory fees (Note 2) | | | 77,331 | | | | 416,231 | |
Transfer agent fees | | | 23,602 | | | | 106,585 | |
Distribution fees - Investor Class | | | 5,972 | | | | 33,121 | |
Audit and tax fees | | | 3,352 | | | | 28,023 | |
Administration and accounting fees | | | 1,695 | | | | 74,852 | |
Printing and shareholder reporting fees | | | 1,471 | | | | 14,762 | |
Registration fees | | | 445 | | | | 7,310 | |
Legal fees | | | — | | | | 14,495 | |
Custodian fees | | | — | | | | 14,273 | |
Director fees | | | — | | | | 11,575 | |
Insurance fees | | | — | | | | 5,331 | |
Officer fees | | | — | | | | 4,000 | |
Other fees | | | 2,075 | | | | 12,416 | |
Total expenses before waivers and/or reimbursements | | | 115,943 | | | | 742,974 | |
Less: waivers and/or reimbursements (Note 2) | | | (10,543 | ) | | | (174,698 | ) |
Net expenses after waivers and/or reimbursements | | | 105,400 | | | | 568,276 | |
Net investment income/(loss) | | | (53,250 | ) | | | (201,433 | ) |
| | | | | | | | | |
NET REALIZED AND UNREALIZED GAIN/(LOSS) FROM INVESTMENTS | | | | | | | | |
Net realized gain/(loss) from investments | | | 3,473,495 | | | | 596,468 | |
Net change in unrealized appreciation/(depreciation) on investments | | | (3,428,005 | ) | | | 12,604,124 | |
Net realized and unrealized gain/(loss) | | | 45,490 | | | | 13,200,592 | |
| | | | | | | | | |
NET INCREASE/(DECREASE) IN NET ASSETS RESULTING FROM OPERATIONS | | $ | (7,760 | ) | | $ | 12,999,159 | |
^ | The Fund changed its fiscal year end to August 31 during the period. The period is from July 1, 2024 to August 31, 2024. |
The accompanying notes are an integral part of these financial statements.
F/m Investments Large Cap Focused Fund
Statements of Changes in Net Assets
| | For the
period Ended
august 31,
2024^ | | | For The
Year Ended
June 30,
2024 | | | For The
Year Ended
June 30,
2023 | |
INCREASE/(DECREASE) IN NET ASSETS RESULTING FROM OPERATIONS | | | | | | | | | | | | |
Net investment income/(loss) | | $ | (53,250 | ) | | $ | (201,433 | ) | | $ | 67,379 | |
Net realized gain/(loss) from investments | | | 3,473,495 | | | | 596,468 | | | | (1,383,722 | ) |
Net change in unrealized appreciation/(depreciation) on investments | | | (3,428,005 | ) | | | 12,604,124 | | | | 15,737,874 | |
NET INCREASE/(DECREASE) IN NET ASSETS RESULTING FROM OPERATIONS | | | (7,760 | ) | | | 12,999,159 | | | | 14,421,531 | |
| | | | | | | | | | | | | |
DIVIDENDS AND DISTRIBUTIONS TO SHAREHOLDERS: | | | | | | | | | | | | |
Institutional Class | | | — | | | | — | | | | (1,103,801 | ) |
Investor Class | | | — | | | | — | | | | (6,385,005 | ) |
Total distributions to shareholders | | | — | | | | — | | | | (7,488,806 | ) |
| | | | | | | | | | | | | |
CAPITAL SHARE TRANSACTIONS | | | | | | | | | | | | |
INVESTOR CLASS | | | | | | | | | | | | |
Proceeds from shares sold | | | 230,302 | | | | 532,377 | | | | 2,882,866 | |
Reinvestments of distributions to shareholders | | | — | | | | — | | | | 1,103,801 | |
Shares redeemed | | | (338,776 | ) | | | (2,089,516 | ) | | | (2,559,333 | ) |
Total Investor Class | | | (108,474 | ) | | | (1,557,139 | ) | | | 1,427,334 | |
| | | | | | | | | | | | | |
INSTITUTIONAL CLASS | | | | | | | | | | | | |
Proceeds from shares sold | | | — | | | | 1,360,760 | | | | 279,786 | |
Reinvestments of distributions to shareholders | | | — | | | | — | | | | 6,385,005 | |
Shares redeemed | | | (479,382 | ) | | | (8,027,363 | ) | | | (19,639,968 | ) |
Total Institutional Class | | | (479,382 | ) | | | (6,666,603 | ) | | | (12,975,177 | ) |
Net increase/(decrease) in net assets from capital share transactions | | | (587,856 | ) | | | (8,223,742 | ) | | | (11,547,843 | ) |
TOTAL INCREASE/(DECREASE) IN NET ASSETS | | | (595,616 | ) | | | 4,775,417 | | | | (4,615,118 | ) |
| | | | | | | | | | | | | |
NET ASSETS: | | | | | | | | | | | | |
Beginning of period | | $ | 66,139,555 | | | $ | 61,364,138 | | | $ | 65,979,256 | |
End of period | | $ | 65,543,939 | | | $ | 66,139,555 | | | $ | 61,364,138 | |
| | | | | | | | | | | | | |
SHARE TRANSACTIONS | | | | | | | | | | | | |
INVESTOR CLASS | | | | | | | | | | | | |
Shares sold | | | 13,884 | | | | 36,101 | | | | 247,255 | |
Shares issued in reinvestment of distributions to shareholders | | | — | | | | — | | | | 107,269 | |
Shares redeemed | | | (20,961 | ) | | | (136,708 | ) | | | (212,368 | ) |
Net increase/(decrease) in shares | | | (7,077 | ) | | | (100,607 | ) | | | 142,156 | |
| | | | | | | | | | | | | |
INSTITUTIONAL CLASS | | | | | | | | | | | | |
Shares sold | | | — | | | | 93,308 | | | | 21,103 | |
Shares issued in reinvestment of distributions to shareholders | | | — | | | | — | | | | 611,005 | |
Shares redeemed | | | (28,096 | ) | | | (579,145 | ) | | | (1,588,452 | ) |
Net increase/(decrease) in shares | | | (28,096 | ) | | | (485,837 | ) | | | (956,344 | ) |
^ | The Fund changed its fiscal year end to August 31 during the period. The period is from July 1, 2024 to August 31, 2024. |
The accompanying notes are an integral part of these financial statements.
F/m Investments Large Cap Focused Fund
Investor Class
Financial Highlights
Contained below is per share operating performance data for shares outstanding, total investment return/(loss), ratios to average net assets and other supplemental data for the respective periods. This information has been derived from information provided in the financial statements.
| | For the
period
Ended
august 31, | | | For the
Year
Ended
June 30, | | | For the
Year
Ended
June 30, | | | For the
Year
Ended
June 30, | | | For the
Year
Ended
June 30, | | | For the
Year
Ended
June 30, | |
| | 2024^ | | | 2024(d) | | | 2023 | | | 2022 | | | 2021 | | | 2020 | |
PER SHARE OPERATING PERFORMANCE | | | | | | | | | | | | | | | | | | | | | | | | |
Net asset value, beginning of period | | $ | 17.17 | | | $ | 13.82 | | | $ | 12.57 | | | $ | 19.96 | | | $ | 15.90 | | | $ | 13.42 | |
Net investment income/(loss) (a) | | | (0.03 | ) | | | (0.09 | ) | | | (0.01 | ) | | | (0.08 | ) | | | (0.12 | ) | | | (0.03 | ) |
Net realized and unrealized gain/ (loss) from investments | | | 0.03 | | | | 3.44 | | | | 3.04 | | | | (3.07 | ) | | | 6.59 | | | | 3.10 | |
Net increase/(decrease) in net assets resulting from operations | | | — | | | | 3.35 | | | | 3.03 | | | | (3.15 | ) | | | 6.47 | | | | 3.07 | |
Dividends and distributions to shareholders from: | | | | | | | | | | | | | | | | | | | | | | | | |
Net investment income | | | — | | | | — | | | | — | | | | — | | | | — | | | | (0.05 | ) |
Net realized capital gains | | | — | | | | — | | | | (1.78 | ) | | | (4.24 | ) | | | (2.41 | ) | | | (0.54 | ) |
Total distributions | | | — | | | | — | | | | (1.78 | ) | | | (4.24 | ) | | | (2.41 | ) | | | (0.59 | ) |
Net asset value, end of period | | $ | 17.17 | | | $ | 17.17 | | | $ | 13.82 | | | $ | 12.57 | | | $ | 19.96 | | | $ | 15.90 | |
Total investments return/(loss) (b) | | | 0.00 | %(e) | | | 24.24 | % | | | 28.91 | % | | | (21.33 | )% | | | 42.64 | % | | | 23.56 | % |
RATIOS/SUPPLEMENTAL DATA | | | | | | | | | | | | | | | | | | | | | | | | |
Net assets, end of period (000’s omitted) | | $ | 14,157 | | | $ | 14,279 | | | $ | 12,887 | | | $ | 9,934 | | | $ | 13,643 | | | $ | 11,157 | |
Ratio of total expenses to average net assets (c) | | | 1.24 | %(f) | | | 1.44 | % | | | 1.39 | % | | | 1.39 | % | | | 1.41 | % | | | 1.50 | % |
Ratio of net expenses to average net assets | | | 1.15 | %(f) | | | 1.15 | % | | | 1.15 | % | | | 1.15 | % | | | 1.15 | % | | | 1.15 | % |
Ratio of net investment income/(loss) to average net assets | | | (0.68 | )%(f) | | | (0.53 | )% | | | (0.11 | )% | | | (0.46 | )% | | | (0.63 | )% | | | (0.24 | )% |
Portfolio turnover rate | | | 19 | %(e) | | | 59 | % | | | 113 | % | | | 169 | % | | | 195 | % | | | 139 | % |
^ | The amounts shown are for the fiscal period from July 1, 2024 to August 31, 2024. |
(a) | Per share net investment income (loss) has been determined on the basis of average number of shares outstanding during the period. |
(b) | Total return is a measure of the change in value of an investment in the Fund over the periods covered, which assumes any dividends or capital gains distributions are reinvested in shares of the Fund. The returns shown do not reflect the deduction of taxes a shareholder would pay on Fund distributions or the redemption of Fund shares. Had the Adviser and/or administrator not reduced/waived its fees, the total returns would have been lower. |
(c) | Ratios were determined based on expenses prior to any fee reductions/waivers by the Adviser and/or administrator (Note 2). |
(d) | Prior to the close of business on October 27, 2023, the Fund was a series (the “Predecessor Fund”) of the F/m Funds Trust Fund, an open-end management investment company organized as an Ohio business trust. The Predecessor Fund was reorganized into the Fund following the close of business on October 27, 2023 (the “Reorganization”). As a result of the Reorganization, the performance and accounting history of the Predecessor Fund was assumed by the Fund. Performance and accounting information prior to October 30, 2023 included herein is that of the Predecessor Fund (Note 1). |
The accompanying notes are an integral part of these financial statements.
F/m Investments Large Cap Focused Fund
Institutional Class
Financial Highlights
Contained below is per share operating performance data for shares outstanding, total investment return/(loss), ratios to average net assets and other supplemental data for the respective periods. This information has been derived from information provided in the financial statements.
| | For the
period
Ended
august 31, | | | For the
Year
Ended
June 30, | | | For the
Year
Ended
June 30, | | | For the
Year
Ended
June 30, | | | For the
Year
Ended
June 30, | | | For the
Year
Ended
June 30, | |
| | 2024^ | | | 2024(e) | | | 2023 | | | 2022 | | | 2021 | | | 2020 | |
PER SHARE OPERATING PERFORMANCE | | | | | | | | | | | | | | | | | | | | | | | | |
Net asset value, beginning of period | | $ | 17.50 | | | $ | 14.06 | | | $ | 12.72 | | | $ | 20.10 | | | $ | 15.96 | | | $ | 13.47 | |
Net investment income/(loss) (a) | | | — | (b) | | | (0.03 | ) | | | 0.02 | | | | (0.02 | ) | | | (0.05 | ) | | | — | (b) |
Net realized and unrealized gain/ (loss) from investments | | | 0.01 | | | | 3.47 | | | | 3.10 | | | | (3.12 | ) | | | 6.60 | | | | 3.11 | |
Net increase/(decrease) in net assets resulting from operations | | | 0.01 | | | | 3.44 | | | | 3.12 | | | | (3.14 | ) | | | 6.55 | | | | 3.11 | |
Dividends and distributions to shareholders from: | | | | | | | | | | | | | | | | | | | | | | | | |
Net investment income | | | — | | | | — | | | | — | | | | — | | | | — | | | | (0.08 | ) |
Net realized capital gains | | | — | | | | — | | | | (1.78 | ) | | | (4.24 | ) | | | (2.41 | ) | | | (0.54 | ) |
Total distributions | | | — | | | | — | | | | (1.78 | ) | | | (4.24 | ) | | | (2.41 | ) | | | (0.62 | ) |
Net asset value, end of period | | $ | 17.51 | | | $ | 17.50 | | | $ | 14.06 | | | $ | 12.72 | | | $ | 20.10 | | | $ | 15.96 | |
Total investments return/(loss) (c) | | | 0.06 | %(f) | | | 24.47 | % | | | 29.31 | % | | | (21.12 | )% | | | 43.00 | % | | | 23.84 | % |
RATIOS/SUPPLEMENTAL DATA | | | | | | | | | | | | | | | | | | | | | | | | |
Net assets, end of period (000’s omitted) | | $ | 51,387 | | | $ | 51,860 | | | $ | 48,477 | | | $ | 56,045 | | | $ | 75,757 | | | $ | 41,963 | |
Ratio of total expenses to average net assets (d) | | | 0.99 | %(g) | | | 1.20 | % | | | 1.14 | % | | | 1.14 | % | | | 1.16 | % | | | 1.25 | % |
Ratio of net expenses to average net assets | | | 0.90 | %(g) | | | 0.90 | % | | | 0.90 | % | | | 0.90 | % | | | 0.90 | % | | | 0.90 | % |
Ratio of net investment income/(loss) to average net assets | | | (0.43 | )%(g) | | | (0.28 | )% | | | 0.16 | % | | | (0.21 | )% | | | (0.38 | )% | | | 0.01 | % |
Portfolio turnover rate | | | 19 | %(f) | | | 59 | % | | | 113 | % | | | 169 | % | | | 195 | % | | | 139 | % |
^ | The amounts shown are for the fiscal period from July 1, 2024 to August 31, 2024. |
(a) | Per share net investment income (loss) has been determined on the basis of average number of shares outstanding during the period. |
(b) | Rounds to less than $0.005 per share. |
(c) | Total return is a measure of the change in value of an investment in the Fund over the periods covered, which assumes any dividends or capital gains distributions are reinvested in shares of the Fund. The returns shown do not reflect the deduction of taxes a shareholder would pay on Fund distributions or the redemption of Fund shares. Had the Adviser and/or administrator not reduced/waived its fees, the total returns would have been lower. |
(d) | Ratios were determined based on expenses prior to any fee reductions/waivers by the Adviser and/or administrator (Note 2). |
(e) | Prior to the close of business on October 27, 2023, the Fund was a series (the “Predecessor Fund”) of the F/m Funds Trust Fund, an open-end management investment company organized as an Ohio business trust. The Predecessor Fund was reorganized into the Fund following the close of business on October 27, 2023 (the “Reorganization”). As a result of the Reorganization, the performance and accounting history of the Predecessor Fund was assumed by the Fund. Performance and accounting information prior to October 30, 2023 included herein is that of the Predecessor Fund. (Note 1). |
The accompanying notes are an integral part of these financial statements.
F/m Investments Large Cap Focused Fund
Notes to Financial Statements
AUGUST 31, 2024
1. ORGANIZATION AND SIGNIFICANT ACCOUNTING POLICIES
The RBB Fund, Inc. (“RBB” or the “Company”) was incorporated under the laws of the State of Maryland on February 29, 1988 and is registered under the Investment Company Act of 1940, as amended (the “1940 Act”), as an open-end management investment company. RBB is a “series fund,” which is an investment company divided into separate portfolios. Each portfolio is treated as a separate entity for certain matters under the 1940 Act, and for other purposes, and a shareholder of one portfolio is not deemed to be a shareholder of any other portfolio. Currently, RBB has sixty-five separate investment portfolios, including the F/m Investments Large Cap Focused Fund (the “Fund”). The Fund commenced operations on October 3, 2016 as a separate series (the “Predecessor Fund”) of the F/m Funds Trust, an open end management investment company established as an Ohio business trust. Effective as of the close of business on October 27, 2023, the Predecessor Fund was reorganized into the Fund, as a new series of RBB in a tax-free reorganization (the “Reorganization”), whereby the Fund acquired all the assets and liabilities of the Predecessor Fund in exchange for shares of the Fund which were distributed pro rata by the Predecessor Fund to its shareholders in complete liquidation and termination of the Predecessor Fund. The Agreement and Plan of Reorganization pursuant to which the Reorganization was accomplished was approved by shareholders of the Predecessor Fund on June 29, 2023. Unless otherwise indicated, references to the “Fund” in these Notes to Financial Statements refer to the Predecessor Fund and Fund. The Fund currently offers two classes of shares: Investor Class shares (sold without any sales loads, but subject to a distribution and/or shareholder servicing fee of up to 0.25% of the average daily net assets attributable to Investor Class shares and requiring a $1,000 initial investment) and Institutional Class shares (sold without any sales loads and distribution and/or shareholder servicing fees and requiring a $100,000 initial investment). Each share class represents an ownership interest of the respective class in the same investment portfolio.
The investment objective of the Fund is long-term growth of capital.
RBB has authorized capital of one hundred billion shares of common stock of which 92.923 billion shares are currently classified into two hundred and thirty-six classes of common stock. Each class represents an interest in an active or inactive RBB investment portfolio.
As a tax-free reorganization, any unrealized appreciation or depreciation on the securities held by the Fund on the date of Reorganization was treated as a non-taxable event, thus the cost basis of the securities held reflects their historical cost basis as of the date of Reorganization. As a result of the Reorganization, the Fund is the accounting successor. The Reorganization was accomplished by a tax-free exchange of the Fund’s shares and value of net assets for the same shares and value of the Predecessor Fund’s shares. For financial reporting purposes, assets received and shares issued by the Fund were recorded at fair value; however, the cost basis of the investments received from the Fund was carried forward to align ongoing reporting of the Fund’s realized and unrealized gains and losses with amounts distributable to shareholders for tax purposes. Immediately prior to the Reorganization, the net assets, fair value of investments, net unrealized appreciation and fund shares outstanding of the Predecessor Fund were as follows:
Net Assets | | Fair Value of
Investments | | | Net Unrealized
Appreciation | | | Fund Shares
Outstanding | |
$ 50,119,303 | | $ | 50,294,970 | | | $ | 1,790,168 | | | | 4,024,353 | |
The Fund changed its fiscal year end to August 31 to reflect the fiscal year end of the other series of the Company. The end of the reporting period for the Fund is August 31, 2024, and the period covered by these Notes to Financial Statements is the fiscal period from July 1, 2024 through August 31, 2024 (the “current fiscal period”).
The Fund is an investment company and follows accounting and reporting guidance under Financial Accounting Standards Board (“FASB”) Accounting Standards Codification Topic 946, “Financial Services – Investment Companies.”
Portfolio valuation – The Fund values its portfolio securities at fair value as of the close of regular trading on the New York Stock Exchange (the “NYSE”) (normally 4:00 p.m. Eastern time) on each business day the NYSE is open for business. The Fund values its listed securities, including common stocks, on the basis of a security’s last sale price on the security’s primary exchange, if available, otherwise at the exchange’s most recently quoted bid price. NASDAQ-listed securities are valued at the NASDAQ official closing price. Investments in registered investment companies, including money market funds, are reported
F/m Investments Large Cap Focused Fund
Notes to Financial Statements (continued)
AUGUST 31, 2024
at their respective NAV as reported by those companies. When using a quoted price and when the market for the security is considered active, the security will be classified as Level 1 within the fair value hierarchy (see below). In the event that market quotations are not readily available or are considered unreliable due to market or other events, the Fund values its securities and other assets at fair value as determined by F/m Investments, LLC (the “Adviser”) as the Valuation Designee (as defined below), in accordance with procedures established by and under the general supervision of the board of directors of the Company (the “Board” or the “Directors”) pursuant to Rule 2a-5 under the Investment Company Act of 1940, as amended, (the “1940 Act”). Under these procedures, the securities will be classified as Level 2 or 3 within the fair value hierarchy, depending on the inputs used. Unavailable or unreliable market quotes may be due to the following factors: a substantial bid-ask spread; infrequent sales resulting in stale prices; insufficient trading volume; small trade size; a temporary lapse in any reliable pricing source; and actions of the securities or futures markets, such as the suspension or limitation of trading. As a result, the prices of securities used to calculate the Fund’s net asset value (“NAV”) may differ from quoted or published prices for the same securities.
The Board has adopted a pricing and valuation policy for use by the Fund and its Valuation Designee (as defined below) in calculating the Fund’s NAV. Pursuant to Rule 2a-5 under the 1940 Act, the Fund has designated the Adviser as its “Valuation Designee” to perform all of the fair value determinations as well as to perform all of the responsibilities that may be performed by the Valuation Designee in accordance with Rule 2a-5. The Valuation Designee is authorized to make all necessary determinations of the fair values of portfolio securities and other assets for which market quotations are not readily available or if it is deemed that the prices obtained from brokers and dealers or independent pricing services are unreliable.
FAIR VALUE MEASUREMENTS – The inputs and valuation techniques used to measure the fair value of the Fund’s investments are summarized into three levels as described in the hierarchy below:
| | ● | Level 1 – Prices are determined using quoted prices in active markets for identical securities. |
| | ● | Level 2 – Prices are determined using other significant observable inputs (including quoted prices for similar securities, interest rates, prepayment speeds, credit risk, etc.). |
| | ● | Level 3 – Prices are determined using significant unobservable inputs (including the Fund’s own assumptions in determining the fair value of investments). |
The inputs or methodologies used for valuing securities are not necessarily an indication of the risk associated with investing in those securities.
The following is a summary of the inputs used, as of the end of the current fiscal period, in valuing the Fund’s investments carried at fair value:
| | Total | | | Level 1 | | | Level 2 | | | Level 3 | |
Common Stocks | | $ | 60,357,070 | | | $ | 60,357,070 | | | $ | — | | | $ | — | |
Short-Term Investments | | | 5,265,183 | | | | 5,265,183 | | | | — | | | | — | |
Total Investments* | | $ | 65,622,253 | | | $ | 65,622,253 | | | $ | — | | | $ | — | |
* | Please refer to the Schedule of Investments for further details. |
At the end of each quarter, management evaluates the classification of Levels 1, 2 and 3 assets and liabilities. Various factors are considered, such as changes in liquidity from the prior reporting period; whether or not a broker is willing to execute at the quoted price; the depth and consistency of prices from third party pricing services; and the existence of contemporaneous, observable trades in the market. Additionally, management evaluates the classification of Levels 1, 2 and 3 assets and liabilities on a quarterly basis for changes in listings or delistings on national exchanges.
Due to the inherent uncertainty of determining the fair value of investments that do not have a readily available market value, the fair value of the Fund’s investments may fluctuate from period to period. Additionally, the fair value of investments may differ significantly from the values that would have been used had a ready market existed for such investments and may differ materially from the values the Fund may ultimately realize. Further, such investments may be subject to legal and other restrictions on resale or otherwise less liquid than publicly traded securities.
F/m Investments Large Cap Focused Fund
Notes to Financial Statements (continued)
AUGUST 31, 2024
For fair valuations using significant unobservable inputs, U.S. generally accepted accounting principles (“U.S. GAAP”) requires the Fund to present a reconciliation of the beginning to ending balances for reported market values that presents changes attributable to total realized and unrealized gains or losses, purchase and sales, and transfers in and out of Level 3 during the period. Transfers in and out between levels are based on values at the end of the period. A reconciliation of Level 3 investments is presented only if the Fund had an amount of Level 3 investments at the end of the reporting period that was meaningful in relation to its net assets. The amounts and reasons for Level 3 transfers in and out of each level is disclosed when the Fund had an amount of total Level 3 transfers during the reporting period that was meaningful in relation to its net assets as of the end of the reporting period.
The Fund did not have any significant Level 3 transfers during the current fiscal period.
USE OF ESTIMATES – The preparation of financial statements in conformity with U.S. GAAP requires management to make estimates and assumptions that affect the reported amounts of assets and liabilities and disclosure of contingent assets and liabilities at the date of the financial statements and the reported amounts of revenues and expenses during the reporting period. Actual results could differ from those estimates and those differences could be significant.
INVESTMENT TRANSACTIONS, INVESTMENT INCOME AND EXPENSES – The Fund records security transactions based on trade date for financial reporting purposes. The cost of investments sold is determined by use of the specific identification method for both financial reporting and income tax purposes in determining realized gains and losses on investments. Interest income (including amortization of premiums and accretion of discounts) is accrued when earned. Dividend income is recorded on the ex-dividend date. Distributions received on securities that represent a return of capital or capital gains are recorded as a reduction of cost of investments and/or as a realized gain. The Fund’s investment income, expenses (other than class specific expenses) and unrealized and realized gains and losses are allocated daily to each class of shares based upon the relative proportion of net assets of each class at the beginning of the day. Certain expenses are shared with The RBB Fund Trust (the “Trust”), a series trust of affiliated funds. Expenses incurred on behalf of a specific class, fund or fund family of the Company or Trust are charged directly to the class, fund or fund family (in proportion to net assets). Expenses incurred for all funds (such as director or professional fees) are charged to all funds in proportion to their average net assets of RBB and the Trust, or in such other manner as the Board deems fair or equitable. Expenses and fees, including investment advisory and administration fees, are accrued daily and taken into account for the purpose of determining the NAV of the Fund.
DIVIDENDS AND DISTRIBUTIONS to shareholders – Distributions to shareholders arising from net investment income and realized capital gains, if any, are declared and paid annually to shareholders. The amount of distributions from net investment income and net realized capital gains are determined in accordance with federal income tax regulations, which may differ from GAAP. Dividends and distributions to shareholders are recorded on the ex-dividend date.
U.S. TAX STATUS – No provision is made for U.S. income taxes as it is the Fund’s intention to continue to qualify for and elect the tax treatment applicable to regulated investment companies under Subchapter M of the Internal Revenue Code of 1986, as amended, and make the requisite distributions to its shareholders which will be sufficient to relieve it from U.S. income and excise taxes.
CASH AND CASH EQUIVALENTS – Cash and cash equivalents are valued at cost plus accrued interest, which approximates market value.
2. INVESTMENT ADVISER AND OTHER SERVICES
Effective October 30, 2023, under the terms of an investment advisory agreement between the Company, on behalf of the Fund, and the Adviser (the “Advisory Agreement”), the Adviser serves as the investment adviser to the Fund, and, the Fund pays the Adviser a fee, which is computed and accrued daily and paid monthly, at the annual rate of 0.70% of its average daily net assets.
Under an expense limitation agreement between the Company, on behalf of the Fund, and the Adviser (the “Expense Limitation Agreement”), the Adviser has contractually agreed until October 30, 2025 to reduce its investment advisory fees and to pay other operating expenses to the extent necessary to limit annual ordinary operating expenses (excluding acquired fund fees and expenses, brokerage commissions, extraordinary items, interest, taxes, and any other items as agreed upon by the parties from time to time) to 1.15% of the average daily net assets allocable to Investor Class shares and 0.90% of Institutional Class shares of the Fund.
F/m Investments Large Cap Focused Fund
Notes to Financial Statements (continued)
AUGUST 31, 2024
Advisory fee reductions and expense reimbursements by the Adviser are subject to repayment by the Fund for a period of three years after such fees and expenses were incurred, provided that the repayments do not cause the Fund’s ordinary operating expenses (excluding interest, taxes, acquired fund fees and expenses, brokerage commissions, dividend expenses on short sales, and other expenditures which are capitalized in accordance with generally accepted accounting principles and other extraordinary expenses) to exceed the expense caps that were in effect when the fees and expenses were paid, waived, or absorbed by the Adviser, as well as the expense cap currently in effect.
During the current fiscal period, investment advisory fees accrued, waived and/or reimbursed were as follows:
GROSS
ADVISORY FEES | | WAIVERS AND/OR
REIMBURSEMENTS | | | RECOUPMENTS | | | NET
ADVISORY FEES | |
$ 77,331 | | $ | (10,543 | ) | | $ | — | | | $ | 66,788 | |
At the end of the current fiscal period, the Fund had amounts available for recoupment by the Adviser as follows:
| | EXPIRATION | |
| | June 30,
2025 | | | June 30,
2026 | | | June 30,
2027 | | | AUGUST 31,
2027 | | | Total | |
| | $ | — | | | $ | — | | | $ | 126,934 | | | $ | 10,543 | | | $ | 137,477 | |
U.S. Bancorp Fund Services, LLC (“Fund Services”), doing business as U.S. Bank Global Fund Services, serves as administrator for the Fund. For providing administrative and accounting services, Fund Services is entitled to receive a monthly fee, subject to certain minimum and out of pocket expenses.
Fund Services serves as the Fund’s transfer and dividend disbursing agent. For providing transfer agent services, Fund Services is entitled to receive a monthly fee, subject to certain minimum and out of pocket expenses.
U.S. Bank, N.A. (the “Custodian”) provides certain custodial services to the Fund. The Custodian is entitled to receive a monthly fee, subject to certain minimum and out of pocket expenses.
Quasar Distributors, LLC (the “Distributor”), a wholly-owned broker-dealer subsidiary of Foreside Financial Group, LLC, serves as the principal underwriter and distributor of the Fund’s shares pursuant to a Distribution Agreement with RBB.
For compensation amounts paid to Fund Services and the Custodian, please refer to the Statement of Operations.
DISTRIBUTION PLAN
The Fund has adopted a plan of distribution (the “Plan”), pursuant to Rule 12b-1 under the 1940 Act which permits Investor Class shares of the Fund to make payments to securities dealers and other financial organizations (including payments directly to the Adviser, Quasar, and Ultimus Fund Distributors, LLC) for expenses related to the distribution and servicing of the Fund’s Investor Class shares. The annual limitation for payment of expenses pursuant to the Plan is 0.25% of the Fund’s average daily net assets allocable to Investor Class shares. The Fund has not adopted a plan of distribution with respect to Institutional Class shares. During the current fiscal period, Investor Class shares of the Fund incurred $5,972 of distribution fees under the Plan.
DIRECTOR AND OFFICER COMPENSATION
The Directors of the Company receive an annual retainer and meeting fees for meetings attended. An employee of Vigilant Compliance, LLC serves as Chief Compliance Officer of the Company. Vigilant Compliance, LLC is compensated for the services provided to the Company. Employees of the Company serve as President, Chief Financial Officer, Chief Operating Officer,
F/m Investments Large Cap Focused Fund
Notes to Financial Statements (continued)
AUGUST 31, 2024
Secretary and Director of Marketing & Business Development of the Company. They are compensated by the Company for services provided. Certain employees of Fund Services serve as officers of the Company. They are not compensated by the Fund or the Company. For Director and Officer compensation amounts, please refer to the Statement of Operations.
3. Investment Transactions
During the current fiscal period, cost of purchases and proceeds from sales of investment securities, other than short-term investments, were $11,631,787 and $16,142,991, respectively.
4. Sector Risk
If the Fund has significant investments in the securities of issuers in industries within a particular business sector, any development affecting that sector will have a greater impact on the value of the net assets of the Fund than would be the case if the Fund did not have significant investments in that sector. In addition, this may increase the risk of loss of an investment in the Fund and increase the volatility of the Fund’s NAV per share. From time to time, circumstances may affect a particular sector and the companies within such sector. For instance, economic or market factors, regulation or deregulation, or other developments may negatively impact all companies in a particular sector and therefore the value of the Fund’s portfolio would be adversely affected. As of August 31, 2024, the Fund had 54.6% of its net assets invested in the Information Technology sector.
5. FEDERAL INCOME TAX INFORMATION
The Fund has qualified and intends to continue to qualify as a regulated investment company under the Internal Revenue Code of 1986, as amended (the “Code”). Accordingly, the Fund intends to distribute its taxable income and net realized gains, if any, to shareholders in accordance with timing requirements imposed by the Code. Therefore, no federal income tax provision is provided in the Fund’s financial statements.
In order to avoid imposition of the excise tax applicable to regulated investment companies, it is also the Fund’s intention to declare as dividends in each calendar year at least 98% of its net investment income (earned during the calendar year) and 98.2% of its net realized capital gains (earned during the twelve months ended October 31) plus undistributed amounts from prior years.
The following information is computed on a tax basis for each item as of August 31, 2024:
Tax cost of portfolio investments | | $ | 47,687,452 | |
Gross unrealized appreciation | | $ | 18,037,954 | |
Gross unrealized depreciation | | | (103,153 | ) |
Net unrealized appreciation | | | 17,934,801 | |
Other accumulated losses | | | (1,864,575 | ) |
Total distributable earnings | | $ | 16,070,226 | |
The difference between the federal income tax cost of investments and the financial statement cost of investments is due to certain timing differences in the recognition of capital gains or losses under income tax regulations and GAAP. These “book/tax” differences are temporary in nature and are primarily due to the tax deferral of losses on wash sales.
During the fiscal period ended August 31, 2024 and year ended June 30, 2024, the Fund did not pay any distributions to shareholders.
The tax character of distributions paid to shareholders during the year ended June 30, 2023 was as follows:
| | Ordinary Income | | | Long Term Capital Gain | | | Total Distributions | |
| | $ | — | | | $ | 7,488,806 | | | $ | 7,488,806 | |
F/m Investments Large Cap Focused Fund
Notes to Financial Statements (CONCLUDED)
AUGUST 31, 2024
As of August 31, 2024, the Fund had short-term capital loss carryforwards (“CLCFs”) in the amount of $1,864,575 for income tax purposes. These CLCFs, which do not expire, may be utilized in future years to offset net realized capital gains, if any, prior to distributing such gains to shareholders. As of August 31, 2024, the Fund utilized 3,473,495 of CLCFs that were available as of June 30, 2024.
For the fiscal period ended August 31, 2024, the Fund reclassified $203,294 of distributable earnings against paid-in capital on the Statement of Assets and Liabilities. These reclassifications are primarily due to the disallowance of net operating losses. Such reclassification, the result of permanent differences between the financial statement and income tax reporting requirements, had no effect on the Fund’s net assets or NAV per share.
The Fund recognizes the tax benefits or expenses of uncertain tax positions only when the position is “more likely than not” to be sustained assuming examination by tax authorities. Management has reviewed the Fund’s tax positions taken on Federal income tax returns for all open tax years (generally, three years) and has concluded that no provision for unrecognized tax benefits or expenses is required in these financial statements and does not expect this to change over the next year. The Fund identifies its major tax jurisdiction as U.S. Federal.
The Fund recognizes interest and penalties, if any, related to unrecognized tax benefits as income tax expense on the Statement of Operations. During the fiscal period ended August 31, 2024, the Fund did not incur any interest or penalties.
6. Non-Diversified Fund
The Fund is a non-diversified fund. A non-diversified fund may or may not have a diversified portfolio of investments at any given time and may have large amounts of assets invested in a very small number of companies, industries or securities. Such lack of diversification substantially increases market risks and the risk of loss associated with an investment in the Fund, because the value of each security will have a greater impact on the Fund’s performance and the value of each shareholder’s investment. When the value of a security in a non-diversified fund falls, it may have a greater impact on the Fund than it would have in a diversified fund.
7. Subsequent Events
Management has evaluated the impact of all subsequent events on the Fund through the date the financial statements were issued and has determined there were no significant events requiring recognition or disclosure in the financial statements.
F/m Investments Large Cap Focused Fund
Report of Independent Registered Public Accounting Firm
To the Shareholders and Board of Directors of
The RBB Fund, Inc.
Opinion on the Financial Statements
We have audited the accompanying statement of assets and liabilities, including the schedule of investments, of F/m Investments Large Cap Focused Fund (the “Fund”), a series of The RBB Fund, Inc., as of August 31, 2024, the related statements of operations for the period from July 1, 2024 through August 31, 2024 and for the year ended June 30, 2024, the statements of changes in net assets for the period from July 1, 2024 through August 31, 2024 and each of the two years ended June 30, 2024 and 2023, and the financial highlights for the period from July 1, 2024 through August 31, 2024 and each of the three years ended June 30, 2024, 2023 and 2022, and the related notes (collectively referred to as the “financial statements”). In our opinion, the financial statements present fairly, in all material respects, the financial position of the Fund as of August 31, 2024, the results of its operations, the changes in net assets, and the financial highlights for each of the periods indicated above, in conformity with accounting principles generally accepted in the United States of America.
The Fund’s financial highlights for the years ended June 30, 2021, and prior, were audited by other auditors whose report dated August 27, 2021, expressed an unqualified opinion on those financial highlights.
Basis for Opinion
These financial statements are the responsibility of the Fund’s management. Our responsibility is to express an opinion on the Fund’s financial statements based on our audits. We are a public accounting firm registered with the Public Company Accounting Oversight Board (United States) (“PCAOB”) and are required to be independent with respect to the Fund in accordance with the U.S. federal securities laws and the applicable rules and regulations of the Securities and Exchange Commission and the PCAOB.
We conducted our audits in accordance with the standards of the PCAOB. Those standards require that we plan and perform the audit to obtain reasonable assurance about whether the financial statements are free of material misstatement whether due to error or fraud.
Our audits included performing procedures to assess the risks of material misstatement of the financial statements, whether due to error or fraud, and performing procedures that respond to those risks. Such procedures included examining, on a test basis, evidence regarding the amounts and disclosures in the financial statements. Our procedures included confirmation of securities owned as of August 31, 2024, by correspondence with the custodian. Our audits also included evaluating the accounting principles used and significant estimates made by management, as well as evaluating the overall presentation of the financial statements. We believe that our audits provide a reasonable basis for our opinion.
We have served as the auditor of one or more investment companies advised by F/m Investments, LLC since 2021.

COHEN & COMPANY, LTD.
Cleveland, Ohio
October 29, 2024
Investment Adviser
F/m Investments, LLC
3050K Street NW,
Suite W-201
Washington, DC 20007
Administrator and Transfer Agent
U.S.Bank Global Fund Services
P.O. Box 701
Milwaukee, Wisconsin 53201-0701
Principal Underwriter
Quasar Distributors, LLC
3 Canal Plaza, Suite 100
Portland, ME 04101
Custodian
U.S. Bank, N.A.
1555 North River Center Drive, Suite 302
Milwaukee, Wisconsin 53212
Independent Registered Public Accounting Firm
Cohen & Company, Ltd.
1350 Euclid Avenue,
Suite 800
Cleveland, OH 44115
Legal Counsel
Faegre Drinker Biddle & Reath LLP
One Logan Square, Suite 2000
Philadelphia, Pennsylvania 19103-6996

Oakhurst Mutual Funds
Financial Statements
August 31, 2024
Oakhurst Fixed Income Fund
Oakhurst Short Duration Bond Fund
Oakhurst Short Duration High Yield Credit Fund
Each a series of The RBB Fund, Inc.
Table of Contents | 
|
| | |
Schedule of Investments | 1 |
Financial Statements | 17 |
Financial Highlights | 22 |
Notes to Financial Statements | 25 |
Report of Independent Registered Public Accounting Firm | 36 |
Other Information | 37 |
OAKHURST FIXED INCOME FUND
Schedule of Investments
August 31, 2024
| | Par | | | Value | |
| | | | | | | | | |
U.S. TREASURY SECURITIES — 30.2% | | | | | | | | |
United States Treasury Note/Bond | | | | | | | | |
5.25%, 11/15/2028 | | | 1,635,000 | | | $ | 1,730,928 | |
5.25%, 02/15/2029 | | | 3,000,000 | | | | 3,195,937 | |
4.13%, 07/31/2031 | | | 2,414,000 | | | | 2,460,017 | |
2.75%, 08/15/2032 | | | 2,500,000 | | | | 2,313,037 | |
4.13%, 11/15/2032 | | | 4,330,000 | | | | 4,412,879 | |
3.50%, 02/15/2033 | | | 4,800,000 | | | | 4,672,219 | |
3.88%, 08/15/2033 | | | 5,348,000 | | | | 5,339,957 | |
4.50%, 11/15/2033 | | | 3,337,000 | | | | 3,491,076 | |
4.00%, 02/15/2034 | | | 1,775,000 | | | | 1,787,619 | |
4.38%, 05/15/2034 | | | 1,000,000 | | | | 1,037,031 | |
3.00%, 05/15/2042 | | | 4,699,000 | | | | 3,961,661 | |
2.50%, 02/15/2045 | | | 4,323,000 | | | | 3,255,253 | |
TOTAL U.S. TREASURY SECURITIES (Cost $38,917,113) | | | | | | | 37,657,614 | |
| | | | | | | | | |
COLLATERALIZED MORTGAGE OBLIGATIONS — 22.6% | | | | | | | | |
ABN Amro Mortgage Corp., Series 2003-12, Class 1A, 5.00%, 12/25/2033 | | | 86,214 | | | | 84,466 | |
Banc of America Mortgage Securities, Inc. | | | | | | | | |
Series 2003-J, Class 2A1, 5.07%, 11/25/2033 (a) | | | 225,523 | | | | 204,722 | |
Series 2004-A, Class 3A1, 6.37%, 02/25/2034 (a) | | | 12,277 | | | | 12,366 | |
Bear Stearns Alt-A Trust, Series 2003-6, Class 2A1, 5.81%, 01/25/2034 (a) | | | 144,566 | | | | 132,283 | |
Countrywide Home Loan Mortgage Pass Through Trust, Series 2003-49, Class A9, 5.72%, 12/19/2033 (a) | | | 31,588 | | | | 30,091 | |
Credit Suisse Management LLC, Series 2002-AR31, Class 4A2, 6.25%, 11/25/2032 (a) | | | 34,686 | | | | 34,514 | |
Credit Suisse Mortgage Capital Certificates, Series 2013-IVR1, Class A2, 3.00%, 03/25/2043 (a)(b) | | | 320,061 | | | | 287,991 | |
Fannie Mae Whole Loan, Series 2004-W3, Class A7, 5.50%, 05/25/2034 | | | 335,351 | | | | 342,243 | |
Federal Home Loan Mortgage Corp. | | | | | | | | |
Series 2569, Class LD, 5.50%, 02/15/2033 | | | 26,571 | | | | 27,534 | |
Series 3622, Class WA, 5.50%, 09/15/2039 | | | 133,243 | | | | 137,490 | |
Series 3793, Class UA, 4.00%, 06/15/2033 | | | 26,998 | | | | 26,324 | |
Series 3827, Class HA, 3.50%, 11/15/2025 | | | 20,600 | | | | 20,380 | |
Series 3940, Class PD, 2.50%, 02/15/2041 | | | 75,764 | | | | 73,572 | |
Series 4077, Class AP, 4.00%, 01/15/2042 | | | 28,729 | | | | 28,352 | |
Series 4183, Class PA, 3.50%, 01/15/2043 | | | 19,764 | | | | 19,549 | |
Series 4566, Class CA, 3.00%, 01/15/2043 | | | 3,178 | | | | 3,170 | |
Series 4753, Class JA, 3.00%, 12/15/2047 | | | 939,713 | | | | 855,884 | |
Series 4760, Class A, 3.00%, 02/15/2048 | | | 590,416 | | | | 558,660 | |
Series 4960, Class PD, 2.00%, 10/25/2049 | | | 653,737 | | | | 550,084 | |
Series 5145, Class AB, 1.50%, 09/25/2049 | | | 1,143,257 | | | | 912,522 | |
The accompanying notes are an integral part of these financial statements.
OAKHURST FIXED INCOME FUND
Schedule of Investments (Continued)
August 31, 2024
| | Par | | | Value | |
| | | | | | | | | |
COLLATERALIZED MORTGAGE OBLIGATIONS — 22.6% (continued) |
Series 5206, Class DV, 3.50%, 06/25/2033 | | | 979,229 | | | $ | 929,417 | |
Series 5227, Class JQ, 4.00%, 04/25/2047 | | | 970,883 | | | | 943,006 | |
Series 5231, Class LV, 4.50%, 05/25/2052 | | | 1,032,025 | | | | 1,010,801 | |
Series 5252, Class BA, 4.00%, 02/25/2050 | | | 1,026,795 | | | | 1,004,213 | |
Federal National Mortgage Association | | | | | | | | |
Series 2005-80, Class BA, 5.00%, 04/25/2029 | | | 19,626 | | | | 20,125 | |
Series 2009-96, Class DB, 4.00%, 11/25/2029 | | | 50,251 | | | | 49,891 | |
Series 2013-13, Class MA, 4.00%, 01/25/2043 | | | 211,100 | | | | 206,958 | |
Series 2014-80, Class KA, 2.00%, 03/25/2044 | | | 257,831 | | | | 201,405 | |
Series 2016-24, Class HA, 3.00%, 04/25/2044 | | | 50,416 | | | | 48,688 | |
Series 2016-49, Class LA, 3.50%, 01/25/2043 | | | 88,753 | | | | 87,544 | |
Series 2016-89, Class CG, 3.00%, 04/25/2046 | | | 102,923 | | | | 95,174 | |
Series 2017-105, Class N, 3.00%, 01/25/2048 | | | 1,137,583 | | | | 1,019,505 | |
Series 2017-22, Class EC, 3.00%, 06/25/2044 | | | 91,543 | | | | 89,423 | |
Series 2018-45, Class AB, 3.00%, 06/25/2048 | | | 195,704 | | | | 175,215 | |
Series 2019-33, Class N, 3.00%, 03/25/2048 | | | 241,809 | | | | 226,919 | |
Series 2022-22, Class EV, 4.00%, 07/25/2033 | | | 702,998 | | | | 681,443 | |
Government National Mortgage Association | | | | | | | | |
Series 2017-84, Class JD, 3.00%, 05/20/2047 | | | 33,459 | | | | 30,119 | |
Series 2018-6, Class JA, 2.75%, 01/20/2048 | | | 194,537 | | | | 180,261 | |
Series 2019-152, Class HA, 3.50%, 08/20/2049 | | | 131,345 | | | | 126,321 | |
Series 2019-61, Class KU, 3.50%, 05/20/2049 | | | 463,234 | | | | 419,355 | |
Series 2019-99, Class JC, 3.00%, 08/20/2049 | | | 68,041 | | | | 62,008 | |
Series 2020-122, Class DP, 2.50%, 07/20/2050 | | | 1,104,384 | | | | 950,126 | |
Series 2020-123, Class PB, 2.25%, 08/20/2050 | | | 549,361 | | | | 451,186 | |
Series 2020-133, Class A, 6.35%, 05/20/2050 (a) | | | 224,698 | | | | 231,750 | |
Series 2020-133, Class HA, 3.50%, 09/20/2050 | | | 266,659 | | | | 244,008 | |
Series 2020-134, Class NP, 2.50%, 09/20/2050 | | | 849,798 | | | | 711,568 | |
Series 2020-183, Class AY, 2.00%, 11/20/2050 | | | 852,671 | | | | 691,412 | |
Series 2020-5, Class NA, 3.50%, 12/20/2049 | | | 196,420 | | | | 183,192 | |
Series 2020-78, Class CB, 5.00%, 09/20/2034 | | | 168,243 | | | | 166,587 | |
Series 2020-84, Class WA, 3.50%, 06/20/2050 | | | 159,940 | | | | 146,660 | |
Series 2020-95, Class NB, 4.50%, 07/20/2050 | | | 21,271 | | | | 20,302 | |
Series 2022-20, Class KA, 2.50%, 01/20/2052 | | | 1,018,160 | | | | 907,134 | |
Series 2022-24, Class BC, 4.00%, 02/20/2052 | | | 639,682 | | | | 609,873 | |
Series 2022-78, Class LA, 4.50%, 07/20/2050 | | | 832,780 | | | | 827,690 | |
GS Mortgage-Backed Securities Trust, Series 2021-PJ1, Class A4, 2.50%, 06/25/2051 (a)(b) | | | 591,888 | | | | 488,959 | |
Harborview Mortgage Loan Trust | | | | | | | | |
Series 2003-1, Class A, 5.85%, 05/19/2033 (a) | | | 38,847 | | | | 34,965 | |
The accompanying notes are an integral part of these financial statements.
OAKHURST FIXED INCOME FUND
Schedule of Investments (Continued)
August 31, 2024
| | Par | | | Value | |
| | | | | | | | | |
COLLATERALIZED MORTGAGE OBLIGATIONS — 22.6% (continued) |
Series 2004-4, Class 2A, 6.02% (1 mo. Term SOFR + 0.67%), 06/19/2034 | | | 50,764 | | | $ | 45,464 | |
Impac CMB Trust, Series 2005-4, Class 2A1, 5.99% (1 mo. Term SOFR + 0.41%), 05/25/2035 | | | 175,975 | | | | 164,923 | |
Impac Funding Corp., Series 2003-3, Class A1, 5.20%, 08/25/2033 (a) | | | 19,889 | | | | 19,463 | |
Impac Secured Assets CMN Owner Trust, Series 2006-1, Class 2A1, 6.09% (1 mo. Term SOFR + 0.81%), 05/25/2036 | | | 80,507 | | | | 73,182 | |
JP Morgan Mortgage Trust | | | | | | | | |
Series 2003-A1, Class 1A1, 5.17%, 10/25/2033 (a) | | | 47,900 | | | | 45,651 | |
Series 2004-A1, Class 4A1, 6.50%, 02/25/2034 (a) | | | 18,213 | | | | 17,991 | |
Series 2004-A3, Class SF3, 6.52%, 06/25/2034 (a) | | | 45,586 | | | | 43,587 | |
Series 2004-A4, Class 2A2, 6.50%, 09/25/2034 (a) | | | 502,589 | | | | 466,215 | |
Series 2004-A5, Class 2A1, 6.89%, 12/25/2034 (a) | | | 22,809 | | | | 23,114 | |
Series 2013-3, Class A3, 3.36%, 07/25/2043 (a)(b) | | | 51,807 | | | | 47,968 | |
Series 2017-2, Class A3, 3.50%, 05/25/2047 (a)(b) | | | 102,270 | | | | 92,007 | |
Mastr Adjustable Rate Mortgages Trust, Series 2003-3, Class 2A1, 7.45%, 09/25/2033 (a) | | | 48,049 | | | | 46,437 | |
MASTR Asset Securitization Trust, Series 2004-1, Class 3A7, 5.25%, 01/25/2034 | | | 35,520 | | | | 34,585 | |
Merrill Lynch Mortgage Investors, Inc. | | | | | | | | |
Series 2004-A3, Class 1A, 5.62%, 05/25/2034 (a) | | | 106,752 | | | | 96,332 | |
Series 2005-A1, Class 1A, 6.48%, 12/25/2034 (a) | | | 193,306 | | | | 188,557 | |
MortgageIT Trust, Series 2004-1, Class A2, 6.29% (1 mo. Term SOFR + 1.01%), 11/25/2034 | | | 662,278 | | | | 627,029 | |
Nationstar Mortgage Loan Trust, Series 2013-A, Class A, 3.75%, 12/25/2052 (a)(b) | | | 31,086 | | | | 29,174 | |
New Residential Mortgage Loan Trust, Series 2017-3A, Class A1, 4.00%, 04/25/2057 (a)(b) | | | 175,454 | | | | 168,857 | |
RCKT Mortgage Trust, Series 2022-1, Class A5, 2.50%, 01/25/2052 (a)(b) | | | 1,296,084 | | | | 1,140,920 | |
Rithm Capital Corp., Series 2015-2A, Class A2, 3.75%, 08/25/2055 (a)(b) | | | 155,103 | | | | 148,152 | |
Sequoia Mortgage Trust | | | | | | | | |
Series 2003-8, Class A1, 6.09% (1 mo. Term SOFR + 0.75%), 01/20/2034 | | | 137,920 | | | | 131,974 | |
Series 2004-6, Class A2, 6.01% (1 mo. Term SOFR + 0.67%), 07/20/2034 | | | 65,830 | | | | 59,379 | |
Series 2013-5, Class A1, 2.50%, 05/25/2043 (a)(b) | | | 151,592 | | | | 131,885 | |
Series 2013-6, Class A2, 3.00%, 05/25/2043 (a) | | | 177,734 | | | | 158,910 | |
Series 2018-5, Class A7, 3.50%, 05/25/2048 (a)(b) | | | 706,859 | | | | 637,257 | |
Series 2019-2, Class A1, 4.00%, 06/25/2049 (a)(b) | | | 510,005 | | | | 476,295 | |
Series 2019-4, Class A1, 3.50%, 11/25/2049 (a)(b) | | | 508,032 | | | | 455,177 | |
Series 2020-4, Class A2, 2.50%, 11/25/2050 (a)(b) | | | 528,752 | | | | 436,217 | |
Structured Adjustable Rate Mortgage Loan Trust, Series 2004-1, Class 4A4, 7.23%, 02/25/2034 (a) | | | 52,388 | | | | 50,393 | |
Structured Asset Mortgage Investments, Inc. | | | | | | | | |
Series 2003-AR4, Class A1, 6.16% (1 mo. Term SOFR + 0.81%), 01/19/2034 | | | 23,375 | | | | 22,501 | |
Series 2004-AR4, Class 1A1, 6.16% (1 mo. Term SOFR + 0.81%), 12/19/2034 | | | 32,461 | | | | 30,456 | |
Series 2004-AR6, Class A1A, 6.16% (1 mo. Term SOFR + 0.81%), 02/19/2035 | | | 903,835 | | | | 835,132 | |
The accompanying notes are an integral part of these financial statements.
OAKHURST FIXED INCOME FUND
Schedule of Investments (Continued)
August 31, 2024
| | Par | | | Value | |
| | | | | | | | | |
COLLATERALIZED MORTGAGE OBLIGATIONS — 22.6% (continued) |
Structured Asset Securities Corp. | | | | | | | | |
Series 2003-34A, Class 5A4, 6.41%, 11/25/2033 (a) | | | 84,895 | | | $ | 82,249 | |
Series 2003-9A, Class 2A1, 6.65%, 03/25/2033 (a) | | | 56,710 | | | | 54,984 | |
Terwin Mortgage Trust, Series 2004-1HE, Class M1, 6.52% (1 mo. Term SOFR + 1.24%), 02/25/2034 (b) | | | 283,949 | | | | 271,918 | |
WaMu Mortgage Pass Through Certificates | | | | | | | | |
Series 2002-AR2, Class A, 4.49% (Enterprise 11th District COFI Replacement Index + 1.25%), 02/27/2034 | | | 74,445 | | | | 70,864 | |
Series 2003-AR8, Class A, 6.31%, 08/25/2033 (a) | | | 130,693 | | | | 125,346 | |
Series 2005-AR13, Class A1A3, 6.95% (1 mo. Term SOFR + 1.67%), 10/25/2045 | | | 116,835 | | | | 115,141 | |
Series 2005-AR2, Class 1A1A, 6.05% (1 mo. Term SOFR + 0.77%), 01/25/2045 | | | 850,389 | | | | 831,059 | |
Wells Fargo Alternative Loan Trust, Series 2002-1, Class 1A1, 6.25%, 08/25/2032 | | | 171,070 | | | | 173,651 | |
Wells Fargo Mortgage Backed Securities Trust, Series 2021-RR1, Class A3, 2.50%, 12/25/2050 (a)(b) | | | 988,746 | | | | 883,649 | |
TOTAL COLLATERALIZED MORTGAGE OBLIGATIONS (Cost $30,396,741) | | | | | | | 28,169,445 | |
| | | | | | | | | |
CORPORATE BONDS — 21.8% | | | | | | | | |
Communications — 1.5% | | | | | | | | |
BellSouth LLC, 6.88%, 10/15/2031 | | | 895,000 | | | | 969,760 | |
Discovery Communications LLC, 5.00%, 09/20/2037 | | | 1,025,000 | | | | 879,447 | |
| | | | | | | | 1,849,207 | |
Consumer Discretionary — 0.8% | | | | | | | | |
Fortune Brands Innovations, Inc., 5.88%, 06/01/2033 | | | 900,000 | | | | 952,855 | |
| | | | | | | | | |
Energy — 2.1% | | | | | | | | |
El Paso Natural Gas Co. LLC, 8.38%, 06/15/2032 | | | 823,000 | | | | 972,137 | |
Gray Oak Pipeline LLC, 3.45%, 10/15/2027 (b) | | | 613,000 | | | | 588,341 | |
Phillips 66 Partners LP | | | | | | | | |
3.55%, 10/01/2026 | | | 565,000 | | | | 539,219 | |
3.75%, 03/01/2028 | | | 515,000 | | | | 483,754 | |
| | | | | | | | 2,583,451 | |
Financials — 8.2% | | | | | | | | |
American Homes 4 Rent LP, 5.50%, 02/01/2034 | | | 970,000 | | | | 988,949 | |
Antares Holdings LP, 7.95%, 08/11/2028 (b) | | | 800,000 | | | | 845,628 | |
Aviation Capital Group LLC, 6.38%, 07/15/2030 (b) | | | 900,000 | | | | 955,755 | |
Bank of America Corp., 5.29% to 04/25/2033 then SOFR + 1.91%, 04/25/2034 | | | 905,000 | | | | 929,621 | |
Blackstone Private Credit Fund, 3.25%, 03/15/2027 | | | 1,033,000 | | | | 978,406 | |
Blue Owl Capital Corp., 2.63%, 01/15/2027 | | | 1,054,000 | | | | 990,642 | |
Bridge Housing Corp., 3.25%, 07/15/2030 | | | 1,045,000 | | | | 919,408 | |
Crown Castle, Inc., 5.10%, 05/01/2033 | | | 968,000 | | | | 969,905 | |
The accompanying notes are an integral part of these financial statements.
OAKHURST FIXED INCOME FUND
Schedule of Investments (Continued)
August 31, 2024
| | Par | | | Value | |
| | | | | | | | | |
CORPORATE BONDS — 21.8% (continued) |
Financials — 8.2% (continued) | | | | | | | | |
First Citizens BancShares, Inc./NC, 3.38% to 03/15/2025 then 3 mo. Term SOFR + 2.47%, 03/15/2030 | | | 141,000 | | | $ | 136,534 | |
FS KKR Capital Corp., 6.88%, 08/15/2029 | | | 950,000 | | | | 977,297 | |
Icahn Enterprises LP / Icahn Enterprises Finance Corp., 4.38%, 02/01/2029 | | | 750,000 | | | | 659,039 | |
Jackson Financial, Inc., 3.13%, 11/23/2031 | | | 1,100,000 | | | | 952,863 | |
| | | | | | | | 10,304,047 | |
Health Care — 2.8% | | | | | | | | |
Bristol-Myers Squibb Co., 5.88%, 11/15/2036 | | | 907,000 | | | | 985,853 | |
CVS Pass-Through Trust, 6.94%, 01/10/2030 | | | 293,625 | | | | 302,544 | |
CVS Pass-Through Trust Series 2009, 8.35%, 07/10/2031 (b) | | | 455,328 | | | | 500,188 | |
CVS Pass-Through Trust Series 2013, Series 2013, 4.70%, 01/10/2036 (b) | | | 193,278 | | | | 179,945 | |
CVS Pass-Through Trust Series 2014, 4.16%, 08/11/2036 (b) | | | 623,232 | | | | 562,908 | |
Quest Diagnostics, Inc., 6.40%, 11/30/2033 | | | 880,000 | | | | 969,745 | |
| | | | | | | | 3,501,183 | |
Industrials — 0.8% | | | | | | | | |
MasTec, Inc., 5.90%, 06/15/2029 | | | 950,000 | | | | 983,482 | |
| | | | | | | | | |
Technology — 3.1% | | | | | | | | |
Applied Materials, Inc., 5.85%, 06/15/2041 | | | 867,000 | | | | 956,655 | |
Hewlett Packard Enterprise Co., 6.20%, 10/15/2035 | | | 857,000 | | | | 923,720 | |
Leidos Holdings, Inc., 5.95%, 12/01/2040 | | | 945,000 | | | | 964,429 | |
Ricoh USA, Inc., 6.75%, 12/01/2025 | | | 1,000,000 | | | | 983,522 | |
| | | | | | | | 3,828,326 | |
Utilities — 2.5% | | | | | | | | |
Berkshire Hathaway Energy Co., 6.50%, 09/15/2037 | | | 858,000 | | | | 961,251 | |
Elwood Energy LLC, 8.16%, 07/05/2026 | | | 233,397 | | | | 219,393 | |
National Rural Utilities Cooperative Finance Corp., 8.00%, 03/01/2032 | | | 805,000 | | | | 961,151 | |
Potomac Electric Power Co., 7.90%, 12/15/2038 | | | 780,000 | | | | 1,014,708 | |
| | | | | | | | 3,156,503 | |
TOTAL CORPORATE BONDS (Cost $27,214,914) | | | | | | | 27,159,054 | |
| | | | | | | | | |
MORTGAGE-BACKED SECURITIES — 9.0% | | | | | | | | |
Federal Home Loan Mortgage Corp. | | | | | | | | |
Pool C91859, 3.50%, 12/01/2035 | | | 191,825 | | | | 186,665 | |
Pool SB8257, 5.50%, 09/01/2038 | | | 916,441 | | | | 930,334 | |
Pool SD3148, 5.00%, 06/01/2053 | | | 1,007,326 | | | | 1,008,000 | |
Pool SD3386, 5.50%, 07/01/2053 | | | 1,423,548 | | | | 1,437,053 | |
The accompanying notes are an integral part of these financial statements.
OAKHURST FIXED INCOME FUND
Schedule of Investments (Continued)
August 31, 2024
| | Par | | | Value | |
| | | | | | | | | |
MORTGAGE-BACKED SECURITIES — 9.0% (continued) |
Federal National Mortgage Association | | | | | | | | |
Pool CB4024, 4.50%, 07/01/2052 | | | 1,270,739 | | | $ | 1,256,012 | |
Pool FM5329, 2.00%, 01/01/2031 | | | 419,863 | | | | 397,820 | |
Pool FS0862, 2.50%, 12/01/2036 | | | 799,008 | | | | 749,137 | |
Pool FS3430, 4.00%, 11/01/2052 | | | 952,683 | | | | 913,218 | |
Pool FS4239, 5.00%, 03/01/2053 | | | 1,269,689 | | | | 1,263,671 | |
Pool FS4522, 5.00%, 05/01/2053 | | | 1,446,571 | | | | 1,437,802 | |
Pool FS5649, 5.50%, 08/01/2053 | | | 384,623 | | | | 387,666 | |
Pool FS5779, 5.50%, 09/01/2053 | | | 1,138,259 | | | | 1,148,953 | |
Pool MA0584, 4.50%, 10/01/2040 | | | 8,812 | | | | 8,545 | |
Pool MA1201, 3.50%, 10/01/2032 | | | 76,432 | | | | 74,610 | |
TOTAL MORTGAGE-BACKED SECURITIES (Cost $11,043,903) | | | | | | | 11,199,486 | |
| | | | | | | | | |
ASSET-BACKED SECURITIES — 8.6% | | | | | | | | |
Air Canada, Series 2017-1, 3.55%, 01/15/2030 (b) | | | 866,000 | | | | 804,776 | |
Alaska Airlines, Inc., Series A, 4.80%, 08/15/2027 (b) | | | 1,252,079 | | | | 1,246,126 | |
American Airlines Group, Inc., Series AA, 3.15%, 02/15/2032 | | | 965,982 | | | | 884,327 | |
Countrywide Asset-Backed Certificates, Series 2004-6, Class 2A3, 6.59% (1 mo. Term SOFR + 1.31%), 11/25/2034 | | | 148,892 | | | | 149,027 | |
DB Master Finance Parent LLC, Series 2021-1A, Class A2II, 2.49%, 11/20/2051 (b) | | | 1,053,218 | | | | 954,012 | |
Domino’s SPV Guarantor LLC, Series 2021-1A, Class A2I, 2.66%, 04/25/2051 (b) | | | 636,988 | | | | 582,983 | |
Flagship Credit Auto Trust, Series 2020-4, Class D, 2.18%, 02/16/2027 (b) | | | 735,000 | | | | 715,617 | |
Impac CMB Trust, Series 2007-A, Class M1, 6.19% (1 mo. Term SOFR + 0.91%), 05/25/2037 (b) | | | 235,937 | | | | 224,451 | |
Jack in the Box, Inc., Series 2022-1A, Class A2I, 3.45%, 02/26/2052 (b) | | | 845,500 | | | | 801,787 | |
Long Beach Mortgage Loan Trust, Series 2004-4, Class 1A1, 5.95% (1 mo. Term SOFR + 0.67%), 10/25/2034 | | | 696,181 | | | | 679,117 | |
SBA Depositor LLC | | | | | | | | |
Series 2020-1-2, 2.33%, 01/15/2028 (b) | | | 10,000 | | | | 9,172 | |
Series 2021-3, 2.59%, 10/15/2031 (b) | | | 1,200,000 | | | | 1,015,959 | |
United Airlines, Inc., 5.88%, 02/15/2037 | | | 960,000 | | | | 979,425 | |
Verizon Master Trust, Series 2023-6, Class A, 5.35%, 09/22/2031 (b) | | | 750,000 | | | | 780,078 | |
World Omni Select Auto Trust, Series 2021-A, Class C, 1.09%, 11/15/2027 | | | 998,000 | | | | 960,107 | |
TOTAL ASSET-BACKED SECURITIES (Cost $10,780,792) | | | | | | | 10,786,964 | |
| | | | | | | | | |
U.S. GOVERNMENT AGENCY ISSUES — 2.8% | | | | | | | | |
Federal Farm Credit Banks Funding Corp 1.15% 08/12/2030 | | | 2,000,000 | | | | 1,690,896 | |
Federal Farm Credit Banks Funding Corp 2.40% 03/24/2036 | | | 900,000 | | | | 727,604 | |
Tennessee Valley Authority 4.65%, 06/15/2035 | | | 1,100,000 | | | | 1,139,212 | |
TOTAL U.S. GOVERNMENT AGENCY ISSUES (Cost $3,885,690) | | | | | | | 3,557,712 | |
The accompanying notes are an integral part of these financial statements.
OAKHURST FIXED INCOME FUND
Schedule of Investments (CONCLUDED)
August 31, 2024
| | Par | | | Value | |
| | | | | | | | | |
FOREIGN CORPORATE BONDS — 2.3% | | | | | | | | |
Energy — 0.7% | | | | | | | | |
Enbridge, Inc., 5.70%, 03/08/2033 | | | 904,000 | | | $ | 943,496 | |
| |
Financials — 1.6% | | | | | | | | |
AerCap Ireland Capital DAC / AerCap Global Aviation Trust, 3.30%, 01/30/2032 | | | 1,075,000 | | | | 956,528 | |
Fairfax Financial Holdings Ltd., 5.63%, 08/16/2032 | | | 966,000 | | | | 986,412 | |
| | | | | | | | 1,942,940 | |
TOTAL FOREIGN CORPORATE BONDS (Cost $2,729,220) | | | | | | | 2,886,436 | |
| | | | | | | | | |
CONVERTIBLE BONDS — 0.8% | | | | | | | | |
Financials — 0.8% | | | | | | | | |
PennyMac Corp., 8.50%, 06/01/2029 (b) | | | 1,000,000 | | | | 1,002,000 | |
TOTAL CONVERTIBLE BONDS (Cost $997,500) | | | | | | | 1,002,000 | |
| | Shares | | | | |
| | | | | | | | | |
SHORT-TERM INVESTMENTS — 1.5% | | | | | | | | |
Money Market Funds — 1.5% | | | | | | | | |
Invesco Treasury Portfolio - Class Institutional, 5.16% (c) | | | 1,832,788 | | | $ | 1,832,788 | |
TOTAL SHORT-TERM INVESTMENTS (Cost $1,832,788) | | | | | | | 1,832,788 | |
| | | | | | | | | |
TOTAL INVESTMENTS — 99.6% (Cost $127,798,661) | | | | | | $ | 124,251,499 | |
Other Assets in Excess of Liabilities — 0.4% | | | | | | | 546,213 | |
TOTAL NET ASSETS — 100.0% | | | | | | $ | 124,797,712 | |
Percentages are stated as a percent of net assets.
SOFR - Secured Overnight Financing Rate
(a) | Coupon rate is variable based on the weighted average coupon of the underlying collateral. To the extent the weighted average coupon of the underlying assets which comprise the collateral increases or decreases, the coupon rate of this security will increase or decrease correspondingly. The rate disclosed is as of August 31, 2024. |
(b) | Security is exempt from registration pursuant to Rule 144A under the Securities Act of 1933, as amended. These securities may only be resold in transactions exempt from registration to qualified institutional investors. As of August 31, 2024, the value of these securities total $17,466,152 or 14.0% of the Fund’s net assets. |
(c) | The rate shown represents the 7-day annualized effective yield as of August 31, 2024. |
The accompanying notes are an integral part of these financial statements.
OAKHURST SHORT DURATION BOND FUND
Schedule of Investments
August 31, 2024
| | Par | | | Value | |
| | | | | | | | | |
COLLATERALIZED MORTGAGE OBLIGATIONS — 37.3% | | | | | | | | |
Citigroup Financial Products, Inc., Series 2005-6, Class A1, 7.56% (1 yr. CMT Rate + 2.10%), 09/25/2035 | | | 66,991 | | | $ | 66,795 | |
Credit Suisse Management LLC, Series 2004-6, Class 2A1, 4.75%, 09/25/2024 | | | 12,056 | | | | 2 | |
Federal Home Loan Mortgage Corp. | | | | | | | | |
Series 2580, Class PY, 4.00%, 03/15/2033 | | | 8,976 | | | | 8,729 | |
Series 3597, Class LH, 4.50%, 07/15/2039 | | | 88,867 | | | | 88,237 | |
Series 3664, Class DA, 4.00%, 11/15/2037 | | | 243,028 | | | | 240,261 | |
Series 4312, Class GA, 2.50%, 12/15/2041 | | | 38,036 | | | | 36,891 | |
Series 4768, Class E, 3.50%, 09/15/2042 | | | 134,130 | | | | 132,941 | |
Series 4938, Class BL, 2.25%, 07/25/2049 | | | 382,439 | | | | 334,981 | |
Series 4960, Class PD, 2.00%, 10/25/2049 | | | 217,912 | | | | 183,361 | |
Federal National Mortgage Association | | | | | | | | |
Series 2005-109, Class PC, 6.00%, 12/25/2035 | | | 27,110 | | | | 27,439 | |
Series 2005-80, Class BA, 5.00%, 04/25/2029 | | | 68,692 | | | | 70,436 | |
Series 2008-17, Class PA, 4.50%, 10/25/2037 | | | 73,003 | | | | 72,086 | |
Series 2008-49, Class PA, 5.00%, 04/25/2038 | | | 61,083 | | | | 60,003 | |
Series 2009-94, Class DA, 4.50%, 10/25/2039 | | | 136,840 | | | | 136,410 | |
Series 2010-112, Class CY, 4.00%, 10/25/2025 | | | 3,857 | | | | 3,840 | |
Series 2012-136, Class PD, 2.50%, 11/25/2042 | | | 171,892 | | | | 165,855 | |
Series 2012-41, Class BA, 2.50%, 04/25/2027 | | | 152,586 | | | | 148,831 | |
Series 2013-82, Class BP, 2.75%, 12/25/2042 | | | 284,714 | | | | 268,663 | |
Series 2014-80, Class KA, 2.00%, 03/25/2044 | | | 79,948 | | | | 62,451 | |
Series 2016-72, Class AP, 3.00%, 07/25/2044 | | | 74,057 | | | | 70,718 | |
Series 2018-14, Class PA, 3.50%, 04/25/2047 | | | 300,877 | | | | 289,241 | |
Government National Mortgage Association | | | | | | | | |
Series 2018-131, Class PG, 3.00%, 09/20/2048 | | | 81,059 | | | | 74,295 | |
Series 2019-152, Class HA, 3.50%, 08/20/2049 | | | 129,868 | | | | 124,900 | |
Series 2019-24, Class PE, 3.25%, 02/20/2049 | | | 177,805 | | | | 166,163 | |
Series 2019-65, Class EB, 3.00%, 05/20/2049 | | | 153,011 | | | | 135,818 | |
Series 2020-95, Class NB, 4.50%, 07/20/2050 | | | 59,638 | | | | 56,920 | |
GSR Mortgage Loan Trust | | | | | | | | |
Series 2003-13, Class 1A1, 6.30%, 10/25/2033 (a) | | | 70,564 | | | | 70,354 | |
Series 2003-7F, Class 1A4, 5.25%, 06/25/2033 | | | 143,412 | | | | 145,170 | |
Series 2004-10F, Class 7A1, 5.50%, 09/25/2034 | | | 16,182 | | | | 15,968 | |
Series 2005-5F, Class 8A2, 5.50% (1 mo. Term SOFR + 0.61%), 06/25/2035 | | | 36,419 | | | | 34,383 | |
Series 2005-AR6, Class 1A1, 6.59%, 09/25/2035 (a) | | | 4,384 | | | | 4,416 | |
Impac CMB Trust, Series 2005-4, Class 2A1, 5.99% (1 mo. Term SOFR + 0.41%), 05/25/2035 | | | 105,374 | | | | 98,756 | |
JP Morgan Mortgage Trust, Series 2018-8, Class A3, 4.00%, 01/25/2049 (a)(b) | | | 86,088 | | | | 79,907 | |
The accompanying notes are an integral part of these financial statements.
OAKHURST SHORT DURATION BOND FUND
Schedule of Investments (Continued)
August 31, 2024
| | Par | | | Value | |
| | | | | | | | | |
COLLATERALIZED MORTGAGE OBLIGATIONS — 37.3% (continued) |
Mastr Adjustable Rate Mortgages Trust | | | | | | | | |
Series 2004-13, Class 2A1, 6.49%, 04/21/2034 (a) | | | 78,714 | | | $ | 76,159 | |
Series 2004-6, Class 4A6, 6.60%, 07/25/2034 (a) | | | 103,980 | | | | 103,630 | |
MASTR Alternative Loans Trust, Series 2003-1, Class 2A1, 6.50%, 01/25/2033 | | | 206,072 | | | | 210,315 | |
MASTR Asset Securitization Trust, Series 2003-11, Class 7A5, 5.25%, 12/25/2033 | | | 173,947 | | | | 172,446 | |
Mastr Seasoned Securities Trust, Series 2005-1, Class 1A1, 5.73%, 09/25/2032 (a) | | | 291,741 | | | | 292,475 | |
MortgageIT Trust | | | | | | | | |
Series 2004-2, Class M1, 6.22% (1 mo. Term SOFR + 0.94%), 12/25/2034 | | | 369,690 | | | | 352,120 | |
Series 2005-5, Class A1, 5.91% (1 mo. Term SOFR + 0.63%), 12/25/2035 | | | 283,615 | | | | 276,991 | |
Nationstar Mortgage Loan Trust, Series 2013-A, Class A, 3.75%, 12/25/2052 (a)(b) | | | 202,057 | | | | 189,631 | |
Structured Adjustable Rate Mortgage Loan Trust, Series 2004-12, Class 3A3, 5.90%, 09/25/2034 (a) | | | 15,164 | | | | 14,799 | |
Structured Asset Mortgage Investments, Inc., Series 2004-AR6, Class A1A, 6.16% (1 mo. Term SOFR + 0.81%), 02/19/2035 | | | 310,924 | | | | 287,289 | |
Structured Asset Securities Corp., Series 2003-34A, Class 3A4, 5.99%, 11/25/2033 (a) | | | 38,662 | | | | 38,342 | |
WaMu Mortgage Pass Through Certificates | | | | | | | | |
Series 2002-AR2, Class A, 4.49% (Enterprise 11th District COFI Replacement Index + 1.25%), 02/27/2034 | | | 13,536 | | | | 12,884 | |
Series 2003-AR8, Class A, 6.31%, 08/25/2033 (a) | | | 57,466 | | | | 55,115 | |
Wells Fargo Mortgage Backed Securities Trust, Series 2004-K, Class 2A6, 7.32%, 07/25/2034 (a) | | | 204,259 | | | | 208,916 | |
TOTAL COLLATERALIZED MORTGAGE OBLIGATIONS (Cost $6,134,712) | | | | | | | 5,766,333 | |
| | | | | | | | | |
CORPORATE BONDS — 37.0% | | | | | | | | |
Communications — 4.0% | | | | | | | | |
AT&T, Inc., 6.55%, 01/15/2028 | | | 210,000 | | | | 221,868 | |
Discovery Communications LLC, 3.95%, 03/20/2028 | | | 205,000 | | | | 194,383 | |
TFCF America, Inc., 3.70%, 09/15/2024 (c) | | | 200,000 | | | | 199,814 | |
| | | | | | | | 616,065 | |
Consumer Discretionary — 4.1% | | | | | | | | |
Macmillan Bloedel Pembroke LP, 7.70%, 02/15/2026 | | | 250,000 | | | | 259,219 | |
Southwest Airlines Co., 3.45%, 11/16/2027 | | | 200,000 | | | | 192,058 | |
United Airlines 2020-1 Class B Pass Through Trust, Series B, 4.88%, 01/15/2026 | | | 189,840 | | | | 187,589 | |
| | | | | | | | 638,866 | |
Energy — 4.8% | | | | | | | | |
El Paso Natural Gas Co. LLC, 7.50%, 11/15/2026 | | | 269,000 | | | | 284,046 | |
Phillips 66 Partners LP, 3.61%, 02/15/2025 | | | 293,000 | | | | 290,184 | |
Texas Gas Transmission LLC, 7.25%, 07/15/2027 | | | 160,000 | | | | 169,286 | |
| | | | | | | | 743,516 | |
The accompanying notes are an integral part of these financial statements.
OAKHURST SHORT DURATION BOND FUND
Schedule of Investments (Continued)
August 31, 2024
| | Par | | | Value | |
| | | | | | | | | |
CORPORATE BONDS — 37.0% (continued) |
Financials — 12.4% | | | | | | | | |
Ally Financial, Inc., 2.20%, 11/02/2028 | | | 215,000 | | | $ | 192,965 | |
American Tower Corp., 5.50%, 03/15/2028 | | | 185,000 | | | | 190,116 | |
Antares Holdings LP, 8.50%, 05/18/2025 (b) | | | 275,000 | | | | 277,866 | |
Ares Capital Corp., 7.00%, 01/15/2027 | | | 175,000 | | | | 181,578 | |
Athene Global Funding, 5.52%, 03/25/2027 (b) | | | 100,000 | | | | 101,995 | |
Aviation Capital Group LLC, 6.25%, 04/15/2028 (b) | | | 185,000 | | | | 192,376 | |
Blue Owl Capital Corp., 2.88%, 06/11/2028 | | | 215,000 | | | | 196,653 | |
Fidelity & Guaranty Life Holdings, Inc., 5.50%, 05/01/2025 (b) | | | 92,000 | | | | 91,643 | |
Goldman Sachs BDC, Inc., 3.75%, 02/10/2025 | | | 290,000 | | | | 287,376 | |
Goldman Sachs Group, Inc., 3.85%, 01/26/2027 | | | 200,000 | | | | 197,153 | |
| | | | | | | | 1,909,721 | |
Health Care — 1.7% | | | | | | | | |
CVS Pass-Through Trust, 6.04%, 12/10/2028 | | | 259,390 | | | | 262,701 | |
| | | | | | | | | |
Industrials — 2.5% | | | | | | | | |
GE Capital Funding LLC, 4.05%, 05/15/2027 | | | 200,000 | | | | 196,441 | |
Ryder System, Inc., 6.30%, 12/01/2028 | | | 185,000 | | | | 197,256 | |
| | | | | | | | 393,697 | |
Materials — 1.5% | | | | | | | | |
International Paper Co., 7.20%, 11/01/2026 | | | 215,000 | | | | 225,020 | |
| | | | | | | | | |
Technology — 3.0% | | | | | | | | |
Leidos, Inc., 3.63%, 05/15/2025 | | | 295,000 | | | | 291,593 | |
Ricoh USA, Inc., 6.75%, 12/01/2025 | | | 180,000 | | | | 177,034 | |
| | | | | | | | 468,627 | |
Utilities — 3.0% | | | | | | | | |
Elwood Energy LLC, 8.16%, 07/05/2026 | | | 203,544 | | | | 191,331 | |
PacifiCorp, 6.71%, 01/15/2026 | | | 270,000 | | | | 274,196 | |
| | | | | | | | 465,527 | |
TOTAL CORPORATE BONDS (Cost $5,713,007) | | | | | | | 5,723,740 | |
| | | | | | | | | |
ASSET-BACKED SECURITIES — 12.7% | | | | | | | | |
Accredited Mortgage Loan Trust, Series 2004-3, Class 2A2, 6.59% (1 mo. Term SOFR + 1.31%), 10/25/2034 | | | 48,502 | | | | 47,892 | |
ACE Securities Corp., Series 2003-NC1, Class A2A, 6.23% (1 mo. Term SOFR + 0.95%), 07/25/2033 | | | 234,621 | | | | 216,171 | |
Alaska Airlines, Inc., Series A, 4.80%, 08/15/2027 (b) | | | 153,764 | | | | 153,033 | |
Argent Securities, Inc. Asset-Backed Pass-Through Certificates, Series 2004-W10, Class A2, 3.56% (1 mo. Term SOFR + 0.89%), 10/25/2034 | | | 211,056 | | | | 204,707 | |
The accompanying notes are an integral part of these financial statements.
OAKHURST SHORT DURATION BOND FUND
Schedule of Investments (Continued)
August 31, 2024
| | Par | | | Value | |
| | | | | | | | | |
ASSET-BACKED SECURITIES — 12.7% (continued) |
CarMax Auto Owner Trust, Series 2021-3, Class A4, 0.74%, 01/15/2027 | | | 160,000 | | | $ | 153,647 | |
Carvana Auto Receivables Trust | | | | | | | | |
Series 2021-N1, Class B, 1.09%, 01/10/2028 | | | 176,914 | | | | 170,239 | |
Series 2021-P2, Class A4, 0.80%, 01/10/2027 | | | 289,151 | | | | 282,115 | |
Countrywide Asset-Backed Certificates, Series 2004-6, Class 2A3, 6.59% (1 mo. Term SOFR + 1.31%), 11/25/2034 | | | 152,019 | | | | 152,157 | |
DB Master Finance Parent LLC, Series 2021-1A, Class A2I, 2.05%, 11/20/2051 (b) | | | 277,163 | | | | 260,023 | |
OneMain Holdings, Inc., Series 2006-1, Class A5, 5.75%, 12/25/2035 (a)(b) | | | 1,001 | | | | 1,080 | |
Soundview Home Equity Loan Trust, Series 2003-2, Class A2, 6.69% (1 mo. Term SOFR + 1.41%), 11/25/2033 | | | 142,591 | | | | 145,533 | |
World Omni Select Auto Trust, Series 2021-A, Class C, 1.09%, 11/15/2027 | | | 175,000 | | | | 168,356 | |
TOTAL ASSET-BACKED SECURITIES (Cost $1,979,261) | | | | | | | 1,954,953 | |
| | | | | | | | | |
U.S. TREASURY SECURITIES — 9.2% | | | | | | | | |
United States Treasury Note/Bond | | | | | | | | |
4.88%, 05/31/2026 | | | 335,000 | | | | 339,737 | |
4.63%, 06/30/2026 | | | 447,000 | | | | 451,916 | |
4.50%, 07/15/2026 | | | 325,000 | | | | 328,053 | |
3.75%, 08/15/2027 | | | 300,000 | | | | 299,660 | |
TOTAL U.S. TREASURY SECURITIES (Cost $1,406,995) | | | | | | | 1,419,366 | |
| | | | | | | | | |
MORTGAGE-BACKED SECURITIES — 1.0% | | | | | | | | |
Federal Home Loan Mortgage Corp., Pool J12630, 4.00%, 07/01/2025 | | | 31,154 | | | | 30,946 | |
Federal National Mortgage Association | | | | | | | | |
Pool AL0300, 4.50%, 06/01/2026 | | | 30,603 | | | | 30,602 | |
Pool AL4309, 4.00%, 10/01/2028 | | | 91,245 | | | | 90,353 | |
TOTAL MORTGAGE-BACKED SECURITIES (Cost $154,403) | | | | | | | 151,901 | |
| | | | | | | | | |
CONVERTIBLE BONDS — 1.0% | | | | | | | | |
Financials — 1.0% | | | | | | | | |
PennyMac Corp., 8.50%, 06/01/2029 (b) | | | 150,000 | | | | 150,300 | |
TOTAL CONVERTIBLE BONDS (Cost $149,625) | | | | | | | 150,300 | |
| | Units | | | | |
| | | | | | | | | |
SHORT-TERM INVESTMENTS — 1.8% | | | | | | | | |
Investments Purchased with Proceeds from Securities Lending — 1.3% | | | | | | | | |
Mount Vernon Liquid Assets Portfolio, LLC 5.42% (d) | | | 197,125 | | | | 197,125 | |
The accompanying notes are an integral part of these financial statements.
OAKHURST SHORT DURATION BOND FUND
Schedule of Investments (CONCLUDED)
August 31, 2024
| | Shares | | | Value | |
| | | | | | | | | |
SHORT-TERM INVESTMENTS — (continued) | | | | | | | | |
Money Market Funds — 0.5% | | | | | | | | |
Invesco Treasury Portfolio - Class Institutional, 5.16% (e) | | | 88,619 | | | $ | 88,619 | |
TOTAL SHORT-TERM INVESTMENTS (Cost $285,744) | | | | | | | 285,744 | |
| | | | | | | | | |
TOTAL INVESTMENTS — 100.0% (Cost $15,823,747) | | | | | | $ | 15,452,337 | |
Other Assets in Excess of Liabilities — 0.0% (e) | | | | | | | 3,909 | |
TOTAL NET ASSETS — 100.0% | | | | | | $ | 15,456,246 | |
Percentages are stated as a percent of net assets.
CMT - Constant Maturity Treasury Rate
SOFR - Secured Overnight Financing Rate
(a) | Coupon rate is variable based on the weighted average coupon of the underlying collateral. To the extent the weighted average coupon of the underlying assets which comprise the collateral increases or decreases, the coupon rate of this security will increase or decrease correspondingly. The rate disclosed is as of August 31, 2024. |
(b) | Security is exempt from registration pursuant to Rule 144A under the Securities Act of 1933, as amended. These securities may only be resold in transactions exempt from registration to qualified institutional investors. As of August 31, 2024, the value of these securities total $1,497,854 or 9.7% of the Fund’s net assets. |
(c) | All or a portion of this security is on loan as of August 31, 2024. The total market value of these securities was $193,061 which represented 1.2% of net assets. |
(d) | The rate shown represents the 7-day annualized effective yield as of August 31, 2024. |
(e) | Represents less than 0.05% of net assets. |
The accompanying notes are an integral part of these financial statements.
OAKHURST SHORT DURATION HIGH YIELD CREDIT FUND
Schedule of Investments
August 31, 2024
| | Par | | | Value | |
| | | | | | | | | |
CORPORATE BONDS — 76.5% | | | | | | | | |
Communications — 5.8% | | | | | | | | |
Cincinnati Bell Telephone Co. LLC, 6.30%, 12/01/2028 | | | 309,000 | | | $ | 292,836 | |
DIRECTV Holdings LLC / DIRECTV Financing Co., Inc., 3.95%, 01/15/2025 | | | 438,000 | | | | 427,050 | |
McGraw-Hill Education, Inc., 5.75%, 08/01/2028 (a) | | | 200,000 | | | | 196,236 | |
Newfold Digital Holdings Group, Inc., 11.75%, 10/15/2028 (a) | | | 240,000 | | | | 238,936 | |
Qwest Corp., 7.25%, 09/15/2025 | | | 250,000 | | | | 249,067 | |
Uber Technologies, Inc., 6.25%, 01/15/2028 (a) | | | 515,000 | | | | 519,707 | |
Univision Communications, Inc., 6.63%, 06/01/2027 (a) | | | 200,000 | | | | 198,143 | |
| | | | | | | | 2,121,975 | |
Consumer Discretionary — 13.4% | | | | | | | | |
Affinity Interactive, 6.88%, 12/15/2027 (a) | | | 300,000 | | | | 257,408 | |
American Airlines, Inc., 7.25%, 02/15/2028 (a) | | | 200,000 | | | | 201,460 | |
Avis Budget Car Rental LLC / Avis Budget Finance, Inc., 5.75%, 07/15/2027 (a) | | | 500,000 | | | | 489,437 | |
Cornerstone Building Brands, Inc., 9.50%, 08/15/2029 (a) | | | 250,000 | | | | 247,793 | |
Empire Resorts, Inc., 7.75%, 11/01/2026 (a) | | | 250,000 | | | | 241,388 | |
GEO Group, Inc., 8.63%, 04/15/2029 | | | 250,000 | | | | 259,566 | |
Landsea Homes Corp., 8.88%, 04/01/2029 (a) | | | 300,000 | | | | 311,708 | |
MGM Resorts International, 5.50%, 04/15/2027 | | | 625,000 | | | | 625,361 | |
PetSmart, Inc. / PetSmart Finance Corp., 4.75%, 02/15/2028 (a) | | | 262,000 | | | | 250,931 | |
Prime Security Services Borrower LLC / Prime Finance, Inc., 5.75%, 04/15/2026 (a) | | | 520,000 | | | | 521,403 | |
Staples, Inc., 10.75%, 09/01/2029 (a) | | | 250,000 | | | | 236,579 | |
United Airlines 2020-1 Class B Pass Through Trust, Series B, 4.88%, 01/15/2026 | | | 474,600 | | | | 468,973 | |
White Cap Parent LLC, 8.25% (includes 9.00% PIK), 03/15/2026 (a) | | | 750,000 | | | | 752,344 | |
| | | | | | | | 4,864,351 | |
Consumer Staples — 5.3% | | | | | | | | |
B&G Foods, Inc., 5.25%, 09/15/2027 | | | 750,000 | | | | 710,235 | |
Energizer Holdings, Inc., 6.50%, 12/31/2027 (a) | | | 708,000 | | | | 719,261 | |
Land O’Lakes Capital Trust I, 7.45%, 03/15/2028 (a) | | | 500,000 | | | | 489,976 | |
| | | | | | | | 1,919,472 | |
Energy — 8.7% | | | | | | | | |
CVR Energy, Inc., 8.50%, 01/15/2029 (a) | | | 250,000 | | | | 254,688 | |
Encino Acquisition Partners Holdings LLC, 8.50%, 05/01/2028 (a) | | | 500,000 | | | | 517,064 | |
Martin Midstream Partners LP / Martin Midstream Finance Corp., 11.50%, 02/15/2028 (a) | | | 250,000 | | | | 273,904 | |
New Fortress Energy, Inc., 6.50%, 09/30/2026 (a) | | | 685,000 | | | | 593,729 | |
Phillips 66 Partners LP | | | | | | | | |
2.45%, 12/15/2024 | | | 20,000 | | | | 19,804 | |
3.61%, 02/15/2025 | | | 529,000 | | | | 523,916 | |
3.55%, 10/01/2026 | | | 5,000 | | | | 4,772 | |
3.75%, 03/01/2028 | | | 73,000 | | | | 68,571 | |
The accompanying notes are an integral part of these financial statements.
OAKHURST SHORT DURATION HIGH YIELD CREDIT FUND
Schedule of Investments (Continued)
August 31, 2024
| | Par | | | Value | |
| | | | | | | | | |
CORPORATE BONDS — 76.5% (continued) |
Energy — 8.7% (continued) | | | | | | | | |
SM Energy Co., 6.63%, 01/15/2027 | | | 663,000 | | | $ | 666,364 | |
Summit Midstream Holdings LLC, 8.63%, 10/31/2029 (a) | | | 250,000 | | | | 259,674 | |
| | | | | | | | 3,182,486 | |
Financials — 18.4% | | | | | | | | |
Armor Holdco, Inc., 8.50%, 11/15/2029 (a) | | | 260,000 | | | | 250,257 | |
Brookfield Property REIT, Inc. / BPR Cumulus LLC / BPR Nimbus LLC / GGSI Sellco LL, 5.75%, 05/15/2026 (a) | | | 519,000 | | | | 518,263 | |
Burford Capital Global Finance LLC, 6.25%, 04/15/2028 (a) | | | 750,000 | | | | 742,621 | |
First Citizens BancShares, Inc./NC, 3.38% to 03/15/2025 then 3 mo. Term SOFR + 2.47%, 03/15/2030 | | | 141,000 | | | | 136,534 | |
Freedom Mortgage Corp., 12.00%, 10/01/2028 (a) | | | 246,000 | | | | 268,042 | |
Hightower Holding LLC, 9.13%, 01/31/2030 (a) | | | 250,000 | | | | 259,051 | |
HUB International Ltd., 5.63%, 12/01/2029 (a) | | | 730,000 | | | | 716,251 | |
Jefferies Finance LLC / JFIN Co.-Issuer Corp., 5.00%, 08/15/2028 (a) | | | 250,000 | | | | 237,726 | |
MBIA, Inc., 7.00%, 12/15/2025 | | | 675,000 | | | | 673,785 | |
Midcap Financial Issuer Trust, 6.50%, 05/01/2028 (a) | | | 750,000 | | | | 720,561 | |
Navient Corp., 5.00%, 03/15/2027 | | | 530,000 | | | | 520,855 | |
New York Community Bancorp, Inc., 8.27% (3 mo. Term SOFR + 3.04%), 11/06/2028 | | | 543,000 | | | | 480,579 | |
Rithm Capital Corp., 6.25%, 10/15/2025 (a) | | | 675,000 | | | | 675,782 | |
Uniti Group LP / Uniti Group Finance, Inc. / CSL Capital LLC, 10.50%, 02/15/2028 (a) | | | 250,000 | | | | 256,806 | |
Voya Financial, Inc., 4.70% to 01/23/2028 then 3 mo. LIBOR US + 2.08%, 01/23/2048 (b) | | | 285,000 | | | | 252,529 | |
| | | | | | | | 6,709,642 | |
Health Care — 2.1% | | | | | | | | |
AdaptHealth LLC, 4.63%, 08/01/2029 (a) | | | 275,000 | | | | 251,211 | |
CHS/Community Health Systems, Inc., 5.63%, 03/15/2027 (a) | | | 270,000 | | | | 261,542 | |
Prime Healthcare Services, Inc., 9.38%, 09/01/2029 (a) | | | 250,000 | | | | 252,411 | |
| | | | | | | | 765,164 | |
Industrials — 3.5% | | | | | | | | |
Brundage-Bone Concrete Pumping Holdings, Inc., 6.00%, 02/01/2026 (a) | | | 720,000 | | | | 720,565 | |
RXO, Inc., 7.50%, 11/15/2027 (a) | | | 550,000 | | | | 570,438 | |
| | | | | | | | 1,291,003 | |
Materials — 5.5% | | | | | | | | |
Arsenal AIC Parent LLC, 11.50%, 10/01/2031 (a) | | | 510,000 | | | | 577,889 | |
Chemours Co., 5.38%, 05/15/2027 | | | 250,000 | | | | 243,142 | |
Clearwater Paper Corp., 4.75%, 08/15/2028 (a) | | | 725,000 | | | | 677,540 | |
Domtar Corp., 6.75%, 10/01/2028 (a) | | | 270,000 | | | | 247,655 | |
Mercer International, Inc., 5.13%, 02/01/2029 | | | 300,000 | | | | 245,658 | |
| | | | | | | | 1,991,884 | |
The accompanying notes are an integral part of these financial statements.
OAKHURST SHORT DURATION HIGH YIELD CREDIT FUND
Schedule of Investments (Continued)
August 31, 2024
| | Par | | | Value | |
| | | | | | | | | |
CORPORATE BONDS — 76.5% (continued) |
Technology — 10.8% | | | | | | | | |
Cloud Software Group, Inc., 6.50%, 03/31/2029 (a) | | | 533,000 | | | $ | 525,787 | |
Gen Digital, Inc., 6.75%, 09/30/2027 (a) | | | 645,000 | | | | 661,124 | |
McAfee Corp., 7.38%, 02/15/2030 (a) | | | 265,000 | | | | 254,432 | |
MicroStrategy, Inc., 6.13%, 06/15/2028 (a) | | | 250,000 | | | | 244,935 | |
Ricoh USA, Inc., 6.75%, 12/01/2025 | | | 700,000 | | | | 688,466 | |
Sabre GLBL, Inc., 11.25%, 12/15/2027 (a) | | | 710,000 | | | | 719,723 | |
Unisys Corp., 6.88%, 11/01/2027 (a) | | | 280,000 | | | | 263,336 | |
Xerox Holdings Corp., 5.00%, 08/15/2025 (a) | | | 600,000 | | | | 591,030 | |
| | | | | | | | 3,948,833 | |
Utilities — 3.0% | | | | | | | | |
AmeriGas Partners LP / AmeriGas Finance Corp., 5.88%, 08/20/2026 | | | 250,000 | | | | 247,413 | |
Elwood Energy LLC, 8.16%, 07/05/2026 | | | 583,072 | | | | 548,088 | |
Ferrellgas LP / Ferrellgas Finance Corp., 5.88%, 04/01/2029 (a) | | | 250,000 | | | | 234,593 | |
Midland Cogeneration Venture LP, 6.00%, 03/15/2025 (a) | | | 58,814 | | | | 58,078 | |
| | | | | | | | 1,088,172 | |
TOTAL CORPORATE BONDS (Cost $27,606,619) | | | | | | | 27,882,982 | |
| | | | | | | | | |
FOREIGN CORPORATE BONDS — 15.0% | | | | | | | | |
Consumer Discretionary — 7.3% | | | | | | | | |
Carnival Corp., 7.63%, 03/01/2026 (a) | | | 695,000 | | | | 702,511 | |
Garda World Security Corp., 4.63%, 02/15/2027 (a) | | | 515,000 | | | | 502,561 | |
Hawaiian Brand Intellectual Property Ltd. / HawaiianMiles Loyalty Ltd., 11.00%, 04/15/2029 (a) | | | 412,500 | | | | 420,532 | |
NCL Corp. Ltd., 3.63%, 12/15/2024 (a) | | | 512,000 | | | | 509,460 | |
Rakuten Group, Inc., 11.25%, 02/15/2027 (a) | | | 500,000 | | | | 543,570 | |
| | | | | | | | 2,678,634 | |
Consumer Staples — 0.7% | | | | | | | | |
Herbalife Nutrition Ltd. / HLF Financing, Inc., 7.88%, 09/01/2025 (a) | | | 260,000 | | | | 259,669 | |
| | | | | | | | | |
Financials — 5.5% | | | | | | | | |
ASG Finance Designated Activity Co., 9.75%, 05/15/2029 (a) | | | 250,000 | | | | 251,832 | |
Fly Leasing Ltd. | | | | | | | | |
5.25%, 10/15/2024 | | | 620,000 | | | | 607,985 | |
7.00%, 10/15/2024 (a) | | | 750,000 | | | | 751,091 | |
Fortress Transportation and Infrastructure Investors LLC, 9.75%, 08/01/2027 (a) | | | 375,000 | | | | 384,956 | |
| | | | | | | | 1,995,864 | |
Industrials — 0.9% | | | | | | | | |
Bombardier, Inc., 7.88%, 04/15/2027 (a) | | | 342,000 | | | | 343,348 | |
The accompanying notes are an integral part of these financial statements.
OAKHURST SHORT DURATION HIGH YIELD CREDIT FUND
Schedule of Investments (CONCLUDED)
August 31, 2024
| | Par | | | Value | |
| | | | | | | | | |
FOREIGN CORPORATE BONDS — 15.0% (continued) |
Materials — 0.6% | | | | | | | | |
First Quantum Minerals Ltd., 9.38%, 03/01/2029 (a) | | | 200,000 | | | $ | 213,177 | |
TOTAL FOREIGN CORPORATE BONDS (Cost $5,377,588) | | | | | | | 5,490,692 | |
| | | | | | | | | |
CONVERTIBLE BONDS — 2.3% | | | | | | | | |
Financials — 2.3% | | | | | | | | |
PennyMac Corp. | | | | | | | | |
5.50%, 11/01/2024 | | | 590,000 | | | | 586,313 | |
8.50%, 06/01/2029 (a) | | | 250,000 | | | | 250,500 | |
| | | | | | | | 836,813 | |
TOTAL CONVERTIBLE BONDS (Cost $838,395) | | | | | | | 836,813 | |
| | | | | | | | | |
ASSET-BACKED SECURITIES — 1.6% | | | | | | | | |
United Airlines, Inc., Series 2016-1B, 3.65%, 01/07/2026 | | | 598,437 | | | | 582,423 | |
TOTAL ASSET-BACKED SECURITIES (Cost $560,061) | | | | | | | 582,423 | |
| | Shares | | | | |
| | | | | | | | | |
SHORT-TERM INVESTMENTS — 3.5% | | | | | | | | |
Money Market Funds — 3.5% | | | | | | | | |
Invesco Treasury Portfolio - Class Institutional, 5.16% (c) | | | 1,260,581 | | | $ | 1,260,581 | |
TOTAL SHORT-TERM INVESTMENTS (Cost $1,260,581) | | | | | | | 1,260,581 | |
| | | | | | | | | |
TOTAL INVESTMENTS — 98.9% (Cost $35,643,244) | | | | | | $ | 36,053,491 | |
Other Assets in Excess of Liabilities — 1.1% | | | | | | | 397,941 | |
TOTAL NET ASSETS — 100.0% | | | | | | $ | 36,451,432 | |
Percentages are stated as a percent of net assets.
LIBOR - London Interbank Offered Rate
PIK - Payment in Kind
SOFR - Secured Overnight Financing Rate
(a) | Security is exempt from registration pursuant to Rule 144A under the Securities Act of 1933, as amended. These securities may only be resold in transactions exempt from registration to qualified institutional investors. As of August 31, 2024, the value of these securities total $24,662,625 or 67.7% of the Fund’s net assets. |
(b) | Securities referencing LIBOR are expected to transition to an alternative reference rate by the security’s next scheduled coupon reset date. |
(c) | The rate shown represents the 7-day annualized effective yield as of August 31, 2024. |
The accompanying notes are an integral part of these financial statements.
Oakhurst Mutual Funds
Statements of Assets and Liabilities
August 31, 2024
| | Oakhurst
Fixed Income
Fund | | | Oakhurst
Short
Duration
Bond Fund | | | Oakhurst
Short
Duration
High Yield
Credit Fund | |
ASSETS | | | | | | | | | | | | |
Investments of securities of unaffiliated issuers, at value (cost $125,965,873, $15,538,003, and $34,382,663, respectively) | | $ | 122,418,711 | | | $ | 15,166,593 | (1) | | $ | 34,792,910 | |
Short-term investments, at value (cost $1,832,788 and $88,619, and $1,260,581, respectively) | | | 1,832,788 | | | | 88,619 | | | | 1,260,581 | |
Investments purchased with proceeds from securities lending collateral, at value (cost $ —, $197,125, and $ —, respectively) | | | — | | | | 197,125 | | | | — | |
Receivable for: | | | | | | | | | | | | |
Due from Adviser (Note 2) | | | — | | | | 33,524 | | | | 7,662 | |
Dividends and interest | | | 833,520 | | | | 104,592 | | | | 640,558 | |
Investments sold | | | — | | | | 148,937 | | | | — | |
Capital shares sold | | | 172,366 | | | | — | | | | 1,373 | |
Securities lending income | | | 161 | | | | 1,884 | | | | 1,298 | |
Prepaid and other expenses | | | 4,771 | | | | — | | | | 4,142 | |
Total assets | | | 125,262,317 | | | | 15,741,274 | | | | 36,708,524 | |
| | | | | | | | | | | | | |
LIABILITIES | | | | | | | | | | | | |
Payables for: | | | | | | | | | | | | |
Capital shares redeemed | | | 207,298 | | | | 41,118 | | | | 198,257 | |
Distributions | | | 157,027 | | | | 1,073 | | | | 6,093 | |
Administration and accounting fees | | | 22,145 | | | | 6,890 | | | | 7,580 | |
Professional fees | | | 19,845 | | | | 20,273 | | | | 20,098 | |
Advisory fees | | | 16,114 | | | | — | | | | — | |
Securities lending collateral (see Note 5) | | | — | | | | 197,125 | | | | — | |
Other accrued expenses and liabilities | | | 42,176 | | | | 18,549 | | | | 25,064 | |
Total liabilities | | | 464,605 | | | | 285,028 | | | | 257,092 | |
Net assets | | | 124,797,712 | | | | 15,456,246 | | | | 36,451,432 | |
| | | | | | | | | | | | | |
NET ASSETS CONSIST OF: | | | | | | | | | | | | |
Par value | | $ | 14,022 | | | $ | 1,628 | | | $ | 4,086 | |
Paid-in capital | | | 137,496,282 | | | | 20,781,830 | | | | 48,181,168 | |
Total distributable earnings/(loss) | | | (12,712,592 | ) | | | (5,327,212 | ) | | | (11,733,822 | ) |
Net assets | | $ | 124,797,712 | | | $ | 15,456,246 | | | $ | 36,451,432 | |
Shares outstanding ($0.001 par value, 100,000,000 shares authorized) | | | 14,021,970 | | | | 1,627,530 | | | | 4,085,714 | |
Net asset value, offering and redemption price per share | | $ | 8.90 | | | $ | 9.50 | | | $ | 8.92 | |
(1) | Includes market value of securities on loan of $193,061. |
The accompanying notes are an integral part of these financial statements.
Oakhurst Mutual Funds
Statements of Operations
FOR THE Year ENDED August 31, 2024
| | Oakhurst
Fixed Income
Fund | | | Oakhurst
Short
Duration
Bond Fund | | | Oakhurst
Short
Duration
High Yield
Credit Fund | |
INVESTMENT INCOME | | | | | | | | | | | | |
Interest | | $ | 5,194,206 | | | $ | 907,005 | | | $ | 2,751,064 | |
Securities lending income, net | | | 861 | | | | 3,870 | | | | 8,591 | |
Total investment income | | | 5,195,067 | | | | 910,875 | | | | 2,759,655 | |
| | | | | | | | | | | | | |
EXPENSES | | | | | | | | | | | | |
Advisory fees (Note 2) | | | 570,542 | | | | 71,777 | | | | 282,199 | |
Administration and accounting fees (Note 2) | | | 119,476 | | | | 51,101 | | | | 58,996 | |
Transfer agent fees (Note 2) | | | 104,914 | | | | 63,585 | | | | 67,293 | |
Audit and tax service fees | | | 18,872 | | | | 22,289 | | | | 20,581 | |
Printing and shareholder reporting fees | | | 11,647 | | | | 9,350 | | | | 9,842 | |
Custodian fees (Note 2) | | | 9,542 | | | | 3,281 | | | | 3,607 | |
Registration and filing fees | | | 9,351 | | | | 10,496 | | | | 9,310 | |
Director fees | | | 5,788 | | | | 5,788 | | | | — | |
Legal fees | | | 4,988 | | | | 5,108 | | | | 878 | |
Other expenses | | | 34,859 | | | | 20,404 | | | | 24,925 | |
Total expenses before waivers and reimbursments | | | 889,979 | | | | 263,179 | | | | 477,631 | |
Less: waivers and reimbursemets (Note 2) | | | (224,568 | ) | | | (140,157 | ) | | | (120,174 | ) |
Net expenses after waivers and reimbursments | | | 665,411 | | | | 123,022 | | | | 357,457 | |
Net investment income/(loss) | | | 4,529,656 | | | | 787,853 | | | | 2,402,198 | |
| | | | | | | | | | | | | |
NET REALIZED AND UNREALIZED GAIN/(LOSS) FROM INVESTMENTS | | | | | | | | | | | | |
Net realized gain/(loss) from investments | | | (2,820,459 | ) | | | (475,847 | ) | | | (425,905 | ) |
Net change in unrealized appreciation/(depreciation) on investments | | | 7,204,480 | | | | 1,126,187 | | | | 1,802,716 | |
Net realized and unrealized gain/(loss) from investments | | | 4,384,021 | | | | 650,340 | | | | 1,376,811 | |
| | | | | | | | | | | | | |
NET INCREASE/(DECREASE) IN NET ASSETS RESULTING FROM OPERATIONS | | $ | 8,913,677 | | | $ | 1,438,193 | | | $ | 3,779,009 | |
The accompanying notes are an integral part of these financial statements.
OAKHURST FIXED INCOME FUND
Statements of Changes in Net Assets
| | Year Ended
August 31,
2024 | | | Year Ended
August 31,
2023 | |
INCREASE/(DECREASE) IN NET ASSETS RESULTING FROM OPERATIONS | | | | | | | | |
Net investment income/(loss) | | $ | 4,529,656 | | | $ | 3,756,470 | |
Net realized gain/(loss) on investments | | | (2,820,459 | ) | | | (4,450,490 | ) |
Net change in unrealized appreciation/(depreciation) on investments | | | 7,204,480 | | | | 50,843 | |
NET INCREASE/(DECREASE) IN NET ASSETS RESULTING FROM OPERATIONS | | | 8,913,677 | | | | (643,177 | ) |
| | | | | | | | | |
DIVIDENDS AND DISTRIBUTIONS TO SHAREHOLDERS FROM: | | | | | | | | |
Total distributable earnings | | | (4,568,696 | ) | | | (3,883,963 | ) |
Net decrease in net assets from dividends and distributions to shareholders | | | (4,568,696 | ) | | | (3,883,963 | ) |
| | | | | | | | | |
CAPITAL SHARE TRANSACTIONS: | | | | | | | | |
Proceeds from shares sold | | | 45,762,565 | | | | 35,053,632 | |
Reinvestment of distributions | | | 2,866,950 | | | | 2,486,866 | |
Shares redeemed | | | (43,584,779 | ) | | | (37,015,263 | ) |
Net increase/(decrease) in net assets from capital share transactions | | | 5,044,736 | | | | 525,235 | |
Total increase/(decrease) in net assets | | | 9,389,717 | | | | (4,001,905 | ) |
| | | | | | | | | |
NET ASSETS: | | | | | | | | |
Beginning of period | | | 115,407,995 | | | | 119,409,900 | |
End of period | | $ | 124,797,712 | | | $ | 115,407,995 | |
| | | | | | | | | |
SHARE TRANSACTIONS: | | | | | | | | |
Shares sold | | | 5,304,313 | | | | 4,050,926 | |
Shares reinvested | | | 332,675 | | | | 288,571 | |
Shares redeemed | | | (5,090,417 | ) | | | (4,287,559 | ) |
Net increase/(decrease) in shares outstanding | | | 546,571 | | | | 51,938 | |
The accompanying notes are an integral part of these financial statements.
OAKHURST SHORT DURATION BOND FUND
Statements of Changes in Net Assets
| | Year Ended
August 31,
2024 | | | Year Ended
August 31,
2023 | |
INCREASE/(DECREASE) IN NET ASSETS RESULTING FROM OPERATIONS | | | | | | | | |
Net investment income/(loss) | | $ | 787,853 | | | $ | 1,336,521 | |
Net realized gain/(loss) on investments | | | (475,847 | ) | | | (2,021,832 | ) |
Net change in unrealized appreciation/(depreciation) on investments | | | 1,126,187 | | | | 1,307,819 | |
NET INCREASE/(DECREASE) IN NET ASSETS RESULTING FROM OPERATIONS | | | 1,438,193 | | | | 622,508 | |
| | | | | | | | | |
DIVIDENDS AND DISTRIBUTIONS TO SHAREHOLDERS FROM: | | | | | | | | |
Total distributable earnings | | | (791,430 | ) | | | (1,417,288 | ) |
Net decrease in net assets from dividends and distributions to shareholders | | | (791,430 | ) | | | (1,417,288 | ) |
| | | | | | | | | |
CAPITAL SHARE TRANSACTIONS: | | | | | | | | |
Proceeds from shares sold | | | 2,661,769 | | | | 7,798,441 | |
Reinvestment of distributions | | | 773,968 | | | | 1,398,059 | |
Shares redeemed | | | (15,735,509 | ) | | | (39,080,692 | ) |
Net increase/(decrease) in net assets from capital share transactions | | | (12,299,772 | ) | | | (29,884,192 | ) |
Total increase/(decrease) in net assets | | | (11,653,009 | ) | | | (30,678,972 | ) |
| | | | | | | | | |
NET ASSETS: | | | | | | | | |
Beginning of period | | | 27,109,255 | | | | 57,788,227 | |
End of period | | $ | 15,456,246 | | | $ | 27,109,255 | |
| | | | | | | | | |
SHARE TRANSACTIONS: | | | | | | | | |
Shares sold | | | 285,193 | | | | 852,160 | |
Shares reinvested | | | 83,538 | | | | 152,703 | |
Shares redeemed | | | (1,692,988 | ) | | | (4,257,943 | ) |
Net increase/(decrease) in shares outstanding | | | (1,324,257 | ) | | | (3,253,080 | ) |
The accompanying notes are an integral part of these financial statements.
OAKHURST SHORT DURATION HIGH YIELD CREDIT FUND
Statements of Changes in Net Assets
| | Year Ended
August 31,
2024 | | | Year Ended
August 31,
2023 | |
INCREASE/(DECREASE) IN NET ASSETS RESULTING FROM OPERATIONS | | | | | | | | |
Net investment income/(loss) | | $ | 2,402,198 | | | $ | 3,341,257 | |
Net realized gain/(loss) on investments | | | (425,905 | ) | | | (8,762,831 | ) |
Net change in unrealized appreciation/(depreciation) on investments | | | 1,802,716 | | | | 7,335,135 | |
NET INCREASE/(DECREASE) IN NET ASSETS RESULTING FROM OPERATIONS | | | 3,779,009 | | | | 1,913,561 | |
| | | | | | | | | |
DIVIDENDS AND DISTRIBUTIONS TO SHAREHOLDERS FROM: | | | | | | | | |
Total distributable earnings | | | (2,416,379 | ) | | | (3,364,705 | ) |
Net decrease in net assets from dividends and distributions to shareholders | | | (2,416,379 | ) | | | (3,883,963 | ) |
| | | | | | | | | |
CAPITAL SHARE TRANSACTIONS: | | | | | | | | |
Proceeds from shares sold | | | 5,749,951 | | | | 10,876,689 | |
Reinvestment of distributions | | | 2,327,603 | | | | 3,291,666 | |
Shares redeemed | | | (16,767,917 | ) | | | (35,451,954 | ) |
Net increase/(decrease) in net assets from capital share transactions | | | (8,690,363 | ) | | | (21,283,599 | ) |
Total increase/(decrease) in net assets | | | (7,327,733 | ) | | | (22,734,743 | ) |
| | | | | | | | | |
NET ASSETS: | | | | | | | | |
Beginning of period | | | 43,779,165 | | | | 66,513,908 | |
End of period | | $ | 36,451,432 | | | $ | 43,779,165 | |
| | | | | | | | | |
SHARE TRANSACTIONS: | | | | | | | | |
Shares sold | | | 652,966 | | | | 1,263,476 | |
Shares reinvested | | | 266,023 | | | | 384,295 | |
Shares redeemed | | | (1,925,652 | ) | | | (4,118,132 | ) |
Net increase/(decrease) in shares outstanding | | | (1,006,663 | ) | | | (2,470,361 | ) |
The accompanying notes are an integral part of these financial statements.
OAKHURST FIXED INCOME FUND
Institutional Shares
Financial Highlights
Contained below is per share operating performance data for shares outstanding, total investment return/(loss), ratios to average net assets and other supplemental data for the respective periods. This information has been derived from information provided in the financial statements.
| | For the
Year
Ended
August 31, | | | For the
Year
Ended
August 31, | | | For the
Year
Ended
August 31, | | | For the
Year
Ended
August 31, | | | For the
Year
Ended
August 31, | |
| | 2024(1) | | | 2023 | | | 2022 | | | 2021 | | | 2020 | |
PER SHARE OPERATING PERFORMANCE | | | | | | | | | | | | | | | | | | | | |
Net asset value, beginning of period | | $ | 8.56 | | | $ | 8.90 | | | $ | 10.28 | | | $ | 10.40 | | | $ | 10.10 | |
Net investment income/(loss)(3) | | | 0.34 | | | | 0.27 | | | | 0.19 | | | | 0.15 | | | | 0.22 | |
Net realized and unrealized gain/(loss) from investments | | | 0.35 | | | | (0.33 | ) | | | (1.26 | ) | | | — | (2) | | | 0.32 | |
Net increase/(decrease) in net assets resulting from operations | | | 0.69 | | | | (0.06 | ) | | | (1.07 | ) | | | 0.15 | | | | 0.54 | |
Dividends and distributions to shareholders from: | | | | | | | | | | | | | | | | | | | | |
Net investment income | | | (0.35 | ) | | | (0.28 | ) | | | (0.22 | ) | | | (0.21 | ) | | | (0.24 | ) |
Net realized gains on investments | | | — | | | | — | | | | (0.09 | ) | | | (0.06 | ) | | | — | |
Total distributions | | | (0.35 | ) | | | (0.28 | ) | | | (0.31 | ) | | | (0.27 | ) | | | (0.24 | ) |
Net asset value, end of period | | $ | 8.90 | | | $ | 8.56 | | | $ | 8.90 | | | $ | 10.28 | | | $ | 10.40 | |
Total investment return/(loss)(4) | | | 8.21 | % | | | (0.62 | )% | | | (10.59 | )% | | | 1.42 | % | | | 5.45 | % |
RATIOS/SUPPLEMENTAL DATA | | | | | | | | | | | | | | | | | | | | |
Net assets at end of period (000’s omitted) | | $ | 124,798 | | | $ | 115,408 | | | $ | 119,410 | | | $ | 126,210 | | | $ | 96,428 | |
Ratio of expenses to average net assets with waivers and/or reimbursements | | | 0.58 | % | | | 0.60 | % | | | 0.60 | % | | | 0.60 | % | | | 0.60 | % |
Ratio of expenses to average net assets without waivers and reimbursements | | | 0.78 | % | | | 0.78 | % | | | 0.84 | % | | | 0.80 | % | | | 0.87 | % |
Ratio of net investment income/(loss) to average net assets with waviers | | | 3.97 | % | | | 3.16 | % | | | 1.97 | % | | | 1.45 | % | | | 2.20 | % |
Portfolio turnover rate | | | 41 | % | | | 36 | % | | | 48 | % | | | 52 | % | | | 43 | % |
(1) | Prior to the close of business on October 27, 2023, the Fund was a series (the “Predecessor Fund”) of F/m Funds Trust, an open-end management investment company organized as an Ohio business trust. The Predecessor Fund was reorganized into the Fund following the close of business on October 27, 2023 (the “Reorganization”). As a result of the Reorganization, the performance and accounting history of the Predecessor Fund was assumed by the Fund. Performance and accounting information prior to October 30, 2023 included herein is that of the Predecessor Fund (Note 1). |
(2) | Rounds to less than $0.01 per share. |
(3) | Per share data calculated using average shares outstanding method. |
(4) | Total investment return is calculated assuming a purchase of shares on the first day and a sale of shares on the last day of the period reported and includes reinvestments of dividends and distributions, if any. The returns shown do not reflect the deduction of taxes a shareholder would pay on Fund distributions or the redemption of Fund shares. Had the Adviser not reduced/waived its fees, the total returns would have been lower. |
The accompanying notes are an integral part of these financial statements.
OAKHURST SHORT DURATION BOND FUND
Institutional Shares
Financial Highlights
Contained below is per share operating performance data for shares outstanding, total investment return/(loss), ratios to average net assets and other supplemental data for the respective periods. This information has been derived from information provided in the financial statements.
| | For the
Year
Ended
August 31, | | | For the
Year
Ended
August 31, | | | For the
Year
Ended
August 31, | | | For the
Year
Ended
August 31, | | | For the
Year
Ended
August 31, | |
| | 2024(1) | | | 2023 | | | 2022 | | | 2021 | | | 2020 | |
PER SHARE OPERATING PERFORMANCE | | | | | | | | | | | | | | | | | | | | |
Net asset value, beginning of period | | $ | 9.18 | | | $ | 9.31 | | | $ | 9.99 | | | $ | 9.98 | | | $ | 9.94 | |
Net investment income/(loss)(2) | | | 0.36 | | | | 0.31 | | | | 0.14 | | | | 0.15 | | | | 0.22 | |
Net realized and unrealized gain/(loss) from investments | | | 0.33 | | | | (0.11 | ) | | | (0.60 | ) | | | 0.07 | | | | 0.07 | |
Net increase/(decrease) in net assets resulting from operations | | | 0.69 | | | | 0.20 | | | | (0.46 | ) | | | 0.22 | | | | 0.29 | |
Dividends and distributions to shareholders from: | | | | | | | | | | | | | | | | | | | | |
Net investment income | | | (0.37 | ) | | | (0.33 | ) | | | (0.22 | ) | | | (0.21 | ) | | | (0.25 | ) |
Net asset value, end of period | | $ | 9.50 | | | $ | 9.18 | | | $ | 9.31 | | | $ | 9.99 | | | $ | 9.98 | |
Total investment return/(loss)(3) | | | 7.68 | % | | | 2.23 | % | | | (4.65 | )% | | | 2.26 | % | | | 2.95 | % |
RATIOS/SUPPLEMENTAL DATA | | | | | | | | | | | | | | | | | | | | |
Net assets at end of period (000’s omitted) | | $ | 15,456 | | | $ | 27,109 | | | $ | 57,788 | | | $ | 131,145 | | | $ | 125,823 | |
Ratio of expenses to average net assets with waivers and/or reimbursements | | | 0.60 | % | | | 0.60 | % | | | 0.60 | % | | | 0.60 | % | | | 0.60 | % |
Ratio of expenses to average net assets without waivers and reimbursements | | | 1.28 | % | | | 1.03 | % | | | 0.77 | % | | | 0.65 | % | | | 0.68 | % |
Ratio of net investment income/(loss) to average net assets with waviers | | | 3.84 | % | | | 3.24 | % | | | 1.58 | % | | | 1.51 | % | | | 2.13 | % |
Portfolio turnover rate | | | 48 | % | | | 22 | % | | | 70 | % | | | 102 | % | | | 70 | % |
(1) | Prior to the close of business on October 27, 2023, the Fund was a diversified series (the “Predecessor Fund”) of F/m Funds Trust, an open-end management investment company organized as an Ohio business trust. The Predecessor Fund was reorganized into the Fund following the close of business on October 27, 2023 (the “Reorganization”). As a result of the Reorganization, the performance and accounting history of the Predecessor Fund was assumed by the Fund. Performance and accounting information prior to October 30, 2023 included herein is that of the Predecessor Fund (Note 1). |
(2) | Per share data calculated using average shares outstanding method. |
(3) | Total investment return is calculated assuming a purchase of shares on the first day and a sale of shares on the last day of the period reported and includes reinvestments of dividends and distributions, if any. The returns shown do not reflect the deduction of taxes a shareholder would pay on Fund distributions or the redemption of Fund shares. Had the Adviser not reduced/waived its fees, the total returns would have been lower. |
The accompanying notes are an integral part of these financial statements.
OAKHURST SHORT DURATION HIGH YIELD CREDIT FUND
Institutional Shares
Financial Highlights
Contained below is per share operating performance data for shares outstanding, total investment return/(loss), ratios to average net assets and other supplemental data for the respective periods. This information has been derived from information provided in the financial statements.
| | For the
Year
Ended
August 31, | | | For the
Year
Ended
August 31, | | | For the
Year
Ended
August 31, | | | For the
Year
Ended
August 31, | | | For the
Year
Ended
August 31, | |
| | 2024(1) | | | 2023 | | | 2022 | | | 2021 | | | 2020 | |
PER SHARE OPERATING PERFORMANCE | | | | | | | | | | | | | | | | | | | | |
Net asset value, beginning of period | | $ | 8.60 | | | $ | 8.79 | | | $ | 10.06 | | | $ | 9.64 | | | $ | 9.95 | |
Net investment income/(loss)(2) | | | 0.56 | | | | 0.53 | | | | 0.47 | | | | 0.47 | | | | 0.52 | |
Net realized and unrealized gain/(loss) from investments | | | 0.33 | | | | (0.19 | ) | | | (1.26 | ) | | | 0.42 | | | | (0.31 | ) |
Net increase/(decrease) in net assets resulting from operations | | | 0.89 | | | | 0.34 | | | | (0.79 | ) | | | 0.89 | | | | 0.21 | |
Dividends and distributions to shareholders from: | | | | | | | | | | | | | | | | | | | | |
Net investment income | | | (0.57 | ) | | | (0.53 | ) | | | (0.48 | ) | | | (0.47 | ) | | | (0.52 | ) |
Net asset value, end of period | | $ | 8.92 | | | $ | 8.60 | | | $ | 8.79 | | | $ | 10.06 | | | $ | 9.64 | |
Total investment return/(loss)(3) | | | 10.66 | % | | | 4.05 | % | | | (8.11 | )% | | | 9.45 | % | | | 2.27 | % |
RATIOS/SUPPLEMENTAL DATA | | | | | | | | | | | | | | | | | | | | |
Net assets at end of period (000’s omitted) | | $ | 36,451 | | | $ | 43,779 | | | $ | 66,514 | | | $ | 101,433 | | | $ | 41,894 | |
Ratio of expenses to average net assets with waivers and/or reimbursements | | | 0.95 | % | | | 0.95 | % | | | 0.95 | % | | | 0.95 | % | | | 0.95 | % |
Ratio of expenses to average net assets without waivers and reimbursements | | | 1.27 | % | | | 1.22 | % | | | 1.11 | % | | | 1.18 | % | | | 1.29 | % |
Ratio of net investment income/(loss) to average net assets with waviers | | | 6.39 | % | | | 6.00 | % | | | 4.84 | % | | | 4.72 | % | | | 5.38 | % |
Portfolio turnover rate | | | 49 | % | | | 52 | % | | | 53 | % | | | 60 | % | | | 113 | % |
(1) | Prior to the close of business on October 27, 2023, the Fund was a diversified series (the “Predecessor Fund”) of F/m Funds Trust, an open-end management investment company organized as an Ohio business trust. The Predecessor Fund was reorganized into the Fund following the close of business on October 27, 2023 (the “Reorganization”). As a result of the Reorganization, the performance and accounting history of the Predecessor Fund was assumed by the Fund. Performance and accounting information prior to October 30, 2023 included herein is that of the Predecessor Fund (Note 1). |
(2) | Per share data calculated using average shares outstanding method. |
(3) | Total investment return is calculated assuming a purchase of shares on the first day and a sale of shares on the last day of the period reported and includes reinvestments of dividends and distributions, if any. The returns shown do not reflect the deduction of taxes a shareholder would pay on Fund distributions or the redemption of Fund shares. Had the Adviser not reduced/waived its fees, the total returns would have been lower. |
The accompanying notes are an integral part of these financial statements.
Oakhurst Mutual Funds
Notes to Financial Statements
August 31, 2024
1. ORGANIZATION AND SIGNIFICANT ACCOUNTING POLICIES
The RBB Fund, Inc. (“RBB” or the “Company”) was incorporated under the laws of the State of Maryland on February 29, 1988 and is registered under the Investment Company Act of 1940, as amended (the “1940 Act”), as an open-end management investment company. RBB is a “series fund,” which is an investment company divided into separate portfolios. Each portfolio is treated as a separate entity for certain matters under the 1940 Act, and for other purposes, and a shareholder of one portfolio is not deemed to be a shareholder of any other portfolio. Currently, RBB has sixty-five separate investment portfolios, including the Oakhurst Fixed Income Fund, Oakhurst Short Duration Bond Fund, and the Oakhurst Short Duration High Yield Credit Fund (each a “Fund” and together the “Funds” or “Oakhurst Mutual Funds”). The Oakhurst Fixed Income Fund, the Oakhurst Short Duration Bond Fund, and the Oakhurst Short Duration High Yield Credit Fund commenced operations on October 31, 2012, April 26, 2013, and October 1, 2015, respectively. Each fund was treated as a separate series (the “Predecessor Funds”) of the F/m Funds Trust, an open end management investment company established as an Ohio business trust. Effective as of the close of business on October 27, 2023, the Predecessor Funds were reorganized into the Funds, as new series of RBB in a tax-free reorganization (the “Reorganization”), whereby the Funds acquired all the assets and liabilities of the Predecessor Funds in exchange for shares of the Funds which were distributed pro rata by the Predecessor Funds to their respective shareholders in complete liquidation and termination of the Predecessor Funds. The Agreement and Plan of Reorganization pursuant to which the Reorganization was accomplished was approved by shareholders of the Predecessor Funds on June 29, 2023 with respect to the Oakhurst Short Duration Bond Fund and Oakhurst Short Duration High Yield Credit Fund, and on July 31, 2023, with respect to the Oakhurst Fixed Income Fund. Unless otherwise indicated, references to the “Funds” in these Notes to Financial Statements refer to the Predecessor Funds and Funds. Each Fund has registered two classes of shares, Institutional shares and Retail shares. As of the date of this report, Retail shares of each Fund are not currently offered. When both share classes of each Fund are offered, each share class of a Fund will represent an ownership interest in the corresponding Fund’s investment portfolio.
The investment objective of Oakhurst Fixed Income Fund is total return.
The investment objective of Oakhurst Short Duration Bond Fund is to seek a high level of income consistent with preservation of capital and liquidity.
The investment objective of Oakhurst Short Duration High Yield Credit Fund is to seek a high level of income and capital appreciation.
RBB has authorized capital of one hundred billion shares of common stock of which 92.923 billion shares are currently classified into two hundred and thirty-six classes of common stock. Each class represents an interest in an active or inactive RBB investment portfolio.
As a tax-free reorganization, any unrealized appreciation or depreciation on the securities held by the Funds on the date of Reorganization was treated as a non-taxable event, thus the cost basis of the securities held reflects their historical cost basis as of the date of Reorganization. As a result of the Reorganization, the Funds are the accounting successors of the Predecessor Funds. The Reorganization was accomplished by a tax-free exchange of the Funds’ shares and value of net assets for the same shares and value of the Predecessor Funds’ shares. For financial reporting purposes, assets received and shares issued by the Funds were recorded at fair value; however, the cost basis of the investments received from the Funds was carried forward to align ongoing reporting of the Funds’ realized and unrealized gains and losses with amounts distributable to shareholders for tax purposes. Immediately prior to the Reorganization, the net assets, fair value of investments, net unrealized depreciation and shares outstanding of the Predecessor Funds were as follows:
Oakhurst Fixed Income Fund: |
Net Assets | | Fair Value of
Investments | | | Net Unrealized
Depreciation | | | Fund Shares
Outstanding | |
$ 106,907,416 | | $ | 106,032,661 | | | $ | (14,475,288 | ) | | | 12,935,591 | |
Oakhurst Mutual Funds
Notes to Financial Statements
August 31, 2024
Oakhurst Short Duration Bond Fund: |
Net Assets | | Fair Value of
Investments | | | Net Unrealized
Depreciation | | | Fund Shares
Outstanding | |
$ 25,997,806 | | $ | 25,801,854 | | | $ | (1,679,767 | ) | | | 2,849,158 | |
Oakhurst Short Duration High Yield Credit Fund: |
Net Assets | | Fair Value of
Investments | | | Net Unrealized
Depreciation | | | Fund Shares
Outstanding | |
$ 40,532,559 | | $ | 39,809,676 | | | $ | (1,974,807 | ) | | | 4,786,327 | |
The Funds are investment companies and follow accounting and reporting guidance under the Financial Accounting Standards Board (“FASB”) Accounting Standards Codification Topic 946 “Financial Services - Investment Companies.”
The end of the reporting period for the Funds is August 31, 2024, and the period covered by these Notes to Financial Statements is the fiscal year ended August 31, 2024 (the “current fiscal period”).
PORTFOLIO VALUATION – The Funds value their investments at fair value. Each Fund’s net asset value (“NAV”) is calculated once daily at the close of regular trading hours on the New York Stock Exchange (“NYSE”) (generally 4:00 p.m. Eastern time) on each day the NYSE is open. Securities held by the Funds are valued using the closing price or the last sale price on a national securities exchange or the National Association of Securities Dealers Automatic Quotation System (“NASDAQ”) market system where they are primarily traded. Equity securities traded in the over-the-counter (“OTC”) market are valued at their closing prices. If there were no transactions on that day, securities traded principally on an exchange or on NASDAQ will be valued at the mean of the last bid and ask prices prior to the market close. Fixed income securities are valued using an independent pricing service, which considers such factors as security prices, yields, maturities and ratings, and are deemed representative of market values at the close of the market. If market quotations are unavailable or deemed unreliable, securities will be valued in accordance with procedures adopted by the Company’s Board of Directors (the “Board”). Relying on prices supplied by pricing services or dealers or using fair valuation may result in values that are higher or lower than the values used by other investment companies and investors to price the same investments. Units of Mount Vernon Liquid Assets Portfolio are not traded on an exchange and are valued at the investment company’s NAV per share.
The Board has adopted a pricing and valuation policy for use by the Funds and its Valuation Designee (as defined below) in calculating each Fund’s NAV. Pursuant to Rule 2a-5 under the 1940 Act, the Funds have designated F/m Investments, LLC d/b/a Oakhurst Capital Management, LLC (the “Adviser”) as its “Valuation Designee” to perform all of the fair value determinations as well as to perform all of the responsibilities that may be performed by the Valuation Designee in accordance with Rule 2a-5. The Valuation Designee is authorized to make all necessary determinations of the fair values of portfolio securities and other assets for which market quotations are not readily available or if it is deemed that the prices obtained from brokers and dealers or independent pricing services are unreliable.
FAIR VALUE MEASUREMENTS — The inputs and valuation techniques used to measure the fair value of the Funds’ investments are summarized into three levels as described in the hierarchy below:
● | Level 1 – Prices are determined using quoted prices in active markets for identical securities. |
● | Level 2 – Prices are determined using other significant observable inputs (including quoted prices for similar securities, interest rates, prepayment speeds, credit risk, etc.). |
● | Level 3 – Prices are determined using significant unobservable inputs (including the Funds’ own assumptions in determining the fair value of investments). |
Oakhurst Mutual Funds
Notes to Financial Statements
August 31, 2024
The inputs or methodologies used for valuing securities are not necessarily an indication of the risk associated with investing in those securities.
The following is a summary of the inputs used, as of the end of the current fiscal period, in valuing the Funds’ investments carried at fair value:
Oakhurst Fixed Income Fund | | Total | | | Level 1 | | | Level 2 | | | Level 3 | |
U.S. Treasury Securities | | $ | 37,657,614 | | | $ | — | | | $ | 37,657,614 | | | $ | — | |
Collateralized Mortgage Obligations | | | 28,169,445 | | | | — | | | | 28,169,445 | | | | — | |
Corporate Bonds | | | 27,159,054 | | | | — | | | | 27,159,054 | | | | — | |
Mortgage-Backed Securities | | | 11,199,486 | | | | — | | | | 11,199,486 | | | | — | |
Asset-Backed Securities | | | 10,786,964 | | | | — | | | | 10,786,964 | | | | — | |
U.S. Government Agency Issues | | | 3,557,712 | | | | — | | | | 3,557,712 | | | | — | |
Foreign Corporate Bonds | | | 2,886,436 | | | | — | | | | 2,886,436 | | | | — | |
Convertible Bonds | | | 1,002,000 | | | | — | | | | 1,002,000 | | | | — | |
Money Market Funds | | | 1,832,788 | | | | 1,832,788 | | | | — | | | | — | |
Total Investments* | | $ | 124,251,499 | | | $ | 1,832,788 | | | $ | 122,418,711 | | | $ | — | |
Oakhurst Short Duration Bond Fund | | Total | | | Level 1 | | | Level 2 | | | Level 3 | |
Collateralized Mortgage Obligations | | $ | 5,766,333 | | | $ | — | | | $ | 5,766,333 | | | $ | — | |
Corporate Bonds | | | 5,723,740 | | | | — | | | | 5,723,740 | | | | — | |
Asset-Backed Securities | | | 1,954,953 | | | | — | | | | 1,954,953 | | | | — | |
U.S. Treasury Securities | | | 1,419,366 | | | | — | | | | 1,419,366 | | | | — | |
Mortgage-Backed Securities | | | 151,901 | | | | — | | | | 151,901 | | | | — | |
Convertible Bonds | | | 150,300 | | | | — | | | | 150,300 | | | | — | |
Investments Purchased with Proceeds from Securities Lending** | | | 197,125 | | | | — | | | | — | | | | — | |
Money Market Funds | | | 88,619 | | | | 88,619 | | | | — | | | | — | |
Total Investments* | | $ | 15,452,337 | | | $ | 88,619 | | | $ | 15,166,593 | | | $ | — | |
Oakhurst Short Duration
High Yield Credit Fund | | Total | | | Level 1 | | | Level 2 | | | Level 3 | |
Corporate Bonds | | $ | 27,882,982 | | | $ | — | | | $ | 27,882,982 | | | $ | — | |
Foreign Corporate Bonds | | | 5,490,692 | | | | — | | | | 5,490,692 | | | | — | |
Convertible Bonds | | | 836,813 | | | | — | | | | 836,813 | | | | — | |
Asset-Backed Securities | | | 582,423 | | | | — | | | | 582,423 | | | | — | |
Money Market Funds | | | 1,260,581 | | | | 1,260,581 | | | | — | | | | — | |
Total Investments* | | $ | 36,053,491 | | | $ | 1,260,581 | | | $ | 34,792,910 | | | $ | — | |
* | Please refer to the Schedule of Investments for further details. |
** | Certain investments that are measured at fair value using the net asset value per share (or its equivalent) practical expedient have not been categorized in the fair value hierarchy. The fair value amounts presented in the table are intended to permit reconciliation of the fair value hierarchy to the amounts presented in the Statements of Assets and Liabilities. |
Oakhurst Mutual Funds
Notes to Financial Statements
August 31, 2024
At the end of each quarter, management evaluates the classification of Levels 1, 2 and 3 assets and liabilities. Various factors are considered, such as changes in liquidity from the prior reporting period; whether or not a broker is willing to execute at the quoted price; the depth and consistency of prices from third party pricing services; and the existence of contemporaneous, observable trades in the market. Additionally, management evaluates the classification of Levels 1, 2 and 3 assets and liabilities on a quarterly basis for changes in listings or delistings on national exchanges.
Due to the inherent uncertainty of determining the fair value of investments that do not have a readily available market value, the fair value of the Funds’ investments may fluctuate from period to period. Additionally, the fair value of investments may differ significantly from the values that would have been used had a ready market existed for such investments and may differ materially from the values the Funds may ultimately realize. Further, such investments may be subject to legal and other restrictions on resale or otherwise less liquid than publicly traded securities.
For fair valuations using significant unobservable inputs, U.S. generally accepted accounting principles (“U.S. GAAP”) requires each Fund to present a reconciliation of the beginning to ending balances for reported market values that presents changes attributable to total realized and unrealized gains or losses, purchase and sales, and transfers in and out of Level 3 during the period. Transfers in and out between levels are based on values at the end of the period. A reconciliation of Level 3 investments is presented only if a Fund had an amount of Level 3 investments at the end of the reporting period that was meaningful in relation to its net assets. The amounts and reasons for Level 3 transfers in and out of each level is disclosed when a Fund had an amount of total Level 3 transfers during the reporting period that was meaningful in relation to its net assets as of the end of the reporting period.
The Funds did not have any significant Level 3 transfers during the current fiscal period.
USE OF ESTIMATES – The preparation of financial statements in conformity with GAAP requires management to make estimates and assumptions that affect the reported amounts of assets and liabilities and disclosure of contingent assets and liabilities as of the date of the financial statements and the reported amounts of revenues and expenses during the reporting period. Actual results could differ from those estimates and those differences could be significant.
INVESTMENT TRANSACTIONS, INVESTMENT INCOME AND EXPENSES – The Funds record security transactions based on trade date for financial reporting purposes. The cost of investments sold is determined by use of the specific identification method for both financial reporting and income tax purposes in determining realized gains and losses on investments. Interest income (including amortization of premiums and accretion of discounts) is accrued when earned. Dividend income is recorded on the ex-dividend date. Distributions received on securities that represent a return of capital or capital gains are recorded as a reduction of cost of investments and/or as a realized gain. The Funds’ investment income, expenses (other than class specific expenses) and unrealized and realized gains and losses are allocated daily to each class of shares based upon the relative proportion of net assets of each class at the beginning of the day. Certain expenses are shared with The RBB Fund Trust (the “Trust”), a series trust of affiliated funds. Expenses incurred on behalf of a specific class, fund or fund family of the Company or Trust are charged directly to the class, fund or fund family (in proportion to net assets). Expenses incurred for all funds (such as director or professional fees) are charged to all funds in proportion to their average net assets of RBB and the Trust, or in such other manner as the Board deems fair or equitable. Expenses and fees, including investment advisory and administration fees, are accrued daily and taken into account for the purpose of determining the NAV of the Funds.
DIVIDENDS AND DISTRIBUTIONS TO SHAREHOLDERS – Each Fund will distribute substantially all of its net investment income and net realized capital gains, if any, to its shareholders. Each Fund expects to declare and pay distributions, if any, monthly, however it may declare and pay distributions more or less frequently. Net realized capital gains (including net short-term capital gains), if any, will be distributed by each Fund at least annually. Income dividends and capital gain distributions are determined in accordance with U.S. federal income tax regulations, which may differ from U.S. GAAP.
U.S. TAX STATUS – No provision is made for U.S. income taxes as it is each Fund’s intention to continue to qualify for and elect the tax treatment applicable to regulated investment companies under Subchapter M of the Internal Revenue Code of 1986, as amended, and make the requisite distributions to its shareholders which will be sufficient to relieve it from U.S. income and excise taxes.
CASH AND CASH EQUIVALENTS – Cash and cash equivalents are valued at cost plus accrued interest, which approximates market value.
Oakhurst Mutual Funds
Notes to Financial Statements
August 31, 2024
OTHER – In the normal course of business, the Funds may enter into contracts that provide general indemnifications. Each Fund’s maximum exposure under these arrangements is dependent on claims that may be made against the Funds in the future, and, therefore, cannot be estimated; however, the Funds expect the risk of material loss from such claims to be remote.
2. INVESTMENT ADVISER AND OTHER SERVICES
Effective October 30, 2023, under the terms of an investment advisory agreement between the Company, on behalf of the Funds, and the Adviser (the “Current Advisory Agreement”), the Adviser serves as the investment adviser to the Funds, and the Funds pay the Adviser a fee, which is computed and accrued daily and paid monthly, at the annual rate of 0.50%, 0.35%, and 0.75% of the average daily net assets of the Oakhurst Fixed Income Fund, Oakhurst Short Duration Bond Fund, and the Oakhurst Short Duration High Yield Credit Fund, respectively. Oakhurst Capital Advisors, LLC (the “Sub-Adviser”) serves as the investment sub-adviser to the Funds. Subject to the supervision of the Board, the Adviser manages the overall investment operations of the Funds, primarily in the form of oversight of the Sub-Adviser pursuant to the terms of the Current Advisory Agreement between the Adviser and the Company on behalf of the Funds. The Sub-Adviser is paid a fee equal to the annual rate of 0.475% of the Oakhurst Fixed Income Fund’s average daily net assets, 0.325% of the Oakhurst Short Duration Bond Fund’s average daily net assets, and 0.725% of the Oakhurst Short Duration High Yield Credit Fund’s average daily net assets. Compensation of the Sub-Adviser is paid by the Adviser (not the Funds) at the annual rate of the average value of a Fund’s daily net assets. The Sub-Adviser’s fee is reduced on a pro-rata basis to the extent that the Adviser reduces its advisory fees or reimburses expenses of the Funds.
Effective October 30, 2023, under an expense limitation agreement between the Company, on behalf of the Funds, and the Adviser (the “Current Expense Limitation Agreement”), the Adviser has contractually agreed until October 30, 2025 to reduce its investment advisory fees and to pay other operating expenses to the extent necessary to limit annual ordinary operating expenses (excluding brokerage commissions, taxes, interest, acquired fund fees and expenses and extraordinary expenses) to 0.60% (0.58% until October 30, 2024) of the average daily net assets allocable to the Institutional Class shares of the Oakhurst Fixed Income Fund, 0.60% of the average daily net assets allocable to the Institutional Class shares of the Oakhurst Short Duration Bond Fund, and 0.95% of the average daily net assets allocable to the Institutional Class shares of the Oakhurst Short Duration High Yield Credit Fund. During the period from October 30, 2023 through August 31, 2024, the Adviser reduced advisory fees for the Oakhurst Fixed Income Fund, Oakhurst Short Duration Bond Fund, and the Oakhurst Short Duration High Yield Credit Fund by $181,008, $108,148, and $94,367, respectively.
Prior to October 30, 2023, the Sub-Adviser served as the investment adviser to the Predecessor Funds pursuant to an investment advisory agreement between the F/m Funds Trust, on behalf of the Predecessor Funds, and the Sub-Adviser (the “Prior Advisory Agreement”). The fee structure under the Prior Advisory Agreement was identical to the fee structure under the Current Advisory Agreement. In addition, the Sub-Adviser contractually agreed through October 29, 2023 to limit the amount of the Predecessor Funds’ total annual operating expenses (excluding brokerage costs, taxes, borrowing costs, interest, acquired fund fees and expense and extraordinary expenses) pursuant to an expense limitation agreement (the “Prior Expense Limitation Agreement”) to 0.60% of the average daily net assets allocable to the Institutional Class shares of the Oakhurst Fixed Income Fund, 0.60% of the average daily net assets allocable to the Institutional Class shares of the Oakhurst Short Duration Bond Fund, and 0.95% of the average daily net assets allocable to the Institutional Class shares of the Oakhurst Short Duration High Yield Credit Fund. During the period from September 1, 2023 through October 29, 2023, the Sub-Adviser reduced advisory fees to the Predecessor Funds by $43,560, $32,009, and $25,807, for the Oakhurst Fixed Income Fund, the Oakhurst Short Duration Bond Fund, and the Oakhurst Short Duration High Yield Credit Fund, respectively.
Advisory fee reductions and expense reimbursements by the Adviser are subject to repayment by the Funds for a period of three years after such fees and expenses were incurred, provided that the repayments do not cause the Funds’ ordinary operating expenses (excluding brokerage commissions, taxes, interest, acquired fund fees and expenses and extraordinary expenses) to exceed the expense caps that were in effect when the fees and expenses were paid, waived, or absorbed by the Adviser, as well as the expense cap currently in effect. The advisory fees and expense waivers and/or reimbursement under the Prior Expense Limitation Agreement are not subject to repayment by the Funds.
Prior to October 30, 2023, the Adviser served as the investment sub-adviser to the Predecessor Funds pursuant to a sub-advisory agreement by and among F/m Funds Trust, on behalf of the Predecessor Funds, the Adviser and the Sub-Adviser (the “Prior Sub-Advisory Agreement”). Pursuant to the Prior Sub-Advisory Agreement, the Adviser received compensation from the Sub-Adviser for its services to the Predecessor Funds. The Adviser was not compensated directly by the Predecessor Funds.
Oakhurst Mutual Funds
Notes to Financial Statements
August 31, 2024
During the current fiscal period, investment advisory fees accrued, waived and/or reimbursed were as follows:
| | Gross
Advisory Fees | | | Waivers and/or
Reimbursements | | | Recoupments | | | Net
Advisory Fees | |
Oakhurst Fixed Income Fund | | $ | 570,542 | | | $ | (224,568 | ) | | $ | — | | | $ | 345,974 | |
Oakhurst Short Duration Bond Fund | | | 71,777 | | | | (140,157 | ) | | | — | | | | (68,380 | ) |
Oakhurst Short Duration High Yield Credit Fund | | | 282,199 | | | | (120,174 | ) | | | — | | | | 162,025 | |
At the end of the current fiscal period, the Fund had amounts available for recoupment by the Adviser as follows:
| | EXPIRATION | |
| | August 31,
2027 | | | Total | |
Oakhurst Fixed Income Fund | | $ | 181,008 | | | $ | 181,008 | |
Oakhurst Short Duration Bond Fund | | $ | 108,148 | | | $ | 108,148 | |
Oakhurst Short Duration High Yield Credit Fund | | $ | 94,367 | | | $ | 94,367 | |
Ultimus Fund Solutions served as administrator for the Funds through October 27, 2023. Effective October 28, 2023, U.S. Bancorp Fund Services, LLC (“Fund Services”), doing business as U.S. Bank Global Fund Services, serves as administrator for the Funds. For providing administrative and accounting services, Fund Services is entitled to receive a monthly fee, subject to certain minimum and out of pocket expenses.
Ultimus Fund Solutions served as transfer and dividend disbursing agent for the Funds through October 27, 2023. Effective October 28, 2023, Fund Services serves as the Funds’ transfer and dividend disbursing agent. For providing transfer agent services, Fund Services is entitled to receive a monthly fee, subject to certain minimum and out of pocket expenses.
U.S. Bank, N.A. (the “Custodian”) provides certain custodial services to the Funds. The Custodian is entitled to receive a monthly fee, subject to certain minimum and out of pocket expenses.
Ultimus Fund Distributors, LLC served as the principal underwriter and distributor of the Funds’ shares pursuant to a distribution agreement with F/m Funds Trust through October 27, 2023. Effective October 28, 2023, Quasar Distributors, LLC (“Quasar”), a wholly-owned broker-dealer subsidiary of Foreside Financial Group, LLC, serves as the principal underwriter and distributor of the Funds’ shares pursuant to a distribution agreement with the Company.
DIRECTOR AND OFFICER COMPENSATION - The Directors of the Company receive an annual retainer and meeting fees for meetings attended. An employee of Vigilant Compliance, LLC serves as Chief Compliance Officer of the Company. Vigilant Compliance, LLC is compensated for the services provided to the Company. Key Bridge Compliance, LLC provided the Chief Compliance Officer and compliance services to F/m Funds Trust. Additionally, certain trustees of the Predecessor Funds were affiliated with the Adviser and were not paid by the Predecessor Funds for serving in such capacities. Employees of the Company serve as President, Chief Financial Officer, Chief Operating Officer, Secretary and Director of Marketing & Business Development of the Company. They are compensated by the Company for services provided. Certain employees of Fund Services serve as officers of the Company. They are not compensated by the Funds or the Company. For Director and Officer compensation amounts, please refer to the Statement of Operations.
Oakhurst Mutual Funds
Notes to Financial Statements
August 31, 2024
3. INVESTMENT TRANSACTIONS
During the current fiscal period ended August 31, 2024, cost of purchases and proceeds from sales and maturities of investment securities, other than short-term investments and U.S. government securities, were as follows:
| | Oakhurst
Fixed Income
Fund | | | Oakhurst
Short Duration
Bond Fund | | | Oakhurst
Short Duration
High Yield
Credit Fund | |
Purchases of investment securities | | $ | 30,607,940 | | | $ | 3,967,314 | | | $ | 17,781,011 | |
Proceeds from sales and maturities of investment securities | | | 33,292,496 | | | | 11,554,790 | | | | 25,639,749 | |
During the current fiscal period ended August 31, 2024, cost of purchases and proceeds from sales and maturities of U.S. government long-term securities were as follows:
| | Oakhurst
Fixed Income
Fund | | | Oakhurst
Short Duration
Bond Fund | | | Oakhurst
Short Duration
High Yield
Credit Fund | |
Purchases of U.S. government long-term securities | | $ | 20,202,065 | | | $ | 5,203,926 | | | $ | — | |
Proceeds from sales and maturities of U.S. government securities | | | 12,655,167 | | | | 3,802,882 | | | | — | |
4. FEDERAL INCOME TAX INFORMATION
Each Fund has qualified and intends to continue to qualify as a regulated investment company under the Internal Revenue Code of 1986, as amended (the “Code”). Accordingly, the Funds intend to distribute their taxable income and net realized gains, if any, to shareholders in accordance with timing requirements imposed by the Code. Therefore, no federal income tax provision is provided in the Funds’ financial statements.
In order to avoid imposition of the excise tax applicable to regulated investment companies, it is also each Fund’s intention to declare as dividends in each calendar year at least 98% of its net investment income (earned during the calendar year) and 98.2% of its net realized capital gains (earned during the twelve months ended October 31) plus undistributed amounts from prior years.
The following information is computed on a tax basis for each item as of August 31, 2024:
| | Oakhurst
Fixed Income
Fund | | | Oakhurst
Short Duration
Bond Fund | | | Oakhurst
Short Duration
High Yield
Credit Fund | |
Tax cost of investments | | $ | 127,957,171 | | | $ | 15,824,501 | | | $ | 35,643,747 | |
Gross unrealized appreciation | | | 1,871,494 | | | | 72,577 | | | | 635,708 | |
Gross unrealized depreciation | | | (5,577,166 | ) | | | (444,741 | ) | | | (225,964 | ) |
Net unrealized appreciation/(depreciation) on investments | | | (3,705,672 | ) | | | (372,164 | ) | | | 409,744 | |
Undistributed ordinary income | | | 226,365 | | | | 42,851 | | | | 13,297 | |
Oakhurst Mutual Funds
Notes to Financial Statements
August 31, 2024
| | Oakhurst
Fixed Income
Fund | | | Oakhurst
Short Duration
Bond Fund | | | Oakhurst
Short Duration
High Yield
Credit Fund | |
Accumulated capital and other losses | | $ | (9,076,258 | ) | | $ | (4,996,826 | ) | | $ | (12,150,770 | ) |
Distributions payable | | | (157,027 | ) | | | (1,073 | ) | | | (6,093 | ) |
Total distributable earnings/(loss) | | $ | (12,712,592 | ) | | $ | (5,327,212 | ) | | $ | (11,733,822 | ) |
The difference between the federal income tax cost of investments and the financial statement cost of investments for each Fund is due to certain timing differences in the recognition of capital gains and losses under income tax regulations and GAAP. These timing differences are temporary in nature and are due to the tax deferral of losses on wash sales.
The tax character of distributions paid to shareholders during the fiscal years ended August 31, 2023 and August 31, 2024 was as follows:
Year Ended | | Ordinary
Income | | | Long-Term
Capital Gains | | | Total
Distributions* | |
Oakhurst Fixed Income Fund: | | | | | | | | | | | | |
August 31, 2023 | | $ | 4,008,527 | | | $ | — | | | $ | 4,008,527 | |
August 31, 2024 | | $ | 4,548,812 | | | $ | — | | | $ | 4,548,812 | |
Oakhurst Short Duration Bond Fund: | | | | | | | | | | | | |
August 31, 2023 | | $ | 1,532,262 | | | $ | — | | | $ | 1,532,262 | |
August 31, 2024 | | $ | 792,322 | | | $ | — | | | $ | 792,322 | |
Oakhurst Short Duration High Yield Credit Fund: | | | | | | | | | | | | |
August 31, 2023 | | $ | 3,601,448 | | | $ | — | | | $ | 3,601,448 | |
August 31, 2024 | | $ | 2,418,079 | | | $ | — | | | $ | 2,418,079 | |
* | Total Distributions may not tie to the amounts listed on the Statements of Changes in Net Assets due to dividends payable amounts. |
As of August 31, 2024, the Funds had the following capital loss carryforwards (“CLCFs”) for federal income tax purposes:
| | Oakhurst
Fixed Income
Fund | | | Oakhurst
Short Duration
Bond Fund | | | Oakhurst
Short Duration
High Yield
Credit Fund | |
Short-term loss carryforwards | | $ | (901,758 | ) | | $ | (1,981,555 | ) | | $ | (4,706,925 | ) |
Long-term loss carryforwards | | | (8,174,500 | ) | | | (3,015,271 | ) | | | (7,443,845 | ) |
Total | | $ | (9,076,258 | ) | | $ | (4,996,826 | ) | | $ | (12,150,770 | ) |
These CLCFs may be carried forward indefinitely and are available to offset net realized capital gains in future years, thereby reducing future taxable capital gain distributions.
Oakhurst Mutual Funds
Notes to Financial Statements
August 31, 2024
The Funds recognize the tax benefits or expenses of uncertain tax positions only when the position is “more likely than not” to be sustained assuming examination by tax authorities. Management has reviewed each Fund’s tax positions taken on Federal income tax returns for the current and all open tax years (generally, three years) and has concluded that no provision for unrecognized tax benefits or expenses is required in these financial statements and does not expect this to change over the next year. Each Fund identifies its major tax jurisdiction as U.S. Federal.
Each Fund recognizes interest and penalties, if any, related to unrecognized tax benefits as income tax expenses on the Statements of Operations. During the fiscal year ended August 31, 2024, the Funds did not incur any interest or penalties.
5. SECURITIES LENDING
The Funds may make secured loans of their portfolio securities to brokers, dealers and other financial institutions to earn additional income and receive cash collateral equal to at least 102% of the current market value of the loaned domestic securities and 105% of the current market value of the loaned foreign securities, as marked to market each day that the NAV of the Funds is determined. When the collateral falls below specified amounts, the Funds’ lending agent will use its best effort to obtain additional collateral on the next business day to meet required amounts under the security lending agreement. The Funds receive compensation in the form of loan fees owed by borrowers and income earned on collateral investments. A portion of the interest received on the loan collateral is retained by the Funds and the remainder is rebated to the borrower of the securities. Pursuant to the securities lending agreement between the Trust, on behalf of the Funds, and the Custodian, each Fund pays a fee to the Custodian for administrative and custodial fees, which is calculated daily and paid monthly, in the amount of 20% of the Fund’s net income. The net amount of interest earned, after the interest rebate and the allocation to the Custodian, is shown below. Collateral is invested in the Mount Vernon Liquid Assets Portfolio, LLC of which the investment objective is to seek to maximize income to the extent consistent with the preservation of capital and liquidity and maintain a stable Net Asset Value of $1.00. The Funds will bear the risk of loss of the invested collateral. Investments purchased with collateral are overnight and continuous. Securities lending will expose the Funds to the risk of loss should a borrower default on its obligation to return the borrowed securities. The market value of the securities on loan and cash collateral as of the end of the reporting period and the net income generated from the program during the current fiscal period with respect to such secured loans were as follows:
FUND | | MARKET VALUE
OF SECURITIES
LOANED | | | MARKET VALUE
OF COLLATERAL | | | INCOME
RECEIVED FROM
SECURITIES
LENDING | |
Oakhurst Fixed Income Fund | | $ | — | | | $ | — | | | $ | 861 | |
Oakhurst Short Duration Bond Fund | | | 193,061 | | | | 197,125 | | | | 3,870 | |
Oakhurst Short Duration High Yield Credit Fund | | | — | | | | — | | | | 8,591 | |
Oakhurst Mutual Funds
Notes to Financial Statements
August 31, 2024
Securities lending transactions are entered into by the Funds’ securities lending agent on behalf of the Funds under a Master Securities Lending Agreement (“MSLA”) which permits the Funds’ securities lending agent on behalf of the Funds under certain circumstances including an event of default (such as bankruptcy or insolvency), to offset amounts payable on behalf of the Funds to the same counterparty against amounts to be received and create one single net payment due to or from the Funds. The following table is a summary of the Funds’ open securities lending transactions which are subject to a MSLA as of the end of the reporting period:
| | | | | | | | | | | | | | | GROSS AMOUNTS NOT OFFSET IN
THE STATEMENTS OF ASSETS AND LIABILITIES | |
FUND | | GROSS AMOUNTS
OF RECOGNIZED
ASSETS | | | GROSS AMOUNTS
OFFSET IN THE
STATEMENTS
OF ASSETS AND
LIABILITIES | | | NET AMOUNTS
OF ASSETS
PRESENTED IN
THE STATEMENTS
OF ASSETS AND
LIABILITIES | | | FINANCIAL
INSTRUMENTS1 | | | CASH
COLLATERAL
RECEIVED | | | NET AMOUNT2 | |
Oakhurst Fixed Income Fund | | $ | — | | | $ | — | | | $ | — | | | $ | — | | | $ | — | | | $ | — | |
Oakhurst Short Duration Bond Fund | | | 193,061 | | | | — | | | | 193,061 | | | | (193,061 | ) | | | — | | | | — | |
Oakhurst Short Duration High Yield Credit Fund | | | — | | | | — | | | | — | | | | — | | | | — | | | | — | |
1 | Amount disclosed is limited to the amount of assets presented in the Statements of Assets and Liabilities. Actual collateral received may be more than the amount shown. |
2 | Net amount represents the net amount receivable from the counterparty in the event of default. |
6. Risks Associated with Collateralized Mortgage Obligations
Oakhurst Fixed Income Fund and Oakhurst Short Duration Bond Fund have each adopted a fundamental policy to concentrate its investments in collateralized mortgage obligations (“CMOs”). This means each Fund generally aims to invest at least 25% of its total assets in agency and non-agency CMOs. The Funds’ investments in CMOs are subject to prepayment risk, especially when interest rates decline. Prepayment risk is the risk that the principal on CMOs, other asset-backed securities or any fixed-income security with an embedded call option may be prepaid at any time, which could reduce yield and market value. This could reduce the effective maturity of a CMO and cause the Funds to reinvest their assets at a lower prevailing interest rate. CMOs are also subject to extension risk, which is the risk that rising interest rates will increase the effective maturity of CMOs due to the deceleration of prepayments. CMOs may also be subject to risks unique to the housing industry, including mortgage lending practices, defaults, foreclosures and changes in real estate values. The Funds’ investments in CMOs are subject to default risk, prepayment and extension risk and market risk when interest rates rise. As a result of each Fund’s policy to concentrate in CMOs, the Funds will be subject to the risks associated with these securities to a greater degree than a fund that does not concentrate in CMOs. As of the end of the current fiscal period, Oakhurst Fixed Income Fund and Oakhurst Short Duration Bond Fund had 22.6% and 37.3%, respectively, of the value of their net assets invested in CMOs.
7. Risks Associated with Lower Rated Debt Securities
Oakhurst Short Duration High Yield Credit Fund invests primarily in lower-rated debt securities (commonly called “junk” bonds). These securities are often considered to be speculative and involve greater risk of default or price changes than higher-rated securities due to changes in the issuer’s creditworthiness. Prices of lower-rated securities have been found to be less sensitive to interest rate changes and more sensitive to adverse economic changes and individual corporate developments than more highly rated investments. An economic downturn tends to disrupt the market for lower-rated securities and may adversely affect their
Oakhurst Mutual Funds
Notes to Financial Statements
August 31, 2024
values. Such an economic downturn may be expected to result in increased defaults by the issuers of such securities. Securities rated below Baa by Moody’s Investors Service, Inc. or BBB by S&P Global Ratings or Fitch Ratings, Inc. are generally considered to be “junk” bonds.
8. Risks Associated with Rule 144A Securities
Rule 144A securities are securities that are exempt from registration in compliance with the Securities Act of 1933, as amended, and the rules thereunder, and may have legal restrictions on resale. Under Rule 144A, these privately placed securities may be resold to qualified institutional buyers (“QIBs”), subject to certain conditions. An insufficient number of QIBs interested in purchasing Rule 144A securities at a particular time could adversely affect the marketability of the securities and a Fund might be unable to dispose of the securities promptly or at a reasonable price. Please refer to the Schedule of Investments for further details regarding each Fund’s investments in 144A securities.
9. Bank Line of Credit
Oakhurst Fixed Income Fund had an uncommitted senior secured line of credit up to $6,000,000 with its custodian bank which expired on December 15, 2023. Oakhurst Short Duration Bond Fund had an uncommitted senior secured line of credit up to $3,000,000, with its custodian bank which expired on December 15, 2023. Oakhurst Short Duration High Yield Credit Fund had an uncommitted senior secured line of credit up to $3,500,000, with its custodian bank which expired on December 15, 2023. All portfolio securities held by each Fund were pledged as collateral for its line of credit. Borrowings under the lines of credit bore interest at a rate per annum equal to the bank’s Prime Rate at the time of borrowing. During the current fiscal period, none of the Funds borrowed under their respective lines of credit.
10. Subsequent Events
In preparing these financial statements, management has evaluated events and transactions for potential recognition or disclosure through the date the financial statements were issued.
Subsequent to the end of the current fiscal period, the Funds paid the following distributions:
Fund | | Record Date | | | EX-DATE/
PAY DATE | | | Distribution
Rate Per Share | |
Oakhurst Fixed Income Fund | | | September 26, 2024 | | | | September 27, 2024 | | | $ | 0.02451799 | |
Oakhurst Short Duration Bond Fund | | | September 26, 2024 | | | | September 27, 2024 | | | $ | 0.02730690 | |
Oakhurst Short Duration High Yield Credit Fund | | | September 26, 2024 | | | | September 27, 2024 | | | $ | 0.04437409 | |
Oakhurst Mutual Funds
Report of Independent Registered Public Accounting Firm
To the Shareholders and Board of Directors of
The RBB Fund, Inc.
Opinion on the Financial Statements
We have audited the accompanying statements of assets and liabilities, including the schedules of investments, of Oakhurst Fixed Income Fund, Oakhurst Short Duration Bond Fund, and Oakhurst Short Duration High Yield Credit Fund (the “Funds”), each a series of The RBB Fund, Inc., as of August 31, 2024, the related statements of operations for the year then ended, the statements of changes in net assets for each of the two years in the period then ended, the financial highlights for each of the five years in the period then ended, and the related notes (collectively referred to as the “financial statements”). In our opinion, the financial statements present fairly, in all material respects, the financial position of each of the Funds as of August 31, 2024, the results of their operations, the changes in net assets, and the financial highlights for each of the periods indicated above in conformity with accounting principles generally accepted in the United States of America.
Basis for Opinion
These financial statements are the responsibility of the Funds’ management. Our responsibility is to express an opinion on the Funds’ financial statements based on our audits. We are a public accounting firm registered with the Public Company Accounting Oversight Board (United States) (“PCAOB”) and are required to be independent with respect to the Funds in accordance with the U.S. federal securities laws and the applicable rules and regulations of the Securities and Exchange Commission and the PCAOB.
We conducted our audits in accordance with the standards of the PCAOB. Those standards require that we plan and perform the audit to obtain reasonable assurance about whether the financial statements are free of material misstatement whether due to error or fraud.
Our audits included performing procedures to assess the risks of material misstatement of the financial statements, whether due to error or fraud, and performing procedures that respond to those risks. Such procedures included examining, on a test basis, evidence regarding the amounts and disclosures in the financial statements. Our procedures included confirmation of securities owned as of August 31, 2024, by correspondence with the custodian and broker. Our audits also included evaluating the accounting principles used and significant estimates made by management, as well as evaluating the overall presentation of the financial statements. We believe that our audits provide a reasonable basis for our opinion.
We have served as the Funds’ auditor since 2017.

COHEN & COMPANY, LTD.
Cleveland, Ohio
October 29, 2024
Oakhurst Mutual Funds
Other Information
(Unaudited)
APPROVAL OF INVESTMENT ADVISORY AGREEMENT
As required by the 1940 Act, the Board, including all of the Directors who are not “interested persons” of the Company, as that term is defined in the 1940 Act (the “Independent Directors”), considered (1) the renewal of the investment advisory agreement between F/m and the Company (the “Investment Advisory Agreement”) on behalf of the Oakhurst Fixed Income Fund, Oakhurst Short Duration Bond Fund, and Oakhurst Short Duration High Yield Credit Fund (for this section only, each a “Fund” and collectively the “Funds”), and (2) the renewal of the sub-advisory agreement among F/m, the Company and Oakhurst Capital Advisors, LLC (the “Sub-Adviser”) (the “Sub-Advisory Agreement”), at a meeting of the Board held on May 15-16, 2024 (the “Meeting”). At the Meeting, the Board, including all of the Independent Directors, approved the Advisory Agreement and the Sub-Advisory Agreement for an additional one-year term ending August 16, 2025. The Board’s decision to approve the Advisory Agreement and the Sub-Advisory Agreement reflects the exercise of its business judgment to continue the existing arrangement. In approving the Advisory Agreement and the Sub-Advisory Agreement, the Board considered information provided by F/m and the Sub-Adviser with the assistance and advice of counsel to the Independent Directors and the Company.
In considering the renewal and approval of the Advisory Agreement with respect to the Funds, and the renewal and approval of the Sub-Advisory Agreement among the Company, F/m and the Sub-Advisers with respect to the Funds, the Directors took into account all materials provided prior to and during the Meeting and at other meetings throughout the past year, the presentations made during the Meeting, and the discussions held during the Meeting. The Directors reviewed these materials with management of F/m, and discussed the aforementioned Agreements with counsel in executive sessions, at which no representatives of F/m or the Sub-Adviser were present. Among other things, the Directors considered (i) the nature, extent, and quality of services provided to the Funds by F/m and the Sub-Adviser; (ii) descriptions of the experience and qualifications of the personnel providing those services; (iii) F/m’s and the Sub-Adviser’s investment philosophies and processes; (iv) F/m’s and the Sub-Adviser’s assets under management and client descriptions; (v) F/m’s and the Sub-Adviser’s soft dollar commission and trade allocation policies, including information on the types of research and services obtained in connection with soft dollar commissions; (vi) F/m’s and the Sub-Adviser’s advisory fee arrangements and other similarly managed clients, as applicable; (vii) F/m’s and the Sub-Adviser’s compliance procedures; (viii) F/m’s and the Sub-Adviser’s financial information and insurance coverage, as applicable; (ix) the extent to which economies of scale are relevant to the Funds; (x) a report prepared by Fuse Research Network, LLC comparing each Fund’s management fees and total expense ratios to a group of mutual funds deemed comparable to the Fund based primarily on investment strategy similarity (“Peer Group”) and comparing the performance of each Fund to the performance of its Peer Group; and (xi) a report comparing the performance of the Fund to the performance of its benchmark.
As part of their review, the Directors considered the nature, extent and quality of the services provided by F/m and the Sub-Adviser. The Directors concluded that F/m and the Sub-Adviser had substantial resources to provide services to the Funds, and that F/m’s and the Sub-Adviser’s services had been acceptable.
The Directors also considered the investment performance of the Funds. Information on the Funds’ investment performance was provided for the three-month, one-year, three-year, five-year, ten-year, and since inception periods ended December 31, 2023, as applicable. The Directors considered the Funds’ investment performance in light of their respective investment objectives and investment strategies. The Directors concluded that the investment performance of each of the Funds as compared to their respective benchmarks and Peer Groups was acceptable.
In reaching this conclusion, the Directors noted that the Oakhurst Fixed Income Fund outperformed its benchmark, the Bloomberg US Aggregate Bond Index, for the one-year, three-year, five-year, ten-year, and since-inception periods ended December 31, 2023, and underperformed its benchmark for the three-month period ended December 31, 2023. The Board noted that the Oakhurst Fixed Income Fund’s total return outperformed the median of its Peer Group for the one-year, three-year, ten-year, and since-inception periods ended December 31, 2023, and underperformed the median of its Peer Group for the three-month and five-year periods ended December 31, 2023.
The Directors noted that the Oakhurst Short Duration Bond Fund outperformed its primary benchmark, the ICE BofA U.S. Corp./Govt. 1-3 Years Bond Index, for the three-month, one-year, three-year, five-year, ten-year, and since-inception periods ended December 31, 2023. The Directors noted that the Oakhurst Short Duration Bond Fund outperformed the median of its Peer Group for the one-year, ten-year, and since-inception periods ended December 31, 2023, and underperformed the median of its Peer Group for the three-month, three-year, and five-year periods ended December 31, 2023.
Oakhurst Mutual Funds
Other Information
(Unaudited)
The Directors noted that the Oakhurst Short Duration High Yield Credit Fund underperformed its primary benchmark, the ICE BofA 1-5 Year U.S. Cash Pay High Yield Constrained Index, for the three-month, one-year, three-year, five-year and since-inception periods ended December 31, 2023. The Directors noted that the Oakhurst Short Duration High Yield Credit Fund outperformed the median of its Peer Group for the three-month and one-year periods ended December 31, 2023, equaled the median of its Peer Group for the since-inception period ended December 31, 2023, and underperformed the median of its Peer Group for the three-year and five-year periods ended December 3, 2023.
The Board also considered the advisory fee rate payable by the Funds under the Advisory Agreement. In this regard, information on the fees paid by a Fund and the Fund’s total operating expense ratios (before and after fee waivers and expense reimbursements) were compared to similar information for mutual funds advised by other, unaffiliated investment advisory firms. The Directors also considered the fees payable to the Sub-Adviser under the Sub-Advisory Agreement and the information provided by F/m on the services provided by the Sub-Adviser. In this regard, the Directors noted that the fees for the Sub-Adviser were paid directly by F/m and not by the Funds. The Directors noted that F/m had contractually agreed to waive management fees and reimburse expenses through at least December 31, 2024, to limit total annual operating expenses to agreed upon levels for the Fund.
The Directors noted that the Oakhurst Fixed Income Fund’s net advisory fee was above the median and ranked in the 4th quintile of its Peer Group and the Fund’s total net expenses were above the median and ranked in the 4th quintile of its Peer Group.
The Directors noted that the Oakhurst Short Duration Bond Fund’s net advisory fee was below the median and ranked in the 1st quintile of its Peer Group, and the Fund’s total net expenses was above the median and ranked in the 4th quintile of its Peer Group.
The Directors noted that the Oakhurst Short Duration High Yield Credit Fund’s net advisory fee was above the median and ranked in the 3rd quintile of its Peer Group, and the Fund’s total net expenses were above the median and ranked in the 5th quintile of its Peer Group.
After reviewing the information regarding F/m’s and the Sub-Adviser’s costs, profitability and economies of scale, and after considering the services to be provided by F/m and the Sub-Adviser, the Directors concluded that the advisory fees to be paid by the Funds to F/m and the sub-advisory fees to be paid to each Sub-Adviser were fair and reasonable and that the Investment Advisory Agreement and Sub-Advisory Agreement should be approved and continued for an additional one-year period ending August 16, 2025.
Investment Adviser
F/m Investments, LLC d/b/a Oakhurst Capital Management, LLC
3050 K Street, NW
Suite 201
Washington, DC 20007
Sub-Adviser
Oakhurst Capital Advisors, LLC
1875 Century Park E,
Suite 950
Los Angeles, CA 90067
Administrator and Transfer Agent
U.S.Bank Global Fund Services
P.O. Box 701
Milwaukee,Wisconsin 53201-0701
Principal Underwriter
Quasar Distributors, LLC
3 Canal Plaza, Suite 100
Portland, ME 04101
Custodian
U.S. Bank, N.A.
1555 North River Center Drive, Suite 302
Milwaukee, Wisconsin 53212
Independent Registered Public Accounting Firm
Cohen & Company, Ltd.
1350 Euclid Avenue,
Suite 800
Cleveland, OH 44115
Legal Counsel
Faegre Drinker Biddle & Reath LLP
One Logan Square, Suite 2000
Philadelphia, Pennsylvania 19103-6996
Financial Statements
August 31, 2024
F/m Opportunistic Income ETF | (Nasdaq: XFIX)
a series of The RBB Fund, Inc.
F/m Investments, LLC d/b/a North Slope Capital, LLC
Table of Contents | 
|
| | |
Schedule of Investments | 1 |
Financial Statements | 4 |
Notes to Financial Statements | 8 |
Report of Independent Registered Public Accounting Firm | 18 |
Shareholder Tax Information | 19 |
Other Information | 20 |
F/m Opportunistic Income ETF
Schedule of Investments
August 31, 2024
| | Par | | | Value | |
| | | | | | | | | |
CORPORATE BONDS — 75.1% | | | | | | | | |
Consumer Discretionary — 9.0% | | | | | | | | |
Ford Motor Co., 3.25%, 02/12/2032 | | $ | 1,843,000 | | | $ | 1,569,730 | |
VF Corp., 2.95%, 04/23/2030(a) | | | 1,885,000 | | | | 1,627,113 | |
| | | | | | | | 3,196,843 | |
| | | | | | | | | |
Energy — 11.7% | | | | | | | | |
Cheniere Energy Partners LP, 4.50%, 10/01/2029 | | | 1,643,000 | | | | 1,606,797 | |
Kinder Morgan, Inc., 5.55%, 06/01/2045 | | | 1,713,000 | | | | 1,661,708 | |
Phillips 66 Partners LP | | | | | | | | |
3.61%, 02/15/2025 | | | 65,000 | | | | 64,362 | |
3.75%, 03/01/2028(a) | | | 500,000 | | | | 469,006 | |
3.15%, 12/15/2029 | | | 365,000 | | | | 318,683 | |
| | | | | | | | 4,120,556 | |
| | | | | | | | | |
Finance and Insurance — 4.5% | | | | | | | | |
Nationwide Financial Services, Inc., 6.75%, 05/15/2037 | | | 1,571,000 | | | | 1,594,565 | |
| | | | | | | | | |
Financials — 9.2% | | | | | | | | |
Bank of America Corp., 5.88% to 03/15/2028 then 3 mo. Term SOFR + 3.19%, Perpetual | | | 1,631,000 | | | | 1,619,692 | |
JPMorgan Chase & Co., 4.60% to 02/01/2025 then 3 mo. Term SOFR + 3.13%, Perpetual | | | 1,638,000 | | | | 1,629,322 | |
| | | | | | | | 3,249,014 | |
| | | | | | | | | |
Health Care — 4.8% | | | | | | | | |
Viatris, Inc., 3.85%, 06/22/2040 | | | 2,218,000 | | | | 1,693,870 | |
| | | | | | | | | |
Industrials — 4.7% | | | | | | | | |
Concentrix Corp., 6.85%, 08/02/2033(a) | | | 1,575,000 | | | | 1,644,824 | |
| | | | | | | | | |
Information Technology — 6.6% | | | | | | | | |
Kyndryl Holdings, Inc., 6.35%, 02/20/2034 | | | 1,605,000 | | | | 1,689,405 | |
VeriSign, Inc., 4.75%, 07/15/2027 | | | 661,000 | | | | 658,905 | |
| | | | | | | | 2,348,310 | |
| | | | | | | | | |
Manufacturing — 9.2% | | | | | | | | |
Celanese US Holdings LLC, 6.33%, 07/15/2029 | | | 1,541,000 | | | | 1,628,948 | |
Dell, Inc., 6.50%, 04/15/2038 | | | 1,490,000 | | | | 1,620,882 | |
| | | | | | | | 3,249,830 | |
The accompanying notes are an integral part of these financial statements.
F/m Opportunistic Income ETF
Schedule of Investments (COntinued)
August 31, 2024
| | Par | | | Value | |
| | | | | | | | | |
CORPORATE BONDS — 75.1% (Continued) | | | | | | | | |
Mining, Quarrying, and Oil and Gas Extraction — 4.0% | | | | | | | | |
Freeport Minerals Corp., 9.50%, 06/01/2031 | | $ | 1,128,000 | | | $ | 1,398,754 | |
| | | | | | | | | |
Professional, Scientific, and Technical Services — 4.5% | | | | | | | | |
Leidos, Inc., 5.75%, 03/15/2033 | | | 1,525,000 | | | | 1,585,571 | |
| | | | | | | | | |
Utilities — 4.5% | | | | | | | | |
Florida Power & Light Co., 3.80%, 12/15/2042 | | | 1,913,000 | | | | 1,600,340 | |
| | | | | | | | | |
Wholesale Trade — 2.4% | | | | | | | | |
Ricoh USA, Inc., 6.75%, 12/01/2025 | | | 875,000 | | | | 860,095 | |
TOTAL CORPORATE BONDS (Cost $25,237,000) | | | | | | | 26,542,572 | |
| | | | | | | | | |
FOREIGN CORPORATE BONDS — 4.3% | | | | | | | | |
Information Technology — 4.3% | | | | | | | | |
Nokia Oyj, 6.63%, 05/15/2039 | | | 1,445,000 | | | | 1,527,760 | |
TOTAL FOREIGN CORPORATE BONDS (Cost $1,429,787) | | | | | | | 1,527,760 | |
| | | | | | | | | |
MUNICIPAL BONDS — 0.4% | | | | | | | | |
New Hampshire Business Finance Authority | | | | | | | | |
3.25%, 04/01/2028 | | | 130,000 | | | | 100,605 | |
3.96%, 10/01/2031 | | | 40,000 | | | | 36,227 | |
TOTAL MUNICIPAL BONDS (Cost $145,506) | | | | | | | 136,832 | |
| | Shares | | | | |
| | | | | | | | | |
EXCHANGE TRADED FUNDS — 18.8% | | | | | | | | |
F/m 10-Year Investment Grade Corporate Bond ETF(c) | | | 30,000 | | | | 1,542,600 | |
F/m 3-Year Investment Grade Corporate Bond ETF(c) | | | 41,200 | | | | 2,098,209 | |
US Treasury 10 Year Note ETF(a)(c) | | | 64,060 | | | | 2,882,700 | |
US Treasury 2 Year Note ETF(c) | | | 2,600 | | | | 126,269 | |
TOTAL EXCHANGE TRADED FUNDS (Cost $6,542,334) | | | | | | | 6,649,778 | |
The accompanying notes are an integral part of these financial statements.
F/m Opportunistic Income ETF
Schedule of Investments (CONCLUDED)
August 31, 2024
| | Units | | | Value | |
| | | | | | | | | |
SHORT-TERM INVESTMENTS — 8.1% | | | | | | | | |
Investments Purchased with Proceeds from Securities Lending — 8.1% | | | | | | | | |
Mount Vernon Liquid Assets Portfolio, LLC, 5.42% (b) | | | 2,860,737 | | | $ | 2,860,737 | |
TOTAL SHORT-TERM INVESTMENTS (Cost $2,860,737) | | | | | | | 2,860,737 | |
TOTAL INVESTMENTS — 106.7% (Cost $36,215,364) | | | | | | | 37,717,679 | |
Liabilities in Excess of Other Assets — (6.7)% | | | | | | | (2,374,582 | ) |
TOTAL NET ASSETS — 100.0% | | | | | | $ | 35,343,097 | |
Percentages are stated as a percent of net assets.
The Global Industry Classification Standard (“GICS®”) was developed by and/or is the exclusive property of MSCI, Inc. (“MSCI”) and Standard & Poor’s Financial Services LLC (“S&P”). GICS® is a service mark of MSCI and S&P and has been licensed for use by U.S. Bank Global Fund Services.
SOFR - Secured Overnight Financing Rate
(a) | All or a portion of this security is on loan as of August 31, 2024. The total market value of these securities was $2,795,195 which represented 7.9% of net assets. |
(b) | The rate shown represents the 7-day annualized effective yield as of August 31, 2024. |
(c) | Affiliated company as defined by the Investment Company Act of 1940, as amended. |
The accompanying notes are an integral part of these financial statements.
F/m Opportunistic Income ETF
Statement of Assets and Liabilities
August 31, 2024
| | | |
ASSETS | | | | |
Investments in securities of unaffiliated issuers, at value (cost $26,812,293) | | $ | 28,207,164 | (1) |
Investments in securities of affiliated issuers, at value (cost $6,542,334) (See Note 8) | | | 6,649,778 | |
Investments purchased with proceeds from securities lending collateral, at value (cost $2,860,737) | | | 2,860,737 | |
Cash equivalents | | | 115,895 | |
Receivables for: | | | | |
Interest | | | 379,330 | |
Securities lending | | | 2,213 | |
Total assets | | | 38,215,117 | |
| | | | | |
LIABILITIES | | | | |
Payables for: | | | | |
Securities lending collateral (see Note 6) | | | 2,860,737 | |
Advisory fees | | | 11,283 | |
Total liabilities | | | 2,872,020 | |
Net assets | | $ | 35,343,097 | |
| | | | | |
NET ASSETS CONSIST OF: | | | | |
Par value | | $ | 670 | |
Paid-in capital | | | 33,723,650 | |
Total distributable earnings/(losses) | | | 1,618,777 | |
Net assets | | $ | 35,343,097 | |
| | | | | |
Shares outstanding ($0.001 par value, 100,000,000 shares authorized) | | | 670,000 | |
Net asset value and redemption price per share | | $ | 52.75 | |
(1) | Includes market value of securities on loan of $2,795,195 |
The accompanying notes are an integral part of these financial statements.
F/m Opportunistic Income ETF
Statement of Operations
FOR THE Period ENDED August 31, 2024(1)
| | | |
INVESTMENT INCOME | | | | |
Interest income | | $ | 1,617,416 | |
Dividends from unaffiliated investments | | | 20,783 | |
Dividends from affiliated investments (See Note 8) | | | 44,505 | |
Securities lending income, net | | | 3,501 | |
Total investment income | | | 1,686,205 | |
| | | | | |
EXPENSES | | | | |
Advisory fees (Note 3) | | | 108,078 | |
Total expenses | | | 108,078 | |
Net investment income/(loss) | | | 1,578,127 | |
| | | | | |
NET REALIZED AND UNREALIZED GAIN/(LOSS) FROM INVESTMENTS | | | | |
Net realized gain/(loss) from investments in unaffiliated issuers | | | (36,843 | ) |
Net realized gain/(loss) from investments in affiliated issuers (See Note 8) | | | 742 | |
Net realized gain from redemption in-kind | | | 178,748 | |
Net change in unrealized appreciation/(depreciation) on investments of unaffiliated issuers | | | 1,394,871 | |
Net change in unrealized appreciation/(depreciation) on investments of affiliated issuers (See Note 8) | | | 107,444 | |
Net realized and unrealized gain/(loss) | | | 1,644,962 | |
NET INCREASE/(DECREASE) IN NET ASSETS RESULTING FROM OPERATIONS | | $ | 3,223,089 | |
(1) | Inception date of the Fund was September 5, 2023. |
The accompanying notes are an integral part of these financial statements.
F/m Opportunistic Income ETF
Statement of Changes in Net Assets
| | FOR THE
Period ENDED
August 31,
2024(1) | |
INCREASE/(DECREASE) IN NET ASSETS RESULTING FROM OPERATIONS | | | | |
Net investment income/(loss) | | $ | 1,578,127 | |
Net realized gain/(loss) from investments | | | 142,647 | |
Net change in unrealized appreciation/(depreciation) on investments | | | 1,502,315 | |
NET INCREASE/(DECREASE) IN NET ASSETS RESULTING FROM OPERATIONS | | | 3,223,089 | |
| | | | | |
DIVIDENDS AND DISTRIBUTIONS TO SHAREHOLDERS FROM: | | | | |
Total distributable earnings | | | (1,425,564 | ) |
Net decrease in net assets from dividends and distributions to shareholders | | | (1,425,564 | ) |
| | | | | |
CAPITAL SHARE TRANSACTIONS: | | | | |
Proceeds from shares sold | | | 39,262,915 | |
Shares redeemed | | | (5,717,343 | ) |
Net increase/(decrease) in net assets from capital share transactions | | | 33,545,572 | |
TOTAL INCREASE/(DECREASE) IN NET ASSETS | | | 35,343,097 | |
| | | | | |
NET ASSETS: | | | | |
Beginning of period | | $ | — | |
End of period | | $ | 35,343,097 | |
| | | | | |
SHARE TRANSACTIONS: | | | | |
Shares sold | | | 780,000 | |
Shares redeemed | | | (110,000 | ) |
Net increase/(decrease) in shares | | | 670,000 | |
(1) | Inception date of the Fund was September 5, 2023. |
The accompanying notes are an integral part of these financial statements.
F/m Opportunistic Income ETF
Financial Highlights
Contained below is per share operating performance data for shares outstanding, total investment return/(loss), ratios to average net assets and other supplemental data for the period. This information has been derived from information provided in the financial statements.
| | FOR THE
Period
ENDED
August 31, | |
| | 2024(1) | |
PER SHARE OPERATING PERFORMANCE | | | | |
Net asset value, beginning of period | | $ | 50.00 | |
Net investment income/(loss)(2) | | | 2.85 | |
Net realized and unrealized gain/(loss) from investments | | | 2.45 | |
Net increase/(decrease) in net assets resulting from operations | | | 5.30 | |
Dividends and distributions to shareholders from: | | | | |
Net investment income | | | (2.55 | ) |
Total dividends and distributions to shareholders | | | (2.55 | ) |
Net asset value, end of period | | $ | 52.75 | |
Market value, end of period | | $ | 52.88 | |
Total investment return/(loss) on net asset value(3) | | | 10.93 | %(5) |
Total investment return/(loss) on market price(4) | | | 11.15 | %(5) |
RATIOS/SUPPLEMENTAL DATA | | | | |
Net assets, end of period (000’s omitted) | | $ | 35,343 | |
Ratio of expenses to average net assets | | | 0.39 | %(6) |
Ratio of net investment income/(loss) to average net assets | | | 5.68 | %(6) |
Portfolio turnover rate | | | 92 | %(5) |
(1) | Inception date of the Fund was September 5, 2023. |
(2) | Per share data calculated using average shares outstanding method. |
(3) | Total investment return/(loss) on net asset value is calculated assuming a purchase of shares on the first day and a sale of shares on the last day of each period reported and includes reinvestments of dividends and distributions, if any. |
(4) | Total investment return/(loss) on market price is calculated assuming an initial investment made at the market price on the first day of the period, reinvestment of dividends and distributions at market price during the period and redemption at market price on the last day of the period. |
The accompanying notes are an integral part of these financial statements.
F/m Opportunistic Income ETF
Notes to Financial Statements
August 31, 2024
1. ORGANIZATION AND SIGNIFICANT ACCOUNTING POLICIES
The RBB Fund, Inc. (“RBB” or the “Company”) was incorporated under the laws of the State of Maryland on February 29, 1988 and is registered under the Investment Company Act of 1940, as amended (the “1940 Act”), as an open-end management investment company. RBB is a “series fund,” which is an investment company divided into separate portfolios. Each portfolio is treated as a separate entity for certain matters under the 1940 Act, and for other purposes, and a shareholder of one portfolio is not deemed to be a shareholder of any other portfolio. Currently, RBB has sixty-five separate investment portfolios, including the F/m Opportunistic Income ETF (the “Fund”). The Fund commenced investment operations on September 5, 2023.
RBB has authorized capital of one hundred billion shares of common stock of which 92.923 billion shares are currently classified into two hundred and thirty-six classes of common stock. Each class represents an interest in an active or inactive RBB investment portfolio.
The investment objective of the Fund is to maximize total return, including both income and appreciation, by identifying undervalued and opportunistic sectors and securities in the U.S. fixed income markets.
The Fund is an investment company and follows accounting and reporting guidance in the Financial Accounting Standards Board (“FASB”) Accounting Standards Codification Topic 946 “Financial Services - Investment Companies.”
The end of the reporting period for the Fund is August 31, 2024, and the period covered by these Notes to Financial Statements is the fiscal period since the Fund’s inception from September 5, 2023 through August 31, 2024 (the “current fiscal period”).
PORTFOLIO VALUATION — The Fund values its investments at fair value. The Fund’s net asset value (“NAV”) is calculated once daily at the close of regular trading hours on the New York Stock Exchange (“NYSE”) (generally 4:00 p.m. Eastern time) on each day the NYSE is open. Securities held by the Fund are valued using the closing price or the last sale price on a national securities exchange or the National Association of Securities Dealers Automatic Quotation System (“NASDAQ”) market system where they are primarily traded. Equity securities traded in the over-the-counter (“OTC”) market are valued at their closing prices. If there were no transactions on that day, securities traded principally on an exchange or on NASDAQ will be valued at the mean of the last bid and ask prices prior to the market close. Fixed income securities are valued using an independent pricing service, which considers such factors as security prices, yields, maturities and ratings, and are deemed representative of market values at the close of the market. If market quotations are unavailable or deemed unreliable, securities will be valued in accordance with procedures adopted by the Company’s Board of Directors (the “Board” or “Directors”). Relying on prices supplied by pricing services or dealers or using fair valuation may result in values that are higher or lower than the values used by other investment companies and investors to price the same investments. Units of Mount Vernon Liquid Assets Portfolio are not traded on an exchange and are valued at the investment company’s NAV per share.
The Board has adopted a pricing and valuation policy for use by the Fund and its Valuation Designee (as defined below) in calculating the Fund’s NAV. Pursuant to Rule 2a-5 under the 1940 Act, the Fund has designated F/m Investments, LLC d/b/a North Slope Capital, LLC (the “Adviser” or “F/m”) as its “Valuation Designee” to perform all of the fair value determinations as well as to perform all of the responsibilities that may be performed by the Valuation Designee in accordance with Rule 2a-5. The Valuation Designee is authorized to make all necessary determinations of the fair values of portfolio securities and other assets for which market quotations are not readily available or if it is deemed that the prices obtained from brokers and dealers or independent pricing services are unreliable.
FAIR VALUE MEASUREMENTS — The inputs and valuation techniques used to measure the fair value of the Fund’s investments are summarized into three levels as described in the hierarchy below:
| | ● | Level 1 – Prices are determined using quoted prices in active markets for identical securities. |
| | ● | Level 2 – Prices are determined using other significant observable inputs (including quoted prices for similar securities, interest rates, prepayment speeds, credit risk, etc.). |
| | ● | Level 3 – Prices are determined using significant unobservable inputs (including the Fund’s own assumptions in determining the fair value of investments). |
The inputs or methodologies used for valuing securities are not necessarily an indication of the risk associated with investing in those securities.
F/m Opportunistic Income ETF
Notes to Financial Statements (continued)
August 31, 2024
The following is a summary of the inputs used, as of the end of the current fiscal period, in valuing the Fund’s investments carried at fair value:
| | TOTAL | | | LEVEL 1 | | | LEVEL 2 | | | LEVEL 3 | |
Corporate Bonds | | $ | 26,542,572 | | | $ | — | | | $ | 26,542,572 | | | $ | — | |
Exchange Traded Funds | | | 6,649,778 | | | | 6,649,778 | | | | — | | | | — | |
Foreign Corporate Bonds | | | 1,527,760 | | | | — | | | | 1,527,760 | | | | — | |
Municipal Bonds | | | 136,832 | | | | — | | | | 136,832 | | | | — | |
Investments Purchased with Proceeds from Securities Lending* | | | 2,860,737 | | | | — | | | | — | | | | — | |
Total Investments** | | $ | 37,717,679 | | | $ | 6,649,778 | | | $ | 28,207,164 | | | $ | — | |
* | Certain investments that are measured at fair value using the net asset value per share (or its equivalent) practical expedient have not been categorized in the fair value hierarchy. The fair value amounts presented in the table are intended to permit reconciliation of the fair value hierarchy to the amounts presented in the Statements of Assets and Liabilities. |
** | Please refer to the Schedule of Investments for further details. |
At the end of each quarter, management evaluates the classification of Levels 1, 2 and 3 assets and liabilities. Various factors are considered, such as changes in liquidity from the prior reporting period; whether or not a broker is willing to execute at the quoted price; the depth and consistency of prices from third party pricing services; and the existence of contemporaneous, observable trades in the market. Additionally, management evaluates the classification of Levels 1, 2 and 3 assets and liabilities on a quarterly basis for changes in listings or delistings on national exchanges.
Due to the inherent uncertainty of determining the fair value of investments that do not have a readily available market value, the fair value of the Fund’s investments may fluctuate from period to period. Additionally, the fair value of investments may differ significantly from the values that would have been used had a ready market existed for such investments and may differ materially from the values the Fund may ultimately realize. Further, such investments may be subject to legal and other restrictions on resale or otherwise less liquid than publicly traded securities.
For fair valuations using significant unobservable inputs, U.S. generally accepted accounting principles (“U.S. GAAP”) requires the Fund to present a reconciliation of the beginning to ending balances for reported market values that presents changes attributable to total realized and unrealized gains or losses, purchase and sales, and transfers in and out of Level 3 during the period. Transfers in and out between levels are based on values at the end of the period. A reconciliation of Level 3 investments is presented only if the Fund had an amount of Level 3 investments at the end of the reporting period that was meaningful in relation to its net assets. The amounts and reasons for Level 3 transfers in and out of each level is disclosed when the Fund had an amount of total Level 3 transfers during the reporting period that was meaningful in relation to its net assets as of the end of the reporting period.
The Fund did not have any significant Level 3 transfers during the current fiscal period.
USE OF ESTIMATES — The preparation of financial statements in conformity with U.S. GAAP requires management to make estimates and assumptions that affect the reported amounts of assets and liabilities and disclosure of contingent assets and liabilities at the date of the financial statements and the reported amounts of revenues and expenses during the reporting period. Actual results could differ from those estimates and those differences could be significant.
INVESTMENT TRANSACTIONS, INVESTMENT INCOME AND EXPENSES — The Fund records security transactions based on trade date for financial reporting purposes. The cost of investments sold is determined by use of the specific identification method for both financial reporting and income tax purposes in determining realized gains and losses on investments. Interest income (including amortization of premiums and accretion of discounts) is accrued when earned. Dividend income is recorded on the ex-dividend date. Distributions received on securities that represent a return of capital or capital gains are recorded as a reduction of cost of investments and/or as a realized gain. The Fund’s investment income, expenses (other than class specific expenses) and unrealized and realized gains and losses are allocated daily to each class of shares based upon the relative proportion
F/m Opportunistic Income ETF
Notes to Financial Statements (continued)
August 31, 2024
of net assets of each class at the beginning of the day. Certain expenses are shared with The RBB Fund Trust (the “Trust”), a series trust of affiliated funds. Expenses incurred on behalf of a specific class, fund or fund family of the Company or Trust are charged directly to the class, fund or fund family (in proportion to net assets). Expenses incurred for all funds (such as director or professional fees) are charged to all funds in proportion to their average net assets of RBB and the Trust, or in such other manner as the Board deems fair or equitable. Expenses and fees, including investment advisory and administration fees, are accrued daily and taken into account for the purpose of determining the NAV of the Fund.
DIVIDENDS AND DISTRIBUTIONS TO SHAREHOLDERS — The Fund will distribute substantially all of its net investment income and net realized capital gains, if any, to its shareholders. The Fund expects to declare and pay distributions, if any, monthly, however it may declare and pay distributions more or less frequently. Net realized capital gains (including net short-term capital gains), if any, will be distributed by the Fund at least annually. Brokers may make the DTC book-entry dividend reinvestment service available to their customers who own the Fund’s Shares. If this service is available and used, dividend distributions of both income and capital gains will automatically be reinvested in additional whole Shares of the Fund purchased on the secondary market. Without this service, investors would receive their distributions in cash. In order to achieve the maximum total return on their investments, investors are encouraged to use the dividend reinvestment service. To determine whether the dividend reinvestment service is available and whether there is a commission or other charge for using this service, consult your broker. Brokers may require the Fund’s shareholders to adhere to specific procedures and timetables.
U.S. TAX STATUS — No provision is made for U.S. income taxes as it is the Fund’s intention to continue to qualify for and elect the tax treatment applicable to regulated investment companies under Subchapter M of the Internal Revenue Code of 1986, as amended, and make the requisite distributions to its shareholders which will be sufficient to relieve it from U.S. income and excise taxes.
OTHER — In the normal course of business, the Fund may enter into contracts that provide general indemnifications. The Fund’s maximum exposure under these arrangements is dependent on claims that may be made against the Fund in the future, and, therefore, cannot be estimated; however, based on experience, the risk of material loss from such claims is considered remote.
2. INVESTMENT POLICIES AND PRACTICES
The sections below describe some of the different types of investments that may be made by the Fund and the investment practices in which the Fund may engage.
Cash Equivalents and Short-Term InvestmentS - The Fund may invest in cash, cash equivalents, and a variety of short-term instruments in such proportions as warranted by prevailing market conditions and the Fund’s principal investment strategies. The Fund may temporarily invest without limit in such instruments for liquidity purposes, or in an attempt to respond to adverse market, economic, political or other conditions. During such periods, the Fund may not be able to achieve its investment objective.
Illiquid Investments - Pursuant to Rule 22e-4 under the 1940 Act, the Fund may invest up to 15% of its net assets in illiquid investments. An illiquid investment as defined in Rule 22e-4 is an investment that the Fund reasonably expects cannot be sold or disposed of in current market conditions within 7 calendar days or less without the sale or disposition significantly changing the market value of the investment. These investments may include restricted securities and repurchase agreements maturing in more than 7 days. Restricted securities are securities that may not be sold to the public without an effective registration statement under the Securities Act of 1933, as amended (the “1933 Act”), and thus may be sold only in privately negotiated transactions or pursuant to an exemption from registration. Subject to the adoption of guidelines by the Board, certain restricted securities that may be sold to institutional investors pursuant to Rule 144A under the 1933 Act and non-exempt commercial paper may be determined to be liquid by the Adviser. Illiquid investments involve the risk that the investments will not be able to be sold at the time the Adviser desires or at prices approximating the value at which the Fund is carrying the investments. To the extent an investment held by the Fund is deemed to be an illiquid investment or a less liquid investment, the Fund will be exposed to a greater liquidity risk.
Inflation Protected Securities - The Fund may invest in inflation protected securities. Inflation protected securities are fixed income securities designed to provide protection against the negative effects of inflation. Two structures are common. The U.S. Treasury and some other issuers use a structure that accrues inflation into the principal value of the bond. Most other issuers pay out the inflation accruals as part of a semiannual coupon.
F/m Opportunistic Income ETF
Notes to Financial Statements (continued)
August 31, 2024
Other Investment Companies - The Fund may invest in other investment companies, including open-end funds, closed-end funds, unit investment trusts, and exchange-traded funds (“ETFs”) registered under the 1940 Act that invest primarily in Fund eligible investments. Under the 1940 Act, the Fund’s investment in such securities is generally limited to 3% of the total voting stock of any one investment company; 5% of such Fund’s total assets with respect to any one investment company; and 10% of such Fund’s total assets in the aggregate. The Fund’s investments in other investment companies may include money market mutual funds. Investments in money market funds are not subject to the percentage limitations set forth above. The SEC has adopted revisions to the rules permitting funds to invest in other investment companies in excess of the limits described above. While Rule 12d1-4 permits more types of fund of fund arrangements without reliance on an exemptive order or no-action letters, it imposes new conditions, including limits on control and voting of acquired funds’ shares, evaluations and findings by investment advisers, fund investment agreements, and limits on most three-tier fund structures. These regulatory changes may adversely impact the Fund’s investment strategies and operations.
U.S. Government Securities - The Fund may invest in U.S. government securities, including bills, notes and bonds differing as to maturity and rates of interest, which are either issued or guaranteed by the U.S. Treasury or by U.S. government agencies or instrumentalities. U.S. government agency securities include securities issued by (a) the Federal Housing Administration, Farmers Home Administration, Export-Import Bank of the United States, Small Business Administration, and the Government National Mortgage Association, whose securities are supported by the full faith and credit of the United States; (b) the Federal Home Loan Banks, Federal Intermediate Credit Banks, and the Tennessee Valley Authority, whose securities are supported by the right of the agency to borrow from the U.S. Treasury; (c) the Federal National Mortgage Association, whose securities are supported by the discretionary authority of the U.S. government to purchase certain obligations of the agency or instrumentality; and (d) the Student Loan Marketing Association, whose securities are supported only by its credit. While the U.S. government provides financial support to such U.S. government-sponsored agencies or instrumentalities, no assurance can be given that it always will do so since it is not so obligated by law. The U.S. government, its agencies and instrumentalities do not guarantee the market value of their securities, and consequently, the value of such securities may fluctuate.
Zero-Coupon and Step Coupon Securities - The Fund may invest in zero-coupon and step coupon securities. Zero-coupon securities pay no cash income to their holders until they mature. When held to maturity, their entire return comes from the difference between their purchase price and their maturity value. Step coupon securities are debt securities that may not pay interest for a specified period of time and then, after the initial period, may pay interest at a series of different rates. Both zero-coupon and step coupon securities are issued at substantial discounts from their value at maturity. Because interest on these securities is not paid on a current basis, the values of securities of this type are subject to greater fluctuations than are the value of securities that distribute income regularly and may be more speculative than such securities. Accordingly, the values of these securities may be highly volatile as interest rates rise or fall. In addition, while such securities generate income for purposes of generally accepted accounting standards, they do not generate cash flow and thus could cause a Fund to be forced to liquidate securities at an inopportune time in order to distribute cash, as required by the Code.
CREDIT RISK - The value of your investment in the Fund may change in response to changes in the credit ratings of the Fund’s portfolio securities, including with respect to the underlying funds. Generally, investment risk and price volatility increase as a security’s credit rating declines. The financial condition of an issuer of a fixed income security held by the Fund may cause it to default or become unable to pay interest or principal due on the security.
Temporary Investments - During periods of adverse market or economic conditions, the Fund may temporarily invest all or a substantial portion of its assets in high-quality, fixed-income securities, money market instruments, and shares of money market mutual funds, or it may hold cash. At such times, the Fund would not be pursuing its stated investment objective with its usual investment strategies. The Fund may also hold these investments for liquidity purposes. Fixed-income securities will be deemed to be of high quality if they are rated “A” or better by S&P or Moody’s or, if unrated, are determined to be of comparable quality by the Adviser. Money market instruments are high-quality, short-term fixed-income obligations (which generally have remaining maturities of one year or less) and may include U.S. Government Securities, commercial paper, certificates of deposit and banker’s acceptances issued by domestic branches of U.S. banks that are members of the Federal Deposit Insurance Corporation, and repurchase agreements for U.S. Government Securities.
F/m Opportunistic Income ETF
Notes to Financial Statements (continued)
August 31, 2024
In lieu of purchasing money market instruments, the Fund may purchase shares of money market mutual funds that invest primarily in U.S. Government Securities and repurchase agreements involving those securities, subject to certain limitations imposed by the 1940 Act. The Fund, as an investor in a money market fund, will indirectly bear that fund’s fees and expenses, which will be in addition to the fees and expenses of the Fund. Repurchase agreements involve certain risks not associated with direct investments in debt securities.
3. INVESTMENT ADVISER AND OTHER SERVICES
The Fund pays all of its expenses other than those expressly assumed by the Adviser. Expenses of the Fund are deducted from the Fund’s total income before dividends are paid. Subject to the supervision of the Board, the Adviser manages the overall investment operations of the Fund in accordance with the Fund’s respective investment objective and policies and formulates a continuing investment strategy for the Fund pursuant to the terms of the investment advisory agreement (the “Advisory Agreement”) between the Adviser and the Company on behalf of the Fund. The Adviser is controlled by Diffractive Managers Group, LLC, a Delaware limited liability company, and EQSF Holdings, LLC, a Delaware limited liability company owned by three officers of the Company. The Fund compensates the Adviser with a unitary management fee for its services at an annual rate of 0.39% of the Fund’s average daily net assets during the month. From the unitary management fee, the Adviser pays most of the expenses of the Fund, including transfer agency, custody, fund administration, legal, audit and other services. However, under the Advisory Agreement, the Adviser is not responsible for interest expenses, brokerage commissions and other trading expenses, taxes, distribution fees and expenses paid by the Fund under any distribution plan adopted, and other extraordinary costs such as litigation and other expenses not incurred in the ordinary course of business. The Adviser will not be liable for any error of judgment, mistake of law, or for any loss suffered by the Fund in connection with the performance of the Advisory Agreement, except a loss resulting from a breach of fiduciary duty with respect to the receipt of compensation for services or a loss resulting from willful misfeasance, bad faith or gross negligence on the part of the Adviser in the performance of its duties, or from reckless disregard of its obligations and duties under the Advisory Agreement.
During the current fiscal period, investment advisory fees accrued were as follows:
U.S. Bancorp Fund Services, LLC (“Fund Services”), doing business as U.S. Bank Global Fund Services, serves as administrator for the Fund. For providing administrative and accounting services, Fund Services is entitled to receive a monthly fee, subject to certain minimum and out of pocket expenses.
Fund Services serves as the Fund’s transfer and dividend disbursing agent. For providing transfer agent services, Fund Services is entitled to receive a monthly fee, subject to certain minimum and out of pocket expenses.
U.S. Bank, N.A. (the “Custodian”) provides certain custodial services to the Fund. The Custodian is entitled to receive a monthly fee, subject to certain minimum and out of pocket expenses.
Quasar Distributors, LLC (“Quasar”), a wholly-owned broker-dealer subsidiary of Foreside Financial Group, LLC, serves as the principal underwriter and distributor of the Fund’s shares pursuant to a Distribution Agreement with RBB.
Under the Fund’s unitary fee, the Adviser compensates Fund Services and the Custodian for services provided.
DIRECTOR AND OFFICER COMPENSATION — The Directors of the Company receive an annual retainer and meeting fees for meetings attended. An employee of Vigilant Compliance, LLC serves as Chief Compliance Officer of the Company. Vigilant Compliance, LLC is compensated for the services provided to the Company. Employees of RBB serve as President, Chief Financial Officer, Chief Operating Officer, Secretary and Director of Marketing & Business Development of the Company. They are compensated by the Company for services provided. Certain employees of Fund Services serve as officers of the Company. They are not compensated by the Fund or the Company. As of the end of the current fiscal period, there were no director and officer fees charged or paid by the Fund.
F/m Opportunistic Income ETF
Notes to Financial Statements (continued)
August 31, 2024
4. PURCHASES AND SALES OF INVESTMENT SECURITIES
During the current fiscal period, aggregate purchases and sales of investment securities (excluding in-kind transactions and short-term investments) of the Fund were as follows:
| | | |
Purchases of investment securities | | $ | 32,961,323 | |
Sales of investment securities | | | 26,074,652 | |
During the current fiscal period, aggregate purchases and sales of in-kind transactions (excluding short-term investments) of the Fund were as follows:
| | | |
In-kind purchases of investment securities | | $ | 32,466,840 | |
Proceeds from in-kind sales of investment securities | | | 5,141,802 | |
There were no purchases or sales of long-term U.S. Government securities during the current fiscal period.
5. FEDERAL INCOME TAX INFORMATION
The Fund has followed the authoritative guidance on accounting for and disclosure of uncertainty in tax positions, which requires the Fund to determine whether a tax position is more likely than not to be sustained upon examination, including resolution of any related appeals or litigation processes, based on the technical merits of the position. The Fund has determined that there was no effect on the financial statements from following this authoritative guidance. In the normal course of business, the Fund is subject to examination by federal, state and local jurisdictions, where applicable, for tax years for which applicable statutes of limitations have not expired.
As of August 31, 2024, the federal tax cost, aggregate gross unrealized appreciation and depreciation of securities held by the Fund were as follows:
| | FEDERAL
TAX COST | | | UNREALIZED
APPRECIATION | | | UNREALIZED
(DEPRECIATION) | | | NET UNREALIZED
APPRECIATION/
(DEPRECIATION) | |
| | $ | 36,215,364 | | | $ | 1,519,194 | | | $ | (16,879 | ) | | $ | 1,502,315 | |
Distributions to shareholders, if any, from net investment income and realized gains are determined in accordance with federal income tax regulations, which may differ from net investment income and realized gains recognized for financial reporting purposes. Accordingly, the character of distributions and composition of net assets for tax purposes may differ from those reflected in the accompanying financial statements. To the extent these differences are permanent, such amounts are reclassified within the capital accounts based on the tax treatment; temporary differences do not require such reclassification.
As of August 31, 2024, there were permanent differences related to redemptions in-kind between distributable earnings/(loss) and paid-in capital, respectively for the Fund:
| | DISTRIBUTABLE
EARNINGS/(LOSS) | | | PAID-IN-CAPITAL | |
| | $ | (178,750 | ) | | $ | 178,750 | |
F/m Opportunistic Income ETF
Notes to Financial Statements (continued)
August 31, 2024
As of August 31, 2024, the components of distributable earnings on a tax basis were as follows:
| | Undistributed
Ordinary
Income | | | Undistributed
Long-Term
Capital Gains | | | NET UNREALIZED
APPRECIATION/
(DEPRECIATION) | | | Capital
loss
Carryover | | | Qualified
Late-year
Loss | |
| | $ | 152,563 | | | $ | — | | | $ | 1,502,315 | | | $ | (36,101 | ) | | $ | — | |
The tax character of distributions paid during the fiscal year ended August 31, 2024 was as follows:
| | Ordinary
Income | | | Long-Term
Capital Gains | |
| | $ | 1,425,564 | | | $ | — | |
The Fund is permitted to carry forward capital losses for an unlimited period. Additionally, capital losses that are carried forward will retain their character as either short-term or long-term capital losses. As of August 31, 2024, the Fund had unexpiring short-term losses of $36,101.
6. SECURITIES LENDING
The Fund may make secured loans of its Fund securities to brokers, dealers and other financial institutions to earn additional income and receive cash collateral equal to at least 102% of the current market value of the loaned domestic securities and 105% of the current market value of the loaned foreign securities, as marked to market each day that the NAV of the Fund is determined. When the collateral falls below specified amounts, the Fund’s lending agent will use its best effort to obtain additional collateral on the next business day to meet required amounts under the security lending agreement. The Fund receives compensation in the form of loan fees owed by borrowers and income earned on collateral investments. A portion of the interest received on the loan collateral is retained by the Fund and the remainder is rebated to the borrower of the securities. Pursuant to the securities lending agreement between the Trust, on behalf of the Fund, and the Custodian, each Fund pays a fee to the Custodian for administrative and custodial fees, which is calculated daily and paid monthly, in the amount of 20% of the Fund’s net income. The net amount of interest earned, after the interest rebate and the allocation to the Custodian, is shown below. Collateral is invested in the Mount Vernon Liquid Assets Portfolio, LLC of which the investment objective is to seek to maximize income to the extent consistent with the preservation of capital and liquidity and maintain a stable Net Asset Value of $1.00. The Fund will bear the risk of loss of the invested collateral. Investments purchased with collateral are overnight and continuous. Securities lending will expose the Fund to the risk of loss should a borrower default on its obligation to return the borrowed securities. The market value of the securities on loan and cash collateral as of the end of the reporting period and the net income generated from the program during the current fiscal period with respect to such secured loans were as follows:
FUND | | MARKET VALUE
OF SECURITIES
LOANED | | | MARKET VALUE
OF COLLATERAL | | | INCOME
RECEIVED FROM
SECURITIES
LENDING | |
F/m Opportunistic Income ETF | | $ | 2,795,195 | | | $ | 2,860,737 | | | $ | 3,501 | |
Securities lending transactions are entered into by the Fund’s securities lending agent on behalf of the Fund under a Master Securities Lending Agreement (“MSLA”) which permits the Fund’s securities lending agent on behalf of the Fund under certain circumstances including an event of default (such as bankruptcy or insolvency), to offset amounts payable on behalf of the Fund to
F/m Opportunistic Income ETF
Notes to Financial Statements (continued)
August 31, 2024
the same counterparty against amounts to be received and create one single net payment due to or from the Fund. The following table is a summary of the Fund’s open securities lending transactions which are subject to a MSLA as of the end of the reporting period:
| | | | | | | | | | | | | | | GROSS AMOUNTS NOT OFFSET IN
THE STATEMENT OF ASSETS AND LIABILITIES | |
FUND | | GROSS AMOUNTS
OF RECOGNIZED
ASSETS | | | GROSS AMOUNTS
OFFSET IN THE
STATEMENT
OF ASSETS AND
LIABILITIES | | | NET AMOUNTS
OF ASSETS
PRESENTED IN
THE STATEMENT
OF ASSETS AND
LIABILITIES | | | FINANCIAL
INSTRUMENTS1 | | | CASH
COLLATERAL
RECEIVED | | | NET AMOUNT2 | |
F/m Opportunistic Income ETF | | $ | 2,795,195 | | | $ | — | | | $ | 2,795,195 | | | $ | (2,795,195 | ) | | $ | — | | | $ | — | |
1 | Amount disclosed is limited to the amount of assets presented in the Statement of Assets and Liabilities. Actual collateral received may be more than the amount shown. |
2 | Net amount represents the net amount receivable from the counterparty in the event of default. |
7. SHARE TRANSACTIONS
Shares of the Fund are listed and traded on the NASDAQ, Inc. (the “Exchange”). Market prices for the shares may be different from their NAV. The Fund issues and redeems shares on a continuous basis at NAV only in blocks of 10,000 shares, called “Creation Units.” Creation Units are issued and redeemed principally in-kind for securities included in a specified universe. Once created, shares generally trade in the secondary market at market prices that change throughout the day. Except when aggregated in Creation Units, shares are not redeemable securities of the Fund. Creation Units may only be purchased or redeemed by certain financial institutions (“Authorized Participants”). An Authorized Participant is either (i) a broker-dealer or other participant in the clearing process through the Continuous Net Settlement System of the National Securities Clearing Corporation or (ii) a Depository Trust Company participant and, in each case, must have executed a Participant Agreement with Quasar. Most retail investors do not qualify as Authorized Participants nor have the resources to buy and sell whole Creation Units. Therefore, they are unable to purchase or redeem shares directly from the Fund. Rather, most retail investors may purchase shares in the secondary market with the assistance of a broker and are subject to customary brokerage commissions or fees.
The Fund currently offers one class of shares, which has no front-end sales load, no deferred sales charge, and no redemption fee. A fixed transaction fee is imposed for the transfer and other transaction costs associated with the purchase or sale of Creation Units. The standard fixed transaction fee for the Fund is $300, payable to the custodian. In addition, a variable fee may be charged on all cash transactions or substitutes for Creation Units of up to a maximum of 2% as a percentage of the value of the Creation Units subject to the transaction. Variable fees are imposed to compensate the Fund for the transaction costs associated with the cash transactions. Variable fees received by the Fund, if any, are displayed in the capital shares transactions section of the Statement of Changes in Net Assets.
F/m Opportunistic Income ETF
Notes to Financial Statements (continued)
August 31, 2024
8. TRANSACTIONS WITH AFFILIATES
The following issuers are affiliated with the Fund. Fund of funds are allowed to invest in other investment companies in excess of the limits imposed, if certain requirements, such as being part of the same group of investment companies, are met. As defined in Section (2)(a)(3) of the 1940 Act, such affiliated issuers are:
| | | September 5, 2023* | | | Additions | | | Reductions | |
Issuer Name | | Share
Balance | | | Cost | | | Share
Balance | | | Cost | | | Share
Balance | | | Proceeds | |
F/m 2-Year Investment Grade Corporate Bond ETF | | | — | | | $ | — | | | | 33,800 | | | $ | 1,694,741 | | | | (33,800 | ) | | $ | (1,694,654 | ) |
F/m 3-Year Investment Grade Corporate Bond ETF | | | — | | | | — | | | | 43,000 | | | | 2,165,763 | | | | (1,800 | ) | | | (90,200 | ) |
F/m 10-Year Investment Grade Corporate Bond ETF | | | — | | | | — | | | | 30,000 | | | | 1,507,200 | | | | — | | | | — | |
U.S. Treasury 3 Month Bill ETF | | | — | | | | — | | | | 310,120 | | | | 15,478,131 | | | | (310,120 | ) | | | (15,479,286 | ) |
U.S. Treasury 2 Year Note ETF | | | — | | | | — | | | | 2,600 | | | | 126,022 | | | | — | | | | — | |
U.S. Treasury 7 Year Note ETF | | | — | | | | — | | | | 8,680 | | | | 418,310 | | | | (8,680 | ) | | | (416,550 | ) |
U.S. Treasury 10 Year Note ETF | | | — | | | | — | | | | 68,610 | | | | 3,033,992 | | | | (4,550 | ) | | | (201,878 | ) |
| | | | — | | | | — | | | | 496,810 | | | | 24,424,159 | | | | (358,950 | ) | | | (17,882,568 | ) |
* | Inception date of the Fund was September 5, 2023. |
F/m Opportunistic Income ETF
Notes to Financial Statements (CONCLUDED)
August 31, 2024
| | | AUGUST 31, 2024 | |
Issuer Name | | Dividend
Income | | | Capital Gain
Distribution | | | Net Change
in Unrealized
Appreciation/
(Depreciation) | | | Realized
Gain/(Loss) | | | Share
Balance | | | Value | | | Cost | |
F/m 2-Year Investment Grade Corporate Bond ETF | | $ | 2,160 | | | $ | — | | | $ | — | | | $ | (87 | ) | | $ | — | | | $ | — | | | $ | — | |
F/m 3-Year Investment Grade Corporate Bond ETF | | | 8,904 | | | | — | | | | 22,343 | | | | 303 | | | | 41,200 | | | | 2,098,209 | | | | 2,075,866 | |
F/m 10-Year Investment Grade Corporate Bond ETF | | | 6,070 | | | | — | | | | 35,400 | | | | — | | | | 30,000 | | | | 1,542,600 | | | | 1,507,200 | |
U.S. Treasury 3 Month Bill ETF | | | 19,219 | | | | — | | | | — | | | | 1,155 | | | | — | | | | — | | | | — | |
U.S. Treasury 2 Year Note ETF | | | — | | | | — | | | | 247 | | | | — | | | | 2,600 | | | | 126,269 | | | | 126,022 | |
U.S. Treasury 7 Year Note ETF | | | — | | | | — | | | | — | | | | (1,760 | ) | | | — | | | | — | | | | — | |
U.S. Treasury 10 Year Note ETF | | | 8,152 | | | | — | | | | 49,454 | | | | 1,131 | | | | 64,060 | | | | 2,882,700 | | | | 2,833,246 | |
| | | $ | 44,505 | | | $ | — | | | $ | 107,444 | | | $ | 742 | | | $ | 137,860 | | | $ | 6,649,778 | | | $ | 6,542,334 | |
9. SUBSEQUENT EVENTS
In preparing these financial statements, the Fund has evaluated events and transactions for potential recognition or disclosure through the date the financial statements were issued.
Subsequent to the end of the current fiscal period, the Fund paid the following distributions:
Record Date | Ex-Date | Pay Date | Distribution
Rate Per Share |
9/3/2024 | 9/3/2024 | 9/4/2024 | $0.22772543 |
10/1/2024 | 10/1/2024 | 10/2/2024 | $0.24258973 |
F/m Opportunistic Income ETF
Report of Independent Registered
Public Accounting Firm
To the Shareholders and Board of Directors of
The RBB Fund, Inc.
Opinion on the Financial Statements
We have audited the accompanying statement of assets and liabilities, including the schedule of investments, of F/m Opportunistic Income ETF (the “Fund”), a series of The RBB Fund, Inc., as of August 31, 2024, the related statements of operations and changes in net assets, and the financial highlights for the period from September 5, 2023 (commencement of operations) through August 31, 2024, and the related notes (collectively referred to as the “financial statements”). In our opinion, the financial statements present fairly, in all material respects, the financial position of the Fund as of August 31, 2024, the results of its operations, the changes in net assets, and the financial highlights for the period indicated above, in conformity with accounting principles generally accepted in the United States of America.
Basis for Opinion
These financial statements are the responsibility of the Fund’s management. Our responsibility is to express an opinion on the Fund’s financial statements based on our audit. We are a public accounting firm registered with the Public Company Accounting Oversight Board (United States) (“PCAOB”) and are required to be independent with respect to the Fund in accordance with the U.S. federal securities laws and the applicable rules and regulations of the Securities and Exchange Commission and the PCAOB.
We conducted our audit in accordance with the standards of the PCAOB. Those standards require that we plan and perform the audit to obtain reasonable assurance about whether the financial statements are free of material misstatement whether due to error or fraud.
Our audit included performing procedures to assess the risks of material misstatement of the financial statements, whether due to error or fraud, and performing procedures that respond to those risks. Such procedures included examining, on a test basis, evidence regarding the amounts and disclosures in the financial statements. Our procedures included confirmation of securities owned as of August 31, 2024, by correspondence with the custodian. Our audit also included evaluating the accounting principles used and significant estimates made by management, as well as evaluating the overall presentation of the financial statements. We believe that our audit provides a reasonable basis for our opinion.
We have served as the auditor of one or more investment companies advised by F/M Investments, LLC since 2021.

COHEN & COMPANY, LTD.
Cleveland, Ohio
October 29, 2024
F/m Opportunistic Income ETF
Shareholder Tax Information
(Unaudited)
Certain tax information regarding the Fund is required to be provided to shareholders based upon the Fund’s income and distributions for the taxable period ended August 31, 2024. The information and distributions reported herein may differ from information and distributions taxable to the shareholders for the calendar year ending December 31, 2024. During the fiscal year ended August 31, 2024, the Fund paid ordinary income dividends, and did not pay long-term capital gains dividends to its shareholders.
Dividends from net investment income and short-term capital gains are treated as ordinary income dividends for federal income tax purposes.
Because the Fund’s fiscal year is not the calendar year, another notification will be sent with respect to calendar year 2024. The second notification, which will reflect the amount, if any, to be used by calendar year taxpayers on their U.S. federal income tax returns, will be made in conjunction with Form 1099-DIV and will be mailed in January 2025.
Foreign shareholders will generally be subject to U.S. withholding tax on the amount of their ordinary income dividends. They will generally not be entitled to a foreign tax credit or deduction for the withholding taxes paid by the Fund, if any. In general, dividends received by tax-exempt recipients (e.g., IRAs and Keoghs) need not be reported as taxable income for U.S. federal income tax purposes. However, some retirement trusts (e.g., corporate, Keogh and 403(b)(7) plans) may need this information for their annual information reporting. Shareholders are advised to consult their own tax advisers with respect to the tax consequences of their investment in the Fund.
F/m Opportunistic Income ETF
Other Information
(Unaudited)
QUARTERLY SCHEDULE OF INVESTMENTS
The Company files a complete schedule of portfolio holdings with the SEC for the first and third fiscal quarters of each fiscal year (quarters ended November 30 and May 31) as an exhibit to its report on Form N-PORT. The Company’s Forms N-PORT filings are available on the SEC’s website at http://www.sec.gov.
FREQUENCY DISTRIBUTIONS OF PREMIUMS AND DISCOUNTS
Information regarding how often shares of the Fund trade on an exchange at a price above (i.e., at a premium) or below (i.e., at a discount) the NAV of the Fund is available, without charge, on the Fund’s website at www.fminvest.com/etfs/xfix.
Investment Adviser
F/m Investments, LLC d/b/a North Slope Capital, LLC
3050 K Street NW, Suite W-201
Washington, DC 20007
Administrator and Transfer Agent
U.S. Bank Global Fund Services
P.O. Box 701
Milwaukee, Wisconsin 53201-0701
Principal Underwriter
Quasar Distributors, LLC
3 Canal Plaza, Suite 100
Portland, ME 04101
Custodian
U.S. Bank, N.A.
1555 North River Center Drive, Suite 302
Milwaukee, Wisconsin 53212
Independent Registered Public Accounting Firm
Cohen & Company, Ltd.
1350 Euclid Avenue, Suite 800
Cleveland, Ohio 44115
Legal Counsel
Faegre Drinker Biddle & Reath LLP
One Logan Square, Suite 2000
Philadelphia, Pennsylvania 19103-6996

FREE MARKET U.S. EQUITY FUND
FREE MARKET INTERNATIONAL EQUITY FUND
FREE MARKET FIXED INCOME FUND
of
The RBB Fund, Inc.
Financial Statements
August 31, 2024
This report is submitted for the general information of the shareholders of the Funds. It is not authorized for distribution unless preceded or accompanied by a current prospectus for the Funds.
FREE MARKET FUNDS
FREE MARKET U.S. EQUITY FUND
Portfolio of Investments
AUGUST 31, 2024
| | | Shares | | | Value | |
OPEN-END FUNDS — 100.0% | | | | |
iShares Core S&P 500 ETF | | | 620,081 | | | $ | 351,430,907 | |
iShares MSCI USA Value Factor ETF | | | 3,699,472 | | | | 399,653,960 | |
U.S. Large Cap Value Portfolio III - Class Institutional(a) | | | 19,819,560 | | | | 644,333,898 | |
U.S. Large Cap Value Series(b) | | | 2,825,615 | | | | 240,685,924 | |
U.S. Large Company Portfolio - Class Institutional(a) | | | 7,646,066 | | | | 287,033,316 | |
U.S. Micro Cap Portfolio - Class Institutional(c) | | | 22,609,423 | | | | 650,473,086 | |
U.S. Small Cap Portfolio - Class Institutional(c) | | | 13,351,197 | | | | 647,666,560 | |
U.S. Small Cap Value Portfolio - Class Institutional(c) | | | 22,115,591 | | | | 1,079,019,682 | |
TOTAL OPEN-END FUNDS (Cost $2,465,972,771) | | | | | | | 4,300,297,333 | |
| | | | | | | | | |
SHORT-TERM INVESTMENTS — 0.1% | | | | |
Money Market Funds — 0.1% | | | | | | | | |
Invesco Government & Agency Portfolio - Class Institutional, 5.19% (d) | | | 3,316,794 | | | | 3,316,794 | |
TOTAL SHORT-TERM INVESTMENTS (Cost $3,316,794) | | | | | | | 3,316,794 | |
TOTAL INVESTMENTS — 100.1% (Cost $2,469,289,565) | | | | | | | 4,303,614,127 | |
Liabilities in Excess of Other Assets — (0.1)% | | | | | | | (2,428,528 | ) |
TOTAL NET ASSETS — 100.0% | | | | | | $ | 4,301,185,599 | |
Percentages are stated as a percent of net assets.
(a) | A portfolio of Dimensional Investment Group Inc. |
(b) | A portfolio of DFA Investment Trust Company. |
(c) | A portfolio of DFA Investment Dimensions Group Inc. |
(d) | The rate shown represents the 7-day effective yield as of August 31, 2024. |
Portfolio holdings are subject to change at any time.
1
The accompanying notes are an integral part of the financial statements.
FREE MARKET FUNDS
FREE MARKET INTERNATIONAL EQUITY FUND
Portfolio of Investments
AUGUST 31, 2024
| | | Shares | | | Value | |
OPEN-END FUNDS — 99.9% | | | | |
Dimensional International Small Cap ETF(a) | | | 10,798,589 | | | $ | 283,678,933 | |
Canadian Small Company Series(b) | | | 2,108,704 | | | | 41,103,028 | |
DFA International Small Cap Value Portfolio - Class Institutional(c) | | | 55,524,361 | | | | 1,321,479,796 | |
DFA International Value Portfolio III - Class Institutional (d) | | | 26,315,159 | | | | 500,514,321 | |
DFA International Value Series(b) | | | 13,260,640 | | | | 488,389,388 | |
Emerging Markets Small Cap Portfolio - Class Institutional(c) | | | 6,501,987 | | | | 157,543,151 | |
Emerging Markets Value Portfolio - Class Institutional(c) | | | 4,903,650 | | | | 157,112,949 | |
iShares Core MSCI EAFE ETF(a) | | | 2,120,454 | | | | 163,677,844 | |
iShares Core MSCI Emerging Markets ETF | | | 3,086,448 | | | | 168,087,958 | |
TOTAL OPEN-END FUNDS (Cost $2,571,703,270) | | | | | | | 3,281,587,368 | |
| | | Units | | | | | |
SHORT-TERM INVESTMENTS — 1.9% | | | | |
Investments Purchased with Proceeds from Securities Lending — 1.8% | | | | | | | | |
Mount Vernon Liquid Assets Portfolio, LLC, 5.42%(e) | | | 60,371,483 | | | | 60,371,482 | |
| | | | | |
| | | Shares | | | | | |
Money Market Funds — 0.1% | | | | | | | | |
Invesco Government & Agency Portfolio - Class Institutional, 5.19% (f) | | | 3,494,131 | | | | 3,494,131 | |
TOTAL SHORT-TERM INVESTMENTS (Cost $63,865,613) | | | | | | | 63,865,613 | |
TOTAL INVESTMENTS — 101.8% (Cost $2,635,568,883) | | | | | | | 3,345,452,981 | |
Liabilities in Excess of Other Assets — (1.8)% | | | | | | | (62,004,762 | ) |
TOTAL NET ASSETS — 100.0% | | | | | | $ | 3,283,448,219 | |
Percentages are stated as a percent of net assets.
(a) | All or a portion of this security is on loan as of August 31, 2024. At August 31, 2024, the total market value of these securities was $59,175,552 which represented 1.8% of net assets. |
(b) | A portfolio of Dimensional Investment Group Inc. |
(c) | A portfolio of DFA Investment Trust Company. |
(d) | A portfolio of DFA Investment Dimensions Group Inc. |
(e) | The rate shown is as of August 31, 2024. |
(f) | The rate shown represents the 7-day effective yield as of August 31, 2024. |
Portfolio holdings are subject to change at any time.
2
The accompanying notes are an integral part of the financial statements.
FREE MARKET FUNDS
FREE MARKET FIXED INCOME FUND
Portfolio of Investments
AUGUST 31, 2024
| | | Shares | | | Value | |
OPEN-END FUNDS — 99.5% | | | | |
DFA One-Year Fixed Income Portfolio - Class Institutional(a) | | | 40,595,446 | | | $ | 415,291,417 | |
DFA Two-Year Global Fixed Income Portfolio - Class Institutional(a) | | | 72,133,191 | | | | 721,331,912 | |
Dimensional Inflation-Protected Securities ETF(b) | | | 3,459,553 | | | | 144,300,377 | |
iShares 1-3 Year Treasury Bond ETF(b) | | | 1,387,785 | | | | 114,908,598 | |
iShares 1-5 Year Investment Grade Corporate Bond ETF(b) | | | 13,273,190 | | | | 694,586,033 | |
iShares 3-7 Year Treasury Bond ETF(b) | | | 1,469,507 | | | | 174,459,871 | |
iShares 5-10 Year Investment Grade Corporate Bond ETF(b) | | | 3,297,917 | | | | 174,987,476 | |
iShares Core International Aggregate Bond ETF(b) | | | 8,487,881 | | | | 435,343,416 | |
TOTAL OPEN-END FUNDS (Cost $2,920,832,785) | | | | | | | 2,875,209,100 | |
| | | Units | | | | | |
SHORT-TERM INVESTMENTS — 2.1% | | | | | | | | |
Investments Purchased with Proceeds from Securities Lending — 1.6% | | | | |
Mount Vernon Liquid Assets Portfolio, LLC, 5.42%(c) | | | 45,081,700 | | | | 45,081,700 | |
| | | | | |
| | | Shares | | | | | |
Money Market Funds — 0.5% | | | | | | | | |
Invesco Government & Agency Portfolio - Class Institutional, 5.19% (d) | | | 15,509,502 | | | | 15,509,502 | |
TOTAL SHORT-TERM INVESTMENTS (Cost $60,591,202) | | | | | | | 60,591,202 | |
TOTAL INVESTMENTS — 101.6% (Cost $2,981,423,987) | | | | | | | 2,935,800,302 | |
Liabilities in Excess of Other Assets — (1.6)% | | | | | | | (44,862,228 | ) |
TOTAL NET ASSETS — 100.0% | | | | | | $ | 2,890,938,074 | |
Percentages are stated as a percent of net assets.
(a) | A portfolio of DFA Investment Dimensions Group Inc. |
(b) | All or a portion of this security is on loan as of August 31, 2024. At August 31, 2024, the total market value of these securities was $44,071,104 which represented 1.5% of net assets. |
(c) | The rate shown is as of August 31, 2024. |
(d) | The rate shown represents the 7-day effective yield as of August 31, 2024. |
Portfolio holdings are subject to change at any time.
3
The accompanying notes are an integral part of the financial statements.
FREE MARKET FUNDS
Statements of Assets and Liabilities
AUGUST 31, 2024
| | | Free Market
U.S. Equity
Fund | | | Free Market
International
Equity Fund | | | Free Market
Fixed Income
Fund | |
ASSETS | | | | | | | | | | | | |
Investments in non-affiliated funds, at value (cost $2,465,972,771, $2,571,703,270 and $2,920,832,785, respectively) | | $ | 4,300,297,333 | | | $ | 3,281,587,368 | | | $ | 2,875,209,100 | |
Short-term investments, at value (cost $3,316,794, $3,494,131 and $15,509,502, respectively) | | | 3,316,794 | | | | 3,494,131 | | | | 15,509,502 | |
Investments purchased with proceeds from securities lending collateral (cost $—, $60,371,482 and $45,081,700, respectively) | | | — | | | | 60,371,482 | | | | 45,081,700 | |
Receivables for: | | | | | | | | | | | | |
Capital shares sold | | | 1,372,632 | | | | 1,168,529 | | | | 1,216,415 | |
Dividends and interest | | | 13 | | | | 19,129 | | | | 2,480,644 | |
Prepaid expenses and other assets | | | 172,483 | | | | 120,416 | | | | 110,521 | |
Total assets | | | 4,305,159,255 | | | | 3,346,761,055 | | | | 2,939,607,882 | |
LIABILITIES | | | | | | | | | | | | |
Payables for: | | | | | | | | | | | | |
Capital shares redeemed | | | 1,923,704 | | | | 1,420,757 | | | | 1,622,583 | |
Advisory fees | | | 1,721,118 | | | | 1,321,467 | | | | 1,203,984 | |
Administration and accounting fees | | | 141,534 | | | | 105,776 | | | | 111,300 | |
Transfer agent fees | | | 5,651 | | | | 7,788 | | | | 7,856 | |
Securities lending collateral (see Note 6) | | | — | | | | 60,371,482 | | | | 45,081,700 | |
Investments purchased | | | — | | | | — | | | | 500,000 | |
Other accrued expenses and liabilities | | | 181,649 | | | | 85,566 | | | | 142,385 | |
Total liabilities | | | 3,973,656 | | | | 63,312,836 | | | | 48,669,808 | |
Net assets | | $ | 4,301,185,599 | | | $ | 3,283,448,219 | | | $ | 2,890,938,074 | |
| | | | | | | | | | | | | |
NET ASSETS CONSIST OF: | | | | | | | | | | | | |
Par value | | $ | 174,161 | | | $ | 264,240 | | | $ | 285,469 | |
Paid-in capital | | | 2,309,260,075 | | | | 2,459,133,575 | | | | 2,948,937,925 | |
Total distributable earnings/(loss) | | | 1,991,751,363 | | | | 824,050,404 | | | | (58,285,320 | ) |
Net assets | | $ | 4,301,185,599 | | | $ | 3,283,448,219 | | | $ | 2,890,938,074 | |
| | | | | | | | | | | | | |
CAPITAL SHARES: | | | | | | | | | | | | |
Net assets | | $ | 4,301,185,599 | | | $ | 3,283,448,219 | | | $ | 2,890,938,074 | |
Shares outstanding ($0.001 par value, 700,000,000 shares authorized) | | | 174,160,756 | | | | 264,239,592 | | | | 285,468,934 | |
Net asset value, offering and redemption price per share | | $ | 24.70 | | | $ | 12.43 | | | $ | 10.13 | |
4
The accompanying notes are an integral part of the financial statements.
FREE MARKET FUNDS
Statements of Operations
FOR THE Year ENDED AUGUST 31, 2024
| | | Free Market
U.S. Equity
Fund | | | Free Market
International
Equity Fund | | | Free Market
Fixed Income
Fund | |
INVESTMENT INCOME | | | | | | | | | | | | |
Dividends from non-affiliated funds | | $ | 62,528,752 | | | $ | 102,476,812 | | | $ | 103,397,366 | |
Interest income | | | 247,464 | | | | 269,011 | | | | 769,707 | |
Securities lending income | | | 27,974 | | | | 184,440 | | | | 156,457 | |
Total investment income | | | 62,804,190 | | | | 102,930,263 | | | | 104,323,530 | |
| | | | | | | | | | | | | |
EXPENSES | | | | | | | | | | | | |
Advisory fees (Note 2) | | | 19,003,981 | | | | 14,615,451 | | | | 13,737,559 | |
Administration and accounting fees (Note 2) | | | 556,767 | | | | 450,429 | | | | 390,760 | |
Director fees | | | 422,578 | | | | 329,344 | | | | 312,975 | |
Officer fees | | | 285,794 | | | | 221,480 | | | | 210,714 | |
Legal fees | | | 190,499 | | | | 147,836 | | | | 142,697 | |
Custodian fees (Note 2) | | | 99,521 | | | | 81,312 | | | | 79,522 | |
Registration and filing fees | | | 89,566 | | | | 72,350 | | | | 71,513 | |
Transfer agent fees (Note 2) | | | 66,537 | | | | 71,342 | | | | 70,768 | |
Printing and shareholder reporting fees | | | 57,485 | | | | 56,001 | | | | 52,805 | |
Audit and tax service fees | | | 42,623 | | | | 43,448 | | | | 41,997 | |
Other expenses | | | 165,464 | | | | 238,488 | | | | 108,612 | |
Total expenses | | | 20,980,815 | | | | 16,327,481 | | | | 15,219,922 | |
Net investment income/(loss) | | | 41,823,375 | | | | 86,602,782 | | | | 89,103,608 | |
| | | | | | | | | | | | | |
NET REALIZED AND UNREALIZED GAIN/(LOSS) FROM INVESTMENTS | | | | | | | | | | | | |
Net realized gain/(loss) from: | | | | | | | | | | | | |
Non-affiliated funds | | | 71,585,093 | | | | 27,470,048 | | | | (18,576,023 | ) |
Capital gain distributions from non-affiliated fund investments | | | 64,832,047 | | | | 1,394,269 | | | | — | |
Net change in unrealized appreciation/(depreciation) on: | | | | | | | | | | | | |
Non-affiliated funds | | | 551,485,192 | | | | 379,850,519 | | | | 99,079,963 | |
Net realized and unrealized gain/(loss) on investments | | | 687,902,332 | | | | 408,714,836 | | | | 80,503,940 | |
NET INCREASE/(DECREASE) IN NET ASSETS RESULTING FROM OPERATIONS | | $ | 729,725,707 | | | $ | 495,317,618 | | | $ | 169,607,548 | |
5
The accompanying notes are an integral part of the financial statements.
FREE MARKET U.S. EQUITY FUND
Statements of Changes in Net Assets
| | | For the
Year Ended
August 31, 2024 | | | For the
Year Ended
August 31, 2023 | |
INCREASE/(DECREASE) IN NET ASSETS FROM OPERATIONS: | | | | | | | | |
Net investment income/(loss) | | $ | 41,823,375 | | | $ | 40,625,266 | |
Net realized gain/(loss) from investments | | | 136,417,140 | | | | 125,519,038 | |
Net change in unrealized appreciation/(depreciation) on investments | | | 551,485,192 | | | | 167,184,995 | |
Net increase/(decrease) in net assets resulting from operations | | | 729,725,707 | | | | 333,329,299 | |
| | | | | | | | | |
DIVIDENDS AND DISTRIBUTIONS TO SHAREHOLDERS: | | | | | | | | |
Total distributable earnings | | | (155,017,081 | ) | | | (254,085,784 | ) |
Net decrease in net assets from dividends and distributions to shareholders | | | (155,017,081 | ) | | | (254,085,784 | ) |
| | | | | | | | | |
CAPITAL SHARE TRANSACTIONS: | | | | | | | | |
Proceeds from shares sold | | | 476,286,979 | | | | 478,766,781 | |
Reinvestment of distributions | | | 154,979,410 | | | | 253,858,591 | |
Shares redeemed | | | (583,688,219 | ) | | | (425,824,595 | ) |
Net increase/(decrease) in net assets from capital shares | | | 47,578,170 | | | | 306,800,777 | |
Total increase/(decrease) in net assets | | | 622,286,796 | | | | 386,044,292 | |
| | | | | | | | | |
NET ASSETS: | | | | | | | | |
Beginning of period | | | 3,678,898,803 | | | | 3,292,854,511 | |
End of period | | $ | 4,301,185,599 | | | $ | 3,678,898,803 | |
| | | | | | | | | |
SHARES TRANSACTIONS: | | | | | | | | |
Shares sold | | | 21,414,430 | | | | 23,305,151 | |
Dividends and distributions reinvested | | | 6,949,749 | | | | 13,098,999 | |
Shares redeemed | | | (26,322,345 | ) | | | (20,585,763 | ) |
Net increase/(decrease) in shares outstanding | | | 2,041,834 | | | | 15,818,387 | |
6
The accompanying notes are an integral part of the financial statements.
FREE MARKET INTERNATIONAL EQUITY FUND
Statements of Changes in Net Assets
| | | For the
Year Ended
August 31, 2024 | | | For the
Year Ended
August 31, 2023 | |
INCREASE/(DECREASE) IN NET ASSETS FROM OPERATIONS: | | | | | | | | |
Net investment income/(loss) | | $ | 86,602,782 | | | $ | 70,936,748 | |
Net realized gain/(loss) from investments | | | 28,864,317 | | | | 1,605,191 | |
Net change in unrealized appreciation/(depreciation) on investments | | | 379,850,519 | | | | 317,867,303 | |
Net increase/(decrease) in net assets resulting from operations | | | 495,317,618 | | | | 390,409,242 | |
| | | | | | | | | |
DIVIDENDS AND DISTRIBUTIONS TO SHAREHOLDERS: | | | | | | | | |
Total distributable earnings | | | (71,432,283 | ) | | | (86,538,910 | ) |
Net decrease in net assets from dividends and distributions to shareholders | | | (71,432,283 | ) | | | (86,538,910 | ) |
| | | | | | | | | |
CAPITAL SHARE TRANSACTIONS: | | | | | | | | |
Proceeds from shares sold | | | 386,235,877 | | | | 387,653,039 | |
Reinvestment of distributions | | | 71,413,639 | | | | 86,521,788 | |
Shares redeemed | | | (423,715,477 | ) | | | (347,793,059 | ) |
Net increase/(decrease) in net assets from capital shares | | | 33,934,039 | | | | 126,381,768 | |
Total increase/(decrease) in net assets | | | 457,819,374 | | | | 430,252,100 | |
| | | | | | | | | |
NET ASSETS: | | | | | | | | |
Beginning of period | | | 2,825,628,845 | | | | 2,395,376,745 | |
End of period | | $ | 3,283,448,219 | | | $ | 2,825,628,845 | |
| | | | | | | | | |
SHARES TRANSACTIONS: | | | | | | | | |
Shares sold | | | 34,170,229 | | | | 38,443,413 | |
Dividends and distributions reinvested | | | 6,416,320 | | | | 8,874,030 | |
Shares redeemed | | | (37,820,659 | ) | | | (33,803,982 | ) |
Net increase/(decrease) in shares outstanding | | | 2,765,890 | | | | 13,513,461 | |
7
The accompanying notes are an integral part of the financial statements.
FREE MARKET FIXED INCOME FUND
Statements of Changes in Net Assets
| | | For the
Year Ended
August 31, 2024 | | | For the
Year Ended
August 31, 2023 | |
INCREASE/(DECREASE) IN NET ASSETS FROM OPERATIONS: | | | | | | | | |
Net investment income/(loss) | | $ | 89,103,608 | | | $ | 46,630,289 | |
Net realized gain/(loss) from investments | | | (18,576,023 | ) | | | (4,986,787 | ) |
Net change in unrealized appreciation/(depreciation) on investments | | | 99,079,963 | | | | 68,242 | |
Net increase/(decrease) in net assets resulting from operations | | | 169,607,548 | | | | 41,711,744 | |
| | | | | | | | | |
DIVIDENDS AND DISTRIBUTIONS TO SHAREHOLDERS: | | | | | | | | |
Total distributable earnings | | | (82,530,062 | ) | | | (42,935,911 | ) |
Net decrease in net assets from dividends and distributions to shareholders | | | (82,530,062 | ) | | | (42,935,911 | ) |
| | | | | | | | | |
CAPITAL SHARE TRANSACTIONS: | | | | | | | | |
Proceeds from shares sold | | | 414,922,883 | | | | 409,425,077 | |
Reinvestment of distributions | | | 82,496,375 | | | | 42,929,725 | |
Shares redeemed | | | (478,913,639 | ) | | | (414,939,183 | ) |
Net increase/(decrease) in net assets from capital shares | | | 18,505,619 | | | | 37,415,619 | |
Total increase/(decrease) in net assets | | | 105,583,105 | | | | 36,191,452 | |
| | | | | | | | | |
NET ASSETS: | | | | | | | | |
Beginning of period | | | 2,785,354,969 | | | | 2,749,163,517 | |
End of period | | $ | 2,890,938,074 | | | $ | 2,785,354,969 | |
| | | | | | | | | |
SHARES TRANSACTIONS: | | | | | | | | |
Shares sold | | | 41,907,589 | | | | 42,009,136 | |
Dividends and distributions reinvested | | | 8,351,711 | | | | 4,445,055 | |
Shares redeemed | | | (48,478,845 | ) | | | (42,657,402 | ) |
Net increase/(decrease) in shares outstanding | | | 1,780,455 | | | | 3,796,789 | |
8
The accompanying notes are an integral part of the financial statements.
FREE MARKET FUNDS
FREE MARKET U.S. EQUITY FUND
Financial Highlights
Contained below is per share operating performance data for each share outstanding, total investment return/(loss), ratios to average net assets and other supplemental data for the respective periods. This information has been derived from information provided in the financial statements. |
| | | For the
Year Ended
August 31, 2024 | | | For the
Year Ended
August 31, 2023 | | | For the
Year Ended
August 31, 2022 | | | For the
Year Ended
August 31, 2021 | | | For the
Year Ended
August 31, 2020 | |
Per Share Operating Performance | | | | | | | | | | | | | | | | | | | | |
Net asset value, beginning of period | | $ | 21.37 | | | $ | 21.07 | | | $ | 23.59 | | | $ | 16.06 | | | $ | 16.90 | |
Net investment income/(loss)(1) | | | 0.24 | | | | 0.24 | | | | 0.21 | | | | 0.21 | | | | 0.17 | |
Net realized and unrealized gain/(loss) on investments | | | 4.00 | | | | 1.68 | | | | (1.69 | ) | | | 7.62 | | | | — | (2) |
Net increase/(decrease) in net assets resulting from operations | | | 4.24 | | | | 1.92 | | | | (1.48 | ) | | | 7.83 | | | | 0.17 | |
Dividends and distributions to shareholders from: | | | | | | | | | | | | | | | | | | | | |
Net investment income | | | (0.25 | ) | | | (0.21 | ) | | | (0.41 | ) | | | (0.08 | ) | | | (0.16 | ) |
Net realized capital gains | | | (0.66 | ) | | | (1.41 | ) | | | (0.63 | ) | | | (0.22 | ) | | | (0.85 | ) |
Total dividends and distributions to shareholders | | | (0.91 | ) | | | (1.62 | ) | | | (1.04 | ) | | | (0.30 | ) | | | (1.01 | ) |
Net asset value, end of period | | $ | 24.70 | | | $ | 21.37 | | | $ | 21.07 | | | $ | 23.59 | | | $ | 16.06 | |
Total investment return/(loss)(3) | | | 20.30 | % | | | 9.92 | % | | | (6.77 | )% | | | 49.28 | % | | | 0.32 | % |
| | | | | | | | | | | | | | | | | | | | | |
Ratios/Supplemental Data | | | | | | | | | | | | | | | | | | | | |
Net assets, end of period (000’s omitted) | | $ | 4,301,186 | | | $ | 3,678,899 | | | $ | 3,292,855 | | | $ | 3,635,318 | | | $ | 2,839,337 | |
Ratio of expenses to average net assets(4) | | | 0.54 | % | | | 0.55 | % | | | 0.56 | % | | | 0.55 | % | | | 0.56 | % |
Ratio of net investment income/(loss) to average net assets(4) | | | 1.08 | % | | | 1.18 | % | | | 0.92 | % | | | 1.05 | % | | | 1.05 | % |
Portfolio turnover rate | | | 4 | % | | | 2 | % | | | 7 | % | | | 5 | % | | | 14 | % |
(1) | The selected per share data is calculated using the average shares outstanding method for the period. |
(2) | Amount less than $(0.005) per share. |
(3) | Total investment return/(loss) is calculated by assuming a purchase of shares on the first day and a sale of shares on the last day of each period reported and includes reinvestments of dividends and distributions, if any. |
(4) | The Fund also will indirectly bear its prorated share of expenses of the underlying funds. Such expenses are not included in the calculation of this ratio. |
9
The accompanying notes are an integral part of the financial statements.
FREE MARKET FUNDS
FREE MARKET INTERNATIONAL EQUITY FUND
Financial Highlights
Contained below is per share operating performance data for each share outstanding, total investment return/(loss), ratios to average net assets and other supplemental data for the respective periods. This information has been derived from information provided in the financial statements. |
| | | For the
Year Ended
August 31, 2024 | | | For the
Year Ended
August 31, 2023 | | | For the
Year Ended
August 31, 2022 | | | For the
Year Ended
August 31, 2021 | | | For the
Year Ended
August 31, 2020 | |
Per Share Operating Performance | | | | | | | | | | | | | | | | | | | | |
Net asset value, beginning of period | | $ | 10.81 | | | $ | 9.66 | | | $ | 11.60 | | | $ | 8.89 | | | $ | 9.09 | |
Net investment income/(loss)(1) | | | 0.33 | | | | 0.27 | | | | 0.34 | | | | 0.18 | | | | 0.19 | |
Net realized and unrealized gain/(loss) on investments | | | 1.57 | | | | 1.22 | | | | (2.13 | ) | | | 2.84 | | | | (0.13 | ) |
Net increase/(decrease) in net assets resulting from operations | | | 1.90 | | | | 1.49 | | | | (1.79 | ) | | | 3.02 | | | | 0.06 | |
Dividends and distributions to shareholders from: | | | | | | | | | | | | | | | | | | | | |
Net investment income | | | (0.28 | ) | | | (0.34 | ) | | | (0.15 | ) | | | (0.13 | ) | | | (0.14 | ) |
Net realized capital gains | | | — | | | | — | | | | — | | | | (0.18 | ) | | | (0.12 | ) |
Total dividends and distributions to shareholders | | | (0.28 | ) | | | (0.34 | ) | | | (0.15 | ) | | | (0.31 | ) | | | (0.26 | ) |
Net asset value, end of period | | $ | 12.43 | | | $ | 10.81 | | | $ | 9.66 | | | $ | 11.60 | | | $ | 8.89 | |
Total investment return/(loss)(2) | | | 17.86 | % | | | 15.82 | % | | | (15.63 | )% | | | 34.43 | % | | | 0.30 | % |
| | | | | | | | | | | | | | | | | | | | | |
Ratios/Supplemental Data | | | | | | | | | | | | | | | | | | | | |
Net assets, end of period (000’s omitted) | | $ | 3,283,448 | | | $ | 2,825,629 | | | $ | 2,395,377 | | | $ | 2,682,213 | | | $ | 2,153,655 | |
Ratio of expenses to average net assets(3) | | | 0.55 | % | | | 0.55 | % | | | 0.56 | % | | | 0.56 | % | | | 0.58 | % |
Ratio of net investment income/(loss) to average net assets(3) | | | 2.92 | % | | | 2.68 | % | | | 3.08 | % | | | 1.70 | % | | | 2.13 | % |
Portfolio turnover rate | | | 13 | % | | | 3 | % | | | 2 | % | | | 5 | % | | | 28 | % |
(1) | The selected per share data is calculated using the average shares outstanding method for the period. |
(2) | Total investment return/(loss) is calculated by assuming a purchase of shares on the first day and a sale of shares on the last day of each period reported and includes reinvestments of dividends and distributions, if any. |
(3) | The Fund also will indirectly bear its prorated share of expenses of the underlying funds. Such expenses are not included in the calculation of this ratio. |
The accompanying notes are an integral part of the financial statements.
10
FREE MARKET FUNDS
FREE MARKET FIXED INCOME FUND
Financial Highlights
Contained below is per share operating performance data for each share outstanding, total investment return/(loss), ratios to average net assets and other supplemental data for the respective periods. This information has been derived from information provided in the financial statements. |
| | | For the
Year Ended
August 31, 2024 | | | For the
Year Ended
August 31, 2023 | | | For the
Year Ended
August 31, 2022 | | | For the
Year Ended
August 31, 2021 | | | For the
Year Ended
August 31, 2020 | |
Per Share Operating Performance | | | | | | | | | | | | | | | | | | | | |
Net asset value, beginning of period | | $ | 9.82 | | | $ | 9.82 | | | $ | 10.56 | | | $ | 10.61 | | | $ | 10.47 | |
Net investment income/(loss)(1) | | | 0.32 | | | | 0.17 | | | | 0.05 | | | | 0.03 | | | | 0.15 | |
Net realized and unrealized gain/(loss) on investments | | | 0.29 | | | | (0.01 | ) | | | (0.74 | ) | | | — | (2) | | | 0.16 | |
Net increase/(decrease) in net assets resulting from operations | | | 0.61 | | | | 0.16 | | | | (0.69 | ) | | | 0.03 | | | | 0.31 | |
Dividends and distributions to shareholders from: | | | | | | | | | | | | | | | | | | | | |
Net investment income | | | (0.30 | ) | | | (0.16 | ) | | | (0.05 | ) | | | (0.05 | ) | | | (0.17 | ) |
Net realized capital gains | | | — | | | | — | | | | — | | | | (0.03 | ) | | | — | |
Return of capital | | | — | | | | — | | | | — | | | | — | (2) | | | — | |
Total dividends and distributions to shareholders | | | (0.30 | ) | | | (0.16 | ) | | | (0.05 | ) | | | (0.08 | ) | | | (0.17 | ) |
Net asset value, end of period | | $ | 10.13 | | | $ | 9.82 | | | $ | 9.82 | | | $ | 10.56 | | | $ | 10.61 | |
Total investment return/(loss)(3) | | | 6.30 | % | | | 1.62 | % | | | (6.51 | )% | | | 0.31 | % | | | 2.98 | % |
| | | | | | | | | | | | | | | | | | | | | |
Ratios/Supplemental Data | | | | | | | | | | | | | | | | | | | | |
Net assets, end of period (000’s omitted) | | $ | 2,890,938 | | | $ | 2,785,355 | | | $ | 2,749,164 | | | $ | 2,820,610 | | | $ | 2,307,909 | |
Ratio of expenses to average net assets(4) | | | 0.55 | % | | | 0.55 | % | | | 0.56 | % | | | 0.56 | % | | | 0.56 | % |
Ratio of net investment income/(loss) to average net assets(4) | | | 3.20 | % | | | 1.72 | % | | | 0.51 | % | | | 0.27 | % | | | 1.39 | % |
Portfolio turnover rate | | | 8 | % | | | 3 | % | | | 3 | % | | | 2 | % | | | 46 | % |
(1) | The selected per share data is calculated using the average shares outstanding method for the period. |
(2) | Amount less than $(0.005) per share. |
(3) | Total investment return/(loss) is calculated by assuming a purchase of shares on the first day and a sale of shares on the last day of each period reported and includes reinvestments of dividends and distributions, if any. |
(4) | The Fund also will indirectly bear its prorated share of expenses of the underlying funds. Such expenses are not included in the calculation of this ratio. |
11
The accompanying notes are an integral part of the financial statements.
FREE MARKET FUNDS
Notes to Financial Statements
AUGUST 31, 2024
1. | Organization and Significant Accounting Policies |
The RBB Fund, Inc. (“RBB” or the “Company”) was incorporated under the laws of the State of Maryland on February 29, 1988 and is registered under the Investment Company Act of 1940, as amended (the “1940 Act”), as an open-end management investment company. RBB is a “series fund,” which is an investment company divided into separate portfolios. Each portfolio is treated as a separate entity for certain matters under the 1940 Act, and for other purposes, and a shareholder of one portfolio is not deemed to be a shareholder of any other portfolio. Currently, RBB has sixty-five separate investment portfolios, including the Free Market U.S. Equity Fund, the Free Market International Equity Fund and the Free Market Fixed Income Fund (each a “Fund” and collectively, the “Funds”). Each Fund operates as a “fund of funds” and commenced investment operations on December 31, 2007.
RBB has authorized capital of one hundred billion shares of common stock of which 92.923 billion shares are currently classified into two hundred and thirty-six classes of common stock. Each class represents an interest in an active or inactive RBB investment portfolio.
Free Market U.S. Equity and Free Market International Equity’s investment objective is to seek long-term capital appreciation. Free Market Fixed Income’s investment objective is to seek total return (consisting of current income and capital appreciation).
The Funds are investment companies and follow accounting and reporting guidance in the Financial Accounting Standards Board (FASB) Accounting Standards Codification Topic 946 “Financial Services - Investment Companies”.
The end of the reporting period for the Funds is August 31, 2024, and the period covered by these Notes to Financial Statements is the fiscal year ended August 31, 2024 (the “current fiscal period”).
Investment Company Securities – The Funds pursue their investment objectives by investing primarily in shares of registered, open-end investment companies and exchange-traded funds (“ETFs”) (collectively, “underlying funds”). When a Fund invests in underlying funds it will indirectly bear its proportionate share of any fees and expenses payable directly by the underlying fund. In connection with its investments in other investment companies, a Fund will incur higher expenses, many of which may be duplicative. Furthermore, because the Funds invest in shares of ETFs and underlying funds their performances are directly related to the ability of the ETFs and underlying funds to meet their respective investment objectives, as well as the allocation of each Fund’s assets among the ETFs and underlying funds. Accordingly, the Funds’ investment performance will be influenced by the investment strategies of and risks associated with the ETFs and underlying funds in direct proportion to the amount of assets the Funds allocate to the ETFs and underlying funds utilizing such strategies. As disclosed in the Portfolio of Investments, the Funds invest in a number of different underlying funds, including underlying funds that are portfolios of DFA Investment Dimensions Group Inc., and Dimensional Investment Group Inc. (collectively, “DFA Underlying Funds”) and iShares by BlackRock (“iShares Underlying Funds”). Information about DFA Underlying Funds’ and iShares Underlying Funds’ risks may be found in such DFA Underlying Funds’ and iShares Underlying Funds’ annual or semiannual report to shareholders, which can be found at us.dimensional.com and iShares.com, respectively. Additional information about derivatives related risks, if applicable, may also be found in each such DFA Underlying Funds’ or iShares Underlying Funds’ annual or semiannual report to shareholders. The annual and semiannual reports to shareholders for the underlying funds may also be found by visiting the Securities and Exchange Commission’s (“SEC”) website at http://www.sec.gov.
PORTFOLIO VALUATION — Investments in the underlying funds are valued at each Fund’s net asset value (“NAV”) determined as of the close of business on the New York Stock Exchange (generally 4:00 p.m. Eastern time). Investments in ETFs are valued at their last reported sale price. As required, some securities and assets may be valued at fair value as determined in good faith by the Company’s Board of Directors (the “Board” or “Directors”). Direct investments in fixed income securities are valued using an independent pricing service, which considers such factors as security prices, yields, maturities and ratings, and are deemed representative of market values at the close of the market.
The Board has adopted a pricing and valuation policy for use by each Fund and its Valuation Designee (as defined below) in calculating the Fund’s NAV. Pursuant to Rule 2a-5 under the 1940 Act, the Board has designated Matson Money, Inc. (“Matson Money” or the “Adviser”) as its “Valuation Designee” to perform all of the fair value determinations as well as to perform all of the responsibilities that may be performed by the Valuation Designee in accordance with Rule 2a-5. The Valuation Designee
12
FREE MARKET FUNDS
Notes to Financial Statements (Continued)
AUGUST 31, 2024
is authorized to make all necessary determinations of the fair values of portfolio securities and other assets for which market quotations are not readily available or if it is deemed that the prices obtained from brokers and dealers or independent pricing services are unreliable.
FAIR VALUE MEASUREMENTS — The inputs and valuation techniques used to measure the fair value of the Funds’ investments are summarized into three levels as described in the hierarchy below:
| | ● Level 1 — | Prices are determined using quoted prices in active markets for identical securities. |
| | ● Level 2 — | Prices are determined using other significant observable inputs (including quoted prices for similar securities, interest rates, prepayment speeds, credit risk, etc.). |
| | ● Level 3 — | Prices are determined using significant unobservable inputs (including the Funds’ own assumptions in determining the fair value of investments). |
The inputs or methodologies used for valuing securities are not necessarily an indication of the risk associated with investing in those securities.
The following is a summary of the inputs used, as of the end of the current fiscal period, in valuing the Funds’ investments carried at fair value:
FREE MARKET U.S. EQUITY Fund
| | | LEVEL 1 | | | LEVEL 2 | | | LEVEL 3 | | | TOTAL | |
Open-End Funds | | $ | 4,059,611,409 | | | $ | — | | | $ | — | | | $ | 4,059,611,409 | |
Investments Measured at Net Asset Value* | | | — | | | | — | | | | — | | | | 240,685,924 | |
Investments Purchased with Proceeds From Securities Lending Collateral* | | | — | | | | — | | | | — | | | | — | |
Short-Term Investments | | | 3,316,794 | | | | — | | | | — | | | | 3,316,794 | |
Total Investments** | | $ | 4,062,928,203 | | | $ | — | | | $ | — | | | $ | 4,303,614,127 | |
* | Certain investments that are measured at fair value using the net asset value per share (or its equivalent) practical expedient have not been categorized in the fair value hierarchy. The fair value amounts presented in the table are intended to permit reconciliation of the fair value hierarchy to the amounts presented in the Statements of Assets and Liabilities. |
** | Please refer to the Portfolio of Investments for further details. |
FREE MARKET INTERNATIONAL EQUITY Fund
| | | LEVEL 1 | | | LEVEL 2 | | | LEVEL 3 | | | TOTAL | |
Open-End Funds | | $ | 2,752,094,952 | | | $ | — | | | $ | — | | | $ | 2,752,094,952 | |
Investments Measured at Net Asset Value* | | | — | | | | — | | | | — | | | | 529,492,416 | |
Investments Purchased with Proceeds From Securities Lending Collateral* | | | — | | | | — | | | | — | | | | 60,371,482 | |
Short-Term Investments | | | 3,494,131 | | | | — | | | | — | | | | 3,494,131 | |
Total Investments** | | $ | 2,755,589,083 | | | $ | — | | | $ | — | | | $ | 3,345,452,981 | |
* | Certain investments that are measured at fair value using the net asset value per share (or its equivalent) practical expedient have not been categorized in the fair value hierarchy. The fair value amounts presented in the table are intended to permit reconciliation of the fair value hierarchy to the amounts presented in the Statements of Assets and Liabilities. |
** | Please refer to the Portfolio of Investments for further details. |
13
FREE MARKET FUNDS
Notes to Financial Statements (Continued)
AUGUST 31, 2024
FREE MARKET FIXED INCOME Fund
| | | LEVEL 1 | | | LEVEL 2 | | | LEVEL 3 | | | TOTAL | |
Open-End Funds | | $ | 2,875,209,100 | | | $ | — | | | $ | — | | | $ | 2,875,209,100 | |
Investments Measured at Net Asset Value* | | | — | | | | — | | | | — | | | | — | |
Investments Purchased with Proceeds From Securities Lending Collateral* | | | — | | | | — | | | | — | | | | 45,081,700 | |
Short-Term Investments | | | 15,509,502 | | | | — | | | | — | | | | 15,509,502 | |
Total Investments** | | $ | 2,890,718,602 | | | $ | — | | | $ | — | | | $ | 2,935,800,302 | |
* | Certain investments that are measured at fair value using the net asset value per share (or its equivalent) practical expedient have not been categorized in the fair value hierarchy. The fair value amounts presented in the table are intended to permit reconciliation of the fair value hierarchy to the amounts presented in the Statements of Assets and Liabilities. |
** | Please refer to the Portfolio of Investments for further details. |
At the end of each quarter, management evaluates the classification of Levels 1, 2 and 3 assets and liabilities. Various factors are considered, such as changes in liquidity from the prior reporting period; whether or not a broker is willing to execute at the quoted price; the depth and consistency of prices from third party pricing services; and the existence of contemporaneous, observable trades in the market. Additionally, management evaluates the classification of Levels 1, 2 and 3 assets and liabilities on a quarterly basis for changes in listings or delistings on national exchanges.
Due to the inherent uncertainty of determining the fair value of investments that do not have a readily available market value, the fair value of the Funds’ investments may fluctuate from period to period. Additionally, the fair value of investments may differ significantly from the values that would have been used had a ready market existed for such investments and may differ materially from the values the Funds may ultimately realize. Further, such investments may be subject to legal and other restrictions on resale or otherwise less liquid than publicly traded securities.
For fair valuations using significant unobservable inputs, U.S. generally accepted accounting principles (“U.S. GAAP”) requires each Fund to present a reconciliation of the beginning to ending balances for reported market values that presents changes attributable to total realized and unrealized gains or losses, purchase and sales, and transfers in and out of Level 3 during the period. Transfers in and out between levels are based on values at the end of the period. A reconciliation of Level 3 investments is presented only when a Fund had an amount of Level 3 investments at the end of the reporting period that was meaningful in relation to its net assets. The amounts and reasons for all Level 3 transfers are disclosed if a Fund had an amount of total Level 3 transfers during the reporting period that was meaningful in relation to its net assets as of the end of the reporting period.
During the current fiscal period, the Funds had no Level 3 transfers.
USE OF ESTIMATES — The preparation of financial statements in conformity with U.S. GAAP requires management to make estimates and assumptions that affect the reported amounts of assets and liabilities and disclosure of contingent assets and liabilities at the date of the financial statements and the reported amounts of revenues and expenses during the reporting period. Actual results could differ from those estimates and those differences could be significant.
INVESTMENT TRANSACTIONS, INVESTMENT INCOME AND EXPENSES — The Funds record security transactions based on trade date for financial reporting purposes. The cost of investments sold is determined by use of the specific identification method for both financial reporting and income tax purposes in determining realized gains and losses on investments. Interest income (including amortization of premiums and accretion of discounts) is accrued when earned. Dividend income is recorded on the ex-dividend date. Distributions received on securities that represent a return of capital or capital gain are recorded as a reduction of cost of investments and/or as a realized gain. Each Fund’s investment income, expenses (other than class specific expenses) and unrealized and realized gains and losses are allocated daily to each class of shares based upon the relative proportion of net assets of each class at the beginning of the day. Certain expenses are shared with The RBB Fund Trust (the “Trust”), a series trust
14
FREE MARKET FUNDS
Notes to Financial Statements (Continued)
AUGUST 31, 2024
of affiliated funds. Expenses incurred on behalf of a specific class, fund or fund family of the Company or Trust are charged directly to the class, fund or fund family (in proportion to net assets). Expenses incurred for all funds (such as director or professional fees) are charged to all funds in proportion to their average net assets of RBB and the Trust, or in such other manner as the Board deems fair or equitable. Expenses and fees, including investment advisory and administration fees, are accrued daily and taken into account for the purpose of determining the NAV of the Funds. In addition to the net annual operating expenses that the Funds bear directly, the shareholders indirectly bear the Funds’ pro-rata expenses of the underlying mutual funds in which each Fund invests.
DIVIDENDS AND DISTRIBUTIONS TO SHAREHOLDERS — Dividends from net investment income and distributions from net realized capital gains, if any, are declared and paid at least annually to shareholders recorded on the ex-dividend date for each Fund with the exception of the Free Market Fixed Income Fund which declares and pays quarterly dividends from net investment income. Income dividends and capital gain distributions are determined in accordance with U.S. federal income tax regulations, which may differ from U.S. GAAP.
U.S. TAX STATUS — No provision is made for U.S. income taxes as it is each Fund’s intention to continue to qualify for and elect the tax treatment applicable to regulated investment companies under Subchapter M of the Internal Revenue Code of 1986, as amended, and make the requisite distributions to its shareholders which will be sufficient to relieve it from U.S. income and excise taxes.
MARKET RISK — The value of a Fund’s shares will fluctuate as a result of the movement of the overall stock market or the value of the underlying fund held by a Fund, and you could lose money.
CASH AND CASH EQUIVALENTS — Cash and cash equivalents are valued at cost plus accrued interest, which approximates market value.
OTHER — In the normal course of business, the Funds may enter into contracts that provide general indemnifications. Each Fund’s maximum exposure under these arrangements is dependent on claims that may be made against the Funds in the future, and, therefore, cannot be estimated; however, the Funds expect the risk of material loss for such claims is considered to be remote.
For additional information about the DFA Underlying Funds’ and iShares Underlying Funds’ valuation policies, refer to the DFA Underlying Funds’ and iShares Underlying Funds’ most recent annual or semiannual report which can be found at us.dimensional.com and iShares.com, respectively.
2. | Investment Adviser and Other Services |
Matson Money, Inc. serves as the investment adviser to each Fund. Each Fund compensates the Adviser for its services at an annual rate based on each Fund’s average daily net assets (the “Advisory Fee”), payable on a monthly basis in arrears, as shown in the following tables.
AVERAGE DAILY NET ASSETS | | ADVISORY FEE | |
For the first $1 billion | | | 0.50 | % |
Over $1 billion to $3 billion | | | 0.49 | |
Over $3 billion to $5 billion | | | 0.48 | |
Over $5 billion | | | 0.47 | |
The Adviser has voluntarily agreed to waive advisory fees and/or reimburse expenses to the extent that total annual Fund operating expenses exceed the rates (“Expense Caps”) shown in the following table annually of each Fund’s average daily net assets. The Adviser may not recoup waived management fees or reimbursed expenses. The Adviser may discontinue these arrangements at any time.
FUND | | EXPENSE CAPS | |
Free Market U.S. Equity Fund | | | 1.13 | % |
Free Market International Equity Fund | | | 1.35 | |
Free Market Fixed Income Fund | | | 1.00 | |
15
FREE MARKET FUNDS
Notes to Financial Statements (Continued)
AUGUST 31, 2024
During the current fiscal period, investment advisory fees accrued were as follows:
FUND | | ADVISORY FEES | |
Free Market U.S. Equity Fund | | $ | 19,003,981 | |
Free Market International Equity Fund | | | 14,615,451 | |
Free Market Fixed Income Fund | | | 13,737,559 | |
U.S. Bancorp Fund Services, LLC, doing business as U.S. Bank Global Fund Services (“Fund Services”), serves as administrator for the Funds. For providing administrative and accounting services, Fund Services is entitled to receive a monthly fee, subject to certain minimum and out of pocket expenses.
Fund Services serves as the Funds’ transfer and dividend disbursing agent. For providing transfer agent services, Fund Services is entitled to receive a monthly fee, subject to certain minimum and out of pocket expenses.
U.S. Bank, N.A. (the “Custodian”) provides certain custodial services to the Funds. The Custodian is entitled to receive a monthly fee, subject to certain minimum and out of pocket expenses.
Vigilant Distributors, LLC (the “Distributor”), serves as the principal underwriter and distributor of the Funds’ shares pursuant to a Distribution Agreement with RBB.
For compensation amounts paid to Fund Services and the Custodian, please refer to the Statements of Operations.
3. | Director and Officer Compensation |
The Directors of the Company receive an annual retainer and meeting fees for meetings attended. An employee of Vigilant Compliance, LLC serves as Chief Compliance Officer of the Company. Vigilant Compliance, LLC is compensated for the services provided to the Company. Employees of RBB serve as President, Chief Financial Officer, Chief Operating Officer, Secretary and Director of Marketing & Business Development of the Company. They are compensated by the Company for services provided. Certain employees of Fund Services serve as officers of the Company. They are not compensated by the Funds or the Company. For Director and Officer compensation amounts, please refer to the Statements of Operations.
4. | Purchases and Sales of Investment Securities |
During the current fiscal period, aggregate purchase and sales of investment securities (excluding short-term investments) of the Funds were as follows:
| | | Purchases | | | Sales | |
Free Market U.S. Equity Fund | | $ | 138,801,469 | | | $ | 141,739,786 | |
Free Market International Equity Fund | | | 414,199,307 | | | | 378,269,317 | |
Free Market Fixed Income Fund | | | 254,454,846 | | | | 232,746,990 | |
There were no purchases or sales of long-term U.S. Government securities during the current fiscal period.
5. | Federal Income Tax Information |
The Funds have followed the authoritative guidance on accounting for and disclosure of uncertainty in tax positions, which requires the Funds to determine whether a tax position is more likely than not to be sustained upon examination, including resolution of any related appeals or litigation processes, based on the technical merits of the position. The Funds have determined that there was no effect on the financial statements from following this authoritative guidance. In the normal course of business, the Funds are subject to examination by federal, state and local jurisdictions, where applicable, for tax years for which applicable statutes of limitations have not expired.
16
FREE MARKET FUNDS
Notes to Financial Statements (Continued)
AUGUST 31, 2024
As of August 31, 2024, the federal tax cost and aggregate gross unrealized appreciation and depreciation of investments held by each Fund were as follows:
| | | FEDERAL
TAX COST | | | UNREALIZED
APPRECIATION | | | UNREALIZED
(DEPRECIATION) | | | NET UNREALIZED
APPRECIATION/
(DEPRECIATION) | |
Free Market U.S. Equity Fund | | $ | 2,424,962,605 | | | $ | 1,900,629,558 | | | $ | (21,978,036 | ) | | $ | 1,878,651,522 | |
Free Market International Equity Fund | | | 2,541,914,986 | | | | 837,789,581 | | | | (34,251,586 | ) | | | 803,537,995 | |
Free Market Fixed Income Fund | | | 2,982,159,803 | | | | 17,662,748 | | | | (64,022,249 | ) | | | (46,359,501 | ) |
Distributions to shareholders, if any, from net investment income and realized gains are determined in accordance with federal income tax regulations, which may differ from net investment income and realized gains recognized for financial reporting purposes. Accordingly, the character of distributions and composition of net assets for tax purposes may differ from those reflected in the accompanying financial statements. To the extent these differences are permanent, such amounts are reclassified within the capital accounts based on the tax treatment; temporary differences do not require such reclassification.
The following permanent differences as of August 31, 2024, primarily attributable to equalization, short term dividend reclass, distribution reclass, and dividend reclass, were reclassified among the following accounts:
| | | DISTRIBUTABLE
EARNINGS/(LOSS) | | | Paid-In
Capital | |
Free Market U.S. Equity Fund | | $ | 113,099,841 | | | $ | 113,099,841 | |
Free Market International Equity Fund | | | 89,087,106 | | | | 89,087,106 | |
Free Market Fixed Income Fund | | | 11,889,373 | | | | 11,889,373 | |
As of August 31, 2024, the components of distributable earnings on a tax basis were as follows:
| | | Undistributed
Ordinary Income | | | Undistributed
Long-Term
Capital Gains | | | Capital Loss
CarryForwards | | | NET Unrealized
Appreciation/
(Depreciation) | |
Free Market U.S. Equity Fund | | $ | 14,101,181 | | | $ | 98,998,660 | | | $ | — | | | $ | 1,878,651,522 | |
Free Market International Equity Fund | | | 89,087,106 | | | | — | | | | (68,574,697 | ) | | | 803,537,995 | |
Free Market Fixed Income Fund | | | 11,889,373 | | | | — | | | | (23,815,192 | ) | | | (46,359,501 | ) |
The differences between the book and tax basis components of distributable earnings relate primarily to the timing of recognition of income and gains for federal income tax purposes and are inclusive of underlying partnerships and investments. Short-term and foreign currency gains, if applicable, are reported as ordinary income for federal income tax purposes.
The tax character of distributions paid during the fiscal years ended August 31, 2023 and August 31, 2024 were as follows:
| | | | | | | Ordinary
Income | | | Long-Term
Gains | | | RETURN OF
CAPITAL | | | Total | |
Free Market U.S. Equity Fund | 2024 | | $ | 42,924,002 | | | $ | 112,093,079 | | | $ | — | | | $ | 155,017,081 | |
| | 2023 | | | 33,276,666 | | | | 220,809,118 | | | | — | | | | 254,085,784 | |
Free Market International Equity Fund | 2024 | | | 71,432,283 | | | | — | | | | — | | | | 71,432,283 | |
| | 2023 | | | 86,538,910 | | | | — | | | | — | | | | 86,538,910 | |
Free Market Fixed Income Fund | 2024 | | | 82,530,062 | | | | — | | | | — | | | | 82,530,062 | |
| | 2023 | | | 42,935,911 | | | | — | | | | — | | | | 42,935,911 | |
Distributions from net investment income and short-term capital gains are treated as ordinary income for federal income tax purposes.
17
FREE MARKET FUNDS
Notes to Financial Statements (Continued)
AUGUST 31, 2024
The Funds are permitted to carry forward capital losses for an unlimited period. Capital losses that are carried forward will retain their character as either short-term or long-term capital losses. As of August 31, 2024, the Free Market International Equity Fund had $16,264,666 of short-term capital loss carryforwards and $52,310,031 of long-term capital loss carryforwards, the Free Market Fixed Income Fund had $4,159,113 of short-term capital loss carryforwards and $19,656,079 of long-term capital loss carryforwards.
6. SECURITIES LENDING
The Funds may make secured loans of their portfolio securities to brokers, dealers and other financial institutions to earn additional income and receive cash collateral equal to at least 102% of the current market value of the loaned securities, as marked to market each day that the NAV of the Funds is determined. When the collateral falls below specified amounts, the Funds’ lending agent will use its best effort to obtain additional collateral on the next business day to meet required amounts under the security lending agreement. The Funds will pay administrative and custodial fees in connection with the loan of securities. Collateral is invested in short-term investments and the Funds will bear the risk of loss of the invested collateral. Investments purchased with proceeds from securities lending are overnight and continuous. Securities lending will expose the Funds to the risk of loss should a borrower default on its obligation to return the borrowed securities. The market value of the securities on loan and cash collateral as of the end of the current fiscal period and the income generated from the program during the current fiscal period with respect to such secured loans were as follows:
Fund | | | | | | Market Value of
Securities Loaned | | | Market Value of
Collateral | | | INCOME RECEIVED
FROM SECURITIES
LENDING | |
Free Market U.S. Equity Fund | | | | | | $ | — | | | $ | — | | | $ | 27,974 | |
Free Market International Equity Fund | | | | | | | 59,175,552 | | | | 60,371,482 | | | | 184,440 | |
Free Market Fixed Income Fund | | | | | | | 44,071,104 | | | | 45,081,700 | | | | 156,457 | |
Securities lending transactions are entered into by the Funds’ securities lending agent on behalf of the Funds under a Master Securities Lending Agreement (“MSLA”) which permits the Funds’ securities lending agent on behalf of the Funds under certain circumstances including an event of default (such as bankruptcy or insolvency), to offset amounts payable on behalf of the Funds to the same counterparty against amounts to be received and create one single net payment due to or from the Funds. The following table is a summary of the Funds’ open securities lending transactions which are subject to a MSLA as of the end of the reporting period:
| | | | | | | | | | | | | | | GROSS AMOUNTS NOT OFFSET IN THE
STATEMENTS OF ASSETS AND LIABILITIES | |
Fund | | GROSS AMOUNTS
OF RECOGNIZED
ASSETS | | | GROSS AMOUNTS
OFFSET IN THE
STATEMENTS
OF ASSETS AND
LIABILITIES | | | NET AMOUNTS
OF ASSETS
PRESENTED IN
THE STATEMENTS
OF ASSETS AND
LIABILITIES | | | FINANCIAL
INSTRUMENTS1 | | | CASH COLLATERAL
RECEIVED | | | Net
Amount2 | |
Free Market U.S. Equity Fund | | $ | — | | | $ | — | | | $ | — | | | $ | — | | | $ | — | | | $ | — | |
Free Market International Equity Fund | | | 59,175,552 | | | | — | | | | 59,175,552 | | | | (59,175,552 | ) | | | — | | | | — | |
Free Market Fixed Income Fund | | | 44,071,104 | | | | — | | | | 44,071,104 | | | | (44,071,104 | ) | | | — | | | | — | |
1 | Amount disclosed is limited to the amount of assets presented in the Statements of Assets and Liabilities. Actual collateral received may be more than the amount shown. |
2 | Net amount represents the net amount receivable from the counterparty in the event of default. |
18
FREE MARKET FUNDS
Notes to Financial Statements (Concluded)
AUGUST 31, 2024
Management has evaluated the impact of all subsequent events on the Funds through the date the financial statements were issued and has determined that there were no subsequent events requiring recognition or disclosure in the financial statements.
19
FREE MARKET FUNDS
Report of Independent Registered Public Accounting Firm
To the Board of Directors of The RBB Fund, Inc. and Shareholders of Free Market U.S. Equity Fund, Free Market International Equity Fund and Free Market Fixed Income Fund
Opinions on the Financial Statements
We have audited the accompanying statements of assets and liabilities, including the portfolios of investments, of Free Market U.S. Equity Fund, Free Market International Equity Fund and Free Market Fixed Income Fund (three of the funds constituting The RBB Fund, Inc., hereafter collectively referred to as the “Funds”) as of August 31, 2024, the related statements of operations for the year ended August 31, 2024, the statements of changes in net assets for each of the two years in the period ended August 31, 2024, including the related notes and the financial highlights for each of the five years in the period ended August 31, 2024 (collectively referred to as the “financial statements”). In our opinion, the financial statements present fairly, in all material respects, the financial position of each of the Funds as of August 31, 2024, the results of each of their operations for the year then ended, the changes in each of their net assets for each of the two years in the period ended August 31, 2024 and each of the financial highlights for each of the five years in the period ended August 31, 2024 in conformity with accounting principles generally accepted in the United States of America.
Basis for Opinions
These financial statements are the responsibility of the Funds’ management. Our responsibility is to express an opinion on the Funds’ financial statements based on our audits. We are a public accounting firm registered with the Public Company Accounting Oversight Board (United States) (PCAOB) and are required to be independent with respect to the Funds in accordance with the U.S. federal securities laws and the applicable rules and regulations of the Securities and Exchange Commission and the PCAOB.
We conducted our audits of these financial statements in accordance with the standards of the PCAOB. Those standards require that we plan and perform the audit to obtain reasonable assurance about whether the financial statements are free of material misstatement, whether due to error or fraud.
Our audits included performing procedures to assess the risks of material misstatement of the financial statements, whether due to error or fraud, and performing procedures that respond to those risks. Such procedures included examining, on a test basis, evidence regarding the amounts and disclosures in the financial statements. Our audits also included evaluating the accounting principles used and significant estimates made by management, as well as evaluating the overall presentation of the financial statements. Our procedures included confirmation of securities owned as of August 31, 2024 by correspondence with the custodian and investment manager of investee funds. We believe that our audits provide a reasonable basis for our opinions.

Philadelphia, Pennsylvania
October 29, 2024
We have served as the auditor of one or more Matson Money, Inc. investment companies since 2008.
20
FREE MARKET FUNDS
Shareholder Tax Information
(Unaudited)
The tax character of dividends and distributions paid during the fiscal year ended August 31, 2024 were as follows:
| | | Ordinary
Income | | | Long-Term
CAPITAL GAINS | | | RETURN OF
CAPITAL | | | Total | |
Free Market U.S. Equity Fund | | $ | 42,924,002 | | | $ | 112,093,079 | | | $ | — | | | $ | 155,017,081 | |
Free Market International Equity Fund | | | 71,432,283 | | | | — | | | | — | | | | 71,432,283 | |
Free Market Fixed Income Fund | | | 82,530,062 | | | | — | | | | — | | | | 82,530,062 | |
Dividends from net investment income and short-term capital gains are treated as ordinary income dividends for federal income tax purposes.
The percentage of taxable ordinary income distributions that are designated as short-term capital gain distributions under Internal Revenue Section 871(k)(2)(c) are 0.00% for each Fund.
The percentage of total ordinary income dividends qualifying for the 15% dividend income tax rate is 100% for the Free Market U.S. Equity Fund and 91.22% for the Free Market International Equity Fund.
The percentage of total ordinary dividends qualifying for the corporate dividends received deduction is 100% for the Free Market U.S. Equity Fund.
The percentage of qualified interest income related dividends not subject to withholding tax for non-resident aliens and foreign corporations is 65.55% for the Free Market Fixed Income Fund. A total of 26.45% of the dividend distributed during the fiscal year was derived from U.S. Government securities, which is generally exempt from state income tax for the Free Market Fixed Income Fund.
Because each Fund’s fiscal year is not the calendar year, another notification will be sent with respect to calendar year 2024. The second notification, which will reflect the amount, if any, to be used by calendar year taxpayers on their U.S. federal income tax returns, will be made in conjunction with Form 1099-DIV and will be mailed in January 2025.
Foreign shareholders will generally be subject to U.S. withholding tax on the amount of their ordinary income dividends. They will generally not be entitled to a foreign tax credit or deduction for the withholding taxes paid by the Funds, if any. The Free Market International Equity Fund passed through foreign tax credits of $10,825,272 and earned $74,603,378 of gross foreign source income during the fiscal year.
In general, dividends received by tax-exempt recipients (e.g., IRAs and Keoghs) need not be reported as taxable income for U.S. federal income tax purposes. However, some retirement trusts (e.g., corporate, Keogh and 403(b)(7) plans) may need this information for their annual information reporting.
Shareholders are advised to consult their own tax advisers with respect to the tax consequences of their investment in the Funds.
21
FREE MARKET FUNDS
Other Information
(Unaudited)
APPROVAL OF INVESTMENT ADVISORY AGREEMENT
As required by the 1940 Act, the Board, including all of the Directors who are not “interested persons” of the Company, as that term is defined in the 1940 Act (the “Independent Directors”), considered the renewal of the investment advisory agreement between Matson Money and the Company (the “Investment Advisory Agreement”) on behalf of the Free Market U.S. Equity Fund, Free Market International Equity Fund and Free Market Fixed Income Fund, (for this section only, each a “Fund” and collectively the “Funds”), at a meeting of the Board held on May 15-16, 2024 (the “Meeting”). At the Meeting, the Board, including all of the Independent Directors, approved the Investment Advisory Agreement for an additional one-year term. The Board’s decision to approve the Investment Advisory Agreement reflects the exercise of its business judgment to continue the existing arrangement. In approving the Investment Advisory Agreement, the Board considered information provided by Matson Money with the assistance and advice of counsel to the Independent Directors and the Company.
In considering the renewal and approval of the Investment Advisory Agreement between the Company and Matson Money with respect to the Funds, the Directors took into account all the materials provided prior to and during the Meeting and at other meetings throughout the past year, the presentations made during the Meeting, and the discussions held during the Meeting. The Directors reviewed these materials with management of Matson Money, and discussed the aforementioned Agreement with counsel in executive sessions, at which no representatives of Matson Money were present. Among other things, the Directors considered (i) the nature, extent, and quality of Matson Money’s services provided to the Funds; (ii) descriptions of the experience and qualifications of Matson Money’s personnel providing those services; (iii) Matson Money’s investment philosophies and processes; (iv) Matson Money’s assets under management and client descriptions; (v) Matson Money’s current advisory fee arrangements with the Company and other similarly managed clients; (vi) Matson Money’s compliance procedures; (vii) Matson Money’s financial information, insurance coverage and profitability analysis related to providing advisory services to the Funds; (viii) the extent to which economies of scale are relevant to the Funds; (ix) a report prepared by Fuse Research Network, LLC comparing each Fund’s management fees and total expense ratios to a group of mutual funds deemed comparable to each Fund based primarily on investment strategy similarity (“Peer Group”) and comparing the performance of each Fund to the performance of its Peer Group; and (x) a report comparing the performance of each Fund to the performance of its primary and composite benchmarks.
As part of their review, the Directors considered the nature, extent and quality of the services provided by Matson Money. The Directors concluded that Matson Money had substantial resources to provide services to the Funds and that Matson Money’s services had been acceptable.
The Directors also considered the investment performance of the Funds and Matson Money. Information on the Funds’ investment performance was provided for the three-month, one-year, three-year, five-year, ten-year, and since-inception periods ended December 31, 2023, as applicable. The Directors considered the Funds’ investment performance in light of their respective investment objectives and investment strategies. The Directors concluded that the investment performance of each of the Funds as compared to their respective benchmarks and Peer Groups was acceptable.
In reaching this conclusion, the Directors observed that the Free Market U.S. Equity Fund outperformed its primary benchmark, the Russell 2500 Index, for the three-year, five-year, and since-inception periods ended December 31, 2023, and underperformed its benchmark for the three-month, one-year, and ten-year periods ended December 31, 2023. The Directors noted that the Free Market U.S. Equity Fund outperformed the median of its Peer Group for the three-month, one-year, three-year, and since-inception periods ended December 31, 2023, and underperformed its Peer Group for the five-year and ten-year periods ended December 31, 2023.
The Directors noted that the Free Market International Equity Fund outperformed its primary benchmark, the MSCI World ex-US Index, for the three-year and since-inception periods ended December 31, 2023, and underperformed its benchmark for the three-month, one-year, five-year, and ten-year periods ended December 31, 2023. The Directors noted that the Free Market International Equity Fund outperformed the median of its Peer Group for the three-year period ended December 31, 2023, and underperformed the median of its Peer Group for the three-month, one-year, five-year, ten-year and since-inception periods ended December 31, 2023.
22
FREE MARKET FUNDS
Other Information (Concluded)
(Unaudited)
The Directors noted that the Free Market Fixed Income Fund outperformed its primary benchmark, the FTSE World Government Bond 1-5 Years, for the three-month and one-year periods ended December 31, 2023, and underperformed its benchmark for the three-year, five-year, ten-year, and since-inception periods ended December 31, 2023. The Directors noted that the Free Market Fixed Income Fund underperformed the median of its Peer Group for the three-month, one-year, three-year, five-year, ten-year, and since-inception periods ended December 31, 2023.
The Board also considered the advisory fee rates payable by the Funds under the Investment Advisory Agreement. In this regard, information on the fees paid by the Funds and the Funds’ total operating expense ratios (before and after the voluntary fee waiver and expense reimbursements) were compared to similar information for mutual funds advised by other, unaffiliated investment advisory firms.
The Directors noted that the Free Market U.S. Equity Fund’s net advisory fee and total net expenses (including acquired fund fees and expenses) both ranked below the median and in the 1st quintile of its Peer Group.
The Directors noted that the net advisory fee of the Free Market International Equity Fund ranked below the median and in the 2nd quintile of its Peer Group, and the Fund’s total net expenses (including acquired fund fees and expenses) were below the median and in the 1st quintile of its Peer Group.
The Directors noted that the net advisory fee of the Free Market Fixed Income Fund ranked above the median and in the 5th quintile of its Peer Group, and the Fund’s total net expenses (including acquired fund fees and expenses) were above the median and in the 4th quintile of its Peer Group.
In addition, the Directors took note that Matson Money had voluntarily agreed to waive its advisory fee and reimburse expenses in order to limit total annual Fund operating expenses to 1.13%, 1.35% and 1.00% of the average daily net assets of the Free Market U.S. Equity Fund, Free Market International Equity Fund and Free Market Fixed Income Fund, respectively.
After reviewing the information regarding the Funds’ costs, profitability and economies of scale, and after considering Matson Money’s services, the Directors concluded that the investment advisory fees to be paid by the Funds were fair and reasonable and that the Investment Advisory Agreement should be approved and continued for an additional one year period ending August 16, 2025.
23
Investment Adviser
Matson Money, Inc.
5955 Deerfield Blvd.
Mason, OH 45040
Administrator and Transfer Agent
U.S. Bank Global Fund Services
P.O. Box 701
Milwaukee, WI 53201
Principal Underwriter
Vigilant Distributors, LLC
Gateway Corporate Center, Suite 216
223 Wilmington West Chester Pike
Chadds Ford, PA 19317
Custodian
U.S. Bank, N.A.
1555 North Rivercenter Drive, Suite 302
Milwaukee, WI 53212
Independent Registered Public Accounting Firm
PricewaterhouseCoopers LLP
Two Commerce Square, Suite 1800
2001 Market Street
Philadelphia, PA 19103-7042
Legal Counsel
Faegre Drinker Biddle & Reath LLP
One Logan Square, Suite 2000
Philadelphia, PA 19103-6996
MATSON MONEY U.S. EQUITY VI PORTFOLIO
MATSON MONEY INTERNATIONAL EQUITY VI PORTFOLIO
MATSON MONEY FIXED INCOME VI PORTFOLIO
of
The RBB Fund, Inc.
Financial Statements
August 31, 2024
This report is submitted for the general information of the shareholders of the Portfolios. It is not authorized for distribution unless preceded or accompanied by a current prospectus for the Portfolios.
MATSON MONEY VI PORTFOLIOS
MATSON MONEY U.S. EQUITY VI PORTFOLIO
Portfolio of Investments
August 31, 2024
| | |
Shares
| | | Value | |
OPEN-END FUNDS — 99.2% | | | | |
U.S. Large Cap Value Portfolio III - Class Institutional(a) | | | 226,934 | | | $ | 7,377,627 | |
U.S. Large Company Portfolio - Class Institutional(a) | | | 103,661 | | | | 3,891,420 | |
U.S. Micro Cap Portfolio – Class Institutional(b) | | | 148,443 | | | | 4,270,714 | |
U.S. Small Cap Portfolio – Class Institutional(b) | | | 88,273 | | | | 4,282,108 | |
U.S. Small Cap Value Portfolio – Class Institutional(b) | | | 58,482 | | | | 2,853,324 | |
VA U.S. Large Value Portfolio(b) | | | 30,654 | | | | 1,146,170 | |
VA U.S. Targeted Value Portfolio(b) | | | 175,341 | | | | 4,266,044 | |
TOTAL OPEN-END FUNDS (Cost $21,413,676) | | | | | | | 28,087,407 | |
| | | | | | | | | |
SHORT-TERM INVESTMENTS — 0.9% | | | | |
Money Market Funds — 0.9% | | | | | | | | |
STIT-Government & Agency Portfolio - Class Institutional, 5.19%(c) | | | 242,702 | | | | 242,702 | |
TOTAL SHORT-TERM INVESTMENTS (Cost $242,702) | | | | | | | 242,702 | |
TOTAL INVESTMENTS — 100.1% (Cost $21,656,378) | | | | | | | 28,330,109 | |
Liabilities in Excess of Other Assets — (0.1)%(d) | | | | | | | (25,435 | ) |
TOTAL NET ASSETS — 100.0% | | | | | | $ | 28,304,674 | |
Percentages are stated as a percent of net assets.
(a) | A portfolio of Dimensional Investment Group Inc. |
(b) | A portfolio of DFA Investment Trust Company. |
(c) | The rate shown represents the 7-day effective yield as of August 31, 2024. |
(d) | Represents less than 0.05% of net assets. |
Portfolio holdings are subject to change at any time.
The accompanying notes are an integral part of the financial statements.
1
MATSON MONEY VI PORTFOLIOS
MATSON MONEY INTERNATIONAL EQUITY VI PORTFOLIO
Portfolio of Investments
August 31, 2024
| | |
Shares
| | | Value | |
OPEN-END FUNDS — 99.4% | | | | | | | | |
DFA International Small Cap Value Portfolio - Class Institutional(a) | | | 247,442 | | | $ | 5,889,112 | |
DFA International Value Portfolio III - Class Institutional(b) | | | 333,095 | | | | 6,335,464 | |
Emerging Markets Small Cap Portfolio - Class Institutional(a) | | | 41,678 | | | | 1,009,868 | |
Emerging Markets Value Portfolio - Class Institutional(a) | | | 31,630 | | | | 1,013,432 | |
iShares Core MSCI EAFE ETF(c) | | | 10,935 | | | | 844,073 | |
iShares Core MSCI Emerging Markets ETF | | | 19,929 | | | | 1,085,333 | |
VA International Small Portfolio(a) | | | 273,868 | | | | 3,579,456 | |
VA International Value Portfolio(a) | | | 68,932 | | | | 1,056,032 | |
TOTAL OPEN-END FUNDS (Cost $16,953,776) | | | | | | | 20,812,770 | |
| | | | | | | | | |
| | | UNITS | | | | | |
SHORT-TERM INVESTMENTS — 4.8% | | | | | | | | |
Investments Purchased with Proceeds from Securities Lending — 3.9% | | | | | | | | |
Mount Vernon Liquid Assets Portfolio, LLC, 5.42%(d) | | | 821,284 | | | | 821,284 | |
| | | | | | | | | |
| | | Shares | | | | | |
Money Market Funds — 0.9% | | | | | | | | |
STIT-Government & Agency Portfolio - Class Institutional, 5.19% (e) | | | 194,498 | | | | 194,498 | |
TOTAL SHORT-TERM INVESTMENTS (Cost $1,015,782) | | | | | | | 1,015,782 | |
TOTAL INVESTMENTS — 104.2% (Cost $17,969,558) | | | | | | | 21,828,552 | |
Liabilities in Excess of Other Assets — (4.2)% | | | | | | | (871,519 | ) |
TOTAL NET ASSETS — 100.0% | | | | | | $ | 20,957,033 | |
Percentages are stated as a percent of net assets.
(a) | A portfolio of DFA Investment Trust Company. |
(b) | A portfolio of DFA Investment Dimensions Group Inc. |
(c) | All or a portion of this security is on loan as of August 31, 2024. At August 31, 2024, the total market value of these securities was $805,015 which represented 3.8% of net assets. |
(d) | The rate shown is as of August 31, 2024. |
(e) | The rate shown represents the 7-day effective yield as of August 31, 2024. |
Portfolio holdings are subject to change at any time.
The accompanying notes are an integral part of the financial statements.
2
MATSON MONEY VI PORTFOLIOS
MATSON MONEY FIXED INCOME VI PORTFOLIO
Portfolio of Investments
August 31, 2024
| | |
Shares
| | | Value | |
OPEN-END FUNDS — 98.7% | | | | | | | | |
DFA One-Year Fixed Income Portfolio - Class Institutional(a) | | | 289,452 | | | $ | 2,961,097 | |
DFA Two-Year Global Fixed Income Portfolio - Class Institutional(a) | | | 387,370 | | | | 3,873,702 | |
Dimensional Inflation-Protected Securities ETF | | | 30,829 | | | | 1,285,899 | |
iShares 1-3 Year Treasury Bond ETF | | | 12,519 | | | | 1,036,573 | |
iShares 1-5 Year Investment Grade Corporate Bond ETF | | | 118,461 | | | | 6,199,064 | |
iShares 3-7 Year Treasury Bond ETF | | | 13,036 | | | | 1,547,634 | |
iShares 5-10 Year Investment Grade Corporate Bond ETF | | | 29,153 | | | | 1,546,858 | |
iShares Core International Aggregate Bond ETF | | | 75,522 | | | | 3,873,524 | |
VA Global Bond Portfolio(a) | | | 256,707 | | | | 2,585,040 | |
VA Short-Term Fixed Income Portfolio(a) | | | 49,758 | | | | 517,485 | |
TOTAL OPEN-END FUNDS (Cost $25,910,608) | | | | | | | 25,426,876 | |
| | | | | | | | | |
SHORT-TERM INVESTMENTS — 1.3% | | | | | | | | |
Money Market Funds — 1.3% | | | | | | | | |
STIT-Government & Agency Portfolio - Class Institutional, 5.19% (b) | | | 326,158 | | | | 326,158 | |
TOTAL SHORT-TERM INVESTMENTS (Cost $326,158) | | | | | | | 326,158 | |
TOTAL INVESTMENTS — 100.0% (Cost $26,236,766) | | | | | | | 25,753,034 | |
Liabilities in Excess of Other Assets — (0.0)% | | | | | | | (30 | ) |
TOTAL NET ASSETS — 100.0% | | | | | | $ | 25,753,004 | |
Percentages are stated as a percent of net assets.
(a) | A portfolio of DFA Investment Dimensions Group Inc. |
(b) | The rate shown represents the 7-day effective yield as of August 31, 2024. |
Portfolio holdings are subject to change at any time.
The accompanying notes are an integral part of the financial statements.
3
MATSON MONEY VI PORTFOLIOS
Statements of Assets and Liabilities
August 31, 2024
| | | MATSON MONEY
U.S. EQUITY
VI PORTFOLIO | | | MATSON MONEY
INTERNATIONAL EQUITY
VI PORTFOLIO | | | MATSON MONEY
FIXED INCOME
VI PORTFOLIO | |
ASSETS | | | | | | | | | | | | |
Investments in non-affiliated funds, at value (cost $21,413,676, $16,953,776 and $25,910,608, respectively) | | $ | 28,087,407 | | | $ | 20,812,770 | | | $ | 25,426,876 | |
Short-term investments, at value (cost $242,702, $194,498 and $326,158, respectively) | | | 242,702 | | | | 194,498 | | | | 326,158 | |
Investments purchased with proceeds from securities lending collateral (cost $—, $821,284 and $—, respectively) | | | — | | | | 821,284 | | | | — | |
Receivables for: | | | | | | | | | | | | |
Investments sold | | | 36,006 | | | | 810 | | | | 64,797 | |
Dividends and interest | | | — | | | | 52 | | | | 14,008 | |
Prepaid expenses and other assets | | | 520 | | | | 64 | | | | 473 | |
Total assets | | | 28,366,635 | | | | 21,829,478 | | | | 25,832,312 | |
| | | | | | | | | | | | | |
LIABILITIES | | | | | | | | | | | | |
Payables for: | | | | | | | | | | | | |
Audit Fees | | $ | 35,918 | | | $ | 35,914 | | | $ | 35,913 | |
Advisory fees | | | 11,726 | | | | 8,659 | | | | 11,084 | |
Capital shares redeemed | | | 8,116 | | | | 2,178 | | | | 26,376 | |
Administration and accounting fees | | | 3,452 | | | | 3,144 | | | | 3,507 | |
Transfer agent fees | | | 673 | | | | 556 | | | | 700 | |
Securities lending collateral (see Note 6) | | | — | | | | 821,284 | | | | — | |
Other accrued expenses and liabilities | | | 2,076 | | | | 710 | | | | 1,728 | |
Total liabilities | | | 61,961 | | | | 872,445 | | | | 79,308 | |
Net assets | | $ | 28,304,674 | | | $ | 20,957,033 | | | $ | 25,753,004 | |
| | | | | | | | | | | | | |
NET ASSETS CONSIST OF: | | | | | | | | | | | | |
Par value | | $ | 807 | | | $ | 742 | | | $ | 1,051 | |
Paid-in capital | | | 19,729,387 | | | | 17,283,397 | | | | 26,615,740 | |
Total distributable earnings/(loss) | | | 8,574,480 | | | | 3,672,894 | | | | (863,787 | ) |
Net assets | | $ | 28,304,674 | | | $ | 20,957,033 | | | $ | 25,753,004 | |
| | | | | | | | | | | | | |
CAPITAL SHARES: | | | | | | | | | | | | |
Net assets | | $ | 28,304,674 | | | $ | 20,957,033 | | | $ | 25,753,004 | |
Shares outstanding ($0.001 par value, 100,000,000 shares authorized) | | | 806,715 | | | | 742,314 | | | | 1,051,418 | |
Net asset value, offering and redemption price per share | | $ | 35.09 | | | $ | 28.23 | | | $ | 24.49 | |
The accompanying notes are an integral part of the financial statements.
4
MATSON MONEY VI PORTFOLIOS
Statements of Operations
FOR THE Year ENDED August 31, 2024
| | | MATSON MONEY
U.S. EQUITY
VI PORTFOLIO | | | MATSON MONEY
INTERNATIONAL EQUITY
VI PORTFOLIO | | | MATSON MONEY
FIXED INCOME
VI PORTFOLIO | |
INVESTMENT INCOME | | | | | | | | | | | | |
Dividends from non-affiliated funds | | $ | 428,541 | | | $ | 746,373 | | | $ | 1,011,936 | |
Interest income | | | 13,530 | | | | 10,484 | | | | 21,798 | |
Securities lending income | | | — | | | | 1,329 | | | | 5,246 | |
Total investment income | | | 442,071 | | | | 758,186 | | | | 1,038,980 | |
| | | | | | | | | | | | | |
EXPENSES | | | | | | | | | | | | |
Advisory fees (Note 2) | | | 138,890 | | | | 103,360 | | | | 134,682 | |
Audit and tax service fees | | | 36,340 | | | | 36,129 | | | | 36,128 | |
Administration and accounting fees (Note 2) | | | 17,337 | | | | 16,488 | | | | 17,289 | |
Printing and shareholder reporting fees | | | 3,237 | | | | 3,024 | | | | 3,116 | |
Director fees | | | 3,054 | | | | 2,279 | | | | 2,979 | |
Custodian fees (Note 2) | | | 2,782 | | | | 2,560 | | | | 2,449 | |
Officer fees | | | 2,165 | | | | 1,606 | | | | 2,119 | |
Legal fees | | | 1,363 | | | | 1,007 | | | | 1,361 | |
Other expenses | | | 4,955 | | | | 4,571 | | | | 4,919 | |
Total expenses | | | 210,123 | | | | 171,024 | | | | 205,042 | |
Net investment income/(loss) | | | 231,948 | | | | 587,162 | | | | 833,938 | |
| | | | | | | | | | | | | |
NET REALIZED AND UNREALIZED GAIN/(LOSS) FROM INVESTMENTS | | | | | | | | | | | | |
Net realized gain/(loss) from: | | | | | | | | | | | | |
Non-affiliated funds | | | 1,375,562 | | | | 350,082 | | | | (324,337 | ) |
Capital gain distributions from non-affiliated fund investments | | | 859,417 | | | | 16,616 | | | | — | |
Net change in unrealized appreciation/(depreciation) on: | | | | | | | | | | | | |
Non-affiliated funds | | | 2,699,915 | | | | 2,366,865 | | | | 1,087,837 | |
Net realized and unrealized gain/(loss) on investments | | | 4,934,894 | | | | 2,733,563 | | | | 763,460 | |
NET INCREASE/(DECREASE) IN NET ASSETS RESULTING FROM OPERATIONS | | $ | 5,166,842 | | | $ | 3,320,725 | | | $ | 1,597,398 | |
The accompanying notes are an integral part of the financial statements.
5
MATSON MONEY U.S. EQUITY VI PORTFOLIO
Statements of Changes in Net Assets
| | | FOR THE
YEAR ENDED
AUGUST 31, 2024 | | | FOR THE
YEAR ENDED
AUGUST 31, 2023 | |
INCREASE/(DECREASE) IN NET ASSETS FROM OPERATIONS: | | | | | | | | |
Net investment income/(loss) | | $ | 231,948 | | | $ | 251,488 | |
Net realized gain/(loss) from investments | | | 2,234,979 | | | | 1,833,022 | |
Net change in unrealized appreciation/(depreciation) on investments | | | 2,699,915 | | | | 656,457 | |
Net increase/(decrease) in net assets resulting from operations | | | 5,166,842 | | | | 2,740,967 | |
| | | | | | | | | |
DIVIDENDS AND DISTRIBUTIONS TO SHAREHOLDERS: | | | | | | | | |
Total distributable earnings | | | (2,176,502 | ) | | | (2,775,746 | ) |
Net decrease in net assets from dividends and distributions to shareholders | | | (2,176,502 | ) | | | (2,775,746 | ) |
| | | | | | | | | |
CAPITAL SHARE TRANSACTIONS: | | | | | | | | |
Proceeds from shares sold | | | 2,413,824 | | | | 1,602,156 | |
Reinvestment of distributions | | | 2,176,501 | | | | 2,775,746 | |
Shares redeemed | | | (7,046,852 | ) | | | (4,389,190 | ) |
Net increase/(decrease) in net assets from capital shares | | | (2,456,527 | ) | | | (11,288 | ) |
Total increase/(decrease) in net assets | | | 533,813 | | | | (46,067 | ) |
| | | | | | | | | |
NET ASSETS: | | | | | | | | |
Beginning of period | | | 27,770,861 | | | | 27,816,928 | |
End of period | | $ | 28,304,674 | | | $ | 27,770,861 | |
| | | | | | | | | |
SHARES TRANSACTIONS: | | | | | | | | |
Shares sold | | | 75,772 | | | | 53,564 | |
Dividends and distributions reinvested | | | 68,790 | | | | 96,851 | |
Shares redeemed | | | (217,257 | ) | | | (142,873 | ) |
Net increase/(decrease) in shares outstanding | | | (72,695 | ) | | | 7,542 | |
The accompanying notes are an integral part of the financial statements.
6
MATSON MONEY INTERNATIONAL EQUITY VI PORTFOLIO
Statements of Changes in Net Assets
| | | FOR THE
YEAR ENDED
AUGUST 31, 2024 | | | FOR THE
YEAR ENDED
AUGUST 31, 2023 | |
INCREASE/(DECREASE) IN NET ASSETS FROM OPERATIONS: | | | | | | | | |
Net investment income/(loss) | | $ | 587,162 | | | $ | 526,970 | |
Net realized gain/(loss) from investments | | | 366,698 | | | | (219,290 | ) |
Net change in unrealized appreciation/(depreciation) on investments | | | 2,366,865 | | | | 2,773,306 | |
Net increase/(decrease) in net assets resulting from operations | | | 3,320,725 | | | | 3,080,986 | |
| | | | | | | | | |
DIVIDENDS AND DISTRIBUTIONS TO SHAREHOLDERS: | | | | | | | | |
Total distributable earnings | | | (638,754 | ) | | | (663,764 | ) |
Net decrease in net assets from dividends and distributions to shareholders | | | (638,754 | ) | | | (663,764 | ) |
| | | | | | | | | |
CAPITAL SHARE TRANSACTIONS: | | | | | | | | |
Proceeds from shares sold | | | 1,745,197 | | | | 1,869,280 | |
Reinvestment of distributions | | | 638,754 | | | | 663,764 | |
Shares redeemed | | | (4,460,211 | ) | | | (3,699,124 | ) |
Net increase/(decrease) in net assets from capital shares | | | (2,076,260 | ) | | | (1,166,080 | ) |
Total increase/(decrease) in net assets | | | 605,711 | | | | 1,251,142 | |
| | | | | | | | | |
NET ASSETS: | | | | | | | | |
Beginning of period | | | 20,351,322 | | | | 19,100,180 | |
End of period | | $ | 20,957,033 | | | $ | 20,351,322 | |
| | | | | | | | | |
SHARES TRANSACTIONS: | | | | | | | | |
Shares sold | | | 66,262 | | | | 84,786 | |
Dividends and distributions reinvested | | | 25,168 | | | | 29,553 | |
Shares redeemed | | | (168,854 | ) | | | (154,187 | ) |
Net increase/(decrease) in shares outstanding | | | (77,424 | ) | | | (39,848 | ) |
The accompanying notes are an integral part of the financial statements.
7
MATSON MONEY FIXED INCOME VI PORTFOLIO
Statements of Changes in Net Assets
| | | FOR THE
YEAR ENDED
AUGUST 31, 2024 | | | FOR THE
YEAR ENDED
AUGUST 31, 2023 | |
INCREASE/(DECREASE) IN NET ASSETS FROM OPERATIONS: | | | | | | | | |
Net investment income/(loss) | | $ | 833,938 | | | $ | 439,628 | |
Net realized gain/(loss) from investments | | | (324,337 | ) | | | (193,139 | ) |
Net change in unrealized appreciation/(depreciation) on investments | | | 1,087,837 | | | | 127,777 | |
Net increase/(decrease) in net assets resulting from operations | | | 1,597,398 | | | | 374,266 | |
| | | | | | | | | |
DIVIDENDS AND DISTRIBUTIONS TO SHAREHOLDERS: | | | | | | | | |
Total distributable earnings | | | (721,924 | ) | | | (338,690 | ) |
Net decrease in net assets from dividends and distributions to shareholders | | | (721,924 | ) | | | (338,690 | ) |
| | | | | | | | | |
CAPITAL SHARE TRANSACTIONS: | | | | | | | | |
Proceeds from shares sold | | | 2,993,093 | | | | 2,633,205 | |
Reinvestment of distributions | | | 721,924 | | | | 338,690 | |
Shares redeemed | | | (5,764,504 | ) | | | (4,379,286 | ) |
Net increase/(decrease) in net assets from capital shares | | | (2,049,487 | ) | | | (1,407,391 | ) |
Total increase/(decrease) in net assets | | | (1,174,013 | ) | | | (1,371,815 | ) |
| | | | | | | | | |
NET ASSETS: | | | | | | | | |
Beginning of period | | | 26,927,017 | | | | 28,298,832 | |
End of period | | $ | 25,753,004 | | | $ | 26,927,017 | |
| | | | | | | | | |
SHARES TRANSACTIONS: | | | | | | | | |
Shares sold | | | 125,742 | | | | 112,199 | |
Dividends and distributions reinvested | | | 30,435 | | | | 14,630 | |
Shares redeemed | | | (241,074 | ) | | | (186,124 | ) |
Net increase/(decrease) in shares outstanding | | | (84,897 | ) | | | (59,295 | ) |
The accompanying notes are an integral part of the financial statements.
8
MATSON MONEY VI PORTFOLIOS
MATSON MONEY U.S. EQUITY VI PORTFOLIO
Financial Highlights
Contained below is per share operating performance data for each share outstanding, total investment return/(loss), ratios to average net assets and other supplemental data for the respective periods. This information has been derived from information provided in the financial statements. |
| | | FOR THE
YEAR ENDED
AUGUST 31, 2024 | | | FOR THE
YEAR ENDED
AUGUST 31, 2023 | | | FOR THE
YEAR ENDED
AUGUST 31, 2022 | | | FOR THE
YEAR ENDED
AUGUST 31, 2021 | | | FOR THE
YEAR ENDED
AUGUST 31, 2020 | |
Per Share Operating Performance | | | | | | | | | | | | | | | | | | | | |
Net asset value, beginning of period | | $ | 31.58 | | | $ | 31.90 | | | $ | 36.70 | | | $ | 25.62 | | | $ | 27.08 | |
Net investment income/(loss)(1) | | | 0.27 | | | | 0.28 | | | | 0.23 | | | | 0.25 | | | | 0.22 | |
Net realized and unrealized gain/(loss) on investments | | | 5.74 | | | | 2.62 | | | | (2.37 | ) | | | 12.06 | | | | (0.04 | ) |
Net increase/(decrease) in net assets resulting from operations | | | 6.01 | | | | 2.90 | | | | (2.14 | ) | | | 12.31 | | | | 0.18 | |
Dividends and distributions to shareholders from: | | | | | | | | | | | | | | | | | | | | |
Net investment income | | | (0.33 | ) | | | (0.26 | ) | | | (0.34 | ) | | | (0.29 | ) | | | (0.24 | ) |
Net realized capital gains | | | (2.17 | ) | | | (2.96 | ) | | | (2.32 | ) | | | (0.94 | ) | | | (1.40 | ) |
Total dividends and distributions to shareholders | | | (2.50 | ) | | | (3.22 | ) | | | (2.66 | ) | | | (1.23 | ) | | | (1.64 | ) |
Net asset value, end of period | | $ | 35.09 | | | $ | 31.58 | | | $ | 31.90 | | | $ | 36.70 | | | $ | 25.62 | |
Total investment return/(loss)(2) | | | 19.90 | % | | | 10.14 | % | | | (6.64 | )% | | | 49.31 | % | | | (0.02 | )% |
| | | | | | | | | | | | | | | | | | | | | |
Ratios/Supplemental Data | | | | | | | | | | | | | | | | | | | | |
Net assets, end of period (000’s omitted) | | $ | 28,305 | | | $ | 27,771 | | | $ | 27,817 | | | $ | 31,796 | | | $ | 25,070 | |
Ratio of expenses to average net assets with waivers, if any(3) | | | 0.76 | % | | | 0.74 | % | | | 0.73 | % | | | 0.74 | % | | | 0.76 | % |
Ratio of expenses to average net assets without waivers, if any(3) | | | 0.76 | % | | | 0.74 | % | | | 0.73 | % | | | 0.74 | % | | | 0.76 | % |
Ratio of net investment income/(loss) to average net assets(3) | | | 0.84 | % | | | 0.90 | % | | | 0.65 | % | | | 0.77 | % | | | 0.86 | % |
Portfolio turnover rate | | | 8 | % | | | 9 | % | | | 15 | % | | | 18 | % | | | 18 | % |
(1) | The selected per share data is calculated using the average shares outstanding method for the period. |
(2) | Total investment return/(loss) is calculated by assuming a purchase of shares on the first day and a sale of shares on the last day of each period reported and includes reinvestments of dividends and distributions, if any. |
(3) | The Portfolio also will indirectly bear its prorated share of expenses of the underlying funds. Such expenses are not included in the calculation of this ratio. |
The accompanying notes are an integral part of the financial statements.
9
MATSON MONEY VI PORTFOLIOS
MATSON MONEY INTERNATIONAL EQUITY VI PORTFOLIO
Financial Highlights
Contained below is per share operating performance data for each share outstanding, total investment return/(loss), ratios to average net assets and other supplemental data for the respective periods. This information has been derived from information provided in the financial statements. |
| | | FOR THE
YEAR ENDED
AUGUST 31, 2024 | | | FOR THE
YEAR ENDED
AUGUST 31, 2023 | | | FOR THE
YEAR ENDED
AUGUST 31, 2022 | | | FOR THE
YEAR ENDED
AUGUST 31, 2021 | | | FOR THE
YEAR ENDED
AUGUST 31, 2020 | |
Per Share Operating Performance | | | | | | | | | | | | | | | | | | | | |
Net asset value, beginning of period | | $ | 24.83 | | | $ | 22.22 | | | $ | 28.00 | | | $ | 21.35 | | | $ | 22.27 | |
Net investment income/(loss)(1) | | | 0.73 | | | | 0.61 | | | | 0.73 | | | | 0.37 | | | | 0.42 | |
Net realized and unrealized gain/(loss) on investments | | | 3.46 | | | | 2.73 | | | | (4.87 | ) | | | 6.80 | | | | (0.25 | ) |
Net increase/(decrease) in net assets resulting from operations | | | 4.19 | | | | 3.34 | | | | (4.14 | ) | | | 7.17 | | | | 0.17 | |
Dividends and distributions to shareholders from: | | | | | | | | | | | | | | | | | | | | |
Net investment income | | | (0.79 | ) | | | (0.50 | ) | | | (0.82 | ) | | | (0.35 | ) | | | (0.52 | ) |
Net realized capital gains | | | — | | | | (0.23 | ) | | | (0.82 | ) | | | (0.17 | ) | | | (0.57 | ) |
Total dividends and distributions to shareholders | | | (0.79 | ) | | | (0.73 | ) | | | (1.64 | ) | | | (0.52 | ) | | | (1.09 | ) |
Net asset value, end of period | | $ | 28.23 | | | $ | 24.83 | | | $ | 22.22 | | | $ | 28.00 | | | $ | 21.35 | |
Total investment return/(loss)(2) | | | 17.23 | % | | | 15.39 | % | | | (15.66 | )% | | | 33.96 | % | | | 0.17 | % |
| | | | | | | | | | | | | | | | | | | | | |
Ratios/Supplemental Data | | | | | | | | | | | | | | | | | | | | |
Net assets, end of period (000’s omitted) | | $ | 20,957 | | | $ | 20,351 | | | $ | 19,100 | | | $ | 22,780 | | | $ | 18,559 | |
Ratio of expenses to average net assets with waivers, if any(3) | | | 0.83 | % | | | 0.80 | % | | | 0.80 | % | | | 0.80 | % | | | 0.83 | % |
Ratio of expenses to average net assets without waivers, if any(3) | | | 0.83 | % | | | 0.80 | % | | | 0.80 | % | | | 0.80 | % | | | 0.83 | % |
Ratio of net investment income/(loss) to average net assets(3) | | | 2.84 | % | | | 2.60 | % | | | 2.86 | % | | | 1.48 | % | | | 1.99 | % |
Portfolio turnover rate | | | 6 | % | | | 11 | % | | | 11 | % | | | 18 | % | | | 26 | % |
(1) | The selected per share data is calculated using the average shares outstanding method for the period. |
(2) | Total investment return/(loss) is calculated by assuming a purchase of shares on the first day and a sale of shares on the last day of each period reported and includes reinvestments of dividends and distributions, if any. |
(3) | The Portfolio also will indirectly bear its prorated share of expenses of the underlying funds. Such expenses are not included in the calculation of this ratio. |
The accompanying notes are an integral part of the financial statements.
10
MATSON MONEY VI PORTFOLIOS
MATSON MONEY FIXED INCOME VI PORTFOLIO
Financial Highlights
Contained below is per share operating performance data for each share outstanding, total investment return/(loss), ratios to average net assets and other supplemental data for the respective periods. This information has been derived from information provided in the financial statements. |
| | | FOR THE
YEAR ENDED
AUGUST 31, 2024 | | | FOR THE
YEAR ENDED
AUGUST 31, 2023 | | | FOR THE
YEAR ENDED
AUGUST 31, 2022 | | | FOR THE
YEAR ENDED
AUGUST 31, 2021 | | | FOR THE
YEAR ENDED
AUGUST 31, 2020 | |
Per Share Operating Performance | | | | | | | | | | | | | | | | | | | | |
Net asset value, beginning of period | | $ | 23.70 | | | $ | 23.67 | | | $ | 25.55 | | | $ | 25.66 | | | $ | 25.38 | |
Net investment income/(loss)(1) | | | 0.74 | | | | 0.37 | | | | 0.10 | | | | 0.02 | | | | 0.43 | |
Net realized and unrealized gain/(loss) on investments | | | 0.69 | | | | (0.05 | ) | | | (1.90 | ) | | | 0.04 | | | | 0.27 | |
Net increase/(decrease) in net assets resulting from operations | | | 1.43 | | | | 0.32 | | | | (1.80 | ) | | | 0.06 | | | | 0.70 | |
Dividends and distributions to shareholders from: | | | | | | | | | | | | | | | | | | | | |
Net investment income | | | (0.64 | ) | | | (0.29 | ) | | | (0.08 | ) | | | (0.16 | ) | | | (0.42 | ) |
Net realized capital gains | | | — | | | | — | | | | — | | | | — | | | | — | |
Return of capital | | | — | | | | — | | | | — | | | | (0.01 | ) | | | — | |
Total dividends and distributions to shareholders | | | (0.64 | ) | | | (0.29 | ) | | | (0.08 | ) | | | (0.17 | ) | | | (0.42 | ) |
Net asset value, end of period | | $ | 24.49 | | | $ | 23.70 | | | $ | 23.67 | | | $ | 25.55 | | | $ | 25.66 | |
Total investment return/(loss)(2) | | | 6.12 | % | | | 1.36 | % | | | (7.08 | )% | | | 0.22 | % | | | 2.80 | % |
| | | | | | | | | | | | | | | | | | | | | |
Ratios/Supplemental Data | | | | | | | | | | | | | | | | | | | | |
Net assets, end of period (000’s omitted) | | $ | 25,753 | | | $ | 26,927 | | | $ | 28,299 | | | $ | 33,103 | | | $ | 27,323 | |
Ratio of expenses to average net assets with waivers, if any(3) | | | 0.76 | % | | | 0.74 | % | | | 0.73 | % | | | 0.73 | % | | | 0.74 | % |
Ratio of expenses to average net assets without waivers, if any(3) | | | 0.76 | % | | | 0.74 | % | | | 0.73 | % | | | 0.73 | % | | | 0.74 | % |
Ratio of net investment income/(loss) to average net assets(3) | | | 3.10 | % | | | 1.59 | % | | | 0.39 | % | | | 0.07 | % | | | 1.69 | % |
Portfolio turnover rate | | | 15 | % | | | 8 | % | | | 7 | % | | | 8 | % | | | 46 | % |
(1) | The selected per share data is calculated using the average shares outstanding method for the period. |
(2) | Total investment return/(loss) is calculated by assuming a purchase of shares on the first day and a sale of shares on the last day of each period reported and includes reinvestments of dividends and distributions, if any. |
(3) | The Portfolio also will indirectly bear its prorated share of expenses of the underlying funds. Such expenses are not included in the calculation of this ratio. |
The accompanying notes are an integral part of the financial statements.
11
MATSON MONEY VI PORTFOLIOS
Notes to Financial Statements
August 31, 2024
1. | Organization and Significant Accounting Policies |
The RBB Fund, Inc. (“RBB” or the “Company”) was incorporated under the laws of the State of Maryland on February 29, 1988 and is registered under the Investment Company Act of 1940, as amended (the “1940 Act”), as an open-end management investment company. RBB is a “series fund,” which is an investment company divided into separate portfolios. Each portfolio is treated as a separate entity for certain matters under the 1940 Act, and for other purposes, and a shareholder of one portfolio is not deemed to be a shareholder of any other portfolio. Currently, RBB has sixty-five separate investment portfolios, including the Matson Money U.S. Equity VI Portfolio, the Matson Money International Equity VI Portfolio and the Matson Money Fixed Income VI Portfolio (each, a “Portfolio” and collectively, the “Portfolios”). Each Portfolio operates as a “fund of funds” and commenced investment operations on February 18, 2014. Shares of the Portfolios are offered to separate accounts of participating life insurance companies for the purpose of funding variable annuity contracts and variable life insurance policies.
RBB has authorized capital of one hundred billion shares of common stock of which 92.923 billion shares are currently classified into two hundred and thirty-six classes of common stock. Each class represents an interest in an active or inactive RBB investment portfolio.
Matson Money U.S. Equity VI Portfolio and Matson Money International Equity VI Portfolio’s investment objective is to seek long-term capital appreciation. Matson Money Fixed Income VI Portfolio’s investment objective is to seek total return (consisting of current income and capital appreciation).
The Portfolios are investment companies and follow accounting and reporting guidance in the Financial Accounting Standards Board (“FASB”) Accounting Standards Codification Topic 946 “Financial Services - Investment Companies”.
The end of the reporting period for the Portfolios is August 31, 2024, and the period covered by these Notes to Financial Statements is the fiscal year ended August 31, 2024 (the “current fiscal period”).
INVESTMENT COMPANY SECURITIES — The Portfolios pursue their investment objectives by investing primarily in shares of registered, open-end investment companies and exchange-traded funds (“ETFs”) (collectively, “underlying funds”). When a Portfolio invests in underlying funds it will indirectly bear its proportionate share of any fees and expenses payable directly by the underlying fund. In connection with its investments in other investment companies, a Portfolio will incur higher expenses, many of which may be duplicative. Furthermore, because the Portfolios invest in shares of ETFs and underlying funds their performances are directly related to the ability of the ETFs and underlying funds to meet their respective investment objectives, as well as the allocation of each Portfolio’s assets among the ETFs and underlying funds. Accordingly, the Portfolios’ investment performance will be influenced by the investment strategies of and risks associated with the ETFs and underlying funds in direct proportion to the amount of assets the Portfolios allocate to the ETFs and underlying funds utilizing such strategies. As disclosed in the Portfolio of Investments, the Portfolios invest in a number of different underlying funds, including underlying funds that are portfolios of DFA Investment Dimensions Group Inc., and Dimensional Investment Group Inc. (collectively, “DFA Underlying Funds”) and iShares by BlackRock (“iShares Underlying Funds”). Information about DFA Underlying Funds’ and iShares Underlying Funds’ risks may be found in such DFA Underlying Funds’ and iShares Underlying Funds’ annual or semiannual report to shareholders, which can be found at us.dimensional.com and iShares.com, respectively. Additional information about derivatives related risks, if applicable, may also be found in each such DFA Underlying Funds’ or iShares Underlying Funds’ annual or semiannual report to shareholders. The annual and semiannual reports to shareholders for the underlying funds may also be found by visiting the SEC’s website at http://www.sec.gov.
PORTFOLIO VALUATION — Investments in the underlying funds are valued at each Portfolio’s net asset value (“NAV”) determined as of the close of business on the New York Stock Exchange (generally 4:00 p.m. Eastern time). Investments in ETFs are valued at their last reported sale price. As required, some securities and assets may be valued at fair value as determined in good faith by the Company’s Board of Directors (the “Board” or “Directors”). Direct investments in fixed income securities are valued using an independent pricing service, which considers such factors as security prices, yields, maturities and ratings, and are deemed representative of market values at the close of the market.
12
MATSON MONEY VI PORTFOLIOS
Notes to Financial Statements (continued)
August 31, 2024
The Board has adopted a pricing and valuation policy for use by each Portfolio and its Valuation Designee (as defined below) in calculating a Portfolio’s NAV. Pursuant to Rule 2a-5 under the 1940 Act, the Board has designated Matson Money, Inc. (“Matson Money” or the “Adviser”) as its “Valuation Designee” to perform all of the fair value determinations as well as to perform all of the responsibilities that may be performed by the Valuation Designee, in accordance with Rule 2a-5. The Valuation Designee is authorized to make all necessary determinations of the fair values of portfolio securities and other assets for which market quotations are not readily available or if it is deemed that the prices obtained from brokers and dealers or independent pricing services are unreliable.
FAIR VALUE MEASUREMENTS — The inputs and valuation techniques used to measure the fair value of the Portfolios’ investments are summarized into three levels as described in the hierarchy below:
| | ● Level 1 — | Prices are determined using quoted prices in active markets for identical securities. |
| | ● Level 2 — | Prices are determined using other significant observable inputs (including quoted prices for similar securities, interest rates, prepayment speeds, credit risk, etc.). |
| | ● Level 3 — | Prices are determined using significant unobservable inputs (including the Portfolios’ own assumptions in determining the fair value of investments). |
The inputs or methodologies used for valuing securities are not necessarily an indication of the risk associated with investing in those securities.
The following is a summary of the inputs used, as of the end of the current fiscal period, in valuing the Portfolios’ investments carried at fair value:
MATSON MONEY U.S. EQUITY VI PORTFOLIO
| | | LEVEL 1 | | | LEVEL 2 | | | LEVEL 3 | | | TOTAL | |
Open-end Funds | | $ | 22,675,193 | | | $ | — | | | $ | — | | | $ | 22,675,193 | |
Investments Measured at Net Asset Value* | | | — | | | | — | | | | — | | | | 5,412,214 | |
Investments Purchased with Proceeds From Securities Lending Collateral* | | | — | | | | — | | | | — | | | | — | |
Short-Term Investments | | | 242,702 | | | | — | | | | — | | | | 242,702 | |
Total Investments** | | $ | 22,917,895 | | | $ | — | | | $ | — | | | $ | 28,330,109 | |
* | Certain investments that are measured at fair value using the net asset value per share (or its equivalent) practical expedient have not been categorized in the fair value hierarchy. The fair value amounts presented in the table are intended to permit reconciliation of the fair value hierarchy to the amounts presented in the Statements of Assets and Liabilities. |
** | Please refer to the Portfolio of Investments for further details. |
MATSON MONEY INTERNATIONAL EQUITY VI PORTFOLIO
| | | LEVEL 1 | | | LEVEL 2 | | | LEVEL 3 | | | TOTAL | |
Open-end Funds | | $ | 16,177,282 | | | $ | — | | | $ | — | | | $ | 16,177,282 | |
Investments Measured at Net Asset Value* | | | — | | | | — | | | | — | | | | 4,635,488 | |
Investments Purchased with Proceeds From Securities Lending Collateral* | | | — | | | | — | | | | — | | | | 821,284 | |
Short-Term Investments | | | 194,498 | | | | — | | | | — | | | | 194,498 | |
Total Investments** | | $ | 16,371,780 | | | $ | — | | | $ | — | | | $ | 21,828,552 | |
* | Certain investments that are measured at fair value using the net asset value per share (or its equivalent) practical expedient have not been categorized in the fair value hierarchy. The fair value amounts presented in the table are intended to permit reconciliation of the fair value hierarchy to the amounts presented in the Statements of Assets and Liabilities. |
** | Please refer to the Portfolio of Investments for further details. |
13
MATSON MONEY VI PORTFOLIOS
Notes to Financial Statements (Continued)
August 31, 2024
MATSON MONEY FIXED INCOME VI PORTFOLIO
| | | LEVEL 1 | | | LEVEL 2 | | | LEVEL 3 | | | TOTAL | |
Open-end Funds | | $ | 22,324,351 | | | $ | — | | | $ | — | | | $ | 22,324,351 | |
Investments Measured at Net Asset Value* | | | — | | | | — | | | | — | | | | 3,102,525 | |
Investments Purchased with Proceeds From Securities Lending Collateral* | | | — | | | | — | | | | — | | | | — | |
Short-Term Investments | | | 326,158 | | | | — | | | | — | | | | 326,158 | |
Total Investments** | | $ | 22,650,509 | | | $ | — | | | $ | — | | | $ | 25,753,034 | |
* | Certain investments that are measured at fair value using the net asset value per share (or its equivalent) practical expedient have not been categorized in the fair value hierarchy. The fair value amounts presented in the table are intended to permit reconciliation of the fair value hierarchy to the amounts presented in the Statements of Assets and Liabilities. |
** | Please refer to the Portfolio of Investments for further details. |
At the end of each quarter, management evaluates the classification of Levels 1, 2 and 3 assets and liabilities. Various factors are considered, such as changes in liquidity from the prior reporting period; whether or not a broker is willing to execute at the quoted price; the depth and consistency of prices from third party pricing services; and the existence of contemporaneous, observable trades in the market. Additionally, management evaluates the classification of Levels 1, 2 and 3 assets and liabilities on a quarterly basis for changes in listings or delistings on national exchanges.
Due to the inherent uncertainty of determining the fair value of investments that do not have a readily available market value, the fair value of the Portfolios’ investments may fluctuate from period to period. Additionally, the fair value of investments may differ significantly from the values that would have been used had a ready market existed for such investments and may differ materially from the values the Portfolios may ultimately realize. Further, such investments may be subject to legal and other restrictions on resale or otherwise less liquid than publicly traded securities.
For fair valuations using significant unobservable inputs, U.S. generally accepted accounting principles (“U.S. GAAP”) requires each Portfolio to present a reconciliation of the beginning to ending balances for reported market values that presents changes attributable to total realized and unrealized gains or losses, purchases and sales, and transfers in and out of Level 3 during the period. Transfers in and out between levels are based on values at the end of the period. A reconciliation of Level 3 investments is presented only when a Portfolio had an amount of Level 3 investments at the end of the reporting period that was meaningful in relation to its net assets. The amounts and reasons for all Level 3 transfers are disclosed if a Portfolio had an amount of total Level 3 transfers during the reporting period that was meaningful in relation to its net assets as of the end of the reporting period.
During the current fiscal period, the Portfolios had no Level 3 transfers.
USE OF ESTIMATES — The preparation of financial statements in conformity with U.S. GAAP requires management to make estimates and assumptions that affect the reported amounts of assets and liabilities and disclosure of contingent assets and liabilities at the date of the financial statements and the reported amounts of revenues and expenses during the reporting period. Actual results could differ from those estimates and those differences could be significant.
INVESTMENT TRANSACTIONS, INVESTMENT INCOME AND EXPENSES — The Portfolios record security transactions based on trade date for financial reporting purposes. The cost of investments sold is determined by use of the specific identification method for both financial reporting and income tax purposes in determining realized gains and losses on investments. Interest income (including amortization of premiums and accretion of discounts) is accrued when earned. Dividend income is recorded on the ex-dividend date. Distributions received on securities that represent a return of capital or capital gain are recorded as a reduction of cost of investments and/or as a realized gain. Each Portfolio’s investment income, expenses (other than class specific expenses) and unrealized and realized gains and losses are allocated daily to each class of shares based upon the relative proportion of net assets of each class at the beginning of the day. Certain expenses are shared with The RBB Fund
14
MATSON MONEY VI PORTFOLIOS
Notes to Financial Statements (Continued)
August 31, 2024
Trust (the “Trust”), a series trust of affiliated funds. Expenses incurred on behalf of a specific class, fund or fund family of the Company or Trust are charged directly to the class, fund or fund family (in proportion to net assets). Expenses incurred for all funds (such as director or professional fees) are charged to all funds in proportion to their average net assets of RBB and the Trust, or in such other manner as the Board deems fair or equitable. Expenses and fees, including investment advisory and administration fees, are accrued daily and taken into account for the purpose of determining the NAV of the Portfolios. In addition to the net annual operating expenses that the Portfolios bear directly, the shareholders indirectly bear the Portfolios’ pro-rata expenses of the underlying mutual funds in which each Portfolio invests.
DIVIDENDS AND DISTRIBUTIONS TO SHAREHOLDERS — Dividends from net investment income and distributions from net realized capital gains, if any, are declared and paid at least annually to shareholders recorded on the ex-dividend date for each Portfolio. Income dividends and capital gain distributions are determined in accordance with U.S. federal income tax regulations, which may differ from U.S. GAAP.
U.S. TAX STATUS — No provision is made for U.S. income taxes as it is each Portfolio’s intention to continue to qualify for and elect the tax treatment applicable to regulated investment companies under Subchapter M of the Internal Revenue Code of 1986, as amended, and make the requisite distributions to its shareholders which will be sufficient to relieve it from U.S. income and excise taxes.
MARKET RISK — The value of a Portfolio’s shares will fluctuate as a result of the movement of the overall stock market or the value of the underlying fund held by a Portfolio, and you could lose money.
CASH AND CASH EQUIVALENTS — Cash and cash equivalents are valued at cost plus accrued interest, which approximates market value.
OTHER — In the normal course of business, the Portfolios may enter into contracts that provide general indemnifications. Each Portfolio’s maximum exposure under these arrangements is dependent on claims that may be made against the Portfolios in the future, and, therefore, cannot be estimated; however, the Portfolios expect the risk of material loss for such claims to be remote.
For additional information about the DFA Underlying Funds’ and iShares Underlying Funds’ valuation policies, refer to the DFA Underlying Funds’ and iShares Underlying Funds’ most recent annual or semiannual report which can be found at us.dimensional.com and iShares.com, respectively.
2. | Investment Adviser and Other Services |
Matson Money, Inc. serves as the investment adviser to each Portfolio. Each Portfolio compensates the Adviser for its services at an annual rate based on each Portfolio’s average daily net assets (the “Advisory Fee”), payable on a monthly basis in arrears, as shown in the following table.
AVERAGE DAILY NET ASSETS | | ADVISORY FEE | |
For the first $1 billion | | | 0.50 | % |
Over $1 billion to $5 billion | | | 0.49 | |
Over $5 billion | | | 0.47 | |
The Adviser has contractually agreed to waive advisory fees and/or reimburse expenses to the extent that total annual Portfolio operating expenses (excluding certain items discussed below) exceed the rates (“Expense Caps”) shown in the following table of each Portfolio’s average daily net assets. In determining the Adviser’s obligation to waive advisory fees and/or reimburse expenses, the following expenses are not taken into account and certain of these expenses could cause total annual Portfolio operating
15
MATSON MONEY VI PORTFOLIOS
Notes to Financial Statements (Continued)
August 31, 2024
expenses to exceed the Expense Caps: acquired fund fees and expenses, brokerage commissions, extraordinary items, interest or taxes. This contractual limitation is in effect until December 31, 2024 and may not be terminated without the approval of the Board. The Adviser may discontinue these arrangements at any time after December 31, 2024.
PORTFOLIO | | EXPENSE CAPS | |
Matson Money U.S. Equity VI Portfolio | | | 1.13 | % |
Matson Money International Equity VI Portfolio | | | 1.35 | |
Matson Money Fixed Income VI Portfolio | | | 1.00 | |
During the current fiscal period, investment advisory fees accrued were as follows:
PORTFOLIO | | ADVISORY FEES | |
Matson Money U.S. Equity VI Portfolio | | $ | 138,890 | |
Matson Money International Equity VI Portfolio | | | 103,360 | |
Matson Money Fixed Income VI Portfolio | | | 134,682 | |
Effective September 1, 2019, if at any time a Portfolio’s total annual Portfolio operating expenses for a year are less than the Expense Cap, the Adviser is entitled to reimbursement by the Portfolio of the advisory fees forgone and other payments remitted by the Adviser to the Portfolio within three years from the date on which such waiver or reimbursement was made, provided such reimbursement does not cause the Portfolio to exceed the Expense Cap that was in effect at the time of the waiver or reimbursement. As of the end of the reporting period, the Portfolios had no amounts available for recoupment.
U.S. Bancorp Fund Services, LLC, doing business as U.S. Bank Global Fund Services (“Fund Services”) serves as administrator for the Portfolios. For providing administrative and accounting services, Fund Services is entitled to receive a monthly fee, subject to certain minimum and out of pocket expenses.
Fund Services serves as the Portfolios’ transfer and dividend disbursing agent. For providing transfer agent services, Fund Services is entitled to receive a monthly fee, subject to certain minimum and out of pocket expenses.
U.S. Bank, N.A. (the “Custodian”) provides certain custodial services to the Portfolios. The Custodian is entitled to receive a monthly fee, subject to certain minimum and out of pocket expenses.
Vigilant Distributors, LLC (the “Distributor”), serves as the principal underwriter and distributor of the Portfolios’ shares pursuant to a Distribution Agreement with RBB.
For compensation amounts paid to Fund Services and the Custodian, please refer to the Statements of Operations.
3. | Director and Officer Compensation |
The Directors of the Company receive an annual retainer and meeting fees for meetings attended. An employee of Vigilant Compliance, LLC serves as Chief Compliance Officer of the Company. Vigilant Compliance, LLC is compensated for the services provided to the Company. Employees of RBB serve as President, Chief Financial Officer, Chief Operating Officer, Secretary and Director of Marketing & Business Development of the Company. They are compensated by the Company for services provided. Certain employees of Fund Services serve as officers of the Company. They are not compensated by the Portfolios or the Company. For Director and Officer compensation amounts, please refer to the Statements of Operations.
16
MATSON MONEY VI PORTFOLIOS
Notes to Financial Statements (CONTINUED)
August 31, 2024
4. | Purchases and Sales of Investment Securities |
During the current fiscal period, aggregate purchases and sales of investment securities (excluding short-term investments) of the Portfolios were as follows:
| | | PURCHASES | | | SALES | |
Matson Money U.S. Equity VI Portfolio | | $ | 2,166,974 | | | $ | 5,690,720 | |
Matson Money International Equity VI Portfolio | | | 1,235,290 | | | | 3,320,390 | |
Matson Money Fixed Income VI Portfolio | | | 4,005,071 | | | | 5,882,874 | |
There were no purchases or sales of long-term U.S. Government securities during the current fiscal period.
5. | Federal Income Tax Information |
The Portfolios have followed the authoritative guidance on accounting for and disclosure of uncertainty in tax positions, which requires the Portfolios to determine whether a tax position is more likely than not to be sustained upon examination, including resolution of any related appeals or litigation processes, based on the technical merits of the position. The Portfolios have determined that there was no effect on the financial statements from following this authoritative guidance. In the normal course of business, the Portfolios are subject to examination by federal, state and local jurisdictions, where applicable, for tax years for which applicable statutes of limitations have not expired.
As of August 31, 2024, the federal tax cost and aggregate gross unrealized appreciation and depreciation of investments held by each Portfolio were as follows:
| | | FEDERAL
TAX COST | | | UNREALIZED
APPRECIATION | | | UNREALIZED
(DEPRECIATION) | | | NET
UNREALIZED
APPRECIATION/
(DEPRECIATION) | |
Matson Money U.S. Equity Portfolio | | $ | 21,868,690 | | | $ | 6,678,753 | | | $ | (217,334 | ) | | $ | 6,461,419 | |
Matson Money International Equity Portfolio | | | 17,658,748 | | | | 4,030,350 | | | | (681,830 | ) | | | 3,348,520 | |
Matson Money Fixed Income Portfolio | | | 26,437,012 | | | | 289,502 | | | | (973,480 | ) | | | (683,978 | ) |
Distributions to shareholders from net investment income and realized gains are determined in accordance with federal income tax regulations, which may differ from net investment income and realized gains recognized for financial reporting purposes. Accordingly, the character of distributions and composition of net assets for tax purposes may differ from those reflected in the accompanying financial statements. To the extent these differences are permanent, such amounts are reclassified within the capital accounts based on the tax treatment; temporary differences do not require such reclassification.
As of August 31, 2024, there were no permanent differences between distributable earnings/(loss) and paid in capital.
As of August 31, 2024, the components of distributable earnings on a tax basis were as follows:
| | | Undistributed
Ordinary Income | | | Undistributed
Long-Term
Capital Gains | | | Capital Loss
CarryForwards | | | Net
Unrealized
Appreciation/
(Depreciation) | |
Matson Money U.S. Equity Portfolio | | $ | 32,566 | | | $ | 2,080,495 | | | $ | — | | | $ | 6,461,419 | |
Matson Money International Equity Portfolio | | | 101,036 | | | | 223,338 | | | | — | | | | 3,348,520 | |
Matson Money Fixed Income Portfolio | | | 232,765 | | | | — | | | | (412,574 | ) | | | (683,978 | ) |
17
MATSON MONEY VI PORTFOLIOS
Notes to Financial Statements (CONTINUED)
August 31, 2024
The differences between the book and tax basis components of distributable earnings relate primarily to the timing of recognition of income and gains for federal income tax purposes. Short-term and foreign currency gains, if applicable, are reported as ordinary income for federal income tax purposes.
The tax character of distributions paid during the fiscal years ended August 31, 2023 and August 31, 2024 were as follows:
| | | | | | | ORDINARY
INCOME | | | LONG-TERM
GAINS | | | RETURN OF
CAPITAL | | | TOTAL | |
Matson Money U.S. Equity Portfolio | 2024 | | $ | 284,964 | | | $ | 1,891,538 | | | | — | | | $ | 2,176,502 | |
| | 2023 | | | 225,930 | | | | 2,549,816 | | | | — | | | | 2,775,746 | |
Matson Money International Equity Portfolio | 2024 | | | 638,754 | | | | — | | | | — | | | | 638,754 | |
| | 2023 | | | 453,501 | | | | 210,263 | | | | — | | | | 663,764 | |
Matson Money Fixed Income Portfolio | 2024 | | | 721,924 | | | | — | | | | — | | | | 721,924 | |
| | 2023 | | | 338,690 | | | | — | | | | — | | | | 338,690 | |
Distributions from net investment income and short-term capital gains are treated as ordinary income for federal income tax purposes.
Pursuant to federal income tax rules applicable to regulated investment companies, the Portfolios may elect to treat certain capital losses between November 1 and August 31 and late year ordinary losses ((i) ordinary losses between January 1 and August 31, and (ii) specified ordinary and currency losses between November 1 and August 31) as occurring on the first day of the following tax year. For the fiscal year ended August 31, 2024, any amount of losses elected within the tax return will not be recognized for federal income tax purposes until September 1, 2024. The Matson Money Fixed Income Portfolio deferred qualified late-year losses of $412,574, which will be treated as arising on the first business day of the following fiscal year.
The Portfolios are permitted to carry forward capital losses for an unlimited period. Capital losses that are carried forward will retain their character as either short-term or long-term capital losses. As of August 31, 2024, the Portfolios had no unexpiring short-term or long-term losses.
6. SECURITIES LENDING
The Portfolios may make secured loans of their portfolio securities to brokers, dealers and other financial institutions to earn additional income and receive cash collateral equal to at least 102% of the current market value of the loaned securities, as marked to market each day that the NAV of the Portfolios is determined. When the collateral falls below specified amounts, the Portfolios’ lending agent will use its best effort to obtain additional collateral on the next business day to meet required amounts under the security lending agreement. The Portfolios will pay administrative and custodial fees in connection with the loan of securities. Collateral is invested in short-term investments and the Portfolios will bear the risk of loss of the invested collateral. Investments purchased with proceeds from securities lending are overnight and continuous. Securities lending will expose the Portfolios to the risk of loss should a borrower default on its obligation to return the borrowed securities. The market value of the securities on loan and cash collateral as of the end of the current fiscal period and the income generated from the program during the current fiscal period with respect to such secured loans were as follows:
FUND | | MARKET VALUE OF
SECURITIES LOANED | | | MARKET VALUE OF
COLLATERAL | | | INCOME RECEIVED
FROM SECURITIES
LENDING | |
Matson Money U.S. Equity Portfolio | | $ | — | | | $ | — | | | $ | — | |
Matson Money Internation Equity Portfolio | | | 805,015 | | | | 821,284 | | | | 1,329 | |
Matson Money Fixed Income Portfolio | | | — | | | | — | | | | 5,246 | |
18
MATSON MONEY VI PORTFOLIOS
Notes to Financial Statements (concluded)
August 31, 2024
Securities lending transactions are entered into by the Portfolios’ securities lending agent on behalf of the Portfolios under a Master Securities Lending Agreement (“MSLA”) which permits the Portfolios’ securities lending agent on behalf of the Portfolios under certain circumstances including an event of default (such as bankruptcy or insolvency), to offset amounts payable on behalf of the Portfolios to the same counterparty against amounts to be received and create one single net payment due to or from the Portfolios. The following table is a summary of the Portfolios’ open securities lending transactions which are subject to a MSLA as of the end of the reporting period:
| | | | | | | | | | | | | | | GROSS AMOUNTS NOT OFFSET IN THE
STATEMENTS OF ASSETS AND LIABILITIES | |
PORTFOLIO | | GROSS AMOUNTS
OF RECOGNIZED
ASSETS | | | GROSS AMOUNTS
OFFSET IN THE
STATEMENTS
OF ASSETS AND
LIABILITIES | | | NET AMOUNTS OF
ASSETS PRESENTED
IN THE STATEMENTS
OF ASSETS AND
LIABILITIES | | | FINANCIAL
INSTRUMENTS1 | | | CASH
COLLATERAL
RECEIVED | | | NET
AMOUNT2 | |
Matson Money U.S. Equity Portfolio | | $ | — | | | $ | — | | | $ | — | | | $ | — | | | $ | — | | | $ | — | |
Matson Money International Equity Portfolio | | | 805,015 | | | | — | | | | 805,015 | | | | (805,015 | ) | | | — | | | | — | |
Matson Money Fixed Income Portfolio | | | — | | | | — | | | | — | | | | — | | | | — | | | | — | |
1 | Amount disclosed is limited to the amount of assets presented in the Statements of Assets and Liabilities. Actual collateral received may be more than the amount shown. |
2 | Net amount represents the net amount receivable from the counterparty in the event of default. |
Management has evaluated the impact of all subsequent events on the Portfolios through the date the financial statements were issued and has determined that there were no subsequent events requiring recognition or disclosure in the financial statements.
19
MATSON MONEY VI PORTFOLIOS
Report of Independent registered public Accounting firm
To the Board of Directors of The RBB Fund, Inc. and Shareholders of Matson Money U.S. Equity VI Portfolio, Matson Money International Equity VI Portfolio and Matson Money Fixed Income VI Portfolio
Opinions on the Financial Statements
We have audited the accompanying statements of assets and liabilities, including the portfolios of investments, of Matson Money U.S. Equity VI Portfolio, Matson Money International Equity VI Portfolio and Matson Money Fixed Income VI Portfolio (three of the funds constituting The RBB Fund, Inc., hereafter collectively referred to as the “Funds”) as of August 31, 2024, the related statements of operations for the year ended August 31, 2024, the statements of changes in net assets for each of the two years in the period ended August 31, 2024, including the related notes and the financial highlights for each of the five years in the period ended August 31, 2024 (collectively referred to as the “financial statements”). In our opinion, the financial statements present fairly, in all material respects, the financial position of each of the Funds as of August 31, 2024, the results of each of their operations for the year then ended, the changes in each of their net assets for each of the two years in the period ended August 31, 2024 and each of the financial highlights for each of the five years in the period ended August 31, 2024 in conformity with accounting principles generally accepted in the United States of America.
Basis for Opinions
These financial statements are the responsibility of the Funds’ management. Our responsibility is to express an opinion on the Funds’ financial statements based on our audits. We are a public accounting firm registered with the Public Company Accounting Oversight Board (United States) (PCAOB) and are required to be independent with respect to the Funds in accordance with the U.S. federal securities laws and the applicable rules and regulations of the Securities and Exchange Commission and the PCAOB.
We conducted our audits of these financial statements in accordance with the standards of the PCAOB. Those standards require that we plan and perform the audit to obtain reasonable assurance about whether the financial statements are free of material misstatement, whether due to error or fraud.
Our audits included performing procedures to assess the risks of material misstatement of the financial statements, whether due to error or fraud, and performing procedures that respond to those risks. Such procedures included examining, on a test basis, evidence regarding the amounts and disclosures in the financial statements. Our audits also included evaluating the accounting principles used and significant estimates made by management, as well as evaluating the overall presentation of the financial statements. Our procedures included confirmation of securities owned as of August 31, 2024 by correspondence with the custodian and investment manager of investee funds. We believe that our audits provide a reasonable basis for our opinions.

Philadelphia, Pennsylvania
October 29, 2024
We have served as the auditor of one or more Matson Money, Inc. investment companies since 2008.
20
MATSON MONEY VI PORTFOLIOS
Shareholder Tax Information
(Unaudited)
The tax character of dividends and distributions paid during the fiscal year ended August 31, 2024 were as follows:
| | | Ordinary
Income | | | Long-Term
CAPITAL GAINS | | | Return of
Capital | | | Total | |
Matson Money U.S. Equity Portfolio | | $ | 284,964 | | | $ | 1,891,538 | | | $ | — | | | $ | 2,176,502 | |
Matson Money International Equity Portfolio | | | 638,754 | | | | — | | | | — | | | | 638,754 | |
Matson Money Fixed Income Portfolio | | | 721,924 | | | | — | | | | — | | | | 721,924 | |
Dividends from net investment income and short-term capital gains are treated as ordinary income dividends for federal income tax purposes.
The percentage of taxable ordinary income distributions that are designated as short-term capital gain distributions under Internal Revenue Section 871(k)(2)(c) are 0.00% for each Portfolio.
The percentage of total ordinary income dividends qualifying for the 15% dividend income tax rate is 100% for the Matson Money U.S. Equity VI Portfolio and 93.40% for the Matson Money International Equity VI Portfolio.
The percentage of total ordinary dividends qualifying for the corporate dividends received deduction is 100% for the Matson Money U.S. Equity VI Portfolio.
The percentage of qualified interest income related dividends not subject to withholding tax for non-resident aliens and foreign corporations is 51.17% for the Matson Money Fixed Income VI Portfolio.
Because each Portfolio’s fiscal year is not the calendar year, another notification will be sent with respect to calendar year 2024. The second notification, which will reflect the amount, if any, to be used by calendar year taxpayers on their U.S. federal income tax returns, will be made in conjunction with Form 1099-DIV and will be mailed in January 2025.
Foreign shareholders will generally be subject to U.S. withholding tax on the amount of their ordinary income dividends. They will generally not be entitled to a foreign tax credit or deduction for the withholding taxes paid by the Portfolios, if any. The Matson Money International Equity VI Portfolio passed through foreign tax credits of $50,835 and earned $671,293 of gross foreign source income during the fiscal year.
In general, dividends received by tax-exempt recipients (e.g., IRAs and Keoghs) need not be reported as taxable income for U.S. federal income tax purposes. However, some retirement trusts (e.g., corporate, Keogh and 403(b)(7) plans) may need this information for their annual information reporting.
Shareholders are advised to consult their own tax advisers with respect to the tax consequences of their investment in the Portfolios.
21
MATSON MONEY VI PORTFOLIOS
Other Information
(Unaudited)
APPROVAL OF INVESTMENT ADVISORY AGREEMENT
As required by the 1940 Act, the Board, including all of the Directors who are not “interested persons” of the Company, as that term is defined in the 1940 Act (the “Independent Directors”), considered the renewal of the investment advisory agreement between Matson Money and the Company (the “Investment Advisory Agreement”) on behalf of the Matson Money U.S. Equity VI Portfolio, Matson Money International Equity VI Portfolio and Matson Money Fixed Income VI Portfolio (for this section only, each a “Fund” and collectively the “Funds”), at a meeting of the Board held on May 15-16, 2024 (the “Meeting”). At the Meeting, the Board, including all of the Independent Directors, approved the Investment Advisory Agreement for an additional one-year term ending August 16, 2025. The Board’s decision to approve the Investment Advisory Agreement reflects the exercise of its business judgment to continue the existing arrangement. In approving the Investment Advisory Agreement, the Board considered information provided by Matson Money with the assistance and advice of counsel to the Independent Directors and the Company.
In considering the renewal and approval of the Investment Advisory Agreement between the Company and Matson Money with respect to the Portfolios, the Directors took into account all the materials provided prior to and during the Meeting and at other meetings throughout the past year, the presentations made during the Meeting, and the discussions held during the Meeting. The Directors reviewed these materials with management of Matson Money, and discussed the aforementioned Investment Advisory Agreement with counsel in executive sessions, at which no representatives of Matson Money were present. Among other things, the Directors considered (i) the nature, extent, and quality of Matson Money’s services provided to the Portfolios; (ii) descriptions of the experience and qualifications of Matson Money’s personnel providing those services; (iii) Matson Money’s investment philosophies and processes; (iv) Matson Money’s assets under management and client descriptions; (v) Matson Money’s current advisory fee arrangements with the Company and other similarly managed clients; (vi) Matson Money’s compliance procedures; (vii) Matson Money’s financial information, insurance coverage and profitability analysis related to providing advisory services to the Portfolios; (viii) the extent to which economies of scale are relevant to the Portfolios; (ix) a report prepared by Fuse Research Network, LLC comparing each Portfolio’s management fees and total expense ratios to a group of mutual funds deemed comparable to the Portfolio based primarily on investment strategy similarity (“Peer Group”) and comparing the performance of each Portfolio to the performance of its Peer Group; and (x) a report comparing the performance of each Portfolio to the performance of its primary and composite benchmarks.
As part of their review, the Directors considered the nature, extent and quality of the services provided by Matson Money. The Directors concluded that Matson Money had substantial resources to provide services to the Portfolios and that Matson Money’s services had been acceptable.
The Directors also considered the investment performance of the Portfolios and Matson Money. Information on the Portfolios’ investment performance was provided for the three-month, one-year, three-year, five-year, and since-inception periods ended December 31, 2024, as applicable. The Directors considered the Portfolios’ investment performance in light of their respective investment objectives and investment strategies. The Directors concluded that the investment performance of each of the Portfolios as compared to their respective benchmarks and Peer Groups was acceptable.
The Directors noted that the Matson Money U.S. Equity VI Portfolio outperformed its primary benchmark, the Russell 2500 Index, for the three-year and five-year periods ended December 31, 2023, and underperformed its benchmark for the three-month, one-year and since inception periods ended December 31, 2023. The Directors noted that the Matson Money U.S. Equity VI Portfolio outperformed the median of its Peer Group for the three-month, one-year, three-year, and since-inception periods ended December 31, 2023 and underperformed the median of its Peer Group for the five-year period ended December 31, 2023.
The Directors noted that the Matson Money International Equity VI Portfolio outperformed its primary benchmark, the MSCI World ex-US Index, for the three-year period ended December 31, 2023, and underperformed its benchmark for the three-month, one-year, five-year and since-inception periods ended December 31, 2023. The Directors noted that the Matson
22
MATSON MONEY VI PORTFOLIOS
Other Information (Concluded)
(Unaudited)
Money International Equity VI Portfolio outperformed the median of its Peer Group for the three-year period ended December 31, 2023, and underperformed the median of its Peer Group for the three-month, one-year, five-year, and since-inception periods ended December 31, 2023.
The Directors noted that the Matson Money Fixed Income VI Portfolio outperformed its primary benchmark, the FTSE World Government Bond 1-5 Years, for the three-month and one-year periods ended December 31, 2023, and underperformed its benchmark for the three-year, five-year, and since-inception periods ended December 31, 2023. The Directors noted that the Matson Money Fixed Income VI Portfolio outperformed the median of its Peer Group for the three-month period ended December 31, 2023, and underperformed the median of its Peer Group for the one-year, three-year, five-year, and since-inception periods ended December 31, 2023.
The Board also considered the advisory fee rates payable by the Portfolios under the Investment Advisory Agreement. In this regard, information on the fees paid by the Portfolios and the Portfolios’ total operating expense ratios (before and after fee waivers and expense reimbursements) were compared to similar information for mutual funds advised by other, unaffiliated investment advisory firms.
The Directors noted that the net advisory fee of the Matson Money U.S. Equity VI Portfolio ranked below the median and in the 2nd quintile of its Peer Group, and the Portfolio’s total net expenses (including acquired fund fees and expenses) were above the median and in the 4th quintile of its Peer Group.
The Directors noted that the net advisory fee of the Matson Money International Equity VI Portfolio ranked below the median and in the 4th quintile of its Peer Group, and the Portfolio’s total net expenses (including acquired fund fees and expenses) were above the median and in the 5th quintile of its Peer Group.
The Directors noted that the net advisory fee of the Matson Money Fixed Income VI Portfolio ranked above the median and in the 3rd quintile of its Peer Group, and the Portfolio’s total net expenses (including acquired fund fees and expenses) were above the median and in the 5th quintile of its Peer Group.
In addition, the Directors noted that Matson Money had contractually agreed to waive management fees and reimburse expenses through at least December 31, 2024 to limit total annual operating expenses to agreed upon levels for the Matson Money U.S. Equity VI Portfolio, Matson Money International Equity VI Portfolio, and Matson Money Fixed Income VI Portfolio.
After reviewing the information regarding the Portfolios’ costs, profitability and economies of scale, and after considering Matson Money’s services, the Directors concluded that the investment advisory fees to be paid by the Portfolios were fair and reasonable and that the Investment Advisory Agreement should be approved and continued for an additional one year period ending August 16, 2025.
23
Investment Adviser
Matson Money, Inc.
5955 Deerfield Blvd.
Mason, OH 45040
Administrator and Transfer Agent
U.S. Bank Global Fund Services
P.O. Box 701
Milwaukee, WI 53201
Principal Underwriter
Vigilant Distributors, LLC
Gateway Corporate Center, Suite 216
223 Wilmington West Chester Pike
Chadds Ford, PA 19317
Custodian
U.S. Bank, N.A.
1555 North Rivercenter Drive, Suite 302
Milwaukee, WI 53212
Independent Registered Public Accounting Firm
PricewaterhouseCoopers LLP
Two Commerce Square, Suite 1800
2001 Market Street
Philadelphia, PA 19103-7042
Legal Counsel
Faegre Drinker Biddle & Reath LLP
One Logan Square, Suite 2000
Philadelphia, PA 19103-6996

Financial Statements
Motley Fool Asset Management ETFs
Series of The RBB Fund, Inc.
8/31/24
Motley Fool Global Opportunities ETF | 
|
Motley Fool Mid-Cap Growth ETF | 
|
Motley Fool 100 Index ETF | 
|
Motley Fool Small-Cap Growth ETF | 
|
Motley Fool Capital Efficiency 100 Index ETF | 
|
Motley Fool Next Index ETF | 
|
Motley Fool Global Opportunities ETF (TMFG) | 
|
Motley Fool Mid-Cap Growth ETF (TMFM) | 
|
Motley Fool 100 Index ETF (TMFC) | 
|
Motley Fool Small-Cap Growth ETF (TMFS) | 
|
Motley Fool Capital Efficiency 100 Index ETF (TMFE) | 
|
Motley Fool Next Index ETF (TMFX) | 
|
Table of Contents | 
|
| | |
Schedules of Investments | 1 |
Financial Statements | 30 |
Notes to Financial Statements | 46 |
Report of Independent Registered Public Accounting Firm | 59 |
Shareholder Tax Information | 61 |
Notice to Shareholders | 62 |
Motley Fool global opportunities ETF
Schedule of Investments
AUGUST 31, 2024
| | Shares | | | Value | |
| | | | | | | | | |
COMMON STOCKS — 94.7% | | | | | | | | |
Argentina — 2.2% | | | | | | | | |
MercadoLibre, Inc. (a) | | | 4,795 | | | $ | 9,885,660 | |
Australia — 1.5% | | | | | | | | |
Atlassian Corp. - Class A (a) | | | 39,751 | | | | 6,582,765 | |
Canada — 9.8% | | | | | | | | |
Brookfield Asset Management Ltd. – Class A | | | 261,214 | | | | 10,647,083 | |
Canadian National Railway Co. (b) | | | 115,890 | | | | 13,654,160 | |
Waste Connections, Inc. | | | 101,209 | | | | 18,875,478 | |
| | | | | | | | 43,176,721 | |
China — 1.7% | | | | | | | | |
Yum China Holdings, Inc. | | | 216,296 | | | | 7,312,968 | |
France — 1.9% | | | | | | | | |
Vivendi | | | 766,495 | | | | 8,595,691 | |
Germany — 2.2% | | | | | | | | |
Symrise | | | 75,276 | | | | 9,906,160 | |
Ireland — 6.0% | | | | | | | | |
ICON PLC (a) | | | 52,805 | | | | 17,006,378 | |
Kerry Group PLC - Class A | | | 76,975 | | | | 7,726,005 | |
Kerry Group PLC - Class A | | | 19,529 | | | | 1,899,687 | |
| | | | | | | | 26,632,070 | |
Japan — 3.4% | | | | | | | | |
Nintendo Co. Ltd. | | | 274,280 | | | | 14,825,642 | |
Kenya — 0.1% | | | | | | | | |
Safaricom PLC | | | 4,000,000 | | | | 450,485 | |
Netherlands — 3.1% | | | | | | | | |
Universal Music Group | | | 525,208 | | | | 13,718,748 | |
Philippines — 2.6% | | | | | | | | |
International Container Terminal Services, Inc. | | | 1,610,522 | | | | 11,364,004 | |
Spain — 3.0% | | | | | | | | |
Cellnex Telecom (c) | | | 338,325 | | | | 13,063,275 | |
Taiwan — 1.9% | | | | | | | | |
Taiwan Semiconductor Manufacturing Co. Ltd. - ADR | | | 47,659 | | | | 8,183,050 | |
The accompanying notes are an integral part of these financial statements.
Motley Fool global opportunities ETF
Schedule of Investments (continued)
AUGUST 31, 2024
| | Shares | | | Value | |
| | | | | | | | | |
COMMON STOCKS (continued) | | | | | | | | |
United Arab Emirates — 0.0%(d) | | | | | | | | |
NMC Health PLC (a)(e) | | | 485,482 | | | $ | 0 | |
United Kingdom — 7.1% | | | | | | | | |
London Stock Exchange Group PLC | | | 89,050 | | | | 11,987,320 | |
Rentokil Initial PLC - ADR (b) | | | 448,276 | | | | 14,447,936 | |
System1 Group PLC (a) | | | 459,245 | | | | 4,704,390 | |
| | | | | | | | 31,139,646 | |
United States — 48.2%(f) | | | | | | | | |
Alphabet, Inc. - Class C | | | 94,401 | | | | 15,586,549 | |
Amazon.com, Inc. (a) | | | 114,105 | | | | 20,367,742 | |
American Tower Corp. | | | 62,958 | | | | 14,106,369 | |
Aon PLC - Class A | | | 30,054 | | | | 10,330,161 | |
Axon Enterprise, Inc. (a) | | | 66,060 | | | | 24,109,918 | |
BioMarin Pharmaceutical, Inc. (a) | | | 82,350 | | | | 7,511,144 | |
Comcast Corp. - Class A | | | 215,388 | | | | 8,522,903 | |
Costco Wholesale Corp. | | | 16,191 | | | | 14,448,525 | |
DexCom, Inc. (a) | | | 181,675 | | | | 12,597,345 | |
Equinix, Inc. | | | 14,044 | | | | 11,717,752 | |
Fastenal Co. | | | 128,190 | | | | 8,752,813 | |
Mastercard, Inc. - Class A | | | 32,076 | | | | 15,503,614 | |
Salesforce, Inc. | | | 40,252 | | | | 10,179,731 | |
SBA Communications Corp. | | | 24,808 | | | | 5,622,981 | |
Starbucks Corp. | | | 97,592 | | | | 9,229,275 | |
Waters Corp. (a) | | | 21,568 | | | | 7,470,077 | |
Watsco, Inc. (b) | | | 34,075 | | | | 16,199,937 | |
| | | | | | | | 212,256,836 | |
TOTAL COMMON STOCKS (Cost $248,904,202) | | | | | | | 417,093,721 | |
| | | | | | | | | |
PREFERRED STOCKS — 2.1% | | | | | | | | |
Germany — 2.1% | | | | | | | | |
Dr. Ing. H.c. F. Porsche 0.00% (c) | | | 119,977 | | | | 9,394,982 | |
TOTAL PREFERRED STOCKS (Cost $11,323,002) | | | | | | | 9,394,982 | |
The accompanying notes are an integral part of these financial statements.
Motley Fool global opportunities ETF
Schedule of Investments (concluded)
AUGUST 31, 2024
| | Units | | | Value | |
| | | | | | | | | |
SHORT-TERM INVESTMENTS — 7.7% | | | | | | | | |
Investments Purchased with Proceeds from Securities Lending — 7.7% | | | | | | | | |
Mount Vernon Liquid Assets Portfolio, LLC, 5.42% (g) | | | 34,052,359 | | | $ | 34,052,359 | |
TOTAL SHORT-TERM INVESTMENTS (Cost $34,052,359) | | | | | | | 34,052,359 | |
| | | | | | | | | |
TOTAL INVESTMENTS — 104.5% (Cost $294,279,563) | | | | | | | 460,541,062 | |
Liabilities in Excess of Other Assets — (4.5)% | | | | | | | (20,078,590 | ) |
TOTAL NET ASSETS — 100.0% | | | | | | $ | 440,462,472 | |
Percentages are stated as a percent of net assets.
The Global Industry Classification Standard (“GICS®”) was developed by and/or is the exclusive property of MSCI, Inc. (“MSCI”) and Standard & Poor’s Financial Services LLC (“S&P”). GICS® is a service mark of MSCI and S&P and has been licensed for use by U.S. Bank Global Fund Services.
ADR — American Depositary Receipt
PLC — Public Limited Company
(a) | Non-income producing security. |
(b) | All or a portion of this security is on loan as of August 31, 2024. At August 31, 2024, the total market value of these securities was $33,637,720 which represented 7.6% of net assets. |
(c) | Security is exempt from registration pursuant to Rule 144A under the Securities Act of 1933, as amended. These securities may only be resold in transactions exempt from registration to qualified institutional investors. As of August 31, 2024, the value of these securities total $22,458,257 or 5.1% of the Fund’s net assets. |
(d) | Represents less than 0.05% of net assets. |
(e) | Fair value determined using significant unobservable inputs in accordance with procedures established by and under the supervision of the Adviser, acting as Valuation Designee. These securities represented $0 or 0.0% of net assets as of August 31, 2024. |
(f) | To the extent that the Fund invests a significant portion of its assets in the securities of companies of a single country or region, it is more likely to be impacted by events or conditions affecting the country or region. |
(g) | The rate shown represents the 7-day annualized effective yield as of August 31, 2024. |
The accompanying notes are an integral part of these financial statements.
Motley Fool mid-cap growth ETF
Schedule of Investments
AUGUST 31, 2024
| | Shares | | | Value | |
| | | | | | | | | |
COMMON STOCKS — 98.4% | | | | | | | | |
Aerospace & Defense — 6.0% | | | | | | | | |
Axon Enterprise, Inc. (a) | | | 33,277 | | | $ | 12,145,107 | |
Air Freight & Logistics — 2.6% | | | | | | | | |
GXO Logistics, Inc. (a)(b) | | | 105,018 | | | | 5,256,151 | |
Automobile Components — 3.3% | | | | | | | | |
Gentex Corp. (b) | | | 214,062 | | | | 6,706,563 | |
Biotechnology — 5.4% | | | | | | | | |
BioMarin Pharmaceutical, Inc. (a) | | | 65,105 | | | | 5,938,227 | |
Ultragenyx Pharmaceutical, Inc. (a)(b) | | | 89,678 | | | | 5,091,917 | |
| | | | | | | | 11,030,144 | |
Building Products — 2.2% | | | | | | | | |
Trex Co., Inc. (a) | | | 71,679 | | | | 4,568,819 | |
Capital Markets — 6.0% | | | | | | | | |
Morningstar, Inc. | | | 14,587 | | | | 4,576,963 | |
StoneX Group, Inc. (a) | | | 92,666 | | | | 7,678,305 | |
| | | | | | | | 12,255,268 | |
Chemicals — 2.5% | | | | | | | | |
Eastman Chemical Co. | | | 49,762 | | | | 5,094,136 | |
Financial Services — 3.4% | | | | | | | | |
Toast, Inc. - Class A (a)(b) | | | 275,596 | | | | 6,851,317 | |
Ground Transportation — 3.7% | | | | | | | | |
RXO, Inc. (a) | | | 261,690 | | | | 7,447,697 | |
Health Care Equipment & Supplies — 10.0% | | | | | | | | |
Cooper Cos., Inc. (a) | | | 71,175 | | | | 7,525,333 | |
DexCom, Inc. (a) | | | 76,925 | | | | 5,333,979 | |
Globus Medical, Inc. - Class A (a) | | | 104,046 | | | | 7,564,144 | |
| | | | | | | | 20,423,456 | |
Health Care Providers & Services — 3.1% | | | | | | | | |
HealthEquity, Inc. (a) | | | 79,555 | | | | 6,329,396 | |
Health Care REITs — 1.8% | | | | | | | | |
Alexandria Real Estate Equities, Inc. (b) | | | 30,916 | | | | 3,696,626 | |
The accompanying notes are an integral part of these financial statements.
Motley Fool mid-cap growth ETF
Schedule of Investments (Continued)
AUGUST 31, 2024
| | Shares | | | Value | |
| | | | | | | | | |
COMMON STOCKS (continued) | | | | | | | | |
Insurance — 10.9% | | | | | | | | |
Brown & Brown, Inc. | | | 122,066 | | | $ | 12,832,799 | |
Goosehead Insurance, Inc. - Class A (a)(b) | | | 109,534 | | | | 9,238,097 | |
| | | | | | | | 22,070,896 | |
Life Sciences Tools & Services — 2.9% | | | | | | | | |
Waters Corp. (a) | | | 16,817 | | | | 5,824,568 | |
Professional Services — 7.1% | | | | | | | | |
Broadridge Financial Solutions, Inc. | | | 45,390 | | | | 9,661,715 | |
TransUnion | | | 48,600 | | | | 4,704,966 | |
| | | | | | | | 14,366,681 | |
Real Estate Management & Development — 2.3% | | | | | | | | |
CoStar Group, Inc. (a) | | | 59,664 | | | | 4,612,027 | |
Software — 11.1% | | | | | | | | |
Alarm.com Holdings, Inc. (a) | | | 97,708 | | | | 5,817,534 | |
Guidewire Software, Inc. (a) | | | 32,342 | | | | 4,811,519 | |
Tyler Technologies, Inc. (a) | | | 20,305 | | | | 11,936,701 | |
| | | | | | | | 22,565,754 | |
Specialized REITs — 3.6% | | | | | | | | |
SBA Communications Corp. | | | 32,144 | | | | 7,285,759 | |
Specialty Retail — 1.8% | | | | | | | | |
Tractor Supply Co. | | | 13,854 | | | | 3,706,638 | |
Trading Companies & Distributors — 8.7% | | | | | | | | |
Fastenal Co. | | | 103,468 | | | | 7,064,795 | |
Herc Holdings, Inc. | | | 32,700 | | | | 4,786,299 | |
Watsco, Inc. (b) | | | 12,110 | | | | 5,757,336 | |
| | | | | | | | 17,608,430 | |
TOTAL COMMON STOCKS (Cost $126,514,287) | | | | | | $ | 199,845,433 | |
The accompanying notes are an integral part of these financial statements.
Motley Fool mid-cap growth ETF
Schedule of Investments (CONCLUDED)
AUGUST 31, 2024
| | Units | | | Value | |
| | | | | | | | | |
SHORT-TERM INVESTMENTS — 14.2% | | | | | | | | |
Investments Purchased with Proceeds from Securities Lending — 14.2% | | | | | | | | |
Mount Vernon Liquid Assets Portfolio, LLC, 5.42% (c) | | | 28,802,749 | | | $ | 28,802,749 | |
TOTAL SHORT-TERM INVESTMENTS (Cost $28,802,749) | | | | | | | 28,802,749 | |
| | | | | | | | | |
TOTAL INVESTMENTS — 112.6% (Cost $155,317,036) | | | | | | | 228,648,182 | |
Liabilities in Excess of Other Assets — (12.6)% | | | | | | | (25,509,210 | ) |
TOTAL NET ASSETS — 100.0% | | | | | | $ | 203,138,972 | |
Percentages are stated as a percent of net assets.
The Global Industry Classification Standard (“GICS®”) was developed by and/or is the exclusive property of MSCI, Inc. (“MSCI”) and Standard & Poor’s Financial Services LLC (“S&P”). GICS® is a service mark of MSCI and S&P and has been licensed for use by U.S. Bank Global Fund Services.
REIT — Real Estate Investment Trust
(a) | Non-income producing security. |
(b) | All or a portion of this security is on loan as of August 31, 2024. At August 31, 2024, the total market value of these securities was $28,330,814 which represented 13.9% of net assets. |
(c) | The rate shown represents the 7-day annualized effective yield as of August 31, 2024. |
The accompanying notes are an integral part of these financial statements.
Motley Fool 100 Index ETF
Schedule of Investments
AUGUST 31, 2024
| | Shares | | | Value | |
| | | | | | | | | |
COMMON STOCKS — 99.7% | | | | | | | | |
Altaba, Inc. - Escrow Shares (a)(b) | | | 8,565 | | | $ | 13,276 | |
Aerospace & Defense — 0.4% | | | | | | | | |
TransDigm Group, Inc. | | | 2,499 | | | | 3,431,652 | |
Air Freight & Logistics — 0.3% | | | | | | | | |
FedEx Corp. | | | 11,101 | | | | 3,316,646 | |
Automobiles — 2.9% | | | | | | | | |
Tesla, Inc. (b) | | | 132,762 | | | | 28,425,672 | |
Banks — 3.0% | | | | | | | | |
JPMorgan Chase & Co. | | | 115,471 | | | | 25,957,881 | |
Truist Financial Corp. | | | 59,447 | | | | 2,643,013 | |
| | | | | | | | 28,600,894 | |
Beverages — 0.2% | | | | | | | | |
Monster Beverage Corp. (b) | | | 46,293 | | | | 2,181,789 | |
Biotechnology — 2.2% | | | | | | | | |
Amgen, Inc. | | | 24,633 | | | | 8,223,234 | |
Biogen, Inc. (b) | | | 6,177 | | | | 1,264,803 | |
Gilead Sciences, Inc. | | | 56,733 | | | | 4,481,907 | |
Moderna, Inc. (b) | | | 14,825 | | | | 1,147,455 | |
Vertex Pharmaceuticals, Inc. (b) | | | 11,691 | | | | 5,797,450 | |
| | | | | | | | 20,914,849 | |
Broadline Retail — 5.4% | | | | | | | | |
Amazon.com, Inc. (b) | | | 278,890 | | | | 49,781,865 | |
Coupang, Inc. (b) | | | 76,492 | | | | 1,694,298 | |
eBay, Inc. (c) | | | 21,628 | | | | 1,278,215 | |
| | | | | | | | 52,754,378 | |
Capital Markets — 1.9% | | | | | | | | |
Charles Schwab Corp. | | | 71,944 | | | | 4,683,554 | |
CME Group, Inc. | | | 16,240 | | | | 3,503,618 | |
Intercontinental Exchange, Inc. | | | 25,546 | | | | 4,126,956 | |
Moody’s Corp. | | | 8,110 | | | | 3,955,572 | |
Nasdaq, Inc. | | | 24,676 | | | | 1,778,646 | |
| | | | | | | | 18,048,346 | |
The accompanying notes are an integral part of these financial statements.
Motley Fool 100 Index ETF
Schedule of Investments (continued)
AUGUST 31, 2024
| | Shares | | | Value | |
| | | | | | | | | |
COMMON STOCKS (continued) | | | | | | | | |
Chemicals — 0.8% | | | | | | | | |
Ecolab, Inc. | | | 12,830 | | | $ | 3,248,300 | |
Sherwin-Williams Co. | | | 11,520 | | | | 4,255,142 | |
| | | | | | | | 7,503,442 | |
Commercial Services & Supplies — 1.0% | | | | | | | | |
Cintas Corp. | | | 4,607 | | | | 3,709,188 | |
Copart, Inc. (b) | | | 44,280 | | | | 2,345,069 | |
Waste Management, Inc. | | | 18,057 | | | | 3,828,806 | |
| | | | | | | | 9,883,063 | |
Communications Equipment — 0.5% | | | | | | | | |
Arista Networks, Inc. (b) | | | 14,340 | | | | 5,067,469 | |
Consumer Staples Distribution & Retail — 1.7% | | | | | | | | |
Costco Wholesale Corp. | | | 17,872 | | | | 15,948,615 | |
Electronic Equipment, Instruments & Components — 0.2% | | | | | | | | |
Corning, Inc. | | | 36,664 | | | | 1,534,388 | |
Entertainment — 2.3% | | | | | | | | |
Electronic Arts, Inc. | | | 11,805 | | | | 1,792,235 | |
Netflix, Inc. (b) | | | 17,372 | | | | 12,183,852 | |
ROBLOX Corp. - Class A (b) | | | 25,246 | | | | 1,110,571 | |
Walt Disney Co. | | | 73,442 | | | | 6,637,688 | |
Warner Bros Discovery, Inc. (b)(c) | | | 104,827 | | | | 821,844 | |
| | | | | | | | 22,546,190 | |
Financial Services — 9.8% | | | | | | | | |
Berkshire Hathaway, Inc. - Class B (b) | | | 95,958 | | | | 45,668,331 | |
Block, Inc. (b) | | | 24,420 | | | | 1,613,674 | |
Mastercard, Inc. - Class A | | | 42,501 | | | | 20,542,433 | |
PayPal Holdings, Inc. (b) | | | 42,035 | | | | 3,044,595 | |
Visa, Inc. - Class A | | | 86,132 | | | | 23,804,301 | |
| | | | | | | | 94,673,334 | |
Ground Transportation — 1.5% | | | | | | | | |
Old Dominion Freight Line, Inc. | | | 9,287 | | | | 1,790,534 | |
Uber Technologies, Inc. (b) | | | 81,019 | | | | 5,924,919 | |
Union Pacific Corp. | | | 27,636 | | | | 7,077,303 | |
| | | | | | | | 14,792,756 | |
The accompanying notes are an integral part of these financial statements.
Motley Fool 100 Index ETF
Schedule of Investments (continued)
AUGUST 31, 2024
| | Shares | | | Value | |
| | | | | | | | | |
COMMON STOCKS (continued) | | | | | | | | |
Health Care Equipment & Supplies — 1.7% | | | | | | | | |
Align Technology, Inc. (b) | | | 3,185 | | | $ | 755,546 | |
Becton Dickinson & Co. | | | 13,264 | | | | 3,215,326 | |
DexCom, Inc. (b) | | | 15,322 | | | | 1,062,427 | |
IDEXX Laboratories, Inc. (b) | | | 3,533 | | | | 1,700,539 | |
Intuitive Surgical, Inc. (b) | | | 15,777 | | | | 7,772,223 | |
ResMed, Inc. (c) | | | 6,227 | | | | 1,525,740 | |
| | | | | | | | 16,031,801 | |
Health Care Providers & Services — 3.7% | | | | | | | | |
CVS Health Corp. | | | 56,008 | | | | 3,205,898 | |
HCA Healthcare, Inc. | | | 11,631 | | | | 4,601,107 | |
McKesson Corp. | | | 5,760 | | | | 3,231,821 | |
UnitedHealth Group, Inc. | | | 42,078 | | | | 24,834,436 | |
| | | | | | | | 35,873,262 | |
Health Care Technology — 0.2% | | | | | | | | |
Veeva Systems, Inc. - Class A (b) | | | 6,866 | | | | 1,486,077 | |
Hotels, Restaurants & Leisure — 2.2% | | | | | | | | |
Airbnb, Inc. - Class A (b) | | | 25,047 | | | | 2,938,264 | |
Booking Holdings, Inc. | | | 1,318 | | | | 5,152,365 | |
Chipotle Mexican Grill, Inc. (b) | | | 56,726 | | | | 3,181,194 | |
DoorDash, Inc. - Class A (b) | | | 17,448 | | | | 2,245,732 | |
Marriott International, Inc. - Class A | | | 12,642 | | | | 2,966,951 | |
Starbucks Corp. | | | 51,151 | | | | 4,837,350 | |
| | | | | | | | 21,321,856 | |
Industrial Conglomerates — 0.3% | | | | | | | | |
3M Co. | | | 24,576 | | | | 3,310,141 | |
Insurance — 0.3% | | | | | | | | |
Aflac, Inc. (c) | | | 25,998 | | | | 2,869,139 | |
Interactive Media & Services — 10.3% | | | | | | | | |
Alphabet, Inc. - Class C | | | 329,638 | | | | 54,426,530 | |
Meta Platforms, Inc. - Class A | | | 87,867 | | | | 45,805,946 | |
| | | | | | | | 100,232,476 | |
The accompanying notes are an integral part of these financial statements.
Motley Fool 100 Index ETF
Schedule of Investments (continued)
AUGUST 31, 2024
| | Shares | | | Value | |
| | | | | | | | | |
COMMON STOCKS (continued) | | | | | | | | |
IT Services — 0.5% | | | | | | | | |
Cognizant Technology Solutions Corp. - Class A | | | 21,268 | | | $ | 1,654,013 | |
Gartner, Inc. (b) | | | 3,276 | | | | 1,611,661 | |
MongoDB, Inc. (b)(c) | | | 2,910 | | | | 846,199 | |
Snowflake, Inc. - Class A (b) | | | 6,697 | | | | 764,998 | |
| | | | | | | | 4,876,871 | |
Life Sciences Tools & Services — 0.1% | | | | | | | | |
Illumina, Inc. (b) | | | 6,772 | | | | 889,841 | |
Machinery — 0.2% | | | | | | | | |
Cummins, Inc. | | | 5,834 | | | | 1,825,167 | |
Media — 0.2% | | | | | | | | |
Trade Desk, Inc. - Class A (b) | | | 20,890 | | | | 2,183,632 | |
Oil, Gas & Consumable Fuels — 0.2% | | | | | | | | |
Kinder Morgan, Inc. | | | 94,945 | | | | 2,047,964 | |
Pharmaceuticals — 3.9% | | | | | | | | |
Bristol-Myers Squibb Co. | | | 78,398 | | | | 3,915,980 | |
Eli Lilly & Co. | | | 35,375 | | | | 33,960,708 | |
| | | | | | | | 37,876,688 | |
Real Estate Management & Development — 0.1% | | | | | | | | |
CoStar Group, Inc. (b) | | | 17,431 | | | | 1,347,416 | |
Semiconductors & Semiconductor Equipment — 12.4% | | | | | | | | |
Advanced Micro Devices, Inc. (b) | | | 63,932 | | | | 9,497,738 | |
Broadcom, Inc. | | | 183,358 | | | | 29,854,349 | |
Lam Research Corp. | | | 5,285 | | | | 4,339,038 | |
NVIDIA Corp. | | | 644,597 | | | | 76,945,544 | |
| | | | | | | | 120,636,669 | |
Software — 15.0% | | | | | | | | |
Adobe Systems, Inc. (b) | | | 17,572 | | | | 10,093,532 | |
Autodesk, Inc. (b) | | | 9,908 | | | | 2,560,227 | |
Crowdstrike Holdings, Inc. - Class A (b) | | | 9,335 | | | | 2,588,409 | |
Datadog, Inc. - Class A (b) | | | 14,297 | | | | 1,662,169 | |
Fair Isaac Corp. (b) | | | 1,025 | | | | 1,773,527 | |
Fortinet, Inc. (b) | | | 32,673 | | | | 2,506,346 | |
Intuit, Inc. | | | 12,531 | | | | 7,897,788 | |
The accompanying notes are an integral part of these financial statements.
Motley Fool 100 Index ETF
Schedule of Investments (continued)
AUGUST 31, 2024
| | Shares | | | Value | |
| | | | | | | | | |
COMMON STOCKS (continued) | | | | | | | | |
Software (continued) | | | | | | | | |
Microsoft Corp. | | | 197,421 | | | $ | 82,352,196 | |
Palo Alto Networks, Inc. (b) | | | 14,746 | | | | 5,348,669 | |
Roper Technologies, Inc. | | | 4,824 | | | | 2,674,474 | |
Salesforce, Inc. | | | 38,300 | | | | 9,686,070 | |
ServiceNow, Inc. (b) | | | 9,450 | | | | 8,079,750 | |
Synopsys, Inc. (b) | | | 6,108 | | | | 3,173,595 | |
Workday, Inc. - Class A (b) | | | 11,348 | | | | 2,986,680 | |
Zoom Video Communications, Inc. - Class A (b) | | | 13,187 | | | | 910,958 | |
Zscaler, Inc. (b) | | | 5,928 | | | | 1,185,481 | |
| | | | | | | | 145,479,871 | |
Specialized REITs — 1.3% | | | | | | | | |
American Tower Corp. | | | 21,574 | | | | 4,833,870 | |
Crown Castle, Inc. | | | 19,428 | | | | 2,176,325 | |
Digital Realty Trust, Inc. | | | 12,813 | | | | 1,942,579 | |
Equinix, Inc. | | | 4,322 | | | | 3,606,104 | |
| | | | | | | | 12,558,878 | |
Specialty Retail — 1.7% | | | | | | | | |
Home Depot, Inc. | | | 45,199 | | | | 16,655,831 | |
Technology Hardware, Storage & Peripherals — 9.7% | | | | | | | | |
Apple, Inc. | | | 410,940 | | | | 94,105,260 | |
Textiles, Apparel & Luxury Goods — 0.5% | | | | | | | | |
NIKE, Inc. - Class B (c) | | | 60,013 | | | | 5,000,283 | |
Wireless Telecommunication Services — 1.1% | | | | | | | | |
T-Mobile US, Inc. | | | 54,954 | | | | 10,920,459 | |
TOTAL COMMON STOCKS (Cost $624,698,031) | | | | | | | 967,166,341 | |
The accompanying notes are an integral part of these financial statements.
Motley Fool 100 Index ETF
Schedule of Investments (Concluded)
AUGUST 31, 2024
| | Units | | | Value | |
| | | | | | | | | |
SHORT-TERM INVESTMENTS — 1.1% | | | | | | | | |
Investments Purchased with Proceeds from Securities Lending — 1.1% | | | | | | | | |
Mount Vernon Liquid Assets Portfolio, LLC, 5.42% (d) | | | 10,257,974 | | | $ | 10,257,974 | |
TOTAL SHORT-TERM INVESTMENTS (Cost $10,257,974) | | | | | | | 10,257,974 | |
| | | | | | | | | |
TOTAL INVESTMENTS — 100.8% (Cost $634,956,005) | | | | | | | 977,424,315 | |
Liabilities in Excess of Other Assets — (0.8)% | | | | | | | (7,539,477 | ) |
TOTAL NET ASSETS — 100.0% | | | | | | $ | 969,884,838 | |
Percentages are stated as a percent of net assets.
The Global Industry Classification Standard (“GICS®”) was developed by and/or is the exclusive property of MSCI, Inc. (“MSCI”) and Standard & Poor’s Financial Services LLC (“S&P”). GICS® is a service mark of MSCI and S&P and has been licensed for use by U.S. Bank Global Fund Services.
REIT — Real Estate Investment Trust
(a) | Fair value determined using significant unobservable inputs in accordance with procedures established by and under the supervision of the Adviser, acting as Valuation Designee. These securities represented $13,276 or 0.0% of net assets as of August 31, 2024. |
(b) | Non-income producing security. |
(c) | All or a portion of this security is on loan as of August 31, 2024. At August 31, 2024, the total market value of these securities was $10,202,881 which represented 1.1% of net assets. |
(d) | The rate shown represents the 7-day annualized effective yield as of August 31, 2024. |
The accompanying notes are an integral part of these financial statements.
MOTLEY FOOL Small-Cap Growth ETF
Schedule of Investments
AUGUST 31, 2024
| | Shares | | | Value | |
| | | | | | | | | |
COMMON STOCKS — 99.4% | | | | | | | | |
Aerospace & Defense — 8.7% | | | | | | | | |
Axon Enterprise, Inc. (a) | | | 9,409 | | | $ | 3,434,003 | |
Leonardo DRS, Inc. (a) | | | 118,368 | | | | 3,378,222 | |
| | | | | | | | 6,812,225 | |
Air Freight & Logistics — 3.6% | | | | | | | | |
GXO Logistics, Inc. (a) | | | 55,712 | | | | 2,788,386 | |
Automobile Components — 4.9% | | | | | | | | |
Fox Factory Holding Corp. (a) | | | 36,738 | | | | 1,487,154 | |
Gentex Corp. | | | 75,312 | | | | 2,359,525 | |
| | | | | | | | 3,846,679 | |
Banks — 3.1% | | | | | | | | |
Live Oak Bancshares, Inc. (b) | | | 57,217 | | | | 2,459,759 | |
Biotechnology — 3.8% | | | | | | | | |
Ultragenyx Pharmaceutical, Inc. (a) | | | 52,913 | | | | 3,004,400 | |
Building Products — 2.3% | | | | | | | | |
Trex Co., Inc. (a) | | | 27,813 | | | | 1,772,801 | |
Capital Markets — 3.4% | | | | | | | | |
StoneX Group, Inc. (a) | | | 32,366 | | | | 2,681,847 | |
Electronic Equipment, Instruments & Components — 1.9% | | | | | | | | |
IPG Photonics Corp. (a) | | | 21,130 | | | | 1,444,658 | |
Financial Services — 3.5% | | | | | | | | |
Toast, Inc. - Class A (a)(b) | | | 109,056 | | | | 2,711,132 | |
Ground Transportation — 5.9% | | | | | | | | |
Landstar System, Inc. | | | 7,452 | | | | 1,360,437 | |
RXO, Inc. (a) | | | 114,440 | | | | 3,256,962 | |
| | | | | | | | 4,617,399 | |
Health Care Equipment & Supplies — 13.8% | | | | | | | | |
Globus Medical, Inc. - Class A (a) | | | 51,400 | | | | 3,736,780 | |
Inari Medical, Inc. (a)(b) | | | 56,160 | | | | 2,427,797 | |
Penumbra, Inc. (a) | | | 9,877 | | | | 1,998,315 | |
UFP Technologies, Inc. (a)(b) | | | 7,680 | | | | 2,620,646 | |
| | | | | | | | 10,783,538 | |
The accompanying notes are an integral part of these financial statements.
MOTLEY FOOL Small-Cap Growth ETF
Schedule of Investments (CONTINUED)
AUGUST 31, 2024
| | Shares | | | Value | |
| | | | | | | | | |
COMMON STOCKS (continued) | | | | | | | | |
Health Care Providers & Services — 3.2% | | | | | | | | |
HealthEquity, Inc. (a) | | | 31,842 | | | $ | 2,533,349 | |
Health Care Technology — 1.3% | | | | | | | | |
Certara, Inc. (a)(b) | | | 85,248 | | | | 1,044,288 | |
Industrial REITs — 2.6% | | | | | | | | |
STAG Industrial, Inc. | | | 51,019 | | | | 2,070,351 | |
Insurance — 4.2% | | | | | | | | |
Goosehead Insurance, Inc. - Class A (a)(b) | | | 39,338 | | | | 3,317,767 | |
Oil, Gas & Consumable Fuels — 3.3% | | | | | | | | |
Northern Oil & Gas, Inc. (b) | | | 63,888 | | | | 2,541,465 | |
Personal Care Products — 2.1% | | | | | | | | |
BellRing Brands, Inc. (a) | | | 28,800 | | | | 1,610,784 | |
Semiconductors & Semiconductor Equipment — 3.0% | | | | | | | | |
SiTime Corp. (a)(b) | | | 13,344 | | | | 1,930,343 | |
Wolfspeed, Inc. (a)(b) | | | 45,794 | | | | 446,491 | |
| | | | | | | | 2,376,834 | |
Software — 16.1% | | | | | | | | |
Alarm.com Holdings, Inc. (a) | | | 56,020 | | | | 3,335,431 | |
DoubleVerify Holdings, Inc. (a) | | | 52,897 | | | | 1,042,071 | |
LiveRamp Holdings, Inc. (a) | | | 46,944 | | | | 1,216,789 | |
nCino, Inc. (a) | | | 52,640 | | | | 1,577,094 | |
Q2 Holdings, Inc. (a)(b) | | | 33,286 | | | | 2,470,154 | |
Smartsheet, Inc. - Class A (a) | | | 59,859 | | | | 2,921,119 | |
| | | | | | | | 12,562,658 | |
Textiles, Apparel & Luxury Goods — 2.4% | | | | | | | | |
Crocs, Inc. (a) | | | 12,859 | | | | 1,879,600 | |
Trading Companies & Distributors — 6.3% | | | | | | | | |
Herc Holdings, Inc. | | | 14,256 | | | | 2,086,651 | |
Watsco, Inc. (b) | | | 5,946 | | | | 2,826,848 | |
| | | | | | | | 4,913,499 | |
TOTAL COMMON STOCKS (Cost $68,204,891) | | | | | | | 77,773,419 | |
The accompanying notes are an integral part of these financial statements.
MOTLEY FOOL Small-Cap Growth ETF
Schedule of Investments (Concluded)
AUGUST 31, 2024
| | Units | | | Value | |
| | | | | | | | | |
SHORT-TERM INVESTMENTS — 27.4% | | | | | | | | |
Investments Purchased with Proceeds from Securities Lending — 27.4% | | | | | | | | |
Mount Vernon Liquid Assets Portfolio, LLC, 5.42% (c) | | | 21,476,806 | | | $ | 21,476,806 | |
TOTAL SHORT-TERM INVESTMENTS (Cost $21,476,806) | | | | | | | 21,476,806 | |
| | | | | | | | | |
TOTAL INVESTMENTS — 126.8% (Cost $89,681,697) | | | | | | | 99,250,225 | |
Liabilities in Excess of Other Assets — (26.8)% | | | | | | | (21,001,545 | ) |
TOTAL NET ASSETS — 100.0% | | | | | | $ | 78,248,680 | |
Percentages are stated as a percent of net assets.
The Global Industry Classification Standard (“GICS®”) was developed by and/or is the exclusive property of MSCI, Inc. (“MSCI”) and Standard & Poor’s Financial Services LLC (“S&P”). GICS® is a service mark of MSCI and S&P and has been licensed for use by U.S. Bank Global Fund Services.
REIT — Real Estate Investment Trust
(a) | Non-income producing security. |
(b) | All or a portion of this security is on loan as of August 31, 2024. At August 31, 2024, the total market value of these securities was $20,968,235 which represented 26.8% of net assets. |
(c) | The rate shown represents the 7-day annualized effective yield as of August 31, 2024. |
The accompanying notes are an integral part of these financial statements.
MOTLEY FOOL CAPITAL EFFICIENCY 100 INDEX ETF
Schedule of Investments
AUGUST 31, 2024
| | Shares | | | Value | |
| | | | | | | | | |
COMMON STOCKS — 99.8% | | | | | | | | |
Air Freight & Logistics — 0.1% | | | | | | | | |
GXO Logistics, Inc. (a) | | | 529 | | | $ | 26,477 | |
Beverages — 0.5% | | | | | | | | |
Boston Beer Co., Inc. - Class A (a) | | | 50 | | | | 13,586 | |
Monster Beverage Corp. (a) | | | 4,444 | | | | 209,446 | |
| | | | | | | | 223,032 | |
Biotechnology — 2.4% | | | | | | | | |
Exelixis, Inc. (a) | | | 1,383 | | | | 36,000 | |
Gilead Sciences, Inc. | | | 6,760 | | | | 534,040 | |
Neurocrine Biosciences, Inc. (a) | | | 557 | | | | 70,772 | |
Vertex Pharmaceuticals, Inc. (a) | | | 1,018 | | | | 504,816 | |
| | | | | | | | 1,145,628 | |
Broadline Retail — 4.8% | | | | | | | | |
Amazon.com, Inc. (a) | | | 11,920 | | | | 2,127,720 | |
eBay, Inc. | | | 2,308 | | | | 136,403 | |
Etsy, Inc. (a) | | | 528 | | | | 29,087 | |
| | | | | | | | 2,293,210 | |
Capital Markets — 0.6% | | | | | | | | |
Cboe Global Markets, Inc. | | | 465 | | | | 95,511 | |
Nasdaq, Inc. | | | 2,215 | | | | 159,657 | |
PJT Partners, Inc. - Class A | | | 139 | | | | 17,167 | |
| | | | | | | | 272,335 | |
Chemicals — 2.2% | | | | | | | | |
Balchem Corp. | | | 136 | | | | 24,076 | |
Ecolab, Inc. | | | 1,366 | | | | 345,844 | |
RPM International, Inc. | | | 728 | | | | 84,630 | |
Sherwin-Williams Co. | | | 1,534 | | | | 566,614 | |
| | | | | | | | 1,021,164 | |
Commercial Services & Supplies — 2.1% | | | | | | | | |
Cintas Corp. | | | 606 | | | | 487,902 | |
Rollins, Inc. | | | 2,582 | | | | 129,565 | |
Waste Management, Inc. | | | 1,820 | | | | 385,913 | |
| | | | | | | | 1,003,380 | |
The accompanying notes are an integral part of these financial statements.
MOTLEY FOOL CAPITAL EFFICIENCY 100 INDEX ETF
Schedule of Investments (Continued)
AUGUST 31, 2024
| | Shares | | | Value | |
| | | | | | | | | |
COMMON STOCKS (continued) | | | | | | | | |
Communications Equipment — 1.0% | | | | | | | | |
Arista Networks, Inc. (a) | | | 1,341 | | | $ | 473,883 | |
Consumer Staples Distribution & Retail — 4.9% | | | | | | | | |
Casey’s General Stores, Inc. | | | 234 | | | | 84,781 | |
Costco Wholesale Corp. | | | 2,527 | | | | 2,255,044 | |
| | | | | | | | 2,339,825 | |
Distributors — 0.1% | | | | | | | | |
LKQ Corp. | | | 1,371 | | | | 57,020 | |
Entertainment — 3.5% | | | | | | | | |
Electronic Arts, Inc. | | | 1,338 | | | | 203,135 | |
Netflix, Inc. (a) | | | 2,090 | | | | 1,465,822 | |
| | | | | | | | 1,668,957 | |
Financial Services — 9.9% | | | | | | | | |
Jack Henry & Associates, Inc. | | | 371 | | | | 64,194 | |
Mastercard, Inc. - Class A | | | 4,896 | | | | 2,366,432 | |
Visa, Inc. - Class A | | | 8,091 | | | | 2,236,110 | |
| | | | | | | | 4,666,736 | |
Food Products — 0.1% | | | | | | | | |
Darling Ingredients, Inc. (a) | | | 615 | | | | 25,664 | |
Ground Transportation — 2.0% | | | | | | | | |
Landstar System, Inc. | | | 177 | | | | 32,313 | |
Old Dominion Freight Line, Inc. | | | 1,044 | | | | 201,283 | |
RXO, Inc. (a) | | | 497 | | | | 14,145 | |
Union Pacific Corp. | | | 2,682 | | | | 686,833 | |
| | | | | | | | 934,574 | |
Health Care Equipment & Supplies — 3.4% | | | | | | | | |
Becton Dickinson & Co. | | | 1,232 | | | | 298,649 | |
IDEXX Laboratories, Inc. (a) | | | 531 | | | | 255,586 | |
Insulet Corp. (a) | | | 351 | | | | 71,172 | |
Intuitive Surgical, Inc. (a) | | | 1,632 | | | | 803,972 | |
ResMed, Inc. | | | 726 | | | | 177,885 | |
STAAR Surgical Co. (a) | | | 243 | | | | 8,041 | |
| | | | | | | | 1,615,305 | |
The accompanying notes are an integral part of these financial statements.
MOTLEY FOOL CAPITAL EFFICIENCY 100 INDEX ETF
Schedule of Investments (Continued)
AUGUST 31, 2024
| | Shares | | | Value | |
| | | | | | | | | |
COMMON STOCKS (continued) | | | | | | | | |
Health Care Providers & Services — 8.2% | | | | | | | | |
CVS Health Corp. | | | 5,561 | | | $ | 318,311 | |
HCA Healthcare, Inc. | | | 1,500 | | | | 593,385 | |
McKesson Corp. | | | 573 | | | | 321,499 | |
UnitedHealth Group, Inc. | | | 4,484 | | | | 2,646,457 | |
| | | | | | | | 3,879,652 | |
Health Care Technology — 0.3% | | | | | | | | |
Veeva Systems, Inc. - Class A (a) | | | 655 | | | | 141,768 | |
Household Durables — 0.1% | | | | | | | | |
Dream Finders Homes, Inc. - Class A (a) | | | 418 | | | | 13,982 | |
Meritage Homes Corp. | | | 161 | | | | 31,889 | |
| | | | | | | | 45,871 | |
Interactive Media & Services — 9.3% | | | | | | | | |
Alphabet, Inc. - Class C | | | 12,272 | | | | 2,026,230 | |
Meta Platforms, Inc. - Class A | | | 4,330 | | | | 2,257,272 | |
Pinterest, Inc. - Class A (a) | | | 3,252 | | | | 104,194 | |
| | | | | | | | 4,387,696 | |
IT Services — 1.4% | | | | | | | | |
Cognizant Technology Solutions Corp. - Class A | | | 2,455 | | | | 190,925 | |
EPAM Systems, Inc. (a) | | | 258 | | | | 51,796 | |
Gartner, Inc. (a) | | | 433 | | | | 213,019 | |
GoDaddy, Inc. - Class A (a) | | | 763 | | | | 127,734 | |
MongoDB, Inc. (a) | | | 340 | | | | 98,869 | |
| | | | | | | | 682,343 | |
Machinery — 0.1% | | | | | | | | |
Tennant Co. | | | 107 | | | | 10,451 | |
Toro Co. | | | 487 | | | | 45,096 | |
| | | | | | | | 55,547 | |
Media — 0.6% | | | | | | | | |
New York Times Co. - Class A | | | 851 | | | | 46,745 | |
Trade Desk, Inc. - Class A (a) | | | 2,134 | | | | 223,067 | |
| | | | | | | | 269,812 | |
Personal Care Products — 0.1% | | | | | | | | |
elf Beauty, Inc. (a) | | | 294 | | | | 44,038 | |
The accompanying notes are an integral part of these financial statements.
MOTLEY FOOL CAPITAL EFFICIENCY 100 INDEX ETF
Schedule of Investments (Continued)
AUGUST 31, 2024
| | Shares | | | Value | |
| | | | | | | | | |
COMMON STOCKS (continued) | | | | | | | | |
Pharmaceuticals — 5.0% | | | | | | | | |
Eli Lilly & Co. | | | 2,478 | | | $ | 2,378,930 | |
Professional Services — 0.0%(b) | | | | | | | | |
TaskUS, Inc. - Class A (a) | | | 473 | | | | 6,291 | |
Upwork, Inc. (a) | | | 644 | | | | 6,208 | |
| | | | | | | | 12,499 | |
Semiconductors & Semiconductor Equipment — 9.6% | | | | | | | | |
Broadcom, Inc. | | | 11,992 | | | | 1,952,538 | |
Cirrus Logic, Inc. (a) | | | 276 | | | | 40,210 | |
Impinj, Inc. (a) | | | 124 | | | | 20,844 | |
Lam Research Corp. | | | 576 | | | | 472,902 | |
NVIDIA Corp. | | | 16,751 | | | | 1,999,567 | |
Universal Display Corp. | | | 236 | | | | 45,718 | |
| | | | | | | | 4,531,779 | |
Software — 15.6% | | | | | | | | |
Adobe Systems, Inc. (a) | | | 2,817 | | | | 1,618,113 | |
Appfolio, Inc. - Class A (a) | | | 175 | | | | 40,598 | |
Autodesk, Inc. (a) | | | 1,188 | | | | 306,979 | |
DocuSign, Inc. (a) | | | 1,071 | | | | 63,414 | |
Fair Isaac Corp. (a) | | | 175 | | | | 302,797 | |
Fortinet, Inc. (a) | | | 4,277 | | | | 328,089 | |
HubSpot, Inc. (a) | | | 244 | | | | 121,773 | |
Manhattan Associates, Inc. (a) | | | 267 | | | | 70,603 | |
Microsoft Corp. | | | 4,893 | | | | 2,041,066 | |
Nutanix, Inc. - Class A (a) | | | 1,581 | | | | 99,904 | |
Palo Alto Networks, Inc. (a) | | | 1,618 | | | | 586,881 | |
Pegasystems, Inc. | | | 485 | | | | 34,377 | |
Samsara, Inc. - Class A (a) | | | 2,475 | | | | 101,648 | |
ServiceNow, Inc. (a) | | | 997 | | | | 852,435 | |
Synopsys, Inc. (a) | | | 862 | | | | 447,878 | |
Workday, Inc. - Class A (a) | | | 1,322 | | | | 347,937 | |
Zuora, Inc. - Class A (a) | | | 710 | | | | 6,241 | |
| | | | | | | | 7,370,733 | |
Specialty Retail — 5.4% | | | | | | | | |
Camping World Holdings, Inc. - Class A | | | 176 | | | | 3,861 | |
Home Depot, Inc. | | | 6,007 | | | | 2,213,580 | |
The accompanying notes are an integral part of these financial statements.
MOTLEY FOOL CAPITAL EFFICIENCY 100 INDEX ETF
Schedule of Investments (Concluded)
AUGUST 31, 2024
| | Shares | | | Value | |
| | | | | | | | | |
COMMON STOCKS (continued) | | | | | | | | |
Specialty Retail (continued) | | | | | | | | |
Stitch Fix, Inc. - Class A (a) | | | 506 | | | $ | 1,913 | |
Tractor Supply Co. | | | 497 | | | | 132,972 | |
Ulta Beauty, Inc. (a) | | | 227 | | | | 80,095 | |
Wayfair, Inc. - Class A (a) | | | 554 | | | | 23,573 | |
Williams-Sonoma, Inc. | | | 494 | | | | 66,359 | |
Winmark Corp. | | | 37 | | | | 13,342 | |
| | | | | | | | 2,535,695 | |
Technology Hardware, Storage & Peripherals — 5.1% | | | | | | | | |
Apple, Inc. | | | 10,125 | | | | 2,318,625 | |
Pure Storage, Inc. - Class A (a) | | | 1,898 | | | | 97,348 | |
| | | | | | | | 2,415,973 | |
Textiles, Apparel & Luxury Goods — 1.2% | | | | | | | | |
NIKE, Inc. - Class B | | | 6,245 | | | | 520,333 | |
Skechers USA, Inc. - Class A (a) | | | 683 | | | | 46,772 | |
Under Armour, Inc. - Class A (a) | | | 2,306 | | | | 17,733 | |
| | | | | | | | 584,838 | |
Trading Companies & Distributors — 0.2% | | | | | | | | |
Watsco, Inc. | | | 199 | | | | 94,609 | |
TOTAL COMMON STOCKS (Cost $36,977,146) | | | | | | | 47,198,973 | |
| | | | | | | | | |
TOTAL INVESTMENTS — 99.8% (Cost $36,977,146) | | | | | | | 47,198,973 | |
Other Assets in Excess of Liabilities — 0.2% | | | | | | | 127,365 | |
TOTAL NET ASSETS — 100.0% | | | | | | $ | 47,326,338 | |
Percentages are stated as a percent of net assets.
The Global Industry Classification Standard (“GICS®”) was developed by and/or is the exclusive property of MSCI, Inc. (“MSCI”) and Standard & Poor’s Financial Services LLC (“S&P”). GICS® is a service mark of MSCI and S&P and has been licensed for use by U.S. Bank Global Fund Services.
(a) | Non-income producing security. |
(b) | Represents less than 0.05% of net assets. |
The accompanying notes are an integral part of these financial statements.
MOTLEY FOOL next index ETF
Schedule of Investments
AUGUST 31, 2024
| | Shares | | | Value | |
| | | | | | | | | |
COMMON STOCKS — 99.7% | | | | | | | | |
Aerospace & Defense — 4.9% | | | | | | | | |
AeroVironment, Inc. (a) | | | 396 | | | $ | 80,689 | |
Axon Enterprise, Inc. (a) | | | 1,070 | | | | 390,518 | |
HEICO Corp. | | | 1,710 | | | | 438,718 | |
Rocket Lab USA, Inc. (a) | | | 6,975 | | | | 43,733 | |
Textron, Inc. | | | 2,702 | | | | 246,422 | |
| | | | | | | | 1,200,080 | |
Air Freight & Logistics — 0.3% | | | | | | | | |
GXO Logistics, Inc. (a) | | | 1,551 | | | | 77,628 | |
Automobile Components — 0.7% | | | | | | | | |
BorgWarner, Inc. | | | 3,227 | | | | 109,944 | |
Phinia, Inc. | | | 649 | | | | 31,126 | |
XPEL, Inc. (a) | | | 391 | | | | 16,926 | |
| | | | | | | | 157,996 | |
Banks — 0.7% | | | | | | | | |
Axos Financial, Inc. (a) | | | 809 | | | | 56,169 | |
Western Alliance Bancorp | | | 1,545 | | | | 126,195 | |
| | | | | | | | 182,364 | |
Beverages — 0.7% | | | | | | | | |
Boston Beer Co., Inc. - Class A (a) | | | 167 | | | | 45,377 | |
Celsius Holdings, Inc. (a) | | | 3,299 | | | | 125,461 | |
| | | | | | | | 170,838 | |
Biotechnology — 5.6% | | | | | | | | |
2seventy bio, Inc. (a) | | | 729 | | | | 3,550 | |
Alnylam Pharmaceuticals, Inc. (a) | | | 1,791 | | | | 470,478 | |
AnaptysBio, Inc. (a) | | | 387 | | | | 14,741 | |
BioMarin Pharmaceutical, Inc. (a) | | | 2,690 | | | | 245,355 | |
Bluebird Bio, Inc. (a) | | | 2,729 | | | | 1,532 | |
Bridgebio Pharma, Inc. (a) | | | 2,649 | | | | 73,775 | |
Editas Medicine, Inc. (a) | | | 1,165 | | | | 4,357 | |
Emergent BioSolutions, Inc. (a) | | | 743 | | | | 6,174 | |
Exact Sciences Corp. (a) | | | 2,613 | | | | 161,196 | |
Exelixis, Inc. (a) | | | 4,124 | | | | 107,348 | |
Ionis Pharmaceuticals, Inc. (a) | | | 2,065 | | | | 98,459 | |
The accompanying notes are an integral part of these financial statements.
MOTLEY FOOL next index ETF
Schedule of Investments (Continued)
AUGUST 31, 2024
| | Shares | | | Value | |
| | | | | | | | | |
COMMON STOCKS (continued) | | | | | | | | |
Biotechnology (continued) | | | | | | | | |
Neurocrine Biosciences, Inc. (a) | | | 1,425 | | | $ | 181,061 | |
| | | | | | | | 1,368,026 | |
Broadline Retail — 0.4% | | | | | | | | |
Etsy, Inc. (a) | | | 1,657 | | | | 91,284 | |
Building Products — 0.4% | | | | | | | | |
Trex Co., Inc. (a) | | | 1,540 | | | | 98,160 | |
Capital Markets — 4.8% | | | | | | | | |
Affiliated Managers Group, Inc. | | | 452 | | | | 78,571 | |
Cboe Global Markets, Inc. | | | 1,490 | | | | 306,046 | |
FactSet Research Systems, Inc. | | | 542 | | | | 229,180 | |
Houlihan Lokey, Inc. | | | 973 | | | | 152,391 | |
Interactive Brokers Group, Inc. - Class A | | | 1,516 | | | | 195,397 | |
Jefferies Financial Group, Inc. | | | 3,003 | | | | 180,030 | |
PJT Partners, Inc. - Class A | | | 340 | | | | 41,990 | |
| | | | | | | | 1,183,605 | |
Chemicals — 1.2% | | | | | | | | |
Balchem Corp. | | | 460 | | | | 81,434 | |
RPM International, Inc. | | | 1,824 | | | | 212,040 | |
| | | | | | | | 293,474 | |
Commercial Services & Supplies — 1.5% | | | | | | | | |
Healthcare Services Group, Inc. (a) | | | 1,043 | | | | 11,359 | |
Rollins, Inc. | | | 6,857 | | | | 344,084 | |
| | | | | | | | 355,443 | |
Communications Equipment — 0.7% | | | | | | | | |
Ubiquiti, Inc. | | | 858 | | | | 166,040 | |
Construction & Engineering — 0.5% | | | | | | | | |
MasTec, Inc. (a) | | | 1,103 | | | | 124,782 | |
Consumer Finance — 0.5% | | | | | | | | |
Nelnet, Inc. - Class A | | | 516 | | | | 59,639 | |
Upstart Holdings, Inc. (a) | | | 1,244 | | | | 52,870 | |
| | | | | | | | 112,509 | |
The accompanying notes are an integral part of these financial statements.
MOTLEY FOOL next index ETF
Schedule of Investments (Continued)
AUGUST 31, 2024
| | Shares | | | Value | |
| | | | | | | | | |
COMMON STOCKS (continued) | | | | | | | | |
Consumer Staples Distribution & Retail — 0.8% | | | | | | | | |
Casey’s General Stores, Inc. | | | 526 | | | $ | 190,575 | |
Distributors — 0.6% | | | | | | | | |
LKQ Corp. | | | 3,779 | | | | 157,169 | |
Diversified Consumer Services — 0.5% | | | | | | | | |
Chegg, Inc. (a) | | | 1,449 | | | | 3,130 | |
Duolingo, Inc. (a) | | | 611 | | | | 129,880 | |
| | | | | | | | 133,010 | |
Diversified Telecommunication Services — 0.0%(b) | | | | | | | | |
Bandwidth, Inc. - Class A (a) | | | 382 | | | | 6,555 | |
Electronic Equipment, Instruments & Components — 2.7% | | | | | | | | |
Cognex Corp. | | | 2,432 | | | | 98,204 | |
Coherent Corp. (a) | | | 2,161 | | | | 168,450 | |
Evolv Technologies Holdings, Inc. (a) | | | 2,212 | | | | 8,715 | |
IPG Photonics Corp. (a) | | | 647 | | | | 44,235 | |
Littelfuse, Inc. | | | 352 | | | | 95,815 | |
Zebra Technologies Corp. - Class A (a) | | | 729 | | | | 251,782 | |
| | | | | | | | 667,201 | |
Energy Equipment & Services — 0.2% | | | | | | | | |
Core Laboratories, Inc. | | | 664 | | | | 12,988 | |
Oceaneering International, Inc. (a) | | | 1,436 | | | | 38,757 | |
| | | | | | | | 51,745 | |
Entertainment — 3.5% | | | | | | | | |
Live Nation Entertainment, Inc. (a) | | | 3,252 | | | | 317,623 | |
Roku, Inc. (a) | | | 1,938 | | | | 131,338 | |
Take-Two Interactive Software, Inc. (a) | | | 2,479 | | | | 400,879 | |
| | | | | | | | 849,840 | |
Financial Services — 2.7% | | | | | | | | |
Euronet Worldwide, Inc. (a) | | | 649 | | | | 70,033 | |
Jack Henry & Associates, Inc. | | | 1,032 | | | | 178,567 | |
Marqeta, Inc. - Class A (a) | | | 7,336 | | | | 39,101 | |
Toast, Inc. - Class A (a) | | | 7,860 | | | | 195,400 | |
Walker & Dunlop, Inc. | | | 479 | | | | 51,282 | |
The accompanying notes are an integral part of these financial statements.
MOTLEY FOOL next index ETF
Schedule of Investments (Continued)
AUGUST 31, 2024
| | Shares | | | Value | |
| | | | | | | | | |
COMMON STOCKS (continued) | | | | | | | | |
Financial Services (continued) | | | | | | | | |
WEX, Inc. (a) | | | 596 | | | $ | 113,848 | |
| | | | | | | | 648,231 | |
Food Products — 2.0% | | | | | | | | |
Darling Ingredients, Inc. (a) | | | 2,264 | | | | 94,477 | |
Freshpet, Inc. (a) | | | 687 | | | | 93,432 | |
McCormick & Co., Inc. | | | 3,767 | | | | 301,473 | |
| | | | | | | | 489,382 | |
Ground Transportation — 2.1% | | | | | | | | |
Landstar System, Inc. | | | 507 | | | | 92,558 | |
RXO, Inc. (a) | | | 1,666 | | | | 47,414 | |
U-Haul Holding Co. (a) | | | 2,686 | | | | 190,760 | |
XPO, Inc. (a) | | | 1,648 | | | | 188,894 | |
| | | | | | | | 519,626 | |
Health Care Equipment & Supplies — 3.1% | | | | | | | | |
Globus Medical, Inc. - Class A (a) | | | 1,912 | | | | 139,003 | |
Inari Medical, Inc. (a) | | | 823 | | | | 35,578 | |
Insulet Corp. (a) | | | 992 | | | | 201,148 | |
Masimo Corp. (a) | | | 754 | | | | 88,610 | |
QuidelOrtho Corp. (a) | | | 949 | | | | 40,095 | |
Solventum Corp. (a) | | | 2,445 | | | | 156,749 | |
STAAR Surgical Co. (a) | | | 697 | | | | 23,064 | |
TransMedics Group, Inc. (a) | | | 468 | | | | 78,652 | |
| | | | | | | | 762,899 | |
Health Care Providers & Services — 1.8% | | | | | | | | |
Fulgent Genetics, Inc. (a) | | | 426 | | | | 9,610 | |
Guardant Health, Inc. (a) | | | 1,732 | | | | 44,305 | |
HealthEquity, Inc. (a) | | | 1,234 | | | | 98,177 | |
Progyny, Inc. (a) | | | 1,350 | | | | 31,711 | |
Quest Diagnostics, Inc. | | | 1,572 | | | | 246,757 | |
| | | | | | | | 430,560 | |
Health Care Technology — 0.6% | | | | | | | | |
Doximity, Inc. - Class A (a) | | | 2,626 | | | | 96,584 | |
GoodRx Holdings, Inc. - Class A (a) | | | 5,312 | | | | 41,965 | |
The accompanying notes are an integral part of these financial statements.
MOTLEY FOOL next index ETF
Schedule of Investments (Continued)
AUGUST 31, 2024
| | Shares | | | Value | |
| | | | | | | | | |
COMMON STOCKS (continued) | | | | | | | | |
Health Care Technology (continued) | | | | | | | | |
Teladoc, Inc. (a) | | | 2,401 | | | $ | 17,215 | |
| | | | | | | | 155,764 | |
Hotels, Restaurants & Leisure — 4.0% | | | | | | | | |
Cava Group, Inc. (a) | | | 1,616 | | | | 184,289 | |
Dave & Buster’s Entertainment, Inc. (a) | | | 561 | | | | 17,582 | |
Hyatt Hotels Corp. - Class A | | | 1,433 | | | | 217,701 | |
Planet Fitness, Inc. - Class A (a) | | | 1,241 | | | | 100,782 | |
Sweetgreen, Inc. - Class A (a) | | | 1,606 | | | | 50,766 | |
Texas Roadhouse, Inc. | | | 946 | | | | 159,637 | |
Vail Resorts, Inc. | | | 535 | | | | 97,209 | |
Wingstop, Inc. | | | 417 | | | | 161,008 | |
| | | | | | | | 988,974 | |
Household Durables — 2.3% | | | | | | | | |
Dream Finders Homes, Inc. - Class A (a) | | | 1,328 | | | | 44,422 | |
iRobot Corp. (a) | | | 408 | | | | 2,986 | |
Meritage Homes Corp. | | | 515 | | | | 102,006 | |
NVR, Inc. (a) | | | 46 | | | | 421,933 | |
| | | | | | | | 571,347 | |
Household Products — 0.2% | | | | | | | | |
Spectrum Brands Holdings, Inc. | | | 414 | | | | 39,048 | |
Industrial REITs — 0.4% | | | | | | | | |
STAG Industrial, Inc. | | | 2,579 | | | | 104,656 | |
Insurance — 2.1% | | | | | | | | |
Kinsale Capital Group, Inc. | | | 329 | | | | 161,569 | |
Lemonade, Inc. (a) | | | 999 | | | | 18,511 | |
Markel Group, Inc. (a) | | | 185 | | | | 296,126 | |
Safety Insurance Group, Inc. | | | 212 | | | | 18,772 | |
Trupanion, Inc. (a) | | | 594 | | | | 27,164 | |
| | | | | | | | 522,142 | |
Interactive Media & Services — 1.9% | | | | | | | | |
Bumble, Inc. - Class A (a) | | | 1,786 | | | | 11,984 | |
Match Group, Inc. (a) | | | 3,572 | | | | 132,914 | |
Pinterest, Inc. - Class A (a) | | | 9,670 | | | | 309,827 | |
| | | | | | | | 454,725 | |
The accompanying notes are an integral part of these financial statements.
MOTLEY FOOL next index ETF
Schedule of Investments (Continued)
AUGUST 31, 2024
| | Shares | | | Value | |
| | | | | | | | | |
COMMON STOCKS (continued) | | | | | | | | |
IT Services — 5.3% | | | | | | | | |
Cloudflare, Inc. - Class A (a) | | | 4,810 | | | $ | 395,093 | |
DigitalOcean Holdings, Inc. (a) | | | 1,292 | | | | 48,360 | |
EPAM Systems, Inc. (a) | | | 786 | | | | 157,797 | |
Fastly, Inc. - Class A (a) | | | 1,936 | | | | 11,655 | |
GoDaddy, Inc. - Class A (a) | | | 1,997 | | | | 334,318 | |
Okta, Inc. (a) | | | 2,381 | | | | 187,456 | |
Twilio, Inc. - Class A (a) | | | 2,425 | | | | 152,193 | |
| | | | | | | | 1,286,872 | |
Leisure Products — 0.6% | | | | | | | | |
Hasbro, Inc. | | | 1,972 | | | | 134,412 | |
Life Sciences Tools & Services — 0.5% | | | | | | | | |
Mesa Laboratories, Inc. | | | 77 | | | | 10,294 | |
Repligen Corp. (a) | | | 792 | | | | 119,537 | |
| | | | | | | | 129,831 | |
Machinery — 3.7% | | | | | | | | |
Chart Industries, Inc. (a) | | | 595 | | | | 72,828 | |
Middleby Corp. (a) | | | 761 | | | | 107,012 | |
Proto Labs, Inc. (a) | | | 360 | | | | 11,009 | |
RBC Bearings, Inc. (a) | | | 412 | | | | 122,714 | |
Tennant Co. | | | 272 | | | | 26,566 | |
Toro Co. | | | 1,471 | | | | 136,215 | |
Westinghouse Air Brake Technologies Corp. | | | 2,497 | | | | 423,416 | |
| | | | | | | | 899,760 | |
Media — 0.6% | | | | | | | | |
Boston Omaha Corp. - Class A (a) | | | 446 | | | | 6,374 | |
New York Times Co. - Class A | | | 2,326 | | | | 127,767 | |
PubMatic, Inc. - Class A (a) | | | 707 | | | | 11,029 | |
| | | | | | | | 145,170 | |
Oil, Gas & Consumable Fuels — 0.9% | | | | | | | | |
Clean Energy Fuels Corp. (a) | | | 3,161 | | | | 9,768 | |
EQT Corp. | | | 6,043 | | | | 202,501 | |
Excelerate Energy, Inc. - Class A | | | 357 | | | | 6,508 | |
Vitesse Energy, Inc. | | | 419 | | | | 10,835 | |
| | | | | | | | 229,612 | |
The accompanying notes are an integral part of these financial statements.
MOTLEY FOOL next index ETF
Schedule of Investments (Continued)
AUGUST 31, 2024
| | Shares | | | Value | |
| | | | | | | | | |
COMMON STOCKS (continued) | | | | | | | | |
Passenger Airlines — 0.3% | | | | | | | | |
Alaska Air Group, Inc. (a) | | | 1,796 | | | $ | 64,854 | |
Hawaiian Holdings, Inc. (a) | | | 735 | | | | 12,730 | |
| | | | | | | | 77,584 | |
Personal Care Products — 0.5% | | | | | | | | |
elf Beauty, Inc. (a) | | | 793 | | | | 118,783 | |
Pharmaceuticals — 0.8% | | | | | | | | |
Viatris, Inc. | | | 16,854 | | | | 203,596 | |
Professional Services — 3.7% | | | | | | | | |
Broadridge Financial Solutions, Inc. | | | 1,675 | | | | 356,540 | |
NV5 Global, Inc. (a) | | | 229 | | | | 22,014 | |
Paycom Software, Inc. | | | 803 | | | | 130,712 | |
Robert Half, Inc. | | | 1,460 | | | | 91,498 | |
SS&C Technologies Holdings, Inc. | | | 3,503 | | | | 263,040 | |
TaskUS, Inc. - Class A (a) | | | 1,246 | | | | 16,572 | |
Upwork, Inc. (a) | | | 1,884 | | | | 18,162 | |
| | | | | | | | 898,538 | |
Real Estate Management & Development — 0.8% | | | | | | | | |
Redfin Corp. (a) | | | 1,692 | | | | 15,803 | |
Zillow Group, Inc. - Class C (a) | | | 3,321 | | | | 183,652 | |
| | | | | | | | 199,455 | |
Retail REITs — 0.1% | | | | | | | | |
Retail Opportunity Investments Corp. | | | 1,805 | | | | 27,598 | |
Semiconductors & Semiconductor Equipment — 4.8% | | | | | | | | |
Cirrus Logic, Inc. (a) | | | 756 | | | | 110,142 | |
Enphase Energy, Inc. (a) | | | 1,873 | | | | 226,708 | |
First Solar, Inc. (a) | | | 1,515 | | | | 344,465 | |
Impinj, Inc. (a) | | | 393 | | | | 66,063 | |
Silicon Laboratories, Inc. (a) | | | 453 | | | | 53,622 | |
Skyworks Solutions, Inc. | | | 2,271 | | | | 248,879 | |
Universal Display Corp. | | | 672 | | | | 130,180 | |
| | | | | | | | 1,180,059 | |
Software — 11.7% | | | | | | | | |
Alarm.com Holdings, Inc. (a) | | | 710 | | | | 42,273 | |
Appfolio, Inc. - Class A (a) | | | 514 | | | | 119,243 | |
The accompanying notes are an integral part of these financial statements.
MOTLEY FOOL next index ETF
Schedule of Investments (Continued)
AUGUST 31, 2024
| | Shares | | | Value | |
| | | | | | | | | |
COMMON STOCKS (continued) | | | | | | | | |
Software (continued) | | | | | | | | |
Appian Corp. - Class A (a) | | | 1,025 | | | $ | 33,251 | |
Asana, Inc. - Class A (a) | | | 3,231 | | | | 45,428 | |
Blackbaud, Inc. (a) | | | 715 | | | | 59,774 | |
BlackLine, Inc. (a) | | | 997 | | | | 49,401 | |
Box, Inc. - Class A (a) | | | 2,052 | | | | 66,895 | |
Braze, Inc. - Class A (a) | | | 1,440 | | | | 64,483 | |
Confluent, Inc. - Class A (a) | | | 4,174 | | | | 88,572 | |
DocuSign, Inc. (a) | | | 2,899 | | | | 171,650 | |
Gitlab, Inc. - Class A (a) | | | 2,251 | | | | 106,697 | |
HubSpot, Inc. (a) | | | 722 | | | | 360,329 | |
Manhattan Associates, Inc. (a) | | | 871 | | | | 230,319 | |
Nutanix, Inc. - Class A (a) | | | 3,493 | | | | 220,723 | |
Pegasystems, Inc. | | | 1,204 | | | | 85,340 | |
Q2 Holdings, Inc. (a) | | | 852 | | | | 63,227 | |
Samsara, Inc. - Class A (a) | | | 7,797 | | | | 320,223 | |
Smartsheet, Inc. - Class A (a) | | | 1,959 | | | | 95,599 | |
Tyler Technologies, Inc. (a) | | | 601 | | | | 353,310 | |
UiPath, Inc. - Class A (a) | | | 8,108 | | | | 104,431 | |
Unity Software, Inc. (a) | | | 5,134 | | | | 84,044 | |
Varonis Systems, Inc. (a) | | | 1,579 | | | | 89,371 | |
Zuora, Inc. - Class A (a) | | | 2,098 | | | | 18,441 | |
| | | | | | | | 2,873,024 | |
Specialty Retail — 7.7% | | | | | | | | |
Camping World Holdings, Inc. - Class A | | | 640 | | | | 14,042 | |
CarMax, Inc. (a) | | | 2,227 | | | | 188,293 | |
Carvana Co. (a) | | | 1,657 | | | | 249,577 | |
Chewy, Inc. - Class A (a) | | | 6,171 | | | | 176,182 | |
Designer Brands, Inc. - Class A | | | 818 | | | | 5,432 | |
Five Below, Inc. (a) | | | 780 | | | | 58,835 | |
GameStop Corp. - Class A (a) | | | 6,035 | | | | 141,340 | |
RH (a) | | | 263 | | | | 66,723 | |
Sleep Number Corp. (a) | | | 318 | | | | 4,837 | |
Stitch Fix, Inc. - Class A (a) | | | 1,731 | | | | 6,543 | |
Tractor Supply Co. | | | 1,526 | | | | 408,281 | |
Ulta Beauty, Inc. (a) | | | 676 | | | | 238,520 | |
Wayfair, Inc. - Class A (a) | | | 1,728 | | | | 73,526 | |
Williams-Sonoma, Inc. | | | 1,821 | | | | 244,615 | |
The accompanying notes are an integral part of these financial statements.
MOTLEY FOOL next index ETF
Schedule of Investments (Concluded)
AUGUST 31, 2024
| | Shares | | | Value | |
| | | | | | | | | |
COMMON STOCKS (continued) | | | | | | | | |
Specialty Retail (continued) | | | | | | | | |
Winmark Corp. | | | 52 | | | $ | 18,751 | |
| | | | | | | | 1,895,497 | |
Technology Hardware, Storage & Peripherals — 1.0% | | | | | | | | |
Pure Storage, Inc. - Class A (a) | | | 4,604 | | | | 236,139 | |
Textiles, Apparel & Luxury Goods — 0.8% | | | | | | | | |
Skechers USA, Inc. - Class A (a) | | | 2,161 | | | | 147,985 | |
Under Armour, Inc. - Class A (a) | | | 6,103 | | | | 46,932 | |
| | | | | | | | 194,917 | |
Trading Companies & Distributors — 1.5% | | | | | | | | |
Watsco, Inc. | | | 527 | | | | 250,546 | |
WESCO International, Inc. | | | 720 | | | | 119,074 | |
| | | | | | | | 369,620 | |
TOTAL COMMON STOCKS (Cost $24,624,583) | | | | | | | 24,426,145 | |
| | | | | | | | | |
TOTAL INVESTMENTS — 99.7% (Cost $24,624,583) | | | | | | | 24,426,145 | |
Other Assets in Excess of Liabilities — 0.3% | | | | | | | 88,426 | |
TOTAL NET ASSETS — 100.0% | | | | | | $ | 24,514,571 | |
Percentages are stated as a percent of net assets.
The Global Industry Classification Standard (“GICS®”) was developed by and/or is the exclusive property of MSCI, Inc. (“MSCI”) and Standard & Poor’s Financial Services LLC (“S&P”). GICS® is a service mark of MSCI and S&P and has been licensed for use by U.S. Bank Global Fund Services.
REIT — Real Estate Investment Trust
(a) | Non-income producing security. |
(b) | Represents less than 0.05% of net assets. |
The accompanying notes are an integral part of these financial statements.
Motley Fool ETFs
Statements of Assets and Liabilities
AUGUST 31, 2024
| | Motley
Fool Global
Opportunities
ETF | | | Motley Fool
Mid-Cap
Growth ETF | | | Motley
Fool 100
Index ETF | | | Motley Fool
Small-Cap
Growth ETF | |
ASSETS | | | | | | | | | | | | | | | | |
Investments in securities of unaffiliated issurers, at value (cost $260,227,204, $126,514,287, $624,698,031 and $68,204,891 respectively)^ | | $ | 426,488,703 | | | $ | 199,845,433 | | | $ | 967,166,341 | | | $ | 77,773,419 | |
Investments purchased with proceeds from securities lending collateral (cost $34,052,359, $28,802,749, $10,257,974 and $21,476,806 respectively) | | | 34,052,359 | | | | 28,802,749 | | | | 10,257,974 | | | | 21,476,806 | |
Cash and cash equivalents | | | 13,848,001 | | | | 3,330,333 | | | | 2,494,703 | | | | 507,825 | |
Receivables for: | | | | | | | | | | | | | | | | |
Dividends and tax reclaims | | | 436,106 | | | | 106,527 | | | | 608,889 | | | | 23,412 | |
Total assets | | | 474,825,169 | | | | 232,085,042 | | | | 980,527,907 | | | | 99,781,462 | |
| | | | | | | | | | | | | | | | | |
LIABILITIES | | | | | | | | | | | | | | | | |
Payables for: | | | | | | | | | | | | | | | | |
Securities lending collateral (see Note 7) | | | 34,052,359 | | | | 28,802,749 | | | | 10,257,974 | | | | 21,476,806 | |
Advisory fees | | | 310,338 | | | | 143,321 | | | | 385,095 | | | | 55,976 | |
Total liabilities | | | 34,362,697 | | | | 28,946,070 | | | | 10,643,069 | | | | 21,532,782 | |
Net assets | | $ | 440,462,472 | | | $ | 203,138,972 | | | $ | 969,884,838 | | | $ | 78,248,680 | |
| | | | | | | | | | | | | | | | | |
NET ASSETS CONSIST OF: | | | | | | | | | | | | | | | | |
Par value | | $ | 14,044 | | | $ | 7,118 | | | $ | 17,625 | | | $ | 2,400 | |
Paid-in capital | | | 221,243,963 | | | | 100,813,106 | | | | 633,389,138 | | | | 85,998,034 | |
Total distributable earnings/(losses) | | | 219,204,465 | | | | 102,318,748 | | | | 336,478,075 | | | | (7,751,754 | ) |
Net assets | | $ | 440,462,472 | | | $ | 203,138,972 | | | $ | 969,884,838 | | | $ | 78,248,680 | |
| | | | | | | | | | | | | | | | | |
Shares outstanding ($0.001 par value, 100,000,000 shares authorized) | | | 14,043,873 | | | | 7,117,511 | | | | 17,625,000 | | | | 2,400,000 | |
Net asset value, price per share | | $ | 31.36 | | | $ | 28.54 | | | $ | 55.03 | | | $ | 32.60 | |
| | | | | | | | | | | | | | | | | |
^ Includes market value of securities on loan | | $ | 33,637,720 | | | $ | 28,330,814 | | | $ | 10,202,881 | | | $ | 20,968,235 | |
The accompanying notes are an integral part of these financial statements.
Motley Fool ETFs
Statements of Assets and Liabilities (concluded)
AUGUST 31, 2024
| | Motley Fool
Capital
Efficiency 100
Index ETF | | | Motley
Fool Next
Index ETF | |
ASSETS | | | | | | | | |
Investments in securities of unaffiliated issurers, at value (cost $36,977,146 and $24,624,583 respectively)^ | | $ | 47,198,973 | | | $ | 24,426,145 | |
Cash and cash equivalents | | | 113,021 | | | | 84,560 | |
Receivables for: | | | | | | | | |
Dividends and tax reclaims | | | 33,546 | | | | 14,317 | |
Total assets | | | 47,345,540 | | | | 24,525,022 | |
| | | | | | | | | |
LIABILITIES | | | | | | | | |
Payables for: | | | | | | | | |
Advisory fees | | | 19,202 | | | | 10,451 | |
Total liabilities | | | 19,202 | | | | 10,451 | |
Net assets | | $ | 47,326,338 | | | $ | 24,514,571 | |
| | | | | | | | | |
NET ASSETS CONSIST OF: | | | | | | | | |
Par value | | $ | 1,850 | | | $ | 1,350 | |
Paid-in capital | | | 37,448,697 | | | | 26,530,059 | |
Total distributable earnings/(losses) | | | 9,875,791 | | | | (2,016,838 | ) |
Net assets | | $ | 47,326,338 | | | $ | 24,514,571 | |
| | | | | | | | | |
Shares outstanding ($0.001 par value, 100,000,000 shares authorized) | | | 1,850,000 | | | | 1,350,000 | |
Net asset value, price per share | | $ | 25.58 | | | $ | 18.16 | |
The accompanying notes are an integral part of these financial statements.
Motley Fool ETFs
Statements of Operations
FOR THE YEAR ENDED AUGUST 31, 2024
| | Motley
Fool Global
Opportunities
ETF | | | Motley Fool
Mid-Cap
Growth ETF | | | Motley
Fool 100
Index ETF | | | Motley Fool
Small-Cap
Growth ETF | |
INVESTMENT INCOME | | | | | | | | | | | | | | | | |
Dividends | | $ | 6,149,134 | | | $ | 1,748,100 | | | $ | 5,449,722 | | | $ | 506,939 | |
Less foreign taxes withheld | | | (397,309 | ) | | | — | | | | — | | | | — | |
Securities lending income | | | 56,860 | | | | 42,484 | | | | 28,436 | | | | 34,158 | |
Total investment income | | | 5,808,685 | | | | 1,790,584 | | | | 5,478,158 | | | | 541,097 | |
| | | | | | | | | | | | | | | | | |
EXPENSES | | | | | | | | | | | | | | | | |
Advisory fees (Note 3) | | | 3,631,316 | | | | 1,633,412 | | | | 3,573,161 | | | | 665,835 | |
Total expenses | | | 3,631,316 | | | | 1,633,412 | | | | 3,573,161 | | | | 665,835 | |
Net investment income/(loss) | | | 2,177,369 | | | | 157,172 | | | | 1,904,997 | | | | (124,738 | ) |
| | | | | | | | | | | | | | | | | |
NET REALIZED AND UNREALIZED GAIN/(LOSS) FROM INVESTMENTS | | | | | | | | | | | | | | | | |
Net realized gain/(loss) from: | | | | | | | | | | | | | | | | |
Investments | | | 73,740,037 | | | | 30,724,805 | | | | 5,115,735 | | | | (11,531,737 | ) |
Foreign currency transactions | | | (659,548 | ) | | | — | | | | — | | | | — | |
Redemption in-kind | | | 28,177,786 | | | | 13,067,346 | | | | 30,127,251 | | | | 4,418,984 | |
Net change in unrealized appreciation/(depreciation) on: | | | | | | | | | | | | | | | | |
Investments | | | (21,782,537 | ) | | | (10,270,372 | ) | | | 169,139,961 | | | | 16,332,435 | |
Foreign currency translation | | | 62,086 | | | | — | | | | — | | | | — | |
Net realized and unrealized gain | | | 79,537,824 | | | | 33,521,779 | | | | 204,382,947 | | | | 9,219,682 | |
NET INCREASE IN NET ASSETS RESULTING FROM OPERATIONS | | $ | 81,715,193 | | | $ | 33,678,951 | | | $ | 206,287,944 | | | $ | 9,094,944 | |
The accompanying notes are an integral part of these financial statements.
Motley Fool ETFs
Statements of Operations (CONCLUDED)
FOR THE YEAR ENDED AUGUST 31, 2024
| | Motley Fool
Capital
Efficiency 100
Index ETF | | | Motley
Fool NEXT
INDEX ETF | |
INVESTMENT INCOME | | | | | | | | |
Dividends | | $ | 315,068 | | | $ | 162,605 | |
Total investment income | | | 315,068 | | | | 162,605 | |
| | | | | | | | | |
EXPENSES | | | | | | | | |
Advisory fees (Note 3) | | | 170,046 | | | | 129,230 | |
Total expenses | | | 170,046 | | | | 129,230 | |
Net investment income/(loss) | | | 145,022 | | | | 33,375 | |
| | | | | | | | | |
NET REALIZED AND UNREALIZED GAIN/(LOSS) FROM INVESTMENTS | | | | | | | | |
Net realized gain/(loss) from: | | | | | | | | |
Investments | | | 743,150 | | | | (121,916 | ) |
Redemption in-kind | | | 1,705,327 | | | | 408,441 | |
Net change in unrealized appreciation/(depreciation) on: | | | | | | | | |
Investments | | | 7,226,975 | | | | 3,254,754 | |
Net realized and unrealized gain | | | 9,675,452 | | | | 3,541,279 | |
NET INCREASE IN NET ASSETS RESULTING FROM OPERATIONS | | $ | 9,820,474 | | | $ | 3,574,654 | |
The accompanying notes are an integral part of these financial statements.
MOTLEY FOOL Global Opportunities ETF
Statements of Changes in Net Assets
| | FOR THE
YEAR ENDED
AUGUST 31,
2024 | | | FOR THE
YEAR ENDED
AUGUST 31,
2023 | |
OPERATIONS | | | | | | | | |
Net investment income/(loss) | | $ | 2,177,369 | | | $ | 1,883,189 | |
Net realized gain from investments and foreign currency transactions | | | 101,258,275 | | | | 20,808,505 | |
Net change in unrealized appreciation/(depreciation) on investments, foreign currency translation and assets and liabilities denominated in foreign currencies | | | (21,720,451 | ) | | | 21,314,343 | |
NET INCREASE/(DECREASE) IN NET ASSETS RESULTING FROM OPERATIONS | | | 81,715,193 | | | | 44,006,037 | |
| | | | | | | | | |
DIVIDENDS AND DISTRIBUTIONS TO SHAREHOLDERS: | | | | | | | | |
Total dividends and distributions to shareholders | | | (23,006,101 | ) | | | (2,705,256 | ) |
| | | | | | | | | |
CAPITAL SHARE TRANSACTIONS: | | | | | | | | |
Proceeds from shares sold | | | 7,701,448 | | | | 1,935,173 | |
Shares redeemed | | | (55,914,052 | ) | | | (46,922,013 | ) |
Net decrease in net assets from capital share transactions | | | (48,212,604 | ) | | | (44,986,840 | ) |
TOTAL INCREASE/(DECREASE) IN NET ASSETS | | | 10,496,488 | | | | (3,686,059 | ) |
| | | | | | | | | |
NET ASSETS: | | | | | | | | |
Beginning of period | | $ | 429,965,984 | | | $ | 433,652,043 | |
End of period | | $ | 440,462,472 | | | $ | 429,965,984 | |
| | | | | | | | | |
SHARES TRANSACTIONS: | | | | | | | | |
Shares sold | | | 275,000 | | | | 75,000 | |
Shares redeemed | | | (1,950,000 | ) | | | (1,875,000 | ) |
Net increase/(decrease) in shares outstanding | | | (1,675,000 | ) | | | (1,800,000 | ) |
The accompanying notes are an integral part of these financial statements.
MOTLEY FOOL Mid-Cap Growth ETF
Statements of Changes in Net Assets
| | FOR THE
YEAR ENDED
AUGUST 31,
2024 | | | FOR THE
YEAR ENDED
AUGUST 31,
2023 | |
OPERATIONS | | | | | | | | |
Net investment income/(loss) | | $ | 157,172 | | | $ | 569,856 | |
Net realized gain from investments and foreign currency transactions | | | 43,792,151 | | | | 17,160,148 | |
Net change in unrealized depreciation on investments, foreign currency translation, and assets and liabilities denominated in foreign currencies | | | (10,270,372 | ) | | | (2,432,722 | ) |
NET INCREASE/(DECREASE) IN NET ASSETS RESULTING FROM OPERATIONS | | | 33,678,951 | | | | 15,297,282 | |
| | | | | | | | | |
DIVIDENDS AND DISTRIBUTIONS TO SHAREHOLDERS: | | | | | | | | |
Total dividends and distributions to shareholders | | | (4,987,801 | ) | | | — | |
| | | | | | | | | |
CAPITAL SHARE TRANSACTIONS: | | | | | | | | |
Proceeds from shares sold | | | 8,257,740 | | | | | |
Shares redeemed | | | (28,155,655 | ) | | | (29,995,560 | ) |
Net decrease in net assets from capital share transactions | | | (19,897,915 | ) | | | (29,995,560 | ) |
TOTAL INCREASE/(DECREASE) IN NET ASSETS | | | 8,793,235 | | | | (14,698,278 | ) |
| | | | | | | | | |
NET ASSETS: | | | | | | | | |
Beginning of period | | $ | 194,345,737 | | | $ | 209,044,015 | |
End of period | | $ | 203,138,972 | | | $ | 194,345,737 | |
| | | | | | | | | |
SHARES TRANSACTIONS: | | | | | | | | |
Shares sold | | | 300,000 | | | | — | |
Shares redeemed | | | (1,075,000 | ) | | | (1,325,000 | ) |
Net increase/(decrease) in shares outstanding | | | (775,000 | ) | | | (1,325,000 | ) |
The accompanying notes are an integral part of these financial statements.
Motley Fool 100 Index ETF
Statements of Changes in Net Assets
| | FOR THE
YEAR ENDED
AUGUST 31,
2024 | | | FOR THE
YEAR ENDED
AUGUST 31,
2023 | |
OPERATIONS: | | | | | | | | |
Net investment income | | $ | 1,904,997 | | | $ | 1,549,001 | |
Net realized gain from investments | | | 35,242,986 | | | | 10,767,400 | |
Net change in unrealized appreciation/(depreciation) on investments | | | 169,139,961 | | | | 78,108,704 | |
NET INCREASE/(DECREASE) IN NET ASSETS RESULTING FROM OPERATIONS | | | 206,287,944 | | | | 90,425,105 | |
| | | | | | | | | |
DIVIDENDS AND DISTRIBUTIONS TO SHAREHOLDERS FROM: | | | | | | | | |
Total distributable earnings | | | (846,637 | ) | | | (1,701,998 | ) |
| | | | | | | | | |
CAPITAL SHARE TRANSACTIONS: | | | | | | | | |
Proceeds from shares sold | | | 255,012,722 | | | | 76,561,270 | |
Shares redeemed | | | (40,092,155 | ) | | | (33,030,150 | ) |
Net increase/(decrease) in net assets from capital share transactions | | | 214,920,567 | | | | 43,531,120 | |
TOTAL INCREASE/(DECREASE) IN NET ASSETS | | | 420,361,874 | | | | 132,254,227 | |
| | | | | | | | | |
NET ASSETS: | | | | | | | | |
Beginning of period | | | 549,522,964 | | | | 417,268,737 | |
End of period | | $ | 969,884,838 | | | $ | 549,522,964 | |
| | | | | | | | | |
SHARES TRANSACTIONS: | | | | | | | | |
Shares sold | | | 5,225,000 | | | | 1,950,000 | |
Shares redeemed | | | (825,000 | ) | | | (1,000,000 | ) |
Net increase/(decrease) in shares outstanding | | | 4,400,000 | | | | 950,000 | |
The accompanying notes are an integral part of these financial statements.
Motley Fool Small-Cap Growth ETF
Statements of Changes in Net Assets
| | FOR THE
YEAR ENDED
AUGUST 31,
2024 | | | FOR THE
YEAR ENDED
AUGUST 31,
2023 | |
OPERATIONS: | | | | | | | | |
Net investment income/(loss) | | $ | (124,738 | ) | | $ | 102,230 | |
Net realized gain/(loss) from investments | | | (7,112,753 | ) | | | (3,442,931 | ) |
Net change in unrealized appreciation/(depreciation) on investments | | | 16,332,435 | | | | 13,349,768 | |
NET INCREASE/(DECREASE) IN NET ASSETS RESULTING FROM OPERATIONS | | | 9,094,944 | | | | 10,009,067 | |
| | | | | | | | | |
DIVIDENDS AND DISTRIBUTIONS TO SHAREHOLDERS FROM: | | | | | | | | |
Total distributable earnings | | | (2,037 | ) | | | (227,522 | ) |
| | | | | | | | | |
CAPITAL SHARE TRANSACTIONS: | | | | | | | | |
Proceeds from shares sold | | | 15,776,198 | | | | 691,953 | |
Shares redeemed | | | (19,475,617 | ) | | | (15,668,161 | ) |
Net increase/(decrease) in net assets from capital share transactions | | | (3,699,419 | ) | | | (14,976,208 | ) |
TOTAL INCREASE/(DECREASE) IN NET ASSETS | | | 5,393,488 | | | | (5,194,663 | ) |
| | | | | | | | | |
NET ASSETS: | | | | | | | | |
Beginning of period | | | 72,855,192 | | | | 78,049,855 | |
End of period | | $ | 78,248,680 | | | $ | 72,855,192 | |
| | | | | | | | | |
SHARES TRANSACTIONS: | | | | | | | | |
Shares sold | | | 550,000 | | | | 25,000 | |
Shares redeemed | | | (650,000 | ) | | | (625,000 | ) |
Net increase/(decrease) in shares outstanding | | | (100,000 | ) | | | (600,000 | ) |
The accompanying notes are an integral part of these financial statements.
MOTLEY FOOL CAPITAL EFFICIENCY 100 INDEX ETF
Statements of Changes in Net Assets
| | FOR THE
YEAR ENDED
AUGUST 31,
2024 | | | FOR THE
YEAR ENDED
AUGUST 31,
2023 | |
OPERATIONS: | | | | | | | | |
Net investment income | | $ | 145,022 | | | $ | 107,613 | |
Net realized gain/(loss) from investments | | | 2,448,477 | | | | (527,598 | ) |
Net change in unrealized appreciation/(depreciation) on investments | | | 7,226,975 | | | | 4,912,480 | |
NET INCREASE/(DECREASE) IN NET ASSETS RESULTING FROM OPERATIONS | | | 9,820,474 | | | | 4,492,495 | |
| | | | | | | | | |
DIVIDENDS AND DISTRIBUTIONS TO SHAREHOLDERS FROM: | | | | | | | | |
Total distributable earnings | | | (109,818 | ) | | | (76,457 | ) |
| | | | | | | | | |
CAPITAL SHARE TRANSACTIONS: | | | | | | | | |
Proceeds from shares sold | | | 20,561,140 | | | | 474,105 | |
Shares redeemed | | | (5,405,930 | ) | | | (3,183,860 | ) |
Net increase/(decrease) in net assets from capital share transactions | | | 15,155,210 | | | | (2,709,755 | ) |
TOTAL INCREASE/(DECREASE) IN NET ASSETS | | | 24,865,866 | | | | 1,706,283 | |
| | | | | | | | | |
NET ASSETS: | | | | | | | | |
Beginning of period | | | 22,460,472 | | | | 20,754,189 | |
End of period | | $ | 47,326,338 | | | $ | 22,460,472 | |
| | | | | | | | | |
SHARES TRANSACTIONS: | | | | | | | | |
Shares sold | | | 900,000 | | | | 25,000 | |
Shares redeemed | | | (225,000 | ) | | | (200,000 | ) |
Net increase/(decrease) in shares outstanding | | | 675,000 | | | | (175,000 | ) |
The accompanying notes are an integral part of these financial statements.
MOTLEY FOOL NEXT INDEX ETF
Statements of Changes in Net Assets
| | FOR THE
YEAR ENDED
AUGUST 31,
2024 | | | FOR THE
YEAR ENDED
AUGUST 31,
2023 | |
OPERATIONS: | | | | | | | | |
Net investment income | | $ | 33,375 | | | $ | 44,071 | |
Net realized gain/(loss) from investments | | | 286,525 | | | | (1,362,880 | ) |
Net change in unrealized appreciation/(depreciation) on investments | | | 3,254,754 | | | | 2,748,952 | |
NET INCREASE/(DECREASE) IN NET ASSETS RESULTING FROM OPERATIONS | | | 3,574,654 | | | | 1,430,143 | |
| | | | | | | | | |
DIVIDENDS AND DISTRIBUTIONS TO SHAREHOLDERS FROM: | | | | | | | | |
Total distributable earnings | | | (46,367 | ) | | | (64,299 | ) |
| | | | | | | | | |
CAPITAL SHARE TRANSACTIONS: | | | | | | | | |
Proceeds from shares sold | | | 420,680 | | | | — | |
Shares redeemed | | | (8,616,947 | ) | | | (4,861,270 | ) |
Net increase/(decrease) in net assets from capital share transactions | | | (8,196,267 | ) | | | (4,861,270 | ) |
TOTAL INCREASE/(DECREASE) IN NET ASSETS | | | (4,667,980 | ) | | | (3,495,426 | ) |
| | | | | | | | | |
NET ASSETS: | | | | | | | | |
Beginning of period | | | 29,182,551 | | | | 32,677,977 | |
End of period | | $ | 24,514,571 | | | $ | 29,182,551 | |
| | | | | | | | | |
SHARES TRANSACTIONS: | | | | | | | | |
Shares sold | | | 25,000 | | | | — | |
Shares redeemed | | | (525,000 | ) | | | (325,000 | ) |
Net increase/(decrease) in shares outstanding | | | (500,000 | ) | | | (325,000 | ) |
The accompanying notes are an integral part of these financial statements.
MOTLEY FOOL Global Opportunities ETF
Financial Highlights
Contained below is per share operating performance data for shares outstanding, total investment return/(loss), ratios to average net assets and other supplemental data for the respective periods. This information has been derived from information provided in the financial statements.
| | YEARS ENDED
AUGUST 31, | |
| | 2024 | | | 2023 | | | 2022 | | | 2021 | | | 2020 | |
PER SHARE OPERATING PERFORMANCE | | | | | | | | | | | | | | | | | | | | |
Net asset value, beginning of period | | $ | 27.35 | | | $ | 24.75 | | | $ | 37.03 | | | $ | 30.17 | | | $ | 25.09 | |
Net investment income/(loss)(1) | | | 0.15 | | | | 0.11 | | | | 0.30 | | | | (0.05 | ) | | | — | * |
Net realized and unrealized gain/(loss) from investments | | | 5.36 | | | | 2.65 | | | | (10.00 | ) | | | 9.03 | | | | 6.21 | |
Net increase/(decrease) in net assets resulting from operations | | | 5.51 | | | | 2.76 | | | | (9.70 | ) | | | 8.98 | | | | 6.21 | |
Dividends and distributions to shareholders from: | | | | | | | | | | | | | | | | | | | | |
Net investment income | | | (0.10 | ) | | | (0.06 | ) | | | (0.77 | ) | | | — | | | | (0.04 | ) |
Net realized capital gains | | | (1.40 | ) | | | (0.10 | ) | | | (1.81 | ) | | | (2.12 | ) | | | (1.09 | ) |
Total dividends and distributions to shareholders | | | (1.50 | ) | | | (0.16 | ) | | | (2.58 | ) | | | (2.12 | ) | | | (1.13 | ) |
Net asset value, end of period | | $ | 31.36 | | | $ | 27.35 | | | $ | 24.75 | | | $ | 37.03 | | | $ | 30.17 | |
Market value, end of period | | $ | 31.30 | | | $ | 27.32 | | | $ | 24.74 | | | $ | — | | | $ | — | |
Total investment return/(loss) on net asset value (2) | | | 21.00 | % | | | 11.24 | % | | | (27.61 | )% | | | 30.86 | % | | | 25.64 | % |
Total investment return/(loss) on market value (3) | | | 20.86 | % | | | 11.19 | % | | | (27.65 | )% | | | — | % | | | — | % |
RATIOS/SUPPLEMENTAL DATA | | | | | | | | | | | | | | | | | | | | |
Net assets, end of period (000’s omitted) | | $ | 440,462 | | | $ | 429,966 | | | $ | 433,652 | | | $ | 181,509 | | | $ | 122,406 | |
Ratio of expenses to average net assets | | | 0.85 | % | | | 0.85 | % | | | 0.87 | % | | | 0.95 | % | | | 0.95 | % |
Ratio of expenses to average net assets (before waivers and reimbursement of expenses and/or recapture of previously waived fees) | | | 0.85 | % | | | 0.85 | % | | | 0.88 | % | | | 0.98 | % | | | 1.00 | % |
Ratio of net investment income/(loss) to average net assets | | | 0.51 | % | | | 0.45 | % | | | 1.08 | % | | | (0.16 | )% | | | (0.01 | )% |
Ratio of net investment income/(loss) to average net assets (before waivers and reimbursement of expenses and/or recapture of previously waived fees) | | | 0.51 | % | | | 0.45 | % | | | 1.07 | % | | | (0.19 | )% | | | (0.06 | )% |
Portfolio turnover rate | | | 38 | % | | | 4 | % | | | 14 | % | | | 12 | % | | | 10 | % |
* | Amount represents less than $0.005 per share. |
(1) | Per share data calculated using average shares outstanding method. |
(2) | Total investment return/(loss) on net asset value is calculated assuming a purchase of shares on the first day and a sale of shares on the last day of each period reported and includes reinvestments of dividends and distributions, if any. |
(3) | Total investment return/(loss) on market price is calculated assuming an initial investment made at the market price on the first day of the period, reinvestment of dividends and distributions at market price during the period and redemption at market price on the last day of the period. |
The accompanying notes are an integral part of these financial statements.
MOTLEY FOOL Mid-Cap Growth ETF
Financial Highlights
Contained below is per share operating performance data for shares outstanding, total investment return/(loss), ratios to average net assets and other supplemental data for the respective periods. This information has been derived from information provided in the financial statements.
| | YEARS ENDED
AUGUST 31, | |
| | 2024 | | | 2023 | | | 2022 | | | 2021 | | | 2020 | |
PER SHARE OPERATING PERFORMANCE | | | | | | | | | | | | | | | | | | | | |
Net asset value, beginning of period | | $ | 24.62 | | | $ | 22.68 | | | $ | 33.20 | | | $ | 29.79 | | | $ | 24.48 | |
Net investment income/(loss)(1) | | | 0.02 | | | | 0.07 | | | | (0.04 | ) | | | (0.09 | ) | | | (0.02 | ) |
Net realized and unrealized gain/(loss) from investments | | | 4.54 | | | | 1.87 | | | | (8.38 | ) | | | 6.90 | | | | 6.79 | |
Net increase/(decrease) in net assets resulting from operations | | | 4.56 | | | | 1.94 | | | | (8.42 | ) | | | 6.81 | | | | 6.77 | |
Dividends and distributions to shareholders from: | | | | | | | | | | | | | | | | | | | | |
Net investment income | | | (0.06 | ) | | | — | | | | — | | | | — | | | | — | |
Net realized capital gains | | | (0.58 | ) | | | — | | | | (2.10 | ) | | | (3.40 | ) | | | (1.46 | ) |
Total dividends and distributions to shareholders | | | (0.64 | ) | | | — | | | | (2.10 | ) | | | (3.40 | ) | | | (1.46 | ) |
Net asset value, end of period | | $ | 28.54 | | | $ | 24.62 | | | $ | 22.68 | | | $ | 33.20 | | | $ | 29.79 | |
Market value, end of period | | $ | 28.52 | | | $ | 24.58 | | | $ | 22.62 | | | $ | — | | | $ | — | |
Total investment return/(loss) on net asset value(2) | | | 18.95 | % | | | 8.58 | % | | | (26.66 | )% | | | 24.38 | % | | | 28.77 | % |
Total investment return/(loss) on market value(3) | | | 19.06 | % | | | 8.65 | % | | | (26.84 | )% | | | — | % | | | — | % |
RATIOS/SUPPLEMENTAL DATA | | | | | | | | | | | | | | | | | | | | |
Net assets, end of period (000’s omitted) | | $ | 203,139 | | | $ | 194,346 | | | $ | 209,044 | | | $ | 54,460 | | | $ | 39,488 | |
Ratio of expenses to average net assets | | | 0.85 | % | | | 0.85 | % | | | 0.90 | % | | | 0.95 | % | | | 0.95 | % |
Ratio of expenses to average net assets (before waivers and reimbursement of expenses and/or recapture of previously waived fees) | | | 0.85 | % | | | 0.85 | % | | | 0.88 | % | | | 0.98 | % | | | 1.00 | % |
Ratio of net investment income/(loss) to average net assets | | | 0.08 | % | | | 0.29 | % | | | (0.17 | )% | | | (0.30 | )% | | | (0.06 | )% |
Ratio of net investment income/(loss) to average net assets (before waivers and reimbursement of expenses and/or recapture of previously waived fees) | | | 0.08 | % | | | 0.29 | % | | | (0.15 | )% | | | (0.33 | )% | | | (0.11 | )% |
Portfolio turnover rate | | | 31 | % | | | 18 | % | | | 2 | % | | | 15 | % | | | 14 | % |
* | Amount represents less than $0.005 per share. |
(1) | Per share data calculated using average shares outstanding method. |
(2) | Total investment return/(loss) on net asset value is calculated assuming a purchase of shares on the first day and a sale of shares on the last day of each period reported and includes reinvestments of dividends and distributions, if any. |
(3) | Total investment return/(loss) on market price is calculated assuming an initial investment made at the market price on the first day of the period, reinvestment of dividends and distributions at market price during the period and redemption at market price on the last day of the period. |
The accompanying notes are an integral part of these financial statements.
Motley Fool 100 Index ETF
Financial Highlights
Contained below is per share operating performance data for shares outstanding, total investment return/(loss), ratios to average net assets and other supplemental data for the respective periods. This information has been derived from information provided in the financial statements.
| | YEARS ENDED
AUGUST 31, | |
| | 2024 | | | 2023 | | | 2022 | | | 2021 | | | 2020 | |
PER SHARE OPERATING PERFORMANCE | | | | | | | | | | | | | | | | | | | | |
Net asset value, beginning of period | | $ | 41.55 | | | $ | 33.99 | | | $ | 42.16 | | | $ | 33.67 | | | $ | 22.46 | |
Net investment income/(loss)(1) | | | 0.13 | | | | 0.13 | | | | 0.08 | | | | 0.05 | | | | 0.11 | |
Net realized and unrealized gain/(loss) from investments | | | 13.41 | | | | 7.57 | | | | (8.15 | ) | | | 8.59 | | | | 11.23 | |
Net increase/(decrease) in net assets resulting from operations | | | 13.54 | | | | 7.70 | | | | (8.07 | ) | | | 8.64 | | | | 11.34 | |
Dividends and distributions to shareholders from: | | | | | | | | | | | | | | | | | | | | |
Net investment income | | | (0.06 | ) | | | (0.14 | ) | | | (0.02 | ) | | | (0.10 | ) | | | (0.13 | ) |
Net realized capital gains | | | — | | | | — | | | | (0.08 | ) | | | (0.05 | ) | | | — | |
Total dividends and distributions to shareholders | | | (0.06 | ) | | | (0.14 | ) | | | (0.10 | ) | | | (0.15 | ) | | | (0.13 | ) |
Net asset value, end of period | | $ | 55.03 | | | $ | 41.55 | | | $ | 33.99 | | | $ | 42.16 | | | $ | 33.67 | |
Market value, end of period | | $ | 54.97 | | | $ | 41.53 | | | $ | 34.00 | | | $ | 42.20 | | | $ | 33.66 | |
Total investment return/(loss) on net asset value(2) | | | 32.61 | % | | | 22.71 | % | | | (19.18 | )% | | | 25.74 | % | | | 50.67 | % |
Total investment return/(loss) on market price(3) | | | 32.54 | % | | | 22.63 | % | | | (19.24 | )% | | | 25.91 | % | | | 50.89 | % |
RATIO/SUPPLEMENTAL DATA | | | | | | | | | | | | | | | | | | | | |
Net assets, end of period (000’s omitted) | | $ | 969,885 | | | $ | 549,523 | | | $ | 417,269 | | | $ | 528,011 | | | $ | 337,547 | |
Ratio of expenses to average net assets | | | 0.50 | % | | | 0.50 | % | | | 0.50 | % | | | 0.50 | % | | | 0.50 | % |
Ratio of net investment income/(loss) to average net assets | | | 0.27 | % | | | 0.37 | % | | | 0.20 | % | | | 0.15 | % | | | 0.43 | % |
Portfolio turnover rate | | | 24 | % | | | 6 | % | | | 15 | % | | | 23 | % | | | 26 | % |
(1) | Per share data calculated using average shares outstanding method. |
(2) | Total investment return/(loss) on net asset value is calculated assuming a purchase of shares on the first day and a sale of shares on the last day of each period reported and includes reinvestments of dividends and distributions, if any. |
(3) | Total investment return/(loss) on market price is calculated assuming an initial investment made at the market price on the first day of the period, reinvestment of dividends and distributions at market price during the period and redemption at market price on the last day of the period. |
The accompanying notes are an integral part of these financial statements.
MOTLEY FOOL Small-Cap Growth ETF
Financial Highlights
Contained below is per share operating performance data for shares outstanding, total investment return/(loss), ratios to average net assets and other supplemental data for the respective periods. This information has been derived from information provided in the financial statements.
| | YEARS ENDED
AUGUST 31, | |
| | 2024 | | | 2023 | | | 2022 | | | 2021 | | | 2020 | |
PER SHARE OPERATING PERFORMANCE | | | | | | | | | | | | | | | | | | | | |
Net asset value, beginning of period | | $ | 29.14 | | | $ | 25.18 | | | $ | 40.73 | | | $ | 32.59 | | | $ | 23.33 | |
Net investment income/(loss)(1) | | | (0.04 | ) | | | 0.04 | | | | (0.15 | ) | | | (0.19 | ) | | | (0.07 | ) |
Net realized and unrealized gain/(loss) from investments | | | 3.50 | | | | 4.00 | | | | (14.53 | ) | | | 10.48 | | | | 9.67 | |
Net increase/(decrease) in net assets resulting from operations | | | 3.46 | | | | 4.04 | | | | (14.68 | ) | | | 10.29 | | | | 9.60 | |
Dividends and distributions to shareholders from: | | | | | | | | | | | | | | | | | | | | |
Net realized capital gains | | | — | | | | (0.08 | ) | | | (0.87 | ) | | | (2.15 | ) | | | (0.34 | ) |
Total dividends and distributions to shareholders | | | — | | | | (0.08 | ) | | | (0.87 | ) | | | (2.15 | ) | | | (0.34 | ) |
Net asset value, end of period | | $ | 32.60 | | | $ | 29.14 | | | $ | 25.18 | | | $ | 40.73 | | | $ | 32.59 | |
Market value, end of period | | $ | 32.60 | | | $ | 29.17 | | | $ | 25.18 | | | $ | 40.74 | | | $ | 32.68 | |
Total investment return/(loss) on net asset value(2) | | | 11.87 | % | | | 16.13 | % | | | (36.66 | )% | | | 32.00 | % | | | 41.58 | % |
Total investment return/(loss) on market price(3) | | | 11.77 | % | | | 16.21 | % | | | (36.65 | )% | | | 31.54 | % | | | 41.88 | % |
RATIO/SUPPLEMENTAL DATA | | | | | | | | | | | | | | | | | | | | |
Net assets, end of period (000’s omitted) | | $ | 78,249 | | | $ | 72,855 | | | $ | 78,050 | | | $ | 189,382 | | | $ | 106,745 | |
Ratio of expenses to average net assets | | | 0.85 | % | | | 0.85 | % | | | 0.85 | % | | | 0.85 | % | | | 0.85 | % |
Ratio of net investment income/(loss) to average net assets | | | (0.16 | )% | | | 0.15 | % | | | (0.46 | )% | | | (0.51 | )% | | | (0.29 | )% |
Portfolio turnover rate | | | 30 | % | | | 62 | % | | | 11 | % | | | 21 | % | | | 27 | % |
* | Amount represents less than $0.005 per share. |
(1) | Per share data calculated using average shares outstanding method. |
(2) | Total investment return/(loss) on net asset value is calculated assuming a purchase of shares on the first day and a sale of shares on the last day of each period reported and includes reinvestments of dividends and distributions, if any. |
(3) | Total investment return/(loss) on market price is calculated assuming an initial investment made at the market price on the first day of the period, reinvestment of dividends and distributions at market price during the period and redemption at market price on the last day of the period. |
The accompanying notes are an integral part of these financial statements.
Motley Fool CAPITAL EFFICIENCY 100 INDEX ETF
Financial Highlights
Contained below is per share operating performance data for shares outstanding, total investment return/(loss), ratios to average net assets and other supplemental data for the respective periods. This information has been derived from information provided in the financial statements.
| | For the
year Ended
august 31, | | | For the
year Ended
august 31, | | | For the
Period Ended
august 31, | |
| | 2024 | | | 2023 | | | 2022(1) | |
PER SHARE OPERATING PERFORMANCE | | | | | | | | | | | | |
Net asset value, beginning of period | | $ | 19.12 | | | $ | 15.37 | | | $ | 20.00 | |
Net investment income/(loss)(2) | | | 0.10 | | | | 0.09 | | | | 0.05 | |
Net realized and unrealized gain/(loss) from investments | | | 6.45 | | | | 3.72 | | | | (4.68 | ) |
Net increase/(decrease) in net assets resulting from operations | | | 6.55 | | | | 3.81 | | | | (4.63 | ) |
Dividends and distributions to shareholders from: | | | | | | | | | | | | |
Net investment income | | | (0.09 | ) | | | (0.06 | ) | | | — | |
Total dividends and distributions to shareholders | | | (0.09 | ) | | | (0.06 | ) | | | — | |
Net asset value, end of period | | $ | 25.58 | | | $ | 19.12 | | | $ | 15.37 | |
Market value, end of period | | $ | 25.61 | | | $ | 19.15 | | | $ | 15.38 | |
Total investment return/(loss) on net asset value(3) | | | 34.44 | % | | | 24.81 | % | | | (23.13 | )%(5) |
Total investment return/(loss) on market price(4) | | | 34.34 | % | | | 24.99 | % | | | (23.09 | )%(5) |
RATIO/SUPPLEMENTAL DATA | | | . | | | | | | | | | |
Net assets, end of period (000’s omitted) | | $ | 47,326 | | | $ | 22,460 | | | $ | 20,754 | |
Ratio of expenses to average net assets | | | 0.50 | % | | | 0.50 | % | | | 0.50 | %(6) |
Ratio of net investment income/(loss) to average net assets | | | 0.43 | % | | | 0.53 | % | | | 0.50 | %(6) |
Portfolio turnover rate | | | 35 | % | | | 25 | % | | | 17 | %(5) |
(1) | Inception date of the Fund was December 30, 2021. |
(2) | Per share data calculated using average shares outstanding method. |
(3) | Total investment return/(loss) on net asset value is calculated assuming a purchase of shares on the first day and a sale of shares on the last day of each period reported and includes reinvestments of dividends and distributions, if any. |
(4) | Total investment return/(loss) on market price is calculated assuming an initial investment made at the market price on the first day of the period, reinvestment of dividends and distributions at market price during the period and redemption at market price on the last day of the period. |
The accompanying notes are an integral part of these financial statements.
MOTLEY FOOL NEXT INDEX ETF
Financial Highlights
Contained below is per share operating performance data for shares outstanding, total investment return/(loss), ratios to average net assets and other supplemental data for the respective periods. This information has been derived from information provided in the financial statements.
| | For the
year Ended
august 31, | | | For the
year Ended
august 31, | | | For the
period Ended
august 31, | |
| | 2024 | | | 2023 | | | 2022(1) | |
PER SHARE OPERATING PERFORMANCE | | | | | | | | | | | | |
Net asset value, beginning of period | | $ | 15.77 | | | $ | 15.02 | | | $ | 20.00 | |
Net investment income/(loss)(2) | | | 0.02 | | | | 0.02 | | | | 0.03 | |
Net realized and unrealized gain/(loss) from investments | | | 2.40 | | | | 0.76 | | | | (5.01 | ) |
Net increase/(decrease) in net assets resulting from operations | | | 2.42 | | | | 0.78 | | | | (4.98 | ) |
Dividends and distributions to shareholders from: | | | | | | | | | | | | |
Net investment income | | | (0.03 | ) | | | (0.03 | ) | | | — | |
Total dividends and distributions to shareholders | | | (0.03 | ) | | | (0.03 | ) | | | — | |
Net asset value, end of period | | $ | 18.16 | | | $ | 15.77 | | | $ | 15.02 | |
Market value, end of period | | $ | 18.15 | | | $ | 15.78 | | | $ | 15.01 | |
Total investment return/(loss) on net asset value(3) | | | 15.31 | % | | | 5.21 | % | | | (24.88 | )%(5) |
Total investment return/(loss) on market price(4) | | | 15.18 | % | | | 5.39 | % | | | (24.97 | )%(5) |
RATIO/SUPPLEMENTAL DATA | | | | | | | | | | | | |
Net assets, end of period (000’s omitted) | | $ | 24,515 | | | $ | 29,183 | | | $ | 32,678 | |
Ratio of expenses to average net assets | | | 0.50 | % | | | 0.50 | % | | | 0.50 | %(6) |
Ratio of net investment income/(loss) to average net assets | | | 0.13 | % | | | 0.15 | % | | | 0.26 | %(6) |
Portfolio turnover rate | | | 18 | % | | | 27 | % | | | 11 | %(5) |
(1) | Inception date of the Fund was December 30, 2021. |
(2) | Per share data calculated using average shares outstanding method. |
(3) | Total investment return/(loss) on net asset value is calculated assuming a purchase of shares on the first day and a sale of shares on the last day of each period reported and includes reinvestments of dividends and distributions, if any. |
(4) | Total investment return/(loss) on market price is calculated assuming an initial investment made at the market price on the first day of the period, reinvestment of dividends and distributions at market price during the period and redemption at market price on the last day of the period. |
The accompanying notes are an integral part of these financial statements.
Motley Fool Asset Management ETFs
Notes to Financial Statements
AUGUST 31, 2024
1. ORGANIZATION AND SIGNIFICANT ACCOUNTING POLICIES
The RBB Fund, Inc. (“RBB” or the “Company”) was incorporated under the laws of the State of Maryland on February 29, 1988 and is registered under the Investment Company Act of 1940, as amended, (the “1940 Act”), as an open-end management investment company. RBB is a “series fund,” which is an investment company divided into separate portfolios. Each portfolio is treated as a separate entity for certain matters under the 1940 Act, and for other purposes, and a shareholder of one portfolio is not deemed to be a shareholder of any other portfolio. Currently, RBB has sixty-five separate investment portfolios, including the Motley Fool Global Opportunities ETF (“Global Opportunities Fund”), the Motley Fool Mid-Cap Growth ETF (“Mid-Cap Growth Fund”), the Motley Fool 100 Index ETF (the “Fool 100 Fund”), the Motley Fool Small-Cap Growth ETF (“Small-Cap Growth Fund”), the Motley Fool Capital Efficiency 100 Index ETF (“Capital Efficiency Fund”) and the Motley Fool Next Index ETF (“Next Fund”) (each a “Fund” and together the “Funds”). The Global Opportunities Fund, Mid-Cap Growth Fund, Fool 100 Fund, Small-Cap Growth Fund, Capital Efficiency Fund and Next Fund commenced investment operations on June 17, 2014, June 17, 2014, January 29, 2018, October 29, 2018, December 30, 2021 and December 30, 2021, respectively.
RBB has authorized capital of one hundred billion shares of common stock of which 92.923 billion shares are currently classified into two hundred and thirty-six classes of common stock. Each class represents an interest in an active or inactive RBB investment portfolio.
The investment objective of each Fund is to achieve long-term capital appreciation. The Global Opportunities Fund pursues its objective by investing primarily in common stocks of United States companies and of companies that are organized under the laws of other countries around the world. The Mid-Cap Growth Fund pursues its objective by investing primarily in common stocks of companies that are organized in the United States and that are engaged in a broad range of industries.
The investment objective of the Fool 100 Fund is to achieve investment results that correspond (before fees and expenses) generally to the total return performance of the Motley Fool 100 Index (the “Fool 100 Index”). The Fool 100 Index was developed by The Motley Fool, LLC (“The Motley Fool”), an affiliate of Motley Fool Asset Management, LLC (the “Adviser”), in 2017 and is a proprietary, rules-based index designed to track the performance of the 100 largest, most liquid U.S. companies that have been recommended by The Motley Fool’s analysts and newsletters or the highest-rated stocks in Fool IQ, the company’s analyst opinion database. Every company include in the Fool 100 Index is incorporated and listed in the U.S. The investment objective of the Small-Cap Growth Fund is to achieve long-term capital appreciation.
The investment objective of the Capital Efficiency Fund is to seek investment results that correspond (before fees and expenses) generally to the total return performance of the Motley Fool Capital Efficiency 100 Index (the “Capital Efficiency 100 Index”). The Capital Efficiency 100 Index was developed by The Motley Fool in 2021 and is a proprietary, rules-based index designed to track the performance of the highest scoring stocks of U.S. companies, measured by a company’s capital efficiency, that have been recommended by The Motley Fool’s analysts and newsletters, and that also meet certain liquidity requirements. Capital efficiency is a measure of how a business turns its investments into revenue and profit and it provides insight into the company’s return on invested capital. Every company included in the Capital Efficiency 100 Index is incorporated and listed in the U.S. The investment objective of the Next Fund is to seek investment results that correspond (before fees and expenses) generally to the total return performance of the Motley Fool Next Index (the “Next Index”). The Next Index was developed by The Motley Fool in 2021 and is a proprietary, rules-based index designed to track the performance of the 100 largest, most liquid U.S. companies that have been recommended by The Motley Fool’s analysts and newsletters. Every company included in the Next Index is incorporated and listed in the U.S.
The Funds are investment companies and follow accounting and reporting guidance in the Financial Accounting Standards Board (“FASB”) Accounting Standards Codification Topic 946 “Financial Services - Investment Companies”.
The end of the reporting period for the Funds is August 31, 2024, and the period covered by these Notes to Financial Statements is the fiscal year ended August 31, 2024 (the “current fiscal period”).
PORTFOLIO VALUATION — Each Fund’s net asset value (“NAV”) is calculated once daily at the close of regular trading hours on the New York Stock Exchange (“NYSE”) (generally 4:00 p.m. Eastern time) on each day the NYSE is open. Securities held by the Funds are valued using the closing price or the last sale price on a national securities exchange or the National Association of Securities Dealers Automatic Quotation System (“NASDAQ”) market system where they are primarily traded. Equity securities traded in the over-the-counter (“OTC”) market are valued at their closing prices. If there were no transactions
Motley Fool Asset Management ETFs
Notes to Financial Statements (continued)
AUGUST 31, 2024
on that day, securities traded principally on an exchange or on NASDAQ will be valued at the mean of the last bid and ask prices prior to the market close. Fixed income securities are valued using an independent pricing service, which considers such factors as security prices, yields, maturities and ratings, and are deemed representative of market values at the close of the market. Foreign securities are valued based on prices from the primary market in which they are traded, and are translated from the local currency into U.S. dollars using current exchange rates. If market quotations are unavailable or deemed unreliable, securities will be valued in accordance with procedures adopted by the Company’s Board of Directors (the “Board”). Relying on prices supplied by pricing services or dealers or using fair valuation may result in values that are higher or lower than the values used by other investment companies and investors to price the same investments. Such procedures use fundamental valuation methods, which may include, but are not limited to, an analysis of the effect of any restrictions on the resale of the security, industry analysis and trends, significant changes in the issuer’s financial position, and any other event which could have a significant impact on the value of the security. Determination of fair value involves subjective judgment as the actual market value of a particular security can be established only by negotiations between the parties in a sales transaction, and the difference between the recorded fair value and the value that would be received in a sale could be significant.
The Board has adopted a pricing and valuation policy for use by each Fund and its Valuation Designee (as defined below) in calculating the Fund’s NAV. Pursuant to Rule 2a-5 under the 1940 Act, the Board has designated the Adviser as its “Valuation Designee” to perform all of the fair value determinations as well as to perform all of the responsibilities that may be performed by the Valuation Designee in accordance with Rule 2a-5. The Valuation Designee is authorized to make all necessary determinations of the fair values of portfolio securities and other assets for which market quotations are not readily available or if it is deemed that the prices obtained from brokers and dealers or independent pricing services are unreliable.
FAIR VALUE MEASUREMENTS — The inputs and valuation techniques used to measure the fair value of the Funds’ investments are summarized into three levels as described in the hierarchy below:
| | ● | Level 1 – Prices are determined using quoted prices in active markets for identical securities. |
| | ● | Level 2 – Prices are determined using other significant observable inputs (including quoted prices for similar securities, interest rates, prepayment speeds, credit risk, etc.). |
| | ● | Level 3 – Prices are determined using significant unobservable inputs (including the Funds’ own assumptions in determining the fair value of investments). |
The inputs or methodologies used for valuing securities are not necessarily an indication of the risk associated with investing in those securities.
The following is a summary of the inputs used, as of the end of the reporting period, in valuing the Funds’ investments carried at fair value:
GLOBAL OPPORTUNITIES FUND
| | LEVEL 1 | | | LEVEL 2 | | | LEVEL 3 | | | Total | |
Assets: | | | | | | | | | | | | | | | | |
Common Stocks | | $ | 417,093,721 | | | $ | — | | | $ | 0 | | | $ | 417,093,721 | |
Preferred Stocks | | | 9,394,982 | | | | — | | | | — | | | | 9,394,982 | |
Investments Purchased with Proceeds From Securities Lending Collateral (a) | | | — | | | | — | | | | — | | | | 34,052,359 | |
Total Assets | | $ | 426,488,703 | | | $ | — | | | $ | — | | | $ | 460,541,062 | |
Motley Fool Asset Management ETFs
Notes to Financial Statements (continued)
AUGUST 31, 2024
MID-CAP GROWTH FUND
| | LEVEL 1 | | | LEVEL 2 | | | LEVEL 3 | | | Total | |
Assets: | | | | | | | | | | | | | | | | |
Common Stocks | | $ | 199,845,433 | | | $ | — | | | $ | — | | | $ | 199,845,433 | |
Investments Purchased with Proceeds From Securities Lending Collateral (a) | | | | | | | — | | | | — | | | | 28,802,749 | |
Total Assets | | $ | 199,845,433 | | | $ | — | | | $ | — | | | $ | 228,648,182 | |
FOOL 100 FUND
| | LEVEL 1 | | | LEVEL 2 | | | LEVEL 3 | | | Total | |
Assets: | | | | | | | | | | | | | | | | |
Common Stocks | | $ | 967,153,065 | | | $ | — | | | $ | 13,276 | | | $ | 967,166,341 | |
Investments Purchased with Proceeds From Securities Lending Collateral (a) | | | | | | | — | | | | — | | | | 10,257,974 | |
Total Assets | | $ | 967,153,065 | | | $ | — | | | $ | 13,276 | | | $ | 977,424,315 | |
SMALL-CAP GROWTH FUND
| | LEVEL 1 | | | LEVEL 2 | | | LEVEL 3 | | | Total | |
Assets: | | | | | | | | | | | | | | | | |
Common Stocks | | $ | 77,773,419 | | | $ | — | | | $ | — | | | $ | 77,773,419 | |
Investments Purchased with Proceeds From Securities Lending Collateral (a) | | | — | | | | — | | | | — | | | | 21,476,806 | |
Total Assets | | $ | 77,773,419 | | | $ | — | | | $ | — | | | $ | 99,250,225 | |
CAPITAL EFFICIENCY FUND
| | LEVEL 1 | | | LEVEL 2 | | | LEVEL 3 | | | Total | |
Assets: | | | | | | | | | | | | | | | | |
Common Stocks | | $ | 47,198,973 | | | $ | — | | | $ | — | | | $ | 47,198,973 | |
Total Assets | | $ | 47,198,973 | | | $ | — | | | $ | — | | | $ | 47,198,973 | |
Motley Fool Asset Management ETFs
Notes to Financial Statements (continued)
AUGUST 31, 2024
NEXT FUND
| | LEVEL 1 | | | LEVEL 2 | | | LEVEL 3 | | | Total | |
Assets: | | | | | | | | | | | | | | | | |
Common Stocks | | $ | 24,426,145 | | | $ | — | | | $ | — | | | $ | 24,426,145 | |
Total Assets | | $ | 24,426,145 | | | $ | — | | | $ | — | | | $ | 24,426,145 | |
Refer to the Schedule of Investments for industry classifications.
(a) | Certain investments that are measured at fair value using the net asset value per share (or its equivalent) practical expedient have not been categorized in the fair value hierarchy. The fair value amounts presented in the table are intended to permit reconciliation of the fair value hierarchy to the amounts listed in the Schedule of Investments. |
At the end of each quarter, management evaluates the classification of Levels 1, 2 and 3 assets and liabilities. Various factors are considered, such as changes in liquidity from the prior reporting period; whether or not a broker is willing to execute at the quoted price; the depth and consistency of prices from third party pricing services; and the existence of contemporaneous, observable trades in the market. Additionally, management evaluates the classification of Levels 1, 2 and 3 assets and liabilities on a quarterly basis for changes in listings or delistings on national exchanges.
Due to the inherent uncertainty of determining the fair value of investments that do not have a readily available market value, the fair value of the Funds’ investments may fluctuate from period to period. Additionally, the fair value of investments may differ significantly from the values that would have been used had a ready market existed for such investments and may differ materially from the values the Funds may ultimately realize. Further, such investments may be subject to legal and other restrictions on resale or otherwise less liquid than publicly traded securities.
For fair valuations using significant unobservable inputs, U.S. generally accepted accounting principles (“U.S. GAAP”) requires each Fund to present a reconciliation of the beginning to ending balances for reported market values that presents changes attributable to total realized and unrealized gains or losses, purchase and sales, and transfers in and out of Level 3 during the period. Transfers in and out between levels are based on values at the end of the period. A reconciliation of Level 3 investments and related disclosures are presented only when a Fund had an amount of Level 3 investments at the end of the reporting period that was meaningful in relation to its net assets. The amounts and reasons for all Level 3 transfers are disclosed if a Fund had an amount of total Level 3 transfers during the reporting period that was meaningful in relation to its net assets as of the end of the reporting period.
During the current fiscal period, the Funds had no Level 3 transfers.
USE OF ESTIMATES — The preparation of financial statements in conformity with U.S. GAAP requires management to make estimates and assumptions that affect the reported amounts of assets and liabilities and disclosure of contingent assets and liabilities at the date of the financial statements and the reported amounts of revenues and expenses during the reporting period. Actual results could differ from those estimates and those differences could be significant.
INVESTMENT TRANSACTIONS, INVESTMENT INCOME AND EXPENSES — The Funds record security transactions based on trade date for financial reporting purposes. The cost of investments sold is determined by use of the specific identification method for both financial reporting and income tax purposes in determining realized gains and losses on investments. Interest income (including amortization of premiums and accretion of discounts) is accrued when earned. Dividend income is recorded on the ex-dividend date. Distributions received on securities that represent a return of capital or capital gains are recorded as a reduction of cost of investments and/or as a realized gain. Certain expenses are shared with The RBB Fund Trust (the “Trust”), a series trust of affiliated funds. Expenses incurred on behalf of a specific class, fund or fund family of the Company or Trust are charged directly to the class, fund or fund family (in proportion to net assets). Expenses incurred for all funds (such as director or professional fees) are charged to all funds in proportion to their average net assets of RBB and the Trust, or in such other manner as the Board deems fair or equitable. Expenses, including investment advisory fees, are accrued daily and taken into account for the purpose of determining the NAV of each Fund.
Motley Fool Asset Management ETFs
Notes to Financial Statements (continued)
AUGUST 31, 2024
DIVIDENDS AND DISTRIBUTIONS TO SHAREHOLDERS — Each Fund pays dividends from its net investment income and distributes any net capital gains that it realizes. Dividends and capital gains distributions are generally paid once a year and as required to comply with federal excise tax requirements. Distributions to shareholders are determined in accordance with tax regulations and recorded on the ex dividend date. Additionally, each Fund reports details of distribution-related transactions on quarterly account statements. You may not receive a separate confirmation statement for these transactions.
U.S. TAX STATUS — No provision is made for U.S. income taxes as it is the Funds’ intention to continue to qualify for and elect the tax treatment applicable to regulated investment companies under Subchapter M of the Internal Revenue Code of 1986, as amended, and make the requisite distributions to its shareholders which will be sufficient to relieve it from U.S. income and excise taxes.
CASH AND CASH EQUIVALENTS — Cash and cash equivalents are valued at cost plus accrued interest, which approximates market value.
FOREIGN CURRENCY TRANSLATION — The books and records of the Funds are maintained in U.S. dollars as follows: (1) the values of investment securities and other assets and liabilities stated in foreign currencies are translated at the exchange rates prevailing at the end of the period; and (2) purchases, sales and income are translated at the rates of exchange prevailing on the respective dates of such transactions. Transaction gains or losses resulting from changes in exchange rates during the reporting period or upon settlement from foreign currency transactions are reported in the Statements of Operations for the current period. The Funds do not isolate the portion of gains and losses on investments.
OTHER — In the normal course of business, the Funds may enter into contracts that provide general indemnifications. Each Fund’s maximum exposure under these arrangements is dependent on claims that may be made against the Funds in the future, and, therefore, cannot be estimated; however, the Funds expect the risk of material loss from such claims to be remote.
2. Investment Policies and Practices
The sections below describe some of the different types of investments that may be made by the Funds and the investment practices in which the Funds may engage.
TYPES OF FIXED-INCOME SECURITIES — Each Fund may invest in bonds and other types of debt obligations of U.S. and foreign issuers. Fixed income securities purchased by a Fund may include, among others, bonds, notes, and debentures issued by corporations; debt securities issued or guaranteed by the U.S. government or one of its agencies or instrumentalities (“U.S. Government Securities”); municipal securities; mortgage-backed and asset-backed securities; and debt securities issued or guaranteed by foreign governments, their agencies, instrumentalities, or political subdivisions, or by government-owned, -controlled, or -sponsored entities, including central banks. These investments also include money market instruments and other types of obligations. Investors should recognize that, although securities ratings issued by S&P Global Ratings (“S&P”), a division of The McGraw-Hill Companies, Inc., and Moody’s Investors Services©, Inc. (“Moody’s”), provide a generally useful guide as to credit risks, they do not offer any criteria to evaluate interest rate risk. Changes in interest rate levels generally cause fluctuations in the prices of fixed-income securities and will, therefore, cause fluctuations in the NAV per share of a Fund. Subsequent to the purchase of a fixed-income security by a Fund, the ratings or credit quality of such security may deteriorate. Any such subsequent adverse changes in the rating or quality of a security held by a Fund would not require a Fund to sell the security.
REAL ESTATE INVESTMENT TRUSTS — Real estate investment trusts (“REITs”) are pooled investment vehicles that manage a portfolio of real estate or real estate-related loans to earn profits for their shareholders. REITs are generally classified as equity REITs, mortgage REITs, or a combination of equity and mortgage REITs. Investing in REITs involves certain unique risks in addition to those risks associated with investing in the real estate industry in general. Equity REITs may be affected by changes in the value of the underlying property owned by the REITs, while mortgage REITs may be affected by the quality of the borrower on any credit extended. REITs are dependent upon management skills, may not be diversified geographically or by property type, and are subject to heavy cash-flow dependency, default by borrowers, and self-liquidation. REITs must also meet certain requirements under the Internal Revenue Code of 1986, as amended (the “Code”), to avoid entity level tax and be eligible to pass through certain tax attributes of their income to shareholders. REITs are consequently subject to the risk of failing to meet these requirements for favorable tax treatment and of failing to maintain their exemptions from registration under the 1940 Act. REITs are also subject to the risks of changes in the Code, affecting their tax status.
Motley Fool Asset Management ETFs
Notes to Financial Statements (continued)
AUGUST 31, 2024
REITs (especially mortgage REITs) are also subject to interest rate risks. When interest rates decline, the value of a REIT’s investment in fixed-rate obligations can be expected to rise. Conversely, when interest rates rise, the value of a REIT’s investment in fixed-rate obligations can be expected to decline. In contrast, as interest rates on adjustable-rate mortgage loans are reset periodically, yields on a REIT’s investments in such loans will gradually align themselves to reflect changes in market interest rates, causing the value of such investments to fluctuate less dramatically in response to interest rate fluctuations than would investments in fixed-rate obligations.
The management of a REIT may be subject to conflicts of interest with respect to the operation of the business of the REIT and may be involved in real estate activities competitive with the REIT. REITs may own properties through joint ventures or in other circumstances in which a REIT may not have control over its investments. REITs may use significant amounts of leverage.
REITs often do not provide complete tax information until after the end of the calendar year. Consequently, because of the delay, it may be necessary for a Fund, if invested in REITs, to request permission to extend the deadline for issuance of Forms 1099-DIV beyond January 31. Alternatively, amended Forms 1099-DIV may be sent.
FOREIGN SECURITIES — The Global Opportunities Fund and the Mid-Cap Growth Fund may invest in equity and fixed-income securities of foreign companies, including companies located in both developed and emerging-market countries. Investment in foreign securities may include the purchase of American Depositary Receipts (“ADRs”) and other depositary receipts (European Depositary Receipts (“EDRs”) and Global Depositary Receipts (“GDRs”)) that represent indirect interests in securities of foreign issuers. A significant portion of a Fund’s exposure to foreign investments may be composed of such investments. Investments in foreign securities are affected by risk factors generally not associated with investments in the securities of U.S. companies in the U.S. With respect to such securities, there may be more limited information publicly available concerning the issuer than would be the case with respect to domestic securities, foreign issuers may use different accounting standards, and foreign trading markets may not be as liquid as are U.S. markets. Foreign securities also involve such risks as currency risks, possible imposition of withholding or confiscatory taxes, possible currency transfer restrictions, expropriation or other adverse political or economic developments, and the difficulty of enforcing obligations in other countries. These risks may be greater in emerging-market countries and in less-developed countries.
The purchase of securities denominated in foreign currencies will subject the value of the Funds’ investments in those securities to fluctuations caused by changes in foreign exchange rates. To hedge against the effects of changes in foreign exchange rates, the Funds may enter into forward foreign currency exchange contracts (“forward contracts”). These contracts represent agreements to exchange an amount of currency at an agreed-upon future date and rate. The Funds will generally use forward contracts only to “lock in” the price in U.S. dollars of a foreign security that a Fund plans to purchase or to sell. In certain limited cases, it may use such contracts to hedge against an anticipated substantial decline in the price of a foreign currency against the U.S. dollar that would adversely affect the U.S. dollar value of foreign securities held by the Fund. Forward contracts will not be used in all cases and, in any event, cannot completely protect the Funds against all changes in the values of foreign securities resulting from fluctuations in foreign exchange rates. The Funds will not enter into a forward contract if, as a result, forward contracts would represent more than 20% of a Fund’s total assets. For hedging purposes, the Funds may also use options on foreign currencies, which expose the Funds to certain risks.
Some foreign securities are traded in the U.S. in the form of ADRs. ADRs are receipts typically issued by a U.S. bank or company evidencing ownership of the underlying securities of foreign issuers. EDRs and GDRs are receipts typically issued by foreign banks or trust companies, evidencing ownership of underlying securities issued by either a foreign or U.S. issuer. Generally, depositary receipts in registered form are designed for use in the U.S. and depositary receipts in bearer form are designed for use in securities markets outside the U.S. Depositary receipts may not necessarily be denominated in the same currency as the underlying securities into which they may be converted. Depositary receipts generally involve the same risks as other investments in foreign securities. However, holders of ADRs and other depositary receipts may not have all the legal rights of shareholders and may experience difficulty in receiving shareholder communications.
PARTICIPATORY NOTES — A participatory note, as used by a Fund, is an instrument used by investors to obtain exposure to an equity investment, including common stocks and warrants, in a local market where direct ownership is not permitted (or is impractical.) In countries where direct ownership by a foreign investor, such as a Fund, is not allowed by local law, such as Saudi Arabia, an investor may gain exposure to the market through a participatory note, which derives its value from a group of underlying equity securities. A participatory note is intended (disregarding the effect of any fees and expenses) to reflect the
Motley Fool Asset Management ETFs
Notes to Financial Statements (continued)
AUGUST 31, 2024
performance of the underlying equity securities on a one-to-one basis so that investors will not normally gain more in absolute terms than they would have made had they invested in the underlying securities directly, and will not normally lose more than they would have lost had they invested in the underlying securities directly.
In addition to providing access to otherwise closed markets, participatory notes can also provide a less expensive option to direct investment (where ownership by foreign investors is permitted) by reducing registration and transaction costs in acquiring and selling local registered shares. The Funds’ investment manager also believes that participatory notes can offer greater liquidity in markets that restrict the ability of the Funds to dispose of an investment by either restricting transactions by size or requiring registration and/or regulatory approvals.
The purchase of participatory notes involves risks that are in addition to the risks normally associated with a direct investment in the underlying securities. The Fund is subject to the risk that the issuer of the participatory note (i.e., the issuing bank or broker-dealer), which is the only responsible party under the note, is unable or refuses to perform under the terms of the participatory note, also known as counterparty risk.
While the holder of a participatory note is entitled to receive from the bank or broker-dealer any dividends or other distributions paid on the underlying securities, the holder is not entitled to the same rights as an owner of the underlying securities, such as voting rights.
Participatory notes may not be traded on exchanges, are privately issued, and may be illiquid. To the extent a participatory note is determined to be illiquid, it would be subject to the Fund’s limitation on investments in illiquid securities. There can be no assurance that the trading price or value of participatory notes will equal the value of the underlying value of the equity securities they seek to replicate.
TEMPORARY INVESTMENTS — During periods of adverse market or economic conditions, a Fund may temporarily invest all or a substantial portion of its assets in high-quality, fixed-income securities, money market instruments, and shares of money market mutual funds, or it may hold cash. At such times, a Fund would not be pursuing its stated investment objective with its usual investment strategies. A Fund may also hold these investments for liquidity purposes. Fixed-income securities will be deemed to be of high quality if they are rated “A” or better by S&P or Moody’s or, if unrated, are determined to be of comparable quality by the Adviser. Money market instruments are high-quality, short-term fixed income obligations (which generally have remaining maturities of one year or less), and may include U.S. Government Securities, commercial paper, certificates of deposit and banker’s acceptances issued by domestic branches of United States banks that are members of the Federal Deposit Insurance Corporation, and repurchase agreements for US. Government Securities. In lieu of purchasing money market instruments, a Fund may purchase shares of money market mutual funds that invest primarily in U.S. Government Securities and repurchase agreements involving those securities, subject to certain limitations imposed by the 1940 Act. A Fund, as an investor in a money market fund, will indirectly bear the fees and expenses of the money market fund. These indirect fees and expenses will be in addition to the fees and expenses of the Funds. Repurchase agreements involve certain risks not associated with direct investments in debt securities.
3. INVESTMENT adviser and other services
Each Fund pays all of its expenses other than those expressly assumed by the Adviser. Expenses of each Fund are deducted from the Fund’s total income before dividends are paid. Subject to the supervision of the Board, the Adviser manages the overall investment operations of each Fund in accordance with the Fund’s respective investment objective and policies and formulates a continuing investment strategy for each Fund pursuant to the terms of the Investment Advisory Agreements between the Adviser and the Company on behalf of each Fund. The Adviser is a wholly-owned subsidiary of Motley Fool Investment Management, LLC, which is a wholly owned subsidiary of The Motley Fool Holdings Inc. (“TMF Holdings”), a multimedia financial-services holding company that also owns The Motley Fool, which publishes investment information and analysis across a wide range of media, including investment newsletter services, websites, and books. TMF Holdings is controlled by David Gardner and Tom Gardner, along with other private shareholders. Each Fund compensates the Adviser with a unitary management fee for its services at an annual rate based on each Fund’s average daily net assets (the “Advisory Fee”), payable on a monthly basis in arrears, as shown on the following table. From the Advisory Fee, the Adviser pays most of the expenses of each Fund, including the cost of
Motley Fool Asset Management ETFs
Notes to Financial Statements (continued)
AUGUST 31, 2024
transfer agency, custody, fund administration, legal, audit and other services. However, the Adviser is not responsible for interest expenses, brokerage commissions and other trading expenses, taxes and other extraordinary costs such as litigation and other expenses not incurred in the ordinary course of business.
FUND | | ADVISORY FEE | |
Global Opportunities Fund | | | 0.85 | % |
Mid-Cap Growth Fund | | | 0.85 | % |
Fool 100 Fund | | | 0.50 | % |
Small-Cap Growth Fund | | | 0.85 | % |
Capital Efficiency Fund | | | 0.50 | % |
Next Fund | | | 0.50 | % |
During the current fiscal period, investment advisory fees accrued were as follows:
FUND | | GROSS ADVISORY
FEES | | | RECOUPMENT/
WAIVERS | | | NET ADVISORY
FEES | |
Global Opportunities Fund | | $ | 3,631,316 | | | $ | — | | | $ | 3,631,316 | |
Mid-Cap Growth Fund | | | 1,633,412 | | | | — | | | | 1,633,412 | |
Fool 100 Fund | | | 3,573,161 | | | | — | | | | 3,573,161 | |
Small-Cap Growth Fund | | | 665,835 | | | | — | | | | 665,835 | |
Capital Efficiency Fund | | | 170,046 | | | | — | | | | 170,046 | |
Next Fund | | | 129,230 | | | | — | | | | 129,230 | |
U.S. Bancorp Fund Services, LLC (“Fund Services”), doing business as U.S. Bank Global Fund Services, serves as administrator for the Funds. For providing administrative and accounting services, Fund Services is entitled to receive a monthly fee, subject to certain minimum and out of pocket expenses.
Fund Services serves as the Funds’ transfer and dividend disbursing agent. For providing transfer agent services, Fund Services is entitled to receive a monthly fee, subject to certain minimum and out of pocket expenses.
U.S. Bank, N.A. (the “Custodian”) provides certain custodial services to the Funds. The Custodian is entitled to receive a monthly fee, subject to certain minimum and out of pocket expenses.
Foreside Funds Distributors, LLC (“Foreside”) serves as the principal underwriter and distributor of the Global Opportunities Fund’s shares and Mid-Cap Growth Fund’s shares pursuant to a Distribution Agreement with RBB.
Quasar Distributors, LLC (“Quasar”), a wholly-owned broker-dealer subsidiary of Foreside Financial Group, LLC, serves as the principal underwriter and distributor of the Fool 100 Fund’s shares, Small-Cap Growth Fund’s shares, Capital Efficiency Fund’s shares and Next Fund’s shares pursuant to a Distribution Agreement with RBB.
Under the Fund’s unitary fee, the Adviser compensates Fund Services and the Custodian for its services provided.
DIRECTOR AND OFFICER COMPENSATION — The Directors of the Company receive an annual retainer and meeting fees for meetings attended. An employee of Vigilant Compliance, LLC serves as Chief Compliance Officer of the Company. Vigilant Compliance, LLC is compensated for the services provided to the Company. Employees of RBB serve as President, Chief Financial Officer, Chief Operating Officer, Secretary and Director of Marketing & Business Development of the Company. They are compensated for services provided. Certain employees of Fund Services serve as officers of the Company. They are not compensated by the Funds or the Company. During the current fiscal period, director and officer fees charged to the Funds were paid by the Adviser out of each Fund’s unitary fee.
Motley Fool Asset Management ETFs
Notes to Financial Statements (continued)
AUGUST 31, 2024
REDEMPTION FEE — Prior to January 1, 2018, the Global Opportunities Fund and Mid-Cap Growth Fund imposed a redemption fee of 2.00% on redemptions/exchanges of Fund shares held less than 90 days. The redemption fee was calculated as a percentage of the net asset value of the total redemption proceeds and was retained by the Funds and accounted for as additional paid-in capital. Effective January 1, 2018, the Funds have eliminated their redemption fees. Please see the Funds’ prospectus for more information.
TRANSACTIONS WITH AFFILIATES — Advisers to investment companies, including the Motley Fool Asset Management Funds, are permitted under 17a-7 of the 1940 Act to purchase or sell securities directly between affiliated clients. When affecting these “cross” transactions, Rule 17a-7 imposes restrictions on how the trades are processed and reported. The specified conditions within Rule 17a-7 are outlined in procedures established by or under the direction of the Board of Directors. The procedures have been designed to provide assurance that any purchase or sale of securities by the Fund from or to another Fund complies with Rule 17a-7 under the 1940 Act.
During the current fiscal period, the Funds did not engage in any security transactions with affiliates.
4. PURCHASES AND SALES OF INVESTMENT SECURITIES
During the current fiscal period, aggregate purchases and sales and maturities of investment securities (excluding in-kind transactions and short-term investments) of the Funds were as follows:
FUND | | PURCHASES | | | SALES | |
Global Opportunities Fund | | $ | 158,893,864 | | | $ | 180,541,208 | |
Mid-Cap Growth Fund | | | 58,997,491 | | | | 65,524,875 | |
Fool 100 Fund | | | 176,114,679 | | | | 170,284,951 | |
Small-Cap Growth Fund | | | 28,238,882 | | | | 22,855,067 | |
Capital Efficiency Fund | | | 12,846,856 | | | | 11,846,009 | |
Next Fund | | | 4,764,198 | | | | 5,181,933 | |
There were no purchases or sales of long-term U.S. Government Securities during the current fiscal period.
During the current fiscal period, aggregate purchases and sales and maturities of in-kind transactions of the Funds were as follows:
FUND | | PURCHASES | | | SALES | |
Global Opportunities Fund | | $ | 7,428,580 | | | $ | 55,963,180 | |
Mid-Cap Growth Fund | | | 7,824,521 | | | | 27,287,734 | |
Fool 100 Fund | | | 248,186,529 | | | | 39,388,187 | |
Small-Cap Growth Fund | | | 14,527,952 | | | | 18,649,915 | |
Capital Efficiency Fund | | | 19,546,440 | | | | 5,330,503 | |
Next Fund | | | 404,519 | | | | 8,253,830 | |
5. Federal Income tax information
The Funds have followed the authoritative guidance on accounting for and disclosure of uncertainty in tax positions, which requires the Funds to determine whether a tax position is more likely than not to be sustained upon examination, including resolution of any related appeals or litigation processes, based on the technical merits of the position. The Funds have determined that there was no effect on the financial statements from following this authoritative guidance. In the normal course of business, the Funds are subject to examination by federal, state and local jurisdictions, where applicable, for tax years for which applicable statutes of limitations have not expired.
Motley Fool Asset Management ETFs
Notes to Financial Statements (continued)
AUGUST 31, 2024
As of August 31, 2024, the federal tax cost, aggregate gross unrealized appreciation and depreciation of securities held by the Funds were as follows:
FUND | | FEDERAL
TAX COST | | | UNREALIZED
APPRECIATION | | | UNREALIZED
(DEPRECIATION) | | | NET UNREALIZED
APPRECIATION/
(DEPRECIATION) | |
Global Opportunities Fund | | $ | 294,396,604 | | | $ | 182,697,242 | | | $ | (16,552,784 | ) | | $ | 166,144,458 | |
Mid-Cap Growth Fund | | | 155,317,036 | | | | 75,749,999 | | | | (2,418,853 | ) | | | 73,331,146 | |
Fool 100 Fund | | | 645,764,427 | | | | 353,845,571 | | | | (22,185,683 | ) | | | 331,659,888 | |
Small-Cap Growth Fund | | | 89,878,141 | | | | 17,620,813 | | | | (8,248,729 | ) | | | 9,372,084 | |
Capital Efficiency Fund | | | 37,237,277 | | | | 10,790,564 | | | | (828,868 | ) | | | 9,961,696 | |
Next Fund | | | 24,638,698 | | | | 4,552,624 | | | | (4,765,177 | ) | | | (212,553 | ) |
Distributions to shareholders, if any, from net investment income and realized gains are determined in accordance with federal income tax regulations, which may differ from net investment income and realized gains recognized for financial reporting purposes. Accordingly, the character of distributions and composition of net assets for tax purposes may differ from those reflected in the accompanying financial statements. To the extent these differences are permanent, such amounts are reclassified within the capital accounts based on the tax treatment; temporary differences do not require such reclassification.
The following permanent differences as of August 31, 2024, primarily attributable to foreign currency transactions and in-kind redemptions gains, were reclassified among the following accounts:
FUND | | DISTRIBUTABLE
EARNINGS/(LOSS) | | | PAID-IN
CAPITAL | |
Global Opportunities Fund | | $ | (28,172,666 | ) | | $ | 28,172,666 | |
Mid-Cap Growth Fund | | | (13,067,346 | ) | | | 13,067,346 | |
Fool 100 Fund | | | (30,058,743 | ) | | | 30,058,743 | |
Small-Cap Growth Fund | | | (4,429,097 | ) | | | 4,429,097 | |
Capital Efficiency Fund | | | (1,689,960 | ) | | | 1,689,960 | |
Next Fund | | | (347,899 | ) | | | 347,899 | |
As of August 31, 2024, the components of distributable earnings on a tax basis were as follows:
FUND | | UNDISTRIBUTED
ORDINARY
INCOME | | | UNDISTRIBUTED
LONG-TERM
CAPITAL GAINS | | | CAPITAL Loss
Carryover | | | Qualified
Late-Year
LOSS DEFERRAL | | | UNREALIZED
APPRECIATION/
(DEPRECIATION) | | | Total | |
Global Opportunities Fund | | $ | 5,617,271 | | | $ | 47,442,736 | | | $ | — | | | $ | — | | | $ | 166,144,458 | | | $ | 219,204,465 | |
Mid-Cap Growth Fund | | | 157,172 | | | | 28,830,430 | | | | — | | | | — | | | | 73,331,146 | | | | 102,318,748 | |
Fool 100 Fund | | | 3,031,288 | | | | 1,786,899 | | | | — | | | | — | | | | 331,659,888 | | | | 336,478,075 | |
Small-Cap Growth Fund | | | — | | | | — | | | | (16,995,261 | ) | | | (128,577 | ) | | | 9,372,084 | | | | (7,751,754 | ) |
Capital Efficiency Fund | | | 109,143 | | | | — | | | | (195,048 | ) | | | — | | | | 9,961,696 | | | | 9,875,791 | |
Next Fund | | | 17,732 | | | | — | | | | (1,822,017 | ) | | | — | | | | (212,553 | ) | | | (2,016,838 | ) |
The differences between the book and tax basis components of distributable earnings (losses) relate primarily to the timing of recognition of income and gains for federal income tax purposes.
Motley Fool Asset Management ETFs
Notes to Financial Statements (continued)
AUGUST 31, 2024
The tax character of dividends and distributions paid during the fiscal years ended August 31, 2023 and August 31, 2024 was as follows:
FUND | | Tax
year | | | ORDINARY
INCOME | | | LONG-TERM
CAPITAL GAIN | | | TOTAL | |
Global Opportunities Fund | | | 2024 | | | $ | 1,589,216 | | | $ | 21,416,885 | | | $ | 23,006,101 | |
| | | | 2023 | | | | 1,203,987 | | | | 1,501,269 | | | | 2,705,256 | |
Mid-Cap Growth Fund | | | 2024 | | | | 486,537 | | | | 4,501,264 | | | | 4,987,801 | |
| | | | 2023 | | | | — | | | | — | | | | — | |
Fool 100 Fund | | | 2024 | | | | 846,637 | | | | — | | | | 846,637 | |
| | | | 2023 | | | | 1,701,998 | | | | — | | | | 1,701,998 | |
Small-Cap Growth Fund | | | 2024 | | | | 2,037 | | | | — | | | | 2,037 | |
| | | | 2023 | | | | — | | | | 227,522 | | | | 227,522 | |
Capital Efficiency Fund | | | 2024 | | | | 109,818 | | | | — | | | | 109,818 | |
| | | | 2023 | | | | 76,457 | | | | — | | | | 76,457 | |
Next Fund | | | 2024 | | | | 46,367 | | | | — | | | | 46,367 | |
| | | | 2023 | | | | 64,299 | | | | — | | | | 64,299 | |
Dividends from net investment income and short-term capital gains are treated as ordinary income dividends for federal income tax purposes.
Pursuant to federal income tax rules applicable to regulated investment companies, the Funds may elect to treat certain capital losses between November 1 and August 31 and late year ordinary losses ((i) ordinary losses between January 1 and August 31, and (ii) specified ordinary and currency losses between November 1 and August 31) as occurring on the first day of the following tax year. For the fiscal year ended August 31, 2024 any amount of losses elected within the tax return will not be recognized for federal income tax purposes until September 1, 2024. The Small-Cap Growth Fund deferred $128,577 post October loss which will be treated as arising on the first business day of the following fiscal year.
Under the Regulated Investment Company Modernization Act of 2010, the Funds are permitted to carry forward capital losses incurred in taxable years beginning after December 22, 2010 for an unlimited period. Additionally, capital losses that are carried forward will retain their character as either short-term or long-term capital losses rather than being considered all short-term as under the previous law. As of August 31, 2024, the Small-Cap fund had $122,332 of short term capital loss carryforwards and $16,872,929 of long-term capital loss carryforwards, the Capital Efficiency Fund had $195,048 of short-term capital loss carryforwards, and the Next Fund had $1,301,761 of short-term capital loss carryforwards and $520,256 of long-term capital loss carryforwards.
6. SHARE TRANSACTIONS
Shares of the Global Opportunities Fund, Mid-Cap Growth Fund, Fool 100 Fund and Small-Cap Growth Fund are listed and trade on the Cboe BZX Exchange, Inc. Shares of the Capital Efficiency Fund and Next Fund are listed and trade on the NYSE, Arca, Inc. Market prices for the shares may be different from their NAV. Each Fund issues and redeems shares on a continuous basis at NAV only in blocks of 25,000 shares, called “Creation Units.” Creation Units are issued and redeemed principally in-kind for securities included in a specified universe. Once created, shares generally trade in the secondary market at market prices that change throughout the day. Except when aggregated in Creation Units, shares are not redeemable securities of each Fund. Creation Units may only be purchased or redeemed by certain financial institutions (“Authorized Participants”). An Authorized Participant is either (i) a broker-dealer or other participant in the clearing process through the Continuous Net Settlement System of the National Securities Clearing Corporation or (ii) a Depository Trust Company participant and, in each case, must have executed a Participant Agreement with the Distributor. Most retail investors do not qualify as Authorized Participants nor have the resources
Motley Fool Asset Management ETFs
Notes to Financial Statements (continued)
AUGUST 31, 2024
to buy and sell whole Creation Units. Therefore, they are unable to purchase or redeem shares directly from each Fund. Rather, most retail investors may purchase shares in the secondary market with the assistance of a broker and are subject to customary brokerage commissions or fees.
Each Fund currently offers one class of shares, which has no front-end sales load, no deferred sales charge, and no redemption fee. A fixed transaction fee is imposed for the transfer and other transaction costs associated with the purchase or sale of Creation Units. The standard fixed transaction fee for each Fund is $250, payable to the custodian. In addition, a variable fee may be charged on all cash transactions or substitutes for Creation Units of up to a maximum of 2% as a percentage of the value of the Creation Units subject to the transaction. Variable fees are imposed to compensate each Fund for the transaction costs associated with the cash transactions. Variable fees received by each Fund, if any, are displayed in the capital shares transactions section of the Statements of Changes in Net Assets. Each Fund may issue an unlimited number of shares of beneficial interest, with $0.001 par value per share. Shares of each Fund have equal rights and privileges.
7. SECURITIES LENDING
The Funds may make secured loans of their portfolio securities to brokers, dealers and other financial institutions to earn additional income and receive cash collateral equal to at least 100% of the current market value of the loaned securities, as marked to market each day that the NAV of the Funds is determined. When the collateral falls below specified amounts, the Funds’ lending agent will use its best effort to obtain additional collateral on the next business day to meet required amounts under the security lending agreement. The Funds will pay administrative and custodial fees in connection with the loan of securities. Collateral is invested in short-term investments and the Funds will bear the risk of loss of the invested collateral. Investments purchased with proceeds from securities lending are overnight and continuous. Securities lending will expose the Funds to the risk of loss should a borrower default on its obligation to return the borrowed securities. The market value of the securities on loan and cash collateral as of the end of the reporting period and the income generated from the program during the current fiscal period with respect to such secured loans were as follows:
FUND | | MARKET VALUE
OF SECURITIES
LOANED | | | MARKET VALUE
OF COLLATERAL | | | INCOME
RECEIVED FROM
SECURITIES
LENDING | |
Global Opportunities Fund | | $ | 33,637,720 | | | $ | 34,052,359 | | | $ | 56,860 | |
Mid-Cap Growth Fund | | | 28,330,814 | | | | 28,802,749 | | | | 42,484 | |
Fool 100 Fund | | | 10,202,881 | | | | 10,257,974 | | | | 28,436 | |
Small-Cap Growth Fund | | | 20,968,235 | | | | 21,476,806 | | | | 34,158 | |
Motley Fool Asset Management ETFs
Notes to Financial Statements (concluded)
AUGUST 31, 2024
Securities lending transactions are entered into by the Funds’ securities lending agent on behalf of the Funds under a Master Securities Lending Agreement (“MSLA”) which permits the Funds’ securities lending agent on behalf of the Funds under certain circumstances including an event of default (such as bankruptcy or insolvency), to offset amounts payable on behalf of the Funds to the same counterparty against amounts to be received and create one single net payment due to or from the Funds. The following table is a summary of the Funds’ open securities lending transactions which are subject to a MSLA as of the end of the reporting period:
| | | | | | | | | | | | | | | GROSS AMOUNTS NOT OFFSET IN THE
STATEMENTS OF ASSETS AND LIABILITIES | |
FUND | | GROSS
AMOUNTS OF
RECOGNIZED
ASSETS | | | GROSS
AMOUNTS
OFFSET IN THE
STATEMENTS
OF ASSETS
AND
LIABILITIES | | | NET AMOUNTS
OF ASSETS
PRESENTED
IN THE
STATEMENTS
OF ASSETS
AND
LIABILITIES | | | FINANCIAL
INSTRUMENTS1 | | | CASH
COLLATERAL
RECEIVED | | | NET
AMOUNT2 | |
Global Opportunities Fund | | $ | 33,637,720 | | | $ | — | | | $ | 33,637,720 | | | $ | (33,637,720 | ) | | $ | — | | | $ | — | |
Mid-Cap Growth Fund | | | 28,330,814 | | | | — | | | | 28,330,814 | | | | (28,330,814 | ) | | | — | | | | — | |
Fool 100 Fund | | | 10,202,881 | | | | — | | | | 10,202,881 | | | | (10,202,881 | ) | | | — | | | | — | |
Small-Cap Growth Fund | | | 20,968,235 | | | | — | | | | 20,968,235 | | | | (20,968,235 | ) | | | — | | | | — | |
1 | Amount disclosed is limited to the amount of assets presented in the Statements of Assets and Liabilities. Actual collateral received may be more than the amount shown. |
2 | Net amount represents the net amount receivable from the counterparty in the event of default. |
8. Subsequent Events
Management has evaluated the impact of all subsequent events on the Funds through the date the financial statements were issued and has determined that there were no significant events requiring recognition or disclosure in the financial statements.
Motley Fool Asset Management ETFs
Report of Independent Registered
Public Accounting Firm
To the Board of Directors of
The RBB Fund, Inc.
and the Shareholders of the Motley Fool ETFs
Opinion on the Financial Statements
We have audited the accompanying statements of assets and liabilities of the Motley Fool Global Opportunities ETF, Motley Fool Mid-Cap Growth ETF, Motley Fool 100 Index ETF, Motley Fool Small-Cap Growth ETF, Motley Fool Capital Efficiency 100 Index ETF, and Motley Fool Next Index ETF (the “Funds”), each a series of The RBB Fund, Inc., including the schedules of investments, as of August 31, 2024, the related statements of operations, the statements of changes in net assets and the financial highlights for each of the periods indicated in the table below, and the related notes (collectively referred to as the “financial statements”). In our opinion, the financial statements present fairly, in all material respects, the financial position of the Funds as of August 31, 2024, the results of their operations, the changes in their net assets, and their financial highlights for the periods indicated in the table below, in conformity with accounting principles generally accepted in the United States of America.
Individual Funds
constituting
Motley Fool
ETFs | Statement of
operations | Statements of
changes in net assets | Financial highlights |
Motley Fool Global Opportunities ETF, Motley Fool Mid-Cap Growth ETF, Motley Fool 100 Index ETF, and Motley Fool Small-Cap Growth ETF | For the year ended August 31, 2024 | For each of the two years in the period ended August 31, 2024 | For each of the five years in the period ended August 31, 2024 |
Motley Fool Capital Efficiency 100 Index ETF and Motley Fool Next Index ETF | For the year ended August 31, 2024 | For each of the two years in the period ended August 31, 2024 | For each of the two years in the period ended August 31, 2024 and for the period December 30, 2021 (commencement of operations) through August 31, 2022 |
Basis for Opinion
These financial statements are the responsibility of the Funds’ management. Our responsibility is to express an opinion on the Funds’ financial statements based on our audits. We are a public accounting firm registered with the Public Company Accounting Oversight Board (United States) (“PCAOB”) and are required to be independent with respect to the Funds in accordance with the U.S. federal securities laws and the applicable rules and regulations of the Securities and Exchange Commission and the PCAOB. We have served as the auditor of one or more of the funds in the Trust since 2011.
We conducted our audits in accordance with the standards of the PCAOB. Those standards require that we plan and perform the audits to obtain reasonable assurance about whether the financial statements are free of material misstatement, whether due to error or fraud. The Funds are not required to have, nor were we engaged to perform, an audit of the Funds’ internal control over financial reporting. As part of our audits, we are required to obtain an understanding of internal control over financial reporting, but not for the purpose of expressing an opinion on the effectiveness of the Funds’ internal control over financial reporting. Accordingly, we express no such opinion.
Our audits included performing procedures to assess the risks of material misstatement of the financial statements, whether due to error or fraud, and performing procedures that respond to those risks. Such procedures included examining, on a test basis, evidence regarding the amounts and disclosures in the financial statements. Our audits also included evaluating the accounting
Motley Fool Asset Management ETFs
Report of Independent Registered
Public Accounting Firm (CONCLUDED)
principles used and significant estimates made by management, as well as evaluating the overall presentation of the financial statements. Our procedures included confirmation of securities owned as of August 31, 2024 by correspondence with the custodian. We believe that our audits provide a reasonable basis for our opinion.
| | 
|
| | TAIT, WELLER & BAKER LLP |
Philadelphia, Pennsylvania
October 30, 2024
Motley Fool Asset Management ETFs
Shareholder Tax Information
(Unaudited)
Certain tax information regarding the Funds is required to be provided to shareholders based upon the Funds’ income and distributions for the taxable period ended August 31, 2024. The information and distributions reported herein may differ from information and distributions taxable to the shareholders for the calendar year ending December 31, 2024. During the fiscal year ended August 31, 2024, the following dividends and distributions were paid by the Funds:
FUND | | ORDINARY
INCOME | | | LONG-TERM
capital gain | |
Global Opportunities Fund | | $ | 1,589,216 | | | $ | 21,416,885 | |
Mid-Cap Growth Fund | | | 486,537 | | | | 4,501,264 | |
Fool 100 Fund | | | 846,637 | | | | — | |
Small-Cap Growth Fund | | | 2,037 | | | | — | |
Capital Efficiency Fund | | | 109,818 | | | | — | |
Next Fund | | | 46,367 | | | | — | |
Dividends from net investment income and short-term capital gains are treated as ordinary income dividends for federal income tax purposes.
Under the Jobs and Growth Tax relief Reconciliation Act of 2003 the following percentages of ordinary dividends paid during the fiscal year ended August 31, 2024 are designated as “qualified dividend income,” as defined in the Act, and are subject to reduced tax rates:
Global Opportunities Fund | 85% |
Mid-Cap Growth Fund | 100% |
Fool 100 Fund | 100% |
Small-Cap Growth Fund | 100% |
Capital Efficiency Fund | 100% |
Next Fund | 100% |
The percentage of total ordinary income dividends paid qualifying for the corporate dividends received deduction for the Funds are as follows:
Global Opportunities Fund | 60% |
Mid-Cap Growth Fund | 100% |
Fool 100 Fund | 100% |
Small-Cap Growth Fund | 100% |
Capital Efficiency Fund | 100% |
Next Fund | 100% |
Because the Funds’ fiscal year is not the calendar year, another notification will be sent with respect to calendar year 2024. The second notification, which will reflect the amount, if any, to be used by calendar year taxpayers on their U.S. federal income tax returns, will be made in conjunction with Form 1099-DIV and will be mailed in January 2025.
Foreign shareholders will generally be subject to U.S. withholding tax on the amount of their ordinary income dividends. They will generally not be entitled to a foreign tax credit or deduction for the withholding taxes paid by the Funds, if any.
In general, dividends received by tax-exempt recipients (e.g., IRAs and Keoghs) need not be reported as taxable income for U.S. federal income tax purposes. However, some retirement trusts (e.g., corporate, Keogh and 403(b)(7) plans) may need this information for their annual information reporting.
Shareholders are advised to consult their own tax advisers with respect to the tax consequences of their investment in the Funds.
Motley Fool Asset Management ETFs
Notice to Shareholders
(Unaudited)
APPROVAL OF INVESTMENT ADVISORY AGREEMENT
As required by the 1940 Act, the Board of the Company, including all of the Directors who are not “interested persons” of the Company, as that term is defined in the 1940 Act (the “Independent Directors”), considered the renewal of the investment advisory agreements between Motley Fool Asset Management, LLC (“MFAM”) and the Company (the “Investment Advisory Agreement”) on behalf of the Motley Fool Mid-Cap Growth ETF, the Motley Fool Global Opportunities ETF, the Motley Fool Small-Cap Growth ETF, Motley Fool 100 Index ETF, Motley Fool Capital Efficiency 100 Index ETF and Motley Fool Next Index ETF (for this section only, each a “Fund” and collectively the “Funds”), at a meeting of the Board held on May 15-16, 2024 (the “Meeting”). At the Meeting, the Board, including all of the Independent Directors, approved the Investment Advisory Agreement for an additional one-year term. The Board’s decision to approve the Investment Advisory Agreement reflects the exercise of its business judgment to continue the existing arrangements. In approving the Investment Advisory Agreement, the Board considered information provided by MFAM with the assistance and advice of counsel to the Independent Directors and the Company.
In considering the renewal and approval of the Investment Advisory Agreement between the Company and MFAM with respect to the Funds, the Directors took into account all the materials provided prior to and during the Meeting and at other meetings throughout the past year, the presentations made during the Meeting, and the discussions held during the Meeting. The Directors reviewed these materials with management of MFAM and discussed the Investment Advisory Agreement with counsel in executive sessions, at which no representatives of MFAM were present. Among other things, the Directors considered (i) the nature, extent, and quality of MFAM’s services provided to the Funds; (ii) descriptions of the experience and qualifications of MFAM’s personnel providing those services; (iii) MFAM’s investment philosophies and processes; (iv) MFAM’s assets under management and client descriptions; (v) MFAM’s soft dollar commission and trade allocation policies, including information on the types of research and services obtained in connection with soft dollar commissions; (vi) MFAM’s advisory fee arrangement with the Company and other similarly managed clients; (vii) MFAM’s compliance policies and procedures; (viii) MFAM’s financial information, insurance coverage and profitability analysis related to providing advisory services to the Funds; (ix) the extent to which economies of scale are relevant to the Funds; (x) a report prepared by Fuse Research Network, LLC comparing each Fund’s management fees and total expense ratios to a group of mutual funds deemed comparable to each Fund based primarily on investment strategy similarity (“Peer Group”) and comparing the performance of each Fund to the performance of its Peer Group; and (xi) a report comparing the performance of the Funds to the performance of their respective benchmark.
As part of their review, the Directors considered the nature, extent and quality of the services provided by MFAM. The Directors concluded that MFAM had substantial resources to provide services to the Funds and that MFAM’s services had been acceptable.
The Directors also considered the investment performance of the Funds. Information on the Funds’ investment performance was provided for the three-month, one-year, three-year, five-year, and since inception periods ended December 31, 2023, as applicable. The Directors considered the Funds’ investment performance in light of their respective investment objectives and investment strategies. The Directors concluded that the investment performance of each of the Funds as compared to their respective benchmarks and Peer Groups was acceptable.
The Directors then noted the performance of the Motley Fool 100 Index ETF, Motley Fool Capital Efficiency 100 Index ETF, and Motley Fool Next Index ETF. The Directors considered that because each of the aforementioned Funds was designed to track the performance of its respective index, the relevant consideration was the extent to which such Fund tracked its index before fees and expenses. The Board also noted that the performance of the index did not take into account the expenses incurred when purchasing or selling securities, which expenses would lower the performance of a fund seeking to replicate some or all of the holdings of the index. The Board noted that for the three-month, one-year, three-year, and since-inception periods ended December 31, 2023, as applicable, each of the aforementioned Fund’s performance was in line with its index before fees and expenses.
The Directors noted that the Motley Fool 100 Index ETF outperformed the median of its Peer Group for the three-month, one-year, three-year, five-year and since-inception periods ended December 31, 2023.
The Directors noted that the Motley Fool Capital Efficiency 100 Index ETF outperformed the median of its Peer Group for the three-month, one-year, and since-inception periods ended December 31, 2023.
Motley Fool Asset Management ETFs
Notice to Shareholders (Concluded)
(Unaudited)
The Directors noted that the Motley Fool Next Index ETF outperformed the median of its Peer Group for the three-month and one-year periods ended December 31, 2023, and underperformed the median of its Peer Group for the since-inception period ended December 31, 2023.
The Directors noted that the Motley Fool Global Opportunities ETF outperformed its primary benchmark, the FTSE Global All Cap Net Tax Index, for the three-month, one-year, five-year, and since inception periods ended December 31, 2023, and underperformed its benchmark for the three-year period ended December 31, 2023. The Directors noted that the Motley Fool Global Opportunities ETF outperformed the median of its Peer Group for the one-year, five-year, and since-inception periods ended December 31, 2023, and underperformed the median of its Peer Group for the three-year period ended December 31, 2023.
The Directors noted that the Motley Fool Mid-Cap Growth ETF underperformed its primary benchmark, the Russell Midcap Growth Index, for the three-month, one-year, three-year, five-year and since inception periods ended December 31, 2023. The Directors noted that the Motley Fool Mid-Cap Growth ETF outperformed the median of its Peer Group for the one-year period ended December 31, 2023, equaled the performance of the median of its Peer Group for the since-inception period ended December 31, 2023, and underperformed the median of its Peer Group for the three-month, three-year, and five-year periods ended December 31, 2023.
The Directors noted that the Motley Fool Small-Cap Growth ETF outperformed its primary benchmark, the Russell 2000 Growth Index, for the one-year, five-year, and since-inception periods ended December 31, 2023, and underperformed its benchmark for the three-month and three-year periods ended December 31, 2023. The Directors noted that the Motley Fool Small-Cap Growth ETF outperformed the median of its Peer Group for the one-year period ended December 31, 2023, equaled the performance of the median of its Peer Group for the since-inception period ended December 31, 2023, and underperformed the median of its Peer Group for the three-month, three-year, and five-year periods ended December 31, 2023.
The Board also considered the advisory fee rates payable by the Funds under the Investment Advisory Agreement. In this regard, information on the fees paid by the Funds and the Funds’ total operating expense ratios were compared to similar information for ETFs advised by other, unaffiliated investment advisory firms.
The Directors noted that the net advisory fee of the Motley Fool Mid-Cap Growth ETF ranked above the median and in the 5th quintile of its Peer Group, and the Fund’s total net expenses were above the median and in the 5th quintile of its Peer Group.
The Directors noted that the net advisory fee of the Motley Fool Global Opportunities ETF ranked above the median and in the 5th quintile of its Peer Group, and the Fund’s total net expenses were below the median and in the 2nd quintile of its Peer Group.
The Directors noted that the net advisory fee of the Motley Fool Small-Cap Growth ETF ranked above the median and in the 3rd quintile of its Peer Group, and the Fund’s total net expenses were below the median and in the 1st quintile of its Peer Group.
The Directors noted that the net advisory fee of the Motley Fool 100 Index ETF equaled the median and in the 3rd quintile of its Peer Group, and the Fund’s total net expenses were below the median and in the 2nd quintile of its Peer Group.
The Directors noted that the net advisory fee of the Motley Fool Capital Efficiency 100 Index ETF equaled the median and in the 3rd quintile of its Peer Group, and the Fund’s total net expenses equaled the median and ranked in the 3rd quintile of its Peer Group.
The Directors noted that both the net advisory fee and total net expenses of the Motley Fool Next Index ETF ranked above the median and in the 4th quintile of its Peer Group.
The Board also took into consideration that the advisory fee for each Fund was a “unitary fee,” meaning those Funds paid no expenses other than the advisory fee and certain other costs such as interest, brokerage and extraordinary expenses. The Board noted that MFAM continued to be responsible for compensating the Funds’ other service providers and paying other expenses of the Funds out of its own fees and resources.
After reviewing the information regarding the Funds’ costs, profitability and economies of scale, and after considering MFAM’s services, the Directors concluded that the investment advisory fees to be paid by the Funds were fair and reasonable and that the Investment Advisory Agreement should be approved and continued for an additional one year period ending August 16, 2025.
Investment Adviser
Motley Fool Asset Management, LLC
2000 Duke Street
Suite 275
Alexandria, VA 22314
Administrator and Transfer Agent
U.S. Bank Global Fund Services
P.O. Box 701
Milwaukee, WI 53201
Principal Underwriter
Quasar Distributors, LLC
3 Canal Plaza, Suite 100
Portland, ME 04101
Custodian
U.S. Bank, N.A.
1555 North Rivercenter Drive, Suite 302
Milwaukee, WI 53212
Independent Registered Public Accounting Firm
Tait, Weller & Baker LLP
Two Liberty Place
50 S 16th St. Suite 2900
Philadelphia, PA 19102-2529
Legal Counsel
Faegre Drinker Biddle & Reath LLP
One Logan Square, Suite 2000
Philadelphia, PA 19103-6996
Optima Strategic Credit Fund
of
THE RBB FUND, INC.
Financial Statements
August 31, 2024
Optima Strategic Credit Fund
Table of Contents
| | |
Schedule of Investments | 1 |
Schedule of Credit Default Swaps | 2 |
Statement of Assets And Liabilities | 3 |
Statement of Operations | 4 |
Statements of Changes in Net Assets | 5 |
Financial Highlights | 6 |
Notes To Financial Statements | 7 |
Report of Independent Registered Public Accounting Firm | 15 |
Shareholder Tax Information | 16 |
Other Information | 17 |
Optima Strategic Credit Fund
Schedule of Investments
as of August 31, 2024
| | | Shares | | | Value | |
SHORT-TERM INVESTMENTS — 76.9% | | | | | | | | |
Money Market Funds — 76.9% | | | | | | | | |
First American Treasury Obligations Fund - Class X, 5.18%(a) | | | 16,454,390 | | | $ | 16,454,390 | |
TOTAL SHORT-TERM INVESTMENTS (Cost $16,454,390) | | | 16,454,390 | |
| | | | | |
TOTAL INVESTMENTS — 76.9% (Cost $16,454,390) | | $ | 16,454,390 | |
Other Assets in Excess of Liabilities — 23.1% | | | 4,931,426 | |
TOTAL NET ASSETS — 100.0% | | $ | 21,385,816 | |
Percentages are stated as a percent of net assets.
(a) | The rate shown represents the 7-day annualized effective yield as of August 31, 2024. |
The accompanying notes are an integral part of the financial statements.
1
Optima Strategic Credit Fund
Schedule of Credit Default Swaps
August 31, 2024
Reference Obligation* | | Financing
Rate Received
(Paid) | | | Rating of
Reference
Entity | | | Maturity
Date | | | Notional
Amount(b) | | | Value(c) | | | Upfront
Payments
(Receipts) | | | Unrealized
Appreciation
(Depreciation) | |
Sell Protection(a): | | | | | | | | | | | | | | | | | | | | | | | | | | | | |
MARKIT CDX North American High Yield (Series #42) | | | 5.00% Quarterly | | | | B/BB(d) | | | | 06/20/2029 | | | | 20,000,000 | | | $ | 1,478,029 | | | $ | 1,039,511 | | | $ | 438,518 | |
| | | | | | | | | | | | | | | | | | | $ | 1,478,029 | | | $ | 1,039,511 | | | $ | 438,518 | |
The Fund has recorded an asset of $19,218 as of August 31, 2024 related to the current day’s variation margin related to these contracts.
(a) | If the Fund is a seller of protection and a credit event occurs, as defined under the terms of that particular swap agreement, the Fund will either (i) pay to the buyer of protection an amount equal to the notional amount of the swap and take delivery of the referenced obligation or underlying securities comprising the referenced index or (ii) pay a net settlement amount in the form of cash or securities equal to the notional amount of the swap less the recovery value of the referenced obligation of underlying securities comprising the referenced index. |
(b) | The maximum potential amount the Fund could be required to pay as a seller of credit protection or receive as a buyer of credit protection if a credit event occurs as defined under the terms of that particular swap agreement. |
(c) | The prices and resulting values for credit default swap agreements on credit indices serve as an indicator of the current status of the payment/performance risk and represent the likelihood of an expected liability (or profit) for the credit derivative should the notional amount of the swap agreement be closed/sold as of the period end. Increasing market values, in absolute terms when compared to the notional amount of the swap, represent a deterioration of the referenced entity’s credit soundness and a greater likelihood or risk of default or other credit event occurring as defined under the terms of the agreement. |
(d) | Rating provided by Markit |
The accompanying notes are an integral part of the financial statements.
2
Optima Strategic Credit Fund
Statement of Assets And Liabilities
August 31, 2024
ASSETS | | | | |
Short-term investments, at value (cost $16,454,390) | | $ | 16,454,390 | |
Cash and cash equivalents | | | 250,000 | |
Deposit at broker for swap contracts | | | 4,685,752 | |
Receivables for: | | | | |
Interest | | | 53,064 | |
Variation margin on centrally cleared swaps | | | 19,218 | |
Prepaid expenses and other assets | | | 1,720 | |
Total assets | | | 21,464,144 | |
| | | | | |
LIABILITIES | | | | |
Payables for: | | | | |
Audit expenses | | | 24,541 | |
Broker fees | | | 22,334 | |
Administration and accounting services fees | | | 10,098 | |
Advisory fees | | | 6,334 | |
Transfer agent fees | | | 5,739 | |
Printing and shareholder reporting fees | | | 2,626 | |
Capital shares redeemed | | | 2,014 | |
Custodian fees | | | 194 | |
Other accrued expenses and liabilities | | | 4,448 | |
Total liabilities | | | 78,328 | |
Net assets | | | 21,385,816 | |
| | | | | |
NET ASSETS CONSIST OF: | | | | |
Par value | | $ | 2,175 | |
Paid-in capital | | | 22,457,329 | |
Total distributable earnings/(losses) | | $ | (1,073,688 | ) |
Net assets | | $ | 21,385,816 | |
| | | | | |
FOUNDERS CLASS SHARES: | | | | |
Net assets | | $ | 21,385,816 | |
Shares outstanding ($0.001 par value, 100,000,000 shares authorized) | | | 2,175,009 | |
Net asset value, offering and redemption price per share | | $ | 9.83 | |
The accompanying notes are an integral part of the financial statements.
3
Optima Strategic Credit Fund
Statement of Operations
For the Year Ended August 31, 2024
INVESTMENT INCOME | | | | |
Interest | | $ | 1,240,311 | |
Broker interest income | | | 137,525 | |
Total investment income | | | 1,377,836 | |
EXPENSES | | | | |
Broker expenses | | | 240,833 | |
Advisory fees (Note 2) | | | 130,215 | |
Transfer agent fees (Note 2) | | | 52,318 | |
Administration and accounting services fees (Note 2) | | | 40,380 | |
Registration and filing fees | | | 26,808 | |
Audit fees and tax services | | | 20,500 | |
Officer fees | | | 16,975 | |
Director fees | | | 16,906 | |
Legal fees | | | 10,763 | |
Printing and shareholder reporting fees | | | 6,199 | |
Custodian fees (Note 2) | | | 533 | |
Broker interest expense | | | 339 | |
Other expenses | | | 9,090 | |
Total expenses before waivers and/or reimbursements | | | 571,859 | |
Waivers and reimbursements (Note 2) | | | (34,140 | ) |
Net expenses after waivers and/or reimbursements | | | 537,719 | |
Net investment income/(loss) | | | 840,117 | |
NET REALIZED AND UNREALIZED GAIN/(LOSS) FROM INVESTMENTS | | | | |
Net realized gain/(loss) from: | | | | |
Short-term investments | | | (1,476 | ) |
Swap contracts | | | 120,869 | |
Net change in unrealized appreciation/(depreciation) from: | | | | |
Short-term investments | | | 14,070 | |
Swap contracts | | | 438,518 | |
Net realized and unrealized gain/(loss) from investments | | | 571,981 | |
NET INCREASE/(DECREASE) IN NET ASSETS RESULTING FROM OPERATIONS | | $ | 1,412,098 | |
The accompanying notes are an integral part of the financial statements.
4
Optima Strategic Credit Fund
Statements of Changes in Net Assets
| | | For the
Year Ended
August 31, 2024 | | | For the
Year Ended
August 31, 2023 | |
INCREASE/(DECREASE) IN NET ASSETS FROM OPERATIONS: | | | | | | | | |
Net investment income/(loss) | | $ | 840,117 | | | $ | 957,345 | |
Net realized gain/(loss) from investments and swap contracts | | | 119,393 | | | | (1,108,197 | ) |
Net change in unrealized appreciation/(depreciation) on investments | | | 452,588 | | | | 172,530 | |
Net increase/(decrease) in net assets resulting from operations | | | 1,412,098 | | | | 21,678 | |
DIVIDENDS AND DISTRIBUTIONS TO SHAREHOLDERS: | | | | | | | | |
Total distributable earnings | | | (1,717,031 | ) | | | (606,258 | ) |
Net decrease in net assets from dividends and distributions to shareholders | | | (1,717,031 | ) | | | (606,258 | ) |
CAPITAL SHARE TRANSACTIONS: | | | | | | | | |
Proceeds from shares sold | | | 3,195,352 | | | | 11,485,654 | |
Proceeds from reinvestment of distributions | | | 1,717,030 | | | | 606,258 | |
Shares redeemed | | | (30,588,784 | ) | | | (5,242,501 | ) |
Net increase/(decrease) in net assets from capital share transactions | | | (25,676,402 | ) | | | 6,849,411 | |
Total increase/(decrease) in net assets | | | (25,981,335 | ) | | | 6,264,831 | |
NET ASSETS: | | | | | | | | |
Beginning of period | | | 47,367,151 | | | | 41,102,320 | |
End of period | | $ | 21,385,816 | | | $ | 47,367,151 | |
SHARE TRANSACTIONS: | | | | | | | | |
Shares sold | | | 329,159 | | | | 1,162,982 | |
Shares reinvested | | | 179,648 | | | | 61,989 | |
Shares redeemed | | | (3,178,245 | ) | | | (534,927 | ) |
Net increase/(decrease) in shares outstanding | | | (2,669,438 | ) | | | 690,044 | |
The accompanying notes are an integral part of the financial statements.
5
Optima Strategic Credit Fund
Financial Highlights
Contained below is per share operating performance data for Founders Class outstanding, total investment return/(loss), ratios to average net assets and other supplemental data for the respective periods. This information has been derived from information provided in the financial statements. |
| | | For the
Year Ended
August 31,
2024 | | | For the
Year Ended
August 31,
2023 | | | For the
Period
December 29,
2021(1)
to August 31,
2022 | |
Per Share Operating Performance | | | | | | | | | | | | |
Net asset value, beginning of period | | $ | 9.78 | | | $ | 9.89 | | | $ | 10.00 | |
Net investment income/(loss)(2) | | | 0.31 | | | | 0.19 | | | | — | |
Net realized and unrealized gain/(loss) from investments | | | 0.25 | | | | (0.18 | ) | | | (0.11 | ) |
Net increase/(decrease) in net assets resulting from operations | | | 0.56 | | | | 0.01 | | | | (0.11 | ) |
Total dividends and distributions to shareholders | | | (0.51 | ) | | | (0.12 | ) | | | — | |
Net asset value, end of period | | $ | 9.83 | | | $ | 9.78 | | | $ | 9.89 | |
Total investment return/(loss)(3) | | | 5.95 | % | | | 0.12 | % | | | (1.10 | )%(4) |
Ratios/Supplemental Data | | | | | | | | | | | | |
Net assets, end of period (000’s omitted) | | $ | 21,386 | | | $ | 47,367 | | | $ | 41,102 | |
Ratio of expenses to average net assets with waivers and/or reimbursements | | | 2.06 | % | | | 1.61 | % | | | 1.48 | %(5) |
Ratio of expenses to average net assets without waivers and/or reimbursements | | | 2.20 | % | | | 1.61 | % | | | 1.94 | %(5) |
Ratio of expenses to average net assets with waivers and reimbursements (excluding broker and interest expense) | | | 1.13 | % | | | 1.18 | % | | | 1.25 | %(5) |
Ratio of expenses to average net assets without waivers and reimbursements (excluding broker and interest expense) | | | 1.27 | % | | | 1.18 | % | | | 1.71 | %(5) |
Ratio of net investment income/(loss) to average net assets | | | 3.23 | % | | | 1.94 | % | | | 0.03 | %(5) |
Portfolio turnover rate | | | 0 | % | | | 0 | % | | | 0 | %(4) |
(1) | Inception date of the Founders Class Shares of the Fund was December 29, 2021. |
(2) | Calculated based on average shares outstanding for the period. |
(3) | Total investment return is calculated assuming a purchase of shares on the first day and a sale of shares on the last day of the period reported and includes reinvestments of dividends and distributions, if any. |
The accompanying notes are an integral part of the financial statements.
6
Optima Strategic Credit Fund
Notes To Financial Statements
August 31, 2024
1. Organization and Significant Accounting Policies
The RBB Fund, Inc. (“RBB” or the “Company”) was incorporated under the laws of the State of Maryland on February 29, 1988 and is registered under the Investment Company Act of 1940, as amended (the “1940 Act”), as an open-end management investment company. RBB is a “series fund,” which is an investment company divided into separate portfolios. Each portfolio is treated as a separate entity for certain matters under the 1940 Act, and for other purposes, and a shareholder of one portfolio is not deemed to be a shareholder of any other portfolio. Currently, RBB has sixty-five separate investment portfolios, including the Optima Strategic Credit Fund (the “Fund”), which commenced investment operations on December 29, 2021. The Fund is authorized to offer two classes of shares, Founders Class Shares and Investor Class Shares. Investor Class Shares have not yet commenced operations as of the end of the reporting period.
RBB has authorized capital of one hundred billion shares of common stock of which 92.923 billion shares are currently classified into two hundred and thirty-six classes of common stock. Each class represents an interest in an active or inactive RBB investment portfolio.
The investment objective of the Fund is to seek total return.
The Fund is an investment company and follows accounting and reporting guidance in the Financial Accounting Standards Board (“FASB”) Accounting Standards Codification Topic 946 “Financial Services – Investment Companies.”
The end of the reporting period for the Fund is August 31, 2024, and the period covered by these Notes to Financial Statements is the fiscal year ended August 31, 2024 (the “current fiscal period”).
Portfolio Valuation — The Fund values its investments at fair value. The Fund’s net asset value (“NAV”) is calculated once daily at the close of regular trading hours on the New York Stock Exchange (“NYSE”) (generally 4:00 p.m. Eastern time) on each day the NYSE is open. Securities listed or traded on U.S. exchanges, including swaps contracts, are valued at the last sales prices on the exchange where they are principally traded. In the absence of a current quotation, a security is valued at the mean between the last bid and asked prices on that exchange. Fixed income securities are valued using an independent pricing service, which considers such factors as security prices, yields, maturities and ratings, and are deemed representative of market values at the close of the market. If market quotations are unavailable or deemed unreliable, securities will be valued in accordance with procedures adopted by the Company’s Board of Directors (the “Board”). Relying on prices supplied by pricing services or dealers or using fair valuation may result in values that are higher or lower than the values used by other investment companies and investors to price the same investments.
The Board has adopted a pricing and valuation policy for use by the Fund and its Valuation Designee (as defined below) in calculating the Fund’s NAV. Pursuant to Rule 2a-5 under the 1940 Act, the Fund has designated Optima Asset Management LLC (the “Adviser”) as its “Valuation Designee” to perform all of the fair value determinations as well as to perform all of the responsibilities that may be performed by the Valuation Designee in accordance with Rule 2a-5. The Valuation Designee is authorized to make all necessary determinations of the fair values of portfolio securities and other assets for which market quotations are not readily available or if it is deemed that the prices obtained from brokers and dealers or independent pricing services are unreliable.
Fair Value Measurements — The inputs and valuation techniques used to measure the fair value of the Fund’s investments are summarized into three levels as described in the hierarchy below:
| | ● Level 1 – | Prices are determined using quoted prices in active markets for identical securities. |
| | ● Level 2 – | Prices are determined using other significant observable inputs (including quoted prices for similar securities, interest rates, prepayment speeds, credit risk, etc.). |
| | ● Level 3 – | Prices are determined using significant unobservable inputs (including the Fund’s own assumptions in determining the fair value of investments). |
The inputs or methodologies used for valuing securities are not necessarily an indication of the risk associated with investing in those securities.
7
Optima Strategic Credit Fund
Notes To Financial Statements (Continued)
August 31, 2024
The following is a summary of the inputs used, as of the end of the current fiscal period, in valuing the Fund’s investments carried at fair value:
| | LEVEL 1 | | | LEVEL 2 | | | LEVEL 3 | | | Total | |
Investments: | | | | | | | | | | | | | | | | |
Money Market Funds | | $ | 16,454,390 | | | $ | — | | | $ | — | | | $ | 16,454,390 | |
Total Investments | | $ | 16,454,390 | | | $ | — | | | $ | — | | | $ | 16,454,390 | |
| | | | | | | | | | | | | | | | | |
Other Financial Instruments: | | | | | | | | | | | | | | | | |
Credit Default Swaps* | | $ | — | | | $ | 438,518 | | | $ | — | | | $ | 438,518 | |
Total Other Financial Instruments | | $ | — | | | $ | 438,518 | | | $ | — | | | $ | 438,518 | |
* | The fair value of the Fund’s investment represents the net unrealized appreciation (depreciation) as of August 31, 2024. |
At the end of each quarter, management evaluates the classification of Levels 1, 2 and 3 assets and liabilities. Various factors are considered, such as changes in liquidity from the prior reporting period; whether or not a broker is willing to execute at the quoted price; the depth and consistency of prices from third party pricing services; and the existence of contemporaneous, observable trades in the market. Additionally, management evaluates the classification of Levels 1, 2 and 3 assets and liabilities on a quarterly basis for changes in listings or delistings on national exchanges.
Due to the inherent uncertainty of determining the fair value of investments that do not have a readily available market value, the fair value of the Fund’s investments may fluctuate from period to period. Additionally, the fair value of investments may differ significantly from the values that would have been used had a ready market existed for such investments and may differ materially from the values the Fund may ultimately realize. Further, such investments may be subject to legal and other restrictions on resale or otherwise less liquid than publicly traded securities.
For fair valuations using significant unobservable inputs, U.S. generally accepted accounting principles (“U.S. GAAP”) requires the Fund to present a reconciliation of the beginning to ending balances for reported market values that presents changes attributable to total realized and unrealized gains or losses, purchase and sales, and transfers in and out of Level 3 during the period. Transfers in and out between levels are based on values at the end of the period. A reconciliation of Level 3 investments is presented only when the Fund had an amount of Level 3 investments at the end of the reporting period that was meaningful in relation to its net assets. The amounts and reasons for Level 3 transfers are disclosed if the Fund had an amount of total Level 3 transfers during the reporting period that was meaningful in relation to its net assets as of the end of the reporting period.
During the current fiscal period, the Fund had no Level 3 transfers.
Use of Estimates — The preparation of financial statements in conformity with U.S. GAAP requires management to make estimates and assumptions that affect the reported amounts of assets and liabilities and disclosure of contingent assets and liabilities at the date of the financial statements and the reported amounts of revenues and expenses during the reporting period. Actual results could differ from those estimates and those differences could be significant.
Investment Transactions, Investment Income and Expenses — The Fund records security transactions based on trade date for financial reporting purposes. The cost of investments sold is determined by use of the specific identification method for both financial reporting and income tax purposes in determining realized gains and losses on investments. Interest income (including amortization of premiums and accretion of discounts) is accrued when earned. Dividend income is recorded on the ex-dividend date. Distributions received on securities that represent a return of capital or capital gain are recorded as a reduction of cost of investments and/or as a realized gain. The Fund’s investment income, expenses (other than class specific expenses) and unrealized and realized gains and losses are allocated daily to each class of shares based upon the relative proportion of net assets of each class at the beginning of the day. Certain expenses are shared with The RBB Fund Trust (the “Trust”), a series trust of affiliated funds. Expenses incurred on behalf of a specific class, fund or fund family of the Company or Trust are charged directly to the class, fund or fund family (in
8
Optima Strategic Credit Fund
Notes To Financial Statements (Continued)
August 31, 2024
proportion to net assets). Expenses incurred for all funds (such as director or professional fees) are charged to all funds in proportion to their average net assets of RBB and the Trust, or in such other manner as the Board deems fair or equitable. Expenses and fees, including investment advisory and administration fees, are accrued daily and taken into account for the purpose of determining the NAV of the Fund.
Credit Default Swap – During the current fiscal period, the Fund entered into credit default swaps to preserve a return or spread on a particular investment or portion of its portfolio, as a duration management technique and to protect against any increase in the price of securities the Fund anticipates purchasing at a later date. In a credit default swap, the protection buyer makes a stream of payments based on a fixed percentage applied to the contract notional amount to the protection seller in exchange for the right to receive a specified return upon the occurrence of a defined credit event on the reference obligation which may be either a single security or a basket of securities issued by corporate or sovereign issuers. Although contract-specific, credit events are generally defined as bankruptcy, failure to pay, restructuring, obligation acceleration, obligation default, or repudiation/moratorium. Upon the occurrence of a defined credit event, the difference between the value of the reference obligation and the swap’s notional amount is recorded as realized gain (for protection written) or loss (for protection sold) in the Statement of Operations. In the case of credit default swaps where the Fund is selling protection, the notional amount approximates the maximum loss. For centrally cleared swaps, the daily change in valuation, and upfront payments, if any, are recorded as a receivable or payable for variation margin on the Statement of Assets and Liabilities. For financial reporting purposes, cash collateral that has been pledged to cover obligations of the Fund, if any, is reported separately as Deposit at Broker for Swap Contracts on the Statement of Assets and Liabilities. The average quarterly notional value of credit default swaps in the Fund during the current fiscal period was as follows:
Portfolio | |
| |
Optima Strategic Credit Fund | | $ | 9,742,000 | |
For the current fiscal period, the Fund invested in derivative contracts, which are reflected in the Statement of Assets and Liabilites, as follows:
| | | | | | | | | | DERIVATIVE ASSETS | |
| | RISK | | | DERIVATIVE TYPE | | | STATEMENT OF ASSETS
AND LIABILITIES
LOCATION | | | NET UNREALIZED
APPRECATION
(DEPRECIATION) | |
| | | Credit | | | | Swap contracts | | | | Variation margin receivable on swap contracts | | | $ | 438,518 | * |
* | Includes cumulative appreciation/(depreciation) as reported on the Schedule of Credit Default Swaps. For centrally cleared credit default swap contracts, only current day’s variation margin is reported within the Statement of Assets and Liabilities. |
For the current fiscal period, the effect of derivative contracts in the Fund’s Statement of Operations was as follows:
| | | STATEMENT OF OPERATIONS | |
RISK | | DERIVATIVE TYPE | | | LOCATION | | | NET REALIZED
GAIN(LOSS) | | | NET CHANGE
IN UNREALIZED
APPRECATION
(DEPRECIATION) | |
Credit | | | Swap contracts | | | | Swap contracts | | | $ | 120,869 | | | $ | 438,518 | |
9
Optima Strategic Credit Fund
Notes To Financial Statements (Continued)
August 31, 2024
Dividends and Distributions to Shareholders — Dividends from net investment income, if any, are declared and paid monthly. Net realized capital gains (including net short-term capital gains), if any, are distributed by the Fund at least annually. Income dividends and capital gain distributions are determined in accordance with U.S. federal income tax regulations, which may differ from U.S. GAAP.
U.S. Tax Status — No provision is made for U.S. income taxes as it is the Fund’s intention to continue to qualify for and elect the tax treatment applicable to regulated investment companies under Subchapter M of the Internal Revenue Code of 1986, as amended, and make the requisite distributions to its shareholders which will be sufficient to relieve it from U.S. income.
Active Management Risk — The Fund is subject to management risk as an actively-managed investment portfolio. The Fund’s ability to achieve its investment objective depends on the investment skill and ability of Anthony Capital Management, LLC (the “Sub-Adviser”) and on the Sub-Adviser’s ability to correctly identify economic trends.
Cash Positions Risk — The Fund may hold a significant position in cash and/or cash equivalent securities. When the Fund’s investment in cash or cash equivalent securities increases, the Fund may not participate in market advances or declines to the same extent that it would if the Fund were more fully invested in other securities.
Counterparty Risk — Counterparty risk is the risk that the other party(s) to an agreement or a participant to a transaction might default on a contract or fail to perform by failing to pay amounts due or failing to fulfill the obligations of the contract or transaction.
Credit Risk — Credit risk is the risk that an issuer or other obligated party of a debt security may be unable or unwilling to make interest and principal payments when due. Changes in an issuer’s credit rating or the market’s perception of an issuer’s creditworthiness may also affect the value of the Fund’s investment in that issuer. Securities rated in the four highest categories by the rating agencies are considered investment grade but they may also have some speculative characteristics. Investment grade ratings do not guarantee that bonds will not lose value or default. In addition, the credit quality of securities may be lowered if an issuer’s financial condition changes. The Fund could also be delayed or hindered in its enforcement of rights against an issuer, guarantor, or counterparty.
Credit Default Swap Risk — Credit default swaps are typically two-party financial contracts that transfer credit exposure between the two parties. Under a typical credit default swap, one party (the “seller”) receives pre-determined periodic payments from the other party (the “buyer”). The seller agrees to make specific payments to the buyer if a negative credit event occurs, such as the bankruptcy of or default by the issuer of the underlying debt instrument. The use of credit default swaps involves investment techniques and risks different from those associated with ordinary portfolio security transactions, such as potentially heightened counterparty or concentration risks.
Cyber Security Risk — Cyber security risk is the risk of an unauthorized breach and access to Fund assets, Fund or customer data (including private shareholder information), or proprietary information, or the risk of an incident occurring that causes the Adviser, Sub-Adviser, custodian, transfer agent, distributor and/or other service providers and financial intermediaries to suffer data breaches, data corruption or lose operational functionality or prevent Fund investors from purchasing, redeeming or exchanging shares or receiving distributions. The Fund and its Adviser and Sub-Adviser have limited ability to prevent or mitigate cyber security incidents affecting third-party service providers. Successful cyber-attacks or other cyber-failures or events affecting the Fund or its service providers may adversely impact and cause financial losses to the Fund or its shareholders. Issuers of securities in which the Fund invests are also subject to cyber security risks, and the value of these securities could decline if the issuers experience cyber-attacks or other cyber-failures.
Fixed Income Securities Risk — Fixed income securities in which the Fund or an Underlying Fund may invest are subject to certain risks, including: interest rate risk, prepayment risk and credit/default risk. Interest rate risk involves the risk that prices of fixed income securities will rise and fall in response to interest rate changes. Prepayment risk involves the risk that in declining interest rate environments prepayments of principal could increase and require the Fund or an Underlying Fund to reinvest proceeds of the prepayments at lower interest rates. Credit risk involves the risk that the credit rating of a security may be lowered.
10
Optima Strategic Credit Fund
Notes To Financial Statements (Continued)
August 31, 2024
Government Intervention and Regulatory Changes — The Dodd-Frank Wall Street Reform and Consumer Protection Act (the “Dodd-Frank Act”) (which was passed into law in July 2010) significantly revised and expanded the rulemaking, supervisory and enforcement authority of federal bank, securities and commodities regulators. There can be no assurance that future regulatory actions including, but not limited to, those authorized by the Dodd-Frank Act will not adversely impact the Fund. Major changes resulting from legislative or regulatory actions could materially affect the profitability of the Fund or the value of investments made by the Fund or force the Fund to revise its investment strategy or divest certain of its investments. Any of these developments could expose the Fund to additional costs, taxes, liabilities, enforcement actions and reputational risk.
In addition, effective August 19, 2022, the Securities and Exchange Commission (the “SEC”) implemented Rule 18f-4 under the 1940 Act (“Rule 18f-4”), providing for the regulation of a registered investment company’s use of derivatives and certain related instruments. Among other things, Rule 18f-4 limits a fund’s derivatives exposure through a value-at-risk test and requires the adoption and implementation of a derivatives risk management program for certain derivatives users. The Fund, as a full derivatives user (as defined in Rule 18f-4), is subject to the full requirements of Rule 18f-4. The Fund is required to comply with Rule18f-4 and has adopted procedures for investing in derivatives and other transactions in compliance with Rule 18f-4.
High Yield Securities — High yield securities, which are rated below investment grade and commonly referred to as “junk” bonds, are high risk, speculative investments that may cause income and principal losses for the Fund. They generally have greater credit risk, are less liquid and have more volatile prices than investment grade securities.
Interest Rate Risk— Interest rate risk is the risk that prices of fixed income securities generally increase when interest rates decline and decrease when interest rates increase. The Fund may lose money if short term or long term interest rates rise sharply or otherwise change in a manner not anticipated by the Sub-Adviser. It is likely there will be less governmental action in the near future to maintain low interest rates. Changing interest rates may have unpredictable effects on the markets and the Fund’s investments and may also affect the liquidity of fixed income securities and instruments held by the Fund. Any future declines in interest rate levels could cause the Fund’s earnings to fall below the Fund’s expense ratio, resulting in a negative yield, and a decline in the Fund’s share price. A general rise in interest rates may cause investors to move out of fixed income securities on a large scale, which could adversely affect the price and liquidity of fixed income securities and could also result in increased redemptions for the Fund. Fluctuations in interest rates may also affect the liquidity of fixed income securities and instruments held by the Fund.
Cash and Cash Equivalents —The Fund maintains cash in bank deposit accounts which, at times, may exceed United States federally insured limits and is classified as Cash and Cash Equivalents on the Statement of Assets and Liabilities.
Other — In the normal course of business, the Fund may enter into contracts that provide general indemnifications. The Fund’s maximum exposure under these arrangements is dependent on claims that may be made against the Fund in the future, and, therefore, cannot be estimated; however, the Fund expects the risk of material loss from such claims to be remote.
2. Investment Adviser and Other Services
Optima Asset Management LLC serves as the investment adviser for the Fund. Anthony Capital Management, LLC serves as the investment sub-adviser to the Fund. Subject to the supervision of the Board, the Adviser manages the overall investment operations of the Fund, primarily in the form of oversight of the Sub-Adviser pursuant to the terms of the Investment Advisory Agreement between the Adviser and the Company on behalf of the Fund. The Fund compensates the Adviser for its services at an annual rate based on the Fund’s average daily net assets (the “Advisory Fee”), payable on a monthly basis in arrears, as shown in the following table. The Adviser compensates the Sub-Adviser out of the Advisory Fee.
The Adviser has contractually agreed to waive its advisory fee and/or reimburse expenses in order to limit total annual Fund operating expenses (excluding certain items discussed below) to the rates (“Expense Cap”) shown in the following table of the Fund’s average daily net assets. In determining the Adviser’s obligation to waive advisory fees
11
Optima Strategic Credit Fund
Notes To Financial Statements (Continued)
August 31, 2024
and/or reimburse expenses, the following expenses are not taken into account and could cause net total annual Fund operating expenses to exceed the Expense Cap as applicable: acquired fund fees and expenses, brokerage commissions, extraordinary expenses, interest and taxes. This contractual limitation is in effect until December 31, 2024 and may not be terminated without the approval of the Board. The Adviser may discontinue these arrangements at any time after December 31, 2024.
Advisory
Fee | Expense Cap |
| | Founders Class |
.50% | 1.25% |
During the current fiscal period, investment advisory fees accrued, waived and/or reimbursed were as follows:
Gross
Advisory
Fees | Waivers/
Recoupment | Net
Advisory
Fees |
$130,215 | $(34,140) | $96,075 |
If at any time the Fund’s total annual fund operating expenses (not including acquired fund fees and expenses, brokerage commissions, extraordinary expenses, interest and taxes) for a year are less than the relevant share class’s Expense Cap, the Adviser may recoup any waived or reimbursed amounts from the Fund within three years from the date on which such waiver or reimbursement was made, provided such reimbursement does not cause the Fund to exceed expense limitations that were in effect at the time of the waiver or reimbursement.
As of the end of the current fiscal period, the Fund had amounts available for recoupment as follows:
Expiration |
AUGUST 31,
2027 |
$34,140 |
U.S. Bancorp Fund Services, LLC (“Fund Services”), doing business as U.S. Bank Global Fund Services, serves as administrator for the Fund. For providing administrative and accounting services, Fund Services is entitled to receive a monthly fee, subject to certain minimum and out of pocket expenses.
Fund Services serves as the Fund’s transfer and dividend disbursing agent. For providing transfer agent services, Fund Services is entitled to receive a monthly fee, subject to certain minimum and out of pocket expenses.
U.S. Bank, N.A. (the “Custodian”) provides certain custodial services to the Fund. The Custodian is entitled to receive a monthly fee, subject to certain minimum and out of pocket expenses.
Quasar Distributors, LLC (the “Distributor”), a wholly-owned broker-dealer subsidiary of Foreside Financial Group, LLC, serves as the principal underwriter and distributor of the Fund’s shares pursuant to a Distribution Agreement with RBB.
For compensation amounts paid to Fund Services and the Custodian, please refer to the Statement of Operations.
3. Director And Officer Compensation
The Directors of the Company receive an annual retainer and meeting fees for meetings attended. An employee of Vigilant Compliance, LLC serves as Chief Compliance Officer of the Company. Vigilant Compliance, LLC is compensated for the services provided to the Company. Employees of RBB serve as President, Chief Financial Officer,
12
Optima Strategic Credit Fund
Notes To Financial Statements (Continued)
August 31, 2024
Chief Operating Officer, Secretary and Director of Marketing & Business Development of the Company. They are compensated by the Fund for services provided. Certain employees of Fund Services serve as officers of the Company. They are not compensated by the Fund or the Company. For Director and Officer compensation amounts, please refer to the Statement of Operations.
4. Purchases and Sales of Investment Securities
During the current fiscal period, there were no purchases or sales of investment securities or long-term U.S. Government securities (excluding short-term investments and derivative transactions) by the Fund.
5. Federal Income Tax Information
The Fund has followed the authoritative guidance on accounting for and disclosure of uncertainty in tax positions, which requires the Fund to determine whether a tax position is more likely than not to be sustained upon examination, including resolution of any related appeals or litigation processes, based on the technical merits of the position. The Fund has determined that there was no effect on the financial statements from following this authoritative guidance. In the normal course of business, the Fund is subject to examination by federal, state and local jurisdictions, where applicable, for tax years for which applicable statutes of limitations have not expired.
As of August 31, 2024, the federal tax cost and aggregate gross unrealized appreciation and depreciation of investments held by the Fund were as follows:
Federal Tax
Cost | Unrealized
Appreciation | Unrealized
(Depreciation) | Net
Unrealized
Appreciation/
(Depreciation) |
$16,454,390 | $0 | $0 | $0 |
Distributions to shareholders, if any, from net investment income and realized gains are determined in accordance with federal income tax regulations, which may differ from net investment income and realized gains recognized for financial reporting purposes. Accordingly, the character of distributions and composition of net assets for tax purposes may differ from those reflected in the accompanying financial statements. To the extent these differences are permanent, such amounts are reclassified within the capital accounts based on the tax treatment; temporary differences do not require such reclassification.
As of August 31, 2024, the components of distributable earnings on a tax basis were as follows:
Undistributed
Ordinary
Income | Undistributed
Long-Term
Capital Gains | Net Unrealized
Appreciation/
(Depreciation) | Capital Loss
Carryforwards | Qualified
Late-Year
Losses | Other
Temporary
Differences |
$890,630 | $0 | $0 | $(1,964,318) | $0 | $0 |
The differences between the book and tax basis components of distributable earnings relate primarily to the timing of recognition of income and gains for federal income tax purposes. Short-term and foreign currency gains, if applicable, are reported as ordinary income for federal income tax purposes.
13
Optima Strategic Credit Fund
Notes To Financial Statements (Concluded)
August 31, 2024
The tax character of dividends and distributions paid during the fiscal years ended August 31, 2023 and August 31, 2024 were as follows:
| | Ordinary
Income | Long-Term
Gains | Total |
2023 | $606,258 | $0 | $606,258 |
2024 | 1,717,031 | 0 | 1,717,031 |
The Fund is permitted to carry forward capital losses for an unlimited period. Capital losses that are carried forward will retain their character as either short-term or long-term capital losses. As of August 31, 2024, the Fund had unexpiring short-term losses of $1,964,318 to offset future capital gains.
6. Subsequent Events
In preparing these financial statements, management of the Fund has evaluated events and transactions for potential recognition or disclosure through the date the financial statements were issued, and has determined that there was the following subsequent event: The Fund paid the following distribution:
RECORD DATE | EX-DATE | PAY DATE | DISTRIBUTION
RATE PER SHARE |
September 26, 2024 | September 27, 2024 | September 27, 2024 | $0.00792420 |
14
Optima Strategic Credit Fund
Report of Independent Registered Public Accounting Firm
To the Shareholders and Board of Directors of
The RBB Fund, Inc.
Opinion on the Financial Statements
We have audited the accompanying statement of assets and liabilities, including the schedule of investments and schedule of credit default swaps, of Optima Strategic Credit Fund (the “Fund”), a series of The RBB Fund, Inc., as of August 31, 2024, the related statement of operations for the year then ended, the statements of changes in net assets for each of the two years in the period then ended, the financial highlights for each of the two years in the period then ended and the period from December 29, 2021 (commencement of operations) through August 31, 2022, and the related notes (collectively referred to as the “financial statements”). In our opinion, the financial statements present fairly, in all material respects, the financial position of the Fund as of August 31, 2024, the results of its operations for the year then ended, the changes in net assets for each of the two years in the period then ended, and the financial highlights for each of the periods indicated above, in conformity with accounting principles generally accepted in the United States of America.
Basis for Opinion
These financial statements are the responsibility of the Fund’s management. Our responsibility is to express an opinion on the Fund’s financial statements based on our audits. We are a public accounting firm registered with the Public Company Accounting Oversight Board (United States) (“PCAOB”) and are required to be independent with respect to the Fund in accordance with the U.S. federal securities laws and the applicable rules and regulations of the Securities and Exchange Commission and the PCAOB.
We conducted our audits in accordance with the standards of the PCAOB. Those standards require that we plan and perform the audit to obtain reasonable assurance about whether the financial statements are free of material misstatement whether due to error or fraud.
Our audits included performing procedures to assess the risks of material misstatement of the financial statements, whether due to error or fraud, and performing procedures that respond to those risks. Such procedures included examining, on a test basis, evidence regarding the amounts and disclosures in the financial statements. Our procedures included confirmation of securities owned as of August 31, 2024, by correspondence with the custodians and broker. Our audits also included evaluating the accounting principles used and significant estimates made by management, as well as evaluating the overall presentation of the financial statements. We believe that our audits provide a reasonable basis for our opinion.
We have served as the Fund’s auditor since 2022.

COHEN & COMPANY, LTD.
Cleveland, Ohio
October 29, 2024
15
Optima Strategic Credit Fund
Shareholder Tax Information
(Unaudited)
Certain tax information regarding the Fund is required to be provided to shareholders based upon the Fund’s income and distributions for the taxable year ended August 31, 2024. The information and distribution reported herein may differ from information and distributions taxable to the shareholders for the calendar year ended December 31, 2024. During the fiscal year ended August 31, 2024, the Fund paid $1,717,031 in ordinary income dividends to its shareholders. Dividends from net investment income and short-term capital gains are treated as ordinary income dividends for federal income tax purposes.
The percentage of taxable ordinary income distributions that are designated as short-term capital gain distributions under Internal Revenue Section 871(k)(2)(c) for the Fund is 0%.
Because the Fund’s fiscal year is not the calendar year, another notification will be sent with respect to calendar year 2024. The second notification, which will reflect the amount, if any, to be used by calendar year taxpayers on their U.S. federal income tax returns, will be made in conjunction with Form 1099-DIV and will be mailed in January 2025. Foreign shareholders will generally be subject to U.S. withholding tax on the amount of their ordinary income dividends. They will generally not be entitled to a foreign tax credit or deduction for the withholding taxes paid by the Fund, if any.
In general, dividends received by tax exempt recipients (e.g., IRAs and Keoghs) need not be reported as taxable income for U.S. federal income tax purposes. However, some retirement trusts (e.g., corporate, Keogh and 403(b)(7) plans) may need this information for their annual information reporting. Shareholders are advised to consult their own tax advisers with respect to the tax consequences of their investment in the Fund.
16
Optima Strategic Credit Fund
Other Information
(Unaudited)
APPROVAL OF INVESTMENT ADVISORY AGREEMENT – OPTIMA STRATEGIC CREDIT FUND
As required by the 1940 Act, the Board, including all of the Directors who are not “interested persons” of the Company, as that term is defined in the 1940 Act (the “Independent Directors”), considered the approval of the investment advisory agreement between the Adviser and the Company (the “Investment Advisory Agreement”) on behalf of the Fund and the approval of the sub-advisory agreement between the Adviser, the Company and the Sub-Adviser (the “Sub-Advisory Agreement”), at a meeting of the Board held on May 15-16, 2024 (the “Meeting”). At the Meeting, the Board, including all of the Independent Directors, approved the Investment Advisory Agreement and the Sub-Advisory Agreement for an additional one-year term ending August 16, 2025. In approving the Investment Advisory Agreement and the Sub-Advisory Agreement, the Board considered information provided by the Adviser and the Sub-Adviser with the assistance and advice of counsel to the Independent Directors and the Company.
In considering the renewal and approval of the Investment Advisory Agreement between the Company and the Adviser with respect to the Fund, and the Investment Sub-Advisory Agreement by and among the Company, the Adviser and the Sub-Adviser with respect to the Fund, the Directors took into account all materials provided prior to and during the Meeting and at other meetings throughout the past year, the presentations made during the Meeting, and the discussions held during the Meeting. The Directors reviewed these materials with management of the Adviser and the Sub-Adviser, and discussed the aforementioned Agreements with counsel in executive sessions, at which no representatives of the Adviser or the Sub-Adviser were present. Among other things, the Directors considered (i) the nature, extent, and quality of services provided to the Fund by the Adviser and the Sub-Adviser; (ii) descriptions of the experience and qualifications of the personnel providing those services; (iii) the Adviser’s and the Sub-Adviser’s investment philosophies and processes; (iv) the Adviser’s and the Sub-Adviser’s assets under management and client descriptions; (v) the Adviser’s and the Sub-Adviser’s soft dollar commission and trade allocation policies, including information on the types of research and services obtained in connection with soft dollar commissions; (vi) the Adviser’s and the Sub-Adviser’s advisory fee arrangements with the Company and other similarly managed clients, as applicable; (vii) the Adviser’s and the Sub-Adviser’s compliance procedures; (viii) the Adviser’s and the Sub-Adviser’s financial information and insurance coverage, as applicable, and the Adviser’s profitability analysis; (ix) the extent to which economies of scale are relevant to the Fund; (x) a report prepared by Fuse Research Network, LLC comparing the Fund’s management fees and total expense ratios to a group of mutual funds deemed comparable to the Fund based primarily on investment strategy similarity (“Peer Group”) and comparing the performance of the Fund to the performance of its Peer Group; and (xi) a report comparing the performance of the Fund to the performance of its benchmark.
As part of their review, the Directors considered the nature, extent and quality of the services provided by the Adviser and the Sub-Adviser. The Directors concluded that the Adviser and the Sub-Adviser had substantial resources to provide services to the Fund.
The Directors also considered the investment performance of the Fund. Information on the Fund’s investment performance was provided for the three-month, one-year, and since-inception periods ended December 31, 2023. The Directors considered the Fund’s investment performance in light of its investment objectives and investment strategies. The Directors concluded that the investment performance of the Fund as compared to its benchmark and Peer Group was acceptable.
In reaching this conclusion, the Directors observed that the Fund outperformed its primary benchmark for the since-inception period ended December 31, 2023, and underperformed its benchmark for the three-month and one-year periods ended December 31, 2023. The Directors noted that the Free Market U.S. Equity Fund outperformed the median of its Peer Group for the since-inception period ended December 31, 2023, and underperformed its Peer Group for the three-month and one-year periods ended December 31, 2023.
The Board also considered the advisory fee rate payable by the Fund under the Investment Advisory Agreement. In this regard, information on the fees paid by the Fund and the Fund’s total operating expense ratios (before and after fee waivers and expense reimbursements) were compared to similar information for mutual funds advised by other,
17
Optima Strategic Credit Fund
Other Information (Concluded)
(Unaudited)
unaffiliated investment advisory firms. The Directors noted that the Fund’s net advisory fee was below the median and ranked in the 1st quintile of its Peer Group, and the Fund’s total net expenses (including acquired fund fees and expenses) equaled the median and ranked in the 3rd quintile of its Peer Group.
The Directors also considered the fees payable to the Sub-Adviser under the Sub-Advisory Agreement and the information provided by the Adviser on the services provided by the Sub-Adviser. In this regard, the Directors noted that the fees for the Sub-Adviser were paid directly by the Adviser and not by the Fund. The Directors noted that the Adviser had contractually agreed to waive management fees and reimburse expenses through at least December 31, 2024, to limit total annual operating expenses to agreed upon levels for the Fund.
After reviewing the information regarding the Adviser’s and the Sub-Adviser’s costs, profitability and economies of scale, and after considering the services to be provided by the Adviser and the Sub-Adviser, the Directors concluded that the investment advisory fees to be paid by the Fund to the Adviser and the sub-advisory fees to be paid by the Adviser to the Sub-Adviser were fair and reasonable and that the Investment Advisory Agreement and Sub-Advisory Agreement should be approved and continued for an additional one-year period ending August 16, 2025.
18
Investment Adviser
Optima Asset Management LLC
10 East 53rd Street
New York, New York 10022
Sub-Adviser
Anthony Capital Management, LLC
421 George Street, Suite 206
De Pere, Wisconsin 54115
Administrator and Transfer Agent
U.S. Bank Global Fund Services, LLC
P.O. Box 701
Milwaukee, WI 53201
Principal Underwriter
Quasar Distributors, LLC
3 Canal Plaza, Suite 100
Portland, ME 04101
Custodian
U.S. Bank, N.A.
1555 North Rivercenter Drive, Suite 302
Milwaukee, WI 53212
Independent Registered Public Accounting Firm
Cohen & Company, Ltd.
1350 Euclid Avenue, Suite 800
Cleveland, Ohio 44115
Legal Counsel
Faegre Drinker Biddle & Reath LLP
One Logan Square, Suite 2000
Philadelphia, PA 19103-6996

SGI U.S. LARGE CAP EQUITY FUND
SGI GLOBAL EQUITY FUND
SGI PRUDENT GROWTH FUND
SGI PEAK GROWTH FUND
SGI SMALL CAP CORE FUND
of
The RBB Fund, Inc.
Financial Statements
August 31, 2024
This report is submitted for the general information of the shareholders of the Funds and may not be used as sales literature unless preceded or accompanied by a current prospectus for the Funds.
SGI U.S. LARGE CAP EQUITY FUND
PORTFOLIO of Investments
as of August 31, 2024
| | | NUMBER OF
Shares | | | Value | |
COMMON STOCKS — 98.2% | | | | | | | | |
Aerospace/Defense — 1.7% | | | | | | | | |
Lockheed Martin Corp. | | | 6,001 | | | $ | 3,409,168 | |
TransDigm Group, Inc. | | | 371 | | | | 509,461 | |
| | | | | | | | 3,918,629 | |
Beverages — 1.2% | | | | | | | | |
Coca-Cola Co. | | | 38,344 | | | | 2,778,790 | |
Biotechnology — 9.0% | | | | | | | | |
Incyte Corp.(a) | | | 55,453 | | | | 3,641,044 | |
Regeneron Pharmaceuticals, Inc.(a) | | | 6,113 | | | | 7,242,010 | |
United Therapeutics Corp.(a) | | | 25,119 | | | | 9,132,012 | |
Vertex Pharmaceuticals, Inc.(a) | | | 2,058 | | | | 1,020,542 | |
| | | | | | | | 21,035,608 | |
Building Materials — 3.9% | | | | | | | | |
Builders FirstSource, Inc.(a) | | | 7,278 | | | | 1,266,372 | |
Owens Corning | | | 43,531 | | | | 7,344,986 | |
Trane Technologies PLC | | | 1,390 | | | | 502,707 | |
| | | | | | | | 9,114,065 | |
Chemicals — 0.3% | | | | | | | | |
LyondellBasell Industries NV - Class A | | | 6,437 | | | | 635,332 | |
Commercial Services — 3.3% | | | | | | | | |
Automatic Data Processing, Inc. | | | 28,003 | | | | 7,726,308 | |
Cosmetics & Personal Care — 3.3% | | | | | | | | |
Colgate-Palmolive Co. | | | 72,136 | | | | 7,682,484 | |
Diversified Financial Services — 3.1% | | | | | | | | |
Interactive Brokers Group, Inc. - Class A | | | 29,667 | | | | 3,823,779 | |
Mastercard, Inc. - Class A | | | 7,070 | | | | 3,417,214 | |
| | | | | | | | 7,240,993 | |
Electric — 3.7% | | | | | | | | |
AES Corp. | | | 26,168 | | | | 448,258 | |
DTE Energy Co. | | | 22,638 | | | | 2,830,203 | |
Evergy, Inc. | | | 52,442 | | | | 3,101,420 | |
NextEra Energy, Inc. | | | 11,659 | | | | 938,666 | |
Sempra | | | 16,234 | | | | 1,334,110 | |
| | | | | | | | 8,652,657 | |
Engineering & Construction — 0.7% | | | | |
EMCOR Group, Inc. | | | 4,170 | | | | 1,639,060 | |
Environmental Control — 1.4% | | | | | | | | |
Republic Services, Inc. | | | 4,641 | | | | 966,303 | |
Waste Management, Inc. | | | 10,805 | | | | 2,291,092 | |
| | | | | | | | 3,257,395 | |
Food — 2.9% | | | | | | | | |
Hershey Co. | | | 1,921 | | | $ | 370,868 | |
Kroger Co., (The) | | | 59,413 | | | | 3,161,366 | |
Performance Food Group Co.(a) | | | 14,831 | | | | 1,106,986 | |
Sysco Corp. | | | 28,445 | | | | 2,217,857 | |
| | | | | | | | 6,857,077 | |
Freight & Logistics — 3.7% | | | | | | | | |
FedEx Corp. | | | 8,243 | | | | 2,462,761 | |
Union Pacific Corp. | | | 18,409 | | | | 4,714,361 | |
United Parcel Service, Inc. - Class B | | | 11,849 | | | | 1,523,189 | |
| | | | | | | | 8,700,311 | |
Gas — 0.2% | | | | | | | | |
Atmos Energy Corp. | | | 3,579 | | | | 467,918 | |
Hand/Machine Tools — 0.2% | | | | | | | | |
Snap-on, Inc. | | | 1,296 | | | | 367,727 | |
Healthcare-Services — 3.3% | | | | |
Elevance Health, Inc. | | | 13,037 | | | | 7,260,175 | |
HCA Healthcare, Inc. | | | 1,288 | | | | 509,520 | |
| | | | | | | | 7,769,695 | |
Home Builders — 3.2% | | | | | | | | |
DR Horton, Inc. | | | 4,945 | | | | 933,418 | |
Lennar Corp. - Class A | | | 6,083 | | | | 1,107,471 | |
NVR, Inc.(a) | | | 585 | | | | 5,365,889 | |
| | | | | | | | 7,406,778 | |
Insurance — 14.1% | | | | | | | | |
Allstate Corp., (The) | | | 18,404 | | | | 3,477,252 | |
American Financial Group, Inc. | | | 12,760 | | | | 1,704,991 | |
American International Group, Inc. | | | 5,694 | | | | 438,723 | |
Arch Capital Group Ltd.(a) | | | 45,691 | | | | 5,167,195 | |
Berkshire Hathaway, Inc. - Class B(a) | | | 1,037 | | | | 493,529 | |
Cincinnati Financial Corp. | | | 3,003 | | | | 411,501 | |
Everest Group Ltd. | | | 21,217 | | | | 8,322,156 | |
MetLife, Inc. | | | 7,507 | | | | 581,642 | |
Progressive Corp. | | | 35,722 | | | | 9,009,088 | |
Reinsurance Group of America, Inc. | | | 10,422 | | | | 2,300,761 | |
RenaissanceRe Holdings Ltd. | | | 1,456 | | | | 370,974 | |
Unum Group | | | 8,252 | | | | 457,904 | |
| | | | 32,735,716 | |
Iron/Steel — 0.2% | | | | | | | | |
Reliance, Inc. | | | 1,772 | | | | 507,944 | |
Mining — 1.1% | | | | | | | | |
Freeport-McMoRan, Inc. | | | 57,750 | | | | 2,557,170 | |
The accompanying notes are an integral part of the financial statements.
3
SGI U.S. LARGE CAP EQUITY FUND
PORTFOLIO of Investments (Concluded)
as of August 31, 2024
| | | NUMBER OF
Shares | | | Value | |
Oil & Gas — 2.8% | | | | | | | | |
Coterra Energy, Inc. | | | 16,397 | | | $ | 398,939 | |
Devon Energy Corp. | | | 74,017 | | | | 3,314,481 | |
EOG Resources, Inc. | | | 8,273 | | | | 1,065,728 | |
Marathon Petroleum Corp. | | | 4,640 | | | | 821,837 | |
Ovintiv, Inc. | | | 9,405 | | | | 402,816 | |
Valero Energy Corp. | | | 2,814 | | | | 412,898 | |
| | | | | | | | 6,416,699 | |
Online Services — 14.4% | | | | | | | | |
Alphabet, Inc. - Class A | | | 43,868 | | | | 7,167,154 | |
Amazon.com, Inc.(a) | | | 20,104 | | | | 3,588,564 | |
GoDaddy, Inc. - Class A(a) | | | 29,925 | | | | 5,009,744 | |
Meta Platforms, Inc. - Class A | | | 10,936 | | | | 5,701,046 | |
Spotify Technology SA(a) | | | 6,925 | | | | 2,374,444 | |
| | | | | | | | 23,840,952 | |
Pharmaceuticals — 10.4% | | | | | | | | |
Cardinal Health, Inc. | | | 55,823 | | | | 6,292,369 | |
Eli Lilly & Co. | | | 4,255 | | | | 4,084,885 | |
McKesson Corp. | | | 10,565 | | | | 5,927,810 | |
Merck & Co., Inc. | | | 43,857 | | | | 5,194,862 | |
Neurocrine Biosciences, Inc.(a) | | | 21,607 | | | | 2,745,385 | |
| | | | | | | | 24,245,311 | |
Pipelines — 0.2% | | | | | | | | |
Cheniere Energy, Inc. | | | 2,489 | | | | 461,112 | |
REITS — 0.2% | | | | | | | | |
Simon Property Group, Inc. | | | 2,857 | | | | 478,119 | |
Retail — 4.9% | | | | | | | | |
Costco Wholesale Corp. | | | 2,449 | | | | 2,185,439 | |
Ferguson Enterprises, Inc. | | | 1,969 | | | | 405,043 | |
Lululemon Athletica, Inc.(a) | | | 5,968 | | | | 1,548,517 | |
Ross Stores, Inc. | | | 7,925 | | | | 1,193,584 | |
Texas Roadhouse, Inc. | | | 2,636 | | | | 444,825 | |
Ulta Beauty, Inc.(a) | | | 3,884 | | | | 1,370,430 | |
Walmart, Inc. | | | 30,805 | | | | 2,379,070 | |
Wingstop, Inc. | | | 4,661 | | | | 1,799,659 | |
| | | | | | | | 11,326,567 | |
Software — 5.2% | | | | | | | | |
Adobe Systems, Inc.(a) | | | 895 | | | | 514,097 | |
AppLovin Corp. - Class A(a) | | | 24,105 | | | | 2,238,631 | |
Atlassian Corp. - Class A(a) | | | 3,196 | | | | 529,258 | |
DocuSign, Inc.(a) | | | 7,190 | | | | 425,720 | |
HubSpot, Inc.(a) | | | 663 | | | | 330,884 | |
Nutanix, Inc. - Class A(a) | | | 7,637 | | | | 482,582 | |
ServiceNow, Inc.(a) | | | 3,490 | | | | 2,983,950 | |
Veeva Systems, Inc. - Class A(a) | | | 8,718 | | | | 1,886,924 | |
| | | | | | | | | |
Software — 5.2% (continued) | | | | | | | | |
Workday, Inc. - Class A(a) | | | 1,963 | | | $ | 516,642 | |
Zoom Video Communications, Inc. - Class A(a) | | | 33,155 | | | | 2,290,347 | |
| | | | | | | | 12,199,035 | |
Technology — 2.5% | | | | |
Accenture PLC - Class A | | | 6,586 | | | | 2,252,083 | |
Apple, Inc. | | | 6,215 | | | | 1,423,235 | |
EPAM Systems, Inc.(a) | | | 1,582 | | | | 317,602 | |
Leidos Holdings, Inc. | | | 11,386 | | | | 1,804,795 | |
| | | | | | | | 5,797,715 | |
Telecommunications — 1.3% | | | | | | | | |
Motorola Solutions, Inc. | | | 6,833 | | | | 3,020,459 | |
| | | | | | | | | |
TOTAL COMMON STOCKS (Cost $196,334,734) | | | | | | | 228,837,626 | |
EXCHANGE TRADED FUNDS — 1.2% | | | | |
iShares MSCI Min Vol USA ETF | | | 29,495 | | | | 2,693,483 | |
TOTAL EXCHANGE TRADED FUNDS (Cost $2,678,070) | | | | | | | 2,693,483 | |
TOTAL INVESTMENTS — 99.4% (Cost $199,012,804) | | | | | | | 231,531,109 | |
Other Assets in Excess of Liabilities — 0.6% | | | | | | | 1,427,273 | |
TOTAL NET ASSETS — 100.0% | | $ | 232,958,382 | |
Percentages are stated as a percent of net assets.
NV - Naamloze Vennootschap
PLC - Public Limited Company
REIT - Real Estate Investment Trust
SA - Sociedad Anónima
ETF - Exchange-Traded Fund
(a) | Non-income producing security. |
The accompanying notes are an integral part of the financial statements.
4
SGI GLOBAL EQUITY FUND
PORTFOLIO of Investments
as of August 31, 2024
| | | NUMBER OF
Shares | | | Value | |
COMMON STOCKS — 97.0% | | | | | | | | |
Aerospace/Defense — 3.1% | | | | | | | | |
Lockheed Martin Corp. | | | 4,418 | | | $ | 2,509,866 | |
Northrop Grumman Corp. | | | 1,649 | | | | 862,773 | |
| | | | | | | | 3,372,639 | |
Auto Manufacturers — 1.9% | | | | | | | | |
Honda Motor Co. Ltd., - ADR | | | 62,975 | | | | 2,075,026 | |
Banks — 3.0% | | | | | | | | |
Credicorp Ltd. | | | 9,718 | | | | 1,733,205 | |
HDFC Bank, Ltd. - ADR | | | 8,455 | | | | 516,685 | |
Popular, Inc. | | | 6,742 | | | | 691,055 | |
Shinhan Financial Group Co., Ltd. - ADR | | | 7,890 | | | | 334,931 | |
| | | | | | | | 3,275,876 | |
Beverages — 4.5% | | | | | | | | |
Coca-Cola Co. | | | 40,299 | | | | 2,920,468 | |
Coca-Cola Femsa SAB de CV - ADR | | | 22,875 | | | | 1,926,990 | |
| | | | | | | | 4,847,458 | |
Biotechnology — 4.6% | | | | | | | | |
Exelixis, Inc.(a) | | | 21,785 | | | | 567,064 | |
United Therapeutics Corp.(a) | | | 7,971 | | | | 2,897,857 | |
Vertex Pharmaceuticals, Inc.(a) | | | 2,955 | | | | 1,465,355 | |
| | | | | | | | 4,930,276 | |
Building Materials — 0.9% | | | | | | | | |
Boise Cascade Co. | | | 1,908 | | | | 258,763 | |
UFP Industries, Inc. | | | 5,801 | | | | 705,808 | |
| | | | | | | | 964,571 | |
Commercial Services — 0.2% | | | | | | | | |
Automatic Data Processing, Inc. | | | 794 | | | | 219,072 | |
Cosmetics & Personal Care — 3.7% | | | | |
Colgate-Palmolive Co. | | | 37,534 | | | | 3,997,371 | |
Diversified Financial Services — 2.0% | | | | |
AerCap Holdings NV | | | 7,047 | | | | 686,519 | |
CME Group, Inc. | | | 3,293 | | | | 710,432 | |
Enact Holdings, Inc. | | | 22,072 | | | | 784,659 | |
| | | | | | | | 2,181,610 | |
Electric — 1.2% | | | | | | | | |
Consolidated Edison, Inc. | | | 4,528 | | | | 459,864 | |
Evergy, Inc. | | | 13,873 | | | | 820,449 | |
| | | | | | | | 1,280,313 | |
Electronics — 1.2% | | | | |
Amphenol Corp. - Class A | | | 12,093 | | | | 815,673 | |
Keysight Technologies, Inc.(a) | | | 3,101 | | | | 477,926 | |
| | | | | | | | 1,293,599 | |
Environmental Control — 2.8% | | | | |
Republic Services, Inc. | | | 3,230 | | | $ | 672,518 | |
Waste Management, Inc. | | | 11,022 | | | | 2,337,105 | |
| | | | | | | | 3,009,623 | |
Food — 4.5% | | | | | | | | |
Flowers Foods, Inc. | | | 18,440 | | | | 428,546 | |
Kroger Co., (The) | | | 53,037 | | | | 2,822,099 | |
Sysco Corp. | | | 4,024 | | | | 313,751 | |
Tyson Foods, Inc. - Class A | | | 20,004 | | | | 1,286,457 | |
| | | | | | | | 4,850,853 | |
Gas — 1.3% | | | | | | | | |
National Fuel Gas Co. | | | 22,764 | | | | 1,360,377 | |
Healthcare-Services — 3.4% | | | | | | | | |
Centene Corp.(a) | | | 3,862 | | | | 304,441 | |
Chemed Corp. | | | 500 | | | | 293,085 | |
Elevance Health, Inc. | | | 1,437 | | | | 800,251 | |
Ensign Group, Inc. | | | 1,574 | | | | 238,241 | |
Humana, Inc. | | | 1,974 | | | | 699,724 | |
Molina Healthcare, Inc.(a) | | | 1,814 | | | | 634,519 | |
UnitedHealth Group, Inc. | | | 1,252 | | | | 738,930 | |
| | | | | | | | 3,709,191 | |
Household Products/Wares — 1.0% | | | | |
Kimberly-Clark Corp. | | | 7,362 | | | | 1,064,987 | |
Insurance — 14.2% | | | | | | | | |
Allstate Corp., (The) | | | 9,916 | | | | 1,873,529 | |
American International Group, Inc. | | | 6,396 | | | | 492,812 | |
Arch Capital Group Ltd.(a) | | | 2,146 | | | | 242,691 | |
Axis Capital Holdings Ltd. | | | 14,731 | | | | 1,176,712 | |
Berkshire Hathaway, Inc. - Class B(a) | | | 3,007 | | | | 1,431,091 | |
Cincinnati Financial Corp. | | | 7,940 | | | | 1,088,018 | |
Everest Group Ltd. | | | 3,613 | | | | 1,417,163 | |
Loews Corp. | | | 6,420 | | | | 526,055 | |
MetLife, Inc. | | | 28,041 | | | | 2,172,617 | |
Progressive Corp. | | | 16,878 | | | | 4,256,632 | |
Reinsurance Group of America, Inc. | | | 1,537 | | | | 339,308 | |
Unum Group | | | 5,351 | | | | 296,927 | |
| | | | | | | | 15,313,555 | |
Lodging — 0.9% | | | | | | | | |
H World Group Ltd. - ADR | | | 31,734 | | | | 965,983 | |
Mining — 3.2% | | | | | | | | |
Agnico Eagle Mines Ltd. | | | 4,928 | | | | 401,484 | |
Rio Tinto PLC - ADR | | | 48,675 | | | | 3,079,667 | |
| | | | | | | | 3,481,151 | |
The accompanying notes are an integral part of the financial statements.
5
SGI GLOBAL EQUITY FUND
PORTFOLIO of Investments (Concluded)
as of August 31, 2024
| | | NUMBER OF
Shares | | | Value | |
Oil & Gas — 1.8% | | | | | | | | |
Cenovus Energy, Inc. | | | 78,136 | | | $ | 1,448,642 | |
Petroleo Brasileiro SA - ADR | | | 21,566 | | | | 328,450 | |
Shell PLC - ADR | | | 3,179 | | | | 227,807 | |
| | | | | | | | 2,004,899 | |
Online Services— 3.2% | | | | | | | | |
Alphabet, Inc. - Class C | | | 9,481 | | | | 1,565,408 | |
GoDaddy, Inc. - Class A(a) | | | 2,355 | | | | 394,250 | |
JD.com, Inc. - ADR | | | 31,903 | | | | 861,381 | |
Vipshop Holdings Ltd. - ADR | | | 47,183 | | | | 591,675 | |
| | | | | | | | 3,412,714 | |
Pharmaceuticals — 14.5% | | | | | | | | |
AstraZeneca PLC - ADR | | | 6,334 | | | | 554,985 | |
BellRing Brands, Inc.(a) | | | 8,656 | | | | 484,130 | |
Cardinal Health, Inc. | | | 16,284 | | | | 1,835,532 | |
Dr Reddy’s Laboratories Ltd. - ADR | | | 27,857 | | | | 2,325,224 | |
Eli Lilly & Co. | | | 256 | | | | 245,765 | |
McKesson Corp. | | | 4,251 | | | | 2,385,151 | |
Merck & Co., Inc. | | | 14,424 | | | | 1,708,523 | |
Neurocrine Biosciences, Inc.(a) | | | 8,996 | | | | 1,143,032 | |
Novo Nordisk AS - ADR | | | 11,012 | | | | 1,532,430 | |
Takeda Pharmaceutical Co., Ltd. - ADR | | | 236,425 | | | | 3,520,368 | |
| | | | | | | | 15,735,140 | |
REITS — 0.1% | | | | | | | | |
Welltower, Inc. | | | 1,120 | | | | 135,162 | |
Retail — 4.4% | | | | | | | | |
Casey’s General Stores, Inc. | | | 554 | | | | 200,720 | |
Costco Wholesale Corp. | | | 1,221 | | | | 1,089,596 | |
McDonald’s Corp. | | | 6,736 | | | | 1,944,414 | |
O’Reilly Automotive, Inc.(a) | | | 349 | | | | 394,359 | |
Walmart, Inc. | | | 15,098 | | | | 1,166,019 | |
| | | | | | | | 4,795,108 | |
Semiconductors — 1.1% | | | | | | | | |
Micron Technology, Inc. | | | 4,987 | | | | 479,949 | |
QUALCOMM, Inc. | | | 4,046 | | | | 709,264 | |
| | | | | | | | 1,189,213 | |
Software — 3.8% | | | | | | | | |
Electronic Arts, Inc. | | | 8,061 | | | | 1,223,821 | |
Microsoft Corp. | | | 6,807 | | | | 2,839,472 | |
| | | | | | | | 4,063,293 | |
Technology— 2.8% | | | | |
Apple, Inc. | | | 5,643 | | | | 1,292,247 | |
Check Point Software Technologies Ltd.(a) | | | 6,017 | | | | 1,158,273 | |
Logitech International SA | | | 6,750 | | | | 614,317 | |
| | | | | | | | 3,064,837 | |
Telecommunications — 6.5% | | | | | | | | |
Chunghwa Telecom Co., Ltd. - ADR | | | 14,552 | | | $ | 562,435 | |
Cisco Systems, Inc. | | | 4,328 | | | | 218,737 | |
Motorola Solutions, Inc. | | | 2,716 | | | | 1,200,581 | |
Nice Ltd. - ADR(a) | | | 8,980 | | | | 1,560,185 | |
Telefonica Brasil SA - ADR | | | 134,444 | | | | 1,243,607 | |
Telkom Indonesia Persero Tbk PT - ADR | | | 41,944 | | | | 822,102 | |
TIM SA - ADR | | | 47,940 | | | | 763,205 | |
T-Mobile US, Inc. | | | 3,586 | | | | 712,610 | |
| | | | | | | | 7,083,462 | |
Transportation — 1.2% | | | | | | | | |
Canadian National Railway Co., (Canada) | | | 5,360 | | | | 631,515 | |
Union Pacific Corp. | | | 2,578 | | | | 660,200 | |
| | | | | | | | 1,291,715 | |
TOTAL COMMON STOCKS (Cost $92,113,182) | | | | | | | 104,969,074 | |
EXCHANGE TRADED FUNDS — 1.1% | | | | |
iShares MSCI Global Min Vol Factor ETF | | | 9,839 | | | | 1,116,431 | |
TOTAL EXCHANGE TRADED FUNDS (Cost $1,114,925) | | | | | | | 1,116,431 | |
TOTAL INVESTMENTS — 98.1% (Cost $93,228,107) | | | | | | | 106,085,505 | |
Other Assets in Excess of Liabilities — 1.9% | | | | | | | 2,101,705 | |
TOTAL NET ASSETS — 100.0% | | $ | 108,187,210 | |
Percentages are stated as a percent of net assets.
ADR - American Depositary Receipt
NV - Naamloze Vennootschap
PLC - Public Limited Company
REIT - Real Estate Investment Trust
SA - Sociedad Anónima
SAB de CV - Sociedad Anónima Bursátil de Capital Variable
ETF - Exchange-Traded Fund
TBK PT - Terbuka Perseroan Terbatas
(a) | Non-income producing security. |
The accompanying notes are an integral part of the financial statements.
6
SGI PRUDENT GROWTH FUND
PORTFOLIO of Investments
as of August 31, 2024
| | | NUMBER OF
Shares | | | Value | |
EXCHANGE TRADED FUNDS — 50.2% | | | | |
iShares 20+ Year Treasury Bond ETF | | | 13,100 | | | $ | 1,264,019 | |
iShares Core U.S. Aggregate Bond ETF | | | 25,360 | | | | 2,542,340 | |
iShares iBoxx $ High Yield Corporate Bond ETF | | | 16,197 | | | | 1,285,070 | |
SGI Dynamic Tactical ETF(a) | | | 43,460 | | | | 1,326,834 | |
SGI Enhanced Core ETF(a) | | | 88,610 | | | | 2,286,138 | |
SGI Enhanced Global Income ETF(a) | | | 90,340 | | | | 2,414,788 | |
SGI U.S. Large Cap Core ETF(a) | | | 68,160 | | | | 2,401,618 | |
TOTAL EXCHANGE TRADED FUNDS (Cost $12,351,165) | | | | | | | 13,520,807 | |
OPEN END FUNDS — 47.2% | | | | |
SGI Global Equity Fund - Class I(a) | | | 59,563 | | | | 2,403,963 | |
SGI Small Cap Core Fund - Class I(a)(b) | | | 67,104 | | | | 2,166,132 | |
SGI U.S. Large Cap Equity Fund - Class I(a)(c) | | | 375,480 | | | | 8,162,944 | |
TOTAL OPEN END FUNDS (Cost $10,712,773) | | | | | | | 12,733,039 | |
TOTAL INVESTMENTS — 97.4% (Cost $23,063,938) | | | | | | | 26,253,846 | |
Other Assets in Excess of Liabilities— 2.6% | | | | | | | 675,292 | |
TOTAL NET ASSETS — 100.0% | | $ | 26,929,138 | |
Percentages are stated as a percent of net assets.
ETF - Exchange-Traded Fund
(a) | Affiliated company as defined by the Investment Company Act of 1940. See Note 6. |
(b) | Non-income producing security. |
(c) | Fair value of this security exceeds 25% of the Fund’s net assets. Additional information for this security, including the financial statements, is available from the SEC’s EDGAR database at www.sec.gov. |
The accompanying notes are an integral part of the financial statements.
7
SGI PEAK GROWTH FUND
PORTFOLIO of Investments
as of August 31, 2024
| | | NUMBER OF
Shares | | | Value | |
OPEN END FUNDS — 60.9% | | | | |
SGI Global Equity Fund - Class I(a) | | | 97,995 | | | $ | 3,955,071 | |
SGI Small Cap Core Fund - Class I(a)(b) | | | 150,204 | | | | 4,848,588 | |
SGI U.S. Large Cap Equity Fund - Class I(a)(c) | | | 379,835 | | | | 8,257,603 | |
TOTAL OPEN END FUNDS (Cost $14,175,604) | | | | | | | 17,061,262 | |
EXCHANGE TRADED FUNDS — 38.4% | | | | |
SGI Dynamic Tactical ETF(a) | | | 89,110 | | | | 2,720,528 | |
SGI Enhanced Core ETF(a) | | | 10,750 | | | | 277,350 | |
SGI Enhanced Global Income ETF(a) | | | 155,590 | | | | 4,158,921 | |
SGI U.S. Large Cap Core ETF(a) | | | 102,610 | | | | 3,615,463 | |
TOTAL EXCHANGE TRADED FUNDS (Cost $9,514,145) | | | | | | | 10,772,262 | |
TOTAL INVESTMENTS — 99.3% (Cost $23,689,749) | | | | | | | 27,833,524 | |
Other Assets in Excess of Liabilities— 0.7% | | | | | | | 173,659 | |
TOTAL NET ASSETS — 100.0% | | $ | 28,007,183 | |
Percentages are stated as a percent of net assets.
ETF - Exchange-Traded Fund
(a) | Affiliated company as defined by the Investment Company Act of 1940. See Note 6. |
(b) | Non-income producing security. |
(c) | Fair value of this security exceeds 25% of the Fund’s net assets. Additional information for this security, including the financial statements, is available from the SEC’s EDGAR database at www.sec.gov. |
The accompanying notes are an integral part of the financial statements.
8
SGI SMALL CAP CORE FUND
PORTFOLIO of Investments
as of August 31, 2024
| | | NUMBER OF
Shares | | | Value | |
COMMON STOCKS — 98.3% | | | | | | | | |
Agriculture — 1.2% | | | | | | | | |
Andersons, Inc. | | | 13,088 | | | $ | 667,096 | |
Fresh Del Monte Produce, Inc. | | | 27,726 | | | | 810,708 | |
Vital Farms, Inc.(a) | | | 1,347 | | | | 42,363 | |
| | | | | | | | 1,520,167 | |
Airlines — 0.4% | | | | | | | | |
SkyWest, Inc.(a) | | | 6,140 | | | | 476,096 | |
Apparel — 1.6% | | | | | | | | |
Kontoor Brands, Inc. | | | 17,681 | | | | 1,323,423 | |
Ralph Lauren Corp. | | | 2,111 | | | | 361,530 | |
Rocky Brands, Inc. | | | 10,708 | | | | 345,226 | |
| | | | | | | | 2,030,179 | |
Auto Parts & Equipment — 0.9% | | | | |
Miller Industries, Inc. | | | 10,020 | | | | 608,314 | |
Visteon Corp.(a) | | | 5,442 | | | | 550,894 | |
| | | | | | | | 1,159,208 | |
Banks — 6.5% | | | | | | | | |
Bank of NT Butterfield & Son Ltd. | | | 32,627 | | | | 1,247,983 | |
Bankwell Financial Group, Inc. | | | 2,479 | | | | 75,560 | |
Business First Bancshares, Inc. | | | 15,793 | | | | 385,665 | |
Civista Bancshares, Inc. | | | 3,610 | | | | 61,262 | |
CNB Financial Corp. | | | 2,578 | | | | 62,671 | |
Financial Institutions, Inc. | | | 15,060 | | | | 391,861 | |
First Business Financial Services, Inc. | | | 1,616 | | | | 73,318 | |
First Internet Bancorp | | | 1,785 | | | | 64,778 | |
Hancock Whitney Corp. | | | 27,750 | | | | 1,491,007 | |
HBT Financial, Inc. | | | 2,790 | | | | 62,552 | |
Independent Bank Corp. | | | 10,318 | | | | 349,574 | |
Metropolitan Bank Holding Corp.(a) | | | 6,238 | | | | 322,567 | |
Midland States Bancorp, Inc. | | | 11,224 | | | | 255,570 | |
OFG Bancorp | | | 33,762 | | | | 1,552,714 | |
Popular, Inc. | | | 12,229 | | | | 1,253,473 | |
QCR Holdings, Inc. | | | 3,526 | | | | 271,960 | |
Republic Bancorp, Inc. - Class A | | | 992 | | | | 63,389 | |
Third Coast Bancshares, Inc.(a) | | | 6,637 | | | | 169,974 | |
| | | | | | | | 8,155,878 | |
Beverages — 0.8% | | | | | | | | |
Coca Cola Bottling Co. | | | 781 | | | | 1,048,414 | |
Biotechnology — 1.9% | | | | | | | | |
ANI Pharmaceuticals, Inc.(a) | | | 19,704 | | | | 1,256,130 | |
Vericel Corp.(a) | | | 20,831 | | | | 1,075,921 | |
| | | | | | | | 2,332,051 | |
Building Materials — 3.7% | | | | | | | | |
AZEK Co., Inc., (The)(a) | | | 1,451 | | | $ | 61,856 | |
Boise Cascade Co. | | | 10,439 | | | | 1,415,737 | |
Gibraltar Industries, Inc.(a) | | | 3,535 | | | | 246,284 | |
Louisiana-Pacific Corp. | | | 12,523 | | | | 1,215,357 | |
Masterbrand, Inc.(a) | | | 20,343 | | | | 326,302 | |
UFP Industries, Inc. | | | 10,626 | | | | 1,292,865 | |
| | | | | | | | 4,558,401 | |
Chemicals — 1.1% | | | | | | | | |
AdvanSix, Inc. | | | 7,666 | | | | 226,607 | |
AZZ. | | | 3,289 | | | | 273,546 | |
Minerals Technologies, Inc. | | | 10,926 | | | | 842,395 | |
| | | | | | | | 1,342,548 | |
Commercial Services — 5.6% | | | | | | | | |
Arlo Technologies, Inc.(a) | | | 4,189 | | | | 49,179 | |
Barrett Business Services, Inc. | | | 24,456 | | | | 892,889 | |
Grand Canyon Education, Inc.(a) | | | 3,097 | | | | 449,096 | |
Heidrick & Struggles International, Inc. | | | 16,230 | | | | 626,478 | |
Herc Holdings, Inc. | | | 9,287 | | | | 1,359,338 | |
Korn/Ferry International | | | 19,735 | | | | 1,441,642 | |
Progyny, Inc.(a) | | | 8,248 | | | | 193,745 | |
TriNet Group, Inc. | | | 6,236 | | | | 641,248 | |
Upbound Group, Inc | | | 37,997 | | | | 1,265,300 | |
Willdan Group, Inc.(a) | | | 1,993 | | | | 75,953 | |
| | | | | | | | 6,994,868 | |
Distribution/Wholesale — 1.3% | | | | |
H&E Equipment Services, Inc. | | | 23,150 | | | | 1,114,671 | |
Resideo Technologies, Inc.(a) | | | 20,856 | | | | 420,457 | |
Rush Enterprises, Inc. - Class B | | | 2,377 | | | | 111,814 | |
| | | | | | | | 1,646,942 | |
Diversified Financial Services — 4.1% | | | | |
Enact Holdings, Inc. | | | 33,080 | | | | 1,175,994 | |
Enova International, Inc.(a) | | | 15,525 | | | | 1,330,958 | |
Evercore, Inc. - Class A | | | 2,586 | | | | 635,483 | |
Pagseguro Digital Ltd. - Class A(a) | | | 4,826 | | | | 53,424 | |
PennyMac Financial Services, Inc. | | | 5,305 | | | | 572,940 | |
Regional Management Corp. | | | 6,392 | | | | 214,324 | |
Virtus Investment Partners, Inc. | | | 5,354 | | | | 1,133,228 | |
| | | | | | | | 5,116,351 | |
Electric — 0.5% | | | | | | | | |
Clearway Energy, Inc. - Class A | | | 20,969 | | | | 563,437 | |
Electrical Components & Equipment — 0.1% | | | | |
Insteel Industries, Inc. | | | 1,948 | | | | 67,011 | |
The accompanying notes are an integral part of the financial statements.
9
SGI SMALL CAP CORE FUND
PORTFOLIO of Investments (CONtinued)
as of August 31, 2024
| | | NUMBER OF
Shares | | | Value | |
Electronics — 1.4% | | | | | | | | |
Avnet, Inc. | | | 23,082 | | | $ | 1,273,664 | |
Bel Fuse, Inc. - Class B | | | 6,095 | | | | 413,424 | |
Benchmark Electronics, Inc. | | | 1,494 | | | | 63,510 | |
| | | | | | | | 1,750,598 | |
Engineering & Construction — 2.6% | | | | |
EMCOR Group, Inc. | | | 3,614 | | | | 1,420,519 | |
Frontdoor, Inc.(a) | | | 28,915 | | | | 1,390,233 | |
Primoris Services Corp. | | | 8,634 | | | | 487,303 | |
| | | | | | | | 3,298,055 | |
Environmental Control — 0.7% | | | | |
Energy Recovery, Inc.(a) | | | 54,019 | | | | 877,269 | |
Food — 2.0% | | | | | | | | |
John B Sanfilippo & Son, Inc. | | | 7,578 | | | | 718,925 | |
Pilgrim’s Pride Corp.(a) | | | 31,437 | | | | 1,464,336 | |
Seneca Foods Corp. - Class A(a) | | | 4,520 | | | | 272,420 | |
| | | | | | | | 2,455,681 | |
Forest Products & Paper — 1.2% | | | | |
Sylvamo Corp. | | | 18,891 | | | | 1,494,089 | |
Gas — 2.1% | | | | | | | | |
National Fuel Gas Co. | | | 22,919 | | | | 1,369,639 | |
New Jersey Resources Corp. | | | 14,347 | | | | 664,410 | |
Southwest Gas Holdings, Inc. | | | 8,698 | | | | 632,519 | |
| | | | | | | | 2,666,568 | |
Multi-Utilities — 0.1% | | | | | | | | |
Avista Corp. | | | 1,730 | | | | 66,847 | |
Healthcare-Products — 3.0% | | | | | | | | |
Castle Biosciences, Inc.(a) | | | 30,441 | | | | 903,184 | |
Inspire Medical Systems, Inc.(a) | | | 4,472 | | | | 804,155 | |
iRadimed Corp. | | | 7,258 | | | | 340,836 | |
LeMaitre Vascular, Inc. | | | 6,192 | | | | 559,076 | |
Omnicell, Inc.(a) | | | 5,075 | | | | 225,736 | |
RxSight, Inc.(a) | | | 8,437 | | | | 475,762 | |
Tactile Systems Technology, Inc.(a) | | | 18,710 | | | | 256,140 | |
Utah Medical Products, Inc. | | | 2,678 | | | | 182,077 | |
| | | | | | | | 3,746,966 | |
Healthcare-Services — 2.7% | | | | | | | | |
Addus HomeCare Corp.(a) | | | 9,877 | | | | 1,313,740 | |
Astrana Health, Inc.(a) | | | 13,003 | | | | 621,413 | |
National HealthCare Corp. | | | 6,329 | | | | 867,896 | |
Pennant Group, Inc.(a) | | | 7,119 | | | | 243,897 | |
Viemed Healthcare, Inc.(a) | | | 33,973 | | | | 258,195 | |
| | | | | | | | 3,305,141 | |
Home Builders — 8.8% | | | | | | | | |
Beazer Homes USA, Inc.(a) | | | 40,298 | | | $ | 1,260,521 | |
Century Communities, Inc. | | | 12,845 | | | | 1,285,399 | |
Forestar Group, Inc.(a) | | | 32,002 | | | | 990,142 | |
Hovnanian Enterprises, Inc. - Class A(a) | | | 6,346 | | | | 1,372,196 | |
Landsea Homes Corp.(a) | | | 28,301 | | | | 337,065 | |
M/I Homes, Inc.(a) | | | 8,873 | | | | 1,414,090 | |
Meritage Homes Corp. | | | 7,229 | | | | 1,431,848 | |
Taylor Morrison Home Corp.(a) | | | 21,396 | | | | 1,440,593 | |
Tri Pointe Homes, Inc.(a) | | | 31,741 | | | | 1,410,570 | |
| | | | | | | | 10,942,424 | |
Household Products/Wares — 0.0%(b) | | | | |
Quanex Building Products Corp. | | | 2,073 | | | | 57,277 | |
Insurance — 4.1% | | | | | | | | |
Brighthouse Financial, Inc.(a) | | | 9,532 | | | | 437,519 | |
Essent Group Ltd. | | | 22,340 | | | | 1,436,238 | |
Fidelis Insurance Holdings, Ltd. | | | 13,161 | | | | 243,742 | |
Horace Mann Educators Corp. | | | 19,271 | | | | 686,240 | |
NMI Holdings, Inc. - Class A(a) | | | 36,323 | | | | 1,491,786 | |
Palomar Holdings, Inc.(a) | | | 2,751 | | | | 272,954 | |
Universal Insurance Holdings, Inc. | | | 26,556 | | | | 568,033 | |
| | | | | | | | 5,136,512 | |
Internet — 0.1% | | | | | | | | |
Cargurus, Inc.(a) | | | 2,645 | | | | 76,652 | |
Lodging — 0.3% | | | | | | | | |
Travel + Leisure Co. | | | 9,282 | | | | 410,821 | |
Machinery-Construction & Mining — 2.3% | | | | |
Hyster-Yale Materials Handling, Inc. | | | 5,678 | | | | 357,487 | |
Oshkosh Corp. | | | 11,709 | | | | 1,263,518 | |
Terex Corp. | | | 22,141 | | | | 1,256,945 | |
| | | | | | | | 2,877,950 | |
Machinery-Diversified — 1.8% | | | | | | | | |
Albany International Corp. - Class A | | | 685 | | | | 64,499 | |
Columbus McKinnon Corp. | | | 7,309 | | | | 250,041 | |
Gorman-Rupp Co. | | | 12,058 | | | | 470,021 | |
Mueller Water Products, Inc. - Class A | | | 67,193 | | | | 1,442,634 | |
| | | | | | | | 2,227,195 | |
Metal Fabricate/Hardware — 0.9% | | | | |
Mueller Industries, Inc. | | | 12,625 | | | | 917,963 | |
Northwest Pipe Co.(a) | | | 5,812 | | | | 255,612 | |
| | | | | | | | 1,173,575 | |
The accompanying notes are an integral part of the financial statements.
10
SGI SMALL CAP CORE FUND
PORTFOLIO of Investments (CONtinued)
as of August 31, 2024
| | | NUMBER OF
Shares | | | Value | |
Mining — 0.1% | | | | | | | | |
Caledonia Mining Corp. PLC | | | 4,675 | | | $ | 60,681 | |
Constellium SE(a) | | | 2,806 | | | | 47,057 | |
| | | | | | | | 107,738 | |
Miscellaneous Manufacturing — 0.9% | | | | |
Federal Signal Corp. | | | 7,999 | | | | 755,826 | |
Trinity Industries, Inc. | | | 12,023 | | | | 396,879 | |
| | | | | | | | 1,152,705 | |
Multi-National — 0.5% | | | | | | | | |
Banco Latinoamericano de Comercio Exterior SA | | | 19,959 | | | | 625,715 | |
Office Furnishings — 1.1% | | | | | | | | |
HNI Corp. | | | 25,050 | | | | 1,348,942 | |
Interface, Inc. | | | 3,726 | | | | 70,347 | |
| | | | | | | | 1,419,289 | |
Oil & Gas — 2.7% | | | | | | | | |
Berry Corp. | | | 45,453 | | | | 281,354 | |
Matador Resources Co. | | | 13,662 | | | | 774,909 | |
Murphy Oil Corp. | | | 1,444 | | | | 53,832 | |
Permian Resources Corp. | | | 62,329 | | | | 887,565 | |
Riley Exploration Permian, Inc. | | | 8,899 | | | | 253,621 | |
SM Energy Co. | | | 11,773 | | | | 537,202 | |
VAALCO Energy, Inc. | | | 81,665 | | | | 531,574 | |
| | | | | | | | 3,320,057 | |
Pharmaceuticals — 3.1% | | | | | | | | |
Alkermes PLC(a) | | | 6,366 | | | | 181,113 | |
Amphastar Pharmaceuticals, Inc.(a) | | | 1,508 | | | | 73,500 | |
BellRing Brands, Inc.(a) | | | 23,682 | | | | 1,324,534 | |
Catalyst Pharmaceuticals Partners, Inc.(a) | | | 75,237 | | | | 1,523,549 | |
Harmony Biosciences Holdings, Inc.(a) | | | 19,263 | | | | 693,083 | |
Nature’s Sunshine Products, Inc.(a) | | | 4,705 | | | | 64,929 | |
| | | | | | | | 3,860,708 | |
Real Estate — 0.2% | | | | | | | | |
RMR Group, Inc. - Class A | | | 9,145 | | | | 233,106 | |
REITS — 5.8% | | | | | | | | |
Alexander & Baldwin, Inc. | | | 41,283 | | | | 816,991 | |
American Assets Trust, Inc. | | | 14,611 | | | | 398,150 | |
Apple Hospitality REIT, Inc. | | | 4,141 | | | | 59,796 | |
CareTrust REIT, Inc. | | | 42,006 | | | | 1,255,139 | |
Chatham Lodging Trust | | | 27,974 | | | | 239,457 | |
EPR Properties | | | 27,988 | | | | 1,328,590 | |
Innovative Industrial Properties, Inc. | | | 5,449 | | | | 677,202 | |
Kilroy Realty Corp. | | | 13,498 | | | | 489,573 | |
NexPoint Residential Trust, Inc. | | | 9,697 | | | | 458,668 | |
REITS — (Continued) | | | | |
Park Hotels & Resorts, Inc. | | | 4,051 | | | $ | 61,899 | |
Ryman Hospitality Properties, Inc. | | | 7,444 | | | | 773,878 | |
TPG RE Finance Trust, Inc. | | | 67,374 | | | | 610,408 | |
Xenia Hotels & Resorts, Inc. | | | 4,627 | | | | 65,889 | |
| | | | | | | | 7,235,640 | |
Retail — 3.7% | | | | | | | | |
Abercrombie & Fitch Co. - Class A(a) | | | 428 | | | | 63,160 | |
American Eagle Outfitters, Inc. | | | 11,129 | | | | 229,035 | |
BlueLinx Holdings, Inc.(a) | | | 11,545 | | | | 1,161,889 | |
Buckle, Inc. | | | 23,728 | | | | 994,203 | |
GMS, Inc.(a) | | | 13,619 | | | | 1,181,993 | |
PC Connection, Inc. | | | 10,443 | | | | 763,174 | |
Shoe Carnival, Inc. | | | 6,308 | | | | 255,096 | |
| | | | | | | | 4,648,550 | |
Savings & Loans — 1.2% | | | | | | | | |
Axos Financial, Inc.(a) | | | 19,681 | | | | 1,366,452 | |
FS Bancorp, Inc. | | | 1,434 | | | | 62,852 | |
| | | | | | | | 1,429,304 | |
Semiconductors — 3.8% | | | | | | | | |
ACM Research, Inc. - Class A(a) | | | 25,878 | | | | 466,839 | |
Alpha & Omega Semiconductor Ltd.(a) | | | 17,374 | | | | 726,407 | |
Amkor Technology, Inc. | | | 40,998 | | | | 1,348,834 | |
Axcelis Technologies, Inc.(a) | | | 7,297 | | | | 797,781 | |
Ultra Clean Holdings, Inc.(a) | | | 35,631 | | | | 1,343,289 | |
Vishay Precision Group, Inc.(a) | | | 1,985 | | | | 54,806 | |
| | | | | | | | 4,737,956 | |
Software — 3.4% | | | | | | | | |
Appfolio, Inc. - Class A(a) | | | 3,225 | | | | 748,168 | |
CommVault Systems, Inc(a) | | | 8,020 | | | | 1,246,308 | |
Health Catalyst, Inc(a) | | | 66,544 | | | | 478,451 | |
SEMrush Holdings, Inc. - Class A(a) | | | 11,664 | | | | 160,263 | |
Smartsheet, Inc. - Class A(a) | | | 17,983 | | | | 877,571 | |
Viant Technology, Inc. - Class A(a) | | | 27,736 | | | | 308,702 | |
Weave Communications, Inc(a) | | | 35,965 | | | | 405,685 | |
| | | | | | | | 4,225,148 | |
Technology — 0.1% | | | | | | | | |
Grid Dynamics Holdings, Inc.(a) | | | 5,044 | | | | 70,213 | |
Rapid7, Inc.(a) | | | 1,457 | | | | 55,089 | |
| | | | | | | | 125,302 | |
The accompanying notes are an integral part of the financial statements.
11
SGI SMALL CAP CORE FUND
PORTFOLIO of Investments (COncluded)
as of August 31, 2024
| | | NUMBER OF
Shares | | | Value | |
Telecommunications — 1.0% | | | | | | | | |
A10 Networks, Inc. | | | 4,298 | | | $ | 59,183 | |
Aviat Networks, Inc.(a) | | | 5,160 | | | | 141,642 | |
Credo Technology Group Holding Ltd.(a) | | | 2,363 | | | | 82,492 | |
IDT Corp. - Class B | | | 16,678 | | | | 639,768 | |
Preformed Line Products Co. | | | 2,693 | | | | 322,972 | |
| | | | | | | | 1,246,057 | |
Transportation — 6.9% | | | | | | | | |
Ardmore Shipping Corp. | | | 61,881 | | | | 1,168,313 | |
Costamare, Inc. | | | 45,491 | | | | 645,517 | |
Covenant Logistics Group, Inc. | | | 8,961 | | | | 471,976 | |
Golden Ocean Group Ltd. | | | 32,617 | | | | 401,189 | |
Hub Group, Inc. - Class A | | | 26,147 | | | | 1,232,308 | |
Matson, Inc. | | | 10,242 | | | | 1,416,469 | |
Scorpio Tankers, Inc. | | | 16,892 | | | | 1,208,454 | |
Teekay Corp.(a) | | | 78,699 | | | | 653,989 | |
Teekay Tankers Ltd. - Class A | | | 24,189 | | | | 1,375,870 | |
Universal Logistics Holdings, Inc. | | | 1,458 | | | | 61,630 | |
| | | | | | | | 8,635,715 | |
TOTAL COMMON STOCKS (Cost $107,022,964) | | | | | | | 122,578,161 | |
TOTAL INVESTMENTS — 98.3% (Cost $107,022,964) | | | | | | | 122,578,161 | |
Other Assets in Excess of Liabilities— 1.7% | | | | | | | 2,141,982 | |
TOTAL NET ASSETS — 100.0% | | $ | 124,720,143 | |
Percentages are stated as a percent of net assets.
PLC - Public Limited Company
REIT - Real Estate Investment Trust
SA - Sociedad Anónima
(a) | Non-income producing security. |
(b) | Represents less than 0.05% of net assets. |
The accompanying notes are an integral part of the financial statements.
12
SUMMIT GLOBAL INVESTMENTS
Statements of Assets and Liabilities
August 31, 2024
| | | SGI U.S.
Large Cap
Equity Fund | | | SGI Global
Equity Fund | |
ASSETS | | | | | | | | |
Investments, at fair value | | | | | | | | |
Unaffiliated investments (cost $199,012,804 and $93,228,107, respectively) | | $ | 231,531,109 | | | $ | 106,085,505 | |
Affiliated investments (cost $— and $—, respectively) | | | — | | | | — | |
Cash and cash equivalents | | | 1,781,859 | | | | 1,996,384 | |
Receivables for: | | | | | | | | |
Capital shares sold | | | 153,304 | | | | 50,437 | |
Dividends | | | 183,873 | | | | 284,699 | |
Prepaid and other expenses | | | 36,763 | | | | 16,310 | |
Total assets | | $ | 233,686,908 | | | $ | 108,433,335 | |
| | | | | | | | | |
LIABILITIES | | | | | | | | |
Payables for: | | | | | | | | |
Capital shares redeemed | | $ | 406,591 | | | $ | 129,458 | |
Advisory fees | | | 134,390 | | | | 31,233 | |
Other accrued expenses and liabilities | | | 187,545 | | | | 85,434 | |
Total liabilities | | | 728,526 | | | | 246,125 | |
Net assets | | $ | 232,958,382 | | | $ | 108,187,210 | |
| | | | | | | | | |
NET ASSETS CONSIST OF: | | | | | | | | |
Par value | | $ | 10,721 | | | $ | 2,680 | |
Paid-in capital | | | 161,792,729 | | | | 78,665,886 | |
Total distributable earnings/(loss) | | | 71,154,932 | | | | 29,518,644 | |
Net assets | | $ | 232,958,382 | | | $ | 108,187,210 | |
| | | | | | | | | |
CLASS I SHARES: | | | | | | | | |
Net assets applicable to Class I Shares | | $ | 211,533,891 | | | $ | 108,187,210 | |
Shares outstanding ($0.001 par value, 100,000,000 shares authorized) | | | 9,732,331 | | | | 2,680,343 | |
Net asset value, offering and redemption price per share | | $ | 21.74 | | | $ | 40.36 | |
| | | | | | | | | |
CLASS A Shares: | | | | | | | | |
Net assets applicable to Class A Shares | | $ | 19,601,423 | | | $ | — | |
Shares outstanding ($0.001 par value, 100,000,000 shares authorized) | | | 900,319 | | | | — | |
Net asset value, offering and redemption price per share | | $ | 21.77 | | | $ | — | |
Maximum offering price per share (100/94.75 of $21.77) | | $ | 22.98 | | | $ | — | |
| | | | | | | | | |
CLASS C Shares: | | | | | | | | |
Net assets applicable to Class C Shares | | $ | 1,823,068 | | | $ | — | |
Shares outstanding ($0.001 par value, 100,000,000 shares authorized) | | | 87,897 | | | $ | — | |
Net asset value, offering and redemption price per share | | $ | 20.74 | | | $ | — | |
| | | | | | | | | |
The accompanying notes are an integral part of the financial statements.
13
SUMMIT GLOBAL INVESTMENTS
Statements of Assets and Liabilities (Concluded)
August 31, 2024
| | | SGI prudent
growth
Fund | | | SGI PEAK
GROWTH
FUND | | | SGI SMALL
CAP core
FUND | |
ASSETS | | | | | | | | | | | | |
Investments, at fair value | | | | | | | | | | | | |
Unaffiliated investments (cost $4,934,949, $—, and $107,022,964, respectively) | | $ | 5,091,429 | | | $ | — | | | $ | 122,578,161 | |
Affiliated investments (cost $18,128,989, $23,689,749, and $—, respectively) (Note 6) | | | 21,162,417 | | | | 27,833,524 | | | | — | |
Cash and cash equivalents | | | 715,464 | | | | 215,381 | | | | 2,205,620 | |
Receivables for: | | | | | | | | | | | | |
Capital shares sold | | | 2,087 | | | | 2,712 | | | | 51,355 | |
Dividends | | | 1,351 | | | | 1,088 | | | | 131,659 | |
Prepaid and other expenses | | | 13,817 | | | | 13,866 | | | | 25,910 | |
Total assets | | $ | 26,986,565 | | | $ | 28,066,571 | | | $ | 124,992,705 | |
| | | | | | | | | | | | | |
LIABILITIES | | | | | | | | | | | | |
Payables for: | | | | | | | | | | | | |
Capital shares redeemed | | $ | — | | | $ | — | | | $ | 104,263 | |
Advisory fees | | | 16,573 | | | | 17,319 | | | | 83,398 | |
Other accrued expenses and liabilities | | | 40,854 | | | | 42,069 | | | | 84,901 | |
Total liabilities | | | 57,427 | | | | 59,388 | | | | 272,562 | |
Net assets | | $ | 26,929,138 | | | $ | 28,007,183 | | | $ | 124,720,143 | |
NET ASSETS CONSIST OF: | | | | | | | | | | | | |
Par value | | $ | 2,257 | | | $ | 2,226 | | | $ | 3,864 | |
Paid-in capital | | | 23,403,072 | | | | 23,954,729 | | | | 109,301,624 | |
Total distributable earnings/(loss) | | | 3,523,809 | | | | 4,050,228 | | | | 15,414,655 | |
Net assets | | $ | 26,929,138 | | | $ | 28,007,183 | | | $ | 124,720,143 | |
CLASS I SHARES: | | | | | | | | | | | | |
Net assets applicable to Class I Shares | | $ | 26,929,138 | | | $ | 28,007,183 | | | $ | 124,720,143 | |
Shares outstanding ($0.001 par value, 100,000,000 shares authorized) | | | 2,257,422 | | | | 2,225,854 | | | | 3,863,816 | |
Net asset value, offering and redemption price per share | | $ | 11.93 | | | $ | 12.58 | | | $ | 32.28 | |
The accompanying notes are an integral part of the financial statements.
14
SUMMIT GLOBAL INVESTMENTS
Statements of Operations
FOR THE Year ENDED August 31, 2024
| | | SGI U.S.
Large Cap
Equity Fund | | | SGI Global
Equity Fund | |
INVESTMENT INCOME | | | | | | | | |
Dividends: | | | | | | | | |
Dividends from unaffiliated investments | | $ | 4,257,728 | | | $ | 2,925,623 | (1) |
Dividends from affiliated investments (Note 6) | | | — | | | | — | |
Interest | | | 274,091 | | | | 107,727 | |
Total investment income | | | 4,531,819 | | | | 3,033,350 | |
| | | | | | | | | |
EXPENSES: | | | | | | | | |
Advisory fees (Note 2) | | | 1,912,790 | | | | 926,566 | |
Transfer agent fees (Note 2) | | | 360,986 | | | | 190,993 | |
Administration and accounting fees (Note 2) | | | 121,123 | | | | 72,306 | |
Legal fees | | | 77,391 | | | | 38,953 | |
Distribution fees - Class A Shares | | | 63,975 | | | | — | |
Printing and shareholder reporting fees | | | — | | | | — | |
Officer fees | | | 55,899 | | | | 29,606 | |
Director fees | | | 55,550 | | | | 27,923 | |
Registration and filing fees | | | 52,057 | | | | 24,738 | |
Audit and tax service fees | | | 36,536 | | | | 34,251 | |
Custodian fees (Note 2) | | | 27,347 | | | | 24,090 | |
Distribution fees - Class C Shares | | | 20,456 | | | | — | |
Other expenses | | | 38,866 | | | | 22,725 | |
Total expenses before waivers and reimbursements | | | 2,822,976 | | | | 1,392,151 | |
Less: waivers and reimbursements (Note 2) | | | (60,639 | ) | | | (280,270 | ) |
Net expenses after waivers and reimbursements | | | 2,762,337 | | | | 1,111,881 | |
Net investment income/(loss) | | | 1,769,482 | | | | 1,921,469 | |
| | | | | | | | | |
NET REALIZED AND UNREALIZED GAIN/(LOSS) FROM INVESTMENTS |
Net realized gain/(loss) from investments | | | | | | | | |
Unaffiliated investments | | | 73,139,764 | | | | 17,759,717 | |
Affiliated investments (Note 6) | | | — | | | | — | |
Distributions from affiliated investments | | | — | | | | — | |
Net change in unrealized appreciation/(depreciation) on investments | | | | | | | | |
Unaffiliated investments | | | (12,203,845 | ) | | | 5,342,595 | |
Affiliated investments (Note 6) | | | — | | | | — | |
Net realized and unrealized gain/(loss) on investments | | | 60,935,919 | | | | 23,102,312 | |
NET INCREASE/(DECREASE) IN NET ASSETS RESULTING FROM OPERATIONS | | $ | 62,705,401 | | | $ | 25,023,781 | |
(1) | Net of foreign withholding taxes of $127,771. |
The accompanying notes are an integral part of the financial statements.
15
SUMMIT GLOBAL INVESTMENTS
Statements of Operations (Concluded)
FOR THE Year ENDED August 31, 2024
| | | SGI Prudent
Growth
Fund | | | SGI Peak
Growth
Fund | | | SGI Small
Cap Core
Fund | |
INVESTMENT INCOME | | | | | | | | | | | | |
Dividends: | | | | | | | | | | | | |
Dividends from unaffiliated investments | | $ | 190,740 | | | $ | 19,951 | | | $ | 1,869,166 | (1) |
Dividends from affiliated investments (Note 6) | | | 178,287 | | | | 180,376 | | | | — | |
Interest | | | 39,716 | | | | 22,578 | | | | 100,603 | |
Total investment income | | | 408,743 | | | | 222,905 | | | | 1,969,769 | |
| | | | | | | | | | | | | |
EXPENSES: | | | | | | | | | | | | |
Advisory fees (Note 2) | | | 179,498 | | | | 175,697 | | | | 1,131,092 | |
Transfer agent fees (Note 2) | | | 29,050 | | | | 27,661 | | | | 135,746 | |
Administration and accounting fees (Note 2) | | | 23,135 | | | | 21,277 | | | | 62,978 | |
Legal fees | | | 6,618 | | | | 6,354 | | | | 36,760 | |
Distribution fees - Class A Shares | | | — | | | | — | | | | — | |
Printing and shareholder reporting fees | | | 634 | | | | — | | | | — | |
Officer fees | | | 5,389 | | | | 4,986 | | | | 20,701 | |
Director fees | | | 4,689 | | | | 4,093 | | | | 21,839 | |
Registration and filing fees | | | 25,230 | | | | 25,146 | | | | 29,372 | |
Audit and tax service fees | | | 33,374 | | | | 33,374 | | | | 32,465 | |
Custodian fees (Note 2) | | | 1,340 | | | | — | | | | 23,725 | |
Distribution fees - Class C Shares | | | — | | | | — | | | | — | |
Other expenses | | | 3,625 | | | | 6,297 | | | | 8,445 | |
Total expenses before waivers and reimbursements | | | 312,582 | | | | 304,885 | | | | 1,503,123 | |
Less: waivers and reimbursements (Note 2) | | | — | | | | — | | | | (38,656 | ) |
Net expenses after waivers and reimbursements | | | 312,582 | | | | 304,885 | | | | 1,464,467 | |
Net investment income/(loss) | | | 96,161 | | | | (81,980 | ) | | | 505,302 | |
| | | | | | | | | | | | | |
NET REALIZED AND UNREALIZED GAIN/(LOSS) FROM INVESTMENTS | | | | | | | | | | | | |
Net realized gain/(loss) from investments | | | | | | | | | | | | |
Unaffiliated investments | | | (129,295 | ) | | | 93,908 | | | | 5,490,049 | |
Affiliated investments (Note 6) | | | 753,939 | | | | 368,368 | | | | — | |
Distributions from affiliated investments | | | 138,238 | | | | 178,437 | | | | — | |
Net change in unrealized appreciation/(depreciation) on investments | | | | | | | | | | | | |
Unaffiliated investments | | | 312,778 | | | | (8,583 | ) | | | 13,527,450 | |
Affiliated investments (Note 6) | | | 2,597,563 | | | | 3,709,763 | | | | — | |
Net realized and unrealized gain/(loss) on investments | | | 3,673,223 | | | | 4,341,893 | | | | 19,017,499 | |
NET INCREASE/(DECREASE) IN NET ASSETS RESULTING FROM OPERATIONS | | $ | 3,769,384 | | | $ | 4,259,913 | | | $ | 19,522,801 | |
| | | | | | | | | | | | | |
(1) | Net of foreign withholding taxes of $3,220. |
The accompanying notes are an integral part of the financial statements.
16
SGI U.S. LARGE CAP EQUITY FUND
Statements of Changes in Net Assets
| | | FOR THE
Year ENDED
AUGUST 31, 2024 | | | FOR THE
Year ENDED
AUGUST 31, 2023 | |
INCREASE/(DECREASE) IN NET ASSETS FROM OPERATIONS: | | | | | | | | |
Net investment income/(loss) | | $ | 1,769,482 | | | $ | 3,909,918 | |
Net realized gain/(loss) on investments | | | | | | | | |
Unaffiliated investments | | | 73,139,764 | | | | 17,344,683 | |
Affiliated investments (Note 6) | | | — | | | | — | |
Distributions from affiliated investments (Note 6) | | | — | | | | — | |
Net change in unrealized appreciation/(depreciation) on investments | | | | | | | | |
Unaffiliated investments | | | (12,203,845 | ) | | | 1,974,967 | |
Affiliated investments (Note 6) | | | — | | | | — | |
Net increase/(decrease) in net assets resulting from operations | | | 62,705,401 | | | | 23,229,568 | |
| | | | | | | | | |
DIVIDENDS AND DISTRIBUTIONS TO SHAREHOLDERS: | | | | | | | | |
Distributable earnings | | | | | | | | |
Class I Shares | | | (14,011,048 | ) | | | (19,244,500 | ) |
Class A Shares | | | (1,193,012 | ) | | | (1,382,773 | ) |
Class C Shares | | | (86,619 | ) | | | (96,977 | ) |
Total distributable earnings | | | (15,290,679 | ) | | | (20,724,250 | ) |
Net decrease in net assets from dividends and distributions to shareholders | | | (15,290,679 | ) | | | (20,724,250 | ) |
| | | | | | | | | |
The accompanying notes are an integral part of the financial statements.
17
SGI U.S. LARGE CAP EQUITY FUND
Statements of Changes in Net Assets (Concluded)
| | | FOR THE
Year ENDED
AUGUST 31, 2024 | | | FOR THE
Year ENDED
AUGUST 31, 2023 | |
INCREASE/(DECREASE) IN NET ASSETS DERIVED FROM CAPITAL SHARE TRANSACTIONS: |
Class I Shares | | | | | | | | |
Proceeds from shares sold | | | 113,718,663 | | | | 48,850,931 | |
Reinvestment of distributions | | | 13,978,703 | | | | 19,066,017 | |
Shares redeemed | | | (310,127,753 | ) | | | (110,308,065 | ) |
Total from Class I Shares | | | (182,430,387 | ) | | | (42,391,117 | ) |
Class A Shares | | | | | | | | |
Proceeds from shares sold | | | 610,987 | | | | 6,201,827 | |
Reinvestment of distributions | | | 1,192,151 | | | | 1,381,238 | |
Shares redeemed | | | (17,914,478 | ) | | | (4,889,029 | ) |
Total from Class A Shares | | | (16,111,340 | ) | | | 2,694,036 | |
Class C Shares | | | | | | | | |
Proceeds from shares sold | | | 52,424 | | | | 121,554 | |
Reinvestment of distributions | | | 86,007 | | | | 96,321 | |
Shares redeemed | | | (985,310 | ) | | | (473,379 | ) |
Total from Class C Shares | | | (846,879 | ) | | | (255,504 | ) |
Net increase/(decrease) in net assets from capital share transactions | | | (199,388,606 | ) | | | (39,952,585 | ) |
Total increase/(decrease) in net assets | | | (151,973,884 | ) | | | (37,447,267 | ) |
| | | | | | | | | |
NET ASSETS: | | | | | | | | |
Beginning of Period | | | 384,932,266 | | | | 422,379,533 | |
End of Period | | $ | 232,958,382 | | | $ | 384,932,266 | |
| | | | | | | | | |
SHARES TRANSACTIONS: | | | | | | | | |
Class I Shares | | | | | | | | |
Shares sold | | | 5,823,434 | | | | 2,762,128 | |
Shares reinvested | | | 766,779 | | | | 1,069,285 | |
Shares redeemed | | | (16,380,384 | ) | | | (6,239,269 | ) |
Total from Class I Shares | | | (9,790,171 | ) | | | (2,407,856 | ) |
Class A Shares | | | | | | | | |
Shares sold | | | 33,263 | | | | 350,650 | |
Shares reinvested | | | 65,363 | | | | 77,361 | |
Shares redeemed | | | (933,980 | ) | | | (274,723 | ) |
Total from Class A Shares | | | (835,354 | ) | | | 153,288 | |
Class C Shares | | | | | | | | |
Shares sold | | | 2,891 | | | | 7,199 | |
Shares reinvested | | | 4,965 | | | | 5,649 | |
Shares redeemed | | | (53,399 | ) | | | (28,153 | ) |
Total from Class C Shares | | | (45,543 | ) | | | (15,305 | ) |
Net increase/(decrease) in shares outstanding | | | (10,671,068 | ) | | | (2,269,873 | ) |
The accompanying notes are an integral part of the financial statements.
18
SGI GLOBAL EQUITY FUND
Statements of Changes in Net Assets
| | | FOR THE
Year ENDED
AUGUST 31, 2024 | | | FOR THE
Year ENDED
AUGUST 31, 2023 | |
INCREASE/(DECREASE) IN NET ASSETS FROM OPERATIONS: | | | | | | | | |
Net investment income/(loss) | | $ | 1,921,469 | | | $ | 1,780,348 | |
Net realized gain/(loss) on investments | | | | | | | | |
Unaffiliated investments | | | 17,759,717 | | | | (1,631,160 | ) |
Affiliated investments (Note 6) | | | — | | | | — | |
Distributions from affiliated investments (Note 6) | | | — | | | | — | |
Net change in unrealized appreciation/(depreciation) on investments | | | | | | | | |
Unaffiliated investments | | | 5,342,595 | | | | 8,032,739 | |
Affiliated investments (Note 6) | | | — | | | | — | |
Net increase/(decrease) in net assets resulting from operations | | | 25,023,781 | | | | 8,181,927 | |
| | | | | | | | | |
DIVIDENDS AND DISTRIBUTIONS TO SHAREHOLDERS: | | | | | | | | |
Total distributable earnings | | | (2,003,073 | ) | | | (4,229,443 | ) |
Net decrease in net assets from dividends and distributions to shareholders | | | (2,003,073 | ) | | | (4,229,443 | ) |
| | | | | | | | | |
INCREASE/(DECREASE) IN NET ASSETS DERIVED FROM CAPITAL SHARE TRANSACTIONS: |
Class I Shares | | | | | | | | |
Proceeds from shares sold | | | 42,758,330 | | | | 42,896,182 | |
Reinvestment of distributions | | | 2,000,278 | | | | 4,221,767 | |
Shares redeemed | | | (109,889,057 | ) | | | (19,033,537 | ) |
Net increase/(decrease) in net assets from capital share transactions | | | (65,130,449 | ) | | | 28,084,412 | |
Total increase/(decrease) in net assets | | | (42,109,741 | ) | | | 32,036,896 | |
| | | | | | | | | |
NET ASSETS: | | | | | | | | |
Beginning of Period | | | 150,296,951 | | | | 118,260,055 | |
End of Period | | $ | 108,187,210 | | | $ | 150,296,951 | |
| |
SHARES TRANSACTIONS: | | | | | | | | |
Class I Shares | | | | | | | | |
Shares sold | | | 1,193,962 | | | | 1,284,747 | |
Shares reinvested | | | 56,601 | | | | 128,236 | |
Shares redeemed | | | (2,976,690 | ) | | | (572,849 | ) |
Net increase/(decrease) in shares outstanding | | | (1,726,127 | ) | | | 840,134 | |
The accompanying notes are an integral part of the financial statements.
19
SGI PRUDENT GROWTH FUND
Statements of Changes in Net Assets
| | | FOR THE
Year ENDED
AUGUST 31, 2024 | | | FOR THE
Year ENDED
AUGUST 31, 2023 | |
INCREASE/(DECREASE) IN NET ASSETS FROM OPERATIONS: | | | | | | | | |
Net investment income/(loss) | | $ | 96,161 | | | $ | 47,006 | |
Net realized gain/(loss) on investments | | | | | | | | |
Unaffiliated investments | | | (129,295 | ) | | | (105,023 | ) |
Affiliated investments (Note 6) | | | 753,939 | | | | (193,894 | ) |
Distributions from affiliated investments (Note 6) | | | 138,238 | | | | 182,199 | |
Net change in unrealized appreciation/(depreciation) on investments | | | | | | | | |
Unaffiliated investments | | | 312,778 | | | | 176,986 | |
Affiliated investments (Note 6) | | | 2,597,563 | | | | 809,842 | |
Net increase/(decrease) in net assets resulting from operations | | | 3,769,384 | | | | 917,116 | |
| | | | | | | | | |
DIVIDENDS AND DISTRIBUTIONS TO SHAREHOLDERS: | | | | | | | | |
Total distributable earnings | | | (114,358 | ) | | | (23,212 | ) |
Net decrease in net assets from dividends and distributions to shareholders | | | (114,358 | ) | | | (23,212 | ) |
| | | | | | | | | |
INCREASE/(DECREASE) IN NET ASSETS DERIVED FROM CAPITAL SHARE TRANSACTIONS: |
Class I Shares | | | | | | | | |
Proceeds from shares sold | | | 8,845,365 | | | | 8,960,109 | |
Reinvestment of distributions | | | 114,358 | | | | 23,212 | |
Shares redeemed | | | (6,902,378 | ) | | | (4,187,290 | ) |
Net increase/(decrease) in net assets from capital share transactions | | | 2,057,345 | | | | 4,796,031 | |
Total increase/(decrease) in net assets | | | 5,712,371 | | | | 5,689,935 | |
| | | | | | | | | |
NET ASSETS: | | | | | | | | |
Beginning of Period | | | 21,216,767 | | | | 15,526,832 | |
End of Period | | $ | 26,929,138 | | | $ | 21,216,767 | |
| | | | | | | | | |
SHARES TRANSACTIONS: | | | | | | | | |
Class I Shares | | | | | | | | |
Shares sold | | | 813,262 | | | | 893,341 | |
Shares reinvested | | | 10,579 | | | | 2,400 | |
Shares redeemed | | | (631,006 | ) | | | (416,101 | ) |
Net increase/(decrease) in shares outstanding | | | 192,835 | | | | 479,640 | |
The accompanying notes are an integral part of the financial statements.
20
SGI PEAK GROWTH FUND
Statements of Changes in Net Assets
| | | FOR THE
Year ENDED
AUGUST 31, 2024 | | | FOR THE
Year ENDED
AUGUST 31, 2023 | |
INCREASE/(DECREASE) IN NET ASSETS FROM OPERATIONS: | | | | | | | | |
Net investment income/(loss) | | $ | (81,980 | ) | | $ | (81,588 | ) |
Net realized gain/(loss) on investments | | | | | | | | |
Unaffiliated investments | | | 93,908 | | | | 37,722 | |
Affiliated investments (Note 6) | | | 368,368 | | | | (106,896 | ) |
Distributions from affiliated investments (Note 6) | | | 178,437 | | | | 211,725 | |
Net change in unrealized appreciation/(depreciation) on investments | | | | | | | | |
Unaffiliated investments | | | (8,583 | ) | | | 84,217 | |
Affiliated investments (Note 6) | | | 3,709,763 | | | | 761,919 | |
Net increase/(decrease) in net assets resulting from operations | | | 4,259,913 | | | | 907,099 | |
| | | | | | | | | |
DIVIDENDS AND DISTRIBUTIONS TO SHAREHOLDERS: | | | | | | | | |
Total distributable earnings | | | (131,475 | ) | | | (1,109 | ) |
Net decrease in net assets from dividends and distributions to shareholders | | | (131,475 | ) | | | (1,109 | ) |
| | | | | | | | | |
INCREASE/(DECREASE) IN NET ASSETS DERIVED FROM CAPITAL SHARE TRANSACTIONS: |
Class I Shares | | | | | | | | |
Proceeds from shares sold | | | 8,526,607 | | | | 7,812,686 | |
Reinvestment of distributions | | | 131,475 | | | | 1,109 | |
Shares redeemed | | | (4,333,988 | ) | | | (2,153,372 | ) |
Net increase/(decrease) in net assets from capital share transactions | | | 4,324,094 | | | | 5,660,423 | |
Total increase/(decrease) in net assets | | | 8,452,532 | | | | 6,566,413 | |
| | | | | | | | | |
NET ASSETS: | | | | | | | | |
Beginning of Period | | | 19,554,651 | | | | 12,988,238 | |
End of Period | | $ | 28,007,183 | | | $ | 19,554,651 | |
| | | | | | | | | |
SHARES TRANSACTIONS: | | | | | | | | |
Class I Shares | | | | | | | | |
Shares sold | | | 752,701 | | | | 752,103 | |
Shares reinvested | | | 11,676 | | | | 113 | |
Shares redeemed | | | (380,709 | ) | | | (209,678 | ) |
Net increase/(decrease) in shares outstanding | | | (383,668 | ) | | | 542,538 | |
The accompanying notes are an integral part of the financial statements.
21
SGI SMALL CAP CORE FUND
Statements of Changes in Net Assets
| | | FOR THE
Year ENDED
AUGUST 31, 2024 | | | FOR THE
Year ENDED
AUGUST 31, 2023 | |
INCREASE/(DECREASE) IN NET ASSETS FROM OPERATIONS: | | | | | | | | |
Net investment income/(loss) | | $ | 505,302 | | | $ | 226,440 | |
Net realized gain/(loss) on investments | | | | | | | | |
Unaffiliated investments | | | 5,490,049 | | | | 3,864,198 | |
Affiliated investments (Note 6) | | | — | | | | — | |
Distributions from affiliated investments (Note 6) | | | — | | | | — | |
Net change in unrealized appreciation/(depreciation) on investments | | | | | | | | |
Unaffiliated investments | | | 13,527,450 | | | | 3,754,938 | |
Affiliated investments (Note 6) | | | — | | | | — | |
Net increase/(decrease) in net assets resulting from operations | | | 19,522,801 | | | | 7,845,576 | |
| | | | | | | | | |
DIVIDENDS AND DISTRIBUTIONS TO SHAREHOLDERS: | | | | | | | | |
Total distributable earnings | | | — | | | | (554,990 | ) |
Net decrease in net assets from dividends and distributions to shareholders | | | — | | | | (554,990 | ) |
| | | | | | | | | |
INCREASE/(DECREASE) IN NET ASSETS DERIVED FROM CAPITAL SHARE TRANSACTIONS: |
Class I Shares | | | | | | | | |
Proceeds from shares sold | | | 61,310,708 | | | | 20,090,886 | |
Reinvestment of distributions | | | — | | | | 548,528 | |
Shares redeemed | | | (59,615,025 | ) | | | (14,264,163 | ) |
Net increase/(decrease) in net assets from capital share transactions | | | 1,695,683 | | | | 6,375,251 | |
Total increase/(decrease) in net assets | | | 21,218,484 | | | | 13,665,837 | |
| | | | | | | | | |
NET ASSETS: | | | | | | | | |
Beginning of Period | | | 103,501,659 | | | | 89,835,822 | |
End of Period | | $ | 124,720,143 | | | $ | 103,501,659 | |
| | | | | | | | | |
SHARES TRANSACTIONS: | | | | | | | | |
Class I Shares | | | | | | | | |
Shares sold | | | 2,139,509 | | | | 767,765 | |
Shares reinvested | | | — | | | | 21,544 | |
Shares redeemed | | | (2,038,827 | ) | | | (545,180 | ) |
Net increase/(decrease) in shares outstanding | | | 100,682 | | | | 244,129 | |
The accompanying notes are an integral part of the financial statements.
22
SGI U.S. LARGE CAP EQUITY FUND
Financial Highlights
Contained below is per share operating performance data for Class I Shares outstanding, total investment return/(loss), ratios to average net assets and other supplemental data for the respective periods. This information has been derived from information provided in the financial statements. |
| | | Class I Shares | |
| | | For the
Year
Ended
August 31,
2024 | | | For the
Year
Ended
August 31,
2023 | | | For the
Year
Ended
August 31,
2022 | | | For the
Year
Ended
August 31,
2021 | | | For the
Year
Ended
August 31,
2020 | |
Per Share Operating Performance: | | | | | | | | | | | | | | | | | | | | |
Net Asset Value, Beginning of Period | | $ | 18.00 | | | $ | 17.85 | | | $ | 23.21 | | | $ | 19.55 | | | $ | 18.24 | |
Income/(Loss) from Investment Operations: | | | | | | | | | | | | | | | | | | | | |
Net investment income/(loss) (1) | | | 0.13 | | | | 0.18 | | | | 0.17 | | | | 0.03 | | | | 0.14 | |
Net realized and unrealized gain/(loss) on investments (2) | | | 4.47 | | | | 0.88 | | | | (2.27 | ) | | | 3.76 | | | | 1.66 | |
Net increase/(decrease) in net assets resulting from operations | | | 4.60 | | | | 1.06 | | | | (2.10 | ) | | | 3.79 | | | | 1.80 | |
Dividends and distributions to shareholders from: | | | | | | | | | | | | | | | | | | | | |
Net investment income | | | (0.17 | ) | | | (0.20 | ) | | | (0.04 | ) | | | (0.08 | ) | | | (0.18 | ) |
Net realized capital gain | | | (0.69 | ) | | | (0.71 | ) | | | (3.22 | ) | | | (0.05 | ) | | | (0.31 | ) |
Total dividends and distributions to shareholders | | | (0.86 | ) | | | (0.91 | ) | | | (3.26 | ) | | | (0.13 | ) | | | (0.49 | ) |
Net Asset Value, end of Period | | $ | 21.74 | | | $ | 18.00 | | | $ | 17.85 | | | $ | 23.21 | | | $ | 19.55 | |
Total investment return/(loss) (3) | | | 26.51 | % | | | 6.02 | % | | | (10.71 | )% | | | 19.46 | % | | | 10.10 | % |
| | | | | | | | | | | | | | | | | | | | | |
Supplemental Data: | | | | | | | | | | | | | | | | | | | | |
Net assets, end of period (000’s omitted) | | $ | 211,534 | | | $ | 351,360 | | | $ | 391,548 | | | $ | 506,159 | | | $ | 556,511 | |
Ratios to Average Net Assets: | | | | | | | | | | | | | | | | | | | | |
Ratio of expenses to average net assets with waivers and reimbursements | | | 0.98 | % | | | 0.98 | % | | | 0.92 | % | | | 0.87 | % | | | 0.85 | % |
Ratio of expenses to average net assets without waivers and reimbursements | | | 1.00 | % | | | 0.97 | % | | | 0.96 | % | | | 0.87 | % | | | 0.85 | % |
Ratio of net investment income/(loss) to average net assets | | | 0.68 | % | | | 0.99 | % | | | 0.85 | % | | | 0.15 | % | | | 0.76 | % |
Portfolio turnover rate(4) | | | 194 | % | | | 88 | % | | | 133 | % | | | 91 | % | | | 129 | % |
(1) | The selected per share data is calculated based on average shares outstanding method for the period. |
(2) | The amount shown may not correlate with the change in the aggregate gains and losses due to the timing of sales and purchases of the Fund’s shares in relation to fluctuating market values for the Fund’s portfolio. |
(3) | Total investment return/(loss) is calculated assuming a purchase of shares on the first day and a sale of shares on the last day of each period reported and includes reinvestments of dividends and distributions, if any. |
(4) | Portfolio turnover is calculated on the basis of the Fund as a whole without distinguishing between the classes of shares issued. |
The accompanying notes are an integral part of the financial statements.
23
SGI U.S. LARGE CAP EQUITY FUND
Financial Highlights (continued)
Contained below is per share operating performance data for Class A Shares outstanding, total investment return/(loss), ratios to average net assets and other supplemental data for the respective periods. This information has been derived from information provided in the financial statements. |
| | | Class a Shares | |
| | | For the
Year
Ended
August 31,
2024 | | | For the
Year
Ended
August 31,
2023 | | | For the
Year
Ended
August 31,
2022 | | | For the
Year
Ended
August 31,
2021 | | | For the
Year
Ended
August 31,
2020 | |
Per Share Operating Performance: | | | | | | | | | | | | | | | | | | | | |
Net Asset Value, Beginning of Period | | $ | 18.02 | | | $ | 17.88 | | | $ | 23.25 | | | $ | 19.59 | | | $ | 18.29 | |
Income/(Loss) from Investment Operations: | | | | | | | | | | | | | | | | | | | | |
Net investment income/(loss) (1) | | | 0.08 | | | | 0.13 | | | | 0.12 | | | | (0.02 | ) | | | 0.08 | |
Net realized and unrealized gain/(loss) on investments (2) | | | 4.48 | | | | 0.87 | | | | (2.27 | ) | | | 3.77 | | | | 1.67 | |
Net increase/(decrease) in net assets resulting from operations | | | 4.56 | | | | 1.00 | | | | (2.15 | ) | | | 3.75 | | | | 1.75 | |
Dividends and distributions to shareholders from: | | | | | | | | | | | | | | | | | | | | |
Net investment income | | | (0.12 | ) | | | (0.15 | ) | | | — | | | | (0.04 | ) | | | (0.14 | ) |
Net realized capital gain | | | (0.69 | ) | | | (0.71 | ) | | | (3.22 | ) | | | (0.05 | ) | | | (0.31 | ) |
Total dividends and distributions to shareholders | | | (0.81 | ) | | | (0.86 | ) | | | (3.22 | ) | | | (0.09 | ) | | | (0.45 | ) |
Net Asset Value, end of Period | | $ | 21.77 | | | $ | 18.02 | | | $ | 17.88 | | | $ | 23.25 | | | $ | 19.59 | |
Total investment return/(loss) (3) | | | 26.19 | % | | | 5.69 | % | | | (10.89 | )% | | | 19.20 | % | | | 9.78 | % |
| | | | | | | | | | | | | | | | | | | | | |
Supplemental Data: | | | | | | | | | | | | | | | | | | | | |
Net assets, end of period (000’s omitted) | | $ | 19,601 | | | $ | 31,276 | | | $ | 28,285 | | | $ | 29,423 | | | $ | 23,424 | |
Ratios to Average Net Assets: | | | | | | | | | | | | | | | | | | | | |
Ratio of expenses to average net assets with waivers and reimbursements | | | 1.22 | % | | | 1.23 | % | | | 1.17 | % | | | 1.12 | % | | | 1.10 | % |
Ratio of expenses to average net assets without waivers and reimbursements | | | 1.25 | % | | | 1.22 | % | | | 1.21 | % | | | 1.12 | % | | | 1.10 | % |
Ratio of net investment income/(loss) to average net assets | | | 0.40 | % | | | 0.74 | % | | | 0.64 | % | | | (0.09 | )% | | | 0.47 | % |
Portfolio turnover rate(4) | | | 194 | % | | | 88 | % | | | 133 | % | | | 91 | % | | | 129 | % |
(1) | The selected per share data is calculated based on average shares outstanding method for the period. |
(2) | The amount shown may not correlate with the change in the aggregate gains and losses due to the timing of sales and purchases of the Fund’s shares in relation to fluctuating market values for the Fund’s portfolio. |
(3) | Total investment return/(loss) is calculated assuming a purchase of shares on the first day and a sale of shares on the last day of each period reported and includes reinvestments of dividends and distributions, if any. Total investment return does not reflect any applicable sales charge. |
(4) | Portfolio turnover is calculated on the basis of the Fund as a whole without distinguishing between the classes of shares issued. |
The accompanying notes are an integral part of the financial statements.
24
SGI U.S. LARGE CAP EQUITY FUND
Financial Highlights (concluded)
Contained below is per share operating performance data for Class C Shares outstanding, total investment return/(loss), ratios to average net assets and other supplemental data for the respective periods. This information has been derived from information provided in the financial statements. |
| | | Class c Shares | |
| | | For the
Year
Ended
August 31,
2024 | | | For the
Year
Ended
August 31,
2023 | | | For the
Year
Ended
August 31,
2022 | | | For the
Year
Ended
August 31,
2021 | | | For the
Year
Ended
August 31,
2020 | |
Per Share Operating Performance: | | | | | | | | | | | | | | | | | | | | |
Net Asset Value, Beginning of Period | | $ | 17.22 | | | $ | 17.12 | | | $ | 22.54 | | | $ | 19.11 | | | $ | 17.79 | |
Income/(Loss) from Investment Operations: | | | | | | | | | | | | | | | | | | | | |
Net investment income/(loss) (1) | | | (0.06 | ) | | | — | | | | (0.03 | ) | | | (0.17 | ) | | | (0.05 | ) |
Net realized and unrealized gain/(loss) on investments (2) | | | 4.27 | | | | 0.83 | | | | (2.17 | ) | | | 3.65 | | | | 1.71 | |
Net increase/(decrease) in net assets resulting from operations | | | 4.21 | | | | 0.83 | | | | (2.20 | ) | | | 3.48 | | | | 1.66 | |
Dividends and distributions to shareholders from: | | | | | | | | | | | | | | | | | | | | |
Net investment income | | | — | | | | (0.02 | ) | | | — | | | | 0.00 | | | | (0.03 | ) |
Net realized capital gain | | | (0.69 | ) | | | (0.71 | ) | | | (3.22 | ) | | | (0.05 | ) | | | (0.31 | ) |
Total dividends and distributions to shareholders | | | (0.69 | ) | | | (0.73 | ) | | | (3.22 | ) | | | (0.05 | ) | | | (0.34 | ) |
Net Asset Value, end of Period | | $ | 20.74 | | | $ | 17.22 | | | $ | 17.12 | | | $ | 22.54 | | | $ | 19.11 | |
Total investment return/(loss) (3) | | | 25.23 | % | | | 4.93 | % | | | (11.54 | )% | | | 18.25 | % | | | 9.47 | % |
| | | | | | | | | | | | | | | | | | | | | |
Supplemental Data: | | | | | | | | | | | | | | | | | | | | |
Net assets, end of period (000’s omitted) | | $ | 1,823 | | | $ | 2,297 | | | $ | 2,546 | | | $ | 2,917 | | | $ | 2,915 | |
Ratios to Average Net Assets: | | | | | | | | | | | | | | | | | | | | |
Ratio of expenses to average net assets with waivers and reimbursements | | | 1.97 | % | | | 1.98 | % | | | 1.92 | % | | | 1.87 | % | | | 1.85 | % |
Ratio of expenses to average net assets without waivers and reimbursements | | | 2.00 | % | | | 1.97 | % | | | 1.96 | % | | | 1.87 | % | | | 1.85 | % |
Ratio of net investment income/(loss) to average net assets | | | (0.35 | )% | | | (0.01 | )% | | | (0.15 | )% | | | (0.84 | )% | | | (0.26 | )% |
Portfolio turnover rate(4) | | | 194 | % | | | 88 | % | | | 133 | % | | | 91 | % | | | 129 | % |
(1) | The selected per share data is calculated based on average shares outstanding method for the period. |
(2) | The amount shown may not correlate with the change in the aggregate gains and losses due to the timing of sales and purchases of the Fund’s shares in relation to fluctuating market values for the Fund’s portfolio. |
(3) | Total investment return/(loss) is calculated assuming a purchase of shares on the first day and a sale of shares on the last day of each period reported and includes reinvestments of dividends and distributions, if any. |
(4) | Portfolio turnover is calculated on the basis of the Fund as a whole without distinguishing between the classes of shares issued. |
The accompanying notes are an integral part of the financial statements.
25
SGI GLOBAL EQUITY FUND
Financial Highlights
Contained below is per share operating performance data for Class I shares outstanding, total investment return/(loss), ratios to average net assets and other supplemental data for the respective periods. This information has been derived from information provided in the financial statements. |
| | | Class I Shares | |
| | | For the
Year
Ended
August 31,
2024 | | | For the
Year
Ended
August 31,
2023 | | | For the
Year
Ended
August 31,
2022 | | | For the
Year
Ended
August 31,
2021 | | | For the
Year
Ended
August 31,
2020 | |
Per Share Operating Performance: | | | | | | | | | | | | | | | | | | | | |
Net Asset Value, Beginning of Period | | $ | 34.11 | | | $ | 33.16 | | | $ | 38.33 | | | $ | 32.93 | | | $ | 32.62 | |
Income/(Loss) from Investment Operations: | | | | | | | | | | | | | | | | | | | | |
Net investment income/(loss) (1) | | | 0.52 | | | | 0.45 | | | | 0.45 | | | | 0.38 | | | | 0.41 | |
Net realized and unrealized gain/(loss) on Investments (2) | | | 6.18 | | | | 1.62 | | | | (3.77 | ) | | | 5.24 | | | | 1.06 | |
Net increase/(decrease) in net assets resulting from operations | | | 6.70 | | | | 2.07 | | | | (3.32 | ) | | | 5.62 | | | | 1.47 | |
Dividends and distributions to shareholders from: | | | | | | | | | | | | | | | | | | | | |
Net investment income | | | (0.45 | ) | | | (0.31 | ) | | | (0.58 | ) | | | (0.22 | ) | | | (0.85 | ) |
Net realized capital gain | | | — | | | | (0.81 | ) | | | (1.27 | ) | | | — | | | | (0.31 | ) |
Total dividends and distributions to shareholders | | | (0.45 | ) | | | (1.12 | ) | | | (1.85 | ) | | | (0.22 | ) | | | (1.16 | ) |
Net Asset Value, end of period | | $ | 40.36 | | | $ | 34.11 | | | $ | 33.16 | | | $ | 38.33 | | | $ | 32.93 | |
Total investment return/(loss) (3) | | | 19.84 | % | | | 6.39 | % | | | (9.20 | )% | | | 17.15 | % | | | 4.53 | % |
| | | | | | | | | | | | | | | | | | | | | |
Supplemental Data: | | | | | | | | | | | | | | | | | | | | |
Net assets, end of period (000’s omitted) | | $ | 108,187 | | | $ | 150,297 | | | $ | 118,260 | | | $ | 112,035 | | | $ | 58,262 | |
Ratios to Average Net Assets: | | | | | | | | | | | | | | | | | | | | |
Ratio of expenses to average net assets with waivers and reimbursements | | | 0.84 | % | | | 0.84 | % | | | 0.84 | % | | | 0.97 | % | | | 0.84 | % |
Ratio of expenses to average net assets without waivers and reimbursements | | | 1.05 | % | | | 1.00 | % | | | 1.01 | % | | | 1.10 | % | | | 0.98 | % |
Ratio of net investment income/(loss) to average net assets | | | 1.45 | % | | | 1.37 | % | | | 1.24 | % | | | 1.26 | % | | | 1.32 | % |
Portfolio turnover rate(4) | | | 102 | % | | | 96 | % | | | 87 | % | | | 88 | % | | | 122 | % |
(1) | The selected per share data is calculated based on the average shares outstanding method for the period. |
(2) | The amount shown may not correlate with the change in the aggregate gains and losses due to the timing of sales and purchases of the Fund’s shares in relation to fluctuating market values for the Fund’s portfolio. |
(3) | Total investment return/(loss) is calculated assuming a purchase of shares on the first day and a sale of shares on the last day of each period reported and includes reinvestments of dividends and distributions, if any. |
(4) | Portfolio turnover is calculated for the Fund, as a whole, for the entire period. |
The accompanying notes are an integral part of the financial statements.
26
SGI PRUDENT GROWTH FUND
Financial Highlights
Contained below is per share operating performance data for Class I shares outstanding, total investment return/(loss), ratios to average net assets and other supplemental data for the respective periods. This information has been derived from information provided in the financial statements. |
| | | CLASS I SHARES | |
| | | For the
Year
Ended
August 31,
2024 | | | For the
Year
Ended
August 31,
2023 | | | For the
Year
Ended
August 31,
2022 | | | For the
Year
Ended
August 31,
2021 | | | FOR THE
PERIOD
ENDED
AUGUST 31,
2020(1) | |
Per Share Operating Performance: | | | | | | | | | | | | | | | | | | | | |
Net Asset Value, Beginning of Period | | $ | 10.28 | | | $ | 9.80 | | | $ | 11.69 | | | $ | 10.60 | | | $ | 10.00 | |
Income/(Loss) from Investment Operations: | | | | | | | | | | | | | | | | | | | | |
Net investment income/(loss) (2) | | | 0.06 | | | | 0.03 | | | | 0.02 | | | | (0.07 | ) | | | (0.03 | ) |
Net realized and unrealized gain/(loss) on Investments (3) | | | 1.64 | | | | 0.46 | | | | (1.26 | ) | | | 1.16 | | | | 0.63 | |
Net increase/(decrease) in net assets resulting from operations | | | 1.70 | | | | 0.49 | | | | (1.24 | ) | | | 1.09 | | | | 0.60 | |
Dividends and distributions to shareholders from: | | | | | | | | | | | | | | | | | | | | |
Net investment income | | | (0.05 | ) | | | (0.01 | ) | | | (0.40 | ) | | | — | (4) | | | — | |
Net realized capital gain | | | — | | | | — | | | | (0.25 | ) | | | — | (4) | | | — | |
Total dividends and distributions to shareholders | | | (0.05 | ) | | | (0.01 | ) | | | (0.65 | ) | | | — | | | | — | |
Net Asset Value, end of period | | $ | 11.93 | | | $ | 10.28 | | | $ | 9.80 | | | $ | 11.69 | | | $ | 10.60 | |
Total investment return/(loss) (5) | | | 16.62 | % | | | 5.04 | % | | | (11.26 | )% | | | 10.34 | % | | | 6.00 | %(7) |
| | | | | | | | | | | | | | | | | | | | | |
Supplemental Data: | | | | | | | | | | | | | | | | | | | | |
Net assets, end of period (000’s omitted) | | $ | 26,929 | | | $ | 21,217 | | | $ | 15,527 | | | $ | 10,807 | | | $ | 6,408 | |
Ratios to Average Net Assets: | | | | | | | | | | | | | | | | | | | | |
Ratio of expenses to average net assets with waivers and reimbursements | | | 1.31 | % | | | 1.47 | % | | | 1.70 | % | | | 1.70 | % | | | 1.70 | %(6) |
Ratio of expenses to average net assets without waivers and reimbursements | | | 1.31 | % | | | 1.37 | % | | | 1.61 | % | | | 1.75 | % | | | 3.97 | %(6) |
Ratio of net investment income/(loss) to average net assets | | | 0.52 | % | | | 0.26 | % | | | 0.23 | % | | | (0.67 | )% | | | (1.08 | )%(6) |
Portfolio turnover rate(8) | | | 61 | % | | | 61 | % | | | 67 | % | | | 170 | % | | | 6 | %(7) |
(1) | The Fund commenced investment operations on June 8, 2020. |
(2) | The selected per share data is calculated based on the average shares outstanding method for the period. |
(3) | The amount shown may not correlate with the change in the aggregate gains and losses due to the timing of sales and purchases of the Fund’s shares in relation to fluctuating market values for the Fund’s portfolio. |
(4) | Amount represents less than $0.005 per share. |
(5) | Total investment return/(loss) is calculated assuming a purchase of shares on the first day and a sale of shares on the last day of each period reported and includes reinvestments of dividends and distributions, if any. |
(8) | Portfolio turnover is calculated for the Fund, as a whole, for the entire period. |
The accompanying notes are an integral part of the financial statements.
27
SGI PEAK GROWTH FUND
Financial Highlights
Contained below is per share operating performance data for Class I shares outstanding, total investment return/(loss), ratios to average net assets and other supplemental data for the respective periods. This information has been derived from information provided in the financial statements. |
| | | CLASS I SHARES | |
| | | For the
Year
Ended
August 31,
2024 | | | For the
Year
Ended
August 31,
2023 | | | For the
Year
Ended
August 31,
2022 | | | For the
Year
Ended
August 31,
2021 | | | FOR THE
PERIOD
ENDED
AUGUST 31,
2020(1) | |
Per Share Operating Performance: | | | | | | | | | | | | | | | | | | | | |
Net Asset Value, Beginning of Period | | $ | 10.61 | | | $ | 9.99 | | | $ | 12.63 | | | $ | 10.94 | | | $ | 10.00 | |
Income/(Loss) from Investment Operations: | | | | | | | | | | | | | | | | | | | | |
Net investment income/(loss) (2) | | | (0.03 | ) | | | (0.06 | ) | | | (0.03 | ) | | | (0.14 | ) | | | (0.04 | ) |
Net realized and unrealized gain/(loss) on Investments (3) | | | 2.07 | | | | 0.68 | | | | (1.27 | ) | | | 1.83 | | | | 0.98 | |
Net increase/(decrease) in net assets resulting from operations | | | 2.04 | | | | 0.62 | | | | (1.30 | ) | | | 1.69 | | | | 0.94 | |
Dividends and distributions to shareholders from: | | | | | | | | | | | | | | | | | | | | |
Net investment income | | | (0.01 | ) | | | — | (4) | | | (0.75 | ) | | | — | | | | — | |
Net realized capital gain | | | (0.06 | ) | | | — | | | | (0.59 | ) | | | — | | | | — | |
Total dividends and distributions to shareholders | | | (0.07 | ) | | | — | | | | (1.34 | ) | | | — | | | | — | |
Net Asset Value, end of period | | $ | 12.58 | | | $ | 10.61 | | | $ | 9.99 | | | $ | 12.63 | | | $ | 10.94 | |
Total investment return/(loss) (5) | | | 19.25 | % | | | 6.22 | % | | | (11.64 | )% | | | 15.45 | % | | | 9.40 | %(6) |
| | | | | | | | | | | | | | | | | | | | | |
Supplemental Data: | | | | | | | | | | | | | | | | | | | | |
Net assets, end of period (000’s omitted) | | $ | 28,007 | | | $ | 19,555 | | | $ | 12,988 | | | $ | 10,940 | | | $ | 7,327 | |
Ratios to Average Net Assets: | | | | | | | | | | | | | | | | | | | | |
Ratio of expenses to average net assets with waivers and reimbursements | | | 1.30 | % | | | 1.53 | % | | | 1.70 | % | | | 1.70 | % | | | 1.70 | %(7) |
Ratio of expenses to average net assets without waivers and reimbursements | | | 1.30 | % | | | 1.48 | % | | | 1.58 | % | | | 1.74 | % | | | 3.52 | %(7) |
Ratio of net investment income/(loss) to average net assets | | | (0.26 | )% | | | (0.55 | )% | | | (0.29 | )% | | | (1.17 | )% | | | (1.58 | )%(7) |
Portfolio turnover rate(8) | | | 44 | % | | | 26 | % | | | 88 | % | | | 178 | % | | | 5 | %(6) |
(1) | The Fund commenced investment operations on June 8, 2020. |
(2) | The selected per share data is calculated based on the average shares outstanding method for the period. |
(3) | The amount shown may not correlate with the change in the aggregate gains and losses due to the timing of sales and purchases of the Fund’s shares in relation to fluctuating market values for the Fund’s portfolio. |
(4) | Amount represents less than $0.005 per share. |
(5) | Total investment return/(loss) is calculated assuming a purchase of shares on the first day and a sale of shares on the last day of each period reported and includes reinvestments of dividends and distributions, if any. |
(8) | Portfolio turnover is calculated for the Fund, as a whole, for the entire period. |
The accompanying notes are an integral part of the financial statements.
28
SGI SMALL CAP CORE FUND
Financial Highlights
Contained below is per share operating performance data for shares outstanding, total investment return/(loss), ratios to average net assets and other supplemental data for the respective periods. This information has been derived from information provided in the financial statements. |
| | | CLASS I SHARES | |
| | | For the
Year
Ended
August 31,
2024 | | | For the
Year
Ended
August 31,
2023 | | | For the
Year
Ended
August 31,
2022 | | | FOR THE
YEAR
ENDED
AUGUST 31,
2021(1) | | | FOR THE
YEAR
ENDED
AUGUST 31,
2020 | |
Per Share Operating Performance: | | | | | | | | | | | | | | | | | | | | |
Net Asset Value, Beginning of Period | | $ | 27.50 | | | $ | 25.53 | | | $ | 38.64 | | | $ | 28.16 | | | $ | 25.67 | |
Income/(Loss) from Investment Operations: | | | | | | | | | | | | | | | | | | | | |
Net investment income/(loss) (2) | | | 0.12 | | | | 0.06 | | | | (0.10 | ) | | | (0.15 | ) | | | (0.10 | ) |
Net realized and unrealized gain/(loss) on Investments (3) | | | 4.66 | | | | 2.06 | | | | (2.97 | ) | | | 12.33 | | | | 2.68 | |
Net increase/(decrease) in net assets resulting from operations | | | 4.78 | | | | 2.12 | | | | (3.07 | ) | | | 12.18 | | | | 2.58 | |
Dividends and distributions to shareholders from: | | | | | | | | | | | | | | | | | | | | |
Net investment income | | | — | | | | — | | | | — | | | | (0.07 | ) | | | — | |
Net realized capital gain | | | — | | | | (0.15 | ) | | | (10.04 | ) | | | (1.63 | ) | | | (0.09 | ) |
Total dividends and distributions to shareholders | | | — | | | | (0.15 | ) | | | (10.04 | ) | | | (1.70 | ) | | | (0.09 | ) |
Net Asset Value, end of period | | $ | 32.28 | | | $ | 27.50 | | | $ | 25.53 | | | $ | 38.64 | | | $ | 28.16 | |
Total investment return/(loss) (4) | | | 17.38 | % | | | 8.37 | % | | | (9.93 | )% | | | 44.61 | % | | | 10.04 | % |
| | | | | | | | | | | | | | | | | | | | | |
Supplemental Data: | | | | | | | | | | | | | | | | | | | | |
Net assets, end of period (000’s omitted) | | $ | 124,720 | | | $ | 103,502 | | | $ | 89,836 | | | $ | 97,409 | | | $ | 57,109 | |
Ratios to Average Net Assets: | | | | | | | | | | | | | | | | | | | | |
Ratio of expenses to average net assets with waivers and reimbursements | | | 1.23 | % | | | 1.23 | % | | | 1.23 | % | | | 1.07 | % | | | 1.25 | % |
Ratio of expenses to average net assets without waivers and reimbursements (5) | | | 1.26 | % | | | 1.25 | % | | | 1.33 | % | | | 1.12 | % | | | 1.38 | % |
Ratio of net investment income/(loss) to average net assets | | | 0.42 | % | | | 0.24 | % | | | (0.34 | )% | | | (0.37 | )% | | | (0.38 | )% |
Portfolio turnover rate (6) | | | 211 | % | | | 197 | % | | | 270 | % | | | 314 | % | | | 302 | % |
(1) | Effective as of the close of business on March 15, 2021, the Adviser took over management of the SGI Small Cap Core Fund from its predecessor investment manager. |
(2) | Calculated based on average shares outstanding for the period. |
(3) | The amount shown may not correlate with the change in the aggregate gains and losses due to the timing of sales and purchases of the Fund’s shares in relation to fluctuating market values for the Fund’s portfolio. |
(4) | Total investment return/(loss) is calculated assuming a purchase of shares on the first day and a sale of shares on the last day of each period reported and includes reinvestments of dividends and distributions, if any. |
(5) | During the current fiscal period, certain fees were waived and/or reimbursed. If such fee waivers and/or reimbursements had not occurred, the ratios would have been as indicated (See Note 2). |
(6) | Portfolio turnover is calculated for the Fund, as a whole, for the entire period. |
The accompanying notes are an integral part of the financial statements.
29
SUMMIT GLOBAL INVESTMENTS
Notes to Financial Statements
August 31, 2024
1. Organization and Significant Accounting Policies
The RBB Fund, Inc. (“RBB” or the “Company”) was incorporated under the laws of the State of Maryland on February 29, 1988 and is registered under the Investment Company Act of 1940, as amended, (the “1940 Act”) as an open-end management investment company. RBB is a “series fund,” which is a mutual fund divided into separate portfolios. Each portfolio is treated as a separate entity for certain matters under the 1940 Act, and for other purposes, and a shareholder of one portfolio is not deemed to be a shareholder of any other portfolio. Currently, RBB has sixty-five separate investment portfolios, including the SGI U.S. Large Cap Equity Fund, the SGI Global Equity Fund, the SGI Prudent Growth Fund, the SGI Peak Growth Fund and the SGI Small Cap Core Fund (each, a “Fund” and collectively, the “Funds”). The SGI Small Cap Core Fund and the SGI U.S. Large Cap Equity Fund commenced investment operations on October 1, 1999 and February 29, 2012, respectively. The SGI Global Equity Fund commenced investment operations on April 1, 2009. The SGI Prudent Growth Fund and the SGI Peak Growth Fund commenced investment operations on June 8, 2020.
Effective as of the close of business on March 15, 2021, Summit Global Investments, LLC (“Summit” or the “Adviser”) took over management of the SGI Small Cap Core Fund from its predecessor investment manager.
As of the end of the reporting period, the SGI U.S. Large Cap Equity Fund and the SGI Global Equity Fund offer three classes of shares: Class I Shares, Class A Shares and Class C Shares; the SGI Prudent Growth Fund, the SGI Peak Growth Fund and the SGI Small Cap Core Fund, all offer one class of shares; Class I Shares. As of the end of the reporting period, Class A Shares and Class C Shares of the SGI Global Equity Fund were not yet operational.
RBB has authorized capital of one hundred billion shares of common stock of which 92.923 billion shares are currently classified into two hundred and thirty-six classes of common stock. Each class represents an interest in an active or inactive investment portfolio of the Company.
The investment objective of each of the SGI U.S. Large Cap Equity Fund, the SGI Global Equity Fund, the SGI Prudent Growth Fund and the SGI Small Cap Core Fund is to seek long-term capital appreciation. The investment objective of the SGI Peak Growth Fund is to seek capital appreciation.
The Funds are investment companies and follow accounting and reporting guidance in the Financial Accounting Standards Board (“FASB”) Accounting Standards Codification Topic 946 “Financial Services - Investment Companies.”
The end of the reporting period for the Funds is August 31, 2024, and the period covered by these Notes to Financial Statements is the fiscal year ended August 31, 2024 (the “current fiscal period”).
Portfolio Valuation — Each Fund’s net asset value (“NAV”) is calculated once daily at the close of regular trading hours on the New York Stock Exchange (“NYSE”) (generally 4:00 p.m. Eastern time) on each day the NYSE is open. Securities held by the Funds are valued using the closing price or the last sale price on a national securities exchange or the National Association of Securities Dealers Automatic Quotation System (“NASDAQ”) market system where they are primarily traded. Equity securities traded in the over-the-counter (“OTC”) market are valued at their closing prices. If there were no transactions on that day, securities traded principally on an exchange or on NASDAQ will be valued at the mean of the last bid and ask prices prior to the market close. Fixed income securities are valued using an independent pricing service, which considers such factors as security prices, yields, maturities and ratings, and are deemed representative of market values at the close of the market. Investments in exchange-traded funds (“ETFs”) are valued at their last reported sale price. Investments in other open-end investment companies, if any, are valued based on the NAV of those investment companies (which may use fair value pricing as disclosed in their prospectuses). If market quotations are unavailable or deemed unreliable, securities will be valued by the Valuation Designee (as defined below) in accordance with procedures adopted by the Company’s Board of Directors (the “Board” or “Directors”). Relying on prices supplied by pricing services or dealers or using fair valuation may result in values that are higher or lower than the values used by other investment companies and investors to price the same investments.
30
SUMMIT GLOBAL INVESTMENTS
Notes to Financial Statements (Continued)
August 31, 2024
The Board has adopted a pricing and valuation policy for use by each Fund and its Valuation Designee (as defined below) in calculating the Fund’s NAV. Pursuant to Rule 2a-5 under the 1940 Act, the Board has designated Summit as its “Valuation Designee” to perform all of the fair value determinations as well as to perform all of the responsibilities that may be performed by the Valuation Designee in accordance with Rule 2a-5. The Valuation Designee is authorized to make all necessary determinations of the fair values of portfolio securities and other assets for which market quotations are not readily available or if it is deemed that the prices obtained from brokers and dealers or independent pricing services are unreliable.
Fair Value Measurements — The inputs and valuation techniques used to measure the fair value of the Funds’ investments are summarized into three levels as described in the hierarchy below:
| | ● | Level 1 — | Prices are determined using quoted prices in active markets for identical securities. |
| | ● | Level 2 — | Prices are determined using other significant observable inputs (including quoted prices for similar securities, interest rates, prepayment speeds, credit risk, etc.). |
| | ● | Level 3 — | Prices are determined using significant unobservable inputs (including the Funds’ own assumptions in determining the fair value of investments). |
The inputs or methodologies used for valuing securities are not necessarily an indication of the risk associated with investing in those securities.
The following is a summary of the inputs used, as of the end of the current fiscal period, in valuing each Fund’s investments carried at fair value:
| | | Level 1 | | | Level 2 | | | Level 3 | | | Total | |
SGI U.S. Large Cap Equity Fund | | | | | | | | | | | | | | | | |
Investments: | | | | | | | | | | | | | | | | |
Common Stocks | | $ | 228,837,626 | | | $ | — | | | $ | — | | | $ | 228,837,626 | |
Exchange Traded Funds | | | 2,693,483 | | | | — | | | | — | | | | 2,693,483 | |
Total Investments | | $ | 231,531,109 | | | $ | — | | | $ | — | | | $ | 231,531,109 | |
| | | | | | | | | | | | | | | | | |
SGI Global Equity Fund | | | | | | | | | | | | | | | | |
Investments: | | | | | | | | | | | | | | | | |
Common Stocks | | $ | 104,969,074 | | | $ | — | | | $ | — | | | $ | 104,969,074 | |
Exchange Traded Funds | | | 1,116,431 | | | | — | | | | — | | | | 1,116,431 | |
Total Investments | | $ | 106,085,505 | | | $ | — | | | $ | — | | | $ | 106,085,505 | |
| | | | | | | | | | | | | | | | | |
SGI PRUDENT GROWTH Fund | | | | | | | | | | | | | | | | |
Investments: | | | | | | | | | | | | | | | | |
Exchange Traded Funds | | $ | 13,520,807 | | | $ | — | | | $ | — | | | $ | 13,520,807 | |
Open End Funds | | | 12,733,039 | | | | — | | | | — | | | | 12,733,039 | |
Total Investments | | $ | 26,253,846 | | | $ | — | | | $ | — | | | $ | 26,253,846 | |
| | | | | | | | | | | | | | | | | |
SGI PEAK GROWTH FUND | | | | | | | | | | | | | | | | |
Investments: | | | | | | | | | | | | | | | | |
Open End Funds | | $ | 17,061,262 | | | $ | — | | | $ | — | | | $ | 17,061,262 | |
Exchange Traded Funds | | | 10,772,262 | | | | — | | | | — | | | | 10,772,262 | |
Total Investments | | $ | 27,833,524 | | | $ | — | | | $ | — | | | $ | 27,833,524 | |
| | | | | | | | | | | | | | | | | |
31
SUMMIT GLOBAL INVESTMENTS
Notes to Financial Statements (Continued)
August 31, 2024
| | | Level 1 | | | Level 2 | | | Level 3 | | | Total | |
SGI SMALL CAP core Fund | | | | | | | | | | | | | | | | |
Investments: | | | | | | | | | | | | | | | | |
Common Stocks | | $ | 122,578,161 | | | $ | — | | | $ | — | | | $ | 122,578,161 | |
Total Investments | | $ | 122,578,161 | | | $ | — | | | $ | — | | | $ | 122,578,161 | |
Please refer to Portfolio of Investments for further details.
At the end of each quarter, management evaluates the classification of Levels 1, 2 and 3 assets and liabilities. Various factors are considered, such as changes in liquidity from the prior reporting period; whether or not a broker is willing to execute at the quoted price; the depth and consistency of prices from third party pricing services; and the existence of contemporaneous, observable trades in the market. Additionally, management evaluates the classification of Levels 1, 2 and 3 assets and liabilities on a quarterly basis for changes in listings or delistings on national exchanges.
Due to the inherent uncertainty of determining the fair value of investments that do not have a readily available market value, the fair value of the Funds’ investments may fluctuate from period to period. Additionally, the fair value of investments may differ significantly from the values that would have been used had a ready market existed for such investments and may differ materially from the values the Funds may ultimately realize. Further, such investments may be subject to legal and other restrictions on resale or otherwise less liquid than publicly traded securities.
For fair valuations using significant unobservable inputs, U.S. generally accepted accounting principles (“U.S. GAAP”) requires each Fund to present a reconciliation of the beginning to ending balances for reported market values that presents changes attributable to total realized and unrealized gains or losses, purchase and sales, and transfers in and out of Level 3 during the period. Transfers in and out between levels are based on values at the end of the period. A reconciliation of Level 3 investments is presented only if a Fund had an amount of Level 3 investments at the end of the reporting period that was meaningful in relation to its net assets. The amounts and reasons for all Level 3 transfers are disclosed if a Fund had an amount of total Level 3 transfers during the reporting period that was meaningful in relation to its net assets as of the end of the reporting period.
During the current fiscal period, the Funds had no Level 3 purchases, sales, or transfers.
Use of Estimates — The preparation of financial statements in conformity with U.S. GAAP requires management to make estimates and assumptions that affect the reported amounts of assets and liabilities and disclosure of contingent assets and liabilities at the date of the financial statements and the reported amounts of revenues and expenses during the reporting period. Actual results could differ from those estimates and those differences could be significant.
Investment Transactions, Investment Income and Expenses — The Funds record security transactions based on trade date for financial reporting purposes. The cost of investments sold is determined by use of the specific identification method for both financial reporting and income tax purposes in determining realized gains and losses on investments. Interest income (including amortization of premiums and accretion of discounts) is accrued when earned. Dividend income is recorded on the ex-dividend date. Distributions received on securities that represent a return of capital or capital gain are recorded as a reduction of cost of investments and/or as a realized gain. The Funds’ investment income, expenses (other than class specific expenses) and unrealized and realized gains and losses are allocated daily to each class of shares based upon the relative proportion of net assets of each class at the beginning of the day. Certain expenses are shared with The RBB Fund Trust (the “Trust”), a series trust of affiliated funds. Expenses incurred on behalf of a specific class, fund or fund family of the Company or Trust are charged directly to the class, fund or fund family (in proportion to net assets). Expenses incurred for all funds (such as director or professional fees) are charged to all funds in proportion to their average net assets of RBB and the Trust, or in such other manner as the Board deems fair or equitable. Expenses and fees, including investment advisory and administration fees, are accrued daily and taken into account for the purpose of determining the NAV of the Funds.
32
SUMMIT GLOBAL INVESTMENTS
Notes to Financial Statements (Continued)
August 31, 2024
Dividends and Distributions to Shareholders — Dividends from net investment income and distributions from net realized capital gains, if any, are declared and paid at least annually to shareholders and recorded on the ex-dividend date. Income dividends and capital gain distributions are determined in accordance with U.S. federal income tax regulations, which may differ from U.S. GAAP.
U.S. tax status — No provision is made for U.S. income taxes as it is each Fund’s intention to continue to qualify for and elect the tax treatment applicable to regulated investment companies under Subchapter M of the Internal Revenue Code of 1986, as amended, and make the requisite distributions to its shareholders which will be sufficient to relieve it from U.S. income and excise taxes.
Cash and Cash Equivalents — Cash and cash equivalents are valued at cost plus accrued interest, which approximates market value.
Other — In the normal course of business, the Funds may enter into contracts that provide general indemnifications. Each Fund’s maximum exposure under these arrangements is dependent on claims that may be made against the Funds in the future, and, therefore, cannot be estimated; however, the Funds expect the risk of material loss from such claims to be remote.
2. Investment Adviser and Other Services
Summit Global Investments, LLC serves as the investment adviser to each Fund. Each Fund compensates the Adviser for its services at an annual rate based on each Fund’s average daily net assets (the “Advisory Fee”), payable on a monthly basis in arrears, as shown in the following table.
The Adviser has contractually agreed to waive advisory fees and/or reimburse expenses to the extent that total annual Fund operating expenses (excluding certain items discussed below) exceed the rates (“Expense Caps”) shown in the following table of each Fund’s average daily net assets. In determining the Adviser’s obligation to waive advisory fees and/or reimburse expenses, the following expenses are not taken into account and could cause total annual Fund operating expenses to exceed the Expense Caps as applicable: acquired fund fees and expenses, brokerage commissions, extraordinary expenses, interest and taxes. This contractual limitation is in effect until December 31, 2024 for each Fund and may not be terminated without the approval of the Board. The Adviser may discontinue these arrangements at any time after a Fund’s respective contractual limitation expiration date.
FUND | | ADVISORY FEE | | | EXPENSE CAPS | |
| | | | | | | CLASS I | | | CLASS A | | | CLASS C | |
SGI U.S. Large Cap Equity Fund | | | 0.70 | % | | | 0.98 | % | | | 1.23 | % | | | 1.98 | % |
SGI Global Equity Fund | | | 0.70 | | | | 0.84 | | | | 1.09 | | | | 1.84 | |
SGI Prudent Growth Fund | | | 0.75 | | | | 1.70 | | | | — | | | | — | |
SGI Peak Growth Fund | | | 0.75 | | | | 1.70 | | | | — | | | | — | |
SGI Small Cap Core Fund | | | 0.95 | | | | 1.23 | | | | — | | | | — | |
If at any time a Fund’s total annual Fund operating expenses for a year are less than the relevant share class’ Expense Cap, the Adviser is entitled to recoup from the Fund the advisory fees forgone and other payments remitted by the Adviser to the Fund within three years from the date on which such waiver or reimbursement was made, provided such recoupment does not cause the Fund to exceed the relevant share class’s Expense Cap that was in effect at the time of the waiver or reimbursement.
33
SUMMIT GLOBAL INVESTMENTS
Notes to Financial Statements (Continued)
August 31, 2024
During the current fiscal period, investment advisory fees accrued, waived and/or reimbursed and recoupments were as follows:
FUND | | Gross
Advisory Fees | | | Waivers AND/OR
Reimbursements | | | RECOUPMENTS | | | Net
Advisory Fees | |
SGI U.S. Large Cap Equity Fund | | $ | 1,912,790 | | | $ | (88,693 | ) | | $ | 28,054 | | | $ | 1,852,151 | |
SGI Global Equity Fund | | | 926,566 | | | | (280,270 | ) | | | — | | | | 646,296 | |
SGI Prudent Growth Fund | | | 179,498 | | | | — | | | | — | | | | 179,498 | |
SGI Peak Growth Fund | | | 175,697 | | | | — | | | | — | | | | 175,697 | |
SGI Small Cap Core Fund | | | 1,131,092 | | | | (59,572 | ) | | | 20,916 | | | | 1,092,436 | |
As of the end of the reporting period, the Funds had amounts available for recoupment by the Adviser as follows:
| | | Expiration | | | | | |
FUND | | August 31,
2025 | | | August 31,
2026 | | | August 31,
2027 | | | Total | |
SGI U.S. Large Cap Equity Fund | | $ | 39,816 | | | $ | 87,307 | | | $ | 88,693 | | | $ | 215,816 | |
SGI Global Equity Fund | | | 209,841 | | | | 210,693 | | | | 280,270 | | | | 700,804 | |
SGI Prudent Growth Fund | | | — | | | | — | | | | — | | | | — | |
SGI Peak Growth Fund | | | — | | | | — | | | | — | | | | — | |
SGI Small Cap Core Fund | | | 88,935 | | | | 21,348 | | | | 59,572 | | | | 169,855 | |
U.S. Bancorp Fund Services, LLC, doing business as U.S. Bank Global Fund Services (“Fund Services”), serves as administrator for the Funds. For providing administrative and accounting services, Fund Services is entitled to receive a monthly fee, subject to certain minimum and out of pocket expenses.
Fund Services serves as the Funds’ transfer and dividend disbursing agent. For providing transfer agent services, Fund Services is entitled to receive a monthly fee, subject to certain minimum and out of pocket expenses.
U.S. Bank, N.A. (the “Custodian”) provides certain custodial services to the Funds. The Custodian is entitled to receive a monthly fee, subject to certain minimum and out of pocket expenses.
Quasar Distributors, LLC (the “Distributor”), a wholly-owned broker-dealer subsidiary of Foreside Financial Group, LLC, serves as the principal underwriter and distributor of the Funds’ shares pursuant to a Distribution Agreement with RBB.
For compensation amounts paid to Fund Services and the Custodian, please refer to the Statements of Operations.
The Board has adopted a Plan of Distribution (the “Plan”) for the Class A Shares and Class C Shares of the Funds pursuant to Rule 12b-1 under the 1940 Act. Under the Plan, the Distributor is entitled to receive from each Fund a distribution fee with respect to the Shares, which is accrued daily and paid monthly, of up to 0.25% on an annualized basis of the average daily net assets of the Class A Shares and up to 1.00% on an annualized basis of the average daily net assets of the Class C Shares. The actual amount of such compensation under the Plan is agreed upon by the Board and by the Distributor. Because these fees are paid out of each Fund’s assets on an ongoing basis, over time these fees will increase the cost of your investment and may cost you more than paying other types of sales charges. Amounts paid to the Distributor under the Plan may be used by the Distributor to cover expenses that are related to (i) the sale of the Shares, (ii) ongoing servicing and/or maintenance of the accounts of shareholders, and (iii) sub-transfer agency services, subaccounting services or administrative services related to the sale of the Shares, all as set forth in each Fund’s 12b-1 Plan.
34
SUMMIT GLOBAL INVESTMENTS
Notes to Financial Statements (continued)
August 31, 2024
3. DIRECTOR AND OFFICER Compensation
The Directors of the Company receive an annual retainer and meeting fees for meetings attended. An employee of Vigilant Compliance, LLC serves as Chief Compliance Officer of the Company. Vigilant Compliance, LLC is compensated for the services provided to the Company. Employees of RBB serve as President, Chief Financial Officer, Chief Operating Officer, Secretary and Director of Marketing & Business Development of the Company. They are compensated by the Company for services provided. Certain employees of Fund Services serve as officers of the Company. They are not compensated by the Funds or the Company. For Director and Officer compensation amounts, please refer to the Statements of Operations.
4. Purchases and Sales of Investment Securities
During the current fiscal period, aggregate purchases and sales of investment securities (excluding short-term investments) of the Funds were as follows:
FUND | | Purchases | | | Sales | |
SGI U.S. Large Cap Equity Fund | | $ | 517,970,715 | | | $ | 726,825,196 | |
SGI Global Equity Fund | | | 132,702,082 | | | | 196,818,801 | |
SGI Prudent Growth Fund | | | 16,820,687 | | | | 14,284,818 | |
SGI Peak Growth Fund | | | 14,673,379 | | | | 10,064,772 | |
SGI Small Cap Core Fund | | | 250,071,000 | | | | 248,319,094 | |
There were no purchases or sales of long-term U.S. Government securities during the current fiscal period.
5. Federal Income Tax Information
The Funds have followed the authoritative guidance on accounting for and disclosure of uncertainty in tax positions, which requires the Funds to determine whether a tax position is more likely than not to be sustained upon examination, including resolution of any related appeals or litigation processes, based on the technical merits of the position. The Funds have determined that there was no effect on the financial statements from following this authoritative guidance. In the normal course of business, the Funds are subject to examination by federal, state and local jurisdictions, where applicable, for tax years for which applicable statutes of limitations have not expired.
As of August 31, 2024, the federal tax cost and aggregate gross unrealized appreciation and depreciation of investments held by each Fund were as follows:
FUND | | Federal Tax
Cost | | | Unrealized
Appreciation | | | Unrealized
(Depreciation) | | | Net Unrealized
Appreciation/
(Depreciation) | |
SGI U.S. Large Cap Equity Fund | | $ | 199,541,743 | | | $ | 34,789,934 | | | $ | (2,800,568 | ) | | $ | 31,989,366 | |
SGI Global Equity Fund | | | 93,544,581 | | | | 14,809,973 | | | | (2,269,049 | ) | | | 12,540,924 | |
SGI Prudent Growth Fund | | | 23,236,885 | | | | 3,189,908 | | | | (172,947 | ) | | | 3,016,961 | |
SGI Peak Growth Fund | | | 24,123,868 | | | | 4,143,776 | | | | (434,120 | ) | | | 3,709,656 | |
SGI Small Cap Core Fund | | | 107,242,820 | | | | 17,091,856 | | | | (1,756,515 | ) | | | 15,335,341 | |
The difference between the book basis and tax basis cost and aggregate gross unrealized appreciation and depreciation of investments is attributable primarily to timing differences related to wash sales and investments in passive foreign investment companies.
35
SUMMIT GLOBAL INVESTMENTS
Notes to Financial Statements (continued)
August 31, 2024
Distributions to shareholders, if any, from net investment income and realized gains are determined in accordance with federal income tax regulations, which may differ from net investment income and realized gains recognized for financial reporting purposes. Accordingly, the character of distributions and composition of net assets for tax purposes may differ from those reflected in the accompanying financial statements. Any permanent differences resulting from different book and tax treatment are reclassified at year-end and have no impact on net income, NAV or NAV per share of the Funds.
The following permanent differences as of August 31, 2024, primarily attributable to Net Operating Losses and Deemed Distributions due to Shareholder Redemptions, were reclassified among the following accounts:
FUND | | Distributable
Earnings/(loss) | | | Paid-in
Capital | |
SGI U.S. Large Cap Equity Fund | | $ | (34,860,265 | ) | | $ | 34,860,265 | |
SGI Global Equity Fund | | | — | | | | — | |
SGI Prudent Growth Fund | | | 76 | | | | (76 | ) |
SGI Peak Growth Fund | | | — | | | | — | |
SGI Small Cap Core Fund | | | 24,302 | | | | (24,302 | ) |
As of August 31, 2024, the components of distributable earnings on a tax basis were as follows:
FUND | | Undistributed
Ordinary
Income | | | Undistributed
Long-term
capital gains | | | Capital
Loss Carry
Forward | | | Qualified
Late-
Year Loss
Deferral | | | Other
Temporary
Differences | | | Net
Unrealized
Appreciation/
(Depreciation) | |
SGI U.S. Large Cap Equity Fund | | $ | 30,480,926 | | | $ | 8,684,640 | | | $ | — | | | $ | — | | | $ | — | | | $ | 31,989,366 | |
SGI Global Equity Fund | | | 4,396,891 | | | | 12,580,829 | | | | — | | | | — | | | | — | | | | 12,540,924 | |
SGI Prudent Growth Fund | | | 485,985 | | | | 29,896 | | | | — | | | | — | | | | (9,033 | ) | | | 3,016,961 | |
SGI Peak Growth Fund | | | 100,150 | | | | 251,652 | | | | — | | | | — | | | | (11,230 | ) | | | 3,709,656 | |
SGI Small Cap Core Fund | | | 529,604 | | | | — | | | | (450,290 | ) | | | — | | | | — | | | | 15,335,341 | |
The differences between the book and tax basis components of distributable earnings relate primarily to wash sales and investments in passive foreign investment companies.
The tax character of dividends and distributions paid during the fiscal year ended August 31, 2024 was as follows:
| | | | | | | 2024 | | | | | |
FUND | | Ordinary
Income | | | Long-Term
Gains | | | TOTAL | |
SGI U.S. Large Cap Equity Fund | | $ | 3,031,713 | | | $ | 12,258,966 | | | $ | 15,290,679 | |
SGI Global Equity Fund | | | 2,003,073 | | | | — | | | | 2,003,073 | |
SGI Prudent Growth Fund | | | 114,358 | | | | — | | | | 114,358 | |
SGI Peak Growth Fund | | | 14,474 | | | | 117,001 | | | | 131,475 | |
SGI Small Cap Core Fund | | | — | | | | — | | | | — | |
36
SUMMIT GLOBAL INVESTMENTS
Notes to Financial Statements (continued)
August 31, 2024
The tax character of dividends and distributions paid during the fiscal year ended August 31, 2023 was as follows:
| | | | | | | 2023 | | | | | |
FUND | | Ordinary
Income | | | Long-Term
Gains | | | TOTAL | |
SGI U.S. Large Cap Equity Fund | | $ | 4,425,439 | | | $ | 16,298,811 | | | $ | 20,724,250 | |
SGI Global Equity Fund | | | 1,176,535 | | | | 3,052,908 | | | | 4,229,443 | |
SGI Prudent Growth Fund | | | 23,212 | | | | — | | | | 23,212 | |
SGI Peak Growth Fund | | | — | | | | 1,109 | | | | 1,109 | |
SGI Small Cap Core Fund | | | — | | | | 554,990 | | | | 554,990 | |
Dividends from net investment income and short-term capital gains are treated as ordinary income dividends for federal income tax purposes.
Under the Regulated Investment Company Modernization Act of 2010, the Funds are permitted to carry forward capital losses incurred in taxable years beginning after December 22, 2010 for an unlimited period. Additionally, capital losses that are carried forward will retain their character as either short-term or long-term capital losses rather than being considered all short-term as under the previous law. As of August 31, 2024, the SGI Small Cap Core Fund had $450,290 of short-term loss carryovers. During the fiscal year, the SGI Prudent Growth Fund utilized $180,794 and the SGI Small Cap Core Fund utilized $5,472,890 of carry forward capital losses.
Pursuant to federal income tax rules applicable to regulated investment companies, the Funds may elect to treat certain capital losses between November 1 and August 31 and late year ordinary losses ((i) ordinary losses between January 1 and August 31, and (ii) specified ordinary and currency losses between November 1 and August 31) as occurring on the first day of the following tax year. For the fiscal year ended August 31, 2024, any amount of losses elected within the tax return will not be recognized for federal income tax purposes until September 1, 2024.
FUND | | | | | | Late-year
ordinary loss
deferral | | | post-october
capital loss
deferral | |
SGI U.S. Large Cap Equity Fund | | | 2024 | | | $ | — | | | $ | — | |
SGI Global Equity Fund | | | 2024 | | | | — | | | | — | |
SGI Prudent Growth Fund | | | 2024 | | | | — | | | | — | |
SGI Peak Growth Fund | | | 2024 | | | | — | | | | — | |
SGI Small Cap Core Fund | | | 2024 | | | | — | | | | — | |
37
SUMMIT GLOBAL INVESTMENTS
Notes to Financial Statements (Continued)
August 31, 2024
6. TRANSACTIONS WITH AFFILIATES
The following issuers are affiliated with the Funds. Fund of funds are allowed to invest in other investment companies in excess of the limits imposed, if certain requirement, such as being part of the same group of investment companies, are met. As defined in Section (2)(a)(3) of the 1940 Act; such issuers are:
| | | August 31, 2023 | | | Additions | | | Reductions | |
Issuer Name | | Share
Balance | | | Cost | | | Share
Balance | | | Cost | | | Share
Balance | | | Cost | |
SGI Prudent Growth Fund | | | | | | | | | | | | | | | | | | | | | | | | |
SGI Dynamic Tactical ETF | | | 148,890 | | | $ | 3,792,279 | | | | 19,269 | | | $ | 515,703 | | | | (124,699 | ) | | $ | (3,204,968 | ) |
SGI Enhanced Core ETF | | | — | | | | — | | | | 101,600 | | | | 2,554,682 | | | | (12,990 | ) | | | (329,591 | ) |
SGI Enhanced Global Income ETF | | | — | | | | — | | | | 93,670 | | | | 2,409,572 | | | | (3,330 | ) | | | (87,660 | ) |
SGI Global Equity Fund | | | 141,279 | | | | 4,638,412 | | | | 20,444 | | | | 727,075 | | | | (102,160 | ) | | | (3,509,307 | ) |
SGI Small Cap Core Fund | | | 69,840 | | | | 2,021,405 | | | | 41,190 | | | | 1,166,426 | | | | (43,925 | ) | | | (1,439,874 | ) |
SGI U.S. Large Cap Core ETF | | | 72,890 | | | | 1,876,034 | | | | 11,993 | | | | 372,499 | | | | (16,723 | ) | | | (482,335 | ) |
SGI U.S. Large Cap Equity Fund | | | 140,420 | | | | 2,510,834 | | | | 269,722 | | | | 5,296,890 | | | | (34,661 | ) | | | (699,089 | ) |
SGI U.S. Small Cap Equity Fund | | | 72,077 | | | | 738,593 | | | | 7,809 | | | | 86,609 | | | | (79,886 | ) | | | (825,202 | ) |
| | | | 645,396 | | | $ | 15,577,557 | | | | 565,697 | | | $ | 13,129,456 | | | | (418,374 | ) | | $ | (10,578,026 | ) |
Issuer Name | | Share
Balance | | | Cost | | | Share
Balance | | | Cost | | | Share
Balance | | | Cost | |
SGI Peak Growth Fund | | | | | | | | | | | | | | | | | | | | | | | | |
SGI Dynamic Tactical ETF | | | 75,030 | | | $ | 1,904,297 | | | | 17,000 | | | $ | 460,681 | | | | (2,920 | ) | | $ | (77,430 | ) |
SGI Enhanced Core ETF | | | — | | | | — | | | | 10,750 | | | | 270,211 | | | | — | | | | — | |
SGI Enhanced Global Income ETF | | | — | | | | — | | | | 155,590 | | | | 4,002,371 | | | | — | | | | — | |
SGI Global Equity Fund | | | 169,059 | | | | 5,518,092 | | | | 45,130 | | | | 1,617,928 | | | | (116,194 | ) | | | (4,053,117 | ) |
SGI Small Cap Core Fund | | | 149,014 | | | | 4,229,239 | | | | 84,579 | | | | 2,417,378 | | | | (83,389 | ) | | | (2,654,799 | ) |
SGI U.S. Large Cap Core ETF | | | 55,530 | | | | 1,425,836 | | | | 50,025 | | | | 1,611,804 | | | | (2,945 | ) | | | (83,626 | ) |
SGI U.S. Large Cap Equity Fund | | | 192,484 | | | | 3,461,172 | | | | 206,384 | | | | 4,024,159 | | | | (19,033 | ) | | | (384,448 | ) |
SGI U.S. Small Cap Equity Fund | | | 100,486 | | | | 1,018,503 | | | | 11,230 | | | | 125,469 | | | | (111,716 | ) | | | (1,143,972 | ) |
| | | | 741,603 | | | $ | 17,557,139 | | | | 580,688 | | | $ | 14,530,001 | | | | (336,197 | ) | | $ | (8,397,392 | ) |
38
SUMMIT GLOBAL INVESTMENTS
Notes to Financial Statements (Continued)
August 31, 2024
| | | August 31, 2024 | |
Issuer Name | | Dividend
Income | | | Capital
Gain
Distribution | | | Net Change in
Unrealized
Appreciation/
(Depreciation) | | | Realized
Gain/(Loss) | | | Share
Balance | | | Value | | | Cost | |
SGI Prudent Growth Fund | | | | | | | | | | | | | | | | | | | | | | | | | | | | |
SGI Dynamic Tactical ETF | | $ | 38,005 | | | $ | — | | | $ | 137,516 | | | $ | 345,825 | | | | 43,460 | | | $ | 1,326,834 | | | $ | 1,103,014 | |
SGI Enhanced Core ETF | | | 20,010 | | | | — | | | | 61,048 | | | | 908 | | | | 88,610 | | | | 2,286,138 | | | | 2,225,091 | |
SGI Enhanced Global Income ETF | | | 16,336 | | | | — | | | | 92,876 | | | | (1,344 | ) | | | 90,340 | | | | 2,414,788 | | | | 2,321,912 | |
SGI Global Equity Fund | | | 67,242 | | | | — | | | | 367,152 | | | | 337,692 | | | | 59,562 | | | | 2,403,963 | | | | 1,856,181 | |
SGI Small Cap Core Fund | | | — | | | | — | | | | 518,988 | | | | (115,793 | ) | | | 67,104 | | | | 2,166,132 | | | | 1,747,957 | |
SGI U.S. Large Cap Core ETF | | | 5,702 | | | | 28,170 | | | | 470,532 | | | | 59,882 | | | | 68,160 | | | | 2,401,618 | | | | 1,766,199 | |
SGI U.S. Large Cap Equity Fund | | | 25,508 | | | | 102,169 | | | | 1,037,584 | | | | (14,652 | ) | | | 375,480 | | | | 8,162,944 | | | | 7,108,635 | |
SGI U.S. Small Cap Equity Fund | | | 5,484 | | | | 7,899 | | | | (88,133 | ) | | | 141,421 | | | | — | | | | — | | | | — | |
| | | $ | 178,287 | | | $ | 138,238 | | | $ | 2,597,563 | | | $ | 753,939 | | | | 792,716 | | | $ | 21,162,417 | | | $ | 18,128,989 | |
| | | | | | | | | | | | | | | | | | | | | | | | | | | | | |
39
SUMMIT GLOBAL INVESTMENTS
Notes to Financial Statements (CONCLUDED)
August 31, 2024
| | | August 31, 2024 | |
Issuer Name | | Dividend
Income | | | Capital
Gain
Distribution | | | Net Change in
Unrealized
Appreciation/
(Depreciation) | | | Realized
Gain/(Loss) | | | Share
Balance | | | Value | | | Cost | |
SGI Peak Growth Fund | | | | | | | | | | | | | | | | | | | | | | | | | | | | |
SGI Dynamic Tactical ETF | | $ | 19,685 | | | $ | — | | | $ | 382,744 | | | $ | 1,880 | | | | 89,110 | | | $ | 2,720,528 | | | $ | 2,287,548 | |
SGI Enhanced Core ETF | | | 2,322 | | | | | | | | 7,139 | | | | — | | | | 10,750 | | | | 277,350 | | | | 270,211 | |
SGI Enhanced Global Income ETF | | | 27,956 | | | | | | | | 156,550 | | | | — | | | | 155,590 | | | | 4,158,921 | | | | 4,002,371 | |
SGI Global Equity Fund | | | 82,669 | | | | — | | | | 623,663 | | | | 312,427 | | | | 97,995 | | | | 3,955,071 | | | | 3,082,903 | |
SGI Small Cap Core Fund | | | — | | | | — | | | | 988,112 | | | | (140,893 | ) | | | 150,204 | | | | 4,848,588 | | | | 3,991,818 | |
SGI U.S. Large Cap Core ETF | | | 4,405 | | | | 21,760 | | | | 532,445 | | | | 5,759 | | | | 102,610 | | | | 3,615,463 | | | | 2,954,014 | |
SGI U.S. Large Cap Equity Fund | | | 35,670 | | | | 145,631 | | | | 1,153,186 | | | | (18,605 | ) | | | 379,835 | | | | 8,257,603 | | | | 7,100,882 | |
SGI U.S. Small Cap Equity Fund | | | 7,669 | | | | 11,046 | | | | (134,076 | ) | | | 207,800 | | | | — | | | | — | | | | — | |
| | | $ | 180,376 | | | $ | 178,437 | | | $ | 3,709,763 | | | $ | 368,368 | | | | 986,094 | | | $ | 27,833,524 | | | $ | 23,689,747 | |
7. SUBSEQUENT EVENTS
Management has evaluated the impact of all subsequent events on the Funds through the date the financial statements were issued and has determined that there were no significant events requiring recognition or disclosure in the financial statements.
40
SUMMIT GLOBAL INVESTMENTS
REPORT OF INDEPENDENT REGISTERED PUBLIC ACCOUNTING FIRM
To the Shareholders of SGI U.S. Large Cap Equity Fund, SGI Global Equity Fund, SGI Prudent Growth Fund, SGI Peak Growth Fund, and SGI Small Cap Core Fund, and Board of Directors of The RBB Fund, Inc.
Opinion on the Financial Statements
We have audited the accompanying statements of assets and liabilities of SGI U.S. Large Cap Equity Fund, SGI Global Equity Fund, SGI Prudent Growth Fund, SGI Peak Growth Fund, and SGI Small Cap Core Fund (collectively referred to as the “Funds”) (five of the portfolios constituting The RBB Fund, Inc. (the “Company”)), including the portfolios of investments, as of August 31, 2024, and the related statements of operations and changes in net assets, and the financial highlights for each of the periods indicated in the table below and the related notes (collectively referred to as the “financial statements”). In our opinion, the financial statements present fairly, in all material respects, the financial position of each of the Funds (five of the portfolios constituting The RBB Fund, Inc.) at August 31, 2024, and the results of their operations, changes in net assets and financial highlights for each of the periods indicated in the table below, in conformity with U.S. generally accepted accounting principles.
Individual portfolio
constituting The RBB Fund, Inc. | Statement of
operations | Statements of changes
in net assets | Financial highlights |
SGI U.S. Large Cap Equity Fund SGI Global Equity Fund | For the year ended August 31, 2024 | For each of the two years in the period ended August 31, 2024 | For each of the five years in the period ended August 31, 2024 |
SGI Small Cap Core Fund | For the year ended August 31, 2024 | For each of the two years in the period ended August 31, 2024 | For each of the four years in the period ended August 31, 2024 |
SGI Prudent Growth Fund SGI Peak Growth Fund | For the year ended August 31, 2024 | For each of the two years in the period ended August 31, 2024 | For each of the four years in the period ended August 31, 2024 and the period June 8, 2020 (commencement of operations) through August 31, 2020 |
The financial highlights of SGI Small Cap Core Fund for each of the periods presented through August 31, 2020, were audited by other auditors whose report dated October 27, 2020, expressed an unqualified opinion on those financial statements.
Basis for Opinion
These financial statements are the responsibility of the Company’s management. Our responsibility is to express an opinion on each of the Funds’ financial statements based on our audits. We are a public accounting firm registered with the Public Company Accounting Oversight Board (United States) (“PCAOB”) and are required to be independent with respect to the Company in accordance with the U.S. federal securities laws and the applicable rules and regulations of the Securities and Exchange Commission and the PCAOB.
We conducted our audits in accordance with the standards of the PCAOB. Those standards require that we plan and perform the audit to obtain reasonable assurance about whether the financial statements are free of material misstatement, whether due to error or fraud. The Company is not required to have, nor were we engaged to perform, an audit of the Company’s internal control over financial reporting. As part of our audits, we are required to obtain an understanding of internal control over financial reporting but not for the purpose of expressing an opinion on the effectiveness of the Company’s internal control over financial reporting. Accordingly, we express no such opinion.
Our audits included performing procedures to assess the risks of material misstatement of the financial statements, whether due to error or fraud, and performing procedures that respond to those risks. Such procedures included examining, on a test basis, evidence regarding the amounts and disclosures in the financial statements. Our procedures
41
SUMMIT GLOBAL INVESTMENTS
REPORT OF INDEPENDENT REGISTERED PUBLIC ACCOUNTING FIRM (Concluded)
included confirmation of securities owned as of August 31, 2024, by correspondence with the custodian. Our audits also included evaluating the accounting principles used and significant estimates made by management, as well as evaluating the overall presentation of the financial statements. We believe that our audits provide a reasonable basis for our opinion.

We have served as the auditor of one or more Summit Global Investments investment companies since 2012.
Philadelphia, Pennsylvania
October 30, 2024
42
SUMMIT GLOBAL INVESTMENTS
SHAREHOLDER TAX INFORMATION (UNAUDITED)
Certain tax information is required to be provided to shareholders based upon the Funds’ income and distributions for the taxable year ended August 31, 2024. The information and distributions reported herein may differ from information and distributions taxable to the shareholders for the calendar year ending December 31, 2024. During the fiscal year ended August 31, 2024, the tax character of distributions paid by the Funds were as follows:
FUND | | | | | | Ordinary Income | | | Long-Term
Gains | |
SGI U.S. Large Cap Equity Fund | | | 2024 | | | $ | 3,031,713 | | | $ | 12,258,966 | |
SGI Global Equity Fund | | | 2024 | | | | 2,003,073 | | | | — | |
SGI Prudent Growth Fund | | | 2024 | | | | 114,358 | | | | — | |
SGI Peak Growth Fund | | | 2024 | | | | 14,474 | | | | 117,001 | |
SGI Small Cap Core Fund | | | 2024 | | | | — | | | | — | |
Distributions from net investment income and short-term capital gains are treated as ordinary income for federal income tax purposes.
Under the Jobs and Growth Tax Relief Reconciliation Act of 2003, the following percentages of ordinary dividends paid during the fiscal year ended August 31, 2024 are designated as “qualified dividend income,” as defined in the Act, and are subject to reduced tax rates:
SGI U.S. Large Cap Equity Fund | | | 69.10 | % |
SGI Global Equity Fund | | | 53.70 | % |
SGI Prudent Growth Fund | | | 12.69 | % |
SGI Peak Growth Fund | | | 85.38 | % |
SGI Small Cap Core Fund | | | 0.00 | % |
The percentage of total ordinary income dividends paid qualifying for corporate dividends received deduction for each Fund is as follows:
SGI U.S. Large Cap Equity Fund | | | 69.03 | % |
SGI Global Equity Fund | | | 25.74 | % |
SGI Prudent Growth Fund | | | 7.60 | % |
SGI Peak Growth Fund | | | 39.91 | % |
SGI Small Cap Core Fund | | | 0.00 | % |
The percentage of qualified interest income related dividends not subject to withholding tax for non-resident aliens and foreign corporations is as follows:
SGI U.S. Large Cap Equity Fund | | | 0.00 | % |
SGI Global Equity Fund | | | 0.00 | % |
SGI Prudent Growth Fund | | | 0.00 | % |
SGI Peak Growth Fund | | | 0.00 | % |
SGI Small Cap Core Fund | | | 0.00 | % |
43
SUMMIT GLOBAL INVESTMENTS
SHAREHOLDER TAX INFORMATION (UNAUDITED) (Concluded)
The percentage of ordinary income distributions designated as qualified short-term gains pursuant to the American Job Creation Act of 2004 is as follows:
SGI U.S. Large Cap Equity Fund | | | 0.00 | % |
SGI Global Equity Fund | | | 0.00 | % |
SGI Prudent Growth Fund | | | 17.80 | % |
SGI Peak Growth Fund | | | 0.00 | % |
SGI Small Cap Core Fund | | | 0.00 | % |
Because the Funds’ fiscal year is not the calendar year, another notification will be sent with respect to calendar year 2024. The second notification, which will reflect the amount, if any, to be used by calendar year taxpayers on their U.S. federal income tax returns, will be made in conjunction with Form 1099-DIV and will be mailed in January 2025.
Foreign shareholders will generally be subject to U.S. withholding tax on the amount of their ordinary income dividends. They will generally not be entitled to a foreign tax credit or deduction for the withholding taxes paid by the Funds, if any.
In general, dividends received by tax-exempt recipients (e.g., IRAs and Keoghs) need not be reported as taxable income for U.S. federal income tax purposes. However, some retirement trusts (e.g., corporate, Keogh and 403(b)(7) plans) may need this information for their annual information reporting.
Shareholders are advised to consult their own tax advisers with respect to the tax consequences of their investment in the Funds.
44
SUMMIT GLOBAL INVESTMENTS
Other Information (Unaudited)
APPROVAL OF INVESTMENT ADVISORY AGREEMENT
As required by the 1940 Act, the Board, including all of the Directors who are not “interested persons” of the Company, as that term is defined in the 1940 Act (the “Independent Directors”), considered the renewal of the investment advisory agreements between Summit Global Investments, LLC (“Summit”) and the Company (the “Investment Advisory Agreements”) on behalf of the SGI U.S. Large Cap Equity Fund, SGI Global Equity Fund, SGI Peak Growth Fund, SGI Prudent Growth Fund, and SGI Small Cap Core Fund (each a “Fund” and together the “Funds”), at a meeting of the Board held on May 15-16, 2024 (for this section only, the “Meeting”). At the Meeting, the Board, including all of the Independent Directors, approved the Investment Advisory Agreements for an additional one-year term ending August 16, 2025. The Board’s decision to approve the Investment Advisory Agreements reflects the exercise of its business judgment to continue the existing arrangement. In approving the Investment Advisory Agreements, the Board considered information provided by Summit with the assistance and advice of counsel to the Independent Directors and the Company.
In considering the renewal and approval of the Investment Advisory Agreements between the Company and Summit with respect to the Funds, the Directors took into account all the materials provided prior to and during the Meeting and at other meetings throughout the past year, the presentations made during the Meeting, and the discussions held during the Meeting. The Directors reviewed these materials with management of Summit, and discussed the Investment Advisory Agreements with counsel in executive sessions, at which no representatives of Summit were present. Among other things, the Directors considered (i) the nature, extent, and quality of Summit’s services provided to the Funds; (ii) descriptions of the experience and qualifications of Summit’s personnel providing those services; (iii) Summit’s investment philosophies and processes; (iv) Summit’s assets under management and client descriptions; (v) Summit’s soft dollar commission and trade allocation policies, including information on the types of research and services obtained in connection with soft dollar commissions; (vi) Summit’s current advisory fee arrangement with the Company and other similarly managed clients; (vii) Summit’s compliance procedures; (viii) Summit’s financial information, insurance coverage and profitability analysis related to providing advisory services to the Funds; (ix) the extent to which economies of scale are relevant to the Funds; (x) a report prepared by FUSE Research Network, LLC comparing each Fund’s management fees and total expense ratios to a group of mutual funds deemed comparable to the Fund based primarily on investment strategy similarity (“Peer Group”) and comparing the performance of each Fund to the performance of its Peer Group; and (xi) a report comparing the performance of each Fund to the performance of its benchmark.
As part of their review, the Directors considered the nature, extent and quality of the services provided by Summit. The Directors concluded that Summit had substantial resources to provide services to the Funds and that Summit’s services had been acceptable.
The Directors also considered the investment performance of the Funds. Information on the Funds’ investment performance was provided for the three-month, one-year, three-year, five-year, ten-year, and since inception periods ended December 31, 2023, as applicable. The Directors considered the Funds’ investment performance in light of their respective investment objectives and investment strategies. The Directors concluded that the investment performance of each of the Funds as compared to their respective benchmarks and Peer Groups was acceptable.
The Directors noted that the SGI U.S. Large Cap Equity Fund outperformed its benchmark, the S&P 500® Low Volatility Index, for the three-month, one-year, five-year, and ten-year periods ended December 31, 2023 and underperformed its benchmark for the three-year and since inception periods ended December 31, 2023. The Directors also noted that the SGI U.S. Large Cap Equity Fund underperformed the median of its Peer Group for the three-month, one-year, three-year, five-year, ten-year, and since-inception periods ended December 31, 2023.
The Directors noted that the SGI Global Equity Fund’s investment performance outperformed its benchmark, the MSCI ACWI Minimum Volatility (USD) Index, for the three-month, one-year, three-year, five-year, and since-inception periods ended December 31, 2023, and underperformed its benchmark for the ten-year period ended December 31,
45
SUMMIT GLOBAL INVESTMENTS
Other Information (Unaudited) (Concluded)
2023. The Directors also noted that the SGI Global Equity Fund outperformed the median of its Peer Group for the since-inception period ended December 31, 2023, and underperformed the median of its Peer Group for the three-month, one-year, three-year, five-year, and ten-year periods ended December 31, 2023.
The Directors noted that the SGI Small Cap Core Fund’s investment performance outperformed its benchmark, the Russell 2000® Index, for the three-month, one-year, three-year, five-year, ten-year, and since-inception periods ended December 31, 2023. The Directors also noted that the SGI Small Cap Core Fund outperformed the median of its Peer Group for the three-month, one-year, five-year, ten-year, and since-inception periods ended December 31, 2023, and underperformed the median of its Peer Group for the three-year period ended December 31, 2023.
Next, the Directors noted that the SGI Peak Growth Fund’s investment performance underperformed its benchmark, the S&P 500 Index, for the three-month, one-year, three-year and since-inception periods ended December 31, 2023. The Directors also noted that the SGI Peak Growth Fund underperformed the median of its Peer Group for the three-month, one-year, three-year and since-inception periods ended December 31, 2023.
Finally, the Directors noted that the SGI Prudent Growth Fund’s investment performance underperformed its benchmark, the S&P 500 Index, for the three-month, one-year, three-year and since-inception periods ended December 31, 2023. The Directors also noted that the SGI Prudent Growth Fund underperformed the median of its Peer Group for the three-month, one-year, three-year and since-inception periods ended December 31, 2023.
The Board also considered the advisory fee rates payable by the Funds under the Investment Advisory Agreements. In this regard, information on the fees paid by the Funds and the Funds’ total operating expense ratios (before and after fee waivers and expense reimbursements) were compared to similar information for mutual funds advised by other, unaffiliated investment advisory firms. The Directors noted that Summit had contractually agreed to waive management fees and reimburse expenses through at least December 31, 2024 for the Funds to limit total annual operating expenses to agreed upon levels for each Fund.
The Directors noted that the SGI U.S. Large Cap Equity Fund’s net advisory fee and total net expenses were each above the median of its Peer Group and each ranked in the 5th quintile of its Peer Group.
The Directors noted that the SGI Global Equity Fund’s net advisory fee was above the median of its Peer Group and ranked in the 3rd quintile of its Peer Group, and its total net expenses was above the median of its Peer Group and ranked in the 3rd quintile of its Peer Group.
The Directors noted that the SGI Small Cap Core Fund’s net advisory fee and total net expenses were each above the median of its Peer Group and each ranked in the 5th quintile of its Peer Group.
The Directors noted that the net advisory fee of the SGI Peak Growth Fund ranked below the median and in the 3rd quintile of its Peer Group, and the Fund’s total net expenses (including acquired fund fees and expenses) were above the median and in the 5th quintile of its Peer Group.
The Directors noted that the net advisory fee of the SGI Prudent Growth Fund ranked above the median and in the 5th quintile of its Peer Group, and the Fund’s total net expenses (including acquired fund fees and expenses) were above the median and in the 5th quintile of its Peer Group.
After reviewing information relating to Summit’s costs, profitability and economies of scale, and after considering the services to be provided by Summit, the Directors concluded that the investment advisory fees to be paid by the Funds to Summit were fair and reasonable and that the Investment Advisory Agreements should be approved and continued for an additional one-year period ending August 16, 2025.
46
Investment Adviser
Summit Global Investments, LLC
620 South Main Street
Bountiful, UT 84010
Administrator and Transfer Agent
U.S. Bancorp Fund Services, LLC
P.O. Box 701
Milwaukee, WI 53201
Principal Underwriter
Quasar Distributors, LLC
3 Canal Plaza, Suite 100
Portland, ME 04101
Custodian
U.S. Bank, N.A.
1555 North Rivercenter Drive, Suite 302
Milwaukee, WI 53212
Independent Registered Public Accounting Firm
Ernst & Young LLP
One Commerce Square
2005 Market Street, Suite 700
Philadelphia, PA 19103
Legal Counsel
Faegre Drinker Biddle & Reath LLP
One Logan Square, Suite 2000
Philadelphia, PA 19103-6996

SGI U.S. LARGE CAP CORE ETF
SGI DYNAMIC TACTICAL ETF
SGI ENHANCED GLOBAL INCOME ETF
SGI ENHANCED CORE ETF
SGI ENHANCED NASDAQ-100 ETF
of
The RBB Fund, Inc.
Financial Statements
August 31, 2024
This report is submitted for the general information of the shareholders of the Funds and may not be used as sales literature unless preceded or accompanied by a current prospectus for the Funds.
SGI U.S. LARGE CAP CORE ETF
Portfolio of Investments
August 31, 2024
| | | Shares | | | Value | |
COMMON STOCKS — 97.5% |
Aerospace/Defense — 0.4% |
TransDigm Group, Inc. | | | 247 | | | $ | 339,183 | |
Auto Manufacturers — 0.8% |
Cummins, Inc. | | | 597 | | | | 186,771 | |
Ford Motor Co. | | | 14,976 | | | | 167,581 | |
General Motors Co. | | | 3,915 | | | | 194,889 | |
PACCAR, Inc. | | | 1,742 | | | | 167,546 | |
| | | | | | | | 716,787 | |
Banks — 2.1% |
Bank of America Corp. | | | 33,933 | | | | 1,382,770 | |
Citigroup, Inc. | | | 3,015 | | | | 188,859 | |
JPMorgan Chase & Co. | | | 842 | | | | 189,282 | |
Popular, Inc. | | | 1,868 | | | | 191,470 | |
| | | | | | | | 1,952,381 | |
Beverages — 0.5% |
Coca-Cola Co. | | | 6,330 | | | | 458,735 | |
Biotechnology — 4.6% |
Regeneron Pharmaceuticals, Inc.(a) | | | 1,895 | | | | 2,244,988 | |
United Therapeutics Corp.(a) | | | 4,915 | | | | 1,786,848 | |
Vertex Pharmaceuticals, Inc.(a) | | | 435 | | | | 215,712 | |
| | | | | | | | 4,247,548 | |
Building Materials — 1.4% |
Louisiana-Pacific Corp. | | | 1,918 | | | | 186,142 | |
Owens Corning | | | 4,488 | | | | 757,260 | |
Trane Technologies PLC | | | 908 | | | | 328,387 | |
| | | | | | | | 1,271,789 | |
Chemicals — 0.5% |
LyondellBasell Industries NV - Class A | | | 4,348 | | | | 429,148 | |
Commercial Services — 1.9% |
Automatic Data Processing, Inc. | | | 6,306 | | | | 1,739,889 | |
Cosmetics & Personal Care — 0.8% |
Colgate-Palmolive Co. | | | 6,667 | | | | 710,036 | |
Distribution/Wholesale — 0.2% |
WW Grainger, Inc. | | | 179 | | | | 176,301 | |
Diversified Financial Services — 4.4% |
American Express Co. | | | 773 | | | | 199,936 | |
Ameriprise Financial, Inc. | | | 435 | | | | 195,506 | |
Interactive Brokers Group, Inc., Class A - Class A | | | 1,467 | | | | 189,082 | |
Mastercard, Inc. - Class A | | | 6,734 | | | | 3,254,812 | |
Synchrony Financial | | | 3,850 | | | | 193,501 | |
| | | | | | | | 4,032,837 | |
Electric — 1.1% |
American Electric Power Co., Inc. | | | 1,860 | | | | 186,521 | |
Exelon Corp. | | | 7,966 | | | | 303,425 | |
Sempra | | | 6,635 | | | | 545,264 | |
| | | | | | | | 1,035,210 | |
Electronics — 0.2% |
Amphenol Corp. - Class A | | | 2,740 | | | $ | 184,813 | |
Environmental Control — 0.3% |
Waste Management, Inc. | | | 1,479 | | | | 313,607 | |
Food — 4.0% |
Kroger Co., (The) | | | 29,768 | | | | 1,583,955 | |
Pilgrim’s Pride Corp.(a) | | | 36,104 | | | | 1,681,724 | |
Sysco Corp. | | | 4,941 | | | | 385,250 | |
| | | | | | | | 3,650,929 | |
Freight & Logistics — 1.9% |
CSX Corp. | | | 6,026 | | | | 206,511 | |
FedEx Corp. | | | 651 | | | | 194,499 | |
Union Pacific Corp. | | | 5,305 | | | | 1,358,558 | |
| | | | | | | | 1,759,568 | |
Healthcare-Products — 0.2% |
Intuitive Surgical, Inc.(a) | | | 372 | | | | 183,258 | |
Healthcare-Services — 2.6% |
Centene Corp.(a) | | | 2,516 | | | | 198,336 | |
Elevance Health, Inc. | | | 1,076 | | | | 599,214 | |
HCA Healthcare, Inc. | | | 595 | | | | 235,376 | |
Humana, Inc. | | | 2,588 | | | | 917,368 | |
Medpace Holdings, Inc.(a) | | | 470 | | | | 166,977 | |
Universal Health Services, Inc. - Class B | | | 1,071 | | | | 254,866 | |
| | | | | | | | 2,372,137 | |
Home Builders — 1.4% |
DR Horton, Inc. | | | 1,274 | | | | 240,480 | |
Lennar Corp. - Class A | | | 3,662 | | | | 666,704 | |
NVR, Inc.(a) | | | 20 | | | | 183,449 | |
PulteGroup, Inc. | | | 1,553 | | | | 204,453 | |
| | | | | | | | 1,295,086 | |
Insurance — 9.2% |
Allstate Corp., (The) | | | 16,727 | | | | 3,160,399 | |
American Financial Group, Inc. | | | 4,042 | | | | 540,092 | |
American International Group, Inc. | | | 2,439 | | | | 187,925 | |
Arch Capital Group Ltd.(a) | | | 3,864 | | | | 436,980 | |
Berkshire Hathaway, Inc. - Class B(a) | | | 1,608 | | | | 765,279 | |
Everest Group Ltd. | | | 502 | | | | 196,904 | |
Hartford Financial Services Group Inc., (The) | | | 1,956 | | | | 227,092 | |
MetLife, Inc. | | | 2,469 | | | | 191,298 | |
Progressive Corp. | | | 9,684 | | | | 2,442,305 | |
Prudential Financial, Inc. | | | 1,425 | | | | 172,653 | |
Unum Group | | | 3,955 | | | | 219,463 | |
| | | | | | | | 8,540,390 | |
Machinery-Construction & Mining — 0.2% |
Caterpillar, Inc. | | | 597 | | | | 212,592 | |
The accompanying notes are an integral part of the financial statements.
1
SGI U.S. LARGE CAP CORE ETF
Portfolio of Investments (Continued)
August 31, 2024
| | | Shares | | | Value | |
Media — 0.5% |
Comcast Corp. - Class A | | | 6,014 | | | $ | 237,974 | |
Walt Disney Co. | | | 2,095 | | | | 189,346 | |
| | | | | | | | 427,320 | |
Mining — 0.4% |
Freeport-McMoRan, Inc. | | | 3,846 | | | | 170,301 | |
Newmont Corp. | | | 4,259 | | | | 227,388 | |
| | | | | | | | 397,689 | |
Oil & Gas — 1.2% |
Chord Energy Corp. | | | 1,184 | | | | 175,741 | |
ConocoPhillips | | | 1,635 | | | | 186,047 | |
Diamondback Energy, Inc. | | | 1,056 | | | | 206,036 | |
EOG Resources, Inc. | | | 1,664 | | | | 214,356 | |
Matador Resources Co. | | | 3,422 | | | | 194,096 | |
Ovintiv, Inc. | | | 4,160 | | | | 178,173 | |
| | | | | | | | 1,154,449 | |
Online Services — 14.4% |
Alphabet, Inc. - Class A | | | 26,370 | | | | 4,308,331 | |
Amazon.com, Inc.(a) | | | 24,369 | | | | 4,349,867 | |
Booking Holdings, Inc. | | | 48 | | | | 187,643 | |
Meta Platforms, Inc. - Class A | | | 7,264 | | | | 3,786,796 | |
Netflix, Inc.(a) | | | 278 | | | | 194,975 | |
Spotify Technology SA(a) | | | 1,415 | | | | 485,175 | |
| | | | | | | | 13,312,787 | |
Pharmaceuticals — 3.9% |
AbbVie, Inc. | | | 1,200 | | | | 235,572 | |
The Cigna Group | | | 554 | | | | 200,443 | |
Eli Lilly & Co. | | | 2,193 | | | | 2,105,324 | |
Neurocrine Biosciences, Inc.(a) | | | 8,539 | | | | 1,084,965 | |
| | | | | | | | 3,626,304 | |
Real Estate — 0.2% |
CBRE Group, Inc. - Class A(a) | | | 1,781 | | | | 205,064 | |
REITS — 2.5% |
Host Hotels & Resorts, Inc. | | | 10,108 | | | | 178,911 | |
Simon Property Group, Inc. | | | 12,791 | | | | 2,140,574 | |
| | | | | | | | 2,319,485 | |
Retail — 4.9% |
Bath & Body Works, Inc. | | | 5,374 | | | | 165,304 | |
Costco Wholesale Corp. | | | 2,602 | | | | 2,321,973 | |
Ferguson Enterprises, Inc. | | | 870 | | | | 178,968 | |
Home Depot, Inc. | | | 1,597 | | | | 588,494 | |
Ross Stores, Inc. | | | 2,150 | | | | 323,812 | |
Target Corp. | | | 1,161 | | | | 178,353 | |
Texas Roadhouse, Inc. | | | 1,078 | | | | 181,913 | |
TJX Cos., Inc. | | | 1,679 | | | | 196,896 | |
Walmart, Inc. | | | 2,780 | | | | 214,699 | |
Wingstop, Inc. | | | 495 | | | | 191,124 | |
| | | | | | | | 4,541,536 | |
Semiconductors — 13.8% |
Advanced Micro Devices, Inc.(a) | | | 1,506 | | | $ | 223,731 | |
Amkor Technology, Inc. | | | 5,629 | | | | 185,194 | |
Applied Materials, Inc. | | | 9,118 | | | | 1,798,617 | |
Broadcom, Inc. | | | 2,128 | | | | 346,481 | |
KLA Corp. | | | 273 | | | | 223,704 | |
Lam Research Corp. | | | 1,958 | | | | 1,607,538 | |
Monolithic Power Systems, Inc. | | | 222 | | | | 207,499 | |
NVIDIA Corp. | | | 42,322 | | | | 5,051,977 | |
QUALCOMM, Inc. | | | 17,549 | | | | 3,076,340 | |
| | | | | | | | 12,721,081 | |
Software — 11.7% |
Adobe, Inc.(a) | | | 865 | | | | 496,865 | |
AppLovin Corp. - Class A(a) | | | 2,247 | | | | 208,679 | |
Autodesk, Inc.(a) | | | 729 | | | | 188,374 | |
Intuit, Inc. | | | 535 | | | | 337,189 | |
Microsoft Corp. | | | 13,733 | | | | 5,728,584 | |
Oracle Corp. | | | 1,322 | | | | 186,785 | |
Salesforce.com, Inc. | | | 752 | | | | 190,181 | |
ServiceNow, Inc.(a) | | | 532 | | | | 454,860 | |
Veeva Systems, Inc. - Class A(a) | | | 12,210 | | | | 2,642,732 | |
Workday, Inc. - Class A(a) | | | 745 | | | | 196,076 | |
Zoom Video Communications, Inc. - Class A(a) | | | 2,422 | | | | 167,312 | |
| | | | | | | | 10,797,637 | |
Technology — 4.6% |
Apple, Inc. | | | 16,867 | | | | 3,862,543 | |
Cognizant Technology Solutions Corp. - Class A | | | 2,387 | | | | 185,637 | |
Leidos Holdings, Inc. | | | 1,246 | | | | 197,503 | |
| | | | | | | | 4,245,683 | |
Telecommunications — 0.7% |
Arista Networks, Inc.(a) | | | 1,709 | | | | 603,926 | |
TOTAL COMMON STOCKS (Cost $84,624,724) | | | | | | | 89,975,185 | |
| |
The accompanying notes are an integral part of the financial statements.
2
SGI U.S. LARGE CAP CORE ETF
Portfolio of Investments (CONCLUDED)
August 31, 2024
| | | Shares | | | Value | |
EXCHANGE TRADED FUNDS — 1.2% |
iShares Core S&P 500 ETF | | | 1,952 | | | $ | 1,106,296 | |
TOTAL EXCHANGE TRADED FUNDS (Cost $1,098,057) | | | | | | | 1,106,296 | |
TOTAL INVESTMENTS — 98.7% (Cost $85,722,781) | | | | | | | 91,081,481 | |
Other Assets in Excess of Liabilities — 1.3% | | | | | | | 1,210,089 | |
TOTAL NET ASSETS — 100.0% | | | | | | $ | 92,291,570 | |
Percentages are stated as a percent of net assets.
ETF - Exchange-Traded Fund
NV - Naamloze Vennootschap
PLC - Public Limited Company
REIT - Real Estate Investment Trust
SA - Sociedad Anónima
(a) | Non-income producing security. |
The accompanying notes are an integral part of the financial statements.
3
SGI DYNAMIC TACTICAL ETF
Portfolio of Investments
August 31, 2024
| | | Shares | | | Value | |
EXCHANGE TRADED FUNDS — 99.7% |
iShares Core MSCI EAFE ETF | | | 39,707 | | | $ | 3,064,983 | |
iShares Core U.S. Aggregate Bond ETF | | | 120,602 | | | | 12,090,351 | |
iShares MSCI USA Min Vol Factor ETF | | | 65,812 | | | | 6,009,952 | |
PGIM Ultra Short Bond ETF | | | 57,505 | | | | 2,862,024 | |
Schwab US Dividend Equity ETF | | | 56,865 | | | | 4,806,798 | |
SGI Enhanced Nasdaq-100 ETF(a)(b) | | | 206,880 | | | | 5,263,151 | |
SGI U.S. Large Cap Core ETF(b)(c) | | | 598,640 | | | | 21,093,080 | |
Vanguard Small-Cap ETF | | | 18,118 | | | | 4,229,104 | |
TOTAL EXCHANGE TRADED FUNDS (Cost $54,134,107) | | | | | | | 59,419,443 | |
TOTAL INVESTMENTS — 99.7% (Cost $54,134,107) | | | | | | | 59,419,443 | |
Assets in Excess of Other Liabilities — 0.3% | | | | | | | 189,294 | |
TOTAL NET ASSETS — 100.0% | | | | | | $ | 59,608,737 | |
Percentages are stated as a percent of net assets.
ETF - Exchange-Traded Fund
(a) | Non-income producing security. |
(b) | Affiliated company as defined by the Investment Company Act of 1940. See Note 6. |
(c) | Fair value of this security exceeds 25% of the Fund’s net assets. Additional information for this security, including the financial statements, is available from the SEC’s EDGAR database at www.sec.gov. |
The accompanying notes are an integral part of the financial statements.
4
SGI ENHANCED GLOBAL INCOME ETF
Portfolio of Investments
August 31, 2024
| | | Shares | | | Value | |
COMMON STOCKS — 98.0% |
Aerospace/Defense — 0.5% |
Lockheed Martin Corp. | | | 638 | | | $ | 362,448 | |
Banks — 11.4% |
Banco Bilbao Vizcaya Argentaria SA - ADR | | | 72,812 | | | | 775,448 | |
Banco Santander SA - ADR | | | 63,918 | | | | 318,312 | |
Bancolombia SA - ADR | | | 53,646 | | | | 1,775,146 | |
Bank of New York Mellon Corp. | | | 5,629 | | | | 384,010 | |
Citizens Financial Group, Inc. | | | 8,653 | | | | 372,512 | |
ICICI Bank Ltd. - ADR | | | 17,294 | | | | 506,887 | |
ING Groep NV - ADR | | | 19,581 | | | | 356,570 | |
JPMorgan Chase & Co. | | | 3,242 | | | | 728,802 | |
Shinhan Financial Group Co. Ltd. - ADR | | | 39,039 | | | | 1,657,205 | |
UBS Group AG | | | 17,551 | | | | 539,869 | |
Woori Financial Group, Inc. - ADR | | | 10,218 | | | | 370,198 | |
| | | | | | | | 7,784,959 | |
Beverages — 3.2% |
Coca-Cola Co. | | | 6,271 | | | | 454,459 | |
Coca-Cola Femsa SAB de CV - ADR | | | 11,272 | | | | 949,553 | |
PepsiCo, Inc. | | | 4,437 | | | | 767,069 | |
| | | | | | | | 2,171,081 | |
Building Materials — 0.5% |
UFP Industries, Inc. | | | 2,940 | | | | 357,710 | |
Commercial Services — 0.9% |
Automatic Data Processing, Inc. | | | 2,263 | | | | 624,384 | |
Cosmetics/Personal Care — 1.5% |
Colgate-Palmolive Co. | | | 5,474 | | | | 582,981 | |
Unilever PLC - ADR | | | 7,366 | | | | 477,243 | |
| | | | | | | | 1,060,224 | |
Diversified Financial Services — 2.1% |
American Express Co. | | | 1,364 | | | | 352,799 | |
Janus Henderson Group PLC | | | 9,186 | | | | 345,485 | |
Mastercard, Inc. - Class A | | | 700 | | | | 338,338 | |
TPG, Inc. Class A | | | 7,633 | | | | 385,085 | |
| | | | | | | | 1,421,707 | |
Electric — 3.4% |
American Electric Power Co., Inc. | | | 3,734 | | | | 374,445 | |
Cia Energetica de Minas Gerais - ADR | | | 329,040 | | | | 674,532 | |
Clearway Energy, Inc. - Class C | | | 12,756 | | | | 369,414 | |
Entergy Corp. | | | 2,865 | | | | 345,777 | |
Evergy, Inc. | | | 9,450 | | | | 558,873 | |
| | | | | | | | 2,323,041 | |
Electronics — 2.0% |
Amphenol Corp. - Class A | | | 15,452 | | | $ | 1,042,237 | |
Honeywell International, Inc. | | | 1,515 | | | | 314,984 | |
| | | | | | | | 1,357,221 | |
Food — 0.4% |
Sysco Corp. | | | 3,711 | | | | 289,347 | |
Healthcare-Services — 0.5% |
Elevance Health, Inc. | | | 635 | | | | 353,625 | |
Home Builders — 1.3% |
DR Horton, Inc. | | | 1,830 | | | | 345,431 | |
Lennar Corp. - Class A | | | 3,027 | | | | 551,095 | |
| | | | | | | | 896,526 | |
Insurance — 4.3% |
Allstate Corp. | | | 1,849 | | | | 349,350 | |
American Financial Group, Inc. | | | 4,781 | | | | 638,837 | |
American International Group, Inc. | | | 4,271 | | | | 329,081 | |
Berkshire Hathaway, Inc. - Class B(a) | | | 734 | | | | 349,325 | |
Corebridge Financial, Inc. | | | 11,053 | | | | 326,727 | |
Progressive Corp. | | | 1,555 | | | | 392,171 | |
Prudential Financial, Inc. | | | 4,499 | | | | 545,099 | |
| | | | | | | | 2,930,590 | |
Machinery-Diversified — 0.4% |
Deere & Co. | | | 708 | | | | 273,104 | |
Mining — 3.3% |
Rio Tinto PLC - ADR | | | 35,194 | | | | 2,226,724 | |
Oil & Gas — 7.8% |
Civitas Resources, Inc. | | | 20,400 | | | | 1,251,132 | |
EOG Resources, Inc. | | | 3,687 | | | | 474,960 | |
Equinor ASA - ADR | | | 72,625 | | | | 1,952,886 | |
Permian Resources Corp. Class A | | | 22,063 | | | | 314,177 | |
Petroleo Brasileiro SA - ADR | | | 60,943 | | | | 928,162 | |
Shell PLC Class A - ADR | | | 5,208 | | | | 373,205 | |
| | | | | | | | 5,294,522 | |
Online Services — 11.1% |
Alibaba Group Holding Ltd. - ADR | | | 8,063 | | | | 671,970 | |
Alphabet, Inc. - Class C | | | 12,944 | | | | 2,137,184 | |
Amazon.com, Inc.(a) | | | 5,749 | | | | 1,026,197 | |
JD.com, Inc. - ADR | | | 10,681 | | | | 288,387 | |
Meta Platforms, Inc. - Class A | | | 5,119 | | | | 2,668,586 | |
PDD Holdings, Inc. - ADR(a) | | | 3,882 | | | | 373,099 | |
Shopify, Inc. - Class A(a) | | | 5,505 | | | | 407,755 | |
| | | | | | | | 7,573,178 | |
Pharmaceuticals — 9.3% |
AbbVie, Inc. | | | 3,567 | | | | 700,238 | |
Bristol-Myers Squibb Co. | | | 14,475 | | | | 723,026 | |
Eli Lilly & Co. | | | 2,803 | | | | 2,690,936 | |
Novo Nordisk AS - ADR | | | 15,877 | | | | 2,209,443 | |
| | | | | | | | 6,323,643 | |
The accompanying notes are an integral part of the financial statements.
5
SGI ENHANCED GLOBAL INCOME ETF
Portfolio of Investments (concluded)
August 31, 2024
| | | Shares | | | Value | |
Private Equity — 0.6% |
Brookfield Corp. | | | 8,097 | | | $ | 407,117 | |
Real Estate — 1.3% |
CBRE Group, Inc. - Class A(a) | | | 7,555 | | | | 869,883 | |
Retail — 3.5% |
Ferguson Enterprises, Inc. | | | 3,237 | | | | 665,883 | |
Home Depot, Inc. | | | 2,735 | | | | 1,007,848 | |
TJX Companies, Inc. | | | 5,912 | | | | 693,300 | |
| | | | | | | | 2,367,031 | |
Semiconductors — 9.2% |
Applied Materials, Inc. | | | 4,904 | | | | 967,363 | |
Broadcom, Inc. | | | 358 | | | | 58,289 | |
Lam Research Corp. | | | 1,177 | | | | 966,329 | |
Micron Technology, Inc. | | | 9,579 | | | | 921,883 | |
NVIDIA Corp. | | | 7,951 | | | | 949,111 | |
QUALCOMM, Inc. | | | 7,963 | | | | 1,395,914 | |
Taiwan Semiconductor Manufacturing Co. Ltd. - ADR | | | 5,884 | | | | 1,010,283 | |
| | | | | | | | 6,269,172 | |
Software — 3.4% |
Microsoft Corp. | | | 4,626 | | | | 1,929,690 | |
SAP SE - ADR | | | 1,721 | | | | 378,121 | |
| | | | | | | | 2,307,811 | |
Technology — 6.4% |
Apple, Inc. | | | 11,139 | | | | 2,550,831 | |
Infosys Ltd. - ADR | | | 64,169 | | | | 1,493,855 | |
Logitech International S.A. | | | 3,731 | | | | 339,558 | |
| | | | | | | | 4,384,244 | |
Telecommunications — 3.9% |
TELUS Corp. | | | 64,509 | | | | 1,041,175 | |
TIM SA - ADR | | | 101,316 | | | | 1,612,951 | |
| | | | | | | | 2,654,126 | |
Transportation — 5.8% |
CSX Corp. | | | 40,039 | | | | 1,372,136 | |
FedEx Corp. | | | 2,239 | | | | 668,946 | |
Frontline PLC | | | 39,129 | | | | 944,574 | |
TFI International, Inc. | | | 2,446 | | | | 362,326 | |
Union Pacific Corp. | | | 2,537 | | | | 649,700 | |
| | | | | | | | 3,997,682 | |
TOTAL COMMON STOCKS (Cost $64,343,973) | | | | | | | 66,881,100 | |
SHORT-TERM INVESTMENTS — 0.8% |
Money Market Funds — 0.8% |
First American Government Obligations Fund - Class X, 5.22%(b) | | | 557,853 | | | $ | 557,853 | |
TOTAL SHORT-TERM INVESTMENTS (Cost $557,853) | | | | | | | 557,853 | |
TOTAL INVESTMENTS — 98.8% (Cost $64,901,826) | | | | | | | 67,438,953 | |
Other Assets in Excess of Liabilities — 1.2% | | | | | | | 799,675 | |
TOTAL NET ASSETS — 100.0% | | | | | | $ | 68,238,628 | |
Percentages are stated as a percent of net assets.
ADR - American Depositary Receipt
AG - Aktiengesellschaft
ASA - Advanced Subscription Agreement
NV - Naamloze Vennootschap
PLC - Public Limited Company
SA - Sociedad Anónima
SAB de CV - Sociedad Anónima Bursátil de Capital Variable
(a) | Non-income producing security. |
(b) | The rate shown represents the 7-day annualized effective yield as of August 31, 2024. |
The accompanying notes are an integral part of the financial statements.
6
SGI ENHANCED CORE ETF
Portfolio of Investments
August 31, 2024
| | | Shares | | | Value | |
SHORT-TERM INVESTMENTS — 73.1% |
Money Market Funds — 73.1% |
Fidelity Government Cash Reserves, 5.00%(a) | | | 21,435,573 | | | $ | 21,435,573 | |
First American Government Obligations Fund - Class X, 5.22%(a) | | | 2,564,614 | | | | 2,564,614 | |
JPMorgan Liquid Assets Money Market Fund - Class I, 5.25%(a) | | | 25,647 | | | | 25,647 | |
PIMCO Government Money Market Fund - Class M(a) | | | 21,440,169 | | | | 21,440,169 | |
T Rowe Price US Treasury Money Fund, Inc. - Class I, 5.04%(a) | | | 45,516 | | | | 45,516 | |
Vanguard Federal Money Market Fund - Class I, 5.25%(a) | | | 24,465,521 | | | | 24,465,521 | |
Vanguard Treasury Money Market Fund - Class I, 5.25%(a) | | | 24,465,871 | | | | 24,465,871 | |
TOTAL SHORT-TERM INVESTMENTS (Cost $94,442,911) | | | | | | | 94,442,911 | |
TOTAL INVESTMENTS — 73.1% (Cost $94,442,911) | | | | | | | 94,442,911 | |
Other Assets in Excess of Liabilities — 26.9% | | | | | | | 34,814,124 | |
TOTAL NET ASSETS — 100.0% | | | | | | $ | 129,257,035 | |
Percentages are stated as a percent of net assets.
(a) | The rate shown represents the 7-day annualized effective yield as of August 31, 2024. |
The accompanying notes are an integral part of the financial statements.
7
SGI ENHANCED CORE ETF
Portfolio of Investments
August 31, 2024
| | | Notional Amount | | | Contracts | | | Value | |
WRITTEN OPTIONS — 0.0%(a)(b)(c) | | | | | | | | | | | | |
Call Options — 0.0%(a) | | | | | | | | | | | | |
S&P 500 Index(b)(c) | | | | | | | | | | | | |
Expiration: 09/03/2024; Exercise Price: $5,735.00 | | $ | (197,694,000 | ) | | | (350 | ) | | $ | (1,750 | ) |
Expiration: 09/03/2024; Exercise Price: $5,750.00 | | | (16,380,360 | ) | | | (29 | ) | | | (145 | ) |
Expiration: 09/04/2024; Exercise Price: $5,800.00 | | | (141,210,000 | ) | | | (250 | ) | | | (1,750 | ) |
Expiration: 09/06/2024; Exercise Price: $5,830.00 | | | (90,374,400 | ) | | | (160 | ) | | | (1,600 | ) |
Total Call Options | | | | | | | | | | | (5,245 | ) |
| | | | | | | | | | | | | |
Put Options — 0.0%(a) | | | | | | | | | | | | |
S&P 500 Index(b)(c) | | | | | | | | | | | | |
Expiration: 09/03/2024; Exercise Price: $5,225.00 | | | (112,968,000 | ) | | | (200 | ) | | | (2,000 | ) |
Expiration: 09/03/2024; Exercise Price: $5,235.00 | | | (28,242,000 | ) | | | (50 | ) | | | (500 | ) |
Expiration: 09/03/2024; Exercise Price: $5,250.00 | | | (338,904,000 | ) | | | (600 | ) | | | (6,000 | ) |
Total Put Options | | | | | | | | | | | (8,500 | ) |
TOTAL WRITTEN OPTIONS (Premiums received $14,948) | | | | | | | | | | $ | (13,745 | ) |
Percentages are stated as a percent of net assets.
(a) | Represents less than 0.05% of net assets. |
(b) | 100 shares per contract. |
The accompanying notes are an integral part of the financial statements.
8
SGI ENHANCED NASDAQ-100 ETF
Portfolio of Investments
August 31, 2024
| | | Shares | | | Value | |
| SHORT-TERM INVESTMENTS — 4.7% |
| Money Market Funds — 4.7% |
First American Government Obligations Fund - Class X, 5.22%(a) | | | 500,034 | | | $ | 500,034 | |
| TOTAL SHORT-TERM INVESTMENTS (Cost $500,034) | | | | | | | 500,034 | |
| TOTAL INVESTMENTS — 4.7% (Cost $500,034) | | | | | | | 500,034 | |
| Other Assets in Excess of Liabilities — 95.3% | | | | | | | 10,053,478 | |
| TOTAL NET ASSETS — 100.0% | | | | | | $ | 10,553,512 | |
Percentages are stated as a percent of net assets.
(a) | The rate shown represents the 7-day annualized effective yield as of August 31, 2024. |
The accompanying notes are an integral part of the financial statements.
9
SGI ENHANCED NASDAQ-100 ETF
Portfolio of Investments
August 31, 2024
| | | Notional Amount | | | Contracts | | | Value | |
WRITTEN OPTIONS — 0.0%(a)(b)(c) | | | | | | | | | | | | |
Call Options — 0.0%(a) | | | | | | | | | | | | |
S&P 500 Index, Expiration: 09/03/2024; Exercise Price: $5,740.00(b)(c) | | $ | (6,778,080 | ) | | | (12 | ) | | $ | (60 | ) |
| | | | | | | | | | | | | |
Put Options — 0.0% (a) | | | | | | | | | | | | |
S&P 500 Index, Expiration: 09/03/2024; Exercise Price: $5,250.00(b)(c) | | | (16,945,200 | ) | | | (30 | ) | | | (300 | ) |
TOTAL WRITTEN OPTIONS (Premiums received $308) | | | | | | | | | | $ | (360 | ) |
Percentages are stated as a percent of net assets.
(a) | Represents less than 0.05% of net assets. |
(b) | 100 shares per contract. |
The accompanying notes are an integral part of the financial statements.
10
SGI ENHANCED NASDAQ-100 ETF
Portfolio of Investments
August 31, 2024
Futures contracts outstanding as of August 31, 2024 were as follows:
Description | | Contracts
Purchased | | | Expiration
Date | | | Notional | | | Value / Unrealized
Appreciation
(Depreciation)(1) | |
Micro E-Mini Nasdaq 100 Future Sept 2024 | | | 5 | | | | 09/20/2024 | | | $ | 196,230 | | | $ | (597 | ) |
Nasdaq 100 Index | | | 25 | | | | 09/20/2024 | | | | 9,811,500 | | | | (98,010 | ) |
Total Unrealized Appreciation (Depreciation) | | | | | | | | | | | | | | $ | (98,607 | ) |
(1) | The Fund has recorded an asset of $1,260,940 as of August 31, 2024 related to the current day’s variation margin related to these contracts. Deposit at broker for futures contracts is reported within the Statement of Assets and Liabilities. |
The accompanying notes are an integral part of the financial statements.
11
SUMMIT GLOBAL INVESTMENTS
Statements of Assets and Liabilities
August 31, 2024
| | | SGI U.S.
Large Cap
CORE ETF | | | SGI
DYNAMIC
TACTICAL ETF | |
ASSETS | | | | | | | | |
Investments, at fair value | | | | | | | | |
Unaffiliated investments (cost $85,722,781 and $30,675,940, respectively) | | $ | 91,081,481 | | | $ | 33,063,212 | |
Affiliated investments (cost $— and $23,458,167, respectively) (see Note 7) | | | — | | | | 26,356,231 | |
Short-term investments, at value (cost $— and $—, respectively) | | | — | | | | — | |
Cash and cash equivalents | | | 1,186,483 | | | | 236,281 | |
Deposit at broker for futures contracts | | | — | | | | — | |
Deposit at broker for options | | | — | | | | — | |
Receivables for: | | | | | | | | |
Investments sold | | | — | | | | — | |
Dividends and interest | | | 88,887 | | | | 1,014 | |
Total Assets | | $ | 92,356,851 | | | $ | 59,656,738 | |
| | | | | | | | | |
LIABILITIES | | | | | | | | |
Written options, at value (premiums received $— and $—, respectively) | | $ | — | | | $ | — | |
Payables for: | | | | | | | | |
Advisory fees | | | 65,281 | | | | 48,001 | |
Investments purchased | | | — | | | | — | |
Broker interest | | | — | | | | — | |
Total Liabilities | | | 65,281 | | | | 48,001 | |
Net assets | | $ | 92,291,570 | | | $ | 59,608,737 | |
| | | | | | | | | |
NET ASSETS CONSIST OF: | | | | | | | | |
Par value | | $ | 2,620 | | | $ | 1,950 | |
Paid-in capital | | | 80,519,895 | | | | 51,859,337 | |
Total distributable earnings/(losses) | | | 11,769,055 | | | | 7,747,450 | |
Net assets | | $ | 92,291,570 | | | $ | 59,608,737 | |
| | | | | | | | | |
Shares outstanding ($0.001 par value, 100,000,000 shares authorized) | | | 2,620,000 | | | | 1,950,000 | |
Net asset value and redemption price per share | | $ | 35.23 | | | $ | 30.57 | |
The accompanying notes are an integral part of the financial statements.
12
SUMMIT GLOBAL INVESTMENTS
Statements of Assets and Liabilities (CONCLUDED)
August 31, 2024
| | | SGI
ENHANCED
GLOBAL
INCOME ETF | | | SGI
ENHANCED
CORE ETF | | | SGI
ENHANCED
NASDAQ-100
ETF | |
ASSETS | | | | | | | | | | | | |
Investments, at fair value | | | | | | | | | | | | |
Unaffiliated investments (cost $64,343,973, $— and $—, respectively) | | $ | 66,881,100 | | | $ | — | | | $ | — | |
Affiliated investments (cost $—, $—, and $—, respectively) (Note 6) | | | — | | | | — | | | | — | |
Short-term investments, at value (cost $557,853, $94,442,911, and $500,034, respectively) | | | 557,853 | | | | 94,442,911 | | | | 500,034 | |
Cash and cash equivalents | | | — | | | | — | | | | — | |
Deposit at broker for futures contracts | | | — | | | | — | | | | 1,260,940 | |
Deposit at broker for options | | | 615,846 | | | | 34,408,660 | | | | 8,766,339 | |
Receivables for: | | | | | | | | | | | | |
Investments sold | | | 10,846 | | | | — | | | | 1,512 | |
Dividends and interest | | | 236,215 | | | | 519,528 | | | | 33,323 | |
Total Assets | | $ | 68,301,860 | | | $ | 129,371,099 | | | $ | 10,562,148 | |
| | | | | | | | | | | | | |
LIABILITIES | | | | | | | | | | | | |
Written options, at value (premiums received $—, $14,948, and $308, respectively) | | $ | — | | | $ | 13,745 | | | $ | 360 | |
Payables for: | | | | | | | | | | | | |
Advisory fees | | | 54,760 | | | | 100,319 | | | | 8,276 | |
Investments purchased | | | 771 | | | | — | | | | — | |
Broker interest | | | 7,701 | | | | — | | | | — | |
Total Liabilities | | | 63,232 | | | | 114,064 | | | | 8,636 | |
Net assets | | $ | 68,238,628 | | | $ | 129,257,035 | | | $ | 10,553,512 | |
| | | | | | | | | | | | | |
NET ASSETS CONSIST OF: | | | | | | | | | | | | |
Par value | | $ | 2,545 | | | $ | 5,010 | | | $ | 415 | |
Paid-in Capital | | | 65,224,756 | | | | 126,476,778 | | | | 10,515,488 | |
Total distributable earnings/(losses) | | | 3,011,327 | | | | 2,775,247 | | | | 37,609 | |
Net assets | | $ | 68,238,628 | | | $ | 129,257,035 | | | $ | 10,553,512 | |
| | | | | | | | | | | | | |
Shares outstanding ($0.001 par value, 100,000,000 shares authorized) | | | 2,545,000 | | | | 5,010,000 | | | | 415,000 | |
Net asset value and redemption price per share | | $ | 26.81 | | | $ | 25.80 | | | $ | 25.43 | |
The accompanying notes are an integral part of the financial statements.
13
SUMMIT GLOBAL INVESTMENTS
Statements of Operations
FOR THE Year ENDED August 31, 2024
| | | SGI U.S.
Large Cap
CORE ETF | | | SGI
DYNAMIC
TACTICAL ETF | |
INVESTMENT INCOME | | | | | | | | |
Dividends | | | | | | | | |
Dividends from unaffiliated investments | | $ | 1,302,674 | (1) | | $ | 1,384,797 | |
Dividends from affiliated investments (Note 6) | | | — | | | | 80,642 | |
Interest | | | 66,088 | | | | 19,002 | |
Total investment income | | | 1,368,762 | | | | 1,484,441 | |
| | | | | | | | | |
EXPENSES | | | | | | | | |
Advisory fees (Note 2) | | | 795,489 | | | | 797,772 | |
Broker interest expense | | | — | | | | — | |
Total expenses | | | 795,489 | | | | 797,772 | |
Net investment income/(loss) | | | 573,273 | | | | 686,669 | |
| | | | | | | | | |
NET REALIZED AND UNREALIZED GAIN/(LOSS) FROM INVESTMENTS | | | | | | | | |
Net realized gain/(loss) from investments | | | | | | | | |
Unaffiliated investments | | | 5,256,994 | | | | 1,443,073 | |
Affiliated investments (Note 6) | | | — | | | | 1,167,462 | |
Distributions from affiliated investments (Note 6) | | | — | | | | 398,373 | |
Written options | | | — | | | | — | |
Futures contracts | | | — | | | | — | |
Net realized gain from redemption in-kind | | | 16,117,021 | | | | 8,237,739 | |
Net change in unrealized appreciation/(depreciation) on investments | | | | | | | | |
Unaffiliated investments | | | 2,451,191 | | | | 490,066 | |
Affiliated investments (Note 6) | | | — | | | | 2,408,213 | |
Written options | | | — | | | | — | |
Futures contracts | | | — | | | | — | |
Net realized and unrealized gain/(loss) on investments | | | 23,825,206 | | | | 14,144,926 | |
NET INCREASE/(DECREASE) IN NET ASSETS RESULTING FROM OPERATIONS | | $ | 24,398,479 | | | $ | 14,831,595 | |
(1) | Net of foreign withholding taxes of $182. |
The accompanying notes are an integral part of the financial statements.
14
SUMMIT GLOBAL INVESTMENTS
Statements of Operations (Concluded)
FOR THE Period ENDED August 31, 2024(1)
| | | SGI
ENHANCED
GLOBAL
INCOME ETF | | | SGI
ENHANCED
core ETF | | | SGI
ENHANCED
NASDAQ-100
ETF | |
INVESTMENT INCOME | | | | | | | | | | | | |
Dividends | | | | | | | | | | | | |
Dividends from unaffiliated investments | | $ | 932,149 | (2) | | $ | 1,701,683 | | | $ | 517 | |
Dividends from affiliated investments (Note 6) | | | — | | | | — | | | | — | |
Interest | | | 29,633 | | | | 429,027 | | | | 60,576 | |
Total investment income | | | 961,782 | | | | 2,130,710 | | | | 61,093 | |
| | | | | | | | | | | | | |
EXPENSES | | | | | | | | | | | | |
Advisory fees (Note 2) | | | 261,368 | | | | 405,684 | | | | 15,052 | |
Broker interest expense | | | 43,016 | | | | 3,491 | | | | 3,012 | |
Total expenses | | | 304,384 | | | | 409,175 | | | | 18,064 | |
Net investment income/(loss) | | | 657,398 | | | | 1,721,535 | | | | 43,029 | |
| | | | | | | | | | | | | |
NET REALIZED AND UNREALIZED GAIN/(LOSS) FROM INVESTMENTS | | | | | | | | |
Net realized gain/(loss) from investments | | | | | | | | | | | | |
Unaffiliated investments | | | (408,372 | ) | | | — | | | | 8,698 | |
Affiliated investments (Note 6) | | | — | | | | — | | | | — | |
Distributions from affiliated investments (Note 6) | | | — | | | | — | | | | — | |
Written options | | | 661,045 | | | | 1,933,544 | | | | 72,659 | |
Futures contracts | | | — | | | | — | | | | 11,882 | |
Net realized gain from redemption in-kind | | | — | | | | — | | | | — | |
Net change in unrealized appreciation/(depreciation) on investments | | | | | | | | | | | | |
Unaffiliated investments | | | 2,537,127 | | | | — | | | | — | |
Affiliated investments (Note 6) | | | — | | | | — | | | | — | |
Written options | | | — | | | | 1,203 | | | | (52 | ) |
Futures contracts | | | — | | | | — | | | | (98,607 | ) |
Net realized and unrealized gain/(loss) on investments | | | 2,789,800 | | | | 1,934,747 | | | | (5,420 | ) |
NET INCREASE/(DECREASE) IN NET ASSETS RESULTING FROM OPERATIONS | | $ | 3,447,198 | | | $ | 3,656,282 | | | $ | 37,609 | |
(1) | Inception date of the SGI Enhanced Global Income ETF, SGI Enhanced Core ETF and SGI Enhanced Nasdaq-100 ETF was February 28, 2024, February 28, 2024 and June 13, 2024, respectively. |
(2) | Net of foreign withholding taxes of $65,249. |
The accompanying notes are an integral part of the financial statements.
15
SGI U.S. LARGE CAP CORE ETF
StatementS of Changes in Net Assets
| | | FOR THE
Year ENDED
AUGUST 31, 2024 | | | FOR THE
PERIOD ENDED
AUGUST 31, 2023(1) | |
INCREASE/(DECREASE) IN NET ASSETS FROM OPERATIONS: | | | | | | | | |
Net investment income/(loss) | | $ | 573,273 | | | $ | 260,042 | |
Net realized gain/(loss) on investments | | | | | | | | |
Unaffiliated investments | | | 5,256,994 | | | | 2,283,197 | |
Affiliated investments (Note 6) | | | — | | | | — | |
Distributions from affiliated investments (Note 6) | | | — | | | | — | |
Written options | | | — | | | | — | |
Futures contracts | | | — | | | | — | |
Net realized gain from redemption in-kind | | | 16,117,021 | | | | — | |
Net change in unrealized appreciation/(depreciation) on investments | | | | | | | | |
Unaffiliated investments | | | 2,451,191 | | | | 2,907,509 | |
Affiliated investments (Note 6) | | | — | | | | — | |
Written options | | | — | | | | — | |
Futures contracts | | | — | | | | — | |
Net increase/(decrease) in net assets resulting from operations | | | 24,398,479 | | | | 5,450,748 | |
| | | | | | | | | |
DIVIDENDS AND DISTRIBUTIONS TO SHAREHOLDERS FROM: | | | | | | | | |
Total distributable earnings | | | (1,544,660 | ) | | | — | |
Net decrease in net assets from dividends and distributions to shareholders | | | (1,544,660 | ) | | | — | |
| |
INCREASE/(DECREASE) IN NET ASSETS FROM CAPITAL SHARE TRANSACTIONS: |
Proceeds from shares sold | | | 106,414,001 | | | | 103,405,429 | |
Shares redeemed | | | (135,001,112 | ) | | | (10,831,315 | ) |
Net increase/(decrease) in net assets from capital shares | | | (28,587,111 | ) | | | 92,574,114 | |
Total increase/(decrease) in net assets | | | (5,733,292 | ) | | | 98,024,862 | |
| | | | | | | | | |
NET ASSETS: | | | | | | | | |
Beginning of period | | | 98,024,862 | | | | — | |
End of period | | $ | 92,291,570 | | | $ | 98,024,862 | |
| | | | | | | | | |
SHARES TRANSACTIONS: | | | | | | | | |
Shares sold | | | 3,385,000 | | | | 3,890,000 | |
Shares redeemed | | | (4,265,000 | ) | | | (390,000 | ) |
Net increase/(decrease) in shares outstanding | | | (880,000 | ) | | | 3,500,000 | |
(1) | Inception date of the Fund was March 30, 2023. |
The accompanying notes are an integral part of the financial statements.
16
SGI DYNAMIC TACTICAL ETF
StatementS of Changes in Net Assets
| | | FOR THE
Year ENDED
AUGUST 31, 2024 | | | FOR THE
PERIOD ENDED
AUGUST 31, 2023(1) | |
INCREASE/(DECREASE) IN NET ASSETS FROM OPERATIONS: | | | | | | | | |
Net investment income/(loss) | | $ | 686,669 | | | $ | 408,384 | |
Net realized gain/(loss) on investments | | | | | | | | |
Unaffiliated investments | | | 1,443,073 | | | | (699,494 | ) |
Affiliated investments (Note 6) | | | 1,167,462 | | | | 2,621 | |
Distributions from affiliated investments (Note 6) | | | 398,373 | | | | — | |
Written options | | | — | | | | — | |
Futures contracts | | | — | | | | — | |
Net realized gain from redemption in-kind | | | 8,237,739 | | | | — | |
Net change in unrealized appreciation/(depreciation) on investments | | | | | | | | |
Unaffiliated investments | | | 490,066 | | | | 1,897,206 | |
Affiliated investments (Note 6) | | | 2,408,213 | | | | 489,851 | |
Written options | | | — | | | | — | |
Futures contracts | | | — | | | | — | |
Net increase/(decrease) in net assets resulting from operations | | | 14,831,595 | | | | 2,098,568 | |
| | | | | | | | | |
DIVIDENDS AND DISTRIBUTIONS TO SHAREHOLDERS FROM: | | | | | | | | |
Total distributable earnings | | | (972,668 | ) | | | — | |
Net decrease in net assets from dividends and distributions to shareholders | | | (972,668 | ) | | | — | |
| | | | | | | | | |
INCREASE/(DECREASE) IN NET ASSETS FROM CAPITAL SHARE TRANSACTIONS: |
Proceeds from shares sold | | | 23,648,762 | | | | 109,300,356 | |
Shares redeemed | | | (88,294,403 | ) | | | (1,003,473 | ) |
Net increase/(decrease) in net assets from capital shares | | | (64,645,641 | ) | | | 108,296,883 | |
Total increase/(decrease) in net assets | | | (50,786,714 | ) | | | 110,395,451 | |
| | | | | | | | | |
NET ASSETS: | | | | | | | | |
Beginning of period | | | 110,395,451 | | | | — | |
End of period | | $ | 59,608,737 | | | $ | 110,395,451 | |
| | | | | | | | | |
SHARES TRANSACTIONS: | | | | | | | | |
Shares sold | | | 845,000 | | | | 4,290,000 | |
Shares redeemed | | | (3,145,000 | ) | | | (40,000 | ) |
Net increase/(decrease) in shares outstanding | | | (2,300,000 | ) | | | 4,250,000 | |
(1) | Inception date of the Fund was March 29, 2023. |
The accompanying notes are an integral part of the financial statements.
17
SGI ENHANCED GLOBAL INCOME ETF
Statement of Changes in Net Assets
| | | FOR THE
Period ENDED
AUGUST 31, 2024(1) | |
INCREASE/(DECREASE) IN NET ASSETS FROM OPERATIONS: | | | | |
Net investment income/(loss) | | $ | 657,398 | |
Net realized gain/(loss) on investments | | | | |
Unaffiliated investments | | | (408,372 | ) |
Affiliated investments (Note 6) | | | — | |
Distributions from affiliated investments (Note 6) | | | — | |
Written options | | | 661,045 | |
Futures contracts | | | — | |
Net realized gain from redemption in-kind | | | — | |
Net change in unrealized appreciation/(depreciation) on investments | | | | |
Unaffiliated investments | | | 2,537,127 | |
Affiliated investments (Note 6) | | | — | |
Written options | | | — | |
Futures contracts | | | — | |
Net increase/(decrease) in net assets resulting from operations | | | 3,447,198 | |
| | | | | |
DIVIDENDS AND DISTRIBUTIONS TO SHAREHOLDERS FROM: | | | | |
Total distributable earnings | | | (435,871 | ) |
Net decrease in net assets from dividends and distributions to shareholders | | | (435,871 | ) |
| | | | | |
INCREASE/(DECREASE) IN NET ASSETS FROM CAPITAL SHARE TRANSACTIONS: |
Proceeds from shares sold | | | 65,227,301 | |
Shares redeemed | | | — | |
Net increase/(decrease) in net assets from capital shares | | | 65,227,301 | |
Total increase/(decrease) in net assets | | | 68,238,628 | |
| | | | | |
NET ASSETS: | | | | |
Beginning of period | | | — | |
End of period | | $ | 68,238,628 | |
| | | | | |
SHARES TRANSACTIONS: | | | | |
Shares sold | | | 2,545,000 | |
Shares redeemed | | | — | |
Net increase/(decrease) in shares outstanding | | | 2,545,000 | |
(1) | Inception date of the Fund was February 28, 2024. |
The accompanying notes are an integral part of the financial statements.
18
SGI ENHANCED CORE ETF
Statement of Changes in Net Assets
| | | FOR THE
Period ENDED
AUGUST 31, 2024(1) | |
INCREASE/(DECREASE) IN NET ASSETS FROM OPERATIONS: | | | | |
Net investment income/(loss) | | $ | 1,721,535 | |
Net realized gain/(loss) on investments | | | | |
Unaffiliated investments | | | — | |
Affiliated investments (Note 6) | | | — | |
Distributions from affiliated investments (Note 6) | | | — | |
Written options | | | 1,933,544 | |
Futures contracts | | | — | |
Net realized gain from redemption in-kind | | | — | |
Net change in unrealized appreciation/(depreciation) on investments | | | | |
Unaffiliated investments | | | — | |
Affiliated investments (Note 6) | | | — | |
Written options | | | 1,203 | |
Futures contracts | | | — | |
Net increase/(decrease) in net assets resulting from operations | | | 3,656,282 | |
| | | | | |
DIVIDENDS AND DISTRIBUTIONS TO SHAREHOLDERS FROM: | | | | |
Total distributable earnings | | | (881,035 | ) |
Net decrease in net assets from dividends and distributions to shareholders | | | (881,035 | ) |
| | | | | |
INCREASE/(DECREASE) IN NET ASSETS FROM CAPITAL SHARE TRANSACTIONS: |
Proceeds from shares sold | | | 126,982,104 | |
Shares redeemed | | | (500,316 | ) |
Net increase/(decrease) in net assets from capital shares | | | 126,481,788 | |
Total increase/(decrease) in net assets | | | 129,257,035 | |
| | | | | |
NET ASSETS: | | | | |
Beginning of period | | | — | |
End of period | | $ | 129,257,035 | |
| | | | | |
SHARES TRANSACTIONS: | | | | |
Shares sold | | | 5,030,000 | |
Shares redeemed | | | (20,000 | ) |
Net increase/(decrease) in shares outstanding | | | 5,010,000 | |
(1) | Inception date of the Fund was February 28, 2024. |
The accompanying notes are an integral part of the financial statements.
19
SGI ENHANCED NASDAQ-100 ETF
Statement of Changes in Net Assets
| | | FOR THE
Period ENDED
AUGUST 31, 2024(1) | |
INCREASE/(DECREASE) IN NET ASSETS FROM OPERATIONS: | | | | |
Net investment income/(loss) | | $ | 43,029 | |
Net realized gain/(loss) on investments | | | | |
Unaffiliated investments | | | 8,698 | |
Affiliated investments (Note 6) | | | — | |
Distributions from affiliated investments (Note 6) | | | — | |
Written options | | | 72,659 | |
Futures contracts | | | 11,882 | |
Net realized gain from redemption in-kind | | | — | |
Net change in unrealized appreciation/(depreciation) on investments | | | | |
Unaffiliated investments | | | — | |
Affiliated investments (Note 6) | | | — | |
Written options | | | (52 | ) |
Futures contracts | | | (98,607 | ) |
Net increase/(decrease) in net assets resulting from operations | | | 37,609 | |
| | | | | |
DIVIDENDS AND DISTRIBUTIONS TO SHAREHOLDERS FROM: | | | | |
Total distributable earnings | | | — | |
Net decrease in net assets from dividends and distributions to shareholders | | | — | |
| | | | | |
INCREASE/(DECREASE) IN NET ASSETS FROM CAPITAL SHARE TRANSACTIONS: |
Proceeds from shares sold | | | 10,515,903 | |
Shares redeemed | | | — | |
Net increase/(decrease) in net assets from capital shares | | | 10,515,903 | |
Total increase/(decrease) in net assets | | | 10,553,512 | |
| | | | | |
NET ASSETS: | | | | |
Beginning of period | | | — | |
End of period | | $ | 10,553,512 | |
| | | | | |
SHARES TRANSACTIONS: | | | | |
Shares sold | | | 415,000 | |
Shares redeemed | | | — | |
Net increase/(decrease) in shares outstanding | | | 415,000 | |
(1) | Inception date of the Fund was June 13, 2024. |
The accompanying notes are an integral part of the financial statements.
20
SGI U.S. LARGE CAP CORE ETF
Financial Highlights
Contained below is per share operating performance data for share outstanding, total investment return/(loss), ratios to average net assets and other supplemental data for the respective periods. This information has been derived from information provided in the financial statements. |
| | | For the
Year
Ended
August 31,
2024 | | | For the
Period
Ended
August 31,
2023(1) | |
PER SHARE OPERATING PERFORMANCE | | | | | | | | |
Net asset value, beginning of period | | $ | 28.01 | | | $ | 25.00 | |
Net investment income/(loss) (2) | | | 0.19 | | | | 0.11 | |
Net realized and unrealized gain/(loss) from investments | | | 7.47 | | | | 2.90 | |
Net increase/(decrease) in net assets resulting from operations | | | 7.66 | | | | 3.01 | |
Dividends and distributions to shareholder from: | | | | | | | | |
Net investment income | | | (0.07 | ) | | | — | |
Net realized capital gains | | | (0.37 | ) | | | — | |
Total dividends and distributions to shareholders | | | (0.44 | ) | | | — | |
Net asset value, end of period | | $ | 35.23 | | | $ | 28.01 | |
Market value, end of period | | $ | 35.24 | | | $ | 28.00 | |
Total investment return/(loss) on net asset value (3) | | | 27.67 | % | | | 12.03 | %(5) |
Total investment return/(loss) on market price (4) | | | 27.72 | % | | | 12.00 | %(5) |
| | | | | | | | | |
RATIOS/SUPPLEMENTAL DATA | | | | | | | | |
Net assets, end of period (000’s) | | $ | 92,292 | | | $ | 98,025 | |
Ratio of expenses to average net assets | | | 0.85 | % | | | 0.85 | %(6) |
Ratio of expenses to average net assets (excluding dividend and interest expense) | | | 0.85 | % | | | 0.85 | %(6) |
Ratio of net investment income/(loss) to average net assets | | | 0.61 | % | | | 1.01 | %(6) |
Portfolio turnover rate | | | 225 | % | | | 95 | %(5) |
(1) | Inception date of the Fund was March 30, 2023. |
(2) | The selected per share data is calculated based on average shares outstanding method for the period. |
(3) | Total investment return/(loss) on net asset value is calculated assuming a purchase of shares on the first day and a sale of shares on the last day of each period reported and includes reinvestments of dividends and distributions, if any. |
(4) | Total investment return/(loss) on market price is calculated assuming an initial investment made at the market price on the first day of the period, reinvestment of dividends and distributions at market price during the period and redemption at market price on the last day of the period. |
The accompanying notes are an integral part of the financial statements.
21
SGI DYNAMIC TACTICAL ETF
Financial Highlights
Contained below is per share operating performance data for share outstanding, total investment return/(loss), ratios to average net assets and other supplemental data for the respective periods. This information has been derived from information provided in the financial statements. |
| | | For the
Year
Ended
August 31,
2024 | | | For the
Period
Ended
August 31,
2023(1) | |
PER SHARE OPERATING PERFORMANCE | | | | | | | | |
Net asset value, beginning of period | | $ | 25.98 | | | $ | 25.00 | |
Net investment income/(loss) (2) | | | 0.22 | | | | 0.13 | |
Net realized and unrealized gain/(loss) from investments | | | 4.61 | | | | 0.85 | |
Net increase/(decrease) in net assets resulting from operations | | | 4.83 | | | | 0.98 | |
Dividends and distributions to shareholder from: | | | | | | | | |
Net investment income | | | (0.24 | ) | | | — | |
Net realized capital gains | | | — | | | | — | |
Total dividends and distributions to shareholders | | | (0.24 | ) | | | — | |
Net asset value, end of period | | $ | 30.57 | | | $ | 25.98 | |
Market value, end of period | | $ | 30.53 | | | $ | 26.05 | |
Total investment return/(loss) on net asset value (3) | | | 18.75 | % | | | 3.90 | %(5) |
Total investment return/(loss) on market price (4) | | | 18.25 | % | | | 4.20 | %(5) |
| | | | | | | | | |
RATIOS/SUPPLEMENTAL DATA | | | | | | | | |
Net assets, end of period (000’s) | | $ | 59,609 | | | $ | 110,395 | |
Ratio of expenses to average net assets | | | 0.95 | % | | | 0.95 | %(6) |
Ratio of expenses to average net assets (excluding dividend and interest expense) | | | 0.95 | % | | | 0.95 | %(6) |
Ratio of net investment income/(loss) to average net assets | | | 0.82 | % | | | 1.18 | %(6) |
Portfolio turnover rate | | | 167 | % | | | 66 | %(5) |
(1) | Inception date of the Fund was March 29, 2023. |
(2) | The selected per share data is calculated based on average shares outstanding method for the period. |
(3) | Total investment return/(loss) on net asset value is calculated assuming a purchase of shares on the first day and a sale of shares on the last day of each period reported and includes reinvestments of dividends and distributions, if any. |
(4) | Total investment return/(loss) on market price is calculated assuming an initial investment made at the market price on the first day of the period, reinvestment of dividends and distributions at market price during the period and redemption at market price on the last day of the period. |
The accompanying notes are an integral part of the financial statements.
22
SGI ENHANCED GLOBAL INCOME ETF
Financial Highlights
Contained below is per share operating performance data for share outstanding, total investment return/(loss), ratios to average net assets and other supplemental data for the period. This information has been derived from information provided in the financial statements. |
| | | For the
Period
Ended
August 31,
2024(1) | |
PER SHARE OPERATING PERFORMANCE | | | | |
Net asset value, beginning of period | | $ | 25.00 | |
Net investment income/(loss) (2) | | | 0.32 | |
Net realized and unrealized gain/(loss) from investments | | | 1.68 | |
Net increase/(decrease) in net assets resulting from operations | | | 2.00 | |
Dividends and distributions to shareholder from: | | | | |
Net investment income | | | (0.19 | ) |
Net realized capital gains | | | — | |
Total dividends and distributions to shareholders | | | (0.19 | ) |
Net asset value, end of period | | $ | 26.81 | |
Market value, end of period | | $ | 26.73 | |
Total investment return/(loss) on net asset value (3) | | | 8.01 | %(5) |
Total investment return/(loss) on market price (4) | | | 7.69 | %(5) |
| | | | | |
RATIOS/SUPPLEMENTAL DATA | | | | |
Net assets, end of period (000’s) | | $ | 68,239 | |
Ratio of expenses to average net assets | | | 1.14 | %(6) |
Ratio of expenses to average net assets (excluding dividend and interest expense) | | | 0.98 | %(6) |
Ratio of net investment income/(loss) to average net assets | | | 2.46 | %(6) |
Portfolio turnover rate (7) | | | 158 | %(5) |
(1) | Inception date of the Fund was February 28, 2024. |
(2) | The selected per share data is calculated based on average shares outstanding method for the period. |
(3) | Total investment return/(loss) on net asset value is calculated assuming a purchase of shares on the first day and a sale of shares on the last day of each period reported and includes reinvestments of dividends and distributions, if any. |
(4) | Total investment return/(loss) on market price is calculated assuming an initial investment made at the market price on the first day of the period, reinvestment of dividends and distributions at market price during the period and redemption at market price on the last day of the period. |
(7) | Portfolio turnover rate excludes all securities, including options, whose maturities or expiration dates at the time of acquisition were one year or less and is calculated for the Fund, as a whole, for the entire period. |
The accompanying notes are an integral part of the financial statements.
23
SGI ENHANCED CORE ETF
Financial Highlights
Contained below is per share operating performance data for share outstanding, total investment return/(loss), ratios to average net assets and other supplemental data for the period. This information has been derived from information provided in the financial statements. |
| | | For the
Period
Ended
August 31,
2024(1) | |
PER SHARE OPERATING PERFORMANCE | | | | |
Net asset value, beginning of period | | $ | 25.00 | |
Net investment income/(loss) (2) | | | 0.53 | |
Net realized and unrealized gain/(loss) from investments | | | 0.49 | |
Net increase/(decrease) in net assets resulting from operations | | | 1.02 | |
Dividends and distributions to shareholder from: | | | | |
Net investment income | | | (0.22 | ) |
Net realized capital gains | | | — | |
Total dividends and distributions to shareholders | | | (0.22 | ) |
Net asset value, end of period | | $ | 25.80 | |
Market value, end of period | | $ | 25.80 | |
Total investment return/(loss) on net asset value (3) | | | 4.10 | %(5) |
Total investment return/(loss) on market price (4) | | | 4.11 | %(5) |
| | | | | |
RATIOS/SUPPLEMENTAL DATA | | | | |
Net assets, end of period (000’s) | | $ | 129,257 | |
Ratio of expenses to average net assets | | | 0.99 | %(6) |
Ratio of expenses to average net assets (excluding dividend and interest expense) | | | 0.98 | %(6) |
Ratio of net investment income/(loss) to average net assets | | | 4.16 | %(6) |
Portfolio turnover rate (7) | | | 0 | %(5) |
(1) | Inception date of the Fund was February 28, 2024. |
(2) | The selected per share data is calculated based on average shares outstanding method for the period. |
(3) | Total investment return/(loss) on net asset value is calculated assuming a purchase of shares on the first day and a sale of shares on the last day of each period reported and includes reinvestments of dividends and distributions, if any. |
(4) | Total investment return/(loss) on market price is calculated assuming an initial investment made at the market price on the first day of the period, reinvestment of dividends and distributions at market price during the period and redemption at market price on the last day of the period. |
(7) | Portfolio turnover rate excludes all securities, including options, whose maturities or expiration dates at the time of acquisition were one year or less and is calculated for the Fund, as a whole, for the entire period. |
The accompanying notes are an integral part of the financial statements.
24
SGI ENHANCED NASDAQ-100 ETF
Financial Highlights
Contained below is per share operating performance data for share outstanding, total investment return/(loss), ratios to average net assets and other supplemental data for the period. This information has been derived from information provided in the financial statements. |
| | | For the
Period
Ended
August 31,
2024(1) | |
PER SHARE OPERATING PERFORMANCE | | | | |
Net asset value, beginning of period | | $ | 25.00 | |
Net investment income/(loss) (2) | | | 0.15 | |
Net realized and unrealized gain/(loss) from investments | | | 0.28 | |
Net increase/(decrease) in net assets resulting from operations | | | 0.43 | |
Dividends and distributions to shareholder from: | | | | |
Net investment income | | | — | |
Net realized capital gains | | | — | |
Total dividends and distributions to shareholders | | | — | |
Net asset value, end of period | | $ | 25.43 | |
Market value, end of period | | $ | 25.44 | |
Total investment return/(loss) on net asset value (3) | | | 1.70 | %(5) |
Total investment return/(loss) on market price (4) | | | 1.76 | %(5) |
| | | | | |
RATIOS/SUPPLEMENTAL DATA | | | | |
Net assets, end of period (000’s) | | $ | 10,554 | |
Ratio of expenses to average net assets | | | 1.18 | %(6) |
Ratio of expenses to average net assets (excluding dividend and interest expense) | | | 0.98 | %(6) |
Ratio of net investment income/(loss) to average net assets | | | 2.80 | %(6) |
Portfolio turnover rate (7) | | | 0 | %(5) |
(1) | Inception date of the Fund was June 13, 2024. |
(2) | The selected per share data is calculated based on average shares outstanding method for the period. |
(3) | Total investment return/(loss) on net asset value is calculated assuming a purchase of shares on the first day and a sale of shares on the last day of each period reported and includes reinvestments of dividends and distributions, if any. |
(4) | Total investment return/(loss) on market price is calculated assuming an initial investment made at the market price on the first day of the period, reinvestment of dividends and distributions at market price during the period and redemption at market price on the last day of the period. |
(7) | Portfolio turnover rate excludes all securities, including options, whose maturities or expiration dates at the time of acquisition were one year or less and is calculated for the Fund, as a whole, for the entire period. |
The accompanying notes are an integral part of the financial statements.
25
SUMMIT GLOBAL INVESTMENTS
Notes to Financial Statements
August 31, 2024
1. Organization and Significant Accounting Policies
The RBB Fund, Inc. (“RBB” or the “Company”) was incorporated under the laws of the State of Maryland on February 29, 1988 and is registered under the Investment Company Act of 1940, as amended, (the “1940 Act”) as an open-end management investment company. RBB is a “series fund,” which is an investment company divided into separate portfolios. Each portfolio is treated as a separate entity for certain matters under the 1940 Act, and for other purposes, and a shareholder of one portfolio is not deemed to be a shareholder of any other portfolio. Currently, RBB has sixty-five separate investment portfolios, including the SGI U.S. Large Cap Core ETF, SGI Dynamic Tactical ETF, SGI Enhanced Global Income ETF, SGI Enhanced Core ETF and the SGI Enhanced Nasdaq-100 ETF (each, a “Fund” and collectively, the “Funds”), which commenced investment operations on March 30, 2023, March 29, 2023, February 28, 2024, February 28, 2024 and June 13, 2024, respectively.
RBB has authorized capital of one hundred billion shares of common stock of which 92.923 billion shares are currently classified into two hundred and thirty-six classes of common stock. Each class represents an interest in an active or inactive RBB investment portfolio.
The investment objective of the SGI U.S. Large Cap Core ETF and the SGI Dynamic Tactical ETF is to provide long-term capital appreciation. The investment objective of the SGI Enhanced Global Income ETF and the SGI Enhanced Nasdaq-100 ETF is to seek income and capital appreciation. The objective of the SGI Enhanced Core ETF is to seek income.
The Funds are investment companies and follow accounting and reporting guidance in the Financial Accounting Standards Board (“FASB”) Accounting Standards Codification Topic 946 “Financial Services - Investment Companies.”
The end of the reporting period for the SGI U.S. Large Cap Core ETF and the SGI Dynamic Tactical ETF is August 31, 2024, and the period covered by these Notes to Financial Statements is the fiscal year ended August 31, 2024 (the “current fiscal period”).
The end of the reporting period for SGI Enhanced Global Income ETF and SGI Enhanced Core ETF is August 31, 2024 and the period covered by these Notes to Financial Statements is from the inception period of February 28, 2024 through August 31, 2024 (the “current fiscal period”).
The end of the reporting period for the SGI Enhanced Nasdaq-100 ETF is August 31, 2024 and the period covered by these Notes to Financial Statements is from the inception period of June 13, 2024 through August 31, 2024 (the “current fiscal period”).
Portfolio Valuation — Each Fund’s net asset value (“NAV”) is calculated once daily at the close of regular trading hours on the New York Stock Exchange (“NYSE”) (generally 4:00 p.m. Eastern time) on each day the NYSE is open. Securities held by the Funds are valued using the closing price or the last sale price on a national securities exchange or the National Association of Securities Dealers Automatic Quotation System (“NASDAQ”) market system where they are primarily traded. Equity securities traded in the over-the-counter (“OTC”) market are valued at their closing prices. If there were no transactions on that day, securities traded principally on an exchange or on NASDAQ will be valued at the mean of the last bid and ask prices prior to the market close. Fixed income securities are valued using an independent pricing service, which considers such factors as security prices, yields, maturities and ratings, and are deemed representative of market values at the close of the market. Investments in exchange-traded funds (“ETFs”) are valued at their last reported sale price. Investments in other open-end investment companies, if any, are valued based on the NAV of those investment companies (which may use fair value pricing as disclosed in their prospectuses). Options for which the primary market is a national securities exchange are valued at the last sale price on the exchange on which they are traded, or, in the absence of any sale, will be valued at the mean of the last bid and ask prices prior to the market close. Options not traded on a national securities exchange are valued at the last quoted bid price for long option positions and the closing ask price for short option positions. Futures contracts are generally valued using the settlement price determined by the relevant exchange. If market quotations are unavailable or deemed unreliable, securities will be valued by the Valuation Designee (as defined below) in accordance with procedures adopted by the
26
SUMMIT GLOBAL INVESTMENTS
Notes to Financial Statements (Continued)
August 31, 2024
Company’s Board of Directors (the “Board” or “Directors”). Relying on prices supplied by pricing services or dealers or using fair valuation may result in values that are higher or lower than the values used by other investment companies and investors to price the same investments.
The Board has adopted a pricing and valuation policy for use by each Fund and its Valuation Designee (as defined below) in calculating the Fund’s NAV. Pursuant to Rule 2a-5 under the 1940 Act, the Board has designated Summit Global Investments, LLC (the “Adviser” or “Summit”) as its “Valuation Designee” to perform all of the fair value determinations as well as to perform all of the responsibilities that may be performed by the Valuation Designee in accordance with Rule 2a-5. The Valuation Designee is authorized to make all necessary determinations of the fair values of portfolio securities and other assets for which market quotations are not readily available or if it is deemed that the prices obtained from brokers and dealers or independent pricing services are unreliable.
Fair Value Measurements — The inputs and valuation techniques used to measure the fair value of the Funds’ investments are summarized into three levels as described in the hierarchy below:
| | ● | Level 1 — | Prices are determined using quoted prices in active markets for identical securities. |
| | ● | Level 2 — | Prices are determined using other significant observable inputs (including quoted prices for similar securities, interest rates, prepayment speeds, credit risk, etc.). |
| | ● | Level 3 — | Prices are determined using significant unobservable inputs (including the Funds’ own assumptions in determining the fair value of investments). |
The inputs or methodologies used for valuing securities are not necessarily an indication of the risk associated with investing in those securities.
The following is a summary of the inputs used, as of the end of the current fiscal period, in valuing each Fund’s investments carried at fair value:
| | | Level 1 | | | Level 2 | | | Level 3 | | | Total | |
SGI U.S. LARGE CAP CORE ETF | | | | | | | | | | | | | | | | |
Investments: | | | | | | | | | | | | | | | | |
Common Stocks | | $ | 89,975,185 | | | $ | — | | | $ | — | | | $ | 89,975,185 | |
Exchange Traded Funds | | | 1,106,296 | | | | — | | | | — | | | | 1,106,296 | |
Total Investments | | $ | 91,081,481 | | | $ | — | | | $ | — | | | $ | 91,081,481 | |
| | | | | | | | | | | | | | | | | |
SGI DYNAMIC TACTICAL ETF | | | | | | | | | | | | | | | | |
Investments: | | | | | | | | | | | | | | | | |
Exchange Traded Funds | | $ | 59,419,443 | | | $ | — | | | $ | — | | | $ | 59,419,443 | |
Total Investments | | $ | 59,419,443 | | | $ | — | | | $ | — | | | $ | 59,419,443 | |
| | | | | | | | | | | | | | | | | |
SGI ENHANCED GLOBAL INCOME ETF | | | | | | | | | | | | | | | | |
Investments: | | | | | | | | | | | | | | | | |
Common Stocks | | $ | 66,881,100 | | | $ | — | | | $ | — | | | $ | 66,881,100 | |
Money Market Funds | | | 557,853 | | | | — | | | | — | | | | 557,853 | |
Total Investments | | $ | 67,438,953 | | | $ | — | | | $ | — | | | $ | 67,438,953 | |
| | | | | | | | | | | | | | | | | |
27
SUMMIT GLOBAL INVESTMENTS
Notes to Financial Statements (Continued)
August 31, 2024
| | | Level 1 | | | Level 2 | | | Level 3 | | | Total | |
SGI ENHANCED CORE ETF | | | | | | | | | | | | | | | | |
Assets: | | | | | | | | | | | | | | | | |
Investments: | | | | | | | | | | | | | | | | |
Money Market Funds | | $ | 94,442,911 | | | $ | — | | | $ | — | | | $ | 94,442,911 | |
Total Investments | | $ | 94,442,911 | | | $ | — | | | $ | — | | | $ | 94,442,911 | |
| | | | | | | | | | | | | | | | | |
Liabilities: | | | | | | | | | | | | | | | | |
Derivatives: | | | | | | | | | | | | | | | | |
Written Options | | $ | (13,745 | ) | | $ | — | | | $ | — | | | $ | (13,745 | ) |
Total Derivatives | | $ | (13,745 | ) | | $ | — | | | $ | — | | | $ | (13,745 | ) |
| | | | | | | | | | | | | | | | | |
SGI ENHANCED NASDAQ-100 ETF |
Assets: | | | | | | | | | | | | | | | | |
Investments: | | | | | | | | | | | | | | | | |
Money Market Funds | | $ | 500,034 | | | $ | — | | | $ | — | | | $ | 500,034 | |
Total Investments | | $ | 500,034 | | | $ | — | | | $ | — | | | $ | 500,034 | |
| | | | | | | | | | | | | | | | | |
Liabilities: | | | | | | | | | | | | | | | | |
Derivatives: | | | | | | | | | | | | | | | | |
Futures - Equity Contracts | | $ | (98,607 | ) | | $ | — | | | $ | — | | | $ | (98,607 | ) |
Written Options | | | (360 | ) | | | — | | | | — | | | | (360 | ) |
Total Derivatives | | $ | (98,967 | ) | | $ | — | | | $ | — | | | $ | (98,967 | ) |
At the end of each quarter, management evaluates the classification of Levels 1, 2 and 3 assets and liabilities. Various factors are considered, such as changes in liquidity from the prior reporting period; whether or not a broker is willing to execute at the quoted price; the depth and consistency of prices from third party pricing services; and the existence of contemporaneous, observable trades in the market. Additionally, management evaluates the classification of Levels 1, 2 and 3 assets and liabilities on a quarterly basis for changes in listings or delistings on national exchanges.
Due to the inherent uncertainty of determining the fair value of investments that do not have a readily available market value, the fair value of the Funds’ investments may fluctuate from period to period. Additionally, the fair value of investments may differ significantly from the values that would have been used had a ready market existed for such investments and may differ materially from the values the Funds may ultimately realize. Further, such investments may be subject to legal and other restrictions on resale or otherwise less liquid than publicly traded securities.
For fair valuations using significant unobservable inputs, U.S. generally accepted accounting principles (“U.S. GAAP”) requires each Fund to present a reconciliation of the beginning to ending balances for reported market values that presents changes attributable to total realized and unrealized gains or losses, purchase and sales, and transfers in and out of Level 3 during the period. Transfers in and out between levels are based on values at the end of the period. A reconciliation of Level 3 investments is presented only if a Fund had an amount of Level 3 investments at the end of the reporting period that was meaningful in relation to its net assets. The amounts and reasons for all Level 3 transfers are disclosed if a Fund had an amount of total Level 3 transfers during the reporting period that was meaningful in relation to its net assets as of the end of the reporting period.
During the current fiscal period, the Funds had no Level 3 purchases, sales, or transfers.
28
SUMMIT GLOBAL INVESTMENTS
Notes to Financial Statements (Continued)
August 31, 2024
DISCLOSURES ABOUT DERIVATIVE INSTRUMENTS AND HEDGING ACTIVITIES
Derivative instruments are defined as financial instruments whose value and performance are based on the value and performance of another security or financial instrument. Derivative instruments that the Fund used during the period include options and futures contracts.
During the current fiscal period, the SGI Enhanced Core ETF used options contracts to seek income in accordance with its investment objective.
During the current fiscal period, the SGI Enhanced Nasdaq-100 ETF used long futures contracts and options contracts to seek capital appreciation and income in accordance with its investment objective.
The following tables provide quantitative disclosures about fair value amounts of, and gains and losses on, the Funds’ derivative instruments as of and for the current fiscal period.
The following table lists the fair values of the Funds’ derivative holdings as of the end of the current fiscal period, grouped by contract type and risk exposure category.
FUND | DERIVATIVE TYPE | | STATEMENT OF
ASSETS AND
LIABILITIES LOCATION | | | VALUE | |
SGI Enhanced Core ETF | Written Options | | | Written options, at fair value | | | $ | (13,745 | ) |
Total Value - Liabilities | | | | | | | $ | (13,745 | ) |
| | | | | | | | | | |
SGI Enhanced Nasdaq-100 ETF | Written Options | | | Written options, at fair value | | | $ | (360 | ) |
SGI Enhanced Nasdaq-100 ETF | Futures Contracts (a) | | | Deposit at broker for futures contract | | | | (98,607 | ) |
Total Value - Liabilities | | | | $ | (98,967 | ) |
(a) | This amount represent the cumulative appreciation/(depreciation) of futures contracts as reported on the Portfolio of Investments. |
The following table lists the amounts of realized gains/(losses) included in net increase/(decrease) in net assets resulting from operations during the current fiscal period.
FUND | DERIVATIVE TYPE | | STATEMENT OF
OPERATIONS LOCATION | | | VALUE | |
SGI Enhanced Core ETF | Written Options | | | Net realized gain/(loss) from written options | | | $ | 1,933,544 | |
Total Realized Gain/(Loss) | | | | | | | $ | 1,933,544 | |
| | | | | | | | | | |
SGI Enhanced Nasdaq-100 ETF | Written Options | | | Net realized gain/(loss) from written options | | | $ | 72,659 | |
SGI Enhanced Nasdaq-100 ETF | Futures Contracts | | | Net realized gain/(loss) from futures contracts | | | | 11,882 | |
Total Realized Gain/(Loss) | | | | $ | 84,541 | |
29
SUMMIT GLOBAL INVESTMENTS
Notes to Financial Statements (Continued)
August 31, 2024
The following table lists the amounts of change in unrealized appreciation/(depreciation) included in net increase/(decrease) in net assets resulting from operations during the current fiscal period.
FUND | DERIVATIVE TYPE | | STATEMENT OF
OPERATIONS LOCATION | | | VALUE | |
SGI Enhanced Core ETF | Written Options | | | Net change in unrealized appreciation/(depreciation) on written options | | | $ | 1,203 | |
Total Change in Unrealized Appreciation/(Depreciation) | | | | | | $ | 1,203 | |
| | | | | | | | | | |
SGI Enhanced Nasdaq-100 ETF | Written Options | | | Net change in unrealized appreciation/(depreciation) on written options | | | $ | (52 | ) |
SGI Enhanced Nasdaq-100 ETF | Futures Contracts | | | Net change in unrealized appreciation/(depreciation) on futures contracts | | | | (98,607 | ) |
Total Change in Unrealized Appreciation/(Depreciation) | | | $ | (98,659 | ) |
During the current fiscal period, the Funds’ quarterly average volume of derivatives were as follows:
FUND | | WRITTEN OPTIONS
(PREMIUMS
RECEIVED) | | | LONG FUTURES
NOTIONAL
AMOUNT | |
SGI Enhanced Core ETF | | $ | 13,844 | | | $ | — | |
SGI Enhanced Global Income ETF | | | 4,051 | | | | — | |
SGI Enhanced Nasdaq-100 ETF | | | 308 | | | | 10,007,730 | |
For financial reporting purposes, the Funds do not offset fair value amounts recognized for derivative instruments and fair value amounts recognized for the right to reclam cash collateral (receivables) or the obligation to return cash collateral (payables) arising from derivative intruments recognized at fair value executed with the same counterparty and master netting arrangement.
Use of Estimates — The preparation of financial statements in conformity with U.S. GAAP requires management to make estimates and assumptions that affect the reported amounts of assets and liabilities and disclosure of contingent assets and liabilities at the date of the financial statements and the reported amounts of revenues and expenses during the reporting period. Actual results could differ from those estimates and those differences could be significant.
Investment Transactions, Investment Income and Expenses — The Funds record security transactions based on trade date for financial reporting purposes. The cost of investments sold is determined by use of the specific identification method for both financial reporting and income tax purposes in determining realized gains and losses on investments. Interest income (including amortization of premiums and accretion of discounts) is accrued when earned. Dividend income is recorded on the ex-dividend date. Distributions received on securities that represent a return of capital or capital gain are recorded as a reduction of cost of investments and/or as a realized gain. The Funds’ investment income, expenses (other than class specific expenses) and unrealized and realized gains and losses are allocated daily to each class of shares based upon the relative proportion of net assets of each class at the beginning of the day. Certain expenses are shared with The RBB Fund Trust (the “Trust”), a series trust of affiliated funds. Expenses incurred on behalf of a specific class, fund or fund family of the Company or Trust are charged directly to the class, fund or fund family (in proportion to net assets). Expenses incurred for all funds (such as director or professional fees) are charged to all funds in proportion to their average net assets of RBB and the Trust, or in such other manner as the Board deems fair or equitable. Expenses and fees, including investment advisory and administration fees, are accrued daily and taken into account for the purpose of determining the NAV of the Funds.
30
SUMMIT GLOBAL INVESTMENTS
Notes to Financial Statements (Continued)
August 31, 2024
Dividends and Distributions to Shareholders — Dividends from net investment income and distributions from net realized capital gains, if any, are declared and paid at least quarterly to shareholders and recorded on the ex-dividend date. Income dividends and capital gain distributions are determined in accordance with U.S. federal income tax regulations, which may differ from U.S. GAAP.
U.S. tax status — No provision is made for U.S. income taxes as it is each Fund’s intention to continue to qualify for and elect the tax treatment applicable to regulated investment companies under Subchapter M of the Internal Revenue Code of 1986, as amended, and make the requisite distributions to its shareholders which will be sufficient to relieve it from U.S. income and excise taxes.
Sec Rule 18f-4 — Effective August 19, 2022, the U.S. Securities and Exchange Commission (the “SEC”) implemented Rule 18f-4 under the 1940 Act (“Rule 18f-4”), providing for the regulation of a registered investment company’s use of derivatives and certain related instruments. Among other things, Rule 18f-4 limits a fund’s derivatives exposure through a value-at-risk test and requires the adoption and implementation of a derivatives risk management program for certain derivatives users. The Funds, as a full derivatives user (as defined in Rule 18f-4), are subject to the full requirements of Rule 18f-4. The Funds are required to comply with Rule 18f-4 and has adopted procedures for investing in derivatives and other transactions in compliance with Rule 18f-4.
WRITTEN OPTIONS — The Funds may enter into options written for: bona fide hedging; attempting to offset changes in the value of securities held or expected to be acquired or be disposed of; attempting to minimize fluctuations in foreign currencies; attempting to gain exposure to a particular market, index or instrument; or other risk management purposes. Such options may relate to particular securities or domestic stock indices, and may or may not be listed on exchanges regulated by the Commodity Futures Trading Commission or on other non-U.S. exchanges. An option on a futures contract gives the purchaser the right, in return for the premium paid, to assume a position in the contract (a long position if the option is a call and a short position if the option is a put) at a specified exercise price at any time during the option exercise period. The writer of the option is required upon exercise to assume a short futures position (if the option is a call) or a long futures position (if the option is a put). Upon exercise of the option, the accumulated cash balance in the writer’s futures margin account is delivered to the holder of the option. That balance represents the amount by which the market price of the futures contract at exercise exceeds, in the case of a call, or is less than, in the case of a put, the exercise price of the option. The maximum risk of loss associated with writing put options is limited to the exercised fair value of the option contract. The maximum risk of loss associated with writing call options is potentially unlimited. The Funds also have the additional risk of being unable to enter into a closing transaction at an acceptable price if a liquid secondary market does not exist. The Funds also may write OTC options where completing the obligation depends upon the credit standing of the other party. Option contracts also involve the risk that they may result in loss due to unanticipated developments in market conditions or other causes. Written options are initially recorded as liabilities to the extent of premiums received and subsequently marked to market to reflect the current value of the option written. Gains or losses are realized when the option transaction expires or closes. When an option is exercised, the proceeds on sales for a written call option or the purchase cost for a written put option is adjusted by the amount of the premium received. Listed option contracts present minimal counterparty credit risk since they are exchange traded and the exchange’s clearinghouse, as counterparty to all exchange-traded options, guarantees the options against default. As of the end of the reporting period, all of the Funds’ written options are exchange-traded options.
FUTURES CONTRACTS — The Funds use futures contracts in the normal course of pursuing their investment objective. Upon entering into a futures contract, a Fund must deposit initial margin in addition to segregating cash or liquid assets sufficient to meet its obligation to purchase or provide securities, or to pay the amount owed at the expiration of an index-based futures contract. Such liquid assets may consist of cash, cash equivalents, liquid debt or equity securities or other acceptable assets. Pursuant to the futures contract, a Fund agrees to receive from, or pay to the broker, an amount of cash equal to the daily fluctuation in value of the contract. Such a receipt of payment is known as “variation margin” and is recorded by a Fund as an unrealized gain or loss. When the contract is closed, a Fund records a realized gain or loss equal to the difference between the proceeds from (or cost of) the closing transactions and a Fund basis in the contract. Futures contracts have market risks, including the risk that the change in the value
31
SUMMIT GLOBAL INVESTMENTS
Notes to Financial Statements (Continued)
August 31, 2024
of the contract may not correlate with changes in the value of the underlying securities. Use of long futures contracts subjects a Fund to risk of loss in excess of the amount shown on the Statement of Assets and Liabilities, up to the notional value of the futures contract. Use of short futures contracts subjects a Fund to unlimited risk of loss.
Cash and Cash Equivalents — Cash and cash equivalents are valued at cost plus accrued interest, which approximates market value.
Other — In the normal course of business, the Funds may enter into contracts that provide general indemnifications. Each Fund’s maximum exposure under these arrangements is dependent on claims that may be made against the Funds in the future, and, therefore, cannot be estimated; however, the Funds expect the risk of material loss from such claims to be remote.
2. Investment Adviser and Other Services
Summit Global Investments, LLC serves as the Adviser to the Funds. SG Trading Solutions, LLC (“SG Trading Solutions” or “Sub-Adviser”) serves as the investment sub-adviser to the Funds. Each Fund pays all of its expenses other than those expressly assumed by the Adviser. Expenses of each Fund are deducted from the Fund’s total income before dividends are paid. Subject to the supervision of the Board, the Adviser manages the overall investment operations of each Fund in accordance with the Fund’s respective investment objective and policies and formulates a continuing investment strategy for each Fund pursuant to the terms of the Investment Advisory Agreement between the Adviser and the Company on behalf of each Fund (each, an “Advisory Agreement” and together, the “Advisory Agreements”). The Funds compensate the Adviser with a unitary management fee for its services at an annual rate of 0.85%, 0.95%, 0.98%, 0.98% and 0.98% of the average daily net assets of the SGI U.S. Large Cap Core ETF, the SGI Dynamic Tactical ETF, the SGI Enhanced Global Income ETF, the SGI Enhanced Core ETF and the SGI Enhanced Nasdaq-100 ETF, respectively. The fee is paid monthly in arrears. From the unitary management fee, the Adviser pays most of the expenses of each Fund, including the cost of sub-advisory fees to SG Trading Solutions, transfer agency, custody, fund administration, legal, audit and other services. However, under each Investment Advisory Agreement, the Adviser is not responsible for interest expenses, brokerage commissions and other trading expenses, taxes and other extraordinary costs such as litigation and other expenses not incurred in the ordinary course of business. The Sub-Adviser is an affiliate of the Adviser. The Sub-Adviser implements rigorous quantitative and fundamental analysis to achieve best execution, and is subject to oversight by the Adviser and the Board. Under the Sub-Advisory Agreement, the Sub-Adviser receives a fee from the Adviser, calculated daily and paid monthly, equal to 0.05% of the average daily net assets of each Fund. During the current fiscal period, investment advisory fees accrued were as follows:
FUND | | ADVISORY FEES | |
SGI U.S. Large Cap Core ETF | | $ | 795,489 | |
SGI Dynamic Tactical ETF | | | 797,772 | |
SGI Enhanced Global Income ETF | | | 261,368 | |
SGI Enhanced Core ETF | | | 405,684 | |
SGI Enhanced Nasdaq-100 ETF | | | 15,052 | |
U.S. Bancorp Fund Services, LLC, doing business as U.S. Bank Global Fund Services (“Fund Services”), serves as administrator for the Funds. For providing administrative and accounting services, Fund Services is entitled to receive a monthly fee, subject to certain minimum and out of pocket expenses.
Fund Services serves as the Funds’ transfer and dividend disbursing agent. For providing transfer agent services, Fund Services is entitled to receive a monthly fee, subject to certain minimum and out of pocket expenses.
U.S. Bank, N.A. (the “Custodian”) provides certain custodial services to the Funds. The Custodian is entitled to receive a monthly fee, subject to certain minimum and out of pocket expenses.
32
SUMMIT GLOBAL INVESTMENTS
Notes to Financial Statements (Continued)
August 31, 2024
Quasar Distributors, LLC (the “Distributor”), a wholly-owned broker-dealer subsidiary of Foreside Financial Group, LLC, serves as the principal underwriter and distributor of the Funds’ shares pursuant to a Distribution Agreement with RBB.
Under the Funds’ unitary fee, the Adviser compensates Fund Services and the Custodian for services provided.
3. DIRECTOR AND OFFICER Compensation
The Directors of the Company receive an annual retainer and meeting fees for meetings attended. An employee of Vigilant Compliance, LLC serves as Chief Compliance Officer of the Company. Vigilant Compliance, LLC is compensated for the services provided to the Company. Employees of RBB serve as President, Chief Financial Officer, Chief Operating Officer, Secretary and Director of Marketing & Business Development of the Company. They are compensated by the Company for services provided. Certain employees of Fund Services serve as officers of the Company. They are not compensated by the Funds or the Company. As of the end of the current fiscal period, there were no director and officer fees charged or paid by the Funds. During the current fiscal period, director and officer fees charged to the Funds were paid by the Adviser out of each Fund’s unitary fee.
4. PURCHASES AND SALES OF INVESTMENT SECURITIES
During the current fiscal period, aggregate purchases and sales of investment securities (excluding in-kind transactions, short-term investments and derivative transactions) of the Funds were as follows:
FUND | | Purchases | | | Sales | |
SGI U.S. Large Cap Core ETF | | $ | 198,193,523 | | | $ | 199,908,287 | |
SGI Dynamic Tactical ETF | | | 140,773,596 | | | | 139,680,097 | |
SGI Enhanced Global Income ETF | | | 101,361,909 | | | | 79,138,684 | |
SGI Enhanced Core ETF | | | — | | | | — | |
SGI Enhanced Nasdaq-100 ETF | | | — | | | | 1,256,653 | |
There were no purchases or sales of long-term U.S. Government securities during the current fiscal period.
During the current fiscal period, aggregate purchases and sales of in-kind transactions (excluding short-term investments) of the Funds were as follows:
FUND | | Purchases | | | Sales | |
SGI U.S. Large Cap Core ETF | | $ | 105,564,560 | | | $ | 133,185,626 | |
SGI Dynamic Tactical ETF | | | 22,586,336 | | | | 88,052,768 | |
SGI Enhanced Global Income ETF | | | 43,022,301 | | | | — | |
SGI Enhanced Core ETF | | | — | | | | — | |
SGI Enhanced Nasdaq-100 ETF | | | 1,247,954 | | | | — | |
5. Federal Income Tax Information
The Funds have followed the authoritative guidance on accounting for and disclosure of uncertainty in tax positions, which requires the Funds to determine whether a tax position is more likely than not to be sustained upon examination, including resolution of any related appeals or litigation processes, based on the technical merits of the position. The Funds have determined that there was no effect on the financial statements from following this authoritative guidance. In the normal course of business, the Funds are subject to examination by federal, state and local jurisdictions, where applicable, for tax years for which applicable statutes of limitations have not expired.
33
SUMMIT GLOBAL INVESTMENTS
Notes to Financial Statements (Continued)
August 31, 2024
As of August 31, 2024, the federal tax cost and aggregate gross unrealized appreciation and depreciation of investments held by the SGI U.S. Large Cap Core ETF, the SGI Dynamic Tactical ETF, the SGI Enhanced Global Income ETF, the SGI Enhanced Core ETF and the SGI Enhanced Nasdaq-100 ETF were as follows:
FUND | | Federal Tax
Cost | | | Unrealized
Appreciation | | | Unrealized
(Depreciation) | | | Net Unrealized
Appreciation/
(Depreciation) | |
SGI U.S. Large Cap Core ETF | | $ | 86,194,647 | | | $ | 6,548,510 | | | $ | (1,661,676 | ) | | $ | 4,886,834 | |
SGI Dynamic Tactical ETF | | | 54,177,445 | | | | 5,309,057 | | | | (67,059 | ) | | | 5,241,998 | |
SGI Enhanced Global Income ETF | | | 65,035,476 | | | | 4,105,477 | | | | (1,702,000 | ) | | | 2,403,477 | |
SGI Enhanced Core ETF | | | 94,443,194 | | | | — | | | | — | | | | — | |
SGI Enhanced Nasdaq-100 ETF | | | 500,034 | | | | — | | | | — | | | | — | |
The difference between the book basis and tax basis cost and aggregate gross unrealized appreciation and depreciation of investments is attributable primarily to timing differences related to wash sales.
Distributions to shareholders, if any, from net investment income and realized gains are determined in accordance with federal income tax regulations, which may differ from net investment income and realized gains recognized for financial reporting purposes. Accordingly, the character of distributions and composition of net assets for tax purposes may differ from those reflected in the accompanying financial statements. Any permanent differences resulting from different book and tax treatment are reclassified at year-end and have no impact on net income, NAV or NAV per share of the Funds.
The following permanent differences as of August 31, 2024, primarily attributable to in-kind redemptions gain and loss, were reclassified among the following accounts:
FUND | | Distributable
Earnings/(loss) | | | Paid-in
Capital | |
SGI U.S. Large Cap Core ETF | | $ | (15,388,091 | ) | | $ | 15,388,091 | |
SGI Dynamic Tactical ETF | | | (8,197,114 | ) | | | 8,197,114 | |
SGI Enhanced Global Income ETF | | | — | | | | — | |
SGI Enhanced Core ETF | | | — | | | | — | |
SGI Enhanced Nasdaq-100 ETF | | | — | | | | — | |
As of August 31, 2024, the components of distributable earnings on a tax basis were as follows:
FUND | | Undistributed
Ordinary
Income | | | Undistributed
Long-term
capital gains | | | Capital
Loss Carry
Forward | | | Qualified
Late-
Year Loss
Deferral | | | Other
Temporary
Differences | | | Net
Unrealized
Appreciation/
(Depreciation) | |
SGI U.S. Large Cap Core ETF | | $ | 6,833,121 | | | $ | 49,100 | | | $ | — | | | $ | — | | | $ | — | | | $ | 4,886,834 | |
SGI Dynamic Tactical ETF | | | 2,002,460 | | | | 502,993 | | | | — | | | | — | | | | — | | | | 5,241,998 | |
SGI Enhanced Global Income ETF | | | 231,881 | | | | 375,969 | | | | — | | | | — | | | | — | | | | 2,403,477 | |
SGI Enhanced Core ETF | | | 1,620,288 | | | | 1,154,959 | | | | — | | | | — | | | | — | | | | — | |
SGI Enhanced Nasdaq-100 ETF | | | 43,029 | | | | — | | | | (5,420 | ) | | | — | | | | — | | | | — | |
34
SUMMIT GLOBAL INVESTMENTS
Notes to Financial Statements (Continued)
August 31, 2024
The differences between the book and tax basis components of distributable earnings relate primarily to wash sales.
The tax character of dividends and distributions paid during the fiscal year ended August 31, 2024 was a follows:
FUND | | ORDINARY INCOME | | | LONG-TERM GAINS | | | TOTAL | |
SGI U.S. Large Cap Core ETF | | $ | 1,543,545 | | | $ | 1,115 | | | $ | 1,544,660 | |
SGI Dynamic Tactical ETF | | | 972,668 | | | | — | | | | 972,668 | |
SGI Enhanced Global Income ETF | | | 435,871 | | | | — | | | | 435,871 | |
SGI Enhanced Core ETF | | | 881,035 | | | | — | | | | 881,035 | |
SGI Enhanced Nasdaq-100 ETF | | | — | | | | — | | | | — | |
Dividends from net investment income and short-term capital gains are treated as ordinary income dividends for federal income tax purposes.
The Funds are permitted to carry forward capital losses for an unlimited period. Capital losses that are carried forward will retain their character as either short-term or long-term capital losses. As of August 31, 2024, the SGI Enhanced Nasdaq-100 ETF had $5,420 of long-term loss carryovers. During the fiscal year, the SGI Dynamic Tactical ETF utilized $499,102 of carry forward capital losses.
Pursuant to federal income tax rules applicable to regulated investment companies, the Funds may elect to treat certain capital losses between November 1 and August 31 and late year ordinary losses ((i) ordinary losses between January 1 and August 31, and (ii) specified ordinary and currency losses between November 1 and August 31) as occurring on the first day of the following tax year. For the fiscal year ended August 31, 2024, any amount of losses elected within the tax return will not be recognized for federal income tax purposes until September 1, 2024. As of August 31, 2024 the Funds had no tax basis qualified late-year loss deferral.
6. TRANSACTIONS WITH AFFILIATES
The following issuers are affiliated with the Funds. Fund of funds are allowed to invest in other investment companies in excess of the limits imposed, if certain requirement, such as being part of the same group of investment companies, are met. As defined in Section (2)(a)(3) of the 1940 Act; such issuers are:
| | | August 31, 2023 | | | Additions | | | Reductions | |
Issuer Name | | Share
Balance | | | Cost | | | Share
Balance | | | Cost | | | Share
Balance | | | Cost | |
SGI Dynamic Tactical ETF | | | | | | | | | | | | | | | | | | | | | | | | |
SGI Small Cap Core Fund | | | — | | | $ | — | | | | 282,196 | | | $ | 7,410,455 | | | | (282,196 | ) | | $ | 7,410,455 | |
SGI U.S. Large Cap Core ET | | | 829,146 | | | | 22,726,237 | | | | 766,626 | | | | 22,494,350 | | | | (997,132 | ) | | | 26,974,854 | |
SGI Enhanced Nasdaq-100 ETF | | | — | | | | — | | | | 245,468 | | | | 6,183,410 | | | | (38,588 | ) | | | 970,976 | |
| | | | 829,146 | | | $ | 22,726,237 | | | | 1,294,290 | | | $ | 36,088,215 | | | | (1,317,916 | ) | | $ | 35,356,285 | |
35
SUMMIT GLOBAL INVESTMENTS
Notes to Financial Statements (CONCLUDED))
August 31, 2024
| | | August 31, 2024 | |
Issuer Name | | Dividend
Income | | | Capital
Gain
Distribution | | | Net Change in
Unrealized
Appreciation/
(Depreciation) | | | Realized
Gain/(Loss) | | | Share
Balance | | | Value | | | Cost | |
SGI Dynamic Tactical ETF | | | | | | | | | | | | | | | | | | | | | | | | | | | | |
SGI Small Cap Core Fund | | $ | — | | | $ | — | | | $ | — | | | $ | 42,329 | | | | — | | | $ | — | | | $ | — | |
SGI U.S. Large Cap Core ETF | | | 80,642 | | | | 398,373 | | | | 2,357,496 | | | | 4,615,629 | | | | 598,640 | | | | 21,093,080 | | | | 18,245,733 | |
SGI Enhanced Nasdaq-100 ETF | | | — | | | | — | | | | 50,717 | | | | (42,869 | ) | | | 206,880 | | | | 5,263,151 | | | | 5,212,434 | |
| | | $ | 80,642 | | | $ | 398,373 | | | $ | 2,408,213 | | | $ | 4,615,089 | | | | 805,520 | | | $ | 26,356,231 | | | $ | 23,458,167 | |
7. SHARE TRANSACTIONS
Shares of the SGI U.S. Large Cap Core ETF are listed and traded on the NYSE. Shares of the SGI Dynamic Tactical ETF, SGI Enhanced Global Income ETF, SGI Enhanced Core ETF and SGI Enhanced Nasdaq-100 ETF are listed and traded on the NASDAQ, Inc. Market prices for the shares may be different from their NAV. Each Fund issues and redeems shares on a continuous basis at NAV only in blocks of 5,000 shares, called “Creation Units.” Creation Units are issued and redeemed principally in-kind for securities included in a specified universe. Once created, shares generally trade in the secondary market at market prices that change throughout the day. Except when aggregated in Creation Units, shares are not redeemable securities of each Fund. Creation Units may only be purchased or redeemed by certain financial institutions (“Authorized Participants”). An Authorized Participant is either (i) a broker-dealer or other participant in the clearing process through the Continuous Net Settlement System of the National Securities Clearing Corporation or (ii) a Depository Trust Company participant and, in each case, must have executed a Participant Agreement with the Distributor. Most retail investors do not qualify as Authorized Participants nor have the resources to buy and sell whole Creation Units. Therefore, they are unable to purchase or redeem shares directly from each Fund. Rather, most retail investors may purchase shares in the secondary market with the assistance of a broker and are subject to customary brokerage commissions or fees.
8. SUBSEQUENT EVENTS
Management has evaluated the impact of all subsequent events on the Funds through the date the financial statements were issued and has determined that there were no significant events requiring recognition or disclosure in the financial statements.
36
SUMMIT GLOBAL INVESTMENTS
Report of Independent Registered
Public Accounting Firm
To the Shareholders of SGI U.S. Large Cap Core ETF, SGI Dynamic Tactical ETF, SGI Enhanced Core ETF, SGI Enhanced Global Income ETF, and SGI Enhanced Nasdaq-100 ETF and Board of Directors of The RBB Fund, Inc.
Opinion on the Financial Statements
We have audited the accompanying statements of assets and liabilities of SGI U.S. Large Cap Core ETF, SGI Dynamic Tactical ETF, SGI Enhanced Core ETF, SGI Enhanced Global Income ETF, and SGI Enhanced Nasdaq-100 ETF (collectively referred to as the “Funds”) (five of the portfolios constituting The RBB Fund, Inc. (the “Company”)), including the portfolios of investments, as of August 31, 2024, and the related statements of operations and changes in net assets, and the financial highlights for each of the periods indicated in the table below and the related notes (collectively referred to as the “financial statements”). In our opinion, the financial statements present fairly, in all material respects, the financial position of each of the Funds (five of the portfolios constituting The RBB Fund, Inc.) at August 31, 2024, and the results of their operations, changes in net assets and financial highlights for each of the periods indicated in the table below, in conformity with U.S. generally accepted accounting principles.
Individual portfolio
constituting The RBB Fund, Inc. | Statement of
operations | Statements of changes
in net assets | Financial highlights |
SGI U.S. Large Cap Core ETF | For the year ended August 31, 2024 | For the year ended August 31, 2024, and for the period from March 30, 2023 (commencement of operations) through August 31, 2023 |
SGI Dynamic Tactical ETF | For the year ended August 31, 2024 | For the year ended August 31, 2024, and for the period from March 29, 2023 (commencement of operations) through August 31, 2023 |
SGI Enhanced Core ETF SGI Enhanced Global Income ETF | For the period from February 28, 2024 (commencement of operations) through August 31, 2024 |
SGI Enhanced Nasdaq-100 ETF | For the period from June 13, 2024 (commencement of operations) through August 31, 2024 |
Basis for Opinion
These financial statements are the responsibility of the Company’s management. Our responsibility is to express an opinion on each of the Fund’s financial statements based on our audits. We are a public accounting firm registered with the Public Company Accounting Oversight Board (United States) (“PCAOB”) and are required to be independent with respect to the Company in accordance with the U.S. federal securities laws and the applicable rules and regulations of the Securities and Exchange Commission and the PCAOB.
We conducted our audits in accordance with the standards of the PCAOB. Those standards require that we plan and perform the audit to obtain reasonable assurance about whether the financial statements are free of material misstatement, whether due to error or fraud. The Company is not required to have, nor were we engaged to perform, an audit of the Company’s internal control over financial reporting. As part of our audits, we are required to obtain an understanding of internal control over financial reporting but not for the purpose of expressing an opinion on the effectiveness of the Company’s internal control over financial reporting. Accordingly, we express no such opinion.
37
SUMMIT GLOBAL INVESTMENTS
REPORT OF INDEPENDENT REGISTERED PUBLIC ACCOUNTING FIRM (Concluded)
Our audits included performing procedures to assess the risks of material misstatement of the financial statements, whether due to error or fraud, and performing procedures that respond to those risks. Such procedures included examining, on a test basis, evidence regarding the amounts and disclosures in the financial statements. Our procedures included confirmation of securities owned as of August 31, 2024, by correspondence with the custodian and brokers. Our audits also included evaluating the accounting principles used and significant estimates made by management, as well as evaluating the overall presentation of the financial statements. We believe that our audits provide a reasonable basis for our opinion.

We have served as the auditor of one or more Summit Global Investment investments companies since 2012.
Philadelphia, Pennsylvania
October 30, 2024
38
SUMMIT GLOBAL INVESTMENTS
Shareholder Tax Information (UNAUDITED)
Certain tax information regarding the Funds is required to be provided to shareholders based upon the Funds’ income and distributions for the taxable period ended August 31, 2024. The information and distributions reported herein may differ from information and distributions taxable to the shareholders for the calendar year ending December 31, 2024. During the fiscal year ended August 31, 2024, the tax character of distributions paid by the Funds were as follows:
FUND | | | | | | Ordinary Income | | | Long-Term
Gains | |
SGI U.S. Large Cap Core ETF | | | 2024 | | | $ | 1,543,545 | | | $ | 1,115 | |
SGI Dynamic Tactical ETF | | | 2024 | | | | 972,668 | | | | — | |
SGI Enhanced Global Income ETF | | | 2024 | | | | 435,871 | | | | — | |
SGI Enhanced Core ETF | | | 2024 | | | | 881,035 | | | | — | |
SGI Enhanced Nasdaq-100 ETF | | | 2024 | | | | — | | | | — | |
Distributions from net investment income and short-term capital gains are treated as ordinary income dividends for federal income tax purposes.
Under the Jobs and Growth Tax Relief Reconciliation Act of 2003, the following percentages of ordinary dividends paid during the fiscal year ended Agusut 31, 2024 are designated as “qualified dividend income,” as defined in the Act, and are subject to reduced tax rates.
SGI U.S. Large Cap Core ETF | | | 25.00 | % |
SGI Dynamic Tactical ETF | | | 31.80 | % |
SGI Enhanced Global Income ETF | | | 100.00 | % |
SGI Enhanced Core ETF | | | 0.00 | % |
SGI Enhanced Nasdaq-100 ETF | | | 0.00 | % |
The percentage of total ordinary income dividends paid qualifying for corporate dividends received deduction for each Fund is as follows:
SGI U.S. Large Cap Core ETF | | | 25.76 | % |
SGI Dynamic Tactical ETF | | | 9.42 | % |
SGI Enhanced Global Income ETF | | | 42.00 | % |
SGI Enhanced Core ETF | | | 0.00 | % |
SGI Enhanced Nasdaq-100 ETF | | | 0.00 | % |
The percentage of qualified interest income related dividends not subject to withholding tax for non-resident aliens and foreign corporations is as follows:
SGI U.S. Large Cap Core ETF | | | 0.00 | % |
SGI Dynamic Tactical ETF | | | 0.00 | % |
SGI Enhanced Global Income ETF | | | 0.00 | % |
SGI Enhanced Core ETF | | | 0.00 | % |
SGI Enhanced Nasdaq-100 ETF | | | 0.00 | % |
39
SUMMIT GLOBAL INVESTMENTS
Shareholder Tax Information (UNAUDITED) (CONCLUDED)
The percentage of ordinary income distributions designated as qualified short-term gains pursuant to the American Job Creation Act of 2004 is as follows:
SGI U.S. Large Cap Core ETF | | | 83.15 | % |
SGI Dynamic Tactical ETF | | | 0.00 | % |
SGI Enhanced Global Income ETF | | | 0.00 | % |
SGI Enhanced Core ETF | | | 0.00 | % |
SGI Enhanced Nasdaq-100 ETF | | | 0.00 | % |
Because the Funds’ fiscal year is not the calendar year, another notification will be sent with respect to calendar year 2024. The second notification, which will reflect the amount, if any, to be used by calendar year taxpayers on their U.S. federal income tax returns, will be made in conjunction with Form 1099-DIV and will be mailed in January 2025.
Foreign shareholders will generally be subject to U.S. withholding tax on the amount of their ordinary income dividends. They will generally not be entitled to a foreign tax credit or deduction for the withholding taxes paid by the Funds, if any.
In general, dividends received by tax-exempt recipients (e.g., IRAs and Keoghs) need not be reported as taxable income for U.S. federal income tax purposes. However, some retirement trusts (e.g., corporate, Keogh and 403(b)(7) plans) may need this information for their annual information reporting. Shareholders are advised to consult their own tax advisers with respect to the tax consequences of their investment in the Funds.
40
SUMMIT GLOBAL INVESTMENTS
Other Information (Unaudited)
APPROVAL OF INVESTMENT ADVISORY AGREEMENT
As required by the 1940 Act, the Board, including all of the Directors who are not “interested persons” of the Company, as that term is defined in the 1940 Act (the “Independent Directors”), considered (1) the renewal of the investment advisory agreement between Summit and the Company (the “Investment Advisory Agreement”) on behalf of the SGI U.S. Large Cap Core ETF and the SGI Dynamic Tactical ETF (each a “Fund” and together the “Funds”), and (2) the renewal of the sub-advisory agreement among Summit, the Company and SG Trading Solutions, LLC (the “Sub-Adviser”) (the “Sub-Advisory Agreement”), at a meeting of the Board held on May 15-16, 2024 (the “Meeting”). At the Meeting, the Board, including all of the Independent Directors, approved the Investment Advisory Agreement and the Sub-Advisory Agreement for an additional one-year term ending August 16, 2025. The Board’s decision to approve the Investment Advisory Agreement and the Sub-Advisory Agreement reflects the exercise of its business judgment to continue the existing arrangement. In approving the Investment Advisory Agreement and the Sub-Advisory Agreement, the Board considered information provided by Summit and the Sub-Adviser with the assistance and advice of counsel to the Independent Directors and the Company.
In considering the renewal and approval of the Investment Advisory Agreement between the Company and Summit with respect to the Funds, and the Sub-Advisory Agreement among the Company, Summit, and the Sub-Adviser with respect to the Funds, the Directors took into account all materials provided prior to and during the Meeting and at other meetings throughout the past year, the presentations made during the Meeting, and the discussions held during the Meeting. The Directors reviewed these materials with management of Summit, and discussed the aforementioned Agreements with counsel in executive sessions, at which no representatives of Summit or the Sub-Adviser were present. Among other things, the Directors considered (i) the nature, extent, and quality of services provided to the Fund by Summit and the Sub-Adviser; (ii) descriptions of the experience and qualifications of the personnel providing those services; (iii) Summit’s and the Sub-Adviser’s investment philosophies and processes; (iv) Summit’s and the Sub-Adviser’s assets under management and client descriptions; (v) Summit’s and the Sub-Adviser’s soft dollar commission and trade allocation policies, including information on the types of research and services obtained in connection with soft dollar commissions; (vi) Summit’s and the Sub-Adviser’s advisory fee arrangements and other similarly managed clients, as applicable; (vii) Summit’s and the Sub-Adviser’s compliance procedures; (viii) Summit’s and the Sub-Adviser’s financial information and insurance coverage, as applicable; (ix) the extent to which economies of scale are relevant to the Funds; (x) a report prepared by Fuse Research Network, LLC comparing each Fund’s management fees and total expense ratios to a group of mutual funds deemed comparable to the Fund based primarily on investment strategy similarity (“Peer Group”) and comparing the performance of each Fund to the performance of its Peer Group; and (xi) a report comparing the performance of the Funds to the performance of its respective benchmark.
As part of their review, the Directors considered the nature, extent and quality of the services provided by Summit and the Sub-Adviser. The Directors concluded that Summit and the Sub-Adviser had substantial resources to provide services to the Fund, and that Summit’s and the Sub-Adviser’s services had been acceptable.
The Directors also considered the investment performance of the Funds. Information on the Funds’ investment performance was provided for the three-month and since inception periods ended December 31, 2023. The Directors considered the Funds’ investment performance in light of their respective investment objectives and investment strategies. The Directors concluded that the investment performance of each of the Funds as compared to their respective benchmarks and Peer Groups was acceptable.
The Directors noted that the SGI U.S. Large Cap Core ETF outperformed its primary benchmark, the S&P 500 Index, for the since-inception period ended December 31, 2023, and underperformed its benchmark for the three-month period ended December 31, 2023. The Directors noted that the SGI U.S. Large Cap Core ETF outperformed the performance of the median of its Peer Group for the three-month and one-year periods ended December 31, 2023.
41
SUMMIT GLOBAL INVESTMENTS
Other Information (Unaudited) (concluded)
The Directors noted that the SGI Dynamic Tactical ETF underperformed its primary benchmark, the S&P 500 Index, for the three-month and since-inception periods ended December, 2023. The Directors noted that the SGI Dynamic Tactical ETF outperformed the performance of the median of its Peer Group for the three-month period ended December 31, 2023, and underperformed the median of its Peer Group for the since-inception period ended December 31, 2023.
The Board also considered the advisory fee rate payable by the Funds under the Investment Advisory Agreement and Sub-Advisory Agreement. In this regard, information on the fees paid by the Fund and the Fund’s total operating expense ratios were compared to similar information for mutual funds advised by other, unaffiliated investment advisory firms.
The Directors noted that the SGI U.S. Large Cap Core ETF’s net advisory fee was above the median of its Peer Group and ranked in the 5th quintile of its Peer Group, and its total net expenses was above the median of its Peer Group and ranked in the 5th quintile of its Peer Group.
The Directors noted that the SGI Dynamic Tactical ETF’s net advisory fee was above the median of its Peer Group and ranked in the 5th quintile of its Peer Group, and its total net expenses (including acquired fund fees and expenses) was below the median of its Peer Group and ranked in the 2nd quintile of its Peer Group.
The Directors also considered the fees payable to the Sub-Adviser under the Sub-Advisory Agreement and the information provided by Summit on the services provided by the Sub-Adviser. In this regard, the Directors noted that the fees for the Sub-Adviser were paid directly by Summit and not by the Funds.
The Board also took into consideration that the advisory fee for each Fund was a “unitary fee,” meaning those Funds paid no expenses other than the advisory fee and certain other costs such as interest, brokerage and extraordinary expenses. The Board noted that Summit continued to be responsible for compensating the Funds’ other service providers and paying other expenses of the Funds out of its own fees and resources.
After reviewing the information regarding Summit’s and the Sub-Adviser’s costs, profitability and economies of scale, and after considering the services to be provided by Summit and the Sub-Adviser, the Directors concluded that the investment advisory fees to be paid by the Fund to Summit and the sub-advisory fees to be paid by Summit to the Sub-Adviser were fair and reasonable and that the Investment Advisory Agreement and Sub-Advisory Agreement should be approved and continued for an additional one-year period ending August 16, 2025.
42
Investment Adviser
Summit Global Investments, LLC
620 South Main Street
Bountiful, UT 84010
Administrator and Transfer Agent
U.S. Bancorp Fund Services, LLC
P.O. Box 701
Milwaukee, WI 53201
Principal Underwriter
Quasar Distributors, LLC
3 Canal Plaza, Suite 100
Portland, ME 04101
Custodian
U.S. Bank, N.A.
1555 North Rivercenter Drive, Suite 302
Milwaukee, WI 53212
Independent Registered Public Accounting Firm
Ernst & Young LLP
One Commerce Square
2005 Market Street, Suite 700
Philadelphia, PA 19103
Legal Counsel
Faegre Drinker Biddle & Reath LLP
One Logan Square, Suite 2000
Philadelphia, PA 19103-6996
Item 8. Changes in and Disagreements with Accountants for Open-End Management Investment Companies.
Not applicable.
Item 9. Proxy Disclosures for Open-End Management Investment Companies.
This information is included in Item 7 of this Form, as part of the financial statements.
Item 10. Remuneration Paid to Directors, Officers, and Others of Open-End Management Investment Companies.
This information is included in Item 7 of this Form, as part of the financial statements.
Item 11. Statement Regarding Basis for Approval of Investment Advisory Contract.
This information is included in Item 7 of this Form, as part of the financial statements.
Item 12. Disclosure of Proxy Voting Policies and Procedures for Closed-End Management Investment Companies.
Not applicable.
Item 13. Portfolio Managers of Closed-End Management Investment Companies.
Not applicable.
Item 14. Purchases of Equity Securities by Closed-End Management Investment Company and Affiliated Purchasers.
Not applicable.
Item 15. Submission of Matters to a Vote of Security Holders.
There have been no material changes to the procedures by which the shareholders may recommend nominees to the registrant’s board of directors, where those changes were implemented after the registrant last provided disclosure in response to the requirements of Item 407(c)(2)(iv) of Regulation S-K (17 CFR 229.407) (as required by Item 22(b)(15) of Schedule 14A (17 CFR 240.14a-101)), or this Item.
Item 16. Controls and Procedures.
| (a) | The Registrant’s Principal Executive and Principal Financial Officers have reviewed the Registrant's disclosure controls and procedures (as defined in Rule 30a-3(c) under the Investment Company Act of 1940, as amended (the “1940 Act”)) as of a date within 90 days of the filing of this report, as required by Rule 30a-3(b) under the Act and Rules 13a-15(b) or 15d-15(b) under the Securities Exchange Act of 1934, as amended. Based on their review, such officers have concluded that the disclosure controls and procedures are effective in ensuring that information required to be disclosed in this report is appropriately recorded, processed, summarized and reported and made known to them by others within the Registrant and by the Registrant’s service provider. |
| (b) | There were no changes in the Registrant's internal control over financial reporting (as defined in Rule 30a-3(d) under the 1940 Act) that occurred during the period covered by this report that has materially affected, or is reasonably likely to materially affect, the Registrant's internal control over financial reporting. |
Item 17. Disclosure of Securities Lending Activities for Closed-End Management Investment Companies
Not applicable.
Item 18. Recovery of Erroneously Awarded Compensation.
Not applicable.
Item 19. Exhibits.
(a)(1) Senior Officer Code of Ethics, or any amendment thereto, that is the subject of disclosure required by Item 2 is attached hereto.
(a)(2) Not applicable.
(a)(3) A separate certification for each Principal Executive Officer and Principal Financial Officer pursuant to Rule 30a-2(a) under the 1940 Act is attached hereto.
(a)(4) Not applicable.
(a)(5) Not applicable.
(b) Certifications pursuant to Section 906 of the Sarbanes Oxley Act of 2002. Furnished herewith.
SIGNATURES
Pursuant to the requirements of the Securities Exchange Act of 1934 and the Investment Company Act of 1940, the registrant has duly caused this report to be signed on its behalf by the undersigned, thereunto duly authorized.
| | (Registrant) | The RBB Fund, Inc. | |
| | | | |
| | By (Signature and Title)* | /s/ Steven Plump | |
| | | Steven Plump, President | |
| | | (Principal Executive Officer) | |
| | | | |
| | Date | 11/12/2024 | |
Pursuant to the requirements of the Securities Exchange Act of 1934 and the Investment Company Act of 1940, this report has been signed below by the following persons on behalf of the registrant and in the capacities and on the dates indicated.
| | By (Signature and Title)* | /s/ Steven Plump | |
| | | Steven Plump, President | |
| | | (Principal Executive Officer) | |
| | | | |
| | Date | 11/12/2024 | |
| | | | |
| | By (Signature and Title)* | /s/ James Shaw | |
| | | James Shaw, Chief Financial Officer | |
| | | (Principal Financial Officer) | |
| | | | |
| | Date | 11/12/2024 | |
| * | Print the name and title of each signing officer under his or her signature. |