FREEPORT-McMoRan COPPER & GOLD INC.
SELECTED FINANCIAL AND OPERATING DATA
| Years Ended December 31, | 2004 | 2003 | 2002 | 2001 | 2000 | ||||||||||
FCXCONSOLIDATED FINANCIAL DATA | (Financial Data in Dollars, Except Average Shares, and in Thousands, Except Per Share Amounts) | ||||||||||||||
| Revenues | $ | 2,371,866 | $ | 2,212,165 | $ | 1,910,462 | $ | 1,838,866 | $ | 1,868,610 | |||||
| Operating income | 703,576 | a | 823,308 | 640,137 | 542,926 | 492,293 | |||||||||
| Net income before cumulative effect of changes in accounting principles | 156,776 | b | 169,812 | c | 130,099 | 76,496 | 39,500 | ||||||||
| Cumulative effect of changes in accounting principles, net | - | (15,593 | )d | (3,049 | )e | - | - | ||||||||
| Net income applicable to common stock | 156,776 | b | 154,219 | c | 127,050 | 76,496 | 39,500 | ||||||||
| Pro forma net income, assuming accounting changes are applied retroactively | 156,776 | b | 169,307 | c, d | 129,635 | 104,847 | 42,610 | ||||||||
| Basic net income per common share | 0.86 | 0.99 | 0.88 | 0.53 | 0.26 | ||||||||||
| Diluted net income per common share: | |||||||||||||||
| Applicable to common stock | 0.85 | b | 0.97 | c, d | 0.87 | 0.53 | 0.26 | ||||||||
| Pro forma, assuming accounting changes are applied retroactively | 0.85 | b | 1.06 | c, d | 0.89 | 0.72 | 0.28 | ||||||||
| Dividends paid per common share | 1.10 | 0.27 | - | - | - | ||||||||||
| Basic average shares outstanding | 182,272 | 155,805 | 144,649 | 143,952 | 153,997 | ||||||||||
| Diluted average shares outstanding | 184,923 | 159,102 | 146,418 | 144,938 | 154,519 | ||||||||||
| At December 31: | |||||||||||||||
| Cash and restricted cash and investments | 551,950 | 498,616 | 115,782 | 149,475 | 7,968 | ||||||||||
| Property, plant, equipment and development costs, net | 3,199,292 | 3,261,697 | 3,320,561 | 3,409,687 | 3,230,564 | ||||||||||
| Total assets | 5,086,995 | 4,718,366 | 4,192,193 | 4,211,929 | 3,950,741 | ||||||||||
| Long-term debt, including current portion and short-term borrowings | 1,951,906 | 2,228,330 | d | 2,038,390 | 2,338,600 | 2,190,025 | |||||||||
| Redeemable preferred stock | - | - | d | 450,003 | 462,504 | 475,005 | |||||||||
| Stockholders’ equity | 1,163,649 | 775,984 | 266,826 | 104,444 | 37,931 | ||||||||||
PT FREEPORT INDONESIA OPERATING DATA, Net of Rio Tinto’s Interest | |||||||||||||||
| Copper (recoverable) | |||||||||||||||
| Production (000s of pounds) | 996,500 | 1,291,600 | 1,524,200 | 1,393,400 | 1,388,100 | ||||||||||
| Production (metric tons) | 452,000 | 585,900 | 691,400 | 632,000 | 629,600 | ||||||||||
| Sales (000s of pounds) | 991,600 | 1,295,600 | 1,522,300 | 1,399,100 | 1,393,700 | ||||||||||
| Sales (metric tons) | 449,800 | 587,700 | 690,500 | 634,600 | 632,200 | ||||||||||
| Average realized price per pound | $1.37 | $0.82 | $0.71 | $0.69 | $0.82 | ||||||||||
| Gold (recoverable ounces) | |||||||||||||||
| Production | 1,456,200 | 2,463,300 | 2,296,800 | 2,634,900 | 1,899,500 | ||||||||||
| Sales | 1,443,000 | 2,469,800 | 2,293,200 | 2,644,800 | 1,921,400 | ||||||||||
| Average realized price per ounce | $412.32 | $366.60 | f | $311.97 | $269.24 | $276.06 | |||||||||
| Silver (recoverable ounces) | |||||||||||||||
| Production | 3,270,700 | 4,112,700 | 4,121,100 | 3,771,500 | 3,542,400 | ||||||||||
| Sales | 3,257,800 | 4,126,700 | 4,116,100 | 3,782,600 | 3,542,300 | ||||||||||
| Average realized price per ounce | $6.10 | $5.15 | $4.66 | $4.80 | $4.98 | ||||||||||
ATLANTIC COPPER OPERATING DATA | |||||||||||||||
| Concentrate and scrap treated (metric tons) | 768,100 | 964,400 | 1,016,700 | 891,100 | 916,300 | ||||||||||
| Anodes | |||||||||||||||
| Production (000s of pounds) | 494,400 | 640,000 | 657,000 | 617,300 | 639,100 | ||||||||||
| Production (metric tons) | 224,300 | 290,300 | 298,000 | 280,000 | 289,900 | ||||||||||
| Sales (000s of pounds) | 36,700 | 97,000 | 101,200 | 87,500 | 80,600 | ||||||||||
| Sales (metric tons) | 16,600 | 44,000 | 45,900 | 39,700 | 36,600 | ||||||||||
| Cathodes | |||||||||||||||
| Production (000s of pounds) | 454,700 | 544,700 | 552,200 | 518,700 | 567,900 | ||||||||||
| Production (metric tons) | 206,200 | 247,100 | 250,500 | 235,300 | 257,600 | ||||||||||
| Sales (including wire rod and wire) | |||||||||||||||
| (000s of pounds) | 479,200 | 546,800 | 556,500 | 549,800 | 562,300 | ||||||||||
| (metric tons) | 217,400 | 248,000 | 252,400 | 249,400 | 255,100 | ||||||||||
| Gold sales in anodes and slimes (ounces) | 316,700 | 929,700 | 813,900 | 831,300 | 605,700 | ||||||||||
Cathode cash production cost per pound before hedgingg | $0.25 | $0.16 | $0.12 | $0.14 | $0.11 | ||||||||||
18
FREEPORT-McMoRan COPPER & GOLD INC. | |||||||||||||||
SELECTED FINANCIAL AND OPERATING DATA | |||||||||||||||
| 2004 | 2003 | 2002 | 2001 | 2000 | |||||||||||
PT SMELTING OPERATING DATA, 25%-Owned by PT Freeport Indonesia | |||||||||||||||
| Concentrate treated (metric tons) | 758,100 | 824,800 | 719,600 | 702,900 | 582,200 | ||||||||||
| Anodes | |||||||||||||||
| Production (000s of pounds) | 466,500 | 545,500 | 465,700 | 479,400 | 383,200 | ||||||||||
| Production (metric tons) | 211,600 | 247,400 | 211,200 | 217,500 | 173,800 | ||||||||||
| Sales (000s of pounds) | 2,300 | 64,600 | 33,000 | 10,100 | 33,100 | ||||||||||
| Sales (metric tons) | 1,000 | 29,300 | 15,000 | 4,600 | 15,000 | ||||||||||
| Cathodes | |||||||||||||||
| Production (000s of pounds) | 464,000 | 492,400 | 424,100 | 468,400 | 349,200 | ||||||||||
| Production (metric tons) | 210,500 | 223,300 | 192,400 | 212,500 | 158,400 | ||||||||||
| Sales (000s of pounds) | 462,900 | 493,500 | 424,100 | 468,800 | 349,700 | ||||||||||
| Sales (metric tons) | 210,000 | 223,800 | 192,400 | 212,600 | 158,600 | ||||||||||
Cathode cash production cost per poundg | $0.12 | $0.10 | $0.14 | $0.12 | $0.13 | ||||||||||
PT FREEPORT INDONESIA, 100% Aggregate Operating Data | |||||||||||||||
| Ore milled (metric tons per day) | 185,100 | 203,000 | 235,600 | 237,800 | 223,500 | ||||||||||
| Average ore grade | |||||||||||||||
| Copper (percent) | .87 | 1.09 | 1.14 | 1.00 | 1.07 | ||||||||||
| Gold (grams per metric ton) | .88 | 1.54 | 1.24 | 1.41 | 1.10 | ||||||||||
| Gold (ounce per metric ton) | .028 | .050 | .040 | .045 | .035 | ||||||||||
| Silver (grams per metric ton) | 3.85 | 4.03 | 3.60 | 3.20 | 2.97 | ||||||||||
| Silver (ounce per metric ton) | .124 | .130 | .116 | .103 | .095 | ||||||||||
| Recovery rates (percent) | |||||||||||||||
| Copper | 88.6 | 89.0 | 88.5 | 86.9 | 88.2 | ||||||||||
| Gold | 81.8 | 87.3 | 88.4 | 89.5 | 84.3 | ||||||||||
| Silver | 56.8 | 61.3 | 61.3 | 59.0 | 60.0 | ||||||||||
| Copper (recoverable) | |||||||||||||||
| Production (000s of pounds) | 1,098,600 | 1,522,900 | 1,839,000 | 1,594,200 | 1,636,700 | ||||||||||
| Production (metric tons) | 498,300 | 690,800 | 834,200 | 723,100 | 742,400 | ||||||||||
| Sales (000s of pounds) | 1,092,700 | 1,527,700 | 1,836,800 | 1,600,900 | 1,643,500 | ||||||||||
| Sales (metric tons) | 495,600 | 693,000 | 833,200 | 726,200 | 745,500 | ||||||||||
| Gold (recoverable ounces) | |||||||||||||||
| Production | 1,536,600 | 3,163,900 | 2,938,800 | 3,488,100 | 2,362,600 | ||||||||||
| Sales | 1,523,600 | 3,171,500 | 2,934,000 | 3,498,300 | 2,387,300 | ||||||||||
| Silver (recoverable ounces) | |||||||||||||||
| Production | 3,873,800 | 4,978,600 | 4,922,900 | 4,264,300 | 3,833,200 | ||||||||||
| Sales | 3,857,500 | 4,994,000 | 4,916,000 | 4,280,400 | 3,847,700 | ||||||||||
The selected consolidated financial data shown above is derived from our audited consolidated financial statements. These historical results are not necessarily indicative of results that you can expect for any future period. You should read this data in conjunction with management’s discussion and analysis and our full consolidated financial statements and notes thereto contained in this annual report.
| a. | Includes a $95.0 million gain on insurance settlement related to the fourth-quarter 2003 slippage and debris flow events at the Grasberg open pit and a $12.0 million charge related to Atlantic Copper’s workforce reduction plan. |
| b. | Includes a $48.8 million ($0.26 per share) gain on insurance settlement related to the fourth-quarter 2003 slippage and debris flow events at the Grasberg open pit; a $20.4 million ($0.11 per share) gain from the sale of a parcel of land in Arizona held by an FCX joint venture; a $7.5 million ($0.04 per share) gain from Atlantic Copper’s sale of its wire rod and wire assets; a $12.0 million ($0.06 per share) charge related to Atlantic Copper’s workforce reduction plan; $13.8 million ($0.07 per share) of losses on early extinguishment and conversion of debt; and a $6.3 million ($0.03 per share) gain on reduction of interest expense for conversion of debt. |
| c. | Includes losses on early extinguishment and conversion of debt totaling $31.9 million ($0.20 per share). |
| d. | Effective January 1, 2003, we adopted Statement of Financial Accounting Standards (SFAS) No. 143, “Accounting for Asset Retirement Obligations,” and recorded a $9.1 million ($0.06 per share) cumulative effect gain. Effective July 1, 2003, we adopted SFAS No. 150, “Accounting for Certain Financial Instruments with Characteristics of both Liabilities and Equity,” and recorded a $24.7 million ($0.16 per share) cumulative effect charge. Our mandatorily redeemable preferred stock was classified as debt effective July 1, 2003. SFAS No. 150 does not allow restatement of prior periods. |
| e. | Effective January 1, 2002, we changed our methodology used in the determination of depreciation associated with PT Freeport Indonesia’s mining and milling life-of-mine assets. |
| f. | Amount was $357.61 before hedging gain resulting from redemption of FCX’s Gold-Denominated Preferred Stock. |
| g. | For a reconciliation of cathode cash production costs per pound to production costs applicable to sales reported in FCX’s consolidated financial statements refer to “Product Revenues and Production Costs” in “Management’s Discussion and Analysis.” |
19
FREEPORT-McMoRan COPPER & GOLD INC.
MANAGEMENT'S DISCUSSION AND ANALYSIS
OVERVIEW
In management’s discussion and analysis, “we,” “us” and “our” refer to Freeport-McMoRan Copper & Gold Inc. (FCX) and its consolidated subsidiaries. References to “aggregate” amounts mean the total of our share and Rio Tinto plc’s share as our joint venture partner. The results of operations reported and summarized below are not necessarily indicative of future operating results. The following discussion should be read together with our consolidated financial statements and the related notes.
We have one of the world’s largest copper and gold mining and production operations in terms of reserves and production. We are also one of the lowest-cost copper producers in the world, after taking into account credits for related gold and silver production. Our principal asset is the Grasberg minerals district, which contains the largest single gold reserve and the second-largest copper reserves of any mine in the world.
We operate through our majority-owned subsidiaries, PT Freeport Indonesia and PT Puncakjaya Power (Puncakjaya Power), and through Atlantic Copper, S.A. (Atlantic Copper) and PT Irja Eastern Minerals (Eastern Minerals), our principal wholly owned subsidiaries. We acquired an 85.7 percent ownership in Puncakjaya Power in 2003. Puncakjaya Power’s sole business is to supply power to PT Freeport Indonesia’s operations (see Note 2 of “Notes to Consolidated Financial Statements”). Atlantic Copper’s operations are in Spain and involve the smelting and refining of copper concentrates and the marketing of refined copper products and precious metals in slimes. PT Freeport Indonesia owns a 25 percent interest in PT Smelting, an Indonesian company which operates a copper smelter and refinery in Gresik, Indonesia. Eastern Minerals conducts mineral exploration activities (which are currently suspended) in Papua, Indonesia.
PT Freeport Indonesia, our principal operating subsidiary, operates under an agreement, called a Contract of Work, with the Government of Indonesia. The Contract of Work allows us to conduct exploration, mining and production activities in a 24,700-acre area called Block A located in Papua, Indonesia. Under the Contract of Work, PT Freeport Indonesia also conducts exploration activities (which are currently suspended,but are under review for resumption) in an approximate 500,000-acre area called Block B in Papua. All of our proven and probable mineral reserves and current mining operations are located in Block A. Eastern Minerals holds an additional Contract of Work originally covering a 2.5-million-acre area. Under the terms of Eastern Minerals’ Contract of Work, we have already relinquished 1.3 million acres and must relinquish an additional 0.6 million acres at the end of the three-year exploration period, which can be extended by the Government of Indonesia for as much as two additional years.
In addition to the PT Freeport Indonesia and Eastern Minerals exploration acreage, we have the right to conduct other mineral exploration activities in Papua pursuant to a joint venture through PT Nabire Bakti Mining. Field exploration activities outside of our current mining operations in Block A have been suspended in recent years because of safety and security issues and regulatory uncertainty relating to a possible conflict between our mining and exploration rights in certain forest areas and an Indonesian Forestry law enacted in 1999 prohibiting open-pit mining in forest preservation areas. Recent Indonesian legislation permits open-pit mining in PT Freeport Indonesia’s Block B area, subject to certain requirements. We are currently assessing these requirements and security issues. The timing for our resumption of exploration activities in our Contract of Work areas outside of Block A depends on the resolution of these matters.
We own 90.64 percent of PT Freeport Indonesia, of which 9.36 percent is owned through our wholly owned subsidiary, PT Indocopper Investama. The Government of Indonesia owns the remaining 9.36 percent of PT Freeport Indonesia.In July 2004, we received a request from the Indonesian Department of Energy and Mineral Resources that we offer to sell to Indonesian nationals shares in PT Indocopper Investama at fair market value. In response to this request and in view of the potential benefits of having additional Indonesian ownership in our project, we have agreed to consider a potential sale of an interest in PT Indocopper Investama at fair market value. Neither our Contract of Work nor Indonesian law requires us to divest any portion of our ownership interest in PT Freeport Indonesia or PT Indocopper Investama.
Joint Ventures with Rio Tinto plc (Rio Tinto)
In 1996, we established joint ventures with Rio Tinto, an international mining company with headquarters in London, England. One joint venture covers PT Freeport Indonesia’s mining operations in Block A and gives Rio Tinto, through 2021, a 40 percent interest in certain assets and future production exceeding specified annual amounts of copper, gold and silver in Block A and, after 2021, a 40 percent interest in all production from Block A. The agreement provides for adjustments to the specified annual metal sharing amounts upon the occurrence of certain events that cause an extended interruption in production to occur, including events such as the fourth-quarter 2003 Grasberg open-pit slippage and debris flow.
Operating, nonexpansion capital and administrative costs are shared proportionately between PT Freeport Indonesia and Rio Tinto based on the ratio of (a) the incremental revenues from production from our expansion completed in 1998 to (b) total revenues from production from Block A, including production from PT Freeport Indonesia’s previously
20
existing reserves. PT Freeport Indonesia receives 100 percent of the cash flow from specified annual amounts of copper, gold and silver through 2021, calculated by reference to its proven and probable reserves as of December 31, 1994, and 60 percent of all remaining cash flow. As noted above, the specified annual amounts of copper, gold and silver attributable 100 percent to PT Freeport Indonesia are adjusted upon the occurrence of certain events. As a result of the Grasberg slippage and debris flow events, the 2004 specified amounts attributable 100 percent to PT Freeport Indonesia were reduced by 178 million pounds for copper and 280,000 ounces for gold. Pursuant to an agreement with Rio Tinto, these reductions are expected to be offset by increases in the specified amounts attributable 100 percent to PT Freeport Indonesia totaling 111 million pounds for copper and 175,000 ounces for gold in 2005, and 67 million pounds for copper and 105,000 ounces for gold in 2021.
Under our joint venture arrangements, Rio Tinto has a 40 percent interest in PT Freeport Indonesia’s Contract of Work and in Eastern Minerals’ Contract of Work. Rio Tinto also has the option to participate in 40 percent of any of our other future exploration projects in Papua. Rio Tinto has elected to participate in 40 percent of our interest and cost in the PT Nabire Bakti exploration joint venture covering approximately 0.5 million acres contiguous to Block B and one of Eastern Minerals’ blocks.
Outlook
In 2004, our sales volumes of copper and gold totaled 1.0 billion pounds of copper and 1.44 million ounces of gold. Our 2004 copper and gold sales volumes were lower than those reported for the last several years because of recovery efforts from the fourth-quarter 2003 slippage and debris flow events at the Grasberg open pit.
Following the October 9, 2003, slippage event and the December 12, 2003, debris flow in a section of the Grasberg open pit, PT Freeport Indonesia accelerated the removal of overburden and mined low grade ore prior to restoring safe access to higher-grade ore areas and resuming normal milling rates in June 2004. Average ore grades improved in the second half of 2004 and are expected to be significantly higher for 2005, compared with 2004. Annual sales are expected to approximate 1.5 billion pounds of copper and 2.9 million ounces of gold in 2005, increases of 50 percent for copper and 100 percent for gold compared with 2004. Assuming average copper prices of $1.35 per pound and average gold prices of $420 per ounce, consolidated operating cash flows in 2005 are expected to exceed $1.1 billion. The impact on our annual cash flow for each $0.10 per pound change in copper prices would approximate $75 million, including the effects of price changes on royalty costs and treatment charges, and for each $25 per ounce change in gold prices would approximate $36 million.
Average annual sales volumes over the next five years (2005 to 2009) are expected to approximate 1.36 billion pounds of copper and 2.2 million ounces of gold. Based on these estimates of average annual sales volumes over the next five years and copper prices of approximately $1.35 per pound and gold prices of approximately $420 per ounce, the impact on our annual cash flow for each $0.10 per pound change in copper prices would approximate $70 million, including the effects of price changes on royalty costs and treatment charges, and for each $25 per ounce change in gold prices would approximate $28 million.
Copper and Gold Markets
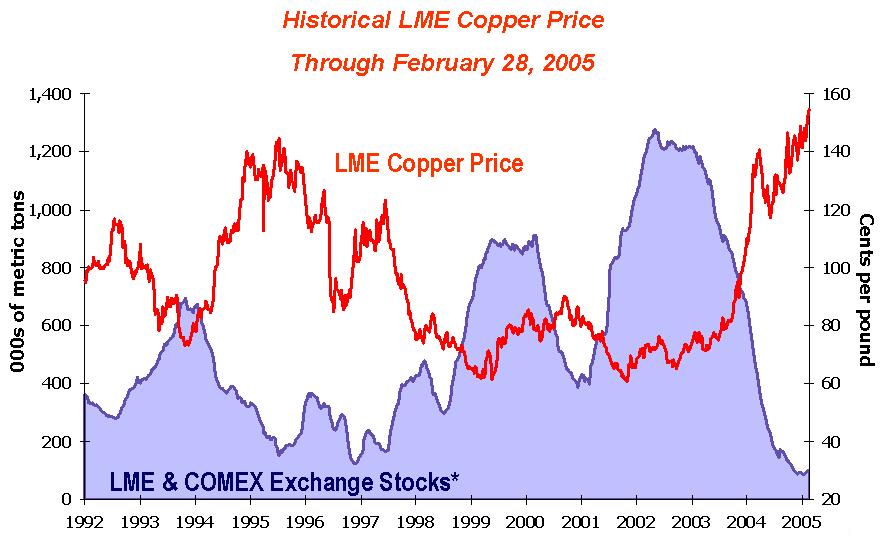
* Excludes Shanghai stocks, producer, consumer and merchant stocks.
The graph above presents London Metal Exchange (LME) copper prices and reported stocks of copper at the LME and New York Commodity Exchange (COMEX) through February 28, 2005. Copper markets have reflected strong demand from China, which has become the world’s largest consumer of copper, stronger U.S. industrial demand for copper and limited incremental supplies from mine production. Global demand for copper exceeded global production during 2003 and 2004, resulting in a significant decline in available inventories, with LME and COMEX inventories declining to levels of less than 100,000 metric tons, less than 10 percent of the available stocks at the beginning of 2003. Copper prices rose sharply beginning in mid-2003 and continued to increase in 2004, with prices ranging from $1.06 per pound to a multi-year high of $1.49 per pound in 2004. Copper prices have remained strong in early 2005 and the LME spot price closed at $1.54 per pound on February 28, 2005. As a result of low inventory levels, expectations of continued strong demand and limited supplies, the outlook for copper markets in 2005 is positive. Market analysts expect copper demand to exceed supply in the first half of 2005, with a possibility of a balance between refined copper supply and demand in the second half of the year. Future copper prices will be determined by demand from China, economic performance in the U.S. and other industrialized countries, the timing of the development of new supplies of copper, production levels of mines and copper smelters and other factors. We consider the underlying supply and demand conditions in the global copper markets to be positive for our company.
21

The positive market environment and investor sentiment toward gold continued during 2004 with gold prices ranging from $374 to $456 per ounce, supported by a weak U.S. dollar reflecting large U.S. deficits, ongoing geopolitical strife and terrorism concerns, growing investment demand for gold and actions by gold producers to reduce hedge positions. Gold prices averaged $410 per ounce in 2004. Recent movements in gold prices have closely followed movements in the U.S. dollar against other currencies and most analysts anticipate that a weak U.S. dollar will continue to support gold prices. The London gold price closed at approximately $435 per ounce on February 28, 2005.
As shown in the graphs above, world metal prices for copper have fluctuated during the period from 1992 through February 2005 from a low of approximately $0.60 per pound in 2001 to a high of approximately $1.54 per pound on February 28, 2005, and world gold prices have fluctuated during the period from 1998 through February 2005 from a low of approximately $250 per ounce in 1999 to a high of approximately $456 per ounce in 2004. Copper and gold prices are affected by numerous factors beyond our control as described further in our Form 10-K for the year ended December 31, 2004.
CRITICAL ACCOUNTING ESTIMATES
Management’s discussion and analysis of our financial condition and results of operations are based on our consolidated financial statements, which have been prepared in conformity with accounting principles generally accepted in the United States. The preparation of these statements requires that we make estimates and assumptions that affect the reported amounts of assets, liabilities, revenues and expenses. We base these estimates on historical experience and on assumptions that we consider reasonable under the circumstances; however, reported results could differ from those based on the current estimates under different assumptions or conditions. The areas requiring the use of management’s estimates are discussed in Note 1 of “Notes to Consolidated Financial Statements” under the subheading “Use of Estimates.” Management has reviewed the following discussion of its development and selection of critical accounting estimates with the Audit Committee of our Board of Directors.
| · | Depreciation and Amortization - As discussed in Note 1 of “Notes to Consolidated Financial Statements,” we depreciate our mining and milling assets using the unit-of-production method based on our estimates of our proven and probable recoverable copper reserves. We have other assets that we depreciate on a straight-line basis over their estimated useful lives. Our estimates of proven and probable recoverable copper reserves and of the useful lives of our straight-line assets impact our depreciation and amortization expense. These estimates affect both our “mining and exploration” and “smelting and refining” segments. |
Effective January 1, 2002, we changed our method of computing depreciation for PT Freeport Indonesia’s mining and milling life-of-mine assets. See Note 1 of “Notes to Consolidated Financial Statements” for a discussion of this change. The cumulative effect of this change through December 31, 2001, as reflected in our 2002 results, reduced net income by $3.0 million ($0.02 per share), net of taxes and minority interest sharing.
The accounting estimates related to depreciation and amortization are critical accounting estimates because (1) the determination of copper reserves involves uncertainties with respect to the ultimate geology of our reserves and the assumptions used in determining the economic feasibility of mining those reserves, including estimated copper and gold prices and costs of conducting future mining activities, and (2) changes in estimated proven and probable recoverable copper reserves and useful asset lives can have a material impact on net income. We perform annual assessments of our existing assets, including a review of asset costs and depreciable lives, in connection with the review of mine operating and development plans. When we determine that assigned asset lives do not reflect the expected remaining period of benefit, we make prospective changes to those depreciable lives.
There are a number of uncertainties inherent in estimating quantities of reserves, including many factors beyond our control. Ore reserves estimates are based upon engineering evaluations of samplings of drill holes and other openings. Our estimates of proven and probable recoverable reserves are prepared by our employees and reviewed and verified by independent experts in mining, geology and reserve determination. As of December 31, 2004, aggregate proven and probable recoverable copper reserves totaled 56.2 billion pounds and PT Freeport Indonesia’s estimated share totaled 40.5 billion pounds.
22
These estimates involve assumptions regarding future copper and gold prices, the geology of our mines, the mining methods we use and the related costs we incur to develop and mine our reserves. Changes in these assumptions could result in material adjustments to our reserve estimates, which could result in changes to unit-of-production depreciation and amortization expense in future periods, with corresponding adjustments to net income. If aggregate estimated copper reserves were 10 percent higher or lower at December 31, 2004, we estimate that our annual depreciation expense for 2005 would change by approximately $14 million, changing net income by approximately $7 million. Although some degree of variability is expected, we believe the extent of our technical data and operating experience - specifically as it relates to our Grasberg open-pit mine, which we have been mining for 15 years - mitigates the potential for significant changes in reserve estimates, especially as compared with mines that are undeveloped or newly developed.
As discussed in Note 1 of “Notes to Consolidated Financial Statements,” we review and evaluate our long-lived assets for impairment when events or changes in circumstances indicate that the related carrying amounts may not be recoverable. Changes to our estimates of proven and probable recoverable copper and gold reserves could have an impact on our assessment of asset impairment. However, we believe it is unlikely that revisions to our estimates of proven and probable recoverable copper and gold reserves would give rise to an impairment of our assets because of the significant size of our reserves in relation to our asset carrying values.
| · | Deferred Mining Costs - Mining costs are charged to operations as incurred. However, because of the configuration and location of the Grasberg ore body and the location and extent of surrounding overburden, the ratio of overburden to ore is much higher in the initial mining of the pit than in later years. As a result, surface mining costs associated with overburden removal at PT Freeport Indonesia’s Grasberg open-pit mine that are estimated to relate to future production are initially deferredwhen the ratio of actual overburden removed to ore mined exceeds the estimated average ratio of overburden to ore over the life of the Grasberg open-pit mine. Those deferred costs are subsequently charged to operating costs when the ratio of actual overburden removed to ore mined falls below the estimated average ratio of overburden removed to ore mined over the life of the Grasberg open-pit mine.We use the proven and probable ore reserves for the Grasberg open pit disclosed in the notes to our consolidated financial statements to calculate the estimated average ratio of overburden to ore over the life of the mine. |
The deferred mining cost method is used by some companies in the metals mining industry; however, industry practice varies. The Emerging Issues Task Force of the Financial Accounting Standards Board (FASB) currently is evaluating this issue. The deferred mining cost method matches the cost of production with the sale of the related metal from the open pit by assigning each metric ton of ore removed an equivalent amount of overburden tonnage, thereby averaging overburden removal costs over the life of the mine. The mining costs capitalized in inventory and the amounts charged to cost of goods sold do not represent the actual costs incurred to mine the ore in any given period. If we were to charge all mining costs to expense when incurred, including all overburden removal costs, as some mining companies do, there would be greater volatility in our period-to-period results of operations.
The application of the deferred mining cost method has resulted in an asset on our balance sheets (“Deferred Mining Costs”), which based on current mine plans, is estimated to continue to increase through about 2010. Subsequently,thesecosts are expected to begin to amortize as a charge to production and delivery costs until they are fully amortized at the end of the open pit’s life, which is estimated to be in approximately 2015. This is because PT Freeport Indonesia expects to mine higher than average amounts of overburden through 2010 and less than average thereafter. Deferred mining costs totaled $220.4 million at December 31, 2004, and $142.6 million at December 31, 2003. Additions to deferred mining costs are classified as increases in deferred mining costs in operating activities in our consolidated statements of cash flows and totaled $77.8 million in 2004, $64.4 million in 2003 and $30.6 million in 2002. We evaluate the recoverability of our deferred mining costs in conjunction with our evaluation of the recoverability of our mining assets. The Grasberg mine is currently our only producing open-pit mine.
The estimated average ratio of overburden to ore over the life of the Grasberg open pit used in our deferred mining costs calculation is a critical accounting estimate because (1) it is susceptible to change from period to period because it requires management to make assumptions about future mining activities and (2) changes could materially affect net income. Our mine plan is derived from a model that takes into consideration available geological data and determines the most efficient and cost-effective method of accessing the economic reserves. Significant assumptions underlying our mine plan include the amount of total overburden and ore we expect to move in a given
23
In the fourth quarter of 2004, PT Freeport Indonesia changed its life-of-mine overburden-to-ore ratio to 2.4 to 1 based on a recently completed annual assessment. PT Freeport Indonesia’s estimated life-of-mine overburden-to-ore ratio averaged 2.3 to 1 in 2004, 2.0 to 1 in 2003 and 1.8 to 1 in 2002. PT Freeport Indonesia’s geologists and engineers reassess the overburden-to-ore ratio and the remaining life of the Grasberg open-pit mine at least annually, and we reflect any changes in our estimates prospectively beginning in the quarter of change. We expect the estimated life-of-mine overburden-to-ore ratio to average 2.4 to 1 for 2005. The increases in the ratio over the last several years primarily relate to changes in the cutoff grade at the open pit caused by a reassessment of the optimal milling rate at our mill facilities including a greater proportional contribution to our total ore processed from our underground Deep Ore Zone mine.
If the life-of-mine overburden-to-ore ratio was 2.4 to 1, as in the fourth quarter of 2004, instead of the 2.2 to 1 ratio used through September 30, 2004, we estimate our deferral of mining costs for 2004 would have been $11.0 million lower and net income would have been $5.6 million ($0.03 per share) lower.
| · | Reclamation and Closure Costs - Our mining operations involve activities that have a significant effect on the surrounding area. Our reclamation and closure costs primarily involve treatment of acidic water (also known as acid rock drainage) created by overburden, reclamation and revegetation of a large area in the lowlands of Papua where mill tailings are deposited, reclamation of overburden stockpiles and decommissioning of operating assets. Through December 31, 2002, we had accrued $29.2 million for estimated closure and reclamation costs on a unit-of-production basis over our total estimated proven and probable recoverable copper reserves. For a discussion of the assumptions that we make to estimate proven and probable recoverable reserves, see “Depreciation and Amortization” above. |
Effective January 1, 2003, we adopted Statement of Financial Accounting Standards (SFAS) No. 143, “Accounting for Asset Retirement Obligations” (see Note 1 of “Notes to Consolidated Financial Statements”). SFAS No. 143 requires that we record the fair value of our estimated asset retirement obligations in the period incurred, with the cumulative effect of adopting SFAS No. 143 as of January 1, 2003, for all existing asset retirement obligations, asset retirement costs and related accumulated depreciation required to be reflected in earnings as a separate line item. The accounting estimates related to reclamation and closure costs are critical accounting estimates because (1) we will not incur most of these costs for a number of years, requiring us to make estimates over a long period; (2) reclamation and closure laws and regulations could change in the future or circumstances affecting our operations could change, either of which could result in significant changes to our current plans; (3) calculating the fair value of our asset retirement obligations in accordance with SFAS No. 143 requires management to assign probabilities to projected cash flows, to make long-term assumptions about inflation rates, to determine our credit-adjusted, risk-free interest rates and to determine market risk premiums that are appropriate for our operations; and (4) given the magnitude of our estimated reclamation and closure costs, changes in any or all of these estimates could have a material impact on net income.
In 2002, we engaged an independent environmental consulting and auditing firm to assist in estimating PT Freeport Indonesia’s aggregate asset retirement obligations, and worked with other consultants in estimating Atlantic Copper’s asset retirement obligations. We estimated these obligations using an expected cash flow approach, in which multiple cash flow scenarios were used to reflect a range of possible outcomes. We estimated these aggregate obligations to be approximately $120 million for PT Freeport Indonesia and $17 million for Atlantic Copper. To calculate the fair value of these obligations, we applied an estimated long-term inflation rate of 2.5 percent, except for Indonesian rupiah-denominated labor costs with respect to PT Freeport Indonesia’s obligations, for which an estimated inflation rate of 9.0 percent was applied. The projected cash flows were discounted at our estimated credit-adjusted, risk-free interest rates which ranged from 9.4 percent to 12.6 percent for the corresponding time periods over which these costs would be incurred. The inflation rates and discount rates we used to calculate the fair value of PT Freeport Indonesia’s asset retirement obligation are critical factors in the calculation of future value and discounted
24
present value costs. An increase of one percent in the inflation rates used results in an approximate 17 percent increase in the discounted present value costs. A decrease of one percent in the discount rates used has a similar effect resulting in an approximate 16 percent increase in the discounted present value costs. After discounting the projected cash flows, a market risk premium of 10 percent was applied to the total to reflect what a third party might require to assume these asset retirement obligations. The market risk premium was based on market-based estimates of rates that a third party would have to pay to insure its exposure to possible future increases in the value of these obligations.
At January 1, 2003, we estimated the fair value of our aggregate asset retirement obligations to be $28.5 million. We recorded the fair value of these obligations and the related additional assets as of January 1, 2003. The net difference between our previously recorded reclamation and closure cost liability and the amounts estimated under SFAS No. 143, after taxes and minority interest, resulted in a gain of $9.1 million (after reduction by $8.5 million for taxes and minority interest sharing), $0.06 per share on a diluted basis, which was recognized as a cumulative effect adjustment for a change in accounting principle. As a result of adopting SFAS No. 143, we expect our future depreciation and amortization expense to be lower and our production costs to be higher, with no significant net impact on earnings for the near term.
The effect of adopting SFAS No. 143 was to increase net income by approximately $1 million, $0.01 per share for 2003. Had we followed SFAS No. 143 during 2002, net income would have increased by approximately $0.5 million or less than $0.01 per share.
At December 31, 2004 and 2003, PT Freeport Indonesia revised its estimates for (1) changes in the projected timing of certain reclamation costs because of the slippage and debris flow events in the Grasberg open pit, (2) changes in certain cost estimates, and (3) additional asset retirement obligations incurred during 2003. We estimated PT Freeport Indonesia’s aggregate asset retirement obligations to be about $149 million at December 31, 2004, and $130 million at December 31, 2003. An analysis of PT Freeport Indonesia’s discounted asset retirement obligation follows (in millions):
| 2004 | 2003 | |||||
| Asset retirement obligation at beginning of year | $ | 25.7 | $ | 27.9 | ||
| Accretion expense | 2.8 | 2.7 | ||||
| Revisions for changes in estimates | (6.5 | ) | (4.3 | ) | ||
| Liabilities incurred | - | 0.6 | ||||
| Liabilities settled | - | (1.2 | ) | |||
| Asset retirement obligation at end of year | $ | 22.0 | $ | 25.7 | ||
The expected deferral of certain costs was the primary change in estimates that caused the decline in the obligation balance over the last two years. These changesreduced the related asset balance and are not expected to have a material impact on future net income.
CONSOLIDATED RESULTS OF OPERATIONS
Consolidated revenues include PT Freeport Indonesia’s sale of copper concentrates, which also contain significant quantities of gold and silver, and the sale by Atlantic Copper of copper anodes, cathodes, wire and wire rod, and gold in anodes and slimes. Consolidated revenues and net income vary significantly with fluctuations in the market prices of copper and gold and other factors. PT Freeport Indonesia’s intercompany sales to Atlantic Copper are eliminated in consolidation. Consolidated revenues were $2.4 billion for 2004, compared with $2.2 billion for 2003, reflecting significantly higher copper and gold prices partly offset by lower- grade ore and reduced mill throughput as PT Freeport Indonesia accelerated the removal of overburden and mined low-grade ore prior to restoring safe access to the higher-grade ore areas in its Grasberg open-pit mine following the fourth-quarter 2003 slippage and debris flow events (see “Mining and Exploration Operations - PT Freeport Indonesia Operating Results”). Atlantic Copper’s 2004 revenues were adversely affected by its scheduled major maintenance turnaround (see “Smelting and Refining Operations - Atlantic Copper Operating Results”) partly offset by higher copper and gold prices. Consolidated revenues in 2003 benefited from higher copper and gold price realizations and higher gold sales volumes, partly offset by lower copper sales volumes when compared with 2002 revenues of $1.9 billion.
Consolidated production and delivery costs were higher in 2004 at $1,450.3 million compared with $1,071.3 million for 2003 and $938.5 million for 2002. The increase in 2004 was primarily because of higher costs of concentrate purchases at Atlantic Copper caused by higher metals prices, higher production costs at PT Freeport Indonesia and the costs of Atlantic Copper’s smelter turnaround. Production and delivery costs in 2003 were higher than in 2002 primarily because of higher concentrates costs at Atlantic Copper caused by the increase in copper and gold prices during the year. Consolidated depreciation and amortization expense was $206.4 million in 2004, $230.8 million in 2003 and $260.4 million in 2002. Depreciation and amortization expense decreased each year during the last three years primarily because a large portion of our depreciation is calculated on a unit-of-production basis and our copper sales volumes at PT Freeport Indonesia declined each year.
Exploration expenses increased to $8.7 million in 2004, from $6.4 million in 2003 and $3.1 million in 2002, reflecting increased exploration drilling in Block A. Our 2004 drilling
25
efforts resulted in additions to our proven and probable reserves as of December 31, 2004 (see “Exploration and Reserves”). All approved exploration costs in the joint venture areas with Rio Tinto are generally shared 60 percent by us and 40 percent by Rio Tinto. The FCX/Rio Tinto joint ventures’ 2005 exploration budgets total approximately $21 million ($15 million for our share).
Consolidated general and administrative expenses increased to $89.9 million in 2004 from $80.3 million in 2003. General and administrative expenses for 2004 include a $2.2 million charge for Atlantic Copper’s workforce reduction plan (see “Smelting and Refining Operations”). The cost of our outstanding stock appreciation rights varies with the price of our common stock price, resulting in increases in general and administrative expenses totaling $0.5 million in 2004 and $7.3 million in 2003. Our parent company charges PT Freeport Indonesia for the in-the-money value of exercised employee stock options. These charges are eliminated in consolidation; however, PT Freeport Indonesia shares these charges with Rio Tinto and Rio Tinto’s reimbursements reduce our consolidated general and administrative expenses. General and administrative expenses are net of Rio Tinto’s share of joint venture reimbursements for employee stock option exercises, which reduced general and administrative expenses by $7.0 million in 2004 and $11.3 million in 2003. In addition, in accordance with our joint venture agreement, Rio Tinto’s percentage share of general and administrative expenses in 2004 was lower because of lower metal sales volumes. Estimated general and administrative expenses for 2005 are expected to approximate the 2004 level before consideration of the new accounting rules for share-based payments discussed in “New Accounting Standards.”
General and administrative expenses increased by $12.0 million to $80.3 million in 2003 from $68.3 million in 2002. The increase relates to charges for costs associated with stock appreciation rights caused by an increase in our stock price, higher compensation and other costs. As a percentage of revenues, general and administrative expenses were 3.8 percent in 2004 and 3.6 percent in 2003 and 2002.
PT Freeport Indonesia maintains property damage and business interruption insurance related to its operations. In December 2004, we entered into an insurance settlement agreement and settled all claims that arose from the fourth-quarter 2003 slippage and debris flow events in the Grasberg open-pit mine.Our insurers agreed to pay us an aggregate of $125.0 million, inclusive of interest and the $20.0 million paid to us in the third quarter of 2004, in connection with our claims.After considering our joint venture partner’s interest in the proceeds, PT Freeport Indonesia’s share of proceeds totaled $95.0 million. As a result of the settlement, we recorded in our Consolidated Statements of Income an $87.0 million gain on insurance settlement for the business interruption recovery and an $8.0 million gain to production costs for the property loss recovery for a net gain of $48.8 million ($0.26 per share), after taxes and minority interest sharing, in 2004.
Total consolidated interest cost (before capitalization) was $151.0 million in 2004, $200.0 million in 2003 and $183.4 million in 2002. Interest costs decreased in 2004 primarily because we reduced average debt levels, including early conversions in 2003 and 2004 of all of the $603.8 million of our 8¼% Convertible Senior Notes into 42.2 million shares of common stock (see Note 5 of “Notes to Consolidated Financial Statements” and “Capital Resources and Liquidity - Financing Activities”). Interest cost increased in 2003 compared to 2002, primarily because of higher average interest rates for our senior notes issued in early 2003 and higher average annual debt levels. Our interest cost for 2005 is expected to be about the same as 2004 unless we elect to prepay certain long-term debt. Capitalized interest totaled $2.9 million in 2004, $3.0 million in 2003 and $12.2 million in 2002. The reduction in capitalized interest in 2003 compared to 2002 reflects the completion of initial development activities at the Deep Ore Zone underground mine in early 2003.
Losses on early extinguishment and conversion of debt in 2004 ($14.0 million) and 2003 ($34.6 million) primarily resulted from the early conversions of our 8¼% Convertible Senior Notes. Gains on sales of assets totaled $28.8 million in 2004 as a result of two transactions. In November 2004, a joint venture in which we own a 50 percent interest completed the sale to a real estate developer of a parcel of land in Arizona where the joint venture previously was engaged in a copper mining research project. Our share of the net proceeds from the sale resulted in a gain of $21.3 million ($20.4 million to net income or $0.11 per share). In December 2004, Atlantic Copper completed a sale of its wire rod and wire assets for $18.3 million cash and recorded a gain of $7.5 million ($7.5 million to net income or $0.04 per share).
Other income (expense) includes the impact of translating into U.S. dollars Atlantic Copper’s net euro-denominated liabilities, primarily its retiree pension obligations. Changes in the U.S. dollar/euro exchange rate require us to adjust the dollar value of our net euro-denominated liabilities and record the adjustment in earnings. Exchange rate effects on our net income from euro-denominated liabilities were losses of $1.6 million in 2004, $13.6 million in 2003 and $11.9 million in 2002. The losses reflect a stronger euro in relation to the U.S. dollar (see “Disclosures About Market Risks”). Other expenses in 2003 also include a $5.6 million ($3.7 million
26
to net income or $0.02 per share) charge associated with the amended FCX and PT Freeport Indonesia credit facility (see “Capital Resources and Liquidity - Financing Activities”) and interest income of $5.9 million in 2004, $8.9 million in 2003 and $4.8 million in 2002.
PT Freeport Indonesia’s Contract of Work provides for a 35 percent corporate income tax rate. PT Indocopper Investama pays a 30 percent corporate income tax on dividends it receives from its 9.36 percent ownership in PT Freeport Indonesia. In addition, the tax treaty between Indonesia and the United States provides for a withholding tax rate of 10 percent on dividends and interest that PT Freeport Indonesia and PT Indocopper Investama pay to their parent company, FCX. We also incurred a U.S. alternative minimum tax at a rate of two percent based primarily on consolidated income, net of smelting and refining results. As a result of the enactment of the American Jobs Creation Act of 2004, the 90 percent limitation on the use of foreign tax credits to offset the U.S. federal alternative minimum tax liability has been repealed effective January 1, 2005. Based on current projections, we expect that the removal of this limitation will significantly reduce our U.S. federal taxes beginning in 2005. Our U.S. federal alternative minimum tax liability totaled $8.2 million in 2004, $9.3 million in 2003 and $8.2 million in 2002. We currently record no income taxes at Atlantic Copper, which is subject to taxation in Spain, because it has not generated significant taxable income in recent years and has substantial tax loss carryforwards for which we have provided no financial statement benefit. We receive no consolidated tax benefit from these losses because they cannot be used to offset PT Freeport Indonesia’s profits in Indonesia.
Parent company costs consist primarily of interest, depreciation and amortization, and general and administrative expenses. We receive minimal tax benefit from these costs, including interest expense, primarily because our parent company generates no taxable income from U.S. sources. As a result, our provision for income taxes as a percentage of our consolidated income before income taxes and minority interests will vary as PT Freeport Indonesia’s income changes absent changes in Atlantic Copper and parent company costs. The provision for income taxes as a percentage of consolidated income before income taxes and minority interests totaled 58 percent for 2004 and 2003 and 55 percent for 2002. Summaries of the approximate significant components of the calculation of our consolidated provision for income taxes are shown below (in thousands, except percentages).
| Years Ended December 31, | |||||||||
| 2004 | 2003 | 2002 | |||||||
Mining and exploration segment operating incomea | $ | 832,112 | $ | 850,253 | $ | 692,634 | |||
| Mining and exploration segment interest expense, net | (22,209 | ) | (44,861 | ) | (71,424 | ) | |||
| Intercompany operating profit (deferred) recognized | (24,683 | ) | 13,828 | (28,807 | ) | ||||
| Income before taxes | 785,220 | 819,220 | 592,403 | ||||||
| Indonesian corporate income tax rate (35%) plus U.S. alternative minimum tax rate (2%) | 37 | % | 37 | % | 37 | % | |||
| Corporate income taxes | 290,531 | 303,111 | 219,189 | ||||||
| Approximate PT Freeport Indonesia net income | 494,689 | 516,109 | 373,214 | ||||||
| Withholding tax on FCX’s equity share | 9.064 | % | 9.064 | % | 9.064 | % | |||
| Withholding taxes | 44,839 | 46,780 | 33,828 | ||||||
| Other, net | (4,690 | ) | (11,838 | ) | (7,499 | ) | |||
| FCX consolidated provision for income taxes | $ | 330,680 | $ | 338,053 | $ | 245,518 | $ | ||
| FCX consolidated effective tax rate | 58 | % | 58 | % | 55 | % | |||
| a. | Excludes charges for FCX stock option exercises, which are eliminated in consolidation, totaling $87.3 million in 2004, $57.8 million in 2003 and $5.5 million in 2002. |
We have two operating segments: “mining and exploration” and “smelting and refining.” The mining and exploration segment consists of our Indonesian activities including PT Freeport Indonesia’s copper and gold mining operations, Puncakjaya Power’s power generating operations (after eliminations with PT Freeport Indonesia) and our Indonesian exploration activities, including those of Eastern Minerals. The smelting and refining segment includes Atlantic Copper’s operations in Spain and PT Freeport Indonesia’s equity investment in PT Smelting. Summary comparative operating income (loss) data by segment follow (in millions):
27
| Years Ended December 31, | ||||||||||
| 2004 | 2003 | 2002 | ||||||||
Mining and explorationa | $ | 744.8 | $ | 792.5 | $ | 687.2 | ||||
| Smelting and refining | (83.5 | ) | (21.8 | ) | 2.6 | |||||
Intercompany eliminations and othera, b | 42.3 | 52.6 | (49.7 | ) | ||||||
| FCX operating income | $ | 703.6 | $ | 823.3 | $ | 640.1 | ||||
| a. | Includes charges to the mining and exploration segment for FCX stock option exercises, which are eliminated in consolidation, totaling $87.3 million in 2004, $57.8 million in 2003 and $5.5 million in 2002. |
| b. | We defer recognizing profits on PT Freeport Indonesia’s sales to Atlantic Copper and on 25 percent of PT Freeport Indonesia’s sales to PT Smelting until their sales of final products to third parties. Changes in the amount of these deferred profits impacted operating income by $(24.7) million in 2004, $13.8 million in 2003 and $(28.8) million in 2002. Our consolidated earnings fluctuate depending on the timing and prices of these sales. At December 31, 2004, our deferred profits to be recognized in future periods’ operating income totaled $80.9 million, $41.6 million to net income, after taxes and minority interest sharing. |
MINING AND EXPLORATIONOPERATIONS
A summary of changes in PT Freeport Indonesia’s revenues follows (in millions):
| 2004 | 2003 | |||||
| PT Freeport Indonesia revenues - prior year | $ | 1,744.6 | $ | 1,519.0 | ||
| Price realizations: | ||||||
| Copper | 545.4 | 146.4 | ||||
| Gold | 66.0 | 134.9 | ||||
| Sales volumes: | ||||||
| Copper | (249.0 | ) | (160.1 | ) | ||
| Gold | (376.4 | ) | 55.1 | |||
| Adjustments, primarily for copper pricing on prior year open sales | 4.9 | 0.6 | ||||
| Treatment charges, royalties and other | 11.1 | 48.7 | ||||
| PT Freeport Indonesia revenues - current year | $ | 1,746.6 | $ | 1,744.6 | ||
PT Freeport Indonesia, Gross Profit Per Pound of Copper, before intercompany profit eliminations (cents):
| Years Ended December 31, | |||||||
| 2004 | 2003 | 2002 | |||||
| Average realized price | 136.9 | 81.9 | 70.6 | ||||
| Production costs: | |||||||
| Site production and delivery, before reclamation, noncash and nonrecurring costs (credits) shown below | 77.1 | a | 47.6 | a | 36.0 | a | |
| Gold and silver credits | (62.2 | ) | (69.8 | ) | (48.2 | ) | |
| Treatment charges | 20.4 | 17.9 | 18.3 | ||||
| Royalty on metals | 4.4 | 2.0 | 1.6 | ||||
| Net cash production costs (credits) | 39.7 | (2.3 | ) | 7.7 | |||
| Depreciation and amortization | 17.0 | 14.7 | 14.4 | ||||
| Reclamation, noncash and nonrecurring costs (credits) | (0.4 | )b | 1.2 | b | 0.5 | ||
| Total production costs | 56.3 | 13.6 | 22.6 | ||||
| Adjustments, primarily for copper pricing on prior year open sales and gold/silver hedging | 1.9 | 2.8 | 0.9 | ||||
| Gross profit per pound of copper, before intercompany profit eliminations | 82.5 | 71.1 | 48.9 | ||||
| a. | Net of deferred mining costs totaling $77.8 million (7.8 cents per pound) in 2004, $64.4 million (5.0 cents per pound) in 2003 and $30.6 million (2.0 cents per pound) in 2002. |
| b. | Includes a gain on insurance settlement totaling $8.0 million (0.8 cents per pound) in 2004 and equipment losses of $8.4 million (0.7 cents per pound) in 2003 related to the fourth-quarter 2003 Grasberg pit events. |
Net cash production costs (credits) per pound of copper is a measure intended to provide investors with information about the cash generating capacity of our mining operations expressed on a basis relating to its primary metal product, copper. PT Freeport Indonesia uses this measure for the same purpose and for monitoring operating performance by its mining operations. This information differs from measures of performance determined in accordance with generally accepted accounting principles and should not be considered in isolation or as a substitute for measures of performance determined in accordance with generally accepted accounting principles. This measure is presented by other copper and gold mining companies, although our
28
measures may not be comparable to similarly titled measures reported by other companies. For a reconciliation of cash production costs per pound to production and delivery costs applicable to sales reported in our consolidated financial statements, see “PT Freeport Indonesia Product Revenues and Net Cash Production Costs” under “Product Revenues and Production Costs.”
PT Freeport Indonesia Operating Results - 2004 Compared with 2003
PT Freeport Indonesia’s 2004 revenues were slightly higher than 2003 revenues, with higher price realizations offset by lower sales volumes. PT Freeport Indonesia reported lower production and sales in 2004, reflecting the mining of lower-grade material and accelerated overburden removal activities following the fourth-quarter 2003 slippage and debris flow events. Copper sales volumes totaled 1.0 billion pounds in 2004, 23 percent lower than the 1.3 billion pounds reported in 2003. Copper price realizations of $1.37 per pound in 2004 were $0.55 per pound higher than the 2003 realizations of $0.82 per pound. Gold sales volumes totaled 1,443,000 ounces in 2004, 42 percent lower than the 2,469,800 ounces reported in 2003. Gold price realizations of $412.32 per ounce in 2004 were $54.71 an ounce higher than the 2003 realizations of $357.61 per ounce, before realized gains related to the redemption of our Gold-Denominated Preferred Stock. Gold realizations were $366.60 per ounce in 2003 after hedging gains from redemption of our Gold-Denominated Preferred Stock.
Treatment charges vary with the volume of metals sold and the price of copper, and royalties vary with the volume of metals sold and the prices of copper and gold. In addition, treatment charges vary based on PT Freeport Indonesia’s customer mix. Market rates for treatment and refining charges increased significantly toward the end of 2004 and are expected to be higher in 2005; however, PT Freeport Indonesia expects its 2005 rates to approximate its 2004 rates because of its customer mix. Total treatment charges for PT Freeport Indonesia in 2004 were lower because of the lower volume of metal sales. Royalty costs totaled $43.5 million in 2004 compared with $26.5 million in 2003, reflecting higher metal prices partly offset by lower sales volumes.
Following the fourth-quarter 2003 Grasberg open-pit slippage and debris flow events, we accelerated the removal of overburden and mined low-grade ore prior to restoring safe access to higher-grade ore areas in the second quarter of 2004 and resuming normal milling rates in June 2004. Mill throughput averaged 185,100 metric tons of ore per day in 2004 and 203,000 metric tons of ore in 2003. Mill throughput, which varies depending on ore types being processed, averaged 229,800 metric tons per day in the fourth quarter of 2004 and is expected to average approximately 235,000 metric tons per day in 2005. Approximate average daily throughput processed at our mill facilities from each of our producing mines follows (metric tons of ore per day):
| Years Ended December 31, | ||||||
| 2004 | 2003 | 2002 | ||||
| Grasberg open pit | 141,500 | 155,700 | 194,500 | |||
| Deep Ore Zone | 43,600 | 40,500 | 21,800 | |||
| Intermediate Ore Zone | - | 6,800 | 19,300 | |||
| Total mill throughput | 185,100 | 203,000 | 235,600 | |||
Production from the Deep Ore Zone (DOZ) underground mine averaged 43,600 metric tons of ore per day, representing 24 percent of total 2004 mill throughput. DOZ operations continue to perform above design capacity of 35,000 metric tons of ore per day. PT Freeport Indonesia is expanding the capacity of the DOZ underground operation to 50,000 metric tons per day with the installation of a second crusher and additional ventilation. PT Freeport Indonesia’s share of capital expenditures for the DOZ expansion in the period 2004 through the projected 2007 ramp-up are expected to approximate $37 million, with $19 million estimated for 2005. The DOZ mine, a block cave operation, is one of the world’s largest underground operations. The Intermediate Ore Zone underground mine was depleted during the third quarter of 2003, producing almost 30 percent more copper and gold throughout its 10-year life than the initial reserve estimates.
Copper ore grades averaged 0.87 percent in 2004, compared with 1.09 percent in 2003. Copper recovery rates were 88.6 percent for 2004, compared with 89.0 percent for 2003. In 2004, gold ore grades averaged 0.88 grams per metric ton (g/t), compared with 1.54 g/t in 2003. Gold recovery rates were 81.8 percent for 2004, compared with 87.3 percent for 2003. The mining of lower grade material resulted in lower 2004 recovery rates. Compared to 2004, ore grades are expected to be higher for 2005 resulting in increased metal production in 2005. Gold recovery rates are expected to improve with the higher ore grades.
Unit net cash production costs, including gold and silver credits, averaged $0.40 per pound of copper during 2004, compared with a net credit of $(0.02) per pound for 2003. Higher unit site production and delivery costs in 2004 reflected significantly lower sales volumes resulting from lower ore grades and the primarily fixed nature of a large portion of PT Freeport Indonesia’s cost structure. In addition, the lower sales volumes resulted in PT Freeport Indonesia being allocated a larger percentage of those fixed costs in 2004 under our joint venture arrangements with Rio Tinto. To a lesser extent, 2004 unit costs were impacted by higher energy costs, increased maintenance costs, the impact of a stronger Australian dollar and increased treatment and refining charge rates caused by higher copper prices and our customer mix.
29
Unit site production and delivery costs in 2004 averaged $0.77 per pound of copper, $0.29 per pound higher than the $0.48 reported in 2003. Unit production and delivery costs are net of deferred mining costs of $0.08 per pound ($77.8 million) for 2004 and $0.05 per pound ($64.4 million) for 2003. The increase in deferred mining costs included the effects of PT Freeport Indonesia’s accelerated overburden removal efforts during 2004. In the fourth quarter of 2004, PT Freeport Indonesia changed its life-of-mine overburden-to-ore ratio to 2.4 to 1 from 2.2 to 1, and in the fourth quarter of 2003 the ratio changed to 2.1 to 1 from 1.9 to 1, as discussed above. The fourth-quarter 2004 change increased 2004 costs by $5.5 million or 0.6 cents per pound. As of December 31, 2004, deferred mining costs totaled $220.4 million compared with $142.6 million at December 31, 2003. See “Critical Accounting Estimates” for a discussion of changes in the estimated life-of-mine overburden-to-ore ratio.
Gold and silver credits were $0.62 per pound for 2004, compared with $0.70 for 2003. The decrease primarily reflects the reduced production and sales of gold during 2004, partly offset by the improved gold realizations.
Unit treatment charges vary with the price of copper, and royalty rates vary with prices of copper and gold. In addition, treatment charges vary based on PT Freeport Indonesia’s customer mix. Royalties of $0.04 per pound were $0.02 per pound above the year-ago period primarily because of higher copper and gold prices. The copper royalty rate payable by PT Freeport Indonesia under its Contract of Work varies from 1.5 percent of copper net revenue at a copper price of $0.90 or less per pound to 3.5 percent at a copper price of $1.10 or more per pound. The Contract of Work royalty rate for gold and silver sales is 1.0 percent. In connection with our fourth concentrator mill expansion completed in 1998, PT Freeport Indonesia agreed to pay the Government of Indonesia additional royalties (royalties not required by the Contract of Work) to provide further support to the local governments and the people of the Indonesian province of Papua. The additional royalties are paid on metal from production from PT Freeport Indonesia’s milling facilities above 200,000 metric tons of ore per day. The additional royalty for copper equals the Contract of Work royalty rate, and for gold and silver equals twice the Contract of Work royalty rates. Therefore, PT Freeport Indonesia’s royalty rate on copper net revenues from production above 200,000 metric tons of ore per day is double the Contract of Work royalty rate, and the royalty rates on gold and silver sales from production above 200,000 metric tons of ore per day are triple the Contract of Work royalty rates. As a result of higher projected copper and gold sales volumes, we expect our 2005 royalty costs to increase compared with 2004 royalty costs of $43.5 million. If copper prices average $1.35 per pound and gold prices average $420 per ounce in 2005, we would expect royalty costs to total approximately $90 million ($0.06 per pound) for 2005. These estimates assume 2005 sales volumes of 1.5 billion pounds of copper and 2.9 million ounces of gold.
Assuming 2005 average prices of $1.35 per pound for copper and $420 per ounce for gold, and copper and gold sales of 1.5 billion pounds and 2.9 million ounces for 2005, PT Freeport Indonesia estimates that its gold credits would essentially offset its cash production costs, resulting in net cash production costs of approximately zero cents per pound for the year 2005. Estimated unit cash costs reflect recent increases in energy costs, a stronger Australian dollar currency and other factors. Net unit cash production costs for 2005 would change by approximately $0.05 per pound for each $25 per ounce change in the average price of gold. Forecasted unit costs are calculated on the same basis as the historical unit costs, which are discussed above and reconciled in “Product Revenues and Production Costs.”
As a result of the lower copper production and sales in 2004, PT Freeport Indonesia’s depreciation rate per pound of copper increased to $0.17 for 2004 compared with $0.15 for 2003. For 2005, PT Freeport Indonesia expects its deprecation rate to decrease to approximately $0.14 per pound, primarily because of higher projected copper production and sales. Because certain assets are depreciated on a straight-line basis, the rate per pound will vary with the level of copper production and sales.
PT Freeport Indonesia Operating Results - 2003 Compared with 2002
PT Freeport Indonesia’s revenues increased by $225.6 million in 2003 from 2002. Both copper and gold price realizations improved during 2003 with copper approximately 15 percent higher at $0.82 per pound and gold approximately 18 percent higher at $366.60 per ounce. Gold revenues include a $22.1 million ($8.99 per ounce) hedging gain from redemption of our Gold-Denominated Preferred Stock. Copper sales volumes declined 15 percent to 1.3 billion pounds in 2003 from 1.5 billion pounds in 2002 because of lower copper ore grades and reduced mill throughput resulting from the fourth-quarter slippage and debris flow events. Gold sales volumes increased 8 percent to 2.5 million ounces in 2003 from 2.3 million ounces in 2002 because of higher gold ore grades partly offset by lower mill throughput. Treatment charges were $46.6 million lower in 2003 compared with 2002 because of lower copper sales volumes and market treatment rates. Royalties were higher at $26.5 million for 2003 compared with $24.5 million for 2002 primarily reflecting higher metals prices.
Mill throughput from production from PT Freeport Indonesia’s producing mines averaged 203,000 metric tons of ore per day in 2003 and 235,600 metric tons of ore per day in 2002. The lower mill throughput rate during 2003 primarily reflects the
30
impact of the fourth-quarter 2003 open-pit slippage and debris flow events and the subsequent clean-up efforts. At the DOZ underground mine, production averaged 40,500 metric tons of ore per day for 2003, compared with 21,800 metric tons of ore per day for 2002. Production from the Intermediate Ore Zone averaged 6,800 metric tons of ore per day for 2003 and 19,300 metric tons of ore per day for 2002.
PT Freeport Indonesia reported record-low average unit net cash production costs of a net credit of $(0.02) per pound in 2003, compared with $0.08 per pound in 2002. Unit site production and delivery costs in 2003 averaged $0.48 per pound of copper, $0.12 per pound higher than the $0.36 in 2002 primarily because of lower copper sales volumes. Higher mine maintenance costs, stronger Indonesian and Australian currencies and higher energy costs also resulted in higher costs compared with 2002.
Gold credits for 2003 of $0.70 per pound were higher than the gold credits of $0.48 per pound in 2002 primarily because of higher gold sales volumes and prices in 2003. Gold ore grades for 2003 improved by 24 percent to 1.54 grams per metric ton in 2003 from 1.24 grams per metric ton in 2002. As a result of the lower copper production and sales in 2003, PT Freeport Indonesia’s depreciation rate per pound of copper increased to $0.15 for 2003 compared with $0.14 for 2002.
PT Freeport Indonesia Sales Outlook
PT Freeport Indonesia sells its copper concentrates primarily under long-term sales agreements denominated in U.S. dollars, mostly to companies in Asia and Europe and to international trading companies. PT Freeport Indonesia’s share of sales for 2005 is projected to approximate 1.5 billion pounds of copper and 2.9 million ounces of gold, and to average 1.36 billion pounds of copper and 2.2 million ounces of gold annually over the next five years (2005-2009). PT Freeport Indonesia expects its sales for the first quarter of 2005 to approximate 310 million pounds of copper and 520,000 ounces of gold. Also, based on the current mine plan for 2005, PT Freeport Indonesia estimates approximately 54 percent of its copper and 60 percent of its gold will be produced in the second half of 2005. Because of the nature of the Grasberg ore body, the sequencing in mining will cause ore grades to vary from quarter to quarter, particularly for gold.
PT Freeport Indonesia has long-term contracts to provide approximately 60 percent of Atlantic Copper’s copper concentrate requirements at market prices and nearly all of PT Smelting’s copper concentrate requirements. Under the PT Smelting contract, for the first 15 years of PT Smelting’s operations beginning December 1998, the treatment and refining charges on the majority of the concentrate PT Freeport Indonesia provides will not fall below specified minimum rates, subject to renegotiation in 2008. The rate was $0.23 per pound during the period from the commencement of PT Smelting’s operations in 1998 until April 2004, when it declined to a minimum of $0.21 per pound. Market rates, excluding price participation, under long-term contracts settled in late 2004 approximate $0.21 per pound.
Exploration and Reserves
During 2004, net additions and revisions to the aggregate proven and probable reserves at the Grasberg mining complex totaled approximately 141 million metric tons of ore representing increases of 2.9 billion recoverable pounds of copper, 2.2 million recoverable ounces of gold and 18.9 million recoverable ounces of silver. The additions were primarily the result of positive drilling results at the Deep Mill Level Zone ore body, a 146-million-metric-ton ore body. We expect to complete additional engineering studies evaluating drilling results on the western side of the ore body in 2005, which could increase the size of the ore body. Our aggregate exploration budget for 2005, including Rio Tinto’s share, is expected to total approximately $21 million ($15 million for our share) with most of the effort focused on testing the Mill Level Zone and Deep Mill Level Zone deposits to the northwest, expansion of the underground Grasberg resource, and testing reconnaissance targets along the Wanagon and Idenberg fault trends. Net of Rio Tinto’s share, PT Freeport Indonesia’s share of proven and probable recoverable reserves as of December 31, 2004, was 40.5 billion pounds of copper, 46.5 million ounces of gold and 124.5 million ounces of silver. FCX’s equity interest in proven and probable recoverable reserves as of December 31, 2004, was 36.7 billion pounds of copper, 42.1 million ounces of gold and 112.8 million ounces of silver (see Note 13 of “Notes to Consolidated Financial Statements”). PT Freeport Indonesia’s share of reserve additions replaced approximately 175 percent of its 2004 copper production, 90 percent of 2004 gold production and 330 percent of 2004 silver production. Estimated recoverable reserves were assessed using a copper price of $0.85 per pound and a gold price of $270 per ounce. If we adjusted metal prices used in our reserve estimates to the approximate average London spot prices for the past three years ($0.94 per pound of copper and $361 per ounce of gold), the additions to proven and probable reserves would not be material to reported reserves.
The Indonesian government previously approved suspensions of our field exploration activities outside of our current mining operations area, which have been in suspension in recent years due to safety and security issues and regulatory uncertainty relating to a possible conflict between our mining and exploration rights in certain forest areas and an Indonesian Forestry law enacted in 1999 prohibiting open-pit mining in forest preservation areas. The current suspensions were granted for one-year periods ending February 26, 2005, for Block B; March 31, 2005, for PT Nabire
31
Bakti Mining; and November 15, 2004, for Eastern Minerals. Recent Indonesian legislation permits open-pit mining in PT Freeport Indonesia’s Block B area, subject to certain requirements. We are currently assessing these requirements and security issues. The timing for our resumption of exploration activities in our Contract of Work areas outside of Block A depends on the resolution of these matters.
SMELTING AND REFINING OPERATIONS
Our investment in smelters serves an important role in our concentrate marketing strategy. PT Freeport Indonesia generally sells approximately one-half of its concentrate production to its affiliated smelters, Atlantic Copper and PT Smelting, and the remainder to other customers. Treatment charges for smelting and refining copper concentrates represent a cost to PT Freeport Indonesia and income to Atlantic Copper and PT Smelting. Through downstream integration, we are assured placement of a significant portion of our concentrate production. While low smelting and refining charges in recent years adversely affected the operating results of Atlantic Copper, they benefited the operating results of PT Freeport Indonesia’s mining operations, effectively achieving a hedge for these charges. Treatment and refining charge rates are currently increasing. Higher future treatment and refining charges will benefit our smelter operations and adversely affect our mining operations. Taking into account taxes and minority ownership interests, an equivalent change in smelting and refining charge rates would essentially offset in our consolidated operating results.
Atlantic Copper Operating Results
| Years Ended December 31, | |||||||||
| (In Millions) | 2004 | 2003 | 2002 | ||||||
| Gross (loss) profit | $ | (69.4 | ) | $ | (10.7 | ) | $ | 11.2 | |
| Add depreciation and amortization expense | 28.6 | 28.5 | 27.7 | ||||||
| Other | 16.4 | a | 4.6 | 4.5 | |||||
| Cash (deficit) margin | $ | (24.4 | )b | $ | 22.4 | $ | 43.4 | ||
| Operating (loss) income (in millions) | $ | (83.5 | ) | $ | (21.8 | ) | $ | 2.6 | |
| Concentrate and scrap treated (metric tons) | 768,100 | 964,400 | 1,016,700 | ||||||
| Anodes production (000s of pounds) | 494,400 | 640,000 | 657,000 | ||||||
| Treatment rates per pound | $0.16 | $0.16 | $0.17 | ||||||
| Cathodes, wire rod and wire sales (000s of pounds) | 479,200 | 546,800 | 556,500 | ||||||
| Cathode cash production cost per pound before hedging | $0.25 | $0.16 | $0.12 | ||||||
| Gold sales in anodes and slimes (ounces) | 316,700 | 929,700 | 813,900 | ||||||
| a. | Includes a $9.8 million charge for Atlantic Copper’s workforce reduction plan. |
| b. | Includes costs related to Atlantic Copper’s 51-day major maintenance turnaround totaling $27.5 million. |
Atlantic Copper Operating Results - 2004 Compared with 2003
Atlantic Copper completed a 51-day scheduled major maintenance turnaround in May 2004, adversely affecting 2004 results. Atlantic Copper’s operating cash margin was a $24.4 million deficit in 2004, compared with a positive $22.4 million in 2003. The deficit in 2004 was primarily because of Atlantic Copper’s major maintenance turnaround. Major maintenance turnarounds of this duration typically occur approximately every nine years for Atlantic Copper, with significantly shorter-term maintenance turnarounds occurring in the interim.
Atlantic Copper treated 768,100 metric tons of concentrate and scrap in 2004, compared with 964,400 metric tons in 2003. Cathode production totaled 454.7 million pounds and sales totaled 479.2 million pounds during 2004, compared with cathode production of 544.7 million pounds and sales of 546.8 million pounds during 2003. Atlantic Copper’s cathode cash production costs per pound of copper, before currency hedging, averaged $0.25 in 2004 and $0.16 in 2003. Unit costs for 2004 were adversely affected by lower production and higher costs from the maintenance turnaround. Treatment charges (including price participation), which are what PT Freeport Indonesia and third parties pay Atlantic Copper to smelt and refine concentrates, continued at historically low levels averaging $0.16 per pound for 2004 and 2003. Excess smelter capacity, combined with limited copper concentrate availability, caused long-term treatment and refining rates to decline since early 1998. However, treatment and refining rates increased in late 2004, and Atlantic Copper expects these higher rates to benefit its operations starting in 2005.
Atlantic Copper reported operating losses of $83.5 million in 2004 and $21.8 million in 2003. The higher losses in 2004
32
include a $12.0 million charge for workforce reductions, lower treatment charges and lower production levels, compared with 2003. The effect of the 51-day turnaround on Atlantic Copper’s results for 2004 was approximately $40 million, including an approximate $12 million impact from lower volumes.
During 2004, Atlantic Copper undertook a cost reduction and operational enhancement plan designed to reduce unit costs, including a reduction in workforce, and enhance operational and administrative efficiencies. The workforce reductions are expected to result in annual cost savings of approximately $8 million. In addition, in December 2004, Atlantic Copper completed a sale of its wire rod and wire assets for $18.3 million cash, resulting in a $7.5 million gain. The sale will enable Atlantic Copper to simplify its business and management structure and reduce working capital requirements. These actions, together with recently negotiated higher treatment charges for 2005, are expected to improve operating results for Atlantic Copper in 2005 significantly.
In March 2004, we used a portion of the proceeds from the sale of our 6⅞% Senior Notes to repay $162.4 million of Atlantic Copper borrowings (see “Capital Resources and Liquidity - Financing Activities”). Atlantic Copper recorded a $3.7 million ($0.02 per share) accounting charge for losses on early extinguishment of debt. As of December 31, 2004, FCX’s net investment in Atlantic Copper totaled $97.4 million, FCX had $189.5 million of loans outstanding to Atlantic Copper and Atlantic Copper’s debt under financing arrangements that are nonrecourse to FCX totaled $12.3 million.
We defer recognizing profits on PT Freeport Indonesia’s sales to Atlantic Copper and on 25 percent of PT Freeport Indonesia’s sales to PT Smelting until the final sales to third parties occur. Changes in these net deferrals resulted in a reduction to our operating income totaling $24.7 million ($12.7 million to net income or $0.07 per share) in 2004, compared with an addition totaling $13.8 million ($7.1 million to net income or $0.04 per share) in 2003. At December 31, 2004, our net deferred profits on PT Freeport Indonesia concentrate inventories at Atlantic Copper and PT Smelting to be recognized in future periods’ net income after taxes and minority interest sharing totaled $41.6 million.
The amount of profit we defer varies with the timing of concentrate shipments and metal prices. In 2003, we recognized previously deferred profit because of reduced shipments to Atlantic Copper and PT Smelting caused by lower production from PT Freeport Indonesia’s open pit following the fourth-quarter slippage and debris flow events. PT Freeport Indonesia resumed normal milling rates in June 2004 after accelerating the removal of overburden and mining low-grade ore following the fourth-quarter 2003 events. As a result of the return to normal milling rates, concentrate shipments to Atlantic Copper and PT Smelting increased in the second half of 2004. These increased shipments and higher metal prices caused the net deferrals and reduction in 2004 operating results. Based on current copper and gold prices and shipping schedules, we expect that a deferral of profits on intercompany sales will result in a decrease to net income of $22 million in the first quarter of 2005 as PT Freeport Indonesia’s shipments to affiliated smelters continue to increase. The actual change in deferred intercompany profits may differ substantially because of changes in the timing of shipments to affiliated smelters and metal prices.
Atlantic Copper Operating Results - 2003 Compared with 2002
Atlantic Copper’s cash margin of $22.4 million in 2003 was $21.0 million lower, compared with $43.4 million in 2002, primarily because of lower treatment charge rates and higher unit costs. Atlantic Copper’s cathode cash production costs per pound of copper, before currency hedging, averaged $0.16 in 2003 and $0.12 in 2002. The higher unit costs in 2003 primarily reflect a stronger euro in relation to the U.S. dollar, which added approximately $0.03 per pound to the 2003 costs when compared to the 2002 costs. Atlantic Copper’s average treatment rates were at historically low levels of $0.16 per pound for 2003 and $0.17 per pound for 2002.
Atlantic Copper recorded an operating loss of $21.8 million in 2003, compared with operating income of $2.6 million in 2002. Atlantic Copper’s operating results also include a $9.6 million gain in 2003 and a $1.2 million charge in 2002 on currency hedging contracts maturing during the year. The effect of changes in the deferred profits on PT Freeport Indonesia’s sales to Atlantic Copper and on 25 percent of PT Freeport Indonesia’s sales to PT Smelting resulted in additions to our operating income totaling $13.8 million ($7.1 million to net income or $0.04 per share) in 2003 and reductions totaling $28.8 million ($14.8 million to net income or $0.10 per share) in 2002.
PT Smelting Operating Results
| Years Ended December 31, | ||||||||||
| (In Millions) | 2004 | 2003 | 2002 | |||||||
| PT Freeport Indonesia sales to PT Smelting | $ | 696.0 | $ | 510.2 | $ | 391.1 | ||||
| Equity in PT Smelting earnings (losses) | 2.0 | 5.6 | (4.2 | ) | ||||||
| PT Freeport Indonesia operating profits (deferred) recognized | (13.8 | ) | 7.0 | (8.4 | ) | |||||
33
PT Smelting Operating Results - 2004 Compared with 2003
PT Freeport Indonesia accounts for its 25 percent interest in PT Smelting using the equity method and provides PT Smelting with substantially all of its concentrate requirements (see Note 9 of “Notes to Consolidated Financial Statements”). During the second quarter of 2004, PT Smelting completed a 31-day maintenance turnaround and resumed normal operations. Major maintenance turnarounds of this duration typically occur approximately every four years for PT Smelting, with significantly shorter-term maintenance turnarounds in the interim. PT Smelting also completed a refinery expansion during the maintenance turnaround, increasing its production capacity to approximately 250,000 metric tons of copper metal per year. PT Smelting treated 758,100 metric tons of concentrate in 2004 and 824,800 metric tons in 2003.
PT Smelting reported production of 464.0 million pounds of cathodes and sales of 462.9 million pounds of cathodes in 2004, compared with production of 492.4 million pounds and sales of 493.5 million pounds in 2003. PT Smelting’s unit cathode cash production costs averaged $0.12 per pound in 2004 and $0.10 per pound in 2003. The 2004 unit costs reflect the impact of lower volumes in 2004 resulting from the scheduled maintenance turnaround.
PT Smelting Operating Results - 2003 Compared with 2002
PT Smelting treated 824,800 metric tons of concentrate in 2003, 15 percent more than the 719,600 metric tons treated in 2002. PT Smelting’s copper cathode cash production costs per pound totaled $0.10 in 2003, compared with $0.14 in 2002, reflecting the impact of the 28-day maintenance turnaround in May 2002.
CAPITAL RESOURCES AND LIQUIDITY
Our operating cash flows vary with prices realized for copper and gold sales, our production levels, production costs, cash payments for income taxes and interest, working capital changes and other factors. Based on the current strong prices for copper and gold and our current mine plans, we expect to generate cash flows significantly above our planned capital expenditures, scheduled debt maturities and other cash requirements in 2005 and for the foreseeable future. We may use available cash to reduce debt in advance of scheduled maturities, pay additional dividends (see discussion of supplemental dividends below) or purchase shares of our common stock under our share purchase program, depending on our financial results, cash requirements, future prospects and other factors.
Operating Activities
Our operating cash flows totaled $341.4 million in 2004, including $85.9 million received as a settlement from insurance coverage related to the fourth-quarter 2003 slippage and debris flow events (see discussion above) and $130.7 million in working capital requirements, compared with $572.1 million in 2003. The decrease in 2004 from the prior year reflects the extended maintenance turnaround at Atlantic Copper and increased working capital requirements. For 2004, significant uses of cash from operating activities included increases in deferred mining costs, accounts receivable and inventories. For 2003, significant uses included increases in deferred mining costs and inventories, and payment of income taxes, partly offset by an increase in our accounts payable and accrued liabilities. We have $195 million available under our revolving credit facility and no amounts have been borrowed under this facility. At December 31, 2004, we had $551.5 million of cash and cash equivalents.
Operating cash flows totaled $572.1 million in 2003, compared with $512.7 million in 2002. Working capital, excluding cash, increased by $18.1 million in 2002 primarily because of increases in accounts receivable and inventories, partly offset by an increase in accrued income taxes payable. Operating activities are expected to generate positive cash flows for the foreseeable future based on anticipated operating results and metal prices. Using current sales estimates and assuming metals prices of $1.35 per pound of copper and $420 per ounce of gold, we expect our consolidated operating cash flows to exceed $1.1 billion in 2005. Each $0.10 per pound change in copper prices would affect 2005 cash flows by approximately $75 million, including the effects of price changes on royalty costs and treatment charges, and each $25 per ounce change in gold prices would affect 2005 cash flows by approximately $36 million.
Investing Activities
Our total 2004 capital expenditures were $141.0 million compared to $139.2 million in 2003. The largest individual capital expenditures for 2004 primarily related to long-term development projects, including development of the DOZ mine, totaling approximately $37 million. Our 2003 capital expenditures included the expansion of the DOZ mine (approximately $22 million) and work on the Grasberg overburden handling system (approximately $21 million). Capital expenditures in 2002, which totaled $188.0 million, included costs at the Grasberg open-pit operations totaling approximately $59 million for replacement capital such as new trucks, shovels, and major development costs totaling approximately $69 million for the overburden handling system and the DOZ mine.
34
Our capital expenditures for 2005 are expected to total approximately $180 million, including approximately $19 million for the DOZ expansion and $17 million for other long-term development projects. We expect to fund our 2005 capital expenditures with operating cash flows and available cash. Capital expenditures are estimated to average approximately $145 million per year over the next five years.
In November 2004, a joint venture in which we own a 50 percent interest completed the sale to a real estate developer of a parcel of land in Arizona where the joint venture previously was engaged in a copper mining research project. Our share of net cash proceeds from the sale totaled $21.6 million. In December 2004, Atlantic Copper completed a sale of its wire rod and wire assets and received $18.3 million cash.
In 2001, we sold $603.8 million of 8¼% Convertible Senior Notes due 2006. The terms of the notes required that we use $139.8 million of the proceeds to purchase a portfolio of U.S. government securities to secure and pay for the first six semiannual interest payments. We sold $6.7 million of these restricted investments in 2004, $46.6 million in 2003 and $47.9 million in 2002 to pay interest. Conversions of these notes allowed us to sell $15.1 million of our restricted investments during 2004 and $27.0 million during 2003 (see below).
In July 2003, we acquired the 85.7 percent ownership interest in PT Puncakjaya Power owned by affiliates of Duke Energy Corporation for $68.1 million cash, net of $9.9 million of cash acquired. PT Freeport Indonesia purchases power from Puncakjaya Power under infrastructure asset financing arrangements.
Financing Activities
We completed several financing transactions over the last several years to improve our balance sheet and debt maturity profile and enhance our financial flexibility. We are continuing to review opportunities to use a portion of future operating cash flow to reduce debt in advance of scheduled maturities and to further improve our debt maturity profile. In January 2004, we completed a tender offer and privately negotiated transactions for a portion of our remaining 8¼% Convertible Senior Notes due 2006 resulting in the early conversion of $226.1 million of notes into 15.8 million shares of FCX common stock. We recorded a $10.9 million charge to losses on early extinguishment and conversion of debt in connection with these conversions. The $10.9 million charge included $6.4 million of previously accrued interest costs, resulting in an equivalent reduction in interest expense. In June 2004, we called for redemption on July 31, 2004, all of the remaining $66.5 million of 8¼% Convertible Senior Notes. During July, all remaining notes were converted into 4.7 million shares of FCX common stock. As of July 31, 2004, all of the 8¼% Convertible Senior Notes, which totaled $603.8 million at issuance in 2001, had been converted into 42.2 million shares of FCX common stock.
On February 3, 2004, we sold $350 million of 6⅞% Senior Notes due 2014 for net proceeds of $344.4 million. We used a portion of the proceeds to repay $162.4 million of Atlantic Copper borrowings and to refinance other FCX 2004 debt maturities. Atlantic Copper recorded a $3.7 million charge to losses on early extinguishment of debt to accelerate amortization of deferred financing costs. Interest on the notes is payable semiannually on February 1 and August 1 of each year, beginning August 1, 2004. We may redeem some or all of the notes at our option at a make-whole redemption price prior to February 1, 2009, and afterwards at stated redemption prices. The indenture governing the notes contains certain restrictions, including restrictions on incurring debt, creating liens, selling assets, entering into transactions with affiliates, paying cash dividends on common stock, repurchasing or redeeming common or preferred equity, prepaying subordinated debt and making investments. During the second quarter of 2004, we purchased in the open market $9.7 million of the 6⅞% Senior Notes for $8.8 million, which resulted in a gain of $0.8 million recorded as a reduction to losses on early extinguishment and conversion of debt, including related deferred financing cost.
On March 30, 2004, we sold 1.1 million shares of 5½% Convertible Perpetual Preferred Stock for $1.1 billion, with net proceeds totaling $1.067 billion. Each share of preferred stock was initially convertible into 18.8019 shares of our common stock, equivalent to a conversion price of approximately $53.19 per common share. The conversion rate is adjustable upon the occurrence of certain events, including any quarter that our common stock dividend exceeds $0.20 per share. As a result of the common stock dividends discussed below and a quarterly dividend paid on February 1, 2005, each share of preferred stock is now convertible into 18.9794 shares of FCX common stock, equivalent to a conversion price of approximately $52.69 per common share. In February 2005, our Board of Directors authorized a supplemental dividend of $0.50 per share payable on March 31, 2005, which will result in another adjustment to the conversion price in March 2005. Beginning March 30, 2009, we may redeem shares of the preferred stock by paying cash, our common stock or any combination thereof for $1,000 per share plus unpaid dividends, but only if our common stock price has exceeded 130 percent of the conversion price for at least 20 trading days within a period of 30 consecutive trading days immediately preceding the notice of redemption. We used a portion of the proceeds from the sale to purchase
35
23.9 million shares of FCX common stock owned by Rio Tinto for $881.9 million (approximately $36.85 per share) and used the remainder for general corporate purposes. Rio Tinto no longer owns any equity interest in FCX; however, it is still PT Freeport Indonesia’s joint venture partner.
As of December 31, 2004, we had total unrestricted cash and cash equivalents of $551.5 million and total outstanding debt of $1.95 billion. In February 2003, our Board of Directors authorized the initiation of an annual cash dividend on our common stock of $0.36 per share, increased the dividend in October 2003 to an annual rate of $0.80 per share and increased the dividend again in October 2004 to an annual rate of $1.00 per share. In December 2004, our Board of Directors authorized a supplemental common stock dividend of $0.25 per share, which was paid on December 29, 2004. Dividend payments on common stock totaled $198.8 million in 2004 and $41.7 million in 2003. As discussed above, in February 2005 the Board authorized a supplemental common stock dividend of $0.50 per share payable March 31, 2005. The declaration and payment of dividends is at the discretion of our Board. The amount of our current quarterly cash dividend on our common stock and the possible payment of additional future supplemental cash dividends will depend on our financial results, cash requirements, future prospects and other factors deemed relevant by the Board. Pursuant to the restricted payment covenants in our 10⅛% Senior Notes and 6⅞% Senior Notes, the amount available for dividend payments and other restricted payments as of December 31, 2004, was approximately $510 million.
In August 2004, we funded the sixth of eight scheduled annual redemption payments on our Silver-Denominated Preferred Stock for $13.9 million. The mandatory redemption resulted in a $12.5 million decrease in debt and a hedging loss to revenues of $1.4 million ($0.7 million to net income or less than $0.01 per share) in 2004. Mandatory partial redemptions of our Silver-Denominated Preferred Stock totaled $10.8 million in 2003 and $11.7 million in 2002.
In 2003, the Board approved a new open market share purchase program for up to 20 million shares, which replaced our previous program. Under this new program, we acquired 3.4 million shares during the second quarter of 2004 for $99.5 million, $29.39 per share average, and 16.6 million shares remain available. No shares were purchased during the second half of 2004 and through February 28, 2005. The timing of future purchases of our common stock is dependent on many factors including the price of our common shares, our cash flow and financial position, and general economic and market conditions.
During the first quarter of 2003, we completed two senior note offerings. On January 29, 2003, we sold $500 million of 10⅛% Senior Notes due 2010. Interest on the notes is payable semiannually on February 1 and August 1 of each year. We may redeem some or all of the notes at our option at a make-whole redemption price prior to February 1, 2007, and afterwards at stated redemption prices. The indenture governing the notes contains certain restrictions on incurring debt, creating liens, entering into sale leaseback transactions, taking actions to limit distributions from certain subsidiaries, selling assets, entering into transactions with affiliates, paying cash dividends on common stock, repurchasing or redeeming common or preferred equity, prepaying subordinated debt and making investments.
In February 2003, we sold $575 million of 7% Convertible Senior Notes due 2011. Interest on the notes is payable semiannually on March 1 and September 1 of each year. The notes are convertible, at the option of the holder, at any time on or prior to maturity into shares of FCX’s common stock at a conversion price of $30.87 per share, which is equal to a conversion rate of approximately 32.39 shares of common stock per $1,000 principal amount of notes. We used a portion of the $1.046 billion in net proceeds from the two first-quarter 2003 note offerings to repay all of the then-outstanding amounts under our bank credit facilities.
In April 2003, we concluded tender offers to purchase our outstanding 7.20% Senior Notes due 2026 and our 7.50% Senior Notes due 2006. Of the $450 million outstanding at March 31, 2003, notes with a face amount of $234.0 million were tendered for $239.0 million cash. We recorded a charge of $6.6 million ($4.8 million to net income or $0.03 per share) in 2003 associated with these early extinguishments of debt. In July 2003, we purchased an additional $76.0 million face amount of our 7.20% Senior Notes for $77.2 million, and recorded a $1.3 million ($0.9 million to net income or less than $0.01 per share) charge to losses on extinguishment of debt. In October 2003, the holders of $68.9 million of the remaining $73.5 million of outstanding 7.20% Senior Notes elected early repayment in November 2003. We currently have outstanding $4.5 million of 7.20% Senior Notes and $66.5 million of 7.50% Senior Notes.
In August 2003, we redeemed 6.0 million shares of Gold-Denominated Preferred Stock for $210.5 million and partially redeemed our Silver-Denominated Preferred Stock for $10.8 million. The mandatory redemptions resulted in a $245.1 million decrease in debt and a hedging gain to revenues of $23.8 million ($12.2 million to net income or $0.08 per share).
In August 2003, we privately negotiated the early conversion of 51.5 percent of our 8¼% Convertible Senior Notes, which resulted in a $311.1 million reduction in debt. The holders converted their notes into 21.76 million shares of FCX common stock and received $23.0 million in cash from restricted investments held in escrow for payment of future
36
interest on these notes. We recorded charges totaling $24.7 million ($24.2 million to net income or $0.15 per share) related to these conversions.
In October 2003, FCX and PT Freeport Indonesia entered into an amended revolving credit facility that provides a commitment of $195 million and matures in September 2006. We recorded charges totaling $5.6 million ($3.7 million to net income or $0.02 per share) in 2003 to accelerate amortization of deferred financing costs related to the prior credit facility.
In December 2003, we called for redemption the depositary shares representing our 7% Step-Up Convertible Preferred Stock. Of the 14.0 million depositary shares outstanding at the time of the call, 13.8 million depositary shares were converted into 11.5 million shares of FCX common stock. The remaining shares were redeemed for approximately $7 million cash.
As a result of the transactions discussed above, we had net cash borrowings (repayments) of debt, including preferred stock redemptions, of $(31.2) million in 2004, $31.7 million in 2003 and $(333.3) million in 2002.
Debt Maturities.Below is a summary (in millions) of our total debt maturities based on loan balances as of December 31, 2004, and original issue amounts for mandatorily redeemable preferred stock.
| 2005 | 2006 | 2007 | 2008 | 2009 | Thereafter | ||||||||||||
| Puncakjaya Power bank debt | $ | 51.6 | $ | 37.2 | $ | 28.0 | $ | 36.0 | $ | 34.2 | $ | - | |||||
| Redeemable preferred stock | 12.5 | 179.9 | - | - | - | - | |||||||||||
| Atlantic Copper debt | 7.8 | 0.1 | 4.4 | - | - | - | |||||||||||
| Equipment loans and other | 6.3 | 13.2 | 13.5 | 13.6 | 13.5 | 13.8 | |||||||||||
| 7.50% Senior Notes due 2006 | - | 66.5 | - | - | - | - | |||||||||||
| 10⅛% Senior Notes due 2010 | - | - | - | - | - | 500.0 | |||||||||||
7% Convertible Senior Notes due 2011a | - | - | - | - | - | 575.0 | |||||||||||
| 6⅞% Senior Notes due 2014 | - | - | - | - | - | 340.3 | |||||||||||
| 7.20% Senior Notes due 2026 | - | - | - | - | - | 4.5 | |||||||||||
| Total debt maturities | $ | 78.2 | $ | 296.9 | $ | 45.9 | $ | 49.6 | $ | 47.7 | $ | 1,433.6 | |||||
Pro forma adjustmentb | 3.7 | 24.9 | - | - | - | - | |||||||||||
| Pro forma debt maturities | $ | 81.9 | $ | 321.8 | $ | 45.9 | $ | 49.6 | $ | 47.7 | $ | 1,433.6 | |||||
| a. | Conversion price is $30.87 per share. |
| b. | Represents additional amounts due above the original issue amounts based on the price of silver and gold, respectively, totaling $3.7 million in 2005 and 2006 for our Silver-Denominated Preferred Stock and $21.2 million in February 2006 for our Gold-Denominated Preferred Stock, Series II. We calculated these amounts using the December 31, 2004, London A.M. gold fixing price for one ounce of gold ($438.00) and the London silver fixing price for one ounce of silver ($6.82) in the London bullion market (which determine the preferred stock redemption amounts). |
Other Contractual Obligations
In addition to our debt and redeemable preferred stock maturities shown above, we have other contractual obligations and commitments, which we expect to fund with projected operating cash flows, available credit facilities or future financing transactions, if necessary. These obligations and commitments include PT Freeport Indonesia’s commitments to provide one percent of its annual revenue for development of the local people in our area of operations through the Freeport Partnership Fund for Community Development and to contribute amounts to a cash fund designed to accumulate at least $100 million by the end of our Indonesian mining activities to pay for mine closure and reclamation. Atlantic Copper has a mostly unfunded contractual obligation denominated in euros to supplement amounts paid to retired employees. In August 2002, Atlantic Copper complied with Spanish legislation by agreeing to fund 7.2 million euros annually for 15 years, beginning August 2002, to an approved insurance company for an estimated 72 million euro contractual obligation to the retired employees. Atlantic Copper had $69.8 million recorded as of December 31, 2004, for this obligation and is amortizing the unaccrued balance of approximately $7.9 million over the remaining 12-year funding period. Atlantic Copper has firm contractual commitments with third parties to purchase concentrates at market prices. We have various noncancelable operating leases and open purchase orders at December 31, 2004. A summary of these various obligations follows (in millions, except concentrates):
37
| Total | 1 Year or Less | Years 2 - 3 | Years 4 - 5 | More than 5 Years | ||||||||||||
| PT Freeport Indonesia funding of mine closure and reclamation fund | $21.6 | a | $0.9 | $1.4 | $1.4 | $17.9 | ||||||||||
| Atlantic Copper contractual obligation to insurance company | $118.1 | $9.8 | $19.7 | $19.7 | $68.9 | |||||||||||
| Atlantic Copper contracts to purchase concentrates at market prices (in thousand metric tons) | 1,234 | 415 | 659 | 160 | - | |||||||||||
Aggregate operating leases, including Rio Tinto’s shareb | $39.9 | $7.6 | $13.5 | $12.6 | $6.2 | |||||||||||
| Open purchase orders at December 31, 2004 | $44.7 | $44.7 | - | - | - | |||||||||||
| a. | Funding plus accrued interest are projected to accumulate to $100.0 million by the end of our Indonesian mining activities. |
| b. | Minimum payments under operating leases have not been reduced by aggregate minimum sublease rentals of $1.1 million due under noncancelable subleases. |
Environmental Matters
We believe that we conduct our Indonesian operations pursuant to applicable permits and that we comply in all material respects with applicable Indonesian environmental laws, rules and regulations. We have had three independent environmental audits conducted by internationally recognized environmental consulting and auditing firms. Audits were completed in 1996 by Dames & Moore, in 1999 by Montgomery Watson, and in 2002 by SGS International Certification Services Indonesia, a member of the Société Générale de Surveillance group. The 2002 audit found that the overall approach to practical management of environmental issues at PT Freeport Indonesia is considered to be very sound. There were no audit findings requiring corrective action.
In connection with obtaining our environmental approvals from the Indonesian government, we committed to performing a one-time environmental risk assessment on the impacts of our tailings management plan. We completed this extensive environmental risk assessment with more than 90 scientific studies conducted over four years and submitted it to the Indonesian government in December 2002. We developed the risk assessment study with input from an independent review panel, which included representatives from the Indonesian government, academia and non-governmental organizations. The risks that we identified during this process were in line with our impact projections of the tailings management program contained in our environmental approval documents.
We will determine our ultimate reclamation and closure activities based on applicable laws and regulations and our assessment of appropriate remedial activities in the circumstances after consultation with governmental authorities, affected local residents and other affected parties. As of December 31, 2004, we estimated aggregate reclamation and closure obligations to be approximately $149 million for PT Freeport Indonesia and $18 million for Atlantic Copper. Estimates of the ultimate reclamation and closure costs we will incur in the future involve complex issues requiring integrated assessments over a period of many years and are subject to revision over time, and actual costs may vary from our estimates. Some reclamation costs will be incurred during mining activities, while most closure costs and the remaining reclamation costs will be incurred at the end of the Grasberg open-pit mining operations and at the end of all mining activities, which are currently estimated to continue for more than 35 years.
In 1996, we began contributing to a cash fund ($6.0 million balance at December 31, 2004) designed to accumulate at least $100 million by the end of our Indonesian mining activities. We plan to use this fund, including accrued interest, to pay mine closure and reclamation costs. Any costs in excess of the $100 million fund would be funded by operational cash flow or other sources. Future changes in regulations could require us to incur additional costs which would be charged against future operations. Estimates involving environmental matters are by their nature imprecise and can be expected to be revised over time because of changes in government regulations, operations, technology and inflation.
The cost of complying with environmental laws is a fundamental cost of our business. We incurred aggregate environmental capital expenditures and other environmental costs totaling $65.1 million in 2004, $72.1 million in 2003 and $62.6 million in 2002, including tailings management levee maintenance and mine reclamation. In 2005, we expect to incur approximately $21 million of aggregate environmental capital expenditures and $39 million of other environmental costs. These environmental expenditures are part of our overall 2005 operating budget.
DISCLOSURES ABOUT MARKET RISKS
Commodity Price Risk
Our consolidated revenues include PT Freeport Indonesia’s sale of copper concentrates, which also contain significant quantities of gold and silver, and Atlantic Copper’s sale of copper anodes, cathodes, wire rod, wire and precious metals in slimes. Atlantic Copper sold its wire rod and wire assets in December 2004. Our consolidated revenues and net income vary significantly with fluctuations in the market prices
38
of copper and gold and other factors. A change of $0.10 in the average price per pound of copper would have an approximate $150 million impact on our 2005 consolidated revenues and an approximate $75 million impact on our 2005 consolidated net income, assuming approximately 1.5 billion pounds of 2005 PT Freeport Indonesia copper sales. A change of $25 in the average price per ounce of gold would have an approximate $72 million impact on our 2005 consolidated revenues and an approximate $36 million impact on our 2005 consolidated net income, assuming approximately 2.9 million ounces of 2005 PT Freeport Indonesia gold sales.
At times, in response to market conditions, we have in the past and may in the future enter into copper and gold price protection contracts for some portion of our expected future mine production to mitigate the risk of adverse price fluctuations. We currently have no commodity price protection contracts relating to our mine production other than our gold-denominated and silver-denominated preferred stock discussed below.
PT Freeport Indonesia’s concentrate sales agreements, with regard to copper, provide for provisional billings at the time of shipment with final pricing settlement generally based on the average LME price for a specified future period. Under SFAS No. 133, “Accounting for Derivative Instruments and Hedging Activities,” PT Freeport Indonesia’s sales based on a provisional sales price contain an embedded derivative, which we bifurcate from the sale of the concentrates at the current spot LME price. The embedded derivative, which does not qualify for hedge accounting, is marked-to-market through earnings each period until the date of final copper pricing (see Note 1 of “Notes to Consolidated Financial Statements”). At December 31, 2004, we had consolidated embedded derivatives on copper sales totaling 292.2 million pounds recorded at an average price of $1.45 per pound. We expect final prices on these sales over the next few months. We estimate that a two-cent movement in the average price used for these embedded derivatives will have an approximate $3 million impact on our 2005 consolidated net income.
We have outstanding two issues of redeemable preferred stock, which have cash dividend and redemption requirements indexed to gold and silver prices. We account for these securities as a hedge of future production and reflect them as debt on our balance sheets at their original issue value less redemptions. As redemption payments occur, differences between the carrying value and the redemption payment, which is based on commodity prices at the time of redemption, are recorded as an adjustment to revenues (see Notes 1, 5 and 11 of “Notes to Consolidated Financial Statements”). During 2003, we redeemed all our gold-denominated preferred stock due in August 2003 and made an annual partial redemption of our silver-denominated stock. We paid $221.3 million to redeem these securities, which had a book balance of $245.1 million. We recorded the $23.8 million gain as revenues. In August 2004, we funded the sixth of eight scheduled annual redemption payments on our Silver-Denominated Preferred Stock for $13.9 million. The mandatory redemption resulted in a $12.5 million decrease in debt and a hedging loss to revenues of $1.4 million ($0.7 million to net income or less than $0.01 per share) in 2004. Future redemption payments denominated in ounces and equivalent value in dollars, as well as dollar-equivalent dividend payments, based on the December 31, 2004, London A.M. gold fixing price for one ounce of gold ($438.00) and the London silver fixing price for one ounce of silver ($6.82) in the London bullion market (which determine the preferred stock redemption and dividend amounts), follow (dollars in millions):
| Gold | Silver | |||||||||||||||||||||
| Redemption | Carrying | Dividend | Redemption | Carrying | Dividend | |||||||||||||||||
| Ounces | Amount | Value | Amount | Ounces | Amount | Value | Amount | |||||||||||||||
| 2005 | - | $ | - | $ | - | $ | 6.1 | 2,380,000 | $ | 16.2 | $ | 12.5 | $ | 1.2 | ||||||||
| 2006 | 430,558 | 188.6 | 167.4 | 1.5 | 2,380,000 | 16.2 | 12.5 | 0.5 | ||||||||||||||
| $ | 188.6 | $ | 167.4 | $ | 32.4 | $ | 25.0 | |||||||||||||||
The fair values of the redeemable preferred stock, based on December 31, 2004, quoted market prices of $43.65 per depositary share for our gold-denominated preferred stock due in 2006 and $7.40 per depositary share for our silver-denominated preferred stock, were $187.9 million for the preferred stock indexed to gold prices and $35.2 million for the preferred stock indexed to silver prices.
Atlantic Copper prices its purchases of copper concentrate at approximately the same time as it sells the refined copper, thereby protecting Atlantic Copper from most copper price risk. Atlantic Copper enters into futures contracts to hedge its price risk whenever its physical purchases and sales pricing periods do not match. At December 31, 2004, Atlantic Copper had contracts, with a fair value of $(0.9) million, to sell 12.7 million pounds of copper at an average price of $1.40 per pound through March 2005.
Foreign Currency Exchange Risk
Our operations are in Indonesia and Spain, where our functional currency is the U.S. dollar. All of our revenues and a significant portion of our costs are denominated in U.S. dollars; however, some costs and certain asset and liability accounts are denominated in Indonesian rupiah, Australian
39
dollars or euros. Generally, our costs are positively affected when the U.S. dollar strengthens in relation to those foreign currencies and adversely affected when the U.S. dollar weakens in relation to those foreign currencies.
One U.S. dollar was equivalent to 9,270 rupiah at December 31, 2004, 8,437 rupiah at December 31, 2003, and 8,940 rupiah at December 31, 2002. PT Freeport Indonesia recorded losses to production costs totaling $0.7 million in 2004, $3.0 million in 2003 and $3.5 million in 2002 related to its rupiah-denominated net monetary assets and liabilities. At December 31, 2004, net liabilities totaled $7.7 million at an exchange rate of 9,270 rupiah to one U.S. dollar.
Operationally, changes in the U.S. dollar to rupiah exchange rate primarily impact PT Freeport Indonesia’s labor costs, which are mostly rupiah denominated. At estimated annual aggregate rupiah payments of 1.4 trillion and an exchange rate of 9,270 rupiah to one U.S. dollar, the exchange rate as of December 31, 2004, a one-thousand-rupiah increase in the exchange rate would result in an approximate $15 million decrease in aggregate annual operating costs. A one-thousand-rupiah decrease in the exchange rate would result in an approximate $18 million increase in aggregate annual operating costs.
PT Freeport Indonesia purchases certain materials, supplies and services denominated in Australian dollars. The exchange rate was $0.78 to one Australian dollar at December 31, 2004, $0.75 to one Australian dollar at December 31, 2003, and $0.56 to one Australian dollar at December 31, 2002. At estimated annual aggregate Australian dollar payments of 225 million and an exchange rate of $0.78 to one Australian dollar, the exchange rate as of December 31, 2004, a $0.01 increase or decrease in the exchange rate would result in an approximate $2 million change in aggregate annual operating costs.
At times, PT Freeport Indonesia has entered into foreign currency forward contracts to hedge a portion of its aggregate anticipated Indonesian rupiah and Australian dollar payments. As of December 31, 2004, PT Freeport Indonesia had foreign currency contracts to hedge 450.0 billion in rupiah payments from April 2005 through December 2005, or approximately 32 percent of aggregate projected rupiah payments for 2005, at an average exchange rate of 10,059 rupiah to one U.S. dollar. PT Freeport Indonesia accounts for these contracts as cash flow hedges. We recorded net gains to production costs totaling $11.0 million in 2002 for PT Freeport Indonesia’s previous foreign currency contracts.
The majority of Atlantic Copper’s revenues are denominated in U.S. dollars; however, operating costs other than concentrate purchases and certain asset and liability accounts are denominated in euros. Atlantic Copper’s estimated annual euro payments total approximately 100 million euros. At a December 31, 2004, exchange rate of $1.36 per euro, a $0.05 increase or decrease in the exchange rate would result in an approximate $5 million change in annual costs.
In connection with refinancing its debt in June 2000, Atlantic Copper’s lenders required it to hedge its anticipated euro-denominated operating costs. This hedging requirement was removed when Atlantic Copper refinanced the facility in March 2004. Atlantic Copper had no outstanding currency hedging contracts at December 31, 2004. Atlantic Copper’s operating results reflect gains (losses) on currency hedging contracts totaling $9.6 million in 2003 and $(1.2) million in 2002.
Atlantic Copper had euro-denominated net monetary liabilities at December 31, 2004, totaling $74.0 million. The exchange rate was $1.36 per euro at December 31, 2004, $1.26 per euro at December 31, 2003, and $1.05 per euro at December 31, 2002. Adjustments to Atlantic Copper’s euro-denominated net monetary liabilities to reflect changes in the exchange rate are recorded in other income (expense) and totaled $(1.6) million in 2004, $(13.6) million in 2003 and $(11.9) million in 2002.
Interest Rate Risk
The table below presents average interest rates for our scheduled maturities of principal for outstanding debt and fair value at December 31, 2004 (dollars in millions).
| 2005 | 2006 | 2007 | 2008 | 2009 | Thereafter | Fair Value | |||||||||||||||
| Fixed-rate debt | $ | - | $ | 66.5 | $ | - | $ | - | $ | - | $ | 1,419.8 | $ | 2,080.8 | |||||||
| Average interest rate | - | 7.5 | % | - | - | - | 8.1 | % | 8.1 | % | |||||||||||
| Variable-rate debt | $ | 78.2 | $ | 230.4 | $ | 45.9 | $ | 49.6 | $ | 47.7 | $ | 13.8 | $ | 273.2 | |||||||
| Average interest rate | 4.6 | % | 4.0 | % | 4.5 | % | 4.6 | % | 4.6 | % | 5.2 | % | 4.3 | % | |||||||
NEW ACCOUNTING STANDARDS
In November 2004, FASB issued SFAS No. 151, “Inventory Costs, an amendment of ARB No. 43, Chapter 4.” SFAS No. 151 clarifies that abnormal amounts of idle facility expense, freight handling costs and wasted materials (spoilage) should be recognized as current-period charges and requires the allocation of fixed production overheads to inventory based on the normal capacity of the production facilities. We must adopt SFAS No. 151 no later than January 1, 2006. We have not yet determined when we will adopt SFAS No. 151; however, we currently do not expect adoption to have a material impact on our accounting for inventory costs.
40
In December 2004, the FASB issued SFAS No. 123 (revised 2004), “Share-Based Payment.” SFAS No. 123 (revised 2004) requires all share-based payments to employees, including grants of employee stock options, to be recognized in the income statement based on their fair values. Through December 31, 2004, we have accounted for grants of employee stock options under the recognition principles of APB Opinion No. 25, “Accounting for Stock Issued to Employees,” and related interpretations, which require compensation costs for stock-based employee compensation plans to be recognized based on the difference on the date of grant, if any, between the quoted market price of the stock and the amount an employee must pay to acquire the stock. If we had applied the fair value recognition provisions of SFAS No. 123, “Accounting for Stock-Based Compensation,” which requires compensation cost for all stock-based employee compensation plans to be recognized based on the use of a fair value method, our net income would have been reduced by $5.2 million, $0.05 per diluted share, for 2004, $4.7 million, $0.05 per diluted share, for 2003 and $6.5 million, $0.07 per diluted share, for 2002 (see Note 1 of “Notes to Consolidated Financial Statements”). We must adopt SFAS No. 123 (revised 2004) no later than July 1, 2005; however, we can elect to adopt SFAS No. 123 (revised 2004) as early as January 1, 2005. We are still reviewing the provisions of SFAS No. 123 (revised 2004) and have not yet determined if we will adopt SFAS No. 123 (revised 2004) before July 1, 2005. Also, stock options were granted to employees in February 2005, including multi-year grants to our senior executive officers. As a result, the annual charges for share-based payments will be higher than the pro forma annual amounts presented in Note 1 of “Notes of Consolidated Financial Statements.” Based on currently outstanding employee stock options, including those granted in February 2005, if we adopt SFAS No. 123 (revised 2004) on July 1, 2005, we estimate the charge to earnings before taxes and minority interest sharing in the second half of 2005 would total approximately $11 million, and the reduction in net income would be approximately $6.5 million, $0.04 per basic share using common shares outstanding at December 31, 2004.
PRODUCT REVENUES AND PRODUCTION COSTS
PT Freeport Indonesia Product Revenues and Net Cash Production Costs
Net cash production costs per pound of copper is a measure intended to provide investors with information about the cash generating capacity of our mining operations expressed on a basis relating to its primary metal product, copper. PT Freeport Indonesia uses this measure for the same purpose and for monitoring operating performance by its mining operations. This information differs from measures of performance determined in accordance with generally accepted accounting principles and should not be considered in isolation or as a substitute for measures of performance determined in accordance with generally accepted accounting principles. This measure is presented by other copper and gold mining companies, although our measures may not be comparable to similarly titled measures reported by other companies.
We calculate gross profit per pound of copper under a “by-product” method, while the copper, gold and silver contained within our concentrates are treated as co-products in our financial statements. We use the by-product method in our presentation of gross profit per pound of copper because (1) the majority of our revenues are copper revenues, (2) we produce and sell one product, concentrates, which contains all three metals and (3) it is not possible to specifically assign our costs to revenues from the copper, gold and silver we produce in concentrates. In the co-product method presentation below, costs are allocated to the different products based on their relative revenue values.
In both the by-product and the co-product method calculations below, we show adjustments to revenues for prior period open sales and for hedging as separate line items. Because the copper pricing adjustments do not result from current period sales, we have reflected these separately from revenues on current period sales. Hedging adjustments, which are attributed to our commodity-indexed preferred stock, are included with pricing adjustments because they result from transactions outside of our sales contracts. Noncash and other nonrecurring costs, which consist of items such as write-offs of equipment or unusual charges, have not been material. They are removed from site production and delivery costs in the calculation of net cash production costs (credits). As discussed above, gold and silver revenues are reflected as credits against site production and delivery costs in the by-product method. PT Freeport Indonesia’s gross profit totals are before considering the impact of the elimination of its share of profits on its sales to PT Smelting. Presentations under both methods are presented below together with a reconciliation to amounts reported in our consolidated financial statements.
41
| Year Ended December 31, 2004 | |||||||||||||||
| By-Product | Co-Product Method | ||||||||||||||
| (In Thousands) | Method | Copper | Gold | Silver | Total | ||||||||||
| Revenues, after adjustments shown below | $ | 1,363,587 | $ | 1,363,587 | $ | 595,206 | $ | 21,593 | $ | 1,980,386 | |||||
| Site production and delivery, before net noncash and nonrecurring credits shown below | 764,206 | 526,191 | 229,682 | 8,333 | 764,206 | ||||||||||
| Gold and silver credits | (616,799 | ) | - | - | - | - | |||||||||
| Treatment charges | 202,243 | 139,254 | 60,784 | 2,205 | 202,243 | ||||||||||
| Royalty on metals | 43,498 | 29,950 | 13,074 | 474 | 43,498 | ||||||||||
| Net cash production costs | 393,148 | 695,395 | 303,540 | 11,012 | 1,009,947 | ||||||||||
| Depreciation and amortization | 168,195 | 115,810 | 50,551 | 1,834 | 168,195 | ||||||||||
| Noncash and nonrecurring credits, net | (4,075 | ) | (2,806 | ) | (1,225 | ) | (44 | ) | (4,075 | ) | |||||
| Total production costs | 557,268 | 808,399 | 352,866 | 12,802 | 1,174,067 | ||||||||||
| Adjustments, primarily for copper pricing on prior period open sales and silver hedging | 11,928 | 13,369 | - | (1,441 | ) | 11,928 | |||||||||
| Gross profit, before intercompany profit eliminations | $ | 818,247 | $ | 568,557 | $ | 242,340 | $ | 7,350 | $ | 818,247 | |||||
| Pounds of copper sold (000s) | 991,600 | 991,600 | |||||||||||||
| Ounces of gold sold | 1,443,000 | ||||||||||||||
| Ounces of silver sold | 3,257,800 |
| Gross profit per pound of copper (cents)/per ounce of gold and silver ($), before intercompany profit eliminations: | |||||||||||||||
| Revenues, after adjustments shown below | 136.9 | 136.9 | 412.32 | 6.10 | |||||||||||
| Site production and delivery, before net noncash and nonrecurring credits shown below | 77.1 | 53.1 | 159.17 | 2.56 | |||||||||||
| Gold and silver credits | (62.2 | ) | - | - | - | ||||||||||
| Treatment charges | 20.4 | 14.0 | 42.12 | 0.68 | |||||||||||
| Royalty on metals | 4.4 | 3.0 | 9.06 | 0.15 | |||||||||||
| Net cash production costs | 39.7 | 70.1 | 210.35 | 3.39 | |||||||||||
| Depreciation and amortization | 17.0 | 11.7 | 35.03 | 0.56 | |||||||||||
| Noncash and nonrecurring credits, net | (0.4 | ) | (0.3 | ) | (0.85 | ) | (0.01 | ) | |||||||
| Total production costs | 56.3 | 81.5 | 244.53 | 3.94 | |||||||||||
| Adjustments, primarily for copper pricing on prior period open sales and silver hedging | 1.9 | 1.9 | 0.15 | 0.10 | |||||||||||
| Gross profit per pound/ounce, before intercompany profit eliminations | 82.5 | 57.3 | 167.94 | 2.26 | |||||||||||
Reconciliation to Amounts Reported | |||||||||||||||
| (In Thousands) | Revenues | Production and Delivery | Depreciation and Amortization | ||||||||||||
| Totals presented above | $ | 1,980,386 | $ | 764,206 | $ | 168,195 | |||||||||
| Net noncash and nonrecurring credits per above | N/A | (4,075 | ) | N/A | |||||||||||
| Less: Treatment charges per above | (202,243 | ) | N/A | N/A | |||||||||||
| Royalty per above | (43,498 | ) | N/A | N/A | |||||||||||
| Adjustments, primarily for copper pricing on prior period open sales and hedging per above | 11,928 | N/A | N/A | ||||||||||||
| Mining and exploration segment | 1,746,573 | 760,131 | 168,195 | ||||||||||||
| Smelting and refining segment | 873,700 | 914,452 | 28,632 | ||||||||||||
| Eliminations and other | (248,407 | ) | (224,292 | ) | 9,581 | ||||||||||
| As reported in FCX’s consolidated financial statements | $ | 2,371,866 | $ | 1,450,291 | $ | 206,408 | |||||||||
42
| Year Ended December 31, 2003 | |||||||||||||||
| By-Product | Co-Product Method | ||||||||||||||
| (In Thousands) | Method | Copper | Gold | Silver | Total | ||||||||||
| Revenues, after adjustments shown below | $ | 1,062,042 | $ | 1,062,042 | $ | 884,666 | $ | 19,613 | $ | 1,966,321 | |||||
| Site production and delivery, before reclamation, noncash and nonrecurring costs shown below | 617,219 | 333,370 | 277,693 | 6,156 | 617,219 | ||||||||||
| Gold and silver credits | (904,279 | ) | - | - | - | - | |||||||||
| Treatment charges | 231,856 | 125,229 | 104,314 | 2,313 | 231,856 | ||||||||||
| Royalty on metals | 26,472 | 14,298 | 11,910 | 264 | 26,472 | ||||||||||
| Net cash production costs (credits) | (28,732 | ) | 472,897 | 393,917 | 8,733 | 875,547 | |||||||||
| Depreciation and amortization | 190,450 | 102,865 | 85,685 | 1,900 | 190,450 | ||||||||||
| Reclamation, noncash and nonrecurring costs | 15,954 | 8,617 | 7,178 | 159 | 15,954 | ||||||||||
| Total production costs | 177,672 | 584,379 | 486,780 | 10,792 | 1,081,951 | ||||||||||
| Adjustments, primarily for copper pricing on prior period open sales and gold/silver hedging | 36,587 | 12,755 | 22,110 | 1,722 | 36,587 | ||||||||||
| Gross profit, before intercompany profit eliminations | $ | 920,957 | $ | 490,418 | $ | 419,996 | $ | 10,543 | $ | 920,957 | |||||
| Pounds of copper sold (000s) | 1,295,600 | 1,295,600 | |||||||||||||
| Ounces of gold sold | 2,469,800 | ||||||||||||||
| Ounces of silver sold | 4,126,700 |
| Gross profit per pound of copper (cents)/per ounce of gold and silver ($), before intercompany profit eliminations: | |||||||||||||||
| Revenues, after adjustments shown below | 81.9 | 81.9 | 366.60 | 5.15 | |||||||||||
| Site production and delivery, before reclamation, noncash and nonrecurring costs shown below | 47.6 | 25.7 | 112.44 | 1.49 | |||||||||||
| Gold and silver credits | (69.8 | ) | - | - | - | ||||||||||
| Treatment charges | 17.9 | 9.7 | 42.24 | 0.56 | |||||||||||
| Royalty on metals | 2.0 | 1.1 | 4.82 | 0.06 | |||||||||||
| Net cash production costs (credits) | (2.3 | ) | 36.5 | 159.50 | 2.11 | ||||||||||
| Depreciation and amortization | 14.7 | 7.9 | 34.69 | 0.46 | |||||||||||
| Reclamation, noncash and nonrecurring costs | 1.2 | 0.7 | 2.91 | 0.04 | |||||||||||
| Total production costs | 13.6 | 45.1 | 197.10 | 2.61 | |||||||||||
| Adjustments, primarily for copper pricing on prior period open sales and gold/silver hedging | 2.8 | 1.1 | 0.55 | 0.01 | |||||||||||
| Gross profit per pound/ounce, before intercompany profit eliminations | 71.1 | 37.9 | 170.05 | 2.55 | |||||||||||
Reconciliation to Amounts Reported | |||||||||||||||
| (In Thousands) | Revenues | Production and Delivery | Depreciation and Amortization | ||||||||||||
| Totals presented above | $ | 1,966,321 | $ | 617,219 | $ | 190,450 | |||||||||
| Reclamation, noncash and nonrecurring costs per above | N/A | 15,954 | N/A | ||||||||||||
| Less: Treatment charges per above | (231,856 | ) | N/A | N/A | |||||||||||
| Royalty per above | (26,472 | ) | N/A | N/A | |||||||||||
| Reclamation costs incurred | N/A | (1,222 | ) | N/A | |||||||||||
| Adjustments, primarily for copper pricing on prior period open sales and hedging per above | 36,587 | N/A | N/A | ||||||||||||
| Mining and exploration segment | 1,744,580 | 631,951 | 190,450 | ||||||||||||
| Smelting and refining segment | 910,417 | 892,681 | 28,464 | ||||||||||||
| Eliminations and other | (442,832 | ) | (453,306 | ) | 11,889 | ||||||||||
| As reported in FCX’s consolidated financial statements | $ | 2,212,165 | $ | 1,071,326 | $ | 230,803 | |||||||||
43
| Year Ended December 31, 2002 | |||||||||||||||
| By-Product | Co-Product Method | ||||||||||||||
| (In Thousands) | Method | Copper | Gold | Silver | Total | ||||||||||
| Revenues, after adjustments shown below | $ | 1,077,277 | $ | 1,077,277 | $ | 715,940 | $ | 18,408 | $ | 1,811,625 | |||||
| Site production and delivery, before noncash and nonrecurring costs shown below | 547,753 | 325,720 | 216,467 | 5,566 | 547,753 | ||||||||||
| Gold and silver credits | (734,348 | ) | - | - | - | - | |||||||||
| Treatment charges | 278,504 | 165,611 | 110,063 | 2,830 | 278,504 | ||||||||||
| Royalty on metals | 24,532 | 14,588 | 9,695 | 249 | 24,532 | ||||||||||
| Net cash production costs | 116,441 | 505,919 | 336,225 | 8,645 | 850,789 | ||||||||||
| Depreciation and amortization | 218,716 | 130,059 | 86,435 | 2,222 | 218,716 | ||||||||||
| Noncash and other nonrecurring costs | 7,117 | 4,232 | 2,813 | 72 | 7,117 | ||||||||||
| Total production costs | 342,274 | 640,210 | 425,473 | 10,939 | 1,076,622 | ||||||||||
| Adjustments, primarily for copper pricing on prior period open sales and silver hedging | 10,421 | 9,591 | - | 830 | 10,421 | ||||||||||
| Gross profit, before intercompany profit eliminations | $ | 745,424 | $ | 446,658 | $ | 290,467 | $ | 8,299 | $ | 745,424 | |||||
| Pounds of copper sold (000s) | 1,522,300 | 1,522,300 | |||||||||||||
| Ounces of gold sold | 2,293,200 | ||||||||||||||
| Ounces of silver sold | 4,116,100 | ||||||||||||||
| Gross profit per pound of copper (cents)/per ounce of gold and silver ($), before intercompany profit eliminations: | |||||||||||||||
| Revenues, after adjustments shown below | 70.6 | 70.6 | 311.97 | 4.66 | |||||||||||
| Site production and delivery, before noncash and nonrecurring costs shown below | 36.0 | 21.4 | 94.40 | 1.35 | |||||||||||
| Gold and silver credits | (48.2 | ) | - | - | - | ||||||||||
| Treatment charges | 18.3 | 10.9 | 48.00 | 0.69 | |||||||||||
| Royalty on metals | 1.6 | 1.0 | 4.23 | 0.06 | |||||||||||
| Net cash production costs | 7.7 | 33.3 | 146.63 | 2.10 | |||||||||||
| Depreciation and amortization | 14.4 | 8.5 | 37.69 | 0.54 | |||||||||||
| Noncash and nonrecurring costs | 0.5 | 0.3 | 1.23 | 0.02 | |||||||||||
| Total production costs | 22.6 | 42.1 | 185.55 | 2.66 | |||||||||||
| Adjustments, primarily for copper pricing on prior period open sales and silver hedging | 0.9 | 0.8 | 0.24 | 0.02 | |||||||||||
| Gross profit per pound/ounce, before intercompany profit eliminations | 48.9 | 29.3 | 126.66 | 2.02 | |||||||||||
Reconciliation to Amounts Reported | |||||||||||||||
| (In Thousands) | Revenues | Production and Delivery | Depreciation and Amortization | ||||||||||||
| Totals presented above | $ | 1,811,625 | $ | 547,753 | $ | 218,716 | |||||||||
| Noncash and nonrecurring costs per above | N/A | 7,117 | N/A | ||||||||||||
| Less: Treatment charges per above | (278,504 | ) | N/A | N/A | |||||||||||
| Royalty per above | (24,532 | ) | N/A | N/A | |||||||||||
| Adjustments, primarily for copper pricing on prior period open sales and hedging per above | 10,421 | N/A | N/A | ||||||||||||
| Mining and exploration segment | 1,519,010 | 554,870 | 218,716 | ||||||||||||
| Smelting and refining segment | 768,680 | 729,789 | 27,652 | ||||||||||||
| Eliminations and other | (377,228 | ) | (346,197 | ) | 14,078 | ||||||||||
| As reported in FCX’s consolidated financial statements | $ | 1,910,462 | $ | 938,462 | $ | 260,446 | |||||||||
44
Atlantic Copper Cathode Cash Production Cost Per Pound Of Copper
Atlantic Copper cathode cash production cost per pound of copper is a measure intended to provide investors with information about the costs it incurs to produce cathodes at its smelting operations in Spain. We use this measure for the same purpose and for monitoring operating performance at Atlantic Copper’s smelting operations. This information differs from measures of performance determined in accordance with generally accepted accounting principles and should not be considered in isolation or as a substitute for measures of performance determined in accordance with generally accepted accounting principles. Other smelting companies present this measure, although Atlantic Copper’s measure may not be comparable to similarly titled measures reported by other companies. The reconciliation below presents reported production costs for our smelting and refining segment (Atlantic Copper) and subtracts or adds those costs that do not directly relate to the process of converting copper concentrates to cathodes. The adjusted production costs amounts are used to calculate Atlantic Copper’s cathode cash production cost per pound of copper (in thousands, except per pound amounts):
| Years Ended December 31, | |||||||||
| 2004 | 2003 | 2002 | |||||||
| Smelting and refining segment production costs reported in FCX’s consolidated financial statements | $ | 914,452 | a | $ | 892,681 | $ | 729,789 | ||
| Less: | |||||||||
| Raw material purchase costs | (249,689 | ) | (384,347 | ) | (330,516 | ) | |||
| Production costs of wire rod and wire | (370,431 | ) | (66,106 | ) | (48,953 | ) | |||
| Production costs of anodes sold | (3,720 | ) | (13,124 | ) | (10,979 | ) | |||
| Currency hedging | - | 9,625 | (1,168 | ) | |||||
| Other | (16,771 | ) | (1,459 | ) | (3,496 | ) | |||
| Credits: | |||||||||
| Gold and silver revenues | (133,960 | ) | (326,948 | ) | (250,766 | ) | |||
| Acid and other by-product revenues | (25,068 | ) | (20,566 | ) | (17,256 | ) | |||
| Production costs used in calculating cathode cash production cost per pound | $ | 114,813 | $ | 89,756 | $ | 66,655 | |||
| Pounds of cathode produced | 454,700 | 544,700 | 552,200 | ||||||
| Cathode cash production cost per pound before hedging | $ | 0.25 | $ | 0.16 | $ | 0.12 | |||
| a. | Includes $27.5 million, $0.06 per pound, for costs related to Atlantic Copper’s major maintenance turnaround. |
PT Smelting Cathode Cash Production Cost Per Pound of Copper
PT Smelting cathode cash production cost per pound of copper is a measure intended to provide investors with information about the costs it incurs to produce cathodes at its smelting operations in Indonesia. We use this measure for the same purpose and for monitoring operating performance at PT Smelting’s smelting operations. This information differs from measures of performance determined in accordance with generally accepted accounting principles and should not be considered in isolation or as a substitute for measures of performance determined in accordance with generally accepted accounting principles. Other smelting companies present this measure, although PT Smelting’s measure may not be comparable to similarly titled measures reported by other companies. The calculation below presents PT Smelting’s reported operating costs and subtracts or adds those costs that do not directly relate to the process of converting copper concentrates to cathodes. PT Smelting’s operating costs are then reconciled to PT Freeport Indonesia’s equity in PT Smelting earnings (losses) reported in FCX’s consolidated financial statements (in thousands, except per pound amounts):
45
| Years Ended December 31, | |||||||||
| 2004 | 2003 | 2002 | |||||||
| Operating costs - PT Smelting (100%) | $ | 64,858 | $ | 55,787 | $ | 64,108 | |||
| Add: Gold and silver refining charges | 4,064 | 6,200 | 4,263 | ||||||
| Less: Acid and other by-product revenues | (13,732 | ) | (10,665 | ) | (5,275 | ) | |||
| Production cost of anodes sold | (225 | ) | (4,743 | ) | (3,135 | ) | |||
| Other | 336 | 1,492 | (1,013 | ) | |||||
| Production costs used in calculating cathode cash production cost per pound | $ | 55,301 | $ | 48,071 | $ | 58,948 | |||
| Pounds of cathode produced | 464,000 | 492,400 | 424,100 | ||||||
| Cathode cash production cost per pound | $ | 0.12 | $ | 0.10 | $ | 0.14 | |||
| Reconciliation to Amounts Reported | |||||||||
| Operating costs per above | $ | (64,858 | ) | $ | (55,787 | ) | $ | (64,108 | ) |
| Other costs | (852,911 | ) | (780,530 | ) | (517,438 | ) | |||
| Revenue and other income | 926,914 | 859,715 | 565,788 | ||||||
| PT Smelting net income (loss) | 9,145 | 23,398 | (15,758 | ) | |||||
| PT Freeport Indonesia’s 25% equity interest | 2,286 | 5,850 | (3,940 | ) | |||||
| Amortization of excess investment cost | (241 | ) | (241 | ) | (241 | ) | |||
| Equity in PT Smelting earnings (losses) reported in FCX’s consolidated financial statements | $ | 2,045 | $ | 5,609 | $ | (4,181 | ) | ||
CAUTIONARY STATEMENT
Our discussion and analysis contains forward-looking statements in which we discuss our expectations regarding future performance. Forward-looking statements are all statements other than historical facts, such as those regarding anticipated sales volumes, ore grades, commodity prices, general and administrative expenses, unit cash production costs, operating cash flows, royalty costs, capital expenditures, future environmental costs, debt repayments and refinancing, debt maturities, treatment charge rates, depreciation rates, exploration efforts and results, dividend payments, liquidity and other financial commitments. We caution you that these statements are not guarantees of future performance, and our actual results may differ materially from those projected, anticipated or assumed in the forward-looking statements. Important factors that can cause our actual results to differ materially from those anticipated in the forward-looking statements include unanticipated mining, milling and other processing problems, accidents that lead to personal injury or property damage, persistent commodity price reductions, changes in political, social or economic circumstances in our area of operations, variances in ore grades, labor relations, adverse weather conditions, the speculative nature of mineral exploration, fluctuations in interest rates and other adverse financial market conditions, and other factors described in more detail under the heading “Risk Factors” in our Form 10-K for the year ended December 31, 2004.
CERTIFICATIONS
We have filed the certifications of our Chief Executive Officer and our Chief Financial Officer required under Section 302 of the Sarbanes-Oxley Act of 2002 as exhibits to our 2004 Form 10-K.
46
REPORT OF INDEPENDENT REGISTERED PUBLIC ACCOUNTING FIRM
TO THE STOCKHOLDERS AND BOARD OF DIRECTORS OF
FREEPORT-McMoRan COPPER & GOLD INC.:
We have audited the accompanying consolidated balance sheets of Freeport-McMoRan Copper & Gold Inc. and its subsidiaries as of December 31, 2004 and 2003, and the related consolidated statements of income, cash flows and stockholders' equity for each of the three years in the period ended December 31, 2004. These consolidated financial statements are the responsibility of the Company's management. Our responsibility is to express an opinion on these consolidated financial statements based on our audits.
We conducted our audits in accordance with the standards of the Public Company Accounting Oversight Board (United States). Those standards require that we plan and perform the audit to obtain reasonable assurance about whether the financial statements are free of material misstatement. An audit includes examining, on a test basis, evidence supporting the amounts and disclosures in the financial statements. An audit also includes assessing the accounting principles used and significant estimates made by management, as well as evaluating the overall financial statement presentation. We believe that our audits provide a reasonable basis for our opinion.
In our opinion, the consolidated financial statements referred to above present fairly, in all material respects, the consolidated financial position of Freeport-McMoRan Copper & Gold Inc. and its subsidiaries at December 31, 2004 and 2003, and the consolidated results of their operations and their cash flows for each of the three years in the period ended December 31, 2004 in conformity with U.S. generally accepted accounting principles.
As discussed in Note 1 to the consolidated financial statements, effective January 1, 2003, the Company adopted Statement of Financial Accounting Standards No. 143, “Accounting for Asset Retirement Obligations,” and effective July 1, 2003, the Company adopted Statement of Financial Accounting Standards No. 150, “Accounting for Certain Financial Instruments with Characteristics of both Liabilities and Equity.” As discussed in Note 1 to the consolidated financial statements, effective January 1, 2002, the Company changed its method of computing depreciation for PT Freeport Indonesia’s mining and milling life-of-mine assets.
We also have audited, in accordance with the standards of the Public Company Accounting Oversight Board (United States), the effectiveness of Freeport-McMoRan Copper & Gold Inc.’s internal control over financial reporting as of December 31, 2004, based on criteria established in Internal Control-Integrated Framework issued by the Committee of Sponsoring Organizations of the Treadway Commission and our report dated March 9, 2005 expressed an unqualified opinion thereon.
Ernst & Young LLP
New Orleans, Louisiana
March 9, 2005
47
MANAGEMENT’S REPORT ON INTERNAL CONTROL OVER FINANCIAL REPORTING
Freeport-McMoRan Copper & Gold Inc.’s (the Company’s) management is responsible for establishing and maintaining adequate internal control over financial reporting. Internal control over financial reporting is defined in Rule 13a-15(f) or 15d-15(f) under the Securities Exchange Act of 1934 as a process designed by, or under the supervision of, the Company’s principal executive and principal financial officers and effected by the Company’s Board of Directors, management and other personnel, to provide reasonable assurance regarding the reliability of financial reporting and the preparation of financial statements for external purposes in accordance with generally accepted accounting principles and includes those policies and procedures that:
| · | Pertain to the maintenance of records that in reasonable detail accurately and fairly reflect the transactions and dispositions of the Company’s assets; |
| · | Provide reasonable assurance that transactions are recorded as necessary to permit preparation of financial statements in accordance with generally accepted accounting principles, and that receipts and expenditures of the Company are being made only in accordance with authorizations of management and directors of the Company; and |
| · | Provide reasonable assurance regarding prevention or timely detection of unauthorized acquisition, use or disposition of the Company’s assets that could have a material effect on the financial statements. |
Because of its inherent limitations, internal control over financial reporting may not prevent or detect misstatements. Projections of any evaluation of effectiveness to future periods are subject to the risk that controls may become inadequate because of changes in conditions, or that the degree of compliance with the policies or procedures may deteriorate. The Company’s internal control system was designed to provide reasonable assurance to the Company’s management and Board of Directors regarding the preparation and fair presentation of its published financial statements.
Our management, including our principal executive officer and principal financial officer, assessed the effectiveness of our internal control over financial reporting as of the end of the fiscal year covered by this annual report on Form 10-K. In making this assessment, our management used the criteria set forth in Internal Control-Integrated Framework issued by the Committee of Sponsoring Organizations of the Treadway Commission (COSO). Based on our management’s assessment, management believes that, as of December 31, 2004, our Company’s internal control over financial reporting is effective based on the COSO criteria.
Ernst & Young LLP, an independent registered public accounting firm, has issued their attestation report on our management’s assessment of the effectiveness of our internal control over financial reporting as of December 31, 2004, as stated in their report dated March 9, 2005, which is included herein.
/s/ Richard C. Adkerson Richard C. Adkerson | /s/ Kathleen L. Quirk Kathleen L. Quirk |
President and Chief | Senior Vice President, |
Executive Officer | Chief Financial Officer and Treasurer |
48
REPORT OF INDEPENDENT REGISTERED PUBLIC ACCOUNTING FIRM
TO THE STOCKHOLDERS AND BOARD OF DIRECTORS
OF FREEPORT-McMoRan COPPER & GOLD INC.:
We have audited management’s assessment, included in the accompanying Management’s Report on Internal Control Over Financial Reporting, that Freeport-McMoRan Copper & Gold Inc. and its subsidiaries maintained effective internal control over financial reporting as of December 31, 2004, based on criteria established in Internal Control-Integrated Framework issued by the Committee of Sponsoring Organizations of the Treadway Commission (COSO). Freeport-McMoRan Copper & Gold Inc.’s management is responsible for maintaining effective internal control over financial reporting and for its assessment of the effectiveness of internal control over financial reporting. Our responsibility is to express an opinion on management’s assessment and an opinion on the effectiveness of the company’s internal control over financial reporting based on our audit.
We conducted our audit in accordance with the standards of the Public Company Accounting Oversight Board (United States). Those standards require that we plan and perform the audit to obtain reasonable assurance about whether effective internal control over financial reporting was maintained in all material respects. Our audit included obtaining an understanding of internal control over financial reporting, evaluating management’s assessment, testing and evaluating the design and operating effectiveness of internal control, and performing such other procedures as we considered necessary in the circumstances. We believe that our audit provides a reasonable basis for our opinion.
A company’s internal control over financial reporting is a process designed to provide reasonable assurance regarding the reliability of financial reporting and the preparation of financial statements for external purposes in accordance with generally accepted accounting principles. A company’s internal control over financial reporting includes those policies and procedures that (1) pertain to the maintenance of records that, in reasonable detail, accurately and fairly reflect the transactions and dispositions of the assets of the company; (2) provide reasonable assurance that transactions are recorded as necessary to permit preparation of financial statements in accordance with generally accepted accounting principles, and that receipts and expenditures of the company are being made only in accordance with authorizations of management and directors of the company; and (3) provide reasonable assurance regarding prevention or timely detection of unauthorized acquisition, use, or disposition of the company’s assets that could have a material effect on the financial statements.
Because of its inherent limitations, internal control over financial reporting may not prevent or detect misstatements. Also, projections of any evaluation of effectiveness to future periods are subject to the risk that controls may be inadequate because of changes in conditions, or that the degree of compliance with the policies or procedures may deteriorate.
In our opinion, management’s assessment that Freeport-McMoRan Copper & Gold Inc. and its subsidiaries maintained effective internal control over financial reporting as of December 31, 2004, is fairly stated, in all material respects, based on the COSO criteria. Also, in our opinion, Freeport-McMoRan Copper & Gold Inc. and its subsidiaries maintained, in all material respects, effective internal control over financial reporting as of December 31, 2004, based on the COSO criteria.
We have also audited, in accordance with the standards of the Public Company Accounting Oversight Board (United States), the consolidated balance sheets of Freeport-McMoRan Copper & Gold Inc. and its subsidiaries as of December 31, 2004 and 2003, and the related statements of income, cash flows and stockholders’ equity for each of the three years in the period ended December 31, 2004 and our report dated March 9, 2005 expressed an unqualified opinion thereon.
Ernst & Young LLP
New Orleans, Louisiana
March 9, 2005
49
FREEPORT-McMoRan COPPER & GOLD INC.
CONSOLIDATED STATEMENTS OF INCOME
| Years Ended December 31, | |||||||||
| 2004 | 2003 | 2002 | |||||||
| (In Thousands, Except Per Share Amounts) | |||||||||
| Revenues | $ | 2,371,866 | $ | 2,212,165 | $ | 1,910,462 | |||
| Cost of sales: | |||||||||
| Production and delivery | 1,450,291 | 1,071,326 | 938,462 | ||||||
| Depreciation and amortization | 206,408 | 230,803 | 260,446 | ||||||
| Total cost of sales | 1,656,699 | 1,302,129 | 1,198,908 | ||||||
| Exploration expenses | 8,664 | 6,449 | 3,112 | ||||||
| General and administrative expenses | 89,927 | 80,279 | 68,305 | ||||||
| Gain on insurance settlement | (87,000 | ) | - | - | |||||
| Total costs and expenses | 1,668,290 | 1,388,857 | 1,270,325 | ||||||
| Operating income | 703,576 | 823,308 | 640,137 | ||||||
| Equity in PT Smelting earnings (losses) | 2,045 | 5,609 | (4,181 | ) | |||||
| Interest expense, net | (148,103 | ) | (197,017 | ) | (171,209 | ) | |||
| Losses on early extinguishment and conversion of debt | (14,011 | ) | (34,589 | ) | - | ||||
| Gains on sales of assets | 28,756 | - | - | ||||||
| Other income (expense), net | 2,121 | (13,536 | ) | (15,085 | ) | ||||
| Income before income taxes and minority interests | 574,384 | 583,775 | 449,662 | ||||||
| Provision for income taxes | (330,680 | ) | (338,053 | ) | (245,518 | ) | |||
| Minority interests in net income of consolidated subsidiaries | (41,437 | ) | (48,469 | ) | (36,441 | ) | |||
| Net income before cumulative effect of changes in accounting principles and preferred dividends | 202,267 | 197,253 | 167,703 | ||||||
| Cumulative effect of changes in accounting principles, net | - | (15,593 | ) | (3,049 | ) | ||||
| Net income | 202,267 | 181,660 | 164,654 | ||||||
| Preferred dividends | (45,491 | ) | (27,441 | ) | (37,604 | ) | |||
| Net income applicable to common stock | $ | 156,776 | $ | 154,219 | $ | 127,050 | |||
| Net income per share of common stock: | |||||||||
| Basic: | |||||||||
| Before cumulative effect | $0.86 | $1.09 | $0.90 | ||||||
| Cumulative effect | - | (0.10 | ) | (0.02 | ) | ||||
| Net income per share of common stock | $0.86 | $0.99 | $0.88 | ||||||
| Diluted: | |||||||||
| Before cumulative effect | $0.85 | $1.07 | $0.89 | ||||||
| Cumulative effect | - | (0.10 | ) | (0.02 | ) | ||||
| Net income per share of common stock | $0.85 | $0.97 | $0.87 | ||||||
| Average common shares outstanding: | |||||||||
| Basic | 182,272 | 155,805 | 144,649 | ||||||
| Diluted | 184,923 | 159,102 | 146,418 | ||||||
| Dividends paid per common share | $1.10 | $0.27 | $ - | ||||||
The accompanying Notes to Consolidated Financial Statements are an integral part of these financial statements.
50
FREEPORT-McMoRan COPPER & GOLD INC.
CONSOLIDATED STATEMENTS OF CASH FLOWS
| Years Ended December 31, | ||||||||||
| 2004 | 2003 | 2002 | ||||||||
| (In Thousands) | ||||||||||
| Cash flow from operating activities: | ||||||||||
| Net income | $ | 202,267 | $ | 181,660 | $ | 164,654 | ||||
| Adjustments to reconcile net income to net cash provided by operating activities: | ||||||||||
| Depreciation and amortization | 206,408 | 230,803 | 260,446 | |||||||
| Gains on sales of assets | (28,756 | ) | - | - | ||||||
| Losses on early extinguishment and conversion of debt | 14,011 | 34,589 | - | |||||||
| Cumulative effect of changes in accounting principles | - | 15,593 | 3,049 | |||||||
| Gain on redemption of gold-denominated and silver-denominated preferred stock | - | (23,832 | ) | (830 | ) | |||||
| Deferred income taxes | 76,253 | 110,653 | 51,476 | |||||||
| Equity in PT Smelting losses (earnings) | (2,045 | ) | (5,609 | ) | 4,181 | |||||
| Minority interests' share of net income | 41,437 | 48,469 | 36,441 | |||||||
| Increase in deferred mining costs | (77,780 | ) | (64,400 | ) | (30,645 | ) | ||||
| Amortization of deferred financing costs | 8,501 | 16,196 | 12,029 | |||||||
| Increase in long-term compensation benefits | 2,830 | 13,689 | 2,198 | |||||||
| Currency translation losses | 1,628 | 13,561 | 11,892 | |||||||
| Equipment loss caused by pit slippage | - | 8,434 | - | |||||||
| Elimination (recognition) of profit on PT Freeport Indonesia sales to PT Smelting | 13,798 | (7,018 | ) | 8,393 | ||||||
| Provision for inventory obsolescence | 4,916 | 6,000 | 6,000 | |||||||
| Other | 8,591 | 11,084 | 1,567 | |||||||
| (Increases) decreases in working capital: | ||||||||||
| Accounts receivable | (235,756 | ) | 8,304 | (70,389 | ) | |||||
| Inventories | (91,744 | ) | (30,607 | ) | (23,793 | ) | ||||
| Prepaid expenses and other | 34,304 | (5,428 | ) | 671 | ||||||
| Accounts payable and accrued liabilities | 97,781 | 60,878 | (33 | ) | ||||||
| Rio Tinto share of joint venture cash flows | 17,793 | (9,806 | ) | 9,894 | ||||||
| Accrued income taxes | 46,918 | (41,141 | ) | 65,531 | ||||||
| Increase in working capital | (130,704 | ) | (17,800 | ) | (18,119 | ) | ||||
| Net cash provided by operating activities | 341,355 | 572,072 | 512,732 | |||||||
| Cash flow from investing activities: | ||||||||||
| PT Freeport Indonesia capital expenditures | (119,207 | ) | (129,245 | ) | (182,896 | ) | ||||
| Atlantic Copper capital expenditures | (21,792 | ) | (9,941 | ) | (5,108 | ) | ||||
| Sale of assets | 39,885 | 2,020 | 2,835 | |||||||
| Sale of restricted investments | 21,804 | 73,629 | 47,938 | |||||||
| Decrease (increase) in Atlantic Copper restricted cash | 11,000 | - | (11,000 | ) | ||||||
| Proceeds from insurance settlement | 6,261 | - | - | |||||||
| Investment in PT Smelting | (1,375 | ) | (932 | ) | - | |||||
| Other | (548 | ) | (222 | ) | (62 | ) | ||||
| Investment in PT Puncakjaya Power, net of cash acquired | - | (68,127 | ) | - | ||||||
| Net cash used in investing activities | (63,972 | ) | (132,818 | ) | (148,293 | ) | ||||
| Cash flow from financing activities: | ||||||||||
| Net proceeds from sales of senior notes | 344,354 | 1,046,437 | - | |||||||
| Proceeds from other debt | 96,122 | 56,698 | 295,498 | |||||||
| Repayments of debt | (457,971 | ) | (844,374 | ) | (617,123 | ) | ||||
| Redemption of mandatorily redeemable preferred stock | (13,673 | ) | (227,081 | ) | (11,671 | ) | ||||
| Net proceeds from sale of convertible perpetual preferred stock | 1,067,000 | - | - | |||||||
| Purchase of FCX common shares from Rio Tinto | (881,868 | ) | - | - | ||||||
| Purchases of other FCX common shares | (99,477 | ) | - | - | ||||||
| Cash dividends paid: | ||||||||||
| Common stock | (198,782 | ) | (41,682 | ) | - | |||||
| Preferred stock | (35,470 | ) | (33,733 | ) | (37,294 | ) | ||||
| Minority interests | (11,447 | ) | (1,623 | ) | - | |||||
| Net proceeds from exercised stock options | 3,196 | 68,776 | 7,777 | |||||||
| Bank credit facilities fees and other | (1,569 | ) | (6,856 | ) | (1,377 | ) | ||||
| Net cash provided by (used in) financing activities | (189,585 | ) | 16,562 | (364,190 | ) | |||||
| Net increase in cash and cash equivalents | 87,798 | 455,816 | 249 | |||||||
| Cash and cash equivalents at beginning of year | 463,652 | 7,836 | 7,587 | |||||||
| Cash and cash equivalents at end of year | $ | 551,450 | $ | 463,652 | $ | 7,836 | ||||
| Interest paid | $ | 143,958 | $ | 163,513 | $ | 173,728 | ||||
| Income taxes paid | $ | 178,379 | $ | 268,796 | $ | 128,320 |
The accompanying Notes to Consolidated Financial Statements, which include information regarding noncash transactions, are an integral part of these financial statements.
51
FREEPORT-McMoRan COPPER & GOLD INC.
CONSOLIDATED BALANCE SHEETS
| December 31, | ||||||||
| 2004 | 2003 | |||||||
| (In Thousands, Except Par Value) | ||||||||
| ASSETS | ||||||||
| Current assets: | ||||||||
| Cash and cash equivalents | $ | 551,450 | $ | 463,652 | ||||
| Restricted cash and investments | 500 | 34,964 | ||||||
| Trade accounts receivable: | ||||||||
| Customers other than PT Smelting | 267,237 | 130,532 | ||||||
| PT Smelting | 87,512 | 33,530 | ||||||
| Other accounts receivable: | ||||||||
| Insurance settlement | 30,450 | - | ||||||
| Rio Tinto receivables | 12,572 | 10,722 | ||||||
| Other | 37,291 | 21,656 | ||||||
| Inventories: | ||||||||
| Product | 253,265 | 170,925 | ||||||
| Materials and supplies, net | 213,447 | 226,102 | ||||||
| Prepaid expenses and other | 6,223 | 8,050 | ||||||
| Total current assets | 1,459,947 | 1,100,133 | ||||||
| Property, plant, equipment and development costs, net | 3,199,292 | 3,261,697 | ||||||
| Deferred mining costs | 220,415 | 142,635 | ||||||
| Other assets | 86,941 | 69,141 | ||||||
| Rio Tinto long-term receivables | 72,598 | 86,581 | ||||||
| Investment in PT Smelting | 47,802 | 58,179 | ||||||
| Total assets | $ | 5,086,995 | $ | 4,718,366 | ||||
| LIABILITIES AND STOCKHOLDERS’ EQUITY | ||||||||
| Current liabilities: | ||||||||
| Accounts payable and accrued liabilities | $ | 386,590 | $ | 311,948 | ||||
| Accrued income taxes | 92,346 | 43,134 | ||||||
| Current portion of long-term debt and short-term borrowings | 78,214 | 152,396 | ||||||
| Rio Tinto share of joint venture cash flows | 60,224 | 39,693 | ||||||
| Accrued interest payable | 47,167 | 49,276 | ||||||
| Unearned customer receipts | 33,021 | 35,335 | ||||||
| Total current liabilities | 697,562 | 631,782 | ||||||
| Long-term debt, less current portion | 1,873,692 | 2,075,934 | ||||||
| Accrued postretirement benefits and other liabilities | 200,228 | 179,837 | ||||||
| Deferred income taxes | 932,416 | 867,270 | ||||||
| Minority interests | 219,448 | 187,559 | ||||||
| Stockholders' equity: | ||||||||
| Convertible perpetual preferred stock, 1,100 shares issued and outstanding | 1,100,000 | - | ||||||
| Class B common stock, par value $0.10, 284,964 shares and 260,001 shares issued, respectively | 28,496 | 26,000 | ||||||
| Capital in excess of par value of common stock | 1,852,816 | 1,468,426 | ||||||
| Retained earnings | 604,680 | 646,933 | ||||||
| Accumulated other comprehensive income | 11,342 | 8,668 | ||||||
| Common stock held in treasury - 105,974 shares and 76,634 shares, at cost, respectively | (2,433,685 | ) | (1,374,043 | ) | ||||
| Total stockholders’ equity | 1,163,649 | 775,984 | ||||||
| Total liabilities and stockholders’ equity | $ | 5,086,995 | $ | 4,718,366 | ||||
The accompanying Notes to Consolidated Financial Statements are an integral part of these financial statements.
52
FREEPORT-McMoRan COPPER & GOLD INC.
CONSOLIDATED STATEMENTS OF STOCKHOLDERS’ EQUITY
| Years Ended December 31, | |||||||||
| 2004 | 2003 | 2002 | |||||||
| (In Thousands) | |||||||||
| Convertible perpetual preferred stock: | |||||||||
| Balance at beginning of year | $ | - | $ | - | $ | - | |||
| Sale of 1,100 shares to the public | 1,100,000 | - | - | ||||||
| Balance at end of year representing 1,100 shares in 2004 | 1,100,000 | - | - | ||||||
| Step-up convertible preferred stock: | |||||||||
| Balance at beginning of year representing 14,000 shares in 2003 and 2002 | - | 349,990 | 349,990 | ||||||
| Conversions to Class B common stock and redemptions | - | (349,990 | ) | - | |||||
| Balance at end of year representing 14,000 shares in 2002 | - | - | 349,990 | ||||||
| Class A common stock: | |||||||||
| Balance at beginning of year representing 97,146 shares in 2002 | - | - | 9,715 | ||||||
| Issued restricted stock representing 141 shares in 2002 | - | - | 14 | ||||||
| Conversion to Class B common stock | - | - | (9,729 | ) | |||||
| Balance at end of year | - | - | - | ||||||
| Class B common stock: | |||||||||
| Balance at beginning of year representing 260,001 shares in 2004, 220,083 shares in 2003 and 121,745 shares in 2002 | 26,000 | 22,008 | 12,174 | ||||||
| Step-up convertible preferred stock conversions | - | 1,146 | - | ||||||
| 8¼% convertible senior notes conversions | 2,046 | 2,176 | - | ||||||
| Class A common stock conversion | - | - | 9,729 | ||||||
| Exercised stock options, issued restricted stock and other representing 4,501 shares in 2004, 6,703 shares in 2003 and 1,051 shares in 2002 | 450 | 670 | 105 | ||||||
| Balance at end of year representing 284,964 shares in 2004, 260,001 shares in 2003 and 220,083 shares in 2002 | 28,496 | 26,000 | 22,008 | ||||||
| Capital in excess of par value of common stock: | |||||||||
| Balance at beginning of year | 1,468,426 | 687,828 | 660,329 | ||||||
| Step-up convertible preferred stock conversions | - | 341,885 | - | ||||||
| 8¼% convertible senior notes conversions | 286,689 | 303,782 | - | ||||||
| Issuance costs of convertible perpetual preferred stock | (33,000 | ) | - | - | |||||
| Exercised stock options and other stock option amounts | 83,648 | 105,577 | 14,220 | ||||||
| Restricted stock grants | 7,486 | 1,380 | 1,250 | ||||||
| Reclass of redeemable preferred stock issuance costs to other assets | - | 26,631 | - | ||||||
| Tax benefit for stock option exercises | 39,567 | 1,343 | 12,029 | ||||||
| Balance at end of year | 1,852,816 | 1,468,426 | 687,828 | ||||||
| Retained earnings: | |||||||||
| Balance at beginning of year | 646,933 | 534,447 | 407,397 | ||||||
| Net income | 202,267 | 181,660 | 164,654 | ||||||
| Dividends on common stock | (199,029 | ) | (41,733 | ) | - | ||||
| Dividends on preferred stock | (45,491 | ) | (27,441 | ) | (37,604 | ) | |||
| Balance at end of year | 604,680 | 646,933 | 534,447 | ||||||
| Accumulated other comprehensive income (loss): | |||||||||
| Balance at beginning of year | 8,668 | 10,963 | (1,184 | ) | |||||
| Other comprehensive income (loss), net of taxes: | |||||||||
| Change in unrealized derivatives’ fair value | 1,226 | 5,195 | 13,615 | ||||||
| Reclass to earnings of net realized derivatives losses (gains) | 1,448 | (7,490 | ) | (1,468 | ) | ||||
| Balance at end of year | 11,342 | 8,668 | 10,963 | ||||||
| Common stock held in treasury: | |||||||||
| Balance at beginning of year representing 76,634 shares in 2004, 75,173 shares in 2003 and 74,915 shares in 2002 | (1,374,043 | ) | (1,338,410 | ) | (1,333,977 | ) | |||
| Tender of 2,024 shares in 2004, 1,461 shares in 2003 and 257 shares in 2002 to FCX for exercised stock options and restricted stock | (78,297 | ) | (35,633 | ) | (4,433 | ) | |||
| Shares purchased representing 27,316 shares in 2004 | (981,345 | ) | - | - | |||||
| Balance at end of year representing 105,974 shares in 2004, 76,634 shares in 2003 and 75,173 shares in 2002 | (2,433,685 | ) | (1,374,043 | ) | (1,338,410 | ) | |||
| Total stockholders’ equity | $ | 1,163,649 | $ | 775,984 | $ | 266,826 |
The accompanying Notes to Consolidated Financial Statements are an integral part of these financial statements.
53
FREEPORT-McMoRan COPPER & GOLD INC.
NOTES TO CONSOLIDATED FINANCIAL STATEMENTS
NOTE 1. SUMMARY OF SIGNIFICANT ACCOUNTING POLICIES
Basis of Presentation. The consolidated financial statements of Freeport-McMoRan Copper & Gold Inc. (FCX) include the accounts of those subsidiaries where FCX directly or indirectly has more than 50 percent of the voting rights and has the right to control significant management decisions. FCX consolidates its 90.6 percent-owned subsidiary PT Freeport Indonesia and its 85.7 percent-owned subsidiary PT Puncakjaya Power (Puncakjaya Power), as well as its wholly owned subsidiaries, primarily Atlantic Copper, S.A. and PT Irja Eastern Minerals. FCX’s unincorporated joint ventures with Rio Tinto plc are reflected using the proportionate consolidation method (Note 2). PT Freeport Indonesia’s 25 percent ownership interest and related investment in PT Smelting is accounted for under the equity method (Note 9). All significant intercompany transactions have been eliminated. Certain prior year amounts have been reclassified to conform to the 2004 presentation. Changes in the accounting principles applied during the years presented are discussed below under the captions “Property, Plant, Equipment and Development Costs,” “Reclamation and Closure Costs” and “Derivative Instruments.”
UseofEstimates. The preparation of FCX’s financial statements in conformity with accounting principles generally accepted in the United States (U.S.) requires management to make estimates and assumptions that affect the amounts reported in these financial statements and accompanying notes. The more significant areas requiring the use of management estimates include mineral reserve estimation, useful asset lives for depreciation and amortization, the estimated average ratio of overburden removed to ore mined over the life of the open-pit mine, allowances for obsolete inventory, reclamation and closure costs, environmental obligations, postretirement and other employee benefits, deferred taxes and valuation allowances and future cash flows associated with assets. Actual results could differ from those estimates.
CashEquivalents,RestrictedCashandInvestments. Highly liquid investments purchased with maturities of three months or less are considered cash equivalents. At December 31, 2003, restricted investments included U.S. government securities, plus accrued interest thereon, totaling $24.0 million, pledged as security for scheduled interest payments through July 31, 2004, on FCX’s 8¼% Convertible Senior Notes (see Note 5). Restricted cash held in escrow as security on Atlantic Copper’s working capital revolver totaled $11.0 million at December 31, 2003 (see Note 5).
OtherAccountsReceivable. Other accounts receivable include $30.5 million at December 31, 2004, related to the settlement of an insurance claim (see Note 10); a receivable from Rio Tinto totaling $11.5 million at December 31, 2004, and $10.5 million at December 31, 2003, for its current share of infrastructure financing arrangements with Puncakjaya Power (see Note 2); and value-added taxes totaling $20.6 million at December 31, 2004, and $12.4 million at December 31, 2003.
Inventories. In-process inventories represent materials that are currently in the process of being converted to a salable product. PT Freeport Indonesia does not have material quantities of in-process inventories. For Atlantic Copper, in-process inventories represent copper concentrates at various stages of conversion into anodes and cathodes. Atlantic Copper’s in-process inventories are valued at the cost of the material fed to the smelting and refining process plus in-process conversion cost. Inventories of materials and supplies, as well as salable products, are stated at the lower of cost or market. PT Freeport Indonesia uses the average cost method for all inventories and Atlantic Copper uses the first-in, first-out (FIFO) cost method for its sales of finished copper products (see Note 3).
Property, Plant, Equipment and Development Costs. Property, plant, equipment and development costs are carried at cost. Mineral exploration costs are expensed as incurred, except in the year when proven and probable reserves have been established for a given property, in which case all exploration costs for that property incurred since the beginning of that year are capitalized. Refer to Note 13 for the definition of proven and probable reserves. No exploration costs were capitalized during the years presented. Development costs are capitalized beginning after proven and probable reserves have been established. Development costs include costs incurred resulting from mine pre-production activities undertaken to gain access to proven and probable reserves including adits, drifts, ramps, permanent excavations, infrastructure and removal of overburden. Additionally, interest expense allocable to the cost of developing mining properties and to constructing new facilities is capitalized until assets are ready for their intended use. Expenditures for replacements and improvements are capitalized. Costs related to periodic scheduled maintenance (turnarounds) are expensed as incurred. Depreciation for mining and milling life-of-mine assets is determined using the unit-of-production method based on estimated recoverable proven and probable copper reserves. Development costs that relate to a specific ore body are depreciated using the unit-of-production method based on estimated recoverable proven and probable copper reserves for the ore body benefited. Recording of depreciation and amortization using the unit-of-production method occurs upon extraction of the recoverable copper from the ore body, at which time it is allocated to inventory cost and then included as a component of cost of goods sold. Other assets are depreciated on a straight-line basis over
54
estimated useful lives of 15 to 20 years for buildings and 3 to 25 years for machinery and equipment.
Effective January 1, 2002, FCX changed its method of computing depreciation for PT Freeport Indonesia’s mining and milling life-of-mine assets. Prior to January 1, 2002, PT Freeport Indonesia depreciated mining and milling life-of-mine assets on a composite basis. Total historical capitalized costs and estimated future development costs relating to its developed and undeveloped reserves were depreciated using the unit-of-production method based on total developed and undeveloped proven and probable copper reserves. Estimated future costs, which are significant, to develop PT Freeport Indonesia’s undeveloped ore bodies are expected to be incurred over the next 20 to 25 years.
After considering the inherent uncertainties and subjectivity relating to the long time frame over which these estimated costs would be incurred, management revised its depreciation methodology prospectively. Effective January 1, 2002, depreciation for the mining and milling life-of-mine assets excludes consideration of future development costs. Under the new methodology, PT Freeport Indonesia depreciates the capitalized costs of individual producing mines over the related proven and probable copper reserves. Infrastructure and other common costs continue to be depreciated over total proven and probable copper reserves.
Asset Impairment. FCX reviews and evaluates its long-lived assets for impairment when events or changes in circumstances indicate that the related carrying amounts may not be recoverable. An impairment loss is measured as the amount by which asset carrying value exceeds its fair value. Fair value is generally determined using valuation techniques such as estimated future cash flows. An impairment is considered to exist if total estimated future cash flows on an undiscounted basis are less than the carrying amount of the asset. An impairment loss is measured and recorded based on discounted estimated future cash flows. Future cash flows for PT Freeport Indonesia’s mining assets, which are considered one asset group, include estimates of recoverable pounds and ounces, metal prices (considering current and historical prices, price trends and related factors), production rates and costs, capital and reclamation costs as appropriate, all based on detailed life-of-mine engineering plans. Future cash flows for Atlantic Copper’s smelting assets include estimates of treatment and refining rates (considering current and historical prices, price trends and related factors), production rates and costs, capital and reclamation costs as appropriate, all based on operating projections. Assumptions underlying future cash flow estimates are subject to risks and uncertainties. No impairment losses were recorded during the periods presented.
Deferred Mining Costs. Mining costs are charged to operations as incurred. However, because of the configuration and location of the Grasberg open-pit ore body and the location and extent of the related surrounding overburden, the ratio of overburden to ore is much higher in the initial mining of the open pit than in later years. As a result, surface mining costs associated with overburden removal at PT Freeport Indonesia’s Grasberg open-pit mine that are estimated to relate to future production are initially deferred when the ratio of actual overburden removed to ore mined exceeds the estimated average ratio of overburden removed to ore mined over the life of the Grasberg open-pit mine. Those deferred costs are subsequently charged to operating costs when the ratio of actual overburden removed to ore mined falls below the estimated average ratio of overburden to ore over the life of the Grasberg open-pit mine. The reserve quantities used to develop the life of mine ratio are the proven and probable ore quantities for the Grasberg open pit disclosed in Note 13.
The deferred mining cost method is used by some companies in the metals mining industry; however, industry practice varies. The Emerging Issues Task Force of the Financial Accounting Standards Board (FASB) currently is evaluating this issue. The deferred mining cost method matches the cost of production with the sale of the related metal from the open pit by assigning each metric ton of ore removed an equivalent amount of overburden tonnage thereby averaging the overburden removal costs over the life of the mine. The mining costs capitalized in inventory and the amounts charged to cost of goods sold do not represent the actual costs incurred to mine the ore in any given period. If PT Freeport Indonesia were to charge all mining costs to expense when incurred, including all overburden removal costs, as some mining companies do, there would be greater volatility in FCX’s period-to-period results of operations.
The application of the deferred mining cost method has resulted in an asset on FCX’s balance sheets (“Deferred Mining Costs”), which based on current mine plans, is estimated to increase through about 2010. Subsequently, these costs are expected to be amortized as a charge to production and delivery costs until they are fully amortized at the end of the open pit’s life, which is estimated to be in approximately 2015. This is because PT Freeport Indonesia expects to mine higher than average amounts of overburden through 2010 and less than average thereafter. Deferred mining costs totaled $220.4 million at December 31, 2004, and $142.6 million at December 31, 2003. Additions to deferred mining costs are classified as increases in deferred mining costs in operating activities in the consolidated statements of cash flows and totaled $77.8 million in 2004, $64.4 million in 2003 and $30.6 million in 2002. PT Freeport Indonesia evaluates the recoverability of these deferred mining costs in conjunction with its evaluation of the recoverability of its mining assets as described in FCX’s
55
“Asset Impairment” accounting policy. The Grasberg mine is currently FCX’s only producing open-pit mine.
PT Freeport Indonesia’s geologists and engineers reassess the overburden to ore ratio and the remaining life of its open-pit mine at least annually, and any changes in estimates are reflected prospectively beginning in the quarter of change. All other variables being equal, increases in the life of mine overburden removed to ore mined ratio would result in more of the overburden removal costs being matched with current period production and therefore charged to expense rather than deferred. Decreases in the life of mine overburden removed to ore mined ratio would result in more of the overburden removal costs being deferred and matched with production in future periods.
PT Freeport Indonesia’s estimated ratio of mine overburden removed to ore mined over the life of the mine in its deferred mining costs calculation averaged 2.3 to 1 in 2004, 2.0 to 1 in 2003 and 1.8 to 1 in 2002. The ratio changed in the fourth quarter of each of the last three years and the impact of the changes on each year’s results was to decrease net income by $2.8 million ($0.02 per share) in 2004, $1.5 million ($0.01 per share) in 2003 and $1.1 million ($0.01 per share) in 2002. If the changes in the ratio in the fourth quarter of 2004 (2.4 to 1) had been applied at the beginning of the year, the deferral of mining costs for 2004 would have been an estimated $11.0 million lower and net income would have been $5.6 million ($0.03 per share) lower. For 2005, the estimated average ratio of overburden to ore over the life of the mine in PT Freeport Indonesia’s deferred mining calculation is expected to be 2.4 to 1.
The increases in the ratio over the last several years primarily relate to changes in the cutoff grade at the Grasberg open pit caused by a reassessment of the optimal milling rate at the mill facilities, including a greater proportional contribution to total ore processed from the underground Deep Ore Zone mine.
Reclamation and Closure Costs. Effective January 1, 2003, FCX adopted Statement of Financial Accounting Standards (SFAS) No. 143, “Accounting for Asset Retirement Obligations,” which requires recording the fair value of an asset retirement obligation associated with tangible long-lived assets in the period incurred. Retirement obligations associated with long-lived assets included within the scope of SFAS No. 143 are those for which there is a legal obligation to settle under existing or enacted law, statute, written or oral contract or by legal construction.
In 2002, FCX engaged an independent environmental consulting and auditing firm to assist in estimating PT Freeport Indonesia’s asset retirement obligations, and FCX worked with other consultants in estimating Atlantic Copper’s asset retirement obligations. FCX estimated these obligations using an expected cash flow approach, in which multiple cash flow scenarios were used to reflect a range of possible outcomes. As of January 1, 2003, FCX estimated these aggregate obligations to be approximately $120 million for PT Freeport Indonesia and $17 million for Atlantic Copper. To calculate the fair value of these obligations, FCX applied an estimated long-term inflation rate of 2.5 percent, except for Indonesian rupiah-denominated labor costs with respect to PT Freeport Indonesia’s obligations, for which an estimated inflation rate of 9.0 percent was applied. The projected cash flows were discounted at FCX’s estimated credit-adjusted, risk-free interest rates which ranged from 9.4 percent to 12.6 percent for the corresponding time periods over which these costs would be incurred. After discounting the projected cash flows, a market risk premium of 10 percent was applied to the total to reflect what a third party might require to assume these asset retirement obligations. The market risk premium was based on market-based estimates of rates that a third party would have to pay to insure its exposure to possible future increases in the value of these obligations.
At January 1, 2003, FCX estimated the fair value of its total asset retirement obligations to be $28.5 million. FCX recorded the fair value of these obligations and the related additional assets as of January 1, 2003. The net difference between FCX’s previously recorded reclamation and closure cost liability and the amounts estimated under SFAS No. 143, after taxes and minority interest, resulted in a gain of $9.1 million (after reduction by $8.5 million for taxes and minority interest sharing), $0.06 per share on a diluted basis, which was recognized as a cumulative effect adjustment for a change in accounting principle. As a result of adopting SFAS No. 143, FCX expects future depreciation and amortization expense to be lower and production costs to be higher, with no significant net impact on net income during the near term. Excluding the cumulative effect adjustment, the net effect of adopting SFAS No. 143 was to increase net income by approximately $1 million, $0.01 per share, in 2003.
Prior to adoption of SFAS No. 143, estimated future reclamation and mine closure costs for PT Freeport Indonesia’s current mining operations in Indonesia were accrued and charged to income over the estimated life of the mine by the unit-of-production method based on estimated recoverable proven and probable copper reserves. Estimated future closure costs for Atlantic Copper’s operations were not considered material and no accruals were made. See Note 10 for further discussion about FCX’s asset retirement obligations as of December 31, 2004 and 2003.
Income Taxes. FCX accounts for income taxes pursuant to SFAS No. 109, “Accounting for Income Taxes.” Deferred income taxes are provided to reflect the future tax consequences of differences between the tax bases of assets and liabilities and their reported amounts in the financial statements (see Note 8).
56
Pro Forma Net Income. Presented below (in thousands, except per share amounts) are FCX’s reported results and pro forma amounts that would have been reported in FCX’s Consolidated Statements of Income had those statements been adjusted for the retroactive application of the 2003 changes in accounting principles (SFAS No. 143 and SFAS No. 150) and the 2002 change in depreciation methodology.
| 2003 | 2002 | |||||
| Actual reported results: | ||||||
| Net income applicable to common stock | $ | 154,219 | $ | 127,050 | ||
| Basic net income per share of common stock | 0.99 | 0.88 | ||||
| Diluted net income per share of common stock | 0.97 | 0.87 | ||||
| Pro forma amounts assuming retroactive application: | ||||||
| Net income applicable to common stock | $ | 169,307 | $ | 129,635 | ||
| Basic net income per share of common stock | 1.09 | 0.90 | ||||
| Diluted net income per share of common stock | 1.06 | 0.89 | ||||
Derivative Instruments. At times FCX and its subsidiaries have entered into derivative contracts to manage certain risks resulting from fluctuations in commodity prices (primarily copper and gold), foreign currency exchange rates and interest rates by creating offsetting market exposures. FCX accounts for derivatives pursuant to SFAS No. 133, “Accounting for Derivative Instruments and Hedging Activities.” SFAS No. 133, as subsequently amended, established accounting and reporting standards requiring that every derivative instrument (including certain derivative instruments embedded in other contracts) be recorded in the balance sheet as either an asset or liability measured at its fair value. The accounting for changes in the fair value of a derivative instrument depends on the intended use of the derivative and the resulting designation. See Note 11 for a summary of FCX’s outstanding derivative instruments at December 31, 2004, and a discussion of FCX’s risk management strategies for those designated as hedges.
FCX elected to continue its historical accounting for its redeemable preferred stock indexed to commodities under the provisions of SFAS No. 133 which allow such instruments issued before January 1, 1998, to be excluded from those instruments required to be adjusted for changes in their fair values. Redeemable preferred stock indexed to commodities is treated as a hedge of future production and is carried at its original issue value. As redemption payments occur, differences between the carrying value and the payment are recorded as an adjustment to revenues (see Note 5).
Effective July 1, 2003, FCX adopted SFAS No. 150, “Accounting for Certain Financial Instruments with Characteristics of both Liabilities and Equity.” On July 1, 2003, FCX reclassified its mandatorily redeemable preferred stock totaling $450.0 million as debt and reclassified the $26.6 million of original issuance costs from capital in excess of par value of common stock to other assets. FCX also recorded a $24.7 million ($0.16 per share) cumulative effect adjustment for the amortization of the original issuance costs through July 1, 2003. Effective July 1, 2003, dividend payments on FCX’s mandatorily redeemable preferred stock are classified as interest expense. SFAS No. 150 does not permit prior period financial statements to be restated to reflect the changes in classification. In addition to the cumulative effect adjustment, adopting SFAS No. 150 decreased net income applicable to common stock by approximately $0.4 million, less than $0.01 per share, in 2003 for amortization after July 1 of original issuance costs.
Revenue Recognition. PT Freeport Indonesia’s sales of copper concentrates, which also contain significant quantities of gold and silver, are recognized in revenues when the title to the concentrates is transferred to the buyer (which coincides with the transfer of the risk of loss) at the point the concentrates are moved over the vessel’s rail at PT Freeport Indonesia’s port facility.
Revenues from PT Freeport Indonesia's concentrate sales are recorded based on either 100 percent of a provisional sales price or a final sales price calculated in accordance with the terms specified in the relevant sales contract. Revenues from concentrate sales are recorded net of royalties, treatment and all refining charges (including price participation, if applicable) and the impact of commodity contracts, including the impact of redemptions of FCX’s mandatorily redeemable preferred stock indexed to commodities (see Notes 5 and 11). Moreover, because a portion of the metals contained in copper concentrates is unrecoverable as a result of the smelting process, our revenues from concentrate sales are also recorded net of allowances based on the quantity and value of these unrecoverable metals. These allowances are a negotiated term of our contracts and vary by customer. Treatment and refining charges represent payments to smelters and refiners and are either fixed or in certain cases vary with the price of copper.
57
PT Freeport Indonesia’s concentrate sales agreements, including its sales to Atlantic Copper and PT Smelting, provide for provisional billings based on world metals prices when shipped, primarily using then-current prices on the London Metal Exchange (LME). Final settlement on the copper portion is generally based on the average LME price for a specified future period, generally three months after the month of arrival at the customer’s facility. PT Freeport Indonesia’s concentrate sales agreements do not allow for net settlement and always result in physical delivery. Final delivery to customers in Asia generally takes up to 25 days and to customers in Europe generally takes up to 57 days.
Under SFAS No. 133, PT Freeport Indonesia’s sales based on a provisional sales price contain an embedded derivative which is required to be bifurcated from the host contract. The host contract is the sale of the metals contained in the concentrates at the current spot LME price. PT Freeport Indonesia applies the normal purchase and sale exception allowed by SFAS No. 133 to the host contract in its concentrate sales agreements because the sales always result in physical delivery. Revenues based on provisional sales prices totaled $391.5 million at December 31, 2004. The embedded derivative, which does not qualify for hedge accounting, is marked-to-market through earnings each period. At December 31, 2004, FCX had consolidated embedded copper derivatives on 292.2 million pounds recorded at an average price of $1.45 per pound based on forward prices for the expected settlement dates. All of these derivatives are expected to be finally priced during the first half of 2005. The impact of fluctuations in the forward prices used for these derivatives through the settlement date is reflected as derivative gains and losses in revenues. A two-cent movement in the average price used for these derivatives would have an approximate $3 million impact on FCX’s 2005 net income. Gold sales are priced according to individual contract terms, generally the average London Bullion Market Association price for a specified month near the month of shipment. At December 31, 2004, FCX had consolidated embedded gold derivatives on 123,400 ounces recorded at an average price of $438 per ounce. For 2004, 2003 and 2002, the maximum net price adjustment to revenues after initial recognition was seven percent for copper revenues and two percent for gold revenues.
PT Freeport Indonesia pays royalties under a Contract of Work (see Note 10). The copper royalty rate payable by PT Freeport Indonesia under its Contract of Work varies from 1.5 percent of copper net revenue at a copper price of $0.90 or less per pound to 3.5 percent at a copper price of $1.10 or more per pound. The Contract of Work royalty rate for gold and silver sales is 1.0 percent.
A large part of the mineral royalties under Government of Indonesia regulations is designated to the provinces from which the minerals are extracted. In connection with its fourth concentrator mill expansion completed in 1998, PT Freeport Indonesia agreed to pay the Government of Indonesia additional royalties (royalties not required by the Contract of Work) to provide further support to the local governments and the people of the Indonesian province of Papua. The additional royalties are paid on metal from production from PT Freeport Indonesia’s milling facilities above 200,000 metric tons of ore per day. The additional royalty for copper equals the Contract of Work royalty rate, and for gold and silver equals twice the Contract of Work royalty rates. Therefore, PT Freeport Indonesia’s royalty rate on copper net revenues from production above 200,000 metric tons of ore per day is double the Contract of Work royalty rate, and the royalty rates on gold and silver sales from production above 200,000 metric tons of ore per day are triple the Contract of Work royalty rates. The combined royalties, including the additional royalties, which became effective January 1, 1999, totaled $43.5 million in 2004, $26.5 million in 2003 and $24.5 million in 2002.
Foreign Currencies. Transaction gains and losses associated with Atlantic Copper’s euro-denominated and PT Freeport Indonesia’s rupiah-denominated monetary assets and liabilities are included in net income. Atlantic Copper’s euro-denominated net monetary liabilities totaled $74.0 million at December 31, 2004, based on an exchange rate of $1.36 per euro. Excluding hedging amounts, net Atlantic Copper foreign currency transaction losses totaled $1.6 million in 2004, $13.6 million in 2003 and $11.9 million in 2002. PT Freeport Indonesia’s rupiah-denominated net monetary liabilities totaled $7.7 million at December 31, 2004, based on an exchange rate of 9,270 rupiah to one U.S. dollar. Excluding hedging amounts, net PT Freeport Indonesia foreign currency transaction losses totaled $0.7 million in 2004, $3.0 million in 2003 and $3.5 million in 2002.
Comprehensive Income. FCX follows SFAS No. 130, “Reporting Comprehensive Income,” for the reporting and display of comprehensive income (net income plus other comprehensive income, or all other changes in net assets from nonowner sources) and its components. FCX’s comprehensive income for 2004, 2003 and 2002 follows (in thousands):
58
| 2004 | 2003 | 2002 | |||||||
| Net income | $ | 202,267 | $ | 181,660 | $ | 164,654 | |||
| Other comprehensive income (loss): | |||||||||
| Change in unrealized derivatives’ fair value, net of taxes of $1.0 million for 2004 and $3.1 million for 2002 | 1,226 | 5,195 | 13,615 | ||||||
| Reclass to earnings, net of taxes of $4.7 million for 2002 | 1,448 | (7,490 | ) | (1,468 | ) | ||||
| Total comprehensive income | $ | 204,941 | $ | 179,365 | $ | 176,801 | |||
Effective January 1996, Atlantic Copper changed its functional currency from the peseta (the Spanish currency at the time) to the U.S. dollar. This change resulted from significant changes in Atlantic Copper’s operations related to a large expansion of its smelting and refining operations financed with U.S. dollar borrowings and the sale of its mining operations that incurred significant peseta operating costs. Accumulated Other Comprehensive Income reported in the Consolidated Statements of Stockholders’ Equity before 2001 totaled $10.2 million and consisted solely of the cumulative foreign currency translation adjustment at Atlantic Copper prior to changing its functional currency, for which there is no tax effect. In accordance with SFAS No. 52, “Foreign Currency Translation,” the currency translation adjustment recorded up through the date of the change in functional currency will only be adjusted in the event of a full or partial disposition of FCX’s investment in Atlantic Copper.
Stock-Based Compensation. As of December 31, 2004, FCX has four stock-based employee compensation plans and two stock-based director compensation plans, which are more fully described in Note 7. FCX accounts for options granted under all of its plans under the recognition and measurement principles of Accounting Principles Board (APB) Opinion No. 25, “Accounting for Stock Issued to Employees,” and related interpretations, which require compensation cost for stock-based employee compensation plans to be recognized based on the difference on the date of grant, if any, between the quoted market price of the stock and the amount an employee must pay to acquire the stock. Because all the plans require that the option exercise price be at least the market price on the date of grant, FCX recognizes no compensation expense on the grant or exercise of its employees’ options. See “New Accounting Standards” below for a discussion of a recently issued revision to SFAS No. 123, which FCX must adopt no later than July 1, 2005. The following table illustrates the effect on net income and earnings per share if FCX had applied the fair value recognition provisions of SFAS No. 123, “Accounting for Stock-Based Compensation,” which requires compensation cost for all stock-based employee compensation plans to be recognized based on a fair value method (in thousands, except per share amounts):
| 2004 | 2003 | 2002 | ||||||||
| Net income applicable to common stock, as reported | $ | 156,776 | $ | 154,219 | $ | 127,050 | ||||
| Add: Stock-based employee compensation expense included in reported net income for stock option conversions, stock appreciation rights (SARs) and restricted stock units, net of taxes and minority interests | 4,809 | 9,512 | 2,320 | |||||||
| Deduct: Total stock-based employee compensation expense determined under fair value-based method for all awards, net of taxes and minority interests | (10,049 | ) | (14,225 | ) | (8,833 | ) | ||||
| Pro forma net income applicable to common stock | $ | 151,536 | $ | 149,506 | $ | 120,537 | ||||
| Earnings per share: | ||||||||||
| Basic - as reported | $ | 0.86 | $ | 0.99 | $ | 0.88 | ||||
| Basic - pro forma | $ | 0.83 | $ | 0.96 | $ | 0.83 | ||||
| Diluted - as reported | $ | 0.85 | $ | 0.97 | $ | 0.87 | ||||
| Diluted - pro forma | $ | 0.80 | $ | 0.92 | $ | 0.80 | ||||
For the pro forma computations, the values of option grants were calculated on the dates of grant using the Black-Scholes option pricing model. No other discounts or restrictions related to vesting or the likelihood of vesting of stock options were applied. The following table summarizes the calculated average fair values and weighted-average assumptions used to determine the fair value of FCX’s stock option grants under SFAS No. 123 during the periods presened.
59
| 2004 | 2003 | 2002 | |||||||
| Fair value per stock option | $ | 15.15 | $ | 10.30 | $ | 7.89 | |||
| Risk-free interest rate | 3.7 | % | 3.8 | % | 5.0 | % | |||
| Expected volatility rate | 49 | % | 47 | % | 47 | % | |||
| Expected life of options (in years) | 6 | 7 | 7 | ||||||
| Assumed annual dividend | $ | 0.80 | $ | 0.36 | a | - | |||
a. Assumed annual dividend for 2003 only applied to grants made after February 5, 2003.
Earnings Per Share. FCX’s basic net income per share of common stock was calculated by dividing net income applicable to common stock by the weighted-average number of common shares outstanding during the year. The following is a reconciliation of net income and weighted-average common shares outstanding for purposes of calculating diluted net income per share (in thousands, except per share amounts):
| 2004 | 2003 | 2002 | ||||||||
| Net income before preferred dividends and cumulative effect of changes in accounting principles | $ | 202,267 | $ | 197,253 | $ | 167,703 | ||||
| Preferred dividends | (45,491 | ) | (27,441 | ) | (37,604 | ) | ||||
| Net income before cumulative effect | 156,776 | 169,812 | 130,099 | |||||||
| Cumulative effect of changes in accounting principles | - | (15,593 | ) | (3,049 | ) | |||||
| Net income applicable to common stock | $ | 156,776 | $ | 154,219 | $ | 127,050 | ||||
| Weighted average common shares outstanding | 182,272 | 155,805 | 144,649 | |||||||
| Add: Dilutive stock options (see Note 7) | 2,197 | 3,094 | 1,498 | |||||||
| Restricted stock (see Note 7) | 454 | 203 | 271 | |||||||
| Weighted average common shares outstanding for purposes of calculating diluted net income per share | 184,923 | 159,102 | 146,418 | |||||||
| Diluted net income per share of common stock: | ||||||||||
| Before cumulative effect | $ | 0.85 | $ | 1.07 | $ | 0.89 | ||||
| Cumulative effect | - | (0.10 | ) | (0.02 | ) | |||||
| Net income per share of common stock | $ | 0.85 | $ | 0.97 | $ | 0.87 | ||||
Outstanding stock options with exercise prices greater than the average market price of FCX’s common stock during the year are excluded from the computation of diluted net income per share of common stock. In addition, certain convertible instruments (see Notes 5 and 7) are excluded because including the conversion of these instruments would have increased reported diluted net income per share. A recap of the excluded amounts follows (in thousands, except exercise prices):
| 2004 | 2003 | 2002 | |||||
| Weighted average outstanding options | - | 1,718 | 7,878 | ||||
| Weighted average exercise price | - | $30.37 | $22.73 | ||||
Interest on 7% Convertible Senior Notes, net of taxesa | $41,430 | $36,873 | N/A | ||||
Weighted average shares issuable upon conversiona | 18,625 | 16,463 | N/A | ||||
Dividends on 5½% Convertible Perpetual Preferred Stockb | $45,491 | N/A | N/A | ||||
Weighted average shares issuable upon conversionb | 15,632 | N/A | N/A | ||||
Interest on 8¼% Convertible Senior Notes, net of taxesc | $3,829 | $39,902 | $50,488 | ||||
Weighted average shares issuable upon conversionc | 3,073 | 33,992 | 42,220 | ||||
Dividends on Step-Up Convertible Preferred Stockd | N/A | $20,532 | $24,499 | ||||
Weighted average shares issuable upon conversiond | N/A | 11,424 | 11,690 | ||||
| a. | FCX’s 7% Convertible Senior Notes were issued on February 11, 2003, and are convertible into 18.6 million shares of common stock (see Note 5). |
| b. | On March 30, 2004, FCX sold 1.1 million shares of 5½% Convertible Perpetual Preferred Stock for $1.1 billion, with net proceeds totaling $1.067 billion (see Note 7). |
| c. | 51.5 percent of FCX’s 8¼% Convertible Senior Notes converted to FCX common stock in August 2003. In January 2004, approximately 37 percent converted to FCX common stock and the remaining notes converted to FCX common stock in July 2004 (see Note 5). |
| d. | FCX’s Step-Up Convertible Preferred Stock was redeemed in December 2003 (see Note 7). |
60
New Accounting Standards.In November 2004, the FASB issued SFAS No. 151, “Inventory Costs, an amendment of ARB No. 43, Chapter 4.” SFAS No. 151 clarifies that abnormal amounts of idle facility expense, freight handling costs and wasted materials (spoilage) should be recognized as current-period charges and requires the allocation of fixed production overheads to inventory based on the normal capacity of the production facilities. FCX must adopt SFAS No. 151 no later than January 1, 2006. FCX has not yet determined when it will adopt SFAS No. 151; however, FCX currently does not expect adoption to have a material impact on its accounting for inventory costs.
In December 2004, the FASB issued SFAS No. 123 (revised 2004), “Share-Based Payment.” SFAS No. 123 (revised 2004) requires all share-based payments to employees, including grants of employee stock options, to be recognized in the income statement based on their fair values.
Through December 31, 2004, FCX accounted for grants of employee stock options under the recognition principles of APB Opinion No. 25, “Accounting for Stock Issued to Employees,” and related interpretations, which require compensation costs for stock-based employee compensation plans to be recognized based on the difference on the date of grant, if any, between the quoted market price of the stock and the amount an employee must pay to acquire the stock. If FCX had applied the fair value recognition provisions of SFAS No. 123, “Accounting for Stock-Based Compensation,” which requires compensation cost for all stock-based employee compensation plans to be recognized based on the use of a fair value method, FCX’s net income would have been reduced by $5.2 million, $0.05 per diluted share, for 2004, $4.7 million, $0.05 per diluted share, for 2003 and $6.5 million, $0.07 per diluted share, for 2002 (see “Stock-Based Compensation”). FCX must adopt SFAS No. 123 (revised 2004) no later than July 1, 2005; however, FCX can elect to adopt SFAS No. 123 (revised 2004) as early as January 1, 2005. FCX is still reviewing the provisions of SFAS No. 123 (revised 2004) and has not yet determined if it will adopt SFAS No. 123 (revised 2004) before July 1, 2005. Also, stock options were granted to employees in February 2005, including multi-year grants to senior executive officers. As a result, the annual charges for share-based payments will be higher than the pro forma annual amounts presented under “Stock-Based Compensation.” Based on currently outstanding employee stock options, including those granted in February 2005, if FCX adopts SFAS No. 123 (revised 2004) on July 1, 2005, FCX estimates the charge to earnings before taxes and minority interest sharing in the second half of 2005 would total approximately $11 million, and the reduction in net income would be approximately $6.5 million, $0.04 per basic share using common shares outstanding at December 31, 2004.
NOTE 2. OWNERSHIP IN SUBSIDIARIES AND JOINT VENTURES WITH RIO TINTO
Ownership in Subsidiaries. FCX’s direct ownership in PT Freeport Indonesia totaled 81.3 percent at December 31, 2004 and 2003. PT Indocopper Investama, an Indonesian company, owns 9.4 percent of PT Freeport Indonesia and FCX owns 100 percent of PT Indocopper Investama. In July 2004, FCX received a request from the Indonesian Department of Energy and Mineral Resources that it offer to sell to Indonesian nationals shares in PT Indocopper Investama at fair market value. In response to this request and in view of the potential benefits of having additional Indonesian ownership in the project, FCX has agreed to consider a potential sale of an interest in PT Indocopper Investama at fair market value. Neither its Contract of Work with the Indonesian government nor Indonesian law requires FCX to divest any portion of its ownership in PT Freeport Indonesia or PT Indocopper Investama. At December 31, 2004, PT Freeport Indonesia’s net assets totaled $2.3 billion and its retained earnings total $2.1 billion. As of December 31, 2004, FCX has two outstanding loans to PT Freeport Indonesia totaling $192.4 million.
Substantially all of PT Freeport Indonesia’s assets are located in Indonesia. Events in Indonesia during 2004 mainly centered on the national elections. The presidential election was conducted peacefully and after a runoff, Susilo Bambang Yudhoyono was declared the new president in October. Indonesia continues to face political, economic and social uncertainties, including separatist movements and civil and religious strife in a number of provinces.
FCX owns 100 percent of the outstanding Atlantic Copper common stock. At December 31, 2004, FCX’s net investment in Atlantic Copper totaled $97.4 million, FCX had $189.5 million of loans outstanding to Atlantic Copper and Atlantic Copper’s debt under financing arrangements that are nonrecourse to FCX totaled $12.3 million. Atlantic Copper is not expected to pay dividends in the near future. Under the terms of its concentrate sales agreements with Atlantic Copper, PT Freeport Indonesia had outstanding trade receivables from Atlantic Copper totaling $146.0 million at December 31, 2004. FCX made cash contributions to Atlantic Copper totaling $202.0 million in 2004, $10.0 million in 2003 and $25.0 million in 2002. These transactions had no impact on FCX’s consolidated financial statements.
FCX owns 100 percent of FM Services Company. FM Services Company provides certain administrative, financial and other services on a cost-reimbursement basis to FCX and provides similar services to two other public companies under management services agreements with fixed fee terms plus reimbursements for special projects and out-of-pocket expenses. The costs billed to FCX and PT Freeport Indonesia, which include related overhead, totaled $34.6 million in 2004, $33.4
61
million in 2003 and $31.1 million in 2002. Management believes these costs do not differ materially from the costs that would have been incurred had the relevant personnel providing these services been employed directly by FCX. The amounts FM Services Company billed to the two other public companies totaled $4.3 million during 2004, $3.6 million during 2003 and $2.6 million during 2002. Long-term receivables from one of those companies totaled $3.2 million at December 31, 2004, and relate to certain FM Services Company long-term employee benefit obligations.
In July 2003, FCX acquired the 85.7 percent ownership interest in Puncakjaya Power owned by affiliates of Duke Energy Corporation for $78 million cash. Puncakjaya Power is the owner of assets supplying power to PT Freeport Indonesia’s operations, including the 3x65 megawatt coal-fired power facilities. PT Freeport Indonesia purchases power from Puncakjaya Power under infrastructure asset financing arrangements. At December 31, 2004, PT Freeport Indonesia had infrastructure asset financing obligations to Puncakjaya Power totaling $258.7 million and Puncakjaya Power had a receivable from PT Freeport Indonesia for $340.1 million, including Rio Tinto’s share. As a result of this transaction, FCX is now consolidating Puncakjaya Power and FCX’s consolidated balance sheet no longer reflects PT Freeport Indonesia’s obligation to Puncakjaya Power or Puncakjaya Power’s receivable from PT Freeport Indonesia, but instead reflects the $187.0 million of outstanding Puncakjaya Power bank debt at December 31, 2004, and a $73.5 million receivable ($11.5 million in other accounts receivable and $62.0 million in long-term assets) for Rio Tinto’s share of Puncakjaya Power’s receivable as provided for in FCX’s joint venture agreement with Rio Tinto.
Joint Ventures With Rio Tinto. In March 2004, FCX purchased Rio Tinto’s 23.9 million shares of FCX common stock for $881.9 million (approximately $36.85 per share) with a portion of the proceeds from the sale of the 5½% Convertible Perpetual Preferred Stock (see Note 7). Rio Tinto acquired these shares from FCX’s former parent company in 1995 in connection with the spinoff of FCX as an independent company. FCX and Rio Tinto have established certain unincorporated joint ventures which are not impacted by FCX’s purchase of its shares from Rio Tinto discussed above. Under the joint venture arrangements, Rio Tinto has a 40 percent interest in PT Freeport Indonesia’s Contract of Work and Eastern Minerals’ Contract of Work, and the option to participate in 40 percent of any other future exploration projects in Papua. Under the arrangements, Rio Tinto funded $100 million in 1996 for approved exploration costs in the areas covered by the PT Freeport Indonesia and Eastern Minerals Contracts of Work. Agreed-upon exploration costs in the joint venture areas are generally shared 60 percent by FCX and 40 percent by Rio Tinto.
Pursuant to the joint venture agreement, Rio Tinto has a 40 percent interest in certain assets and future production exceeding specified annual amounts of copper, gold and silver through 2021 in Block A of PT Freeport Indonesia’s Contract of Work, and, after 2021, a 40 percent interest in all production from Block A. Operating, nonexpansion capital and administrative costs are shared proportionately between PT Freeport Indonesia and Rio Tinto based on the ratio of (a) the incremental revenues from production from PT Freeport Indonesia’s most recent expansion completed in 1998 to (b) total revenues from production from Block A, including production from PT Freeport Indonesia’s previously existing reserves. PT Freeport Indonesia will continue to receive 100 percent of the cash flow from specified annual amounts of copper, gold and silver through 2021 calculated by reference to its proven and probable reserves as of December 31, 1994, and 60 percent of all remaining cash flow. The agreement provides for adjustments to the specified annual amounts of copper, gold and silver attributable 100 percent to PT Freeport Indonesia upon the occurrence of certain events which cause an extended interruption in production to occur, including the events such as the fourth-quarter 2003 Grasberg open-pit slippage and debris flow. As a result of the Grasberg slippage and debris flow events, the 2004 specified amounts attributable 100 percent to PT Freeport Indonesia were reduced by 178 million pounds for copper and 280,000 ounces for gold. These reductions were offset by increases in the specified amounts attributable to PT Freeport Indonesia totaling 111 million pounds for copper and 175,000 ounces for gold in 2005, and 67 million pounds for copper and 105,000 ounces for gold in 2021.
NOTE 3. INVENTORIES
The components of inventories follow (in thousands):The average cost method was used to determine the cost of essentially all materials and supplies inventory. Materials and supplies inventory is net of obsolescence reserves totaling $17.1 million at December 31, 2004, and $17.6 million at December 31, 2003.
| December 31, | ||||||||
| 2004 | 2003 | |||||||
| PT Freeport Indonesia: | Concentrates - Average cost | $ | 11,830 | $ | 2,643 | |||
| Atlantic Copper: | Concentrates - FIFO | 148,246 | 81,668 | |||||
| Work in process - FIFO | 86,710 | 76,689 | ||||||
| Finished goods - FIFO | 6,479 | 9,925 | ||||||
| Total product inventories | 253,265 | 170,925 | ||||||
| Total materials and supplies, net | 213,447 | 226,102 | ||||||
| Total inventories | $ | 466,712 | $ | 397,027 | ||||
62
NOTE 4. PROPERTY, PLANT, EQUIPMENT AND DEVELOPMENT COSTS, NET
The components of net property, plant, equipment and development costs follow (in thousands):
| December 31, | |||||||
| 2004 | 2003 | ||||||
| Development and other | $ | 1,495,854 | $ | 1,445,879 | |||
| Buildings and infrastructure | 1,440,873 | 1,425,223 | |||||
| Machinery and equipment | 2,200,844 | 2,141,878 | |||||
| Mobile equipment | 758,073 | 699,038 | |||||
| Construction in progress | 72,525 | 144,160 | |||||
| Property, plant, equipment and development costs | 5,968,169 | 5,856,178 | |||||
| Accumulated depreciation and amortization | (2,768,877 | ) | (2,594,481 | ) | |||
| Property, plant, equipment and development costs, net | $ | 3,199,292 | $ | 3,261,697 | |||
Development and other includes costs related to investments in consolidated subsidiaries. These costs consist of $69.5 million related to FCX’s purchase in December 1992 of 49 percent of the capital stock of PT Indocopper Investama, $34.5 million related to PT Freeport Indonesia’s issuance of its shares to FCX in 1993 and 1994 to settle a convertible loan due to FCX and $268.4 million related to FCX’s acquisition of the remaining 51 percent of the capital stock of PT Indocopper Investama in February 2002. These costs relate to the value of the proven and probable reserves FCX acquired and are amortized using the unit-of-production method based on estimated recoverable proven and probable copper reserves. Additionally, other costs include $20.8 million related to FCX’s acquisition of Atlantic Copper in 1993 and relate to its smelter assets. These costs are amortized using the straight-line method based on the estimated life of Atlantic Copper’s smelter assets.
NOTE 5. LONG-TERM DEBT
| December 31, | |||||||
| 2004 | 2003 | ||||||
| (In Thousands) | |||||||
| Notes Payable: | |||||||
| Puncakjaya Power bank debt, average rate 3.2% in 2004 and 3.0% in 2003 | $ | 187,009 | $ | 235,491 | |||
| Equipment loans and capital leases, average rate 4.4% in 2004 and 4.2% in 2003 | 72,545 | 110,313 | |||||
| Atlantic Copper facility, average rate 3.6% in 2004 and 3.5% in 2003 | 4,381 | 132,972 | |||||
| Atlantic Copper working capital revolver, average rate 3.7% in 2003 | - | 55,000 | |||||
| Atlantic Copper deferral loan, average rate 4.0% in 2003 | - | 30,000 | |||||
| Other notes payable and short-term borrowings | 9,254 | 21,027 | |||||
| FCX and PT Freeport Indonesia credit facility | - | - | |||||
| Senior Notes: | |||||||
| 7% Convertible Senior Notes due 2011 | 575,000 | 575,000 | |||||
| 10⅛% Senior Notes due 2010 | 500,000 | 500,000 | |||||
| 6⅞% Senior Notes due 2014 | 340,295 | - | |||||
| 7.50% Senior Notes due 2006 | 66,516 | 66,516 | |||||
| 7.20% Senior Notes due 2026 | 4,525 | 4,525 | |||||
| 8¼% Convertible Senior Notes | - | 292,604 | |||||
| Redeemable Preferred Stock: | |||||||
| Gold-Denominated Preferred Stock, Series II | 167,379 | 167,379 | |||||
| Silver-Denominated Preferred Stock | 25,002 | 37,503 | |||||
| Total debt | 1,951,906 | 2,228,330 | |||||
| Less current portion of long-term debt and short-term borrowings | 78,214 | 152,396 | |||||
| Long-term debt, less current portion | $ | 1,873,692 | $ | 2,075,934 | |||
63
Notes Payable. As discussed in Note 2, FCX acquired the 85.7 percent ownership interest in Puncakjaya Power owned by affiliates of Duke Energy Corporation in July 2003. Puncakjaya Power’s bank debt is secured by the power-related assets operated by Puncakjaya Power.
At December 31, 2003, FCX and PT Freeport Indonesia had vendor-financed equipment loans secured by certain PT Freeport Indonesia assets. The FCX loan had a $19.3 million balance. PT Freeport Indonesia had three equipment loans with this vendor ($43.4 million outstanding at December 31, 2003) and had capital leases with this vendor totaling $47.6 million at December 31, 2003. Interest rates on all of the equipment loans and the leases are variable. In 2004, FCX and PT Freeport Indonesia paid the outstanding balances of their loans and PT Freeport Indonesia had capital leases totaling $72.5 million at December 31, 2004.
Atlantic Copper has a variable-rate project loan (the Atlantic Copper facility). In February 2004, FCX used a portion of the proceeds from the sale of the 6⅞% Senior Notes (see below) to repay $162.4 million of Atlantic Copper’s borrowings and to refinance certain other FCX debt maturities. Atlantic Copper recorded a $3.7 million charge for losses on early extinguishment of debt for repayment of certain of its debt. As of December 31, 2004, the variable-rate project loan, nonrecourse to FCX, consisted of a $50.0 million working capital revolver ($4.4 million outstanding at December 31, 2004) that matures December 2007. Subsequent to December 31, 2004, the commitment was reduced to $44.0 million. The Atlantic Copper facility restricts other borrowings and borrowings under the facility are secured by certain Atlantic Copper receivables and inventory. Atlantic Copper’s other working capital revolver required 20 percent of amounts borrowed under the facility to be deposited in a restricted account which totaled $11.0 million at December 31, 2003.
FCX and PT Freeport Indonesia have a $195 million revolving credit facility, which matures in September 2006. The facility sets limitations on liens and limitations on transactions with affiliates, and requires that certain financial ratios be maintained. The credit facility allows common stock dividends, common stock purchases and investments as long as availability under the facility plus available cash exceeds $200 million or otherwise as long as certain other thresholds are exceeded. Security for obligations outstanding under the credit facility includes over 80 percent of PT Freeport Indonesia’s assets, 50.1 percent of the outstanding stock of PT Freeport Indonesia, the outstanding stock of PT Indocopper Investama owned by FCX, and a pledge of PT Freeport Indonesia’s rights under its Contract of Work (see Note 10). PT Freeport Indonesia and FCX guarantee each other’s obligations under the credit facility. No amounts are currently outstanding under the facility. FCX and PT Freeport Indonesia recorded charges to other expense totaling $5.6 million, $3.7 million to net income, in 2003 to accelerate amortization of deferred financing costs related to the prior credit facility.
Senior Notes. In February 2003, FCX sold $575 million of 7% Convertible Senior Notes due 2011 for net proceeds of $559.1 million. Interest on the notes is payable semiannually on March 1 and September 1 of each year, beginning September 1, 2003. The notes are convertible, at the option of the holder, at any time on or prior to maturity into shares of FCX’s common stock at a conversion price of $30.87 per share, which is equal to a conversion rate of approximately 32.39 shares of common stock per $1,000 principal amount of notes. The notes are unsecured.
In January 2003, FCX sold $500 million of 10⅛% Senior Notes due 2010 for net proceeds of $487.3 million. Interest on the notes is payable semiannually on February 1 and August 1 of each year, beginning August 1, 2003. FCX may redeem some or all of the notes at its option at a make-whole redemption price prior to February 1, 2007, and afterwards at stated redemption prices. The indenture governing the notes contains restrictions and limitations on incurring debt, creating liens, entering into sale leaseback transactions, taking actions to limit distributions from certain subsidiaries, selling assets, entering into certain transactions with affiliates, paying cash dividends on common stock, repurchasing or redeeming common or preferred equity, prepaying subordinated debt and making investments. The notes are unsecured.
In February 2004, FCX sold $350 million of 6⅞% Senior Notes due 2014 for net proceeds of $344.4 million. Interest on the notes is payable semiannually on February 1 and August 1 of each year, beginning August 1, 2004. FCX may redeem some or all of the notes at its option at a make-whole redemption price prior to February 1, 2009, and afterwards at stated redemption prices. The indenture governing the notes contains certain restrictions, including restrictions on incurring debt, creating liens, selling assets, entering into certain transactions with affiliates, paying cash dividends on common stock, repurchasing or redeeming common or preferred equity, prepaying subordinated debt and making investments. During the second quarter of 2004, FCX purchased in the open market $9.7 million of the 6⅞% Senior Notes for $8.8 million, which, including deferred financing costs, resulted in a gain of $0.8 million recorded as a reduction to losses on early extinguishment and conversion of debt.
In April 2003, FCX concluded tender offers for its 7.20% Senior Notes due 2026 and its 7.50% Senior Notes due 2006. Of the total $450 million outstanding at December 31, 2002,
64
notes with a face amount of $234.0 million were tendered for $239.0 million cash. FCX recorded a charge of $6.6 million ($4.8 million to net income) to losses on early extinguishments of debt. In July 2003, FCX purchased an additional $76.0 million face amount of its 7.20% Senior Notes for $77.2 million, and recorded a charge to losses on early extinguishment of debt of $1.3 million ($0.9 million to net income). In October 2003, holders of $68.9 million of 7.20% Senior Notes elected early repayment as permitted under their terms. At December 31, 2004, FCX had outstanding $66.5 million of its 7.50% Senior Notes and $4.5 million of its 7.20% Senior Notes.
During the first quarter of 2004, FCX completed a tender offer and privately negotiated transactions for a portion of its remaining 8¼% Convertible Senior Notes due 2006 resulting in the early conversion of $226.1 million of notes into 15.8 million shares of FCX common stock. FCX recorded a $10.9 million charge to losses on early extinguishment and conversion of debt in the first quarter of 2004 in connection with these conversions. The $10.9 million charge included $6.4 million of previously accrued interest costs that were reversed, resulting in an equivalent reduction to interest expense. In June 2004, the remaining $66.5 million of notes were called for redemption on July 31, 2004. During July, all of these notes were converted into 4.7 million shares of FCX’s common stock. As of July 31, 2004, all of the 8¼% Convertible Notes, which totaled $603.8 million at issuance in 2001, had been converted into 42.2 million shares of FCX common stock.
Redeemable Preferred Stock. As discussed in Note 1, upon adoption of SFAS No. 150 on July 1, 2003, mandatorily redeemable preferred stock totaling $450.0 million was reclassified as debt. On August 1, 2003, FCX redeemed the 6.0 million depositary shares representing its Gold-Denominated Preferred Stock for $210.5 million. The mandatory redemption of the Gold-Denominated Preferred Stock shares reduced total consolidated debt by $232.6 million and resulted in a hedging gain to revenues of $22.1 million in 2003.
FCX has outstanding 4.3 million depositary shares representing 215,279 shares of its Gold-Denominated Preferred Stock, Series II totaling $167.4 million. Each depositary share has a cumulative quarterly cash dividend equal to the value of 0.0008125 ounce of gold and is mandatorily redeemable in February 2006 for the cash value of 0.1 ounce of gold. These depositary shares trade on the New York Stock Exchange (NYSE) under the symbol “FCX PrC.”
FCX has outstanding 4.8 million depositary shares representing 29,750 shares of its Silver-Denominated Preferred Stock totaling $25.0 million at December 31, 2004, and had 44,625 shares totaling $37.5 million at December 31, 2003. As of December 31, 2004, each depositary share has a cumulative quarterly cash dividend equal to the value of 0.01031 ounce of silver, which will decline by 50 percent after the next scheduled redemption payment. FCX made six annual mandatory partial redemption payments on the underlying Silver-Denominated Preferred Stock through August 2004. For each of the partial redemptions, the difference between FCX’s carrying amount of $12.5 million and the actual redemption payments was recorded in revenues as a hedging gain or loss. On August 1, 2004, FCX made the sixth of eight scheduled annual redemption payments on its Silver-Denominated Preferred Stock for $13.9 million. The mandatory redemptions resulted in hedging gains (losses) to revenues of $(1.4) million in 2004, $1.7 million in 2003 and $0.8 million in 2002. Two annual redemption payments remain and will vary with the price of silver. These depositary shares trade on the NYSE under the symbol “FCX PrD.”
Maturities and Capitalized Interest. Maturities of debt instruments based on the amounts and terms outstanding at December 31, 2004, totaled $78.2 million in 2005, $296.9 million in 2006, $45.9 million in 2007, $49.6 million in 2008, $47.7 million in 2009 and $1,433.6 million thereafter. Capitalized interest totaled $2.9 million in 2004, $3.0 million in 2003 and $12.2 million in 2002.
NOTE 6. ACCRUED POSTRETIREMENT BENEFITS AND OTHER LIABILITIES
The following is a detail of FCX’s accrued postretirement benefits and other liabilities (in thousands):
| 2004 | 2003 | ||||
Atlantic Copper contractual obligation to insurance company (Note 9) | $ | 69,767 | $ | 68,013 | |
| Pension and long-term incentive compensation (Note 9) | 76,009 | 53,641 | |||
| Asset retirement obligations (Note 10) | 22,848 | 26,486 | |||
| Reserve for non-income taxes (Note 10) | 18,910 | 19,000 | |||
| Other long-term liabilities and reserves | 12,694 | 12,697 | |||
| Total accrued postretirement benefits and other liabilities | $ | 200,228 | $ | 179,837 | |
65
NOTE 7. STOCKHOLDERS’ EQUITY
Common Stock. FCX has 473.6 million authorized shares of capital stock consisting of 423.6 million shares of common stock and 50.0 million shares of preferred stock. At the 2002 annual shareholder meeting, FCX’s shareholders approved the conversion of each outstanding share of Class A common stock into one share of Class B common stock. FCX now has only one class of common stock. The conversion created a new measurement date for FCX’s Class A stock options that were converted to Class B stock options. Under accounting rules followed by FCX for stock-based compensation, the in-the-money value of these stock options on the new measurement date ($8.8 million) must be charged to earnings over the remaining vesting period of the options, which extends through January 2006. The related charge to general and administrative expenses totaled $2.1 million in 2004, $2.3 million in 2003 and $1.6 million in 2002.
In 2003, FCX’s Board of Directors approved a new open market share purchase program for up to 20 million shares, which replaced FCX’s previous program. Under this new program, FCX acquired 3.4 million shares during the second quarter of 2004 for $99.5 million, $29.39 per share average, and 16.6 million shares remain available. No other shares were purchased through February 28, 2005. The timing of future purchases of FCX’s common stock is dependent on many factors including the price of FCX’s common shares, FCX’s cash flow and financial position, and general economic and market conditions.
Preferred Stock. In December 2003, FCX called for redemption the depositary shares representing its Step-Up Convertible Preferred Stock. Of the 14.0 million depositary shares outstanding at the time of call, 13.8 million depositary shares converted into 11.5 million shares of FCX common stock. The remaining depositary shares outstanding were redeemed for approximately $7 million in cash.
In March 2004, FCX sold 1.1 million shares of 5½% Convertible Perpetual Preferred Stock for $1.1 billion, with net proceeds totaling $1.067 billion. Each share of preferred stock was initially convertible into 18.8019 shares of FCX common stock, equivalent to a conversion price of approximately $53.19 per common share. The conversion rate is adjustable upon the occurrence of certain events, including any quarter that FCX’s common stock dividend exceeds $0.20 per share. In October 2004, FCX’s Board of Directors increased the annual common stock dividend rate to $1.00 per share ($0.25 per share quarterly). In December 2004, the Board authorized a supplemental common stock dividend of $0.25 per share, which was paid on December 29, 2004. The increased quarterly dividend payments and the supplemental dividend resulted in adjustments to the conversion rate. After FCX’s February 2005 quarterly dividend, each share of preferred stock is now convertible into 18.9794 shares of FCX common stock, equivalent to a conversion price of approximately $52.69 per common share. In February 2005, the Board authorized a supplemental common stock dividend of $0.50 per share payable on March 31, 2005, which will result in another adjustment to the conversion price in March 2005. Beginning March 30, 2009, FCX may redeem shares of the preferred stock by paying cash, FCX common stock or any combination thereof for $1,000 per share plus unpaid dividends, but only if FCX’s common stock price has exceeded 130 percent of the conversion price for at least 20 trading days within a period of 30 consecutive trading days immediately preceding the notice of redemption. FCX used a portion of the proceeds from the sale to purchase 23.9 million shares of FCX common stock owned by Rio Tinto for $881.9 million (approximately $36.85 per share) and used the remainder for general corporate purposes.
Stock Award Plans. FCX currently has six stock-based compensation plans. FCX’s Adjusted Stock Award Plan provided for the issuance of certain stock awards to employees, officers and directors of Freeport-McMoRan Inc. (FTX), the former parent of FCX, in connection with FTX’s distribution of FCX shares to its shareholders in 1995. Under this plan, FCX made a one-time grant of awards to purchase up to 10.7 million common shares, including SARs, at prices equivalent to the original FTX price at date of grant as adjusted for the proportionate market value of FCX shares at the time of the distribution. All options granted under this plan expire 10 years from the original FTX date of grant.
FCX’s 1995 Stock Option Plan provides for the issuance of stock options and other stock-based awards (including SARs) for up to 10.0 million common shares at no less than market value at the time of grant. FCX’s 1995 Stock Option Plan for Non-Employee Directors authorizes FCX to grant options to purchase up to 2.0 million shares and to grant up to 1.3 million SARs.
FCX’s 1999 Stock Incentive Plan (the 1999 Plan) and 2003 Stock Incentive Plan (the 2003 Plan) provide for the issuance of stock options, SARs, restricted stock units and other stock-based awards. Each plan allows FCX to grant awards for up to 8.0 million common shares to eligible participants and also allows FCX senior executives to elect to receive restricted stock units in place of all or part of their cash incentive compensation. Restricted stock unit grants vest over three years and are valued on the date of grant at 50 percent above the cash incentive compensation they replace. FCX granted 0.2 million shares of restricted stock units in 2004 and 0.1 million shares in each of 2003 and 2002.
66
In May 2004, FCX’s shareholders approved the “2004 Director Compensation Plan” (the 2004 Plan). The 2004 Plan authorizes awards of options and restricted stock units for up to 1.0 million shares and the one-time grant of 66,882 SARs.
Awards granted under all of the plans generally expire 10 years after the date of grant and vest in 25 percent annual increments beginning one year from the date of grant. Awards for 0.7 million shares under the 2004 Plan, 6.7 million shares under the 2003 Plan and 0.1 million shares under the 1999 Plan were available for new grants as of December 31, 2004. A summary of stock options outstanding, including 0.3 million SARs, follows:
| 2004 | 2003 | 2002 | |||||||||||||
| Weighted | Weighted | Weighted | |||||||||||||
| Number | Average | Number | Average | Number | Average | ||||||||||
| Of | Option | Of | Option | of | Option | ||||||||||
| Options | Price | Options | Price | Options | Price | ||||||||||
| Balance at January 1 | 10,327,745 | $ | 19.38 | 15,944,087 | $ | 17.82 | 15,711,696 | $ | 18.55 | ||||||
| Granted | 1,472,399 | 34.74 | 1,315,172 | 20.09 | 3,706,313 | 14.30 | |||||||||
| Exercised | (4,581,273 | ) | 18.42 | (6,625,475 | ) | 15.75 | (1,051,010 | ) | 11.18 | ||||||
| Expired/Forfeited | (352,066 | ) | 21.65 | (306,039 | ) | 19.93 | (2,422,912 | ) | 20.00 | ||||||
| Balance at December 31 | 6,866,805 | 23.20 | 10,327,745 | 19.38 | 15,944,087 | 17.82 | |||||||||
In 1998, two FCX executive officers were granted stock options under the 1995 Stock Option Plan to purchase a total of 2.6 million shares of FCX stock at $19.03 per share. The options were granted in return for a five-year cap on their cash incentive compensation. Summary information of stock options outstanding at December 31, 2004, excluding SARs, follows:
| Options Outstanding | Options Exercisable | |||||||||||
| Weighted | Weighted | Weighted | ||||||||||
| Number | Average | Average | Number | Average | ||||||||
| Of | Remaining | Option | Of | Option | ||||||||
| Range of Exercise Prices | Options | Life | Price | Options | Price | |||||||
| $9.09 to $11.31 | 408,875 | 6.0 years | $ | 10.99 | 180,125 | $ | 10.61 | |||||
| $13.78 to $20.27 | 3,472,663 | 5.7 years | 15.65 | 988,943 | 15.59 | |||||||
| $26.69 to $36.77 | 2,683,425 | 8.8 years | 35.34 | 1,350,425 | 34.75 | |||||||
| 6,564,963 | 2,519,493 | |||||||||||
NOTE 8. INCOME TAXES
The components of FCX’s deferred taxes follow (in thousands):
| December 31, | |||||||
| 2004 | 2003 | ||||||
| Deferred tax asset: | |||||||
| Foreign tax credits | $ | 417,853 | $ | 381,184 | |||
| Atlantic Copper net operating loss carryforwards | 148,338 | 98,896 | |||||
| U.S. alternative minimum tax credits | 91,755 | 84,852 | |||||
| Intercompany profit elimination | 27,130 | 17,592 | |||||
| Valuation allowance | (657,946 | ) | (564,932 | ) | |||
| Total deferred tax asset | 27,130 | 17,592 | |||||
| Deferred tax liability: | |||||||
| Property, plant, equipment and development costs | (702,586 | ) | (683,245 | ) | |||
| Undistributed earnings in PT Freeport Indonesia | (172,491 | ) | (141,246 | ) | |||
| Deferred mining cost | (77,145 | ) | (49,922 | ) | |||
| Other | (7,324 | ) | (10,449 | ) | |||
| Total deferred tax liability | (959,546 | ) | (884,862 | ) | |||
| Net deferred tax liability | $ | (932,416 | ) | $ | (867,270 | ) | |
67
FCX has provided a valuation allowance equal to its tax credit carryforwards ($509.6 million at December 31, 2004, and $466.0 million at December 31, 2003) as these would only be used should FCX be required to pay regular U.S. tax, which is considered unlikely for the foreseeable future and because the foreign tax credits expire after ten years. Atlantic Copper is subject to taxation in Spain and has not generated significant taxable income in recent years. FCX has provided a valuation allowance equal to the future tax benefits resulting from Atlantic Copper’s net operating losses totaling $423.8 million at December 31, 2004, and $282.6 million at December 31, 2003, which expire through the year 2019.
PT Freeport Indonesia’s Indonesian income tax returns prior to 2000 have been audited or are no longer subject to review by the Indonesian tax authorities. FCX’s provision for income taxes consists of the following (in thousands):
| 2004 | 2003 | 2002 | ||||||||
| Current income taxes: | ||||||||||
| Indonesian | $ | 236,836 | $ | 218,017 | $ | 186,418 | ||||
| United States and other | 7,049 | 9,383 | 7,624 | |||||||
| 243,885 | 227,400 | 194,042 | ||||||||
| Deferred Indonesian taxes | 86,795 | 110,653 | 51,476 | |||||||
| Provision for income taxes per income statements | 330,680 | 338,053 | 245,518 | |||||||
| Tax effect of cumulative effect adjustments | - | 6,306 | (2,352 | ) | ||||||
| Total provision for income taxes | $ | 330,680 | $ | 344,359 | $ | 243,166 | ||||
Differences between income taxes computed at the contractual Indonesian tax rate and income taxes recorded follow (dollars in thousands):
| 2004 | 2003 | 2002 | ||||||||||||||
| Amount | Percent | Amount | Percent | Amount | Percent | |||||||||||
| Income taxes computed at the contractual Indonesian tax rate | $ | 201,034 | 35 | % | $ | 204,321 | 35 | % | $ | 157,382 | 35 | % | ||||
| Indonesian withholding tax on: | ||||||||||||||||
| Earnings/dividends | 47,347 | 8 | 42,632 | 7 | 34,955 | 8 | ||||||||||
| Interest | 1,120 | - | 1,223 | - | 1,551 | - | ||||||||||
| Other adjustments: | ||||||||||||||||
| Parent company costs | 40,435 | 7 | 61,923 | 11 | 45,279 | 10 | ||||||||||
| Atlantic Copper net loss | 36,186 | 6 | 20,488 | 3 | 12,093 | 3 | ||||||||||
| U.S. alternative minimum tax | 8,200 | 2 | 9,300 | 2 | 8,200 | 2 | ||||||||||
| Intercompany interest expense | - | - | (4,789 | ) | (1 | ) | (8,496 | ) | (2 | ) | ||||||
| Other, net | (3,642 | ) | - | 2,955 | 1 | (5,446 | ) | (1 | ) | |||||||
| Provision for income taxes per income statements | 330,680 | 58 | % | 338,053 | 58 | % | 245,518 | 55 | % | |||||||
| Tax effect of cumulative effect adjustments | - | 6,306 | (2,352 | ) | ||||||||||||
| Total provision for income taxes | $ | 330,680 | $ | 344,359 | $ | 243,166 | ||||||||||
NOTE 9. INVESTMENT IN PT SMELTING AND EMPLOYEE BENEFITS
PT Smelting. PT Smelting, an Indonesian company, operates a smelter/refinery in Gresik, Indonesia. In 2004, PT Smelting increased its stated production capacity of 200,000 metric tons of copper metal per year to 250,000 metric tons. PT Freeport Indonesia, Mitsubishi Materials Corporation (Mitsubishi Materials), Mitsubishi Corporation (Mitsubishi) and Nippon Mining & Metals Co., Ltd. (Nippon) own 25 percent, 60.5 percent, 9.5 percent and 5 percent, respectively, of the outstanding PT Smelting common stock. PT Freeport Indonesia provides nearly all of PT Smelting’s copper concentrate requirements. Under the PT Smelting contract, for the first 15 years of PT Smelting’s commercial operations beginning December 1998, the treatment and refining charges on the majority of the concentrate PT Freeport Indonesia provides will not fall below specified minimum rates, subject to renegotiation in 2008. The rate was $0.23 per pound during the period from the commencement of PT Smelting’s operations in 1998 until April 2004, when it declined to a minimum of $0.21 per pound. In December 2003, PT Smelting’s shareholder agreement was amended to eliminate PT Freeport Indonesia’s assignment of its earnings in PT Smelting to support a 13 percent cumulative annual return to Mitsubishi Materials, Mitsubishi and Nippon for
68
the first 20 years of commercial operations. No amounts were paid under this assignment. PT Smelting had project-specific debt, nonrecourse to PT Freeport Indonesia, totaling $259.5 million at December 31, 2004, and $283.1 million at December 31, 2003.
Pension Plans. During 2000, FCX and FM Services Company elected to terminate their defined benefit pension plans covering substantially all U.S. and certain overseas expatriate employees and replace these plans, which have substantially the same provisions, with defined contribution plans, as further discussed below. All participants’ account balances in the defined benefit plans were fully vested on June 30, 2000, and interest credits continue to accrue under the plans until the assets are finally liquidated. The final distribution will occur once approved by the Internal Revenue Service and the Pension Benefit Guaranty Corporation. The plans’ investment portfolios were liquidated and invested in primarily short duration fixed-income securities in the fourth quarter of 2000 to reduce exposure to equity market volatility. All of the FCX plan assets shown in the table below relate to these plans and the unfunded liability totaled $2.2 million at December 31, 2004.
In February 2004, FCX established an unfunded Supplemental Executive Retirement Plan (SERP) for its two most senior executive officers. The SERP provides for retirement benefits payable in the form of a joint and survivor annuity or an equivalent lump sum. The annuity will equal a percentage of the executive’s highest average compensation for any consecutive three-year period during the five years immediately preceding the earlier of the executive’s retirement or completion of 25 years of credited service. The SERP benefit will be reduced by the value of all benefits due under FCX’s cash-balance pension plan and all other benefit plans sponsored by FCX or any other predecessor employer. Unrecognized prior service cost at inception of the SERP totaled $18.9 million and is being amortized over the five-year term of the executive officers’ current employment agreements. FCX also has an unfunded pension plan for its directors.
PT Freeport Indonesia has a defined benefit pension plan denominated in Indonesian rupiahs covering substantially all of its Indonesian national employees. PT Freeport Indonesia funds the plan and invests the assets in accordance with Indonesian pension guidelines. The pension obligation was valued at an exchange rate of 9,270 rupiah to one U.S. dollar on December 31, 2004, and 8,437 rupiah to one U.S. dollar on December 31, 2003. Labor laws enacted in 2003, which replace labor laws enacted in 2001, in Indonesia require that companies provide a minimum level of benefits to employees upon employment termination based on the reason for termination and the employee’s years of service. PT Freeport Indonesia’s pension benefit disclosures for 2003, as shown below, include the impact of this law as a $5.0 million increase in the benefit obligation and a component of unrecognized prior service cost being amortized over an approximate 11-year period.
Atlantic Copper has a contractual obligation denominated in euros to supplement amounts paid to certain retired Spanish national employees. Amended Spanish legislation required that Atlantic Copper begin funding its contractual obligation to the retired employees through a third party in November 2002. In August 2002, Atlantic Copper complied with the amended Spanish legislation by agreeing to fund 7.2 million euros annually for 15 years to an approved insurance company for its estimated 72 million euro contractual obligation to the retired employees. The insurance company invests the plan assets in accordance with Spanish regulations and Atlantic Copper has no control over these investments. Atlantic Copper is amortizing the unrecognized net actuarial loss over the remaining 12-year funding period.
Information as of December 31, 2004 and 2003, on the FCX (including FM Services Company’s plan and FCX’s SERP and director plans), PT Freeport Indonesia and Atlantic Copper plans follows (dollars in thousands):
69
FCX (U.S. and expatriate employees) | PT Freeport Indonesia (Indonesian employees) | Atlantic Copper (Spanish retirees) | ||||||||||||||||
| 2004 | 2003 | 2004 | 2003 | 2004 | 2003 | |||||||||||||
| Change in benefit obligation: | ||||||||||||||||||
| Benefit obligation at beginning of year | $ | (29,495 | ) | $ | (29,723 | ) | $ | (37,224 | ) | $ | (25,553 | ) | $ | (85,089 | ) | $ | (74,732 | ) |
| SERP and director plan additions | (21,300 | ) | - | - | - | - | - | |||||||||||
| Service cost | (731 | ) | - | (3,355 | ) | (3,148 | ) | - | - | |||||||||
| Interest cost | (2,633 | ) | (1,085 | ) | (3,365 | ) | (3,366 | ) | (5,035 | ) | (4,821 | ) | ||||||
| Actuarial gains (losses) | 888 | - | (3,819 | ) | (1,246 | ) | (608 | ) | (235 | ) | ||||||||
| Effect of changes in law | - | - | - | (5,031 | ) | - | - | |||||||||||
| Foreign exchange gain (loss) | - | - | 3,632 | (1,686 | ) | (4,572 | ) | (11,595 | ) | |||||||||
| Benefits paid | 8,077 | 1,313 | 3,243 | 2,806 | 7,805 | 6,294 | ||||||||||||
| Benefit obligation at end of year | (45,194 | ) | (29,495 | ) | (40,888 | ) | (37,224 | ) | (87,499 | ) | (85,089 | ) | ||||||
| Change in plan assets: | ||||||||||||||||||
| Fair value of plan assets at beginning of year | 24,071 | 24,633 | 18,536 | 13,861 | 8,275 | 6,071 | ||||||||||||
| Actual return on plan assets | 481 | 751 | 3,084 | 1,541 | - | - | ||||||||||||
Employer contributionsa | 135 | - | 3,694 | 3,281 | 9,370 | 8,498 | ||||||||||||
| Foreign exchange (loss) gain | - | - | (4,260 | ) | 1,551 | - | - | |||||||||||
| Benefits paid | (8,077 | ) | (1,313 | ) | (2,098 | ) | (1,698 | ) | (7,805 | ) | (6,294 | ) | ||||||
| Fair value of plan assets at end of year | 16,610 | 24,071 | 18,956 | 18,536 | 9,840 | 8,275 | ||||||||||||
| Funded status | (28,584 | ) | (5,424 | ) | (21,932 | ) | (18,688 | ) | (77,659 | ) | (76,814 | ) | ||||||
| Unrecognized net actuarial (gain) loss | (651 | ) | - | 12,075 | 6,994 | 7,892 | 8,801 | |||||||||||
| Unrecognized prior service cost | 15,647 | - | 6,897 | 8,601 | - | - | ||||||||||||
| Intangible asset/minimum liability adjustment | (14,135 | ) | - | (4,643 | ) | (2,220 | ) | - | - | |||||||||
| Accrued benefit cost | $ | (27,723 | ) | $ | (5,424 | ) | $ | (7,603 | ) | $ | (5,313 | ) | $ | (69,767 | ) | $ | (68,013 | ) |
| Accumulated benefit obligation | $ | (45,194 | ) | $ | (29,495 | ) | $ | (25,166 | ) | $ | (23,849 | ) | $ | (87,499 | ) | $ | (85,089 | ) |
| Weighted-average assumptions used to determine benefit obligations (percent): | ||||||||||||||||||
| Discount rate | 6.00 | b | N/A | 10.00 | 10.00 | 6.77 | 6.77 | |||||||||||
| Rate of compensation increase | N/A | b | N/A | 8.00 | c | 8.00 | - | - | ||||||||||
| Weighted-average assumptions to determine net periodic benefit cost (percent): | ||||||||||||||||||
| Discount rate | 6.25 | b | N/A | 10.00 | 10.00 | 6.77 | 6.77 | |||||||||||
| Expected return on plan assets | N/A | b | N/A | 7.50 | 10.00 | - | - | |||||||||||
| Rate of compensation increase | N/A | b | N/A | 8.00 | c | 8.00 | - | - |
| a. | Employer contributions for 2005 are expected to approximate $3.8 million for the PT Freeport Indonesia plan (based on a December 31, 2004, exchange rate of 9,270 Indonesian rupiah to one U.S. dollar), $9.8 million for the Atlantic Copper plan (based on a December 31, 2004, exchange rate of $1.36 per euro) and none for the FCX plan. |
| b. | As discussed above, FCX and FM Services Company elected to terminate their defined benefit pension plans and ceased accruing benefits on June 30, 2000. The assumptions shown only relate to the SERP. |
| c. | Rate of compensation increase assumption for 2005 is 10.0 percent for staff employees and 14.0 percent for non-staff employees and 8.0 percent for all years thereafter. |
The components of net periodic benefit cost for FCX’s, including the SERP and director plan, and, since October 1, 2002, FM Services Company’s pension plans
follow (in thousands):
| 2004 | 2003 | 2002 | |||||||
| Service cost | $ | 731 | $ | - | $ | - | |||
| Amortization of prior service cost | 5,416 | - | - | ||||||
| Interest cost | 2,633 | 1,085 | 887 | ||||||
| Actual return on plan assets | (481 | ) | (751 | ) | (639 | ) | |||
| Net periodic benefit cost | $ | 8,299 | $ | 334 | $ | 248 | |||
The components of net periodic benefit cost for PT Freeport Indonesia’s and Atlantic Copper’s pension plans follow (in thousands):
70
| PT Freeport Indonesia | Atlantic Copper | |||||||||||||||||
| 2004 | 2003 | 2002 | 2004 | 2003 | 2002 | |||||||||||||
| Service cost | $ | 3,355 | $ | 3,148 | $ | 2,041 | $ | - | $ | - | $ | - | ||||||
| Interest cost | 3,365 | 3,366 | 2,166 | 5,035 | 4,821 | 4,266 | ||||||||||||
| Expected return on plan assets | (1,829 | ) | (1,888 | ) | (1,217 | ) | - | - | - | |||||||||
| Amortization of prior service cost | 969 | 894 | 514 | - | - | - | ||||||||||||
| Amortization of net actuarial loss | 243 | 478 | 242 | 1,517 | 1,316 | 785 | ||||||||||||
| Net periodic benefit cost | $ | 6,103 | $ | 5,998 | $ | 3,746 | $ | 6,552 | $ | 6,137 | $ | 5,051 | ||||||
The pension plan weighted-average asset allocations for the FCX and PT Freeport Indonesia plans at December 31, 2004 and 2003, follow:
| FCX | PT Freeport Indonesia | |||||||
| 2004 | 2003 | 2004 | 2003 | |||||
| Debt securities | 99 | % | 97 | % | 5 | % | 5 | % |
| Cash and bank deposits | 1 | 3 | 95 | 95 | ||||
| Total | 100 | % | 100 | % | 100 | % | 100 | % |
The FCX and FM Services Company pension plans were terminated in 2000 as discussed above. Therefore, the entire asset balance of $16.6 million at December 31, 2004, will be liquidated and any unfunded benefits will be paid after Internal Revenue Service and Pension Benefit Guaranty Corporation approval. The expected benefit payments for FCX’s SERP and director plan total $0.2 million for each year in the period 2005 through 2008, $15.4 million in 2009 and $14.4 million thereafter. The rupiah benefit payments that are expected to be paid for PT Freeport Indonesia‘s pension plan (based on a December 31, 2004, exchange rate of 9,270 Indonesian rupiah to one U.S. dollar) total $3.8 million in 2005, $3.4 million in 2006, $4.0 million in 2007, $5.1 million in 2008, $6.0 million in 2009 and $30.9 million for 2010 through 2014. Atlantic Copper’s plan is administered by a third-party insurance company and Atlantic Copper is not provided asset allocations or benefit payment projections.
Other Benefits. FCX and FM Services Company also provide certain health care and life insurance benefits for retired employees. FCX and FM Services Company have the right to modify or terminate these benefits. The initial health care cost trend rate used for the other benefits was 10 percent for 2005, decreasing ratably each year until reaching 5 percent in 2010. A one-percentage-point increase or decrease in assumed health care cost trend rates would not have a significant impact on total service or interest cost. Information on the employee health care and life insurance benefits FCX and FM Services Company provide follows (in thousands):
| 2004 | 2003 | |||||
| Change in benefit obligation: | ||||||
| Benefit obligation at beginning of year | $ | (5,410 | ) | $ | (4,812 | ) |
| Service cost | (137 | ) | (127 | ) | ||
| Interest cost | (335 | ) | (327 | ) | ||
| Actuarial gains (losses) | 148 | (455 | ) | |||
| Plan amendment | 118 | - | ||||
| Participant contributions | (160 | ) | (192 | ) | ||
| Benefits paid | 427 | 503 | ||||
| Benefit obligation at end of year | (5,349 | ) | (5,410 | ) | ||
| Change in plan assets: | ||||||
| Fair value of plan assets at beginning of year | - | - | ||||
| Employer/participant contributions | 427 | 503 | ||||
| Benefits paid | (427 | ) | (503 | ) | ||
| Fair value of plan assets at end of year | - | - | ||||
| Funded status | (5,349 | ) | (5,410 | ) | ||
| Unrecognized net actuarial loss | 450 | 619 | ||||
| Unrecognized prior service cost | (483 | ) | (503 | ) | ||
| Accrued benefit cost | $ | (5,382 | ) | $ | (5,294 | ) |
| Discount rate assumption (percent) | 6.00 | 6.25 | ||||
71
Expected benefit payments for these plans total $0.4 million for each year in the period from 2005 through 2009, and $2.2 million for the period from 2010 through 2014. The components of net periodic benefit cost for FCX’s and, since October 1, 2002, FM Services Company’s health care and life insurance benefits follow (in thousands):
| 2004 | 2003 | 2002 | |||||||
| Service cost | $ | 137 | $ | 127 | $ | 57 | |||
| Interest cost | 335 | 327 | 152 | ||||||
| Amortization of prior service (credit) cost | (139 | ) | 273 | (62 | ) | ||||
| Amortization of net actuarial loss (gain) | 22 | 14 | (33 | ) | |||||
| Net periodic benefit cost | $ | 355 | $ | 741 | $ | 114 | |||
FCX and FM Services Company have employee savings plans under Section 401(k) of the Internal Revenue Code that generally allow eligible employees to contribute up to 50 percent of their pre-tax compensation, but no more than a specified annual limit (currently $14,000). FCX and FM Services Company match 100 percent of the first 5 percent of the employees’ contribution. New plan participants vest 100 percent in FCX’s and FM Services Company’s matching contributions upon three years of service.
During 2000, FCX and FM Services Company also established additional defined contribution plans for substantially all their employees following their decision to terminate their defined benefit pension plans. Under these plans, FCX and FM Services Company contribute amounts to individual accounts totaling either 4 percent or 10 percent of each employee’s pay, depending on a combination of each employee’s age and years of service. The costs charged to operations for FCX’s and, since October 1, 2002, FM Services Company’s employee savings plans and defined contribution plans totaled $3.2 million in 2004, $2.8 million in 2003 and $1.2 million in 2002. FCX and FM Services Company have other employee benefit plans, certain of which are related to FCX’s performance, which costs are recognized currently in general and administrative expense. Atlantic Copper has a defined contribution plan and recorded charges totaling $0.5 million in 2004, $0.4 million in 2003 and $0.3 million in 2002 for annual service costs related to this plan.
During 2004, Atlantic Copper undertook a cost reduction and operational enhancement plan designed to reduce unit costs, including a reduction in workforce, and enhance operational and administrative efficiencies. In connection with implementing this cost reduction and operational enhancement plan, Atlantic Copper submitted a workforce reduction plan to the Spanish Labour Authority and, in December 2004, received approval for this workforce reduction plan. Atlantic Copper recorded a $12.0 million charge in 2004 related to the workforce reduction under this plan. These charges include $8.1 million in one-time termination benefits for those affected employees eligible for early retirement benefits, $0.8 million in severance payments for those affected employees not eligible for early retirement and $3.1 million for contract termination costs. Atlantic Copper paid $1.4 million of these benefits in December 2004 and expects to pay the balance in the first quarter of 2005.
NOTE 10. COMMITMENTS AND CONTINGENCIES
Grasberg Open-Pit Slippage Events. On October 9, 2003, a slippage of material occurred in a section of the Grasberg open pit, resulting in eight fatalities. On December 12, 2003, a debris flow involving a relatively small amount of loose material occurred in the same section of the open pit resulting in only minor property damage. All material involved in the affected mining areas has been removed. The events caused PT Freeport Indonesia to alter its short-term mine sequencing plans and to focus its open-pit operations on accelerating the removal of overburden from the south wall to restore safe access to high-grade ore areas in the pit. In April 2004, PT Freeport Indonesia established safe access and initiated mining in higher-grade ore areas while continuing overburden removal activities. While PT Freeport Indonesia resumed normal milling rates in June 2004, no assurance can be given that similar events will not occur in the future.
As a result of the fourth-quarter 2003 slippage and debris flow events, PT Freeport Indonesia notified its copper concentrate customers that it was declaring force majeure under the terms of its contracts as it would be unable to satisfy its annual sales and delivery commitments. In December 2004, PT Freeport Indonesia terminated the force majeure that had been in effect since December 2003 under its concentrate sales contracts.
PT Freeport Indonesia maintains property damage and business interruption insurance related to its operations. FCX and its insurers entered into an insurance settlement agreement in December 2004 (Settlement Agreement). Under the Settlement Agreement, all claims that arose from the fourth-quarter 2003 slippage and debris flow events in the Grasberg open-pit mine were settled. The insurers agreed to pay an aggregate of $125.0 million, inclusive of interest and the $20.0 million previously paid to PT Freeport Indonesia in the third quarter of 2004, in connection with its claims. Through December 31, 2004, the insurers had paid $94.5
72
million and the remaining $30.5 million was paid in January 2005. After considering its joint venture partner’s interest in the proceeds, PT Freeport Indonesia’s joint venture share of proceeds totaled $95.0 million. As a result of the settlement, FCX recorded on its income statement an $87.0 million gain on insurance settlement for the business interruption recovery and an $8.0 million gain to production costs for the property loss recovery for a net gain of $48.8 million, after taxes and minority interest sharing, in 2004.
Environmental, Reclamation and Mine Closure. FCX has an environmental policy committing it not only to compliance with federal, state and local environmental statutes and regulations, but also to continuous improvement of its environmental performance at every operational site. FCX believes that its operations are being conducted pursuant to applicable permits and are in compliance in all material respects with applicable environmental laws, rules and regulations. FCX incurred aggregate environmental capital expenditures and other environmental costs, including Rio Tinto’s share, totaling $65.1 million in 2004, $72.1 million in 2003 and $62.6 million in 2002.
The ultimate amount of reclamation and closure costs to be incurred at PT Freeport Indonesia’s operations will be determined based on applicable laws and regulations and PT Freeport Indonesia’s assessment of appropriate remedial activities in the circumstances, after consultation with governmental authorities, affected local residents and other affected parties and cannot currently be projected with precision. Estimates of the ultimate reclamation and closure costs PT Freeport Indonesia will incur in the future involve complex issues requiring integrated assessments over a period of many years and are subject to revision over time as more complete studies are performed. Some reclamation costs will be incurred during mining activities, while most closure costs and the remaining reclamation costs will be incurred at the end of mining activities, which are currently estimated to continue for more than 35 years.
Effective January 1, 2003, FCX adopted SFAS No. 143 (see Note 1). At December 31, 2004 and 2003, PT Freeport Indonesia revised its reclamation and closure estimates for (1) changes in the projected timing of certain reclamation costs, (2) changes in certain cost estimates and (3) additional asset retirement obligations incurred during 2003. At December 31, 2004, FCX estimated these aggregate obligations to be approximately $149 million for PT Freeport Indonesia and $18 million for Atlantic Copper, and estimated PT Freeport Indonesia’s aggregate discounted asset retirement obligations to be $22.0 million and Atlantic Copper’s to be $0.8 million. At December 31, 2003, FCX estimated these aggregate obligations to be approximately $130 million for PT Freeport Indonesia and $17 million for Atlantic Copper, and estimated PT Freeport Indonesia’s aggregate discounted asset retirement obligations to be $25.7 million and Atlantic Copper’s to be $0.8 million. The changes reduced the related asset balances and are not expected to have a material impact on future net income. A rollforward of FCX’s consolidated discounted asset retirement obligations for 2004 and 2003 follows (in thousands):
| 2004 | 2003 | |||||
| Asset retirement obligation at beginning of year | $ | 26,486 | $ | 28,485 | ||
| Liabilities incurred | - | 605 | ||||
| Liabilities settled | - | (1,222 | ) | |||
| Accretion expense | 2,985 | 2,852 | ||||
| Revision for changes in estimates | (6,698 | ) | (4,333 | ) | ||
| Foreign exchange loss | 75 | 99 | ||||
| Asset retirement obligation at end of year | $ | 22,848 | $ | 26,486 | ||
In 1996, PT Freeport Indonesia began contributing to a cash fund ($6.0 million balance at December 31, 2004) designed to accumulate at least $100 million (including interest) by the end of its Indonesian mining activities. PT Freeport Indonesia plans to use this fund, including accrued interest, to pay the above-mentioned mine closure and reclamation costs. Any costs in excess of the $100 million fund would be funded by operational cash flow or other sources. Future changes in regulations could require FCX to incur additional costs that would be charged against future operations. Estimates involving environmental matters are by their nature imprecise and can be expected to be revised over time because of changes in government regulations, operations, technology and inflation.
Contract of Work. FCX is entitled to mine in Indonesia under the “Contract of Work” between PT Freeport Indonesia and the Government of Indonesia. The original Contract of Work was entered into in 1967 and was replaced with a new Contract of Work in 1991. The initial term of the current Contract of Work expires in 2021, but can be extended by PT Freeport Indonesia for two 10-year periods, subject to Indonesian government approval, which cannot be withheld or delayed unreasonably. Given the importance of contracts of work under the Indonesian legal system and PT Freeport Indonesia’s over 35 years of working with the Indonesian
73
government, which included entering into the Contract of Work in 1991 well before the expiration of the 1967 Contract of Work, PT Freeport Indonesia fully expects that the government will approve the extensions as long as it continues to comply with the terms of the Contract of Work.
Social and Economic Development Programs. FCX has a comprehensive social, employment and human rights policy to ensure that its operations are conducted in a manner respecting basic human rights, the laws and regulations of the host country, and the culture of the people who are indigenous to the areas in which FCX operates. In 1996, PT Freeport Indonesia established the Freeport Partnership Fund for Community Development, which was previously called the Freeport Fund for Irian Jaya Development, through which PT Freeport Indonesia has made available funding and expertise to support the economic and social development of the area. PT Freeport Indonesia has committed to provide one percent of its annual revenue for the development of the local people through the Freeport Partnership Fund for Community Development. PT Freeport Indonesia charged $17.5 million in 2004, $17.4 million in 2003 and $15.2 million in 2002 to production costs for this commitment.
Long-Term Contracts and Operating Leases. Atlantic Copper has firm contractual commitments with parties other than PT Freeport Indonesia to purchase concentrate totaling 415,000 metric tons in 2005, 384,000 metric tons in 2006, 275,000 metric tons in 2007 and 160,000 metric tons in 2008 at market prices.
As of December 31, 2004, FCX’s aggregate minimum annual contractual payments, including Rio Tinto’s share, under noncancelable long-term operating leases which extend to 2030 totaled $7.6 million in 2005, $6.8 million in 2006, $6.7 million in 2007, $6.6 million in 2008, $6.0 million in 2009 and $6.2 million thereafter. Minimum payments under operating leases have not been reduced by aggregate minimum sublease rentals of $1.1 million due under noncancelable subleases. Total aggregate rental expense under operating leases amounted to $7.9 million in 2004, $6.6 million in 2003 and $2.4 million in 2002.
Share Purchase Program. In June 2000, FCX’s Board of Directors authorized a 20-million-share increase in FCX’s open market share purchase program, bringing the total shares approved for purchase under this program to 80 million. From inception of this program in July 1995 through October 2003, FCX has purchased a total of 70.7 million shares for $1.24 billion (an average of $17.53 per share). In October 2003, FCX’s Board of Directors approved a new open market share purchase program for up to 20 million shares which replaced the previous program. The timing of future purchases of common stock is dependent upon many factors including the price of FCX’s common shares, its cash flow and financial position, and general economic and market conditions. As discussed in Note 5, two of FCX’s senior notes and, in certain circumstances, FCX’s credit facility contain limitations on common stock purchases. In 2004, FCX purchased 3.4 million shares of its common stock for $99.5 million ($29.39 per share average) under its 20-million-share purchase program, of which 16.6 million shares remain available.
Contingencies For Non-Income Taxes.Atlantic Copper and PT Freeport Indonesia accrue and pay certain non-income taxes and other government charges, such as value-added, withholding, payroll, local and other taxes and charges. For certain transactions, issues arise as to the applicability of these other taxes and charges. Based on management’s review and prior experience, a reserve for the estimated liability has been established (see Note 6).
NOTE 11. FINANCIAL INSTRUMENTS
FCX and its subsidiaries have entered into derivative contracts in limited instances to achieve specific objectives. Currently, these objectives principally relate to managing risks associated with foreign currency and commodity price risks. In addition, in response to volatility in the Indonesian rupiah and Australian dollar currencies, FCX has sought to manage certain foreign currency risks with PT Freeport Indonesia’s mining operations. In the past, FCX has also entered into derivative contracts related to PT Freeport Indonesia’s exposure to copper and gold prices, but activities in this regard since 1997 have been limited to establishing fixed prices for open copper sales under PT Freeport Indonesia’s concentrate sales contracts. FCX does not enter into derivative contracts for speculative purposes.
Summarized below are financial instruments whose carrying amounts are not equal to their fair value and unmatured derivative financial instruments at December 31, 2004 and 2003 (in thousands). Fair values are based on quoted market prices and other available market information.
74
| 2004 | 2003 | |||||||||||
| Carrying | Fair | Carrying | Fair | |||||||||
| Amount | Value | Amount | Value | |||||||||
| Commodity contracts: | ||||||||||||
| Open contracts in asset position | $ | 950 | $ | 950 | $ | - | $ | - | ||||
| Open contracts in liability position | (1,806 | ) | (1,806 | ) | (3,374 | ) | (3,374 | ) | ||||
| Embedded derivatives in concentrate sales contracts | 16,082 | 16,082 | 10,611 | 10,611 | ||||||||
| Foreign exchange contracts: | ||||||||||||
| $U.S./Indonesian rupiah | 2,879 | 2,879 | - | - | ||||||||
Long-term debta | (1,951,906 | ) | (2,353,987 | ) | (2,228,330 | ) | (3,277,320 | ) | ||||
| Interest rate swap contracts | (96 | ) | (96 | ) | (1,576 | ) | (1,576 | ) | ||||
a. Includes redeemable preferred stock classified as debt in accordance with SFAS No. 150 (see Note 5).
FCX follows SFAS No. 133 and changes in the fair value of unrealized derivative contracts that qualify as hedges are not reported in current earnings, but are included in other comprehensive income (see Note 1). A recap of gains (losses) charged to earnings for redeemable preferred stock redemptions, derivative contracts and embedded derivatives follows (in millions):
| 2004 | 2003 | 2002 | ||||||||
| FCX: | ||||||||||
| Silver-Denominated preferred stock | $ | (1.4 | ) | $ | 1.7 | $ | 0.8 | |||
| Gold-Denominated preferred stock | - | 22.1 | - | |||||||
| PT Freeport Indonesia: | ||||||||||
| Foreign currency exchange contracts | - | - | 11.0 | |||||||
| Embedded derivatives in concentrate sales contracts | 56.9 | 38.9 | 1.0 | |||||||
| Atlantic Copper: | ||||||||||
| Foreign currency exchange contracts | - | 9.6 | (1.2 | ) | ||||||
| Forward copper contracts | (5.6 | ) | 8.0 | 0.6 | ||||||
| Interest rate contracts | (1.4 | ) | (2.1 | ) | (3.2 | ) | ||||
Commodity Contracts. From time to time, PT Freeport Indonesia has entered into forward and option contracts to hedge the market risk associated with fluctuations in the prices of commodities it sells. The primary objective of these contracts has been to set a minimum price and the secondary objective is to retain market upside, if available at a reasonable cost. As of December 31, 2004, FCX had no price protection contracts relating to its mine production. FCX has outstanding gold-denominated and silver-denominated redeemable preferred stock with dividends and redemption amounts determined by commodity prices. FCX elected to continue its historical accounting for its redeemable preferred stock indexed to commodities under the provisions of SFAS No. 133 which allow such instruments issued before January 1, 1998, to be excluded from those instruments required to be adjusted for changes in their fair values. Therefore, FCX’s redeemable preferred stock is recorded at its original issue value less redemptions, and totaled $192.4 million at December 31, 2004 (see Note 5).
Certain of PT Freeport Indonesia’s concentrate sales contracts allow for final pricing in future periods. Under SFAS No. 133, these pricing terms cause a portion of the contracts to be considered embedded derivatives, which must be recorded at fair value. PT Freeport Indonesia adjusts its revenues for these embedded derivatives to reflect fair value based on forward prices for the final pricing periods on each reporting date. Changes in the fair value of these embedded derivatives are recorded in current period revenues.
Atlantic Copper enters into forward copper contracts designed to hedge its copper price risk whenever its physical purchases and sales pricing periods do not match. Although these contracts are intended to hedge against changes in copper prices, they do not qualify for hedge accounting treatment under SFAS No. 133 because Atlantic Copper bases its hedging contracts on its net sales and purchases position, and contracts to hedge a net position do not qualify for hedge accounting under SFAS No. 133. At December 31, 2004, Atlantic Copper held forward copper sales contracts for 12.7 million pounds at an average price of $1.40 per pound through March 2005.
75
Foreign Currency Exchange Contracts. PT Freeport Indonesia and Atlantic Copper enter into foreign currency forward contracts to hedge the market risks of their forecasted costs denominated in a currency other than the U.S. dollar, their functional currency. The primary objective of these contracts is either to lock in an exchange rate or to minimize the impact of adverse exchange rate changes. As of December 31, 2004, PT Freeport Indonesia had foreign currency contracts to hedge 450.0 billion in rupiah payments from April 2005 through December 2005, or approximately 32 percent of aggregate projected rupiah payments for 2005, at an average exchange rate of 10,059 rupiah to one U.S. dollar. PT Freeport Indonesia accounts for these contracts as cash flow hedges. As of December 31, 2004, PT Freeport Indonesia expects to reclass $2.9 million of unrealized gains to 2005 earnings related to its outstanding foreign currency contracts.
Debt and Interest Rate Contracts. Atlantic Copper entered into interest rate swaps to manage exposure to interest rate changes on a portion of its variable-rate debt. The primary objective of these contracts is to lock in an interest rate considered to be favorable. Under the terms of its swaps, Atlantic Copper will pay 3.6 percent on $36.5 million in the first quarter of 2005. Interest on comparable floating rate debt averaged 3.6 percent in 2004, 4.4 percent in 2003 and 1.9 percent in 2002, resulting in additional interest costs totaling $1.4 million in 2004, $2.1 million in 2003 and $3.2 million in 2002.
Atlantic Copper is a party to letters of credit totaling $13.0 million at December 31, 2004. Fair value of these letters of credit approximates their face value at December 31, 2004.
NOTE 12. SEGMENT INFORMATION
FCX follows SFAS No. 131, “Disclosures About Segments of an Enterprise and Related Information,” which requires that companies disclose segment data based on how management makes decisions about allocating resources to segments and measuring their performance. FCX has two operating segments: “mining and exploration” and “smelting and refining.” The mining and exploration segment includes the copper and gold mining operations of PT Freeport Indonesia in Indonesia and FCX’s Indonesian exploration activities. The smelting and refining segment includes Atlantic Copper’s operations in Spain and PT Freeport Indonesia’s equity investment in PT Smelting in Gresik, Indonesia. The segment data presented below were prepared on the same basis as the consolidated FCX financial statements.
76
| Mining and Exploration | Smelting and Refining | Eliminations and Other | FCX Total | ||||||||||
| (In Thousands) | |||||||||||||
| 2004 | |||||||||||||
| Revenues | $ | 1,746,573 | a | $ | 873,700 | $ | (248,407 | ) | $ | 2,371,866 | |||
| Production and delivery | 760,131 | 914,452 | (224,292 | )b | 1,450,291 | ||||||||
| Depreciation and amortization | 168,195 | 28,632 | 9,581 | 206,408 | |||||||||
| Exploration expenses | 8,471 | - | 193 | 8,664 | |||||||||
| General and administrative expenses | 151,944 | c | 14,196 | (76,213 | )c | 89,927 | |||||||
| Gain on insurance settlement | (87,000 | ) | - | - | (87,000 | ) | |||||||
| Operating income (loss) | $ | 744,832 | $ | (83,580 | ) | $ | 42,324 | $ | 703,576 | ||||
| Equity in PT Smelting earnings | $ | - | $ | 2,045 | $ | - | $ | 2,045 | |||||
| Interest expense, net | $ | 22,209 | $ | 13,783 | $ | 112,111 | $ | 148,103 | |||||
| Provision for income taxes | $ | 266,372 | $ | - | $ | 64,308 | $ | 330,680 | |||||
| Capital expenditures | $ | 119,426 | $ | 21,792 | $ | (219 | ) | $ | 140,999 | ||||
| Total assets | $ | 4,070,767 | d | $ | 753,883 | e | $ | 262,345 | $ | 5,086,995 | |||
| 2003 | |||||||||||||
| Revenues | $ | 1,744,580 | a | $ | 910,417 | $ | (442,832 | ) | $ | 2,212,165 | |||
| Production and delivery | 631,951 | 892,681 | (453,306 | )b | 1,071,326 | ||||||||
| Depreciation and amortization | 190,450 | 28,464 | 11,889 | 230,803 | |||||||||
| Exploration expenses | 6,284 | - | 165 | 6,449 | |||||||||
| General and administrative expenses | 123,408 | c | 11,023 | (54,152 | )c | 80,279 | |||||||
| Operating income (loss) | $ | 792,487 | $ | (21,751 | ) | $ | 52,572 | $ | 823,308 | ||||
| Equity in PT Smelting earnings | $ | - | $ | 5,609 | $ | - | $ | 5,609 | |||||
| Interest expense, net | $ | 44,861 | $ | 16,675 | $ | 135,481 | $ | 197,017 | |||||
| Provision for income taxes | $ | 273,378 | $ | - | $ | 64,675 | $ | 338,053 | |||||
| Capital expenditures | $ | 129,029 | $ | 9,941 | $ | 216 | $ | 139,186 | |||||
| Total assets | $ | 3,656,714 | d | $ | 689,213 | e | $ | 372,439 | $ | 4,718,366 | |||
| 2002 | |||||||||||||
| Revenues | $ | 1,519,010 | a | $ | 768,680 | $ | (377,228 | ) | $ | 1,910,462 | |||
| Production and delivery | 554,870 | 729,789 | (346,197 | )b | 938,462 | ||||||||
| Depreciation and amortization | 218,716 | 27,652 | 14,078 | 260,446 | |||||||||
| Exploration expenses | 2,965 | - | 147 | 3,112 | |||||||||
| General and administrative expenses | 55,302 | c | 8,675 | 4,328 | c | 68,305 | |||||||
| Operating income (loss) | $ | 687,157 | $ | 2,564 | $ | (49,584 | ) | $ | 640,137 | ||||
| Equity in PT Smelting losses | $ | - | $ | 4,181 | $ | - | $ | 4,181 | |||||
| Interest expense, net | $ | 71,424 | $ | 18,436 | $ | 81,349 | $ | 171,209 | |||||
| Provision for income taxes | $ | 221,527 | $ | - | $ | 23,991 | $ | 245,518 | |||||
| Capital expenditures | $ | 181,092 | $ | 5,108 | $ | 1,804 | $ | 188,004 | |||||
| Total assets | $ | 3,339,449 | d | $ | 650,640 | e | $ | 202,104 | $ | 4,192,193 | |||
| a. | Includes PT Freeport Indonesia’s sales to PT Smelting totaling $696.0 million in 2004, $510.2 million in 2003 and $391.1 million in 2002. |
| b. | Includes deferrals (recognition) of intercompany profits on 25 percent of PT Freeport Indonesia’s sales to PT Smelting, for which the final sale has not occurred, totaling $13.8 million in 2004, $(7.0) million in 2003 and $8.4 million in 2002. |
| c. | Includes charges to the mining and exploration segment for FCX stock option exercises which are eliminated in consolidation totaling $87.3 million in 2004, $57.8 million in 2003 and $5.5 million in 2002. |
| d. | Includes PT Freeport Indonesia’s trade receivables with PT Smelting totaling $87.5 million at December 31, 2004, $33.5 million at December 31, 2003, and $51.2 million at December 31, 2002. |
| e. | Includes PT Freeport Indonesia’s equity investment in PT Smelting totaling $47.8 million at December 31, 2004, $58.2 million at December 31, 2003, and $44.6 million at December 31, 2002. |
77
Through its operating subsidiaries, FCX markets its products worldwide primarily pursuant to the terms of long-term contracts. As a percentage of consolidated revenues, revenues under long-term contracts totaled approximately 96 percent in 2004 and 95 percent in 2003 and 2002. The only customer under long-term contracts with over ten percent of revenues in at least one of the past three years is PT Smelting with 29 percent in 2004, 23 percent in 2003 and 20 percent in 2002.
FCX revenues attributable to various countries based on the location of the customer follow (in thousands):
| 2004 | 2003 | 2002 | |||||||
| Indonesia (PT Smelting) | $ | 696,022 | $ | 510,245 | $ | 391,071 | |||
| Spain | 490,647 | 372,791 | 378,817 | ||||||
| Japan | 414,386 | 412,404 | 342,899 | ||||||
| Korea | 142,924 | 69,134 | 79,352 | ||||||
| Switzerland | 64,145 | 130,518 | 146,062 | ||||||
| Others | 563,742 | 717,073 | 572,261 | ||||||
| Total | $ | 2,371,866 | $ | 2,212,165 | $ | 1,910,462 | |||
FCX revenues attributable to the products it produces follow (in thousands):
| 2004 | 2003 | 2002 | |||||||
Copper in concentratesa | $ | 996,331 | $ | 612,443 | $ | 599,358 | |||
| Gold in concentrates | 516,554 | 685,230 | 546,048 | ||||||
| Silver in concentrates | 17,091 | 16,374 | 14,740 | ||||||
| Refined copper products | 716,959 | 603,177 | 532,769 | ||||||
| Gold and silver in slimes | 124,383 | 272,050 | 209,136 | ||||||
| Royalties | (43,498 | ) | (26,472 | ) | (24,532 | ) | |||
| Sulphur and other | 44,046 | 49,363 | 32,943 | ||||||
| Total | $ | 2,371,866 | $ | 2,212,165 | $ | 1,910,462 | |||
| a. | Amounts are net of treatment and refining charges totaling $175.9 million for 2004, $179.1 million for 2003 and $215.8 million for 2002. |
NOTE13. SUPPLEMENTARY MINERAL RESERVE INFORMATION (UNAUDITED)
Proven and probable reserves were determined by the use of mapping, drilling, sampling, assaying and evaluation methods generally applied in the mining industry, as more fully discussed below. The term “reserve,” as used in the reserve data presented here, means that part of a mineral deposit which can be economically and legally extracted or produced at the time of the reserve determination. The term “proven reserves” means reserves for which (a) quantity is computed from dimensions revealed in outcrops, trenches, workings or drill holes; (b) grade and/or quality are computed from the result of detailed sampling; and (c) the sites for inspection, sampling and measurements are spaced so closely and the geologic character is sufficiently defined that size, shape, depth and mineral content of reserves are well established. The term “probable reserves” means reserves for which quantity and grade are computed from information similar to that used for proven reserves but the sites for sampling are farther apart or are otherwise less adequately spaced. The degree of assurance, although lower than that for proven reserves, is high enough to assume continuity between points of observation.
All of PT Freeport Indonesia’s current aggregate (including Rio Tinto’s share) proven and probable reserves, shown below, are located in Block A of PT Freeport Indonesia’s Contract of Work. The initial term of the Contract of Work covering Block A expires at the end of 2021. PT Freeport Indonesia can extend this term for two successive 10-year periods, subject to the approval of the Indonesian government, which cannot be withheld or delayed unreasonably. PT Freeport Indonesia’s reserve amounts reflect its estimates of the reserves that can be recovered before the end of 2041 (the expiration of the two 10-year extensions). PT Freeport Indonesia’s current mine plan has been developed and its operations are based on receiving the two 10-year extensions. As a result, PT Freeport Indonesia does not anticipate the mining of all of its reserves prior to the end of 2021 based on its current mine plan, and there can be no assurance that the Indonesian government will approve the extensions. Prior to the end of 2021, under its current mine plan PT Freeport Indonesia expects to mine approximately 47 percent of aggregate proven and probable ore, representing approximately 55 percent of its share of recoverable copper reserves and approximately 69 percent of its share of recoverable gold reserves.
78
| Average Ore Grade Per Metric Ton | Proven and Probable Recoverable Reserves | |||||||||||||||||
| Year-End | Ore | Copper | Gold | Silver | Copper | Gold | Silver | |||||||||||
| (Thousand | (%) | (Grams) | (Ounces) | (Grams) | (Ounces) | (Billions | (Millions | (Millions | ||||||||||
| Metric Tons) | of Lbs.) | of Ozs.) | of Ozs.) | |||||||||||||||
| 2000 | 2,514,532 | 1.10 | 1.04 | .033 | 3.40 | .109 | 50.9 | 63.7 | 139.6 | |||||||||
| 2001 | 2,583,883 | 1.13 | 1.05 | .034 | 3.72 | .120 | 52.5 | 64.5 | 151.6 | |||||||||
| 2002 | 2,584,465 | 1.12 | 1.02 | .033 | 3.73 | .120 | 53.3 | 62.6 | 147.6 | |||||||||
| 2003 | 2,695,883 | 1.08 | 0.98 | .032 | 3.72 | .120 | 54.4 | 60.4 | 159.4 | |||||||||
2004 | 2,769,102 | 1.09 | 0.97 | .031 | 3.84 | .123 | 56.2 | 61.0 | 174.5 | |||||||||
| By Ore Body at December 31, 2004: | ||||||||||||||||||
| Developed and producing: | ||||||||||||||||||
| Grasberg open pit | 710,607 | 1.11 | 1.30 | . | .042 | 2.58 | .083 | 14.9 | 24.9 | 29.9 | ||||||||
| Deep Ore Zone | 155,243 | 0.92 | 0.63 | .020 | 4.98 | .160 | 2.5 | 2.3 | 12.6 | |||||||||
| Undeveloped: | ||||||||||||||||||
| Grasberg block cave | 873,792 | 1.00 | 0.76 | .024 | 2.82 | .091 | 16.2 | 14.2 | 42.2 | |||||||||
| Kucing Liar | 498,999 | 1.30 | 1.18 | .038 | 5.61 | .180 | 12.4 | 9.3 | 38.7 | |||||||||
| Mill Level Zone | 158,773 | 0.87 | 0.76 | .024 | 3.93 | .126 | 2.6 | 3.0 | 12.6 | |||||||||
| Deep Mill Level Zone | 146,417 | 1.22 | 0.95 | .031 | 6.25 | .201 | 3.4 | 3.4 | 18.4 | |||||||||
| Ertsberg Stockwork | ||||||||||||||||||
| Zone | 121,714 | 0.49 | 0.90 | .029 | 1.65 | .053 | 1.1 | 2.7 | 4.2 | |||||||||
| Dom block cave | 43,651 | 1.09 | 0.31 | .010 | 5.91 | .190 | 0.8 | 0.3 | 4.0 | |||||||||
| Big Gossan | 32,906 | 2.63 | 0.92 | .030 | 15.72 | .505 | 1.6 | 0.7 | 8.1 | |||||||||
| Dom open pit | 27,000 | 1.80 | 0.43 | .014 | 9.60 | .309 | 0.7 | 0.2 | 3.8 | |||||||||
| Total | 2,769,102 | 1.09 | 0.97 | .031 | 3.84 | .123 | 56.2 | 61.0 | 174.5 | |||||||||
| PT Freeport Indonesia’s share | 40.5 | 46.5 | 124.5 | |||||||||||||||
FCX’s equity sharea | 36.7 | 42.1 | 112.8 | |||||||||||||||
| a. | Reflects FCX’s 90.6 percent ownership interest (see Note 2). |
Estimated recoverable reserves were assessed using a copper price of $0.85 per pound, a gold price of $270 per ounce and a silver price of $5.00 per ounce. With respect to the proven and probable reserves presented above, if metal prices were adjusted to the approximate average London spot prices for the past three years, i.e., copper prices adjusted from $0.85 per pound to $0.94 per pound and gold prices adjusted from $270 per ounce to $361 per ounce, the additions to proven and probable reserves would not be material to reported reserves.
Incremental cash flow attributable to the fourth concentrator mill expansion is shared 60 percent by PT Freeport Indonesia and 40 percent by Rio Tinto (Note 2). Incremental cash flow consists of amounts generated from production in excess of specified annual amounts based on the December 31, 1994, reserves and mine plan. The incremental revenues from production from the expansion and total revenues from production from Block A, including production from PT Freeport Indonesia’s previously existing operations, share proportionately in operating, nonexpansion capital and administrative costs. PT Freeport Indonesia receives 100 percent of cash flow from its existing pre-expansion production facilities as specified by the contractual arrangements. PT Freeport Indonesia’s estimated net share of recoverable reserves and FCX’s equity interest in those reserves follow:
| PT Freeport Indonesia | FCXa | ||||||||||||
| Year-End | Copper | Gold | Silver | Copper | Gold | Silver | |||||||
| (Billions | (Millions | (Millions | (Billions | (Millions | (Millions | ||||||||
| of Lbs.) | of Ozs.) | Of Ozs.) | of Lbs.) | of Ozs.) | of Ozs.) | ||||||||
| 2000 | 38.9 | 50.3 | 108.5 | 33.4 | 43.2 | 93.2 | |||||||
| 2001 | 39.4 | 50.2 | 114.5 | 35.7 | 45.5 | 103.8 | |||||||
| 2002 | 39.4 | 48.5 | 110.9 | 35.7 | 44.0 | 100.5 | |||||||
| 2003 | 39.7 | 46.6 | 116.8 | 36.0 | 42.2 | 105.9 | |||||||
2004 | 40.5 | 46.5 | 124.5 | 36.7 | 42.1 | 112.8 | |||||||
| a. | Reflects FCX’s 85.9 percent ownership interest through 2000 and 90.6 percent ownership interest thereafter (see Note 2). |
79
NOTE 14. QUARTERLY FINANCIAL INFORMATION (UNAUDITED)
| Net Income (Loss) | Net Income | ||||||||||||||||
| Operating | Applicable to | (Loss) Per Share | |||||||||||||||
| Revenues | Income | Common Stock | Basic | Diluted | |||||||||||||
| (In Thousands, Except Per Share Amounts) | |||||||||||||||||
| 2004 | |||||||||||||||||
| 1st Quarter | $ | 360,185 | $ | 41,376 | $ | (19,551 | )a | $ | (0.10 | )a | $ | (0.10 | )a | ||||
| 2nd Quarter | 486,334 | 46,702 | (53,311 | ) | (0.30 | ) | (0.30 | ) | |||||||||
| 3rd Quarter | 600,556 | 148,636 | 17,133 | 0.10 | 0.10 | ||||||||||||
| 4th Quarter | 924,791 | 466,862 | b | 212,505 | c | 1.19 | c | 1.08 | c | ||||||||
| $ | 2,371,866 | $ | 703,576 | $ | 156,776 | a | 0.86 | a | 0.85 | a | |||||||
| 2003 | |||||||||||||||||
| 1st Quarter | $ | 524,596 | $ | 191,326 | $ | 49,245 | d | $ | 0.34 | d | $ | 0.33 | d | ||||
| 2nd Quarter | 609,455 | 241,226 | 57,372 | e | 0.39 | e | 0.37 | e | |||||||||
| 3rd Quarter | 631,990 | 286,278 | 47,366 | e,f | 0.30 | e,f | 0.29 | e,f | |||||||||
| 4th Quarter | 446,124 | 104,478 | 236 | e | - | e | - | e | |||||||||
| $ | 2,212,165 | $ | 823,308 | $ | 154,219 | 0.99 | 0.97 | ||||||||||
| a. | Includes losses on early extinguishment and conversion of debt totaling $14.4 million ($0.07 per share) in the first quarter and $13.8 million ($0.08 per basic share and $0.07 per diluted share) for the year, both partly offset by a $6.3 million ($0.03 per share) gain on reduction of interest expense for conversion of debt. |
| b. | Includes a $95.0 million gain from insurance proceeds related to the fourth-quarter 2003 slippage and debris flow events at the Grasberg open pit and a $12.0 million charge related to Atlantic Copper’s workforce reduction plan. |
| c. | Includes a $48.8 million ($0.27 per basic share and $0.22 per diluted share) gain from insurance proceeds discussed in note b., a $20.4 million ($0.11 per basic share and $0.09 per diluted share) gain from the sale of a parcel of land in Arizona held by an FCX joint venture, a $7.5 million ($0.04 per basic share and $0.03 per diluted share) gain from Atlantic Copper’s sale of its wire rod and wire assets and a $12.0 million ($0.07 per basic share and $0.05 per diluted share) charge related to Atlantic Copper’s workforce reduction plan. |
| d. | Includes a $9.1 million ($0.06 per share) gain for the cumulative effect of an accounting change associated with the adoption of SFAS No. 143 effective January 1, 2003 (see Note 1). |
| e. | Includes losses on early extinguishment and conversion of debt totaling $4.8 million ($0.03 per basic share and $0.02 per diluted share) in the second quarter, $25.1 million ($0.16 per basic share and $0.13 per diluted share) in the third quarter and $2.0 million ($0.01 per share) in the fourth quarter. |
| f. | Includes a $24.7 million ($0.15 per basic share and $0.13 per diluted share) charge for the cumulative effect of an accounting change associated with the adoption of SFAS No. 150 effective July 1, 2003 (see Note 1). |
80