| |
| |
| UNITED STATES |
| SECURITIES AND EXCHANGE COMMISSION |
| Washington, D.C. 20549 |
| |
| FORM 10-Q |
| |
| (Mark One) |
| [X] QUARTERLY REPORT PURSUANT TO SECTION 13 OR 15(d) OF THE SECURITIES EXCHANGE ACT OF 1934 |
| For the quarterly period ended March 31, 2008 |
| OR |
| [ ] TRANSITION REPORT PURSUANT TO SECTION 13 OR 15(d) OF THE SECURITIES EXCHANGE ACT OF 1934 |
| For the transition period from | | To |
| Commission File Number: 1-9916 |
| |
|
| |
| Freeport-McMoRan Copper & Gold Inc. |
| (Exact name of registrant as specified in its charter) |
| Delaware | 74-2480931 |
| (State or other jurisdiction of | (I.R.S. Employer Identification No.) |
| incorporation or organization) | |
| | |
| One North Central Avenue | |
| Phoenix, AZ | 85004-4414 |
| (Address of principal executive offices) | (Zip Code) |
| |
| (602) 366-8100 |
| (Registrant's telephone number, including area code) |
| |
Indicate by check mark whether the registrant (1) has filed all reports required to be filed by Section 13 or 15(d) of the Securities Exchange Act of 1934 during the preceding 12 months (or for such shorter period that the registrant was required to file such reports), and (2) has been subject to such filing requirements for the past 90 days. R Yes ÿo No
Indicate by check mark whether the registrant is a large accelerated filer, an accelerated filer, a non-accelerated filer or a smaller reporting company. See the definitions of “large accelerated filer,” “accelerated filer” and “smaller reporting company” in Rule 12b-2 of the Exchange Act.
Large accelerated filer R Accelerated filer o Non-accelerated filer o Smaller reporting company oÿ
Indicate by check mark whether the registrant is a shell company (as defined in Rule 12b-2 of the Exchange Act). ÿo Yes R No
On April 30, 2008, there were issued and outstanding 383,219,916 shares of the registrant’s Common Stock, par value $0.10 per share.
FREEPORT-McMoRan COPPER & GOLD INC.
| | |
| | Page |
| 3 |
| | |
| |
| | |
| 3 |
| | |
| 4 |
| | |
| 5 |
| | |
| 6 |
| | |
| 7 |
| | |
| 16 |
| | |
| |
| 17 |
| | |
| 53 |
| | |
| 53 |
| | |
| 53 |
| | |
| 53 |
| | |
| 54 |
| | |
| 54 |
| | |
| 54 |
| | |
| 55 |
| | |
| E-1 |
| | |
FREEPORT-McMoRan COPPER & GOLD INC.
FREEPORT-McMoRan COPPER & GOLD INC.
| | | March 31, | | | December 31, | |
| | | 2008 | | | 2007 | |
| | | (In Millions) | |
| ASSETS | | | | | | | | |
| Current assets: | | | | | | | | |
| Cash and cash equivalents | | $ | 1,831 | | | $ | 1,626 | |
| Trade accounts receivable | | | 1,949 | | | | 1,099 | |
| Other accounts receivable | | | 181 | | | | 196 | |
| Product inventories and materials and supplies, net | | | 2,187 | | | | 2,178 | |
| Mill and leach stockpiles | | | 773 | | | | 707 | |
| Prepaid expenses and other current assets | | | 97 | | | | 97 | |
| Total current assets | | | 7,018 | | | | 5,903 | |
| Property, plant, equipment and development costs, net | | | 25,814 | | | | 25,715 | |
| Goodwill | | | 6,048 | | | | 6,105 | |
| Long-term mill and leach stockpiles | | | 1,153 | | | | 1,106 | |
| Trust assets | | | 599 | | | | 606 | |
| Intangible assets, net | | | 464 | | | | 472 | |
| Other assets and deferred charges | | | 732 | | | | 754 | |
| Total assets | | $ | 41,828 | | | $ | 40,661 | |
| | | | | | | | | |
| LIABILITIES AND STOCKHOLDERS’ EQUITY | | | | | | | | |
| Current liabilities: | | | | | | | | |
| Accounts payable and accrued liabilities | | $ | 2,242 | | | $ | 2,345 | |
| Accrued income taxes | | | 640 | | | | 420 | |
| Current portion of reclamation and environmental liabilities | | | 226 | | | | 263 | |
| Dividends payable | | | 212 | | | | 212 | |
| Current portion of long-term debt and short-term borrowings | | | 36 | | | | 31 | |
| Copper price protection program | | | – | | | | 598 | |
| Total current liabilities | | | 3,356 | | | | 3,869 | |
| Long-term debt, less current portion: | | | | | | | | |
| Senior notes | | | 6,887 | | | | 6,928 | |
| Project financing, equipment loans and other | | | 352 | | | | 252 | |
| Revolving credit facility | | | 296 | | | | – | |
| Total long-term debt, less current portion | | | 7,535 | | | | 7,180 | |
| Deferred income taxes | | | 7,135 | | | | 7,300 | |
| Reclamation and environmental liabilities, less current portion | | | 1,893 | | | | 1,733 | |
| Other liabilities | | | 1,093 | | | | 1,106 | |
| Total liabilities | | | 21,012 | | | | 21,188 | |
| Minority interests in consolidated subsidiaries | | | 1,510 | | | | 1,239 | |
| Stockholders’ equity: | | | | | | | | |
| 5½% Convertible Perpetual Preferred Stock | | | 1,100 | | | | 1,100 | |
| 6¾% Mandatory Convertible Preferred Stock | | | 2,875 | | | | 2,875 | |
| Common stock | | | 50 | | | | 50 | |
| Capital in excess of par value | | | 13,552 | | | | 13,407 | |
| Retained earnings | | | 4,554 | | | | 3,601 | |
| Accumulated other comprehensive income | | | 43 | | | | 42 | |
| Common stock held in treasury | | | (2,868 | ) | | | (2,841 | ) |
| Total stockholders’ equity | | | 19,306 | | | | 18,234 | |
| Total liabilities and stockholders’ equity | | $ | 41,828 | | | $ | 40,661 | |
| | | | | | | | | |
The accompanying notes are an integral part of these consolidated financial statements.
FREEPORT-McMoRan COPPER & GOLD INC.
| | Three Months Ended | |
| | March 31, | |
| | 2008 | | 2007 | |
| | (In Millions, Except Per Share Amounts) | |
| Revenues | $ | 5,672 | | $ | 2,246 | |
| Cost of sales: | | | | | | |
| Production and delivery | | 2,722 | | | 903 | |
| Depreciation, depletion and amortization | | 418 | | | 116 | |
| Total cost of sales | | 3,140 | | | 1,019 | |
| Selling, general and administrative expenses | | 84 | | | 48 | |
| Exploration and research expenses | | 52 | | | 7 | |
| Total costs and expenses | | 3,276 | | | 1,074 | |
| Operating income | | 2,396 | | | 1,172 | |
| Interest expense, net | | (165 | ) | | (52 | ) |
| Losses on early extinguishment of debt | | (6 | ) | | (88 | ) |
| Other income, net | | 2 | | | 24 | |
| Equity in affiliated companies’ net earnings | | 7 | | | 5 | |
| Income from continuing operations before income taxes and minority interests | | 2,234 | | | 1,061 | |
| Provision for income taxes | | (729 | ) | | (458 | ) |
| Minority interests in net income of consolidated subsidiaries | | (319 | ) | | (114 | ) |
| Income from continuing operations | | 1,186 | | | 489 | |
| Income from discontinued operations, net of taxes | | – | | | 4 | |
| Net income | | 1,186 | | | 493 | |
| Preferred dividends | | (64 | ) | | (17 | ) |
| Net income applicable to common stock | $ | 1,122 | | $ | 476 | |
| | | | | | | |
| Basic net income per share of common stock: | | | | | | |
| Continuing operations | $ | 2.93 | | $ | 2.18 | |
| Discontinued operations | | – | | | 0.02 | |
| Basic net income per share of common stock | $ | 2.93 | | $ | 2.20 | |
| | | | | | | |
| Diluted net income per share of common stock: | | | | | | |
| Continuing operations | $ | 2.64 | | $ | 2.00 | |
| Discontinued operations | | – | | | 0.02 | |
| Diluted net income per share of common stock | $ | 2.64 | | $ | 2.02 | |
| | | | | | | |
| Average common shares outstanding: | | | | | | |
| Basic | | 383 | | | 217 | |
| Diluted | | 449 | | | 244 | |
| | | | | | | |
| Dividends declared per share of common stock | $ | 0.4375 | | $ | 0.3125 | |
The accompanying notes are an integral part of these consolidated financial statements.
FREEPORT-McMoRan COPPER & GOLD INC.
| | | Three Months Ended | |
| | | March 31, | |
| | | 2008 | | | 2007 | |
| | | (In Millions) | |
| Cash flow from operating activities: | | | | | | | | |
| Net income | | $ | 1,186 | | | $ | 493 | |
| Adjustments to reconcile net income to net cash provided by operating activities: | | | | | | | | |
| Depreciation, depletion and amortization | | | 418 | | | | 116 | |
| Minority interests in net income of consolidated subsidiaries | | | 319 | | | | 114 | |
| Noncash compensation and benefits | | | 37 | | | | 26 | |
| Unrealized losses on copper price protection program | | | – | | | | 38 | |
| Losses on early extinguishment of debt | | | 6 | | | | 88 | |
| Deferred income taxes | | | (48 | ) | | | (46 | ) |
| Other, net | | | 38 | | | | 42 | |
| (Increases) decreases in working capital, excluding amounts acquired from | | | | | | | | |
| Phelps Dodge: | | | | | | | | |
| Accounts receivable | | | (950 | ) | | | (398 | ) |
| Inventories | | | (81 | ) | | | 81 | |
| Prepaid expenses and other | | | 1 | | | | 1 | |
| Accounts payable and accrued liabilities | | | (527 | ) | | | (30 | ) |
| Accrued income taxes | | | 216 | | | | 144 | |
| Net cash provided by operating activities | | | 615 | | | | 669 | |
| | | | | | | | | |
| Cash flow from investing activities: | | | | | | | | |
| Phelps Dodge capital expenditures | | | (388 | ) | | | (61 | ) |
| PT Freeport Indonesia capital expenditures | | | (115 | ) | | | (74 | ) |
| Other capital expenditures | | | (5 | ) | | | (7 | ) |
| Acquisition of Phelps Dodge, net of cash acquired | | | (1 | ) | | | (13,888 | ) |
| Proceeds from the sale of assets and other, net | | | 22 | | | | – | |
| Net cash used in investing activities | | | (487 | ) | | | (14,030 | ) |
| | | | | | | | | |
| Cash flow from financing activities: | | | | | | | | |
| Proceeds from term loans under bank credit facility | | | – | | | | 10,000 | |
| Repayments of term loans under bank credit facility | | | – | | | | (5,618 | ) |
| Net proceeds from sales of senior notes | | | – | | | | 5,880 | |
| Net proceeds from sale of common stock | | | – | | | | 2,816 | |
| Net proceeds from sale of 6¾% Mandatory Convertible Preferred Stock | | | – | | | | 2,803 | |
| Proceeds from revolving credit facility and other debt | | | 473 | | | | 101 | |
| Repayments of revolving credit facility and other debt | | | (118 | ) | | | (48 | ) |
| Cash dividends paid: | | | | | | | | |
| Common stock | | | (169 | ) | | | (63 | ) |
| Preferred stock | | | (64 | ) | | | (15 | ) |
| Minority interests | | | (49 | ) | | | (47 | ) |
| Net payments for exercised stock options | | | (8 | ) | | | (45 | ) |
| Excess tax benefit from exercised stock options | | | 12 | | | | 1 | |
| Bank credit facilities fees and other, net | | | – | | | | (185 | ) |
| Net cash provided by financing activities | | | 77 | | | | 15,580 | |
| | | | | | | | | |
| Net increase in cash and cash equivalents | | | 205 | | | | 2,219 | |
| Cash and cash equivalents at beginning of year | | | 1,626 | | | | 907 | |
| Cash and cash equivalents at end of period | | $ | 1,831 | | | $ | 3,126 | |
The accompanying notes are an integral part of these consolidated financial statements.
FREEPORT-McMoRan COPPER & GOLD INC.
| | | | | | | | | | | | | | | | | | | |
| | | Convertible Perpetual | | Mandatory Convertible | | | | | | | | Accumulated | | Common Stock | | | | |
| | | Preferred Stock | | Preferred Stock | | Common Stock | | | | | | Other | | Held in Treasury | | | | |
| | | Number | | | | Number | | | | Number | | | | Capital in | | | | Compre- | | Number | | | | | | |
| | | of | | At Par | | of | | At Par | | of | | At Par | | Excess of | | Retained | | hensive | | of | | At | | Stockholders’ | |
| | | Shares | | Value | | Shares | | Value | | Shares | | Value | | Par Value | | Earnings | | Income | | Shares | | Cost | | Equity | |
| | | (In Millions) | |
| Balance at December 31, 2007 | | 1 | | $ | 1,100 | | | 29 | | $ | 2,875 | | | 497 | | $ | 50 | | $ | 13,407 | | $ | 3,601 | | $ | 42 | | | 114 | | $ | (2,841 | ) | $ | 18,234 | |
| Exercised stock options, issued | | | | | | | | | | | | | | | | | | | | | | | | | | | | | | | | | | | | |
| restricted stock and other | | – | | | – | | | – | | | – | | | 1 | | | – | | | 114 | | | – | | | – | | | – | | | – | | | 114 | |
| Stock-based compensation costs | | – | | | – | | | – | | | – | | | – | | | – | | | 25 | | | – | | | – | | | – | | | – | | | 25 | |
| Tax benefit for stock option | | | | | | | | | | | | | | | | | | | | | | | | | | | | | | | | | | | | |
| exercises | | – | | | – | | | – | | | – | | | – | | | – | | | 6 | | | – | | | – | | | – | | | – | | | 6 | |
| Tender of shares for exercised | | | | | | | | | | | | | | | | | | | | | | | | | | | | | | | | | | | | |
| stock options and restricted | | | | | | | | | | | | | | | | | | | | | | | | | | | | | | | | | | | | |
| stock | | – | | | – | | | – | | | – | | | – | | | – | | | – | | | – | | | – | | | 1 | | | (27 | ) | | (27 | ) |
| Dividends on common stock | | – | | | – | | | – | | | – | | | – | | | – | | | – | | | (169 | ) | | – | | | – | | | – | | | (169 | ) |
| Dividends on preferred stock | | – | | | – | | | – | | | – | | | – | | | – | | | – | | | (64 | ) | | – | | | – | | | – | | | (64 | ) |
| Comprehensive income: | | | | | | | | | | | | | | | | | | | | | | | | | | | | | | | | | | | | |
| Net income | | – | | | – | | | – | | | – | | | – | | | – | | | – | | | 1,186 | | | – | | | – | | | – | | | 1,186 | |
| Other comprehensive income, | | | | | | | | | | | | | | | | | | | | | | | | | | | | | | | | | | | | |
| net of taxes: | | | | | | | | | | | | | | | | | | | | | | | | | | | | | | | | | | | | |
| Defined benefit plans: | | | | | | | | | | | | | | | | | | | | | | | | | | | | | | | | | | | | |
| Amortization of | | | | | | | | | | | | | | | | | | | | | | | | | | | | | | | | | | | | |
| unrecognized amounts | | – | | | – | | | – | | | – | | | – | | | – | | | – | | | – | | | 1 | | | – | | | – | | | 1 | |
| Other comprehensive income | | – | | | – | | | – | | | – | | | – | | | – | | | – | | | – | | | 1 | | | – | | | – | | | 1 | |
| Total comprehensive income | | – | | | – | | | – | | | – | | | – | | | – | | | – | | | – | | | – | | | – | | | – | | | 1,187 | |
| Balance at March 31, 2008 | | 1 | | $ | 1,100 | | | 29 | | $ | 2,875 | | | 498 | | $ | 50 | | $ | 13,552 | | $ | 4,554 | | $ | 43 | | | 115 | | $ | (2,868 | ) | $ | 19,306 | |
| | | | | | | | | | | | | | | | | | | | | | | | | | | | | | | | | | | | | |
The accompanying notes are an integral part of these consolidated financial statements.
FREEPORT-McMoRan COPPER & GOLD INC.
The accompanying unaudited consolidated financial statements have been prepared in accordance with the instructions to Form 10-Q and do not include all information and disclosures required by generally accepted accounting principles (GAAP) in the United States (U.S.). Therefore, this information should be read in conjunction with Freeport-McMoRan Copper & Gold Inc.’s (FCX) consolidated financial statements and notes contained in its 2007 Annual Report on Form 10-K. The information furnished herein reflects all adjustments which are, in the opinion of management, necessary for a fair statement of the results for the interim periods reported. With the exception of certain adjustments associated with the acquisition of Phelps Dodge Corporation (Phelps Dodge), all such adjustments are, in the opinion of management, of a normal recurring nature. Operating results for the three-month period ended March 31, 2008, are not necessarily indicative of the results that may be expected for the year ending December 31, 2008.
As further discussed in Note 2, on March 19, 2007, FCX completed its acquisition of Phelps Dodge. First-quarter 2007 financial results include Phelps Dodge’s results beginning March 20, 2007. Additionally, Phelps Dodge had an international wire and cable business, Phelps Dodge International Corporation (PDIC), which FCX sold on October 31, 2007. As a result of the sale, Phelps Dodge’s first-quarter 2007 operating results have been restated to remove PDIC from continuing operations and report PDIC as discontinued operations in the consolidated statements of income (see Note 3).
| 2. | ACQUISITION OF PHELPS DODGE |
On March 19, 2007, Phelps Dodge became a wholly owned subsidiary of FCX. The estimated fair value of assets acquired and liabilities assumed and the results of Phelps Dodge’s operations are included in FCX’s consolidated financial statements beginning March 20, 2007.
The acquisition was accounted for under the purchase method as required by Statement of Financial Accounting Standards (SFAS) No. 141, “Business Combinations,” with FCX as the accounting acquirer. In the acquisition, each share of Phelps Dodge common stock was exchanged for 0.67 of a share of FCX common stock and $88.00 in cash. As a result, FCX issued 136.9 million shares and paid $18.0 billion in cash to Phelps Dodge stockholders for total consideration of $25.8 billion.
In accordance with the purchase method of accounting, the purchase price paid was determined at the date of the public announcement of the transaction and was allocated to the assets acquired and liabilities assumed based upon their estimated fair values on the closing date of March 19, 2007. In valuing acquired assets and assumed liabilities, fair values were based on, but were not limited to: quoted market prices, where available; the intent of FCX with respect to whether the assets purchased were to be held, sold or abandoned; expected future cash flows; current replacement cost for similar capacity for certain fixed assets; market rate assumptions for contractual obligations; and appropriate discount rates and growth rates. The excess of the purchase price over the fair value of the net assets acquired has been recorded as goodwill. A decline in copper or molybdenum prices from those used to estimate the fair values of the acquired assets could result in impairment to the carrying amounts assigned to inventories; mill and leach stockpiles; property, plant and equipment; and goodwill. At the date of acquisition of Phelps Dodge, price projections used to value the assets acquired ranged from a near-term price of $2.98 per pound for copper and $26.20 per pound for molybdenum to a long-term average price of $1.20 per pound for copper and $8.00 per pound for molybdenum.
A summary of the final purchase price allocation as of March 19, 2007, follows (in billions):
| | | | | | Purchase | |
| | Historical | | Fair Value | | Price | |
| | Balances | | Adjustments | | Allocation | |
| Cash and cash equivalents | $ | 4.2 | | $ | – | | $ | 4.2 | |
| Inventories, including mill and leach stockpiles | | 0.9 | | | 2.8 | | | 3.7 | |
Property, plant and equipmenta | | 6.0 | | | 16.2 | | | 22.2 | |
| Other assets | | 3.1 | | | 0.2 | | | 3.3 | |
| Allocation to goodwill | | – | | | 6.2 | | | 6.2 | b |
| Total assets | | 14.2 | | | 25.4 | | | 39.6 | |
Deferred income taxes (current and long-term)c | | (0.7 | ) | | (6.3 | ) | | (7.0 | ) |
| Other liabilities | | (4.1 | ) | | (1.5 | ) | | (5.6 | ) |
| Minority interests | | (1.2 | ) | | – | | | (1.2 | ) |
| Total | $ | 8.2 | | $ | 17.6 | | $ | 25.8 | |
| | | | | | | | | | |
| a. | Includes amounts for proven and probable reserves and values assigned to value beyond proven and probable reserves (VBPP). |
| b. | Includes $160 million of goodwill associated with PDIC, which was sold in the fourth quarter of 2007. |
| c. | Deferred income taxes have been recognized based on the difference between the tax basis and the fair values assigned to net assets. |
Goodwill arising from the acquisition of Phelps Dodge was $6.2 billion, which primiarily related to the requirement to recognize a deferred tax liability for the difference between the assigned values and the tax bases of the assets acquired and liabilities assumed in a business combination. FCX allocated goodwill to the individual mines it believes have contributed to the excess purchase price and also included consideration of the mines’ potential for future growth (see Note 10 for the allocation of goodwill to FCX's reportable segments).
Pro Forma Financial Information. The following pro forma information assumes that FCX acquired Phelps Dodge effective January 1, 2007. The most significant adjustments relate to the purchase accounting impacts on the carrying values of acquired metal inventories (including mill and leach stockpiles) and property, plant and equipment using March 19, 2007, metal prices and assumptions (in millions, except per share data):
| | Historical | | | | | |
| | | | | Phelps | | Pro Forma | | Pro Forma | |
| Three months ended March 31, 2007 | FCX | | Dodgea | | Adjustments | | Consolidated | |
| Revenues | $ | 2,246 | | $ | 2,294 | | $ | 30 | | $ | 4,570 | b |
| Operating income | $ | 1,172 | | $ | 793 | | $ | (489 | ) | $ | 1,476 | b,c |
| Income from continuing operations before | | | | | | | | | | | | |
| income taxes and minority interests | $ | 1,061 | | $ | 837 | | $ | (581 | ) | $ | 1,317 | b,c,d,e |
| Net income from continuing operations | | | | | | | | | | | | |
| applicable to common stock | $ | 472 | | $ | 493 | | $ | (427 | ) | $ | 538 | b,c,d,e |
| Diluted net income per share of common | | | | | | | | | | | | |
| stock from continuing operations | $ | 2.00 | | | N/A | | | N/A | | $ | 1.35 | b,c,d,e |
| Diluted weighted-average shares of | | | | | | | | | | | | |
| common stock outstanding | | 244 | | | N/A | | | N/A | | | 446 | f |
| | | | | | | | | | | | | |
| a. | Represents the results of Phelps Dodge’s operations from January 1, 2007, through March 19, 2007. Beginning March 20, 2007, the results of Phelps Dodge’s operations are included in FCX’s consolidated financial statements. |
Additionally, for comparative purposes, the historical Phelps Dodge financial information for first-quarter 2007 represents results from continuing operations, and therefore, excludes the results of PDIC (i.e., discontinued operations).
| b. | Includes charges to revenues for mark-to-market accounting adjustments on the copper price protection program totaling $58 million ($36 million to net income or $0.08 per share) in the first quarter of 2007. Also includes pro forma credits for amortization of acquired intangible liabilities totaling $30 million ($19 million to net income or $0.04 per share). |
| c. | Includes charges associated with the impacts of the increases in the carrying values of acquired metal inventories (including mill and leach stockpiles) and property, plant and equipment, and also includes the amortization of intangible assets and liabilities resulting from the acquisition totaling $755 million ($476 million to net income or $1.07 per share). |
| d. | Excludes net losses on early extinguishment of debt totaling $88 million ($69 million to net income or $0.15 per share) for financing transactions related to the acquisition of Phelps Dodge. |
| e. | Includes interest expense from the debt issued in connection with the acquisition of Phelps Dodge totaling $186 million ($145 million to net income or $0.33 per share). Also includes accretion on the fair value of environmental liabilities resulting from the acquisition totaling $24 million ($19 million to net income or $0.04 per share). |
| f. | Estimated pro forma diluted weighted-average shares of common stock outstanding for the three months ended March 31, 2007, follows (in millions): |
| Average number of basic shares of FCX common stock | | | |
| outstanding prior to the acquisition of Phelps Dodge | | 197 | |
| Shares of FCX common stock issued in the acquisition | | 137 | |
| Sale of shares of FCX common stock | | 47 | |
| Assumed conversion of Mandatory Convertible Preferred Stock | | 39 | |
| Assumed conversion of other dilutive securities | | 26 | |
| Pro forma weighted-average shares of FCX common stock outstanding | | 446 | |
| | | | |
The above pro forma consolidated information has been prepared for illustrative purposes only and is not intended to be indicative of the results that would actually have occurred, or the results expected in future periods, had the events reflected herein occurred on the dates indicated.
| 3. | DISCONTINUED OPERATIONS |
On October 31, 2007, FCX sold its international wire and cable business, PDIC, for $735 million, which resulted in a net loss of $14 million ($9 million to net income) for transaction-related costs. The transaction generated after-tax proceeds of approximately $650 million (net proceeds of $597 million after taxes, transaction-related costs and PDIC cash).
As a result of the sale, the operating results of PDIC have been removed from continuing operations in the consolidated statements of income. Selected financial information related to discontinued operations for the period March 20, 2007, through March 31, 2007, follows (in millions):
| Revenues | $ | 57 | |
| Operating income | | 7 | |
| Provision for income taxes | | 2 | |
| Income from discontinued operations | | 4 | |
| | | | |
| 4. | PENSION AND POSTRETIREMENT BENEFITS |
The components of net periodic benefit cost for pension and postretirement benefits (first-quarter 2007 included Phelps Dodge’s plans for the period March 20, 2007, through March 31, 2007) follow (in millions):
| | | Three Months Ended | |
| | | March 31, | |
| | | 2008 | | 2007 | |
| Service cost | | $ | 9 | | $ | 2 | |
| Interest cost | | | 27 | | | 6 | |
| Expected return on plan assets | | | (32 | ) | | (4 | ) |
| Amortization of prior service cost | | | 2 | | | 1 | |
| Net periodic benefit cost | | $ | 6 | | $ | 5 | |
| | | | | | | | |
The increase in service and interest costs and the expected return on plan assets resulted primarily from the impact of Phelps Dodge for a full three months in first-quarter 2008 compared with only 12 days in first-quarter 2007.
FCX’s basic net income per share of common stock was calculated by dividing net income applicable to common stock by the weighted-average shares of common stock outstanding during the period. The following is a reconciliation of net income and weighted-average shares of common stock outstanding for purposes of calculating diluted net income per share (in millions, except per share amounts):
| | | Three Months Ended | |
| | | March 31, | |
| | | 2008 | | 2007 | |
| Income from continuing operations | | $ | 1,186 | | $ | 489 | |
| Preferred dividends | | | (64 | ) | | (17 | ) |
| Income from continuing operations applicable to common stock | | | 1,122 | | | 472 | |
| Plus income impact of assumed conversion of: | | | | | | | |
| 6¾% Mandatory Convertible Preferred Stock | | | 49 | | | 2 | |
| 5½% Convertible Perpetual Preferred Stock | | | 15 | | | 15 | |
| Diluted net income from continuing operations applicable to common stock | | | 1,186 | | | 489 | |
| Income from discontinued operations | | | – | | | 4 | |
| Diluted net income applicable to common stock | | $ | 1,186 | | $ | 493 | |
| | | | | | | | |
| Weighted-average shares of common stock outstanding: | | | 383 | | | 217 | |
| Add stock issuable upon conversion, exercise or vesting of: | | | | | | | |
| 6¾% Mandatory Convertible Preferred Stock | | | 39 | | | 2 | |
| 5½% Convertible Perpetual Preferred Stock | | | 23 | | | 23 | |
| Dilutive stock options | | | 2 | | | 1 | |
| Restricted stock | | | 2 | | | 1 | |
| Weighted-average shares of common stock outstanding for purposes of | | | | | | | |
| calculating diluted net income per share | | | 449 | | | 244 | |
| | | | | | | | |
| Diluted net income per share of common stock: | | | | | | | |
| Continuing operations | | $ | 2.64 | | $ | 2.00 | |
| Discontinued operations | | | – | | | 0.02 | |
| Diluted net income per share of common stock | | $ | 2.64 | | $ | 2.02 | |
| | | | | | | | |
Outstanding stock options with exercise prices greater than the average market price of FCX’s common stock during the period are excluded from the computation of diluted net income per share of common stock. FCX’s convertible instruments are also excluded when including the conversion of these instruments increases reported diluted net income per share. No amounts were excluded for first-quarter 2008. Excluded amounts
were approximately one million stock options with a weighted-average exercise price of $63.76 in first-quarter 2007.
| 6. | INVENTORIES, AND MILL AND LEACH STOCKPILES |
The components of inventories follow (in millions):
| | | March 31, | | December 31, | |
| | | 2008 | | 2007 | |
| Mining Operations: | | | | | | | |
| Raw materials | | $ | 32 | | $ | 1 | |
| Work-in-process | | | 77 | | | 71 | |
Finished goodsa | | | 794 | | | 898 | |
| Atlantic Copper: | | | | | | | |
| Raw materials (concentrates) | | | 139 | | | 164 | |
| Work-in-process | | | 237 | | | 220 | |
| Finished goods | | | 17 | | | 6 | |
| Total product inventories | | | 1,296 | | | 1,360 | |
Total materials and supplies, netb | | | 891 | | | 818 | |
| Total inventories | | $ | 2,187 | | $ | 2,178 | |
| | | | | | | | |
| a. | Primarily includes concentrates and cathodes. |
| b. | Materials and supplies inventory is net of obsolescence reserves totaling $17 million at March 31, 2008, and $16 million at December 31, 2007. |
The following is a detail of mill and leach stockpiles (in millions):
| | | March 31, | | December 31, | |
| | | 2008 | | 2007 | |
| Current: | | | | | | | |
| Mill stockpiles | | $ | 4 | | $ | 6 | |
| Leach stockpiles | | | 769 | | | 701 | |
| Total current mill and leach stockpiles | | $ | 773 | | $ | 707 | |
| | | | | | | | |
Long-terma: | | | | | | | |
| Mill stockpiles | | $ | 279 | | $ | 248 | |
| Leach stockpiles | | | 874 | | | 858 | |
| Total long-term mill and leach stockpiles | | $ | 1,153 | | $ | 1,106 | |
| | | | | | | | |
| a. | Metals in stockpiles not expected to be recovered within the next 12 months. |
FCX’s first-quarter 2008 income tax provision from continuing operations resulted from taxes on international operations ($579 million) and U.S. taxes ($150 million). The difference between FCX’s consolidated effective income tax rate of approximately 33 percent for first-quarter 2008 and the U.S. federal statutory rate of 35 percent primarily was attributable to a U.S. benefit for percentage depletion and an international tax rate differential, partially offset by withholding taxes on earnings from Indonesia and South America mining operations and a U.S. foreign tax credit limitation.
FCX’s first-quarter 2007 income tax provision from continuing operations resulted from taxes on earnings at international operations ($504 million), partially offset by a tax benefit from losses in the U.S. ($46 million). The first-quarter 2007 income tax provision primarily related to the operations of PT Freeport Indonesia and also included $31 million associated with Phelps Dodge’s earnings for the 12-day period ending March 31, 2007. The difference between FCX’s consolidated effective income tax rate of approximately 43 percent for first-
quarter 2007 and the U.S. federal statutory rate of 35 percent primarily was attributable to withholding taxes incurred in connection with earnings from Indonesia mining operations.
Interest expense excludes capitalized interest of $22 million in first-quarter 2008 and $7 million in first-quarter 2007.
| 9. | NEW ACCOUNTING STANDARDS |
Fair Value Measurements. In September 2006, the Financial Accounting Standards Board (FASB) issued SFAS No. 157, “Fair Value Measurements,” which provides enhanced guidance for using fair value to measure assets and liabilities. SFAS No. 157 does not require any new fair value measurements under U.S. GAAP but rather establishes a common definition of fair value, provides a framework for measuring fair value under U.S. GAAP and expands disclosure requirements about fair value measurements. In February 2008, FASB issued FSP FAS 157-2, which delays the effective date of SFAS No. 157 for nonfinancial assets or liabilities that are not required or permitted to be measured at fair value on a recurring basis to fiscal years beginning after November 15, 2008, and interim periods within those years. Effective January 1, 2008, FCX adopted SFAS No. 157 for financial assets and liabilities recognized at fair value on a recurring basis. This partial adoption of SFAS No. 157 did not have a material impact on our financial reporting and disclosures as FCX’s financial assets are measured using quoted market prices, or Level 1 inputs. FCX is currently evaluating the impact that the adoption of SFAS No. 157 will have on its financial reporting and disclosures for pension and postretirement related financial assets and nonfinancial assets or liabilities not valued on a recurring basis (at least annually).
Disclosures about Derivative Instruments and Hedging Activities. In March 2008, FASB issued SFAS No. 161, “Disclosures about Derivative Instruments and Hedging Activities – an amendment of FASB Statement No. 133.” SFAS No. 161 amends the disclosure requirements for derivative instruments and hedging activities contained in SFAS No. 133, “Accounting for Derivative Instruments and Hedging Activities.” Under SFAS No 161, entities are required to provide enhanced disclosures about (i) how and why an entity uses derivative instruments, (ii) how derivative instruments and related hedged items are accounted for under SFAS No. 133 and related interpretations and (iii) how derivative instruments and related hedged items affect an entity’s financial position, financial performance and cash flows. SFAS No. 161 is effective for fiscal years and interim periods beginning after November 15, 2008, with early application encouraged. SFAS No. 161 encourages, but does not require disclosure for earlier periods presented for comparative purposes at initial adoption. The adoption of SFAS No. 161 will not affect FCX’s accounting for derivative financial instruments; however, FCX is currently evaluating the impact on its related disclosures.
FCX has a regional approach to the management of its mining operations. FCX has organized its mining operations geographically into three primary operating divisions – North America mining, South America mining and Indonesia mining. Notwithstanding this geographic structure, FCX internally reports information on a mine by mine basis. Therefore, in accordance with SFAS No. 131, “Disclosures about Segments of an Enterprise and Related Information,” FCX concluded that its operating segments include individual mines. Operating segments that meet SFAS No. 131 thresholds are reportable segments. FCX has revised its segment disclosures for first-quarter 2007 to conform with current year presentation. Further discussion of the reportable segments included in FCX’s primary operating divisions, as well as FCX’s other reportable segment – Atlantic Copper Smelting & Refining, follows.
North America Mining. North America mining operations are comprised of copper operations from mining through rod production, molybdenum operations from mining through conversion to chemical and metallurgical products, and the marketing and sale of both product lines. FCX has six operating copper mines in North America – Morenci, Bagdad, Sierrita and Safford in Arizona and Chino and Tyrone in New Mexico, as well as one operating molybdenum mine – Henderson in Colorado. The North America mining division includes the Morenci copper mine, Rod & Refining operations and Molybdenum operations as reportable segments.
Morenci. The Morenci open-pit mine, located in southeastern Arizona, primarily produces copper cathodes and copper concentrates. In addition to copper, the Morenci mine produces molybdenum concentrates as a by-product. FCX owns an 85 percent undivided interest in Morenci via an unincorporated joint venture.
Rod & Refining. The Rod & Refining segment consists of copper conversion facilities, including a refinery, rod mills and a specialty copper products facility. This segment processes copper produced at FCX’s North America mines and purchased copper into copper anode, cathode, rod and custom copper shapes. At times this segment refines copper and produces copper rod and shapes for customers on a toll basis. Toll arrangements require the tolling customer to deliver appropriate copper-bearing material to FCX’s facilities for processing into a product that is returned to the customer, who pays FCX for processing its material into the specified products.
Molybdenum. The Molybdenum segment includes FCX’s wholly owned Henderson molybdenum mine in Colorado, related conversion facilities and a technology center. The Henderson underground mine produces high-purity, chemical-grade molybdenum concentrates, which are typically further processed into value-added molybdenum chemical products. This segment is an integrated producer of molybdenum, with mining, roasting and processing facilities that produce high-purity, molybdenum-based chemicals, molybdenum metal powder and metallurgical products, which are sold to customers around the world. This segment also includes a sales company that purchases molybdenum from Henderson and FCX’s North America and South America copper mines and sells it to third parties. In addition, at times this segment roasts and/or processes material on a toll basis. Toll arrangements require the tolling customer to deliver appropriate molybdenum-bearing material to FCX’s facilities for processing into a product that is returned to the customer, who pays FCX for processing its material into the specified products. This segment also includes a technology center whose primary activity is developing new engineered products and applications.
The Molybdenum segment also includes FCX’s wholly owned Climax molybdenum mine in Colorado, which has been on care-and-maintenance status since 1995. In December 2007, FCX announced a $500 million project to restart the Climax mine with start up expected in 2010.
Other North America Mining Operations. Other North America mining operations include FCX’s other operating southwestern U.S. copper mines – Bagdad, Sierrita, Safford, Chino and Tyrone. In addition to copper, the Bagdad, Sierrita and Chino mines produce molybdenum, gold and silver, and the Sierrita mine also produces rhenium. Other North America mining operations also include the Miami copper mine, which FCX is undertaking a project to restart; the Miami smelter, which processes our North America concentrates and provides a significant source of sulfuric acid for the various North America leaching operations; and a sales company, which functions as an agent to purchase and sell copper from the North America mines and the Rod & Refining operations and also purchases and sells any copper not sold by the South America mines to third parties.
South America Mining. FCX has four operating copper mines in South America – Cerro Verde in Peru, and Candelaria, Ojos del Salado and El Abra in Chile. These operations include open-pit and underground mining, sulfide ore concentrating, leaching, solution extraction and electrowinning (SX/EW). The South America mining division includes the Cerro Verde copper mine as a reportable segment.
Cerro Verde. The Cerro Verde open-pit copper mine, located near Arequipa, Peru, produces copper cathodes and copper concentrates. In addition to copper, the Cerro Verde mine produces molybdenum concentrates. FCX owns a 53.56 percent interest in Cerro Verde.
Other South America Mining Operations. Other South America mining operations include FCX’s Chilean copper mines – Candelaria, Ojos del Salado and El Abra – which include open-pit and underground mining, sulfide ore concentrating, leaching and SX/EW operations. In addition to copper, the Candelaria and Ojos del Salado mines produce gold and silver. FCX owns an 80 percent interest in both the Candelaria and Ojos del Salado mines, and owns a 51 percent interest in the El Abra mine.
Indonesia Mining. Indonesia mining includes PT Freeport Indonesia’s Grasberg copper and gold mining operations and PT Puncakjaya Power’s power-generating operations (after eliminations with PT Freeport Indonesia). FCX owns 90.64 percent of PT Freeport Indonesia, including 9.36 percent owned through PT Indocopper Investama, and the remaining 9.36 percent is owned by the Government of Indonesia. In 1996, FCX established an unincorporated joint venture with Rio Tinto, which covers PT Freeport Indonesia’s mining operations in Block A and gives Rio Tinto, through 2021, a 40 percent interest in certain assets and future production exceeding specified annual amounts of copper, gold and silver. After 2021, Rio Tinto will have a 40 percent interest in all production from Block A.
Atlantic Copper Smelting & Refining. Atlantic Copper, FCX’s wholly owned smelting unit in Spain, smelts and refines copper concentrates and markets refined copper and precious metals in slimes.
Other. Intersegment sales by the Indonesia and South America mines are based on similar arms-length transactions with third parties at the time of the sale. Intersegment sales of any individual mine may not be reflective of the actual prices ultimately realized because of a variety of factors, including additional processing, timing of sales to unaffiliated customers and transportation premiums.
FCX allocates certain operating costs, expenses and capital to the operating divisions and individual segments. However, not all costs and expenses applicable to a mine or operation are allocated. All federal and state income taxes are recorded and managed at the corporate level with the exception of foreign income taxes, which are generally recorded and managed at the applicable mine or operation. Accordingly, the following segment information reflects management determinations that may not be indicative of what the actual financial performance of each operating division or segment would be if it was an independent entity.
Business Segments
| (In Millions) | North America | | South America | | Indonesia | | | | | | | |
| | | | | | | | | Other | | Total | | | | Other | | Total | | | | Atlantic | | Corporate, | | | |
| | | | | | | | | North | | North | | | | South | | South | | | | Copper | | Other & | | | |
| | | | | Rod & | | Molyb- | | America | | America | | Cerro | | America | | America | | | | Smelting | | Elimi- | | FCX | |
| First-Quarter 2008 | Morenci | | Refining | | denum | | Mining | | Mining | | Verde | | Mining | | Mining | | Grasberg | | & Refining | | nations | | Total | |
| Revenues: | | | | | | | | | | | | | | | | | | | | | | | | | |
| Unaffiliated customers | $ | 50 | | $ | 1,680 | | $ | 719 | | $ | 823 | | $ | 3,272 | | $ | 462 | | $ | 503 | | $ | 965 | | $ | 887 | a | $ | 665 | | $ | (117 | ) | $ | 5,672 | |
| Intersegment | | 541 | | 8 | | – | | (548 | ) | 1 | | 253 | | 375 | | 628 | | 165 | | – | | (794 | ) | – | |
Production and deliveryb | | 272 | | 1,676 | | 460 | | (270 | ) | 2,138 | | 162 | | 270 | | 432 | | 399 | | 651 | | (898 | ) | 2,722 | |
Depreciation, depletion and amortizationb | | 81 | | 2 | | 39 | | 105 | | 227 | | 43 | | 87 | | 130 | | 45 | | 9 | | 7 | | 418 | |
| Exploration and research expenses | | – | | – | | – | | – | | – | | – | | – | | – | | – | | – | | 52 | | 52 | |
| Selling, general and administrative expenses | | – | | – | | 6 | | 4 | | 10 | | – | | – | | – | | 37 | | 8 | | 29 | | 84 | |
Operating income (loss)b | | 238 | | 10 | | 214 | | 436 | | 898 | | 510 | | 521 | | 1,031 | | 571 | | (3 | ) | (101 | ) | 2,396 | |
| | | | | | | | | | | | | | | | | | | | | | | | | | |
| Interest expense, net | | 1 | | 1 | | – | | 10 | | 12 | | 1 | | – | | 1 | | 1 | | 4 | | 147 | | 165 | |
| Provision for income taxes | | – | | – | | – | | – | | – | | 173 | | 160 | | 333 | | 239 | | – | | 157 | | 729 | |
| Goodwill | | 1,912 | | – | | 703 | | 2,299 | | 4,914 | | 763 | | 366 | | 1,129 | | – | | – | | 5 | | 6,048 | |
| Total assets at March 31, 2008 | | 6,932 | | 604 | | 4,179 | | 12,746 | | 24,461 | | 5,464 | | 4,833 | | 10,297 | | 3,932 | | 994 | | 2,144 | | 41,828 | |
| Capital expenditures | | 77 | | 3 | | 12 | | 83 | | 175 | | 17 | | 46 | | 63 | | 115 | | 5 | | 150 | | 508 | |
| | | | | | | | | | | | | | | | | | | | | | | | | | |
| First-Quarter 2007 | | | | | | | | | | | | | | | | | | | | | | | | | |
| Revenues: | | | | | | | | | | | | | | | | | | | | | | | | | |
| Unaffiliated customers | | – | | 206 | | 52 | | 61 | | 319 | | 14 | | 126 | | 140 | | 1,332 | a | 454 | | 1 | | 2,246 | |
| Intersegment | | 21 | | 2 | | – | | (23 | ) | – | | 97 | | 25 | | 122 | | 377 | | – | | (499 | ) | – | |
Production and deliveryb | | 29 | | 206 | | 52 | | 40 | | 327 | | 44 | | 72 | | 116 | | 323 | | 427 | | (290 | ) | 903 | |
Depreciation, depletion and amortizationb | | 5 | | – | | 3 | | 6 | | 14 | | 9 | | 19 | | 28 | | 59 | | 10 | | 5 | | 116 | |
| Exploration and research expenses | | – | | – | | – | | – | | – | | – | | – | | – | | – | | – | | 7 | | 7 | |
| Selling, general and administrative expenses | | – | | – | | – | | 1 | | 1 | | – | | – | | – | | 44 | | 4 | | (1 | ) | 48 | |
Operating income (loss)b | | (13 | ) | 2 | | (3 | ) | (9 | ) | (23 | ) | 58 | | 60 | | 118 | | 1,283 | | 13 | | (219 | ) | 1,172 | |
| | | | | | | | | | | | | | | | | | | | | | | | | | |
| Interest expense, net | | – | | – | | – | | – | | – | | – | | – | | – | | 4 | | 7 | | 41 | | 52 | |
| Provision for income taxes | | – | | – | | – | | – | | – | | 22 | | 19 | | 41 | | 462 | | – | | (45 | ) | 458 | |
| Total assets at March 31, 2007 | | 4,775 | | 631 | | 1,918 | | 8,705 | | 16,029 | | 4,011 | | 4,491 | | 8,502 | | 4,549 | | 1,075 | | 11,279 | c | 41,434 | |
| Capital expenditures | | 15 | | 1 | | 2 | | 35 | | 53 | | 1 | | 1 | | 2 | | 74 | | 7 | | 6 | | 142 | |
| | | | | | | | | | | | | | | | | | | | | | | | | | |
| a. | Includes PT Freeport Indonesia’s sales to PT Smelting totaling $464 million in first-quarter 2008 and $584 million in first-quarter 2007. |
| b. | The following tables summarize the impact of purchase accounting fair value adjustments on first-quarters 2008 and 2007 operating income (loss) primarily associated with the impacts of the increases in the carrying values of Phelps Dodge’s metals inventories (including mill and leach stockpiles) and property, plant and equipment: |
| First-Quarter 2008 | | | | | | | | | | | | | | | | | | | | | | | | | |
| Production and delivery | $ | (18 | ) | $ | – | | $ | (14 | ) | $ | (15 | ) | $ | (47 | ) | $ | (9 | ) | $ | (16 | ) | $ | (25 | ) | N/A | | N/A | | $ | – | | $ | (72 | ) |
| Depreciation, depletion and amortization | | (47 | ) | – | | (34 | ) | (55 | ) | (136 | ) | (21 | ) | (49 | ) | (70 | ) | N/A | | N/A | | (1 | ) | (207 | ) |
| Reduction of operating income | $ | (65 | ) | $ | – | | $ | (48 | ) | $ | (70 | ) | $ | (183 | ) | $ | (30 | ) | $ | (65 | ) | $ | (95 | ) | N/A | | N/A | | $ | (1 | ) | $ | (279 | ) |
| | | | | | | | | | | | | | | | | | | | | | | | | | |
| First-Quarter 2007 | | | | | | | | | | | | | | | | | | | | | | | | | | | | | | | | | | |
| Production and delivery | $ | (16 | ) | $ | – | | $ | (13 | ) | $ | (19 | ) | $ | (48 | ) | $ | (20 | ) | $ | (28 | ) | $ | (48 | ) | N/A | | N/A | | $ | – | | $ | (96 | ) |
| Depreciation, depletion and amortization | | (3 | ) | – | | (2 | ) | (1 | ) | (6 | ) | (6 | ) | (15 | ) | (21 | ) | N/A | | N/A | | (1 | ) | (28 | ) |
| Reduction of operating income | $ | (19 | ) | $ | – | | $ | (15 | ) | $ | (20 | ) | $ | (54 | ) | $ | (26 | ) | $ | (43 | ) | $ | (69 | ) | N/A | | N/A | | $ | (1 | ) | $ | (124 | ) |
| | | | | | | | | | | | | | | | | | | | | | | | | | |
| c. | Includes preliminary goodwill of $6.9 billion, which had not yet been allocated to reporting units, and also includes assets of $1.1 billion associated with discontinued operations (see Note 3). |
TO THE BOARD OF DIRECTORS AND STOCKHOLDERS OF
FREEPORT-McMoRan COPPER & GOLD INC.
We have reviewed the condensed consolidated balance sheet of Freeport-McMoRan Copper & Gold Inc. as of March 31, 2008, the related consolidated statements of income and cash flows for the three-month periods ended March 31, 2008 and 2007, and the related consolidated statement of stockholders’ equity for the three-month period ended March 31, 2008. These financial statements are the responsibility of the Company’s management.
We conducted our review in accordance with the standards of the Public Company Accounting Oversight Board (United States). A review of interim financial information consists principally of applying analytical procedures and making inquiries of persons responsible for financial and accounting matters. It is substantially less in scope than an audit conducted in accordance with the standards of the Public Company Accounting Oversight Board, the objective of which is the expression of an opinion regarding the financial statements taken as a whole. Accordingly, we do not express such an opinion.
Based on our review, we are not aware of any material modifications that should be made to the condensed consolidated financial statements referred to above for them to be in conformity with U.S. generally accepted accounting principles.
We have previously audited, in accordance with the standards of the Public Company Accounting Oversight Board (United States), the consolidated balance sheet of Freeport-McMoRan Copper & Gold Inc. as of December 31, 2007, and the related consolidated statements of income, cash flows, and stockholders’ equity for the year then ended (not presented herein), and in our report dated February 29, 2008, we expressed an unqualified opinion on those consolidated financial statements and which report included an explanatory paragraph for the Company’s adoption of FASB Interpretation No. 48, “Accounting for Uncertainty in Income Taxes – an interpretation of FASB Statement No. 109,” effective January 1, 2007; Statement of Financial Accounting Standards (SFAS) No. 123 (revised 2004), “Share-Based Payment,” effective January 1, 2006; Emerging Issues Task Force Issue No. 04-6, “Accounting for Stripping Costs Incurred during Production in the Mining Industry,” effective January 1, 2006; and SFAS No. 158, “Employers’ Accounting for Defined Benefit Pension and Other Postretirement Plans, an amendment of FASB Statements No. 87, 88, 106 and 132R,” effective December 31, 2006. In our opinion, the information set forth in the accompanying condensed consolidated balance sheet as of December 31, 2007, is fairly stated, in all material respects, in relation to the consolidated balance sheet from which it has been derived.
ERNST & YOUNG LLP
Phoenix, Arizona
May 6, 2008
OVERVIEW
In Management’s Discussion and Analysis of Financial Condition and Results of Operations, “we,” “us” and “our” refer to Freeport-McMoRan Copper & Gold Inc. (FCX) and its consolidated subsidiaries, including, except as otherwise stated, Phelps Dodge Corporation (Phelps Dodge) and its subsidiaries, which we acquired on March 19, 2007. You should read this discussion in conjunction with our financial statements, the related Management’s Discussion and Analysis of Financial Condition and Results of Operations and the discussion of our “Business and Properties” in our Form 10-K for the year ended December 31, 2007, filed with the Securities and Exchange Commission. The results of operations reported and summarized below are not necessarily indicative of future operating results. In particular, the financial results included for 2007 include the operations of Phelps Dodge for only 12 days, not the full first quarter of 2007 because of the accounting treatment for the acquisition. References to “Notes” are Notes included in our “Notes to Consolidated Financial Statements.” Throughout Management's Discussion and Analysis of Financial Condition and Results of Operations all references to earnings or losses per share are on a diluted basis, unless otherwise noted.
We are one of the world’s largest copper, gold and molybdenum mining companies in terms of reserves and production. One of our principal assets is the Grasberg minerals district in Indonesia, which contains the largest single recoverable copper reserve and the largest single gold reserve of any mine in the world based on the latest available reserve data provided by third-party industry consultants.
On March 19, 2007, we acquired Phelps Dodge, a fully integrated producer of copper and molybdenum, with mines in North and South America and processing capabilities for other by-product minerals, such as gold, silver and rhenium, and several development projects, including Tenke Fungurume in the Democratic Republic of Congo (DRC).
In North America, we have six operating copper mines – Morenci, Bagdad, Sierrita and Safford in Arizona and Chino and Tyrone in New Mexico, as well as one operating molybdenum mine – Henderson in Colorado. In addition, we are restarting the Miami copper mine in Arizona and the Climax molybdenum mine in Colorado. All of these mining operations are wholly owned, except for Morenci. We have an 85 percent undivided interest in Morenci, an unincorporated joint venture. The North America mining operations are operated in an integrated fashion and have long-lived reserves with additional development potential.
In South America, we have four operating copper mines – Cerro Verde in Peru, and Candelaria, Ojos del Salado and El Abra in Chile. We own a 53.56 percent interest in Cerro Verde, an 80 percent interest in both Candelaria and Ojos del Salado and a 51 percent interest in El Abra.
We own 90.64 percent of PT Freeport Indonesia, including 9.36 percent owned through our wholly owned subsidiary, PT Indocopper Investama. The Government of Indonesia owns the remaining 9.36 percent of PT Freeport Indonesia. PT Freeport Indonesia operates under an agreement, called a Contract of Work, with the Government of Indonesia. The Contract of Work allows us to conduct exploration, mining and production activities in a 24,700-acre area called Block A located in Papua, Indonesia. Under the Contract of Work, PT Freeport Indonesia also conducts exploration activities (which had been suspended, but resumed in 2007) in an approximate 500,000-acre area called Block B in Papua. All of PT Freeport Indonesia’s proven and probable mineral reserves and current mining operations, including the Grasberg minerals district, are located in Block A.
We also operate Atlantic Copper S.A. (Atlantic Copper), a wholly owned subsidiary, located in Spain. Atlantic Copper’s operations involve the smelting and refining of copper concentrates and the marketing of refined copper and precious metals in slimes. Additionally, PT Freeport Indonesia owns a 25 percent interest in PT Smelting, an Indonesian company, which operates a copper smelter and refinery in Gresik, Indonesia.
Phelps Dodge also had an international manufacturing division, Phelps Dodge International Corporation (PDIC), which manufactured engineered wire and cable products principally for the global energy sector. On October 31, 2007, we sold PDIC, and as a result, the operating results of PDIC for the 12-day period ended March 31, 2007, have been removed from continuing operations and reported as discontinued operations in the consolidated statements of income.
ACQUISITION OF PHELPS DODGE
Phelps Dodge became our wholly owned subsidiary on March 19, 2007. In the acquisition, each share of Phelps Dodge common stock was exchanged for 0.67 of a share of FCX common stock and $88.00 in cash. As a result, we issued 136.9 million shares and paid $18.0 billion in cash to Phelps Dodge shareholders for total consideration of $25.8 billion. The results of Phelps Dodge’s operations are included in our consolidated financial statements beginning March 20, 2007.
Accounting for the Acquisition. The acquisition of Phelps Dodge was accounted for under the purchase method as required by Statement of Financial Accounting Standards (SFAS) No. 141, “Business Combinations,” with FCX as the accounting acquirer. In accordance with the purchase method of accounting, the purchase price has been allocated to the assets acquired and liabilities assumed based upon their fair values on the acquisition date of March 19, 2007. In valuing acquired assets and assumed liabilities, fair values were based on, but were not limited to: quoted market prices, where available; our intent with respect to whether the assets purchased were to be held, sold or abandoned; expected future cash flows; current replacement cost for similar capacity for certain fixed assets; market rate assumptions for contractual obligations; and appropriate discount rates and growth rates. The excess of the purchase price over the fair value of net tangible and identifiable intangible assets has been recorded as goodwill. At March 31, 2008, the carrying value of goodwill associated with our acquisition of Phelps Dodge totaled approximately $6.0 billion (refer to Note 2 for further discussion of goodwill and to Note 10 for the allocation of goodwill to our reportable segments).
The following table summarizes the impacts of purchase accounting fair value adjustments on first-quarter 2008 and 2007 operating income and income from continuing operations, which are primarily associated with increases in the carrying values of Phelps Dodge’s property, plant and equipment and metal inventories, including mill and leach stockpiles (in millions):
| | First-Quarter | | |
| | 2008 | | 2007a | | |
| Purchase accounting impacts: | | | | | | | |
| Depreciation, depletion and amortization | $ | 207 | | $ | 28 | | |
| Production and delivery costs | | 72 | | | 96 | | |
| Reduction of operating income | $ | 279 | | $ | 124 | | |
| | | | | | | | |
| Reduction of income from continuing operations | $ | 184 | b | $ | 79 | | |
| a. | Represents purchase accounting impacts for the 12-day period ended March 31, 2007. |
| b. | Includes net purchase accounting fair value adjustments related to other non-operating income and expenses of $15 million ($9 million to net income). |
COPPER, GOLD AND MOLYBDENUM MARKETS
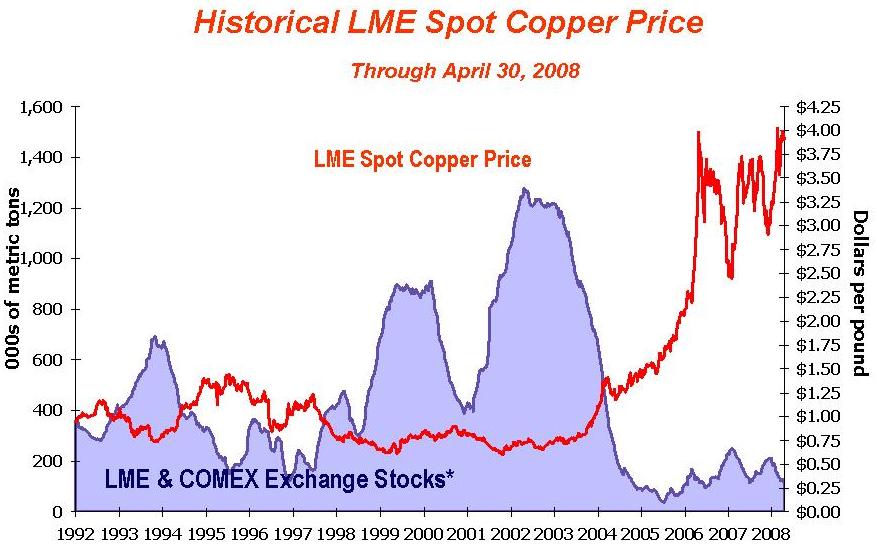
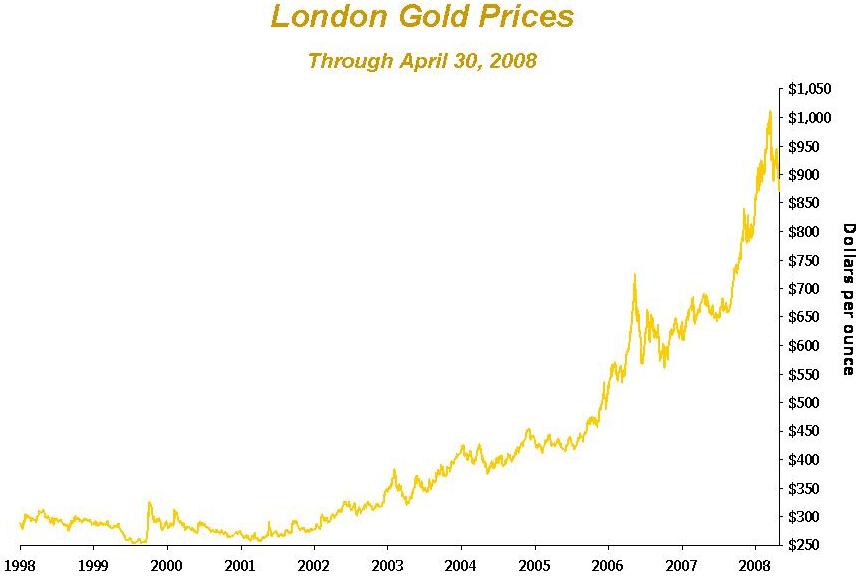
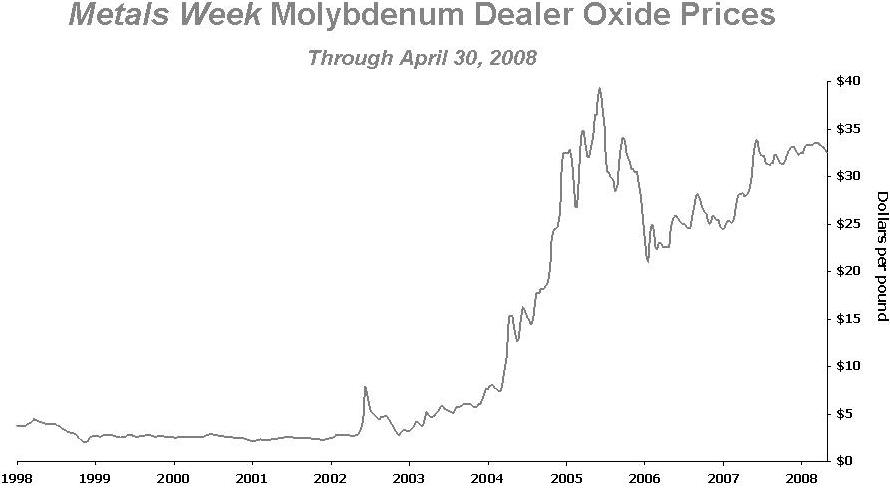
The graphs below are intended to illustrate the movements in metals prices during the periods presented. World metal prices for copper have fluctuated significantly from 1992 through April 2008, with the London Metal Exchange (LME) spot copper price varying from a low of $0.60 per pound in 2001 to record highs above $4.00 per pound in March 2008. World gold prices have also fluctuated widely from 1998 through April 2008 from a low of approximately $250 per ounce in 1999 to record highs above $1,000 per ounce in March 2008. During the period from 1998 through April 2008, Metals Week Molybdenum Dealer Oxide prices have ranged from a low of $2.00 per pound in 1998 to a high of $40.00 per pound in 2005. Copper, gold and molybdenum prices are affected by numerous factors beyond our control as described further in our “Risk Factors” contained in Part I, Item 1A of our Form 10-K for the year ended December 31, 2007.
* Excludes Shanghai stocks, producer, consumer and merchant stocks.
The graph above presents LME spot copper prices and reported stocks of copper at the LME and New York Commodity Exchange (COMEX) through April 30, 2008. Since 2003 global demand has exceeded supply, evidenced by the decline in exchange warehouse inventories. Combined LME and COMEX stocks of approximately 123,000 metric tons at March 31, 2008, remain at historically low levels, representing less than three days of global consumption. Disruptions associated with strikes, unrest and other operational issues resulted in low levels of inventory throughout 2006 and 2007. During first-quarter 2008, copper prices were strong, with LME copper prices ranging from $3.02 per pound to record highs above $4.00 per pound and averaging $3.52 per pound. Future copper prices may continue to be volatile and are expected to be influenced by demand from China, economic activity in the United States (U.S.) and other industrialized countries, the timing of the development of new supplies of copper, production levels of mines and copper smelters and the level of direct participation by investors. We consider the current underlying supply and demand conditions in the global copper markets to be positive for our company and continue to pursue opportunities to expand production. The LME spot price closed at $3.93 per pound on April 30, 2008.
Gold prices continue to be supported by increased investment demand for gold, ongoing geopolitical tensions, a weak U.S. dollar, inflationary pressures and reduced mine supply. During first-quarter 2008, gold prices ranged from approximately $847 per ounce to record highs above $1,000 per ounce and averaged approximately $925 per ounce. On April 30, 2008, London gold prices closed at approximately $871 per ounce.
Molybdenum markets have been strong in recent years with growing demand and limited supply. During first-quarter 2008, molybdenum prices ranged from $32.00 per pound to $33.80 per pound and averaged $33.24 per pound. The Metals Week Molybdenum Dealer Oxide price closed at $32.45 per pound on April 28, 2008.
OUTLOOK
Consolidated sales volumes for first-quarter 2008 totaled 911 million pounds of copper, 280 thousand ounces of gold and 20 million pounds of molybdenum, compared with 520 million pounds of copper, 956 thousand ounces of gold and 2 million pounds of molybdenum for first-quarter 2007. Pro forma sales volumes for first-quarter 2007, including Phelps Dodge sales volumes prior to the acquisition, totaled 1.0 billion pounds of copper, 977 thousand ounces of gold and 19 million pounds of molybdenum.
Because of mine sequencing at Grasberg and the ramp up of production at the Safford mine, second-half 2008 production and sales are expected to be higher than the first half of 2008. Approximately 56 percent of projected 2008 copper sales and 64 percent of projected 2008 gold sales are expected in the second half of the year. Projected consolidated sales volumes for the full year 2008 are estimated to be 4.2 billion pounds of copper, 1.4 million ounces of gold and 75 million pounds of molybdenum, including 930 million pounds of copper, 225 thousand ounces of gold and 18 million pounds of molybdenum for second-quarter 2008. Achievement of these sales estimates depends on the achievement of targeted mining rates and expansion plans, the successful operation of production facilities, the impact of weather conditions and other factors. Additionally, sales volumes may vary from these estimates depending on the areas being mined within the Grasberg open pit, with quarterly sales volumes expected to vary significantly. Refer to “Mining Operations” for further discussion of sales volumes at our North America, South America and Indonesia mining operations.
Consolidated revenues, operating cash flows and net income vary significantly with fluctuations in the market prices of copper, gold and molybdenum, sales volumes and other factors. Based on projected consolidated sales volumes (excluding purchased copper and molybdenum) for 2008 and assuming an average price of $3.75 per pound of copper, $900 per ounce of gold and $30 per pound of molybdenum for the remainder of 2008, our consolidated operating cash flow would exceed $6.5 billion in 2008, including net reductions for estimated working capital requirements totaling $1.1 billion. Each $0.20 per pound change in copper prices for the balance of the year would have an approximate $450 million impact on 2008 operating cash flows.
CONSOLIDATED RESULTS
| | First-Quarter | |
| | 2008 | | 2007 | |
Financial Data (in millions, except per share amounts) | | | | | | |
| Revenues | $ | 5,672 | a | $ | 2,246 | a,b |
| Operating income | | 2,396 | a,c | | 1,172 | a,b,c |
Income from continuing operations applicable to common stockd | | 1,122 | c,e | | 472 | b,c,f |
Net income applicable to common stockd | | 1,122 | c,e | | 476 | b,c,f |
Diluted net income per share of common stockg: | | | | | | |
| Continuing operations | $ | 2.64 | | $ | 2.00 | |
| Discontinued operations | | – | | | 0.02 | |
Diluted net income per share of common stockh | $ | 2.64 | c,e | $ | 2.02 | b,c,f |
Diluted average common shares outstandingg,h | | 449 | | | 244 | |
| | | | | | | |
| Operating Data - Sales from Mines, Excluding Sales of Purchased Metal | | | | | | |
| Copper | | | | | | |
| Consolidated share (millions of recoverable pounds) | | 911 | | | 520 | |
| Average realized price per pound | $ | 3.69 | | $ | 3.00 | b |
| Gold | | | | | | |
| Consolidated share (thousands of recoverable ounces) | | 280 | | | 956 | |
| Average realized price per ounce | $ | 932.55 | | $ | 654.63 | |
| Molybdenum | | | | | | |
| Consolidated share (millions of recoverable pounds) | | 20 | | | 2 | |
| Average realized price per pound | $ | 31.67 | | | 23.26 | |
| a. | A summary of revenues and operating income (loss) by operating division, for first-quarter 2008 and 2007 follows (in millions): |
| | First-Quarter 2008 | | | First-Quarter 2007 | |
| | | | Operating | | | | | Operating | |
| | | | Income | | | | | Income | |
| | Revenues | | (Loss) | | | Revenues | | (Loss) | |
| North America mining | $ | 3,273 | | $ | 898 | | | $ | 319 | | $ | (23 | ) |
| South America mining | | 1,593 | | | 1,031 | | | | 262 | | | 118 | |
| Indonesia mining | | 1,052 | | | 571 | | | | 1,709 | | | 1,283 | |
| Atlantic Copper smelting & refining | | 665 | | | (3 | ) | | | 454 | | | 13 | |
| Corporate, other & eliminations | | (911 | ) | | (101 | ) | | | (498 | ) | | (219 | ) |
| Total FCX | $ | 5,672 | | $ | 2,396 | | | $ | 2,246 | | $ | 1,172 | |
Refer to Note 10 for further discussion of our operating divisions.
| b. | Includes charges to revenues for mark-to-market accounting adjustments on the 2007 copper price protection program totaling $38 million ($23 million to net income or $0.10 per share) and a reduction in average realized copper prices of $0.07 per pound. |
| c. | First-quarter 2008 includes the impact of purchase accounting fair value adjustments associated with the acquisition of Phelps Dodge totaling $279 million to operating income ($175 million to net income or $0.39 per share), and also includes $9 million to net income or $0.02 per share for other non-operating income and expenses. First-quarter 2007 includes impacts totaling $124 million to operating income ($79 million to net income or $0.32 per share). |
| d. | After preferred dividends. |
| e. | Includes a loss on early extinguishment of debt totaling $6 million ($5 million to net income or $0.01 per share) associated with an open-market purchase of our 9.5% Senior Notes. |
| f. | Includes net losses on early extinguishment of debt totaling $88 million ($75 million to net income or $0.31 per share) primarily related to premiums paid and the accelerated recognition of deferred financing costs associated with prepayments of debt. |
| g. | Reflects assumed conversion of our 7% Convertible Senior Notes, 5½% Convertible Perpetual Preferred Stock and 6¾% Mandatory Convertible Preferred Stock. |
| h. | On March 19, 2007, we issued 137 million common shares to acquire Phelps Dodge, and on March 28, 2007, we sold 47 million common shares. Common shares outstanding on March 31, 2008, totaled 383 million. Assuming conversion of the instruments discussed in Note g above and including dilutive stock options and restricted stock units, total common shares outstanding would approximate 449 million at March 31, 2008. |
Revenues
Consolidated revenues include the sales of copper, gold, molybdenum and other metals and metal-related products by our North and South America mining operations, our Indonesia mining operation’s sale of copper concentrates, which also contain significant quantities of gold and silver, and the sale by Atlantic Copper of copper anodes, copper cathodes, and gold in anodes and slimes. Consolidated revenues for first-quarter 2008 were approximately $3.4 billion higher than first-quarter 2007. The increase in revenues reflects higher overall copper and molybdenum sales volumes because of a full three months of activity from Phelps Dodge operations, compared with only 12 days in first-quarter 2007. Higher first-quarter 2008 revenues also reflect higher copper, gold and molybdenum prices. These favorable factors were partly offset by lower copper and gold sales volumes at our Indonesia mining operations associated with mining lower-grade ore during first-quarter 2008 (refer to “Indonesia Mining” for further discussion).
Approximately two-thirds of our copper is sold in concentrate and cathodes and the remaining one-third is sold primarily as rod (principally from our North America operations). Substantially all of our concentrate sales contracts and some of our cathode sales contracts provide final copper pricing in a specified future period (generally one to four months from the shipment date) based on quoted LME or COMEX prices. We ultimately receive market prices based on prices in the specified future period; however, the accounting rules applied to these sales result in changes recorded to revenues until the specified future period. We record revenues and
invoice customers at the time of shipment based on then-current LME or COMEX prices, which results in an embedded derivative on our provisional priced concentrate and cathode sales that is adjusted to fair value through earnings each period until the date of final pricing. To the extent final prices are higher or lower than what was recorded on a provisional basis, an increase or decrease to revenues is recorded each reporting period until the date of final pricing. Accordingly, in times of rising copper prices, our revenues during a quarter benefit from higher prices received for contracts priced at current market rates and also from an increase related to the final pricing of provisionally priced contracts entered into in prior periods; in times of falling copper prices, the opposite occurs.
While first-quarter 2008 LME copper prices averaged $3.52 per pound, our average recorded price of $3.69 per pound was heavily weighted to the applicable forward curve price at the end of the quarter ($3.82 per pound). Approximately half of our consolidated copper sales during first-quarter 2008 were provisionally priced at the time of shipment and are subject to final pricing later in 2008. At December 31, 2007, 402 million pounds of copper (net of minority interests) were provisionally priced at $3.02 per pound. Copper prices increased in first-quarter 2008 resulting in adjustments to these prior period sales that increased consolidated revenues by $294 million ($127 million to net income or $0.28 per share), compared with a decrease of $15 million ($8 million to net income or $0.03 per share) in first-quarter 2007.
At March 31, 2008, our consolidated copper sales included 362 million pounds of copper (net of minority interests) priced at an average of $3.82 per pound and subject to final pricing over the next several months. We estimate that each $0.05 change in the price realized from the March 31, 2008, provisional price recorded would impact our 2008 consolidated revenues by $25 million ($11 million to net income).
On limited past occasions, in response to market conditions, we have entered into copper and gold price protection contracts for a portion of our expected future mine production to mitigate the risk of adverse price fluctuations. Also, in connection with the Phelps Dodge acquisition, FCX assumed the 2007 copper price protection program, which resulted in charges to revenues for first-quarter 2007 totaling $38 million ($23 million to net income or $0.10 per share). The 2007 copper price protection program matured on December 31, 2007, and in January 2008, we made a $598 million payment upon the settlement of contracts. We do not intend to enter into similar hedging programs in the future.
Production and Delivery Costs
Consolidated production and delivery costs for first-quarter 2008 were approximately $1.8 billion higher than first-quarter 2007 reflecting a full three months of costs associated with Phelps Dodge operations, compared with only 12 days in first-quarter 2007. Also impacting first-quarter 2008 production and delivery costs were higher costs of concentrate purchases at Atlantic Copper associated with higher copper and gold prices.
Energy Costs. Energy, including electricity, diesel fuel, coal and natural gas, is a significant portion of our production costs. As a result, we have been negatively impacted by rising energy prices and could continue to be impacted by future energy availability issues and/or additional increases in energy prices. For 2008, we expect energy costs to approximate 25 percent of our production costs.
We own a one-third interest in the Luna Energy Facility (Luna) located near Deming, New Mexico, which became operational in April 2006. Public Service Company of New Mexico (PNM), a subsidiary of PNM Resources, and Tucson Electric Power, a subsidiary of Unisource Energy Corporation, partnered in the purchase of Luna, each owning a one-third interest and each responsible for one-third of the costs and expenses. PNM is the operating partner of the plant. Approximately 190 megawatts, or one-third of the plant’s electricity, is available to satisfy a portion of the electricity demands of our New Mexico and Arizona operations. Electricity in excess of our demand is sold on the wholesale market. This efficient, low-cost plant is expected to continue to stabilize our southwest North America mining operations’ energy costs and increase the reliability of our energy supply.
Cost Structure. We continue to experience increases in our worldwide copper production costs. In addition to energy, costs have been affected by the prices of commodity input costs, royalties and profit sharing arrangements, equipment consumed or used in our operations and labor costs.
Additionally, we are developing large-scale underground operations in Indonesia that are more sensitive to labor costs than our large-scale open pit and mill processing operations. Increasing labor costs without corresponding productivity gains will adversely impact our current and future underground development and operations.
Depreciation, Depletion and Amortization
Consolidated depreciation, depletion and amortization expense of $418 million for first-quarter 2008 was $302 million higher than first-quarter 2007. The increase reflects higher purchase accounting impacts of $179 million related to the increase in the carrying values of acquired property, plant and equipment, and also includes the impact of higher overall copper sales volumes under the unit-of-production method resulting from a full three months of Phelps Dodge operations, compared with only 12 days in first-quarter 2007.
Exploration and Research Expenses
Consolidated exploration and research expenses totaled $52 million for first-quarter 2008, compared with $7 million for first-quarter 2007. The increase in expenditures for first-quarter 2008 primarily reflects a full three months, or $46 million, of exploration and research expenses associated with Phelps Dodge operations, compared with $3 million for the 12-day period ended March 31, 2007. Refer to “Exploration Activities” for further discussion of our exploration activities.
Selling, General and Administrative Expenses
Consolidated selling, general and administrative expenses for first-quarter 2008 were $36 million higher than first-quarter 2007 primarily related to a full three months of expense associated with the Phelps Dodge operations, compared with only 12 days in first-quarter 2007, partly offset by reductions totaling approximately $40 million to adjust 2007 incentive compensation to actual cash and stock-based awards approved by the Corporate Personnel Committee of FCX’s Board of Directors in January 2008.
Interest Expense, Net
Consolidated interest expense (before capitalization) totaled $187 million for first-quarter 2008, compared with $59 million for first-quarter 2007. The increase in first-quarter 2008 primarily relates to a full three months of interest on the debt incurred in connection with the March 19, 2007, acquisition of Phelps Dodge. Additionally, first-quarter 2008 consolidated interest expense includes net purchase accounting impacts of $19 million primarily related to accretion on assumed environmental obligations.
Capitalized interest totaled $22 million for first-quarter 2008, compared with $7 million for first-quarter 2007. Higher capitalized interest for first-quarter 2008 primarily relates to our development projects, including Tenke Fungurume (refer to “Development Projects” for further discussion).
Losses on Early Extinguishment of Debt
During first-quarter 2008, we purchased, in an open market transaction, $33 million of the 9.5% Senior Notes for $46 million, which resulted in a net charge of $6 million ($5 million to net income or $0.01 per share) for early extinguishment of debt.
During first-quarter 2007, we recorded net charges totaling $88 million ($75 million to net income or $0.31 per share) for early extinguishment of debt primarily related to the accelerated recognition of deferred financing costs associated with early repayment of amounts under our $11.5 billion senior credit facility.
Other Income, Net
Other income, net, for first-quarter 2008 was $22 million lower than first-quarter 2007 primarily because of higher foreign currency exchange losses caused by a weaker U.S. dollar. Foreign currency losses totaled $20 million for first-quarter 2008, compared with minimal foreign currency exchange gains for first-quarter 2007.
Provision for Income Taxes
Our first-quarter 2008 income tax provision from continuing operations resulted from taxes on international operations ($579 million) and U.S. taxes ($150 million). The difference between FCX’s consolidated effective income tax rate of approximately 33 percent for first-quarter 2008 and the U.S. federal statutory rate of 35 percent primarily was attributable to a U.S. benefit for percentage depletion and an international tax rate differential, partly offset by withholding taxes on earnings from our Indonesia and South America mining operations and a U.S. foreign tax credit limitation.
Our first-quarter 2007 income tax provision from continuing operations resulted from taxes on earnings at international operations ($504 million), partly offset by a tax benefit from losses in the U.S. ($46 million). The
first-quarter 2007 income tax provision primarily related to the operations of PT Freeport Indonesia, and also included $31 million associated with Phelps Dodge’s earnings for the 12-day period ended March 31, 2007. The difference between FCX’s consolidated effective income tax rate of approximately 43 percent for first-quarter 2007 and the U.S. federal statutory rate of 35 percent primarily was attributable to withholding taxes incurred in connection with earnings from Indonesia mining operations.
A summary of the approximate amounts in the calculation of our consolidated provision for income taxes for first-quarter 2008 and 2007 follows (in millions, except percentages):
| | | | | | | | | | | | | | | | | |
| | | First-Quarter 2008 | | First-Quarter 2007 | |
| | | | | | | Effective | | Provision for | | | | | | Effective | | Provision for | |
| | | Incomea | | | Tax Rate | | Income Tax | | Incomea | | | Tax Rate | | Income Tax | |
| U.S. | | $ | 978 | | | 23% | | $ | 228 | | $ | (76 | ) | | 32% | | $ | (25 | ) |
| South America | | | 1,118 | | | 33% | | | 365 | | | 187 | | | 34% | | | 65 | |
| Indonesia | | | 577 | | | 42% | | | 239 | | | 1,086 | | | 43% | | | 462 | |
| Eliminations and other | | | (145 | ) | | N/A | | | (3 | ) | | (13 | ) | | N/A | | | 1 | |
| Purchase accounting adjustments | | | (294 | ) | | 37% | | | (110 | ) | | (124 | ) | | 37% | | | (45 | ) |
Annualized rate adjustmentb | | | N/A | | | N/A | | | 10 | | | N/A | | | N/A | | | – | |
| Consolidated FCX | | $ | 2,234 | | | 33% | | $ | 729 | | $ | 1,060 | | | 43% | | $ | 458 | |
| a. | Represents income from continuing operations before income taxes and minority interests. |
| b. | In accordance with APB Opinion No. 28, “Interim Financial Reporting,” and FASB Interpretation No. 18, “Accounting for Income Taxes in Interim Periods – an interpretation of APB Opinion No. 28,” we adjust our interim provision for income taxes to equal our estimated annualized tax rate. |
Minority Interests in Net Income of Consolidated Subsidiaries
Minority interests in net income of consolidated subsidiaries for first-quarter 2008 was $205 million higher than first-quarter 2007 because of higher minority interests associated with our South America mining operations reflecting a full three months of Phelps Dodge operations, compared with only 12 days for first-quarter 2007. Greater minority interest shares in our South America mining operations’ net income were partly offset by a lower minority interest share of PT Freeport Indonesia net income because of lower earnings in first-quarter 2008.
MINING OPERATIONS
North America Mining
Our North America mining operations include copper operations from mining through rod production, molybdenum operations from mining through conversion to chemical and metallurgical products, and the marketing and sale of both product lines. We have six operating copper mines in North America – Morenci, Bagdad, Sierrita, Safford, Chino and Tyrone, and one operating molybdenum mine – Henderson.
The North America mining division includes the Morenci copper mine, Rod & Refining operations and Molybdenum operations as reportable segments. Following is further discussion of these reportable segments, as well as other operations included in the North America mining division.
Morenci. We have an 85 percent undivided interest in the Morenci open-pit mine, located in southeastern Arizona, which primarily produces copper cathodes and copper concentrates. In addition to copper, Morenci produces molybdenum concentrates as a by-product. The concentrate-leach, direct-electrowinning facility at Morenci is ramping up production following commissioning in third-quarter 2007. The facility uses FCX’s proprietary medium-temperature, pressure-leaching and direct-electrowinning technology, which enhances cost savings by processing concentrates on-site instead of shipping concentrates to smelters for treatment and by providing acid for leaching operations.
Rod & Refining. The Rod & Refining segment consists of copper conversion facilities, including a refinery, rod mills and a specialty copper products facility. This segment processes copper produced at our North America mines and purchased copper into copper anode, cathode, rod and custom copper shapes. At times this segment refines copper and produces copper rod and shapes for customers on a toll basis. Toll arrangements require the
tolling customer to deliver appropriate copper-bearing material to our facilities for processing into a product that is returned to the customer, who pays us for processing their material into the specified products.
Molybdenum. The Molybdenum segment includes our wholly owned Henderson molybdenum mine in Colorado, related conversion facilities and a technology center. The Henderson underground mine produces high-purity, chemical-grade molybdenum concentrates, which are typically further processed into value-added molybdenum chemical products. This segment is an integrated producer of molybdenum, with mining, roasting and processing facilities that produce high-purity, molybdenum-based chemicals, molybdenum metal powder and metallurgical products, which are sold to customers around the world. The Molybdenum segment also includes a sales company that purchases molybdenum from Henderson and our North America and South America copper mines and sells it to third parties. In addition, at times this segment roasts and/or processes material on a toll basis. Toll arrangements require the tolling customer to deliver appropriate molybdenum-bearing material to our facilities for processing into a product that is returned to the customer, who pays us for processing their material into the specified products. This segment also includes a technology center whose primary activity is developing new engineered products and applications.
The Molybdenum segment also includes our wholly owned Climax molybdenum mine in Colorado, which has been on care-and-maintenance status since 1995. In December 2007, we announced a project to restart the Climax mine, which is believed to be the largest, highest-grade and lowest-cost undeveloped molybdenum ore body in the world (refer to “Development Projects” for further discussion).
Other North America mining operations. Other North America mining operations include our other operating southwestern U.S. copper mines – Bagdad, Sierrita, Safford, Chino and Tyrone. In addition to copper, the Bagdad, Sierrita and Chino mines produce molybdenum, gold and silver, and the Sierrita mine also produces rhenium. Other North America mining operations also include the Miami copper mine, which we are undertaking a project to restart (refer to “Development Projects” for further discussion); the Miami smelter, which processes our North America concentrates and provides a significant source of sulfuric acid for the various North America leaching operations; and a sales company, which functions as an agent to purchase and sell copper from the North America mines and from the Rod & Refining operations and also sells any copper not sold by our South America mines to third parties.
North America Mining Revenues. A summary of changes in revenues at our North America mining operations from first-quarter 2007 to first-quarter 2008 follows (in millions):
| First-quarter 2007 North America mining revenues | $ | 319 | |
Sales volumesa: | | | |
| Copper | | 896 | |
| Molybdenum | | 437 | |
| Price realizations: | | | |
| Copper | | 224 | |
| Molybdenum | | 172 | |
| Purchased copper and molybdenum | | 1,125 | b |
| Impact of the 2007 copper price protection program | | 38 | |
| Other | | 62 | |
| First-quarter 2008 North America mining revenues | $ | 3,273 | |
| a. | The significant increase in sales volumes reflects a full three months of sales for first-quarter 2008, compared with only 12 days in first-quarter 2007. |
| b. | Includes a change of $505 million related to revenues associated with purchases of copper and molybdenum from our South America mines, which is sold to third parties by our North America copper and molybdenum sales companies. |
North America Mining Operating Results. The following discussion of our North America mining operations covers actual first-quarter 2008 results and pro forma first-quarter 2007 results, which includes the period prior to our acquisition of these operations:
| | | First-Quarter | |
| | | 2008 | | 2007 | |
| | | (Actual) | | (Pro Forma) | |
| Consolidated Operating Data, Net of Joint Venture Interest | | | | | | | |
Copper (millions of recoverable pounds) | | | | | | | |
| Production | | | 327 | | | 301 | |
| Sales, excluding purchases | | | 339 | | | 307 | |
| Average realized price per pound | | $ | 3.50 | | $ | 2.51 | a |
| | | | | | | | |
Molybdenum (millions of recoverable pounds) | | | | | | | |
| Production | | | 17 | | | 17 | |
| Sales, excluding purchases | | | 20 | | | 19 | |
| Average realized price per pound | | $ | 31.67 | | $ | 23.00 | |
| | | | | | | | |
| 100% Operating Data, Including Joint Venture Interest | | | | | | | |
| Solution extraction/electrowinning (SX/EW) operations | | | | | | | |
| Leach ore placed in stockpiles (metric tons per day) | | | 1,134,900 | | | 677,300 | |
| Average copper ore grade (percent) | | | 0.19 | | | 0.29 | |
| Copper production (millions of recoverable pounds) | | | 217 | | | 228 | |
| | | | | | | | |
| Mill operations | | | | | | | |
| Ore milled (metric tons per day) | | | 244,000 | | | 209,000 | |
| Average ore grade (percent): | | | | | | | |
| Copper | | | 0.39 | | | 0.31 | |
| Molybdenum | | | 0.02 | | | 0.02 | |
| Production (millions of recoverable pounds): | | | | | | | |
| Copper | | | 136 | | | 101 | |
| Molybdenum (by-product) | | | 8 | | | 7 | |
| | | | | | | | |
| Molybdenum operations (Henderson) | | | | | | | |
| Ore milled (metric tons per day) | | | 25,000 | | | 24,500 | |
| Average molybdenum ore grade (percent) | | | 0.22 | | | 0.22 | |
| Molybdenum production (millions of recoverable pounds) | | | 9 | | | 10 | |
| a. | Amount was $2.70 per pound before charges for mark-to-market accounting adjustments on the 2007 copper price protection program. |
First-Quarter 2008 Compared with Pro Forma First-Quarter 2007. Consolidated copper sales from North America operations totaled approximately 339 million pounds in first-quarter 2008, compared with 307 million pounds in first-quarter 2007. The increase in North America copper sales volumes in first-quarter 2008 primarily reflects higher copper production from the recently commissioned Safford mine. Consolidated copper sales volumes from our North America mining operations are expected to total approximately 1.5 billion pounds in 2008. During first-quarter 2008, average realized copper prices for the North America mining operations improved by $0.80 per pound to an average of $3.50 per pound, compared with $2.70 per pound in first-quarter 2007, which excluded the impact of the 2007 copper price protection program.
Consolidated molybdenum sales volumes increased to approximately 20 million pounds in first-quarter 2008, compared with 19 million pounds in first-quarter 2007, reflecting production from the Cerro Verde mill operations in first-quarter 2008, which is sold by our molybdenum sales company. Consolidated molybdenum sales volumes are expected to approximate 75 million pounds in 2008. Approximately 85 percent of our expected 2008 molybdenum production is committed for sale throughout the world pursuant to annual or quarterly agreements based primarily on prevailing market prices one month prior to the time of sale. During first-quarter 2008, average realized molybdenum prices improved by $8.67 per pound to an average of $31.67 per pound, compared with $23.00 per pound in first-quarter 2007.
Unit Net Cash Costs. Unit net cash costs per pound of copper and molybdenum are measures intended to provide investors with information about the cash-generating capacity of our mining operations expressed on a basis relating to the primary metal product for our respective operations. We use this measure for the same purpose and for monitoring operating performance by our mining operations. This information differs from measures of performance determined in accordance with U.S. GAAP and should not be considered in isolation or as a substitute for measures of performance determined in accordance with U.S. GAAP. This measure is presented by other mining companies, although our measures may not be comparable to similarly titled measures reported by other companies.
The following tables summarize the unit net cash costs at the North America copper mines for first-quarter 2008 and pro forma first-quarter 2007, which includes the period prior to our acquisition of these operations. Beginning in first-quarter 2008, we have included the impacts of purchase accounting fair value adjustments as additional depreciation, depletion and amortization and noncash and nonrecurring costs. Accordingly, we have revised the first-quarter 2007 pro forma disclosures to conform to the current period presentation. Henderson, our operating molybdenum mine, is not included in these tables – see “Henderson Unit Net Cash Costs.” For an explanation of the “by-product” and “co-product” methods and a reconciliation of unit net cash costs per pound to production and delivery costs applicable to sales reported in FCX’s consolidated financial statements for first-quarter 2008 and FCX’s pro forma consolidated financial results for first-quarter 2007, refer to “Product Revenues and Production Costs.”
Gross Profit per Pound of Copper and Molybdenum for North America Copper Mines
| Three Months Ended March 31, 2008 | | | | | | | | | |
| | | By-Product | | Co-Product Method | |
| | | Method | | | Copper | | | Molybdenum | a |
| | | | | | | | | | |
| Revenues, after adjustments shown below | $ | 3.50 | | $ | 3.50 | | $ | 32.75 | |
| | | | | | | | | | |
| Site production and delivery, before net noncash and | | | | | | | | | |
| nonrecurring costs shown below | | 1.64 | | | 1.43 | | | 9.75 | |
By-product creditsa | | (0.77 | ) | | – | | | – | |
| Treatment charges | | 0.09 | | | 0.09 | | | – | |
| Unit net cash costs | | 0.96 | | | 1.52 | | | 9.75 | |
| Depreciation, depletion and amortization | | 0.53 | | | 0.47 | | | 2.47 | |
| Noncash and nonrecurring costs, net | | 0.09 | | | 0.09 | | | 0.11 | |
| Total unit costs | | 1.58 | | | 2.08 | | | 12.33 | |
| Revenue adjustments, primarily for pricing on prior period | | | | | | | | | |
| open sales | | 0.13 | | | 0.13 | | | – | |
| Idle facility and other non-inventoriable costs | | (0.04 | ) | | (0.04 | ) | | (0.02 | ) |
| Gross profit | $ | 2.01 | | $ | 1.51 | | $ | 20.40 | |
| | | | | | | | | | |
| Consolidated sales (millions of recoverable pounds) | | | | | | | | | |
| Copper | | 337 | | | 337 | | | | |
| Molybdenum | | | | | | | | 8 | |
| a. | Molybdenum by-product credits and revenues reflect volumes produced at market-based pricing and also include tolling revenues at Sierrita. |
| Three Months Ended March 31, 2007 (Pro Forma) | | | | | | | | | |
| | | By-Product | | Co-Product Method | |
| | | Method | | | Copper | | | Molybdenum | a |
| | | | | | | | | | |
| Revenues, after adjustments shown below | $ | 2.70 | | $ | 2.70 | | $ | 25.13 | |
| | | | | | | | | | |
| Site production and delivery, before net noncash and | | | | | | | | | |
| nonrecurring costs shown below | | 1.31 | | | 1.15 | | | 9.59 | |
By-product creditsa | | (0.54 | ) | | – | | | – | |
| Treatment charges | | 0.07 | | | 0.07 | | | – | |
| Unit net cash costs | | 0.84 | | | 1.22 | | | 9.59 | |
| Depreciation, depletion and amortization | | 0.48 | | | 0.40 | | | 3.33 | |
| Noncash and nonrecurring costs, net | | 1.12 | | | 0.93 | | | 7.87 | |
| Total unit costs | | 2.44 | | | 2.55 | | | 20.79 | |
| Revenue adjustments, primarily for pricing on prior period | | | | | | | | | |
| open sales and hedging | | 0.02 | | | 0.02 | | | – | |
| Idle facility and other non-inventoriable costs | | (0.03 | ) | | (0.03 | ) | | – | |
| Gross profit | $ | 0.25 | | $ | 0.14 | | $ | 4.34 | |
| | | | | | | | | | |
| Consolidated sales (millions of recoverable pounds) | | | | | | | | | |
| Copper | | 301 | | | 301 | | | | |
| Molybdenum | | | | | | | | 7 | |
| a. | Molybdenum by-product credits and revenues reflect volumes produced at market-based pricing and also include tolling revenues at Sierrita. |
First-Quarter 2008 Compared with Pro Forma First-Quarter 2007. The North America mining operations have experienced production cost increases in recent years primarily as a result of higher energy costs and costs of other consumables, higher mining and milling rates, labor costs and other factors.
First-quarter 2008 unit net cash costs for the North America copper mines were higher, compared with first-quarter 2007, primarily because of an increase in tons mined and lower ore grades at Morenci, combined with higher unit net cash costs at Safford as the mine ramps up to full production rates. Other increases for first-quarter 2008 related to higher energy and labor costs, partly offset by higher copper production. Also offsetting these higher costs in the by-product calculation were higher molybdenum credits in first-quarter 2008 resulting from higher average molybdenum prices and production.
The North America copper mines had lower noncash and nonrecurring costs for first-quarter 2008, compared with first quarter 2007, primarily because of higher purchase accounting impacts in first-quarter 2007 associated with the carrying value of inventories.
Assuming average prices of $3.75 per pound of copper and $30 per pound of molybdenum for the remainder of 2008 and achievement of current sales estimates, we estimate that the 2008 average unit net cash costs for our North America copper mines, including molybdenum credits, would approximate $1.14 per pound of copper.
Henderson Unit Net Cash Costs. The following table summarizes the unit net cash costs at our Henderson operation for first-quarter 2008 and pro forma first-quarter 2007, which includes the period prior to our acquisition of these operations. Beginning in first-quarter 2008, we have included the impacts of purchase accounting fair value adjustments as additional depreciation and amortization and noncash and nonrecurring costs. Accordingly, we have revised the first-quarter 2007 pro forma disclosures to conform to the current period presentation. For an explanation of the “by-product” and “co-product” methods and a reconciliation of unit net cash costs per pound to production and delivery costs applicable to sales reported in FCX’s consolidated financial statements for first-quarter 2008 and FCX’s pro forma consolidated financial results for first-quarter 2007, refer to “Product Revenues and Production Costs.”
Gross Profit per Pound of Molybdenum for Henderson Molybdenum Mine
| | | | | | | | | |
| | First-Quarter | | |
| | 2008 | | 2007 | | |
| | (Actual) | | (Pro Forma) | | |
| Revenues | $ | 29.45 | | $ | 22.17 | | |
| Site production and delivery, before net noncash | | | | | | | |
| and nonrecurring costs shown below | | 5.10 | | | 4.15 | | |
| Unit net cash costs | | 5.10 | | | 4.15 | | |
| Depreciation, depletion and amortization | | 4.26 | | | 3.93 | | |
| Noncash and nonrecurring costs, net | | 0.10 | | | 0.02 | | |
| Total unit costs | | 9.46 | | | 8.10 | | |
Gross profita | $ | 19.99 | | $ | 14.07 | | |
| | | | | | | | |
| Consolidated molybdenum sales (millions of recoverable pounds) | | 9 | | | 10 | | |
| a. | Gross profit reflects sales of Henderson products based on volumes produced at market-based pricing. On a consolidated basis, the Molybdenum segment includes profits on sales as they are made to third parties and realizations based on actual contract terms. As a result, the actual gross profit realized will differ from the amounts reported in this table. |
First-Quarter 2008 Compared with Pro Forma First-Quarter 2007. Henderson’s unit net cash costs per pound of molybdenum for first-quarter 2008 were higher than first-quarter 2007 primarily because of higher input costs, including labor, maintenance supplies and energy costs.
Assuming achievement of current sales estimates, we estimate that the 2008 average unit net cash costs for Henderson would approximate $4.75 per pound of molybdenum.
South America Mining
We have four operating copper mines in South America – Cerro Verde in Peru, and Candelaria, Ojos del Salado and El Abra in Chile. These operations include open-pit and underground mining, sulfide ore concentrating, leaching and SX/EW.
The South America mining division includes the Cerro Verde copper mine as a reportable segment. Following is further discussion of this reportable segment, as well as other operations included in the South America mining division.
Cerro Verde. We own a 53.56 percent interest in Cerro Verde. The Cerro Verde open-pit mine, located near Arequipa, Peru, produces copper cathodes and copper concentrates. In addition to copper, the Cerro Verde mine produces molybdenum concentrates. In mid-2007, the recently expanded mill at Cerro Verde reached design capacity of 108,000 metric tons of ore per day. The expansion enables Cerro Verde to produce approximately 650 million pounds of copper per year (approximately 348 million pounds per year for our share) and approximately 8 million pounds of molybdenum per year (approximately 4 million pounds per year for our share) for the next several years.
Cerro Verde has provided a variety of community support projects over the years. During 2006, as a result of discussions with local mayors in the Arequipa region, Cerro Verde agreed to design domestic water and sewage
treatment plants for the benefit of the region. These facilities are being designed in a modular fashion so that initial installations can be readily expanded in the future. The cost associated with the construction of these facilities, which will be split equally between Cerro Verde and local municipalities, is currently under review.
During 2006, the Peruvian government announced that all mining companies operating in Peru will make annual contributions to local development funds for a five-year period. The contribution is equal to 3.75 percent of after-tax profits, of which 2.75 percent is contributed to a local mining fund and 1.00 percent to a regional mining fund. As the contribution program was being established, Cerro Verde negotiated an agreement that allowed a credit against contributions to the local mining fund for Cerro Verde’s contributions made to the Arequipa region for construction of local water and sewage treatment facilities. During third-quarter 2007, the agreement with the government was modified to exclude this credit. The first-quarter 2008 includes a $14 million charge to production and delivery costs for local mining fund contributions. At March 31, 2008, Cerro Verde’s liability associated with the local mining fund contributions totaled $62 million, which is recorded as a current liability in our consolidated balance sheets.
Other South America Mining Operations. Other South America mining operations include our Chilean copper mines – Candelaria, Ojos del Salado and El Abra – which include open-pit and underground mining, sulfide ore concentrating, leaching and SX/EW operations. In addition to copper, the Candelaria and Ojos del Salado mines produce gold and silver. We own an 80 percent interest in both the Candelaria and Ojos del Salado mines, and own a 51 percent interest in the El Abra mine.
El Abra has a labor agreement covering certain of its employees, which expires October 2008. In late April 2008, El Abra and its workers successfully negotiated a new four-year agreement, effective August 1, 2008. The new agreement provides for an increase in base wages, bonuses and an employee loan program. The estimated cost of the increased wages and bonuses over the four year term is approximately $40 million.
South America Mining Revenues. A summary of changes in revenues at our South America mining operations from first-quarter 2007 to first-quarter 2008 follows (in millions):
| First-quarter 2007 South America mining revenues | $ | 262 | |
Sales volumesa: | | | |
| Copper | | 880 | |
| Gold | | 13 | |
| Price realizations: | | | |
| Copper | | 253 | |
| Gold | | 7 | |
| Adjustments, primarily for copper pricing on prior year open sales | | 190 | |
| Treatment charges and other | | (12 | ) |
| First-quarter 2008 South America mining revenues | $ | 1,593 | |
| a. | The significant increase in sales volumes reflects a full three months of sales for first-quarter 2008, compared with only 12 days in first-quarter 2007. |
South America Mining Operating Results. The following discussion of our South America mining operations covers actual first-quarter 2008 results and pro forma first-quarter 2007 results, which includes the period prior to our acquisition of these operations:
| | | First-Quarter | |
| | | 2008 | | 2007 | |
| | | (Actual) | | (Pro Forma) | |
Copper (millions of recoverable pounds) | | | | | | | |
| Production | | | 353 | | | 307 | |
| Sales | | | 365 | | | 301 | |
| Average realized price per pound | | $ | 3.78 | | $ | 2.73 | |
| | | | | | | | |
Gold (thousands of recoverable ounces) | | | | | | | |
| Production | | | 26 | | | 24 | |
| Sales | | | 27 | | | 25 | |
| Average realized price per ounce | | $ | 936.08 | | $ | 538.12 | |
| | | | | | | | |
Molybdenum (millions of recoverable pounds) | | | | | | | |
| Production | | | 1 | | | – | |
| | | | | | | | |
| SX/EW operations | | | | | | | |
| Leach ore placed in stockpiles (metric tons per day) | | | 274,100 | | | 276,000 | |
| Average copper ore grade (percent) | | | 0.39 | | | 0.39 | |
| Copper production (millions of recoverable pounds) | | | 135 | | | 149 | |
| | | | | | | | |
| Mill operations | | | | | | | |
| Ore milled (metric tons per day) | | | 170,700 | | | 141,300 | |
| Average copper ore grade (percent): | | | | | | | |
| Copper | | | 0.74 | | | 0.66 | |
| Molybdenum | | | 0.02 | | | N/A | |
| Production (millions of recoverable pounds): | | | | | | | |
| Copper | | | 218 | | | 158 | |
| Molybdenum | | | 1 | | | – | |
First-Quarter 2008 Compared with Pro Forma First-Quarter 2007. Consolidated copper sales from South America operations increased to approximately 365 million pounds in first-quarter 2008, compared with 301 million pounds in first-quarter 2007, primarily reflecting higher production from the Cerro Verde concentrator, which reached design capacity in mid-2007. Consolidated copper sales volumes from our South America mining operations are expected to approximate 1.5 billion pounds in 2008. During first-quarter 2008, average realized copper prices for the South America mining operations improved by $1.05 per pound to an average of $3.78 per pound, compared with $2.73 per pound in first-quarter 2007.
Unit Net Cash Costs. Unit net cash costs per pound of copper is a measure intended to provide investors with information about the cash-generating capacity of our mining operations expressed on a basis relating to the primary metal product for our respective operations. We use this measure for the same purpose and for monitoring operating performance by our mining operations. This information differs from measures of performance determined in accordance with U.S. GAAP and should not be considered in isolation or as a substitute for measures of performance determined in accordance with U.S. GAAP. This measure is presented by other mining companies, although our measures may not be comparable to similarly titled measures reported by other companies.
The following tables summarize the unit net cash costs at the South America copper mines for first-quarter 2008 and pro forma first-quarter 2007, which includes the period prior to our acquisition of these operations. The below tables reflect unit net cash costs per pound of copper under the by-product and co-product methods as the South America mines also had small amounts of gold and silver sales. Additionally, beginning in first-quarter 2008 we have included the impacts of purchase accounting fair value adjustments as additional depreciation, depletion and amortization, and noncash and nonrecurring costs. Accordingly, we have revised the first-quarter 2007 pro forma disclosures to conform to the current period presentation. For an explanation of the “by-product”
and “co-product” methods and a reconciliation of unit net cash costs per pound to production and delivery costs applicable to sales reported in FCX’s consolidated financial statements for first-quarter 2008 and FCX’s pro forma consolidated financial results for first-quarter 2007, refer to “Product Revenues and Production Costs.”
Gross Profit per Pound of Copper for South America Copper Mines
| Three Months Ended March 31, 2008 | | | | |
| | By-Product | | Co-Product | |
| | Method | | Method | |
| Revenues, after adjustments shown below | $ | 3.78 | | $ | 3.78 | |
| Site production and delivery, before net noncash and | | | | | | |
| nonrecurring costs shown below | | 1.08 | | | 1.05 | |
| By-product credits | | (0.14 | ) | | – | |
| Treatment charges | | 0.21 | | | 0.21 | |
| Unit net cash costs | | 1.15 | | | 1.26 | |
| Depreciation, depletion and amortization | | 0.35 | | | 0.34 | |
| Noncash and nonrecurring costs, net | | 0.07 | | | 0.07 | |
| Total unit costs | | 1.57 | | | 1.67 | |
| Revenue adjustments, primarily for pricing on prior period | | | | | | |
| open sales | | 0.63 | | | 0.63 | |
| Other non-inventoriable costs | | (0.02 | ) | | (0.01 | ) |
| Gross profit | $ | 2.82 | | $ | 2.73 | |
| | | | | | | |
| Consolidated sales | | | | | | |
| Copper (millions of recoverable pounds) | | 365 | | | 365 | |
| Three Months Ended March 31, 2007 (Pro Forma) | | | | |
| | By-Product | | Co-Product | |
| | Method | | Method | |
| Revenues, after adjustments shown below | $ | 2.73 | | $ | 2.73 | |
| Site production and delivery, before net noncash and | | | | | | |
| nonrecurring costs shown below | | 0.84 | | | 0.81 | |
| By-product credits | | (0.08 | ) | | – | |
| Treatment charges | | 0.18 | | | 0.18 | |
| Unit net cash costs | | 0.94 | | | 0.99 | |
| Depreciation, depletion and amortization | | 0.32 | | | 0.31 | |
| Noncash and nonrecurring costs, net | | 0.54 | | | 0.52 | |
| Total unit costs | | 1.80 | | | 1.82 | |
| Revenue adjustments, primarily for pricing on prior period | | | | | | |
| open sales | | 0.20 | | | 0.20 | |
| Other non-inventoriable costs | | (0.02 | ) | | (0.02 | ) |
| Gross profit | $ | 1.11 | | $ | 1.09 | |
| | | | | | | |
| Consolidated sales | | | | | | |
| Copper (millions of recoverable pounds) | | 301 | | | 301 | |
First-Quarter 2008 Compared with Pro Forma First-Quarter 2007. Because of the fixed nature of a large portion of our South America mining costs, unit costs vary significantly from period to period depending on volumes of copper sold during the period. The South America mining operations have also experienced production cost increases in recent years primarily as a result of higher energy costs and costs of other consumables, higher mining costs and milling rates, labor costs and other factors.
South America unit net cash costs were higher in first-quarter 2008, compared with first-quarter 2007, reflecting higher energy costs at all sites and higher profit sharing and contributions at Cerro Verde. Other first-quarter 2008 increases at our South America mining operations included higher crushing and milling costs at Cerro Verde and Candelaria. Offsetting these factors in the by-product calculation were higher by-product credits reflecting higher average gold prices and first-quarter 2008 molybdenum production at Cerro Verde.
South America mining operations had lower noncash and nonrecurring costs for first-quarter 2008, compared with first quarter 2007, primarily because of higher purchase accounting impacts in first-quarter 2007 associated with the carrying value of inventories.
Assuming average prices of $3.75 per pound of copper for the remainder of 2008 and achievement of current sales estimates, we estimate that 2008 average unit net cash costs for our South America mines, including gold and molybdenum credits, would approximate $1.07 per pound of copper.
Indonesia Mining
We own 90.64 percent of PT Freeport Indonesia, including 9.36 percent owned through our wholly owned subsidiary, PT Indocopper Investama. The Government of Indonesia owns the remaining 9.36 percent of PT Freeport Indonesia. In July 2004, we received a request from the Indonesian Department of Energy and Mineral Resources that we offer to sell shares in PT Indocopper Investama to Indonesian nationals at fair market value. In response to this request and in view of the potential benefits of having additional Indonesian ownership in our operations, we agreed, at that time, to consider a potential sale of an interest in PT Indocopper Investama at fair market value. Neither our Contract of Work nor Indonesian law requires us to divest any portion of our ownership interest in PT Freeport Indonesia or PT Indocopper Investama.
Joint Ventures with Rio Tinto plc (Rio Tinto). In 1996, we established joint ventures with Rio Tinto, an international mining company with headquarters in London, England. One joint venture covers PT Freeport Indonesia’s mining operations in Block A and gives Rio Tinto, through 2021, a 40 percent interest in certain assets and future production exceeding specified annual amounts of copper, gold and silver in Block A, and, after 2021, a 40 percent interest in all production from Block A. All of PT Freeport Indonesia’s current mining operations and reserves are in Block A.
Operating, nonexpansion capital and administrative costs are shared proportionately between PT Freeport Indonesia and Rio Tinto based on the ratio of the incremental revenues from production from our expansion completed in 1998 to total revenues from Block A, including production from PT Freeport Indonesia’s previously existing reserves. PT Freeport Indonesia receives 100 percent of the cash flow from specified annual amounts of copper, gold and silver through 2021, calculated by reference to its proven and probable reserves as of December 31, 1994, and 60 percent of all remaining cash flow.
Indonesia Mining Revenues. A summary of changes in PT Freeport Indonesia’s revenues from first-quarter 2007 to first-quarter 2008 follows (in millions):
| First-quarter 2007 PT Freeport Indonesia revenues | $ | 1,709 | |
| Sales volumes: | | | |
| Copper | | (649 | ) |
| Gold | | (456 | ) |
| Price realizations: | | | |
| Copper | | 151 | |
| Gold | | 70 | |
| Adjustments, primarily for copper pricing on prior year open sales | | 112 | |
| Treatment charges, royalties and other | | 115 | |
| First-quarter 2008 PT Freeport Indonesia revenues | $ | 1,052 | |
| | | | |
Indonesia Mining Operating Results. The following discussion of our Indonesia mining operations covers first-quarter 2008 and 2007:
| | | First-Quarter | |
| | | 2008 | | 2007 | |
| Consolidated Operating Data, Net of Joint Venture Interest | | | | | | | |
Copper (millions of recoverable pounds) | | | | | | | |
| Production | | | 200 | | | 468 | |
| Sales | | | 207 | | | 417 | |
| Average realized price per pound | | $ | 3.82 | | $ | 3.09 | |
| | | | | | | | |
Gold (thousands of recoverable ounces) | | | | | | | |
| Production | | | 246 | | | 1,074 | |
| Sales | | | 251 | | | 947 | |
| Average realized price per ounce | | $ | 931.71 | | $ | 654.79 | |
| | | | | | | | |
| 100% Operating Data, Including Joint Venture Interest | | | | | | | |
| Ore milled (metric tons per day): | | | | | | | |
Grasberg open pita | | | 118,600 | | | 179,300 | |
Deep Ore Zone (DOZ) underground minea | | | 61,200 | | | 49,200 | |
| Total | | | 179,800 | | | 228,500 | |
| Average ore grade: | | | | | | | |
| Copper (percent) | | | 0.70 | | | 1.21 | |
| Gold (grams per metric ton) | | | 0.61 | | | 2.01 | |
| Recovery rates (percent): | | | | | | | |
| Copper | | | 89.7 | | | 91.0 | |
| Gold | | | 79.0 | | | 87.8 | |
| Production (recoverable): | | | | | | | |
| Copper (millions of pounds) | | | 214 | | | 480 | |
| Gold (thousands of ounces) | | | 246 | | | 1,146 | |
| a. | Amounts represent the approximate average daily throughput processed at PT Freeport Indonesia’s mill facilities from each producing mine. |
First-Quarter 2008 Compared with First-Quarter 2007. PT Freeport Indonesia’s share of sales totaled 207 million pounds of copper and 251 thousand ounces of gold for first-quarter 2008, compared with 417 million pounds of copper and 947 thousand ounces of gold for first-quarter 2007. At the Grasberg mine, the sequencing in mining areas with varying ore grades causes fluctuations in the timing of ore production, resulting in varying quarterly and annual sales of copper and gold. Copper and gold sales volumes for first-quarter 2008 decreased, compared to first-quarter 2007, as a result of mining in a lower ore grade section of the Grasberg open pit. PT Freeport Indonesia expects to continue mining in a relatively low-grade section of the Grasberg open pit in second-quarter 2008 and a higher-grade section in the second half of 2008, with approximately 64 percent of its projected copper sales and 65 percent of its projected gold sales expected in the second half of 2008. Total consolidated sales from PT Freeport Indonesia for 2008 are expected to approximate 1.2 billion pounds of copper and 1.3 million ounces of gold.
During first-quarter 2008, realized copper prices at PT Freeport Indonesia improved by $0.73 per pound to an average of $3.82 per pound, compared with $3.09 per pound in first-quarter 2007. Additionally, realized gold prices improved by $276.92 per ounce in first-quarter 2008 to an average of $931.71 per ounce, compared with $654.79 per ounce in first-quarter 2007.
Treatment charges vary with the volume of metals sold and the price of copper, and royalties vary with the volume of metals sold and the prices of copper and gold. Royalties decreased to $25 million in first-quarter 2008, compared with $50 million in first-quarter 2007, primarily reflecting lower copper and gold sales volumes; partly offset by higher metal prices. Assuming average prices of $3.75 per pound of copper and $900 per ounce of gold for the remainder of 2008 and achievement of current sales estimates for PT Freeport Indonesia, royalty costs would total approximately $154 million ($0.13 per pound of copper) in 2008.
Unit Net Cash Costs. Unit net cash costs per pound of copper is a measure intended to provide investors with information about the cash-generating capacity of our mining operations expressed on a basis relating to the primary metal product for our respective operations. We use this measure for the same purpose and for monitoring operating performance by our mining operations. This information differs from measures of performance determined in accordance with U.S. GAAP and should not be considered in isolation or as a substitute for measures of performance determined in accordance with U.S. GAAP. This measure is presented by other mining companies, although our measures may not be comparable to similarly titled measures reported by other companies.
The following tables summarize the unit net cash costs at our Indonesia mining operations for the three months ended March 31, 2008 and 2007. For an explanation of “by-product” and “co-product” methods and a reconciliation of unit net cash costs per pound to production and delivery costs applicable to sales reported in FCX’s consolidated financial statements, refer to “Production Revenues and Production Costs.”
Gross Profit per Pound of Copper/per Ounce of Gold for PT Freeport Indonesia
| Three Months Ended March 31, 2008 | | | | | | | | |
| | By-Product | | Co-Product | |
| | Method | | Copper | | Gold | |
| Revenues, after adjustments shown below | $ | 3.82 | | $ | 3.82 | | $ | 931.71 | |
| | | | | | | | | | |
| Site production and delivery, before net noncash and | | | | | | | | | |
| nonrecurring costs shown below | | 1.86 | | | 1.41 | | | 349.08 | |
| Gold and silver credits | | (1.23 | ) | | – | | | – | |
| Treatment charges | | 0.33 | | | 0.25 | | | 61.71 | |
| Royalty on metals | | 0.12 | | | 0.09 | | | 22.69 | |
| Unit net cash costs | | 1.08 | | | 1.75 | | | 433.48 | |
| Depreciation and amortization | | 0.22 | | | 0.17 | | | 40.82 | |
| Noncash and nonrecurring costs, net | | 0.07 | | | 0.05 | | | 12.76 | |
| Total unit costs | | 1.37 | | | 1.97 | | | 487.06 | |
| Revenue adjustments, primarily for pricing on prior | | | | | | | | | |
| period open sales | | 0.48 | | | 0.48 | | | 27.32 | |
| PT Smelting intercompany profit elimination | | (0.02 | ) | | (0.02 | ) | | (4.27 | ) |
| Gross profit | $ | 2.91 | | $ | 2.31 | | $ | 467.70 | |
| | | | | | | | | | |
| Consolidated sales | | | | | | | | | |
| Copper (millions of recoverable pounds) | | 207 | | | 207 | | | | |
| Gold (thousands of recoverable ounces) | | | | | | | | 251 | |
| Three Months Ended March 31, 2007 | | | | | | | | |
| | By-Product | | Co-Product Method | |
| | Method | | Copper | | Gold | |
| Revenues, after adjustments shown below | $ | 3.09 | | $ | 3.09 | | $ | 654.79 | |
| | | | | | | | | | |
| Site production and delivery, before net noncash and | | | | | | | | | |
| nonrecurring costs shown below | | 0.75 | | | 0.50 | | | 106.26 | |
| Gold and silver credits | | (1.54 | ) | | – | | | – | |
| Treatment charges | | 0.37 | | | 0.25 | | | 51.94 | |
| Royalty on metals | | 0.12 | | | 0.08 | | | 16.86 | |
| Unit net cash costs (credits) | | (0.30 | ) | | 0.83 | | | 175.06 | |
| Depreciation and amortization | | 0.14 | | | 0.10 | | | 20.05 | |
| Noncash and nonrecurring costs, net | | 0.02 | | | 0.01 | | | 2.99 | |
| Total unit costs (credits) | | (0.14 | ) | | 0.94 | | | 198.10 | |
| Revenue adjustments, primarily for pricing on prior | | | | | | | | | |
| period open sales | | (0.04 | ) | | (0.04 | ) | | 2.72 | |
| PT Smelting intercompany profit elimination | | (0.09 | ) | | (0.06 | ) | | (12.09 | ) |
| Gross profit | $ | 3.10 | | $ | 2.05 | | $ | 447.32 | |
| | | | | | | | | | |
| Consolidated sales | | | | | | | | | |
| Copper (millions of recoverable pounds) | | 417 | | | 417 | | | | |
| Gold (thousands of recoverable ounces) | | | | | | | | 947 | |
First-Quarter 2008 Compared with First-Quarter 2007. Because of the fixed nature of a large portion of PT Freeport Indonesia’s costs, unit costs vary significantly from period to period depending on volumes of copper and gold sold during the period. PT Freeport Indonesia has also experienced significant increases in production costs in recent years primarily as a result of higher energy costs and costs of other consumables, higher mining costs and milling rates, labor costs and other factors.
PT Freeport Indonesia’s higher unit net cash costs in first-quarter 2008, compared with first-quarter 2007, primarily reflected lower copper and gold sales volumes resulting from mine sequencing, attributable to mining in a lower ore grade section of the Grasberg open pit during first-quarter 2008. Partly offsetting lower volumes in the by-product calculation were higher average realized gold prices, which benefited gold credits in first-quarter 2008.
Unit treatment charges vary with the price of copper, and unit royalty costs vary with prices of copper and gold. Market rates for treatment charges have decreased since 2006 and will vary based on PT Freeport Indonesia’s customer mix.
Because certain assets are depreciated on a straight-line basis, PT Freeport Indonesia’s unit depreciation rate varies with the level of copper production and sales. Accordingly, PT Freeport Indonesia’s unit depreciation rate increased in first-quarter 2008, compared with first-quarter 2007, resulting from lower first-quarter 2008 copper volumes.
Assuming average copper prices of $3.75 per pound and average gold prices of $900 per ounce for the remainder of 2008 and achievement of current sales estimates, PT Freeport Indonesia estimates that its annual 2008 unit net cash costs, including gold and silver credits, would approximate $0.73 per pound, and each $25 per ounce change in gold prices for the remainder of the year would have an approximate $0.02 per pound impact on PT Freeport Indonesia’s 2008 unit net cash costs. Because the majority of PT Freeport Indonesia’s costs are fixed, unit costs vary with volumes sold and the price of gold, and are currently projected to be higher during 2008 than in 2007 primarily because of lower projected gold sales volumes.
DEVELOPMENT PROJECTS
We have significant development activities recently completed or under way to expand our production volumes, extend our mine lives and develop large-scale underground ore bodies. Capital costs have continued to be affected by the prices of input costs, including equipment, materials and supplies and labor. We will continue to review and update our capital cost estimates for major development projects as engineering and construction activities progress. Following is further discussion of our major development projects.
Safford. Construction of a major new copper mine in Safford, Arizona, is complete and the mine is ramping up to design capacity of 240 million pounds per year. During first-quarter 2008, Safford produced over 20 million pounds of copper and is expected to reach design capacity in the second half of 2008. The Safford copper mine will produce ore from two open-pit mines and includes a SX/EW facility. The total capital investment for this project approximated $675 million. We are continuing to pursue additional exploration and development potential in this district, including the Lone Star project, a potentially large mineral resource that is currently being evaluated with a drilling program.
Climax. In December 2007, our Board of Directors approved the restart of the Climax molybdenum mine near Leadville, Colorado. The Climax mine, which has been on care-and-maintenance status since 1995, is believed to be the largest, highest-grade and lowest-cost undeveloped molybdenum ore body in the world. The initial $500 million project involves the restart of open-pit mining and the construction of new milling facilities. A new air permit was received from the state of Colorado in March 2008. Engineering is in progress and construction activities are scheduled to commence in second-quarter 2008.
Annual production is expected to approximate 30 million pounds of molybdenum beginning in 2010. The project is designed to enable the consideration of a further large-scale expansion of the Climax mine. We continue to evaluate a second phase of the Climax project, which could potentially double future annual molybdenum production to approximately 60 million pounds.
We also plan to increase our annual molybdenum processing capacity by 20 million pounds through the conversion of our copper concentrate leach facility at Bagdad, Arizona, to a molybdenum concentrate leach facility by 2010.
Miami. We are pursuing a project to restart the Miami copper mine in Arizona as we continue to conduct reclamation activities associated with historical mining operations. We expect full rates of production of approximately 100 million pounds of copper per year by 2010, and an approximate five-year mine life. The capital investment for this project is expected to total approximately $100 million, primarily for mining equipment.
El Abra. We are advancing the development of a large sulfide deposit at El Abra that will extend the mine life by over 10 years. Initial production from the sulfides is targeted to begin in 2010 and is expected to average approximately 325 million pounds of copper per year beginning in 2012, replacing depleting oxide production. Existing facilities at El Abra will be used to process the additional sulfide reserves. We estimate total capital for this project to approximate $450 million. In March 2008, we received approval of the environmental impact study associated with this project.
Incremental Expansions. As an initial step in evaluating our potential for expansion opportunities associated with existing ore bodies, we are developing projects for incremental expansions at the Morenci, Sierrita and Bagdad mines in Arizona and the Cerro Verde mine in Peru. Based on scoping level estimates, these projects are expected to provide incremental production ramping up to over 200 million pounds of copper and 7 million pounds of molybdenum by 2011, with preliminary capital cost estimates of approximately $400 million. Detailed engineering for these projects is under way, which is expected to result in revised capital estimates and potential project scope changes.
DOZ Expansion. In mid-2007, PT Freeport Indonesia completed the expansion of the capacity of the DOZ underground operation to allow a sustained rate of 50,000 metric tons per day. PT Freeport Indonesia’s further expansion of the DOZ mine to 80,000 metric tons of ore per day is under way with completion targeted by 2010. The capital cost for this further expansion is expected to approximate $100 million, with PT Freeport Indonesia’s 60 percent share totaling approximately $60 million. We believe that the success of the development of the DOZ
mine, one of the world’s largest underground mines, provides confidence in the future development of PT Freeport Indonesia’s large-scale undeveloped underground ore bodies.
Grasberg Block Cave (and associated Common Infrastructure). In 2004, PT Freeport Indonesia commenced its Common Infrastructure project to provide access to its large undeveloped underground ore bodies located in the Grasberg minerals district through a tunnel system located approximately 400 meters deeper than its existing underground tunnel system. In addition to providing access to our underground ore bodies, the tunnel system will enable PT Freeport Indonesia to conduct future exploration in prospective areas associated with currently identified ore bodies. We are completing the feasibility study for the development of the Grasberg block cave, which accounts for over one-third of our reserves in Indonesia, and expect to initiate multi-year mine development activities during 2008. Aggregate mine development capital for the Grasberg block cave (and associated Common Infrastructure) is expected to approximate $3.1 billion to be incurred between 2008 and 2021, with PT Freeport Indonesia’s share totaling approximately $2.8 billion. Industry-wide increases in construction, labor and equipment costs have resulted in higher development cost estimates. Our underground operations in Indonesia are more sensitive to changes in labor costs than our open-pit and process operations. We will continue to pursue productivity initiatives to mitigate the impact of increased labor costs.
Big Gossan. The Big Gossan underground mine is a high-grade deposit located near the existing milling complex. The Big Gossan mine is being developed as an open-stope mine with backfill consisting of mill tailings and cement, an established mining methodology expected to be higher-cost than the block-cave method used at the DOZ mine. Production is expected to ramp up to full production of 7,000 metric tons per day in 2011 (average annual aggregate incremental production of 125 million pounds of copper and 65,000 ounces of gold, with PT Freeport Indonesia receiving 60 percent of these amounts). The total capital investment for this project is currently estimated at approximately $480 million. Capital expenditures incurred to date on this project total $224 million ($206 million for PT Freeport Indonesia’s share).
Tenke Fungurume. We hold an effective 57.75 percent interest in the Tenke Fungurume copper and cobalt mining concessions in the Katanga province of the DRC and are the operator of the project. The initial project at Tenke Fungurume is based on initial ore reserve estimates of approximately 100 million metric tons with ore grades of 2.3 percent copper and 0.3 percent cobalt. We are currently engaged in drilling activities, exploration and metallurgical testing to evaluate the potential of this highly prospective district, and expect that the results of drilling activities will significantly increase ore reserves over time. We are responsible for funding 70 percent of project development costs and for financing our partner’s share of certain project overruns.
Construction activities are being advanced with over 2,200 construction personnel onsite. Current activities are focused on concrete placement, steel tank erection, structural steel and infrastructure development, including shops, warehouses and extensive social and regional infrastructure programs. All long lead-time equipment has been ordered and initial production is targeted during the second half of 2009, with average annual production of approximately 250 million pounds of copper and approximately 18 million pounds of cobalt. We expect the results of current drilling activities will enable significant future expansion of the initial production.
Capital expenditures incurred to date on this project total approximately $475 million. Capital cost estimates for the project were previously estimated to be $900 million (approximately $1 billion including loans to a third party for the refurbishment of provincial power facilities). A capital cost review prepared in April 2008 indicates estimated capital costs of approximately $1.75 billion for this project (approximately $1.9 billion including loans to a third party for power development). These revised estimates include substantial amounts for infrastructure to support a larger-scale operation than the initial phase of the project, including the provision for expanded electrical power-generating capacity and improved power reliability for the region. The regional power infrastructure investment is now estimated to approximate $175 million, the majority of which is expected to be funded through a loan to the DRC power authority. The current estimates also include expanded housing and support facilities for the project work force; enhancements to national roads and bridges; and also reflect the industry-wide escalation in construction costs and the incremental costs for project development in Central Africa where infrastructure and logistics are challenging in developing a greenfield project. We continue to review these costs with our partners and will strive to enhance the economic returns of the project while progressing with plans to develop infrastructure in areas that will enable rapid expansion of this high-potential resource. We will continue to review and, as necessary, update our capital cost estimate as construction activities progress.
In February 2008, we received a letter from the Ministry of Mines, Government of the DRC, seeking our comment on proposed material modifications to our mining contract for the Tenke Fungurume concession, including the amount of transfer payments payable to the government, the government’s percentage ownership and involvement in the management of the mine, regularization of certain matters under Congolese law and the implementation of social plans. Our mining contract was negotiated transparently and approved by the Government of the DRC following extended negotiations, and we believe it complies with Congolese law and is enforceable without modifications. We are currently working cooperatively with the government to resolve these matters while continuing with our project development activities.
EXPLORATION ACTIVITIES
We are conducting exploration activities near our existing mines and in other high potential areas around the world. Aggregate exploration expenditures are expected to approximate $180 million for the full year 2008.
Our exploration efforts in North America include drilling of the Lone Star deposit located approximately four miles from the Safford mine, as well as targets in the Morenci and Bagdad districts, and near the Henderson molybdenum ore body. In South America, exploration is ongoing in and around the Cerro Verde, Candelaria and Ojos del Salado deposits. In Africa, we are actively pursuing targets outside of the area of initial development at Tenke Fungurume and on the potential to add additional oxide reserves in the near term.
PT Freeport Indonesia’s exploration efforts in Indonesia include testing extensions of the Grasberg underground and Kucing Liar mine complex and evaluating targets in the area between the Ertsberg East and Grasberg mineral systems from the new Common Infrastructure tunnels. Initial drill results from the Common Infrastructure tunnel are positive and additional drilling is in process. We continue efforts to resume exploration activities in certain prospective areas in Papua, outside Block A (the Grasberg contract area).
The number of drill rigs operating on these and other programs near FCX’s mine sites increased from 26 at the end of March 2007 to 80 currently.
ATLANTIC COPPER SMELTING & REFINING
Our investment in smelters serves an important role in our concentrate marketing strategy. PT Freeport Indonesia generally sells, under long-term contracts, approximately one-half of its concentrate production to its affiliated smelters, Atlantic Copper and PT Smelting, and the remainder to other customers. Additionally, during first-quarter 2008 certain of our South America mining operations began selling a portion of their concentrate and cathode inventories to Atlantic Copper. Treatment charges for smelting and refining copper concentrates represent a cost to PT Freeport Indonesia and our South America mining operations and income to Atlantic Copper and PT Smelting. Through downstream integration, we are assured placement of a significant portion of PT Freeport Indonesia’s concentrate production. Smelting and refining charges consist of a base rate and, in certain contracts, price participation based on copper prices. Higher treatment and refining charges benefit our smelter operations at Atlantic Copper and adversely affect our mining operations in Indonesia and South America. North America mining operations are not significantly affected by changes in treatment and refining charges because these operations are fully integrated.
Atlantic Copper has a labor contract covering certain employees, which expired in December 2007. The contract has been provisionally extended and a further extension is currently being negotiated.
The following discussion of Atlantic Copper’s operations covers the first quarters of 2008 and 2007:
| | | First-Quarter | |
| | | 2008 | | 2007 | |
| Gross profit (in millions) | | $ | 5 | | $ | 17 | |
| Add depreciation and amortization expense (in millions) | | | 9 | | | 10 | |
| Cash margin (in millions) | | $ | 14 | | $ | 27 | |
| | | | | | | | |
| Operating income (loss) (in millions) | | $ | (3 | ) | $ | 13 | |
| Concentrate and scrap treated (thousands of metric tons) | | | 261 | | | 243 | |
| Anodes production (millions of pounds) | | | 142 | | | 149 | |
| Treatment rates per pound | | $ | 0.24 | | $ | 0.35 | |
| Cathodes sales (millions of pounds) | | | 142 | | | 135 | |
| Gold sales in anodes and slimes (thousands of ounces) | | | 110 | | | 114 | |
| | | | | | | | |
First-Quarter 2008 Compared with First-Quarter 2007. Atlantic Copper’s operating cash margin was $14 million in first-quarter 2008, compared with $27 million in first-quarter 2007, and operating losses totaled $3 million in first-quarter 2008, compared with operating income of $13 million in first-quarter 2007. The reduction in Atlantic Copper’s cash margin and operating income for first-quarter 2008, compared with first-quarter 2007, reflected lower treatment rates and higher operating costs primarily resulting from a stronger euro and increased energy costs.
Atlantic Copper’s treatment charges, including price participation, which are what PT Freeport Indonesia, our South America mines and third parties pay Atlantic Copper to smelt and refine concentrates, averaged $0.24 per pound in first-quarter 2008, compared with $0.35 per pound in first-quarter 2007. Market treatment rates have been volatile in recent years. Rates began declining in 2006 as a result of limited concentrate availability, and this has continued into 2008. Assuming average copper prices of $3.75 per pound for the remainder of 2008, we expect these rates to average approximately $0.19 per pound in 2008.
We defer recognizing profits on PT Freeport Indonesia’s and our South America mines’ sales to Atlantic Copper and on 25 percent of PT Freeport Indonesia’s sales to PT Smelting until final sales to third parties occur. Changes in these net deferrals resulted in additions to net income totaling $6 million or $0.01 per share in first-quarter 2008, compared with reductions to net income totaling $109 million to net income or $0.45 per share in first-quarter 2007. At March 31, 2008, our net deferred profits on inventories at Atlantic Copper and PT Smelting to be recognized in future periods’ net income after taxes and minority interests totaled $87 million. Assuming average copper prices of $3.75 per pound and gold prices of $900 per ounce for the remainder of 2008 and current shipping schedules, we estimate the net change in deferred profits on intercompany sales would not have a significant impact on second-quarter 2008 net income. The actual change in deferred intercompany profits may differ substantially from this estimate because of changes in the timing of shipments to affiliated smelters and metal prices.
CAPITAL RESOURCES AND LIQUIDITY
Our operating cash flows vary with prices realized from copper, gold and molybdenum sales, our production levels, production costs, cash payments for income taxes and interest, other working capital changes and other factors. Based on current mine plans and subject to future copper, gold and molybdenum prices, during 2008 we expect to generate cash flows greater than our budgeted capital expenditures, minority interest distributions, dividends and other cash requirements.
Cash and Cash Equivalents
At March 31, 2008, we had consolidated cash and cash equivalents of $1.8 billion. The following table reflects the U.S. and international components of consolidated cash and cash equivalents at March 31, 2008, and December 31, 2007 (in billions):
| | March 31, | | December 31, | |
| | 2008 | | 2007 | |
Cash at parent companya | $ | 0.3 | | $ | 0.3 | |
| Cash from international operations | | 1.5 | | | 1.3 | |
| Total consolidated cash and cash equivalents | | 1.8 | | | 1.6 | |
| Less: minority interests’ share | | (0.5 | ) | | (0.3 | ) |
| Cash, net of minority interests’ share | | 1.3 | | | 1.3 | |
Withholding and other taxes if distributedb | | (0.2 | ) | | (0.2 | ) |
| Net cash available to FCX | $ | 1.1 | | $ | 1.1 | |
| a. | Includes cash at our North America mining operations. |
| b. | Cash at our international operations is subject to foreign withholding taxes of up to 22 percent upon repatriation into the U.S. |
Operating Activities
We generated operating cash flows totaling $615 million for first-quarter 2008, net of $1.3 billion used for working capital, which included a $598 million payment made in January 2008 upon the settlement of contracts related to the 2007 copper price protection program. Operating cash flows for first-quarter 2007 totaled $669 million, net of $202 million used for working capital. Excluding the $598 million payment made upon the settlement of the contracts related to the copper price protection program, first-quarter 2008 operating cash flows, which reflected the benefit of a full three months of operating cash flows from Phelps Dodge operations, were higher when compared with first-quarter 2007, which only included 12 days of Phelps Dodge results.
Operating activities are expected to generate positive cash flows for the foreseeable future based on anticipated operating results and metal prices. Based on estimated sales volumes (refer to “Outlook”) and assuming average prices of $3.75 per pound of copper, $900 per ounce of gold and $30 per pound of molybdenum for the remainder of 2008, operating cash flows in 2008 would exceed $6.5 billion, including approximately $6 billion for the remainder of 2008. Based on these pricing assumptions for the remainder of the year, second-half 2008 operating cash flows would be significantly higher than the first half.
Investing Activities
Capital expenditures, including capitalized interest, totaled $508 million for first-quarter 2008, compared with $142 million for first-quarter 2007. The increase in capital expenditures for first-quarter 2008 primarily resulted from a full three months of capital spending associated with Phelps Dodge operations, compared with only 12 days in first-quarter 2007. Capital expenditures for first-quarter 2008 included $143 million associated with the Tenke Fungurume project in the DRC (refer to “Development Projects” for further discussion).
Capital expenditures are expected to approximate $3.0 billion for 2008, including $1.8 billion for major projects. Following is a summary of capital expenditures (excluding capitalized interest) for first-quarter 2008 and projected capital expenditures (excluding capitalized interest) for the full year 2008 associated with major projects (refer to “Development Projects” for further discussion of these projects) (in millions):
| | First-Quarter | | Full Year | |
| | 2008 | | 2008 | |
| Tenke Fungurume mine development | $ | 127 | | $ | 1,000 | |
| Climax molybdenum mine restart | | 5 | | | 160 | |
| Incremental expansions | | 21 | | | 170 | |
| Big Gossan mine development | | 38 | | | 160 | |
| Grasberg Block Cave/Common Infrastructure | | 11 | | | 75 | |
| El Abra sulfide mine | | – | | | 70 | |
| Other major projects | | 48 | | | 165 | |
| | $ | 250 | | $ | 1,800 | |
Capital costs have been affected by the prices of input costs, including energy, equipment, materials and supplies, and labor. We will continue to review and update our capital cost estimates as engineering and construction activities progress on our major projects.
Financing Activities
At March 31, 2008, we had $7.6 billion in debt, compared with $7.2 billion at December 31, 2007. During first-quarter 2008, we borrowed under our $1.5 billion revolving credit facilities to fund significant working capital requirements, which we expect to repay over the next several months. At March 31, 2008, we had $296 million of borrowings and $62 million of letters of credit issued, resulting in total availability of approximately $1.1 billion under the facilities. Our $1.5 billion revolving credit facilities contain restrictions on the amount available for dividend payments, purchases of our common stock and certain debt prepayments. With the repayment of the $10 billion of term loans at year-end 2007, these restrictions do not apply as long as pro forma availability under the revolvers plus domestic cash exceeds $750 million. As of March 31, 2008, we had availability under the revolvers plus available domestic cash totaling approximately $1.6 billion.
During first-quarter 2008, we purchased in the open market $33 million of our 9.5% Senior Notes for $46 million.
In April 2008, Standard & Poor’s Rating Services and Fitch Ratings raised our corporate credit rating and the ratings on our unsecured debt to BBB- (investment grade). As a result of the upgrade of our unsecured notes to investment grade, the restricted payment covenants contained in our $6.0 billion in senior notes used to finance the acquisition of Phelps Dodge and 6⅞% Senior Notes have been suspended. To the extent the rating is lowered below investment grade, the covenants would again be effective.
In December 2007, our Board of Directors approved a new open market share purchase program for up to 20 million shares. As of April 30, 2008, no shares have been purchased under this program. The timing of future purchases of our common stock is dependent on many factors, including the price of our common shares, our operating results, cash flows and financial position, copper, gold and molybdenum prices, and general economic and market conditions.
For first-quarter 2008, common stock dividends paid totaled $169 million. In December 2007, our Board of Directors increased our annual cash dividend on our common stock from $1.25 per share to its current rate of $1.75 per share, which is paid at a quarterly rate of $0.4375 per share. On March 27, 2008, FCX declared a regular quarterly dividend, which was paid on May 1, 2008, to common shareholders of record at the close of business on April 15, 2008. The declaration and payment of dividends is at the discretion of our Board of Directors. The amount of our current quarterly cash dividend on our common stock and possible payment of additional future supplemental cash dividends will be dependent upon our financial results, cash requirements, future prospects and other factors deemed relevant by our Board of Directors. Based on outstanding common shares on March 31, 2008, our annual common stock dividend totals approximately $670 million.
For first-quarter 2008, preferred stock dividends paid totaled $64 million representing dividends on our 5½% Convertible Perpetual Preferred Stock and 6¾% Mandatory Convertible Preferred Stock. Annual preferred stock
dividends on our 5½% Convertible Perpetual Preferred Stock and 6¾% Mandatory Convertible Preferred Stock total approximately $255 million.
Each share of our 5½% Convertible Perpetual Preferred Stock was initially convertible into 18.8019 shares of our common stock. The conversion rate is adjustable upon the occurrence of certain events, including any quarter that our common stock dividend exceeds $0.20 per share. As a result of the quarterly and supplemental common stock dividends paid through May 1, 2008, each share of preferred stock is now convertible into 21.3414 shares of FCX common stock, or an aggregate of 23.5 million shares of FCX common stock. Beginning March 30, 2009, we may redeem shares of the 5½% Convertible Perpetual Preferred Stock by paying cash, our common stock or any combination thereof for $1,000 per share plus unpaid dividends, but only if our common stock has exceeded 130 percent of the conversion price for at least 20 trading days within a period of 30 consecutive trading days immediately preceding the notice of redemption. On March 27, 2008, FCX declared a regular quarterly dividend of $13.75 per share of FCX’s 5½% Convertible Perpetual Preferred Stock, which was paid on May 1, 2008, to shareholders of record at the close of business on April 15, 2008.
In March 2007, we sold 28.75 million shares of 6¾% Mandatory Convertible Preferred Stock, which will automatically convert on May 1, 2010, into between approximately 39 million and 47 million shares of FCX common stock. The conversion rate is adjustable upon the occurrence of certain events, including any quarter that our common stock dividend exceeds $0.3125 per share. However, adjustments that do not exceed one percent are carried forward and must be made no later than August of each year. For this reason, no adjustment was required to be made as a result of the quarterly common stock dividends paid on February 1, 2008, and May 1, 2008. Holders may elect to convert at any time prior to May 1, 2010, at a conversion rate equal to 1.3605 shares of common stock for each share of 6¾% Mandatory Convertible Preferred Stock. On March 27, 2008, FCX declared a regular quarterly dividend of $1.6875 per share of FCX’s 6¾% Mandatory Convertible Preferred Stock, which was paid on May 1, 2008, to shareholders of record at the close of business on April 15, 2008.
Cash dividends paid to minority interests for first-quarter 2008 totaled $49 million reflecting dividends paid to the minority interest owners of our South America mines. First-quarter 2007 dividends paid to the minority interest owner of PT Freeport Indonesia totaled $47 million.
CONTRACTUAL OBLIGATIONS
Other than in the ordinary course of business, there have been no material changes in our contractual obligations since year-end 2007. Refer to Item 7 in our report on Form 10-K for the year ended December 31, 2007, for further information regarding our contractual obligations.
ENVIRONMENTAL AND RECLAMATION MATTERS
Our mining, exploration, production and historical operating activities are subject to stringent laws and regulations governing the protection of the environment. Other than in the ordinary course of business, there have been no material changes to our environmental and reclamation obligations since year-end 2007. Refer to Note 15 in our report on Form 10-K for the year ended December 31, 2007, for further information regarding our environmental and reclamation obligations.
Fair Value Measurements. In September 2006, the Financial Accounting Standards Board (FASB) issued SFAS No. 157, “Fair Value Measurements,” which provides enhanced guidance for using fair value to measure assets and liabilities. SFAS No. 157 does not require any new fair value measurements under U.S. GAAP but rather establishes a common definition of fair value, provides a framework for measuring fair value under U.S. GAAP and expands disclosure requirements about fair value measurements. In February 2008, the FASB issued FSP FAS 157-2, which delays the effective date of SFAS No. 157 for nonfinancial assets or liabilities that are not required or permitted to be measured at fair value on a recurring basis to fiscal years beginning after November 15, 2008, and interim periods within those years. Effective January 1, 2008, we adopted SFAS No. 157 for financial assets and liabilities recognized at fair value on a recurring basis. This partial adoption of SFAS No. 157 did not have a material impact on our financial reporting and disclosures as our financial assets are measured using quoted market prices, or Level 1 inputs. We are currently evaluating the impact that the adoption of SFAS No. 157 will have on our financial reporting and disclosures for pension and postretirement related financial
assets and on nonfinancial assets or liabilities that are not required or permitted to be measured at fair value on a recurring basis.
Disclosures about Derivative Instruments and Hedging Activities. In March 2008, the FASB issued SFAS No. 161, “Disclosures about Derivative Instruments and Hedging Activities – an amendment of FASB Statement No. 133.” SFAS No. 161 amends the disclosure requirements for derivative instruments and hedging activities contained in SFAS No. 133, “Accounting for Derivative Instruments and Hedging Activities.” Under SFAS No. 161, entities are required to provide enhanced disclosures about (i) how and why an entity uses derivative instruments, (ii) how derivative instruments and related hedged items are accounted for under SFAS No. 133 and related interpretations, and (iii) how derivative instruments and related hedged items affect an entity’s financial position, financial performance and cash flows. SFAS No. 161 is effective for fiscal years and interim periods beginning after November 15, 2008, with early application encouraged. SFAS No. 161 encourages, but does not require disclosure for earlier periods presented for comparative purposes at initial adoption. The adoption of SFAS No. 161 will not affect our accounting for derivative financial instruments; however, we are currently evaluating its impact on our related disclosures.
PRODUCT REVENUES AND PRODUCTION COSTS
Unit net cash cost per pound of copper and molybdenum are measures intended to provide investors with information about the cash-generating capacity of our mining operations expressed on a basis relating to the primary metal product for the respective operations. We use this measure for the same purpose and for monitoring operating performance by our mining operations. This information differs from measures of performance determined in accordance with U.S. GAAP and should not be considered in isolation or as a substitute for measures of performance determined in accordance with U.S. GAAP. This measure is presented by other mining companies, although our measures may not be comparable to similarly titled measures reported by other companies.
We present gross profit per pound of copper using both a “by-product” method and a “co-product” method. We use the by-product method in our presentation of gross profit per pound of copper because (i) the majority of our revenues are copper revenues, (ii) we mine ore, which contains copper, gold, molybdenum and other metals, (iii) it is not possible to specifically assign all of our costs to revenues from the copper, gold, molybdenum and other metals we produce, (iv) it is the method used to compare mining operations in certain industry publications and (v) it is the method used by our management and Board of Directors to monitor operations. In the co-product method presentation below, costs are allocated to the different products based on their relative revenue values, which will vary to the extent our metals sales volumes and realized prices change.
In both the by-product and the co-product method calculations, we show adjustments to copper revenues for prior period open sales as separate line items. Because the copper pricing adjustments do not result from current period sales, we have reflected these separately from revenues on current period sales. Noncash and nonrecurring costs consist of items such as stock-based compensation costs, write-offs of equipment or unusual charges. They are removed from site production and delivery costs in the calculation of unit net cash costs. As discussed above, gold, molybdenum and other metal revenues at copper mines are reflected as credits against site production and delivery costs in the by-product method. Additionally, beginning in first-quarter 2008 we have included the impacts of purchase accounting fair value adjustments as additional depreciation, depletion and amortization, and noncash and nonrecurring costs. Accordingly, we have revised the first-quarter 2007 pro forma disclosures for our North America copper mining operations, Henderson molybdenum mine, and South America mining operations to conform to the current period presentation. Presentations under both methods are shown below together with reconciliations to amounts reported in our consolidated financial statements or pro forma consolidated financial results.
North America Copper Mining Product Revenues and Production Costs
| Three Months Ended March 31, 2008 | | | | |
| | By-Product | | Co-Product Method | |
| (In millions) | Method | | Copper | | Molybdenum | a | Other | b | Total | |
| Revenues, after adjustments shown below | $ | 1,179 | | $ | 1,179 | | $ | 256 | | $ | 16 | | $ | 1,451 | |
| | | | | | | | | | | | | | | | |
| Site production and delivery, before net noncash | | | | | | | | | | | | | | | |
| and nonrecurring costs shown below | | 553 | | | 481 | | | 76 | | | 7 | | | 564 | |
By-product creditsa | | (261 | ) | | – | | | – | | | – | | | – | |
| Treatment charges | | 31 | | | 31 | | | – | | | – | | | 31 | |
| Net cash costs | | 323 | | | 512 | | | 76 | | | 7 | | | 595 | |
| Depreciation, depletion and amortization | | 180 | | | 159 | | | 19 | | | 2 | | | 180 | |
| Noncash and nonrecurring costs, net | | 30 | | | 29 | | | 1 | | | – | | | 30 | |
| Total costs | | 533 | | | 700 | | | 96 | | | 9 | | | 805 | |
| Revenue adjustments, primarily for pricing on prior | | | | | | | | | | | | | | | |
| period open sales | | 42 | | | 42 | | | – | | | – | | | 42 | |
| Idle facility and other non-inventoriable costs | | (13 | ) | | (13 | ) | | – | | | – | | | (13 | ) |
| Gross profit | $ | 675 | | $ | 508 | | $ | 160 | | $ | 7 | | $ | 675 | |
| | | | | | | | | | | | | | | | |
| Reconciliation to Amounts Reported | | | | | | | | | | | | | | | |
| (In millions) | | | | | | | Depreciation, | | | | | | | |
| | | | | Production | | | Depletion and | | | | | | | |
| | Revenues | | and Delivery | | | Amortization | | | | | | | |
| Totals presented above | $ | 1,451 | | $ | 564 | | $ | 180 | | | | | | | |
| Net noncash and nonrecurring costs per above | | N/A | | | 30 | | | N/A | | | | | | | |
| Treatment charges per above | | N/A | | | 31 | | | N/A | | | | | | | |
| Revenue adjustments, primarily for pricing on prior | | | | | | | | | | | | | | | |
| period open sales per above | | 42 | | | N/A | | | N/A | | | | | | | |
| North America copper mines | | 1,493 | | | 625 | | | 180 | | | | | | | |
| Henderson molybdenum operations | | 282 | | | 50 | | | 41 | | | | | | | |
| Other North America mining operations, including | | | | | | | | | | | | | | | |
other molybdenum operations and eliminationsc | | 1,498 | | | 1,463 | | | 6 | | | | | | | |
| Total North America mining operations | | 3,273 | | | 2,138 | | | 227 | | | | | | | |
| South America mining operations | | 1,593 | | | 432 | | | 130 | | | | | | | |
| Indonesia mining operations | | 1,052 | | | 399 | | | 45 | | | | | | | |
| Atlantic Copper smelting & refining | | 665 | | | 651 | | | 9 | | | | | | | |
| Corporate, other & eliminations | | (911 | ) | | (898 | ) | | 7 | | | | | | | |
| As reported in FCX’s consolidated financial statements | $ | 5,672 | | $ | 2,722 | | $ | 418 | | | | | | | |
| a. | Molybdenum by-product credits and revenues reflect volumes produced at market-based pricing and also include tolling revenues at Sierrita. |
| b. | Includes gold and silver product revenues and production costs. |
| c. | Includes amounts associated with the copper and molybdenum sales companies and Rod & Refining, which are included in North America mining operations. |
| Three Months Ended March 31, 2007 (Pro Forma) | | | | |
| | By-Product | | Co-Product Method | |
| (In millions) | Method | | Copper | | Molybdenum | a | Other | b | Total | |
| Revenues, after adjustments shown below | $ | 812 | | $ | 812 | | $ | 178 | | $ | 10 | | $ | 1,000 | |
| | | | | | | | | | | | | | | | |
| Site production and delivery, before net noncash | | | | | | | | | | | | | | | |
| and nonrecurring costs shown below | | 394 | | | 347 | | | 68 | | | 6 | | | 421 | |
By-product creditsa | | (161 | ) | | – | | | – | | | – | | | – | |
| Treatment charges | | 22 | | | 22 | | | – | | | – | | | 22 | |
| Net cash costs | | 255 | | | 369 | | | 68 | | | 6 | | | 443 | |
| Depreciation, depletion and amortization | | 144 | | | 120 | | | 24 | | | – | | | 144 | |
| Noncash and nonrecurring costs, net | | 336 | | | 280 | | | 56 | | | – | | | 336 | |
| Total costs | | 735 | | | 769 | | | 148 | | | 6 | | | 923 | |
| Revenue adjustments, primarily for pricing on prior | | | | | | | | | | | | | | | |
| period open sales and hedging | | 8 | | | 8 | | | – | | | – | | | 8 | |
| Idle facility and other non-inventoriable costs | | (10 | ) | | (10 | ) | | – | | | – | | | (10 | ) |
| Gross profit | $ | 75 | | $ | 41 | | $ | 30 | | $ | 4 | | $ | 75 | |
| | | | | | | | | | | | | | | | |
| Reconciliation to Amounts Reported | | | | | | | | | | | | | | | |
| (In millions) | | | | | | | Depreciation, | | | | | | | |
| | | | | Production | | | Depletion and | | | | | | | |
| | Revenues | | and Delivery | | | Amortization | | | | | | | |
| Totals presented above | $ | 1,000 | | $ | 421 | | $ | 144 | | | | | | | |
| Net noncash and nonrecurring costs per above | | N/A | | | 336 | | | N/A | | | | | | | |
| Treatment charges per above | | N/A | | | 22 | | | N/A | | | | | | | |
| Revenue adjustments, primarily for pricing on prior | | | | | | | | | | | | | | | |
| period open sales and hedging per above | | 8 | | | N/A | | | N/A | | | | | | | |
| Eliminations and other | | 3,562 | | | 1,845 | | | 211 | | | | | | | |
| As reported in FCX’s pro forma consolidated | | | | | | | | | | | | | | | |
| financial results | $ | 4,570 | | $ | 2,624 | | $ | 355 | | | | | | | |
| a. | Molybdenum by-product credits and revenues reflect volumes produced at market-based pricing and also include tolling revenues at Sierrita. |
| b. | Includes gold and silver product revenues and production costs. |
Henderson Product Revenues and Production Costs
| | Three Months Ended | | | | | | | |
| | March 31, | | | | | | | |
| | 2008 | | 2007 | | | | | | | |
| (In millions) | (Actual) | | (Pro Forma) | | | | | | | | | | |
| Revenues | $ | 282 | | $ | 208 | | | | | | | | | | |
| | | | | | | | | | | | | | | | |
| Site production and delivery, before net noncash | | | | | | | | | | | | | | | |
| and nonrecurring costs shown below | | 49 | | | 39 | | | | | | | | | | |
| Net cash costs | | 49 | | | 39 | | | | | | | | | | |
| Depreciation, depletion and amortization | | 41 | | | 37 | | | | | | | | | | |
| Noncash and nonrecurring costs, net | | 1 | | | – | | | | | | | | | | |
| Total costs | | 91 | | | 76 | | | | | | | | | | |
Gross profita | $ | 191 | | $ | 132 | | | | | | | | | | |
| | | | | | | | | | | | | | | | |
| | | | | | | | | | | | | | | | |
| Reconciliation to Amounts Reported | | | | | | | | | | |
| (In millions) | | | | | Depreciation, | | |
| | | | | Production | | Depletion and | | |
| | Revenues | | and Delivery | | Amortization | | |
| Three Months Ended March 31, 2008 | | | | | | | | | | |
| Totals presented above | $ | 282 | | $ | 49 | | $ | 41 | | |
| Net noncash and nonrecurring costs per above | | N/A | | | 1 | | | N/A | | |
Other molybdenum operations and eliminationsb | | 437 | | | 410 | | | (2 | ) | |
| Total Molybdenum operations | | 719 | | | 460 | | | 39 | | |
| Other North America copper mining operations and eliminations | | 2,554 | | | 1,678 | | | 188 | | |
| Total North America mining operations | | 3,273 | | | 2,138 | | | 227 | | |
| South America mining operations | | 1,593 | | | 432 | | | 130 | | |
| Indonesia mining operations | | 1,052 | | | 399 | | | 45 | | |
| Atlantic Copper smelting & refining | | 665 | | | 651 | | | 9 | | |
| Corporate, other & eliminations | | (911 | ) | | (898 | ) | | 7 | | |
| As reported in FCX’s consolidated financial statements | $ | 5,672 | | $ | 2,722 | | $ | 418 | | |
| | | | | | | | | | | |
| Three Month Ended March 31, 2007 (Pro Forma) | | | | | | | | | | |
| Totals presented above | $ | 208 | | $ | 39 | | $ | 37 | | |
| Eliminations and other | | 4,362 | | | 2,585 | | | 318 | | |
| As reported in FCX’s pro forma consolidated financial results | $ | 4,570 | | $ | 2,624 | | $ | 355 | | |
| | | | | | | | | | | |
| a. | Gross profit reflects sales of Henderson products based on volumes produced at market-based pricing. On a consolidated basis, the Molybdenum segment includes profits on sales as they are made to third parties and realizations based on actual contract terms. As a result, the actual gross profit realized will differ from the amounts reporting in this table. |
| b. | Primarily includes amounts associated with the molybdenum sales company that are included in Molybdenum operations. |
South America Mining Product Revenues and Production Costs
| Three Months Ended March 31, 2008 | | | | | | | | |
| | By-Product | | Co-Product Method | |
| (In millions) | Method | | Copper | | Other a | | Total | |
| Revenues, after adjustments shown below | $ | 1,380 | | $ | 1,380 | | $ | 59 | | $ | 1,439 | |
| | | | | | | | | | | | | |
| Site production and delivery, before net noncash | | | | | | | | | | | | |
| nonrecurring costs shown below | | 395 | | | 381 | | | 20 | | | 401 | |
| By-product credits | | (53 | ) | | – | | | – | | | – | |
| Treatment charges | | 76 | | | 76 | | | – | | | 76 | |
| Net cash costs | | 418 | | | 457 | | | 20 | | | 477 | |
| Depreciation, depletion and amortization | | 130 | | | 126 | | | 4 | | | 130 | |
| Noncash and nonrecurring costs, net | | 25 | | | 25 | | | – | | | 25 | |
| Total costs | | 573 | | | 608 | | | 24 | | | 632 | |
| Revenue adjustments, primarily for pricing on prior | | | | | | | | | | | | |
| period open sales | | 230 | | | 230 | | | – | | | 230 | |
| Other non-inventoriable costs | | (9 | ) | �� | (8 | ) | | (1 | ) | | (9 | ) |
| Gross profit | $ | 1,028 | | $ | 994 | | $ | 34 | | $ | 1,028 | |
| | | | | | | | | | | | | |
| Reconciliation to Amounts Reported | | | | | | | | | | | | |
| (In millions) | | | | | | Depreciation, | | | | |
| | | | | Production | | Depletion and | | | | |
| | Revenues | | and Delivery | | Amortization | | | | |
| Totals presented above | $ | 1,439 | | $ | 401 | | $ | 130 | | | | |
| Net noncash and nonrecurring costs per above | | N/A | | | 25 | | | N/A | | | | |
| Less: Treatment charges per above | | (76 | ) | | N/A | | | N/A | | | | |
| Revenue adjustments, primarily for pricing on prior | | | | | | | | | | | | |
| period open sales per above | | 230 | | | N/A | | | N/A | | | | |
| Purchased metal | | 74 | | | 74 | | | N/A | | | | |
| Eliminations and other | | (74 | ) | | (68 | ) | | – | | | | |
| Total South America mining operations | | 1,593 | | | 432 | | | 130 | | | | |
| North America mining operations | | 3,273 | | | 2,138 | | | 227 | | | | |
| Indonesia mining operations | | 1,052 | | | 399 | | | 45 | | | | |
| Atlantic Copper smelting & refining | | 665 | | | 651 | | | 9 | | | | |
| Corporate, other & eliminations | | (911 | ) | | (898 | ) | | 7 | | | | |
| As reported in FCX’s consolidated financial statements | $ | 5,672 | | $ | 2,722 | | $ | 418 | | | | |
| | | | | | | | | | | | | |
| a. | Includes gold, silver and molybdenum product revenues and production costs. |
| Three Months Ended March 31, 2007 (Pro Forma) | | | | | | | | |
| | By-Product | | Co-Product Method | |
| (In millions) | Method | | Copper | | Other a | | Total | |
| Revenues, after adjustments shown below | $ | 824 | | $ | 824 | | $ | 24 | | $ | 848 | |
| | | | | | | | | | | | | |
| Site production and delivery, before net noncash | | | | | | | | | | | | |
| nonrecurring costs shown below | | 253 | | | 243 | | | 10 | | | 253 | |
| By-product credits | | (24 | ) | | – | | | – | | | – | |
| Treatment charges | | 55 | | | 55 | | | – | | | 55 | |
| Net cash costs | | 284 | | | 298 | | | 10 | | | 308 | |
| Depreciation, depletion and amortization | | 96 | | | 94 | | | 2 | | | 96 | |
| Noncash and nonrecurring costs, net | | 163 | | | 159 | | | 4 | | | 163 | |
| Total costs | | 543 | | | 551 | | | 16 | | | 567 | |
| Revenue adjustments, primarily for pricing on prior | | | | | | | | | | | | |
| period open sales | | 61 | | | 62 | | | (1 | ) | | 61 | |
| Other non-inventoriable costs | | (6 | ) | | (6 | ) | | – | | | (6 | ) |
| Gross profit | $ | 336 | | $ | 329 | | $ | 7 | | $ | 336 | |
| | | | | | | | | | | | | |
| Reconciliation to Amounts Reported | | | | | | | | | | | | |
| (In millions) | | | | | | Depreciation, | | | | |
| | | | | Production | | Depletion and | | | | |
| | Revenues | | and Delivery | | Amortization | | | | |
| Totals presented above | $ | 848 | | $ | 253 | | $ | 96 | | | | |
| Net noncash and nonrecurring costs per above | | N/A | | | 163 | | | N/A | | | | |
| Less: Treatment charges per above | | (55 | ) | | N/A | | | N/A | | | | |
| Revenue adjustments, primarily for pricing on prior | | | | | | | | | | | | |
| period open sales per above | | 61 | | | N/A | | | N/A | | | | |
| Purchased metal | | 68 | | | 68 | | | N/A | | | | |
| Eliminations and other | | 3,648 | | | 2,140 | | | 259 | | | | |
| As reported in FCX’s pro forma consolidated financial results | $ | 4,570 | | $ | 2,624 | | $ | 355 | | | | |
| | | | | | | | | | | | | |
| a. | Includes gold and silver product revenues and production costs. |
Indonesia Mining Product Revenues and Production Costs
| Three Months Ended March 31, 2008 | | | | |
| | By-Product | | Co-Product Method | |
| (In millions) | Method | | Copper | | Gold | | Silver | | Total | |
| Revenues, after adjustments shown below | $ | 802 | | $ | 802 | | $ | 241 | | $ | 15 | | $ | 1,058 | |
| | | | | | | | | | | | | | | | |
| Site production and delivery, before net noncash | | | | | | | | | | | | | | | |
| and nonrecurring costs shown below | | 385 | | | 292 | | | 88 | | | 5 | | | 385 | |
| Gold and silver credits | | (256 | ) | | – | | | – | | | – | | | – | |
| Treatment charges | | 68 | | | 52 | | | 15 | | | 1 | | | 68 | |
| Royalty on metals | | 25 | | | 19 | | | 6 | | | – | | | 25 | |
| Net cash costs | | 222 | | | 363 | | | 109 | | | 6 | | | 478 | |
| Depreciation and amortization | | 45 | | | 34 | | | 10 | | | 1 | | | 45 | |
| Noncash and nonrecurring costs, net | | 14 | | | 11 | | | 3 | | | – | | | 14 | |
| Total costs | | 281 | | | 408 | | | 122 | | | 7 | | | 537 | |
| Revenue adjustments, primarily for pricing on prior | | | | | | | | | | | | | | | |
| period open sales | | 87 | | | 87 | | | – | | | – | | | 87 | |
| PT Smelting intercompany profit elimination | | (5 | ) | | (3 | ) | | (2 | ) | | – | | | (5 | ) |
| Gross profit | $ | 603 | | $ | 478 | | $ | 117 | | $ | 8 | | $ | 603 | |
| | | | | | | | | | | | | | | | |
| Reconciliation to Amounts Reported | | | | | | | | | | | | | | | |
| (In millions) | | | | | Depreciation, | | | | | | | |
| | | | Production | | Depletion and | | | | | | | |
| | Revenues | | and Delivery | | Amortization | | | | | | | |
| Totals presented above | $ | 1,058 | | $ | 385 | | $ | 45 | | | | | | | |
| Net noncash and nonrecurring costs per above | | N/A | | | 14 | | | N/A | | | | | | | |
| Less: Treatment charges per above | | (68 | ) | | N/A | | | N/A | | | | | | | |
| Less: Royalty per above | | (25 | ) | | N/A | | | N/A | | | | | | | |
| Revenue adjustments, primarily for pricing on prior | | | | | | | | | | | | | | | |
| period open sales per above | | 87 | | | N/A | | | N/A | | | | | | | |
| Total Indonesia mining operations | | 1,052 | | | 399 | | | 45 | | | | | | | |
| North America mining operations | | 3,273 | | | 2,138 | | | 227 | | | | | | | |
| South America mining operations | | 1,593 | | | 432 | | | 130 | | | | | | | |
| Atlantic Copper smelting & refining | | 665 | | | 651 | | | 9 | | | | | | | |
| Corporate, other & eliminations | | (911 | ) | | (898 | ) | | 7 | | | | | | | |
| As reported in FCX’s consolidated financial | | | | | | | | | | | | | | | |
| statements | $ | 5,672 | | $ | 2,722 | | $ | 418 | | | | | | | |
| | | | | | | | | | | | | | | | |
| Three Months Ended March 31, 2007 | | | | |
| | By-Product | | Co-Product Method | |
| (In millions) | Method | | Copper | | Gold | | Silver | | Total | |
| Revenues, after adjustments shown below | $ | 1,298 | | $ | 1,298 | | $ | 622 | | $ | 21 | | $ | 1,941 | |
| | | | | | | | | | | | | | | | |
| Site production and delivery, before net noncash | | | | | | | | | | | | | | | |
| and nonrecurring costs shown below | | 314 | | | 210 | | | 101 | | | 3 | | | 314 | |
| Gold and silver credits | | (643 | ) | | – | | | – | | | – | | | – | |
| Treatment charges | | 153 | | | 102 | | | 49 | | | 2 | | | 153 | |
| Royalty on metals | | 50 | | | 33 | | | 16 | | | 1 | | | 50 | |
| Net cash costs (credits) | | (126 | ) | | 345 | | | 166 | | | 6 | | | 517 | |
| Depreciation and amortization | | 59 | | | 40 | | | 19 | | | – | | | 59 | |
| Noncash and nonrecurring costs, net | | 9 | | | 6 | | | 3 | | | – | | | 9 | |
| Total costs (credits) | | (58 | ) | | 391 | | | 188 | | | 6 | | | 585 | |
| Revenue adjustments, primarily for pricing on prior | | | | | | | | | | | | | | | |
| period open sales | | (29 | ) | | (29 | ) | | – | | | – | | | (29 | ) |
| PT Smelting intercompany profit elimination | | (36 | ) | | (24 | ) | | (11 | ) | | (1 | ) | | (36 | ) |
| Gross profit | $ | 1,291 | | $ | 854 | | $ | 423 | | $ | 14 | | $ | 1,291 | |
| | | | | | | | | | | | | | | | |
| Reconciliation to Amounts Reported | | | | | | | | | | | | | | | |
| (In millions) | | | | | Depreciation, | | | | | | | |
| | | | Production | | Depletion and | | | | | | | |
| | Revenues | | and Delivery | | Amortization | | | | | | | |
| Totals presented above | $ | 1,941 | | $ | 314 | | $ | 59 | | | | | | | |
| Net noncash and nonrecurring costs per above | | N/A | | | 9 | | | N/A | | | | | | | |
| Less: Treatment charges per above | | (153 | ) | | N/A | | | N/A | | | | | | | |
| Less: Royalty per above | | (50 | ) | | N/A | | | N/A | | | | | | | |
| Revenue adjustments, primarily for pricing on prior | | | | | | | | | | | | | | | |
| period open sales per above | | (29 | ) | | N/A | | | N/A | | | | | | | |
| Total Indonesia mining operations | | 1,709 | | | 323 | | | 59 | | | | | | | |
| North America mining operations | | 319 | | | 327 | | | 14 | | | | | | | |
| South America mining operations | | 262 | | | 116 | | | 28 | | | | | | | |
| Atlantic Copper smelting & refining | | 454 | | | 427 | | | 10 | | | | | | | |
| Corporate, other & eliminations | | (498 | ) | | (290 | ) | | 5 | | | | | | | |
| As reported in FCX’s consolidated financial | | | | | | | | | | | | | | | |
| statements | $ | 2,246 | | $ | 903 | | $ | 116 | | | | | | | |
| | | | | | | | | | | | | | | | |
CAUTIONARY STATEMENT
Our discussion and analysis contains forward-looking statements in which we discuss our expectations regarding future performance. Forward-looking statements are all statements other than historical facts, such as those regarding anticipated sales volumes, ore grades, milling rates, commodity prices, unit net cash costs, operating cash flows, royalty costs, capital expenditures, the impact of copper, gold and molybdenum price changes, the impact of changes in deferred intercompany profits on earnings, treatment charge rates, depreciation rates, exploration efforts and results, dividend payments, liquidity and other financial commitments. Accuracy of the forward-looking statements depends on assumptions about events that change over time and is thus susceptible to periodic change based on actual experience and new developments. We caution readers that we assume no obligation to update or publicly release any revisions to the forward-looking statements in this Form 10-Q and, except to the extent required by applicable law, do not intend to update or otherwise revise the forward-looking statements more frequently than quarterly. Additionally, important factors that might cause future results to differ from these forward-looking statements include mine sequencing, production rates, industry risks, regulatory changes, commodity prices, political risks, weather-related risks, labor relations, environmental risks, litigation results, currency translation risks and other factors described in more detail under the heading “Risk Factors” in Part I, Item 1A. of our report on Form 10-K for the year ended December 31, 2007.
There have been no material changes in FCX’s market risks during the three months ended March 31, 2008. For additional information on market risk, refer to “Disclosures About Market Risks” included in Part II, Item 7A of our report on Form 10-K for the year ended December 31, 2007.
| (a) | Evaluation of disclosure controls and procedures. Our chief executive officer and chief financial officer, with the participation of management, have evaluated the effectiveness of our “disclosure controls and procedures” (as defined in Rules 13a-14(c) and 15d-14(c) under the Securities Exchange Act of 1934) as of the end of the period covered by this quarterly report on Form 10-Q. Based on their evaluation, they have concluded that our disclosure controls and procedures are effective in timely alerting them to material information relating to FCX (including our consolidated subsidiaries) required to be disclosed in our periodic Securities and Exchange Commission filings. |
| (b) | Changes in internal controls. There has been no change in our internal control over financial reporting that occurred during the three months ended March 31, 2008, that has materially affected, or is reasonably likely to materially affect our internal controls over financial reporting. |
Environmental Proceedings
EPA Notice re Violation of Consent Decree – Sierrita operations. Information regarding this legal proceeding is incorporated by reference to Item 3. Legal Proceedings of Part I of the FCX Form 10-K for the year ended December 31, 2007. At the joint request of all parties, the court found that Sierrita satisfied all Consent Decree terms and, therefore, terminated the Consent Decree on March 10, 2008.
Blackwell, Oklahoma Litigation. On April 14, 2008, a purported class action was filed in the District Court of Kay County, Oklahoma against FCX, and several direct and indirect subsidiaries, including Blackwell Zinc Company (BZC), and several other parties, entitled Coffey, et al., Plaintiffs, v. Freeport-McMoRan Copper & Gold, Inc., et al., Defendants, Kay County, Oklahoma District Court, Case No. CJ-2008-68. The suit alleges that the operations of BZC’s zinc smelter in Blackwell, Oklahoma, from 1918 to 1974 resulted in contamination of the soils and groundwater in Blackwell and the surrounding area. Unspecified compensatory and punitive damages are sought on behalf of the putative class members for alleged diminution in property values. There is also a request for an order compelling remediation of alleged contaminated properties and the establishment of a monetary fund to monitor the present and future health of the putative class members. We intend to defend this matter vigorously. For more information about FCX’s remediation activities in Blackwell, Oklahoma, refer to Note
15 to FCX’s consolidated financial statements contained in its Form 10-K for the year ended December 31, 2007.
There have been no material changes to our risk factors during the three months ended March 31, 2008. For additional information on risk factors, refer to “Risk Factors” included in Part I, Item IA of our report on Form 10-K for the year ended December 31, 2007.
(c) The following table sets forth information with respect to shares of common stock of FCX purchased by FCX during the three months ended March 31, 2008:
| | | | | | | | | | |
| | | | | | | | (c) Total Number of | | (d) Maximum Number |
| | | (a) Total Number | | (b) Average | | Shares Purchased as Part | | of Shares That May |
| | | of Shares | | Price Paid | | of Publicly Announced | | Yet Be Purchased Under |
| Period | | Purchaseda | | Per Share | | Plans or Programsb | | the Plans or Programsb |
| January 1-31, 2008 | | 953 | | $ | 95.50 | | – | | 20,000,000 |
| February 1-29, 2008 | | 153,377 | | | 90.89 | | – | | 20,000,000 |
| March 1-31, 2008 | | 88,748 | | | 104.34 | | – | | 20,000,000 |
| Total | | 243,078 | | | 95.82 | | – | | 20,000,000 |
| | | | | | | | | | |
| a. | Consists of shares repurchased under FCX’s applicable stock incentive plans (Plans) and its non-qualified supplemental savings plan (SSP). Through the Plans, FCX repurchased 243,031 shares to satisfy tax obligations on restricted stock awards and to cover the cost of option exercises. Under the SSP, FCX repurchased 47 shares as a result of dividends paid. |
| b. | In December 2007, our Board of Directors approved a new open market share purchase program for up to 20 million shares, which replaced our previous program. The program does not have an expiration date. No shares were purchased during the three-month period ended March 31, 2008, and 20 million shares remain available for purchase. |
The exhibits to this report are listed in the Exhibit Index beginning on Page E-1 hereof.
FREEPORT-McMoRan COPPER & GOLD INC.
Pursuant to the requirements of the Securities Exchange Act of 1934, the registrant has duly caused this report to be signed on its behalf by the undersigned hereunto duly authorized.
FREEPORT-McMoRan COPPER & GOLD INC.
By: /s/ C. Donald Whitmire, Jr.
C. Donald Whitmire, Jr.
Vice President and
Controller-Financial Reporting
(authorized signatory and
Principal Accounting Officer)
Date: May 12, 2008
FREEPORT-McMoRan COPPER & GOLD INC.
| | | Filed | | | | |
| Exhibit | | with this | Incorporated by Reference |
| | | | | |
| 2.1 | Agreement and Plan of Merger dated as of November 18, 2006, by and among Freeport-McMoRan Copper & Gold Inc. (FCX), Phelps Dodge Corporation and Panther Acquisition Corporation. | | S-4 | 333-139252 | 12/11/2006 |
| 3.1 | Amended and Restated Certificate of Incorporation of FCX. | | 8-K | 001-11307-01 | 03/19/2007 |
| 3.2 | Amended and Restated By-Laws of FCX, as amended through May 1, 2007. | | 8-K | 001-11307-01 | 05/04/2007 |
| 4.1 | Certificate of Designations of 5½% Convertible Perpetual Preferred Stock of FCX. | | 8-K | 001-11307-01 | 03/31/2004 |
| 4.2 | Certificate of Designations of 6¾% Mandatory Convertible Preferred Stock of FCX. | | 8-K | 001-11307-01 | 03/27/2007 |
| 4.3 | Rights Agreement dated as of May 3, 2000, between FCX and ChaseMellon Shareholder Services, L.L.C., as Rights Agent. | | 10-Q | 001-09916 | 05/15/2000 |
| 4.4 | Amendment No. 1 to Rights Agreement dated as of February 26, 2002, between FCX and Mellon Investor Services. | | 10-Q | 001-09916 | 05/07/2002 |
| 4.5 | Indenture dated as of February 11, 2003, from FCX to The Bank of New York, as Trustee, with respect to the 7% Convertible Senior Notes due 2011. | | 8-K | 001-09916 | 02/25/2003 |
| 4.6 | Indenture dated as of March 19, 2007, from FCX to The Bank of New York, as Trustee, with respect to the 8.25% Senior Notes due 2015, 8.375% Senior Notes due 2017, and the Senior Floating Rate Notes due 2015. | | 8-K | 001-11307-01 | 03/19/2007 |
| 4.7 | Credit Agreement dated as of March 19, 2007, by and among FCX, the lenders party thereto, the issuing banks party thereto, JPMorgan Chase Bank, N.A. as administrative agent and collateral agent, and Merrill Lynch, Pierce, Fenner & Smith Incorporated, as syndication agent. | | 8-K | 001-11307-01 | 03/19/2007 |
| 4.8 | Amendment Agreement dated as of July 3, 2007, amending the Credit Agreement dated as of March 19, 2007, among FCX, the Lenders party thereto, the Issuing Banks party thereto, and JPMorgan Chase Bank, N.A., as Administrative Agent and as Collateral Agent, and Merrill Lynch, Pierce, Fenner & Smith Incorporated, as Syndication Agent. | | 8-K | 001-11307-01 | 07/11/2007 |
| 4.9 | Amended and Restated Credit Agreement dated as of March 19, 2007, by and among FCX, PT Freeport Indonesia, the lenders party thereto, the issuing banks party thereto, JPMorgan Chase Bank, N.A. as administrative agent, collateral agent, security agent and JAA security agent, U.S. Bank National Association, as FI trustee, and Merrill Lynch, Pierce, Fenner & Smith Incorporated, as syndication agent. | | 8-K | 001-11307-01 | 03/19/2007 |
| 4.10 | Amendment Agreement dated as of July 3, 2007, amending the Amended and Restated Credit Agreement dated as of March 19, 2007, which amended and restated the Amended and Restated Credit Agreement, dated as of July 25, 2006, which amended and restated the Amended and Restated Credit Agreement, dated as of September 30, 2003, which amended and restated the Amended and Restated Credit Agreement, dated as of October 19, 2001, which amended and restated both the Credit Agreement, originally dated as of October 27, 1989 and amended and restated as of June 1, 1993 and the Credit Agreement, originally dated as of June 30, 1995, among FCX, PT Freeport Indonesia, U.S. Bank National Association, as trustee for the Lenders and certain other lenders under the FI Trust Agreement, the Lenders party thereto, the Issuing Banks party thereto, and JPMorgan Chase Bank, N.A., as Administrative Agent, Security Agent, JAA Security Agent and Collateral Agent, and Merrill Lynch, Pierce, Fenner & Smith Incorporated, as Syndication Agent. | | 8-K | 001-11307-01 | 07/11/2007 |
| | | | | | |
| | Filed | | | | |
| Exhibit | | with this | Incorporated by Reference |
| | | | | |
| 10.1 | Contract of Work dated December 30, 1991, between the Government of the Republic of Indonesia and PT Freeport Indonesia. | | S-3 | 333-72760 | 11/05/2001 |
| 10.2 | Contract of Work dated August 15, 1994, between the Government of the Republic of Indonesia and PT Irja Eastern Minerals Corporation. | | S-3 | 333-72760 | 11/05/2001 |
| 10.3 | Participation Agreement dated as of October 11, 1996, between PT Freeport Indonesia and P.T. RTZ-CRA Indonesia with respect to a certain contract of work. | | S-3 | 333-72760 | 11/05/2001 |
| 10.4 | Agreement dated as of October 11, 1996, to Amend and Restate Trust Agreement among PT Freeport Indonesia, FCX, the RTZ Corporation PLC, P.T. RTZ-CRA Indonesia, RTZ Indonesian Finance Limited and First Trust of New York, National Association, and The Chase Manhattan Bank, as Administrative Agent, JAA Security Agent and Security Agent. | | 8-K | 001-09916 | 11/13/1996 |
| 10.5 | Concentrate Purchase and Sales Agreement dated effective December 11, 1996, between PT Freeport Indonesia and PT Smelting. | | S-3 | 333-72760 | 11/05/2001 |
| 10.6 | Second Amended and Restated Joint Venture and Shareholders’ Agreement dated as of December 11, 1996, among Mitsubishi Materials Corporation, Nippon Mining and Metals Company, Limited and PT Freeport Indonesia. | | S-3 | 333-72760 | 11/05/2001 |
| 10.7 | Participation Agreement, dated as of March 16, 2005, among Phelps Dodge Corporation, Cyprus Amax Minerals Company, a Delaware corporation, Cyprus Metals Company, a Delaware corporation, Cyprus Climax Metals Company, a Delaware corporation, Sumitomo Corporation, a Japanese corporation, Summit Global Management, B.V., a Dutch corporation, Sumitomo Metal Mining Co., Ltd., a Japanese corporation, Compañia de Minas Buenaventura S.A.A., a Peruvian sociedad anonima abierta, and Sociedad Minera Cerro Verde S.A.A., a Peruvian sociedad anonima abierta. | | 8-K | 001-00082 | 03/22/2005 |
| 10.8 | Shareholders Agreement, dated as of June 1, 2005, among Phelps Dodge Corporation, Cyprus Climax Metals Company, a Delaware corporation, Sumitomo Corporation, a Japanese corporation, Sumitomo Metal Mining Co., Ltd., a Japanese corporation, Summit Global Management B.V., a Dutch corporation, SMM Cerro Verde Netherlands, B.V., a Dutch corporation, Compañia de Minas Buenaventura S.A.A., a Peruvian sociedad anonima abierta, and Sociedad Minera Cerro Verde S.A.A., a Peruvian sociedad anonima abierta. | | 8-K | 001-00082 | 06/07/2005 |
| 10.9 | Master Agreement and Plan of Merger between Columbian Chemicals Company, Columbian Chemicals Acquisition LLC and Columbian Chemicals Merger Sub, Inc., dated November 15, 2005. | | 10-K | 001-00082 | 02/27/2006 |
| 10.10 | Reclamation and Remediation Trust Agreement between Phelps Dodge Corporation and Wells Fargo Delaware Trust Company, dated December 22, 2005. | | 10-K | 001-00082 | 02/27/2006 |
| 10.11* | FCX Director Compensation | | 10-K | 001-11307-01 | 03/16/2005 |
| 10.12* | Consulting Agreement dated December 22, 1988, with Kissinger Associates, Inc. (Kissinger Associates). | | 10-K405 | 001-09916 | 03/31/1998 |
| 10.13* | Letter Agreement dated May 1, 1989, with Kent Associates, Inc. (Kent Associates, predecessor in interest to Kissinger Associates). | | 10-K405 | 001-09916 | 03/31/1998 |
| 10.14* | Letter Agreement dated January 27, 1997, among Kissinger Associates, Kent Associates, FCX, Freeport-McMoRan Inc. (FTX), and FM Services Company (FMS). | | 10-K405 | 001-09916 | 03/08/2002 |
| 10.15* | Supplemental Agreement with Kissinger Associates and Kent Associates, effective as of January 1, 2008. | | 10-Q | 001-11307-01 | 11/07/2007 |
| 10.16* | Agreement for Consulting Services between FTX and B. M. Rankin, Jr. effective as of January 1, 1990 (assigned to FMS as of January 1, 1996). | | 10-K405 | 001-09916 | 03/31/1998 |
| 10.17* | Supplemental Agreement dated December 15, 1997, between FMS and B. M. Rankin, Jr. | | 10-K405 | 001-09916 | 03/31/1998 |
| | Filed | | | | |
| Exhibit | | with this | Incorporated by Reference |
| | | | | |
| 10.18* | Supplemental Letter Agreement between FMS and B. M. Rankin, Jr., effective as of January 1, 2008. | | 10-K | 001-11307-01 | 02/29/2008 |
| 10.19* | Letter Agreement effective as of January 7, 1997, between Senator J. Bennett Johnston, Jr. and FMS. | | 10-K405 | 001-09916 | 03/08/2002 |
| 10.20* | Supplemental Letter Agreement dated July 14, 2003, between J. Bennett Johnston, Jr. and FMS. | | 10-Q | 001-11307-01 | 08/12/2003 |
| 10.21* | Supplemental Letter Agreement between FMS and J. Bennett Johnston, Jr., dated January 18, 2005. | | 10-K | 001-11307-01 | 03/16/2005 |
| 10.22* | Supplemental Agreement between FMS and J. Bennett Johnston, Jr., effective as of January 1, 2008. | | 10-Q | 001-11307-01 | 11/07/2007 |
| 10.23* | Letter Agreement dated November 1, 1999, between FMS and Gabrielle K. McDonald. | | 10-K405 | 001-09916 | 03/20/2000 |
| 10.24* | Supplemental Letter Agreement between FMS and Gabrielle K. McDonald, effective as of January 1, 2008. | | 10-Q | 001-11307-01 | 11/07/2007 |
| 10.25* | Agreement for Consulting Services between FMS and Dr. J. Taylor Wharton, effective as of January 11, 2008. | | 10-K | 001-11307-01 | 02/29/2008 |
| 10.26* | Executive Employment Agreement dated April 30, 2001, between FCX and James R. Moffett. | | 10-Q | 001-09916 | 07/30/2001 |
| 10.27* | Change of Control Agreement dated April 30, 2001, between FCX and James R. Moffett. | | 10-Q | 001-09916 | 07/30/2001 |
| 10.28* | First Amendment to Executive Employment Agreement dated December 10, 2003, between FCX and James R. Moffett. | | 10-K | 001-11307-01 | 03/10/2004 |
| 10.29* | First Amendment to Change of Control Agreement dated December 10, 2003, between FCX and James R. Moffett. | | 10-K | 001-11307-01 | 03/10/2004 |
| 10.30* | Change of Control Agreement dated February 3, 2004, between FCX and Michael J. Arnold. | | 10-K | 001-11307-01 | 03/10/2004 |
| 10.31* | Executive Employment Agreement effective January 29, 2008, between FCX and Richard C. Adkerson. | | 10-K | 001-11307-01 | 02/29/2008 |
| 10.32* | Executive Employment Agreement effective January 29, 2008, between FCX and Kathleen L. Quirk. | | 10-K | 001-11307-01 | 02/29/2008 |
| 10.33* | Form of Change of Control Agreement (amended and restated effective January 1, 2005), adopted by Phelps Dodge Corporation for agreements entered into between Phelps Dodge Corporation and other of its executive officers and other members of its senior management team. | | 10-K/A | 001-00082 | 03/19/2007 |
| 10.34* | Form of Severance Agreement (as amended and restated effective January 1, 2005) adopted by Phelps Dodge Corporation and entered into between Phelps Dodge Corporation and certain of its executives. | | 10-K/A | 001-00082 | 03/19/2007 |
| 10.35* | FCX Executive Services Program. | | 8-K | 001-11307-01 | 05/05/2006 |
| 10.36* | FCX Supplemental Executive Retirement Plan, as amended and restated. | | 8-K | 001-11307-01 | 02/05/2007 |
| 10.37* | FCX President’s Award Program. | | S-3 | 333-72760 | 11/05/2001 |
| FCX Supplemental Executive Capital Accumulation Plan. | X | | | |
| FCX Supplemental Executive Capital Accumulation Plan Amendment One. | X | | | |
| 10.40* | FCX 1995 Stock Option Plan, as amended and restated. | | 10-Q | 001-11307-01 | 05/10/2007 |
| 10.41* | FCX 1995 Stock Option Plan for Non-Employee Directors, as amended and restated. | | 10-Q | 001-11307-01 | 05/10/2007 |
| 10.42* | FCX Amended and Restated 1999 Stock Incentive Plan, as amended and restated. | | 10-Q | 001-11307-01 | 05/10/2007 |
| 10.43* | FCX 1999 Long-Term Performance Incentive Plan. | | 10-K | 001-09916 | 03/20/2000 |
| 10.44* | FM Services Company Performance Incentive Awards Program, as amended effective February 2, 1999. | | 10-K | 001-09916 | 03/19/1999 |
| | Filed | | | | |
| Exhibit | | with this | Incorporated by Reference |
| | | | | |
| 10.45* | FCX Stock Appreciation Rights Plan dated May 2, 2000. | | 10-Q | 001-09916 | 07/30/2001 |
| 10.46* | FCX 2003 Stock Incentive Plan, as amended and restated. | | 10-Q | 001-11307-01 | 05/10/2007 |
| 10.47* | Phelps Dodge 2003 Stock Option and Restricted Stock Plan, as amended. | | S-8 | 333-141358 | 03/16/2007 |
| 10.48* | FCX 2004 Director Compensation Plan. | | 10-K | 001-11307-01 | 03/16/2005 |
| 10.49* | Form of Amendment No. 1 to Notice of Grant of Nonqualified Stock Options and Stock Appreciation Rights under the 2004 Director Compensation Plan. | | 8-K | 001-11307-01 | 05/05/2006 |
| 10.50* | FCX 2004 Director Compensation Plan, as amended and restated. | | 10-Q | 001-11307-01 | 05/10/2007 |
| 10.51* | FCX 2005 Annual Incentive Plan. | | 8-K | 001-11307-01 | 05/06/2005 |
| 10.52* | The Phelps Dodge Corporation Supplemental Retirement Plan, amended and restated effective January 1, 2005 and adopted on March 16, 2007. | | 10-Q | 001-11307-01 | 05/10/2007 |
| First Amendment to the Phelps Dodge Corporation Supplemental Retirement Plan, dated as of November 9, 2007. | X | | | |
| 10.54* | The Phelps Dodge Corporation Supplemental Savings Plan, amended and restated effective January 1, 2005, and adopted on March 16, 2007. | | 10-Q | 001-11307-01 | 05/10/2007 |
| 10.55* | First Amendment to the Phelps Dodge Corporation Supplemental Savings Plan, dated March 16, 2007. | | 10-Q | 001-11307-01 | 05/10/2007 |
| 10.56* | Second Amendment to the Phelps Dodge Corporation Supplemental Savings Plan, dated as of March 16, 2007. | | 10-Q | 001-11307-01 | 05/10/2007 |
| Third Amendment to the Phelps Dodge Corporation Supplemental Savings Plan, dated as of November 14, 2007. | X | | | |
| 10.58* | FCX Amended and Restated 2006 Stock Incentive Plan. | | 8-K | 001-11307-01 | 07/13/2007 |
| 10.59* | FCX Performance Incentive Awards Program, as amended effective December 4, 2007. | | 10-K | 001-11307-01 | 02/29/2008 |
| 10.60* | Form of Notice of Grant of Nonqualified Stock Options for grants under the FCX 1999 Stock Incentive Plan, the 2003 Stock Incentive Plan and the 2006 Stock Incentive Plan. | | 10-K | 001-11307-01 | 02/29/2008 |
| 10.61* | Form of Restricted Stock Unit Agreement for grants under the FCX 1999 Stock Incentive Plan, the 2003 Stock Incentive Plan and the 2006 Stock Incentive Plan. | | 10-K | 001-11307-01 | 02/29/2008 |
| 10.62* | Form of Performance-Based Restricted Stock Unit Agreement for grants under the FCX 1999 Stock Incentive Plan, the 2003 Stock Incentive Plan and the 2006 Stock Incentive Plan. | | 10-K | 001-11307-01 | 02/29/2008 |
| 10.63* | Form of Restricted Stock Unit Agreement (form used in connection with participant elections) for grants under the FCX 1999 Stock Incentive Plan, the 2003 Stock Incentive Plan and the 2006 Stock Incentive Plan. | | 10-K | 001-11307-01 | 02/29/2008 |
| 10.64* | Form of Performance-Based Restricted Stock Unit Agreement (form used in connection with participant elections) for grants under the FCX 1999 Stock Incentive Plan, the 2003 Stock Incentive Plan and the 2006 Stock Incentive Plan. | | 10-K | 001-11307-01 | 02/29/2008 |
| 10.65* | Form of Amendment to the ELIP Split Dollar Life Insurance Agreement (Endorsement Method) adopted by Phelps Dodge Corporation and entered into by and between Phelps Dodge and certain of its executives. | | 10-Q | 001-11307-01 | 05/10/2007 |
| 10.66* | Letter of employment by and between FCX and Timothy R. Snider, dated April 4, 2007. | | 10-Q | 001-11307-01 | 05/10/2007 |
| Letter from Ernst & Young LLP regarding unaudited interim financial statements. | X | | | |
| Certification of Principal Executive Officer pursuant to Rule 13a-14(a)/15d – 14(a). | X | | | |
| | Filed | | | | |
| Exhibit | | with this | Incorporated by Reference |
| | | | | |
| Certification of Principal Financial Officer pursuant to Rule 13a-14(a)/15d – 14(a). | X | | | |
| Certification of Principal Executive Officer pursuant to 18 U.S.C. Section 1350. | X | | | |
| Certification of Principal Financial Officer pursuant to 18 U.S.C Section 1350. | X | | | |
_______________________
Note: Certain instruments with respect to long-term debt of FCX have not been filed as exhibits to this Quarterly Report on Form 10-Q since the total amount of securities authorized under any such instrument does not exceed 10 percent of the total assets of FCX and its subsidiaries on a consolidated basis. FCX agrees to furnish a copy of each such instrument upon request of the Securities and Exchange Commission.
* Indicates management contract or compensatory plan or arrangement.