00008312592023FYfalse7.1259.56.125http://fasb.org/us-gaap/2024#Liabilitieshttp://fasb.org/us-gaap/2024#Liabilitieshttp://fasb.org/us-gaap/2024#Liabilitieshttp://www.fcx.com/20241231#EnvironmentalAndAssetRetirementObligationsCurrenthttp://www.fcx.com/20241231#EnvironmentalAndAssetRetirementObligationsCurrenthttp://www.fcx.com/20241231#EnvironmentalAndAssetRetirementObligationsCurrenthttp://www.fcx.com/20241231#EnvironmentalAndAssetRetirementObligationsNoncurrenthttp://www.fcx.com/20241231#EnvironmentalAndAssetRetirementObligationsNoncurrenthttp://www.fcx.com/20241231#EnvironmentalAndAssetRetirementObligationsNoncurrenthttp://fasb.org/us-gaap/2024#PropertyPlantAndEquipmentNethttp://fasb.org/us-gaap/2024#PropertyPlantAndEquipmentNethttp://fasb.org/us-gaap/2024#AccountsPayableAndAccruedLiabilitiesCurrenthttp://fasb.org/us-gaap/2024#AccountsPayableAndAccruedLiabilitiesCurrenthttp://fasb.org/us-gaap/2024#AccountsPayableAndAccruedLiabilitiesCurrenthttp://fasb.org/us-gaap/2024#AccountsPayableAndAccruedLiabilitiesCurrenthttp://fasb.org/us-gaap/2024#OtherLiabilitiesNoncurrenthttp://fasb.org/us-gaap/2024#OtherLiabilitiesNoncurrenthttp://fasb.org/us-gaap/2024#OtherLiabilitiesNoncurrenthttp://fasb.org/us-gaap/2024#OtherLiabilitiesNoncurrenthttp://fasb.org/us-gaap/2024#AccountsReceivableNetCurrenthttp://fasb.org/us-gaap/2024#AccountsReceivableNetCurrenthttp://fasb.org/us-gaap/2024#AccountsReceivableNetCurrenthttp://fasb.org/us-gaap/2024#AccountsReceivableNetCurrenthttp://fasb.org/us-gaap/2024#OtherAssetsCurrenthttp://fasb.org/us-gaap/2024#OtherAssetsCurrenthttp://fasb.org/us-gaap/2024#OtherAssetsCurrenthttp://fasb.org/us-gaap/2024#OtherAssetsCurrenthttp://fasb.org/us-gaap/2024#AccountsPayableAndAccruedLiabilitiesCurrenthttp://fasb.org/us-gaap/2024#AccountsPayableAndAccruedLiabilitiesCurrenthttp://fasb.org/us-gaap/2024#AccountsPayableAndAccruedLiabilitiesCurrenthttp://fasb.org/us-gaap/2024#AccountsPayableAndAccruedLiabilitiesCurrenthttp://fasb.org/us-gaap/2024#OtherLiabilitiesNoncurrenthttp://fasb.org/us-gaap/2024#OtherAssetsNoncurrenthttp://fasb.org/us-gaap/2024#OtherLiabilitiesNoncurrenthttp://fasb.org/us-gaap/2024#OtherAssetsNoncurrenthttp://fasb.org/us-gaap/2024#OtherAssetsCurrenthttp://fasb.org/us-gaap/2024#OtherAssetsCurrenthttp://fasb.org/us-gaap/2024#OtherAssetsNoncurrenthttp://fasb.org/us-gaap/2024#OtherAssetsNoncurrent
UNITED STATES
SECURITIES AND EXCHANGE COMMISSION
Washington, D.C. 20549
FORM 10-K
(Mark one)
| | | | | |
| ☒ | ANNUAL REPORT PURSUANT TO SECTION 13 OR 15(d) OF THE SECURITIES EXCHANGE ACT OF 1934 |
For the fiscal year ended December 31, 2024
OR
| | | | | |
| ☐ | TRANSITION REPORT PURSUANT TO SECTION 13 OR 15(d) OF THE SECURITIES EXCHANGE ACT OF 1934 |
For the transition period from to
Commission file number: 001-11307-01
Freeport-McMoRan Inc.
(Exact name of registrant as specified in its charter)
| | | | | | | | |
| Delaware | | 74-2480931 |
| (State or other jurisdiction of | | (I.R.S. Employer Identification No.) |
| incorporation or organization) | | |
| | | | | | | | | | | | | | | | | | | | |
| 333 North Central Avenue | | | | |
| Phoenix | | Arizona | | | | 85004-2189 |
| (Address of principal executive offices) | | | | (Zip Code) |
(602) 366-8100
(Registrant’s telephone number, including area code)
Securities registered pursuant to Section 12(b) of the Act:
| | | | | | | | |
| Title of each class | Trading Symbol(s) | Name of each exchange on which registered |
| Common Stock, par value $0.10 per share | FCX | The New York Stock Exchange |
Securities registered pursuant to Section 12(g) of the Act: None
Indicate by check mark if the registrant is a well-known seasoned issuer, as defined in Rule 405 of the Securities Act ☑ Yes ☐ No
Indicate by check mark if the registrant is not required to file reports pursuant to Section 13 or Section 15(d) of the Act. ☐ Yes ☑ No
Indicate by check mark whether the registrant (1) has filed all reports required to be filed by Section 13 or 15(d) of the Securities Exchange Act of 1934 during the preceding 12 months (or for such shorter period that the registrant was required to file such reports), and (2) has been subject to such filing requirements for the past 90 days. ☑ Yes ☐ No
Indicate by check mark whether the registrant has submitted electronically every Interactive Data File required to be submitted pursuant to Rule 405 of Regulation S-T during the preceding 12 months (or for such shorter period that the registrant was required to submit such files). ☑ Yes ☐ No
Indicate by check mark whether the registrant is a large accelerated filer, an accelerated filer, a non-accelerated filer, a smaller reporting company, or an emerging growth company. See the definitions of “large accelerated filer,” “accelerated filer,” “smaller reporting company,” and “emerging growth company” in Rule 12b-2 of the Exchange Act.
| | | | | | | | | | | |
| Large accelerated filer | ☑ | Accelerated filer | ☐ |
| Non-accelerated filer | ☐ | Smaller reporting company | ☐ |
| | Emerging growth company | ☐ |
If an emerging growth company, indicate by check mark if the registrant has elected not to use the extended transition period for complying with any new or revised financial accounting standards provided pursuant to Section 13(a) of the Exchange Act. ☐
Indicate by check mark whether the registrant has filed a report on and attestation to its management’s assessment of the effectiveness of its internal control over financial reporting under Section 404(b) of the Sarbanes-Oxley Act (15 U.S.C. 7262(b)) by the registered public accounting firm that prepared or issued its audit report. ☑
If securities are registered pursuant to Section 12(b) of the Act, indicate by check mark whether the financial statements of the registrant included in the filing reflect the correction of an error to previously issued financial statements. ☐
Indicate by check mark whether any of those error corrections are restatements that required a recovery analysis of incentive-based compensation received by any of the registrant’s executive officers during the relevant recovery period pursuant to §240.10D-1(b). ☐
Indicate by check mark whether the registrant is a shell company (as defined in Rule 12b-2 of the Act). ☐ Yes ☑ No
The aggregate market value of common stock held by non-affiliates of the registrant was $69.5 billion on June 30, 2024.
Common stock issued and outstanding was 1,437,073,006 shares on January 31, 2025.
DOCUMENTS INCORPORATED BY REFERENCE
| | |
| Portions of the registrant’s proxy statement for its 2025 annual meeting of stockholders are incorporated by reference into Part III of this report. |
Freeport-McMoRan Inc.
| | | | | |
| TABLE OF CONTENTS |
| | |
| | Page |
| |
| |
| |
| |
| |
| |
| |
| |
| | |
| |
| |
| |
| Item 6. Reserved | |
| |
| |
| |
| |
| |
| |
| |
| | |
| |
| |
| |
| |
| |
| |
| |
| | |
| |
| |
| |
| |
| |
| | |
| |
| | |
| |
| |
| |
PART I
Items 1. and 2. Business and Properties.
All of our periodic reports filed with the United States (U.S.) Securities and Exchange Commission (SEC) pursuant to Section 13(a) or 15(d) of the Securities Exchange Act of 1934, as amended, are available, free of charge, through our website, fcx.com, including our annual reports on Form 10-K, quarterly reports on Form 10-Q, current reports on Form 8-K and any amendments to those reports. These reports and amendments are available through our website as soon as reasonably practicable after we electronically file or furnish such material to the SEC. Our website is for information only and the contents of our website or information connected thereto are not incorporated in, or otherwise to be regarded as part of, this Form 10-K.
References to “we,” “us” and “our” refer to Freeport-McMoRan Inc. (FCX) and its consolidated subsidiaries. References to “Notes” refer to the Notes to Consolidated Financial Statements included herein (refer to Item 8.), and references to “MD&A” refer to Management’s Discussion and Analysis of Financial Condition and Results of Operations and Quantitative and Qualitative Disclosures About Market Risk included herein (refer to Items 7. and 7A.). The following discussions include forward-looking statements that are not guarantees of future performance and actual results may differ materially (refer to Item 1A. “Risk Factors” and “Cautionary Statement” in MD&A for further discussion).
GENERAL
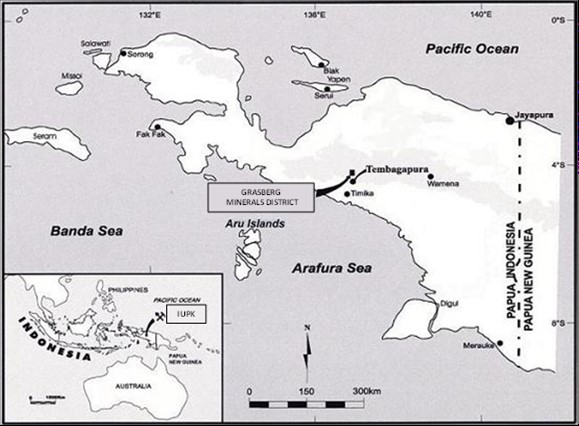
We are a leading international metals company with the objective of being foremost in copper. Headquartered in Phoenix, Arizona, we operate large, long-lived, geographically diverse assets with significant proven and probable mineral reserves of copper, gold and molybdenum. We are one of the world’s largest publicly traded copper producers. Our portfolio of assets includes the Grasberg minerals district in Indonesia, one of the world’s largest copper and gold deposits; and significant operations in North America and South America, including the large-scale Morenci minerals district in Arizona and the Cerro Verde operation in Peru.
Our results for 2024 reflect solid execution of our operating plans and we are committed to enhancing productivity, managing costs and capital and advancing opportunities for long-term profitable growth and value creation. We believe the actions we have taken in recent years to strengthen our balance sheet and maintain flexible organic growth options will allow us to continue to execute our business plans, and reliably and responsibly generate cash flows to pursue value-enhancing organic growth options and return cash to shareholders.
We believe that we have a high-quality portfolio of long-lived copper assets positioned to generate long-term value, and we remain focused on executing our operating and investment plans. Our underground mining operations at the Grasberg minerals district in Indonesia continue to perform well, with copper production increasing in each of the past three years. During 2024, construction of PT Freeport Indonesia’s (PT-FI) new smelter and precious metals refinery (PMR) (collectively, PT-FI’s new downstream processing facilities) in Eastern Java, Indonesia were completed and as part of start-up activities, PT-FI commenced gold production from the PMR in December 2024. In October 2024, during start-up activities of the new smelter, a fire occurred requiring a temporary suspension of smelting operations to complete repairs. PT-FI expects repairs to be completed by mid-2025 and ramp-up to full capacity to be achieved by year-end 2025.
We are progressing initiatives across our North America and South America operations by incorporating new applications, technologies and data analytics to our leaching processes. Incremental copper production from these initiatives totaled 214 million pounds in 2024, compared with a total of 144 million pounds in 2023. We have projects underway to apply recent operational enhancements to our leaching processes on a larger scale and are testing new innovative technology applications that we believe have the potential for significant increases in recoverable metal from leach stockpiles beyond the current run rate.
We believe we benefit from significant copper reserves and resources with embedded growth options, an experienced team and exposure to markets with a favorable fundamental outlook.
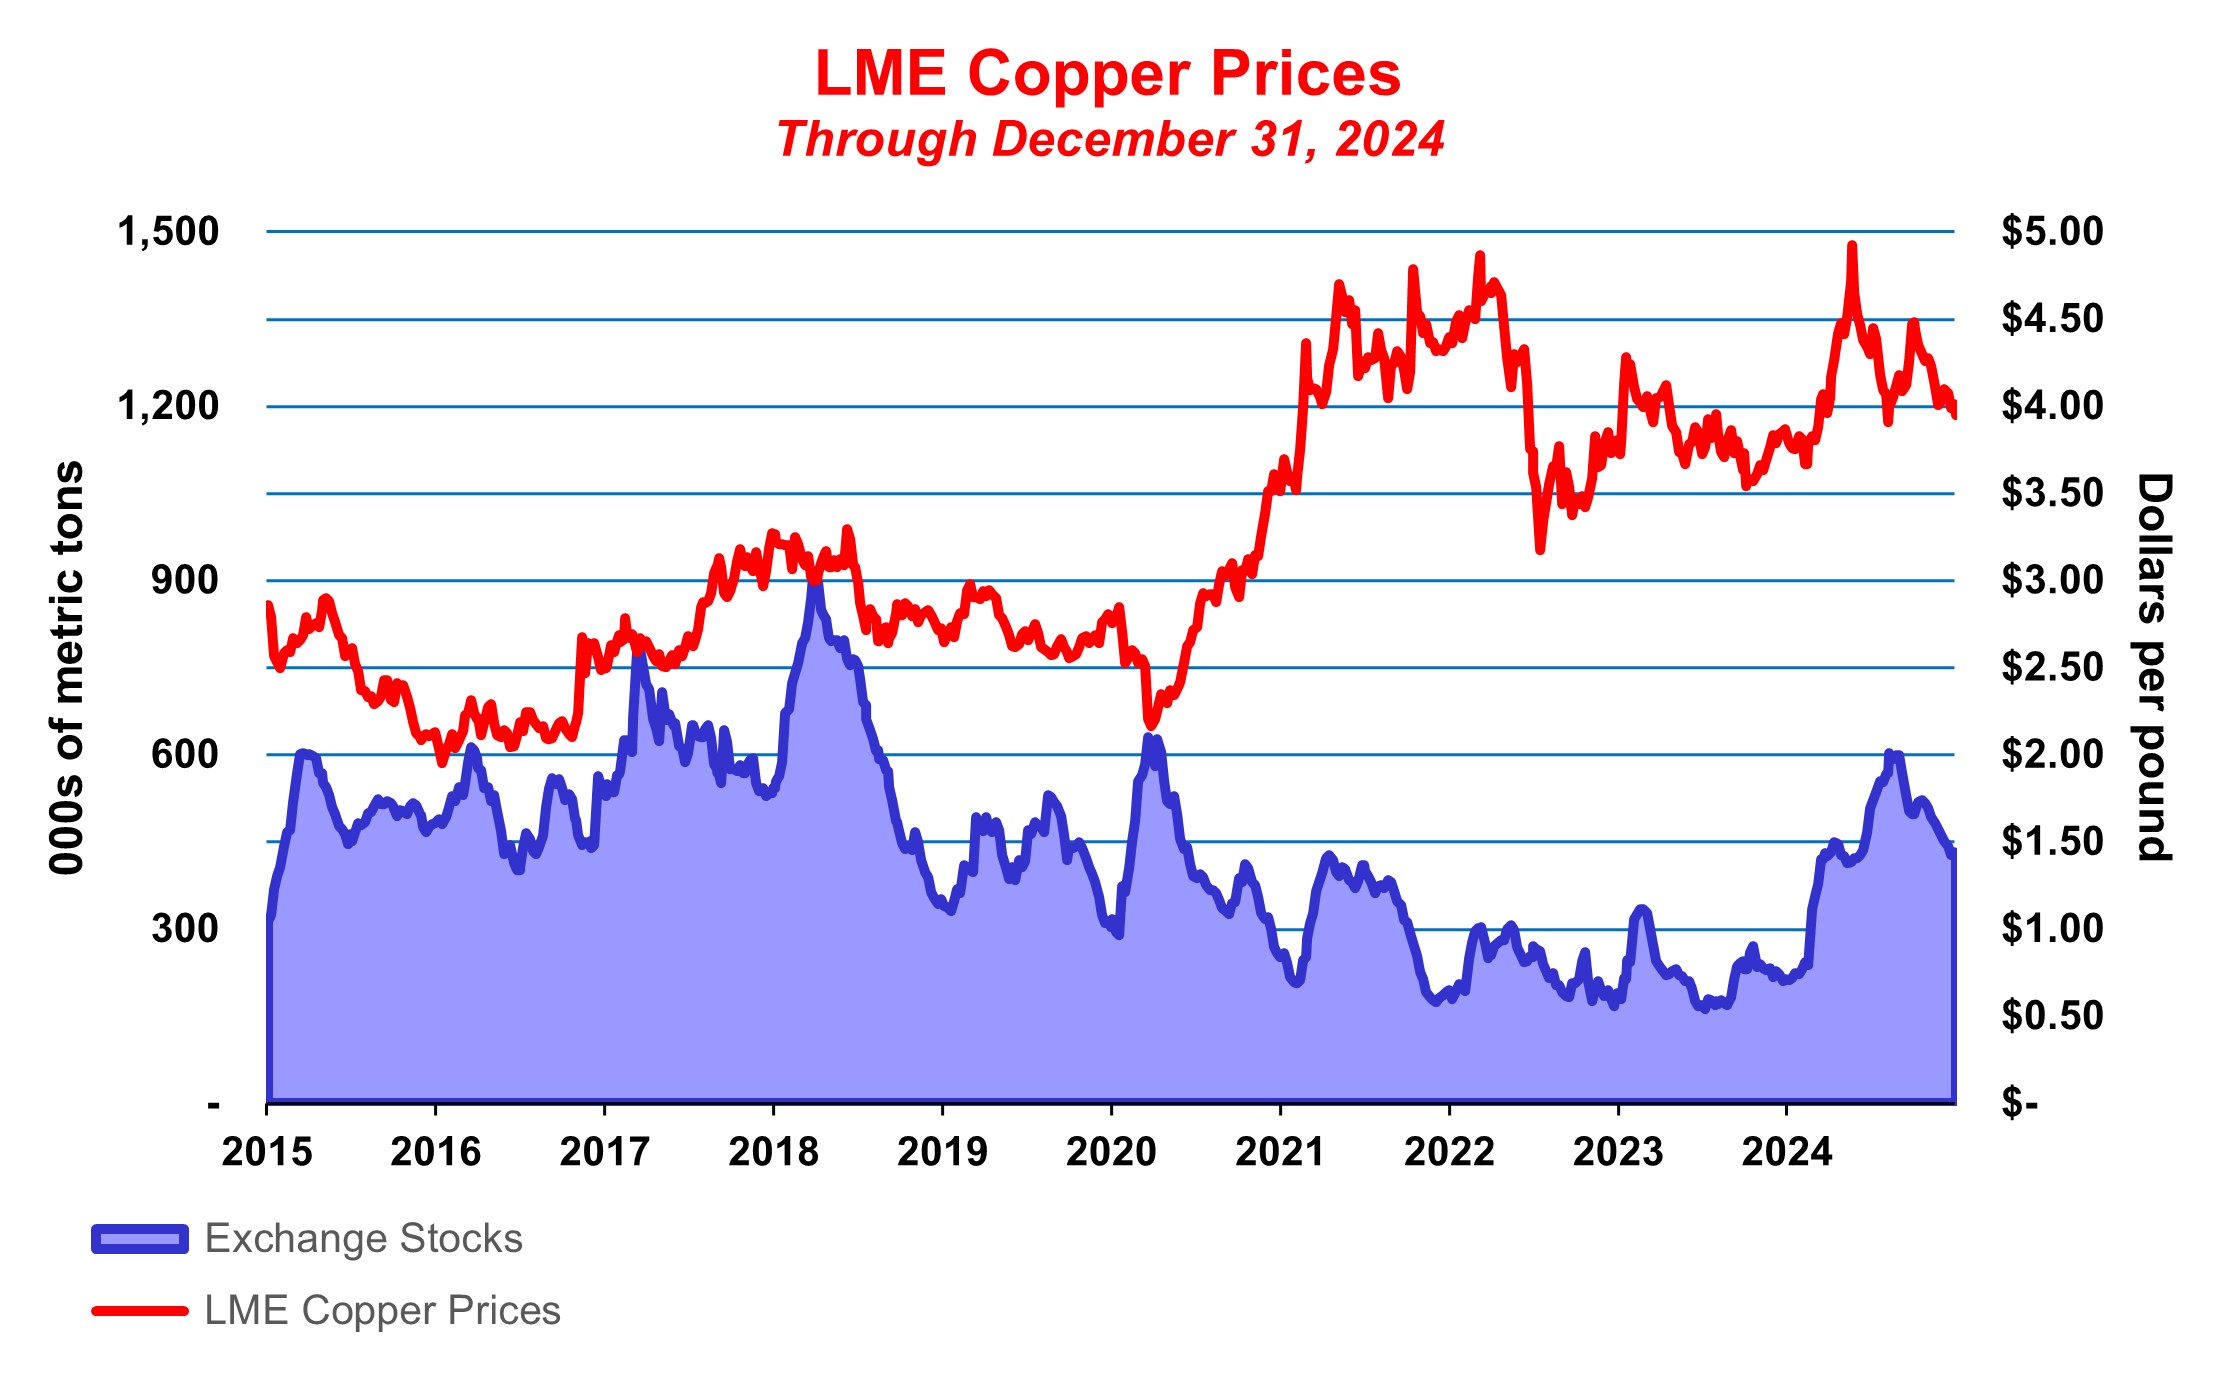
For the year 2024, the London Metal Exchange (LME) copper settlement prices averaged $4.15 per pound (ranging from a low of $3.67 per pound to a high of $4.92 per pound) and closed at $3.95 per pound on December 31, 2024. We believe fundamentals for copper are favorable with growing demand supported by copper’s critical role in the global transition to renewable power, electric vehicles and other carbon-reduction initiatives, continued urbanization in developing countries, data centers and artificial intelligence developments and growing connectivity globally.
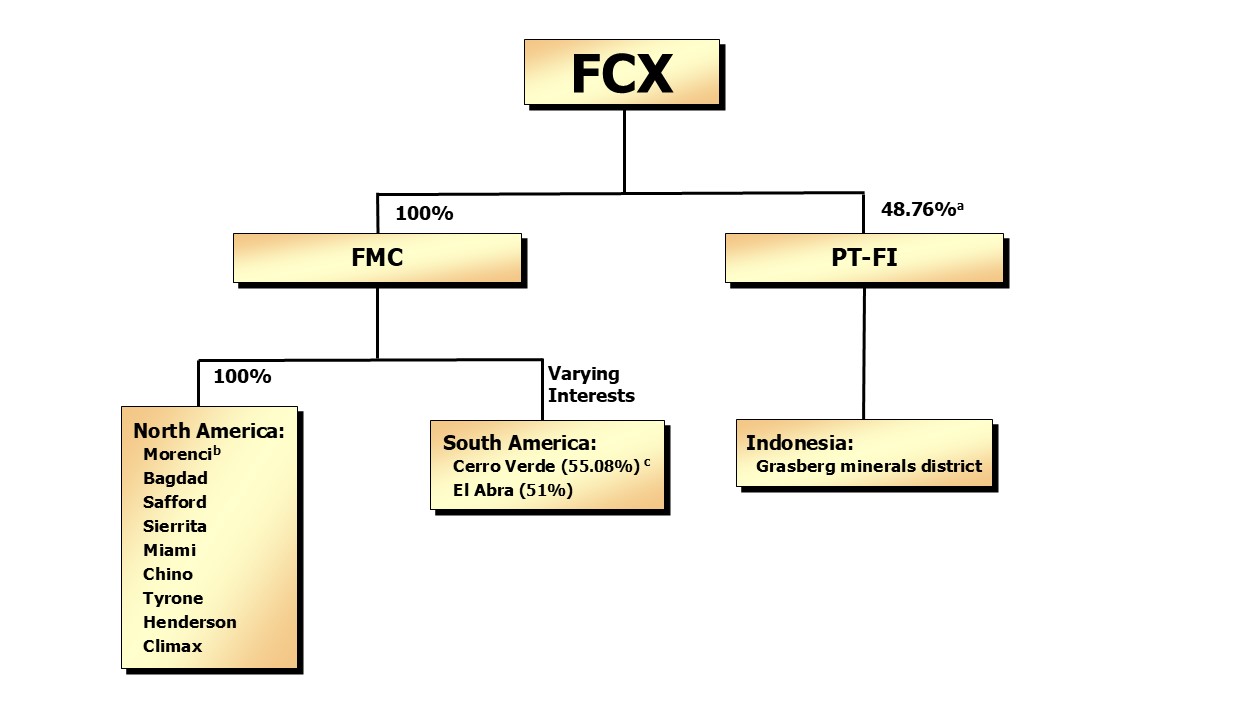
Following are our ownership interests at December 31, 2024, in operating mines through our consolidated subsidiaries, Freeport Minerals Corporation (FMC) and PT-FI:
a.Refer to Note 2 for discussion of our conclusion to consolidate PT-FI.
b.FMC has a 72% undivided interest in Morenci via an unincorporated joint venture. Refer to Note 2 for further discussion.
c.FMC’s interest in Cerro Verde is 55.08%, and prior to September 2024 was 53.56%.
Following is the allocation of our estimated consolidated recoverable proven and probable mineral reserves at December 31, 2024, by geographic location (refer to “Operations” and “Mineral Reserves” for further discussion):
| | | | | | | | | | | | | | | | | | | | |
| Copper | | Gold | | Molybdenum | |
| North America | 43 | % | | 3 | % | | 79 | % | a |
| South America | 29 | | | — | | | 21 | | |
| Indonesia | 28 | | | 97 | | | — | | |
| 100 | % | | 100 | % | | 100 | % | |
a.Our North America copper mines contain 61% of our estimated consolidated recoverable proven and probable molybdenum reserves, and our Henderson and Climax molybdenum mines contain 18%.
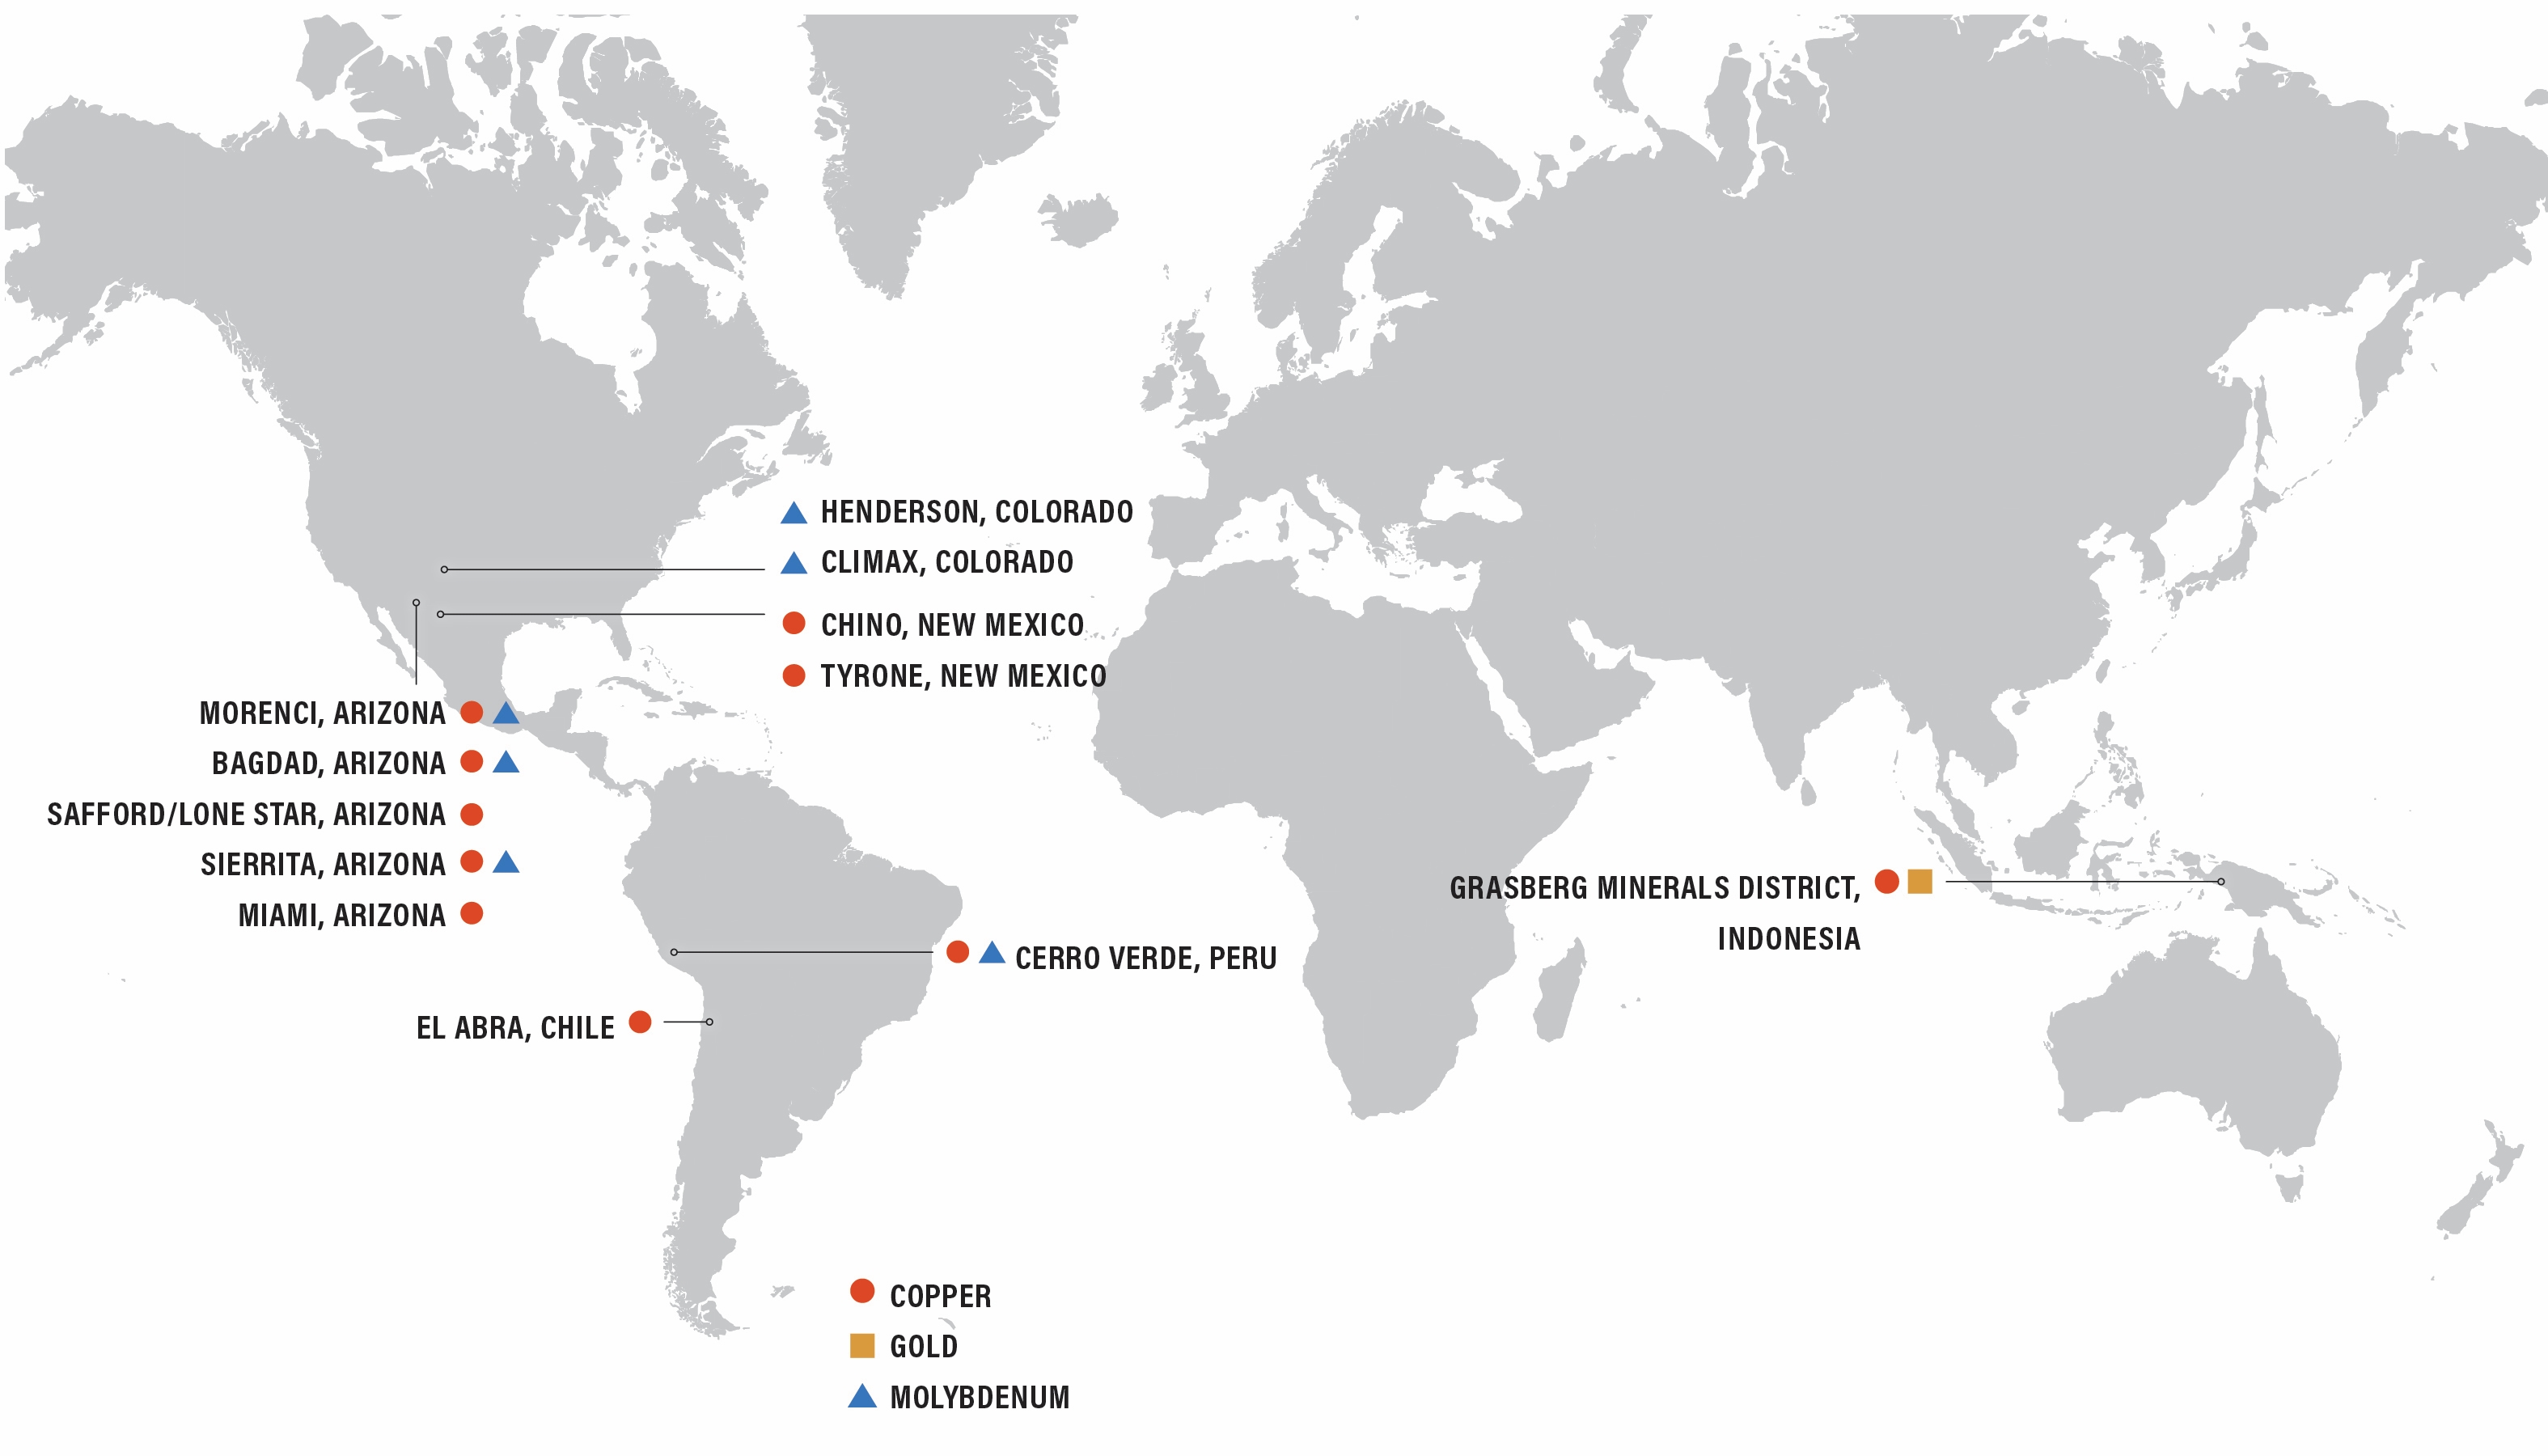
In North America, we manage seven copper operations – Morenci, Bagdad, Safford (including Lone Star), Sierrita and Miami in Arizona, and Chino and Tyrone in New Mexico, and two molybdenum mines – Henderson and Climax in Colorado. We also operate a copper smelter in Miami, Arizona. In addition to copper, certain of our North America copper mines also produce molybdenum concentrate, gold and silver.
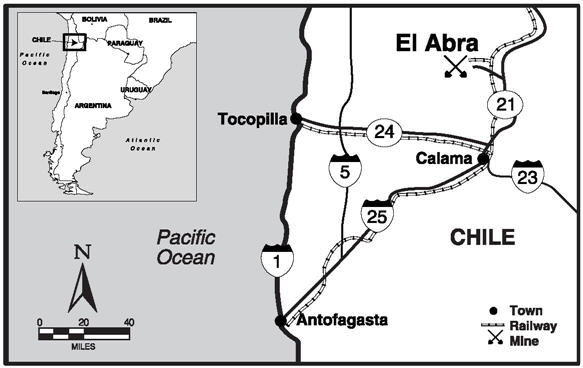
In South America, we manage two copper operations – Cerro Verde in Peru and El Abra in Chile. In addition to copper, the Cerro Verde mine also produces molybdenum concentrate and silver.
In Indonesia, PT-FI operates in the Grasberg minerals district. In addition to copper, the Grasberg minerals district also produces gold and silver. Upon completion and full ramp-up of PT-FI’s new downstream processing facilities, PT-FI will be a fully integrated producer of refined copper and gold.
Following is the allocation of our consolidated copper, gold and molybdenum production for the year 2024 by geographic location (refer to “Operations” and MD&A for further information):
| | | | | | | | | | | | | | | | | | | | |
| Copper | | Gold | | Molybdenum | |
| North America | 29 | % | | 1 | % | | 75 | % | a |
| South America | 28 | | | — | | | 25 | | |
| Indonesia | 43 | | | 99 | | | — | | |
| 100 | % | | 100 | % | | 100 | % | |
a.Our North America copper mines produced 38% of our consolidated molybdenum production, and our Henderson and Climax molybdenum mines produced 37%.
Copper production from three of our mines (the Morenci mine in North America, the Cerro Verde mine in Peru and the Grasberg minerals district in Indonesia) together totaled 77% of our consolidated copper production in 2024.
The geographic locations of our operating mines are shown on the world map below.
COPPER, GOLD AND MOLYBDENUM
The following provides a summary of our primary natural resources – copper, gold and molybdenum. Refer to MD&A for further discussion of historical and current market prices of these commodities and Item 1A. “Risk Factors” for discussion of factors that can cause price fluctuations.
Copper
Copper is an internationally traded commodity, and its prices are determined by the major metals exchanges – the LME, Commodity Exchange Inc. (COMEX) and Shanghai Futures Exchange. Prices on these exchanges generally reflect the worldwide balance of copper supply and demand, and can be volatile and cyclical.
In general, demand for copper reflects the rate of underlying world economic growth, particularly in industrial production and construction. According to a 2024 report from Wood Mackenzie, a widely followed independent metals market consultant, copper’s end-use markets (and their estimated shares of total consumption) are electrical applications (29%), construction (25%), consumer products (21%), transportation (14%) and industrial machinery (11%). We believe copper will continue to be essential in these basic uses as well as contribute significantly to new technologies for clean energy and advancement in communications, including the global transition to renewable
power, electric vehicles and other carbon-reduction initiatives, continued urbanization in developing countries, data centers and artificial intelligence developments and growing connectivity globally. Examples of areas we believe will require additional copper in the future include: (i) high efficiency motors, which consume up to 75% more copper than a standard motor; (ii) electric vehicles, which consume up to four times the amount of copper in terms of weight compared to vehicles of similar size with an internal combustion engine, and require copper-intensive charging station infrastructure to refuel; and (iii) renewable energy such as wind and solar, which consume four to five times the amount of copper compared to traditional fossil fuel generated power.
Gold
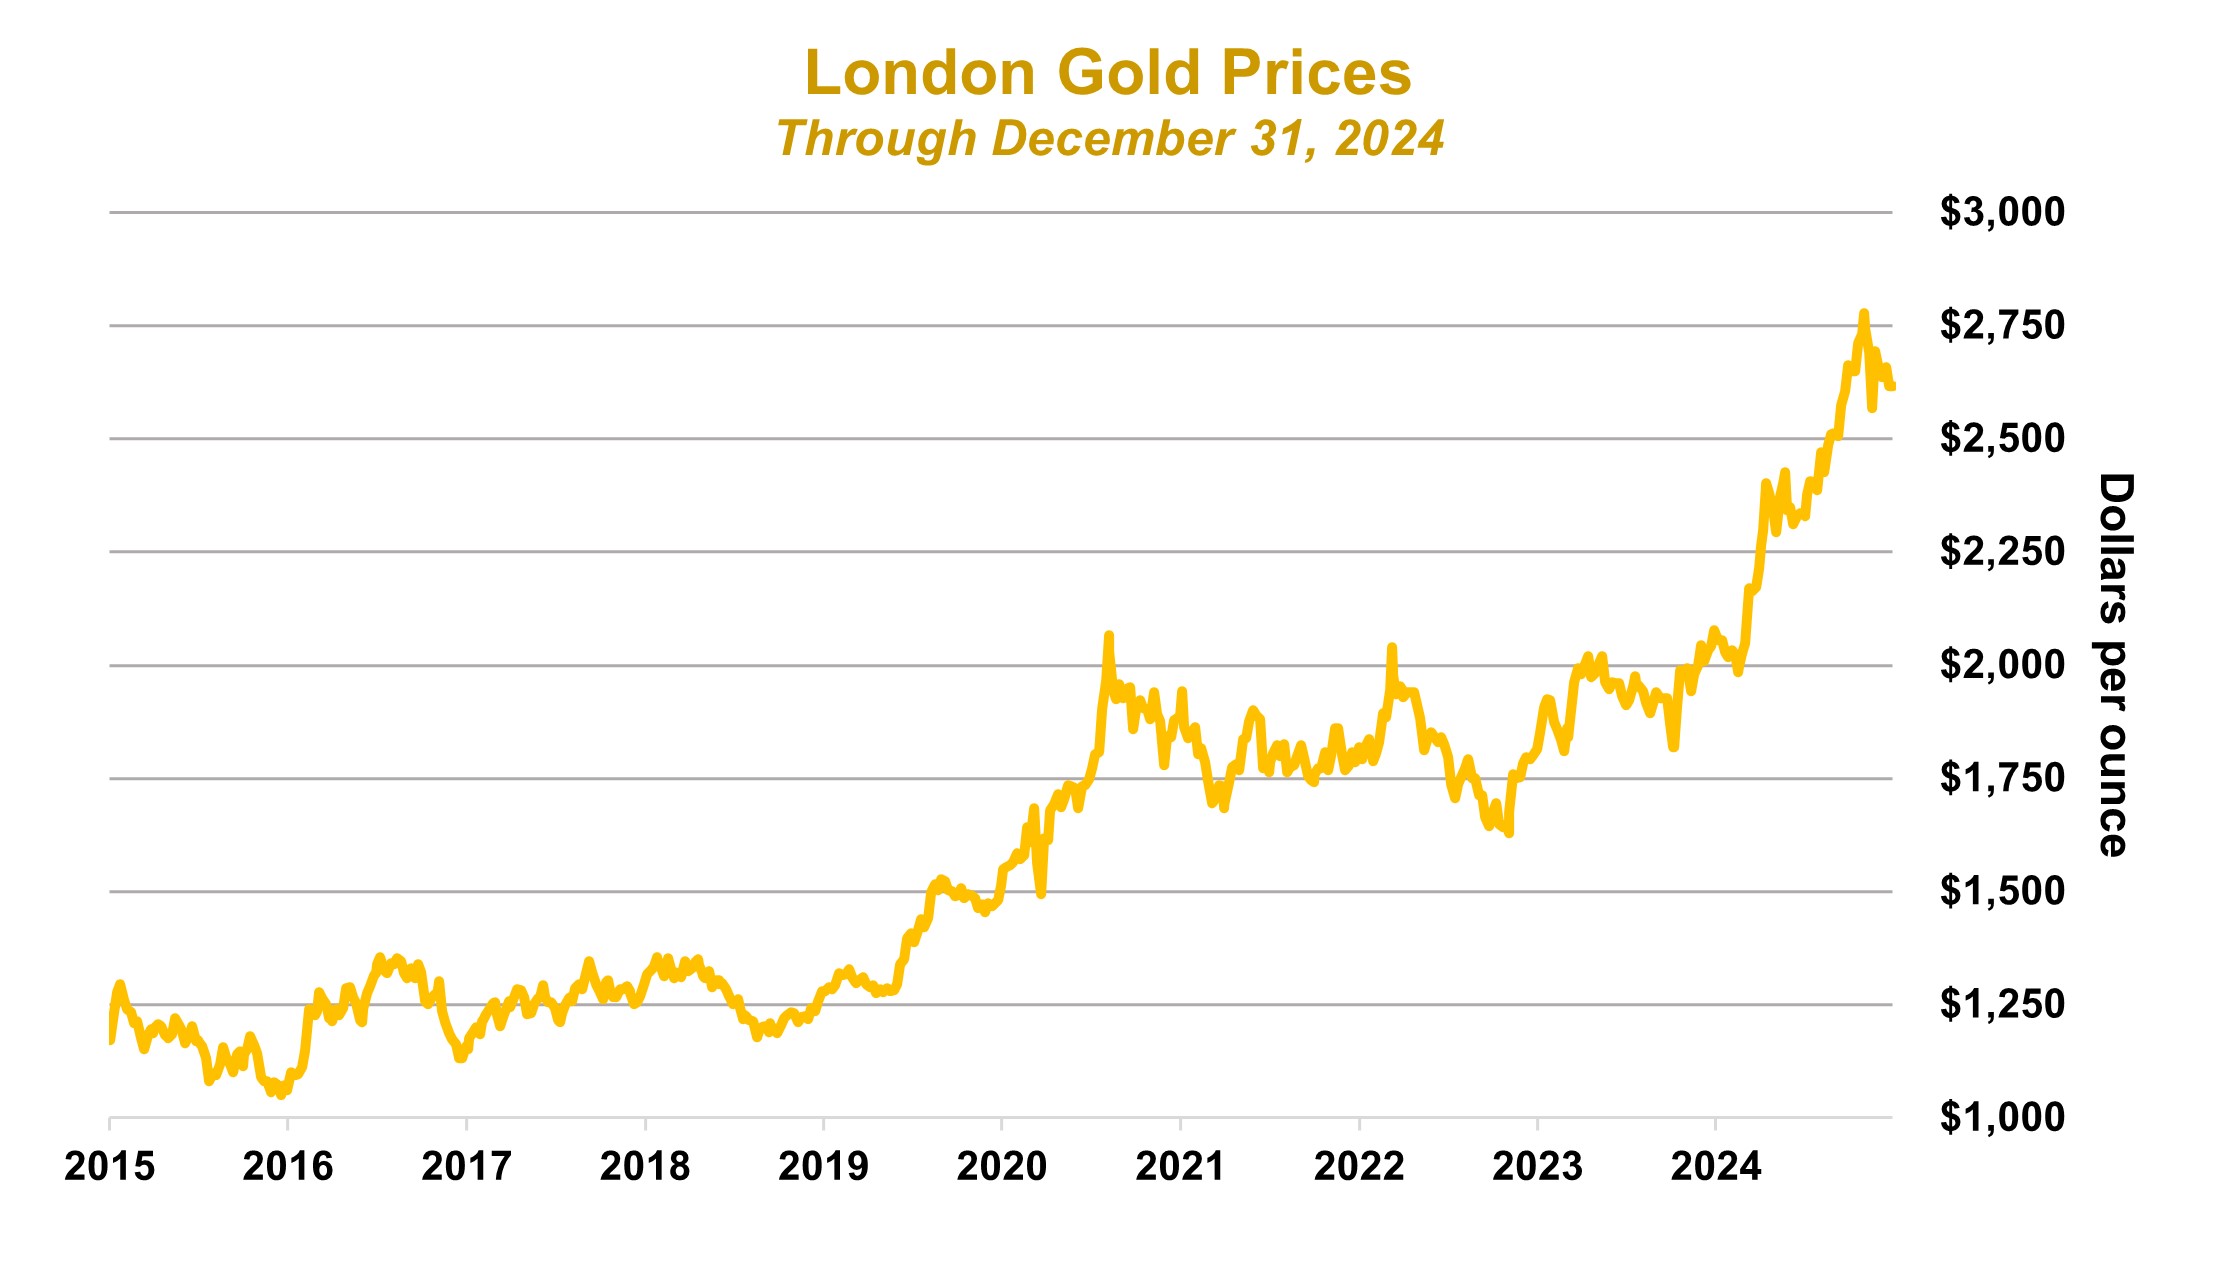
Gold is used for jewelry, coinage and bullion as well as various industrial and electronic applications. Gold can be readily sold on numerous markets throughout the world. Benchmark prices are generally based on London Bullion Market Association (London) quotations.
Molybdenum
Molybdenum is a key alloying element in steel and the raw material for several chemical-grade products used in catalysts, lubrication, smoke suppression, corrosion inhibition and pigmentation. Molybdenum-based chemicals are used to produce high-purity molybdenum metal used in electronics such as flat-panel displays and in super alloys used in aerospace. Like copper, demand for molybdenum is positively impacted by new technologies for clean energy. Reference prices for molybdenum are available in several publications, but generally based on Platts Metals Daily.
PRODUCTS AND SALES
Our consolidated revenues for 2024 primarily included sales of copper (74%), gold (17%) and molybdenum (7%). For the three years ended December 31, 2024, the only customers that accounted for 10% or more of our consolidated revenues were Mitsubishi Materials Corporation (MMC), PT-FI’s joint venture partner in PT Smelting (PT-FI’s 66%-owned copper smelter and refinery), in 2024 and PT Smelting in 2022. Beginning January 1, 2023, PT-FI’s commercial arrangement with PT Smelting changed to a tolling arrangement so there were no further sales from PT-FI to PT Smelting (refer to Note 2 for further discussion) during 2023 and 2024. Refer to Note 14 for a summary of our consolidated revenues by product and geographic area, and revenues and operating income (loss) by business segment.
Copper Products
We are one of the world’s leading producers of copper concentrate, cathode and continuous cast copper rod. During 2024, 45% of our mined copper was sold in concentrate, 34% as cathode and 21% as rod. The copper ore from our mines is generally processed either by smelting and refining or by solution extraction and electrowinning (SX/EW) as described below.
Copper Concentrate. We produce copper concentrate at six of our mines in which mined ore is crushed and treated to produce a copper concentrate with copper content of approximately 20% to 30%. In North America, copper concentrate is produced at the Morenci, Bagdad, Sierrita and Chino mines, and a significant portion is shipped to our Miami smelter in Arizona for further processing. Copper concentrate is also produced at the Cerro Verde mine in Peru and the Grasberg minerals district in Indonesia. Historically, copper concentrate produced in the Grasberg minerals district has been shipped to PT Smelting in Indonesia, Atlantic Copper in Spain and third-party smelters outside of Indonesia. Once PT-FI’s new smelter is fully operational, all of Grasberg’s copper concentrate is expected to be processed within Indonesia.
Copper Cathode. We produce copper cathode at our electrolytic refinery located in El Paso, Texas, and at nine of our mines.
SX/EW cathode is produced from the Morenci, Bagdad, Safford, Sierrita, Miami, Chino and Tyrone mines in North America, and from the Cerro Verde and El Abra mines in South America. For ore subject to the SX/EW process, the ore is placed on stockpiles and copper is extracted from the ore by dissolving it with a weak sulfuric acid solution. The copper content of the solution is increased in two additional SX stages, and then the copper-bearing solution undergoes an EW process to produce cathode that is, on average, 99.99% copper. Our copper cathode is used as the raw material input for copper rod, brass mill products and for other uses.
Copper cathode is also produced at Atlantic Copper (our wholly owned copper smelting and refining unit in Spain) and PT Smelting. Copper concentrate is smelted (i.e., subjected to extreme heat) to produce copper anode, which
weighs between 700 and 900 pounds and has an average copper content of 99.5%. We operate a copper smelter in Miami, Arizona that produces copper anode. The anode is further treated by electrolytic refining to produce copper cathode, which weighs between 100 and 350 pounds and has an average copper content of 99.99%. Refer to “Smelting Facilities and Other Mining Properties” for further discussion of PT-FI’s new downstream processing facilities, Atlantic Copper, PT Smelting and the Miami smelter.
Continuous Cast Copper Rod. We manufacture continuous cast copper rod at our facilities in El Paso, Texas and Miami, Arizona, primarily using copper cathode produced at our North America copper mines.
Copper Sales
North America. The majority of the copper produced at our North America copper mines and refined in our El Paso, Texas refinery is consumed at our rod plants to produce copper rod, which is then sold to wire and cable manufacturers. The remainder of our North America copper production is sold in the form of copper cathode or copper concentrate under U.S. dollar-denominated annual contracts. Generally, copper cathode is sold to rod, brass or tube fabricators. Cathode and rod contract prices are generally based on the prevailing COMEX monthly average settlement price for the month of shipment and include a premium.
South America. Production from our South America operations is sold as copper concentrate or copper cathode under U.S. dollar-denominated, annual and multi-year contracts. During 2024, our South America operations sold 74% of their copper production in concentrate and 26% as cathode.
Substantially all of our South America copper concentrate and cathode sales contracts provide final copper pricing in a specified future month (generally one to four months from the shipment date) primarily based on quoted LME monthly average settlement copper prices. Revenues from our South America concentrate sales are recorded net of royalties and treatment charges (i.e., fees paid to smelters that are generally negotiated annually). In addition, because a portion of the metals contained in copper concentrate is unrecoverable from the smelting process, revenues from our South America concentrate sales are also recorded net of allowances for unrecoverable metals, which are a negotiated term of the contracts and vary by customer.
Indonesia. PT-FI has historically sold its production in the form of copper concentrate, which contains significant quantities of gold and silver, primarily under U.S. dollar-denominated, long-term contracts. PT-FI sells a small amount of copper concentrate in the spot market. Following the full ramp-up of PT-FI’s new downstream processing facilities, PT-FI’s mining and smelting operations will be fully integrated and copper sales will be in the form of copper cathodes.
Beginning in 2023, PT-FI’s commercial arrangement with PT Smelting changed to a tolling arrangement so there were no further sales from PT-FI to PT Smelting during 2023 and 2024. Under this arrangement, PT-FI pays PT Smelting a tolling fee to smelt and refine its concentrate and PT-FI retains title to all products for sale to third parties. PT-FI’s sale of copper cathodes under the tolling arrangement are priced in the month of shipment and are not subject to provisional pricing.
During 2024, PT-FI sold 56% of its copper production in concentrate and 44% as cathode.
Substantially all of PT-FI’s copper concentrate sales contracts provide final pricing in a specified future month (generally one to four months from the shipment date) primarily based on quoted LME monthly average settlement copper prices. Revenues from PT-FI’s concentrate sales are recorded net of royalties, export duties, treatment charges and allowances for unrecoverable metals. Revenues from PT-FI’s cathode sales are recorded net of royalties.
Refer to Item 1A. “Risk Factors,” “Operations – Indonesia” in MD&A and Notes 10 and 11 for a discussion of Indonesia regulatory matters, including those related to export licenses, export duties and export proceeds.
Gold Products and Sales
We produce gold almost exclusively from our mines in the Grasberg minerals district. The gold we produce is primarily sold as a component of our copper concentrate or in anode slimes, which are a product of the smelting and refining process. Gold generally is priced at the average London price for a specified month near the month of shipment. Revenues from gold sold as a component of our copper concentrate are recorded net of treatment charges, royalties, export duties and allowances for unrecoverable metals. Revenues from gold sold in anode slimes are recorded net of royalties and refining charges. As part of start-up activities, PT-FI commenced gold production from its new PMR in December 2024. We began selling gold bars produced by the PMR in February 2025 and the related revenues are recorded net of royalties.
Molybdenum Products and Sales
According to Wood Mackenzie, we are the world’s largest producer of molybdenum and molybdenum-based chemicals. In addition to production from the Henderson and Climax molybdenum mines, we produce molybdenum concentrate at certain of our North America copper mines and our Cerro Verde copper mine in Peru. The majority of our molybdenum concentrate is processed in our own conversion facilities. Our molybdenum sales are primarily priced based on the average published Platts Metals Daily prices for the month prior to the month of shipment.
GOVERNMENTAL REGULATIONS
Our operations are subject to a broad range of laws and regulations imposed by governments and regulatory bodies, both in the U.S. and internationally. These laws and regulations touch all aspects of our operations, the most significant of which include how we extract, process and explore for minerals and how we conduct our business, including laws and regulations governing matters such as mining rights, environmental and reclamation matters, climate change, occupational health and safety, and human rights. Compliance with these laws and regulations requires expenditures for the implementation, operation and maintenance of systems and programs, but has not had and is not expected to have a material adverse effect on our expenditures, results of operations or competitive position. We continuously monitor and strive to maintain compliance with changes in laws and regulations that impact our business.
Mining Rights
We conduct our mining and exploration activities pursuant to concessions granted by, or under contracts with, the host government in the countries where we operate. These countries include, among others, the U.S., Peru, Chile and Indonesia. Mining rights include our license to operate and involve our payment of applicable taxes and royalties to the host governments. The concessions and contracts are subject to the political risks associated with the host countries. For information about mining rights, governmental agreements, licenses to operate, and tax regulations and related matters refer to “Operations” below, Item 1A. “Risk Factors” and Notes 2, 9, 10 and 11.
Environmental Matters
Our operations are subject to extensive and complex environmental laws and regulations governing the generation, storage, treatment, transportation and disposal of hazardous substances; solid waste disposal; air emissions; wastewater discharges; remediation, restoration and reclamation of environmental contamination, including mine closures and reclamation; protection of endangered and threatened species and designation of critical habitats; and other related matters. In addition, we must obtain regulatory permits and approvals to start, continue and expand operations. As a mining company, compliance with environmental, health and safety laws and regulations is an integral and costly part of our business. We conduct our operations in a manner that aims to protect public health and the environment. We believe our operations follow applicable laws and regulations in all material respects, and we have internal company policies that in some instances go beyond compliance with such laws and regulations.
At December 31, 2024, we had $2.0 billion recorded in our consolidated balance sheet for environmental obligations and $3.7 billion recorded for asset retirement obligations. We incurred environmental capital expenditures and other environmental costs (including our joint venture partners’ shares) to comply with applicable environmental laws and regulations that affect our operations totaling $0.6 billion in 2024, $0.5 billion in 2023 and $0.4 billion in 2022, and we expect to incur approximately $0.6 billion in 2025. The timing and amounts of estimated payments could change as a result of changes in regulatory requirements, changes in scope and costs of reclamation activities, the settlement of environmental matters and the rate at which actual spending occurs on continuing matters.
For information about environmental laws and regulations at our global operations, including legal proceedings and related costs, and reclamation matters, see below as well as Item 1A. “Risk Factors,” Item 3 “Legal Proceedings” and Notes 1, 10 and 11.
United States. There are a number of federal and state environmental laws and regulations that apply to our properties and may affect our operations. Laws such as the Comprehensive Environmental Response, Compensation and Liability Act of 1980, as amended (CERCLA) and similar state laws may expose us to joint and several liability for environmental damages caused by our operations, or by previous owners or operators of properties we acquired or are currently operating or at sites where we previously sent materials for processing, recycling or disposal. Other federal and comparable state environmental laws have affected, or could in the future affect, us including, but not limited to, the Resource Conservation and Recovery Act, the Clean Air Act and the National Environmental Policy Act. We have substantial obligations for environmental remediation on mining properties previously owned or operated by FMC and certain of its affiliates.
Our operations are subject to state regulations governing mine closures and reclamation. Closure plans are required to be updated every six years in Arizona and every five years in New Mexico and Colorado. We are also required by U.S. federal and state laws and regulations to provide financial assurance sufficient to allow a third party to implement approved closure and reclamation plans for our mining properties if we are unable to do so. Most of our financial assurance obligations are imposed by state laws that vary significantly by jurisdiction, depending on how each state regulates land use and groundwater quality. The U.S. Environmental Protection Agency (EPA) and state agencies may also require financial assurance for investigation and remediation actions that are required under settlements of enforcement actions under CERCLA or similar state laws.
Regulations have been, and may in the future be, considered at various governmental levels to increase financial responsibility requirements both for mine closure and reclamation. Further, there has been consideration of reforms to federal mining laws, including enhancement of laws, regulations and policies governing financial assurance, which if ever enacted, may be applicable to us.
Our U.S. mining operations are also subject to regulations under the Endangered Species Act (ESA) that are intended to protect species listed by the Department of the Interior’s Fish & Wildlife Service (FWS) as endangered or threatened, along with critical habitat designated by FWS for these listed species. The ESA may affect the ability of landowners, including us, to obtain federal permits or authorizations needed for expansion of our operations, and may also affect our ability to obtain, retain or deliver water to some operations.
New or revised environmental regulatory requirements are frequently proposed, many of which result in substantially increased costs for our business, including those regarding financial assurance discussed above and in Item 1A. “Risk Factors.” For example, in May 2024, EPA amended its rule establishing standards for hazardous air pollutant emissions from primary copper smelters. This final rule will impact our Miami, Arizona smelter operations, which process a significant portion of the copper concentrate produced by our North America copper mines. We are evaluating processes and equipment modifications and the costs involved, which could be significant in connection with the revised rule requirements. Our appeal of EPA’s final rule to the Court of Appeals for the District of Columbia Circuit is suspended pending resolution of several petitions for reconsideration to the EPA filed by us and other parties.
EPA and state agencies continue to consider regulations for man-made organic compounds that could be present in soil, groundwater and surface water at our existing and former operations. These regulations may include drinking water standards, hazardous waste requirements, and hazardous substance designations for Perfluorooctanesulfonic and Perfluorooctanoic acids. In January 2024, EPA announced through guidance that, effective immediately, it lowered the recommended screening levels for investigation and cleanup of lead in residential soils, and in January 2025, EPA published its final toxicological assessment for inorganic arsenic, which may be used to calculate cleanup levels at state and federal remediation sites and may lead to regulatory guidance, rulemaking and other regulatory activities. We are working with state agencies to understand possible ramifications of this guidance to our projects. This EPA guidance and future changes to EPA’s lead and arsenic cleanup levels could result in increases to our environmental reserves for ongoing residential property cleanup projects near former smelter sites.
In 2023, EPA and the U.S. Army Corps of Engineers issued a final rule to amend the final revised definition of the “waters of the United States.” Although future court decisions may further affect the scope of the final rule and legal challenges have already been successful, we may need federal authorization under the Clean Water Act to expand some of our operations.
Peru. The General Environmental Law (Law No. 28611) establishes the main environmental guidelines and principles applicable in Peru. Pursuant to the General Environmental Law, Ministry of Energy and Mines (MINEM) issued national environmental regulations, which have gradually replaced prior guidelines governing governmental agencies’ environmental competencies. The Environmental Evaluation and Oversight Agency has the authority to inspect mining operations and fine companies that fail to comply with prescribed environmental regulations and their approved environmental assessments.
Cerro Verde is subject to regulation under the Mine Closure Law administered by MINEM. Under the closure regulations, mines must submit a closure plan that includes the reclamation methods, closure cost estimates, methods of control and verification, closure and post-closure plans, and financial assurance. In compliance with the requirement for five-year updates, Cerro Verde submitted its updated closure plan and cost estimates and received approval from MINEM in December 2023.
The Cerro Verde mine has developed and continues to implement detailed, comprehensive mine waste and tailings management programs to meet the applicable Peru waste regulations and our environmental management practices. These programs incorporate commitments included in the Environmental and Social Impact Studies and the engineer of record designs for the specific cases of tailings storage facilities and certain leach pad stockpiles. For any future projects, including for existing facilities, Cerro Verde also may be required by MINEM or the National Environmental Certification Service for Sustainable Investments to incur additional costs to comply with the requirements of new regulations that provide for the adequacy of the transportation and final disposal of tailings.
Chile. El Abra is subject to regulation under the Mine Closure Law administered by the Chile Mining and Geology Agency. In compliance with the requirement for five-year updates, El Abra is working to submit an updated plan with closure cost estimates in the second half of 2025.
Indonesia. PT-FI holds multiple permits from national, provincial, and regency regulatory agencies, including groundwater use permits, effluent and air discharge permits, solid and hazardous waste storage and management permits and protection of forest borrow-to-use permits. Where permits have specific terms, renewal applications are made to the relevant regulatory authority as required, prior to the end of the permit term.
In December 2018, Indonesia’s Ministry of Environment and Forestry (MOEF) issued a revised environmental permit to PT-FI to address certain operational activities that it alleged were inconsistent with earlier studies. PT-FI and the MOEF also established a new framework known as the Tailings Management Roadmap for continuous improvement in environmental practices at PT-FI’s operations, including initiatives to potentially increase tailings retention and to evaluate large scale beneficial uses of tailings within Indonesia. The third-party expert nominated by MOEF to perform the framework evaluation submitted its report to the MOEF in June 2021. In 2024, PT-FI continued to work with MOEF on the Tailings Management Roadmap objectives, including further reduction of non-tailings sediment entering the tailings management area, construction of bamboo and geotube structures in the estuary portion of the tailings management area to increase sedimentation and reduce erosion, as well as continue pursuing additional beneficial uses of tailings in infrastructure and other projects. In October 2024, MOEF approved the next phase of the Tailings Management Roadmap, which extends from 2025 to 2030 and continues activities from the initial period with additional programs and studies for continuous improvement in tailings management.
In 2020, PT-FI initiated a new environmental impact analysis (called an Analisis Mengenai Dampak Lingkungan or AMDAL) in preparation for the proposed activities associated with the transition from Grasberg surface mine to underground operations, and PT-FI completed the approval requirements of the AMDAL covering all support activities for the underground transition in 2023. In December 2023, PT-FI received technical approval for its tailings management activities. In 2024, the MOEF approved an addendum to the AMDAL that covers activities associated with the conversion of PT-FI’s power plant from coal-fired to liquefied natural gas (LNG). Permitting related to the conversion to LNG continues to progress.
A detailed mine closure plan and five-year reclamation plan have been approved by Indonesia regulators as required by Indonesia law. The mine closure plan is reviewed annually and required reclamation bonds are in place. In 2019, PT-FI completed and received approval on an updated mine closure plan to reflect Grasberg minerals district production operations until 2041 and PT-FI will be required to fund the next mine closure guarantee in 2025. PT-FI’s most recent five-year reclamation plan covering 2022 through 2026 was approved in early 2022. In the future, additional approval will be required for the diversion of the Aghawagon/Otomona River out of the tailings management area at the end of the mine life.
Climate
In many of the jurisdictions in which we or our customers operate, governmental bodies are increasingly enacting legislation and regulations in response to the potential impacts of climate change, including:
•As a result of the 2015 Paris Agreement, a number of governments, including Peru, Indonesia and Chile, have pledged “Nationally Determined Contributions” to control and reduce greenhouse gas emissions (GHG).
•Several states in the U.S., including Colorado and New Mexico, have advanced goals reducing or eliminating fossil fuel-based energy production and use.
•Carbon tax legislation also has been adopted in jurisdictions where we operate, including Indonesia, Chile and the European Union (EU). Starting in 2025, PT-FI's coal-fired power plant will be subject to a carbon emissions trade system based on reported emissions submitted to the regulators in early 2026. Refer to “Operations – Indonesia” below for discussion of PT-FI’s plans to transition its existing energy source from coal to natural gas.
Regulations that affect us also may include mandated corporate climate-related reporting, including:
•The SEC’s new climate-related disclosure rules, which are being challenged in federal courts.
•The EU’s Corporate Sustainability Reporting Directive, which requires in scope entities to provide detailed reporting on climate change and other sustainability topics.
•The EU’s Corporate Sustainability Due Diligence Directive which will require in scope entities to identify, assess and address various social and environmental topics.
•California’s Climate Corporate Data Accountability Act and Climate-Related Financial Risk Act, which are being challenged in federal courts, and Voluntary Carbon Market Disclosures Act, which were enacted in 2023. Legislation similar to California’s is also under consideration in other states.
While it is not yet possible to reasonably estimate the nature, extent, timing and cost or other impacts of any future carbon pricing mechanisms, mandatory disclosures, other climate change regulatory programs or future legislative action that may be enacted, we anticipate that we will dedicate more resources and incur more costs to comply and remediate in response to legislative or regulatory changes.
For information about the risks posed by the potential impacts of climate change and related regulations, refer to Item 1A. “Risk Factors.”
Health and Safety
Our highest priority is the health, safety and well-being of our employees and contractors. We also work to promote our safety-first values with our suppliers and in the communities where we operate. We believe health and safety considerations are integral to, and fundamental for, all other functions in our organization, and we understand the health and safety of our workforce is critical to our operational efficiency and long-term success. We are subject to extensive U.S. and international regulation of worker health and safety, including the requirements of the U.S. Occupational Safety and Health Act and similar laws of other jurisdictions. For example, in the U.S., the operation of our mines is subject to regulation by the U.S. Mine Safety and Health Administration (MSHA) under the Federal Mine Safety and Health Act of 1977 (Mine Act). MSHA inspects our mines on a regular basis and issues citations and orders when it believes a violation has occurred under the Mine Act. In 2024, MSHA enacted the Safety Program for Surface Mobile Equipment regulation and finalized a new regulation, which reduces permissible exposure limits of respirable crystalline silica effective April 2026. Our compliance with these or any other new health and safety regulations could increase our mining costs. If we were found to be in violation of these regulations we could face penalties or restrictions that may materially and adversely affect our operations.
Additionally, in the U.S., various state agencies have concurrent jurisdiction arising under state law that regulate worker health and safety in both our industrial facilities and mines. If regulatory inspections result in an alleged violation, we may be subject to fines and penalties and, in instances of alleged significant violations, our mining operations or industrial facilities could be subject to temporary or extended closures. Refer to Exhibit 95.1 to this Form 10-K for additional information regarding certain orders and citations issued by MSHA for our operations during the year ended December 31, 2024. For information about health and safety, refer to “Human Capital” below and Item 4. “Mine Safety Disclosures.”
Human Rights
We are dedicated to the recognition, respect and promotion of human rights wherever we do business. We are committed to respecting the rights of all people, including our employees, business partners, community members and others who potentially may be impacted by our business activities. We take this obligation seriously in all aspects of our business, and we expect the same of our business partners.
For information about human rights, refer to “Community and Human Rights” below.
COMPETITION
The top 10 producers of copper comprise approximately 40% of total worldwide mined copper production. Based on Wood Mackenzie’s December 2024 estimates, we ranked third among those producers for the year 2024, with approximately 6% of estimated total worldwide mined copper production based on net equity ownership. We believe our competitive position is based on the size, quality and grade of our ore bodies and our ability to manage costs compared with other producers. We have a diverse portfolio of mining operations with varying ore grades and cost structures. Our costs are driven by the location, grade and nature of our ore bodies, and the level of input costs, including energy, labor and equipment. The metals markets are cyclical, and we believe our ability to maintain our competitive position over the long term is based on our ability to acquire and develop quality deposits (including the expansion of deposits at our existing mine sites); recruit, retain, develop and advance a skilled workforce; and to manage our costs.
OPERATIONS
Responsible Production
We demonstrate our responsible production performance through the Copper Mark, a comprehensive assurance framework developed specifically for the copper industry, and recently extended to other metals including molybdenum. To achieve the Copper Mark, each site is required to complete an independent external assurance process to assess conformance with various environmental, social and governance criteria. Awarded sites must be revalidated every three years. We have achieved, and are committed to maintaining, the Copper Mark and/or Molybdenum Mark, as applicable, at all of our operating sites globally.
We are also a founding member of the International Council on Mining & Metals (ICMM), an organization dedicated to a safe, fair and sustainable mining and metals industry, aiming continuously to strengthen performance across the global mining and metals industry. As a member company, we are required to implement the 10 Mining Principles which define good environmental, social and governance practices, and associated position statements, while also meeting 39 performance expectations.
Tailings Management
We dedicate substantial financial resources and internal and external technical resources to pursue the safe management of our tailings facilities and to reduce or eliminate the number of and potential consequences of credible failure modes. Our tailings management and stewardship program, which involves qualified external engineers of record and periodic oversight by an independent tailings review board and our tailings stewardship team, conform with the tailings governance framework on preventing catastrophic failure of tailings storage facilities adopted by the ICMM. Further, our tailings management policy outlines our continued commitment to managing our tailings responsibly and effectively across our sites globally. As an ICMM member and in accordance with our commitment in our tailings management policy, we also have implemented the Global Industry Standard on Tailings Management (the Tailings Standard) for all tailings storage facilities with “Extreme” or “Very High” potential consequences based on “credible failure modes” and are committed to implementing the Tailings Standard by August 2025 for all other tailing storage facilities that have not been deemed “Safely Closed” (each as defined in the Tailings Standard). We believe we have the financial capacity to meet current estimated lifecycle costs, including estimated closure, post-closure and reclamation obligations associated with our tailings storage facilities. We continue to enhance our existing practices to strengthen the design, operation and closure of tailings storage facilities in an effort to reduce the risk of severe or catastrophic failure of those facilities.
Refer to Item 1A. “Risk Factors” for further discussion of the risks associated with our tailings management.
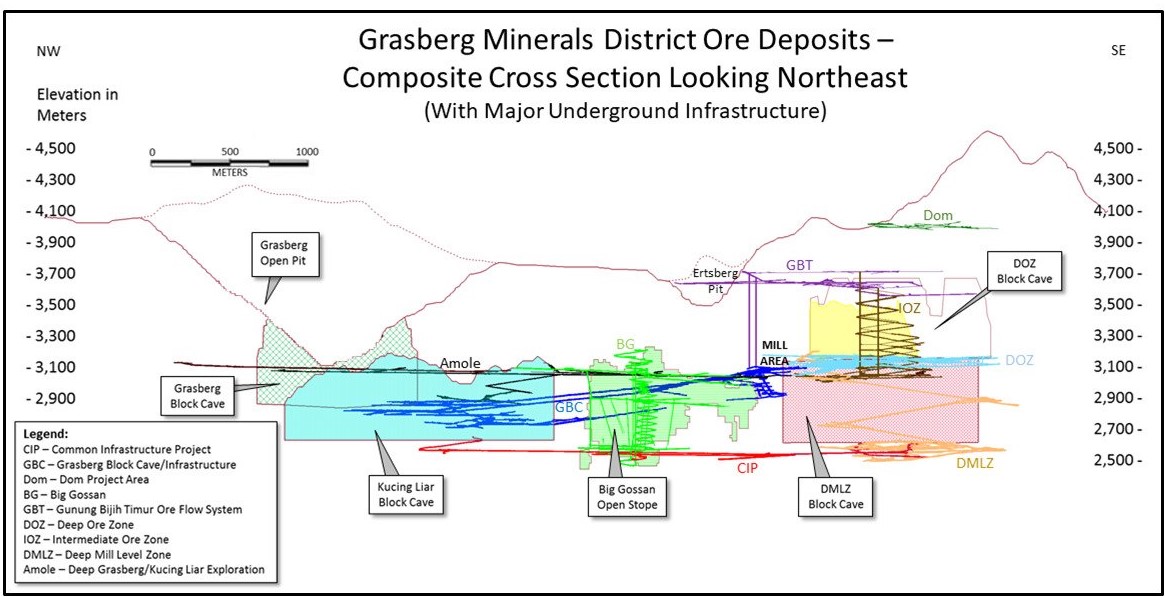
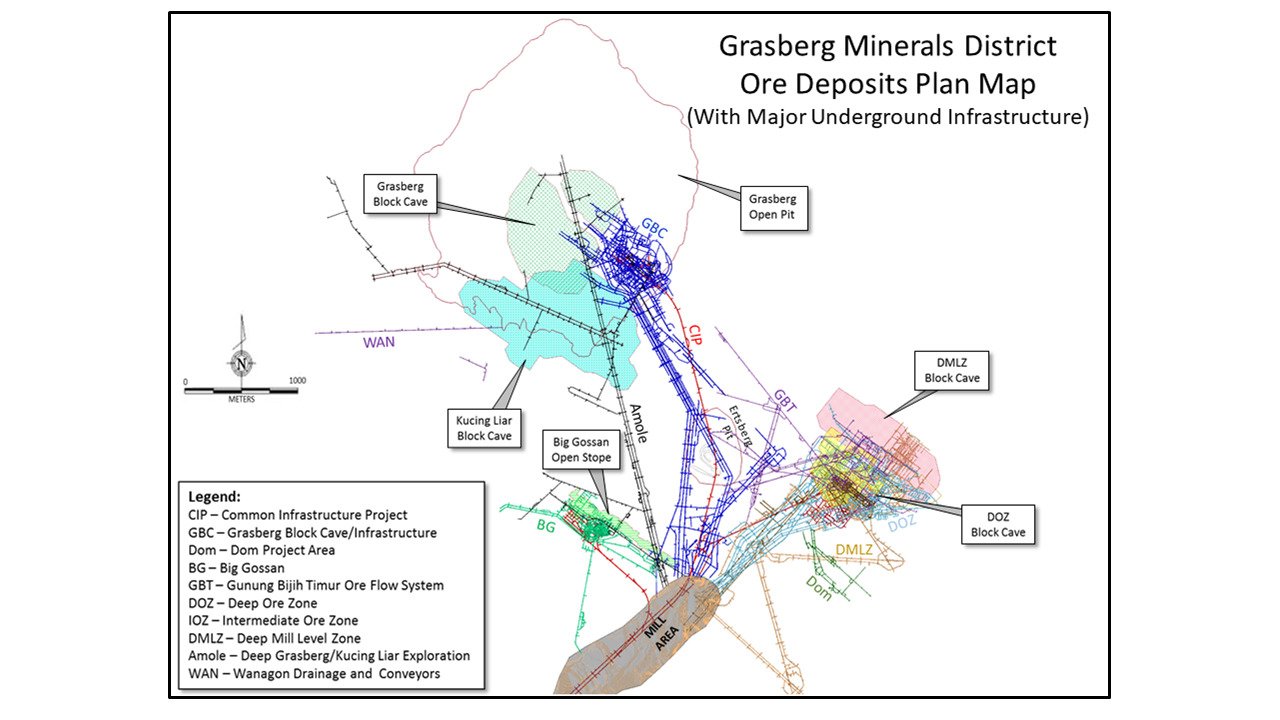
Overview of Mines
Following are maps and descriptions of our copper and molybdenum mining operations in North America, South America and Indonesia. We consider our material mines, as defined under the disclosure requirements of Subpart 1300 of SEC Regulation S-K, to be the Morenci mine in the U.S., the Cerro Verde mine in Peru and the Grasberg minerals district in Indonesia. Refer to Exhibits 96.1, 96.2 and 96.3 for the Technical Report Summaries that have been prepared for our material mines.
North America
In the U.S., most of the land occupied by our copper and molybdenum mines, concentrators, SX/EW facilities, smelter, refinery, rod mills, molybdenum roasters and processing facilities is owned by us or is located on unpatented mining claims owned by us. Certain portions of our Bagdad, Sierrita, Miami, Chino, Tyrone, Henderson and Climax operations are located on government-owned land and are operated under a Mine Plan of Operations or other use permit. We hold various federal and state permits or leases on government land for purposes incidental to mine operations.
Morenci
We own a 72% undivided interest in Morenci, with the remaining 28% owned by Sumitomo Metal Mining Arizona, Inc. (15%) and SMM Morenci, Inc. (13%). Each partner takes in kind its share of Morenci’s production.
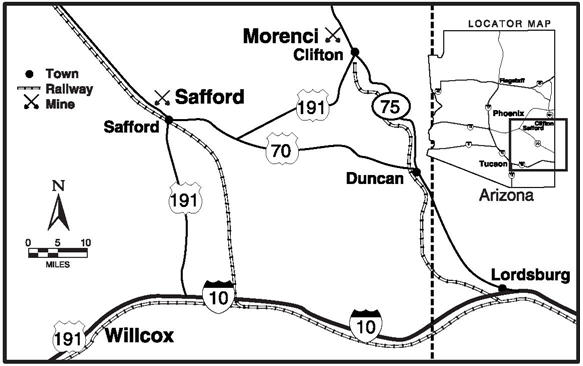
Morenci is an open-pit copper and molybdenum mining complex that has been in continuous operation since 1939 and previously was mined through underground workings. In the 1880s, Phelps Dodge & Company (Phelps Dodge) first invested in the area, and through acquisition, consolidated all mining operations in the area by the 1920s. Phelps Dodge was acquired by FCX in 2007. Morenci is located in Greenlee County, Arizona, approximately 50 miles northeast of Safford on U.S. Highway 191. The property is located at latitude 33.07 degrees north and longitude 109.35 degrees west using the World Geodetic System (WGS) 84 coordinate system. The site is accessible by a paved highway and a railway spur.
The Morenci mine is a porphyry copper deposit that has oxide, secondary sulfide and primary sulfide mineralization. The predominant oxide copper mineral is chrysocolla. Chalcocite is the most important secondary copper sulfide mineral, with chalcopyrite as the dominant primary copper sulfide.
The Morenci operation consists of two concentrators with a milling design capacity of 132,000 metric tons of ore per day, which produce copper and molybdenum concentrate; a 72,500 metric ton-per-day, crushed-ore leach pad and stacking system; a low-grade run-of-mine (ROM) leaching system; four SX plants; and three EW tank houses that produce copper cathode. Total EW tank house capacity is approximately 900 million pounds of copper per year. Morenci’s available mining fleet consists of one hundred and forty-one 235-metric-ton haul trucks loaded by 13 electric shovels with bucket sizes ranging from 47 to 59 cubic meters. Morenci’s mining fleet is capable of moving an average of 785,000 metric tons of material per day. Our share of Morenci’s net property, plant, equipment (PP&E) and mine development costs at December 31, 2024, totaled $2.2 billion.
Morenci’s production, including our joint venture partners’ share, totaled 0.7 billion pounds of copper and 3 million pounds of molybdenum in 2024, 0.8 billion pounds of copper and 3 million pounds of molybdenum in 2023, and 0.9 billion pounds of copper and 4 million pounds of molybdenum in 2022.
Morenci is located in a desert environment with rainfall averaging 13 inches per year. The highest bench elevation is 1,900 meters above sea level and the ultimate pit bottom is expected to have an elevation of 760 meters above sea level. The Morenci operation encompasses approximately 61,700 acres, comprising 51,300 acres of fee lands and 10,400 acres of unpatented mining claims held on public mineral estate and numerous state or federal permits, easements and rights-of-way.
The Morenci operation’s electrical power is supplied by our wholly owned subsidiary, The Morenci Water & Electric Company (MW&E). MW&E sources its generation services through our wholly owned subsidiary, Freeport-McMoRan Copper and Gold Energy Services LLC, through capacity rights at the Luna Energy Facility in Deming, New Mexico, and other power purchase agreements. Although we believe the Morenci operation has sufficient water sources to support current operations, we are a party to litigation that may impact our water right claims or rights to continued use of currently available water supplies, which could adversely affect our water supply for the Morenci operation. Refer to “Governmental Regulations” above, Item 1A. “Risk Factors” and Item 3. “Legal Proceedings” for further discussion.
Bagdad
Our wholly owned Bagdad mine is an open-pit copper and molybdenum mining complex that has been in continuous operation since 1945 and prior mining was conducted through underground workings. Bagdad is located in Yavapai County in west-central Arizona, approximately 60 miles west of Prescott and 100 miles northwest of Phoenix. The property can be reached by U.S. Highway 93 to State Route 97 or Arizona Highway 96, which ends at the town of Bagdad. The closest railroad is at Hillside, Arizona, 24 miles southeast on Arizona Highway 96.
The Bagdad mine is a porphyry copper deposit containing both sulfide and oxide mineralization. Chalcopyrite and molybdenite are the dominant primary sulfides and are the primary economic minerals in the mine. Chalcocite is the most common secondary copper sulfide mineral, and the predominant oxide copper minerals are chrysocolla, malachite and azurite.
The Bagdad operation consists of a concentrator with a milling design capacity of 77,100 metric tons of ore per day that produces copper and molybdenum concentrate, a SX/EW plant that can produce approximately 9 million pounds per year of copper cathode from solution generated by low-grade stockpile leaching, and a pressure-leach plant to process molybdenum concentrate. The available mining fleet consists of thirty-eight 235-metric-ton haul trucks loaded by 6 electric shovels and 2 loaders with bucket sizes ranging from 30 to 48 cubic meters, which are capable of moving an average of 236,000 metric tons of material per day. In 2023, we announced a project to convert Bagdad’s fleet of haul trucks to become fully autonomous. The testing of the autonomous fleet is expected to begin in second-quarter 2025 with anticipated project completion by year-end 2025. Bagdad’s net PP&E and mine development costs at December 31, 2024, totaled $1.0 billion.
Bagdad’s production totaled 146 million pounds of copper and 13 million pounds of molybdenum in 2024, 146 million pounds of copper and 10 million pounds of molybdenum in 2023, and 165 million pounds of copper and 9 million pounds of molybdenum in 2022.
We have a potential expansion project to more than double the concentrator capacity of the Bagdad operation in northwest Arizona. Bagdad’s reserve life currently exceeds 80 years and supports an expanded operation. In late 2023, we completed technical and economic studies, which indicate the opportunity to construct new concentrating facilities to increase copper production by 200 to 250 million pounds per year at estimated incremental project
capital costs of approximately $3.5 billion. Expanded operations would provide improved efficiency and reduce unit net cash costs through economies of scale. Project economics indicate that the expansion would require an incentive copper price in the range of $3.50 to $4.00 per pound and approximately three to four years to complete. The decision of whether to proceed and timing of the potential expansion will take into account overall copper market conditions, availability of labor and other factors, including pending conversion of the existing haul truck fleet to autonomous to support long-range plans. In parallel, we are enhancing local infrastructure and advancing activities for expanded tailings infrastructure projects required under long-range plans in order to advance the potential construction timeline. Refer to Item 1A. “Risk Factors” for further discussion.
Bagdad is located in a desert environment with rainfall averaging 15 inches per year. The highest bench elevation is 1,250 meters above sea level and the ultimate pit bottom is expected to be 120 meters above sea level. The Bagdad operation encompasses approximately 53,300 acres, comprising 40,000 acres of fee lands and 13,300 acres of unpatented mining claims held on public mineral estate and numerous state or federal permits, easements and rights-of-ways.
Bagdad receives electrical power from Arizona Public Service Company. We believe the Bagdad operation has sufficient water sources to support current operations.
Safford, including Lone Star
Our wholly owned Safford mine is an open-pit copper mining complex that has been in operation since 2007. Safford is located in Graham County, Arizona, 8 miles north of the town of Safford and 170 miles east of Phoenix. The site is accessible by a paved county road off U.S. Highway 70.
The Safford mine includes three copper deposits that have oxide mineralization overlaying primary copper sulfide mineralization. The predominant oxide copper minerals are chrysocolla and copper-bearing iron oxides with the predominant copper sulfide material being chalcopyrite. The only Safford deposit currently being mined is Lone Star.
We have commenced pre-feasibility studies in the Lone Star district of Safford to define a potential significant expansion opportunity. Positive drilling conducted in recent years indicates a large, mineralized district with opportunities to pursue a further expansion project. We are expecting to complete these studies in 2026. The decision of whether to proceed and timing of the potential expansion will take into account results of technical and economic studies, overall copper market conditions and other factors.
Safford is a mine-for-leach operation that produces copper cathode. The operation feeds a crushing facility with a design capacity of 103,500 metric tons of ore per day. The crushed ore is delivered to a leach pad by a series of overland and portable conveyors. Leach solutions feed a SX/EW facility with a capacity of 320 million pounds of copper per year. A sulfur burner plant is also in operation at Safford, providing a cost-effective source of sulfuric acid used in SX/EW operations. The available mining fleet consists of fifty-nine 235-metric-ton haul trucks loaded by 7 electric shovels with bucket sizes ranging from 34 to 47 cubic meters, which are capable of moving an average of 408,000 metric tons of material per day. Safford’s net PP&E and mine development costs at December 31, 2024, totaled $1.7 billion.
Safford’s copper production totaled 249 million pounds in 2024, 245 million pounds in 2023 and 285 million pounds in 2022.
Safford is located in a desert environment with rainfall averaging 10 inches per year. The highest bench elevation is 1,783 meters above sea level and the ultimate pit bottom is expected to have an elevation of 716 meters above sea level. The Safford operation encompasses approximately 78,600 acres, comprising 38,000 acres of fee lands and 40,600 acres of unpatented claims held on public mineral estate.
The Safford operation’s electrical power is primarily sourced from Tucson Electric Power Company, Arizona Public Service Company and the Luna Energy facility. Although we believe the Safford operation has sufficient water sources to support current operations, we are a party to litigation that may impact our water right claims or rights to continued use of currently available water supplies, which could adversely affect our water supply for the Safford operation. Refer to “Governmental Regulations” above, Item 1A. “Risk Factors” and Item 3. “Legal Proceedings” for further discussion.
Sierrita
Our wholly owned Sierrita mine is an open-pit copper and molybdenum mining complex that has been in operation since 1959. Sierrita is located in Pima County, Arizona, approximately 20 miles southwest of Tucson and 7 miles west of the town of Green Valley and Interstate Highway 19. The site is accessible by a paved highway and by rail.
The Sierrita mine is a porphyry copper deposit that has oxide, secondary sulfide and primary sulfide mineralization. The predominant oxide copper minerals are malachite, azurite and chrysocolla. Chalcocite is the most important secondary copper sulfide mineral, and chalcopyrite and molybdenite are the dominant primary sulfides.
The Sierrita operation includes a concentrator with a milling design capacity of 100,000 metric tons of ore per day that produces copper and molybdenum concentrate. Sierrita also produces copper from a ROM oxide-leaching system. Cathode copper is plated at the Twin Buttes EW facility, which has a design capacity of approximately 50 million pounds of copper per year. The Sierrita operation also has molybdenum facilities consisting of a leaching circuit, two molybdenum roasters and a packaging facility. The molybdenum facilities process molybdenum concentrate produced by Sierrita, from our other mines and from third-party sources. The available mining fleet consists of twenty-five 235-metric-ton haul trucks loaded by 4 electric shovels with bucket sizes ranging from 34 to 56 cubic meters, which are capable of moving an average of 200,000 metric tons of material per day. Sierrita’s net PP&E and mine development costs at December 31, 2024, totaled $0.9 billion.
Sierrita’s production totaled 165 million pounds of copper and 15 million pounds of molybdenum in 2024, 185 million pounds of copper and 18 million pounds of molybdenum in 2023, and 184 million pounds of copper and 17 million pounds of molybdenum in 2022.
Sierrita is located in a desert environment with rainfall averaging 14 inches per year. The highest bench elevation is 1,387 meters above sea level and the ultimate pit bottom is expected to be 427 meters above sea level. The Sierrita operation, including the adjacent Twin Buttes site, encompasses approximately 47,700 acres, comprising 38,700 acres of fee lands including split estate lands and 9,000 acres of unpatented mining claims held on public mineral estate.
Sierrita receives electrical power through long-term contracts with the Tucson Electric Power Company. Although we believe the Sierrita operation has sufficient water sources to support current operations, we are a party to litigation that may impact our water rights claims or rights to continued use of currently available water supplies, which could
adversely affect our water supply for the Sierrita operation. Refer to “Governmental Regulations” above, Item 1A. “Risk Factors” and Item 3. “Legal Proceedings” for further discussion.
Miami
Our wholly owned Miami mine is an open-pit copper mining complex located in Gila County, Arizona, 90 miles east of Phoenix and 6 miles west of the city of Globe on U.S. Highway 60. The site is accessible by a paved highway and by rail.
The Miami mine is a porphyry copper deposit that has leachable oxide and secondary sulfide mineralization. The predominant oxide copper minerals are chrysocolla, copper-bearing clays, malachite and azurite. Chalcocite and covellite are the most important secondary copper sulfide minerals.
Since about 1915, the Miami mining operation had processed copper ore using both flotation and leaching technologies. The design capacity of the SX/EW plant is 200 million pounds of copper per year. Miami is no longer mining ore, but currently produces copper through leaching material already placed on stockpiles. Miami’s net PP&E and mine development costs at December 31, 2024, totaled $13 million.
Miami’s copper production totaled 9 million pounds in 2024, 12 million pounds in 2023 and 11 million pounds in 2022.
Miami is located in a desert environment with rainfall averaging 18 inches per year. The highest bench elevation is 1,390 meters above sea level and mining advanced the pit bottom to an elevation of 810 meters above sea level. Subsequent sloughing of material into the pit has filled it back to an elevation estimated to be 900 meters above sea level. The Miami operation encompasses approximately 14,800 acres, comprising 10,400 acres of fee lands and 4,400 acres of unpatented mining claims held on public mineral estate.
Miami receives electrical power through long-term contracts with the Salt River Project and natural gas through long-term contracts with El Paso Natural Gas as the transporter. We believe the Miami operation has sufficient water sources to support current operations. Refer to “Governmental Regulations” above and Item 1A. “Risk Factors” for further discussion.
Chino and Tyrone
Chino. Our wholly owned Chino mine is an open-pit copper mining complex that has been in operation since 1910. Chino is located in Grant County, New Mexico, approximately 15 miles east of Silver City, along State Highway 180. The mine is accessible by paved roads and by rail.
The Chino mine is a porphyry copper deposit with adjacent copper skarn deposits. There is leachable oxide, secondary sulfide and millable primary sulfide mineralization. The predominant oxide copper mineral is chrysocolla. Chalcocite is the most important secondary copper sulfide mineral, and chalcopyrite and molybdenite are the dominant primary sulfides.
The Chino operation consists of a concentrator with a milling design capacity of 36,000 metric tons of ore per day that produces copper concentrate, and a 150 million pound-per-year SX/EW plant that produces copper cathode from solution generated by ROM leaching. The available mining fleet consists of twenty 240-metric-ton haul trucks loaded by 3 electric shovels with bucket sizes ranging from 31 to 48 cubic meters, which are capable of moving an average of 180,000 metric tons of material per day. Chino’s net PP&E and mine development costs at December 31, 2024, totaled $0.6 billion.
Chino’s copper production totaled 133 million pounds in 2024, 141 million pounds in 2023 and 130 million pounds in 2022.
Chino is located in a desert environment with rainfall averaging 16 inches per year. The highest bench elevation is 2,250 meters above sea level and the ultimate pit bottom is expected to be 1,508 meters above sea level. The Chino operation encompasses approximately 129,700 acres, comprising 111,900 acres of fee lands and 17,800 acres of unpatented mining claims held on public mineral estate.
Chino receives electrical power from the Luna Energy facility and from the open market. We believe the Chino operation has sufficient water sources to support current operations. Refer to “Governmental Regulations” above and Item 1A. “Risk Factors” for further discussion.
Tyrone. Our wholly owned Tyrone mine is an open-pit copper mining complex and has been in operation since 1967. Tyrone is located in Grant County, New Mexico, 10 miles south of Silver City, along State Highway 90. The site is accessible by paved roads and by rail.
The Tyrone mine is a porphyry copper deposit. Mineralization is predominantly secondary sulfide consisting of chalcocite, with leachable oxide mineralization consisting of chrysocolla.
Copper processing facilities consist of a SX/EW operation with a maximum capacity of approximately 100 million pounds of copper cathode per year. The available mining fleet consists of six 240-metric-ton haul trucks loaded by 1 electric shovel with a bucket size of 47 cubic meters, which is capable of moving an average of 108,000 metric tons of material per day. Tyrone’s net PP&E and mine development costs at December 31, 2024, totaled $0.1 billion.
Tyrone’s copper production totaled 43 million pounds in 2024, 51 million pounds in 2023 and 59 million pounds in 2022.
Tyrone is located in a desert environment with rainfall averaging 16 inches per year. The highest bench elevation is 2,070 meters above sea level and the ultimate pit bottom is expected to have an elevation of 1,475 meters above sea level. The Tyrone operation encompasses approximately 78,500 acres, comprising 65,500 acres of fee lands and 13,000 acres of unpatented mining claims held on public mineral estate.
Tyrone receives electrical power from the Luna Energy facility and from the open market. We believe the Tyrone operation has sufficient water sources to support current operations. Refer to “Governmental Regulations” above and Item 1A. “Risk Factors” for further discussion.
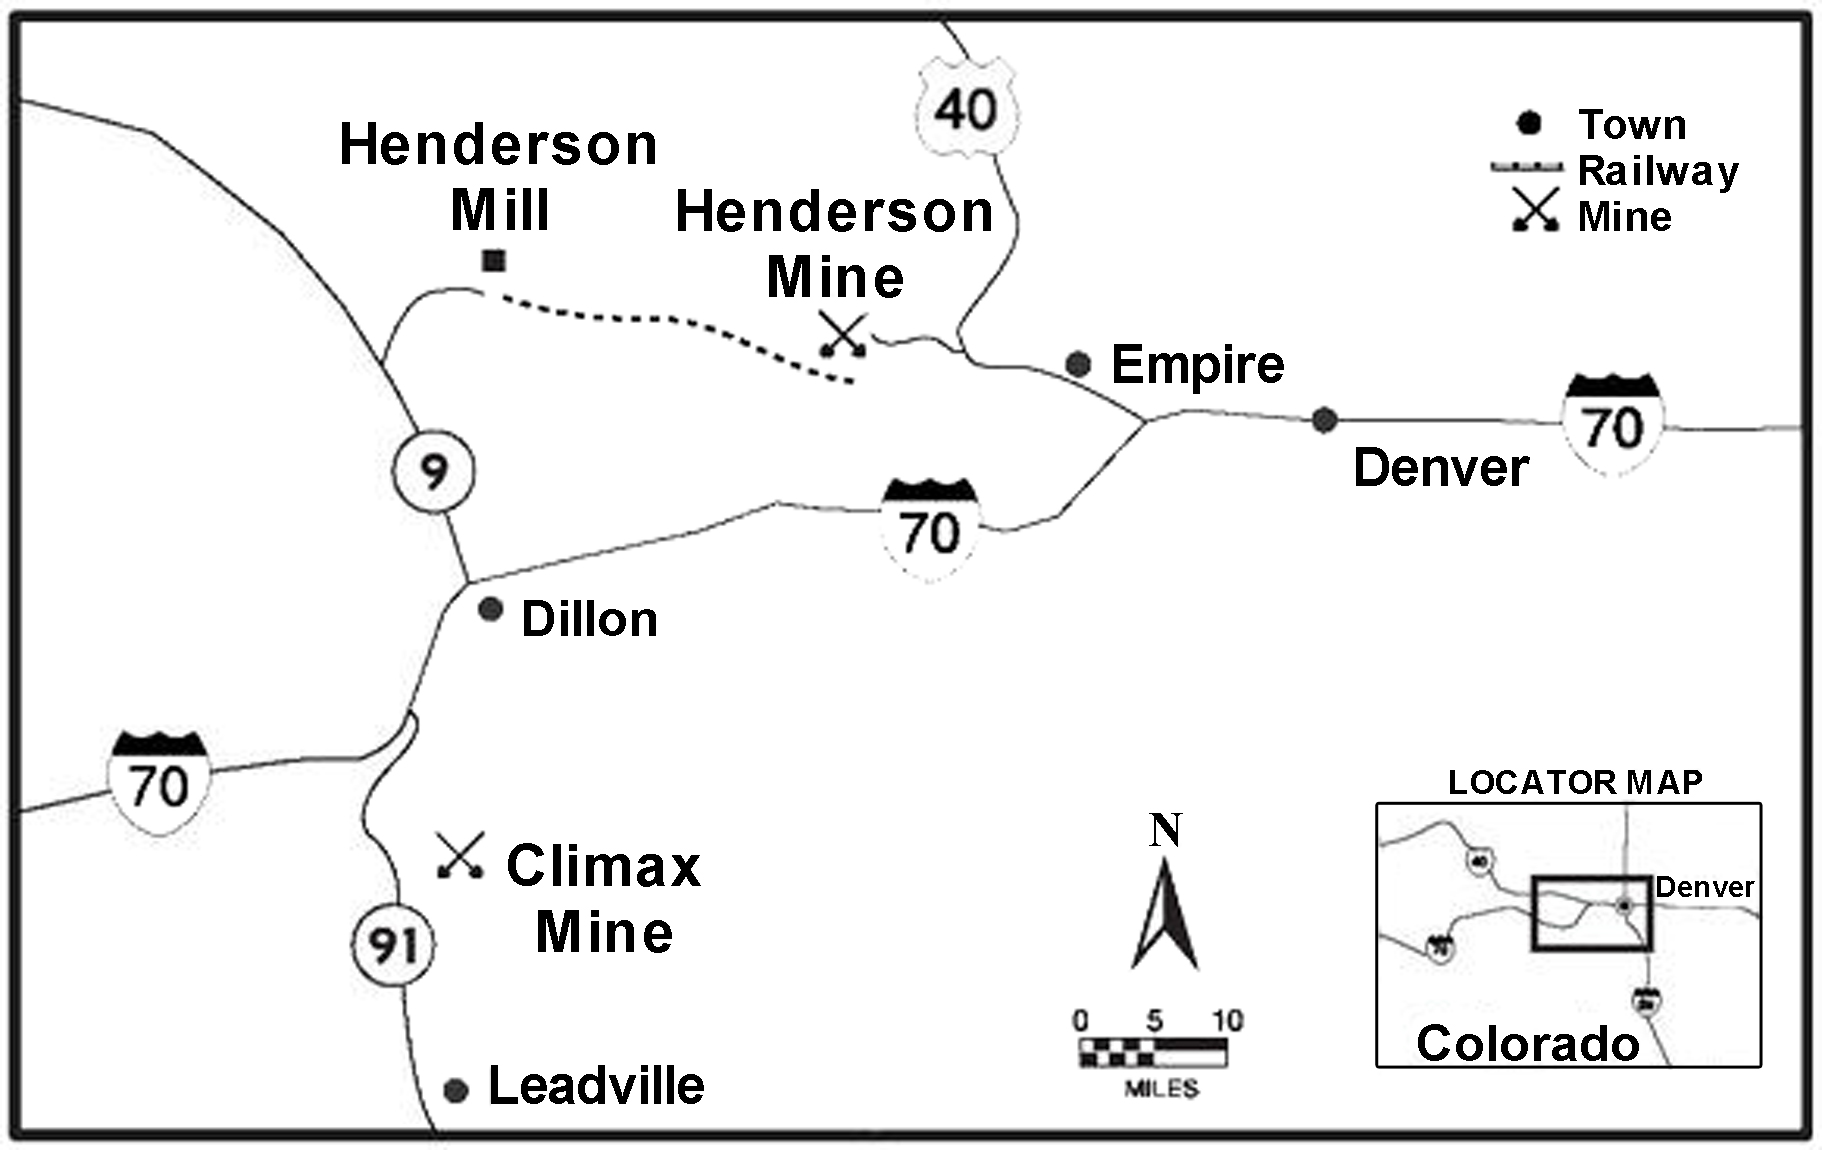
Climax and Henderson
Climax. Our wholly owned Climax mine is an open-pit molybdenum mine that is located 13 miles northeast of Leadville, Colorado, off Colorado State Highway 91 at the top of Fremont Pass. The mine is accessible by paved roads. Climax was placed on care and maintenance status by its previous owner in 1995 and, after being acquired by FMC, began commercial production in 2012.
The Climax ore body is a porphyry molybdenum deposit, with molybdenite as the primary sulfide mineral.
The Climax mine includes a 25,000 metric tons of ore per day mill facility. Climax has the capacity to produce approximately 30 million pounds of molybdenum per year. The majority of the molybdenum concentrate produced is shipped to our Fort Madison, Iowa, processing facility. The available mining fleet consists of thirteen 177-metric-ton haul trucks loaded by 2 hydraulic shovels with bucket sizes of 34 cubic meters, which are capable of moving an average of 90,000 metric tons of material per day. Climax’s net PP&E and mine development costs at December 31, 2024, totaled $1.4 billion.
Climax’s molybdenum production totaled 18 million pounds in 2024, 17 million pounds in 2023 and 21 million pounds in 2022.
The Climax mine is located in a mountainous region. The highest bench elevation is approximately 4,050 meters above sea level and the ultimate pit bottom is expected to have an elevation of approximately 3,100 meters above sea level. This region experiences significant snowfall during the winter months. The Climax operation encompasses approximately 15,100 acres, comprising 14,300 acres of privately owned land and 800 acres of federal claims.
Climax operations receive electrical power through long-term contracts with Xcel Energy and natural gas supply with United Energy Trading (with Xcel as the transporter). We believe the Climax operation has sufficient water sources to support current operations. Refer to “Governmental Regulations” above and Item 1A. “Risk Factors” for further discussion.
Henderson. Our wholly owned Henderson molybdenum mining complex has been in operation since 1976. Henderson is located 42 miles west of Denver, Colorado, off U.S. Highway 40. Nearby communities include the towns of Empire, Georgetown and Idaho Springs. The Henderson mill site is located 15 miles west of the mine and is accessible from Colorado State Highway 9. The Henderson mine and mill are connected by a 10-mile conveyor tunnel under the Continental Divide and an additional 5-mile surface conveyor. The tunnel portal is located 5 miles east of the mill.
The Henderson mine is a porphyry molybdenum deposit, with molybdenite as the primary sulfide mineral.
The Henderson operation consists of a block-cave underground mining complex feeding a concentrator with a design capacity of approximately 32,000 metric tons per day. Henderson has the capacity to produce approximately 15 million pounds of molybdenum per year. The majority of the molybdenum concentrate produced is shipped to our Fort Madison, Iowa, processing facility. The available underground mining equipment fleet consists of fifteen 9-metric-ton load-haul-dump (LHD) units and seven 73-metric-ton haul trucks, which deliver ore to a gyratory crusher feeding a series of 3 overland conveyors to the mill stockpiles. Henderson’s net PP&E and mine development costs at December 31, 2024, totaled $0.3 billion.
Henderson’s molybdenum production totaled 12 million pounds in 2024, 13 million pounds in 2023 and 12 million pounds in 2022.
The Henderson mine is located in a mountainous region with the main access shaft at 3,180 meters above sea level. The main production levels are currently at elevations of 2,200 and 2,350 meters above sea level. This region experiences significant snowfall during the winter months. The Henderson mine and mill operations encompass approximately 17,200 acres, comprising 13,000 acres of fee lands, 4,200 acres of unpatented mining claims held on public mineral estate and a 50-acre easement with the U.S. Forest Service for the surface portion of the conveyor corridor.
Henderson operations receive electrical power through long-term contracts with Xcel Energy and natural gas supply with United Energy Trading (with Xcel Energy as the transporter). We believe the Henderson operation has sufficient water sources to support current operations. Refer to “Governmental Regulations” above and Item 1A. “Risk Factors” for further discussion.
South America
At our operations in South America, mine properties and facilities are controlled through mining claims or concessions under the general mining laws of the relevant country. The claims or concessions are owned or controlled by the operating companies in which we or our subsidiaries have a controlling ownership interest. Roads, power lines and aqueducts are controlled by easements.
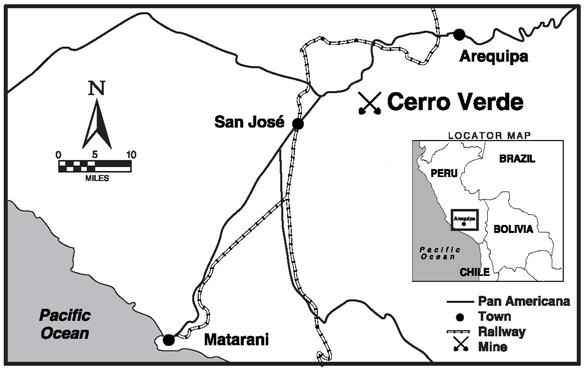
Cerro Verde
In September 2024, we purchased 5.3 million shares of Cerro Verde common stock for $210 million, increasing our ownership interest in Cerro Verde to 55.08% from 53.56%. The remaining 44.92% ownership interest in Cerro Verde is held by SMM Cerro Verde Netherlands B.V. (21.0%), Compañia de Minas Buenaventura S.A.A. (19.58%) and other stockholders whose Cerro Verde shares are publicly traded on the Lima Stock Exchange (4.34%).
Cerro Verde is an open-pit copper and molybdenum mining complex that has been in operation since the 1970s. Cerro Verde is located 20 miles southwest of Arequipa, Peru. Prior to being acquired in 1994 by a predecessor of Phelps Dodge, the mine was previously operated by the Peru government. The property is located at latitude 16.53 degrees south and longitude 71.58 degrees west using the WGS 84 coordinate system. The site is accessible by paved highways. Cerro Verde’s copper cathode and concentrate production that is not sold locally is transported approximately 70 miles by truck and by rail to the Port of Matarani for shipment to international markets. Molybdenum concentrate is transported by truck to either the Ports of Callao or Matarani for shipment.
The Cerro Verde mine is a porphyry copper deposit that has oxide, secondary sulfide and primary sulfide mineralization. The predominant oxide copper minerals are brochantite, chrysocolla, malachite and copper “pitch.” Chalcocite and covellite are the most important secondary copper sulfide minerals. Chalcopyrite and molybdenite are the dominant primary sulfides.
Cerro Verde’s operation includes 2 concentrating facilities with an annual average permitted milling capacity of 409,500 metric tons of ore per day (and the ability to annually treat up to 10% more for a total of 450,450 metric tons of ore per day). As a result of several efficiency initiatives implemented over the past several years, in 2024, Cerro Verde’s 2 concentrators were able to achieve a combined average milling rate of 415,500 metric tons of ore per day in 2024. Cerro Verde also operates a 100,000-metric-ton-per-day ROM leach system coupled with SX/EW leaching facilities, which have a production capacity of approximately 200 million pounds of copper per year.
The available fleet consists of fifty-four 300-metric-ton haul trucks, ninety-one 250-metric-ton haul trucks (8 of which are currently on standby) and 8 leased 380-metric-ton haul trucks loaded by 14 electric shovels with bucket sizes ranging from 33 to 57 cubic meters. This fleet is capable of moving an average of approximately 1,000,000 metric tons of material per day. Cerro Verde’s net PP&E and mine development costs at December 31, 2024, totaled $5.8 billion.
Cerro Verde’s production totaled 0.9 billion pounds of copper and 20 million pounds of molybdenum in 2024, 1.0 billion pounds of copper and 22 million pounds of molybdenum in 2023, and 1.0 billion pounds of copper and 23 million pounds of molybdenum in 2022.
Cerro Verde is located in a desert environment with rainfall averaging less than two inches per year and is in an active seismic zone. The highest bench elevation is 2,768 meters above sea level and the ultimate pit bottom is expected to be 1,538 meters above sea level. The Peru general mining law and Cerro Verde’s mining stability agreement grant the surface rights of mining concessions located on government land. Government land obtained after 1997 must be leased or purchased. Cerro Verde has a mining concession covering approximately 175,500 acres, including 61,500 acres of surface rights and access to 14,600 acres granted through an easement from the Peru National Assets Office, plus 151 acres of owned property, and 1,065 acres of rights-of-way outside the mining concession area leased from both government agencies and private parties.
Cerro Verde currently receives electrical power, including hydro-generated power, under long-term contracts with ElectroPerú S.A. and Engie Energía Peru S.A. During 2023, Cerro Verde entered into a new power purchase agreement that is expected to transition its electric power to fully renewable energy sources in 2026.
Water for our Cerro Verde processing operations comes from renewable sources through a series of storage reservoirs on the Río Chili watershed that collect water primarily from seasonal precipitation and from wastewater collected from the city of Arequipa and treated at a wastewater treatment plant originally constructed and currently operated by Cerro Verde. We believe the Cerro Verde operation has sufficient water sources to support current operations, but we are closely monitoring ongoing weather patterns. Refer to “Governmental Regulations” above and Item 1A. “Risk Factors” for further discussion.
El Abra
We have a 51% ownership interest in El Abra, and the remaining 49% interest is held by the state-owned copper enterprise Corporación Nacional del Cobre de Chile.
El Abra is an open-pit copper mining complex that has been in operation since 1996. El Abra is located 47 miles north of Calama in Chile’s El Loa province of the northern Chilean region of Antofagasta. The site is accessible by paved highways and by rail.
The El Abra mine is a porphyry copper deposit that has sulfide and oxide mineralization. The predominant primary sulfide copper minerals are bornite and chalcopyrite. There is a minor amount of secondary sulfide mineralization as chalcocite. The oxide copper minerals are chrysocolla and pseudomalachite. There are lesser amounts of copper bearing clays and tenorite.
The El Abra operation consists of a SX/EW facility with a capacity of 500 million pounds of copper cathode per year from a 115,000-metric-ton-per-day crushed leach circuit and a ROM leaching operation. The available fleet consists of twenty-three 242-metric-ton haul trucks loaded by 4 electric shovels with buckets ranging in size from 29 to 41 cubic meters, which are capable of moving 217,000 metric tons of material per day. El Abra’s net PP&E and mine development costs at December 31, 2024, totaled $0.8 billion.
El Abra’s copper production totaled 219 million pounds in 2024, 217 million pounds in 2023 and 202 million pounds in 2022.
We have completed substantial drilling and evaluations to define a large sulfide resource that would support a potential major mill project similar to the large-scale concentrator at Cerro Verde. We are preparing data for a potential submission of an environmental impact statement by year-end 2025, subject to ongoing stakeholder engagement and economic evaluations. Preliminary estimates, which remain under review, indicate that the project economics would be supported using an incentive copper price of less than $4.00 per pound. The decision of whether to proceed and timing of the potential project will take into account overall copper market conditions, required permitting and other factors.
El Abra is located in a desert environment with rainfall averaging less than one inch per year and is in an active seismic zone. The highest bench elevation is 4,225 meters above sea level and the ultimate pit bottom is expected to be 3,340 meters above sea level. El Abra controls a total of approximately 183,700 acres of mining claims covering the ore deposit, stockpiles, process plant, and water wellfield and pipeline. El Abra also has land surface rights for the road between the processing plant and the mine, the water wellfield, power transmission lines and for the water pipeline from the Salar de Ascotán aquifer.
El Abra currently receives electrical power under a long-term contract with Engie Energía Chile S.A. Water for our El Abra processing operations currently comes from the continued pumping of groundwater from the Salar de Ascotán aquifer pursuant to regulatory approval. We believe El Abra has sufficient water sources to support current operations, although we are evaluating options for water infrastructure alternatives to provide options to extend existing operations and support a future expansion. Refer to “Governmental Regulations” above and Item 1A. “Risk Factors” for further discussion.
Indonesia
Ownership. PT-FI is a limited liability company organized under the laws of the Republic of Indonesia. On December 21, 2018, we completed the transaction with the Indonesia government regarding PT-FI’s long-term mining rights and share ownership (the 2018 Transaction). Following the 2018 Transaction, we have a 48.76% share ownership in PT-FI and the remaining 51.24% share ownership is collectively held by PT Mineral Industri Indonesia (MIND ID), an Indonesia state-owned enterprise, and PT Indonesia Papua Metal Dan Mineral (formerly known as PT Indocopper Investama), which is expected to be owned by MIND ID and the provincial/regional government in Central Papua, Indonesia.
IUPK. Concurrent with closing the 2018 Transaction, the Indonesia government granted PT-FI a special mining business license (IUPK) to replace its former contract of work. Under the terms of the IUPK, PT-FI has been granted an extension of mining rights through 2031, with rights to extend mining rights through 2041, subject to PT-FI completing the construction of additional domestic smelting and refining capacity in Indonesia and fulfilling its defined fiscal obligations to the Indonesia government. The IUPK, and related documentation, contains legal and fiscal terms and is legally enforceable through 2041. In addition, we, as a foreign investor, have rights to resolve investment disputes with the Indonesia government through international arbitration.
Pursuant to regulations issued during 2024, PT-FI is eligible to apply for an extension of its mining rights beyond 2041, provided certain conditions are met, including ownership of integrated downstream facilities that have entered the operational stage; domestic ownership of at least 51% and agreement with a state-owned enterprise for an additional 10% ownership; and commitments for additional exploration and increases in refining capacity, each as approved by the Ministry of Energy and Mineral Resources. Application for extension may be submitted at any time up to one year prior to the expiration of the current IUPK. PT-FI expects to apply for an extension during 2025, pending agreement with MIND ID on a purchase and sale agreement for the transfer in 2041 of an additional 10% interest in PT-FI. An extension would enable continuity of large-scale operations for the benefit of all stakeholders and provide growth options through additional resource development opportunities in the highly attractive Grasberg minerals district.
Refer to Item 1A. “Risk Factors” and Notes 10 and 11 for discussion of PT-FI’s IUPK, export licenses and risks associated with our Indonesia operations.
Downstream Processing Facilities. In connection with the 2018 Transaction, PT-FI agreed to expand its domestic smelting and refining capacity. The new smelter and PT Smelting will smelt and refine copper concentrate from PT-FI, and the PMR will process anode slimes from the new smelter and PT Smelting. Once its new downstream processing facilities are operational, PT-FI’s operations will be fully integrated.
During 2024, construction of PT-FI’s new smelter in Eastern Java, Indonesia was completed. In October 2024, during start-up activities, a fire occurred that required a temporary suspension of smelting operations to complete repairs. Procurement of long-lead items is advanced and repairs are scheduled to be completed by mid-2025, and PT-FI expects ramp-up to full capacity to be achieved by year-end 2025.
As part of start-up activities, PT-FI commenced gold production from its new PMR in December 2024. The PMR has the design capacity to refine all precious metals from PT-FI’s new smelter as well as from PT Smelting.
Pursuant to the terms of its IUPK regarding force majeure events, PT-FI has requested approval from the Indonesia government to permit exports of copper concentrate in 2025 until the required repairs of its new smelter following the October 2024 fire incident and full ramp-up are complete. Based on discussions with the Indonesia government, PT-FI expects to re-commence exports of copper concentrate during first-quarter 2025, and pursuant to current regulations, would be required to pay a 7.5% export duty on all copper concentrate exports during 2025.
Refer to “Smelting Facilities and Other Mining Properties” below, Item 1A. “Risk Factors,” MD&A and Notes 10 and 11 for additional discussion of PT-FI’s new downstream processing facilities.
Grasberg Minerals District. PT-FI operates in the remote highlands of the Sudirman Mountain Range in the province of Central Papua, Indonesia, which is on the western half of the island of New Guinea. Since 1967, we and our predecessors have been the only operator of exploration and mining activities in the approximately 24,600-acre operating area. The operating area is accessible by coastal portsite facilities on the Arafura Sea and by the Timika airport. The project site is located at latitude 4.08 degrees south and longitude 137.12 degrees east using the WGS 84 coordinate system. The project area includes a 70-mile main service road from portsite to the mill complex. PT-FI’s net PP&E and mine development costs at December 31, 2024, including the new downstream processing facilities, totaled $21.1 billion.
Production from the Grasberg minerals district totaled 1.8 billion pounds of copper and 1.9 million ounces of gold in 2024, 1.7 billion pounds of copper and 2.0 million ounces of gold in 2023, and 1.6 billion pounds of copper and 1.8 million ounces of gold in 2022.
Over a multi-year investment period, PT-FI has successfully commissioned three large-scale underground mines in the Grasberg minerals district (Grasberg Block Cave, Deep Mill Level Zone (DMLZ) and Big Gossan). Milling rates for ore from these underground mines averaged 208,400 metric tons of ore per day in 2024, 198,300 metric tons of ore per day in 2023 and 192,600 metric tons of ore per day in 2022. Production from these underground mines is expected to continue through 2041 and an extension of PT-FI’s operating rights beyond 2041 would extend the lives of these mines. In December 2024, PT-FI completed construction of a new copper cleaner circuit, a mill recovery project to enhance recoveries and optimize concentrate production, with commissioning underway. Refer to Item 1A. “Risk Factors” for discussion of risks associated with development projects and underground mines.
PT-FI plans to transition its existing energy source from coal to natural gas, which would meaningfully reduce PT-FI’s Scope 1 GHG emissions at the Grasberg minerals district. The majority of PT-FI’s planned investments in a new gas-fired combined cycle facility are expected to be incurred over the next three years, at a cost of approximately $1 billion, which represents an incremental cost of $0.4 billion compared to previously planned investments to refurbish the existing coal units. Once complete, PT-FI’s dual-fuel power plant and the new gas-fired combined cycle facility will be fueled by natural gas, supplied by a floating liquefied natural gas storage and regassification unit.
A combination of naturally occurring mountain streams and water derived from our underground operations provides water for our operations. Our Indonesia operations are in an active seismic zone and experience average annual rainfall of approximately 200 inches.
Grasberg Block Cave Underground Mine
The Grasberg Block Cave ore body is the same ore body historically mined from the surface in the Grasberg open pit. Undercutting, drawbell construction and ore extraction activities in the Grasberg Block Cave underground mine continue to track expectations. As of December 31, 2024, the Grasberg Block Cave underground mine had 469 open drawbells.
Ore milled from the Grasberg Block Cave underground mine averaged 133,800 metric tons per day in 2024, 117,300 metric tons per day in 2023 and 103,300 metric tons per day in 2022.
The Grasberg Block Cave fleet consists of approximately 530 pieces of mobile equipment. The primary mining equipment directly associated with production and development includes an available fleet of 96 LHD units and 16 haul trucks. Each production LHD unit typically carries approximately 11 metric tons of ore and transfers ore into the rail haulage system. The Grasberg Block Cave has an automated rail haulage system currently operating with 14 locomotives and 143 ore wagons that haul the ore to 3 gyratory crushers located underground. Each ore wagon typically carries 35 metric tons. The crushed ore is conveyed to surface stockpiles for processing.
DMLZ Underground Mine
The DMLZ ore body lies below the depleted Deep Ore Zone underground mine at the 2,590-meter elevation and represents the downward continuation of mineralization in the Ertsberg East Skarn system and neighboring Ertsberg porphyry.
Hydraulic fracturing operations have been effective in managing rock stresses and pre-conditioning the cave following mining-induced seismic activity experienced from time to time. As of December 31, 2024, the DMLZ underground mine had 174 open drawbells.
Ore milled from the DMLZ underground mine averaged 64,900 metric tons per day in 2024, 75,900 metric tons per day in 2023 and 76,300 metric tons per day in 2022.
The DMLZ fleet consists of approximately 310 pieces of mobile equipment, which includes 59 LHD units and 26 haul trucks used in production and development activities. Each production LHD unit typically carries approximately 9 metric tons of ore and transfers ore into the truck haulage system. The haul trucks have a capacity of 55 to 60 metric tons and load ore from chutes fed by the LHDs and transfer it to one of two gyratory crushers. The crushed ore is conveyed to surface stockpiles for processing.
Big Gossan Underground Mine
The Big Gossan ore body lies underground and adjacent to the current mill site. It is a tabular, near vertical ore body with approximate dimensions of 1,200 meters along strike and 800 meters down dip with varying thicknesses from 20 meters to 120 meters. The mine utilizes a blasthole stoping method with delayed paste backfill. Stopes of varying sizes are mined and the ore dropped down passes to a truck haulage level. Trucks are chute loaded and transport the ore to a jaw crusher. The crushed ore is then hoisted vertically via a two-skip production shaft to a level where it is loaded onto a conveyor belt. The belt carries the ore to one of the main underground conveyors where the ore is transferred and conveyed to the surface stockpiles for processing.
Ore milled from the Big Gossan underground mine averaged 8,000 metric tons per day in 2024, 7,900 metric tons per day in 2023 and 7,600 metric tons per day in 2022.
The Big Gossan fleet consists of approximately 70 pieces of mobile equipment, which includes 7 LHD units and 10 haul trucks used in development and production activities.
Kucing Liar Underground Mine
Long-term mine development activities are ongoing for PT-FI’s Kucing Liar deposit in the Grasberg minerals district. Kucing Liar is expected to produce over 7 billion pounds of copper and 6 million ounces of gold between 2029 and the end of 2041, and an extension of PT-FI’s operating rights beyond 2041 would extend the life of the project. Development activities commenced in 2022 and are expected to continue over an approximate 10-year timeframe. Capital investments for Kucing Liar are estimated to total $4 billion over the next 7 to 8 years (averaging approximately $0.5 billion per annum). Approximately $0.6 billion has been incurred through December 31, 2024. At full operating rates, annual production from Kucing Liar is expected to approximate 560 million pounds of copper and 520 thousand ounces of gold, providing PT-FI with sustained long-term, large-scale and low-cost production. Kucing Liar will benefit from substantial shared infrastructure and PT-FI’s experience and long-term success in block-cave mining.
Description of Indonesia Ore Bodies. Our Indonesia ore bodies are located within and around two main igneous intrusions, the Grasberg monzodiorite and the Ertsberg diorite. The host rocks of these ore bodies include both carbonate and clastic rocks that form the ridge crests and upper flanks of the Sudirman Range, and the igneous rocks of monzonitic to dioritic composition that intrude them. The igneous-hosted ore bodies (the Grasberg Block Cave and portions of the DMLZ) occur as vein stockworks and disseminations of copper sulfides, dominated by chalcopyrite and, to a lesser extent, bornite. The sedimentary-rock hosted ore bodies (portions of the DMLZ and Kucing Liar and all of the Big Gossan) occur as “magnetite-rich, calcium/magnesian skarn” replacements, whose
location and orientation are strongly influenced by major faults and by the chemistry of the carbonate rocks along the margins of the intrusions.
The copper mineralization in these skarn deposits is dominated by chalcopyrite, but higher bornite concentrations are common. Moreover, gold occurs in significant concentrations in all of the district’s ore bodies, though rarely visible to the naked eye. These gold concentrations usually occur as inclusions within the copper sulfide minerals, though, in some deposits, these concentrations can also be strongly associated with pyrite.
The following diagram indicates the relative elevations (in meters) of our reported Indonesia ore bodies.
The following map, which encompasses an area of 42 square kilometers, indicates the relative positions and sizes of our reported Indonesia ore bodies and their locations.
Smelting Facilities and Other Mining Properties
PT-FI’s New Downstream Processing Facilities. PT-FI’s new smelter and PT Smelting (see further discussion below) will smelt and refine copper concentrate from PT-FI, and the PMR will process anode slimes from the new smelter and PT Smelting. Once its new downstream processing facilities are operational, PT-FI’s operations will be fully integrated.
PT-FI’s new greenfield smelter in Eastern Java, Indonesia has a capacity to process approximately 1.7 million metric tons of copper concentrate per year. During start-up activities, a fire occurred in October 2024, requiring a temporary suspension of smelting operations to complete repairs. Procurement of long-lead items is advanced and repairs are scheduled to be completed by mid-2025. PT-FI expects restoration, repair and replacement costs to approximate $100 million, which are expected to be mostly offset through recovery under construction insurance programs. PT-FI expects ramp-up to full capacity to be achieved by year-end 2025.
As part of start-up activities, PT-FI commenced gold production from its new PMR in December 2024.
PT Smelting. PT Smelting, an Indonesian joint venture between PT-FI and MMC, owns a copper smelter and refinery in Gresik, Indonesia. In December 2023, PT Smelting completed the expansion of its capacity by 30% to process approximately 1.3 million metric tons of copper concentrate per year. The project was funded by PT-FI with loans totaling $254 million that converted to equity effective June 30, 2024, increasing PT-FI’s ownership in PT Smelting to 66% from 39.5%. As discussed in Note 2, PT-FI continues to account for its investment in PT Smelting under the equity method.
Beginning in 2023, PT-FI’s commercial arrangement with PT Smelting changed from a copper concentrate sales agreement to a tolling arrangement. Under the arrangement, PT-FI pays PT Smelting a tolling fee (which PT-FI records as production costs in the consolidated statements of income) to smelt and refine its copper concentrate and PT-FI retains title to all products for sale to unaffiliated third parties (i.e., there are no further sales to PT Smelting). Refer to MD&A and Note 2 for further discussion.
PT Smelting’s copper anode production from its smelter totaled 398,200 metric tons in 2024, 251,300 metric tons in 2023 and 316,700 metric tons in 2022. Copper cathode production from its refinery totaled 335,200 metric tons in 2024, 212,000 metric tons in 2023 and 268,400 metric tons in 2022.
PT Smelting’s major scheduled maintenance turnarounds (which approximate 30 days to complete) are expected to occur every two years, with short-term maintenance turnarounds in the interim. PT Smelting completed an 18-day maintenance turnaround during October 2022, a 72-day shutdown in July 2023 associated with its expansion project and a 7-day shutdown in November 2023 to complete final tie-in of the expansion project. The next maintenance turnaround is scheduled for mid-year 2025.
Atlantic Copper. Our wholly owned Atlantic Copper smelter and refinery is located on land concessions from the Huelva, Spain, port authorities, which are scheduled to expire in 2038.
The smelter has a design capacity to process approximately 300,000 metric tons of copper per year, and the refinery has a capacity to process 286,000 metric tons of copper per year. Atlantic Copper’s copper anode production from its smelter totaled 247,600 metric tons in 2024, 261,900 metric tons in 2023 and 215,000 metric tons in 2022. Copper cathode production from its refinery totaled 254,400 metric tons in 2024, 260,300 metric tons in 2023 and 218,400 metric tons in 2022.
During 2024, Atlantic Copper purchased 30% of its concentrate from our copper mining operations (15% from South America operations, 13% from Indonesia operations and 2% from the North America copper mines) and 70% from third parties.
Atlantic Copper’s major maintenance turnarounds typically occur approximately every eight years, with shorter-term maintenance turnarounds in the interim. Atlantic Copper completed a 17-day maintenance turnaround in 2024 and a 78-day major maintenance turnaround in 2022.
Atlantic Copper is developing an e-material recycling project as a result of the significant and continued
growth in electronic waste material. Atlantic Copper’s existing smelting and refining facilities provide synergies to recycle this type of material, and the project, which is expected to commence operations in 2026, would include an addition of a smelting furnace and associated equipment to recover copper, gold, silver, palladium, tin, nickel and
platinum from electronic materials. Atlantic Copper estimates that the initial project capital will approximate $435 million.
Miami Smelter. We own and operate a smelter at our Miami mining operation in Arizona. The smelter has been operating for over 100 years and has been upgraded numerous times during that period to implement new technologies, improve production and comply with air quality requirements.
The Miami smelter processes copper concentrate primarily from our North America copper mines. Concentrate processed through the smelter totaled 840,600 metric tons in 2024, 810,900 metric tons in 2023 and 781,000 metric tons in 2022, and copper anode production from the smelter totaled 214,000 metric tons in 2024, 222,000 metric tons in 2023 and 202,000 metric tons in 2022. In addition, because sulfuric acid is a by-product of smelting concentrate, the Miami smelter is also the most significant source of sulfuric acid for our North America leaching operations.
Major maintenance turnarounds are anticipated to occur approximately every three to four years for the Miami smelter. We performed a major maintenance turnaround during 2021 and the next major maintenance turnaround is scheduled for mid-year 2025, for which we expect to incur maintenance charges and idle facility costs of approximately $85 million.
Rod & Refining Operations. Our Rod & Refining operations consist of conversion facilities located in North America, including a refinery in El Paso, Texas, and rod mills in El Paso, Texas and Miami, Arizona. We refine our copper anode production from our Miami smelter at our El Paso refinery. The El Paso refinery has the potential to operate at an annual production capacity of approximately 410,000 metric tons of copper cathode, which is sufficient to refine all of the copper anode we produce at our Miami smelter. Copper cathode production from the El Paso refinery totaled 221,300 metric tons in 2024, 217,800 metric tons in 2023 and 208,900 metric tons in 2022. Our El Paso refinery also produces nickel carbonate, copper telluride and autoclaved slimes material containing gold, silver, platinum and palladium.
Molybdenum Conversion Facilities. We process molybdenum concentrate at our conversion plants in the U.S. and Europe into such products as technical-grade molybdic oxide, ferromolybdenum, pure molybdic oxide, ammonium molybdates and molybdenum disulfide. We operate molybdenum roasters in Sierrita, Arizona; Fort Madison, Iowa; and Rotterdam, the Netherlands, and we operate a molybdenum pressure-leach plant in Bagdad, Arizona. We also produce ferromolybdenum for customers worldwide at our conversion plant located in Stowmarket, United Kingdom.
Other North America Copper Mines. We have five non-operating copper mines – Ajo, Bisbee, Tohono, Twin Buttes and Christmas, which are located in Arizona – that have been on care and maintenance status for several years and would require new or updated environmental studies, new permits, and additional capital investment, which could be significant, to return them to operating status.
MINING DEVELOPMENT PROJECTS AND EXPLORATION ACTIVITIES
In 2024, capital expenditures totaled $4.8 billion (including $2.1 billion for major mining projects – primarily for underground development activities in the Grasberg minerals district – and $1.2 billion for PT-FI’s new downstream processing facilities).
We have several projects and potential opportunities to expand production volumes, extend mine lives and develop large-scale underground ore bodies. As further discussed in MD&A, our near-term major development projects will focus on the underground development activities in the Grasberg minerals district. Considering the long-term nature and large size of our development projects, actual costs and timing could vary from estimates. Additionally, in response to market conditions, the timing of our expenditures will continue to be reviewed. We continue to review our mine development and processing plans to maximize the value of our mineral reserves.
Additionally, based on the current reserve life through 2041, full development of PT-FI’s underground mineral reserves at the Grasberg minerals district is expected to require approximately $4 billion (most of which will be incurred over the next 8 years) of capital expenditures at our processing facilities to optimize the handling of underground ore from the Grasberg Block Cave, DMLZ and Kucing Liar deposits. Increases in power loads at these processing facilities and the underground mines are expected to require additional power generation and as such, PT-FI is planning investments in a new gas-fired combined cycle facility. The majority of PT-FI’s planned
investments in a new gas-fired combined cycle facility are expected to be incurred over the next three years, at a cost of approximately $1 billion, which represents an incremental cost of $0.4 billion compared to previously planned investments to refurbish the existing coal units. Once complete, PT-FI’s dual-fuel power plant and the new gas-fired combined cycle facility will be fueled by natural gas, supplied by a floating liquefied natural gas storage and regassification unit.
In 2024, exploration spending associated with our mining operations totaled $113 million. Our mining exploration activities are primarily associated with our existing mines, focusing on opportunities to expand mineral reserves and resources to support development of additional future production capacity. Exploration results continue to indicate opportunities for significant future potential reserve additions at our existing properties.
Refer to Item 1A. “Risk Factors” for further discussion of risks associated with mine development projects and exploration activities, and PT-FI’s IUPK.
SOURCES AND AVAILABILITY OF ENERGY, NATURAL RESOURCES AND RAW MATERIALS
Our copper mining operations require significant amounts of energy, principally diesel, electricity, coal and natural gas, most of which is obtained from third parties under long-term contracts. In 2024, energy represented 16% of our copper mine site operating costs, including purchases of approximately 270 million gallons of diesel fuel; approximately 8,550 gigawatt hours of electricity at our North America and South America copper mining operations (we generate all of our power at our Indonesia mining operation); approximately 750 thousand metric tons of coal for our coal power plant in Indonesia; and approximately 2 million MMBtu (million British thermal units) of natural gas at certain of our North America mines. Based on current cost estimates, energy is expected to approximate 16% of our copper mine site operating costs for the year 2025.
Our mining operations also require significant quantities of water for mining, ore processing and related support facilities. The loss of water rights for any of our mines, in whole or in part, or shortages of water to which we have rights, could require us to curtail or shut down mining operations. For a further discussion of risks and legal proceedings associated with the availability of water, refer to “Governmental Regulations” above, Item 1A. “Risk Factors” and Item 3. “Legal Proceedings.”
Sulfuric acid is used in the SX/EW process and is produced as a by-product of the smelting process at our smelters and from our sulfur burners at the Safford mine. Sulfuric acid needs in excess of the sulfuric acid produced by our operations are purchased from third parties.
For further discussion of risks associated with various input costs, refer to Item 1A. “Risk Factors.”
HUMAN CAPITAL
We are committed to promoting the health, safety and well-being of our workforce and striving to further strengthen our commitment to promoting an inclusive, diverse and agile workplace. We believe our global workforce is the foundation of our success. Our Board of Directors (Board) oversees our policies and implementation programs that govern our approach to human capital management, with the Corporate Responsibility Committee (CRC) having oversight of health and safety matters and the Compensation Committee having oversight of other human capital matters, including those relating to workforce recruitment, retention and development, pay equity, and inclusion and diversity.
Workforce
At December 31, 2024, we had approximately 28,500 employees (13,900 in North America, 6,900 in South America, 6,600 in Indonesia and 1,100 in Europe and other locations). We also had contractors that employed personnel at many of our operations at various times throughout 2024, including approximately 32,200 in Indonesia (approximately 8,100 at PT-FI’s new downstream processing facilities and approximately 24,100 at the Grasberg minerals district), 25,500 in North America, 6,300 at our South America mining operations and 1,700 in Europe and other locations. Certain of these contractors work on projects that are temporary in nature and fluctuate from year to year.
Approximately 28% of our global employee population is covered by collective labor agreements (CLAs). In North America, our employees are not covered by a CLA. Rather, our hourly, full-time employees at our active North
America sites elect to work directly with management using our Guiding Principles, which outline how we work together to achieve our collective goals within the values of the company.
We prioritize open engagement with our employees and, where applicable, union leadership to negotiate and uphold labor agreements effectively. Prolonged strikes and other work stoppages can adversely affect our business, our workforce and regional stakeholders. In 2024, there were no strikes or lockouts at any of our operations, and Cerro Verde completed new multi-year CLAs with its two unions, PT-FI completed a new two-year CLA with its three unions and Atlantic Copper completed a new CLA with its three unions.
A summary of employees covered by CLAs on December 31, 2024, including the number of employees covered and the expiration date of the applicable CLA, follows:
| | | | | | | | | | | | | | | | | |
| Location | Number of Unions | Number of
Employees Covered by a CLA | | Expiration Date |
|
| PT-FI – Indonesia | 3 | 2,849 | | | March 2026 | |
| Cerro Verde – Peru | 2 | 3,544 | | | August 2028 and August 2029 | |
| El Abra – Chile | 2 | 915 | | | April 2026 | |
| Atlantic Copper – Spain | 3 | 525 | | | December 2026 |
|
| | | | | |
| | | | | |
| Stowmarket – United Kingdom | 1 | 41 | | | May 2026 | |
In 2024, our employees formerly covered by a CLA in Rotterdam, The Netherlands eliminated their union representation and decided to negotiate directly with management through their internal works council. An employee benefits agreement replaced the CLA and is expected to be negotiated again in March 2025.
Health and Safety
Our highest priority is the health, safety and well-being of our employees and contractors. We also work to promote our safety-first values with our suppliers and in the communities where we operate. We believe that health and safety considerations are integral to, and fundamental for, all other functions in our organization, and we understand the health and safety of our workforce is critical to our operational efficiency and long-term success. Our global health and safety strategy, “Safe Production Matters,” is focused on fatality prevention, eliminating systemic root causes of incidents and continuous improvement through robust management systems, which are supported by leaders empowering our teams to work safely. Our culture of leading by example at all levels of the organization and our Safe Production Matters strategy underpin our Fatal Risk Management (FRM) program. The goal of our FRM program is to achieve zero workplace fatalities by strengthening preventative measures and raising awareness to fatal risks and the measures necessary to mitigate them.
We further seek to prevent fatalities and high-risk incidents by leveraging technology to support safe work practices in the field and data analytics to identify opportunities for improvement. Our framework for managing risks and compliance obligations is certified company-wide in accordance with the ISO 45001 Health and Safety Management System (ISO 45001), most recently certified in January 2023. ISO 45001 requires third-party site-level verification of requirements, with an overall goal of preventing fatalities and reducing safety incidents.
As part of our commitment to providing a healthy and safe workplace, we strive to provide the training, tools and resources needed so our workforce can identify risks and consistently apply effective controls. We share information and key learnings about potential fatal events (PFEs), high-risk incidents and best practices throughout the company, and we engage with industry peers and professional organizations to learn and continuously improve our health and safety program. Our corporate team communicates safety performance to executive management regularly, including reviews of high-risk, potential fatal and fatal incidents. The CRC provides input on the overall direction of our health and safety programs and reviews safety statistics, trends and incident investigation reports. In the event of a fatal incident, executive management and the Chair of the CRC are notified immediately, and we review and discuss all fatal incident investigations with the CRC and the Board.
Our objective is to achieve zero workplace fatalities and to decrease injuries and occupational illnesses. We measure our safety performance through regularly established benchmarks, including the industry-established Total Recordable Incident Rate (TRIR), and our company-established PFEs, both of which include employees and contractors company-wide. Regrettably, we had two work-related fatalities in 2024 and one work-related fatality in
2023. In addition, we had 30 PFEs in 2024 and 46 PFEs in 2023. Our TRIR per 200,000 man-hours worked was 0.52 in 2024 and 0.60 in 2023.
Employee Engagement, Training and Development
We aim to recruit and retain talented employees with diverse perspectives by offering, among other things, competitive compensation and benefits and pathways for career advancement. We prioritize a highly engaged, agile workforce and, in addition to physical and psychological safety, we aim to support the overall health and well-being of our workforce by providing access to health and wellness programs, and offering opportunities for flexible work schedules, where practicable, among other programs.
We continued to face challenges in 2024 with an increasingly competitive and tight labor market, specifically in North America, and we remain committed to assessing our recruitment and training and development programs to adapt to the changing labor market and our employee needs.
To support the advancement of our employees, we conduct regular strategic talent reviews and leadership planning. We offer training and development programs to encourage the growth of internal talent and to continue to promote a strong and experienced management pipeline. We leverage both formal and informal programs to identify, foster and retain top talent at both the corporate and operations levels. We expect our talent management processes and corresponding training and development programs will continue to mature and evolve in line with our commitment to continuous improvement.
Workplace Culture
We are dedicated to cultivating a company culture prioritizing safety, respect, inclusivity, and representation of the diverse communities in which we operate. As a global organization that operates in regions of varying ethnic, religious and cultural backgrounds, we value and prioritize inclusion and diversity within our workforce. A broad range of experience, knowledge, background, culture and heritage drives innovation, enhances operational performance and improves relationships with stakeholders.
We are often the largest employer in our local communities, which are typically in remote areas, and hiring locally is a commitment we make to the communities surrounding our operations and to our host countries. We retain expatriate expertise for managerial and technical roles when the required expertise is not available in local communities. We offer cultural awareness training to expatriates and inpatriates for new locations.
We strive for, promote and foster a workplace where everyone feels a sense of belonging, is treated with respect and their opinions are valued. We believe an inclusive environment gives our people the confidence to speak up, share ideas that drive innovation and achieve operational excellence. We believe our inclusive environment is the foundation of our high-performance culture and is paramount to the long-term sustainable success of our business.
We are also committed to providing equal pay for equal work regardless of gender, race, ethnicity or any other characteristic protected by applicable law. We periodically conduct internal compensation reviews to identify and address, as appropriate, possible pay gaps, which cannot be explained through performance, distribution of jobs, experience, time in role and other legitimate business-related factors.
Additional information regarding our workforce can be found in our Annual Report on Sustainability, which is available on our website and updated annually.
Refer to Item 1A. “Risk Factors” for further information on human capital matters.
COMMUNITY AND HUMAN RIGHTS
We have adopted policies that govern our working relationships with the communities where we operate and that are designed to guide our practices and programs in a manner that respects human rights and the culture of the local people impacted by our operations. In addition, global regulations with regard to human rights and environmental due diligence in supply chains require us to identify, and to prevent, or at least mitigate, adverse impacts on human rights and the environment.
We continue to make significant expenditures on community development, health, education, training and cultural programs, which include:
•comprehensive job training programs
•clean water and sanitation projects
•public health programs, including malaria control
•agricultural assistance programs
•small and medium enterprise development programs
•basic education programs
•advanced education scholarships
•cultural resources promotion and preservation programs
•community infrastructure development
•charitable donations
In 2000, we endorsed the joint U.S. State Department-British Foreign Office Voluntary Principles on Security and Human Rights (Voluntary Principles). We participated in developing these Voluntary Principles with other major natural resource companies and international human rights organizations and they are incorporated into our Human Rights Policy. The Voluntary Principles provide guidelines for our security programs, including interaction with host-government security personnel, private security contractors and our internal security employees.
Our Human Rights Policy reflects our commitment to implementing the United Nations Guiding Principles on Business and Human Rights. We conduct site-level human rights impact assessments (HRIAs) at our global operations, which help us to embed human rights considerations into our business practices. We completed HRIAs at Cerro Verde in 2024, our PT-FI Grasberg operations in 2023, Arizona operations in 2022, El Abra in 2021 and New Mexico operations in 2018. We are at the mid-way point of our HRIA at PT-FI’s new downstream processing facilities and plan to initiate our HRIA at our Colorado operations later in 2025. We continue to participate in a multi-industry human rights working group to gain insight from peer companies and experts in the field to learn how best practices are evolving.
We believe that our social and economic development programs are responsive to the issues raised by the local communities near our areas of operation and help us maintain good relations with the surrounding communities and avoid disruptions of mining operations. As part of our ongoing commitment to our community stakeholders, we have made and expect to continue making investments in certain social programs, including in-kind support and administration, across our global operations from time to time. Over the last three years, charges for these investments have averaged approximately $185 million per year. Nevertheless, social and political instability in the areas of our operations may adversely impact our mining operations. Refer to Item 1A. “Risk Factors” for further discussion.
South America. Cerro Verde has provided a variety of community support projects over the years. Following engagements with regional and local governments, civic leaders and development agencies, Cerro Verde constructed a potable water treatment plant to serve Arequipa. In addition, the development of a water storage network was financed by Cerro Verde and a distribution network was financed by the Cerro Verde Civil Association.
In 2015, Cerro Verde completed construction of a wastewater treatment plant for the city of Arequipa, which, in addition to supplementing existing water supplies to support Cerro Verde’s concentrator expansion, also improves the local water quality, enhances agriculture products grown in the area and reduces the risk of waterborne illnesses. In addition to these projects, Cerro Verde annually makes significant community development investments in the Arequipa region.
Security Matters. Consistent with our operating permits in Peru and our commitment to protect our employees and property, we have taken steps to provide a safe and secure working environment. As part of its security program,
Cerro Verde maintains its own internal security department. Both employees and contractors perform functions such as protecting company facilities, monitoring shipments of supplies and products, assisting in traffic control and aiding in emergency response operations. The security department receives human rights and Voluntary Principles training annually. Cerro Verde’s costs for its internal civilian security department totaled $8 million in both 2024 and 2023 and $7 million in 2022.
Cerro Verde, like all businesses and residents of Peru, relies on the Peru government for the maintenance of public order, upholding the rule of law and the protection of personnel and property. The Peru government is responsible for employing police personnel and directing their operations. Cerro Verde has limited public security forces in support of its operation, with the arrangement defined through an Inter-institutional Cooperation Agreement with the Peru National Police. Cerro Verde’s share of support costs for government-provided security approximated $1 million in 2024, 2023 and 2022. Refer to Item 1A. “Risk Factors” for further discussion of security risks in Peru.
Indonesia. PT-FI provides funding and technical assistance to support various community development programs in areas such as health, education, economic development and local infrastructure. In 1996, PT-FI established a social investment fund with the aim of contributing to social and economic development in the Mimika Regency. Prior to 2019, the fund was mainly managed by the Amungme and Kamoro Community Development Organization, a community-led institution. In 2019, a new foundation, the Amungme and Kamoro Community Empowerment Foundation (Yayasan Pemberdayaan Masyarakat Amungme dan Kamoro, or YPMAK), was established, and in 2020, PT-FI appointed YPMAK to assist in distributing a significant portion of PT-FI’s funding to support the development and empowerment of the local Indigenous Papuan people. YPMAK is governed by a Board of Governors consisting of seven representatives, including four from PT-FI.
In addition, since 2001, PT-FI has voluntarily established and contributed to land rights trust funds administered by Amungme and Kamoro representatives that focus on socioeconomic initiatives, human rights and environmental issues.
PT-FI is committed to the continued funding of YPMAK programs and the land rights trust funds, as well as other local-community development initiatives, making annual investments in public health, education, and local economic development. PT-FI recorded charges totaling $141 million in 2024 and $123 million in both 2023 and 2022 to production and delivery costs for social and economic development programs.
Security Matters. Consistent with our ongoing commitment to protect our employees and property, we have taken steps to provide a safe and secure working environment. As part of its security program, PT-FI maintains its own internal civilian security department. Both employees and contractors perform functions such as protecting company facilities, monitoring shipments of supplies and products, assisting in traffic control and aiding in emergency response operations. The security department receives human rights training annually.
PT-FI’s costs for its internal civilian security department totaled $49 million in 2024, $51 million in 2023 and $50 million in 2022.
PT-FI, like all businesses and residents of Indonesia, relies on the Indonesia government for the maintenance of public order, upholding the rule of law and protection of personnel and property. The Grasberg minerals district has been designated by the Indonesia government as one of Indonesia’s national vital objects. This designation results in the police and, to a lesser extent, the military playing a significant role in protecting the area of our operations. The Indonesia government is responsible for employing police and military personnel and directing their operations. As part of pre-deployment, all military and police personnel receive human rights training.
From the outset of PT-FI’s operations, the Indonesia government has looked to PT-FI to provide logistical and infrastructure support and assistance for these necessary services because of the limited resources of the Indonesia government and the remote location of and lack of development in the province of Central Papua. PT-FI’s financial support of the Indonesia government security institutions assigned to PT-FI’s operations area represents a prudent response to PT-FI’s requirements and commitments to protect its workforce and property, better ensuring that personnel are properly fed and lodged and have the logistical resources to patrol PT-FI’s roads and secure its area of operations. In addition, the provision of such support is consistent with our philosophy of responsible corporate citizenship and reflects our commitment to pursue practices that protect and respect human rights.
PT-FI’s support costs for the government-provided security totaled $24 million in 2024 and $25 million in both 2023 and 2022. This supplemental support consists of various infrastructure and other costs, including food, housing, fuel, travel, vehicle repairs, allowances to cover incidental and administrative costs, and community assistance programs conducted by the military and police. Refer to Item 1A. “Risk Factors” for further discussion of security risks in Indonesia.
MINING PRODUCTION AND SALES DATA
| | | | | | | | | | | | | | | | | | | | | | | | | | | | | | | | | | | | | | |
| Years Ended December 31, | |
| Production | | Sales | |
COPPER (millions of recoverable pounds) | 2024 | | 2023 | | 2022 | | 2024 | | 2023 | | 2022 | |
| (FCX’s net interest in %) | | | | | | | | | | | | |
| North America | | | | | | | | | | | | |
Morenci (72%)a | 505 | | | 575 | | | 636 | | | 517 | | | 578 | | | 639 | | |
| Safford (100%) | 249 | | | 245 | | | 285 | | | 246 | | | 250 | | | 281 | | |
| Sierrita (100%) | 165 | | | 185 | | | 184 | | | 167 | | | 183 | | | 186 | | |
| Bagdad (100%) | 146 | | | 146 | | | 165 | | | 146 | | | 148 | | | 169 | | |
| Chino (100%) | 133 | | | 141 | | | 130 | | | 133 | | | 143 | | | 127 | | |
| Tyrone (100%) | 43 | | | 51 | | | 59 | | | 44 | | | 53 | | | 59 | | |
| Miami (100%) | 9 | | | 12 | | | 11 | | | 10 | | | 12 | | | 11 | | |
| Other (100%) | (4) | | | (5) | | | (3) | | | (6) | | | (6) | | | (3) | | |
| Total North America | 1,246 | | | 1,350 | | | 1,467 | | | 1,257 | | | 1,361 | | | 1,469 | | |
| South America | | | | | | | | | | | | |
Cerro Verde (55.08%)b | 949 | | | 985 | | | 974 | | | 958 | | | 988 | | | 964 | | |
| El Abra (51%) | 219 | | | 217 | | | 202 | | | 219 | | | 212 | | | 198 | | |
| | | | | | | | | | | | |
| Total South America | 1,168 | | | 1,202 | | | 1,176 | | | 1,177 | | | 1,200 | | | 1,162 | | |
| Indonesia | | | | | | | | | | | | |
Grasberg minerals district (48.76%)c | 1,800 | | | 1,660 | | | 1,567 | | | 1,632 | | | 1,525 | | | 1,582 | | |
| Consolidated | 4,214 | | | 4,212 | | | 4,210 | | | 4,066 | | d | 4,086 | | d | 4,213 | | d |
| | | | | | | | | | | | |
| | | | | | | | | | | | |
| Less noncontrolling interests | 1,465 | | | 1,414 | | | 845 | | | 1,384 | | | 1,344 | | | 840 | | |
| Net | 2,749 | | | 2,798 | | | 3,365 | | | 2,682 | | | 2,742 | | | 3,373 | | |
| Average realized price per pound | | | | | | | $ | 4.21 | | | $ | 3.85 | | | $ | 3.90 | | |
GOLD (thousands of recoverable ounces) | | | | | | | | | | | | |
| (FCX’s net interest in %) | | | | | | | | | | | | |
| North America (100%) | 19 | | | 15 | | | 13 | | | 20 | | | 16 | | | 12 | | |
| | | | | | | | | | | | |
Indonesia (48.76%)c | 1,861 | | | 1,978 | | | 1,798 | | | 1,817 | | | 1,697 | | | 1,811 | | |
| Consolidated | 1,880 | | | 1,993 | | | 1,811 | | | 1,837 | | | 1,713 | | | 1,823 | | |
| Less noncontrolling interests | 953 | | | 952 | | | 337 | | | 931 | | | 808 | | | 339 | | |
| Net | 927 | | | 1,041 | | | 1,474 | | | 906 | | | 905 | | | 1,484 | | |
| Average realized price per ounce | | | | | | | $ | 2,418 | | | $ | 1,972 | | | $ | 1,787 | | |
MOLYBDENUM (millions of recoverable pounds) | | | | | | | | | | | | |
| (FCX’s net interest in %) | | | | | | | | | | | | |
| Climax (100%) | 18 | | | 17 | | | 21 | | | N/A | | N/A | | N/A | |
| Henderson (100%) | 12 | | | 13 | | | 12 | | | N/A | | N/A | | N/A | |
North America copper mines (100%)a | 30 | | | 30 | | | 29 | | | N/A | | N/A | | N/A | |
Cerro Verde (55.08%)b | 20 | | | 22 | | | 23 | | | N/A | | N/A | | N/A | |
| Consolidated | 80 | | | 82 | | | 85 | | | 78 | | | 81 | | | 75 | | |
| Less noncontrolling interest | 9 | | | 10 | | | 11 | | | 9 | | | 10 | | | 10 | | |
| Net | 71 | | | 72 | | | 74 | | | 69 | | | 71 | | | 65 | | |
| Average realized price per pound | | | | | | | $ | 21.77 | | | $ | 24.64 | | | $ | 18.71 | | |
a.Amounts are net of Morenci’s joint venture partners’ undivided interest.
b.Our economic interest in Cerro Verde is 55.08%, and prior to September 2024 it was 53.56%.
c.Our economic interest in PT-FI is 48.76% and prior to 2023, it approximated 81% (refer to Note 2 for further discussion).
d.Consolidated sales volumes exclude purchased copper of 158 million pounds in 2024, 103 million pounds in 2023 and 124 million pounds in 2022.
SELECTED OPERATING DATA
| | | | | | | | | | | | | | | | | | | | | | | | | | | | | | | | |
| | Years Ended December 31, | |
| | 2024 | | 2023 | | 2022 | | 2021 | | 2020 | |
| CONSOLIDATED MINING | | | | | | | | | | |
| Copper (millions of recoverable pounds) | | | | | | | | | | |
| Production | 4,214 | | | 4,212 | | | 4,210 | | | 3,843 | | | 3,206 | | |
| Sales, excluding purchases | 4,066 | | | 4,086 | | | 4,213 | | | 3,807 | | | 3,202 | | |
| Average realized price per pound | $ | 4.21 | | | $ | 3.85 | | | $ | 3.90 | | | $ | 4.33 | | | $ | 2.95 | | |
| Gold (thousands of recoverable ounces) | | | | | | | | | | |
| Production | 1,880 | | | 1,993 | | | 1,811 | | | 1,381 | | | 857 | | |
| Sales, excluding purchases | 1,837 | | | 1,713 | | | 1,823 | | | 1,360 | | | 855 | | |
| Average realized price per ounce | $ | 2,418 | | | $ | 1,972 | | | $ | 1,787 | | | $ | 1,796 | | | $ | 1,832 | | |
| Molybdenum (millions of recoverable pounds) | | | | | | | | | | |
| Production | 80 | | | 82 | | | 85 | | | 85 | | | 76 | | |
| Sales, excluding purchases | 78 | | | 81 | | | 75 | | | 82 | | | 80 | | |
| Average realized price per pound | $ | 21.77 | | | $ | 24.64 | | | $ | 18.71 | | | $ | 15.56 | | | $ | 10.20 | | |
| | | | | | | | | | |
| NORTH AMERICA COPPER MINES | | | | | | | | | | |
Operating Data, Net of Joint Venture Interestsa | | | | | | | | | | |
| Copper (millions of recoverable pounds) | | | | | | | | | | |
| Production | 1,246 | | | 1,350 | | | 1,467 | | | 1,460 | | | 1,418 | | |
| Sales, excluding purchases | 1,257 | | | 1,361 | | | 1,469 | | | 1,436 | | | 1,422 | | |
| Average realized price per pound | $ | 4.29 | | | $ | 3.93 | | | $ | 4.08 | | | $ | 4.30 | | | $ | 2.82 | | |
| Molybdenum (millions of recoverable pounds) | | | | | | | | | | |
| Production | 30 | | | 30 | | | 29 | | | 34 | | | 33 | | |
| 100% Operating Data | | | | | | | | | | |
| Leach operations | | | | | | | | | | |
| Leach ore placed in stockpiles (metric tons per day) | 609,400 | | | 692,000 | | | 676,400 | | | 665,900 | | | 714,300 | | |
| Average copper ore grade (%) | 0.20 | | | 0.23 | | | 0.29 | | | 0.29 | | | 0.27 | | |
| Copper production (millions of recoverable pounds) | 842 | | | 941 | | | 1,019 | | | 1,056 | | | 1,047 | | |
| Mill operations | | | | | | | | | | |
| Ore milled (metric tons per day) | 311,700 | | | 308,500 | | | 294,200 | | | 269,500 | | | 279,700 | | |
| Average ore grade (%): | | | | | | | | | | |
| Copper | 0.30 | | | 0.32 | | | 0.37 | | | 0.38 | | | 0.35 | | |
| Molybdenum | 0.02 | | | 0.02 | | | 0.02 | | | 0.03 | | | 0.02 | | |
| Copper recovery rate (%) | 83.2 | | | 81.8 | | | 81.8 | | | 81.2 | | | 84.1 | | |
| Copper production (millions of recoverable pounds) | 601 | | | 633 | | | 695 | | | 649 | | | 647 | | |
| | | | | | | | | | |
| SOUTH AMERICA OPERATIONS | | | | | | | | | | |
| Copper (millions of recoverable pounds) | | | | | | | | | | |
| Production | 1,168 | | | 1,202 | | | 1,176 | | | 1,047 | | | 979 | | |
| Sales | 1,177 | | | 1,200 | | | 1,162 | | | 1,055 | | | 976 | | |
| Average realized price per pound | $ | 4.16 | | | $ | 3.82 | | | $ | 3.80 | | | $ | 4.34 | | | $ | 3.05 | | |
| | | | | | | | | | |
| | | | | | | | | | |
| | | | | | | | | | |
| | | | | | | | | | |
| Molybdenum (millions of recoverable pounds) | | | | | | | | | | |
| Production | 20 | | | 22 | | | 23 | | | 21 | | | 19 | | |
| Leach operations | | | | | | | | | | |
| Leach ore placed in stockpiles (metric tons per day) | 164,300 | | | 191,200 | | | 163,000 | | | 163,900 | | | 160,300 | | |
| Average copper ore grade (%) | 0.42 | | | 0.35 | | | 0.35 | | | 0.32 | | | 0.35 | | |
| Copper production (millions of recoverable pounds) | 295 | | | 317 | | | 302 | | | 256 | | | 241 | | |
| Mill operations | | | | | | | | | | |
| Ore milled (metric tons per day) | 415,500 | | | 417,400 | | | 409,200 | | | 380,300 | | | 331,600 | | |
| Average ore grade (%): | | | | | | | | | | |
| Copper | 0.33 | | | 0.34 | | | 0.32 | | | 0.31 | | | 0.34 | | |
| | | | | | | | | | |
| Molybdenum | 0.01 | | | 0.01 | | | 0.01 | | | 0.01 | | | 0.01 | | |
| Copper recovery rate (%) | 83.6 | | | 81.3 | | | 85.3 | | | 87.3 | | | 84.3 | | |
| Copper production (millions of recoverable pounds) | 873 | | | 885 | | | 874 | | | 791 | | | 738 | | |
a.Amounts are net of Morenci’s joint venture partners’ undivided interest.
SELECTED OPERATING DATA (Continued)
| | | | | | | | | | | | | | | | | | | | | | | | | | | | | | | | |
| | Years Ended December 31, | |
| | 2024 | | 2023 | | 2022 | | 2021 | | 2020 | |
| INDONESIA OPERATIONS | | | | | | | | | | |
| | | | | | | | | | |
| Copper (millions of recoverable pounds) | | | | | | | | | | |
| Production | 1,800 | | | 1,660 | | | 1,567 | | | 1,336 | | | 809 | | |
| Sales | 1,632 | | | 1,525 | | | 1,582 | | | 1,316 | | | 804 | | |
| Average realized price per pound | $ | 4.19 | | | $ | 3.81 | | | $ | 3.80 | | | $ | 4.34 | | | $ | 3.08 | | |
| Gold (thousands of recoverable ounces) | | | | | | | | | | |
| Production | 1,861 | | | 1,978 | | | 1,798 | | | 1,370 | | | 848 | | |
| Sales | 1,817 | | | 1,697 | | | 1,811 | | | 1,349 | | | 842 | | |
| Average realized price per ounce | $ | 2,418 | | | $ | 1,972 | | | $ | 1,787 | | | $ | 1,796 | | | $ | 1,832 | | |
| Mill operations | | | | | | | | | | |
| Ore milled (metric tons per day) | 208,400 | | | 198,300 | | | 192,600 | | | 151,600 | | | 87,700 | | |
| Average ore grade: | | | | | | | | | | |
| Copper (%) | 1.27 | | | 1.22 | | | 1.19 | | | 1.30 | | | 1.32 | | |
| Gold (grams per metric ton) | 1.00 | | | 1.12 | | | 1.05 | | | 1.04 | | | 1.10 | | |
| Recovery rates (%): | | | | | | | | | | |
| Copper | 88.4 | | | 89.7 | | | 90.0 | | | 89.8 | | | 91.9 | | |
| Gold | 76.9 | | | 77.9 | | | 77.7 | | | 77.0 | | | 78.1 | | |
| | | | | | | | | | |
| | | | | | | | | | |
| | | | | | | | | | |
| | | | | | | | | | |
| MOLYBDENUM MINES | | | | | | | | | | |
| Ore milled (metric tons per day) | 28,000 | | | 27,900 | | | 26,100 | | | 21,800 | | | 20,700 | | |
| Average molybdenum ore grade (%) | 0.16 | | | 0.15 | | | 0.18 | | | 0.19 | | | 0.17 | | |
| Molybdenum production (millions of recoverable pounds) | 30 | | | 30 | | | 33 | | | 30 | | | 24 | | |
| | | | | | | | | | |
| | | | | | | | | | |
| | | | | | | | | | |
| | | | | | | | | | |
| | | | | | | | | | |
| | | | | | | | | | |
| | | | | | | | | | |
| | | | | | | | | | |
| | | | | | | | | | |
| | | | | | | | | | |
| | | | | | | | | | |
| | | | | | | | | | |
| | | | | | | | | | |
| | | | | | | | | | |
| | | | | | | | | | |
| | | | | | | | | | |
| | | | | | | | | | |
| | | | | | | | | | |
| | | | | | | | | | |
| | | | | | | | | | |
| | | | | | | | | | |
| | | | | | | | | | |
| | | | | | | | | | |
| | | | | | | | | | |
| | | | | | | | | | |
| | | | | | | | | | |
MINERAL RESERVES
Our estimates of mineral reserves have been prepared using industry accepted practice and conform to the disclosure requirements of Subpart 1300 of SEC Regulation S-K. Proven and probable mineral reserves were determined from the application of relevant modifying factors to geological data to establish an operational, economically viable mine plan. The estimates are based on mapping, drilling, sampling, assaying and evaluation methods generally applied in the mining industry. Mineral reserves, as used in the mineral reserve data presented here, means the economically mineable part of a measured or indicated resource, which includes diluting materials and allowances for losses that may occur when the material is mined or extracted. Proven mineral reserves mean the economically mineable part of a measured mineral resource, from geological evidence revealed in outcrops, trenches, workings or drill holes with grades and/or quality estimates from detailed, closely spaced sampling, and geologic characterization that defines the size, shape, depth and mineral content to a high degree of confidence. Probable mineral reserves means the economically mineable part of an indicated mineral resource, for which quantity and grade are estimated from information similar to that used for measured mineral resources where the samples are farther apart, and the geological characterization is adequate. Probable mineral reserves can also include remaining portions of a measured mineral resource. The degree of assurance, although lower than that for proven mineral reserves, is high enough to assume continuity between points of observation.
Our estimates of recoverable proven and probable mineral reserves are prepared by and are the responsibility of our employees. These estimates are reviewed and verified regularly by independent experts in mining, geology and reserve determination. Our mineral reserve estimates are based on the latest available geological and geotechnical studies. We conduct ongoing studies of our ore bodies to evaluate economic values and to manage risk. We revise our mine plans and estimates of recoverable proven and probable mineral reserves as required in accordance with the latest available studies. Refer to Item 1A. “Risk Factors” for discussion of risks associated with our estimates of proven and probable mineral reserves.
Estimated recoverable proven and probable mineral reserves at December 31, 2024, were determined using metal price assumptions of $3.25 per pound for copper, $1,600 per ounce for gold and $12.00 per pound for molybdenum. For the three-year period ended December 31, 2024, LME copper settlement prices averaged $4.00 per pound, London PM gold prices averaged $2,044 per ounce and the weekly average price for molybdenum quoted by Platts Metals Daily averaged $21.41 per pound.
The estimated recoverable proven and probable mineral reserves presented in the table below represent the estimated metal quantities from which we expect to be paid after application of estimated metallurgical recoveries and smelter recoveries, where applicable.
| | | | | | | | | | | | | | | | | | | | |
| | Estimated Recoverable Proven and Probable Mineral Reserves at December 31, 2024 | |
| Coppera (billion pounds) | | Gold (million ounces) | | Molybdenum (billion pounds) | |
| North America | 41.6 | | | 0.6 | | | 2.51 | | |
South Americab | 28.4 | | | — | | | 0.66 | | |
Indonesiac | 27.0 | | | 22.4 | | | — | | |
Consolidated basisd | 97.0 | | | 23.0 | | | 3.16 | | |
Net equity intereste | 70.2 | | | 11.5 | | | 2.87 | | |
Note: May not foot because of rounding.
a.Estimated consolidated recoverable copper reserves include 1.4 billion pounds in leach stockpiles and 0.3 billion pounds in mill stockpiles (refer to “Mill and Leach Stockpiles” for further discussion).
b.Excludes the El Abra mill project discussed in “Operations – South America” (estimated potential addition of approximately 20 billion recoverable pounds of copper in concentrate and cathode).
c.Estimated recoverable proven and probable mineral reserves from Indonesia reflect estimates of minerals that can be recovered through the life of the IUPK in 2041. We believe an extension would provide additional material reserves. Refer to Note 11 for discussion of PT-FI’s IUPK.
d.Consolidated mineral reserves represent estimated metal quantities after reduction for joint venture partner interests at the Morenci mine in North America (refer to Note 2 for further discussion of our Morenci joint venture). Excluded from the table above are our estimated recoverable proven and probable silver reserves of 318 million ounces, which were determined using $20 per ounce.
e.Net equity interest mineral reserves represent estimated consolidated metal quantities further reduced for noncontrolling interest ownership (refer to Note 2 for further discussion of our ownership in subsidiaries). Excluded from the table above are our estimated recoverable proven and probable silver reserves of 213 million ounces.
| | | | | | | | | | | | | | | | | | | | | | | | | | | | | | | | | | | | | | | | | | | | | | | | | | | | | | | | | | | | | | | | | | | | | | | | | | | | | | | | | | | | | | | | | |
| Estimated Recoverable Proven and Probable Mineral Reserves |
| at December 31, 2024 |
| | | | | | Proven Mineral Reserves | | | Probable Mineral Reserves | |
| | | | | | Million Metric Tons | | Average Ore Grade | | | Million Metric Tons | | Average Ore Grade | |
| | FCX’s | | Processing | | FCX’s | | 100% | | Copper | | Gold | | Moly | | Silver | | | FCX’s | | 100% | | Copper | | Gold | | Moly | | Silver | |
| | Interest | | Method | | Interest | | Basis | | % | | g/t | | % | | g/t | | | Interest | | Basis | | % | | g/t | | % | | g/t | |
| North America | | | | | | | | | | | | | | | | | | | | | | | | | | | | | |
| Morenci | 72% | | Mill | | 525 | | | 730 | | | 0.33 | | | — | | | 0.02 | | | — | | | | 50 | | | 69 | | | 0.32 | | | — | | | 0.03 | | | — | | |
| | | | Crushed leach | | 63 | | | 88 | | | 0.36 | | | — | | | — | | | — | | | | 1 | | | 2 | | | 0.31 | | | — | | | — | | | — | | |
| | | | ROM leach | | 1,787 | | | 2,481 | | | 0.17 | | | — | | | — | | | — | | | | 313 | | | 435 | | | 0.15 | | | — | | | — | | | — | | |
| Bagdad | 100% | | Mill | | 2,032 | | | 2,032 | | | 0.35 | | | — | | a | 0.02 | | | 1.46 | | | | 380 | | | 380 | | | 0.33 | | | — | | a | 0.02 | | | 1.36 | | |
| | | | ROM leach | | 11 | | | 11 | | | 0.34 | | | — | | | — | | | — | | | | 7 | | | 7 | | | 0.26 | | | — | | | — | | | — | | |
| Safford, including Lone Star | 100% | | Crushed leach | | 659 | | | 659 | | | 0.43 | | | — | | | — | | | — | | | | 87 | | | 87 | | | 0.41 | | | — | | | — | | | — | | |
| | | | | | | | | | | | | | | | | | | | | | | | | | | | | |
| Sierrita | 100% | | Mill | | 1,824 | | | 1,824 | | | 0.23 | | | — | | a | 0.03 | | | 1.08 | | | | 382 | | | 382 | | | 0.25 | | | — | | a | 0.02 | | | 1.16 | | |
| | | | | | | | | | | | | | | | | | | | | | | | | | | | | |
| | | | | | | | | | | | | | | | | | | | | | | | | | | | | |
| Chino, including Cobre | 100% | | Mill | | 201 | | | 201 | | | 0.49 | | | 0.05 | | | — | | | 0.92 | | | | 100 | | | 100 | | | 0.52 | | | 0.05 | | | — | | | 0.96 | | |
| | | | ROM leach | | 61 | | | 61 | | | 0.24 | | | — | | | — | | | — | | | | 8 | | | 8 | | | 0.25 | | | — | | | — | | | — | | |
| Tyrone | 100% | | ROM leach | | 62 | | | 62 | | | 0.19 | | | — | | | — | | | — | | | | 7 | | | 7 | | | 0.21 | | | — | | | — | | | — | | |
| Henderson | 100% | | Mill | | 31 | | | 31 | | | — | | | — | | | 0.16 | | | — | | | | 13 | | | 13 | | | — | | | — | | | 0.16 | | | — | | |
| Climax | 100% | | Mill | | 130 | | | 130 | | | — | | | — | | | 0.15 | | | — | | | | 11 | | | 11 | | | — | | | — | | | 0.10 | | | — | | |
| | | | | | | | | | | | | | | | | | | | | | | | | | | | | |
| | | | | | | | | | | | | | | | | | | | | | | | | | | | | |
| | | | | | 7,385 | | | 8,309 | | | | | | | | | | | | 1,361 | | | 1,502 | | | | | | | | | | |
| South America | | | | | | | | | | | | | | | | | | | | | | | | | | | | | |
| Cerro Verde | 55.08% | | Mill | | 347 | | | 629 | | | 0.36 | | | — | | | 0.02 | | | 1.90 | | | | 1,755 | | | 3,186 | | | 0.34 | | | — | | | 0.01 | | | 1.79 | | |
| | | | | | | | | | | | | | | | | | | | | | | | | | | | | |
| | | | ROM leach | | 10 | | | 17 | | | 0.41 | | | — | | | — | | | — | | | | 34 | | | 62 | | | 0.19 | | | — | | | — | | | — | | |
| El Abra | 51% | | Crushed leach | | 232 | | | 454 | | | 0.48 | | | — | | | — | | | — | | | | 29 | | | 57 | | | 0.39 | | | — | | | — | | | — | | |
| | | | ROM leach | | 45 | | | 89 | | | 0.25 | | | — | | | — | | | — | | | | 6 | | | 11 | | | 0.18 | | | — | | | — | | | — | | |
| | | | | | 633 | | | 1,189 | | | | | | | | | | | | 1,824 | | | 3,316 | | | | | | | | | | |
| Indonesia | | | | | | | | | | | | | | | | | | | | | | | | | | | | | |
| Grasberg Block Cave | 48.76% | | Mill | | 93 | | | 191 | | | 1.27 | | | 0.90 | | | — | | | 3.48 | | | | 257 | | | 528 | | | 0.89 | | | 0.58 | | | — | | | 3.61 | | |
| DMLZ | 48.76% | | Mill | | 37 | | | 77 | | | 0.92 | | | 0.74 | | | — | | | 4.07 | | | | 122 | | | 250 | | | 0.68 | | | 0.55 | | | — | | | 3.45 | | |
| | | | | | | | | | | | | | | | | | | | | | | | | | | | | |
| Big Gossan | 48.76% | | Mill | | 10 | | | 20 | | | 2.43 | | | 1.03 | | | — | | | 15.15 | | | | 14 | | | 28 | | | 2.10 | | | 0.90 | | | — | | | 12.68 | | |
| | | | | | | | | | | | | | | | | | | | | | | | | | | | | |
Kucing Liarb | 48.76% | | Mill | | 49 | | | 100 | | | 1.17 | | | 1.03 | | | — | | | 6.16 | | | | 131 | | | 268 | | | 1.08 | | | 0.91 | | | — | | | 5.55 | | |
| | | | | | 189 | | | 388 | | | | | | | | | | | | 524 | | | 1,074 | | | | | | | | | | |
| Total FCX – 100% Basis | | | | | | | 9,886 | | | | | | | | | | | | | | 5,893 | | | | | | | | | | |
Total FCX – Consolidated basisc | | | | | | 8,963 | | | | | | | | | | | | | | 5,751 | | | | | | | | | | |
Total FCX – Net equity interestd | | | | | | 8,207 | | | | | | | | | | | | | | 3,708 | | | | | | | | | | |
| | | | | | | | | | | | | | | | | | | | | | | | | | | | | |
Note: Totals may not foot because of rounding.
a.Amounts not shown because of rounding.
b.PT-FI has commenced long-term mine development activities for the Kucing Liar deposit. See “Operations – Indonesia” for discussion of Kucing Liar capital investments.
c.Consolidated reserves represent estimated quantities after reduction for Morenci’s joint venture partner interests (refer to Note 2 for further discussion).
d.Net equity interest represents estimated consolidated quantities further reduced for noncontrolling interest ownership (refer to Note 2 for further discussion of our ownership in subsidiaries).
The reserve table above and the tables on the following pages utilize the abbreviations described below:
•g/t – grams per metric ton
•Moly – Molybdenum
| | | | | | | | | | | | | | | | | | | | | | | | | | | | | | | | | | | | | | | | | | | | | | | | | | | | | | | | | | | | | | | | | | | | | | | | | | |
| Estimated Recoverable Proven and Probable Mineral Reserves |
| at December 31, 2024 (continued) |
|
| | | | | Proven and Probable | | | |
| | | | | | Million Metric Tons | | Average Ore Grade | | Recoveriesa | |
| | FCX’s | | Processing | | FCX’s | | 100% | | Copper | | Gold | | Moly | | Silver | | Copper | | Gold | | Moly | | Silver | |
| | Interest | | Method | | Interest | | Basis | | % | | g/t | | % | | g/t | | % | | % | | % | | % | |
| North America | | | | | | | | | | | | | | | | | | | | | | | | |
| Morenci | 72% | | Mill | | 575 | | | 799 | | | 0.33 | | | — | | | 0.02 | | | — | | | 82.8 | | | — | | | 44.1 | | | — | | |
| | | | Crushed leach | | 64 | | | 90 | | | 0.36 | | | — | | | — | | | — | | | 83.2 | | | — | | | — | | | — | | |
| | | | ROM leach | | 2,100 | | | 2,916 | | | 0.17 | | | — | | | — | | | — | | | 49.7 | | | — | | | — | | | — | | |
| Bagdad | 100% | | Mill | | 2,412 | | | 2,412 | | | 0.35 | | | — | | b | 0.02 | | | 1.44 | | | 84.2 | | | 59.1 | | | 77.1 | | | 49.3 | | |
| | | | ROM leach | | 18 | | | 18 | | | 0.31 | | | — | | | — | | | — | | | 43.8 | | | — | | | — | | | — | | |
| Safford, including Lone Star | 100% | | Crushed leach | | 746 | | | 746 | | | 0.43 | | | — | | | — | | | — | | | 70.1 | | | — | | | — | | | — | | |
| | | | | | | | | | | | | | | | | | | | | | | | |
| Sierrita | 100% | | Mill | | 2,206 | | | 2,206 | | | 0.23 | | | — | | b | 0.03 | | | 1.10 | | | 81.2 | | | 59.1 | | | 78.0 | | | 49.3 | | |
| | | | | | | | | | | | | | | | | | | | | | | | |
| | | | | | | | | | | | | | | | | | | | | | | | |
| Chino, including Cobre | 100% | | Mill | | 301 | | | 301 | | | 0.50 | | | 0.05 | | | — | | | 0.93 | | | 79.5 | | | 77.9 | | | — | | | 78.5 | | |
| | | | ROM leach | | 69 | | | 69 | | | 0.25 | | | — | | | — | | | — | | | 37.4 | | | — | | | — | | | — | | |
| Tyrone | 100% | | ROM leach | | 69 | | | 69 | | | 0.19 | | | — | | | — | | | — | | | 57.8 | | | — | | | — | | | — | | |
| Henderson | 100% | | Mill | | 44 | | | 44 | | | — | | | — | | | 0.16 | | | — | | | — | | | — | | | 87.8 | | | — | | |
| Climax | 100% | | Mill | | 141 | | | 141 | | | — | | | — | | | 0.15 | | | — | | | — | | | — | | | 88.8 | | | — | | |
| | | | | | | | | | | | | | | | | | | | | | | | |
| | | | | | | | | | | | | | | | | | | | | | | | |
| | | | | | 8,746 | | | 9,811 | | | | | | | | | | | | | | | | | | |
| South America | | | | | | | | | | | | | | | | | | | | | | | | |
| Cerro Verde | 55.08% | | Mill | | 2,102 | | | 3,815 | | | 0.34 | | | — | | | 0.01 | | | 1.81 | | | 85.6 | | | — | | | 54.4 | | | 44.9 | | |
| | | | | | | | | | | | | | | | | | | | | | | | |
| | | | ROM leach | | 43 | | | 79 | | | 0.24 | | | — | | | — | | | — | | | 48.9 | | | — | | | — | | | — | | |
| El Abra | 51% | | Crushed leach | | 261 | | | 511 | | | 0.47 | | | — | | | — | | | — | | | 50.3 | | | — | | | — | | | — | | |
| | | | ROM leach | | 51 | | | 100 | | | 0.24 | | | — | | | — | | | — | | | 39.3 | | | — | | | — | | | — | | |
| | | | | | 2,457 | | | 4,505 | | | | | | | | | | | | | | | | | | |
| Indonesia | | | | | | | | | | | | | | | | | | | | | | | | |
| Grasberg Block Cave | 48.76% | | Mill | | 351 | | | 719 | | | 0.99 | | | 0.66 | | | — | | | 3.57 | | | 85.1 | | | 67.3 | | | — | | | 58.4 | | |
| DMLZ | 48.76% | | Mill | | 159 | | | 326 | | | 0.74 | | | 0.60 | | | — | | | 3.60 | | | 83.0 | | | 77.8 | | | — | | | 63.4 | | |
| | | | | | | | | | | | | | | | | | | | | | | | |
| Big Gossan | 48.76% | | Mill | | 23 | | | 48 | | | 2.23 | | | 0.95 | | | — | | | 13.69 | | | 91.4 | | | 68.5 | | | — | | | 63.6 | | |
| | | | | | | | | | | | | | | | | | | | | | | | |
Kucing Liarc | 48.76% | | Mill | | 180 | | | 369 | | | 1.10 | | | 0.94 | | | — | | | 5.72 | | | 79.2 | | | 55.5 | | | — | | | 45.7 | | |
| | | | | | 713 | | | 1,462 | | | | | | | | | | | | | | | | | | |
| Total FCX – 100% Basis | | | | | | | 15,779 | | | | | | | | | | | | | | | | | | |
Total FCX – Consolidated basisd | | | | | | 14,714 | | | | | | | | | | | | | | | | | | |
Total FCX – Net equity intereste | | | | | | 11,916 | | | | | | | | | | | | | | | | | | |
Note: Amounts may not equal the sum of proven and probable mineral reserves as presented on the previous page because of rounding. In addition, totals may not foot because of rounding.
a.Recoveries are net of estimated mill and smelter losses.
b.Amounts not shown because of rounding.
c.PT-FI has commenced long-term mine development activities for the Kucing Liar deposit. See “Operations – Indonesia” for discussion of Kucing Liar capital investments.
d.Consolidated reserves represent estimated quantities after reduction for Morenci’s joint venture partner interests (refer to Note 2 for further discussion).
e.Net equity interest represents estimated consolidated quantities further reduced for noncontrolling interest ownership (refer to Note 2 for further discussion of our ownership in subsidiaries).
| | | | | | | | | | | | | | | | | | | | | | | | | | | | | | | | | | | | | | |
| Estimated Recoverable Proven and Probable Mineral Reserves |
| at December 31, 2024 (continued) |
|
| | | | | | Recoverable Mineral Reserves |
| | | | | | Copper | | Gold | | Moly | | Silver | |
| | FCX’s | | Processing | | billion | | million | | billion | | million | |
| | Interest | | Method | | lbs. | | ozs. | | lbs. | | ozs. | |
| North America | | | | | | | | | | | | |
| Morenci | 72% | | Mill | | 4.8 | | | — | | | 0.17 | | | — | | |
| | | | Crushed leach | | 0.6 | | | — | | | — | | | — | | |
| | | | ROM leach | | 5.4 | | | — | | | — | | | — | | |
| Bagdad | 100% | | Mill | | 15.7 | | | 0.2 | | | 0.86 | | | 55.2 | | |
| | | | ROM leach | | 0.1 | | | — | | | — | | | — | | |
| Safford, including Lone Star | 100% | | Crushed leach | | 4.9 | | | — | | | — | | | — | | |
| | | | | | | | | | | | |
| Sierrita | 100% | | Mill | | 9.2 | | | 0.1 | | | 0.96 | | | 38.4 | | |
| | | | | | | | | | | | |
| | | | | | | | | | | | |
| Chino, including Cobre | 100% | | Mill | | 2.6 | | | 0.4 | | | — | | | 7.1 | | |
| | | | ROM leach | | 0.1 | | | — | | | — | | | — | | |
| Tyrone | 100% | | ROM leach | | 0.2 | | | — | | | — | | | — | | |
| Henderson | 100% | | Mill | | — | | | — | | | 0.14 | | | — | | |
| Climax | 100% | | Mill | | — | | | — | | | 0.40 | | | — | | |
| | | | | | | | | | | | |
| | | | | | | | | | | | |
| | | | | | 43.6 | | | 0.6 | | | 2.53 | | | 100.6 | | |
Recoverable metal in stockpilesa | | | | 1.1 | | | — | | b | 0.03 | | | 0.2 | | |
| 100% operations | | | | 44.7 | | | 0.6 | | | 2.55 | | | 100.8 | | |
| Consolidated | | | | 41.6 | | | 0.6 | | | 2.51 | | | 100.8 | | |
| Net equity interest | | | | 41.6 | | | 0.6 | | | 2.51 | | | 100.8 | | |
| | | | | | | | | | | | |
| South America | | | | | | | | | | | | |
| Cerro Verde | 55.08% | | Mill | | 24.6 | | | — | | | 0.65 | | | 99.4 | | |
| | | | | | | | | | | | |
| | | | ROM leach | | 0.2 | | | — | | | — | | | — | | |
| El Abra | 51% | | Crushed leach | | 2.6 | | | — | | | — | | | — | | |
| | | | ROM leach | | 0.2 | | | — | | | — | | | — | | |
| | | | | | 27.7 | | | — | | | 0.65 | | | 99.4 | | |
Recoverable metal in stockpilesa | | | | 0.7 | | | — | | | 0.01 | | | 0.8 | | |
| 100% operations | | | | 28.4 | | | — | | | 0.66 | | | 100.2 | | |
| Consolidated | | | | 28.4 | | | — | | | 0.66 | | | 100.2 | | |
| Net equity interest | | | | 15.5 | | | — | | | 0.36 | | | 55.2 | | |
| | | | | | | | | | | | |
| Indonesia | | | | | | | | | | | | |
| Grasberg Block Cave | 48.76% | | Mill | | 13.4 | | | 10.3 | | | — | | | 48.3 | | |
| DMLZ | 48.76% | | Mill | | 4.4 | | | 4.9 | | | — | | | 23.9 | | |
| | | | | | | | | | | | |
| Big Gossan | 48.76% | | Mill | | 2.2 | | | 1.0 | | | — | | | 13.5 | | |
| | | | | | | | | | | | |
Kucing Liarc | 48.76% | | Mill | | 7.1 | | | 6.2 | | | — | | | 31.0 | | |
| | | | | | | | | | | | |
| | | | | | | | | | | |
| 100% operations | | | | 27.0 | | | 22.4 | | | — | | | 116.6 | | |
| Consolidated | | | | 27.0 | | | 22.4 | | | — | | | 116.6 | | |
| Net equity interest | | | | 13.2 | | | 10.9 | | | — | | | 56.8 | | |
| | | | | | | | | | | |
| Total FCX – 100% basis | | | | 100.1 | | | 23.0 | | | 3.21 | | | 317.5 | | |
Total FCX – Consolidated basisd | | | | 97.0 | | | 23.0 | | | 3.16 | | | 317.5 | | |
Total FCX – Net equity intereste | | | | 70.2 | | | 11.5 | | | 2.87 | | | 212.8 | | |
Note: Totals may not foot because of rounding.
a.Refer to “Mill and Leach Stockpiles” for additional information.
b.Amounts not shown because of rounding.
c.PT-FI has commenced long-term mine development activities for the Kucing Liar deposit. See “Operations – Indonesia” for discussion of Kucing Liar capital investments.
d.Consolidated mineral reserves represent estimated metal quantities after reduction for Morenci’s joint venture partner interests (refer to Note 2 for further discussion).
e.Net equity interest mineral reserves represent estimated consolidated metal quantities further reduced for noncontrolling interest ownership (refer to Note 2 for further discussion of our ownership in subsidiaries).
The table below summarizes changes in estimated recoverable copper, gold and molybdenum in mineral reserves between December 31, 2023 and 2024, for our material properties:
| | | | | | | | | | | | | | | | | | | | | | | | | | | | | | | | | | | | | | |
| Estimated Recoverable Mineral Reserves at 100% Basis | |
| Copper
(billion lbs.) | | Gold
(million ozs.) | | Molybdenum
(billion lbs.) | |
| Morenci | | Cerro Verde | | Grasberg minerals district | | Grasberg minerals district | | Morenci | | Cerro Verde | |
Mineral reserves as of December 31, 2023a | 12.6 | | | 27.0 | | | 29.0 | | | 23.9 | | | 0.23 | | | 0.68 | | |
| Production | (0.7) | | | (0.9) | | | (1.8) | | | (1.9) | | | — | | b | (0.02) | | |
Adjustmentsc | (0.8) | | | (0.8) | | | (0.1) | | | 0.3 | | | (0.06) | | | — | | b |
Mineral reserves as of December 31, 2024a | 11.1 | | | 25.2 | | | 27.0 | | | 22.4 | | | 0.17 | | | 0.66 | | |
| Year-over-year percentage change | (12) | % | | (7) | % | | (7) | % | | (6) | % | | (26) | % | | (3) | % | |
| | | | | | | | | | | | | | | | | | | | | | | | | | | | | | | | | | | | | | |
| Estimated Recoverable Mineral Reserves at Net Equity Basis | |
| Copper
(billion lbs.) | | Gold
(million ozs.) | | Molybdenum
(billion lbs.) | |
| Morenci | | Cerro Verde | | Grasberg minerals district | | Grasberg minerals district | | Morenci | | Cerro Verde | |
| (72%) | | (55.08%)d | | (48.76%) | | (48.76%) | | (72%) | | (55.08%)d | |
Mineral reserves as of December 31, 2023a | 9.1 | | | 14.5 | | | 14.1 | | | 11.6 | | | 0.17 | | | 0.36 | | |
| Production | (0.5) | | | (0.5) | | | (0.9) | | | (0.9) | | | — | | b | (0.01) | | |
Adjustmentsc | (0.6) | | | — | | b,e | (0.1) | | | 0.2 | | | (0.04) | | | 0.01 | | e |
Mineral reserves as of December 31, 2024a | 8.0 | | | 13.9 | | | 13.2 | | | 10.9 | | | 0.12 | | | 0.36 | | |
| Year-over-year percentage change | (12) | % | | (4) | % | | (6) | % | | (6) | % | | (29) | % | | — | % | |
Note: Totals may not foot because of rounding.
a.Includes estimated recoverable metals contained in stockpiles. Refer to “Mill and Leach Stockpiles” for additional information.
b.Amounts not shown because of rounding.
c.The downward adjustments at Morenci are primarily the result of mine plan changes and updated geologic models, partly offset by increased leach recovery assumptions. The downward adjustments at Cerro Verde are primarily the result of updated geologic modeling. The adjustments at the Grasberg minerals district are primarily the result of mine design changes.
d.FCX’s interest in Cerro Verde is 55.08%, and prior to September 2024 it was 53.56%.
e.Includes the impact of the increase in FCX’s ownership percentage in 2024.
After accounting for production, changes to the estimates of mineral reserves and mineral resources for the Morenci mine and Grasberg minerals district were not material as compared to the previously filed Technical Report Summaries for each of these properties. After accounting for production, changes to the estimate of mineral reserves for the Cerro Verde mine were not material as compared to the previously filed Technical Report Summary as of December 31, 2022. However, Cerro Verde has had a material change to its estimate of mineral resources (refer to “Mineral Resources” below). See the 2024 Technical Report Summary of Mineral Reserves and Resources for the Cerro Verde mine dated December 31, 2024, filed as Exhibit 96.1 to this Form 10-K.
In defining our open-pit mineral reserves, we apply an “operational cutoff grade” strategy, wherein multiple processing options, throughput constraints, mine development and ore availability are given consideration to maximize the value of our operations. In defining our open-pit mineral resources, internal cutoff grades are applied. The internal cutoff grade is defined for a metric ton of ore as that equivalent copper grade, once produced and sold, that generates sufficient revenue to cover estimated processing and administrative costs. We use “break-even cutoff grades” to define the in-situ mineral reserves and resources for our underground ore bodies. The break-even cutoff grade is defined for a metric ton of ore as that equivalent copper grade, once produced and sold, that generates sufficient revenue to cover all estimated operating and administrative costs associated with our production.
Our copper mines may contain other commercially recoverable metals, such as gold, molybdenum and silver. We value all commercially recoverable metals in terms of a copper equivalent percentage to determine a single cutoff grade. Copper equivalent percentage is used to express the relative value of multi-metal ores in terms of one metal. The calculation expresses the relative value of the ore using estimates of contained metal quantities, metals prices as used for reserve or resource determination, recovery rates, treatment charges and royalties. Our molybdenum properties use a molybdenum cutoff grade.
The table below shows the minimum cutoff grade for mineral reserves by process for each of our existing ore bodies as of December 31, 2024:
| | | | | | | | | | | | | | | | | | | | | | | |
| Copper Equivalent Cutoff Grade (%) | | Molybdenum
Cutoff Grade
(%) |
| Mill | | Crushed
Leach | | ROM
Leach | | Mill |
| North America | | | | | | | |
| Morenci | 0.22 | | 0.20 | | 0.03 | | — |
| Bagdad | 0.16 | | — | | 0.08 | | — |
| Safford, including Lone Star | — | | 0.14 | | — | | — |
| | | | | | | |
| Sierrita | 0.18 | | — | | — | | — |
| | | | | | | |
| Chino, including Cobre | 0.22 | | — | | 0.07 | | — |
| Tyrone | — | | — | | 0.02 | | — |
| Henderson | — | | — | | — | | 0.13 |
| Climax | — | | — | | — | | 0.05 |
| | | | | | | |
| South America | | | | | | | |
| Cerro Verde | 0.13 | | — | | 0.08 | | — |
| El Abra | — | | 0.14 | | 0.12 | | — |
| Indonesia | | | | | | | |
| Grasberg Block Cave | 0.55 | | — | | — | | — |
| DMLZ | 0.64 | | — | | — | | — |
| | | | | | | |
| Big Gossan | 1.70 | | — | | — | | — |
| | | | | | | |
| Kucing Liar | 0.64 | | — | | — | | — |
Production Sequencing
The following chart illustrates our current plans for sequencing and producing our proven and probable mineral reserves at each of our ore bodies and the years in which we currently expect production from each ore body and related stockpiles. Our proven and probable mineral reserves in Indonesia reflect estimates of minerals that can be recovered through the end of 2041, and our current mine plan and planned operations are based on the assumption that PT-FI will comply with its obligations under the IUPK and receive the second 10-year extension from 2031 through 2041 (refer to Item 1A. “Risk Factors” and Note 11 for further discussion). We develop our mine plans based on maximizing the net present value from the ore bodies. Significant additional capital expenditures will be required at many of these mines in order to achieve the life-of-mine plans reflected below.
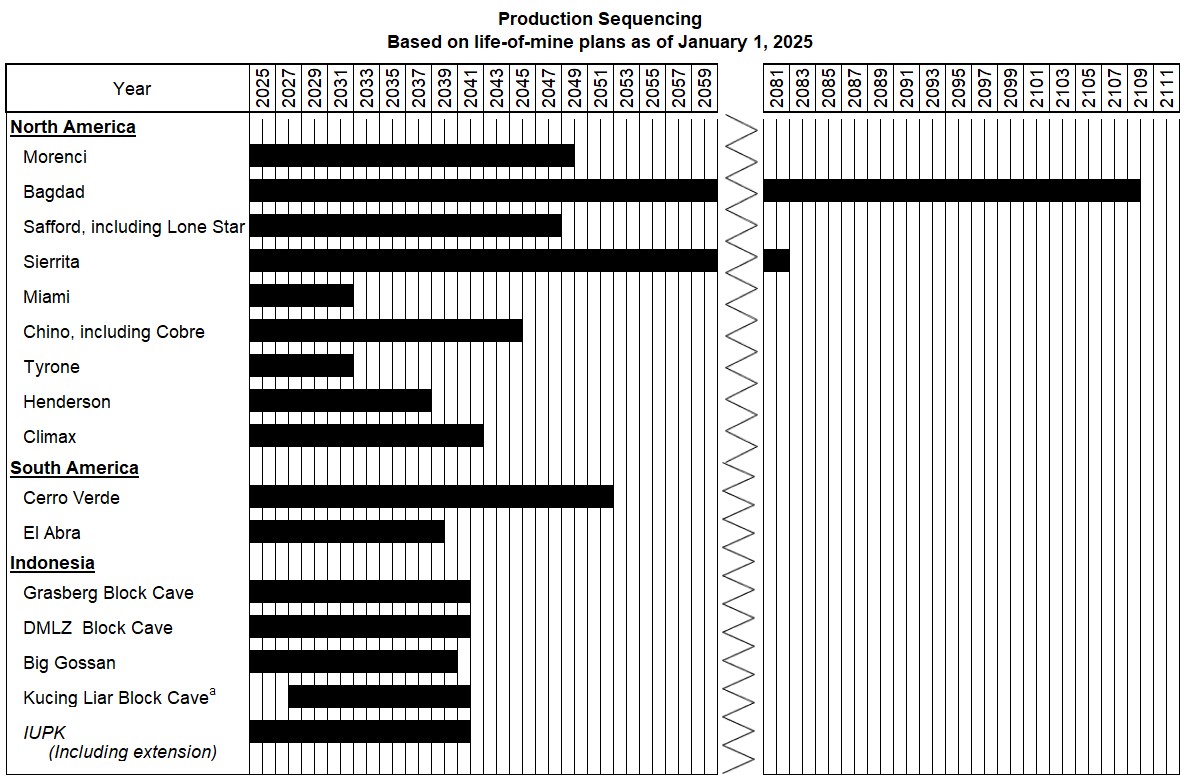
a.The ultimate timing of the start of production at Kucing Liar is dependent upon a number of factors and may vary from the date shown here. Refer to "Operations – Indonesia" for further discussion.
Mill and Leach Stockpiles
Mill and leach stockpiles generally contain lower grade ores that have been extracted from an ore body and are available for metal recovery. Mill stockpiles contain sulfide ores and recovery of metal is through milling, concentrating, smelting and refining or, alternatively, by concentrate leaching. Leach stockpiles contain oxide ores and certain secondary sulfide ores and recovery of metal is through exposure to acidic solutions that dissolve contained copper and deliver it in solution to extraction processing facilities.
Because it is impracticable to determine copper contained in mill and leach stockpiles by physical count, reasonable estimation methods are employed. The quantity of material delivered to mill and leach stockpiles is based on surveyed volumes of mined material and daily production records. Sampling and assaying of blasthole cuttings determine the estimated copper grades of material delivered to mill and leach stockpiles.
Expected copper recoveries for mill stockpiles are determined by metallurgical testing. The recoverable copper in mill stockpiles, once entered into the production process, can be produced into copper concentrate almost immediately.
Expected copper recoveries for leach stockpiles are determined using small-scale laboratory tests, small- to large-scale column testing (which simulates the production process), historical trends and other factors, including mineralogy of the ore and rock type. Total copper recovery in leach stockpiles can vary significantly from a low percentage to more than 80% depending on several variables, including processing methodology, processing variables, mineralogy and particle size of the rock. For newly placed material on active stockpiles, as much as 80% of total copper recovery may be extracted during the first year, and the remaining copper may be recovered over many years. Processes and copper recoveries for mill and leach stockpiles are monitored regularly, and recovery estimates are adjusted annually based on new information and as related technology and processing methods change. Based on our annual review of mill and leach stockpiles, we increased our estimated consolidated recoverable copper in certain leach stockpiles, net of joint venture interests, by 164 million pounds in 2024, primarily associated with Morenci leach stockpiles, partly offset by a decrease for Safford leach stockpiles.
Following are our stockpiles and the estimated recoverable copper contained within those stockpiles as of December 31, 2024:
| | | | | | | | | | | | | | | | | | | | | | | | | | | | | | | | | | | | | | |
| | | | | | | | | | | Recoverable | |
| FCX’s | | Million Metric Tons | | Average | | Recoveries | | Copper | |
| Interest | | FCX’s Interest | | 100% Basis | | Ore Grade (%) | | (%) | | (billion lbs.) | |
| Mill stockpiles | | | | | | | | | | | | |
| Cerro Verde | 55.08% | | 29 | | | 53 | | | 0.26 | | | 65.5 | | | 0.2 | | |
North America copper minesa | | | 11 | | | 11 | | | 0.31 | | | 77.1 | | | 0.1 | | |
| | | 40 | | | 64 | | | | | | | 0.3 | | |
| | | | | | | | | | | | |
| Leach stockpiles | | | | | | | | | | | | |
| Morenci | 72% | | 5,594 | | | 7,775 | | | 0.24 | | | 0.6 | | | 0.3 | | |
| Bagdad | 100% | | 506 | | | 506 | | | 0.25 | | | 0.9 | | | — | | b |
| Safford, including Lone Star | 100% | | 489 | | | 489 | | | 0.43 | | | 4.4 | | | 0.2 | | |
| | | | | | | | | | | | |
| Sierrita | 100% | | 650 | | | 650 | | | 0.15 | | | 7.6 | | | 0.2 | | |
| Miami | 100% | | 498 | | | 498 | | | 0.39 | | | 1.3 | | | 0.1 | | |
| Chino, including Cobre | 100% | | 1,803 | | | 1,803 | | | 0.25 | | | 2.0 | | | 0.2 | | |
| Tyrone | 100% | | 1,223 | | | 1,223 | | | 0.28 | | | 1.2 | | | 0.1 | | |
| Cerro Verde | 55.08% | | 347 | | | 629 | | | 0.44 | | | 4.0 | | | 0.2 | | |
| El Abra | 51% | | 499 | | | 978 | | | 0.43 | | | 3.0 | | | 0.3 | | |
| | | 11,609 | | | 14,551 | | | | | | | 1.5 | | |
| | | | | | | | | | | | |
| Total FCX – 100% basis | | | | | | | | | | | 1.8 | | |
Total FCX – Consolidated basisc | | | | | | | | | | | 1.7 | | |
Total FCX – Net equity interestd | | | | | | | | | | | 1.4 | | |
| | | | | | | | | | | | |
Note: Totals may not foot because of rounding.
a.Our net equity interest in all North America copper mines is 100% except for Morenci, which is 72%.
b.Rounds to less than 0.1 billion pounds of recoverable copper.
c.Consolidated stockpiles represent estimated metal quantities after reduction for Morenci’s joint venture partner interests (refer to Note 2 for further discussion).
d.Net equity interest represents estimated consolidated metal quantities further reduced for noncontrolling interest ownership (refer to Note 2 for further discussion of our ownership in subsidiaries).
Mineral Resources
In addition to mineral reserves, our properties contain mineral resources that we believe could be brought into production should market conditions warrant. However, permitting and significant capital expenditures may be required before mining of these resources could commence at these properties. A mineral resource is a concentration or occurrence of material of economic interest in such form, grade or quality, and quantity that there are reasonable prospects for economic extraction. Such a deposit cannot qualify as recoverable proven and probable mineral reserves until engineering, legal and economic feasibility are confirmed based upon a comprehensive evaluation of development and operating costs, grades, recoveries and other material factors. Mineral resources include measured, indicated and inferred mineral classifications.
•A measured mineral resource is a resource for which the quantity and grade are estimated from detailed, closely spaced sampling, and geologic characterization that defines the size, shape, depth and mineral content to a high degree of confidence.
•An indicated mineral resource is a resource for which quantity and grade are estimated from information similar to that used for measured mineral resources where the samples are farther apart, and the geological characterization is adequate.
•An inferred mineral resource is a resource for which quantity and grade are estimated from information similar to that used for measured and indicated mineral resources, but with limited geological evidence and sampling. Inferred mineral resource grade and mineralization continuity have a lower degree of confidence.
Our estimates of mineral resources have been prepared in accordance with the disclosure requirements of Subpart 1300 of SEC Regulation S-K. No assurance can be given that the estimated mineral resources not included in mineral reserves will become proven and probable mineral reserves.
Estimated mineral resources as presented on the following pages were assessed using prices of $3.75 per pound for copper, $1,700 per ounce for gold, $15 per pound for molybdenum and $20 per ounce for silver. Cutoff grade strategy and expected recoveries used to evaluate mineral resources are consistent with those for mineral reserves but would require additional work to substantiate. Refer to Item 1A. “Risk Factors” for discussion of risks associated with our estimates of mineral resources.
| | | | | | | | | | | | | | | | | | | | | | | | | | | | | | | | | | | | | | | | | | | | | | | | | | | | | | | | | | | | | | | | | | | | | | | | | | | | | | | | | | | | | | | | | | | | | | | | | | | | | | | | | | | | | | | | | | | | | | | |
| Estimated Mineral Resources |
at December 31, 2024a |
| | | | | | Measured | | Indicated | | Inferred |
| | | | | | Million Metric Tons | | Average Ore Grade | | Million Metric Tons | | Average Ore Grade | | Million Metric Tons | | Average Ore Grade |
| | FCX’s | | Processing | | FCX’s | | 100% | | Copper | | Gold | | Moly | | Silver | | FCX’s | | 100% | | Copper | | Gold | | Moly | | Silver | | FCX’s | | 100% | | Copper | | Gold | | Moly | | Silver |
| | Interest | | Method | | Interest | | Basis | | % | | g/t | | % | | g/t | | Interest | | Basis | | % | | g/t | | % | | g/t | | Interest | | Basis | | % | | g/t | | % | | g/t |
| North America | | | | | | | | | | | | | | | | | | | | | | | | | | | | | | | | | | | | | | | |
| Morenci | 72% | | Milling | | 607 | | | 843 | | | 0.29 | | | — | | | 0.02 | | | — | | | 493 | | | 685 | | | 0.32 | | | — | | | 0.02 | | | — | | | 293 | | | 406 | | | 0.32 | | | — | | | 0.02 | | | — | |
| | | Leaching | | 1,409 | | | 1,958 | | | 0.17 | | | — | | | — | | | — | | | 750 | | | 1,042 | | | 0.15 | | | — | | | — | | | — | | | 441 | | | 613 | | | 0.12 | | | — | | | — | | | — | |
| Bagdad | 100% | | Milling | | 380 | | | 380 | | | 0.31 | | | — | | b | 0.02 | | | 1.28 | | | 487 | | | 487 | | | 0.26 | | | — | | b | 0.02 | | | 1.08 | | | 534 | | | 534 | | | 0.18 | | | — | | b | 0.01 | | | 0.72 | |
| | | Leaching | | — | | b | — | | b | 0.13 | | | — | | | — | | | — | | | 2 | | | 2 | | | 0.10 | | | — | | | — | | | — | | | 1 | | | 1 | | | 0.12 | | | — | | | — | | | — | |
| Safford, including Lone Star | 100% | | Milling | | 1,350 | | | 1,350 | | | 0.38 | | | 0.03 | | | — | | b | 1.15 | | | 1,613 | | | 1,613 | | | 0.32 | | | 0.01 | | | 0.01 | | | 0.93 | | | 432 | | | 432 | | | 0.27 | | | — | | b | — | | b | 0.93 | |
| | | Leaching | | 557 | | | 557 | | | 0.29 | | | — | | | — | | | — | | | 410 | | | 410 | | | 0.29 | | | — | | | — | | | — | | | 118 | | | 118 | | | 0.28 | | | — | | | — | | | — | |
| Sierrita | 100% | | Milling | | 751 | | | 751 | | | 0.18 | | | — | | b | 0.02 | | | 0.83 | | | 310 | | | 310 | | | 0.20 | | | — | | b | 0.02 | | | 0.94 | | | 32 | | | 32 | | | 0.18 | | | — | | b | 0.01 | | | 0.86 | |
| Chino, including Cobre | 100% | | Milling | | 147 | | | 147 | | | 0.35 | | | 0.03 | | | 0.02 | | | 0.68 | | | 78 | | | 78 | | | 0.44 | | | 0.04 | | | 0.01 | | | 0.80 | | | 33 | | | 33 | | | 0.36 | | | 0.03 | | | 0.01 | | | 0.65 | |
| | | Leaching | | 7 | | | 7 | | | 0.25 | | | — | | | — | | | — | | | 2 | | | 2 | | | 0.36 | | | — | | | — | | | — | | | 2 | | | 2 | | | 0.45 | | | — | | | — | | | — | |
| Tyrone | 100% | | Leaching | | 45 | | | 45 | | | 0.33 | | | — | | | — | | | — | | | 7 | | | 7 | | | 0.27 | | | — | | | — | | | — | | | 3 | | | 3 | | | 0.44 | | | — | | | — | | | — | |
| Henderson | 100% | | Milling | | 61 | | | 61 | | | — | | | — | | | 0.16 | | | — | | | 25 | | | 25 | | | — | | | — | | | 0.13 | | | — | | | — | | | — | | | — | | | — | | | — | | | — | |
| Climax | 100% | | Milling | | 304 | | | 304 | | | — | | | — | | | 0.18 | | | — | | | 53 | | | 53 | | | — | | | — | | | 0.11 | | | — | | | 9 | | | 9 | | | — | | | — | | | 0.08 | | | — | |
| Ajo | 100% | | Milling | | 489 | | | 489 | | | 0.39 | | | 0.07 | | | 0.01 | | | 0.94 | | | 241 | | | 241 | | | 0.32 | | | 0.05 | | | — | | b | 0.70 | | | 19 | | | 19 | | | 0.33 | | | 0.04 | | | — | | b | 1.04 | |
| Cochise/Bisbee | 100% | | Leaching | | 146 | | | 146 | | | 0.49 | | | — | | | — | | | — | | | 118 | | | 118 | | | 0.41 | | | — | | | — | | | — | | | 20 | | | 20 | | | 0.38 | | | — | | | — | | | — | |
| Sanchez | 100% | | Leaching | | 79 | | | 79 | | | 0.35 | | | — | | | — | | | — | | | 72 | | | 72 | | | 0.24 | | | — | | | — | | | — | | | 7 | | | 7 | | | 0.19 | | | — | | | — | | | — | |
| Tohono | 100% | | Milling | | 277 | | | 277 | | | 0.63 | | | 0.09 | | | 0.01 | | | 1.90 | | | 31 | | | 31 | | | 0.67 | | | 0.09 | | | 0.01 | | | 1.72 | | | 4 | | | 4 | | | 0.65 | | | 0.07 | | | — | | b | 1.44 | |
| | | Leaching | | 249 | | | 249 | | | 0.68 | | | — | | | — | | | — | | | 48 | | | 48 | | | 0.53 | | | — | | | — | | | — | | | 25 | | | 25 | | | 0.48 | | | — | | | — | | | — | |
| Twin Buttes | 100% | | Milling | | 139 | | | 139 | | | 0.65 | | | 0.01 | | | 0.04 | | | 6.62 | | | 10 | | | 10 | | | 0.63 | | | 0.01 | | | 0.03 | | | 6.31 | | | 5 | | | 5 | | | 0.77 | | | 0.01 | | | 0.02 | | | 8.22 | |
| | | Leaching | | 55 | | | 55 | | | 0.24 | | | — | | | — | | | — | | | 15 | | | 15 | | | 0.21 | | | — | | | — | | | — | | | 7 | | | 7 | | | 0.25 | | | — | | | — | | | — | |
| Christmas | 100% | | Milling | | 67 | | | 67 | | | 0.53 | | | 0.06 | | | — | | b | 1.56 | | | 231 | | | 231 | | | 0.37 | | | 0.06 | | | — | | b | 0.93 | | | 39 | | | 39 | | | 0.40 | | | 0.06 | | | — | | b | 0.95 | |
| South America | | | | | | | | | | | | | | | | | | | | | | | | | | | | | | | | | | | | | | | |
| Cerro Verde | 55.08% | | Milling | | 46 | | | 83 | | | 0.29 | | | — | | | 0.01 | | | 1.57 | | | 944 | | | 1,714 | | | 0.32 | | | — | | | 0.01 | | | 1.70 | | | 344 | | | 624 | | | 0.34 | | | — | | | 0.01 | | | 1.80 | |
| | | Leaching | | 2 | | | 4 | | | 0.37 | | | — | | | — | | | — | | | 7 | | | 13 | | | 0.30 | | | — | | | — | | | — | | | 8 | | | 14 | | | 0.33 | | | — | | | — | | | — | |
| El Abra | 51% | | Milling | | 607 | | | 1,190 | | | 0.43 | | | 0.02 | | | 0.01 | | | 1.42 | | | 959 | | | 1,880 | | | 0.37 | | | 0.02 | | | 0.01 | | | 1.17 | | | 862 | | | 1,690 | | | 0.29 | | | 0.01 | | | — | | b | 0.92 | |
| | | Leaching | | 44 | | | 86 | | | 0.24 | | | — | | | — | | | — | | | 24 | | | 46 | | | 0.26 | | | — | | | — | | | — | | | 7 | | | 14 | | | 0.29 | | | — | | | — | | | — | |
| Indonesia | | | | | | | | | | | | | | | | | | | | | | | | | | | | | | | | | | | | | | | |
| Grasberg minerals district | 48.76% | | Milling | | 197 | | | 404 | | | 0.77 | | | 0.62 | | | — | | | 4.00 | | | 1,234 | | | 2,530 | | | 0.69 | | | 0.57 | | | — | | | 3.70 | | | 149 | | | 306 | | | 0.44 | | | 0.37 | | | — | | | 2.53 | |
| Total FCX – 100% basis | | | | | | | 9,672 | | | | | | | | | | | | | 11,662 | | | | | | | | | | | | | 4,957 | | | | | | | | | |
Total FCX – Consolidated basisc | | | | | | 8,887 | | | | | | | | | | | | | 11,178 | | | | | | | | | | | | | 4,671 | | | | | | | | | |
Total FCX – Net equity interestd | | | | | | 8,016 | | | | | | | | | | | | | 8,162 | | | | | | | | | | | | | 3,393 | | | | | | | | | |
| | | | | | | | | | | | | | | |
Note: Totals may not foot because of rounding.
a.Mineral resources are exclusive of mineral reserves.
b.Amounts not shown because of rounding.
c.Consolidated basis represents estimated mineral resources after reduction for Morenci’s joint venture partner interests (refer to Note 2 for further discussion).
d.Net equity interest represents estimated consolidated mineral resources further reduced for noncontrolling interest ownership (refer to Note 2 for further discussion of our ownership in subsidiaries).
| | | | | | | | | | | | | | | | | | | | | | | | | | | | | | | | | | | | | | | | | | | | | | | | | | | | | | | | | | | | | | | | | | | | | | | | | | | | | | | | | | | | | | | | | | | | |
| Estimated Mineral Resources |
at December 31, 2024a (continued) |
| | | | | | | Measured + Indicated | | Total Mineral Resources |
| | | | | | | Million Metric Tons | | Million Metric Tons | | Average Ore Grade | | Contained Metalb | | Cutoff Gradec |
| | | FCX’s | | Processing | | FCX’s | | 100% | | FCX’s | | 100% | | Copper | | Gold | | Moly | | Silver | | Copper | | Gold | | Moly | | Silver | | |
| | | Interest | | Method | | Interest | | Basis | | Interest | | Basis | | % | | g/t | | % | | g/t | | billion lbs. | | million ozs. | | billion lbs. | | million ozs. | | Grade % |
| North America | | | | | | | | | | | | | | | | | | | | | | | | | | | | | | |
| Morenci | | 72% | | Milling | | 1,100 | | | 1,527 | | | 1,392 | | | 1,934 | | | 0.31 | | | — | | | 0.02 | | | — | | | 13.1 | | | — | | | 0.98 | | | — | | | 0.16 | |
| | | | Leaching | | 2,159 | | | 3,000 | | | 2,600 | | | 3,613 | | | 0.16 | | | — | | | — | | | — | | | 12.3 | | | — | | | — | | | — | | | 0.03 | |
| Bagdad | | 100% | | Milling | | 868 | | | 868 | | | 1,401 | | | 1,401 | | | 0.24 | | | — | | d | 0.02 | | | 1.00 | | | 7.5 | | | 0.1 | | | 0.56 | | | 45.0 | | | 0.11 | |
| | | | Leaching | | 2 | | | 2 | | | 2 | | | 2 | | | 0.11 | | | — | | | — | | | — | | | — | | d | — | | | — | | | — | | | 0.04 | |
| Safford, including Lone Star | | 100% | | Milling | | 2,963 | | | 2,963 | | | 3,395 | | | 3,395 | | | 0.34 | | | 0.01 | | | — | | d | 1.02 | | | 25.2 | | | 1.5 | | | 0.37 | | | 111.0 | | | 0.14 | |
| | | | Leaching | | 967 | | | 967 | | | 1,085 | | | 1,085 | | | 0.29 | | | — | | | — | | | — | | | 6.9 | | | — | | | — | | | — | | | 0.11 | |
| Sierrita | | 100% | | Milling | | 1,061 | | | 1,061 | | | 1,093 | | | 1,093 | | | 0.18 | | | — | | d | 0.02 | | | 0.86 | | | 4.4 | | | 0.1 | | | 0.52 | | | 30.2 | | | 0.14 | |
| Chino, including Cobre | | 100% | | Milling | | 225 | | | 225 | | | 258 | | | 258 | | | 0.38 | | | 0.04 | | | 0.01 | | | 0.71 | | | 2.2 | | | 0.3 | | | 0.08 | | | 5.9 | | | 0.18 | |
| | | | Leaching | | 9 | | | 9 | | | 11 | | | 11 | | | 0.30 | | | — | | | — | | | — | | | 0.1 | | | — | | | — | | | — | | | 0.06 | |
| Tyrone | | 100% | | Leaching | | 52 | | | 52 | | | 55 | | | 55 | | | 0.33 | | | — | | | — | | | — | | | 0.4 | | | — | | | — | | | — | | | 0.04 | |
| Henderson | | 100% | | Milling | | 86 | | | 86 | | | 86 | | | 86 | | | — | | | — | | | 0.15 | | | — | | | — | | | — | | | 0.29 | | | — | | | 0.12 | |
| Climax | | 100% | | Milling | | 357 | | | 357 | | | 366 | | | 366 | | | — | | | — | | | 0.16 | | | — | | | — | | | — | | | 1.33 | | | — | | | 0.05 | |
| Ajo | | 100% | | Milling | | 729 | | | 729 | | | 748 | | | 748 | | | 0.36 | | | 0.06 | | | 0.01 | | | 0.87 | | | 6.0 | | | 1.5 | | | 0.11 | | | 20.8 | | | 0.15 | |
| Cochise/Bisbee | | 100% | | Leaching | | 264 | | | 264 | | | 284 | | | 284 | | | 0.45 | | | — | | | — | | | — | | | 2.8 | | | — | | | — | | | — | | | 0.14 | |
| Sanchez | | 100% | | Leaching | | 151 | | | 151 | | | 159 | | | 159 | | | 0.29 | | | — | | | — | | | — | | | 1.0 | | | — | | | — | | | — | | | 0.09 | |
| Tohono | | 100% | | Milling | | 308 | | | 308 | | | 312 | | | 312 | | | 0.64 | | | 0.09 | | | 0.01 | | | 1.87 | | | 4.4 | | | 0.9 | | | 0.04 | | | 18.8 | | | 0.17 | |
| | | | Leaching | | 297 | | | 297 | | | 322 | | | 322 | | | 0.64 | | | — | | | — | | | — | | | 4.6 | | | — | | | — | | | — | | | 0.14 | |
| Twin Buttes | | 100% | | Milling | | 149 | | | 149 | | | 155 | | | 155 | | | 0.65 | | | 0.01 | | | 0.04 | | | 6.65 | | | 2.2 | | | — | | d | 0.12 | | | 33.1 | | | 0.19 | |
| | | | Leaching | | 70 | | | 70 | | | 78 | | | 78 | | | 0.24 | | | — | | | — | | | — | | | 0.4 | | | — | | | — | | | — | | | 0.01 | |
| Christmas | | 100% | | Milling | | 297 | | | 297 | | | 337 | | | 337 | | | 0.41 | | | 0.06 | | | — | | d | 1.06 | | | 3.0 | | | 0.6 | | | 0.02 | | | 11.4 | | | 0.22 | |
| South America | | | | | | | | | | | | | | | | | | | | | | | | | | | | | | |
| Cerro Verde | | 55.08% | | Milling | | 990 | | | 1,797 | | | 1,334 | | | 2,421 | | | 0.32 | | | — | | | 0.01 | | | 1.72 | | | 17.2 | | | — | | | 0.63 | | | 133.8 | | | 0.11 | |
| | | | Leaching | | 9 | | | 17 | | | 17 | | | 30 | | | 0.32 | | | — | | | — | | | — | | | 0.2 | | | — | | | — | | | — | | | 0.08 | |
| El Abra | | 51% | | Milling | | 1,566 | | | 3,070 | | | 2,427 | | | 4,760 | | | 0.36 | | | 0.02 | | | 0.01 | | | 1.14 | | | 37.4 | | | 2.6 | | | 0.81 | | | 174.9 | | | 0.12 | |
| | | | Leaching | | 68 | | | 133 | | | 75 | | | 147 | | | 0.25 | | | — | | | — | | | — | | | 0.8 | | | — | | | — | | | — | | | 0.10 | |
| Indonesia | | | | | | | | | | | | | | | | | | | | | | | | | | | | | | |
| Grasberg minerals district | | 48.76% | | Milling | | 1,431 | | | 2,934 | | | 1,580 | | | 3,240 | | | 0.67 | | | 0.56 | | | — | | | 3.62 | | | 48.1 | | | 58.3 | | | — | | | 377.5 | | | 0.53 | |
| Total FCX – 100% basis | | | | | | | | 21,334 | | | | | 26,291 | | | | | | | | | | | 200.3 | | | 65.9 | | | 5.86 | | | 962.4 | | | |
Total FCX – Consolidated basise | | | | | | 20,065 | | | | | 24,736 | | | | | | | | | | | 193.2 | | | 65.9 | | | 5.59 | | | 962.4 | | | |
Total FCX – Net equity interestf | | | | | | 16,178 | | | | | 19,571 | | | | | | | | | | | 141.9 | | | 34.7 | | | 4.91 | | | 623.2 | | | |
| | | | | | | | | | | | | | | | | | | | | | | | | | | | | | |
Note: Totals may not foot because of rounding. In addition, amounts for “Measured + Indicated” and “Total Mineral Reserves” may not equal the sum of measured, indicated and inferred (as presented on the prior page) because of rounding.
a.Mineral resources are exclusive of mineral reserves.
b.Estimated recoveries are consistent with those for mineral reserves but would require additional work to substantiate.
c.All sites report a % equivalent copper grade except for Climax and Henderson, which report a % molybdenum grade. Our underground mines report a breakeven cutoff grade, and our open-pit mines report an internal cutoff grade.
d.Amounts not shown because of rounding.
e.Consolidated basis represents estimated mineral resources after reduction for Morenci’s joint venture partner interests (refer to Note 2 for further discussion).
f.Net equity interest represents estimated consolidated mineral resources further reduced for noncontrolling interest ownership (refer to Note 2 for further discussion of our ownership in subsidiaries).
The table below summarizes changes in estimated contained copper, gold and molybdenum in mineral resources between December 31, 2023 and 2024, for our material properties:
| | | | | | | | | | | | | | | | | | | | | | | | | | | | | | | | | | | |
| Estimated Contained Mineral Resources at 100% Basis |
| Copper
(billion lbs.) | | Gold
(million ozs.) | | Molybdenum
(billion lbs.) |
| Morenci | | Cerro Verde | | Grasberg minerals district | | Grasberg minerals district | | Morenci | | Cerro Verde |
| Mineral resources as of December 31, 2023 | 30.3 | | | 23.0 | | | 48.2 | | | 58.4 | | | 1.72 | | | 0.78 | |
Adjustmentsa | (4.8) | | | (5.5) | | | (0.1) | | | (0.2) | | | (0.74) | | | (0.15) | |
| Mineral resources as of December 31, 2024 | 25.5 | | | 17.5 | | | 48.1 | | | 58.3 | | | 0.98 | | | 0.63 | |
| Year-over-year percentage change | (16) | % | | (24) | % | | — | % | | — | % | | (43) | % | | (19) | % |
| | | | | | | | | | | | | | | | | | | | | | | | | | | | | | | | | | | | | | |
| Estimated Contained Mineral Resources at Net Equity Basis | |
| Copper
(billion lbs.) | | Gold
(million ozs.) | | Molybdenum
(billion lbs.) | |
| Morenci | | Cerro Verde | | Grasberg minerals district | | Grasberg minerals district | | Morenci | | Cerro Verde | |
| (72%) | | (55.08%)b | | (48.76%) | | (48.76%) | | (72%) | | (55.08%)b | |
| Mineral resources as of December 31, 2023 | 21.8 | | | 12.3 | | | 23.5 | | | 28.5 | | | 1.24 | | | 0.42 | | |
Adjustmentsa | (3.5) | | | (2.7) | | | — | | c | (0.1) | | | (0.53) | | | (0.07) | | |
| Mineral resources as of December 31, 2024 | 18.3 | | | 9.6 | | | 23.5 | | | 28.4 | | | 0.71 | | | 0.35 | | |
| Year-over-year percentage change | (16) | % | | (22) | % | | — | % | | — | % | | (43) | % | | (17) | % | |
Note: Totals may not foot because of rounding
a.The downward adjustments at Morenci are primarily the result of higher cost assumptions and updates to the geologic modeling, partially offset by increased leach recovery assumptions. The downward adjustments at Cerro Verde are primarily the result of updates to geologic modeling. The slight downward adjustments at Grasberg minerals district are primarily the result of reassessment of the resource shapes.
b.FCX’s interest in Cerro Verde is 55.08%, and prior to September 2024 it was 53.56%.
c.Rounds to less than 0.1 billion pounds
Internal Controls over the Mineral Reserves and Mineral Resources Estimation Process
We have internal controls over the mineral reserves and mineral resources estimation processes that result in reasonable and reliable estimates aligned with industry practice and reporting regulations. Annually, qualified persons and other employees review the estimates of mineral reserves and mineral resources, the supporting documentation, and compliance with the internal controls and, based on their review of such information, recommend approval to use the mineral reserve and mineral resource estimates to our senior management. Our controls utilize management systems including but not limited to, formal quality assurance and quality control protocols, standardized procedures, workflow processes, supervision and management approval, internal and external reviews and audits, reconciliations, and data security covering record keeping, chain of custody and data storage.
Our systems cover exploration activities, sample preparation and analysis, data verification, mineral processing, metallurgical testing, recovery estimation, mine design and sequencing, and mineral reserve and resource evaluations, with environmental, social and regulatory considerations. Our quality assurance and control protocols over sampling and assaying of drill hole samples include insertion of blind samples consisting of standards, blanks, and duplicates in the primary sample streams, as well as selective sample validation at secondary laboratories.
These controls and other methods help to validate the reasonableness of the estimates. The effectiveness of the controls is reviewed periodically to address changes in conditions and the degree of compliance with policies and procedures. Refer to Item 1A. “Risk Factors” for discussion of risks associated with our estimates of mineral reserves and mineral resources.
Item 1A. Risk Factors.
This report contains forward-looking statements in which we discuss our potential future performance, operations and projects. Forward-looking statements are all statements other than statements of historical facts, such as plans, projections, or expectations relating to business outlook, strategy, goals or targets; global market conditions; ore grades and milling rates; production and sales volumes; unit net cash costs (credits) and operating costs; capital expenditures; operating plans (including mine sequencing); cash flows; liquidity; PT Freeport Indonesia’s (PT-FI) commissioning, remediation, including expected costs, insurance recovery and timing, and full ramp-up of its new smelter and full production at the precious metals refinery (PMR); potential extension of PT-FI’s special mining business license (IUPK) beyond 2041; export licenses, export duties and export volumes, including PT-FI’s ability to continue exports of copper concentrate until full ramp-up is achieved at its new smelter in Indonesia; timing of shipments of inventoried production; our commitment to deliver responsibly produced copper and molybdenum, including plans to implement, validate and maintain validation of our operating sites under specific frameworks; execution of our energy and climate strategies and the underlying assumptions and estimated impacts on our business and stakeholders related thereto; achievement of 2030 climate targets and 2050 net zero aspiration; improvements in operating procedures and technology innovations and applications; exploration efforts and results; development and production activities, rates and costs; future organic growth opportunities; tax rates; the impact of copper, gold and molybdenum price changes; the impact of deferred intercompany profits on earnings; mineral reserve and mineral resource estimates; final resolution of settlements associated with ongoing legal and environmental proceedings; debt repurchases; and the ongoing implementation of our financial policy and future returns to shareholders, including dividend payments (base or variable) and share repurchases.
We undertake no obligation to update any forward-looking statements, which speak only as of the date made. We caution readers that forward-looking statements are not guarantees of future performance and actual results may differ materially from those anticipated, expected, projected or assumed in the forward-looking statements. Important factors that can cause our actual results to differ materially from those anticipated in the forward-looking statements are included below.
Risk Factor Summary
Investing in our securities involves a high degree of risk and uncertainties. You should carefully consider the risks described below and the information included in other sections of this annual report on Form 10-K, including, but not limited to, Items 1. and 2. “Business and Properties,” Item 1C. “Cybersecurity,” Items 7. and 7A. “Management’s Discussion and Analysis of Financial Condition and Results of Operations and Quantitative and Qualitative Disclosures About Market Risk” (MD&A) and Item 3. “Legal Proceedings” prior to investing in our securities. If any of the following risks occur, they may have a material adverse impact on our business, financial performance, stock price, results of operations, operating flexibility, reputation, costs or liabilities and you could lose part or all of your investment. The summary and risks that follow are organized under headings as determined to be most applicable, but such risks also may be relevant to other headings. Moreover, the risk factors described herein are not all of the risks we may face and there may be other risks not presently known to us or that we currently believe are immaterial or general risks that apply to all companies operating in the United States (U.S.) and globally, which may emerge or become material.
Financial risks
•Fluctuations or extended material declines in the market prices of the commodities we produce;
•Fluctuations in price and availability of consumables and components we purchase as well as constraints on supply and logistics, and transportation services;
•Less flexibility because of our debt and other financial commitments;
•Changes in or failure to comply with financial assurance requirements relating to our mine closure reclamation obligations;
•Unanticipated legal proceedings or negative developments in pending legal proceedings or other contingencies; and
•Changes in tax laws and regulations.
International risks
•Geopolitical, economic, regulatory and social risks for our operations; and
•PT-FI’s failure to meet its commitments to achieve the extension of its IUPK.
Operational risks
•Operational risks inherent in our operations, including underground mining and the ability to smelt and refine;
•Environmental, safety and engineering challenges and risks associated with management of waste rock and tailings;
•Environmental challenges associated with our Indonesia operations;
•Violence, civil and religious strife, and activism;
•Availability of significant quantities of secure water supplies for our operations, including future expansions or development projects;
•Disruptions, damage, failure and implementation and integration risks associated with information and operational technology systems;
•Failure to successfully implement or develop and risks associated with new technologies; and
•Any major public health crisis.
Human capital risks
•Failure to maintain good relations with our workforce and labor disputes or labor unrest; and
•Ability to recruit, retain, develop and advance qualified personnel.
Risks related to development projects and mineral reserves
•Inherent risks associated with development projects and unique risks associated with development of underground mining;
•Ability to maintain or grow our mineral reserves; and
•Inherent uncertainty associated with estimates of mineral reserves and mineral resources.
Regulatory, environmental and social risks
•Compliance with applicable environmental, health and safety laws and regulations;
•Remediation of properties no longer in operation;
•Ability to meet our energy requirements while complying with climate-related regulations and expectations and other energy transition policy changes;
•The physical impacts of climate change on our operations, workforce, communities, biodiversity and ecosystems, supply chains and customers;
•Increasing scrutiny, action and evolving expectations from stakeholders and other third parties with respect to our environmental, social and governance (ESG) practices, performance, commitments and disclosures; and
•Failure or perceived failure to manage relationships with the communities and/or Indigenous Peoples where we operate or that are near our operations.
Risks related to our common stock
•Impact of our holding company structure on our ability to service debt, declare cash dividends, or repurchase shares and debt; and
•Impact of anti-takeover provisions in our charter documents and under Delaware law.
Financial risks
Fluctuations in the market prices of the commodities we produce have caused and may continue to cause significant volatility in our financial performance and in the trading prices of our common stock. Extended material declines in the market prices of such commodities could adversely affect our financial condition and operating plans.
Our financial results are significantly influenced by and vary with fluctuations in the market prices of the commodities we produce, primarily copper and gold, and to a lesser extent molybdenum. Extended material declines in market prices of such commodities could have a material adverse effect on our financial results and the value of our assets, may depress the price of our common stock, and may have a material adverse effect on our ability to comply with financial and other covenants in our debt agreements, service our debt and meet our other
obligations. For additional information regarding recent macroeconomic and geopolitical factors, see the risk factor below regarding the price and availability of consumables and components we purchase and constraints on supply and logistics, and transportation services.
There has been a history of significant volatility in the commodities markets, including the copper market. Fluctuations in commodities prices are caused by varied and complex factors beyond our control, including global supply and demand and inventory levels; global economic and political conditions (such as election results, level of economic growth, or recession and political or geopolitical tensions and conflicts); national and international regulatory, trade and/or tax policies, including tariffs and other controls on imports and exports; commodities investment activity and speculation; interest rates; current inflation rates and expectations regarding future inflation rates; the strength of the U.S. dollar compared to foreign currencies; the price and availability of substitute products; and changes in technology. Volatility in global economic growth, particularly in developing economies, has the potential to affect adversely future demand and prices for commodities. Geopolitical uncertainty and protectionism can inhibit international trade and negatively impact business confidence, which creates the risk of constraints on our ability to deal in certain markets and has the potential to increase price volatility. For additional information regarding the historical fluctuations of the prices of copper, gold and molybdenum, refer to “Markets” in MD&A.
In addition to the factors discussed above, copper prices may be affected by demand from China, which is currently the largest consumer of refined copper in the world, including as a result of geopolitical uncertainty and tension between the U.S. and China as well as uncertainties about China’s economy. Copper demand and prices also may be affected by industry production, substitution, and thrifting. The adoption and expansion of trade restrictions, or other governmental action related to tariffs and other controls on imports and exports or trade agreements or policies are difficult to predict and could adversely affect copper prices, demand for our products, our costs, our customers, our suppliers and the global economy, which in turn could have a material adverse effect on our business, results of operations or financial condition. We believe long-term fundamentals for copper are favorable with growing demand supported by copper’s critical role in the global transition to renewable power, electric vehicles and other carbon-reduction initiatives, continued urbanization in developing countries, data center and artificial intelligence (AI) developments and growing connectivity globally; however if these markets, industries and transitions do not develop as we expect, or develop more slowly than we expect, future demand and prices for copper may be negatively affected, impacting our business. Copper demand and prices also may be affected by inadequate investment in and limited production from existing copper mining operations, and copper demand globally, including North America, Europe, and Asian countries other than China.
Additional factors affecting gold prices may include purchases and sales of gold by governments and central banks, demand from China and India, two of the world’s largest consumers of gold, and global demand for jewelry containing gold.
If market prices for the primary commodities we produce were to decline and remain low for a sustained period of time, we may have to revise our operating plans, including curtailing or modifying our mining and processing operations, as we have done in the past, and our cash flows, ability to return capital to shareholders and capital expenditure plans could be negatively affected. We may be unable to decrease our costs in an amount sufficient to offset reductions in revenues, in which case we may incur losses, and those losses may be material.
Declines in prices of commodities we sell could also result in metals inventory adjustments and impairment charges for our long-lived assets.
Fluctuations in the price and availability of consumables and components for key machines and equipment we purchase, and constraints on supply and logistics could affect our profitability and operating plans. Further, significant delays or increases in costs affecting transportation services may affect our business.
Consumables and components for key machines and equipment we purchase are subject to price volatility caused by global economic factors that are beyond our control, including, but not limited to, supply chain disruptions, labor shortages, wage pressures, inflation and economic slowdown or recession, as well as fuel and energy costs (for example, the price of diesel), the impact of interruption by fire, power shortages, industrial accidents, hostile acts, cybersecurity attacks, natural disasters or extreme weather events, major public health crises, geopolitical tensions or conflicts (including trade policies such as tariffs and other controls on exports and imports), and foreign currency exchange rate fluctuations.
Prices of consumables used in our operations, such as natural gas, diesel, coal, other sources of energy, ammonium nitrate, chemical reagents (including sulfuric acid), and steel-related products, and components impact the costs of production at our operations and the costs of development projects. These prices fluctuate and can be volatile. Since 2022, we have experienced price volatility for certain consumables, including diesel fuel, ammonium nitrate and sulfuric acid, and certain components, which has impacted our operating results, and we may experience volatility in the price and availability of other consumables in the future. We also experienced increased costs for equipment, parts and other operating supplies and services. Significant volatility or further increases could have a material adverse effect on our results of operations and could result in material changes to our operating plans or development projects.
Ensuring continuity of supply of such consumables to our operations is critical to our business. We also rely on the availability of components from suppliers for key machines and equipment, which may be impacted by competition demands as well as the availability of input materials in the creation of such equipment. A supplier’s failure to supply consumables or components in a timely manner or to meet our quality, quantity, cost requirements or our technical specifications, or our inability to obtain alternative sources of consumables or components on a timely basis or on terms acceptable to us, could adversely affect our operations. We have also experienced longer lead times on delivery of certain consumables, including fuel, lubricants, ammonium nitrate and sulfuric acid. While these delays did not significantly impact our results for the three years ended December 31, 2024, these delays may continue and could become material. Further, delays and logistical constraints may occur as a result of weather-related impacts or violence, civil and religious strife, and activism at or near our operations or those of our suppliers, as described in the related risk factor below.
Following any interruption to our business, we can require substantial recovery time, experience significant expenditures to resume operations, and lose significant revenues, which could have a material adverse effect on our results of operations. Because we may rely on limited sources and long-lead times for consumables and components for key machines and equipment, a business interruption affecting or requiring such sources would exacerbate any negative consequences to us.
Our business depends on timely inbound transportation of consumables and components we use and outbound transportation of the commodities we produce such as by truck, rail and ocean freight. Any significant increase in the cost of or significant delays in the transportation of consumables or components used in our operations or the commodities we produce, as a result of increases in fuel or labor costs, higher demand for logistics services, weather-related impacts (such as low water levels along shipping routes) or otherwise, could adversely affect our results of operations. Additionally, if transportation service providers fail to deliver consumables or components used in our operations to us or the commodities we produce to our customers in a timely manner or at all, such failure could adversely impact our ability to meet our production schedules, delay our projects and capital initiatives, negatively affect our customer relationships and have a material adverse effect on our financial position and results of operations.
Our debt and other financial commitments may limit our financial and operating flexibility.
At December 31, 2024, our total consolidated debt was $8.9 billion (see MD&A and Note 6) and our total consolidated cash and cash equivalents was $3.9 billion ($4.7 billion including restricted cash and cash equivalents associated with PT-FI’s export proceeds required to be temporarily deposited in Indonesia banks as described in MD&A and Note 10). We also have various other financial commitments, including reclamation and environmental obligations, take-or-pay contracts and leases. Although we have been successful in servicing debt in the past, refinancing our bank facilities and issuing new debt securities in capital markets transactions at the parent and subsidiary levels, there can be no assurance that we can continue to do so. In addition, we may incur additional debt in future periods or reduce our holdings of cash and cash equivalents in connection with funding existing operations, capital expenditures, dividends, share or debt repurchases, or in pursuing other business opportunities. For further information, see the risk factors below relating to mine closure and reclamation regulations and the increasing scrutiny and evolving expectations from stakeholders and other third parties, including creditors, with respect to our environmental and social practices, performance and disclosures.
Our level of indebtedness, restricted cash and other financial commitments could have important consequences to our business, including the following:
•Limiting our flexibility in planning for, or reacting to, changes in the industry in which we operate;
•Increasing our vulnerability to general adverse economic, financial, industry and regulatory conditions;
•Limiting our ability to fund future working capital, capital expenditures, general corporate requirements and/or material contingencies, to engage in future development activities or other business opportunities, or to otherwise realize the value of our assets and opportunities fully because of the need to dedicate a substantial portion of our cash flows from operations to payments on our debt;
•Requiring us to sell assets to reduce debt; or
•Placing us at a competitive disadvantage compared to our competitors that have less debt and/or fewer financial commitments.
Any failure to comply with the financial and/or other covenants in our debt agreements may result in an event of default that would allow the creditors to accelerate maturities of the related debt, which in turn may trigger cross-acceleration or cross-default provisions in other debt agreements. Our available cash and liquidity may not be sufficient to fully repay borrowings under our debt instruments that may be accelerated upon an event of default.
As of January 31, 2025, our senior unsecured debt was rated “Baa2” with a stable outlook by Moody’s Investors Service, “BBB” with a stable outlook by Fitch Ratings, and “BBB-” with a stable outlook by Standard & Poor’s. If we are unable to maintain our indebtedness and financial ratios at levels acceptable to these credit rating agencies, or should our business prospects deteriorate, our current credit ratings could be downgraded, which could adversely affect the value of our outstanding securities and existing debt, our ability to obtain new financing on favorable terms and could increase our borrowing costs.
Changes in or the failure to comply with the requirements of mine closure and reclamation regulations could have a material adverse effect on our business.
We are required by U.S. federal and state laws and regulations to provide financial assurance sufficient to allow a third party to implement approved closure and reclamation plans for our mining properties if we are unable to do so. As of December 31, 2024, our financial assurance obligations totaled $2.0 billion for closure and reclamation costs of U.S. mining sites. We are also subject to financial assurance requirements in connection with our remaining oil and gas properties and certain of our previously sold oil and gas properties under both state and federal laws. Refer to Note 10 for additional information regarding our financial assurance obligations and Items 1. and 2. “Business and Properties” for a discussion of certain of such U.S. federal and state laws and regulations applicable to us. A substantial portion of our financial assurance obligations are satisfied by guarantees by us and certain of our subsidiaries. Our ability to continue to provide guarantees depends on state and other regulatory requirements, our financial performance and our financial condition. Other forms of assurance, such as letters of credit and surety bonds, are costly to provide and, depending on our financial condition and market conditions, may be difficult or impossible to obtain. Failure to provide or maintain the required financial assurance could result in the closure of the affected properties.
Plans and provisions for mine closure, reclamation and remediation and oil and gas properties plugging and abandonment obligations may change over time as a result of changes in stakeholder and other third-party expectations, legislation, standards, and technical understanding and techniques, which may cause our actual costs of closure, reclamation and remediation and plugging and abandonment obligations to be higher than estimated for asset retirement obligations (AROs) and environmental obligations and could materially affect our financial position or results of operations. For example, our implementation of the Global Industry Standard for Tailings Management (the Tailings Standard) (refer to Items 1. and 2. “Business and Properties” for further discussion) has required changes and could require additional changes to our closure and reclamation plans or modifications to previously completed reclamation actions. In addition, climate change could lead to changes in the physical risks posed to our operations, which could result in changes in our closure and reclamation plans to address such risks. Any modifications to our closure and reclamation plans that may be required to address physical climate risks may increase our financial assurance obligations and may materially increase the actual costs associated with implementing closure and reclamation at any or all of our active or inactive mine sites or smelter sites. Refer to Notes 1 and 10 for further discussion of our environmental obligations and AROs and see the risk factors below relating to the potential physical impacts of climate change and our related obligations as part of our commitment to implementing the Tailings Standard.
Unanticipated legal proceedings or negative developments in pending legal proceedings or other contingencies could have a material adverse effect on our financial condition.
We are, and may in the future become, involved in various legal proceedings and subject to other contingencies that have arisen or may arise in the ordinary course of our business or are associated with environmental matters, including those described in Note 10, Items 1. and 2. “Business and Properties” and in Item 3. “Legal Proceedings.” We are also involved periodically in other reviews, inquiries, investigations and proceedings initiated by or involving government agencies, some of which may result in adverse judgments, settlements, fines, penalties, injunctions or other relief. For example, we have been cooperating with and responding to a subpoena from the U.S. Securities and Exchange Commission (SEC) and an information request from the Department of Justice related to our public disclosures about the engineering design and construction of the new smelter in Indonesia, which is also the subject matter in a separate whistleblower complaint from a former contractor that we are defending before the Department of Labor. We cannot predict the outcome of these investigations, and the outcome of any legal proceeding is inherently uncertain and adverse developments or outcomes can result in significant monetary damages, penalties, other sanctions or injunctive relief against us, limitations on our property rights, or regulatory interpretations that increase our operating costs, some of which may not be covered by insurance. Further, to the extent that societal pressures or political or other factors are involved, it is possible that liability could be imposed without regard to our causation of or contribution to the asserted damage, or to other mitigating factors. Management does not believe, based on currently available information, that the outcome of any individual legal proceeding currently pending will have a material adverse effect on our financial condition, although individual or cumulative outcomes could be material to our operating results for a particular period, depending on the nature and magnitude of the outcome and the operating results for the period.
Regardless of the merit of particular claims, defending against legal proceedings or responding to investigations can be expensive, time-consuming, disruptive to our operations and distracting to management. In recognition of these considerations, we may enter into agreements or other arrangements to settle legal proceedings and resolve such challenges. There can be no assurance such agreements can be obtained on acceptable terms or that legal proceedings will not occur.
From time to time, we are involved in disputes over the allocation of environmental response costs and obligations at “Superfund” and other sites. We may be held responsible for the costs of addressing contamination at the site of current or former activities or at third-party sites or be held liable to third parties for exposure to hazardous substances should those be identified in the future. For further discussion of our environmental obligations, see the regulatory, environmental and social risks below.
Further, we are a global business with operations in various jurisdictions. In the event of a dispute arising at our foreign operations, we may be subject to the exclusive jurisdiction of foreign courts or arbitral panels, or may not be successful in subjecting foreign persons to the jurisdiction of courts or arbitral panels in the U.S. or in enforcing the judgment of a foreign court or arbitral panel against a sovereign nation. Our inability to enforce our rights and the enforcement of rights on a prejudicial basis by foreign courts or arbitral panels, including against a sovereign nation, could have an adverse effect on our results of operations and financial position.
Changes in tax laws and regulations could have a material adverse effect on our financial condition.
As a global business, we are subject to income, royalty, transaction and other taxes in the U.S. and various foreign jurisdictions. Uncertainties exist with respect to our tax liabilities, including those arising from changes in laws in the jurisdictions in which we do business. Additionally, we are subject to regular review and audit by both domestic and foreign tax authorities. Although we believe our tax estimates are reasonable, the ultimate tax outcome may differ from the tax amounts recorded in our financial statements and may materially affect our income tax provision, net income, or cash flows in the period or periods for which such determination and settlement occurs.
We have significant net operating losses (NOLs) in the U.S. generated in prior years. These NOLs are available to offset future regular taxable income, which we believe will result in minimal estimated regular income tax liability in the U.S. over the next several years at current metals market prices. As discussed in MD&A and Note 9, the provisions of the U.S. Inflation Reduction Act of 2022 (the Act) became applicable to us on January 1, 2023. The Act includes, among other provisions, a new Corporate Alternative Minimum Tax (CAMT) of 15% on the adjusted financial statement income (AFSI) of corporations with average annual AFSI exceeding $1.0 billion over a three-year period. In September 2024, the Internal Revenue Service (IRS) issued proposed regulations that provide guidance on the application of CAMT, which are not final and subject to change. Based on the proposed guidance
released by the IRS, we have determined that the provisions of the Act did not impact our financial results for the years 2024 or 2023.
In December 2021, the Organisation for Economic Co-operation and Development (OECD) published a framework for Pillar Two of the Global Anti-Base Erosion Rules, which was designed to coordinate participating jurisdictions in updating the international tax system to ensure that large multinational companies pay a minimum level of income tax. Recommendations from the OECD regarding a global minimum income tax and other changes are being considered and/or implemented in jurisdictions where we operate. At current metals market prices, we do not expect enactment of the recommended framework in jurisdictions where we operate to materially impact our financial results.
International risks
Our operations are subject to evolving geopolitical, economic, regulatory and social risks.
We are a U.S.-based metals company with substantial assets located outside of the U.S. Risks of conducting business in the countries where we operate or do business, can include:
•Delays in obtaining or renewing, or the inability to obtain, maintain or renew, or the renegotiation, cancellation, revocation or forced modification (including the inherent risk of these actions being taken unilaterally by a foreign government or government owned entity) of contracts, leases, licenses, permits, easements, rights-of-way, stability agreements or other agreements and/or approvals;
•Expropriation or nationalization of property, protectionism, or restrictions on repatriation of earnings or capital;
•Changes in and differing interpretations of the host country’s laws, regulations and policies (which may be applied retroactively), including, but not limited to, those relating to labor, taxation, royalties, duties, tariffs, licenses, divestment, imports, exports (including restrictions on the export of copper concentrates and anode slimes, copper and/or gold), trade laws and regulations, immigration, currency, human rights and environmental matters (including land use and water use and, in some cases, consent), additional requirements on foreign operations and investment, and/or fines, fees and sanctions, criminal liability and other penalties imposed for failure to comply with the laws and regulations of the jurisdictions in which we operate, the risk of any of which may increase with rising “resource nationalism” in countries around the world;
•Geopolitical tensions, conflicts and events, social and economic instability, bribery, extortion, corruption, civil unrest, blockades, acts of war, guerrilla activities, insurrection and terrorism, certain of which may result in, among other things, an inability to access our property or transport our commodities;
•Risk of loss associated with illegal activity, including trespass, illegal mining, theft (including piracy), sabotage (including of critical infrastructure) and vandalism;
•Changes in U.S. trade, tariff and other controls on imports and exports, tax, immigration or other policies that may impact relations with foreign countries or result in retaliatory policies;
•Increases in training and other costs and challenges relating to requirements to employ nationals of a country in which a particular operation is located;
•Foreign exchange controls and fluctuations in foreign currency exchange rates; and
•Reduced protection for intellectual property rights.
Accordingly, our activities in the U.S. and outside of the U.S. may be substantially affected by many external factors beyond our control, any of which could have a material adverse effect on our cash flows, results of operations and financial condition.
We are required to comply with a wide range of laws and regulations in the countries where we operate or do business. For example, our international operations must comply with the U.S. Foreign Corrupt Practices Act (FCPA) and similar anti-corruption and anti-bribery laws of the other jurisdictions in which we operate. We are investigating whether activities of PT Smelting may have violated aspects of the FCPA or other laws, including laws of non-U.S. jurisdictions. PT Smelting is an Indonesian joint venture between PT-FI and Mitsubishi Materials Corporation (MMC). An affiliate of MMC serves as operator of PT Smelting (see Note 2). We have voluntarily
notified the SEC and Department of Justice that we have engaged outside counsel to conduct this investigation of PT Smelting’s activities. Any determination that operations or activities are not in compliance with existing laws, including the FCPA, could result in the imposition of fines, penalties and equitable remedies. We cannot currently predict the outcome of the investigation.
We operate in jurisdictions that have experienced public and private sector corruption and where significant anti-corruption enforcement activities, prosecutions and settlements have occurred. We have a large number of contracts with local and foreign business partners, including suppliers and contractors, who may take action contrary to or fail to adopt standards, controls and procedures, including health, safety, environmental, human rights and community standards that are equivalent to our standards, controls and procedures. There can be no assurance that our policies, procedures and internal controls will protect us from misinterpretation of or noncompliance with applicable laws and internal policies, recklessness, fraudulent behavior, dishonesty or other inappropriate acts committed by our affiliates, employees, contractors or other business partners. As such, our policies, procedures and internal controls may not prevent or detect all potential breaches of law or governance practices. Any breaches could result in safety events that may result in injuries or fatalities; significant criminal or civil fines, penalties, litigation or regulatory action or inquiries or other enforcement actions; shareholder or other stakeholder activism (such as to stop using a certain business partner); civil unrest or other adverse impacts on human rights; termination of contracts; loss of operating licenses or permits; and damage to our reputation, any of which could have a material adverse effect on our cash flows, results of operations and financial condition.
In addition, our insurance does not cover most losses caused by the risks described above. For example, we do not have political risk insurance.
We conduct international operations and exploration activities in Indonesia, Peru and Chile as well as other foreign jurisdictions. Accordingly, in addition to the usual risks associated with conducting business in countries outside the U.S., our business may be adversely affected by political, economic, social and regional uncertainties in each of these countries. Other risks specific to certain countries in which we operate are discussed in more detail below.
Because our operations in Indonesia are material to our business, our business may be adversely affected by political, economic, regulatory and social uncertainties in Indonesia.
Maintaining a good working relationship with the Indonesia government, PT Mineral Industri Indonesia (Persero) (MIND ID), an Indonesia state-owned enterprise and shareholder in PT-FI, and the local population, is important because of the significance of our Indonesia operations to our business, and because our operations there are among Indonesia’s most significant business enterprises. Partially because of the Grasberg minerals district’s significance to Indonesia’s economy, the environmentally sensitive area where it is located, and the number of local people employed, our Indonesia operations have been the subject of political debates and criticism in the Indonesia press and have been the target of protests and occasional violence. Improper management of our working relationship with the Indonesia government, MIND ID or the local population could lead to a disruption of operations and/or impact our reputation in Indonesia and in the region where we operate, which could adversely affect our business.
The mining industry is subject to extensive regulation within Indonesia, and there have been major developments in laws and regulations applicable to mining concession holders, some of which have conflicted with PT-FI’s contractual rights and may conflict with PT-FI’s contractual rights in the future.
For example, in 2009, the Indonesia government enacted a mining law that sought to modify PT-FI’s former contract of work, certain provisions of which were not required under or conflicted with PT-FI’s former contract of work. In December 2018, PT-FI was granted an IUPK to replace its former contract of work, enabling PT-FI to conduct operations in the Grasberg minerals district through 2041, subject to certain requirements. Refer to Note 11 for a summary of the IUPK’s key fiscal terms and requirement to develop additional smelting and refining capacity. Pursuant to regulations issued during 2024, PT-FI is eligible to apply for an extension of its mining rights beyond 2041, provided certain conditions are met. Refer to Note 10 for a summary of such conditions. Application for extension may be submitted at any time up to one year prior to the expiration of PT-FI’s IUPK. PT-FI expects to apply for an extension during 2025, pending agreement with MIND ID on a purchase and sale agreement for the transfer in 2041 of an additional 10% interest in PT-FI. We cannot guarantee that PT-FI will receive an extension of mining rights beyond 2041.
Since 2019, the Indonesia government has enacted various laws and regulations related to downstream processing of various products. Refer to “Operations – Indonesia” in MD&A and Notes 10 and 11 for a discussion of Indonesia
regulatory matters, including those related to export licenses, export duties, export proceeds, smelter assurance bonds and PT-FI’s new smelter and PMR (collectively, PT-FI’s new downstream processing facilities) in Eastern Java, Indonesia.
In October 2024, a fire occurred during commissioning of PT-FI’s new smelter in Eastern Java, Indonesia, requiring a temporary suspension of smelting operations to complete repairs. Procurement of long-lead items is advanced, and repairs are scheduled to be completed by mid-2025. Current regulations in Indonesia prohibit exports of copper concentrate as of January 1, 2025. Pursuant to the terms of its IUPK regarding force majeure events, PT-FI has requested approval from the Indonesia government to permit the export of copper concentrates in 2025 until the required repairs of its new smelter following the October 2024 fire incident and full ramp-up are complete. Based on discussions with the Indonesia government, PT-FI expects to re-commence exports of copper concentrate during first-quarter 2025, and pursuant to current regulations, would be required to pay a 7.5% export duty on all copper concentrate exports during 2025. If PT-FI does not receive a timely export license or if any limitations on exports or additional export duties resulting from Indonesia regulations were to be implemented prior to PT-FI’s new downstream processing facilities becoming operational, PT-FI could be required to reduce production levels or be subject to increased costs, which could adversely impact our revenues and operations.
There can be no assurance that future regulatory changes affecting the mining industry in Indonesia will not be introduced or unexpectedly repealed, or that new interpretations of existing laws and regulations will not be issued, any of which may conflict with PT-FI’s contractual rights, which could adversely affect our business, financial condition and results of operations.
Beginning in 2022, the Indonesia government divided the Indonesia portion of the island of New Guinea from two provinces into a total of six provinces, which has resulted in public protest and civil unrest. For further discussion of violence, civil and religious strife, and activism affecting our operations in Indonesia, see the related risk factor below. Further, we cannot predict the impact of splitting provinces on local and regional regulations, permits and other governmental administrative functions, which could have an adverse impact on our business.
In 2024, Indonesia held national legislative elections, including the presidential election. Political considerations and administrative changes resulting from these elections or future elections could affect, among other things, national and local policies pertaining to foreign investment, permitting and export restrictions, which could adversely affect our Indonesia operations.
In accordance with a regulation issued by the Indonesia government in 2023, 30% of PT-FI’s gross export proceeds are being temporarily deposited into Indonesia banks for a period of 90 days before withdrawal. The Indonesia government is considering changes to this regulation, which could increase the amount and length of the requirement, but also allow withdrawals from the balances to fund business requirements. The details of the modifications have not been finalized.
PT-FI will not mine all of the ore reserves in the Grasberg minerals district before the initial term of its IUPK expires in 2031. PT-FI’s IUPK may not be extended through 2041 if PT-FI fails to abide by its terms and conditions and applicable laws and regulations.
Under the terms of PT-FI’s IUPK, PT-FI has been granted mining rights through 2031, with rights to extend its mining rights through 2041, subject to certain terms and conditions. Refer to Note 11 for a summary of the IUPK’s key fiscal terms.
Our proven and probable mineral reserves in Indonesia reflect estimates of minerals that can be recovered through the end of 2041, and PT-FI’s current long-term mine plan and planned operations are based on the assumption that PT-FI will abide by the terms and conditions of the IUPK and will be granted the 10-year extension from 2031 through 2041. As a result, PT-FI will not mine all of these mineral reserves during the initial term of the IUPK. Prior to the end of 2031, we expect to mine 40% of aggregate proven and probable recoverable mineral reserves at December 31, 2024, representing 45% of FCX’s net equity share of recoverable copper reserves in Indonesia and 44% of FCX’s net equity share of recoverable gold reserves in Indonesia.
If PT-FI does not achieve full ramp-up at the new downstream processing facilities, or fulfill its defined fiscal obligations to the Indonesia government as set forth in the IUPK, the IUPK may not be extended from 2031 through 2041, and PT-FI would be unable to mine all of its proven and probable mineral reserves in the Grasberg minerals district, which could adversely affect our business, results of operations and financial position.
PT-FI and the Indonesia government continue to engage in discussions regarding the extension of PT-FI’s IUPK beyond 2041. While PT-FI expects to apply for an extension during 2025, pending agreement with MIND ID on a purchase and sale agreement for the transfer in 2041 of an additional 10% interest in PT-FI, we cannot predict whether the application will be successful in extending PT-FI’s IUPK beyond 2041.
Operational risks
Our operations are subject to significant operational risks that could adversely affect our business, including the ability to smelt and refine, and our underground mining operations have higher risks than a surface mine.
We have assets in a variety of geographic locations, all of which exist in and around broader communities and environments. Maintaining the operational integrity and performance of our assets is crucial to protect our people, the environment and communities in which we operate. Our operations are very large in scale and, by their nature are subject to significant operational risks, some of which are outside of our control, and many of which are not covered fully, or in some cases even partially, by insurance. These operational risks, which could materially adversely affect our business, operating results and cash flows, include earthquakes, rainstorms, floods, landslides, wildfires and other natural disasters and extreme weather events; environmental hazards, including discharge of metals, concentrates, pollutants or hazardous chemicals; surface or underground fires; equipment failures; accidents, including in connection with mining equipment, milling equipment or conveyor systems, transportation of chemicals, explosives or other materials and in the transportation of employees and other individuals to and from sites (including where these services are provided by third parties such as vehicle and aircraft transport); wall failures and rock slides in our open-pit mines, and structural collapses of our underground mines or tailings impoundments; underground water and ore management; lower than expected ore grades or recovery rates; and seismic activity resulting from unexpected or difficult geological formations or conditions (whether in mineral or gaseous form).
For a discussion of risks specific to our tailings management, see the risk factors below relating to our management of waste rock and tailings, including our river transport system for tailings management in Indonesia.
We are facing continued geotechnical challenges because of the older age of some of our open-pit mines and a trend toward mining deeper pits and more complex deposits. There can be no assurance that unanticipated geotechnical and hydrological conditions may not occur, nor whether these conditions may lead to events such as landslides and pit wall failures, or that such events will be detected in advance. Geotechnical instabilities can be difficult to predict and are often affected by risks and hazards outside of our control, such as seismic activity or extreme weather, which have in the past and may in the future lead to floods, mudslides, pit-wall instability and possibly even slippage of material, which has and may in the future require suspension of operations and impact operating results.
We also experience mining induced seismic activity, including landslides, from time to time in the Grasberg minerals district in addition to extreme weather. The mine site is in an active seismic area and has experienced earth tremors from time to time. In addition to the usual risks encountered in the mining industry, our Indonesia mining operations involve additional risks given their location in steep mountainous terrain in a remote area of Indonesia. These conditions have required us to overcome special engineering difficulties and develop extensive infrastructure facilities. The area also receives extreme rainfall, which has led to periodic floods and mudslides. In February 2023, PT-FI’s operations were temporarily disrupted because of significant rainfall and landslides, which restricted access to infrastructure near its milling operations. We cannot predict whether similar weather-related or seismic events will occur in the future or the extent to which any such event would affect these, or any of our other operations.
Underground mining operations have unique risks that can be particularly dangerous, such as those associated with supporting the underground openings. In May 2013, the rock structure above the ceiling of an underground training facility at the Grasberg minerals district collapsed, which resulted in 28 fatalities and 10 injuries. While we have implemented preventative measures, we cannot guarantee that any incidents will not occur in the future.
The occurrence of one or more of these operational risks in connection with our operations may result in the death of, or personal injury or illness to, our employees, other personnel or third parties, the loss of mining equipment, damage to or destruction of mineral properties or production facilities, significant repair costs, monetary losses, deferral or unanticipated fluctuations in production, extensive community disruption (including short- and long-term health and safety risks), loss of licenses, permits or necessary approvals to operate, loss of workforce confidence,
loss of infrastructure and services, disruption to essential supplies or delivery of our products, environmental damage and potential legal liabilities, any of which may adversely affect our reputation, business, prospects, results of operations and financial position. Further, the impacts of any serious incidents that occur may also be amplified if we fail to respond timely or in an appropriate manner.
In addition, we could also be subject to additional operational risks at our smelters and refineries, including those specific to PT-FI once it is fully dependent on its ability to smelt and refine domestically all its concentrates. Any delay, suspension, loss of access, shutdown of affected facilities or limited availability and capacity related to these smelting and refinery facilities, including equipment or mechanical failures, fires, explosions, unanticipated or extended shutdowns, inability to sell certain by-products, lack of capacity to store certain by-products, extreme weather or natural disasters, social or political unrest or any major public health crisis, any of which may not be recognized as a force majeure event, may significantly impact our ability to export and sell our products, particularly in Indonesia even if alternative refineries or smelters outside of Indonesia are available, and could adversely impact our costs, revenues and results of operations or require us to revise our operating plans, including curtailing or modifying our mining and milling operations. As discussed above and in Note 10, a fire occurred in October 2024 during start-up activities at PT-FI’s new smelter, requiring a temporary suspension of smelting operations to complete repairs. PT-FI expects repairs to be completed by mid-2025 and ramp-up to full capacity to be achieved by year-end 2025.
We maintain insurance at amounts we believe to be reasonable to cover some of these risks and hazards; however, our insurance may not sufficiently cover losses from certain of these risks and hazards. There can be no assurance that such insurance will continue to be maintained or available at economically feasible premiums, that the proceeds of such insurance will be paid in a timely manner or that we will be adequately compensated for losses actually incurred, if at all. We may elect not to purchase insurance for certain risks because of the high premium costs associated with insuring such risk or for various other reasons. For example, we do not have coverage for certain environmental losses, including the legal liabilities associated with these risks. The lack of, or insufficiency of, insurance coverage could adversely affect our cash flows and overall profitability.
Our management of waste rock and tailings are subject to significant environmental, safety and engineering challenges and risks that could adversely affect our business.
The waste rock (including overburden) and tailings produced in our mining operations represent our largest volume of mine waste material. Managing the volume of waste rock and tailings presents significant environmental, safety and engineering challenges and risks primarily relating to structural stability, geochemistry, water quality and dust generation. Management of this waste is regulated in the jurisdictions where we operate and our programs are designed to comply with applicable national, state and local laws, permits and approved environmental impact studies.
We maintain large leach pads and tailings impoundments containing viscous material. Our leaching innovation initiatives include measures that are intended to enhance solution flow through our leach stockpiles, which may increase risks for physical instability of such stockpiles. Tailings impoundments include large embankments that must be engineered, constructed and monitored to ensure structural stability and avoid structural collapse. Our tailings impoundments in arid areas must have effective programs to suppress fugitive dust emissions to meet regulatory requirements, which vary depending on location, and to limit potential impacts of dust emissions from our operations on surrounding communities and the environment. Additionally, we must effectively monitor, prevent and treat acid rock drainage at all of our operations. In Indonesia, we use a controlled riverine tailings management system, which presents other risks discussed in more detail in the risk factor below relating to the environmental challenges at our Indonesia mining operations.
As of December 31, 2024, we operated 15 active tailings storage facilities (13 in the U.S. and 2 in Peru), of which 10 have an upstream design and 5 have a centerline design. Additionally, we have one centerline tailing storage facility in development. We also manage 29 tailings storage facilities in the U.S. that are inactive or closed (23 with an upstream design, 2 with a centerline design and 4 with a downstream design) and another 25 that are deemed “safely closed” according to the definition in the Tailings Standard (22 with an upstream design and 3 with a centerline design). In 2024, we produced approximately 346 million metric tons of tailings globally. The failure of tailings storage facilities, other embankments or stockpiles at any of our mining operations could cause severe, and in some cases catastrophic, property and environmental damage and loss of life, as well as adverse effects on our business and reputation. Some of our tailings storage facilities are located in areas where a failure has the potential to impact individual dwellings, and at least one of our impoundments is in an area where a failure has the potential
to impact nearby communities or mining infrastructure. There can be no assurance that a severe or catastrophic failure of any of our facilities will not occur in the future. For additional information regarding the company’s tailings management and stewardship program, including our implementation of the requirements of the Tailings Standard, refer to Items 1. and 2. “Business and Properties.”
Based on observations from tailings failures at unaffiliated mines and our risk assessment process, which assesses a range of potential risks to our tailings storage facilities, in addition to fatalities and severe personal, property and environmental damages, these events could result in limited or restricted access to mine sites, physical failures at sites (such as overtopping of an impoundment), suspension of operations, decrease in mineral reserves, legal liability, government investigations, additional regulations and restrictions on mining operations in response to any such failure, increased monitoring costs and production costs, increased insurance costs or costs associated with insufficiency of or inability to obtain insurance, increased costs and/or limited access to capital, remediation costs, inability to comply with any additional safety requirements or obtain necessary certifications, evacuation or relocation of communities or other emergency action, impacts on occupational health and safety, social risks, and other impacts, which could have a material adverse effect on our operations and financial position.
Our Indonesia mining operations are susceptible to difficult and costly environmental challenges, and future changes in Indonesia environmental laws could increase our costs.
Mining operations on the scale of our Indonesia operations involve significant environmental risks and challenges. Given the unique site-specific topographical, hydrological and geotechnical conditions of the project area, our primary challenge is to dispose of the large volume of tailings we produce. In 2024, PT-FI produced approximately 73 million metric tons of tailings. Our tailings management plan, which has been approved by the Indonesia government, uses an unnavigable part of a river in the highlands to transport the tailings and natural sediments from the mill in the highlands to an engineered tailings management area in the lowlands. Levees have been constructed along both sides of the lowlands tailings management area to act as containment structures to laterally contain the depositional footprint of the tailings and natural sediment within the approved tailings management area.
Another major environmental challenge at PT-FI is managing overburden stockpiles and other waste rock and conditions in the open pit. Overburden is rock that was previously moved aside in the Grasberg open pit mining process to reach the ore. In the presence of air, water and naturally occurring bacteria, some of this material can generate acid rock drainage (acidic water containing dissolved metals) that, if not properly managed, can adversely affect the environment or be costly to manage. There is no guarantee our actions to prevent and manage the quality of any discharge of impacted water will be successful. PT-FI may modify its re-sloping, erosion control and water management plans in the future, which could lead to material increases in costs.
In addition, in the past, certain Grasberg overburden stockpiles experienced erosion over time that caused mineralized overburden material to enter into the lowlands tailings management area. This erosion affected the volume as well as the physical and chemical characteristics of the sediment material deposited in the lowlands tailings management area, which, if not properly managed, could result in environmental impacts. The underlying overburden erosion and run-off are being managed and controlled through an extensive re-sloping and water management project which is ongoing, and PT-FI has not experienced similar erosion issues since 2018.
PT-FI maintains a tailings deposition management plan and environmental monitoring program which consider the presence of this potentially acid-forming overburden in the lowlands tailings management area. PT-FI has expanded the scope of its environmental monitoring program which assesses potential environmental and human health impacts from overburden and tailings. As part of the expanded scope, in 2022 and 2023, PT-FI assisted the Mimika local health authority (LHA) with broad-based community health surveys, which provided further data on an extensive range of community health issues. There were no impacts attributable to PT-FI’s operations (inclusive of tailings and overburden) that were determined to be a priority focus of the LHA following the results of these assessments. In response to the health survey results, PT-FI and the LHA have agreed to collaborate on public health challenges moving forward. During 2024, PT-FI continued its routine assessments of surface waters, groundwaters, sediments and soils, dust and terrestrial and aquatic tissues.
In the past, the Indonesia government, stakeholders and other third parties have raised questions with respect to PT-FI’s tailings management systems and plans. We continue to revisit studies for alternative tailings management options. Our Indonesia mining operations are remotely located in steep mountainous terrain and in an active seismic area, which also experiences extreme weather events. Independent environmental management expert audits have reaffirmed conclusions from previous studies that PT-FI’s controlled riverine tailings management
system represents the best alternative for tailings management given the volume of tailings produced and the site-specific conditions of the area.
Overtopping or failure of any of the PT-FI tailings containment structures (levees or protection structures) induced by extreme weather events such as floods, a major seismic event or naturally occurring weak ground under the structures, are potential risks. The potential impacts from any such occurrence could vary significantly depending upon the specific location of the failure. Unanticipated structural failure of these structures in certain areas in the future could result in flooding of the nearby communities and related loss of lives and/or severe personal, property and environmental damages. Under certain conditions, a failure may necessitate evacuation or relocation of communities or other emergency action, financial assistance to the communities impacted, and remediation costs to repair and compensate for the social, cultural and economic impacts associated with such failure.
In addition, in the southern (estuary) portion of the approved tailings management area, mathematical modeling of certain sediment transport scenarios indicates that tailings have the potential to be deposited outside of the approved lateral levees in adjacent mangroves. PT-FI has proposed additional extensions to the existing levees to the Indonesia regulators and is further evaluating the potential benefits and impacts. Indonesia regulators have further proposed a different strategy involving efforts to increase sediment retention through various methods as well as increase beneficial use of tailings. If the additional retention efforts are not successful, or if the permitting for these proposed protection structures is not reconsidered, any such depositional impacts outside of our existing approved footprint could impact the environment and communities. Refer to Items 1. and 2. “Business and Properties” for further discussion of our environmental obligations in Indonesia.
Managing these environmental challenges at our Indonesia operations could result in reputational harm and increased costs that could be significant.
There can be no assurance that future environmental changes affecting the mining industry in Indonesia will not be introduced or unexpectedly altered or repealed, or that new interpretations of existing Indonesia environmental laws and regulations will not be issued, which could have a significant impact on PT-FI.
Violence, civil and religious strife, and activism could result in loss of life and disrupt our operations.
Indonesia
Indonesia has long faced separatist movements and civil and religious strife in a number of provinces. Several separatist groups have sought increased political independence for the province of Central Papua, where our Grasberg minerals district is located. In Central Papua, there have been attacks on civilians by separatists and conflicts between separatists and the Indonesia military and police. In addition, illegal miners have clashed with police who have attempted to move them away from our facilities. Social, economic and political instability in Central Papua could materially adversely affect us if it results in damage to our property or interruption of our Indonesia operations.
Shooting incidents have occurred within the PT-FI project area, including along the road leading to our mining and milling operations, which in some instances have involved fatalities or injuries to our employees, contractors, government security personnel and civilians. We incurred no fatalities or injuries relating to shootings within the PT-FI project area since April 2020, and we have had no shootings associated with the PT-FI project area since January 2021. In 2024, based on publicly available reports, we believe that there were more than 60 incidents of separatist violence, resulting in approximately 50 fatalities outside of the PT-FI project area at the Grasberg minerals district but within the province of Central Papua. In one such incident, which did not directly involve or target PT-FI’s operations or workforce, gunfire was exchanged between government security forces and separatists in an area adjacent to the PT-FI project area. Separatist security incidents, including shootings, attacks on civil infrastructure and arson, continue to occur in Central Papua and other areas near the PT-FI project area. PT-FI actively monitors security conditions and the occurrence of incidents both regionally and within the project and support areas.
The safety of our workforce is a critical concern, and PT-FI continues to work with the Indonesia government to enhance security and address security-related issues within the PT-FI project area and in nearby areas, including at PT-FI’s new downstream processing facilities. Although we have implemented measures and safeguards consistent with both international standards and our own internal standards relating to the use of force and respect for human rights, the implementation of these measures and safeguards does not guarantee that personnel, national police or other security forces will uphold these standards in every instance.
We also expect to be exposed to security risks relating to loss and theft of refined precious metals at the PMR. Any such loss or theft could lead to financial loss or a failure to satisfy our customer commitments, which could have an adverse impact on our reputation and business.
We cannot predict whether additional incidents will occur that could result in loss of life, or disruption or suspension of PT-FI’s operations. If other disruptive incidents occur, they could adversely affect our results of operations and financial condition.
South America
South America countries have historically experienced periods of economic growth, as well as recession, periods of high inflation and general economic and political instability.
In Peru, political uncertainty has created instability in the regulatory environment. Beginning in December 2022 and continuing in 2023, heightened tensions, protests and social unrest emerged in Peru following a change in the country’s political leadership, which temporarily resulted in delays in the transport of supplies, products and people at our Cerro Verde mine. During first-quarter 2023, Cerro Verde also operated at reduced rates from time-to-time until it resumed normal operations in March 2023. Other mining operations in the region temporarily halted mining activities as a result of the civil unrest. While demonstrations and road blockages subsided in 2023, the political situation in Peru remains complex. In addition, the potential for civil unrest, including in relation to mining operations, and disruption of commerce and supply chains continues. Other operations in the region have encountered significant issues with trespassers, illegal miners and civil demonstrations that impact their current operations, expansion projects, logistical supply and product transport. Such protests have occasionally been accompanied by acts of violence and property damage and continue intermittently in the region.
In Chile, despite the overwhelming electoral approval of a proposal to rewrite the constitution in a 2020 referendum, the product of the constitutional assembly was rejected by a majority of voters in 2022 and 2023. The political environment remains polarized and political parties are preparing for presidential elections by the end of 2025.
We cannot predict whether similar or more significant incidents of civil unrest or political instability will occur in the future in Peru or Chile. Although such civil unrest has not significantly impacted our results, similar events in the future could cause our South America operations to be materially impacted, in which case, we may not be able to meet our production and sales targets.
U.S.
The occurrence of one or more unexpected events in the U.S., including civil unrest, domestic or foreign terrorism, and other acts of violence, could adversely affect our North America operations and financial performance.
Our operations, including future expansions or developments, depend on the availability of significant quantities of secure water supplies.
We recognize that access to clean, safe and reliable water supplies is vital to the health and livelihood of our host communities. Our operations require physical availability and secure legal rights to significant quantities of water, and the increasing pressure on water sources requires us to consider both current and future conditions in our approach. We aim to balance our operational water requirements with those of the local communities, environment and ecosystems. Most of our North America and South America operations are in areas where competition for water supplies is significant, and where climate change may lead to increasing scarcity of water sources in the future. Continuous production at our operations and any future expansions or developments are dependent on many factors, including our ability to maintain our water rights and claims, and the continuing physical availability of the water supplies. Current and long-term water risks include those that arise from our operations and events that we do not control (such as extreme weather and other physical risks associated with climate change). For further discussion of the potential physical impacts of climate change, see the related risk factor below.
As discussed in Item 3. “Legal Proceedings,” in Arizona, where our operations use both surface water and groundwater, we are a participant in an active adjudication in which Arizona courts have been attempting, for 50 years, to quantify and prioritize surface water claims for the Gila River watershed, one of the state’s largest river systems. If we are not able to satisfactorily resolve the issues being addressed in the adjudications, our water uses
could be diminished or curtailed, and our operations and any future expansions at Morenci, Safford (including Lone Star) and Sierrita could be adversely affected unless we are able to acquire alternative water sources.
Water for our Cerro Verde operation in Peru comes from renewable sources through a series of storage reservoirs on the Rio Chili watershed that collects water primarily from seasonal precipitation and from wastewater collected from the city of Arequipa and treated at a wastewater treatment plant constructed by us. Weather patterns have contributed to ongoing drought conditions in the area and water shortages at our Cerro Verde operation are possible, which could impact our operations.
Water for our El Abra operation in Chile currently comes from the continued pumping of groundwater from the Salar de Ascotán aquifer. The agreement to pump from this aquifer is subject to continued monitoring through 2029 of the aquifer water levels and select flora species to ensure that environmentally sensitive areas are not impacted by our pumping, which if impacted could cause reductions in pumping to restore water levels and could have an adverse effect on production from El Abra. Our permit for pumping of groundwater will expire in 2029 and any renewal or provisional extension may be challenging. We are evaluating water infrastructure alternatives to provide options to extend existing operations and support a future expansion, while continuing to monitor Chile’s regulatory and fiscal matters, as well as trends in capital costs for similar projects. There can be no assurance that we will be able to execute such water infrastructure plans or obtain a new permit or provisional extension, which could have an adverse impact on our operations. For further discussion, see the risk factor above relating to the geopolitical, economic and social risks associated with our operations.
Although our operations currently have access to sufficient water sources to support current operational demands, as discussed above, the availability of additional supplies for potential future expansions or development will require additional investments and will take time to develop, if available. While we are taking actions to acquire additional back-up water supplies for current and future mining operations, such supplies may not be available at acceptable cost, or at all. As such, the loss of a water right or currently available water supply could force us to curtail operations or force premature closures, and the ability to obtain future water supplies could prevent future expansions or developments, thereby increasing and/or accelerating costs or foregoing profitable operations.
We typically have sufficient water for our Indonesia operations, but at times and for reasons out of our control, we may have too much or not enough. The PT-FI project area receives considerable rainfall that makes it susceptible to periodic floods and mudslides, the nature and magnitude of which cannot be predicted. Conversely, the area has experienced, and may in the future experience, certain extended periods without rainfall, which can impact water availability at the milling operations.
Our information and operational technology systems have been and in the future may be adversely affected by cybersecurity events, disruptions, damage, failure and risks associated with implementation and integration.
Our industry has become increasingly supported by and dependent on digital technologies. Our strategy of operating large, long-lived, geographically diverse assets has been increasingly dependent on our ability to become fully integrated and highly automated. Many of our business and operational processes are heavily dependent on traditional and emerging technology systems to conduct day-to-day operations, improve safety and efficiency, and lower costs.
As our dependence on information systems, including those of our third-party service providers and vendors, grows, we have become more vulnerable to an increasing threat of continually evolving cybersecurity risks. In recent years, cybersecurity events have increased in frequency and magnitude and the methods used to gain unauthorized access change frequently, making it increasingly difficult for us to prevent cybersecurity incidents or detect and remediate incidents in a timely and effective manner. Attacks have included and may include, but are not limited to, installation of malicious software, phishing, ransomware, social engineering tactics and credential attacks, insider threats, denial of service attacks, unauthorized access to data and other advanced and sophisticated cybersecurity breaches and threats, including those that increasingly target critical operational technologies and process control networks and those that are increasingly using AI and quantum computing. Such attacks may be perpetrated by a variety of bad actors, some of which may reside in jurisdictions where law enforcement measures to address such attacks are ineffective.
We have experienced targeted and non-targeted cybersecurity events in the past and may experience them in the future. In August 2023, we determined that we were subject to a cybersecurity incident that affected certain of our
information systems. We performed an investigation of the incident and its associated impact and incurred costs to remediate, which were not material. We cannot guarantee that events of a similar nature, with potentially greater exposure, will not occur in the future.
Cybersecurity threats could subject us to manipulation or improper use of our systems and networks, production downtimes, loss of sales, communication interruption or other disruptions and delays to our operations or to the transportation of products or infrastructure utilized by our operations, unauthorized release of proprietary, commercially sensitive, confidential or otherwise protected information, a misappropriation or loss of funds, the corruption of data, significant health and safety consequences, physical destruction of assets, environmental damage, loss of intellectual property, fines, penalties, litigation, regulatory or governmental investigation, liability under or termination of our contracts with third parties, damage to our reputation or financial losses from remedial actions, any of which could have a material adverse effect on our cash flows, results of operations and financial condition, and which in addition could adversely impact the effectiveness of our internal control over financial reporting. We do not maintain cyber risk insurance, and the lack of insurance coverage could adversely affect our cash flows and overall profitability in the event of a cybersecurity incident that has a material adverse effect on our business.
While cybersecurity events have not had a material impact on us, we can provide no assurance that we will not experience any such impact or additional interruptions to our operations in the future. Given the unpredictability of the timing and the evolving nature and scope of information and operational technology system disruptions, the various procedures and controls we use to monitor and protect against cybersecurity threats and to mitigate potential risks arising from such threats have not been effective in some instances and may not be sufficient in preventing future cybersecurity incidents. Further, as cybersecurity threats continue to evolve, we may be required to expend significant additional resources to continue to modify or enhance our protective measures or to investigate and remediate vulnerabilities to cybersecurity threats.
We could also be adversely affected by system or network disruptions if new or upgraded information or operational technology systems are defective, not installed properly or not properly integrated into our operations. System modification failures could have a material adverse effect on our business, financial position and results of operations and could, if not successfully implemented, adversely impact the effectiveness of our internal control over financial reporting.
Further, we increasingly depend on our information technology infrastructure for electronic communications among our operations, personnel, customers and suppliers around the world, including as a result of remote working and flexible working arrangements. These information technology systems, some of which are managed by third parties that we do not control, may be susceptible to damage, disruptions or shutdowns because of failures during the process of upgrading or replacing software, databases or components thereof, cutover activities in our restructuring and simplification initiatives, power outages, hardware failures, telecommunication failures, human errors, catastrophic events or other problems. Refer to Item 1C. “Cybersecurity” for further information on our cybersecurity governance, risk management and strategy.
Failure to successfully implement or develop new technology systems and increased exposure to risks associated with the use of these systems may adversely affect our business.
Information and operational technology systems continue to evolve and, in order to remain competitive, we must implement new technologies in a timely, cost-effective and efficient manner. For example, we may develop and apply AI in decision support systems, material characterization, equipment reliability, mineral extraction and remote/autonomous operation. We may also pursue strategic alliances, partnership or licensing arrangements with other companies in areas where we believe collaboration can produce technological and industry advancement, which involves special risks that may negatively impact us or our reputation, may not achieve intended objectives, and may not perform as contemplated. We also are advancing a series of initiatives to incorporate new applications, technologies and data analytics to our leaching processes. For additional information on our leaching innovation initiatives, see MD&A. Our failure to successfully implement or develop new technologies, including AI, may adversely affect our competitiveness and, consequently, our results of operations. In addition, we utilize AI and other new technologies in our software, applications and technology platforms to enhance our capabilities in producing copper, improve business processes and respond to threats to our technology platforms. The use of AI may increase our exposure to cybersecurity risks and additional risks relating to the protection of data, including increased exposure of confidential or otherwise protected information to unauthorized recipients, which could result
in liability under or termination of our contracts with third parties, misuse of our intellectual property or other unintended consequences, as discussed in more detail in the risk factor above.
Major public health crises may have an adverse impact on our business.
Pandemics, epidemics, widespread illness or other major public health crises could negatively impact the global economy and adversely affect our operations and business, including our ability to conduct business, demand for the commodities we produce and our profit margins. Actions taken by governmental authorities and third parties to contain and mitigate the risk of spread of any major public health crisis may negatively impact our business, including a disruption of or change to our operating plans. For example, in March 2020, we had to temporarily transition our Cerro Verde mine to care and maintenance status and adjust operations to prioritize critical activities in response to a decree issued by the Peru government relating to COVID-19.
Our business and results of operations could be adversely affected if significant portions of our workforce are unable to work effectively, including because of illness, quarantines, government actions or other restrictions, or if workplace entry and travel are restricted resulting in the delay of key personnel or external consultants accessing our sites. A major health crisis at any of our operating sites, and particularly at PT-FI’s remote operating site, could disrupt or change our operating plans, which may have a material adverse effect on our business and results of operations.
Human capital risks
Labor disputes or labor unrest could disrupt our operations.
Our business is dependent on maintaining good relations with our workforce. A significant portion of our global employee population is covered by collective labor agreements with varying durations and expiration dates. Refer to Items 1. and 2. “Business and Properties” for additional information regarding labor matters, and expiration dates of such agreements. As of December 31, 2024, approximately 28% of our global employee population was covered by collective labor agreements and none of our global employee population was covered by agreements that will expire during 2025.
Labor agreements are negotiated on a periodic basis and may not be renewed on reasonably satisfactory terms to us or at all. If we do not successfully negotiate new collective labor agreements with our union employees, we may incur prolonged strikes and other work stoppages at our mining operations, which could adversely affect our financial condition and results of operations. Additionally, if we enter into a new labor agreement with any union that significantly increases our labor costs relative to our competitors, our ability to compete may be materially adversely affected.
We have in the past and could in the future experience labor disruptions such as work stoppages, work slowdowns, union organizing campaigns, strikes, or lockouts that could adversely affect our operations. There were no strikes or lockouts at any of our operations for the three years ended December 31, 2024.
We cannot predict whether additional labor disruptions will occur. Significant reductions in productivity or protracted work stoppages at one or more of our operations could significantly reduce our production and sales volumes or disrupt operations, which could adversely affect our cash flows, results of operations and financial condition.
Our success depends on our ability to recruit, retain, develop and advance qualified personnel.
Our success is dependent on the contributions of our highly skilled and experienced workforce. Our business depends on our ability to recruit, retain, develop and advance a qualified, inclusive and diverse workforce at all levels, including sufficient personnel to develop, implement and operate new technologies. Our ability to recruit qualified personnel is affected by the available pool of candidates with the training and skills necessary to fill the vacant positions, the impact on the labor supply because of general economic conditions and our ability to offer competitive compensation and benefit packages. We continued to face challenges in 2024 with an increasingly competitive and tight labor market, specifically in North America. The tight labor market, hiring more contract workers, and increased competition from other employers in North America continue to represent strategic challenges that are increasing our costs, reducing efficiency, impacting production and our ability to further expand current mining rates and will impact the timing of future developments in North America. If we fail to recruit, retain, develop and advance qualified, inclusive and diverse personnel necessary for the efficient operation of our business
or fail to maintain a safe environment, we could continue to face labor challenges, which may result in, but are not limited to, decreased profitability, further decreases to productivity and efficiency, ongoing safety performance challenges, and the further delay of current and potential development projects, any of which may have a material adverse effect on our performance. Refer to Items 1. and 2. “Business and Properties” for further discussion of our human capital management, including health and safety, and employee engagement, training and development.
Risks related to development projects and mineral reserves
Development projects are inherently risky and may require more capital and have lower economic returns than anticipated, and the development of our underground mines are also subject to other unique risks.
Mine development projects typically require a number of years and significant expenditures during the development phase before production is possible. There are many risks and uncertainties inherent in all development projects including, but not limited to, unexpected or difficult geological formations or conditions and environmental challenges, potential delays (including the ability and timeframe to obtain permits, or because of weather events, social or political unrest or any major public health crisis), cost overruns, availability of economic sources and reliable access to water, power and infrastructure, lower levels of production during ramp-up periods, shortages of materials or labor, construction defects, equipment breakdowns and injuries to persons and property, social acceptance and, in some cases, Indigenous and community consent for potential impacts, partner alignment and efficient and profitable operation of mature properties. Creating and maintaining an inventory of projects depends on many factors and although we devote significant time and resources to our project planning, approval and review processes, many of our development projects are highly complex and rely on factors that are outside of our control, which may cause the actual time and capital required to complete a development project and operating costs after completion to exceed our estimates, especially in periods of high inflation.
All of our copper and gold production in Indonesia comes from underground mining in the Grasberg minerals district. The development of our underground mines is subject to other unique risks including, but not limited to, underground fires or floods, ventilating harmful gases, fall-of-ground accidents, and seismic activity resulting from unexpected or difficult geological formations or conditions, which we experience from time to time in the Grasberg minerals district. While we anticipate taking all measures that we deem reasonable and prudent in connection with the development of our underground mines to safely manage production, there can be no assurance that these risks will not cause schedule delays, revised mine plans, injuries to persons and property, or increased capital costs, any of which may have a material adverse impact on our cash flows, results of operations and financial condition. Refer to Items 1. and 2. “Business and Properties” and MD&A for further discussion of PT-FI’s development of the Kucing Liar deposit in the Grasberg minerals district and our other development projects.
We may not be able to maintain or grow our mineral reserves.
Our existing mineral reserves will be depleted over time by production from our operations. Because our profits are primarily derived from our mining operations, our ability to replenish our mineral reserves is essential to our long-term success. Depleted mineral reserves can be replaced in several ways, including expanding known ore bodies, reducing operating costs that could extend the life of a mine by allowing us to cost-effectively process ore types that were previously considered uneconomic, investing in and advancing new technologies (such as our leaching innovation initiatives), locating new deposits or acquiring interests in mineral reserves from third parties.
Exploration is highly speculative in nature, involves many risks and uncertainties, requires substantial capital expenditures (which may differ significantly from those estimated) and, in some instances, advances in processing technology, and is frequently unsuccessful in discovering significant mineral resources since new, large, long-life deposits are increasingly scarce. Accordingly, our current or future exploration programs may not result in the discovery of additional deposits that can be produced profitably. Even if significant mineral resources are discovered, it will likely take many years from the initial phases of exploration until commencement of production, during which time the economic feasibility of production may change.
We may not be able to discover, enhance, develop or acquire mineral reserves in sufficient quantities to maintain or grow our current reserve levels, which could negatively affect our cash flows, results of operations and financial condition.
Estimates of mineral reserves and mineral resources are uncertain and the volume and grade of ore actually recovered may vary from our estimates.
Our estimates of mineral reserves and mineral resources have been prepared in accordance with the disclosure requirements of Subpart 1300 of SEC Regulation S-K. There are numerous uncertainties inherent in mineral estimates. Such estimates are, to a large extent, based on assumed long-term prices for the commodities we produce, primarily copper, gold and molybdenum, and interpretations of geologic data obtained from drill holes and other exploration techniques, which may not necessarily be indicative of future results. Our mineral estimates are based on the latest available geological and geotechnical studies. We conduct ongoing studies of our ore bodies to evaluate economic values and to manage risk. We revise our mine plans and estimates of recoverable proven and probable mineral reserves as required in accordance with the latest available studies. Geological assumptions about our mineral resources that are valid at the time of estimation may change significantly when new information becomes available.
Estimates of mineral reserves, or the cost at which we anticipate the mineral reserves will be recovered, are based on assumptions, such as metal prices and other economic inputs. Changes to such assumptions may require revisions to mineral reserve estimates which could affect our asset carrying values and may also negatively impact our future financial condition and results. Until mineral reserves are actually mined and processed, the quantity of ore and grades must be considered as an estimate only.
In addition, if the market prices for the commodities we produce decline from assumed levels, if production costs increase or recovery rates decrease, or if applicable laws and regulations are adversely changed, there can be no assurance that the indicated level of recovery will be realized or that mineral reserves can be mined or processed profitably. If we determine that certain of our estimated recoverable proven and probable mineral reserves have become uneconomic, this may ultimately lead to a reduction in our aggregate reported mineral reserves, which could have a material adverse effect on our business, financial condition and results of operations.
Additionally, the term “mineral resources” does not indicate recoverable proven and probable mineral reserves as defined by the SEC. Estimates of mineral resources are subject to further exploration and evaluation of development and operating costs, grades, recoveries and other material factors, and, therefore, are subject to considerable uncertainty. Mineral resources do not meet the threshold for mineral reserve modifying factors, such as engineering, legal and/or economic feasibility, that would allow for the conversion to mineral reserves. Accordingly, there can be no assurance that the estimated mineral resources not included in mineral reserves will become recoverable proven and probable mineral reserves.
Regulatory, environmental and social risks
The costs of compliance with environmental, health and safety laws and regulations applicable to our operations may constrain existing operations or expansion opportunities. Related permit and other approval requirements may delay or result in a suspension of our operations.
Our operations are subject to extensive and complex environmental laws and regulations governing the generation, storage, treatment, transportation and disposal of hazardous substances; solid waste disposal; air emissions; wastewater discharges; remediation, restoration and reclamation of environmental contamination, including mine closures and reclamation; protection of endangered and threatened species and designation of critical habitats; and other related matters. These laws and regulations are subject to change and to changing interpretation by governmental agencies and other bodies vested with broad supervisory authority. As a mining company, compliance with environmental, health and safety laws and regulations is an integral and costly part of our business. In addition, we must obtain regulatory permits and other approvals to start, continue and expand operations, which could be challenged causing delays or possible denial of necessary permits and other approvals.
Certain federal and similar state laws and regulations may expose us to joint and several liability for environmental damages caused by our operations, or by previous owners or operators of properties we acquired or are currently operating or at sites where we previously sent materials for processing, recycling or disposal. As discussed in more detail in the risk factor below relating to costs incurred for remediating environmental conditions on our properties that are no longer in operation, we have substantial obligations for environmental remediation on properties previously owned or operated by Freeport Minerals Corporation (FMC) and certain of its affiliates. Noncompliance with these laws and regulations could result in material penalties or other liabilities. In addition, compliance with these laws may from time to time result in delays in or changes to our development or expansion plans. Compliance
with these laws and regulations imposes substantial costs, which we expect will continue to increase over time because of increased regulatory oversight, adoption of increasingly stringent environmental standards, and other factors.
New or revised environmental regulatory requirements are frequently proposed, many of which have resulted and may in the future result in substantially increased costs for our business, including those regarding financial obligations. Regulations have been considered at various governmental levels to increase financial responsibility requirements for mine closure and reclamation. Adoption of such environmental regulations or more stringent application of existing regulations may materially increase our costs, threaten certain operating activities and constrain our expansion opportunities. In addition, there can be no assurance that restrictions relating to conservation will not have an adverse impact on expansion of our operations or not result in delays in project development, or constraints on exploration or operations in impacted areas.
We have incurred and expect to incur environmental capital expenditures and other environmental costs (including our joint venture partners’ shares) to comply with applicable environmental laws and regulations that affect our operations. The timing and amounts of estimated payments could change as a result of changes in regulatory requirements, changes in scope and costs of reclamation activities, the settlement of environmental matters and the rate at which actual spending occurs on continuing matters. For example, revised federal regulations governing hazardous air pollutant emissions at our Miami, Arizona smelter were finalized in May 2024 and are under evaluation.
We are also subject to extensive regulation of worker health and safety. Our mines are inspected on a regular basis by government regulators who may issue citations and orders when they believe a violation has occurred under applicable mining regulations. If inspections result in an alleged violation, we may be subject to fines and penalties and, in instances of alleged significant violations, our mining operations or industrial facilities could be subject to temporary or extended closures.
Many other governmental bodies regulate other aspects of our operations, and our failure to comply with these legal requirements can result in substantial penalties. In addition, new laws and regulations, including executive orders, or changes to or new interpretations of existing laws and regulations by courts or regulatory authorities occur regularly, but are difficult to predict. For instance, the U.S. Supreme Court’s 2024 decision in Loper Bright Enterprises v. Raimondo (Loper Bright) overruled Chevron U.S.A., Inc. v. Natural Resources Defense Council, Inc. (Chevron). Since 1984, Chevron had required courts to give judicial deference to administrative agency actions and reasonable agency interpretations where a statute was silent or ambiguous. In Loper Bright, the Supreme Court held that the U.S. Administrative Procedure Act requires courts to exercise independent judgment when deciding whether an agency acted within its statutory authority and that courts may not defer to agency interpretations solely because a statute is ambiguous. This decision may result in additional legal challenges to regulations and guidance issued by federal regulatory agencies, including those that impact our industry. Changes under a new president, administration and Congress in the U.S. are also difficult to predict. Any such variations could negatively impact the mining sector, including our business, substantially increase costs to achieve compliance or otherwise have a material adverse effect on our cash flows, results of operations and financial condition.
For additional information regarding the various regulations affecting us, see Items 1. and 2. “Business and Properties.”
We incur significant costs for remediating environmental conditions on or related to properties that have not been operated in many years.
FMC and its subsidiaries, and many of their affiliates and predecessor companies, have been involved in exploration, mining, milling, smelting and manufacturing in the U.S. for more than a century. Activities that occurred in the late 19th century and the 20th century prior to the advent of modern environmental laws generally were not subject to environmental regulation and were conducted before U.S. industrial companies fully understood the long-term effects of their operations on the surrounding environment.
Companies like FMC are now legally responsible for remediating hazardous substances released into the environment on or from properties owned or operated by them as well as properties where they arranged for disposal of such substances, irrespective of when the release into the environment occurred or who caused it. That liability is often asserted on a joint and several basis with other prior and subsequent owners, operators and arrangers, meaning that each owner or operator of the property is, and each arranger may be, held fully responsible
for the remediation, although in many cases some or all of the other responsible parties no longer exist, do not have the financial ability to respond or cannot be found. As a result, because of our acquisition of FMC, many of the subsidiary companies we now own are potentially responsible for a wide variety of environmental remediation projects throughout the U.S., and we expect to spend substantial sums annually for many years to address those remediation issues. We are also subject to claims where the release of hazardous substances is alleged to have resulted in injury, destruction or loss of natural resources.
At December 31, 2024, we had more than 80 active remediation projects in 20 U.S. states. In addition, FMC and certain affiliates and predecessor companies were parties to agreements relating to the transfer of businesses or properties that contained indemnification provisions relating to environmental matters, and from time to time these provisions become the source of claims against us.
Our environmental obligation estimates are primarily based upon our current knowledge and understanding of:
•Complex scientific and historical facts and circumstances that in many cases occurred many decades ago;
•Assumptions regarding the nature, extent and duration of remediation activities that we will be required to undertake and the estimated costs of those remediation activities, which are subject to varying interpretations; and
•Interpretation of the requirements that are imposed on us by existing laws and regulations and, in some cases, the clarification of uncertain regulatory requirements that could materially affect our environmental obligation estimates.
Significant adjustments to these estimates are likely to occur in the future as additional information becomes available. The actual environmental costs may exceed our current and future accruals for these costs, and any such changes could be material.
In addition, remediation standards imposed by the U.S. Environmental Protection Agency (EPA) and state environmental agencies have generally become more stringent over time and may become even more stringent in the future. Imposition of more stringent remediation standards, particularly for arsenic and lead in soils, poses a risk that additional remediation work could be required at our active remediation sites and at sites that we have already remediated to the satisfaction of the responsible governmental agencies, and may increase the risk of toxic tort litigation. In January 2024, the EPA released guidance lowering the recommended screening levels for investigating lead-contaminated soils and in January 2025, EPA published its final toxicological assessment for inorganic arsenic. This guidance and assessment can be used to establish cleanup levels by some agencies at state and federal remediation sites and may lead to additional regulatory guidance, rulemaking and other regulatory activities. More stringent cleanup levels often lead to higher costs through exponential volume increases due to resulting expanded project footprints.
Refer to Items 1. and 2. “Business and Properties” and Note 10 for further discussion of our environmental obligations.
We face increasing, complex and changing regulatory and stakeholder and other third-party expectations relating to our climate and energy transition plans, which may adversely affect our business. Further, we may not be able to timely or successfully transition from fossil fuel sources for our significant energy needs, which may result in reputational damage.
Our operations require significant energy, much of which is currently from fossil fuel sources and is obtained from third parties under long-term contracts. Energy represented 16% of our copper mine site operating costs in 2024, and based on currently available information and projected operations, is expected to approximate 16% in 2025. The principal sources of energy consumption at our mining operations are: diesel fuel, which powers mine trucks and other transportation equipment; purchased electricity, which powers core facilities and certain on-site metal processing operations; and coal and natural gas, which provide electricity at certain operations.
Existing and proposed governmental conventions, laws, rules, regulations, policies and standards as well as existing and proposed voluntary disclosure standards and frameworks (both in the U.S. and internationally), including those related to climate change, carbon taxes, carbon markets or greenhouse gas (GHG) emissions, may in the future add significantly to our operating costs, limit or modify our operations, impact the competitiveness of the commodities we produce, and require more resources to comply and remediate in response. For additional
information on climate change conventions, laws, regulations and standards applicable or that may in the future be applicable to FCX or its subsidiaries, refer to Items 1. and 2. “Business and Properties.”
In response to climate change and societal or stakeholder demands for action, we are advancing 2030 GHG emissions reduction targets and a 2050 net zero aspiration, each of which will result in additional costs to us, the totality of which we cannot currently estimate with accuracy, and we cannot guarantee that we will be able to achieve any current or future GHG emissions targets or aspirations.
While we strive to transition to more renewable power sources for our mining operations, as a commercial consumer of power, our ability to reduce our GHG emissions associated with our power consumption demand is largely dependent upon the mix of our suppliers and locally available renewable energy resources at our various sites, including our ability to successfully develop renewable energy projects and negotiate power purchase agreements. The transition to renewable and other energy sources could, among other things, increase our capital expenditures, and operating and energy costs, depending on the scope, magnitude and timing of increased regulation of fossil-fuel based energy production, including GHG emissions, as well as the availability of alternative energy sources.
In certain aspects of our operations, our ability to reduce our GHG emissions is directly dependent on the actions of third parties and technological solutions and innovation, and our ability to make significant, rapid changes in our GHG emissions in response to potential future regulations may be limited. For example, our diesel-fueled haul trucks are a significant contributor to GHG emissions at our North America and South America operations. We are evaluating options for the electrification of our haul trucks, but reduction of emissions from such haul trucks will depend upon the development and availability of commercially viable alternative-fueled mining equipment by our third-party suppliers. At our remote mining operations in Indonesia, PT-FI owns and operates a coal-fired power plant and continues to advance plans to transition its existing energy source from coal to natural gas. Once complete, PT-FI’s dual-fuel power plant and the new gas-fired combined cycle facility will be fueled by natural gas, supplied by a floating liquefied natural gas storage and regassification unit. Our ability to transition to commercially viable alternative sources of energy across our operations globally will depend on, among other things, additional studies, technological considerations, or permit or other approvals. Even if we do implement new technologies, our stakeholders and other third parties may not be satisfied with our approach to reducing our GHG emissions. For further information, see the risk factor below relating to the increasing scrutiny and evolving expectations from stakeholders and other third parties, including creditors, with respect to our environmental and social practices, performance and disclosures.
The physical impacts of climate change may adversely affect our mining operations, workforce, communities, biodiversity and ecosystems, supply chains and customers, which may result in increased costs.
We recognize that as the climate changes, our operations, workforce, communities, biodiversity and ecosystems, supply chains and customers may be exposed to changes in the frequency, intensity and/or duration of intense storms, drought, flooding (including from sea level rise at our coastal operations), wildfire, and other extreme weather events and patterns (such as extreme heat). For example, we experienced severe flooding, debris flow from heavy rain and landslides in early 2023 at our remote mining operations in Indonesia, which temporarily halted mining and processing work and damaged infrastructure near the milling complex. Such potential physical impacts of climate change on our operations are highly uncertain and would vary by operation based on particular geographic circumstances. For example, at many of our mine sites, climate change is projected to impact local precipitation regimes, resulting in shorter-duration, higher-intensity storm events, and the potential for less precipitation overall. We could face increased operational costs associated with managing additional volumes of storm water during more intense future events, including supply disruption, delays, damage to or inaccessibility of our facilities and increased pricing of consumables and components we purchase. In addition, the potential for overall decreases in precipitation could affect the availability of water needed for our operations, leading to increased operating costs, or in extreme cases, disruptions to our mining operations. For additional information regarding risks relating to availability of water and operational risks inherent in mining, see related risk factors above.
Increasing scrutiny, action and evolving expectations from stakeholders and other third parties with respect to our ESG practices, performance, commitments and disclosures may impact our reputation, increase our costs and impact our access to capital or business strategy.
Stakeholder and other third-party scrutiny related to our ESG practices, commitments, performance and disclosures continues to increase and evolve. We have adopted certain policies and programs, including with respect to responsible production frameworks, climate change, water stewardship, biodiversity and land management, tailings management and stewardship, waste management (including of hazardous materials), safety and health, human capital management, human rights, social performance and community and Indigenous Peoples relations, political activity and spending practices, and supply chains/responsible sourcing. It is possible, however, that our stakeholders and other third parties might not be satisfied or even disagree with our ESG practices, goals, initiatives, commitments, performance and/or disclosures, or the speed of their adoption, implementation and measurable success. If we do not meet our stakeholders’ and other third parties’ evolving expectations, including any failure or perceived failure to achieve our stated goals and targets or industry standards or any allegations that our stated goals or targets should be altered, our reputation, competitiveness, access to and cost of capital, business strategy and stock price could be negatively impacted, and legal or regulatory proceedings could be brought against us.
Certain investor advocacy groups, institutional investors, investment funds, creditors and other influential investors are focused on our ESG practices and place importance on the ESG implications of their investments and lending decisions. Our ability to attract capital could be adversely impacted if they incorporate more stringent ESG considerations as a part of their portfolios.
Organizations that provide information to investors and financial institutions on ESG performance and related matters have developed quantitative and qualitative data collection processes and ratings processes for evaluating companies on their approach to these matters. Such ratings are used by some investors to inform their investment and voting decisions. In addition, many investors have created their own proprietary ratings that inform their investment and voting decisions. Unfavorable ratings or assessment of our ESG practices, including our compliance with certain voluntary disclosure standards and frameworks, may lead to negative investor sentiment toward us, which could have a negative impact on our stock price and our access to and cost of capital.
Similarly, many financial institutions are increasingly incorporating ESG ratings or assessments into their credit risk assessments, and screen companies based on their ESG practices and performance when making lending decisions. If we are unable to meet the ESG lending criteria set by our creditors or are required to take certain remediation steps to satisfy such criteria, our access to capital on terms we find favorable may be limited and our costs may increase.
Our public disclosures may reflect goals, aspirations, commitments, cost estimates and other expectations and assumptions, including over long timeframes, which are necessarily uncertain and may not be realized. Further, the voluntary disclosure standards or frameworks we choose to align with are evolving and may change over time and our interpretation of such disclosure standards and frameworks may differ from those of others, either of which may result in a lack of consistent or meaningful comparative data from period to period and/or significant revisions to our goals and aspirations or reported progress in achieving such goals and aspirations.
Ensuring that there are adequate systems and processes in place to comply with the various ESG tracking and disclosure obligations, or to respond to business partners or other affiliates in our value chain that have requested, or may in the future request, ESG-related data or information from us to meet their disclosure obligations, will require management’s time and expense. If we do not adapt to or comply with stakeholder or other third parties’ expectations, including with respect to evolving ESG disclosure standards and frameworks, or if we are perceived to have not responded appropriately, regardless of whether there is a legal requirement to do so, we may suffer from reputational damage and our business, financial condition, cost of capital and/or stock price could be materially adversely affected.
In addition, our customers, end users and other third parties may require that we implement certain additional ESG procedures or standards before they will start or continue to do business with us, which could lead to preferential buying based on our ESG practices compared to our competitors’ ESG practices. Further, being associated with activities by business partners or other affiliates that have or are perceived to have individual or cumulative adverse impacts on the environment, climate, biodiversity, nature and land management, water access and management, human rights or cultural heritage could negatively affect our reputation and impose additional costs.
Failure or the perceived failure to manage our relationships with the communities and/or Indigenous Peoples where we operate or that are near our operations could harm our reputation and social license to operate.
Our relationships with the communities and/or Indigenous Peoples where we operate or that are adjacent to or near our operations are critical to the long-term success of our existing operations and the development of any future projects. There is ongoing and increasing stakeholder and other third-party concern relating to a company’s social license to operate and the actual, potential and perceived effects of mining activities on the environment and on communities impacted by such activities. We may engage in activities, such as exploration, production, construction or expansion of our operations that have or are perceived to have adverse impacts on the local communities and their relevant stakeholders, society as a whole, Indigenous Peoples, cultural heritage, human rights and the environment, including land management and associated biodiversity, among other things. For example, our operations may take place on or adjacent to Indigenous Peoples’ ancestral lands, and such Indigenous Peoples may assert rights to such lands. Further, we may be required or expected by our stakeholders and other third parties to consult with and/or obtain consent from Indigenous Peoples for potential impacts. We also may be required to demonstrate our capacity to protect ecosystems through improved practices and technological solutions to maintain our social license to operate, or to obtain such social license to operate for future development projects or expansions.
In addition, our assets are generally long-lived and stakeholders’ perceptions and expectations can change over the life of the mine. Changes in the aspirations and expectations of local communities and/or Indigenous Peoples where we operate, with respect to our employee health and safety performance and our contributions to infrastructure, community development, environmental management, including land management and associated biodiversity, and other factors could affect our social license to operate and reputation, and could lead to delays and/or increased costs if expansions or new projects are blocked either temporarily or for extended periods. Failure to effectively engage with communities on an ongoing basis, including the withdrawal of consent or support of Indigenous Peoples, other stakeholders or other third parties, could adversely impact our business, damage our reputation and/or result in loss of rights to explore, operate or develop our projects.
Risks related to our common stock
Our holding company structure may impact our ability to service our debt, declare dividends, and repurchase shares and debt.
We are a holding company with no material assets other than the capital stock and intercompany receivables of our subsidiaries. As a result, our ability to service our indebtedness, pay dividends, and repurchase shares and debt is dependent on the generation of cash flows by our subsidiaries and their ability to make such cash available to us, by dividend, loan, debt repayment or otherwise. Our subsidiaries do not have any obligation to make funds available to us to service our indebtedness, pay dividends, or repurchase shares and debt. Dividends from subsidiaries that are not wholly owned are shared with other equity owners. Cash at our international operations is also typically subject to foreign withholding taxes upon repatriation into the U.S.
In addition, our subsidiaries may not be able to, or be permitted to, make distributions to us or repay loans to us, to enable us to service our indebtedness, pay dividends, or repurchase shares and debt. Each of our subsidiaries is a distinct legal entity and, under certain circumstances, legal restrictions, as well as the financial condition and operating requirements of our subsidiaries, may limit our ability to obtain cash from our subsidiaries. Certain of our subsidiaries are parties to credit agreements that restrict their ability to make distributions or loan repayments to us if such subsidiary is in default under such agreements, or to transfer substantially all of the assets of such subsidiary without the consent of the lenders. Further, PT-FI has certain amounts of restricted cash and cash equivalents associated with its export proceeds that are required to be temporarily deposited in Indonesia banks, as described in MD&A and Note 10, which regulations may be revised including to increase the amount deposited and duration held. Our rights to participate in any distribution of our subsidiaries’ assets upon their liquidation, reorganization or insolvency would generally be subject to the prior claims of the subsidiaries’ creditors, including any trade creditors.
As more fully described in Note 8, during 2021, our Board of Directors (Board) adopted a performance-based payout framework, which currently includes base and variable dividends and a share repurchase program. Our ability to continue to pay dividends (base or variable) and the timing and amount of any share repurchases is at the discretion of our Board and management, respectively, and is subject to a number of factors, including not exceeding our net debt target, capital availability, our financial results, cash requirements, global economic
conditions, changes in laws, contractual restrictions and other factors deemed relevant by our Board or management, as applicable. Repurchases of our common stock under our repurchase program are discretionary up to the Board-approved limit, and our share repurchase program may be modified, increased, suspended or terminated at any time at the Board’s discretion. Our dividend payments and share repurchases may change, and there can be no assurance that we will continue to declare dividends or repurchase shares at all or in any particular amounts. A reduction or suspension in our dividend payments or share repurchases could have a negative effect on the price of our common stock.
Anti-takeover provisions in our charter documents and Delaware law may make an acquisition of us more difficult.
Anti-takeover provisions in our charter documents and Delaware law may make an acquisition of us more difficult. These provisions may discourage potential takeover attempts, discourage bids for our common stock at a premium over market price or adversely affect the market price of, and the voting and other rights of the holders of, our common stock. These provisions could also discourage proxy contests and make it more difficult for stockholders to elect directors other than the candidates nominated by the Board. Refer to Exhibit 4.1 for further discussion of our anti-takeover provisions.
Further, our By-Laws provide to the fullest extent permitted by law that unless we consent in writing to the selection of an alternative forum, the Court of Chancery of the State of Delaware (or, if the Court of Chancery does not have, or declines to accept, jurisdiction, the U.S. District Court for the District of Delaware) will be the sole and exclusive forum for any (i) derivative action or proceeding brought on our behalf, (ii) action asserting a claim that is based upon a violation of a duty by any of our current or former directors, officers, employees or stockholders in such capacity, (iii) action asserting a claim arising pursuant to any provision of the Delaware General Corporation Law (DGCL) or to which the DGCL confers jurisdiction upon the Court of Chancery of the State of Delaware, (iv) action asserting a claim governed by the internal affairs doctrine, or (v) action asserting an “internal corporate claim” as that term is defined in Section 115 of the DGCL. The exclusive forum provision may increase costs to bring a claim, discourage claims or limit a stockholder’s ability to bring a claim in a judicial forum that it finds favorable for disputes with us or our directors, officers or other employees, which may discourage such lawsuits against us or our directors, officers and other employees. Alternatively, if a court were to find the exclusive forum provision contained in our By-Laws to be inapplicable or unenforceable in an action, we may incur additional costs associated with resolving such action in other jurisdictions. The exclusive forum provision in our By-Laws will not preclude or contract the scope of exclusive federal or concurrent jurisdiction for actions brought under the federal securities laws including the Securities Exchange Act of 1934, as amended, or the Securities Act of 1933, as amended, or the respective rules and regulations promulgated thereunder.
In addition, because we are incorporated in Delaware, we are governed by the provisions of Section 203 of the DGCL, which may prohibit large stockholders from consummating a merger with, or acquisition of, us.
These provisions may deter an acquisition of us that might otherwise be attractive to our stockholders.
Item 1B. Unresolved Staff Comments.
Not applicable.
Item 1C. Cybersecurity.
Risk Management and Strategy
We maintain a cyber risk management program designed to assess, identify, manage, mitigate and respond to cybersecurity threats and incidents. We seek to address material risks from cybersecurity threats through a cross-functional approach, and we utilize various processes to inform our identification, assessment and management of material risks from cybersecurity threats. Our cyber risk management program is integrated into our overall enterprise risk management (ERM) program. Cybersecurity risks are identified and assessed through our ERM program, which is designed to provide cross-functional executive insight across the business to identify and monitor risks, opportunities and emerging trends that can impact our strategic business objectives. The underlying controls of our cyber risk management program are based on recognized best practices and standards for cybersecurity and information technology, including the National Institute of Standards and Technology Cybersecurity Framework.
We utilize dedicated internal and external cybersecurity personnel to focus on assessing, detecting, identifying, managing, preventing and responding to cybersecurity threats and incidents. Our approach to cybersecurity incorporates a layered portfolio of technology controls, including strategic partnerships for our cybersecurity platforms, documented policies and procedures, periodic end user training, including cybersecurity awareness training for employees and certain contractors, and dedicated resources to manage and monitor the evolving threat landscape, including through the gathering of actionable threat intelligence. We maintain and periodically evaluate and, as needed, update our information security policy and an incident response plan, which describes the processes we use to prepare for, detect, respond to and recover from a cybersecurity incident, including processes to assess severity, escalate, contain, investigate and remediate an incident, as well as to comply with potentially applicable legal and disclosure obligations.
We regularly evaluate and assess the threat landscape and our security controls, including through audits and assessments, regular network and endpoint monitoring, vulnerability testing, penetration testing and tabletop exercises that include senior management. To assess the design and effectiveness of our cybersecurity controls, we engage with assessors, consultants, auditors and other third parties, including through independent third-party reviews of our information technology security program conducted on at least an annual basis. We also have processes to oversee and identify material cybersecurity risks associated with our use of third-party service providers, including utilizing safeguards to protect sensitive data, performing diligence on certain third parties that have access to our systems, data or facilities that store such systems or data, continually monitoring cybersecurity threat risks identified through such diligence and contracting to manage cybersecurity risks in specified ways such as requiring agreements to be subject to periodic cybersecurity audits.
We have experienced targeted and non-targeted cybersecurity incidents in the past, including an incident in August 2023 that affected certain of our information systems and resulted in temporary disruptions to parts of our operations. However, prior cybersecurity incidents, including the August 2023 incident, have not materially affected us. Notwithstanding our cyber risk management program, we may not be successful in preventing or mitigating a cybersecurity incident that could materially affect us, including our business strategy, results of operations or financial condition. Refer to Item 1A. “Risk Factors” for further information on the risks we face from cybersecurity threats.
Governance
Our Senior Vice President and Chief Innovation Officer, who has served in various senior leadership roles in operational improvement and technology during his nearly 30-year tenure with us, leads our innovation and technology initiatives, corporate information systems and financial shared services. Our cybersecurity risk management and strategy processes described in “Risk Management and Strategy” above are led by our Chief Information Officer (CIO) and our Chief Information Security Officer (CISO). Our CIO and CISO each report to our Chief Innovation Officer. Our CIO is responsible for the strategy, deployment, operational effectiveness and risk management of our technology systems and operations. Our CIO has over 30 years of experience in technology, cybersecurity and risk management, including leading information and technology initiatives for companies in the mining and energy sectors as a partner and senior managing director at a global professional services public company specializing in information technology services and management consulting. Our CISO is responsible for protecting our global technology systems from cybersecurity incidents, which includes overseeing the deployment of cybersecurity controls, managing a team of cybersecurity professionals and reporting on cybersecurity matters to management and the Audit Committee of our Board. Our CISO has 30 years of experience in the technology and
cybersecurity industries, including 15 years serving as CISO for public companies. Our CISO is also a Certified Information Systems Security Professional.
Our ERM management committee is responsible for providing input and oversight on our ERM program, including cybersecurity risks. Our ERM management committee is comprised of senior leaders, including our Chief Innovation Officer, with responsibility across operations and core business functions, and with a breadth of knowledge, influence and experience covering the risks we face. An annual report on our enterprise risks, including cybersecurity risks, is presented to the Audit Committee and/or the full Board of Directors (Board).
While management is responsible for the day-to-day management of cybersecurity risks, our Board and its Audit Committee have ongoing oversight roles. The Audit Committee reviews and discusses with management, including reports from our Chief Innovation Officer, at least annually:
•the adequacy and effectiveness of our information technology security processes and procedures,
•the assessment of risks and threats to our information technology systems,
•the internal controls regarding information technology security and cybersecurity, and
•the steps management has taken to monitor and mitigate information technology security and cybersecurity risks.
The Audit Committee also periodically receives reports on notable cybersecurity incidents and briefs the full Board on these matters.
Item 3. Legal Proceedings.
Below is a discussion of pending legal proceedings not otherwise required to be disclosed in our Notes to Consolidated Financial Statements. Refer to Note 10 for further discussion.
In addition to the proceedings discussed below and in Note 10, we are involved periodically in ordinary routine litigation incidental to our business and not required to be disclosed, some of which may result in adverse judgments, settlements, fines, penalties, injunctions or other relief.
United States (U.S.) Securities and Exchange Commission (SEC) regulations require us to disclose environmental proceedings involving a governmental authority if we reasonably believe that such proceedings may result in monetary sanctions above a stated threshold. Pursuant to the SEC regulations, we use a threshold of $1 million for purposes of determining whether disclosure of any such environmental proceedings is required.
Management does not believe, based on currently available information, that the outcome of any currently pending legal proceeding will have a material adverse effect on our financial condition; although individual or cumulative outcomes could be material to our operating results for a particular period, depending on the nature and magnitude of the outcome and the operating results for the period.
Water Rights Adjudications
Our operations in the western U.S. require significant secure quantities of water for mining and ore processing activities, and related support facilities. Continuous operation of our mines is dependent on, among other things, our ability to maintain our water rights and claims and the continuing physical availability of the water supplies. In the arid western U.S., where certain of our mines are located, water rights are often contested, and disputes over water rights are generally time-consuming, expensive and not necessarily dispositive unless they resolve both actual and potential claims. The loss of a water right or a currently available water supply could force us to curtail operations, or force premature closures, thereby increasing and/or accelerating costs or foregoing profitable operations.
At our North America operations, certain of our water supplies are supported by surface water rights, which give us the right to use public waters for a statutorily defined beneficial use at a designated location. In Arizona, where our operations use both surface and groundwater, we are a participant in an active adjudication in which Arizona courts have been attempting, for 50 years, to quantify and prioritize surface water claims for the Gila River system, one of the state’s largest river systems. This Gila River adjudication primarily affects our Morenci, Safford (including Lone Star) and Sierrita mines. The Gila River adjudication is addressing the state law claims of thousands of competing users, including us, as well as significant federal water claims that are potentially adverse to the state law claims of both surface water and groundwater users. Groundwater is treated differently from surface water under Arizona law,
which historically allowed landowners to pump unlimited quantities of subsurface water, subject only to the requirement of putting it to “reasonable use.” However, court decisions in the adjudication have concluded that some subsurface water constitutes “subflow” that is to be treated legally as surface water and is therefore subject to the Arizona doctrine of prior appropriation and to the adjudication, and potentially unavailable to groundwater pumpers, including us, in the absence of valid surface water claims. Any re-characterization of groundwater as surface water could affect the ability of consumers, farmers, ranchers, municipalities, and industrial users like us to continue to access water supplies that have been relied on for decades. Because we are a user of both groundwater and surface water in Arizona, we are an active participant in the Gila River adjudication.
In Re The General Adjudication of All Rights to Use Water in the Gila River System and Sources, Maricopa County, Superior Court, Cause Nos. W-1 (Salt), W-2 (Verde), W-3 (Upper Gila), and W-4 (San Pedro). This case was originally initiated in 1974 with the filing of a petition with the Arizona State Land Department and was consolidated and transferred to the Maricopa County Superior Court in 1981. The principal parties, in addition to us, include: Arizona Public Service Company, ASARCO, LLC; BHP Copper, Inc; the state of Arizona; various cities and towns and water companies; the Gila Valley Irrigation District; the Franklin Irrigation District; the San Carlos Irrigation and Drainage District; the Salt River Project; the San Carlos Apache Tribe; the Gila River Indian Community; and the U.S. on behalf of those tribes, on its own behalf, and on behalf of the White Mountain Apache Tribe, the Fort McDowell Mohave-Apache Indian Community, the Salt River Pima-Maricopa Indian Community, and the Payson Community of Yavapai Apache Indians. Prior to January 1, 1983, various Indian tribes filed separate suits in the U.S. District Court in Arizona claiming superior rights to water being used by many other parties, including us, and claiming damages for prior use in derogation of their allegedly superior rights. These federal proceedings have been stayed in favor of the adjudications pending in Arizona state courts, and some of the federal suits have since been settled.
In 2005, the Maricopa County Superior Court directed the Arizona Department of Water Resources (ADWR) to prepare detailed recommendations regarding the delineation of the “subflow” zone of the San Pedro River, a tributary of the Gila River. Subsurface water within the subflow zone is presumed to constitute appropriable subflow rather than groundwater. Although we have minimal interests in the San Pedro River Basin, a decision that re-characterizes groundwater in that basin as appropriable subflow may set a precedent for other river systems in Arizona that could have material implications for many commercial, industrial, municipal and agricultural users of groundwater, including our Arizona operations. In 2017, the court approved ADWR’s proposed subflow zone maps; water pumped from wells located inside the mapped subflow zone is now presumed to be appropriable subflow. No party has appealed that decision.
ADWR is now in the process of preparing subflow zone delineations for the applicable watercourses in the Verde River watershed. In December 2021, ADWR issued a report proposing a subflow zone delineation for the Verde River mainstem and Sycamore Creek and objections to that report were submitted in May 2022. While we do not have any active mining operations in the Verde River watershed that would be impacted by this phase of the adjudication, we filed a set of limited objections on issues that could set a precedent for other watersheds in Arizona that could have material implications for many users of groundwater, including our Arizona operations. The Special Master has directed ADWR to submit revised subflow zone delineations consistent with our objections.
In 2014, ADWR submitted a proposal for the development of procedures for “cone of depression” analyses to determine whether a well located outside of the subflow zone creates a cone of depression that intersects the subflow zone. Based on these cone of depression analyses, wells outside of the subflow zone could be subject to the adjudications pending in Arizona state courts. In the absence of a valid surface water claim to support the pumping, owners of wells deemed to be depleting the subflow zone through their cones of depression may be subject to claims that they must refrain from pumping subflow or must pay damages. In January 2017, ADWR issued a report containing its recommended cone of depression test.
In November 2018, the Special Master for the Gila River adjudication issued a final decision rejecting ADWR’s recommended cone of depression test, adopting our position that a numeric model capable of accounting for complexities of the aquifer system should be used. However, the Special Master confirmed that the cone of depression test would be the initial test for determining which wells are subject to the adjudications, rather than proving that a well is pumping subflow or establishing how much of a well’s water production is subflow. Such matters will be determined by a subsequent “subflow depletion test,” which is currently under development. While some of our adversaries objected to the Special Master’s final decision, in July 2022, the Arizona Superior Court issued a decision affirming the Special Master’s decision in all respects. No party has appealed that decision.
In December 2018, ADWR submitted its initial report on the “subflow depletion test,” noting that the test will specify the methodology a well owner must use to quantify the portion of the water drawn from a well that is subflow as opposed to groundwater. In February 2024, ADWR issued a report setting forth its proposed subflow depletion test, and objections were filed in April 2024. The Special Master ordered ADWR to file an addendum to its report concerning various issues raised in the objections. A status conference is scheduled for February 2025.
An issue litigated in the 2018 proceeding concerned whether for the subflow depletion test the subflow zone should be represented in the numeric model as extending only as deep as the bottom of the floodplain alluvium or extend all the way down to bedrock. In August 2021, the Special Master issued an order recognizing our position that if the vertical extent of the subflow zone is extended below the floodplain alluvium, it would result in overstated depletion calculations. Accordingly, the Special Master ordered that the vertical boundary of the subflow zone be restricted to the floodplain alluvium. No party has appealed that decision, and we expect the guidance from the Special Master’s order to be reflected in the subflow depletion test.
In proceedings separate from the development of the subflow depletion test, in June 2020, the Special Master designated legal questions to be resolved concerning a well owner’s ability to obtain a surface water right for subsurface water that, while initially believed to be non-appropriable groundwater, is ultimately determined to be appropriable subflow. In April 2021, the Special Master ruled that, for uses initiated after enactment of the 1919 permitting statute, a well owner may not pursue a surface water right for subsurface water now unless the well owner filed an application for a permit to appropriate prior to initiating the water use. We, along with allied parties, have objected to the Special Master’s ruling and are awaiting further proceedings before the Arizona Superior Court. Regardless of the outcome in the Arizona Superior Court, we anticipate this issue will be appealed to the Arizona Supreme Court.
As part of the adjudications, the U.S. has asserted numerous claims for express and implied “reserved” surface water and groundwater rights on Indian and non-Indian federal lands throughout Arizona. These claims are related to reservations of federal land for specific purposes (e.g., Indian reservations, national parks, military bases and wilderness areas). Unlike state law-based water rights, federal reserved water rights are given priority in the “prior appropriation” system based on the date the land was reserved, not the date that water was first used on the land. In addition, federal reserved water rights may enjoy greater protection from groundwater pumping than is accorded to state law-based water rights.
In multiple instances, the U.S. asserts a right to all water in a particular watershed that was not effectively appropriated under state law prior to the establishment of the federal reservation. This creates risks for both surface water users and groundwater users because such expansive claims may severely impede competing uses of water within the same watershed. Because there are numerous federal reservations in watersheds across Arizona, the reserved water right claims of the U.S. pose a significant risk to multiple operations, including Morenci and Safford (including Lone Star) in the Upper Gila River watershed, and Sierrita in the Santa Cruz watershed. Because federal reserved water rights may adversely affect water uses at each of these operations, we have been actively involved in litigation over these claims. Because federal reserved water rights have not yet been quantified, the task of determining how much water each federal reservation may use has been left to the Arizona Superior Court handling the Gila River adjudication. Various “contested cases” to quantify reserved water rights for particular federal reservations in Arizona are currently pending, four of which have been resolved at this time. The first resolved decision was issued in In re Aravaipa Canyon Wilderness Area, which pertained to the U.S.’s claims to water for the Aravaipa Canyon Wilderness Area. The court issued a decision in December 2018 supportive of our position on almost all issues, rejecting the U.S.’s argument that wilderness areas are entitled to all water that was not appropriated at the time the reservation was created. The second resolved decision was issued in In re Redfield Canyon Wilderness Area, which was another case pertaining to claims for a wilderness area. The court issued its decision in August 2022 supportive of our position on almost all issues, denying the U.S.’s federal reserved water rights claims for the wilderness area. The U.S. declined to pursue an interlocutory appeal in either of the In re Aravaipa Canyon Wilderness Area or In re Redfield Canyon Wilderness Area cases. The third resolved decision was issued in In re San Pedro Riparian National Conservation Area, which pertained to the U.S.’s claims to water for a national conservation area. The court issued its decision in August 2023 supportive of our position on nearly all issues, rejecting the U.S.’s argument that quantification was based on a more lenient standard than the “minimal need” doctrine, and holding that the U.S. may not obtain a federal reserved right to “optimal” flows to support the riparian and aquatic resources. The court adopted our proposed period of record for quantifying the stream, and therefore adopted our proposed streamflow, and rejected the U.S.’s claims for “streamflow augmentation” and claims to water from various point sources. We anticipate that a decree will be entered in 2025. It is unknown whether the U.S. will pursue an interlocutory appeal. The fourth resolved decision was issued in, In re Fort
Huachuca, which involved the U.S.’s claims to water for an Arizona army base. Trial concluded in February 2017. The court issued its decision in September 2024 supportive of our position on almost all issues and entered a decree in December 2024. The result was an approximate 80% reduction of the total acre-feet per year claimed by the U.S. It is unknown whether the U.S. will pursue an interlocutory appeal.
In addition, in January 2023, the U.S. filed several federal reserved water rights claims for wilderness areas in portions of the Verde River watershed, as well as a claim for the Verde River pursuant to the Wild and Scenic Rivers Act, claiming all unappropriated flow within each of the wilderness areas, along with alternative claims to specific stream flows. In reliance on the favorable precedent created in the cases discussed above, we successfully defeated the claims to all unappropriated flow on summary judgment. We anticipate that the Special Master will establish litigation schedules concerning the other claims to specific stream flows.
Given the legal and technical complexity of these adjudications, their long history, and their long-term legal, economic and political implications, it is difficult to predict the timing or the outcome of these proceedings. If we are not able to satisfactorily resolve the issues being addressed in the adjudications, our water uses could be diminished or curtailed, and our operations and any future expansions at Morenci, Safford (including Lone Star) and Sierrita could be adversely affected unless we are able to acquire alternative water sources.
Item 4. Mine Safety Disclosures.
Our highest priority is the health, safety and well-being of our workforce. We believe health and safety considerations are integral to, and fundamental for, all other functions in our organization, and we understand that the health and safety of our workforce is critical to our operational efficiency and long-term success. Our global health and safety strategy, “Safe Production Matters,” is focused on fatality prevention, eliminating systemic root causes of incidents and continuous improvement through robust management systems, which are supported by leaders empowering our teams to work safely. Foundational to our Safe Production Matters strategy is our Fatal Risk Management (FRM) program. The goal of our FRM program is to achieve zero workplace fatalities by raising awareness to fatal risks and the measures necessary to mitigate them.
Refer to Exhibit 95.1 for mine safety disclosures required in accordance with Section 1503(a) of the Dodd-Frank Wall Street Reform and Consumer Protection Act and Item 104 of SEC Regulation S-K.
Information About Our Executive Officers.
Certain information as of February 14, 2025, about our executive officers is set forth in the following table and accompanying text:
| | | | | | | | | | | | | | |
| Name | | Age | | Position or Office |
| Kathleen L. Quirk | | 61 | | President and Chief Executive Officer |
| Maree E. Robertson | | 49 | | Executive Vice President and Chief Financial Officer |
| Richard C. Adkerson | | 78 | | Chairman of the Board of Directors |
| Stephen T. Higgins | | 67 | | Executive Vice President and Chief Administrative Officer |
| Douglas N. Currault II | | 60 | | Executive Vice President and General Counsel |
Kathleen L. Quirk has served as Chief Executive Officer (CEO) since June 2024, as President since February 2021 and as a director of the Board of Directors (Board) since February 2023. Ms. Quirk previously served as Chief Financial Officer (CFO) from December 2003 to March 2022, Executive Vice President from March 2007 to February 2021, Senior Vice President from December 2003 to March 2007 and Treasurer from February 2000 to August 2018. Ms. Quirk also serves on the Board of Directors of Vulcan Materials Company.
Maree E. Robertson has served as Executive Vice President since July 2024 and CFO since March 2022. She previously served as Senior Vice President from March 2022 to June 2024. Prior to joining the company, Ms. Robertson served as CFO, Energy and Minerals of Rio Tinto Group, a multinational metals and mining company, from September 2019 to December 2021. Prior to joining Rio Tinto, Ms. Robertson had a 17-year career at BHP Group, a multinational natural resources company, serving in a broad range of international finance functions, including Vice President, Finance, Petroleum USA; Head of Finance, Conventional and Potash, Petroleum, USA; Vice President, Finance, Potash Canada; and Vice President, Finance, Minera Escondida Ltda.
Richard C. Adkerson has served as Chairman of the Board since February 2021 and has been a director since October 2006. Mr. Adkerson previously served as CEO from December 2003 to June 2024, Vice Chairman of the Board from May 2013 to February 2021, President from January 2008 to February 2021 and also from April 1997 to March 2007, and CFO from October 2000 to December 2003.
Stephen T. Higgins has served as Executive Vice President since July 2024 and Chief Administrative Officer since January 2019. Mr. Higgins previously served as Senior Vice President from August 2018 to June 2024, Vice President – Sales and Marketing from March 2007 to August 2018 and President of Freeport-McMoRan Sales Company Inc. from April 2006 to August 2019.
Douglas N. Currault II has served as Executive Vice President since July 2024 and General Counsel since October 2019. Mr. Currault previously served as Senior Vice President from October 2019 to June 2024, Deputy General Counsel from January 2015 to October 2019, Assistant General Counsel from January 2008 to January 2015, Secretary from May 2007 to December 2019 and Assistant Secretary from February 2000 to May 2007.
PART II
Item 5. Market for Registrant’s Common Equity, Related Stockholder Matters and Issuer Purchases of Equity Securities.
Unregistered Sales of Equity Securities
There were no unregistered sales of equity securities during the quarter ended December 31, 2024.
Common Stock
Our common stock is traded on the New York Stock Exchange under the symbol “FCX.” At January 31, 2025, there were 9,109 holders of record of our common stock.
Common Stock Dividends
In February 2021, our Board of Directors (Board) reinstated a cash dividend on our common stock (base dividend) at an annual rate of $0.30 per share, and in November 2021, the Board approved a variable cash dividend on our common stock at an annual rate of $0.30 per share. The combined annual rate of the base dividend and the variable dividend totaled $0.60 per share in 2024 and 2023.
In December 2024, our Board declared cash dividends totaling $0.15 per share on our common stock (including a $0.075 per share quarterly base cash dividend and a $0.075 per share variable, performance-based cash dividend), which was paid on February 3, 2025, to shareholders of record as of January 15, 2025. Based on current market conditions, the base and variable dividends on our common stock are anticipated to total $0.60 per share for 2025 (including the dividends paid on February 3, 2025), comprised of a $0.30 per share base dividend and $0.30 per share variable dividend. The declaration and payment of dividends (base or variable) is at the discretion of our Board and will depend upon our financial results, cash requirements, global economic conditions and other factors deemed relevant by our Board. See “Cautionary Statement” in Items 7. and 7A. “Management’s Discussion and Analysis of Financial Condition and Results of Operations and Quantitative and Qualitative Disclosures About Market Risk” and Note 8 for further discussion.
Issuer Purchases of Equity Securities
The following table sets forth information with respect to shares of FCX common stock purchased by us during the quarter ended December 31, 2024, and the approximate dollar value of shares that may yet be purchased pursuant to our share repurchase program:
| | | | | | | | | | | | | | | | | | | | | | | | | | |
| Period | | (a) Total
Number of
Shares Purchased | | (b) Average
Price Paid Per Share | | (c) Total Number of Shares Purchased as Part of Publicly Announced Plans or Programsa | | (d) Approximate Dollar Value of Shares That May Yet Be Purchased Under the Plans or Programsa |
| October 1-31, 2024 | | — | | | $ | — | | | — | | | $ | 3,105,744,136 | |
| November 1-30, 2024 | | — | | | $ | — | | | — | | | $ | 3,105,744,136 | |
| December 1-31, 2024 | | — | | | $ | — | | | — | | | $ | 3,105,744,136 | |
| Total | | — | | | $ | — | | | — | | | |
a.On November 1, 2021, our Board approved a share repurchase program authorizing repurchases of up to $3.0 billion of our common stock. On July 19, 2022, our Board authorized an increase in the share repurchase program up to $5.0 billion. The share repurchase program does not obligate us to acquire any specific amount of shares and does not have an expiration date.
The timing and amount of the share repurchases is at the discretion of management and will depend on a variety of factors. The share repurchase program may be modified, increased, suspended or terminated at any time at our Board’s discretion. See Item 1A. “Risk Factors” and Note 8 for further discussion.
Item 6. Reserved.
Items 7. and 7A. Management’s Discussion and Analysis of Financial Condition and Results of Operations and Quantitative and Qualitative Disclosures About Market Risk.
In Management’s Discussion and Analysis of Financial Condition and Results of Operations and Quantitative and Qualitative Disclosures About Market Risk (MD&A), “we,” “us” and “our” refer to Freeport-McMoRan Inc. and its consolidated subsidiaries. The results of operations reported and summarized below include forward-looking statements that are not guarantees of future performance and are not necessarily indicative of future operating results (refer to “Cautionary Statement” below for further discussion). References to “Notes” are Notes included in our Notes to Consolidated Financial Statements. Throughout MD&A, all references to income or losses per share are on a diluted basis.
This section of our Form 10-K discusses the results of operations for the years 2024 and 2023 and comparisons between these years. Discussion of the results of operations for the year 2022 and comparisons between the years 2023 and 2022 are not included in this Form 10-K and can be found in Items 7. and 7A. “Management’s Discussion and Analysis of Financial Condition and Results of Operations and Quantitative and Qualitative Disclosures About Market Risk” contained in Part II of our Annual Report on Form 10-K for the fiscal year ended December 31, 2023.
OVERVIEW
We are a leading international metals company with the objective of being foremost in copper. Headquartered in Phoenix, Arizona, we operate large, long-lived, geographically diverse assets with significant proven and probable mineral reserves of copper, gold and molybdenum. We are one of the world’s largest publicly traded copper producers. Our portfolio of assets includes the Grasberg minerals district in Indonesia, one of the world’s largest copper and gold deposits; and significant operations in North America and South America, including the large-scale Morenci minerals district in Arizona and the Cerro Verde operation in Peru.
Our results for 2024 reflect solid execution of our operating plans and we are committed to enhancing productivity, managing costs and capital and advancing opportunities for long-term profitable growth and value creation. We believe the actions we have taken in recent years to strengthen our balance sheet and maintain flexible organic growth options will allow us to continue to execute our business plans, and reliably and responsibly generate cash flows to pursue value-enhancing organic growth options and return cash to shareholders.
We believe that we have a high-quality portfolio of long-lived copper assets positioned to generate long-term value, and we remain focused on executing our operating and investment plans. Our underground mining operations at the Grasberg minerals district in Indonesia continue to perform well, with copper production increasing in each of the past three years. During 2024, construction of PT Freeport Indonesia’s (PT-FI) new smelter and precious metals refinery (PMR) (collectively, PT-FI’s new downstream processing facilities) in Eastern Java, Indonesia were completed and as part of start-up activities, PT-FI commenced gold production from the PMR in December 2024. In October 2024, during start-up activities of the new smelter, a fire occurred requiring a temporary suspension of smelting operations to complete repairs. PT-FI expects repairs to be completed by mid-2025 and ramp-up to full capacity to be achieved by year-end 2025.
We are progressing initiatives across our North America and South America operations by incorporating new applications, technologies and data analytics to our leaching processes. Incremental copper production from these initiatives totaled 214 million pounds in 2024, compared with a total of 144 million pounds in 2023. We have projects underway to apply recent operational enhancements to our leaching processes on a larger scale and are testing new innovative technology applications that we believe have the potential for significant increases in recoverable metal from leach stockpiles beyond the current run rate.
We believe we benefit from significant copper reserves and resources with embedded growth options, an experienced team and exposure to markets with a favorable fundamental outlook.
Net income attributable to common stock totaled $1.9 billion in 2024 and $1.8 billion in 2023. Our results in 2024, compared to 2023, primarily reflect higher average realized copper and gold prices and higher gold sales volumes, partly offset by higher operating costs and higher income attributable to noncontrolling interests primarily related to higher operating income at PT-FI. Refer to “Consolidated Results” for discussion of items impacting our consolidated results for the two years ended December 31, 2024.
At December 31, 2024, we had consolidated debt of $8.9 billion and consolidated cash and cash equivalents of $3.9 billion, $4.7 billion including current restricted cash and cash equivalents associated with a portion of PT-FI’s export proceeds required to be temporarily deposited in Indonesia banks. Net debt totaled $1.06 billion, excluding $3.2 billion of debt for PT-FI’s new downstream processing facilities. Refer to “Net Debt” for reconciliations of consolidated debt, consolidated cash and cash equivalents and current restricted cash associated with PT-FI's export proceeds to net debt.
At December 31, 2024, we had $3.0 billion of availability under our revolving credit facility, and PT-FI and Cerro Verde had $1.5 billion and $350 million, respectively, of availability under their revolving credit facilities. In November 2024, we repaid $0.7 billion in scheduled senior note maturities using cash on hand and have no further senior note maturities until 2027. Refer to Note 6 and “Capital Resources and Liquidity” for further discussion of our debt.
We have significant mineral reserves, mineral resources and future development opportunities within our portfolio of mining assets. At December 31, 2024, our estimated consolidated recoverable proven and probable mineral reserves totaled 97.0 billion pounds of copper, 23.0 million ounces of gold and 3.16 billion pounds of molybdenum. Refer to Note 15 and “Critical Accounting Estimates – Mineral Reserves” for further discussion.
During 2024, production from our mines totaled 4.2 billion pounds of copper, 1.9 million ounces of gold and 80 million pounds of molybdenum. Following is the allocation of our consolidated copper, gold and molybdenum production in 2024 by geographic location:
| | | | | | | | | | | | | | | | | | | | |
| Copper | | Gold | | Molybdenum | |
| North America | 29 | % | | 1 | % | | 75 | % | a |
| South America | 28 | | | — | | | 25 | | |
| Indonesia | 43 | | | 99 | | | — | | |
| 100 | % | | 100 | % | | 100 | % | |
a.Our North America copper mines produced 38% of consolidated molybdenum production, and our Henderson and Climax molybdenum mines produced 37%.
Copper production from three of our mines (the Morenci mine in North America, the Cerro Verde mine in Peru and the Grasberg minerals district in Indonesia) together totaled 77% of our consolidated copper production in 2024.
OUTLOOK
Our financial results vary as a result of fluctuations in market prices primarily for copper, gold and, to a lesser extent, molybdenum, as well as other factors. World market prices for these commodities have fluctuated historically and are affected by numerous factors beyond our control. Refer to “Markets,” and Item 1A. “Risk Factors” contained in Part I of our annual report on Form 10-K for the year ended December 31, 2024, for further discussion. Because we cannot control the prices of our products, the key measures that management focuses on in operating our business are sales volumes, unit net cash costs, operating cash flows and capital expenditures. The forward-looking statements in the below section and elsewhere in this annual report on Form 10-K are based on current market conditions, speak only as of the filing date of this annual report on Form 10-K, are based on several assumptions and are subject to significant risks and uncertainties. Refer to “Cautionary Statement” below.
Consolidated Sales Volumes
Following are our projected consolidated sales volumes for 2025 and actual consolidated sales volumes for 2024:
| | | | | | | | | | | | | | |
| 2025 | | 2024 | |
| (Projected) | | (Actual) | |
Copper (millions of recoverable pounds): | | | | |
| North America copper mines | 1,360 | | | 1,257 | | |
| South America mining | 1,090 | | | 1,177 | | |
| Indonesia mining | 1,550 | | | 1,632 | | |
| Total | 4,000 | | | 4,066 | | |
| | | | |
| | | | |
| | | | |
Gold (thousands of recoverable ounces) | 1,625 | | | 1,837 | | |
| | | | |
Molybdenum (millions of recoverable pounds) | 88 | | a | 78 | | |
a.Includes 53 million pounds from our North America and South America copper mines and 35 million pounds from our Molybdenum mines.
Projected sales volumes are dependent on operational performance; Indonesia regulatory approval to export copper concentrate until repairs and full ramp-up of PT-FI’s new smelter are complete; weather-related conditions; timing of shipments and other factors. For further discussion of other important factors that could cause results to differ materially from projections, refer to Item 1A. “Risk Factors” contained in Part I of our annual report on Form 10-K for the year ended December 31, 2024.
Consolidated Unit Net Cash Costs
Consolidated unit net cash costs (net of by-product credits) for our copper mines are expected to average $1.60 per pound of copper for the year 2025, based on achievement of current sales volume estimates (including estimates for copper concentrate exports from Indonesia) and cost estimates and assuming average prices of $2,700 per ounce of gold and $20.00 per pound of molybdenum for the year 2025.
Quarterly unit net cash costs vary with fluctuations in sales volumes, including the ratio of copper and gold sales within a period, and realized prices, primarily for gold and molybdenum. The impact of price changes on consolidated unit net cash costs for the year 2025 would approximate $0.04 per pound of copper for each $100 per ounce change in the average price of gold and $0.03 per pound of copper for each $2 per pound change in the average price of molybdenum.
Consolidated Operating Cash Flows
Our consolidated operating cash flows vary with sales volumes; prices realized from copper, gold and molybdenum sales; production costs; income taxes; other working capital changes; and other factors. Our consolidated operating cash flows are estimated to approximate $6.2 billion for the year 2025, based on current sales volume and cost estimates, and assuming average prices of $4.00 per pound of copper, $2,700 per ounce of gold and $20.00 per pound of molybdenum for the year 2025. Estimated consolidated operating cash flows in 2025 also reflect a projected income tax provision of $2.6 billion (refer to “Consolidated Results – Income Taxes” for further discussion of our projected income tax rate). The impact of price changes on operating cash flows for the year 2025 would approximate $375 million for each $0.10 per pound change in the average price of copper, $140 million for each $100 per ounce change in the average price of gold and $135 million for each $2 per pound change in the average price of molybdenum.
Consolidated Capital Expenditures
Following is a summary of expected capital expenditures for the year 2025 (in billions):
| | | | | | | | |
| Major mining projects | $ | 2.8 | | a |
| PT-FI’s new downstream processing facilities | 0.6 | | b |
| Sustaining capital and other | 1.6 | | |
| Total | $ | 5.0 | | |
a.Includes $1.1 billion for planned projects, primarily associated with underground mine development, supporting mill and power capital costs and a portion of spending on a new gas-fired combined cycle facility in the Grasberg minerals district, and expansion projects in North America, and $1.7 billion for discretionary growth projects, primarily in the Grasberg minerals district for the development of Kucing Liar and at the Bagdad mine for tailings infrastructure.
b.Excludes capitalized interest, commissioning and owner’s costs. Capital expenditures for PT-FI’s new downstream processing facilities are expected to be funded with PT-FI’s cash flows from operations and availability under PT-FI’s revolving credit facility.
We closely monitor market conditions and will adjust our operating plans, including capital expenditures, to protect our liquidity and preserve our asset values, as necessary.
MARKETS
Prices for copper, gold and molybdenum are affected by numerous factors beyond our control and can fluctuate significantly (for further discussion refer to “Risk Factors” contained in Part I, Item 1A. of our annual report on Form 10-K for the year ended December 31, 2024). The following graphs present the London Metal Exchange (LME) copper settlement prices, the London Bullion Market Association (London) PM gold prices, and the Platts Metals Daily Molybdenum Dealer Oxide weekly average prices since January 2015.
This graph presents LME copper settlement prices and the combined reported stocks of copper at the LME, Commodity Exchange Inc. (COMEX) and the Shanghai Futures Exchange from January 2015 through December 2024. Copper sales from our South America and Indonesia operations are generally based on quoted LME monthly average copper settlement prices. For the year 2024, the LME copper settlement prices averaged $4.15 per pound (ranging from a low of $3.67 per pound to a high of $4.92 per pound) and closed at $3.95 per pound on December 31, 2024. The LME copper settlement prices averaged $4.07 per pound in January 2025, and closed at $4.25 per pound on February 13, 2025.
Copper sales from our North America copper mines are generally based on prevailing COMEX monthly average copper settlement prices. For the year 2024, COMEX copper settlement prices averaged $4.22 per pound (ranging from a low of $3.69 per pound to a high of $5.12 per pound) and closed at $3.99 per pound on December 31, 2024. COMEX copper settlement prices averaged $4.25 per pound in January 2025, and closed at $4.77 per pound on February 13, 2025.
We believe fundamentals for copper are favorable with growing demand supported by copper’s critical role in the global transition to renewable power, electric vehicles and other carbon-reduction initiatives, continued urbanization in developing countries, data centers and artificial intelligence developments and growing connectivity globally.
This graph presents London PM gold prices from January 2015 through December 2024. For the year 2024, London PM gold prices averaged $2,386 per ounce (ranging from a low of $1,985 per ounce to a high of $2,778 per ounce) and closed at $2,609 per ounce on December 31, 2024. Interest rate reductions, geopolitical tensions and strong demand from central banks positively impacted gold prices during 2024. The London PM gold prices averaged $2,710 in January 2025, and closed at $2,915 per ounce on February 13, 2025.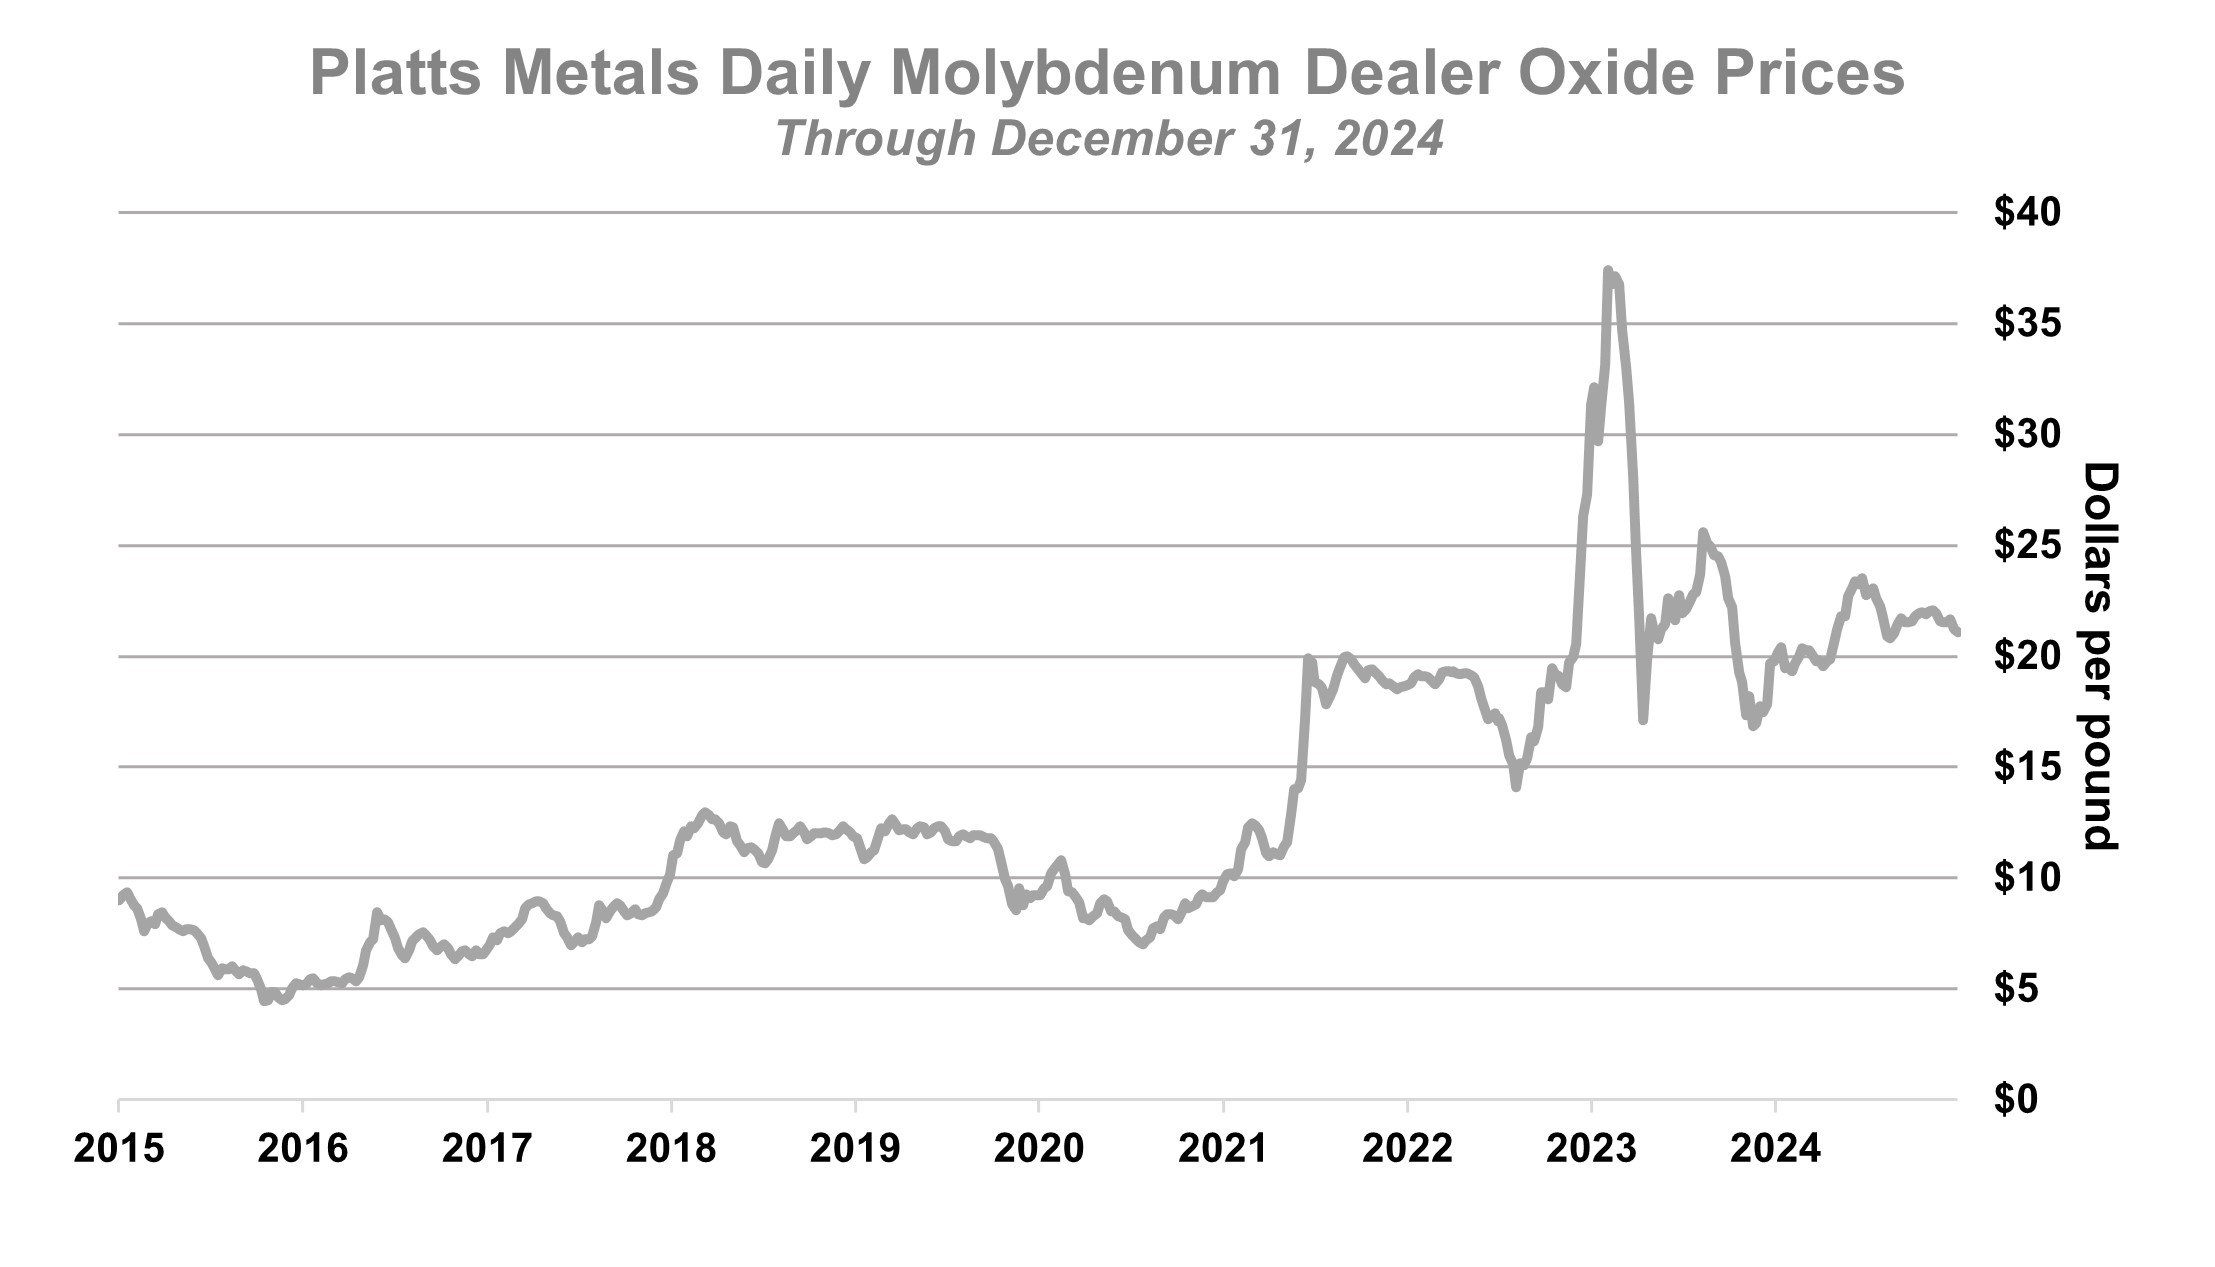
This graph presents the Platts Metals Daily Molybdenum Dealer Oxide weekly average prices from January 2015 through December 2024. For the year 2024, the weekly average prices for molybdenum averaged $21.30 per pound (ranging from a low of $19.34 per pound to a high of $23.52 per pound) and was $21.08 per pound on December 31, 2024. Overall global demand for molybdenum is driven by energy, power generation, aerospace,
defense and construction sectors. We believe fundamentals for molybdenum are positive with favorable demand drivers and limited supply. The Platts Metals Daily Molybdenum Dealer Oxide weekly average price for January 2025 was $20.82 per pound and was $20.70 per pound on February 13, 2025.
CRITICAL ACCOUNTING ESTIMATES
MD&A is based on our consolidated financial statements, which have been prepared in conformity with generally accepted accounting principles (GAAP) in the U.S. The preparation of these statements requires that we make estimates and assumptions that affect the reported amounts of assets, liabilities, revenues and expenses. We base these estimates on historical experience and on assumptions that we consider reasonable under the circumstances; however, reported results could differ from those based on the current estimates under different assumptions or conditions. The areas requiring the use of management’s estimates are also discussed in Note 1 under the subheading “Use of Estimates.” Management has reviewed the following discussion of its development and selection of critical accounting estimates with the Audit Committee of our Board of Directors (Board).
Income Taxes
Refer to Note 9, and Item 1A. “Risk Factors” contained in Part I of our annual report on Form 10-K for the year ended December 31, 2024, for further discussion of our consolidated income taxes.
In preparing our consolidated financial statements, we estimate the actual amount of income taxes currently payable or receivable as well as deferred income tax assets and liabilities attributable to temporary differences between the financial statement carrying amounts of existing assets and liabilities and their respective tax bases. Deferred income tax assets and liabilities are measured using enacted tax rates expected to apply to taxable income in the years in which these temporary differences are expected to be recovered or settled. The effect on deferred income tax assets and liabilities of a change in tax rates or laws is recognized in income in the period in which such changes are enacted.
Income taxes represent a critical accounting estimate as our operations are in multiple tax jurisdictions where uncertainties arise in the application of complex tax regulations and our income tax returns are subject to examination by tax authorities in those jurisdictions who may challenge any tax position on these returns. Some of these tax regimes are defined by contractual agreements with the local government, while others are defined by general tax laws and regulations. We and our subsidiaries are subject to reviews of our income tax filings and other tax payments, and disputes can arise with the taxing authorities over the interpretation of our contracts or laws. Uncertainty in a tax position may arise because tax laws are subject to interpretation. We use significant judgment to (1) determine whether, based on the technical merits, a tax position is more likely than not to be sustained upon examination by taxing authorities and (2) measure the amount of tax benefit that qualifies for recognition.
A valuation allowance is provided for those deferred income tax assets for which available information, including positive and negative evidence, suggests that the related benefits will not be realized. In determining the amount of the valuation allowance, we consider carryback opportunities, future reversals of existing taxable temporary differences, prudent and feasible tax planning strategies in each jurisdiction, as well as future taxable income exclusive of reversing temporary differences. If we determine that we will not realize all or a portion of our deferred income tax assets, we will increase our valuation allowance. Conversely, if we determine that we will ultimately be able to realize all or a portion of the related benefits for which a valuation allowance has been provided, all or a portion of the related valuation allowance will be reduced. Refer to Note 9 for further discussion of our valuation allowances.
On January 1, 2023, the provisions of the U.S. Inflation Reduction Act of 2022 (the Act) became applicable to us. The Act includes, among other provisions, a new Corporate Alternative Minimum Tax (CAMT) of 15% on the adjusted financial statement income (AFSI) of corporations with average annual AFSI exceeding $1.0 billion over a three-year period.
In September 2024, the Internal Revenue Service (IRS) issued proposed regulations that provide guidance on the application of the CAMT, which are not final and subject to change. Based on the proposed guidance released by the IRS, we determined that the provisions of the Act did not impact our financial results for the years 2024 or 2023.
In December 2021, the Organisation for Economic Cooperation and Development (OECD) published a framework for Pillar Two of the Global Anti-Base Erosion Rules, which was designed to coordinate participating jurisdictions in updating the international tax system to ensure that large multinational companies pay a minimum level of income
tax. Recommendations from the OECD regarding a global minimum income tax and other changes are being considered and/or implemented in jurisdictions where we operate. At current metals market prices, we do not expect enactment of the recommended framework in jurisdictions where we operate to materially impact our financial results.
We have uncertain tax positions related to income tax assessments in Peru and Indonesia, including penalties and interest, which have not been recorded at December 31, 2024. Final taxes paid may be dependent upon many factors, including negotiations with taxing authorities. In certain jurisdictions, we pay a portion of the disputed amount before formally appealing an assessment. Such payment is recorded as a receivable if we believe the amount is collectible. Refer to Note 10 for further discussion.
Environmental Obligations
Refer to Notes 1 and 10, and Item 1A. “Risk Factors” contained in Part I of our annual report on Form 10-K for the year ended December 31, 2024, for further discussion of environmental obligations, including a summary of changes in our estimated environmental obligations for the three years ended December 31, 2024.
Our current and historical operating activities are subject to various national, state and local environmental laws and regulations that govern emissions of air pollutants; discharges of water pollutants; generation, handling, storage, treatment, transportation and disposal of hazardous substances, hazardous wastes and other toxic materials; and remediation, restoration and reclamation of environmental contamination, and compliance with these laws and regulations requires significant expenditures. Environmental expenditures are charged to expense or capitalized, depending upon their future economic benefits. The guidance provided by U.S. GAAP requires that liabilities for contingencies be recorded when it is probable that obligations have been incurred, and the cost can be reasonably estimated. At December 31, 2024, environmental obligations recorded in our consolidated balance sheet totaled $2.0 billion, which reflect obligations for environmental liabilities attributed to the Comprehensive Environmental Response, Compensation, and Liability Act of 1980 or analogous state programs and for estimated future costs associated with environmental matters.
Accounting for environmental obligations represents a critical accounting estimate because (i) changes to environmental laws and regulations and/or circumstances affecting our operations could result in significant changes to our estimates, which could have a significant impact on our results of operations, (ii) we will not incur most of these costs for a number of years, requiring us to make estimates over a long period, (iii) calculating the discounted cash flows for certain of our environmental obligations requires management to estimate the amounts and timing of projected cash flows and make long-term assumptions about inflation rates and (iv) changes in estimates used in determining our environmental obligations could have a significant impact on our results of operations.
We perform a comprehensive annual review of our environmental obligations and also review changes in facts and circumstances associated with these obligations at least quarterly. Judgments and estimates are based upon currently available facts, existing technology, presently enacted laws and regulations, remediation experience, whether we are a potentially responsible party (PRP), the ability of other PRPs to pay their allocated portions and take into consideration reasonably possible outcomes. Our cost estimates can change substantially as additional information becomes available regarding the nature or extent of site contamination, updated cost assumptions (including increases and decreases to cost estimates), changes in the anticipated scope and timing of remediation activities, the settlement of environmental matters, required remediation methods and actions by or against governmental agencies or private parties.
Asset Retirement Obligations
Refer to Notes 1 and 10, and Item 1A. “Risk Factors” contained in Part I of our annual report on Form 10-K for the year ended December 31, 2024, for further discussion of reclamation and closure costs, including a summary of changes in our asset retirement obligations (AROs) for the three years ended December 31, 2024.
We record the fair value of our estimated AROs associated with tangible long-lived assets in the period incurred. Fair value is measured as the present value of cash flow estimates after considering inflation and a market risk premium. Our cost estimates are reflected on a third-party cost basis and comply with our legal obligation to retire tangible long-lived assets in the period incurred. These cost estimates may differ from financial assurance cost estimates for reclamation activities because of a variety of factors, including obtaining updated cost estimates for reclamation activities, the timing of reclamation activities, changes in scope and the exclusion of certain costs not
considered reclamation and closure costs. At December 31, 2024, AROs recorded in our consolidated balance sheet totaled $3.7 billion.
Generally, ARO activities are specified by regulations or in permits issued by the relevant governing authority, and management’s judgment is required to estimate the extent and timing of expenditures. Accounting for AROs represents a critical accounting estimate because (i) we will not incur most of these costs for a number of years, requiring us to make estimates over a long period, (ii) reclamation and closure laws and regulations could change in the future, we may commit to taking additional closure actions and/or circumstances affecting our operations could change, (iii) the methods used or required to plug and abandon non-producing oil and gas wellbores, remove platforms, tanks, production equipment and flow lines, and restore the wellsite could change, (iv) calculating the fair value of our AROs requires management to estimate projected cash flows, make long-term assumptions about inflation rates, determine our credit-adjusted, risk-free interest rates and determine market risk premiums that are appropriate for our operations and (v) given the magnitude of our estimated reclamation, mine closure and wellsite abandonment and restoration costs, changes in any or all of these estimates could have a significant impact on our results of operations.
Mineral Reserves
Refer to Note 15, and Items 1. and 2. “Business and Properties” and Item 1A. “Risk Factors” contained in Part I of our annual report on Form 10-K for the year ended December 31, 2024, for further information regarding, and risks associated with, our estimated recoverable proven and probable mineral reserves.
Recoverable proven and probable mineral reserves were determined from the application of relevant modifying factors to geological data, in order to establish an operational, economically viable mine plan, and have been prepared in accordance with the disclosure requirements of Subpart 1300 of U.S. Securities and Exchange Commission Regulation S-K. The determination of mineral reserves represents a critical accounting estimate because it involves numerous uncertainties with respect to the ultimate geology of the ore bodies, including quantities, grades and recoveries. Estimating the quantity and grade of mineral reserves requires us to determine the size, shape and depth of our ore bodies by analyzing geological data, such as samplings of drill holes, tunnels and other underground workings. In addition to the geology of our mines, assumptions are required to determine the economic feasibility of mining these reserves, including estimates of future commodity prices, the mining methods we use and the related costs incurred to develop and mine our mineral reserves. Our estimates of recoverable proven and probable mineral reserves are prepared by and are the responsibility of our employees. These estimates are reviewed and verified regularly by independent experts in mining, geology and reserve determination.
Our estimated recoverable proven and probable mineral reserves at December 31, 2024, were determined using metal price assumptions of $3.25 per pound of copper, $1,600 per ounce of gold and $12.00 per pound of molybdenum. The following table summarizes changes in our estimated consolidated recoverable proven and probable mineral reserves during 2024:
| | | | | | | | | | | | | | | | | | | | | | | |
| | Copper (billion pounds) | | Gold (million ounces) | | Molybdenum (billion pounds) | |
| | | | | | | |
| | | | | | | |
| | | | | | | |
| | | | | | | |
Reserves at December 31, 2023a | | 104.1 | | | 24.5 | | | 3.34 | | |
| Net revisions | | (3.0) | | b | 0.4 | | | (0.10) | | |
| Production | | (4.2) | | | (1.9) | | | (0.08) | | |
Reserves at December 31, 2024a,c | | 97.0 | | | 23.0 | | | 3.16 | | |
| | | | | | | |
a.Includes estimated recoverable metals contained in stockpiles. See below for additional discussion of recoverable copper in stockpiles.
b.Revisions are primarily the result of higher cost assumptions and updated geologic models.
c.May not foot because of rounding.
As discussed in Note 1, we depreciate our life-of-mine mining and milling assets and values assigned to proven and probable mineral reserves using the unit-of-production (UOP) method based on our estimated recoverable proven and probable mineral reserves. Because the economic assumptions used to estimate mineral reserves may change from period to period and additional geological data is generated during the course of operations, estimates of mineral reserves may change, which could have a significant impact on our results of operations, including changes to prospective depreciation rates and impairments of long-lived asset carrying values. Based on projected copper sales volumes, if estimated copper reserves at our mines were 10% higher at December 31, 2024, we estimate that our annual depreciation, depletion and amortization (DD&A) expense for 2025 would decrease by approximately
$110 million (approximately $43 million to net income attributable to common stock), and a 10% decrease in copper reserves would increase DD&A expense by approximately $137 million (approximately $53 million to net income attributable to common stock). We perform annual assessments of our existing assets in connection with the review of mine operating and development plans. If it is determined that assigned asset lives do not reflect the expected remaining period of benefit, any change could affect prospective DD&A rates.
As discussed below, we review and evaluate our long-lived assets for impairment when events or changes in circumstances indicate that the related carrying amount of such assets may not be recoverable, and changes to our estimates of recoverable proven and probable mineral reserves could have an impact on our assessment of asset recoverability.
Recoverable Copper in Stockpiles
Refer to Note 1 for further discussion of our accounting policy for recoverable copper in mill and leach stockpiles, including adjustments to stockpile inventory volumes and Item 1A. “Risk Factors” contained in Part I of our annual report on Form 10-K for the year ended December 31, 2024, for risks associated with implementation of new technologies associated with the recovery of copper in leach stockpiles.
We record, as inventory, applicable costs for copper contained in mill and leach stockpiles that are expected to be processed in the future based on proven processing technologies. Mill and leach stockpiles are evaluated periodically to ensure that they are stated at the lower of weighted-average cost or net realizable value.
Accounting for recoverable copper from mill and leach stockpiles represents a critical accounting estimate because (i) it is impracticable to determine copper contained in mill and leach stockpiles by physical count, thus requiring management to employ reasonable estimation methods and (ii) recoveries from leach stockpiles can vary significantly.
At December 31, 2024, estimated consolidated recoverable copper was 1.4 billion pounds in leach stockpiles (with a carrying value of $2.2 billion) and 0.3 billion pounds in mill stockpiles (with a carrying value of $0.4 billion).
Impairment of Long-Lived Mining Assets
Refer to Note 1, and Item 1A. “Risk Factors” contained in Part I of our annual report on Form 10-K for the year ended December 31, 2024, for further information regarding, and risks associated with, impairment of long-lived mining assets.
We assess the carrying values of our long-lived mining assets when events or changes in circumstances indicate that the related carrying amounts of such assets may not be recoverable. In evaluating our long-lived mining assets for recoverability, we use estimates of pre-tax undiscounted future cash flows of our mines.
Estimates of future cash flows are derived from current business plans, which are developed using near-term metal price forecasts reflective of the current price environment and management’s projections for long-term average metal prices. In addition to near- and long-term metal price assumptions, other key assumptions include estimates of commodity-based and other input costs; proven and probable mineral reserves estimates, including the timing and cost to develop and produce the mineral reserves; value beyond proven and probable mineral reserve estimates; and the use of appropriate discount rates in the measurement of fair value. We believe our estimates and models used to determine fair value are similar to what a market participant would use. As quoted market prices are unavailable for our individual mining operations, fair value is determined through the use of after-tax discounted estimated future cash flows.
During the two-year period ended December 31, 2024, no material impairments of our long-lived mining assets were recorded.
In addition to decreases in future metal price assumptions, other events that could result in future impairment of our long-lived mining assets include, but are not limited to, decreases in estimated recoverable proven and probable mineral reserves and any event that might otherwise have a material adverse effect on mine site production levels or costs.
CONSOLIDATED RESULTS
| | | | | | | | | | | | | | | | |
| | Years Ended December 31, | | | |
| | 2024 | | 2023 | | | |
| SUMMARY FINANCIAL DATA | (in millions, except per share amounts) | | | |
Revenuesa,b | $ | 25,455 | | | $ | 22,855 | | | | |
Operating incomea,c | $ | 6,864 | |
| $ | 6,225 | |
| | |
| | | | | | |
Net income attributable to common stockb,c | $ | 1,889 | | d | $ | 1,848 | | e | | |
Diluted net income per share attributable to common stockb,c | $ | 1.30 | | d | $ | 1.28 | | e | | |
| | | | | | |
| | | | | | |
| | | | | | |
| | | | | | |
| Diluted weighted-average common shares outstanding | 1,445 | | | 1,443 | | | | |
Operating cash flowsf | $ | 7,160 | | | $ | 5,279 | | | | |
| Capital expenditures | $ | 4,808 | | | $ | 4,824 | | | | |
| At December 31: | | | | | | |
| Cash and cash equivalents | $ | 3,923 | | | $ | 4,758 | | | | |
Restricted cash and cash equivalents, currentg | $ | 888 | | | $ | 1,208 | |
| | |
| Total debt, including current portion | $ | 8,948 | | | $ | 9,422 | | | | |
a.Refer to Note 14 for a summary of revenues and operating income by operating division.
b.Includes favorable adjustments to prior period provisionally priced concentrate and cathode copper sales totaling $28 million ($9 million to net income attributable to common stock or $0.01 per share) in 2024 and $183 million ($62 million to net income attributable to common stock or $0.04 per share) in 2023 (refer to Note 12).
c.We defer recognizing profits on intercompany sales until final sales to third parties occur. Changes in these deferrals attributable to variability in intercompany volumes resulted in net additions (reductions) to operating income totaling $21 million ($(3) million to net income attributable to common stock or less than $0.01 per share) in 2024 and $64 million ($37 million to net income attributable to common stock or $0.03 per share) in 2023.
d.Includes net charges totaling $257 million ($0.18 per share), primarily associated with adjustments to PT-FI’s ARO, oil and gas charges for impairments and abandonment obligations, metals inventory adjustments, net adjustments to environmental obligations and related litigation reserves and nonrecurring labor-related charges at Cerro Verde, partly offset by net credits associated with historical tax matters at PT-FI and a reduction in accruals for uncertain U.S. tax positions.
e.Includes net charges totaling $373 million ($0.26 per share), primarily associated with net adjustments to environmental obligations and related litigation reserves, contested tax rulings issued by the Peru Supreme Court, impairment of oil and gas properties and an accrual for an administrative fine in Indonesia, partly offset by adjustments to PT-FI’s ARO.
f.Working capital and other uses totaled $29 million in 2024 and $880 million in 2023.
g.Includes $0.7 billion at December 31, 2024, and $1.1 billion at December 31, 2023, associated with a portion of PT-FI’s export proceeds required to be temporarily deposited in Indonesia banks for 90 days in accordance with Indonesia regulations (refer to Notes 10 and 12).
| | | | | | | | | | | | | | | | |
| Years Ended December 31, | | | |
| 2024 | | 2023 | | | |
| SUMMARY OPERATING DATA | | | | | | |
Copper (millions of recoverable pounds) | | | | | | |
| Production | 4,214 | | | 4,212 | | | | |
| Sales, excluding purchases | 4,066 | | | 4,086 | | | | |
| Average realized price per pound | $ | 4.21 | | | $ | 3.85 | | | | |
Site production and delivery costs per pounda | $ | 2.49 | | | $ | 2.36 | | | | |
Unit net cash costs per pounda | $ | 1.56 | | | $ | 1.61 | | | | |
Gold (thousands of recoverable ounces) | | | | | | |
| Production | 1,880 | | | 1,993 | | | | |
| Sales, excluding purchases | 1,837 | | | 1,713 | | | | |
| Average realized price per ounce | $ | 2,418 | | | $ | 1,972 | | | | |
Molybdenum (millions of recoverable pounds) | | | | | | |
| Production | 80 | | | 82 | | | | |
| Sales, excluding purchases | 78 | | | 81 | | | | |
| Average realized price per pound | $ | 21.77 | | | $ | 24.64 | | | | |
| | | | | | |
| | | | | | |
| | | | | | |
| | | | | | |
| | | | | | |
| | | | | | |
| | | | | | |
| | | | | | |
a.Reflects per pound weighted-average production and delivery costs and unit net cash costs (net of by-product credits) for all copper mines, before net noncash and other costs. For reconciliations of the per pound unit net cash costs by operating division to production and delivery costs applicable to sales reported in our consolidated financial statements, refer to “Product Revenues and Production Costs.”
Revenues
Consolidated revenues totaled $25.5 billion in 2024 and $22.9 billion in 2023. Our revenues primarily include the sale of copper concentrate, copper cathode, copper rod, gold in concentrate and anode slimes, and molybdenum. Following is a summary of changes in our consolidated revenues from 2023 to 2024 (in millions):
| | | | | | | | | | |
| | | | |
| | | | |
| Consolidated revenues – 2023 | $ | 22,855 | | | | |
| Mining operations: | | | | |
| (Lower) higher sales volumes: | | | | |
| Copper | (73) | | | | |
| Gold | 316 | | | | |
| Molybdenum | (63) | | | | |
| Higher (lower) averaged realized prices: | | | | |
| Copper | 1,464 | | | | |
| Gold | 836 | | | | |
| Molybdenum | (225) | | | | |
| Adjustments for prior year provisionally priced copper sales | (155) | | | | |
| Higher Atlantic Copper revenues | 207 | | | | |
| Higher revenues from sales of purchased copper | 277 | | | | |
| Lower treatment charges | 142 | | | | |
| Higher export duties and royalties | (246) | | | | |
| | | | |
| | | | |
| | | | |
| Other, including intercompany eliminations | 120 | | | | |
| Consolidated revenues – 2024 | $ | 25,455 | | | | |
Sales Volumes. Copper sales volumes in 2024 were slightly lower than 2023, primarily reflecting lower ore grades and operating rates in North America, partly offset by higher ore grades and operating rates in Indonesia. Gold sales volumes were higher in 2024, compared to 2023, primarily reflecting the timing of shipments at PT-FI. Refer to “Operations” for further discussion of sales volumes at our mining operations.
Realized Prices. Our consolidated revenues can vary significantly as a result of fluctuations in the market prices of copper, gold and molybdenum. In 2024, our average realized prices, compared with 2023, were 9% higher for copper, 23% higher for gold and 12% lower for molybdenum.
Certain sales contracts for copper and gold provide final pricing in a specified future month (generally one to four months from the shipment date). We record revenues and invoice customers at the time of shipment based on then-current LME or London PM prices, which results in an embedded derivative on provisionally priced sales that are adjusted to fair value through earnings each period, using the period-end forward prices, until final pricing on the date of settlement. To the extent final prices are higher or lower than what was recorded on a provisional basis, an increase or decrease to revenues is recorded each reporting period until the date of final pricing. Accordingly, in times of rising copper and gold prices, our revenues benefit from adjustments to the final pricing of provisionally priced sales pursuant to contracts entered into in prior periods; in times of falling copper and gold prices, the opposite occurs.
Consolidated revenues include net favorable (unfavorable) adjustments to current year provisionally priced copper sales (i.e., provisionally priced sales during the years 2024 and 2023) totaling $89 million for 2024 and $(86) million for 2023. See below for discussion of adjustments related to prior year provisionally priced copper sales.
Prior Year Provisionally Priced Copper Sales. Net favorable adjustments to prior years’ provisionally priced copper sales (i.e., provisionally priced copper sales at December 31, 2023 and 2022) recorded in consolidated revenues totaled $28 million in 2024 and $183 million in 2023. Refer to “Disclosures About Market Risks – Commodity Price Risk” for further discussion of our provisionally priced copper sales, and to Note 12 for a summary of total adjustments to prior period and current period provisionally priced copper sales.
Atlantic Copper Revenues. Higher Atlantic Copper revenues of $3.0 billion in 2024, compared with $2.8 billion in 2023, primarily reflects higher copper prices.
Sales of Purchased Copper. We purchase copper cathode primarily for processing by our Rod & Refining operations. The volumes of copper purchases vary depending on cathode production from our operations and totaled 158 million pounds in 2024 and 103 million pounds in 2023. Revenues associated with the sale of purchased copper vary with the volume of copper purchases and changes in copper prices.
Treatment Charges. Revenues from our concentrate sales are recorded net of treatment charges (i.e., fees paid to smelters that are generally negotiated annually), which will vary with the sales volumes and the price of copper. The decrease in treatment charges in 2024, compared to 2023, primarily reflects lower copper concentrate sales volumes in South America.
Export Duties and Royalties. Export duties and royalties are primarily associated with PT-FI sales. Effective March 29, 2023, PT-FI’s export duties of 2.5% were eliminated upon verification that construction progress of its new smelter exceeded 50%, but were reinstated at a rate of 7.5% in July 2023 under a revised regulation. PT-FI incurred export duties totaling $457 million in 2024 and $324 million in 2023. Royalties will vary with the volume of metal sold and the prices of copper and gold. Refer to Note 11 for discussion of PT-FI’s export duties and royalties.
Production and Delivery Costs
Consolidated production and delivery costs totaled $15.6 billion in 2024, compared with $13.6 billion in 2023. Higher production and delivery costs in 2024 primarily reflect increased costs at PT-FI associated with higher operating rates and sales volumes, and for adjustments to its ARO (refer to Note 10 for discussion of Indonesia reclamation and closure programs). Production and delivery costs also includes oil and gas charges totaling $217 million in 2024 and $70 million in 2023, mostly for impairments and assumed abandonment obligations from bankruptcies of other companies (refer to Note 10) and nonrecurring labor-related charges totaling $97 million in 2024 associated with Cerro Verde’s new collective labor agreements (CLA). Refer to Note 14 for details of production and delivery costs by operating segment.
Mining Unit Site Production and Delivery Costs Per Pound. Site production and delivery costs for our copper mining operations primarily include labor, energy and other commodity-based inputs, such as sulfuric acid, steel, reagents, liners, tires and explosives. Consolidated unit site production and delivery costs (before net noncash and other costs) for our copper mines averaged $2.49 per pound of copper in 2024 and $2.36 per pound in 2023. Refer to “Operations – Unit Net Cash Costs” for further discussion of unit net cash costs associated with our operating divisions, and to “Product Revenues and Production Costs” for reconciliations of per pound costs by operating division to production and delivery costs applicable to sales reported in our consolidated financial statements.
Our copper mining operations require significant amounts of energy, principally diesel, electricity, coal and natural gas, most of which is obtained from third parties under long-term contracts. Our take-or-pay contractual obligations for electricity totaled approximately $0.2 billion at December 31, 2024. We do not have take-or-pay contractual obligations for other energy commodities. Energy represented 16% of our copper mine site operating costs in 2024, including purchases of approximately 270 million gallons of diesel fuel; approximately 8,550 gigawatt hours of electricity at our North America and South America copper mining operations (we generate all of our power at our Indonesia mining operation); approximately 750 thousand metric tons of coal for our coal power plant in Indonesia; and approximately 2 million MMBtu (million British thermal units) of natural gas at certain of our North America mines. Based on current cost estimates, energy will approximate 16% of our copper mine site operating costs for the year 2025.
Depreciation, Depletion and Amortization
Depreciation will vary under the UOP method as a result of changes in sales volumes and the related UOP rates at our mining operations. Consolidated DD&A totaled $2.2 billion in 2024 and $2.1 billion in 2023. Our consolidated DD&A is estimated to approximate $2.5 billion for the year 2025, based on current sales volume estimates. The increase in 2025, compared to 2024, primarily reflects expected completion of commissioning activities for PT-FI’s new downstream processing facilities.
Environmental Obligations and Shutdown Costs
Environmental obligation costs reflect net revisions to our long-term environmental obligations, which vary from period to period because of changes to environmental laws and regulations, the settlement of environmental matters and/or circumstances affecting our operations that could result in significant changes in our estimates (refer to “Critical Accounting Estimates – Environmental Obligations” for further discussion). Shutdown costs include care-and-maintenance costs and any litigation, remediation or related expenditures associated with closed facilities or operations.
Net charges for environmental obligations and shutdown costs totaled $127 million in 2024, including $82 million in net adjustments to environmental obligations. Net charges totaled $319 million in 2023, including $195 million in net adjustments to environmental obligations and $65 million associated with an adjustment to the proposed settlement of talc-related litigation. Refer to Note 10 for further discussion of environmental obligations and litigation matters.
Interest Expense, Net
Consolidated interest costs (before capitalization) totaled $710 million in 2024 and $782 million in 2023. The year 2023 included $74 million of interest charges associated with Cerro Verde’s contested tax rulings issued by the Peru Supreme Court.
Capitalized interest totaled $391 million in 2024 and $267 million in 2023. The increase in capitalized interest in 2024, compared with 2023, resulted from construction and development projects in process, primarily related to PT-FI’s new downstream processing facilities. Refer to “Operations” and “Capital Resources and Liquidity – Investing Activities” for further discussion of current development projects.
Other Income, Net
Other income, net, which totaled $362 million in 2024 and $286 million in 2023, primarily includes amounts associated with interest income, currency exchange gains and losses, and mark-to-market impacts of trust assets used to satisfy financial assurance obligations for our New Mexico mining operations. The year 2024 also includes a credit of $26 million associated with the reduction in the accrual to indemnify PT Mineral Industri Indonesia (MIND ID) from potential losses arising from historical tax disputes, and the year 2023 also includes a $69 million charge associated with Cerro Verde’s contested tax rulings issued by the Peru Supreme Court.
Income Taxes
Refer to Note 9, and Item 1A. “Risk Factors” contained in Part I of our annual report on Form 10-K for the year ended December 31, 2024, for further discussion of income taxes.
Following is a summary of the approximate amounts used in the calculation of our consolidated income tax provision for the years ended December 31 (in millions, except percentages):
| | | | | | | | | | | | | | | | | | | | | | | | | | | | | | | | | | | | | | |
| 2024 | | 2023 | |
| Income (Loss)a | | Effective
Tax Rate | | Income Tax
(Provision)
Benefit | | Income (Loss)a | | Effective
Tax Rate | | Income Tax
(Provision)
Benefit | |
U.S.b | $ | (533) | | c | 7% | | $ | 36 | | c | $ | 55 | | | —% | d | $ | 1 | | |
| South America | 1,519 | | | 40% | | (604) | | | 1,303 | | | 40% | | (515) | | |
| Indonesia | 5,754 | | | 36% | | (2,089) | | | 4,830 | | | 37% | | (1,771) | | |
| Cerro Verde historical tax matters | — | | | N/A | | — | | | (142) | | e | N/A | | 3 | | |
| PT-FI historical tax matters | 16 | | f | N/A | | 182 | | f | (5) | | | N/A | | (3) | | |
| | | | | | | | | | | | |
| | | | | | | | | | | | |
| | | | | | | | | | | | |
| | | | | | | | | | | | |
| | | | | | | | | | | | |
| | | | | | | | | | | | |
| | | | | | | | | | | | |
| | | | | | | | | | | | |
| | | | | | | | | | | | |
| | | | | | | | | | | | |
| Eliminations and other | 151 | | | N/A | | (48) | | | (35) | | | N/A | | 15 | | |
| | | | | | | | | | | | |
| | | | | | | | | | | | |
| | | | | | | | | | | | |
| Consolidated FCX | $ | 6,907 | | | 37% | | $ | (2,523) | | | $ | 6,006 | | | 38% | | $ | (2,270) | | |
a.Represents income before income taxes, equity in affiliated companies’ net earnings and noncontrolling interests.
b.In addition to our North America mining operations, which had operating income of $0.8 billion in 2024 and $1.0 billion in 2023 (refer to Note 14), the U.S. jurisdiction reflects non-operating sites and corporate-level expenses, which include interest expense associated with our senior notes and general and administrative expenses. The U.S. jurisdiction also includes net revisions to environmental obligation estimates and charges associated with oil and gas abandonment obligations and impairments.
c.Includes net credits associated with the closure of our 2017 and 2018 U.S. federal income tax exams.
d.Includes a valuation allowance release on prior year unbenefited net operating losses.
e.Reflects net charges associated with contested tax rulings issued by the Peru Supreme Court.
f.Reflects net credits associated with closure of PT-FI’s 2021 corporate income tax audit and resolution of a framework for Indonesia disputed tax matters.
Assuming achievement of current sales volume and cost estimates and average prices of $4.00 per pound for copper, $2,700 per ounce for gold and $20.00 per pound for molybdenum, we estimate our consolidated effective tax rate for the year 2025 would approximate 40%. Changes in projected sales volumes and average prices during 2025 would incur tax impacts at estimated effective rates of 39% for Peru, 36% for Indonesia and 0% for the U.S., which excludes any impacts from the Act.
Net Income Attributable to Noncontrolling Interests
Refer to Note 2 for ownership in our subsidiaries.
Net income attributable to noncontrolling interests, which is primarily associated with PT-FI, Cerro Verde and El Abra, totaled $2.5 billion in 2024 and $1.9 billion in 2023. In September 2024, we increased our ownership interest in Cerro Verde to 55.08% from 53.56%. Refer to Note 14 for net income attributable to noncontrolling interests for each of our business segments.
Based on achievement of current sales volume and cost estimates and assuming average prices of $4.00 per pound of copper, $2,700 per ounce of gold and $20.00 per pound of molybdenum for the year 2025, we estimate that net income attributable to noncontrolling interests will approximate $2.3 billion for the year 2025. The impact of price changes on net income attributable to noncontrolling interests for the year 2025 would approximate $0.2 billion for each $0.25 per pound change in the average price of copper for the year 2025. The actual amount will depend on many factors, including relative performance of each business segment, commodity prices, costs and other factors.
OPERATIONS
Responsible Production
Refer to Items 1. and 2. “Business and Properties” and Item 1A. “Risk Factors” contained in Part I of our annual report on Form 10-K for the year ended December 31, 2024, for discussion of our involvement with the International Council on Mining & Metals and environmental (including climate) and social-related risks.
We demonstrate our responsible production performance through the Copper Mark, a comprehensive assurance framework developed specifically for the copper industry, and recently extended to other metals including molybdenum. To achieve the Copper Mark, each site is required to complete an independent external assurance process to assess conformance with various environmental, social and governance criteria. Awarded sites must be revalidated every three years. We have achieved, and are committed to maintaining, the Copper Mark and/or Molybdenum Mark, as applicable, at all of our operating sites globally.
Technology and Leaching Innovation Initiatives
We are progressing initiatives across our North America and South America operations by incorporating new applications, technologies and data analytics to our leaching processes. In late 2023, we achieved our initial incremental annual run rate target of approximately 200 million pounds of copper. Incremental copper production from these initiatives totaled 214 million pounds in 2024, compared with a total of 144 million pounds in 2023. We have projects underway to apply recent operational enhancements to our leaching processes on a larger scale and are testing new innovative technology applications that we believe have the potential for significant increases in recoverable metal from leach stockpiles beyond the current run rate. Continued success with these initiatives could contribute to favorable adjustments in recoverable copper in certain leach stockpiles and positively impact average unit net cash costs.
In addition to technology-driven leaching initiatives, we are pursuing opportunities to leverage new technologies and analytic tools in automation and operating practices with a goal of improving operating efficiencies, and reducing costs and capital intensity of our current operations and future development projects. We believe these technology and leaching initiatives are particularly important to our North America operations, which have lower ore grades.
Feasibility and Optimization Studies
We are engaged in various studies associated with potential future expansion projects primarily at our mining operations. The costs for these studies are charged to production and delivery costs as incurred and totaled $155 million in 2024 and $185 million in 2023. We estimate the costs of these studies will approximate $240 million for the year 2025, subject to market conditions and other factors.
North America
We manage seven copper operations in North America – Morenci, Bagdad, Safford (including Lone Star), Sierrita and Miami in Arizona, and Chino and Tyrone in New Mexico. We also operate a copper smelter in Miami, Arizona. All of the North America operations are wholly owned, except for Morenci. We record our 72% undivided joint venture interest in Morenci using the proportionate consolidation method.
The North America copper operations include open-pit mining, sulfide-ore concentrating, leaching and solution extraction/electrowinning (SX/EW) facilities. A majority of the copper produced at our North America copper operations is cast into copper rod by our Rod & Refining segment. The remainder of our North America copper production is sold as copper cathode or copper concentrate, a portion of which is shipped to Atlantic Copper (our wholly owned smelter and refinery in Spain). Molybdenum concentrate, gold and silver are also produced by certain of our North America copper operations.
Development Activities. Refer to Item 1A. “Risk Factors” contained in Part I of our annual report on Form 10-K for the year ended December 31, 2024, for further discussion of risks associated with development projects.
We have substantial reserves and future opportunities in the U.S., primarily associated with existing mining operations.
We have a potential expansion project to more than double the concentrator capacity of the Bagdad operation in northwest Arizona. Bagdad’s reserve life currently exceeds 80 years and supports an expanded operation. In late 2023, we completed technical and economic studies, which indicate the opportunity to construct new concentrating facilities to increase copper production by 200 to 250 million pounds per year at estimated incremental project capital costs of approximately $3.5 billion. Expanded operations would provide improved efficiency and reduce unit net cash costs through economies of scale. Project economics indicate that the expansion would require an incentive copper price in the range of $3.50 to $4.00 per pound and approximately three to four years to complete. The decision of whether to proceed and timing of the potential expansion will take into account overall copper market conditions, availability of labor and other factors, including deployment of our autonomous haul truck fleet conversion expected by year-end 2025 and expanding housing alternatives to support long-range plans. In parallel, we are enhancing local infrastructure and advancing activities for expanded tailings infrastructure projects required under long-range plans in order to advance the potential construction timeline.
We have commenced pre-feasibility studies in the Lone Star district of Safford to define a potential significant expansion opportunity. Positive drilling conducted in recent years indicates a large, mineralized district with opportunities to pursue a further expansion project. We expect to complete these studies in 2026. The decision of whether to proceed and timing of the potential expansion will take into account results of technical and economic studies, overall copper market conditions and other factors.
Operating Data. Following is summary operating data for the North America copper mines for the years ended December 31:
| | | | | | | | | | | | | | |
| | 2024 | | 2023 | |
| Operating Data, Net of Joint Venture Interests | | | | |
Copper (millions of recoverable pounds) | | | | |
| Production | 1,246 | | | 1,350 | | |
| Sales, excluding purchases | 1,257 | | | 1,361 | | |
| Average realized price per pound | $ | 4.29 | | | $ | 3.93 | | |
| | | | |
Molybdenum (millions of recoverable pounds) | | | | |
Productiona | 30 | | | 30 | | |
| | | | |
| 100% Operating Data | | | | |
| Leach operations | | | | |
| Leach ore placed in stockpiles (metric tons per day) | 609,400 | | | 692,000 | | |
| Average copper ore grade (%) | 0.20 | | | 0.23 | | |
| Copper production (millions of recoverable pounds) | 842 | | | 941 | | |
| | | | |
| Mill operations | | | | |
| Ore milled (metric tons per day) | 311,700 | | | 308,500 | | |
| Average ore grade (%): | | | | |
| Copper | 0.30 | | | 0.32 | | |
| Molybdenum | 0.02 | | | 0.02 | | |
| Copper recovery rate (%) | 83.2 | | | 81.8 | | |
| Copper production (millions of recoverable pounds) | 601 | | | 633 | | |
a.Refer to “Consolidated Results” for our consolidated molybdenum sales volumes, which include sales of molybdenum produced at the North America copper mines.
Our consolidated copper production and sales volumes from the North America copper mines in 2024 were below 2023 volumes, primarily reflecting lower ore grades and operating rates, partly offset by leach recovery initiatives.
North America copper sales are estimated to approximate 1.4 billion pounds in 2025. Refer to “Outlook” for projected molybdenum sales volumes.
Unit Net Cash Costs. We believe unit net cash costs per pound of copper is a measure that provides investors with information about the cash-generating capacity of our mining operations expressed on a basis relating to the primary metal product for our respective operations. We use this measure for the same purpose and for monitoring operating performance by our mining operations. This information differs from measures of performance determined in accordance with U.S. GAAP and should not be considered in isolation or as a substitute for measures of performance determined in accordance with U.S. GAAP. This measure is presented by other metals mining companies, although our measure may not be comparable to similarly titled measures reported by other companies.
Gross Profit per Pound of Copper and Molybdenum
The following table summarizes unit net cash costs and gross profit per pound at our North America copper mines for the two years ended December 31, 2024. Refer to “Product Revenues and Production Costs” for an explanation of the “by-product” and “co-product” methods and a reconciliation of unit net cash costs per pound to production and delivery costs applicable to sales reported in our consolidated financial statements.
| | | | | | | | | | | | | | | | | | | | | | | | | | | | | | | | | | | |
| | 2024 | | 2023 |
| | By- | | Co-Product Method | | By- | | Co-Product Method |
| Product
Method | | Copper | | Molyb- denuma | | Product
Method | | Copper | | Molyb- denuma |
| Revenues, excluding adjustments | $ | 4.29 | | | $ | 4.29 | | | $ | 20.13 | | | $ | 3.93 | | | $ | 3.93 | | | $ | 23.38 | |
| Site production and delivery, before net noncash | | | | | | | | | | | |
| and other costs shown below | 3.46 | | | 3.10 | | | 16.20 | | | 3.00 | | | 2.65 | | | 17.63 | |
| By-product credits | (0.48) | | | — | | | — | | | (0.49) | | | — | | | — | |
| Treatment charges | 0.13 | | | 0.12 | | | — | | | 0.12 | | | 0.12 | | | — | |
| Unit net cash costs | 3.11 | | | 3.22 | | | 16.20 | | | 2.63 | | | 2.77 | | | 17.63 | |
| DD&A | 0.34 | | | 0.31 | | | 1.19 | | | 0.30 | | | 0.27 | | | 1.30 | |
| | | | | | | | | | | |
| Noncash and other costs, net | 0.19 | | b | 0.18 | | | 0.36 | | | 0.18 | | b | 0.16 | | | 0.77 | |
| Total unit costs | 3.64 | | | 3.71 | | | 17.75 | | | 3.11 | | | 3.20 | | | 19.70 | |
| Revenue adjustments, primarily for pricing on prior period open sales | — | | | — | | | — | | | 0.01 | | | 0.01 | | | — | |
| Gross profit per pound | $ | 0.65 | | | $ | 0.58 | | | $ | 2.38 | | | $ | 0.83 | | | $ | 0.74 | | | $ | 3.68 | |
| | | | | | | | | | | |
| Copper sales (millions of recoverable pounds) | 1,263 | | | 1,263 | | | | | 1,367 | | | 1,367 | | | |
Molybdenum sales (millions of recoverable pounds)a | | | | | 30 | | | | | | | 30 | |
a.Reflects sales of molybdenum produced by certain of the North America copper mines to our molybdenum sales company at market-based pricing.
b.Includes charges totaling $0.05 per pound of copper in 2024 and $0.08 per pound of copper in 2023 for feasibility and optimization studies. Also, includes charges totaling $0.05 per pound of copper in 2024 and $0.01 per pound of copper in 2023 for metals inventory adjustments.
Our North America copper mines have varying cost structures because of differences in ore grades and characteristics, processing costs, by-product credits and other factors. Average unit net cash costs (net of by-product credits) for the North America copper mines of $3.11 per pound of copper in 2024 were higher than average unit net cash costs of $2.63 per pound of copper in 2023, primarily reflecting lower copper volumes and higher mining and labor costs.
Because certain assets are depreciated on a straight-line basis, North America’s average unit depreciation rate may vary with asset additions and the level of copper production and sales.
Revenue adjustments primarily result from changes in prices on provisionally priced copper sales recognized in prior periods. Refer to “Consolidated Results – Revenues” for further discussion of adjustments to prior period provisionally priced copper sales.
Average unit net cash costs (net of by-product credits) for the North America copper mines are expected to approximate $3.00 per pound of copper for the year 2025, based on achievement of current sales volume and cost estimates and assuming an average price of $20.00 per pound of molybdenum. North America’s average unit net cash costs for the year 2025 would change by approximately $0.05 per pound for each $2 per pound change in the average price of molybdenum.
South America
We manage two copper operations in South America – Cerro Verde in Peru (in which we own a 55.08% interest) and El Abra in Chile (in which we own a 51% interest), which are consolidated in our financial statements.
In September 2024, we purchased 5.3 million shares of Cerro Verde common stock for $210 million, increasing our ownership interest in Cerro Verde to 55.08% from 53.56%.
South America operations includes open-pit mining, sulfide-ore concentrating, leaching and SX/EW facilities. Production from our South America operations is sold as copper concentrate or cathode under long-term contracts.
Our South America operations also sell a portion of their copper concentrate production to Atlantic Copper. In addition to copper, the Cerro Verde mine produces molybdenum concentrate and silver.
Development Activities. Refer to Item 1A. “Risk Factors” contained in Part I of our annual report on Form 10-K for the year ended December 31, 2024, for further discussion of risks associated with development projects.
At the El Abra operations in Chile, we have completed substantial drilling and evaluations to define a large sulfide resource that would support a potential major mill project similar to the large-scale concentrator at Cerro Verde. We are preparing data for a potential submission of an environmental impact statement by year-end 2025, subject to ongoing stakeholder engagement and economic evaluations. Preliminary estimates, which remain under review, indicate that the project economics would be supported using an incentive copper price of less than $4.00 per pound. The decision of whether to proceed and timing of the potential project will take into account overall copper market conditions, required permitting and other factors.
Operating Data. Following is summary consolidated operating data for our South America operations for the years ended December 31.
| | | | | | | | | | | | | | |
| | 2024 | | 2023 | |
Copper (millions of recoverable pounds) | | | | |
| Production | 1,168 | | | 1,202 | | |
| Sales | 1,177 | | | 1,200 | | |
| Average realized price per pound | $ | 4.16 | | | $ | 3.82 | | |
| | | | |
| | | | |
| | | | |
| | | | |
| | | | |
| | | | |
Molybdenum (millions of recoverable pounds) | | | | |
Productiona | 20 | | | 22 | | |
| | | | |
| Leach operations | | | | |
| Leach ore placed in stockpiles (metric tons per day) | 164,300 | | | 191,200 | | |
| Average copper ore grade (%) | 0.42 | | | 0.35 | | |
| Copper production (millions of recoverable pounds) | 295 | | | 317 | | |
| | | | |
| Mill operations | | | | |
| Ore milled (metric tons per day) | 415,500 | | | 417,400 | |
|
| Average ore grade (%): | | | | |
| Copper | 0.33 | | | 0.34 | | |
| | | | |
| Molybdenum | 0.01 | | | 0.01 | | |
| Copper recovery rate (%) | 83.6 | | | 81.3 | | |
| Copper production (millions of recoverable pounds) | 873 | | | 885 | | |
a.Refer to “Consolidated Results” for our consolidated molybdenum sales volumes, which include sales of molybdenum produced at Cerro Verde.
Our consolidated copper production and sales volumes from our South America operations in 2024 were slightly lower than 2023 volumes, primarily reflecting lower operating rates, offset by higher ore grades.
South America copper sales volumes are expected to approximate 1.1 billion in 2025 as a result of slightly lower expected ore grades. Refer to “Outlook” for projected molybdenum sales volumes.
Unit Net Cash Costs. We believe unit net cash costs per pound of copper is a measure that provides investors with information about the cash-generating capacity of our mining operations expressed on a basis relating to the primary metal product for our respective operations. We use this measure for the same purpose and for monitoring operating performance by our mining operations. This information differs from measures of performance determined in accordance with U.S. GAAP and should not be considered in isolation or as a substitute for measures of performance determined in accordance with U.S. GAAP. This measure is presented by other metals mining companies, although our measure may not be comparable to similarly titled measures reported by other companies.
Gross Profit per Pound of Copper
The following table summarizes unit net cash costs and gross profit per pound of copper at our South America operations for the two years ended December 31, 2024. Unit net cash costs per pound of copper are reflected under the by-product and co-product methods as the South America operations also had sales of molybdenum and silver. Refer to “Product Revenues and Production Costs” for an explanation of the “by-product” and “co-product” methods and a reconciliation of unit net cash costs per pound to production and delivery costs applicable to sales reported in our consolidated financial statements.
| | | | | | | | | | | | | | | | | | | | | | | |
| | 2024 | | 2023 |
| By-Product
Method | | Co-Product
Method | | By-Product
Method | | Co-Product
Method |
| Revenues, excluding adjustments | $ | 4.16 | | | $ | 4.16 | | | $ | 3.82 | | | $ | 3.82 | |
| Site production and delivery, before net noncash | | | | | | | |
| and other costs shown below | 2.63 | | | 2.43 | | | 2.57 | | | 2.34 | |
| By-product credits | (0.34) | | | — | | | (0.39) | | | — | |
| Treatment charges | 0.16 | | | 0.16 | | | 0.19 | | | 0.19 | |
| Royalty on metals | 0.01 | | | 0.01 | | | 0.01 | | | 0.01 | |
| Unit net cash costs | 2.46 | | | 2.60 | | | 2.38 | | | 2.54 | |
| DD&A | 0.38 | | | 0.35 | | | 0.38 | | | 0.35 | |
| | | | | | | |
| Noncash and other costs, net | 0.08 | | a | 0.07 | | | 0.08 | | a | 0.07 | |
| Total unit costs | 2.92 | | | 3.02 | | | 2.84 | | | 2.96 | |
| Revenue adjustments, primarily for pricing on | | | | | | | |
| prior period open sales | 0.03 | | | 0.03 | | | 0.06 | | | 0.06 | |
| Gross profit per pound | $ | 1.27 | | | $ | 1.17 | | | $ | 1.04 | | | $ | 0.92 | |
| | | | | | | |
| Copper sales (millions of recoverable pounds) | 1,177 | | | 1,177 | | | 1,200 | | | 1,200 | |
a.Includes $0.05 per pound of copper in 2024 and $0.04 per pound of copper in 2023 for feasibility and optimization studies.
Our South America operations have varying cost structures because of differences in ore grades and characteristics, processing costs, by-product credits and other factors. Average unit net cash costs (net of by-product credits) for South America operations of $2.46 per pound of copper in 2024 were higher than average unit net cash costs of $2.38 per pound in 2023, primarily reflecting charges totaling $97 million ($0.08 per pound of copper) associated with nonrecurring labor-related charges at Cerro Verde associated with new multi-year CLAs with its two unions and lower by-product credits.
Revenues from Cerro Verde’s copper concentrate sales are recorded net of treatment charges, which will vary with Cerro Verde’s sales volumes and the price of copper.
Because certain assets are depreciated on a straight-line basis, South America’s unit depreciation rate may vary with asset additions and the level of copper production and sales.
Revenue adjustments primarily result from changes in prices on provisionally priced copper sales recognized in prior periods. Refer to “Consolidated Results – Revenues” for further discussion of adjustments to prior period provisionally priced copper sales.
Average unit net cash costs (net of by-product credits) for South America operations are expected to approximate $2.50 per pound of copper for the year 2025, based on achievement of current sales volume and cost estimates and assuming an average price of $20.00 per pound of molybdenum.
Indonesia
PT-FI operates one of the world’s largest copper and gold mines at the Grasberg minerals district in Central Papua, Indonesia. PT-FI produces copper concentrate that contains significant quantities of gold and silver. We have a 48.76% ownership interest in PT-FI and manage its operations. PT-FI's results are consolidated in our financial statements. Once the full ramp-up of the new downstream processing facilities is achieved, PT-FI will be a fully integrated producer of refined copper and gold.
Concentrate Exports. Current regulations in Indonesia prohibit exports of copper concentrate as of January 1, 2025. Pursuant to the terms of its special mining business license (IUPK) regarding force majeure events, PT-FI has requested approval from the Indonesia government to permit the export of copper concentrate in 2025 until the
required repairs of its new smelter following the October 2024 fire incident (see below for further discussion) and full ramp-up are complete. Based on discussions with the Indonesia government, PT-FI expects to re-commence exports of copper concentrate during first-quarter 2025, and pursuant to current regulations, would be required to pay a 7.5% export duty on copper concentrate exports during 2025.
Refer to Notes 10 and 11 for further discussion of Indonesia regulatory matters, including its IUPK, export proceeds and export duties.
Long-Term Mining Rights. Pursuant to regulations issued during 2024, PT-FI is eligible to apply for an extension of its mining rights beyond 2041, provided certain conditions are met, including ownership of integrated downstream facilities that have entered the operational stage; domestic ownership of at least 51% and agreement with a state-owned enterprise for an additional 10% ownership; and commitments for additional exploration and increases in refining capacity, each as approved by the Ministry of Energy and Mineral Resources. Application for extension may be submitted at any time up to one year prior to the expiration of PT-FI’s IUPK. PT-FI expects to apply for an extension during 2025, pending agreement with MIND ID on a purchase and sale agreement for the transfer in 2041 of an additional 10% interest in PT-FI.
An extension would enable continuity of large-scale operations for the benefit of all stakeholders and provide growth options through additional resource development opportunities in the highly attractive Grasberg minerals district.
Operating and Development Activities. Refer to Item 1A. “Risk Factors” contained in Part I of our annual report on Form 10-K for the year ended December 31, 2024, for further discussion of risks associated with development projects.
Over a multi-year investment period, PT-FI has successfully commissioned three large-scale underground mines in the Grasberg minerals district (Grasberg Block Cave, Deep Mill Level Zone (DMLZ) and Big Gossan). Milling rates for ore from these underground mines averaged 208,400 metric tons of ore per day in 2024 and 198,300 metric tons of ore per day in 2023. In December 2024, PT-FI completed construction of a new copper cleaner circuit, a mill recovery project to enhance recoveries and optimize concentrate production, with commissioning underway.
Kucing Liar. Long-term mine development activities are ongoing for PT-FI’s Kucing Liar deposit in the Grasberg minerals district. Kucing Liar is expected to produce over 7 billion pounds of copper and 6 million ounces of gold between 2029 and the end of 2041, and an extension of PT-FI’s operating rights beyond 2041 would extend the life of the project. Development activities commenced in 2022 and are expected to continue over an approximate 10-year timeframe. Capital investments for Kucing Liar are estimated to total $4 billion over the next seven to eight years (averaging approximately $0.5 billion per annum). Approximately $0.6 billion has been incurred through December 31, 2024. At full operating rates, annual production from Kucing Liar is expected to approximate 560 million pounds of copper and 520 thousand ounces of gold, providing PT-FI with sustained long-term, large-scale and low-cost production. Kucing Liar will benefit from substantial shared infrastructure and PT-FI’s experience and long-term success in block-cave mining.
Natural Gas Facilities. PT-FI plans to transition its existing energy source from coal to natural gas, which would meaningfully reduce PT-FI’s Scope 1 greenhouse gas emissions at the Grasberg minerals district. The majority of PT-FI’s planned investments in a new gas-fired combined cycle facility are expected to be incurred over the next three years, at a cost of approximately $1 billion, which represents an incremental cost of $0.4 billion compared to previously planned investments to refurbish the existing coal units. Once complete, PT-FI’s dual-fuel power plant and the new gas-fired combined cycle facility will be fueled by natural gas, supplied by a floating liquefied natural gas storage and regassification unit.
Downstream Processing Facilities.
New Smelter. Construction of the new greenfield smelter in Eastern Java, Indonesia was completed during 2024. In October 2024, during start-up activities, a fire occurred that required a temporary suspension of smelting operations to complete repairs. Procurement of long-lead items is advanced and repairs are scheduled to be completed by mid-2025, and PT-FI expects ramp-up to full capacity to be achieved by year-end 2025. PT-FI expects restoration, repair and replacement costs to approximate $100 million, which are expected to be mostly offset through recovery under construction insurance programs.
PMR. As part of start-up activities, PT-FI commenced gold production at its new PMR in December 2024. The facility has capacity to refine all precious metals from PT-FI’s new smelter as well as from PT Smelting, PT-FI’s 66%-owned smelter and refinery in Gresik, Indonesia.
Refer to “Smelting and Refining” and Note 2 for further discussion of PT Smelting.
Operating Data. Following is summary consolidated operating data for Indonesia operations for the years ended December 31.
| | | | | | | | | | | | | | |
| | 2024 | | 2023 | |
| Operating Data | | | | |
Copper (millions of recoverable pounds) | | | | |
| Production | 1,800 | | | 1,660 | | |
| Sales | 1,632 | | | 1,525 | | |
| Average realized price per pound | $ | 4.19 | | | $ | 3.81 | | |
| | | | |
Gold (thousands of recoverable ounces) | | | | |
| Production | 1,861 | | | 1,978 | | |
| Sales | 1,817 | | | 1,697 | | |
| Average realized price per ounce | $ | 2,418 | | | $ | 1,972 | | |
| | | | |
| Ore extracted and milled (metric tons per day): | | | | |
| Grasberg Block Cave underground mine | 133,800 | | | 117,300 | | |
| DMLZ underground mine | 64,900 | | | 75,900 | | |
| Big Gossan underground mine | 8,000 | | | 7,900 | | |
| | | | |
| Other adjustments | 1,700 | | | (2,800) | | |
| Total | 208,400 | | | 198,300 | | |
| | | | |
| Average ore grade: | | | | |
| Copper (%) | 1.27 | | | 1.22 | | |
| Gold (grams per metric ton) | 1.00 | | | 1.12 | | |
| Recovery rates (%): | | | | |
| Copper | 88.4 | | | 89.7 | | |
| Gold | 76.9 | | | 77.9 | | |
| | | | |
| | | | |
| | | | |
Higher consolidated copper and gold sales volumes in 2024, compared with 2023, primarily reflected higher mining and milling rates, higher copper ore grades and the timing of shipments.
PT-FI’s consolidated copper production volumes for 2024 exceeded sales volumes, reflecting an increase in concentrate inventory held at PT-FI’s new downstream processing facilities expected to be sold as refined metal in the second half of 2025. PT-FI’s consolidated copper and gold production volumes for 2023 exceeded sales volumes, reflecting the deferral of sales recognition related to the PT Smelting tolling arrangement (as discussed below and in Note 2).
Consolidated sales volumes from PT-FI are expected to approximate 1.55 billion pounds of copper and 1.6 million ounces of gold in 2025. PT-FI’s projected sales volumes in 2025 reflect reduced operating rates associated with two major maintenance projects in its concentrating facilities. Projected sales volumes are dependent on operational performance; Indonesia regulatory approval to export copper concentrate until repairs and full ramp-up of PT-FI’s new smelter are complete; weather-related conditions; and other factors detailed in the “Cautionary Statement” below.
Unit Net Cash (Credits) Costs. We believe unit net cash (credits) costs per pound of copper is a measure that provides investors with information about the cash-generating capacity of our mining operations expressed on a basis relating to the primary metal product for our respective operations. We use this measure for the same purpose and for monitoring operating performance by our mining operations. This information differs from measures of performance determined in accordance with U.S. GAAP and should not be considered in isolation or as a substitute for measures of performance determined in accordance with U.S. GAAP. This measure is presented by other metals mining companies, although our measure may not be comparable to similarly titled measures reported by other companies.
Gross Profit per Pound of Copper and per Ounce of Gold
The following table summarizes the unit net cash (credits) costs and gross profit per pound of copper and per ounce of gold at our Indonesia mining operations for the two years ended December 31, 2024. Refer to “Product Revenues and Production Costs” for an explanation of “by-product” and “co-product” methods and a reconciliation of unit net cash costs per pound to production and delivery costs applicable to sales reported in our consolidated financial statements.
| | | | | | | | | | | | | | | | | | | | | | | | | | | | | | | | | | | |
| | 2024 | | 2023 |
| | By-
Product | | Co-Product Method | | By-
Product | | Co-Product Method |
| Method | | Copper | | Gold | | Method | | Copper | | Gold |
| Revenues, excluding adjustments | $ | 4.19 | | | $ | 4.19 | | | $ | 2,418 | | | $ | 3.81 | | | $ | 3.81 | | | $ | 1,972 | |
| Site production and delivery, before net noncash | | | | | | | | | | | |
| and other costs shown below | 1.64 | | | 0.98 | | | 566 | | | 1.62 | | | 1.01 | | | 522 | |
| Gold, silver and other by-product credits | (2.82) | | | — | | | — | | | (2.30) | | | — | | | — | |
| Treatment charges | 0.35 | | | 0.21 | | | 120 | | | 0.35 | | | 0.22 | | | 114 | |
| Export duties | 0.28 | | | 0.17 | | | 96 | | | 0.21 | | | 0.13 | | | 69 | |
| Royalty on metals | 0.27 | | | 0.16 | | | 92 | | | 0.22 | | | 0.14 | | | 71 | |
| Unit net cash (credits) costs | (0.28) | | | 1.52 | | | 874 | | | 0.10 | | | 1.50 | | | 776 | |
| DD&A | 0.73 | | | 0.44 | | | 252 | | | 0.68 | | | 0.42 | | | 218 | |
| | | | | | | | | | | |
| Noncash and other costs, net | 0.22 | | a | 0.13 | | | 77 | | | 0.01 | | b | 0.01 | | | 5 | |
| Total unit costs | 0.67 | | | 2.09 | | | 1,203 | | | 0.79 | | | 1.93 | | | 999 | |
| Revenue adjustments, primarily for pricing on | | | | | | | | | | | |
| prior period open sales | 0.01 | | | 0.01 | | | (2) | | | 0.08 | | | 0.07 | | | 9 | |
| PT Smelting intercompany profit | — | | | — | | | — | | | 0.07 | | | 0.05 | | | 24 | |
| Gross profit per pound/ounce | $ | 3.53 | | | $ | 2.11 | | | $ | 1,213 | | | $ | 3.17 | | | $ | 2.00 | | | $ | 1,006 | |
| | | | | | | | | | | |
| Copper sales (millions of recoverable pounds) | 1,632 | | | 1,632 | | | | | 1,525 | | | 1,525 | | | |
| Gold sales (thousands of recoverable ounces) | | | | | 1,817 | | | | | | | 1,697 | |
a.Includes charges of $0.09 per pound of copper associated with ARO adjustments, $0.08 per pound of copper for operational readiness and start-up costs associated with PT-FI’s new downstream processing facilities, $0.02 per pound of copper for amounts capitalized in prior years associated with construction of PT-FI’s new downstream processing facilities and $0.02 per pound of copper for feasibility and optimization studies.
b.Includes credits of $0.07 per pound of copper associated with ARO adjustments, and charges of $0.04 per pound of copper associated with an administrative fine and $0.02 per pound of copper for feasibility and optimization studies.
A significant portion of PT-FI’s costs are fixed and unit costs vary depending on volumes and other factors. PT-FI’s unit net cash credits (including gold, silver and other by-product credits) of $0.28 per pound of copper in 2024 was favorable compared to the unit net cash costs (net of gold, silver and other by-product credits) of $0.10 per pound of copper in 2023, primarily reflecting higher gold credits and higher copper volumes.
Treatment charges vary with the volume of metals sold and the price of copper, and royalties vary with the volume of metals sold and the prices of copper and gold. PT-FI royalties totaled $433 million in 2024 and $338 million in 2023.
Export duties totaled $457 million in 2024 and $324 million in 2023. Refer to Note 11 for further discussion of PT-FI’s export duties.
Because certain assets are depreciated on a straight-line basis, PT-FI’s unit depreciation rate may vary with asset additions and the level of copper volumes and changes in copper and gold inventory.
Revenue adjustments primarily result from changes in prices on provisionally priced copper sales recognized in prior periods. Refer to “Consolidated Results – Revenues” for further discussion of adjustments to prior period provisionally priced copper sales.
As discussed in Note 2, beginning in 2023, PT-FI’s commercial arrangement with PT Smelting changed from a copper concentrate sales agreement to a tolling arrangement and there are no further sales from PT-FI to PT Smelting. PT Smelting’s intercompany profit for 2023 represents the change in the deferral of PT-FI’s profit on prior sales to PT Smelting.
Average unit net cash credits (including gold, silver and other by-product credits) for PT-FI are expected to approximate $0.27 per pound of copper for the year 2025, based on achievement of current sales volumes (including estimates for copper concentrate exports) and cost estimates and assuming an average price of $2,700 per ounce of gold. PT-FI’s average unit net cash costs for the year 2025 would change by approximately $0.09 per pound of copper for each $100 per ounce change in the average price of gold.
PT-FI’s projected sales volumes and unit net cash costs for the year 2025 are dependent on operational performance; Indonesia regulatory approval to export copper concentrate until repairs and full ramp-up of PT-FI’s new smelter are complete; weather-related conditions; timing of shipments; and other factors. Refer to “Cautionary Statement” below, and Item 1A. “Risk Factors” contained in Part I of our annual report on Form 10-K for the year ended December 31, 2024, for further discussion of factors that could cause results to differ materially from projections.
Molybdenum Mines
We operate two wholly owned primary molybdenum operations in Colorado – the Climax open-pit mine and the Henderson underground mine. The Climax and Henderson mines produce high-purity, chemical-grade molybdenum concentrate, which is typically further processed into value-added molybdenum chemical products. The majority of the molybdenum concentrate produced at the Climax and Henderson mines, as well as from our North America copper mines and South America operations, is processed at our conversion facilities.
Operating and Development Activities. Production from the Molybdenum mines totaled 30 million pounds of molybdenum in both 2024 and 2023. Refer to “Consolidated Results” for our consolidated molybdenum operating data, which includes sales of molybdenum produced at our primary molybdenum operations and from our North America copper mines and South America operations. Refer to “Outlook” for projected consolidated molybdenum sales volumes and to “Markets” for a discussion of molybdenum prices.
Unit Net Cash Costs per Pound of Molybdenum. We believe unit net cash costs per pound of molybdenum is a measure that provides investors with information about the cash-generating capacity of our mining operations expressed on a basis relating to the primary metal product for our respective operations. We use this measure for the same purpose and for monitoring operating performance by our mining operations. This information differs from measures of performance determined in accordance with U.S. GAAP and should not be considered in isolation or as a substitute for measures of performance determined in accordance with U.S. GAAP. This measure is presented by other metals mining companies, although our measure may not be comparable to similarly titled measures reported by other companies.
Average unit net cash costs for our Molybdenum mines of $17.89 per pound of molybdenum in 2024 were higher than $15.13 per pound of molybdenum in 2023, primarily reflecting contract labor transition costs. Average unit net cash costs for the Molybdenum mines are expected to approximate $15.20 per pound of molybdenum for the year 2025, based on achievement of current sales volumes and cost estimates. Refer to “Product Revenues and Production Costs” for a reconciliation of unit net cash costs per pound to production and delivery costs applicable to sales reported in our consolidated financial statements.
Smelting and Refining
Through our downstream integration, we are able to assure placement of a significant portion of our copper concentrate production. PT-FI wholly owns and operates its new downstream facilities in Eastern Java, Indonesia, and has a 66% ownership interest in PT Smelting (39.5% prior to June 30, 2024), which is operated by Mitsubishi Materials Corporation (refer to Note 2 for further discussion of PT Smelting). We wholly own and operate the Miami smelter in Arizona, the El Paso refinery in Texas, and Atlantic Copper smelter and refinery in Huelva, Spain.
During 2024, PT-FI completed construction of its new downstream processing facilities. In October 2024, during start-up activities of the new smelter, a fire occurred requiring a temporary suspension of smelting operations to complete repairs (for further discussion refer to “Operations – Indonesia – Downstream Processing Facilities”). The new smelter will smelt and refine copper concentrate from PT-FI and the PMR, which commenced gold production as part of start-up activities in December 2024, will process anode slimes from the new smelter and PT Smelting. Once its new downstream processing facilities are operational, PT-FI’s operations will be fully integrated and treatment charges reflecting the cost of smelting and refining operations will be recorded in production and delivery costs. PT-FI recorded charges for operational readiness and startup costs associated with the new downstream processing facilities totaling $133 million in 2024. We estimate that operational readiness and startup costs associated with the new downstream processing facilities will approximate $120 million for the year 2025.
The Miami smelter has been operating for over 100 years and has been upgraded numerous times during that period to implement new technologies, improve production and comply with air quality requirements. Major maintenance turnarounds are anticipated to occur approximately every three to four years for the Miami smelter. We performed a major maintenance turnaround for the Miami smelter during 2021 and the next major maintenance turnaround is scheduled for mid-year 2025, for which we expect to incur maintenance charges and idle facility costs of approximately $85 million.
Atlantic Copper smelts and refines copper concentrate and markets refined copper and precious metals in slimes. During the year 2024, Atlantic Copper’s copper concentrate purchases included 30% from our copper mining operations and 70% from third parties. Atlantic Copper’s treatment charges, which consist of a base rate per pound of copper and per ounce of gold, are generally fixed and represent a cost to our mining operations and income to Atlantic Copper (i.e., higher treatment charges benefit our Atlantic Copper operations). Our North America copper mines are less significantly affected by changes in treatment charges because these operations are largely integrated with our Miami smelter and El Paso refinery.
We defer recognizing profits on sales from our mining operations to Atlantic Copper until final sales to third parties occur. Changes in these deferrals attributable to variability in intercompany volumes resulted in net additions (reductions) to operating income totaling $21 million ($(3) million to net income attributable to common stock) in 2024 and $64 million ($37 million to net income attributable to common stock) in 2023. Our net deferred profits on our inventories at Atlantic Copper to be recognized in future periods’ operating income totaled $181 million ($60 million to net income attributable to common stock) at December 31, 2024. Quarterly variations in ore grades, the timing of intercompany shipments and changes in product prices will result in variability in our net deferred profits and quarterly earnings.
In May 2024, the U.S. Environmental Protection Agency (EPA) amended its rule establishing standards for hazardous air pollutant emissions from primary copper smelters. This final rule will impact our Miami, Arizona smelter operations, which process a significant portion of the copper concentrate produced by our North America copper mines. We are evaluating processes and equipment modifications and the costs involved, which could be significant in connection with the revised rule requirements. Our appeal of EPA’s final rule to the Court of Appeals for the District of Columbia Circuit is suspended, pending resolution of several petitions for reconsideration to EPA filed by us and other parties. Refer to “Governmental Regulations – Environmental Matters” in Items 1 and 2. “Business and Properties” and Item 1A. “Risk Factors” contained in Part I of our annual report on Form 10-K for the year ended December 31, 2024, for additional information on new and revised environmental regulatory requirements that may result in substantial increased costs for our business.
CAPITAL RESOURCES AND LIQUIDITY
Our consolidated operating cash flows vary with sales volumes; prices realized from copper, gold and molybdenum sales; production costs; income taxes; other working capital changes; and other factors. See “Consolidated Results,” and Item 1A. “Risk Factors” contained in Part I of our annual report on Form 10-K for the year ended December 31, 2024, for further discussion of our energy requirements and related costs.
We remain focused on managing costs efficiently and continue to advance several important value-enhancing initiatives. We believe the actions we have taken in recent years to build a solid balance sheet, successfully expand low-cost operations and maintain flexible organic growth options while maintaining sufficient liquidity, will allow us to continue to execute our business plans in a prudent manner during periods of economic uncertainty while preserving substantial future asset values. We closely monitor market conditions and will adjust our operating plans to protect liquidity and preserve our asset values, if necessary. We expect to maintain a strong balance sheet and liquidity position as we focus on building long-term value in our business, executing our operating plans safely, responsibly and efficiently, and prudently managing costs and capital expenditures.
Based on current sales volume, cost and metal price estimates and planned capital expenditures discussed in “Outlook,” our available cash and cash equivalents plus our projected consolidated operating cash flows of $6.2 billion for the year 2025 exceed our expected consolidated capital expenditures of $5.0 billion. We have cash on hand and the financial flexibility to fund capital expenditures and our other cash requirements for the next twelve months, including noncontrolling interest distributions, income tax payments, current common stock dividends (base and variable) and any share or debt repurchases. Planned capital expenditures for major mining projects over the next few years are primarily associated with underground mine development in the Grasberg minerals district and
potential expansion projects in North America. At December 31, 2024, we had $3.9 billion of consolidated cash and cash equivalents ($4.7 billion including $0.7 billion of current restricted cash associated with a portion of PT-FI’s export proceeds required to be temporarily deposited in Indonesia banks), and FCX, PT-FI and Cerro Verde have $3.0 billion, $1.5 billion and $350 million, respectively, available under their revolving credit facilities.
Financial Policy. Our financial policy is aligned with our strategic objectives of maintaining a solid balance sheet, providing cash returns to shareholders and advancing opportunities for future growth. The policy includes a base dividend and a performance-based payout framework, whereby up to 50% of available cash flows generated after planned capital spending and distributions to noncontrolling interest would be allocated to shareholder returns and the balance to debt reduction and investments in value enhancing growth projects, subject to us maintaining our net debt at a level not to exceed the net debt target of $3.0 billion to $4.0 billion (excluding debt for PT-FI’s new downstream processing facilities). Our Board reviews the structure of the performance-based payout framework at least annually.
At December 31, 2024, our net debt, excluding $3.2 billion of debt for PT-FI’s new downstream processing facilities, totaled $1.06 billion. Refer to “Net Debt” for further discussion.
On December 18, 2024, our Board declared cash dividends totaling $0.15 per share on our common stock (including a $0.075 per share quarterly base cash dividend and a $0.075 per share quarterly variable, performance-based cash dividend), which was paid on February 3, 2025, to shareholders of record as of January 15, 2025. The declaration and payment of dividends (base or variable) are at the discretion of our Board and will depend on our financial results, cash requirements, global economic conditions and other factors deemed relevant by our Board.
During 2024 we acquired 1.2 million shares of our common stock for a total cost of $59 million ($50.48 average cost per share) bringing total purchases under our $5.0 billion share repurchase program to 49.0 million shares for a cost of $1.9 billion ($38.64 average cost per share). The timing and amount of share repurchases are at the discretion of management and will depend on a variety of factors. The share repurchase program may be modified, increased, suspended or terminated at any time at the Board’s discretion.
Refer to Item 1A. “Risk Factors” contained in Part I of our annual report on Form 10-K for the year ended December 31, 2024, and “Cautionary Statement” below for further discussion.
Cash
Following is a summary of the U.S. and international components of consolidated cash and cash equivalents available to the parent company, net of noncontrolling interests’ share and withholding taxes, at December 31, 2024 (in billions):
| | | | | | | | | |
| | | |
| Cash at domestic companies | $ | 1.5 | | | |
| Cash at international operations | 2.4 | | a | |
| Total consolidated cash and cash equivalents | 3.9 | | | |
| Noncontrolling interests’ share | (1.1) | | | |
| Cash, net of noncontrolling interests’ share | 2.8 | | | |
| Withholding taxes | (0.1) | |
| |
| Net cash available | $ | 2.7 | | | |
a.Excludes $0.7 billion of current restricted cash associated with a portion of PT-FI's export proceeds required to be temporarily deposited in Indonesia banks for 90 days in accordance with a regulation issued by the Indonesia government (refer to Note 10).
Cash held at our international operations is generally used to support our foreign operations’ capital expenditures, operating expenses, debt repayments, working capital or other cash needs. Management believes that sufficient liquidity is available in the U.S. from cash balances and availability from our revolving credit facility. We have not elected to permanently reinvest earnings from our foreign subsidiaries, and we have recorded deferred tax liabilities for foreign earnings that are available to be repatriated to the U.S. From time to time, our foreign subsidiaries distribute earnings to the U.S. through dividends that are subject to applicable withholding taxes and noncontrolling interests’ share. See Item 1A. “Risk Factors” contained in Part I of our annual report on Form 10-K for the year ended December 31, 2024, for further discussion of our holding company structure and the potential impact of changes in tax laws.
Debt
At December 31, 2024, consolidated debt totaled $8.9 billion, with a weighted-average interest rate of 5.2%. Refer to “Interest Rate Risk” for further discussion of our fixed- and variable-rate debt.
In November 2024, we repaid $0.7 billion in scheduled senior note maturities using cash on hand and our next senior note maturities are in 2027. Our total debt has an average remaining duration of approximately 10 years.
At December 31, 2024, we had no borrowings and $7 million in letters of credit issued under our $3.0 billion revolving credit facility, PT-FI had $250 million in borrowings outstanding under its $1.75 billion revolving credit facility and Cerro Verde had no borrowings under its $350 million revolving credit facility. Refer to Note 6 for further discussion.
Operating Activities
We generated consolidated operating cash flows of $7.2 billion in 2024 and $5.3 billion in 2023. Higher operating cash flows in 2024, compared with 2023, primarily reflect higher average realized copper and gold prices and higher gold sales volumes, as well as working capital changes related to the timing of approval of PT-FI’s permitted copper concentrate export quota for 2024 and routine timing related impacts associated with payments to suppliers.
Investing Activities
Capital Expenditures. Capital expenditures, including capitalized interest, totaled $4.8 billion in 2024 and 2023, including amounts for major mining projects ($2.1 billion in 2024 and $1.8 billion in 2023) primarily associated with the underground development activities in the Grasberg minerals district, and for PT-FI’s new downstream processing facilities ($1.2 billion in 2024 and $1.7 billion in 2023).
Refer to “Outlook” for further discussion of projected capital expenditures for 2025.
Acquisition of Additional Ownership Interest in Cerro Verde. In September 2024, we purchased 5.3 million shares of Cerro Verde common stock for a total cost of $210 million, increasing our ownership interest in Cerro Verde to 55.08% from 53.56%.
Loans to PT Smelting for Expansion. PT-FI made loans to PT Smelting totaling $28 million in 2024 and $129 million in 2023 to fund PT Smelting’s expansion project. Refer to Note 2 for further discussion.
Financing Activities
Debt Transactions. Net repayments of debt totaled $0.5 billion in 2024, including the repayment of our 4.55% Senior Notes that matured in November 2024 totaling $730 million, partly offset by $250 million in borrowings under the PT-FI revolving credit facility that were used to fund capital expenditures for PT-FI’s new downstream processing facilities.
Net repayments of debt totaled $1.2 billion in 2023, including the repayment of our 3.875% Senior Notes that matured in March 2023 totaling $996 million and open-market purchases of senior notes totaling $221 million.
Cash Dividends on Common Stock. We paid cash dividends on our common stock totaling $0.9 billion in 2024 and in 2023. The declaration and payment of dividends (base or variable) is at the discretion of our Board and will depend on our financial results, cash requirements, global economic conditions and other factors deemed relevant by our Board. Refer to Item 1A. “Risk Factors” contained in Part I of our annual report on Form 10-K for the year ended December 31, 2024, and “Cautionary Statement” below.
Cash Dividends and Distributions Paid to Noncontrolling Interests. Cash dividends and distributions paid to noncontrolling interests at our international operations totaled $1.8 billion (including $1.4 billion paid to PT-FI’s noncontrolling shareholders) in 2024 and $0.6 billion (including $0.3 billion paid to PT-FI’s noncontrolling shareholders) in 2023. Cash dividends and distributions to noncontrolling interests vary based on the operating results and cash requirements of our consolidated subsidiaries.
Treasury Stock Purchases. In 2024, we acquired 1.2 million shares of our common stock for a total cost of $59 million ($50.48 average cost per share) under the share repurchase program. There were no shares acquired under the program in 2023. As of February 14, 2025, $3.1 billion remains available under the share repurchase program. Refer to Note 8 for further discussion.
Contributions from Noncontrolling Interests. We received equity contributions totaling $50.0 million in 2023 from MIND ID for its share of capital spending on the underground mine development projects in the Grasberg minerals district.
CONTINGENCIES
Environmental Obligations and AROs
Refer to Note 10 and “Critical Accounting Estimates,” and Items 1. and 2. “Business and Properties” and Item 1A. “Risk Factors” contained in Part I of our annual report on Form 10-K for the year ended December 31, 2024, for further information about contingencies associated with environmental matters and AROs.
For 2025, we expect to incur approximately $0.6 billion of aggregate environmental capital expenditures and other environmental costs and $0.2 billion in aggregate ARO expenditures.
Leases
Refer to Note 11, and Item 1A. “Risk Factors” contained in Part I of our annual report on Form 10-K for the year ended December 31, 2024, for information about lease commitments.
Litigation and Other Contingencies
Refer to Note 10, and Item 1A. “Risk Factors” and Item 3. “Legal Proceedings” contained in Part I of our annual report on Form 10-K for the year ended December 31, 2024, for further discussion of contingencies associated with legal proceedings and other matters, including tax and Indonesia regulatory matters.
DISCLOSURES ABOUT MARKET RISKS
Commodity Price Risk
Our 2024 consolidated revenues from our copper mining operations include the sale of copper concentrate, copper cathode, copper rod, gold, silver, molybdenum and other metals, the sale of molybdenum in various forms by our molybdenum operations, and the sale of copper cathode, copper anode and gold in anode and slimes by Atlantic Copper. Our financial results will vary with fluctuations in the market prices of the commodities we produce, primarily copper and gold, and to a lesser extent molybdenum. For projected sensitivities of our operating cash flow to changes in commodity prices, refer to “Outlook.” World market prices for these commodities have fluctuated historically and are affected by numerous factors beyond our control. Refer to Item 1A. “Risk Factors” contained in Part I of our annual report on Form 10-K for the year ended December 31, 2024, for further discussion of financial risks associated with fluctuations in the market prices of the commodities we sell.
During 2024, our mined copper was sold 45% in concentrate, 34% as cathode and 21% as rod. All of our copper concentrate and some cathode sales contracts provide final copper pricing in a specified future month (generally one to four months from the shipment date) based primarily on quoted LME monthly average copper settlement prices. We receive market prices based on prices in the specified future period, which results in price fluctuations recorded through revenues until the date of settlement. We record revenues and invoice customers at the time of shipment based on then-current LME prices, which results in an embedded derivative on our provisionally priced concentrate and cathode sales that is adjusted to fair value through earnings each period, using the period-end forward prices, until final pricing on the date of settlement. To the extent final prices are higher or lower than what was recorded on a provisional basis, an increase or decrease to revenues is recorded each reporting period until the date of final pricing. Accordingly, in times of rising copper prices, our revenues benefit from adjustments to the final pricing of provisionally priced sales pursuant to contracts entered into in prior periods; in times of falling copper prices, the opposite occurs.
Following are the favorable impacts of net adjustments to the prior years’ provisionally priced copper sales for the years ended December 31 (in millions, except per share amounts):
| | | | | | | | | | | | | | | |
| | 2024 | | 2023 | | |
| Revenues | $ | 28 | | | $ | 183 | | | |
| Net income attributable to common stock | $ | 9 | | | $ | 62 | | | |
| Net income per share attributable to common stock | $ | 0.01 | | | $ | 0.04 | | | |
At December 31, 2024, we had provisionally priced copper sales at our copper mining operations totaling 133 million pounds of copper (net of intercompany sales and noncontrolling interests) recorded at an average price of $3.96 per pound, subject to final pricing over the next several months. We estimate that each $0.05 change in the price realized from the December 31, 2024, provisional price recorded would have an approximate $12 million effect on 2025 revenues ($4 million to net income attributable to common stock). The LME copper settlement price closed at $4.25 per pound on February 13, 2025.
Foreign Currency Exchange Risk
The functional currency for most of our operations is the U.S. dollar. Substantially all of our revenues and a significant portion of our costs are denominated in U.S. dollars; however, some costs and certain asset and liability accounts are denominated in local currencies, including the Indonesia rupiah, Peruvian sol, Chilean peso and euro. We recognized foreign currency translation gains on balances denominated in foreign currencies totaling $17 million in 2024 and $20 million in 2023. Generally, our operating results are positively affected when the U.S. dollar strengthens in relation to those foreign currencies and are adversely affected when the U.S. dollar weakens in relation to those foreign currencies.
Following is a summary of estimated annual payments and the impact of changes in foreign currency rates on our annual operating costs:
| | | | | | | | | | | | | | | | | | | | | | | | | | | | | | | | | | | | | |
| Exchange Rate per $1
at December 31, | | Estimated Annual Payments | | 10% Change in Exchange Rate (in millions of U.S. dollars)a |
| | 2024 | | 2023 | | | | (in local currency) | | (in millions of U.S. dollars)b | | Increase | | Decrease |
| Indonesia | | | | | | | | | | | | | |
| Rupiah | 16,081 | | | 15,339 | | | | | 17.9 trillion | | $ | 1,113 | | | $ | (101) | | | $ | 124 | |
| Australian dollar | 1.61 | | | 1.47 | | | | | 283 million | | $ | 175 | | | $ | (16) | | | $ | 19 | |
| South America | | | | | | | | | | | | | |
| Peruvian sol | 3.77 | | | 3.71 | | | | | 2.1 billion | | $ | 555 | | | $ | (50) | | | $ | 62 | |
| Chilean peso | 996 | | | 877 | | | | | 252 billion | | $ | 253 | | | $ | (23) | | | $ | 28 | |
| Spain | | | | | | | | | | | | | |
| Euro | 0.96 | | | 0.91 | | | | | 164 million | | $ | 170 | | | $ | (15) | | | $ | 19 | |
a.Reflects the estimated impact on annual operating costs assuming a 10% increase or decrease in the exchange rate reported at December 31, 2024.
b.Based on exchange rates at December 31, 2024.
Interest Rate Risk
At December 31, 2024, we had total future debt maturities based on principal amounts of $9.0 billion, of which 97% was fixed-rate debt. The table below presents average interest rates for our scheduled maturities of principal for our outstanding debt and the related fair values at December 31, 2024 (in millions, except percentages):
| | | | | | | | | | | | | | | | | | | | | | | | | | | | | | | | | | | | | | | | | |
| | 2025 | | 2026 | | 2027 | | 2028 | | 2029 | | Thereafter | | Fair Value |
| Fixed-rate debt | $ | 10 | | | $ | 5 | | | $ | 1,321 | | | $ | 923 | | | $ | 477 | | | $ | 5,985 | | | $ | 8,526 | |
| Average interest rate | 0.7 | % | | 1.7 | % | | 5.0 | % | | 4.2 | % | | 5.2 | % | | 5.4 | % | | 5.2 | % |
| | | | | | | | | | | | | |
| Variable-rate debt | $ | 31 | | | $ | — | | | $ | — | | | $ | 250 | | | $ | — | | | $ | — | | | $ | 281 | |
| Average interest rate | 3.4 | % | | — | % | | — | % | | 6.0 | % | | — | % | | — | % | | 5.7 | % |
NEW ACCOUNTING STANDARDS
Refer to Note 1 for discussion of recently issued accounting standards and their projected impact on our future financial statements and disclosures.
NET DEBT
We believe that net debt provides investors with information related to the performance-based payout framework in our financial policy, which requires us to maintain our net debt at a level not to exceed the net debt target of $3 billion to $4 billion, excluding debt for PT-FI’s new downstream processing facilities. We define net debt as consolidated debt less (i) consolidated cash and cash equivalents and (ii) current restricted cash associated with PT-FI’s export proceeds. This information differs from consolidated debt determined in accordance with U.S. GAAP and should not be considered in isolation or as a substitute for consolidated debt determined in accordance with U.S. GAAP. Our net debt, which may not be comparable to similarly titled measures reported by other companies, follows (in millions):
| | | | | | | | | | |
| As of December 31, 2024 | |
| | | | |
| Current portion of debt | $ | 41 | | | | |
| Long-term debt, less current portion | 8,907 | | | | |
| Consolidated debt | 8,948 | | | | |
| Less: consolidated cash and cash equivalents | 3,923 | | | | |
| Less: current restricted cash associated with PT-FI’s export proceeds | 736 | | a | | |
| FCX net debt | 4,289 | | | | |
| Less: debt for PT-FI’s new downstream processing facilities | 3,233 | | b | | |
| FCX net debt, excluding debt for PT-FI’s new downstream processing facilities | $ | 1,056 | | | | |
a.In accordance with a regulation issued by the Indonesia government, 30% of PT-FI’s export proceeds are being temporarily deposited into Indonesia banks for a period of 90 days before withdrawal and are presented as current restricted cash and cash equivalents in our consolidated balance sheet. As the 90-day holding period is the only restriction on the cash, we have included such amount in the calculation of net debt.
b.Represents PT-FI’s senior notes and $250 million of borrowings under PT-FI’s revolving credit facility.
PRODUCT REVENUES AND PRODUCTION COSTS
Mining Product Revenues and Unit Net Cash Costs (Credits)
We believe unit net cash costs (credits) per pound of copper and molybdenum are measures intended to provide investors with information about the cash-generating capacity of our mining operations expressed on a basis relating to the primary metal product for the respective operations. We use this measure for the same purpose and for monitoring operating performance by our mining operations. This information differs from measures of performance determined in accordance with U.S. GAAP and should not be considered in isolation or as a substitute for measures of performance determined in accordance with U.S. GAAP. These measures are presented by other metals mining companies, although our measures may not be comparable to similarly titled measures reported by other companies.
We present gross profit per pound of copper in the following tables using both a “by-product” method and a “co-product” method. We use the by-product method in our presentation of gross profit per pound of copper because (i) the majority of our revenues are copper revenues, (ii) we mine ore, which contains copper, gold, molybdenum and other metals, (iii) it is not possible to specifically assign all of our costs to revenues from the copper, gold, molybdenum and other metals we produce, and (iv) it is the method used by our management and Board to monitor our operations and to compare mining operations in certain industry publications. In the co-product method presentations, shared costs are allocated to the different products based on their relative revenue values, which will vary to the extent our metals sales volumes and realized prices change.
We show revenue adjustments for prior period open sales as separate line items. Because these adjustments do not result from current period sales, these amounts have been reflected separately from revenues on current period sales. Noncash and other costs, net which are removed from site production and delivery costs in the calculation of unit net cash costs, consist of items such as ARO accretion and other adjustments, inventory write-offs and adjustments, stock-based compensation costs, long-lived asset impairments, idle facility costs, feasibility and optimization study costs, operational readiness and startup costs, restructuring and/or unusual charges. As discussed above, gold, molybdenum and other metal revenues at copper mines are reflected as credits against site production and delivery costs in the by-product method. The following schedules are presentations under both the by-product and co-product methods together with reconciliations to amounts reported in our consolidated financial statements.
North America Copper Mines Product Revenues, Production Costs and Unit Net Cash Costs
| | | | | | | | | | | | | | | | | | | | | | | | | | | | | | | | |
| Year Ended December 31, 2024 | | | | |
| (In millions) | | By-Product | | Co-Product Method |
| | Method | | Copper | | Molybdenuma | | Otherb | | Total |
| Revenues, excluding adjustments | | $ | 5,417 | |
| $ | 5,417 | | | $ | 608 | | | $ | 186 | | | $ | 6,211 | |
Site production and delivery, before net noncash
and other costs shown below | | 4,362 | | | 3,911 | | | 489 | | | 152 | | | 4,552 | |
| By-product credits | | (604) | | | — | | | — | | | — | | | — | |
| Treatment charges | | 169 | | | 161 | | | — | | | 8 | | | 169 | |
| Net cash costs | | 3,927 | | | 4,072 | | | 489 | | | 160 | | | 4,721 | |
| DD&A | | 439 | | | 394 | | | 36 | | | 9 | | | 439 | |
| | | | | | | | | | |
| Noncash and other costs, net | | 235 | | c | 222 | | | 11 | | | 2 | | | 235 | |
| Total costs | | 4,601 | | | 4,688 | | | 536 | | | 171 | | | 5,395 | |
| | | | | | | | | | |
| Gross profit | | $ | 816 | | | $ | 729 | | | $ | 72 | | | $ | 15 | | | $ | 816 | |
| | | | | | | | | | |
| Copper sales (millions of recoverable pounds) | | 1,263 | | | 1,263 | | | | | | | |
Molybdenum sales (millions of recoverable pounds)a | | | | | | 30 | | | | | |
| | | | | | | | | | |
| Gross profit per pound of copper/molybdenum: | | | | | |
| | | | | | | | | | |
| Revenues, excluding adjustments | | $ | 4.29 | | | $ | 4.29 | | | $ | 20.13 | | | | | |
Site production and delivery, before net noncash
and other costs shown below | | 3.46 | | | 3.10 | | | 16.20 | | | | | |
| By-product credits | | (0.48) | | | — | | | — | | | | | |
| Treatment charges | | 0.13 | | | 0.12 | | | — | | | | | |
| Unit net cash costs | | 3.11 | | | 3.22 | | | 16.20 | | | | | |
| DD&A | | 0.34 | | | 0.31 | | | 1.19 | | | | | |
| | | | | | | | | | |
| Noncash and other costs, net | | 0.19 | | c | 0.18 | | | 0.36 | | | | | |
| Total unit costs | | 3.64 | | | 3.71 | | | 17.75 | | | | | |
| | | | | | | | | | |
| Gross profit per pound | | $ | 0.65 | | | $ | 0.58 | | | $ | 2.38 | | | | | |
| | | | | | | | | | |
| Reconciliation to Amounts Reported | | | | | | | | |
| | | | | | | | | | |
| | | | | Production | | | | | | |
| | Revenues | | and Delivery | | DD&A | | | | |
| Totals presented above | | $ | 6,211 | | | $ | 4,552 | | | $ | 439 | | | | | |
| Treatment charges | | (4) | | | 165 | | | — | | | | | |
| Noncash and other costs, net | | — | | | 235 | | | — | | | | | |
| | | | | | | | | | |
| Eliminations and other | | 33 | | | 44 | | | — | | | | | |
| North America copper mines | | 6,240 | | | 4,996 | | | 439 | | | | | |
Other miningd | | 25,337 | | | 16,246 | | | 1,744 | | | | | |
| | | | | | | | | | |
| | | | | | | | | | |
| Corporate, other & eliminations | | (6,122) | | | (5,688) | | | 58 | | | | | |
| As reported in our consolidated financial statements | | $ | 25,455 | | | $ | 15,554 | | | $ | 2,241 | | | | | |
a.Reflects sales of molybdenum produced by certain of the North America copper mines to our molybdenum sales company at market-based pricing.
b.Includes gold and silver product revenues and production costs.
c.Includes charges totaling $62 million ($0.05 per pound of copper) for feasibility and optimization studies and $60 million ($0.05 per pound of copper) for metals inventory adjustments.
d.Represents the combined total for our other mining operations as presented in Note 14.
North America Copper Mines Product Revenues, Production Costs and Unit Net Cash Costs
| | | | | | | | | | | | | | | | | | | | | | | | | | | | | | | | |
| Year Ended December 31, 2023 | | | | |
| (In millions) | | By-Product | | Co-Product Method |
| | Method | | Copper | | Molybdenuma | | Otherb | | Total |
| Revenues, excluding adjustments | | $ | 5,368 | | | $ | 5,368 | | | $ | 710 | | | $ | 171 | | | $ | 6,249 | |
Site production and delivery, before net noncash
and other costs shown below | | 4,093 | | | 3,621 | | | 535 | | | 149 | | | 4,305 | |
| By-product credits | | (669) | | | — | | | — | | | — | | | — | |
| Treatment charges | | 169 | | | 161 | | | — | | | 8 | | | 169 | |
| Net cash costs | | 3,593 | | | 3,782 | | | 535 | | | 157 | | | 4,474 | |
| DD&A | | 418 | | | 371 | | | 39 | | | 8 | | | 418 | |
| | | | | | | | | | |
| Noncash and other costs, net | | 242 | | c | 215 | | | 24 | | | 3 | | | 242 | |
| Total costs | | 4,253 | | | 4,368 | | | 598 | | | 168 | | | 5,134 | |
Other revenue adjustments, primarily for pricing
on prior period open sales | | 13 | | | 13 | | | — | | | — | | | 13 | |
| Gross profit | | $ | 1,128 | | | $ | 1,013 | | | $ | 112 | | | $ | 3 | | | $ | 1,128 | |
| | | | | | | | | | |
| Copper sales (millions of recoverable pounds) | | 1,367 | | | 1,367 | | | | | | | |
Molybdenum sales (millions of recoverable pounds)a | | | | | | 30 | | | | | |
| | | | | | | | | | |
| Gross profit per pound of copper/molybdenum: | | | | | |
| | | | | | | | | | |
| Revenues, excluding adjustments | | $ | 3.93 | | | $ | 3.93 | | | $ | 23.38 | | | | | |
Site production and delivery, before net noncash
and other costs shown below | | 3.00 | | | 2.65 | | | 17.63 | | | | | |
| By-product credits | | (0.49) | | | — | | | — | | | | | |
| Treatment charges | | 0.12 | | | 0.12 | | | — | | | | | |
| Unit net cash costs | | 2.63 | | | 2.77 | | | 17.63 | | | | | |
| DD&A | | 0.30 | | | 0.27 | | | 1.30 | | | | | |
| | | | | | | | | | |
| Noncash and other costs, net | | 0.18 | | c | 0.16 | | | 0.77 | | | | | |
| Total unit costs | | 3.11 | | | 3.20 | | | 19.70 | | | | | |
Other revenue adjustments, primarily for pricing
on prior period open sales | | 0.01 | | | 0.01 | | | — | | | | | |
| Gross profit per pound | | $ | 0.83 | | | $ | 0.74 | | | $ | 3.68 | | | | | |
| | | | | | | | | | |
| Reconciliation to Amounts Reported | | | | | | | | | | |
| | | | | | | | | | |
| | | | | Production | | | | | | |
| | Revenues | | and Delivery | | DD&A | | | | |
| Totals presented above | | $ | 6,249 | | | $ | 4,305 | | | $ | 418 | | | | | |
| Treatment charges | | (9) | | | 160 | | | — | | | | | |
| Noncash and other costs, net | | — | | | 242 | | | — | | | | | |
Other revenue adjustments, primarily for pricing
on prior period open sales | | 13 | | | — | | | — | | | | | |
| Eliminations and other | | 63 | | | 71 | | | — | | | | | |
| North America copper mines | | 6,316 | | | 4,778 | | | 418 | | | | | |
Other miningd | | 22,791 | | | 14,867 | | | 1,586 | | | | | |
| | | | | | | | | | |
| | | | | | | | | | |
| Corporate, other & eliminations | | (6,252) | | | (6,018) | | | 64 | | | | | |
| As reported in our consolidated financial statements | | $ | 22,855 | | | $ | 13,627 | | | $ | 2,068 | | | | | |
a.Reflects sales of molybdenum produced by certain of the North America copper mines to our molybdenum sales company at market-based pricing.
b.Includes gold and silver product revenues and production costs.
c.Includes charges totaling $107 million ($0.08 per pound of copper) for feasibility and optimization studies and $11 million ($0.01 per pound of copper) for metals inventory adjustments.
d.Represents the combined total for our other mining operations as presented in Note 14.
South America Operations Product Revenues, Production Costs and Unit Net Cash Costs
| | | | | | | | | | | | | | | | | | | | | | | |
| Year Ended December 31, 2024 | | | | | | | |
| (In millions) | By-Product | | Co-Product Method |
| Method | | Copper | | Othera | | Total |
| Revenues, excluding adjustments | $ | 4,894 | | | $ | 4,894 | | | $ | 446 | | | $ | 5,340 | |
Site production and delivery, before net noncash
and other costs shown below | 3,094 | | b | 2,865 | | | 281 | | | 3,146 | |
| By-product credits | (394) | | | — | | | — | | | — | |
| Treatment charges | 193 | | | 193 | | | — | | | 193 | |
| Royalty on metals | 8 | | | 7 | | | 1 | | | 8 | |
| Net cash costs | 2,901 | | | 3,065 | | | 282 | | | 3,347 | |
| DD&A | 446 | | | 409 | | | 37 | | | 446 | |
| | | | | | | |
| Noncash and other costs, net | 87 | | c | 85 | | | 2 | | | 87 | |
| Total costs | 3,434 | | | 3,559 | | | 321 | | | 3,880 | |
Other revenue adjustments, primarily for pricing
on prior period open sales | 32 | | | 33 | | | (1) | | | 32 | |
| Gross profit | $ | 1,492 | | | $ | 1,368 | | | $ | 124 | | | $ | 1,492 | |
| | | | | | | |
| Copper sales (millions of recoverable pounds) | 1,177 | | | 1,177 | | | | | |
| | | | | | | |
| Gross profit per pound of copper: | | | |
| | | | | | | |
| Revenues, excluding adjustments | $ | 4.16 | | | $ | 4.16 | | | | | |
Site production and delivery, before net noncash
and other costs shown below | 2.63 | | b | 2.43 | | | | | |
| By-product credits | (0.34) | | | — | | | | | |
| Treatment charges | 0.16 | | | 0.16 | | | | | |
| Royalty on metals | 0.01 | | | 0.01 | | | | | |
| Unit net cash costs | 2.46 | | | 2.60 | | | | | |
| DD&A | 0.38 | | | 0.35 | | | | | |
| | | | | | | |
| Noncash and other costs, net | 0.08 | | c | 0.07 | | | | | |
| Total unit costs | 2.92 | | | 3.02 | | | | | |
Other revenue adjustments, primarily for pricing
on prior period open sales | 0.03 | | | 0.03 | | | | | |
| Gross profit per pound | $ | 1.27 | | | $ | 1.17 | | | | | |
| | | | | | | |
| Reconciliation to Amounts Reported | | | | | | | |
| | | | | | | |
| | | | Production | | | | |
| Revenues | | and Delivery | | DD&A | | |
| Totals presented above | $ | 5,340 | | | $ | 3,146 | | | $ | 446 | | | |
| Treatment charges | (193) | | | — | | | — | | | |
| Royalty on metals | (8) | | | — | | | — | | | |
| Noncash and other costs, net | — | | | 87 | | | — | | | |
Other revenue adjustments, primarily for pricing
on prior period open sales | 32 | | | — | | | — | | | |
| Eliminations and other | — | | | (3) | | | — | | | |
| South America operations | 5,171 | | | 3,230 | | | 446 | | | |
Other miningd | 26,406 | | | 18,012 | | | 1,737 | | | |
| | | | | | | |
| | | | | | | |
| Corporate, other & eliminations | (6,122) | | | (5,688) | | | 58 | | | |
| As reported in our consolidated financial statements | $ | 25,455 | | | $ | 15,554 | | | $ | 2,241 | | | |
a.Includes silver sales of 3.6 million ounces ($29.35 per ounce average realized price) and sales of molybdenum produced by Cerro Verde to our molybdenum sales company at market-based pricing.
b.Includes $97 million ($0.08 per pound of copper) associated with nonrecurring labor-related charges at Cerro Verde related to the new CLAs with its unions.
c.Includes charges totaling $57 million ($0.05 per pound of copper) for feasibility and optimization studies.
d.Represents the combined total for our other mining operations as presented in Note 14.
South America Operations Product Revenues, Production Costs and Unit Net Cash Costs
| | | | | | | | | | | | | | | | | | | | | | | |
| Year Ended December 31, 2023 | | | | | | | |
| (In millions) | By-Product | | Co-Product Method |
| Method | | Copper | | Othera | | Total |
| Revenues, excluding adjustments | $ | 4,583 | | | $ | 4,583 | | | $ | 526 | | | $ | 5,109 | |
Site production and delivery, before net noncash
and other costs shown below | 3,083 | | | 2,810 | | | 339 | | | 3,149 | |
| By-product credits | (463) | | | — | | | — | | | — | |
| Treatment charges | 234 | | | 234 | | | — | | | 234 | |
| Royalty on metals | 8 | | | 7 | | | 1 | | | 8 | |
| Net cash costs | 2,862 | | | 3,051 | | | 340 | | | 3,391 | |
| DD&A | 459 | | | 412 | | | 47 | | | 459 | |
| | | | | | | |
| Noncash and other costs, net | 92 | | b | 87 | | | 5 | | | 92 | |
| Total costs | 3,413 | | | 3,550 | | | 392 | | | 3,942 | |
Other revenue adjustments, primarily for pricing
on prior period open sales | 71 | | | 71 | | | 3 | | | 74 | |
| Gross profit | $ | 1,241 | | | $ | 1,104 | | | $ | 137 | | | $ | 1,241 | |
| | | | | | | |
| Copper sales (millions of recoverable pounds) | 1,200 | | | 1,200 | | | | | |
| | | | | | | |
| Gross profit per pound of copper: | | | |
| | | | | | | |
| Revenues, excluding adjustments | $ | 3.82 | | | $ | 3.82 | | | | | |
Site production and delivery, before net noncash
and other costs shown below | 2.57 | | | 2.34 | | | | | |
| By-product credits | (0.39) | | | — | | | | | |
| Treatment charges | 0.19 | | | 0.19 | | | | | |
| Royalty on metals | 0.01 | | | 0.01 | | | | | |
| Unit net cash costs | 2.38 | | | 2.54 | | | | | |
| DD&A | 0.38 | | | 0.35 | | | | | |
| | | | | | | |
| Noncash and other costs, net | 0.08 | | b | 0.07 | | | | | |
| Total unit costs | 2.84 | | | 2.96 | | | | | |
Other revenue adjustments, primarily for pricing
on prior period open sales | 0.06 | | | 0.06 | | | | | |
| Gross profit per pound | $ | 1.04 | | | $ | 0.92 | | | | | |
| | | | | | | |
| Reconciliation to Amounts Reported | | | | | | | |
| | | | | | | |
| | | | Production | | | | |
| Revenues | | and Delivery | | DD&A | | |
| Totals presented above | $ | 5,109 | | | $ | 3,149 | | | $ | 459 | | | |
| Treatment charges | (234) | | | — | | | — | | | |
| Royalty on metals | (8) | | | — | | | — | | | |
| Noncash and other costs, net | — | | | 92 | | | — | | | |
Other revenue adjustments, primarily for pricing
on prior period open sales | 74 | | | — | | | — | | | |
| Eliminations and other | — | | | (2) | | | — | | | |
| South America operations | 4,941 | | | 3,239 | | | 459 | | | |
Other miningc | 24,166 | | | 16,406 | | | 1,545 | | | |
| | | | | | | |
| | | | | | | |
| Corporate, other & eliminations | (6,252) | | | (6,018) | | | 64 | | | |
| As reported in our consolidated financial statements | $ | 22,855 | | | $ | 13,627 | | | $ | 2,068 | | | |
a.Includes silver sales of 4.1 million ounces ($23.57 per ounce average realized price) and sales of molybdenum produced by Cerro Verde to our molybdenum sales company at market-based pricing.
b.Includes charges totaling $44 million ($0.04 per pound of copper) for feasibility and optimization studies.
c.Represents the combined total for our other mining operations as presented in Note 14.
Indonesia Operations Product Revenues, Production Costs and Unit Net Cash (Credits) Costs
| | | | | | | | | | | | | | | | | | | | | | | | | | | | | |
| Year Ended December 31, 2024 | | | |
| (In millions) | | | Co-Product Method |
| By-Product
Method | | Copper | | Gold | | Silver & Othera | | Total |
| Revenues, excluding adjustments | $ | 6,842 | | | $ | 6,842 | | | $ | 4,389 | | | $ | 218 | | | $ | 11,449 | |
Site production and delivery, before net noncash
and other costs shown below | 2,681 | | | 1,602 | | | 1,028 | | | 51 | | | 2,681 | |
| Gold, silver and other by-product credits | (4,605) | | | — | | | — | | | — | | | — | |
| Treatment charges | 571 | | | 341 | | | 219 | | | 11 | | | 571 | |
| Export duties | 457 | | | 273 | | | 175 | | | 9 | | | 457 | |
| Royalty on metals | 433 | | | 260 | | | 167 | | | 6 | | | 433 | |
| Net cash (credits) costs | (463) | | | 2,476 | | | 1,589 | | | 77 | | | 4,142 | |
| DD&A | 1,193 | | | 713 | | | 457 | | | 23 | | | 1,193 | |
| | | | | | | | | |
| Noncash and other costs, net | 362 | | b | 217 | | | 139 | | | 6 | | | 362 | |
| Total costs | 1,092 | | | 3,406 | | | 2,185 | | | 106 | | | 5,697 | |
Other revenue adjustments, primarily for pricing
on prior period open sales | 7 | | | 7 | | | (1) | | | (1) | | | 5 | |
| | | | | | | | | |
| Gross profit | $ | 5,757 | | | $ | 3,443 | | | $ | 2,203 | | | $ | 111 | | | $ | 5,757 | |
| | | | | | | | | |
| Copper sales (millions of recoverable pounds) | 1,632 | | | 1,632 | | | | | | | |
| Gold sales (thousands of recoverable ounces) | | | | | 1,817 | | | | | |
| | | | | | | | | |
| Gross profit per pound of copper/per ounce of gold: | | | | | |
| | | | | | | | | |
| Revenues, excluding adjustments | $ | 4.19 | | | $ | 4.19 | | | $ | 2,418 | | | | | |
Site production and delivery, before net noncash
and other costs shown below | 1.64 | | | 0.98 | | | 566 | | | | | |
| Gold, silver and other by-product credits | (2.82) | | | — | | | — | | | | | |
| Treatment charges | 0.35 | | | 0.21 | | | 120 | | | | | |
| Export duties | 0.28 | | | 0.17 | | | 96 | | | | | |
| Royalty on metals | 0.27 | | | 0.16 | | | 92 | | | | | |
| Unit net cash (credits) costs | (0.28) | | | 1.52 | | | 874 | | | | | |
| DD&A | 0.73 | | | 0.44 | | | 252 | | | | | |
| | | | | | | | | |
| Noncash and other costs, net | 0.22 | | b | 0.13 | | | 77 | | | | | |
| Total unit costs | 0.67 | | | 2.09 | | | 1,203 | | | | | |
Other revenue adjustments, primarily for pricing
on prior period open sales | 0.01 | | | 0.01 | | | (2) | | | | | |
| | | | | | | | | |
| Gross profit per pound/ounce | $ | 3.53 | | | $ | 2.11 | | | $ | 1,213 | | | | | |
| | | | | | | | | |
| Reconciliation to Amounts Reported | | | | | | | | | |
| | | | | | | | | |
| | | | Production | | | | | | |
| Revenues | | and Delivery | | DD&A | | | | |
| Totals presented above | $ | 11,449 | | | $ | 2,681 | | | $ | 1,193 | | | | | |
| Treatment charges | (245) | | | 326 | | c | — | | | | | |
| Export duties | (457) | | | — | | | — | | | | | |
| Royalty on metals | (433) | | | — | | | — | | | | | |
| Noncash and other costs, net | — | | | 362 | | | — | | | | | |
Other revenue adjustments, primarily for pricing
on prior period open sales | 5 | | | — | | | — | | | | | |
| | | | | | | | | |
| Eliminations and other | (1) | | | (1) | | | — | | | | | |
| Indonesia operations | 10,318 | | | 3,368 | | | 1,193 | | | | | |
Other miningd | 21,259 | | | 17,874 | | | 990 | | | | | |
| | | | | | | | | |
| | | | | | | | | |
| Corporate, other & eliminations | (6,122) | | | (5,688) | | | 58 | | | | | |
| As reported in our consolidated financial statements | $ | 25,455 | | | $ | 15,554 | | | $ | 2,241 | | | | | |
a.Includes silver sales of 6.9 million ounces ($28.52 per ounce average realized price).
b.Includes charges totaling (i) $144 million ($0.09 per pound of copper) associated with ARO adjustments, (ii) $133 million ($0.08 per pound of copper) for operational readiness and startup costs associated with the new downstream processing facilities, (iii) $34 million ($0.02 per pound of copper) related to amounts capitalized in prior years associated with the construction of the new downstream processing facilities, and (iv) $28 million ($0.02 per pound of copper) for feasibility and optimization studies.
c.Represents tolling costs paid to PT Smelting.
d.Represents the combined total for our other mining operations as presented in Note 14.
Indonesia Operations Product Revenues, Production Costs and Unit Net Cash Costs
| | | | | | | | | | | | | | | | | | | | | | | | | | | | | |
| Year Ended December 31, 2023 | | | |
| (In millions) | | | Co-Product Method |
| By-Product
Method | | Copper | | Gold | | Silver & Othera | | Total |
| Revenues, excluding adjustments | $ | 5,801 | | | $ | 5,801 | | | $ | 3,346 | | | $ | 157 | | | $ | 9,304 | |
Site production and delivery, before net noncash
and other costs shown below | 2,467 | | | 1,538 | | | 887 | | | 42 | | | 2,467 | |
| Gold, silver and other by-product credits | (3,520) | | | — | | | — | | | — | | | — | |
| Treatment charges | 537 | | | 335 | | | 193 | | | 9 | | | 537 | |
| Export duties | 324 | | | 202 | | | 117 | | | 5 | | | 324 | |
| Royalty on metals | 338 | | | 212 | | | 121 | | | 5 | | | 338 | |
| Net cash costs | 146 | | | 2,287 | | | 1,318 | | | 61 | | | 3,666 | |
| DD&A | 1,028 | | | 641 | | | 370 | | | 17 | | | 1,028 | |
| | | | | | | | | |
| Noncash and other costs, net | 22 | | b | 14 | | | 8 | | | — | | | 22 | |
| Total costs | 1,196 | | | 2,942 | | | 1,696 | | | 78 | | | 4,716 | |
Other revenue adjustments, primarily for pricing
on prior period open sales | 114 | | | 114 | | | 18 | | | (1) | | | 131 | |
| PT Smelting intercompany profit | 112 | | | 70 | | | 40 | | | 2 | | | 112 | |
| Gross profit | $ | 4,831 | | | $ | 3,043 | | | $ | 1,708 | | | $ | 80 | | | $ | 4,831 | |
| | | | | | | | | |
| Copper sales (millions of recoverable pounds) | 1,525 | | | 1,525 | | | | | | | |
| Gold sales (thousands of recoverable ounces) | | | | | 1,697 | | | | | |
| | | | | | | | | |
| Gross profit per pound of copper/per ounce of gold: | | | | | |
| | | | | | | | | |
| Revenues, excluding adjustments | $ | 3.81 | | | $ | 3.81 | | | $ | 1,972 | | | | | |
Site production and delivery, before net noncash
and other costs shown below | 1.62 | | | 1.01 | | | 522 | | | | | |
| Gold, silver and other by-product credits | (2.30) | | | — | | | — | | | | | |
| Treatment charges | 0.35 | | | 0.22 | | | 114 | | | | | |
| Export duties | 0.21 | | | 0.13 | | | 69 | | | | | |
| Royalty on metals | 0.22 | | | 0.14 | | | 71 | | | | | |
| Unit net cash costs | 0.10 | | | 1.50 | | | 776 | | | | | |
| DD&A | 0.68 | | | 0.42 | | | 218 | | | | | |
| | | | | | | | | |
| Noncash and other costs, net | 0.01 | | b | 0.01 | | | 5 | | | | | |
| Total unit costs | 0.79 | | | 1.93 | | | 999 | | | | | |
Other revenue adjustments, primarily for pricing
on prior period open sales | 0.08 | | | 0.07 | | | 9 | | | | | |
| PT Smelting intercompany profit | 0.07 | | | 0.05 | | | 24 | | | | | |
| Gross profit per pound/ounce | $ | 3.17 | | | $ | 2.00 | | | $ | 1,006 | | | | | |
| | | | | | | | | |
| Reconciliation to Amounts Reported | | | | | | | | | |
| | | | | | | | | |
| | | | Production | | | | | | |
| Revenues | | and Delivery | | DD&A | | | | |
| Totals presented above | $ | 9,304 | | | $ | 2,467 | | | $ | 1,028 | | | | | |
| Treatment charges | (336) | | | 201 | | c | — | | | | | |
| Export duties | (324) | | | — | | | — | | | | | |
| Royalty on metals | (338) | | | — | | | — | | | | | |
| Noncash and other costs, net | — | | | 22 | | | — | | | | | |
Other revenue adjustments, primarily for pricing
on prior period open sales | 131 | | | — | | | — | | | | | |
| PT Smelting intercompany profit | — | | | (112) | | | — | | | | | |
| Eliminations and other | — | | | (8) | | | — | | | | | |
| Indonesia operations | 8,437 | | | 2,570 | | | 1,028 | | | | | |
Other miningd | 20,670 | | | 17,075 | | | 976 | | | | | |
| | | | | | | | | |
| | | | | | | | | |
| Corporate, other & eliminations | (6,252) | | | (6,018) | | | 64 | | | | | |
| As reported in our consolidated financial statements | $ | 22,855 | | | $ | 13,627 | | | $ | 2,068 | | | | | |
a.Includes silver sales of 6.0 million ounces ($23.37 per ounce average realized price).
b.Includes credits of $112 million ($0.07 per pound of copper) associated with ARO adjustments, and charges of $55 million ($0.04 per pound of copper) associated with an administrative fine and $27 million ($0.02 per pound of copper) for feasibility and optimization studies.
c.Represents tolling costs paid to PT Smelting.
d.Represents the combined total for our other mining operations as presented in Note 14.
Molybdenum Mines Product Revenues, Production Costs and Unit Net Cash Costs
| | | | | | | | | | | | | | | | | | | | | | | | | | |
| | Years Ended December 31, | | | | | |
| (In millions) | 2024 | | 2023 | | | | | |
Revenues, excluding adjustmentsa | $ | 619 | | | $ | 702 | | | | | | |
Site production and delivery, before net noncash
and other costs shown below | 508 | | | 423 | | | | | | |
| Treatment charges and other | 27 | | | 25 | | | | | | |
| Net cash costs | 535 | | | 448 | | | | | | |
| DD&A | 73 | | | 66 | | | | | | |
| | | | | | | | |
| Noncash and other costs, net | 22 | | | 16 | | | | | | |
| Total costs | 630 | | | 530 | | | | | | |
| Gross (loss) profit | $ | (11) | | | $ | 172 | | | | | | |
| | | | | | | | |
Molybdenum sales (millions of recoverable pounds)a | 30 | | | 30 | | | | | | |
| | | | | | | | |
| Gross (loss) profit per pound of molybdenum: | | |
| | | | | | | | |
Revenues, excluding adjustmentsa | $ | 20.66 | | | $ | 23.71 | | | | | | |
Site production and delivery, before net noncash
and other costs shown below | 16.99 | | | 14.28 | | | | | | |
| Treatment charges and other | 0.90 | | | 0.85 | | | | | | |
| Unit net cash costs | 17.89 | | | 15.13 | | | | | | |
| DD&A | 2.43 | | | 2.24 | | | | | | |
| | | | | | | | |
| Noncash and other costs, net | 0.73 | | | 0.55 | | | | | | |
| Total unit costs | 21.05 | | | 17.92 | | | | | | |
| Gross (loss) profit per pound | $ | (0.39) | | | $ | 5.79 | | | | | | |
| | | | | | | | |
| Reconciliation to Amounts Reported | | | | | | | | |
| | | | | | | | |
| | | Production | | | | | |
| Year Ended December 31, 2024 | Revenues | | and Delivery | | DD&A | | | |
| Totals presented above | $ | 619 | | | $ | 508 | | | $ | 73 | | | | |
| Treatment charges and other | (27) | | | — | | | — | | | | |
| Noncash and other costs, net | — | | | 22 | | | — | | | | |
| Molybdenum mines | 592 | | | 530 | | | 73 | | | | |
Other miningb | 30,985 | | | 20,712 | | | 2,110 | | | | |
| | | | | | | | |
| | | | | | | | |
| Corporate, other & eliminations | (6,122) | | | (5,688) | | | 58 | | | | |
| As reported in our consolidated financial statements | $ | 25,455 | | | $ | 15,554 | | | $ | 2,241 | | | | |
| | | | | | | | |
| Year Ended December 31, 2023 | | | | | | | | |
| Totals presented above | $ | 702 | | | $ | 423 | | | $ | 66 | | | | |
| Treatment charges and other | (25) | | | — | | | — | | | | |
| Noncash and other costs, net | — | | | 16 | | | — | | | | |
| | | | | | | | |
| | | | | | | | |
| Molybdenum mines | 677 | | | 439 | | | 66 | | | | |
Other miningb | 28,430 | | | 19,206 | | | 1,938 | | | | |
| | | | | | | | |
| | | | | | | | |
| Corporate, other & eliminations | (6,252) | | | (6,018) | | | 64 | | | | |
| As reported in our consolidated financial statements | $ | 22,855 | | | $ | 13,627 | | | $ | 2,068 | | | | |
| | | | | | | | |
a.Reflects sales of the Molybdenum mines’ production to the molybdenum sales company at market-based pricing. On a consolidated basis, realizations are based on the actual contract terms for sales to third parties; as a result, our consolidated average realized price per pound of molybdenum will differ from the amounts reported in this table.
b.Represents the combined total for our other mining operations as presented in Note 14. Also includes amounts associated with the molybdenum sales company, which includes sales of molybdenum produced by the Molybdenum mines and by certain of the North America and South America copper mines.
CAUTIONARY STATEMENT
Our discussion and analysis contains forward-looking statements in which we discuss our potential future performance, operations and projects. Forward-looking statements are all statements other than statements of historical facts, such as plans, projections, or expectations relating to business outlook, strategy, goals or targets; global market conditions; ore grades and milling rates; production and sales volumes; unit net cash costs (credits) and operating costs; capital expenditures; operating plans (including mine sequencing); cash flows; liquidity; PT-FI’s commissioning, remediation and full ramp-up of its new smelter and full production at the PMR; potential extension of PT-FI’s IUPK beyond 2041; export licenses, export duties, and export volumes, including PT-FI’s ability to continue exports of copper concentrate until full ramp-up is achieved at its new smelter in Indonesia; timing of shipments of inventoried production; our commitment to deliver responsibly produced copper and molybdenum, including plans to implement, validate and maintain validation of our operating sites under specific frameworks; execution of our energy and climate strategies and the underlying assumptions and estimated impacts on our business and stakeholders related thereto; achievement of 2030 climate targets and 2050 net zero aspiration; improvements in operating procedures and technology innovations and applications; exploration efforts and results; development and production activities, rates and costs; future organic growth opportunities; tax rates; the impact of copper, gold and molybdenum price changes; the impact of deferred intercompany profits on earnings; mineral reserve and mineral resource estimates; final resolution of settlements associated with ongoing legal and environmental proceedings; debt repurchases; and the ongoing implementation of our financial policy and future returns to shareholders, including dividend payments (base or variable) and share repurchases. The words “anticipates,” “may,” “can,” “plans,” “believes,” “estimates,” “expects,” “projects,” “targets,” “intends,” “likely,” “will,” “should,” “could,” “to be,” ”potential,” “assumptions,” “guidance,” “aspirations,” “future,” “commitments,” “pursues,” “initiatives,” “objectives,” “opportunities,” “strategy” and any similar expressions are intended to identify those assertions as forward-looking statements. The declaration and payment of dividends (base or variable), and timing and amount of any share repurchases are at the discretion of our Board and management, respectively, and are subject to a number of factors, including not exceeding our net debt target, capital availability, our financial results, cash requirements, global economic conditions, changes in laws, contractual restrictions and other factors deemed relevant by our Board or management, as applicable. Our share repurchase program may be modified, increased, suspended or terminated at any time at the Board’s discretion.
We caution readers that forward-looking statements are not guarantees of future performance and actual results may differ materially from those anticipated, expected, projected or assumed in the forward-looking statements. Important factors that can cause our actual results to differ materially from those anticipated in the forward-looking statements include, but are not limited to, supply of and demand for, and prices of the commodities we produce, primarily copper and gold; PT-FI’s ability to export and sell or inventory copper concentrates through remediation and full ramp-up of its new smelter in Indonesia; changes in export duties; completion of remediation activities and achieving full ramp-up of the new smelter in Indonesia; full production at the PMR; production rates; timing of shipments; price and availability of consumables and components we purchase as well as constraints on supply and logistics, and transportation services; changes in our cash requirements, financial position, financing or investment plans; changes in general market, economic, geopolitical, regulatory or industry conditions; reductions in liquidity and access to capital; changes in tax laws and regulations; political and social risks, including the potential effects of violence in Indonesia, civil unrest in Peru, and relations with local communities and Indigenous Peoples; operational risks inherent in mining, with higher inherent risks in underground mining; mine sequencing; changes in mine plans or operational modifications, delays, deferrals or cancellations, including the ability to smelt and refine or inventory; results of technical, economic or feasibility studies; potential inventory adjustments; potential impairment of long-lived mining assets; satisfaction of requirements in accordance with PT-FI’s IUPK to extend mining rights from 2031 through 2041; process relating to the extension of PT-FI’s IUPK beyond 2041; cybersecurity risks; any major public health crisis; labor relations, including labor-related work stoppages and increased costs; compliance with applicable environmental, health and safety laws and regulations; weather- and climate-related risks; environmental risks, including availability of secure water supplies; impacts, expenses or results from litigation or investigations; tailings management; our ability to comply with our responsible production commitments under specific frameworks; and any changes to such frameworks and other factors described in more detail in Item 1A. “Risk Factors” contained in Part I of our annual report on Form 10-K for the year ended December 31, 2024.
Investors are cautioned that many of the assumptions upon which our forward-looking statements are based are likely to change after the date the forward-looking statements are made, including for example commodity prices, which we cannot control, and production volumes and costs or technological solutions and innovations, some aspects of which we may not be able to control. Further, we may make changes to our business plans that could affect our results. We undertake no obligation to update any forward-looking statements, which speak only as of the date made, notwithstanding any changes in our assumptions, changes in business plans, actual experience or other changes.
Estimates of mineral reserves and mineral resources are subject to considerable uncertainty. Such estimates are, to a large extent, based on metal prices for the commodities we produce and interpretations of geologic data, which may not necessarily be indicative of future results or quantities ultimately recovered. Our annual report on Form 10-K for the year ended December 31, 2024, also includes forward-looking statements regarding mineral resources not included in proven and probable mineral reserves. A mineral resource, which includes measured, indicated and inferred mineral resources, is a concentration or occurrence of material of economic interest in or on the Earth’s crust in such form, grade or quality, and quantity that there are reasonable prospects for economic extraction. Such a deposit cannot qualify as recoverable proven and probable mineral reserves until legal and economic feasibility are confirmed based upon a comprehensive evaluation of development and
operating costs, grades, recoveries and other material modifying factors. Accordingly, no assurance can be given that the estimated mineral resources will become proven and probable mineral reserves.
Our annual report on Form 10-K for the year ended December 31, 2024, also contains measures such as net debt and unit net cash costs (credits) per pound of copper and molybdenum, which are not recognized under U.S. GAAP. Refer to “Operations – Unit Net Cash Costs (Credits)” for further discussion of unit net cash costs (credits) associated with our operating divisions, and to “Product Revenues and Production Costs” for reconciliations of per pound costs by operating division to production and delivery costs applicable to sales reported in our consolidated financial statements. Refer to “Net Debt” for reconciliations of consolidated debt, consolidated cash and cash equivalents and current restricted cash associated with PT-FI’s export proceeds to net debt. For forward-looking unit net cash costs (credits) per pound of copper and molybdenum measures, we are unable to provide a reconciliation to the most comparable GAAP measure without unreasonable effort because estimating such GAAP measures and providing a meaningful reconciliation is extremely difficult and requires a level of precision that is unavailable for these future periods and the information needed to reconcile these measures is dependent upon future events, many of which are outside of our control as described above. Forward-looking non-GAAP measures are estimated consistent with the relevant definitions and assumptions.
Item 8. Financial Statements and Supplementary Data.
MANAGEMENT’S REPORT ON INTERNAL CONTROL OVER FINANCIAL REPORTING
Freeport-McMoRan Inc.’s (the Company’s) management is responsible for establishing and maintaining adequate internal control over financial reporting. Internal control over financial reporting is defined in Rule 13a-15(f) or 15d-15(f) under the Securities Exchange Act of 1934 as a process designed by, or under the supervision of, the Company’s principal executive and principal financial officers and effected by the Company’s Board of Directors, management and other personnel, to provide reasonable assurance regarding the reliability of financial reporting and the preparation of financial statements for external purposes in accordance with generally accepted accounting principles and includes those policies and procedures that:
•Pertain to the maintenance of records that in reasonable detail accurately and fairly reflect the transactions and dispositions of the Company’s assets;
•Provide reasonable assurance that transactions are recorded as necessary to permit preparation of financial statements in accordance with generally accepted accounting principles, and that receipts and expenditures of the Company are being made only in accordance with authorizations of management and directors of the Company; and
•Provide reasonable assurance regarding prevention or timely detection of unauthorized acquisition, use or disposition of the Company’s assets that could have a material effect on the financial statements.
Because of its inherent limitations, internal control over financial reporting may not prevent or detect misstatements. Projections of any evaluation of effectiveness to future periods are subject to the risk that controls may become inadequate because of changes in conditions, or that the degree of compliance with the policies or procedures may deteriorate.
Our management, including our principal executive officer and principal financial officer, assessed the effectiveness of our internal control over financial reporting as of the end of the fiscal year covered by this annual report on Form 10-K. In making this assessment, our management used the criteria set forth in Internal Control-Integrated Framework issued by the Committee of Sponsoring Organizations of the Treadway Commission (2013 framework) (the COSO criteria). Based on its assessment, management concluded that, as of December 31, 2024, our Company’s internal control over financial reporting is effective based on the COSO criteria.
Ernst & Young LLP, an independent registered public accounting firm, who audited the Company’s consolidated financial statements included in this Form 10-K, has issued an attestation report on the Company’s internal control over financial reporting, which is included herein.
| | | | | | | | |
| /s/ Kathleen L. Quirk | | /s/ Maree E. Robertson |
| Kathleen L. Quirk | | Maree E. Robertson |
| President and | | Executive Vice President and |
| Chief Executive Officer | | Chief Financial Officer |
REPORT OF INDEPENDENT REGISTERED PUBLIC ACCOUNTING FIRM
To the Board of Directors and Stockholders of
Freeport-McMoRan Inc.
Opinion on Internal Control Over Financial Reporting
We have audited Freeport-McMoRan Inc.’s internal control over financial reporting as of December 31, 2024, based on criteria established in Internal Control-Integrated Framework issued by the Committee of Sponsoring Organizations of the Treadway Commission (2013 framework) (the COSO criteria). In our opinion, Freeport-McMoRan Inc. (the Company) maintained, in all material respects, effective internal control over financial reporting as of December 31, 2024, based on the COSO criteria.
We also have audited, in accordance with the standards of the Public Company Accounting Oversight Board (United States) (PCAOB), the consolidated balance sheets of the Company as of December 31, 2024 and 2023, the related consolidated statements of income, comprehensive income, equity and cash flows for each of the three years in the period ended December 31, 2024, and the related notes and our report dated February 14, 2025 expressed an unqualified opinion thereon.
Basis for Opinion
The Company’s management is responsible for maintaining effective internal control over financial reporting and for its assessment of the effectiveness of internal control over financial reporting included in the accompanying Management’s Report on Internal Control Over Financial Reporting. Our responsibility is to express an opinion on the Company’s internal control over financial reporting based on our audit. We are a public accounting firm registered with the PCAOB and are required to be independent with respect to the Company in accordance with the U.S. federal securities laws and the applicable rules and regulations of the Securities and Exchange Commission and the PCAOB.
We conducted our audit in accordance with the standards of the PCAOB. Those standards require that we plan and perform the audit to obtain reasonable assurance about whether effective internal control over financial reporting was maintained in all material respects.
Our audit included obtaining an understanding of internal control over financial reporting, assessing the risk that a material weakness exists, testing and evaluating the design and operating effectiveness of internal control based on the assessed risk, and performing such other procedures as we considered necessary in the circumstances. We believe that our audit provides a reasonable basis for our opinion.
Definition and Limitations of Internal Control Over Financial Reporting
A company’s internal control over financial reporting is a process designed to provide reasonable assurance regarding the reliability of financial reporting and the preparation of financial statements for external purposes in accordance with generally accepted accounting principles. A company’s internal control over financial reporting includes those policies and procedures that (1) pertain to the maintenance of records that, in reasonable detail, accurately and fairly reflect the transactions and dispositions of the assets of the company; (2) provide reasonable assurance that transactions are recorded as necessary to permit preparation of financial statements in accordance with generally accepted accounting principles, and that receipts and expenditures of the company are being made only in accordance with authorizations of management and directors of the company; and (3) provide reasonable assurance regarding prevention or timely detection of unauthorized acquisition, use, or disposition of the company’s assets that could have a material effect on the financial statements.
Because of its inherent limitations, internal control over financial reporting may not prevent or detect misstatements. Also, projections of any evaluation of effectiveness to future periods are subject to the risk that controls may become inadequate because of changes in conditions, or that the degree of compliance with the policies or procedures may deteriorate.
/s/ Ernst & Young LLP
Phoenix, Arizona
February 14, 2025
REPORT OF INDEPENDENT REGISTERED PUBLIC ACCOUNTING FIRM
To the Board of Directors and Stockholders of
Freeport-McMoRan Inc.
Opinion on the Financial Statements
We have audited the accompanying consolidated balance sheets of Freeport-McMoRan Inc. (the Company) as of December 31, 2024 and 2023, the related consolidated statements of income, comprehensive income, equity and cash flows for each of the three years in the period ended December 31, 2024, and the related notes (collectively referred to as the “consolidated financial statements”). In our opinion, the consolidated financial statements present fairly, in all material respects, the financial position of the Company at December 31, 2024 and 2023, and the results of its operations and its cash flows for each of the three years in the period ended December 31, 2024, in conformity with U.S. generally accepted accounting principles.
We also have audited, in accordance with the standards of the Public Company Accounting Oversight Board (United States) (PCAOB), the Company’s internal control over financial reporting as of December 31, 2024, based on criteria established in Internal Control-Integrated Framework issued by the Committee of Sponsoring Organizations of the Treadway Commission (2013 framework) and our report dated February 14, 2025 expressed an unqualified opinion thereon.
Basis for Opinion
These financial statements are the responsibility of the Company’s management. Our responsibility is to express an opinion on the Company’s financial statements based on our audits. We are a public accounting firm registered with the PCAOB and are required to be independent with respect to the Company in accordance with the U.S. federal securities laws and the applicable rules and regulations of the Securities and Exchange Commission and the PCAOB.
We conducted our audits in accordance with the standards of the PCAOB. Those standards require that we plan and perform the audit to obtain reasonable assurance about whether the financial statements are free of material misstatement, whether due to error or fraud. Our audits included performing procedures to assess the risks of material misstatement of the financial statements, whether due to error or fraud, and performing procedures that respond to those risks. Such procedures included examining, on a test basis, evidence regarding the amounts and disclosures in the financial statements. Our audits also included evaluating the accounting principles used and significant estimates made by management, as well as evaluating the overall presentation of the financial statements. We believe that our audits provide a reasonable basis for our opinion.
Critical Audit Matters
The critical audit matters communicated below are matters arising from the current period audit of the consolidated financial statements that were communicated or required to be communicated to the audit committee and that: (1) relate to accounts or disclosures that are material to the consolidated financial statements and (2) involved our especially challenging, subjective, or complex judgments. The communication of critical audit matters does not alter in any way our opinion on the consolidated financial statements, taken as a whole, and we are not, by communicating the critical audit matters below, providing separate opinions on the critical audit matters or on the accounts or disclosures to which they relate.
| | | | | | | | | | |
| Tax Contingencies | | | |
| Description of the Matter | As discussed in Note 10 to the consolidated financial statements, the Company operates in multiple tax jurisdictions, and its income tax returns are subject to examination by tax authorities in those jurisdictions who may challenge any tax position on these returns. Uncertainty in a tax position may arise because tax laws are subject to interpretation. The Company uses significant judgment, specifically as it relates to Peru and Indonesia, to determine whether, based on the technical merits, a tax position is more likely than not to be sustained upon examination by taxing authorities. | | | |
| | | | |
| | | | | | | | |
| Auditing management’s tax positions involved significant auditor judgment, because management’s tax positions require a high degree of judgment and are based on interpretations of tax laws and legal rulings. | |
| | |
| | | | | | | | |
| How We Addressed the Matter in Our Audit | We obtained an understanding, evaluated the design and tested the operating effectiveness of controls over the Company’s accounting process for tax contingencies. This included testing controls over management’s review of the technical merits of tax positions and disputed tax assessments, including the process to measure the financial statement impact of these tax matters. | |
| | |
| Our audit procedures included, among others, evaluating the Company’s accounting for these tax positions by using our knowledge of and experience with the application of respective tax laws by the relevant tax authorities, and/or our understanding of the contractual arrangements with the applicable government, if the position is governed by a contract. We analyzed the Company’s assumptions and data used to determine the tax assessments and tested the accuracy of the calculations. We involved our tax professionals located in the respective jurisdictions to assess the technical merits of the Company’s tax positions and to evaluate the application of relevant tax laws in the Company’s recognition determination. We obtained and assessed the Company’s correspondence with the relevant tax authorities and, as applicable, third-party tax or legal opinions or other external correspondence and analyses. We also evaluated the adequacy of the Company’s disclosures included in Notes 9 and 10 in relation to these tax matters. | |
| | |
| Environmental Obligations | |
| Description of the Matter | As discussed in Note 10 to the consolidated financial statements, the Company is subject to various national, state and local environmental laws and regulations that govern the protection of the environment, including remediation, restoration and reclamation of environmental contamination. Liabilities for environmental contingencies are recorded when it is probable that obligations have been incurred and the costs can be reasonably estimated. As of December 31, 2024, the Company’s consolidated environmental obligations totaled $2.0 billion. | |
| | |
| Auditing management’s accounting for environmental obligations was challenging because significant judgment is required by the Company to estimate the future costs to remediate the environmental matters. The significant judgment was primarily due to the inherent estimation uncertainty relating to the amount of future costs. Such uncertainties involve assumptions regarding the nature and extent of site contamination, the anticipated costs, scope and timing of remediation activities and required remediation methods under presently enacted laws and regulations, and allocation of costs among other potentially responsible parties. | |
| | |
| How We Addressed the Matter in Our Audit | We obtained an understanding, evaluated the design and tested the operating effectiveness of controls over the Company’s measurement of the environmental obligations. For example, we tested controls over management’s review of the environmental obligations calculations and management’s assessment to evaluate key judgments and estimates affecting the environmental obligations. | |
| | | | | | | | |
| | |
| To test the Company’s measurement of the environmental obligations, among other procedures, we inspected correspondence with regulatory agencies, including correspondence related to remediation activities and methods and potentially responsible parties, obtained external legal counsel confirmation letters, and inspected environmental studies. Additionally, we tested the accuracy and completeness of the underlying data used in the Company’s analyses and tested the significant assumptions discussed above. We utilized our environmental professionals to search for new or contrary evidence related to the Company’s sites and to assist in evaluating the estimated future costs by comparing the estimated future costs to environmental permits, third party observable data such as vendor quotes, and to historical costs incurred for similar activities. | |
| | |
/s/ Ernst & Young LLP
We have served as the Company’s auditor since 2002.
Phoenix, Arizona
February 14, 2025
Freeport-McMoRan Inc.
CONSOLIDATED STATEMENTS OF INCOME
| | | | | | | | | | | | | | | | | |
| | Years Ended December 31, |
| | 2024 | | 2023 | | 2022 |
| | (In millions, except per share amounts) |
| Revenues | $ | 25,455 | | | $ | 22,855 | | | $ | 22,780 | |
| Cost of sales: | | | | | |
| Production and delivery | 15,554 | | | 13,627 | | | 13,070 | |
| Depreciation, depletion and amortization | 2,241 | | | 2,068 | | | 2,019 | |
| | | | | |
| | | | | |
| Total cost of sales | 17,795 | | | 15,695 | | | 15,089 | |
| Selling, general and administrative expenses | 513 | | | 479 | | | 420 | |
| Exploration and research expenses | 156 | | | 137 | | | 115 | |
| Environmental obligations and shutdown costs | 127 | | | 319 | | | 121 | |
| | | | | |
| Net gain on sales of assets | — | | | — | | | (2) | |
| | | | | |
| Total costs and expenses | 18,591 | | | 16,630 | | | 15,743 | |
| Operating income | 6,864 | | | 6,225 | | | 7,037 | |
| Interest expense, net | (319) | | | (515) | | | (560) | |
| Net gain on early extinguishment of debt | — | | | 10 | | | 31 | |
| | | | | |
| Other income, net | 362 | | | 286 | | | 207 | |
| Income before income taxes and equity in affiliated companies’ net earnings | 6,907 | | | 6,006 | | | 6,715 | |
| Provision for income taxes | (2,523) | | | (2,270) | | | (2,267) | |
| Equity in affiliated companies’ net earnings | 15 | | | 15 | | | 31 | |
| | | | | |
| | | | | |
| Net income | 4,399 | | | 3,751 | | | 4,479 | |
| Net income attributable to noncontrolling interests | (2,510) | | | (1,903) | | | (1,011) | |
| | | | | |
| | | | | |
| Net income attributable to common stockholders | $ | 1,889 | | | $ | 1,848 | | | $ | 3,468 | |
| | | | | |
| Net income per share attributable to common stockholders: | | | | | |
| Basic | $ | 1.31 | | | $ | 1.28 | | | $ | 2.40 | |
| | | | | |
| | | | | |
| | | | | |
| | | | | |
| Diluted | $ | 1.30 | | | $ | 1.28 | | | $ | 2.39 | |
| | | | | |
| | | | | |
| | | | | |
| Weighted-average common shares outstanding: | | | | | |
| Basic | 1,438 | | | 1,434 | | | 1,441 | |
| Diluted | 1,445 | | | 1,443 | | | 1,451 | |
| | | | | |
| Dividends declared per share of common stock | $ | 0.60 | | | $ | 0.60 | | | $ | 0.60 | |
The accompanying Notes to Consolidated Financial Statements are an integral part of these consolidated financial statements.
Freeport-McMoRan Inc.
CONSOLIDATED STATEMENTS OF COMPREHENSIVE INCOME
| | | | | | | | | | | | | | | | | |
| Years Ended December 31, |
| 2024 | | 2023 | | 2022 |
| (In millions) |
| | | | | |
| Net income | $ | 4,399 | | | $ | 3,751 | | | $ | 4,479 | |
| | | | | |
| Other comprehensive (loss) income, net of taxes: | | | | | |
| | | | | |
| Defined benefit plans: | | | | | |
| Actuarial (losses) gains arising during the period, net of taxes | (44) | | | 39 | | | 62 | |
| Prior service costs arising during the period | — | | | — | | | (1) | |
| Amortization of unrecognized amounts included in net periodic benefit costs | 3 | | | 5 | | | 8 | |
| Foreign exchange losses | (1) | | | — | | | (1) | |
| | | | | |
| | | | | |
| Other comprehensive (loss) income | (42) | | | 44 | | | 68 | |
| | | | | |
| Total comprehensive income | 4,357 | | | 3,795 | | | 4,547 | |
| Total comprehensive income attributable to noncontrolling interests | (2,508) | | | (1,901) | | | (1,011) | |
| | | | | |
| | | | | |
| Total comprehensive income attributable to common stockholders | $ | 1,849 | | | $ | 1,894 | | | $ | 3,536 | |
The accompanying Notes to Consolidated Financial Statements are an integral part of these consolidated financial statements.
Freeport-McMoRan Inc.
CONSOLIDATED STATEMENTS OF CASH FLOWS
| | | | | | | | | | | | | | | | | | | | |
| | | Years Ended December 31, |
| | 2024 | | 2023 | | 2022 |
| | | (In millions) |
| Cash flow from operating activities: | | | | | | |
| Net income | | $ | 4,399 | | | $ | 3,751 | | | $ | 4,479 | |
| Adjustments to reconcile net income to net cash provided by operating activities: | | | | | | |
| Depreciation, depletion and amortization | | 2,241 | | | 2,068 | | | 2,019 | |
| | | | | | |
| Net charges for environmental and asset retirement obligations, including accretion | | 622 | | | 295 | | | 369 | |
| Payments for environmental and asset retirement obligations | | (234) | | | (250) | | | (274) | |
| Stock-based compensation | | 109 | | | 109 | | | 95 | |
| Talc-related litigation charges | | — | | | 65 | | | — | |
| Net charges for defined pension and postretirement plans | | 35 | | | 62 | | | 45 | |
| Pension plan contributions | | (78) | | | (75) | | | (54) | |
| Net gain on early extinguishment of debt | | — | | | (10) | | | (31) | |
| | | | | | |
| Deferred income taxes | | (76) | | | 182 | | | 36 | |
| | | | | | |
| | | | | | |
| | | | | | |
| | | | | | |
| | | | | | |
| | | | | | |
| Changes in deferred profit on PT Freeport Indonesia’s sales to PT Smelting | | — | | | (112) | | | (14) | |
| Charges for social investment programs at PT Freeport Indonesia | | 103 | | | 84 | | | 84 | |
| Payments for social investment programs at PT Freeport Indonesia | | (54) | | | (44) | | | (11) | |
| Impairment of oil and gas properties | | 69 | | | 67 | | | — | |
| | | | | | |
| | | | | | |
| | | | | | |
| Other, net | | 53 | | | (33) | | | (3) | |
| Changes in working capital and other: | | | | | | |
| Accounts receivable | | 460 | | | 166 | | | 56 | |
| Inventories | | (638) | | | (873) | | | (573) | |
| Other current assets | | (41) | | | (29) | | | (12) | |
| Accounts payable and accrued liabilities | | 143 | | | (161) | | | (73) | |
| Accrued income taxes and timing of other tax payments | | 47 | | | 17 | | | (999) | |
| Net cash provided by operating activities | | 7,160 | | | 5,279 | | | 5,139 | |
| | | | | | |
| Cash flow from investing activities: | | | | | | |
| Capital expenditures: | | | | | | |
| North America copper mines | | (1,033) | | | (761) | | | (597) | |
| South America operations | | (375) | | | (368) | | | (304) | |
| Indonesia operations | | (2,908) | | | (3,411) | | | (2,381) | |
| Molybdenum mines | | (117) | | | (84) | | | (33) | |
| Other | | (375) | | | (200) | | | (154) | |
| | | | | | |
| | | | | | |
| | | | | | |
| Proceeds from sales of assets | | 19 | | | 27 | | | 108 | |
| | | | | | |
| Acquisition of additional ownership interest in Cerro Verde | | (210) | | | — | | | — | |
| Loans to PT Smelting for expansion | | (28) | | | (129) | | | (65) | |
| | | | | | |
| Other, net | | (1) | | | (30) | | | (14) | |
| Net cash used in investing activities | | (5,028) | | | (4,956) | | | (3,440) | |
| | | | | | |
| Cash flow from financing activities: | | | | | | |
| Proceeds from debt | | 2,251 | | | 1,781 | | | 5,735 | |
| Repayments of debt | | (2,731) | | | (2,980) | | | (4,515) | |
| | | | | | |
| | | | | | |
| Finance lease payments | | (41) | | | (3) | | | (7) | |
| Cash dividends and distributions paid: | | | | | | |
| Common stock | | (865) | | | (863) | | | (866) | |
| Noncontrolling interests | | (1,833) | | | (625) | | | (840) | |
| Treasury stock purchases | | (59) | | | — | | | (1,347) | |
| Contributions from noncontrolling interests | | — | | | 50 | | | 189 | |
| Proceeds from exercised stock options | | 29 | | | 47 | | | 125 | |
| Payments for withholding of employee taxes related to stock-based awards | | (35) | | | (50) | | | (55) | |
| Debt financing costs | | — | | | (7) | | | (42) | |
| Net cash used in financing activities | | (3,284) | | | (2,650) | | | (1,623) | |
| | | | | | |
| Net (decrease) increase in cash, cash equivalents and restricted cash and cash equivalents | | (1,152) | | | (2,327) | | | 76 | |
| | | | | | |
| Cash, cash equivalents and restricted cash and cash equivalents at beginning of year | | 6,063 | | | 8,390 | | | 8,314 | |
| Cash, cash equivalents and restricted cash and cash equivalents at end of year | | $ | 4,911 | | | $ | 6,063 | | | $ | 8,390 | |
| | | | | | |
|
The accompanying Notes to Consolidated Financial Statements are an integral part of these consolidated financial statements.
Freeport-McMoRan Inc.
CONSOLIDATED BALANCE SHEETS
| | | | | | | | | | | |
| | December 31, |
| | 2024 | | 2023 |
| | (In millions, except par value) |
| ASSETS | | | |
| Current assets: | | | |
| Cash and cash equivalents | $ | 3,923 | | | $ | 4,758 | |
| Restricted cash and cash equivalents | 888 | | | 1,208 | |
| Trade accounts receivable | 578 | | | 1,209 | |
| Value added and other tax receivables | 564 | | | 455 | |
| | | |
| Inventories: | | | |
| Product | 3,038 | | | 2,472 | |
| Materials and supplies, net | 2,382 | | | 2,169 | |
| Mill and leach stockpiles | 1,388 | | | 1,419 | |
| Other current assets | 535 | | | 375 | |
| | | |
| Total current assets | 13,296 | | | 14,065 | |
| Property, plant, equipment and mine development costs, net | 38,514 | | | 35,295 | |
| | | |
| | | |
| | | |
| Long-term mill and leach stockpiles | 1,225 | | | 1,336 | |
| | | |
| | | |
| Other assets | 1,813 | | | 1,810 | |
| | | |
| Total assets | $ | 54,848 | | | $ | 52,506 | |
| | | |
| LIABILITIES AND EQUITY | | | |
| Current liabilities: | | | |
| Accounts payable and accrued liabilities | $ | 4,057 | | | $ | 3,729 | |
| Accrued income taxes | 859 | | | 786 | |
| Current portion of environmental and asset retirement obligations | 320 | | | 316 | |
| Dividends payable | 219 | | | 218 | |
| | | |
| | | |
| Current portion of debt | 41 | | | 766 | |
| Total current liabilities | 5,496 | | | 5,815 | |
| Long-term debt, less current portion | 8,907 | | | 8,656 | |
| Environmental and asset retirement obligations, less current portion | 5,404 | | | 4,624 | |
| Deferred income taxes | 4,376 | | | 4,453 | |
| Other liabilities | 1,887 | | | 1,648 | |
| | | |
| Total liabilities | 26,070 | | | 25,196 | |
| | | |
| | | |
| | | |
| Equity: | | | |
| Stockholders’ equity: | | | |
| Common stock, par value $0.10, 1,624 shares and 1,619 shares issued, respectively | 162 | | | 162 | |
| Capital in excess of par value | 23,797 | | | 24,637 | |
| Accumulated deficit | (170) | | | (2,059) | |
| Accumulated other comprehensive loss | (314) | | | (274) | |
| Common stock held in treasury – 187 shares and 184 shares, respectively, at cost | (5,894) | | | (5,773) | |
| Total stockholders’ equity | 17,581 | | | 16,693 | |
| Noncontrolling interests | 11,197 | | | 10,617 | |
| Total equity | 28,778 | | | 27,310 | |
| Total liabilities and equity | $ | 54,848 | | | $ | 52,506 | |
| | | |
|
The accompanying Notes to Consolidated Financial Statements are an integral part of these consolidated financial statements.
Freeport-McMoRan Inc.
CONSOLIDATED STATEMENTS OF EQUITY
| | | | | | | | | | | | | | | | | | | | | | | | | | | | | | | | | | | | | | | | | | | | | | | | | | | | | | | | | | | |
| | Stockholders’ Equity | | | | |
| Common Stock | | | | Accumulated Deficit | | Accumu-
lated
Other Compre-hensive
Loss | | Common Stock
Held in Treasury | | Total
Stock-
holders’
Equity | | | | |
| Number
of
Shares | | At Par
Value | | Capital in
Excess of
Par Value | | | | Number
of
Shares | | At
Cost | | | Non-
controlling
Interests | | Total
Equity |
| | (In millions) |
| Balance at January 1, 2022 | 1,603 | | | $ | 160 | | | $ | 25,875 | | | $ | (7,375) | | | $ | (388) | | | 146 | | | $ | (4,292) | | | $ | 13,980 | | | $ | 9,039 | | | $ | 23,019 | |
| | | | | | | | | | | | | | | | | | | |
| | | | | | | | | | | | | | | | | | | |
| | | | | | | | | | | | | | | | | | | |
| Exercised and issued stock-based awards | 10 | | | 1 | | | 131 | | | — | | | — | | | — | | | — | | | 132 | | | — | | | 132 | |
| Stock-based compensation, including the tender of shares | — | | | — | | | 88 | | | — | | | — | | | 2 | | | (62) | | | 26 | | | (11) | | | 15 | |
| | | | | | | | | | | | | | | | | | | |
| | | | | | | | | | | | | | | | | | | |
| Treasury stock purchases | — | | | — | | | — | | | — | | | — | | | 35 | | | (1,347) | | | (1,347) | | | — | | | (1,347) | |
| Dividends | — | | | — | | | (864) | | | — | | | — | | | — | | | — | | | (864) | | | (820) | | | (1,684) | |
| | | | | | | | | | | | | | | | | | | |
| | | | | | | | | | | | | | | | | | | |
| Contributions from noncontrolling interests | — | | | — | | | 92 | | | — | | | — | | | — | | | — | | | 92 | | | 97 | | | 189 | |
| | | | | | | | | | | | | | | | | | | |
| Net income attributable to common stockholders | — | | | — | | | — | | | 3,468 | | | — | | | — | | | — | | | 3,468 | | | — | | | 3,468 | |
| Net income attributable to noncontrolling interests | — | | | — | | | — | | | — | | | — | | | — | | | — | | | — | | | 1,011 | | | 1,011 | |
| Other comprehensive income | — | | | — | | | — | | | — | | | 68 | | | — | | | — | | | 68 | | | — | | | 68 | |
| Balance at December 31, 2022 | 1,613 | | | 161 | | | 25,322 | | | (3,907) | | | (320) | | | 183 | | | (5,701) | | | 15,555 | | | 9,316 | | | 24,871 | |
| | | | | | | | | | | | | | | | | | | |
| | | | | | | | | | | | | | | | | | | |
| | | | | | | | | | | | | | | | | | | |
| Exercised and issued stock-based awards | 6 | | | 1 | | | 68 | | | — | | | — | | | — | | | — | | | 69 | | | — | | | 69 | |
| Stock-based compensation, including the tender of shares | — | | | — | | | 87 | | | — | | | — | | | 1 | | | (72) | | | 15 | | | (1) | | | 14 | |
| | | | | | | | | | | | | | | | | | | |
| | | | | | | | | | | | | | | | | | | |
| | | | | | | | | | | | | | | | | | | |
| Dividends | — | | | — | | | (864) | | | — | | | — | | | — | | | — | | | (864) | | | (625) | | | (1,489) | |
| | | | | | | | | | | | | | | | | | | |
| | | | | | | | | | | | | | | | | | | |
| Contributions from noncontrolling interests | — | | | — | | | 24 | | | — | | | — | | | — | | | — | | | 24 | | | 26 | | | 50 | |
| | | | | | | | | | | | | | | | | | | |
| | | | | | | | | | | | | | | | | | | |
| | | | | | | | | | | | | | | | | | | |
| | | | | | | | | | | | | | | | | | | |
| Net income attributable to common stockholders | — | | | — | | | — | | | 1,848 | | | — | | | — | | | — | | | 1,848 | | | — | | | 1,848 | |
| Net income attributable to noncontrolling interests | — | | | — | | | — | | | — | | | — | | | — | | | — | | | — | | | 1,903 | | | 1,903 | |
| Other comprehensive income (loss) | — | | | — | | | — | | | — | | | 46 | | | — | | | — | | | 46 | | | (2) | | | 44 | |
| Balance at December 31, 2023 | 1,619 | | | 162 | | | 24,637 | | | (2,059) | | | (274) | | | 184 | | | (5,773) | | | 16,693 | | | 10,617 | | | 27,310 | |
| Exercised and issued stock-based awards | 5 | | | — | | | 56 | | | — | | | — | | | 1 | | | — | | | 56 | | | — | | | 56 | |
| Stock-based compensation, including the tender of shares | — | | | — | | | 92 | | | — | | | — | | | 1 | | | (62) | | | 30 | | | (4) | | | 26 | |
| Treasury stock purchases | — | | | — | | | — | | | — | | | — | | | 1 | | | (59) | | | (59) | | | — | | | (59) | |
| Acquisition of additional ownership interest in Cerro Verde | — | | | — | | | (125) | | | — | | | — | | | — | | | — | | | (125) | | | (90) | | | (215) | |
| Dividends | — | | | — | | | (866) | | | — | | | — | | | — | | | — | | | (866) | | | (1,833) | | | (2,699) | |
| Change in consolidated subsidiary ownership interests | — | | | — | | | 3 | | | — | | | — | | | — | | | — | | | 3 | | | (1) | | | 2 | |
| | | | | | | | | | | | | | | | | | | |
| | | | | | | | | | | | | | | | | | | |
| | | | | | | | | | | | | | | | | | | |
| | | | | | | | | | | | | | | | | | | |
| Net income attributable to common stockholders | — | | | — | | | — | | | 1,889 | | | — | | | — | | | — | | | 1,889 | | | — | | | 1,889 | |
| Net income attributable to noncontrolling interests | — | | | — | | | — | | | — | | | — | | | — | | | — | | | — | | | 2,510 | | | 2,510 | |
| Other comprehensive loss | — | | | — | | | — | | | — | | | (40) | | | — | | | — | | | (40) | | | (2) | | | (42) | |
| Balance at December 31, 2024 | 1,624 | | | $ | 162 | | | $ | 23,797 | | | $ | (170) | | | $ | (314) | | | 187 | | | $ | (5,894) | | | $ | 17,581 | | | $ | 11,197 | | | $ | 28,778 | |
| | | | | | | | | | | | | | | | | | | |
|
The accompanying Notes to Consolidated Financial Statements are an integral part of these consolidated financial statements.
Freeport-McMoRan Inc.
NOTES TO CONSOLIDATED FINANCIAL STATEMENTS
NOTE 1. SUMMARY OF SIGNIFICANT ACCOUNTING POLICIES
Basis of Presentation. The consolidated financial statements of Freeport-McMoRan Inc. (FCX) include the accounts of those subsidiaries where it directly or indirectly has more than 50% of the voting rights and/or has control over the subsidiary. As of December 31, 2024, the most significant entities that FCX consolidates include its 48.76%-owned subsidiary PT Freeport Indonesia (PT-FI) and its wholly owned subsidiary, Freeport Minerals Corporation (FMC). Refer to Note 2 for further discussion, including FCX’s conclusion to consolidate PT-FI.
FMC’s unincorporated joint venture at Morenci is reflected using the proportionate consolidation method (refer to Note 2). Investments in unconsolidated companies over which FCX has the ability to exercise significant influence, but does not control, are accounted for under the equity method and include PT-FI’s investment in PT Smelting (refer to Note 2). Investments in unconsolidated companies owned less than 20%, and for which FCX does not exercise significant influence, are recorded at (i) fair value for those that have a readily determinable fair value or (ii) cost, less any impairment, for those that do not have a readily determinable fair value. All significant intercompany transactions have been eliminated. Dollar amounts in tables are stated in millions, except per share amounts.
Business Segments. FCX has organized its mining operations into four primary divisions – North America copper mines, South America operations, Indonesia operations and Molybdenum mines, and operating segments that meet certain thresholds are reportable segments. FCX’s reportable segments include the Morenci and Cerro Verde copper mines, the integrated Indonesia operations (including the Grasberg minerals district and PT-FI’s new smelter and precious metals refinery (PMR) - collectively - PT-FI’s new downstream processing facilities), the Rod & Refining operations and Atlantic Copper Smelting & Refining (Atlantic Copper, S.L.U. (Atlantic Copper)). Refer to Note 14 for further discussion.
Use of Estimates. The preparation of FCX’s financial statements in conformity with accounting principles generally accepted in the United States (U.S.) requires management to make estimates and assumptions that affect the amounts reported in these financial statements and accompanying notes. The more significant areas requiring the use of management estimates include mineral reserve estimation; asset lives for depreciation, depletion and amortization; environmental obligations; asset retirement obligations (AROs); estimates of recoverable copper in mill and leach stockpiles; deferred taxes and valuation allowances; reserves for contingencies and litigation; asset impairment, including estimates used to derive future cash flows associated with those assets; pension benefits; and valuation of derivative instruments. Actual results could differ from those estimates.
Functional Currency. The functional currency for the majority of FCX’s foreign operations is the U.S. dollar. For foreign subsidiaries whose functional currency is the U.S. dollar, monetary assets and liabilities denominated in the local currency are translated at current exchange rates, and non-monetary assets and liabilities, such as inventories, property, plant, equipment and mine development costs, are translated at historical exchange rates. Gains and losses resulting from translation of such account balances are included in other income, net, as are gains and losses from foreign currency transactions. Foreign currency net gains totaled $17 million in 2024, $20 million in 2023 and $9 million in 2022.
Cash and Cash Equivalents. Highly liquid investments purchased with maturities of three months or less are considered cash equivalents.
Restricted Cash and Cash Equivalents. Restricted cash and cash equivalents are classified as a current or long-term asset based on the timing and nature of when or how the cash is expected to be used or when the restrictions are expected to lapse. FCX’s restricted cash and cash equivalents are primarily related to a portion of PT-FI’s export proceeds required to be temporarily deposited in Indonesia banks for 90 days in accordance with Indonesia regulations, assurance bonds to support PT-FI’s commitment for smelter development in Indonesia, and guarantees and commitments for certain mine closure obligations. Refer to Notes 10 and 12 for further information.
Inventories. Inventories include product, materials and supplies, and mill and leach stockpiles. Inventories are stated at the lower of weighted-average cost or net realizable value (NRV).
Product. Product inventories represent copper, gold, and molybdenum products in various salable forms that are valued based on the weighted-average cost of source material plus applicable conversion costs at our processing facilities. Product inventories include labor and benefits, supplies, energy, depreciation, depletion, amortization, site overhead costs and other necessary costs associated with the extraction and processing of ore, such as mining, milling, smelting, leaching, solution extraction and electrowinning (SX/EW), refining, roasting and chemical processing. Product inventories exclude corporate general and administrative costs.
Materials and Supplies, net. Materials and supplies inventory of $2.4 billion at December 31, 2024, and $2.2 billion at December 31, 2023, is net of obsolescence reserves totaling $54 million at December 31, 2024, and $41 million at December 31, 2023.
Mill and Leach Stockpiles. Mill and leach stockpiles are work-in-process inventories for FCX’s mining operations. Estimated metals in stockpiles not expected to be recovered within the next 12 months are classified as long-term. Mill and leach stockpiles contain ore that has been extracted from an ore body and is available for metal recovery. Mill stockpiles contain sulfide ores, and recovery of metal is through milling, concentrating and smelting and refining or, alternatively, by concentrate leaching. Leach stockpiles contain oxide ores and certain secondary sulfide ores and recovery of metal is through exposure to acidic solutions that dissolve contained copper and deliver it in solution to extraction processing facilities (i.e., SX/EW). The recorded cost of mill and leach stockpiles includes mining and haulage costs incurred to deliver ore to stockpiles, depreciation, depletion, amortization and site overhead costs. Material is removed from the stockpiles at a weighted-average cost per pound. Each mine site maintains one work-in-process balance on a weighted-average cost basis for each process (i.e., leach, mill or concentrate leach) regardless of the number of stockpile systems at that site.
Because it is impracticable to determine copper contained in mill and leach stockpiles by physical count, reasonable estimation methods are employed. The quantity of material delivered to mill and leach stockpiles is based on surveyed volumes of mined material and daily production records. Sampling and assaying of blasthole cuttings determine the estimated copper grade of the material delivered to mill and leach stockpiles.
Expected copper recoveries for mill stockpiles are determined by metallurgical testing. The recoverable copper in mill stockpiles, once entered into the production process, can be produced into copper concentrate almost immediately.
Expected copper recoveries for leach stockpiles are determined using small-scale laboratory tests, small- to large-scale column testing (which simulates the production process), historical trends and other factors, including mineralogy of the ore and rock type. Total copper recovery in leach stockpiles can vary significantly from a low percentage to more than 80% depending on several variables, including processing methodology, processing variables, mineralogy and particle size of the rock. For newly placed material on active stockpiles, as much as 80% of the total copper recovery may occur during the first year, and the remaining copper may be recovered over many years.
Process rates and copper recoveries for mill and leach stockpiles are monitored regularly, and recovery estimates are adjusted annually based on new information and as related technology and processing methods change. Recovery adjustments will typically result in a future impact to the value of the material removed from the stockpiles at a revised weighted-average cost per pound of recoverable copper. For example, an increase in recovery rates increases recoverable copper in the leach stockpiles resulting in a lower weighted-average cost per pound of recoverable copper and a decrease in recovery rates decreases recoverable copper in the leach stockpiles and results in a higher weighted-average cost per pound of recoverable copper.
Based on an annual review of mill and leach stockpiles, FCX increased its estimated consolidated recoverable copper in certain leach stockpiles, net of joint venture interests, by 164 million pounds in 2024 and 73 million pounds in 2023. These revised estimates did not have a material impact on the weighted-average cost per pound of recoverable copper or FCX’s consolidated site production and delivery costs in 2024 or 2023.
Property, Plant, Equipment and Mine Development Costs. Property, plant, equipment and mine development costs are carried at cost. Mineral exploration costs, as well as drilling and other costs incurred for the purpose of converting mineral resources to proven and probable mineral reserves or identifying new mineral resources at development or production stage properties, are charged to expense as incurred. Development costs are capitalized beginning after proven and probable mineral reserves have been established. Development costs include costs incurred resulting from mine pre-production activities undertaken to gain access to proven and probable mineral reserves, including shafts, adits, drifts, ramps, permanent excavations, infrastructure and removal of overburden. For underground mines certain costs related to panel development, such as undercutting and drawpoint development, are also capitalized as mine development costs until production reaches sustained design capacity for the mine. After reaching design capacity, the underground mine transitions to the production phase and panel development costs are allocated to inventory and included as a component of production and delivery costs. Additionally, interest expense allocable to the cost of developing mines and to constructing new facilities is capitalized until assets are ready for their intended use.
Expenditures for replacements and improvements are capitalized. Costs related to periodic scheduled maintenance (i.e., turnarounds) are charged to expense as incurred. Depreciation for mining and milling life-of-mine assets, infrastructure and other common costs is determined using the unit-of-production (UOP) method based on total estimated recoverable proven and probable copper reserves (for primary copper mines) and proven and probable molybdenum reserves (for primary molybdenum mines). Development costs and acquisition costs for proven and probable mineral reserves that relate to a specific ore body are depreciated using the UOP method based on estimated recoverable proven and probable mineral reserves for the ore body benefited. Depreciation, depletion and amortization using the UOP method is recorded upon extraction of the recoverable copper or molybdenum from the ore body or production of finished goods (as applicable), at which time it is allocated to inventory cost and then included as a component of production and delivery costs. Other assets are depreciated on a straight-line basis over estimated useful lives for the related assets of up to 50 years for buildings and 3 to 50 years for machinery and equipment, and mobile equipment.
Included in property, plant, equipment and mine development costs is value beyond proven and probable mineral reserves (VBPP), primarily resulting from FCX’s acquisition of FMC. The concept of VBPP may be interpreted differently by different mining companies. FCX’s VBPP is attributable to (i) measured and indicated mineral resources that FCX believes could be brought into production with the establishment or modification of required permits and should market conditions and technical assessments warrant, (ii) inferred mineral resources and (iii) exploration potential.
Carrying amounts assigned to VBPP are not charged to expense until the VBPP becomes associated with additional proven and probable mineral reserves and the reserves are produced or the VBPP is determined to be impaired. Additions to proven and probable mineral reserves for properties with VBPP will carry with them the value assigned to VBPP at the date acquired, less any impairment amounts. Refer to Note 3 for further discussion.
Impairment of Long-Lived Mining Assets. FCX assesses the carrying values of its long-lived mining assets for impairment when events or changes in circumstances indicate that the related carrying amounts of such assets may not be recoverable. In evaluating long-lived mining assets for recoverability, estimates of pre-tax undiscounted future cash flows of FCX’s individual mines are used. An impairment is considered to exist if total estimated undiscounted future cash flows are less than the carrying amount of the asset. Once it is determined that an impairment exists, an impairment loss is measured as the amount by which the asset carrying value exceeds its fair value. The estimated undiscounted cash flows used to assess recoverability of long-lived assets and to measure the fair value of FCX’s mining operations are derived from current business plans, which are developed using near-term price forecasts reflective of the current price environment and management’s projections for long-term average metal prices. In addition to near- and long-term metal price assumptions, other key assumptions include estimates of commodity-based and other input costs; proven and probable mineral reserves estimates, including the timing and cost to develop and produce the reserves; VBPP estimates; and the use of appropriate discount rates in the measurement of fair value. FCX believes its estimates and models used to determine fair value are similar to what a market participant would use. As quoted market prices are unavailable for FCX’s individual mining operations, fair value is determined through the use of after-tax discounted estimated future cash flows (i.e., Level 3 measurement).
Deferred Mining Costs. Stripping costs (i.e., the costs of removing overburden and waste material to access mineral deposits) incurred during the production phase of an open-pit mine are considered variable production costs and are included as a component of inventory produced during the period in which stripping costs are incurred. Major development expenditures, including stripping costs to prepare unique and identifiable areas outside the current mining area for future production that are considered to be pre-production mine development, are capitalized and amortized using the UOP method based on estimated recoverable proven and probable mineral reserves for the ore body benefited. However, where a second or subsequent pit or major expansion is considered to be a continuation of existing mining activities, stripping costs are accounted for as a current production cost and a component of the associated inventory.
Environmental Obligations. Environmental expenditures are charged to expense or capitalized, depending upon their future economic benefits. Accruals for such expenditures are recorded when it is probable that obligations have been incurred and the costs can be reasonably estimated. Environmental obligations attributed to the Comprehensive Environmental Response, Compensation, and Liability Act of 1980 (CERCLA) or analogous state programs are considered probable when a claim is asserted, or is probable of assertion, and FCX, or any of its subsidiaries, have been associated with the site. Other environmental remediation obligations are considered probable based on specific facts and circumstances. FCX’s estimates of these costs are based on an evaluation of various factors, including currently available facts, existing technology, presently enacted laws and regulations, remediation experience, whether or not FCX is a potentially responsible party (PRP) and the ability of other PRPs to pay their allocated portions. With the exception of those obligations assumed in the acquisition of FMC that were initially recorded at estimated fair values (refer to Note 10 for further discussion), environmental obligations are recorded on an undiscounted basis. Where the available information is sufficient to estimate the amount of the obligation, that estimate has been used. Where the information is only sufficient to establish a range of probable liability and no point within the range is more likely than any other, the lower end of the range has been used. Possible recoveries of some of these costs from other parties are not recognized in the consolidated financial statements until they become probable. Legal costs associated with environmental remediation (such as fees to third-party legal firms for work relating to determining the extent and type of remedial actions and the allocation of costs among PRPs) are included as part of the estimated obligation.
Environmental obligations assumed in the 2007 acquisition of FMC, which were initially recorded at fair value and estimated on a discounted basis, are accreted to full value over time through charges to interest expense. Adjustments arising from changes in amounts and timing of estimated costs and settlements may result in increases and decreases in these obligations and are calculated in the same manner as they were initially estimated. Unless these adjustments qualify for capitalization, changes in environmental obligations are charged to operating income when they occur.
FCX performs a comprehensive review of its environmental obligations annually and also reviews changes in facts and circumstances associated with these obligations at least quarterly.
Asset Retirement Obligations. FCX records the fair value of estimated AROs associated with tangible long-lived assets in the period incurred. AROs associated with long-lived assets are those for which there is a legal obligation to settle under existing or enacted law, statute, written or oral contract or by legal construction. These obligations, which are initially estimated based on discounted cash flow estimates, are accreted to full value over time through charges to production and delivery costs. In addition, asset retirement costs (ARCs) are capitalized as part of the related asset’s carrying value and are depreciated over the asset’s useful life.
For mining operations, reclamation costs for disturbances are recognized as an ARO and as a related ARC in the period of the disturbance and depreciated primarily on a UOP basis. FCX’s AROs for mining operations consist primarily of costs associated with mine reclamation and closure activities. These activities, which are site specific, generally include costs for earthwork, revegetation, water treatment and demolition.
For non-operating properties and operating mines whose reclamation-related assets have been fully depreciated, changes to the ARO are recorded in production and delivery costs.
At least annually, FCX reviews its ARO estimates for changes in the projected timing of certain reclamation and closure/restoration costs, changes in cost estimates and additional AROs incurred during the period. Refer to Note 10 for further discussion.
Revenue Recognition. FCX recognizes revenue for its products upon transfer of control in an amount that reflects the consideration it expects to receive in exchange for those products. Transfer of control is in accordance with the terms of customer contracts, which is generally upon shipment or delivery of the product. While payment terms vary by contract, terms generally include payment to be made within 30 days, but not longer than 60 days. Certain of FCX’s concentrate and cathode sales contracts also provide for provisional pricing, which is accounted for as an embedded derivative (refer to Note 12 for further discussion). For provisionally priced sales, 90% to 100% of the provisional invoice amount is collected upon shipment or within 20 days, and final balances are settled in a contractually specified future month (generally one to four months from the shipment date) based on quoted monthly average copper settlement prices on the London Metal Exchange (LME) or the Commodity Exchange Inc. (COMEX), and quoted monthly average London Bullion Market Association (London) PM gold prices.
FCX’s product revenues are also recorded net of treatment charges, royalties and export duties. Moreover, because a portion of the metals contained in copper concentrate is unrecoverable as a result of the smelting process, FCX’s revenues from concentrate sales are also recorded net of allowances based on the quantity and value of these unrecoverable metals. These allowances are a negotiated term of FCX’s contracts and vary by customer. Treatment and refining charges represent payments or price adjustments to smelters and refiners that are generally fixed. Refer to Note 14 for a summary of revenue by product type.
Gold sales are priced according to individual contract terms, generally the average London PM gold price for a specified month near the month of shipment.
The majority of FCX’s molybdenum sales are priced based on the Platts Metals Daily Molybdenum Dealer Oxide weekly average price, plus conversion premiums for products that undergo additional processing, such as ferromolybdenum and molybdenum chemical products, for the month prior to the month of shipment.
Stock-Based Compensation. Compensation costs for share-based payments to employees are measured at fair value and charged to expense over the requisite service period for awards that are expected to vest. The fair value of stock options is determined using the Black-Scholes-Merton option valuation model. The fair value for stock-settled restricted stock units (RSUs) is based on FCX’s stock price on the date of grant. Shares of common stock are issued at the vesting date for stock-settled RSUs. The fair value of performance share units (PSUs) are determined using FCX’s stock price and a Monte-Carlo simulation model. The fair value for liability-classified awards (i.e., cash-settled RSUs) is remeasured each reporting period using FCX’s stock price. FCX has elected to recognize compensation costs for stock option awards that vest over several years on a straight-line basis over the vesting period, and for RSUs using the graded-vesting method over the vesting period. Refer to Note 8 for further discussion.
Earnings Per Share. FCX calculates its basic net income per share of common stock under the two-class method and calculates its diluted net income per share of common stock using the more dilutive of the two-class method or the treasury-stock method. Basic net income per share of common stock was computed by dividing net income attributable to common stockholders (after deducting undistributed dividends and earnings allocated to participating securities) by the weighted-average shares of common stock outstanding during the year. Diluted net income per share of common stock was calculated by including the basic weighted-average shares of common stock outstanding adjusted for the effects of all potential dilutive shares of common stock, unless their effect would be antidilutive.
Reconciliations of net income and weighted-average shares of common stock outstanding for purposes of calculating basic and diluted net income per share for the years ended December 31 follow:
| | | | | | | | | | | | | | | | | | | | |
| | 2024 | | 2023 | | 2022 | |
| Net income | $ | 4,399 | | | $ | 3,751 | | | $ | 4,479 | | |
| Net income attributable to noncontrolling interests | (2,510) | | | (1,903) | | | (1,011) | | |
| | | | | | |
| Undistributed dividends and earnings allocated to participating securities | (6) | | | (6) | | | (7) | | |
| | | | | | |
| | | | | | |
| | | | | | |
| | | | | | |
| | | | | | |
| | | | | | |
| Net income attributable to common stockholders | $ | 1,883 | | | $ | 1,842 | | | $ | 3,461 | | |
| | | | | | |
| (shares in millions) | | | | | | |
| Basic weighted-average shares of common stock outstanding | 1,438 | | | 1,434 | | | 1,441 | | |
| Add shares issuable upon exercise or vesting of dilutive stock options, PSUs and RSUs | 7 | | | 9 | |
| 10 | | |
| | | | | | |
| | | | | | |
| Diluted weighted-average shares of common stock outstanding | 1,445 | | | 1,443 | | | 1,451 | | |
| | | | | | |
| | | | | | |
| Net income per share attributable to common stockholders: | | | | | | |
| Basic | $ | 1.31 | | | $ | 1.28 | | | $ | 2.40 | | |
| | | | | | |
| | | | | | |
| | | | | | |
| Diluted | $ | 1.30 | | | $ | 1.28 | | | $ | 2.39 | | |
| | | | | | |
| | | | | | |
| | | | | | |
| | | | | | |
| | | | | | |
| | | | | | |
Outstanding stock options with exercise prices greater than the average market price of FCX’s common stock during the year are excluded from the computation of diluted net income per share of common stock. Excluded shares of common stock associated with outstanding stock options totaled less than 1 million shares in 2024 and 2023 and 1 million shares in 2022.
Global Intangible Low-Taxed Income (GILTI). FCX has elected to treat taxes due on future U.S. inclusions in taxable income related to GILTI as a current period expense when incurred.
New Accounting Standards. We did not adopt any new accounting standards in 2024 that had a material impact on our consolidated financial statements.
Segment Reporting. In November 2023, the Financial Accounting Standards Board (FASB) issued an accounting standards update (ASU) related to segment reporting that requires disclosure of significant segment expenses that are regularly provided to the chief operating decision maker (CODM) and included within each reported measure of segment profit or loss, the title and position of the CODM, and an explanation of how the CODM uses the reported measure(s) of segment profit or loss in assessing segment performance and deciding how to allocate resources. This ASU is effective for FCX’s consolidated financial statements for the year ended December 31, 2024, and subsequent interim consolidated financial statements, and did not materially impact FCX’s segment reporting as presented within Note 14.
Income Taxes. In December 2023, the FASB issued an ASU requiring enhancements to disclosures related to income taxes, including the rate reconciliation and information on income taxes paid. This ASU is effective for FCX’s consolidated financial statements for the year ended December 31, 2025.
Disaggregation of Expenses. In November 2024, the FASB issued an ASU requiring entities to provide disaggregated disclosures of specified categories of expenses that are included in relevant line items on the face of the income statement, including: purchases of inventory, employee compensation, depreciation, intangible asset amortization and depletion. This ASU is effective for FCX’s consolidated financial statements for the year ended December 31, 2027, and subsequent interim consolidated financial statements.
Subsequent Events. FCX evaluated events after December 31, 2024, and through the date the consolidated financial statements were issued, and determined any events or transactions occurring during this period that would require recognition or disclosure are appropriately addressed in these consolidated financial statements.
NOTE 2. OWNERSHIP IN SUBSIDIARIES AND JOINT VENTURES
Ownership in Subsidiaries. FCX owns 100% of FMC. FMC produces copper and molybdenum from mines in North America and South America. At December 31, 2024, FMC’s operating mines in North America were Morenci, Bagdad, Safford (including Lone Star), Sierrita and Miami located in Arizona; Tyrone and Chino located in New Mexico; and Henderson and Climax located in Colorado. FMC has a 72% interest in Morenci (refer to “Joint Ventures. Sumitomo and SMM Morenci, Inc.”) and owns 100% of the other North America mines. At December 31,
2024, operating mines in South America were Cerro Verde (55.08% owned - refer to “Cerro Verde” below) located in Peru and El Abra (51% owned) located in Chile. At December 31, 2024, FMC’s net assets totaled $17.4 billion and its accumulated deficit totaled $13.5 billion. FCX had no loans to FMC outstanding at December 31, 2024 and 2023.
FCX owns 48.76% of PT-FI (refer to “PT-FI Divestment” below). At December 31, 2024, PT-FI’s net assets totaled $16.6 billion and its retained earnings totaled $12.1 billion. FCX had no loans to PT-FI outstanding at December 31, 2024 and 2023.
FCX owns 100% of Atlantic Copper (FCX’s smelting and refining unit in Spain). At December 31, 2024, Atlantic Copper’s net assets totaled $132 million and its accumulated deficit totaled $407 million. FCX had loans to Atlantic Copper outstanding totaling $644 million at December 31, 2024, and $611 million at December 31, 2023.
Cerro Verde. In September 2024, FCX purchased 5.3 million shares of Cerro Verde common stock for a total cost of $210 million, increasing FCX’s ownership interest in Cerro Verde to 55.08% from 53.56%. As a result of the transaction, the carrying value of Cerro Verde’s noncontrolling interest was reduced by $90 million, with $125 million recorded to capital in excess to par value, including a $5 million deferred tax impact.
PT-FI Divestment. On December 21, 2018, FCX completed the transaction with the Indonesia government regarding PT-FI’s long-term mining rights and share ownership (the 2018 Transaction). Pursuant to the divestment agreement and related documents, PT Mineral Industri Indonesia (MIND ID), an Indonesia state-owned enterprise, acquired all of Rio Tinto plc’s (Rio Tinto) interests associated with its joint venture with PT-FI (the former Rio Tinto Joint Venture) and 100% of FCX’s interests in PT Indonesia Papua Metal Dan Mineral (PTI).
In connection with the 2018 Transaction, PT-FI acquired all of the common stock of PT Rio Tinto Indonesia that held the former Rio Tinto Joint Venture interest. After the 2018 Transaction, MIND ID’s (26.24%) and PTI’s (25.00%) collective share ownership of PT-FI totals 51.24% and FCX’s share ownership totals 48.76%. The arrangements provide for FCX and the other pre-transaction PT-FI shareholders (i.e., MIND ID) to retain the economics of the revenue and cost sharing arrangements under the former Rio Tinto Joint Venture. As a result, FCX’s economic interest, including the attribution of net income or loss and dividends paid, in PT-FI approximated 81% through 2022 and is 48.76% in 2023 and thereafter (see “Attribution of PT-FI Net Income or Loss” below).
FCX, PT-FI, PTI and MIND ID entered into a shareholders agreement (the PT-FI Shareholders Agreement), which includes provisions related to the governance and management of PT-FI. FCX considered the terms of the PT-FI Shareholders Agreement and related governance structure, including whether MIND ID has substantive participating rights, and concluded that FCX has retained control and would continue to consolidate PT-FI in its financial statements following the 2018 Transaction. Among other terms, the governance arrangements under the PT-FI Shareholders Agreement transfers control over the management of PT-FI’s mining operations to an operating committee, which is controlled by FCX. Additionally, as discussed above, the existing PT-FI shareholders retained the economics of the revenue and cost sharing arrangements under the former Rio Tinto Joint Venture, so that FCX’s economic interest in the project through 2041 will not be significantly affected by the 2018 Transaction. FCX believes its conclusion to continue to consolidate PT-FI in its financial statements is in accordance with the U.S. Securities and Exchange Commission (SEC) Regulation S-X, Rule 3A-02 (a), which provides for situations in which consolidation of an entity, notwithstanding the lack of majority ownership, is necessary to present fairly the financial position and results of operations of the registrant, because of the existence of a parent-subsidiary relationship by means other than recorded ownership of voting stock.
Attribution of PT-FI Net Income or Loss. FCX concluded that the attribution of PT-FI’s net income or loss from December 21, 2018 (the date of the divestment transaction), through December 31, 2022 (the Initial Period), should be based on FCX’s and MIND ID’s economic interest, as previously discussed. PT-FI’s cumulative net income during the Initial Period totaled $6.0 billion, of which $4.9 billion was attributed to FCX.
Beginning January 1, 2023, the attribution of PT-FI’s net income or loss is based on equity ownership percentages (48.76% for FCX, 26.24% for MIND ID and 25.00% for PTI), except for net income in 2023 associated with the sale of approximately 190,000 ounces of gold because PT-FI did not achieve the Gold Target (as defined in the PT-FI Shareholders Agreement), and net income in 2024 associated with the closure of its 2021 corporate income tax audit and resolution of the framework for Indonesia disputed tax matters (refer to Note 9), which were attributed approximately 81% to FCX. For all of its other partially owned consolidated subsidiaries, FCX attributes net income or loss based on equity ownership percentages.
Joint Ventures.
Sumitomo and SMM Morenci, Inc. FMC owns a 72% undivided interest in Morenci via an unincorporated joint venture. The remaining 28% is owned by Sumitomo (15%) and SMM Morenci, Inc. (13%). Each partner takes in kind its share of Morenci’s production. FMC purchased 15 million pounds during 2024 and 46 million pounds during 2023 of Morenci’s copper cathode from Sumitomo and SMM Morenci, Inc. at market prices for $63 million and $177 million, respectively. FMC had receivables from Sumitomo and SMM Morenci, Inc. totaling $23 million at December 31, 2024, and $17 million at December 31, 2023.
PT Smelting. PT Smelting is an Indonesia company that owns a copper smelter and refinery in Gresik, Indonesia. In 1996, PT-FI entered into a joint venture and shareholder agreement with Mitsubishi Materials Corporation (MMC) to jointly construct the PT Smelting facilities. PT Smelting commenced operations in 1999. In December 2023, PT Smelting completed the expansion of its capacity by 30% to process approximately 1.3 million metric tons of copper concentrate per year. The project was funded by PT-FI with loans totaling $254 million that converted to equity effective June 30, 2024, increasing PT-FI’s common stock ownership in PT Smelting to 66% from 39.5%. MMC owns the remaining 34% of PT Smelting’s outstanding common stock and serves as the operator of the facilities.
FCX has determined that PT Smelting is a variable interest entity, however, as mutual consent of both PT-FI and MMC is required to make the decisions that most significantly impact the economic performance of PT Smelting, PT-FI is not the primary beneficiary. As PT-FI has the ability to exercise significant influence over PT Smelting, PT-FI is continuing to account for its investment in PT Smelting under the equity method (refer to Note 4).
PT-FI’s maximum exposure to loss is its investment in PT Smelting (refer to Note 4). PT-FI’s equity in PT Smelting’s earnings totaled $8 million in 2024, $10 million in 2023 and $24 million in 2022.
Beginning January 1, 2023, PT-FI’s commercial arrangement with PT Smelting changed from a copper concentrate sales agreement to a tolling arrangement. Under this arrangement, PT-FI pays PT Smelting a tolling fee to smelt and refine its copper concentrate and PT-FI retains title to all products for sale to third parties (i.e., there are no further sales from PT-FI to PT Smelting). PT-FI recorded tolling-related charges of $326 million in 2024 and $183 million in 2023.
NOTE 3. PROPERTY, PLANT, EQUIPMENT AND MINE DEVELOPMENT COSTS, NET
The components of net property, plant, equipment and mine development costs follow:
| | | | | | | | | | | |
| | December 31, |
| | 2024 | | 2023 |
| Proven and probable mineral reserves | $ | 7,159 | | | $ | 7,160 | |
| VBPP | 358 | | | 359 | |
| Mine development and other | 12,828 | | | 12,265 | |
| Buildings and infrastructure | 10,667 | | | 10,165 | |
| Machinery and equipment | 16,337 | | | 15,246 | |
| Mobile equipment | 5,597 | | | 4,986 | |
| Construction in progress | 9,364 | | | 6,945 | |
| Oil and gas properties | 27,485 | | | 27,441 | |
| Total | 89,795 | | | 84,567 | |
Accumulated depreciation, depletion and amortizationa | (51,281) | | | (49,272) | |
| Property, plant, equipment and mine development costs, net | $ | 38,514 | | | $ | 35,295 | |
a.Includes accumulated amortization for oil and gas properties of $27.4 billion at December 31, 2024 and 2023.
FCX recorded $1.6 billion for VBPP in connection with its 2007 acquisition of FMC (excluding $0.6 billion associated with mining operations that were subsequently sold) and transferred $0.8 billion to proven and probable mineral reserves through 2024 (approximately $1 million in both 2024 and 2023). Cumulative impairments of and adjustments to VBPP total $0.5 billion, which were primarily recorded in 2008.
Capitalized interest, which primarily related to FCX’s mining operations’ capital projects, including the construction and development of PT-FI’s new downstream processing facilities, totaled $391 million in 2024, $267 million in 2023 and $150 million in 2022.
During the three-year period ended December 31, 2024, no material impairments of FCX’s long-lived mining assets were recorded.
NOTE 4. OTHER ASSETS
The components of other assets follow:
| | | | | | | | | | | |
| | December 31, |
| | 2024 | | 2023 |
Intangible assetsa | $ | 428 | | | $ | 422 | |
Legally restricted trust assetsb | 217 | | | 212 | |
Disputed tax assessments:c | | | |
| Cerro Verde | 275 | | | 274 | |
| PT-FI | 10 | | | 10 | |
| Investments: | | | |
PT Smeltingd | 354 | | | 123 | |
| Fixed income, equity securities and other | 102 | | | 84 | |
Restricted time depositse | 100 | | | 97 | |
| | | |
| Cloud computing arrangements | 151 | | | 76 | |
Long-term receivable for taxesf | 43 | | | 70 | |
| Long-term employee receivables | 24 | | | 26 | |
| Prepaid rent and deposits | 9 | | | 39 | |
Loans to PT Smelting for expansiond | — | | | 233 | |
Contingent consideration associated with sales of assetsg | — | | | 38 | |
| | | |
| | | |
| Other | 100 | | | 106 | |
| Total other assets | $ | 1,813 | | | $ | 1,810 | |
a.Indefinite-lived intangible assets totaled $214 million at December 31, 2024 and 2023. Definite-lived intangible assets totaled $214 million at December 31, 2024, and $208 million at December 31, 2023, which were net of accumulated amortization totaling $46 million and $43 million, respectively.
b.Reflects amounts held in trusts for AROs related to properties in New Mexico (refer to Note 10).
c.Refer to Note 10.
d.Refer to Note 2.
e.Relates to PT-FI’s regulatory commitments (refer to Notes 10 and 12).
f.Includes tax overpayments and refunds not expected to be realized within the next 12 months.
g.Refer to Note 13.
NOTE 5. ACCOUNTS PAYABLE AND ACCRUED LIABILITIES
The components of accounts payable and accrued liabilities follow:
| | | | | | | | | | | |
| | December 31, |
| | 2024 | | 2023 |
| Accounts payable | $ | 2,789 | | | $ | 2,466 | |
| Salaries, wages and other compensation | 361 | | | 343 | |
Accrued interesta | 135 | | | 146 | |
Pension, postretirement, postemployment and other employee benefitsb | 128 | | | 129 | |
Leasesb,c | 98 | | | 84 | |
| Deferred revenue | 91 | | | 161 | |
| Accrued taxes, other than income taxes | 81 | | | 88 | |
| Community development programs | 75 | | | 58 | |
PT-FI administrative fined | 59 | | | 55 | |
PT-FI contingenciese | 49 | | | 67 | |
MIND ID indemnificationf | 49 | | | — | |
| Litigation accruals | 34 | | | 51 | |
| | | |
| | | |
| | | |
| Other | 108 | | | 81 | |
| Total accounts payable and accrued liabilities | $ | 4,057 | | | $ | 3,729 | |
a.Third-party interest paid, net of capitalized interest, was $206 million in 2024, $419 million in 2023 and $417 million in 2022.
b.Refer to Note 7 for long-term portion.
c.Refer to Note 11.
d.Refer to Note 10.
e.Primarily reflects Indonesia tax matters. Refer to Note 10.
f.Refer to Note 11. At December 31, 2023, the MIND ID indemnification balance was included in other long-term liabilities (refer to Note 7).
NOTE 6. DEBT
FCX’s debt at December 31, 2024, is net of reductions of $58 million ($67 million at December 31, 2023) for unamortized net discounts and unamortized debt issuance costs. The components of debt follow:
| | | | | | | | | | | |
| | December 31, |
| | 2024 | | 2023 |
| | | |
| Revolving credit facilities: | | | |
| FCX | $ | — | | | $ | — | |
| PT-FI | 250 | | | — | |
| Cerro Verde | — | | | — | |
| | | |
| Senior notes and debentures: | | | |
| Issued by FCX: | | | |
| 4.55% Senior Notes due 2024 | — | | | 730 | |
| 5.00% Senior Notes due 2027 | 449 | | | 448 | |
| 4.125% Senior Notes due 2028 | 484 | | | 483 | |
| 4.375% Senior Notes due 2028 | 431 | | | 430 | |
| 5.25% Senior Notes due 2029 | 469 | | | 468 | |
| 4.25% Senior Notes due 2030 | 447 | | | 446 | |
| 4.625% Senior Notes due 2030 | 589 | | | 588 | |
| 5.40% Senior Notes due 2034 | 724 | | | 723 | |
| 5.450% Senior Notes due 2043 | 1,688 | | | 1,689 | |
| Issued by PT-FI: | | | |
| 4.763% Senior Notes due 2027 | 747 | | | 746 | |
| 5.315% Senior Notes due 2032 | 1,491 | | | 1,490 | |
| 6.200% Senior Notes due 2052 | 745 | | | 744 | |
| Issued by FMC: | | | |
| 7 1/8% Debentures due 2027 | 115 | | | 115 | |
| 9 1/2% Senior Notes due 2031 | 119 | | | 121 | |
| 6 1/8% Senior Notes due 2034 | 119 | | | 118 | |
| | | |
| | | |
| | | |
| | | |
| | | |
| | | |
| | | |
| | | |
| | | |
| Other | 81 | | | 83 | |
| Total debt | 8,948 | | | 9,422 | |
| Less current portion of debt | (41) | | | (766) | |
| Long-term debt | $ | 8,907 | | | $ | 8,656 | |
Revolving Credit Facilities.
FCX. FCX and PT-FI have a $3.0 billion, unsecured revolving credit facility that matures in October 2027. Under the terms of the revolving credit facility, FCX may obtain loans and issue letters of credit in an aggregate amount of up to $3.0 billion, with a $1.5 billion sublimit on the issuance of letters of credit and a $500 million limit on PT-FI’s borrowing capacity. At December 31, 2024, there were no borrowings and $7 million in letters of credit issued under FCX’s revolving credit facility. Interest on loans made under the revolving credit facility may, at the option of FCX or PT-FI, be determined based on the Secured Overnight Financing Rate (SOFR) plus a spread to be determined by reference to a grid based on FCX’s credit rating.
The revolving credit facility contains customary affirmative covenants and representations, and also contains various negative covenants that, among other things and subject to certain exceptions, restrict the ability of FCX’s subsidiaries that are not borrowers or guarantors to incur additional indebtedness (including guarantee obligations) and the ability of FCX or FCX’s subsidiaries to: create liens on assets; enter into sale and leaseback transactions; engage in mergers, liquidations and dissolutions; and sell assets. In addition, the revolving credit facility contains a total leverage ratio financial covenant.
PT-FI. At December 31, 2024, PT-FI had $250 million in borrowings outstanding under its $1.75 billion senior unsecured revolving credit facility that matures in November 2028. PT-FI’s revolving credit facility is available for its general corporate purposes, including to fund PT-FI’s projects related to its new downstream processing facilities. Interest on loans made under PT-FI’s revolving credit facility are determined based on the SOFR plus a margin.
PT-FI’s revolving credit facility contains customary affirmative covenants and representations and also contains standard negative covenants that, among other things, restrict, subject to certain exceptions, the ability of PT-FI to incur additional indebtedness; create liens on assets; enter into sale and leaseback transactions; sell assets; and modify or amend the shareholders agreement or related governance structure. The credit facility also contains
financial covenants governing maximum total leverage and minimum interest expense coverage and other covenants addressing certain environmental and social compliance requirements.
Cerro Verde. At December 31, 2024, Cerro Verde had no borrowings outstanding under its $350 million senior unsecured revolving credit facility that matures in May 2027. Cerro Verde’s revolving credit facility contains customary representations and affirmative and negative covenants.
At December 31, 2024, FCX, PT-FI and Cerro Verde were in compliance with their respective credit facility’s covenants.
Senior Notes.
FCX. In November 2024, FCX repaid $0.7 billion for the balance of its maturing 4.55% Senior Notes.
In 2023, FCX purchased $0.2 billion aggregate principal amount of its senior notes in open-market transactions for a total cost of $0.2 billion and recorded gains on early extinguishment of debt of $10 million. In 2022, FCX purchased $1.1 billion aggregate principal amount of its senior notes in open market transactions for a total cost of $1.0 billion and recorded gains on early extinguishment of debt of $44 million. FCX has not purchased senior notes in open-market transactions since July 2023.
The senior notes listed below are redeemable in whole or in part, at the option of FCX, at specified redemption prices prior to the dates stated below and beginning on the dates stated below at 100% of principal.
| | | | | | | | |
| Debt Instrument | | Date |
| 5.00% Senior Notes due 2027 | | September 1, 2025 |
| 4.125% Senior Notes due 2028 | | March 1, 2026 |
| 4.375% Senior Notes due 2028 | | August 1, 2026 |
| 5.25% Senior Notes due 2029 | | September 1, 2027 |
| | |
| | |
The senior notes listed below are redeemable in whole or in part, at the option of FCX, at a make-whole redemption price prior to the dates stated below, at specified redemption prices beginning on the dates stated below, and at 100% of principal two years before maturity.
| | | | | | | | |
| Debt Instrument | | Date |
| | |
| | |
| | |
| | |
| 4.25% Senior Notes due 2030 | | March 1, 2025 |
| 4.625% Senior Notes due 2030 | | August 1, 2025 |
The senior notes listed below are redeemable in whole or in part, at the option of FCX, at a make-whole redemption price prior to the dates stated below and beginning on the dates stated below at 100% of principal.
| | | | | | | | |
| Debt Instrument | | Date |
| | |
| 5.40% Senior Notes due 2034 | | May 14, 2034 |
| 5.450% Senior Notes due 2043 | | September 15, 2042 |
FCX’s senior notes contain limitations on liens and rank equally with FCX’s other existing and future unsecured and unsubordinated indebtedness.
PT-FI. In April 2022, PT-FI completed the sale of $3.0 billion aggregate principal amount of unsecured senior notes, consisting of $750 million of 4.763% Senior Notes due 2027, $1.5 billion of 5.315% Senior Notes due 2032 and $750 million of 6.200% Senior Notes due 2052. PT-FI used $0.6 billion of the net proceeds to repay the borrowings under its term loan and recorded a loss on early extinguishment of debt of $10 million in 2022. PT-FI used the remaining net proceeds to finance its downstream processing facilities.
The senior notes listed below are redeemable in whole or in part, at the option of PT-FI, at a make-whole redemption price prior to the dates stated below and beginning on the dates stated below at 100% of principal.
| | | | | | | | |
| Debt Instrument | | Date |
| 4.763% Senior Notes due 2027 | | March 14, 2027 |
| 5.315% Senior Notes due 2032 | | January 14, 2032 |
| 6.200% Senior Notes due 2052 | | October 14, 2051 |
Maturities. Maturities of debt instruments based on the principal amounts outstanding at December 31, 2024, total $41 million in 2025, $5 million in 2026, $1.3 billion in 2027, $1.2 billion in 2028, $477 million in 2029 and $6.0 billion thereafter.
NOTE 7. OTHER LIABILITIES, INCLUDING EMPLOYEE BENEFITS
The components of other liabilities follow:
| | | | | | | | | | | |
| | December 31, |
| | 2024 | | 2023 |
Leasesa | $ | 692 | | | $ | 347 | |
Pension, postretirement, postemployment and other employment benefitsb | 689 | | | 704 | |
| Litigation accruals | 163 | | | 163 | |
| Provision for tax positions | 136 | | | 174 | |
| | | |
| | | |
| Social investment programs | 111 | | | 79 | |
Indemnification of MIND IDa | — | | | 75 | |
| | | |
| | | |
| Other | 96 | | | 106 | |
| Total other liabilities | $ | 1,887 | | | $ | 1,648 | |
a.Refer to Note 5 for current portion and Note 11 for further discussion.
b.Refer to Note 5 for current portion.
Pension Plans. Following is a discussion of FCX’s pension plans.
FMC Plans. FMC has U.S. trusteed, non-contributory pension plans covering some U.S. employees and some employees of its international subsidiaries hired before 2007. The applicable FMC plan design determines the manner in which benefits are calculated for any particular group of employees. Benefits are calculated based on final average monthly compensation and years of service or based on a fixed amount for each year of service. Non-bargained FMC employees hired after December 31, 2006, are not eligible to participate in the FMC U.S. pension plan. Effective September 1, 2020, the FMC Retirement Plan, the largest FMC plan, was amended such that participants no longer accrue any additional benefits.
FCX’s funding policy for these plans provides that contributions to pension trusts shall be at least equal to the minimum funding requirements of the Employee Retirement Income Security Act of 1974, as amended, for U.S. plans; or, in the case of international plans, the minimum legal requirements that may be applicable in the various countries. Additional contributions also may be made from time to time.
FCX’s primary investment objectives for the FMC plan assets held in a master trust (Master Trust) are to maintain funds sufficient to pay all benefit and expense obligations when due, minimize the volatility of the plan’s funded status to the extent practical, and to maintain prudent levels of risk consistent with the plan’s investment policy. The FMC plan assets are invested in a risk-mitigating portfolio, which is allocated among multiple fixed income managers. The current target allocation of the portfolio is long-duration credit (50%); long-duration U.S. government/credit (20%); core fixed income (22%); long-term U.S. Treasury Separate Trading of Registered Interest and Principal Securities (7%); and cash equivalents (1%).
The expected rate of return on plan assets is evaluated at least annually, taking into consideration asset allocation, historical and expected future performance on the types of assets held in the Master Trust, and the current economic environment. Based on these factors, FCX expects the pension assets will earn an average of 5.20% per annum beginning January 1, 2025, which is based on the target asset allocation and long-term capital market return expectations.
For estimation purposes, FCX assumes the long-term asset mix for these plans generally will be consistent with the current mix. Changes in the asset mix could impact the amount of recorded pension costs, the funded status of the
plans and the need for future cash contributions. A lower-than-expected return on assets also would decrease plan assets and increase the amount of recorded pension costs in future years. When calculating the expected return on plan assets, FCX uses the market value of assets.
Among the assumptions used to estimate the pension benefit obligation is a discount rate used to calculate the present value of expected future benefit payments for service to date. The discount rate assumption for FCX’s U.S. plans is designed to reflect yields on high-quality, fixed-income investments for a given duration. The determination of the discount rate for these plans is based on expected future benefit payments together with the Mercer Yield Curve – Above Mean. The Mercer Yield Curve – Above Mean is constructed from the bonds in the Mercer Pension Discount Curve that have a yield higher than the regression mean yield curve. The Mercer Yield Curve – Above Mean consists of spot (i.e., zero coupon) interest rates at one-half-year increments for each of the next 30 years and is developed based on pricing and yield information for high-quality corporate bonds. Changes in the discount rate are reflected in FCX’s benefit obligation and, therefore, in future pension costs.
SERP Plan. FCX has an unfunded Supplemental Executive Retirement Plan (SERP) for its Chairman of the Board. The SERP provides for retirement benefits payable in the form of a joint and survivor annuity, life annuity or an equivalent lump sum. The participant has elected to receive an equivalent lump sum payment. The payment will equal a percentage of the participant’s highest average compensation for any consecutive three-year period during the five years immediately preceding the completion of 25 years of credited service. The SERP benefit will be reduced by the value of all benefits from current and former retirement plans (qualified and nonqualified) sponsored by FCX, by FM Services Company, FCX’s wholly owned subsidiary, or by any predecessor employer (including FCX’s former parent company), except for benefits produced by accounts funded exclusively by deductions from the participant’s pay.
PT-FI Plan. PT-FI has a defined benefit pension plan denominated in Indonesia rupiah covering substantially all of its Indonesia national employees. PT-FI funds the plan and invests the assets in accordance with Indonesia pension guidelines. The pension obligation was valued at an exchange rate of 16,081 rupiah to one U.S. dollar on December 31, 2024, and 15,339 rupiah to one U.S. dollar on December 31, 2023. Indonesia labor laws require that companies provide a minimum severance to employees upon employment termination based on the reason for termination and the employee’s years of service. PT-FI’s pension benefit obligation includes benefits determined in accordance with this law. PT-FI’s expected rate of return on plan assets is evaluated at least annually, taking into consideration its long-range estimated return for the plan based on the asset mix. Based on these factors, PT-FI expects its pension assets will earn an average of 7% per annum beginning January 1, 2025. The discount rate assumption for PT-FI’s plan is based on the Indonesia Government Security Yield Curve. Changes in the discount rate are reflected in PT-FI’s benefit obligation and, therefore, in future pension costs.
Plan Information. FCX uses a measurement date of December 31 for its plans. Information for qualified and non-qualified plans where the projected benefit obligations and the accumulated benefit obligations exceed the fair value of plan assets follows:
| | | | | | | | | | | |
| | December 31, |
| | 2024 | | 2023 |
| Projected and accumulated benefit obligation | $ | 1,734 | | | $ | 1,828 | |
| | | |
| Fair value of plan assets | 1,379 | | | 1,475 | |
Information on the qualified and non-qualified FCX (FMC and SERP plans) and PT-FI plans as of December 31 follows:
| | | | | | | | | | | | | | | | | | | | | | | |
| FCX | | PT-FI |
| | 2024 | | 2023 | | 2024 | | 2023 |
| Change in benefit obligation: | | | | | | | |
| Benefit obligation at beginning of year | $ | 1,880 | | | $ | 1,884 | | | $ | 221 | | | $ | 215 | |
| Service cost | 16 | | | 15 | | | 12 | | | 11 | |
| Interest cost | 93 | | | 98 | | | 14 | | | 14 | |
| Actuarial (gains) losses | (76) | | | 15 | | | (3) | | | 3 | |
| Foreign exchange losses (gains) | — | | | 1 | | | (11) | | | 4 | |
| | | | | | | |
| | | | | | | |
| Benefits and administrative expenses paid | (133) | | | (133) | | | (23) | | | (27) | |
| Other | — | | | — | | | 3 | | | 1 | |
| Benefit obligation at end of year | 1,780 | | | 1,880 | | | 213 | | | 221 | |
| | | | | | | |
| Change in plan assets: | | | | | | | |
| Fair value of plan assets at beginning of year | 1,537 | | | 1,483 | | | 203 | | | 205 | |
| Actual return on plan assets | (31) | | | 121 | | | 1 | | | 11 | |
Employer contributionsa | 63 | | | 65 | | | 14 | | | 9 | |
| | | | | | | |
| Foreign exchange gains (losses) | — | | | 1 | | | (10) | | | 4 | |
| Benefits and administrative expenses paid | (133) | | | (133) | | | (23) | | | (26) | |
| Fair value of plan assets at end of year | 1,436 | | | 1,537 | | | 185 | | | 203 | |
| Funded status | $ | (344) | | | $ | (343) | | | $ | (28) | | | $ | (18) | |
| | | | | | | |
| Accumulated benefit obligation | $ | 1,780 | | | $ | 1,878 | | | $ | 165 | | | $ | 182 | |
| | | | | | | |
| Weighted-average assumptions used to determine benefit obligations: | | | | | | | |
| | | | | | | |
| Discount rate | 5.67 | % | | 5.15 | % | | 7.00 | % | | 6.75 | % |
| Rate of compensation increase | N/A | | N/A | | 4.00 | % | | 4.00 | % |
| | | | | | | |
| Balance sheet classification of funded status: | | | | | | | |
| Other assets | $ | 11 | | | $ | 9 | | | $ | — | | | $ | — | |
| Accounts payable and accrued liabilities | (3) | | | (3) | | | — | | | — | |
| Other liabilities | (352) | | | (349) | | | (28) | | | (18) | |
| Total | $ | (344) | | | $ | (343) | | | $ | (28) | | | $ | (18) | |
a.Employer contributions for 2025 are currently expected to approximate $64 million for the FCX plans and $11 million for the PT-FI plan (based on a December 31, 2024, exchange rate of 16,081 Indonesia rupiah to one U.S. dollar).
The actuarial gain of $76 million in 2024 and loss of $15 million in 2023 for the FCX pension plans primarily resulted from the changes in the discount rate, which were 5.67% at December 31, 2024, 5.15% at December 31, 2023, and 5.41% at December 31, 2022.
The weighted-average assumptions used to determine net periodic benefit cost and the components of net periodic benefit cost for FCX’s pension plans for the years ended December 31 follow:
| | | | | | | | | | | | | | | | | |
| | 2024 | | 2023 | | 2022 |
Weighted-average assumptions:a | | | | | |
| Discount rate | 5.15 | % | | 5.41 | % | | 2.85 | % |
| Expected return on plan assets | 5.75 | % | | 5.00 | % | | 3.00 | % |
| | | | | |
| Service cost | $ | 16 | | | $ | 15 | | | $ | 15 | |
| Interest cost | 93 | | | 98 | | | 71 | |
| Expected return on plan assets | (86) | | | (72) | | | (62) | |
| | | | | |
| Amortization of net actuarial losses | 13 | | | 15 | | | 15 | |
| Net periodic benefit cost | $ | 36 | | | $ | 56 | | | $ | 39 | |
a.The assumptions shown relate only to the FMC Retirement Plan.
The weighted-average assumptions used to determine net periodic benefit cost and the components of net periodic benefit cost for PT-FI’s pension plan for the years ended December 31 follow:
| | | | | | | | | | | | | | | | | |
| | 2024 | | 2023 | | 2022 |
| Weighted-average assumptions: | | | | | |
| Discount rate | 6.75 | % | | 7.00 | % | | 6.50 | % |
| Expected return on plan assets | 7.00 | % | | 7.00 | % | | 7.00 | % |
| Rate of compensation increase | 4.00 | % | | 4.00 | % | | 4.00 | % |
| | | | | |
| Service cost | $ | 12 | | | $ | 11 | | | $ | 12 | |
| Interest cost | 14 | | | 14 | | | 14 | |
| Expected return on plan assets | (13) | | | (14) | | | (15) | |
| Amortization of prior service cost | — | | | 2 | | | 1 | |
| Amortization of net actuarial gains | (1) | | | (1) | | | (1) | |
| Special termination benefit | — | | | 1 | | | 2 | |
| Net periodic benefit cost | $ | 12 | | | $ | 13 | | | $ | 13 | |
The service cost component of net periodic benefit cost is included in operating income, and the other components are included in other income, net in the consolidated statements of income.
Included in accumulated other comprehensive loss are the following amounts that have not been recognized in net periodic pension cost as of December 31:
| | | | | | | | | | | | | | | | | | | | | | | |
| 2024 | | 2023 |
| | Before Taxes | | After Taxes and Noncontrolling Interests | | Before Taxes | | After Taxes and Noncontrolling Interests |
| Net actuarial losses | $ | 421 | | | $ | 289 | | | $ | 382 | | | $ | 257 | |
| Prior service costs | (4) | | | (4) | | | (1) | | | (2) | |
| $ | 417 | | | $ | 285 | | | $ | 381 | | | $ | 255 | |
Plan assets are classified within a fair value hierarchy that prioritizes the inputs to valuation techniques used to measure fair value. The hierarchy gives the highest priority to unadjusted quoted prices in active markets for identical assets or liabilities (Level 1), then to prices derived using significant observable inputs (Level 2) and the lowest priority to prices derived using significant unobservable inputs (Level 3).
A summary of the fair value for pension plan assets, including those measured at net asset value (NAV) as a practical expedient, associated with the FCX plans follows:
| | | | | | | | | | | | | | | | | | | | | | | | | | | | | |
| | Fair Value at December 31, 2024 |
| | Total | | NAV | | Level 1 | | Level 2 | | Level 3 |
| Commingled/collective funds: | | | | | | | | | |
| | | | | | | | | |
| Fixed income securities | $ | 395 | | | $ | 395 | | | $ | — | | | $ | — | | | $ | — | |
| | | | | | | | | |
| | | | | | | | | |
| | | | | | | | | |
| | | | | | | | | |
| | | | | | | | | |
| | | | | | | | | |
| | | | | | | | | |
| | | | | | | | | |
| | | | | | | | | |
| | | | | | | | | |
| | | | | | | | | |
| | | | | | | | | |
| Short-term investments | 37 | | | 37 | | | — | | | — | | | — | |
| | | | | | | | | |
| Fixed income: | | | | | | | | | |
| Corporate bonds | 624 | | | — | | | — | | | 624 | | | — | |
| Government bonds | 238 | | | — | | | — | | | 238 | | | — | |
| | | | | | | | | |
| | | | | | | | | |
| Private equity investments | 68 | | | 68 | | | — | | | — | | | — | |
| Other investments | 57 | | | — | | | 1 | | | 56 | | | — | |
| Total investments | 1,419 | | | $ | 500 | | | $ | 1 | | | $ | 918 | | | $ | — | |
| | | | | | | | | |
| Cash and receivables | 20 | | | | | | | | | |
| Payables | (3) | | | | | | | | | |
| Total pension plan net assets | $ | 1,436 | | | | | | | | | |
| | | | | | | | | | | | | | | | | | | | | | | | | | | | | |
| | Fair Value at December 31, 2023 |
| | Total | | NAV | | Level 1 | | Level 2 | | Level 3 |
| Commingled/collective funds: | | | | | | | | | |
| | | | | | | | | |
| Fixed income securities | $ | 417 | | | $ | 417 | | | $ | — | | | $ | — | | | $ | — | |
| | | | | | | | | |
| | | | | | | | | |
| | | | | | | | | |
| | | | | | | | | |
| | | | | | | | | |
| | | | | | | | | |
| | | | | | | | | |
| | | | | | | | | |
| | | | | | | | | |
| Short-term investments | 24 | | | 24 | | | — | | | — | | | — | |
| | | | | | | | | |
| | | | | | | | | |
| | | | | | | | | |
| | | | | | | | | |
| | | | | | | | | |
| | | | | | | | | |
| | | | | | | | | |
| | | | | | | | | |
| Fixed income: | | | | | | | | | |
| Corporate bonds | 677 | | | — | | | — | | | 677 | | | — | |
| Government bonds | 276 | | | — | | | — | | | 276 | | | — | |
| | | | | | | | | |
| Private equity investments | 67 | | | 67 | | | — | | | — | | | — | |
| Other investments | 63 | | | — | | | 1 | | | 62 | | | — | |
| Total investments | 1,524 | | | $ | 508 | | | $ | 1 | | | $ | 1,015 | | | $ | — | |
| | | | | | | | | |
| Cash and receivables | 17 | | | | | | | | | |
| Payables | (4) | | | | | | | | | |
| Total pension plan net assets | $ | 1,537 | | | | | | | | | |
Following is a description of the pension plan asset categories included in the above tables and the valuation techniques used to measure fair value. There have been no changes to the techniques used to measure fair value.
Commingled/collective funds are managed by several fund managers and are valued at the NAV per unit of the fund. For most of these funds, the majority of the underlying assets are actively traded securities. These funds primarily require up to a two-business-day notice for redemptions.
Fixed income investments include corporate and government bonds held directly by the Master Trust. Fixed income securities are valued using a bid-evaluation price or a mid-evaluation price and, as such, are classified within Level 2 of the fair value hierarchy. A bid-evaluation price is an estimated price at which a dealer would pay for a security. A mid-evaluation price is the average of the estimated price at which a dealer would sell a security and the estimated price at which a dealer would pay for a security. These evaluations are based on quoted prices, if available, or models that use observable inputs.
Private equity investments are valued at NAV using information from general partners and have inherent restrictions on redemptions that may affect the ability to sell the investments at their NAV in the near term.
A summary of the fair value hierarchy for pension plan assets associated with the PT-FI plan follows:
| | | | | | | | | | | | | | | | | | | | | | | |
| | Fair Value at December 31, 2024 |
| | Total | | Level 1 | | Level 2 | | Level 3 |
| Government bonds | $ | 96 | | | $ | 96 | | | $ | — | | | $ | — | |
| Common stocks | 53 | | | 53 | | | — | | | — | |
| Mutual funds | 12 | | | 12 | | | — | | | — | |
| Total investments | 161 | | | $ | 161 | | | $ | — | | | $ | — | |
| | | | | | | |
Cash and receivablesa | 24 | | | | | | | |
| | | | | | | |
| Total pension plan net assets | $ | 185 | | | | | | | |
| | | | | | | | | | | | | | | | | | | | | | | |
| | Fair Value at December 31, 2023 |
| | Total | | Level 1 | | Level 2 | | Level 3 |
| Government bonds | $ | 102 | | | $ | 102 | | | $ | — | | | $ | — | |
| Common stocks | 67 | | | 67 | | | — | | | — | |
| Mutual funds | 12 | | | 12 | | | — | | | — | |
| Total investments | 181 | | | $ | 181 | | | $ | — | | | $ | — | |
| | | | | | | |
Cash and receivablesa | 22 | | | | | | | |
| | | | | | | |
| Total pension plan net assets | $ | 203 | | | | | | | |
a.Cash consists primarily of short-term time deposits.
Following is a description of the valuation techniques used for pension plan assets measured at fair value associated with the PT-FI plan. There have been no changes to the techniques used to measure fair value.
Government bonds, common stocks and mutual funds are valued at the closing price reported on the active market on which the individual securities are traded and, as such, are classified within Level 1 of the fair value hierarchy.
The techniques described above may produce a fair value calculation that may not be indicative of NRV or reflective of future fair values. Furthermore, while FCX believes its valuation techniques are appropriate and consistent with those used by other market participants, the use of different techniques or assumptions to determine the fair value of certain financial instruments could result in a different fair value measurement at the reporting date.
The expected benefit payments for FCX’s and PT-FI’s pension plans follow:
| | | | | | | | | | | |
| FCX | | PT-FIa |
| 2025 | $ | 126 | | | $ | 14 | |
| 2026 | 190 | | | 27 | |
| 2027 | 129 | | | 29 | |
| 2028 | 129 | | | 31 | |
| 2029 | 129 | | | 28 | |
| 2030 through 2034 | 633 | | | 133 | |
a.Based on a December 31, 2024, exchange rate of 16,081 Indonesia rupiah to one U.S. dollar.
Postretirement and Other Benefits. FCX also provides postretirement medical and life insurance benefits for certain U.S. employees and, in some cases, employees of certain international subsidiaries. These postretirement benefits vary among plans, and many plans require contributions from retirees. The expected cost of providing such postretirement benefits is accrued during the years employees render service.
The benefit obligation (funded status) for the postretirement medical and life insurance benefit plans consisted of a current portion of $5 million (included in accounts payable and accrued liabilities) and a long-term portion of $31 million (included in other liabilities) at December 31, 2024, and a current portion of $5 million and a long-term portion of $34 million at December 31, 2023.
FCX has a number of postemployment plans covering severance, long-term disability income, continuation of health and life insurance coverage for disabled employees or other welfare benefits. The accumulated postemployment benefit obligation consisted of a current portion of $7 million (included in accounts payable and accrued liabilities) and a long-term portion of $43 million (included in other liabilities) at December 31, 2024, and a current portion of $7 million and a long-term portion of $46 million at December 31, 2023.
FCX also sponsors a retirement savings plan for most of its U.S. employees. The plan allows employees to contribute a portion of their income in accordance with specified guidelines. The savings plan is a qualified 401(k) plan for all U.S. salaried and non-bargained hourly employees. Participants exercise control and direct the investment of their contributions and account balances among various investment options under the plan. FCX contributes to the plan and matches a percentage of employee contributions up to certain limits. For employees whose eligible compensation exceeds certain levels, FCX provides a nonqualified unfunded defined contribution plan, which had a liability balance of $69 million at December 31, 2024, and $62 million at December 31, 2023, all of which was included in other liabilities.
The costs charged to operations for the employee savings plan totaled $131 million in 2024, $119 million in 2023 and $101 million in 2022. FCX has other employee benefit plans, certain of which are related to FCX’s financial results, which are recognized in operating costs.
NOTE 8. STOCKHOLDERS’ EQUITY AND STOCK-BASED COMPENSATION
FCX’s authorized shares of capital stock consists of 3.0 billion shares of common stock and 50 million shares of preferred stock.
Financial Policy. FCX’s financial policy, which was adopted by its Board of Directors (Board) in 2021, includes a base dividend and a performance-based payout framework, whereby up to 50% of available cash flows generated after planned capital spending and distributions to noncontrolling interests is allocated to shareholder returns and the balance to debt reduction and investments in value enhancing growth projects, subject to FCX maintaining its net debt at a level not to exceed the net debt target of $3.0 billion to $4.0 billion (excluding net project debt for PT-FI’s new downstream processing facilities). The Board reviews the structure of the performance-based payout framework at least annually.
Under its $5.0 billion share repurchase program, FCX has acquired a total of 49.0 million shares of common stock for a cost of $1.9 billion ($38.64 average cost per share), including 1.2 million shares of its common stock for a total cost of $59 million in 2024 and 35.1 million shares of its common stock for a total cost of $1.3 billion in 2022 (no purchases were made in 2023). As of February 14, 2025, FCX has $3.1 billion available for repurchases under the program.
On December 18, 2024, FCX declared quarterly cash dividends totaling $0.15 per share on its common stock (including a $0.075 per share base dividend and $0.075 per share variable dividend), which were paid on February 3, 2025, to common stockholders of record as of January 15, 2025.
The declaration and payment of dividends (base or variable) and timing and amount of any share repurchases are at the discretion of FCX’s Board and management, respectively, and are subject to a number of factors, including not exceeding FCX’s net debt target, capital availability, FCX’s financial results, cash requirements, global economic conditions, changes in laws, contractual restrictions and other factors deemed relevant by FCX’s Board or management, as applicable. FCX’s share repurchase program may be modified, increased, suspended or terminated at any time at the Board’s discretion.
Accumulated Other Comprehensive Loss. A summary of changes in the balances of each component of accumulated other comprehensive loss, net of tax, follows: | | | | | | | | | | | | | | | | | | | |
| Defined Benefit Plans | | | | Translation Adjustment | | Total |
| Balance at January 1, 2022 | $ | (398) | | | | | $ | 10 | | | $ | (388) | |
| | | | | | | |
Amounts arising during the perioda,b | 61 | | | | | — | | | 61 | |
Amounts reclassifiedc | 7 | | | | | — | | | 7 | |
| | | | | | | |
| Balance at December 31, 2022 | (330) | | | | | 10 | | | (320) | |
| | | | | | | |
Amounts arising during the perioda,b | 41 | | | | | — | | | 41 | |
Amounts reclassifiedc | 5 | | | | | — | | | 5 | |
| | | | | | | |
| Balance at December 31, 2023 | (284) | | | | | 10 | | | (274) | |
| | | | | | | |
Amounts arising during the perioda,b | (44) | | | | | — | | | (44) | |
Amounts reclassifiedc | 4 | | | | | — | | | 4 | |
| | | | | | | |
| Balance at December 31, 2024 | $ | (324) | | | | | $ | 10 | | | $ | (314) | |
a.Includes net actuarial gains (loss), net of noncontrolling interest, totaling $59 million for 2022, $38 million for 2023 and $(46) million for 2024.
b.Includes tax benefits totaling $2 million for 2022, 2023 and 2024.
c.Includes amortization primarily related to actuarial losses, net of taxes of less than $1 million for 2022, 2023 and 2024.
Stock Award Plans. FCX currently has awards outstanding under various stock-based compensation plans. The stockholder-approved 2016 Stock Incentive Plan (the 2016 Plan) provides for the issuance of stock options, stock appreciation rights, restricted stock, RSUs, PSUs and other stock-based awards for up to 72 million common shares. As of December 31, 2024, 15.0 million shares were available for grant under the 2016 Plan, and no shares were available under other plans.
Stock-Based Compensation Cost. Compensation cost charged against earnings for stock-based awards for the years ended December 31 follows:
| | | | | | | | | | | | | | | | | | | | |
| 2024 | | 2023 | | 2022 | |
| Selling, general and administrative expenses | $ | 65 | | | $ | 64 | | | $ | 57 | | |
| Production and delivery | 44 | | | 45 | | | 38 | | |
| | | | | | |
| Total stock-based compensation | 109 | | | 109 | | | 95 | | |
| | | | | | |
Tax benefit and noncontrolling interests’ sharea | (4) | | | (5) | | | (4) | | |
| Impact on net income | $ | 105 | | | $ | 104 | | | $ | 91 | | |
a. Charges in the U.S. are not expected to generate a future tax benefit.
Stock Options. Stock options granted under the plans generally expire 10 years after the date of grant and vest in one-third annual increments beginning one year from the date of grant. The award agreements provide that participants will receive the following year’s vesting upon retirement. Therefore, on the date of grant, FCX accelerates one year of amortization for retirement-eligible employees. The award agreements also provide for accelerated vesting upon certain qualifying terminations of employment within one year following a change of control. FCX has not granted stock options since 2021.
A summary of stock options outstanding as of December 31, 2024, and activity during the year ended December 31, 2024, follows:
| | | | | | | | | | | | | | | | | | | | | | | | | | |
| Number of
Options | | Weighted-
Average
Exercise Price
Per Share | | Weighted-
Average
Remaining
Contractual
Term (years) | | Aggregate
Intrinsic
Value | |
| Balance at January 1 | 8,749,933 | | | $ | 15.63 | | | | | | |
| | | | | | | | |
| Exercised | (3,140,886) | | | 18.13 | | | | | | |
| | | | | | | | |
| Balance at December 31 | 5,609,047 | | | 14.22 | | | 4.1 | | $ | 134 | | |
| | | | | | | | |
| Vested and exercisable at December 31 | 5,609,047 | | | 14.22 | | | 4.1 | | $ | 134 | | |
The total intrinsic value of options exercised was $95 million during 2024, $52 million during 2023 and $148 million during 2022. The total fair value of options vested was less than $1 million during 2024, $3 million during 2023 and $23 million during 2022.
Stock-Settled PSUs and RSUs. Since 2014, FCX’s executive officers received annual grants of PSUs that vest after a three-year performance period. The total grant date target shares related to the PSU grants were 0.4 million for each of 2024, 2023 and 2022, of which the executive officers will earn (i) between 0% and 200% of the target shares based on achievement of financial metrics and (ii) may be increased or decreased up to 25% of the target shares based on FCX’s total shareholder return compared to the total shareholder return of a peer group. PSU awards for FCX’s executive officers who are retirement-eligible are non-forfeitable. As such, FCX charges the estimated fair value of the non-forfeitable PSU awards to expense at the time the financial and operational metrics are established, which is typically grant date. The fair value of PSU awards for FCX’s executive officers who are not retirement-eligible are charged to expense over the performance period.
FCX grants RSUs that vest over a period of three years or at the end of three years to certain employees. Some award agreements allow for participants to receive the following year’s vesting upon retirement. Therefore, on the date of grant of these RSU awards, FCX accelerates one year of amortization for retirement-eligible employees. FCX also grants RSUs to its directors, which vest on the first anniversary of the date of grant. The fair value of the RSUs is amortized over the vesting period or the period until the director becomes retirement eligible, whichever is shorter. Upon a director’s retirement, all of their unvested RSUs immediately vest. For retirement-eligible directors, the fair value of RSUs is recognized in earnings on the date of grant.
The award agreements provide for accelerated vesting of all RSUs held by directors if there is a change of control (as defined in the award agreements) and for accelerated vesting of all RSUs held by employees if they experience a qualifying termination within one year following a change of control. Dividends attributable to RSUs and PSUs accrue and are paid if the awards vest. A summary of outstanding stock-settled RSUs and PSUs as of December 31, 2024, and activity during the year ended December 31, 2024, follows:
| | | | | | | | | | | | | | | | | |
| Number of Awards | | Weighted-Average Grant-Date Fair Value Per Award | | Aggregate
Intrinsic
Value |
| Balance at January 1 | 5,699,575 | | | $ | 37.23 | | | |
| Granted | 2,262,830 | | | 39.46 | | | |
| Vested | (2,224,239) | | | 34.37 | | | |
| Forfeited | (15,082) | | | 41.00 | | | |
| Balance at December 31 | 5,723,084 | | | 39.21 | | | $ | 218 | |
The total fair value of stock-settled RSUs and PSUs granted was $92 million during 2024, $93 million during 2023 and $83 million during 2022. The total intrinsic value of stock-settled RSUs and PSUs vested was $84 million during 2024, $136 million during 2023 and $138 million during 2022. As of December 31, 2024, FCX had $27 million of total unrecognized compensation cost related to unvested stock-settled RSUs and PSUs expected to be recognized over approximately 1.1 years.
Cash-Settled RSUs. Cash-settled RSUs are similar to stock-settled RSUs but are settled in cash rather than in shares of common stock. These cash-settled RSUs generally vest over three years of service. Some award agreements allow for participants to receive the following year’s vesting upon retirement. Therefore, on the date of grant of these cash-settled RSU awards, FCX accelerates one year of amortization for retirement-eligible employees. The cash-settled RSUs are classified as liability awards, and the fair value of these awards is remeasured each reporting period until the vesting dates. The award agreements for cash-settled RSUs provide for accelerated vesting upon certain qualifying terminations of employment within one year following a change of control.
Dividends attributable to cash-settled RSUs accrue and are paid if the awards vest. A summary of outstanding cash-settled RSUs as of December 31, 2024, and activity during the year ended December 31, 2024, follows:
| | | | | | | | | | | | | | | | | |
| Number of Awards | | Weighted-Average Grant-Date Fair Value Per Award | | Aggregate
Intrinsic
Value |
| Balance at January 1 | 858,741 | | | $ | 40.23 | | | |
| Granted | 626,050 | | | 39.58 | | | |
| Vested | (398,727) | | | 38.19 | | | |
| Forfeited | (22,578) | | | 40.72 | | | |
| Balance at December 31 | 1,063,486 | | | 40.60 | | | $ | 40 | |
The total grant-date fair value of cash-settled RSUs was $25 million during 2024, $24 million during 2023 and $15 million during 2022. The intrinsic value of cash-settled RSUs vested was $15 million during 2024, $20 million during 2023 and $26 million during 2022. The accrued liability associated with cash-settled RSUs consisted of a current portion of $22 million (included in accounts payable and accrued liabilities) and a long-term portion of $8 million (included in other liabilities) at December 31, 2024, and a current portion of $19 million and a long-term portion of $7 million at December 31, 2023.
Other Information. The following table includes amounts related to exercises of stock options and vesting of RSUs and PSUs during the years ended December 31:
| | | | | | | | | | | | | | | | | | | | |
| | 2024 | | 2023 | | 2022 | |
| FCX shares tendered or withheld to pay the exercise | | | | | | |
price and/or the statutory withholding taxesa | 1,505,675 | | | 1,633,519 | | | 1,511,072 | | |
| Cash received from stock option exercises | $ | 29 | | | $ | 47 | | | $ | 125 | | |
| Actual tax benefit realized for tax deductions | $ | 5 | | | $ | 4 | | | $ | 13 | | |
| Amounts FCX paid for employee taxes | $ | 35 | | | $ | 50 | | | $ | 55 | | |
a.Under terms of the related plans, upon exercise of stock options, vesting of stock-settled RSUs and payout of PSUs, employees may tender or have withheld FCX shares to pay the exercise price and/or required withholding taxes.
NOTE 9. INCOME TAXES
Geographic sources of (losses) income before income taxes and equity in affiliated companies’ net earnings for the years ended December 31 follow:
| | | | | | | | | | | | | | | | | |
| | 2024 | | 2023 | | 2022 |
| U.S. | $ | (547) | | | $ | 68 | | | $ | 840 | |
| Foreign | 7,454 | | | 5,938 | | | 5,875 | |
| Total | $ | 6,907 | | | $ | 6,006 | | | $ | 6,715 | |
Income taxes are provided on the earnings of FCX’s material foreign subsidiaries under the assumption that these earnings will be distributed. FCX has not provided deferred income taxes for other differences between the book and tax carrying amounts of its investments in material foreign subsidiaries as FCX considers its ownership positions to be permanent in duration, and quantification of the related deferred tax liability is not practicable.
FCX’s provision for income taxes for the years ended December 31 follows:
| | | | | | | | | | | | | | | | | | | | |
| | 2024 | | 2023 | | 2022 | |
| Current income taxes: | | | | | | |
| Federal | $ | 36 | | | $ | 5 | | | $ | — | | |
| State | (1) | | | (6) | | | 1 | | |
| Foreign | (2,635) | | | (2,087) | | | (2,232) | | |
| Total current | (2,600) | | | (2,088) | | | (2,231) | | |
| | | | | | |
| Deferred income taxes: | | | | | | |
| Federal | 1 | | | (50) | | | (149) | | |
| State | (1) | | | (3) | | | (6) | | |
| Foreign | 74 | | | (320) | | | (144) | | |
| Total deferred | 74 | | | (373) | | | (299) | | |
| | | | | | |
| Adjustments | — | | | 6 | | | 1 | |
|
| Operating loss carryforwards | 3 | | | 185 | | | 262 | | |
| Provision for income taxes | $ | (2,523) | | | $ | (2,270) | | | $ | (2,267) | | |
| | | | | | |
A reconciliation of the U.S. federal statutory tax rate to FCX’s effective income tax rate for the years ended December 31 follows:
| | | | | | | | | | | | | | | | | | | | | | | | | | | | | | | | | | | |
| | 2024 | | 2023 | | 2022 |
| | Amount | | % | | Amount | | % | | Amount | | % |
| U.S. federal statutory tax rate | $ | (1,450) | | | (21) | % | | $ | (1,261) | | | (21) | % | | $ | (1,410) | | | (21) | % |
Foreign tax credit expiration/ limitationa | (1,053) | | | (15) | | | (289) | | | (5) | | | (50) | | | (1) | |
Valuation allowancea | 898 | | | 13 | | | 119 | | | 2 | | | 65 | | | — | |
| Withholding and other impacts on | | | | | | | | | | | |
| foreign earnings | (753) | | | (11) | | | (615) | | | (10) | | | (673) | | | (10) | |
| Effect of foreign rates different than the U.S. | | | | | | | | | | | |
| federal statutory rate | (373) | | | (6) | | | (313) | | | (5) | | | (314) | | | (5) | |
PT-FI historical tax disputesb | 185 | | | 2 | | | — | | | — | | | (8) | | | — | |
| Percentage depletion | 123 | | | 2 | | | 183 | | | 3 | | | 189 | | | 3 | |
| State income taxes | (52) | | | (1) | | | 3 | | | — | | | (41) | | | — | |
| Non-deductible permanent differences | (41) | | | — | | | (68) | | | (1) | | | (29) | | | — | |
| Uncertain tax positions | 5 | | | — | | | (28) | | | (1) | | | (17) | | | — | |
| | | | | | | | | | | |
| | | | | | | | | | | |
| | | | | | | | | | | |
| | | | | | | | | | | |
| | | | | | | | | | | |
| | | | | | | | | | | |
| | | | | | | | | | | |
| | | | | | | | | | | |
| | | | | | | | | | | |
| Other items, net | (12) | | | — | | | (1) | | | — | | | 21 | | | — | |
| Provision for income taxes | $ | (2,523) | | | (37) | % | | $ | (2,270) | | | (38) | % | | $ | (2,267) | | | (34) | % |
a.Refer to “Valuation Allowances” below.
b.Refer to “Indonesia Tax Matters” below.
FCX paid federal, state and foreign income taxes totaling $2.8 billion in 2024, $2.1 billion in 2023 and $3.1 billion in 2022. FCX received refunds of federal, state and foreign income taxes totaling $248 million in 2024, less than $1 million in 2023 and $46 million in 2022.
The components of deferred taxes follow:
| | | | | | | | | | | |
| | December 31, |
| | 2024 | | 2023 |
| Deferred tax assets: | | | |
| | | |
| | | |
| Net operating losses | $ | 1,814 | | | $ | 1,761 | |
| Accrued expenses | 1,657 | | | 1,390 | |
| Foreign tax credits | 184 | | | 1,228 | |
| Employee benefit plans | 76 | | | 78 | |
| | | |
| Other | 214 | | | 215 | |
| Deferred tax assets | 3,945 | | | 4,672 | |
| Valuation allowances | (2,984) | | | (3,894) | |
| Net deferred tax assets | 961 | | | 778 | |
| | | |
| Deferred tax liabilities: | | | |
| Property, plant, equipment and mine development costs | (4,193) | | | (4,118) | |
| | | |
| Undistributed earnings | (981) | | | (911) | |
| Other | (155) | | | (195) | |
| Total deferred tax liabilities | (5,329) | | | (5,224) | |
| Net deferred tax liabilities | $ | (4,368) | | | $ | (4,446) | |
Tax Attributes. At December 31, 2024, FCX had (i) U.S. foreign tax credits of $0.2 billion that will expire between 2025 and 2034, (ii) U.S. federal net operating losses (NOLs) of $6.0 billion, of which $0.7 billion can be carried forward indefinitely, with the remainder primarily expiring between 2036 and 2037, (iii) U.S. state NOLs of $10.6 billion, of which $3.5 billion can be carried forward indefinitely, with the remainder primarily expiring between 2025 and 2044, and (iv) Atlantic Copper NOLs of $0.5 billion that can be carried forward indefinitely.
Valuation Allowances. On the basis of available information at December 31, 2024, including positive and negative evidence, FCX has provided valuation allowances for certain of its deferred tax assets where it believes it is more-likely-than-not that some portion or all of such assets will not be realized. Valuation allowances totaled $3.0 billion at December 31, 2024, and covered all of FCX’s U.S. foreign tax credits and U.S. federal NOLs, substantially all of its U.S. state and foreign NOLs, as well as a portion of its U.S. federal, state and foreign deferred tax assets.
The valuation allowance related to FCX’s U.S. foreign tax credits totaled $0.2 billion at December 31, 2024. FCX has operations in tax jurisdictions where statutory income taxes and withholding taxes are in excess of the U.S. federal income tax rate. Valuation allowances are recognized on foreign tax credits for which no benefit is expected to be realized.
The valuation allowance related to FCX’s U.S. federal, state and foreign NOLs totaled $1.8 billion and other deferred tax assets totaled $1.0 billion at December 31, 2024. NOLs and deferred tax assets represent future deductions for which a benefit will only be realized to the extent these deductions offset future income. FCX develops an estimate of which future tax deductions will be realized and recognizes a valuation allowance to the extent these deductions are not expected to be realized in future periods.
Valuation allowances will continue to be carried on U.S. foreign tax credits, U.S. federal, state and foreign NOLs and U.S. federal, state and foreign deferred tax assets, until such time that (i) FCX generates taxable income against which any of the assets, credits or NOLs can be used, (ii) forecasts of future income provide sufficient positive evidence to support reversal of the valuation allowances or (iii) FCX identifies a prudent and feasible means of securing the benefit of the assets, credits or NOLs that can be implemented.
The $0.9 billion net decrease in the valuation allowances during 2024 is primarily related to a decrease for expirations of U.S. foreign tax credits.
U.S. Inflation Reduction Act of 2022. The provisions of the U.S. Inflation Reduction Act of 2022 (the Act) became applicable to FCX on January 1, 2023. The Act includes, among other provisions, a new Corporate Alternative Minimum Tax (CAMT) of 15% on the adjusted financial statement income (AFSI) of corporations with average annual AFSI exceeding $1.0 billion over a three-year period.
In September 2024, the Internal Revenue Service (IRS) issued proposed regulations that provide guidance on the application of CAMT, which are not final and subject to change. Based on the proposed guidance released by the IRS, FCX determined that the provisions of the Act did not impact its financial results for the years 2024 or 2023.
Pillar Two of the Global Anti-Base Erosion Rules. In 2021, the Organisation for Economic Co-operation and Development (OECD) published a framework for Pillar Two of the Global Anti-Base Erosion Rules, which was designed to coordinate participating jurisdictions in updating the international tax system to ensure that large multinational companies pay a minimum level of income tax. Recommendations from the OECD regarding a global minimum income tax and other changes are being considered and/or implemented in jurisdictions where FCX operates. At current metals market prices, FCX does not expect enactment of the recommended framework in jurisdictions where it operates to materially impact its financial results.
Indonesia Tax Matters. During 2024, in conjunction with closure of PT-FI’s 2021 corporate income tax audit and resolution of Indonesia disputed tax matters, PT-FI recorded credits to net income of $215 million, including $199 million to provision for income taxes, $8 million to production and delivery and $8 million to interest expense, net.
Peru Tax Matters. Cerro Verde’s current mining stability agreement subjects it to a stable income tax rate of 32% through the expiration of the agreement on December 31, 2028. The enacted tax rate on dividend distributions, which is not stabilized by the agreement, is 5%.
Chile Tax Matters. Under the US-Chilean Tax Treaty, which became effective in 2024, FCX’s share of income from El Abra is subject to an income tax rate of 35%.
Effective January 1, 2024, mining royalty taxes in Chile consist of two main components: (i) profitability-based mining royalty rates on a sliding scale of 8% to 26% (depending on a defined operational margin) and (ii) an additional ad valorem royalty tax based on 1% of sales.
Uncertain Tax Positions. Tax positions reflected in the consolidated financial statements are, based on their technical merits, more-likely-than-not to be sustained upon examination by taxing authorities or have otherwise been effectively settled. Such tax positions reflect the largest amount of benefit, determined on a cumulative probability basis, that is more-likely-than-not to be realized upon settlement with the applicable taxing authority with full knowledge of all relevant information. FCX’s policy associated with uncertain tax positions is to record accrued
interest in interest expense and accrued penalties in other income, net, rather than in the provision for income taxes.
A summary of the activities associated with FCX’s reserve for unrecognized tax benefits for the years ended December 31 follows.
| | | | | | | | | | | | | | | | | |
| 2024 | | 2023 | | 2022 |
| Balance at beginning of year | $ | 720 | | | $ | 810 | | | $ | 808 | |
| Additions: | | | | | |
| Prior year tax positions | 13 | | | 27 | | | 26 | |
| Current year tax positions | 10 | | | 28 | | | 25 | |
| | | | | |
| Decreases: | | | | | |
| Prior year tax positions | (54) | | | (13) | | | (12) | |
| | | | | |
| Settlements with taxing authorities | (492) | | | (132) | | | (37) | |
| Lapse of statute of limitations | (36) | | | — | | | — | |
| | | | | |
| Balance at end of year | $ | 161 | | | $ | 720 | | | $ | 810 | |
The total amount of accrued interest and penalties associated with unrecognized tax benefits was $264 million at December 31, 2024, primarily relating to unrecognized tax benefits associated with royalties and the timing of advance payments, $536 million at December 31, 2023, and $551 million at December 31, 2022. Amounts include unpaid items on the consolidated balance sheet of $26 million at December 31, 2024, $33 million at December 31, 2023, and $36 million at December 31, 2022. Benefits (charges) for interest and penalties related to unrecognized tax benefits totaled $8 million in 2024, $(153) million in 2023 and $(7) million in 2022.
The reserve for unrecognized tax benefits of $161 million at December 31, 2024, included $153 million ($52 million net of income tax benefits and valuation allowances) that, if recognized, would reduce FCX’s provision for income taxes. Changes in the reserve for unrecognized tax benefits associated with current and prior-year tax positions were primarily related to uncertainties associated with FCX’s tax treatment of cost recovery methods, various non-deductible costs, and royalties and other mining taxes. There continues to be uncertainty related to the timing of settlements with taxing authorities, but if additional settlements are agreed upon during the year 2025, FCX could experience a change in its reserve for unrecognized tax benefits.
FCX or its subsidiaries file income tax returns in the U.S. federal jurisdiction and various state and foreign jurisdictions. The tax years for FCX’s major tax jurisdictions that remain subject to examination are as follows:
| | | | | | | | | | | | | | |
| Jurisdiction | | Years Subject to Examination | | Additional Open Years |
| U.S. Federal | | — | | 2021-2024 |
| Indonesia | | 2017, 2020 | | 2022-2024 |
| Peru | | 2020-2021 | | 2017-2019, 2022-2024 |
| Chile | | 2023 | | 2021-2022, 2024 |
| | | | |
NOTE 10. CONTINGENCIES
Environmental. FCX’s operations are subject to various environmental laws and regulations that govern the generation, storage, treatment, transportation and disposal of hazardous substances; solid waste disposal; air emissions; wastewater discharges; remediation, restoration and reclamation of environmental contamination, including mine closures and reclamation; protection of endangered and threatened species and designation of critical habitats; and other related matters. FCX subsidiaries that operate in the U.S. also are subject to potential liabilities arising under CERCLA and similar state laws that impose responsibility on current and previous owners and operators of a facility for the remediation of hazardous substances released from the facility into the environment, including damages to natural resources, in some cases irrespective of when the damage to the environment occurred or who caused it. Remediation liability also extends to persons who arranged for the disposal of hazardous substances or transported the hazardous substances to a disposal site selected by the transporter. These liabilities are often shared on a joint and several basis, meaning that each responsible party is fully responsible for the remediation if some or all of the other historical owners or operators no longer exist, do not have the financial ability to respond or cannot be found. As a result, because of FCX’s acquisition of FMC, many of the subsidiary companies FCX now owns are responsible for a wide variety of environmental remediation projects throughout the U.S., and FCX expects to spend substantial sums annually for many years to address those
remediation issues. Certain FCX subsidiaries have been advised by the U.S. Environmental Protection Agency (EPA), the Department of the Interior, the Department of Agriculture and various state agencies that, under CERCLA or similar state laws and regulations, they may be liable for costs of responding to environmental conditions at a number of sites that have been or are being investigated to determine whether releases of hazardous substances have occurred and, if so, to develop and implement remedial actions to address environmental concerns. FCX is also subject to claims where the release of hazardous substances is alleged to have caused natural resource damages (NRD) and to litigation by individuals allegedly exposed to hazardous substances. As of December 31, 2024, FCX had more than 80 active remediation projects, including NRD claims, in 20 U.S. states. The largest obligations discussed below account for approximately 85% of the total balance at December 31, 2024.
A summary of changes in FCX’s estimated environmental obligations for the years ended December 31 follows:
| | | | | | | | | | | | | | | | | |
| | 2024 | | 2023 | | 2022 |
| Balance at beginning of year | $ | 1,939 | | | $ | 1,740 | | | $ | 1,664 | |
Accretion expensea | 131 | | | 119 | | | 110 | |
Net additionsb | 82 | | | 195 | | | 43 | |
| | | | | |
| Spending | (112) | | | (115) | | | (77) | |
| Balance at end of year | 2,040 | | | 1,939 | | | 1,740 | |
| Less current portion | (131) | | | (131) | | | (125) | |
| Long-term portion | $ | 1,909 | | | $ | 1,808 | | | $ | 1,615 | |
a.Represents accretion of the fair value of environmental obligations assumed in the acquisition of FMC, which were determined on a discounted cash flow basis.
b.Primarily reflects revisions for changes in the anticipated scope and timing of projects. See further discussion below.
Estimated future environmental cash payments (on an undiscounted and de-escalated basis) total $4.4 billion, including $131 million in 2025, $111 million in 2026, $122 million in 2027, $112 million in 2028, $77 million in 2029 and $3.8 billion thereafter. The amount and timing of these estimated payments will change as a result of changes in regulatory requirements, changes in scope and timing of remediation activities, the settlement of environmental matters and as actual spending occurs.
At December 31, 2024, FCX’s environmental obligations totaled $2.0 billion, including $1.9 billion recorded on a discounted basis for those obligations assumed in the FMC acquisition at fair value. FCX estimates it is reasonably possible that these obligations could range between $3.9 billion and $5.1 billion on an undiscounted and de-escalated basis.
At December 31, 2024, the most significant environmental obligations were associated with the Pinal Creek site in Arizona; the Newtown Creek site in New York City; historical smelter sites principally located in Arizona, Indiana, Kansas, Missouri, New Jersey, Oklahoma and Pennsylvania; and uranium mining sites in the western U.S. The recorded environmental obligations for these sites totaled $1.7 billion at December 31, 2024. FCX may also be subject to litigation brought by private parties, regulators and local governmental authorities related to these historical sites. A discussion of these sites follows.
Pinal Creek. The Pinal Creek site was listed under the Arizona Department of Environmental Quality’s (ADEQ) Water Quality Assurance Revolving Fund program in 1989 for contamination in the shallow alluvial aquifers within the Pinal Creek drainage near Miami, Arizona. Since that time, environmental remediation has been performed by members of the Pinal Creek Group, consisting of Freeport-McMoRan Miami Inc. (Miami), an indirect wholly owned subsidiary of FCX, and two other companies. Pursuant to a 2010 settlement agreement, Miami agreed to take full responsibility for future groundwater remediation at the Pinal Creek site, with limited exceptions. Remediation work consisting of groundwater extraction and treatment plus source control capping is expected to continue for many years. During 2023, FCX recorded adjustments to the Pinal Creek environmental obligation totaling $61 million associated with a refined engineering scope and cost estimate for work to be completed within the next several years. FCX’s environmental liability balance for this site was $517 million at December 31, 2024.
Newtown Creek. From the 1930s until 1964, Phelps Dodge Refining Corporation (PDRC), an indirect wholly owned subsidiary of FCX, operated a copper smelter, and from the 1930s until 1984, a copper refinery, on the banks of Newtown Creek (the creek), which is a 3.5-mile-long waterway that forms part of the boundary between Brooklyn and Queens in New York City. Heavy industrial uses on and around the creek and discharges from the City of New York’s sewer system over more than a century resulted in significant environmental contamination of the waterway. In 2010, EPA designated the creek as a Superfund site and identified PDRC, four other companies and the City of
New York as potentially responsible parties (PRPs). The following year, PDRC and the four other companies (the Newtown Creek Group, NCG) and the City of New York entered an Administrative Order on Consent to perform a remedial investigation/feasibility study (RI/FS) to assess the nature and extent of environmental contamination in the creek and identify remedial options. EPA approved the final RI report in April 2023. The NCG’s FS work is ongoing. EPA currently expects to approve the final FS report by April 2028, although this timeframe may be further extended. EPA is also considering performing the FS evaluation and remedy selection by creek segment. At the agency’s request, the NCG prepared a focused feasibility study (FFS) for an early action remediation project focusing on the East Branch tributary of the creek. EPA approved the FFS report and, in January 2025, the agency issued a record of decision selecting an interim remedy for the East Branch. EPA has identified 30 PRPs for the site, including the NCG members and New York City, and invited all PRPs to participate in performing the East Branch remedial design. During 2023, FCX recorded adjustments to Newtown Creek environmental obligations totaling $64 million based on updated cost estimates from the draft early action FFS and no further adjustment was considered necessary based on the issuance of the 2025 record of decision. FCX’s environmental liability balance for this site was $452 million at December 31, 2024. The scope and design of the site remedy (or remedies), final costs of the site investigation and remediation, and allocation of costs among PRPs are uncertain and subject to change. Changes to the overall cost of this remedial obligation and the portion ultimately allocated to PDRC could be material to FCX.
Historical Smelter Sites. FCX subsidiaries and their predecessors at various times owned or operated copper, zinc and lead smelters or refineries in states including Arizona, Indiana, Kansas, Missouri, New Jersey, Oklahoma and Pennsylvania. For some of these former processing sites, certain FCX subsidiaries have been advised by EPA or state agencies that they may be liable for costs of investigating and, if appropriate, remediating environmental conditions associated with these former processing facilities. At other sites, certain FCX subsidiaries have entered into state voluntary remediation programs to investigate and, if appropriate, remediate on-site and off-site conditions associated with the facilities. The historical processing sites are in various stages of assessment and remediation. At some of these sites, disputes with local residents and elected officials regarding alleged health effects or the effectiveness of remediation efforts have resulted in litigation of various types, and similar litigation at other sites is possible.
From 1920 until 1986, United States Metals Refining Company (USMR), an indirect wholly owned subsidiary of FCX, owned and operated a copper smelter and refinery in the Borough of Carteret, New Jersey. Since the early 1980s, the site has been the subject of environmental investigation and remediation, under the direction and supervision of the New Jersey Department of Environmental Protection (NJDEP). On-site contamination is in the later stages of remediation. In 2012, after receiving a request from NJDEP, USMR also began investigating and remediating off-site properties, which is ongoing. As a result of off-site soil sampling in public and private areas near the former Carteret smelter, FCX established an environmental obligation for known and potential off-site environmental remediation; that work has been essentially completed at the end of 2024. Assessments of sediments in the adjacent Arthur Kill and possible remedial actions could result in additional adjustments to the related environmental obligation in future periods.
In January 2024, the EPA released guidance lowering the recommended screening levels for investigating lead-contaminated soils from 400 to 200 parts per million (ppm) or 100 ppm where there are other sources of lead exposure (such as lead-based paint that is common in older homes). Screening levels can be used to establish cleanup levels by some agencies and more stringent cleanup levels often lead to higher costs through exponential volume increases due to resulting expanded project footprints. In January 2025, EPA published its final toxicological assessment for inorganic arsenic, which may be used to calculate cleanup levels at state and federal remediation sites and may lead to regulatory guidance, rulemaking and other regulatory activities. FCX is working with state agencies to understand possible ramifications of this guidance on its projects. This EPA guidance and future changes to EPA’s lead and arsenic cleanup levels could result in increases to FCX’s environmental obligations for ongoing residential property cleanup projects near former smelter sites.
FCX’s environmental liability balance for historical smelter sites, including in the Borough of Carteret, New Jersey, was $266 million at December 31, 2024.
Uranium Mining Sites. During a period between 1940 and the early 1980s, certain FCX subsidiaries and their predecessors were involved in uranium exploration and mining in the western U.S., primarily on federal and tribal lands in the Four Corners region of the Southwest. Similar exploration and mining activities by other companies have also caused environmental impacts warranting remediation.
In 2017, the Department of Justice, EPA, Navajo Nation, and two FCX subsidiaries reached an agreement regarding the financial contribution of the U.S. Government and the FCX subsidiaries and the scope of the environmental investigation and remediation work for 94 former uranium mining sites on tribal lands. Under the terms of the Consent Decree executed in May 2017, and approved by the U.S. District Court for the District of Arizona, the U.S. contributed $335 million into a trust fund to cover the government’s initial share of the costs, and
FCX’s subsidiaries are proceeding with the environmental investigation and remediation work at the 94 sites. The program is expected to take more than 20 years to complete. The Consent Decree excluded 23 former uranium mine sites at which an FCX subsidiary may also be potentially liable, but for which the U.S. recovered funds as part of a larger bankruptcy settlement with Tronox. In 2021, EPA informed an FCX subsidiary as well as two other federal entities that it does not expect to have funds sufficient to remediate all of the sites covered by the Tronox bankruptcy settlement. Based on information from EPA, it is currently considered unlikely that EPA will deplete the Tronox settlement funds in the near-term.
FCX is also conducting site surveys of historical uranium mining claims associated with FCX subsidiaries on non-tribal federal lands in the Four Corners region. Under a memorandum of understanding with the U.S. Bureau of Land Management (BLM), site surveys are being performed on approximately 15,000 mining claims, ranging from undisturbed claims to claims with mining features. Based on these surveys, BLM has issued no further action determinations for certain undisturbed claims. A similar agreement is in place with the U.S. Forest Service for mine features on U.S. Forest Service land. Either BLM or the U.S. Forest Service may request additional assessment or remediation activities for other claims with mining features. FCX will update this obligation when it has a sufficient number of remedy decisions from the BLM or the U.S. Forest Service to support a reasonably certain range of outcomes. FCX expects it will take several years to complete this work.
FCX’s environmental liability balance for the uranium mining sites was $473 million at December 31, 2024.
AROs. FCX’s ARO estimates are reflected on a third-party cost basis and are based on FCX’s legal obligation to retire tangible, long-lived assets. A summary of changes in FCX’s AROs for the years ended December 31 follows:
| | | | | | | | | | | | | | | | | | | | |
| | 2024 | | 2023 | | 2022 | |
| Balance at beginning of year | $ | 3,001 | | | $ | 3,043 | | | $ | 2,716 | | |
| | | | | | |
| Liabilities incurred | 16 | | | 18 | | | 9 | | |
| Revisions to cash flow estimates and settlements, net | 635 | | a | 54 | | | 381 | | a |
| Accretion expense | 154 | | | 20 | | b | 134 | | |
| | | | | | |
| Spending | (122) | | | (134) | | | (197) | | |
| | | | | | |
| Balance at end of year | 3,684 | | | 3,001 | | | 3,043 | | |
| Less current portion | (189) | | | (185) | | | (195) | | |
| Long-term portion | $ | 3,495 | | | $ | 2,816 | | | $ | 2,848 | | |
a.Primarily reflects adjustments for oil and gas properties, Sierrita, PT-FI, Climax and Henderson for the year 2024, and PT-FI, Morenci and Bagdad for the year 2022. See further discussion below.
b.Includes a $112 million adjustment at PT-FI to correct certain inputs in the historical PT-FI ARO model.
ARO costs may increase or decrease significantly in the future as a result of changes in regulations, changes in engineering designs and technology, permit modifications or updates, changes in mine plans, settlements, inflation or other factors and as reclamation (concurrent with mining operations or post mining) spending occurs. ARO activities and expenditures for mining operations generally are made over an extended period of time commencing near the end of the mine life; however, certain reclamation activities may be accelerated if legally required or if determined to be economically beneficial. For ARO activities and expenditures for oil and gas operations, the methods used or required to plug and abandon non-producing oil and gas wellbores; remove platforms, tanks, production equipment and flow lines; and restore wellsites could change over time.
Financial Assurance. New Mexico, Arizona, Colorado and other states, as well as U.S. regulations governing mine operations on federal land, require financial assurance to be provided for the estimated costs of mine reclamation and closure, including groundwater quality protection programs. FCX has satisfied financial assurance requirements by using a variety of mechanisms, primarily involving parent company performance guarantees and financial capability demonstrations, but also trust funds, surety bonds, letters of credit and other collateral. The applicable regulations specify financial strength tests that are designed to confirm a company’s or guarantor’s financial capability to fund estimated reclamation and closure costs. The amount of financial assurance FCX subsidiaries are required to provide will vary with changes in laws, regulations, reclamation and closure requirements, and cost
estimates. At December 31, 2024, FCX’s financial assurance obligations associated with these U.S. mine closure and reclamation/restoration costs totaled $2.0 billion, of which $1.2 billion was in the form of guarantees issued by FCX and FMC. At December 31, 2024, FCX had trust assets totaling $0.2 billion (included in other assets), which are legally restricted to be used to satisfy its financial assurance obligations for its mining properties in New Mexico. In addition, FCX subsidiaries have financial assurance obligations for their oil and gas properties associated with plugging and abandoning wells and facilities totaling $0.7 billion. Where oil and gas guarantees associated with the Bureau of Ocean Energy Management do not include a stated cap, the amounts reflect management’s estimates of the potential exposure.
New Mexico Environmental and Reclamation Programs. FCX’s New Mexico operations are regulated under the New Mexico Water Quality Act and regulations adopted by the Water Quality Control Commission. In connection with discharge permits, the New Mexico Environment Department (NMED) has required each of these operations to submit closure plans for NMED’s approval. The closure plans must include measures to assure meeting applicable groundwater quality standards following the closure of discharging facilities and to abate groundwater or surface water contamination to meet applicable standards. FCX’s New Mexico operations also are subject to regulation under the 1993 New Mexico Mining Act (the Mining Act) and the related rules that are administered by the Mining and Minerals Division of the New Mexico Energy, Minerals and Natural Resources Department. Under the Mining Act, mines are required to obtain approval of reclamation plans. The agencies approved updates to the closure plan and financial assurance instruments and completed a permit renewal for Chino in 2020 and Tyrone in 2021. At December 31, 2024, FCX had accrued reclamation and closure costs of $553 million for its New Mexico operations. Additional accruals may be required based on the state’s periodic review of FCX’s updated closure plans and any resulting permit conditions, and the amount of those accruals could be material.
Arizona Environmental and Reclamation Programs. FCX’s Arizona operations are subject to regulatory oversight by the ADEQ. ADEQ has adopted regulations for its aquifer protection permit (APP) program that require permits for, among other things, certain facilities, activities and structures used for mining, leaching, concentrating and smelting, and require compliance with aquifer water quality standards during operations and closure. An application for an APP requires a proposed closure strategy that will meet applicable groundwater protection requirements following cessation of operations and an estimate of the implementation cost, with a more detailed closure plan required at the time operations cease. A permit applicant must demonstrate its financial ability to meet the closure costs approved by ADEQ. Closure costs for facilities covered by APPs are required to be updated every six years and financial assurance mechanisms are required to be updated every two years. During 2022, the Morenci and Bagdad mines increased their AROs by $118 million and $65 million, respectively, associated with their updated closure strategies and plans for stockpiles and tailings impoundments that were submitted to ADEQ for approval. In accordance with FCX’s commitment to the Global Industry Standard on Tailings Management (the Tailings Standard), in 2024 Sierrita revised its closure plan and cost estimates resulting in a $157 million increase in its AROs. FCX will continue evaluating and, as necessary, updating its closure plans and closure cost estimates at other Arizona sites, and any such updates may also result in increased costs that could be significant.
Portions of Arizona mining facilities that operated after January 1, 1986, also are subject to the Arizona Mined Land Reclamation Act (AMLRA). AMLRA requires reclamation to achieve stability and safety consistent with post-mining land use objectives specified in a reclamation plan. Reclamation plans must be approved by the Arizona State Mine Inspector (ASMI) and must include an estimate of the cost to perform the reclamation measures specified in the plan along with financial assurance. In 2023, the ASMI requested updates to reclamation cost estimates and associated financial assurance for FCX’s Arizona mine sites, and in 2024, FCX submitted updated closure scopes of work and associated costs for Miami, Bagdad and Morenci. FCX will continue to evaluate options for future reclamation and closure activities at its operating and non-operating sites, which are likely to result in adjustments to FCX’s AROs, and those adjustments could be material.
At December 31, 2024, FCX had accrued reclamation and closure costs of $837 million for its Arizona operations and facilities.
Colorado Reclamation Programs. FCX’s Colorado operations are regulated by the Colorado Mined Land Reclamation Act (Reclamation Act) and regulations promulgated thereunder, which are consistent with the Tailings Standard. Under the Reclamation Act, mines are required to obtain approval of plans for reclamation of lands affected by mining operations to be performed during mining or upon cessation of mining operations. In 2024, both Henderson and Climax updated cost estimates associated with reclamation plans under the Reclamation Act and recorded a total increase of $162 million to their related AROs.
In 2019, Colorado enacted legislation that requires proof of an end date for water treatment as a condition of permit authorizations for new mining operations and expansions beyond current permit authorizations. While this requirement does not apply to existing operations, it may lead to changes in long-term water management requirements at Climax and Henderson operations and their related AROs.
As of December 31, 2024, FCX had accrued reclamation and closure costs of $351 million for its Colorado operations.
Chile Reclamation and Closure Programs. El Abra is subject to regulation under the Mine Closure Law administered by the National Geology and Mining Service. In 2020, El Abra received approval of its updated closure plan and cost estimates, and in compliance with the requirement for five-year updates, El Abra expects to submit an updated plan with closure cost estimates in 2025. At December 31, 2024, FCX had accrued reclamation and closure costs of $105 million for its El Abra operation.
Peru Reclamation and Closure Programs. Cerro Verde is subject to regulation under the Mine Closure Law administered by the Peru Ministry of Energy and Mines (MINEM). Under the closure regulations, mines must submit a closure plan that includes the reclamation methods, closure cost estimates, methods of control and verification, closure and post-closure plans, and financial assurance. In compliance with the requirement for five-year updates, Cerro Verde submitted its updated closure plan and cost estimates and received approval from MINEM in December 2023. At December 31, 2024, FCX had accrued reclamation and closure costs of $230 million for its Cerro Verde operation.
Indonesia Reclamation and Closure Programs. The ultimate amount of reclamation and closure costs to be incurred at PT-FI’s operations will be determined based on applicable laws and regulations and PT-FI’s assessment of appropriate remedial activities under the circumstances, after consultation with governmental authorities, affected local residents and other affected parties and cannot currently be projected with precision. Some reclamation costs will be incurred during mining activities, while the remaining reclamation costs will be incurred after the end of mining activities, which are currently estimated to continue through 2041. In 2022, PT-FI recorded net increases to its ARO totaling $99 million related to higher estimated costs associated with West Wanagon slope stabilization remediation and increased reclamation activities and increased costs. In 2024, PT-FI recorded net increases to its ARO totaling $122 million primarily for revised reclamation plans for the Grasberg open pit area and adjustments resulting from a review and update of the PT-FI ARO model. At December 31, 2024, FCX had accrued reclamation and closure costs of $1.0 billion for its PT-FI operations.
Indonesia government regulations issued in 2010 require a company to provide a mine closure guarantee in the form of a time deposit placed in a state-owned bank in Indonesia. At December 31, 2024, PT-FI had restricted time deposits totaling $100 million for mine closure included in other assets.
Oil and Gas Properties. Substantially all of Freeport McMoRan Oil & Gas LLC’s (FM O&G’s), FCX’s subsidiary that holds its remaining oil and gas operations, oil and gas leases require that, upon termination of economic production, the working interest owners plug and abandon non-producing wellbores, remove equipment and facilities from leased acreage, and restore land in accordance with applicable local, state and federal laws. Following several sales transactions, FM O&G’s remaining operating areas primarily include offshore California and the Gulf of Mexico (GOM, also referred to as Gulf of America). FM O&G recorded increases to its ARO totaling $163 million in 2024 and $91 million in 2023. As of December 31, 2024, FM O&G AROs cover approximately 180 wells and 150 platforms and other structures and it had accrued reclamation and closure costs of $538 million.
FM O&G’s ARO adjustments for 2024 include $116 million associated with assumed oil and gas abandonment obligations resulting from bankruptcies of other companies and were charged to production and delivery costs. FM O&G, as a predecessor-in-interest in oil and natural gas leases, is in the chain of title with unrelated third parties either directly or by virtue of divestiture of certain oil and natural gas assets previously owned and assigned by its subsidiaries. Certain counterparties in these divestiture transactions or third parties in existing leases have filed for bankruptcy protection or undergone associated reorganizations and have not performed the required abandonment obligations. Accordingly, regulations or federal laws require that other working interest owners, including FM O&G, assume such obligations.
Litigation. In addition to the pending legal proceedings discussed below and above under “Environmental,” we are involved periodically in ordinary routine litigation incidental to our business, some of which may result in adverse judgments, settlements, fines, penalties, injunctions or other relief. SEC regulations require us to disclose
environmental proceedings involving a governmental authority if we reasonably believe that such proceedings may result in monetary sanctions above a stated threshold. Pursuant to the SEC regulations, we use a threshold of $1 million for purposes of determining whether disclosure of any such environmental proceedings is required. Management does not believe, based on currently available information, that the outcome of any current pending legal proceeding will have a material adverse effect on FCX’s financial condition, although individual or cumulative outcomes could be material to FCX’s operating results for a particular period, depending on the nature and magnitude of the outcome and the operating results for the period.
Asbestos and Talc Claims. Since approximately 1990, various FCX affiliates have been named as defendants in a large number of lawsuits alleging personal injury from exposure to asbestos or talc allegedly contained in industrial products such as electrical wire and cable, raw materials such as paint and joint compounds, talc-based lubricants used in rubber manufacturing or from asbestos contained in buildings and facilities located at properties owned or operated by affiliates of FCX. Many of these suits involve a large number of codefendants. Based on litigation results to date and facts currently known, FCX believes that the amounts of any such losses, individually or in the aggregate, are not material to its consolidated financial statements. There can be no assurance that future developments will not alter this conclusion.
There has been a significant increase in the number of cases alleging the presence of asbestos contamination in talc-based cosmetic and personal care products and in cases alleging exposure to talc products that are not alleged to be contaminated with asbestos. The primary targets have been the producers of those products, but defendants in many of these cases also include talc miners. Cyprus Amax Minerals Company (CAMC), an indirect wholly owned subsidiary of FCX, and Cyprus Mines Corporation (Cyprus Mines), a wholly owned subsidiary of CAMC, are among those targets. Cyprus Mines was engaged in talc mining and processing from 1964 until 1992 when it exited its talc business by conveying it to a third party in two related transactions. Those transactions involved (1) a transfer by Cyprus Mines of the assets of its talc business to a newly formed subsidiary that assumed all pre-sale and post-sale talc liabilities, subject to limited reservations, and (2) a sale of the stock of that subsidiary to the third party. In 2011, the third party sold that subsidiary to Imerys Talc America (Imerys), an affiliate of Imerys S.A.
In accordance with the terms of the 1992 transactions and subsequent agreements, Cyprus Mines has contractual indemnification rights, subject to limited reservations, against Imerys, which historically acknowledged those indemnification obligations and took responsibility for all talc lawsuits against Cyprus Mines and CAMC tendered to it. However, in February 2019, Imerys filed for Chapter 11 bankruptcy protection, which triggered an immediate automatic stay under the federal bankruptcy code prohibiting any party from continuing or initiating litigation or asserting new claims against Imerys. As a result, Imerys stopped defending the talc lawsuits against Cyprus Mines and CAMC.
In January 2021, Imerys filed the form of a global settlement agreement to be entered into by CAMC, Cyprus Mines, FCX, Imerys and the other debtors, tort claimants’ committee and future claims representative in the Imerys bankruptcy. In accordance with the global settlement, among other things, (1) CAMC agreed to contribute a total of $130 million in cash to a settlement trust in seven annual installments, which will be guaranteed by FCX, and (2) CAMC and Cyprus Mines and their affiliates will contribute to the settlement trust all rights that they have to the proceeds of certain legacy insurance policies as well as indemnity rights they have against Johnson & Johnson. In accordance with the settlement, Cyprus Mines commenced its bankruptcy process in February 2021, with all talc lawsuits against CAMC, Cyprus Mines and FCX being stayed. The claimants failed to approve the Imerys bankruptcy plan in 2021, which resulted in a lengthy mediation process among the interested parties.
Mediation resulted in CAMC agreeing to contribute an additional $65 million over seven years to the claimant trust for a total contribution of $195 million. The claimants in both the Imerys and Cyprus Mines bankruptcy cases approved the global settlement in January 2025, which now remains subject to bankruptcy court approvals in both cases. There can be no assurance that the global settlement will be approved and successfully implemented.
At December 31, 2024, FCX had a litigation reserve of $195 million associated with the proposed settlement.
Tax Matters. FCX’s operations are in multiple jurisdictions where uncertainties arise in the application of complex tax regulations. Some of these tax regimes are defined by contractual agreements with the local government, while others are defined by general tax laws and regulations. FCX and its subsidiaries are subject to reviews of its income tax filings and other tax payments, and disputes can arise with the taxing authorities over the interpretation of its contracts or laws. The final taxes paid may be dependent upon many factors, including negotiations with taxing authorities. In certain jurisdictions, FCX pays a portion of the disputed amount before formally appealing an assessment. Such payment is recorded as a receivable if FCX believes the amount is collectible.
Peru Tax Matters. Cerro Verde has received assessments from the National Superintendency of Customs and Administration (SUNAT) for additional taxes, penalties and interest related to various audit exceptions for income and other taxes. Cerro Verde has filed or will file objections to the assessments because it believes it has properly determined and paid its taxes. A summary of these assessments follows:
| | | | | | | | | | | | | | | | | | | | | | | |
| Tax Year | | Tax Assessment | | Penalties and Interest | | Total | |
| 2003 to 2008 | | $ | 32 | | | $ | 112 | | | $ | 144 | | |
| 2009 | | 9 | | | 30 | | | 39 | | |
| 2010 | | 8 | | | 69 | | | 77 | | |
| 2011 and 2012 | | 5 | | | 36 | | | 41 | | |
| 2013 | | 8 | | | 26 | | | 34 | | |
| 2014 to 2022 | | 88 | | | 40 | | | 128 | | |
| | | | | | | |
| | $ | 150 | | | $ | 313 | | | $ | 463 | | |
As of December 31, 2024, Cerro Verde had paid $454 million of disputed tax assessments. A reserve has been applied against these payments totaling $179 million, resulting in a net receivable of $275 million (included in other assets), which Cerro Verde believes is collectible.
Cerro Verde’s income tax assessments, penalties and interest included in the table above totaled $397 million at December 31, 2024, of which $245 million has not been charged to expense.
Indonesia Tax Matters. PT-FI has received assessments from the Indonesia tax authorities for additional taxes and interest related to various audit exceptions for income and other taxes. PT-FI has filed objections to the assessments because it believes it has properly determined and paid its taxes. A summary of these assessments follows:
| | | | | | | | | | | | | | | | | | | | |
| Tax Year | | Tax Assessment | | Penalties and Interest | | Total |
| 2005 | | $ | 61 | | | $ | 29 | | | $ | 90 | |
| | | | | | |
| 2007 | | 45 | | | 21 | | | 66 | |
| | | | | | |
| | | | | | |
| | | | | | |
| | | | | | |
| | | | | | |
| | | | | | |
| | | | | | |
| | | | | | |
| | | | | | |
| 2013 and 2017 | | 7 | | | 4 | | | 11 | |
| | $ | 113 | | | $ | 54 | | | $ | 167 | |
As of December 31, 2024, PT-FI has paid $10 million on these disputed tax assessments (included in Other Assets), which PT-FI believes is collectible. The disputed tax assessments above include pending cases at the Indonesia Supreme Court related to withholding taxes for employees and other service providers for the years 2005 and 2007, which total $41 million (included in accounts payable and accrued liabilities) as of December 31, 2024.
PT-FI’s income tax assessments, penalties and interest included in the table above totaled $121 million at December 31, 2024, of which $117 million has not been charged to expense.
Indonesia Regulatory Matters.
Export Licenses. Current regulations in Indonesia prohibit exports of copper concentrate as of January 1, 2025. Pursuant to the terms of its special mining business license (IUPK) regarding force majeure events, PT-FI has requested approval from the Indonesia government to permit the export of copper concentrate in 2025 until the required repairs to its new smelter following the October 2024 fire incident and full ramp-up are complete.
Long-term Mining Rights. Pursuant to regulations issued during 2024, PT-FI is eligible to apply for an extension of its mining rights beyond 2041, provided certain conditions are met, including ownership of integrated downstream facilities that have entered the operational stage; domestic ownership of at least 51% and agreement with a state-owned enterprise for an additional 10% ownership; and commitments for additional exploration and increases in refining capacity, each as approved by the Ministry of Energy and Mineral Resources (MEMR). Application for extension may be submitted at any time up to one year prior to the expiration of PT-FI’s IUPK.
Administrative Fines. In June 2021, the MEMR, issued a ministerial decree for the calculation of an administrative fine for lack of smelter development in light of the COVID-19 pandemic, and in 2021, PT-FI recorded charges totaling $16 million for a potential settlement of the administrative fine. In January 2022, the Indonesia government submitted a new estimate of the administrative fine totaling $57 million, and in March 2022, PT-FI paid the administrative fine and recorded an additional charge of $41 million.
In May 2023, the MEMR issued a new decree prescribing a revised formula for administrative fines for delays in construction of smelting and refining facilities, taking into account allowances for certain delays associated with the COVID-19 pandemic as verified by a third-party. In mid-July 2023, PT-FI submitted its third-party verified calculation, which resulted in an accrual for a potential administrative fine of $55 million based on the formula prescribed by the decree related to the period from August 2020 through January 2022. In December 2024, the Indonesia government assessed PT-FI a $59 million administrative fine for delays in development of the new downstream processing facilities related to the period from August 2020 through January 2022. As a result, PT-FI increased its accrual by $4 million at December 31, 2024.
Smelter Assurance. The May 2023 decree issued by MEMR also required assurance in the form of an escrow account, which can be withdrawn if smelter development progress is at least 90% on June 10, 2024. During 2023, PT-FI deposited $10 million in a joint account with the Indonesia government while it continued to discuss the applicability of the May 2023 decree. At December 31, 2024, development of PT-FI’s new downstream processing facilities was complete; as such, PT-FI does not believe additional deposits are necessary. Refer to Note 12 for discussion of PT-FI’s assurance bonds to support its commitment for smelter development in Indonesia.
Export Proceeds. In accordance with a regulation issued by the Indonesia government in 2023, 30% of PT-FI’s gross export proceeds are being temporarily deposited into Indonesia banks for a period of 90 days before withdrawal. At December 31, 2024, FCX had $0.7 billion in current restricted cash and cash equivalents deposited in Indonesia banks in accordance with this regulation.
The Indonesia government is considering changes to this regulation, which could increase the amount and length of the requirement, but also allow withdrawals from the balances to fund business requirements. The details of the modifications have not been finalized.
Letters of Credit, Bank Guarantees and Surety Bonds. Letters of credit and bank guarantees totaled $638 million at December 31, 2024, primarily associated with reclamation and AROs, and copper concentrate shipments from PT-FI to Atlantic Copper as required by Indonesia regulations. In addition, FCX had surety bonds totaling $504 million at December 31, 2024, primarily associated with environmental obligations and AROs.
Insurance. FCX purchases a variety of insurance products to mitigate potential losses, which typically have specified deductible amounts or self-insured retentions and policy limits. FCX generally is self-insured for U.S. workers’ compensation but purchases excess insurance up to statutory limits. An actuarial analysis is performed twice a year on the various casualty insurance programs covering FCX’s U.S.-based mining operations, including workers’ compensation, to estimate expected losses. At December 31, 2024, FCX’s liability for expected losses under these insurance programs totaled $54 million, which consisted of a current portion of $14 million (included in accounts payable and accrued liabilities) and a long-term portion of $40 million (included in other liabilities). In addition, FCX has receivables of $18 million (a current portion of $9 million included in other accounts receivable and a long-term portion of $9 million included in other assets) for expected claims associated with these losses to be filed with insurance carriers.
NOTE 11. COMMITMENTS AND GUARANTEES
Leases. The components of FCX’s leases presented in the consolidated balance sheets as of December 31 follow:
| | | | | | | | | | | | | | | | |
| | | | | | |
| | | | |
| 2024 | | 2023 | | | |
| Lease right-of-use assets (included in property, plant, equipment and mine development costs, net) | $ | 853 | | | $ | 448 | | | | |
| | | | | | |
Short-term lease liabilities (included in accounts payable and accrued liabilities) | $ | 98 | | | $ | 84 | | | | |
Long-term lease liabilities (included in other liabilities) | 692 | | | 347 | |
| | |
Total lease liabilitiesa | $ | 790 | | | $ | 431 | | | | |
| | | | | | |
| | | | | | |
a.Includes finance leases associated with PT-FI’s new downstream processing facilities, including for an oxygen plant ($217 million at December 31, 2024), shallow draft vessels ($119 million at December 31, 2024), land ($95 million at December 31, 2024, and $130 million at December 31, 2023) and wharf ($90 million at December 31, 2024, and $93 million at December 31, 2023).
Operating lease costs, primarily included in production and delivery expense in the consolidated statements of income, for the years ended December 31 follow:
| | | | | | | | | | | | | | | | | | | | |
| | 2024 | | 2023 | | 2022 |
| | | | | | |
| Operating leases | | $ | 44 | | | $ | 48 | | | $ | 46 | |
| | | | | | |
| Variable and short-term leases | | 146 | | a | 126 | | a | 84 | |
| Total operating lease costs | | $ | 190 | | | $ | 174 | | | $ | 130 | |
| | | | | | |
| | | | | | |
| | | | | | |
| | | | | | |
| | | | | | |
| | | | | | |
| | | | | | |
| | | | | | |
| | | | | | |
| | | | | | |
| | | | | | |
a.Includes $50 million in 2024 and $30 million in 2023 related to a variable lease component of PT-FI’s tolling arrangement with PT Smelting. Refer to Note 2 for additional discussion of PT-FI’s commercial arrangement with PT Smelting.
Total finance lease costs, including both depreciation and interest, were $24 million in 2024 and $6 million in 2023 and 2022.
FCX acquired right-of-use assets through lease arrangements of $482 million in 2024, $167 million in 2023 and $76 million in 2022. FCX payments included in operating cash flows for its lease liabilities totaled $61 million in 2024 and 2023 and $41 million in 2022. FCX payments included in financing cash flows for its lease liabilities totaled $41 million in 2024, $3 million in 2023 and $7 million in 2022. As of December 31, 2024, the weighted-average discount rate used to determine the lease liabilities was 4.9% (4.7% as of December 31, 2023) and the weighted-average remaining lease term was 15.0 years (13.1 years as of December 31, 2023).
The future minimum payments for leases presented in the consolidated balance sheet at December 31, 2024, follow:
| | | | | | | |
| | | |
| 2025 | $ | 131 | | | |
| 2026 | 96 | | | |
| 2027 | 81 | | | |
| 2028 | 67 | | | |
| 2029 | 113 | | | |
| Thereafter | 612 | | | |
| Total payments | 1,100 | | | |
| Less amount representing interest | (310) | | | |
| Present value of net minimum lease payments | 790 | | | |
| Less current portion | (98) | | | |
| Long-term portion | $ | 692 | | | |
Contractual Obligations. At December 31, 2024, based on applicable prices on that date, FCX has unconditional purchase obligations (including take-or-pay contracts with terms less than one year) of $3.7 billion, primarily comprising the procurement of copper concentrate ($3.1 billion), electricity ($0.2 billion) and transportation services ($0.2 billion). Some of FCX’s unconditional purchase obligations are settled based on the prevailing market rate for the service or commodity purchased. In some cases, the amount of the actual obligation may change over time because of market conditions. Obligations for copper concentrate provide for deliveries of specified volumes to Atlantic Copper at market-based prices. Transportation obligations are primarily associated with contracted ocean freight agreements for our South America and Indonesia operations. Electricity obligations are primarily for long-term power purchase agreements in North America and contractual minimum demand at the South America mines.
FCX’s unconditional purchase obligations total $1.8 billion in 2025, $1.1 billion in 2026, $0.4 billion in 2027, $0.2 billion in 2028, $0.1 billion in 2029 and $0.1 billion thereafter. During the three-year period ended December 31, 2024, FCX fulfilled its minimum contractual purchase obligations.
IUPK – Indonesia. In December 2018, FCX completed the 2018 Transaction with the Indonesia government regarding PT-FI’s long-term mining rights and share ownership. Concurrent with the closing of the 2018 Transaction, the Indonesia government granted PT-FI an IUPK to replace its former contract of work. Under the terms of the IUPK, PT-FI was granted an extension of mining rights through 2031, with rights to extend mining rights through 2041, subject to PT-FI completing the development of additional smelting and refining capacity in Indonesia and fulfilling its defined fiscal obligations to the Indonesia government. The IUPK, and related documentation, contains legal and fiscal terms and is legally enforceable through 2041, assuming the additional extension is received. In addition, FCX, as a foreign investor, has rights to resolve investment disputes with the Indonesia government through international arbitration.
The key fiscal terms set forth in the IUPK include a 25% corporate income tax rate, a 10% profits tax on net income, and royalty rates of 4% for copper, 3.75% for gold and 3.25% for silver. PT-FI’s royalties charged against revenues totaled $433 million in 2024, $338 million in 2023 and $357 million in 2022.
Dividend distributions from PT-FI to FCX totaled $1.5 billion in 2024, $0.4 billion in 2023 and $2.5 billion in 2022, and are subject to a 10% withholding tax.
Export Duties. The IUPK required PT-FI to pay export duties of 5%, declining to 2.5% when smelter development progress exceeded 30% and eliminated when development progress for additional smelting and refining capacity in Indonesia exceeded 50%. In December 2022, PT-FI received approval, based on construction progress achieved, for a reduction in export duties from 5% to 2.5%, which was effective immediately. In March 2023, the Indonesia government further verified that construction progress of the new smelter exceeded 50% and PT-FI’s export duties were eliminated effective March 29, 2023.
In July 2023, the Ministry of Finance issued a revised regulation on duties for various exported products, including copper concentrates. Under the revised regulation PT-FI was assessed export duties for copper concentrates at 7.5% in the second half of 2023 (totaling $307 million). For 2024, the revised regulation assessed export duties for copper concentrates at 10% for companies with smelter progress of 70% to 90% and at 7.5% for companies with smelter progress exceeding 90%. As of December 31, 2023, construction progress of PT-FI’s smelter projects exceeded 90%; however, PT-FI was subject to the 10% export duty during 2024 until it received a revised concentrate export license. In July 2024, PT-FI was granted copper concentrate and anode slimes export licenses, which were valid through December 2024, subjecting PT-FI to a 7.5% export duty. PT-FI’s export duties totaled $457 million in 2024, $324 million in 2023 and $307 million in 2022.
Indemnification. The PT-FI divestment agreement, discussed in Note 2, provides that FCX will indemnify MIND ID and PTI from any losses (reduced by receipts) arising from any tax disputes of PT-FI disclosed to MIND ID in a Jakarta, Indonesia, tax court letter limited to PTI’s respective percentage share at the time the loss is finally incurred. Any net obligations arising from any tax settlement would be paid on December 21, 2025. FCX had accrued $49 million as of December 31, 2024, (included in accounts payable in the consolidated balance sheets) and $75 million as of December 31, 2023, (included in other long-term liabilities in the consolidated balance sheets) related to this indemnification.
Cobalt Business. In September 2021, FCX’s 56%-owned subsidiary, Koboltti Chemicals Holdings Limited (KCHL), completed the sale of its remaining cobalt business based in Kokkola, Finland (Freeport Cobalt) to Jervois Global Limited (Jervois) for $208 million (before post-closing adjustments), consisting of cash consideration of $173 million and 7% of Jervois common stock (valued at $35 million at the time of closing). In 2022, KCHL sold these shares for $60 million. In addition, KCHL has the right to receive contingent consideration through 2026 of up to $40 million based on the future performance of Freeport Cobalt. Any gain related to the contingent consideration will be recognized when received. Following this transaction, FCX no longer has cobalt operations.
Community Development Programs. FCX has adopted policies that govern its working and engagement relationships with the communities where it operates. These policies are designed to guide FCX’s practices and programs in a manner that respects and promotes basic human rights and the culture of the local people impacted by FCX’s operations. FCX continues to make significant expenditures on community development, education, health, training and cultural programs.
PT-FI provides funding and technical assistance to support various community development and empowerment programs in areas such as health, education, economic development and local infrastructure. In 1996, PT-FI established a social investment fund with the aim of contributing to social and economic development in the Mimika Regency. In 2019, a new foundation, the Amungme and Kamoro Community Empowerment Foundation (Yayasan Pemberdayaan Masyarakat Amungme dan Kamoro, or YPMAK) was established, and in 2020, PT-FI appointed YPMAK to assist in distributing a significant portion of PT-FI’s funding to support the development and empowerment of the local Indigenous Papuan people. YPMAK is governed by a Board of Governors consisting of seven representatives of Indigenous Kamoro-Amungme, PT-FI and Mind ID.
In addition, since 2001, PT-FI has voluntarily established and contributed to land rights trust funds administered by Amungme and Kamoro representatives that focus on socioeconomic initiatives, human rights and environmental issues.
PT-FI is committed to the continued funding of YPMAK programs and the land rights trust funds, as well as for other local-community development initiatives through the end of PT-FI's IUPK in support of public health, education, local economic development and empowerment. PT-FI recorded charges to production and delivery costs totaling $141 million in 2024 and $123 million in both 2023 and 2022 for social and economic development programs.
Guarantees. FCX provides certain financial guarantees (including indirect guarantees of the indebtedness of others) and indemnities.
Prior to its acquisition by FCX, FMC and its subsidiaries have, as part of merger, acquisition, divestiture and other transactions, from time to time, indemnified certain sellers, buyers or other parties related to the transaction from and against certain liabilities associated with conditions in existence (or claims associated with actions taken) prior to the closing date of the transaction. As part of these transactions, FMC indemnified the counterparty from and against certain excluded or retained liabilities existing at the time of sale that would otherwise have been transferred to the party at closing. These indemnity provisions generally now require FCX to indemnify the party against certain liabilities that may arise in the future from the pre-closing activities of FMC for assets sold or purchased. The indemnity classifications include environmental, tax and certain operating liabilities, claims or litigation existing at closing and various excluded liabilities or obligations. Most of these indemnity obligations arise from transactions that closed many years ago, and given the nature of these indemnity obligations, it is not possible to estimate the maximum potential exposure. Except as described in the following sentence, FCX does not consider any of such obligations as having a probable likelihood of payment that is reasonably estimable, and accordingly, has not recorded any obligations associated with these indemnities. With respect to FCX’s environmental indemnity obligations, any expected costs from these guarantees are accrued when potential environmental obligations are considered by management to be probable and the costs can be reasonably estimated.
NOTE 12. FINANCIAL INSTRUMENTS
FCX does not purchase, hold or sell derivative financial instruments unless there is an existing asset or obligation, or it anticipates a future activity that is likely to occur and will result in exposure to market risks, which FCX intends to offset or mitigate. FCX does not enter into any derivative financial instruments for speculative purposes, but has entered into derivative financial instruments in limited instances to achieve specific objectives. These objectives principally relate to managing risks associated with commodity price changes, foreign currency exchange rates and interest rates.
Commodity Contracts. From time to time, FCX has entered into derivative contracts to hedge the market risk associated with fluctuations in the prices of commodities it purchases and sells. Derivative financial instruments used by FCX to manage its risks do not contain credit risk-related contingent provisions.
A discussion of FCX’s derivative contracts and programs follows.
Derivatives Designated as Hedging Instruments – Fair Value Hedges
Copper Futures and Swap Contracts. Some of FCX’s U.S. copper rod and cathode customers request a fixed market price instead of the COMEX average copper price in the month of shipment. FCX hedges this price exposure in a manner that allows it to receive the COMEX average price in the month of shipment while the customers pay the fixed price they requested. FCX accomplishes this by entering into copper futures or swap contracts. Hedging gains or losses from these copper futures and swap contracts are recorded in revenues. FCX did not have any significant gains or losses resulting from hedge ineffectiveness during the three years ended December 31, 2024. At December 31, 2024, FCX held copper futures and swap contracts that qualified for hedge accounting for 109 million pounds at an average contract price of $4.31 per pound, with maturities through November 2026.
Summary of (Losses) Gains. A summary of realized and unrealized (losses) gains recognized in revenues for derivative financial instruments related to commodity contracts that are designated and qualify as fair value hedge transactions, including on the related hedged item for the years ended December 31 follows:
| | | | | | | | | | | | | | | | | |
| | 2024 | | 2023 | | 2022 |
| Copper futures and swap contracts: | | | | | |
| Unrealized (losses) gains: | | | | | |
| Derivative financial instruments | $ | (32) | | | $ | 3 | | | $ | (11) | |
| Hedged item – firm sales commitments | 32 | | | (3) | | | 11 | |
| | | | | |
| Realized gains (losses): | | | | | |
| Matured derivative financial instruments | 29 | | | (4) | | | (63) | |
Derivatives Not Designated as Hedging Instruments
Embedded Derivatives. Certain FCX sales contracts provide for provisional pricing primarily based on the LME copper price or the COMEX copper price and the London gold price at the time of shipment as specified in the contract. FCX receives market prices based on prices in the specified future month, which results in price fluctuations recorded in revenues until the date of settlement.
FCX records revenues and invoices customers at the time of shipment based on then-current LME or COMEX copper prices and the London gold price as specified in the contracts, which results in an embedded derivative (i.e., a pricing mechanism that is finalized after the time of delivery) that is required to be bifurcated from the host contract. The host contract is the sale of the metals contained in the concentrate, cathode or anode slimes at the then-current LME copper, COMEX copper or London gold prices. FCX applies the normal purchases and normal sales scope exception in accordance with derivatives and hedge accounting guidance to the host contract in its concentrate, cathode and anode slime sales agreements since these contracts do not allow for net settlement and always result in physical delivery. The embedded derivative does not qualify for hedge accounting and is adjusted to fair value through earnings each period, using the period-end LME or COMEX copper forward prices and the adjusted London gold price, until the date of final pricing. Similarly, FCX purchases copper under contracts that provide for provisional pricing. Mark-to-market price fluctuations from these embedded derivatives are recorded through the settlement date and are reflected in revenues for sales contracts and in inventory for purchase contracts.
A summary of FCX’s embedded derivatives at December 31, 2024, follows:
| | | | | | | | | | | | | | | | | | | | | | | |
| Open | | Average Price
Per Unit | | Maturities |
| | Positions | | Contract | | Market | | Through |
| Embedded derivatives in provisional sales contracts: | | | | | | | |
| Copper (millions of pounds) | 282 | | | $ | 4.16 | | | $ | 3.96 | | | May 2025 |
| Gold (thousands of ounces) | 125 | | | 2,646 | | | 2,625 | | | February 2025 |
| Embedded derivatives in provisional purchase contracts: | | | | | | | |
| Copper (millions of pounds) | 74 | | | 4.09 | | | 3.96 | | | March 2025 |
| | | | | | | |
Copper Forward Contracts. Atlantic Copper enters into copper forward contracts designed to hedge its copper price risk whenever its physical purchases and sales pricing periods do not match. These economic hedge transactions are intended to hedge against changes in copper prices, with the mark-to-market hedging gains or losses recorded in production and delivery costs. At December 31, 2024, Atlantic Copper held net copper forward sales contracts for 85 million pounds at an average contract price of $4.06 per pound, with maturities through February 2025.
Summary of Gains (Losses). A summary of the realized and unrealized gains (losses) recognized in operating income for commodity contracts that do not qualify as hedge transactions, including embedded derivatives, for the years ended December 31 follows:
| | | | | | | | | | | | | | | | | |
| | 2024 | | 2023 | | 2022 |
Embedded derivatives in provisional sales contractsa: | | | | | |
| Copper | $ | 117 | | | $ | 97 | | | $ | (479) | |
| Gold and other metals | 169 | | | 55 | | | (12) | |
| | | | | |
| | | | | |
| | | | | |
| | | | | |
Copper forward contractsb | 1 | | | (6) | | | 37 | |
a.Amounts recorded in revenues.
b.Amounts recorded in cost of sales as production and delivery costs.
Unsettled Derivative Financial Instruments
A summary of the fair values of unsettled commodity derivative financial instruments follows:
| | | | | | | | | | | |
| | December 31, |
| | 2024 | | 2023 |
| Commodity Derivative Assets: | | | |
| Derivatives designated as hedging instruments: | | | |
| Copper futures and swap contracts | $ | — | | | $ | 4 | |
| Derivatives not designated as hedging instruments: | | | |
| Embedded derivatives in provisional sales/purchase contracts | 10 | | | 76 | |
| | | |
| Copper forward contracts | 10 | | | — | |
| Total derivative assets | $ | 20 | | | $ | 80 | |
| | | | | | | | | | | |
| Commodity Derivative Liabilities: | | | |
| Derivatives designated as hedging instruments: | | | |
| Copper futures and swap contracts | $ | 28 | | | $ | — | |
| Derivatives not designated as hedging instruments: | | | |
| Embedded derivatives in provisional sales/purchase contracts | 60 | | | 23 | |
| | | |
| | | |
| Copper forward contracts | 1 | | | 1 | |
| Total derivative liabilities | $ | 89 | | | $ | 24 | |
FCX’s commodity contracts have netting arrangements with counterparties with which the right of offset exists, and it is FCX’s policy to generally offset balances by contract on its balance sheet. FCX’s embedded derivatives on provisional sales/purchase contracts are netted with the corresponding outstanding receivable/payable balances.
A summary of these net unsettled commodity contracts in the balance sheet follows (there were no offsetting amounts at December 31, 2024 and 2023):
| | | | | | | | | | | | | | | | | | | | | | | | | | |
| | Assets at December 31, | | Liabilities at December 31, |
| | 2024 | | 2023 | | 2024 | | 2023 |
| | | | | | | | |
| | | | | | | | |
| | | | | | | | |
| | | | | | | | |
| | | | | | | | |
| | | | | | | | |
| | | | | | | | |
| | | | | | | | |
| | | | | | | | |
| | | | | | | | |
| | | | | | | | |
| | | | | | | | |
| | | | | | | | |
| | | | | | | | |
| | | | | | | | |
| | | | | | | | |
| | | | | | | | |
| Amounts presented in balance sheet: | | | | | | | | |
| Commodity contracts: | | | | | | | | |
| Embedded derivatives in provisional | | | | | | | | |
| sales/purchase contracts | | $ | 10 | | | $ | 76 | | | $ | 60 | | | $ | 23 | |
| | | | | | | | |
| Copper derivatives | | 10 | | | 4 | | | 29 | | | 1 | |
| | $ | 20 | | | $ | 80 | | | $ | 89 | | | $ | 24 | |
| | | | | | | | |
| Balance sheet classification: | | | | | | | | |
| Trade accounts receivable | | $ | — | | | $ | 76 | | | $ | 53 | | | $ | 2 | |
| Other current assets | | 10 | | | 4 | | | — | | | — | |
| | | | | | | | |
| Accounts payable and accrued liabilities | | 10 | | | — | | | 35 | | | 22 | |
| Other liabilities | | — | | | — | | | 1 | | | — | |
| | $ | 20 | | | $ | 80 | | | $ | 89 | | | $ | 24 | |
Credit Risk. FCX is exposed to credit loss when financial institutions with which it has entered into derivative transactions (commodity, foreign exchange and interest rate swaps) are unable to pay. To minimize the risk of such losses, FCX uses counterparties that meet certain credit requirements and periodically reviews the creditworthiness of these counterparties. As of December 31, 2024, the maximum amount of credit exposure associated with derivative transactions was $20 million.
Other Financial Instruments. Other financial instruments include cash, cash equivalents, restricted cash and cash equivalents, accounts receivable, investment securities, legally restricted trust assets, accounts payable and accrued liabilities, accrued income taxes, dividends payable and debt. The carrying value for these financial instruments classified as current assets or liabilities approximates fair value because of their short-term nature and generally negligible credit losses (refer to Note 13 for the fair values of investment securities, legally restricted funds and debt).
Cash, Cash Equivalents and Restricted Cash and Cash Equivalents. The following table provides a reconciliation of total cash, cash equivalents and restricted cash and cash equivalents presented in the consolidated statements of cash flows:
| | | | | | | | | | | | | | |
| | December 31, |
| | 2024 | | 2023 |
| Balance sheet components: | | | | |
Cash and cash equivalentsa | | $ | 3,923 | | | $ | 4,758 | |
| | | | |
Restricted cash and cash equivalents, currentb | | 888 | | | 1,208 | |
| Restricted cash and cash equivalents, long-term – included in other assets | | 100 | | | 97 | |
| Total cash, cash equivalents and restricted cash and cash equivalents presented in the consolidated statements of cash flows | | $ | 4,911 | | | $ | 6,063 | |
a.Includes (i) time deposits of $0.1 billion at December 31, 2024, and $0.3 billion at December 31, 2023, and (ii) cash designated for PT-FI’s new downstream processing facilities totaling $0.2 billion at December 31, 2023.
b.Includes (i) $0.7 billion at December 31, 2024, and $1.1 billion at December 31, 2023, associated with 30% of PT-FI’s export proceeds required to be temporarily deposited in Indonesia banks for 90 days in accordance with a regulation issued by the Indonesia government and (ii) $0.1 billion at December 31, 2024 and 2023, in assurance bonds to support PT-FI’s commitment for its new downstream processing facilities.
NOTE 13. FAIR VALUE MEASUREMENT
Fair value accounting guidance includes a hierarchy that prioritizes the inputs to valuation techniques used to measure fair value. The hierarchy gives the highest priority to unadjusted quoted prices in active markets for identical assets or liabilities (Level 1) and the lowest priority to unobservable inputs (Level 3). FCX did not have any significant transfers in or out of Level 3 for 2024.
FCX’s financial instruments are recorded on the consolidated balance sheets at fair value except for contingent consideration associated with the sale of the Deepwater GOM oil and gas properties (which was recorded under the loss recovery approach) and debt. A summary of the carrying amount and fair value of FCX’s financial instruments (including those measured at NAV as a practical expedient), other than cash and cash equivalents, restricted cash and cash equivalents, accounts receivable, accounts payable and accrued liabilities, accrued income taxes and dividends payable (refer to Note 12), follows:
| | | | | | | | | | | | | | | | | | | | | | | | | | | | | | | | | | | |
| | At December 31, 2024 |
| Carrying | | Fair Value |
| | Amount | | Total | | NAV | | Level 1 | | Level 2 | | Level 3 |
| Assets | | | | | | | | | | | |
Investment securities:a,b | | | | | | | | | | | |
| U.S. core fixed income fund | $ | 27 | | | $ | 27 | | | $ | 27 | | | $ | — | | | $ | — | | | $ | — | |
| Equity securities | 9 | | | 9 | | | — | | | 9 | | | — | | | — | |
| | | | | | | | | | | |
| Total | 36 | | | 36 | | | 27 | | | 9 | | | — | | | — | |
| | | | | | | | | | | |
Legally restricted funds:a | | | | | | | | | | | |
| U.S. core fixed income fund | 66 | | | 66 | | | 66 | | | — | | | — | | | — | |
| Government mortgage-backed securities | 54 | | | 54 | | | — | | | — | | | 54 | | | — | |
| Government bonds and notes | 34 | | | 34 | | | — | | | — | | | 34 | | | — | |
| Corporate bonds | 31 | | | 31 | | | — | | | — | | | 31 | | | — | |
| Money market funds | 19 | | | 19 | | | — | | | 19 | | | — | | | — | |
| Asset-backed securities | 12 | | | 12 | | | — | | | — | | | 12 | | | — | |
| Collateralized mortgage-backed securities | 1 | | | 1 | | | — | | | — | | | 1 | | | — | |
| | | | | | | | | | | |
| Total | 217 | | | 217 | | | 66 | | | 19 | | | 132 | | | — | |
| | | | | | | | | | | |
Derivatives:c | | | | | | | | | | | |
| Embedded derivatives in provisional sales/purchase contracts in a gross asset position | 10 | | | 10 | | | — | | | — | | | 10 | | | — | |
| | | | | | | | | | | |
| Copper forward contracts | 10 | | | 10 | | | — | | | 4 | | | 6 | | | — | |
| | | | | | | | | | | |
| | | | | | | | | | | |
| Total | 20 | | | 20 | | | — | | | 4 | | | 16 | | | — | |
| | | | | | | | | | | |
Contingent consideration for the sale of the Deepwater GOM oil and gas propertiesa | 3 | | | 3 | | | — | | | — | | | — | | | 3 | |
| | | | | | | | | | | |
| | | | | | | | | | | |
| | | | | | | | | | | |
| | | | | | | | | | | | | | | | | | | | | | | | | | | | | | | | | | | |
| | | | | | | | | | | |
| Liabilities | | | | | | | | | | | |
Derivatives:c | | | | | | | | | | | |
| Embedded derivatives in provisional sales/purchase contracts in a gross liability position | 60 | | | 60 | | | — | | | — | | | 60 | | | — | |
| | | | | | | | | | | |
| | | | | | | | | | | |
| Copper futures and swap contracts | 28 | | | 28 | | | — | | | 17 | | | 11 | | | — | |
| Copper forward contracts | 1 | | | 1 | | | — | | | 1 | | | — | | | — | |
| | | | | | | | | | | |
| Total | 89 | | | 89 | | | — | | | 18 | | | 71 | | | — | |
| | | | | | | | | | | |
| | | | | | | | | | | |
| | | | | | | | | | | |
Long-term debt, including current portiond | 8,948 | | | 8,807 | | | — | | | — | | | 8,807 | | | — | |
| | | | | | | | | | | |
| | | | | | | | | | | |
| | | | | | | | | | | | | | | | | | | | | | | | | | | | | | | | | | | |
| At December 31, 2023 |
| | Carrying | | Fair Value |
| | Amount | | Total | | NAV | | Level 1 | | Level 2 | | Level 3 |
| Assets | | | | | | | | | | | |
Investment securities:a,b | | | | | | | | | | | |
| U.S. core fixed income fund | $ | 27 | | | $ | 27 | | | $ | 27 | | | $ | — | | | $ | — | | | $ | — | |
| Equity securities | 6 | | | 6 | | | — | | | 6 | | | — | | | — | |
| | | | | | | | | | | |
| Total | 33 | | | 33 | | | 27 | | | 6 | | | — | | | — | |
| | | | | | | | | | | |
Legally restricted funds:a | | | | | | | | | | | |
| U.S. core fixed income fund | 65 | | | 65 | | | 65 | | | — | | | — | | | — | |
| | | | | | | | | | | |
| | | | | | | | | | | |
| | | | | | | | | | | |
| Government mortgage-backed securities | 51 | | | 51 | | | — | | | — | | | 51 | | | — | |
| Government bonds and notes | 37 | | | 37 | | | — | | | — | | | 37 | | | — | |
| Corporate bonds | 29 | | | 29 | | | — | | | — | | | 29 | | | — | |
| Money market funds | 17 | | | 17 | | | — | | | 17 | | | — | | | — | |
| Asset-backed securities | 12 | | | 12 | | | — | | | — | | | 12 | | | — | |
| Collateralized mortgage-backed securities | 1 | | | 1 | | | — | | | — | | | 1 | | | — | |
| | | | | | | | | | | |
| Total | 212 | | | 212 | | | 65 | | | 17 | | | 130 | | | — | |
| | | | | | | | | | | |
Derivatives:c | | | | | | | | | | | |
| Embedded derivatives in provisional sales/purchase contracts in a gross asset position | 76 | | | 76 | | | — | | | — | | | 76 | | | — | |
| Copper futures and swap contracts | 4 | | | 4 | | | — | | | 3 | | | 1 | | | — | |
| | | | | | | | | | | |
| | | | | | | | | | | |
| | | | | | | | | | | |
| Total | 80 | | | 80 | | | — | | | 3 | | | 77 | | | — | |
| | | | | | | | | | | |
Contingent consideration for the sale of the Deepwater GOM oil and gas propertiesa | 50 | | | 42 | | | — | | | — | | | — | | | 42 | |
| | | | | | | | | | | |
| | | | | | | | | | | |
| | | | | | | | | | | |
| Liabilities | | | | | | | | | | | |
Derivatives:c | | | | | | | | | | | |
| Embedded derivatives in provisional sales/purchase contracts in a gross liability position | 23 | | | 23 | | | — | | | — | | | 23 | | | — | |
| Copper forward contracts | 1 | | | 1 | | | — | | | 1 | | | — | | | — | |
| Total | 24 | | | 24 | | | — | | | 1 | | | 23 | | | — | |
| | | | | | | | | | | |
| | | | | | | | | | | |
Long-term debt, including current portiond | 9,422 | | | 9,364 | | | — | | | — | | | 9,364 | | | — | |
| | | | | | | | | | | |
| | | | | | | | | | | |
a.Current portion included in other current assets and long-term portion included in other assets.
b.Excludes amounts included in restricted cash and cash equivalents and other assets (which approximated fair value), primarily associated with (i) PT-FI’s export proceeds ($0.7 billion at December 31, 2024, and $1.1 billion at December 31, 2023), (ii) assurance bonds to support PT-FI’s commitment for new downstream processing facilities ($0.1 billion at December 31, 2024 and 2023) and (iii) PT-FI’s mine closure and reclamation guarantees ($0.1 billion at December 31, 2024 and 2023).
c.Refer to Note 12 for further discussion and balance sheet classifications.
d.Recorded at cost except for debt assumed in acquisitions, which are recorded at fair value at the respective acquisition dates.
Valuation Techniques. The U.S. core fixed income fund is valued at NAV. The fund strategy seeks total return consisting of income and capital appreciation primarily by investing in a broad range of investment-grade debt securities, including U.S. government obligations, corporate bonds, mortgage-backed securities, asset-backed securities and money market instruments. There are no restrictions on redemptions (which are usually within one business day of notice).
Equity securities are valued at the closing price reported on the active market on which the individual securities are traded and, as such, are classified within Level 1 of the fair value hierarchy.
Fixed income securities (government securities, corporate bonds, asset-backed securities and collateralized mortgage-backed securities) are valued using a bid-evaluation price or a mid-evaluation price. These evaluations are based on quoted prices, if available, or models that use observable inputs and, as such, are classified within Level 2 of the fair value hierarchy.
Money market funds are classified within Level 1 of the fair value hierarchy because they are valued using quoted market prices in active markets.
FCX’s embedded derivatives on provisional copper concentrate, copper cathode and gold purchases and sales are valued using quoted monthly LME or COMEX copper forward prices and the adjusted London gold prices at each reporting date based on the month of maturity (refer to Note 12 for further discussion); however, FCX’s contracts themselves are not traded on an exchange. As a result, these derivatives are classified within Level 2 of the fair value hierarchy.
FCX’s derivative financial instruments for copper futures and swap contracts and copper forward contracts that are traded on the respective exchanges are classified within Level 1 of the fair value hierarchy because they are valued using quoted monthly COMEX or LME prices at each reporting date based on the month of maturity (refer to Note 12 for further discussion). Certain of these contracts are traded on the over-the-counter market and are classified within Level 2 of the fair value hierarchy based on COMEX and LME forward prices.
In December 2016, FCX’s sale of its Deepwater GOM oil and gas properties included up to $150 million in contingent consideration (to be received over time) that was recorded at the total amount under the loss recovery approach. The fair value of this contingent consideration was calculated based on a discounted cash flow model using inputs that include third-party estimates for reserves, production rates and production timing, and discount rates. Because significant inputs are not observable in the market, the contingent consideration is classified within Level 3 of the fair value hierarchy. In third-quarter 2024, FCX determined that only $4 million of the remaining balance was collectible and recorded a net impairment of $32 million (consisting of a $42 million impairment to the contingent consideration receivable and an offsetting reduction of $10 million to the related overriding royalty interest payable).
Long-term debt, including current portion, is primarily valued using available market quotes and, as such, is classified within Level 2 of the fair value hierarchy.
The techniques described above may produce a fair value that may not be indicative of NRV or reflective of future fair values. Furthermore, while FCX believes its valuation techniques are appropriate and consistent with other market participants, the use of different techniques or assumptions to determine fair value of certain financial instruments could result in a different fair value measurement at the reporting date. There have been no changes in the techniques used at December 31, 2024, as compared to those techniques used at December 31, 2023.
NOTE 14. BUSINESS SEGMENT INFORMATION
Product Revenues. FCX’s revenues attributable to the products it sold for the years ended December 31 follow:
| | | | | | | | | | | | | | | | | |
| | 2024 | | 2023 | | 2022 |
| Copper: | | | | | |
| Cathode | $ | 8,316 | | | $ | 6,629 | | | $ | 5,134 | |
| Concentrate | 6,726 | | | 7,127 | | | 9,650 | |
| Rod and other refined copper products | 3,851 | | | 3,659 | | | 3,699 | |
Purchased coppera | 693 | | | 416 | | | 481 | |
| Gold | 4,446 | | | 3,472 | | | 3,397 | |
| Molybdenum | 1,801 | | | 2,006 | | | 1,416 | |
| Silver and other | 631 | | | 585 | | | 688 | |
| Adjustments to revenues: | | | | | |
Royalty expenseb | (442) | | | (346) | | | (366) | |
| Treatment charges | (396) | | | (538) | | | (503) | |
PT-FI export dutiesc | (457) | | | (307) | | | (325) | |
| Revenues from contracts with customers | 25,169 | | | 22,703 | | | 23,271 | |
Embedded derivativesd | 286 | | | 152 | | | (491) | |
| Total consolidated revenues | $ | 25,455 | | | $ | 22,855 | | | $ | 22,780 | |
a.FCX purchases copper cathode primarily for processing by its Rod & Refining operations.
b.Reflects royalties on sales from PT-FI and Cerro Verde that will vary with the volume of metal sold and prices.
c.Refer to Note 11 for further discussion of PT-FI export duties. Amounts include credits (charges) of $17 million in 2023 and $(18) million in 2022 associated with adjustments to prior-period export duties.
d.Refer to Note 12 for discussion of embedded derivatives related to FCX’s provisionally priced concentrate and cathode sales contracts.
Geographic Area. Information concerning financial data by geographic area follows:
| | | | | | | | | | | |
| December 31, |
| | 2024 | | 2023 |
Long-lived assets:a | | | |
| Indonesia | $ | 22,580 | | | $ | 20,602 | |
| U.S. | 10,468 | | | 9,386 | |
| Peru | 6,452 | | | 6,563 | |
| | | |
| Chile | 1,120 | | | 1,105 | |
| Other | 496 | | | 355 | |
| Total | $ | 41,116 | | | $ | 38,011 | |
a.Excludes deferred tax assets and intangible assets.
| | | | | | | | | | | | | | | | | |
| Years Ended December 31, |
| | 2024 | | 2023 | | 2022 |
Revenues:a | | | | | |
| U.S. | $ | 7,806 | | | $ | 7,264 | | | $ | 7,339 | |
| Japan | 5,930 | | | 3,431 | | | 2,462 | |
| Switzerland | 4,251 | | | 3,971 | | | 2,740 | |
| Singapore | 1,116 | | | 1,178 | | | 1,492 | |
| Indonesia | 1,108 | | | 767 | | | 3,026 | |
| Spain | 1,052 | | | 1,251 | | | 1,174 | |
| China | 743 | | | 1,081 | | | 929 | |
| Germany | 500 | | | 714 | | | 632 | |
| Chile | 451 | | | 428 | | | 383 | |
| France | 306 | | | 226 | | | 177 | |
| Philippines | 283 | | | 396 | | | 249 | |
| India | 273 | | | 354 | | | 330 | |
| Egypt | 239 | | | 229 | | | 149 | |
| South Korea | 203 | | | 267 | | | 302 | |
| United Kingdom | 115 | | | 171 | | | 355 | |
| Other | 1,079 | | | 1,127 | | | 1,041 | |
| Total | $ | 25,455 | | | $ | 22,855 | | | $ | 22,780 | |
a.Revenues are attributed to countries based on the location of the customer.
Major Customers and Affiliated Companies. Sales to MMC, PT-FI’s joint venture partner in PT Smelting, were 17% of FCX’s consolidated revenues in 2024 and totaled $4.4 billion in 2024, $2.0 billion in 2023 and $0.6 billion in 2022. Sales to PT Smelting were 13% of FCX’s consolidated revenues in 2022 and totaled $3.0 billion in 2022. Sales to PT Smelting totaled $27 million in 2023 (reflecting adjustments to prior period provisionally priced concentrate sales). MMC and PT Smelting are the only customers that accounted for 10% or more of FCX’s annual consolidated revenues during the three years ended December 31, 2024.
Consolidated revenues include sales to the noncontrolling interest owners of FCX’s South America mining operations and Morenci’s joint venture partners totaling $1.6 billion in 2024, $1.4 billion in 2023 and $1.7 billion in 2022.
Labor Matters. As of December 31, 2024, approximately 28% of FCX’s global labor force was covered by collective labor agreements (CLAs), none of which will expire during 2025.
Business Segments. FCX has organized its mining operations into four primary divisions – North America copper mines, South America operations, Indonesia operations and Molybdenum mines, and operating segments that meet certain thresholds are reportable segments. Separately disclosed in the following tables are FCX’s reportable segments, which include the Morenci and Cerro Verde copper mines, the Indonesia operations (including the Grasberg minerals district and PT-FI’s new downstream processing facilities), the Rod & Refining operations and Atlantic Copper Smelting & Refining.
FCX's Chief Executive Officer is identified as its CODM under business segment reporting guidance. Operating income (loss) is the financial measure of profit or loss used by the CODM to review segment results, and the significant segment expenses reviewed by the CODM are consistent with the operating expense line items presented in FCX’s consolidated statements of income. The CODM uses operating income (loss) to assess segment performance against forecasted results and to allocate resources, including capital investment in mining operations and potential expansions.
The 2023 and 2022 tables have been adjusted to conform with the current year presentation, primarily for the combination of the Grasberg minerals district and PT-FI’s new downstream processing facilities. PT-FI’s new downstream processing facilities will exclusively receive concentrate from the Grasberg minerals district, which reflects PT-FI’s integrated and dependent operations within Indonesia (i.e., Indonesia operations). The PMR will receive anode slimes from the smelter and from PT Smelting. FCX's CODM makes executive management decisions, including resource allocation and mine planning, for the Indonesia operations as a single business segment.
Intersegment sales between FCX’s business segments are based on terms similar to arm’s-length transactions with third parties at the time of the sale. Intersegment sales may not be reflective of the actual prices ultimately realized because of a variety of factors, including additional processing, the timing of sales to unaffiliated customers and transportation premiums.
FCX defers recognizing profits on intercompany sales to Atlantic Copper until final sales to third parties occur. Until December 31, 2022, FCX also deferred recognizing 39.5% of PT-FI’s sales to PT Smelting, until final sales to third parties occurred. Beginning in 2023, PT-FI’s commercial arrangement with PT Smelting changed to a tolling arrangement and there were no further sales from PT-FI to PT Smelting during 2023 and 2024. Quarterly variations in ore grades, the timing of intercompany shipments and changes in product prices result in variability in FCX’s net deferred profits and quarterly earnings.
FCX allocates certain operating costs, expenses and capital expenditures to its operating divisions and individual segments. However, not all costs and expenses applicable to an operation are allocated. U.S. federal and state income taxes are recorded and managed at the corporate level (included in Corporate, Other & Eliminations), whereas foreign income taxes are recorded and managed at the applicable country level. In addition, some selling, general and administrative costs are not allocated to the operating divisions or individual reportable segments. Accordingly, the following segment information reflects management determinations that may not be indicative of what the actual financial performance of each operating division or reportable segment would be if it was an independent entity.
North America Copper Mines. FCX operates seven open-pit copper mines in North America – Morenci, Safford (including Lone Star), Bagdad, Sierrita and Miami in Arizona, and Chino and Tyrone in New Mexico. The North America copper mines include open-pit mining, sulfide-ore concentrating, leaching and SX/EW operations. A majority of the copper produced at the North America copper mines is cast into copper rod by FCX’s Rod & Refining segment. In addition to copper, certain of FCX’s North America copper mines also produce molybdenum concentrate, gold and silver.
The Morenci open-pit mine, located in southeastern Arizona, produces copper cathode and copper concentrate. In addition to copper, the Morenci mine also produces molybdenum concentrate. During 2024, the Morenci mine produced 41% of FCX’s North America copper and 12% of FCX’s consolidated copper production.
South America Operations. South America operations includes two operating copper mines – Cerro Verde in Peru and El Abra in Chile. These operations include open-pit mining, sulfide-ore concentrating, leaching and SX/EW operations.
The Cerro Verde open-pit copper mine, located near Arequipa, Peru, produces copper cathode and copper concentrate. In addition to copper, the Cerro Verde mine also produces molybdenum concentrate and silver. During 2024, the Cerro Verde mine produced 81% of FCX’s South America copper and 23% of FCX’s consolidated copper production.
Indonesia Operations. Indonesia operations include PT-FI’s Grasberg minerals district that produces copper concentrate that contains significant quantities of gold and silver, and PT-FI’s new downstream processing facilities. During 2024, PT-FI’s Grasberg minerals district produced 43% of FCX’s consolidated copper production and 99% of FCX’s consolidated gold production.
Molybdenum Mines. Molybdenum mines include the wholly owned Henderson underground mine and Climax open-pit mine, both in Colorado. The Henderson and Climax mines produce high-purity, chemical-grade molybdenum concentrate, which is typically further processed into value-added molybdenum chemical products.
Rod & Refining. The Rod & Refining segment consists of copper conversion facilities located in North America, and includes a refinery and two rod mills, which are combined in accordance with segment reporting aggregation guidance. These operations process copper produced at FCX’s North America copper mines and purchased copper into copper cathode and rod. At times these operations refine copper and produce copper rod for customers on a toll basis. Toll arrangements require the tolling customer to deliver appropriate copper-bearing material to FCX’s facilities for processing into a product that is returned to the customer, who pays FCX for processing its material into the specified products.
Atlantic Copper Smelting & Refining. Atlantic Copper smelts and refines copper concentrate and markets refined copper and precious metals in slimes. During 2024, Atlantic Copper purchased 2% of its concentrate requirements from FCX’s North America copper mines, 15% from FCX’s South America operations and 13% from FCX’s Indonesia operations, with the remainder purchased from unaffiliated third parties.
Corporate, Other & Eliminations. Corporate, Other & Eliminations consists of FCX’s other mining, oil and gas operations and other corporate and elimination items, which include the Miami smelter, molybdenum conversion facilities in the U.S. and Europe, certain non-operating copper mines in North America (Ajo, Bisbee and Tohono in Arizona) and other mining support entities.
Financial Information by Business Segment
| | | | | | | | | | | | | | | | | | | | | | | | | | | | | | | | | | | | | | | | | | | | | | | | | | | | | | | | | | | | | | | | | | | | | | | | | | | | | | | | | | | | |
| | | | | | | | |
| North America Copper Mines | | South America Operations | | | | | | | | | | | | | | | | | | | | | |
| | | | | | | | | | | | | | | | | | | | | | | Atlantic | | | | | | | | Corporate, | | | |
| | | | | | | | | | | | | | | | | | | | | | | Copper | | | | | | | | Other | | | |
| | | | | | | | | Cerro | | | | | | Indonesia | | | | Molybdenum | | Rod & | | Smelting | | | | | | | | & Elimi- | | FCX | |
| Morenci | | | | Other | | Total | | Verde | | Other | | Total | | Operations | | | | Mines | | Refining | | & Refining | | | | | | | | nations | | Total | |
| Year Ended December 31, 2024 | | | | | | | | | | | | | | | | | | | | | | | | | | | | | | | | | | |
| Revenues: | | | | | | | | | | | | | | | | | | | | | | | | | | | | | | | | | | |
| Unaffiliated customers | $ | 101 | | | | | $ | 79 | | | $ | 180 | | | $ | 3,618 | | | $ | 915 | | | $ | 4,533 | | | $ | 9,774 | | | | | $ | — | | | $ | 6,196 | | | $ | 3,009 | | | | | | | | | $ | 1,763 | | a | $ | 25,455 | | |
| Intersegment | 2,246 | | | | | 3,814 | | | 6,060 | | | 638 | | | — | |
| 638 | | | 544 | | | | | 592 | | | 43 | | | 8 | | | | | | | | | (7,885) | | | — | | |
| Production and delivery | 1,826 | | | | | 3,170 | | | 4,996 | | | 2,529 | | b | 701 | | | 3,230 | | | 3,368 | | c | | | 530 | | | 6,206 | | | 2,912 | | | | | | | | | (5,688) | | d | 15,554 | | e |
| Depreciation, depletion and amortization | 187 | | | | | 252 | | | 439 | | | 380 | | | 66 | | | 446 | | | 1,193 | | | | | 73 | | | 4 | | | 28 | | | | | | | | | 58 | | | 2,241 | | |
| | | | | | | | | | | | | | | | | | | | | | | | | | | | | | | | | | |
| | | | | | | | | | | | | | | | | | | | | | | | | | | | | | | | | | |
| Selling, general and administrative expenses | 2 | | | | | 2 | | | 4 | | | 8 | | | — | | | 8 | | | 127 | | | | | — | | | — | | | 28 | | | | | | | | | 346 | |
| 513 | | |
| Exploration and research expenses | 17 | | | | | 27 | | | 44 | | | 12 | | | 4 | | | 16 | | | 8 | | | | | — | | | — | | | — | | | | | | | | | 88 | | | 156 | | |
| Environmental obligations and shutdown costs | — | | | | | — | | | — | | | — | | | — | | | — | | | — | | | | | — | | | — | | | — | | | | | | | | | 127 | | | 127 | | |
| | | | | | | | | | | | | | | | | | | | | | | | | | | | | | | | | | |
| | | | | | | | | | | | | | | | | | | | | | | | | | | | | | | | | | |
| Operating income (loss) | 315 | | | | | 442 | | | 757 | | | 1,327 | | | 144 | | | 1,471 | | | 5,622 | | | | | (11) | | | 29 | | | 49 | |
| | | | | | | (1,053) | | | 6,864 | | |
| | | | | | | | | | | | | | | | | | | | | | | | | | | | | | | | | | |
| Interest expense, net | — | | | | | 1 | | | 1 | | | 21 | | | — | | | 21 | | | 28 | | | | | — | | | — | | | 36 | | | | | | | | | 233 | |
| 319 | | |
| | | | | | | | | | | | | | | | | | | | | | | | | | | | | | | | | | |
| Other (expense) income, net | (1) | | | | | 2 | | | 1 | | | 42 | | | 24 | | | 66 | | | 136 | | | | | — | | | (1) | | | 13 | | | | | | | | | 147 | | | 362 | | |
| Provision for (benefit from) income taxes | — | | | | | — | | | — | | | 542 | |
| 62 | | | 604 | | | 1,907 | | f | | | — | | | — | | | (11) | | | | | | | | | 23 | | | 2,523 | | |
| Equity in affiliated companies’ net earnings | — | | | | | — | | | — | | | — | | | — | | | — | | | 7 | | | | | — | | | — | | | — | | | | | | | | | 8 | | | 15 | | |
| Net income attributable to noncontrolling interests | — | | | | | — | | | — | | | 412 | | g | 67 | | | 479 | | | 2,022 | | h | | | — | | | — | | | — | | | | | | | | | 9 | | | 2,510 | | |
| Net income attributable to common stockholders | | | | | | | | | | | | | | | | | | | | | | | | | | | | | | | | | 1,889 | | |
| Total assets at December 31, 2024 | 3,228 | | | | | 6,766 | | | 9,994 | | | 8,096 | | | 2,060 | | | 10,156 | | | 27,309 | | | | | 2,018 | | | 202 | | | 1,705 | | | | | | | | | 3,464 | | | 54,848 | | |
| Capital expenditures | 184 | | | | | 849 | | | 1,033 | | | 293 | | | 82 | | | 375 | | | 2,908 | | | | | 117 | | | 35 | | | 142 | | | | | | | | | 198 | | | 4,808 | | |
| | | | | | | | | | | | | | | | | | | | | | | | | | | | | | | | | | |
| | | | | | | | | | | | | | | | | | | | | | | | | | | | | | | | | | | | | | | | | | | | | | | | | | | | | | | | | | | | | | | | | | | | | | | | | | | | | | | | | | | | |
| | | | | | | | |
| North America Copper Mines | | South America Operations | | | | | | | | | | | | | | | | | | | | | |
| | | | | | | | | | | | | | | | | | | | | | | Atlantic | | | | | | | | Corporate, | | | |
| | | | | | | | | | | | | | | | | | | | | | | Copper | | | | | | | | Other | | | |
| | | | | | | | | Cerro | | | | | | Indonesia | | | | Molybdenum | | Rod & | | Smelting | | | | | | | | & Elimi- | | FCX | |
| Morenci | | | | Other | | Total | | Verde | | Other | | Total | | Operations | | | | Mines | | Refining | | & Refining | | | | | | | | nations | | Total | |
| Year Ended December 31, 2023 | | | | | | | | | | | | | | | | | | | | | | | | | | | | | | | | | | |
| Revenues: | | | | | | | | | | | | | | | | | | | | | | | | | | | | | | | | | | |
| Unaffiliated customers | $ | 91 | | | | | $ | 152 | | | $ | 243 | | | $ | 3,330 | | | $ | 824 | | | $ | 4,154 | | | $ | 7,816 | | i | | | $ | — | | | $ | 5,886 | | | $ | 2,791 | | | | | | | | | $ | 1,965 | | a | $ | 22,855 | | |
| Intersegment | 2,328 | | | | | 3,745 | | | 6,073 | | | 787 | | | — | | | 787 | | | 621 | | | | | 677 | | | 40 | | | 19 | | | | | | | | | (8,217) | | | — | | |
| Production and delivery | 1,730 | | | | | 3,048 | | | 4,778 | | | 2,529 | | | 710 | | | 3,239 | | | 2,570 | | c | | | 439 | | | 5,901 | | | 2,718 | |
| | | | | | | (6,018) | | d | 13,627 | | e |
| Depreciation, depletion and amortization | 175 | | | | | 243 | | | 418 | | | 395 | | | 64 | | | 459 | | | 1,028 | | | | | 66 | | | 5 | | | 28 | | | | | | | | | 64 | | | 2,068 | | |
| | | | | | | | | | | | | | | | | | | | | | | | | | | | | | | | | | |
| | | | | | | | | | | | | | | | | | | | | | | | | | | | | | | | | | |
| Selling, general and administrative expenses | 2 | | | | | 2 | | | 4 | | | 9 | | | — | | | 9 | | | 129 | | | | | — | | | — | | | 28 | | | | | | | | | 309 | | | 479 | | |
| Exploration and research expenses | 11 | | | | | 39 | | | 50 | | | 10 | | | 4 | | | 14 | | | 2 | | | | | — | | | — | | | — | | | | | | | | | 71 | | | 137 | | |
| Environmental obligations and shutdown costs | (1) | | | | | 28 | | | 27 | | | — | | | — | | | — | | | — | | | | | — | | | — | | | — | | | | | | | | | 292 | | j | 319 | | |
| | | | | | | | | | | | | | | | | | | | | | | | | | | | | | | | | | |
| | | | | | | | | | | | | | | | | | | | | | | | | | | | | | | | | | |
| Operating income (loss) | 502 | | | | | 537 | | | 1,039 | | | 1,174 | | | 46 | | | 1,220 | | | 4,708 | | | | | 172 | | | 20 | | | 36 | | | | | | | | | (970) | | | 6,225 | | |
| | | | | | | | | | | | | | | | | | | | | | | | | | | | | | | | | | |
| Interest expense, net | — | | | | | 1 | | | 1 | | | 77 | | k | — | | | 77 | | | 35 | | | | | — | | | — | | | 31 | | | | | | | | | 371 | | | 515 | | |
| Net gain on early extinguishment of debt | — | | | | | — | | | — | | | — | | | — | | | — | | | — | | | | | — | | | — | | | — | | | | | | | | | 10 | | | 10 | | |
| Other (expense) income, net | (5) | | | | | 3 | | | (2) | | | (13) | | k | 11 | | | (2) | | | 122 | | | | | (1) | | | (2) | | | (8) | | | | | | | | | 179 | | | 286 | | |
| Provision for (benefit from) income taxes | — | | | | | — | | | — | | | 495 | | | 17 | | | 512 | | | 1,774 | | | | | — | | | — | | | — | | | | | | | | | (16) | | | 2,270 | | |
| Equity in affiliated companies’ net earnings | — | | | | | — | | | — | | | — | | | — | | | — | | | 10 | | | | | — | | | — | | | — | | | | | | | | | 5 | | | 15 | | |
| Net income (loss) attributable to noncontrolling interests | — | | | | | — | | | — | | | 300 | | g | 36 | | | 336 | | | 1,614 | | h | | | — | | | — | | | — | | | | | | | | | (47) | | | 1,903 | | |
| Net income attributable to common stockholders | | | | | | | | | | | | | | | | | | | | | | | | | | | | | | | | | 1,848 | | |
| Total assets at December 31, 2023 | 3,195 | | | | | 5,996 | | | 9,191 | | | 8,120 | | | 1,930 | | | 10,050 | | | 25,548 | | | | | 1,782 | | | 172 | | | 1,326 | | | | | | | | | 4,437 | | | 52,506 | | |
| Capital expenditures | 232 | | | | | 529 | | | 761 | | | 271 | | | 97 | | | 368 | | | 3,324 | | | | | 84 | | | 13 | | | 64 | | | | | | | | | 210 | | | 4,824 | | |
Financial Information by Business Segment (continued)
| | | | | | | | | | | | | | | | | | | | | | | | | | | | | | | | | | | | | | | | | | | | | | | | | | | | | | | | | | | | | | | | | | | | | | | | | | | | | | | | | | | | |
| | | | | | | | |
| North America Copper Mines | | South America Operations | | | | | | | | | | | | | | | | | | | | | |
| | | | | | | | | | | | | | | | | | | | | | | Atlantic | | | | | | | | Corporate, | | | |
| | | | | | | | | | | | | | | | | | | | | | | Copper | | | | | | | | Other | | | |
| | | | | | | | | Cerro | | | | | | Indonesia | | | | Molybdenum | | Rod & | | Smelting | | | | | | | | & Elimi- | | FCX | |
| Morenci | | | | Other | | Total | | Verde | | Other | | Total | | Operations | | | | Mines | | Refining | | & Refining | | | | | | | | nations | | Total | |
| Year Ended December 31, 2022 | | | | | | | | | | | | | | | | | | | | | | | | | | | | | | | | | | |
| Revenues: | | | | | | | | | | | | | | | | | | | | | | | | | | | | | | | | | | |
| Unaffiliated customers | $ | 175 | | | | | $ | 253 | | | $ | 428 | | | $ | 3,444 | | | $ | 768 | | | $ | 4,212 | | | $ | 8,028 | | i | | | $ | — | | | $ | 6,281 | | | $ | 2,439 | | | | | | | | | $ | 1,392 | | a | $ | 22,780 | | |
| Intersegment | 2,514 | | | | | 3,768 | | | 6,282 | | | 506 | | | — | |
| 506 | | | 398 | | | | | 565 | | | 31 | | | 4 | | | | | | | | | (7,786) | | | — | | |
| Production and delivery | 1,550 | | | | | 2,827 | | | 4,377 | | | 2,369 | | | 705 | | | 3,074 | | | 2,686 | | c | | | 359 | | | 6,330 | | | 2,452 | | l | | | | | | | (6,208) | | d | 13,070 | | e |
| Depreciation, depletion and amortization | 177 | | | | | 233 | | | 410 | | | 357 | | | 51 | | | 408 | | | 1,025 | | | | | 74 | | | 5 | | | 27 | | | | | | | | | 70 | | | 2,019 | | |
| | | | | | | | | | | | | | | | | | | | | | | | | | | | | | | | | | |
| | | | | | | | | | | | | | | | | | | | | | | | | | | | | | | | | | |
| Selling, general and administrative expenses | 2 | | | | | 3 | | | 5 | | | 8 | | | — | | | 8 | | | 117 | | | | | — | | | — | | | 25 | | | | | | | | | 265 | | | 420 | | |
| Exploration and research expenses | 2 | | | | | 45 | | | 47 | | | 5 | | | 4 | | | 9 | | | — | | | | | 3 | | | — | | | — | | | | | | | | | 56 | | | 115 | | |
| Environmental obligations and shutdown costs | (5) | | | | | 1 | | | (4) | | | — | | | — | | | — | | | — | | | | | — | | | — | | | — | | | | | | | | | 125 | | | 121 | | |
| | | | | | | | | | | | | | | | | | | | | | | | | | | | | | | | | | |
| Net gain on sales of assets | — | | | | | — | | | — | | | — | | | — | | | — | | | — | | | | | — | | | — | | | — | | | | | | | | | (2) | |
| (2) | | |
| Operating income (loss) | 963 | | | | | 912 | | | 1,875 | | | 1,211 | | | 8 | | | 1,219 | | | 4,598 | | | | | 129 | | | (23) | | | (61) | | | | | | | | | (700) | | | 7,037 | | |
| | | | | | | | | | | | | | | | | | | | | | | | | | | | | | | | | | |
| Interest expense, net | 1 | | | | | 1 | | | 2 | | | 15 | | | — | | | 15 | | | 38 | | | | | — | | | — | | | 15 | | | | | | | | | 490 | | | 560 | | |
| Net (loss) gain on early extinguishment of debt | — | | | | | — | | | — | | | — | | | — | | | — | | | (11) | | | | | — | | | — | | | — | | | | | | | | | 42 | | | 31 | | |
| Other (expense) income, net | (2) | | | | | (30) | | | (32) | | | 13 | | | 4 | | | 17 | | | 120 | | | | | — | | | (1) | | | 13 | | | | | | | | | 90 | | | 207 | | |
| Provision for (benefit from) income taxes | — | | | | | — | | | — | | | 461 | | | (8) | | | 453 | | | 1,820 | | | | | — | | | — | | | (1) | | | | | | | | | (5) | | | 2,267 | | |
| Equity in affiliated companies’ net earnings | — | | | | | — | | | — | | | — | | | — | | | — | | | 24 | | | | | — | | | — | | | — | | | | | | | | | 7 | | | 31 | | |
| Net income attributable to noncontrolling interests | — | | | | | — | | | — | | | 372 | | g | 35 | | | 407 | | | 592 | | h | | | — | | | — | | | — | | | | | | | | | 12 | | | 1,011 | | |
| Net income attributable to common stockholders | | | | | | | | | | | | | | | | | | | | | | | | | | | | | | | | | 3,468 | | |
| Total assets at December 31, 2022 | 3,052 | | | | | 5,552 | | | 8,604 | | | 8,398 | | | 1,873 | | | 10,271 | | | 22,727 | | | | | 1,697 | | | 183 | | | 1,262 | | | | | | | | | 6,349 | |
| 51,093 | | |
| Capital expenditures | 263 | | | | | 334 | | | 597 | | | 164 | | | 140 | | | 304 | | | 2,382 | | | | | 33 | | | 9 | | | 76 | | | | | | | | | 68 | | | 3,469 | | |
a.Includes revenues from FCX’s molybdenum sales company, which includes sales of molybdenum produced by the Molybdenum mines and by certain of the North America and South America copper mines.
b.Includes nonrecurring labor-related charges totaling $97 million associated with Cerro Verde’s new CLAs with its two unions.
c.Includes charges for administrative fines of $4 million in 2024, $55 million in 2023 and $41 million in 2022. Also includes charges (credits) totaling $144 million in 2024, $(112) million in 2023 and $116 million in 2022 associated with ARO adjustments. Refer to Note 10 for further discussion.
d.Includes oil and gas charges totaling $217 million in 2024, $70 million in 2023 and $6 million in 2022 related to asset impairments and adjustments to AROs, including assumed abandonment obligations resulting from bankruptcies of other companies.
e.Includes metals inventory adjustments of $91 million in 2024, $14 million in 2023, and $29 million in 2022.
f.Includes a net benefit to income taxes totaling $182 million associated with the closure of PT-FI’s 2021 corporate income tax audit and resolution of the framework for Indonesia disputed tax matters. Refer to Note 9 for further discussion.
g.Beginning in September 2024, FCX’s interest in Cerro Verde is 55.08%, and prior to September 2024 was 53.56%.
h.Beginning January 1, 2023, FCX’s economic and ownership interest in PT-FI is 48.76% except for net income associated with the settlement of historical tax matters in 2024 and approximately 190 thousand ounces of gold sales in 2023, which were attributed based on the economic interests prior to January 1, 2023 (i.e., approximate 81% to FCX and 19% to MIND ID). Refer to Note 2 for further discussion.
i.Includes sales to PT Smelting totaling $27 million in 2023 (reflecting adjustments to prior period provisionally priced concentrate sales), and $3.0 billion in 2022.
j.Includes a charge of $65 million associated with an adjustment to the proposed settlement of talc-related litigation.
k.Interest expense, net includes $74 million of charges associated with contested tax rulings issued by the Peru Supreme Court, partly offset by a $13 million credit for the settlement of interest on Cerro Verde’s historical profit sharing liability. Other (expense) income, net includes a charge of $69 million associated with contested tax rulings issued by the Peru Supreme Court.
l.Includes maintenance charges and idle facility costs associated with a major maintenance turnaround at Atlantic Copper totaling $41 million.
NOTE 15. SUPPLEMENTARY MINERAL RESERVE INFORMATION (UNAUDITED)
Recoverable proven and probable mineral reserves as of December 31, 2024, have been prepared using industry accepted practice and conform to the disclosure requirements under Subpart 1300 of SEC Regulation S-K. FCX’s proven and probable mineral reserves may not be comparable to similar information regarding mineral reserves disclosed in accordance with the guidance in other countries. Proven and probable mineral reserves were determined by the use of mapping, drilling, sampling, assaying and evaluation methods generally applied in the mining industry. Mineral reserves, as used in the reserve data presented here, mean an estimate of tonnage and grade of measured and indicated mineral resources that, in the opinion of the qualified person, can be the basis of an economically viable project. Proven mineral reserves are the economically mineable part of a measured mineral resource. To classify an estimate as a proven mineral reserve, the qualified person must possess a high degree of confidence of tonnage, grade and quality. Probable mineral reserves are the economically mineable part of an indicated or, in some cases, a measured mineral resource. The qualified person’s level of confidence will be lower in determining a probable mineral reserve than it would be in determining a proven mineral reserve. To classify an estimate as a probable mineral reserve, the qualified person’s confidence must still be sufficient to demonstrate that extraction is economically viable considering reasonable investment and market assumptions.
FCX’s mineral reserve estimates are based on the latest available geological and geotechnical studies. FCX conducts ongoing studies of its ore bodies to evaluate economic values and to manage risk. FCX revises its mine plans and estimates of proven and probable mineral reserves as required in accordance with the latest available studies.
Estimated recoverable proven and probable mineral reserves at December 31, 2024, were determined using metals price assumptions of $3.25 per pound for copper, $1,600 per ounce for gold and $12.00 per pound for molybdenum. For the three-year period ended December 31, 2024, LME copper settlement prices averaged $4.00 per pound, London PM gold prices averaged $2,044 per ounce and the weekly average price for molybdenum quoted by Platts Metals Daily averaged $21.41 per pound.
The recoverable proven and probable mineral reserves presented in the table below represent the estimated metal quantities from which FCX expects to be paid after application of estimated metallurgical recoveries and smelter recoveries, where applicable.
| | | | | | | | | | | | | | | | | | | | |
| Estimated Recoverable Proven and Probable Mineral Reserves | |
| at December 31, 2024 | |
| Coppera (billion pounds) | | Gold (million ounces) | | Molybdenum (billion pounds) | |
| North America | 41.6 | | | 0.6 | | | 2.51 | | |
| South America | 28.4 | | | — | | | 0.66 | | |
Indonesiab | 27.0 | | | 22.4 | | | — | | |
Consolidated basisc | 97.0 | | | 23.0 | | | 3.16 | | |
Net equity interestb,d | 70.2 | | | 11.5 | | | 2.87 | | |
Note: Totals may not foot because of rounding.
a.Estimated consolidated recoverable copper reserves included 1.4 billion pounds in leach stockpiles and 0.3 billion pounds in mill stockpiles.
b.Estimated recoverable proven and probable mineral reserves from Indonesia reflect estimates of minerals that can be recovered through 2041. As a result, PT-FI’s current long-term mine plan and planned operations are based on the assumption that PT-FI will abide by the terms and conditions of the IUPK and will be granted the 10-year extension from 2031 through 2041 (refer to Note 11 for discussion of PT-FI’s IUPK). As a result, PT-FI will not mine all of these mineral reserves during the initial term of the IUPK. Prior to the end of 2031, PT-FI expects to mine 40% of its recoverable proven and probable mineral reserves at December 31, 2024, representing 45% of FCX’s net equity share of recoverable copper reserves and 44% of FCX’s net equity share of recoverable gold reserves in Indonesia.
c.Consolidated mineral reserves represent estimated metal quantities after reduction for joint venture partner interests at the Morenci mine in North America (refer to Note 2 for further discussion). Excluded from the table above were FCX’s estimated recoverable proven and probable mineral reserves of 318 million ounces of silver, which were determined using $20 per ounce.
d.Net equity interest mineral reserves represent estimated consolidated metal quantities further reduced for noncontrolling interest ownership (refer to Note 2 for further discussion of FCX’s ownership in subsidiaries). Excluded from the table above were FCX’s estimated recoverable proven and probable mineral reserves of 213 million ounces of silver.
| | | | | | | | | | | | | | | | | | | | | | | | | | | | | | | | | | | | | | | | | | | | | | | | | | | | | | | | |
| | | Estimated Recoverable Proven and Probable Mineral Reserves | |
| | | at December 31, 2024 | |
| | | Orea (million metric tons) | | Average Ore Grade Per Metric Tona | | Recoverable Proven and Probable Mineral Reservesb | |
| FCX’s
Interest | | FCX’s
Interest | | 100%
Basis | | Copper (%) | | Gold (grams) | | Molybdenum (%) | | Copper
(billion pounds) | | Gold
(million ounces) | | Molybdenum
(billion pounds) | |
| | | | | | | | | | | | | | | | | | |
| | | | | | | | | | | | | | | | | | |
| | | | | | | | | | | | | | | | | | |
| | | | | | | | | | | | | | | | | | |
| | | | | | | | | | | | | | | | | | |
| North America | | | | | | | | | | | | | | | | | | |
| Production stage: | | | | | | | | | | | | | |
| Morenci | 72% | | 2,739 | | | 3,804 | | | 0.21 | | — | | | — | | c | 11.1 | | | — | | | 0.17 | | |
| Sierrita | 100% | | 2,206 | | | 2,206 | | | 0.23 | | — | | c | 0.03 | | | 9.4 | | | 0.1 | | | 0.96 | | |
| Bagdad | 100% | | 2,430 | | | 2,430 | | | 0.35 | | — | | c | 0.02 | | | 15.8 | | | 0.2 | | | 0.86 | | |
| Safford, including Lone Star | 100% | | 746 | | | 746 | | | 0.43 | | — | | | — | | | 5.1 | | | — | | | — | | |
| Chino, including Cobre | 100% | | 370 | | | 370 | | | 0.45 | | 0.04 | | — | | | 3.0 | | | 0.4 | | | — | | |
| Climax | 100% | | 141 | | | 141 | | | — | | | — | | | 0.15 | | | — | | | — | | | 0.42 | | |
| Henderson | 100% | | 44 | | | 44 | | | — | | | — | | | 0.16 | | | — | | | — | | | 0.14 | | |
| | | | | | | | | | | | | | | | | | |
| Tyrone | 100% | | 69 | | | 69 | | | 0.19 | | — | | | — | | | 0.3 | | | — | | | — | | |
| Miami | 100% | | — | | | — | | | — | | | — | | | — | | | 0.1 | | | — | | | — | | |
| | | | | | | | | | | | | | | | | | |
| | | | | | | | | | | | | | | | | | |
| | | | | | | | | | | | | | | | | | |
| South America | | | | | | | | | | | | | | | | | | |
| Production stage: | | | | | | | | | | | | | |
| Cerro Verde | 55.08% | | 2,145 | | | 3,894 | | | 0.34 | | — | | | 0.01 | | | 25.2 | | | — | | | 0.66 | | |
| El Abra | 51% | | 312 | | | 611 | | | 0.43 | | — | | | — | | | 3.1 | | | — | | | — | | |
| | | | | | | | | | | | | | | | | | |
Indonesiad | | | | | | | | | | | | | | | | | | |
| Production stage: | | | | | | | | | | | | | |
| Grasberg Block Cave | 48.76% | | 351 | | | 719 | | | 0.99 | | 0.66 | | — | | | 13.4 | | | 10.3 | | | — | | |
| Deep Mill Level Zone | 48.76% | | 159 | | | 326 | | | 0.74 | | 0.60 | | — | | | 4.4 | | | 4.9 | | | — | | |
| Big Gossan | 48.76% | | 23 | | | 48 | | | 2.23 | | 0.95 | | — | | | 2.2 | | | 1.0 | | | — | | |
| | | | | | | | | | | | | | | | | | |
| | | | | | | | | | | | | | | | | | |
| Development stage: | | | | | | | | | | | | | | | | | | |
| Kucing Liar | 48.76% | | 180 | | | 369 | | | 1.10 | | 0.94 | | — | | | 7.1 | | | 6.2 | | | — | | |
| Total 100% basis | | | | | 15,779 | | | | | | | | | 100.1 | | | 23.0 | | | 3.21 | | |
Consolidated basise | | | | | 14,714 | | | | | | | | | 97.0 | | | 23.0 | | | 3.16 | | |
FCX’s net equity interestf | | | | | 11,916 | | | | | | | | | 70.2 | | | 11.5 | | | 2.87 | | |
Note: Totals may not foot because of rounding.
a.Excludes material contained in stockpiles.
b.Includes estimated recoverable metals contained in stockpiles.
c.Amounts not shown because of rounding.
d.Estimated recoverable proven and probable mineral reserves from Indonesia reflect estimates of minerals that can be recovered through 2041. Refer to Note 11 for discussion of PT-FI’s IUPK.
e.Consolidated mineral reserves represent estimated metal quantities after reduction for Morenci’s joint venture partner interests (refer to Note 2 for further discussion).
f.Net equity interest mineral reserves represent estimated consolidated metal quantities further reduced for noncontrolling interest ownership (refer to Note 2 for further discussion of FCX’s ownership in subsidiaries).
Item 9. Changes in and Disagreements with Accountants on Accounting and Financial Disclosure.
Not applicable.
Item 9A. Controls and Procedures.
(a) Evaluation of disclosure controls and procedures. Our chief executive officer and chief financial officer, with the participation of management, have evaluated the effectiveness of our “disclosure controls and procedures” (as defined in Rules 13a-15(e) and 15d-15(e) under the Securities Exchange Act of 1934) as of the end of the period covered by this annual report on Form 10-K. Based on their evaluation, they have concluded that our disclosure controls and procedures are effective as of the end of the period covered by this report.
(b) Changes in internal controls over financial reporting. There has been no change in our internal control over financial reporting that occurred during the quarter ended December 31, 2024, that has materially affected, or is reasonably likely to materially affect, our internal control over financial reporting.
(c) Management’s annual report on internal control over financial reporting and the report thereon of Ernst & Young LLP are included herein under Item 8. “Financial Statements and Supplementary Data.”
Item 9B. Other Information.
Director and Officer Trading Arrangements
During the quarter ended December 31, 2024, no director or officer of FCX adopted or terminated any “Rule 10b5-1 trading arrangement” or “non-Rule 10b5-1 trading arrangement,” as such terms are defined in Item 408(a) of Regulation S-K.
Amended and Restated Executive Employment Agreement
As previously reported, Kathleen L. Quirk, the President of FCX, was promoted to the additional role of Chief Executive Officer (CEO) of FCX effective June 11, 2024. In light of her expanded responsibilities, on February 11, 2025, she and FCX entered into an Amended and Restated Executive Employment Agreement (the Agreement), which amends and restates the Amended and Restated Executive Employment Agreement between FCX and Ms. Quirk dated effective December 2, 2008, and amended effective April 27, 2011 (the Prior Agreement). The Agreement reflects Ms. Quirk’s roles with FCX and includes other updates to incorporate current market practices. The Agreement is effective through December 31, 2027, after which it will automatically renew for additional one-year periods unless prior written notice of non-renewal is provided to the other party in accordance with the terms of the Agreement.
The principal terms of the Agreement are substantially similar to the Prior Agreement and does not change Ms. Quirk’s current compensation, although her base salary has been updated to reflect her base salary as of the date she assumed the role of CEO. The Agreement revises certain potential severance benefits to better align with current market practices. Specifically, in connection with a termination without Cause or with Good Reason unrelated to a Change in Control (as such terms are defined in the Agreement), the severance payment multiple has been reduced from three times to two times. In connection with a termination without Cause or with Good Reason related to a Change in Control, the multiple remains at three times, but the protected period has been reduced from three years to two years and includes a limited pre-Change in Control period. In addition, the severance payment related to a Change in Control will be calculated using the three-year average bonus (instead of the highest bonus during that period), and the pro-rated bonus for the year of termination will likewise be based on the three-year average bonus (instead of actual results for the year). The benefit continuation period in connection with all qualifying terminations has been reduced from three years to two years.
The Agreement also requires Ms. Quirk to deliver a release in favor of FCX in order to receive certain severance benefits, extends Ms. Quirk’s limited covenant not to compete from six months to eighteen months post-termination, and specifically confirms the application of FCX’s Incentive-Based Compensation Recovery Policy on Ms. Quirk’s compensation, where applicable.
The foregoing description of the Agreement does not purport to be complete and is subject to, and qualified in its entirety by, the full text of the Agreement, which is attached this Form 10-K as Exhibit 10.8 and incorporated by reference herein.
Item 9C. Disclosure Regarding Foreign Jurisdictions that Prevent Inspections.
Not applicable.
PART III
Item 10. Directors, Executive Officers and Corporate Governance.
The information required by this item regarding our executive officers appears in a separately captioned heading after Item 4. “Information About Our Executive Officers” in Part I of this report.
We have a Principles of Business Conduct, which defines the expected behavior of our Board of Directors and all of our employees, including our principal executive officer, principal financial officer, principal accounting officer and controller, and persons performing similar functions. We have posted a copy of our Principles of Business Conduct on our website at fcx.com under “About Us – Corporate Governance – Governance Documents.” Amendments to, or waivers of, our Principles of Business Conduct granted to any of our directors or executive officers will be published promptly on our website at fcx.com.
The information required by this item is incorporated by reference to “Information About Director Nominees,” “Board Committees,” and “Board and Committee Independence; Audit Committee Financial Experts,” and “Compensation Processes and Policies” in our definitive proxy statement to be filed with the United States Securities and Exchange Commission (SEC), relating to our 2025 annual meeting of stockholders.
Item 11. Executive Compensation.
The information required by this item is incorporated herein by reference to “Director Compensation” and “Executive Officer Compensation” in our definitive proxy statement to be filed with the SEC, relating to our 2025 annual meeting of stockholders.
Item 12. Security Ownership of Certain Beneficial Owners and Management and Related Stockholder Matters.
Equity Compensation Plan Information
Only our stockholder-approved 2016 Stock Incentive Plan has shares of our common stock available for future grant. However, we have equity compensation plans pursuant to which awards have previously been made that could result in issuance of our common stock to employees and non-employees as compensation.
The following table presents information regarding our equity compensation plans as of December 31, 2024:
| | | | | | | | | | | | | | |
| Number of Securities To be Issued Upon Exercise of Outstanding Options, Warrants and Rights | | Weighted-Average Exercise Price of Outstanding Options, Warrants and Rights | Number of Securities Remaining Available for Future Issuance Under Equity Compensation Plans (Excluding Securities Reflected in Column (a)) |
| (a) | | (b) | (c) |
| Equity compensation plans approved by security holders | 12,773,631 | | a | $ | 14.22 | | 15,048,374 | |
| Equity compensation plans not approved by security holders | 13,500 | | b | | — | |
| Total | 12,787,131 | | | $ | 14.22 | | 15,048,374 | |
a.Includes shares of our common stock issuable upon the vesting of 3,325,514 restricted stock units (RSUs) and 2,619,000 performance share units at maximum performance levels, and the termination of deferrals with respect to 1,220,070 RSUs that were vested as of December 31, 2024. These awards are not reflected in column (b) because they do not have an exercise price. The number of securities to be issued in column (a) does not include RSUs that are payable solely in cash.
b.Represents securities to be issued under awards assumed in our acquisition of McMoRan Exploration Co. The shares are issuable upon the termination of deferrals with respect to 13,500 RSUs that were vested as of December 31, 2024, and the awards are not reflected in column (b) because they do not have an exercise price.
The other information required by this item is incorporated by reference to “Stock Ownership of Directors and Executive Officers” and “Stock Ownership of Certain Beneficial Owners” in our definitive proxy statement to be filed with the SEC, relating to our 2025 annual meeting of stockholders.
Item 13. Certain Relationships and Related Transactions, and Director Independence.
The information required by this item is incorporated by reference to “Certain Transactions” and “Board and Committee Independence; Audit Committee Financial Experts” in our definitive proxy statement to be filed with the SEC, relating to our 2025 annual meeting of stockholders.
Item 14. Principal Accounting Fees and Services.
The information required by this item is incorporated by reference to “Independent Registered Public Accounting Firm” in our definitive proxy statement to be filed with the SEC (including fees billed to us by Ernst & Young, PCAOB ID No. 42), relating to our 2025 annual meeting of stockholders.
PART IV
Item 15. Exhibits, Financial Statement Schedules.
(a)(1). Financial Statements.
The consolidated statements of income, comprehensive income, cash flows and equity, and the consolidated balance sheets are included as part of Item 8. “Financial Statements and Supplementary Data.”
(a)(2). Financial Statement Schedules.
The following financial statement schedule is presented below.
Schedule II – Valuation and Qualifying Accounts
Schedules other than the one above have been omitted since they are either not required, not applicable or the required information is included in the financial statements or notes thereto.
REPORT OF INDEPENDENT REGISTERED PUBLIC ACCOUNTING FIRM
To the Board of Directors and Stockholders of
Freeport-McMoRan Inc.
We have audited the consolidated financial statements of Freeport-McMoRan Inc. (the Company) as of December 31, 2024 and 2023, for each of the three years in the period ended December 31, 2024, and have issued our report thereon dated February 14, 2025 included elsewhere in this Form 10-K. Our audits of the consolidated financial statements included the financial statement schedule listed in Item 15 (a)(2) of this Form 10-K (the “schedule”). This schedule is the responsibility of the Company’s management. Our responsibility is to express an opinion on the Company’s schedule, based on our audits.
In our opinion, the schedule presents fairly, in all material respects, the information set forth therein when considered in conjunction with the consolidated financial statements.
/s/ Ernst & Young LLP
Phoenix, Arizona
February 14, 2025
SCHEDULE II – VALUATION AND QUALIFYING ACCOUNTS (In millions)
| | | | | | | | | | | | | | | | | | | | | | | | | | | | | | | | |
| | | | | Additions (Deductions) | | | | |
| | | Balance at | | Charged to | | Charged to | | | | Balance at |
| | | Beginning of | | Costs and | | Other | | Other | | End of |
| | | Year | | Expense | | Accounts | | Deductions | | Year |
| Reserves and allowances deducted | | | | | | | | | | |
| from asset accounts: | | | | | | | | | | |
| | | | | | | | | | |
| | | | | | | | | | |
| | | | | | | | | | |
| | | | | | | | | | |
| Valuation allowance for deferred tax assets | | | | | | | | | | |
| Year Ended December 31, 2024 | | $ | 3,894 | | | $ | (918) | | a | $ | 8 | | b | $ | — | |
| $ | 2,984 | |
| Year Ended December 31, 2023 | | 3,985 | | | (80) | | c | (11) | | b | — | | | 3,894 | |
| Year Ended December 31, 2022 | | 4,087 | | | (87) | | d | (15) | | b | — | | | 3,985 | |
| | | | | | | | | | |
| Reserves for non-income taxes: | | | | | | | | | | |
| Year Ended December 31, 2024 | | $ | 28 | | | $ | 6 | | | $ | — | | | $ | (5) | | e | $ | 29 | |
| Year Ended December 31, 2023 | | 24 | | | 9 | | | — | | | (5) | | e | 28 | |
| Year Ended December 31, 2022 | | 59 | | | (32) | | | — | | | (3) | | e | 24 | |
a.Primarily relates to expirations of United States (U.S.) foreign tax credits.
b.Relates to a valuation allowance for tax benefits primarily associated with actuarial losses (gains) for U.S. defined benefit plans included in other comprehensive income.
c.Primarily relates to $32 million of U.S. federal net operating losses (NOLs) utilized during 2023 and a $292 million decrease related to expirations of U.S. foreign tax credits, partially offset by an increase of $188 million, primarily associated with changes in U.S. federal temporary differences and a $22 million increase in valuation allowances against Section 163(j) deferred tax assets.
d.Primarily relates to $163 million of U.S. federal NOLs utilized during 2022 and a $22 million decrease related to expiration of U.S. foreign tax credits, partially offset by an increase of $104 million, primarily associated with changes in U.S. federal temporary differences.
e.Represents amounts paid or adjustments to reserves based on revised estimates.
(a)(3). Exhibits.
| | | | | | | | | | | | | | | | | |
|
|
| | | Filed | | | |
| Exhibit | | with this | Incorporated by Reference |
| Number | Exhibit Title | Form 10-K | Form | File No. | Date Filed |
| | | | | |
| | | | | |
| | | | | |
| | | | | |
| | | | | |
| | | | | |
| | | | | |
| | | | | |
| PT-FI Divestment Agreement dated as of September 27, 2018 among FCX, International Support LLC, PT Freeport Indonesia, PT Indocopper Investama and PT Indonesia Asahan Aluminium (Persero). | | 10-Q | 001-11307-01 | 11/9/2018 |
| Supplemental and Amendment Agreement to the PT-FI Divestment Agreement, dated December 21, 2018, among FCX, PT Freeport Indonesia, PT Indonesia Papua Metal Dan Mineral (f/k/a PT Indocopper Investama), PT Indonesia Asahan Aluminium (Persero) and International Support LLC. | | 10-K | 001-11307-01 | 2/15/2019 |
| Composite Certificate of Incorporation of FCX, effective as of June 11, 2024. | | 10-Q | 001-11307-01 | 8/7/2024 |
| Amended and Restated By-Laws of FCX, effective as of June 11, 2024. | | 8-K | 001-11307-01 | 6/12/2024 |
| Description of Common Stock of FCX. | | 10-Q | 001-11307-01 | 8/7/2024 |
| Form of Certificate representing shares of common stock, par value $0.10. | | 8-A/A | 001-11307-01 | 8/10/2015 |
| Indenture dated as of February 13, 2012, between FCX and U.S. Bank National Association, as Trustee (relating to the 5.40% Senior Notes due 2034). | | 8-K | 001-11307-01 | 2/13/2012 |
| Fourth Supplemental Indenture dated as of May 31, 2013, between FCX and U.S. Bank National Association, as Trustee (relating to the 5.40% Senior Notes due 2034). | | 8-K | 001-11307-01 | 6/3/2013 |
| Eighth Supplemental Indenture dated as of November 14, 2014 between FCX and U.S. Bank National Association, as Trustee (relating to the 5.40% Senior Notes due 2034). | | 8-K | 001-11307-01 | 11/14/2014 |
| | | | | |
|
|
| | | | | |
| | | |
| | | | | |
| Indenture dated as of March 7, 2013, between FCX and U.S. Bank National Association, as Trustee (relating to the 5.450% Senior Notes due 2043). | | 8-K | 001-11307-01 | 3/7/2013 |
| | | | | |
| | | | | |
| | | | | |
| | | | | |
|
|
| | | | | |
| | | | | |
| | | | | |
| Supplemental Indenture dated as of May 31, 2013, between FCX and U.S. Bank National Association, as Trustee (relating to the 5.450% Senior Notes due 2043). | | 8-K | 001-11307-01 | 6/3/2013 |
| Form of Indenture dated as of September 22, 1997, between Phelps Dodge Corporation and The Chase Manhattan Bank, as Trustee (relating to the 7 1/8% Debentures due 2027, the 9 1/2% Senior Notes due 2031 and the 6 1/8% Senior Notes due 2034). | | S-3 | 333-36415 | 9/25/1997 |
| Form of 7 1/8% Debenture due November 1, 2027 of Phelps Dodge Corporation issued on November 5, 1997, pursuant to the Indenture dated as of September 22, 1997, between Phelps Dodge Corporation and The Chase Manhattan Bank, as Trustee (relating to the 7 1/8% Debentures due 2027). | | 8-K | 001-00082 | 11/3/1997 |
| Form of 9 1/2% Note due June 1, 2031 of Phelps Dodge Corporation issued on May 30, 2001, pursuant to the Indenture dated as of September 22, 1997, between Phelps Dodge Corporation and First Union National Bank, as successor Trustee (relating to the 9 1/2% Senior Notes due 2031). | | 8-K | 001-00082 | 5/30/2001 |
| | | | | | | | | | | | | | | | | |
| | Filed | | | |
| Exhibit | | with this | Incorporated by Reference |
| Number | Exhibit Title | Form 10-K | Form | File No. | Date Filed |
| | | | | |
| | | |
| | | | | |
| | | | | |
| Form of 6 1/8% Note due March 15, 2034 of Phelps Dodge Corporation issued on March 4, 2004, pursuant to the Indenture dated as of September 22, 1997, between Phelps Dodge Corporation and First Union National Bank, as successor Trustee (relating to the 6 1/8% Senior Notes due 2034). | | 10-K | 001-00082 | 3/7/2005 |
| Supplemental Indenture dated as of April 4, 2007 to the Indenture dated as of September 22, 1997, among Phelps Dodge Corporation, as Issuer, Freeport-McMoRan Copper & Gold Inc., as Parent Guarantor, and U.S. Bank National Association, as Trustee (relating to the 7 1/8% Debentures due 2027, the 9 1/2% Senior Notes due 2031 and the 6 1/8% Senior Notes due 2034). | | 10-K | 001-11307-01 | 2/26/2016 |
| | | | | |
|
|
| | | | | |
| | | | | |
| | | | | |
| Indenture dated as of August 15, 2019, between FCX and U.S. Bank National Association, as Trustee (relating to the 5.00% Senior Notes due 2027, the 4.125% Senior Notes due 2028, the 4.375% Senior Notes due 2028, the 5.25% Senior Notes due 2029, the 4.25% Senior Notes due 2030 and the 4.625% Senior Notes due 2030). | | 8-K | 001-11307-01 | 8/15/2019 |
| First Supplemental Indenture dated as of August 15, 2019, between FCX and U.S. Bank National Association, as Trustee (including the form of 5.00% Senior Notes due 2027). | | 8-K | 001-11307-01 | 8/15/2019 |
| Second Supplemental Indenture dated as of August 15, 2019, between FCX and U.S. Bank National Association, as Trustee (including the form of 5.25% Senior Notes due 2029). | | 8-K | 001-11307-01 | 8/15/2019 |
| Third Supplemental Indenture dated as of March 4, 2020, between FCX and U.S. Bank National Association, as Trustee (including the form of 4.125% Senior Notes due 2028). | | 8-K | 001-11307-01 | 3/4/2020 |
| Fourth Supplemental Indenture dated as of March 4, 2020, between FCX and U.S. Bank National Association, as Trustee (including the form of 4.25% Senior Notes due 2030). | | 8-K | 001-11307-01 | 3/4/2020 |
| Fifth Supplemental Indenture dated as of March 31, 2020, between FCX and U.S. Bank National Association, as Trustee (relating to the 4.125% Senior Notes due 2028 and the 4.25% Senior Notes due 2030). | | 10-Q | 001-11307-01 | 8/7/2020 |
| Sixth Supplemental Indenture dated as of July 27, 2020, between FCX and U.S. Bank National Association, as Trustee (including the form of 4.375% Senior Notes due 2028). | | 8-K | 001-11307-01 | 7/27/2020 |
| Seventh Supplemental Indenture dated as of July 27, 2020, between FCX and U.S. Bank National Association, as Trustee (including the form of 4.625% Senior Notes due 2030). | | 8-K | 001-11307-01 | 7/27/2020 |
| | | | | |
| | | | | |
| | | | | |
| | | | | |
| | | | | |
| | | | | |
| | | | | |
| | | | | |
| | | | | |
| | | | | |
| | | | | |
| | | | | |
| | | | | |
| Shareholders Agreement dated as of December 21, 2018, among FCX, PT Freeport Indonesia, PT Indonesia Papua Metal Dan Mineral and PT Indonesia Asahan Aluminium (Persero). | | 10-K | 001-11307-01 | 2/15/2019 |
| PT Freeport Indonesia Special Mining Business License (IUPK) from the Minister of Energy and Mineral Resources of the Republic of Indonesia (English translation). | | 10-K | 001-11307-01 | 2/15/2019 |
| | | | | | | | | | | | | | | | | |
| | Filed | | | |
| Exhibit | | with this | Incorporated by Reference |
| Number | Exhibit Title | Form 10-K | Form | File No. | Date Filed |
| | | | | |
| Participation Agreement, dated as of March 16, 2005, among Phelps Dodge Corporation, Cyprus Amax Minerals Company, a Delaware corporation, Cyprus Metals Company, a Delaware corporation, Cyprus Climax Metals Company, a Delaware corporation, Sumitomo Corporation, a Japanese corporation, Summit Global Management, B.V., a Dutch corporation, Sumitomo Metal Mining Co., Ltd., a Japanese corporation, Compañia de Minas Buenaventura S.A.A., a Peruvian sociedad anonima abierta, and Sociedad Minera Cerro Verde S.A.A., a Peruvian sociedad anonima abierta. | | 8-K | 001-00082 | 3/22/2005 |
| Shareholders Agreement, dated as of June 1, 2005, among Phelps Dodge Corporation, Cyprus Climax Metals Company, a Delaware corporation, Sumitomo Corporation, a Japanese corporation, Sumitomo Metal Mining Co., Ltd., a Japanese corporation, Summit Global Management B.V., a Dutch corporation, SMM Cerro Verde Netherlands, B.V., a Dutch corporation, Compañia de Minas Buenaventura S.A.A., a Peruvian sociedad anonima abierta, and Sociedad Minera Cerro Verde S.A.A., a Peruvian sociedad anonima abierta. | | 8-K | 001-00082 | 6/7/2005 |
| Revolving Credit Agreement dated as of October 19, 2022, among FCX, PT Freeport Indonesia, JPMorgan Chase Bank, N.A., as administrative agent, Bank of America, N.A., as syndication agent, and each of the lenders and issuing banks party thereto. | | 8-K | 001-11307-01 | 10/25/2022 |
| Letter Agreement dated as of December 19, 2013, by and between FCX and Richard C. Adkerson. | | 8-K | 001-11307-01 | 12/23/2013 |
| FCX Director Compensation. | | 10-K | 001-11307-01 | 2/16/2024 |
| | | | | |
| | | | | |
| | | | | | | | | | | | | | | | | |
|
|
| Amended and Restated Executive Employment Agreement dated effective as of February 11, 2025 between FCX and Kathleen L. Quirk. | X | | | |
| | | | | |
| FCX Executive Services Program. | | 10-K | 001-11307-01 | 2/15/2023 |
| FCX Supplemental Executive Retirement Plan, as amended and restated. | | 8-K | 001-11307-01 | 2/5/2007 |
| FCX 1996 Supplemental Executive Capital Accumulation Plan. | | 10-Q | 001-11307-01 | 5/12/2008 |
| FCX 1996 Supplemental Executive Capital Accumulation Plan Amendment One. | | 10-Q | 001-11307-01 | 5/12/2008 |
| FCX 1996 Supplemental Executive Capital Accumulation Plan Amendment Two. | | 10-K | 001-11307-01 | 2/26/2009 |
| FCX 1996 Supplemental Executive Capital Accumulation Plan Amendment Three. | | 10-K | 001-11307-01 | 2/27/2015 |
| FCX 1996 Supplemental Executive Capital Accumulation Plan Amendment Four. | | 10-K | 001-11307-01 | 2/27/2015 |
| FCX 2005 Supplemental Executive Capital Accumulation Plan, as amended and restated effective January 1, 2015. | | 10-K | 001-11307-01 | 2/27/2015 |
| | | | | | | | | | | | | | | | | |
| | Filed | | | |
| Exhibit | | with this | Incorporated by Reference |
| Number | Exhibit Title | Form 10-K | Form | File No. | Date Filed |
| FCX 2005 Supplemental Executive Capital Accumulation Plan Amendment One. | | 10-K | 001-11307-01 | 2/16/2021 |
| FCX 2005 Supplemental Executive Capital Accumulation Plan Amendment Two. | | 10-K | 001-11307-01 | 2/16/2021 |
| FCX 2005 Supplemental Executive Capital Accumulation Plan Amendment Three. | | 10-K | 001-11307-01 | 2/16/2021 |
| Freeport Minerals Corporation Supplemental Retirement Plan, as amended and restated. | | 10-K | 001-11307-01 | 2/15/2019 |
| FCX 2004 Director Compensation Plan, as amended and restated. | | 10-Q | 001-11307-01 | 8/6/2010 |
| FCX Amended and Restated 2006 Stock Incentive Plan. | | 10-K | 001-11307-01 | 2/27/2014 |
| FCX 2016 Stock Incentive Plan. | | 8-K | 001-11307-01 | 6/9/2016 |
| Form of Nonqualified Stock Options Grant Agreement under the FCX stock incentive plans (effective February 2014). | | 10-K | 001-11307-01 | 2/27/2014 |
| | | | | |
| Form of Notice of Grant of Restricted Stock Units (for grants made to non-management directors). | | 10-K | 001-11307-01 | 2/24/2017 |
| Form of Performance Share Unit Agreement (effective February 2018). | | 10-K | 001-11307-01 | 2/20/2018 |
|
|
| | | | | |
| Form of Performance Share Unit Agreement (effective February 2021). | | 10-K | 001-11307-01 | 2/15/2022 |
| Form of Performance Share Unit Agreement (effective February 2025). | X | | | |
| Form of Nonqualified Stock Options Grant Agreement (effective February 2018). | | 10-K | 001-11307-01 | 2/20/2018 |
| Form of Restricted Stock Unit Agreement (effective February 2018). | | 10-K | 001-11307-01 | 2/20/2018 |
| Form of Restricted Stock Unit Agreement (effective February 2025). | X | | | |
| FCX Annual Incentive Plan (effective January 2019). | | 10-K | 001-11307-01 | 2/15/2019 |
| FCX Executive Change in Control Severance Plan. | | 10-K | 001-11307-01 | 2/15/2022 |
| | | | | |
| FCX Insider Trading Policy. | X | | | |
| List of Subsidiaries of FCX. | X | | | |
| Consent of Ernst & Young LLP. | X | | | |
| Consents of Qualified Persons for Technical Report Summary of Mineral Reserves and Mineral Resources for Cerro Verde Mine. | X | | | |
| Consents of Qualified Persons for Technical Report Summary of Mineral Reserves and Mineral Resources for Grasberg Minerals District. | X | | | |
| Consents of Qualified Persons for Technical Report Summary of Mineral Reserves and Mineral Resources for Morenci Mine. | X | | | |
| Certified resolution of the Board of Directors of FCX authorizing this report to be signed on behalf of any officer or director pursuant to a Power of Attorney. | X | | | |
| Powers of Attorney pursuant to which this report has been signed on behalf of certain officers and directors of FCX. | X | | | |
| Certification of Principal Executive Officer pursuant to Rule 13a-14(a)/15d - 14(a). | X | | | |
| | | | | | | | | | | | | | | | | |
| | Filed | | | |
| Exhibit | | with this | Incorporated by Reference |
| Number | Exhibit Title | Form 10-K | Form | File No. | Date Filed |
| Certification of Principal Financial Officer pursuant to Rule 13a-14(a)/15d - 14(a). | X | | | |
| Certification of Principal Executive Officer pursuant to 18 U.S.C. Section 1350. | X | | | |
| Certification of Principal Financial Officer pursuant to 18 U.S.C Section 1350. | X | | | |
| Mine Safety Disclosure. | X | | | |
| | | | | |
| Technical Report Summary of Mineral Reserves and Mineral Resources for Cerro Verde Mine, effective as of December 31, 2024. | X | | | |
| Technical Report Summary of Mineral Reserves and Mineral Resources for Grasberg Minerals District, effective as of December 31, 2022. | | 10-K | 001-11307-01 | 2/15/2023 |
| Technical Report Summary of Mineral Reserves and Mineral Resources for Morenci Mine, effective as of December 31, 2023. | | 10-K | 001-11307-01 | 2/16/2024 |
| FCX Incentive-Based Compensation Recovery Policy, effective as of October 2, 2023. | | 10-K | 001-11307-01 | 2/16/2024 |
| 101.INS | XBRL Instance Document - the XBRL Instance Document does not appear in the Interactive Data File because its XBRL tags are embedded within the Inline XBRL document. | X | | | |
| 101.SCH | Inline XBRL Taxonomy Extension Schema. | X | | | |
| 101.CAL | Inline XBRL Taxonomy Extension Calculation Linkbase. | X | | | |
| 101.DEF | Inline XBRL Taxonomy Extension Definition Linkbase. | X | | | |
| | | | | |
| | | | | |
| | | | | |
| | | |
| | | | | |
| 101.LAB | Inline XBRL Taxonomy Extension Label Linkbase. | X | | | |
| 101.PRE | Inline XBRL Taxonomy Extension Presentation Linkbase. | X | | | |
| 104 | The cover page from this Annual Report on Form 10-K, formatted in Inline XBRL and contained in Exhibit 101. | X | | | |
Note: Certain instruments with respect to long-term debt of FCX have not been filed as exhibits to this Annual Report on Form 10-K since the total amount of securities authorized under any such instrument does not exceed 10% of the total assets of FCX and its subsidiaries on a consolidated basis. FCX agrees to furnish a copy of each such instrument upon request of the United States Securities and Exchange Commission.
* Indicates management contract or compensatory plan or arrangement.
Item 16. Form 10-K Summary.
Not applicable.
GLOSSARY OF TERMS
Following is a glossary of selected terms used throughout this Annual Report on Form 10-K that are technical in nature:
Adits. A horizontal passage leading into a mine for the purposes of access or drainage.
Alluvial aquifers. A water-bearing deposit of loosely arranged gravel, sand or silt left behind by a river or other flowing water.
Anode. A positively charged metal sheet, usually lead, on which oxidation occurs. During the electro-refining process, anodes are impure copper sheets from the smelting process that require further processing to produce refined copper cathode.
Azurite. A bluish supergene copper mineral and ore found in the oxidized portions of copper deposits often associated with malachite.
Bench. The horizontal floor cuttings along which mining progresses in an open-pit mine. As the pit progresses to lower levels, safety benches are left in the walls to catch any falling rock.
Blasthole stoping. An underground mining method that extracts the ore zone in large vertical rooms. The ore is broken by blasting using large-diameter vertical drill holes.
Block cave. A general term used to describe an underground mining method where the extraction of ore depends largely on the action of gravity. By continuously removing a thin horizontal layer at the bottom mining level of the ore column, the vertical support of the ore column is removed and the ore then caves by gravity.
Bornite. A red-brown isometric mineral comprising copper, iron and sulfur.
British thermal unit or Btu. One British thermal unit is the amount of heat required to raise the temperature of one pound of water by one degree Fahrenheit.
Brochantite. A greenish-black copper mineral occurring in the oxidation zone of copper sulfide deposits.
Cathode. Refined copper produced by electro-refining of impure copper or by electrowinning.
Chalcocite. A grayish copper sulfide mineral, usually found as a supergene in copper deposits formed from the re-deposition of copper minerals that were solubilized from the oxide portion of the deposit.
Chalcopyrite. A brass-yellow sulfide of mineral copper and iron.
Chrysocolla. A bluish-green to emerald-green oxide copper mineral that forms incrustations and thin seams in oxidized parts of copper-mineral veins; a source of copper and an ornamental stone.
Cobalt. A tough, lustrous, nickel-white or silvery-gray metallic element often associated with nickel and copper ores from which it is obtained as a by-product.
Concentrate. The resulting product from the concentrating process that is composed predominantly of copper sulfide or molybdenum sulfide minerals. Further processing might include smelting and electro-refining, or roasting.
Concentrating. The process by which ore is separated into metal concentrate through crushing, milling and flotation.
Concentrator. A process plant used to separate targeted minerals from gangue and produce a mineral concentrate that can be marketed or processed by additional downstream processes to produce salable metals or mineral products. Term is used interchangeably with Mill.
Contained metal. The amount of metal in a mineral sample before the reduction of amounts unable to be recovered during the metallurgical process.
Covellite. A metallic, indigo-blue supergene mineral found in copper deposits.
Crushed-ore leach pad. A slightly sloping pad upon which leach ores are placed in lifts for processing.
Cutoff grade. The minimum grade contained in the ore for processing. When percentages are below this grade, the material would be routed to an overburden stockpile or left unmined. When percentages are above grade, the material would be processed using concentrating or leaching methods.
Disseminations. A mineral deposit in which the desired minerals occur as scattered particles in the rock that has sufficient quantity to be considered an ore deposit.
Electrolytic refining. The purification of metals by electrolysis. A large piece of impure copper is used as the anode with a thin strip of pure copper as the cathode.
Electrowinning. A process that uses electricity to plate copper contained in an electrolyte solution into copper cathode.
Flotation. A concentrating process in which valuable minerals attach themselves to bubbles of an oily froth for separation as concentrate. The gangue material from the flotation process reports as a tailing product.
Grade. The relative quality or percentage of metal content.
Indigenous Peoples. Indigenous Peoples are distinct social and cultural groups that share collective ancestral ties to the lands and natural resources where they live, occupy or from which they have been displaced.
Leach stockpiles. A quantity of leachable ore placed on a leach pad or in another suitable location that permits leaching and collection of solutions that contain solubilized metal.
Leaching. The process of extracting copper using a chemical solution to dissolve copper contained in ore.
Malachite. A bright-green copper mineral (ore) that often occurs with azurite in oxidized zones of copper deposits.
Metric ton. The equivalent of 2,204.62 pounds.
Mill stockpile. Millable ore that has been mined, and is available for future processing.
Mine-for-leach. A mining operation focused on mining only leachable ores. Also, referred to as crushed leach.
Mineralization. The process by which a mineral is introduced into a rock, resulting in concentration of minerals that may form a valuable or potentially valuable deposit.
Molybdenite. A black, platy, disulfide of molybdenum. It is the most common ore of molybdenum.
Ore body. A continuous, well-defined mass of mineralized material of sufficient ore content to make extraction economically feasible.
Oxide. In mining, oxide is used as an ore classification relating to material that usually leaches well but does not perform well in a concentrator. Oxide minerals in mining refer to an oxidized form.
Paste backfill. A slurry of paste material produced from tailings with engineered cement and water content that is used to fill underground mined out stopes.
Porphyry. A deposit in which minerals of copper, molybdenum, gold or, less commonly, tungsten and tin are disseminated or occur in stock-work of small veinlets within a large mass of hydro-thermally altered igneous rock. The host rock is commonly an intrusive porphyry, but other rocks intruded by a porphyry can also be hosts for ore minerals.
Production level. With respect to underground mining, the elevation of the underground works that permit extraction/transport of the ore to a common point, shaft or plant.
Pseudomalachite. A dark-green monoclinic copper mineral.
Roasting. The heating of sulfide ores to oxidize sulfides to facilitate further processing.
Run-of-Mine (ROM). Leachable ore that is mined and directly placed on a leach pad without utilizing any further processes to reduce particle size prior to leaching.
Skarn. A Swedish mining term for silicate gangue of certain iron ore and sulfide deposits of Archaean age, particularly those that have replaced limestone and dolomite. Its meaning has been generally expanded to include lime-bearing silicates, of any geologic age, derived from nearly pure limestone and dolomite with the introduction of large amounts of silicon, aluminum, iron and magnesium.
Smelting. The process of melting and oxidizing concentrate to separate copper and precious metals from metallic and non-metallic impurities, including iron, silica, alumina and sulfur.
Solution extraction. A process that transfers copper from a copper-bearing ore to an organic solution, then to an electrolyte. The electrolyte is then pumped to a tankhouse where the copper is extracted, using electricity, into a copper cathode (refer to the term Electrowinning), together referred to as solution extraction/electrowinning (SX/EW).
Stope. An underground mining method that is usually applied to highly inclined or vertical veins. Ore is extracted by driving horizontally upon it in a series of workings, one immediately over the other. Each horizontal working is called a stope because when a number of them are in progress, each working face under attack assumes the shape of a flight of stairs.
Sulfide. A mineral compound containing sulfur and a metal. Copper sulfides can be concentrated or leached, depending on the mineral type.
Tailings. The crushed and ground material remaining after economically recoverable minerals have been extracted. In upstream design and construction, tailings are deposited on the upstream side of the starter embankment, with subsequent crest raises progressively shifting upstream of each previous raise, using deposited tailings as a foundation. In downstream design and construction, tailings are deposited on the upstream side of the starter embankment. Borrow fill or a portion of the tailings are placed on the downstream side of the starter embankment. Subsequent crest raises progressively shift downstream of each previous raise, such that the previous raise becomes the foundation of the subsequent raise. As a result, the toe and the crest of the embankment progressively shift downstream as the embankment is raised. In centerline design and construction, tailings are deposited on the upstream side of the starter embankment. Borrow fill or a portion of the tailings are placed on the crest of the starter embankment. Subsequent crest raises are constructed vertically along the centerline of the previous raise such that the previous raise becomes the foundation of the subsequent raise. As a result, the toe of the embankment shifts downstream but the crest stays along initial alignment as the embankment is raised.
Tolling. The process of converting customer-owned material into specified products, which is then returned to the customer.
Working interest. An interest in an oil and gas lease that gives the owner of the interest the right to drill for and produce oil and gas on the leased acreage and requires the owner to pay a share of the costs of drilling and production operations.
SIGNATURES
Pursuant to the requirements of Section 13 or 15(d) of the Securities Exchange Act of 1934, the registrant has duly caused this report to be signed on its behalf by the undersigned, thereunto duly authorized, on February 14, 2025.
Freeport-McMoRan Inc.
By:/s/ Kathleen L. Quirk
Kathleen L. Quirk
President and Chief Executive Officer
Pursuant to the requirements of the Securities Exchange Act of 1934, this report has been signed by the following persons on behalf of the registrant in the capacities indicated on February 14, 2025.
| | | | | |
| /s/ Kathleen L. Quirk | President and Chief Executive Officer |
| Kathleen L. Quirk | (Principal Executive Officer) |
| |
| /s/ Maree E. Robertson | Executive Vice President and Chief Financial Officer |
| Maree E. Robertson | (Principal Financial Officer) |
| |
| * | Vice President and Chief Accounting Officer |
| Ellie L. Mikes | (Principal Accounting Officer) |
| |
| * | Chairman of the Board |
| Richard C. Adkerson | |
| |
| * | Director |
| David P. Abney | |
| |
| * | Director |
| Marcela E. Donadio | |
| |
| * | Director |
| Robert W. Dudley | |
| |
| * | Director |
| Hugh Grant | |
| |
| * | Director |
| Lydia H. Kennard | |
| |
| * | Director |
| Ryan M. Lance | |
| |
| * | Director |
| Sara Grootwassink Lewis | |
| |
| * | Director |
| Dustan E. McCoy | |
| |
| * | Director |
| John J. Stephens | |
| |
| * | Director |
| Frances Fragos Townsend | |
| |
| * By: /s/ Kathleen L. Quirk | |
| Kathleen L. Quirk | |
| Attorney-in-Fact | |