UNITED STATES
SECURITIES AND EXCHANGE COMMISSION
Washington, D.C. 20549
SCHEDULE 14A INFORMATION
Proxy Statement Pursuant to Section 14(a) of the
Securities Exchange Act of 1934
(Amendment No. )
Filed by the Registrant x Filed by a Party other than the Registrant ¨
Check the appropriate box:
| | | | |
| ¨ | | Preliminary Proxy Statement |
| |
| ¨ | | Confidential, for Use of the Commission Only (as permitted by Rule 14a-6(e)(2)) |
| |
| ¨ | | Definitive Proxy Statement |
| |
| x | | Definitive Additional Materials |
| |
| ¨ | | Soliciting Material under Rule 14a-12 |
|
FREEPORT-MCMORAN COPPER & GOLD INC.
|
| (Name of registrant as specified in its charter) |
|
|
| (Name of person(s) filing proxy statement, if other than the registrant) |
|
| Payment of Filing Fee (Check the appropriate box): |
| |
| x | | No fee required. |
| |
| ¨ | | Fee computed on table below per Exchange Act Rules 14a-6(i)(4) and 0-11. |
| | |
| | (1) | | Title of each class of securities to which transaction applies: |
| | | | |
| | (2) | | Aggregate number of securities to which transaction applies: |
| | | | |
| | (3) | | Per unit price or other underlying value of transaction computed pursuant to Exchange Act Rule 0-11 (set forth the amount on which the filing fee is calculated and state how it was determined): |
| | | | |
| | (4) | | Proposed maximum aggregate value of transaction: |
| | | | |
| | (5) | | Total fee paid: |
| | |
| | | | |
| | | | |
| |
| ¨ | | Fee paid previously with preliminary materials. |
| |
| ¨ | | Check box if any part of the fee is offset as provided by Exchange Act Rule 0-11(a)(2) and identify the filing for which the offsetting fee was paid previously. Identify the previous filing by registration statement number, or the Form or Schedule and the date of its filing. |
| | |
| | (1) | | Amount Previously Paid: |
| | | | |
| | (2) | | Form, Schedule or Registration Statement No.: |
| | | | |
| | (3) | | Filing Party: |
| | | | |
| | (4) | | Date Filed: |
| | | | |
Explanatory Note - Commencing May 11, 2012, Freeport-McMoRan Copper & Gold Inc. will refer to the attached presentation in discussions with shareholders.
|
May/June 2012 May/June 2012 Proxy Discussion Say-On-Pay Proxy Discussion Say-On-Pay |
|
Summary Agenda FCX Overview and Summary of 2011 Performance Feedback on 2011 Say-On-Pay Vote Modifications to Our Executive Compensation Program Summary of 2011 Executive Compensation Questions/Discussion 2 |
|
FCX Overview World’s Largest Publicly Traded Copper Company World’s Largest Producer of Molybdenum & Significant Gold Producer World Class, Long-Lived, Geographically Diverse Operations Environmentally and Socially Responsible Financially Strong #135 in the 2012 Fortune 500 Rankings Long Track Record of Providing Shareholder Returns ~30,000 Employees Worldwide 3 |
|
2011 Highlights Excellent Financial Performance – Exceeded 2010 Records Solid Operating Performance Impacted by Labor Disruptions New Labor Agreements at Grasberg, Cerro Verde & El Abra Advanced Growth Projects to Increase Copper Production by ~25% Over Next Several Years Significant Exploration Drilling Program for Future Reserve & Production Growth Strong Balance Sheet and Financial Returns Paid $1.4 Billion in Common Stock Dividends ($1.50 per share) Fortune 500 Statistics - Net Income – Ranked 40 th - Profits as Percentage of Revenues – Ranked 28 th - 33.5% Annual Growth in EPS from 2001 to 2011 – Ranked 12 th 4 |
|
Total Shareholder Returns 5 FCX -36.8% 216.7% 60.0% Peer Group Median -33.6% 97.0% 43.2% Peer Group 75 th % -22.2% 176.4% 73.1% S&P 500 2.1% 48.6% 1.1% 1-Year 3-Year 5-Year 1-Year 3-Year 5-Year The Peer Group consists of the following companies: Alcoa Inc. Anglo American plc Antofagasta plc Barrick Gold Corporation BHP Billiton plc Newmont Mining Corp. Rio Tinto plc Southern Copper Corporation Teck Resources Limited United States Steel Corporation Vale S.A. Xstrata plc |
|
Feedback on 2011 Say-on-Pay Vote FCX’s Institutional Shareholders • Recognized Strong Performance • Cited Pay Magnitude as Primary Reason for Negative Vote • Commented on 6% Return on Investment (ROI) Measure in Annual Incentive Plan (AIP) – Lacked Rigor • Wanted More Disclosure of Qualitative Factors Considered 6 |
|
Feedback on 2011 Say-on-Pay Vote Proxy Advisory Firms • Recognized Strong Performance • Cited Pay Magnitude as Primary Reason for Negative Vote • Other Factors Noted: - AIP Design 6% ROI Measure – Lack of Rigor Lack of Reasonable Upper Limit - Significant Perquisites - No Clawback Policy 7 |
|
Goals of Changing Executive Compensation Program Maintain Entrepreneurial Culture of the Company Continue to Align Compensation with Interests of Stockholders Maintain Strong Pay-for-Performance Link • Emphasize Performance-Based Compensation • Tie to Key Measures Used in Assessing Company Value Address Pay Magnitude with Caps Based on Salary Multiples • Base Salaries of Executives Not Changed Since 2007 Increase Rigor of Performance Measures Independent Corporate Personnel Committee to Retain Some Discretion with Respect to Executive Compensation Awards Maintain Straightforward Program 8 |
|
Modifications to Program “Umbrella” Cap: AIP + Equity-Based = $20 million per year Reduced AIP Limits • Reduced Total Cap from 8X to 6X Salary • Reduced Cash Component Cap from 4X to 3X Salary Performance RSUs – Two-Fold Performance-Based Hurdles • 1 st Performance-Based Hurdle Maintained: - Amount Granted Determined as AIP Award - AIP Awards Based on Cash Flow, ROI, Qualitative Performance Measures (see next slide) • 2 nd Performance-Based Hurdle Added: - Amount Ultimately Vesting After Three Years Now Based on Total Shareholder Return Component (TSR) - Relative Measure: FCX’s TSR Compared to Peer Group - 20% of Award Subject to Forfeiture if FCX’s TSR Below Median 9 |
|
AIP Performance Measures • Maintained Incentive Pool Based on Cash Flow • Increased Rigor of the ROI Performance Measure in AIP - Maintained Current Five-Year ROI of 6% - Added Following Guideline Matrix: • Qualitative Measures - Measures Considered: Safety; Environmental & Social; Operational Metrics; Growth Initiatives; TSR & ROI Compared to Peers; Exploration Results; Financial Management - Added Disclosure of Qualitative Factors Considered (see pages 35-38 of proxy statement) Modifications to Program (cont’d) 10 Average Copper Price per Pound 2x 3x 4x 5x 6x Salary Multiples – Annual ROI Thresholds $2.51 - $3.00 6% 7% 10% 13% 16% $3.01 - $3.50 9% 10% 13% 16% 19% $3.51 - $4.00 12% 13% 16% 19% 23% >$4.01 15% 17% 20% 23% 27% |
|
Modifications to Program (cont’d) Revised Stock Option Methodology • Option Grants Subject to “Umbrella” Cap • Stock Options Valued Under Black-Scholes (Rather than Fixed Share Basis) • Stock Options and RSUs Would Vest Following a Change of Control Only If Employee Terminated from Employment Within One Year • Only Applies to Future Equity Awards Adopted Clawback Policy • FCX May Recover Incentive Awards Paid Based on Restated Financial Statements Under Certain Circumstances • To Be Adjusted as Needed to Comply with New SEC Rules 11 Implemented “Double Trigger” Vesting of Equity Awards |
|
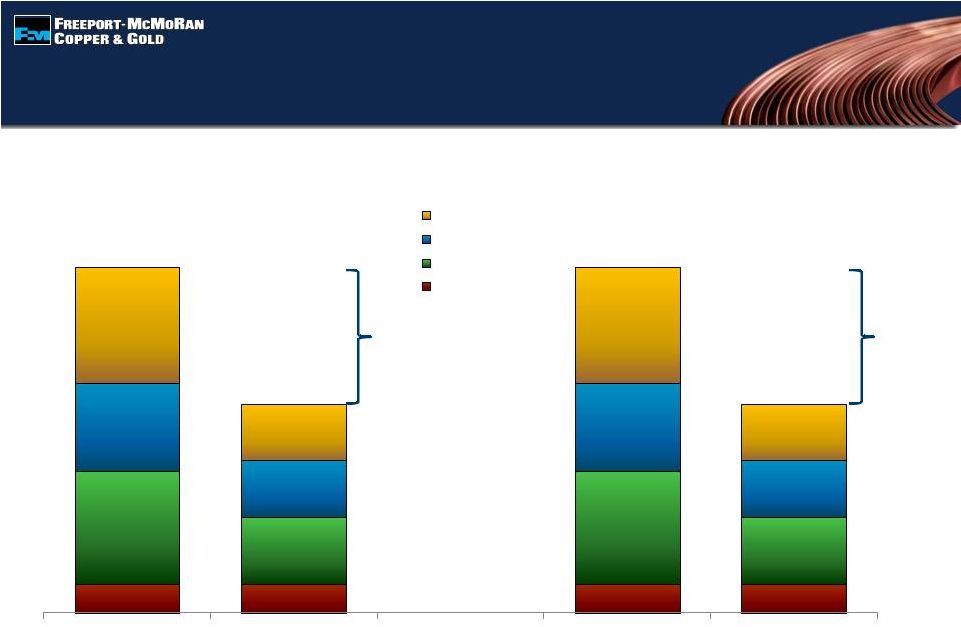
Total Direct Compensation 2010 and 2011 12 ($ millions) Chairman CEO $30.6 $18.5 $30.6 $18.5 40% Reduction 40% Reduction 2010 2011 2010 2011 Stock Options AIP - RSUs AIP - Cash Salary |
|
Overview of Executive Compensation Awarded for 2011 2011 Was an Outstanding Year for FCX Resulting in the Best Financial Results in Company’s History In Awarding 2011 Incentive Compensation (AIP Awards and Stock Options), Our Corporate Personnel Committee Considered: • Strong Company Performance in 2011, Including the Quantitative and Qualitative Measures Cited in CD&A • Newly Implemented Caps • Grant Date Value of Stock Options • FCX’s TSR, Including the Negative TSR in 2011 • Shareholders’ Concern with Pay Magnitude for 2010 Compensation Significantly Reduced from 2010 • Each of the Chairman and the CEO Awarded Over 40% Less Incentive Compensation for 2011 Than Awarded for 2010 - Incentive Amount Awarded – 20% Less Than New Umbrella Cap • 2011 Total Direct Compensation (Salary, AIP Awards, Stock Options) for All Named Executive Officers Down 38% From 2010 13 |
|
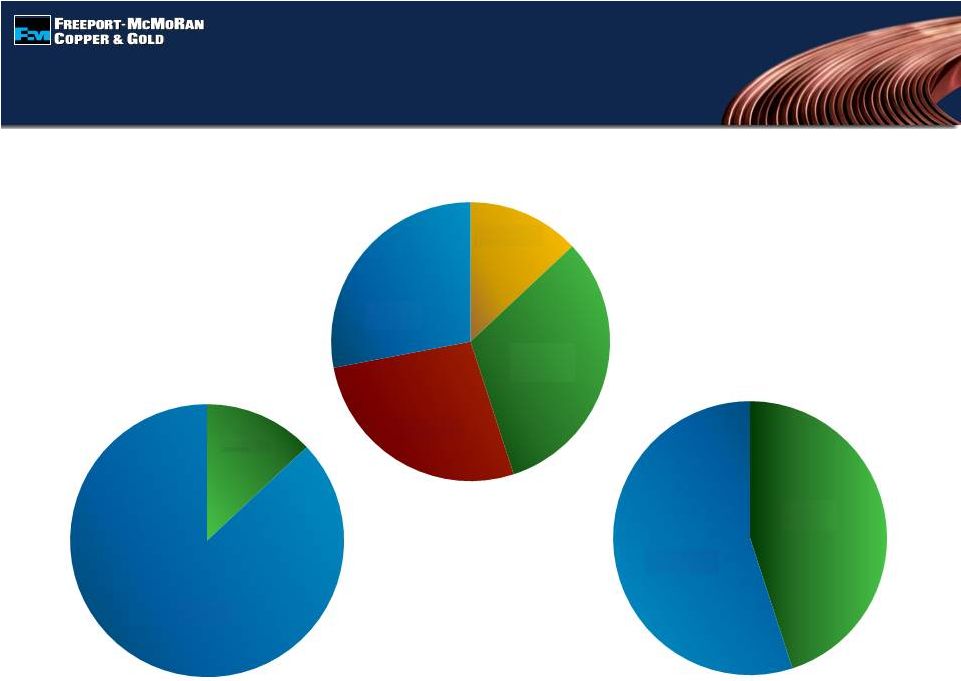
2011 Component Mix of Total Direct Compensation Equity-Based Salary AIP Cash 14 Components of Compensation Performance-Based/Fixed Compensation Equity/Cash Compensation Cash AIP RSUs Fixed 13% 32% 27% 28% Options 13% 87% 45% 55% Performance-based |
|
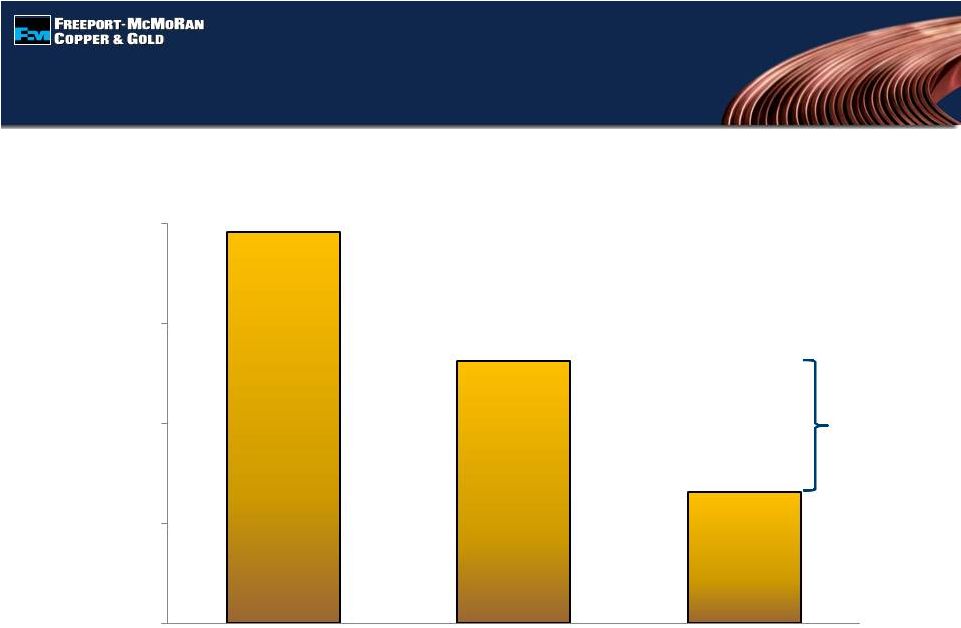
Total Black-Scholes Value of Options Granted to NEOs 15 ($ millions) 2.54MM Options as Adjusted for Stock Split 2.54MM Options as Adjusted for Stock Split 1.27MM Options 1.27MM Options 0.87MM Options 0.87MM Options 50% Reduction $39.2 $26.2 $13.1 $0 $10 $20 $30 $40 2009 2010 2011 |
|
Executive Compensation – Last Two Years 16 1 Reflects the year of performance for which the RSUs and stock options were awarded even though granted in February of the following year (differs from amounts reflected in the Summary Compensation Table on page 48); for 2011,values reflect preliminary estimates reviewed by CPC at time of grant 2 Reflects the amounts from the Change in Pension Value column and the amounts of Plan Contributions included in All Other Compensation column of the Summary Compensation Table on page 48 Total Direct Compensation and Total Compensation (in millions) Moffett 2011 $2.50 $ 6.000 $5.000 $4.95 $18.45 $2.60 $0.92 $21.97 2010 2.50 10.000 7.768 10.30 30.57 2.24 0.77 33.58 Adkerson 2011 2.50 6.000 5.000 4.95 18.45 3.44 0.62 22.51 2010 2.50 10.000 7.768 10.30 30.57 5.21 0.58 36.36 Quirk 2011 0.65 1.625 1.625 1.65 5.55 0.16 0.04 5.75 2010 0.65 2.600 2.290 3.09 8.63 0.11 0.04 8.78 Arnold 2011 0.55 1.375 1.375 1.50 4.80 0.13 0.05 4.98 2010 0.55 2.200 1.800 2.47 7.02 0.09 0.05 7.16 Year Salary Cash RSUs¹ Stock Options¹ Total Direct Retirement Benefits² All Other Total AIP Awards |
|
Performance-Based Compensation vs Stock Performance 17 Options RSUs Cash $19.2 $79.3 $70.6 $41.1 $0 $15 $30 $45 $60 $75 $0 $20 $40 $60 $80 $100 2008 2009 2010 2011 Stock Price |
|
Questions/ Discussion Questions/ Discussion |
|
19 Additional Disclosure Additional Disclosure This information is being provided to certain shareholders in addition to Freeport-McMoRan Copper & Gold Inc.’s proxy statement dated April 27, 2012, that has been available since such date. Please read the complete proxy statement and accompanying materials carefully before you make a voting decision. Even if voting instructions for your proxy have already been given, you can change your vote at any time before the annual meeting by giving new voting instructions as described in more detail in the proxy statement. The proxy statement, and any other documents filed by Freeport- McMoRan Copper & Gold Inc. with the Securities and Exchange Commission (“SEC”), may be obtained free of charge at the SEC web site at www.sec.gov and from the Company’s web site at www.fcx.com. Freeport-McMoRan Copper & Gold Inc. and its directors and officers may be deemed to be participants in the solicitation of proxies from Freeport-McMoRan Copper & Gold Inc.’s shareholders in connection with the upcoming annual meeting of shareholders. Information about Freeport-McMoRan Copper & Gold Inc.’s directors and executive officers and their ownership of Freeport-McMoRan Copper & Gold Inc. stock is set forth in the proxy statement for Freeport-McMoRan Copper & Gold Inc.’s 2012 annual meeting of shareholders. |