September 30, 2016
VIA EDGAR CORRESPONDENCE
Securities and Exchange Commission
Division of Corporation Finance
Mail Stop 4546
Washington, D.C. 20549
Attention: Jim B. Rosenberg, Senior Assistant Chief Accountant, Office of Healthcare and Insurance
| Re: | Spectrum Pharmaceuticals, Inc. |
| File No. 001-35006 |
| Responses to Commission Staff comments made by letter dated September 2, 2016 |
Ladies and Gentlemen:
Spectrum Pharmaceuticals, Inc. (the “Company,” “we” or “us”) hereby respectfully submits its response to the Staff’s comments made by letter dated September 2, 2016, relating to the Company’s Form 10-K for the fiscal year ended December 31, 2015,Form 10-Q for the quarterly period ended June 30, 2016 and Form 8-K dated August 9, 2016. The Company’s response is preceded by a reproduction of the Staff’s comment contained in the September 2, 2016 letter. The Company has filed this response letter on EDGAR under the form label CORRESP.
The Company acknowledges the following;
| • | that it is responsible for the adequacy and accuracy of the disclosure in its filings; |
| • | that Staff comments or changes to disclosure in response to Staff comments do not foreclose the Commission from taking any action with respect to the filings; and |
| • | that it may not assert the Staff comments as a defense in any proceeding initiated by the Commission or any person under the federal securities laws of the United States. |
Form 10-K for the year ended December 31, 2015:
Item 1. Business
Product Portfolio, page 3
1. Please provide us with an expanded discussion of your products to provide more information about usage. For example, both FOLOTYN and BELEODAQ were developed for the treatment of Relapsed/Refractory PTCL. Are these products competitors; is BELEODAQ to be used in combination with FOLOTYN; or are there circumstances which would make FOLOTYN or BELEODAQ a better treatment option than the other. Additionally, confirm that you will provide this expanded disclosure in future filings.
1
Response 1
In response to the Staff’s comment, the Company advises the Staff that there are currently three drugs that are approved by the FDA to treat relapsed/refractory PTCL, including FOLOTYN and BELEODAQ, and one drug that is approved to treat only a specific subtype of relapsed/refractory PTCL. FOLOTYN and BELEODAQ have different mechanisms of action. FOLOTYN is a folate analogue metabolic inhibitor while BELEODAQ is a histone deacytelase inhibitor. While one could view the drugs as competitors, the unfortunate fact for patients is that the overall response rates across relapsed/refractory PTCL for these three drugs is quite low (approximately 25-30%). Thus, many patients don’t respond to the first drug and then try the second drug and so on. And even when patients do respond to therapy, the median duration of responses for these three drugs range from approximately 8 to 13 months. It is common for patients to receive multiple drugs over the course of their treatment for the disease. In addition, physicians may prefer one drug over another based on specific patient factors such as the subtype of PTCL being treated, existing comorbidities, or performance status of the patient. These drugs are not approved to be used in combination with one another, although there have been some early studies that have started to look at the possibility of its combination in treating relapsed/refractory PTCL patients. The approvals for both of these drugs were based on single-arm studies. There has been no head-to-head study that would allow us to make a statement about one drug being better for a certain type of patient.
In our future Form 10-K filings, we propose to include the following disclosure:
We market both FOLOTYN and BELEODAQ for the treatment of relapsed/refractory PTCL. These drugs have different mechanisms of action, and as a result, the treating physician may prefer to start treatment with one drug over the other. In addition, physicians may prefer one drug over another based on specific patient factors such as the subtype of PTCL being treated, existing comorbidities, or the performance status of the patient. However, both drugs have similar response rates of approximately 25-30% and thus it is common for patients to cycle through multiple drugs, including both FOLOTYN and BELEODAQ. These drugs are not approved for use in combination with one another.
2. Please indicate all serious adverse effects related to use of your products and product candidates and confirm that you will provide this disclosure in future filings.
Response 2
In response to the Staff’s comment, below is a list of all the serious adverse effects as excerpted from the full prescribing information contained in each of our product’s websites:
FUSILEV
FUSILEV is indicated for use in two indications (combination with Methotrexate and combination with 5-FU). The full prescribing information lists the adverse events for each indication separately. The events listed as Grade 3+ are considered serious.
Clinical Studies in High-Dose Methotrexate Therapy
Since clinical trials are conducted under widely varying conditions, adverse reaction rates observed in the clinical trials of a drug cannot be directly compared to rates in the clinical trials of another drug and may not reflect the rates observed in practice. The following table presents the frequency of adverse reactions which occurred during the administration of 58 courses of high-dose methotrexate 12 grams/m2 followed by FUSILEV rescue for osteosarcoma in 16 patients age 6-21. Most patients received FUSILEV 7.5 mg every 6 hours for 60 hours or longer beginning 24 hours after completion of methotrexate.
2
Table 2 Adverse Reactions with High-Dose Methotrexate Therapy
Body System/Adverse Reactions | Number (%) of Patients with Adverse Reactions | Number (%) of Courses with Adverse Reactions | ||||||||||||||
| (N =16) | (N = 58) | |||||||||||||||
| All | Grade 3+ | All | Grade 3+ | |||||||||||||
Gastrointestinal | ||||||||||||||||
Stomatitis | 6 (37.5) | 1 (6.3) | 10 (17.2) | 1 (1.7) | ||||||||||||
Vomiting | 6 (37.5) | 0 | 14 (24.1) | 0 | ||||||||||||
Nausea | 3 (18.8) | 0 | 3 (5.2) | 0 | ||||||||||||
Diarrhea | 1 (6.3) | 0 | 1 (1.7) | 0 | ||||||||||||
Dyspepsia | 1 (6.3) | 0 | 1 (1.7) | 0 | ||||||||||||
Typhlitis | 1 (6.3) | 1 (6.3) | 1 (1.7) | 1 (1.7) | ||||||||||||
Respiratory | ||||||||||||||||
Dyspnea | 1 (6.3) | 0 | 1 (1.7) | 0 | ||||||||||||
Skin and Appendages | ||||||||||||||||
Dermatitis | 1 (6.3) | 0 | 1 (1.7) | 0 | ||||||||||||
Other | ||||||||||||||||
Confusion | 1 (6.3) | 0 | 1 (1.7) | 0 | ||||||||||||
Neuropathy | 1 (6.3) | 0 | 1 (1.7) | 0 | ||||||||||||
Renal function abnormal | 1 (6.3) | 0 | 3 (5.2) | 0 | ||||||||||||
Taste perversion | 1 (6.3) | 0 | 1 (1.7) | 0 | ||||||||||||
Total number of patients | 9 (56.3) | 2 (12.5) | ||||||||||||||
Total number of courses | 25 (43.1) | 2 (3.4) | ||||||||||||||
The incidence of adverse reactions may be underestimated because not all patients were fully evaluable for toxicity for all cycles in the clinical trials. Leukopenia and thrombocytopenia were observed, but could not be attributed to high-dose methotrexate with FUSILEV rescue because patients were receiving other myelosuppressive chemotherapy.
Clinical Studies in Combination with 5-FU in Colorectal Cancer
A randomized controlled trial conducted by the North Central Cancer Treatment Group (NCCTG) in patients with advanced colorectal cancer failed to show superiority of a regimen of 5-FU + levoleucovorin to 5-FU +d,l-leucovorin in overall survival. Patients were randomized to 5-FU 370 mg/m2 intravenously and levoleucovorin 100 mg/m2 intravenously, both daily for 5 days, or with 5-FU 370 mg/m2 intravenously andd,l-leucovorin 200 mg/m2 intravenously, both daily for 5 days. Treatment was repeated week 4 and week 8, and then every 5 weeks until disease progression or unacceptable toxicity. The following table presents the most frequent adverse reactions which occurred in patients in the 2 treatment arms.
3
Table 3 Adverse Reactions Occurring in³ 10% of Patients in Either Arm
| Adverse Reaction | Levoleucovorin/5FU n=318 | d,l-Leucovorin/5FU n=307 | ||||||
| Adverse Event N (%) | Grade 1-4 | Grade 3-4 | Grade 1-4 | Grade 3-4 | ||||
Gastrointestinal Disorders | ||||||||
Stomatitis | 229 (72%) | 37 (12%) | 221 (72%) | 44 (14%) | ||||
Diarrhea | 222 (70%) | 61 (19%) | 201 (65%) | 51 (17%) | ||||
Nausea | 197 (62%) | 25 (8%) | 186 (61%) | 26 (8%) | ||||
Vomiting | 128 (40%) | 17 (5%) | 114 (37%) | 18 (6%) | ||||
Abdominal Pain1 | 45 (14%) | 10 (3%) | 57 (19%) | 10 (3%) | ||||
General Disorders | ||||||||
Asthenia/Fatigue/Malaise | 91 (29%) | 15 (5%) | 99 (32%) | 34 (11%) | ||||
Metabolism and Nutrition | ||||||||
Anorexia/Decreased Appetite | 76 (24%) | 13 (4%) | 77 (25%) | 5 (2%) | ||||
Skin Disorders | ||||||||
Dermatitis | 91 (29%) | 3 (1%) | 86 (28%) | 4 (1%) | ||||
Alopecia | 83 (26%) | 1 (0.3%) | 87 (28%) | 3 (1%) | ||||
| 1 | Includes abdominal pain, upper abdominal pain, lower abdominal pain, and abdominal tenderness |
FOLOTYN
Table 4 summarizes the most frequent adverse reactions, regardless of causality, using the National Cancer Institute-Common Terminology Criteria for Adverse Events (NCI CTCAE, version 3.0).
4
Table 4 Adverse Reactions Occurring in PTCL Patients (Incidence³ 10% of patients)
| N=111 | ||||||||||||||||||||||||
| Total | Grade 3 | Grade 4 | ||||||||||||||||||||||
Preferred Term | N | % | N | % | N | % | ||||||||||||||||||
Any Adverse Event | 111 | 100 | 48 | 43 | 34 | 31 | ||||||||||||||||||
Mucositisa | 78 | 70 | 19 | 17 | 4 | 4 | ||||||||||||||||||
Thrombocytopeniab | 45 | 41 | 15 | 14 | 21 | 19 | b | |||||||||||||||||
Nausea | 44 | 40 | 4 | 4 | 0 | 0 | ||||||||||||||||||
Fatigue | 40 | 36 | 5 | 5 | 2 | 2 | ||||||||||||||||||
Anemia | 38 | 34 | 17 | 15 | 2 | 2 | ||||||||||||||||||
Constipation | 37 | 33 | 0 | 0 | 0 | 0 | ||||||||||||||||||
Pyrexia | 36 | 32 | 1 | 1 | 1 | 1 | ||||||||||||||||||
Edema | 33 | 30 | 1 | 1 | 0 | 0 | ||||||||||||||||||
Cough | 31 | 28 | 1 | 1 | 0 | 0 | ||||||||||||||||||
Epistaxis | 29 | 26 | 0 | 0 | 0 | 0 | ||||||||||||||||||
Vomiting | 28 | 25 | 2 | 2 | 0 | 0 | ||||||||||||||||||
Neutropenia | 27 | 24 | 14 | 13 | 8 | 7 | ||||||||||||||||||
Diarrhea | 23 | 21 | 2 | 2 | 0 | 0 | ||||||||||||||||||
Dyspnea | 21 | 19 | 8 | 7 | 0 | 0 | ||||||||||||||||||
Anorexia | 17 | 15 | 3 | 3 | 0 | 0 | ||||||||||||||||||
Hypokalemia | 17 | 15 | 4 | 4 | 1 | 1 | ||||||||||||||||||
Rash | 17 | 15 | 0 | 0 | 0 | 0 | ||||||||||||||||||
Pruritus | 16 | 14 | 2 | 2 | 0 | 0 | ||||||||||||||||||
Pharyngolaryngeal pain | 15 | 14 | 1 | 1 | 0 | 0 | ||||||||||||||||||
Liver function test abnormalc | 14 | 13 | 6 | 5 | 0 | 0 | ||||||||||||||||||
Abdominal pain | 13 | 12 | 4 | 4 | 0 | 0 | ||||||||||||||||||
Pain in extremity | 13 | 12 | 0 | 0 | 0 | 0 | ||||||||||||||||||
Back pain | 12 | 11 | 3 | 3 | 0 | 0 | ||||||||||||||||||
Leukopenia | 12 | 11 | 3 | 3 | 4 | 4 | ||||||||||||||||||
Night sweats | 12 | 11 | 0 | 0 | 0 | 0 | ||||||||||||||||||
Asthenia | 11 | 10 | 1 | 1 | 0 | 0 | ||||||||||||||||||
Tachycardia | 11 | 10 | 0 | 0 | 0 | 0 | ||||||||||||||||||
Upper respiratory tract infection | 11 | 10 | 1 | 1 | 0 | 0 | ||||||||||||||||||
| a | Stomatitis or mucosal inflammation of the gastrointestinal and genitourinary tracts. |
| b | Five patients with platelets < 10,000/mcL |
| c | Alanine aminotransferase, aspartate aminotransferase, and transaminases increased |
5
Serious Adverse Events
Forty-four percent of patients (n = 49) experienced a serious adverse event while on study or within 30 days after their last dose of FOLOTYN. The most common serious adverse events (> 3%), regardless of causality, were pyrexia, mucositis, sepsis, febrile neutropenia, dehydration, dyspnea, and thrombocytopenia. One death from cardiopulmonary arrest in a patient with mucositis and febrile neutropenia was reported in this trial. Deaths from mucositis, febrile neutropenia, sepsis, and pancytopenia occurred in 1.2% of patients treated on all FOLOTYN trials at doses ranging from 30 to 325 mg/m2.
ZEVALIN
Adverse Reactions
The following serious adverse reactions are discussed in greater detail in other sections of the label:
| • | Serious Infusion Reactions [see Boxed Warning and Warnings and Precautions (5.1)]. |
| • | Prolonged and Severe Cytopenias [see Boxed Warning and Warnings and Precautions (5.2)]. |
Reference ID: 3366104
| • | Severe Cutaneous and Mucocutaneous Reactions [see Boxed Warning and Warnings and Precautions (5.3)]. |
| • | Leukemia and Myelodysplastic Syndrome [see Warnings and Precautions (5.5)]. |
The most common adverse reactions of ZEVALIN are cytopenias, fatigue, nasopharyngitis, nausea, abdominal pain, asthenia, cough, diarrhea, and pyrexia.
The most serious adverse reactions of ZEVALIN are prolonged and severe cytopenias (thrombocytopenia, anemia, lymphopenia, neutropenia) and secondary malignancies.
Because the ZEVALIN therapeutic regimen includes the use of rituximab, see prescribing information for rituximab.
Clinical Trials Experience
Because clinical trials are conducted under widely varying conditions, adverse reaction rates observed in the clinical trials of a drug cannot be directly compared to rates in the clinical trials of another drug and may not reflect the rates observed in practice.
The reported safety data reflects exposure to ZEVALIN in 349 patients with relapsed or refractory, low-grade, follicular or transformed NHL across 5 trials (4 single arm and 1 randomized) and in 206 patients with previously untreated follicular NHL in a randomized trial (Study 4) who received any portion of the ZEVALIN therapeutic regimen. The safety data reflect exposure to ZEVALIN in 270 patients with relapsed or refractory NHL with platelet counts³150,000/ mm3 who received 0.4 mCi/kg (14.8 MBq/kg) of Y-90 ZEVALIN (Group 1 in Table 4), 65 patients with relapsed or refractory NHL with platelet counts of³100,000 but³ 149,000/mm3 who received 0.3 mCi/kg (11.1 MBq/kg) of Y-90 ZEVALIN (Group 2 in Table 4), and 204 patients with previously untreated NHL with platelet counts³150,000/ mm3 who received 0.4 mCi/kg (14.8 MBq/kg) of Y-90 ZEVALIN; all patients received a single course of ZEVALIN.
Table 2 displays selected adverse reaction incidence rates in patients who received any portion of the Zevalin therapeutic regimen (n=206) or no further therapy (n=203) following first-line chemotherapy (Study 4).
6
Table 2.
Per-Patient Incidence (%) of Selecteda Adverse Reactions Occurring in³ 5% of Patients with Previously Untreated Follicular NHL Treated with the ZEVALIN Therapeutic Regimen
| Zevalin (n=206) | Observation (n=203) | |||||||||||||||
| All Gradesb | Gradeb 3-4 | All Gradesb | Gradeb 3-4 | |||||||||||||
| % | % | % | % | |||||||||||||
Gastrointestinal Disorders |
| |||||||||||||||
Abdominal pain | 17 | 2 | 13 | <1 | ||||||||||||
Diarrhea | 11 | 0 | 3 | 0 | ||||||||||||
Nausea | 18 | 0 | 2 | 0 | ||||||||||||
Body as a Whole |
| |||||||||||||||
Asthenia | 15 | 1 | 8 | <1 | ||||||||||||
Fatigue | 33 | 1 | 9 | 0 | ||||||||||||
Influenza-like illness | 8 | 0 | 3 | 0 | ||||||||||||
Pyrexia | 10 | 3 | 4 | 0 | ||||||||||||
Musculoskeletal |
| |||||||||||||||
Myalgia | 9 | 0 | 3 | 0 | ||||||||||||
Metabolism |
| |||||||||||||||
Anorexia | 8 | 0 | 2 | 0 | ||||||||||||
Respiratory, Thoracic & Media |
| |||||||||||||||
Cough | 11 | <1 | 5 | 0 | ||||||||||||
Pharyngolaryngeal pain | 7 | 0 | 2 | 0 | ||||||||||||
Epistaxis | 5 | 2 | <1 | 0 | ||||||||||||
Nervous System |
| |||||||||||||||
Dizziness | 7 | 0 | 2 | 0 | ||||||||||||
Vascular |
| |||||||||||||||
Hypertension | 7 | 3 | 2 | <1 | ||||||||||||
Skin & Subcutaneous |
| |||||||||||||||
Night sweats | 8 | 0 | 2 | 0 | ||||||||||||
Petechiae | 8 | 2 | 0 | 0 | ||||||||||||
Pruritus | 7 | 0 | 1 | 0 | ||||||||||||
Rash | 7 | 0 | <1 | 0 | ||||||||||||
Infections & Infestations |
| |||||||||||||||
Bronchitis | 8 | 0 | 3 | 0 | ||||||||||||
Nasopharyngitis | 19 | 0 | 10 | 0 | ||||||||||||
Rhinitis | 8 | 0 | 2 | 0 | ||||||||||||
Sinusitis | 7 | <1 | <1 | 0 | ||||||||||||
Urinary tract infection | 7 | <1 | 3 | 0 | ||||||||||||
Blood and Lymphatic System |
| |||||||||||||||
Thrombocytopenia | 62 | 51 | 1 | 0 | ||||||||||||
Neutropenia | 45 | 41 | 3 | 2 | ||||||||||||
Anemia | 22 | 5 | 4 | 0 | ||||||||||||
Leukopenia | 43 | 36 | 4 | 1 | ||||||||||||
Lymphopenia | 26 | 18 | 9 | 5 | ||||||||||||
| a) | Between-group difference of³5% |
| b) | NCI CTCAE version 2.0 |
7
Table 3 shows hematologic toxicities in 349 Zevalin-treated patients with relapsed or refractory, low-grade, follicular or transformed B-cell NHL. Grade 2-4 hematologic toxicity occurred in 86% of Zevalin-treated patients.
Table 3.
Per-Patient Incidence (%) of Hematologic Adverse Reactions in Patients with Relapsed or Refractory Low-grade, Follicular or Transformed B-cell NHLa(N = 349)
| All Grades % | Grade 3-4 % | |||||||
Thrombocytopenia | 95 | 63 | ||||||
Neutropenia | 77 | 60 | ||||||
Anemia | 61 | 17 | ||||||
Ecchymosis | 7 | <1 | ||||||
| a) | Occurring within the 12 weeks following the first rituximab infusion of the ZEVALIN therapeutic regimen |
Prolonged and Severe Cytopenias
Patients in clinical studies were not permitted to receive hematopoietic growth factors beginning 2 weeks prior to administration of the ZEVALIN therapeutic regimen.
The incidence and duration of severe hematologic toxicity in previously treated NHL patients (N=335) and in previously untreated patients (Study 4) receiving Y-90 ZEVALIN are shown in Table 4.
Table 4.
Severe Hematologic Toxicity in Patients Receiving ZEVALIN
Baseline Platelet Count | Group 1 (n=270) ³ 150,000/mm3 | Group 2 (n=65 ) ³ 100,000 but £ 149,000/mm3 | Study 4 (n=204) ³ 150,000/mm3 | |||||||||
Y-90 Zevalin Dose | 0.4 mCi/kg (14.8 MBq/kg) | 0.3 mCi/kg (11.1 MBq/kg) | 0.4 mCi/kg (14.8 MBq/kg) | |||||||||
ANC | ||||||||||||
Median nadir ( per mm3) | 800 | 600 | 721 | |||||||||
Per Patient Incidence | ||||||||||||
ANC <1000/mm3 | 57 | % | 74 | % | 65 | % | ||||||
Per Patient Incidence | ||||||||||||
ANC <500/mm3 | 30 | % | 35 | % | 26 | % | ||||||
Median Duration (Days)a | ||||||||||||
ANC <1000/mm3 | 22 | 29 | 29 | |||||||||
Median Time to Recoveryb | 12 | 13 | 15 | |||||||||
Platelets | ||||||||||||
Median nadir (per mm3) | 41,000 | 24,000 | 42,000 | |||||||||
Per Patient Incidence Platelets <50,000/mm3 | 61 | % | 78 | % | 61 | % | ||||||
Per Patient Incidence Platelets <10,000/mm3 | 10 | % | 14 | % | 4 | % | ||||||
Median Duration (Days)c Platelets <50,000/mm3 | 24 | 35 | 26 | |||||||||
Median Time to Recoveryb | 13 | 14 | 14 | |||||||||
| a) | Day from last ANC³1000/mm3 to first ANC³1000/mm3 following nadir, censored at next treatment or death |
| b) | Day from nadir to first count at level of Grade 1 toxicity or baseline |
| c) | Day from last platelet count³50,000/mm3 to day of first platelet count³50,000/mm3 following nadir, censored at next treatment or death |
8
Cytopenias were more severe and more prolonged among eleven (5%) patients who received Zevalin after first-line fludarabine or a fludarabine-containing chemotherapy regimen as compared to patients receiving non-fludarabine-containing regimens. Among these eleven patients, the median platelet nadir was 13,000/mm3 with a median duration of platelets below 50,000/mm3 of 56 days and the median time for platelet recovery from nadir to Grade 1 toxicity or baseline was 35 days. The median ANC was 355/mm3, with a median duration of ANC below 1,000/mm3 of 37 days and the median time for ANC recovery from nadir to Grade 1 toxicity or baseline was 20 days.
The median time to cytopenia was similar across patients with relapsed/refractory NHL and those completing first-line chemotherapy, with median ANC nadir at 61-62 days, platelet nadir at 49-53 days, and hemoglobin nadir at 68-69 days after Y-90- ZEVALIN administration.
Information on hematopoietic growth factor use and platelet transfusions is based on 211 patients with relapsed/refractory NHL and 206 patients following first-line chemotherapy. Filgrastim was given to 13% of patients and erythropoietin to 8% with relapsed or refractory disease; 14% of patients receiving ZEVALIN following first-line chemotherapy received granulocyte-colony stimulating factors and 5% received erythopoiesis-stimulating agents. Platelet transfusions were given to approximately 22% of all ZEVALIN-treated patients. Red blood cell transfusions were given to 20% of patients with relapsed or refractory NHL and 2% of patients receiving ZEVALIN following first-line chemotherapy.
Infections
In relapsed or refractory NHL patients, infections occurred in 29% of 349 patients during the first 3 months after initiating the ZEVALIN therapeutic regimen and 3% developed serious infections (urinary tract infection, febrile neutropenia, sepsis, pneumonia, cellulitis, colitis, diarrhea, osteomyelitis, and upper respiratory tract infection). Life-threatening infections were reported in 2% (sepsis, empyema, pneumonia, febrile neutropenia, fever, and biliary stent-associated cholangitis). From 3 months to 4 years after ZEVALIN treatment, 6% of patients developed infections; 2% were serious (urinary tract infection, bacterial or viral pneumonia, febrile neutropenia, perihilar infiltrate, pericarditis, and intravenous drug-associated viral hepatitis) and 1% were life-threatening infections (bacterial pneumonia, respiratory disease, and sepsis).
When administered following first-line chemotherapy (Table 2), Grade 3-4 infections occurred in 8% of ZEVALIN treated patients and in 2% of controls and included neutropenic sepsis (1%), bronchitis, catheter sepsis, diverticulitis, herpes zoster, influenza, lower respiratory tract infection, sinusitis, and upper respiratory tract infection.
Leukemia and Myelodysplastic Syndrome
Among 746 patients with relapsed/refractory NHL, 19 (2.6%) patients developed MDS/AML with a median follow-up of 4.4 years. The overall incidence of MDS/AML among the 211 patients included in the clinical studies was 5.2% (11/211), with a median follow-up of 6.5 years and median time to development of MDS/AML of 2.9 years. The cumulative Kaplan-Meier estimated incidence of MDS/secondary leukemia in this patient population was 2.2% at 2 years and 5.9% at 5 years. The incidence of MDS/AML among the 535 patients in the expanded access programs was 1.5% (8/535) with a median follow-up of 4.4 years and median time to development of MDS/AML of 1.5 years. Multiple cytogenetic abnormalities were described, most commonly involving chromosomes 5 and/or 7. The risk of MDS/AML was not associated with the number of prior treatments (0-1 versus 2-10).
Among 204 patients receiving Y-90- ZEVALIN following first-line treatment, 7 (3%) patients developed MDS/AML between approximately 2 to 7 years after ZEVALIN administration [see Warnings and Precautions (5.5)].
9
MARQIBO
ADVERSE REACTIONS
The following adverse reactions are also discussed in other sections of the labeling:
For intravenous use only [see Warnings and Precautions ( )]
Extravasation tissue injury [see Warnings and Precautions ( )]
Peripheral Neuropathy [see Warnings and Precautions ( )]
Myelosuppression [see Warnings and Precautions ( )]
Tumor lysis syndrome [see Warnings and Precautions ( )]
Constipation and bowel obstruction [see Warnings and Precautions ( )]
Fatigue [see Warnings and Precautions ( )]
Hepatic toxicity [see Warnings and Precautions ( )]
Clinical Trials Safety Experience
Because clinical trials are conducted under widely varying conditions, adverse reaction rates observed in the clinical trials of a drug cannot be directly compared to rates in the clinical trials of another drug and may not reflect the rates observed in clinical practice.
Integrated Summary of Safety in Relapsed and/or Refractory Ph- Adult Acute Lymphoblastic Leukemia
MARQIBO, at a dose of 2.25 mg/m2 weekly, was studied in a total of 83 patients in two trials: study 1 and study 2. Adverse reactions were observed in 100% of patients. The most common adverse reactions (>30%) were constipation (57%), nausea (52%), pyrexia (43%), fatigue (41%), peripheral neuropathy (39%), febrile neutropenia (38%), diarrhea (37%), anemia (34%), decreased appetite (33%), and insomnia (32%).
Adverse reactions of Grade 3 or greater were reported in 96% of patients. Adverse reactions of Grade 3 or greater and occurring in³ 5% of patients are summarized in Table 1.
10
Table 1. Most Commonly Reported (> 5%) Grade a 3 or Greater Adverse Reactions among 83 Patients Receiving the Clinical Dosing Regimen
Adverse Reactions Grade³ 3 | Study 1 and 2 (N=83) n (%) | |
Blood and Lymphatic System Disorders | 47 (56.6) | |
Febrile Neutropenia | 26 (31.3) | |
Neutropenia | 15 (18.1) | |
Anemia | 14 (16.9) | |
Thrombocytopenia | 14 (16.9) | |
Infections | 33 (39.8) | |
Pneumonia | 7 (8.4) | |
Septic Shock | 5 (6.0) | |
Staphylococcal Bacteremia | 5 (6.0) | |
Neuropathyb | 27 (32.5) | |
Peripheral Sensory and Motor Neuropathy | 14 (16.7) | |
Constipation | 4 (4.8) | |
Ileus, Colonic Pseudo-Obstruction | 5 (6.0) | |
Asthenia | 4 (4.8) | |
Muscular Weakness | 1 (1.2) | |
Respiratory Thoracic and Mediastinal Disorders | 17 (20.5) | |
Respiratory Distress | 5 (6.0) | |
Respiratory Failure | 4 (4.8) | |
General Disorders and Administration Site Condition | 31 (37.3) | |
Pyrexia | 12 (14.5) | |
Fatigue | 10 (12.0) | |
Pain | 7 (8.4) | |
Gastrointestinal Disorders | 21 (25.3) | |
Abdominal Pain | 7 (8.4) | |
Investigations | 20 (24.1) | |
Aspartate Aminotransferase Increased | 6 (7.2) | |
Vascular Disorders | 8 (9.6) | |
Hypotension | 5 (6.0) | |
Psychiatric Disorders | 9 (10.8) | |
Mental Status Changes | 3 (3.6) | |
Cardiac Disorders | 9 (10.8) | |
Cardiac Arrest | 5 (6.0) | |
Renal and Urinary Disorders | 6 (7.2) | |
Musculoskeletal and Connective Tissue Disorders | 7 (8.4) |
| a | National Cancer Institute (NCI) Common Terminology Criteria for Adverse Events (CTCAE) v3.0. |
| b | Including neuropathy-associated adverse reactions. |
A total of 75.9% of patients experienced serious adverse events (SAEs) during the studies. The most commonly reported SAEs included febrile neutropenia (20.5%), pyrexia (13.3%), hypotension (7.2%), respiratory distress (6.0%), and cardiac arrest (6.0%).
Dose reduction, delay, or omission occurred in 53% of patients during the treatment.
11
Twenty-eight percent of patients experienced adverse reactions leading to treatment discontinuation. The most common adverse reactions that caused treatment discontinuation were peripheral neuropathy (10%),leukemia-related (7%), and tumor lysis syndrome (2%).
Adverse reactions related to neuropathy and leading to treatment discontinuation were decreased vibratory sense, facial palsy, hyporeflexia, constipation, asthenia, fatigue, and musculoskeletal pain, each reported in at least 1 patient.
Deaths occurred in 23% of patients in study 1. The non-leukemia related causes of deaths were brain infarct (1), intracerebral hemorrhage (2), liver failure (1), multi system organ failure (2), pneumonia and septic shock (3), respiratory failure (4), pulmonary hemorrhage (1), and sudden cardiac death (1).
BELEODAQ
Adverse Reactions
The following serious adverse reactions are described in more detail in other sections of the prescribing information.
| • | Hematologic Toxicity[see Warnings and Precautions (5.1)] |
| • | Infection[see Warnings and Precautions (5.2)] |
| • | Hepatotoxicity[see Warnings and Precautions (5.3)] |
| • | Tumor Lysis Syndrome [see Warnings and Precautions (5.4)] |
| • | Gastrointestinal Toxicity[see Warnings and Precautions (5.5)] |
The most common adverse reactions observed in the trial of patients with relapsed or refractory PTCL treated with BELEODAQ were nausea, fatigue, pyrexia, anemia, and vomiting[see Clinical Studies (14)].
Clinical Trials Experience
Because clinical trials are conducted under widely varying conditions, adverse reaction rates observed in the clinical trials of BELEODAQ may not reflect the rates observed in practice.
Adverse Reactions in Patients with Peripheral T-Cell Lymphoma
The safety of BELEODAQ was evaluated in 129 patients with relapsed or refractory PTCL in the single arm clinical trial in which patients were administered BELEODAQ at a dosage of 1,000 mg/m2 administered over 30 minutes by IV infusion once daily on Days 1-5 of a 21-day cycle[see Clinical Studies (14)]. The median duration of treatment was 2 cycles (range 1 – 33 cycles).
Table 2 summarizes the adverse reactions regardless of causality from the trial in patients with relapsed or refractory PTCL.
12
Table 2: Adverse Reactions Occurring in³ 10% of Patients by Preferred Term and Severity in Patients with Relapsed or Refractory PTCL (NCI-CTC Grade 1-4)
MedDRA Preferred Term | Percentage of Patients (%) (N=129) | |||||||
| All Grades | Grade 3 or 4 | |||||||
All Adverse Reactions | 97 | 61 | ||||||
Nausea | 42 | 1 | ||||||
Fatigue | 37 | 5 | ||||||
Pyrexia | 35 | 2 | ||||||
Anemia | 32 | 11 | ||||||
Vomiting | 29 | 1 | ||||||
Constipation | 23 | 1 | ||||||
Diarrhea | 23 | 2 | ||||||
Dyspnea | 22 | 6 | ||||||
Rash | 20 | 1 | ||||||
Peripheral Edema | 20 | 0 | ||||||
Cough | 19 | 0 | ||||||
Thrombocytopenia | 16 | 7 | ||||||
Pruritus | 16 | 3 | ||||||
Chills | 16 | 1 | ||||||
Increased Blood Lactate Dehydrogenase | 16 | 2 | ||||||
Decreased Appetite | 15 | 2 | ||||||
Headache | 15 | 0 | ||||||
Infusion Site Pain | 14 | 0 | ||||||
Hypokalemia | 12 | 4 | ||||||
Prolonged QT | 11 | 4 | ||||||
Abdominal pain | 11 | 1 | ||||||
Hypotension | 10 | 3 | ||||||
Phlebitis | 10 | 1 | ||||||
Dizziness | 10 | 0 | ||||||
Note: Adverse reactions are listed by order of incidence in the “All Grades” category first, then by incidence in “ the Grade 3 or 4” category; MedDRA = Medical Dictionary for Regulatory Activities; Severity measured by National Cancer Institute Common Terminology Criteria for Adverse Events (NCI-CTCAE) version 3.0
Serious Adverse Reactions
Sixty-one patients (47.3%) experienced serious adverse reactions while taking BELEODAQ or within 30 days after their last dose of BELEODAQ. The most common serious adverse reactions (> 2%) were pneumonia, pyrexia, infection, anemia, increased creatinine, thrombocytopenia, and multi-organ failure. One treatment-related death associated with hepatic failure was reported in the trial.
13
One patient with baseline hyperuricemia and bulky disease experienced Grade 4 tumor lysis syndrome during the first cycle of treatment and died due to multi-organ failure. A treatment-related death from ventricular fibrillation was reported in another monotherapy clinical trial with BELEODAQ. ECG analysis did not identify QTc prolongation.
EVOMELA
Adverse Reactions
The following serious adverse reactions are described in more detail in other sections of the prescribing information.
| • | Bone Marrow Suppression[see Warnings and Precautions (5.1)] |
| • | Gastrointestinal Toxicity[see Warnings and Precautions (5.2)] |
| • | Hepatotoxicity [see Warnings and Precautions (5.3)] |
| • | Hypersensitivity[see Warnings and Precautions (5.4)] |
| • | Secondary Malignancies[see Warnings and Precautions (5.5)] |
Clinical Trials Experience
Because clinical studies are conducted under widely varying conditions, adverse reaction rates observed in the clinical studies of EVOMELA may not reflect the rates observed in practice.
The most common adverse reactions observed in at least 50% of patients with multiple myeloma treated with EVOMELA were neutrophil count decreased, white blood cell count decreased, lymphocyte count decreased, platelet count decreased, diarrhea, nausea, fatigue, hypokalemia, anemia, and vomiting.
Myeloablative Conditioning in Multiple Myeloma Patients Undergoing ASCT
The safety of EVOMELA was evaluated in 61 patients with multiple myeloma in a single arm clinical trial in which patients were administered EVOMELA at a dosage of 100 mg/m2/day administered over ~30 minutes (range: 24-48 minutes) by intravenous (IV) infusion for 2 consecutive days (Day -3 and Day -2) prior to autologous stem cell transplant (ASCT, Day 0).
Table 1 summarizes the adverse reactions from the single-arm trial in patients with multiple myeloma. Severe myelosuppression is expected and these adverse reactions are not listed below.
Table 1: Non-hematologic Adverse Reactions in³ 25% of Patients with Multiple Myeloma Who Received Evomela Conditioning for ASCT
Adverse Reactions | Number (%) of Patients (N=61) | |||
| All Grades | Grade 3 or 4 | |||
All Adverse Reactions | 61 | 61 | ||
Diarrhea | 57 (93%) | 2 (3%) | ||
Nausea | 55 (90%) | 1 (2%) | ||
Fatigue | 47 (77%) | 1 (2%) | ||
Hypokalemia | 45 (74%) | 17 (28%) | ||
Vomiting | 39 (64%) | 0 (0%) | ||
Hypophosphatemia | 30 (49%) | 29 (48%) | ||
Decreased Appetite | 30 (49%) | 0 (0%) | ||
Pyrexia | 29 (48%) | 2 (3%) | ||
Constipation | 29 (48%) | 0 (0%) | ||
Febrile Neutropenia | 25 (41%) | 17 (28%) | ||
Mucosal Inflammation | 23 (38%) | 6 (10%) | ||
Dizziness | 23 (38%) | 0 (0%) | ||
Edema Peripheral | 20 (33%) | 0 (0%) | ||
Stomatitis | 17 (28%) | 3 (5%) | ||
Abdominal Pain | 17 (28%) | 0 (0%) | ||
Dysgeusia | 17 (28%) | 0 (0%) | ||
Dyspepsia | 16 (26%) | 0 (0%) | ||
14
Serious Adverse Reactions
Twelve (20%) patients experienced a treatment emergent serious adverse reaction while on study. The most common serious adverse reactions (>1 patient, 1.6%) were pyrexia, hematochezia, febrile neutropenia, and renal failure. Treatment-related serious adverse reactions reported in >1 patient were pyrexia (n=2, 3%), febrile neutropenia (n=2, 3%), and hematochezia (n=2, 3%).
Rather than restate all of the above voluminous and technical information in our future filings which may be confusing to some readers, we propose adding the following language at the end of each product paragraph within the “Product Portfolio” section of Item 1 of our future reports on Form 10-K:
For full prescribing information including a list of serious adverse events and clinical trial results please visit the website* at:http://fusilev.com/downloads/m1-14-1-3-1125-000503-clean.pdf
For full prescribing information including a list of serious adverse events and clinical trial results please visit the website* at: http://folotyn.com/downloads/2016_05_folotyn_FPI.pdf
For full prescribing information including a list of serious adverse events and clinical trial results please visit the website* at: http://www.zevalin.com/downloads/Zevalin_Package_Insert.pdf
For full prescribing information including a list of serious adverse events and clinical trial results please visit the website* at:http://www.marqibo.com/pi/
For full prescribing information including a list of serious adverse events and clinical trial results please visit the website* at:http://beleodaq.com/downloads/Final_Beleodaq_PI.pdf
For full prescribing information including a list of serious adverse events and clinical trial results please visit the website* at:http://www.evomela.com/img/EVOMELA_Prescribing_Information.pdf#viewer.action=download
| * | The contents of this website are not incorporated by reference into this Annual Report on Form 10-K and should not be considered to be a part hereof. |
15
3. With respect to your products that received FDA approval based on the FDA’s accelerated approval program, please describe the results that were used to support approval and confirm that you will provide this disclosure in future filings. For example, if you performed clinical trials please indicate what type of clinical trial you performed and describe the results including the primary endpoints.
Response 3
In response to the Staff’s comment, we believe that the best way to deliver the Staff’s requested information to our readers would be to direct them to each product website (specifically for FOLOTYN, BELEODAQ, and MARQIBO, the products for which we have received accelerated approval). We plan to include the website references at the end of each product paragraph within the “Product Portfolio” section ofItem 1 of our future reports on Form 10-K as indicated in our Response 2.
4. With respect to recently approved products, please describe your clinical trials and results supporting FDA approval, including primary endpoints. Similarly, with respect to product candidates, describe the clinical trials including the primary endpoints and the results of any completed trials. Additionally, confirm that you will provide this disclosure in future filings.
Response 4
In response to the Staff’s comment, we have provided a summary of the clinical trials that were the basis for the approved indications of each of our approved drugs. This information was taken from the FDA approved package insert of each product.
FUSILEV
High-Dose Methotrexate Therapy
The safety and efficacy of FUSILEV rescue following high-dose methotrexate were evaluated in 16 patients age 6-21 who received 58 courses of therapy for osteogenic sarcoma. High-dose methotrexate was one component of several different combination chemotherapy regimens evaluated across several trials. Methotrexate 12 g/m2 IV over 4 hours was administered to 13 patients, who received FUSILEV 7.5 mg every 6 hours for 60 hours or longer beginning 24 hours after completion of methotrexate. Three patients received methotrexate 12.5 g/m2 IV over 6 hours, followed by FUSILEV 7.5 mg every 3 hours for 18 doses beginning 12 hours after completion of methotrexate. The mean number of FUSILEV doses per course was 18.2 and the mean total dose per course was 350 mg. The efficacy of FUSILEV rescue following high-dose methotrexate was based on the adverse reaction profile.[See Adverse Reactions (6)]
Combination with 5-FU in Colorectal Cancer
In a randomized clinical study conducted by the Mayo Clinic and the North Central Cancer Treatment Group (Mayo/NCCTG) in patients with advanced metastatic colorectal cancer, three treatment regimens were compared:d,l-leucovorin (LV) 200 mg/m2 and 5-fluorouracil (5-FU) 370 mg/m2 versus LV 20 mg/m2 and 5-FU 425 mg/m2 versus 5-FU 500 mg/m2. All drugs were administered by slow intravenous infusion daily for 5 days repeated every 28 to 35 days. Response rates were 26% (p=0.04 versus 5-FU alone), 43% (p=0.001 versus 5-FU alone) and 10% for the high dose leucovorin, low dose leucovorin and 5-FU alone groups, respectively. Respective median survival times were 12.2 months (p=0.037), 12 months (p=0.050), and 7.7 months. The low dose LV regimen gave a statistically significant improvement in weight gain of more than 5%, relief of symptoms, and improvement in performance status. The high dose LV regimen gave a statistically significant improvement in performance status and trended toward improvement in weight gain and in relief of symptoms but these were not statistically significant.
16
In a second Mayo/NCCTG randomized clinical study the 5-FU alone arm was replaced by a regimen of sequentially administered methotrexate (MTX), 5-FU, and LV. Response rates with LV 200 mg/m2 and 5-FU 370 mg/m2 versus LV 20 mg/m2 and 5-FU 425 mg/m2 versus sequential MTX and 5-FU and LV were respectively 31% (p£0.01), 42% (p£0.01), and 14%. Respective median survival times were 12.7 months (p£0.04), 12.7 months (p£0.01), and 8.4 months. No statistically significant difference in weight gain of more than 5% or in improvement in performance status was seen between the treatment arms.
A randomized controlled trial conducted by the NCCTG in patients with advanced metastatic colorectal cancer failed to show superiority of a regimen of 5-FU + levoleucovorin to 5-FU +d,l-leucovorin in overall survival. Patients were randomized to 5-FU 370 mg/m2 intravenously and levoleucovorin 100 mg/m2 intravenously, both daily for 5 days, or with 5-FU 370 mg/m2 intravenously andd,l-leucovorin 200 mg/m2 intravenously, both daily for 5 days. Treatment was repeated week 4 and week 8, and then every 5 weeks until disease progression or unacceptable toxicity. FUSILEV is dosed at one-half the usual dose of racemicd,l-leucovorin.
FOLOTYN
Peripheral T-cell Lymphoma (PTCL)
The safety and efficacy of FOLOTYN was evaluated in an open-label, single-arm, multi-center, international trial that enrolled 115 patients with relapsed or refractory PTCL. One hundred and eleven patients were treated with FOLOTYN at 30 mg/m2 once weekly by IV push over 3-5 minutes for 6 weeks in 7-week cycles until disease progression or unacceptable toxicity. Of the 111 patients treated, 109 patients were evaluable for efficacy. Evaluable patients had histologically confirmed PTCL by independent central review using the Revised European American Lymphoma (REAL) World Health Organization (WHO) disease classification, and relapsed or refractory disease after at least one prior treatment.
The primary efficacy endpoint was overall response rate (complete response, complete response unconfirmed, and partial response) as assessed by International Workshop Criteria (IWC). The key secondary efficacy endpoint was duration of response. Response assessments were scheduled at the end of cycle 1 and then every other cycle (every 14 weeks). Duration of response was measured from the first day of documented response to disease progression or death. Response and disease progression were evaluated by independent central review using the IWC.
17
The median age of treated patients was 59.0 years (range 21-85); 68% were male and 32% were female. Most patients were White (72%) and other racial origins included: Black (13%), Hispanic (8%), Asian (5%), other and unknown (<1% each). Patients had an Eastern Cooperative Oncology Group (ECOG) performance status at study entry of 0 (39%), 1 (44%), or 2 (17%). The median time from initial diagnosis to study entry was 15.6 months (range 0.8 – 322.3).
18
The median number of prior systemic therapies was 3 (range 1-12). Approximately one-fourth of patients (24%, n = 27) did not have evidence of response to any previous therapy. Approximately two-thirds of patients (63%, n = 70) did not have evidence of response to their most recent prior therapy before entering the study.
In all evaluable patients (n = 109) treated with FOLOTYN, the response rate, as determined by independent central review by IWC, was 27% (n = 29) (Table 5).
Table 5 Response Analysis per Independent Central Review (IWC)
| Evaluable Patients (N=109) | ||||||||
| N (%) | 95% CI | Median Duration of Response | Range of Duration of Response | |||||
Overall Response | ||||||||
CR+CRu+PR | 29 (27) | 19, 36 | 287 days (9.4 months) | 1-503 days | ||||
CR/CRu | 9 (8) | |||||||
PR | 20 (18) | |||||||
Responses³ 14 weeks | ||||||||
CR+CRu+PR | 13 (12) | 7, 20 | Not Reached | 98-503 days | ||||
CR/CRu | 7 (6) | |||||||
PR | 6 (6) | |||||||
ZEVALIN
Relapsed or Refractory, Low-grade or Follicular Lymphoma
Study 1 was a single arm study of 54 patients with relapsed follicular lymphoma, who were refractory to rituximab treatment. Patients had a World Health Organization (WHO) Performance Status (PS) 0-2, <25% bone marrow involvement by NHL, no prior bone marrow transplantation, and acceptable hematologic, renal, and hepatic function. Refractoriness to rituximab was defined as failure to achieve a complete or partial response or time-to-disease-progression (TTP) of < 6 months. The main efficacy outcome measure of the study was the overall response rate (ORR) using the International Workshop Response Criteria (IWRC). Other efficacy outcome measures included time-to-diseaseprogression (TTP) and duration of response (DR). Table 7 summarizes efficacy data from Study 1.
Study 2 was a randomized (1:1), open-label, multicenter study comparing the ZEVALIN therapeutic regimen with rituximab. The trial was conducted in 130 patients with relapsed or refractory low-grade or follicular non-Hodgkin’s lymphoma (NHL); no patient had received prior rituximab. Patients had histologically confirmed NHL requiring therapy, a WHO PS 0-2, <25% bone marrow involvement by NHL, no prior bone marrow transplantation, and acceptable hematologic function. Sixty-four patients received the ZEVALIN therapeutic regimen, and 66 patients received rituximab given as an IV infusion at 375 mg per m2 weekly times 4 doses. The main efficacy outcome measure of the study was ORR using the IWRC. The ORR was significantly higher for patients receiving the ZEVALIN therapeutic regimen (83% vs. 55%, p<0.001). Time-to-disease-progression was not significantly different between study arms. Table 7 summarizes efficacy data from Study 2.
19
Table 7.
Summary of Efficacy Dataa
| Study 1 | Study 2 | |||||
| Zevalin therapeutic regimen N = 54 | Zevalin therapeutic regimen N = 64 | Rituximab N = 66 | ||||
Overall Response Rate (%) | 74 | 83 | 55 | |||
Complete Response Rateb (%) | 15 | 38 | 18 | |||
Median DRc,d (Months) | 6.4 [0.5-49.9+] | 14.3 [1.8-47.6+] | 11.5 [1.2-49.7+] | |||
Median TTPc,f(Months) | 6.8 [1.1-50.9+] | 12.1 [2.1-49.0+] | 10.1 [0.7-51.3+] | |||
| a) | IWRC: International Workshop Response Criteria |
| b) | CRu and CR: Unconfirmed and confirm complete response |
| c) | Estimated with observed range |
| d) | Duration of response: interval from the onset of response to disease progression |
| e) | “+” indicates an ongoing response |
| f) | Time to Disease Progression: interval from the first infusion to disease progression |
Study 3 was a single arm study of 30 patients of whom 27 had relapsed or refractory low-grade, follicular NHL and a platelet count 100,000 to 149,000/mm3. Patients with³ 25% lymphomatous marrow involvement, prior myeloablative therapy with stem cell support, prior external beam radiation to > 25% of active marrow or neutrophil count <1,500/mm3 were ineligible for Study 3. All patients received Y-90 Zevalin [0.3 mCi per kg (11.1 MBq per kg)]. Objective, durable clinical responses were observed [89% ORR (95% CI: 70-97%) with a median duration of response of 11.6 months (range: 1.0-42.4+ months)]. Reference ID: 3366104
Follicular, B-Cell NHL Upon Completion of First-Line Chemotherapy
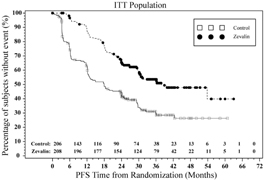
Study 4 was a multi-center, randomized, open-label study conducted in patients with follicular NHL with a partial (PR) or complete response (CR/CRu) upon completion of first-line chemotherapy. Randomization was stratified by center and response to first-line therapy (CR or PR). Key eligibility criteria were <25% bone marrow involvement, no prior external beam radiation or myeloablative therapy, and recovery of platelets to normal levels. Patients were randomized to receive ZEVALIN (n=208) or no further therapy (n=206). Y-90 ZEVALIN was administered at least 6 weeks but no more than 12 weeks following the last dose of chemotherapy. The main efficacy outcome measure was progression-free survival (PFS) assessed by study investigators using the International Workshop to Standardize Response Criteria for non-Hodgkin’s Lymphoma (1999).
20
Among the 414 patients, 49% were male, 99% were Caucasian, 12% were³65 years old, 83% had a WHO performance status of 0, and 65% had Stage IV disease. Thirty-nine (9.5%) patients received single agent chlorambucil, 22 (5%) patients received fludarabine or a fludarabine-containing regimen, 294 (71%) patients received cyclophosphamide containing combination chemotherapy [CHOP (31%); CHOP-like (15%); CVP/COP (26%)] and 59 (14%) patients received rituximab-containing combination chemotherapy as first-line treatment.
Progression-free survival was significantly prolonged among ZEVALIN-treated patients compared to those receiving no further treatment [median PFS 38 months vs. 18 months; HR 0.46 (95% CI: 0.35, 0.60) p<0.0001 Cox model stratified by response to first-line therapy and initial treatment strategy (immediate vs. watch-and-wait)]. The number of patients who died was too small to permit a reliable comparison on survival.
The results for PFS are presented in Figure 1.
Figure 1. Study 4: Kaplan-Meier Estimator for Investigator-Assessed Progression Free Survival Time
MARQIBO
Acute Lymphoblastic Leukemia
MARQIBO was studied in an international, open-label, multi-center, single-arm trial (Study 1). Eligible patients were 18 years of age or older with Philadelphia chromosome negative ALL in second or greater relapse or whose disease progressed after two or greater treatment lines of anti-leukemia therapy. Patients had to have achieved a complete remission (CR) to at least one prior anti-leukemia chemotherapy, defined by a leukemia-free interval of equal or more than 90 days. Patients were not eligible for immediate hematopoietic stem cell transplantation (HSCT) at the time of screening and enrollment.
Patients received intravenous MARQIBO monotherapy at 2.25 mg/m2 over 60 minutes every 7 days. Concomitant corticosteroids were not permitted beyond Day 5.
21
The treated population included 65 patients who received at least 1 dose of MARQIBO. All of the treated patients had received prior vincristine sulfate and 80% had evidence of residual neuropathy at study baseline. Among treated patients, 51% were male, 86% were white, 45% were under 30 years of age, 11% were age 65 or older, 48% had undergone prior HSCT, 51% had received 3 or more prior therapies, and 45% were refractory to their immediate prior therapy. Disease characteristics were 85% precursor B-cell ALL and 15% precursor T-cell ALL. In addition, 22 of 65 (34%) treated patients did not receive asparaginase products prior to enrollment. Efficacy results are shown in Table 4.
Table 4. Study 1 Results
Study 1
(N=65)
n (%)
Complete remission (CR) | 3 (4.6) | |
CR with incomplete blood count recovery (CRi) | 7 (10.8) | |
CR + CRi (95% CIa) | 10 (15.4) (7.6 – 26.5) | |
MEDIAN DURATION of CR or CRi: | Days (95% CI) | |
Based on the first date of CR or CRi to the date of the last available histologic assessment of the same response (n=8) | 28 (7, 36) | |
Based on the first date of CR or CRi to date of documented relapse, death, or subsequent chemotherapies including hematopoietic stem cell transplant (HSCT) (n=10) | 56 (9, 65) | |
a CI = Confidence interval (Clopper-Pearson). | ||
BELEODAQ
Relapsed or Refractory Peripheral T-cell Lymphoma (PTCL)
In an open-label, single-arm, non-randomized international trial conducted at 62 centers, 129 patients with relapsed or refractory PTCL were treated with BELEODAQ 1,000 mg/m2 administered over 30 minutes via IV infusion once daily on Days 1-5 of a 21-day cycle. There were 120 patients who had histologically confirmed PTCL by central review evaluable for efficacy. Patients were treated with repeat cycles every three weeks until disease progression or unacceptable toxicity.
The primary efficacy endpoint was response rate (complete response and partial response) as assessed by an independent review committee (IRC) using the International Workshop Criteria (IWC) (Cheson 2007). The key secondary efficacy endpoint was duration of response. Response assessments were evaluated every 6 weeks for the first 12 months and then every 12 weeks until 2 years from the start of study treatment. Duration of response was measured from the first day of documented response to disease progression or death. Response and progression of disease were evaluated by the IRC using the IWC.
22
Table 3 summarizes the baseline demographic and disease characteristics of the study population, who were evaluable for efficacy.
Table 3: Baseline Patient Characteristics (PTCL Population)
Characteristics | Evaluable Patients (N=120) | |||
Age (years) | ||||
Median (range) | 64.0 (29-81) | |||
Sex, % Male Female |
| 52 48 |
| |
Race, % White Black Asian Latin Other |
| 88 6 3 3 2 |
| |
PTCL Subtype Based on Central Diagnosis, % PTCL Unspecified (NOS) Angioimmunoblastic T-cell lymphoma (AITL) ALK-1 negative anaplastic large cell lymphoma (ALCL) Other |
| 64 18 11 7 |
| |
Baseline Platelet Count, % ³100,000/mL <100,000/mL |
| 83 17 |
| |
ECOG Performance Status, % 0 1 2 3 |
| 34 43 22 1 |
| |
Median time (months) from Initial PTCL Diagnosis (Range) | 12.0 (2.6 – 266.4) | |||
Median Number of Prior Systemic Therapies (Range) | 2.0 (1-8) | |||
In all evaluable patients (N = 120) treated with BELEODAQ, the overall response rate per central review using IWC was 25.8% (n = 31) (Table 4) with rates of 23.4% for PTCL, NOS and 45.5% for AITL, the two largest subtypes enrolled.
Table 4: Response Analysis per Central Assessment Using IWC in Patients with Relapsed or Refractory PTCL
| Evaluable Patients (N=120) | ||||||||
Response Rate | n (%) | (95% CI) | ||||||
CR+PR | 31 (25.8) | 18.3-34.6 | ||||||
CR | 13 (10.8) | 5.9-17.8 | ||||||
PR | 18 (15.0) | 9.1 – 22.7 | ||||||
CI=confidence interval, CR=complete response, PR=partial response
The median duration of response based on the first date of response to disease progression or death was 8.4 months (95% CI: 4.5 – 29.4). Of the responders, the median time to response was 5.6 weeks (range 4.3 - 50.4 weeks). Nine patients (7.5%) were able to proceed to a stem cell transplant after treatment with BELEODAQ.
23
EVOMELA
Myeloablative Conditioning in Patients with Multiple Myeloma Undergoing ASCT
An open-label, single-arm, non-randomized trial of EVOMELA was conducted at 5 US centers. The 61 patients enrolled had symptomatic multiple myeloma, and had at least 2 × 10⁶ CD34+ cells/kg cryopreserved stem cells available. The median age was 62 years (range 32 to 73); 57% male, 80% white, 18% black, 2% Asian. EVOMELA was administered at 100 mg/m2/day over 30 minutes by IV infusion for two consecutive days (Day -3 and Day -2) prior to ASCT (Day 0).
The objective of the trial was to determine the overall safety and toxicity profile of 200 mg/m2 of EVOMELA in patients with multiple myeloma undergoing ASCT.[See Adverse Reactions (6.1)]The efficacy was evaluated by the International Myeloma Working Group response criteria comparing the disease response immediately prior to the ASCT procedure to the disease response assessed 90 to 100 days post-transplant. In addition, successful myeloablation, and time to engraftment were evaluated.
The overall response rate (partial response or better) improved from 79% (48 of 61) prior to the ASCT procedure to 95% (58 of 61) at 90 to 100 days post-transplant. There was also an increase in the number of patients with a stringent complete response from 0 patients prior to the ASCT procedure to 16% (10 of 61) at 90 to 100 days post-transplant.
Myeloablation and engraftment were evaluated by complete blood cell count tests daily until neutrophil and platelet engraftment, and then weekly until Day 30, and at Day 60 and Day 90-100. Myeloablation was defined as any of the following: absolute neutrophil count (ANC) < 500/mm3, absolute lymphocyte count < 100/mm3, or platelet count < 20,000/mm3. Neutrophil engraftment was defined as ANC > 500/mm3 ×3 consecutive daily assessments. Platelet engraftment was defined as untransfused platelet counts > 20,000/mm3 ×3 consecutive daily assessments. Nonengraftment was defined as failure to reach an ANC > 500/mm3 ×3 consecutive daily assessments by Day 90-100.
Myeloablation, neutrophil engraftment and platelet engraftment were achieved by all 61 patients. Myeloablation occurred on ASCT Day 5 (range ASCT days -1 to 6) with the median time to myeloablation from dosing of 8 days. The median time to neutrophil engraftment was 12 days (range ASCT days 10 to 16). The median time to platelet engraftment was 13 days (range ASCT days 10 to 28).
Palliative Treatment of Patients with Multiple Myeloma
A randomized trial compared prednisone plus IV melphalan to prednisone plus oral melphalan in the treatment of multiple myeloma. As discussed below, Overall Response Rates at Week 22 were comparable; however, because of changes in trial design, conclusions as to the relative activity of the 2 formulations after Week 22 are impossible to make.
Both arms received oral prednisone starting at 0.8 mg/kg/day with doses tapered over 6 weeks. Melphalan doses in each arm were:
Arm 1:Oral melphalan 0.15 mg/kg/day x 7 followed by 0.05 mg/kg/day when WBC began to rise.
Arm 2:IV melphalan 16 mg/m2 q 2 weeks x 4 (over 6 weeks) followed by the same dose every 4 weeks.
One hundred seven patients were randomized to the oral melphalan arm and 203 patients to the IV melphalan arm. More patients had a poor-risk classification (58% versus 44%) and high tumor load (51% versus 34%) on the oral arm compared to the IV arm (P<0.04). Response rates at Week 22 are shown in the following table:
24
Table 2: Response Rates at Week 22 for Patients with Multiple Myeloma Who Received Oral or IV Melphalan with Prednisone
Initial Arm | Evaluable Patients | Responders n (%) | P | |||
Oral melphalan | 100 | 44 (44%) | P>0.2 | |||
IV melphalan | 195 | 74 (38%) |
Because of changes in protocol design after Week 22, other efficacy parameters 408 such as Response Duration and Survival could not be compared.
In response to the Staff’s comment, rather than restate all the above voluminous technical information in our future filings, as indicated in our Response 2 above, we believe that the best way to deliver the Staff’s requested information to readers would be to direct them to each product website. We propose to include the website reference at the end of each product paragraph within the “Product Portfolio” section of our future reports on Form 10-K as indicated in our Response 2.
Research and Development, page 9
5. The table indicating the stage of development is confusing because of the accelerated approval of BELEODAQ and FOLOTYN by the FDA and the table’s implication that FOLOTYN and BELEODAQ are the products that currently require the most amount of work prior to commercialization, please consider a textual discussion explaining this table or an alternate presentation clarifying that status of your products that received accelerated approval and the additional development work required.
Response 5
In response to the Staff’s comment, we propose to add the following asterisked disclosure to the below table that summarizes our research and development activity status within the “Research and Development” section ofItem 1 of our future Form 10-Ks.
25
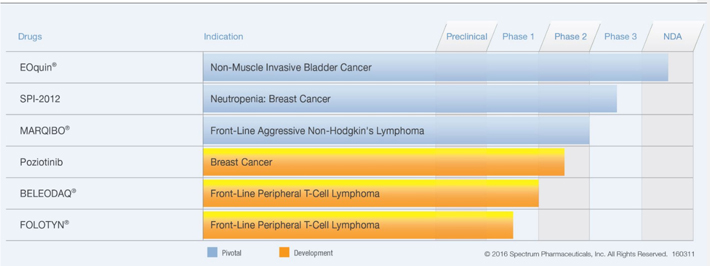
| ** | Both BELEODAQ and FOLOTYN gained accelerated approval for the treatment of relapsed/refractory PTCL. Each such drug is also under clinical investigation for the potential treatment of front-line PTCL, as indicated in the table above. |
Notes to Consolidated Financial Statements
Note 2: Summary of Significant Accounting Policies and Use of Estimates
(i)Revenue Recognition, page F-10
6. Please address each of the following issues by referencing the authoritative literature you rely upon to support your policy and provide us proposed revised policy disclosure, where appropriate, to be included in future periodic reports:
| • | Revise the second criterion under your product sales policy to indicate that the price is substantially fixed or determinable as stipulated in ASC 605-15-25-1a. In this regard the price does not need to be both fixed and determinable. |
| • | Tell us when and how you recognize licensing revenue “based on the contractual terms of each agreement and [y]our application of pertinent GAAP.” Given your disclosure of the existence of upfront fees, milestone payments and royalties tell us your consideration of the multiple-element arrangements guidance in ASC 605-25 and the milestone method guidance in ASC 605-28. |
| • | Tell us when and how you recognize service revenue “when the corresponding milestone is achieved” as compared to when “the revenue is otherwise earned and due [you] through [y]our on-going activities.” |
Response 6
In response to the Staff’s comments:
| • | In our future 10-Q and 10-K filings, we will revise the second criterion under our product sales policy to indicate that the price is substantially fixedor determinable in accordance with605-15-25-1a. |
| • | We recognize revenue for our licensing of intellectual property to third parties (i.e., out-licenses), based on the contractual terms of each agreement that establish the legal rights and obligations between us and our licensees. For our new agreements, in accordance withASC 605-25-25-1,we first assess (i) the units of accounting, which occurs when we determine the |
26
elements in our multiple element arrangement have standalone value (determined in accordance withASC 605-25-25-5), and (ii) the measurement and allocation of arrangement consideration, that is, how the arrangement consideration should be measured and allocated among the separate units of accounting. Our criteria for dividing an arrangement into separate units of accounting is applied consistently to arrangements with similar characteristics and in similar circumstances, in accordance withASC 605-25-25-4 and605-25-25-5. |
Given the terms of our typical agreements, this usually results in revenue recognition in the same period that our licensee has sales for which we are entitled to a resulting royalty payment. However, in certain instances, we may receive an upfront payment from our licensee in consideration for the exclusive marketing rights of our out-licensed drug product within a specific territory(s). These proceeds may be recognized by us as revenue in the period of contract execution, or deferred and recognized over the actual or implied contractual term. The timing of this revenue recognition is dependent upon (1) the results of our accounting analysis (applying the multiple-element arrangement diagram withinASC 605-25-55-1), and (2) our analysis of any on-going contractual service obligations to the licensee (including any requirements for us to provide on-going support services, and/or for us to supply drug products for the licensee’s future sales).
Our out-license arrangements also may provide that we receive payment from our licensees upon their achievement of regulatory approval and/or achievement of sales thresholds (in addition to upfront fees and royalties). Although sales-based milestones do not fall within the scope ofASC 605-28(as regulatory milestones do), our consistent accounting policy election has been to apply the milestone method of revenue recognition for both regulatory and sales-based milestones. UnderASC 605-28-25-3,“…If the consideration from an individual milestone is not considered to relate solely to past performance, the vendor is not precluded from using the milestone methodfor other milestones[i.e., sales-based milestones]in the arrangement.” Since all contingencies associated with both our substantive regulatory and sales-based milestones are resolved upon achievement (i.e., relate solely to past performance), and no remaining performance obligations exist in relation to their payment, the associated revenue is properly recognized in the period of milestone achievement.
We analyze and document the appropriate accounting under GAAP (as discussed above) for each of our agreements upon execution.
The disclosure requirements for arrangements that contain milestone consideration is included inASC 605-28-50, and requires each of the following:
| 1. | A description of each milestone and related contingent consideration. |
| 2. | A determination of whether each milestone is considered substantive. |
| 3. | The factors that the entity considered in determining whether the milestone or milestones are substantive. |
| 4. | The amount of consideration recognized during the period for the milestone or milestones. |
We included this information, as applicable, for our out-licenses and other arrangements that could result in future revenue recognition withinNote 17: Commitments and Contingencies, section (b)Licensing Agreements, Co-Development Agreements, and Milestone Payments to our 2015 Form 10-K.
27
We propose to reviseNote 2: Summary of Significant Accounting Policies and Use of Estimates for Revenue Recognition (License Fees section) in our future reports on Forms 10-Q and K as follows:
License Fees
Our out-license arrangements may include one or more of the following: (a) upfront license fees, (b) royalties from our licensees’ sales, and (c) milestone payments from our licensees’ sales or regulatory achievements. We recognize such revenue based on the contractual terms that establish the legal rights and obligations between us and our licensees. This requires us to first assess (i) the units of accounting (i.e., whether the arrangement should be divided into separate units of accounting) and (ii) the measurement and allocation of arrangement consideration (i.e., how the arrangement consideration should be measured and allocated among the separate units of accounting).
| (a) | For upfront license fees, we consider whether the revenue is earned and realizable at the time of contract execution. We give specific consideration to whether we have any on-going contractual service obligations to the licensee, including any requirements for us provide on-going support services, and/or for us to supply drug products for the licensee’s future sales. As a result, we may either recognize all upfront license fees as revenue in the period of contract execution, or recognize these fees over the actual (or implied) contractual term of the out-license. |
| (b) | For royalties, we recognize revenue in the period that our licensee has sales for which we are contractually entitled to a percentage-based royalty payment. |
| (c) | For our licensees’ sales or regulatory milestone achievements that result in payments due to us, revenue recognition occurs in the period that the substantive milestone is achieved by the licensee, since (1) all contingencies associated with each milestone is resolved upon its achievement, and (2) no remaining milestone performance obligations exist in relation for our receipt of payment. |
| • | In limited circumstances, we receive fees under certain arrangements for sales and marketing services, research and development activities, clinical trial management, and supply chain services. Payment may be triggered by an established fixed-fee schedule, the successful completion of a phase of development, favorable results from a clinical trial, regulatory approval events, or the completion of product delivery in our capacity as a procurement agent. |
We consider all deliverables in an arrangement to determine whether they represent separate units of accounting (as performed at the inception of the arrangement, and as each item in the arrangement is delivered). Our criteria for dividing an arrangement into separate units of accounting is applied consistently to arrangements with similar characteristics and in similar circumstances, in accordance withASC 605-25-25-4 and605-25-25-5.
This requires us to first assess (i) the units of accounting, which occurs when we determine the elements in our multiple element arrangement have standalone value (determined in accordance withASC 605-25-25-5), and (ii) the measurement and allocation of arrangement consideration, that is, how the arrangement consideration should be measured and allocated among the separate units of accounting.
Our successful completion of a phase of development, favorable results from a clinical trial, and regulatory approval events represent discreet milestone events that trigger payments due to us. One or all of these may be included within a single arrangement with our customer. In accordance withASC 605-28-25-2, we also assess whether these milestones are “substantive” at the inception of the arrangement. Our revenue recognition from the achievement of a milestone must meet all of the following for the milestone to be considered substantive: (i) our performance to achieve the milestone or the enhancement of the value of the delivered item(s) as a result of a specific outcome resulting from our performance to achieve the milestone; (ii) it relates solely to our past performance; and (iii) it is reasonable relative to all of the deliverables and payment terms (including other potential milestone consideration) within the arrangement. As a result, we recognize revenue when the corresponding substantive milestone is achieved in accordance with the “milestone-method of revenue recognition” underASC 605-28-25-1 and ASC 605-28-25-2.
28
In the case of service arrangements that do not include research and development deliverables (specifically for our sales and marketing services and product procurement services), we consider whether the revenue is otherwise earned and realizable through our completed activities, the contractual terms of the arrangement, and the application ofASC 605to our facts. We also consider gross vs. net presentation of this service revenue in accordance with the guidance ofASC 605-45-45.
We propose to reviseNote 2: Summary of Significant Accounting Policies and Use of Estimates for Revenue Recognition (Service Revenue section) in our future periodic reports as follows:
Service Revenue
We receive fees under certain arrangements for (a) sales and marketing services, (b) supply chain services (c) research and development services, and (d) clinical trial management services. Payment for these services may be triggered by (i) an established fixed-fee schedule, (ii) the completion of product delivery in our capacity as a procurement agent, (iii) the successful completion of a phase of development, (iv) favorable results from a clinical trial, and/or (v) regulatory approval events.
For our service arrangements that do not include milestones, we consider whether the revenue is earned and realizable based on our completed services or deliverables during the period, and the contractual terms of the arrangement that include fee schedules.
For any/all milestone achievements that contractually result in fixed payments due to us, we apply the “milestone method” of revenue recognition. Accordingly, this revenue recognition occurs as each substantive milestone is achieved by us, since (1) all contingencies associated with each milestone is resolved upon its achievement, (2) the milestone achievement relates solely to our past performance, and (3) no remaining milestone performance obligations exist in relation to our receipt of payment.
Note 10: Business Combinations and Contingent Consideration
(b) Acquisition of Rights to EVOMELA and Related Contingent Consideration, page F-28
7. It appears based on the table of your contingent consideration liability on page F-29 and the corresponding table from page 23 of your June 30, 2016 Form 10-Q that your liability only includes the $6 million milestone due Ligand Pharmaceuticals, Inc. upon regulatory approval occurring in March 2016. Please tell us why your contingent consideration liability is zero at June 30, 2016 when you appear to owe Ligand up to an additional $60 million in regulatory and sales-based milestones and also owe them royalties of 20% of future net sales. Reference for us the authoritative literature you rely upon to support your accounting.
Response 7
In response to the Staff’s comment, the Company advises the Staff that in March 2013, it completed the acquisition of exclusive global development and commercialization rights to EVOMELA (formerly referred to as “Captisol-Enabled MELPHALAN”) from CyDex Pharmaceuticals, Inc. (“CyDex”) a wholly-owned subsidiary of Ligand Pharmaceuticals Incorporated (“Ligand”). Ligand acquired CyDex in January 2011 and operated it as a wholly-owned subsidiary. CyDex was the licensor of the development and commercialization rights to EVOMELA that we acquired.
We paid an initial license fee of $3.0 million as consideration for the rights granted to us by CyDex. We also agreed to make future payments to CyDex upon our achievement of regulatory and annual net sales milestones, as well as royalty on our net sales of the licensed product during the royalty obligation term.
29
Based on the fair value analysis we performed at the time of the acquisition (discussed below), we recorded an asset for the license acquired, which we valued at $7.7 million, and contingent consideration initially valued at $4.7 million.
We accounted for this transaction as a business combination in accordance withASC 805-20-25-1 through25-3, which required that assets acquired and liabilities assumed be recognized on the balance sheet at their fair values as of the transaction date. The fair value of the license acquired was valued using the “Greenfield Method” of the “Income Approach” on the basis that the expected useful life of the assets included in the composite was tied to the use of the technology, and that the assets included in the composite cannot be monetized separately from one another. The contingent consideration was valued using the “Discounted Cash Flow Method of the Income Approach,” based on the terms of the license, with particular consideration to the regulatory and annual sales-based milestones.
We considered the 20% royalty payment on any future sales of EVOMELA at the time of the business combination (which had yet to receive FDA approval), and determined that this potential obligation should be presented on a net basis with the underlying intangible asset (i.e., our EVOMELA distribution rights). We believe that this view is consistent with the fact that this license could not be sold or sub-licensed to another party without the related “at-market” royalty obligations. Specifically, we evaluated the unit of account based on what we acquired from CyDex and its relationship with Ligand. We determined no separation was required since the royalty obligation was considered an element of the acquired contract-based intangible, rather than a separate unit of account. In making this determination, we followed, by analogy, the examples provided in Sections2.14and 2.15 of theAICPA Accounting and Valuation Guide for Assets Acquired to Be Used in Research and Development Activities. Accordingly, we included our expected royalty payments to Ligand (which were calculated based on expected annual sales that any market participant would consider) within our cash flow forecasts to estimate the license value.
Prior to the FDA approval, this license asset properly remained unamortized on our balance sheet (as IPR&D), and we adjusted the fair value of the contingent consideration liability through “other income/expense” each quarter. As of December 31, 2015, the contingent consideration was re-valued at $5.2 million, representing the probability-adjusted, discounted value of the $6.0 million regulatory milestone payment that would be owed, should EVOMELA be approved by the FDA. On March 10, 2016, the FDA approved EVOMELA and we re-valued the contingent consideration to the full $6.0 million payment due to Ligand. In April 2016, we made this payment and the associated contingent consideration was then removed from our balance sheet in accordance withASC 805.
The $7.7 million value of the EVOMELA in-license has been reclassified to a definite-lived intangible from IPR&D upon its FDA approval, and is being amortized over the period of anticipated cash flows through operating costs and expenses within the “amortization and impairment of intangible assets” line on our Consolidated Statement of Operations. Future royalty expenses for EVOMELA will be included within our “cost of product sales” line on our Consolidated Statement of Operations.
We remain obligated to pay Ligand additional amounts up to an aggregate $60 million, upon the achievement of EVOMELA net sales thresholds. Based on our estimated EVOMELA market size at the time of the business combination (and re-valuation at each quarter-end period thereafter), the first revenue milestone for achievement of $100 million in annual sales implied a market share of nearly 100%. Based on the anticipated competitive response, and historical physician drug adoption behavior, we determined at the time of this transaction (and at each quarter-end period thereafter) that none of these sales milestones will be achieved during the term of the license, and as a result, no sales-based milestone payments will be made. Accordingly, no value was ascribed to the sales-related milestones at the time of the business combination and at each quarter-end thereafter, due to its near-zero value.
30
Form 10-Q for the Quarterly Period Ended June 30, 2016
Notes to Condensed Consolidated Financial Statements
Note 4: Gross-to-Net Product Sales, page 17
8. It is apparent that your commercial rebate and government chargebacks revenue reduction increased from 27.6% of gross product sales for the six months ended June 30, 2015 to 36.0% for the comparable period in 2016. Also, it is apparent that your data and distribution fees revenue reduction decreased from 8.0% of gross product sales in the 2015 period to 5.2% in the 2016 period. Finally, it appears from comparable disclosure in your 2015 Form 10-K that the referenced amounts in 2016 are not reasonably consistent with comparable rates for the last three fiscal years. Please tell us where you have disclosed the underlying causes for these changes in rates consistent with your July 23, 2013 response to comment 3 of our June 24, 2013 letter. Otherwise, in your response tell us why these rates changed and explain your consideration for disclosing the reasons in your filing.
Response 8
In response to the Staff’s comment, the driver of the percentage changes in our commercial rebate and data and distribution fees were the unique market dynamics created in April 2015 with a generic entrant that competes with our FUSILEV product. This led to our deferred revenue for FUSILEV in these 2015 and 2016 periods (due to our inability to estimate future increased commercial rebate values that we expected to issue, with requisite precision, as result of this generic competition). We recognized contractual data and distribution fees that are associated with unit shipments of FUSILEV to wholesalers during these periods, despite our revenue recognition in subsequent periods. The nature of this FUSILEV deferred revenue, and our subsequent recognition of it, is discussed inNote 3(i) to our 2015 Form 10-K,Note 3(i) to our June 30, 2015 Form 10-Q, andNote 3(i) to our June 30, 2016 Form 10-Q.
Our revenue reduction increased from 27.6% of gross product sales for the six months ended June 30, 2015 to 36.0% for the comparable period in 2016, primarily as a result of these commercial rebate and government chargebacks that correspond with our FUSILEV product. Commencing with our March 31, 2015 Form 10-Q, we reported the competitive launch in April 2015 of generic levo-leucovorin product that competes with FUSILEV. We disclosed in the MD&A section for “Product sales, net” of our March 31, 2015 Form 10-Q, that commercial rebate discounts would need to be adjusted for this product to compete with this generic competition, and as a result, we deferred $7 million of FUSILEV revenue (which affects the GTN percentages in the comparable periods):
FUSILEV revenue decreased due to a modest decrease in our unit sales to customers, as well as a slight decrease in our net average sales price per unit. In addition, we deferred revenue recognition for $7.0 million related to certain FUSILEV product shipments in the first quarter of 2015 that did not meet our revenue recognition criteria (seeNote 2(i)(a)). The deferral resulted from inability to estimate rebates that will be offered to compete with the generic levo-leucovorin products later in 2015. We expect to recognize this $7.0 million of deferred revenue within the next 12 months. FUSILEV sales for the remainder of the year are expected to significantly decline due to this competitive launch of generic levo-leucovorin products in April 2015 (see Note 3(e)).
Our revenue reduction for data and distribution fees decreased from 8.0% of gross product sales in the 2015 period to 5.2% in the 2016 period. These fees are recorded when the product is delivered to our distributors, since it is contractually due to our service provider at that time, and not necessarily when we
31
meet our revenue recognition thresholds under GAAP for those specific shipments. For FUSILEV, we deferred certain revenue recognition during the first quarter of 2015 through the first quarter of 2016, which resulted a time difference of recording these distribution, data, and GPO administrative fees (i.e., recognized as reduction of gross revenue when the product was delivered in that period – not when revenue was recognized). Thus, these fees were not included as a reduction of gross revenue in the same period that we ultimately recognized this deferred revenue. As a result, these fees were a higher proportion of gross revenue in the 2015 period than in the 2016 period.
Although we did not specifically discuss the comparative gross versus net percentages for each of the GTN categories on a quantitative basis within our MD&A or footnotes for these periods, we provided the aforementioned qualitative disclosure for readers to understand the unique matters affecting our business as they arose, and its impact on our reported net revenue (specifically for FUSILEV), which consequently affected these GTN percentages. In addition, we have historically included a “Gross-to-Net Product Sales” footnote [seeNote 4 in our June 30, 2016 Form 10-Q] that summarizes each of these GTN categories and reconciles its impact to our reported net revenue from gross revenue in each period.
We also refer the Staff to the below selected disclosure excerpts fromNote 2 – Revenue Recognition of our 2015 Form 10-K. Our existing disclosure highlights the vagaries in prospective revenue adjustments that normally result within our business sector from commercial rebates and government chargeback programs, as well as distribution, data, and GPO administrative fees:
Our gross revenue is reduced by our gross-to-net (“GTN”) estimates each period, resulting in our reported “product sales, net” in the accompanying Consolidated Statements of Operations. We defer revenue recognition in full if these estimates are not reasonably determinable at the time of sale. These estimates are based upon information received from external sources (such as written and oral information obtained from our customers with respect to their period-end inventory levels and their sales to end-users during the period), in combination with management’s informed judgments. Due to the inherent uncertainty of estimates, the actual amount we incur may be materially different than our GTN estimates, and require prospective revenue adjustments in periods after the initial sale was recorded.
Our GTN estimates are comprised of the following categories:
Government Chargebacks: Our products are subject to pricing limits under certain federal government programs. Qualifying entities (end-users) purchase product from our wholesalers at their qualifying discounted price. The chargeback amount we incur represents the difference between our original sales price to the wholesaler, and the end-user’s applicable discounted purchase price. There may be significant lag time between our original sale to the wholesaler and our receipt of the corresponding government chargeback claims from our wholesalers.
Commercial Rebates: Commercial rebates are based on (i) our estimates of end-user purchases through a group purchasing organization (“GPO”), (ii) the corresponding contractual rebate percentage tier we expect each GPO to achieve, and (iii) our estimates of the impact of any prospective rebate program changes made by us.
Distribution, Data, and GPO Administrative Fees: Distribution, data, and GPO administrative fees are paid to authorized wholesalers/distributors of our products (except for U.S. sales of ZEVALIN) for various commercial services, including: contract administration, inventory management, delivery of end-user sales data, and product returns processing. These fees are based on a contractually-determined percentage of our applicable sales.
32
Form 8-K filed August 9, 2016
Exhibit 99.1 Press Release dated August 9, 2016
Non-GAAP Financial Measures
9. Your statements that your non-GAAP measures reflect adjustment for items that are not indicative of your on-going core operating performance and are important components of how you measure your internal performance does not satisfy Item 10(e)(1)(i)(C) and (D) of Regulation S-K. Please provide us proposed disclosure for inclusion in future earnings releases that:
| • | Clearly identifies each non-GAAP measure and its most directly comparable financial measure calculated and presented in accordance with GAAP; |
| • | Explains why you consider each of your non-GAAP measures to be useful to investors and how each adjustment contributes to the usefulness of the measures; and |
| • | To the extent material, explains the additional purposes, if any, for which you use each non-GAAP measure presented. |
In this regard, we note that you disclose in your reconciliation table amounts for many of the line items in your statement of operations, including total revenues, selling, general and administrative expenses, research and development expenses, etc., and you do not explain why each of these non-GAAP amounts is relevant and useful to investors. Also, it is unclear why the removal of large expenses as non-GAAP adjustments for items that relate to prior acquisitions (such as amortization of intangibles, milestone payments and the change in fair value of contingent consideration) is not indicative of your core operating results given that part of your stated primary strategy relates to the acquisition of products.
Response 9
We acknowledge the Staff’s comment. We will revise our future filings to include the disclosures required byItem 10(e) ofRegulation S-K whenever we disclose non-GAAP financial measures in our filings. In doing so, we will limit our presentation of non-GAAP financial measures within our filings to only those non-GAAP financial measures that we believe are useful and meaningful to investors and that are used by management in the operation and evaluation of our business. Specifically, management uses these non-GAAP financial measures (a) to evaluate our historical and current financial performance, (b) to set internal sales targets and spending budgets, (c) to measure operational profitability and the accuracy of forecasting, (d) to assess financial discipline over operational expenditures, and (e) as an important factor in determining variable compensation for management and employees. We believe these non-GAAP financial measures are frequently used by securities analysts, investors, and other interested parties to evaluate similar-positioned companies in our industry.
In response to the Staff’s specific inquiry regarding our adjustments that relate to prior acquisitions (such as amortization of intangibles, milestone payments, and the change in fair value of contingent consideration), we acknowledge that (1) our business strategy includes in-licensing drug products for development and commercialization, and (2) the aforementioned adjustment categories are directly attributable to this business development activity. We adjust for these items to reflect what we believe is a more meaningful representation of the period-over-period success of our overall operations and financial results, as well as our future working capital requirements. Further, although our contingent consideration results from our prior acquisitions, its change in value that impacts GAAP earnings typically results from variables other than our current commercial activity or other operating performance measures (e.g., discount rates and updated revenue forecasts) that are a focus of our management. We believe our views on these non-GAAP adjustments are substantially aligned with the views of our analysts, investors, and other financial statement users based on various discussions with each through our senior management.
Accordingly, for each such individually referenced non-GAAP financial measure disclosed in our future Form 8-K filings or otherwise (as illustrated below), we will: provide a reconciliation to the most directly comparable GAAP financial measure in accordance withItem 10(e)(1)(i)(B) ofRegulation SK andRegulation G; in accordance withItems 10(e)(1)(i)(C) and10(e)(1)(i)(D), explain why management believes each non-GAAP financial measure provides useful information to investors and, if material, any additional purposes for which management uses such non-GAAP measure; place more prominence on the
33
GAAP information by presenting each GAAP financial measure in bold face text or other reasonably prominent type; and include the following revised cautionary language paragraph in our “Non-GAAP Financial Measures” disclosure to further emphasize the limitations of these non-GAAP reported financial results:
In this press release, Spectrum reports certain historical “non-GAAP financial measures,” as defined inRegulation G of theSecurities Exchange Act of 1934. Non-GAAP financial measures differ from financial statements reported in conformity to U.S. generally accepted accounting principles (“GAAP”). In accordance withRegulation G, we reconciled each non-GAAP financial measure to its most directly comparable GAAP measure. Management uses non-GAAP financial measures to assess our company’s performance and allocate company resources, and believes that providing these non-GAAP financial measures allows investors to view the Company’s financial results in the way that management views the financial results. We believe non-GAAP disclosures also provide investors with information used generally in our industry for evaluating operating results. Investors should not place undue reliance on non-GAAP financial measures, nor should investors consider non-GAAP financial measures as more meaningful than, or as substitutes or replacements for, financial measures prepared in accordance with GAAP.
The non-GAAP financial measures presented exclude the items summarized in the below table. Management believes that adjustments for these items assist investors in making comparisons of period-to-period operating results and that these items are not indicative of the Company’s on-going core operating performance.
The non-GAAP financial measures presented herein have certain limitations in that they do not reflect all of the costs associated with the operations of the Company’s business as reported under GAAP. Therefore, investors should consider non-GAAP financial measures in addition to, and not as a substitute for, or as superior to, measures of financial performance prepared in accordance with GAAP. The non-GAAP financial measures presented by the Company may be different from the non-GAAP financial measures used by other companies.
34
We also propose to revise the presentation and disclosure of our “Reconciliation of Non-GAAP Adjustments for Condensed Consolidated Statements of Operations” (now labeled “Reconciliation of Non-GAAP Adjustments for Selected Lines on our Condensed Consolidated Statements of Operations”), using our second quarter 2016 financial results for illustrative purposes, including our proposed explanations as to why each of our non-GAAP measures is relevant and useful to investors, and is substantially as follows:
SPECTRUM PHARMACEUTICALS, INC.
Reconciliation of Non-GAAP Adjustments for Selected Lines on our Condensed Consolidated Statements of Operations
(In thousands, expect per share amounts)
(Unaudited)
| Three months ended June 30, | Six months ended June 30, | |||||||||||||||
| 2016 | 2015 | 2016 | 2015 | |||||||||||||
(1) GAAP product sales, net & license fees and service revenue | $ | 33,949 | $ | 44,982 | $ | 77,815 | $ | 83,599 | ||||||||
Non GAAP adjustments to product sales, net & license fees and service revenue: | — | (9,682 | ) | (6,000 | ) | (9,682 | ) | |||||||||
|
|
|
|
|
|
|
| |||||||||
Non-GAAP product sales & license and contract revenue | $ | 33,949 | $ | 35,300 | $ | 71,815 | $ | 73,917 | ||||||||
|
|
|
|
|
|
|
| |||||||||
(2) GAAP selling, general and administrative expenses | $ | 27,620 | $ | 22,552 | $ | 49,583 | $ | 45,886 | ||||||||
Non GAAP adjustments to SG&A: | ||||||||||||||||
Stock-based compensation | (2,790 | ) | (3,087 | ) | (5,559 | ) | (5,116 | ) | ||||||||
Litigation expenses | (8,518 | ) | 25 | (10,813 | ) | 441 | ||||||||||
Insurance reimbursement under D&O policy | — | 365 | — | 1,746 | ||||||||||||
Depreciation expense | (164 | ) | (177 | ) | (329 | ) | (345 | ) | ||||||||
|
|
|
|
|
|
|
| |||||||||
Non-GAAP selling, general and administrative | $ | 16,148 | $ | 19,678 | $ | 32,882 | $ | 42,612 | ||||||||
|
|
|
|
|
|
|
| |||||||||
(3) GAAP research and development | $ | 14,281 | $ | 9,558 | $ | 29,744 | $ | 25,409 | ||||||||
Non-GAAP adjustments to R&D: | ||||||||||||||||
Stock-based compensation | (637 | ) | (441 | ) | (1,045 | ) | (873 | ) | ||||||||
Depreciation expense | (3 | ) | (3 | ) | (6 | ) | (6 | ) | ||||||||
Other R&D milestone payments | (770 | ) | — | (2,826 | ) | (3,000 | ) | |||||||||
|
|
|
|
|
|
|
| |||||||||
Non-GAAP research and development | $ | 12,871 | $ | 9,114 | $ | 25,867 | $ | 21,530 | ||||||||
|
|
|
|
|
|
|
| |||||||||
(4) GAAP net loss | $ | (24,295 | ) | $ | (2,346 | ) | $ | (33,616 | ) | $ | (27,908 | ) | ||||
Non-GAAP adjustments to net loss: | ||||||||||||||||
Adjustments included in (1), (2), (3) above for revenue, SG&A, and R&D | 12,882 | (6,364 | ) | 14,578 | (2,529 | ) | ||||||||||
Amortization and impairment | 6,306 | 6,916 | 12,145 | 20,938 | ||||||||||||
Adjustment to other (expense) income | 1,495 | 1,317 | 3,694 | 4,234 | ||||||||||||
Adjustment to benefit (provision) for income taxes | (106 | ) | (23 | ) | (171 | ) | 115 | |||||||||
|
|
|
|
|
|
|
| |||||||||
Non-GAAP pre-tax net loss | $ | (3,718 | ) | $ | (500 | ) | $ | (3,370 | ) | $ | (5,150 | ) | ||||
|
|
|
|
|
|
|
| |||||||||
(5) GAAP loss per share (Basic and Diluted) | $ | (0.35 | ) | $ | (0.04 | ) | $ | (0.50 | ) | $ | (0.43 | ) | ||||
|
|
|
|
|
|
|
| |||||||||
Non-GAAP loss per share (Basic and Diluted) | $ | (0.05 | ) | $ | (0.01 | ) | $ | (0.05 | ) | $ | (0.08 | ) | ||||
|
|
|
|
|
|
|
| |||||||||
Weighted average shares outstanding: | ||||||||||||||||
Basic & Diluted | 68,575,021 | 65,466,004 | 67,146,188 | 65,167,162 | ||||||||||||
|
|
|
|
|
|
|
| |||||||||
35
(1) Non-GAAP product sales & license and contract revenue: These amounts reflect adjustments to reverse revenue recognition for upfront revenue from out-licenses and revenue from milestone achievement(s) that do not consistently recur. The resulting non-GAAP revenue solely consists of our (i) product sales, (ii) percentage-based royalties from our licensees’ sales, and (iii) on-going service revenue. We believe this measure of non-GAAP revenue is more indicative of the period-over-period success of our core on-going product sales and service revenue.
(2) Non-GAAP selling, general and administrative: These amounts reflect adjustments to reverse allocated operating expenses for certain non-cash items (including stock-based compensation and depreciation), as well as the reversal of irregular operating expense items such as non-recurring legal fees and settlements. We believe the resulting non-GAAP SG&A value is more indicative of the period-over-period success of our administrative expense control, and more reflective of our normalized SG&A expense trends.
(3) Non-GAAP research and development: These amounts reflect adjustments to reverse allocated operating expenses for certain non-cash items (including stock-based compensation and depreciation), as well as non-recurring R&D milestone achievements that we record to expense for our in-licenses. We believe the resulting non-GAAP R&D value is more reflective of our true R&D expense trends.
(4) Non-GAAP net loss: These amounts reflect all non-GAAP adjustments described in(1) through(3) above, plus other non-cash and/or non-recurring items, including: (i) adjustments to reverse cost of service expense recognition for certain service arrangements that do not consistently recur (which corresponds with our non-GAAP reversal of license and contract revenue, as discussed in(1) above); (ii) adjustments to reverse operating expenses for non-cash amortization and impairment of intangible assets (the reversal of these non-cash expenses allows for a clearer representation of the period-over-period success of our overall financial results and future working capital requirements); (iii) adjustments to reverse the impact of income taxes; and (iv) adjustments to reverse the impact of mark-to-market contingent consideration (although our contingent consideration results from prior acquisitions and is a part of our business strategy, these adjustments through earnings typically result from variables other than our current commercial activity or other operating performance measures that are a focus of our management), (v) reversal of foreign exchange gains and losses (non-cash), and (vi) debt discount accretion expense (non-cash) for our convertible notes.
(5) Non-GAAP loss per share: These amounts reflect all non-GAAP adjustments in(1) through(4) above to present our overall non-GAAP financial results for each period on a per-share basis.
***
We hope the foregoing answers are responsive to your comments. If you have any questions regarding the responses set forth herein or require additional information, please contact me by telephone at (949) 788-6700, ext. 9278.
| Sincerely, |
/s/ Kurt A. Gustafson |
Kurt A. Gustafson |
| Executive Vice President and Chief Financial Officer |
36