Table of Contents
UNITED STATES
SECURITIES AND EXCHANGE COMMISSION
Washington, D.C. 20549
FORM N-CSR
CERTIFIED SHAREHOLDER REPORT OF REGISTERED
MANAGEMENT INVESTMENT COMPANIES
Investment Company Act file number | 811-05536 |
Capital One Funds
| (Exact name of registrant as specified in charter) |
| 3435 Stelzer Road, Columbus, Ohio | 43219 | |
| (Address of principal executive offices) | (Zip code) |
Citi Fund Services Ohio, Inc., 3435 Stelzer Road, Columbus, Ohio 43219
| (Name and address of agent for service) |
Registrant’s telephone number, including area code: 1-800-999-0426
Date of fiscal year end: August 31
Date of reporting period: August 31, 2008
Table of Contents
| Item 1. | Reports to Stockholders. |
Table of Contents
Table of Contents
2
Management’s Discussion of Fund Performance
4
14
16
18
37
44
Report of Independent Registered Public Accounting Firm
54
55
Board of Trustees and Trust Officers
56
Voting Proxies on Fund Portfolio Securities
Back Cover
Back Cover
Table of Contents
Dear Shareholder:
We are pleased to provide you with the Annual Report for the Capital One Funds. This report covers the 12-month fiscal period from September 1, 2007 through August 31, 2008. It includes a discussion of factors affecting the Funds’ performance during the past fiscal year and a complete listing of each Fund’s portfolio holdings and audited financial statements.
Over the 12-month fiscal period, the domestic economy has shown erratic growth, with some evidence of slowing. However, despite the drag created by the weak housing market, which negatively impacted the economy throughout the period, GDP1 has generally exceeded expectations and, so far, avoided falling into negative territory. Strength in exports, aided by the weak U.S. dollar, has provided notable support to the U.S. economy, especially in the second calendar quarter of 2008, in which exports provided nearly all the growth in real GDP. Consumer spending, which comprises over two thirds of domestic GDP, has held up well during most of the period, but has showed signs of slowing in more recent months due to sluggish wage growth, high energy and commodity prices, declining home values and negative consumer confidence.
The U.S. equity markets performed poorly during the period, as investors became more risk averse due to the continuing financial crisis, and as earnings estimates for certain economic sectors became more suspect, particularly the beleaguered financial companies. The S&P 500 Index of large capitalization stocks declined 11.14% while the S&P MidCap 400 Index fared better with a decline of 4.22%. The S&P SmallCap 600 Index declined by 6.20%, indicating that investors were challenged to find opportunities for growth in domestic stocks.
The U.S. investment grade fixed income market exhibited returns near the long-term historical averages, despite the rather low yields available in the U.S. Treasury market at the beginning of the period. The 10-year U.S. Treasury note yielded 4.53% on August 31, 2007, and investors watched this yield decline to 3.81% on the last trading day of August 2008, a 72 basis point decrease (0.72%). Dramatic yield declines occurred across the Treasury maturity spectrum during the year, as investors on a global scale sought the safety of U.S. Treasuries during the mounting credit crisis. Treasuries were the top performer for the period on a total return basis, as exhibited by the Lehman U.S. Government bond index, which produced an 8.09% return over the Funds’ fiscal year. The more broadly-based Lehman Aggregate Index, which is designed to measure the performance on the entire domestic investment grade bond market, produced a respectable 5.86% return. “Spread product”, or investment grade fixed-income securities with some measure of credit risk exposure, performed less well than Treasuries as risk aversion caused spreads to widen, dampening capital gains in a declining rate environment.
The Capital One equity funds, including the Capital One Capital Appreciation Fund and the Capital One Mid Cap Equity Fund, produced negative returns in the hostile equity market environment. The comments from the funds’ portfolio manager describing the factors affecting performance are included in the pages that follow.
The Capital One fixed income funds produced positive returns commensurate with their objectives and risk posture. Please read the portfolio manager commentaries that follow.
The Capital One Cash Reserve Fund and Capital One U.S. Treasury Money Market Fund produced healthy returns while strictly following their mandate to preserve capital. The period measured was one in which money market rates declined dramatically. The target Federal Funds rate, set by the Federal Reserve’s Open Market Committee, was on a downward path during the period, falling from 5.25% in September, 2007, to 2.0% at the end of April, 2008. The target rate has been held at that level since that time. Yields on the Capital One money market funds declined in step with the Fed’s policy moves. The Cash Reserve Fund’s 30-day yield declined from 4.78% at the beginning of the period to 1.78% as the fiscal year ended. Likewise, the U.S. Treasury Money Market Fund experienced a 30-day yield that declined from 4.17% to 1.34% during the fiscal year.
ANNUAL REPORT
2
Table of Contents
President’s Message (continued)
During the month of September, the markets entered a period of extreme disruption, sending stocks lower, and equity market volatility to record levels. In one month, we experienced the two major quasi-governmental housing agencies, Fannie Mae and Freddie Mac, being placed into conservatorship by the U.S. Treasury, the merger of Merrill Lynch into Bank of America, the Chapter 11 bankruptcy filing of Lehman Brothers, the creation of an $85 billion credit facility for AIG by the Federal Reserve as its share price plummeted, the conversion of Morgan Stanley and Goldman Sachs into bank holding companies, the acquisition of Washington Mutual by J.P. Morgan Chase, and the consideration of a bill by Congress that would authorize the purchase of $700 billion of mortgage-related assets from financial institutions to free up the flow of credit in the economy. The bill eventually passed in early October. Uncertainty about the future and the lack of confidence in the creditworthiness of counterparties is driving individual and institutional investors as well as financial institutions to dramatically reduce their risk-taking. The U.S. Treasury and Federal Reserve have worked in concert to reduce the impact of this crisis, and we believe that they will ultimately succeed in overcoming it.
Thank you for investing through the Capital One Funds. We are committed to providing you with professional investment management in the financial markets with an emphasis on diversification and a high level of service.
Sincerely,

Richard L. Chauvin, Jr. CFA
President
October 7, 2008
Investment Considerations:
An investment in the Capital One Money Market funds is not insured or guaranteed by the FDIC or any other government agency. Although the funds seek to preserve the value of your investment at $1.00 per share, it is possible to lose money by investing in the funds.
On October 7, 2008 the Capital One Cash Reserve Fund participated in the Treasury Money Market Guarantee Program. The Program is for shareholders as of September 19, 2008 and generally covers the lesser of the amount that the shareholder held on September 19 or the amount they hold on the date the fund needs to utilize the guarantee. If a shareholder closes their account with the fund or broker dealer after September 19, any future investment in the Fund will not be guaranteed. The guarantee is through December 18, but may be extended at the Treasury’s discretion. For further discussion on this, please refer to Note 9 on page 54 in the Notes to Financial Statements.
Equity securities (stocks) are more volatile and carry more risk than other forms of investments, including investments in high-grade fixed income securities. The net asset value per share of the Capital One equity funds will fluctuate as the value of the securities in the portfolio changes.
Mid-capitalization funds typically carry additional risks since smaller companies generally have a higher risk of failure.
Bonds offer a relatively stable level of income, although bond prices will fluctuate providing the potential for principal gain or loss. Intermediate-term, higher-quality bonds generally offer less risk than longer-term bonds and a lower rate of return.
Past performance does not guarantee future results. The yield data quoted represents past performance and current returns may be lower or higher. The investment return and net asset value will fluctuate so that an investor’s shares, when redeemed may be worth more or less than the original cost. To obtain performance information current to the most recent month end, call 1-800-999-0426.
1 | Gross Domestic Product (“GDP”) is defined as the monetary value of all the goods and services produced by an economy over a specified period. It includes consumption, government purchases, investments, and exports minus imports. |
For detailed information pertaining to the Funds’ performance, please refer to the Management’s Discussion of Fund Performance section which begins on page 4 of this report.
ANNUAL REPORT
3
Table of Contents
2008 Annual Report Management’s Discussion of Fund Performance
Capital One Capital Appreciation Fund (Unaudited)
Market Review
The domestic equity markets experienced a sharp decline during the Fund’s fiscal year ended August 31, 2008. Worries about continuing problems in the financial sector drove investors to reign in risk tolerance leading to a sell-off in risky assets.
The S&P 500 Index1 returned -11.14% on a total return basis while the S&P MidCap 400 Index1 returned -4.22% and the S&P SmallCap 600 Index1 returned -6.20%. A sharp sell-off began in mid-October 2007 that carried through the spring of 2008. As it began to appear that the worst of the financial crisis was behind us, equity markets staged a strong rally in the early summer. This rally began to unwind as more and more troubles began to plague the financial sector and stocks sold off through the end of August. The credit crisis has morphed into a liquidity crisis at the nation’s major financial institutions causing major disruptions among both commercial and investment banks.
Investors in this environment have become solidly risk-averse. In addition to equity market declines, corporate bond spreads are indicative of a flight to quality unlike any seen in recent times. While financial companies stocks began to show signs of this as early as the spring of 2007, it was not until the fall of 2007 that it began to spread to the market as a whole, as noted above.
Portfolio Performance
The Capital One Capital Appreciation Fund produced a total return of -7.38% (Class A Shares at net asset value) for the fiscal year ended August 31, 2008, while the S&P 500 Index returned -11.14%. The portfolio was managed in close accordance with the Adviser’s risk-controlled core-diversified process.
The Fund’s outperformance during the fiscal year was mainly generated during the late fall and winter of 2007 when the overall market began its decline. A number of stocks substantially outperformed the market during that period, including Mosaic (chemicals), Amazon (eCommerce), MEMC Electronics (semiconductor manufacturing), McKesson (pharmaceuticals), and Apache Corp (energy). Notable underperformers during the year included Computer Sciences (technology), JC Penney and Mens’ Warehouse (apparel), and Citigroup and were sold from the portfolio.†
Strategy
The risk-controlled, core-diversified process entails utilization of a multi-factor approach to identifying equity securities that are expected to outperform the market. This approach looks at earnings growth and quality indicators as well as valuation measures. Portfolio construction uses the results of that multi-factor approach in conjunction with a risk management process designed to limit equity portfolio exposure to certain identifiable risks that the Adviser believes do not add value in a risk/reward context. The Adviser controls for exposures to risks via proxies such as weighted average market capitalization, portfolio beta2, style (i.e., growth vs. value) exposure, and industry and sector weightings. The portfolio is compared to the benchmark in these respects, and exposure to these characteristics is kept closely in line with the benchmark characteristics.
As a result of this process, factors that materially affected the Fund performance were substantially limited to security selection. Portfolio holdings are constantly evaluated in accordance with the Adviser’s equity ranking process and transactions made throughout the year are made in close accordance to that process.
Investment Considerations:
Equity securities (stocks) are more volatile and carry more risk than other forms of investments, including investments in high-grade fixed income securities. The net asset value per share of this Fund will fluctuate as the value of the securities in the portfolio changes.
1 | The Standard & Poor’s 500 Index (“S&P 500”) is an unmanaged capitalization-weighted index of 500 stocks designed to measure performance of the broad domestic economy through changes in the aggregate market value of 500 stocks representing all major industries. Standard & Poor’s SmallCap 600 Index (“S&P Small Cap 600”) is an unmanaged capitalization-weighted index representing all major industries in the small-cap of the U.S. stock market. Standard & Poor’s MidCap 400 Index (“S&P MidCap 400”) is an unmanaged index generally representative of 400 stocks in the mid-range sector of the domestic stock market, representing all major industries. It is not possible to invest directly in any index. |
2 | Beta analyzes the market risk of a fund by showing how responsive the fund is to the market, which has a beta of 1.00. Usually, higher betas represent riskier investments. |
† | Portfolio composition is subject to change. |
Past performance does not guarantee future results. Performance data quoted represents past performance and current returns may be lower or higher. Total return figures include change in share price, reinvestment of dividends and capital gains. The investment return and net asset value will fluctuate so that an investor’s shares, when redeemed, may be worth more or less than the original cost. For performance data current to the most recent month end, visit our website at www.capitalone.com or call 1-800-999-0426.
ANNUAL REPORT
4
Table of Contents
Capital One Capital Appreciation Fund (Unaudited)
PERFORMANCE as of August 31, 2008
Assumes a $10,000 investment in the Class A Shares.
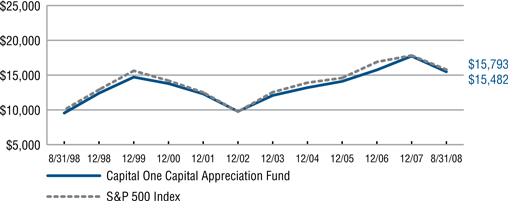
Performance data quoted represents past performance which is no guarantee of future results. The above graph assumes an initial hypothetical investment of $10,000 from August 31, 1998 to August 31, 2008 and includes changes in share price, reinvestment of dividends and capital gains and does not reflect taxes that a shareholder would pay on fund distributions or on the redemption of fund shares. The calculation assumes the 4.50% maximum sales charge applicable to Class A Shares.
PERFORMANCE as of August 31, 2008
| AVERAGE ANNUAL TOTAL RETURN | NET EXPENSE RATIO† | GROSS EXPENSE RATIO† | ||||||||||||||||||
| Inception Date | 1-Year | 3-Year | 5-Year | 10-Year | ||||||||||||||||
Class A Shares* | 10/14/88 | -11.53 | % | 2.79 | % | 6.25 | % | 4.47 | % | 1.23 | % | 1.23 | % | |||||||
Class B Shares** | 12/2/96 | -12.82 | % | 2.76 | % | 6.21 | % | 4.33 | % | 1.98 | % | 1.98 | % | |||||||
S&P 500 Index | -11.14 | % | 3.66 | % | 6.92 | % | 4.68 | % | ||||||||||||
Past performance does not guarantee future results. The performance data quoted represents past performance and current returns may be lower or higher. The investment return and net asset value will fluctuate so that an investor’s shares, when redeemed may be worth more or less than the original cost. To obtain performance information current to the most recent month end, call 1-800-999-0426.
The performance above reflects fee reductions in effect for the periods presented. Voluntary fee reductions may be discontinued at any time. If such fee reductions had not occurred, the quoted performance would be lower.
| * | Reflects 4.50% maximum sales charge. |
| ** | Reflects the applicable contingent deferred sales charge (CDSC), maximum of 5.50%. |
| † | The above expense ratios are from the Fund’s prospectus dated December 14, 2007. Additional information pertaining to the Fund’s expense ratios as of August 31, 2008 can be found in the Financial Highlights. |
The Performance of the Capital One Appreciation Fund is measured against the Standard & Poor’s 500 Index (“S&P 500”) an unmanaged index of 500 selected common stocks most of which are listed of the New York Stock Exchange. The index is heavily weighted toward stocks with large market capitalizations and represents two-thirds of the total market value of all domestic common stocks. The index does not reflect the deduction of fees associated with a mutual fund, such as investment management and fund accounting fees. The Fund’s performance reflects the deduction of fees for these services. Investors cannot invest directly in an index.
The Capital One Funds are distributed by Foreside Distribution Services, L.P. Capital One Asset Management, LLC is the Investment Adviser and Capital One, N.A. is the custodian to the Capital One Funds and receives compensation for their services.
ANNUAL REPORT
5
Table of Contents
Capital One Louisiana Municipal Income Fund (Unaudited)
Market Review
The year ended August 31, 2008 was a year in which long rates did not change significantly (a decline of 40 basis points (0.40%)) point to point, but experienced significant volatility in the interim. The yield on the 10-year note declined 0.72% in the year, with the steepest decline occurring early spring as continued fear of deteriorating credit conditions spurred strong demand for U.S. Treasury securities. The Federal funds target rate was lowered from 5.25% to 2.00%. Economic weakness, illiquidity in the debt markets, financial institution failure and government bailouts continue to plague our financial system. Municipals rallied in late 2007 in response to slower economic fundamentals, but reversed course in 2008 as bond insurers began to be downgraded. The failure of many short term auction securities to clear the market also added the anxiety among investors, which led to relative underperformance by municipals relative to the U.S. Treasury markets. The Louisiana market further lagged the general municipal market. As an example the Lehman Brothers 10 year Municipal Index returned 5.73% while the Louisiana component returned only 5.21%.
Portfolio Performance
The 12-month return on the Louisiana Municipal Income Fund was 4.91% (Class A Shares at net asset value) compared to the Lipper Other States Municipal Debt Funds Average1 of 0.76%, and ranked in the 2nd percentile among 145 funds in the Other States Municipal Debt Funds category. The Fund returns lagged the primary benchmark, the Lehman Brothers Seven Year Insured Bond Index which produced 6.71%. The benchmark’s outperformance was primarily due to the muted performance of Louisiana bonds during the year. Beginning with calendar year 2008, the Fund added the Lehman Brothers 1 - 10 Year Municipal Blend Index as a secondary performance benchmark.
Strategy
The Fund’s strategy through most of the fiscal year was focused upon delivering enhanced performance while managing duration and credit risk within acceptable parameters that are consistent with the Fund’s objectives. Portfolio strategy has generally been focused on delivering a high level of income, exempt from both Federal and Louisiana income taxes, consistent with the management of interest rate and credit risk. Until late August, 2008, the strategy with respect to the Fund was to maintain a neutral stance relative to benchmark duration and to take advantage of market opportunities in the Louisiana municipal marketplace.
As part of Capital One’s exit from the proprietary fund business, Capital One Asset Management (COAM) began an orderly liquidation of the Louisiana Municipal Income Fund on Monday, August 25, 2008, following final shareholder approval on that same date. The Fund’s tax-exempt assets have since been sold and the Fund now holds cash equivalent securities and federal agency discount notes in order to preserve capital pending final distribution of the assets to Fund shareholders. This is scheduled to occur on October 17, 2008.
Investment Considerations:
Bonds offer a relatively stable level of income, although bond prices will fluctuate providing the potential for principal gain or loss. Intermediate-term, higher-quality bonds generally offer less risk than longer-term bonds and a lower rate of return.
Certain shareholders may be subject to the Alternative Minimum Tax (AMT). Federal income tax rules will apply to any capital gains distributions.
The Fund’s income may be subject to certain state and local taxes and, depending on your tax status, the federal alternative minimum tax.
| 1 | The Lipper Other States Municipal Debt Funds Average is an equally weighted average consisting of managed mutual funds that invest in municipal debt issues and are exempt from taxation on a specified city or state basis. For the one-year period ended August 31, 2008, the Capital One Louisiana Municipal Income Fund ranked 2 out of 145 funds within the Other States Municipal Debt Funds category. For the five- and 10-year periods ended August 31, 2008, the Fund ranked 25 out of 136 and 10 out of 116, respectively. The Lipper rankings are based on total return and do not reflect a sales charge. |
| † | Portfolio composition is subject to change. |
Past performance does not guarantee future results. Performance data quoted represents past performance and current returns may be lower or higher. Total return figures include change in share price, reinvestment of dividends and capital gains. The investment return and net asset value will fluctuate so that an investor’s shares, when redeemed, may be worth more or less than the original cost. For performance data current to the most recent month end, visit our website at www.capitalone.com or call 1-800-999-0426.
ANNUAL REPORT
6
Table of Contents
Capital One Louisiana Municipal Income Fund (Unaudited)
PERFORMANCE as of August 31, 2008
Assumes a $10,000 investment in the Class A Shares.
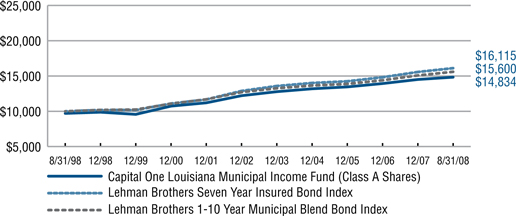
Performance data quoted represents past performance which is no guarantee of future results. The above graph assumes an initial hypothetical investment of $10,000 from August 31, 1998 to August 31, 2008 and includes changes in share price, reinvestment of dividends and capital gains and does not reflect taxes that a shareholder would pay on fund distributions or on the redemption of fund shares. The calculation assumes the 3.00% maximum sales charge applicable to Class A Shares.
PERFORMANCE as of August 31, 2008
| AVERAGE ANNUAL TOTAL RETURN | NET EXPENSE RATIO † | GROSS EXPENSE RATIO† | |||||||||||||||||||||
| Inception Date | 1-Year | 3-Year | 5-Year | 10-Year | Since Inception*** | ||||||||||||||||||
Class A Shares* | 10/14/88 | 1.75 | % | 2.18 | % | 3.17 | % | 4.02 | % | — | 0.78 | % | 1.10 | % | |||||||||
Class B Shares** | 11/15/01 | -1.49 | % | 1.13 | % | 2.60 | % | — | 3.06 | % | 1.63 | % | 1.85 | % | |||||||||
Lehman Brothers Seven Year Insured Bond Index | 6.71 | % | 4.14 | % | 4.32 | % | 4.89 | % | — | ||||||||||||||
Lehman Brothers 1 -10 Year Municipal Blend Bond Index | 6.29 | % | 4.02 | % | 3.95 | % | 4.56 | % | — | ||||||||||||||
Past performance does not guarantee future results. The performance data quoted represents past performance and current returns may be lower or higher. The investment return and net asset value will fluctuate so that an investor’s shares, when redeemed may be worth more or less than the original cost. To obtain performance information current to the most recent month end, call 1-800-999-0426.
The performance above reflects fee reductions in effect for the periods presented. Voluntary fee reductions may be discontinued at any time. If such fee reductions had not occurred, the quoted performance would be lower.
| * | Reflects 3.00% maximum sales charge. |
| ** | Reflects the applicable contingent deferred sales charge (CDSC), maximum of 5.50%. |
| *** | Since inception performance is not shown for any class period greater than 10 years. |
| † | The above expense ratios are from the Fund’s prospectus dated December 14, 2007. Additional information pertaining to the Fund’s expense ratios as of August 31, 2008 can be found in the Financial Highlights. |
The performance of the Capital One Louisiana Municipal Income Fund is measured against the Lehman Brothers Seven Year Insured Bond Index. The Lehman Brothers Seven Year Insured Bond Index is a broad-based market index comprised of investment-grade municipal bonds with maturities close to seven years. The Lehman Brothers 1-10 Year Municipal Blend Index is a rules-based and market-value weighted index engineered for the long-term tax-exempt bond market. This index is the 1-10 Year Blend (1-12) component of the Municipal Bond index. It is comprised of 20% equal weighting of the Lehman 1-, 3-, 5-, 7- and 10-year municipal indexes. To be included in the index, bonds must have a minimum credit rating of at least Baa, and outstanding par value of at least $5 million and be issued as part of a transaction of at least $50 million. Bonds must have a dated date after 12/31/90 and be at least one year from their maturity date. These indices are unmanaged and do not reflect the deduction of fees associated with a mutual fund, such as investment management and fund accounting. The Fund’s performance reflects the deduction of fees for these services. Investors cannot invest directly in an index.
The Capital One Funds are distributed by Foreside Distribution Services, L.P. Capital One Asset Management, LLC is the Investment Adviser and Capital One, N.A. is the custodian to the Capital One Funds and receives compensation for their services.
ANNUAL REPORT
7
Table of Contents
Capital One Mid Cap Equity Fund (Unaudited)
Market Review
The domestic equity markets experienced a sharp decline during the fund’s fiscal year ended August 31, 2008. Worries about continuing problems in the financial sector drove investors to reign in risk tolerance leading to a sell-off in risky assets.
The S&P 500 Index1 returned -11.14% on a total return basis while the S&P MidCap 400 Index1 returned -4.22% and the S&P SmallCap 600 Index1 returned -6.20%. A sharp sell-off began in mid-October 2007 that carried through the spring of 2008. As it began to appear that the worst of the financial crisis was behind us, equity markets staged a strong rally in the early summer. This rally began to unwind as more and more troubles began to plague the financial sector and stocks sold off through the end of August. The credit crisis has morphed into a liquidity crisis at the nation’s major financial institutions causing major disruptions among both commercial and investment banks.
Investors in this environment have become solidly risk-averse. In addition to equity market declines, corporate bond spreads are indicative of a flight-to-quality unlike any seen in recent times. While financial companies stocks began to show signs of this as early as the spring of 2007, it was not until the fall of 2007 that it began to spread to the market as a whole, as noted above .
Portfolio Performance
The Capital One Mid Cap Equity Fund produced a total return of -9.43% (Class A Shares at net asset value) for the fiscal year ended August 31, 2008, while the S&P MidCap 400 Index returned -4.22%. The portfolio was managed in close accordance with the Adviser’s risk-controlled core-diversified process.
The Fund’s Portfolio underperformance during the fiscal year ended August 31, 2008 was mainly generated during the rally that began in March of 2008 and culminated in mid-June of 2008. This was largely attributable to the earnings momentum factors utilized in the multi-factor equity evaluation approach being “out-of-sync” with the market. The market was not rewarding those factors during that time-period in the way that the Adviser believes it does over extended market cycles. Stocks that contributed to this underperformance during this time included, Hospitality Properties and Colonial Properties (REIT’s), Humana and Coventry Health Care (Health Care), and Tesoro (energy). A number of stocks that helped boost performance during the time included, Celanese Corp (chemicals), Steel Dynamics (metals), Joy Global (mining), and Cabot Oil & Gas and Tidewater (energy).†
Strategy
The risk-controlled, core-diversified process entails utilization of a multi-factor approach to identifying equity securities that are expected to outperform the market. This approach looks at earnings growth and quality indicators as well as valuation measures. Portfolio construction uses the results of that multi-factor approach in conjunction with a risk management process designed to limit equity portfolio exposure to certain identifiable risks that the Adviser believes do not add value in a risk/reward context. The Adviser controls for exposures to risks via proxies such as weighted average market capitalization, portfolio beta2, style (i.e., growth vs. value) exposure, and industry and sector weightings. The portfolio is compared to the benchmark in these respects, and exposure to these characteristics is kept closely in line with the benchmark characteristics.
As a result of this process, factors that materially affected the Fund performance was substantially limited to security selection. Portfolio holdings are constantly evaluated in accordance with the Adviser’s equity ranking process and transactions made throughout the year are made in close accordance to that process.
Investment Considerations:
Equity securities (stocks) are more volatile and carry more risk than other forms of investments, including investments in high-grade fixed income securities. The net asset value per share of this Fund will fluctuate as the value of the securities in the portfolio changes.
Mid-capitalization funds typically carry additional risks since smaller companies generally have a higher risk of failure.
1 | The Standard & Poor’s 500 Index (“S&P 500”) is an unmanaged capitalization-weighted index of 500 stocks designed to measure performance of the broad domestic economy through changes in the aggregate market value of 500 stocks representing all major industries. Standard & Poor’s SmallCap 600 Index (“S&P Small Cap 600”) is an unmanaged capitalization-weighted index representing all major industries in the small-cap of the U.S. stock market. Standard & Poor’s MidCap 400 Index (“S&P MidCap 400”) is an unmanaged index generally representative of 400 stocks in the mid-range sector of the domestic stock market, representing all major industries. It is not possible to invest directly in any index. |
2 | Beta analyzes the market risk of a fund by showing how responsive the fund is to the market, which has a beta of 1.00. Usually, higher betas represent riskier investments. |
† | Portfolio composition is subject to change. |
Past performance does not guarantee future results. Performance data quoted represents past performance and current returns may be lower or higher. Total return figures include change in share price, reinvestment of dividends and capital gains. The investment return and net asset value will fluctuate so that an investor’s shares, when redeemed, may be worth more or less than the original cost. For performance data current to the most recent month end, visit our website at www.capitalone.com or call 1-800-999-0426.
ANNUAL REPORT
8
Table of Contents
Capital One Mid Cap Equity Fund (Unaudited)
PERFORMANCE as of August 31, 2008
Assumes a $10,000 investment in the Class A Shares.
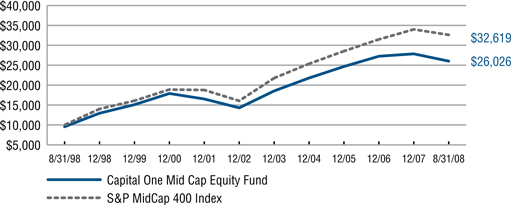
Performance data quoted represents past performance which is no guarantee of future results. The above graph assumes an initial hypothetical investment of $10,000 from August 31, 1998 to August 31, 2008 and includes changes in share price, reinvestment of dividends and capital gains and does not reflect taxes that a shareholder would pay on fund distributions or on the redemption of fund shares. The calculation assumes the 4.50% maximum sales charge applicable to Class A Shares.
PERFORMANCE as of August 31, 2008
| AVERAGE ANNUAL TOTAL RETURN | NET EXPENSE RATIO† | GROSS EXPENSE RATIO† | ||||||||||||||||||
| Inception Date | 1-Year | 3-Year | 5-Year | 10-Year | ||||||||||||||||
Class A Shares* | 5/1/86 | -13.51 | % | 1.07 | % | 8.29 | % | 10.04 | % | 1.26 | % | 1.26 | % | |||||||
Class B Shares** | 7/13/98 | -14.41 | % | 0.86 | % | 8.20 | % | 9.91 | % | 2.01 | % | 2.01 | % | |||||||
S&P MidCap 400 Index | -4.22 | % | 5.97 | % | 10.80 | % | 12.55 | % | ||||||||||||
Past performance does not guarantee future results. The performance data quoted represents past performance and current returns may be lower or higher. The investment return and net asset value will fluctuate so that an investor’s shares, when redeemed may be worth more or less than the original cost. To obtain performance information current to the most recent month end, call 1-800-999-0426.
The performance above reflects fee reductions in effect for the periods presented. Voluntary fee reductions may be discontinued at any time. If such fee reductions had not occurred, the quoted performance would be lower.
| * | Reflects 4.50% maximum sales charge. |
| ** | Reflects the applicable contingent deferred sales charge (CDSC), maximum of 5.50%. |
| † | The above expense ratios are from the Fund’s prospectus dated December 14, 2007. Additional information pertaining to the Fund’s expense ratios as of August 31, 2008 can be found in the Financial Highlights. |
The Performance of the Capital One Mid Cap Equity Fund is measured against the Standard & Poor’s MidCap 400 Index (“S&P MidCap 400”) which is an unmanaged index generally representative of 400 stocks in the mid-range sector of the domestic stock market, representing all major industries. The index does not reflect the deduction of fees associated with a mutual fund, such as investment management and fund accounting fees. The Fund’s performance reflects the deduction of fees for these services. It is not possible to invest directly in any index.
The Capital One Funds are distributed by Foreside Distribution Services, L.P. Capital One Asset Management, LLC is the Investment Adviser and Capital One, N.A. is the custodian to the Capital One Funds and receives compensation for their services.
ANNUAL REPORT
9
Table of Contents
Capital One Total Return Bond Fund (Unaudited)
Market Review
The year ended August 31, 2008 was a year in which long rates did not change significantly (a decline of 40 basis points (0.40%)) point to point, but experienced significant volatility in the interim. The yield on the 10-year note declined 0.72% in the year, with the steepest decline occurring early spring as continued fear of deteriorating credit conditions spurred strong demand for U.S. Treasury securities. The fed funds target rate was lowered from 5.25% to 2.00%. Economic weakness, illiquidity in the debt markets, financial institution failure and government bailouts continue to plague our financial system. Spreads on government sponsored enterprises obligations including Agency mortgage backed securities increased to historically high levels and remain high despite dramatic government intervention. The yield curve steepened, with the 2-year maturity moving down over 200 basis points (2.00%) while the 30-year maturity declined 45 basis points (0.45%).
Portfolio Performance
Portfolio strategy over the past year involved modest shifts in portfolio duration based on the relative value of bonds within a range. Credit quality was kept high quality relative to the index and credit concentrations were minimized. The conservative credit posture of the Fund has contributed to marked improvement in the Fund’s standing relative to peers in the Lipper Average. As of August 31, 2008 the Fund ranked in the 16th percentile for the 12-month period among 556 funds in the Intermediate Investment Grade Debt Funds category. The Fund’s 12 month return was 5.52% (at net asset value) compared to a Lipper Intermediate Investment Grade Debt Funds Average1 of 1.58%. The Lehman Brothers U.S. Aggregate Index return was 5.86%. The Index return was aided by a higher percentage of U.S. Treasury securities than was held by the Fund.
Strategy
The portfolio is currently positioned with a duration that is neutral to the benchmark, with modest over-weight positions in Agency securities and Commercial Mortgage Backed Securities.†
Investment Considerations:
Bonds offer a relatively stable level of income, although bond prices will fluctuate providing the potential for principal gain or loss. Intermediate-term, higher-quality bonds generally offer less risk than longer-term bonds and a lower rate of return.
1 | The Lipper Intermediate Investment Grade Debt Funds Average is an equally weighted average consisting of managed mutual funds that invest at least 65% of their assets in investment grade issues (rated in the top four grades) with dollar-weighted average maturities of five to ten years. For the one-year period ended August 31, 2008, the Capital One Total Return Bond Fund ranked 16 out of 556 funds within the Intermediate Investment Grade Debt Funds category. For the five- and 10-year periods ended August 31, 2008, the Fund ranked 55 out of 398 and 66 out of 200, respectively. The Lipper rankings are based on total return and do not reflect a sales charge. |
† | Portfolio composition is subject to change. |
Past performance does not guarantee future results. Performance data quoted represents past performance and current returns may be lower or higher. Total return figures include change in share price, reinvestment of dividends and capital gains. The investment return and net asset value will fluctuate so that an investor’s shares, when redeemed, may be worth more or less than the original cost. For performance data current to the most recent month end, visit our website at www.capitalone.com or call 1-800-999-0426.
ANNUAL REPORT
10
Table of Contents
Capital One Total Return Bond Fund (Unaudited)
PERFORMANCE as of August 31, 2008
Assumes a $10,000 investment in the Fund.
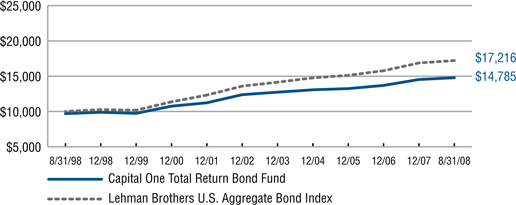
Performance data quoted represents past performance which is no guarantee of future results. The above graph assumes an initial hypothetical investment of $10,000 from August 31, 1998 to August 31, 2008 and includes changes in share price, reinvestment of dividends and capital gains and does not reflect taxes that a shareholder would pay on fund distributions or on the redemption of fund shares. The calculation assumes the 3.00% maximum sales charge applicable to the Fund.
PERFORMANCE as of August 31, 2008
| AVERAGE ANNUAL TOTAL RETURN | NET EXPENSE RATIO† | GROSS EXPENSE RATIO† | ||||||||||||||||||
| Inception Date | 1-Year | 3-Year | 5-Year | 10-Year | ||||||||||||||||
Total Return Bond Fund* | 11/2/92 | 2.34 | % | 2.30 | % | 2.79 | % | 3.99 | % | 0.80 | % | 1.20 | % | |||||||
Lehman Brothers U.S. Aggregate Index | 5.86 | % | 4.26 | % | 4.61 | % | 5.58 | % | ||||||||||||
Past performance does not guarantee future results. The performance data quoted represents past performance and current returns may be lower or higher. The investment return and net asset value will fluctuate so that an investor’s shares, when redeemed may be worth more or less than the original cost. To obtain performance information current to the most recent month end, call 1-800-999-0426.
The performance above reflects any fee reductions in effect for the periods presented. Voluntary fee reductions may be discontinued at any time. If such fee reductions had not occurred, the quoted performance would be lower.
| * | Reflects 3.00% maximum sales charge. |
| † | The above expense ratios are from the Fund’s prospectus dated December 14, 2007. Additional information pertaining to the Fund’s expense ratios as of August 31, 2008 can be found in the Financial Highlights. |
The performance of the Capital One Total Return Bond Fund is measured against the Lehman Brothers U.S. Aggregate Index which is an unmanaged market value-weighted performance benchmark for investment-grade, fixed-rate debt issues, including government, corporate, asset-backed, and mortgage-backed securities, with maturities of at least one year. The index does not reflect the deduction of fees associated with a mutual fund, such as investment management and fund accounting fees. The Fund’s performance reflects the deduction of fees for these services. It is not possible to invest directly in any index.
The Capital One Funds are distributed by Foreside Distribution Services, L.P. Capital One Asset Management, LLC is the Investment Adviser and Capital One, N.A. is the custodian to the Capital One Funds and receives compensation for their services.
ANNUAL REPORT
11
Table of Contents
Capital One U.S. Government Income Fund (Unaudited)
Market Review
The year ended August 31, 2008 was a year in which long rates did not change significantly (a decline of 40 basis points (0.40%)) point to point, but experienced significant volatility in the interim. The yield on the 10-year note declined 0.72% in the year, with the steepest decline occurring early spring as continued fear of deteriorating credit conditions spurred strong demand for U.S. Treasury securities. The fed funds target rate was lowered from 5.25% to 2.00%.
Economic weakness, illiquidity in the debt markets, financial institution failure and government bailouts continue to plague our financial system. Given these extreme crosscurrents, we have managed the Fund relatively neutral to the benchmarks throughout the entire year. We believe the Federal Reserve will ultimately be successful in restoring order and growth to the U.S. economy and at some point a rising interest rate environment may likely re-emerge, but until that scenario comes into sharper focus we expect to continue a relatively neutral duration policy.
Portfolio Performance
The Capital One U.S. Government Income Fund produced a total return of 6.06% (at net asset value) for the 12-month period ended August 31, 2008. The Lipper Intermediate U.S. Government Funds Average1 returned 5.24% for the period. The Fund’s benchmark, the Lehman Brothers Intermediate Government Index produced a total return of 7.73%.
Performance has lagged the benchmark throughout the year due to our underweight in U.S. Treasury securities and overweight in spread product versus the Lehman Brothers U.S. Government Intermediate Index. While we have intermittently benefited from this strategy throughout the past 12 months, the flight to quality trade (i.e., Treasury securities) has dominated the market due to economic weakness, stress in the capital markets and geopolitical unrest. Our Treasury allocation in the Fund is 23.89% versus the 66.09% allocation in the Lehman Brothers Government Intermediate Index.†
Strategy
Portfolio strategy continue to focus on high quality, income-producing government or government sponsored Agency securities with a minor allocation to credit. Going forward we expect to maintain a relatively neutral duration strategy in this Fund.†
Investment Considerations:
Bonds offer a relatively stable level of income, although bond prices will fluctuate providing the potential for principal gain or loss. Intermediate-term, higher-quality bonds generally offer less risk than longer-term bonds and a lower rate of return.
1 | The Lipper Intermediate U.S. Government Funds Average is an equally weighted average consisting of managed mutual funds that invest at least 65% of their assets in securities issued or guaranteed by the U.S. government, its agencies, or its instrumentalities, with dollar-weighted average maturities of five to ten years. |
† | Portfolio composition is subject to change. |
Past performance does not guarantee future results. Performance data quoted represents past performance and current returns may be lower or higher. Total return figures include change in share price, reinvestment of dividends and capital gains. The investment return and net asset value will fluctuate so that an investor’s shares, when redeemed, may be worth more or less than the original cost. For performance data current to the most recent month end, visit our website at www.capitalone.com or call 1-800-999-0426.
ANNUAL REPORT
12
Table of Contents
Capital One U.S. Government Income Fund (Unaudited)
PERFORMANCE as of August 31, 2008
Assumes a $10,000 investment in the Fund.
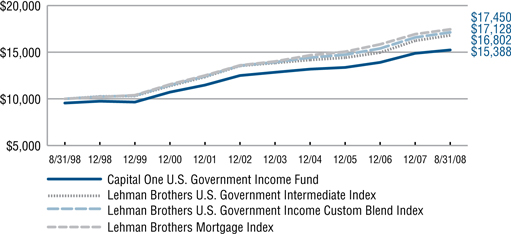
Performance data quoted represents past performance which is no guarantee of future results. The above graph assumes an initial hypothetical investment of $10,000 from August 31, 1998 to August 31, 2008 and includes changes in share price, reinvestment of dividends and capital gains and does not reflect taxes that a shareholder would pay on fund distributions or on the redemption of fund shares. The calculation assumes the 3.00% maximum sales charge applicable to the Fund.
PERFORMANCE as of August 31, 2008
| AVERAGE ANNUAL TOTAL RETURN | NET EXPENSE RATIO† | GROSS EXPENSE RATIO† | ||||||||||||||||||
| Inception Date | 1-Year | 3-Year | 5-Year | 10-Year | ||||||||||||||||
U.S. Government Income Fund* | 10/14/88 | 2.92 | % | 3.33 | % | 3.24 | % | 4.40 | % | 0.62 | % | 0.96 | % | |||||||
Lehman Brothers U.S. Government Intermediate Index | 7.73 | % | 5.19 | % | 4.35 | % | 5.33 | % | ||||||||||||
Lehman Brothers U.S. Government Income Blend Index | 7.39 | % | 5.14 | % | 4.70 | % | 5.53 | % | ||||||||||||
Lehman Brothers Mortgage Index | 7.03 | % | 5.08 | % | 5.04 | % | 5.73 | % | ||||||||||||
Past performance does not guarantee future results. The performance data quoted represents past performance and current returns may be lower or higher. The investment return and net asset value will fluctuate so that an investor’s shares, when redeemed may be worth more or less than the original cost. To obtain performance information current to the most recent month end, call 1-800-999-0426.
The performance above reflects any fee reductions in effect for the periods presented. Voluntary fee reductions may be discontinued at any time. If such fee reductions had not occurred, the quoted performance would be lower.
| * | Reflects 3.00% maximum sales charge. |
| † | The above expense ratios are from the Fund’s prospectus dated December 14, 2007. Additional information pertaining to the Fund’s expense ratios as of August 31, 2008 can be found in the Financial Highlights. |
The performance of the Capital One U.S. Government Income Fund is measured against the Lehman Brothers Intermediate Government Index, the Lehman Brothers U.S. Government Income Blend Index (which consists of a blend of 50% of the Lehman Brothers Intermediate Government Index and 50% of the Lehman Brothers Mortgage Index) and the Lehman Brothers Mortgage Index. The Lehman Brothers Intermediate Government Index is comprised of all publicly issued, non-convertible domestic debt of the U.S. government or any agency thereof, or any quasi-federal corporation and of corporate debt guaranteed by the U.S. government. Only notes and bonds with minimum outstanding principal of $1 million and minimum maturity of one year and maximum maturity of ten years are included. The Lehman Brothers Mortgage Index is a broad-based index that represents the general performance of fixed rate mortgage bonds. These indices are unmanaged and do not reflect the deduction of fees which are associated with a mutual fund, such as investment management and fund accounting fees. The Fund’s performance reflects the deduction of fees for these services. Investors cannot invest directly in an index.
The Capital One Funds are distributed by Foreside Distribution Services, L.P. Capital One Asset Management, LLC is the Investment Adviser and Capital One, N.A. is the custodian to the Capital One Funds and receives compensation for their services.
ANNUAL REPORT
13
Table of Contents
Capital One Funds—Financial Highlights
(For a share outstanding throughout each period)
| Investment Activities | Dividends | Ratios to Average Net Assets | |||||||||||||||||||||||||||||||||||||||||||
Year | Net Asset Value, Beginning of Period | Net Investment Income (Loss) | Net Realized and Unrealized Gain (Loss) on Investments | Total from Investment Operations | Distributions from Net Investment Income | Return of Capital | Distributions from Net Realized Gain on Investments | Total Distributions | Net Asset Value, End of Period | Total Return1 | Net Expenses | Net Investment Income (Loss) | Expense Waiver2 | Net Assets, End of Period (000 omitted) | Portfolio Turnover Rate† | ||||||||||||||||||||||||||||||
Capital Appreciation Fund—Class A Shares |
| ||||||||||||||||||||||||||||||||||||||||||||
2008 | $ | 16.19 | 0.10 | 3 | (1.21 | ) | (1.11 | ) | (0.10 | ) | — | (0.85 | ) | (0.95 | ) | $ | 14.13 | (7.38 | )% | 1.25 | % | 0.67 | % | 0.04 | % | $ | 120,847 | 51 | % | ||||||||||||||||
2007 | $ | 19.11 | 0.09 | 3 | 2.59 | 2.68 | (0.10 | ) | — | (5.50 | ) | (5.60 | ) | $ | 16.19 | 14.81 | % | 1.24 | % | 0.47 | % | — | $ | 171,380 | 42 | % | |||||||||||||||||||
2006 | $ | 19.42 | 0.11 | 3 | 1.17 | 1.28 | (0.08 | ) | — | (1.51 | ) | (1.59 | ) | $ | 19.11 | 6.98 | % | 1.25 | % | 0.57 | % | — | $ | 224,576 | 51 | % | |||||||||||||||||||
2005 | $ | 18.31 | 0.13 | 3 | 2.26 | 2.39 | (0.15 | ) | — | (1.13 | ) | (1.28 | ) | $ | 19.42 | 13.44 | % | 1.26 | % | 0.70 | % | — | $ | 240,297 | 32 | % | |||||||||||||||||||
2004 | $ | 17.82 | 0.08 | 3 | 1.62 | 1.70 | (0.07 | ) | — | (1.14 | ) | (1.21 | ) | $ | 18.31 | 9.87 | % | 1.25 | % | 0.41 | % | — | $ | 239,871 | 22 | % | |||||||||||||||||||
Capital Appreciation Fund—Class B Shares |
| ||||||||||||||||||||||||||||||||||||||||||||
2008 | $ | 14.87 | (0.01 | )3 | (1.10 | ) | (1.11 | ) | (0.02 | ) | — | (0.85 | ) | (0.87 | ) | $ | 12.89 | (8.06 | )% | 2.00 | % | (0.07 | )% | 0.04 | % | $ | 2,673 | 51 | % | ||||||||||||||||
2007 | $ | 17.99 | (0.05 | )3 | 2.44 | 2.39 | (0.01 | ) | — | (5.50 | ) | (5.51 | ) | $ | 14.87 | 13.98 | % | 1.99 | % | (0.28 | )% | — | $ | 4,518 | 42 | % | |||||||||||||||||||
2006 | $ | 18.42 | (0.03 | )3 | 1.11 | 1.08 | — | — | (1.51 | ) | (1.51 | ) | $ | 17.99 | 6.20 | % | 2.00 | % | (0.17 | )% | — | $ | 6,148 | 51 | % | ||||||||||||||||||||
2005 | $ | 17.42 | (0.01 | )3 | 2.14 | 2.13 | — | — | (1.13 | ) | (1.13 | ) | $ | 18.42 | 12.56 | % | 2.01 | % | (0.04 | )% | — | $ | 9,077 | 32 | % | ||||||||||||||||||||
2004 | $ | 17.06 | (0.06 | )3 | 1.56 | 1.50 | — | — | (1.14 | ) | (1.14 | ) | $ | 17.42 | 9.08 | % | 2.00 | % | (0.34 | )% | — | $ | 11,981 | 22 | % | ||||||||||||||||||||
Louisiana Municipal Income Fund—Class A Shares |
| ||||||||||||||||||||||||||||||||||||||||||||
2008 | $ | 10.62 | 0.36 | 3 | 0.15 | 0.51 | (0.36 | ) | — | (0.04 | ) | (0.40 | ) | $ | 10.73 | 4.91 | % | 0.73 | % | 3.39 | % | 0.34 | % | $ | 37,948 | 71 | % | ||||||||||||||||||
2007 | $ | 10.76 | 0.40 | (0.13 | ) | 0.27 | (0.38 | ) | — | (0.03 | ) | (0.41 | ) | $ | 10.62 | 2.61 | % | 0.80 | % | 3.68 | % | 0.33 | % | $ | 46,957 | 69 | % | ||||||||||||||||||
2006 | $ | 11.26 | 0.40 | (0.17 | ) | 0.23 | (0.40 | ) | — | (0.33 | ) | (0.73 | ) | $ | 10.76 | 2.19 | % | 0.77 | % | 3.64 | % | 0.36 | % | $ | 60,324 | 10 | % | ||||||||||||||||||
2005 | $ | 11.36 | 0.46 | (0.07 | ) | 0.39 | (0.46 | ) | — | (0.03 | ) | (0.49 | ) | $ | 11.26 | 3.49 | % | 0.76 | % | 3.98 | % | 0.34 | % | $ | 75,298 | 53 | % | ||||||||||||||||||
2004 | $ | 11.21 | 0.48 | 0.17 | 0.65 | (0.47 | ) | — | (0.03 | ) | (0.50 | ) | $ | 11.36 | 5.88 | % | 0.75 | % | 4.20 | % | 0.33 | % | $ | 78,288 | 11 | % | |||||||||||||||||||
Louisiana Municipal Income Fund—Class B Shares |
| ||||||||||||||||||||||||||||||||||||||||||||
2008 | $ | 10.63 | 0.27 | 3 | 0.15 | 0.42 | (0.27 | ) | — | (0.04 | ) | (0.31 | ) | $ | 10.74 | 4.01 | % | 1.58 | % | 2.54 | % | 0.24 | % | $ | 1,571 | 71 | % | ||||||||||||||||||
2007 | $ | 10.77 | 0.31 | (0.13 | ) | 0.18 | (0.29 | ) | — | (0.03 | ) | (0.32 | ) | $ | 10.63 | 1.75 | % | 1.65 | % | 2.83 | % | 0.23 | % | $ | 1,907 | 69 | % | ||||||||||||||||||
2006 | $ | 11.27 | 0.30 | (0.16 | ) | 0.14 | (0.31 | ) | — | (0.33 | ) | (0.64 | ) | $ | 10.77 | 1.32 | % | 1.62 | % | 2.79 | % | 0.26 | % | $ | 2,672 | 10 | % | ||||||||||||||||||
2005 | $ | 11.37 | 0.36 | (0.07 | ) | 0.29 | (0.36 | ) | — | (0.03 | ) | (0.39 | ) | $ | 11.27 | 2.60 | % | 1.61 | % | 3.13 | % | 0.24 | % | $ | 3,342 | 53 | % | ||||||||||||||||||
2004 | $ | 11.21 | 0.38 | 0.19 | 0.57 | (0.38 | ) | — | (0.03 | ) | (0.41 | ) | $ | 11.37 | 5.08 | % | 1.60 | % | 3.35 | % | 0.23 | % | $ | 3,569 | 11 | % | |||||||||||||||||||
Mid Cap Equity Fund—Class A Shares |
| ||||||||||||||||||||||||||||||||||||||||||||
2008 | $ | 18.01 | 0.01 | 3 | (1.57 | ) | (1.56 | ) | (0.00 | )4 | (0.04 | ) | (2.11 | ) | (2.15 | ) | $ | 14.30 | (9.43 | )% | 1.28 | % | 0.05 | % | 0.03 | % | $ | 85,081 | 73 | % | |||||||||||||||
2007 | $ | 17.70 | 0.05 | 3 | 2.24 | 2.29 | (0.04 | ) | — | (1.94 | ) | (1.98 | ) | $ | 18.01 | 13.69 | % | 1.26 | % | 0.25 | % | — | $ | 157,805 | 54 | % | |||||||||||||||||||
2006 | $ | 17.70 | 0.02 | 3 | 0.82 | 0.84 | (0.04 | ) | — | (0.80 | ) | (0.84 | ) | $ | 17.70 | 4.97 | % | 1.30 | % | 0.13 | % | — | $ | 132,247 | 50 | % | |||||||||||||||||||
2005 | $ | 14.39 | 0.03 | 3 | 4.00 | 4.03 | — | — | (0.72 | ) | (0.72 | ) | $ | 17.70 | 28.80 | % | 1.36 | % | 0.20 | % | — | $ | 123,321 | 37 | % | ||||||||||||||||||||
2004 | $ | 12.92 | (0.02 | )3 | 1.56 | 1.54 | — | — | (0.07 | ) | (0.07 | ) | $ | 14.39 | 12.01 | % | 1.45 | % | (0.14 | )% | — | $ | 74,783 | 51 | % | ||||||||||||||||||||
Mid Cap Equity Fund—Class B Shares |
| ||||||||||||||||||||||||||||||||||||||||||||
2008 | $ | 16.70 | (0.10 | )3 | (1.44 | ) | (1.54 | ) | — | — | (2.11 | ) | (2.11 | ) | $ | 13.05 | (10.11 | )% | 2.03 | % | (0.72 | )% | 0.03 | % | $ | 1,383 | 73 | % | |||||||||||||||||
2007 | $ | 16.62 | (0.09 | )3 | 2.11 | 2.02 | — | — | (1.94 | ) | (1.94 | ) | $ | 16.70 | 12.87 | % | 2.01 | % | (0.50 | )% | — | $ | 3,152 | 54 | % | ||||||||||||||||||||
2006 | $ | 16.75 | (0.10 | )3 | 0.77 | 0.67 | — | — | (0.80 | ) | (0.80 | ) | $ | 16.62 | 4.19 | % | 2.05 | % | (0.62 | )% | — | $ | 4,112 | 50 | % | ||||||||||||||||||||
2005 | $ | 13.75 | (0.09 | )3 | 3.81 | 3.72 | — | — | (0.72 | ) | (0.72 | ) | $ | 16.75 | 27.85 | % | 2.11 | % | (0.56 | )% | — | $ | 5,025 | 37 | % | ||||||||||||||||||||
2004 | $ | 12.44 | (0.12 | )3 | 1.50 | 1.38 | — | — | (0.07 | ) | (0.07 | ) | $ | 13.75 | 11.19 | % | 2.20 | % | (0.89 | )% | — | $ | 4,321 | 51 | % | ||||||||||||||||||||
| † | Portfolio turnover rate is calculated on the basis of the Fund as a whole without distinguishing between classes of shares issued. |
| 1 | Based on net asset value, which does not reflect the sales charge, redemption fee or contingent deferred sales charge, if applicable. |
| 2 | Expense waiver is reflected in both the net expense and net investment income (loss) ratios. |
| 3 | Based on average shares outstanding. |
| 4 | Represents less than $0.001. |
| 5 | The portfolio turnover rate significantly changed from the prior period due to a change in investment strategies that include the purchase of short-term versus long-term instruments. |
(See Notes to Financial Statements)
ANNUAL REPORT
14
Table of Contents
Capital One Funds—Financial Highlights (continued)
(For a share outstanding throughout each period)
| Investment Activities | Dividends | Ratios to Average Net Assets | |||||||||||||||||||||||||||||||||||
Year | Net Asset Value, Beginning of Period | Net Investment Income (Loss) | Net Realized and Unrealized Gain (Loss) on Investments | Total from Investment Operations | Distributions from Net Investment Income | Total Distributions | Net Asset Value, End of Period | Total Return1 | Net Expenses | Net Investment Income (Loss) | Expense Waiver2 | Net Assets, End of Period (000 omitted) | Portfolio Turnover Rate† | ||||||||||||||||||||||||
Total Return Bond Fund |
| ||||||||||||||||||||||||||||||||||||
2008 | $ | 9.33 | 0.41 | 0.10 | 0.51 | (0.42 | ) | (0.42 | ) | $ | 9.42 | 5.52 | % | 0.63 | % | 4.36 | % | 0.44 | % | $ | 44,681 | 38 | %5 | ||||||||||||||
2007 | $ | 9.38 | 0.43 | (0.05 | ) | 0.38 | (0.43 | ) | (0.43 | ) | $ | 9.33 | 4.17 | % | 0.82 | % | 4.51 | % | 0.40 | % | $ | 34,971 | 153 | % | |||||||||||||
2006 | $ | 9.78 | 0.41 | (0.38 | ) | 0.03 | (0.43 | ) | (0.43 | ) | $ | 9.38 | 0.37 | % | 0.91 | % | 4.33 | % | 0.27 | % | $ | 48,730 | 114 | % | |||||||||||||
2005 | $ | 9.89 | 0.38 | (0.05 | ) | 0.33 | (0.44 | ) | (0.44 | ) | $ | 9.78 | 3.39 | % | 0.98 | % | 3.92 | % | 0.41 | % | $ | 53,319 | 123 | % | |||||||||||||
2004 | $ | 9.98 | 0.41 | (0.05 | ) | 0.36 | (0.45 | ) | (0.45 | ) | $ | 9.89 | 3.72 | % | 1.01 | % | 4.08 | % | 0.40 | % | $ | 51,957 | 22 | % | |||||||||||||
U.S. Government Income Fund |
| ||||||||||||||||||||||||||||||||||||
2008 | $ | 9.86 | 0.43 | 0.16 | 0.59 | (0.46 | ) | (0.46 | ) | $ | 9.99 | 6.06 | % | 0.61 | % | 4.26 | % | 0.36 | % | $ | 78,147 | 73 | % | ||||||||||||||
2007 | $ | 9.82 | 0.45 | 0.04 | 0.49 | (0.45 | ) | (0.45 | ) | $ | 9.86 | 5.13 | % | 0.63 | % | 4.62 | % | 0.34 | % | $ | 90,214 | 76 | % | ||||||||||||||
2006 | $ | 10.07 | 0.44 | (0.25 | ) | 0.19 | (0.44 | ) | (0.44 | ) | $ | 9.82 | 2.01 | % | 0.73 | % | 4.52 | % | 0.34 | % | $ | 88,710 | 114 | % | |||||||||||||
2005 | $ | 10.30 | 0.38 | (0.16 | ) | 0.22 | (0.45 | ) | (0.45 | ) | $ | 10.07 | 2.14 | % | 0.74 | % | 3.74 | % | 0.33 | % | $ | 71,695 | 86 | % | |||||||||||||
2004 | $ | 10.30 | 0.38 | 0.03 | 0.41 | (0.41 | ) | (0.41 | ) | $ | 10.30 | 4.08 | % | 0.70 | % | 3.71 | % | 0.31 | % | $ | 82,231 | 29 | % | ||||||||||||||
Cash Reserve Fund—Class A Shares |
| ||||||||||||||||||||||||||||||||||||
2008 | $ | 1.00 | 0.032 | (0.000 | )4 | 0.032 | (0.032 | ) | (0.032 | ) | $ | 1.00 | 3.26 | % | 0.50 | % | 3.27 | % | 0.42 | % | $ | 176,538 | — | ||||||||||||||
2007 | $ | 1.00 | 0.047 | 0.000 | 4 | 0.047 | (0.047 | ) | (0.047 | ) | $ | 1.00 | 4.95 | % | 0.49 | % | 4.84 | % | 0.40 | % | $ | 222,375 | — | ||||||||||||||
2006 | $ | 1.00 | 0.040 | (0.000 | )4 | 0.040 | (0.040 | ) | (0.040 | ) | $ | 1.00 | 4.08 | % | 0.53 | % | 4.04 | % | 0.41 | % | $ | 179,836 | — | ||||||||||||||
2005 | $ | 1.00 | 0.019 | (0.000 | )4 | 0.019 | (0.019 | ) | (0.019 | ) | $ | 1.00 | 1.97 | % | 0.56 | % | 1.89 | % | 0.42 | % | $ | 134,356 | — | ||||||||||||||
2004 | $ | 1.00 | 0.005 | 0.000 | 4 | 0.005 | (0.005 | ) | (0.005 | ) | $ | 1.00 | 0.55 | % | 0.56 | % | 0.55 | % | 0.40 | % | $ | 166,616 | — | ||||||||||||||
Cash Reserve Fund—Class B Shares |
| ||||||||||||||||||||||||||||||||||||
2008 | $ | 1.00 | 0.031 | (0.000 | )4 | 0.031 | (0.031 | ) | (0.031 | ) | $ | 1.00 | 3.10 | % | 0.65 | % | 3.05 | % | 1.02 | % | $ | 421 | — | ||||||||||||||
2007 | $ | 1.00 | 0.047 | 0.000 | 4 | 0.047 | (0.047 | ) | (0.047 | ) | $ | 1.00 | 4.78 | % | 0.64 | % | 4.69 | % | 1.01 | % | $ | 400 | — | ||||||||||||||
2006 | $ | 1.00 | 0.039 | (0.000 | )4 | 0.039 | (0.039 | ) | (0.039 | ) | $ | 1.00 | 3.92 | % | 0.68 | % | 3.86 | % | 1.01 | % | $ | 395 | — | ||||||||||||||
2005 | $ | 1.00 | 0.018 | (0.000 | )4 | 0.018 | (0.018 | ) | (0.018 | ) | $ | 1.00 | 1.81 | % | 0.71 | % | 1.78 | % | 1.02 | % | $ | 387 | — | ||||||||||||||
2004 | $ | 1.00 | 0.003 | 0.001 | 0.004 | (0.004 | ) | (0.004 | ) | $ | 1.00 | 0.40 | % | 0.71 | % | 0.39 | % | 1.00 | % | $ | 417 | — | |||||||||||||||
U.S. Treasury Money Market Fund |
| ||||||||||||||||||||||||||||||||||||
2008 | $ | 1.00 | 0.025 | — | 0.025 | (0.025 | ) | (0.025 | ) | $ | 1.00 | 2.49 | % | 0.52 | % | 2.48 | % | 0.13 | % | $ | 99,481 | — | |||||||||||||||
2007 | $ | 1.00 | 0.048 | (0.000 | )4 | 0.048 | (0.048 | ) | (0.048 | ) | $ | 1.00 | 4.64 | % | 0.55 | % | 4.55 | % | 0.10 | % | $ | 104,496 | — | ||||||||||||||
2006 | $ | 1.00 | 0.036 | (0.000 | )4 | 0.036 | (0.036 | ) | (0.036 | ) | $ | 1.00 | 3.69 | % | 0.62 | % | 3.57 | % | 0.03 | % | $ | 156,318 | — | ||||||||||||||
2005 | $ | 1.00 | 0.017 | (0.000 | )4 | 0.017 | (0.017 | ) | (0.017 | ) | $ | 1.00 | 1.69 | % | 0.70 | % | 1.74 | % | — | $ | 204,027 | — | |||||||||||||||
2004 | $ | 1.00 | 0.003 | — | 0.003 | (0.003 | ) | (0.003 | ) | $ | 1.00 | 0.34 | % | 0.66 | % | 0.34 | % | — | $ | 152,264 | — | ||||||||||||||||
(See Notes to Financial Statements)
ANNUAL REPORT
15
Table of Contents
Capital One Funds—Shareholder Expense Example (Unaudited)
As a shareholder of the Capital One Funds (“Funds”), you incur two types of costs: (1) transaction costs, including sales charges (loads) on purchase or redemption payments; and (2) ongoing costs, including management fees; to the extent applicable, distribution (12b-1) fees and/or shareholder services fees; and other Fund expenses. These examples are intended to help you understand your ongoing costs (in dollars) of investing in the Funds and to compare these costs with the ongoing costs of investing in other mutual funds. These examples are based on an investment of $1,000 invested at the beginning of the period and held for the entire period from March 1, 2008 to August 31, 2008.
Actual Expenses
The first section of the table below provides information about actual account values and actual expenses. You may use the information below, together with the amount you invested, to estimate the expenses that you incurred over the period. Simply divide your account value by $1,000 (for example, an $8,600 account value divided by $1,000 = 8.6), then multiply the result by the number in the first section under the heading entitled “Expenses Paid During Period” to estimate the expenses attributable to your account during this period.
Hypothetical Example for Comparison Purposes
The second section of the table below provides information about hypothetical account values and hypothetical expenses based on the Funds’ actual expense ratios and an assumed rate of return of 5% per year before expenses, which are not the Funds’ actual returns. Thus, you should not use the hypothetical account values and expenses to estimate the actual ending account balance or your expenses for the period. Rather, these figures are required to be provided to enable you to compare the ongoing costs of investing in the Funds with other funds. To do this, compare this 5% hypothetical example with the 5% hypothetical examples that appear in the shareholder reports of the other funds.
Please note that the expenses shown in the table are meant to highlight your ongoing costs only and do not reflect any transactional costs, such as sales charges (loads) on purchases or redemption payments. Therefore, the hypothetical examples are useful in comparing ongoing costs only, and will not help you determine the relative total costs of owning different funds. In addition, if these transaction costs were included, your costs would have been higher.
| Beginning Account Value 3/1/08 | Ending Account Value 8/31/08 | Expenses Paid During Period1 | |||||||
Capital One Capital Appreciation Fund | |||||||||
Actual | |||||||||
Class A Shares | $ | 1,000.00 | $ | 964.20 | $ | 6.12 | |||
Class B Shares | $ | 1,000.00 | $ | 960.50 | $ | 9.81 | |||
Hypothetical (assuming a 5% return before expenses) | |||||||||
Class A Shares | $ | 1,000.00 | $ | 1,018.90 | $ | 6.29 | |||
Class B Shares | $ | 1,000.00 | $ | 1,015.13 | $ | 10.08 | |||
Capital One Louisiana Municipal Income Fund | |||||||||
Actual | |||||||||
Class A Shares | $ | 1,000.00 | $ | 1,038.50 | $ | 3.74 | |||
Class B Shares | $ | 1,000.00 | $ | 1,035.00 | $ | 8.08 | |||
Hypothetical (assuming a 5% return before expenses) | |||||||||
Class A Shares | $ | 1,000.00 | $ | 1,021.47 | $ | 3.71 | |||
Class B Shares | $ | 1,000.00 | $ | 1,017.19 | $ | 8.01 | |||
Capital One Mid Cap Equity Fund | |||||||||
Actual | |||||||||
Class A Shares | $ | 1,000.00 | $ | 1,009.30 | $ | 6.57 | |||
Class B Shares | $ | 1,000.00 | $ | 1,005.40 | $ | 10.33 | |||
Hypothetical (assuming a 5% return before expenses) | |||||||||
Class A Shares | $ | 1,000.00 | $ | 1,018.60 | $ | 6.60 | |||
Class B Shares | $ | 1,000.00 | $ | 1,014.83 | $ | 10.38 | |||
Capital One Total Return Bond Fund | |||||||||
Actual | $ | 1,000.00 | $ | 999.10 | $ | 2.96 | |||
Hypothetical (assuming a 5% return before expenses) | $ | 1,000.00 | $ | 1,022.17 | $ | 3.00 | |||
Capital One U.S. Government Income Fund | |||||||||
Actual | $ | 1,000.00 | $ | 1,004.20 | $ | 3.12 | |||
Hypothetical (assuming a 5% return before expenses) | $ | 1,000.00 | $ | 1,022.02 | $ | 3.15 | |||
Capital One Cash Reserve Fund | |||||||||
Actual | |||||||||
Class A Shares | $ | 1,000.00 | $ | 1,010.90 | $ | 2.53 | |||
Class B Shares | $ | 1,000.00 | $ | 1,010.10 | $ | 3.28 | |||
Hypothetical (assuming a 5% return before expenses) | |||||||||
Class A Shares | $ | 1,000.00 | $ | 1,022.62 | $ | 2.54 | |||
Class B Shares | $ | 1,000.00 | $ | 1,021.87 | $ | 3.30 | |||
Capital One U.S. Treasury Money Market Fund | |||||||||
Actual | $ | 1,000.00 | $ | 1,007.70 | $ | 2.67 | |||
Hypothetical (assuming a 5% return before expenses) | $ | 1,000.00 | $ | 1,022.47 | $ | 2.69 | |||
| 1 | Expenses are equal to the Funds’ annualized net expense ratios, multiplied by the average account value over the period, multiplied by 184/366 (to reflect the one-half year period). |
ANNUAL REPORT
16
Table of Contents
Capital One Funds—Shareholder Expense Example (Unaudited) (continued)
The annualized net expense ratios were as follows:
| Funds Annualized Expense Ratio | |||
Capital One Capital Appreciation Fund | |||
Class A Shares | 1.24 | % | |
Class B Shares | 1.99 | % | |
Capital One Louisiana Municipal Income Fund | |||
Class A Shares | 0.73 | % | |
Class B Shares | 1.58 | % | |
Capital One Mid Cap Equity Fund | |||
Class A Shares | 1.30 | % | |
Class B Shares | 2.05 | % | |
Capital One Total Return Bond Fund | 0.59 | % | |
Capital One U.S. Government Income Fund | 0.62 | % | |
Capital One Cash Reserve Fund | |||
Class A Shares | 0.50 | % | |
Class B Shares | 0.65 | % | |
Capital One U.S. Treasury Money Market Fund | 0.53 | % |
ANNUAL REPORT
17
Table of Contents
Capital One Capital Appreciation Fund—Portfolio of Investments Summary Table (Unaudited)
At August 31, 2008, the Fund’s Portfolio composition was as follows:
Investment Type | Percentage of Total Net Assets | ||
Energy Minerals | 13.4 | % | |
Finance | 12.5 | % | |
Consumer Non-Durables | 9.1 | % | |
Electronic Technology | 8.0 | % | |
Health Technology | 6.7 | % | |
Producer Manufacturing | 6.2 | % | |
Communications | 5.1 | % | |
Retail Trade | 5.1 | % | |
Consumer Services | 4.6 | % | |
Distribution Services | 4.6 | % | |
Insurance | 4.6 | % | |
Technology Services | 4.2 | % | |
Industrial Services | 3.8 | % | |
Health Services | 2.4 | % | |
Commercial Services | 2.2 | % | |
Transportation | 2.2 | % | |
Metal | 1.7 | % | |
Process Industrials | 1.2 | % | |
Human Resources | 0.8 | % | |
Utilities | 0.6 | % | |
Consumer Durables | 0.5 | % | |
Cash Equivalents1 | 0.4 | % | |
Other Assets and Liabilities-Net2 | 0.1 | % | |
TOTAL | 100.0 | % | |
| 1 | Cash Equivalents include any investments in money market mutual funds. |
| 2 | Assets, other than investments in securities, less liabilities. See Statements of Assets and Liabilities. |
ANNUAL REPORT
18
Table of Contents
Capital One Capital Appreciation Fund—Portfolio of Investments
As of August 31, 2008
Shares | Security Description | Value($) | ||
| COMMON STOCKS — 99.5% | ||||
| Commercial Services — 2.2% | ||||
| 33,650 | Accenture, Ltd., Class A | 1,391,764 | ||
| 5,420 | MasterCard, Inc., Class A | 1,314,621 | ||
| 2,706,385 | ||||
| Communications — 5.1% | ||||
| 50,000 | AT&T, Inc. | 1,599,500 | ||
| 21,710 | Research In Motion, Ltd.1 | 2,639,936 | ||
| 58,000 | Verizon Communications, Inc. | 2,036,960 | ||
| 6,276,396 | ||||
| Consumer Durables — 0.5% | ||||
| 130,650 | Ford Motor Co.1 | 582,699 | ||
| Consumer Non-Durables — 9.1% | ||||
| 18,170 | Bunge, Ltd | 1,623,671 | ||
| 39,110 | Colgate-Palmolive Co. | 2,973,533 | ||
| 21,780 | Crown Holdings, Inc.1 | 604,177 | ||
| 12,570 | Nike, Inc. , Class B | 761,868 | ||
| 39,860 | Philip Morris International, Inc | 2,140,482 | ||
| 59,050 | The Coca-Cola Co | 3,074,734 | ||
| 11,178,465 | ||||
| Consumer Services — 4.6% | ||||
| 13,660 | Marvel Entertainment, Inc.1 | 462,664 | ||
| 42,870 | McDonald’s Corp. | 2,660,083 | ||
| 80,970 | The Walt Disney Co. | 2,619,380 | ||
| 5,742,127 | ||||
| Distribution Services — 4.6% | ||||
| 30,670 | Grainger (W.W.), Inc. | 2,761,220 | ||
| 51,290 | McKesson HBOC, Inc. | 2,963,536 | ||
| 5,724,756 | ||||
| Electronic Technology — 8.0% | ||||
| 9,970 | Adobe Systems, Inc.1 | 427,015 | ||
| 24,930 | Apple Computer, Inc.1 | 4,226,383 | ||
| 51,140 | Hewlett-Packard Co | 2,399,489 | ||
| 25,800 | MEMC Electronic Materials, Inc.1 | 1,266,522 | ||
| 63,340 | Texas Instruments, Inc. | 1,552,463 | ||
| 9,871,872 | ||||
| Energy Minerals — 13.4% | ||||
| 2,835 | Alpha Natural Resources, Inc.1 | 280,948 | ||
| 20,510 | Apache Corp. | 2,345,934 | ||
| 20,480 | Chevron Corp | 1,767,834 | ||
| 35,000 | ConocoPhillips | 2,887,850 | ||
| 45,100 | El Paso Corp. | 755,876 | ||
| 45,000 | Exxon Mobil Corp. | 3,600,450 | ||
| 4,200 | First Solar, Inc.1 | 1,161,930 | ||
| 11,020 | Murphy Oil Corp. | 865,401 | ||
| 70,150 | Public Service Enterprise Group, Inc. | 2,860,015 | ||
| 16,526,238 | ||||
| Finance — 12.5% | ||||
| 40,000 | Bank of America Corp. | 1,245,600 | ||
| 27,760 | Equity Residential, REIT | 1,171,472 | ||
| 13,170 | Franklin Resources, Inc. | 1,376,265 | ||
| 11,670 | Goldman Sachs Group, Inc. | 1,913,530 | ||
| 49,290 | JPMorgan Chase & Co. | 1,897,172 | ||
| 23,850 | Northern Trust Corp. | 1,917,301 | ||
| 35,510 | State Street Corp. | 2,402,962 | ||
| 38,990 | The NASDAQ OMX Group, Inc.1 | 1,274,583 | ||
| 70,010 | U.S. Bancorp | 2,230,519 | ||
| 15,429,404 | ||||
| Health Services — 2.4% | ||||
| 36,470 | Endo Pharmaceuticals Holdings, Inc.1 | 828,598 | ||
| 21,760 | Genentech, Inc.1 | 2,148,800 | ||
| 2,977,398 | ||||
| Health Technology — 6.7% | ||||
| 32,280 | Baxter International, Inc. | 2,187,293 | ||
| 11,000 | Invitrogen Corp.1 | 467,060 | ||
| 51,470 | Johnson & Johnson, Inc. | 3,625,032 | ||
| 36,480 | Merck & Co., Inc. | 1,301,241 | ||
| 14,560 | St. Jude Medical, Inc.1 | 667,285 | ||
| 8,247,911 | ||||
| Human Resources — 0.8% | ||||
| 20,000 | Manpower, Inc. | 961,200 | ||
| Industrial Services — 3.8% | ||||
| 13,480 | CF Industries Holdings, Inc. | 2,054,352 | ||
| 17,860 | FMC Technologies, Inc.1 | 956,582 | ||
| 12,480 | Foster Wheeler, Ltd.1 | 620,131 | ||
| 8,760 | Transocean, Inc.1 | 1,114,272 | ||
| 4,745,337 | ||||
| Insurance — 4.6% | ||||
| 58,120 | Chubb Corp. | 2,790,341 | ||
| 27,460 | McDermott International, Inc.1 | 953,686 | ||
| 44,420 | Travelers Cos., Inc. | 1,961,587 | ||
| 5,705,614 | ||||
| Metal — 1.7% | ||||
| 8,960 | AK Steel Holding Corp. | 471,386 | ||
| 22,620 | Express Scripts, Inc., Class A1 | 1,660,534 | ||
| 2,131,920 | ||||
| Process Industrials — 1.2% | ||||
| 12,530 | Monsanto Co. | 1,431,553 | ||
| Producer Manufacturing — 6.2% | ||||
| 18,260 | Deere & Co. | 1,288,608 | ||
| 68,160 | Honeywell International, Inc. | 3,419,588 | ||
| 3,857 | John Bean Technologies Corp.1 | 50,141 | ||
| 25,430 | Lockheed Martin Corp | 2,961,069 | ||
| 7,719,406 | ||||
Continued
ANNUAL REPORT
19
Table of Contents
Capital One Capital Appreciation Fund—Portfolio of Investments (continued)
As of August 31, 2008
Shares | Security Description | Value($) | |||
| COMMON STOCKS — CONTINUED | |||||
| Retail Trade — 5.1% | |||||
| 19,610 | Costco Wholesale Corp | 1,315,047 | |||
| 43,940 | CVS Corp. | 1,608,204 | |||
| 58,290 | TJX Cos., Inc | 2,112,429 | |||
| 22,260 | Wal-Mart Stores, Inc. | 1,314,898 | |||
| 6,350,578 | |||||
| Technology Services — 4.2% | |||||
| 18,950 | BMC Software, Inc.1 | 617,012 | |||
| 2,560 | Google, Inc.1 | 1,186,022 | |||
| 69,120 | Microsoft Corp. | 1,886,285 | |||
| 66,980 | Oracle Corp.1 | 1,468,872 | |||
| 5,158,191 | |||||
| Transportation — 2.2% | |||||
| 99,160 | Southwest Airlines Co. | 1,510,207 | |||
| 13,900 | Union Pacific Corp. | 1,166,210 | |||
| 2,676,417 | |||||
| Utilities — 0.6% | |||||
| 17,190 | Edison International | 789,365 | |||
| TOTAL COMMON STOCKS (Identified cost $98,306,009) | 122,933,232 | ||||
| MUTUAL FUND — 0.4% | |||||
| 443,019 | Fidelity Institutional Cash Treasury Money Market Fund - I Shares, 1.86%2 | 443,019 | |||
| TOTAL MUTUAL FUND (Identified cost $443,019) | 443,019 | ||||
| TOTAL INVESTMENTS — 99.9% (Identified cost $98,749,028) | 123,376,251 | ||||
| OTHER ASSETS AND LIABILITIES-NET — 0.1% | 144,149 | ||||
| TOTAL NET ASSETS — 100.0% | $ | 123,520,400 | |||
| 1 | Non-income producing security. |
| 2 | Rate disclosed is as of August 31, 2008. |
REIT—Real Estate Investment Trust
(See Notes to Financial Statements)
ANNUAL REPORT
20
Table of Contents
Capital One Louisiana Municipal Income Fund—Portfolio of Investments Summary Table (Unaudited)
At August 31, 2008, the Fund’s Portfolio composition was as follows1:
Investment Type | Percentage of Total Investments | ||
Public Schools | 21.3 | % | |
Local Government—Revenue | 21.0 | % | |
Cash Equivalents | 18.7 | % | |
Public Utilities | 11.0 | % | |
Local Government—General Obligations | 9.4 | % | |
Higher Education | 6.4 | % | |
Transportation | 2.8 | % | |
Health Facilities | 2.7 | % | |
All Others | 6.6 | % | |
TOTAL | 100.0 | % | |
| 1 | Sector classifications, and the assignment of holdings to such sectors, are based upon economic sector and/or revenue source of the underlying obligor, as determined by the Fund’s adviser. For securities that have been enhanced by a third-party (other than a bond issuer), such as guarantor, sector classifications are based upon economic sector and/or revenue source of the third-party as determined by the Fund’s adviser. Securities that are issued by a bond insurer are assigned to the “Insured” sector. Prerefunded securities are those whose debt service is paid from escrowed assets, usually U.S. government securities. |
ANNUAL REPORT
21
Table of Contents
Capital One Louisiana Municipal Income Fund—Portfolio of Investments
As of August 31, 2008
Principal | Security Description | Value($) | ||
| MUNICIPAL BONDS — 80.9% | ||||
| Georgia — 2.0% | ||||
| 775,000 | Macon, GA, Water Authority, Water & Sewer Revenue, 5.25%, (Original Issue Yield: 4.87%), 10/1/2014 | 792,972 | ||
| Kansas — 0.9% | ||||
| 365,000 | Wyandotte County, KS, School District No.204 Bonner Springs, GO, (Series A), 6.38%, (FSA INS), (Original Issue Yield: 4.90%), 9/1/2008 | 365,041 | ||
| �� | ||||
| Louisiana — 66.7% | ||||
| 1,035,000 | Bossier Parish, LA, School Board Sales & Use Tax, Revenue Bonds, 4.50%, (Assured Guaranty), (Original Issue Yield: 3.51%), 4/1/2013 | 1,081,761 | ||
| 555,000 | Caddo Parish, LA, Parish Wide School District, GO, 5.00%, (CIFG INS), (Original Issue Yield: 3.77%), 3/1/2014 | 597,768 | ||
| 1,070,000 | Caddo Parish, LA, Parish Wide School District, GO, (Series A), 5.25%, (FSA INS), (Original Issue Yield: 3.86%), 3/1/2015 | 1,191,723 | ||
| 1,000,000 | East Baton Rouge Parish, LA, Revenue Bonds, 4.50%, (MBIA INS), (Original Issue Yield: 4.50%), 2/1/2013 | 1,071,300 | ||
| 1,265,000 | East Baton Rouge, LA, Sewer Commission, (Series A), 5.00%, (FSA INS), (Original Issue Yield: 4.05%), 2/1/2015 | 1,385,668 | ||
| 585,000 | Ernest N Morial-New Orleans, LA, Exhibit Hall Authority, Special Tax, (Sub-series A), 5.00%, (AMBAC INS), (Original Issue Yield: 3.06%), 7/15/2009 | 601,128 | ||
| 545,000 | Hammond, LA, Sales & Use Tax, Revenue Bonds, 4.00%, (CIFG INS), (Original Issue Yield: 3.40%), 12/1/2010 | 560,625 | ||
| 755,000 | Iberia Parish, LA, Parish Wide School District, GO, 5.50%, (MBIA INS), (Original Issue Yield: 4.13%), 3/1/2013 | 826,393 | ||
| 205,000 | Jefferson, LA, Sales Tax District, Special Sales Tax Revenue, 5.00%, (AMBAC INS), (Original Issue Yield: 3.45%), 12/1/2012 | 219,832 | ||
| 1,150,000 | Jefferson, LA, Sales Tax District, Special Sales Tax Revenue, (Series B), 5.00%, (AMBAC INS), (Original Issue Yield: 4.08%), 12/1/2013 | 1,240,057 | ||
| 300,000 | Jefferson, LA, Sales Tax District, Special Sales Tax Revenue, 5.00%, (FSA INS), (Original Issue Yield: 5.20%), 12/1/2018 | 305,652 | ||
| 250,000 | Lafayette, LA, Public Improvement Sales Tax, (Series C), 5.00%, (AMBAC INS), (Original Issue Yield: 3.69%), 5/1/2014 | 273,068 | ||
| 1,655,000 | Lafayette, LA, Public Power Authority Electric, Revenue Bonds, (Series B), 5.00%, (AMBAC INS), (Original Issue Yield: 3.22%), 11/1/2011 | 1,749,749 | ||
| 1,000,000 | Lafourche Parish, LA, Consolidated School District, No. 1 Parish Wide, 5.00%, (MBIA INS), (Original Issue Yield: 3.99%), 2/1/2015 | 1,079,910 | ||
| 320,000 | Louisiana Local Government Environmental Facilities Community Development Authority, Revenue Bonds, 4.00%, (Shreveport Utility System Project), (MBIA INS), (Original Issue Yield: 3.80%), 12/1/2014 | 324,874 | ||
| 1,000,000 | Louisiana Local Government Environmental Facilities Community Development Authority, Revenue Bonds, 5.00%, (AMBAC GTD), (Original Issue Yield: 4.30%), 3/1/2015 | 1,056,200 | ||
| 1,405,000 | Louisiana Local Government Environmental Facilities Community Development Authority, Revenue Bonds, 5.00%, (AMBAC INS), (Original Issue Yield: 3.91%), 12/1/2016 | 1,502,366 | ||
| 1,000,000 | Louisiana PFA, Revenue Bonds, (Series A), 5.00%, (Original Issue Yield: 4.49%), 5/15/2012 | 1,039,890 | ||
| 1,260,000 | Louisiana PFA, Revenue Bonds, 5.00%, (Department Public Safety Project), (FSA INS), (Original Issue Yield: 3.73%), 8/1/2015 | 1,385,257 | ||
| 500,000 | Louisiana PFA, Revenue Bonds, (Series A1), 5.00%, (Tulane University Project, LA), (MBIA INS), (Original Issue Yield: 4.12%), 2/15/2021 | 518,705 | ||
| 225,000 | Louisiana PFA, Revenue Refunding Bonds, (Series A), 5.00%, (AMBAC INS), (Original Issue Yield: 3.19%), 7/1/2032 | 243,529 | ||
| 785,000 | Louisiana State Military Department, Revenue Bonds, 5.00%, (Original Issue Yield: 4.40%), 8/1/2012 | 828,520 | ||
| 1,000,000 | Louisiana State University and Agricultural and Mechanical College Board, (Auxiliary Series A), 5.00%, (AMBAC INS), (Original Issue Yield: 3.76%), 7/1/2015 | 1,095,580 | ||
| 575,000 | Louisiana State University and Agricultural and Mechanical College Board, Revenue Bonds, 5.00%, (Auxiliary), (FSA INS), (Original Issue Yield: 3.43%), 7/1/2012 | 621,155 | ||
| 600,000 | Louisiana State, GO UT, (Series A), 4.00%, (FGIC INS), (Original Issue Yield: 4.10%), 4/1/2011 | 620,292 | ||
| 1,000,000 | Louisiana State, GO UT, (Series A), 5.00%, (MBIA INS), (Original Issue Yield: 3.66%), 8/1/2014 | 1,089,010 | ||
| 800,000 | Louisiana State, GO UT, (Series A), 5.00%, (FGIC INS), (Original Issue Yield: 5.42%), 11/15/2019 | 847,528 | ||
| 780,000 | Ouachita Parish, LA, East Ouachita Parish School District, GO UT, 5.75%, (FGIC INS), (Original Issue Yield: 5.81%), 3/1/2021 | 823,001 | ||
| 1,020,000 | Ouachita Parish, LA, East Ouachita Parish School District, GO UT, 5.75%, (FGIC INS), (Original Issue Yield: 5.85%), 3/1/2024 | 1,076,233 | ||
| 1,000,000 | Shreveport LA, (Series B), 5.00%, (FSA INS), (Original Issue Yield: 3.96%), 3/1/2016 | 1,100,340 | ||
| 26,357,114 | ||||
| Michigan — 3.9% | ||||
| 1,500,000 | Charlotte, MI, Public School District, GO, 5.25%, (FGIC INS), (Original Issue Yield: 5.45%), 5/1/2025 | 1,535,940 | ||
| New Hampshire — 1.0% | ||||
| 400,000 | Manchester, NH, New Public Housing Authority, Revenue Bonds, 6.00%, U.S. Govt. GTD, 9/1/2008 | 400,048 | ||
| Texas — 6.4% | ||||
| 1,000,000 | Harris County, TX, Flood Control District, GO, (Series A), 3.00%, (Original Issue Yield: 2.56%), 10/1/2008 | 1,001,144 | ||
| 1,500,000 | Texas State, Tax & Revenue Anticipation Notes, 3.00%, | |||
8/28/2009 | 1,521,014 | |||
| 2,522,158 | ||||
Continued
ANNUAL REPORT
22
Table of Contents
Capital One Louisiana Municipal Income Fund—Portfolio of Investments (continued)
As of August 31, 2008
Principal Amount($) of Shares | Security Description | Value($) | |||
| MUNICIPAL BONDS — CONTINUED | |||||
| TOTAL MUNICIPAL BONDS (Identified cost $31,555,488) | 31,973,273 | ||||
| MUTUAL FUNDS — 5.6% | |||||
| 1,582,000 | Federated Tax-Free Obligations Fund, 1.49%1 | 1,582,000 | |||
| 609,199 | Fidelity Institutional Cash Treasury Money Market Fund - I Shares, 1.86%1 | 609,199 | |||
| 1 | Goldman Sachs ILA Tax-Free Instruments Fund, 1.54%1 | 1 | |||
| TOTAL MUTUAL FUNDS (Identified cost $2,191,200) | 2,191,200 | ||||
| TOTAL INVESTMENTS — 86.5% (Identified cost $33,746,688) | 34,164,473 | ||||
| OTHER ASSETS AND LIABILITES-NET — 13.5% | 5,354,303 | ||||
| NET ASSETS — 100.0% | $ | 39,518,776 | |||
| 1 | Rate disclosed is as of August 31, 2008. |
AMBAC—American Municipal Bond Insurance Corp.
CIFG—County IXIS Financial Guaranty
FGIC—Financial Guaranty Insurance Co.
FSA—Federal Security Assurance
GO—General Obligation
GTD—Guaranteed
INS—Insured
MBIA—Municipal Bond Insurance Organization
PFA—Public Facility Authority
UT—Unlimited Tax
(See Notes to Financial Statements)
ANNUAL REPORT
23
Table of Contents
Capital One Mid Cap Equity Fund—Portfolio of Investments Summary Table (Unaudited)
At August 31, 2008, the Fund’s Portfolio composition was as follows:
Investment Type | Percentage of Total Net Assets | ||
Finance | 14.5 | % | |
Producer Manufacturing | 12.0 | % | |
Technology Services | 8.9 | % | |
Retail Trade | 8.1 | % | |
Utilities | 8.1 | % | |
Energy Minerals | 5.3 | % | |
Industrial Services | 4.5 | % | |
Commercial Services | 4.4 | % | |
Health Services | 4.4 | % | |
Health Technology | 4.2 | % | |
Distribution Services | 3.6 | % | |
Consumer Services | 3.0 | % | |
Process Industrials | 2.7 | % | |
Transportation | 2.7 | % | |
Consumer Non-Durables | 2.6 | % | |
Insurance | 2.6 | % | |
Non-Energy Minerals | 2.3 | % | |
Education Services | 1.6 | % | |
Cash Equivalents1 | 1.2 | % | |
Electronic Technology | 1.1 | % | |
Consumer Durables | 0.9 | % | |
Publishing | 0.7 | % | |
Communications | 0.5 | % | |
Other Assets and Liabilities-Net2 | 0.1 | % | |
TOTAL | 100.0 | % | |
| 1 | Cash Equivalents include any investments in money market mutual funds. |
| 2 | Assets, other than investments in securities, less liabilities. See Statements of Assets and Liabilities. |
ANNUAL REPORT
24
Table of Contents
Capital One Mid Cap Equity Fund—Portfolio of Investments
As of August 31, 2008
Shares | Security Description | Value($) | ||
| COMMON STOCKS — 98.7% | ||||
| Commercial Services — 4.4% | ||||
| 10,300 | Dun & Bradstreet Corp. | 947,291 | ||
| 72,400 | IKON Office Solutions, Inc. | 1,253,244 | ||
| 23,500 | The Brink’s Co. | 1,639,830 | ||
| 3,840,365 | ||||
| Communications — 0.5% | ||||
| 4,500 | CenturyTel, Inc. | 173,835 | ||
| 5,600 | Telephone and Data System, Inc. | 215,040 | ||
| 388,875 | ||||
| Consumer Durables — 0.9% | ||||
| 14,700 | Fossil, Inc.1 | 439,824 | ||
| 39,800 | Furniture Brands International, Inc. | 356,210 | ||
| 796,034 | ||||
| Consumer Non-Durables — 2.6% | ||||
| 28,000 | American Greetings Corp., Class A | 450,240 | ||
| 22,100 | Hormel Foods Corp. | 788,086 | ||
| 5,400 | Molson Coors Brewing Co. | 257,310 | ||
| 30,300 | Packaging Corp. of America | 780,225 | ||
| 2,275,861 | ||||
| Consumer Services — 3.0% | ||||
| 31,300 | Bob Evans Farms, Inc. | 878,591 | ||
| 22,400 | Expedia, Inc.1 | 395,584 | ||
| 35,000 | Lennox International, Inc. | 1,295,000 | ||
| 2,569,175 | ||||
| Distribution Services — 3.6% | ||||
| 61,600 | Avnet, Inc.1 | 1,807,960 | ||
| 7,100 | Grainger (W.W.), Inc. | 639,213 | ||
| 34,700 | Ingram Micro, Inc., Class A1 | 656,177 | ||
| 3,103,350 | ||||
| Education Services — 1.6% | ||||
| 26,100 | DeVry, Inc. | 1,346,238 | ||
| 1,346,238 | ||||
| Electronic Technology — 1.1% | ||||
| 20,100 | MEMC Electronic Materials, Inc.1 | 986,709 | ||
| 986,709 | ||||
| Energy Minerals — 5.3% | ||||
| 60,400 | Cabot Oil & Gas Corp., Class A | 2,684,176 | ||
| 24,900 | Cimarex Energy Co. | 1,382,946 | ||
| 50,070 | Global Industries, Ltd.1 | 484,177 | ||
| 4,551,299 | ||||
| Finance — 14.5% | ||||
| 30,000 | Assurant, Inc. | 1,752,900 | ||
| 23,000 | Bank of Hawaii Corp. | 1,216,240 | ||
| 79,700 | Colonial Properties Trust, REIT | 1,507,127 | ||
| 16,500 | Cullen/Frost Bankers, Inc. | 918,720 | ||
| 134,900 | First Niagara Financial Group, Inc. | 2,018,104 | ||
| 35,400 | Hospitality Properties Trust, REIT | 802,872 | ||
| 5,300 | Jones Lang LaSalle, Inc. | 263,940 | ||
| 199,200 | LaBranche & Co., Inc.1 | 1,280,856 | ||
| 35,000 | Mack-Cali Realty Corp., REIT | 1,414,700 | ||
| 20,800 | Ryder System, Inc. | 1,342,016 | ||
| 12,517,475 | ||||
| Health Services — 4.4% | ||||
| 32,500 | Herbalife, Ltd. | 1,530,750 | ||
| 49,500 | Patterson Cos., Inc.1 | 1,610,730 | ||
| 19,800 | Perrigo Co. | 692,802 | ||
| 3,834,282 | ||||
| Health Technology — 4.2% | ||||
| 11,600 | Charles River Laboratories International, Inc.1 | 761,076 | ||
| 15,300 | ImClone Systems, Inc.1 | 985,320 | ||
| 24,700 | Techne Corp.1 | 1,906,099 | ||
| 3,652,495 | ||||
| Industrial Services — 4.5% | ||||
| 136,000 | Allied Waste Industries, Inc.1 | 1,827,840 | ||
| 9,800 | Fluor Corp. | 785,274 | ||
| 8,910 | Granite Construction, Inc. | 326,819 | ||
| 19,100 | Terra Industries, Inc. | 957,674 | ||
| 3,897,607 | ||||
| Insurance — 2.6% | ||||
| 8,500 | Everest Re Group, Ltd. | 698,105 | ||
| 33,000 | Humana, Inc.1 | 1,531,200 | ||
| 2,229,305 | ||||
| Non-Energy Minerals — 2.3% | ||||
| 80,000 | Steel Dynamics, Inc. | 1,986,400 | ||
| Process Industrials — 2.7% | ||||
| 60,000 | Celanese Corp. | 2,313,600 | ||
| Producer Manufacturing — 12.0% | ||||
| 35,000 | Cooper Tire & Rubber Co. | 334,600 | ||
| 50,000 | Cummins, Inc. | 3,258,000 | ||
| 9,800 | Goodrich Corp. | 502,250 | ||
| 15,900 | Holly Corp. | 508,800 | ||
| 44,100 | Joy Global, Inc. | 3,132,864 | ||
| 29,600 | Potlatch Corp. | 1,382,024 | ||
| 13,300 | SunPower Corp., Class A1 | 1,297,415 | ||
| 10,415,953 | ||||
| Publishing — 0.7% | ||||
| 21,500 | Scholastic Corp. | 561,150 | ||
Continued
ANNUAL REPORT
25
Table of Contents
Capital One Mid Cap Equity Fund—Portfolio of Investments (continued)
As of August 31, 2008
Principal or Shares | Security Description | Value($) | |||
| Retail Trade — 8.1% | |||||
| 30,300 | Barnes & Noble, Inc. | 749,319 | |||
| 29,600 | BJ’s Wholesale Club, Inc.1 | 1,125,688 | |||
| 35,600 | Mattel, Inc. | 688,148 | |||
| 79,100 | RadioShack Corp. | 1,503,691 | |||
| 62,700 | Ross Stores, Inc. | 2,521,167 | |||
| 12,600 | Ruddick Corp. | 401,184 | |||
| 6,989,197 | |||||
| Technology Services — 8.9% | |||||
| 57,300 | Applied Biosystems, Inc. | 2,090,877 | |||
| 32,200 | BMC Software, Inc.1 | 1,048,432 | |||
| 57,800 | Cypress Semiconductor Corp.1 | 1,873,876 | |||
| 79,100 | Sybase, Inc.1 | 2,721,831 | |||
| 7,735,016 | |||||
| Transportation — 2.7% | |||||
| 38,900 | Tidewater, Inc. | 2,360,063 | |||
| Utilities — 8.1% | |||||
| 49,900 | Alliant Energy Corp. | 1,744,005 | |||
| 33,130 | Energen Corp. | 1,849,979 | |||
| 70,200 | MDU Resources Group, Inc | 2,319,408 | |||
| 28,500 | NRG Energy, Inc.1 | 1,072,740 | |||
| 6,986,132 | |||||
| TOTAL COMMON STOCKS (Identified cost $71,614,302) | 85,336,581 | ||||
| MUTUAL FUND — 1.2% | |||||
| 1,041,734 | Fidelity Institutional Cash Treasury Money Market Fund - I Shares, 1.86%2 | 1,041,734 | |||
| TOTAL MUTUAL FUND (Identified cost $1,041,734) | 1,041,734 | ||||
| TOTAL INVESTMENTS — 99.9% (Identified cost $72,656,036) | 86,378,315 | ||||
| OTHER ASSETS AND LIABILITIES-NET — 0.1% | 85,201 | ||||
| TOTAL NET ASSETS — 100.0% | $ | 86,463,516 | |||
| 1 | Non-income producing security. |
| 2 | Rate disclosed is as of August 31, 2008. |
REIT—Real Estate Investment Trust
(See Notes to Financial Statements)
ANNUAL REPORT
26
Table of Contents
Capital One Total Return Bond Fund—Portfolio of Investments Summary Table (Unaudited)
At August 31, 2008, the Fund’s Portfolio composition was as follows:
Investment Type | Percentage of Total Net Assets | ||
Mortgage Backed Securities1 | 40.9 | % | |
Corporate Bonds | 20.8 | % | |
Government Agencies | 19.7 | % | |
U.S. Treasury and Agency Securities | 16.3 | % | |
Cash Equivalents2 | 0.6 | % | |
Other Assets and Liabilities-Net3 | 1.7 | % | |
TOTAL | 100.0 | % | |
| 1 | For purposes of the table, mortgage-backed securities include mortgage-backed securities guaranteed by Government Sponsored Entities (GSEs) and adjustable rate mortgage-backed securities. |
| 2 | Cash Equivalents include any investments in money market mutual funds. |
| 3 | Assets, other than investments in securities, less liabilities. See Statements of Assets and Liabilities. |
ANNUAL REPORT
27
Table of Contents
Capital One Total Return Bond Fund—Portfolio of Investments
As of August 31, 2008
Principal | Security Description | Value($) | ||
| COMMERCIAL MORTGAGE BACKED SECURITIES— 2.1% | ||||
| Finance — 2.1% | ||||
| 1,000,000 | LB-UBS Commercial Mortgage Trust 2008-C1, Class A2, 6.32%, 4/15/20411 | 936,831 | ||
| TOTAL COMMERCIAL MORTGAGE BACKED SECURITIES (Identified cost $1,000,407) | 936,831 | |||
| CORPORATE BONDS — 20.8% | ||||
| Airlines — 2.1% | ||||
| 250,000 | General Dynamics Corp., 5.38%, 8/15/2015 | 260,508 | ||
| 500,000 | Southwest Airlines Co., 6.50%, 3/1/2012 | 500,035 | ||
| 200,000 | United Technologies Corp., 6.05%, 6/1/2036 | 200,444 | ||
| 960,987 | ||||
| Banks — 1.9% | ||||
| 500,000 | Bank of America Corp., 5.75%, 8/15/2016 | 464,027 | ||
| 400,000 | Bank of New York Mellon Corp., Series G, MTN, 4.95%, 11/1/2012 | 399,866 | ||
| 863,893 | ||||
| Communications — 1.6% | ||||
| 350,000 | AT&T, Inc., 5.60%, 5/15/2018 | 343,585 | ||
| 375,000 | Verizon Virginia, Inc., 4.63%, 3/15/2013 | 361,309 | ||
| 704,894 | ||||
| Consumer Non-Durables — 1.7% | ||||
| 400,000 | Anheuser-Busch Cos., Inc., 4.95%, 1/15/2014 | 377,719 | ||
| 350,000 | Kimberly-Clark Corp., 5.00%, 8/15/2013 | 360,570 | ||
| 738,289 | ||||
| �� | Energy Minerals — 1.2% | |||
| 500,000 | ConocoPhillips, 6.65%, 7/15/2018 | 547,871 | ||
| Finance — 4.8% | ||||
| 500,000 | Berkshire Hathaway Finance Corp., 5.10%, 7/15/2014 | 507,812 | ||
| 200,000 | General Electric Capital Corp., Series A, 6.15%, 8/7/2037 | 190,288 | ||
| 300,000 | Goldman Sachs Group, Inc., 6.15%, 4/1/2018 | 287,479 | ||
| 500,000 | JPMorgan Chase & Co., Note, 4.50%, 11/15/2010 | 499,047 | ||
| 300,000 | MetLife, Inc., 5.50%, 6/15/2014 | 295,426 | ||
| 350,000 | Wells Fargo & Co., 4.63%, 8/9/2010 | 354,518 | ||
| 2,134,570 | ||||
| Health Services — 0.5% | ||||
| 250,000 | Johnson & Johnson, 4.95%, 5/15/2033 | 229,160 | ||
| Health Technology — 0.8% | ||||
| 350,000 | Genentech, Inc., Note, 4.75%, 7/15/2015 | 338,095 | ||
| Producer Manufacturing — 2.6% | ||||
| 300,000 | Caterpillar, Inc., 5.70%, 8/15/2016 | 306,384 | ||
| 325,000 | Honeywell International, 5.63%, 8/1/2012 | 340,751 | ||
| 150,000 | Rockwell Automation, Inc., 6.25%, 12/1/2037 | 151,090 | ||
| 350,000 | Textron, Inc., 6.50%, 6/1/2012 | 367,489 | ||
| 1,165,714 | ||||
| Retail Trade — 0.8% | ||||
| 350,000 | McDonald’s Corp., 5.30%, 3/15/2017 | 348,452 | ||
| Technology Services — 2.4% | ||||
| 250,000 | Hewlett-Packard Co., 5.40%, 3/1/2017 | 247,737 | ||
| 350,000 | IBM Corp., 5.70%, 9/14/2017 | 357,543 | ||
| 250,000 | Koninklijke Philips Electronics NV, 5.75%, 3/11/2018 | 247,491 | ||
| 200,000 | Oracle Corp., 6.50%, 4/15/2038 | 202,755 | ||
| 1,055,526 | ||||
| Utilities — 0.4% | ||||
| 200,000 | Duke Energy Corp., 5.30%, 10/1/2015 | 201,881 | ||
| TOTAL CORPORATE BONDS (Identified cost $9,401,484) | 9,289,332 | |||
| GOVERNMENT AGENCIES — 19.7% | ||||
| Federal Farm Credit Bank — 1.2% | ||||
| 500,000 | 5.10%, 8/5/2013 | 524,341 | ||
| Federal Home Loan Bank — 5.0% | ||||
| 1,000,000 | 4.00%, 9/6/2013 | 1,000,535 | ||
| 800,000 | 4.88%, 11/18/2011 | 825,194 | ||
| 400,000 | 5.50%, 8/13/2014 | 428,665 | ||
| 2,254,394 | ||||
| Federal Home Loan Mortgage Corporation — 6.0% | ||||
| 500,000 | 3.38%, 4/15/2009 | 500,976 | ||
| 500,000 | 4.63%, 10/25/2012 | 515,057 | ||
| 650,000 | 5.00%, 4/18/2017 | 671,951 | ||
| 1,000,000 | 5.25%, 2/24/2011 | 1,008,783 | ||
| 2,696,767 | ||||
| Federal National Mortgage Association — 7.5% | ||||
| 1,650,000 | 4.55%, 1/4/2013 | 1,647,150 | ||
| 600,000 | 4.63%, 10/15/2014 | 613,275 | ||
| 1,000,000 | 7.13%, 6/15/2010 | 1,069,462 | ||
| 3,329,887 | ||||
| TOTAL GOVERNMENT AGENCIES (Identified cost $8,742,959) | 8,805,389 | |||
| MORTGAGE BACKED SECURITIES — 38.8% | ||||
| Federal Home Loan Mortgage Corporation 10 Year — 2.2% | ||||
| 974,696 | Pool 1J1214, 5.31%, 9/1/2035 | 986,670 | ||
| Federal Home Loan Mortgage Corporation 15 Year — 11.5% | ||||
| 1,697,217 | Pool G12410, 5.00% , 5/1/20212 | 1,690,386 | ||
| 947,312 | Pool G12321, 5.50% , 9/1/20212 | 956,382 | ||
| 953,360 | Pool G12806, 5.50%, 9/1/2022 | 961,987 | ||
| 1,499,999 | Pool G18265, 5.50%, 7/1/2023 | 1,513,422 | ||
| 5,122,177 | ||||
| Federal Home Loan Mortgage Corporation 20 Year — 2.4% | ||||
| 1,064,973 | Pool C91030, 5.50% , 5/1/20272 | 1,061,307 | ||
Continued
ANNUAL REPORT
28
Table of Contents
Capital One Total Return Bond Fund—Portfolio of Investments (continued)
As of August 31, 2008
Principal | Security Description | Value($) | |||
| MORTGAGE BACKED SECURITIES �� CONTINUED | |||||
| Federal Home Loan Mortgage Corporation 30 Year — 2.1% | |||||
| 912,551 | Pool G08003, 6.00% , 7/1/20342 | 923,845 | |||
| Federal National Mortgage Association 30 Year — 17.6% | |||||
| 1,123,837 | Pool 745064, 4.96% , 11/1/20352 | 1,135,750 | |||
| 2,343,068 | Pool 725027, 5.00% , 11/1/20332 | 2,268,572 | |||
| 922,198 | Pool 725424, 5.50% , 4/1/20342 | 911,709 | |||
| 905,121 | Pool 725946, 5.50% , 11/1/20342 | 897,938 | |||
| 1,867,428 | Pool 817423, 5.50% , 8/1/20352 | 1,850,565 | |||
| 828,747 | Pool 937392, 5.50% , 6/1/20372 | 819,404 | |||
| 614 | Pool 85131, 11.00% , 5/1/20172 | 675 | |||
| 7,884,613 | |||||
| Government National Mortgage Association 15 Year — 0.1% | |||||
| 25,135 | Pool 420153, 7.00% , 9/15/20102 | 26,023 | |||
| Government National Mortgage Association 30 Year — 2.9% | |||||
| 970,464 | Pool 678949, 6.50% , 10/15/20372 | 1,001,660 | |||
| 18,322 | Pool 345031, 7.00% , 10/15/20232 | 19,547 | |||
| 24,270 | Pool 345090, 7.00% , 11/15/20232 | 25,894 | |||
| 14,156 | Pool 360772, 7.00% , 2/15/20242 | 15,098 | |||
| 16,614 | Pool 302101, 7.00% , 6/15/20242 | 17,720 | |||
| 5,936 | Pool 404653, 7.00% , 9/15/20252 | 6,334 | |||
| 20,961 | Pool 408884, 7.00% , 9/15/20252 | 22,365 | |||
| 10,240 | Pool 410108, 7.00% , 9/15/20252 | 10,925 | |||
| 6,601 | Pool 415865, 7.00% , 9/15/20252 | 7,042 | |||
| 54,738 | Pool 418781, 7.00% , 9/15/20252 | 58,402 | |||
| 33,910 | Pool 420157, 7.00% , 10/15/20252 | 36,180 | |||
| 37,424 | Pool 415427, 7.50% , 8/15/20252 | 40,297 | |||
| 10,202 | Pool 168511, 8.00% , 7/15/20162 | 11,057 | |||
| 1,515 | Pool 174673, 8.00% , 8/15/20162 | 1,642 | |||
| 5,225 | Pool 177145, 8.00% , 1/15/20172 | 5,675 | |||
| 3,602 | Pool 212660, 8.00% , 4/15/20172 | 3,913 | |||
| 2,170 | Pool 217533, 8.00% , 5/15/20172 | 2,357 | |||
| 11,416 | Pool 216950, 8.00% , 6/15/20172 | 12,401 | |||
| 5,199 | Pool 291100, 9.00% , 5/15/20202 | 5,703 | |||
| 2,056 | Pool 253449, 10.00% , 10/15/20182 | 2,330 | |||
| 114 | Pool 279619, 10.00% , 9/15/20192 | 130 | |||
| 1,306,672 | |||||
| TOTAL MORTGAGE BACKED SECURITIES (Identified cost $17,313,800) | 17,311,307 | ||||
| U.S. TREASURY OBLIGATIONS — 16.3% | |||||
| U.S. Treasury Bonds — 2.8% | |||||
| 100,000 | 4.38%, 2/15/2038 | 99,321 | |||
| 250,000 | 5.50%, 8/15/2028 | 283,711 | |||
| 650,000 | 8.00%, 11/15/2021 | 893,141 | |||
| 1,276,173 | |||||
| U.S. Treasury Notes — 13.5% | |||||
| 1,450,000 | 4.00%, 8/15/2018 | 1,472,543 | |||
| 1,000,000 | 4.63%, 11/15/2016 | 1,071,485 | |||
| 1,450,000 | 4.75%, 5/31/2012 | 1,548,442 | |||
| 1,800,000 | 4.88%, 7/31/2011 | 1,917,142 | |||
| 6,009,612 | |||||
| TOTAL U.S. TREASURY OBLIGATIONS (Identified cost $7,250,523) | 7,285,785 | ||||
| MUTUAL FUND — 0.6% | |||||
| 273,194 | Fidelity Institutional Cash Treasury Money Market Fund - I Shares, 1.86%1 | 273,194 | |||
| TOTAL MUTUAL FUND (Identified cost $273,194) | 273,194 | ||||
| TOTAL INVESTMENTS — 98.3% (Identified cost $43,982,367) | 43,901,838 | ||||
| OTHER ASSETS AND LIABILITIES-NET — 1.7% | 778,917 | ||||
| NET ASSETS — 100.0% | $ | 44,680,755 | |||
| 1 | Rate disclosed is as of August 31, 2008. |
| 2 | Because of monthly principal payments, the average lives of certain government securities are less than the indicated periods. |
MTN—Medium Term Note
(See Notes to Financial Statements)
ANNUAL REPORT
29
Table of Contents
Capital One U.S. Government Income Fund—Portfolio of Investments Summary Table (Unaudited)
At August 31, 2008, the Fund’s Portfolio composition was as follows:
Investment Type | Percentage of Total Net Assets | ||
U.S. Government Agency Securities | 48.1 | % | |
U.S. Treasury Notes | 23.7 | % | |
Mortgage Backed Securities1 | 14.5 | % | |
Corporate Bonds | 6.2 | % | |
Cash Equivalents2 | 4.3 | % | |
Collateralized Mortgage Obligations | 2.2 | % | |
Other Assets and Liabilities-Net3 | 1.0 | % | |
TOTAL | 100.0 | % | |
| 1 | For purposes of the table, mortgage-backed securities include mortgage-backed securities guaranteed by Government Sponsored Entities (GSEs) and adjustable rate mortgage-backed securities. |
| 2 | Cash Equivalents include any investments in money market mutual funds. |
| 3 | Assets, other than investments in securities, less liabilities. See Statements of Assets and Liabilities. |
ANNUAL REPORT
30
Table of Contents
Capital One U.S. Government Income Fund—Portfolio of Investments
As of August 31, 2008
Principal Amount($) | Security Description | Value($) | ||
| COMMERCIAL MORTGAGE BACKED SECURITIES — 2.5% | ||||
| 992,826 | Banc of America Commercial Mortgage, Inc. 2004-6, Class A2, 4.16%, 12/10/2042 | 984,778 | ||
| 1,000,000 | GE Capital Commercial Mortgage Corp. 2005-C1, Class A2, 4.35%, 6/10/2048 | 990,375 | ||
| TOTAL COMMERCIAL MORTGAGE BACKED SECURITIES (Identified cost $1,928,901) | 1,975,153 | |||
| COLLATERALIZED MORTGAGE OBLIGATIONS — 2.2% | ||||
| 424,417 | Federal Home Loan Mortgage Corp. Series 3062, Class LJ, 5.50%, 11/15/2035 | 411,218 | ||
| 387,757 | Federal Home Loan Mortgage Corp. Series 3347, Class PA, 5.00%, 6/15/2028 | 393,115 | ||
| 463,502 | Federal Home Loan Mortgage Corp. Series 3446, Class QD, 5.50%, 12/31/2049 | 464,026 | ||
| 425,000 | Government National Mortgage Association Series 2007-48, Class BL, 6.25%, 8/20/2037 | 432,890 | ||
| TOTAL COLLATERALIZED MORTGAGE OBLIGATIONS (Identified cost $1,705,650) | 1,701,249 | |||
| CORPORATE BONDS — 6.2% | ||||
| Energy Minerals — 1.3% | ||||
| 1,000,000 | ConocoPhillips, 4.40%, 5/15/2013 | 991,778 | ||
| Finance — 4.6% | ||||
| 1,000,000 | American General Financial Services, (Series H), MTN, 4.00%, 3/15/2011 | 888,478 | ||
| 1,250,000 | General Electric Capital Corp., (Series A), MTN, 5.50%, 11/15/2011 | 1,252,559 | ||
| 1,000,000 | HSBC Finance Corp., 6.50%, 11/15/2008 | 1,004,550 | ||
| 450,000 | John Deere Capital Corp., (Series D), MTN, 4.50%, 4/3/2013 | 447,582 | ||
| 3,593,169 | ||||
| Technology Services — 0.3% | ||||
| 250,000 | Oracle Corp., 4.95%, 4/15/2013 | 253,639 | ||
| TOTAL CORPORATE BONDS (Identified cost $4,927,571) | 4,838,586 | |||
| GOVERNMENT AGENCIES — 48.1% | ||||
| Federal Farm Credit Bank — 0.6% | ||||
| 500,000 | 5.38%, 12/5/2013 | 502,869 | ||
| Federal Home Loan Bank — 17.3% | ||||
| 1,000,000 | 2.48%, 10/27/20081 | 996,201 | ||
| 500,000 | 3.50%, 7/16/2010 | 503,661 | ||
| 1,000,000 | 3.63%, 12/17/2010 | 1,008,294 | ||
| 500,000 | 3.88%, 5/13/2011 | 500,342 | ||
| 1,000,000 | 4.88%, 5/17/2017 | 1,024,066 | ||
| 1,150,000 | 5.00%, 1/29/2015 | 1,150,061 | ||
| 1,000,000 | 5.00%, 11/17/2017 | 1,031,343 | ||
| 1,000,000 | 5.10%, 2/13/2018 | 990,282 | ||
| 500,000 | 5.13%, 8/14/2013 | 525,549 | ||
| 1,235,000 | 5.48%, 7/30/2018 | 1,233,658 | ||
| 1,000,000 | 5.60%, 11/28/2017 | 1,003,757 | ||
| 1,500,000 | 5.80%, 9/2/2008 | 1,500,237 | ||
| 2,000,000 | 5.80%, 2/23/2017 | 2,016,344 | ||
| 13,483,795 | ||||
| Federal Home Loan Mortgage Corporation — 12.5% | ||||
| 1,000,000 | 3.88%, 6/29/2011 | 1,011,270 | ||
| 1,000,000 | 4.13%, 11/30/2009 | 1,013,235 | ||
| 1,000,000 | 4.38%, 11/27/2015 | 991,346 | ||
| 500,000 | 4.50%, 6/12/2013 | 501,836 | ||
| 1,000,000 | 4.63%, 10/25/2012 | 1,030,114 | ||
| 500,000 | 5.00%, 12/14/2018 | 407,845 | ||
| 1,000,000 | 5.13%, 11/17/2017 | 1,041,245 | ||
| 1,000,000 | 5.40%, 2/2/2012 | 1,008,473 | ||
| 1,000,000 | 5.45%, 11/21/2013 | 1,004,498 | ||
| 1,000,000 | 5.50%, 12/5/2017 | 1,000,626 | ||
| 800,000 | 6.00%, 10/3/2022 | 796,858 | ||
| 9,807,346 | ||||
| Federal National Mortgage Association — 17.7% | ||||
| 500,000 | 3.25%, 5/21/2010 | 498,129 | ||
| 500,000 | 4.50%, 6/19/2013 | 501,533 | ||
| 750,000 | 4.75%, 11/19/2012 | 776,349 | ||
| 2,000,000 | 5.00%, 10/15/2011 | 2,082,552 | ||
| 315,000 | 5.00%, 12/26/2013 | 315,408 | ||
| 2,000,000 | 5.00%, 5/11/2017 | 2,066,526 | ||
| 500,000 | 5.00%, 4/30/20182 | 491,730 | ||
| 2,000,000 | 5.38%, 6/12/2017 | 2,117,952 | ||
| 1,000,000 | 5.55%, 2/16/2017 | 1,021,038 | ||
| 170,000 | 5.60%, 2/1/2017 | 173,126 | ||
| 1,000,000 | 5.80%, 9/8/2016 | 1,013,342 | ||
| 2,118,000 | 6.00%, 5/15/2011 | 2,257,911 | ||
| 500,000 | 6.38%, 6/15/2009 | 513,198 | ||
| 13,828,794 | ||||
| TOTAL GOVERNMENT AGENCIES (Identified cost $37,223,640) | 37,622,804 | |||
| MORTGAGE BACKED SECURITIES — 12.0% | ||||
| Federal Home Loan Mortgage Corporation 15 Year — 3.8% | ||||
| 153,882 | Pool E98272, 4.50% , 8/1/20133 | 149,103 | ||
| 751,134 | Pool J02868, 5.50% , 7/1/20213 | 758,326 | ||
| 200,245 | Pool J03253, 6.00% , 8/1/20213 | 205,133 | ||
| 1,649,130 | Pool G12397, 6.00% , 9/1/20213 | 1,689,387 | ||
| 41,476 | Pool 294383, 8.75% , 2/1/20173 | 43,678 | ||
| 1,892 | Pool 170170, 9.00% , 6/1/20163 | 2,065 | ||
| 59 | Pool 170193, 9.00% , 9/1/20163 | 64 | ||
| 267 | Pool 170196, 9.00% , 10/1/20163 | 292 | ||
| 2,478 | Pool 170210, 9.00% , 1/1/20173 | 2,727 | ||
| 7,205 | Pool 360029, 10.00% , 6/1/20183 | 8,185 | ||
| 2,858,960 | ||||
| Federal Home Loan Mortgage Corporation 30 Year — 0.6% | ||||
| 487,049 | Pool C03185, 5.50% , 3/1/20383 | 480,749 | ||
Continued
ANNUAL REPORT
31
Table of Contents
Capital One U.S. Government Income Fund—Portfolio of Investments (continued)
As of August 31, 2008
Principal | Security Description | Value($) | |||
| MORTGAGE BACKED SECURITIES — CONTINUED | |||||
Federal National Mortgage Association 15 Year — 0.7% | |||||
| 283,784 | Pool 256297, 6.00% , 6/1/20163 | 293,381 | |||
| 257,235 | Pool 845502, 6.00% , 6/1/20213 | 263,878 | |||
| 13,424 | Pool 313707, 7.00% , 8/1/20123 | 14,099 | |||
| 571,358 | |||||
Federal National Mortgage Association 30 Year — 3.0% | |||||
| 54,264 | Pool 254325, 5.00% , 4/1/20093 | 54,682 | |||
| 301,168 | Pool 896530, 6.00% , 8/1/20363 | 304,566 | |||
| 315,849 | Pool 887836, 6.00% , 9/1/20363 | 319,412 | |||
| 857,466 | Pool 888421, 6.00% , 6/1/20373 | 866,738 | |||
| 367,002 | Pool 771178, 6.50% , 3/1/20343 | 379,268 | |||
| 273,102 | Pool 255673, 6.50% , 3/1/20353 | 281,546 | |||
| 63,674 | Pool 254093, 7.00% , 12/1/20313 | 67,132 | |||
| 80,214 | Pool 591249, 7.50% , 7/1/20313 | 86,347 | |||
| 14,680 | Pool 102873, 9.50% , 8/1/20203 | 16,380 | |||
| 2,376,071 | |||||
Federal National Mortgage Association 9 Year — 1.1% | |||||
| 831,841 | Pool 888979, 6.00%, 12/1/20173 | 854,490 | |||
Government National Mortgage Association 15 Year — 0.3% | |||||
| 205,164 | Pool 688458, 5.50% , 5/15/20083 | 209,693 | |||
| 14,060 | Pool 427552, 6.50% , 2/15/20173 | 14,636 | |||
| 1,844 | Pool 780052, 7.00% , 12/15/20083 | 1,851 | |||
| 1,354 | Pool 405378, 7.00% , 11/15/20093 | 1,385 | |||
| 11,182 | Pool 405476, 7.00% , 9/15/20103 | 11,577 | |||
| 239,142 | |||||
Government National Mortgage Association 30 Year — 2.5% | |||||
| 1,041,351 | Pool 615486, 5.50% , 7/15/20343 | 1,043,378 | |||
| 32,997 | Pool 609007, 5.50% , 8/15/20363 | 33,020 | |||
| 50,420 | Pool 502638, 6.50% , 4/15/20293 | 52,277 | |||
| 127,582 | Pool 357260, 7.00% , 9/15/20233 | 136,114 | |||
| 75,569 | Pool 2933, 7.00% , 6/20/20303 | 80,269 | |||
| 52,822 | Pool 569622, 7.00% , 2/15/20323 | 56,149 | |||
| 53,169 | Pool 552475, 7.00% , 3/15/20323 | 56,518 | |||
| 20,601 | Pool 329790, 7.50% , 10/15/20223 | 22,150 | |||
| 29,400 | Pool 345096, 7.50% , 3/15/20263 | 31,654 | |||
| 45,094 | Pool 424000, 7.50% , 9/15/20263 | 48,550 | |||
| 24,882 | Pool 2839, 7.50% , 11/20/20293 | 26,660 | |||
| 30,443 | Pool 2853, 7.50% , 12/20/20293 | 32,619 | |||
| 20,663 | Pool 3011, 7.50% , 12/20/20303 | 22,127 | |||
| 66,990 | Pool 297829, 8.00% , 1/15/20223 | 73,147 | |||
| 49,996 | Pool 319358, 8.00% , 4/15/20223 | 54,591 | |||
| 44,587 | Pool 328183, 8.00% , 8/15/20223 | 48,685 | |||
| 47,765 | Pool 422007, 8.00% , 10/15/20293 | 52,279 | |||
| 16,055 | Pool 2868, 8.00% , 1/20/20303 | 17,514 | |||
| 19,489 | Pool 2884, 8.00% , 2/20/20303 | 21,260 | |||
| 22,771 | Pool 2897, 8.00% , 3/20/20303 | 24,840 | |||
| 9,687 | Pool 1956, 8.50% , 2/20/20253 | 10,662 | |||
| 15,606 | Pool 288103, 9.00% , 2/15/20203 | 17,118 | |||
| 17,066 | Pool 290127, 9.50% , 6/15/20203 | 19,004 | |||
| 1,980,585 | |||||
Principal or Shares | Security Description | Value($) | |||
| MORTGAGE BACKED SECURITIES — CONTINUED | |||||
| TOTAL MORTGAGE BACKED SECURITIES (Identified cost $9,244,450) | 9,361,355 | ||||
| U.S. TREASURY OBLIGATIONS — 23.7% | |||||
U.S. Treasury Bond — 4.3% | |||||
| 1,000,000 | 7.50%, 11/15/2016 | 1,264,610 | |||
| 1,500,000 | 8.88%, 8/15/2017 | 2,066,836 | |||
| 3,331,446 | |||||
U.S. Treasury Notes — 19.4% | |||||
| 1,000,000 | 4.50%, 11/15/2015 | 1,070,704 | |||
| 1,000,000 | 4.63%, 8/31/2011 | 1,057,969 | |||
| 500,000 | 4.63%, 7/31/2012 | 532,696 | |||
| 1,500,000 | 4.63%, 2/15/2017 | 1,603,595 | |||
| 4,000,000 | 4.75%, 5/15/2014 | 4,340,004 | |||
| 1,500,000 | 4.88%, 8/15/2016 | 1,632,774 | |||
| 3,500,000 | 5.13%, 5/15/2016 | 3,875,431 | |||
| 1,000,000 | 6.50%, 2/15/2010 | 1,062,657 | |||
| 15,175,830 | |||||
| TOTAL U.S. TREASURY OBLIGATIONS (Identified cost $17,614,436) |
| 18,507,276 | |||
| MUTUAL FUNDS — 4.3% | |||||
| 1,406,553 | Federated Treasury Obligation Fund - I Shares, 1.62%2 | 1,406,553 | |||
| 1 | Fidelity Institutional Cash Treasury Money Market Fund - I Shares, 1.86%2 | 1 | |||
| 1,963,957 | Fidelity Institutional Government Money Market Fund - I Shares, 2.06%2 | 1,963,957 | |||
| TOTAL MUTUAL FUNDS (Identified cost $3,370,511) |
| 3,370,511 | |||
| TOTAL INVESTMENTS — 99.0% (Identified cost $76,015,159) |
| 77,376,934 | |||
| OTHER ASSETS AND LIABILITIES-NET — 1.0% | 770,397 | ||||
| NET ASSETS — 100.0% | $ | 78,147,331 | |||
| 1 | Rate shown represents yield to maturity. |
| 2 | Rate disclosed is as of August 31, 2008. |
| 3 | Because of monthly principal payments, the average lives of certain government securities are less than the indicated periods. |
MTN—Medium Term Note
(See Notes to Financial Statements)
ANNUAL REPORT
32
Table of Contents
Capital One Cash Reserve Fund—Portfolio of Investments Summary Table (Unaudited)
At August 31, 2008, the Fund’s Portfolio composition was as follows:
Investment Type | Percentage of Total Net Assets | ||
Commercial Paper | 82.2 | % | |
U.S. Government Agency Securities | 11.3 | % | |
Cash Equivalents1 | 6.6 | % | |
Other Assets and Liabilities-Net2 | (0.1 | )% | |
TOTAL | 100.0 | % | |
| 1 | Cash Equivalents include any investments in money market mutual funds. |
| 2 | Assets, other than investments in securities, less liabilities. See Statements of Assets and Liabilities. |
(See Notes to Financial Statements)
ANNUAL REPORT
33
Table of Contents
Capital One Cash Reserve Fund—Portfolio of Investments
As of August 31, 2008
Principal or Shares | Security Description | Value($) | ||||
| COMMERCIAL PAPER — 82.2% | ||||||
Communications-Telecom Wireless — 5.1% | ||||||
| 9,000,000 | AT&T, Inc., 2.29%, 9/30/2008 | 8,983,470 | ||||
Consumer Durables — 4.5% | ||||||
| 8,000,000 | Toyota Motor Corp., 2.42%, 10/20/2008 | 7,973,758 | ||||
Consumer Non-Durables — 10.2% | ||||||
| 9,000,000 | Cargill, Inc., 2.57%, 9/17/2008 | 8,989,800 | ||||
| 9,000,000 | Coca-Cola Co., 2.37%, 9/22/20081 | 8,987,820 | ||||
| 17,977,620 | ||||||
Finance — 62.4% | ||||||
| 9,500,000 | American Express Credit Corp., 2.58%, 9/8/20081 | 9,495,327 | ||||
| 9,500,000 | American General Investment Co., 2.75%, 9/2/2008 | 9,499,277 | ||||
| 9,000,000 | American Honda Finance Corp., 2.45%, 9/12/2008 | 8,993,290 | ||||
| 8,000,000 | Chevron Oil Finance Co., 2.08%, 9/17/2008 | 7,992,604 | ||||
| 9,000,000 | Citigroup Funding, Inc., 2.66%, 9/19/2008 | 8,988,075 | ||||
| 8,000,000 | General Electric Capital Corp., 2.45%, 10/20/20081 | 7,973,758 | ||||
| 8,500,000 | GOVCO LLC, 2.74%, 10/20/2008 | 8,468,531 | ||||
| 8,500,000 | HSBC Finance Corp., 2.53%, 10/6/2008 | 8,479,340 | ||||
| 6,141,000 | Jupiter Securitization Corp., 2.45%, 9/16/20081 | 6,134,731 | ||||
| 9,000,000 | Prudential Funding LLC, 2.41%, 9/17/2008 | 8,990,400 | ||||
| 8,500,000 | Rabobank USA, 2.10%, 9/4/20081 | 8,498,534 | ||||
| 9,000,000 | Societe General North America, Inc., 2.68%, 9/15/20081 | 8,990,655 | ||||
| 8,000,000 | Wells Fargo & Co., 2.47%, 9/2/20081 | 7,999,460 | ||||
| 110,503,982 | ||||||
| TOTAL COMMERCIAL PAPER (Identified cost $145,438,830) |
| 145,438,830 |
| |||
| U.S. GOVERNMENT AGENCY SECURITIES — 11.3% | ||||||
Federal Home Loan Bank — 11.3% | ||||||
| 10,000,000 | 2.04%, 9/3/20081 | 9,998,866 | ||||
| 10,000,000 | 2.80%, 2/6/2009 | 10,000,000 | ||||
| 19,998,866 | ||||||
| TOTAL U.S. GOVERNMENT AGENCY SECURITIES (Identified cost $19,998,866) |
| 19,998,866 |
| |||
| MUTUAL FUND — 6.6% | ||||||
| 3,215,322 | Federated Treasury Obligation Fund - I Shares, 1.62%2 | 3,215,322 | ||||
| 8,500,000 | Fidelity Institutional Cash Treasury Money Market Fund - I Shares, 1.86%2 | 8,500,000 | ||||
| TOTAL MUTUAL FUND (Identified cost $11,715,322) |
| 11,715,322 |
| |||
| TOTAL INVESTMENTS — 100.1% (Identified cost $177,153,018) |
| 177,153,018 |
| |||
| OTHER ASSETS AND LIABILITIES-NET — (0.1)% | (193,901 | ) | ||||
| NET ASSETS — 100.0% | $ | 176,959,117 | ||||
| 1 | Rate shown represents yield to maturity. |
| 2 | Rate disclosed is as of August 31, 2008. |
LLC—Limited Liability Co.
(See Notes to Financial Statements)
ANNUAL REPORT
34
Table of Contents
Capital One U.S. Treasury Money Market Fund—Portfolio of Investments Summary Table (Unaudited)
At August 31, 2008, the Fund’s Portfolio composition was as follows:
Investment Type | Percentage of Total Net Assets | ||
Cash Equivalents1 | 69.8 | % | |
U.S. Treasury Securities | 30.2 | % | |
Other Assets and Liabilities-Net2 | 0.0 | % | |
TOTAL | 100.0 | % | |
| 1 | Cash Equivalents include any investments in money market mutual funds and repurchase agreements. |
| 2 | Assets, other than investments in securities, less liabilities. See Statements of Assets and Liabilities. |
ANNUAL REPORT
35
Table of Contents
Capital One U.S. Treasury Money Market Fund—Portfolio of Investments
As of August 31, 2008
Principal Amount($) or Shares | Security Description | Value($) | |||
| U.S. TREASURY OBLIGATIONS — 30.2% | |||||
U.S. Treasury Bills — 25.1% | |||||
| 15,000,000 | 1.61%, 9/18/20081 | 14,988,655 | |||
| 10,000,000 | 1.84%, 9/15/20081 | 9,992,864 | |||
| 24,981,519 | |||||
U.S. Treasury Notes — 5.1% | |||||
| 5,000,000 | 4.88%, 10/31/2008 | 5,026,048 | |||
| TOTAL U.S. TREASURY OBLIGATIONS (Identified cost $30,007,567) | 30,007,567 | ||||
| MUTUAL FUND — 5.5% | |||||
| 964,907 | Federated Treasury Obligation Fund - I Shares, 1.62%2 | 964,907 | |||
| 4,500,000 | Fidelity Institutional Cash Treasury Money Market Fund - I Shares, 1.86%2 | 4,500,000 | |||
| TOTAL MUTUAL FUND (Identified cost $5,464,907) | 5,464,907 | ||||
| REPURCHASE AGREEMENT — 64.3% | |||||
| 64,000,000 | UBS, 1.95%, dated 8/28/08, maturing 9/2/2008 (Proceeds at maturity $64,017,333, collateralized by a U.S. Government Agency with a maturity of 8/31/2009, value $65,278,000) |
| 64,000,000 | ||
| TOTAL REPURCHASE AGREEMENT (Identified cost $64,000,000) |
| 64,000,000 | |||
| TOTAL INVESTMENTS — 100.0% (Identified cost $99,472,474) |
| 99,472,474 | |||
| OTHER ASSETS AND LIABILITIES-NET — 0.0% | 8,785 | ||||
| NET ASSETS — 100.0% | $ | 99,481,259 | |||
| 1 | Rate shown represents yield to maturity. |
| 2 | Rate disclosed is as of August 31, 2008. |
(See Notes to Financial Statements)
ANNUAL REPORT
36
Table of Contents
Capital One Funds—Statements of Assets and Liabilities
As of August 31, 2008
| Capital Appreciation Fund | Louisiana Municipal Income Fund | Mid Cap Equity Fund | Total Return Bond Fund | |||||||||||||
Assets: | ||||||||||||||||
Investments in securities, at value | $ | 123,376,251 | $ | 34,164,473 | $ | 86,378,315 | $ | 43,901,838 | ||||||||
Cash | — | — | 1 | 1 | ||||||||||||
Income receivable | 161,426 | 469,214 | 95,066 | 357,687 | ||||||||||||
Receivable for investments sold | — | 5,032,189 | — | 426,565 | ||||||||||||
Receivable for shares sold | 9,169 | — | 6,881 | 808 | ||||||||||||
Prepaid and other expenses | 15,682 | 8,856 | 12,012 | 9,075 | ||||||||||||
Total assets | 123,562,528 | 39,674,732 | 86,492,275 | 44,695,974 | ||||||||||||
Liabilities: | ||||||||||||||||
Payable for shares redeemed | 3,000 | 138,327 | 1 | — | ||||||||||||
Payable for master services fees (Note 5) | 10,843 | 6,448 | 7,853 | 3,617 | ||||||||||||
Payable for compliance services fees (Note 5) | 2,081 | 763 | 1,465 | 772 | ||||||||||||
Accrued expenses | 26,204 | 10,418 | 19,440 | 10,830 | ||||||||||||
Total liabilities | 42,128 | 155,956 | 28,759 | 15,219 | ||||||||||||
Total Net Assets | $ | 123,520,400 | $ | 39,518,776 | $ | 86,463,516 | $ | 44,680,755 | ||||||||
Net Assets Consist of: | ||||||||||||||||
Paid-in capital | $ | 85,975,352 | $ | 38,228,637 | $ | 78,166,270 | $ | 47,772,016 | ||||||||
Accumulated net investment income (loss) | 56,314 | 69,512 | — | 65,711 | ||||||||||||
Accumulated net realized gain (loss) on investments | 12,861,511 | 802,842 | (5,425,033 | ) | (3,076,443 | ) | ||||||||||
Net unrealized appreciation (depreciation) of investments | 24,627,223 | 417,785 | 13,722,279 | (80,529 | ) | |||||||||||
Total Net Assets | $ | 123,520,400 | $ | 39,518,776 | $ | 86,463,516 | $ | 44,680,755 | ||||||||
Net Assets: | ||||||||||||||||
| $ | 120,847,000 | 1 | $ | 37,947,658 | 1 | $ | 85,080,565 | 1 | $ | 44,680,755 | ||||||
| 2,673,400 | 2 | 1,571,118 | 2 | 1,382,951 | 2 | — | ||||||||||
Total Net Assets | $ | 123,520,400 | $ | 39,518,776 | $ | 86,463,516 | $ | 44,680,755 | ||||||||
Shares Outstanding, No Par Value, Unlimited Shares Authorized: | ||||||||||||||||
| 8,551,056 | 1 | 3,537,337 | 1 | 5,949,551 | 1 | 4,744,683 | ||||||||||
| 207,427 | 2 | 146,344 | 2 | 105,974 | 2 | — | ||||||||||
Total Shares Outstanding | 8,758,483 | 3,683,681 | 6,055,525 | 4,744,683 | ||||||||||||
Net Asset Value Per Share: | ||||||||||||||||
| $ | 14.13 | 1 | $ | 10.73 | 1 | $ | 14.30 | 1 | $ | 9.42 | ||||||
| $ | 12.89 | 2 | $ | 10.74 | 2 | $ | 13.05 | 2 | $ | — | ||||||
Offering Price Per Share3: | ||||||||||||||||
| $ | 14.80 | 1,4 | $ | 11.06 | 1, 5 | $ | 14.97 | 1, 4 | $ | 9.71 | 5 | |||||
| $ | 12.89 | 2 | $ | 10.74 | 2 | $ | 13.05 | 2 | $ | — | ||||||
Redemption Proceeds Per Share6: | ||||||||||||||||
| $ | 14.13 | 1 | $ | 10.73 | 2 | $ | 14.30 | 2 | $ | 9.42 | ||||||
| $ | 12.18 | 2,7 | $ | 10.15 | 2, 7 | $ | 12.33 | 2, 7 | $ | — | ||||||
Total Investments, at identified cost | $ | 98,749,028 | $ | 33,746,688 | $ | 72,656,036 | $ | 43,982,367 | ||||||||
| 1 | Represents Class A Shares. |
| 2 | Represents Class B Shares. |
| 3 | See “What Do Shares Cost” in the Prospectus. |
| 4 | Maximum offering price = (100% / (100% - 4.50%)) of net asset value adjusted to the nearest cent per share. |
| 5 | Maximum offering price = (100% / (100% - 3.00%)) of net asset value adjusted to the nearest cent per share. |
| 6 | See “How to Redeem and Exchange Shares” in the Prospectus. |
| 7 | Computation of redemption proceeds per share assumes the maximum contingent deferred sales charge of 5.50%. The actual redemption price per share will vary by length of time shares are held. |
(See Notes to Financial Statements)
ANNUAL REPORT
37
Table of Contents
Capital One Funds—Statements of Assets and Liabilities (continued)
As of August 31, 2008
| U.S. Government Income Fund | Cash Reserve Fund | U.S. Treasury Money Market Fund | ||||||||||
Assets: | ||||||||||||
Investments in repurchase agreements | $ | — | $ | — | $ | 64,000,000 | ||||||
Investments in securities, at value | 77,376,934 | 177,153,018 | 35,472,474 | |||||||||
Total investments in securities, at value | 77,376,934 | 177,153,018 | 99,472,474 | |||||||||
Cash | 23,587 | 1 | — | |||||||||
Income receivable | 761,219 | 30,120 | 102,640 | |||||||||
Receivable for investments sold | 399 | — | — | |||||||||
Receivable for shares sold | 671 | 90,698 | 40,111 | |||||||||
Prepaid and other expenses | 10,511 | 19,159 | 8,323 | |||||||||
Total assets | 78,173,321 | 177,292,996 | 99,623,548 | |||||||||
Liabilities: | ||||||||||||
Payable for shares redeemed | 1,769 | — | — | |||||||||
Income payable | — | 281,646 | 111,856 | |||||||||
Payable for master services fees (Note 5) | 5,058 | 6,682 | 4,174 | |||||||||
Payable for compliance services fees (Note 5) | 1,327 | 3,094 | 1,631 | |||||||||
Accrued expenses | 17,836 | 42,457 | 24,628 | |||||||||
Total liabilities | 25,990 | 333,879 | 142,289 | |||||||||
Total Net Assets | $ | 78,147,331 | $ | 176,959,117 | $ | 99,481,259 | ||||||
Net Assets Consist of: | ||||||||||||
Paid-in capital | 78,551,120 | 177,076,433 | 99,508,851 | |||||||||
Accumulated net investment income (loss) | 94,375 | (217 | ) | 33,674 | ||||||||
Accumulated net realized gain (loss) on investments | (1,859,939 | ) | (117,099 | ) | (61,266 | ) | ||||||
Net unrealized appreciation/(depreciation) of investments | 1,361,775 | — | — | |||||||||
Total Net Assets | $ | 78,147,331 | $ | 176,959,117 | $ | 99,481,259 | ||||||
Net Assets: | ||||||||||||
| $ | 78,147,331 | $ | 176,537,826 | 1 | $ | 99,481,259 | ||||||
| $ | — | $ | 421,291 | 2 | $ | — | ||||||
Total Net Assets | $ | 78,147,331 | $ | 176,959,117 | $ | 99,481,259 | ||||||
Shares Outstanding, No Par Value, Unlimited Shares Authorized: | ||||||||||||
| 7,824,711 | 176,653,770 | 1 | 99,508,860 | |||||||||
| — | 421,556 | 2 | — | |||||||||
Total Shares Outstanding | 7,824,711 | 177,075,326 | 99,508,860 | |||||||||
Net Asset Value Per Share: | ||||||||||||
| $ | 9.99 | $ | 1.00 | 1 | $ | 1.00 | ||||||
| $ | — | $ | 1.00 | 2 | $ | — | ||||||
Offering Price Per Share3: | ||||||||||||
| $ | 10.30 | 3 | $ | 1.00 | 1 | $ | 1.00 | |||||
| $ | — | $ | 1.00 | 2 | $ | — | ||||||
Redemption Proceeds Per Share6: | ||||||||||||
| $ | 9.99 | $ | 1.00 | 1 | $ | 1.00 | ||||||
| $ | — | $ | 0.95 | 2, 7 $ | — | |||||||
Total Investments, at identified cost | $ | 76,015,159 | $ | 177,153,018 | $ | 99,472,474 | ||||||
(See Notes to Financial Statements)
ANNUAL REPORT
38
Table of Contents
Capital One Funds—Statements of Operations
For the Year Ended August 31, 2008
| Capital Appreciation Fund | Louisiana Municipal Income Fund | Mid Cap Equity Fund | Total Return Bond Fund | |||||||||||||
Investment Income: | ||||||||||||||||
Dividends | $ | 3,011,668 | $ | 34,252 | $ | 1,380,860 | $ | 39,179 | ||||||||
Interest | — | 1,897,789 | 122,859 | 1,968,590 | ||||||||||||
Total income | 3,011,668 | 1,932,041 | 1,503,719 | 2,007,769 | ||||||||||||
Expenses: | ||||||||||||||||
Investment adviser fees (Note 5) | 1,175,019 | 211,203 | 848,280 | 201,345 | ||||||||||||
Master services fees (Note 5) | 159,527 | 77,398 | 110,814 | 48,709 | ||||||||||||
Chief Compliance Officer fees (Note 5) | 10,930 | 2,961 | 9,091 | 2,347 | ||||||||||||
Custodian fees (Note 5) | 36,316 | 15,000 | 27,336 | 15,000 | ||||||||||||
Trustees’ fees (Note 5) | 26,653 | 7,063 | 18,402 | 5,413 | ||||||||||||
Professional fees | 139,274 | 41,663 | 102,995 | 36,416 | ||||||||||||
Distribution services fees (Note 5) | 409,573 | 1 | 126,866 | 2 | 293,896 | 3 | 100,672 | |||||||||
Shareholder services fees (Note 5) | 8,950 | 5 | 4,766 | 5 | 5,568 | 5 | — | |||||||||
Compliance services fees (Note 5) | 17,308 | 5,043 | 13,038 | 4,135 | ||||||||||||
Miscellaneous expenses | 59,525 | 23,674 | 71,886 | 15,035 | ||||||||||||
Total expenses | 2,043,075 | 515,637 | 1,501,306 | 429,072 | ||||||||||||
Waivers (Note 5): | ||||||||||||||||
Waiver of investment adviser fees | (56,349 | ) | (112,777 | ) | (38,603 | ) | (135,351 | ) | ||||||||
Waiver of distribution services fees | — | (45,027 | )6 | — | (40,268 | ) | ||||||||||
Net expenses | 1,986,726 | 357,833 | 1,462,703 | 253,453 | ||||||||||||
Net investment income (loss) | 1,024,942 | 1,574,208 | 41,016 | 1,754,316 | ||||||||||||
Realized and Unrealized Gain (Loss) on Investments: | ||||||||||||||||
Net realized gain (loss) on investments | 16,692,424 | * | 848,384 | (5,397,875 | ) | 248,806 | ||||||||||
Net change in unrealized appreciation/(depreciation) of investments | (27,797,743 | ) | (200,347 | ) | (5,815,788 | ) | (9,247 | ) | ||||||||
Net realized and unrealized gain (loss) on investments | (11,105,319 | ) | 648,037 | (11,213,663 | ) | 239,559 | ||||||||||
Change in net assets resulting from operations | $ | (10,080,377 | ) | $ | 2,222,245 | $ | (11,172,647 | ) | $ | 1,993,875 | ||||||
| * | Includes realized gains of $3,369,497 on securities transferred on redemption-in-kind transactions (See Note 8 in Notes to Financial Statements). |
| 1 | Represents distribution services fee of $382,722 and $26,851, for Class A Shares and Class B Shares, respectively. |
| 2 | Represents distribution services fees of $112,569 and $14,297, for Class A Shares and Class B Shares, respectively. |
| 3 | Represents distribution services fee of $277,192 and $16,704, for Class A Shares and Class B Shares, respectively. |
| 4 | Represents distribution services fees of $492,781 and $3,140, for Class A Shares and Class B Shares, respectively. |
| 5 | Represents shareholder services fees for Class B Shares. |
| 6 | Represents distribution services fee waiver for Class A Shares. |
| 7 | Represents distribution services fees waiver of $295,671 and $3,140, for Class A Shares and Class B Shares, respectively. |
(See Notes to Financial Statements)
ANNUAL REPORT
39
Table of Contents
Capital One Funds—Statements of Operations (continued)
For the Year Ended August 31, 2008
| U.S. Government Income Fund | Cash Reserve Fund | U.S. Treasury Money Market Fund | ||||||||||
Investment Income: | ||||||||||||
Dividends | $ | 55,635 | $ | 183,144 | $ | 115,156 | ||||||
Interest | 3,851,603 | 7,244,534 | 2,927,532 | |||||||||
Total income | 3,907,238 | 7,427,678 | 3,042,688 | |||||||||
Expenses: | ||||||||||||
Investment adviser fees (Note 5) | 361,455 | 790,126 | 406,288 | |||||||||
Master services fees (Note 5) | 77,348 | 141,525 | 75,392 | |||||||||
Chief Compliance Officer fees (Note 5) | 5,122 | 13,087 | 6,462 | |||||||||
Custodian fees (Note 5) | 20,062 | 44,476 | 25,240 | |||||||||
Trustees’ fees (Note 5) | 12,195 | 31,216 | 15,453 | |||||||||
Professional fees | 71,928 | 169,995 | 86,494 | |||||||||
Distribution services fees (Note 5) | 200,807 | 495,921 | 4 | — | ||||||||
Shareholder services fees (Note 5) | — | 1,047 | 5 | — | ||||||||
Compliance services fees (Note 5) | 8,632 | 20,606 | 10,754 | |||||||||
Miscellaneous expenses | 21,835 | 106,908 | 33,588 | |||||||||
Total expenses | 779,384 | 1,814,907 | 659,671 | |||||||||
Waivers (Note 5): | ||||||||||||
Waiver of investment adviser fees | (207,809 | ) | (532,823 | ) | (129,701 | ) | ||||||
Waiver of distribution services fees | (80,322 | ) | (298,811 | )7 | — | |||||||
Net expenses | 491,253 | 983,273 | 529,970 | |||||||||
Net investment income (loss) | 3,415,985 | 6,444,405 | 2,512,718 | |||||||||
Realized and Unrealized Gain (Loss) on Investments: | ||||||||||||
Net realized gain (loss) on investments | 207,378 | (5,002 | ) | — | ||||||||
Net change in unrealized appreciation/(depreciation) of investments | 1,223,696 | — | — | |||||||||
Net realized and unrealized gain (loss) on investments | 1,431,074 | (5,002 | ) | — | ||||||||
Change in net assets resulting from operations | $ | 4,847,059 | $ | 6,439,403 | $ | 2,512,718 | ||||||
(See Notes to Financial Statements)
ANNUAL REPORT
40
Table of Contents
Capital One Funds—Statements of Changes in Net Assets
| Capital Appreciation Fund | Louisiana Municipal Income Fund | Mid Cap Equity Fund | ||||||||||||||||||||||
| Year Ended August 31, 2008 | Year Ended August 31, 2007 | Year Ended August 31, 2008 | Year Ended August 31, 2007 | Year Ended August 31, 2008 | Year Ended August 31, 2007 | |||||||||||||||||||
Increase (Decrease) in Net Assets: | ||||||||||||||||||||||||
Operations: | ||||||||||||||||||||||||
Net investment income (loss) | $ | 1,024,942 | $ | 988,065 | $ | 1,574,208 | $ | 2,061,967 | $ | 41,016 | $ | 343,308 | ||||||||||||
Net realized gain (loss) on investments | 16,692,424 | † | 44,587,985 | 848,384 | 99,838 | (5,397,875 | ) | 17,908,614 | ||||||||||||||||
Net change in unrealized appreciation (depreciation) on investments | (27,797,743 | ) | (12,234,525 | ) | (200,347 | ) | (690,515 | ) | (5,815,788 | ) | (1,292,210 | ) | ||||||||||||
Change in net assets resulting from operations | (10,080,377 | ) | 33,341,525 | 2,222,245 | 1,471,290 | (11,172,647 | ) | 16,959,712 | ||||||||||||||||
Distributions to Shareholders: | ||||||||||||||||||||||||
Distributions from net investment income | (1,064,099 | )1 | (1,240,052 | )3 | (1,555,550 | )5 | (1,983,748 | )7 | (56,240 | )9 | (352,227 | )9 | ||||||||||||
Distributions from net realized gain on investments | (9,164,012 | )2 | (64,372,071 | )4 | (186,475 | )6 | (182,907 | )8 | (17,905,966 | )10 | (14,716,872 | )11 | ||||||||||||
Return of Capital | — | — | — | — | (245,364 | )9 | — | |||||||||||||||||
Change in net assets resulting from distributions to shareholders | (10,228,111 | ) | (65,612,123 | ) | (1,742,025 | ) | (2,166,655 | ) | (18,207,570 | ) | (15,069,099 | ) | ||||||||||||
Capital Transactions: | ||||||||||||||||||||||||
Proceeds from sales of shares | 18,047,004 | 17,750,985 | 3,872,442 | 4,102,069 | 20,294,249 | 49,931,250 | ||||||||||||||||||
Value of shares issued to shareholders in payment of distributions declared | 8,215,482 | 53,492,508 | 699,755 | 822,386 | 12,576,020 | 10,169,565 | ||||||||||||||||||
Value of shares redeemed | (58,331,845 | )† | (93,798,361 | ) | (14,397,522 | ) | (18,360,444 | ) | (77,983,320 | ) | (37,393,566 | ) | ||||||||||||
Change in net assets resulting from share transactions | (32,069,359 | ) | (22,554,868 | ) | (9,825,325 | ) | (13,435,989 | ) | (45,113,051 | ) | 22,707,249 | |||||||||||||
Change in net assets | (52,377,847 | ) | (54,825,466 | ) | (9,345,105 | ) | (14,131,354 | ) | (74,493,268 | ) | 24,597,862 | |||||||||||||
Net Assets: | ||||||||||||||||||||||||
Beginning of period | 175,898,247 | 230,723,713 | 48,863,881 | 62,995,235 | 160,956,784 | 136,358,922 | ||||||||||||||||||
End of period | $ | 123,520,400 | $ | 175,898,247 | $ | 39,518,776 | $ | 48,863,881 | $ | 86,463,516 | $ | 160,956,784 | ||||||||||||
Accumulated net investment income (loss) | $ | 56,314 | $ | 95,471 | $ | 69,512 | $ | 41,092 | $ | — | $ | 15,224 | ||||||||||||
| † | Includes realized gain or redemptions as a result of an in-kind transfer (See Note 8 in Notes to Financial Statements). |
| 1 | Represents income distributions of $1,059,699 and $4,400 for Class A Shares and Class B Shares, respectively. |
| 2 | Represents gain distributions of $8,930,407 and $233,605, for Class A Shares and Class B Shares, respectively. |
| 3 | Represents income distributions of $1,234,863 and $5,189 for Class A Shares and Class B Shares, respectively. |
| 4 | Represents gain distributions of $62,763,926 and $1,608,145 for Class A Shares and Class B Shares, respectively. |
| 5 | Represents income distributions of $1,508,063 and $47,487 for Class A Shares and Class B Shares, respectively. |
| 6 | Represents gain distributions of $178,991 and $7,484 for Class A Shares and Class B Shares, respectively. |
| 7 | Represents income distributions of $1,916,220 and $67,528 for Class A Shares and Class B Shares, respectively. |
| 8 | Represents gain distributions of $174,861 and $8,046 for Class A Shares and Class B Shares, respectively. |
| 9 | Represents income distributions for Class A Shares. |
| 10 | Represents gain distributions of $17,536,975 and $368,991 for Class A Shares and Class B Shares, respectively. |
| 11 | Represents gain distributions of $14,297,687 and $419,185 for Class A Shares and Class B Shares, respectively. |
(See Notes to Financial Statements)
ANNUAL REPORT
41
Table of Contents
Capital One Funds—Statements of Changes in Net Assets (continued)
| Total Return Bond Fund | U.S. Government Income Fund | |||||||||||||||
| Year Ended August 31, 2008 | Year Ended August 31, 2007 | Year Ended August 31, 2008 | Year Ended August 31, 2007 | |||||||||||||
Increase (Decrease) in Net Assets: | ||||||||||||||||
Operations: | ||||||||||||||||
Net investment income (loss) | $ | 1,754,316 | $ | 1,849,226 | $ | 3,415,985 | $ | 4,208,752 | ||||||||
Net realized gain (loss) on investments | 248,806 | (376,789 | ) | 207,378 | (165,583 | ) | ||||||||||
Net change in unrealized appreciation (depreciation) on investments | (9,247 | ) | 259,519 | 1,223,696 | 496,124 | |||||||||||
Change in net assets resulting from operations | 1,993,875 | 1,731,956 | 4,847,059 | 4,539,293 | ||||||||||||
Distributions to Shareholders: | ||||||||||||||||
Distributions from net investment income | (1,782,453 | ) | (1,872,723 | ) | (3,646,743 | ) | (4,210,421 | ) | ||||||||
Change in net assets resulting from distributions to shareholders | (1,782,453 | ) | (1,872,723 | ) | (3,646,743 | ) | (4,210,421 | ) | ||||||||
Capital Transactions: | ||||||||||||||||
Proceeds from sales of shares | 18,537,459 | 7,662,965 | 28,062,699 | 27,039,910 | ||||||||||||
Value of shares issued to shareholders in payment of distributions declared | 768,904 | 1,171,275 | 791,314 | 1,083,174 | ||||||||||||
Value of shares redeemed | (9,807,591 | ) | (22,452,541 | ) | (42,121,082 | ) | (26,947,748 | ) | ||||||||
Change in net assets resulting from share transactions | 9,498,772 | (13,618,301 | ) | (13,267,069 | ) | 1,175,336 | ||||||||||
Change in net assets | 9,710,194 | (13,759,068 | ) | (12,066,753 | ) | 1,504,208 | ||||||||||
Net Assets: | ||||||||||||||||
Beginning of period | 34,970,561 | 48,729,629 | 90,214,084 | 88,709,876 | ||||||||||||
End of period | $ | 44,680,755 | $ | 34,970,561 | $ | 78,147,331 | $ | 90,214,084 | ||||||||
Accumulated net investment income (loss) | $ | 65,711 | $ | 34,173 | $ | 94,375 | $ | 165,280 | ||||||||
(See Notes to Financial Statements)
ANNUAL REPORT
42
Table of Contents
Capital One Funds—Statements of Changes in Net Assets (continued)
| Cash Reserve Fund | U.S. Treasury Money Market Fund | |||||||||||||||
| Year Ended August 31, 2008 | Year Ended August 31, 2007 | Year Ended August 31, 2008 | Year Ended August 31, 2007 | |||||||||||||
Increase (Decrease) in Net Assets: | ||||||||||||||||
Operations: | ||||||||||||||||
Net investment income (loss) | $ | 6,444,405 | $ | 9,588,150 | $ | 2,512,718 | $ | 5,607,117 | ||||||||
Net realized gain (loss) on investments | (5,002 | ) | 92 | — | (27,107 | ) | ||||||||||
Change in net assets resulting from operations | 6,439,403 | 9,588,242 | 2,512,718 | 5,580,010 | ||||||||||||
Distributions to Shareholders: | ||||||||||||||||
Distributions from net investment income | (6,444,564 | )1 | (9,589,442 | )2 | (2,512,714 | ) | (5,607,085 | ) | ||||||||
Change in net assets resulting from distributions to shareholders | (6,444,564 | ) | (9,589,442 | ) | (2,512,714 | ) | (5,607,085 | ) | ||||||||
Capital Transactions: | ||||||||||||||||
Proceeds from sales of shares | 365,444,144 | * | 410,299,629 | 149,837,173 | 330,451,925 | |||||||||||
Net asset value of shares issued to shareholders in payment of distributions declared | 2,716,260 | 5,261,002 | 907,410 | 1,591,142 | ||||||||||||
Value of shares redeemed | (413,970,791 | ) | (373,015,649 | ) | (155,758,987 | ) | (383,838,222 | ) | ||||||||
Change in net assets resulting from share transactions | (45,810,387 | ) | 42,544,982 | (5,014,404 | ) | (51,795,155 | ) | |||||||||
Change in net assets | (45,815,548 | ) | 42,543,782 | (5,014,400 | ) | (51,822,230 | ) | |||||||||
Net Assets: | ||||||||||||||||
Beginning of period | 222,774,665 | 180,230,883 | 104,495,659 | 156,317,889 | ||||||||||||
End of period | $ | 176,959,117 | $ | 222,774,665 | $ | 99,481,259 | $ | 104,495,659 | ||||||||
Accumulated net investment income (loss) | $ | (217 | ) | $ | (58 | ) | $ | 33,674 | $ | 33,670 | ||||||
| * | Capital One Asset Management, LLC made a capital contribution of $1,107 to the Class B Shares of the Cash Reserve Fund |
| 1 | Represents income distributions of $6,431,833 and $12,731 for Class A Shares and Class B Shares, respectively. |
| 2 | Represents income distributions of $9,570,824 and $18,618 for Class A Shares and Class B Shares, respectively. |
(See Notes to Financial Statements)
ANNUAL REPORT
43
Table of Contents
Capital One Funds—Notes to Financial Statements
As of August 31, 2008
| (1) | ORGANIZATION |
Capital One Funds (the “Trust”), organized as a Massachusetts business trust, is registered under the Investment Company Act of 1940, as amended (the “Act”), as an open-end management investment company. The Trust consists of seven portfolios (individually referred to as the “Fund”, or collectively as the “Funds”) which are presented herein:
Portfolio Name | Diversification | Investment Objective | ||
| Capital One Capital Appreciation Fund (“Capital Appreciation Fund”) | diversified | provide growth of capital and income | ||
| Capital One Louisiana Municipal Income Fund (“Louisiana Municipal Income Fund”) | non-diversified | provide current income which is generally exempt from federal regular income tax and personal income taxes imposed by the state of Louisiana | ||
| Capital One Mid Cap Equity Fund (“Mid Cap Equity Fund”) | diversified | total return | ||
| Capital One Total Return Bond Fund (“Total Return Bond Fund”) | diversified | maximize total return | ||
| Capital One U.S. Government Income Fund (“U.S. Government Income Fund”) | diversified | provide current income | ||
| Capital One Cash Reserve Fund (“Cash Reserve Fund”) | diversified | provide current income consistent with stability of principal | ||
| Capital One U.S. Treasury Money Market Fund (“U.S. Treasury Money Market Fund”) | diversified | provide current income consistent with stability of principal and liquidity | ||
The assets of each Fund are segregated and a shareholder’s interest is limited to the Fund in which shares are held. The Trust is authorized to issue an unlimited amount of shares without par value. Capital Appreciation Fund, Louisiana Municipal Income Fund, Mid Cap Equity Fund and Cash Reserve Fund offer two classes of shares: Class A Shares and Class B Shares. All shares of Capital Appreciation Fund, Louisiana Municipal Income Fund, Mid Cap Equity Fund and Cash Reserve Fund have equal rights and privileges except with respect to the fees paid under the Distribution Plan, Shareholder Services Fees and voting rights on matters affecting a single class of shares and sales charges. The Class A Shares of the Capital Appreciation Fund and the Mid Cap Equity Fund have a maximum sales charge of 4.50% as a percentage of the original purchase price. The Class A Shares of the Louisiana Municipal Income Fund has a maximum sales charge of 3.00% as a percentage of the original purchase price. The Total Return Bond Fund and the U.S. Government Income Fund have a maximum front-end sales charge of 3.00% as a percentage of the original price. The Class B Shares of the Capital Appreciation Fund, the Mid Cap Equity Fund and the Louisiana Municipal Income Fund are offered without any front-end sales charge but will be subject to a Contingent Deferred Sales Charge (“CDSC”) ranging from a maximum of 5.50% if redeemed less than one year after purchase to 0.00% if redeemed more than six years after purchase.
Under the Funds’ organizational documents, its Officers and Trustees are indemnified against certain liabilities arising out of the performance of their duties to the Funds. In addition, in the normal course of business, the Funds may enter into contracts with their vendors and others that provide for general indemnifications. The Funds’ maximum exposure under these arrangements is unknown as this would involve future claims that may be made against the Funds. However, based on experience, the Funds expect that risk of loss to be remote.
| (2) | SIGNIFICANT ACCOUNTING POLICIES |
The following is a summary of significant accounting policies followed by the Funds in the preparation of their financial statements. These policies are in conformity with U.S. generally accepted accounting principles (“GAAP”). The preparation of financial statements requires management to make estimates and assumptions that affect the reported amounts. Actual results could differ from those estimates.
Investment Valuations:
Municipal bonds are valued by an independent pricing service, taking into consideration yield, liquidity, risk, credit quality, coupon, maturity, type of issue and any other factors or market data the pricing service deems relevant. Total Return Bond Fund and U.S. Government Income Fund generally value fixed income securities according to prices furnished by an independent pricing service, except that fixed income securities with remaining maturities of less than 60 days at the time of purchase may be valued at amortized cost, which approximates fair market value. Listed equity securities are valued at the last sale price or official closing price reported on a national securities exchange, if available. If unavailable, the security is generally valued at the mean between the last closing bid and asked prices. Cash Reserve Fund and U.S. Treasury Money Market Fund use the amortized cost method to value portfolio securities in accordance with Rule 2a-7 under the Act. Capital Appreciation Fund, Louisiana Municipal Income Fund, Mid Cap Equity Fund, Total Return Bond Fund and U.S. Government Income Fund generally value short-term securities according to prices furnished by an independent pricing service, except that short-term securities with remaining maturities of less than 60 days at the time of purchase
ANNUAL REPORT
44
Table of Contents
Capital One Funds—Notes to Financial Statements (continued)
As of August 31, 2008
may be valued at amortized cost, which approximates fair market value. Fixed income and short-term security prices furnished by an independent pricing service are intended to be indicative of the mean between the bid and asked prices currently offered to institutional investors for the securities. Investments in other open-end regulated investment companies are valued at net asset value. Securities for which no quotations are readily available are valued at fair value as determined in accordance with procedures established by and under general supervision of the Board of Trustees (the “Trustees”). In addition, specific securities may need to be valued by or at the direction of the Funds’ Board of Trustees due to potentially significant events. Examples of potentially significant events that could affect the value of an individual security include corporate actions by the issuer, announcements by the issuer relating to its earnings or profits, regulatory news, natural disasters and litigation. Examples of potentially significant events that could affect multiple securities held by a Fund include governmental actions, natural disasters and armed conflicts.
Repurchase Agreements:
The Funds will enter into repurchase agreements only with banks and other recognized financial institutions, such as securities dealers, deemed creditworthy by the Funds’ investment adviser Capital One Asset Management LLC. Repurchase agreements are transactions in which a Fund buys a security from a dealer or bank and agrees to sell the security back at a mutually agreed-upon time and price. The repurchase price is greater than the price paid by the Funds, reflecting an agreed-upon market interest rate during the purchaser’s holding period. While the maturities of the underlying collateral securities in repurchase transactions may be more than one year, the term of each repurchase agreement will always be less than one year.
In addition, the value of the collateral underlying the repurchase agreement will always be at least equal to the repurchase price, including any accrued interest earned on the repurchase agreement. The collateral underlying the repurchase agreement is held by the Funds’ custodian or sub-custodian. In the event of a default or bankruptcy by a selling financial institution, the Funds will seek to liquidate such collateral which could involve certain costs or delays and, to the extent that proceeds from any sale upon a default of the obligation to repurchase were less than the repurchase price, the Funds’ could suffer a loss. The Funds’ also may experience difficulties and incur certain costs in exercising its rights to the collateral and may lose the interest the Funds’ expected to receive under the repurchase agreement.
Investment Income, Gains and Losses, Expenses and Distributions:
Interest income and expenses are accrued daily. Dividend income and distributions to shareholders are recorded on the ex-dividend date. Distributions of net investment income are declared daily and paid monthly for Cash Reserve Fund and U.S. Treasury Money Market Fund. Distributions of net investment income are declared and paid quarterly for Capital Appreciation Fund and Mid Cap Equity Fund. Distributions of net investment income are declared and paid monthly for Louisiana Municipal Income Fund, Total Return Bond Fund and U.S. Government Income Fund. Non-cash dividends included in dividend income, if any, are recorded at fair value. Investment income, realized and unrealized gains and losses, and certain fund-level expenses are allocated to each class based on relative average daily net assets, except that each class bears certain expenses unique to that class such as distribution and shareholder services fees. Dividends are declared separately for each class. No class has preferential dividend rights; differences in per share dividend rates are generally due to differences in separate class expenses.
The Funds’ net realized gains, if any, are distributed to shareholders at least annually. Additional distributions are also made to the Funds’ shareholders to the extent necessary to avoid the federal excise tax on certain undistributed income and net capital gains of regulated investment companies.
The character of income and gains distributed are determined in accordance with federal income tax regulations, which may differ from GAAP. These “book/tax” differences are either considered temporary or permanent in nature. To the extent these differences are permanent in nature (e.g. reclass of market discounts, net operating loss, certain gain/loss, paydowns and certain distributions), such amounts are reclassified within the composition of net assets based on their federal tax-basis treatment; temporary differences (e.g. wash sales) do not require reclassification. Dividends to shareholders which exceed net investment income and net realized gains for tax purposes are reported as distributions of capital
Premium and Discount Amortization/Paydown Gains and Losses:
All premiums and discounts on fixed income securities are amortized/accreted for financial statement purposes. Gains and losses realized on principal payment of mortgage-backed securities (paydown gains and losses) are classified as part of investment income.
Federal Taxes:
It is the Funds’ policy to comply with the Subchapter M provision of the Internal Revenue Code (the “Code”) and to distribute to shareholders each year substantially all of their income. Accordingly, no provision for federal income tax is necessary.
Withholding taxes, and where appropriate, deferred withholding taxes, on foreign interest, dividends and capital gains has been provided for in accordance with the applicable country’s tax rules and rates.
In addition, effective February 29, 2008, the Funds adopted Financial Accounting Standards Board Interpretation No. 48, Accounting for Uncertainty in Income Taxes (“FIN 48”). FIN 48 provides guidance for how uncertain tax positions should be recognized, measured, presented and disclosed in the financial statements. FIN 48 requires the affirmative evaluation of tax positions taken or expected to be taken in the course of preparing the Funds’ tax returns to determine whether it is more-likely-than-not (i.e., greater than 50-percent) that each tax position will be sustained upon examination by a taxing authority based on the technical merits of the position. A tax position that meets the more-likely-than-not recognition threshold is measured to determine the amount of benefit to recognize in the financial statements. Differences between tax positions taken in a tax return and amounts recognized in the financial statements will generally result in an increase in a liability for taxes payable (or a reduction of a tax refund receivable), including the recognition of any related interest and penalties as an operating expense. Implementation of FIN 48 included a review of tax positions taken in tax years that remain subject to examination by tax authorities (i.e., the last 4 tax year ends and the interim tax period since then, as applicable). The adoption of FIN 48 did not impact the Funds’ net assets or results of operations.
ANNUAL REPORT
45
Table of Contents
Capital One Funds—Notes to Financial Statements (continued)
As of August 31, 2008
When-Issued and Delayed Delivery Transactions:
The Funds may engage in when-issued or delayed delivery transactions. The Funds record when-issued securities on the trade date and maintain security positions such that sufficient liquid assets will be available to make payment for the securities purchased. Securities purchased on a when-issued or delayed delivery basis are marked to market daily and begin earning interest on the settlement date. Losses may occur on these transactions due to changes in market conditions or the failure of counterparties to perform under the contract.
Other:
Investment transactions are recorded no later than one business day after trade date throughout the period. For financial reporting purposes, investment transactions are recorded on trade date on the last business day of the reporting period. Realized gains and losses from investment transactions are recorded on an identified cost basis.
Real Estate Investment Trusts:
The Funds may own shares of real estate investment trusts (“REITs”) which report information on the source of their distributions annually. Certain distributions received from REITs during the year, which are known to be a return of capital, are recorded as a reduction to the cost of the individual REIT.
New Accounting Standards:
In September 2006, the Financial Accounting Standards Board (FASB) issued Statement on Financial Accounting Standards (SFAS) No. 157, “Fair Value Measurements.” This standard establishes a single authoritative definition of fair value, sets out a framework for measuring fair value and requires additional disclosures about fair value measurements. SFAS No. 157 applies to fair value measurements already required or permitted by existing standards. SFAS No. 157 is effective for financial statements issued for fiscal years beginning after November 15, 2007 and interim periods within those fiscal years. The changes to current generally accepted accounting principles from the application of this Statement relate to the definition of fair value, the methods used to measure fair value, and the expanded disclosures about fair value measurements. As of August 31, 2008, the Funds do not believe the adoption of SFAS No. 157 will impact the financial statement amounts, however, additional disclosures will be required about the inputs used to develop the measurements and the effect of certain of the measurements on changes in net assets for the period.
In March 2008, the Financial Accounting Standards Board issued the Statement of Financial Accounting Standards No. 161, “Disclosures about Derivative Instruments and Hedging Activities” (“SFAS 161”). SFAS 161 effective for fiscal years and interim periods beginning after November 15, 2008. SFAS 161 requires enhanced disclosures about the Funds’ derivative and hedging activities, including how such activities are accounted for and their effect on the Funds’ financial positions, performance and cash flows. Management is currently evaluating the impact the adoption of SFAS 161 will have on the Funds’ financial statements and related disclosures.
| (3) | SHARES OF BENEFICIAL INTEREST |
The following tables summarize share activity:
EQUITY AND INCOME FUNDS
| Capital Appreciation Fund | ||||||||||||||
| Year Ended August 31, 2008 | Year Ended August 31, 2007 | |||||||||||||
| Shares | Dollars | Shares | Dollars | |||||||||||
| Class A Shares | ||||||||||||||
Shares sold | 1,193,634 | $ | 18,008,138 | 950,881 | $ | 17,637,272 | ||||||||
Shares issued to shareholders in payment of distributions declared | 508,382 | 7,981,583 | 3,044,326 | 51,904,521 | ||||||||||
Shares redeemed | (3,733,977 | ) | (56,703,978 | ) | (5,166,156 | ) | (91,286,316 | ) | ||||||
Net change resulting from Class A Share Transactions | (2,031,961 | ) | $ | (30,714,257 | ) | (1,170,949 | ) | $ | (21,744,523 | ) | ||||
| Class B Shares | ||||||||||||||
Shares sold | 2,774 | $ | 38,866 | 6,600 | $ | 113,713 | ||||||||
Shares issued to shareholders in payment of distributions declared | 16,307 | 233,899 | 100,178 | 1,587,987 | ||||||||||
Shares redeemed | (115,469 | ) | (1,627,867 | ) | (144,734 | ) | (2,512,045 | ) | ||||||
Net change resulting from Class B Share Transactions | (96,388 | ) | $ | (1,355,102 | ) | (37,956 | ) | $ | (810,345 | ) | ||||
Net change resulting from Fund Share Transactions | (2,128,349 | ) | $ | (32,069,359 | ) | (1,208,905 | ) | $ | (22,554,868 | ) | ||||
ANNUAL REPORT
46
Table of Contents
Capital One Funds—Notes to Financial Statements (continued)
As of August 31, 2008
| Louisiana Municipal Income Fund | ||||||||||||||
| Year Ended August 31, 2008 | Year Ended August 31, 2007 | |||||||||||||
| Shares | Dollars | Shares | Dollars | |||||||||||
| Class A Shares | ||||||||||||||
Shares sold | 360,223 | $ | 3,872,442 | 385,210 | $ | 4,102,069 | ||||||||
Shares issued to shareholders in payment of distributions declared | 61,796 | 660,874 | 71,751 | 767,349 | ||||||||||
Shares redeemed | (1,306,909 | ) | (14,004,465 | ) | (1,642,877 | ) | (17,572,848 | ) | ||||||
Net change resulting from Class A Share Transactions | (884,890 | ) | $ | (9,471,149 | ) | (1,185,916 | ) | $ | (12,703,430 | ) | ||||
| Class B Shares | ||||||||||||||
Shares sold | — | $ | — | — | $ | — | ||||||||
Shares issued to shareholders in payment of distributions declared | 3,632 | 38,881 | 5,142 | 55,037 | ||||||||||
Shares redeemed | (36,792 | ) | (393,057 | ) | (73,813 | ) | (787,596 | ) | ||||||
Net change resulting from Class B Share Transactions | (33,160 | ) | $ | (354,176 | ) | (68,671 | ) | $ | (732,559 | ) | ||||
Net change resulting from Fund Share Transactions | (918,050 | ) | $ | (9,825,325 | ) | (1,254,587 | ) | $ | (13,435,989 | ) | ||||
| Mid Cap Equity Fund | ||||||||||||||
| Year Ended August 31, 2008 | Year Ended August 31, 2007 | |||||||||||||
| Shares | Dollars | Shares | Dollars | |||||||||||
| Class A Shares | ||||||||||||||
Shares sold | 1,310,852 | $ | 20,271,530 | 2,674,401 | $ | 49,836,961 | ||||||||
Shares issued to shareholders in payment of distributions declared | 798,458 | 12,233,936 | 577,628 | 9,776,760 | ||||||||||
Shares redeemed | (4,921,365 | ) | (76,503,212 | )† | (1,960,508 | ) | (35,863,514 | ) | ||||||
Net change resulting from Class A Share Transactions | (2,812,055 | ) | $ | (43,997,746 | ) | 1,291,521 | $ | 23,750,207 | ||||||
| Class B Shares | ||||||||||||||
Shares sold | 1,654 | $ | 22,719 | 5,471 | $ | 94,289 | ||||||||
Shares issued to shareholders in payment of distributions declared | 24,382 | 342,084 | 24,988 | 392,805 | ||||||||||
Shares redeemed | (108,800 | ) | (1,480,108 | ) | (89,041 | ) | (1,530,052 | ) | ||||||
Net change resulting from Class B Share Transactions | (82,764 | ) | $ | (1,115,305 | ) | (58,582 | ) | $ | (1,042,958 | ) | ||||
Net change resulting from Fund Share Transactions | (2,894,819 | ) | $ | (45,113,051 | ) | 1,232,939 | $ | 22,707,249 | ||||||
| Total Return Bond Fund | ||||||||||||||
| Year Ended August 31, 2008 | Year Ended August 31, 2007 | |||||||||||||
| Shares | Dollars | Shares | Dollars | |||||||||||
Shares sold | 1,947,228 | $ | 18,537,459 | 814,696 | $ | 7,662,965 | ||||||||
Shares issued to shareholders in payment of distributions declared | 81,255 | 768,904 | 124,936 | 1,171,275 | ||||||||||
Shares redeemed | (1,030,351 | ) | (9,807,591 | ) | (2,387,521 | ) | (22,452,541 | ) | ||||||
Net change resulting from Capital Share Transactions | 998,132 | $ | 9,498,772 | (1,477,889 | ) | $ | (13,618,301 | ) | ||||||
| U.S. Government Income Fund | ||||||||||||||
| Year Ended August 31, 2008 | Year Ended August 31, 2007 | |||||||||||||
| Shares | Dollars | Shares | Dollars | |||||||||||
Shares sold | 2,788,637 | $ | 28,062,699 | 2,748,401 | $ | 27,039,910 | ||||||||
Shares issued to shareholders in payment of distributions declared | 79,175 | 791,314 | 110,120 | 1,083,174 | ||||||||||
Shares redeemed | (4,196,819 | ) | (42,121,082 | ) | (2,741,571 | ) | (26,947,748 | ) | ||||||
Net change resulting from Capital Share Transactions | (1,329,007 | ) | $ | (13,267,069 | ) | 116,950 | $ | 1,175,336 | ||||||
ANNUAL REPORT
47
Table of Contents
Capital One Funds—Notes to Financial Statements (continued)
As of August 31, 2008
MONEY MARKET FUNDS
| Cash Reserve Fund | ||||||||||||||
| Year Ended August 31, 2008 | Year Ended August 31, 2007 | |||||||||||||
| Shares | Dollars | Shares | Dollars | |||||||||||
| Class A Shares | ||||||||||||||
Shares sold | 365,401,069 | $ | 365,401,069 | 410,247,819 | $ | 410,247,819 | ||||||||
Shares issued to shareholders in payment of distributions declared | 2,703,565 | 2,703,565 | 5,242,525 | 5,242,525 | ||||||||||
Shares redeemed | (413,936,819 | ) | (413,936,819 | )† | (372,949,721 | ) | (372,949,721 | ) | ||||||
Net change resulting from Class A Share Transactions | (45,832,185 | ) | $ | (45,832,185 | ) | 42,540,623 | $ | 42,540,623 | ||||||
| Class B Shares | ||||||||||||||
Shares sold | 41,968 | $ | 43,075 | ‡ | 51,810 | $ | 51,810 | |||||||
Shares issued to shareholders in payment distributions declared | 12,695 | 12,695 | 18,477 | 18,477 | ||||||||||
Shares redeemed | (33,972 | ) | (33,972 | ) | (65,928 | ) | (65,928 | ) | ||||||
Net change resulting from Class B Share Transactions | 20,691 | $ | 21,798 | 4,359 | $ | 4,359 | ||||||||
Net change resulting from Fund Share Transactions | (45,811,494 | ) | $ | (45,810,387 | ) | 42,544,982 | $ | 42,544,982 | ||||||
| U.S. Treasury Money Market Fund | ||||||||||||||
| Year Ended August 31, 2008 | Year Ended August 31, 2007 | |||||||||||||
| Shares | Dollars | Shares | Dollars | |||||||||||
Shares sold | 149,837,173 | $ | 149,837,173 | 330,451,925 | $ | 330,451,925 | ||||||||
Shares issued to shareholders in payment of distributions declared | 907,410 | 907,410 | 1,591,142 | 1,591,142 | ||||||||||
Shares redeemed | (155,758,987 | ) | (155,758,987 | ) | (383,838,222 | ) | (383,838,222 | ) | ||||||
Net change resulting from Capital Share Transactions | (5,014,404 | ) | $ | (5,014,404 | ) | (51,795,155 | ) | $ | (51,795,155 | ) | ||||
| † | Includes approximately $38 million and $57 million related to the redemption of an account by an affiliate to Capital One Asset Management LLC in the Mid Cap Equity Fund and Cash Reserve Fund, respectively, in connection with the integration of the former Hibernia 401-K Plan with the Capital One Savings Plan. |
| ‡ | Capital One Asset Management LLC made a capital contribution of $1,107 to the Class B Shares of the Cash Reserve Fund. |
| (4) | FEDERAL TAX INFORMATION |
The timing and character of income and capital gain distributions are determined in accordance with income tax regulations, which may differ from GAAP. These differences are due in part to differing treatments for Real Estate Investment Trust reclasses, and discount accretion/premium amortization on debt securities and redemptions-in-kind.
As of the tax year ended August 31, 2008, permanent differences identified and reclassified among the components of net assets were as follows:
Fund | Paid In Capital | Undistributed Net Investment Income | Accumulated Net Realized Gains (Losses) | ||||||||
Capital Appreciation Fund | $ | 3,369,497 | $ | — | $ | (3,369,497 | ) | ||||
Louisiana Municipal Income Fund | — | 9,762 | (9,762 | ) | |||||||
Mid Cap Equity Fund | (245,350 | ) | 245,364 | (14 | ) | ||||||
Total Return Bond Fund | (1 | ) | 59,675 | (59,674 | ) | ||||||
U.S. Government Income Fund | 1 | 159,853 | (159,854 | ) | |||||||
Net investment income, net realized gains (losses), and net assets were not affected by this reclassification.
ANNUAL REPORT
48
Table of Contents
Capital One Funds—Notes to Financial Statements (continued)
As of August 31, 2008
The tax character of distributions reported on the Statements of Changes in Net Assets for the years ended August 31, 2008 and 2007, was as follows:
| 2008 | 2007 | ||||||||||||||||||||
| Tax–Exempt | Ordinary | Return of | Long–Term | Tax–Exempt | Ordinary | Long–Term | |||||||||||||||
Fund | Income | Income* | Capital | Capital Gains | Income | Income* | Capital Gains | ||||||||||||||
Capital Appreciation Fund | $ | — | $ | 2,903,464 | $ | — | $ | 7,324,647 | $ | — | $ | 3,260,951 | $ | 62,351,172 | |||||||
Louisiana Municipal Income Fund | 1,520,861 | 43,748 | — | 177,416 | 1,981,756 | 1,992 | 182,907 | ||||||||||||||
Mid Cap Equity Fund | — | 415,048 | 245,364 | 17,547,158 | — | 424,111 | 14,644,988 | ||||||||||||||
Total Return Bond Fund | — | 1,782,453 | �� | — | — | — | 1,872,723 | — | |||||||||||||
U.S. Government Income Fund | — | 3,646,743 | — | — | — | 4,210,421 | — | ||||||||||||||
Cash Reserve Fund | — | 6,444,564 | — | — | — | 9,589,442 | — | ||||||||||||||
U.S. Treasury Money Market Fund | — | 2,512,714 | — | — | — | 5,607,085 | — | ||||||||||||||
| * | For tax purposes short-term capital gain distributions are considered ordinary income. |
As of the tax year ended August 31, 2008, the components of distributable earnings on a tax basis were as follows:
| Net | |||||||||||||||||||||
| Undistributed | Undistributed | Undistributed | Unrealized | Accumulated | |||||||||||||||||
| Tax–Exempt | Ordinary | Long–Term | Appreciation/ | Capital and | Dividend | ||||||||||||||||
Fund | Income | Income* | Capital Gains | Depreciation | Other Losses | Payable | |||||||||||||||
Capital Appreciation Fund | $ | — | $ | 56,314 | $ | 12,868,347 | $ | 24,620,387 | $ | — | $ | — | |||||||||
Louisiana Municipal Income Fund | 69,512 | — | 788,274 | 432,353 | — | — | |||||||||||||||
Mid Cap Equity Fund | — | — | — | 13,711,813 | (5,414,567 | ) | — | ||||||||||||||
Total Return Bond Fund | — | 65,711 | — | (149,939 | ) | (3,007,033 | ) | — | |||||||||||||
U.S. Government Income Fund | — | 94,375 | — | 1,215,537 | (1,713,701 | ) | — | ||||||||||||||
Cash Reserve Fund | — | 281,429 | — | — | (117,099 | ) | (281,646 | ) | |||||||||||||
U.S. Treasury Money Market Fund | — | 145,530 | — | — | (61,266 | ) | (111,856 | ) | |||||||||||||
| * | For tax purposes short-term capital gain distributions are considered ordinary income. |
For federal income tax purposes, the following amounts apply as of August 31, 2008:
| Net Unrealized | ||||||||||||||
| Cost of | Unrealized | Unrealized | Appreciation/ | |||||||||||
Fund | Investments | Appreciation | Depreciation | (Depreciation) | ||||||||||
Capital Appreciation Fund | $ | 98,755,864 | $ | 30,727,906 | $ | (6,107,519 | ) | $ | 24,620,387 | |||||
Louisiana Municipal Income Fund | 33,732,120 | 459,024 | (26,671 | ) | 432,353 | |||||||||
Mid Cap Equity Fund | 72,666,502 | 19,854,844 | (6,143,031 | ) | 13,711,813 | |||||||||
Total Return Bond Fund | 44,051,777 | 294,349 | (444,288 | ) | (149,939 | ) | ||||||||
U.S. Government Income Fund | 76,161,397 | 1,626,637 | (411,100 | ) | 1,215,537 | |||||||||
Cash Reserve Fund* | 177,153,018 | — | — | — | ||||||||||
U.S. Treasury Money Market Fund* | 99,472,474 | — | — | — | ||||||||||
| * | at amortized cost. |
The difference between book-basis and tax-basis unrealized appreciation/depreciation is due in part to differing treatments for tax deferral of losses on wash sales and discount accretion/premium amortization on debt securities.
As of the year ended August 31, 2008, Mid Cap Equity Fund, Total Return Bond Fund, U.S. Government Income Fund, Cash Reserve Fund and U.S. Treasury Money Market Fund had capital loss carryforwards, as noted below, which will reduce each Fund’s taxable income arising from future net realized gain on investments, if any, to the extent permitted by the Code, and thus will reduce the amount of the distributions to shareholders which would otherwise be necessary to relieve each Fund of any liability for federal income tax. Pursuant to the Code, such capital loss carryforwards will expire as follows:
| Expiration Years | ||||||||||||||||||||||||
Fund | 2010 | 2011 | 2012 | 2013 | 2014 | 2015 | 2016 | Total | ||||||||||||||||
Mid Cap Equity Fund | $ | — | $ | — | $ | — | $ | — | $ | — | $ | — | $ | 2,736,559 | $ | 2,736,559 | ||||||||
Total Return Bond Fund | 32,661 | 1,926,558 | — | — | 916 | 935,052 | — | 2,895,187 | ||||||||||||||||
U.S. Government Income Fund | — | 55,983 | 180,486 | — | 61,397 | 1,343,372 | — | 1,641,238 | ||||||||||||||||
Cash Reserve Fund | 931 | 44,663 | 3,035 | — | 614 | 62,854 | — | 112,097 | ||||||||||||||||
U.S. Treasury Money Market Fund | — | — | — | 393 | — | 33,766 | 9,000 | 43,159 | ||||||||||||||||
ANNUAL REPORT
49
Table of Contents
Capital One Funds—Notes to Financial Statements (continued)
As of August 31, 2008
Under current tax law, capital losses realized after October 31 may be deferred and treated as occurring on the first business day of the following tax fiscal year. The following Funds had deferred losses, which will be treated as arising on the first day of the tax fiscal year ended August 31, 2009:
Fund | |||
Mid Cap Equity Fund | $ | 2,678,008 | |
Total Return Bond Fund | 111,846 | ||
U.S. Government Income Fund | 72,463 | ||
Cash Reserve Fund | 5,002 | ||
U.S. Treasury Money Market Fund | 18,107 | ||
During the year ended August 31, 2008, the following Funds utilized capital loss carryforwards to offset capital gains realized:
Fund | |||
Total Return Bond Fund | $ | 18,537 | |
U.S. Government Income Fund | 34,040 | ||
INVESTMENT ADVISER FEE AND OTHER TRANSACTIONS WITH AFFILIATES
Investment Adviser Fee:
Capital One Asset Management LLC, the Funds’ investment adviser (the “Adviser”), receives for its services an annual investment adviser fee based on a percentage of each Fund’s average daily net assets. Expenses incurred by the Funds are included on the Statements of Operations as “Investment adviser fees.” Information regarding these transactions is as follows for the year ended August 31, 2008:
| Annual | |||
Fund | Rate | ||
Capital Appreciation Fund | 0.75 | % | |
Louisiana Municipal Income Fund | 0.45 | % | |
Mid Cap Equity Fund | 0.75 | % | |
Total Return Bond Fund | 0.50 | % | |
U.S. Government Income Fund | 0.45 | % | |
Cash Reserve Fund | 0.40 | % | |
U.S. Treasury Money Market Fund | 0.40 | % |
The Adviser may voluntarily choose to waive any portion of its fee. The Adviser can modify or terminate this voluntary waiver at any time at its sole discretion. Expenses voluntarily waived are included in the Statements of Operations as “Waiver of investment adviser fees”. These fees are not available to be recouped in subsequent years. For the year ended August 31, 2008, the Adviser voluntarily waived a portion of its fee for the following Funds:
Fund | |||
Capital Appreciation Fund | $ | 56,349 | |
Louisiana Municipal Income Fund | 112,777 | ||
Mid Cap Equity Fund | 38,603 | ||
Total Return Bond Fund | 135,351 | ||
U.S. Government Income Fund | 207,809 | ||
Cash Reserve Fund | 532,823 | ||
U.S. Treasury Money Market Fund | 129,701 | ||
The Adviser provides a Chief Compliance Officer (“CCO”) to the Funds. The Adviser is entitled to an amount equal to a portion of the compensation and reimbursement of certain expenses related to the individual performing the CCO services. The fee is paid annually to the Adviser. The total expenses incurred by the Funds for these services are reflected on the Statements of Operations as “Chief Compliance Officer fees.”
ANNUAL REPORT
50
Table of Contents
Capital One Funds—Notes to Financial Statements (continued)
As of August 31, 2008
Master Services Fees:
The Funds and Citi Fund Services Ohio, Inc. (the “Administrator”) are parties to a Master Services Agreement. The Administrator is a subsidiary of Citigroup, Inc. The Administrator provides administration, fund accounting and transfer agency services pursuant to this agreement and, in consideration of these services, receives a fee based on the average aggregate daily net assets and a base fee for the Form N-Q plus reimbursement of certain expenses. Expenses incurred by the Funds are reflected on the Statements of Operations as “Master services fees.” Information regarding these transactions is as follows for the year ended August 31, 2008:
Asset–Based | Average Aggregate Daily Net Assets of the Trust | ||
| 0.050 | % | on the first $900 million | |
| 0.040 | % | on the next $1.1 billion | |
| 0.035 | % | on the next $3 billion | |
| 0.030 | % | on assets in excess of $5 billion |
For the year ended August 31, 2008, the net fee paid to the Administrator was 0.05% of average aggregate net assets of the Funds.
Shareholder Services Fee:
Capital One Capital Appreciation Fund, Capital One Louisiana Municipal Income Fund, Capital One Mid Cap Equity Fund and Capital One Cash Reserve Fund may pay fees (service fees) up to 0.25% of the average daily net assets of each Fund’s Class B Shares to financial intermediaries for providing services to shareholders and maintaining shareholder accounts.
Compliance Services Fee:
Under a compliance services agreement between the Funds and the Administrator (the “Agreement”), the Administrator provides infrastructure and support in implementing the written policies and procedures comprising the Funds’ compliance program, including support services to the Chief Compliance Officer. For the services provided under the Agreement, the Funds paid $66,842 for a 12-month period, plus reimbursement of certain expenses. Expenses incurred by the Funds’ are reflected on the Statements of Operations as “Compliance services fees.”
Distribution Services Fee:
The Funds have adopted a Distribution Plan (the “Plan”) pursuant to Rule 12b-1 under the Act. Under the terms of the Plan, the Funds will reimburse Foreside Distribution Services, LP (the “Distributor”), from the net assets of the Funds to finance activities intended to result in the sale of each Fund’s shares. The Distributor is a subsidiary of the Foreside Financial Group, LLC. The Plan provides that the Funds, except for Class B Shares of Capital Appreciation Fund, Louisiana Municipal Income Fund, Mid Cap Equity Fund, and Cash Reserve Fund, may incur distribution expenses up to 0.25% of the average daily net assets of the Funds, annually, to compensate the Distributor. Class B Shares of Capital Appreciation Fund, Louisiana Municipal Income Fund, Mid Cap Equity Fund, and Cash Reserve Fund may incur distribution expenses of up to 0.75% of average daily net assets of the Class B Shares, annually, to compensate the Distributor. Expenses incurred under the terms of the Plan are reflected on the Statements of Operations as “Distribution fees.” The Distributor receives an annual fee of $60,000 from the Funds. To the extent the Funds cannot pay the Distributor such compensation and expense reimbursements in full from available monies already accrued pursuant to the Plan, it is contemplated that the Adviser will pay any unpaid portion of such compensation and expense reimbursements to the Distributor. During the year ended August 31, 2008, the Adviser paid the annual fee to the Distributor. The Distributor may voluntarily choose to waive any portion of its fee. Expenses voluntarily waived by the Distributor are included in the Statements of Operations as “Waiver of distribution fees.”
The Distributor can modify or terminate this voluntary waiver at any time at its sole discretion. For the year ended August 31, 2008, the Distributor voluntarily waived a portion of its distribution fees for the following Funds:
Fund | |||
Louisiana Municipal Income Fund | $ | 45,027 | |
Total Return Bond Fund | 40,268 | ||
U.S. Government Income Fund | 80,322 | ||
Cash Reserve Fund | 298,811 | ||
For the year ended August 31, 2008, U.S. Treasury Money Market Fund did not incur a distribution fee. When the Distributor receives fees, it may pay some or all of them to financial intermediaries whose customers purchase Shares.
Sales Charges:
The Distributor is entitled to receive commissions on sales of shares of the Funds. For the year ended August 31, 2008, the Distributor received $11,742 from commissions earned on sales of shares of the Funds. Commissions paid to affiliated broker-dealers during the year ended August 31, 2008 were $3,547.
ANNUAL REPORT
51
Table of Contents
Capital One Funds—Notes to Financial Statements (continued)
As of August 31, 2008
Custodian Fees:
Capital One National Association serves as the Funds’ custodian and receives compensation based on the average daily net assets of each Fund, subject to an annual minimum of $15,000. Expenses incurred by the Funds are reflected on the Statements of Operations as “Custodian fees.” Information regarding these transactions is as follows for the year ended August 31, 2008:
Maximum Custodian Fee | Average Aggregate Daily Net Assets of each Fund | ||
| 0.025 | % | on the first $100 million | |
| 0.020 | % | on the next $200 million | |
| 0.010 | % | on the next $200 million | |
| 0.005 | % | on assets in excess of $500 million |
General:
Certain Officers of the Funds are affiliated with the Adviser or the Administrator. Such Officers receive no compensation from the Funds for serving in their respective roles. Each of the four non-interested Trustees who serve on both the Board and the Audit Committee are compensated $4,500 per quarter and $2,000 for each regularly scheduled meeting, plus reimbursement for certain expenses.
| (6) | INVESTMENT TRANSACTIONS |
The cost of investment purchases and the proceeds from the sale of securities (excluding long-term U.S. Government securities and securities maturing less than one year from acquisition), for the year ended August 31, 2008 were as follows:
Fund | Purchases | Sales | ||||
Capital Appreciation Fund | $ | 78,956,629 | $ | 120,127,131 | ||
Louisiana Municipal Income Fund | 31,268,624 | 52,552,264 | ||||
Mid Cap Equity Fund | 79,541,638 | 136,382,058 | ||||
Total Return Bond Fund | 39,205,066 | 7,225,619 | ||||
U.S. Government Income Fund | 15,759,135 | 10,393,043 | ||||
Purchases and sales of U.S. Government Securities (excluding securities maturing less than one year from acquisition) for the year ended August 31, 2008 were as follows:
| Purchases | Sales | |||||
Total Return Bond Fund | $ | 26,657,566 | $ | 7,295,551 | ||
U.S. Government Income Fund | 44,577,943 | 45,023,005 | ||||
| (7) | CONCENTRATION OF CREDIT RISK |
Since the Louisiana Municipal Income Fund invests a substantial portion of its assets in issuers located in one state, it will be more susceptible to factors adversely affecting issuers of that state than would be a comparable tax-exempt mutual fund that invests nationally. In order to reduce the credit risk associated with such factors, at August 31, 2008, 68.2% of the securities in the portfolio of investments were backed by letters of credit or bond insurance of various financial institutions and financial guaranty assurance agencies. The largest percentage of investments insured by or supported (backed) by a letter of credit from any one institution or agency was 23.0% of total investments.
| (8) | REDEMPTION-IN-KIND TRANSACTIONS |
During the year ended August 31, 2008, the Capital Appreciation Fund delivered securities of the Fund in exchange for the redemption of Class A Shares (redemption-in-kind). Cash and securities were transferred for redemptions at a fair value. For financial reporting purposes the Capital Appreciation Fund recorded net realized gains in connection with the transactions. Information on the transactions were as follows:
Fund | Shares Redeemed | Value | Net Realized Gains | |||||
Capital Appreciation Fund | 897,696 | $ | 13,330,780 | $ | 3,369,497 | |||
However, for tax purposes, the transactions received tax-free treatment. These permanent book to tax differences were reclassified within the components of net assets in accordance with the Fund’s accounting policies as discussed in Note 2 to Notes to Financial Statements.
| (9) | SUBSEQUENT EVENTS AND FUND CHANGES |
Fund Mergers:
On June 19, 2008, the Board of Trustees of the Trust unanimously approved a form of Agreement and Plan of Reorganization (“Reorganization Plans”) to be entered into between each of the six portfolios of the Trust listed below (the “Capital One Funds”) and certain registered investment companies which are sponsored and advised by Fidelity Management and Research Company (“Fidelity” and each registered investment company advised by Fidelity, a “Fidelity Fund”). The Reorganization Plans, which provide
ANNUAL REPORT
52
Table of Contents
Capital One Funds—Notes to Financial Statements (continued)
As of August 31, 2008
for the reorganization of the Capital One Funds into corresponding Fidelity Funds (each a “Reorganization” and collectively, the “Reorganizations”), were submitted to a vote of shareholders of the applicable Capital One Funds at a shareholder meeting held on October 21, 2008 (“Shareholder Meeting”). At the Shareholder Meeting, the Reorganization Plans were approved by shareholders, and the Reorganizations are expected to occur in November 2008 (“Reorganization Date”). Until the Reorganization Date, shareholders will be able to redeem or exchange Capital One Fund shares, subject to the usual limitations described in the Trust’s Prospectus. However, purchase orders into the Capital One Funds may be restricted shortly before the closing of the Reorganizations. Shareholders of the Capital One Funds may also receive a capital gains distribution prior to the closing of the Reorganization.
The following outlines the approved Reorganizations, as well as the acquiring Fidelity Funds:
Capital One Funds | Corresponding Fund and Class of Fidelity Funds | |||
| Proposal 1 | Capital One Capital Appreciation Fund | Fidelity Advisor Growth & Income Fund | ||
| Class A | Class A | |||
| Class B | Class A | |||
| Proposal 2 | Capital One Mid Cap Equity Fund | Fidelity Advisor Mid Cap II Fund | ||
| Class A | Class A | |||
| Class B | Class A | |||
| Proposal 3 | Class One Total Return Bond Fund | Fidelity Advisor Investment Grade Bond Fund | ||
| Class A | ||||
| Proposal 4 | Capital One U.S. Government Income Fund | Fidelity Advisor Government Income Fund | ||
| Class A | ||||
| Proposal 5 | Capital One Cash Reserve Fund | Fidelity Institutional Money Market Fund – Prime Money Market Portfolio | ||
| Class A | Class III | |||
| Class B | Class III | |||
| Proposal 6 | Capital One U.S. Treasury Money Market Fund | Fidelity Institutional Money Market Fund – Treasury Portfolio | ||
| Class III | ||||
Fund Liquidation:
On June 19, 2008, the Board of Trustees of the Trust unanimously approved a Plan of Liquidation (“Liquidation Plan”) on behalf of the Capital One Louisiana Municipal Income Fund. At a Special Meeting of Shareholders of the Capital One Louisiana Municipal Income Fund held on August 25, 2008, a proposal to consider the Liquidation Plan was approved. The number of shares voted for, against or abstained are as follows:
For | Against | Abstain | ||
2,735,912 | 12,477 | 12,980 |
The Capital One Louisiana Municipal Income Fund was fully liquidated on October 17, 2008, and shareholders received proceeds for their ending share balance.
Participation in Treasury Money Market Guarantee Program (Unaudited):
The Board of Trustees of the Trust, on behalf of the Capital One Cash Reserve Fund (the “Fund” or “Cash Reserve Fund”), has approved and the Fund has applied for participation in the U.S. Treasury Department’s Temporary Guarantee Program for money market funds (the “Guarantee Program”). The Fund participation agreement was reviewed and accepted by the Treasury on October 20, 2008.
Subject to certain conditions and limitations, share amounts held by investors in the Fund as of the close of business on September 19, 2008 are guaranteed against loss under the Guarantee Program in the event the market-based net asset value per share is less than $0.995 (a “Guarantee Event”). If a Guarantee Event occurs the Fund will be required to liquidate in order to receive payment under the Guarantee Program. The maximum amount covered under the Guarantee Program is the equivalent of the amount a shareholder held in the Fund on September 19, 2008. The Guarantee Program is subject to an overall limit of approximately $50 billion for all money market funds participating in the Guarantee Program.
The cost to participate in the Guarantee Program for the initial three months is 0.01% of the net asset value of the Fund as of September 19, 2008 and will be borne by the Fund. The initial term of the Program expires December 18, 2008. However, Fund shareholders were previously mailed a proxy statement/prospectus notifying them of a proposed reorganization of the Fund into the Fidelity Institutional Money Market Fund—Prime Money Market Portfolio (the “Fidelity Prime Money Market Portfolio”) which is advised by Fidelity Management & Research Company (“Fidelity”). On October 21, 2008 shareholders of the Fund approved the reorganization of the Fund into the Fidelity Prime Money Market Portfolio, which is scheduled to occur on or about November 21, 2008. Fidelity has indicated that, following the reorganization of the Fund, Fidelity will file an acknowledgment to the Treasury agreeing to be bound by the Fund’s guarantee agreement, thereby seeking to ensure that Fund shareholders will have the benefit of the Guarantee Program through December 18, 2008.
ANNUAL REPORT
53
Table of Contents
Capital One Funds—Report of Independent Registered Public Accounting Firm
The Board of Trustees and Shareholders of Capital One Funds:
We have audited the accompanying statements of assets and liabilities of the Capital One Funds (comprised of the Capital One Capital Appreciation Fund, Capital One Louisiana Municipal Income Fund, Capital One Mid Cap Equity Fund, Capital One Total Return Bond Fund, Capital One U.S. Government Income Fund, Capital One Cash Reserve Fund, and Capital One U.S. Treasury Money Market Fund) (the Funds), including the portfolios of investments, as of August 31, 2008, and the related statements of operations for the year then ended, the statements of changes in net assets for each of the two years in the period then ended, and the financial highlights for each of the five years in the period then ended. These financial statements and financial highlights are the responsibility of the Funds’ management. Our responsibility is to express an opinion on these financial statements and financial highlights based on our audits.
We conducted our audits in accordance with the standards of the Public Company Accounting Oversight Board (United States). Those standards require that we plan and perform the audits to obtain reasonable assurance about whether the financial statements and financial highlights are free of material misstatement. We were not engaged to perform an audit of the Funds’ internal control over financial reporting. Our audits included consideration of internal control over financial reporting as a basis for designing audit procedures that are appropriate in the circumstances, but not for the purpose of expressing an opinion on the effectiveness of the Funds’ internal control over financial reporting. Accordingly, we express no such opinion. An audit also includes examining, on a test basis, evidence supporting the amounts and disclosures in the financial statements and financial highlights, assessing the accounting principles used and significant estimates made by management, and evaluating the overall financial statement presentation. Our procedures included confirmation of securities owned as of August 31, 2008, by correspondence with the custodian and brokers. We believe that our audits provide a reasonable basis for our opinion.
In our opinion, the financial statements and financial highlights referred to above present fairly, in all material respects, the financial position of each of the Funds constituting the Capital One Funds at August 31, 2008, the results of their operations for the year then ended, the changes in their net assets for each of the two years in the period then ended, and the financial highlights for each of the five years in the period then ended, in conformity with U.S. generally accepted accounting principles.

Columbus, Ohio
October 21, 2008
ANNUAL REPORT
54
Table of Contents
Capital One Funds—Federal Tax Information (Unaudited)
As of August 31, 2008
For the year ended August 31, 2008, the amount of long-term capital gain designated by the Funds was as follows:
Fund | |||
Capital Appreciation Fund | $ | 7,324,647 | |
Louisiana Municipal Income Fund | 177,416 | ||
Mid Cap Equity Fund | 17,547,158 | ||
At August 31, 2008, the following amounts represent the portion of distributions from net investment income which are exempt from federal income tax, other than AMT:
Fund | |||
Louisiana Municipal Income Fund | $ | 1,520,861 | |
Of the ordinary income (including short-term capital gain) distributions made by the Funds during the year ended August 31, 2008, the following percentages qualify for the dividend received deduction available to corporate shareholders:
Fund | |||
Capital Appreciation Fund | 100.00 | % | |
Mid Cap Equity Fund | 100.00 | % | |
For the fiscal year ended August 31, 2008, the following percentages of total ordinary dividends paid by the Funds are qualifying dividends which may be subject to a maximum tax rate of 15%, as provided for by the Jobs and Growth Tax Relief Act of 2003. Complete information is reported in conjunction with the reporting of your distributions on Form 1099-DIV. The percentages were as follows:
Fund | |||
Capital Appreciation Fund | 100.00 | % | |
Mid Cap Equity Fund | 100.00 | % | |
ANNUAL REPORT
55
Table of Contents
Capital One Funds—Board of Trustees and Trust Officers (Unaudited)
The following tables give information about the Independent Trustees (i.e., those Trustees who are not “interested persons” of the Trust, as defined in the 1940 Act) and the senior officers of the Trust. As of August 31, 2008, the Capital One Fund Complex consisted of seven portfolios. Each Officer is elected annually. Unless otherwise noted, each Board of Trustees member oversees all portfolios in the Capital One Fund Complex and serves for an indefinite term. The Funds’ Statement of Additional Information includes additional information about the Funds’ Trustees and is available, without charge and upon request, by calling 1-800-999-0426.
| Principal Occupation(s) for Past Five Years, | ||||||
Name, Address and Date of Birth | Positions Held with Trust | Length of Time Served | Other Directorships Held and Previous Position(s) | |||
| INDEPENDENT TRUSTEE | ||||||
Arthur Rhew Dooley, Jr. c/o Citi Fund Services 3435 Stelzer Road Columbus, Ohio 43219 DOB: December 17, 1942 | Trustee | Began Serving: July 1999 | Principal Occupation: Chairman, Dooley Tackaberry, Inc. (distributors and fabricators of fire protection and safety equipment), 1967 to Present; Registered Professional Engineer (Inactive).
Other Directorships Held: Director, Loop Cold Storage Company. | |||
Teri G. Fontenot c/o Citi Fund Services 3435 Stelzer Road Columbus, Ohio 43219 DOB: June 16, 1953 | Trustee | Began Serving: June 2001 | Principal Occupation: President and Chief Executive Officer of Woman’s Hospital, Baton Rouge, LA.
Other Directorships Held: Federal Reserve Bank of Atlanta; Hospital Billing and Collection Services; Louisiana State University Research and Technology Foundation Executive Committee; Louisiana Hospital Association Professional and General Liability Funds; AHA Health Forum. | |||
Joe N. Averett, Jr. c/o Citi Fund Services 3435 Stelzer Road Columbus, Ohio 43219 DOB: February 4, 1943 | Trustee | Began Serving: June 2001 | Principal Occupation: Retired.
Previous Position: President and Chief Executive Officer of Crystal Gas Storage, Inc., a wholly owned subsidiary of El Paso Corporation (NYSE:EP).
Other Directorships Held: Penn Virginia Corporation, past director; Sci Port Discovery Center, Past Chairman and Current Director; Sci-Port Foundation, Director; Community Foundation of Shreveport-Bossier, Chairman and Director; Committee of 100, Director; Louisiana State University in Shreveport Foundation, Past President and Current Director; Petroleum Club of Shreveport, Past President and Director; Caddo Public Education Foundation, past Chairman and Director; Red River Radio Network (affiliate of National Public Radio), past Director. | |||
Ernest E. Howard III c/o Citi Fund Services 3435 Stelzer Road Columbus, Ohio 43219 DOB: March 26, 1943 | Trustee | Began Serving: March 2003 | Principal Occupation: Retired.
Previous Positions: President and Chief Executive Officer of FM Properties, predecessor to Stratus Properties, Inc. (NASDAQ:STRS) and Senior Vice President of Freeport- McMoRan Inc. and Freeport-McMoRan Copper & Gold Inc. (NYSE:FCX).
Other Directorships Held: Director, Superior Energy Services, Inc. | |||
ANNUAL REPORT
56
Table of Contents
Capital One Funds—Board of Trustees and Trust Officers (Unaudited) (continued)
| Principal Occupation(s) for Past Five Years | ||||||
Name, Address and Date of Birth | Positions Held with Trust | Length of Time Served | and Previous Position(s) | |||
| EXECUTIVE OFFICERS | ||||||
Richard L. Chauvin 440 Third Street, 4th Floor Baton Rouge, LA 70802 DOB: November 16, 1954 | President | Began Serving: November 2006 | Principal Occupations: Director of Research, Capital One Asset Management
Previous Positions: Chief Investment Officer, Capital One Asset Management, 2003-2008; Senior Portfolio Manager, Hibernia National Bank, Private Client Group, 2001-2003; Strategist and Senior Portfolio Manager, Commonwealth Advisors, Inc., 1997-2001; State Director of Portfolio Management, Bank One Investment Advisors, Inc., 1996-1997. | |||
Donald P. Lee 313 Carondelet Street, 3rd Floor New Orleans, LA 70130 DOB: December 6, 1959 | Chief Compliance Officer | Began Serving: June 2004 | Principal Occupations: Director, Private Client Group Risk Management, Capital One, N.A.
Previous Positions: Corporate Counsel, Hibernia National Bank, 2002-2003; General Counsel and Corporate Secretary IBERIA Bank, 1997-2001. | |||
Troy A. Sheets 3435 Stelzer Road Columbus, OH 43219 DOB: May 29, 1971 | Treasurer | Began Serving: February 2008 | Principal Occupation: Senior Vice President, Citi Fund Services
Previous Positions: Senior Manager, KPMG LLP, 1993-2002 | |||
Daniel J. Igo 100 Summer Street, Suite 1500 Boston, MA 02110 DOB: September 25, 1970 | Secretary | Began Serving: July 2007 | Principal Occupation: Project Manager, Assistant Vice President, Citi Fund Services
Previous Positions: Compliance Manager, Citi CCO Compliance Services, 7/2006-3/2007; Legal Services Manager, Citi Fund Services, 2004-2006; Manager, State Street Research and Management Company, 2003-2004; Senior Manager, Columbia Management Group, Inc., 2002-2003. | |||
ANNUAL REPORT
57
Table of Contents
Mutual funds are not bank deposits, or obligations, are not guaranteed by any bank, and are not insured or guaranteed by the U.S. government, the Federal Deposit Insurance Corporation, the Federal Reserve Board, or any other government agency. Investment in mutual funds involves investment risk, including the possible loss of principal. An investment in Capital One Cash Reserve Fund and Capital One U.S. Treasury Money Market Fund is neither insured nor guaranteed by the Federal Deposit Insurance Corporation or any other government agency. Although the Money Market Funds seek to preserve the value of your investment at $1.00 per share, it is possible to lose money by investing in these Funds. On October 7, 2008 the Capital One Cash Reserve Fund participated in the Treasury Money Market Guarantee Program.
This report is authorized for distribution to prospective investors only when preceded or accompanied by the Funds’ prospectus, which contains facts concerning their objectives and policies, management fees, expenses and other information.
VOTING PROXIES ON FUND PORTFOLIO SECURITIES
A description of the policies and procedures that the Funds use to determine how to vote proxies relating to securities held in a Fund’s portfolio is available, without change and upon request, by calling 1-800-562-9007, Ext. 2-0937. A report of how the Funds voted any such proxies during the most recent 12-month period ended June 30 is available through the Capital One Funds website. Go to www.capitalone.com; select “Investments”, “Mutual Funds”, Proxy Voting Record; then select a Fund. This report on “Form N-PX” is also available from the EDGAR database on the SEC’s website at www.sec.gov.
The Funds file with the SEC a complete schedule of their portfolio holdings, as of the close of the first and third quarters of their fiscal year, on “Form N-Q.” These filings are available from the EDGAR database on the SEC’s website at www.sec.gov; and may be reviewed and copied at the SEC’s Public Reference Room in Washington, DC. (Call 1-800-SEC-0330 for information on the operation of the Public Reference Room).
This report has been prepared for the general information of Capital One Funds shareholders. It is not authorized for distribution to prospective investors unless accompanied or preceded by an effective Capital One Funds prospectus. The prospectus contains more complete information about Capital One Funds’ investment objectives, management fees and expenses, risks and operating policies. Please read the prospectus carefully before investing or sending money.
Past performance does not guarantee future results. The performance data quoted represents past performance and current returns may be lower or higher. The investment return and net asset value will fluctuate so that an investor’s shares, when redeemed may be worth more or less than the original cost. To obtain performance information current to the most recent month end, and after-tax returns call 1-800-999-0426.
Capital One Asset Management, LLC is the investment adviser and Capital One, N.A. is the custodian to the Capital One Funds and receives compensation for these services.
Foreside Distribution Services, L.P. is distributor of the Capital One Funds.
007697 (10/08)
Table of Contents
| Item 2. | Code of Ethics. |
(a) The registrant has adopted a code of ethics that applies to the registrant’s principal executive officer, principal financial officer, principal accounting officer or controller, or persons performing similar functions. This code of ethics is included as an Exhibit.
(b) During the period covered by the report, with respect to the registrant’s code of ethics that applies to its principal executive officer, principal financial officer, principal accounting officer or controller, or persons performing similar functions; there have been no amendments to, nor any waivers granted from, a provision that relates to any element of the code of ethics definition enumerated in paragraph (b) of this Item 2.
| Item 3. | Audit Committee Financial Expert. |
3(a)(1) The registrant’s board of directors has determined that each member of the Board’s Audit Committee is an “audit committee financial expert,” and that each such member is “independent,” for purposes of this Item. The Audit Committee consists of the following Board members: Joe N. Averett, Jr., Arthur Rhew Dooley, Jr., Teri G. Fontenot and Ernest E. Howard, III.
| Item 4. | Principal Accountant Fees and Services. |
(a) Audit Fees
2007 $149,100
2008 $149,100
(b) Audit-Related Fees
2007 $0
2008 $8,000
The fees for 2008 relate to the consent issuance in two Form N-14 filings and such amounts were paid by Capital One Asset Management.
Table of Contents
(c) Tax Fees
2007 $0
2008 $0
(d) All Other Fees
2007 $0
2008 $0
(e)(1) The Audit Committee (“Audit Committee”) of the Board of Trustees (“Board”) of Capital One Funds (the “Trust”) is required to pre-approve audit services provided to the Trust, and non-audit services provided not only to the Trust, but also to the investment advisor to the funds of the Trust and to other entities in the fund complex, if the relevant entity provides ongoing services to the Trust and the independent auditor’s services have a direct impact on the Trust’s operations or financial reporting. This pre-approval of non-audit services performed by the independent auditors is required in order to assure that the provision of such services do not impair the auditor’s independence. Unless a type of service to be provided by the independent auditor has received general pre-approval, it will require specific pre-approval by the Audit Committee. Any proposed services exceeding pre-approved cost levels will require specific pre-approval by the Audit Committee.
The term of the general pre-approval is 12 months from the date of pre-approval, unless the Audit Committee specifically provides for a different period. The Audit Committee will annually review and pre-approve the services that may be provided by the independent auditors without obtaining specific pre-approval from the Audit Committee. The Audit Committee may revise the list of general pre-approved services from time to time, based on subsequent determinations. The Audit Committee will not delegate its responsibilities to pre-approve services performed by the independent auditors to management.
The Audit Committee delegates pre-approval authority to the Chairman of the Audit Committee. The Chairman will report any pre-approval decisions to the Audit Committee at its next scheduled meeting. The Audit Committee will designate another member with pre-approval authority when the Chairman is unavailable.
AUDIT SERVICES
The annual Audit services engagement terms and fees will be subject to the specific pre-approval of the Audit Committee. The Audit Committee will approve, if necessary, any changes in terms, conditions and fees resulting from changes in audit scope, Trust structure or other matters.
In addition to the annual Audit services engagement specifically approved by the Audit Committee, the Audit Committee may grant general pre-approval for other Audit services, which are those services that are normally provided by the independent auditor in connection with statutory and regulatory filings or engagements.
With respect to the provisions of services other than audit, review or attest services the pre-approval requirement is waived if:
(1) The aggregate amount of all such services provided constitutes no more than five percent of the total amount of revenues paid by the Trust to its independent auditor during the fiscal year in which the services are provided;
(2) Such services were not recognized by the issuer or Trust at the time of the engagement to be non-audit services; and
(3) Such services are promptly brought to the attention of the Audit Committee and approved prior to the completion of the audit by the Audit Committee or by one or more members of the Audit Committee who are members of the Board to whom authority to grant such approvals has been delegated by the Audit Committee.
AUDIT-RELATED SERVICES
Audit-related services are assurance and related services that are reasonably related to the performance of the audit or review of the Trust’s financial statement or that are traditionally performed by the independent auditor.
TAX SERVICES
The Audit Committee believes that the independent auditor can provide Tax services to the Trust such as tax compliance, tax planning and tax advice without impairing the auditor’s independence. However, the Audit Committee will not permit the retention of the independent auditor in connection with a transaction initially recommended by the independent auditor, the purpose of which may be tax avoidance and the tax treatment of which may not be supported n the Internal Revenue Code and related regulations.
Table of Contents
ALL OTHER SERVICES
The Audit Committee may grant general pre-approval to those permissible non-audit services classified as All Other Services that it believes are routine and recurring services, and would not impair the independence of the auditors.
The SEC’s rules and relevant guidance should be consulted to determine the precise definitions of these services and the applicability of exceptions to certain of the prohibitions.
PRE-APPROVAL FEE LEVELS
Pre-approval fee levels for all services to be provided by the independent auditor will be established annually by the Audit Committee. Any proposed services exceeding these levels will require specific pre-approval by the Audit Committee.
PROCEDURES
Requests or applications to provide services that require specific approval by the Audit Committee will be submitted to the Audit Committee by both the independent auditor and the Fund’s Principal Accounting Officer and must include a joint statement as to whether, in their view, the request or application is consistent with the SEC’s rules on auditor independence.
In accordance with PCAOB Rule 3524, request for pre-approval of permissible tax services by the independent auditor must have the following items described in writing for the Audit Committee:
| • | the scope of the proposed tax service; |
| • | the fee structure for the engagement; |
| • | any side letters, amendments to the engagement letter or any other agreements, whether oral, written or otherwise, relating to the services between the audit firm and the Trust; and |
| • | any compensation arrangements or other agreements between the audit firm and any third party with respect to promoting, marketing, or recommending a transaction covered by the proposed tax service. |
The Audit Committee will require the audit firm to discuss the potential impact of the proposed tax service on the audit firm’s independence in accordance with PCAOB 3524.
| (e)(2) |
2007 0%
2008 0%
(f) Not applicable.
(g) The aggregate non-audit fees for Capital One Funds and certain entities, totaled $26,300 in fiscal 2007 and $99,778 in fiscal 2008, related to SAS 70 services and FHLB reports for Capital One N.A. and the consent issuance on two N-14 filings for the Capital One Funds.
(h) The Audit Committee considered the non-audit services rendered to the registrant’s investment adviser and any entity controlling, controlled by, or under common control with the investment adviser, and believes the services are compatible with the principal accountant’s independence.
| Item 5. | Audit Committee of Listed Registrants. |
Not applicable.
Table of Contents
| Item 6. | Investments. |
(a) The Schedule of Investments as of the close of the reporting period are included as part of the report the shareholders filed under Item 1 of the Form N-CSR.
(b) Not applicable.
| Item 7. | Disclosure of Proxy Voting Policies and Procedures for Closed-End Management Investment Companies. |
Not applicable.
| Item 8. | Portfolio Managers of Closed-End Management Investment Companies. |
Not applicable.
| Item 9. | Purchases of Equity Securities by Closed-End Management Investment Company and Affiliated Purchasers. |
Not applicable.
| Item 10. | Submission of Matters to a Vote of Security Holders. |
Not applicable.
| Item 11. | Controls and Procedures. |
(a) The registrant’s principal executive officer and principal financial officer have concluded, based on their evaluation of the registrant’s disclosure controls and procedures as conducted within 90 days of the filing date of this report, that these disclosure controls and procedures are adequately designed and are operating effectively to ensure that information required to be disclosed by the registrant on Form N-CSR is recorded, processed, summarized and reported within the time periods specified in the Securities and Exchange Commission’s rules and forms.
(b) There were no changes in the registrant’s internal control over financial reporting (as defined in Rule 30a-3(d) under the Act (17 CFR 270.30a-3(d)) that occurred during the second fiscal quarter of the period covered by this report that have materially affected or are reasonably likely to materially affect, the registrant’s internal control over financial reporting.
| Item 12. | Exhibits. |
(a)(1) The code of ethics that is the subject of the disclosure required by Item 2 is attached hereto.
(a)(2) Certifications pursuant to Rule 30a-2(a) are attached hereto.
(a)(3) Not applicable.
(b) Certifications pursuant to Rule 30a-2(b) are furnished herewith.
Table of Contents
SIGNATURES
Pursuant to the requirements of the Securities Exchange Act of 1934 and the Investment Company Act of 1940, the registrant has duly caused this report to be signed on its behalf by the undersigned, thereunto duly authorized.
| (Registrant) Capital One Funds | ||
| By (Signature and Title)* | /s/ Richard L. Chauvin | |
| Richard L. Chauvin, President | ||
| Date November 6, 2008 | ||
Pursuant to the requirements of the Securities Exchange Act of 1934 and the Investment Company Act of 1940, this report has been signed below by the following persons on behalf of the registrant and in the capacities and on the dates indicated.
| By (Signature and Title)* | /s/ Richard L. Chauvin | |
| Richard L. Chauvin, President | ||
| Date November 6, 2008 | ||
| By (Signature and Title)* | /s/ Troy A. Sheets | |
| Troy A. Sheets, Treasurer | ||
| Date November 6, 2008 | ||
| * | Print the name and title of each signing officer under his or her signature. |