EX 99.1
For further information: TRADED: NYSE (IEX)
Investor Contact:
Heath Mitts
Senior Vice President and Chief Financial Officer
(847) 498-7070
WEDNESDAY, JULY 22, 2015
IDEX REPORTS SECOND QUARTER EPS OF 89 CENTS AND REAFFIRMS FULL YEAR EPS GUIDANCE OF $3.50 -- $3.60
LAKE FOREST, IL, JULY 22 - IDEX Corporation (NYSE: IEX) today announced its financial results for the three month period ended June 30, 2015.
Second Quarter 2015 Highlights
| |
| • | EPS of 89 cents with operating margin of 21.3 percent |
| |
| • | Free cash flow of $86 million was 124 percent of net income |
| |
| • | Repurchased 661 thousand shares of common stock for $51 million |
| |
| • | Completed the acquisitions of Novotema and Alfa Valvole in the second quarter, and the acquisition of CiDRA Precision Services on July 1, 2015 |
Second Quarter 2015
Orders of $505 million were down 8 percent (-4 percent organic, +1 percent acquisitions and -5 percent foreign currency translation) compared with the prior year period. Sales of $515 million were down 6 percent (-2 percent organic, +1 percent acquisitions and -5 percent foreign currency translation) compared with the prior year period.
Gross margin of 45.0 percent was up 90 basis points from the prior year period, while operating margin of 21.3 percent was up 80 basis points from the prior year.
Net income of $70 million decreased 3 percent from the prior year period, while earnings per share of 89 cents increased 1 cent, or 1 percent, from the prior year period. EBITDA of $128 million was 25 percent of sales and covered interest expense by more than 12 times, while free cash flow of $86 million was 124 percent of net income.
The Company repurchased 661 thousand shares of common stock for $51 million in the second quarter of 2015. Year-to-date, the Company has repurchased 1.5 million shares of common stock for $113 million.
“Solid execution across the IDEX portfolio delivered EPS of 89 cents and operating margin of 21.3 percent, an 80 basis point improvement compared to the second quarter of 2014. Sales remain challenged due to the expected headwinds from a strong U.S. dollar and the softness in energy prices. Couple this with a now slowing North American industrial market, and the result was a 2 percent decrease in organic sales for the second quarter of 2015.
With six months completed, a 2015 market recovery is unlikely. Our teams are keenly focused on productivity to offset the profitability challenges of a muted growth environment. In the second half, we will gain further efficiencies by taking restructuring actions across all segments. The anticipated cost of these actions will not exceed $8 million and will be completed by year-end.
Looking ahead, we remain confident in our ability to deliver superior shareholder returns. Over the past sixty days we continued to execute our balanced capital deployment plan by utilizing nearly $200 million of available cash on the strategic acquisitions of Novotema, Alfa Valvole, and CiDRA Precision Services, while also retiring €81 million of European private placement notes. These acquisitions are great additions to our existing sealing, valves and scientific fluidics businesses and we are excited to have them as part of the IDEX family.
Including the impact of purchase accounting, these three acquisitions will be neutral from an EPS perspective for 2015, and we expect all three to be accretive in 2016. For the full year 2015, we are holding our prior EPS guidance of $3.50 to $3.60, with an operating margin around 21 percent and flat organic sales. We project third quarter 2015 EPS to be 88 to 90 cents. This guidance excludes the cost impact from the restructuring actions in the second half.”
Andrew K. Silvernail
Chairman and Chief Executive Officer
Second Quarter 2015 Segment Highlights
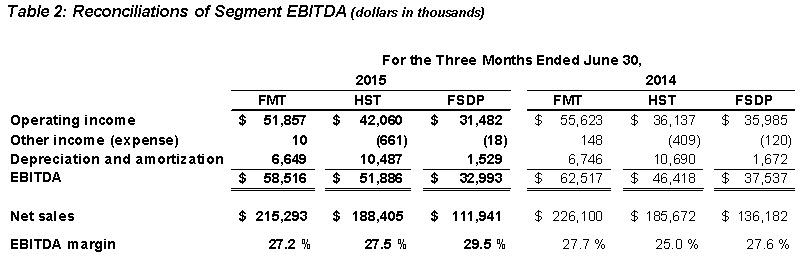
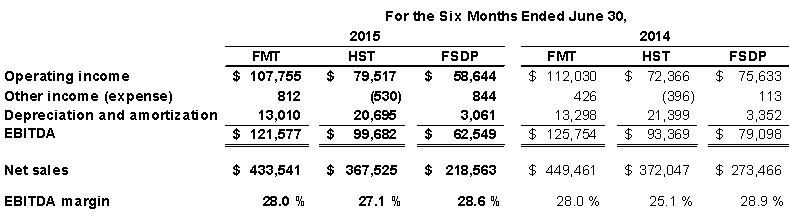
Fluid & Metering Technologies
| |
| • | Sales of $215 million reflected a 5 percent decrease compared to the second quarter of 2014 (-2 percent organic, +1 percent acquisition and -4 percent foreign currency translation). |
| |
| • | Operating margin of 24.1 percent represented a 50 basis point decrease compared with the second quarter of 2014 primarily due to lower volume. |
| |
| • | EBITDA of $58.5 million resulted in an EBITDA margin of 27.2 percent, down 50 basis points compared with the second quarter of 2014. |
Health & Science Technologies
| |
| • | Sales of $188 million reflected a 2 percent increase compared to the second quarter of 2014 (+4 percent organic, +2 percent acquisitions and -4 percent foreign currency translation). |
| |
| • | Operating margin of 22.3 percent represented a 280 basis point increase compared with the second quarter of 2014 primarily due to increased volume, the benefits of productivity initiatives and favorable business unit mix. |
| |
| • | EBITDA of $51.9 million resulted in an EBITDA margin of 27.5 percent, up 250 basis points compared with the second quarter of 2014. |
Fire & Safety/Diversified Products
| |
| • | Sales of $112 million reflected an 18 percent decrease compared to the second quarter of 2014 (-11 percent organic and -7 percent foreign currency translation). |
| |
| • | Operating margin of 28.1 percent represented a 170 basis point increase compared with the second quarter of 2014 primarily due to the benefits of productivity initiatives and favorable product mix. |
| |
| • | EBITDA of $33.0 million resulted in an EBITDA margin of 29.5 percent, up 190 basis points compared with the second quarter of 2014. |
For the second quarter of 2015, Fluid & Metering Technologies contributed 42 percent of sales, 41 percent of operating income and 41 percent of EBITDA; Health & Science Technologies accounted for 36 percent of sales, 34 percent of operating income and 36 percent of EBITDA; and Fire & Safety/Diversified Products represented 22 percent of sales, 25 percent of operating income and 23 percent of EBITDA.
Non-U.S. GAAP Measures of Financial Performance
The Company supplements certain U.S. GAAP financial performance metrics with non-U.S. GAAP financial performance metrics in order to provide investors with better insight and increased transparency while also allowing for a more comprehensive understanding of the financial information used by management in its decision making. Reconciliations of non-U.S. GAAP financial performance metrics to their most comparable U.S. GAAP financial performance metrics are defined and presented below and in no way are considered a substitute for, nor superior to, the financial data prepared in accordance with U.S. GAAP. There were no adjustments to U.S. GAAP financial performance metrics other than the items noted below.
| |
| • | Consolidated EBITDA is calculated as net income plus interest expense plus provision for income taxes plus depreciation and amortization; while segment EBITDA is calculated as operating income plus or minus other income (expense) plus depreciation and amortization. |
| |
| • | Free cash flow is calculated as cash flow from operating activities less capital expenditures plus the excess tax benefit from share-based compensation. |
Conference Call to be Broadcast over the Internet
IDEX will broadcast its second quarter earnings conference call over the Internet on Thursday, July 23, 2015 at 9:30 a.m. CT. Chairman and Chief Executive Officer Andy Silvernail and Senior Vice President and Chief Financial Officer Heath Mitts will discuss the Company’s recent financial performance and respond to questions from the financial analyst community. IDEX invites interested investors to listen to the call and view the accompanying slide presentation, which will be carried live on its website at www.idexcorp.com. Those who wish to participate should log on several minutes before the discussion begins. After clicking on the presentation icon, investors should follow the instructions to ensure their systems are set up to hear the event and view the presentation slides, or download the correct applications at no charge. Investors will also be able to hear a replay of the call by dialing 877.660.6853 (or 201.612.7415 for international participants) using the ID # 13598713.
Forward-Looking Statements
This news release contains forward-looking statements within the meaning of Section 27A of the Securities Act of 1933, as amended, and Section 21E of the Exchange Act of 1934, as amended. These statements may relate to, among other things, capital expenditures, cost reductions, cash flow, and operating improvements and are indicated by words or phrases such as “anticipate,” “estimate,” “plans,” “expects,” “projects,” “should,” “will,” “management believes,” “the company believes,” “the company intends,” and similar words or phrases. These statements are subject to inherent uncertainties and risks that could cause actual results to differ materially from those anticipated at the date of this news release. The risks and uncertainties include, but are not limited to, the following: economic and political consequences resulting from terrorist attacks and wars; levels of industrial activity and economic conditions in the U.S. and other countries around the world; pricing pressures and other competitive factors, and levels of capital spending in certain industries - all of which could have a material impact on order rates and IDEX’s results, particularly in light of the low levels of order backlogs it typically maintains; its ability to make acquisitions and to integrate and operate acquired businesses on a profitable basis; the relationship of the U.S. dollar to other currencies and its impact on pricing and cost competitiveness; political and economic conditions in foreign countries in which the company operates; interest rates; capacity utilization and the effect this has on costs; labor markets; market conditions and material costs; and developments with respect to contingencies, such as litigation and environmental matters. The forward-looking statements included here are only made as of the date of this news release, and management undertakes no obligation to publicly update them to reflect subsequent events or circumstances. Investors are cautioned not to rely unduly on forward-looking statements when evaluating the information presented here.
About IDEX
IDEX Corporation is an applied solutions company specializing in fluid and metering technologies, health and science technologies, and fire, safety and other diversified products built to its customers’ exacting specifications. Its products are sold in niche markets to a wide range of industries throughout the world.
IDEX shares are traded on the New York Stock Exchange and Chicago Stock Exchange under the symbol “IEX”.
For further information on IDEX Corporation and its business units, visit the company’s website at www.idexcorp.com.
(Financial reports follow)
|
| | | | | | | | |
| IDEX CORPORATION |
| Condensed Consolidated Statements of Operations |
| (in thousands except per share amounts) |
| (unaudited) |
| | | | | | | | | |
| | | | | | | | | |
| | | Three Months Ended | | Six Months Ended |
| | | June 30, | | June 30, |
| | | 2015 | | 2014 | | 2015 | | 2014 |
| | | | | | | | | |
| Net sales | | $ 514,881 | | $ 546,693 | | $1,017,079 | | $1,090,689 |
| Cost of sales | | 283,266 | | 305,561 | | 559,423 | | 605,137 |
| Gross profit | | 231,615 | | 241,132 | | 457,656 | | 485,552 |
| Selling, general and administrative expenses | | 121,706 | | 129,044 | | 245,990 | | 259,629 |
| Operating income | | 109,909 | | 112,088 | | 211,666 | | 225,923 |
| Other (income) expense - net | | 827 | | 137 | | (896) | | (707) |
| Interest expense | | 10,584 | | 10,405 | | 21,181 | | 20,862 |
| Income before income taxes | | 98,498 | | 101,546 | | 191,381 | | 205,768 |
| Provision for income taxes | | 28,913 | | 29,769 | | 55,842 | | 59,443 |
| Net income | | $ 69,585 | | $ 71,777 | | $ 135,539 | | $ 146,325 |
| | | | | | | | | |
| | | | | | | | | |
| Earnings per Common Share: | | | | | | | | |
Basic earnings per common share (a) | | $ 0.89 | | $ 0.89 | | $ 1.74 | | $ 1.81 |
Diluted earnings per common share (a) | | $ 0.89 | | $ 0.88 | | $ 1.72 | | $ 1.79 |
| | | | | | | | | |
| | | | | | | | | |
| Share Data: | | | | | | | | |
| Basic weighted average common shares outstanding | 77,466 | | 80,106 | | 77,731 | | 80,317 |
| | | | | | | | | |
| Diluted weighted average common shares outstanding | 78,297 | | 81,149 | | 78,576 | | 81,362 |
| | | | | | | | | |
| | | | | | | | | |
|
| | | | |
| Condensed Consolidated Balance Sheets |
| (in thousands) |
| (unaudited) |
| | | June 30, | | December 31, |
| | | 2015 | | 2014 |
| | | | | |
| Assets | | | | |
| Current assets | | | |
| Cash and cash equivalents | $ 311,495 | | $ 509,137 |
| Receivables - net | 286,111 | | 256,040 |
| Inventories | 260,814 | | 237,631 |
| Other current assets | 75,177 | | 72,983 |
| Total current assets | 933,597 | | 1,075,791 |
| Property, plant and equipment - net | 234,634 | | 219,543 |
| Goodwill and intangible assets | 1,711,354 | | 1,592,441 |
| Other noncurrent assets | 23,773 | | 20,295 |
| Total assets | $2,903,358 | | $2,908,070 |
| | | | | |
| Liabilities and shareholders' equity | | | |
| Current liabilities | | | |
| Trade accounts payable | $ 136,550 | | $ 127,462 |
| Accrued expenses | 145,771 | | 163,409 |
| Short-term borrowings | 469 | | 98,946 |
| Dividends payable | 24,875 | | 22,151 |
| Total current liabilities | 307,665 | | 411,968 |
| Long-term borrowings | 874,777 | | 765,006 |
| Other noncurrent liabilities | 266,108 | | 244,645 |
| Total liabilities | 1,448,550 | | 1,421,619 |
| Shareholders' equity | 1,454,808 | | 1,486,451 |
| Total liabilities and shareholders' equity | $2,903,358 | | $2,908,070 |
|
| | | |
| IDEX CORPORATION |
| Condensed Consolidated Statements of Cash Flow |
| (in thousands) |
| (unaudited) |
| | | | |
| | Six Months Ended June 30, |
| | 2015 | | 2014 |
| | |
| Cash flows from operating activities | | | |
| Net income | $ 135,539 | | $ 146,325 |
| Adjustments to reconcile net income to net cash provided by operating activities: | | | |
| Depreciation and amortization | 17,460 | | 16,741 |
| Amortization of intangible assets | 20,137 | | 21,932 |
| Amortization of debt issuance costs | 860 | | 859 |
| Share-based compensation expense | 11,802 | | 11,963 |
| Deferred income taxes | 524 | | (471) |
| Excess tax benefit from share-based compensation | (4,083) | | (3,680) |
| Non-cash interest expense associated with forward starting swaps | 3,539 | | 3,637 |
| Changes in (net of the effect from acquisitions): | | | |
| Receivables | (15,274) | | (16,218) |
| Inventories | (10,473) | | (15,584) |
| Other current assets | (630) | | (3,352) |
| Trade accounts payable | 4,158 | | 13,291 |
| Accrued expenses | (15,886) | | (5,852) |
| Other — net | 755 | | (3,411) |
| Net cash flows provided by operating activities | 148,428 | | 166,180 |
| Cash flows from investing activities | | | |
| Purchases of property, plant and equipment | (23,826) | | (23,299) |
| Acquisition of businesses, net of cash acquired | (173,333) | | (25,995) |
| Other — net | (105) | | (29) |
| Net cash flows used in investing activities | (197,264) | | (49,323) |
| Cash flows from financing activities | | | |
| Borrowings under revolving facilities | 350,342 | | 80,014 |
| Payments under revolving facilities | (240,586) | | (36,181) |
| Payment of 2.58% Senior Euro Notes | (88,420) | | 0 |
| Debt issuance costs | (1,323) | | 0 |
| Dividends paid | (46,910) | | (41,193) |
| Proceeds from stock option exercises | 13,459 | | 8,831 |
| Excess tax benefit from share-based compensation | 4,083 | | 3,680 |
| Purchase of common stock | (113,592) | | (83,060) |
| Unvested shares surrendered for tax withholding | (3,202) | | (2,836) |
| Net cash flows used in financing activities | (126,149) | | (70,745) |
| Effect of exchange rate changes on cash and cash equivalents | (22,657) | | (406) |
| Net increase (decrease) in cash | (197,642) | | 45,706 |
| Cash and cash equivalents at beginning of year | 509,137 | | 439,629 |
| Cash and cash equivalents at end of period | $ 311,495 | | $ 485,335 |
|
| | | | | | | | | | | | | |
| IDEX CORPORATION |
| Company and Segment Financial Information |
| (dollars in thousands) |
| (unaudited) |
| | | | | | | | | | | | | | |
| | | | Three Months Ended | | | Six Months Ended | |
| | | | June 30, (b) | | | June 30, (b) | |
| | | | 2015 | | | 2014 | | | 2015 | | | 2014 | |
| | | | | | | | | | | | | | |
| | Fluid & Metering Technologies | | | | | | | | | | | |
| | Net sales | | $ 215,293 | | | $ 226,100 | | | $ 433,541 | | | $ 449,461 | |
| | Operating income (c) | 51,857 | | | 55,623 | | | 107,755 | | | 112,030 | |
| | Operating margin | 24.1 | % | | 24.6 | % | | 24.9 | % | | 24.9 | % |
| | EBITDA (d) | | $ 58,516 | | | $ 62,517 | | | $ 121,577 | | | $ 125,754 | |
| | EBITDA margin | 27.2 | % | | 27.7 | % | | 28.0 | % | | 28.0 | % |
| | Depreciation and amortization | $ 6,649 | | | $ 6,746 | | | $ 13,010 | | | $ 13,298 | |
| | Capital expenditures | 8,555 | | | 3,554 | | | 13,524 | | | 7,563 | |
| | | | | | | | | | | | | | |
| | Health & Science Technologies | | | | | | | | | | | |
| | Net sales | | $ 188,405 | | | $ 185,672 | | | $ 367,525 | | | $ 372,047 | |
| | Operating income (c) | | 42,060 | | | 36,137 | | | 79,517 | | | 72,366 | |
| | Operating margin | | 22.3 | % | | 19.5 | % | 21.6 | % | | 19.5 | % |
| | EBITDA (d) | | $ 51,886 | | | $ 46,418 | | | $ 99,682 | | | $ 93,369 | |
| | EBITDA margin | 27.5 | % | | 25.0 | % | 27.1 | % | | 25.1 | % |
| | Depreciation and amortization | $ 10,487 | | | $ 10,690 | | | $ 20,695 | | | $ 21,399 | |
| | Capital expenditures | 2,677 | | | 5,318 | | | 5,562 | | | 8,827 | |
| | | | | | | | | | | | | | |
| | Fire & Safety/Diversified Products | | | | | | | | | | | |
| | Net sales | | $ 111,941 | | | $ 136,182 | | | $ 218,563 | | | $ 273,466 | |
| | Operating income (c) | | 31,482 | | | 35,985 | | | 58,644 | | | 75,633 | |
| | Operating margin | | 28.1 | % | | 26.4 | % | 26.8 | % | | 27.7 | % |
| | EBITDA (d) | | $ 32,993 | | | $ 37,537 | | | $ 62,549 | | | $ 79,098 | |
| | EBITDA margin | 29.5 | % | | 27.6 | % | 28.6 | % | | 28.9 | % |
| | Depreciation and amortization | $ 1,529 | | | $ 1,672 | | | $ 3,061 | | | $ 3,352 | |
| | Capital expenditures | 1,790 | | | 2,692 | | | 3,112 | | | 4,499 | |
| | | | | | | | | | | | | | |
| | Company | | | | | | | | | | | | |
| | Net sales | | $ 514,881 | | | $ 546,693 | | | $ 1,017,079 | | | $ 1,090,689 | |
| | Operating income | | 109,909 | | | 112,088 | | | 211,666 | | | 225,923 | |
| | Operating margin | | 21.3 | % | | 20.5 | % | 20.8 | % | | 20.7 | % |
| | EBITDA (e) | | $ 128,169 | | | $ 131,367 | | | $ 250,159 | | | $ 265,303 | |
| | EBITDA margin | 24.9 | % | | 24.0 | % | 24.6 | % | | 24.3 | % |
| | Depreciation and amortization (f) | $ 19,087 | | | $ 19,416 | | | $ 37,597 | | | $ 38,673 | |
| | Capital expenditures | 13,749 | | | 12,490 | | | 23,826 | | | 23,299 | |
| | | | | | | | | | | | | | |
| (a) | Calculated by applying the two-class method of allocating earnings to common stock and participating securities as required by ASC 260, Earnings Per Share. |
| (b) | Three and six month data includes acquisition of Aegis (April 2014) and Alfa Valvole (June 2015) in the Fluid & Metering Technologies segment and Novotema (June 2015) in the Health & Science Technologies segment from the date of acquisition. |
| (c) | Segment operating income excludes unallocated corporate operating expenses. |
| (d) | Segment EBITDA calculated as operating income plus or minus other income (expense) plus depreciation and amortization. |
| (e) | Consolidated EBITDA calculated as net income plus interest expense plus provision for income taxes plus depreciation and amortization. |
| (f) | Depreciation and amortization excludes amortization of debt issuance costs. |