Exhibit 99.1

| IDEX Corporation Third Quarter 2010 Earnings Release October 19, 2010 |

| Agenda IDEX Longer Term Outlook Q3 2010 Summary Q3 2010 Segment Performance Fluid & Metering Health & Science Dispensing Equipment Fire & Safety 2010 Guidance Update Q&A 2 |

| Replay Information Dial toll-free: 800.642.1687 International: 706.645.9291 Conference ID: #97280162 Log on to: www.idexcorp.com 3 |

| Cautionary Statement Under the Private Securities Litigation Reform Act This presentation and discussion will include forward- looking statements. Our actual performance may differ materially from that indicated or suggested by any such statements. There are a number of factors that could cause those differences, including those presented in our most recent annual report and other company filings with the SEC. 4 |

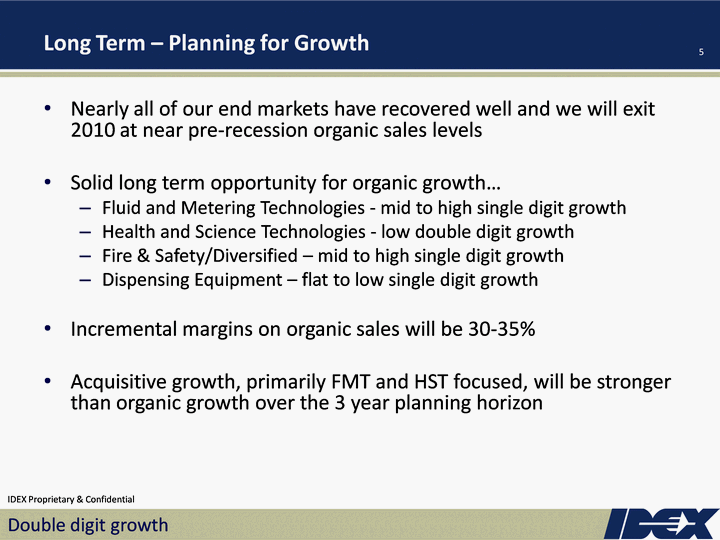
| Nearly all of our end markets have recovered well and we will exit 2010 at near pre-recession organic sales levels Solid long term opportunity for organic growth... Fluid and Metering Technologies - mid to high single digit growth Health and Science Technologies - low double digit growth Fire & Safety/Diversified - mid to high single digit growth Dispensing Equipment - flat to low single digit growth Incremental margins on organic sales will be 30-35% Acquisitive growth, primarily FMT and HST focused, will be stronger than organic growth over the 3 year planning horizon Long Term - Planning for Growth Double digit growth 5 |

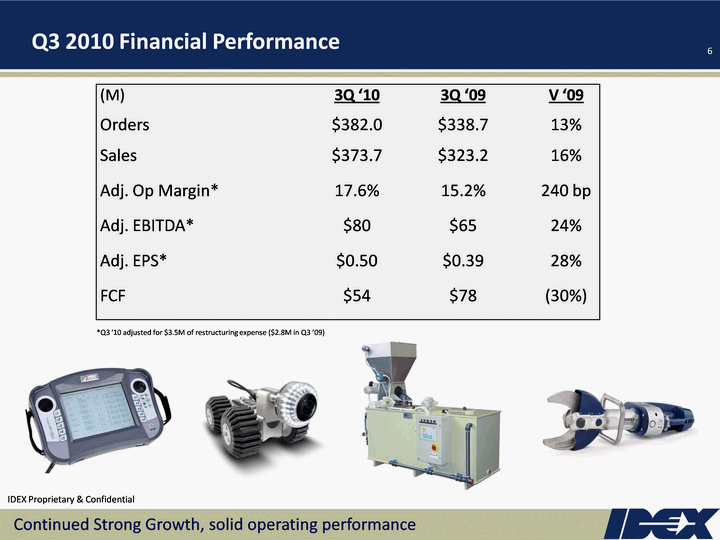
| Q3 2010 Financial Performance Continued Strong Growth, solid operating performance 6 *Q3 '10 adjusted for $3.5M of restructuring expense ($2.8M in Q3 '09) (M) 3Q '10 3Q '09 V '09 Orders $382.0 $338.7 13% Sales $373.7 $323.2 16% Adj. Op Margin* 17.6% 15.2% 240 bp Adj. EBITDA* $80 $65 24% Adj. EPS* $0.50 $0.39 28% FCF $54 $78 (30%) |

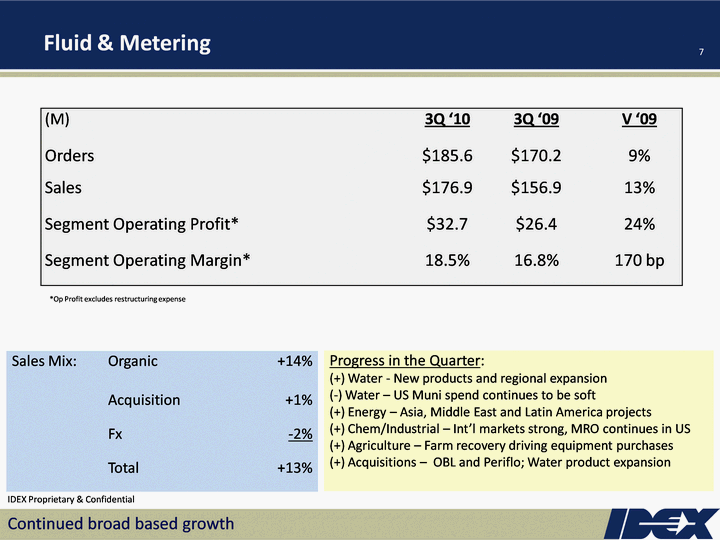
| Fluid & Metering Continued broad based growth 7 (M) 3Q '10 3Q '09 V '09 Orders $185.6 $170.2 9% Sales $176.9 $156.9 13% Segment Operating Profit* $32.7 $26.4 24% Segment Operating Margin* 18.5% 16.8% 170 bp Sales Mix: Organic +14% Acquisition +1% Fx -2% Total +13% Progress in the Quarter: (+) Water - New products and regional expansion (-) Water - US Muni spend continues to be soft (+) Energy - Asia, Middle East and Latin America projects (+) Chem/Industrial - Int'l markets strong, MRO continues in US (+) Agriculture - Farm recovery driving equipment purchases (+) Acquisitions - OBL and Periflo; Water product expansion *Op Profit excludes restructuring expense |

| Health & Science Firing on all cylinders 8 (M) 3Q '10 3Q '09 V '09 Orders $102.3 $75.5 36% Sales $104.3 $76.1 37% Segment Operating Profit* $24.0 $15.3 57% Segment Operating Margin* 23.0% 20.1% 290 bp Sales Mix: Organic +24% Acquisition +14% Fx -1% Total +37% Progress in the Quarter: (+) Continued success with UHPLC (next gen) platforms (+) Gaining content on OEM platforms (+) New product launch into dental market well received (+) Seals acquisition performing well (+) Successfully completed large facility consolidation *Op Profit excludes restructuring expense |

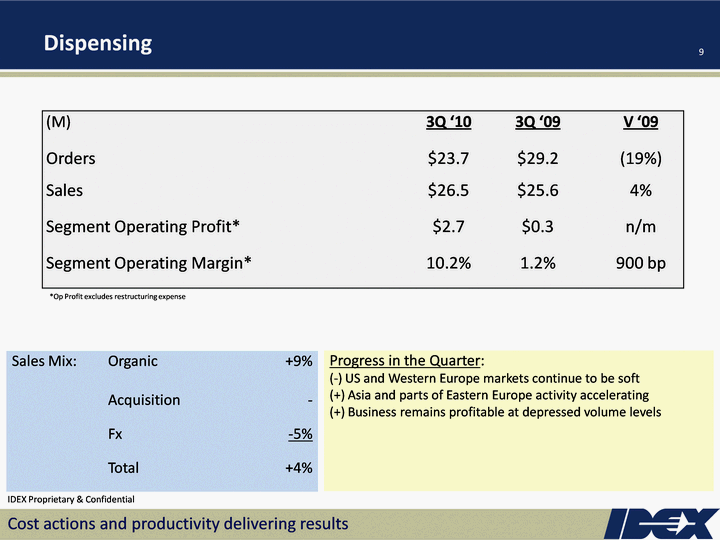
| Dispensing Cost actions and productivity delivering results 9 (M) 3Q '10 3Q '09 V '09 Orders $23.7 $29.2 (19%) Sales $26.5 $25.6 4% Segment Operating Profit* $2.7 $0.3 n/m Segment Operating Margin* 10.2% 1.2% 900 bp Sales Mix: Organic +9% Acquisition - Fx -5% Total +4% Progress in the Quarter: (-) US and Western Europe markets continue to be soft (+) Asia and parts of Eastern Europe activity accelerating (+) Business remains profitable at depressed volume levels *Op Profit excludes restructuring expense |

| Fire & Safety International gains offset domestic market softness 10 (M) 3Q '10 3Q '09 V '09 Orders $70.0 $64.3 9% Sales $67.0 $65.5 2% Segment Operating Profit* $17.0 $16.0 7% Segment Operating Margin* 25.4% 24.4% 100 bp Sales Mix: Organic +6% Acquisition - Fx -4% Total +2% Progress in the Quarter: (+) eDraulic (next gen) rescue gaining significant traction (+) International market growth (+) New applications expanding BAND IT globally (-) Fire truck builds in North America continue at historic lows (+) Fire business winning with OEM's in other parts of the world *Op Profit excludes restructuring expense |

| Outlook: 2010 Guidance Summary Q4 2010 EPS estimate range: $0.49 - $0.51 Organic revenue growth approaching 10% Negative Fx impact of ~3% to sales (at Sep 30 rates) Positive impact of ~4% from acquisitions FY 2010 EPS estimate range: $1.95 - $1.97 Organic revenue growth of ~10% Operating margins of 17%+ Negative Fx impact of ~1% to sales (at Sep 30 rates) Positive impact of ~2% from acquisitions Tax rate = 33% Other modeling items Cap Ex $34-36M Free Cash Flow significantly exceeds net income EPS estimate excludes potential restructuring and acquisition charges 11 |

| Q&A 12 |