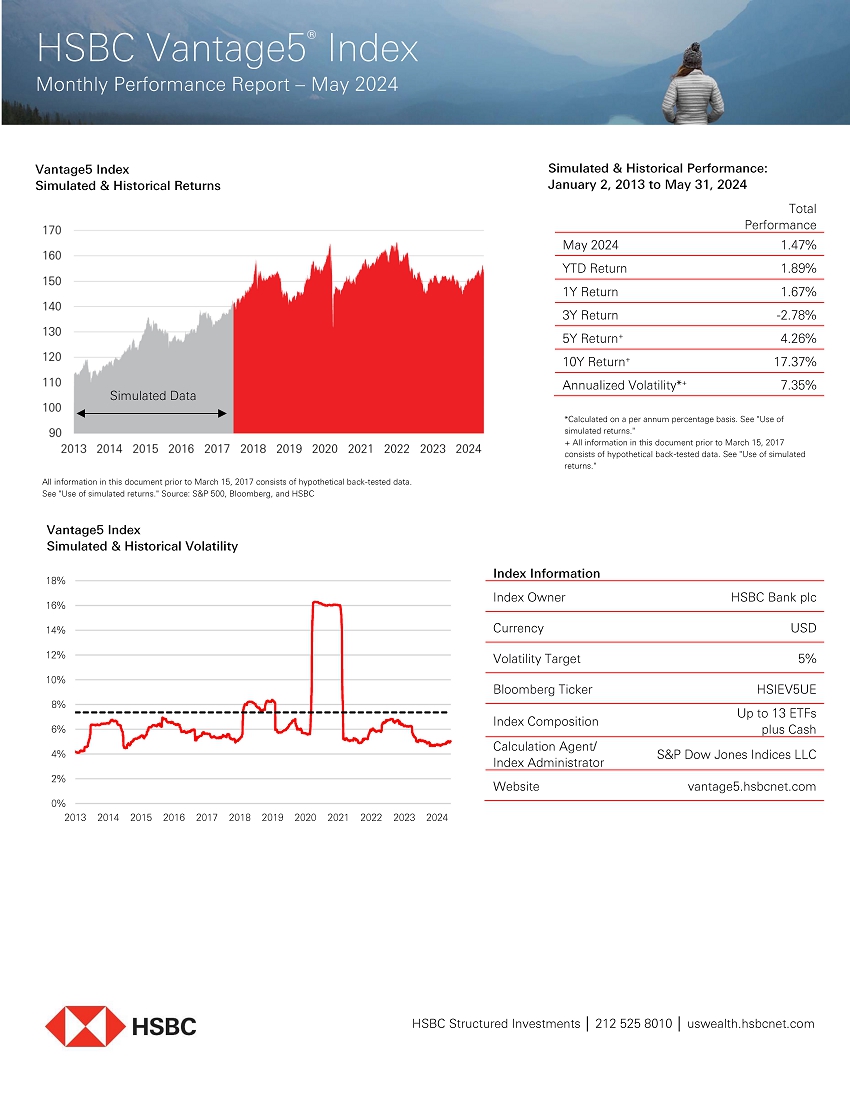
Vantage5 Index Simulated & Historical Returns 170 160 150 140 130 120 110 100 90 Simulated Data 2013 2014 2015 2016 2017 2018 2019 2020 2021 2022 2023 2024 All information in thi,:; document prior to March 15, 2017 consists of hypothetical back-tested data. See "Use of simulated returns." Source: S&P 500, Bloomberg, and HSBC Vantage5 Index Simulated & Historical Volatility 18% 16% 14% 12% 10% 8% 6% 4% 2% 0% 2013 2014 2015 2016 2017 2018 2019 2020 2021 2022 2023 2024 Simulated & Historical Performance: January 2, 2013 to May 31, 2024 Tota l Performance May 2024 1.47% YTD Return 1.89% 1 Y Return 1.67% 3Y Return -2.78% 5Y Return• 4.26% 1 0Y Return• 17.37% Annualized Volatility*' 7.35% *CJlculJted on u per unnurn percentcJge bcJsis. See "Use of simulated returns." + All informJtion in this document prior to March 15. 201 7 consists of hypotheticJI b<Jck-tested dJt<J. See ·use of simulated returns." Index Information Index Owner Currency Volatility Target Bloomberg Ticker Index Composition Calculation Agent/ Index Administrator Website HSBC Bank pie USO 5% HSIEV5UE Up to 13 ETFs lus Cash S&P Dow Jones Indices LLC vantage5. hsbcnet.com ~ HSBC HSBC Structured Investments 212 525 80 10 uswea lth.hsbcnet ..com
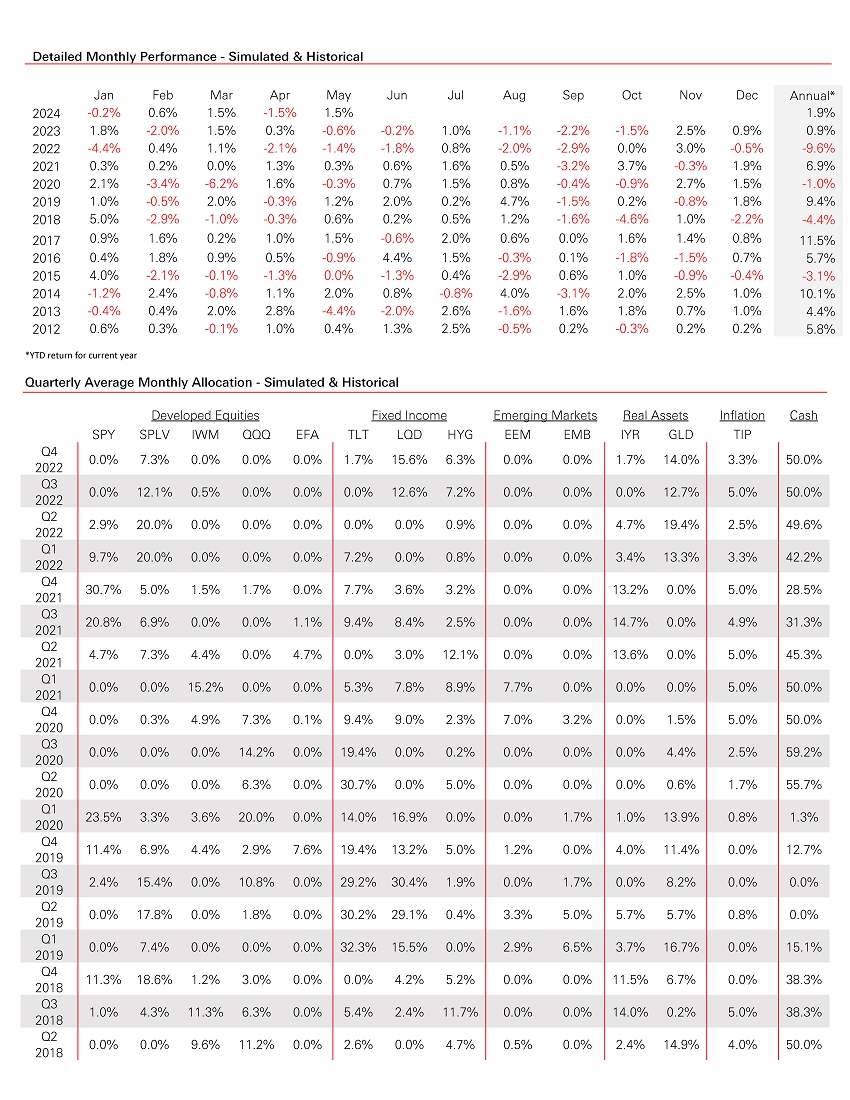
Detailed Monthly Performance - Simulated & Historical Jan Feb Mar Apr May Jun Jul Aug Sep Oct Nov Dec Annual* 2024 -0.2% 0.6% 1.5% -1.5% 1.5% 1.9% 2023 1.8% -2.0% 1.5% 0.3% -0.6% -0.2% 1.0% -1 .1% -2 .2% -1 .5% 2.5% 0.9% 0.9% 2022 -4.4% 0.4% 1.1% -2 .1% -1 .4% -1 .8% 0.8% -2 .0% -2.9% 0.0% 3.0% -0.5% -9.6% 2021 0.3% 0.2% 0.0% 1.3% 0.3% 0.6% 1.6% 0.5% -3.2% 3.7% -0.3% 1.9% 6.9% 2020 2.1% -3.4% -6.2% 1.6% -0.3% 0.7% 1.5% 0.8% -0.4% -0.9% 2.7% 1.5% -1.0% 2019 1.0% -0.5% 2.0% -0.3% 1.2% 2.0% 0.2% 4.7% -1.5% 0.2% -0.8% 1.8% 9.4% 2018 5.0% -2.9% -1 .0% -0.3% 0.6% 0.2% 0.5% 1.2% -1.6% -4.6% 1.0% -2.2% -4.4% 2017 0.9% 1.6% 0.2% 1.0% 1.5% -0.6% 2.0% 0.6% 0.0% 1.6% 1.4% 0.8% 11 .5% 2016 0.4% 1.8% 0.9% 0.5% -0.9% 4.4% 1.5% -0.3% 0.1% -1.8% -1.5% 0.7% 5.7% 2015 4.0% -2.1% -0.1% -1 .3% 0.0% -1 .3% 0.4% -2 .9% 0.6% 1.0% -0.9% -0.4% -3.1% 2014 -1 .2% 2.4% -0.8% 1.1% 2.0% 0.8% -0.8% 4.0% -3.1% 2.0% 2.5% 1.0% 10.1% 2013 -0.4% 0.4% 2.0% 2.8% -4.4% -2 .0% 2.6% -1 .6% 1.6% 1.8% 0.7% 1.0% 4.4% 2012 0.6% 0.3% -0.1% 1.0% 0.4% 1.3% 2.5% -0.5% 0.2% -0.3% 0.2% 0.2% 5.8% Quarterly Average Monthly Allocation - Simulated & Historical Develoged Eguities Fixed Income Emerging Markets Rea l Assets Inflation Cash SPY SPLV IWM 000 EFA TLT LOO HYG EEM EMB IYR GLD TIP 04 0.0% 7.3% 0.0% 0.0% 0.0% 1.7% 15.6% 6.3% 0.0% 0.0% 1.7% 14.0% 3.3% 50.0% 2022 03 0.0% 12.1% 0.5% 0.0% 0.0% 0.0% 12.6% 7.2% 0.0% 0.0% 0.0% 12.7% 5.0% 50.0% 2022 02 2.9% 20.0% 0.0% 0.0% 0.0% 0.0% 0.0% 0.9% 0.0% 0.0% 4.7% 19.4% 2.5% 49.6% 2022 01 9.7% 20.0% 0.0% 0.0% 0.0% 7.2% 0.0% 0.8% 0.0% 0.0% 3.4% 13.3% 3.3% 42.2% 2022 04 30.7% 5.0% 1.5% 1.7% 0.0% 7.7% 3.6% 3.2% 0.0% 0.0% 13.2% 0.0% 5.0% 28.5% 2021 03 20.8% 6.9% 0.0% 0.0% 1.1% 9.4% 8.4% 2.5% 0.0% 0.0% 14.7% 0.0% 4.9% 31 .3% 2021 02 4.7% 7.3% 4.4% 0.0% 4.7% 0.0% 3.0% 12.1% 0.0% 0.0% 13.6% 0.0% 5.0% 45.3% 2021 01 0.0% 0.0% 15.2% 0.0% 0.0% 5.3% 7.8% 8.9% 7.7% 0.0% 0.0% 0.0% 5.0% 50.0% 2021 04 0.0% 0.3% 4.9% 7.3% 0.1% 9.4% 9.0% 2.3% 7.0% 3.2% 0.0% 1.5% 5.0% 50.0% 2020 03 0.0% 0.0% 0.0% 14.2% 0.0% 19.4% 0.0% 0.2% 0.0% 0.0% 0.0% 4.4% 2.5% 59.2% 2020 02 0.0% 0.0% 0.0% 6.3% 0.0% 30.7% 0.0% 5.0% 0.0% 0.0% 0.0% 0.6% 1.7% 55.7% 2020 01 23.5% 3.3% 3.6% 20.0% 0.0% 14.0% 16.9% 0.0% 0.0% 1.7% 1.0% 13.9% 0.8% 1.3% 2020 04 11.4% 6.9% 4.4% 2.9% 7.6% 19.4% 13.2% 5.0% 1.2% 0.0% 4.0% 11 .4% 0.0% 12.7% 2019 03 2.4% 15.4% 0.0% 10.8% 0.0% 29.2% 30.4% 1.9% 0.0% 1.7% 0.0% 8.2% 0.0% 0.0% 2019 02 0.0% 17.8% 0.0% 1.8% 0.0% 30.2% 29.1% 0.4% 3.3% 5.0% 5.7% 5.7% 0.8% 0.0% 2019 01 0.0% 7.4% 0.0% 0.0% 0.0% 32.3% 15.5% 0.0% 2.9% 6.5% 3.7% 16.7% 0.0% 15.1% 2019 04 11.3% 18.6% 1.2% 3.0% 0.0% 0.0% 4.2% 5.2% 0.0% 0.0% 11 .5% 6.7% 0.0% 38.3% 2018 03 1.0% 4.3% 11 .3% 6.3% 0.0% 5.4% 2.4% 11 .7% 0.0% 0.0% 14.0% 0.2% 5.0% 38.3% 2018 02 0.0% 0.0% 9.6% 11.2% 0.0% 2.6% 0.0% 4.7% 0.5% 0.0% 2.4% 14.9% 4.0% 50.0% 2018
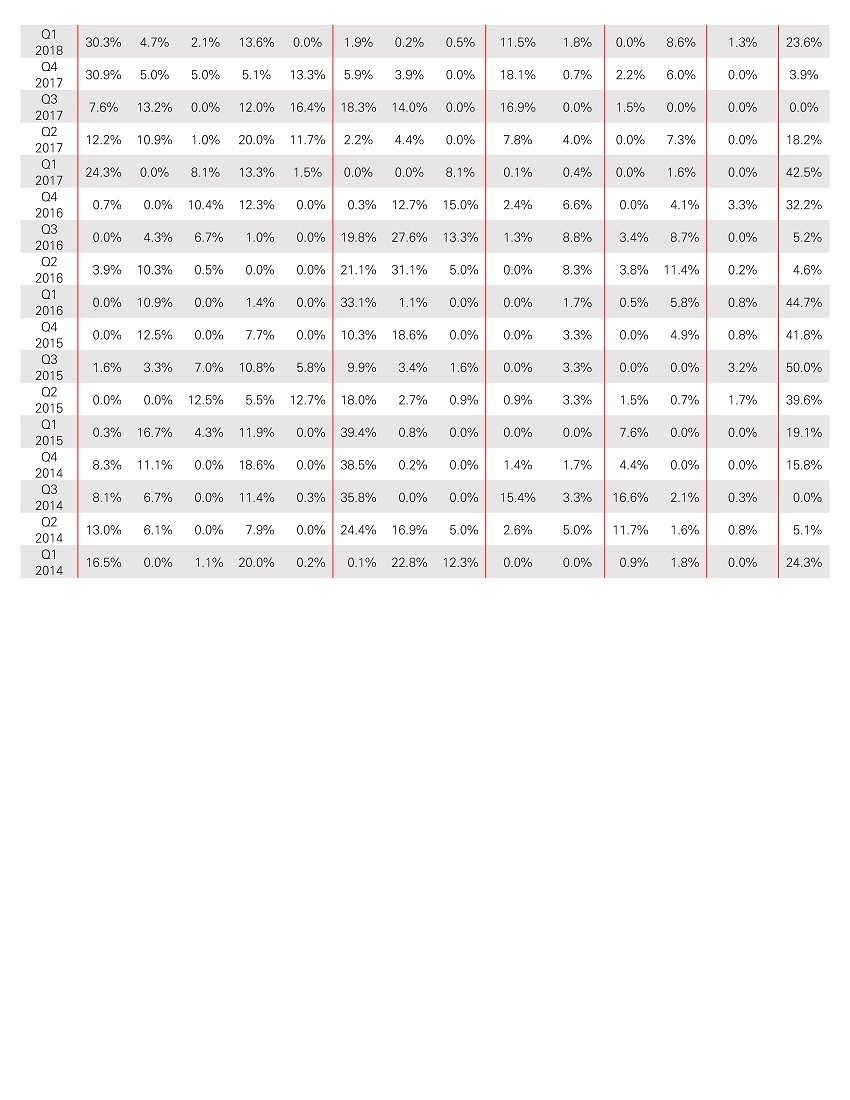
01 30.3% 4.7% 2.1% 13.6% 0.0% 1.9% 0.2% 0.5% 11.5% 1.8% 0.0% 8.6% 1.3% 23.6% 201 8 04 30.9% 5.0% 5.0% 5.1% 13.3% 5.9% 3.9% 0.0% 18. 1% 0.7% 2.2% 6. 0% 0.0% 3.9% 2017 03 7.6% 13.2% 0.0% 12.0% 16.4% 18.3% 14.0% 0.0% 16.9% 0.0% 1.5% 0.0% 0.0% 0.0% 2017 02 12.2% 10.9% 1.0% 20.0% 11 .7% 2.2% 4.4% 0.0% 7.8% 4.0% 0.0% 7.3% 0.0% 18.2% 201 7 01 24.3% 0.0% 8.1% 13.3% 1.5% 0.0% 0.0% 8.1% 0.1% 0.4% 0.0% 1.6% 0.0% 42.5% 2017 04 0.7% 0.0% 10.4% 12.3% 0.0% 0.3% 12.7% 15.0% 2.4% 6.6% 0.0% 4.1% 3.3% 32.2% 201 6 03 0.0% 4.3% 6.7% 1.0% 0.0% 19.8% 27.6% 13.3% 1.3% 8.8% 3.4% 8.7% 0.0% 5.2% 2016 02 3.9% 10.3% 0.5% 0.0% 0.0% 21.1 % 31.1% 5.0% 0.0% 8.3% 3.8% 11 .4% 0.2% 4.6% 201 6 01 0.0% 10.9% 0.0% 1.4% 0.0% 33. 1% 1.1% 0.0% 0.0% 1.7% 0.5% 5.8% 0.8% 44.7% 2016 04 0.0% 12.5% 0.0% 7.7% 0.0% 10.3% 18.6% 0.0% 0.0% 3.3% 0.0% 4.9% 0.8% 41 .8% 2015 03 1.6% 3.3% 7.0% 10.8% 5.8% 9. 9% 3.4% 1.6% 0.0% 3.3% 0.0% 0.0% 3.2% 50.0% 2015 02 0.0% 0.0% 12.5% 5.5% 12.7% 18.0% 2.7% 0.9% 0.9% 3.3% 1.5% 0.7% 1.7% 39.6% 2015 01 0.3% 16.7% 4.3% 11 .9% 0.0% 39.4% 0.8% 0.0% 0.0% 0.0% 7.6% 0.0% 0.0% 19.1% 2015 04 8.3% 11 .1% 0.0% 18.6% 0.0% 38.5% 0.2% 0.0% 1.4% 1.7% 4.4% 0.0% 0.0% 15.8% 2014 03 8.1% 6.7% 0.0% 11 .4% 0.3% 35.8% 0.0% 0.0% 15.4% 3.3% 16.6% 2.1% 0.3% 0.0% 2014 02 13.0% 6.1% 0.0% 7.9% 0.0% 24.4% 16.9% 5.0% 2.6% 5.0% 11.7% 1.6% 0.8% 5.1% 2014 01 16.5% 0.0% 1.1% 20.0% 0.2% 0.1% 22.8% 12.3% 0.0% 0.0% 0.9% 1.8% 0.0% 24.3% 2014

Risks related to the index Please review carefully these risk factors. and any risk fact ors in an offering document for any security or financial instrument referencing the Index. before making any investment S&P, the Index Calculation Agent, may adjust the Index in a way that affects its level, and S&P has no obligation to consider your interests. The Index may not be successful and may not outperform any alternative st rategy that might be employed in respect of the ETFs or achieve its target volatility. The Index hns n limited opemting history nnd mny perform in unn nticipnted wnys. The ETFs composing the Index may be replaced by a substit ute ETF in certain ext raordinary events. The Index may perform poorly during periods characterized by short-term volat ility. An investment linked to the Index carries the risks associated w ith t he Index's momentum investment strategy. The Index may be partially uninvested. Correlat ion of performnnces nmong the ETFs may reduce the periormnnce of the Index. The Index is subject to market risks Changes in the value of the ETFs may offset each other. The level of the Index will include the deduction of a change in the SOFR plus a spread adjustment of 0.26161 % and a fee. The Index compri ses notional assets. Important Information Any information relating to performance contained in t hese materials prior to March 15, 2017 is illust ra t ive only No assurance is given that any indicative returns, periormance or results. whether historical or hypothetical, w ill be achieved. Any specific terms or methodology remains subiect t o change, and HSBC undertakes no duty to update this information. This document may be amended, superseded or replaced in its entirety by a subsequent term sheet, disclosure or prospectus supplement, and/or offering circular or similar document and the documents referred to therein. In the event of Jny inconsistency between t he informntion presented herein end Jny such term sheet. disclosure or prospectus supplement. nndior offering c irculm or similm document. such term sheet. disclosure or prospectus supplement. end/or offering circulm or sirn ilm document slrn ll govern. Use of simulated returns Any historical performance information included in this document prior to March 15, 2017 represents only hypothetical historical results. You should note t hat the index constituents have not t raded together in the manner shown in the composite hypothetical historical results. No representation is being made that t he indices w ill achieve a periormance record similur to thnt shown. In foct. there muy often be shurp differences between hypothetic~! periormunce nnd JctuJI performunce. Back-testing and other stJtistica l analysis material provided to you in connect ion with the explanations of the potential returns associated with an investment in the Index use simulJted analysis and hypothetical assumptions in order to illust rate t he manner in which the Index may have performed in peri ods prior to the actual existence of the Index. The hypothet icnl back-tested Jnnunlized periomrnnce nnd Jnnunlized volatility of the Index huve inherent limirntions. These perfo rmance end volntility results were nchieved by means of a retroactive application of a back-tested volatility model designed w ith the benefit of hindsight. All hypothetical levels shown have inherent limitations. Alternative modelling techniques or assumptions may produce different hypothet ical information that mig ht prove to be more appropriate and that might differ signif icant ly from the hypothetical informat ion set forth above. Actual annualized periormance and volatilities may vary materially from the informat ion shown. The results obtnined from "bnck-testing" inforrnntion should not be considered indicntive of nct unl results that might be obtnined from nn investment or pnrticipntion in n financinl instrument or transaction referencing the Index. You should not place undue reliance on t he "back-t esting" information. w hich is provided for illustrati ve purposes only. HSBC provides no assurance or guarantee that t he Index will operate or would have operated in the past in a manner consistent w ith the results presented in t hese mat erials. Hypothetical back-tested results are neither an indicator nor a guarantee of future ret urn s. Actual results will vary, perhaps materially, from the analysis implied in the hypothet ica l in formcit ion. You should review und consider t he hypothet irnl infomrntion only w ith the f ull Index methodology. HSBC has filed a regist ration statement (including a prospectus and prospectus supplement) w ith the Securities and Exchange Commission for any offering t o which this free w rit ing prospectus may relate. Before you invest, you should read th e prospectus and prospectus supplement in that registrat ion statement and other documents HSBC has fi led w ith the SEC for more complete information about HSBC and any related offering. You may get these documents for free by visiting EDGAR on the SEC's web site at www.sec.gov. Alternat ively, HSBC Securities (USA) Inc. or any dealer partic ipating in the related offering will arrange to send you t he prospectus and prospectus supplement if you request them by calling to ll-free 1-866-8 11 -8049 Data sourced and ca lculated by Bloomberg and HSBC HSBC Vantage5 Index (the " Index") is the exclusive property of HSBC Bank pie and its affiliates, which has contracted with S&P Opco, LLC (a subsidiary of S&P Dow Jones Indices LLC) to ildminister. mnintnin end cci lculilte the Index. The Index is not endorsed by S&P or its cffilintes or its thi rd -puny licensors. including Swndnrd & Poor's Finilnciul Services LLC end Dow Jones Trademmk Holdings LLC (collectively "S&P Dow Jones Indices"). " Cil lculnted by S&P Custom Indices" ,ind its reluted stylized mnrk(s) Jre service mnrks of S&P Dow Jones Indices and have been licensed for use by HSBC Bank pie and its affiliates. S&F" is a registered trademark of St andard & Poor's Financial Services LLC and Dow Jones' is a registered trademark of Dow Jones Trademark Holdings LLC. S&P Dow Jones Indices shall have no liability for any errors or omissions in calc ulating the Index. HSBC Bank pie. ilS the index owner. mnkes no express or implied represenwtions or warrnnties ns to (il) the advisability of purchnsing or nssuming nny risk in connection w ith Jny transact ion or investment linked to t he Index. (b) the levels at which the Index stands at any particular t ime on any particular date. (c) the results to be obtained by any party from the use of the Index or any data included in it for the purposes of issuing any financial inst ruments or carrying out any financial t ransaction linked to the Index or (d) any other matte r. Calculations may be based on information obtained from various publicly available sources. The index calculation agent has relied on these sources and has not independent ly verif ied the information extracted from these sources and accept no responsibility or liabi lity in respect thereof 1 This cap can increase in increments of 10% (subject to a maximum weight of 100%) as described furt her in the offering document. ~ HSBC ISSUER FREE WRITING PROSPECTUS Filed Pursuilnt to Rule 433 Registrntion Stmement No. 333-277211 June 3. 2024